Driven by our passion for food, together we serve and help ...
204
Annual Report and Financial Statements 2021 Driven by our passion for food, together we serve and help every customer
-
Upload
khangminh22 -
Category
Documents
-
view
4 -
download
0
Transcript of Driven by our passion for food, together we serve and help ...

Annual Report and Financial Statements 2021
Driven by our passion for food, together we serve and help every customer

Offering delicious, great quality food at competitive prices has been at the heart of what we do since John James and Mary Ann Sainsbury opened our first store in 1869. Today, inspiring and delighting our customers with tasty food remains our priority.
Our purpose is that driven by our passion for food, together we serve and help every customer.
Our focus on great value food and convenient shopping, whether in-store or online is supported by our brands – Argos, Habitat, Tu, Nectar and Sainsbury’s Bank. Sainsbury’s has over 600 supermarkets and over 800 convenience stores. Argos is a leading digital retailer and is the third most visited retail website in the UK, with over 90 per cent of its sales starting online. Argos is conveniently available for customers to collect from hundreds of Sainsbury’s stores. Digital and technology enables us to adapt as customers shop differently and our profitable, fast-growing online channels offer customers quick and convenient delivery and collection capability.
Our 189,000 colleagues are integral to our success, now and in the future.

Performance highlights
£356mUnderlying profit before tax, down 39 per cent
£(261)mStatutory loss before tax, versus statutory profit before tax of £255m in 2019/20
7.3%Retail sales growth (inc. VAT, excl fuel)
11.7pUnderlying basic earnings per share, down 41 per cent
(13.0)pBasic loss per share, versus 5.8p basic earnings per share in 2019/20
5.5%Return on capital employed, down 190 bps
£35mRaised for good causes
14%reduction in absolute greenhouse gas emissions within our own operations, against our 2018/19 baseline
81%Percentage of colleagues that are highly engaged
7%Increase in colleague friendliness score
Read more about our KPIs on page 24.
Strategic Report01 Contents and Performance highlights02 Chairman’s letter04 Chief Executive Officer’s Q&A 07 Business model09 Our strategy10 Our priorities14 Net Zero17 Our people19 Engaging with our stakeholders and
our Section 172 statement23 Non-financial information statement24 Our KPIs26 Financial Review32 Our principal risks and uncertainties
Governance Report46 Board of Directors50 Operating Board 53 Board leadership and Company purpose56 Division of responsibilities57 Composition, succession and evaluation62 Corporate Responsibility and Sustainability
Committee Report64 Audit, risk and internal control70 Annual Statement from the Remuneration
Committee Chair76 Annual Report on Remuneration88 Additional statutory information
Financial Statements92 Statement of Directors’ Responsibilities93 Independent auditor’s report to the
members of J Sainsbury plc100 Consolidated Financial Statements105 Notes to the Consolidated Financial
Statements108 Income Statement Notes122 Financial Position Notes163 Cash Flows Notes169 Employee Remuneration Notes178 Additional Disclosures184 Company Financial Statements186 Notes to the Company Financial Statements 191 Additional shareholder information194 Alternative performance measures199 Glossary
Find out more atwww.about.sainsburys.co.uk/ar2021
01Strategic Report J Sainsbury plc Annual Report 2021
Governance ReportStrategic Report
Financial Statements

2020/21 highlights
£356mUnderlying profit before tax, down 39 per cent
£(261)mStatutory loss before tax, versus statutory profit before tax of £255m in 2019/20
11.7pUnderlying basic earnings per share, down 41 per cent
(13.0)pBasic loss per share, versus 5.8p basic earnings per share in 2019/20
7.4pProposed final dividend per share
10.6pProposed full-year dividend per share
This has been an exceptional year and I am so proud of how our business has adapted to help and support our customers, colleagues and communities throughout the COVID-19 pandemic. Safety has been our highest priority over the past 12 months and, by acting quickly and decisively, we have helped keep our colleagues and customers safe. Our colleagues have worked relentlessly to keep shelves full and, by working closely with suppliers, we have maintained good product availability.
We have prioritised elderly and vulnerable customers for home deliveries, supported food banks and donated millions of pounds to charity. I am pleased with how Sainsbury’s has stepped up. Our colleagues have been on the frontline of our national response and we are grateful to them for pulling together to protect our customers and each other.
Throughout the year we have had three key priorities: keeping our customers and colleagues safe, helping to feed the nation and supporting our communities and those most vulnerable in society.
Led first by Mike Coupe and then by Simon Roberts, we have been guided by a clear sense of purpose. We have tried to do the right thing throughout the pandemic and the Board has been fully behind the Executive Team as they have worked tirelessly on behalf of our customers.
Simon became Chief Executive on 1 June 2020. In his first year Simon has led Sainsbury’s brilliantly and his unwavering commitment to always put the welfare of our customers and colleagues first is testimony to his strong character and values. His energy and passion have been instrumental in helping us respond quickly and his strategic vision for Sainsbury’s is clear. Simon leads a highly capable Operating Board, who deserve to be recognised for everything they have achieved this year. I am looking forward to continuing to work closely with them as we drive value for all our stakeholders.
“I am so pleased with how Sainsbury’s has stepped up. Our colleagues have been on the frontline of our national
response and we are so grateful to them for pulling
together to protect our customers and each other.”
Financial reviewWe delivered a strong operating performance, with grocery sales up 7.8 per cent, general merchandise sales up 8.3 per cent and digital sales up 102 per cent. Underlying profit before tax was £356 million, a decrease of 39 per cent, impacted by £485 million of direct COVID-19 costs incurred while protecting our customers and colleagues. We gave full pay to all colleagues who were required to shield for each shielding period and supported colleagues who needed to self-isolate. We invested more than £100 million in our frontline colleagues through increasing the hourly rate of pay for Sainsbury’s and Argos store colleagues and awarding three special recognition payments. We did not take up the government’s offer of furlough payments, we repaid business rates relief on all Sainsbury’s stores and did not defer VAT payments. This year we made a loss before tax of £261 million; this reflects one-off costs and impairments mainly associated with the bold decisions and choices we are making to set our business up for the future. Underlying basic earnings per share was 11.7 pence and basic loss per share was 13.0 pence. We generated retail free cash flow of £784 million to reinvest in the customer offer and shareholder returns and we are upgrading our four-year net debt reduction target to at least £950 million from £750 million by 2022/23.
More information on our financial performance can be found in the Financial Review on pages 26-31.
02 Strategic Report J Sainsbury plc Annual Report 2021
Chairman’s letterChairman Martin Scicluna reviews the business activity in the year.

RemunerationAs noted at our interim results in November, given the unexpected pressures our business has had to manage this year and the challenges facing our colleagues, Simon informed the Board that if a bonus was payable, he would waive his bonus entitlement for this financial year. Simon’s decision is a personal one and another example of his integrity as a leader.
For more information on this year’s remuneration awards please see pages 70 to 87.
DividendThe Board has proposed a final dividend of 7.4 pence per share, bringing the full-year dividend to 10.6 pence per share, which is in line with last year (when treating the Special dividend announced in November 2020 of 7.3p as part of 2019/20), despite lower underlying profits and diverging from our policy of a dividend covered 1.9x by underlying earnings. This reflects the Board’s belief that shareholders should not bear the full short-term financial impact this year of the business making the right decisions for customers and colleagues through the COVID-19 pandemic. Given our strong underlying cash generation, it also reflects the Board’s commitment to prioritise payment of dividends to shareholders over net debt reduction.
Business ratesBack in December we decided to forgo business rates relief on all Sainsbury’s stores. In March we announced we would continue to forgo the relief offered to retailers on all Sainsbury’s stores until the end of June and that we would also forgo the business rates relief on all standalone Argos stores once they re-open. This rates relief would have largely offset the £485 million of costs associated with helping to protect our customers and colleagues from COVID-19. As an essential business, Sainsbury’s stores have been able to stay open throughout lockdowns and we believe repaying business rates on those stores is the right thing to do. Our hope is that this goes some way towards helping other affected businesses and encourages broader discussion around business taxation and the urgent need for business rates reform.
Brexit This year we also had to navigate the considerable complexities of Britain’s departure from the European Union. We invested significant time and effort in contingency planning prior to the formal exit and our teams were well placed to respond to the final deal. Despite this, a lot remains unclear and the additional bureaucracy required to import and export items from and into the European Union is
a significant challenge. We continue to urge the government to find solutions that simplify border requirements, particularly in Northern Ireland where the added complexity risks impacting choice and availability for customers longer term.
Our plan to put food back at the heart of Sainsbury’sWe are clear on our purpose: driven by our passion for food, together we serve and help every customer. Everything we do is rooted in doing a better job for customers. As well as adapting to respond to the pandemic, Simon has been transforming the way we work so we can put food back at the heart of our business.
Building on everything we have learnt over the last 12 months, we are raising our ambitions and speeding up the pace of change across our business, simplifying our operations and accelerating our cost savings programmes. We are on track to reduce our retail operating cost to sales ratio by 200bps by March 2024 so we can invest in food quality, choice, innovation and consistently lower prices for our customers. Simon has made some bold choices and we recognise that it has been a year of significant change for our colleagues. We are confident that our plan is the right one for the highly competitive and rapidly evolving market that we operate in and we have made good early progress.
Net ZeroWe are investing £1 billion to become Net Zero across our own operations by 2040. The Board is accountable for the delivery of our Net Zero plan and we regularly review progress and plans as part of our Board agenda. Despite the challenges presented by the pandemic, we have been making good progress and I am pleased with the initiatives we have launched so far, such as adding a new commitment to reduce our absolute GHG by 30 per cent by 2030 and signing up to Science Based Targets.
We are the Principal Supermarket Partner for the UN Climate Change Conference, COP26, set to take place in Glasgow this November. This is a clear demonstration of our commitment in this area. On 17 June this year, we will host our inaugural Environmental, Social and Governance day for investors, demonstrating that helping everyone eat better is imperative to our business strategy and long-term success. We are also signatories of the Task Force on Climate-related Financial Disclosures, to provide consistent information to our stakeholders.
BoardIn May last year Mike Coupe retired after 15 years at Sainsbury’s, with almost six of those as Chief Executive. Mike was bold and ambitious and made sound strategic moves for Sainsbury’s. He remained committed to
our business throughout and was instrumental in shaping our response to the start of the pandemic. I would like to thank him again for his tremendous efforts.
In July we appointed Keith Weed as a member of the Audit Committee, the Corporate Responsibility and Sustainability Committee and the Nomination Committee. Keith is an exceptionally capable marketing and digital leader who has championed new ways of integrating sustainability into businesses and building brands with purpose.
The Board was also pleased to appoint Tanuj Kapilashrami to the Nomination and Remuneration Committees in July. Tanuj is a thoughtful and energetic HR leader who has significant international insights. She will be an excellent addition to the Board as we continue to adapt our business and support our colleagues in a rapidly changing marketplace.
Keith and Tanuj replace Matt Brittin and Jean Tomlin who both stepped down earlier this financial year. We would like to thank both Matt and Jean for their service to Sainsbury’s and we wish them both well.
In January this year Lesley Jones became Chair of Sainsbury’s Bank, replacing Roger Davis. Her extensive experience in banking will be highly valuable to us as we work to deliver the five-year plan we set out at our Capital Markets Day in September 2019. On behalf of the Board, I would like to thank Roger for his stewardship over the past seven years.
In April this year Adrian Hennah joined the Audit Committee and Nomination Committee and he will take over as Chair of the Audit Committee following our AGM. Adrian replaces David Keens who has served on the Board for six years. I would like to thank David for his service. He has been a wise counsel and influential voice on the Board and we are grateful for his significant contribution.
More information on our Board of Directors can be found on pages 46-49.
Thank youAs I said at the beginning, this has been an exceptional year. I want to say a heartfelt thank you to all our colleagues who stepped up to feed the nation. We are very proud of you. And, a massive thank you to our leadership team, led by Simon. They have led our teams superbly and ably dealt with safety, the shift to home working for office colleagues, increased customer demand and supply challenges, including Brexit. We are committed to sustaining our renewed sense of purpose and agility.
Martin SciclunaChairman
03Strategic Report J Sainsbury plc Annual Report 2021
Governance ReportStrategic Report
Financial Statements

2020/21 highlights
£356mUnderlying profit before tax, down 39 per cent
£(261)mStatutory loss before tax, versus statutory profit before tax of £255m in 2019/20
7.3%Retail sales growth (inc. VAT, excl fuel)
£640mNon-lease net debt
14%reduction in absolute greenhouse gas emissions within our own operations, against our 2018/19 baseline
An extraordinary year 1. How would you sum up the
last year?Looking back over the last 12 months, I am humbled by everything my colleagues have achieved and delivered. Those in stores and depots have been nothing short of heroic on the frontline every day, going above and beyond to serve our customers and communities. Colleagues usually based in offices have had to quickly adapt how they work, focusing all efforts on keeping essential items available and helping customers. I am enormously grateful to each and every one of my colleagues for the way they have looked after our customers and each other. Our industry has stepped up and worked tirelessly across food supply chains and we are hugely proud of the part Sainsbury’s has played. I also want to especially recognise our suppliers for all their support and partnership throughout this year in keeping goods flowing for our customers. They have done a fantastic job.
It has been a year of significant progress and change for our business. As well as navigating the challenges of the pandemic, we are absolutely focused on listening and responding to our customers; we have a three-year plan to put food back at the heart of Sainsbury’s and we are fully mobilised to deliver this. As a result, we are transforming the way we work and I am encouraged that we are already making good progress against our plan, making a number of bold strategic choices and adapting and simplifying how we do things. Only by making these changes can we strengthen our business and do the best job for our customers both now and in the future.
2. How has the business adapted to the pandemic?
At the heart of absolutely every decision we made last year was doing the right thing for our customers and our colleagues – and safety has been our priority. We installed safety screens at checkouts, provided hand sanitiser stations and implemented social distancing floor markers and signs in and outside stores and ran a number of campaigns reminding customers how to shop safely with us. We have greeters and security guards at store entrances to help colleagues and customers feel safe and I am grateful that shoppers have largely supported us with this. I am pleased that customers recognised our efforts and we achieved record customer satisfaction scores for availability, friendliness and speed of service and were recognised for best customer safety according to an external survey.
“I am humbled by everything my colleagues
have achieved and delivered. Those in stores
and depots have been nothing short of heroic on
the frontline every day, going above and beyond to
serve our customers and communities.”
We have responded with tremendous energy, agility and pace. We recruited thousands more frontline colleagues and Argos, Habitat and Sainsbury’s Bank colleagues worked in Sainsbury’s to help our efforts to feed the nation. Customer demand for online grocery shopping skyrocketed and our teams worked around the clock to more than double capacity. We have prioritised over 12 million elderly and vulnerable customers for home delivery and Click & Collect and also given priority store access to these customers, as well as NHS and care workers, to help them shop as safely as possible.
04 Strategic Report J Sainsbury plc Annual Report 2021
Chief Executive Officer’s Q&AIn his first year as Chief Executive Officer of Sainsbury’s, Simon Roberts
explains how the business has adapted to serve and help every customer.

We remain totally focused on keeping our customers and colleagues safe. This has been and will continue to be our top priority. We will continue to put doing what is right for our customers and colleagues first every time.
3. Tell us about this year’s financial results?
It is fair to say that the pandemic has heavily influenced this year’s financial results. Group like-for-like sales, including VAT and excluding fuel, were up 7.3 per cent. Grocery sales were up 7.8 per cent, general merchandise sales were up 8.3 per cent and digital sales were up 102 per cent. Food and Argos sales are significantly higher as customers spent more time at home. Groceries Online had an exceptional year as more people opted for home delivery and Click & Collect. Underlying profit before tax was down 39 per cent to £356 million, with the benefit to profits of strong sales growth more than offset by £485 million of COVID-19 costs and the impact of COVID-19 on Financial Services. Loss before tax was £261 million, reflecting one-off costs and impairments associated with strategic changes announced in November. Retail free cash flow of £784 million was very strong, with a working capital inflow of more than £400 million, driven by strong trading, particularly at Argos. While some of this working capital benefit will reverse as trading normalises, our underlying free cash flow remains strong. This enables us to pay down debt and pay a consistent dividend. We expect to generate average retail cash flow of at least £500 million per year over the three years to March 2025 and we are upgrading our four-year net debt reduction target to at least £950 million from £750 million by 2022/23. We are pleased to propose a full-year dividend which is in line with last year, protecting shareholder income from the full impact of COVID-19 on profits.
More information on our financial performance can be found in the Financial Review on pages 26-31.
The market4. What is going on in the
retail market?The pandemic has totally transformed how customers are shopping and what they are buying. It has been a really tough year for lots of retailers and with many shops being forced to close and people spending more time at home.
In food retail, we have seen a return of the weekly shop – transactions have declined significantly and basket size has increased. People have been enjoying scratch cooking at home and making the most of seasonal celebrations and special moments such as Halloween, Christmas, Mother’s Day and Easter. But, despite large supermarkets serving more shoppers, the cost of keeping everyone safe in stores and throughout supply chains has heavily affected our profits.
General merchandise sales have declined overall, but Argos has benefited from being largely an online retailer. People have focused their spending on home improvements, office and fitness equipment and entertainment. The clothing market has faced similar challenges and declined overall.
5. What are the big trends you are seeing?
There is fierce competition in the food retail industry. Value will be an important battleground as people work hard to manage their budgets, which is why we are so focused on offering great value. But we also know that customers are prepared to trade up to new and interesting products and we are tripling the rate at which we add new products to our ranges. Customers expect more than ever to be able to choose to shop how and when suits them best, fuelling the rise of “on demand” services across food service and grocery in particular. COVID-19 has introduced many customers to online shopping for the first time and across grocery, general merchandise and clothing this has accelerated dramatically the pace of online growth. The rate of digital sales growth across Sainsbury’s, Argos and Tu clothing is a demonstration of the strength of our digital platforms and the flexibility of our fulfilment network. This positions us well in the rapidly changing retail environment.
6. In a challenging market, what gives you confidence?
Our business is built on great assets and great people. Sainsbury’s is a trusted brand that is loved by millions of customers. Our scale is a source of competitive advantage, as is our strength in food and our convenient locations. We have strong positive operating cash flows and serve an attractive customer base, with a bias to a more affluent demographic than many of our competitors. We have invested in technology and Nectar is now a powerful platform for us to reward loyalty and get to know our customers even better. All of this is a really strong foundation to build on and it gives the team and me real confidence that we can build on it to deliver improved performance and improved shareholder returns.
To read more about our business model see page 7.
The new plan7. What is your new plan?We will totally transform our business over the next three years. We are putting food back at the heart of Sainsbury’s, building on the changes we have made as we have adapted our business during the pandemic. We are raising our ambitions, speeding up the pace of change, simplifying our operations and accelerating our cost savings programmes so we can invest more in food quality, choice, innovation and consistently lower prices for our customers.
Our portfolio brands are supporting our core food business, delivering for both customers and shareholders. We are reducing complexity, transforming our cost base by at least two per cent of sales and are focused on robust profit delivery and consistent, dependable cash flow. And we will pursue partnerships or outsource where it makes sense for our business and our customers.
We have a lot to do, but we have the right strategy and the right team in place to deliver for our customers, which will in turn deliver for all our stakeholders.
More information on our strategy can be found on page 9.
05Strategic Report J Sainsbury plc Annual Report 2021
Governance ReportStrategic Report
Financial Statements

8. What progress have you made against your plan this year?
We are right at the start but I am pleased to say we are already making encouraging progress. We have invested in value, launching our bold Sainsbury’s Quality, Aldi Price Match campaign on our entry level own-brand products, which complemented our biggest ever Price Lock on primarily branded products. We have put foundations in place to deliver a faster and stronger pipeline of innovative product development and we have accelerated our digital transformation this year as we focus on serving customers, however they want to shop with us. We have more than doubled our online grocery sales and have done this while improving profitability. Argos digital sales grew almost 70 per cent and our Argos transformation plan is on track to improve customer availability while reducing our costs. We launched Habitat as our main home and furniture brand and we have repositioned the home and furniture ranges, adding customer choice and making prices more accessible. We now have one global team that sources products for Sainsbury’s, Habitat and Argos, maximising our scale positions with suppliers and driving efficiencies within our own business. And we continue to make good progress reshaping, strengthening and simplifying our Financial Services business.
We have made some bold decisions so that we can do a better job for customers, including closing 176 Argos stores as part of our plan to reduce the number to around 100 standalone stores over the next three years. We also closed our loss-making meat, fish and deli counters. I know these changes are difficult for our colleagues, but in a highly competitive market, we must challenge ourselves to really focus on the areas that customers really value.
More information on our strategy can be found on page 9.
9. How is your leadership team helping you to deliver your new plan?
I have re-shaped the Operating Board to ensure we are in the best position to deliver our new plan. Clo Moriarty is our Retail and Digital Director and she will make sure we serve our customers brilliantly, whenever and however they choose to shop with us. As our Chief Marketing Officer, Mark Given is responsible for ensuring we understand our customers and connect with them using the power of Nectar. Rhian Bartlett, our Food Commercial Director, is responsible for ensuring we offer delicious, innovative food at the right prices for our customers. In addition to his existing responsibilities as Chief Information Officer, Phil Jordan will also take on responsibility for Business Transformation as we accelerate our plans
to adapt how we work in the future. I am also looking forward to welcoming Paula Nickolds to the team. Paula joins in June as General Merchandise & Clothing Commercial Director and will ensure that Argos, Tu and Habitat are delivering for our customers and shareholders. With some of the industry’s best leaders we have a strong team that I am confident will deliver the very best for our customers and our business.
More information on our Operating Board can be found on pages 50 and 51.
Working together with communities and suppliers10. What are you doing to support
communities and suppliers? We play an active role in the communities we serve and this year a key priority for us has been to support our communities and vulnerable people. I am pleased that we raised £35 million for good causes including our partners Comic Relief and FareShare. We also created an additional £1 million local community fund for stores in January and created a digital version of our instore Food Donation Programme. We also donated 2,000 laptops to support Mail Force’s Computers for Kids campaign, helping pupils in lockdown.
We work closely and collaboratively with our suppliers, who went above and beyond throughout the pandemic to get the products that people really needed to our stores. Only by working together can we grow our business and theirs. We also supported suppliers in distress with vital cash flow and started paying nearly 1,500 small businesses earlier. We want to treat people fairly and this year we also supported the government’s response to the Xinjiang sourcing issues on forced labour, working collaboratively with industry and our suppliers on policies, training and mappings risks.
More information on how we support our communities and suppliers can be found on page 21.
11. What progress are you making on the Net Zero plan?
Last year we announced our commitment to invest £1 billion over 20 years to become Net Zero across our own operations by no later than 2040. This is a long-term goal that requires fundamental change and we are making good early progress to reduce carbon emissions, food waste, manage our plastic packaging and water usage and increase recycling, biodiversity and healthy and sustainable eating.
Sainsbury’s will be supporting the UN Climate Change Conference, COP26, as Principal Supermarket Sponsor, a major commitment that shows we are taking this seriously. We have taken our Net Zero
commitment further with the addition of an ambitious Scope 3 target which requires the reduction of absolute GHG emissions by 30 per cent by 2030. Overall, we have reduced our absolute GHG emissions within our operations to 818,161 tCO2e, a reduction of three per cent year-on-year and 14 per cent from our 2018/19 baseline, keeping us on course for our headline target.
We reduced the food waste we send to anaerobic digestion in our own operations by over 5,000 tonnes, a reduction of 16 per cent year-on-year. We continue to drive our plastic reduction initiatives and we have developed a new approach to defining healthier choices.
See pages 14 to 16 for more detail on our Net Zero plan and progress.
We also approved remuneration targets for the Board against key Net Zero pillars. More information on this can be found on page 80.
The future12. What do you expect for the
year ahead?We have real momentum in the business as we head into the new financial year, which we have started strongly. However, as customers start shopping more normally, we are prudent about prospects for the year. We continue to expect underlying profit before tax in the financial year to March 2022 to exceed the £586 million reported in the year to March 2020 and we are comfortable with consensus forecasts of around £620 million. Within this, we expect Financial Services to return to a full-year profit.
Whatever the future holds, safety will continue to be our top priority and we will keep listening closely to our customers and colleagues to make sure we are doing the right thing.
We are at the very beginning of a three-year plan and, along with my leadership team, I am absolutely focused on delivering against our plan and the eight metrics we have set out. I believe that we have a real opportunity to make our brand more relevant, to excite customers in our offer and to create value for all our stakeholders. I am enthusiastic about the year ahead and absolutely committed to delivering the plan.
Simon RobertsChief Executive Officer
06 Strategic Report J Sainsbury plc Annual Report 2021

We are putting food back at the heart of Sainsbury’s. We create value for stakeholders by building on the heritage and scale of our food business and our strong assets. Everything we do is underpinned by data and technology innovation. And the single infrastructure that supports our brands enables
us to drive value and efficiency.
Being a sustainable business is vital to our success and we have a clear plan to be Net Zero across our own operations by 2040. This requires fundamental
change and we are making good early progress.
See pages 14 to 16 for more detail.
Building on our brand and strong assets
Creating value for our stakeholders
Sainsbury’s brand and own brand heritage
Online scale and capability
Our stores Good catchments,
strength in convenience
Scale Second largest food retailer
Strong operating cash flow
Attractive customer base
Reputation for service
Customers Colleagues Communities Suppliers Shareholders
Nectar, investment in digital and innovation
Underpinned by data, technology innovation and capability
Name Badge
07Strategic Report J Sainsbury plc Annual Report 2021
Governance ReportStrategic Report
Financial Statements
Business modelDriven by our passion for food, together we serve and help every customer.

How we create value
The Sainsbury’s Difference
Sainsbury’s brandSainsbury’s is a trusted, well-loved brand that has been bringing high quality, great value food to customers for over 150 years. Argos, Habitat, Tu, Nectar and Sainsbury’s Bank are complementary and give customers more reasons to shop with us.
ScaleWe offer customers a choice of quality products. We have scale positions in both food and non-food purchasing and can profitably deliver a wide range of products and services to customers.
Strong operating cash flowsOur scale, customer proposition and operational efficiency generate strong operating cash flows to reinvest in our customer offer and adapt to rapidly changing shopping habits, while also paying dividends and strengthening the balance sheet.
Attractive customer baseSainsbury’s is a trusted brand, loved by millions of customers across the UK. We serve an attractive customer base and two thirds of the UK population have shopped with Sainsbury’s over the last year1 with a bias to a more affluent sociodemographic than key competitors.
StoresOur stores are well-placed, with a strong presence in the South and in high footfall convenience locations. This helps us offer customers complementary products, such as Tu, Argos and Habitat, as well as complementary services such as financial services. Through our stores we can also present the offers of carefully selected concession partners.
ServiceCustomers come to Sainsbury’s for our outstanding customer service. Our 189,000 colleagues are integral to our long term success.
Online scaleOur Groceries Online business is increasingly profitable as we benefit from our in-store pick model and Click & Collect. We have more than doubled our capacity over the last year and we are now the second largest online grocery retailer by market share. Argos is now a digital first business with over 90 per cent of sales originating online and we are reducing the number of Argos standalone stores and building high volume Local Fulfilment Centres (LFCs) to improve choice and availability.
NectarNectar provides a vital competitive advantage to our food business, our brands and a wide range of partners. It has strong profit growth prospects through data monetisation and growing coalitions.
For customersWe listen carefully to our customers and we invest in what matters to them. Our focus is on offering a broad range of great value, high quality products – we then focus on strong availability and excellent customer service, all delivered through our attractive stores and a range of convenient digital channels. And we reward our customers for their loyalty. We want to help everyone eat better and are helping our customers to improve diets while reducing their impact on the environment, one plate at a time.
For more information about how we engage with our stakeholders, see pages 19 to 22.
For colleagues We invest in our colleagues. This year we awarded three one off payments and increased the hourly rate of pay for Sainsbury’s and Argos colleagues in recognition of their extraordinary efforts. By creating an engaged workforce that is invested in the progress of the business and the role they play in our success, we will achieve high retention rates and deliver superior customer service.See pages 17 and 18 for more detail.
For communities We play an active role in local communities. Our customer feedback programme and customer surveys help shape our community programmes and this year we raised £35 million for good causes.See page 21 for more detail.
For suppliersWe are proud of our strong supplier relationships and we work collaboratively with them to grow our business and theirs. By improving technology and simplifying processes we are making it easier for our suppliers to do business with us.See page 21 for more detail.
For shareholdersWe are committed to continuing our track record of strong cash generation. This allows us to reinvest in the business and consistently generate free cash flow which accrues to shareholders through consistent dividends and net debt reduction. We expect to generate average retail free cash flow of at least £500 million over the three years to March 2025 and are upgrading our four-year net debt reduction target to at least £950 million from £750 million by March 2023. We additionally stated in November 2020 that we expected the new plan we outlined to deliver an inflection in underlying profit momentum.
08 Strategic Report J Sainsbury plc Annual Report 2021
1 Nielsen panel data 52 weeks to 6 March 2021.

We are raising our ambitions and speeding up the pace of change, simplifying our operations and accelerating our cost savings programmes so we can invest more in food quality, choice, innovation and consistently lower prices for our customers. Our portfolio brands are supporting our core food business, delivering for customers and shareholders in their own right. And we will pursue partnerships or outsource where faster and where they will make a big impact for our customers.
We are reducing complexity, aiming to reduce our retail operating costs to sales ratio by at least 200 basis points and are focused on robust profit delivery and consistent dependable cash flow. By delivering for our customers we will drive stronger financial outcomes.
Priorities
— Better value and innovation — Underpinned by buying benefits and lower cost to serve
Our clear priority is to build on our strong brand heritage and reputation for quality, range and innovation while lowering prices and offering more consistent value. We will offer high quality, great value food wherever and however customers want to shop with us. This is what putting food back at the heart of Sainsbury’s means. Collaborating and simplifying how we work with suppliers will create buying benefits and lower our cost to serve.
— Customer and profit focus — Supporting the core food business
We are refocusing the role of our portfolio brands to ensure that they contribute positively in their own right. Argos, Habitat, Tu, Nectar and Sainsbury’s Bank are all delivering for their customers and are on track to drive sustainable, profitable growth to support our core food business.
— Structurally lower operating costs to fuel investment in the core — Cutting complexity and increasing pace of execution
We will deliver a step change in efficiency by transforming our approach to costs, simplifying our organisation and delivering a structural reduction in our operating cost base. We are on track with our plan to reduce our retail operating costs to sales ratio by at least 200 basis points, so we can reinvest in our customer offer and deliver improved financial returns.
Knowing and understanding our customers better than anyone else is fundamental to our success. Nectar unlocks our ability to connect with customers and drive that insight into our business decision-making and there are now 7.4 million downloads of the Nectar app. We listen to our customers and over 2.7 million respond to our customer satisfaction feedback programmes a year.
As a responsible retailer, we want to help everyone eat better, offering our products in a way that helps customers reduce their impact on the environment one plate at a time. Last year we announced our commitment to invest £1 billion over 20 years to become Net Zero across our own operations by no later than 2040.
09Strategic Report J Sainsbury plc Annual Report 2021
Governance ReportStrategic Report
Financial Statements
Our strategyIn November we set out a plan to transform our business over the next three years. We are clear on our priorities. We are putting food back at
the heart of Sainsbury’s, building on the changes we have made as we have adapted our business during the pandemic.
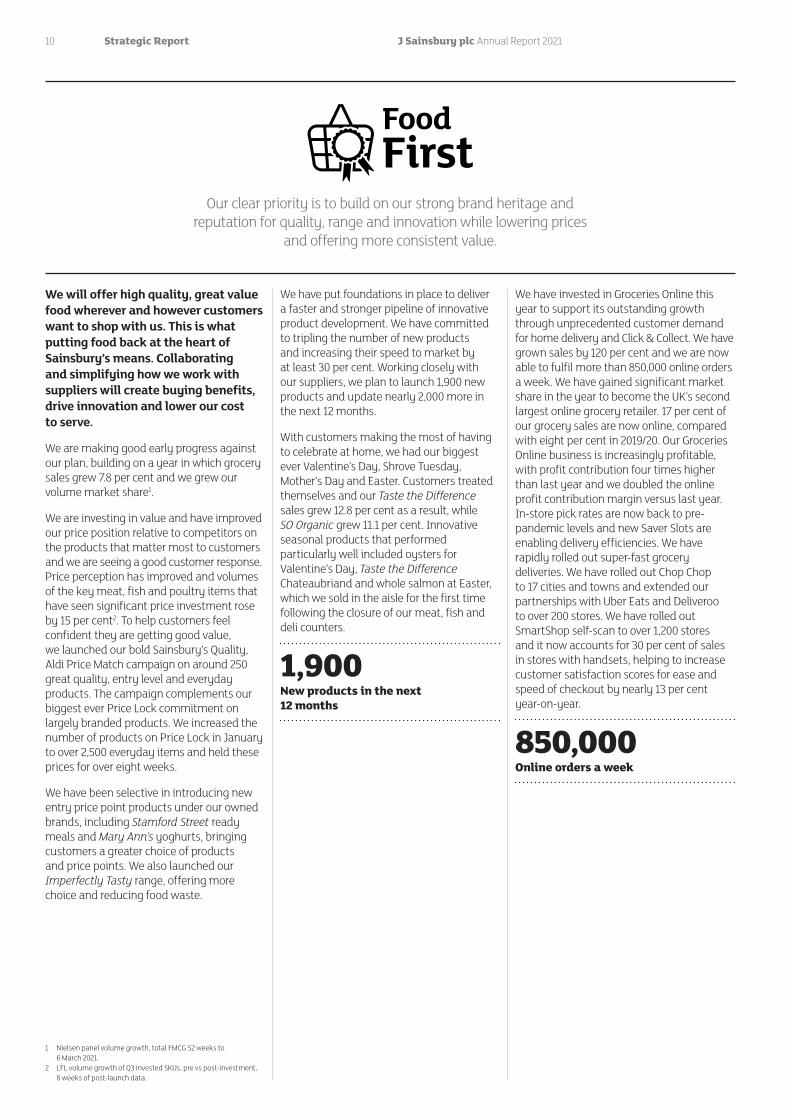
We will offer high quality, great value food wherever and however customers want to shop with us. This is what putting food back at the heart of Sainsbury’s means. Collaborating and simplifying how we work with suppliers will create buying benefits, drive innovation and lower our cost to serve.
We are making good early progress against our plan, building on a year in which grocery sales grew 7.8 per cent and we grew our volume market share1.
We are investing in value and have improved our price position relative to competitors on the products that matter most to customers and we are seeing a good customer response. Price perception has improved and volumes of the key meat, fish and poultry items that have seen significant price investment rose by 15 per cent2. To help customers feel confident they are getting good value, we launched our bold Sainsbury’s Quality, Aldi Price Match campaign on around 250 great quality, entry level and everyday products. The campaign complements our biggest ever Price Lock commitment on largely branded products. We increased the number of products on Price Lock in January to over 2,500 everyday items and held these prices for over eight weeks.
We have been selective in introducing new entry price point products under our owned brands, including Stamford Street ready meals and Mary Ann’s yoghurts, bringing customers a greater choice of products and price points. We also launched our Imperfectly Tasty range, offering more choice and reducing food waste.
We have put foundations in place to deliver a faster and stronger pipeline of innovative product development. We have committed to tripling the number of new products and increasing their speed to market by at least 30 per cent. Working closely with our suppliers, we plan to launch 1,900 new products and update nearly 2,000 more in the next 12 months.
With customers making the most of having to celebrate at home, we had our biggest ever Valentine’s Day, Shrove Tuesday, Mother’s Day and Easter. Customers treated themselves and our Taste the Difference sales grew 12.8 per cent as a result, while SO Organic grew 11.1 per cent. Innovative seasonal products that performed particularly well included oysters for Valentine’s Day, Taste the Difference Chateaubriand and whole salmon at Easter, which we sold in the aisle for the first time following the closure of our meat, fish and deli counters.
1,900New products in the next 12 months
We have invested in Groceries Online this year to support its outstanding growth through unprecedented customer demand for home delivery and Click & Collect. We have grown sales by 120 per cent and we are now able to fulfil more than 850,000 online orders a week. We have gained significant market share in the year to become the UK’s second largest online grocery retailer. 17 per cent of our grocery sales are now online, compared with eight per cent in 2019/20. Our Groceries Online business is increasingly profitable, with profit contribution four times higher than last year and we doubled the online profit contribution margin versus last year. In-store pick rates are now back to pre-pandemic levels and new Saver Slots are enabling delivery efficiencies. We have rapidly rolled out super-fast grocery deliveries. We have rolled out Chop Chop to 17 cities and towns and extended our partnerships with Uber Eats and Deliveroo to over 200 stores. We have rolled out SmartShop self-scan to over 1,200 stores and it now accounts for 30 per cent of sales in stores with handsets, helping to increase customer satisfaction scores for ease and speed of checkout by nearly 13 per cent year-on-year.
850,000Online orders a week
10 Strategic Report J Sainsbury plc Annual Report 2021
1 Nielsen panel volume growth, total FMCG 52 weeks to 6 March 2021.
2 LFL volume growth of Q3 invested SKUs, pre vs post-investment, 8 weeks of post-launch data.
Our clear priority is to build on our strong brand heritage and reputation for quality, range and innovation while lowering prices
and offering more consistent value.
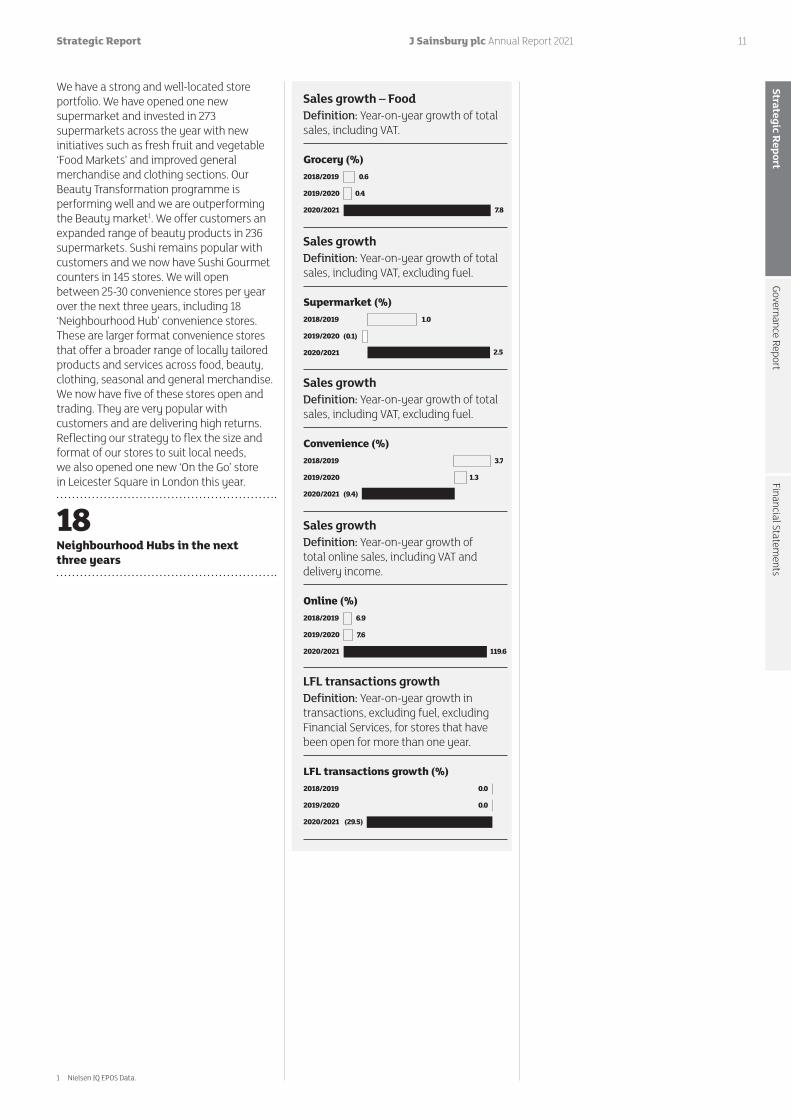
We have a strong and well-located store portfolio. We have opened one new supermarket and invested in 273 supermarkets across the year with new initiatives such as fresh fruit and vegetable ‘Food Markets’ and improved general merchandise and clothing sections. Our Beauty Transformation programme is performing well and we are outperforming the Beauty market1. We offer customers an expanded range of beauty products in 236 supermarkets. Sushi remains popular with customers and we now have Sushi Gourmet counters in 145 stores. We will open between 25-30 convenience stores per year over the next three years, including 18 ‘Neighbourhood Hub’ convenience stores. These are larger format convenience stores that offer a broader range of locally tailored products and services across food, beauty, clothing, seasonal and general merchandise. We now have five of these stores open and trading. They are very popular with customers and are delivering high returns. Reflecting our strategy to flex the size and format of our stores to suit local needs, we also opened one new ‘On the Go’ store in Leicester Square in London this year.
18Neighbourhood Hubs in the next three years
Sales growth – FoodDefinition: Year-on-year growth of total sales, including VAT.
Grocery (%)2018/2019
2019/2020
2020/2021
0.6
0.4
7.8
Sales growthDefinition: Year-on-year growth of total sales, including VAT, excluding fuel.
Supermarket (%)2018/2019
(0.1)
1.0
2.5
2019/2020
2020/2021
Sales growthDefinition: Year-on-year growth of total sales, including VAT, excluding fuel.
Convenience (%)2018/2019
2019/2020
2020/2021
1.3
(9.4)
3.7
Sales growthDefinition: Year-on-year growth of total online sales, including VAT and delivery income.
Online (%)2018/2019
7.6
119.6
6.9
2019/2020
2020/2021
LFL transactions growthDefinition: Year-on-year growth in transactions, excluding fuel, excluding Financial Services, for stores that have been open for more than one year.
LFL transactions growth (%)2018/2019
(29.5)
2019/2020
2020/2021
0.0
0.0
11Strategic Report J Sainsbury plc Annual Report 2021
Governance ReportStrategic Report
Financial Statements
1 Nielsen IQ EPOS Data.

Nectar supports our plan by rewarding customers for their loyalty. It is performing ahead of target with 7.4 million downloads of the app to date. Over 150,000 customers signed up to our new partnership with British Airways in the first seven weeks. We also continue to make good progress with Nectar360, our marketing services business. We launched a retail media platform that helps brands and advertising agencies reach and engage shoppers more effectively on our Groceries Online website, delivering a more personalised experience for customers and stronger returns for brands.
3 millioncustomers new to shopping at Argos
Argos digital sales grew 68 per cent in the year, with 90 per cent of sales starting online. Argos’s strength in digital and our leading Fast Track delivery has helped us adapt quickly to the changes in the way people wanted to shop through the pandemic. While standalone Argos stores were closed for much of the year during lockdowns, home delivery sales increased significantly and collection from Sainsbury’s stores was popular. Over the year we welcomed over three million new customers to Argos and sales were boosted by particularly strong growth in home and office furniture, garden essentials and home entertainment, including games consoles such as the new PlayStation 5 and Xbox.
We are making good progress transforming Argos, focusing on improving customer availability while reducing our costs. We have closed 170 standalone Argos stores as well as the six Argos stores in Homebase stores, as part of our plan to reduce the number to around 100 over the next three years1, reducing our operating costs by £105 million by March 2024. We have opened 30 new Argos stores in Sainsbury’s stores, 35 collection points and one new standalone store. This is part of our plan to reach
430-460 Argos stores in Sainsbury’s and reach 450-500 collection points by March 2024. As at 6 March 2021, Argos had 737 stores, of which 336 are stores in Sainsbury’s. Customers can also pick up products from 306 collection points. We have also started work on our first Local Fulfilment Centre (LFC) in Bristol, which will open in June. This is the first of 32 LFCs that will become our new distribution network, offering customers improved availability and quicker delivery and collection options.
7.4 millionNectar app downloads
We have made great progress integrating Habitat with Argos and Sainsbury’s. We launched Habitat as our main home and furniture brand and we have adapted our home and furniture ranges, increasing customer choice and making prices more accessible. We now have one global team that sources products for Sainsbury’s, Habitat and Argos, maximising our scale positions with suppliers and driving efficiencies within our own business. We are also using the same website infrastructure for Habitat and Argos, ensuring a consistent shopping experience for customers while reducing costs. Habitat had three stores which were closed for lockdown at year end but re-opened on 12 April.
While Tu clothing sales were down 18.3 per cent in the first half of the year, they recovered in the second half, increasing by 1.5 per cent and we continue to gain clothing market share. Tu online performed strongly throughout the year, with sales up 65 per cent and full price sales up 15 per cent as customers stocked up on pyjamas, loungewear and childrenswear.
We continue to make good progress reshaping, strengthening and simplifying our Financial Services business. This has helped us to mitigate the impact of COVID-19. In line with our guidance at Interims, the Bank returned to profit in the second half of the year with an underlying operating profit of £34 million, to deliver a Financial Services underlying operating loss of £21 million for the full year. The underlying loss reflects the
changed economic environment driven by COVID-19 where we have seen significantly reduced demand across consumer credit, combined with increased bad debt provisions and less activity in our fee-based products, particularly Travel Money.
Over 90 per cent of product sales now start online and we continue to improve customers’ ability to self-serve online. We are making good strategic progress to be a simple, mobile-led Financial Services business for loyal Sainsbury’s and Argos customers. We remain committed to doubling profit contribution and returns in our Financial Services business within five years to March 20242. The Bank has a strong balance sheet and a significant surplus capital position.
1 Excluding Republic of Ireland.2 On a Group contribution basis by FY23/24.
12 Strategic Report J Sainsbury plc Annual Report 2021
Sales growthDefinition: Year-on-year growth of total sales, including VAT.
General merchandise(including Argos) (%)2018/2019
(2.9)
8.3
0
2019/2020
2020/2021
Sales growthDefinition: Year-on-year growth of total sales, including VAT, excluding fuel.
Clothing (including Argos) (%)2018/2019
1.22019/2020
2020/2021
(0.8)
(8.5)
Bank sales growthDefinition: Year-on-year growth of total sales, including VAT.Bank(including Argos Financial Servces) (%)2018/2019 5.0
5.02019/2020
2020/2021 (24.3)
We are refocusing the role of our portfolio brands to ensure that they contribute positively in their own right. Argos, Habitat, Tu, Nectar and Sainsbury’s Bank are all delivering for their customers and we are on track to drive strong, sustainable, profitable growth to support our core food business.

We are accelerating our cost saving plans to unlock new opportunities in order to fund the improvement of our food offer and to ensure we can meet the growth in customers shopping across a broad range of channels.
We are on track with our plan to reduce our retail operating costs to sales ratio by at least 200 basis points, delivering major structural cost savings to support investment in our core customer offer and deliver improved financial returns.
£150 million saving from integrating supply chains
Transforming our approach to costs and radically simplifying our organisation is delivering results at pace. We have achieved this by reducing the number of Argos standalone stores, closing our meat, fish and deli counters, simplifying our store management structures, reducing 500 roles in our Store Support Centres and cutting office space. We are also consulting with colleagues on plans to close our Online Fulfilment Centre in Bromley-by-Bow to drive online efficiency and profitability.
In addition, we are accelerating the integration of the Sainsbury’s, Argos and Habitat supply chain and logistics networks and creating an operating model which will save £150 million over the next three years and deliver working capital benefits.
Our property rationalisation programme is progressing well and our Argos transformation programme, which includes the changes we are making to our Argos store estate, will reduce our cost to serve by £105 million.
£105 million saving from Argos transformation programme
We are proud of our strong relationships with suppliers and are working closely with them to drive value and simplify processes. This means we can buy better and lower our cost to serve.
13Strategic Report J Sainsbury plc Annual Report 2021
Governance ReportStrategic Report
Financial Statements
We will deliver a step change in efficiency by transforming our approach to costs, simplifying our organisation and delivering
a structural reduction in our operating cost base.
We are implementing a programme of change, focusing on reducing carbon emissions, food waste, plastic packaging and water usage and increasing recycling, biodiversity and healthy and sustainable eating.
Last year we announced our commitment to invest £1 billion over 20 years to become Net Zero across our own operations by no later than 2040. This target includes Scopes 1 and 2, covering our direct and indirect emissions within our operations.
This year we have taken our ambitious Net Zero by 2040 plan further with the addition of a Scope 3 target, which covers indirect emissions that occur throughout our value chain. We want to reduce the environmental impact of our business and work with farmers, growers and suppliers throughout our supply chain to help them reduce theirs.
To support our commitment and to drive long-lasting and meaningful change, we will be supporting the UN Climate Change Conference, COP26, as Principal Supermarket Sponsor in the upcoming year. We have also set remuneration targets for the Board against our key Net Zero by 2040 pillars to help drive business performance. More information on this can be found on page 72.
CarbonThe Science Based Targets initiative (SBTi) has approved our Science Based Targets for Scopes 1, 2 and 3. For Scopes 1 and 2, these include the reduction of greenhouse gas (GHG) emissions from Sainsbury’s own operations to Net Zero by 2040 in a bid to limit global warming to 1.5°C.
14%reduction in absolute greenhouse gas emissions within our own operations (against our 2018/19 baseline)
We worked with the Carbon Trust to define an ambitious Scope 3 target which requires the reduction of absolute greenhouse gas (GHG) emissions by 30 per cent by 2030, to align to a well below 2°C scenario. The baseline is 26,663,081 tC02e (2018/19). The target includes reducing emissions from purchased goods, upstream transport and distribution, services sold and our customers’ use and consumption of the products we sell. We have also committed to working closely with our vast global supplier base to help them develop and then meet their own targets.
79%of supermarkets fully upgraded with LED lighting (on track to install 100% by the end of 2021)
The impact of the pandemic on our emissions has been substantial. We have seen a reduction of energy usage due to the closure of certain areas of stores such as cafes and counters and all of our office space. We have seen more fuel usage due to the rise of online shopping and an increase in the amount of products going through our supply chain. Overall, we have reduced our absolute GHG emissions within our operations to 818,161 tCO2e, a reduction of three per cent year-on-year and 14 per cent from our 2018/19 baseline, keeping us on course for our headline target. We continue to roll out our LED lighting programme, with 79 per cent of supermarkets already fully upgraded and we remain on track to install 100 per cent in our supermarkets by the end of 2021.
We are proud to be recognised by CDP, an environmental impact disclosure system, for our environmental transparency. We were awarded an A rating for climate change for the seventh consecutive year, the only UK retailer to have achieved this. We were also recognised by CDP as a Supplier Engagement Leader for our work engaging with our suppliers to tackle climate change.
Plastic packagingWe committed to reduce our use of plastic packaging by 50 per cent by 2025. COVID-19 has had a significant impact on our usage this year due to an increase in sales volume which has led to an increase in plastic packaging used overall. Therefore progress made in plastic weight reductions this year have been outweighed by the challenges of the pandemic. Year-on-year the tonnage has increased by 3,496 tonnes to 117,959 tonnes, which puts us behind our target trajectory. Overall there has been a 1.7 per cent reduction in our food plastic packaging from our 2018 baseline.
Although volume has increased this year, we continue to drive our plastic reduction initiatives. Examples include an 86 per cent reduction in pancake mix packaging and a 70 per cent reduction in steak packaging. We also trialled a new plant-based alternative for our own-brand teabags, using Polylactic acid (PLA) made from the sugars in cornstarch, cassava or sugar cane and launched a 63-store trial for an in-store recycling system for flexible plastics. The innovative recycling system allows customers to recycle Polypropylene (PP) film found in several household products. We recognise we have a lot more to do on plastic packaging reduction and along with new initiatives and a focus on collaboration, we look forward to making greater progress in the upcoming year.
Healthy sustainable dietsWe know that food that is better for us is also better for the planet. This is why we have committed to develop and deliver healthy, sustainable diets for all. This year we announced a mass colleague and customer campaign, helping everyone eat better, to raise awareness and drive behaviour change. We want to help make eating well affordable, easy and tasty, to support having a positive impact on health and the health of the planet.
14 Strategic Report J Sainsbury plc Annual Report 2021
We have committed to investing £1 billion over twenty years towards becoming a Net Zero business across our own operations by 2040, aligned to the highest ambitions
of the Paris Climate Change Agreement.

In November 2020, we reported on the volume of ‘healthy’ sales relative to total sales. Moving forward, we believe reporting the tonnage of healthy sales relative to total sales is a more credible way to reflect the weight of plate from healthy choices, similar to the approach of the Eatwell Guide, and therefore this is how we will be defining a future target. Our current position is 55.3 per cent healthy sales tonnage, remaining the same year-on-year. We undertook an extensive piece of work to review the nutrition criteria used to define healthy and healthier sales. This approach will help us identify better choices within categories for both branded and own-label products, along a spectrum from less healthy to most healthy.
We continue to reformulate and innovate to launch healthier products. We have been utilising ‘test and learns’ to help nudge customer behaviour by incentivising customers with value pricing or additional Nectar points with initiatives such as our discounted 60 pence fruit and vegetable campaign and The Great Big Fruit & Veg Challenge.
Food wasteWe have committed to reducing food waste by 50 per cent across the whole value chain by 2030. This year we reduced the food waste we send to anaerobic digestion in our own operations by over 5,000 tonnes, a reduction of 16 per cent year-on-year, which puts us ahead of our target trajectory. This has been driven by reductions in our overall operational waste figure, owing to propositional changes in our food service departments, as well as growth in the volume redistributed to both humans and animals as a result of impacts from the pandemic and process improvement. We are working on further process improvements to support us on delivering our commitment.
16%reduction in food waste year-on-year
We continue to support the delivery of Courtauld 2025/Champions 12.3 and the UK Food Waste Reduction Roadmap. We wrote to our suppliers to encourage their participation in this initiative, and we are pleased to have seen an increase in participation this year. We have also continued to work on our pilot whole-chain waste reduction projects in collaboration with WRAP and our suppliers. We will finalise and implement findings from this project in the year ahead. We have trials looking at diverting waste produce to animal feed and are looking into initiatives to further divert surplus food for human consumption. For more information on surplus food donations, see page 18.
To find out more about what we are doing in these areas, as well as our performance on our recycling, water neutrality and biodiversity pillars, please visit www.about.sainsburys.co.uk to read our Sustainability Update.
Task Force for Climate Related Financial Disclosure (TCFD)
Introduction As part of our Net Zero by 2040 launch last year, we committed to implementing the recommendations of Task Force for Climate Related Financial Disclosure (TCFD). Since then, we have made progress towards embedding climate considerations into our reporting and decision making and have targets in place to measure progress and incentivise performance. Over the coming months we will focus on extending our scenario analysis from direct operations to the wider business and our value chain. We will use this to inform our risks and opportunities in the future.
GovernanceOur Net Zero by 2040 plan, which includes commitments across carbon, plastic and recycling, biodiversity, water, food waste and health, is channelled through our Net Zero Steering Group and reports to the Corporate Responsibility and Sustainability Committee.
We set up a TCFD working group this year to consider how best to respond to and implement the recommendations of the TCFD framework. A key pillar of the framework focuses on governance around climate-related risks and opportunities. We are enhancing our existing governance structures to further catalyse TCFD implementation, including clearly defining management’s role in assessing and managing climate-related risks and opportunities. We will be identifying opportunities to improve alignment towards our climate ambition across the business, focusing on the more technical aspects of the framework and ensuring sufficient delivery support.
A full disclosure of our governance for sustainability can be found from page 46.
StrategyEnvironment and Sustainability is a principal risk for our business, core to our values and forms a key pillar of our strategic priorities. It is important for us to understand the long term physical and transitional risks to protect our business and identify future opportunities.
Scenario analysis has been used in the business to better understand climate change risk and opportunities, and currently we use a pessimistic scenario of above 2°C and an optimistic scenario of well below 2°C or 1.5°C in line with our Science Based Target, with a time horizon of up to 2040.
Our operational estate has been a primary focus as a key area in which to measure substantive physical and transitional risks, as well as opportunities. It also enables us to develop procedures, policies, and actions to prevent or mitigate impact, as well as control over future capital investment. Meeting our environmental targets is important for us; we have modelled scenarios, up to 2040, of where and when investments in renewable and low carbon technologies are made. This has and will continue to inform commercial decision making, and in the short term has provided us with a glide path of achieving Net Zero by 2040 in our own operations.
15Strategic Report J Sainsbury plc Annual Report 2021
Governance ReportStrategic Report
Financial Statements

Our Net Zero strategy has also identified, and aims to mitigate against, the future risk to the availability of water across the UK as well as the significant increase in flood risk that is expected to occur in the future. Flooding affects our stores directly and indirectly by hindering access for our customers and suppliers. We have carried out scenario analysis using the World Resources Institute Aqueduct tool to model our locations based on future water risk, including water stress, variability from season-to-season, pollution, and water access. Improving our understanding of future water related risks provides us with the opportunity to assess the need for future building adaptations, for example flood defences. We have a target aiming to be water neutral by 2040, and these scenarios show where water conservation will have the biggest impact, informing our strategy.
Our next step is to extend scenario analysis across our business, which will include our supply chain, to identify material climate-related risks and opportunities and assess our exposure to climate vulnerability. We anticipate using qualitative and quantitative scenario analysis and, going forward, we are likely to consider 1.5°C, 2°C and 4°C scenarios. We are looking to estimate the financial impact of climate-related risk and opportunities for materially vulnerable aspects of the business.
Risk ManagementThe risks of climate change on our business model – our climate resilience – are identified from both the bottom-up and emerging risk assessments carried out across the business and then reviewed in a specific climate change risk workshop to assess completeness. Climate resilience risks identified form an integral part of a number of our corporate risks and have been referenced in the existing principal risks we are disclosing, where appropriate. These risks can be found from page 32. Going forward, we will continue to enhance how climate resilience risks are identified, assessed, and managed across our value chain.
Targets and MetricsWe understand the importance of setting carbon reduction targets, and this year, Science Based Targets initiative (SBTi) approved our science-based targets for Scopes 1, 2 and 3. For Scope 1 and 2, these include the reduction of Green House Gas (GHG) emissions from our own operations to Net Zero by 2040 in a bid to limit temperature increase to 1.5°C. More information on our progress towards our Net Zero by 2040 plan can be found on page 14.
We have also introduced targets for our Executive Directors directly aligned to our Scope 1, 2 and 3 emissions for the first time. Full information can be found on page 79.
We worked with the Carbon Trust to define an ambitious Scope 3 target which requires the reduction of absolute GHG emissions by 30 percent by 2030, to align to a well below 2°C scenario. The methodology for modelling our emissions has been developed in line with the accepted international standard for GHG value chain modelling, the Greenhouse Gas Protocol. The baseline year chosen is 1 April 2018 – 31 March 2019, as it is representative of our current activities and was the most recent year with complete and verifiable data. The Scope 3 calculation considers the full value chain of our global operations where we have either operational control, or significant ability to influence outcomes either directly or indirectly. This covers the full life cycle of all goods and services directly purchased by us to be sold to end customers, upstream transport, and distribution. This includes the emissions associated with Argos, Habitat, Tu clothing and Sainsbury’s Bank.
Engaging with our supply chain is key for supporting this reduction, we will be working with selected suppliers to develop their own Scope 1 and 2 targets, and measure their performance through industry disclosures such as CDP and the Higg Index. Over the next year, we will extend our strategy in collecting supplier information and reporting on our progress in reducing our Scope 3 emissions.
Our Scope 1 and 2 emissions and methodology can be found in Streamlined Energy and Carbon Reporting (SECR) on page 89.
Our Scope 3 emissions can be found on page 14.
16 Strategic Report J Sainsbury plc Annual Report 2021

Our colleagues make a big difference to our customers, serving them well day in, day out, and we know that having engaged colleagues is critical to the long-term success of our business. We are committed to being an inclusive employer where everybody is treated fairly and with respect, and where colleagues love to work and are encouraged to develop their skills and fulfil their potential. We continue to play an active role in our communities, and we have high ethical standards that we and our suppliers adhere to.
Our colleaguesColleagues are at the heart of everything we do. We need them to understand our purpose and valued behaviours and we are working on a significant culture change project to achieve that. We want our colleagues to feel connected and engaged and we measure this through our annual colleague engagement survey. This year we increased our sustainable engagement score by six per cent to 81 per cent, with 86 per cent of colleagues agreeing with the statement ‘I feel I am able to be myself at work’, up from 85 per cent last year. We also introduced a check-in survey to ensure we’re engaging with colleagues regularly on how they’re feeling and get their input on business activities. We’re also proud to have received 89 per cent on the Workforce Disclosure Initiative (WDI) survey this year, which aims to increase corporate transparency and accountability on workforce issues.
COVID-19 has had a major impact on colleagues across the business both professionally and personally. Colleagues adapted positively and at pace to support our response to help feed the nation. We have listened and responded to our colleagues and customers throughout the pandemic and our colleagues have helped to inform many of the changes we have made throughout. We continue to invest in our colleagues, identifying and nurturing talent, providing training and development opportunities and ensuring they are rewarded fairly. More information on fair pay, including the thank-you payments made to recognise the hard work and commitment of our frontline colleagues during the pandemic, can be found on page 74.
We are active in our drive for inclusivity and the progression of our diverse talent, for example:
— Mandatory e-learning ‘Inclusion starts with I’ was launched this year and has been completed by over 171,000 colleagues — Senior management must have a personal goal that is inclusion-focused, and link remuneration to positive improvements in this area — We continue to be a Disability Confident Leader – the highest tier of accreditation in the government’s Disability Confident Programme — We were ranked 71st in the Stonewall Workplace Equality Index, the highest scoring business in the retail sector — Our development programme for senior women with high potential is now in its second year — We expanded our development programme for ethnically diverse colleagues in the earlier stages of our pipeline this year, with over 250 participants joining the programme — Each Operating Board member sponsors a high potential, ethnically diverse colleague and many also have a ‘reverse mentor’ from the I AM ME ethnically diverse network — Our Women in Tech initiatives are designed to attract, develop and retain great female talent into technology roles — We actively monitor and seek to improve the diversity of our Operating Board succession plans and the composition of our talent pools — Race fluency upskilling sessions were completed by our top 1,400 leaders, including the Board — Mandatory inclusive recruitment processes are well-embedded. In store support centre roles we have maintained the number of offers to ethnically diverse candidates at 21 per cent this year. An increase from 14 per cent over the past three years
— We amplified cultural and religious events with customers, including Pride, Diwali and Black History Month, and are working hard to improve the proposition, range and experience for all our customers — We have a zero-tolerance policy on racist or offensive commentary, both externally and internally
We continue to work on representation and transparency across the business and we incorporated our ethnicity pay gap into our Gender Pay Gap Report for the first time this year. We have reduced our gender pay gap by 0.8 per cent to 9.7 per cent, while our median gender pay gap has increased slightly to 5.0 per cent. Our mean ethnicity pay gap is 0.4 per cent. We set ourselves a target of reaching 10 per cent ethnically diverse representation in senior positions (top 230 leaders) by the end of 2020/21; this currently stands at 8.07 per cent, remaining the same year-on-year. The proportion of women in senior management roles currently stands at 37.67 per cent, against our target of 40 per cent by 2020/21, an increase of 2.5 per cent year-on-year. Across the entire business, female representation is 52.9 per cent.
To ensure sustained improvement, we continue to look at focused initiatives, culture and accountability through targets. We have set new, stretching targets to take us to 2024 which covers more of our talent pipeline and also covers Black representation specifically (see table). Importantly, these targets will form part of our long-term incentives for management. For more information on our Gender and Ethnicity Pay Report, visit www.about.sainsburys.co.uk.
Being an inclusive organisation with diverse representation at all levels of our business is important to us. We acknowledge we still have a way to go, and we are committed to driving positive, sustainable change to improve the lived experience and opportunities for under-represented groups, be they colleagues or customers.
17Strategic Report J Sainsbury plc Annual Report 2021
Governance ReportStrategic Report
Financial Statements
Our people

Health and safetyThe health and safety of our colleagues and customers is a key part of our strategy. We have seen a long-term decline in both colleague and customer reportable injuries over the past five years; our colleague reportable injury rate has declined by over 25 per cent, whilst our customer reportable injury rate has declined by over 20 per cent. An independent safety team supports our retail and logistics operations. They provide a combination of coaching, expertise and challenge to our line managers using our innovative risk mapping tool, utilising data from a wide range of sources to identify the key areas requiring support in any of our stores across the business. This helps us to ensure that we have the right level of compliance in place around key areas such as training, fire safety and adherence to procedures, as well as reviewing culture in individual stores through the lens of colleagues, regional management, and safety teams.
We have strong governance in place which ensures colleagues can feedback on issues, regular engagement with our unions and Board oversight. This includes our Great Place to Work groups, divisional level safety steering groups, our Group Safety Committee which reports into the Operating Board, as well as quarterly updates to the plc Board. We have strong and well-established Primary Authority relationships in place that cover all our risk areas across health and safety, food safety, fire safety and petroleum safety. These relationships are built on a foundation of trust and we openly share information with our Primary Authority
partners, including policies, procedures and accident and incident data, to ensure we respond effectively at pace to any issues or incidents that occur.
Our communitiesWe play an active role in the communities we serve and this year a key priority for us has been to support our communities and the most vulnerable in society during the pandemic. To support the huge amount of pressure on foodbanks, charities and community groups at the start of the pandemic, we made a £3 million commitment to FareShare. During this time, Sainsbury’s funded and supported distribution of over 24 million meals, via 3,945 unique charities.
We supported Comic Relief and Children in Need by matching our customers’ donations £ for £ in The Big Night In Appeal, with the total donations exceeding £4 million, split between the two charities, to support those severely affected by the pandemic. Alongside our community investment, we make positive economic contributions through our responsible approach to tax. We contributed £2.2 billion in taxes borne and collected this year; this includes the business rates relief Sainsbury’s chose to forgo. For more information on how we serve our communities and our community response to COVID-19, visit www.about.sainsburys.co.uk for our Sustainability Update.
£3 millioncommitment to FareShare
Our suppliersWe want to treat people fairly throughout our business and supply chains and we remain committed to respecting human rights. We identify vulnerable workers and do not tolerate any form of slavery or servitude in our own operations. We also provided training for 170 suppliers this year on how to prevent modern slavery in our supply chains. We launched our Modern Slavery Risk Tool in 2017; this gives us unique insights into slavery risks across a complex global supply chain and we continue to embed the tool into the business by using its results for internal risk assessments. This year we also supported the government’s response to the Xinjiang sourcing issues on forced labour, working collaboratively with industry and our suppliers on policies, training and mappings risks. For more information on our Human Rights Policy and Modern Slavery Statement, visit www.about.sainsburys.co.uk.
170 suppliersprovided training this year
18 Strategic Report J Sainsbury plc Annual Report 2021
Diversity and Inclusion targets
2021 Target – senior leadership positions
(top 230 leaders)
2024 Target – senior leadership positions
(top 230 leaders)
2024 Target – senior management positions
(the top 1,200 leaders beneath the top 230 senior
leadership positions)
Female 40% (currently 37.67%)
50% 43%
Ethnically diverse 10% (currently 8.07%)
12% 12%
Black (new target set for 2024)
N/A (currently 1.35%)
3% 3%
Female Male Undisclosed
Total colleagues
100,007(52.9%)
189,02689,017(47.1%)
2
189,026
Voluntary turnover Involuntary turnover
Colleague turnover
Retention
26,757(14.8%)
42,613(23.6%)
119,656(61.6%)
189,026

Stakeholder considerations and our culture are an important part of the Board’s discussions and decision-making in promoting the long-term success of the Company. This statement explains how the Board has embedded stakeholder considerations in its decision-making.
There are different processes across the business to manage stakeholders’ considerations depending on the nature of the decision and which stakeholders are impacted. Our governance structure has been reviewed and strengthened during the year and ensures that business decisions are made by the right people or forum and we take account of the impact on stakeholders.
The Board believes that it has acted in accordance with Section 172(1) of the Companies Act 2006 during the year ended 6 March 2021. This requires each Director to act in the way he or she considers, in good faith, would be most likely to promote the success of the Company for the benefit of its members as a whole and, in doing so, have regard to the interest of other stakeholders, whilst maintaining high standards of business conduct.
The Board acknowledges that decisions made will not necessarily result in a positive outcome for every stakeholder group. The Board does, however, aim to take into account the potential consequences of its decisions on stakeholders and has a process in place for decision-making and engaging
with stakeholders that takes into account Sainsbury’s strategic priorities, purpose, culture and values.
The following pages provide examples of the key matters that the Board has considered during the year and sets out key stakeholder considerations that influenced discussions and outcomes. Further examples can be found in our Governance section on page 54.
“The last year has really shown that we are at our best when
we listen and respond at pace to what matters most to our
customers, our colleagues and all our stakeholders.”
Simon Roberts
Customers Two thirds of the UK population have shopped with Sainsbury’s over the last year1 and there are now 7.4 million downloads of the Nectar app. In Financial Services, we have 1.8 million active Sainsbury’s Bank customers and 2.2 million Argos Financial Services customers.
Key customer prioritiesThe Board has focused this year on delivering for customers on our strategic priorities:
— Food First – putting food back at the heart of Sainsbury’s and offering customers great value and high quality products — Connected to customers – customers are central in our thinking and decision-making — Brands that deliver – Argos, Habitat, Tu, Nectar and Sainsbury’s Bank — Net Zero by 2040 – reducing our impact on the environment
We believe that satisfied customers are key to our long-term success.
1 Nielsen panel data 52 weeks to 6 March 2021.
Engaging with our customersWe heard what mattered to our customers through:
— 2.7 million responses per year across all of our customer feedback programmes (CSAT) — Social media listening — Market research — Qualitative customer focus groups and quantitative surveys — Nectar data which helps us understand how customers are shopping — Brand tracking which assesses the performance and perception of our different brands
The Board was regularly updated on consumer sentiment, trends and the overall metrics from our customer feedback programme. Throughout the pandemic, customer feedback on matters such as safety helped steer our response to ensure we were doing the right thing for our customers and those most in need.
The Board’s understanding of our customers also helped shape our strategy detailed on page 9. For example, we know that price perception is one of the main barriers to customers shopping with us; by lowering prices on everyday items we are offering customers consistently good value on the products they buy every day.
Sustainability has also been a big focus this year following the launch of our Net Zero by 2040 plan. The Corporate Responsibility and Sustainability (CR&S) Committee was updated on customer insight analysis to understand how customers view our progress in relation to our plan. This feedback has helped shape the projects being implemented to meet our Net Zero commitments.
19Strategic Report J Sainsbury plc Annual Report 2021
Governance ReportStrategic Report
Financial Statements
Engaging with our stakeholders and our Section 172 statement

ColleaguesOur colleagues include everyone who is employed by the business.
Key colleague prioritiesColleagues are central to our business and their commitment to our purpose and values is key to the business’s long-term success. Connected, engaged colleagues, working in safe stores with better technology leads to greater efficiency, increased availability of products and improved customer service.
Engaging with our colleaguesThe Board engages directly with colleagues through the Great Place to Work National Group, our Workforce Advisory Panel. It receives detailed presentations on culture, colleague engagement, wellbeing, and diversity and inclusion from our Group HR Director, and regular summaries from the Chief Executive Officer on key initiatives. Colleagues are kept updated on decisions made following their feedback through regular internal communications from the Chief Executive Officer and Operating Board members.
Our colleague engagement activities include the following: — Great Place to Work National Group, our Workforce Advisory Panel, made up of colleagues from across the business elected by their peers to represent their views. Non-Executive Directors attend these meetings — Continual feedback on internal social media including live question and answer sessions with the Chief Executive Officer and Operating Board members which is fed back to the Board — Our annual colleague engagement survey ‘We’re Listening’ invites every colleague to give honest, confidential feedback on what it is like to work for the business — ‘We’re All Ears’, a short ‘temperature check’ survey issued several times a year, helps us understand how colleagues are feeling and their views on what we are planning, so the Board can act swiftly on colleague feedback and suggestions — Updates on culture, engagement, inclusion and colleague pay to the Board, Remuneration Committee and CR&S Committee
Colleague feedback has been essential to our COVID-19 response and this has fed directly into the Board from the Chief Executive Officer. The Board has been supportive of the pace at which the Operating Board has turned feedback and ideas into action.
For example, the rapid installation of safety screens in all our stores and our decision to limit customer numbers, were adapted based on feedback.
Our ‘Save to Invest’ strategy enables us to improve our customer offer and become a simpler, faster, more efficient business. To drive the strategy forward, we have undertaken a number of organisational changes that have impacted our colleagues, such as closing our meat, fish and delicatessen counters and some Argos standalone stores. The Operating Board thought very carefully about these proposals and their impact on colleagues and did everything possible to ensure alternative roles were found for colleagues who were affected by the changes. This was also considered by the Board at relevant meetings.
The results of the colleague engagement survey highlighted what colleagues wanted. The Operating Board made four key commitments to address the feedback and these were supported by the Board: great conversations about development and performance; understand what’s happening across our business; develop our mental health and wellbeing programmes; and help colleagues see the impact of their feedback. As a result of this insight, we have expanded our wellbeing activity to include the launch of Wellbeing Champions, trials of trained Mental Health First Aiders and we are testing a wellbeing app for colleagues which we will roll out soon. We have also launched a new everyday feedback model to underpin our approach to great performance and development.
It is vital we have a diverse workforce that can thrive in an inclusive culture and reflects the communities we serve. The Board was supportive of the additional commitments made by the Operating Board in support of our Black colleagues, all of which were part of our focus on changing the conversation about race. Initiatives included upskilling leaders to talk fluently about race, which was also attended by the Board, tripling our investment in development programmes for our ethnically diverse colleagues, publishing our ethnicity pay gap data and introducing a mandatory approach to inclusive recruitment.
More information on our colleague engagement activities can be found on page 17 and our colleague engagement KPI can be found on page 25.
20 Strategic Report J Sainsbury plc Annual Report 2021

SuppliersWe have over 4,360 Goods For Resale (GFR) suppliers that supply products for food, general merchandise and clothing and over 2,000 Goods Not For Resale (GNFR) suppliers across the Group supporting all functions including Logistics, Marketing, Technology and Retail. Our suppliers range from large multi-national companies to small independently run businesses.
Key supplier prioritiesOur GFR suppliers are fundamental to the quality and variety of products we sell and enable us to meet the high standards that we set ourselves.
Our GNFR suppliers provide operational excellence and access to new technology and innovation to ensure we keep pace with the evolving and changing needs of our customers.
Engaging with our suppliersOur suppliers have access to our online supplier portals where we share news about the organisation and develop new ways of working with them which ensures a consistent forum for communication. We take part in annual, independent surveys which benchmark us against other retailers and highlight areas for improvement; these include the Advantage survey and Groceries Supply Code of Practice supplier survey. During the year, the CR&S Committee was updated on initiatives that led to improved performance in these surveys.
During the pandemic, the principal feedback from our small suppliers was around cash flow. The Board was supportive of management’s approach to provide cash flow support to suppliers
through adjustment in payment terms, where necessary, despite the impact it had on our working capital. We particularly supported small suppliers by paying them immediately and we continue to support them with a permanent commitment to pay them within 14 days.
The Board is cognisant of the impact its decisions have on suppliers and receives regular updates on supplier relationships. Suppliers have been heavily involved in our new plan and provided insightful feedback on our ways of working to help us achieve lower prices for our customers. Working collaboratively with our suppliers helps us deliver innovation in food and we continue to build stronger relationships with exclusive brands. For more information on our plan, see page 9.
This year, the Board approved a target to reduce our Scope 3 carbon emissions by 30 per cent by 2030. We requested that suppliers set their own targets to reduce their emissions in line with the Paris Climate Change Agreement and the CR&S Committee monitored progress in this area as well as supplier feedback. We also actively engage with our suppliers to prevent modern slavery and human trafficking in our business operations and supply chains, and report this through our Modern Slavery Statement. For more information see page 18.
Management actively engaged with both the GFR and GNFR supply chain to manage key risks across the year, including increased volumes due to COVID-19 and Brexit implications. This maintained operational excellence throughout our supply chain and ensured continuity of supply to customers.
CommunitiesWe play an active role in our communities and aim to generate a positive impact in the communities we serve and source from worldwide.
Key community prioritiesOur business relies on resilient communities and we have a long history of building strong partnerships and making a difference in the communities we serve, both locally and internationally. In response to the pandemic, the Board approved three clear priorities: keeping our customers and colleagues safe, helping to feed the nation, and supporting our communities and the most vulnerable in society. This clear purpose has enabled us to make decisions at pace and allocate resources and investment for maximum impact.
Engaging with our communitiesCustomer feedback provides the Board with valuable information on how we can best support our customers and local communities. These insights helped shape our activities during the pandemic. For example, following customer feedback we introduced dedicated shopping hours and priority access to Groceries Online shopping slots for elderly, disabled and vulnerable customers, as well as NHS and care workers.
The CR&S Committee received regular updates on our community activities and was highly supportive of the following new initiatives:
— Increasing digital fundraising methods such as using donation barcodes, charity QR codes and contactless donation points — Creation of a £5 million community fund for local charities and good causes as part of our Help Brighten a Million Christmases campaign — Our first digital food donation programme with FareShare through Groceries Online — Community and charity partnerships which generated over £20 million
For more information on our communities, please see page 18.
21Strategic Report J Sainsbury plc Annual Report 2021
Governance ReportStrategic Report
Financial Statements

GovernmentThe UK Government and devolved administrations in Scotland, Wales and Northern Ireland set the regulatory environment in which our business operates.
Key Government prioritiesAs a UK-based business and a major employer of 189,000 colleagues, it is appropriate and responsible for a business of our scale to engage with Government.
Engaging with GovernmentThe Board receives updates when regulation is relevant to the business through summaries on the following activities:
— Responding to Government consultations — Direct meetings — Trade association meetings — Government organised roundtables — Participation in Government organised forums such as the Food and Drink Sector Council (Defra) or the Retailer Panel for Exiting the EU (BEIS)
The business has worked particularly closely with Government this year to support vulnerable customers and communities across the UK. The Chief Executive Officer and senior management have been in regular dialogue with Ministers and officials primarily to ensure ongoing supply of and access to essential groceries, and to manage the safety of customers and colleagues throughout the pandemic.
ShareholdersWe have more than 112,000 shareholders, including large institutional investors and smaller individual shareholders.
Key shareholder prioritiesThis year shareholders’ key questions centred around the following:
— How we intend to improve our grocery market share performance and compete with the discounters — How we intend to improve our product innovation — Whether we needed to improve our price versus competitors — How the dilutive impact of operating margins on higher Groceries Online penetration will be addressed — What Argos’s transition to a predominantly digital business means for the future of the store estate — How we will improve returns in the Financial Services business and reduce the risk of the business requiring capital injections from the Group — Providing confidence in profit, cash flow and dividend prospects
Engaging with our shareholdersThe Board receives reports and updates on shareholder relations at each meeting. These summarise key feedback from our principal shareholders derived from a programme that consists of:
— One-on-one investor meetings with the Chairman, Chief Executive Officer, Chief Financial Officer and Head of Investor Relations — Real time feedback from investors immediately after meetings and presentations — The Annual General Meeting (AGM)
— Attendance at key investor conferences and tours — Regular email and telephone contact with investors and analysts — ShareSoc event for individual investors
The Board was keen to address shareholders’ priorities when determining our strategy, found on page 9. Shareholders wanted greater visibility of the impact that COVID-19 was having on the business. In response, the Board has increased the level of disclosure since the start of the pandemic, giving greater visibility of trading patterns and laying out clear assumptions of expected impacts.
It also listened to shareholder feedback before making dividend decisions. In particular it agreed to pay a special dividend of 7.3p to shareholders, in lieu of a final dividend for the 2019/20 financial year, in light of improved visibility, strong trading and a strong balance sheet position and has proposed a final dividend of 7.4p for the 2020/21 financial year, which would make a flat full year dividend payment year on year despite a decline in underlying earnings.
Our shareholders are increasingly interested in Environmental, Social and Governance (ESG) issues. To address this, we will be holding an ESG event in June 2021, which will cover the integration of ESG into our business model.
Shareholders are keen to understand our remuneration decisions. The Remuneration Committee consulted with shareholders on the targets for the 2020 Long-Term Incentive Plan (LTIP), as the setting of these targets was delayed due to COVID-19. In addition, it consulted shareholders on the approach to remuneration for 2021/22 including the new LTIP measures and the potential vesting outturn of the 2018 LTIP award. For more information, please see the Remuneration Report on page 70.
22 Strategic Report J Sainsbury plc Annual Report 2021

The following aligns to the non-financial reporting requirements contained in sections 414CA and 414CB of the Companies Act 2006 and reflects our commitment and management of the environment, colleagues, social matters, human rights and anti-bribery and anti-corruption.
EnvironmentWe have a responsibility to our colleagues and the communities we serve to reduce the impact our business has on the environment. Under our Net Zero by 2040 plan, we are investing in a programme of changes, focusing on reducing carbon emissions, food waste, plastic packaging and water usage and increasing recycling, biodiversity and healthy and sustainable eating. You can read more about our Net Zero by 2040 plan on pages 14 to 16, in our Non-financial KPIs on page 25, in our Principal risks and uncertainties on page 39 and in our CR&S Committee report on pages 62 to 63.
Our policies support our approach to the environment and help our suppliers meet our sustainability goals. They include our Sustainable Sourcing Policy Goods for Resale, which helps support suppliers to effectively carry out their ethical trading responsibilities and meet Sainsbury’s ethical commitments as well as outlining how suppliers should implement our Code of Conduct for Ethical Trade including protection of the environment. The policy can be found on our website www.about.sainsburys.co.uk/making-a-difference/corporate-responsibility.
ColleaguesWe want to be a place where people love to work and shop. This means being an inclusive employer where colleagues are treated fairly and with respect, and where they are encouraged to develop their skills and fulfil their potential. Read more on our colleagues in Our People on page 17, Engaging with our stakeholders and our Section 172 statement on page 20, our Non-financial KPIs on page 25, and in the Board diversity policy in our Nomination Committee report on page 61.
Social mattersWe have a long history of building partnerships and delivering great impact in our communities, locally and internationally. We are committed to supporting social cohesion, economic prosperity and inclusive growth and we aim to positively impact those in need through fundraising, volunteering, donations and by raising awareness.
Read more about our communities on page 18 and 21, and the CR&S Committee report on pages 62 to 63.
Human rightsOur customers want to be confident that the people who make, grow or sell our products are not being exploited or exposed to infringements on their human rights. Although the primary duty to protect human rights sits with national governments, we fully recognise our responsibility as a company to respect human rights throughout all our operations. Our commitment covers all aspects of our business; our colleagues, customers and suppliers, and is supported by our Human Rights Policy. Our Human Rights Policy reinforces our approach that we do not tolerate any form of human rights abuse within our Company or supply chains. Through our due diligence processes, we seek to identify, prevent and mitigate adverse human rights risks that are linked to our operations, products or services and deal with any adverse impacts caused. You can read more about human rights on page 18 under our suppliers.
Anti-corruption and anti-briberyOur values form the framework which guides the behaviours of all colleagues across the business. We expect all our colleagues and contractors to act with honesty and integrity and never to engage in any activity which could be considered to be accepting a bribe or giving a bribe. Our Anti-Bribery and Corruption Policy provides guidance and expectations on our colleagues’ responsibilities and our expectations to prevent bribery and fraud. We have a Disciplinary and Appeals Policy to help encourage everyone to achieve and maintain our rules and standard of conduct, attendance and performance. Our Whistleblowing Policy covers how to report wrongdoing when honesty and integrity are compromised. More information on whistleblowing can be found on page 66.
Other informationOther information to support this statement can be found as follows:
— Description of our business model on page 7 — Non-financial KPIs on page 25 — Principal risks and uncertainties on pages 32 to 43 — Statement of Viability on page 44 — Audit Committee report on pages 64 to 69 — All of our public policies, reports, codes and standards are available at www.about.sainsburys.co.uk
23Strategic Report J Sainsbury plc Annual Report 2021
Governance ReportStrategic Report
Financial Statements
Non-financial information statement

Group measuresUnderlying profit before tax (£m)1
Definition: Profit before tax adjusted for certain items in note 5 which, by virtue of their size and/or nature, do not reflect the Group’s underlying performance
Underlying basic earnings per share (pence)1
Definition: Earnings per share using underlying profit
Retail operating cash flow (£m)Definition: Retail cash generated from operations after changes in working capital and pension contributions, and before exceptional pension contributions
Retail free cash flow (£m)1
Definition: Net cash generated from retail operations, adjusted for exceptional pension contributions, after cash capital expenditure but before strategic capital expenditure and after investments in joint ventures and associates and Sainsbury’s Bank capital injections
2016/17
2017/18
2018/192
2019/20
2020/21
581
589
601
586
356
2016/17
2017/18
2018/192
2019/20
2020/21
21.8
20.4
19.8
11.7
20.7
2016/17
2017/18
2018/192
2019/20
2020/21
1,259
1,128
1,921
1,971
2,275
2016/17
2017/18
2018/192
2019/20
2020/21
319
432
456
611
784
Retail underlying EBITDAR margin (%)1
Definition: Underlying profit before tax before underlying net finance costs, underlying share of post-tax results from joint ventures, depreciation, amortisation and rent, divided by sales excluding VAT, including fuel, excluding Financial Services
Retail underlying operating margin (%)1
Definition: Underlying profit before tax before underlying net finance costs and underlying share of post-tax results from joint ventures, divided by retail sales excluding VAT, including fuel, excluding Financial Services
Dividend per share (pence)Definition: Total proposed dividend per share in relation to the financial year
Core retail capital expenditure (£m)1
Definition: Capital expenditure excluding Financial Services, before proceeds from disposal of property, plant and equipment and before strategic capital expenditure
2016/173
2017/18
2018/192
2019/20
2020/21
7.47
6.65
7.56
7.44
7.40 2016/17
2017/18
2018/192
2019/20
2020/21 2.55
2.42
2.24
3.45
3.30
2016/17
2017/18
2018/19
2019/204
2020/214
10.2
10.2
11.0
10.6
10.6
2016/17
2017/18
2018/19
2019/20
2020/21
588
542
508
599
568
At our interim results we announced 8 key metrics to ensure we deliver for customers and drive stronger financial results. These will be the group’s key performance indicators (KPIs) as we deliver the new plan and will be the focus of reporting from next year. For this year we are including our previous KPI set which were in place at the start of the year.
Operational Financial — Grocery market share performance — UPBT growth
— Strong customer satisfaction scores — 200bps+ reduction in retail operating cost to sales
— Maintain strong colleague engagement — Dependable retail free cash flow: £500m pa average
— Deliver our Net Zero commitment — Increase Return on Capital employed
24 Strategic Report J Sainsbury plc Annual Report 2021
Our KPIsFinancial key performance indicators are critical to understanding and measuring our financial health.
1 Refer to APMs on page 194.2 2018/19 restated for IFRS 16. 2016/17 to 2018/19 not restated for IFRS 16.3 2016/17 restated to include Argos on a post acquisition consolidation basis.4 Special dividend paid in lieu of final dividend for 2019/20 following the deferral of dividend decision.
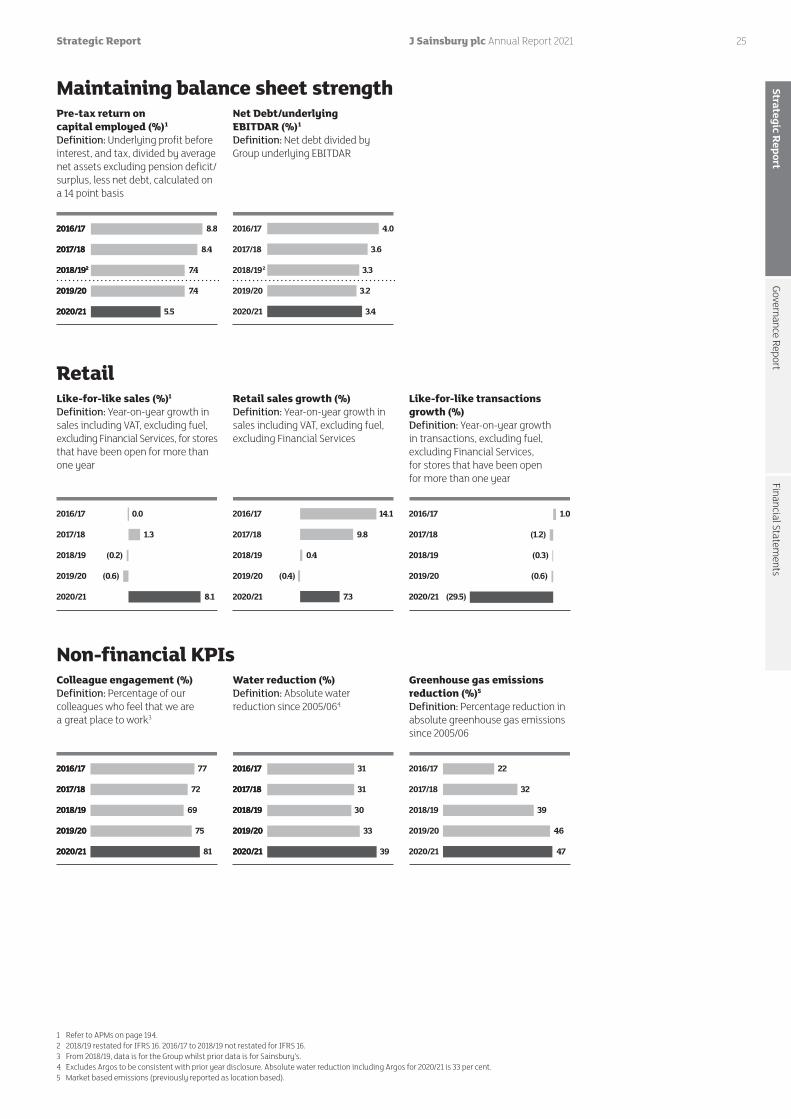
Maintaining balance sheet strengthPre-tax return on capital employed (%)1
Definition: Underlying profit before interest, and tax, divided by average net assets excluding pension deficit/surplus, less net debt, calculated on a 14 point basis
Net Debt/underlying EBITDAR (%)1
Definition: Net debt divided by Group underlying EBITDAR
2016/17
2017/18
2018/192
2019/20
2020/21
2016/17
2017/18
2018/192
2019/20
2020/21 5.5
8.8
8.4
7.4
7.4
2016/17
2017/18
2018/19 2
2019/20
2020/21
4.0
3.3
3.2
3.4
3.6
RetailLike-for-like sales (%)1
Definition: Year-on-year growth in sales including VAT, excluding fuel, excluding Financial Services, for stores that have been open for more than one year
Retail sales growth (%)Definition: Year-on-year growth in sales including VAT, excluding fuel, excluding Financial Services
Like-for-like transactions growth (%)Definition: Year-on-year growth in transactions, excluding fuel, excluding Financial Services, for stores that have been open for more than one year
2016/17
2017/18
2018/19
2019/20
2020/21
0.0
1.3
(0.2)
(0.6)
8.1
2016/17
2017/18
2018/19
2019/20
2020/21
0.4
14.1
9.8
7.3
(0.4)
2016/17
2017/18
2018/19
2019/20
2020/21
1.0
(0.3)
(0.6)
(1.2)
(29.5)
Non-financial KPIsColleague engagement (%)Definition: Percentage of our colleagues who feel that we are a great place to work3
Water reduction (%)Definition: Absolute water reduction since 2005/064
Greenhouse gas emissions reduction (%)5
Definition: Percentage reduction in absolute greenhouse gas emissions since 2005/06
2016/17
2017/18
2018/19
2019/20
2020/21
2016/17
2017/18
2018/19
2019/20
2020/21
77
72
69
75
81
2016/17
2017/18
2018/19
2019/20
2020/21
2016/17
2017/18
2018/19
2019/20
2020/21
31
31
30
39
33
2016/17
2017/18
2018/19
2019/20
2020/21
22
32
39
46
47
25Strategic Report J Sainsbury plc Annual Report 2021
Governance ReportStrategic Report
Financial Statements
1 Refer to APMs on page 194.2 2018/19 restated for IFRS 16. 2016/17 to 2018/19 not restated for IFRS 16.3 From 2018/19, data is for the Group whilst prior data is for Sainsbury’s. 4 Excludes Argos to be consistent with prior year disclosure. Absolute water reduction including Argos for 2020/21 is 33 per cent.5 Market based emissions (previously reported as location based).

2020/21 was a year of significant business disruption across every industry; a year shaped by the COVID-19 pandemic and a series of lockdowns. During this we stayed focused on delivering for our customers in challenging conditions, rapidly growing online capacity and ensuring the safety of customers and colleagues, while reshaping our business as we delivered our new strategy. Although early days, we are making good progress on the plan outlined at our interim results in November.
This was a year of significant COVID-19 costs and of significant one-off costs associated with the big and bold decisions we’ve made as part of our plan. We have also delivered strong profitable sales growth and very strong cash performance. While delivering our new Food First strategy at pace we remain focused on robust delivery of consistent and dependable cashflow. We’ve paid a stable dividend and we’re more confident on the pace of deleveraging, reflecting strong underlying cash generation.
Delivering profitable sales growthIn a highly competitive market Group sales (including VAT) were down 0.3 per cent to £32,285 million with strong growth in grocery and general merchandise sales offset by a material reduction in fuel sales, a decline in clothing sales and a reduction in Financial Services income. Retail sales excluding fuel grew by 7.3 per cent year-on-year. Grocery growth was driven by increased consumption of food at home as a result of the pandemic and increased online capacity. General merchandise sales grew because of strong demand for home and garden products and we were able to fulfil these through Argos stores in Sainsbury’s, home delivery and collection points in Sainsbury’s stores. This allowed us to continue to serve customers during periods of lockdown when standalone Argos stores were closed.
We improved the value of our food ranges, most recently with the introduction of our Sainsbury’s Quality, Aldi Price Match initiative and we are changing the way we work to deliver our commitment to increase our rate of food innovation. We also closed 170 standalone Argos stores, including relocating 30 into Sainsbury’s stores as we streamline the business as part of our Save to Invest plan. We are focused on accelerating cost savings to reinvest in the areas of the offer that matter most to customers. We are transforming at pace, and have good momentum in the business as a result of the changes we are making.
Delivering during disruption while reshaping our businessOur statutory loss before tax was £(261) million (2019/20: profit before tax of £255 million), with the benefit to profits of higher grocery and general merchandise sales more than offset by COVID-19 costs, a year-on-year increase in non-underlying items and a loss from Financial Services. Excluding the impact of non-underlying items, underlying profit before tax (‘UPBT’) decreased by 39.2 per cent to £356 million (2019/20: £586 million).
Both Retail and Financial Services profits were affected by the pandemic with higher costs in the Retail business, and the impact of COVID-19 on lending volumes, commission incomes and provisions in Financial Services. We also decided to forgo business rates relief in Sainsbury’s. Cost savings more than offset the impact of underlying cost inflation, but COVID-19 costs of £485 million resulted in Retail underlying operating margin decreasing 75 basis points to 2.55 per cent.
Our statutory loss before tax of £(261) million was due to a year-on-year increase in non-underlying items. Non-underlying items in 2020/21 predominantly related to restructuring programmes. Restructuring initiatives, including the decision to close around 420 Argos standalone stores by March 2024 and restructure our logistics network, resulted in £423 million of costs (2019/20: £202million). Other non-underlying costs incurred include impairment charges relating to assets impacted by operating model and structure changes accelerated by evolving customer habits.
Group statutory loss after tax is £(280) million (2019/20: profit after tax of £152 million).
Basic loss per share was (13.0) pence from 5.8 pence earnings per share in 2019/20. Underlying basic earnings per share decreased to 11.7 pence (2019/20: 19.8 pence) due to the decrease in underlying earnings.
Delivering our cash and net debt reduction agendaIn 2020/21 we continued to drive our agenda on cash and working capital management. We delivered Retail Free Cash flow and net debt reduction ahead of guidance. Retail Free Cash Flow increased year-on-year by £173 million to £784 million (2019/20: £611 million). This growth was predominantly driven by a reduction in working capital. Free cash flow will be unusually low in 2021/22 due to the reversal of working capital benefits but we expect average annual free cash flow for the three years to March 2022 to be at least £500 million and this is consistent with the free cash flow guidance we have reiterated for the three years to March 2025. Interest costs continue to decline as we repay debt and this year we redeemed the £250 million Perpetual Capital Securities. Whilst maintaining a disciplined approach to our cash flow, we continue to sustainably fund investment into the business to deliver our strategy, with core retail cash capital expenditure of £568 million.
Overall, we reduced non-lease net debt by £539 million in 2020/21 and are increasing our four year target to reduce non-lease net debt by at least £950 million from the £750 million we outlined in December 2020. This improvement is driven by strong core performance despite the impact of COVID-19 costs and the disciplined delivery of sustainable working capital reductions we have been able to identify as part of the Argos transformation. Due to the unwind of working capital reductions, we expect a small increase in net debt in 2021/22. Our Balance Sheet remains strong and the business had £1.6 billion undrawn facilities at the end of the year.
As at 6 March 2021 the Group pension scheme IAS 19 accounting surplus (excluding deferred tax) was £744 million (2019/20: £1,119 million surplus), a decrease from 2019/20 driven by lower than expected asset returns and increased inflation expectations.
Financial Services proving resilient in a challenging yearSainsbury’s Bank made good progress with the Financial Services transformation plan. Financial Services experienced an underlying operating loss of £21 million in 2020/21 as noted in the November 2020 guidance (2019/20: underlying operating profit of £48 million), due to changes in the economic environment driven by the pandemic. A fall in interest income was driven by lower consumer demand and lower loan balances. There was also materially lower activity in fee-based products, especially Travel Money. The number of Bank active users reduced by 14 per cent year-on-year while Argos Financial Services customer numbers remained consistent with the previous year. Despite this, Financial Services returned to profit in the second half of the year. Looking ahead, we are on track with our five-year plan to double the Group contribution of our Financial Services business by 2023/24. We ended the year with a strong position in terms of capital, bad debt coverage and liquidity.
Entering the new financial year with momentumThe impact of COVID-19 on the business has been material. Despite that, the business has shown incredible resilience, and with the support of our exceptional colleagues we managed to successfully feed the nation while reshaping our business in a time of great uncertainty. We enter the new financial year with momentum and remain confident that the financial robustness of our business puts us in a strong position to deliver our new plan and to deliver against the eight metrics we have set out.
Kevin O’ByrneChief Financial Officer
26 Strategic Report J Sainsbury plc Annual Report 2021
Financial ReviewDelivering in a year of uncertainty and change
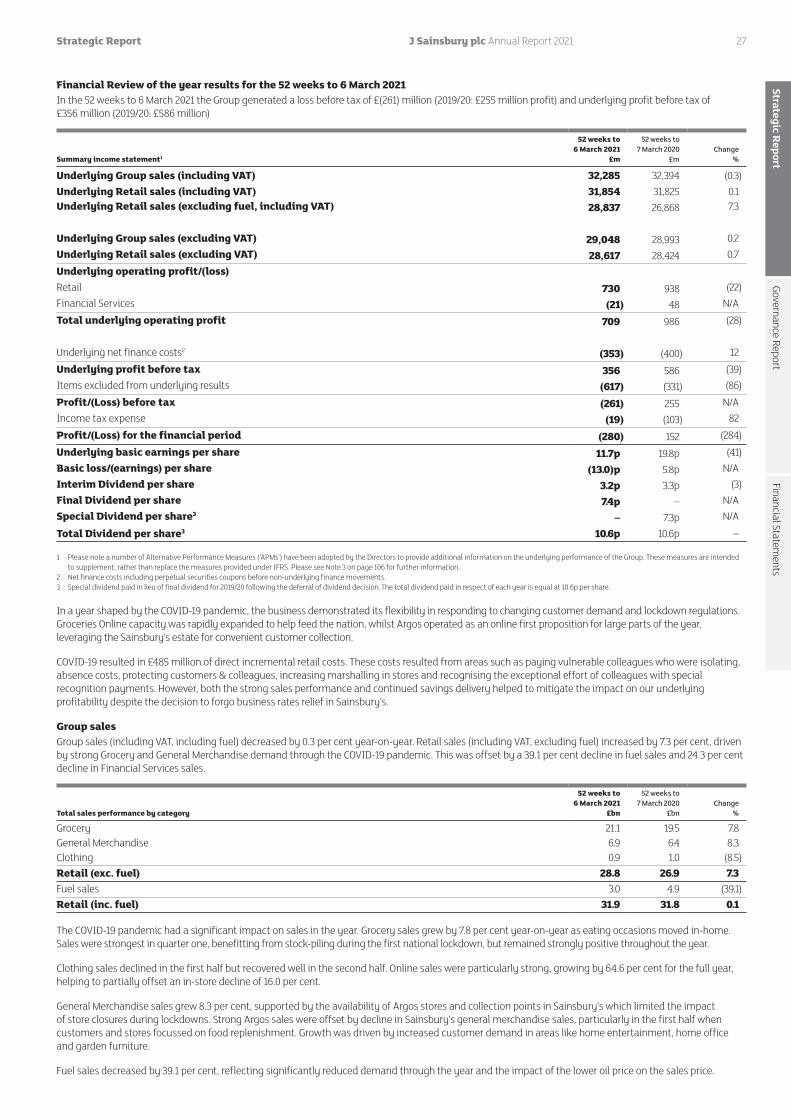
Financial Review of the year results for the 52 weeks to 6 March 2021In the 52 weeks to 6 March 2021 the Group generated a loss before tax of £(261) million (2019/20: £255 million profit) and underlying profit before tax of £356 million (2019/20: £586 million)
Summary income statement1
52 weeks to6 March 2021
£m
52 weeks to 7 March 2020
£mChange
%
Underlying Group sales (including VAT) 32,285 32,394 (0.3)Underlying Retail sales (including VAT) 31,854 31,825 0.1 Underlying Retail sales (excluding fuel, including VAT) 28,837 26,868 7.3
Underlying Group sales (excluding VAT) 29,048 28,993 0.2 Underlying Retail sales (excluding VAT) 28,617 28,424 0.7 Underlying operating profit/(loss) Retail 730 938 (22)Financial Services (21) 48 N/ATotal underlying operating profit 709 986 (28)
Underlying net finance costs2 (353) (400) 12 Underlying profit before tax 356 586 (39)Items excluded from underlying results (617) (331) (86)Profit/(Loss) before tax (261) 255 N/AIncome tax expense (19) (103) 82 Profit/(Loss) for the financial period (280) 152 (284) Underlying basic earnings per share 11.7p 19.8p (41) Basic loss/(earnings) per share (13.0)p 5.8p N/AInterim Dividend per share 3.2p 3.3p (3)Final Dividend per share 7.4p – N/ASpecial Dividend per share3 – 7.3p N/A
Total Dividend per share3 10.6p 10.6p –
1 Please note a number of Alternative Performance Measures (‘APMs’) have been adopted by the Directors to provide additional information on the underlying performance of the Group. These measures are intended to supplement, rather than replace the measures provided under IFRS. Please see Note 3 on page 106 for further information.
2 Net finance costs including perpetual securities coupons before non-underlying finance movements.3 Special dividend paid in lieu of final dividend for 2019/20 following the deferral of dividend decision. The total dividend paid in respect of each year is equal at 10.6p per share.
In a year shaped by the COVID-19 pandemic, the business demonstrated its flexibility in responding to changing customer demand and lockdown regulations. Groceries Online capacity was rapidly expanded to help feed the nation, whilst Argos operated as an online first proposition for large parts of the year, leveraging the Sainsbury’s estate for convenient customer collection.
COVID-19 resulted in £485 million of direct incremental retail costs. These costs resulted from areas such as paying vulnerable colleagues who were isolating, absence costs, protecting customers & colleagues, increasing marshalling in stores and recognising the exceptional effort of colleagues with special recognition payments. However, both the strong sales performance and continued savings delivery helped to mitigate the impact on our underlying profitability despite the decision to forgo business rates relief in Sainsbury’s.
Group salesGroup sales (including VAT, including fuel) decreased by 0.3 per cent year-on-year. Retail sales (including VAT, excluding fuel) increased by 7.3 per cent, driven by strong Grocery and General Merchandise demand through the COVID-19 pandemic. This was offset by a 39.1 per cent decline in fuel sales and 24.3 per cent decline in Financial Services sales.
Total sales performance by category
52 weeks to6 March 2021
£bn
52 weeks to7 March 2020
£bnChange
%
Grocery 21.1 19.5 7.8General Merchandise 6.9 6.4 8.3Clothing 0.9 1.0 (8.5)Retail (exc. fuel) 28.8 26.9 7.3Fuel sales 3.0 4.9 (39.1)Retail (inc. fuel) 31.9 31.8 0.1
The COVID-19 pandemic had a significant impact on sales in the year. Grocery sales grew by 7.8 per cent year-on-year as eating occasions moved in-home. Sales were strongest in quarter one, benefitting from stock-piling during the first national lockdown, but remained strongly positive throughout the year.
Clothing sales declined in the first half but recovered well in the second half. Online sales were particularly strong, growing by 64.6 per cent for the full year, helping to partially offset an in-store decline of 16.0 per cent.
General Merchandise sales grew 8.3 per cent, supported by the availability of Argos stores and collection points in Sainsbury’s which limited the impact of store closures during lockdowns. Strong Argos sales were offset by decline in Sainsbury’s general merchandise sales, particularly in the first half when customers and stores focussed on food replenishment. Growth was driven by increased customer demand in areas like home entertainment, home office and garden furniture.
Fuel sales decreased by 39.1 per cent, reflecting significantly reduced demand through the year and the impact of the lower oil price on the sales price.
27Strategic Report J Sainsbury plc Annual Report 2021
Governance ReportStrategic Report
Financial Statements

Total sales performance by channel52 weeks to
6 March 202152 weeks to
7 March 2020
Supermarkets (inc. Argos stores in Sainsbury’s) 2.5% (0.1)%Convenience (9.4)% 1.3%Groceries Online 119.6% 7.6%
Supermarket sales, excluding Groceries Online, grew by 2.5 per cent, including sales from Argos store in Sainsbury’s. Convenience sales fell by 9.4 per cent as many urban sites were impacted by reduced footfall, whilst neighbourhood locations benefited from customers shopping locally. Groceries Online sales grew by 119.6 per cent. Responding to the increased demand we rapidly grew capacity to help feed the nation through the COVID-19 pandemic, prioritising elderly and vulnerable customers. We increased order slots to over 850,000 per week by the end of the year and Click & Collect orders grew by over 850 per cent in the year.
Retail like-for-like sales performance52 weeks to
6 March 202152 weeks to
7 March 2020
Like-for-like sales (exc. fuel) 8.1% (0.6)%Like-for-like sales (inc. fuel) 0.7% (0.5)%
Retail like-for-like (‘LFL’) sales, excluding fuel, increased by 8.1 per cent (2019/20: 0.6 per cent decrease), due to increased demand and supported by successful sales transfer to online both for grocery and Argos. The impact of stores temporarily closed due to COVID-19 have been included within LFL sales, with only permanently closed sites treated as not LFL.
SpaceIn 2020/21, Sainsbury’s opened 1 new supermarket and closed 11 (2019/20: opened 2 new supermarkets and closed 2). There were 15 new Convenience stores opened in the year and 9 were closed (2019/20: 14 opened and 27 stores closed).
During the period 30 new Argos stores in Sainsbury’s were opened. 170 standalone Argos stores and the 6 Argos in Homebase stores were closed, in line with the update given in our interim results. The number of Argos collection points in Sainsbury’s stores increased from 281 to 306. As at 6 March 2021, Argos had 737 stores including 336 stores in Sainsbury’s. Habitat had 3 stores which were closed for lockdown at year end, but re-opened on April 12.
Store numbers and retailing space
As at7 March
2020 New storesDisposals/
closures
Extensions/ refurbishments/
downsizes
As at6 March
2021
Supermarkets 608 1 (11) – 598 Supermarkets area ’000 sq ft 21,167 18 (193) (170) 20,822 Convenience 807 15 (9) – 813 Convenience area ’000 sq ft 1,898 44 (18) 5 1,929 Sainsbury's total store numbers 1,415 16 (20) – 1,411
Argos stores 570 1 (170) – 401 Argos stores in Sainsbury's 306 30 – – 336 Argos in Homebase 6 – (6) – – Argos total store numbers 882 31 (176) – 737 Argos collection points 281 35 (10) – 306 Habitat 16 – (13) – 3
In FY 2021/22, we expect to open 4 supermarkets and around 25 new convenience stores, and to close around 5 supermarkets and around 25 convenience stores.
In FY 2021/22, we expect to open around 70 Argos stores inside Sainsbury’s, and close around 70 Argos standalone stores.
In the UK, the standalone Argos store estate will reduce to around 100 stores by March 2024, while we expect to have 430-460 Argos stores inside Sainsbury’s supermarkets as well as 450-500 collection points.
Retail underlying operating profitRetail underlying operating profit decreased by 22.2 per cent to £730 million (2019/20: £938 million). Retail underlying operating margin reduced by 75 basis points year-on-year to 2.55 per cent (2019/20: 3.30 per cent). The reduction was driven by £485 million of COVID-19 costs, partially offset by strong sales, whilst savings programmes more than offset underlying inflation in the business.
We invested significantly in our estate to ensure the safety of our customers and colleagues during the pandemic. We implemented protective measures in store such as checkout screens, personal protective equipment and increased cleaning. We supported our colleagues through absence caused by COVID-19 and saw an overall increase in labour hours as a result of social distancing, marshalling and the increase in online demand. We also incurred additional costs due to the pandemic within our Groceries Online channel from lower picking speeds as a result of social distancing measures and the reintroduction of bags as a COVID-19 precaution. We made three special recognition payments to our colleagues, awarded for their exceptional efforts responding to the pandemic.
We were able to more than offset cost inflation with savings programmes. This was partly driven by improvements to our central operating model, which delivered efficiencies within a number of areas, including Logistics and Distribution through the introduction of a single freight management system. Changes to our store estate continue to bring our businesses together, lowering costs and providing a better integrated customer offer. We also achieved in store efficiencies through initiatives such as SmartShop and the Stock Replenishment App for colleagues. These investments in technology provide a more convenient shopping experience for our customers whilst simultaneously lowering our cost to serve. In line with our commitment to reduce operating costs as a percentage of sales by 200 basis points to fuel investment in the customer proposition, we expect to accelerate cost saving programmes in 2021/22 through the Argos store transformation, continued delivery of our supply chain and logistics savings and further actions across the cost-base.
28 Strategic Report J Sainsbury plc Annual Report 2021
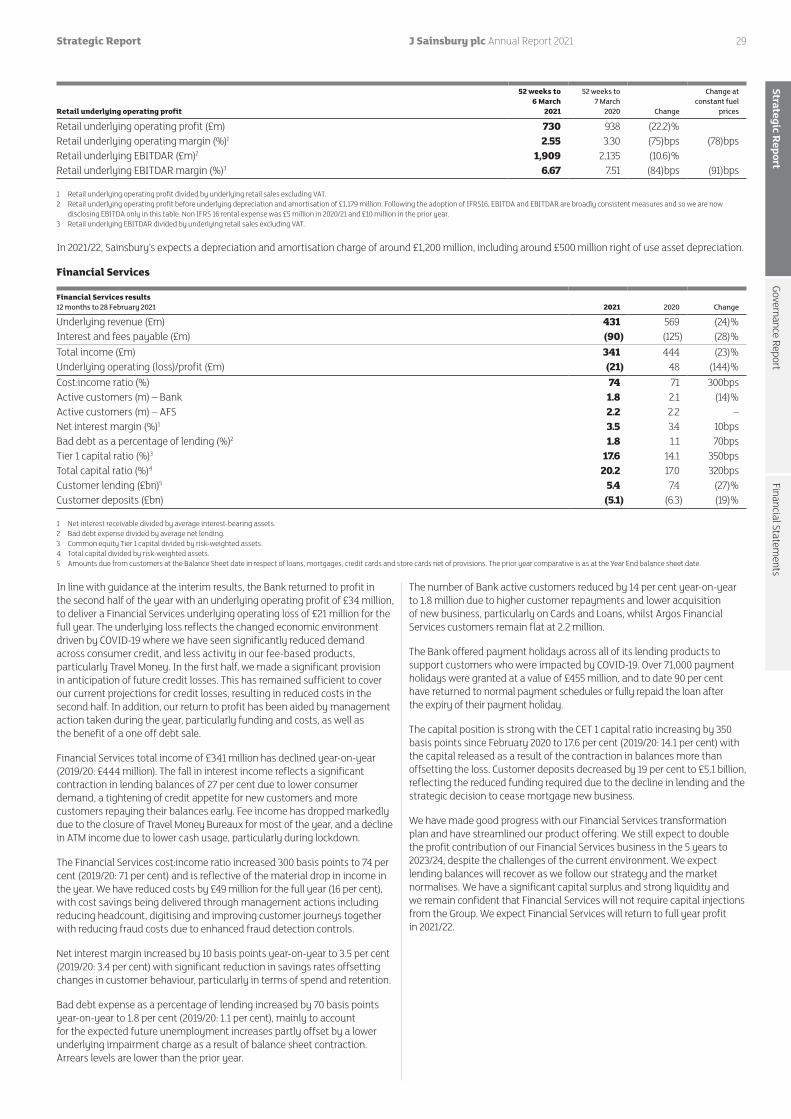
Retail underlying operating profit
52 weeks to6 March
2021
52 weeks to7 March
2020 Change
Change at constant fuel
prices
Retail underlying operating profit (£m) 730 938 (22.2)% Retail underlying operating margin (%)1 2.55 3.30 (75)bps (78)bpsRetail underlying EBITDAR (£m)2 1,909 2,135 (10.6)% Retail underlying EBITDAR margin (%)3 6.67 7.51 (84)bps (91)bps
1 Retail underlying operating profit divided by underlying retail sales excluding VAT.2 Retail underlying operating profit before underlying depreciation and amortisation of £1,179 million. Following the adoption of IFRS16, EBITDA and EBITDAR are broadly consistent measures and so we are now
disclosing EBITDA only in this table. Non IFRS 16 rental expense was £5 million in 2020/21 and £10 million in the prior year.3 Retail underlying EBITDAR divided by underlying retail sales excluding VAT.
In 2021/22, Sainsbury’s expects a depreciation and amortisation charge of around £1,200 million, including around £500 million right of use asset depreciation.
Financial Services
Financial Services results 12 months to 28 February 2021 2021 2020 Change
Underlying revenue (£m) 431 569 (24)%Interest and fees payable (£m) (90) (125) (28)%Total income (£m) 341 444 (23)%Underlying operating (loss)/profit (£m) (21) 48 (144)%Cost:income ratio (%) 74 71 300bpsActive customers (m) – Bank 1.8 2.1 (14)%Active customers (m) – AFS 2.2 2.2 –Net interest margin (%)1 3.5 3.4 10bpsBad debt as a percentage of lending (%)2 1.8 1.1 70bpsTier 1 capital ratio (%)3 17.6 14.1 350bpsTotal capital ratio (%)4 20.2 17.0 320bpsCustomer lending (£bn)5 5.4 7.4 (27)%Customer deposits (£bn) (5.1) (6.3) (19)%
1 Net interest receivable divided by average interest-bearing assets. 2 Bad debt expense divided by average net lending. 3 Common equity Tier 1 capital divided by risk-weighted assets.4 Total capital divided by risk-weighted assets.5 Amounts due from customers at the Balance Sheet date in respect of loans, mortgages, credit cards and store cards net of provisions. The prior year comparative is as at the Year End balance sheet date.
In line with guidance at the interim results, the Bank returned to profit in the second half of the year with an underlying operating profit of £34 million, to deliver a Financial Services underlying operating loss of £21 million for the full year. The underlying loss reflects the changed economic environment driven by COVID-19 where we have seen significantly reduced demand across consumer credit, and less activity in our fee-based products, particularly Travel Money. In the first half, we made a significant provision in anticipation of future credit losses. This has remained sufficient to cover our current projections for credit losses, resulting in reduced costs in the second half. In addition, our return to profit has been aided by management action taken during the year, particularly funding and costs, as well as the benefit of a one off debt sale.
Financial Services total income of £341 million has declined year-on-year (2019/20: £444 million). The fall in interest income reflects a significant contraction in lending balances of 27 per cent due to lower consumer demand, a tightening of credit appetite for new customers and more customers repaying their balances early. Fee income has dropped markedly due to the closure of Travel Money Bureaux for most of the year, and a decline in ATM income due to lower cash usage, particularly during lockdown.
The Financial Services cost:income ratio increased 300 basis points to 74 per cent (2019/20: 71 per cent) and is reflective of the material drop in income in the year. We have reduced costs by £49 million for the full year (16 per cent), with cost savings being delivered through management actions including reducing headcount, digitising and improving customer journeys together with reducing fraud costs due to enhanced fraud detection controls.
Net interest margin increased by 10 basis points year-on-year to 3.5 per cent (2019/20: 3.4 per cent) with significant reduction in savings rates offsetting changes in customer behaviour, particularly in terms of spend and retention.
Bad debt expense as a percentage of lending increased by 70 basis points year-on-year to 1.8 per cent (2019/20: 1.1 per cent), mainly to account for the expected future unemployment increases partly offset by a lower underlying impairment charge as a result of balance sheet contraction. Arrears levels are lower than the prior year.
The number of Bank active customers reduced by 14 per cent year-on-year to 1.8 million due to higher customer repayments and lower acquisition of new business, particularly on Cards and Loans, whilst Argos Financial Services customers remain flat at 2.2 million.
The Bank offered payment holidays across all of its lending products to support customers who were impacted by COVID-19. Over 71,000 payment holidays were granted at a value of £455 million, and to date 90 per cent have returned to normal payment schedules or fully repaid the loan after the expiry of their payment holiday.
The capital position is strong with the CET 1 capital ratio increasing by 350 basis points since February 2020 to 17.6 per cent (2019/20: 14.1 per cent) with the capital released as a result of the contraction in balances more than offsetting the loss. Customer deposits decreased by 19 per cent to £5.1 billion, reflecting the reduced funding required due to the decline in lending and the strategic decision to cease mortgage new business.
We have made good progress with our Financial Services transformation plan and have streamlined our product offering. We still expect to double the profit contribution of our Financial Services business in the 5 years to 2023/24, despite the challenges of the current environment. We expect lending balances will recover as we follow our strategy and the market normalises. We have a significant capital surplus and strong liquidity and we remain confident that Financial Services will not require capital injections from the Group. We expect Financial Services will return to full year profit in 2021/22.
29Strategic Report J Sainsbury plc Annual Report 2021
Governance ReportStrategic Report
Financial Statements

Underlying net finance costsUnderlying net finance costs reduced by 12 per cent to £353 million (2019/20: £400 million). These costs include £60 million of net non-lease interest (2019/20: £77 million). The reduction of net non-lease interest is driven by the repayment of the £450 million Convertible Bond in November 2019, and the redemption of the £250 million perpetual subordinated capital securities in July 2020. The interest costs on lease liabilities have reduced to £293 million (2019/20: £323 million) due to lower interest rates on new leases.
Sainsbury’s expects underlying net finance costs in 2021/22 of between £340 million – £350 million, including around £290 million – £300 million lease interest.
Items excluded from underlying resultsIn order to provide shareholders with insight into the underlying performance of the business, items recognised in reported profit or loss before tax which, by virtue of their size and or nature, do not reflect the Group’s underlying performance are excluded from the Group’s underlying results and shown in the table below.
Items excluded from underlying results
52 weeks to6 March
2021£m
52 weeks to7 March
2020£m
Restructuring programmes (423) (202)Impairment charges (220) (126)Financial Services transition and other (17) (29)ATM business rates reimbursement 42 –IAS 19 pension income 6 19Property, finance and acquisition adjustments (5) 7Items excluded from underlying results (617) (331)
— An updated plan was announced in November 2020 in which it was communicated that the structural integration of Sainsbury’s and Argos would be accelerated, as well as further streamlining the Argos business model. The closure of around 420 Argos stores was announced as well as plans to simplify the logistics network and other areas of the business. Restructuring programme costs of £423 million have therefore been recognised that relate to store closures and asset write downs.
— The Group concluded that the combination of COVID-19 and the accelerated integration programme was an impairment indicator, following which impairment charges of £220 million were recognised in addition to the closure costs above. £105 million relates to Financial Services and £115 million in relation to Retail assets.
— 2019/20 restructuring charges of £202 million and impairment of £126 million primarily relate to store closures and asset write downs announced at our Capital Markets Day in September 2019.
— Financial Services transition and other costs of £17 million (2019/20: £29 million) were predominantly the previously announced costs incurred in transitioning to a new banking platform and write-downs of ATMs.
— ATM income of £42 million (2019/20: £nil) arises following the Supreme Court’s ruling that ATMs outside stores should not be assessed for additional business rates on top of normal store rates. By year end £27 million had been received in cash.
— IAS 19 Pension income of £6 million (2019/20: £19 million) comprises pension finance income of £19 million and scheme expenses of £13 million.
— Other movements of £5 million cost (2019/20: income of £7 million) relate to property profits and acquisition adjustments.
— Cash outflows relating to restructuring programmes, impairment and financial services transition were £54 million, lower than previously guided due to the timing of dilapidations payments relating to the property strategy announcements. Total cash outflows were £61 million. This was offset by £54 million of cash inflows driven by the ATM business rates reimbursement and property disposal proceeds.
Including costs taken this year, we still expect that we will incur one off costs from these infrastructure, operating model and structure changes announced in November 2020 of £900 million to £1 billion in the period to March 2024 (approximately £300 million cash). We expect to incur the remaining costs evenly over the next 3 years, including £125 million of restructuring cash costs in 2021/22.
TaxationThe tax charge was £19 million (2019/20: £103 million). The underlying tax rate was 29.5 per cent (2019/20: 25.4 per cent) and the effective tax rate is (7.3) per cent (2019/20: 40.4 per cent).
The underlying tax rate is higher than the prior year. The underlying tax rate is adversely impacted by a year on year reduction in the underlying profit before tax, which increases the relative weighting of non-deductable property charges which were flat year on year.
The effective tax rate is lower than the prior year but is distorted by the fact there is an accounting loss before tax for 2020/21. The factors driving the effective tax rate in 2020/21 are the impact of non-tax deductible non-underlying costs, including the impairment of fixed assets and the partial derecognition of capital losses which are partially offset by the tax impact of property disposals.
Sainsbury’s expects an underlying tax rate in 2021/22 of around 25 per cent.
Earnings per shareUnderlying basic earnings per share decreased to 11.7 pence (2019/20: 19.8 pence) driven by the decrease in underlying earnings. Basic loss per share was (13.0) pence (2019/20: 5.8 pence earning per share).
DividendsAs guided when Sainsbury’s announced its decision to forgo business rates relief in December 2020, the Board believes shareholders should not bear the full short-term impact of the effect of COVID-19 on the business and so have proposed a final dividend of 7.4 pence per share. This brings the full year dividend to 10.6p per share, which is flat year on year (when treating the Special Dividend announced in November 2020 of 7.3p as part of 2019/20).
This represents an exception to our normal dividend policy of 1.9 times cover by full year underlying earnings, reflecting the Board’s commitment to prioritise dividend payments ahead of net debt reduction and its confidence in the strength of underlying cash generation. The full year dividend is covered 1.5 times by underlying earnings.
This final dividend will be paid on 16 July 2021 to shareholders on the Register of Members at the close of business on 11 June 2021. Sainsbury’s has a Dividend Reinvestment Plan (DRIP), which allows shareholders to reinvest their cash dividends in our shares. The last date that shareholders can elect for the DRIP is 25 June 2021.
Sainsbury’s plans to return to paying a full-year dividend covered 1.9 times by full-year underlying earnings from 2021/22.
Net debt and retail cash flowsAs at 6 March 2021, net debt was £6,469 million (7 March 2020: £6,947 million), a decrease of £478 million (2019/20: £399 million reduction). Excluding the impact of lease liabilities on net debt, Sainsbury’s reduced net debt by £539 million in the year. Sainsbury’s now expects to reduce non lease net debt by at least £950 million over a four-year period compared to 2018/19 year end net debt excluding lease liabilities of £1,522 million, £200 million more than previous guidance. Free cash flow will be unusually low in 2021/22 due to partial reversal of working capital benefits but we expect average annual free cash flow for the three years to March 2022 to be at least £500 million and this is consistent with the free cash flow guidance we have reiterated for the three years to March 2025. Over the 2 years to March 2022, the group will have delivered strong net debt reduction, despite the impact of reduced profits in 2020/21 due to COVID-19.
Group net debt includes the impact of capital injections into Sainsbury’s Bank, but excludes Financial Services’ own net debt balances. Financial Services balances are excluded because they are part of the daily operating cycle of the Bank rather than for financing purposes.
Net debt includes lease liabilities under IFRS 16 of £5,829 million (2019/20: £5,768 million) and the perpetual securities of £248 million (2019/20: £496 million).
30 Strategic Report J Sainsbury plc Annual Report 2021

Summary cash flow statement1
Retail 52 weeks to
6 March2021
£m
Retail 52 weeks to
7 March2020
£m
Retail underlying operating profit 730 938Adjustments for:Retail underlying depreciation and amortisation 1,179 1,197 Share based payments and other 26 34 Retail non-underlying operating cash flows
(excluding pensions)(12) (49)
Adjusted retail operating cash flow before changes in working capital2, 3
1,923 2,120
Decrease/(increase) in working capital3 453 (97)Net interest paid3 (372) (405)Pension cash contributions (101) (52)Corporation tax paid (94) (113)Net cash generated from
operating activities1,809 1,453
Cash capital expenditure (568) (599)Repayments of obligations under leases (499) (419)Initial direct costs on right-of-use assets (7) (13)Proceeds from disposal of property, plant and
equipment27 81
Bank capital injections – (35)Dividends and distributions received3 22 143 Retail free cash flow 784 611 Dividends paid on ordinary shares (232) (247)Repayment of borrowings3 (539) (379)Other3 (13) (3)Net increase/(decrease) in cash and
cash equivalents– (18)
Decrease in Debt 1,038 798 Other non-cash and net interest movements4 (560) (381)Movement in net debt 478 399 Opening net debt (6,947) (7,346)Closing net debt (6,469) (6,947)of which: Lease Liabilities (5,829) (5,768) Net Debt Excluding Lease Liabilities (640) (1,179)
1 See note 7 for a reconciliation between Retail and Group cash flow.2 Excludes working capital and pension contributions.3 Refer to the Alternative Performance Measures on pages 194 to 198 for reconciliation.4 Other non-cash includes new leases and lease modifications and fair value movements on derivatives
used for hedging long term borrowings.
Adjusted retail operating cash flow before changes in working capital decreased by £197 million year-on-year to £1,923 million (2019/20: £2,120 million). Working Capital decreased by £453 million (2019/20: £97 million increase), as a result of the strong trading performance driving increased payables balances despite the impact of lower fuel sales and moving to reduced payment terms to support smaller suppliers. In addition, challenges sourcing stock on certain product ranges have further reduced inventory in our non-food business.
Cash capital expenditure was £568 million (2019/20: £599 million). There were no capital injections to the Bank this year (2019/20: £35 million).
Dividends and distributions received of £22 million (2019/20: £143 million) reduced to normal levels, with the prior year benefitting from the proceeds of the sale of properties held in a joint venture with British Land.
Retail free cash flow increased by £173 million year-on-year to £784 million (2019/20: £611 million), driven by the working capital reduction. Free cash flow was used to fund dividends and reduce borrowings.
Dividends of £232 million were paid in the year, which were covered 3.3 times by free cash flow (2019/20: 2.5 times).
The Group held undrawn committed credit facilities of £1,450 million and undrawn uncommitted facilities of £195 million as at 6 March 2021.
Capital expenditure Core retail cash capital expenditure was £568 million (2019/20: £599 million).
Sainsbury’s expects core retail cash capital expenditure (excluding Financial Services) to be around £700-£750 million per annum over the next three years, reflecting investment in high-returning supply chain, logistics and infrastructure projects including the Argos transformation.
Financial Ratios
Key financial ratios
52 weeks to6 March
2021
52 weeks to7 March
2020
Return on capital employed (%)1 5.5 7.4 Net debt to EBITDA2 3.4 times 3.2 times Fixed charge cover3 2.2 times 2.7 times
1 ROCE: Return is defined as a 52 week rolling underlying profit before interest and tax. Capital employed is defined as group net assets excluding the pension deficit/surplus less net debt (excluding perpetual securities). This is calculated using the average of 14 datapoints – the prior year closing capital employed, the current year closing capital employed and 12 intra-year periods as this more closely aligns to the recognition of profit/loss.
2 Net debt of £6,469 million includes lease obligations under IFRS 16 and perpetual securities treated as debt, divided by Group underlying EBITDA of £1,911 million.
3 Group underlying EBITDA divided by rent (both capital and interest) and net underlying finance costs, where interest on perpetual securities is treated as an underlying finance cost.
Property valueAs at 6 March 2021, Sainsbury’s estimated market value of properties, with values based on a 25 year lease with RPI increases, including our share of properties held within property joint ventures or investment vehicles, was £10.1 billion (7 March 2020: £9.9 billion), with the increase driven by a small reduction in property yields.
Defined benefit pensionsThe Pension Scheme is valued on different bases for different purposes. For the corporate annual accounts, the value of the retirement benefit is calculated under IAS19 while the funding of the Scheme is determined by the Trustee’s triennial valuation.
At 6 March 2021, the net defined benefit surplus under IAS19 for the Group was £744 million (excluding deferred tax). The £375 million reduction from 7 March 2020 was primarily driven by lower than expected asset returns and increased inflation expectations.
For 2021/22, total pension scheme cash contributions and are expected to be £76 million.
Retirement benefit obligations
Sainsbury’sas at
6 March2021
£m
Argosas at
6 March2021
£m
Groupas at
6 March2021
£m
Groupas at
7 March2020
£m
Present value of funded obligations
(8,808) (1,410) (10,218) (10,335)
Fair value of plan assets 9,596 1,404 11,000 11,491 Pension surplus/(deficit) 788 (6) 782 1,156 Present value of unfunded
obligations(21) (17) (38) (37)
Retirement benefit obligations
767 (23) 744 1,119
Deferred income tax (liability)/asset
(178) (14) (192) (214)
Net retirement benefit obligations
589 (37) 552 905
Kevin O’ByrneChief Financial Officer
31Strategic Report J Sainsbury plc Annual Report 2021
Governance ReportStrategic Report
Financial Statements

Below and on the following pages, we set out an overview of our risk management framework, the principal risks at year end, ongoing mitigations and how these align to our strategy. The Board monitors these principal risks on an ongoing basis and flexes mitigations where appropriate. Particular focus is currently given to how we adapt and respond to the medium and longer-term impacts of the COVID-19 pandemic, as they become clearer.
Risk management framework The management of risk is based on the balance between risk and reward, determined through a careful assessment of both the potential outcomes and impact as well as risk appetite. Consideration is given to both reputational and financial impact, recognising the significant commercial value of the Sainsbury’s brand. The risk management process is aligned to our strategy and each principal risk and uncertainty is considered in the context of how it relates to the achievement of our strategic objectives.
The following diagram provides an overview of the key risk management activities undertaken by leadership that allow the Board to fulfil its obligations under the UK Corporate Governance Code 2018. Please refer to page 53 for the role and remit of these governance bodies.
Divisional leadership teamsBottom-up risk identification
— Divisional risk maps reviewed and challenged
— Divisional emerging risk map reviewed
— Monitor risk actions
Governance forumsRisk identification and monitoring
— Divisional risks relevant to forums’ area of scope reviewed
— Governance forum risk maps reviewed
Operating BoardBi-annual Corporate risk updates and deep dives
— Corporate risk map updated and actions monitored
— Risk deep dives received — Emerging risk map reviewed
Audit CommitteeCorporate risk updates, deep dives and approve risk framework
— Corporate and emerging risk maps reviewed
— Risk deep dives received — Risk policy and framework approved — Internal audit reporting
plc BoardReview of risk process, corporate risks and approval of risk disclosures
— Annual internal controls certification by management
— Principal Risk and Uncertainty disclosures
Our risk management process is designed to identify key risks and to provide reasonable but not absolute assurance that they are fully understood and managed in line with management’s risk appetite.
The plc Board has overall responsibility for risk management and internal controls, and for reviewing their effectiveness at least annually. Certain responsibilities have been delegated to the Audit Committee, as outlined on page 64.
The risk management process is embedded at the Operating Board level and is supported by the bottom-up risk process within divisions and governance forums. The Operating Board maintains an overall corporate risk map, which captures the key risks to achieving our strategic objectives and identifies the potential impact and likelihood at both a gross and net level.
The Operating Board formally reviews the risk map twice a year to discuss and agree the level of risk that the business is prepared to accept for each key risk. The target risk position is also captured to reflect management’s risk appetite where this differs to the current net position. This enables the Operating Board to agree and monitor appropriate actions as required.
Operating Board members confirm annually that they are responsible for managing their business objectives and internal controls to provide reasonable, but not absolute, assurance that the risks in their areas of responsibility are appropriately identified, evaluated and managed. This is reported to the plc Board.
The Risk and Internal Audit team provide the Audit Committee with a risk management update at each meeting, which includes changes to the corporate risk map agreed by the Operating Board as well as the key risk activities undertaken within functions, governance forums and at divisional and corporate levels. The corporate risk map is formally discussed with the Board.
The COVID-19 pandemic has demonstrated that risk and issue management is an inherent part of doing business and has tested our risk and resilience processes. The impact of COVID-19 on our principal risks continues to be assessed by the Board and is set out, where relevant, in our risk disclosures.
32 Strategic Report J Sainsbury plc Annual Report 2021
Our principal risks and uncertainties

Developments in our risk management processFollowing the update of our strategy (see the ‘Our Strategy’ section on page 9), the corporate risk map was refreshed. The Risk and Internal Audit team met members of the Operating Board to discuss key risks associated with the updated strategy. The outputs were discussed with the Operating Board and the corporate risk map was refreshed. This revised corporate risk map was shared with the Audit Committee. Key changes include:
— The ‘Business strategy and change’ risk associated with delivery of the updated strategic priorities was updated to include new risk descriptions and associated mitigations, with future actions to further mitigate the risk agreed by the Operating Board member owning the risk. — In previous years, we reported the ‘Product safety and sourcing’ risk as part of a broader ‘Health and safety – people and product’ principal risk. In recognition of the importance of this area, we have separated this risk out and are now monitoring and reporting on it individually. The health and safety of our colleagues and customers remains a principal risk. — Brexit was removed as a specific principal risk, reflecting that the future trading arrangements with the EU are known. Residual risks associated with Brexit are set out in the ‘Political and Regulatory’ principal risk.
The revised corporate risks have been mapped to the principal risks included in this report to ensure completeness.
Emerging risks and opportunities were also formally reviewed in the year through the risk assessment process. This allows emerging risks to be regularly discussed and identified by each division and then to be collated into a business-wide assessment of risks and opportunities. The review assessed how emerging risks and opportunities may impact our business, considering their potential timeframe and degree of certainty. The outcomes were reported to the Operating Board and Audit Committee and relevant actions were agreed.
Climate change risks are assessed in terms of the impact on our business model (climate resilience) and our impact on the environment. Risks are identified from the bottom-up and emerging risk assessments across the business and then reviewed in a specific climate change risk workshop to assess completeness. Climate resilience risks identified form an integral part of a number of our corporate risks and have been referenced in the existing principal risks we are disclosing, where appropriate. Risks around our impact on the environment are considered in the ‘Environment and sustainability’ principal risk. See page 15 for more information on our ongoing implementation of the TCFD recommendations.
The specific risk management activities undertaken in the financial year to 6 March 2021 include:
— The Risk and Internal Audit team facilitated risk workshops with divisional leadership teams to identify the key risks which may prevent the achievement of objectives. A risk map is maintained for each division, setting out key risks and their gross, net and target positions. A consolidated view of relevant risks was then discussed at each key governance forum – safety, data governance and operational resilience — Divisional management and governance forums reviewed key risks and the effectiveness and robustness of the mitigating controls as part of their normal business activities — Emerging risks and opportunities were formally assessed and will continue to be monitored — Risks to the delivery of our updated strategy were discussed with Operating Board members to identify themes for broader discussion with the full Operating Board — The Operating Board reviewed and challenged the output of the bottom-up risk process including new risks, risk movements and key themes — The plc Board reviewed the risk management process and corporate risks at the year end and approved our principal risks and uncertainties disclosure, as set out on pages 34 to 43 — Internal Audit provided independent assurance to management and the Audit Committee over specific risk areas as part of their annual audit plan — As set out over the following pages, deeper risk discussions were undertaken with the Operating Board and/or Audit Committee for a selection of principal risks. Deep dives will continue, with focus on assessing whether we are within our risk appetite
The most significant principal risks identified by the Board and the mitigations are set out on the following pages in no order of priority.
The net risk movement from the prior year for each principal risk and uncertainty has been assessed and is presented as follows:
No change
Increased net risk exposure
Reduced net risk exposure
NEWNew risk
Mitigations in place, supporting the management of the risk to a net risk position, are also described for each principal risk and uncertainty.
Where principal risks have been included in the risk modelling undertaken as part of the preparation of the viability statement (see page 44), this has been indicated with the following symbol:
Strategic link
Food First
Brands that Deliver
Save to Invest
Connected to Customers
Net Zero by 2040
Key risk movementsAs noted, the principal and emerging risks are discussed and monitored throughout the year to identify changes to the risk landscape. Risks are reviewed in line with the strategic objectives of the business.
The key risk movements disclosed relate to increases in the net risk position for:a. business continuity, operational resilience and major incident
response – the risk position regressed to reflect the business disruption and costs associated with responding to COVID-19
b. business strategy and change – the risk position regressed following the strategy update. The overall impact of not delivering the strategy was assessed as being higher, although due to the mitigations in place, the likelihood was assessed as lower
33Strategic Report J Sainsbury plc Annual Report 2021
Governance ReportStrategic Report
Financial Statements

Business continuity, operational resilience and major incident response RISK DEEP DIVE
Risk Mitigations
A major incident or catastrophic event could affect the business or its individual brands’ ability to trade. Sainsbury’s exposure to operational resilience and major incident risks may be greater because of operational complexities and some ageing systems.
In the last year, the impact of and response to COVID-19 has affected most, if not all, of our business operations. This was and continues to be actively managed, although many of our mitigations are now part of day-to-day ways of working.
The level of business disruption caused by COVID-19 is outside of our risk appetite. We will continue to monitor the situation and return to pre-COVID business practices in line with government guidance and customer sentiment.
— The Group Operational Resilience Committee (GORC) meets quarterly, chaired by the CFO, with support from our Company Secretary and Chief Information Officer. The GORC sets the operational resilience strategy for the business and monitors progress against this — To support this, the Operational Resilience Committee, which includes representatives from functions across Sainsbury’s, including the Bank, meets regularly to ensure that the operational resilience policy and strategy is implemented — Business-wide resilience exercises are undertaken to imitate real life business continuity scenarios and test our ability to respond effectively. Actions in response to lessons learnt are agreed — Key strategic locations have an automated emergency call cascade solution implemented which allows for emergency communications to be made to all colleagues and for responses to be received back when required — COVID-19 confirmed that colleagues can work from home if required. Sainsbury’s Bank has arrangements with a third-party to provide secondary back-up sites — Key business processes are assessed for operational resilience against a set of minimum standards and contingency measures are tested
Crisis management — In the event of any unplanned or unforeseen events, the Incident Response Team (‘the IRT’) is convened to manage the response and any associated risk to the business
— The business has plans in place, supported by senior representatives who have the experience and the authority levels to make decisions in the event of a potentially disruptive incident — The IRT was convened at various times through the year to co-ordinate our response to changing COVID-19 guidance across the devolved nations. The Chair reports to the Operating Board, which provided strategic direction and decision making across financial, operational and regulatory matters, considering all stakeholders. The IRT was also briefly convened at year-end in response to Brexit but was stood down as our response was managed by existing business forums — We recognise that there is an increasing risk to our supply chains from extreme weather events due to climate change, which we will continue to manage through diversification of our supply chain. Our operations will also continue to be more impacted by flood risks due to climate change, leading to the need to prevent and/or respond to such events effectively. These risks are managed to limit the impact on customers and our business
Direct oversight: Group Operational Resilience Committee
Link to strategy:
Movement:
The risk position regressed to reflect the business disruption and costs associated with COVID-19
34 Strategic Report J Sainsbury plc Annual Report 2021
Business strategy and change RISK DEEP DIVE
Risk Mitigations
The strategy requires significant, concurrent change activities to be delivered in the right sequence and at pace to drive business value. Key risks associated with this include an inability to prioritise resources to deliver competing change activities and/or not having the right skills, capabilities and culture in place to deliver and embed the required changes/within required timescales.
— Our business strategy, as set out in this Strategic Report, is focussed on the following priorities:
— Food First — Brands that Deliver — Save to Invest — Connected to Customers — Net Zero 2040
— The Operating Board has regular sessions to discuss strategy, supported by a dedicated Strategy team. The strategy is communicated and the business continually engages with a wide range of stakeholders, including shareholders, colleagues, customers and suppliers — To ensure focus is maintained on delivering the strategic priorities of the business, new transformational change projects are approved by the Business Performance Review (BPR) forum, once they have been through robust challenge on expected costs and benefits, proposed timeframes for achieving the benefits and risks associated with their delivery. The BPR also monitors and reviews the “in year” implementation of the plans to meet budget targets — During the year, the Operating Board reviewed roles and responsibilities and defined clear operational accountability for delivering our strategic priorities. Governance forums were also reviewed and refreshed to simplify the business’s review and decision making process. See the Board Leadership and Company Purpose section on page 53 for more information — The Operating Board also reviewed our culture to identify strengths to build on and opportunities to enhance the behaviours required to embed the changes required to deliver our strategic objectives. As a result, our performance management process has been refreshed and rolled out — We defined 8 key operational and financial metrics, linked to Executive Director incentives (see page 80), that will be used to measure and report on our strategic performance in a clear and consistent manner. We will continue to monitor these metrics and respond as appropriate to how they change over time
Direct oversight: Business Performance Review, Operating Board
Link to strategy:
Movement:
The risk position changed following the strategy update. The overall impact of not delivering the strategy was assessed as being higher, although due to the mitigations in place, the likelihood was assessed as lower. On balance, this represents a regression to the risk position. The Operating Board continues to monitor this.
35Strategic Report J Sainsbury plc Annual Report 2021
Governance ReportStrategic Report
Financial Statements

Colleague engagement, retention and capability
Risk Mitigations
The business employs 189,000 colleagues who are critical to the success of our business. Attracting talented colleagues, investing in training and development, maintaining good relations and rewarding colleagues fairly are essential to the efficiency and sustainability of business operations. An inability to attract, motivate and retain talent, specific skillsets and capability impacts our ability to deliver our strategic objectives, thus increasing its impact.
In the last year, the impact of COVID-19 has affected most, if not all, of our store, depot and office-based colleagues. This was and continues to be actively managed, although many of our mitigations are now part of day-to-day ways of working.
The challenging trading environment requires a focus on efficient operations, which may include change initiatives affecting colleagues, therefore presenting a risk of loss of colleague trust or engagement.
— During the last year, we enhanced our regular and transparent communication with colleagues so they understand the actions we are taking to support them and customers through the pandemic. As part of this, we made additional resources and guidance available — We flexed our policies to support our colleagues and managers during COVID-19. From the very start of the pandemic, we committed to paying all colleagues that were required to shield full pay for each of the shielding periods. We also supported colleagues self-isolating or with COVID-19-related sickness — Colleagues were redeployed across the business and we recruited additional temporary and permanent colleagues to support during the pandemic — We invested in a series of additional recognition activities for colleagues across all areas of the business. We also made three special payments to frontline colleagues in our stores, depots and contact centres, and two payments to frontline managers, to acknowledge their hard work and commitment this year — Physical and mental wellbeing support, including guides, tips and webinars, plus remote working guides are provided to colleagues, along with financial payments for furniture and peripherals to support home working — Employment policies and remuneration and benefits packages are regularly reviewed and are designed to be competitive with other companies, fair and consistent, as well as providing colleagues with fulfilling career opportunities — Reviews are performed to help develop the skills colleagues need to deliver objectives and this is supported by embracing new ways of attracting talent — In addition to strong leadership and nurturing of talent by line managers, formal processes are also in place to identify talent and actively manage succession planning throughout the business — Our business priority, ‘Be a place where we all love to work’ reinforces our commitment to giving people the opportunity to be the best they can be — We continue to work tirelessly to be an inclusive place to work for all. Over the last 12 months we increased our focus on ethnic diversity, rolling out race fluency development to our top 1400 leaders, tripling our investment in development programmes for ethnically diverse colleagues and publishing our first ethnicity pay gap report — We continue to listen closely to colleagues to inform and adapt our future plans and actions. We use regular online surveys, analysis of Yammer activity and engagement with trade unions and our Great Place to Work groups to understand colleague sentiment — As change initiatives are implemented, the methods described above will continue to be employed to understand and maintain colleague trust and engagement — One of our key metrics used to measure and report on our strategic performance is to “maintain strong colleague engagement” as explained in the “Our KPIs” section of this report. We will continue to monitor this metric and respond as appropriate to how it changes over time
Direct oversight: Operating Board
Link to strategy:
Movement:
36 Strategic Report J Sainsbury plc Annual Report 2021

Customer
Risk Mitigations
We are a business incorporating Sainsbury’s, Argos, Habitat, Tu clothing, Nectar and Sainsbury’s Bank; our business must continue to evolve to meet customer needs and maintain customer loyalty. A failure to align with, and respond to changes in customer sentiment, behaviours, expectations and circumstances, exacerbated by uncertainties around customer behaviours post the COVID-19 pandemic, will impact our ability to retain existing and attract new customers.
— Customer trends, attitudes and behaviours are continually monitored over time through their response to our propositions and feedback, as well as reviewing future customer and macro trends on a quarterly basis, to help set our future direction — We implemented a proactive quality and pricing strategy that focuses both on what our existing customers want and on what will attract new customers. As part of this, we launched our Sainsbury’s Quality, Aldi Price Match campaign in February 2021 — We change and evolve to meet the needs of our customers. To react to customer demand during the COVID-19 pandemic, we more than doubled our Groceries Online and Click & Collect capacity over the last year. We continue to invest in these arrangements for now and the future, monitoring customer behaviour closely so that we respond appropriately as we move out of the COVID-19 pandemic — Nectar supports our strategy of being Connected to Customers, allowing us to know and serve our customers better. The launch of Digital Nectar has given us more control over how we reward and recognise our customers, with focus on personalising specific offers and rewards. Customers can now collect and spend their Nectar rewards with hundreds of brands online as well as with our core partners — We continue to review our products and services to ensure that we respond to the increasingly environmentally conscious expectations of our customer. We are taking a leading role in offering delicious, affordable food that supports healthy and sustainable diets and helps customers reduce their impact on the environment one plate at a time — One of our key metrics used to measure and report on our strategic performance is to deliver “strong customer satisfaction scores” as explained in the “Our KPIs” section of this report. We will continue to monitor this metric and respond as appropriate to how it changes over time
Direct oversight: Operating Board and Sainsbury’s Bank Management Board; Customer, Commercial and Channels Forum
Link to strategy:
Movement:
37Strategic Report J Sainsbury plc Annual Report 2021
Governance ReportStrategic Report
Financial Statements

Data security RISK DEEP DIVE
Risk Mitigations
It is essential that the security of customer, colleague and company confidential data be maintained. A major information security breach could have a significant negative financial and reputational impact on the business. The risk landscape is increasingly challenging with deliberate acts of cybercrime on the rise, targeting all markets and heightening the risk exposure to broader business disruption as well as to data breaches.
— A Data Governance Committee (DGC) is established and is supported by focussed working groups looking at the management of colleague, customer and commercial data, information security and associated awareness and training — The Data Governance and Information Security function, with the support of colleagues in the Technology division, continue to develop information security strategies and to build the necessary capability to respond to the increasing number and sophistication of attacks, alongside focusing on improving how we handle data and protect systems across the organisation — A suite of information security policies are in place, which focus on encryption, network security, access controls, system security, data protection and information handling — All colleagues are required to complete mandatory training on how to keep our information safe. This is supplemented by regular awareness campaigns, focusing on specific aspects of data and information security — Reviews of key third parties who hold sensitive customer or colleague data continue to take place and progress is monitored by the DGC — A risk based security testing approach across IT infrastructure and systems is in place to identify ongoing vulnerabilities and allow us to adapt and improve our defences
Direct oversight: Data Governance Committee
Link to strategy:
Movement:
38 Strategic Report J Sainsbury plc Annual Report 2021
Environment and sustainability
Risk Mitigations
The environment and sustainability are core to Sainsbury’s values, with our Net Zero 2040 commitments forming a key pillar of our strategic priorities. The key focus of the business in this area relates to reducing our environmental impact, which, if not achieved, could result in a financial and/or reputational risk.
— In line with our commitment made in 2020, we continue to invest £1 billion over 20 years to deliver on our Net Zero strategy, which focuses on becoming Net Zero across our operations by 2040, see page 14 for more information. Specific working groups are responsible for driving and executing the Net Zero Strategy, through delivering on seven commitments:ReducingCarbon emissions Plastic packaging Water usage Food waste
IncreasingRecycling Biodiversity Healthy and sustainable diets
— In February 2021, we cemented our commitment to reducing greenhouse gas emissions by having our Scope 1, 2 and 3 targets approved by the Science Based Targets Initiative which shows our approach is aligned with the climate science and the ambitions of the Paris agreement — The Net Zero Steering Group, which leads the operational execution of the Net Zero plan and oversees working group activity, met 8 times during the year. In each meeting, the working groups provided the Steering Group with an update on progress being made towards our Net Zero commitments — The Corporate Responsibility and Sustainability (CR&S) Committee, which oversees the delivery of our Corporate Social Responsibility agenda, met three times during the year. In each meeting, the Net Zero Steering Group provided the Committee with an update on progress being made on delivering our Net Zero strategy. The CR&S Committee also receives progress updates on wider sustainability initiatives. See page 62 for more information — One of our key metrics used to measure and report on our strategic performance is to “deliver our Net Zero commitment” as explained in the “Our KPIs” section of this report. We will continue to monitor this metric and respond as appropriate to how it changes over time. We also publicly report on progress towards achieving our Net Zero targets twice a year, to ensure transparency — See page 15 for more information on our ongoing implementation of the TCFD recommendations
Direct oversight: Net Zero Steerco, Corporate Responsibility and Sustainability Committee
Link to strategy:
Movement:
39Strategic Report J Sainsbury plc Annual Report 2021
Governance ReportStrategic Report
Financial Statements

Financial and treasury RISK DEEP DIVE
Risk Mitigations
The main financial risk relates to availability of short and long-term funding to meet business needs and fluctuations in interest, commodity and foreign currency rates.
— The plc Board approved Treasury policies are in place to address liquidity risk, refinancing risk, financial markets risk and counterparty credit risk. In addition, the business funding strategy is approved annually by the plc Board — The Treasury function is responsible for managing liquid resources, funding requirements, commodity, interest rate and currency exposures as set out in line with the Treasury policy and overseen by the Treasury Committee — The Treasury function has clear operating procedures, which are regularly reviewed and audited — A long-term funding plan is formed as part of the annual corporate plan process, which includes an assessment of short and long-term core funding requirements and contingent funding requirements — A short-term funding plan is formalised as part of the annual budget process, which includes an assessment of the core and contingent funding requirements for the following year and the market conditions for each of the debt markets accessible to the business — Annually, the Audit Committee reviews and approves the viability and going concern statements and reports to the plc Board — Finance commercial reviews are held each period, chaired by the CFO, to review the balance sheet, P&L and net debt, with relevant actions and mitigations agreed — There is a long-term funding framework in place for the pension deficit and there is ongoing communication and engagement with the Pension Trustees — We use 8 key metrics to measure and report on our strategic performance, including “200bp+ reduction in retail operating cost to sales” and “dependable retail free cash flow: £500m pa average” as explained in the “Our KPIs” section of this report. We will continue to monitor these metrics and respond as appropriate to how they change over time — Financial and Treasury risk in respect of Sainsbury’s Bank are detailed separately
Direct oversight: The Board of J Sainsbury plc
Link to strategy: Movement:
40 Strategic Report J Sainsbury plc Annual Report 2021

Health and safety RISK DEEP DIVE
Risk Mitigations
Prevention of injury or loss of life for both colleagues and customers is of utmost importance and is paramount to maintaining the confidence our customers have in our business.In the last year, the impact of COVID-19 has affected the health and safety of our customers and colleagues. This was and continues to be actively managed, although many of our mitigations are now part of day-to-day ways of working.
— Clear policies and procedures are in place detailing the controls required to manage health and safety across the business and comply with all applicable regulations. These cover the end-to-end operations, including the auditing and vetting of construction contractors and the health and safety processes in place in our depots, stores and offices — The Operating Board were regularly updated on colleague and customer health and safety matters throughout the COVID-19 pandemic. Policies and procedures were adjusted in response, particularly focused on increased cleaning and monitoring and limiting customer numbers in stores, in line with government guidance. Significant investment was made in providing colleagues and customers with facemasks, hand sanitiser and protective screens — With the need for remote working in response to COVID-19 lockdown requirements, individual workplace risk assessments were performed and equipment provided to colleagues where required for health and safety purposes — Process compliance is supported through oversight from our Primary Authority partners, internal training programmes and management monitoring, all which align to both health and safety laws and our internal policies. We invested in technology solutions to direct and monitor process completion, with oversight provided by field teams in both Safety and Internal Audit — The Group Safety Committee (GSC) met four times during the year, receiving detailed reports on a wide range of topics including COVID management and control, growth of online operations, building fabric review and safety training. The GSC were also supported by additional working groups to manage the ever-changing risk the COVID-19 pandemic presented — The Operating Board and plc Board receive quarterly reports on safety and also receive an annual safety update and deep dive facilitated by the Head of Group Safety
Direct oversight: Group Safety Committee
Link to strategy:
Movement:
This risk included Product Safety in last year’s Principal Risks and Uncertainties, but this year only relates to Health & Safety. The Product Safety risk is reported on separately, given the importance of this risk area and its increased profile.
41Strategic Report J Sainsbury plc Annual Report 2021
Governance ReportStrategic Report
Financial Statements

Political and regulatory environment
Risk Mitigations
There is a trend of increasing regulation, together with enforcement action, across all areas of our business. This increases the risk of non-compliance, adds additional cost as we respond to the regulations and drives complexity into our business processes.
— We continually monitor for changes to existing regulations that would impact the business, so that we can respond appropriately. Areas in the last year where the risk profile has changed include:
— the impact of complying with the post-Brexit regulatory and enforcement regime, including what it means to be trading under both UK and EU regulations in Ireland — responding to proposed new rules associated with obesity, plastic, packaging and food waste — anticipating and responding to emerging areas of regulatory focus on environment and climate change, and associated reporting requirements
— We regularly review the implications of Brexit on our supply chain activities, particularly in relation to new customs regulations and our ability to both import products from the EU into the UK and maintain supplies to our stores in Northern Ireland — We complete an annual regulatory risk assessment with key areas of the organisation to identify emerging regulation that may impact the business, so that we can plan and implement an appropriate response — As a responsible business, we proactively engage with Government, devolved administrations, regulators and industry bodies in the areas in which we operate, on public policy issues impacting our customers and colleagues. Our engagement is transparent, and we allow our responses to government consultations to be made public
Direct oversight: Operating Board
Link to strategy:
Movement:
We reported a separate Brexit risk in last year’s Principal Risks and Uncertainties. Now the trading arrangements with the EU are agreed and managed as part of our day-to-day ways of working, we removed the specific risk but included the impact of future Brexit-related uncertainty in this risk.
Product safety and sourcing
Risk Mitigations
Failure to manage safety and sourcing risks for both food and non-food products leads to injury or loss of life, breach of regulation and/or reputational damage.
— Clear policies and procedures are in place detailing the controls required to manage product safety, fraud and ethical risks across the business and comply with all applicable regulations — These cover the end-to-end operations, including product safety processes in place in our depots and stores and the quality management controls in place to ensure product safety and integrity — In addition, established supplier audit and product testing programmes are in place to support rigorous monitoring of supplier sites, product safety, traceability, integrity and ethical issues, including modern slavery — Supplier terms, conditions and product specifications set clear standards for product/raw material safety and quality with which suppliers are expected to comply — The Group Safety Committee receive regular reports on product safety from the Head of Technical Operations and from the Head of Group Safety on operational food safety risks. In addition, the Corporate Responsibility and Sustainability Committee discussed matters related to product sourcing risk, including supply chain transparency, modern slavery and human trafficking — We work collaboratively with our suppliers to manage any challenges associated with product availability. This received additional focus during both the COVID-19 pandemic and the Brexit transition period
Direct oversight: Group Safety Committee
Link to strategy:
Movement: NEW
Given the importance of this risk area and its increased profile, we are now reporting on this risk separately, where last year it was included with the health and safety risk.
42 Strategic Report J Sainsbury plc Annual Report 2021

Sainsbury’s Bank
Risk Mitigations
Sainsbury’s Bank is exposed to a number of risks. These include operational risk, regulatory risk, credit risk, capital risk, funding, liquidity risk, and market risk.
— The Bank is managed through defined governance structures that include the Board of Sainsbury’s Bank plc, its Risk Committee and Audit Committee. The Board of Sainsbury’s Bank plc is comprised of Executive Directors, Non-Executive Directors and a J Sainsbury plc Executive Director — The Bank has a defined risk appetite aligned to delivery of strategic objectives and has implemented a risk management framework that is overseen by its Risk Committee. This Committee monitors the effectiveness of risk management activities against strategic, operational, compliance and financial risks, and is updated on, and discusses, emerging risk areas. In particular, the Risk Committee reviews the results of stress testing including the internal Liquidity and Capital Adequacy Assessments
— The actual management of risks is through an executive governance structure, which manages the day-to-day operations of the business. This includes the Sainsbury’s Bank Management Board, an Executive Risk Committee and an Asset and Liability Committee — Oversight by J Sainsbury plc is provided through:
— Membership of the Board of Sainsbury’s Bank plc – one J Sainsbury plc Operating Board member is on the Board of Sainsbury’s Bank plc and provides updates to the Board of J Sainsbury plc on Bank matters — Updates on key matters arising from meetings of the Risk Committee and Audit Committee are reported to the J Sainsbury plc Audit Committee — There are a number of reserved matters where Sainsbury’s Bank plc needs to obtain permission from J Sainsbury plc
Direct oversight: The Boards of J Sainsbury plc and Sainsbury’s Bank plc
Link to strategy:
Movement:
Trading environment and competitive landscape
Risk Mitigations
We operate in a highly competitive market during a time of economic uncertainty, primarily driven by the COVID-19 pandemic. With the outlook set to remain the same for the immediate future, we need to respond appropriately to external market conditions while maintaining clear focus on delivering our strategic objectives. We also need to be mindful of the ongoing risk of supplier failure and the operational and/or financial consequences for our business.
— We have a wide, differentiated product offer, incorporating Sainsbury’s, Argos, Habitat, Tu clothing, Nectar and Sainsbury’s Bank — We continually monitor current market trends and price points across competitors, and respond through actively managing price positions, developing sales propositions and adjusting promotional and marketing activity — We implemented a proactive quality and pricing strategy that focuses on what our existing customers want and that will attract new customers. As part of this, we launched our Sainsbury’s Quality, Aldi Price Match campaign in February 2021 — Related to supplier continuity specifically, we maintain regular, open dialogue with key suppliers concerning their ability to trade. During the height of the COVID-19 pandemic, we supported our smaller suppliers by expediting payments to help maintain continuity of supply in light of the ongoing uncertainty — One of our key metrics used to measure and report on our strategic performance is “grocery market share performance” as explained in the “Our KPIs” section of this report. We will continue to monitor this metric and respond as appropriate to how it changes over time
Direct oversight: Customer, Commercial and Channels Forum; Operating Board
Link to strategy:
Movement:
43Strategic Report J Sainsbury plc Annual Report 2021
Governance ReportStrategic Report
Financial Statements
Statement of Viability1 How Sainsbury’s assesses its prospectsThe Group’s business activities and strategy are central to assessing its future prospects. These, together with factors likely to affect its future development, performance and position are set out in the Strategic Report on pages 1 to 45. The financial position of the Group, its cash flows and liquidity are highlighted in the Financial Review on pages 26 to 31.
The Group manages its financing by diversifying funding sources, structuring core borrowings with long-term maturities and maintaining sufficient levels of contingent funding via the committed Revolving Credit Facility. Maintaining a suitable level of undrawn additional funding capacity minimises liquidity risk.
The Group’s prospects are assessed primarily through its corporate planning process. This includes an annual review which considers profitability, the Group’s cash flows, committed funding and forecasted future funding requirements over three years, with a further two years of indicative movements. As part of the strategic planning process, the Directors make a number of assumptions about business performance and the availability and effectiveness of mitigating actions available to the Group. In particular, cashflow forecasting gives visibility of the Group’s headroom, comparing net debt to the level of committed facilities over the planning period.
The most recent corporate plan was signed off in October 2020, and refreshed in March 2021, as part of the normal budgeting process. This is reviewed by the Operating Board and ultimately by the PLC Board with involvement throughout from both the Chief Financial Officer and Chief Executive Officer. Part of the Board’s role is to consider the appropriateness of any key assumptions, taking into account the external environment, business strategy and model.
2 The assessment periodThe Directors have determined that the three years to March 2024 is an appropriate period over which to provide its viability statement. This was considered the appropriate timeframe by the Directors because:
— This period is consistent to that used for the Group’s corporate planning process as detailed above, and reflects the Directors’ best estimate of the future prospects of the business — The Group does not earn revenue through long-term contracts. Therefore, changes to the Group’s Corporate Plan are predominantly impacted by sales and cost assumptions. These are more difficult to predict beyond a three-year time-horizon. Both have been stress-tested as part of the viability assessment — The Directors considered whether the assessment period of three years should be revisited in light of COVID-19. However, given the outcomes of the modelling below, combined with the lesser impact to which the food sector is adversely impacted than others, it was concluded that the three-year timeframe remained appropriate
3 Assessment of viabilityTo make the assessment of viability the following has been performed:
— Scenarios have been modelled over and above those in the corporate plan, based upon a number of the Group’s principal risks and uncertainties (as documented on pages 32 to 43). The scenarios were overlaid into the corporate plan to assess the potential impact on net debt of one or more of these crystallising over the assessment period, and have been tested in isolation and in combination with one another. The impact of the movements in net debt on the Group’s funding headroom were then assessed. Where required, available mitigating actions to maintain funding headroom were considered as part of the assessment. These include reducing any non-essential capital expenditure and operating expenditure on projects, bonuses and dividend payments — Reverse stress-testing was performed to determine the extent to which cash flows would need to deteriorate before fully-utilising the Group’s funding headroom, and after taking into account any mitigating actions as detailed above
Whilst each of the risks on pages 32 to 43 has a potential impact and have been considered as part of the assessment, only those that represent severe but plausible scenarios were selected for modelling through the corporate plan.
44 Strategic Report J Sainsbury plc Annual Report 2021

All scenarios modelled and their link to the Group’s Principal Risks and Uncertainties are detailed below:
Scenario modelledLink to Principal Risks & Uncertainties
Scenario 1COVID-19Despite the Group’s positive performance in light of the pandemic, as COVID-19 continues to evolve with a degree of uncertainty, downside scenarios have been considered. UK GDP movements seen during the recession of FY2008/09 have been applied to forecast sales, however to differing extents per category based on the specific impact of FY2008/09 recession on Sainsbury’s and Argos respectively.
— Customer — Business continuity, operational resilience and major incident response
Scenario 2Competitive price cutting/price matchingGiven the challenging trading environment, the impact of additional price investment on the business was considered, notably to cut prices in light of discounters within the market. Therefore, an additional price investment of circa. £160 million per year has been modelled in each of the three assessment years.
— Trading environment and competitive landscape
Scenario 3Data and legal breachesThe impact of any regulatory fines has been considered. The largest considered are the General Data Protection Regulation (“GDPR”) fine for data breaches, and fines levied by the Groceries Supply Code of Practice (“GSCOP”).Fines were considered both in isolation, and in conjunction with a fall in sales volumes as a result of any reputational brand damage in each of the assessment years.
— Data security — Product safety and sourcing — Health and safety — Political and regulatory environment
Scenario 4UK’s withdrawal from the EUAs Britain has now ended the Brexit transition period with a tariff free agreement on goods, the impact on Northern Ireland has been considered, where trade flows have proved more difficult and grace periods are due to expire this year. Modelling includes the impact of increased supply chain costs to ensure goods are available in Ireland.
— Political and regulatory environment
Scenario 5Sainsbury’s Bank capital and liquidity requirementsWe have considered the strength of the Bank’s capital and liquidity positions to withstand extreme-but-plausible stress scenarios such as a pandemic, or political instability leading to high unemployment and very low interest rates.
— Sainsbury’s Bank
Scenario 6Failure to deliver sustainable cost savingsDelays in delivering the Save to Invest programme, which would have an impact of circa. £150 million in each year of the assessment period, were considered.
— Business strategy and change
Scenario 7Reverse stress testIn addition to modelling regulatory fines and price investments as above, the level of forecast sales decline required before the Group fully utilises its available funding and mitigations was considered. The required reduction was considered extreme and implausible.
In performing the above analysis, the Directors have made certain assumptions around the availability and effectiveness of the mitigating actions available to the Group.
The scenarios above are hypothetical and severe for the purpose of creating outcomes that have the ability to threaten the viability of the Group; however, multiple control measures are in place to prevent and mitigate any such occurrences from taking place.
In year one, the modelling has shown that the business is able to withstand a combination of all of the scenarios and still maintain funding headroom. For years two and three, none of the scenarios modelled individually fully utilised the funding headroom. However, all of the scenarios modelled together would fully utilise the funding headroom. Management does, however, have controllable mitigating actions available as detailed above to ensure the Group remains viable.
Taking into account the Group’s current prospects and principal risks and uncertainties, the Directors confirm that they have a reasonable expectation that the Group will be able to continue in operation and meet its liabilities as they fall due over the three years to March 2024.
4 Going concernAs a consequence of the work performed to support the viability statement above, the Directors also considered it appropriate to adopt the going concern basis in preparing the financial statements which are shown on pages 91 to 190.
45Strategic Report J Sainsbury plc Annual Report 2021
Governance ReportStrategic Report
Financial Statements

Martin SciclunaChairmanC NAppointment to the Board: 1 November 2018. Martin joined the Board as Chairman Designate and Non-Executive Director on 1 November 2018. He was appointed Chairman of the Board on 10 March 2019.Skills and experience: Martin is Chairman of RSA Insurance Group plc and was previously Chairman of Great Portland Estates plc. He brings a wealth of experience from over 25 years’ service as an executive and non-executive board director at a wide range of companies. Career experience: Previous roles include Senior Independent Director and Chair of the Audit Committee of Worldpay Inc. and Non-Executive Director and Chair of the Audit Committee of Lloyds Banking Group plc. He was a partner at Deloitte LLP for 26 years, serving as Chairman from 1995 to 2007, where his clients included Dixons, WHSmith, Alliance Unichem and Cadbury.Current directorships/business interests: Chairman of RSA Insurance Group plc.Specific contributions to the Company: Martin has extensive experience as a Chair. He brings valuable knowledge and skills in developing strategy and evaluating business opportunities, along with understanding of the financial services sector and how it operates. Martin also led a robust selection process, culminating in the appointment of Simon Roberts as Sainsbury’s Chief Executive Officer.
Simon Roberts Chief Executive OfficerCAppointment to the Board: 1 June 2020. Simon was appointed as Chief Executive Officer on 1 June 2020, having joined Sainsbury’s and the Operating Board in July 2017 as Retail & Operations Director, responsible for Stores, Central Operations and Logistics. Skills and experience: Simon brings a wide range of experience and leadership skills to the Board from previous executive and non-executive roles. He has over 30 years’ experience leading major UK retail brands, having spent 15 years at Marks and Spencer and 13 years at Boots.Career experience: Prior to joining Sainsbury’s, Simon was Executive Vice President of Walgreens Boots Alliance and President of Boots UK and Ireland. During his tenure, Simon led Boots to achieve growth in sales and transactions, increased retail gross margin and doubled sales online. Before Boots, Simon was at Marks and Spencer Group plc, where he started his career in stores. Current directorships/business interests: Non-Executive Chairman of the Institute of Customer Service.Specific contributions to the Company: Simon led Sainsbury’s industry-leading store operations restructure and digitalisation throughout 2018, which is now delivering improved customer satisfaction, market leading productivity and further investment in value for customers. He has enabled a significant transformation in capabilities and leadership across Sainsbury’s operations. Simon is a dedicated, determined and enthusiastic champion of customers and colleagues. He is the Operating Board Sponsor of diversity and inclusion within Sainsbury’s.
Kevin O’Byrne Chief Financial Officer
Appointment to the Board: 9 January 2017.Skills and experience: Kevin brings a wealth of retail and finance experience to the Board from his varied previous Chief Executive and Chief Financial Officer roles. His skills and experience in leading finance and driving performance improvement provide the business with valuable expertise in pursuing its strategy.Career experience: Kevin was previously Chief Executive Officer of Poundland Group Limited until December 2016 and held executive roles at Kingfisher plc from 2008 to 2015, including Divisional Director UK, China and Turkey, Chief Executive Officer of B&Q UK & Ireland and Group Finance Director. Prior to this, he was Group Finance Director of Dixons Retail plc and European Finance Director of Quaker Oats. He was a Non-Executive Director of Land Securities Group PLC from 2008 to September 2017, where he was Chairman of the Audit Committee and Senior Independent Director.Current directorships/business interests: Non-Executive Director and Chairman of the Audit Committee of Centrica plc.Specific contributions to the Company: Kevin is a skilled Chief Financial Officer, with extensive international retail and finance experience gained during previous and current executive and non-executive positions. He has applied this knowledge to the Finance, Internal Audit, Investor Relations, Property, Procurement and Strategy functions at Sainsbury’s, driving the performance of the business. Kevin is the Operating Board Sponsor for the LGBT+ inclusion stream within Sainsbury’s.
Brian CassinNon-Executive DirectorA NAppointment to the Board: 1 April 2016. Skills and experience: Brian brings relevant experience of running a FTSE 30 group with knowledge of big data and analytics, both areas of key importance to Sainsbury’s. As Chief Executive Officer of Experian plc, Brian brings strong leadership experience and a substantial background in operating within a regulated environment.Career experience: Brian joined Experian plc as Chief Financial Officer in April 2012, a post he held until his appointment as Chief Executive Officer in July 2014. Prior to this, Brian spent his career in investment banking at Greenhill & Co, where he was Managing Director and Partner. Brian has also held various roles at Baring Brothers International and at the London Stock Exchange.Current directorships/business interests: Chief Executive Officer of Experian plc.Specific contributions to the Company: Brian’s experience as a current chief executive and his work in the financial and technology sectors provide valuable industry insight.
Jo HarlowNon-Executive DirectorC N R
Appointment to the Board: 11 September 2017.Skills and experience: Jo brings a wealth of experience in consumer-facing businesses and the telecoms and technology industries, both in the UK and internationally. Career experience: Jo was Corporate Vice President of the Phones Business Unit at Microsoft Corporation and before that was Executive Vice President of Smart Devices at Nokia Corporation, following a number of senior management roles at Nokia from 2003. Prior to that, she held marketing, sales and management roles at Reebok International Limited from 1992 to 2003 and at Procter & Gamble Company from 1984 to 1992.Current directorships/business interests: Non-Executive Director and Chair of the Remuneration Committee of InterContinental Hotels Group plc, Non-Executive Director and Chair of the Remuneration Committee of Halma plc and Member of the Supervisory Board of Ceconomy AG.Specific contributions to the Company: Jo has broad experience from executive and non-executive roles and as Chair of the Corporate Responsibility and Sustainability Committee, she has helped the business deliver its sustainability strategy. She also brings current external Remuneration Committee experience.
Adrian Hennah Non-Executive DirectorA N Appointment to the Board: 1 April 2021.Skills and experience: Adrian has significant financial and strategic expertise leading the performance and strategy of many large companies.Career experience: Adrian started his career working in audit and consultancy with PwC and Stadtsparkasse Koeln, the German regional bank. Adrian spent 18 years in Chief Financial Officer roles at three FTSE 100 companies. He was Chief Financial Officer at Reckitt Benckiser (RB) for seven years and held the same position at Smith & Nephew and Invensys. Prior to this he spent 18 years at GlaxoSmithKline working in both finance and operations. He was also previously Non-Executive Director and Chair of the Audit Committee at RELX.Current directorships/business interests: External member (NED) of the Finance Committee (Board) of Oxford University Press.Specific contributions to the Company: Adrian brings extensive financial and leadership experience to Sainsbury’s gained from Chief Financial Officer positions held in some of the UK’s largest companies, notably at RB, which produces leading hygiene, health and nutritional brands. His considerable financial expertise will be valuable as successor to the Chair of the Audit Committee.
46 Governance J Sainsbury plc Annual Report 2021
J Sainsbury plc Board of Directors
Key to Committee members A Audit Committee C Corporate Responsibility and
Sustainability Committee N Nomination Committee R Remuneration CommitteeA C N R Denotes Chair of Committee
Retirements in 2020/21 Mike Coupe, Matt Brittin and Jean Tomlin retired from the Board on 2 July 2020.
Life President Lord Sainsbury of Preston Candover KG.

Martin SciclunaChairmanC NAppointment to the Board: 1 November 2018. Martin joined the Board as Chairman Designate and Non-Executive Director on 1 November 2018. He was appointed Chairman of the Board on 10 March 2019.Skills and experience: Martin is Chairman of RSA Insurance Group plc and was previously Chairman of Great Portland Estates plc. He brings a wealth of experience from over 25 years’ service as an executive and non-executive board director at a wide range of companies. Career experience: Previous roles include Senior Independent Director and Chair of the Audit Committee of Worldpay Inc. and Non-Executive Director and Chair of the Audit Committee of Lloyds Banking Group plc. He was a partner at Deloitte LLP for 26 years, serving as Chairman from 1995 to 2007, where his clients included Dixons, WHSmith, Alliance Unichem and Cadbury.Current directorships/business interests: Chairman of RSA Insurance Group plc.Specific contributions to the Company: Martin has extensive experience as a Chair. He brings valuable knowledge and skills in developing strategy and evaluating business opportunities, along with understanding of the financial services sector and how it operates. Martin also led a robust selection process, culminating in the appointment of Simon Roberts as Sainsbury’s Chief Executive Officer.
Simon Roberts Chief Executive OfficerCAppointment to the Board: 1 June 2020. Simon was appointed as Chief Executive Officer on 1 June 2020, having joined Sainsbury’s and the Operating Board in July 2017 as Retail & Operations Director, responsible for Stores, Central Operations and Logistics. Skills and experience: Simon brings a wide range of experience and leadership skills to the Board from previous executive and non-executive roles. He has over 30 years’ experience leading major UK retail brands, having spent 15 years at Marks and Spencer and 13 years at Boots.Career experience: Prior to joining Sainsbury’s, Simon was Executive Vice President of Walgreens Boots Alliance and President of Boots UK and Ireland. During his tenure, Simon led Boots to achieve growth in sales and transactions, increased retail gross margin and doubled sales online. Before Boots, Simon was at Marks and Spencer Group plc, where he started his career in stores. Current directorships/business interests: Non-Executive Chairman of the Institute of Customer Service.Specific contributions to the Company: Simon led Sainsbury’s industry-leading store operations restructure and digitalisation throughout 2018, which is now delivering improved customer satisfaction, market leading productivity and further investment in value for customers. He has enabled a significant transformation in capabilities and leadership across Sainsbury’s operations. Simon is a dedicated, determined and enthusiastic champion of customers and colleagues. He is the Operating Board Sponsor of diversity and inclusion within Sainsbury’s.
Kevin O’Byrne Chief Financial Officer
Appointment to the Board: 9 January 2017.Skills and experience: Kevin brings a wealth of retail and finance experience to the Board from his varied previous Chief Executive and Chief Financial Officer roles. His skills and experience in leading finance and driving performance improvement provide the business with valuable expertise in pursuing its strategy.Career experience: Kevin was previously Chief Executive Officer of Poundland Group Limited until December 2016 and held executive roles at Kingfisher plc from 2008 to 2015, including Divisional Director UK, China and Turkey, Chief Executive Officer of B&Q UK & Ireland and Group Finance Director. Prior to this, he was Group Finance Director of Dixons Retail plc and European Finance Director of Quaker Oats. He was a Non-Executive Director of Land Securities Group PLC from 2008 to September 2017, where he was Chairman of the Audit Committee and Senior Independent Director.Current directorships/business interests: Non-Executive Director and Chairman of the Audit Committee of Centrica plc.Specific contributions to the Company: Kevin is a skilled Chief Financial Officer, with extensive international retail and finance experience gained during previous and current executive and non-executive positions. He has applied this knowledge to the Finance, Internal Audit, Investor Relations, Property, Procurement and Strategy functions at Sainsbury’s, driving the performance of the business. Kevin is the Operating Board Sponsor for the LGBT+ inclusion stream within Sainsbury’s.
Brian CassinNon-Executive DirectorA NAppointment to the Board: 1 April 2016. Skills and experience: Brian brings relevant experience of running a FTSE 30 group with knowledge of big data and analytics, both areas of key importance to Sainsbury’s. As Chief Executive Officer of Experian plc, Brian brings strong leadership experience and a substantial background in operating within a regulated environment.Career experience: Brian joined Experian plc as Chief Financial Officer in April 2012, a post he held until his appointment as Chief Executive Officer in July 2014. Prior to this, Brian spent his career in investment banking at Greenhill & Co, where he was Managing Director and Partner. Brian has also held various roles at Baring Brothers International and at the London Stock Exchange.Current directorships/business interests: Chief Executive Officer of Experian plc.Specific contributions to the Company: Brian’s experience as a current chief executive and his work in the financial and technology sectors provide valuable industry insight.
Jo HarlowNon-Executive DirectorC N R
Appointment to the Board: 11 September 2017.Skills and experience: Jo brings a wealth of experience in consumer-facing businesses and the telecoms and technology industries, both in the UK and internationally. Career experience: Jo was Corporate Vice President of the Phones Business Unit at Microsoft Corporation and before that was Executive Vice President of Smart Devices at Nokia Corporation, following a number of senior management roles at Nokia from 2003. Prior to that, she held marketing, sales and management roles at Reebok International Limited from 1992 to 2003 and at Procter & Gamble Company from 1984 to 1992.Current directorships/business interests: Non-Executive Director and Chair of the Remuneration Committee of InterContinental Hotels Group plc, Non-Executive Director and Chair of the Remuneration Committee of Halma plc and Member of the Supervisory Board of Ceconomy AG.Specific contributions to the Company: Jo has broad experience from executive and non-executive roles and as Chair of the Corporate Responsibility and Sustainability Committee, she has helped the business deliver its sustainability strategy. She also brings current external Remuneration Committee experience.
Adrian Hennah Non-Executive DirectorA N Appointment to the Board: 1 April 2021.Skills and experience: Adrian has significant financial and strategic expertise leading the performance and strategy of many large companies.Career experience: Adrian started his career working in audit and consultancy with PwC and Stadtsparkasse Koeln, the German regional bank. Adrian spent 18 years in Chief Financial Officer roles at three FTSE 100 companies. He was Chief Financial Officer at Reckitt Benckiser (RB) for seven years and held the same position at Smith & Nephew and Invensys. Prior to this he spent 18 years at GlaxoSmithKline working in both finance and operations. He was also previously Non-Executive Director and Chair of the Audit Committee at RELX.Current directorships/business interests: External member (NED) of the Finance Committee (Board) of Oxford University Press.Specific contributions to the Company: Adrian brings extensive financial and leadership experience to Sainsbury’s gained from Chief Financial Officer positions held in some of the UK’s largest companies, notably at RB, which produces leading hygiene, health and nutritional brands. His considerable financial expertise will be valuable as successor to the Chair of the Audit Committee.
47Governance J Sainsbury plc Annual Report 2021
Governance ReportStrategic Report
Financial Statements
Key to Committee members A Audit Committee C Corporate Responsibility and
Sustainability Committee N Nomination Committee R Remuneration CommitteeA C N R Denotes Chair of Committee
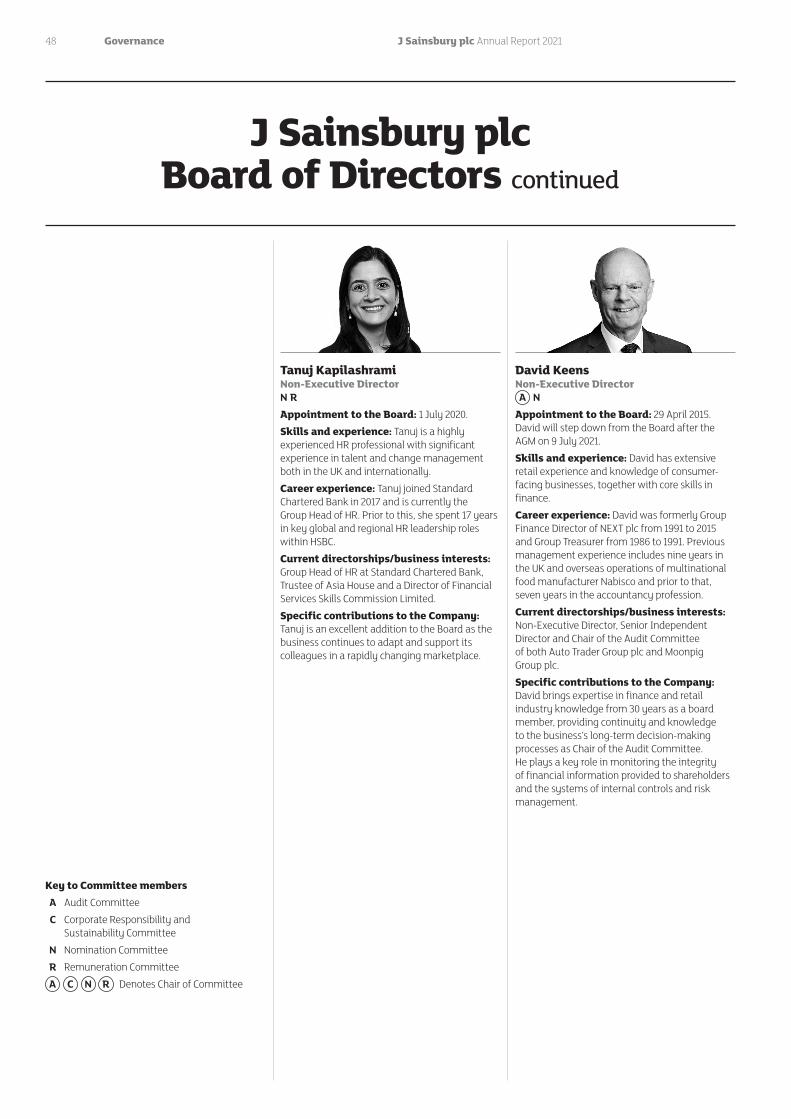
Tanuj KapilashramiNon-Executive DirectorN R Appointment to the Board: 1 July 2020.Skills and experience: Tanuj is a highly experienced HR professional with significant experience in talent and change management both in the UK and internationally. Career experience: Tanuj joined Standard Chartered Bank in 2017 and is currently the Group Head of HR. Prior to this, she spent 17 years in key global and regional HR leadership roles within HSBC. Current directorships/business interests: Group Head of HR at Standard Chartered Bank, Trustee of Asia House and a Director of Financial Services Skills Commission Limited.Specific contributions to the Company: Tanuj is an excellent addition to the Board as the business continues to adapt and support its colleagues in a rapidly changing marketplace.
David Keens Non-Executive DirectorA N
Appointment to the Board: 29 April 2015. David will step down from the Board after the AGM on 9 July 2021.Skills and experience: David has extensive retail experience and knowledge of consumer-facing businesses, together with core skills in finance. Career experience: David was formerly Group Finance Director of NEXT plc from 1991 to 2015 and Group Treasurer from 1986 to 1991. Previous management experience includes nine years in the UK and overseas operations of multinational food manufacturer Nabisco and prior to that, seven years in the accountancy profession.Current directorships/business interests: Non-Executive Director, Senior Independent Director and Chair of the Audit Committee of both Auto Trader Group plc and Moonpig Group plc.Specific contributions to the Company: David brings expertise in finance and retail industry knowledge from 30 years as a board member, providing continuity and knowledge to the business’s long-term decision-making processes as Chair of the Audit Committee. He plays a key role in monitoring the integrity of financial information provided to shareholders and the systems of internal controls and risk management.
Dame Susan RiceNon-Executive DirectorN R Appointment to the Board: 1 June 2013. Susan has been the Senior Independent Director since 6 July 2016.Skills and experience: Susan has extensive experience as a Non-Executive Director, as well as in retail banking, financial services, leadership and sustainability. Career experience: Susan has been a member of the Scottish First Minister’s Council of Economic Advisors, a Managing Director of Lloyds Banking Group Scotland and Chief Executive, then Chairman, of Lloyds TSB Scotland plc. She has also held a range of non-executive directorships, including at the Bank of England and SSE plc.Current directorships/business interests: Chair of Scottish Water and Scottish Water Business Stream Limited, Chair of the Banking Standards Board, Chair of the Scottish Fiscal Commission and Senior Independent Director of The North American Income Trust plc.Specific contributions to the Company: Susan provides insight to the Board from her extensive experience gained as Chair, Senior Independent Director and Non-Executive Director of various businesses. As Chair of the Remuneration Committee, she has played a key role in revising the current Remuneration Policy and strategy. Her expertise in financial services is invaluable to the Board as part of its oversight of Sainsbury’s Bank and Argos Financial Services.
Keith Weed CBENon-Executive DirectorA C N Appointment to the Board: 1 July 2020.Skills and experience: Keith is an exceptionally capable marketing and digital leader. He has championed new ways of integrating sustainability into business and building brands with purpose.Career experience: Keith has a strong business background, having spent 36 years at Unilever, most recently as Chief Marketing and Communications Officer which included leading the company’s ground-breaking sustainability programme globally. While at Unilever, Keith led different parts of the business, where he worked closely with Sainsbury’s and other retailers. He has strong international experience and knowledge, having run international businesses and worked in other countries. Current directorships/business interests: Non-Executive Director of WPP PLC, President of the Advertising Association, Trustee Director of Business in the Community and President of the Royal Horticulture Society. He is also a trustee of Grange Park Opera. Keith was awarded a CBE for services to the advertising and marketing industry in the 2021 New Year Honours List.Specific contributions to the Company: Keith plays an important role as Sainsbury’s focuses on putting food back at the heart of the business and delivering the Net Zero by 2040 plan. He has an excellent understanding of sustainability and digital and the ways that technology is transforming businesses.
J Sainsbury plc Board of Directors continued
48 Governance J Sainsbury plc Annual Report 2021
Key to Committee members A Audit Committee C Corporate Responsibility and
Sustainability Committee N Nomination Committee R Remuneration CommitteeA C N R Denotes Chair of Committee

Tanuj KapilashramiNon-Executive DirectorN R Appointment to the Board: 1 July 2020.Skills and experience: Tanuj is a highly experienced HR professional with significant experience in talent and change management both in the UK and internationally. Career experience: Tanuj joined Standard Chartered Bank in 2017 and is currently the Group Head of HR. Prior to this, she spent 17 years in key global and regional HR leadership roles within HSBC. Current directorships/business interests: Group Head of HR at Standard Chartered Bank, Trustee of Asia House and a Director of Financial Services Skills Commission Limited.Specific contributions to the Company: Tanuj is an excellent addition to the Board as the business continues to adapt and support its colleagues in a rapidly changing marketplace.
David Keens Non-Executive DirectorA N
Appointment to the Board: 29 April 2015. David will step down from the Board after the AGM on 9 July 2021.Skills and experience: David has extensive retail experience and knowledge of consumer-facing businesses, together with core skills in finance. Career experience: David was formerly Group Finance Director of NEXT plc from 1991 to 2015 and Group Treasurer from 1986 to 1991. Previous management experience includes nine years in the UK and overseas operations of multinational food manufacturer Nabisco and prior to that, seven years in the accountancy profession.Current directorships/business interests: Non-Executive Director, Senior Independent Director and Chair of the Audit Committee of both Auto Trader Group plc and Moonpig Group plc.Specific contributions to the Company: David brings expertise in finance and retail industry knowledge from 30 years as a board member, providing continuity and knowledge to the business’s long-term decision-making processes as Chair of the Audit Committee. He plays a key role in monitoring the integrity of financial information provided to shareholders and the systems of internal controls and risk management.
Dame Susan RiceNon-Executive DirectorN R Appointment to the Board: 1 June 2013. Susan has been the Senior Independent Director since 6 July 2016.Skills and experience: Susan has extensive experience as a Non-Executive Director, as well as in retail banking, financial services, leadership and sustainability. Career experience: Susan has been a member of the Scottish First Minister’s Council of Economic Advisors, a Managing Director of Lloyds Banking Group Scotland and Chief Executive, then Chairman, of Lloyds TSB Scotland plc. She has also held a range of non-executive directorships, including at the Bank of England and SSE plc.Current directorships/business interests: Chair of Scottish Water and Scottish Water Business Stream Limited, Chair of the Banking Standards Board, Chair of the Scottish Fiscal Commission and Senior Independent Director of The North American Income Trust plc.Specific contributions to the Company: Susan provides insight to the Board from her extensive experience gained as Chair, Senior Independent Director and Non-Executive Director of various businesses. As Chair of the Remuneration Committee, she has played a key role in revising the current Remuneration Policy and strategy. Her expertise in financial services is invaluable to the Board as part of its oversight of Sainsbury’s Bank and Argos Financial Services.
Keith Weed CBENon-Executive DirectorA C N Appointment to the Board: 1 July 2020.Skills and experience: Keith is an exceptionally capable marketing and digital leader. He has championed new ways of integrating sustainability into business and building brands with purpose.Career experience: Keith has a strong business background, having spent 36 years at Unilever, most recently as Chief Marketing and Communications Officer which included leading the company’s ground-breaking sustainability programme globally. While at Unilever, Keith led different parts of the business, where he worked closely with Sainsbury’s and other retailers. He has strong international experience and knowledge, having run international businesses and worked in other countries. Current directorships/business interests: Non-Executive Director of WPP PLC, President of the Advertising Association, Trustee Director of Business in the Community and President of the Royal Horticulture Society. He is also a trustee of Grange Park Opera. Keith was awarded a CBE for services to the advertising and marketing industry in the 2021 New Year Honours List.Specific contributions to the Company: Keith plays an important role as Sainsbury’s focuses on putting food back at the heart of the business and delivering the Net Zero by 2040 plan. He has an excellent understanding of sustainability and digital and the ways that technology is transforming businesses.
49Governance J Sainsbury plc Annual Report 2021
Governance ReportStrategic Report
Financial Statements
Key to Committee members A Audit Committee C Corporate Responsibility and
Sustainability Committee N Nomination Committee R Remuneration CommitteeA C N R Denotes Chair of Committee

Simon Roberts Chief Executive OfficerSee page 46.
Kevin O’Byrne Chief Financial Officer See page 46.
Rhian Bartlett Food Commercial DirectorDate of appointment: November 2020.Skills and experience: Rhian joined the Operating Board in November 2020, having returned to Sainsbury’s in 2019 as Director of Fresh Food. Rhian is responsible for delivering the commercial performance of Sainsbury’s food business and brands. She has over 20 years’ experience in the retail industry and has held a variety of senior commercial roles, including Customer and Digital Director at Screwfix and Director of UK Trading at eBay. Rhian’s previous roles at Sainsbury’s include Business Unit Director Non-Food Grocery and Head of Online Merchandising. Rhian is a Non-Executive Director at Speedy Hire Plc and is a Trustee of Grocery Aid.
Jim BrownChief Executive Officer, Sainsbury’s BankDate of appointment: June 2019.Skills and experience: Jim joined Sainsbury’s Bank in June 2019. He has held several senior international financial services roles, most recently at RBS in the UK as Chief Executive Officer of Williams and Glyn. Prior to that, Jim was Chief Executive Officer of Ulster Bank in Northern Ireland and the Republic of Ireland. Before moving to Ireland, Jim was based in Hong Kong and was Chief Executive Officer of Retail and Commercial Banking, Asia and the Middle East for RBS and ABN AMRO. He has also been a member of the RBS Group Management Committee, ABN AMRO Top Executive Group, ABN AMRO Global Consumer Leadership Team and the RBS/Bank of China Joint Steering Committee. Earlier in his career, he held senior executive roles for Citibank in Asia, Australia and New Zealand. Jim has also held board positions at Ulster Bank, Saudi Hollandi Bank, The Royal Bank of Scotland (China) Co. Ltd and RBS (Pakistan) Ltd. He is also a past President of the Institute of Banking in Ireland. He is currently a Certified Bank Director.
Tim Fallowfield OBECompany Secretary and Corporate Services DirectorDate of appointment: September 2004.Skills and experience: Tim joined Sainsbury’s in 2001 as Company Secretary, having previously held the position of Company Secretary and General Counsel at Exel plc, the global logistics company, now part of DHL. Tim is a qualified solicitor and began his career at the international law firm, Clifford Chance. He joined Sainsbury’s Operating Board in September 2004 and in addition to his role as Company Secretary, he is responsible for the Corporate Services Division, comprising Legal Services, Data Governance and Information Security, Safety and Insurance, and Shareholder Services. He also chairs the Group Safety Committee and the Data Governance Committee. Tim is Chairman of the Disability Confident Business Leaders Group, which works with Government in shaping the disability employment agenda and in raising awareness of the benefits of employing disabled people. He was awarded an OBE for services to disability awareness in the 2020 New Year Honours List.
Mark Given Chief Marketing Officer Date of appointment: June 2020. Skills and experience: Mark joined the Operating Board in June 2020. He has significant experience in customer insight, brand communication and digital marketing.Mark joined Sainsbury’s in 2012, becoming Marketing Director in 2017. He was appointed Chief Marketing Officer in August 2019 and has responsibility for marketing across the Sainsbury’s, Argos, Tu clothing and Habitat brands. Mark has also been responsible for the Nectar Loyalty coalition and Nectar360 since the business was acquired by Sainsbury’s in 2018. Prior to joining Sainsbury’s, Mark built his digital skills leading the Priority programme at O2 where he was Head of Sponsorship. Before this, Mark worked with key brands at Heineken UK where he was Brand Director. He began his career at Procter & Gamble UK and worked across Europe on a variety of brands. Mark is currently a Council Member of the Incorporated Society of British Advertisers (ISBA) and a Fellow of the Marketing Society.
50 Governance J Sainsbury plc Annual Report 2021
J Sainsbury plc Operating Board

Phil Jordan Chief Information Officer Date of appointment: January 2018. Skills and experience: Phil joined the Board in January 2018 and has brought a fresh, global perspective on technology to the Operating Board, in addition to a wealth of experience in digital, data and business transformation. Prior to joining Sainsbury’s, Phil had a long and successful track record in telecommunications. Most recently, he was Global Chief Information Officer at Telefonica, overseeing Digital Transformation and Information Technology and prior to that, was Chief Information Officer for Vodafone UK/Ireland. Phil has worked as a Non-Executive Advisor on Technology in the Investment & Retail Banking sector and is currently a Non-Executive Director, member of the Audit Committee and Chair of the Cyber-Security Committee of TalkTalk Telecom Group PLC.
Clodagh Moriarty Retail and Digital Director Date of appointment: June 2018. Skills and experience: Clodagh was appointed Retail and Digital Director in June 2020, having served as Chief Digital Officer since June 2018, when she joined the Operating Board. Clodagh is responsible for all stores and their operations, as well as Sainsbury’s digital offer and strategy, ensuring customers experience an integrated and seamless shopping experience across Sainsbury’s, Argos, Tu, Sainsbury’s Bank and Nectar. She is also a member of the Sainsbury’s Bank Board and sits on its Nomination and Remuneration Committees. Clodagh has previously been Director of Online, Head of Online Trading, Merchandising & Content and Category Manager for Meal Solutions at Sainsbury’s. She joined Sainsbury’s as Head of Strategy, following nine years at Bain & Company.
Angie RisleyGroup HR DirectorDate of appointment: January 2013.Skills and experience: Angie was appointed Group HR Director and became a member of the Operating Board with responsibility for human resources in January 2013. Before joining Sainsbury’s, Angie was the Group HR Director for Lloyds Banking Group and an Executive Director of Whitbread PLC with responsibility for HR and Corporate Social Responsibility. She was previously a Non-Executive Director and Chair of the Remuneration Committee of Serco plc. Angie is currently a Non-Executive Director, member of the Compliance & Culture Committee and Chair of the Remuneration Committee at Smith & Nephew plc.
Paula NickoldsGeneral Merchandise & Clothing Commercial DirectorPaula Nickolds will join the Operating Board in June 2021.
51Governance J Sainsbury plc Annual Report 2021
Governance ReportStrategic Report
Financial Statements
Dear ShareholderThis has been an exceptional year for the business
and our colleagues and customers, and this is reflected in the Board’s engagement and commitment over
the last 12 months.
During the pandemic, we have received regular updates and taken decisive action on trading matters, the financial consequences of our virus-related activities, our focus on the safety of customers and colleagues, our governance and shareholder returns. The Board is proud of the leadership shown by Simon Roberts, and by Mike Coupe until he stepped down as Chief Executive Officer, and of the outstanding contributions of our management teams and colleagues. It is right that I should thank them all on behalf of the Board in this Annual Report.
It has been an important part of the Board’s role over the year to support the transition from Mike to Simon as Chief Executive Officer and ensure an effective handover. In addition to taking over the leadership of the business during the pandemic, Simon has put in place a strong management team, refocused the culture and purpose of the business, and launched a new plan to put food back at the heart of Sainsbury’s. The Board has been fully engaged in the development of the strategy, joining the Operating Board in discussions as the key elements were formulated, so that our feedback and challenge could be fully considered and integrated into the plan that Simon shared with investors at our Interims presentation. Simon has made a strong start as our Chief Executive Officer and has skilfully managed the exceptional challenges of the pandemic whilst making real progress with the priorities of the business.
Our focus has now shifted to monitoring the delivery of the strategy, with regular reporting on the key measures at Board meetings as part of the enhanced performance management culture that Simon and the Operating Board are instilling throughout the business.
This focus on performance reflects one of the actions that we agreed in our Board Evaluation this year, as described in detail on page 59. This evaluation also gave us the opportunity to complete a full review of our overall effectiveness, our succession planning, our interaction with the Operating Board, and the business’s ability to react to a fast-moving retail sector, including our customer focus, our digital and online capabilities, and our approach to sustainability.
We have also overseen our diversity and sustainability priorities. We have regularly monitored both our progress to becoming a more inclusive business, and the actions and targets that have been set for the next three years, as set out in detail on pages 17 and 18. The Board held our own Race Matters upskilling session with colleagues from the business, as part of the programme completed by our top 1,400 leaders.
Our sustainability strategy, and wider Environmental, Social and Corporate Governance (ESG) agenda, continues to be a key priority of the Board and the CR&S Committee, whose report is set out on pages 62 and 63. Directors will attend the ESG Investor Day planned for June and, as part of the Board’s overall upskilling on sustainability, we have scheduled a meeting with the Cambridge Institute for Sustainability Leadership in the same month.
Overall, the Board and Committees have covered an important and wide-ranging agenda in this exceptional year. We have effectively adapted our ways of working to a virtual environment by necessity, and this has enabled us to maintain strong governance and robust decision-making. As described on pages 60 and 61, we have achieved this whilst managing not only the transition from Mike to Simon, but also a number of changes to our Non-Executive Directors. I will again express my thanks to each of the departing Non-Executive Directors and to Mike for their many years of contributing so much to the Board. We welcome Adrian Hennah, Tanuj Kapilashrami and Keith Weed to the Board and look forward to the part they can play in Sainsbury’s future.
Finally, I would like to thank my Board colleagues for their commitment during the last year. We have met on numerous occasions in addition to our scheduled Board and Committee meetings, often at short notice, and their participation and engagement have played a decisive part in our achievements and progress during the year.
Martin SciclunaChairman
52 Governance J Sainsbury plc Annual Report 2021
Governance Report
UK Corporate Governance Code The UK Corporate Governance Code 2018 (Code) is the key governance measure to which we referred during the financial year to 6 March 2021. The Code can be found at www.frc.org.uk.
The Company makes every effort to comply with the Code in full. Further details on how we comply in key areas are available in the Strategic and Governance Reports, as outlined below.
Provision 38 of the Code requires that pensions contribution rates, or payments in lieu, for executive directors are aligned with those available to the workforce. Kevin O’Byrne’s contractual cash pension supplement is not yet aligned with the pension contribution rates available to the workforce. This has been addressed by a clear incremental reduction plan, as set out in full in our Directors’ Remuneration Report within the 2020 Annual Report and Accounts, which shareholders approved by 98.87 per cent. Full compliance will be achieved by the end of the 2022 calendar year. Further detail is outlined in the Directors’ Remuneration Report on page 71.
The Board considers that the Company has complied with the Principles and Provisions of the Code in all other respects.
Compliance with the Code Board leadership and Company purposeMore information can be found on pages 53 to 55.
Division of responsibilitiesMore information can be found on page 56.
Composition, succession and evaluationMore information can be found on pages 57 to 59.
Audit, risk and internal controlMore information can be found on pages 64 to 69.
RemunerationMore information can be found on pages 70 to 87.

Role of the BoardThe Board is the principal decision-making body in the Company. It is collectively responsible for promoting the long-term success of the business for the benefit of its members, achieving this through the creation and delivery of sustainable shareholder value. The Board also carefully considers its wider stakeholders, including colleagues, customers and suppliers, when making decisions and more information can be found on pages 19 to 22.In addition to setting the strategy of the business and overseeing its implementation by management, the Board provides leadership to the business on purpose, culture, values and ethics, sustainability, monitoring overall financial performance of the business, and ensuring effective corporate governance, succession planning and stakeholder engagement. The Board is also responsible for ensuring that effective internal control and risk management systems are in place. The Matters Reserved for the Board can be found on our website at www.about.sainsburys.co.uk.
The Board has formally delegated certain governance responsibilities to its Board Committees and the Operating Board to assist with fulfilling its responsibilities, as outlined in the table below.
Operating BoardMatters not specifically reserved for the Board have been delegated to the Operating Board, which was chaired by Mike Coupe and, from June 2020, Simon Roberts. The Operating Board concentrates on the day-to-day management of the business and the execution of the strategy set out by the Board. During the year, it led the business through the challenges of the pandemic and Brexit, and our cultural, sustainability and strategic progress. Each Operating Board Director has a range of responsibilities, which are detailed in their biographies on pages 50 and 51.
During the year, the Business Performance Review, comprising all Operating Board Directors, was established to replace the Investment Board and Customer & Trading Forum. This governance structure simplifies the review and decision-making processes of the business, and provides a clear link between strategy and performance management.
Sainsbury’s Bank Board Sainsbury’s Bank plc Board membership comprises an independent Chair, four Independent Non-Executive Directors and a Non-Executive Director from the Operating Board representing J Sainsbury plc, together with the Bank’s Chief Executive Officer and Chief Financial Officer. The Bank’s Chief Executive Officer is supported by the Sainsbury’s Bank Executive Committee and is responsible for the day-to-day management of the business and executing its strategy. The Bank’s Chief Executive Officer is a member of the Operating Board, bringing the Bank’s priorities and perspective to the wider business.
53Governance J Sainsbury plc Annual Report 2021
Governance ReportStrategic Report
Financial Statements
Board leadership and Company purpose
Board CommitteesThe Board Committees support the Board in specific areas of its responsibilities, as outlined below. The Chairs summarise Committee meetings and provide updates to the Board.
Audit Committee — Reviews integrity of financial information prior to publication
— Oversees systems of internal control and risk management
— Approves the internal and external audit process
— Maintains relationship with auditors
— Carries out in-depth reviews of specific risks, including information security and data governance
More information on page 64.
Corporate Responsibility and Sustainability (CR&S) Committee
— Reviews the sustainability strategy, Net Zero by 2040 plan, and broader environmental and social matters
— Monitors engagement of the business with colleagues, customers, suppliers, the community, shareholders and government on sustainability and corporate responsibility matters
More information on page 62.
Nomination Committee — Reviews the balance of skills, knowledge, experience, independence and
diversity of the Board
— Proposes new Board appointments
— Plans succession at Board and senior management levels
More information on page 60.
Remuneration Committee — Recommends and reviews the Remuneration Policy, ensuring it is aligned
to the long-term success of the business
— Approves the remuneration and benefits of Executive Directors and the Operating Board
— Approves the remuneration principles throughout the business
More information on page 70.
Operating Board CommitteesThe Operating Board Committees support the work of the Operating Board through delegated powers, as outlined below. Members of senior management provide updates from these Committee meetings to the Operating Board.
Business Performance Review — Monitors and reviews the ‘in-year’ implementation of the Group’s plans to meet
budget targets as set out by the Operating Board
— Approves the ‘in-year’ capital expenditure
— Monitors the performance of the business with regards to the customer, the market, the product proposition and perceptions of our brand
— Steers the diversity and inclusion agenda and measures progress against targets
Group Data Governance Committee — Oversees programmes that deliver compliance with Data Protection,
Data Security and Payment Card Industry data security standards
— Oversees effective information security throughout the business
Group Safety Committee — Implements food safety, health and safety, and fire safety management systems
— Oversees standards for management and monitoring of colleague and customer safety
Group Operational Resilience Committee — Sets operational resilience strategy — Monitors implementation of business continuity and disaster recovery
arrangements
Net Zero Steering Committee — Leads operational execution of Net Zero by 2040 plan
— Oversees Net Zero working groups’ activities in relation to this strategy to ensure delivery of performance
The Terms of Reference for these Committees can be found on our website at www.about.sainsburys.co.uk.
Each of these Committees has approved Terms of Reference setting out its areas of responsibility.
Key areas of focus for the BoardThe Board’s programme of meetings allows key areas of focus to be established and reviewed on a regular basis. A review of this forward agenda was undertaken in the year to align it to the updated strategy.
In line with COVID-19 safety guidance, the Board held all meetings remotely during the year, with management teams and colleagues joining online to review performance, discuss progress and agree key priorities for the short and medium term. The Board intends to hold its scheduled meetings in person and at various business locations as soon it is safe to do so.
The following sets out the key areas of focus for the Board during the year.
COVID-19 The impact of COVID-19 was a fundamental area of focus during the year, with the Board undertaking regular and detailed reviews of our response to the pandemic throughout the business and our governance in scheduled and additional Board meetings. The Board received updates from the Operating Board and management colleagues to better understand the day-to-day approach and emphasise the importance of our three key priorities: keeping our customers and colleagues safe, helping to feed the nation, and supporting our communities and the most vulnerable in society.COVID-19 measures for in-store colleagues and our customers were reviewed and discussed by the Board at every meeting, with a safety-first approach taken. The Board reflected on colleague and customer feedback on the Company’s response to COVID-19 at Board meetings. In order to keep our colleagues safe, Board meetings were held virtually to adhere to governmental restrictions and the wellbeing of store and home-working colleagues was discussed through feedback from the Great Place to Work National Group.The Board remained cognisant of the need to help to feed the nation, especially at times of peak trading. The measures in place to support the timely delivery of products to customers was kept in view throughout the year, particularly given the significant growth in demand for online shopping.The trading performance, costs incurred and financial impact of COVID-19 were reviewed on a regular basis throughout the year in each area of the business, including the Bank. The Audit Committee regularly reported to the Board on their COVID-19 scenario reviews to support our Going Concern and Viability statements, and on broader related internal controls.The deferral of the final dividend payment decision, and the subsequent decision to pay a special dividend in November 2020, were fully discussed by the Board before approval. The Board also twice considered and approved forgoing the business rates relief offered by the Government on Sainsbury’s stores until the end of June 2020 and on standalone Argos stores once they re-opened. This decision considered the impact on stakeholders. The Board made a commitment to shareholders to prioritise the payment of dividends over net debt reduction, if the business delivered profits, believing that shareholders should not bear the full short-term financial impact of the business making the right decisions for customers and colleagues through the pandemic.
More information can be found throughout this Annual Report.
StrategyThe Board played a key role in our plan to put food back at the heart of Sainsbury’s. Simon Roberts and the Operating Board led the work to clarify our strategy, simplify the operating model, accelerate cost savings programmes, and provide a detailed multi-year road map. The strategy was developed over a number of months and, throughout its development, the Board reviewed the key strategic proposals made by management, enabling Directors to provide constructive feedback and direction. Feedback from customers, colleagues, investors and other stakeholders provided alternative viewpoints which helped to shape the updated strategy. After thoroughly reviewing each area of the business and the related plans, the Board approved the updated strategy and resulting organisational changes.The Board discusses performance and strategy at each meeting, with deep dives into each key area. The Board has reviewed customer insight and recent progress on driving value and innovation as part of our Food First plan, as well as plans relating to the store estate.
More information on pages 9 to 16.
PurposeAs part of our new plan, the Board considered the proposals for our new purpose: Driven by our passion for food, together we serve and help every customer. The Board reviewed the insight from different stakeholder groups on this purpose and ensured that it aligned with our culture, diversity and inclusion, and sustainability initiatives. The clear purpose has framed developments across the business, ensured cohesive focus when implementing change, and informed branding and marketing.
More information on page 7.
Colleagues, values and cultureCulture is a critical enabler to our success. Since the appointment of Simon Roberts, the Board has reviewed culture, including receiving feedback from colleague listening groups and our We’re Listening and other surveys, which provided a snapshot of how colleagues across the business felt. It also examined how the business responded positively and at pace to the impact of the pandemic, including faster decision-making, greater empowerment and a renewed collective pride. Using this insight, the Board and Operating Board have explored ways to align culture to our updated strategy, particularly focusing on decision pace and accountability, values and leadership, and performance edge and prioritisation. These cultural changes will be a key area of focus in the year ahead to complement and support our strategy.
More information on pages 17 and 18, and 20.
Net Zero by 2040 planOur Net Zero by 2040 plan is a key part of our updated strategy and is an area of focus for the CR&S Committee and the Board. The Board received an update following each CR&S Committee meeting, ensuring that the new approach to sustainability under the expanded Net Zero by 2040 commitment remained in focus, aligned with the updated strategy and met expectations in the market. The Board has also agreed to hold an investor day in June focusing on environment, social and governance matters.
More information on pages 14 to 16.
54 Governance J Sainsbury plc Annual Report 2021

Governance and riskThe Board takes its responsibility for the identification and management of risks very seriously to ensure the successful operation of the business. Throughout the year, the principal and emerging risks identified included COVID-19 and Brexit, which remain an important focus of the Board and the Audit Committee. Corporate governance continued to be a key focus in an ever-changing landscape and the Board received regular updates on how operational decision-making was being governed during the pandemic. The Board considered all aspects of safety, in order to keep colleagues and customers safe in rapidly changing circumstances. Updates on Audit Committee discussions and decisions were reviewed at Board meetings, enabling the Board to monitor internal controls, stress testing and risk mitigation across the business.
More information on pages 32 to 43, and 64 to 69.
Succession and leadershipSuccession planning was a key focus of the Nomination Committee during the year. The Board welcomed Simon Roberts as Chief Executive Officer, and Tanuj Kapilashrami, Keith Weed and Adrian Hennah as Non-Executive Directors, following the departures of Mike Coupe, Jean Tomlin and Matt Brittin. David Keens notified the Board that he would not be seeking re-election to the Board at the 2021 Annual General Meeting, and Adrian Hennah will replace him as Chair of the Audit Committee after the meeting. An internal Board Evaluation was undertaken to review the effectiveness of the Board and its Committees, incorporating themes from the previous external evaluation and identifying actions for the next financial year.
More information on pages 57 to 59, and 60 to 61.
FinanceThe Board regularly reviewed and discussed business performance, including trading updates and the market’s response to announcements. The impact of COVID-19 on the financial position of the Company was discussed with financial resilience, forecasting and cost management process changes outlined. The Company’s Preliminary and Interim results and Annual Report were scrutinised and approved by the Board.
More information on pages 26 to 31.
StakeholdersStakeholder considerations and culture are an important part of the Board’s discussions and decision-making. The information on pages 19 to 22 explains how the Board has embedded stakeholder considerations in decision-making.Workforce engagement is shared amongst Non-Executive Directors. Non-Executive Directors attend our Great Place to Work National Group, which is a Workforce Advisory Panel, on a rolling schedule. The topics covered at the meetings are those which have been raised by colleagues as being most important to them. This year, attendees discussed matters such as job security and wellbeing, safety and face coverings, remote working, Brexit and customer feedback. The open and honest dialogue enabled the Board to benefit from first-hand colleague feedback, and the value and insight provided by the Great Place to Work National Group helped inform Board decision-making.
More information on pages 19 to 22.
BrexitBrexit remained a focus of the Board throughout the year to ensure that the impact on the business, colleagues and customers was minimised. The Board received updates on the progress of the Brexit working group at each stage of the process.
More information on page 42.
55Governance J Sainsbury plc Annual Report 2021
Governance ReportStrategic Report
Financial Statements

How the Board operates The Board and its Committees have a scheduled forward programme of meetings, aligned to the updated strategy, to ensure that sufficient time is allocated to each key area and the Board’s time is used effectively. There is sufficient flexibility for items to be added to the agenda, which enables the Board to focus on key matters relating to the business at the right time.
In addition to eight scheduled meetings in 2020/21, there were seven unscheduled Board meetings to monitor our COVID-19 response and agree the strategic priorities, and a number of meetings of the Nomination Committee relating to the appointment of the new Non-Executive Directors. These meetings were often at short notice and very well attended by Board and Committee members.
Our Board usually comprises the Chairman, two Executive Directors and six independent Non-Executive Directors. Simon Roberts joined the Board as Chief Executive Officer on 1 June 2020. Keith Weed and Tanuj Kapilashrami replaced Jean Tomlin and Matt Brittin as Non-Executive Directors on 1 July 2020. Adrian Hennah joined the Board as a Non-Executive Director on 1 April 2021, working closely with David Keens during the handover period before David steps down after the AGM on 9 July 2021. Each of their responsibilities is listed below and more information on their specific contributions can be found in their biographies on pages 46 to 49.
Chairman Martin Scicluna
Responsible for the leadership and effectiveness of the Board and for setting the Board agenda. Ensures effective communication so that the Board is aware of the views of shareholders and other stakeholders, and demonstrates objective judgement. Promotes a culture of openness and debate in the boardroom and constructive relations between Executive and Non-Executive Directors. Led the searches for the new Non-Executive Directors.
Chief Executive OfficerSimon Roberts (From 1 June 2020)
Responsible for the day-to-day management of the business and for executing the strategy agreed by the Board. Creates a framework of strategy, values, culture, performance management and objectives to ensure the successful delivery of results for the business and allocates management responsibilities accordingly. Responsible for managing risk and creating a framework of internal controls.
Chief Financial OfficerKevin O’Byrne
Supports the Chief Executive Officer in implementing the strategy and in the financial performance of the business. His executive responsibilities are described on page 46.
Senior Independent DirectorSusan Rice
Acts as a sounding board for the Chairman and a trusted intermediary for other Directors. Available to discuss with shareholders any concerns that cannot be resolved through the normal channels of communication with the Chairman or the Executive Directors. Leads the other Directors in evaluating the performance of the Chairman.
Independent Non-Executive DirectorsBrian Cassin Jo Harlow Adrian Hennah Tanuj Kapilashrami David Keens Keith Weed
Responsible for bringing an external perspective, sound judgement and objectivity to the Board’s deliberations and decision-making. Support and constructively challenge the Executive Directors, holding them to account and offering specialist advice using their wide and varied experience. Monitor delivery of the agreed strategy within the risk management framework set by the Board. Independent of management and free from any business or other relationships that could compromise their independence.
Company Secretary and Corporate Services DirectorTim Fallowfield
Advises and assists the Board and the Chairman, particularly in relation to governance, Board evaluations, induction, training and formulating the agenda for Board meetings. Ensures that Board procedures are effective and there is good information flow to the Board and its Committees.
The Chairman and Non-Executive Directors also met without the Executive Directors being present, and the Senior Independent Director held discussions with the Non-Executive Directors without the Executive Directors or the Chairman being present.
Directors were made aware of the key discussions and decisions made at each of the four principal Committees – Audit, Nomination, Remuneration, and Corporate Responsibility and Sustainability. The Chair of each Committee provided a detailed summary at the Board meeting following the relevant Committee meeting.
On the rare occasions that a Director is unavoidably unable to attend a meeting, they receive a briefing from the Chairman before the meeting, so that their comments and input can be taken into account at the meeting, and the Chairman provides an update to them after the meeting.
The following table shows the attendance of Directors at scheduled Board meetings. Seven unscheduled meetings also took place during the year, which were well attended by all Directors.
Martin Scicluna 8(8) David Keens 8(8)Matt Brittin1 3(3) Kevin O’Byrne 8(8)Brian Cassin 8(8) Susan Rice 8(8)Mike Coupe2 1(3) Simon Roberts4 7(7)Jo Harlow 8(8) Jean Tomlin5 2(3)Tanuj Kapilashrami3 6(6) Keith Weed3 6(6)
The maximum number of scheduled meetings held during the year that each Director could attend is shown in brackets.1. Matt Brittin stepped down from the Board on 2 July 2020.2 Mike Coupe stepped down from the Board on 2 July 2020. 3 Tanuj Kapilashrami and Keith Weed joined the Board on 1 July 2020.4 Simon Roberts joined the Board on 1 June 2020.5 Jean Tomlin stepped down from the Board on 2 July 2020.6 Adrian Hennah joined the Board on 1 April 2021, after year end, and did not attend any Board meetings
in the year.
Director independenceThe Chairman satisfied the independence criteria of the Code on his appointment to the Board and all the Non-Executive Directors are considered to be independent. The new Non-Executive Directors were determined to be independent before their appointment through the recruitment process. The independence of the Non-Executive Directors is closely monitored by the Board.
Time commitment and conflicts of interestPrior to appointment, each prospective Non-Executive Director confirms that they will have sufficient time available to be able to discharge their responsibilities effectively and that they have no conflicts of interest, and this is discussed by the Board before any appointment is made. In addition, the Board reviews and approves in advance requests by Directors wishing to undertake new responsibilities or directorships, and considers both the time commitments involved and any potential conflicts. The conflicts of interest register is reviewed annually to ensure it is up to date and that there are no new conflicts to consider. No changes were recorded during the year that would impact the independence of any of the Directors.
The Board supports Executive Directors having a non-executive directorship as part of their continuing development, provided they have sufficient time to balance their commitments to the business with any external role. Subject to Board approval, each Executive Director may have one non-executive director position. Whilst recognising the benefits of Non-Executive Directors having varied and broad experiences, the Board keeps in mind investor guidance and reviews the commitments of each Director annually. Throughout the year, all Directors have good attendance records at scheduled meetings, and demonstrated high levels of availability and responsiveness for additional meetings and discussions where these have been required. The Board remains confident that individual members continue to devote sufficient time to undertake their responsibilities effectively.
56 Governance J Sainsbury plc Annual Report 2021
Division of responsibilities

Director developmentInductionWe have a comprehensive and tailored induction programme in place for Directors when they join the Board to ensure their smooth transition into the business and enable them to gain an understanding of all aspects of the business, including our purpose, vision, strategy, culture, values, sustainability, governance, and the opportunities and challenges facing the business. The pandemic placed restrictions on the usual induction format as certain briefings were conducted by video conference with some face-to-face engagements and site visits.
When joining the Board, a new Non-Executive Director typically meets individually with each Board and Operating Board member, and also with senior management from key areas of the business to gain an insight into their respective areas of responsibility. The Company Secretary and Corporate Services Director briefs them on policies, Board and Committee procedures, and core governance practice, which includes directors’ duties and Market Abuse Regulation. They also receive induction materials including recent Board and Committee papers and minutes, strategy papers, investor presentations, Matters Reserved for the Board and the Board Committees’ Terms of Reference. They visit stores, depots and other business locations and meets key advisers. Director inductions are ongoing processes over a number of years during which they will cover the following:
The Directors’ induction process
Understanding the business
Understanding the sector and environment
Meet the Sainsbury’s internal team and advisers
Visit Group operations
— Business strategy, purpose and vision
— Overview of each business area and its opportunities
— Operating plans, current KPIs and targets
— Key business relationships — Board and governance procedures
— Board effectiveness reviews and actions
— Matters relevant to the Board Committees they join
— Recent Board and Committee papers and minutes
— Key people and succession plans
— Remuneration and reward across the business
— Finance, treasury and tax overviews
— Risk profile and approach — Internal audit, risk and internal controls
— Customer trends — Consumer and regulatory environment
— Brand perception and reputation
— The market and competitors — Analyst and investor perspectives
— Key stakeholders’ views
— Directors — Committee Chairs — Company Secretary and Corporate Services Director
— Members of the Operating Board
— Senior management across the business
— Members of the external audit team
— Remuneration consultants — Brokers
— Store visits — Distribution centres — Store Support Centres
Simon Roberts started his induction programme as an Executive Director prior to joining the Board on 1 June 2020. As Simon already had a thorough understanding of the business through his role as an Operating Board member and the various senior positions he has held within Sainsbury’s and other retailers, his induction programme was tailored to give him a greater understanding of his increased responsibilities as a plc director, particularly around the regulatory and investor landscape.
Tanuj Kapilashrami and Keith Weed started their induction programmes as Non-Executive Directors upon joining the Board on 1 July 2020. As part of their inductions, they both met with Board members, Operating Board members, senior management, and visited a number of stores, which provided them with an excellent opportunity to engage directly with store colleagues. These visits helped Tanuj and Keith develop an understanding of key business challenges, colleague experiences and the culture embedded
across the business. In addition to this, they also spent time with Sainsbury’s external advisers and consultants who provided them with detailed insight of the retail sector. Separately, as an Audit Committee member, Keith spent time with EY, our external auditors, and as a Remuneration Committee member Tanuj spent time with Deloitte, our remuneration consultants, for an overview of remuneration related matters and current market analysis.
Adrian Hennah joined the Board as a Non-Executive Director on 1 April 2021. Adrian will succeed David Keens as Audit Committee Chair when David steps down after the Annual General Meeting on 9 July 2021. Adrian has extensive financial and plc experience, and his induction will be tailored particularly to reflect his experience and his responsibilities as Audit Committee Chair. His induction is in progress and will be reported in the next Annual Report.
57Governance J Sainsbury plc Annual Report 2021
Governance ReportStrategic Report
Financial Statements
Composition, succession and evaluation

Continuing developmentNon-Executive Directors continue to learn about the business by meeting with management, colleagues, suppliers and other stakeholders as described above. All the Non-Executive Directors continue to engage with different aspects of the business to support their ongoing development. The continuing development of the Chair of the Corporate Responsibility and Sustainability Committee and Audit Committee Chair are examples provided below.
During the year, Jo Harlow, in her capacity as Chair of the Corporate Responsibility and Sustainability Committee, hosted monthly Zoom meetings for Sustainability Chairs on behalf of Chapter Zero, a network of company Chairs, Committee Chairs and Non-Executive Directors who are committed to developing their knowledge of the implications of climate change for UK businesses. She participated in an interactive Proud at Sainsbury’s Zoom interview to discuss her career experience as an LGBTQ+ individual. She also participated in an interactive High-Potential Women’s Group session to discuss executive and non-executive careers, pitfalls and life lessons. Jo had also met with the Chair of the Sainsbury’s Foundation, attended the Sainsbury’s Virtual Farm Conference, and a Sainsbury’s Great Place to Work colleague listening session with the Group HR Director and the Chairman. Jo’s participation in these various meetings and events throughout the year has enabled her to develop a greater understanding of the business and its various activities, particularly around colleague engagement and sustainability. In turn, this has allowed Jo, along with the Chairman, to bring first-hand experience of our colleagues’ views into the boardroom. In addition to this, the knowledge Jo has gained from professional seminars, such as those hosted by PwC, Deloitte, and the ones she has spoken at including the Climate Risk & Green Finance Regulatory Forum, has been reflected in her all-round contribution as a Non-Executive Director.
In his sixth year as Audit Committee Chair, David Keens has continued to engage directly with business operations. He met with Group Finance to discuss internal controls and risk management, the Treasury team to discuss refinancing, senior management at Sainsbury’s Bank, and the Group’s internal and external auditors. He also had discussions with the Groceries Supplier Code Adjudicator. More information can be found on page 64.
Professional development and trainingTo ensure the Board updates and refreshes its skills and knowledge, we have a programme to support Directors’ training and development requirements in relation to governance, investor expectations and regulatory impacts. This includes regular presentations from management on relevant governance matters. Both the Audit and Remuneration Committees received updates on relevant accounting and remuneration developments, trends and changing disclosure requirements from external advisers and management. The CR&S Committee received an update on environmental, social and governance (ESG) matters and their importance to our investors and stakeholders. They were also updated on ESG regulatory developments. More information can be found on page 62.
The Board and Committees were updated on compliance with the Modern Slavery Act, Task Force on Climate-related Financial Disclosures, the 2018 UK Corporate Governance Code and Directors’ responsibilities under Section 172 of the Companies Act. The Directors also had access to the advice of the Company Secretary and independent professional advice is available at the Company’s expense, if necessary, in fulfilling their duties and responsibilities.
Board evaluation In line with best practice, we review the Board’s effectiveness on an annual basis through formal performance evaluation, including an assessment of the Board and its Committees. An external evaluator conducts the review every third year, and in the two intervening years this is carried out by the Company Secretary, to ensure continuity over the three-year cycle. Last year’s external evaluation was carried out by Clare Chalmers, an experienced independent provider of board effectiveness reviews.
This year’s internal evaluation was conducted from December 2020 to February 2021 and led by the Company Secretary and Corporate Services Director, Tim Fallowfield. This review explored the key areas of focus set out below and themes that arose for action in the 2019/2020 external evaluation. Board members completed an online questionnaire, based on previous years to maintain continuity, which also incorporated last year’s key feedback topics and recent developments in the business, its strategy and governance.
The key areas of focus included: the effectiveness, role and priorities of the Board and its Committees; the Board’s composition, skills, succession and culture; the alignment of purpose, strategy and values; leadership of the Board and the business; the Board’s response to and ways of working during the pandemic, and broader risk management; and engagement with stakeholders. Each Director was given the opportunity to raise their own additional points. The results of the internal questionnaire were discussed with each of the Directors in individual discussions with Tim.
Following the individual discussions, Tim discussed the conclusions (including any feedback with individual Directors) with the Chairman Martin Scicluna, and then presented a written report to the Board. A separate meeting with the Board was held to discuss the findings and the Board then agreed the key actions. Tim also met with Susan Rice to discuss feedback for Martin, which she subsequently shared with him as part of his review meeting. Each of the Committee Chairs received specific feedback on the effectiveness of the relevant Committee for their consideration.
Findings of the 2020/21 reviewThe report identified a number of strengths of the Board including:
— The Board is well led and is well balanced in its consideration of strategy, operations, and governance.
— The Board has a good balance of skills with both new Non-Executive Directors having made material contributions.
— The Board has responded appropriately to the key issues arising from the pandemic.
— There is a good understanding of the views of shareholders and colleagues.
— The Committees are well led and effective at addressing each of the Committee’s current issues.
— The Chairman has shown strong leadership, and encouraged constructive debate.
— Simon Roberts in his new Chief Executive Officer role has encouraged a culture of openness and transparency, and there have been robust and meaningful discussions on the strategy between the Board and Operating Board.
— Individual evaluation shows each member of the Board continues to contribute effectively.
Board CommitteesAs described above, the evaluation process also assessed the effectiveness of the Board Committees. The findings concluded that each of the Committees continued to operate effectively, was well led and was efficient in dealing with current issues. Any specific findings and action points are overseen by each Committee Chair, with consideration of the overall Board findings where deemed relevant to the Committee’s work.
58 Governance J Sainsbury plc Annual Report 2021

Key areas of focus from 2019/20 review Progress and actions implemented during 2020/21
CultureThe Board will continue to drive a performance culture whilst maintaining Sainsbury’s colleague-focused ethos.
A new framework of specific KPIs has been developed to drive a more performance-related culture. The Board has supported this development and will review them at each meeting. The cultural changes within the business, aligned with our updated strategy, will continue to be monitored by the Board.
Succession planningThe Board and Nomination Committee will revise the Board’s skills matrix for the future to assist with orderly and effective succession planning.
The Nomination Committee revised its matrix to confirm the skill sets that would be needed to replace the two Non-Executive Directors who left the business last year and the soon to be departing Audit Committee Chair. The outcome of these actions and resulting rigorous search processes enabled the Board to identify and appoint three new Non-Executive Directors with the appropriate skill sets and capabilities from diverse backgrounds. The revised skills matrix has also enabled the Board to look further ahead in its succession planning.
Sainsbury’s BankThe Board will continue to build its connectivity with the Sainsbury’s Bank Board, whilst observing the independence of the Bank’s governance, particularly in light of the recent appointment of the Bank’s new Chief Executive Officer, and the planned succession of the Bank’s Chairman and other changes to the Bank Board Directors.
Good progress has been made by the Board in enhancing ways of working with the Sainsbury’s Bank Board since Jim Brown was appointed. This has included greater transparency of the Bank’s strategy and more relevant updates being provided to the Board.
Strategic focusThe Board will develop its strategic thinking with external thought leadership in a changing retail environment.
The Board is planning to have strategic external perspectives for the Board’s October Strategy Conference and Board dinners.
Chief Executive Officer transitionThe Non-Executive Directors will mentor the new Chief Executive Officer as he takes over leadership of the business.
The Board has received positive feedback on Simon’s impact since his appointment. Simon’s open and transparent ways of working have enhanced Board engagement and robust and meaningful discussions on strategy.
Agreed actions and areas for development for 2021/22
— Ensuring the Board continues to evolve in key strategic areas such as digital and technology change, and sustainability and climate change issues. — Continued focus on meaningful customer insight and behaviour data to further drive our strategy. — Supporting further engagement with Sainsbury’s key suppliers. — Additional consideration to wider societal issues, including community, government, non-governmental organisations and key society topics. — Effective and appropriate transitioning plan, including face-to-face meetings of the Board, management and key stakeholders, once the COVID-19 restrictions have eased.
A combination of Board evaluation
and Director appraisal
Progress and actions
implemented during 2020/21
Agreed actions for 2021/22
Board evaluation cycle
Year 1Independent
and externally facilitated review
Year 3Year 2 progress
reviewed and areas of focus identified
Year 2Review focused
on Year 1 findings raised and any new findings
arising
59Governance J Sainsbury plc Annual Report 2021
Governance ReportStrategic Report
Financial Statements
Nomination Committee Report
Dear ShareholderIt has been another busy year for the Committee with a number of changes in our Non-Executive Directors.
We welcomed Keith Weed and Tanuj Kapilashrami to the Board in July 2020. They have made a strong start and we value the expertise they have brought to the Board and Committees during the year. Jean Tomlin and Matt Brittin stepped down from the Board on 2 July 2020 and David Keens is stepping down from the Board after the AGM on 9 July. We successfully recruited Adrian Hennah who started on 1 April. Adrian brings significant and varied expertise and financial experience. He will be a great addition to our Board and Audit Committee, and I look forward to working with him. In an unprecedented year, I would like to thank all Board members for the significant contributions they have made.
As well as recruiting new Board members, we continue to ensure that the composition of the Board and its Committees is regularly reviewed and there is a balance of skills and experience, independence and knowledge on the Board as well as diversity in the broadest sense, including gender and ethnicity. As part of the Board’s succession planning, we reviewed the overall skill sets of the Board, Board tenure and how the Board works together as a team. We also considered our longer-term succession planning and the skills we would need to future proof the leadership of the business.
Our Board evaluation gave us the chance to assess the Board and Committees’ effectiveness and the results fed into our discussions on the composition of the Board and the longer-term succession planning. The Committee continues to be effective in its role and succession planning will continue to form a key part of our agenda.
Inclusivity through the business is highly important to us and we continue to focus on this and the development of our diverse talent pipeline. We are highly supportive of the diversity and inclusion initiatives in place which are detailed on pages 60 to 61. We also undertook a talent review of the Operating Board and its direct reports to ensure that we are well set up to deliver our strategy.
Martin SciclunaChair, Nomination Committee
Principal role and responsibilitiesThe responsibilities of the Nomination Committee include reviewing the balance of skills, knowledge, experience, independence and diversity of the Board and its Committees, and making recommendations to the Board for any changes. It is responsible for formulating plans for succession at Board and senior management levels, taking into account the challenges and opportunities facing the business, and the skills and expertise needed to ensure its long-term success.
The Committee’s Terms of Reference are available on the Company’s website www.about.sainsburys.co.uk.
The Committee held two scheduled meetings in the year, together with several unscheduled meetings relating to recruitment and succession planning.
Attendance at the scheduled Nomination Committee meetings:
Martin Scicluna 2(2) David Keens 2(2)Brian Cassin 2(2) Susan Rice 2(2)Jo Harlow 2(2) Keith Weed 2(2)Tanuj Kapilashrami 2(2)
The number of meetings held during the year is shown in brackets.Matt Brittin and Jean Tomlin stepped down from the Board on 2 July 2020. There were no scheduled meetings for them to attend between 8 March and 2 July 2020. Adrian Hennah joined the Board on 1 April 2021, after year end, and did not attend any meetings in the year.
Committee membershipThe Committee consists of all of the current Non-Executive Directors, all of whom are independent. The Chairman of the Board is also the Chair of the Committee, and the Company Secretary or his nominee acts as the Secretary of the Committee. Simon Roberts attends meetings by invitation.
Succession planningNon-Executive Director succession The Committee, led by the Chairman, oversaw the search and appointment for three new Non-Executive Directors during the year. Matt Brittin and Jean Tomlin announced their retirements on 30 October 2019 and stepped down from the Board following the 2020 AGM, after nine and seven years’ service respectively. David Keens announced on 19 January 2021 his intention to step down from the Board following the 2021 AGM, after six years’ service. The Board takes succession planning seriously and has a thorough and inclusive process in place. External searches are followed by interview processes which give Directors the opportunity to meet shortlisted candidates. The Chairman leads the process, receiving support from the Group HR Director and the Company Secretary as appropriate. There is good communication throughout, and the Directors are kept well informed.
The Committee held several unscheduled meetings in relation to the appointments of Keith Weed, Tanuj Kapilashrami and Adrian Hennah. They also received a number of informal updates during the process. MWM Consulting had been selected in a tender process in 2019 to assist with the search process for the new Chief Executive Officer which led to the appointment of Simon Roberts. MWM Consulting was also chosen for all three Non-Executive Director appointments. They are one of the small number of firms accredited by the Hampton-Alexander Committee for their leading work in promoting gender diversity. They had no connection with the Company prior to appointment as recruitment consultants and had no relevant connections with individual Directors.
IdentifyThe Committee discussed the overall skill sets of the Board and agreed a detailed job specification, skill sets and preferred attributes for the appointees. A thorough review of potential candidates was undertaken. MWM Consulting presented a diverse long list of external candidates from a broad range of backgrounds. The Committee shortlisted a number of candidates.
InterviewThe Chairman and several of the Directors met with the shortlisted candidates who confirmed their interest in the role(s). Following the interviews, the Nomination Committee members met to discuss feedback.
SelectThe Committee was unanimous in its final selection of candidates. It recommended to the Board that Keith Weed, Tanuj Kapilashrami and Adrian Hennah be appointed as Non-Executive Directors. Their specific contributions to the Company can be found in their biographies on pages 46 to 49.
AppointKeith Weed’s and Tanuj Kapilashrami’s appointments as Non-Executive Directors were announced on 12 May 2020 and took effect on 2 July 2020. Following a separate appointment process, Adrian Hennah’s appointment was announced on 8 March 2021 and took effect on 1 April 2021.
Diversity and inclusionWe are committed to being the most inclusive retailer where all our colleagues can be themselves and feel that they belong, and where all of our customers feel welcome when they shop with us. Simon Roberts and the Operating Board provide clear and committed leadership of our inclusion agenda, with members of the Operating Board acting as sponsors for different strands of the inclusion agenda. During the year, the governance of inclusion became a regular part of the Business Performance Review (BPR) agenda.
60 Governance J Sainsbury plc Annual Report 2021

Three years ago, we set targets for 40 per cent female and 10 per cent ethnically diverse representation at senior management1 level. We have now reached the end of that target period. We have made steady, positive improvement against those targets, however in spite of our level of commitment and action, we have fallen short of our aspiration; 37.67 per cent of our senior management are women and 8.07 per cent are ethnically diverse. We are currently setting new, stretching three-year targets which will go deeper into our talent pipelines, and also include Black specific targets for Black senior managers. These will also form part of our long-term incentives for management.Actions to support the progression and representation of our ethnically diverse colleagues are an important part of our strategy. We made additional commitments during the year in support of our Black colleagues, all of whom are part of our focus on changing the conversation around race. To understand the measures we have in place to support our drive for inclusivity and the progression of our diverse talent, please see page 17.
The Board receives regular updates on our inclusion initiatives and the Board, CR&S Committee and Nomination Committee receive detailed presentations throughout the year on our inclusion priorities and the progress we are making. The Remuneration Committee also reviewed and approved the Ethnicity and Gender Pay Report which can be found on our website www.about.sainsburys.co.uk/making-a-difference/gender-pay-gap.
Board diversity We promote diversity on our Board and we believe there is good balance amongst our Non-Executive Directors, with extensive and wide-ranging experience of retail and other consumer-facing businesses and varying length of service. Our Non-Executive Directors also have other highly relevant skills derived from serving in a range of major executive and non-executive positions throughout their careers and an array of cognitive, and personal strengths and backgrounds.
We are keen to ensure that Board membership reflects diversity in its broadest sense, our colleague base and the communities in which we serve. The Board’s approach to its own diversity is as follows:
Aim to maintain a level of at least 33 per cent female Directors and at least one Director who identifies as ethnically diverse on the Board.Three of our nine Board Directors are women (33 per cent) and one identifies as ethnically diverse. In making its recommendations to the Board, the Committee has due regard to the UK Corporate Governance Code and other best practice and will consider the balance of skills, experience, independence and knowledge of the Board, its diversity in the broadest sense, including gender and ethnicity, how the Board works together as a team and other factors relevant to its effectiveness.
The Board continues to review the development of the pipeline of both ethnically diverse and female senior management within the business. Of the ten members of our Operating Board, three are women (30 per cent). More information on diversity and inclusion can be found on pages 17 and 18.
Consider candidates for appointment as Non-Executive Directors from a wide pool.During the year, the Nomination Committee discussed Non-Executive Director appointments and succession. It worked closely with MWM Consulting in compiling long and short lists of candidates from various backgrounds and sectors. Candidates were identified, interviewed and measured against a detailed job specification, skill sets and preferred attributes.
Assist the development of a pipeline of high-potential colleagues by encouraging key members of senior management within the business to take on additional roles to gain valuable Board experience. The Board supports and encourages initiatives that strengthen the pipeline of talent in the Company including:
— A comprehensive talent management review is presented and discussed by the Board
— Highly personalised plans and initiatives for high-potential colleagues to broaden their skill sets and experience to prepare them for future senior roles; for example, through boardroom exposure, and non-executive and trustee roles outside of the business
— Senior management mentoring schemes sponsored by Board and Operating Board members
1 The definition of ‘senior management’ in the Code should be the executive committee or the first layer of management below board level, including the company secretary. For reporting against gender balance, it should include those in senior management and their direct reports. With such a large workforce, we believe including our top 230 senior management in the scope of our targets ensures that we are focused on improving diversity in all of our most significant leadership positions and developing our pipeline of talent. Our top 230 lead large teams and are critical role models in the organisation, playing a vital role in shaping the inclusive culture that we are working hard to create. We want all of our colleagues to see visible and diverse leaders in every part of the business.
61Governance J Sainsbury plc Annual Report 2021
Governance ReportStrategic Report
Financial Statements
0-3 years 4-6 years 7-9 years
Board tenure (Non-Executive Directors and Chairman)
3
3
1
Men Women
Board gender diversity
6
3
WhiteEthnically diverse
Board ethnic diversity
8
1
Non-Executive DirectorsExecutive Directors
Board balance
2
7
Corporate transactions
Sustainability
E-commerce/Technology
Operations/General Retailing Experience
Risk management/Audit
Remuneration
Finance/Accounting/Audit
Financial Services
Consumer/Customer Service
HR/People
Current or recent CEO experience
Brand/Marketing
Digital/Social media
Strategy development/Implementation
Board skills matrix5
5
6
6
4
3
8
8
9
9
9
7
7
8
Adrian Hennah joined the Board on 1 April 2021, after year end, and therefore is not included in the above charts.
Corporate Responsibility and Sustainability Committee Report
Dear ShareholderAs a responsible retailer, we want to help everyone eat
better, offering our products in a way that helps customers reduce their impact on the environment
one plate at a time.
The Committee oversees the governance of being a sustainable business. The third year of my tenure as Chair of the Committee has seen some significant developments across the business, including the expansion of our Net Zero by 2040 plan to include Scope 3, which we announced in February 2021. The inclusion of Net Zero targets for senior management remuneration targets for 2021/22 has been a step forward and I’m really pleased that Net Zero by 2040 is a central part of our plan to put food back at the heart of Sainsbury’s. This past year has also been unprecedented in terms of the business change required to adapt to the impact of the pandemic, and I am proud of the pace at which we’ve adapted to best support our customers, colleagues and the communities we serve.
In January 2020 we announced our Net Zero by 2040 plan and committed to report on progress biannually, with our first results published in November 2020. As the business adapted to feeding the nation, the impact of the pandemic played a considerable role in our progress this year. We have seen changes in energy usage due to the closure of certain stores and all of our office space, as well as the increase of deliveries into homes and stores. Changes in our food service provision and food surplus redistribution have also impacted our food waste. Even in a year of great change, we continue to drive forward initiatives to reach our Net Zero by 2040 commitments. You can read more about these and how we have performed on page 14.
As well as our Net Zero by 2040 target for Scope 1 and 2 emissions, in line with the Paris Agreement to limit global warming to within 1.5°C, this year the Committee approved our Scope 3 target. The target is to reduce greenhouse gas emissions (GHG) by 30 per cent by 2030, to align to a well below 2°C scenario. We were pleased the Science Based Targets initiative (SBTi) approved our Science Based Targets for Scopes 1, 2 and 3. This year the Committee worked with the Remuneration Committee to approve remuneration targets linked to plastic reduction and reducing GHG emissions across Scopes 1, 2 and 3, further embedding these objectives into the business. More information on these targets can be found on page 72.
We became signatories of the Task Force on Climate-related Financial Disclosures (TCFD) in January 2020, and this year we have taken this further by reporting our roadmap for TCFD disclosure on page 15. We are also disclosing against the Sustainability Accounting Standards Board (SASB) framework for the first time this year. For a summary of this, visit www.about.sainsburys.co.uk.
COVID-19 has had a significant impact on the business over the past year, and the Committee has kept abreast of our key priorities to keep our customers and colleagues safe, help feed the nation and support our communities and the most vulnerable in society. The amount of change has been substantial for colleagues this year and therefore ongoing engagement and clear communication have been essential. We are pleased that colleagues have remained engaged, with our colleague engagement score increasing by 6 per cent to 81 per cent. The Committee was also highly supportive of the initiatives put in place to reduce the pressure on foodbanks and help those in our communities most severely impacted by the pandemic.
As a Committee, we continue to focus on stakeholder engagement including our customers, colleagues, suppliers and the community. We have listened to and engaged with our stakeholders and more information about our work can be found on page 19.
There have been a number of changes to the Committee this year. Martin Scicluna and Simon Roberts joined the Committee on 1 June 2020. We also welcomed Keith Weed to the Committee on 1 July 2020 following Jean Tomlin’s departure. Keith has significant sustainability experience having championed new ways of integrating sustainability into business and building brands with purpose in previous roles. He has been a great addition to the Committee. I would like to thank all members for their contribution this year.
We are looking forward to holding an investor day in June 2021 focusing on Environment, Social and Corporate Governance (ESG) where we intend to share what we are doing to help the planet and society and ensure we have a sustainable future. The recordings from the day will be available online for all shareholders to view. We are also really pleased we were chosen to be a Principal Partner of the UN Climate Change Conference, COP26, taking place in Glasgow in November 2021. Climate change is a key global challenge which remains at the top of our agenda; we recognise the scale of the issue and know the solution is through collaboration.
Jo HarlowChair, Corporate Responsibility and Sustainability Committee
Principal role and responsibilitiesThe Committee’s principal role is to review the sustainability strategy, ensuring it is aligned with the Company’s purpose, strategy, culture, vision and values. The Committee also plays a part in monitoring the business’s engagement with stakeholders including customers, suppliers, the community, colleagues, shareholders and government on sustainability and corporate responsibility matters.
The Committee held three scheduled meetings in the year, together with one unscheduled meeting to discuss remuneration targets.
Attendance at scheduled Committee meetings:
Jo Harlow 3(3) Martin Scicluna3 3(3)
Mike Coupe1 1(1) Jean Tomlin4 0(1)
Simon Roberts2 3(3) Keith Weed5 2(2)
The maximum number of meetings held during the year that each Director could attend is shown in brackets.1 Mike Coupe stepped down from the Board on 2 July 2020.2 Simon Roberts joined the Committee on 1 June 2020.3 Martin Scicluna joined the Committee on 1 June 2020.4 Jean Tomlin stepped down from the Board on 2 July 2020.5 Keith Weed joined the Committee on 1 July 2020.
62 Governance J Sainsbury plc Annual Report 2021

Principal activities in the yearThe Committee met three times during the year for scheduled meetings and one additional meeting was arranged to discuss remuneration targets. The meetings focused on our Net Zero by 2040 plan and stakeholder engagement – customers, colleagues, the community, suppliers and shareholders. Updates and progress against our Net Zero by 2040 plan was a key focus of the Committee this year and the Committee played a fundamental role in approving the Scope 3 GHG emissions targets.
The Committee was updated on our customer and community response to the pandemic. This included our evolved fundraising approach with the development of new digital fundraising channels and initiatives to support the income of existing partners. More information can be found on page 18.
Culture and colleague engagement were an important part of the Committee’s agenda. The Committee was updated throughout the year on the impact of the pandemic on colleagues and the ongoing steps being taken to keep our colleagues and customers safe. Members were provided with the results of the colleague engagement surveys and discussed the initiatives put in place to address colleague feedback. More information can be found on page 17.
The Committee was pleased with the progress made on supplier engagement and the steps taken during the year that led to an increase in our benchmark position in both the Advantage Suppliers Survey and Groceries Code Adjudicator report. The Committee also received feedback from the Chair of Sainsbury’s Foundation Advisory Board on the Sainsbury’s Fairly Traded Programme, including how the Foundation has functioned and opportunities for the future. More information on suppliers can be found on page 21.
Committee members were also keen to understand the actions being taken to respond to regulatory developments such as supply chain legislation, including a Defra consultation on deforestation and on EU human rights due diligence, and the cost and impact of these on the business. The Committee was also updated on the impact of extended producer responsibility, and increased campaigner action and public awareness of illegality in supply chains. Modern slavery and human trafficking are abhorrent practices that still exist in many parts of the world, including the UK. The Committee reviewed the steps being taken to prevent modern slavery and human trafficking in our business operations and supply chain and recommended that the Board approve our Modern Slavery Statement. Further details can be found on page 23.
Engaging with shareholders on ESG matters is becoming increasingly important. The Committee discussed our approach and developments in this area and the hosting of an ESG focused event with investors was approved for the upcoming year. The Committee also worked with the Remuneration Committee to review and approve the remuneration targets for senior management against key areas of our Net Zero by 2040 pillars. See page 72 for further information.
For further information on our Corporate Responsibility and Sustainability agenda, please see:
— Page 14 for progress on our Net Zero by 2040 commitments — Page 15 for our TCFD plans — Page 17 for an update on our people — For further information, please visit www.about.sainsburys.co.uk to read our Sustainability Update
Governance
J Sainsbury plc BoardOversight of the sustainability strategy.
Chair: Martin Scicluna
Corporate Responsibility and Sustainability CommitteeReviews the sustainability strategy. It also monitors the business’s engagement with colleagues, customers, suppliers, the community, shareholders and government on sustainability and corporate responsibility matters.
Chair: Jo Harlow
Operating BoardDefines business-wide strategy including our sustainability strategy, adapting to new regulatory requirements and trends. Reviews cross-value progress and signs off major investments.
Chair: Simon Roberts (as of June 2020)
Net Zero Steering Committee1
Leads operational execution of our Net Zero by 2040 plan by overseeing working group activity, ensuring delivery of performance.
Chair(s): Simon Roberts, CEO and Paul Mills-Hicks, Commercial Director/Mark Given, Chief Marketing Officer (as of Jan 2021)2
Net Zero Working Groups:1. Carbon (Scopes 1 & 2) & Water 4. Plastics & Recycling2. Carbon Scope 3 5. Food Waste3. Healthy Sustainable Diets 6. Biodiversity1 The Net Zero Steerco was established in February 2020 to support delivery of our Net Zero
by 2040 plan. This forum initially existed alongside our Value Management Groups which governed our 2020 Sustainability Plan. These forums were phased out over the past year on completion of this plan, and our social agenda has been governed via Director forums and the Operating Board. To ensure effective governance across our ESG agenda, we are refreshing our CR&S governance structure which we intend to implement in the upcoming year.
2 Mark Given became Chair from January 2021, replacing Co-Chairs Simon Roberts and Paul Mills-Hicks.
63Governance J Sainsbury plc Annual Report 2021
Governance ReportStrategic Report
Financial Statements

Audit Committee Report
Dear ShareholderThis is my sixth annual report to shareholders as Audit
Chair and I will be retiring from the Board at the conclusion of our 2021 AGM. This year the Audit
Committee, management and auditors have operated in the difficult environment of COVID-19 and remote
working. I am grateful to all involved for the quality of work, debate and challenge exhibited, which has
continued with no less vigour than in previous years.
The Committee has naturally considered the impact that COVID-19 may have had on our operations, risks and controls. We do not believe that as a consequence of the pandemic there has been a lessening of focus by management on financial reporting or internal controls. There have been additional costs incurred and benefits received from incremental sales, all as detailed elsewhere in this Annual Report. Management have kept us informed of these costs and benefits, and their accounting treatments.
Going concern and viability statements were reviewed and discussed in detail. Various scenarios were modelled and stress-tested, such as further uncertainties from Brexit and COVID-19, prior to recommending approval by the Board. Other significant matters taken into account for this purpose included non-underlying items and cash flow generally. The Committee received regular presentations detailing Group borrowing facilities, maturities and proposals.
The Company maintains dialogue with many regulatory, advisory and stakeholder bodies, two of which are of primary interest to the Audit Committee. We monitor compliance with the Groceries Supply Code Of Practice (GSCOP), the Groceries Code Adjudicator (GCA) has direct communication with our Internal Audit function and I meet with the GCA at least annually. Our Annual Report Financial Statements and external audit quality is open to review by the Financial Reporting Council (FRC) and they recently completed a review of our 2020 Annual Report.
Through the annual evaluation process (pages 58 and 59), I can report that the Board has again confirmed the effectiveness of this Committee in its role of supporting the J Sainsbury plc Board in compliance with its duties.
Membership of the Audit Committee has this year seen a mix of change and continuity. Jean Tomlin retired from the Committee and the Board last year; she contributed a different and balanced set of skills for which I was most appreciative. We welcomed Keith Weed, and he is bringing a fresh perspective to our discussions. Brian Cassin will become our longest serving member at five years when I step down in July; and his deep knowledge of specialist areas has proved invaluable. Last but not least, we welcomed Adrian Hennah to the Committee in April and he will succeed me as Audit Chair. His financial and management experience in large, complex businesses makes him well suited to the role.
David KeensChair, Audit Committee
Principal role and responsibilitiesThe Audit Committee assists the Board in fulfilling its oversight responsibilities by reviewing and monitoring the integrity of the financial information provided to shareholders, the Company’s systems of internal control and risk management, the internal and external audit process, the auditors, and the process for compliance with relevant laws and regulations.
The Committee’s Terms of Reference are available on the Company’s website www.about.sainsburys.co.uk
The Committee held four scheduled meetings in the year, together with one unscheduled meeting.
Attendance at scheduled Audit Committee meetings:
David Keens 4(4) Jean Tomlin1 0(1)
Brian Cassin 4(4) Keith Weed2 3(3)
The maximum number of meetings held during the year that each Director could attend is shown in brackets.1 Jean Tomlin stepped down from the Board on 2 July 2020.2 Keith Weed joined the Board on 1 July 2020.3 Adrian Hennah joined the Board on 1 April 2021, after year end, and did not attend any Board meetings
in the year.
Committee membershipThe members of the Committee are independent Non-Executive Directors who, together, have competence relevant to the retail sector. They also have extensive general business and management experience. Their biographies are on pages 46 to 49.
The Board has determined that David Keens and Adrian Hennah have recent and relevant financial experience. Adrian Hennah, who joined the Audit Committee on 1 April 2021, was Chief Financial Officer of three FTSE 100 companies spanning 18 years and a Non-Executive Director and Audit Committee Chair of another FTSE 100 company for nine years.
Regular attendees at Committee meetings include the Chairman of the Board, Chief Executive Officer, Chief Financial Officer, Director of Internal Audit, Director of Group Finance, Company Secretary and Corporate Services Director, Deputy Company Secretary and representatives of Sainsbury’s Bank and the external auditor.
64 Governance J Sainsbury plc Annual Report 2021
Audit, risk and internal control
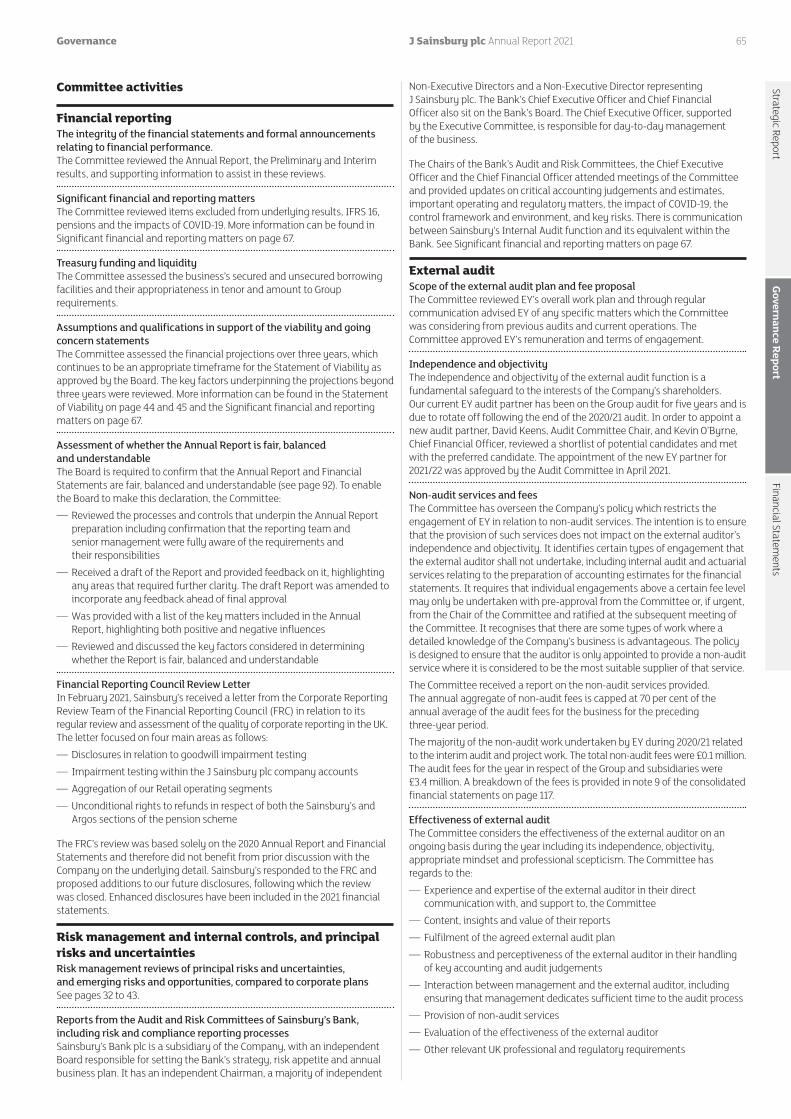
Committee activities
Financial reporting The integrity of the financial statements and formal announcements relating to financial performance.The Committee reviewed the Annual Report, the Preliminary and Interim results, and supporting information to assist in these reviews.
Significant financial and reporting mattersThe Committee reviewed items excluded from underlying results, IFRS 16, pensions and the impacts of COVID-19. More information can be found in Significant financial and reporting matters on page 67.
Treasury funding and liquidityThe Committee assessed the business’s secured and unsecured borrowing facilities and their appropriateness in tenor and amount to Group requirements.
Assumptions and qualifications in support of the viability and going concern statementsThe Committee assessed the financial projections over three years, which continues to be an appropriate timeframe for the Statement of Viability as approved by the Board. The key factors underpinning the projections beyond three years were reviewed. More information can be found in the Statement of Viability on page 44 and 45 and the Significant financial and reporting matters on page 67.
Assessment of whether the Annual Report is fair, balanced and understandableThe Board is required to confirm that the Annual Report and Financial Statements are fair, balanced and understandable (see page 92). To enable the Board to make this declaration, the Committee:
— Reviewed the processes and controls that underpin the Annual Report preparation including confirmation that the reporting team and senior management were fully aware of the requirements and their responsibilities
— Received a draft of the Report and provided feedback on it, highlighting any areas that required further clarity. The draft Report was amended to incorporate any feedback ahead of final approval
— Was provided with a list of the key matters included in the Annual Report, highlighting both positive and negative influences
— Reviewed and discussed the key factors considered in determining whether the Report is fair, balanced and understandable
Financial Reporting Council Review LetterIn February 2021, Sainsbury’s received a letter from the Corporate Reporting Review Team of the Financial Reporting Council (FRC) in relation to its regular review and assessment of the quality of corporate reporting in the UK. The letter focused on four main areas as follows:
— Disclosures in relation to goodwill impairment testing — Impairment testing within the J Sainsbury plc company accounts — Aggregation of our Retail operating segments — Unconditional rights to refunds in respect of both the Sainsbury’s and Argos sections of the pension scheme
The FRC’s review was based solely on the 2020 Annual Report and Financial Statements and therefore did not benefit from prior discussion with the Company on the underlying detail. Sainsbury’s responded to the FRC and proposed additions to our future disclosures, following which the review was closed. Enhanced disclosures have been included in the 2021 financial statements.
Risk management and internal controls, and principal risks and uncertaintiesRisk management reviews of principal risks and uncertainties, and emerging risks and opportunities, compared to corporate plansSee pages 32 to 43.
Reports from the Audit and Risk Committees of Sainsbury’s Bank, including risk and compliance reporting processesSainsbury’s Bank plc is a subsidiary of the Company, with an independent Board responsible for setting the Bank’s strategy, risk appetite and annual business plan. It has an independent Chairman, a majority of independent
Non-Executive Directors and a Non-Executive Director representing J Sainsbury plc. The Bank’s Chief Executive Officer and Chief Financial Officer also sit on the Bank’s Board. The Chief Executive Officer, supported by the Executive Committee, is responsible for day-to-day management of the business.
The Chairs of the Bank’s Audit and Risk Committees, the Chief Executive Officer and the Chief Financial Officer attended meetings of the Committee and provided updates on critical accounting judgements and estimates, important operating and regulatory matters, the impact of COVID-19, the control framework and environment, and key risks. There is communication between Sainsbury’s Internal Audit function and its equivalent within the Bank. See Significant financial and reporting matters on page 67.
External auditScope of the external audit plan and fee proposalThe Committee reviewed EY’s overall work plan and through regular communication advised EY of any specific matters which the Committee was considering from previous audits and current operations. The Committee approved EY’s remuneration and terms of engagement.
Independence and objectivityThe independence and objectivity of the external audit function is a fundamental safeguard to the interests of the Company’s shareholders. Our current EY audit partner has been on the Group audit for five years and is due to rotate off following the end of the 2020/21 audit. In order to appoint a new audit partner, David Keens, Audit Committee Chair, and Kevin O’Byrne, Chief Financial Officer, reviewed a shortlist of potential candidates and met with the preferred candidate. The appointment of the new EY partner for 2021/22 was approved by the Audit Committee in April 2021.
Non-audit services and feesThe Committee has overseen the Company’s policy which restricts the engagement of EY in relation to non-audit services. The intention is to ensure that the provision of such services does not impact on the external auditor’s independence and objectivity. It identifies certain types of engagement that the external auditor shall not undertake, including internal audit and actuarial services relating to the preparation of accounting estimates for the financial statements. It requires that individual engagements above a certain fee level may only be undertaken with pre-approval from the Committee or, if urgent, from the Chair of the Committee and ratified at the subsequent meeting of the Committee. It recognises that there are some types of work where a detailed knowledge of the Company’s business is advantageous. The policy is designed to ensure that the auditor is only appointed to provide a non-audit service where it is considered to be the most suitable supplier of that service. The Committee received a report on the non-audit services provided. The annual aggregate of non-audit fees is capped at 70 per cent of the annual average of the audit fees for the business for the preceding three-year period.The majority of the non-audit work undertaken by EY during 2020/21 related to the interim audit and project work. The total non-audit fees were £0.1 million. The audit fees for the year in respect of the Group and subsidiaries were £3.4 million. A breakdown of the fees is provided in note 9 of the consolidated financial statements on page 117.
Effectiveness of external auditThe Committee considers the effectiveness of the external auditor on an ongoing basis during the year including its independence, objectivity, appropriate mindset and professional scepticism. The Committee has regards to the:
— Experience and expertise of the external auditor in their direct communication with, and support to, the Committee
— Content, insights and value of their reports — Fulfilment of the agreed external audit plan — Robustness and perceptiveness of the external auditor in their handling of key accounting and audit judgements
— Interaction between management and the external auditor, including ensuring that management dedicates sufficient time to the audit process
— Provision of non-audit services — Evaluation of the effectiveness of the external auditor — Other relevant UK professional and regulatory requirements
65Governance J Sainsbury plc Annual Report 2021
Governance ReportStrategic Report
Financial Statements

The Committee conducted an audit effectiveness review which was facilitated by management, who distributed questionnaires to those Directors and managers in the business directly involved in the audit. The review sought feedback on their experience with the external auditor, considering areas such as the knowledge and experience of the audit team, audit strategy and planning, and the quality of communication. Management collated the responses and reported back to the Board. As a result of the review, it was determined that EY maintained good working relationships and adapted well to working remotely as a result of COVID-19. They were robust in their questioning and provided good support whilst challenging management effectively. The Committee concluded that EY remained effective, objective and independent in their role as external auditor.
The Committee has confirmed compliance with the provisions of the Statutory Audit Services Order 2014.
Recommendation of the reappointment of EY as auditorThe Committee has recommended to the Board the reappointment of EY as auditor for the 2021/22 financial year. A resolution to this effect will be tabled at the 2021 AGM.
Tender of external auditorEY was appointed in July 2015 as the Company’s external auditor following a tender process. We are next required to undertake a tender in 2024 or we may do so at an earlier time as determined or required by the Company.
Internal Audit Director of Internal AuditThe Director of Internal Audit reports to the Committee Chair and has direct access to all members of the Committee. The purpose, authority and responsibility of Internal Audit are defined in the Internal Audit Charter, which the Committee reviews annually.
Internal controls frameworkInformation on our internal controls framework is on page 69.
Management’s responsiveness to Internal Audit’s findings and recommendationsThe Committee was provided with updates on Internal Audit’s findings and agreed actions at each meeting.
Internal Audit PlanThe Committee reviewed and approved the scope of the Internal Audit Plan and subsequent amendments. The amendments included a focus on areas where there was an increased risk of error, fraud or cash loss due to COVID-19. As a consequence, audits were postponed where there was little or no change to the risk profile, or where other assurances were in place.
Effectiveness of the Internal Audit functionThe Committee reviewed Internal Audit resources, budget, work programme, results, and management’s implementation of required actions. The Director of Internal Audit provides an annual overview of Internal Audit’s performance to the Audit Committee, including key performance indicators and stakeholder feedback. Improvement and actions required are highlighted, and used to assist in reviewing the effectiveness of Internal Audit. The Committee concluded that Internal Audit continued to be effective.
Other Audit Committee’s effectivenessThe review of the Committee’s effectiveness formed part of the Board evaluation. See pages 58 and 59.
Significant issues raised through the whistleblowing processThe Committee received updates at each meeting on any significant whistleblowing matters. The Committee Chair receives earlier notification of matters that may develop into a significant incident. No issues arose that required the Committee to be updated ahead of a scheduled meeting. All issues were escalated to the relevant manager for investigation. The availability of the Rightline whistleblowing facility was communicated across the business during the year.
Data governance and information securityUpdates were provided during the year covering the integration of the merged data governance and information security functions, compliance with General Data Protection Regulation (GDPR), Payment Card Industry (PCI) and information security standard ISO27001, ethical hacking, access controls and security.
Sainsbury’s RetailThe Retail and Digital Director presented updates on store safety, risk management, code control and accountability.
Ongoing material litigationThe Committee is appraised on all material litigation and potential impacts on financial reporting disclosures. These are also provided to the Board.
Compliance with the Groceries Supply Code of Practice (‘GSCOP’)GSCOP sets out how large retailers should manage certain aspects of their relationship with grocery suppliers. Each retailer to which it applies has to appoint a Code Compliance Officer (CCO) whose duties include hearing disputes between suppliers and the retailer. Sainsbury’s has appointed the Director of Internal Audit as its CCO.
GSCOP requires that the business delivers an annual compliance report to the Groceries Code Adjudicator (GCA), as approved by the Chairman of the Audit Committee, and a summary must be included in the Annual Report and Financial Statements. This is set out below.
Summary Annual Compliance ReportSainsbury’s GSCOP compliance framework is based on a collaborative relationship with the GCA, clear policies and procedures, mandatory training and regular monitoring and reporting of compliance. Sainsbury’s also has specific internal resource who provide all relevant colleagues with day-to-day advice and guidance.
The CCO and the GCA meet on a regular basis to discuss general and emerging risk areas as well as Sainsbury’s approach to compliance. The new Chief Executive Officer met with the new GCA, emphasising the importance to the business of strong supplier relationships, underpinned by GSCOP principles.
Relevant policies are reviewed and updated on at least an annual basis and are made available to colleagues. This is supported by Sainsbury’s GSCOP training, which is compulsory for colleagues who are part of the Buying Team and for colleagues who are directly or indirectly involved in decisions that impact GSCOP. As a result, over 1,700 colleagues completed appropriate training during the year. GSCOP training is reviewed and refreshed annually. This year, the format of training was updated to reflect the move to home working and the content was updated to provide specific advice in relation to COVID-19.
Regular meetings are held between the CCO, Legal, Internal Audit and the Commercial Planning team to identify and assess emerging risk areas and an established compliance monitoring programme is embedded within the business. The Operating Board and Audit Committee are updated four times a year on GSCOP matters.
A key area of focus this year has been to work collaboratively with our suppliers to ensure continuity of food supplies. Our legal team provided real-time support and advice to the business on a variety of issues. We also provided financial support for suppliers by accelerating payments to smaller suppliers and other suppliers in financial difficulties.
This increased collaboration may have contributed to the lower number of potential breaches raised by suppliers in comparison to last financial year. Eight potential breaches were reported in FY20/21 (17 in FY19/20). Of the eight potential breaches of GSCOP, one was deemed to be outside of the Code. The remaining seven were resolved either within our Trading Division using standard escalation procedures, or through discussions between the CCO and the supplier. None were pursued as formal disputes with the CCO or referred to the GCA for arbitration. Causes of potential breaches are reviewed to identify areas for improvement.
66 Governance J Sainsbury plc Annual Report 2021

Significant financial reporting matters and judgements The areas of focus and actions taken by the Committee in relation to the 2021 Annual Report are outlined below. The Committee was satisfied in each case with the accounting and disclosure in the financial statements.
Area of focus Actions taken
Restructuring following strategic reviews The Group has recognised material restructuring provisions and asset impairments during the year.See note 5, Profit before non-underlying items, on page 107.See note 17, Impairment of non-financial assets, on page 129.
The Committee reviewed management reports, assumptions and outcomes of business restructuring, including store and site closures. The Committee challenged the assumptions made, the consistent application of accounting methodology and the basis of the business plans that underpinned the review.A non-underlying charge of £423 million has been recognised. More detail is included within note 5 and note 17 on pages 107 and 129. Impairment sensitivities are included within note 17.
Presentation of financial statementsThe Group uses Alternative Performance Measures (APMs) and in line with guidance issued by the European Securities and Markets Authority (ESMA) includes additional disclosures, including reconciliations to statutory measures, see pages 194 to 198. Any changes to APMs are detailed in note 3 of the financial statements on page 106.See note 5, Profit before non-underlying items, on page 107.
The Committee considers it important to take account of both the statutory measures and the APMs when reviewing these financial statements. In particular, items excluded from underlying results were reviewed by the Committee and it is satisfied that the presentation of these items is clear, applied consistently across years and that the level of disclosure is appropriate. The net non-underlying charge against profits this year was £617 million (2020: £331 million). Excluded items are detailed on pages 107 to 111. Material non-underlying charges were recognised following the strategy update announced during the year. Other items are specific and relate to decisions made or activities undertaken during the year.The Committee gave particular attention to whether the additional COVID-19 related costs incurred during the year met the Group’s definition of non-underlying. Whilst some items are discrete and can be separately quantified, others such as benefit from incremental food sales cannot be reliably disaggregated. COVID-19 related costs of £485 million are therefore reported within underlying profit. The repayment of business rates relief announced in December has also been treated as underlying, due to rates being a cost that would have been incurred in an ordinary trading year.
IFRS 16Although adopted during the prior year, the implementation of IFRS 16 represents a significant change in financial reporting.See note 15, Leases, on page 124.
Management implemented IFRS 16 last year using the full retrospective approach. As part of this the Committee received regular updates, showing the outcome of the transition and supporting disclosures. The implementation of IFRS 16 has a material impact on the financial statements, requiring the recognition of lease liabilities and corresponding right of use assets, and operating lease rentals being replaced with depreciation and interest. A number of changes to lease term estimates were recognised in the year which, with hindsight, should have been reflected in the prior year. Since the impact to the income statement was less than £2 million and considering a number of other qualitative factors, the Committee agreed with management’s assessment that this was not material and that reporting within the 2021 results was appropriate. Detailed discussions were also held with EY on these matters.The Committee will continue to monitor the IFRS 16 accounting and control framework. In doing so, it notes that IFRS 16 requires the Group to make estimates as to the life and cash rental cost for in excess of 18,000 leases to which it is a party. In the normal course of business, and over time, some of these estimates will prove to be incorrect. For example, at a future date a store may be exited and the lease terminated before its IFRS 16 end lease date. Therefore, some adjustment to the prior year lease liability/right of use asset can be expected annually.
Pensions accountingThe Group’s balance sheet shows a pension surplus of £744 million, which comprises £11,000 million of assets, and £(10,256) million of liabilities. This compares to a net surplus in the prior year of £1,119 million. See note 38, Retirement benefit obligations, on page 169.
The Committee reviewed a summary of the actuarial assumptions used in arriving at the valuation for the defined benefit pension scheme.Mortality trends are a key assumption and these have been impacted in 2020 by the increased rate of death within the general population as a consequence of COVID-19. Ordinarily, a reduction in longevity would result in a reduction in future pension liabilities. The Committee discussed management’s analysis and agreed that it would not be prudent to give full effect to the exceptional 2020 increase in mortality rates, as allowed by CMI 2020 (Continuous Mortality Improvement model). Our mortality rates remain broadly in line with CMI 2018, see pages 174 to 175.
Going concern and viabilityGoing concern and viability projections are produced bi-annually and monitored regularly, especially given the current uncertainties surrounding COVID-19. See Statement of Viability on page 44.
The Committee undertook a detailed review of the financial liquidity of the business over the viability assessment period of three years, taking into account cash flows, current levels of debt and the availability of future finance. The viability assessment was discussed by the Committee in March 2021 and scenarios to be stress-tested through the business’s corporate plan were agreed. The outcomes were discussed in April 2021 which included specific scenarios in relation to COVID-19.
67Governance J Sainsbury plc Annual Report 2021
Governance ReportStrategic Report
Financial Statements
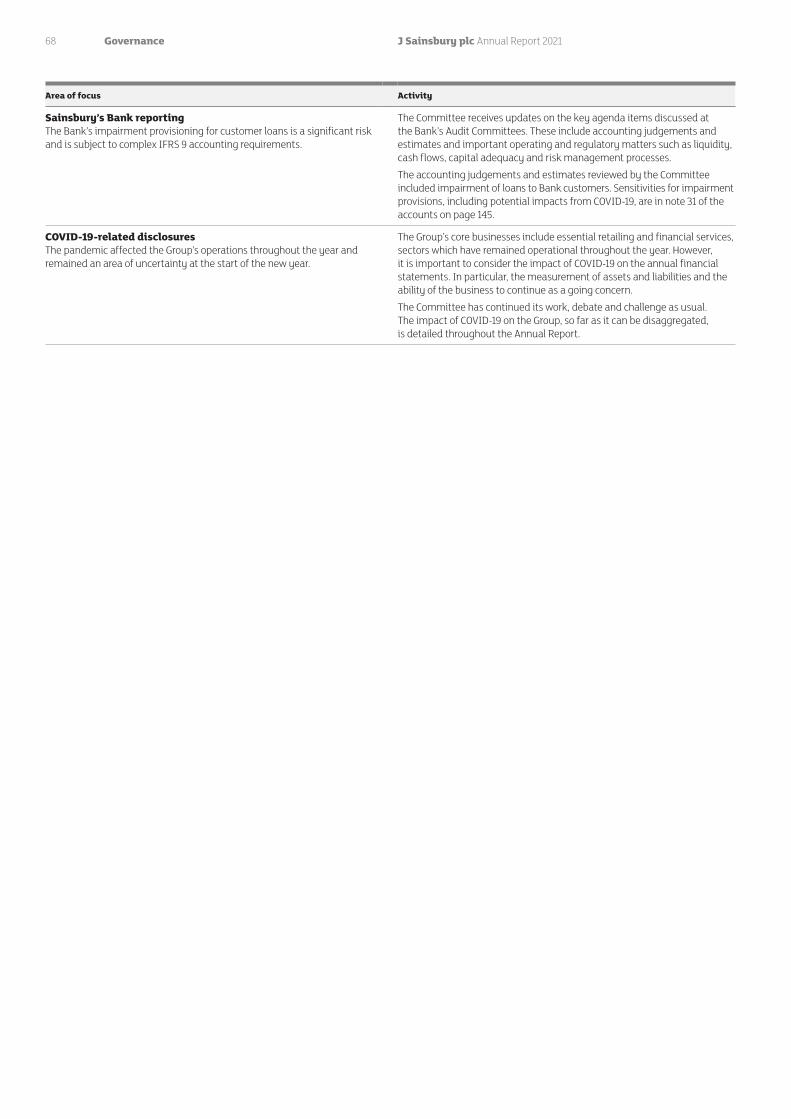
Sainsbury’s Bank reportingThe Bank’s impairment provisioning for customer loans is a significant risk and is subject to complex IFRS 9 accounting requirements.
The Committee receives updates on the key agenda items discussed at the Bank’s Audit Committees. These include accounting judgements and estimates and important operating and regulatory matters such as liquidity, cash flows, capital adequacy and risk management processes. The accounting judgements and estimates reviewed by the Committee included impairment of loans to Bank customers. Sensitivities for impairment provisions, including potential impacts from COVID-19, are in note 31 of the accounts on page 145.
COVID-19-related disclosuresThe pandemic affected the Group’s operations throughout the year and remained an area of uncertainty at the start of the new year.
The Group’s core businesses include essential retailing and financial services, sectors which have remained operational throughout the year. However, it is important to consider the impact of COVID-19 on the annual financial statements. In particular, the measurement of assets and liabilities and the ability of the business to continue as a going concern. The Committee has continued its work, debate and challenge as usual. The impact of COVID-19 on the Group, so far as it can be disaggregated, is detailed throughout the Annual Report.
Area of focus Activity
68 Governance J Sainsbury plc Annual Report 2021

Internal controls frameworkThe internal controls framework encompasses controls relating to financial reporting, preparation of consolidated Group accounts, operations and compliance, risk management and Sainsbury’s interests in joint ventures.
The Audit Committee reviews the effectiveness of internal controls on an ongoing basis and monitors any remedial action required. An overview of key elements of the control framework is set out below.
Our control environment — The Board discusses and approves the Company’s strategy, plans, objectives, budget and the risks to achieving them
— Group-wide policies covering delegations of authority, anti-bribery and corruption and key compliance requirements such as keeping information safe and HR policies set clear parameters for colleagues
— Management regularly reviews risks to achieving objectives, with mitigating controls identified and actions taken
Controls embedded in the business — Policies, procedures and controls are embedded within business processes
— Specific teams, such as Central Retail and Technical Operations, support the design and implementation of specific controls across the business
— Training programmes are provided to support implementation and compliance with key policies, processes and controls
Monitoring and oversight — Compliance with policies, standards and controls is monitored and evaluated in finance, accounting, treasury, information security and safety management
— The Investment Board, and latterly the Business Performance Review, provides oversight and approval of capital spend
— The Capital Returns Forum monitors the outcome of capital spend — Quarterly commercial reviews by Executive Directors of financial and operational performance cover all business areas
— Oversight and governance committees have delegated responsibility for monitoring key risk areas such as the Data Governance, Group Safety, Operational Resilience and Treasury Committees
Our assurance framework — Operating Board members certify annually that they are responsible for managing their business objectives and internal controls to provide reasonable, but not absolute, assurance that the risks in their areas of responsibility are appropriately identified, evaluated and managed
— The Board and the Committee review any significant fraudulent activity and whistleblowing by colleagues, suppliers or other parties and actions being taken to remedy any control weaknesses
— Reports from management are presented to the Operating Board and Audit Committee on how we manage material risks
— Management and the Audit Committee review the scope and results of the work of Internal Audit across the Company and of the implementation of their recommendations
— The Committee reviews the scope and results of the work of the external auditor and any significant issues arising
Risk management and internal controlsThe Board has overall responsibility for risk management and internal controls, and for reviewing their effectiveness. The risk management process is designed to manage rather than eliminate the risk of failure to achieve the Company’s business objectives and can only provide reasonable, not absolute assurance against material misstatement or loss. Certain responsibilities have been delegated to the Audit Committee as outlined below.
The risk management process and internal controls have been in place for the whole year, up to the date of approval of the Annual Report and Financial Statements and accord with the UK Financial Reporting Council’s Guidance on Risk Management, Internal Control and Related Financial Business Reporting and the Code. The annual risk management process is illustrated in the diagram on page 32.
The Board received updates on risk management and internal controls from the Chair of the Audit Committee. All Committee papers and minutes were made available to the whole Board.
The Board received reports on matters relating to safety, other relevant risks, controls and governance. Any significant matters which could have affected the Company’s reputation were reported to the Board as they occurred.
The Audit Committee assesses the effectiveness of internal controls on an ongoing basis, enabling a cumulative assessment to be made.
The annual risk management process concludes with the Board’s assessment of the Company’s principal risks and uncertainties disclosure, including those that would threaten its business model, future performance, solvency or liquidity.
More details of key risk management activities are provided on pages 32 to 33.
69Governance J Sainsbury plc Annual Report 2021
Governance ReportStrategic Report
Financial Statements

Dear Shareholder
I’m pleased to present the Directors’ Remuneration Report for the year ended 6 March 2021. This has been a truly exceptional year, dominated by the COVID-19
pandemic, in which our colleagues have worked tirelessly to feed the nation.
As always, the Remuneration Committee reviews executive pay in the context of Company results, the broader retail and economic environment, and pay across the business. This year it has been even more important to make sure colleagues are recognised and fairly rewarded. For executives, the Committee remains committed to pay for performance.
When determining reward outcomes for this year the Committee considered a number of additional factors. A key consideration was the underlying performance of the business, its financial resilience and how business performance was impacted by COVID-19. It noted the exceptional, non-revenue generating costs incurred in connection with COVID-19 as well as the Board’s decision to repay business rates relief. A key factor was the experience of its stakeholders – customers, colleagues and shareholders.
Response to the COVID-19 pandemicCustomersDuring the year the Company’s mission was to help feed the nation and to serve our customers and communities. We responded by investing quickly and extensively in a range of protective measures to ensure customers and colleagues were able to shop and work safely. We prioritised support for elderly and vulnerable customers, making over 12 million grocery deliveries to them.
The total direct cost of helping to protect customers and colleagues from COVID-19 during the year was £485 million. While we saw some offsetting benefit from stronger Grocery and General Merchandise sales and the acceleration of our online strategy, this investment has still resulted in a year on year underlying profit reduction of 39 per cent.
ColleaguesOur colleagues have responded brilliantly and the Committee is full of admiration for the way that they took on the challenges created by COVID-19. Many of our Argos, Sainsbury’s Bank, food counters and cafe colleagues changed roles to support the food business.
To support our colleagues during this difficult year the Company made a number of policy, reward and recognition decisions which the Committee welcomed. The Company has provided support for colleagues’ mental and physical wellbeing as well as financially supporting those who have been unable to work. From the very start of the pandemic, we committed to paying all colleagues who were required to shield full pay for each of the shielding periods. We also supported colleagues who were self-isolating or absent with COVID-19 related sickness.
To recognise the huge effort and dedication of our front line colleagues and managers whose work had such a positive impact on our customers, we have made two Thank You payments equivalent to 10 per cent of pay for two separate four week periods in March and October 2020. Around 140,000 hourly-paid colleagues and 12,000 managers benefited from these payments. In addition, a further special recognition payment was paid to all hourly-paid colleagues in May 2021, equivalent to 3 per cent of annual salary. These three payments totalled over £800 for a full-time colleague. On top of this support, we continued to invest in the base rate of hourly-paid colleagues. From March 2021, the Sainsbury’s and Argos retail hourly rate increased to £9.50. This, together with the three exceptional payments, represents an investment of over £100 million.
ShareholdersWhen we announced our decision to forgo business rates relief, we stated that if the Company succeeds in delivering profits and cash generation at least in line with its current expectations, the Board believes that shareholders should
not bear the full short-term financial impact this year of the business making the right decisions for customers and colleagues throughout the COVID-19 pandemic. In light of our year-end position, we will be paying a final dividend of 7.4 pence per share, bringing the full year dividend to 10.6 pence per share.
Remuneration in 2020/21Given the decisions taken by management to support the country at a time of national crisis and safeguard the long-term interests of our shareholders, the Committee has considered a number of factors when determining incentive outcomes for the year and it believes that some adjustments are appropriate.
The Committee adopted a prudent and balanced approach to considering the exceptional, non-revenue generating COVID-19 costs. However, the Committee is cognisant that while the direct COVID-19 costs are discrete and can be quantified, the pandemic has also resulted in increased sales, particularly within the food business. While the Committee noted the Company’s decision to repay business rates relief, as this is a normal cost of doing business, this was not the primary driver in the Committee’s decision-making.
The underpinning principle for the reward decisions this year was the alignment of reward to the shareholder experience following the dividend decision.
In line with the 2018 Corporate Governance Code (Code), the Committee reviewed the outcomes of the individual incentive plans as well as the overall levels of remuneration to ensure that they are appropriate considering the underlying performance of the business. The Committee is satisfied that the total remuneration received by Executive Directors in respect of 2020/21 is a reasonable reflection of performance over the period, taking the current unusual market conditions into account, alongside the strong actions of management to navigate the business through the crisis and the shareholder experience.
Annual bonusProfit accounts for 50 per cent of the overall bonus. On a formulaic basis nothing would have paid out as the targets assume the business rates relief was retained, while the year-end UPBT included the repayment. If the Committee were to add back the exceptional, non-revenue generating COVID-19 costs this would have led to a maximum payout, which the Committee did not believe was appropriate, as the Company saw some offsetting benefit. Reflecting the underlying performance of the business and the shareholder experience, the Committee determined an on-target payout for UPBT. This results in a profit payout of 25 per cent (out of a possible 50 per cent).
This year, part of the bonus is based on a balanced scorecard consisting of free cash flow, volume share, customer satisfaction and colleague engagement. The Committee considered a number of data points when reviewing performance, including the Company’s strong free cash flow performance (£784 million), the growth in customer satisfaction scores in Sainsbury’s, an improvement in our colleague engagement score as a result of safety measures and recognition, and the launch of a number of inclusion initiatives. However, while we made good progress against our inclusion targets, we did not achieve our 2021 targets. There was also a decline in Argos customer satisfaction scores, heavily influenced by the pandemic. The Committee determined that this element should pay out at 31.5 per cent (out of a possible 35 per cent).
Kevin O’Byrne demonstrated strong financial leadership during an exceptional year, delivering on cash and debt commitments while driving underlying performance and, as such, for the individual strategic objectives the Committee determined an outcome of 13.5 per cent (out of a possible 15 per cent). This results in an overall bonus outcome of 70 per cent of the maximum. Kevin O’Byrne has volunteered to take the whole of this year’s bonus in deferred shares, which will vest after two years (rather than the normal approach of 50 per cent in cash and 50 per cent in shares), to further align his interests with those of shareholders.
Simon Roberts would have been entitled to a bonus on the same basis as Kevin O’Byrne but, as stated in our interim results, Simon has waived his bonus for 2020/21.
Annual Statement from the Remuneration Committee Chair
70 Governance J Sainsbury plc Annual Report 2021

2018 Future BuilderClearly the impact of COVID-19 could not be anticipated at the point that the 2018 Future Builder targets were set. On a formulaic basis, the vesting multiplier would be 2.0 (out of a maximum of 4.0) or 50 per cent of maximum. As outlined above for the bonus, the Committee did not believe it was appropriate to add back the exceptional, non-revenue generating COVID-19 costs (this would have resulted in a near maximum payout).
The Committee determined to use an approach that was consistent with that applied to the bonus and so used an on-target UPBT for the 2018 Future Builder. This has no impact on the EPS outcome as the threshold target is still missed, but does increase the ROCE outturn by around 10 per cent of the award. The Committee also adjusted downwards the free cash flow outturn to be reflective of a more typical year, but this still resulted in maximum vesting. No adjustment was made to the cost savings figure which vested in full. Overall the result is a performance multiplier of 2.4 (out of a maximum of 4.0), meaning it vests at 60 per cent of the maximum.
2020 Future BuilderDue to the unfolding COVID-19 pandemic and our need to understand its impact on the business and the wider economy, we were unable to set our 2020 Future Builder targets in time to publish them in last year’s Directors Remuneration Report. The Committee consulted with shareholders on the proposed targets in November before publishing on our website. Details can be found on page 86.
Leadership changesFollowing almost six years as Chief Executive Officer and 15 years working for the business, Mike Coupe retired from Sainsbury’s this year, leaving the business on 2 July 2020. In line with the shareholder approved Remuneration Policy and as disclosed last year, the Committee approved good leaver status for Mike in relation to bonus and share awards that were outstanding after he retired. Mike waived any entitlement to his bonus and Future Builder grant in relation to his period of employment during the 2020/21 financial year.
Simon Roberts was promoted to the position of Chief Executive Officer on 1 June 2020. Simon’s salary on appointment was £875,000 (which is over 10 per cent lower than Mike Coupe’s salary at the point of his retirement) and he receives a pension salary supplement of 7.5 per cent of salary, in line with the pension available to the majority of the workforce. This results in Simon’s fixed pay (salary, benefits and pension) being 25 per cent lower than Mike’s. Simon’s incentive opportunities have been aligned with Mike’s and are consistent with our Remuneration Policy.
2021/22 Remuneration Our refreshed 2020 Remuneration Policy, which governs executive pay at Sainsbury’s, was approved by 97 per cent of our shareholders at the 2020 AGM and the Committee would like to thank our shareholders for their support. We also consulted with shareholders and proxy agencies in March 2021 to discuss our proposals for the coming year.
2021 Long-Term Incentive PlanIn November 2020, Simon shared our updated strategy with the market, clearly articulating our priorities of placing food back at the heart of Sainsbury’s, simplifying our operations, accelerating cost savings and focusing on brands that support our core food business. We have set out eight key metrics which will help us to track progress against our updated strategy.
In order to fully align incentives with our business priorities and deliver long-term success we have relaunched our Long-Term Incentive Plan (LTIP), previously called Future Builder, to support the updated strategy. The new 2021 Win in Food incentive plan has the same structure as Future Builder, but the performance measures have been updated and will include the eight key metrics that we are using to track our success. For Executive Directors 80 per cent of the plan will be based on the four key financial measures (free cash flow, ROCE, EPS and cost savings). The remaining 20 per cent of the plan will be subject to key strategic indicators (market share, customer, colleague and Net Zero). Further details are provided on pages 80 to 81.
Senior Leaders will play a vital role in delivering the strategy over the next three years and on a one-off basis we will be making enhanced award levels to the c. 230 participants and extending the plan to include another 1,200 senior leaders.
The maximum award level for the Chief Executive Officer will remain at 250 per cent of salary in line with the current shareholder approved remuneration policy limit. The Committee has decided to increase the Chief
Financial Officer’s (Kevin O’Byrne) award level from 200 per cent to 250 per cent of salary in 2021 only, to be in line with the Chief Executive Officer’s award level. This award recognises the strategic importance of Kevin’s role, and his individual impact, to the successful delivery of our updated strategy over the next three years and, in particular, our Save to Invest agenda. From 2022, it is expected that the Chief Financial Officer’s award level will be set at 225 per cent of salary to ensure the package continues to be weighted towards the long-term on an on-going basis.
Salary and pensionNeither Executive Director will receive a pay increase in 2021. As disclosed last year, the pension of our Chief Financial Officer, Kevin O’Byrne, will be reduced again this year towards the colleague rate of 7.5 per cent of salary. Although it was initially envisaged that Kevin O’Byrne’s pension would align with the all-colleague rate in March 2024, this year he volunteered a further accelerated reduction to his contractual pension entitlement, meaning it will be aligned to the all-colleague rate by the end of the 2022 calendar year.
Pay across Sainsbury’sThe Remuneration Committee considers wider colleague reward when determining pay arrangements for the Executive Directors and this remains a fundamental part of our approach to pay. We believe that it is important that the pay for all our colleagues remains consistent with the principles of simplicity and fairness.
During the year, the Committee reviewed the Group’s Ethnicity and Gender Pay Gap Report – this is the first time we have published our ethnicity pay gap. We pay colleagues according to their role, regardless of their gender or ethnicity. The Board is committed to achieving better representation at senior levels and believes in transparency. Our mean ethnicity pay gap is 0.4 per cent (mean black pay gap is 1.7 per cent) and our median ethnicity pay gap is -3.1 per cent (median black pay gap is -4.5 per cent). This negative median gap is driven by the high proportion of ethnically diverse colleagues working in our London stores who receive a location premium. In 2020, our mean gender pay gap reduced by 0.8 percentage points to 9.7 per cent and our median gender pay gap increased by 1.2 percentage points to 5 per cent.
Sainsbury’s is a values-driven business and we seek to adopt a responsible approach to pay that reflects our culture and values at all levels throughout the organisation.
Dame Susan RiceChair, Remuneration Committee
The Committee held four scheduled meetings within the year, together with a number of unscheduled meetings. Attendance of Directors at scheduled Remuneration Committee meetings:
Susan Rice 4(4) Jo Harlow 4(4)
Matt Brittin 1(1) Tanuj Kapilashrami 3(3)
The maximum number of meetings held during the year that each Director could attend is shown in brackets. Matt Brittin stepped down from the Board on 2 July 2020. Tanuj Kapilashrami joined the Board on 1 July 2020.
Principal role and responsibilities — Determining and agreeing with the Board the Remuneration Policy for the Chairman, Executive Directors and the Operating Board Directors;
— Setting individual remuneration arrangements for the Chairman, Executive Directors and Operating Board Directors;
— Reviewing and noting the pay and benefits applying to colleagues across the Company and taking these into account when determining executive pay;
— Approving the service agreements of each Executive Director, including termination arrangements; and
— Considering the achievement of the performance conditions under annual and long-term incentive arrangements.
The Committee’s Terms of Reference are available on the Company’s website www.about.sainsburys.co.uk.
71Governance J Sainsbury plc Annual Report 2021
Governance ReportStrategic Report
Financial Statements

Summary of 2020/21 remuneration decisionsPay element 2020/21 decisions
SalaryIncreases in line with colleagues
— Annual salary: Mike Coupe (up to 2 July 2020) – £981,543, Simon Roberts (from 1 June 2020 on appointment as Chief Executive Officer) – £875,000 and Kevin O’Byrne – £657,403.
— Salary increase of 1.1 per cent for Chief Financial Officer in March 2020 in line with other management and central colleagues.
Annual bonusAward of 70 per cent of maximum
— Simon Roberts has waived his bonus. — The 2020/21 bonus outturn was 70 per cent of the maximum. — The Committee based the bonus outturn on an on-target UPBT, resulting in the profit element paying out at 25 per cent (out of 50 per cent).
— The balanced score card element paid out at 31.5 per cent (out of 35 per cent) as a result of excellent free cash flow performance and good progress against customer satisfaction, volume share and colleague engagement metrics.
— Kevin’s O’Byrne’s individual annual objectives paid out at 13.5 per cent (out of 15 per cent). All of the bonus to be paid in deferred shares.
— Further details of the bonus measures and outturn can be found on pages 76 and 77.
31.5% 13.5%25%
Maximum opportunity
Actual % of maximum
50% 35% 15%
Profit • Balanced scorecard • Individual annual objective• Group profit • Annual operational objectives
LTIP/Future BuilderVesting at 60 per cent of maximum
— Future Builder, based on performance to March 2021, will vest at 60 per cent of the maximum. — Partial vesting was achieved under the ROCE element, full vesting was achieved under the free cash flow and cost savings elements and no vesting under the EPS element.
— Further detail on the outcomes is set out on page 78.
Maximum opportunity
Actual % of maximum 20%
ROCE EPS Free Cash Flow • Cost Savings
• Group profit • Annual operational objectives
Financial Returns to shareholders • Relative performance • Strategic priorities25%
25%
25% 25%25%
10% 25% 25%
25% 25%
Total remuneration for 2020/21
Simon Roberts1 £000
Kevin O’Byrne2 £000
Mike Coupe3 £000
2020/21 2019/20 2020/21 2019/20 2020/21 2019/20
Fixed pay Salary 673 – 657 650 317 982
Benefits 13 – 17 17 39 17
Pension 50 – 148 163 95 294
Performance-related pay Annual bonus (including 2019/20 Deferred Share Award) 0 – 828 257 0 475
LTIP/Future Builder 583 – 674 653 985 1,231
Total pay 1,319 – 2,324 1,740 1,436 2,999
1 Simon Roberts was appointed to the Board on 1 June 2020. Simon waived his full year bonus for 2020/21.2 Kevin O’Byrne volunteered to take the whole of his 2020/21 annual bonus in deferred shares which vest after two years to further align his interests with those of shareholders.3 Mike Coupe’s 2019/20 DSA is as reported last year but a portion of these shares lapsed due to pro-ration to reflect his period of employment during the retention period. The 2020/21 LTIP figure is post pro-ration.
72 Governance J Sainsbury plc Annual Report 2021

Summary of remuneration for 2021/22Pay element Approach for 2020/21
SalaryNo salary increases for Executive Directors
— There was no increase to the Executive Directors’ salaries which will be unchanged for 2021/22: — Simon Roberts – £875,000 — Kevin O’Byrne – £657,403
BenefitsNo changes
— No changes to current arrangements.
Retirement benefitsChief Financial Officer’s rate reducing and aligning over time
— Salary supplement in lieu of pension for new hires, including Simon Roberts, is aligned with the rate available to the majority of colleagues. This is currently 7.5 per cent of salary.
— As disclosed last year, the rate for Kevin O’Byrne will be reduced to 7.5 per cent of salary over time. For 2021/22 it will be reduced from 22.5 per cent to 20 per cent of salary. This year, Kevin volunteered a further acceleration of the reduction to his contractual benefit, meaning that his pension will be reduced to 7.5 per cent by the end of the 2022 calendar year.
Annual bonus Metrics aligned to strategy
— Performance is based on profit (50 per cent), free cash flow (20 per cent) and strategic objectives (30 per cent). — Bonus paid 50 per cent in cash after the year-end and 50 per cent deferred into shares for two years. — Maximum opportunity of up to 250 per cent of salary per annum. — The maximum award for 2021/22 is:
— Simon Roberts – 220 per cent of salary — Kevin O’Byrne – 180 per cent of salary
LTIP/2021 Win in Food incentive planMetrics aligned to strategy and adjustment to CFO maximum
— Awards are subject to a three-year performance period followed by a two-year retention period. — Maximum award of up to 250 per cent of salary per annum. — Awards are structured as core awards, with a performance multiplier of up to four times. The 2021 maximum awards are:
— Simon Roberts – core award of 62.5 per cent of salary (max 250 per cent) — Kevin O’Byrne – core award of 62.5 per cent of salary (max 250 per cent). This will change to a core award of 56.25 per cent (max 225 per cent) in 2022.
— Following the strategy review, the Committee revised the performance measures to ensure alignment.
Measure Weighting
Threshold target 1.0
x award
Maximum target 4.0
x award
Cumulative free cash flow1 20% £1,000m £1,500m
ROCE1 20% 6.75% 9.75%
Underlying basic EPS1 20% 19.8p 26.5p
Cumulative cost savings 20% 80bps improvement 280bps improvement
Strategic indicators 20% Based on market share, customer, colleague and Net Zero. Further details set out on pages 80 and 81
1 These measures are defined in the Alternative Performance Measures section of the Annual Report on pages 194 to 198.
Shareholding guidelinesNo changes
— The Executive Directors are required to build a significant shareholding in the Company. For the Chief Executive Officer this is three times salary, and for the Chief Financial Officer this is two times salary.
— Post-employment shareholding guidelines were introduced following the 2020 AGM: Executives will be required to hold shares equivalent to their in-employment shareholding guideline for two years post departure. This requirement will apply only to shares acquired from Company incentive plans.
Recovery provisionsNo changes
— The Executive Directors’ incentive arrangements are subject to malus and clawback.
73Governance J Sainsbury plc Annual Report 2021
Governance ReportStrategic Report
Financial Statements

Remuneration in contextOur reward objectivesOur objective is to have a fair, equitable and competitive total reward package that encourages colleagues to serve and help every customer, drives profitable sales and provides opportunities for colleagues to share in Sainsbury’s success.
Executive remuneration principlesThe above reward objectives apply to our senior executive population as well. In addition, the Committee believes it is important that a significant portion of the Executive Directors’ package is performance-related, delivered in shares and that the performance conditions applying to incentive arrangements support the delivery of the Company’s strategy and long-term shareholder value.
The Remuneration Policy for our senior executives is therefore, based on the following principles:
Linked to our business strategy
Encourages the right behaviours
to deliver long-term growth
Aligned to our values and
culture
Secures high calibre leaders
Enables share ownership
Linking executive pay to our business strategyThe Committee carefully considers the performance metrics incorporated into the annual bonus and long-term incentive plan to ensure they support our strategic priorities. The annual bonus is linked to key financial and individual strategic objectives, while the long-term incentive plan rewards for delivery against our key strategic objectives. This is clearly demonstrated in the 2021 Win in Food incentive plan which includes all eight key performance metrics. The achievement of these metrics supports long-term sustainable performance and value creation for our shareholders.
Key considerationsWhen reviewing the Remuneration Policy for Executive Directors and determining the approach to pay, in line with the Code, the Committee gives consideration to the following:
— Simplicity and transparency: The Remuneration Policy has been designed to incentivise senior executives to achieve clearly defined financial, operational and strategic objectives. The Committee reviews performance metrics and targets each year to ensure that they continue to be clear and aligned to the delivery of the strategy. The changes made to the LTIP, the 2021 Win in Food incentive plan, demonstrate this.
— Alignment to our purpose, values and culture: Sainsbury’s has a clear purpose and strong value set resulting in a unique culture which plays an essential role in achieving our strategy. Our culture is underpinned by our Purpose (our core reason for being); our valued behaviours (what we want from our people); and being a Great Place to Work (encouraging colleagues to want to be their best). The Committee ensures our pay practices drive the right behaviours in line with our values and culture.
— Risk mitigation: The Committee reviews and sets performance targets each year to ensure that they drive the right behaviours and are appropriately stretching without encouraging unnecessary risks. Under the annual bonus and LTIP the Committee has the ability to adjust incentive outcomes to ensure that they are reflective of the underlying financial and non-financial performance of the participants and the Company. The Committee believes that this discretion is an important feature and mitigates the risk of unwarranted vesting outcomes. In addition, in the event that certain risk events come to light the Committee may operate recovery provisions on all incentive awards.
— Potential outcomes: When setting, and subsequently implementing, the policy for senior executives, the Committee considers our business goals, the retail market and competitors, the potential and actual outcome and cost to the Company, stakeholder views and best practice. The Committee believes it is important to exercise sound judgement at all stages during the process to ensure that executive pay levels appropriately reflect performance and are aligned with the interests of shareholders.
Fair pay for colleaguesWhen considering remuneration arrangements for Executive Directors, the Committee takes into account, as a matter of course, the pay and conditions of colleagues at all levels throughout the Company. The Committee receives regular updates regarding any major changes to the pay and benefits of colleagues and has been kept informed of all pay decisions relating to treatment of colleagues during the COVID-19 pandemic. The Committee also reviews information on internal measures, including details of our ethnicity and gender pay gap and the ratio of Chief Executive Officer remuneration to the remuneration of our colleagues, and considers how these compare externally.
Sainsbury’s employs over 189,000 colleagues who work hard to deliver for our customers. The Committee recognises that our colleagues are the cornerstone of our business and essential to the overall success of our plans. The remuneration objectives for our colleagues follow the same principles as the policy for the Executive Directors. Pay and benefits reflect the nature and contribution of the role and take into account levels of pay in comparable roles in the market.
Reward and benefits — All colleagues are entitled to base salary, pension and a range of benefits. — Managers participate in annual bonus plans which are aligned under a common set of principles. — Senior executives also participate in our Long-Term Incentive Plan. In 2021, we will operate a ‘one off’ Long-Term Incentive Plan which will be extended to an additional 1,200 colleagues including store managers of our biggest stores.
— We offer colleague discount in Sainsbury’s, Argos and Habitat and during 2020/21 colleagues saved over £60 million.
74 Governance J Sainsbury plc Annual Report 2021

Recognition, development and wellbeing — During the pandemic, we have protected, supported and recognised our colleagues. — As outlined in the Remuneration Committee Chair’s letter we made three exceptional Thank You payments and provided financial support to colleagues who have been unable to work due to COVID-19.
— Being a place where colleagues love to work is really important to us and we recognise colleagues who go the extra mile and bring our values to life through LOVE, our colleague recognition scheme. During the pandemic we invested in our recognition scheme and over 500,000 instant rewards and 20,000 exceptional performance awards have been given to colleagues, with a cash value of over £7 million.
— The Company provides support on mental and physical wellbeing through a variety of mechanisms and we have an Employee Assistance Programme.
— We want to support colleagues in their career goals and operate a number of development programmes including one designed to support retail colleagues looking to move into front line management and leadership roles.
Pensions and life assurance — Participation in a pension plan is offered to all colleagues on a contributory basis, with the Company contribution varying by grade. Hourly-paid store colleagues are offered a matching scheme up to 7.5 per cent of salary.
— We have c. 130,000 colleagues in our pension plans. — Colleagues in our pension plan also receive six times life assurance (one times if not in a pension or in an auto-enrolled scheme).
Share ownership — All colleagues have the opportunity to become shareholders in the Company through our all-employee share plans. — Around 31,000 colleagues participate in our Sharesave plans, representing an uptake rate of 18.5 per cent. — Colleagues can also participate in Sainsbury’s Share Purchase Plan (SSPP), which is our name for the partnership element of the Share Incentive Plan.
Ethnicity and gender pay — Our colleagues are paid according to their role not their gender or ethnicity. — 2020 is the first year we have published our Ethnicity Pay Gap Report. The ethnicity pay gap shows the difference in the average hourly rate of pay of ethnically diverse colleagues compared to that of white colleagues. Our mean ethnicity pay gap is 0.4 per cent and our median ethnicity pay gap is -3.1 per cent. Location plays a key part in explaining the gap, as over half of our ethnically diverse colleagues work in our London stores earning a location premium. However, we know our ethnically diverse colleagues make up only 8 per cent of our senior leadership population and we have much more work to do in this area.
— In 2020, our mean gender pay gap reduced by 0.8 percentage points to 9.7 per cent and our median gender pay gap increased by 1.2 percentage points to 5 per cent. Like a lot of companies our gap is caused by the fact that we have more men than women in our most senior roles, more women than men in our hourly-paid roles, and more men in hourly-paid specialist roles that attract premiums, such as online delivery drivers.
— The Board is committed to improving gender and ethnically diverse representation and we have made good progress against our targets of 40 per cent female and 10 per cent ethnically diverse in senior management roles. We have set ourselves stretching targets for the years ahead.
CEO pay ratios — Our CEO pay ratio of 122:1 reflects the size and make up of our colleague base. This is a significant decline from last year’s ratio of 173:1, as a result of the change in Chief Executive with lower overall remuneration and it has also been impacted by the Thank You payments made to hourly colleagues during the year.
— The 25th, 50th and 75th percentiles ranked by total remuneration are all store-based hourly-paid colleagues.
Colleague engagement — The Board recognises the important role our colleagues play in the success of Sainsbury’s. It takes colleague engagement and the views of colleagues seriously. We communicate regularly with colleagues to provide information about our strategy, our performance and on operational matters as well as asking for feedback on how colleagues are feeling. Further details are set out on pages 17 and 20 of the Annual Report.
— Our Great Place to Work groups operate at store level rolling up to a national group (which is our Workforce Advisory Panel), which meets with Board members on a regular basis to discuss current issues. Whilst we do not formally consult with colleagues on the setting of the Executive Director Remuneration Policy, we have used these discussion groups for Non-Executive Directors to engage with colleagues directly on executive remuneration to give them the opportunity to share their views and opinions. The last listening sessions covering executive pay were held in March 2020 and May 2021.
— Colleagues are able to become shareholders in the Company and can comment on the policy in the same way as other shareholders.
75Governance J Sainsbury plc Annual Report 2021
Governance ReportStrategic Report
Financial Statements
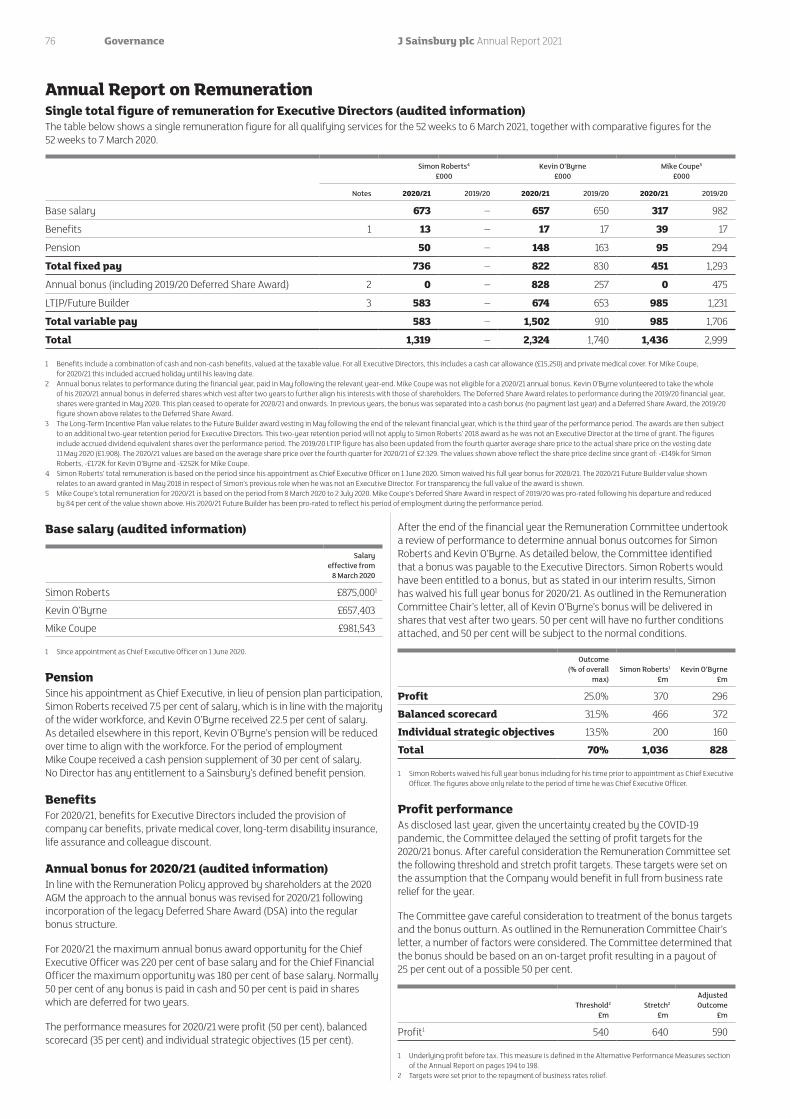
Annual Report on RemunerationSingle total figure of remuneration for Executive Directors (audited information)The table below shows a single remuneration figure for all qualifying services for the 52 weeks to 6 March 2021, together with comparative figures for the 52 weeks to 7 March 2020.
Simon Roberts4 £000
Kevin O’Byrne £000
Mike Coupe5 £000
Notes 2020/21 2019/20 2020/21 2019/20 2020/21 2019/20
Base salary 673 – 657 650 317 982
Benefits 1 13 – 17 17 39 17
Pension 50 – 148 163 95 294
Total fixed pay 736 – 822 830 451 1,293
Annual bonus (including 2019/20 Deferred Share Award) 2 0 – 828 257 0 475
LTIP/Future Builder 3 583 – 674 653 985 1,231
Total variable pay 583 – 1,502 910 985 1,706
Total 1,319 – 2,324 1,740 1,436 2,999
1 Benefits include a combination of cash and non-cash benefits, valued at the taxable value. For all Executive Directors, this includes a cash car allowance (£15,250) and private medical cover. For Mike Coupe, for 2020/21 this included accrued holiday until his leaving date.
2 Annual bonus relates to performance during the financial year, paid in May following the relevant year-end. Mike Coupe was not eligible for a 2020/21 annual bonus. Kevin O’Byrne volunteered to take the whole of his 2020/21 annual bonus in deferred shares which vest after two years to further align his interests with those of shareholders. The Deferred Share Award relates to performance during the 2019/20 financial year, shares were granted in May 2020. This plan ceased to operate for 2020/21 and onwards. In previous years, the bonus was separated into a cash bonus (no payment last year) and a Deferred Share Award, the 2019/20 figure shown above relates to the Deferred Share Award.
3 The Long-Term Incentive Plan value relates to the Future Builder award vesting in May following the end of the relevant financial year, which is the third year of the performance period. The awards are then subject to an additional two-year retention period for Executive Directors. This two-year retention period will not apply to Simon Roberts’ 2018 award as he was not an Executive Director at the time of grant. The figures include accrued dividend equivalent shares over the performance period. The 2019/20 LTIP figure has also been updated from the fourth quarter average share price to the actual share price on the vesting date 11 May 2020 (£1.908). The 2020/21 values are based on the average share price over the fourth quarter for 2020/21 of £2.329. The values shown above reflect the share price decline since grant of: -£149k for Simon Roberts, -£172K for Kevin O’Byrne and -£252K for Mike Coupe.
4 Simon Roberts’ total remuneration is based on the period since his appointment as Chief Executive Officer on 1 June 2020. Simon waived his full year bonus for 2020/21. The 2020/21 Future Builder value shown relates to an award granted in May 2018 in respect of Simon’s previous role when he was not an Executive Director. For transparency the full value of the award is shown.
5 Mike Coupe’s total remuneration for 2020/21 is based on the period from 8 March 2020 to 2 July 2020. Mike Coupe’s Deferred Share Award in respect of 2019/20 was pro-rated following his departure and reduced by 84 per cent of the value shown above. His 2020/21 Future Builder has been pro-rated to reflect his period of employment during the performance period.
Base salary (audited information)
Salary effective from
8 March 2020
Simon Roberts £875,0001
Kevin O’Byrne £657,403
Mike Coupe £981,543
1 Since appointment as Chief Executive Officer on 1 June 2020.
Pension Since his appointment as Chief Executive, in lieu of pension plan participation, Simon Roberts received 7.5 per cent of salary, which is in line with the majority of the wider workforce, and Kevin O’Byrne received 22.5 per cent of salary. As detailed elsewhere in this report, Kevin O’Byrne’s pension will be reduced over time to align with the workforce. For the period of employment Mike Coupe received a cash pension supplement of 30 per cent of salary. No Director has any entitlement to a Sainsbury’s defined benefit pension.
Benefits For 2020/21, benefits for Executive Directors included the provision of company car benefits, private medical cover, long-term disability insurance, life assurance and colleague discount.
Annual bonus for 2020/21 (audited information)In line with the Remuneration Policy approved by shareholders at the 2020 AGM the approach to the annual bonus was revised for 2020/21 following incorporation of the legacy Deferred Share Award (DSA) into the regular bonus structure.
For 2020/21 the maximum annual bonus award opportunity for the Chief Executive Officer was 220 per cent of base salary and for the Chief Financial Officer the maximum opportunity was 180 per cent of base salary. Normally 50 per cent of any bonus is paid in cash and 50 per cent is paid in shares which are deferred for two years.
The performance measures for 2020/21 were profit (50 per cent), balanced scorecard (35 per cent) and individual strategic objectives (15 per cent).
After the end of the financial year the Remuneration Committee undertook a review of performance to determine annual bonus outcomes for Simon Roberts and Kevin O’Byrne. As detailed below, the Committee identified that a bonus was payable to the Executive Directors. Simon Roberts would have been entitled to a bonus, but as stated in our interim results, Simon has waived his full year bonus for 2020/21. As outlined in the Remuneration Committee Chair’s letter, all of Kevin O’Byrne’s bonus will be delivered in shares that vest after two years. 50 per cent will have no further conditions attached, and 50 per cent will be subject to the normal conditions.
Outcome (% of overall
max)Simon Roberts1
£mKevin O’Byrne
£m
Profit 25.0% 370 296
Balanced scorecard 31.5% 466 372
Individual strategic objectives 13.5% 200 160
Total 70% 1,036 828
1 Simon Roberts waived his full year bonus including for his time prior to appointment as Chief Executive Officer. The figures above only relate to the period of time he was Chief Executive Officer.
Profit performanceAs disclosed last year, given the uncertainty created by the COVID-19 pandemic, the Committee delayed the setting of profit targets for the 2020/21 bonus. After careful consideration the Remuneration Committee set the following threshold and stretch profit targets. These targets were set on the assumption that the Company would benefit in full from business rate relief for the year.
The Committee gave careful consideration to treatment of the bonus targets and the bonus outturn. As outlined in the Remuneration Committee Chair’s letter, a number of factors were considered. The Committee determined that the bonus should be based on an on-target profit resulting in a payout of 25 per cent out of a possible 50 per cent.
Threshold2
£mStretch2
£m
Adjusted Outcome
£m
Profit1 540 640 590
1 Underlying profit before tax. This measure is defined in the Alternative Performance Measures section of the Annual Report on pages 194 to 198.
2 Targets were set prior to the repayment of business rates relief.
76 Governance J Sainsbury plc Annual Report 2021

Balanced scorecardThe table below shows the composition of the balanced scorecard which carried a weighting of 35 per cent of the annual bonus.
At the time that the 2020/21 annual bonus scheme was designed, the Remuneration Committee intended to set specific targets for the balanced scorecard measures. While the measures and weightings remained unchanged, the setting of targets was delayed due to the disruption caused by COVID-19 and, as the pandemic continued to affect our business in unanticipated ways, it became clear that a broader, more rounded performance assessment would need to be taken at the end of the performance period. The Committee has reviewed information on historic performance, performance during the course of the year along with narrative on relevant factors in order to determine an appropriate level of payout.
The Committee determined a payout of 31.5 per cent out of a possible 35 per cent.
Metric % of max bonus Performance assessment Outturn
Free cash flow1 15% Free cash flow of £784 million, ahead of stretch target 15.0% (out of 15%)
Customer satisfaction 10% CSAT growth of 4.8 per cent points in Sainsbury’s Food driven by customer safety, and minimised the decline in Argos CSAT related to the pandemic
8.5% (out of 10%)
Volume share 5% Sainsbury’s grew volume share compared to Big 4 and maintained share across market, and Argos increased share compared to peers
4.0% (out of 5%)
Colleague – culture of engagement and inclusion
5% Colleague engagement score grew during pandemic as a result of safety measures and recognition. Launched a number of inclusion initiatives and made year on year progress but did not achieve our representation targets – 38 per cent of Senior Managers and Directors are women (target 40 per cent) and 8 per cent are ethnically diverse (target 10 per cent)
4.0% (out of 5%)
Total 35% 31.5% (out of 35%)
1 These measures are defined in the Alternative Performance Measures section of the Annual Report on pages 194 to 198.
Individual strategic objectivesDuring 2020/21 the Executive Directors performed strongly against their individual strategic objectives. The table below sets out a summary of the achievements of the Executive Directors in relation to these objectives as assessed by the Remuneration Committee. The Committee has determined an award of 13.5 per cent out of a possible 15 per cent for both Executive Directors.
Shared objectives
Driving strategy and delivering business change Good actual and relative start to delivering the new Food First plan versus peers – consistently lowered prices, launch of Sainsbury’s Quality, Aldi Price Match and biggest ever Price Lock event Adapted to in-year channel shifts, with outstanding digital performance with sales up 102 per centPut colleague and customer safety first – outperformed competitors on customer safety
Delivering for shareholders Continued improvement in financial strength of the organisation: very strong free cash flow delivery and net debt reduction (excluding leases) of £539 millionRobust cost reduction plans developed and being actioned to deliver 2021/22 targets In November, paid an exceptional dividend – strong free cash flow enabled Sainsbury’s to protect dividend from decline in profit as a result of COVID-19
Simon Roberts Kevin O’Byrne
Director-specific Strong leadership skills in navigating an exceptional first year as Chief ExecutiveDeveloping and communicating new strategyDeveloping and embedding a new performance-led culture with a focus on accountability and deliveryProgress against the four Net Zero metrics; added a Net Zero Scope 3 target and Principal Supermarket Sponsor of the upcoming UN Climate Change Conference COP26
Strong financial leadership skills during an exceptional year, delivering on cash and debt commitments while driving underlying performanceDeveloping and communicating new strategyDriving a focus on working capital management through a number of long-term strategic initiativesRestructured the finance organisation to deliver efficiencies while improving focus on business performance and control environment
77Governance J Sainsbury plc Annual Report 2021
Governance ReportStrategic Report
Financial Statements

2018 Future Builder (2018/19 to 2020/21 performance period) (audited information)The Long-Term Incentive Plan operated at Sainsbury’s in prior years was known as Future Builder. Around 230 senior managers across the business participate in this arrangement. Awards are granted under the Long-Term Incentive Plan approved by shareholders in 2016. A core award of shares is granted, calculated as a percentage of salary and scaled according to level of seniority. Vesting of the core award is dependent on performance against specific targets tested at the end of a three-year performance period. The core awards can grow up to four times at stretch levels of performance. Any vested award is subject to a two-year retention period.
The 2018 Future Builder award was subject to ROCE, EPS, free cash flow and cost savings targets. In addition, a performance gateway had to be achieved before any element could vest. The ROCE and EPS targets have been re-stated on a like-for-like basis to reflect the adoption of the new accounting standard, IFRS 16. The Committee is comfortable that the re-stated target ranges are comparable to the original target ranges set on the basis of the previous accounting rules.
As outlined in the Remuneration Committee Chair’s letter, a number of factors were considered when determining the vesting outturn. The Committee consulted with shareholders on its approach in March/April 2021. The Committee determined that it was appropriate to make adjustments, in line with the bonus, and base awards on an on-target profit. This approach has no impact on the EPS outcome as the threshold target is still missed, but increased the ROCE outturn by around 10 per cent of the award. The Committee also adjusted downwards the free cash flow outturn to be reflective of a more typical year, but this still resulted in maximum vesting. No adjustment was made to the cost savings figure which vested in full. This resulted in a performance multiplier of 2.4 out of 4.0 (60 per cent of the maximum). The Committee reviewed the outcome of the awards in the context of the Company’s performance this year and determined that this was an appropriate outcome.
The table below sets out the extent to which each performance measure was achieved.
Weighting
Threshold target
(1.0x core award)
Maximum target
(4.0x core award)
Adjusted outcome
Multiplier achieved(out of a
maximum 4.0x)
ROCE1 25% 6.75% 9.75% 7.3% 0.4x
Underlying basic EPS1 25% 21.5p 28.5p 20.7p 0.0x
Cumulative free cash flow1 25% £800m £1,300m 1,416m 1.0x
Cumulative strategic cost savings 25% £450m £550m £610m 1.0x
Performance gateway The Remuneration Committee must be satisfied that the Company’s underlying performance over
the period justifies the level of vesting.
Achieved
Total 2.4x out of a maximum of 4.0x
1 These measures are defined in the Alternative Performance Measures section of the Annual Report on pages 194 to 198.
Departure terms for Mike CoupeAs disclosed in last year’s Directors’ Remunerations Report, after almost six years as Chief Executive Officer and 15 years working for the business, Mike Coupe retired as Chief Executive Officer from 31 May 2020. Thereafter he remained a Director until the AGM on 2 July 2020 at which point he retired from the Company.
In line with the shareholder approved Remuneration Policy, the Remuneration Committee approved good leaver status for Mike in relation to bonus and share awards that were outstanding when he retired. All awards were treated in accordance with the plan rules and remained subject to performance (as applicable) and pro-rated for the period of employment. Share awards will be released on the normal dates.
Mike’s salary and benefits continued until he retired from the Company on 2 July 2020, but Mike agreed to waive any entitlement to bonus and share awards in relation to his period of employment during the 2020/21 financial year.
There were no payments in lieu of notice.
78 Governance J Sainsbury plc Annual Report 2021

Shareholding guidelines (audited information)The Executive Directors are required to build up a specified level of shareholding in the Company. This is to create greater alignment of the Directors’ interests with those of shareholders, in line with the objectives of the Remuneration Policy.
The guidelines in the 2020 Directors Remuneration policy require the Chief Executive Officer to have a holding of three times salary. And other Executive Directors to hold shares with a value of two times salary. Executive Directors are required to hold all vested share awards (net of tax) until the guideline has been met. In addition to shares held, share awards under the Deferred Share Award and Future Builder awards where the performance period has ended count towards the guideline (on a net of tax basis).
Simon Roberts currently holds 0.9x salary following his appointment as Chief Executive Officer in 2020. Kevin O’Byrne was appointed to the Board in January 2017 and has now met the shareholding requirement. Mike Coupe, while he was a Director, exceeded the shareholding guideline.
Post-departure, Executive Directors will be expected to maintain a shareholding equal to their guideline (or actual shareholding if lower) for two years post-employment irrespective of the reason for leaving. This requirement will apply to shares acquired from Company incentive plans.
Shareholding Share awards Guidelines
Num
ber o
f sha
res (
000)
Simon Roberts Kevin O’Byrne
1,250
1,000
750
250
500
0
Shareholding guidelines
0.9 x salary
2.8 x salary
Remuneration in 2021/22Base salaryWhen considering salaries the Committee takes account of a number of factors, with particular focus on the general level of salary increases awarded throughout the Company. Where relevant, the Committee also considers external market data on salary and total remuneration but the Committee applies judgement when considering such data.
For 2021/22 Simon Roberts and Kevin O’Byrne will not receive a salary increase.
Salary effective from
7 March 2021
Simon Roberts £875,000
Kevin O’Byrne £657,403
Pension Under the 2020 Remuneration Policy, the pension supplement for any future appointments is capped at 7.5 per cent of salary, in line with the opportunity offered to the majority of the workforce. This is the rate that Simon Roberts receives as Chief Executive Officer.
As disclosed last year, on appointment Kevin O’Byrne received a contractual cash supplement of 25 per cent of salary, in line with the Policy in place at the time. In recognition of the new Policy, Kevin has agreed to a reduction in his pension supplement over a period of time to the rate offered to the majority of the workforce (7.5 per cent of salary). In March 2020 Kevin O’Byrne’s cash supplement was reduced to 22.5 per cent of salary and in March 2021 his supplement was reduced to 20 per cent. It will reduce to 17.5 per cent in March 2022. As disclosed last year Kevin’s pension was due to reduce to 12.5 per cent in March 2023 and then to 7.5 per cent in March 2024. However, Kevin O’Byrne this year volunteered a further acceleration of the reduction to his contractual entitlement and his pension will move to 7.5 per cent by the end of the 2022 calendar year.
Benefits Benefits for Executive Directors in 2021/22 are unchanged and will include the provision of company car benefits, private medical cover, long-term disability insurance, life assurance and colleague discount.
Annual bonusFor 2021/22 the annual bonus for Executive Directors will be based 50 per cent on profit, 20 per cent on free cash flow and 30 per cent on strategic objectives.
The maximum annual bonus award opportunity for the Chief Executive Officer is 220 per cent of base salary and for the Chief Financial Officer is 180 per cent of base salary. 50 per cent will be paid in cash and 50 per cent in shares deferred for two years.
The profit and free cash flow targets are set against the Company’s expected performance and are subject to a rigorous process of challenge before the proposals are considered by the Board. The targets are set such that considerably stretching performance in excess of internal and external forecasts is required for maximum payout. The strategic objectives ensure that management continue to focus on operational priorities which contribute to the achievement of Group performance over the short and long-term. For 2021/22 the strategic objectives will be aligned to our priorities and will be based on customer goals (10 per cent), colleague goals (10 per cent) and individual objectives (10 per cent).
The Board is of the opinion that any performance targets for the current year annual bonus are commercially sensitive as the Company operates in a highly competitive, consumer-facing sector. The disclosure of targets would provide competitors with insights into the Company’s strategic aims, budgeting and growth projections. However, in line with previous years, the Company will retrospectively disclose the targets in next year’s Annual Report.
Due to the continuing impact of COVID-19, the Committee will monitor business conditions and exercise judgement in applying discretion in relation to the 2021/22 annual bonus. At year-end, when the Committee assesses performance, we will consider results in light of the context during the year and the shareholder experience. Full disclosure will be provided in next year’s Remuneration Report.
79Governance J Sainsbury plc Annual Report 2021
Governance ReportStrategic Report
Financial Statements

2021 Win in Food incentive planIn November 2020 Simon Roberts presented our updated strategy to shareholders alongside seven key metrics, now updated to eight, that will be a measure of our success. In order to fully align incentives with our business priorities and deliver long-term success we have relaunched our Long-Term Incentive Plan (LTIP), previously called Future Builder, to support the updated strategy. The new 2021 Win in Food incentive plan structure is the same structure as Future Builder, but the performance measures have been updated and will include all eight key metrics. For Executive Directors 80 per cent of the plan will be based on the four key financial measures (free cash flow, ROCE, EPS and cost savings). The remaining 20 per cent of the plan will be subject to key strategic indicators (market share, customer and colleague and Net Zero).
The award level for the Chief Executive Officer will be unchanged for 2021. Simon Roberts will receive a core award of 62.5 per cent of salary (maximum 250 per cent of salary).
For the reasons outlined in the Remuneration Committee Chair’s letter, in 2021 Kevin O’Byrne will receive a core award of 62.5 per cent of salary (maximum 250 per cent of salary).
Future Builder awards are subject to a two-year retention period following the end of the three-year performance period. This will result in awards to Executive Directors being released after a five-year period.
The Committee has set stretching targets against these measures for the 2021 awards as follows:
WeightingThreshold
25% of element vestsMaximum
100% of element vests
Cumulative free cash flow1 20% £1,000m £1,500m
Return on capital employed1 20% 6.75% 9.75%
Underlying basic EPS1 20% 19.8p 26.5p
Cost reduction 20% 80bps improvement 280bps improvement
Strategic indicators 20% (equally weighted)
— Market share – targets are commercially sensitive but we intend to provide full disclosure of targets at the end of the performance period
— Customer satisfaction – improvement in Sainsbury’s score between 300bps to 900bps and Argos score between 210bps to 510bps
— Colleague – progress against our representation targets (see below) and maintain colleague engagement scores
— Net Zero – progress against our Net Zero Scope 1 & 2, Scope 3 and plastic reduction targets (see below)
1 These measures are defined in the Alternative Performance Measures section of the Annual Report on pages 194 to 198.
In line with previous grants, the Remuneration Committee must be satisfied that the Company’s underlying performance over the period justifies the level of vesting; vesting will be reduced if this is not the case. When making this judgement the Committee has scope to consider such factors as it deems relevant. The Committee believes that this discretion is an important feature of the Future Builder arrangement and mitigates the risk of unwarranted vesting outcomes. This performance gateway assessment applies to all outstanding Future Builder awards.
Colleague Representation Targets2024 Target – senior leadership positions
(top 230 leaders)2024 Target – senior management positions
(1,200 leaders beneath senior leadership)
Female 50% 43%Ethnically diverse 12% 12%Black heritage 3% 3%
Net Zero Targets Baseline Threshold Stretch
Net Zero Scope 1 & 2 – GHG emissions 949,744 (tC02e) 18/19 FY 761,991 705,870
Net Zero Scope 3 – GHG emissions 26,663,081 (tC02e) 18/19 FY 24,503,081 23,996,773
Plastic – Food – tonnes of plastic packaging 120,000 tonnes 2018 CY 91,200 80,400
Plastic – Non-Food – tonnes of plastic packaging 9,836 tonnes 2018 CY 7,180 6,590
80 Governance J Sainsbury plc Annual Report 2021

2021 Future Builder performance measures (definitions for other awards can be found in the relevant Annual Report)
Free cash flow — Free cash flow measures the total flow of cash in and out of the business as well as providing an assessment of underlying profitability. — Free cash flow for these purposes is net cash generated from retail operations, after perpetual security coupons and cash capital expenditure but before strategic capital expenditure. It includes payments of lease obligations, cash flows from joint ventures and associates and Sainsbury’s Bank capital injections. It is measured on a cumulative basis over the three-year performance period.
Return On Capital Employed (ROCE) — ROCE reflects the returns generated for shareholders and measures the efficiency of capital use. — It is defined as return divided by average capital employed where:
— Return is defined as 52-week underlying profit before interest and tax. — Capital employed is defined as Group net assets excluding the pension deficit/surplus, less net debt (excluding the perpetual securities). The average is calculated on a 14-point basis.
— More information can be found in the Alternative Performance Measures section of the Annual Report on pages 194 to 198.
EPS — EPS directly reflects returns generated for shareholders. — Underlying basic EPS is underlying profit after tax attributable to the equity holders of the parent, divided by the weighted average number of ordinary shares in issue during the year.
Cost reduction — Cost reduction will be measured as an improvement in Retail selling, general and administrative (SG&A) costs as a percentage of retail sales (including VAT, excluding fuel). Costs also exclude fuel, bonus and share-based payments expenses, non-underlying items and Group support functions. Given the abnormal nature of 2020/21, improvement will be assessed against 2019/20 results.
Market share — Sainsbury’s market share (volume) based on Nielsen panel data.
Customer — Based on an annual weighted average of Sainsbury’s CSAT and Argos CSAT (excluding Bank and Tu). Given the unusual nature of 2020/21, Sainsbury’s improvement will be assessed against 2019/20 results.
Colleague — Internally we measure representation at senior and middle management grades for gender, ethnically diverse and Black Heritage colleagues. Colleague engagement is measured using our annual We’re Listening survey. Given the unusual nature of 2020/21, colleague engagement will be assessed against 2019/20 results.
Net Zero — Further details on the measures can be found in the Net Zero section of the Annual Report.
81Governance J Sainsbury plc Annual Report 2021
Governance ReportStrategic Report
Financial Statements

Non-Executive Director remuneration Single total figure of remuneration for Non-Executive Directors (audited information) The table below shows a single remuneration figure for all qualifying services for the 52 weeks to 6 March 2021 for each Non-Executive Director, together with comparative figures for the 52 weeks to 7 March 2020.
2020/21 2019/20
Fees1
£000Benefits2
£000Total £000
Fees1
£000Benefits2
£000Total £000
Martin Scicluna 480 0 480 475 0 475
Matt Brittin3 22 0 22 68 0 68
Brian Cassin 68 0 68 68 0 68
Jo Harlow 83 0 83 81 2 83
Tanuj Kapilashrami4 47 0 47 – – –
David Keens 88 2 90 87 17 104
Susan Rice 107 3 110 107 11 118
Jean Tomlin3 22 1 23 68 0 68
Keith Weed4 47 0 47 – – –
1 Paid in relation to the year.2 The benefits for the other Non-Executive Directors relate to the reimbursement of travelling expenses to Board meetings held at the Company’s registered office.3 Matt Brittin and Jean Tomlin stepped down from the Board on 2 July and the figures quoted relate to the period up to their departure. 4 Tanuj Kapilashrami and Keith Weed were appointed to the Board on 1 July 2020 and the figures quoted relate to the period from their appointment.
Following his appointment as Chairman on 10 March 2019, on a fee of £475,000, Martin Scicluna’s fee increased by 1.1 per cent to £480,225 from March 2020. Fees were reviewed in March 2021 and there was no change. Martin receives no benefits other than a colleague discount card.
Non-Executive Directors receive a base annual cash fee; additional fees are paid to the Senior Independent Director and to the Chairs of the Audit, Remuneration and Corporate Responsibility and Sustainability Committees. Non-Executive Directors receive no benefits other than a colleague discount card and reasonable business travel expenses.
Non-Executive Director fees for 2020/21In March 2020, the Non-Executive Director fees were reviewed against the market and as a result the basic fee was increased by 1.1 per cent to £68,250. The fee for the Chair of the Corporate Responsibility and Sustainability Committee was also increased from £13,500 to £15,000, in recognition of the increasing focus on this area both externally and internally in light of our Net Zero by 2040 commitment. The Non-Executive Directors’ fees were reviewed in March 2021 and no changes were made. The following table sets out the current fee levels.
Fees effective from 7 March
2021
Base fee £68,250
Senior Independent Director fee (additional) £19,500
Chair of Remuneration Committee fee (additional) £19,500
Chair of Audit Committee fee (additional) £19,500
Chair of Corporate Responsibility and Sustainability Committee fee (additional)
£15,000
Non-Executive Directors’ shareholdings and share interestsThe beneficial interest of the Non-Executive Directors, in the shares of the Company are shown below.
Ordinary shares1
7 March 2020 6 March 2021 27 April 2021
Martin Scicluna 15,000 15,000 15,000
Matt Brittin2 14,090 14,090 –
Brian Cassin 25,000 25,000 25,000
Jo Harlow 8,000 8,000 8,000
Adrian Hennah3 – – 0
Tanuj Kapilashrami4 – 5,000 5,000
David Keens 100,000 100,000 100,000
Susan Rice 4,000 4,000 4,000
Jean Tomlin2 4,415 4,415 –
Keith Weed4 – 2,446 2,446
1 Ordinary shares are beneficial holdings which include the Directors’ personal holdings and those of their spouses and minor children.
2 Matt Brittin and Jean Tomlin stepped down from the Board on 2 July. The figures in the 6 March 2021 column are their share interests on their leave date.
3 Adrian Hennah was appointed to the Board on 1 April 2021.4 Keith Weed and Tanuj Kapilashrami were appointed to the Board on 1 July 2020.
82 Governance J Sainsbury plc Annual Report 2021
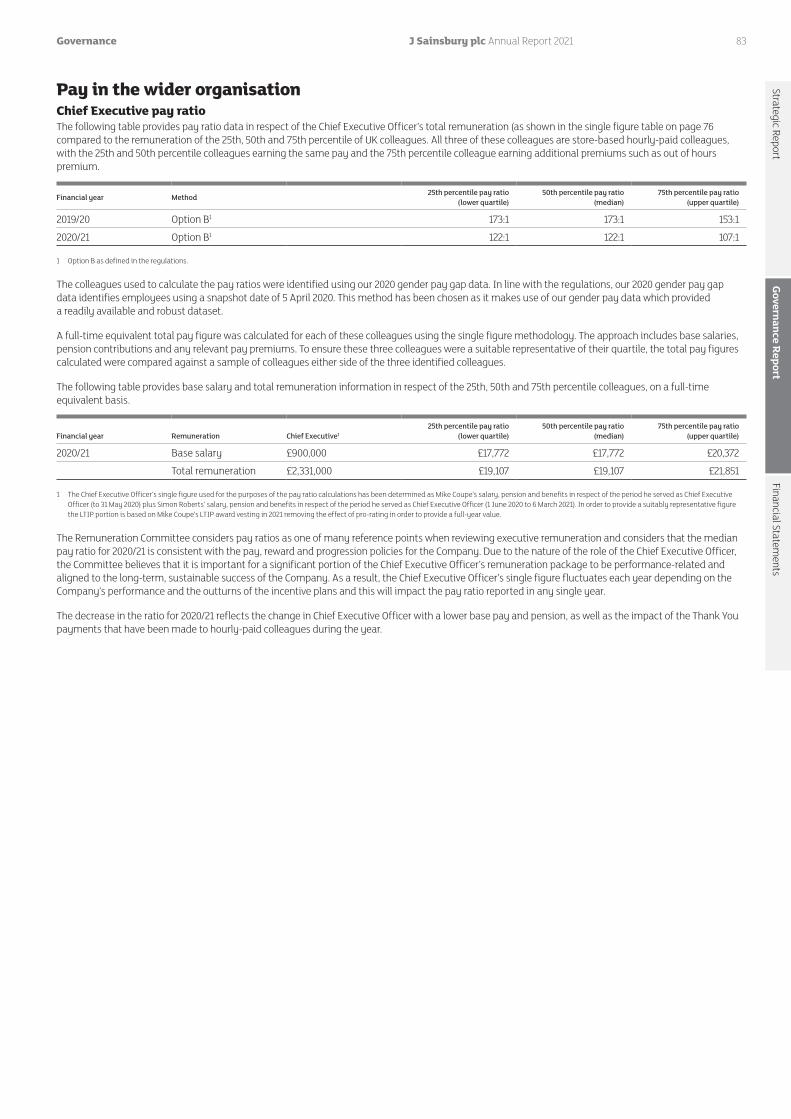
Pay in the wider organisationChief Executive pay ratioThe following table provides pay ratio data in respect of the Chief Executive Officer’s total remuneration (as shown in the single figure table on page 76 compared to the remuneration of the 25th, 50th and 75th percentile of UK colleagues. All three of these colleagues are store-based hourly-paid colleagues, with the 25th and 50th percentile colleagues earning the same pay and the 75th percentile colleague earning additional premiums such as out of hours premium.
Financial year Method 25th percentile pay ratio (lower quartile)
50th percentile pay ratio(median)
75th percentile pay ratio(upper quartile)
2019/20 Option B1 173:1 173:1 153:1
2020/21 Option B1 122:1 122:1 107:1
1 Option B as defined in the regulations.
The colleagues used to calculate the pay ratios were identified using our 2020 gender pay gap data. In line with the regulations, our 2020 gender pay gap data identifies employees using a snapshot date of 5 April 2020. This method has been chosen as it makes use of our gender pay data which provided a readily available and robust dataset.
A full-time equivalent total pay figure was calculated for each of these colleagues using the single figure methodology. The approach includes base salaries, pension contributions and any relevant pay premiums. To ensure these three colleagues were a suitable representative of their quartile, the total pay figures calculated were compared against a sample of colleagues either side of the three identified colleagues.
The following table provides base salary and total remuneration information in respect of the 25th, 50th and 75th percentile colleagues, on a full-time equivalent basis.
Financial year Remuneration Chief Executive125th percentile pay ratio
(lower quartile)50th percentile pay ratio
(median)75th percentile pay ratio
(upper quartile)
2020/21 Base salary £900,000 £17,772 £17,772 £20,372
Total remuneration £2,331,000 £19,107 £19,107 £21,851
1 The Chief Executive Officer’s single figure used for the purposes of the pay ratio calculations has been determined as Mike Coupe’s salary, pension and benefits in respect of the period he served as Chief Executive Officer (to 31 May 2020) plus Simon Roberts’ salary, pension and benefits in respect of the period he served as Chief Executive Officer (1 June 2020 to 6 March 2021). In order to provide a suitably representative figure the LTIP portion is based on Mike Coupe’s LTIP award vesting in 2021 removing the effect of pro-rating in order to provide a full-year value.
The Remuneration Committee considers pay ratios as one of many reference points when reviewing executive remuneration and considers that the median pay ratio for 2020/21 is consistent with the pay, reward and progression policies for the Company. Due to the nature of the role of the Chief Executive Officer, the Committee believes that it is important for a significant portion of the Chief Executive Officer’s remuneration package to be performance-related and aligned to the long-term, sustainable success of the Company. As a result, the Chief Executive Officer’s single figure fluctuates each year depending on the Company’s performance and the outturns of the incentive plans and this will impact the pay ratio reported in any single year.
The decrease in the ratio for 2020/21 reflects the change in Chief Executive Officer with a lower base pay and pension, as well as the impact of the Thank You payments that have been made to hourly-paid colleagues during the year.
83Governance J Sainsbury plc Annual Report 2021
Governance ReportStrategic Report
Financial Statements

Percentage change in Executive and Non-Executive Director remunerationThe table below shows how the percentage change in the salary, benefits and bonus of Executive and Non-Executive Directors between 2019/20 and 2020/21 compares with the percentage change in the average of each of those components of pay for all our colleagues.
Salary % change
Benefits% change6
Bonus % change
Simon Roberts1 N/A N/A N/A
Kevin O’Byrne2 1.1% 0.0% 222.2%
Mike Coupe3 0.0% 0.0% N/A
Martin Scicluna 1.1% 0.0% N/A
Matt Brittin4 1.1% 0.0% N/A
Brian Cassin 1.1% 0.0% N/A
Jo Harlow 2.8% -100% N/A
Tanuj Kapilashrami1 N/A N/A N/A
David Keens 0.9% -88.2% N/A
Susan Rice 0.7% -72.7% N/A
Jean Tomlin4 1.1% N/A N/A
Keith Weed1 N/A N/A N/A
All colleagues5 4.0% -15.3% 308.1%
1 Simon Roberts, Tanuj Kapilashrami and Keith Weed were all appointed during 2020/21 and therefore no annual change is shown for 2020/21.
2 The bonus change shown for Kevin O’Byrne compares his 2020/21 bonus with the 2019/20 bonus and Deferred Share Award as disclosed on page 76.
3 Mike Coupe stepped down during 2020/21. In order to provide a meaningful comparison, the percentage change figures have been calculated on a full-year equivalent basis. Mike Coupe did not participate in the annual bonus for 2020/21 and therefore no annual change is shown.
4 Matt Brittin and Jean Tomlin stepped down during 2020/21. In order to provide a meaningful comparison, the percentage change figures have been calculated on a full-year equivalent basis.
5 Figures relate to average based on number of full-time equivalent colleagues. During 2020/21, we made three one-off exceptional payments to our hourly colleagues these have not been included in the figures above. While the all-colleague benefits figure has declined we have not changed our benefit offering and this relates to a change in management mix.
6 Non-Executive Directors receive no benefits other than a colleague discount card and reasonable business travel expenses. The percentage change figures are in respect of the Directors’ taxable business travel expenses only. The significant reductions reported for 2020/21 reflect the reduction in business travel during the year.
Relative importance of spend on payThe table below illustrates the year-on-year change in total colleague pay (being the aggregate staff costs as set out in note 37 to the financial statements) and distributions to shareholders (being declared dividends).
Colleague pay Distribution to shareholders
2019/20 £m
2020/21 £m % change
2019/20£m
2020/21£m % change
3,227 3,752 16.2% 247 232 -6.1%
84 Governance J Sainsbury plc Annual Report 2021

Performance and Chief Executive remuneration The graph shows the TSR performance of an investment of £100 in J Sainsbury plc shares over the last ten years compared with an equivalent investment in the FTSE 100 Index. The FTSE 100 Index has been selected to provide an established and broad-based index. The graph also includes data for the FTSE All-Share Food & Drug Retailers Index. The Company is a constituent of both indices. The table details the total remuneration for the Chief Executive over this period.
Sainsbury’s FTSE 100 FTSE All-Share Food & Drug Retailers
Mar 11 Mar 13Mar 12 Mar 14 Mar 15 Mar 16 Mar 17 Mar 18 Mar 20 Mar 21Mar 19
250
200
150
100
50
0
TSR performance since March 2011
CEO 2011/12 2012/13 2013/14 2014/151 2015/16 2016/17 2017/18 2018/19 2019/20 2020/21
Single figure remuneration (£000)
S Roberts M Coupe J King
––
3,471
––
4,366
––
3,906
–1,507
405
–2,802
–
–2,354
–
–3,630
–
–3,569
–
–2,999
–
1,3191,436
–
Bonus/DSA award as a percentage of maximum
S Roberts M Coupe J King
––
61%
––
84%
––
73%
–26%0%
–78%
–
–35%
–
–57%
–
–56%
–
–22%
–
0%0%
–
LTIP vesting percentage of maximum
S Roberts M Coupe J King
––
43%
––
44%
––
40%
–0%0%
–0%
–
–22.5%
–
–42.5%
–
–55%
–
–65%
–
60%60%
–
1 For 2014/15, Justin King’s figures relate to the time he was Chief Executive Officer and, consistent with the single figure table, the figures for Mike Coupe relate to the whole of 2014/15; he was Chief Executive Officer from 9 July 2014.
2 For 2020/21, Simon Robert’s figures relate to the time he was Chief Executive Officer during 2020/21 and, consistent with the single figure table, the figures for Mike Coupe relate to the time up until his departure on 2 July 2020.
Governance – the Remuneration Committee
Committee membershipThe Remuneration Committee during the year comprised Susan Rice (Chair), Matt Brittin, Jo Harlow and Tanuj Kapilashrami. Matt Brittin’s appointment ended on 2 July 2020 and Tanuj Kapilashrami’s commenced on 1 July 2020. All members of the Committee are independent Non-Executive Directors.
Tim Fallowfield, Company Secretary, acts as secretary to the Committee. Martin Scicluna, Simon Roberts, Angie Risley (Group HR Director), the Head of Reward and the Director of Group Finance are invited to attend Committee meetings either fully or partially. The Committee considers their views when reviewing the remuneration of the Executive Directors and Operating Board Directors. Individuals who attend Remuneration Committee meetings are not present when their own remuneration is being determined.
The Committee typically meets four times each year, or more often as required. The Committee has a calendar of standard items within its remit and in addition it held in-depth discussions on specific topics during the year. In 2020/21 there were a number of unscheduled meetings regarding setting the bonus and Long-Term Incentive Plan targets (delayed due to COVID-19), changes to the Operating Board as well as discussions on performance outturns for annual bonus and the Long-Term Incentive Plan. The Committee complies with relevant regulations and considers the Code and best practice when determining pay and policy.
Advisers to the Remuneration CommitteeThe Committee is authorised by the Board to appoint external advisers if it considers this beneficial. Over the course of the year, the Committee was supported by its appointed advisers, Deloitte LLP (Deloitte). Deloitte were reappointed by the Committee as advisers in 2013 following a competitive tender.
Deloitte are members of the Remuneration Consulting Group and, as such, operate under the Code of Conduct in relation to executive remuneration consulting in the UK. During the year, the Committee reviewed the advice provided by Deloitte and has confirmed that it has been objective and independent. The Committee has also determined that the Deloitte partner who provides remuneration advice to the Committee does not have any connections with the Company that may impact their independence. The Committee has reviewed the potential for conflicts of interest and judged that there were appropriate safeguards against such conflicts.
During the year they provided advice to the Committee on a range of topics including remuneration trends, corporate governance, incentive plan design and incentive plan rules. Their consultants attended all of the Committee meetings. In relation to their advice, Deloitte received fees of circa £92,000 (fees are based on hours spent). During the year, Deloitte provided the Company with unrelated advice and consultancy in respect of information technology, operating models, data analytics and taxation.
Statement of voting at general meetingThe table below sets out the votes on the Annual Report on Remuneration at the 2020 AGM and on the Directors’ Remuneration Policy at the 2020 AGM. The Committee is keen to hear the views of all shareholders and continually reviews the Remuneration Policy and its implementation.
Votes for Votes against Votes abstained
Remuneration Report (2020 vote) 98.87%1,674 million
1.13% 19 million
–0.2 million
Remuneration Policy (2020 vote) 97.00%1,636 million
3.00%51 million
–6.0 million
85Governance J Sainsbury plc Annual Report 2021
Governance ReportStrategic Report
Financial Statements

Directors’ contractsExecutive Directors have rolling contracts which are terminable on 12 months’ notice by either party. Non-Executive Directors are appointed for an initial three-year period, which may be extended for a further term by mutual consent. The initial appointments and any subsequent reappointments are subject to annual election or re-election by shareholders. Non-Executive Directors’ appointments may be terminated at any time by giving three months’ written notice by either party; six months’ in the case of the Non-Executive Chairman.
Executive Directors’ shareholdings and share interests (audited information) The table below sets out details of the Executive Directors’ shareholdings and a summary of their outstanding share awards at the end of the 2020/21 financial year. Further details of the movements of the Executive Directors’ share awards during the year are set out on page 87.
Ordinary shares2 Scheme interests3
7 March 2020 6 March 2021 27 April 2020Deferred Share
Awards4
Future Builder awards with
performance period
completed5
Future Builder awards with
performance period
outstanding6 SAYE
Simon Roberts 10,000 153,858 153,858 233,107 131,422 1,903,788 4,873
Kevin O’Byrne 329,116 489,256 489,256 273,174 323,123 1,677,296 3,461
Mike Coupe1 2,105,567 2,105,567 N/A 213,686 609,691 1,111,932 0
1 The table above shows the number of shares originally awarded to Mike Coupe. As noted above, a portion of Mike Coupe’s share awards shown have lapsed due to pro-rating following his retirement. The year-end shareholding (shown under 6 March 2021 column) above relates to his departure date of 2 July 2020.
2 Ordinary shares are beneficial holdings which include the Directors’ personal holdings and those of their spouses and minor children. They also include the beneficial interests in shares which are held in trust under the Sainsbury’s Share Purchase Plan.
3 Deferred Share Awards and Future Builder awards are structured as nil-cost options.4 Relates to 2018/19 and 2019/20 Deferred Share Awards.5 Relates to 2017 Future Builder awards6 Relates to 2018, 2019 and 2020 Future Builder awards (maximum) where the performance period has not ended. As noted above, following the year-end, the 2018 award will vest at 60 per cent of maximum.Note: The Executive Directors are potential beneficiaries of the Company’s Employee Benefit Trust, which is used to satisfy awards under the Company’s employee share plans, and they are therefore treated as interested in the 17.2 million shares (2020: 6.2 million) held by the Trustees.
Share awards made during the financial year (audited information)The following share awards were made to Executive Directors during the year. The Future Builder award levels are determined by the normal grant policy for the role.
SchemeBasis of award
(maximum) Face valuePercentage vesting at threshold
performance Number of sharesPerformance period
end date
Simon Roberts3 Future Builder1 250% of salary £2,041,102 25% of each element 1,025,164 4 March 2023
Kevin O’Byrne Future Builder1 200% of salary £1,314,801 25% of each element 660,372 4 March 2023
DSA2 40% of salary £257,498 N/A 129,331 N/A
Mike Coupe4 DSA2 48% of salary £475,067 N/A 238,607 N/A
1 The performance conditions applying to 2020 Future Builder awards are set out later in this section. The basis of award shows the maximum value being four times the core award. The award was made on 7 May 2020 and the number of shares has been calculated using the average share price between 7 April and 6 May 2020 of £1.991. Subject to performance, the award will vest in May 2023 and will be released after a two-year retention period. The award is structured as a nil-cost option with an exercise period of up to six years from grant.
2 The Deferred Share Award was made on 7 May 2020 based on performance over the 2019/20 financial year. The award was made at 44 per cent of the maximum level (maximum of 110 per cent of salary for Mike Coupe and 90 per cent of salary for Kevin O’Byrne. The number of shares has been calculated using the average share price between 7 April and 6 May 2020 £1.991. No further performance conditions apply. Awards become exercisable in March 2022. The award is structured as a nil-cost option with an exercise period of up to ten years from grant.
3 Simon Robert’s award was calculated as 250 per cent of his average salary for the 2020/21 financial year, including the period prior to his appointment as Chief Executive Officer.4 A portion of the shares lapsed following retirement. The table shows the number of shares originally awarded. Subsequently, 200,260 shares lapsed, leaving 38,347 outstanding due to pro-rating following his
retirement.
Unvested Future Builder awardsThe targets for Future Builder awards granted in 2019 and 2020 are set out in the tables below. As disclosed last year, the ROCE and EPS targets for the 2019 Future Builder have been re-stated on a like-for-like basis to reflect the adoption of the new accounting standard, IFRS 16. The Committee is comfortable that the re-stated target ranges are comparable to the original target ranges set on the basis of the previous accounting rules.
2019 Future Builder (2019/20 to 2021/22 performance period) Weighting
Threshold target core (1.0x award)
Maximum target (4.0x core award)
ROCE1 25% 6.75% 9.75%
Underlying basic EPS1 25% 21.5p 28.5p
Cumulative free cash flow1 25% £900m £1,400m
Cumulative strategic cost savings 25% £600m £750m
2020 Future Builder (2020/21 to 2022/23 performance period) Weighting
Threshold target core (1.0x award)
Maximum target (4.0x core award)
Cumulative free cash flow1 50% £900m £1,400m
ROCE1 25% 6.75% 9.75%
Underlying basic EPS1 25% 19.8p 26.5p
1 These measures are defined in the Alternative Performance Measures section of the Annual Report on pages 194 to 198.
86 Governance J Sainsbury plc Annual Report 2021

Details of the Executive Directors’ share awards and movements during the year (audited information) The table below shows the conditional awards granted and exercised under each of the Company’s share plans.
Name AwardDate of
award
Share price at date of award
(pence)
Option price
(pence)
Number of options held at
7 March 2020
Number of options
granted/ dividend
shares allocated
during the year
Number of options
exercised during the
year
Number of options lapsed
during the year
Share price on exercise
(pence)Date of
exercise
Notional gain on
exercise(£000)4
Number of options held
at 6 March 2021
Simon Roberts
Long-Term Incentive Plan1
11/05/2017 265 Nil 404,372 16,337 147,756 141,531 187 29/07/2020 277 131,422
11/05/2018 307 Nil 366,440 – – – – – – 366,440
09/05/2019 211 Nil 512,184 – – – – – – 512,184
07/05/2020 193 Nil 0 1,025,164 – – – – – 1,025,164
Deferred Share Award2
11/05/2018 307 Nil 114,321 9,839 124,160 – 187 29/07/2020 232 0
09/05/2019 211 Nil 122,745 – – – – – – 122,745
07/05/2020 193 Nil 0 110,362 – – – – – 110,362
Sharesave310/12/2019 220 161 3,040 – – – – – – 3,040
14/12/2020 226 161 1,833 – – – – – – 1,833
Total 1,524,935 1,161,702 271,916 141,531 – – 509 2,273,190
Kevin O’Byrne
Long-Term Incentive Plan1
26/01/2017 258 Nil 131,907 22,436 154,343 – 187 29/07/2020 289 0
11/05/2017 265 Nil 468,024 18,909 – 163,810 – – – 323,123
11/05/2018 307 Nil 424,120 – – – – – – 424,120
09/05/2019 211 Nil 592,804 – – – – – – 592,804
07/05/2020 193 Nil 0 660,372 – – – – – 660,372
Deferred Share Award2
11/05/2018 307 Nil 136,592 11,755 148,347 – 187 29/07/2020 278 0
09/05/2019 211 Nil 143,843 – – – – – – 143,843
07/05/2020 193 Nil 0 129,331 – – – – – 129,331
Sharesave3 07/12/2018 300 260 3,461 – – – – – – 3,461
Total 1,900,751 842,803 302,690 163,810 – – 567 2,277,054
Mike Coupe
Long-Term Incentive Plan1
12/05/2016 253 Nil 241,157 41,020 282,177 – 197 03/07/2020 555 0
11/05/2017 265 Nil 883,092 35,682 – 309,083 – – – 609,691
11/05/2018 307 Nil 800,260 – – 181,016 – – – 619,244
09/05/2019 211 Nil 1,118,540 – – 625,852 – – – 492,688
Deferred Share Award2
11/05/2018 307 Nil 252,003 21,962 273,695 – 197 03/07/20 540 0
09/05/2019 211 Nil 265,379 – – 90,040 – – – 175,339
07/05/2020 193 Nil 0 238,607 – 200,260 – – – 38,347
Sharesave3 11/12/2013 388 332 4,518 – – 4,518 – – – 0
Total 3,564,949 337,271 555,872 1,410,769 – – 1,095 1,935,309
1 The LTIP share figures relate to the maximum that could be achieved.2 The Deferred Share Award figures are after the application of performance conditions.3 Sharesave is an all-employee share option plan and has no performance conditions as per HMRC Regulations.4 This is the notional gain on the date of exercise had all shares been sold.
87Governance J Sainsbury plc Annual Report 2021
Governance ReportStrategic Report
Financial Statements

Additional statutory information required by the Accounts Regulations can be found below:
Directors’ interests The beneficial interests of the Directors and their connected persons in the shares of the Company are shown on pages 82 and 86. During the year, no Director had any material interest in any contract of significance to the Group’s business.
Directors’ indemnities The Directors are entitled to be indemnified by the Company, to the extent permitted by law and the Company’s Articles of Association, in respect of all losses arising out of or in connection with the execution of their powers, duties and responsibilities. The Company has executed deeds of indemnity for the benefit of each Director in respect of liabilities which may attach to them in their capacity as Directors of the Company. The Company purchased and maintained Directors’ and Officers’ liability insurance throughout 2020/21, which has been renewed for 2021/22. Neither the indemnities nor the insurance provide cover in the event that the Director is proved to have acted fraudulently.
Research and development In the ordinary course of business, the Company regularly develops new products and services. See page 10 for more information.
Employment policies The Company values the different perspectives, experiences and abilities of all our colleagues. We ensure that those living with a disability or long-term health condition are fully and fairly considered for employment with the Company through well-developed policies for the equal treatment of all. We have a workplace adjustments process in place for our colleagues who find themselves with a disability or long-term health condition; workplace adjustments can be made at any point during a colleague’s employment with us. We are committed to providing equal opportunities for all colleagues and applicants through training, development and promotion. Further information can be found on page 17.
Health and safety The health and safety of our colleagues and customers is a key part of our strategy. See page 18 for more information.
Colleague engagement Details on how we engage with our colleagues can be found on page 20.
Political donations The Company made no political donations in 2020/21 (2019/20: £nil).
Post balance sheet events There are no post balance sheet events.
Financial risk management and financial instruments
Notes 31 and 32 on pages 141 to 158 disclose details relating to financial risk management and financial instruments.
Disclosure of information to the auditor Each Director has confirmed that, so far as he/she is aware, there is no relevant audit information of which the auditor is unaware. Each Director has taken all steps that he/she ought to have taken as a Director in order to make himself/herself aware of any relevant audit information and to establish that the auditor is aware of that information. For further information, please see the Statement of Directors’ responsibilities on page 92.
Dividends Details of the payment of the final dividend can be found on page 122.
Ordinary shares Details of the changes to the ordinary issued share capital during the year are shown on page 139. As at 23 April 2021, 2,234,268,178 ordinary shares of 284/7 pence have been issued, are fully paid up and are listed on the London Stock Exchange.
Share capital Except as described below in relation to the Company’s employee share plans, there are no restrictions on the voting rights attaching to the Company’s ordinary shares or the transfer of securities in the Company; no person holds securities in the Company carrying special rights with regard to control of the Company; and the Company is not aware of any agreements between holders of securities that may result in restrictions in the transfer of securities or voting rights. Further details of the rights, restrictions and obligations attaching to the share capital of the Company, including voting rights, are contained in the Company’s Articles of Association. The Articles of Association may only be changed with the agreement of shareholders.Shares acquired for the Company’s employee share plans by the Trustee rank pari passu with shares in issue and have no special rights. Where, under the Company’s All Employee Share Ownership Plan, participants are beneficial owners of the shares but the Trustee is the registered owner, the voting rights are normally exercised by the registered owner at the direction of the participants. All shares held by the J Sainsbury Employee Benefit Trust is held on an unallocated basis. As such, the Trustees waive their rights to vote and to receive dividends on these shares. Total dividends waived by the Trustees during the financial year amounted to £1,849,686.18. Some of the Company’s employee share plans include restrictions on transfer of shares while the shares are held within the plan.At the annual general meeting held in July 2020, the Company was authorised by shareholders to purchase its own shares, within certain limits and as permitted by the Articles of Association. The Company made no purchases of its own shares during the year and no shares were acquired by forfeiture or surrender or made subject to a lien or charge.
Change of control All of the Company’s employee share plans contain provisions relating to a change of control. On a change of control, options and awards granted to employees under the Company’s share plans may vest and become exercisable, subject to the satisfaction of any applicable performance conditions at that time.A number of the Company’s credit facilities and banking arrangements contain change of control clauses under which lenders may cancel their commitments and declare all outstanding amounts immediately due and payable. There are no other significant agreements that would take effect, alter or terminate upon a change of control following a takeover bid.
88 Governance J Sainsbury plc Annual Report 2021
Additional statutory information

Major interests in sharesAs at 23 April 2021, the Company had been notified by the following investors of their interests in three per cent or more of the Company’s shares. These interests were notified to the Company pursuant to DTR5 of the Disclosure Guidance and Transparency Rules:
Date notified
Number of ordinary shares
% of voting rights1
Qatar Holdings LLC 12 April 2021 335,446,132 15.02
VESA Equity Investment S.à r.l. 13 April 2021 223,031,367 9.99
Schroders plc 31 March 2021 116,161,658 5.22
BlackRock, Inc. 09 July 2020 111,186,097 5.00
Pzena Investment Management, Inc
29 January 2021 104,292,488 4.69
1 Percentages shown are as a percentage of the Company’s issued share capital when the Company was notified of the change in holding.
As at 23 April 2021, no further changes had been notified.
Directors’ ReportThe Directors’ Report comprises pages 1 to 90 of this Annual Report and Financial Statements. The following information required by Rule 9.8.4R of the UK Listing Rules (LR) is also incorporated into the Directors’ Report:
Information requirement Location within Annual Report
Interest capitalised See note 14 of the consolidated financial statements
Publication of unaudited financial information See note 31
Details of any long-term incentive plans See Remuneration Report, Remuneration Policy and note 39
Shareholder waiver of dividends See note 30
Shareholder waiver of future dividends See note 30
Other information requirements set out in LR 9.8.4R are not applicable to the Company.
Streamlined energy and carbon (SECR) reporting J Sainsbury plc has calculated and publicly reported its emissions of carbon dioxide and other greenhouse gases (GHG) for several years. We have measured our emissions since 2005 and set ourselves challenging targets throughout the years. In 2020, we announced our commitment to reaching Net Zero by 2040 across our operations and set our new baseline year as 2018/19. As part of our Net Zero by 2040 plan, we have committed to investing £1 billion over twenty years towards becoming a Net Zero business across our own operations by 2040, aligned to the highest ambitions of the Paris Climate Change Agreement. The investment will enable Sainsbury’s to fulfil Scope one and Scope two emissions, putting the business on course to reach Net Zero a decade ahead of the UK government’s deadlines. In addition, we are working with suppliers to set their own ambitious Net Zero commitments, in line with the Paris Agreement goals, and have a target to reduce our Scope 3 emissions by 30% by 2030.
Methodology In line with the GHG Protocol Corporate Accounting and Reporting Standard (revised edition), we will be reflecting the performance of Sainsbury’s, and Argos and Habitat emissions separately, as well as the combined Group performance. We have reported on all of the emission sources required under the Companies Act 2006 (Strategic Report and Directors’ Reports) Regulations 2013. We have calculated and reported our emissions in line with the GHG Protocol Corporate Accounting and Reporting Standard (revised edition) and emission factors from UK Government’s GHG Conversion Factors for Company Reporting 2020, and IEA 2019 for those overseas. The reporting period is the financial year 2020/21, the same as that covered by the Annual Report and Financial Statements. The boundaries of the GHG inventory are defined using the operational control approach. In general, the emissions reported are the same as those which would be reported based on a financial control boundary. Emissions for previous years are retrospectively adjusted as and when more accurate data is provided.
The following report compares Scope 1 and 2 Greenhouse gas emissions for 2020/21 and 2019/20.
UK and Global Annual Energy and Carbon Sainsbury’s Group Total Carbon Figures and Intensities
GHG Emissions (tCO2e) – Location-base
Emission source 2020/21 2019/20
Scope 1 527,173 521,616
Scope 2 329,425 396,009
Total (tCO2e) 856,598 917,624
Intensity measurement (tCO2e/’000 sq ft) 35.12 36.41
GHG Emissions (tCO2e) – Market-base
Emission source 2020/21 2019/20
Scope 1 527,173 521,616
Scope 2 290,988 319,064
Total (tCO2e) 818,161 840,680
Intensity measurement (tCO2e/’000 sq ft) 33.54 33.36
89Governance J Sainsbury plc Annual Report 2021
Governance ReportStrategic Report
Financial Statements

Sainsbury’s BreakdownUK Locations
Energy Consumption (kWh) Location-Based (tCO2e) Market-Based (tCO2e)
Emission source 2020/21 2019/20 2020/21 2019/20 2020/21 2019/20
Combustion of fuel and operation of facilities (‘Scope 1’) 1,567,391,292 1,353,703,950 448,307 447,422 448,307 447,442
Electricity, heat, steam and cooling purchased for own use (‘Scope 2’)
1,309,198,189 1,423,901,380 304,533 362,995 266,723 289,272
Total 2,876,589,480 2,777,605,330 752,839 810,417 715,030 736,694
Global Locations (excludes UK)
Energy Consumption (kWh) Location- Based (tCO2e) Market- Based (tCO2e)
Emission source 2020/21 2019/20 2020/21 2019/20 2020/21 2019/20
Combustion of fuel and operation of facilities (‘Scope 1’) – – – – – –
Electricity, heat, steam and cooling purchased for own use (‘Scope 2’)
314,062 374,082 213 249 213 249
Total 314,062 374,082 213 249 213 249
Argos and Habitat BreakdownUK Locations
Energy Consumption (kWh) Location- Based (tCO2e) Market- Based (tCO2e)
Emission source 2020/21 2019/20 2020/21 2019/20 2020/21 2019/20
Combustion of fuel and operation of facilities (‘Scope 1’) 336,643,741 316,764,007 78,567 74,019 78,567 74,019
Electricity, heat, steam and cooling purchased for own use (‘Scope 2’)
96,622,140 118,875,033 22,526 30,384 24,002 29,486
Total 433,265,881 435,639,041 101,094 104,403 102,569 103,505
Global Locations (excludes UK)
Energy Consumption (kWh) Location- Based (tCO2e) Market- Based (tCO2e)
Emission source 2020/21 2019/20 2020/21 2019/20 2020/21 2019/20
Combustion of fuel and operation of facilities (‘Scope 1’) 1,624,552 953,504 299 175 299 175
Electricity, heat, steam and cooling purchased for own use (‘Scope 2’)
5,614,349 6,204,842 2,153 2,380 49 57
Total 7,238,901 7,158,346 2,451 2,556 348 232
Dual emissions reporting Overall emissions have been presented to reflect both location and market-based methodologies, affecting both Scope 1 and Scope 2 emissions.
Scope 1: All Scope 1 market-based emissions have been calculated using UK Government’s GHG Conversion Factors for Company Reporting 2020 for all sources.
Scope 2: As 20 per cent of electricity usage is covered by either a Power Purchase Agreement (PPA), a certified green tariff, or falls within onsite renewable generation from wind and solar energy, it means that 20 per cent of electricity emissions for the Group have been reported at zero emissions. The remaining electricity has been reported at supplier-specific emissions rate, and non-UK electricity has been reported at local grid average, unless supplied by a certified green tariff.
Energy Efficiency Actions To grow our business sustainably, we are continuously working to cut GHG and ensure we maximise energy efficiency. A few of the projects we have newly implemented this year includes:
— LED lighting upgrades at over 143 stores equating to approximately 12,126,000 kWh annual savings — Our ongoing rollout of Aerofoil technology preventing cold air from leaving the cabinet and directing it back into the fridge which reduces energy consumption by 15%, keeping aisles warmer and reducing food waste by maintaining products at their optimal temperature
— Optimisation and monitoring programs which includes AC control optimisation, chilled door monitoring and night blinds
As a result of our ongoing investment in energy reduction initiatives, for 2020-21: — Group absolute UK electricity consumption decreased this year-on-year by 4 per cent and 14 per cent versus 2018/19 baseline — Sainsbury’s absolute UK electricity consumption has decreased year-on-year by 8 per cent and 13 per cent versus 2018/19 baseline — Argos and Habitat absolute UK electricity consumption decreased year-on-year by 19 percent and 25 per cent versus the 2018/19 baseline
By order of the Board
Tim FallowfieldCompany Secretary and Corporate Services Director27 April 2021
90 Governance J Sainsbury plc Annual Report 2021

Additional Disclosures178 Note 40 Capital commitments179 Note 41 Financial commitments179 Note 42 Contingent liabilities179 Note 43 Related party transactions180 Note 44 Details of related undertakings
Company Financial Statements 184 Company balance sheet185 Company statement of changes in equity
Notes to the Company Financial Statements186 Note 1 Basis of preparation187 Note 2 Investments in subsidiaries, joint ventures and associates187 Note 3 Trade and other receivables187 Note 4 Trade and other payables188 Note 5 Borrowings188 Note 6 Provisions188 Note 7 Taxation189 Note 8 Share capital and reserves190 Note 9 Retained earnings190 Note 10 Contingent liabilities
92 Statement of Directors’ Responsibilities
93 Independent Auditor’s Report to the Members of J Sainsbury plc
Consolidated Financial Statements100 Consolidated income statement101 Consolidated statement of comprehensive income/(loss)102 Consolidated balance sheet 103 Consolidated cash flow statement104 Consolidated statement of changes in equity
Notes to the Consolidated Financial Statements105 Note 1 General information105 Note 2 Significant accounting policies106 Note 3 Alternative performance measures107 Note 4 Significant accounting judgements,
estimates and assumptions
Income Statement107 Note 5 Profit before non-underlying items111 Note 6 Revenue112 Note 7 Segment reporting116 Note 8 Supplier arrangements117 Note 9 Operating profit117 Note 10 Finance income and finance costs118 Note 11 Taxation121 Note 12 Earnings per share122 Note 13 Dividends
Financial Position122 Note 14 Property, plant and equipment124 Note 15 Leases127 Note 16 Intangible assets129 Note 17 Impairment of non-financial assets132 Note 18 Investments in joint ventures and associates133 Note 19 Financial assets at fair value through
other comprehensive income 133 Note 20 Inventories134 Note 21 Receivables135 Note 22 Financial Services loans and advances to customers135 Note 23 Assets held for sale136 Note 24 Trade and other payables137 Note 25 Amounts due to Financial Services customers and banks137 Note 26 Provisions139 Note 27 Called up share capital, share premium and merger reserve139 Note 28 Capital redemption and other reserves140 Note 29 Perpetual securities141 Note 30 Retained earnings141 Note 31 Financial risk management153 Note 32 Financial instruments 158 Note 33 Derivative financial instruments and hedge accounting
Cash Flows163 Note 34 Cash and cash equivalents165 Note 35 Analysis of net debt168 Note 36 Borrowings
Employee Remuneration169 Note 37 Employee costs169 Note 38 Retirement benefit obligations176 Note 39 Share-based payments
91Financial Statements J Sainsbury plc Annual Report 2021
Governance ReportStrategic Report
Financial Statements
Financial Statements
The Directors are responsible for preparing the Annual Report and Financial Statements in accordance with applicable law and regulations.
Company law requires the Directors to prepare financial statements for each financial year that give a true and fair view of the state of affairs of the Group and the Company as at the end of the financial year, and of the profit or loss of the Group for the financial year. Under that law, the Directors have prepared the Group financial statements in accordance with International Accounting Standards (IASs) in conformity with the requirements of the Companies Act 2006 and additionally in accordance with International Financial Reporting Standards (IFRSs) adopted pursuant to Regulation (EC) No. 1606/2002 as it applies in the European Union. The Directors have elected to prepare the Parent Company financial statements in accordance with United Kingdom Generally Accepted Accounting Practice, including FRS 101 ‘Reduced Disclosure Framework’ (UK Accounting Standards and applicable law). Under company law the Directors must not approve the financial statements unless they are satisfied that they give a true and fair view of the state of affairs of the Group and the Company and of the profit or loss of the Group for that period. In preparing these financial statements, the Directors are required to:
— select suitable accounting policies and then apply them consistently; — make judgements and accounting estimates that are reasonable and prudent;
— state whether IASs in conformity with the requirements of the Companies Act 2006, IFRSs adopted pursuant to Regulation (EC) No. 1606/2002 as it applies in the European Union, and applicable UK Accounting Standards have been followed, subject to any material departures disclosed and explained in the Group and Company financial statements respectively; and
— prepare the financial statements on the going concern basis unless it is inappropriate to presume that the Group and the Company will continue in business.
The Directors are responsible for keeping adequate accounting records that are sufficient to show and explain the Group’s and the Company’s transactions and disclose with reasonable accuracy at any time the financial position of the Company and the Group and enable them to ensure that the financial statements and the Directors’ Remuneration Report comply with the Companies Act 2006 and, as regards the Group financial statements, Article 4 of the IAS Regulation. They are also responsible for safeguarding the assets of the Company and the Group and hence for taking reasonable steps for the prevention and detection of fraud and other irregularities. Having taken all the matters considered by the Board and brought to the attention of the Board during the year into account, we are satisfied that the Annual Report and Financial Statements, taken as a whole, is fair, balanced and understandable.
The Board believes that the disclosures set out in this Annual Report provide the information necessary for shareholders to assess the Group’s performance, business model and strategy.
The Directors are responsible for the maintenance and integrity of the Company’s website. Legislation in the United Kingdom governing the preparation and dissemination of financial statements may differ from legislation in other jurisdictions.
Each of the Directors, whose names and functions are listed on pages 46 to 49, confirms that, to the best of their knowledge:
— the financial statements, which have been prepared in accordance with the relevant financial reporting framework give a true and fair view of the assets, liabilities, financial position and profit of the Group and Company; and
— the Strategic Report and Directors’ Report contained in the Annual Report and Financial Statements include a fair review of the development and performance of the business and the position of the Group, together with a description of the emerging and principal risks and uncertainties that it faces; and
— the Annual Report and Financial Statements, taken as a whole, are fair, balanced and understandable and provide the information necessary for shareholders to assess the Group’s position and performance, business model and strategy.
By order of the Board
Tim FallowfieldCompany Secretary and Corporate Services Director27 April 2021
Statement of Directors’ responsibilities
92 Financial Statements J Sainsbury plc Annual Report 2021

Conclusions relating to going concernIn auditing the financial statements, we have concluded that the directors’ use of the going concern basis of accounting in the preparation of the financial statements is appropriate. Our evaluation of the directors’ assessment of the group and parent company’s ability to continue to adopt the going concern basis of accounting included:
— In conjunction with our walkthrough of the group’s financial close process, we confirmed our understanding of management’s going concern assessment process. We also engaged with management early to understand the process undertaken to evaluate the operational and economic impacts of COVID-19 on the Group, and to reflect these in the Group’s forecasts and validate that all key factors were considered in their assessment.
— We challenged the key factors to validate management had correctly identified these factors.
— We obtained management’s going concern assessment, including the cash forecast for the going concern period ending 28 April 2022, and considered significant events falling in the period beyond management’s assessment. The group has modelled various adverse scenarios in their cash forecasts in order to incorporate unexpected changes to the forecast liquidity of the Group.
— We tested the clerical accuracy of the model used to prepare the Group’s going concern assessment.
— We challenged the appropriateness of the methods used to calculate the cash forecasts and determined through inspection and testing of the methodology and calculations that the methods utilised were appropriately sophisticated to be able to make an assessment for the entity.
— We considered whether the Group’s forecasts used in the going concern assessment were consistent with other forecasts used by the Group in its accounting estimates, including impairment.
— We considered the adverse scenarios modelled and challenged the assumptions agreeing them to supporting information, and searched for contrary evidence to challenge those assumptions, such as analyst reports.
— We challenged the mitigating actions (e.g., reduced levels of dividend payments and capital expenditure) available to the Group and whether they are realistic.
— We also obtained evidence of the group’s available facilities, noting no associated financial covenants.
— We challenged the reverse stress testing scenario, performed to identify what factors would lead to the Group utilising all liquidity during the going concern period.
— We reviewed the Group’s going concern disclosures included in the Annual Report and Financial Statements in order to assess that the disclosures were appropriate and in conformity with the reporting standards.
We observe that in management’s base case and downside scenarios, there is significant headroom without taking the benefit of any identified mitigations.
Based on the work we have performed, we have not identified any material uncertainties relating to events or conditions that, individually or collectively, may cast significant doubt on the Group and parent company’s ability to continue as a going concern for the period to 28 April 2022.
In relation to the group and parent company’s reporting on how they have applied the UK Corporate Governance Code, we have nothing material to add or draw attention to in relation to the directors’ statement in the financial statements about whether the directors considered it appropriate to adopt the going concern basis of accounting.
Our responsibilities and the responsibilities of the directors with respect to going concern are described in the relevant sections of this report. However, because not all future events or conditions can be predicted, this statement is not a guarantee as to the group’s ability to continue as a going concern.
OpinionIn our opinion:
— J Sainsbury plc’s group financial statements and parent company financial statements (the ‘financial statements’) give a true and fair view of the state of the group’s and of the parent company’s affairs as at 6 March 2021 and of the group’s loss for the period then ended;
— the group financial statements have been properly prepared in accordance with International Accounting Standards in conformity with the requirements of the Companies Act 2006 and International Financial Reporting Standards adopted pursuant to Regulation (EC) No. 1606/2002 as it applies in the European Union;
— the parent company financial statements have been properly prepared in accordance with United Kingdom Generally Accepted Accounting Practice; and
— the financial statements have been prepared in accordance with the requirements of the Companies Act 2006.
We have audited the financial statements of J Sainsbury plc (the ‘parent company’) and its subsidiaries (the ‘group’) for the period ended 6 March 2021 which comprise:
Group Parent company
Consolidated balance sheet as at 6 March 2021
Company balance sheet as at 6 March 2021
Consolidated income statement for the period then ended
Company statement of changes in equity for the period then ended
Consolidated statement of comprehensive income for the period then ended
Related notes 1 to 10 to the financial statements including a summary of significant accounting policies
Consolidated statement of changes in equity for the period then endedConsolidated statement of cash flows for the period then endedRelated notes 1 to 44 to the financial statements, including a summary of significant accounting policies
The financial reporting framework that has been applied in the preparation of the group financial statements is applicable law International Accounting Standards in conformity with the requirements of the Companies Act 2006 and International Financial Reporting Standards adopted pursuant to Regulation (EC) No. 1606/2002 as it applies in the European Union. The financial reporting framework that has been applied in the preparation of the parent company financial statements is applicable law and United Kingdom Accounting Standards, including FRS 101 ‘Reduced Disclosure Framework’ (United Kingdom Generally Accepted Accounting Practice).
Basis for opinionWe conducted our audit in accordance with International Standards on Auditing (UK) (ISAs (UK)) and applicable law. Our responsibilities under those standards are further described in the Auditor’s responsibilities for the audit of the financial statements section of our report. We are independent of the group in accordance with the ethical requirements that are relevant to our audit of the financial statements in the UK, including the FRC’s Ethical Standard as applied to listed public interest entities, and we have fulfilled our other ethical responsibilities in accordance with these requirements.
We believe that the audit evidence we have obtained is sufficient and appropriate to provide a basis for our opinion.
Independent auditor’s report to the members of J Sainsbury plc
93Financial Statements J Sainsbury plc Annual Report 2021
Governance ReportStrategic Report
Financial Statements

Changes from the prior yearThe change in the total number of specific scope components from 15 in the prior year to 54 in the current year is as a result of a reduction in our Group materiality as described below within the section ‘Our application of materiality’.
Involvement with component teamsIn establishing our overall approach to the Group audit, we determined the type of work that needed to be undertaken at each of the components by us, as the primary audit engagement team, or by component auditors from other EY global network firms operating under our instruction. Of the 15 full scope components, audit procedures were performed on the head office company, J Sainsbury plc, Sainsbury’s Supermarkets Ltd, Sainsbury’s Bank plc, Argos Limited and consolidation of the Group by the primary audit team and EY teams in Edinburgh and Luton. The work at the specific scope components was performed by EY teams in Edinburgh, Luton, the Isle of Man and the primary team. For the full and specific scope components, where the work was performed by component auditors, we determined the appropriate level of involvement to enable us to determine that sufficient audit evidence had been obtained as a basis for our opinion on the Group as a whole.
During the current audit cycle, due to the travel restrictions from the COVID-19 pandemic, we could not travel to Edinburgh. We therefore performed alternative procedures, including virtual visits and live reviews of our component audit team’s working papers.
The Senior Statutory Auditor is also responsible for the audit of Sainsbury’s Supermarkets Ltd and Argos Limited. For Sainsbury’s Bank plc and Argos Financial Services, the Senior Statutory Auditor virtually met and held discussions with the component team. The virtual visits used video technology and our global audit software to meet with our component team to discuss and direct their audit approach, reviewing relevant working papers and understanding the significant audit findings in response to the risk areas including financial services customer receivables impairment. The primary audit team interacted regularly with the component team where appropriate during various stages of the audit and virtually attended the component audit closing meeting. This, together with the additional procedures performed at Group level, gave us appropriate evidence for our opinion on the Group financial statements. For the insurance company, the team discussed the audit approach with the component team and interacted regularly with the component team where appropriate during various stages of the audit in order to understand the key audit findings.
Key audit mattersKey audit matters are those matters that, in our professional judgment, were of most significance in our audit of the financial statements of the current period and include the most significant assessed risks of material misstatement (whether or not due to fraud) that we identified. These matters included those which had the greatest effect on: the overall audit strategy, the allocation of resources in the audit; and directing the efforts of the engagement team. These matters were addressed in the context of our audit of the financial statements as a whole, and in our opinion thereon, and we do not provide a separate opinion on these matters.
Risk Supplier arrangementsRefer to the Accounting policies (page 116); and note 8 of the Consolidated Financial Statements (page 116)
The Group receives material discounts from suppliers, referred to as supplier arrangements. The accounting for some of these supplier arrangements is complex since management applies judgement, processing is either manual or more complicated (‘complex supplier arrangements’) and the quantum of agreements is high. We focused our audit procedures on these complex supplier arrangements. Additionally, we also considered the risk of management’s ability to override controls in relation to the routine arrangements which are not considered complex.
Complex supplier arrangements recognised in the income statement for the financial year are £374 million (2019/20: £451 million).
Overview of our audit approachAudit scope
— We performed a full scope audit of the complete financial information of the following components: J Sainsbury plc, Sainsbury’s Supermarkets Ltd, Argos Limited and Sainsbury’s Bank plc. We performed audit procedures on specific balances of Argos Financial Services, Nectar, Habitat, material property companies, the information systems company, material joint ventures and the insurance company due to the size and risk of certain individual balances within these components.
— The components where we performed full or specific audit procedures accounted for 100 per cent of Profit before tax before one-off items, 100 per cent of Revenue and 100 per cent of Total assets.
Key audit matters — Supplier arrangements — Aspects of revenue recognition — Restructuring programmes — Assessment of the carrying value of non-current assets — Defined Benefit Scheme accounting — Financial services customer receivables impairment — IT environment
Materiality — Overall Group materiality of £27 million which represents 5 per cent of normalised adjusted profit before tax
An overview of the scope of the parent company and group auditsTailoring the scopeOur assessment of audit risk, our evaluation of materiality and our allocation of performance materiality determine our audit scope for each company within the Group. Taken together, this enables us to form an opinion on the consolidated financial statements. We take into account size, risk profile, the organisation of the group and effectiveness of group-wide controls, changes in the business environment and other factors such as recent Internal audit results when assessing the level of work to be performed at each company.
In assessing the risk of material misstatement to the Group financial statements, and to ensure we had adequate quantitative coverage of significant accounts in the financial statements, of the 113 reporting components of the Group, we selected 69 components covering entities within the UK and the Isle of Man, which represent the principal business units within the Group.
Of the 69 components selected, we performed an audit of the complete financial information of 15 components (‘full scope components’) which were selected based on their size or risk characteristics. For the remaining 54 components (‘specific scope components’), we performed audit procedures on specific accounts within that component that we considered had the potential for the greatest impact on the significant accounts in the financial statements either because of the size of these accounts or their risk profile.
The table below illustrates the coverage obtained from the work performed by our audit teams.
Number
% Group Profit
before tax
% Group Profit
before tax
% Group Revenue
% Total assets
2020/21 2019/20 2020/21 2019/20 2020/21 2019/20
Full scope 15 52% 69% 99% 98% 84% 81%Specific scope 54 48% 31% 1% 2% 16% 19%Full and specific
scope coverage69 100% 100% 100% 100% 100% 100%
Remaining components
44 0% 0% 0% 0% 0% 0%
Total Reporting components
113 100% 100% 100% 100% 100% 100%
94 Financial Statements J Sainsbury plc Annual Report 2021

Key observations communicated to the Audit CommitteeAdjustments to revenue have been appropriately recognised.
Risk Restructuring programmesRefer to the Audit Committee Report (page 67); Accounting policies (page 108); and note 5 of the Consolidated Financial Statements (page 108)
Restructuring programmes were initiated in the current year. Given the scale of the programmes (£423 million recognised in the income statement) and the number of significant judgments and estimates, there is a risk the restructuring provision recognised on the balance sheet of £301 million is incorrectly valued particularly in relation to dilapidation and strip out costs as well as the valuation of the associated property right of use assets.
Our response to the risk — We performed procedures over restructuring programmes at Sainsbury’s Supermarkets Limited and Argos Limited components.
— We obtained a detailed understanding of the various restructuring programmes through enquiries of management.
— With respect to impairments (£85 million), we reviewed the valuation approach utilised against the requirements of IAS 36 ‘Impairment of assets’. We compared budgets to actual results to understand the historical accuracy of forecasting, based on past experience. We challenged the estimates and assumptions used to derive the projected future cash flows, including growth rates, where applicable. In conjunction with our valuation specialists, we assessed the discount rates used by reviewing the methodology used to calculate the rates and by independently determining a range of acceptable rates, considering market data and comparable organisations, and comparing these ranges to the rates used by management. We tested the arithmetic accuracy of the impairment calculations.
— With respect to closure costs (£240 million) and provisions, we validated that the provisions met the IAS 37 ‘Provisions, Contingent Liabilities and Contingent Assets’ recognition criteria. Where applicable, we challenged the estimates and assumptions used to calculate the provisions, including assessing management’s historical accuracy of calculating similar provisions. We tested a sample of closure costs to source documentation, including, where applicable, third party invoices. We tested the arithmetic accuracy of the calculations.
— With respect to redundancy costs (£61 million), we validated that the provisions met the IAS 37 ‘Provisions, Contingent Liabilities and Contingent Assets’ recognition criteria. We checked there was a formal plan in place, supported by an approved business case and that a valid expectation had been raised with the affected individuals. We tested a sample of transactions to signed contracts and payslips, vouching the amount recognised was complete and accurate. We tested the arithmetic accuracy of the calculations.
— We read the financial statements disclosure in respect of the restructuring programmes recorded in the income statement and balance sheet to confirm completeness and accuracy of amounts disclosed.
Key observations communicated to the Audit CommitteeRestructuring programmes are appropriately recognised in the income statement and balance sheet and the disclosure in the financial statements is appropriate.
Risk Assessment of the carrying value of non-current assetsRefer to the Accounting policies (page 129); and note 17 of the Consolidated Financial Statements (page 129)
The Group holds £8,587 million in respect of Property, plant and equipment, £4,747 million in respect of right-of-use assets and £914 million in respect of goodwill and other intangible assets.
At the interim reporting date (19 September 2020), an impairment trigger was identified and full impairment assessment was performed. This resulted in £105 million of impairment charges being recognised within the Financial Services segment and £109 million within the Retail segment.
At year end, further impairment charges of £6 million were recognised.
Our response to the risk — We performed procedures over supplier arrangements at both the Sainsbury’s Supermarkets Limited and Argos Limited components.
— We walked through the controls in place within the supplier arrangements process. Due to the significant manual nature of these adjustments, we performed substantive audit procedures.
— We selected a sample of suppliers to whom we sent confirmations across certain ‘deal’ types to confirm key deal input terms. Where we did not receive a response from the supplier, we performed alternative procedures, including obtaining evidence of initiation and if settled, settlement of the arrangement.
— We tested the existence and valuation of balance sheet amounts recognised in accounts receivable and as a contra-asset in accounts payable by reviewing post-period end settlement. We also performed a ‘look-back’ analysis of prior period balance sheet amounts to check that these amounts were appropriately recovered.
— We tested the settlement of a sample of supplier arrangements recognised in the income statement, which included settlement in cash or by off-set to accounts payable.
— Using data extracted from the accounting system, we tested the appropriateness of journal entries and other adjustments, meeting a pre-defined criterion, to corroborating evidence such as third party invoices.
— We tested deals recorded post period end by obtaining the supplier agreement to validate that the deal was correctly recorded post period end.
— We read the financial statements disclosure in respect of supplier arrangement amounts recorded in the income statement and balance sheet to confirm completeness and accuracy of amounts disclosed.
Key observations communicated to the Audit CommitteeSupplier arrangement amounts are appropriately recognised in the income statement and balance sheet and the disclosure in the financial statements is appropriate.
RiskAspects of revenue recognitionRefer to the Accounting policies (page 111); and note 6 of the Consolidated Financial Statements (page 111)
Our assessment is that the vast majority of the Group’s revenue transactions are non-complex, with no judgement applied over the amount recorded. We focused our work on the manual adjustments that are made to revenue where the amount of the revenue recorded can be different to the amount of cash received. These entries include Nectar points, coupons, vouchers and commission arrangements.
Our procedures were designed to address the risk of manipulation of accounting records and the ability to override controls.
Our response to the risk — We performed procedures over adjustments to revenue at both the Sainsbury’s Supermarkets Limited and Argos Limited components.
— We obtained a detailed understanding of these manual adjustments. Due to the manual nature of these adjustments, we performed substantive audit procedures.
— We used data analytics tools to identify those revenue journals for which the corresponding entry was not cash.
— We obtained corroborating evidence for such corresponding entries. For the Nectar points adjustment we obtained evidence that revenue is deferred appropriately based on the number of points issued and redeemed, and for the breakage assumption, we understood and verified to the Nectar account dormancy rates. For third party coupons and vouchers we obtained evidence of collection and settlement.
— Using data extracted from the accounting system, we tested the appropriateness of journal entries, meeting a pre-defined criterion and impacting revenue, as well as other adjustments made in the preparation of the financial statements. We considered the validity of unusual journals such as those posted outside of expected hours, or by unexpected individuals and for large or unusual amounts.
95Financial Statements J Sainsbury plc Annual Report 2021
Governance ReportStrategic Report
Financial Statements

— With respect to unquoted pension assets: — We obtained independent confirmations of the assets held directly from the fund managers.
— We reviewed Service Organisation Control reports for each of the fund managers to assess the control environment, particularly over asset valuation. For a sample of asset valuations, we tested the valuation with the assistance of our valuation specialists, by primarily independently valuing the assets and comparing this to management’s valuation.
— Where an adjustment had been made to the valuation to reflect updated assumptions from the date of the original valuation, in conjunction with our valuation specialists, we tested that the relevant assumptions used were appropriate.
— We read the financial statements disclosure in respect of the defined benefit schemes to confirm completeness and accuracy of amounts disclosed.
Key observations communicated to the Audit CommitteeThe impact of the defined benefit schemes is appropriately recognised in the income statement/Other Comprehensive Income and balance sheet and the disclosure in the financial statements is appropriate.
Risk Financial Services impairment against customer receivables Refer to the Audit Committee Report (page 68); Accounting policies (page 144); and note 31 of the Consolidated Financial Statements (page 144)
Financial Services customer receivables relate to Sainsbury’s Bank credit cards, loans and mortgages; and Argos store cards. Total amounts recognised at year-end are £5,670 million (2019/2020: £7,671 million). The provision for impairment is £263 million (2019/2020: £267 million).
The risk of collectability of Financial Services customer receivables, through either credit cards, loans, mortgages or Argos store cards, is significant, especially in the current year as a result of the COVID-19 pandemic. There is judgement in the assumptions applied to calculate the impairment against customer receivables.
Our response to the risk — We walked through the controls in place within the process, and assessed the design effectiveness of controls and the operating effectiveness of the controls.
— The impairment against customer receivable methodology was reviewed, to confirm it was consistent with IFRS 9.
— We verified the completeness and accuracy of the data utilised from underlying systems that were used in the impairment models.
— We challenged the key assumptions used by management, including the probability of default and the loss given default, with reference to industry/peer benchmarks with the assistance of our financial services risk management specialists.
— We tested that the key assumptions had been accurately reflected in the impairment models.
— We independently calculated a reasonable range of outcomes to assess the provision for high risk segments.
— We challenged the macro-economic scenarios, including COVID-19 scenarios, with the support of our economic modelling experts.
Key observations communicated to the Audit CommitteeWe conclude that the Financial Services impairment against customer receivables is appropriately recognised.
Our response to the risk — We understood the methodology applied by management in performing the impairment test for each of the relevant cash-generating units (‘CGUs’), and compared this to the requirements of IAS 36 ‘Impairment of assets’.
— For the CGUs where there were indicators of impairment (including as a result of COVID-19 or Brexit), we performed detailed testing to critically assess and corroborate the key inputs to the valuation, including:
— Analysing the historical accuracy of budgets to actual results to determine whether forecast cash flows are reliable based on past experience;
— Challenging the estimates and assumptions used to derive the projected future cash flows, including growth rates, where applicable. We challenged the estimates and assumptions by agreeing them to supporting information, and searched for contrary evidence to challenge those assumptions, such as analyst reports.
— In conjunction with our valuation specialists, we assessed the discount rates used by reviewing the methodology used to calculate the rates and by independently determining a range of acceptable rates, considering market data and comparable organisations, and comparing these ranges to the rates used by management.
— We tested the arithmetic accuracy of the impairment calculations. — We challenged the allocation of the impairment loss to ensure it is consistent with the requirements of IAS 36, with impairment losses first being allocated to goodwill and then the long-lived assets of the CGU, on an appropriate basis.
— We read the financial statements disclosure to confirm completeness and accuracy of amounts disclosed.
Key observations communicated to the Audit CommitteeImpairment charges are appropriately recognised in the income statement and the disclosure in the financial statements is appropriate.
Risk Defined Benefit Scheme accountingRefer to the Audit Committee Report (page 67); Accounting policies (page 169); and note 38 of the Consolidated Financial Statements (page 169)
The valuation of the defined benefit liabilities requires technical expertise to select appropriate valuation assumptions. Changes in key assumptions (discount rates, price inflation, salary increases, and demographic assumptions) can have a material impact on the valuation of the liabilities.
Additionally, the valuation of certain unquoted assets (2020/2021: £3.1 billion; 2019/2020: £2.5 billion) requires technical expertise due to the judgements applied in the valuation calculation.
The Sainsbury’s Supermarket Limited’s defined benefit pension scheme liabilities amount to £8.8 billion (2019/2020: £8.9 billion) and the Argos Limited’s defined benefit pension scheme liabilities amount to £1.4 billion (2019/2020: £1.4 billion).
Our response to the risk — We performed procedures over both Sainsbury’s Supermarkets Limited and Argos Limited components.
— With respect to the valuation of the defined benefit liability, and in conjunction with our internal pension actuaries:
— We met the Group’s external actuaries virtually to understand the process used to develop the key assumptions.
— We compared the assumptions applied to those used in the prior year and understood the basis for change.
— We compared the assumptions selected to our own independent assessment of appropriate actuarial assessments for the respective durations.
— We tested the clerical accuracy of the actuarial calculation utilising a roll forward methodology.
— We evaluated the independence and qualifications of management’s external actuaries involved in the valuation process.
96 Financial Statements J Sainsbury plc Annual Report 2021

Following the impact of COVID-19 and considering the Group’s revised adjusted profit before taxation, after the voluntary rates payment, we concluded that normalised adjusted profit before taxation provided the most relevant performance measure to the stakeholders of J Sainsbury plc. This reflects underlying profits adjusted for items that recur each year.
We determined materiality for the Group to be £27 million (2019/2020: £31.8 million), which is 5 per cent of normalised adjusted profit before taxation (2019/2020: 5%) of adjusted profit before taxation. The decrease of £4.8 million (15 per cent) in Group materiality since 2019/2020 reflects the reduction in adjusted profit before taxation driven principally by the impact of COVID-19. We updated our approach to calculating materiality, moving to a normalised measure, to reflect the volatility in the Group arising from the impact of COVID-19. We calculated normalised adjusted profits by averaging the last 3 years of adjusted profits, which reflects the impact of COVID-19 whilst recognising the expected return to more normal trading levels once lockdown restrictions are lifted.
Materiality basis 2018/19 adjusted PBT £615 million2019/20 adjusted PBT £637 million2020/21 adjusted PBT £356 million*
Normalised adjusted PBT (average of the above)
£536 million
Materiality 5 per cent of normalised adjusted profit before tax
£27 million
* £356 million is 2020/2021 underlying profit adjusted for recurring items being property profits, perpetual securities, pension income and non-underlying finance movements.
We determined materiality for the Parent Company to be £132.5 million (2019/2020: £150 million), which is 2 per cent (2019/2020: 2 per cent) of net assets. The materiality of the parent company is greater than the Group because the parent company is a holding company with significant net assets. For any parent company balances that are consolidated into the Group financial statements, an allocation of Group performance materiality was used.
Performance materialityThe application of materiality at the individual account or balance level. It is set at an amount to reduce to an appropriately low level the probability that the aggregate of uncorrected and undetected misstatements exceeds materiality.
On the basis of our risk assessments, together with our assessment of the Group’s overall control environment, our judgement was that performance materiality was 50 per cent (2019/2020: 75 per cent) of our planning materiality, namely £13.5 million (2019/2020: £23.8 million). The reduction in performance materiality is as a result of reflecting on the pervasive impact of the COVID-19 pandemic can have on entity wide controls and taking into consideration the cumulative level of misstatements identified during the course of 2020/2021 and 2019/2020.
Audit work at component locations for the purpose of obtaining audit coverage over significant financial statement accounts is undertaken based on a percentage of total performance materiality. The performance materiality set for each component is based on the relative scale and risk of the component to the Group as a whole and our assessment of the risk of misstatement at that component. In the current year, the range of performance materiality allocated to components was £2.7 million to £12.7 million (2019/2020: £5 million to £23 million).
Reporting thresholdAn amount below which identified misstatements are considered as being clearly trivial.
We agreed with the Audit Committee that we would report to them all uncorrected audit differences in excess of £1.3 million (2019/2020: £1.5 million), which is set at 5 per cent of planning materiality, as well as differences below that threshold that, in our view, warranted reporting on qualitative grounds.
We evaluate any uncorrected misstatements against both the quantitative measures of materiality discussed above and in light of other relevant qualitative considerations in forming our opinion.
Risk The IT environmentThe IT systems across the Group are complex and there are varying levels of integration between them. The systems are vital to the ongoing operations of the business and to the integrity of the financial reporting process.
During the current year we reported deficiencies in certain IT controls. These deficiencies related to IT systems that are part of the Group’s control framework over financial reporting and required us to perform incremental procedures.
Our response to the risk — We held discussions with management to understand the IT environment and walked through the key financial processes to understand where IT systems were integral to the Group’s controls over financial reporting. From this we identified which IT systems to include in the scope for our detailed IT testing.
— We assessed the IT general controls environment for the key systems impacting the accurate recording of transactions and the presentation of the financial statements.
— We designed our IT audit procedures to assess the IT environment, including an assessment of controls over changes made to the system and controls over appropriate access to the systems.
— Where we found that adequate IT general controls were not in place, we performed incremental substantive audit procedures in response to the deficiencies identified for the systems within the scope of our audit.
Key observations communicated to the Audit CommitteeWe completed additional substantive testing in order to mitigate the risk of material misstatement.
In the prior year, our auditor’s report included a key audit matter in relation to IFRS 16 following the implementation of this standard. The risks and audit effort required during the implementation phase of the standard are no longer present/required post implementation and therefore we have removed this as a key audit matter. Additionally, in the prior year, our auditor’s report included a key audit matter in relation to COVID-19. The key aspect of this matter was in relation to going concern. Given the headroom available within the current year’s going concern assessment, we no longer consider this a key audit matter. Our procedures in respect of going concern have been incorporated separately within this report – see section above. In the current year, we have included a new key audit matter in relation to the defined benefit scheme accounting as this is considered a significant risk to the audit requiring significant audit effort. We have also included a new key audit matter in relation to restructuring costs associated to programmes initiated in the current year as certain aspects of the provisions are considered a significant risk to the audit requiring significant audit effort and allocation of resources. Additionally, a new key audit matter has been included in the current year in relation to the assessment of the carrying values of non-current assets due to the impact of the COVID-19 pandemic.
Our application of materialityWe apply the concept of materiality in planning and performing the audit, in evaluating the effect of identified misstatements on the audit and in forming our audit opinion.
MaterialityThe magnitude of an omission or misstatement that, individually or in the aggregate, could reasonably be expected to influence the economic decisions of the users of the financial statements. Materiality provides a basis for determining the nature and extent of our audit procedures.
We set our planning materiality at £31.9m, based on 2020/2021 forecast adjusted profit before taxation which we believed was the most relevant performance measure to the stakeholders of J Sainsbury plc. At the time of setting our planning materiality, we had understood the potential impact of COVID-19 but Sainsbury’s had not made a decision to voluntarily pay business rates.
97Financial Statements J Sainsbury plc Annual Report 2021
Governance ReportStrategic Report
Financial Statements

Other informationThe other information comprises the information included in the annual report set out on pages 1 to 90, other than the financial statements and our auditor’s report thereon. The directors are responsible for the other information contained within the annual report.
Our opinion on the financial statements does not cover the other information and, except to the extent otherwise explicitly stated in this report, we do not express any form of assurance conclusion thereon.
Our responsibility is to read the other information and, in doing so, consider whether the other information is materially inconsistent with the financial statements or our knowledge obtained in the course of the audit or otherwise appears to be materially misstated. If we identify such material inconsistencies or apparent material misstatements, we are required to determine whether there is a material misstatement in the financial statements themselves. If, based on the work we have performed, we conclude that there is a material misstatement of the other information, we are required to report that fact.
We have nothing to report in this regard.
Opinions on other matters prescribed by the Companies Act 2006In our opinion, the part of the directors’ remuneration report to be audited has been properly prepared in accordance with the Companies Act 2006.In our opinion, based on the work undertaken in the course of the audit:
— the information given in the strategic report and the directors’ report for the financial year for which the financial statements are prepared is consistent with the financial statements; and
— the strategic report and the directors’ report have been prepared in accordance with applicable legal requirements.
Matters on which we are required to report by exceptionIn the light of the knowledge and understanding of the group and the parent company and its environment obtained in the course of the audit, we have not identified material misstatements in the strategic report or the directors’ report.
We have nothing to report in respect of the following matters in relation to which the Companies Act 2006 requires us to report to you if, in our opinion:
— adequate accounting records have not been kept by the parent company, or returns adequate for our audit have not been received from branches not visited by us; or
— the parent company financial statements and the part of the Directors’ Remuneration Report to be audited are not in agreement with the accounting records and returns; or
— certain disclosures of directors’ remuneration specified by law are not made; or
— we have not received all the information and explanations we require for our audit
Corporate Governance StatementThe Listing Rules require us to review the directors’ statement in relation to going concern, longer-term viability and that part of the Corporate Governance Statement relating to the group and company’s compliance with the provisions of the UK Corporate Governance Code specified for our review.
Based on the work undertaken as part of our audit, we have concluded that each of the following elements of the Corporate Governance Statement is materially consistent with the financial statements or our knowledge obtained during the audit:
— Directors’ statement with regards to the appropriateness of adopting the going concern basis of accounting and any material uncertainties identified set out on page 105;
— Directors’ explanation as to its assessment of the company’s prospects, the period this assessment covers and why the period is appropriate set out on page 44;
— Directors’ statement on fair, balanced and understandable set out on page 92;
— Board’s confirmation that it has carried out a robust assessment of the emerging and principal risks set out on page 32;
— The section of the annual report that describes the review of effectiveness of risk management and internal control systems set out on page 32; and;
— The section describing the work of the audit committee set out on page 64
Responsibilities of directorsAs explained more fully in the directors’ responsibilities statement set out on page 92, the directors are responsible for the preparation of the financial statements and for being satisfied that they give a true and fair view, and for such internal control as the directors determine is necessary to enable the preparation of financial statements that are free from material misstatement, whether due to fraud or error.
In preparing the financial statements, the directors are responsible for assessing the group and parent company’s ability to continue as a going concern, disclosing, as applicable, matters related to going concern and using the going concern basis of accounting unless the directors either intend to liquidate the group or the parent company or to cease operations, or have no realistic alternative but to do so.
Auditor’s responsibilities for the audit of the financial statementsOur objectives are to obtain reasonable assurance about whether the financial statements as a whole are free from material misstatement, whether due to fraud or error, and to issue an auditor’s report that includes our opinion. Reasonable assurance is a high level of assurance, but is not a guarantee that an audit conducted in accordance with ISAs (UK) will always detect a material misstatement when it exists. Misstatements can arise from fraud or error and are considered material if, individually or in the aggregate, they could reasonably be expected to influence the economic decisions of users taken on the basis of these financial statements.
Explanation as to what extent the audit was considered capable of detecting irregularities, including fraudIrregularities, including fraud, are instances of non-compliance with laws and regulations. We design procedures in line with our responsibilities, outlined above, to detect irregularities, including fraud. The risk of not detecting a material misstatement due to fraud is higher than the risk of not detecting one resulting from error, as fraud may involve deliberate concealment by, for example, forgery or intentional misrepresentations, or through collusion. The extent to which our procedures are capable of detecting irregularities, including fraud is detailed below.
However, the primary responsibility for the prevention and detection of fraud rests with both those charged with governance of the company and management.
— We obtained an understanding of the legal and regulatory frameworks that are applicable to the group and determined that the most significant are:
— Those that relate to the form and content of the financial statements, such as International Accounting Standards in conformity with the requirements of the Companies Act 2006, Companies Act 2006 and the UK Corporate Governance Code;
— Those that relate to the Bank, such as the regulations, license conditions and supervisory requirements of the Prudential Regulation Authority (‘PRA’) and the Financial Conduct Authority (‘FCA’); and
— Industry related such as compliance with the requirements of the Grocery Supply Code of Practice.
— We understood how J Sainsbury plc is complying with those frameworks by making enquiries of management, internal audit and those responsible for legal and compliance procedures. We corroborated our enquiries through our review of board minutes and papers provided to the Audit Committee and attendance at all meetings of the Audit Committee, as well as consideration of the results of our audit procedures across the Group.
— We assessed the susceptibility of the group’s financial statements to material misstatement, including how fraud might occur by making an assessment of the key fraud risks to the Group and the manner in which such risks may manifest themselves in practice, based on our previous knowledge of the Group as well as an assessment of the current business environment.
98 Financial Statements J Sainsbury plc Annual Report 2021

— Based on this understanding we designed our audit procedures to identify non-compliance with such laws and regulations. Where the risk was considered to be higher, we performed audit procedures to address each identified fraud risk. These procedures included testing manual journals and were designed to provide reasonable assurance that the financial statements were free of material fraud or error. We evaluated the design and operational effectiveness of controls put in place to address the risks identified, or that otherwise prevent, deter and detect fraud. We also considered performance targets and their influence on efforts made by management to manage earnings.
A further description of our responsibilities for the audit of the financial statements is located on the Financial Reporting Council’s website at https://www.frc.org.uk/auditorsresponsibilities. This description forms part of our auditor’s report.
Other matters we are required to address — Following the recommendation from the Audit Committee we were appointed by the Company at its annual general meeting on 8 July 2015 to audit the financial statements for the period ended 12 March 2016 and subsequent financial periods.
— The period of total uninterrupted engagement including previous renewals and reappointments is 6 years, covering the periods ended 12 March 2016 to 6 March 2021.
— The non-audit services prohibited by the FRC’s Ethical Standard were not provided to the Group or the parent company and we remain independent of the group and the parent company in conducting the audit.
— The audit opinion is consistent with the additional report to the audit committee
Use of our reportThis report is made solely to the company’s members, as a body, in accordance with Chapter 3 of Part 16 of the Companies Act 2006. Our audit work has been undertaken so that we might state to the company’s members those matters we are required to state to them in an auditor’s report and for no other purpose. To the fullest extent permitted by law, we do not accept or assume responsibility to anyone other than the company and the company’s members as a body, for our audit work, for this report, or for the opinions we have formed.
Ben Marles (Senior statutory auditor)for and on behalf of Ernst & Young LLP, Statutory AuditorLondon28 April 2021
99Financial Statements J Sainsbury plc Annual Report 2021
Governance ReportStrategic Report
Financial Statements
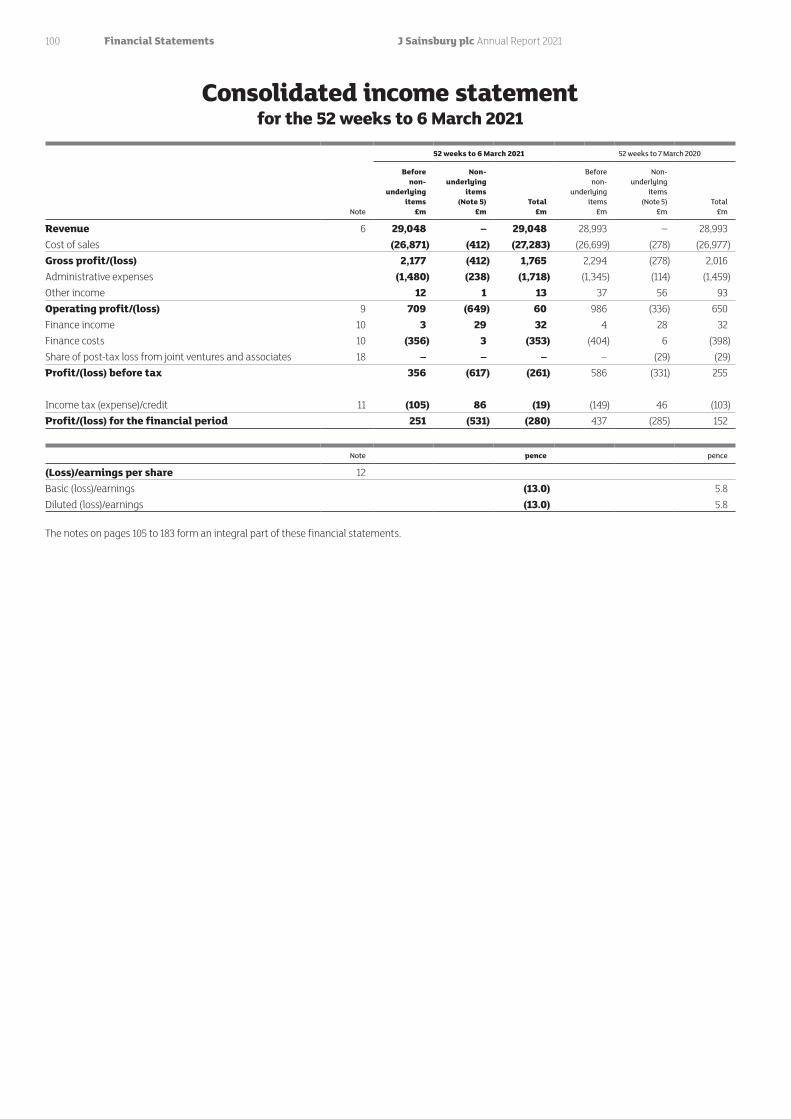
52 weeks to 6 March 2021 52 weeks to 7 March 2020
Note
Before non-
underlying items
£m
Non- underlying
items (Note 5)
£mTotal
£m
Before non-
underlying items
£m
Non- underlying
items (Note 5)
£mTotal
£m
Revenue 6 29,048 – 29,048 28,993 – 28,993Cost of sales (26,871) (412) (27,283) (26,699) (278) (26,977)Gross profit/(loss) 2,177 (412) 1,765 2,294 (278) 2,016Administrative expenses (1,480) (238) (1,718) (1,345) (114) (1,459)Other income 12 1 13 37 56 93Operating profit/(loss) 9 709 (649) 60 986 (336) 650Finance income 10 3 29 32 4 28 32Finance costs 10 (356) 3 (353) (404) 6 (398)Share of post-tax loss from joint ventures and associates 18 – – – – (29) (29)Profit/(loss) before tax 356 (617) (261) 586 (331) 255 Income tax (expense)/credit 11 (105) 86 (19) (149) 46 (103)Profit/(loss) for the financial period 251 (531) (280) 437 (285) 152
Note pence pence
(Loss)/earnings per share 12Basic (loss)/earnings (13.0) 5.8Diluted (loss)/earnings (13.0) 5.8
The notes on pages 105 to 183 form an integral part of these financial statements.
Consolidated income statementfor the 52 weeks to 6 March 2021
100 Financial Statements J Sainsbury plc Annual Report 2021
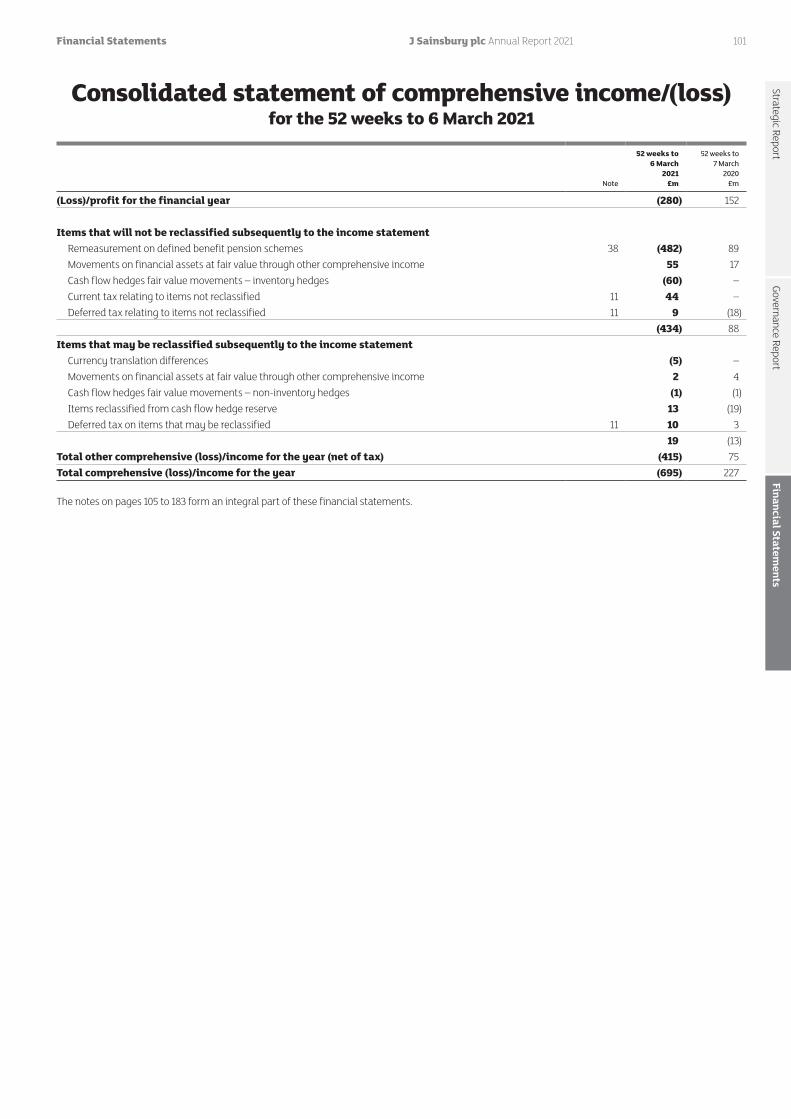
Note
52 weeks to 6 March
2021£m
52 weeks to 7 March
2020£m
(Loss)/profit for the financial year (280) 152 Items that will not be reclassified subsequently to the income statement Remeasurement on defined benefit pension schemes 38 (482) 89 Movements on financial assets at fair value through other comprehensive income 55 17 Cash flow hedges fair value movements – inventory hedges (60) – Current tax relating to items not reclassified 11 44 – Deferred tax relating to items not reclassified 11 9 (18) (434) 88Items that may be reclassified subsequently to the income statement Currency translation differences (5) – Movements on financial assets at fair value through other comprehensive income 2 4 Cash flow hedges fair value movements – non-inventory hedges (1) (1) Items reclassified from cash flow hedge reserve 13 (19) Deferred tax on items that may be reclassified 11 10 3 19 (13)Total other comprehensive (loss)/income for the year (net of tax) (415) 75Total comprehensive (loss)/income for the year (695) 227
The notes on pages 105 to 183 form an integral part of these financial statements.
Consolidated statement of comprehensive income/(loss)for the 52 weeks to 6 March 2021
101Financial Statements J Sainsbury plc Annual Report 2021
Governance ReportStrategic Report
Financial Statements

Note
6 March 2021
£m
7 March 2020
Restated £m
Non-current assets Property, plant and equipment 14 8,587 8,949Right-of-use assets 15 4,747 4,826Intangible assets 16 914 974Investments in joint ventures and associates 18 5 9Financial assets at fair value through other comprehensive income 19 754 972Trade and other receivables 21 50 43Amounts due from Financial Services customers 22 2,280 3,453Derivative financial assets 33 8 6Net retirement benefit surplus 38 744 1,119 18,089 20,351Current assets Inventories 20 1,625 1,732Trade and other receivables 21 725 811Amounts due from Financial Services customers 22 3,127 3,951Financial assets at fair value through other comprehensive income 19 90 82Derivative financial assets 33 5 12Cash and cash equivalents 34 1,477 994 7,049 7,582Assets held for sale 23 24 4 7,073 7,586Total assets 25,162 27,937Current liabilities Trade and other payables 24 (4,488) (4,275)Amounts due to Financial Services customers and other deposits 25 (6,086) (6,890)Borrowings 36 (258) (48)Lease liabilities 15 (524) (510)Derivative financial liabilities 33 (93) (53)Taxes payable (59) (163)Provisions 26 (209) (108) (11,717) (12,047)Net current liabilities (4,644) (4,461)Non-current liabilities Other payables 24 (20) (11)Amounts due to Financial Services customers and other deposits 25 (203) (1,204)Borrowings 36 (748) (1,248)Lease liabilities 15 (5,310) (5,264)Derivative financial liabilities 33 (44) (36)Deferred income tax liability 11 (255) (265)Provisions 26 (261) (89) (6,841) (8,117)Total liabilities (18,558) (20,164)Net assets 6,604 7,773Equity Called up share capital 27 637 634Share premium 27 1,173 1,159Merger reserve 27 568 568Capital redemption reserve 28 680 680Other reserves 28 167 168Retained earnings 30 3,131 4,068Total equity before perpetual securities 6,356 7,277Perpetual capital securities 29 – 248Perpetual convertible bonds 29 248 248Total equity 6,604 7,773
The notes on pages 105 to 183 form an integral part of these financial statements.
The financial statements on pages 100 to 183 were approved by the Board of Directors on 27 April 2021, and are signed on its behalf by:
Simon Roberts Kevin O’ByrneChief Executive Chief Financial Officer
Consolidated balance sheetAt 6 March 2021 and 7 March 2020
102 Financial Statements J Sainsbury plc Annual Report 2021

52 weeks to
6 March 202152 weeks to
7 March 2020
Note £m £m
Cash flows from operating activities (Loss)/Profit before tax (261) 255 Net finance costs 321 366 Share of post-tax loss from joint ventures – 29 Operating profit 60 650 Adjustments for:
Depreciation expense 14, 15 1,113 1,127 Amortisation expense 16 136 129 Net impairment loss on property, plant and equipment, right-of-use assets, intangible assets 14, 15, 16 321 263 Non-cash adjustments arising from acquisitions (1) (2)Financial Services impairment losses on loans and advances 85 80 Loss/(profit) on sale of properties and early termination of leases 9 (17) (56)Share-based payments expense 39 29 37 Defined benefit scheme expenses 38 13 9 Cash contributions to benefit schemes 38 (101) (52)
Operating cash flows before changes in working capital 1,638 2,185 Changes in working capital
Decrease in inventories 117 197 Decrease/(increase) in financial assets at fair value through other comprehensive income 267 (177)Decrease/(increase) in trade and other receivables 62 (129)Decrease/(increase) in amounts due from Financial Services customers and other deposits 1,912 (499)Increase/(decrease) in trade and other payables 321 (195)(Decrease)/increase in amounts due to Financial Services customers and other deposits (1,805) 492 Increase/(decrease) in provisions and other liabilities 273 (8)
Cash generated from operations 2,785 1,866 Interest paid (349) (384)Corporation tax paid (93) (110)Net cash generated from operating activities 2,343 1,372 Cash flows from investing activities Purchase of property, plant and equipment (423) (519)Initial direct costs on new leases (7) (13)Purchase of intangible assets (172) (120)Proceeds from disposal of property, plant and equipment 27 81 Interest received – 2 Dividends and distributions received 18 22 143 Net cash used in investing activities (553) (426)Cash flows from financing activities Proceeds from issuance of ordinary shares 27, 30 17 15 Proceeds from borrowings – 250 Proceeds from short-term borrowings 660 – Repayment of borrowings (289) (169)Repayment of short-term borrowings (660) – Repayment upon maturity of convertible bonds – (450)Repayment of perpetual capital securities (250) – Purchase of own shares 30 (30) (18)Repayment of capital element of lease obligations (501) (420)Repayment of capital element of obligations under hire purchase arrangements – (10)Dividends paid on ordinary shares 13 (232) (247)Dividends paid on perpetual securities 29 (23) (23)Net cash used in financing activities (1,308) (1,072)Net increase/(decrease) in cash and cash equivalents 482 (126)Opening cash and cash equivalents 994 1,120 Closing cash and cash equivalents 34 1,476 994
The notes on pages 105 to 183 form an integral part of these financial statements.
Consolidated cash flow statement for the 52 weeks to 6 March 2021
103Financial Statements J Sainsbury plc Annual Report 2021
Governance ReportStrategic Report
Financial Statements

Note
Called up share capital
£m
Share premium
account£m
Merger reserve
£m
Capital redemption
and other reserves
£m
Retained earnings
£m
Total equity before
perpetual securities
£m
Perpetual capital
securities£m
Perpetual convertible
bonds£m
Total equity
£m
At 8 March 2020 634 1,159 568 848 4,068 7,277 248 248 7,773Loss/(profit) for the period 29, 30 – – – – (287) (287) – 7 (280)Other comprehensive income/(loss) 28, 30 – – – 4 (482) (478) – – (478)Tax relating to other comprehensive
income/(loss)30 – – – (4) 67 63 – – 63
Total comprehensive (loss)/income for the period ended 6 March 2021
– – – – (702) (702) – 7 (695)
Cash flow hedges gains and losses
transferred to inventory28, 33 – – – (1) – (1) – – (1)
Transactions with owners: Dividends 13, 30 – – – – (232) (232) – – (232) Distribution to holders of perpetual
securities29 – – – – – – – (7) (7)
Share-based payment 39 – – – – 29 29 – – 29 Purchase of own shares 30 – – – – (30) (30) – – (30) Allotted in respect of share option
schemes27, 30 3 14 – – – 17 – – 17
Redemption of perpetual capital securities
30 – – – – (2) (2) (248) – (250)
At 6 March 2021 637 1,173 568 847 3,131 6,356 – 248 6,604
At 10 March 2019 630 1,147 568 852 4,089 7,286 248 248 7,782Profit for the period – – – – 129 129 16 7 152Other comprehensive income – – – 1 89 90 – – 90Tax relating to other comprehensive
income/(loss)– – – – (15) (15) – – (15)
Total comprehensive income/(loss) for the period ended 7 March 2020
– – – 1 203 204 16 7 227
Transactions with owners: Dividends – – – – (247) (247) – – (247) Distribution to holders of perpetual
securities – – – – – – (16) (7) (23)
Amortisation of convertible bond equity component
– – – (5) 5 – – – –
Share-based payment – – – – 37 37 – – 37 Purchase of own shares – – – – (18) (18) – – (18) Allotted in respect of share option
schemes 4 12 – – (1) 15 – – 15
Tax on items charged to equity – – – – – – – – –At 7 March 2020 634 1,159 568 848 4,068 7,277 248 248 7,773
The notes on pages 105 to 183 form an integral part of these financial statements.
Consolidated statement of changes in equityfor the 52 weeks to 6 March 2021
104 Financial Statements J Sainsbury plc Annual Report 2021

1 General informationJ Sainsbury plc is a public limited company (the ‘Company’) incorporated in the United Kingdom, whose shares are publicly traded on the London Stock Exchange. The Company is domiciled in the United Kingdom and its registered address is 33 Holborn, London EC1N 2HT, United Kingdom.
The financial year represents the 52 weeks to 6 March 2021 (prior financial year: 52 weeks to 7 March 2020). The consolidated financial statements for the 52 weeks to 6 March 2021 comprise the financial statements of the Company and its subsidiaries (the ‘Group’) and the Group’s share of the post-tax results of its joint ventures and associates.
The Group’s principal activities are Food, General Merchandise and Clothing retailing and Financial Services.
2 Significant accounting policies2.1 Basis of preparationThe Group’s financial statements have been prepared in accordance with International Financial Reporting Standards (IFRSs) adopted pursuant to Regulation (EC) No. 1606/2002 as it applies in the European Union, and also in accordance with international accounting standards in conformity with the requirements of the Companies Act 2006.
The financial statements are presented in sterling, rounded to the nearest million (‘£m’) unless otherwise stated. They have been prepared under the historical cost convention, except for derivative financial instruments, defined benefit pension scheme assets and financial assets at fair value through other comprehensive income that have been measured at fair value.
Sainsbury’s Bank Plc and its subsidiaries have been consolidated for the twelve months to 28 February 2021 being the Bank’s year-end date (prior financial year: 29 February 2020). There have been no significant transactions or events that occurred between this date and the Group’s balance sheet date, and therefore no adjustments have been made to reflect the difference in year-end dates.
Significant accounting policies have been included in the relevant notes to which the policies relate, and those relating to the financial statements as a whole can be read further below. Unless otherwise stated, significant accounting policies have been applied consistently to all periods presented in the financial statements.
In accordance with IAS 1 ‘Presentation of Financial Statements’, within the consolidated statement of comprehensive income the Group presents separately items that will not be subsequently reclassified to the income statement and items that may be subsequently reclassified to the income statement, which includes the fair value movements on effective cash flow hedges. In accordance with IFRS 9 ‘Financial Instruments’, cash flow hedge gains and losses in relation to inventory purchases are recognised as part of the cost of inventory, and therefore the carrying value of inventory is adjusted for the accumulated gains or losses recognised directly in other comprehensive income (a basis adjustment), and then recognised in the income statement when the inventory is sold.
This basis adjustment is not part of other comprehensive income. The Group has therefore separately presented effective fair value movements on inventory hedges and non-inventory hedges within the consolidated statement of comprehensive income and shown the inventory basis adjustments as a separate line within the statement of changes in equity. Comparative period amounts have not been adjusted on the grounds of materiality.
2.2 Going concernThe Directors are satisfied that the Group has sufficient resources to continue in operation for a period of at least 12 months from the date of approval.
Accordingly, they continue to adopt the going concern basis in preparing the financial statements. The assessment period for the purposes of considering going concern is the 12 months to 28 April 2022.
In assessing the Group’s ability to continue as a going concern, the Directors have considered the Group’s most recent corporate planning and budgeting processes. This includes an annual review which considers profitability, the Group’s cash flows, committed funding and liquidity positions and forecasted future funding requirements over three years, with a further two years of indicative movements. The most recent corporate plan was prepared in October 2020, and refreshed in March 2021 as part of the normal budgeting process. This was reviewed by the Operating Board and ultimately by the PLC Board with involvement throughout from both the Chief Financial Officer and Chief Executive.
The Group manages its financing by diversifying funding sources, structuring core borrowings with long-term maturities and maintaining sufficient levels of standby liquidity via the committed Revolving Credit Facility. This seeks to minimise liquidity risk by maintaining a suitable level of undrawn additional funding capacity.
The Revolving Credit Facility is split into two Facilities, a £300 million Facility (A) and a £1,150 million Facility (B). Facility A has a final maturity of April 2025 and Facility B has a final maturity of October 2024. As at 6 March 2021, the Revolving Credit Facility was undrawn. In addition, the Group maintains uncommitted facilities of £195 million to provide additional capacity to fund short-term working capital requirements. The uncommitted facilities were undrawn at 6 March 2021.
In assessing going concern, scenarios in relation to the Group’s principal risks have been considered in line with those disclosed in the viability statement on page 44 by overlaying them into the corporate plan and assessing the impact on cash flows, net debt and funding headroom. These severe but plausible scenarios included modelling the ongoing impact of COVID-19, recognising the degree of uncertainty that continues to exist, the impact of any regulatory fines, failure to deliver planned cost savings and the impact of the UK’s withdrawal from the EU on the Group’s Northern Ireland operations where trade flows have proved more difficult.
In performing the above analysis, the Directors have made certain assumptions around the availability and effectiveness of the mitigating actions available to the Group. These include reducing any non-essential capital expenditure and operating expenditure on projects, bonuses and dividend payments.
As a consequence of the work performed, the Directors considered it appropriate to adopt the going concern basis in preparing the Financial Statements with no material uncertainties to disclose.
2.3 Basis of consolidationa) SubsidiariesSubsidiaries are all entities, including structured entities (see below), over which the Group has control. This is when the Group is exposed to, or has rights to, variable returns from its involvement with the entity and has the ability to affect those returns through its power over the entity. The results of subsidiaries are included in the income statement from the date of acquisition or, in the case of disposals, up to the effective date of disposal. Intercompany transactions and balances between Group companies are eliminated upon consolidation.
Sainsbury’s Property Scottish Partnership, Sainsbury’s Property Scottish Limited Partnership, Sainsbury’s Thistle Scottish Limited Partnership and Nectar 360 Services LLP, are partnerships which are fully consolidated into these Group accounts. The Group has taken advantage of the exemption conferred by Regulation 7 of the Partnerships (‘Accounts’) Regulations 2008 and has therefore not appended the accounts of these qualifying partnerships to these accounts.
Notes to the consolidated financial statements
105Financial Statements J Sainsbury plc Annual Report 2021
Governance ReportStrategic Report
Financial Statements

Significant judgement – Consolidation of structured entitiesSainsbury’s Thistle Scottish Limited Partnership (‘the Partnership’) is a structured entity which the Group fully consolidates.
A structured entity is one in which the Group does not hold the majority interest but for which management has concluded that voting rights are not the dominant factor in deciding who controls the entity. The Partnership, in which both the Group and Pension Scheme Trustee hold an interest, was established following the 2018 triennial valuation of the Group’s defined benefit scheme.
The Group has determined that the relevant activities of the Partnership are the funding of the Scheme and whether the funding targets have been met. Furthermore, a general partner wholly owned by the Group has exclusive responsibility for the management and control of the Partnership and sole authority to exercise the Partnership’s rights. This includes the ability to make additional contributions to the Scheme such that the funding targets are met. As the Group can direct the Partnership’s relevant activities and affect its returns (through reaching the Scheme’s funding targets), it has been concluded that the Group controls the Partnership, despite not having a majority interest. It is therefore consolidated in the Group accounts. Further information is included in note 38.
b) Joint ventures and associatesThe Group applies IFRS 11 to all joint arrangements. Under IFRS 11, investments in joint arrangements are classified as either joint operations or joint ventures depending on the contractual rights and obligations of each investor. The Group has assessed the nature of its joint arrangements and determined them to be joint ventures. Further information is included in note 18.
c) Foreign currenciesThe consolidated financial statements are presented in sterling, which is the ultimate parent company’s functional currency.
Foreign operationsThe Group has operations in Asia that source and purchase certain general merchandise and clothing inventory. In addition the Group has a trading entity in Ireland. On consolidation, assets and liabilities of foreign operations are translated into sterling at year-end exchange rates. The results of foreign operations are translated into sterling at average rates of exchange for the year. Exchange differences arising are recognised in the Group statement of comprehensive income/(loss) and are included in the Group’s translation reserve.
Foreign currency transactionsTransactions denominated in foreign currencies are translated at the exchange rate at the date of the transaction. Monetary assets and liabilities denominated in foreign currencies at the balance sheet date are translated at the exchange rate ruling at that date. Foreign exchange differences arising on translation are recognised in the income statement.
2.4 Amendments to published standards Effective for the Group and Company in these financial statements:The Group has considered the following amendments to published standards that are effective for the Group for the financial year beginning 8 March 2020 and concluded that they are either not relevant to the Group or that they do not have a significant impact on the Group’s financial statements other than disclosures.
— Amendments to References to Conceptual Framework in IFRS Standards — Amendments to IFRS 3 ‘Business Combinations’ on the definition of a business
— Amendments to IAS 1 ‘Presentation of Financial Statements’ and IAS 8 ‘Accounting Policies, Changes in Accounting Estimates and Errors’ on the definition of material
— Amendments to IFRS 9 ‘Financial Instruments’, IAS 39 ‘Financial Instruments: Recognition and Measurement’ and IFRS 7 ‘Financial Instruments: Disclosures’ on the Interest Rate Benchmark Reform
The Group has noted the exemption granted in the ‘COVID-19-related rent concessions’ amendment to IFRS 16 ‘Leases’. This exemption applies for periods commencing on or after 1 June 2020, with an option to early adopt. The Group has elected not to apply the exemption granted as the Group has not received material COVID-19-related rent concessions as a lessee.
Standards and revisions effective for future periods:The following standards and revisions will be effective for future periods:
— Amendments to IFRS 3 ‘Business Combinations’ with reference to the Conceptual Framework
— Amendments to IAS 37 ‘Provisions, Contingent Liabilities and Contingent Assets’ on Onerous Contracts – Cost of Fulfilling a Contract
— Amendments to IAS 16 ‘Property, Plant and Equipment’ on Proceeds before Intended Use
— Amendments to IAS 1 ‘Presentation of Financial Statements’ on the classification of liabilities as current or non-current
— IFRS 17 ‘Insurance Contracts’
The Group has considered the impact of the remaining above standards and revisions and have concluded that they will not have a significant impact on the Group’s financial statements.
Interest Rate Benchmark ReformThe Group applied the Phase 1 amendments to IFRS 9, IAS 39, IFRS 7, IFRS 4 and IFRS 16 which became effective from 1 January 2020 and early adopted the Phase 2 amendments from 8 March 2020 retrospectively. However, in accordance with exceptions provided in the Phase 2 amendments, the Group has elected not to restate the prior period to reflect the application of these amendments, including not providing additional disclosures for 2020. There is no impact on opening equity balances as a result of retrospective application.
Both Phase 1 and Phase 2 are relevant to the Group because it applies hedge accounting to its interest rate benchmark exposures. The Group has no variable lease payments that are linked to LIBOR.
The Phase 1 amendments provided reliefs that may otherwise have resulted in the Group no longer being able to apply hedge accounting for certain hedge relationships as a result of uncertainties arising from the LIBOR benchmark reform. As a result of the reliefs the Group was able to continue existing hedge accounting whilst implementing its LIBOR to SONIA transition project.
The Phase 2 amendments to IFRS 9 provide a series of reliefs from certain hedge accounting requirements when a change required by interest rate benchmark reform occurs to a hedged item and/or hedging instrument and consequently the hedge relationship can be continued without any interruption. Further information is included in note 33.
3 Alternative performance measures (APMs)In the reporting of financial information, the Directors use various APMs. These APMs should be considered in addition to, and are not intended to be a substitute for, IFRS measurements. As they are not defined by International Financial Reporting Standards, they may not be directly comparable with other companies’ APMs.
3.1 Purpose of APMsThe Directors believe that these APMs provide additional useful information for understanding the financial performance and health of the Group. They are also used to enhance the comparability of information between reporting periods (such as like-for-like sales and underlying profit) by adjusting for non-recurring or uncontrollable factors which affect IFRS measures, to aid users in understanding the Group’s performance.
Consequently, APMs are used by the Directors and management for performance analysis, planning, reporting and incentive setting purposes.
The APMs that the Group has focused on in the period are detailed on page 194. All of the APMs relate to the current period’s results and comparative periods.
3.2 Changes to APMsThe following APMs have been updated during the period:
— Like-for-like sales: The impact on sales of stores which were temporarily closed due to COVID-19 have been included within like-for-like sales. During the year due to temporary store closures as a result of the
2 Significant accounting policies continued
106 Financial Statements J Sainsbury plc Annual Report 2021

COVID-19 pandemic there has been a material increase in digital sales. It is not possible to calculate the exact transfer of sales from temporarily closed stores to online as a result of the pandemic therefore the like-for-like definition has been adjusted to include temporary store closures as a result of COVID-19. Only permanently closed sites and those temporarily closed for non COVID-19 related reasons are excluded from like-for-like sales.
— Net cash generated from retail operations (per Financial Review): The presentation of the summary cash flow statement on page 103 has been modified to provide useful additional information of the build from Retail underlying operating profit.
— Earnings before interest, tax, depreciation and amortisation (EBITDA): Following the adoption of IFRS16, EBITDA and EBITDAR (earnings before interest, tax, depreciation, amortisation and rent) are broadly consistent measures. Therefore EBITDA is now being disclosed instead of EBITDAR.
4 Significant accounting judgements, estimates and assumptions The preparation of financial statements requires the use of judgements, estimates and assumptions that affect the reported amounts of assets and liabilities at the date of the financial statements and the reported amounts of revenues and expenses during the reporting period. Those which are significant to the Group are discussed separately below:
JudgementsIn the process of applying the Group’s accounting policies, management has made the following judgements, which have the most significant effect on the amounts recognised in the consolidated financial statements:
— Consolidation of structured entities – refer to note 2.3 — Non-underlying items – refer to note 5 — Aggregation of operating segments – refer to note 7 — Lease term – refer to note 15
Sources of estimation uncertaintyThe areas where estimates and assumptions are significant to the financial statements are as listed below. The estimates and associated assumptions are based on historical experience and various other factors that are believed to be reasonable under the circumstances, the results of which form the basis of making the judgements about carrying values of assets and liabilities that are not readily apparent from other sources. Actual results may differ from these estimates.
— Nectar accounting (breakage estimates) – refer to note 6 — Effective interest rates on Financial Services loans and receivables – refer to note 6
— Lease liabilities (derivation of discount rates) – refer to note 15 — Impairment of non-financial assets – refer to note 17 — Provisions – refer to note 26 — Impairment of Financial Services loans and advances – refer to note 31 — Post-employment benefits (assets and liabilities) – refer to note 38
The following estimates, which were disclosed as key estimates in the prior year financial statements, are no longer deemed to be key estimates:
— Supplier arrangements – Supplier incentives, rebates and discounts are inherently mechanical in nature. The Group has moved away from volume-based supplier arrangements and therefore this is no longer a source of estimation uncertainty. Equally, agreements in relation to fixed amounts and marketing and advertising income are sufficiently detailed to significantly reduce the degree of estimation required to be applied by the Group. Therefore, supplier arrangements are no longer deemed to be a significant estimate.
— Inventory – Estimates are used in the calculation of inventory provisions including those for obsolete, slow moving stock and waste. However, any reasonably possible changes in the estimates applied in calculating these provisions would not have a material impact on the provisions recognised. Furthermore, the provisions recognised in cases where the expected net realisable value of inventory is lower than its carrying amount are calculated using actual sales price and cost price data,
and therefore minimal estimation is applied in the calculation of the provisions. Therefore, inventory provisioning is no longer deemed to be a significant estimate.
— Determining fair values – Details of the financial assets and liabilities held at fair value in the Group’s financial statements are included in note 32. The majority of the Group’s financial assets and liabilities are classified as Level 1 or 2, and therefore fair values are derived from quoted market prices or other observable inputs, and therefore no estimation is required. The Level 3 financial assets predominantly represent the Group’s beneficial interest in a commercial property investment pool, the fair value for which is based on discounted cash flows discounted at the Group’s weighted average cost of capital. The estimates included are therefore in relation to growth rates and the discount rate. Sensitivities are included in note 32, however, any reasonably possible changes in the key assumptions used in the valuation would not result in a material impact on the fair value of the assets. Therefore, the determination of fair values is no longer deemed a source of significant estimation uncertainty.
5 Profit before non-underlying items In order to provide shareholders with additional insight into the underlying performance of the business, certain items are excluded from the Group’s underlying results and presented as ‘profit before non-underlying items’ on the face of the income statement. This is consistent with how the performance of the Group is reviewed by management. Determining which items are to be adjusted requires judgement, and considers both the nature and scale of the item, as well as the circumstances surrounding it. Reversals of prior non-underlying items are considered based on the same criteria.
Profit before non-underlying items is not defined by International Financial Reporting Standards and is one of the APMs used by the Group (see page 106). Therefore it may not be directly comparable with adjusted measures of other companies.
The most significant non-underlying items in the current year relate to restructuring programmes, impairment charges and income relating to the Supreme Court ruling on ATM business rates. More details on each are included further below.
The Group has also excluded the following items from underlying profit: — Financial Services transition – multi-year costs incurred in transitioning to a new, more flexible banking platform as part of the previously announced New Bank Programme. These principally comprise contractor and service provider costs relating to the migration of data and other services to the Bank’s new infrastructure and operating model.
— Profit or loss on disposal of properties – such disposals are not part of the Group’s underlying business.
— Investment property fair value movements – these reflect the difference between the fair value of an investment property at the reporting date and its carrying amount at the previous reporting date and are held within the property JVs. The valuations are impacted by external market factors and can therefore vary significantly year-on-year.
— Perpetual securities coupons – these are accounted for as equity in line with IAS 32 ‘Financial Instruments: Presentation’, however are accrued on a straight-line basis and included as an expense within underlying profit as they are included by management when assessing Group borrowings.
— Non-underlying finance movements – these include fair value remeasurements on derivatives not in a hedging relationship. The fair value measurements are impacted by external market factors and can fluctuate significantly year-on-year. Lease interest on impaired non-trading sites, including site closures, is excluded from underlying profit as those sites do not contribute to the underlying business.
— IAS 19 pension interest and expenses include the financing element and scheme expenses of the Group’s defined benefit scheme. These are reported outside underlying profit as they no longer relate to the Group’s ongoing activities following closure of the scheme to future accrual.
— Acquisition adjustments – these reflect the adjustments arising from acquisitions including the fair value unwind and amortisation of acquired intangibles.
2 Significant accounting policies continued
107Financial Statements J Sainsbury plc Annual Report 2021
Governance ReportStrategic Report
Financial Statements

The Group has not included any additional costs incurred or credits received directly in relation to the impacts of COVID-19 within non-underlying items. Whilst some items (such as additional expenses incurred protecting colleagues and customers) are discrete and can be separately quantified, others, such as incremental food sales, cannot be reliably disaggregated from the Group’s underlying performance. The Group has therefore concluded that presenting some movements as underlying and others as non-underlying would give an imbalanced view that is not easily comparable to past and subsequent periods. In addition, the repayment of business rates relief announced in December 2020 has also been treated as underlying, due to being a cost that would have been incurred in an ordinary trading year.
Cost of sales
£m
Administrative expenses
£m
Other income
£m
Net finance income/
(costs) £m
Total adjustments
before tax £m
Tax £m
Total adjustments
£m
Restructuring programmes (342) (81) – – (423) 76 (347)Impairment of non-financial assets (112) (108) – – (220) 33 (187)Financial Services transition and other – (17) – – (17) 3 (14)Total restructuring, impairment and integration (454) (206) – – (660) 112 (548) Property, finance, pension and
acquisition adjustments
ATM business rates reimbursement 42 – – – 42 (8) 34 Profit on disposal of properties – – 1 – 1 7 8Perpetual securities coupons – – – 14 14 – 14Non-underlying finance movements – – – (1) (1) – (1)IAS 19 pension (expenses)/income – (13) – 19 6 (1) 5Acquisition adjustments – (19) – – (19) 4 (15)Total property, finance, pension and
acquisition adjustments42 (32) 1 32 43 2 45
Tax adjustments Derecognition of capital losses – – – – – (28) (28)
Total adjustments (412) (238) 1 32 (617) 86 (531)
Restructuring programmesDuring the financial period, it has been agreed to accelerate the structural integration of Sainsbury’s and Argos and further simplify the Argos business model. As a result, around 420 Argos stores will be closed by March 2024, leaving the total number of UK standalone stores at around 100. To support this, a total of 32 Local Fulfilment Centres will be built across the UK that will operate the Group’s fast track delivery operations, delivering to customers’ homes and to Argos stores and collection points across the country.
In addition, the Group is creating a new supply chain and logistics operating model, moving to a single integrated supply chain and logistics network across Sainsbury’s and Argos. As a result of this, a number of existing depots are closing. Further, the Group has reviewed its Store Support Centre ways of working and as a result is reducing its office space.
Further opportunities to rationalise the Group’s supermarkets, and convenience estate have been identified, building on last year’s property strategy programme that was announced at the Capital Markets Day in September 2019. At that time it was communicated that 10 to 15 supermarkets and 30 to 40 convenience stores would close. It is now expected that 15 to 20 supermarkets and 55 to 65 convenience stores will close or be sold.
Costs totalling £423 million have been recognised in the period in relation to the above and comprise the following:
£m
Write downs of property, plant and equipment 26Write downs of leased assets 72Write downs of intangible assets 3Closure provisions 240Accelerated depreciation of assets 27Redundancy provisions 61Consultancy costs 10Gain on lease terminations (16)
423
Closure provisions relate to onerous contract costs, dilapidations and strip out costs on leased sites. Onerous contract costs have been recognised where sites are forecast to close before the end of the contractual lease term, and relate to the unavoidable costs that the business will incur by virtue of remaining in a lease, such as service charges, insurance and security.
The remaining useful economic lives of corresponding sites have been reassessed to align with closure dates, resulting in an acceleration in depreciation of these assets. The existing depreciation of these assets (depreciation that would have been recognised absent of a closure decision) is recognised within underlying expenses, whereas accelerated depreciation above this is recognised within non-underlying expenses.
Gains on lease terminations relate to sites impaired in the prior year for which it has been negotiated to exit the leases before the contractual end date.
5 Profit before non-underlying items continued
108 Financial Statements J Sainsbury plc Annual Report 2021

With regards to the above restructuring and impairment charges, the costs incurred arise as a result of implementing changes for the future to evolve and reshape the business. They are therefore different in nature to the COVID-19-related income and costs that were incurred to maintain business as usual activity and which have been reported within underlying profit.
As the costs incurred facilitate future underlying cost savings, it was considered whether it was appropriate to report these costs within underlying profit. Whilst they arise from changes in the Group’s underlying operations, they can be separately identified, are material in size and do not relate to ordinary in-year trading activity. In addition, the areas being closed or restructured no longer relate to the Group’s remaining underlying operations and their exclusion provides meaningful comparison between financial years.
Impairment of non-financial assetsIn addition to the above, in line with IAS 36 ‘Impairment of Non-financial Assets’, the Group is required to assess whether there is any indication that an asset (or cash-generating unit (CGU)) may be impaired (i.e. its carrying amount may be higher than its recoverable amount).
The COVID-19 pandemic has resulted in changes to customer shopping habits, patterns and sources of finance. Despite this, the Group has proved resilient through the pandemic, with higher grocery sales growth helping to offset the additional in-store costs. However the changes in customer behaviour have led to an acceleration of the Group’s structural integration of Sainsbury’s and Argos during the period and through this, a review of the economic performance of the Group’s assets has been performed as a result of store rationalisation, changes in channel mix, and changes in customer borrowing and cash usage behaviour. This has been deemed an indicator of impairment and a full impairment review has therefore been performed covering both Retail and Financial Services non-financial assets.
An impairment charge of £220 million has been recognised in the period and comprises:
£m
Impairment of property, plant and equipment 62Impairment of leased assets 65Impairment of intangible assets 93
220
Of the total charge of £220 million, £105 million is in relation to assets within the Financial Services segment, with the remaining £115 million within the Retail segment. Further details of the impairment charge are included within note 17.
Financial Services transition These predominantly comprise Financial Services transition costs and were incurred in transitioning to new banking platforms as part of the previously announced New Bank Programme. These principally comprise contractor and service provider costs relating to the migration of data and other services to the Bank’s new infrastructure and operating model.
ATM business rates reimbursement£42 million of income is due to be received (of which £27 million has been received as at 6 March 2021) from the Valuation Office following the Supreme Court’s ruling that ATMs outside stores should not be assessed for additional business rates on top of normal store rates.
Property, finance, pension and acquisition adjustments — Profit on disposal of properties for the financial period comprised £1 million for the Group and £nil for the joint ventures. — The coupons on the perpetual subordinated capital securities and the perpetual subordinated convertible bonds are accounted for as equity in line with IAS 32 ‘Financial Instruments: Presentation’, however are accrued on a straight-line basis and included as an expense within underlying profit before tax. During the year, the perpetual capital securities were redeemed.
— Non-underlying finance movements for the financial year comprised £(1) million for the Group and £nil for the joint ventures. These are presented separately in note 10.
— Defined benefit pension interest and expenses comprises pension finance income of £19 million and scheme expenses of £(13) million (see note 38). — Acquisition adjustments of £(19) million reflect the unwind of non-cash fair value adjustments arising from Home Retail Group and Nectar UK acquisitions and are recognised as follows:
52 weeks to 6 March 2021 52 weeks to 7 March 2020
Argos
£mNectar
£mTotal Group
£mArgos
£mNectar
£mTotal Group
£m
Cost of sales 1 – 1 2 – 2 Depreciation 4 – 4 (2) – (2)Amortisation (18) (6) (24) (18) (8) (26) (13) (6) (19) (18) (8) (26)
5 Profit before non-underlying items continued
109Financial Statements J Sainsbury plc Annual Report 2021
Governance ReportStrategic Report
Financial Statements
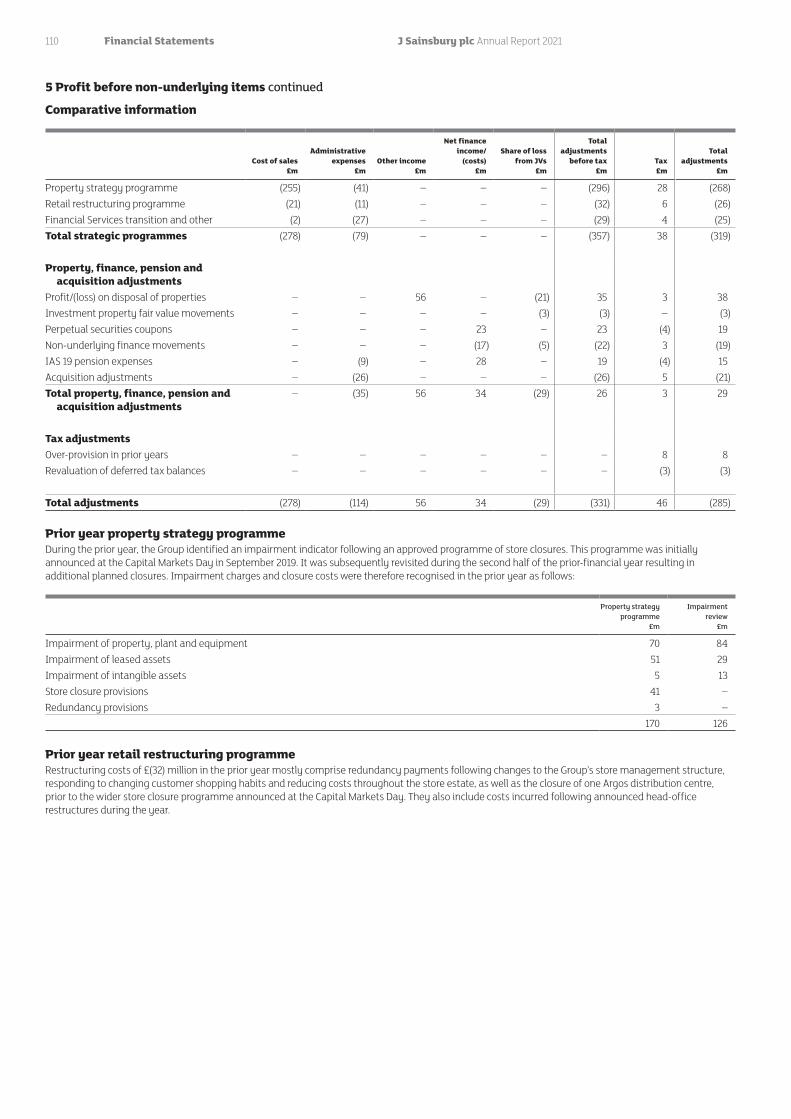
Comparative information
Cost of sales£m
Administrative expenses
£mOther income
£m
Net finance income/
(costs)£m
Share of loss from JVs
£m
Total adjustments
before tax£m
Tax£m
Total adjustments
£m
Property strategy programme (255) (41) – – – (296) 28 (268)Retail restructuring programme (21) (11) – – – (32) 6 (26)Financial Services transition and other (2) (27) – – – (29) 4 (25)Total strategic programmes (278) (79) – – – (357) 38 (319) Property, finance, pension and
acquisition adjustments
Profit/(loss) on disposal of properties – – 56 – (21) 35 3 38 Investment property fair value movements – – – – (3) (3) – (3)Perpetual securities coupons – – – 23 – 23 (4) 19 Non-underlying finance movements – – – (17) (5) (22) 3 (19)IAS 19 pension expenses – (9) – 28 – 19 (4) 15 Acquisition adjustments – (26) – – – (26) 5 (21)Total property, finance, pension and
acquisition adjustments– (35) 56 34 (29) 26 3 29
Tax adjustments Over-provision in prior years – – – – – – 8 8 Revaluation of deferred tax balances – – – – – – (3) (3) Total adjustments (278) (114) 56 34 (29) (331) 46 (285)
Prior year property strategy programme During the prior year, the Group identified an impairment indicator following an approved programme of store closures. This programme was initially announced at the Capital Markets Day in September 2019. It was subsequently revisited during the second half of the prior-financial year resulting in additional planned closures. Impairment charges and closure costs were therefore recognised in the prior year as follows:
Property strategy programme
£m
Impairment review
£m
Impairment of property, plant and equipment 70 84Impairment of leased assets 51 29Impairment of intangible assets 5 13Store closure provisions 41 –Redundancy provisions 3 –
170 126
Prior year retail restructuring programmeRestructuring costs of £(32) million in the prior year mostly comprise redundancy payments following changes to the Group’s store management structure, responding to changing customer shopping habits and reducing costs throughout the store estate, as well as the closure of one Argos distribution centre, prior to the wider store closure programme announced at the Capital Markets Day. They also include costs incurred following announced head-office restructures during the year.
5 Profit before non-underlying items continued
110 Financial Statements J Sainsbury plc Annual Report 2021
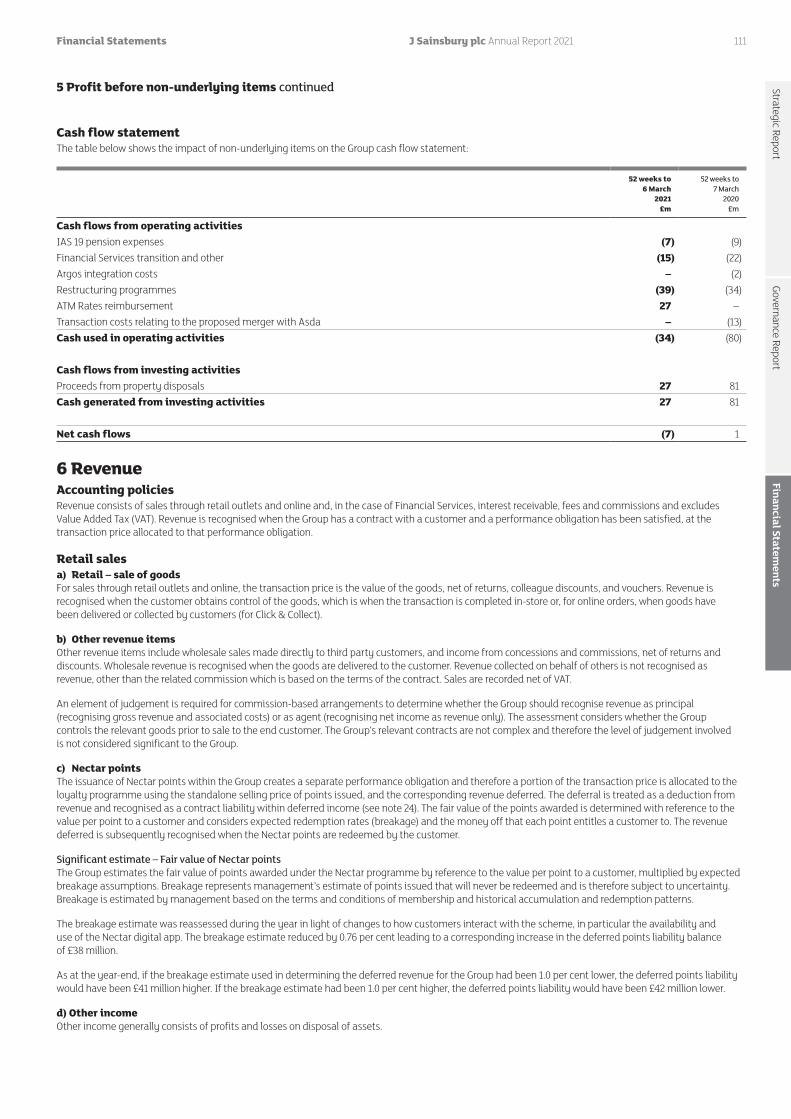
Cash flow statement The table below shows the impact of non-underlying items on the Group cash flow statement:
52 weeks to 6 March
2021 £m
52 weeks to 7 March
2020 £m
Cash flows from operating activities IAS 19 pension expenses (7) (9)Financial Services transition and other (15) (22)Argos integration costs – (2)Restructuring programmes (39) (34)ATM Rates reimbursement 27 –Transaction costs relating to the proposed merger with Asda – (13)Cash used in operating activities (34) (80) Cash flows from investing activities Proceeds from property disposals 27 81 Cash generated from investing activities 27 81 Net cash flows (7) 1
6 RevenueAccounting policies Revenue consists of sales through retail outlets and online and, in the case of Financial Services, interest receivable, fees and commissions and excludes Value Added Tax (VAT). Revenue is recognised when the Group has a contract with a customer and a performance obligation has been satisfied, at the transaction price allocated to that performance obligation.
Retail salesa) Retail – sale of goodsFor sales through retail outlets and online, the transaction price is the value of the goods, net of returns, colleague discounts, and vouchers. Revenue is recognised when the customer obtains control of the goods, which is when the transaction is completed in-store or, for online orders, when goods have been delivered or collected by customers (for Click & Collect).
b) Other revenue itemsOther revenue items include wholesale sales made directly to third party customers, and income from concessions and commissions, net of returns and discounts. Wholesale revenue is recognised when the goods are delivered to the customer. Revenue collected on behalf of others is not recognised as revenue, other than the related commission which is based on the terms of the contract. Sales are recorded net of VAT.
An element of judgement is required for commission-based arrangements to determine whether the Group should recognise revenue as principal (recognising gross revenue and associated costs) or as agent (recognising net income as revenue only). The assessment considers whether the Group controls the relevant goods prior to sale to the end customer. The Group’s relevant contracts are not complex and therefore the level of judgement involved is not considered significant to the Group.
c) Nectar pointsThe issuance of Nectar points within the Group creates a separate performance obligation and therefore a portion of the transaction price is allocated to the loyalty programme using the standalone selling price of points issued, and the corresponding revenue deferred. The deferral is treated as a deduction from revenue and recognised as a contract liability within deferred income (see note 24). The fair value of the points awarded is determined with reference to the value per point to a customer and considers expected redemption rates (breakage) and the money off that each point entitles a customer to. The revenue deferred is subsequently recognised when the Nectar points are redeemed by the customer.
Significant estimate – Fair value of Nectar pointsThe Group estimates the fair value of points awarded under the Nectar programme by reference to the value per point to a customer, multiplied by expected breakage assumptions. Breakage represents management’s estimate of points issued that will never be redeemed and is therefore subject to uncertainty. Breakage is estimated by management based on the terms and conditions of membership and historical accumulation and redemption patterns.
The breakage estimate was reassessed during the year in light of changes to how customers interact with the scheme, in particular the availability and use of the Nectar digital app. The breakage estimate reduced by 0.76 per cent leading to a corresponding increase in the deferred points liability balance of £38 million.
As at the year-end, if the breakage estimate used in determining the deferred revenue for the Group had been 1.0 per cent lower, the deferred points liability would have been £41 million higher. If the breakage estimate had been 1.0 per cent higher, the deferred points liability would have been £42 million lower.
d) Other incomeOther income generally consists of profits and losses on disposal of assets.
5 Profit before non-underlying items continued
111Financial Statements J Sainsbury plc Annual Report 2021
Governance ReportStrategic Report
Financial Statements

Financial Servicesa) Interest incomeInterest income is recognised in the income statement for all instruments measured at amortised cost using the effective interest method. This calculation takes into account all amounts that are integral to the yield as well as incremental transaction costs.
The effective interest rate of a financial asset is calculated on initial recognition and is applied to the gross carrying amount of the asset. For financial assets that have become credit-impaired subsequent to initial recognition, interest income is calculated by applying the effective interest rate to the amortised cost of the financial asset net of impairment. If the asset is no longer credit impaired, then the calculation of interest income reverts to the gross basis.
Significant estimate – effective interest ratesIn calculating the effective interest rate of a financial instrument the Group takes into account all amounts that are integral to the yield of a financial instrument as well as incremental transaction costs. In the case of loans and advances to customers significant judgement is applied in estimating the effect of various factors, including future customer transactional and repayment behaviours, on future cash flows.
Estimates are based on historical experience from similar product types. Management considers that the most material judgement is the estimated life of credit card balances which is a maximum of 60 months. To the extent that estimated life differs by +/- 12 months, the value of loans and advances to customers on the balance sheet would be £7 million higher or £8 million lower respectively.
b) Fees and commission incomeFees and commissions that are not integral to the effective interest rate calculation relate primarily to certain credit card and storecard fees, ATM interchange fees, insurance introduction commission and warranty commission receivable. These are recognised in the income statement on an accruals basis as performance obligations are satisfied. Where in the case of insurance commissions the income comprises an initial commission and profit share, both are recognised on completion of the service to the extent reliably measurable. Where there is a risk of potential clawback, an appropriate element of the commission receivable is deferred and amortised over the clawback period.
Margin from the sale of travel money, representing the difference between the cost price and the selling price, is recognised when the sale to the customer takes place within other operating income.
2021 £m
2020 £m
Grocery and General Merchandise & Clothing (GM&C) 26,103 24,296Fuel 2,514 4,128Total retail sales 28,617 28,424
Financial Services interest receivable 344 405Financial Services fees and commission 87 164Total Financial Services income 431 569
Total revenue 29,048 28,993
Financial Services interest receivable includes £344 million (2020: £405 million) recognised using the effective interest rate method.
7 Segment reportingBackgroundManagement has determined the operating segments based on the information provided to the Operating Board (the Chief Operating Decision Maker for the Group) to make operational decisions on the management of the Group. Three operating segments were identified as follows:
— Retail – Food — Retail – General Merchandise and Clothing — Financial Services
Significant judgement – aggregation of operating segmentsManagement has considered the economic characteristics, in particular average gross margin, similarity of products, production processes, customers, sales methods and regulatory environment of its two Retail segments. In doing so it has been concluded that they should be aggregated into one ‘Retail’ segment in the financial statements. This aggregated information provides users the financial information needed to evaluate the business and the environment in which it operates.
The Operating Board assesses the performance of all segments on the basis of underlying profit before tax. Underlying profit before tax is an APM as described in note 3. All material operations and assets are in the UK.
Segment results, assets and liabilities include items directly attributable to a segment as well as those that can be allocated on a reasonable basis. Segment capital expenditure is the total cost incurred during the period to acquire segment assets that are expected to be used for more than one period.
Segment revenue presents a disaggregation of revenue from customers consistent with the Group’s primary revenue streams.
6 Revenue continued
112 Financial Statements J Sainsbury plc Annual Report 2021

Income statement and balance sheet
52 weeks to 6 March 2021Retail
£m
Financial Services
£mGroup
£m
Segment revenue Retail sales to external customers 28,617 – 28,617 Financial Services to external customers – 431 431 Revenue 28,617 431 29,048 Underlying operating profit/(loss) 730 (21) 709 Underlying finance income 3 – 3 Underlying finance costs (356) – (356)Underlying share of post tax profit from joint ventures and associates – – –Underlying profit/(loss) before tax 377 (21) 356Non-underlying expense (note 5) (617)Loss before tax (261)Income tax expense (note 11) (19)Loss for the financial period (280) Assets 17,637 7,520 25,157 Investment in joint ventures and associates 5 – 5Segment assets 17,642 7,520 25,162 Segment liabilities (11,940) (6,618) (18,558) Other segment items Additions to non-current assets Property, plant and equipment 419 – 419 Intangible assets 145 27 172 Right-of-use assets 542 – 542Depreciation expense1
Property, plant and equipment 627 2 629 Right-of-use assets 483 1 484 Amortisation expense2
Intangible assets 116 20 136Impairment charges 216 105 321Restructuring charges 322 – 322Share based payments 26 3 29 1 Depreciation within the Retail segment includes a £(4) million credit in relation to the unwind of fair value adjustments recognised on acquisition of HRG. 2 Amortisation within the Retail segment includes a £24 million charge in relation to the unwind of fair value adjustments recognised on acquisition of HRG and Nectar UK.
7 Segment reporting continued
113Financial Statements J Sainsbury plc Annual Report 2021
Governance ReportStrategic Report
Financial Statements

52 weeks to 7 March 2020Retail
£m
Financial Services
£mGroup
£m
Segment revenue Retail sales to external customers 28,424 – 28,424
Financial Services to external customers – 569 569Underlying revenue 28,424 569 28,993Revenue 28,424 569 28,993
Underlying operating profit 938 48 986Underlying finance income 4 – 4
Underlying finance costs (404) – (404)
Underlying share of post-tax profit from joint ventures and associates – – –Underlying profit before tax 538 48 586
Non-underlying expense (note 5) (331)Profit before tax 255Income tax expense (note 11) (103)Profit for the financial period 152
Assets 18,463 9,465 27,928
Investment in joint ventures and associates 9 – 9Segment assets 18,472 9,465 27,937Segment liabilities (11,738) (8,426) (20,164)
Other segment items
Additions to non-current assets Property, plant and equipment 527 1 528 Intangible assets 88 36 124 Right-of-use assets 406 – 406Depreciation expense1
Property, plant and equipment 627 7 634 Right-of-use assets 492 1 493Amortisation expense2
Intangible assets 106 23 129Impairment charges 257 6 263Restructuring charges 44 – 44Share-based payments 34 3 37
1 Depreciation within the Retail segment includes a £2 million charge in relation to the unwind of fair value adjustments recognised on acquisition of HRG and Nectar UK.2 Amortisation expense within the Retail segment includes £26 million charge in relation to the unwind of fair value adjustments recognised on acquisition of HRG and Nectar UK.
Geographical segmentsThe Group trades predominantly in the UK and the Republic of Ireland and consequently the majority of revenues, capital expenditure and segment net assets arise there. The profits, turnover and assets of the businesses in the Republic of Ireland are not material to the Group.
7 Segment reporting continued
114 Financial Statements J Sainsbury plc Annual Report 2021

Cash flow 52 weeks to 6 March 2021 52 weeks to 7 March 2020
APM reference
Retail £m
Financial Services
£mGroup
£mRetail
£m
Financial Services
£mGroup
£m
(Loss)/Profit before tax (114) (147) (261) 235 20 255Net finance costs 321 – 321 363 3 366Share of post-tax loss from joint ventures and associates – – – 29 – 29Operating profit 207 (147) 60 627 23 650Adjustments for: Depreciation and amortisation expense 1,226 23 1,249 1,225 31 1,256Net impairment charge on property, plant and equipment,
right-of-use assets and intangible assets 216 105 321 257 6 263
Non-cash adjustments arising from acquisitions (1) – (1) (2) – (2)Financial Services impairment losses on loans and advances – 85 85 – 80 80(Profit)/loss on sale of properties and early termination of leases (19) 2 (17) (56) – (56)Share-based payments expense 26 3 29 34 3 37Non-cash defined benefit scheme expenses 13 – 13 9 – 9Cash contributions to defined benefit scheme (101) – (101) (52) – (52)Operating cash flows before changes in working capital 1,567 71 1,638 2,042 143 2,185Movements in working capital Movements in working capital 708 439 1,147 (71) (248) (319)Cash generated from operations 2,275 510 2,785 1,971 (105) 1,866Interest paid a (349) – (349) (384) – (384)Corporation tax (paid)/received (94) 1 (93) (113) 3 (110)Net cash generated/(used) from operating activities 1,832 511 2,343 1,474 (102) 1,372Cash flows from investing activitiesPurchase of property, plant and equipment (423) – (423) (517) (2) (519)Initial direct costs on new leases (7) – (7) (13) – (13)Purchase of intangible assets (145) (27) (172) (82) (38) (120)Proceeds from disposal of property, plant and equipment 27 – 27 81 – 81Interest received a – – – 2 – 2Dividends and distributions received e 22 – 22 143 – 143Net cash used in investing activities (526) (27) (553) (386) (40) (426)Cash flows from financing activities Proceeds from issuance of ordinary shares d 17 – 17 15 – 15Proceeds from borrowings c – – – 250 – 250Proceeds from short-term borrowings c 660 – 660 – – –Repayment of borrowings c (289) – (289) (169) – (169)Repayment of short-term borrowings c (660) – (660) – – –Repayment upon maturity of convertible bonds c – – – (450) – (450)Repayment of perpetual capital securities c (250) – (250) – – –Purchase of own shares d (30) – (30) (18) – (18)Repayment of capital element of obligations under lease liabilities b (499) (2) (501) (419) (1) (420)Repayment of capital element of obligations under hire purchase agreements c – – – (10) – (10)Dividends paid on ordinary shares (232) – (232) (247) – (247)Dividends paid on perpetual securities a (23) – (23) (23) – (23)Net cash used in financing activities (1,306) (2) (1,308) (1,071) (1) (1,072)
Bank capital injections – – – (35) 35 –Net cash (used in)/generated from intra group funding – – – (35) 35 –Net increase/(decrease) in cash and cash equivalents – 482 482 (18) (108) (126)
7 Segment reporting continued
115Financial Statements J Sainsbury plc Annual Report 2021
Governance ReportStrategic Report
Financial Statements
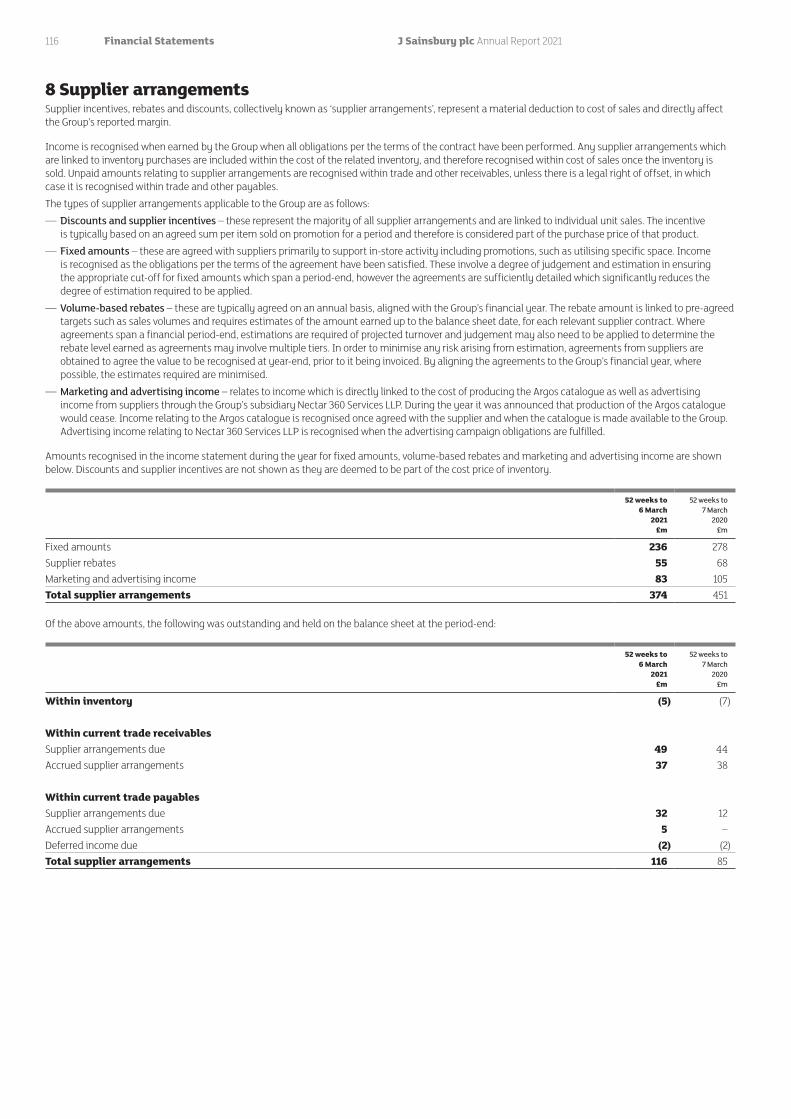
8 Supplier arrangementsSupplier incentives, rebates and discounts, collectively known as ‘supplier arrangements’, represent a material deduction to cost of sales and directly affect the Group’s reported margin.
Income is recognised when earned by the Group when all obligations per the terms of the contract have been performed. Any supplier arrangements which are linked to inventory purchases are included within the cost of the related inventory, and therefore recognised within cost of sales once the inventory is sold. Unpaid amounts relating to supplier arrangements are recognised within trade and other receivables, unless there is a legal right of offset, in which case it is recognised within trade and other payables.The types of supplier arrangements applicable to the Group are as follows:
— Discounts and supplier incentives – these represent the majority of all supplier arrangements and are linked to individual unit sales. The incentive is typically based on an agreed sum per item sold on promotion for a period and therefore is considered part of the purchase price of that product.
— Fixed amounts – these are agreed with suppliers primarily to support in-store activity including promotions, such as utilising specific space. Income is recognised as the obligations per the terms of the agreement have been satisfied. These involve a degree of judgement and estimation in ensuring the appropriate cut-off for fixed amounts which span a period-end, however the agreements are sufficiently detailed which significantly reduces the degree of estimation required to be applied.
— Volume-based rebates – these are typically agreed on an annual basis, aligned with the Group’s financial year. The rebate amount is linked to pre-agreed targets such as sales volumes and requires estimates of the amount earned up to the balance sheet date, for each relevant supplier contract. Where agreements span a financial period-end, estimations are required of projected turnover and judgement may also need to be applied to determine the rebate level earned as agreements may involve multiple tiers. In order to minimise any risk arising from estimation, agreements from suppliers are obtained to agree the value to be recognised at year-end, prior to it being invoiced. By aligning the agreements to the Group’s financial year, where possible, the estimates required are minimised.
— Marketing and advertising income – relates to income which is directly linked to the cost of producing the Argos catalogue as well as advertising income from suppliers through the Group’s subsidiary Nectar 360 Services LLP. During the year it was announced that production of the Argos catalogue would cease. Income relating to the Argos catalogue is recognised once agreed with the supplier and when the catalogue is made available to the Group. Advertising income relating to Nectar 360 Services LLP is recognised when the advertising campaign obligations are fulfilled.
Amounts recognised in the income statement during the year for fixed amounts, volume-based rebates and marketing and advertising income are shown below. Discounts and supplier incentives are not shown as they are deemed to be part of the cost price of inventory.
52 weeks to 6 March
2021£m
52 weeks to 7 March
2020£m
Fixed amounts 236 278 Supplier rebates 55 68 Marketing and advertising income 83 105 Total supplier arrangements 374 451
Of the above amounts, the following was outstanding and held on the balance sheet at the period-end:
52 weeks to 6 March
2021£m
52 weeks to 7 March
2020£m
Within inventory (5) (7) Within current trade receivables Supplier arrangements due 49 44 Accrued supplier arrangements 37 38 Within current trade payables Supplier arrangements due 32 12 Accrued supplier arrangements 5 –Deferred income due (2) (2)Total supplier arrangements 116 85
116 Financial Statements J Sainsbury plc Annual Report 2021

9 Operating profitAccounting policiesCost of salesCost of sales consists of all costs that are directly attributable to the point of sale including warehouse, transportation costs and all the costs of operating retail outlets. In the case of Financial Services, cost of sales includes interest expense on operating activities, calculated using the effective interest method.
Operating profit is stated after charging/(crediting) the following items:
52 weeks to 6 March
2021£m
52 weeks to 7 March
2020£m
Employee costs (note 37) 3,752 3,227Depreciation expense1 (note 14 and 15) 1,113 1,127Amortisation expense2 (note 16) 136 129Profit on disposal of properties3 (note 5) (17) (56)Foreign exchange losses 6 20IFRS 9 impairment losses on loans and advances 85 80Impairment charges 321 263
1 Depreciation expense includes £(4) million credit (2020: £2 million charge) in relation to the unwind of acquisition adjustments.2 Amortisation expense includes £24 million charge (2020: £26 million) in relation to the unwind of fair value adjustments recognised on acquisition of HRG and Nectar UK.3 Comprises £1 million property profit and £16 million gains on early termination of leases (refer to note 5).
2021£m
2020£m
Auditor's remuneration Fees payable to the Company's auditor for the audit of the parent company and consolidated financial statements 1.0 1.0Fees payable to the Company's auditor for other services:
The audit of the Company’s subsidiaries 2.3 2.9Audit related assurance services 0.1 0.1
Total fees 3.4 4.0
10 Finance income and finance costs Accounting policiesFinance income and costs, excluding those arising from Financial Services, are recognised in the income statement for financial assets and liabilities measured at amortised cost using the effective interest method. For Financial Services, finance income and finance costs are recognised in revenue and cost of sales.
Interest paid and interest received for the purpose of the cash flow statement relates to retail only, with Financial Services interest paid and interest received included in the net operating cash flow.
The coupons on the perpetual capital securities and perpetual convertible bonds are accounted for as dividends in accordance with IAS 32 ‘Financial Instruments: Presentation’ and hence are not a finance cost. These are included as a finance cost in the presentation of underlying results, but do not qualify as a finance cost for IFRS statutory purposes.
Fair value remeasurements relate to net fair value movements on derivative financial instruments not designated in a hedging relationship.
2021 2020
Underlying£m
Non-underlying
£mTotal
£mUnderlying
£mNon-underlying
£mTotal
£m
Interest on bank deposits and other financial assets 1 – 1 2 – 2 Fair value measurements – 10 10 – – – IAS 19 pension financing income – 19 19 – 28 28 Finance income on net investment in leases 2 – 2 2 – 2 Finance income 3 29 32 4 28 32
Secured borrowings (49) – (49) (50) – (50)Unsecured borrowings (1) – (1) (12) – (12)Lease liabilities (295) (10) (305) (323) (9) (332)Provisions – amortisation of discount (1) (1) (2) – – – Fair value measurements – – – – (8) (8)Interest capitalised – qualifying assets 4 – 4 4 – 4 Perpetual securities coupon (14) 14 – (23) 23 – Finance costs (356) 3 (353) (404) 6 (398)
117Financial Statements J Sainsbury plc Annual Report 2021
Governance ReportStrategic Report
Financial Statements

11 TaxationAccounting policiesCurrent taxCurrent tax is accounted for on the basis of tax laws enacted or substantively enacted at the balance sheet date. Current tax is charged or credited to the income statement, except when it relates to items charged to equity or other comprehensive income.
Deferred taxDeferred tax is accounted for on the basis of temporary differences arising from differences between the tax base and accounting base of assets and liabilities.
Deferred tax is recognised for all temporary differences, except to the extent where it arises from the initial recognition of an asset or a liability in a transaction that is not a business combination and, at the time of transaction, affects neither accounting profit nor taxable profit. It is determined using tax rates (and laws) that have been enacted or substantively enacted by the balance sheet date and are expected to apply when the related deferred income tax asset is realised or the deferred income tax liability is settled.
Deferred tax assets are recognised to the extent that it is probable that future taxable profits will be available against which the temporary differences can be utilised.
Deferred tax is charged or credited to the income statement, except when it relates to items charged or credited directly to equity or other comprehensive income.
Deferred tax is provided on temporary differences associated with investments in subsidiaries, branches and joint ventures except where the Group is able to control the timing of the reversal of the temporary difference and it is probable that the temporary difference will not reverse in the foreseeable future.
52 weeks to 6 March
2021£m
52 weeks to 7 March
2020£m
Current year UK tax 16 96 Current year overseas tax 6 5 Over-provision in prior years (12) (13)Total current tax expense 10 88 Origination and reversal of temporary differences (46) (2)Under-provision in prior years 27 17 Derecognition of capital losses 28 –Total deferred tax expense 9 15 Total income tax expense in income statement 19 103 Analysed as:
Underlying tax 105 149 Non-underlying tax (86) (46)
Total income tax expense in income statement 19 103 Underlying tax rate 29.5% 25.4%Effective tax rate (7.3)% 40.4%
118 Financial Statements J Sainsbury plc Annual Report 2021

The effective tax rate of (7.3) per cent (2020: 40.4 per cent) is lower than (2020: higher than) the standard rate of corporation tax in the UK of 19 per cent. The differences are explained below:
52 weeks to 6 March
2021£m
52 weeks to 7 March
2020£m
Profit before tax (261) 255 Income tax at UK corporation tax rate of 19.00% (50) 48Effects of underlying items:
Disallowed depreciation on UK properties 23 24Under-provision in prior years 15 11Revaluation of deferred tax balances – 1Other – 2
Effects of non-underlying items: (Loss)/profit on disposal of properties (7) (10)Non-underlying financial movements – 1Over-provision in prior years – (7)Revaluation of deferred tax balances – 3Investment in property fair value movements – 1Impairment of non-financial assets 9 28Retail restructuring programme 4 – Financial Services transition and other – 2Derecognition of capital losses 28 –Perpetual capital securities (3) –Other – (1)
Total income tax expense in income statement 19 103
In the current period, the substantively enacted UK Corporation tax rate applicable to the company from 1 April 2020 was increased from 17 per cent to 19 per cent. The closing deferred tax assets and liabilities have been calculated at 19 per cent and accordingly a rate change adjustment has arisen as the opening deferred tax balance had been calculated taking into account the previously enacted rate of 17 per cent.
It was announced in the UK Government’s Budget on 3 March 2021 that the main UK corporation tax rate will increase to 25 per cent from 1 April 2023. This change has not yet been substantively enacted.
As a result, existing temporary differences on which deferred tax has been provided may unwind in periods subject to the 19 per cent/25 per cent rate. Considering known items that will unwind at 19 per cent, the impact of the post balance sheet date change in tax rate is expected to increase the deferred tax liability by approximately £100 million. The charge will be split between income statement and other comprehensive income.
Income tax charged or (credited) to equity and/or other comprehensive income during the year is as follows:
Share based payment
reserve£m
Actuarial reserve
£m
Fair value movements
£mTotal
£m
52 weeks to 6 March 2021 Current tax in equity or other comprehensive income – (44) – (44)Deferred tax in equity or other comprehensive income – (23) 4 (19) – (67) 4 (63)
52 weeks to 7 March 2020 Current tax in equity or other comprehensive income – – – –Deferred tax in equity or other comprehensive income – 15 – 15
– 15 – 15
11 Taxation continued
119Financial Statements J Sainsbury plc Annual Report 2021
Governance ReportStrategic Report
Financial Statements

The current and deferred tax in relation to the Group’s defined benefit pension scheme’s remeasurements, cash flow hedge movements and financial assets at fair value through other comprehensive income have been charged or credited through other comprehensive income where appropriate.
The movements in deferred income tax assets and liabilities during the financial year, prior to the offsetting of the balances within the same tax jurisdiction, are shown below:
Accelerated capital
allowances£m
Capital losses
£m
Fair value movements
£m
Rolled over capital gains
£m
Retirement benefit
obligations£m
Share-based payments
£mLeases
£mOther
£mTotal
£m
At 8 March 2020 (143) 93 (46) (83) (214) 12 124 (8) (265)Prior year adjustment to income statement (20) (10) – 10 – (5) (1) (1) (27)Credit/(charge) to income statement 39 (28) 4 – (1) 1 (15) 18 18(Charge)/credit to equity or other comprehensive
income– – (1) – 48 – – – 47
Revaluation adjustment to income statement (17) 9 (2) (8) – 1 18 (1) –Revaluation adjustment to equity or other
comprehensive income– – (3) – (25) – – – (28)
At 6 March 2021 (141) 64 (48) (81) (192) 9 126 8 (255)
At 10 March 2019 (146) 93 (50) (84) (216) 14 162 (8) (235)Prior year adjustment to income statement (17) 1 – – – (4) – 3 (17)Prior year adjustment to equity or other
comprehensive income– – – – – – – – –
Credit/(charge) to income statement 23 (1) 5 1 19 2 (38) (5) 6(Charge)/credit to equity or other comprehensive
income– – – – (17) – – – (17)
Revaluation adjustment to income statement (3) – (1) – (2) – – 2 (4)Revaluation adjustment to equity or other
comprehensive income– – – – 2 – – – 2
At 7 March 2020 (143) 93 (46) (83) (214) 12 124 (8) (265)
2021£m
2020£m
Total deferred income tax liabilities (462) (494)Total deferred income tax assets 207 229Net deferred income tax liability recognised in non-current liabilities (255) (265)
Deferred income tax assets have been recognised in respect of all temporary differences and tax losses giving rise to deferred income tax assets because it is probable that these assets will be recovered. Deferred income tax assets and liabilities are only offset where there is a legally enforceable right of offset and the deferred income tax assets and the deferred income tax liabilities relate to income taxes levied by the same taxation authority.
Finance Act 2020 included legislation restricting the amount of chargeable (capital) gains that a company can relieve with its carried-forward capital losses from previous accounting periods. Broadly, a company can now only offset up to 50 per cent of chargeable gains using carried-forward capital losses that are not subject to any wider restrictions.
The Group’s carried forward unrestricted capital losses were fully recognised at 7 March 2020. The changes to the tax law have reduced the recognition of deferred tax assets, creating an impact of £28 million in the period.
11 Taxation continued
120 Financial Statements J Sainsbury plc Annual Report 2021

12 Earnings per shareBasic earnings per share is calculated by dividing the earnings attributable to ordinary shareholders by the weighted average number of ordinary shares in issue during the year, excluding those held by the Employee Share Ownership Trusts (note 30), which are treated as cancelled.
For diluted earnings per share, the earnings attributable to the ordinary shareholders are adjusted by the coupons on the perpetual subordinated convertible bonds (and also interest on the senior convertible bonds (net of tax) in the prior year). The weighted average number of ordinary shares in issue is adjusted to assume conversion of all potentially dilutive ordinary shares. These represent share options granted to employees where the exercise price is less than the average market price of the Company’s ordinary shares during the year and the number of shares that would be issued if all senior convertible bonds and perpetual subordinated convertible bonds are assumed to be converted.
Underlying earnings per share is provided by excluding the effect of any non-underlying items as defined in note 5. This alternative measure of earnings per share is presented to reflect the Group’s underlying trading performance. All operations are continuing for the periods presented.
2021million
2020million
Weighted average number of shares in issue1 2,210.0 2,207.6 Weighted average number of dilutive share options1 21.7 24.1 Weighted average number of dilutive senior convertible bonds1 – 153.7 Weighted average number of dilutive subordinated perpetual convertible bonds1 88.4 84.6 Total number of shares for calculating diluted earnings per share 2,320.1 2,470.0
£m £m
(Loss)/profit for the financial period (net of tax) (280) 152 Less profit attributable to: Holders of perpetual capital securities – (16)Holders of perpetual convertible bonds (7) (7)(Loss)/profit for the financial period attributable to ordinary shareholders (287) 129 (Loss)/profit for the financial period attributable to ordinary shareholders (287) 129 Add interest on senior convertible bonds (net of tax)1 – 9 Add coupon on subordinated perpetual convertible bonds (net of tax)1 – 6 Diluted (loss)/earnings for calculating diluted (loss)/earnings per share (287) 144 (Loss)/profit for the financial period attributable to ordinary shareholders of the parent (287) 129 Adjusted for non-underlying items (note 5) 617 331 Tax on non-underlying items (86) (46)Add back coupons on perpetual securities (net of tax)2 14 23 Underlying profit after tax attributable to ordinary shareholders of the parent 258 437 Add interest on convertible bonds (net of tax) – 9 Add coupon on subordinated perpetual convertible bonds (net of tax) 6 6 Diluted underlying profit after tax attributable to ordinary shareholders of the parent 264 452
Pence
per sharePence
per share
Basic (loss)/earnings (13.0) 5.8Diluted (loss)/earnings (13.0) 5.8Underlying basic earnings 11.7 19.8Underlying diluted earnings 11.4 18.3
1 In accordance with IAS 33, ‘Earnings per Share’, dilutive share options and their respective earnings adjustments are excluded from the calculation of diluted earnings per share when the impact is anti-dilutive.2 Underlying earnings per share calculation is based on underlying profit after tax attributable to ordinary shareholders. Therefore the perpetual securities coupons are added back.
121Financial Statements J Sainsbury plc Annual Report 2021
Governance ReportStrategic Report
Financial Statements

13 Dividends
2021pence
per share
2020pence
per share
2021
£m
2020
£m
Amounts recognised as distributions to ordinary shareholders in the year: Final dividend of prior financial year – 7.9 – 174Interim dividend of current financial year 3.2 3.3 71 73Special dividend 7.3 – 161 – 10.5 11.2 232 247
On 27 April 2021, after the balance sheet date, a final dividend of 7.4 pence per share was proposed by the Directors in respect of the 52 weeks to 6 March 2021. This results in a total final proposed dividend of £164 million.
In the prior year, no final dividend was proposed. Given the wide range of potential profit and cash flow outcomes of COVID-19 at the time, the Board believed it was prudent to defer any dividend payment decisions until later in the financial year. Accordingly, a special dividend of 7.3 pence per share (£161 million) was paid on 18 December 2020 along with the interim dividend.
Subject to shareholders’ approval at the Annual General Meeting, the dividend will be paid on 16 July 2021 to the shareholders on the register at 11 June 2021. The proposed final dividend has not been included as a liability at 6 March 2021.
14 Property, plant and equipmentAccounting policiesa) Land and buildingsLand and buildings are held at historical cost less accumulated depreciation and any recognised provision for impairment. Capital work in progress is held at cost less any recognised provision for impairment. Cost includes the original purchase price of the asset and the costs attributable to bringing the asset to its working condition for intended use. This includes capitalised borrowing costs.
b) Fixtures and equipmentFixtures, equipment and vehicles are held at cost less accumulated depreciation and any recognised provision for impairment. Cost includes the original purchase price of the asset and the costs attributable to bringing the asset to its working condition and its intended use.
c) DepreciationDepreciation is calculated to write down the cost of the assets to their residual values, on a straight-line basis, using the following rates:
— Freehold buildings and leasehold improvements – 50 years, or the lease term if shorter — Fixtures, equipment and vehicles – three to 15 years — Freehold land is not depreciated
Capital work in progress is not depreciated prior to being brought to its working condition and its intended use. Capital work in progress does not include land.
Gains and losses on disposal are determined by comparing proceeds less any associated costs of disposal with the asset’s carrying amount and are recognised within operating profit.
The assets’ residual values and useful lives are reviewed, and adjusted if appropriate, at the end of each reporting period.
122 Financial Statements J Sainsbury plc Annual Report 2021

Capitalisation of interestBorrowing costs that are directly attributable to the acquisition or construction of qualifying assets are capitalised to the cost of the asset, gross of tax relief.
Impairment of non-financial assets Refer to note 17 for details of impairment policies and impairment charges.
Land and buildings
£m
Fixtures and equipment
£mTotal
£m
Cost At 8 March 2020 9,712 5,303 15,015Adjustment to opening balance 3 22 25Reclassification between intangibles and PPE 1 37 38At 8 March 2020 restated (refer below) 9,716 5,362 15,078Additions 89 330 419Disposals (59) (404) (463)Transfer to asset held for sale (91) – (91)At 6 March 2021 9,655 5,288 14,943 Accumulated depreciation and impairment At 8 March 2020 2,690 3,414 6,104Adjustment to opening balance 3 22 25At 8 March 2020 restated (refer below) 2,693 3,436 6,129Depreciation expense for the year 173 456 629Impairment loss for the year 26 62 88Disposals (32) (391) (423)Transfer to asset held for sale (67) – (67)At 6 March 2021 2,793 3,563 6,356 Net book value at 6 March 2021 6,862 1,725 8,587 Capital work-in-progress included above 122 320 442 Cost At 10 March 2019 9,917 5,111 15,028Additions 31 497 528Disposals (245) (305) (550)Transfer from asset held for sale 9 – 9At 7 March 2020 9,712 5,303 15,015 Accumulated depreciation and impairment At 10 March 2019 2,644 3,191 5,835Depreciation expense for the year 184 450 634Impairment loss for the year 123 37 160Disposals (269) (264) (533)Transfer from asset held for sale 8 – 8At 7 March 2020 2,690 3,414 6,104 Net book value at 7 March 2020 7,022 1,889 8,911 Capital work-in-progress included above 141 295 436
The prior cost and accumulated depreciation have been restated, with no impact on the reported net book value of property, plant & equipment. An adjustment had been erroneously recorded against assets that had been disposed of across a number of different reporting periods.
Refer to note 16 on the reclassifications between property, plant & equipment and intangible assets.
14 Property, plant and equipment continued
123Financial Statements J Sainsbury plc Annual Report 2021
Governance ReportStrategic Report
Financial Statements

Interest capitalisedInterest capitalised included in additions amounted to £4 million (2020: £4 million) for the Group. Accumulated interest capitalised included in the cost of property, plant and equipment net of disposals amounted to £334 million (2020: £333 million) for the Group. The capitalisation rate used to determine the amount of borrowing costs eligible for capitalisation is 4.0 per cent (2020: 4.1 per cent).
SecurityProperty, plant and equipment pledged as security is as follows:
2021 2020
Number of
properties
Net book value
£bn
Number of
properties
Net book value
£bn
Loan due 2031 48 0.9 48 0.9Revolving Credit Facility 60 1.3 60 1.3Asset backed pension contribution scheme 48 1.2 48 1.2Bank loans due 2021 10 0.2 10 0.2Loan due 2024 – – 5 0.1Other 6 0.1 6 0.1 172 3.7 177 3.8
15 LeasesGroup as lesseeThe Group’s lease portfolio is principally comprised of property leases of land and buildings in relation to stores, distribution centres and support offices, but also includes other assets such as motor vehicles. The leases have varying terms and often include break clauses or options to renew beyond the non-cancellable periods.
Accounting policiesRight-of-use assetsRight-of-use assets are recognised at the commencement date of the lease (i.e. the date the underlying asset is available for use). Right-of-use assets are measured at cost, less any accumulated depreciation and impairment losses, and adjusted for any subsequent remeasurement of lease liabilities. The cost of right-of-use assets includes the amount of lease liabilities recognised, initial direct costs incurred, and lease payments made at or before the commencement date less any lease incentives received.
The recognised right-of-use assets are depreciated on a straight-line basis over the shorter of the estimated useful life and the lease term. Right-of-use assets are subject to impairment.
Lease liabilitiesLease liabilities are recognised at the commencement date of the lease and are measured at the present value of lease payments to be made over the lease term, discounted using the incremental borrowing rate (IBR) at the lease commencement date if the interest rate implicit in the lease is not readily determinable. The majority of the Group’s leases are discounted using the IBR.
The IBRs depend on the start date and term of the lease, and are determined based on a reference (risk free) rate and adjustments to reflect the Group’s credit risk. The reference rates are based on UK overnight swap rates and the credit risk adjustments are based on the prices of instruments issued by the Group and quoted credit default swaps (‘CDS’). IBRs are determined quarterly and depend on the term and start date of the lease.
The Group determines the lease term as the non-cancellable term of the lease, together with any periods covered by an option to extend the lease if it is reasonably certain to be exercised, or any periods covered by an option to terminate the lease (a break clause), if it is reasonably certain not to be exercised.
The lease payments include fixed payments and variable lease payments that depend on an index or a rate (using the relevant rate at the commencement date of the lease), less any lease incentives receivable. The variable lease payments that do not depend on an index or a rate are recognised as expense in the period in which the event or condition that triggers the payment occurs. Agreements which contain both lease and non-lease components are reviewed, and non-lease components such as cleaning and maintenance services are excluded from the lease payments used to measure the lease liabilities.
After the commencement date of the lease, the lease liability is subsequently measured at amortised cost using the effective interest rate method. The carrying amount of lease liabilities is remeasured when there is a change in the future lease payments due to a change in the lease term such as a recognition of an extension or break option, a change in the fixed lease payments or a change in the assessment to purchase the underlying asset.
Short-term leases and leases of low-value assetsThe Group applies the short-term lease recognition exemption to those leases that have a lease term of 12 months or less from the commencement date and do not contain a purchase option. It also applies the low-value asset recognition exemption to groups of underlying leases that are considered uniformly low value (i.e. below £5,000). Lease payments on short-term leases and leases of low-value assets are expensed to the income statement, as well as costs relating to variable lease payments dependent on performance of usage and ‘out of contract’ payments.
14 Property, plant and equipment continued
124 Financial Statements J Sainsbury plc Annual Report 2021

Set out below are the carrying amounts of right-of-use assets recognised and the movements during the period.
Net book value
Land and buildings
£mEquipment
£mTotal
£m
At 8 March 2020 4,536 290 4,826New leases and modifications 413 129 542Depreciation charge (398) (86) (484)Impairment charge (137) – (137)At 6 March 2021 4,414 333 4,747
At 10 March 2019 4,747 246 4,993New leases and modifications 285 121 406Depreciation charge (416) (77) (493)Impairment charge (80) – (80)At 7 March 2020 4,536 290 4,826
Refer to note 17 for further details of the impairment charge recognised.
Set out below are the carrying amounts of lease liabilities and the movements during the period:
Lease liability
2021£m
2020£m
At 8 March 2020 and 10 March 2019 5,774 5,831New leases and modifications1 561 373Interest expense 305 332Payments (806) (762)At 6 March 2021 and 7 March 2020 5,834 5,774Current 524 510Non-current 5,310 5,264
1. Refer significant judgement section below
Significant judgement – lease termsThe inclusion of a lease extension period or lease break period in the lease term is a key judgement for the Group and considers all relevant factors that create an economic incentive for it to exercise them. For leased properties, this includes the current and expected profitability of the respective site, as well as the length of time until the option can be exercised. Any changes to the Group’s judgement over lease terms will impact both the right of use asset and lease liability.
The accelerated structural integration of Sainsbury’s and Argos which commenced in the prior year has led to changes in the IFRS 16 right of use asset and lease liability balances.
The judgements applied in the exercising of lease breaks have changed. The store rationalisation programme is deemed a change in circumstances within the control of the Group and means that lease breaks will be exercised, whereas the judgement applied to these leases on transition to IFRS 16 in 2020 was that the break would not be exercised. The Group has also revisited its assumptions about the way that lease breaks will be exercised across the portfolio and made it more specific for each part of the store estate. This acts to decrease the lease liability and right of use asset by circa £200 million. With hindsight, the trigger for the recognition of this modification was the Capital Markets Day in September 2019 as this is the point at which the Group’s first stage of store rationalisation was announced.
In conjunction with store rationalisation, the Group has been actively pursuing lease extension opportunities across well-performing supermarket sites. This ensures key stores remain in the portfolio as the Group seeks to open more Argos store-in-stores, as well as increasing its online capacity through its in-store picking model. The extensions act to increase the lease liability and right-of-use asset as a result of committing to future additional rental payments, as well as reflecting updated discount rates which are typically lower than those previously used. Certain extensions agreed in the prior year were not reflected in lease modifications in the prior year. This acts to increase the lease liability and right of use asset by circa £415m.
The net impact of these items is an increase to lease liability and right of use assets of circa £215m. The impact of the adjustments, both quantitatively and qualitatively, was considered in detail, and it was concluded that they were not sufficiently material to warrant a restatement of the prior year accounts. The adjustments are predominantly balance sheet in nature, with none of them impacting KPIs or financial covenants, and the impact on the 2020 income statement is less than £2 million. The adjustments have therefore been reported within the £561 million new leases and modifications in the current period.
Significant estimate – discount ratesAs noted above, lease liabilities are measured at the present value of lease payments to be made over the lease term, discounted using the IBR at the lease commencement date (for additions) or at the lease modification date (for modifications).
The IBRs depend on the start date and term of the lease, and are determined based on a number of inputs including a reference (risk free) rate and adjustments to reflect the Group’s credit risk. The reference rates are based on UK overnight swap rates and the credit risk adjustments are based on the prices of instruments issued by the Group and quoted credit default swaps (‘CDS’).
15 Leases continued
125Financial Statements J Sainsbury plc Annual Report 2021
Governance ReportStrategic Report
Financial Statements

The following table summarises the impact that a reasonable possible change in the IBR would have had on the lease liability additions and modifications recognised during the year:
Increase/(decrease) in
lease liability recognised
£m
Increase in IBR of 1% (79)Decrease in IBR of 1% 102
Other information – Group as lesseeSet out below are the undiscounted future rental payments not currently included within the reported lease liability where lease extensions have not been included, or where lease breaks have been assumed:
2021£m
2020£m
Extension options expected to not be exercised 4,590 4,590Lease breaks expected to be exercised 463 514
The following are the amounts recognised in profit or loss:
2021£m
2020 £m
Depreciation of right-of-use assets (484) (493)Impairment of right-of-use assets (137) (80)Interest on lease liabilities (305) (332)Variable lease payments not included in the measurement of lease liabilities (1) (1)Finance income from sub-leasing of right-of-use assets 2 2Operating sublet income 42 47Expenses relating to short-term leases (33) (28)Expenses relating to leases of low-value assets (2) (8)Total amount recognised in profit or loss (918) (893)
Total cash outflow for leases (841) (798)
There were no leases with residual value guarantees. There have been no sale or leaseback transactions during the period. The Group does not hold any leases as investment properties under IAS 40. All right-of-use assets are recognised on a historical cost convention. Approximately £2,856 million (2020: £2,830 million) of the Group’s lease liabilities are subject to inflation-linked rentals and a further £268 million (2020: £111 million) are subject to rent reviews. Rental changes linked to inflation or rent reviews typically occur on an annual or five-yearly basis. The Group is committed to payments totalling £32 million (2020: £38 million) in relation to leases that have been signed but have not yet commenced.
Maturity analysis
2021£m
2020£m
Contractual undiscounted cash flows Less than one year 748 820One to two years 716 772Two to three years 643 725Three to four years 594 640Four to five years 547 585Total less than five years 3,248 3,542Five to ten years 2,420 2,278Ten to fifteen years 2,078 1,696More than fifteen years 3,706 4,271Total undiscounted lease liability 11,452 11,787Lease liabilities included in the statement of financial position 5,834 5,774Current 524 510Non-current 5,310 5,264
15 Leases continued
126 Financial Statements J Sainsbury plc Annual Report 2021

Group as lessorLessor accountingThe Group leases out owned properties and sublets leased properties under operating and finance leases. Such properties include mall units, stores and units within stores. Where the Group subleases assets, the sublease classification is assessed with reference to the head lease right-of-use asset. This assessment considers, among other factors, whether the sublease represents the majority of the remaining of life of the head lease. The ratio of rental income to head lease rental payments is used to determine how much of the right-of-use asset should be derecognised, or analysis of square foot leased in the headlease and sublease where appropriate. This assessment takes into consideration whether the sublease/headlease are above or below market rate.
Amounts due from lessees under finance leases are recorded as a receivable at an amount equal to the net investment in the lease. This is initially calculated and recognised using the IBR prevalent in the underlying headlease at the recognition date. Any difference between the derecognised right-of-use asset and the newly recognised amounts due for lessees under finance leases is recognised in the income statement. The Group recognises finance income over the lease term, reflecting a constant periodic rate of return on the Group’s net investment in the lease. Operating lease income is recognised as earned on a straight-line basis over the lease term.
The below table sets out the maturity analysis of lease receivables classified as operating leases:
2021£m
2020£m
Less than one year 17 19One to two years 15 16Two to three years 13 14Three to four years 11 11Four to five years 9 9Five to ten years 28 28Ten to fifteen years 8 11More than fifteen years 13 15Total undiscounted lease payments receivable 114 123
The net book value of property, plant & equipment subject to operating leases at year-end is not material to the accounts.
The below table sets out the maturity analysis of lease receivables classified as finance leases:
2021£m
2020£m
Contractual undiscounted cash flows Less than one year 7 5One to five years 26 17More than five years 15 16Total undiscounted net investment in lease receivable 48 38Lease receivables included in the statement of financial position 34 25Current 5 9Non-current 29 16
16 Intangible assetsAccounting policiesa) GoodwillGoodwill represents the excess of the fair value of the consideration of an acquisition over the fair value of the Group’s share of the net identifiable assets of the acquired subsidiary at the date of acquisition. Goodwill is considered to have an indefinite useful life. Goodwill is tested for impairment annually and again whenever indicators of impairment are detected and is carried at cost less any provision for impairment.
b) Computer software Computer software is carried at cost less accumulated amortisation and any provision for impairment. Externally acquired computer software and software licences are amortised on a straight-line basis over their useful economic lives of five to fifteen years. Costs relating to development of computer software for internal use are capitalised once the recognition criteria of IAS 38, ‘Intangible Assets’ are met. Other development expenditures that do not meet these criteria are expensed as incurred. When the software is available for its intended use, these costs are amortised on a straight-line basis over their useful economic lives of five to fifteen years within administrative expenses.
c) Acquired intangible assetsIntangible assets acquired in a business combination are recognised at fair value at the acquisition date. Intangible assets with finite useful economic lives are carried at cost less accumulated amortisation and any provision for impairment and are amortised on a straight-line basis over their estimated useful economic lives, ranging from five to ten years, within administrative expenses.
15 Leases continued
127Financial Statements J Sainsbury plc Annual Report 2021
Governance ReportStrategic Report
Financial Statements

16 Intangible assets continued
Impairment of non-financial assets Refer to note 17 for details of impairment policies.
Goodwill£m
Computer software
£m
Acquired brands
£m
Customer relationships
£mTotal
£m
Cost At 8 March 2020 400 494 231 32 1,157Adjustment to opening balance – 293 – – 293Reclassification between intangibles and PPE – (38) – – (38)At 8 March 2020 restated (refer below) 400 749 231 32 1,412Additions – 172 – – 172Disposals (6) (22) (2) – (30)At 6 March 2021 394 899 229 32 1,554 Accumulated amortisation and impairment At 8 March 2020 22 (12) 109 26 145Adjustment to opening balance – 293 – – 293At 8 March 2020 restated (refer below) 22 281 109 26 438Amortisation expense for the year – 114 20 2 136Impairment loss for the year 12 84 – – 96Disposals (6) (22) (2) – (30)At 6 March 2021 28 457 127 28 640 Net book value at 6 March 2021 366 442 102 4 914 Cost At 10 March 2019 400 617 231 32 1,280Additions – 124 – – 124Disposals – (247) – – (247)At 7 March 2020 400 494 231 32 1,157 Accumulated amortisation and impairment At 10 March 2019 4 122 89 22 237Amortisation expense for the year – 105 20 4 129Impairment loss for the year 18 5 – – 23Disposals – (244) – – (244)At 7 March 2020 22 (12) 109 26 145 Net book value at 7 March 2020 378 506 122 6 1,012
The prior year cost and accumulated amortisation have been restated, with no impact on the reported net book value of intangible assets. An adjustment had been erroneously recorded against assets that had been disposed of across a number of different reporting periods.
The reclassifications between intangible assets and property, plant & equipment relate to work in progress originally capitalised into intangibles that should have been recognised within property, plant & equipment. The prior year balance sheet has been restated to reflect this.
Goodwill balances are detailed in note 17.
128 Financial Statements J Sainsbury plc Annual Report 2021
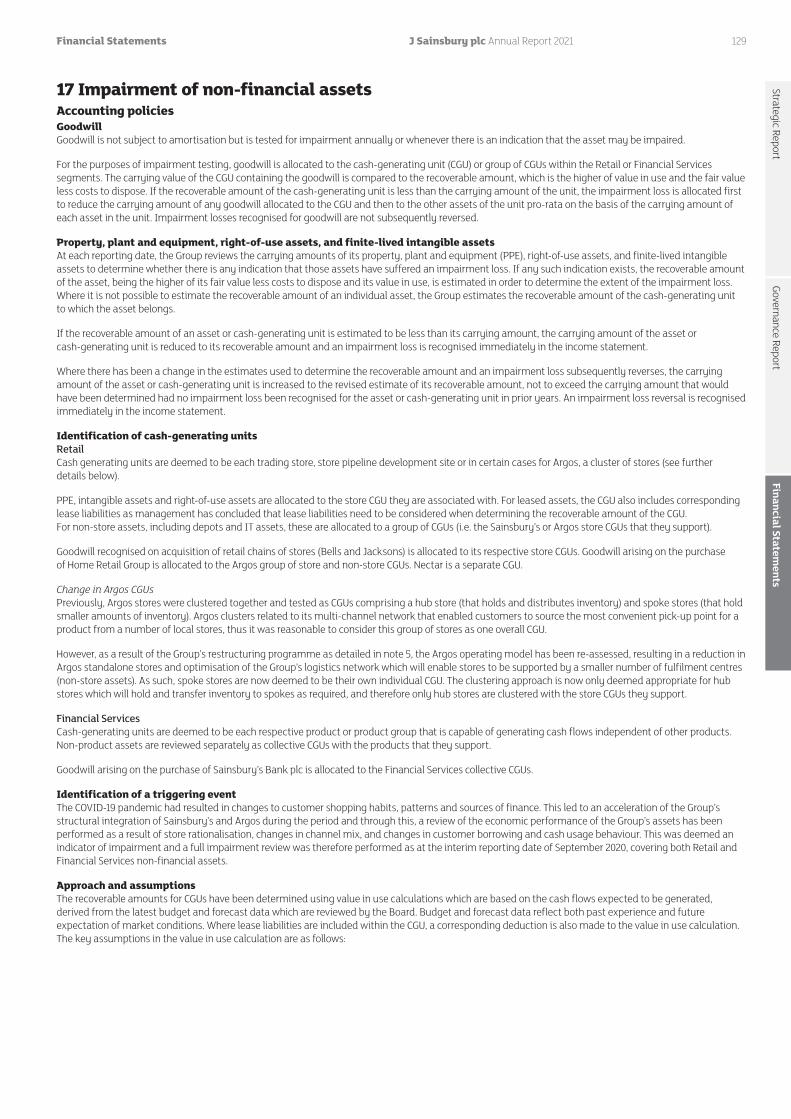
17 Impairment of non-financial assetsAccounting policiesGoodwillGoodwill is not subject to amortisation but is tested for impairment annually or whenever there is an indication that the asset may be impaired.
For the purposes of impairment testing, goodwill is allocated to the cash-generating unit (CGU) or group of CGUs within the Retail or Financial Services segments. The carrying value of the CGU containing the goodwill is compared to the recoverable amount, which is the higher of value in use and the fair value less costs to dispose. If the recoverable amount of the cash-generating unit is less than the carrying amount of the unit, the impairment loss is allocated first to reduce the carrying amount of any goodwill allocated to the CGU and then to the other assets of the unit pro-rata on the basis of the carrying amount of each asset in the unit. Impairment losses recognised for goodwill are not subsequently reversed.
Property, plant and equipment, right-of-use assets, and finite-lived intangible assetsAt each reporting date, the Group reviews the carrying amounts of its property, plant and equipment (PPE), right-of-use assets, and finite-lived intangible assets to determine whether there is any indication that those assets have suffered an impairment loss. If any such indication exists, the recoverable amount of the asset, being the higher of its fair value less costs to dispose and its value in use, is estimated in order to determine the extent of the impairment loss. Where it is not possible to estimate the recoverable amount of an individual asset, the Group estimates the recoverable amount of the cash-generating unit to which the asset belongs.
If the recoverable amount of an asset or cash-generating unit is estimated to be less than its carrying amount, the carrying amount of the asset or cash-generating unit is reduced to its recoverable amount and an impairment loss is recognised immediately in the income statement.
Where there has been a change in the estimates used to determine the recoverable amount and an impairment loss subsequently reverses, the carrying amount of the asset or cash-generating unit is increased to the revised estimate of its recoverable amount, not to exceed the carrying amount that would have been determined had no impairment loss been recognised for the asset or cash-generating unit in prior years. An impairment loss reversal is recognised immediately in the income statement.
Identification of cash-generating unitsRetailCash generating units are deemed to be each trading store, store pipeline development site or in certain cases for Argos, a cluster of stores (see further details below).
PPE, intangible assets and right-of-use assets are allocated to the store CGU they are associated with. For leased assets, the CGU also includes corresponding lease liabilities as management has concluded that lease liabilities need to be considered when determining the recoverable amount of the CGU. For non-store assets, including depots and IT assets, these are allocated to a group of CGUs (i.e. the Sainsbury’s or Argos store CGUs that they support).
Goodwill recognised on acquisition of retail chains of stores (Bells and Jacksons) is allocated to its respective store CGUs. Goodwill arising on the purchase of Home Retail Group is allocated to the Argos group of store and non-store CGUs. Nectar is a separate CGU.
Change in Argos CGUsPreviously, Argos stores were clustered together and tested as CGUs comprising a hub store (that holds and distributes inventory) and spoke stores (that hold smaller amounts of inventory). Argos clusters related to its multi-channel network that enabled customers to source the most convenient pick-up point for a product from a number of local stores, thus it was reasonable to consider this group of stores as one overall CGU.
However, as a result of the Group’s restructuring programme as detailed in note 5, the Argos operating model has been re-assessed, resulting in a reduction in Argos standalone stores and optimisation of the Group’s logistics network which will enable stores to be supported by a smaller number of fulfilment centres (non-store assets). As such, spoke stores are now deemed to be their own individual CGU. The clustering approach is now only deemed appropriate for hub stores which will hold and transfer inventory to spokes as required, and therefore only hub stores are clustered with the store CGUs they support.
Financial ServicesCash-generating units are deemed to be each respective product or product group that is capable of generating cash flows independent of other products. Non-product assets are reviewed separately as collective CGUs with the products that they support.
Goodwill arising on the purchase of Sainsbury’s Bank plc is allocated to the Financial Services collective CGUs.
Identification of a triggering event The COVID-19 pandemic had resulted in changes to customer shopping habits, patterns and sources of finance. This led to an acceleration of the Group’s structural integration of Sainsbury’s and Argos during the period and through this, a review of the economic performance of the Group’s assets has been performed as a result of store rationalisation, changes in channel mix, and changes in customer borrowing and cash usage behaviour. This was deemed an indicator of impairment and a full impairment review was therefore performed as at the interim reporting date of September 2020, covering both Retail and Financial Services non-financial assets.
Approach and assumptionsThe recoverable amounts for CGUs have been determined using value in use calculations which are based on the cash flows expected to be generated, derived from the latest budget and forecast data which are reviewed by the Board. Budget and forecast data reflect both past experience and future expectation of market conditions. Where lease liabilities are included within the CGU, a corresponding deduction is also made to the value in use calculation. The key assumptions in the value in use calculation are as follows:
129Financial Statements J Sainsbury plc Annual Report 2021
Governance ReportStrategic Report
Financial Statements
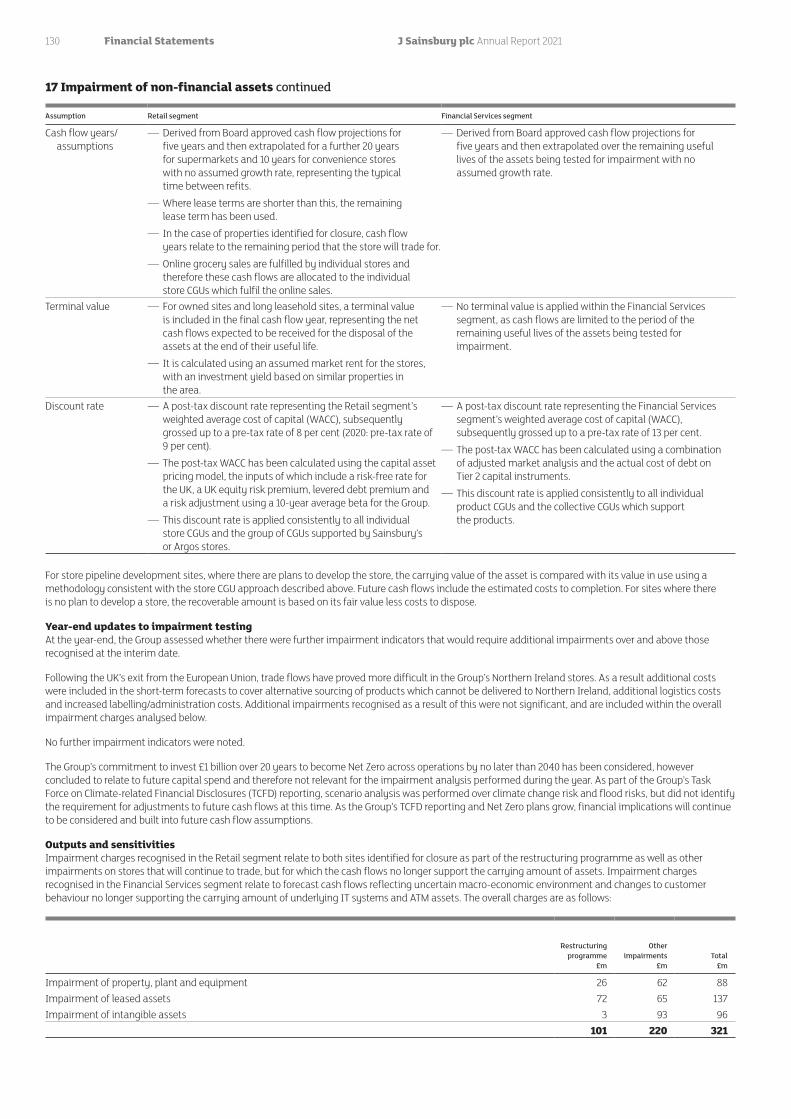
Assumption Retail segment Financial Services segment
Cash flow years/assumptions
— Derived from Board approved cash flow projections for five years and then extrapolated for a further 20 years for supermarkets and 10 years for convenience stores with no assumed growth rate, representing the typical time between refits.
— Where lease terms are shorter than this, the remaining lease term has been used.
— In the case of properties identified for closure, cash flow years relate to the remaining period that the store will trade for.
— Online grocery sales are fulfilled by individual stores and therefore these cash flows are allocated to the individual store CGUs which fulfil the online sales.
— Derived from Board approved cash flow projections for five years and then extrapolated over the remaining useful lives of the assets being tested for impairment with no assumed growth rate.
Terminal value — For owned sites and long leasehold sites, a terminal value is included in the final cash flow year, representing the net cash flows expected to be received for the disposal of the assets at the end of their useful life.
— It is calculated using an assumed market rent for the stores, with an investment yield based on similar properties in the area.
— No terminal value is applied within the Financial Services segment, as cash flows are limited to the period of the remaining useful lives of the assets being tested for impairment.
Discount rate — A post-tax discount rate representing the Retail segment’s weighted average cost of capital (WACC), subsequently grossed up to a pre-tax rate of 8 per cent (2020: pre-tax rate of 9 per cent).
— The post-tax WACC has been calculated using the capital asset pricing model, the inputs of which include a risk-free rate for the UK, a UK equity risk premium, levered debt premium and a risk adjustment using a 10-year average beta for the Group.
— This discount rate is applied consistently to all individual store CGUs and the group of CGUs supported by Sainsbury’s or Argos stores.
— A post-tax discount rate representing the Financial Services segment’s weighted average cost of capital (WACC), subsequently grossed up to a pre-tax rate of 13 per cent.
— The post-tax WACC has been calculated using a combination of adjusted market analysis and the actual cost of debt on Tier 2 capital instruments.
— This discount rate is applied consistently to all individual product CGUs and the collective CGUs which support the products.
For store pipeline development sites, where there are plans to develop the store, the carrying value of the asset is compared with its value in use using a methodology consistent with the store CGU approach described above. Future cash flows include the estimated costs to completion. For sites where there is no plan to develop a store, the recoverable amount is based on its fair value less costs to dispose.
Year-end updates to impairment testingAt the year-end, the Group assessed whether there were further impairment indicators that would require additional impairments over and above those recognised at the interim date.
Following the UK’s exit from the European Union, trade flows have proved more difficult in the Group’s Northern Ireland stores. As a result additional costs were included in the short-term forecasts to cover alternative sourcing of products which cannot be delivered to Northern Ireland, additional logistics costs and increased labelling/administration costs. Additional impairments recognised as a result of this were not significant, and are included within the overall impairment charges analysed below.
No further impairment indicators were noted.
The Group’s commitment to invest £1 billion over 20 years to become Net Zero across operations by no later than 2040 has been considered, however concluded to relate to future capital spend and therefore not relevant for the impairment analysis performed during the year. As part of the Group’s Task Force on Climate-related Financial Disclosures (TCFD) reporting, scenario analysis was performed over climate change risk and flood risks, but did not identify the requirement for adjustments to future cash flows at this time. As the Group’s TCFD reporting and Net Zero plans grow, financial implications will continue to be considered and built into future cash flow assumptions.
Outputs and sensitivitiesImpairment charges recognised in the Retail segment relate to both sites identified for closure as part of the restructuring programme as well as other impairments on stores that will continue to trade, but for which the cash flows no longer support the carrying amount of assets. Impairment charges recognised in the Financial Services segment relate to forecast cash flows reflecting uncertain macro-economic environment and changes to customer behaviour no longer supporting the carrying amount of underlying IT systems and ATM assets. The overall charges are as follows:
Restructuringprogramme
£m
Other impairments
£mTotal
£m
Impairment of property, plant and equipment 26 62 88Impairment of leased assets 72 65 137Impairment of intangible assets 3 93 96
101 220 321
17 Impairment of non-financial assets continued
130 Financial Statements J Sainsbury plc Annual Report 2021

Of the total impairment charge of £(321) million, £(216) million is in relation to assets within the Retail segment, with the remaining £(105) million within the Financial Services segment.
Of the above assumptions, the value-in-use calculations are most sensitive to changes in the discount rate, cash flows and rental yield (inputs underpinning the terminal value for Retail stores). The tables below set out the key sensitivities performed on the value-in-use models. The sensitivity analysis performed considers the reasonable possible changes in these assumptions, which incorporates increased uncertainty caused by the COVID-19 pandemic. The impact of changing one sensitivity does not have a consequential impact on other sensitivities.
Retail segment
Sensitivity area Sensitivity
Increase/(decrease) in impairment
£m
Discount rate Increase of 1% 15Decrease of 1% (3)
Cash flows Increase of 5% (3)Decrease of 5% 6
Rental yield (input for terminal values) Increase of 1% 2Decrease of 1% (3)
Financial Services segment
Sensitivity area Sensitivity
Increase/(decrease) in impairment
£m
Discount rate Increase of 1% 10Decrease of 1% (10)
Cash flows Increase of 5% (18)Decrease of 5% 18
GoodwillGoodwill was separately tested at the year-end as required under IAS 36. Goodwill comprises the following:
2021£m
2020£m
Jacksons Stores Limited 28 38Home Retail Group 119 119Sainsbury’s Bank plc 45 45Nectar 147 147Bells Stores Limited 9 12Other 18 18 366 378
Jacksons Stores Limited and Bells Stores Limited goodwill balances are allocated to individual store CGUs to which they relate, within the Retail segment detailed above. Home Retail Group goodwill is allocated to the collective Argos store and non-store CGUs. Sainsbury’s Bank plc goodwill is allocated to the Financial Services collective CGUs, as noted above. Nectar is a separate CGU.
Goodwill impairments of £10 million were recognised in the year as part of the interim impairment review, detailed above. This impairment was in relation to the store CGUs to which Jacksons Stores Limited and Bells Stores Limited goodwill amounts are allocated to. There was no impairment identified at the collective CGU level for Argos nor Financial Services, thus there was nil impairment in the Home Retail Group or Sainsbury’s Bank plc goodwill amounts. No impairments were recognised to Nectar goodwill.
As required by IAS 36, all goodwill balances were tested separately at the year-end balance sheet date. This was performed consistently with the methodology described above. This resulted in further impairments in goodwill of £2 million, in relation to the store CGUs to which Jacksons Stores Limited goodwill amounts are allocated to.
Sensitivity analysis on the impairment tests for each group of cash-generating units to which goodwill has been allocated has been performed. The valuations indicate sufficient headroom such that a reasonably possible change to key assumptions would not result in any impairment of goodwill. While goodwill impairments of £2 million were noted on certain store CGUs to which Jacksons Stores Limited goodwill amounts are allocated to, any reasonable possible changes in assumptions would not lead to changes in this impairment amount of more or less than £1 million.
The headroom disclosed below for goodwill in Jacksons Stores Limited and Bells Stores Limited relates to all store CGUs to which these goodwill amounts are allocated. Overall, management are satisfied that there are no reasonable possible changes to assumptions that would lead to further impairments in Jacksons Stores Limited, or impairments in any other goodwill.
17 Impairment of non-financial assets continued
131Financial Statements J Sainsbury plc Annual Report 2021
Governance ReportStrategic Report
Financial Statements

Sensitivities (revised headroom)
Carrying amount
£mHeadroom
£m
Discount rate Cash flows
Decrease of 1%£m
Increase of 1%£m
Decrease of 5%£m
Increase of 5%£m
Jacksons Stores Limited 28 58 63 54 53 63Home Retail Group 119 1,198 1,537 938 1,095 1,301Sainsbury’s Bank plc 45 232 272 198 210 254Nectar UK 147 824 988 700 774 874Bells Stores Limited 9 23 25 22 21 25Other 18 54 58 49 49 58
18 Investments in joint ventures and associatesAccounting policiesThe Group applies IFRS 11 to all joint arrangements. Under IFRS 11, investments in joint arrangements are classified as either joint operations or joint ventures depending on the contractual rights and obligations of each investor. The Group has assessed the nature of its joint arrangements and determined them to be joint ventures. Associates are entities over which the Group has significant influence but not control.
Investments in joint ventures and associates are carried in the Group balance sheet at historical cost plus post-acquisition changes in the Group’s share of net assets of the entity, less any provision for impairment. Where the Group transacts with a joint venture or associate, profits and losses are eliminated to the extent of the Group’s interest in the joint venture or associate.
A full list of the Group’s joint ventures is included in note 44. Joint ventures with a different year-end date to the Group are reported to include the results up to 28 February 2021, the nearest month-end to the Group’s year-end. Adjustments are made for the effects of significant transactions or events that occurred between 28 February and the Group’s balance sheet date. No joint venture arrangements are considered significant to the Group.
2021£m
2020£m
At 8 March 2020 9 205Disposals – (21)Dividends and distributions received (4) (140)Share of retained profit: Underlying loss after tax – – Investment property fair value movements – (3) Fair value movements – (5) Share of loss on disposal of properties – (21)Share of retained loss – (29)Disposals from the Group – (6)At 6 March 2021 5 9
The disposal in the prior year relates to a capital repayment and is included within dividends and distributions in the prior year cash flow statement. £18 million of dividends had not been received at the prior year-end but were received during the current year. They are therefore included within the £22 million dividends received that are reported in the cash flow statement.
17 Impairment of non-financial assets continued
132 Financial Statements J Sainsbury plc Annual Report 2021

19 Financial assets at fair value through other comprehensive income Accounting policiesFinancial assets that are held for both the purpose of collecting contractual cash flows and to sell are classified as fair value through other comprehensive income (FVOCI). They are included in non-current assets unless management intends to dispose of the investment within 12 months of the balance sheet date. Equity investments have been irrevocably designated as fair value through other comprehensive income. Subsequent to initial recognition at fair value plus transaction costs, these assets are recorded at fair value at each period end with the movements recognised in other comprehensive income until derecognition or impaired. On derecognition, the cumulative gain or loss previously recognised in other comprehensive income reserves is recognised in the income statement for debt instruments. Gains and losses on equity instruments are never recycled to the income statement. Dividends on financial assets at fair value through other comprehensive income are recognised in the income statement when the entity’s right to receive payment is established.
Interest on financial assets at fair value through other comprehensive income debt instruments is recognised using the effective interest method.
52 weeks to 6 March
2021£m
52 weeks to 7 March
2020£m
Non-current Equity Other financial assets 306 251 Debt Interest bearing financial assets 1 1 Financial Services related investment securities 447 720 754 972 Current Debt Financial Services related investment securities 90 82 844 1,054
The other financial asset predominantly represents the Group’s beneficial interest in a commercial property investment pool. The fair value of the other financial asset is based on discounted cash flows assuming a property rental growth rate of 0 per cent (2020: 0.6 per cent) and a discount rate of seven per cent (2020: nine per cent). There were no disposals in the current year (2020: nil) and no impairment provisions in either the current or the previous financial year. Sensitivities are included in note 32.
20 InventoriesAccounting policiesInventories comprise goods held for resale and are valued on a weighted average cost basis and carried at the lower of cost or net realisable value. Net realisable value represents the estimated selling price less all estimated costs of completion and costs to be incurred in marketing, selling and distribution. Cost includes all direct expenditure and other appropriate attributable costs incurred in bringing inventories to their present location and condition.
52 weeks to 6 March
2021£m
52 weeks to 7 March
2020£m
Gross finished goods 1,751 1,844 Inventory provision (126) (112)Inventory recognised on Group balance sheet 1,625 1,732
The amount of inventories recognised as an expense and charged to cost of sales for the 52 weeks to 6 March 2021 was £21,459 million (2020: £21,673 million).
Inventory losses and provisions recognised as an expense for the year were £500 million (2020: £561 million).
133Financial Statements J Sainsbury plc Annual Report 2021
Governance ReportStrategic Report
Financial Statements

21 Receivables(a) Trade and other receivablesAccounting policiesTrade and other receivables are non-interest bearing and are on commercial terms. They are initially recognised at fair value and subsequently measured at amortised cost less allowances for expected credit losses, using the simplified approach under IFRS 9, with adjustments for factors specific to each receivable.
2021£m
2020£m
Non-current Other receivables 43 36 Prepayments 7 7 50 43 Current Trade receivables 161 140 Other receivables 405 499 Accrued income 4 4 Prepayments 155 168 725 811
Trade and other receivables include £86 million relating to supplier arrangements where there is no right of offset. Refer to note 8. In addition, current other receivables of £405 million (2020: £499 million) include £152 million (2020: £199 million) of bank funds in the course of settlement. The carrying amounts of trade and other receivables are denominated in sterling.
(b) Allowance for expected credit lossesThe Group’s exposure to credit risk arising from its retail operations is minimal given that the customer base is large and unrelated and that the overwhelming majority of customer transactions are settled through cash or secure electronic means. New parties wishing to obtain credit terms with the Group are credit checked prior to invoices being raised and credit limits are determined on an individual basis.
2021
Not past due
£m
0 to 6 months past due
£m
6 to 12 months past due
£m
Over 1 year past due
£mTotal
£m
Trade receivables 140 24 3 5 172Other receivables 457 8 9 4 478Gross carrying amount – Trade and other receivables 597 32 12 9 650Allowance for expected credit losses (17) (7) (9) (8) (41)Net carrying amount on balance sheet 580 25 3 1 609
2020
Not past due
£m
0 to 6 months past due
£m
6 to 12 months past due
£m
Over 1 year past due
£mTotal
£m
Trade receivables 107 20 4 2 133Other receivables 517 34 0 3 554Gross carrying amount – Trade and other receivables 624 54 4 5 687Allowance for expected credit losses (1) (4) (3) (4) (12)Net carrying amount on balance sheet 623 50 1 1 675
(c) Major counterpartiesThe Group has seven (2020: six) major counterparties totalling £218 million (2020: £167 million). No major counterparty balances are considered overdue or impaired.
134 Financial Statements J Sainsbury plc Annual Report 2021

22 Financial Services loans and advances to customersAccounting policiesLoans and advances are initially recognised at fair value and subsequently held at amortised cost, using the effective interest method, less provision for impairment and recognised on the balance sheet when cash is advanced.
Refer to note 32 for a detailed description of the accounting policies applicable to financial assets and note 31 for the accounting policies applicable to impairment of financial assets.
2021£m
2020£m
Non-current Loans and advances to customers 2,332 3,528 Impairment of loans and advances (52) (75) 2,280 3,453 Current Loans and advances to customers 3,338 4,143 Impairment of loans and advances (211) (192) 3,127 3,951
Sainsbury’s Bank has securitised and pledged Personal Loans and Mortgage assets with the Bank of England as part of the Bank of England’s Term Funding Scheme (TFS) and Indexed Long Term Repo Facility (ILTR). As at 6 March 2021 £623 million (2020: £1,590 million) of Personal Loans assets and £955 million (2020: £nil) of Mortgage assets were pledged to the Bank of England facilitating funding of £950 million (2020: £950 million) from the TFS and £150 million (2020: £75 million) from the ILTR.
Refer to note 31 for further details on Financial Services impairments of loans and advances.
23 Assets held for saleAccounting policiesAssets are classified as held for sale if their carrying amount is to be recovered principally through a sale transaction rather than through continuing use. This condition is regarded as met only when the sale is highly probable within one year from the date of classification and the assets are available for sale in their present condition. Assets held for sale are stated at the lower of the carrying amount and fair value less costs to dispose.
6 March 2021
£m
7 March 2020
£m
Opening balance 4 8Classified as held for sale in the year 24 2No longer classified as held for sale – (3)Sold in the year (4) (3)Closing balance 24 4
Of the Group’s assets held for sale at 7 March 2020, £4 million were sold during the current financial year. There were £24 million additional assets classed as held for sale during the current financial year. For the remaining assets, the sale is still considered probable in the next financial year and so they remain classified as held for sale. The fair value of assets held for sale is based on independent market valuations of the assets.
135Financial Statements J Sainsbury plc Annual Report 2021
Governance ReportStrategic Report
Financial Statements

24 Trade and other payablesAccounting policiesThe Group’s policy on payment of creditors is to agree terms of payment prior to commencing trade with a supplier and to abide by those terms on the timely submission of satisfactory invoices.
Trade payables are initially recognised at fair value, which is typically the invoiced amount and then held at amortised cost. They are shown net of supplier arrangements due where there is a contractual right of offset.
2021£m
2020£m
Current Trade payables 2,873 2,960Other payables 711 508Accruals 499 470Deferred income 405 337 4,488 4,275 Non-current Trade payables 1 –Other payables 5 8Accruals 13 –Deferred income 1 3 20 11
Deferred incomeThe following table presents a reconciliation of deferred income during the year:
2021£m
2020£m
Opening balance 340 356 Revenue deferred in the year 393 376Revenue recognised in the year which has previously been deferred (327) (392)Closing balance 406 340
The deferred revenue balance includes £323 million (2020: £327 million) in relation to deferred Nectar points.
Foreign currency riskThe Group has net euro denominated trade payables of £50 million (2020: £38 million) and US dollar denominated trade payables of £124 million (2020: £138 million).
Supplier financing arrangementsThe Group has a supply chain finance programme in place. The programme acts as an alternative source of financing for the suppliers who have the option to trade their invoices with funding providers in order to receive cash earlier than the invoice due dates. The payment terms offered to suppliers who are party to the supply chain finance programmes are within standard supplier payment terms and agreed directly between the Group and the supplier.
Balances outstanding under the supplier financing arrangements are classified as trade payables, and cash flows are included in operating cash flows, since the financing arrangements are agreed between the supplier, the funding providers and the third party platform provider. The Group does not provide additional credit enhancement nor obtain any working capital benefit from the arrangements.
Included in trade payables at 6 March 2021 are amounts of £349 million (7 March 2020: £590 million) drawn by suppliers who are party to the supply chain finance programmes.
136 Financial Statements J Sainsbury plc Annual Report 2021

25 Amounts due to Financial Services customers and banks Accounting policiesWith the exception of fixed rate bonds, amounts due to Financial Services customers are generally repayable on demand and accrue interest at retail deposit rates.
2021£m
2020£m
Current Customer accounts 4,924 6,059Other deposits 1,162 730Senior secured loan notes – 101 6,086 6,890 Non-current Customer accounts 203 253Other deposits – 951 203 1,204
Sainsbury’s Bank, via its subsidiary undertakings, is party to a bilateral securitisation transaction. This facility entered the amortisation phase in May 2019 where the facility is reducing in line with the maturity profile of the underlying secured assets. On 27 May 2020, the Bank’s Lochside asset purchaser personal loans securitisation programme was fully redeemed, resulting in the full redemption of the Senior Class A note of £101 million.
Other deposits of £1,162 million (2020: £1,681 million) relate to deposits from wholesale counterparties.
26 ProvisionsAccounting policies and key informationProvisions are recognised when there is a present legal or constructive obligation as a result of a past event, for which it is probable that an outflow of economic benefits will be required to settle the obligation and where the amount can be reliably estimated. Provisions are measured at the present value of the expenditures expected to be required to settle the obligation using a pre-tax rate that reflects current market assessments of the time value of money and the risks specific to the obligation. The increase in the provision due to passage of time is recognised as interest expense.
Property provisionsProperty provisions include provisions for onerous contracts which are recognised where expected cash outflows exceed the anticipated future benefits. The charge for the year includes provisions raised for store, depot and office closures which form part of the restructuring programmes announced during the year, as detailed in note 5. The amounts provided are based on the Group’s best estimate of the likely committed outflow, net of anticipated future benefits. These provisions do not include rent in accordance with IFRS 16, however do include unavoidable costs related to the lease, such as service charges and business rates.
Property provisions also include provisions for dilapidations which are recognised where the Group has the obligation to make-good its leased properties. These provisions are recognised based on historically settled dilapidations which form the basis of the estimated future cash outflows. Any difference between amounts expected to be settled and the actual cash outflow will be accounted for in the period when such determination is made.
Insurance provisionsThe provision relates to the Group’s outstanding insurance claims liabilities in relation to public and employer’s liability claims, and third party motor claims. Claims provisions are based on assumptions regarding past claims experience and on assessments by an independent actuary and are intended to provide a best estimate of the most likely or expected outcome.
Restructuring provisionsA restructuring provision is recognised when the Group has developed a detailed formal plan for the restructuring and has raised a valid expectation in those affected that it will carry out the restructuring by starting to implement the plan or announcing its main features to those affected by it. The measurement of a restructuring provision includes only the direct expenditures arising from the restructuring.
The charge for the year mostly comprises redundancy payments as part of the store and depot closures announced during the year as detailed in note 5, as well as announced head-office restructures during the year.
137Financial Statements J Sainsbury plc Annual Report 2021
Governance ReportStrategic Report
Financial Statements

Financial Services related provisions Financial Services loan commitment provisions reflect expected credit losses modelled in relation to loan commitments not yet recognised on the balance sheet (on credit cards and Argos store cards).
Other Financial Services related provisions are primarily in relation to Argos Financial Services customers in respect of potential redress payable arising from the historic sales of Payment Protection Insurance (PPI), and in respect of potential customer redress payable in relation to other customer conduct issues arising from a review of the governance and risk management framework.
With regards to PPI provisions, the eventual cost is dependent on response rates, uphold rates, complaint rates, redress costs and claim handling costs. The provision represents management’s best estimate of future costs. These assumptions are inherently uncertain and the ultimate financial impact may differ from the amount provided.
The remaining customer redress costs incorporate detailed calculations combined with historic experience, therefore elements of these estimates are inherently uncertain and the ultimate financial impact may be different from that provided. The provision reflects management’s best estimates and is expected to be utilised within one year.
Property provisions
£m
Insurance provisions
£mRestructuring
£m
Financial Services
related provisions
£m
Other provisions
£mTotal
£m
At 8 March 2020 61 63 20 37 16 197Additional provisions 245 33 61 7 32 378Unused amounts reversed (5) (2) – (2) – (9)Utilisation of provision (18) (27) (27) (16) (10) (98)Amortisation of discount 2 – – – – 2At 6 March 2021 285 67 54 26 38 470Current 82 24 53 21 29 209Non-current 203 43 1 5 9 261At 10 March 2019 34 71 22 57 20 204Additional provisions 46 25 22 11 14 118Unused amounts reversed (4) (9) – (13) (10) (36)Utilisation of provision (15) (24) (24) (18) (8) (89)At 7 March 2020 61 63 20 37 16 197Current 25 23 20 31 9 108Non-current 36 40 – 6 7 89
Significant estimate – provisionsThe Group’s provisions are estimates and the actual costs and timing of future cash flows are dependent on future events and market conditions. Thus there is inherently an element of estimation uncertainty within the provisions recognised by the Group. Any difference between expectations and the actual future liability will be accounted for in the period when such determination is made.
The provisions are most sensitive to estimates of the future cash outflows. The following table summarises the impact that a reasonable possible change in the cash outflow assumptions when estimating provisions would have had on the amounts recognised during the year.
Increase/(decrease) in provisions recognised
Property provisions
£m
Insurance provisions
£mRestructuring
£m
Financial Services
related provisions
£m
Other provisions
£mTotal
£m
Increase in cash outflows of 5% 12 2 3 – 2 19Decrease in cash outflows of 5% (12) (2) (3) – (2) (19)
26 Provisions continued
138 Financial Statements J Sainsbury plc Annual Report 2021

27 Called up share capital, share premium and merger reserveAccounting policiesOrdinary shares are classified as equity. Incremental costs directly attributable to the issue of new ordinary shares or options are shown in equity as a deduction, net of tax, from the proceeds.
2021million
2020million
2021£m
2020£m
Called up share capital Allotted and fully paid ordinary shares 28 4/7p 2,231 2,217 637 634 Share premium account Share premium 1,173 1,159
The movements in the called up share capital, share premium and merger reserve are set out below:
Number of ordinary shares
million
Ordinary shares
£m
Share premium account
£m
Merger reserve
£m
At 8 March 2020 2,217 634 1,159 568Allotted in respect of share option schemes 14 3 14 –At 6 March 2021 2,231 637 1,173 568 At 10 March 2019 2,206 630 1,147 568Allotted in respect of share option schemes 11 4 12 –At 7 March 2020 2,217 634 1,159 568
28 Capital redemption and other reserves
Currency translation
reserve£m
Financial assets at fair value
through other comprehensive
income£m
Cash flow hedge
£m
Convertible bond
£m
Total other reserves
£m
Capital redemption
reserve£m
At 8 March 2020 5 209 (46) – 168 680Currency translation differences (5) – – – (5) –Financial assets at fair value through other comprehensive
income movements– 57 – – 57 –
Cash flow hedges gains and losses transferred to inventory – – (1) – (1) –Cash flow hedges effective portion of fair value movements – – (61) – (61) –Items reclassified from cash flow hedge reserve – – 13 – 13 –Deferred tax – (15) 11 – (4) –At 6 March 2021 – 251 (84) – 167 680 At 10 March 2019 5 192 (30) 5 172 680Financial assets at fair value through other comprehensive
income movements– 21 – – 21 –
Cash flow hedges effective portion of fair value movements – – (1) – (1) –Items reclassified from cash flow hedge reserve – – (19) – (19) –Amortisation of convertible bond – equity component – – – (5) (5) –Deferred tax – (4) 4 – – –At 7 March 2020 5 209 (46) – 168 680
The currency translation reserve represents the cumulative foreign exchange differences on the translation of the net assets of the Group’s foreign operations from their functional currency to the presentation currency of the parent.
The financial assets at fair value through other comprehensive income reserve represents the fair value gains and losses on the financial assets at fair value through other comprehensive income held by the Group. The cash flow hedge reserve represents the cumulative effective fair value gains and losses on cash flow hedges in the Group.
The convertible bond reserve represents the equity component of the £450 million convertible bond issued in November 2014. This bond matured in November 2019.
The capital redemption reserve arose on the redemption of B shares. Shareholders approved a £680 million return of share capital, by way of a B share scheme, at the Company’s Extraordinary General Meeting on 12 July 2004. The final redemption date for B shares was 18 July 2007 and all transactions relating to the B shares have now been completed.
139Financial Statements J Sainsbury plc Annual Report 2021
Governance ReportStrategic Report
Financial Statements

29 Perpetual securities Accounting policies and key informationPerpetual securities (perpetual subordinated capital securities and perpetual subordinated convertible bonds) are issued securities that qualify for recognition as equity. Accordingly any periodic returns are accounted for as dividends and recognised directly in equity at the time it becomes obligated to pay the periodic return. Any associated tax impacts are recognised in the income statement as this is where the distributable profits were generated in line with IAS 12 ‘Income Taxes’.
On 30 July 2015 the Group issued £250 million of perpetual subordinated capital securities and £250 million of perpetual subordinated convertible bonds, collectively known as perpetual securities. Costs directly associated with the issue of £6 million were offset against the value of the proceeds. The perpetual securities have no fixed redemption date. Holders of the perpetual securities do not benefit from any put option rights.
The Group redeemed the £250 million perpetual subordinated capital securities, at the first call date on 30 July 2020.
The Group has the right to call the £250 million perpetual subordinated convertible bonds at their principal amount on 30 July 2021. The perpetual subordinated convertible bonds may be converted into ordinary shares of the Group at the option of the holders at any time up to 23 July 2021 at the prevailing conversion price on the date the option is exercised. The current conversion price is 273.2807 pence.
The Group has the right to defer coupons on the perpetual subordinated convertible bonds on any coupon payment date if the Group has either not paid a dividend on its ordinary shares nor bought back ordinary shares (excluding shares bought to satisfy employee share schemes) within the previous 12 month period. The coupon rate on the perpetual subordinated convertible bonds increases after the sixth anniversary from 2.875 per cent to 9.727 per cent above the five-year swap rate.
The next coupon date on the perpetual subordinated convertible bonds is 30 July 2021. As the Group paid a dividend to ordinary shareholders in the 12 months prior to this date, the periodic distributions of £7 million (2020: £7 million) for the perpetual subordinated convertible bonds have been recognised in the financial year.
Perpetual capital
securities£m
Perpetual convertible
bonds£m
At 8 March 2020 248 248Distributions to holders of perpetual securities – (7)Redemption of perpetual capital securities (248) –Profit for the year attributable to holders of perpetual securities – 7At 6 March 2021 – 248 At 10 March 2019 248 248Distributions to holders of perpetual securities (16) (7)Profit for the year attributable to holders of perpetual securities 16 7At 7 March 2020 248 248
140 Financial Statements J Sainsbury plc Annual Report 2021

30 Retained earningsOwn shares held by Employee Share Ownership Trust (ESOT) The Group owns 17,204,213 (2020: 7,269,702) of its ordinary shares of 284/7 pence nominal value each. At 6 March 2021, the total nominal value of the own shares was £4.9 million (2020: £2.1 million).
All shares (2020: all shares) are held by a Group trust for the Executive Share Plans. The Group trust waives the rights to the dividends receivable in respect of the shares under the above schemes.
The cost of the own shares is deducted from equity in the Group financial statements. The market value of the own shares at 6 March 2021 was £40 million (2020: £15 million).
Own shares
£m
Profit and loss account
£m
Total retained earnings
£m
At 8 March 2020 (16) 4,084 4,068Profit for the year – (287) (287)Remeasurements on defined benefit pension schemes – (482) (482)Current tax on retirement benefit obligations – 44 44Deferred tax on retirement benefit obligations – 23 23Dividends paid – (232) (232)Share-based payment – 29 29Purchase of own shares (30) – (30)Allotted in respect of share option schemes 13 (13) –Redemption of perpetual capital securities – (2) (2)At 6 March 2021 (33) 3,164 3,131 At 10 March 2019 (19) 4,108 4,089Profit for the year – 129 129Remeasurements on defined benefit pension schemes (net of tax) – 89 89Deferred tax on retirement benefit obligations – (15) (15)Dividends paid – (247) (247)Amortisation of convertible bond – equity component – 5 5Share-based payment – 37 37Purchase of own shares (18) – (18)Allotted in respect of share option schemes 21 (22) (1)At 7 March 2020 (16) 4,084 4,068
31 Financial risk managementThe principal financial risks faced by the Group relate to liquidity risk, credit risk, market risk (foreign currency risk, interest rate risk and commodity risk) and capital risk.
Financial risk management is managed by a central treasury department in accordance with policies and guidelines which are reviewed and approved by the Board of Directors. The risk management policies are designed to minimise potential adverse effects on the Group’s financial performance by identifying financial exposures and setting appropriate risk limits and controls. The risk management policies also ensure sufficient liquidity is available to the Group to meet foreseeable financial obligations and that cash assets are invested safely.
Financial risk management with respect to Financial Services is separately managed within the Financial Services’ governance structure.
Liquidity riskLiquidity risk is the risk that the Group may be unable to meet its financial obligations as they fall due.
The principal operational cash flow of the Group is largely stable and predictable reflecting the low business risk profile of the food retail sector and the cyclical profile of the non-food retail sector. Cash flow forecasts are produced to assist management in identifying future liquidity requirements. The Group’s liquidity policy sets a minimum funding headroom of £400 million in excess of forecast funding requirements over a rolling 12 month time horizon. The Group manages its liquidity risk by maintaining a core of long-dated borrowings, pre-funding future cash flow commitments and holding contingent committed credit facilities. The Group has prepared additional cash flow forecasts in connection to COVID-19, to identify associated liquidity requirements.
The Group’s committed £1,450 million Revolving Credit Facility was undrawn at 6 March 2021. The facility is provided by a syndicate of 16 banking partners. The Group has no financial covenants. In September 2019 the maturity of part of the £1,450 million RCF was extended by one year. The facility is split into two Facilities, a £300 million Facility (A) and a £1,150 million Facility (B). Facility A has a final maturity of April 2025 and Facility B has a final maturity of October 2024.
141Financial Statements J Sainsbury plc Annual Report 2021
Governance ReportStrategic Report
Financial Statements

The table below analyses the Group’s financial liabilities into relevant maturity groupings based on the remaining period to the contractual maturity date. The amounts disclosed in the tables are the contractual undiscounted cash flows or an estimate of cash flows in respect of floating interest rate liabilities.
Less than one year
£m
One to two-years
£m
Two to five years
£m
More than five years
£m
At 6 March 2021Non-derivative financial liabilitiesSecured loans: Loan due 20311 (73) (74) (229) (373)Unsecured loans: Bank loans due 20212 (201) – – – Bank loans due 20242 – – – –Trade and other payables (4,083) (19) – –Amounts due to Financial Services customers and banks5 (6,088) (126) (82) –Derivative contracts – net settled Commodity contracts 2 1 – –Interest rate swaps in hedging relationships1, 4 (27) (23) (3) –Derivative contracts – gross settledForeign exchange forwards – outflow3 (1,570) (198) – –Foreign exchange forwards – inflow3 1,483 196 – –Commodity contracts – outflow (10) (9) (21) (13)Commodity contracts – inflow 11 9 23 15
Less than one year
£m
One to two-years
£m
Two to five years
£m
More than five years
£m
At 7 March 2020 Non-derivative financial liabilitiesSecured loans: Loan due 20311 (72) (74) (233) (488)Unsecured loans: Bank loans due 20212 (3) (201) – – Bank loans due 20242 (3) (3) (258) –Trade and other payables (3,835) – – –Amounts due to Financial Services customers and banks5 (6,883) (1,116) (95) –Derivative contracts – net settled Commodity contracts – – – –Interest rate swaps in hedging relationships1, 4 (8) (4) – (1)Derivative contracts – gross settledForeign exchange forwards – outflow3 (1,837) (193) – –Foreign exchange forwards – inflow3 1,822 194 – –Commodity contracts – outflow (11) (8) (18) (16)Commodity contracts – inflow 8 6 18 19
Assumptions:1 Cash flows relating to debt and swaps linked to inflation rates have been calculated using a RPI of 2.7 per cent for the year ended 6 March 2021, 1.4 per cent for the year ending 5 March 2022 and 1.4 per cent for
future years (2020: RPI of 2.6 per cent for the year ended 7 March 2020, 2.6 per cent for the year ending 6 March 2021 and 2.7 per cent for future years).2 Cash flows relating to debt bearing a floating interest rate have been calculated using prevailing interest rates as at 6 March 2021 and 7 March 2020.3 Cash flows in foreign currencies have been translated using spot rates as at 6 March 2021 and 7 March 2020.4 The swap rate that matches the remaining term of the interest rate swaps as at 6 March 2021 has been used to calculate the floating rate cash flows over the life of the interest rate swaps shown above
(2020: 7 March 2020).5 Cash flows relating to amounts due to Sainsbury’s Bank customers and banks are calculated using contractual terms and interest rates for fixed rate instruments. Where balances are contractually repayable
on demand, behavioural assumptions are applied to estimate the interest payable on those balances. These are shown as due within one year.
Financial ServicesLiquidity risk is the risk that Sainsbury’s Bank and its subsidiaries (the Bank) cannot meet its payment obligations as they fall due, or can only do so at excessive cost. The Bank seeks to ensure that financial obligations can be met at all times, even under liquidity stress conditions.
The annual Internal Liquidity Adequacy Assessment Process (ILAAP) enables the Bank to:(1) Identify and assess its most relevant liquidity risk drivers; (2) Quantify its liquidity needs under various stress scenarios; and(3) Put in place appropriate limits and controls to mitigate liquidity risks.
In meeting its internal limits as well as PRA requirements, the Bank maintains a stock of high quality liquid assets that can be readily monetised by outright sale or repurchase agreement to meet the Bank’s obligations to depositors and other creditors.
31 Financial risk management continued
142 Financial Statements J Sainsbury plc Annual Report 2021

The Bank’s Liquidity Coverage Ratio (LCR) and Net Stable Funding Ratio (NSFR) are regularly monitored and forecast alongside cash flow and funding ratios. Long-term and short-term forecasts are prepared to assess liquidity requirements, taking into account factors such as ATM cash management, contractual maturities and customer deposit patterns (stable or less stable deposits) as well as outflows regarding undrawn commitments. These reports support daily liquidity management, with early warning indicators reviewed on a daily basis and appropriate triggers for escalation and action in line with risk appetite, Liquidity and Funding Policy and Liquidity Contingency Plan. Asset encumbrance ratios and risk indicators for wholesale funding concentrations by type (total/secured/unsecured), maturity, sector, geography are counterparty are also regularly monitored and reported to the Asset-Liability Committee (ALCO).
Asset encumbrance
2021 2020
Carrying value of
encumbered assets
£m
Matching liabilities,
contingent liabilities or
securities lent £m
Carrying value of
encumbered assets
£m
Matching liabilities,
contingent liabilities or
securities lent £m
Loans and advances to customers 1,596 1,110 1,774 1,126Debt securities 27 – 339 299Other assets 76 27 76 29Cash and balances with central banks 17 – 18 –
The primary sources of encumbrance in the Bank relate to margin requirements for derivative transactions and collateral relating to secured funding transactions. Cash collateral is advanced and received as variation margin on derivative transactions, whilst eligible treasury assets (primarily gilts and Treasury bills) are pledged as collateral for initial margin requirements on derivatives which are centrally cleared. Eligible personal loans and mortgages, with applicable haircuts, are used as collateral for Bank of England funding facilities, including the Term Funding Scheme (TFS), and Indexed Long Term Repo (ILTR) facilities.
Credit riska. Retail credit risk managementCounterparty credit risk is the risk of a financial loss arising from counterparty default or non-performance in respect of the Group’s holdings of cash and cash equivalents, derivative financial assets, deposits with banks, investments in marketable securities, trade and other receivables and loans and advances to customers.
Specifically within Financial Services, retail credit risk is the possibility of losses arising from a retail customer failing to meet their agreed repayment terms as they fall due under mortgage, credit card or store card arrangements. The Financial Services division utilises automated scorecards to assess the credit worthiness and affordability criteria of new applicants and ongoing behavioural characteristics of existing customers. The outcomes from all scorecard models are monitored utilising a set of credit quality metrics to ensure actual performance is in line with agreed expectations. Additional expert underwriting of credit applications is undertaken by a specialist operational team where further consideration is appropriate.
The Retail Credit Risk Committee of Sainsbury’s Bank provides portfolio oversight control over credit strategy to maintain lending in line with the Board approved risk appetite, with additional oversight and control provided by the Executive Risk Committee and Board Risk Committee. Internal Audit provide additional assurance by undertaking regular reviews on the adequacy of credit risk policies and procedures.
b. Wholesale and derivative credit risk managementThe Group (excluding Financial Services) sets counterparty limits for each of its banking and investment counterparties based on their credit ratings. The minimum unsecured long-term credit rating accepted by the Group is BBB- (Standard & Poor’s and Fitch) or Baa3 (Moody’s) or, in the case of sterling liquidity funds, AAA or Aaa/MR1+ from Moody’s. In the event of a split credit rating, the lower rating applies.
The table below analyses the Group’s cash and cash equivalents by credit exposure excluding bank balances, store cash, cash in transit and cash at ATMs.
Counterparty Long-term rating
Group 2021
£m
Group 2020
£m
Financial institutions – Money market deposits AAAm/Aaa 198 –Financial institutions – Money market deposits AA+/Aa1 to A/A2 200 202Deposits at central banks AA+/Aa1 852 273
The table below analyses the fair value of the Group’s derivative financial assets by credit exposure, excluding any collateral held.
Counterparty Long-term rating
Group 2021
£m
Group 2020
£m
Interest rate swaps AA+/Aa1 to A/A2 1 4FX forward contracts AA+/Aa1 to A/A2 2 14Commodity forward contracts AA+/Aa1 to A/A2 4 –
The Bank’s treasury portfolio is held primarily for liquidity management purposes and in the case of derivatives, for the purpose of managing market risk. The liquidity portfolio is invested in eligible investment securities that qualify for the regulatory Liquidity Coverage Ratio (LCR) and internal Operational Liquidity Pool (OLP). These investments include the Bank of England’s (BoE) reserve account, UK government securities (gilts or Treasury bills), multilateral development bank securities, government guaranteed agency securities, UK regulated covered bond programmes and asset backed securities.
31 Financial risk management continued
143Financial Statements J Sainsbury plc Annual Report 2021
Governance ReportStrategic Report
Financial Statements

Limits are established for all counterparty and asset class exposures based on their respective credit quality and market liquidity. Consideration is also given to geographical region and the strength of relevant sovereign credit ratings. Derivatives are subject to the same credit risk control procedures as are applied to other wholesale market instruments and the credit risk arising from mark to market derivative valuations is mitigated by daily margin calls, posting cash collateral to cover exposures. Daily monitoring is undertaken by the Bank’s Treasury department, including early warning indicators with appropriate triggers for escalation.
c. Maximum exposure to credit riskThe table below shows the maximum exposure to credit risk for the components of the balance sheet, including derivatives. The maximum exposure is shown gross, before the effect of mitigation through the use of collateral agreements.
2021 £m
2020 £m
Credit risk exposures relating to on balance sheet itemsLoans and advances to customers Unsecured 4,152 5,542 Secured 1,255 1,862Cash and balances with central banks 1,477 994Derivative financial instruments 13 18Investment securities 538 803Other assets 609 675Credit risk exposures relating to off balance sheet itemsLoans commitment and other related liabilities 64 80Total credit risk exposures 8,108 9,974
The commitments to lend disclosed in the above table do not include undrawn limits on credit cards and store cards. These are not considered contractual commitments but, because in practice Financial Services does not expect to withdraw these credit limits from customers, they are within the scope of impairment provisioning.
d. Impairment of financial assetsAccounting policiesImpairments on financial assets are accounted for using a three-stage forward-looking expected credit loss (ECL) approach in line with IFRS 9. The Group is required to record an allowance for ECL for all loans and other debt financial assets not held at FVTPL, together with loan commitments and financial guarantee contracts.
ECLs are based on the difference between the cash flows due in accordance with the contract and all the cash flows that the Group expects to receive, discounted at an approximation of the original effective interest rate. The expected cash flows will include cash flows from the sale of collateral held or other credit enhancements that are integral to the contractual terms.
For trade receivables and contract assets, the Group recognises a loss allowance against trade receivables to reflect the lifetime expected credit loss, consistent with the simplified approach under IFRS 9. The loss is calculated by using a provision matrix based on the past due status of receivables.
For Financial Services portfolios of loans, such as credit card lending, scorecard lending and personal loans, impairment provisions are calculated for groups of assets, otherwise impairment is identified at a counterparty specific level. The allowance is calculated by reference to the estimated probability of default (PD), exposure at default (EAD) and loss given default (LGD).
— The probability of default represents the likelihood of a borrower defaulting within 12 months from the balance sheet date or within the expected lifetime of the borrower.
— Exposure at default represents the expected amount due from the borrower at the point of default by reference to exposure at the balance sheet date adjusted for expected future changes including repayments and utilisation of undrawn facilities.
— Loss given default represents the expected percentage loss at the point of default relative to the EAD. The estimate takes into account utilisation of any expected collections and recoveries strategies, debt sale arrangements and collateral.
ECL three-stage model — Stage 1 – Impairment allowance on financial assets that have not significantly increased in credit risk since origination, nor are credit impaired, is calculated using the probability that a borrower will default within 12 months from the balance sheet date. Interest income is recognised on the gross carrying value of the financial asset.
— Stage 2 – Where a financial asset exhibits a significant increase in credit risk (SICR) but is not yet considered to be credit impaired, the probability of default considered in the impairment allowance is based upon the lifetime probability of the borrower defaulting. Interest income continues to be recognised on the gross carrying value of the financial asset.
— Stage 3 – Assets considered to be credit impaired resulting from one or more events that have occurred that have resulted in a detrimental impact on the estimated future cash flows of the asset. Stage 3 assets will continue to recognise lifetime expected impairment losses (with a 100 per cent probability of default) and interest income will be recognised on the net carrying amount (i.e. gross amount less impairment allowance).
Purchase or originated credit impaired (POCI)POCI financial assets are assets that are credit-impaired on initial recognition. For POCI assets, lifetime ECLs are incorporated into the calculation of the effective interest rate on initial recognition. Consequently, POCI assets do not carry an impairment allowance on initial recognition. The amount recognised as a loss allowance subsequent to initial recognition is equal to the changes in lifetime ECL since initial recognition of the asset. POCI assets will always be classified as POCI regardless of changes in credit quality post initial recognition. A credit-adjusted effective interest rate is used as the discount rate when discounting future cash flows for POCI assets.
31 Financial risk management continued
144 Financial Statements J Sainsbury plc Annual Report 2021
Significant increases in credit riskThe Group determines whether there has been a significant increase in credit risk by reference to quantitative thresholds, qualitative indicators and the backstop presumption that credit risk has significantly increased if contractual payments are more than 30 days past due.
Quantitative thresholds have been determined that when the lifetime PD of an instrument as at the reporting date has increased to greater than a specified multiple of the origination lifetime PD, a significant increase in credit risk is deemed to have occurred.
Qualitative tests are based around the Group’s credit origination policy rules for Financial Services customers. These rules are in place at account origination in order to decline accounts that may demonstrate risk factors outside of risk appetite that are not yet reflected in PD measures. At the reporting date, if an account satisfies any policy decline rules that it had not at the point of origination, it will be considered to have significantly increased in credit risk.
There is no probationary period applied in respect of accounts that cure from Stage 2 to Stage 1. Transfer criteria have been subject to extensive analysis to ensure that they appropriately reflect the flow of accounts from origination to default so as to maximise the number of accounts that flow through the stages and minimise accounts that jump from Stage 1 to Stage 3, or that fail to enter Stage 3 from Stage 2.
The Group has applied the low credit risk exemption in respect of its high quality treasury portfolio held for liquidity purposes. This exemption permits low credit risk debt securities (i.e. those considered investment grade) to remain in Stage 1 without an assessment of significant increase in credit risk.
COVID-19 impact on IFRS 9 staging There has been no material change in the approach to assessing significant increases in credit risk as a result of COVID-19. However, due to the impact of COVID-19 on the economic environment and subsequent expected impacts on customers, the portion of unsecured loans in Stage 2 increased from 8.5 per cent in 2020 to 12.4 per cent in 2021. There was no material movement in secured loans.
The increase in Stage 2 assets was triggered by updated macro-economic forecasts, reflecting a more negative outlook and increasing the volume of customer accounts exhibiting significant increases in credit risk.
Definition of defaultThe Group’s definition of default is used in determining those accounts classified as Stage 3 (i.e. credit impaired). The Group has chosen not to rebut the backstop presumption prescribed by IFRS 9 that where an account is 90 days or more past its due date then default has occurred.
The Group has also defined a number of unlikeliness-to-pay criteria that result in an account being deemed to have defaulted. These include: — Where operational collections activities have been exhausted on accounts that are less than 90 days past due and the account is subject to recoveries processes
— If any forbearance has been granted on the account — Where the customer is subject to insolvency proceedings — Where the customer is deceased
Where an account no longer meets any of the default criteria, such as by bringing payments back up to date, the Group will continue to consider the account as being in default for a period of 24 months from the date when it last met the definition of default.
Write-offLoans and advances to customers are written off (either partially or in full) when there is no realistic prospect of recovery. This is generally the case when the Group determines that the borrower does not have assets or sources of income that could generate sufficient cash flows to repay the amounts subject to write-off.
Subsequent recoveries of amounts previously written off result in impairment gains recorded in the statement of comprehensive income.
Expected lifetimeFor the purposes of considering the lifetime probability of default, the expected lifetime of a financial asset is the contractual term where this is fixed within the contract, or in the case of revolving products such as credit cards a behavioural life is determined by reference to historic trends.
Modified financial assetsWhen the contractual cash flows of a financial asset have been renegotiated or modified and the financial asset was not derecognised, its gross carrying amount is recalculated as the present value of the modified contractual cash flows, discounted at the original effective interest rate with a gain or loss recognised in the income statement.
e. Macro-economic scenariosIFRS 9 requires that the measurement of ECL should reflect an unbiased and probability weighted amount that is determined by evaluating a range of forward-looking economic assumptions. The Bank has engaged an external supplier to provide economic forecasts which are subject to review, challenge and approval through the Bank’s governance processes.
For the year ended 6 March 2021 the Bank commissioned economic scenarios to take account of the potential ramifications of COVID-19 which include a range of assumptions relating to exit from social restrictions, vaccine roll out and furlough and also include an additional severe downside economic scenario.
The ECL models utilise four scenarios (2020: three scenarios) including a ‘base case’ scenario considered to be the most likely outcome together with an upside, downside and severe downside. The base case has been assigned a probability weighting of 40 per cent with the upside, downside and severe downside scenarios weighted 30 per cent, 25 per cent, 5 per cent respectively (2020: base scenario 40 per cent, upside and downside scenario 30 per cent each).
31 Financial risk management continued
145Financial Statements J Sainsbury plc Annual Report 2021
Governance ReportStrategic Report
Financial Statements
The key macro-economic assumptions included in the ECL calculation (shown as 5 year averages from the reporting date) were:
As at 6 March 2021
Base%
Upside%
Downside%
Severe downside
%
Unemployment rate 5.2 4.5 6.4 8.2Consumer price growth 1.8 1.9 1.7 1.6GDP 3.1 4.0 2.7 2.3Mortgage debt as a percentage of household income 101.6 100.6 102.0 102.4Real household disposable income 1.9 2.2 1.7 1.4Probability weighting (%) 40 30 25 5Sensitivity analysis impact on impairment of 100 per cent weighting £(1)m £(14)m £13m £29m
f. Management overlaysIn the context of IFRS 9, management overlays are short-term increases or decreases to the ECL at either a customer or portfolio level to account for items that have not been fully reflected in the existing models.
Internal governance is in place to regularly monitor management overlays and to reduce the reliance on management overlays through model recalibration or redevelopment, as appropriate.
Management overlays applied in estimating the reported ECL at 6 March 2021 are set out in the following table. The table includes adjustments in relation to data and model limitations resulting from COVID-19 economic conditions. It shows the adjustments applicable to the scenario weighted ECL numbers.
Movement in ECL
At 6 March 2021
£m
At 7 March 2020
£m
Economic adjustment 21 7PD adjustment 10 –LGD adjustment 9 –Operational overlays 2 3Total 42 10
The proportion of management overlay is 16 per cent of the total ECL provision as at 6 March 2021 (2020: 4 per cent).
The Economic, LGD and PD adjustments all relate to adjusting the modelled provision for the impact of COVID-19. The Economic adjustment is applied where the IFRS 9 models do not react to the severe economic shock of COVID-19 as expected. Therefore, challenger models have been developed to respond to the latest economic data to produce a more reasonable ECL that appropriately reacts to severe negative economic data. The further PD adjustment is held to account for the uncertainty around both the economic assumptions regarding COVID-19 and the subsequent recovery and the impact that this will have on the Bank’s ECL.
The LGD adjustment is applied to the ECL to account for the expectation that LGD will deteriorate due to the nature of COVID-19. Currently the IFRS 9 models’ LGD estimate is not impacted by economic variables.
The majority of the Operational overlays relate to model limitations that have been manually corrected whilst a permanent fix is being developed.
g. Loans and advances to customers per stageThe tables below summarise the breakdown of the gross carrying amount of loans and advances to customers per stage. Unsecured lending represents Sainsbury’s Bank credit cards and personal loan lending in addition to Argos storecards. Secured lending represents Sainsbury’s Bank mortgage lending.
31 Financial risk management continued
146 Financial Statements J Sainsbury plc Annual Report 2021

At 6 March 2021Unsecured lending
Stage 1£m
Stage 2£m
Stage 3£m
Total£m
ImpairedLess than 3 months, but impaired – – 38 38Over 3 months – – 76 76Recoveries – – 93 93Total gross impaired loans – – 207 207
Past due 30 days to 3 months – 21 – 21Past due less than 30 days 8 26 – 34Not past due 3,640 499 – 4,139
Total gross amount due 3,648 546 207 4,401
ImpairmentImpairment on gross balance (40) (63) (157) (260)Undrawn commitments impairment (9) (5) (1) (15)Total impairment (49) (68) (158) (275)
Coverage 1.3% 12.4% 76.3% 6.3%
At 6 March 2021Secured lending
Stage 1£m
Stage 2£m
Stage 3£m
Total£m
ImpairedLess than 3 months, but impaired – – 10 10Over 3 months – – 1 1Recoveries – – – –Total gross impaired loans – – 11 11
Past due 30 days to 3 months – – – –Past due less than 30 days – 1 – 1Not past due 1,189 46 – 1,235
Total gross amount due 1,189 47 11 1,247
ImpairmentImpairment on gross balance – – (3) (3)Undrawn commitments impairment – – – –Total impairment – – (3) (3)
Coverage – 0.4% 27.2% 0.2%
The above loans and advances to customers are summarised as follows:
2021£m
2020£m
Impaired 218 243Past due but not impaired 56 67Neither past due nor impaired 5,374 7,334Gross 5,648 7,644Allowance for impairment (263) (267)Hedging fair value adjustment 22 27Net book value 5,407 7,404
31 Financial risk management continued
147Financial Statements J Sainsbury plc Annual Report 2021
Governance ReportStrategic Report
Financial Statements

The table below summarises the movement in the loss allowance on loans and advances to customers:
2021 2020
Stage 1£m
Stage 2£m
Stage 3£m
Total £m
Stage 1£m
Stage 2£m
Stage 3£m
Total£m
Opening loss allowance (37) (52) (178) (267) (34) (64) (149) (247)Transfers between stages 59 3 (62) – 30 6 (36) –Additional provisions less amounts recovered – 2 12 14 (6) (6) (1) (13)Write-offs – 1 88 89 – 1 59 60Changes in credit risk during the year (62) (17) (20) (99) (27) 11 (51) (67)Closing loss allowance (40) (63) (160) (263) (37) (52) (178) (267)
h. Credit quality per class of loans and advancesThe Group defines the following classifications for all loans and advances to customers: High, Satisfactory, Low and Credit impaired. These are segmented by 12 month probability of default (PD) under IFRS 9.
IFRS 9 12 month PD
High quality <=3.02%Satisfactory quality >3.02%; < 11.11%Low quality >= 11.11%Credit impaired 100%
Unsecured lending
Stage 1£m
Stage 2£m
Stage 3£m
Total£m
6 March 2021High quality 3,176 161 – 3,337Satisfactory quality 420 252 – 672Low quality 52 133 – 185Credit impaired – – 207 207Total 3,648 546 207 4,401
Stage 1£m
Stage 2£m
Stage 3£m
Total£m
7 March 2020High quality 4,515 112 – 4,627Satisfactory quality 502 246 – 748Low quality 39 134 – 173Credit impaired – – 235 235Total 5,056 492 235 5,783
Secured lending
Stage 1£m
Stage 2£m
Stage 3£m
Total£m
6 March 2021High quality 1,189 45 – 1,234Satisfactory quality – 2 – 2Low quality – – – –Credit impaired – – 11 11Total 1,189 47 11 1,247
Stage 1£m
Stage 2£m
Stage 3£m
Total£m
7 March 2020High quality 1,778 73 – 1,851Satisfactory quality – 1 – 1Low quality – 2 – 2Credit impaired – – 8 8Total 1,778 76 8 1,862
31 Financial risk management continued
148 Financial Statements J Sainsbury plc Annual Report 2021
j. Collateral relating to loans and advances to customersMortgages held over residential properties represent the only collateral held by the Group for retail exposures. The market value of collateral held for impaired loans and loans past due but not impaired was £26 million (2020: £19 million). The fair value of collateral held against possession cases was £nil (2020: £nil).
An analysis by loan-to-value (LTV) ratio of the Bank’s residential mortgage lending is presented below. The value of collateral used in determining the LTV ratios has been estimated based upon the last actual valuation, adjusted to take into account subsequent movements in house prices.
Stage 1£m
Stage 2£m
Stage 3£m
Total £m
At 6 March 2021Less than 70% 795 37 8 84070% to 80% 265 7 2 27480% to 90% 128 3 1 13290% to 100% 1 – – 1Greater than 100% – – – –Total mortgages 1,189 47 11 1,247
Stage 1£m
Stage 2£m
Stage 3£m
Total £m
At 7 March 2020Less than 70% 1,032 45 6 1,08370% to 80% 377 12 1 39080% to 90% 304 16 1 32190% to 100% 65 3 – 68Greater than 100% – – – –Total mortgages 1,778 76 8 1,862
k. ForbearanceThe Group provides support to customers who are experiencing financial difficulties. Forbearance is relief granted by a lender to assist customers in financial difficulty, through arrangements which temporarily allow the customer to pay an amount other than the contractual amounts due. These temporary arrangements may be initiated by the customer or the Group where financial difficulty would prevent repayment within the original terms and conditions of the contract.
The main aim of forbearance is to support customers in returning to a position where they are able to meet their contractual obligations. The Group has adopted the definition of forbearance as published in Regulation EU 2015/227. The Group reports all accounts meeting this definition, providing for them appropriately.
The Group has well defined forbearance policies and processes. A number of forbearance options are made available to customers. These include, arrangements to repay arrears over a period of time, by making payments above the contractual amount, that ensure the loan is repaid within the original repayment term and short-term concessions, where the borrower is allowed to make reduced repayments (or in exceptional circumstances, no repayments) on a temporary basis to assist with short-term financial hardship.
The table below details the values of secured and unsecured advances that are subject to forbearance programmes, in accordance with the European Banking Authority (EBA) definition.
2021 2020
Gross loans and advances
subject to forbearance
£m
Forbearance as a total of
loans and advances
%
Forbearancecovered by
impairment provision
%
Gross loans and advancessubject to
forbearance£m
Forbearance as a total of
loans and advances
%
Forbearancecovered by
impairment provision
%
Unsecured 130 3.0 43.8 117 2.0 53.5Secured 4 0.3 24.6 3 0.2 4.2Total 134 2.4 43.3 120 1.6 52.1
31 Financial risk management continued
149Financial Statements J Sainsbury plc Annual Report 2021
Governance ReportStrategic Report
Financial Statements

Emergency Payment Freeze (EPF)The table below shows live EPFs at 6 March 2021 provided in response to COVID-19 for both secured and unsecured lending, including any agreed second payment holidays. The table excludes cases which have been completed prior to this date.
Gross lending on EPF ECL Proportion of loan book
6 March 2021Stage 1
£mStage 2
£mStage 3
£mTotal
£mStage 1
£mStage 2
£mStage 3
£mTotal
£mStage 1
%Stage 2
%Stage 3
%Total
%
Unsecured 15 10 2 27 – 1 1 2 0.4 1.8 0.8 0.6Secured 9 – – 9 – – – – 0.8 0.3 – 0.7
Market riskThe Group uses forward contracts to hedge foreign exchange and commodity exposures, and interest rate swap contracts to hedge interest rate exposures. The use of financial derivatives is governed by Board approved policies which prohibits the use of derivative financial instruments for speculative purposes.
a. Foreign currency riskCurrency risk is the risk of increased costs arising from unexpected movements in exchange rates impacting the Group’s foreign currency denominated supply contracts.
The Group’s currency risk policy seeks to limit the impact of fluctuating exchange rates on the Group’s income statement by requiring highly probable foreign currency cash flows to be hedged. Highly probable foreign currency cash flows, which may be either contracted or un-contracted, are hedged on a layered basis using foreign currency forward contracts.
The Group has exposure to currency risk on balances held in foreign currency denominated bank accounts, which may arise due to short-term timing differences on maturing hedges and underlying supplier payments.
The Group considers that a ten per cent movement in exchange rates against sterling is a reasonable measure of volatility. The impact of a ten per cent movement in the exchange rate of the US dollar and euro versus sterling as at the balance sheet date, with all other variables held constant, is summarised in the table below:
Group
2021 Change in
exchange rate impact on
post-tax profit
+/-10% £m
2021 Change in
exchange rate impact on cash
flow hedge reserve +/-10%
£m
2020Change in
exchange rate impact on
post-tax profit
+/-10% £m
2020 Change in
exchange rate impact on cash
flow hedge reserve +/-10%
£m
USD/GBP 3/(4) (112)/137 3/(3) (120)/147EUR/GBP 3/(3) (27)/33 2/(2) (27)/33
Financial ServicesThe Bank is exposed to FX risk through its holding of cash denominated in foreign currencies, primarily euro and US dollar, within its travel money bureaux in J Sainsbury’s stores. The FX positions are hedged on a regular basis. Furthermore a US dollar deposit is held with MasterCard. This exposure is also hedged.
Further information on the Group’s hedging is included within note 33.
Interest rate riskInterest rate risk is the risk of increased costs or lower income arising from unexpected movements in interest rates and inflation rates impacting the Group’s borrowing and investment portfolios. The Group’s interest rate policy seeks to limit the impact of fluctuating interest and inflation rates by maintaining a diversified mix of fixed rate, floating rate and variable capped rate liabilities.
Interest on financial instruments is classified as fixed rate if interest re-sets on the borrowings are less frequent than once every 12 months. Interest on financial instruments is classified as floating rate if interest re-sets on the borrowings occur every 12 months or more frequently. Floating rate instruments are considered variable capped rate if the nominal interest rate is subject to a cap.
31 Financial risk management continued
150 Financial Statements J Sainsbury plc Annual Report 2021

The mix of the Group’s financial assets and liabilities at the balance sheet date was as follows:
GroupFixed
£mFloating
£m
Variable capped
£mTotal
£m
At 6 March 2021Interest bearing financial assets at fair value through other comprehensive income 74 464 – 538Amounts due from Financial Services customers 3,102 2,305 – 5,407Cash and cash equivalents 166 1,311 – 1,477Borrowings (179) (200) (627) (1,006)Amounts due to Financial Services customers and banks (675) (5,614) – (6,289)Derivative effect: Interest rate swaps (2,951) 2,951 – – Inflation linked swaps (490) – 490 –Total (953) 1,217 (137) 127At 7 March 2020Interest bearing financial assets at fair value through other comprehensive income 155 647 – 802Amounts due from Financial Services customers 4,505 2,899 – 7,404Cash and cash equivalents 351 643 – 994Borrowings (180) (449) (667) (1,296)Amounts due to Financial Services customers and banks (1,262) (6,832) – (8,094)Derivative effect: Interest rate swaps (4,407) 4,407 – – Inflation linked swaps (490) – 490 –Total (1,328) 1,315 (177) (190)
Further information relating to interest rate risk in Financial Services is more fully described in the section on Financial Services financial risk factors below.
(i) Cash flow sensitivity for floating rate instrumentsThe Group considers that a 100 basis point movement in interest rates is a reasonable measure of volatility. The sensitivity of floating rate balances to a change of 100 basis points in the interest rate (or such lesser amount as would result in a zero rate of interest) at the balance sheet date is shown below:
2021 Impact on
post-tax profit
£m
2021 Impact oncash flow
hedgereserve
£m
2020 Impact on
post-tax profit £m
2020 Impact oncash flow
hedgereserve
£m
Change in floating rate +/-100bps (9)/5 1/(1) (13)/16 4/(4)
(ii) Cash flow sensitivity for variable capped rate liabilitiesThe Group holds £627 million of capped inflation-linked borrowings (2020: £667 million) of which £490 million (2020: £490 million) have been swapped into fixed rate borrowings using inflation rate swaps maturing in April 2023.
The Group considers that a 100 basis point movement in the RPI rate is a reasonable measure of volatility. The sensitivity of variable capped balances to a change of 100 basis points in the RPI rate at the balance sheet date is shown below:
2021 Impact on
post-tax profit
£m
2021 Impact oncash flow
hedgereserve
£m
2020 Impact on
post-tax profit
£m
2020 Impact oncash flow
hedgereserve
£m
Change in floating rate +/-100bps (2)/2 9/(9) (2)/2 13/(13)
Financial ServicesInterest Rate Risk in the Banking Book (IRRBB) arises from interest rate movements which impact the present value and timing of future cash flows resulting in changes in the underlying value of a bank’s assets and liabilities and hence its economic value. Interest rate movements also affect a bank’s earnings by altering interest-sensitive income and expenses, affecting its net interest income.
The main types of interest rate risk faced by the Bank are: — Repricing gap risk: the risk arising from timing differences in the interest rate changes of bank assets and liabilities (e.g. fixed rate personal loans and instant access savings accounts).
— Yield curve risk: the risk arising from changes in the slope and shape of the yield curve. — Basis risk: risk arising from imperfect correlation between different interest rate indices (e.g. administered rate on savings products and treasury assets linked to LIBOR).
— Prepayment risk: the risk arising from the timing of customer prepayments which differ from planning and hedging assumptions. — Pipeline risk: the risk of a customer drawing down, or not, a product at a rate which is unfavourable for the Bank. — Credit spread risk: the risk of adverse effects resulting from a change in credit spreads, arising via the Bank’s Treasury portfolio.
31 Financial risk management continued
151Financial Statements J Sainsbury plc Annual Report 2021
Governance ReportStrategic Report
Financial Statements

Interest risk exposure is actively managed within limits that are aligned with the Bank’s risk appetite by using financial instruments such as interest rate swaps and by taking into account natural hedges between assets and liabilities with similar repricing characteristics. Hedging strategies are implemented and reviewed to ensure the Bank remains within its limits.
In order to measure the exposure to interest rate risk the Bank adopts a Capital at Risk (‘CaR’) approach to assess the value sensitivity of the Bank’s capital to movements in interest rates under various interest rates shock scenarios, as well as via an annual earnings at risk metric which measures the sensitivity of the Bank’s earnings to movements in interest rates over the 12 month period. The CaR measure is an aggregate measure of five separate risk components, each being a distinct form of interest rate risk including repricing risk, basis risk, prepayment risk, MTM risk and credit spread risk.
Capital risk managementThe Group defines capital as total equity plus net debt.
The Board’s capital objective is to maintain a strong and efficient capital base to support the Group’s strategic objectives, provide optimal returns for shareholders and safeguard the Group’s status as a going concern. There has been no change to capital risk management policies during the year.
The Board monitors a broad range of financial metrics including return on capital employed, balance sheet gearing and fixed charge cover.
The Board can manage the Group’s capital structure by diversifying the debt portfolio, adjusting the size and timing of dividends paid to shareholders, recycling capital through sale and leaseback transactions, issuing new shares or repurchasing shares in the open market and flexing capital expenditure.
From time-to-time the Company purchases its own shares in the market for the purpose of issuing shares under the Group’s share option programmes however the Group does not operate a defined share buy-back plan.
Whilst there are no repeating financial covenants, part of the Group’s capital risk management is to ensure compliance with the general covenants included in the Group’s borrowing facilities. Examples of general covenants include restrictions on the permitted value of asset disposals and incremental secured indebtedness. In addition to there being no breaches of general covenants in the financial year ended 6 March 2021, there is healthy headroom within all general covenants as at 6 March 2021.
Information relating to Financial Services capital risk management is detailed below.
Financial Services capital resources (unaudited)The following table analyses the regulatory capital resources under CRD IV. From a prudential perspective, the Bank is monitored and supervised on a consolidated basis with its subsidiary, Home Retail Group Card Services Limited, from the point of acquisition of Argos Financial Services in September 2016. The Bank has obtained an individual consolidation waiver from the PRA, which allows the Bank to monitor its capital position on a consolidated basis only. Therefore, the capital position shown below is on a regulatory consolidated basis.
The Bank implemented IFRS 9, effective 1 March 2018. The following table analyses the regulatory capital resources under CRD IV and aligns to the phase-in approach of IFRS 9 impacts on capital, over a five-year period. The current year transitional data also includes adjustments introduced to mitigate against the impact of COVID-19, reflecting an additional benefit received for ECL increases.
Transitional 2021
IFRS 9 £m
Full impact 2021
IFRS 9 £m
Transitional 2020
IFRS 9 £m
Full impact 2020
IFRS 9 £m
Common Equity Tier 1 (CET 1) capital: Ordinary share capital 901 901 901 901 Allowable reserves (44) (44) 93 93 Regulatory adjustments (66) (131) (172) (239)Tier 1 capital 791 726 822 755Tier 2 capital (loan notes – listed) 120 119 167 167Total capital 911 845 989 922
Regulatory capital is calculated under the Capital Requirements Regulations and Capital Requirements Directive (collectively known as CRD IV) as enacted in the UK. Common Equity Tier 1 (CET 1) capital includes ordinary share capital, other reserves, losses and regulatory deductions.
31 Financial risk management continued
152 Financial Statements J Sainsbury plc Annual Report 2021

The movement of CET 1 capital during the financial year is analysed as follows:
Transitional 2021
IFRS 9 £m
Full impact 2021
IFRS 9 £m
Transitional 2020
IFRS 9 £m
Full impact 2020
IFRS 9 £m
At 1 March 2020 and 1 March 2019 822 756 785 705Share capital issued – – 35 35Verified profits/(losses) attributable to shareholders (142) (142) 20 20Transitional adjustments (1) – (13) –Other reserve movements 5 5 7 7Movement in intangible assets 107 107 (12) (12)At 28 February 2021 and 29 February 2020 791 726 822 755
Leverage ratio (unaudited)The leverage ratio is defined as the ratio of Tier 1 capital to adjusted assets, which is measured below on a regulatory consolidated basis. The denominator represents the total non-risk weighted assets of the regulatory group (Bank and Home Retail Group Card Services Limited) adjusted for certain off balance sheet exposures assets and regulatory deductions and provides a non-risk-weighted ‘backstop’ capital measure. The leverage ratio is calculated below as at 6 March 2021. The Bank’s leverage ratio of 9.5 per cent exceeds the minimum Basel leverage ratio of 3 per cent.
Transitional 2021
IFRS 9 £m
Full impact 2021
IFRS 9 £m
Transitional 2020
IFRS 9 £m
Full impact 2020
IFRS 9 £m
Components of the leverage ratioTotal assets as per published financial statements (Sainsbury’s Bank plc) 7,438 7,438 9,402 9,402Uplift on consolidation of subsidiary undertakings 58 58 58 58Exposure value for derivatives and securities financing transactions 22 22 15 15Off balance sheet exposures: unconditionally cancellable (10%) 917 917 906 906Off balance sheet: other (100%) 13 13 16 16Other adjustments (79) (143) (238) (238)
8,369 8,305 10,159 10,159Tier 1 capital 791 726 822 755Leverage ratio 9.5% 8.8% 8.1% 7.4%
Capital managementThe Bank manages its capital structure and makes adjustments to it in light of changes in economic conditions and the risk characteristics of its activities. Capital adequacy is monitored on an on-going basis by senior management, the ALCO, the Executive Risk Committee and the Board Risk Committee. Our submissions to the PRA in the year have shown that the Bank has complied with all externally imposed capital requirements.
The Bank will disclose Pillar 3 information as required by the Capital Requirements Regulations and PRA prudential sourcebook on the J Sainsbury plc external website.
32 Financial instrumentsAccounting policiesa) Financial assetsThe Group classifies all of its financial assets as either amortised cost, fair value through other comprehensive income (FVOCI) or fair value through profit or loss (FVTPL).
To determine their classification and measurement category, IFRS 9 requires all financial assets, except equity instruments and derivatives, to be assessed based on a combination of the entity’s business model for managing the assets and the instruments’ contractual cash flow characteristics.
In order for a financial asset to be classified and measured at amortised cost or fair value through OCI, it needs to give rise to cash flows that are ‘solely payments of principal and interest (SPPI)’ on the principal amount outstanding. This assessment is referred to as the SPPI test and is performed at an instrument level.
The business model assessment reflects how the Group manages the risks relating to the underlying financial assets, including whether the Group’s principal objective is to collect the contractual cash flows arising from the instruments (amortised cost), to sell the financial instruments (FVTPL) or a combination thereof (FVOCI).
31 Financial risk management continued
153Financial Statements J Sainsbury plc Annual Report 2021
Governance ReportStrategic Report
Financial Statements

Financial instruments at amortised costFinancial assets that are principally held for the collection of contractual cash flows and which pass the SPPI test are classified as amortised cost. For the Group, these are financial assets that are held within a business model with the objective to hold financial assets in order to collect contractual cash flows, and where the contractual terms of the financial asset give rise on specified dates to cash flows that are solely payments of principal and interest on the principal amount outstanding. The Group has no intention of trading these loans and receivables and they include amounts due from Financial Services customers and amounts due from other banks. With the exception of trade receivables that do not contain a significant financing component, the Group initially measures these financial assets at fair value plus transaction costs. Subsequently these assets are carried at amortised cost less impairment using the effective interest rate method. Income from these financial assets is calculated on an effective interest rate basis and is recognised in the income statement.
Financial assets at fair value through other comprehensive income Accounting policies are detailed in note 19.
Financial assets at fair value through profit and lossFinancial assets at fair value through profit or loss include financial assets held for trading, financial assets designated upon initial recognition at fair value through profit or loss, or financial assets mandatorily required to be measured at fair value. Financial assets are classified as held for trading if they are acquired for the purpose of selling or repurchasing in the near term. Derivatives are also classified as held for trading unless they are designated as effective hedging instruments. Financial assets with cash flows that are not solely payments of principal and interest are classified and measured at fair value through profit or loss, irrespective of the business model.
Financial assets at fair value through profit or loss are carried in the statement of financial position at fair value with net changes in fair value recognised in the income statement.
Financial assets are derecognised when the contractual cash flows from the asset have expired or have been transferred, usually by sale, and with them either substantially all the risks and rewards of the asset or significant risks and rewards, along with the unconditional ability to sell or pledge the asset.
b) Financial liabilities The Group recognises all of its financial liabilities at amortised cost and all derivative financial liabilities are classified as FVTPL.
Financial liabilities costs, including premiums payable on settlement or redemption and direct issue costs, are accounted for on an accrual basis in the income statement using the effective interest rate method and are added to the carrying amount of the instrument to the extent that they are not settled in the period in which they arise.
Interest-bearing bank loans, overdrafts, other deposits and amounts due to Sainsbury’s Bank customers are recorded initially at fair value, which is generally the proceeds received, net of direct issue costs. Subsequently, these liabilities are held at amortised cost using the effective interest rate method.
Financial liabilities are derecognised when the obligation under the liability is discharged, cancelled or expires.
Financial assets and liabilities by categorySet out below are the accounting classification of each class of financial assets and liabilities as at 6 March 2021 and 7 March 2020.
Group
Amortised cost
£m
Fair value through OCI
£m
Fair value through profit
or loss £m
Total £m
At 6 March 2021Cash and cash equivalents 1,477 – – 1,477Trade and other receivables 609 – – 609Amounts due from Financial Services customers 5,407 – – 5,407Financial assets at FVOCI – 844 – 844Trade and other payables (4,102) – – (4,102)Current borrowings (258) – – (258)Non-current borrowings (748) – – (748)Amounts due to Financial Services customers and banks (6,289) – – (6,289)Derivative financial instruments – – (124) (124)Lease liabilities (5,834) – – (5,834)
(9,738) 844 (124) (9,018)
32 Financial instruments continued
154 Financial Statements J Sainsbury plc Annual Report 2021

Group
Amortised cost
£m
Fair value through OCI
£m
Fair value through profit
or loss £m
Total £m
At 7 March 2020Cash and cash equivalents 841 – 153 994Trade and other receivables 506 – 169 675Amounts due from Financial Services customers 7,404 – – 7,404Financial assets at FVOCI – 1,054 – 1,054Trade and other payables (3,835) – – (3,835)Current borrowings (48) – – (48)Non-current borrowings (1,248) – – (1,248)Amounts due to Financial Services customers and banks (8,094) – – (8,094)Derivative financial instruments – – (71) (71)Lease liabilities (5,774) – – (5,774)
(10,248) 1,054 251 (8,943)
Travel Money, cash in ATMs and ATM cash in transit (included in cash, balances with central banks and other demand deposits) of £322 million as at 7 March 2020 were previously classified as fair value through profit or loss and have been reclassified as amortised cost. There were no changes to amounts recognised as a result of the classification due to the book value of cash equalling its fair value.
c) Fair value estimationSet out below is a comparison of the carrying amount and the fair value of financial instruments that are carried in the financial statements at a value other than fair value. The fair values of financial assets and liabilities are based on prices available from the market on which the instruments are traded. Where market values are not available, the fair values of financial assets and liabilities have been calculated by discounting expected future cash flows at prevailing interest rates. The fair values of short-term deposits, trade receivables, other receivables, overdrafts and payables and lease liabilities are assumed to approximate to their book values.
GroupCarrying amount
£m
Group Fair
value£m
At 6 March 2021Financial assetsAmounts due from Financial Services customers and other banks1 5,407 5,418
Financial liabilitiesLoans due 2031 (627) (761)Bank loans due 2021 (199) (199)Tier 2 capital due 2023 (179) (183)Amounts due to Financial Services customers and other banks (6,289) (6,298)
(1,887) (2,023)
GroupCarrying amount
£m
Group
Fair value£m
At 7 March 2020Financial assetsAmounts due from Financial Services customers1 7,405 7,455
Financial liabilitiesLoans due 2031 (667) (888)Bank loans due 2021 (199) (199)Bank loans due 2024 (250) (250)Tier 2 capital due 2023 (180) (177)Amounts due to Financial Services customers and other banks (8,093) (8,100)
(1,984) (2,159)
1 Included within a portfolio fair value hedging relationship with £3,984 million (2020: £4,512 million) of interest rate swaps.
The fair value of financial assets as disclosed in the table above as at 6 March 2021 was £5,455 million (2020: £7,455 million). The fair value of the financial assets has been calculated by discounting cash flows at prevailing interest rates and is within Level 2 of the fair value hierarchy (see below for fair value hierarchy description). The fair value of financial liabilities was £7,441 million (2020: £9,614 million) which has been calculated by discounting cash flows at prevailing interest rates and is within Level 2 of the fair value hierarchy.
32 Financial instruments continued
155Financial Statements J Sainsbury plc Annual Report 2021
Governance ReportStrategic Report
Financial Statements

Fair value measurements recognised in the balance sheetThe following table provides an analysis of financial instruments that are recognised at fair value, grouped into Levels 1 to 3 based on the degree to which the fair value is observable:
— Level 1 fair value measurements are derived from quoted market prices (unadjusted) in active markets for identical assets or liabilities at the balance sheet date. This level includes listed equity securities and debt instruments on public exchanges;
— Level 2 fair value measurements are derived from inputs other than quoted prices included within Level 1 that are observable for the asset or liability, either directly (i.e. as prices) or indirectly (i.e. derived from prices). The fair value of financial instruments is determined by discounting expected cash flows at prevailing interest rates; and
— Level 3 fair value measurements are derived from valuation techniques that include inputs for the asset or liability that are not based on observable market data (unobservable inputs).
GroupLevel 1
£m Level 2
£mLevel 3
£m Total
£m
At 6 March 2021Financial instruments at fair value through other comprehensive incomeInterest bearing financial assets – 1 – 1Other financial assets – 15 291 306Investment securities 537 – – 537
Derivative financial assets – 7 6 13
Derivative financial liabilities – (137) – (137)
At 7 March 2020Financial instruments at fair value through other comprehensive incomeInterest bearing financial assets – 1 – 1Other financial assets – 14 237 251Investment securities 802 – – 802
Derivative financial assets – 18 – 18
Derivative financial liabilities – (86) (3) (89)
Reconciliation of Level 3 fair value measurements of financial assets and liabilities:
Financial instruments
at FVTOCI£m
Commodity derivatives
£mTotal
£m
At 7 March 2020 237 (3) 234In finance cost in the Group income statement – 9 9In other comprehensive income 54 – 54At 6 March 2021 291 6 297
Financial instruments at
FVTOCI£m
Commodity derivatives
£mTotal
£m
At 9 March 2019 220 1 221In finance cost in the Group income statement – (4) (4)In other comprehensive income 17 – 17At 7 March 2020 237 (3) 234
32 Financial instruments continued
156 Financial Statements J Sainsbury plc Annual Report 2021

The financial instruments at fair value through OCI relate to the Group’s beneficial interest in a property investment pool. The net present value of the Group’s interest in the various freehold reversions owned by the property investment pool has been derived by assuming a property growth rate of zero per cent per annum (2020: 0.6 per cent) and a discount rate of seven per cent (2020: nine per cent) (see note 19). The sensitivity of this balance to changes of one per cent in the assumed rate of property rental growth and one per cent in the discount rate holding other assumptions constant is shown below:
2021 Change in
growth rate +/-1.0%
£m
2021 Change in
discount rate +/-1.0%
£m
2020 Change in
growth rate +/-1.0%
£m
2020 Change in
discount rate +/-1.0%
£m
Financial instruments at fair value through OCI 9/(9) (6)/6 11/(10) (7)/7
The Group has entered into several long-term fixed price Power Purchase agreements with independent producers. Included within derivative financial liabilities is £6 million (2020: £(4) million) relating to these agreements. The Group values its Power Purchase agreements as the net present value of the estimated future usage at the contracted fixed price less the market implied forward energy price discounted at the prevailing swap rate. The Group also makes an assumption regarding expected energy output based on the historical performance and the producer’s estimate of expected electricity output. The sensitivity of this balance to changes of 20 per cent in the assumed rate of energy output and 20 per cent in the implied forward energy prices holding other assumptions constant is shown below:
2021 Change
in volume +/-20.0%
£m
2021 Change in
electricity forward price
+/-20.0%£m
2020 Change
in volume +/-20.0%
£m
2020 Change in electricity
forward price +/-20.0%
£m
Derivative financial instruments 1/(1) 7/(7) (1)/1 6/(8)
d) Offsetting financial instrumentsFinancial assets and liabilities are offset and the net amount reported in the balance sheet when there is a legally enforceable right to offset the recognised amounts and there is an intention to settle on a net basis, or realise the asset and settle the liability simultaneously. The legally enforceable right must not be contingent on future events and must be enforceable in the normal course of business and in the event of default, insolvency or bankruptcy of the company or the counterparty.
The following table sets out the Group’s financial assets and financial liabilities that are subject to counterparty offsetting or a master netting agreement. The master netting agreements regulate settlement amounts in the event either party defaults on their obligations.
Amounts not offset in balance sheet
Gross amounts of recognised
financial assets and liabilities
£m
Amounts offset in the
balancesheet
£m
Net amounts recognised
in the balance
sheet£m
Balances subject to a contractual
right ofoffset
£m
Cash collateral pledged
£mNet amounts
£m
At 6 March 2021AssetsDerivative financial assets 19 (6) 13 (2) (2) 9Trade and other receivables 756 (147) 609 – – 609Cash and cash equivalents 1,477 – 1,477 – – 1,477Total assets 2,252 (153) 2,099 (2) (2) 2,095
LiabilitiesDerivative financial liabilities (143) 6 (137) 2 30 (105)Trade and other payables (4,249) 147 (4,102) – – (4,102)Total liabilities (4,392) 153 (4,239) 2 30 (4,207)
At 7 March 2020 AssetsDerivative financial assets 18 – 18 2 – 20Trade and other receivables 737 (62) 675 – – 675Cash and cash equivalents 994 – 994 – – 994Total assets 1,749 (62) 1,687 2 – 1,689
LiabilitiesDerivative financial liabilities (89) – (89) (2) (28) (119)Trade and other payables (3,897) 62 (3,835) – – (3,835)Total liabilities (3,986) 62 (3,924) (2) (28) (3,954)
32 Financial instruments continued
157Financial Statements J Sainsbury plc Annual Report 2021
Governance ReportStrategic Report
Financial Statements
The Group holds certain financial derivatives which are subject to credit support agreements. Under these agreements cash collateral is posted by one party to the other party should the fair value of the financial derivative exceed a pre-agreed level. As at 6 March 2021, the Group held no collateral against these financial derivative assets (2020: £nil).
Financial Services has derivatives that are governed by the International Swaps and Derivatives Association and their associated credit support annex bilateral agreements where if the fair value exceeds a pre-agreed level, cash collateral is posted. As at 6 March 2021, Financial Services and its subsidiary had pledged/posted collateral of £30 million (2020: provided collateral of £28 million) against the derivatives and received collateral of £2 million (2020: £nil).
The Group also operates a cash pooling arrangement and collective net overdraft facility with its main clearing bank. As at 6 March 2021 the Group had a net overdraft of £1 million (2020: £nil) under this facility.
33 Derivative financial instruments and hedge accountingAccounting policiesThe Group uses derivative financial instruments to hedge its exposure to foreign exchange, interest rate and commodity risks. All derivative financial instruments are initially measured at fair value on the contract date and are also measured at fair value at subsequent reporting dates. Where derivatives do not qualify for hedge accounting, any changes in the fair value of the derivative financial instrument are recognised in the income statement as finance income or costs as they arise.
To qualify for hedge accounting, the Group documents, at the inception of the hedge, the hedging risk management strategy, the relationship between the hedging instrument and the hedged item or transaction, the nature of the risks being hedged and an assessment of the effectiveness of the hedging relationship to ensure it is highly effective on an ongoing basis.
Where a derivative does qualify for hedge accounting, any changes in fair value are recognised depending on the nature of the hedge relationship and the item being hedged as follows:
i) Cash flow hedgesHedge relationships are classified as cash flow hedges where the derivative financial instruments hedge the Group’s exposure to variability in cash flows resulting from a highly probable forecasted transaction. These include the exchange rate risk of inventory purchases denominated in foreign currency, interest rate risk and commodity risk on purchases of power and fuel. Changes in the fair value of derivative financial instruments that are designated and effective as hedges of future cash flows are recognised directly in other comprehensive income and the ineffective portion is recognised immediately in the income statement.
If a cash flow hedge is hedging a firm commitment or forecast transaction that results in the recognition of a non-financial asset or liability, then, at the time the asset or liability is recognised, the associated gains or losses on the derivative that had previously been recognised in other comprehensive income are included in the initial measurement of the asset or liability. This applies to the Group’s foreign currency hedges in relation to inventory purchases.
ii) Fair value hedgesThe Group designates certain derivatives as fair value hedges where the derivative financial instrument hedges the change in fair value of the particular risks inherent in recognised assets or liabilities (fair value hedges).
The Group has adopted IFRS 9 hedge accounting requirements for its fair value hedges of investment securities and its one-for-one hedge on Tier 2 Debt issuance within Sainsbury’s Bank. The Group continues to adopt IAS 39 for its macro portfolio fair value hedges of fixed rate personal loans and residential mortgages, as it is permitted to do so under IFRS 9 and until the point that the new macro hedge accounting standard is finalised and adopted.
Fair value hedging matches the change in fair value of designated hedged items against the corresponding change in value of the hedging derivative. The designated hedged item can be a recognised asset or liability, a firm commitment or an identified portion of an asset.
The effective part of any gain or loss on the hedged item adjusts the balance of the hedged item and is recognised in the income statement, offsetting the gain or loss on the hedging derivative. Should circumstances arise where the hedge relationship subsequently proves ineffective, is early settled or is terminated the adjustment to the balance of the hedged item is amortised over the remaining life of the hedged item and to the income statement.
Micro fair value hedging – IFRS 9The Group has purchased a number of fixed rate debt investment securities and has issued fixed rate subordinated debt within Sainsbury’s Bank. These instruments are hedged via plain vanilla interest rate swaps, with the critical economic terms of both the hedging instrument and hedged item matching. The notional amount, fixed interest legs and maturity dates are economically matched.
Portfolio fair value hedging – IAS 39The Group uses portfolio fair value hedging as a risk management tool for hedging interest rate risk on the personal loans and mortgage portfolios. Portfolio fair value hedging allows the designation of the whole or part of a portfolio of assets or liabilities with similar risk exposures. The hedged item can be designated based on expected maturities to match the hedging derivative maturity. Hedge effectiveness is considered to have been met where the change in fair value of the hedged item offsets the change in fair value of hedging instruments, within the 80 to 125 per cent ratio corridor.
IBOR reformIn the financial year to 6 March 2021, the Group completed its London Interbank Offered Rate (LIBOR) transition project. Prior to August 2019, all balance sheet interest rate exposures were hedged with swaps referencing LIBOR, however since that date all new hedges have been transacted referencing the Sterling Overnight Index Average (SONIA) index. As at 6 March 2021, the Group had interest rate derivatives with a notional of £1,805 million referencing LIBOR. Of this, £888 million was represented by equal and offsetting LIBOR swaps transacted as a necessary step in the transition. These were collapsed and exited at London Clearing House (LCH) on 8 and 9 March 2021 and were excluded from fair value hedge accounting relationships as at 6 March 2021. The remaining £917 million of LIBOR exposures has a maturity date prior to 31 December 2021. As a result of this these swaps were excluded from the Group’s LIBOR transition project and were included in fair value hedge accounting relationships. No interest rate derivatives will reference LIBOR following 31 December 2021.
32 Financial instruments continued
158 Financial Statements J Sainsbury plc Annual Report 2021

IFRS amendmentsThe Group has adopted Interest Rate Benchmark Reform – Phase 1 (Amendments to IFRS 9, IAS 39 and IFRS 7) and elected to early adopt Interest Rate Benchmark Reform – Phase 2 (Amendments to IFRS 9, IAS 39, IFRS 7, IFRS 4 and IFRS 16).
If a hedging relationship is directly affected by IBOR reform, then the Group applies certain exceptions (referred to as ‘the Phase 1 amendments’) to the general hedge accounting policy. The effect of this is as follows:a. For the purpose of evaluating whether the hedging relationship is expected to be highly effective (i.e. prospective effectiveness assessment), the Group
assumes that the benchmark interest rate is not altered as a result of IBOR reform.b. If the Group concludes that the actual result of a hedging relationship is outside the range of 80–125 per cent (i.e. retrospective assessment), then the
Group determines whether the hedging relationship continues to qualify for hedge accounting or whether it needs to be discontinued. This includes, for example, determining that the hedge is expected to be highly effective prospectively and that the effectiveness of the hedging relationship can be reliably measured.
The Group will cease to apply the respective Phase 1 amendments when the uncertainty arising from IBOR reform is no longer present or when the hedging relationship is discontinued.
The Phase 2 amendments provide practical relief from certain requirements in the standards. When the basis for determining the contractual cash flows of a financial instrument is changed as a direct consequence of interest rate benchmark reform and is made on an economically equivalent basis, the Phase 2 amendments provide a practical expedient to update the effective interest rate of a financial instrument before applying the existing requirements in the standards. The Phase 2 amendments also provide a series of reliefs from certain hedge accounting requirements when a change required by interest rate benchmark reform occurs to a hedged item and/or hedging instrument and consequently the hedge relationship can be continued without any interruption.
Outside of hedging, the other impact of the IBOR reform on the Group is with regards to its setting of Incremental Borrowing Rates (IBRs) to apply to the measurement of lease liabilities (refer to note 15). The Group currently uses UK overnight swap rates when setting its IBRs; however as part of the IBOR reform these will be replaced with UK gilts. This transition will occur in the period ending 5 March 2022.
The effects of hedge accounting on the Group’s financial position and performanceThe fair value of derivative financial instruments has been disclosed in the balance sheet as follows:
2021Asset
£m
2021Liability
£m
2020Asset
£m
2020Liability
£m
Non-current 8 (44) 6 (36)Current 5 (93) 12 (53)Total 13 (137) 18 (89)
The table below provides a breakdown of the type of derivatives in fair value and cash flow hedges as well as derivatives not in a formal hedge accounting relationship.
2021 2020
Asset Liability Asset Liability
Fair value£m
Notional £m
Fair value£m
Notional £m
Fair value£m
Notional£m
Fair value£m
Notional£m
Fair value hedgesInterest rate swaps 1 724 (29) 3,260 5 282 (35) 4,230Cash flow hedgesInterest rate swaps – – (1) 200 – – – 200Inflation rate swaps – – (13) 490 – – (15) 490Foreign exchange forward contracts 1 28 (94) 1,586 13 729 (26) 1,000Commodity contracts 4 26 – 10 – – (8) 56Derivatives not in a formal hedging relationshipInterest rate swaps – 444 – 453 – – – 259Cross currency swaps 1 57 – 5 – 127 (1) 66Commodity contracts 6 11 – – – – (4) 13Total 13 1,290 (137) 6,004 18 1,138 (89) 6,314
Fair value hedgesWithin the Financial Services business, interest rate swaps are executed to hedge interest rate risk arising from fixed rate exposures in its retail personal loan and retail mortgage books, and certain fixed rate treasury investment securities, which are predominantly funded by variable rate linked liabilities. The Group has also executed an interest rate swap to hedge interest rate risk arising from its fixed Tier 2 notes issued. This is achieved by hedging specific balance sheet exposures.
The cash flows under the hedging instruments (interest rate swap derivatives) substantially match the cash flow profile of the hedged items (personal loans, mortgages, treasury investment securities and borrowings). The changes in fair value of the derivatives offset changes in the fair value of the hedged items through the income statement, with any ineffective portion also being recognised in the income statement.
The main source of ineffectiveness within the micro hedge relationships relates to the floating leg valuation changes inherent within the hedging instrument that do not exist within the hedged item.
33 Derivative financial instruments and hedge accounting continued
159Financial Statements J Sainsbury plc Annual Report 2021
Governance ReportStrategic Report
Financial Statements

Ineffectiveness on portfolio hedges can arise as a result of several factors, including floating leg valuation changes inherent within the hedging instrument that do not exist within the hedged item, mismatch in cash flow maturities between the hedged item and hedging instrument and basis risk between cash flows discounted using different benchmark rates e.g. LIBOR v OIS (Overnight Indexed Swap).
At 6 March 2021 the maturity profile and average price/rate of the hedging instruments used in the Group’s non-dynamic hedging strategies were as follows:
Maturity
Less than 1 month 1 to 3 months
3 months to 1 year
One to five years
More than five years
At 6 March 2021Fair value hedgesInterest rate riskInterest rate swaps Notional amount – 328 973 1,441 1,242 Average net interest (pay)/receive – (0.82)% (0.66)% (0.60)% –
Maturity
Less than 1 month 1 to 3 months
3 months to 1 year
One to five years
More than five years
At 7 March 2020Fair value hedgesInterest rate riskInterest rate swaps Notional amount – 270 1,402 2,831 9 Average net interest (pay)/receive – (0.31)% (0.32)% (0.19)% 0.05%
The impact of the hedged items on Group’s financial statements is as follows:
Carrying amount of the hedged item
Change in fair value used for measuring ineffectiveness
for the period
Accumulated amount of fair value hedge adjustments included in the carrying
amount of the hedged item
Line item in financial statementsAssets
£mLiabilities
£m £mAssets
£mLiabilities
£m
At 6 March 2021Fair value hedgesInterest rate swaps 3,164 – (5) 22 – Amounts due from Financial Services customersInterest rate swaps 73 – – (1) – Financial assets at FVOCIInterest rate swaps – (179) 1 – (3) Borrowings
3,237 (179) (4) 21 (3)
Carrying amount of the hedged item
Change in fair value used for measuring ineffectiveness
for the period
Accumulated amount of fair value hedge adjustments included in the carrying
amount of the hedged item
Line item in financial statementsAssets
£mLiabilities
£m £mAssets
£mLiabilities
£m
At 7 March 2020Fair value hedgesInterest rate swaps 4,536 – 28 27 – Amounts due from Financial Services customersInterest rate swaps 156 – (1) (1) – Financial assets at FVOCIInterest rate swaps – (180) (2) – (4) Borrowings
4,692 (180) 25 26 (4)
The impact of the hedging instruments on the financial statements is as follows:
Notional amount
£m
Carrying amountChange in fair value for measuring
ineffectiveness for the period£m Line item in financial statements
Asset£m
Liability£m
At 6 March 2021Fair value hedgesInterest rate swaps (loans and mortgages) 3,912 1 (29) 5 Derivative financial liabilitiesInterest rate swaps (Tier 2 capital) – – – (5) Derivative financial assetsInterest rate swaps (investment securities) 72 – – 2 Derivative financial liabilities
3,984 1 (29) 2
33 Derivative financial instruments and hedge accounting continued
160 Financial Statements J Sainsbury plc Annual Report 2021
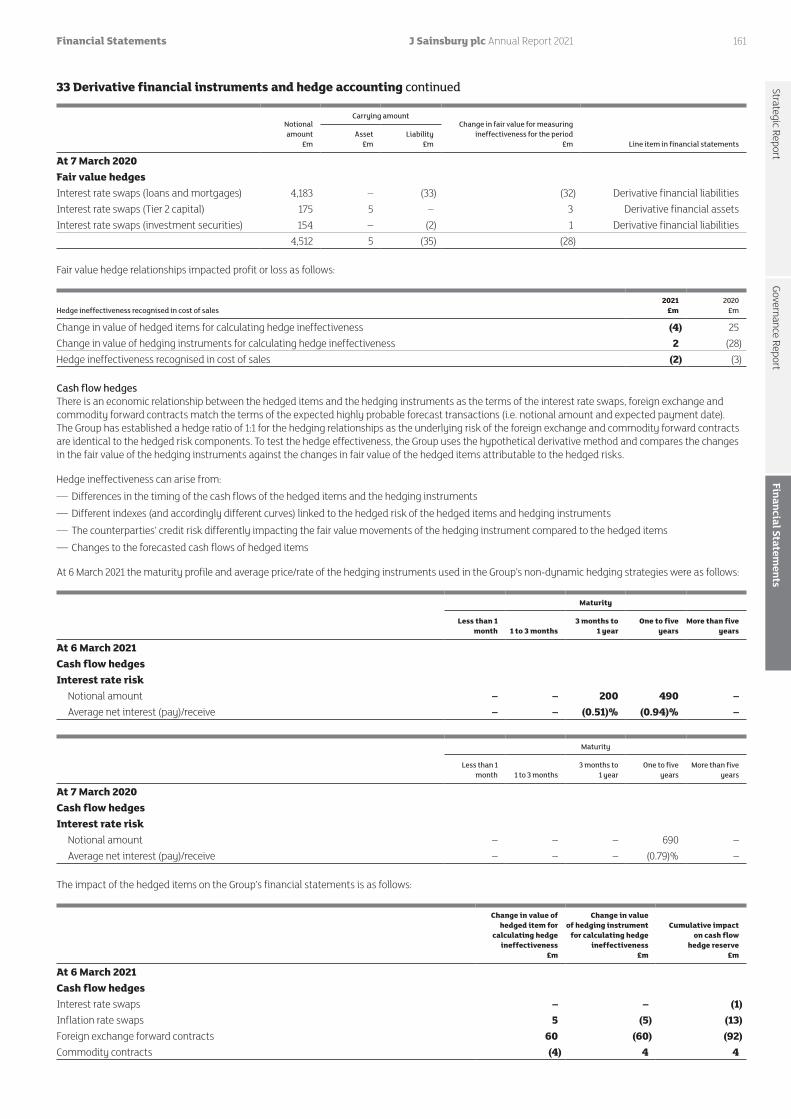
Notional amount
£m
Carrying amountChange in fair value for measuring
ineffectiveness for the period£m Line item in financial statements
Asset£m
Liability£m
At 7 March 2020Fair value hedgesInterest rate swaps (loans and mortgages) 4,183 – (33) (32) Derivative financial liabilitiesInterest rate swaps (Tier 2 capital) 175 5 – 3 Derivative financial assetsInterest rate swaps (investment securities) 154 – (2) 1 Derivative financial liabilities
4,512 5 (35) (28)
Fair value hedge relationships impacted profit or loss as follows:
Hedge ineffectiveness recognised in cost of sales2021
£m2020
£m
Change in value of hedged items for calculating hedge ineffectiveness (4) 25Change in value of hedging instruments for calculating hedge ineffectiveness 2 (28)Hedge ineffectiveness recognised in cost of sales (2) (3)
Cash flow hedgesThere is an economic relationship between the hedged items and the hedging instruments as the terms of the interest rate swaps, foreign exchange and commodity forward contracts match the terms of the expected highly probable forecast transactions (i.e. notional amount and expected payment date). The Group has established a hedge ratio of 1:1 for the hedging relationships as the underlying risk of the foreign exchange and commodity forward contracts are identical to the hedged risk components. To test the hedge effectiveness, the Group uses the hypothetical derivative method and compares the changes in the fair value of the hedging instruments against the changes in fair value of the hedged items attributable to the hedged risks.
Hedge ineffectiveness can arise from: — Differences in the timing of the cash flows of the hedged items and the hedging instruments — Different indexes (and accordingly different curves) linked to the hedged risk of the hedged items and hedging instruments — The counterparties’ credit risk differently impacting the fair value movements of the hedging instrument compared to the hedged items — Changes to the forecasted cash flows of hedged items
At 6 March 2021 the maturity profile and average price/rate of the hedging instruments used in the Group’s non-dynamic hedging strategies were as follows:
Maturity
Less than 1 month 1 to 3 months
3 months to 1 year
One to five years
More than five years
At 6 March 2021Cash flow hedgesInterest rate risk Notional amount – – 200 490 – Average net interest (pay)/receive – – (0.51)% (0.94)% –
Maturity
Less than 1 month 1 to 3 months
3 months to 1 year
One to five years
More than five years
At 7 March 2020Cash flow hedgesInterest rate risk Notional amount – – – 690 – Average net interest (pay)/receive – – – (0.79)% –
The impact of the hedged items on the Group’s financial statements is as follows:
Change in value of hedged item for
calculating hedge ineffectiveness
£m
Change in value of hedging instrument
for calculating hedge ineffectiveness
£m
Cumulative impact on cash flow
hedge reserve£m
At 6 March 2021Cash flow hedgesInterest rate swaps – – (1)Inflation rate swaps 5 (5) (13)Foreign exchange forward contracts 60 (60) (92)Commodity contracts (4) 4 4
33 Derivative financial instruments and hedge accounting continued
161Financial Statements J Sainsbury plc Annual Report 2021
Governance ReportStrategic Report
Financial Statements

Change in value of hedged item for
calculating hedge ineffectiveness
£m
Change in value of hedging instrument
for calculating hedge ineffectiveness
£m
Cumulative impact
on cash flow hedge reserve
£m
At 7 March 2020Cash flow hedgesInterest rate swaps – – (1)Inflation rate swaps 10 (10) (13)Foreign exchange forward contracts (18) 18 (31)Commodity contracts 9 (9) (8)
There are no amounts remaining in the hedging reserves for which hedge accounting is no longer applied.
The following table presents a reconciliation by risk category of the cash flow hedge reserve and analysis of other comprehensive income in relation to hedge accounting:
Opening£m
Fair value movements recognised in other
comprehensive income£m
Amounts reclassified
£mClosing
£mReclassification
recognised in
At 6 March 2021Interest rate swaps (1) – – (1) Finance costsInflation rate swaps (13) (5) 5 (13) Finance costsForeign exchange forward contracts (31) (60) (1) (92) InventoryCommodity contracts (8) 4 8 4 Cost of salesTax 7 11 – 18 (46) (50) 12 (84)
Opening£m
Fair value movements recognised in other
comprehensive income£m
Amounts reclassified
£mClosing
£mReclassification
recognised in
7 March 2020Interest rate swaps (1) – – (1) Finance costsInflation rate swaps (8) (10) 5 (13) Finance costsForeign exchange forward contracts (25) 18 (24) (31) InventoryCommodity contracts 1 (9) – (8) Cost of salesTax 3 4 – 7 (30) 3 (19) (46)
Derivatives not in a hedge relationshipSome of the Group’s derivative contracts do not qualify for hedge accounting and are therefore not designated in a hedging relationship. In addition, where gains or losses on a derivative contract economically offset the losses or gains on an underlying transaction, the derivative is not designated as being in a hedging relationship.
Sainsbury’s Bank and its subsidiaries had a £9 million portfolio of interest rate swaps hedging mortgage pipeline offers that cannot be entered into a hedge accounting relationship (2020: £9 million) with fair value fluctuations fully accounted for in the P&L, with no effective offset.
Additionally, Sainsbury’s Bank and its subsidiaries had £888 million of compressed and offsetting LIBOR swaps forming part of the Bank’s novation project from LIBOR to SONIA derivatives (2020: £nil). Compressed and offsetting LIBOR swaps cannot be entered into a hedge accounting relationship with fair value fluctuations fully accounted for in the P&L, with no effective offset.
The fair value fluctuations crediting the income statement for interest rate derivatives not in a hedge accounting relationship was a credit of £nil million (2020: a cost of £2 million).
33 Derivative financial instruments and hedge accounting continued
162 Financial Statements J Sainsbury plc Annual Report 2021

34 Cash and cash equivalentsAccounting policiesCash and cash equivalentsCash and bank balances comprise cash in hand and at bank, deposits at central banks, investments in money market funds and deposits and other short-term highly liquid investments.
To be classified as cash and cash equivalents, an asset must: — Be readily convertible into cash; — Have an insignificant risk of changes in value; and — Have a maturity period of typically three months or less at acquisition.
Bank overdrafts that are repayable on demand and form an integral part of the Group’s cash management are included as a component of cash and cash equivalents for the purposes of the cash flow statement.
Cash flow statementThe Group presents its cash flow statement using the indirect method, whereby profit is reconciled to net cash from operating activities by adjusting profit and loss for non-cash items.
Interest, dividends and taxesThe Group has chosen to present interest received on bank deposits and other financial assets as well as dividends received as cash flows from investing activities because they are returns on the Group’s investments.
Dividends paid are presented as financing cash flows as they are considered a cost of obtaining financial resources.
Interest paid on borrowings is presented within cash flows from operating activities as they are held for cash management purposes.
Lease payments and receiptsLease payments are presented as follows in the Group cash flow statement:
— Cash payments for the principal element of the lease liabilities are presented as cash flows from financing activities — Cash payments for the interest element of lease liabilities are presented as interest paid within cash flows from operating activities consistent with presentation of interest payments
— Short-term lease payments, payments for leases of low-value assets and variable lease payments are not included in the measurement of the lease liabilities as cash flows from operating activities
— Cash receipts in relation to sub-leases (both operating and finance leases) are included within operating cash flows
For the purposes of the cash flow statement, cash and cash equivalents comprise the following:
2021£m
2020£m
Cash in hand and bank balances 227 519
Money market funds and deposits 398 202
Deposits at central banks 852 273
Cash and bank balances as reported in the Group balance sheet 1,477 994
Bank overdrafts (1) –
Net cash and cash equivalents as reported in the Group cash flow statement 1,476 994
Of the above balance, £20 million (2020: £21 million) was restricted as at year-end. Of the £20 million (2020: £21 million) restricted cash, £17 million (2020: £18 million) is held as a reserve deposit with the Bank of England in accordance with statutory requirements. This deposit is not available for use in day-to-day operations. A further £3 million (2020: £2 million) is restricted for Insurance purposes.
163Financial Statements J Sainsbury plc Annual Report 2021
Governance ReportStrategic Report
Financial Statements
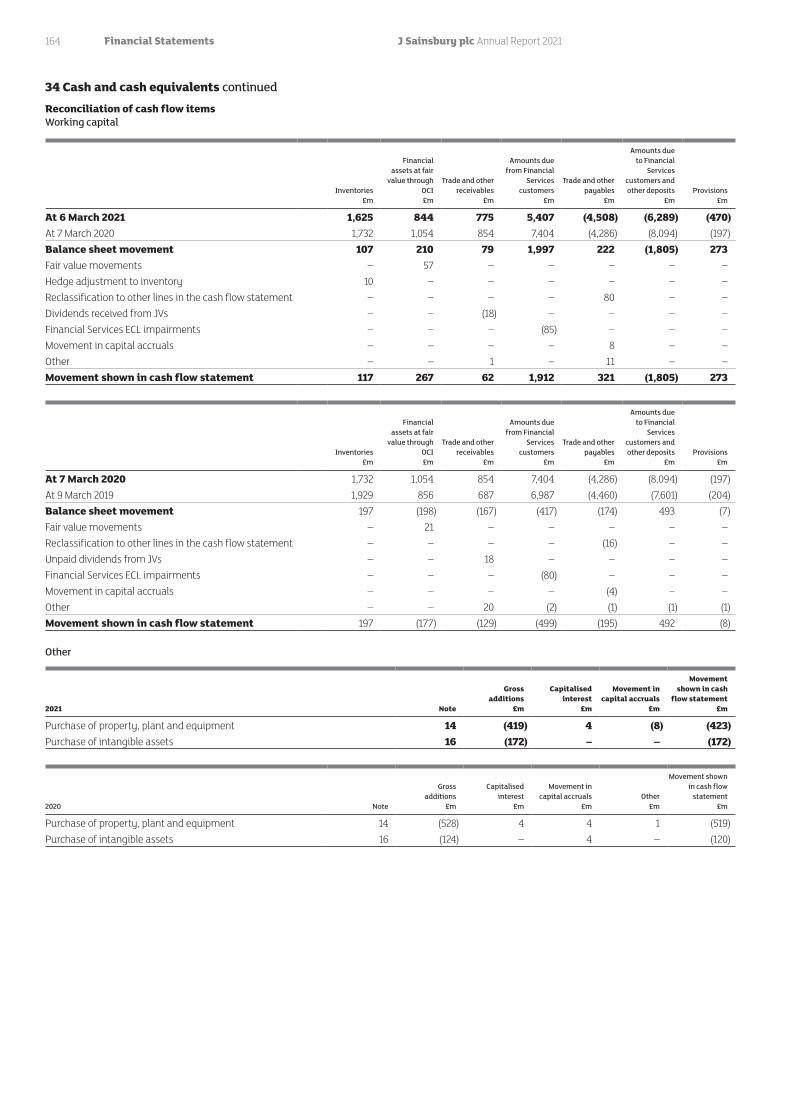
Reconciliation of cash flow itemsWorking capital
Inventories
£m
Financial assets at fair
value through OCI£m
Trade and other receivables
£m
Amounts due from Financial
Services customers
£m
Trade and other payables
£m
Amounts due to Financial
Services customers and other deposits
£mProvisions
£m
At 6 March 2021 1,625 844 775 5,407 (4,508) (6,289) (470)At 7 March 2020 1,732 1,054 854 7,404 (4,286) (8,094) (197)Balance sheet movement 107 210 79 1,997 222 (1,805) 273Fair value movements – 57 – – – – – Hedge adjustment to inventory 10 – – – – – – Reclassification to other lines in the cash flow statement – – – – 80 – – Dividends received from JVs – – (18) – – – – Financial Services ECL impairments – – – (85) – – – Movement in capital accruals – – – – 8 – – Other – – 1 – 11 – –Movement shown in cash flow statement 117 267 62 1,912 321 (1,805) 273
Inventories£m
Financial assets at fair
value through OCI£m
Trade and other receivables
£m
Amounts due from Financial
Services customers
£m
Trade and other payables
£m
Amounts due to Financial
Services customers and other deposits
£mProvisions
£m
At 7 March 2020 1,732 1,054 854 7,404 (4,286) (8,094) (197)At 9 March 2019 1,929 856 687 6,987 (4,460) (7,601) (204)Balance sheet movement 197 (198) (167) (417) (174) 493 (7)Fair value movements – 21 – – – – –Reclassification to other lines in the cash flow statement – – – – (16) – –Unpaid dividends from JVs – – 18 – – – –Financial Services ECL impairments – – – (80) – – –Movement in capital accruals – – – – (4) – –Other – – 20 (2) (1) (1) (1)Movement shown in cash flow statement 197 (177) (129) (499) (195) 492 (8)
Other
2021 Note
Gross additions
£m
Capitalised interest
£m
Movement in capital accruals
£m
Movement shown in cash
flow statement£m
Purchase of property, plant and equipment 14 (419) 4 (8) (423)Purchase of intangible assets 16 (172) – – (172)
2020 Note
Gross additions
£m
Capitalised interest
£m
Movement in capital accruals
£mOther
£m
Movement shown in cash flow
statement£m
Purchase of property, plant and equipment 14 (528) 4 4 1 (519)Purchase of intangible assets 16 (124) – 4 – (120)
34 Cash and cash equivalents continued
164 Financial Statements J Sainsbury plc Annual Report 2021

35 Analysis of net debtThe Group’s definition of net debt includes the following:
— Cash — Borrowings and overdrafts — Lease liabilities — Perpetual securities — Financial assets at fair value through other comprehensive income — Derivatives
Net debt includes the capital injections to Sainsbury’s Bank, but excludes the net debt of Sainsbury’s Bank and its subsidiaries. Sainsbury’s Bank’s net debt balances are excluded because they are part of the daily operating cycle of the Bank rather than for financing purposes.
Financial assets at fair value through other comprehensive income exclude equity related financial assets which predominantly relate to the Group’s beneficial interest in a commercial property investment pool.
Derivatives exclude those not used to hedge borrowings, and borrowings exclude bank overdrafts as they are disclosed separately.
A reconciliation of opening to closing net debt is included below. Balances and movements for the total Group and Financial Services are shown in addition to Retail to enable reconciliation between the Group balance sheet and Group cash flow statement.
165Financial Statements J Sainsbury plc Annual Report 2021
Governance ReportStrategic Report
Financial Statements

Cash movements Non-cash movements
7 March 2020
£m
Cash flows excluding
interest£m
Net interest (received)/paid
£m
Accrued interest
£m
Other non-cash movements
£m
Changes in fair value
£m
6 March
2021£m
Retail Net derivative financial instruments (15) – 6 (5) 5 (5) (14)Bank overdrafts – (1) – – – – (1)Borrowings (excluding overdrafts) (1,116) 289 38 (37) – – (826)Lease liabilities (5,768) 499 305 (305) (560) – (5,829)Arising from financing activities (6,899) 787 349 (347) (555) (5) (6,670) Financial assets at fair value through other comprehensive
income1 – – – – – 1
Cash and cash equivalents 447 1 – – – – 448 Retail net debt (excluding perpetual securities) (6,451) 788 349 (347) (555) (5) (6,221) Financial Services Net derivative financial instruments 4 – – – – (4) –Bank overdrafts – – – – – – –Borrowings (excluding overdrafts) (180) – – – – 1 (179)Lease liabilities (6) 2 – – (1) – (5)Arising from financing activities (182) 2 – – (1) (3) (184) Financial assets at fair value through other comprehensive
income802 (267) – – – 2 537
Cash and cash equivalents 547 482 – – – – 1,029 Financial Services net debt 1,167 217 – – (1) (1) 1,382 Group Net derivative financial instruments (11) – 6 (5) 5 (9) (14)Bank overdrafts – (1) – – – – (1)Borrowings (excluding overdrafts) (1,296) 289 38 (37) – 1 (1,005)Lease liabilities (5,774) 501 305 (305) (561) – (5,834)Arising from financing activities (7,081) 789 349 (347) (556) (8) (6,854) Financial assets at fair value through other comprehensive
income803 (267) – – – 2 538
Cash and cash equivalents 994 483 – – – – 1,477 Group net debt (excluding perpetual securities) (5,284) 1,005 349 (347) (556) (6) (4,839) Retail net debt (excluding perpetual securities) (6,451) 788 349 (347) (555) (5) (6,221)Perpetual capital securities (248) 250 – – (2) – – Perpetual convertible bonds (248) – – – – – (248)Retail net debt (including perpetual securities) (6,947) 1,038 349 (347) (557) (5) (6,469)Of which: Leases (5,768) (5,829)Net debt excluding lease liabilities (1,179) (640)
Other non-cash movements relate to interest accruals and new leases.
35 Analysis of net debt continued
166 Financial Statements J Sainsbury plc Annual Report 2021

Cash movements Non-cash movements
9 March 2019
£m
Cash flows excluding
interest£m
Net interest (received)/paid
£m
Accrued interest
£m
Other non-cash movements
£m
Changes in fair value
£m
7 March 2020
£m
Retail Net derivative financial instruments (9) – 4 (5) 5 (10) (15)Bank overdrafts (1) 1 – – – – – Borrowings (excluding overdrafts) (1,483) 369 48 (50) – – (1,116)Lease liabilities and hire purchase arrangements (5,824) 429 332 (332) (373) – (5,768)Arising from financing activities (7,317) 799 384 (387) (368) (10) (6,899)
Financial assets at fair value through other comprehensive income
1 – – – – – 1
Cash and cash equivalents 466 (19) (2) 2 – – 447 Retail net debt (excluding perpetual securities) (6,850) 780 382 (385) (368) (10) (6,451) Financial Services Net derivative financial instruments – – – – – 4 4 Bank overdrafts – – – – – – – Borrowings (excluding overdrafts) (176) – – – – (4) (180)Lease liabilities and hire purchase arrangements (7) 1 – – – – (6)Arising from financing activities (183) 1 – – – – (182)
Financial assets at fair value through other comprehensive income
622 177 – – – 3 802
Cash and cash equivalents 655 (108) – – – – 547 Financial Services net debt 1,094 70 – – – 3 1,167 Group Net derivative financial instruments (9) – 4 (5) 5 (6) (11)Bank overdrafts (1) 1 – – – – – Borrowings (excluding overdrafts) (1,659) 369 48 (50) – (4) (1,296)Lease liabilities and hire purchase arrangements (5,831) 430 332 (332) (373) – (5,774)Arising from financing activities (7,500) 800 384 (387) (368) (10) (7,081)
Financial assets at fair value through other comprehensive income
623 177 – – – 3 803
Cash and cash equivalents 1,121 (127) (2) 2 – – 994 Group net debt (excluding perpetual securities) (5,756) 850 382 (385) (368) (7) (5,284)
Retail net debt (excluding perpetual securities) (6,850) 780 382 (385) (368) (10) (6,451)Perpetual capital securities (248) (248)Perpetual convertible bonds (248) (248)Retail net debt (including perpetual securities) (7,346) 780 382 (385) (368) (10) (6,947)Of which: Leases (5,824) (5,768)Net debt excluding lease liabilities (1,522) (1,179)
35 Analysis of net debt continued
167Financial Statements J Sainsbury plc Annual Report 2021
Governance ReportStrategic Report
Financial Statements

Reconciliation of net cash flow to movement in net debt:
52 weeks to6 March
2021£m
52 weeks to7 March
2020£m
Opening net debt (6,947) (7,346) Cash flow movements Net increase/(decrease) in cash and cash equivalents (including overdrafts) 482 (126)Elimination of Financial Services movement in cash and cash equivalents (482) 108 Repayment of perpetual capital securities 250 – Decrease in Retail borrowings and overdrafts 289 369 Decrease in Retail lease obligations 499 429 Net interest paid on components of Retail net debt 349 382 Changes in net debt resulting from cash flow 1,387 1,162 Non-cash movements Accrued interest (347) (385)Retail fair value and other non-cash movements (562) (378)Changes in net debt resulting from non-cash movements (909) (763) Movement in net debt 478 399 Closing net debt (6,469) (6,947)
36 Borrowings2021 2020
Current£m
Non-current£m
Total£m
Current£m
Non-current£m
Total£m
Loan due 2031 55 572 627 45 622 667Bank overdrafts 1 – 1 – – –Bank loans due 2021 199 – 199 – 199 199Bank loans due 2024 – – – – 250 250Sainsbury’s Bank Tier 2 capital due 2023 3 176 179 3 177 180 258 748 1,006 48 1,248 1,296
a) Loan due 2031The loan is secured against 48 (2020: 48) supermarket properties (note 14). This is an inflation linked amortising loan from the finance company Longstone Finance plc with an outstanding principal value of £614 million (2020: £653 million) fixed at a real rate of 2.36 per cent where principal and interest rate are uplifted annually by RPI subject to a cap at five per cent and a floor at nil per cent. The carrying value of the loan is £627 million (2020: £667 million) with a final repayment date of April 2031.
The Group has entered into inflation swaps to convert £490 million (2020: £490 million) of the £614 million (2020: £653 million) loan from RPI linked interest to fixed rate interest until April 2023. These transactions have been designated as cash flow hedges (note 33).
The principal activity of Longstone Finance plc is the issuing of commercial mortgage backed securities and applying the proceeds towards the secured loans due 2031 with the Group as summarised above.
Intertrust Corporate Services Limited holds all the issued share capital of Longstone Finance Holdings Limited on trust for charitable purposes. Longstone Finance Holdings Limited beneficially owns all the issued share capital of Longstone Finance plc. As the Group has no interest, power or bears any risk over these entities they are not included in the Group consolidation.
b) Bank overdraftsBank overdrafts are repayable on demand and bear interest at a spread above Bank of England base rate.
c) Bank loan due 2021In May 2019, the Group extended the £200 million secured bank loan by 2 years from August 2019 to August 2021. The bank loan is held at a floating rate of interest.
In February 2020, the Group entered into £200 million of interest rate swaps to convert from a floating rate of interest to fixed rate interest from August 2020 until August 2021 (2020: £200 million interest rate swap due August 2021). These transactions have been designated as cash flow hedges (note 33).
d) Bank loan due 2024In July 2020 the Group prepaid in full the secured £250m Bilateral Loan Facility due July 2024.
35 Analysis of net debt continued
168 Financial Statements J Sainsbury plc Annual Report 2021

e) Sainsbury’s Bank Tier 2 Capital due 2027The Bank issued £175 million of fixed rate reset callable subordinated Tier 2 notes on 23 November 2017. The notes pay interest on the principal amount at a rate of six per cent per annum, payable in equal instalments semi-annually in arrears, until 23 November 2022 at which time the interest rate will reset. The Bank has the option to redeem these notes on 23 November 2022.
f) Short-term borrowingsThe Revolving Credit Facility is split into two Facilities, a £300 million Facility (A) and a £1,150 million Facility (B). Facility A has a final maturity of April 2025 and Facility B has a final maturity of October 2024. At 6 March 2021, the Revolving Credit Facility was undrawn (2020: undrawn).
The Revolving Credit Facility charges commitment fees at market rates and drawings bear interest at a margin over LIBOR.
The Group maintains uncommitted facilities to provide additional capacity to fund short-term working capital requirements. Drawings under uncommitted facilities bear interest at a margin over LIBOR. The uncommitted facilities were undrawn at 6 March 2021 (2020: undrawn).
37 Employee costs
2021£m
2020£m
Employee costs for the Group during the year amounted to: Wages and salaries, including bonus and termination benefits 3,302 2,846 Social security costs 230 187 Pension costs – defined contribution schemes 191 157 Share-based payments expense 29 37 3,752 3,227
2021 ’000
2020 ’000
The average number of employees, including Directors, during the year was: Full-time 65 26Part-time 115 146 180 172Full-time equivalent 117 112
Details of key management compensation can be found in note 43 and within the Directors’ Remuneration Report on page 76.
38 Retirement benefit obligationsAccounting policies The surplus or deficit recognised in the balance sheet for defined benefit schemes represents the difference between the fair value of the plan assets and the present value of the defined benefit obligation at the balance sheet date. The defined benefit obligation is actuarially calculated on an annual basis using the projected unit credit method.
Actuarial gains and losses are reported in the statement of other comprehensive income as incurred, and comprise both the effects of changes in actuarial assumptions and experience adjustments arising because of differences between the previous actuarial assumptions and what has actually occurred.
The income statement charge consists of a financing charge, which is the net of interest cost on pension scheme liabilities and interest income on plan assets and defined benefit pension scheme expenses.
The financing charge is determined by applying the discount rate used to measure the defined benefit obligation to the pension scheme liabilities and plan assets at the beginning of the financial year.
The Group contributions to defined contribution pension schemes are charged to the income statement as incurred. Any contributions unpaid at the balance sheet date are included as an accrual as at that date. The Group has no further payment obligations once the contributions have been paid.
BackgroundAll retirement benefit obligations are related to the Sainsbury’s Pension Scheme plus three unfunded pension liabilities relating to former senior employees of Sainsbury’s and Home Retail Group.
On 20 March 2018, the Home Retail Group Pension Scheme was merged into the Sainsbury’s Pension Scheme. The Sainsbury’s Pension Scheme has two sections, the Sainsbury’s section which holds all the Scheme assets and liabilities relating to members who were in the original Sainsbury’s Pension Scheme, and the Argos section which holds all the assets and liabilities relating to former members of the Home Retail Group Pension Scheme. Each section’s assets are segregated by deed and ring fenced for the benefit of the members of that section. The Scheme has nine Trustee directors.
The retirement benefit obligations at the year-end have been calculated by Isio, the actuarial advisers to the Group, using the projected unit credit method and based on adjusting the position at the date of the previous triennial valuations (see below) for known events and changes in market conditions as allowed under IAS 19 ‘Employee Benefits’.
36 Borrowings continued
169Financial Statements J Sainsbury plc Annual Report 2021
Governance ReportStrategic Report
Financial Statements

Sainsbury’s sectionThe Sainsbury’s section of the Scheme has three different benefit categories: final salary, career average and cash balance. For final salary and career average members, benefits at retirement are determined by length of service and salary when leaving the Scheme. For cash balance members, benefits are determined by the accrued retirement account credits.
The section was closed to new employees on 31 January 2002 and closed to future accrual on 28 September 2013. The Scheme is also used to pay life assurance benefits to current (including new) colleagues.
Argos sectionThe section holds the assets and liabilities of the former Home Retail Group Pension Scheme, which was closed to new employees in 2009 and to future accrual in January 2013. Pension benefits at retirement are based on service and final salary when leaving the Scheme.
Triennial valuationIn these financial statements the Group accounts for pension costs in accordance with IAS 19 ‘Employee Benefits’. Under this standard, the difference between the fair values of scheme assets and the present value of scheme liabilities is reported as a surplus or deficit in the balance sheet. The accounting value is different from the result obtained using the triennial funding basis.
The accounts show a surplus compared to the deficit in the triennial funding valuation. The main reason for this is the different assumptions used to value the liabilities in the accounting and triennial funding valuations. The triennial funding valuation assumptions are used to determine the contributions that the Group is required to pay into the Scheme to ensure that the Scheme has sufficient assets to pay all the benefits due in future. Regulations require that the triennial funding assumptions are set conservatively. These assumptions therefore place a relatively high value on the Scheme’s liabilities. By contrast, the IAS 19 accounting standard requires all companies to value their pension scheme liabilities on ‘best estimate’ assumptions. This approach places a lower value on pension scheme liabilities and results in a more favourable financial position.
The Scheme was subject to a triennial actuarial valuation, carried out by Willis Towers Watson for the Trustee, as at 30 September 2018 on the projected unit basis and a recovery plan was agreed. On the basis of the assumptions agreed, the actuarial deficit as at 30 September 2018 was £538 million.
Under the revised funding plan, Sainsbury’s established a new Scottish Limited partnership – Sainsbury’s Thistle Scottish Limited Partnership (‘the Partnership’) with the Scheme on 17 July 2019. This replaced the existing property partnership (Sainsbury’s Property Scottish Partnership).
In respect of the establishment of the Partnership, properties with a valuation of £1,350 million were transferred into a newly formed property holding company – Sainsbury’s Property Holdings Limited (‘Propco’) from the Sainsbury’s Property Scottish Partnership and other Sainsbury’s Group companies. The Propco is a wholly owned subsidiary of the Group and leases the transferred properties to other Group companies. Rental receipts facilitate payments of interest and capital on loan notes issued to the Partnership, in which the Scheme holds an interest.
The Partnership is controlled by Sainsbury’s and its results are consolidated by the Group. The Group’s balance sheet, IAS 19 deficit and income statement are unchanged by the establishment of the Partnership. The investment held by the Scheme in the Partnership does not qualify as a plan asset for the purposes of the Group’s consolidated financial statements and is therefore not included within the fair value of plan assets.
The value of the properties transferred to the Propco remains included within the Group’s property, plant and equipment on the balance sheet. In addition, the Group retains full operational flexibility to extend, develop and substitute the properties within the Propco.
The Scheme’s interest in the Partnership entitles it to annual distributions over up to 20 years. The distributions will be made through three payment streams: 1) Payments to the Sainsbury’s section (approximately £15 million per year) 2) Payments to the Argos section (approximately £20 million per year) 3) Switching payment stream, paid to either the Sainsbury’s section or Argos section (initially approximately £23 million per year, increasing to £33 million
by 2038)
In addition to the above, further cash contributions of £40 million were agreed for FY20/21 and £10 million for FY21/22. No additional cash contributions have been agreed for subsequent years.
The payments to the Sainsbury’s and Argos sections (streams 1 and 2) stop in 2030, or when the relevant section reaches its funding target, if earlier.
The switching stream is initially paid to the Sainsbury’s section. Once that funding target is achieved, payments switch to the Argos section. Payments continue until 2038 or until both sections have reached their funding targets, if earlier.
The level of property in the Propco reduces as the Scheme reaches the funding targets.
IFRIC 14IFRIC 14 is the interpretation that details when a company can recognise any pension surplus that exists. If the company has a funding commitment in excess of the IAS 19 deficit, then IFRIC 14 requires recognition of this excess in those circumstances when the surplus that would result on fulfilling that commitment cannot be recognised. A surplus may be recognised either because of an unconditional right to a refund to the company, or on the grounds of a future contribution reduction where schemes are still open to future accrual.
Management is of the view that it has an unconditional right to a refund of surplus under IFRIC 14. As such no adjustment has been made for potential additional liabilities.
38 Retirement benefit obligations continued
170 Financial Statements J Sainsbury plc Annual Report 2021

In forming this conclusion management has considered whether the Group can control the run-off of the Scheme until there are no liabilities left, consistent with IFRIC 14. For example, if the Trustee has a unilateral power to wind up the Scheme while there are liabilities remaining then it is viewed that the Group cannot access surplus through this route. For both sections, management have assessed that the Group can control run-off until no liabilities remain by complying with its obligations under the Scheme rules and pensions legislation, and there will therefore be a gradual settlement of the planned liabilities over the life of each section.
The Scheme rules list certain situations under which the Trustee can wind up the Scheme, however whilst there is gradual settlement of the Scheme’s liabilities as determined above, these are concluded to be within the control of the Group. As a result it is concluded that the Trustee does not have a unilateral power to wind up the Scheme nor augment benefits while the Scheme is ongoing.
Unfunded pension liabilitiesThe unfunded pension liabilities are unwound when each employee reaches retirement and takes their pension from the Group payroll or is crystallised in the event of an employee leaving or retiring and choosing to take the provision as a one-off cash payment.
a) Income statementThe amounts recognised in the income statement are as follows:
2021£m
2020£m
Excluded from underlying profit before tax: Interest cost on pension liabilities1 (163) (248) Interest income on plan assets 182 276Total included in finance income/(costs) 19 28Defined benefit pension scheme expenses (7) (9)Past service cost (6) –Total excluded from underlying profit before tax 6 19Total income statement expense 6 19
1 Includes interest of £1 million for the unfunded pension scheme (2020: £1 million) and £nil in relation to interest on the minimum funding requirement (2020: £4 million).
Past service costsOn 26 October 2018, the High Court ruled in the landmark Lloyds Banking Group case on Guaranteed Minimum Pensions (GMPs). The judgement requires equalisation between men and women for the effect of unequal GMPs. The Group worked with the Trustee of the Scheme and independent actuaries and estimated the cost of equalising benefits at £98m for the Sainsbury’s section and £3m for the Argos section. This cost for the Sainsbury’s section was recognised in the consolidated income statement as a non-underlying item for the 52 weeks ended 9 March 2019. The cost for the Argos section was recognised as an experience loss in other comprehensive income due to GMP equalisation in 1997.
On 20 November 2020, the High Court ruled that pension schemes will need to revisit individual transfer payments made since 17 May 1990 to ascertain if any additional value is due as a result of GMP equalisation. As a result of this, the Group recognised a further past service cost of £6 million.
b) Other comprehensive incomeRemeasurement of the retirement benefit obligations have been recognised as follows:
2021£m
2020£m
Return on plan assets, excluding amounts included in interest (458) 1,512 Actuarial gains/(losses) arising from changes in: Finance assumptions1 (115) (1,507) Demographic assumptions2 24 (29) Experience3 67 113Total actuarial losses (24) (1,423) Total remeasurements (482) 89
1 Includes £nil for the unfunded pension scheme (2020: £5 million loss). Prior year includes £138 million gain on the minimum funding requirement.2 Includes £nil for the unfunded pension scheme (2020: £nil).3 Includes £2 million loss for the unfunded pension scheme (2020: £3 million gain).
38 Retirement benefit obligations continued
171Financial Statements J Sainsbury plc Annual Report 2021
Governance ReportStrategic Report
Financial Statements
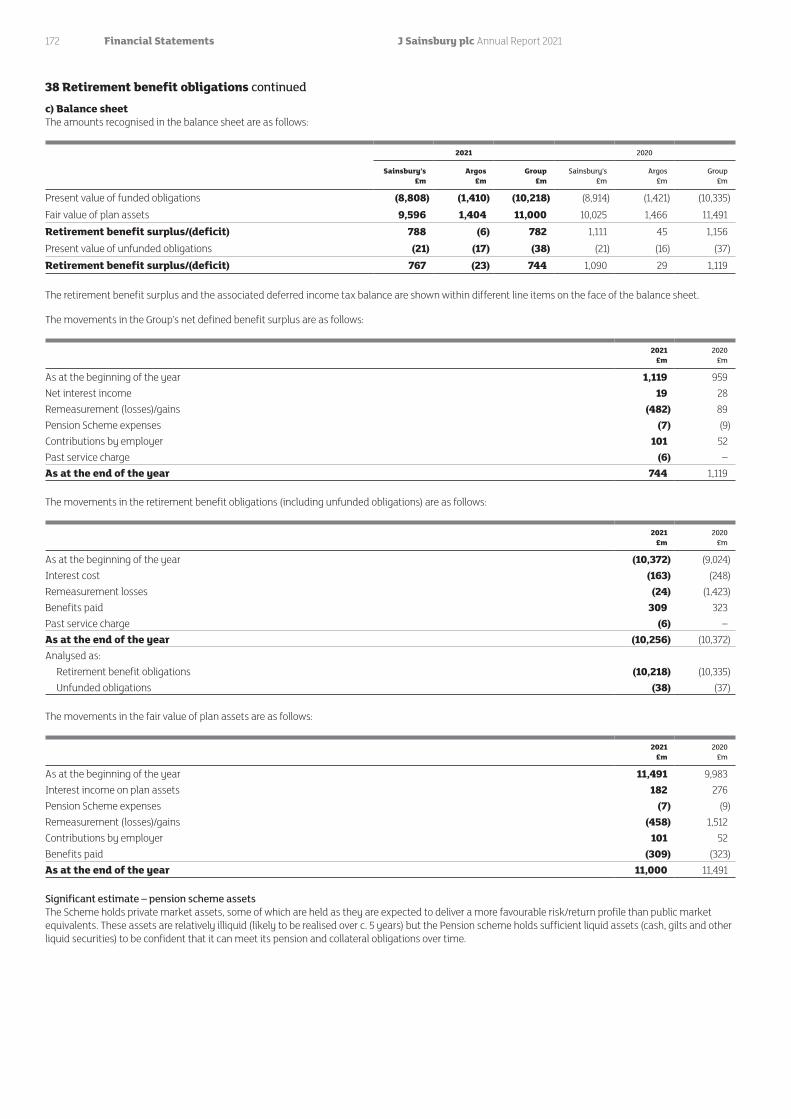
c) Balance sheetThe amounts recognised in the balance sheet are as follows:
2021 2020
Sainsbury’s£m
Argos£m
Group£m
Sainsbury’s£m
Argos£m
Group£m
Present value of funded obligations (8,808) (1,410) (10,218) (8,914) (1,421) (10,335)Fair value of plan assets 9,596 1,404 11,000 10,025 1,466 11,491Retirement benefit surplus/(deficit) 788 (6) 782 1,111 45 1,156Present value of unfunded obligations (21) (17) (38) (21) (16) (37)Retirement benefit surplus/(deficit) 767 (23) 744 1,090 29 1,119
The retirement benefit surplus and the associated deferred income tax balance are shown within different line items on the face of the balance sheet.
The movements in the Group’s net defined benefit surplus are as follows:
2021£m
2020£m
As at the beginning of the year 1,119 959Net interest income 19 28Remeasurement (losses)/gains (482) 89Pension Scheme expenses (7) (9)Contributions by employer 101 52Past service charge (6) –As at the end of the year 744 1,119
The movements in the retirement benefit obligations (including unfunded obligations) are as follows:
2021£m
2020£m
As at the beginning of the year (10,372) (9,024)Interest cost (163) (248)Remeasurement losses (24) (1,423)Benefits paid 309 323Past service charge (6) –As at the end of the year (10,256) (10,372)Analysed as: Retirement benefit obligations (10,218) (10,335) Unfunded obligations (38) (37)
The movements in the fair value of plan assets are as follows:
2021£m
2020£m
As at the beginning of the year 11,491 9,983Interest income on plan assets 182 276Pension Scheme expenses (7) (9)Remeasurement (losses)/gains (458) 1,512Contributions by employer 101 52Benefits paid (309) (323)As at the end of the year 11,000 11,491
Significant estimate – pension scheme assetsThe Scheme holds private market assets, some of which are held as they are expected to deliver a more favourable risk/return profile than public market equivalents. These assets are relatively illiquid (likely to be realised over c. 5 years) but the Pension scheme holds sufficient liquid assets (cash, gilts and other liquid securities) to be confident that it can meet its pension and collateral obligations over time.
38 Retirement benefit obligations continued
172 Financial Statements J Sainsbury plc Annual Report 2021

The valuation of these assets is based on the audited accounts of the funds, where available, and net asset value statements from the investment managers where recent accounts are not available. For many of the investments the valuations provided are at 31 December. The Group therefore performs a roll-forward for these valuations, adjusting for cash received or paid and applying the changes seen in relevant liquid indices as follows:
Asset class Returns from 31 Dec-20 to 6 Mar-21
Global equity USD return 1.66%Global High Yield Debt USD return 0.78%US loans USD return 1.74%UK REITS GBP return 0.62%
The roll-forward has increased the valuation of illiquid assets by £14 million. A 1 per cent increase/decrease in the indices used would have caused a £10 million increase/decrease in the adjustment.
Investment strategy and risks associated with the Group’s defined benefit pension schemeThe Trustee considers that its primary responsibility in respect of investments is to ensure, for the duration of the Scheme, that funds will be available to meet the benefit payment obligations as they fall due. Based on this responsibility and its obligation to manage the investments, its investment objectives are as follows:
In respect of the Sainsbury’s section: 1. Target a 50 per cent or better chance of being fully funded on a gilts + 0.5 per cent p.a. funding level basis by March 2022; and 2. To limit the downside risk associated with the investment policy, wherever possible.
In respect of the Argos section: 1. Target a 50 per cent or better chance of being fully funded on a gilts + 0.5 per cent funding level basis by September 2022; and 2. To limit the downside risk associated with the investment policy, wherever possible.
The risks associated with achieving the above strategy are as follows:
Risk Description Mitigation
Longevity risk The Scheme pays benefits longer than expected due to Scheme members’ increasing life expectancy.
Longevity risk is managed as part of the Scheme’s integrated risk management framework. The Scheme monitors longevity risk closely and aims to achieve a sufficient funding level by meeting milestone targets to prepare for members’ increasing life expectancy.
Currency risk The Scheme’s unhedged foreign currency exposure leads to additional volatility for non-sterling denominated assets’ returns.
Foreign currency exposure is closely monitored, and hedging programmes are implemented to efficiently control foreign currency risk at reasonable hedging costs.
Investment strategy risk
Underperformance of the Defined Benefit investment strategy relative to the Pension Scheme’s liabilities reduces the future resources available to meet pension obligations.
The Scheme adopts a liability driven investment framework to generate favourable asset returns with reference to its liabilities by largely removing its interest and inflation uncertainties.
Investment implementation risk
Poor execution including investment manager underperformance relative to their objectives leads to lower asset returns relative to pension liabilities.
Over two thirds of investment mandates are passively managed relative to their portfolio benchmarks with limited investment decisions made by managers.
Custody risk Inadequate controls lead to inaccurate record keeping and loss of assets through investment fraud.
The top tier global custodian Northern Trust is used to oversee the Scheme’s assets. The Trustee also uses an independent third party to review Northern Trust.
Sustainability, including ESG and climate risks
Investment managers have poor ESG, stewardship and climate risks oversight policies.
The Scheme incorporates ESG, stewardship and other related risks into its Statement of Investment Principles (SIP) and publishes an annual Implementation Statement. Investment managers are requested to confirm whether they operate in line with the Scheme’s official policies.
Investment regulatory risk
Insufficient training and awareness of regulatory requirements results in non-compliance with regulations.
The Scheme is advised by Eversheds Sutherland on legal and regulatory matters, and closely follows changes in regulatory and other legal requirements for pensions and investments.Periodic training is provided to the Investment Committee and advisers by relevant experts.
Investment liquidity risk
Insufficient liquidity to meet ongoing cash flow requirements in respect of member benefit payments.
The Scheme adopts a collateral sufficiency framework which ensures sufficient high quality liquid assets are maintained in order to meet liquidity requirements, even in times of market stress. The Investment Adviser liaises with the Scheme Actuary to understand future cash flow requirements.
Investment counterparty risk
Financial losses may be incurred due to failure of counterparties or inability to roll-over derivative positions.
Investment Managers maintain credit limits for all their derivative counterparty exposures and monitor positions over derivative roll dates.
38 Retirement benefit obligations continued
173Financial Statements J Sainsbury plc Annual Report 2021
Governance ReportStrategic Report
Financial Statements

The major categories of plan assets are as follows:
Quoted2021
£m
Unquoted1
2021£m
Quoted2020
£m
Unquoted2020
£m
Equity Public – – 922 – Private – 304 – 316 Bonds2 Government Bonds 1,356 76 1,639 – Corporate Bonds 5,378 507 4,878 91 Emerging Market Bonds 380 8 523 1 Derivatives3 164 581 802 567 Alternatives Real Estate – 670 64 619 Private Debts – 690 – 595 Diversified Growth – 286 – 279 Cash and Cash equivalents 596 4 211 (16) 7,874 3,126 9,039 2,452
1 Certain unquoted fixed interest securities, private equity and debt investments and property investments are stated at fair value. These fair values may differ from their realisable values due to the absence of liquid markets in these investments.
2 Bonds – circa 84 per cent of the Scheme’s corporate bonds are invested in investment grade credit. The remainder are either unrated or below investment grade.3 Swap contract derivatives outstanding at the year-end are stated at the net present value of future discounted cash flows of each leg of the swap.
Of the above assets, £4,155 million are denominated in sterling and £6,845 million are denominated in overseas currencies.
d) AssumptionsThe principal actuarial assumptions used at the balance sheet date are as follows:
2021 %
2020 %
Discount rate 1.95 1.6Inflation rate – RPI 3.15 2.7Inflation rate – CPI 2.45 1.7Future pension increases 2.15 – 3.10 1.65 – 2.70
Discount rateThe discount rate for the Scheme is derived from the expected yields on high quality corporate bonds over the duration of the Group’s pension scheme and extrapolated in line gilts with no theoretical growth assumptions. High quality corporate bonds are those for which at least one of the main ratings agencies considers to be at least AA (or equivalent).
InflationOn 25 November, the Government and UK Statistics Authority’s joint consultation response on RPI reform was published. This confirmed their intention to amend the RPI calculation methodology to be aligned to that already in use for the calculation of the CPI (including housing) with effect from 2030.
As a result, the Group has reduced the post 2030 gap between RPI and CPI to nil, effectively assuming RPI will be aligned with CPI post 2030, resulting in a single weighted average RPI-CPI gap of 0.70% p.a. for the 6th March 2021 year-end. The RPI-CPI gap used for the prior year was 1% p.a.
MortalityThe base mortality assumptions are based on the SAPS S2 tables, with adjustments to reflect the Scheme’s population. Future mortality improvements are Continuous Mortality Improvement (CMI) 2019 projections with a long term rate of improvement of 1.25 per cent p.a. at 2020 and CMI 2020 projections with a long term rate of improvement of 1.25 per cent p.a. at 2021.
While COVID-19 has had an impact on mortality in 2020, the impact on future mortality trends is currently unknown. All IAS 19 calculations use the (CMI) model, which measures potential changes to future mortality trends. The Group’s policy is to use the available version as at the year-end (the 2020 results used the CMI 2018 model). The latest CMI model, CMI 2020, was released on 4th March 2021.
The CMI 2020 model shows a significant reduction of 11.8 per cent in the 2020 rates of longevity for the general population. This is well outside the range of annual mortality changes in the last 40 years.
As a result of this significant change in mortality, the CMI modified the calibration process for CMI 2020 to allow choice on the weighting placed on an individual year’s data. For the Core version of CMI 2020, a weight of 0% is applied to 2020 data and weightings of 100 per cent for other years, so the potentially exceptional 2020 experience is ignored when modelling future improvements.
The Group has determined that putting a high weighting on the impact of 2020 could undervalue the liability, and there is currently insufficient information and data to be able to predict with any certainty the impact of COVID-19 in future trends. A zero per cent weighting has therefore been applied to the 2020 mortality data. The impact of different weightings on the Scheme liabilities is included in the sensitivities section within this note.
38 Retirement benefit obligations continued
174 Financial Statements J Sainsbury plc Annual Report 2021

38 Retirement benefit obligations continued
The life expectancy for members aged 65 years at the balance sheet date is as follows:
Sainsbury’s section
Main Scheme2021
Years
Sainsbury’s section
Executive Scheme
2021Years
Argos section
2021Years
Sainsbury’s section
Main Scheme2020
Years
Sainsbury’s section
Executive Scheme
2020Years
Argos section
2020Years
Male pensioner 20.0 24.1 21.7 20.0 24.1 21.6 Female pensioner 23.8 25.3 24.0 23.7 25.2 24.0
The life expectancy at age 65 for members aged 45 years at the balance sheet date is as follows:
Sainsbury’s section
Main Scheme2021
Years
Sainsbury’s section
Executive Scheme
2021Years
Argos section
2021Years
Sainsbury’s section
Main Scheme2020
Years
Sainsbury’s section
Executive Scheme
2020Years
Argos section
2020Years
Male pensioner 21.3 25.3 23.0 21.3 25.4 23.0 Female pensioner 25.3 26.7 25.5 25.2 26.7 25.5
e) SensitivitiesThe present value of the scheme’s liabilities recognised at the balance sheet date and the net financing charge recognised in the income statement are dependent on the discount rate. Other key assumptions within this calculation are based on market conditions or estimates of future events, including mortality rates. The carrying value of the retirement benefit obligations is impacted by changes to any of the assumptions used, however is most sensitive to changes in the discount rate.
The following sensitivities are based on management’s best estimate of a reasonably anticipated change. The sensitivities are calculated using the same methodology used to calculate the retirement benefit obligation, by considering the change in the retirement benefit obligation for a given change in assumption. The net retirement benefit obligation is the difference between the retirement benefit obligation and the fair value of plan assets. Changes in the assumptions may occur at the same time as changes in the fair value of plan assets. There has been no change in the calculation methodology since the prior period.
Sainsbury’s£m
Argos £m
Total£m
Financial sensitivitiesAn increase of 0.5% in the discount rate would decrease the present value of funded obligations by 790 137 927A decrease of 0.5% in the discount rate would increase the present value of funded obligations by 905 159 1,064An increase of 0.5% in the inflation rate would increase the present value of funded obligations by 558 127 685A decrease of 0.5% in the inflation rate would decrease the present value of funded obligations by 575 125 700An increase of 0.5% in the inflation rate for future pension increases would increase the present value of funded obligations by 337 98 435A decrease of 0.5% in the inflation rate for future pension increases would reduce the present value of funded obligations by 383 101 484
Demographic sensitivitiesAn increase of one year to the life expectancy would increase the present value of funded obligations by 339 53 392Changing the 2020 weighting parameter in CMI 2020 to w2020=10% would reduce the present value of funded obligations by 65 9 74Changing the 2020 weighting parameter in CMI 2020 to w2020=25% would reduce the present value of funded obligations by 145 22 167
f) Future benefit paymentsDetails of future committed payments are included in the Background section at the beginning of this note. Expected cash contributions in FY21/22 are approximately £76 million.
The duration of the plan liabilities is around 21 years for the Sainsbury’s section and 22 years for the Argos section. The following table provides information on the timing of benefit payments (amounts undiscounted):
2021 £m
2020£m
Within the next 12 months (next annual reporting period) 199 192Between 2 and 5 years 936 892Between 6 and 15 years 3,662 3,545Between 16 and 25 years 4,317 4,391Beyond 25 years 6,591 6,997Total expected payments 15,705 16,017
175Financial Statements J Sainsbury plc Annual Report 2021
Governance ReportStrategic Report
Financial Statements

39 Share-based paymentsAccounting policiesThe Group provides benefits to employees (including Directors) of the Group in the form of equity-settled and cash-settled share-based payment transactions, whereby employees render services in exchange for shares, rights over shares or the value of those shares in cash terms.
For equity-settled share-based payments, the fair value of the employee services rendered is determined by reference to the fair value of the shares awarded or options granted, excluding the impact of any non-market vesting conditions. All share options are valued using an option-pricing model (Black-Scholes). This fair value is charged to the income statement over the vesting period of the share-based payment scheme with a corresponding increase in equity.
For cash-settled share-based payments, the fair value of the employee services rendered is determined at each balance sheet date and the charge recognised through the income statement over the vesting period of the share-based payment scheme, with a corresponding increase in accruals.
The value of the charge is adjusted in the income statement over the remainder of the vesting period to reflect expected and actual levels of options vesting, with the corresponding adjustments made in equity and accruals.
The grant by the Company of options over its equity instruments to the employees of subsidiary undertakings in the Group is treated as a capital contribution. The fair value of employee services received, measured by reference to the grant date fair value, is recognised over the vesting period as an increase to investment in subsidiary undertakings, with a corresponding credit to equity.
The Group recognised £29 million (2020: £37 million) of employee costs (note 37) related to share-based payment transactions made during the financial year. Of these, a credit of £nil million (2020: £nil million) were cash-settled.
The Group operates a number of share-based payment schemes as follows:
a) Savings-Related Share Option Scheme (Sharesave)The Group operates a Savings-Related Share Option Scheme, which is open to all UK employees with more than three months’ continuous service. This is an approved HMRC scheme and was established in 1980.
Under Sharesave, participants remaining in the Group’s employment at the end of the three-year (and historically also five-year) savings period are entitled to use their savings to purchase shares in the Company at a stated exercise price.
Employees leaving for certain reasons can use their savings to purchase shares within six months of their leaving.
A reconciliation of Sharesave option movements is shown below:
2021Number of
optionsmillion
2021Weighted
average exercise price
pence
2020Number of
optionsmillion
2020Weighted
average exercise price
pence
Outstanding at beginning of year 60.8 190 61.4 211 Granted 23.7 161 23.7 161 Lapsed/forfeited (11.4) 196 (17.1) 224 Exercised (9.0) 186 (7.2) 188 Outstanding at end of year 64.1 179 60.8 190 Exercisable at end of year 6.2 186 6.3 193 Exercisable range 161 to 260 185 to 332
The weighted average share price for options exercised over the year was 216 pence (2020: 211 pence). The weighted average remaining contractual life of options outstanding at 6 March 2021 was 2.2 years (2020: 2.2 years).
Options granted during the year were valued using the Black-Scholes option-pricing model. No performance conditions were included in the fair value calculations. The fair value per option granted during the year and the assumptions used in the calculation are as follows:
2021 2020
Share price at grant date (pence) 226 220Exercise price (pence) 161 161Expected volatility – 3 year period (%) 29.9 26.1
– 5 year period (%) – 27.8Option life – 3 year period (years) 3.2 3.2
– 5 year period (years) – 5.2Expected dividends (expressed as dividend yield %) 5.2 2.9Risk-free interest rate – 3 year period (%) 0.1 0.6
– 5 year period (%) – 0.7Fair value per option – 3 year period (pence) 55 59
– 5 year period (pence) – 62
The expected volatility is based on the standard deviation of the Group’s share price for the period immediately prior to the date of grant of award, over the period identical to the vesting period of the award, adjusted for management’s view of future volatility of the share price.
176 Financial Statements J Sainsbury plc Annual Report 2021

b) Long-Term Incentive Plan
Under the Long-Term Incentive Plan, shares are conditionally awarded to the senior managers in the Company. The core awards are calculated as a percentage of the participants’ salaries and scaled according to grades.
Performance is measured at the end of the three-year performance period. If the required performance conditions have been met, the awards vest and 50 per cent of the award will be released. Subject to participants remaining in employment for a further year, the balance will then be released one year after the vesting date. Options granted to acquire the award of shares will expire five years from the grant date.
For Executive Directors, awards will normally be subject to a two-year holding period following the end of the three-year performing period. Options granted to acquire the award of shares will expire six years from the date of grant.
Dividends will accrue on the shares that vest in the form of additional shares.
The core award can grow by up to four times, dependent on the level of performance. Straight-line vesting will apply if performance falls between two points. Awards are structured as nil-cost options.
A reconciliation of the number of shares conditionally allocated is shown below:
2021Million
2020Million
Outstanding at beginning of year 10.2 8.9 Conditionally allocated 7.8 7.2 Released to participants (4.4) (4.1)Lapsed (1.4) (1.8)Outstanding at end of year 12.2 10.2
The weighted average remaining contractual life of share options outstanding at 6 March 2021 was 1.4 years (2020: 1.5 years).
Details of shares conditionally allocated at 6 March 2021 are set out below:
Date of conditional award
2021Million
2020Million
14 May 2015 (2015 Future Builder) – 0.1 12 May 2016 (2016 Future Builder) 0.1 2.0 11 May 2017 (2017 Future Builder) 3.3 2.2 11 May 2018 (2018 Future Builder) 2.1 2.2 09 May 2019 (2019 Future Builder) 3.1 3.7 07 May 2020 (2020 Future Builder) 3.6 – 12.2 10.2
No performance conditions were included in the fair value calculations. The fair value per option granted during the year and the assumptions used in the calculation are as follows:
2021 2020
Share price at grant date (pence) 199 219Option life (years) 3 or 4 3 or 4Fair value per option (pence) 199 219
During the year, a total number of 4.4 million shares were exercised (2020: 4.1 million shares). The weighted average share price during the year for options exercised was 194 pence (2020: 213 pence).
c) Deferred Share AwardThis plan is no longer operated, the last awards made under this plan were in 2020/21. The Deferred Share Award targets a diverse range of financial and strategic scorecard measures. These are intended to reward the Directors in the Company, including Executive Directors, for driving the short-term objectives that will directly lead to building the sustainable, long-term growth of the Company. Awards are structured as nil-cost options.
Share-based awards are made to participants subject to performance against a basket of measures. At least 50 per cent of the awards are based on the delivery of financial performance and returns to shareholders. The balance is based on measures which will assess the Company’s performance relative to its competitors as well as key strategic goals.
Performance against the target is measured over one financial year. Any shares awarded are deferred for a further two-years to ensure that management’s interests continue to be aligned with those of shareholders. The shares are subject to forfeiture if the participant resigns or is dismissed. Dividends accrue on the shares that vest in the form of additional shares.
39 Share-based payments continued
177Financial Statements J Sainsbury plc Annual Report 2021
Governance ReportStrategic Report
Financial Statements

A reconciliation of the number of shares granted over the year is shown below:
2021Million
2020Million
Outstanding at beginning of year 3.8 3.5 Granted 2.1 2.6 Lapsed (0.6) (0.7)Exercised (1.7) (1.6)Outstanding at end of year 3.6 3.8
The number of shares allocated at the end of the year is set out below:
2021Million
2020Million
11 May 2018 – 1.7 9 May 2019 1.9 2.1 7 May 2020 1.7 – 3.6 3.8
The weighted average remaining contractual life of share options outstanding at 6 March 2021 was 0.5 years (2020: 0.6 years). The weighted average share price during the year for options exercised was 195 pence (2020: 215 pence).
d) Bonus Share AwardThe bonus arrangements for our senior leaders include corporate and personal performance targets. A profit gateway is in place where a certain level of underlying profit before tax must be achieved before any bonus related to the corporate element of the bonus is released.
Senior Managers and supermarket managers receive 60 per cent of their bonus in cash and 40 per cent of the award in shares. Director level management receive 50 per cent of their bonus in cash and 50 per cent of the award in shares. Before 2021, awards had a three-year deferral period, however awards granted from 2021 now have a deferral period of two years. These awards are automatically released following the end of the deferral period.
Dividends accrue on these shares and are released at the end of the retention period.
A reconciliation of the number of shares granted over the year is shown below:
2021Million
2020Million
Outstanding at beginning of year 12.7 11.4 Granted 1.7 8.5 Exercised in the period (2.9) (5.4)Lapsed (0.9) (1.8)Outstanding at end of year 10.6 12.7
The number of shares allocated at the end of the year is set out below:
2021Million
2020Million
12 May 2017 – 2.2 11 May 2018 3.2 3.6 9 May 2019 6.1 6.9 7 May 2020 1.3 – 10.6 12.7
The weighted average remaining contractual life of share options outstanding at 6 March 2021 was 0.8 years (2020: 1.4 years). The weighted average share price during the year for options exercised was 184 pence (2020: 225 pence).
40 Capital commitments At 6 March 2021, capital commitments contracted, but not provided for by the Group, amounted to £113 million (7 March 2020: £112 million) and £nil for the property joint ventures (7 March 2020: £nil).
In addition, the Group is committed to payments totalling £32 million (2020: £38 million) in relation to leases that have been signed but have not yet commenced.
39 Share-based payments continued
178 Financial Statements J Sainsbury plc Annual Report 2021

41 Financial commitments Sainsbury’s Bank has off-balance sheet commitments to extend credit to customers of £64 million (2020: £80 million).
At the year-end, £15 million of expected credit loss provisions are recognised in respect of off-balance sheet loan commitments in line with IFRS 9 (2020: £20 million).
42 Contingent liabilitiesThe Group has a number of contingent liabilities in respect of historic lease guarantees, particularly in relation to the disposal of assets, which if the current tenant and their ultimate parents become insolvent, may expose the Group to a material liability. This liability decreases over time as the leases expire. The Group has considered a number of factors, including past history of default as well as the profitability and cash generation of the current leaseholders, and has concluded that the likelihood of payout is remote.
Along with other retailers, the Group is currently subject to claims from current and ex-employees in the Employment Tribunal for equal pay under the Equality Act 2010 and/or the Equal Pay Act 1970. There are currently circa 8,400 claims in which the claimants are alleging that their work within Sainsbury’s stores is of equal value to that of colleagues working in Sainsbury’s distribution centres, and that differences in terms and conditions relating to pay are not objectively justifiable. The claimants are seeking the differential back pay based on the higher wages in distribution centres, and the equalisation of wages and terms and conditions on an ongoing basis. Typically, claims of this nature can take many years to be determined. Given that the claims against the Group are still at a relatively early stage and the outcome of such claims is highly uncertain at this stage, the Group cannot make any assessment of the likelihood nor quantum of any outcome. No provision has therefore been recognised on the Group’s balance sheet. There are substantial factual and legal defences to these claims and the Group intends to defend them vigorously.
43 Related party transactions a) Key management personnelThe key management personnel of the Group comprise members of the J Sainsbury plc Board of Directors and the Operating Board. The key management personnel compensation is as follows:
2021£m
2020£m
Short-term employee benefits 9 12Post-employment employee benefits 1 1Share-based payments 5 6 15 19
Five key management personnel had credit card balances with Financial Services (2020: two). These arose in the normal course of business and were immaterial to the Group and the individuals. Three key management personnel held saving deposit accounts with Financial Services (2020: one). These balances arose in the normal course of business and were immaterial to the Group and the individuals.
b) Joint ventures and associatesTransactions with joint ventures and associatesFor the 52 weeks to 6 March 2021, the Group entered into various transactions with joint ventures and associates as set out below. All transactions with joint ventures and associates are at arms-length.
2021£m
2020£m
Dividends and distributions received 4 141Disposals of joint ventures – (21)Rental expenses paid (6) (14)
Year-end balances arising from transactions with joint ventures and associates
2021£m
2020£m
PayablesOther payables (2) 18
c) Retirement benefit obligationsAs discussed in note 38, the Group has entered into an arrangement with the Pension Scheme Trustee as part of the funding plan for the actuarial deficit in the Scheme. Full details of this arrangement are set out in note 38 to these financial statements.
179Financial Statements J Sainsbury plc Annual Report 2021
Governance ReportStrategic Report
Financial Statements

44 Details of related undertakingsAll companies listed below are owned by the Group and all interests are in the ordinary share capital, except where otherwise indicated. All subsidiaries have been consolidated.
a) Subsidiary undertakingsThe Group holds a majority of the voting rights of the following undertakings:
Entity Country of Incorporation Interest Holding Address*
ARG Personal Loans Limited UK 100% Indirect AveburyARG Services Limited UK 100% Indirect 33 HolbornArgos Best Sellers Limited UK 100% Indirect 33 HolbornArgos Business Solutions Limited UK 100% Indirect AveburyArgos Card Transactions Limited UK 100% Indirect 33 HolbornArgos Direct Limited UK 100% Indirect 33 HolbornArgos Distributors (Ireland) Limited Ireland 100% Indirect Unit 7, Ashbourne Retail ParkArgos Extra Limited UK 100% Indirect 33 HolbornArgos Holdings Limited UK 100% Indirect AveburyArgos Limited UK 100% Indirect AveburyArgos (N.I.) Ltd UK 100% Indirect Forestside Shopping CentreArgos Retail Group Limited UK 100% Indirect 33 HolbornArgos Superstores Limited UK 100% Indirect 33 HolbornArgos Surbs Investments Limited UK 100% Indirect AveburyBarleygold Limited UK 100% Indirect 50 Bedford StreetBed Store & More Limited UK 100% Indirect 33 HolbornBells Stores Limited UK 100% Direct 33 HolbornBLSSP (PHC 7) Limited UK 100% Indirect 33 HolbornBraemar Castle Limited UK 100% Direct 33 HolbornBrand-Leader’s Limited UK 100% Indirect 33 HolbornChad Valley Limited UK 100% Indirect 33 HolbornClearance Bargains Limited UK 100% Indirect 33 HolbornCliffrange Limited UK 100% Indirect 33 HolbornCoolidge Investments Limited UK 100% Indirect 33 HolbornFinancial Recovery Services Limited UK 100% Indirect AveburyFirst Stop Stores Limited UK 100% Indirect 33 HolbornFlint Castle Limited UK 100% Direct 33 HolbornGlobal (Guernsey) Limited Guernsey 100% Indirect PO BOX 33 Dorey CourtHabitat Retail Limited UK 100% Indirect AveburyHolborn UK Investments Limited UK 100% Direct 33 HolbornHome Retail Group Limited UK 100% Indirect AveburyHome Retail Group (Cyprus) Limited Cyprus 100% Indirect 5 Anastasios Leventis StreetHome Retail Group (Finance) LLP UK 100% Indirect AveburyHome Retail Group (Guernsey) LP Guernsey 100% Indirect PO Box 33 Dorey CourtHome Retail Group (Jersey) Limited Jersey 100% Indirect 44 Esplanade Home Retail Group (UK) Limited UK 100% Indirect AveburyHome Retail Group Card Services Limited UK 100% Indirect AveburyHome Retail Group Holdings (Overseas) Limited UK 100% Indirect 33 HolbornHome Retail Group Insurance Services Limited UK 100% Indirect AveburyHome Retail Group Nominees Limited UK 100% Indirect 33 HolbornHome Retail Group Pension Scheme Nominees Limited UK 100% Indirect AveburyHome Retail Group UK Service Company Limited UK 100% Indirect 33 HolbornHome Store & More Limited UK 100% Indirect 33 HolbornJ Sainsbury Limited Ireland 100% Direct 6th Floor, South Bank HouseJ Sainsbury Common Investment Fund Limited UK 100% Indirect 33 HolbornJ Sainsbury Distribution Limited UK 100% Direct 33 HolbornJ Sainsbury Pension Scheme Trustees Limited UK 100% Direct 33 HolbornJ Sainsbury Trustees Limited UK 100% Indirect 33 HolbornJacksons Stores Limited UK 100% Direct 33 HolbornJacksons Stores 2002 Limited UK 100% Indirect 33 HolbornJS Information Systems Limited UK 100% Direct 33 HolbornJS Insurance Limited Isle of Man 100% Direct Third Floor, St George’s CourtJSD (London) Limited UK 100% Indirect 33 Holborn
* See full addresses on page 183.
180 Financial Statements J Sainsbury plc Annual Report 2021

Entity Country of Incorporation Interest Holding Address*
Jungle Online UK 100% Indirect 33 HolbornJungle.com Limited UK 100% Indirect 33 HolbornJungle.com Holdings Limited UK 100% Indirect 33 HolbornNash Court (Kenton) Limited UK 100% Indirect 33 HolbornNectar 360 Limited UK 100% Indirect 33 HolbornNectar 360 Services LLP UK 100% Indirect 33 HolbornNectar EMEA Limited UK 100% Indirect 33 HolbornNectar Loyalty Holding Limited UK 100% Direct 33 HolbornPremier Incentives Limited UK 100% Indirect 33 HolbornRamheath Properties Limited UK 100% Direct 33 HolbornSainsbury Bridgeco Holdco Limited UK 100% Direct 33 HolbornSainsbury Holdco A Limited UK 100% Direct 33 HolbornSainsbury Holdco B Limited UK 100% Direct 33 HolbornSainsbury Propco A Limited UK 100% Indirect 33 HolbornSainsbury Propco B Limited UK 100% Indirect 33 HolbornSainsbury Propco C Limited UK 100% Direct 33 HolbornSainsbury Propco D Limited UK 100% Direct 33 HolbornSainsbury Property Investments Limited UK 100% Direct 33 HolbornSainsbury’s Argos Asia Limited Hong Kong 100% Indirect 7/F, 348 Kwun Tong RoadSainsbury’s Argos Asia Commercial Limited Hong Kong 100% Indirect 7/F, 348 Kwun Tong RoadSainsbury’s Argos Asia Sourcing Limited Hong Kong 100% Indirect 7/F, 348 Kwun Tong RoadSainsbury’s Argos Asia Technical Limited Hong Kong 100% Indirect 7/F, 348 Kwun Tong RoadSainsbury’s Argos Commercial Consulting (Shanghai) Limited China 100% Indirect 26/F, Tower 1Sainsbury’s Bank plc UK 100% Direct 33 HolbornSainsbury’s Convenience Stores Limited UK 100% Direct 33 HolbornSainsburys Corporate Director Limited UK 100% Direct 33 HolbornSainsbury’s Group Holdings Limited UK 100% Direct 33 HolbornSainsbury’s Heather GP Limited UK 100% Indirect 3 Lochside AvenueSainsbury’s Intermediate Holdings Limited UK 100% Direct 33 HolbornSainsbury’s Limited Ireland 100% Direct 6th Floor, South Bank HouseSainsbury’s Limited UK 100% Direct 3 Lochside AvenueSainsbury’s Manor GP Limited UK 100% Direct 3 Lochside AvenueSainsbury’s Manor II Property Limited UK 100% Direct 3 Lochside AvenueSainsbury’s Manor Property Limited UK 100% Direct 3 Lochside AvenueSainsburys (NI) Ltd UK 100% Indirect Forestside Shopping CentreSainsbury’s Planet Limited UK 100% Direct 33 HolbornSainsbury’s Property Scottish Limited Partnership UK 100% Indirect 3 Lochside AvenueSainsbury’s Property Scottish Partnership UK 100% Indirect 3 Lochside AvenueSainsbury’s Rose LP Limited UK 100% Indirect 33 HolbornSainsbury’s Supermarkets Limited UK 100% Direct 33 HolbornSainsbury’s Thistle Scottish Limited Partnership UK 100% Indirect 3 Lochside AvenueSainsbury’s Tyne Property Holdings Limited UK 100% Indirect 33 HolbornSoftware Warehouse Holdings Limited UK 100% Indirect 33 HolbornStamford House Investments Limited UK 100% Direct 33 HolbornStamford Properties One Limited UK 100% Direct 33 HolbornStamford Properties Three Limited UK 100% Direct 33 HolbornStamford Properties Two Limited UK 100% Direct 33 HolbornStanhope Finance Limited UK 100% Indirect 33 HolbornTintagel Castle Limited UK 100% Direct 33 HolbornTown Centre Retail (Bicester) Limited UK 100% Indirect 33 Holborn
* See full addresses on page 183.
44 Details of related undertakings continued
181Financial Statements J Sainsbury plc Annual Report 2021
Governance ReportStrategic Report
Financial Statements

b) Associated undertakingsThe Group has a participating interest in the following undertakings:
Entity Country of Incorporation Interest Holding Address*
3BW Limited UK 50% Indirect 5 St John’s LaneBL Sainsbury Superstores Limited UK 50% Indirect York HouseHarvest 2 GP Limited UK 50% Indirect 100 Victoria StreetHarvest 2 Limited Partnership UK 50% Indirect 100 Victoria StreetHarvest Development Management Limited UK 50% Indirect 100 Victoria StreetHarvest GP Limited UK 50% Indirect 100 Victoria StreetHedge End Park Limited UK 50% Direct 33 Holborn
c) Undertakings other than subsidiaries and associated undertakingsThe direct or indirect holder of 100 per cent of the voting interests in the following undertakings is an associate of the Group:
Entity Country of Incorporation Interest Holding Address*
BL Superstores (Funding) Limited UK 50% Indirect York HouseBL Superstores Finance PLC UK 50% Indirect York HouseBLSSP (Cash Management) Limited UK 50% Indirect York HouseBLSSP (Lending) Limited UK 50% Indirect York HouseBLSSP (PHC 1 2010) Limited UK 50% Indirect York HouseBLSSP (PHC 1 2012) Limited UK 50% Indirect York HouseBLSSP (PHC 12) Limited UK 50% Indirect York HouseBLSSP (PHC 2 2010) Limited UK 50% Indirect York HouseBLSSP (PHC 20) Limited UK 50% Indirect York HouseBLSSP (PHC 25) Limited UK 50% Indirect York HouseBLSSP Property Holdings Limited UK 50% Indirect York HouseBritish Land Superstores (Non-Securitised) UK 50% Indirect York HouseHarvest 2 Selly Oak Limited UK 50% Indirect 100 Victoria StreetHarvest Nominee No. 1 Limited** UK 50% Indirect 100 Victoria StreetHarvest Nominee No. 2 Limited** UK 50% Indirect 100 Victoria StreetPencilscreen Limited UK 50% Indirect York House
d) Overseas branchesThe Group has the following branches overseas.
Entity Country Holding Address*
Sainsbury’s Argos Asia Limited – Bangladesh Liaison Office India Indirect Level 10, Simpletree AnarkaliSainsbury’s Argos Asia Limited – India Branch Office India Indirect Unit No. 1, 1st Floor, Ambience Corporate Tower II
* See full addresses on page 183.** An application was made to Companies House to strike this company off the register on 16 February 2021.
44 Details of related undertakings continued
182 Financial Statements J Sainsbury plc Annual Report 2021

Address Full Address
3 Lochside Avenue 3 Lochside Avenue, Edinburgh, EH12 9DJ, United Kingdom5 Anastasios Leventis Street 5 Anastasios Leventis Street, Leventis Gallery Tower, 8th Floor, 1097 Nicosia, Cyprus5 St John’s Lane 5 St John’s Lane, London, EC1M 4BH, United Kingdom6th Floor, South Bank House 6th Floor, South Bank House, Barrow Street, Dublin 4, D04 TR29, Ireland7/F, 348 Kwun Tong Road 7/F, 348 Kwun Tong Road, Kowloon, Hong Kong26/F, Tower 1 26/F, Tower 1, Kerry Everbright City Phase III-Enterprise Centre, No.128, West Tian Mu Road,
Shanghai 200070, People’s Republic of China33 Holborn 33 Holborn, London, EC1N 2HT, United Kingdom44 Esplanade 44 Esplanade, St Helier, Jersey, JE4 9WG, Channel Islands50 Bedford Street 50 Bedford Street, Belfast, BT2 7FN, United Kingdom100 Victoria Street 100 Victoria Street, London, SW1E 5JL, United KingdomAvebury Avebury, 489-499 Avebury Boulevard, Milton Keynes, MK9 2NW, United KingdomForestside Shopping Centre Forestside Shopping Centre, Upper Galwally, Belfast, BT8 6FX, United KingdomLevel 10, Simpletree Anarkali Level 10, Simpletree Anarkali, 89 Gulshan Avenue Plet 03, Block – CWS(A),
Dhaka – 1212 BangladeshPO Box 33 Dorey Court PO Box 33, Dorey Court, Admiral Park, St Peter Port, GUERNSEY GY1 4ATThird Floor, St George’s Court Third Floor, St George’s Court, Upper Church Street, Douglas, IM1 1EE, Isle of ManUnit 7, Ashbourne Retail Park Unit 7 , Ashbourne Retail Park, Ballybin Road, Ashbourne, Co. Meath, IrelandUnit No. 1, 1st Floor, Ambience Corporate Tower II Unit No. 1, 1st Floor, Ambience Corporate Tower II, Ambience Island, NH-8, Gurgaon – 122011,
Haryana, IndiaYork House York House, 45 Seymour Street, London, W1H 7LX, United Kingdom
44 Details of related undertakings continued
183Financial Statements J Sainsbury plc Annual Report 2021
Governance ReportStrategic Report
Financial Statements

Note2021
£m2020
£m
Non-current assets Investments in subsidiaries, joint ventures and associates 2 7,610 7,750Financial assets at fair value through other comprehensive income 1 1Trade and other receivables 3 161 175Derivative financial assets – 14 7,772 7,940Current assets Trade and other receivables 3 1,489 1,784Taxes receivable 16 –Derivative financial assets 14 1Cash and cash equivalents 353 156 1,872 1,941Total assets 9,644 9,881Current liabilities Trade and other payables 4 (2,789) (2,138)Borrowings 5 (199) –Derivative financial liabilities (1) (1)Taxes payable – (3)Provisions 6 (1) (2) (2,990) (2,144)Net Current Liabilities (1,118) (203)Non-current liabilities Borrowings 5 – (449)Derivative financial liabilities (13) (14)Deferred income tax liability 7 (12) – (25) (463)Total liabilities (3,015) (2,607)Net assets 6,629 7,274Equity Called up share capital 8 637 634Share premium 8 1,173 1,159Capital redemption reserve 8 680 680Merger reserve 8 568 568Other reserves 8 3 3Retained earnings 9 3,320 3,734Total equity before perpetual securities 6,381 6,778Perpetual capital securities – 248Perpetual convertible bonds 248 248Total equity 6,629 7,274
The loss after tax for the Company for the year was £(202) million (2020: loss of £(30) million).
The notes on pages 186 to 190 form an integral part of these financial statements.
The financial statements on pages 184 to 190 were approved by the Board of Directors on 27 April 2021, and are signed on its behalf by:
Simon Roberts Kevin O’ByrneChief Executive Chief Financial Officer
The Company’s registered number is 00185647.
Company balance sheetAt 6 March 2021 and 7 March 2020
184 Financial Statements J Sainsbury plc Annual Report 2021

Note
Called up share
capital£m
Share premium
account£m
Merger reserve
£m
Capital redemption
and other reserves
£m
Retained earnings
£m
Total equity before
perpetual securities
£m
Perpetual capital
securities£m
Perpetual convertible
bonds£m
Total equity
£m
At 8 March 2020 634 1,159 568 683 3,734 6,778 248 248 7,274(Loss)/profit for the year 9 – – – (209) (209) – 7 (202)Other comprehensive income – – – – – – – – –Total comprehensive (expense)/income
for the year ended 6 March 2021 – – – – (209) (209) – 7 (202)
Transactions with owners: Dividends 9 – – – – (232) (232) (232) Distribution to holders of
perpetual securities – – – – – – – (7) (7)
Allotted in respect of share option schemes
8, 9 3 14 – – 29 46 – – 46
Redemption of perpetual capital securities
– – – – (2) (2) (248) – (250)
At 6 March 2021 637 1,173 568 683 3,320 6,381 – 248 6,629 At 10 March 2019 630 1,147 568 688 3,992 7,025 248 248 7,521(Loss)/profit for the year 9 – – – – (53) (53) 16 7 (30)Other comprehensive income – – – – – – – – –Total comprehensive (expense)/income
for the year ended 7 March 2020 – – – – (53) (53) 16 7 (30)
Transactions with owners: Dividends 9 – – – – (247) (247) – – (247) Distribution to holders of perpetual
securities – – – – – – (16) (7) (23)
Amortisation of convertible bond equity component
8, 9 – – – (5) 5 – – – –
Allotted in respect of share option schemes
8, 9 4 12 – – 37 53 – – 53
At 7 March 2020 634 1,159 568 683 3,734 6,778 248 248 7,274
The notes on pages 186 to 190 form an integral part of these financial statements.
Company statement of changes in equityfor the 52 weeks to 6 March 2021
185Financial Statements J Sainsbury plc Annual Report 2021
Governance ReportStrategic Report
Financial Statements

1 Basis of preparationThe parent company’s financial statements are prepared in accordance with United Kingdom Accounting Standards, in particular Financial Reporting Standard 101 Reduced Disclosure Framework (FRS 101) and the Companies Act 2006. FRS 101 sets out a reduced disclosure framework for a ‘qualifying entity’ as defined in the Standard, which addresses the financial reporting requirements and disclosure exemptions in the individual financial statements of qualifying entities that otherwise apply the recognition measurement and disclosure requirements of International Financial Reporting Standards (IFRSs) adopted pursuant to Regulation (EC) No. 1606/2002 as it applies in the European Union.
The Company’s transition date to FRS 101 was 13 March 2016. FRS 101 sets out amendments to IFRS as adopted by the European Union that are necessary to achieve compliance with the Companies Act and related regulations.
The financial year represents the 52 weeks to 6 March 2021 (prior financial year 52 weeks to 7 March 2020).
The disclosure exemptions adopted by the Company in accordance with FRS 101 are as follows: — The requirements of IAS 7 to present a cash flow statement. — The requirements of paragraph 17 of IAS 24 ‘Related Party Transactions’, to disclose information related to key management personnel, and the requirements of IAS 24 to disclose related party transactions between two or more members of a group for wholly owned subsidiaries.
— The requirements of paragraphs 30 and 31 of IAS 8 to disclose information assessing the possible impact of new standards issued but which are not yet effective.
— The requirements of IFRS 7 and IFRS 13 for disclosure of financial instruments and fair values.
The financial statements are presented in sterling, rounded to the nearest £million unless otherwise stated. They have been prepared on the going concern basis under the historical cost convention, except for derivative financial instruments and financial assets at fair value through other comprehensive income that have been measured at fair value.
Amendments to published standards Effective for the Company in these financial statements:The Company has considered the following amendments to published standards that are effective for the financial year beginning 8 March 2020 and concluded that they are either not relevant to the Company or that they do not have a significant impact on the Company’s financial statements other than disclosures. These standards and interpretations have been endorsed by the European Union.
— Amendments to References to Conceptual Framework in IFRS Standards — Amendments to IFRS 3 ‘Business Combinations’ on the definition of a business — Amendments to IAS 1 ‘Presentation of Financial Statements’ and IAS 8 ‘Accounting Policies, Changes in Accounting Estimates and Errors’ on the definition of material
— Amendments to IFRS 9 ‘Financial Instruments’, IAS 39 ‘Financial Instruments: Recognition and Measurement’ and IFRS 7 ‘Financial Instruments: Disclosures’ on the Interest Rate Benchmark Reform
The Company applied the Phase 1 amendments to IFRS 9, IAS 39, IFRS 7, IFRS 4 and IFRS 16 which became effective from 1st January 2020 and early adopted the Phase 2 amendments from 8 March 2020 retrospectively. Refer to note 2.4 to the Group financial statements for more information.
Standards and revisions effective for future periods:The following standards and revisions will be effective for future periods:
— Amendments to IFRS 3 ‘Business Combinations’ with reference to the Conceptual Framework — Amendments to IAS 37 ‘Provisions, Contingent Liabilities and Contingent Assets’ on Onerous Contracts – Cost of Fulfilling a Contract — Amendments to IAS 16 ‘Property, Plant and Equipment’ on Proceeds before Intended Use — Amendments to IAS 1 ‘Presentation of Financial Statements’ on the classification of liabilities as current or non-current — IFRS 17 ‘Insurance Contracts’
The Company has considered the impact of the remaining above standards and revisions and have concluded that they will not have a significant impact on the Company’s financial statements.
The Directors have taken advantage of the exemption available under Section 408 of the Companies Act 2006 and not presented an income statement nor a statement of comprehensive income for the Company alone.
Notes to the Company financial statements
186 Financial Statements J Sainsbury plc Annual Report 2021

2 Investments in subsidiaries, joint ventures and associatesAccounting policiesInvestments in subsidiaries, joint ventures and associates are carried at cost less any impairment loss in the financial statements of the Company.
At each reporting period, the Company assesses the carrying amounts of its investments to determine whether there is any indication of impairment. Where such an indication exists, the Company makes an estimate of the recoverable amount. If the recoverable amount of the investment is less than its carrying amount, the investment is written down to its recoverable amount. Any impairment loss is immediately recognised in the income statement.
Significant estimate – impairment of investments in subsidiariesThe Company considers impairment of its investment in subsidiaries by estimating the recoverable amounts of the investments, which are based on either the net assets of the subsidiary, or value-in-use calculations. Where a value-in-use calculation is used, discounted cash flows have been derived from the latest five-year Board-approved cash flows to perpetuity with no growth rate applied, discounted at a pre-tax rate of 7 per cent to 13 per cent.
2021£m
2020£m
Subsidiaries At the beginning of the year 7,749 6,161Additions 29 1,588Impairments (169) –At the end of the year 7,609 7,749
Joint ventures and associates 1 1Subsidiaries, joint ventures and associates 7,610 7,750
The Directors acknowledged that as at 6 March 2021 the market capitalisation of J Sainsbury plc was less than the net assets of the Company, which primarily consist of investments in subsidiaries. This was considered an indicator of impairment and an impairment test over the investment in subsidiaries was performed.
An impairment charge of £169 million was recognised in the year in relation to the Company’s investment in its subsidiary Sainsbury’s Bank plc, reducing the Company’s investment to £856 million based on remaining net assets. No impairment charge was recognised over the Company’s other investments in subsidiaries.
3 Trade and other receivablesAccounting policiesReceivables are recognised initially at fair value, and subsequently at amortised cost using the effective interest rate method, less provision for impairment.
2021£m
2020£m
Non-current Amounts owed by Group companies 161 175 Current Amounts owed by Group companies 1,478 1,765 Prepayments and accrued income 11 19 1,489 1,784
Receivable balances with other Group entities are reviewed for potential impairment based on the ability of the counterparty to meet its obligations. This is assessed by considering the net asset position of the entity and whether the amounts owed to the Company are covered. Where this is not the case, the estimated future cash flows of the counterparty are considered in line with the methodology detailed in note 2. No impairment losses were recognised in the year.
4 Trade and other payablesAccounting policiesPayables are recognised initially at fair value, and subsequently at amortised cost using the effective interest rate method.
2021£m
2020£m
Current Amounts owed to Group entities 2,782 2,115 Other payables 7 23 2,789 2,138
187Financial Statements J Sainsbury plc Annual Report 2021
Governance ReportStrategic Report
Financial Statements
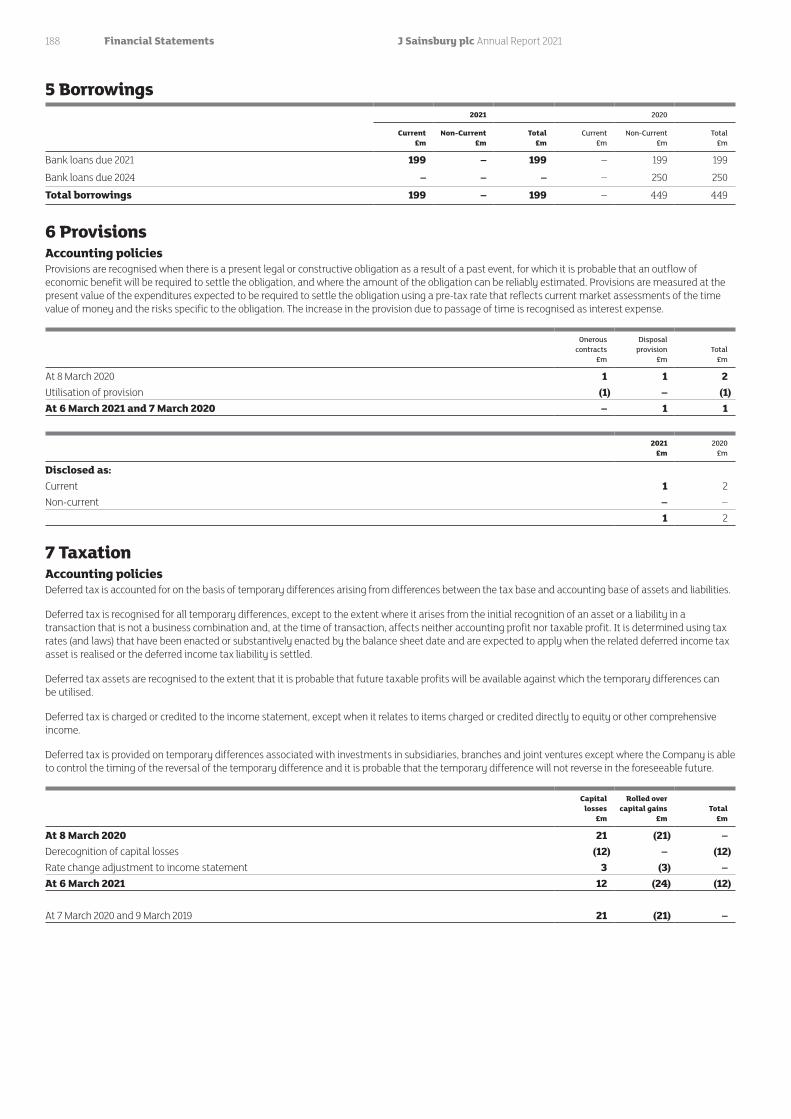
5 Borrowings 2021 2020
Current£m
Non-Current£m
Total£m
Current£m
Non-Current£m
Total£m
Bank loans due 2021 199 – 199 – 199 199
Bank loans due 2024 – – – – 250 250
Total borrowings 199 – 199 – 449 449
6 ProvisionsAccounting policiesProvisions are recognised when there is a present legal or constructive obligation as a result of a past event, for which it is probable that an outflow of economic benefit will be required to settle the obligation, and where the amount of the obligation can be reliably estimated. Provisions are measured at the present value of the expenditures expected to be required to settle the obligation using a pre-tax rate that reflects current market assessments of the time value of money and the risks specific to the obligation. The increase in the provision due to passage of time is recognised as interest expense.
Onerous contracts
£m
Disposal provision
£mTotal
£m
At 8 March 2020 1 1 2 Utilisation of provision (1) – (1)At 6 March 2021 and 7 March 2020 – 1 1
2021£m
2020£m
Disclosed as:Current 1 2 Non-current – – 1 2
7 TaxationAccounting policiesDeferred tax is accounted for on the basis of temporary differences arising from differences between the tax base and accounting base of assets and liabilities.
Deferred tax is recognised for all temporary differences, except to the extent where it arises from the initial recognition of an asset or a liability in a transaction that is not a business combination and, at the time of transaction, affects neither accounting profit nor taxable profit. It is determined using tax rates (and laws) that have been enacted or substantively enacted by the balance sheet date and are expected to apply when the related deferred income tax asset is realised or the deferred income tax liability is settled.
Deferred tax assets are recognised to the extent that it is probable that future taxable profits will be available against which the temporary differences can be utilised.
Deferred tax is charged or credited to the income statement, except when it relates to items charged or credited directly to equity or other comprehensive income.
Deferred tax is provided on temporary differences associated with investments in subsidiaries, branches and joint ventures except where the Company is able to control the timing of the reversal of the temporary difference and it is probable that the temporary difference will not reverse in the foreseeable future.
Capital losses
£m
Rolled over capital gains
£mTotal
£m
At 8 March 2020 21 (21) –Derecognition of capital losses (12) – (12)Rate change adjustment to income statement 3 (3) –At 6 March 2021 12 (24) (12)
At 7 March 2020 and 9 March 2019 21 (21) –
188 Financial Statements J Sainsbury plc Annual Report 2021
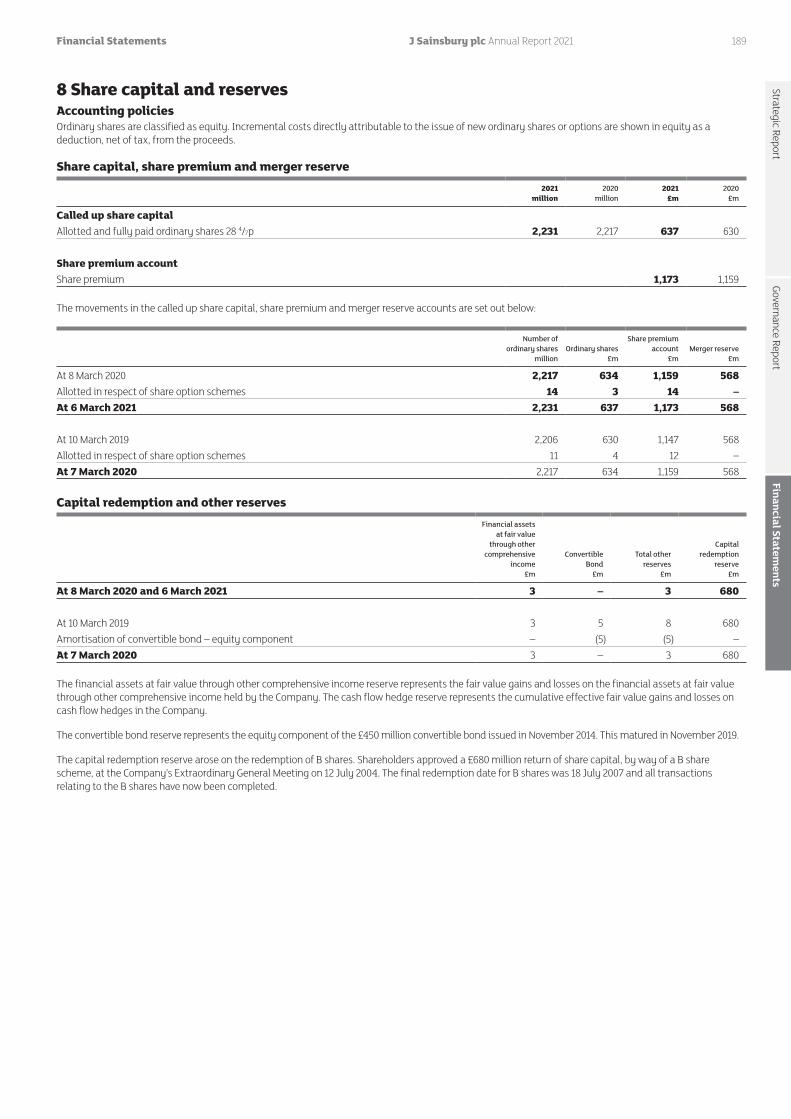
8 Share capital and reservesAccounting policiesOrdinary shares are classified as equity. Incremental costs directly attributable to the issue of new ordinary shares or options are shown in equity as a deduction, net of tax, from the proceeds.
Share capital, share premium and merger reserve
2021million
2020million
2021£m
2020£m
Called up share capital Allotted and fully paid ordinary shares 28 4/7p 2,231 2,217 637 630 Share premium account Share premium 1,173 1,159
The movements in the called up share capital, share premium and merger reserve accounts are set out below:
Number of ordinary shares
millionOrdinary shares
£m
Share premium account
£mMerger reserve
£m
At 8 March 2020 2,217 634 1,159 568Allotted in respect of share option schemes 14 3 14 –At 6 March 2021 2,231 637 1,173 568 At 10 March 2019 2,206 630 1,147 568Allotted in respect of share option schemes 11 4 12 –At 7 March 2020 2,217 634 1,159 568
Capital redemption and other reserves
Financial assets at fair value
through other comprehensive
income£m
Convertible Bond
£m
Total other reserves
£m
Capital redemption
reserve£m
At 8 March 2020 and 6 March 2021 3 – 3 680 At 10 March 2019 3 5 8 680Amortisation of convertible bond – equity component – (5) (5) –At 7 March 2020 3 – 3 680
The financial assets at fair value through other comprehensive income reserve represents the fair value gains and losses on the financial assets at fair value through other comprehensive income held by the Company. The cash flow hedge reserve represents the cumulative effective fair value gains and losses on cash flow hedges in the Company.
The convertible bond reserve represents the equity component of the £450 million convertible bond issued in November 2014. This matured in November 2019.
The capital redemption reserve arose on the redemption of B shares. Shareholders approved a £680 million return of share capital, by way of a B share scheme, at the Company’s Extraordinary General Meeting on 12 July 2004. The final redemption date for B shares was 18 July 2007 and all transactions relating to the B shares have now been completed.
189Financial Statements J Sainsbury plc Annual Report 2021
Governance ReportStrategic Report
Financial Statements

9 Retained earnings2021
£m2020
£m
Beginning of the year 3,734 3,992 Loss for the year (209) (53)Dividends paid (232) (247)Amortisation of convertible bond – equity component – 5Allotted in respect of share option schemes 29 37 Redemption of perpetual capital securities (2) –End of the year 3,320 3,734
10 Contingent liabilitiesThrough the normal course of business, the Company has issued guarantees covering various commitments of its subsidiaries. No liabilities have been recognised in the Company’s accounts as it is considered remote that the guarantees will be called on.
190 Financial Statements J Sainsbury plc Annual Report 2021

Additional shareholder information
Financial calendarQ1 Trading Statement 6 July 2021Annual General Meeting 9 July 2021Interim Results announced 4 November 2021Q3 Trading Statement 12 January 2022 Preliminary Results announced 28 April 2022*Annual General Meeting 8 July 2022** provisional dates
An interim and special dividend was paid on 18 December 2020.
ShareholdersEnd of year shareholder information as at 6 March 2021.
2021 2020
Number of shareholders 112,571 113,914Number of shares in issue 2,230,782,394 2,217,340,901
Annual General Meeting (AGM)The AGM will be held at 33 Holborn, London EC1N 2HT at 11.00am on Friday, 9 July 2021 with facilities to attend electronically. The Notice of the Meeting and the proxy card for the meeting are enclosed with this report and further details will be available on our website www.about.sainsburys.co.uk.
RegistrarsFor information about the AGM, shareholdings, dividends and to report changes to personal details, shareholders should contact:Equiniti RegistrarsAspect HouseSpencer RoadLancing BN99 6DATelephone: 0333 207 6557**Lines are open 9am to 5pm (UK time), Monday to Friday (excluding public holidays in England and Wales).
Please remember to tell Equiniti if you change your residential address or bank details, or if there is any other change to your account information.
You can view and manage your shareholding online at www.shareview.co.uk. You will require your 11-digit Shareholder Reference Number (SRN) to log in. It can be found on share certificates and dividend confirmations.
DividendsWe are simplifying the way we pay dividends. From December 2021, payments to shareholders will no longer be made by cheque. To continue to receive dividends and any other money payable to you in connection with your J Sainsbury plc Ordinary Shares, you will need to provide your bank or building society account details, so that payments can be made directly to your nominated account by direct credit. Please visit www.shareview.co.uk for details on how to register for direct credit.
Dividend Reinvestment Plan (DRIP)The Company has a DRIP, which allows shareholders to reinvest their cash dividends in the Company’s shares bought in the market through a specially arranged share dealing service. No new shares are allotted under this DRIP and approximately 24,533 shareholders participate in it. Full details of the DRIP and its charges, together with mandate forms, are available from Equiniti. Alternatively, you can elect to join the DRIP by registering for Shareview at www.shareview.co.uk.
Shareholder communications websiteJ Sainsbury plc Interim and Annual Reports, and results announcements are available via our website at www.about.sainsburys.co.uk. As well as providing share price data and financial history, the site also provides background information about the Company, regulatory and news releases, and current issues.
Electronic shareholder communicationsThe Company encourages all shareholders to receive their shareholder communications electronically in order to reduce our impact on the environment and has set up a facility for shareholders to take advantage of electronic communications. The service allows you to:
— View the Annual Report and Financial Statements on the day it is published — Receive electronic notification of the availability of future shareholder information (you must register your email address for this service) — Check the balance and current value of your shareholding and view your dividend history — Submit your vote online prior to a general meeting
To register, visit www.shareview.co.uk. You will need your 11-digit Shareholder Reference Number which can be found on your share certificate or recent dividend confirmation.
Financial Statements 191J Sainsbury plc Annual Report 2021
Governance ReportStrategic Report
Financial Statements

Shareholder securitySome of our shareholders have received unsolicited telephone calls or correspondence from organisations or persons claiming or implying that they have some connection with the Company. These are typically from purported ‘brokers’ who offer to buy shares at a price often far in excess of their market value. Shareholders are advised to be very wary of any offers of unsolicited advice, discounted shares, premium prices for shares they own or free Company reports.
If you receive any such unsolicited calls, correspondence or investment advice: — make sure you get the name of the person and organisation — check that they are properly authorised by the FCA before getting involved by visiting https://register.fca.org.uk; and — report the matter to the FCA either by calling 0800 111 6768 or by completing an online form at www.fca.org.uk/consumers/report-scam-unauthorised-firm.
More detailed information on this or similar activity can be found on the FCA website https://www.fca.org.uk/scamsmart.
To understand how Sainsbury’s processes shareholder data, please visit www.about.sainsburys.co.uk/site-services/privacy-policy.
Share dealing servicesTo buy or sell your J Sainsbury plc ordinary shares, please visit your stockbroker or your bank who will usually be able to assist you. Alternatively, you may consider using Equiniti. Equiniti offers a telephone and internet facility, which gives shareholders the opportunity to trade at a known price. The telephone service is available from 8.00am to 4.30pm, Monday to Friday, excluding bank holidays, on telephone number 0371 384 2030. The internet share dealing service gives shareholders the option to submit instructions to trade online and more information can be found by visiting www.shareview.co.uk.
American Depository Receipts (ADRs)The Company has a sponsored Level I ADR programme for which The Bank of New York Mellon acts as depository. The ADRs are traded on the over-the-counter (OTC) market in the US under the symbol JSAIY, where one ADR is equal to four ordinary shares. All enquiries relating to ADRs should be addressed to:
Bank of New York MellonShareholder CorrespondencePO Box 505000LouisvilleKY 40233-5000Toll Free Telephone number for US domestic callers: 1-888-269-2377International callers can call: +1-201-680-6825Website: www.mybnymdr.comEmail: [email protected]
ShareGiftIf you have only a small number of shares which would cost more for you to sell than they are worth, you may wish to consider donating them to the charity ShareGift (Registered Charity 1052686) which specialises in accepting such shares as donations. The relevant stock transfer form may be obtained from Equiniti. There are no implications for Capital Gains Tax purposes (no gain or loss) on gifts of shares to charity. If you are a UK taxpayer, it is also possible to obtain income tax relief. Further information about ShareGift may be obtained by calling 0207 930 3737, emailing [email protected] or from www.sharegift.org.
ProSearchSainsbury’s has instructed ProSearch, a specialist tracing company, to identify and communicate with shareholders who may be owed dividends or shares in Sainsbury’s. If you have received a communication from ProSearch and think you may be due some dividends or shares in Sainsbury’s and would like further information, please contact ProSearch directly. You can call them on 0800 389 6479* or, for more information, visit www.prosearchassets.com.* Lines are open 9am to 5pm Monday to Friday (excluding UK public holidays).
Financial StatementsAdditional shareholder information continued
192 J Sainsbury plc Annual Report 2021

Key contacts and advisers
General contact detailsFor any customer enquiries, please visit our websites:
— Sainsbury’s https://help.sainsburys.co.uk/help — Argos www.argos.co.uk/help/contact-us — Habitat www.habitat.co.uk/contact-us — Nectar www.nectar.com/help — Sainsbury’s Bank www.sainsburysbank.co.uk/insuring/support/customer_support_zone
Registered officeJ Sainsbury plc33 HolbornLondon EC1N 2HTRegistered number 185647
Investor relationsJames CollinsHead of Investor RelationsJ Sainsbury plc33 Holborn London EC1N [email protected]
RegistrarEquiniti RegistrarsAspect HouseSpencer RoadLancing BN99 6DAwww.shareview.co.uk
AuditorsErnst & Young LLP1 More London PlaceLondon SE1 2AF
SolicitorsLinklaters LLPOne Silk StreetLondon EC2Y 8HQ
StockbrokersUBS5 BroadgateLondon EC2M 2QS
Cautionary statementCertain statements included in this Annual Report are forward-looking. Such statements are based on current expectations and are subject to a number of risks and uncertainties that could cause actual events or results to differ materially from any expected future events or results referred to in these forward-looking statements. They appear in a number of places throughout this Annual Report and include statements regarding our intentions, beliefs or current expectations and those of our officers, Directors and employees concerning, amongst other things, our results of operations, financial condition, liquidity, prospects, growth, strategies and the business we operate. Unless otherwise required by applicable law, regulation or accounting standard, we do not undertake any obligation to update or revise any forward-looking statements, whether as a result of new information, future developments or otherwise.
Financial Statements 193J Sainsbury plc Annual Report 2021
Governance ReportStrategic Report
Financial Statements

In the reporting of financial information, the Directors use various APMs which they believe provide additional useful information for understanding the financial performance and financial health of the Group. These APMs should be considered in addition to, and are not intended to be a substitute for, IFRS measurements. As they are not defined by International Financial Reporting Standards, they may not be directly comparable with other companies who use similar measures.
All of the following APMs relate to the current period’s results and comparative periods where provided.
APMClosest equivalent IFRS measure Definition/ Purpose Reconciliation
Income statement – Revenue
Underlying Group sales
Revenue Total sales less acquisition fair value unwinds on Argos Financial Services.This is the headline measure of revenue for the Group. It shows the annual rate of growth in the Group’s sales and is considered a good indicator of how rapidly the Group’s core business is growing.
A reconciliation of the measure is provided in note 7 of the financial statements.
Underlying Retail sales
Revenue Underlying Group sales as above, less underlying Financial Services revenue.Shows the annual rate of growth in the Group’s Retail business sales.
A reconciliation of the measure is provided in note 7 of the financial statements.
Like-for-like sales No direct equivalent
Year-on-year growth in sales including VAT, excluding fuel, excluding Financial Services, for stores that have been open for more than one year.The relocation of Argos stores into Sainsbury’s supermarkets is classified as new space, while the host supermarket is classified like-for-like.The impact on sales of stores which were temporarily closed due to COVID-19 have been included within LFL sales. Only permanently closed sites and those temporarily closed for non-COVID-19 related reasons are treated as non-LFL.The measure is used widely in the retail industry as an indicator of current trading performance and is useful when comparing growth between retailers that have different profiles of expansion, disposals and closures.
The reported retail like-for-like sales (excluding fuel) increase of 8.1 per cent is based on a combination of Sainsbury’s like-for-like sales and Argos like-for-like sales for the 52 weeks to 6 March 2021. See movements below:
52 weeks to 6 March
2021
52 weeks to 7 March
2020
Underlying retail like-for-like (exc. fuel) 8.1 (0.6)Underlying net new space impact (0.8) 0.2Underlying total retail sales growth
(exc. fuel)7.3 (0.4)
Fuel impact (7.2) 0.3Underlying total retail sales growth
(inc. fuel)0.1 (0.1)
Income statement – Profit
Retail underlying operating profit
Profit before tax
Underlying earnings before interest, tax, Financial Services operating profit and Sainsbury’s underlying share of post-tax profit from joint ventures and associates.
52 weeks to 6 March
2021£m
52 weeks to 7 March
2020£m
Group PBT (note 7) (261) 255Add back Group non-underlying items
(note 5)617 331
Group UPBT (note 7) 356 586
Financial Services underlying operating loss/(profit) (note 7)
21 (48)
Retail underlying operating profit (note 7) 377 538Net underlying finance costs (note 10) 353 400Retail underlying operating profit
(note 7)730 938
Alternative performance measures (APMs)
Financial Statements194 J Sainsbury plc Annual Report 2021

APMClosest equivalent IFRS measure Definition/ Purpose Reconciliation
Underlying profit before tax
Profit before tax
Profit or loss before tax excluding items which by virtue of their size or nature may obscure understanding of the Group’s underlying performance.
Underlying profit before tax is bridged to statutory profit before tax in the income statement and note 5 of the financial statements.The adjusted items are as follows:
— Financial Services transition – multi-year costs incurred in transitioning to a new, more flexible banking platform as part of the previously announced New Bank Programme. These principally comprise contractor and service provider costs relating to the migration of data and other services to the Bank’s new infrastructure and operating model.
— Profit on disposal of properties – such disposals are not part of the Group’s underlying business
— Investment property fair value movements – these reflect the difference between the fair value of an investment property at the reporting date and its carrying amount at the previous reporting date and are held within the property JVs. The valuations are impacted by external market factors and can therefore vary significantly year-on-year.
— Perpetual securities coupons – these are accounted for as equity in line with IAS 32 ‘Financial Instruments: Presentation’, however are accrued on a straight-line basis and included as an expense within underlying profit as they are included by management when assessing Group borrowing.
— Non-underlying finance movements – these include fair value remeasurements on derivatives not in a hedging relationship. The fair value measurements are impacted by external market factors and can fluctuate significantly year-on-year. Lease interest on impaired non-trading sites, including site closures, is excluded from underlying profit as those sites do not contribute to the underlying business.
— IAS 19 pension expenses include the financing element and scheme expenses of the Group’s defined benefit scheme. These are reported outside underlying profit as they no longer relate to the Group’s ongoing activities following closure of the scheme to future accrual.
— Acquisition adjustments – these reflect the adjustments arising from acquisitions including the fair value unwind and amortisation of acquired intangibles.
— Other – these are items which are material and infrequent in nature and do not relate to the Group’s underlying performance and in the current year include restructuring programmes, impairment charges and income relating to the Supreme Court ruling on ATM business rates.
Underlying basic earnings per share
Basic earnings per share
Earnings per share using underlying profit as described above.
A reconciliation of the measure is provided in note 12 of the financial statements.
Retail underlying EBITDA
No direct equivalent
Retail underlying operating profit as above, before rent, depreciation and amortisation.
52 weeks to 6 March
2021£m
52 weeks to 7 March
2020£m
Retail underlying operating profit (note 7a) 730 938Add: Retail depreciation and amortisation
expense (note 7)1,226 1,225
Less: Non-underlying depreciation and amortisation (note 5)
(47) (28)
1,909 2,135
Financial Statements 195J Sainsbury plc Annual Report 2021
Governance ReportStrategic Report
Financial Statements
Alternative performance measures (APMs) continued

APMClosest equivalent IFRS measure Definition/ Purpose Reconciliation
Underlying net finance costs
Finance income less finance costs
Net finance costs before any non-underlying items as defined above that are recognised within finance income / expenses
A reconciliation of this measure is included in note 10 of the financial statements.The adjusted items are as follows:
— Fair value remeasurements on derivatives not in a hedging relationship. The fair value measurements are impacted by external market factors and can fluctuate significantly year-on-year.
— Lease interest on impaired non-trading sites, including site closures, is excluded from underlying profit as those sites do not contribute to the underlying business.
— The financing element of the Group’s defined benefit scheme. This is reported outside underlying profit as it no longer relates to the Group’s ongoing activities following closure of the scheme to future accrual.
— Perpetual securities coupons – these are accounted for as equity in line with IAS 32 ‘Financial Instruments: Presentation’, however are accrued on a straight-line basis and included as an expense within underlying profit as they are included by management when assessing Group borrowing
Underlying tax rate Effective tax rate
Tax on underlying items, divided by underlying profit before tax.Provides an indication of the tax rate across the Group before the impact of non-underlying items.
The tax on non-underlying items is included in note 5 of the financial statements.
Cash flows and net debt
Retail cash flow items in Financial Review
No direct equivalent
To help the reader understand cash flows of the business a summarised cash flow statement is included within the Financial Review.As part of this a number of line items have been combined. The cash flow in note 7 of the financial statements includes a reference to show what has been combined in these line items.
Ref
52 weeks to 6 March
2021£m
52 weeks to7 March
2020£m
Net interest paid a (372) (405)Repayment of lease liabilities b (499) (419)(Repayment)/proceeds from
borrowingsc (539) (379)
Other d (13) (3)Joint ventures e 22 143
Retail free cash flow Net cash generated from operating activities
Net cash generated from retail operations, after perpetual security coupons and cash capital expenditure but before strategic capital expenditure, and including payments of lease obligations, cash flows from joint ventures and associates and Sainsbury’s Bank capital injections.This measures cash generation, working capital efficiency and capital expenditure of the retail business.
52 weeks to 6 March
2021£m
52 weeks to 7 March
2020£m
Cash generated from retail operations
2,275 1,971
Net interest paid (ref (a) above) (372) (405)Corporation tax (94) (113)Retail purchase of property, plant and
equipment (423) (517)
Retail purchase of intangible assets (145) (82)Retail proceeds from disposal of property,
plant and equipment27 81
Initial direct costs on right-of-use assets (7) (13)Repayments of obligations under leases (499) (419)Dividends and distributions received 22 143Bank capital injections – (35)Retail free cash flow 784 611
Financial Statements196 J Sainsbury plc Annual Report 2021
Alternative performance measures (APMs) continued

APMClosest equivalent IFRS measure Definition/ Purpose Reconciliation
Underlying working capital movements
No direct equivalent
To provide a reconciliation of the working capital movement in the financial statements to the underlying working capital movement in the Financial Review.Removes working capital and cash movements relating to non-underlying items.
52 weeks to 6 March
2021£m
52 weeks to 7 March
2020£m
Retail working capital movements per cash flow (note 7)
708 (71)
Adjustments for:Retail non-underlying impairment charges
(per note 7)216 257
Non-underlying restructuring and impairment charges (per note 5)
(643) (328)
Accelerated depreciation (per note 5) 27 –Less Bank impairment charges (per note 5) 105 –Gains on early termination of leases
(per note 5)(16) –
ATM income (per note 5) 42 –Other 2 (3)Non-underlying working capital
movements before cash movements(267) (74)
Non-underlying cash movements:Restructuring (per note 5) 39 34ATM income (per note 5) (27) –Argos integration costs (per note 5) – 2Transaction costs relating to the proposed
merger with Asda (per note 5)– 13
Other – (1)12 48
Total adjustments for non-underlying working capital
(255) (26)
Underlying working capital movements
453 (97)
Net cash generated from retail operations (per Financial Review)
Cash generated from operations
This enables management to assess the cash generated from its core retail operations.A reconciliation between this and cash generated from operations per the accounts is shown here:
52 weeks to 6 March
2021£m
52 weeks to7 March
2020£m
Retail cash generated from operating activities (per note 7)
1,832 1,474
Perpetual security coupons (23) (23)Interest received – 2Net retail cash generated 1,809 1,453
Core retail capital expenditure
No direct equivalent
Capital expenditure excludes Sainsbury’s Bank, before proceeds on disposals and before strategic capital expenditure.This allows management to assess core retail capital expenditure in the period in order to review the strategic business performance.The reconciliation from the cash flow statement is included here.
52 weeks to 6 March
2021£m
52 weeks to7 March
2020£m
Purchase of PPE (423) (517)Purchase of intangibles (145) (82)Cash capital expenditure before
strategic capital expenditure (note 7)
(568) (599)
Financial Statements 197J Sainsbury plc Annual Report 2021
Governance ReportStrategic Report
Financial Statements
Alternative performance measures (APMs) continued

APMClosest equivalent IFRS measure Definition/ Purpose Reconciliation
Net debt Borrowings, cash, derivatives, financial assets at FVTOCI, lease liabilities
Net debt includes the capital injections into Sainsbury’s Bank, but excludes the net debt of Sainsbury’s Bank and its subsidiaries.It is calculated as: financial assets at fair value through other comprehensive income (excluding equity investments) + net derivatives to hedge borrowings + net cash and cash equivalents + loans + lease obligations + perpetual securities.This shows the overall strength of the balance sheet alongside the liquidity and its indebtedness and whether the Group can cover its debt commitments.
A reconciliation of the measure is provided in note 35 of the financial statements. In addition, to aid comparison to the balance sheet, reconciliations between financial assets at FVTOCI and derivatives per the balance sheet and Group net debt (i.e. including Financial Services) is included below:
6 March2021
£m
7 March2020
£m
Financial instruments at FVTOCI per balance sheet
844 1,054
Less equity-related securities (306) (251)Financial instruments at FVTOCI included in
Group net debt538 803
Net derivatives per balance sheet (124) (71)Less derivatives not used to hedge
borrowings110 60
Derivatives included in Net Debt (14) (11)Other
Net debt/ underlying EBITDA
No direct equivalent
Net debt divided by Group underlying EBITDA.This helps management measure the ratio of the business’s debt to operational cash flow.
Net debt as provided in note 35. Group underlying EBITDA is reconciled within the fixed charge cover analysis below.
Return on capital employed
No direct equivalent
Return on capital employed is calculated as return divided by average capital employed.Return is defined as 52 week rolling underlying profit before interest and tax.Capital employed is defined as Group net assets excluding pension deficit/surplus, less net debt (excluding perpetual securities). The average is calculated on a 14-point basis.The 14-point basis uses the average of 14 datapoints – the prior year closing capital employed, the current year closing capital employed and 12 intra-year periods as this more closely aligns to the recognition of amounts in the income statement.This represents the total capital that the Group has utilised in order to generate profits. Management use this to assess the performance of the business.
Return is reconciled as follows:52 weeks
to 6 March 2021
£m
52 weeks to7 March
2020£m
Underlying profit before tax 356 586Add: Underlying net interest 353 400Return 709 986
Capital employed is reconciled as follows:52 weeks
to 6 March 2021
£m
52 weeks to7 March
2020£m
Group net assets 6,604 7,773Less: Pension surplus (note 38) (744) (1,119)Deferred tax on pension surplus 192 214Less: net debt (ex-perpetual securities)
(note 35)6,221 6,451
Effect of in-year averaging 546 28Capital employed 12,819 13,347
Return on capital employed 5.5% 7.4%
Fixed charge cover No direct equivalent
Group underlying EBITDA divided by rent (representing capital and interest repayments on leases) and underlying net finance costs, where interest on perpetual securities is treated as an underlying finance cost. All items are calculated on a 52 week rolling basis.This helps assess the Group’s ability to satisfy fixed financing expenses from performance of the business.
52 weeks to 6 March
2021£m
52 weeks to7 March
2020£m
Group underlying operating profit (note 7) 709 986Add: Group depreciation and amortisation
expense (note 7)1,249 1,256
Less: Non-underlying depreciation and amortisation (note 5)
(47) (28)
Other – (1)Group underlying EBITDA 1,911 2,213
Repayment of capital element of lease obligations (note 7)
(501) (420)
Underlying finance income (note 10) 3 4Underlying finance costs (note 10) (356) (404)Fixed charge (854) (820)
Fixed charge cover 2.2 2.7
Financial Statements198 J Sainsbury plc Annual Report 2021
Alternative performance measures (APMs) continued

Annual General Meeting (AGM) – This year the AGM will be held on Friday 9 July 2021 at our registered office 33 Holborn, London EC1N 2HT at 11.00am.
Argos Financial Services (AFS) – ARG Personal Loans Limited; Home Retail Group Card Services Limited; and Home Retail Group Insurance Services Limited
bps – Basis points.
by Sainsbury’s – Core own-label brand.
Click & Collect – Service which allows customers to place general merchandise and grocery orders online for collection in-store.
Corporate Responsibility and Sustainability (CR&S) – The need to act responsibly in managing our impact on a range of stakeholders: customers, colleagues, investors, suppliers, the community and the environment
CPI – Consumer Price Index.
Dividend cover – Underlying profit after tax from continuing operations attributable to ordinary shareholders divided by total value of dividends declared during the year.
Earnings Per Share (EPS) – Earnings attributable to ordinary shareholders of the parent divided by the weighted average number of ordinary shares in issue during the year, excluding those held by ESOP Trusts, which are treated as cancelled.
Fair value – The amount for which an asset could be exchanged, or a liability settled, between knowledgeable, willing parties in an arm’s length transaction.
FVTPL – Fair value through profit or loss. Method of valuing a financial instrument where changes in fair value are recognised directly in the income statement.
Group – The Company and its subsidiaries.
IFRIC – International Financial Reporting Interpretations Committee.
IFRSs – International Financial Reporting Standard(s).
Joint venture (JV) – A business jointly owned by two or more parties.
Live Well for Less – Sainsbury’s customer commitment to continue to help people live the life they want to live, with quality products at fair prices.
LTIP – Long-Term Incentive Plan.
Nectar – One of the most popular loyalty schemes in the UK.
PRA – Prudential Regulation Authority.
RPI – Retail Price Index.
Taste the Difference – Sainsbury’s premium own-brand range of products.
Total Shareholder Return (TSR) – The growth in value of a shareholding over a specified period, assuming that dividends are reinvested to purchase additional units of the stock.
Tu – Sainsbury’s own-label clothing range.
Glossary
Financial Statements 199J Sainsbury plc Annual Report 2021
Governance ReportStrategic Report
Financial Statements

Financial Statements200 J Sainsbury plc Annual Report 2021

This report is printed on UPM Fine. The printer is certified to the environmental management system ISO 14001 and is also CarbonNeutral™
This product is made of material from well-managed, FSC®-certified forests and other controlled sources.
Designed by mslgroup.co.uk

Find out more atwww.about.sainsburys.co.uk/ar2021