Dr. Warren E. Farb Part II - Dr. Do - Institute of Public Utilities
228
ANALYSIS OF SELECTED FINANCIAL ASPECTS OF THE ELECTRIC UTILITY INDUSTRY prepared by Part I - Dr. Warren E. Farb Part II - Dr. Douglas N. Jones, Mr. W. David Duran, Mr. Curtis Odle Part III - Dr. R. J. Krasniewski, Dr. R. J. Murdock for THE NATIONAL REGULATORY RESEARCH INSTITUTE 2130 Neil Avenue Columbus, Ohio 43210 SEPTEMBER 1979
-
Upload
khangminh22 -
Category
Documents
-
view
1 -
download
0
Transcript of Dr. Warren E. Farb Part II - Dr. Do - Institute of Public Utilities

ANALYSIS OF SELECTED FINANCIAL ASPECTS OF THE ELECTRIC UTILITY INDUSTRY
prepared by
Part I - Dr. Warren E. Farb Part II - Dr. Douglas N. Jones, Mr. W. David Duran, Mr. Curtis Odle
Part III - Dr. R. J. Krasniewski, Dr. R. J. Murdock
for
THE NATIONAL REGULATORY RESEARCH INSTITUTE 2130 Neil Avenue
Columbus, Ohio 43210
SEPTEMBER 1979
This report was prepared for The National Regulatory Research Institute (NRRI) under contract No. EC-77-C-Ol-8683 with the U.s. Department of Energy (DOE), Economic Regulatory Administration, Division of Regulatory Assistance. The opinions expressed herein are solely those of the authors and do not necessarily reflect the opinions nor the policies of either the NRRI or the DOE.
The NRRI is making this report available to those concerned with state utility regulatory issues since the subject matter presented here is believed to be of timely interest to regulatory agencies and to others concerned with utilities regulation.

PREFACE
This study presents three separate reports on several aspects of electric utility finances. They are not intended to tell an integrated story but rather to shed additional light on three major themes in the general area of utility finance - capital needs of the industry; regulation in a period of sustained inflation; and comparative returns and risk in the regulated and non-regulated sectors.
Recent increases in energy costs and the reported decline in the financial position of electric utilities have led some analysts to predict future capital shortages in this industry. Such claims are typically based on various analyses of future plant requirements by the electric industry, analyses of the total supply of investible funds, and predictions concerning the future competitive position of the electric industry in capital markets. Since capital shortages have the potential of disrupting the provision of electric services and regulators must pass on proposed investment decisions, understanding the basis for these predictions has important implications for regulation. Part I treats this subject.
At the same time, there exists substantial evidence that a portion of commission regulation has in the past decade become a matter of accountlng for inflation. The regulatory response in the face of an inflationary environment has centered on a whole series of devices and practices designed to give financial relief to the power sector. Part II considers th~s issue in narrative fashion.
_Company requests for rate increases and_the efforts of consumer groups toward IIholding the line" on utility prices have been combined to place deliberations of public utility commissions increasingly in the limelight. The close scrutiny resulting from such pressures has still further enhanced the need of regulatory bodies for accurate, useful financial data on utilities to enable them to carry out their regulatory mandates. A definite need exists for accurate and current information comparing the rates of return for the regulated and non-regulated sectors. Part III helps provide that information.


PART I - AN ANALYSIS OF SELECTED STUDIES OF
CAPITAL NEEDS IN THE ELECTRIC UTILITY INDUSTRY*
*This report was prepared for The National Regulatory Research Institute at The Ohio State University. The views expressed are those of the author, Dr. Warren E. Farb, Consulting Economist, and do not necessarily reflect those of the Institute.


LIST OF TABLES . . .
EXECUTIVE SUMMARY
I. INTRODUCTION ..
TABLE OF CONTENTS page
i i
iii
II. FORECASTS OF CAPITAL NEEDS. .... ...... 8 A. Electric World, 29th Annual Electric Industry Forecast. 8 B. Data Resources Incorporated . . . . 11 C. Bankers Trust Company . . . 16 D. Baughman, Joskow and Kamat . 25 E. U.s. Department of Energy 30 F. Other Estimates
1. Has s . . . . . . . . . 2. Temple, Barker and Sloane 3. The National Power Survey
III. CONCLUSIONS .... A. Sales and Peak Demand B. Plant Mix ....... . C. Reserve Margins ...... .
FOOTNOTES . . . . . . .
i
37 38
42
44
47 48 49
51
54

Table
LI OF TABLES
ectric Utili Amount and Share tal Market, 1972 - 1977 ...
Credit
Table 2 Total Electric Power System Capi Expenditures As a Share of Total Business Expenditures for New
page
3
Plant and Equipment, 1967 to 1977 . . . . . . 5
Table 3 Electrical World Forecast of Annual Growth in E1 ectri c Uti 1 i ty Sa 1 es, 1979 - 1990 . . . . . 10
Table 4 Electrical World Forecast of Electric Utility Capital Needs, 1979 - 1999 . . . . . . . . . . . . . . . .. 12
Table 5 DRI and Selected Alternative Forecasts of Electric Utility Capital Needs, 1979 - 1990 . . . . . . . .. 17
Table 6 BTC Estimates of Average Annual Growth of Electricity Demand by Consuming Sectors, 1979 - 1982 . . . . .. 19
Table 7 BTC Forecast of Growth of Energy Fuel Source Demand for Electric Generation, 1978 - 1982 . . . . . . .. 22
Table 8 Bankers Trust Company Forecast of Electric Utility Capital Needs, 1979 - 1982 . . . . . . . . . . . 24
Table 9 Baughman, Joskow and Kamat Forecast of Capital Needs of the Electric Utility Sector, 1979 - 1990 28
Table 10 Macroeconomic Assumptions of the DOE Forecasts 33
Table 11 U.S. Department of Energy Forecasts of Electric Utility Capital Needs, 1978 - 1985 . . . . . . . 39
Table 12 Summary of Forecasts of Capital Needs of the U.S. Electric Utility Sector Made Prior To 1976 40
Table 13 Forecasts of Nuclear Generation 50
Table 14 Summary of Forecasts of Capital Needs of Electric Utilities. . . . . . . . . . . . . . . . . 53
i i

EXECUTIVE SUMMARY
selected forecasts of capital needs of the try ng the next decade. It aims at
ng of these forecasts, and draws upon them own assessment the c utilities i stry1s needs 19..90.
es, r timeliness, but because they incorporate a and reflect a variety of instituti ves, are exami i y: Electrical Worldis ) September 1978 annual forecast; an unpublished forecast by Data Resources, Inc. CDRI), based on their long-term trend macroeconomic forecast prepared during the winter of 1979; Bankers Trust Company1s (BTC) U.S. Energy and Capital: A Forecast 19..79-82 (1978); an estimate developed in a forthcoming book by Martin Baughman, Paul Joskow, and Dilip Kamat (~JK1, Electrif Power in the United States: Models and Policy Analysis; and the U.S. Department of Energy1s 19..78 projection of electric uttltty capital need whi.ch is included in the Energy Information Administratfon l s Annual ReRort to Congress, 1. II. A number of earlier studies are also reviewed briefly and compared with the EW, ORI, ,BJK, and DOE forecasts.
EWls forecast essentially judgmental, while the others are based on econometric models of di.ffering size and complexity; the most complex being DOEls Mid-range Energy Forecasting System. Of all the forecasts included in this analysis, DRIls is the most independent of its assumptions, since it is based on simUltaneous macroeconomic and energy-sector models. Prelimi'nary results are thus allowed' to feed back on the overall conditions which produce them. In contrast, BJK's model is based on assumed external economic conditions, though it determines demand internally and uses cost factors and construction lags rather than assumptions to project the distribution of plant type. DOE's model is the most detailed, even though it currently relies on assumed macroeconomic conditions. In addition, DOEls model is probably the most responsive to factors affecting supply and demand for energy products of a 11 types. Throughout the 19.79 to 1990 peri od, because of lags between initial planning and completion, all of the forecasts are heavily influenced by announced plans, work in progress, and the assumed rates of postponement and cancellationo
Perhaps the most striking conclusion of this analysis is that the estimates of capital need are relatively independent of the estimation procedure. EW, DRI, BJK, and the DOE all produce remarkably similar results. The variations that do exist seem to be primarily a result of differences in assumptions. Among the most important of these assumptions are the rate of increase in electric sales and peak demand, the mix of plant type and assumed reserve margins.
The following table summarizes the aggregate forecast of capital needs for each of these studies:
iii

FORECAST
Baughman, et. a1.
Bankers Trust Company
Department of Energy
Data Resources, Inc.
Electrical World
SUMMARY OF FORECASTS OF CAPITAL NEEDS OF
ELECTRIC UTILITIES
TIME PERIOD OF FORECAST
.1979-1990
1979-1982
1979-1985
1979-1990
1979-1990
iv
CAPITAL NEEDS (billions of 1979 $)
453
114
229
451
582

1. INTRODUCTION
This report examines selected forecasts of the capital needs of the
U.s. electric utilities industry during the next decade. It aims at pro
vtding a better understanding of these forecasts, and draws upon them to
arrive at its own assessment of the electric lities industry's probable
capital need between now and 1990.
The electric utilities sector is comprised of both investor- and
publicly-owned companies. The latter account for about 25% of industry
sales. They also tend to rely more heavily than investor-owned utilities
on hydroelectric generation, and are therefore less burdened by the in
creasing cost of alternative energy sources. Also, because of their
access to the public bond market, their financing costs are lower.
Despite these differences in the financial characteristics of investor
and publicly-owned electric utilities, however, this report treats their
capital needs in the aggregate. The prfmary concern here is not the cost
of capital, but how much will be needed, and by implication (but not
considered in this report) whether U.S. and foreign capital markets
will be able to meet the demand.
If electric utilities could finance their needs entirely from internal
sources, they would make few demands on national or international capital
markets. In fact, however, in recent years they have relied increasingly
on external financing.' In the 1970 1 s, investor-owned utilities met 40-50
percent of their capital requirements externally. By 1972, the share of
external financing had increased to 61 percent, and by 19]4, to 71 percent.
Th.e surge in external fi.nanci.ng i.n 19]4 seems to have been something
of an aberration, resulting from the cumulative impact of inflation, high
I-l

interest rates, and reductions in the rate of growth of demand for
electricity. In 1976, however, after significant rate hikes, ,interest
rate reductions, and curtailed plant construction had improved electric
ut i 1 i ties I fi nanc i.a 1 cond; ti on, the industry IS externa 1 fi nanc i ng sha re
was still 57 percent. In the current inflati nary environment, this heavy
reli~nce on outside capital is likely to continue, especially if electri
city demand returns to pre-1974 growth rates. Inflation tends to reduce
utiliti,es i capacity to generate investment capital internally as costs
increase more rapidly than rates.
Through the 1970 ' s and into the early part of this decade, the
capital requirements of the electric utilities increased dramatically
relative to the rest of the economy. In 1970, capital outlays for investor
owned utilities amounted to 6.4 percent of all non-fin~ncfal 5us{ness outlays.
By 1971, the figure had reached 10 percent, and Hass estimated (jn a study
published in 1974) that it would average about 10.5 percent through 1985. 2
A more recent study by Bankers Trust Company Cl978} tends to sustain Hass I
leveling projection. It also indicates a sharp drop in the electric por
tion of total energy industry capital demand (see Table l)~ If there has
be.en a leveling tendency in electricity's share of the business market,
it is probably the result of increased energy prices, slowdowns in the
growt~ of the peak demand, reduced sales growth, regulation, and uncer
tai.nties about nuclear power. However, the apparent drop 1.n electricity's
share of the energy industries I total capital demand reflects the i.ncreased
ca.pital needs of the otl and gas sector followjng the 1973 OPEC embargo
rath.er than a scal ing tiack of e.lectric capital demand.
1-2

TABLE 1
ELECTRIC UTILITY AMOUNT AND SHARE OF CREDIT AND CAPITAL MARKET,
1972 to 1977
1972 1973 1974
Capital and Credit Market (billions of dollars)
Electric Utility External 8.8 10.3 14.4 Financing
Energy Industry 11 ,,3 13.3 20.3
Business Market 83 106 100
Total Market 178 202 189.
~lectric Utility Share of ( percent)
Energy Industry 77.'l 77.4 70.9-
Business Market 10.6 ~L8 14.4
Total Market 4.9- 5. 1 7.6
1975 1976 1977
9.7 10.8 10.6
17.5 21 .5 22.5
45 77 115
206 269- 338
55.4 50 .. 2 47.0
21 .6 14.0 9-.2
4.7 4.0 3. 1
Source: U.s. Energy and Capital: A Forecast 1978-82, Bankers Trust Campa ny, 19]8.
I-3

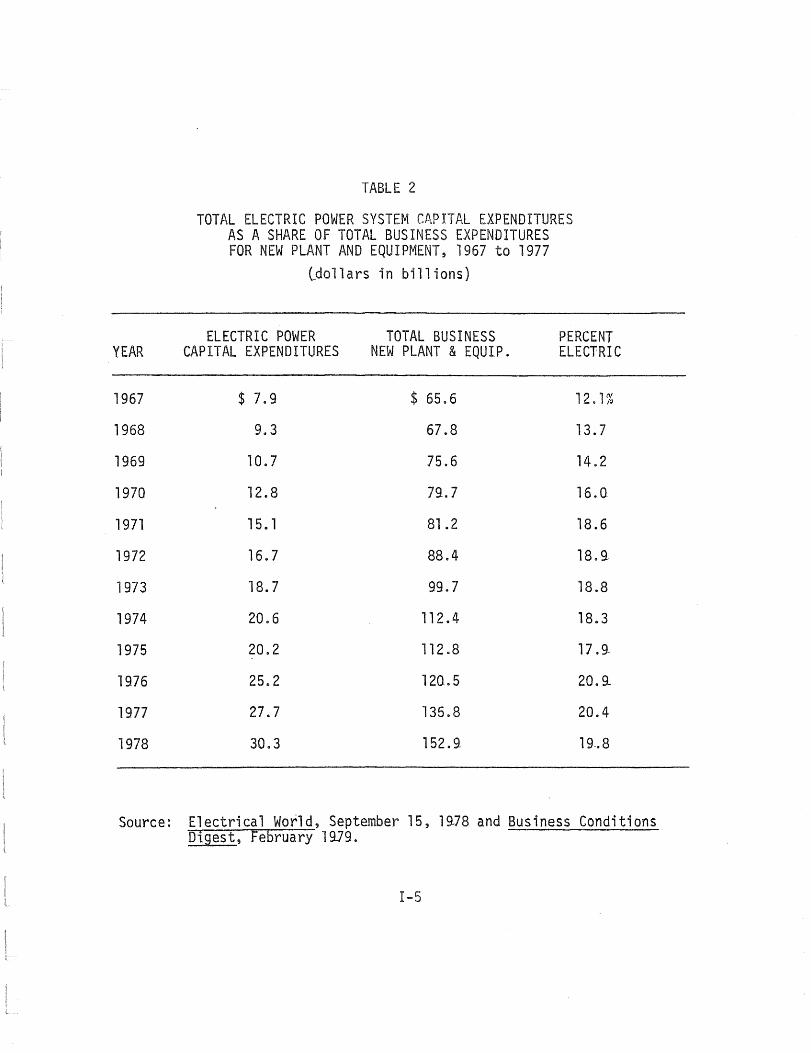
In absolute terms, the Bankers Trust findings suggest that electric
capital demand overall has tended to increase steadily during the past
several years.3 Moreover, a second recent study by Electrical World
indicates that absolute increases in electric power system capital expen-
ditures may have been even larger than Ban Trust believes. 4 Table 2
shows total U.S. electric power system cap; expenditures as a share of
total business expenditures for new plant and equipment.
Differences of opinion or method of counting the industry's past
capital requirements complicate efforts to project such requirements
through 1990. Surprisingly, however as we will see, there is substantial
agreement on this issue among recent forecasts. The degree of consensus
is especially interesting in view of the contingencies likely to affect
electric utilities' capital investment over the next decade. First and
foremost of these contingencies is the condition of the overall economy,
and particularly the inflation rate. Inflation exerts a powerful influence
on capital needs, not only because it tends to increase the utilities'
dependency on external financing, but also because it affects economic
growth and the growth in electricity demand.
In addition, environmental regulations continue to exert an uncertain
influence on the amount of capital necessary to meet generation, transmission
and distribution goals. Forecasts in the early 1970's, even if they assumed
that anti-pollution restrictions would be imposed on the utilities, could
only guess at the timing and cost of implementation. Recent studies are
more informed about timing, but cost questions have yet to be answered
with assurance.
1-4
YEAR
1967
1968
1969
1970
1971
1972
1973
1974
1975
1976
1977
1978
TABLE 2
TOTAL ELECTRIC POWER SYSTEM CAPITAL EXPENDITURES AS A SHARE OF TOTAL BUSINESS EXPENDITURES FOR NEW PLANT AND EQUIPMENT~ 1967 to 1977
ldo1lars in billions)
ELECTRIC POWER TOTAL BUSINESS PERCENT CAPITAL EXPENDITURES NEW PLANT & EQUIP. ELECTRIC
$ 7.9 $ 65.6 12.1%
9.3 67.B 13.7
10.7 75.6 14.2
12.B 79-.7 16.0
15. 1 81 .2 18.6
16.7 88.4 18.9-
1B.7 99-.7 18.B
20.6 112.4 18.3
20.2 112.B 17.9-
25.2 120.5 20.9.-
27.7 135.8 20.4
30.3 152.9- 19 .. 8
Source: Electrical World, September 15, 19-78 and Business Conditions Digest, February 1919.
1-5

Energy prices and the effectiveness of the national energy conserva
tion program are also powerful contingent influences on capital need.
However, the mix of conventional and nuclear generating faci1ities may
be. eve.n more i.mportant. As a rule, nuclear plants cost more than con
ventional ones, and take longer to bring lion line II For technical and
political reasons, they are also most subject to postponements and can
cellations in construction. While cancellations often reduce capital
requirements, the effects of postponements are harder to anticipate. In
the short term, decisions to extend construction schedules probably
decrease capital requirements. However, continued delays may increase
interest costs; single-shift construction may be less efficient; lower
productivity may result from uncertain work schedules; and escalator
clauses may apply over longer periods.
Finally, uncertainty about regional reserve requirements also increases
the difficulty of forecasting electric uti.lity capital needs. Assumptions
about probable or "optimal" reserve margins are fundamental to all pro
jections of peak generating capacity and therefore to estimates of capital
needed for new generating facilities. Narrower reserve margins mean smaller
capital requirements.
Several conti ngent factors--especi a 11 y plant mt.x, energy pri ces ,
and inflation--have had a more profound influence on electric utilfty
capital needs than could have been anticipated even a few years ago. In
effect, the oil embargo and its aftermath,'public ambi.valence toward
nuclear power, and nagging inflation constitute a water-shed between fore
casts of the early 1970·s and those of the past twelve or eighteen months.
The most recent forecasts also reflect greater certainty about the timing
1-6

of regulatory implementation; they are based on more up-to-date information
on utility companies I construction plans; and they take account of the
slower growth in electricity demand during the last half-decade.
For these reasons, recent forecasts of electric utility capital need
are examined more extensively in the following pages than several well-known
earlier studi.es, which are also reviewed. These recent studies have been
selected not only because of their timeliness, but also because they incor
porate a range of methodologies and reflect a variety of institutional
perspectives. Of the five studies in this group, Electrical World's (EW)
annual forecast is probably the most widely known and used in the industry.
EW I S project; ons, whi ch extend through 19-95, are not based on a forma 1
econometric model. Hence, in a technical sense, they are more IIsubjective ll
than other estimates considered here. In contrast, the Data Resources,
Inc. (ORr) forecast is based on the integration of simultaneous macro
economic and energy sector models. ORI updates it~ projections several
times each.year. The forecast considered here is based on their 10ng-
term trend macroeconomic forecast prepared during the winter of 1979. 5
Bankers Trust Company's (~TC} U.S. Energy and Capital: A Forecast 1979-82
(1978) is included as a representative banking industry perspective on
electric utility capital requirements. A fourth estimate, drawn from a
forthcoming book by Martin Baughman, Paul Jaskow, and Oili.p Kamat CBJK) , is
the only recent "academic ll forecast examined. 6 A federal persepective is
provided by the Department of Energy's annual projection of electric
utility capital need. 7 DOE's findings are based on a sophtsticated linear
programmingmodel--formerly called the Project Independence Evaluation
System (YIES1, now called the Mid-range Energy Forecasting System (~EFS)--
which has been the controversial basis of much of the Department's analysis.
I-7

Three important~ but dated, additional studies are also reviewed
briefly below and compared with the EW, DRI, BTC, BJK and DOE forecasts:
Financi.ng the Energy Industry (J 974), by Jerome Hass, Edward Mi tchell ,
and Bernell Stone; Economic and Financial Impacts of Federal Air and
Water Polluti.on Control on the' Electric Utility Industry (1976), tly
Temple, Barker, and Sloane, Inc.; and the Federal Power Commission's
National Power Survey, The Financial Outlook for the Electric Power
Industry 09741.
II. FORECASTS OF CAPITAL NEEDS
A. Electrical World, 29th Annual Electric Industry Forecast
The annual forecast prepared by the staff of Electrical World is among
the most widely used forecasts of the electric utility industry. The
most recent EW. forecast was published Septernher 15, 19.78, and makes pro
jections to 1995. It begins with a projection of overall economic
growth and works toward the implications for the electric utility sector.
for the 1980 to 1990 pertod, real economic growth is expected to average
about 3.4 percent per year, with more rapid growth during the early 19.80·s,
slowing to about 3% in the second half of the decade. This relatively
modest projection assumes that accelerating wages, continued sluggish pro
ductivity growth, troubJes with the dollar, and increasi.ng energy prices
1Iril1 keep inflation rates high in the near term. In fact, recent develop
ments suggest that the EW estimate of 6.3 percent inflation for the 19J7
to 1981 period may prove conservati ve. For the 1982 to 19.9.0. peri ad, EW
anticipates an average 5 percent inflation rate. 8
I-8

EWls macroeconomic projections assume that current Administration
efforts will have little short-term impact on inflation, and that per
sistent inflati.on combined with increasing real energy prices which drain
purchasi.ng power from other sectors wi.ll slow overall expansion. EWls
general outlook also takes account of implications for slower growth
of an expected one perce.nt increase in the worki.ng age population over the
forecast period, down from two percent in 1967 to 1978. This reduction
is important because new labor force entrants tend to be the principal
purchasers of durable goods. In addition, EW notes that aging of the U.S.
population at large implies an increase in the age groups that have already
made. major expendi.tures and are unlikely to reenter the market.
In translating economi.c growth into in~reased electric utility sales,
EW breaks sales tnto four cate.gories--residential, industrial, commercial,
and other. Sales and peak demand are then estimated lndependently by region.
Total sales are expected to grow at an average annual rate of 4.0 percent
over the 1979 to 1990 period. In 1978, growth was less than 2.5 percent
which EW believes artificially depressed the forecast base. EWassumes
that the lost sales will be made up by a 4.4 percent increase in sales in
1979- despite their projection of slower economic growth in 19.79 than in
1978.
Table. 3 summarizes EWls electricity sales growth forecast. Growth
in i.ndustrial use of electrici.ty is projected to average 3.9- percent
over the 19]9 to 199-0 period, a sharp downward shift from previous EW
forecasts. This change is the result of slower-than-expected growth in
the late 70·s, a downward revi.sion of expectations about industrial pro
duction i.n the second half of the 19.20 I s, and an upward revision in
estimates of the potential gains from conservation and improved energy
management. I-9

YEAR
1979-
1980
1981
1982
1983
1984
1985
19-86
1987
1988
1989
1990
1979-1990
TABLE 3
ELECTRICAL WORLD FORECAST OF ANNUAL GROWTH IN ELECTRIC UTILITY SALES
(billions of KWH) 1979 to 1990
RESIDENTIAL INDUSTRIAL COMMERCIAL
4.4% 4.2% 5.0%
4.4 3.6 3.0
5.0 4.2 5.0
4.7 3.8 5.5
4.5 3.5 5.0
4.4 3.8 4.5
4.0 3.9 4.2
3.6 3.9 4.0
3.7 3.9- 3.9
3.4 4.0 3.9
3.3 4 .. 0 3.8
3.3 4.0 3.8
4.0 3.9 4.2
Source: Electrical World, September 15, 19.78
1-10
OTHER TOTAL
3.6% 4.3%
3.4 3.8
3.4 4.6
3.4 4.5
3.4 4.3
3.4 4.2
3.3 4.0
3.4 3.8
3.5 3.8
3.4 3.7
3.4 3.7
3.4 3.7
3.4 4.0

In determining capital needs, EW considers changes in peak demand and
the gross peak margin to De more important than, and independent of, total
sales increases. It reports that as a result of surp~ising'y slow peak
demand growtn in 1978, an unusually high reserve capacity margin, and
continuing "load factor deteri orat; on, del":::rments and cance 11 ati ons of
planned projects are likely in the near term. However, EW is not prepared
to view the low growth in 19-78 peak as a harbinger of future developments.
It forecasts a gradual decline in the gross peak margin from about 38
percent in 1978 to 18 percent in 1~9D, and anticipates that large capital
expenditures for generation will continue to be required to meet the ex
pected growth in peak demand. However, this estimate of peak demand growth
and continued deterioration in load factor is based on past trends and
judgement and may prove to be mt.staken in an environment of rising real
energy costs.
Table 4 summarizes EW estimates of capi.tal expenditures for the 1979
to 1990 period. These estimates reflect the current slowdown in nuclear
plant construction, althougb it is assumed that nuclear construction will
pick up during the early 19.80'5. The estimates also reflect the costs of
anti-polluti.on requirements. About one-third of distribution expenditures
are expected to go for plant replacement, which makes them extremely sensi
tive to year-by-year decisions of management. Expenditures for transmission
facilities are linked to generation additions and, therefore, reflect those
patterns.
B. Data Resources Incorporated
Data Resources, Inc. CDRlt has estimated the capital needs of the
e.lectric utility sector as an integral part of their long-term macro
economic forecast of the U.S. economy. DRI projects the capital needs
1-11
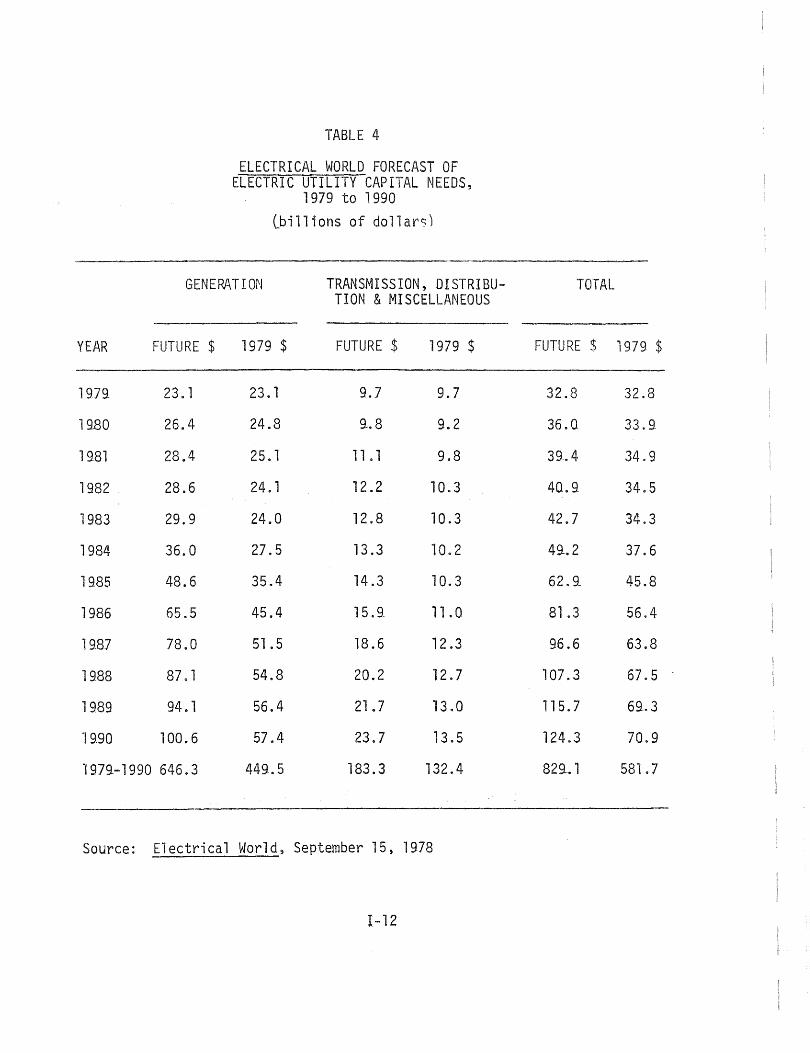
TABLE 4
ELECTRICAL WORLD FORECAST OF ELECTRIC UTILITY CAPITAL NEEDS,
1979 to 1990
lbil1ions of dollars)
GENERATION TRANSMISSION, DISTRIBU-TION & MISCELLANEOUS
YEAR FUTURE $ 1979 $ FUTURE $ 1979 $
1979- 23.1 23.1 9.7 9.7
19.80 26.4 24.8 q.8 9.2
1981 28.4 25.1 11 . 1 9.8
1982 28.6 24. 1 12.2 10.3
1983 29.9 24.0 12.8 10.3
1984 36.0 27.5 13.3 10.2
1985 48.6 35.4 14.3 10.3
1986 65.5 45.4 15.9. 11 .0
19B7 78.0 51 .5 18.6 12.3
1988 87. 1 54.8 20.2 12.7
1989 94.1 56.4 21 .7 13.0
1990 100.6 57.4 23.7 13.5
1979-1990 646.3 449 .. 5 183.3 132.4
Source: Electrical World, September 15, lS78
1-12
TOTAL
FUTURE $ 1979 $
32.8 32.8
36.Q 33.9
3fL4 34.9
40.9- 34.5
42.7 34.3
4q.2 37.6
62.9_ 45.8
81 .3 56.4
96.6 63.8
107.3 67.5
115.7 69..3
124.3 70.9
82SL 1 581.7

of electric utilities based on their forecast of overall economic activity
and then modifies these requirements by allowing the energy sector to "feed
back!! on their macroeconomic forecast. Prior to 1987, however, modeled
forecasts of the utiltties D needs are determined in conjunction with the
announced construction plans of the
The DRI energy forecast discussed here is based on DRI's long-ter~
trend macroeconomic forecast prepared during the winter of 1979. This
forecast indicates that real GNP will grow by about 3.9 percent per year
through. 1985 3 wi th eycl i cal downturns in 19J9- and 19.82. For the 1986 to
1990 period, DRT expects real GNP growth to be about 3.1 percent per year.
Throughout the 1979 to 1990 period, they foresee an inflation rate fluctu
ating between 5.4 percent and 7.6 percent--high by historical standards,
but relatively stable.
From this macroeconomic base, ORI forecasts energy prices, which are
combined with the industrial production index to determine industrial
demand for electri.city by region of the country. Per capita disposable
income, population, and the stock of electri.cal household goods interact
with energy prices to determine regional residential demand for electricity.
Commerci.al electri.c demand 1s determined by energy prices and commercial
employment by region. Throughout this process the DRI model permits sub
stitution among fuels as various prices change in response to demand. Energy
price.s fed hack. into the macroeconomic model allow simultaneous determina
tion of energy prices and relevant economic variables such as industrial
production. In contrast, EW seems to rely exclusively on announced plans
and judgement in determining demand and the mix of new generating plants.
Once regi.ona 1 demands for e 1 ectri.c i. ty are determi ned by the DR! model,
th.e tota 1 s are adj us ted to inc 1 uda interdepartmenta 1, own, and ra i 1 road use.
1-13
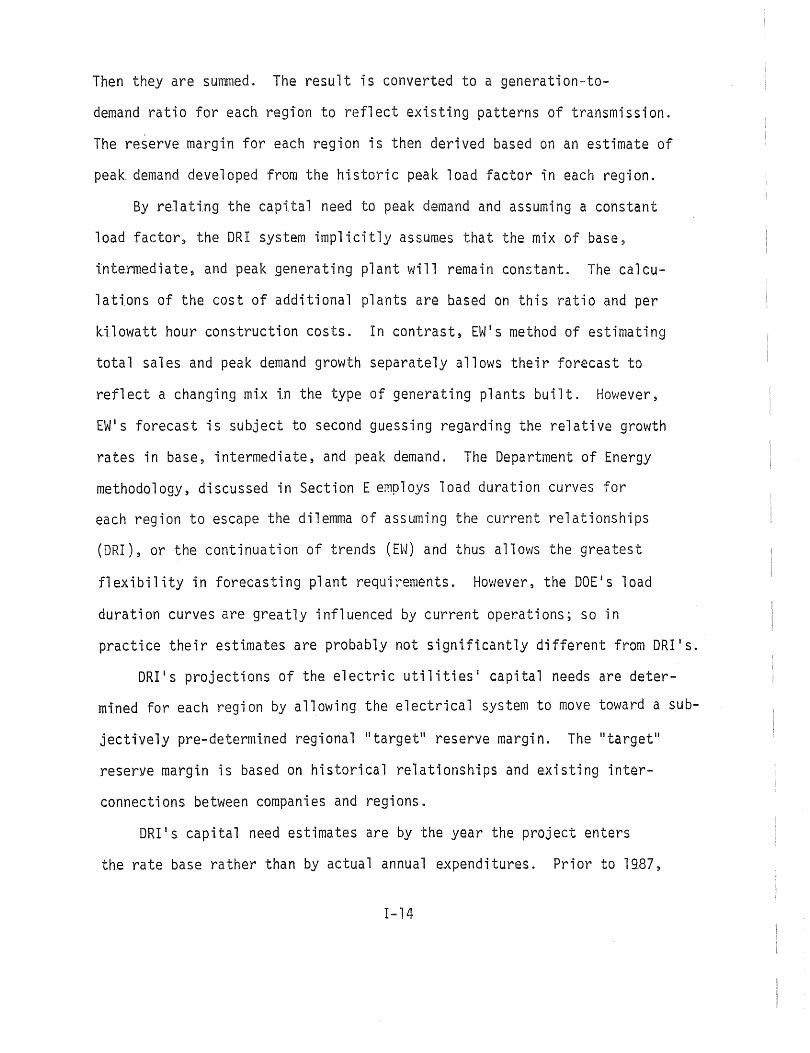
Then they are summed. The result is converted to a generation-to-
demand ratio for each region to reflect existing patterns of transmission.
The re~erve margin for each region is then derived based on an estimate of
peak demand developed from the historic peak load factor in each region.
By re.lattng the capi.tal need to peak demand and assuming a constant
load factor, the ORl system implicitly assumes that the mix of base,
inte.rmediate, and peak generating plant will remain constant. The calcu
lations of the cost of additional plants are based on this ratio and per
kilowatt hour construction costs. In contrast~ EW's method of estimating
total sales and peak demand growth separately allows their forecast to
reflect a changing mix in the type of generating plants built. However,
EW's forecast is subject to second guessing regarding the relative growth
rates in base, intermediate, and peak demand. The Department of Energy
methodology, discussed in Section E e~ploys load duration curves for
each region to escape the dilemma of assuming the current relationships
(ORr), or the continuation of trends (EW) and thus allows the greatest
flexibility in forecasting plant requirements. However, the OOE's load
duration curves are greatly influenced by current operations; so in
practice their estimates are probably not significantly different from ORI's.
ORr's projections of the electric utilities l capital needs are deter
mined for each region by allowing the electrical system to move toward a sub-
jectively pre-determined regional Jltarget" reserve margin. The "target ll
reserve margi.n is based on historical relationships and existing inter
connections between companies and regions.
ORr's capital need estimates are by the year the project enters
the rate base rather than by actual annual expenditures. Prior to lQ87,
I-14

therefore, work planned and in progress modifies the model is attempt to
move the system toward the target reserve margin since it would be impos-
sible to plan, build, and open a ant 1987 that is not already somewhere
in the planning-construction cycle. Also, projects already fully committed
cannot be cancelled even if they will not needed. The costs of conven-
tional generati.on facilities are determined summing the planned increases
in rate base across all companies. As in the EW forecast, each electric
utility company is considered separately. For nuclear plants, ORI exercises
some judgement in extending the reported timetables because of the poor
track record of utilities in completing these projects according to plan.
While the ORI methodology can he criticized as being overly tied to
past relationsh.ips, i.t does provide a benchmark for gauging alternative
assumptions. If it is assumed that the load factor continues its downward
trend, the DRl estimates will be low. Alternatively, if the load factor
improves, the DRI estimate will be high. Regardless of the actual result,
the basis for comparison is a known.
It should be noted that the DRI model assumes a continuation of
existing regional generation-to-demand ratios. These ratios may also
change over time, affecting the capital needs estimates. It is also
likely that revised versions of the DRl model wi.ll attempt to estimate
the growth in peak demand di.rectly rather than assume a fixed relationship
to sales growth. But, this "improvement ll may be of limited value since
it will necessarily be tied to weather, the rate of tech.nological change,
and conservation.
Finally, it is important to remember that the DR! esti.mates of capital
needs are not year-by-year expenditures. They are capital increases
I-15

coming on line in a given year. In most jurisdictions, this means that the
total cost of a given plant i~ counted in the year it enters the rate base.
Consequently, the ORr capital needs forecast is not comparable to the
others which are reported here on a year-by-year basis. An approximate
comparison, however, can be made by summing the expenditures over several "'
years. Table 5 shows the capital expenditure estimates of DR! and selected
a1ternattve forecasts for 1979- to 1985,1986 to 1990, and for the entire
1979 to 1990 period.
As is expected from the relatively high, but perhaps realistic, infla-
tion rate incorporated in the ORr forecast, the current dollar estimates
appear higher, in comparison with the other projections, than the estimates
based on constant dollars. Nevertheless, the DR! forecast of capital
requirements tends to be on the low side, primarily because of a relatively
low estimate (3.2 percent) of annual growth in electric sales for the fore
cast period. Moreover, because of the way the DRI model is constructed,
the introduction of a business Cdownturn would reduce the demand for elec-
tricity and consequently the optimal capital requirements. The reduction in the
optimal capital needs would reduce the actual capital needs in the 1986 to
1990 period and would probably result in further delays in the completions
and activation of nuclear plants.
C. Bankers Trust Company
In 1978, Bankers Trust Company (BTC) published a IIbest guess ll as to
the capital needs of the electric utility industry extending through 1982.
This estimate is a part of a planned biennial review of the U.S. demand
and supply of energy and the consequent capital needs for the energy
industry as a whole. 9
I-16

DATA RESOURCES INCORPORATED
Generation
Transmission, Distribution, & Mi sc.
TOTAL
ELECTRICAL WORLD
Generation
Transmission, Distribution, & Misc.
TOTAL
BOUGHMAN, JOSKOW & KAMAT
Generation
TY'ansmiss i on, Distribution, & Misc.
TOTAL
TABLE 5
ORr AND SELECTED ALTERNATIVE FORECASTS OF ELECTRIC UTILITY CAPITAL NEEDS,
1979 to 1990 (billions of dollars)
FUTURE $
1979-1985 1986-1990 1979-1990 1979-1985
207.5 321.4 528.9- 164.3
73.4 68. 1 141 .5 60.3
280..9. 389-.5 670.4 224.4
221.0 425.3 646.3 184.Q
83.2 100. 1 183.3 69-.9_
304 .. 2 525.4 829..6 253.8
135.8 216.2 352.0 113.2
125.5 166.3 29-1 .8 104.8
261.3 382.5 643.8 218.0
Source: Table 4, Table 9 and Data Resources Incorporated
I-17
1979 $
1986-1990 1979-1990
186.9. 351 . 1
39-.8 100.1
226.5 450.9-
265.5 449..5
62.5 132.4
32] . 9- 581.7
132.9- 246. 1
102.0 20.6.8
234.9- 452.9.

Unlike DR!, EW and other forecasters, BTC assumes certain macro
economic conditions rather than determining them independently; though
it seems likely that their assumptions are influenced by the available
e.conomic forecasts including DRI's and EW's. BTC assumes that economic
growth, as measured by the rate of increase in real GNP, will range between
3.2 and 4.3 percent and average 3.8 percent between lS78 and 1982.
The relatively narrow range of assumed annual GNP increases seems to
indicate tha t BTC expects the economy to b.e free of any maj or cycl es over
th.e forecast period. BTC also seems to assume that the domestic inflation
rate and the rate of increase in world crude oil prices will be relatively
constant at about 6 percent. They expect domestic energy prices to rise
somewhat faster, however, because of increases toward world price levels
of domestic oil and gas. Domestic crude oil, is assumed to equal world
prices by 1982, and natural gas is assumed to approach the world price of
crude oil by 1982 (on the basis of equivalent BTU content). BTC assumes
more rapid price advances for capital goods in the energy sector (6.3
percent} than for the economy as a whole. The 5-percent differential is
attributed to high rates of investment in some of the energy industries
that force up the cost of materials and skilled labor.
Finally, BTC also assumes that government tax policy will not play
a significant role in determining energy use; that there will be adequate
available supplies of oil and natural gas; that any shortage of domestic
capital will be made up from foreign sources, since rates of return will
lie hi.gh. enough to attract the needed capt ta 1; and that there wi 11 be no
significant alteration in government statutes or regulations relating to
envi.ronmental protecti.on.
1-18
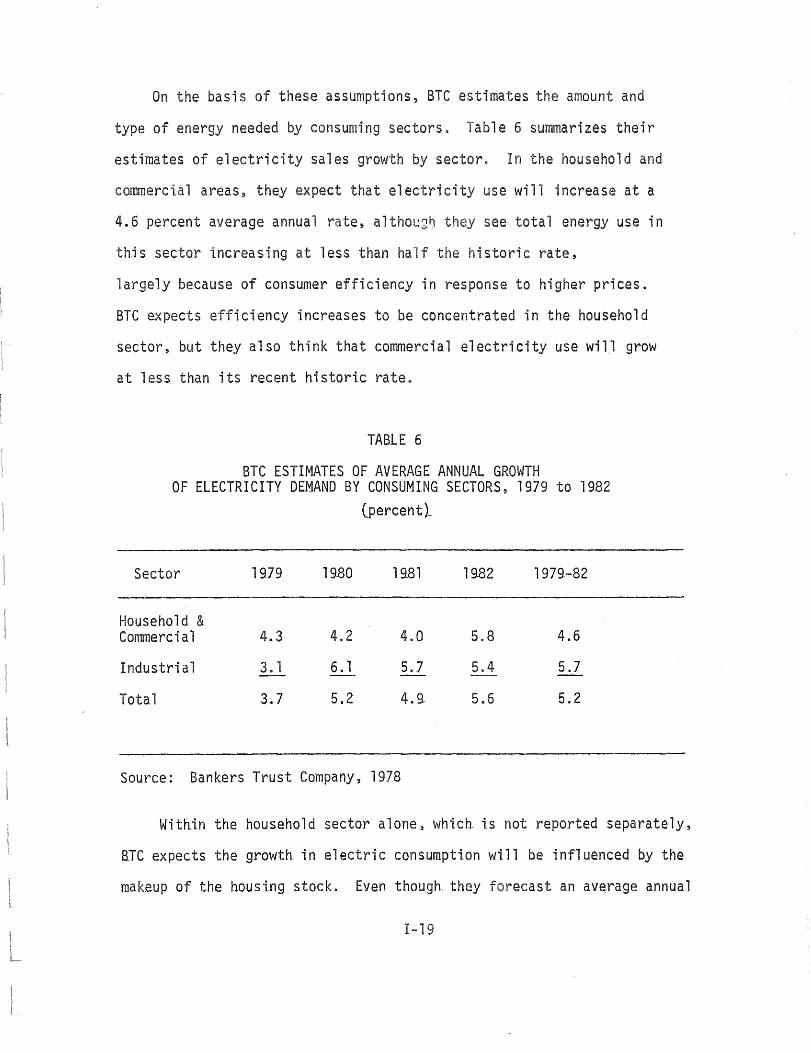
On the basis of these assumptions, BTC estimates the amount and
type of energy needed by consuming sectors. Table 6 summarizes their
estimates of electricity sales growth by sector. In the household and
commercial areas, they expect that electricity use will increase at a
4.6 percent average annual rate, although see total energy use in
this sector increasing at less than half the storie rate,
largely because of consumer efficiency in response to higher prices.
BTC expects efficiency increases to be concentrated in the household
sector, but they also think that commercial electricity use will grow
at less than its recent historic rate.
TABLE 6
BTC ESTIMATES OF AVERAGE ANNUAL GROWTH OF ELECTRICITY DEMAND BY CONSUMING SECTORS, 1979 to 1982
Sector
Household & Commercial
Industrial
Total
1979
4 .. 3
3. 1
3.7
19.80
4.2
6. 1
5.2
(percentt
1981
4.0
5.7
4.9
Source: Bankers Trust Company, 1978
1982
5.8
5.4
5.6
1979-82
4.6
5.7
5.2
Within the household sector alone, whic~ is not reported separately,
aTC expects the growth- in e 1 ectri c consumption wi 11 be i nfl uenced by the
makeup of the housi..ng stock. Even though they forecast an average annual
1-19

rate of more than 2 million new units, they think these houses will be
more energy efficient than older units. They see space heating demands
for all types of energy moderating as uninsulated older units are
replaced with~ore energy efficient ones. Also, BTC estimates that 3 to
4 m t 11 ton add i. t i. 0 n a 1 ex i s tin g ho us i n 9 un its wi 11 be ins u 1 a ted e a c h year,
further reducing the growth in energy demand of the housing sector.
BTC estimates that commercial use of all energy will grow at 6.5
percent per year. While this is more than the average rate of increase
for the economy as a whole, it is well below historic growth rates for
the commercial sector which have ranged up to 9. percent per year. BTC
attributes this still relatively high C6.5 percentl projection to con
tinuing increases in services as a share of GNP. Since the conservation
potential of this sector is comparable to the household sector, some
reduction from the historic growth rate is to be expected. Judging from
the esti.mates shown in Table 6, however, it appears that BTC expects most
of the savings to be reflected in reduced growth in demand for non-electric
energy sources instead of electricity itself.
BTC's assumption about the sensitivity of energy demand to price is
particularly evident in the industrial sector. They see total energy
demand by industry i.ncreasing by only 2.5 percent per year. Electricity
consumption, however, is forecast to increase 5.7 percent per year--a
rate comparable to pre-embargo electric demand growth. Even though
electri.ci.ty pri.ces, are expected to increase, BTC does not hel ieve that
the industri.al sector will be able to substitute fuels or significantly
improve the efficiency of electricity use. The ORI model, in contrast,
specifically allows for fuel substitution in response to fuel price
1-20

changes. The major link between DRl's macroeconomic and energy models
is the impact of fuel price increases on demand for each type of fuel
and the simultaneous impact of changes in energy prices on industrial
production. In view of the different time horizons of the two forecasts,
this contrast is probably less important it appears. While it is
reasonable to assume that industries will ust to the increasing real
price of energy over time, the process is likely to be an extended one.
Even with the relatively rapid rate of increase in commercial uSe
of electricity, BTC forecasts only a 5.2 percent annual growth 'in the
total demand between 1978 and 1982. This is considerably below the 1970
to 1973 rate of 6.6 percent, but well above the rates assumed by EW and ORI.
BTC does not consider the rate of increase of peak demand growth
separately from sales growth. Consequently, even though the BTC analysts
foresee some efficiency improvement as a result of price increases, they
do not expect thts to affect load factors. The mi.x of base and peak
load generati.ng capacity is, therefore, implicitly assumed to be un
changed over the forecast period.
In converting the estimates of increased electric consumption to
required additional generation capacity and capital needs, BTC concen
trates not only on aggregate demand, but on the electric industry as a
primary consumer of fuel. As Table 7 shows, they expect electric
utilities' total energy demand to increase at a 4.6 percent average
annual rate between 1978 and 19.82, with largest increases for coal and
nuclear generati.on.
BTC projects that the electric utility sector will increase its
dependence on coal-fired generation, and that by 1982, it will produce
1-21

TABLE 7
BTC FORECAST OF GROWTH OF ENERGY FUEL SOURCE DEMAND FOR ELECTRIC GENERATION
1978 to 1982 (percent)
Demand for: 1979 1980 1981 1982
Coal 7.0 5.7 6.2 4.4
Petroleum 4.7 2.2 2.2 0.0
Natural Gas -14.8 -13.0 -15.0 -11 .8
Nuclear Power 14.8 19.4 16.2 23.3
Hydro Power 0.0 0.0 0.0 0.0
Total 4. 1 6.0 3.4 5. 1
Source: Bankers Trus t Company, 1978
1-22
1978-1982
5.8
2.2
,-9.6
18.4
0.0
4.6

ha 1 f of its tota 1 power output wi th coa 1. More 'importantl y, in terms of
capital demand, BTC contends that, despite cancellations and delays in
construction, nuclear facilities will meet 18 percent of the utilities'
generation by 1982. In 1976, nuclear plants accounted for only
about 9 percent of the electric utility 1 es' energy requirement.
BTeis estimates of the capital needs electric utility sector
for 1979 to 1982 are summarized tn Table 8. These forecasts are based
on announced plans, but they also try to allow for slippage in construc-
tion schedules, opti"mi.sm, inconsistency with the industry needs and insti
tutional and other factors. Although Table 8 is constructed to be comparable
with the other similar tables in this report, the BTC study provides details
which are not presented there. In particular, it includes two categories of
capital expenditure not considered separately by the others: flue gas de
sulfurization; and working capital. In Table 8, the flue gas desulfurization
ts added to the generation category. The worki.ng capital estimates,
important to BTC because of their interest in total financial require-
ments of the industry, are short term and not a direct indtcati'on of the
industry's need for investment funds. Thus, they 'are excluded. BTC
also hreaks down the capital needs estimate i.nto internal and external
financing requirements. The industry's external financing needs are
projected to be lower during the 19]~ to 1982 period than during the
1970's. BTC estimates that only about 4 percent of total capital and
credit, and 10 to 11 percent of the share of the capital and credit going
to business, will be absorbed by the electric utiltty industry over the
forecast period. 'In the early 1970's, electric utilities accounted for
5 to 7 percent of the, tota 1 capital and credit market, and for the 1972
to 19]7 period, on average, atiout 13 percent' of the business (see Tabl e 2 t.
1-23

1979
1 g80
1981
1982
1979-1982
TABLE 8
BANKERS TRUST COMPANY FORECAST OF ELECTRIC UTILITY CAPITAL NEEDS
1979 to 1982
(billions of dollarsl
GENERATION TRANSMISSION, DISTRIBUTION & MISCELLANEOUS
FUTURE $ 1979 $ FUTURE $ 19]9 $
19.6 19.6 9.8 9.8
19.5 18.3 10.5 9.9..
21 .4 18.9 11 . 1 9.8
23.3 19.4 11 .7 9-.7
81.8 74.2 43. 1 39..2
Source: Bankers Trust Company, 1978
1-24
TOTAL
FUTURE $ 19-79- $
27.4 27.3
30.0 28.2
32.5 28.8
35.0. 29-. 1
124.9- 113.5

BTCls forecast of $74 billion in real capital needs for generation
between 1979 and 1982 is considerably lower than EWls or ORIs. The
di screpancy may stem partly from the proximity of BTC is time har; zon
and from the presumed impact of energy conservation. More importantly,
however, BTC analysts may have been persuaded to stretch out estimated
constructi.on schedules because of declining growth tn electricity demand
in the late 1970·5, and because they foresee high reserve margins and in
creasing reliance on nuclear generation during the forecast period.
Historically, nuclear plants have taken longer to bring lion line,1I
and have been more susceptible to construction delays and cancellations
than conventional facilities.
Although BTCls projected capital needs for generation is lower than
other forecasts, they expect generation expenditures to increase more
rapidly than expenditures for transmission and distribution. This is
partly because of the high cost of nuclear plant construction, but also
because of anticipated construction delays which tend to increase overall
production estimates. In contrast, EW assumes continuation of past average
trends in constructi.on expenditures for generation. Surprisingly, however,
thei..r estimates of transmission and distribution outlays are about the
same as those forecas t by BTC.
D. Baughman, Joskow and Kamat
In a forthcoming book on the electric utilities industry, Martin
Baughman, Paul Joskow and Dili:p Kamat (BJK) have three main goals: to
forecast the capital needs of the industry over the next twenty-five years
and the primary sources of that capital; to demonstrate that a capital
shortage for a regulated i:ndustry is conceivable; and to examine the
I:-25

effects on the electric utility industry of several regulatory and tax
policy changes. 10 ca tal need forecast covers 1976 to 2000, but
only the results for
BJK have
1979 to 1990 period are considered here.
their own model of the U.S. electrical power
industry. In developi.ng thei"r base case , they incorporate
wha t they be 1 to be the best estimates of current trends and expec-
tations the various macroeconomic, energy supply, capital equipment
cost, and regulatory parameters. They make optimistic assumptions about
financial conditions to bias the results slightly away from a capital
shortage situation. In this way the impact of changes in the regulatory
environment on capital availability can be more fully appreciated. 11
However, it should be recognized that 8JK 1 s estimates of electric utility
capital need are somewhat higher than they would have been if financial
conditions were assumed to be less favorable to the industry. In fact,
BJK1s esti.mates are still relatively conservative, even for projections
made in 1976. Between 1975 and 1979, most electric utility analysts
have been revising their forecasts of capital needs downward as demand
has increased more slowly than expected.
The BJK model does not attempt to forecast basic economic variables
for the forecast period. Instead, it assumes that the economy will grow
at an average annual rate of 3.8 percent, somewhat higher than the ORr
forecast. The inflation rate is assumed to be 5.5 percent per year,
which is probably low given today's economy. Other exogenous variables
include population, income and value added in manufacturing. This last
var1.abJe is a measure of industrial production and plays an important
ro 1 e i.n dete..rmi.n tng indus tria 1 demand for e 1 ectri c power.
1-26

In conjunction with assumed primary energy prices, these economic
variables determine the price of electric power by region. Once energy
prices are determined, the model forecasts total electric demand, which
is converted to a peak demand fdrecast through the use of historical
load factors for each region of the country_ Unlike the DR! forecast
which assumes historic load factors, however, BJK expect load factors to
decline slightly throughout the 1980's and then hold constant through the
rest of the forecast period by BJK. Their forecasts of peak demand are,
therefore, dependent on two key exogenous assumptions--the growth rate
of the economy and the. 10ad factor. Slower economic growth or cycl; ca 1
rather than steady growth woul d resul t i.n lower estimates of peak demand.
Also, if load factors should improve, lower estimates of peak demand would
result. From the peak demand estimates; the model determines the necessary
electric generating capacity.
Additions to capacity depend on the' lead time required, the cost of
alternative types of generation plants, and the reserve margin in each
region. BJK assumes that nuclear plants require 10 years, foss11 fuel
plants 4 years, and gas turb.ine plants 2.5 years. to come lion 1 ine. II The
target reserve margin is set at 20 percent tn all regions; but through
1985 the additions to capacity are modified to take into consideration
pl ans a 1 re.ady announced. As ts true in the other forecasts cons i dered
here, the announced nuclear plans are stretched out to allow for con
struction and regulatory delays.
Table 9 summarizes BJK1s base case forecast of the electric power
lndustry 1 s capital expenditures through 19.90. BJK differ considerably
from other estimates with regard to the composition of the expenditures
1-27

19.79
1980
1981
19.82
1953
1984
19.85
1986
1987
1988
1989.
1990
19]9-1990
TABLE 9
BAUGHMAN, JOSKOW AND KAMAT FORECAST OF CAPITAL NEEDS OF THE ELECTRIC UTILITY SECTOR
1979. to 1990
(billions of dollars)
TRANSMISSION, DISTRIBUTION,
GENERATION & MISCELLANEOUS TOTAL
FUTURE $ 1979 $ FUTURE $ 1979 $ FUTURE $
10.5 10.5 12.5 12.5 23.0
14.9 14. 1 13.3 12.6 28.2
19.7 17.7 16.4 14.7 36.1
22.4 19.. 1 18.3 15.6 40.7
19.2 15.5 . 20.2 16.3 39.4
19.9 15.2 20.9 16.0 40.8
29.2 21 .2 23.9 17.3 53. 1
38.7 26.6 27.8 19 .• 1 66.5
42.6 27.7 31.0 20.2 73.6
41.5 25.6 32.9 20.3 74.4
43.4 25.4 35. 1 20.5 78.5
50.0 27.7 39.5 2'1.9 89.5
352.0 246.3 291.8 207.0 643.8
Source: Baughman, Joskow and Kamat, forthcoming
I-28
1979 $
23.0
26.7
32.4
34.7
31 .8
31.2
38.5
45.7
47.9
45.9.
45.9.
49.6
453.2

between transmission and generation~ and the distribution of these
expenditures over time. In the EW and DRI forecasts, nearly 80 percent
of all capi.tal expenditures between 1979- and 19.90 are generation.
In contrast, K expect tnese expenditures to be about evenly split
between genel'ati.on and transmiss ,di on and miscellaneous.
though the sparity is not complete"ly for, BJK paint out
that they include the costs of any transmission required to tie new
generati.ng plant into the transmission grid as a transmission expendi
ture, while EW and the others follow the more usual convention of
counting these as generation expenditures.
Other disparities in the proportion of expenditures for generation
may arise from differing assumptions about generation-to-demand ratios
for each region. EW and DR! follow historical patterns to determine
regional load factors. In the DR! model, these load factors are used to
develop estimates of peak demand which are then compared with generation
capacity to determine the region1s reserve margin. Regions traditionally
selling large amounts of power to neighhoring areas are, therefore,
assigned higher target reserve margins than regions that have a history
of purchasing power to meet peaks.
BJK1s targeting of all regions to a 20-percent reserve margin after
1985, makes a different pattern of expenditures inevitable. While it
'is i'mpossib 1 e to determine whi.ch of the assumpti ons regardi ng reserve
margins is better, it is clear that a lower target margin reduces capital
needs for generati.on capacity, but possibly increases the capital needs
for transmission and distribution facilities. The DR! projections for
new plants, therefore, may be somewhat lower because they allow for some
1-29

reserve margins to go as low as 15 percent. However, this may not be
reflected in the summary tables because of ORr's practice of including
costs of tyi ng a plant into the transmi 55 ion gr'i d as genera ti on expen-
dftures. The relatfvely high EW forecast also allows reserve margins to
fall below 20 percent, on average. The EW , however, is also
heavily influenced by its estimates of sales and peak growth in deter
mining capital needs.
E. United States Department of Energy
The Department of Energy's (DOE) forecast of the capital needs of
the electric uti.lity industry is included as a part of their annual pro
jections of national supply and demand for energy. Three separate
estimates are reported based on alternative assumptions put through
the Mid-Range Energy Forecasting System (NEFS), formerly known as the
Project Independence Evaluation System (PIES).
MEFS is a comprehensive energy model designed to forecast energy
equilibrium conditions in the U.S. economy.12 Of the models discussed
in the report, it is by far the most extensive and complex. Moreover,
the electric utility sub-model of MEFS is the most detailed and complex
of the vari.ous pi.eces that make up the complete system. MEFS produces
II snapshots ll of the energy economy on an average day at specified pl anning
horizons. For the 1978 Annual Report, these snapshots were for January
1,1985 and 1990. The capital needs estimates, however, were only calcu-
lated for the 1985 equilibrium. It is expected that the 19]9 report
will show capital need forecasts for each year through 199D.
MEFS can be thought of as having three basic pieces: a demand mOdel,
a supply model, and an equilibrating mechanism that brings the supply
1-30

and demand sides together equilibrating mechanism, which is the
heart of the system, is a static linear programming model which produces
optimum supply and equilibrium pieces given forecast demand levels,
capacity and cost considerations, i
regulations that can influence market or.
utility I MEFS estimates future demand
sions such as price
the electric
ectricity, capacity
additions, capital coefficients, activity levels, and capital require
ments in dollars.
The MEFS equilibrating mechanism, or integrating model, determines
a partial equilibrium of supply and demand for different fuel types for
each of ten DOE regions. The model forecasts energy consumption levels
in eac~ of the regions and shows how consumption is distributed among
ten fuel products, including electricity. It also identifies the geo
graphic source of these fuels, how they will be transported, and how
they will be converted for fi.nal consumption. This is done through a
series of 300 fuel demand functions that are estimated econometrically,
and numerous fuel supply schedules that are estimated by engineering
economic models which penui.t profit maximizing private behavior. The
integrating model then finds the least-cost way to satisfy the demands,
subject to the costs of transporting and converting raw energy into the
energy products demanded, and subject to the other constraints including
the linear program. MEFS supplies information about the entire energy
sector. In this report, however, only those parts of the model that
relate to the capital needs of the electric utility industry are discussed.
To negin the forecasting process, MEFS requires that the equilibrium
values of GNP, population, and income for the years be assumed or
supplied from some other source. For the 1977 Annual Report, ten alternative
combinations were developed, but only three were used to estimate capital
1-31

needs. One of these, the reference case, is based on mid-range supply
and reserve, and moderate economic grovJth assumptions. The "highll case
assumes high resource availability, low capital equipment cost inflation
and relattve1y rapid economic growth. The third or 1I1ow li case assumes
that resources will be scarce, capital cost i ation high, and economic
growth slow. All three alternatives assume that the world real price of
crude oil will be constant at $15.32 (although some of the other alterna
tives allow the price to increase 5 percent per year).
The demand side of MEFS is relatively simple in comparison with the
supply side. Demand functions are estimated for 30 separate products
in each of the ten regions. These functions are governed by the general
level of economic activity, the nature and extent of conservation programs,
and numerous other assumpti ons .13 Unl ike the ORI model, neith-er these
econometrically-derived demand functions, nor any of the subsequent
assumptions or estimates feed back on a macroeconomic model.
Future development of MEFS will include much more detailed demand
sectors, particularly for households, that will interact with the rest
of the model. Until these new modules are completed, however, the Depart
ment of Energy will probably continue to use widely available macroeconomic
forecasts (e.g. ORIls) that reflect a consensus view of aggregate demand.
Since the models which generate these forecasts incorporate energy sectors,
albeit much more aggregated ones than MEFS, it is possible that unknown
biases are being introduced into the MEFS forecast.
Taille 10 summarizes the three key macroeconomic assumptions for
the MEFls IIhigh,1I II medium,1I and 11ow" forecasts. MEFSIS reference or
IImedium" case macroeconomic assumptions are those of the DRr "TRENOLONG,II
1-32
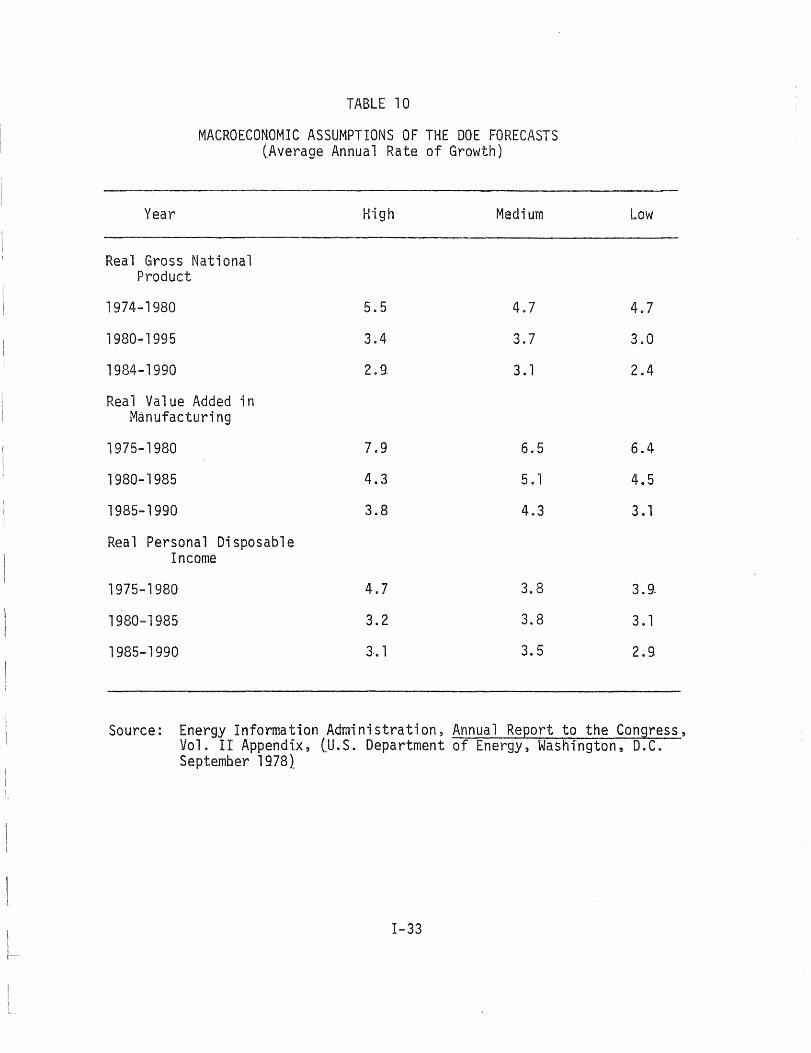
TABLE 10
MACROECONOMIC ASSUMPTIONS OF THE DOE FORECASTS (Average Annual Rate of Growth)
Year High Medium
Real Gross National Product
1974-1980 5.5 4.7
1980-1995 3.4 3.7
1984-1990 2.9- 3. 1
Real Value Added in Manufacturing
1975-1980 7.9 6.5
1980-1985 4.3 5. 1
1985-1990 3.8 4.3
Real Personal Disposable Income
1975-1980 4.7 3.8
1980-1985 3.2 3.8
1985-1990 3.. 1 3.5
Low
4.7
3.0
2.4
6.4
4.5
3. 1
3.9-
3. 1
2.9
Source: Energy 1nformati:onAdministration, Annual Report to the Congress, Vol. II Appendix, (~.S. Department of Energy, Washington, D.C. Septemb_er 19781
1-33

released in August 1977. According to this forecast, the economy will
grow at an average annual rate of about 3.7 percent between 1980 and
1985, and then slow to a 3.1 percent rate during the 1985 to 1990 period.
Inflation i.s expected to average about 5.5 percent through 1983, with
the annual rate declining to 4.1 percent 1990. Energy prices at the
wholesale level are expected to increase at an annual average rate of
about 7.5 percent, which is roughly consistent with the MEFS assumption
of a constant real-world oil price.
The IIhighli forecast is based on the ORI IiCEASPIRIT" of early 1977.
The economic strength projected in this forecast assumes a somewhat slower
average rate of inflation through 1983 than the "medium" case (about 5.2
percent}, and a significantly slower rate of i_ncrease in wholesale energy
prices (5 percent). This later assumption is inconsistent with the MEFS
assumption of constant world oil prices, and therefore causes MEFS to
estimate supplies of the various energy products at higher prices than
ORI used to determine aggregate demand. Any bias this may introduce
into the estimates, however, is at the least partially offset by the
assumed larger domestic oil supply.
MEFfs IIlow ll estimates are based on the ORr "CYCLELONG" alternative
of August 1977. In this simulation, inflation is forecast at a 7-percent
annual rate through 1983, increasing to 8 percent during the 1984 to 1990
period. Over the full forecast period of 1978 to 199.0, the 1I1 ow" alter
native predicts an average annual rise of more than 12 percent in whole
sale energy prices. However, any excess supply of energy resulting from
higher prices is offset by assumed lower domestic supplies.
The supply side of MEFS is comprised of a series of independent
models which represent the flow of fuels from production through conversion
1-34

to final demand. The electric uti.lities submodel estimates the new
generating capacity required to meet the demand for elec city.
Subject to price and supply constraints, the model chooses the types and
mi.x of capacity required to meet load demands that is consistent with
th.e avera 11 opti.miza ti on throughout MEFS.
The results of the MEFS model, therefore, ect the generating
capacity that is lion 1 ine, II as do the ORI estimatese.In contrast to ORr,
however, since a primary ;'nterest of the DOE is to indi cate the impact
of energy supply and demand on the capital market, they have adjusted the
MEFS results to show capital expenditures made during the forecast period.
These initial results from MEFS are reduced by an estimate of capital
costs made prior to 1978, and to the extent possible, based on announced
plans adjusted for delays and postponements. Through 19.84, the capital
cost of work in progress on plants not yet in service but under con-
struction is added.
Even after the adjustments for work in progress are made, however,
the DOE estimates are still not easily compared with the others included
in this report. Because the MEFS model is designed to forecast an equi
librium for a given date, its capital need forecast is not annual. In
the case of the Annual Report for 1977, for example, the estimate of
capi.tal needs covers the entire period from January 1, 19.78 to January
1, 1985.
In determini.ng capi.tal needs, the electric utilities submodel converts
demand into base, i.ntermediate, and peak load by using regional load dura
tion curves. Although these curves are determined exogenously, they follow
existing load patterns. 14 The model then nes the amount arid type
I-35

of generating plant needed to meet the three modes of demand within each
region. Regions are constrained to build enough capacity to meet their
own demand within certain bounds. The upper bounds for 1985 consist
of the announced plans of utilities. No region is allowed to build
more capacity in 1985 than had entered the anning stage by 1~78. By
1990, except for nuclear plant construction, which has a very long planning
and building cycle, upper bounds are generated by the model. The lower
bounds require that fully committed plans be completed, hut allow post-
ponement and cancellation of other projects. The determination of con
struction needs is also based on the assumption that each region will move
toward a 20-percent reserve margin.
MEFS assumes that a broad spectrum of generation equipment will be
used, including nuclear and coal, residual oil, simple-cycle turbines,
combined-cycle turbines, and hydroelectric. Assumptions about capital
and operating costs are established for each equipment type and each
set of load factor characteristics. The capital costs vary by region,
plant type and target year of operation. In addition, the required
expenditure per unit of construction includes the cost of a unit of
transmission and distribution equipment. In the case of coal facilities,
separate cost assumptions are made by type of coal for plants with and
without scrubbers. 15
Table 11 shows the DOE estimates of electric utility capital needs
for the period between January 1,1978 and January 1,1985. These
estimates are based on the MEFS forecast of capacity and equipment require
ments for 1985 and 1990. It is assumed that the plant openings are spread
evenly over the period 1978 to 19.85. Capital expenditures are distributed
I-36

equally over a ten-year period for nuclear plants and over a seven-year
period for fossil fuel pl MEFS's capital need estimates are then
adjusted to exclude the capital costs incurred prior to January 1978 for
plants opening the forecast period. Conversely, capital costs
incurred prior to January 1, 1985 of
1990, are lncluded in the estimate. Since
ing between 1985 and
1~90 cutoff date is too
early to capture all of the capital costs incurred prior to 1985) it is
assumed tha t an equal number of plants \.!i 11 open bet'tJeen 1990 and 1995
as vJi 11 open beb'Jeen 1985 and 1990. To fae i 1 ita te campa ri son, the DOE
forecast is juxtaposed in Table 11 with the portions of the EW and BJK
projections falling within the MEFS forecast period. It should be noted,
however, that since the EH and BJK forecasts do not include 19-78, they
are biased slightly upward.
F. Other Estimates
The previous sections have presented several estimates developed
over the past 3 years of the future capital needs of the United States
electric pm'Jer tndustry. Hhile these estimates vary, all reflect the
impact of increased energy prices following the 1973 OPEC embargo; in
particular, reductions in sales and peak demand growth, Undesirably high
reserve margins, and reduced estimates of physical plant requirements.
Because of the ni.gher than anticipated 'inflati.on rate since 19.73, however>
recent forecasts of capi.tal need may not vary much from earlier estimates.
The latest forecasts also ac~ount more fully for capital expenditures
needed to meet anti-pollution requirements. Earlier forecasts, even if
they assumed that clean air and water restrictions \I/ould be implemented:>
could only guess at the timing and cost. It can be argued that the current
1-37

forecasts are still only guessing at the costs of anti-pollution equip-
ment~ Nonetheless, more cost information is available, and the timing
of the standards appears to be settledo
Despite these differences, comparison of the latest forecasts and
those of the recent past based on similar methodologies reveals a similarity,;
in capital needs estimates that seems puzzling. The early studi~sl higher
estiloates of electric utility grm'lth ought to yield higher estimates of
capttal need if the cost of capital remained constant. Costs, however",
increased rapidly beh'Je?n the early 1970 1 s and the COlThl1on base year of
this report, 1979. Moreover, capital costs to electric utilities were
increasing more rapid1y than the general inflation rate. Unfortunately~
data limitations have made it necessary for the purposes of this report
to adjust the results of these studies with general rather than differen-
tial inflation rates. Consequently) the estimates summarized in Table 12
understate the capital needs that would have been projected had it been
possible to fully adjust for the especially rapid increases in the cost
of electric generating equipment.
The results of several of the forecasts from the pre-1Q76 period are
summarized in Table 12. 16
1 D Hass
The Hass study covers the 13-year peri ad beh'Jeen 1972 and 1985
rather than the 12-year, 1979 to 1990 period which is the standard for
this study. To obta in a 12-year estimate from Hass I s research, ..,./e m; ght
assume that his projected expenditures are spread equally over 13 years.
Suhtracting one-thirteenth of the total expenditure would leave a 12-year
estimate of $578.7 billion in constant 197~ dollars. Alternatively,
1-38'

TABLE 11
UNITED STATES DEPARTMENT OF ENERGY FORECASTS OF ELECTRIC UTILITY CAPITAL NEEDS
January 1, 1978 to January 1, 1985
(billions of 1979 dollars}
Generation* Transmission & Distribution
Total
Hedium Case .$ 168.4 $ 60.3 $228 .. 7
Annual average
High Case
Annual average
Loltl Case
P.nnua" Average
Electrical World, 1979-1984
Annual Average
Boughman, Joskow & Kamat, 1979-1989
Annual Average
24. 1 8 .. 6
168 .. 0- 63.7
24.0 9 .. 1
159.8 53.8
22.8 7,,7
~L9.
14 .. 6
* Includes conversions to coal and oil/gas interchange, and scrubber retrofit.
32.7
231 .. 7
33 .. 1
213,,6
34 .. 5
34 .. 5
30 .. 0
Source: Energy Information Administration, Annual Report to Congress, Vol$ II (Washington, D.C .. : u.s. Department of Energy, April 1978).
1-:39

Hass 1972-1985
TABLE 12
SUMMARY OF FORECASTS OF CAPITAL NEEDS OF THE U.S. ELECTRIC UTILITY SECTOR MADE PRIOR TO 1976
RATE OF PEAK DEMAND GROWTH (%)
6.9*
CUMULATIVE ESTIMATE OF CAPITAL NEEDS (Billions of 1979 $) **
627.4
Templ e, Bay'ker & Sloane, Inc. 1979 to 1990 Baseline Forecast
National PmlJer Survey ~ 1979-1990
Baseline
All Electric
5.3*
5.8
3.6
9.4
543.2
542.8
260.3
1:.183.0
*Capacity growth rate is used because peak demand "is not available.
**Assumes 8 percent inflation in 1979.
Source: Jerome Hass, Edward Mitchell, and Bernice Stone, Financing the Energy Industry, (Cambridge: 1974), Ballingei Publishing Co.
Temple, Barker and Sloane, Inc., Economlc and Financial I~pacts of Federal Air and Water Pollution Controls on the Electric Utility Indu);try, Technical Report prepared for Environmental Protection Agency, Office of Planning and Evaluation, May 1976.
Federal Power Commission, National Power Survey, The Financial 9utlook for The Electric Power Industry: The Report and Recommendations of the Technical Advisory Committee on Finance, u.s~ Government Printing Office, December 19]4.
1-40

subtracting actual 1972 capital expenditures yields a l2-year estimate
of $600 billion. Because of Hass1s optimistic expectations about demand
growth, these 12-year estimates are much too high for the 1979 to 1990
period. However~ they offer a reasonable benchmark for capital needs in
any given 12-year period given Hass's assumptions. It must also
be remembered that whenever there was a choice alternative plausible
assumptions, Hass chose the one that would have the highest implicit or
explicit cost in order to lIascertain the extent to which financing
problems might seriously threaten the ability of the energy industry to
meet the demands placed on it." l]
Hass's methodology involves three distinct steps: estimating pro-
duction capacity growth and mix; estimating the cost of production
capacity and associated transmission and distribution facilities; and
combining the first two steps with an expenditure pattern to determine
aggregate capital expenditures.
He assumed a decline in the 8.1 percent average annual rate (1950 to
1971) of increase in production capacity to 6.9 percent, and a continuation
of the 6.9 percent average annual rate of growth in peak demand. 18 He also
assumed that the mix of production capacity would shift toward nuclear
generation--that between 1972 and 1990, 40 percent, and after 1990, half,
of all new production facilities would be nuclear. These assumptions are
not defended on cost or other grounds. However, they are comparable to
then-available NPS estimates that by 1980, 22 percent, by 1985, 32 percent,
and by 1990, 41 percent of total capacity would be nuclear.
Step two of the Hass forecasting procedure based the estimates of
the cost of capacity expansion on 1973 surveys of electric utilities.
1-41

These estimates were increased to reflect coal plant desulfurization costs,
thermal reduction apparatus for fossil-fired plants, and cooling facilities
for nuclear plants~ Transmission and distribution expenditures were then
calculated as 12Q percent of the cost per kilowatt of conventional plant
and totalled with generation capacity estimates.
Finally, Hass calculated aggregate capital expenditure based on the
number of kilowatts of capacity built, the cost per kilowatt of installed
capaci.ty each year, and the expenditure pattern. The number of kilowatts
built combined the assumption of capacity growth with replacements based
on a 30-year life and the ~istorical growth rate of 7 percent. To reach
a final cost estimate, Hass assumed that expenditures would be spread
equally over five years. He recognized that the actual outlay period is
longer than five years, particularly for nuclear plants, but argued that,
lithe rate of outlays is much higher in the last years of installing these
plants; thus, the five years seems a reasonable estimate when combined with
the assumption of equal payments each year. 1I19
2. Temple, Barker and Sloane
The Temple, Barker and Sloane (TBS) forecast is based on a model
initially constructed to provide projections for the Technical Advisory
Committee on Finance of the 1973 National Power Survey. The model has
three principal components of II modules ll: environmental, physical and
financial. The general economic conditions and any other factors that
determine the demand for electricity are considered exogenous to the
model. Consumers l peak and average demand, target reserve margins,
equipment mix, power drain, and the impact of pollution abatement regu
lations on generating efficiency are assumed and combined to determine
capital needs.
I-42

The primary function of the environmental module is to introduce
the assumed values of the modells exogenous variables. These include
annual sales, peak demand growth, current and future pollution control
requirements, operating and equipment costs 3 and the proportion of new
nuclear capacity. TBS assumes an average annual growth rate for both
electric sales and peak demand of 5.3 percent over the 1979 to 1990
period. Their estimates of capital needs for the early 1980's, however,
are influenced by a forecast of construction starts in the late 1970's
that is based on an even higher assumed growth rate (~han that projected
for 1979 to 1990).
The physical plant and equipment module determines the amount of
generation capacity necessary to meet the demand assumptions at any time.
In addition to demand level, the capacity calculation depends on desired
reserve margins, and on various factors affecting generating efficiency
as well as on retirements of old generating units. There is apparently no
adjustment built into the model to allow for regional differences. The
number of new plants assumed to be in construction at any time depends
on the forecast of total additions to capacity, adjusted for the construc
tion lag which differ by type of plant. The average construction lag is,
therefore, a function of the assumed future mix of the various types of
generating capacity.
The financial module of the TBS model converts physical capital needs
to financial needs based on the proportions of conventional and nuclear
plants to be built, the cost per unit of each type of asset, and the
schedule of payments required by contractors while the plants are under
construction. I-43

The TBS model is continually revised, updated and reused. Despite
the fact that it is among the most detailed models of the electric power
industry available, however, its usefulness as a forecasting tool is
limited. Since it is a recursive model, its results are heavily influenced
by the initial assumptions. It is, theref~r2, probably best to think of
the TBS procedures as being automatically calculated rather than IImodeled."
In addition, the TBS model has no provision for changing relationships
among capital expenditures for generating, and transmission and distribu
tion facilities. The study identifies the share of total capital expendi
tures needed for transmission and distribution, but gives no indication
of how capital requirements for. these purposes have been determined.
Furthermore, the model has limited value in analyzing regional capital
needs, since it is unclear how it accounts for regional differences. This
is especially troublesome given the shifting population and growing grid
systems across the country and the likelihood that reserve margins will
vary widely across regions.
3. The National Power Survey
By presenting a range of eight forecasts, three of which are included
in Table 12, the 1974 National Power Survey (~PS} projections provide a
benchmark from which the impact of the slower rate of growth on capital
needs can be judged. The alternative NPS forecasts summarized here are
their baseline, all-electric, and low-growth projections. In retrospect,
the low-growth alternative may have been the most realistic.
All of the NPS forecasts for capital needs of the electric utility
sector are based on the TBS model. However, these forecasts differ
significantly in their assumptions relating to the growth in peak demand,
1-44

the rate of construction cost escalation, and the impact of environ
mental requirements on capital costSe The NPS projections also tend
toward the high side because they are based on expectations of more rapid
growth in the 70's than actually occurred.
NPS's baseline forecast incorporates growth rates in peak demand that
in 1973 were considered to be moderately high. Today they would be con
sidered far too high~ For the 1976 to 1980 period, (the decision period
for capital expenditures in the early 80 1 s) NPS assumed that peak demand
would grow at an average annual rate of 6.5 percent, declining to 6.0
percent between 1981 to 1985, and 5.5 percent between 19.86 and 1990.
Construction cost escalation was assumed to follow what was labeled the
"highll path, or about double the rate of increase assumed for the GNP
deflator. For generating plants this meant a cost escalation of 7.5
percent per year between 1976 and 1980, falling to 5 percent thereafter.
Transmission and distribution costs were assumed to increase at an
average annual rate of 5 percent throughout the period. Looking back,
of course, NPS·s "high ll construction cost escalation estimates seem
rather modest.
Projected envttonmental protection costs are a third major source of
difference among the NPS alternatives. The baseline assumptions are that
these costs, which include cooling towers for fossil and nuclear plants
and flue gas desulfurization (scrubbers), will follow a 1I1 ow" path of
increase (i.e., a 507-percent annual rate of increase between lS76 and
1980, and a 3-percent rate thereafter).
As in the baseline case, NPSis low-growth alternative also seems
to lead to over-estimated near-term capital needs. It assumes an average
I-45

annual growth in peak demand between 1976 and 1980 of 5 percent, which
would lead to an overstatement of the requirements for the early 80's.
However, the assumed growth rate falls to 4 percent between 1981 and 1985,
and 3 percent between 1986 and 1990. It is, of course, still too early
to know what the actual capital needs will in the late 80's, but the
assumed growth rate for the entire decade of 3.5 percent makes the NPS
low-growth alternative a reasonable long-term guide, all other things
being equal. The construction cost escalation path assumed for the low
growth alternative is the NPS "10w ll path, which assumes that construction
costs in the 1980·s will rise at an average annual rate of 3 percent, less
than the rate of increase assumed for the GNP deflator. Environmental
costs follo\'J the "high" path which assumes an annual rate of increase of
about 5 per'cent, somewhat above the assumed overall inflation rate.
Despite the low-growth alternative's relatively high assumed growth
in peak demand for the late 70's, it is interesting to note that its
estimate of average annual capital need in the 80 l s is $23.6 billion.
If it is assumed that the low-growth case generates constant annua1
capital needs over the 1979 to 1990 period, this $23.6 billion estimate
is about equal to the more recently prepared forecasts for 197~.
The NPS all-electric alternative is considered here for purposes
of comparison. It is based on an assumed 8.0 percent annual rate of
increase in peak demand through 1980, 10 percent between 1981 and 1985,
and 9 percent thereafter. Construction costs increases are assumed to
follow the high path, and environmental protection costs, the low path.
To make the NPS forecasts comparable to the others discussed in this
report it was necessary to convert NPS's current dollar estimates into
1-46

constant 1979 dollars$ In all of the other cases, the conversion to 1979
dollars was made easier by the fact that the forecaster had reported
the results in constant dollars, so only the base year had to be adjusted.
Since some prices were assumed rising faster than the GNP deflator
and others more slowly, the estimates given in the table should be viewed
as only apprOXimations of the NPS result. It was also necessary to
adjust the forecast period to make the' results comparable. The NPS
results for the forecast period of 1980 to lSS9 were extrapolated fore
ward and backward one year to derive the 1979 to 1990 forecast reported.
Although NPS did not report annual estimates of electric industry capital
needs, which probably increase over time, any bias introduced by extrapo
lation at one end is probably offset at the other end.
III. CONCLUSIONS
Forecasting the capital needs of the electric utility sector of the
United States has become increasingly sophisticated over the decade of
the 70's. Pre-1975 forecasts, such as NPSls and TBS·s are primarily
determined by exogenous assumptions. The most recent forecasts,
(e.g.) BJKis or ORIls are still dependent on their assumptions, but
they allow far more interaction among variables. The ORI forecast ;,s
per~aps the most independent of its assumptions since it is based on a
simultaneous model that allows the preliminary results to feed back on
the initial conditions. The BJK model, although based on externally
assumed economic conditions, determines demand internally and bases the
distribution of plant type on cost factors and construction lags rather
than the assumed continuation of existing relationships. The DOE model
I-47

is the most detailed, even though it currently relies on assumed macro
economic conditions. It is probably also the most responsive to factors
that affect the supply and demand for all types of energy products.
Throughout the 19]9 to 1990 period, however, because of the lags between
initial planning and completion, all of the forecasts are heavily influenced
by announced plans, work in progress, and the assumed rates of postponement
and cancellation.
Perhaps the most striking conclusion of this analysis is that the
estimates of capital need are relatively consistent irrespective of the
estimation procedure. The EW subjective forecasts, the DRI simultaneous
model, the BJK recursive model and the DOE linear programming model produce
remarkably similar results. The variations that do exist seem to be
primarily a result of differences in assumptions. Among the most important
of these assumptions are the rate of increase in electric sales and peak
demand, the mix of plant type, and assumed reserve margins.
A. Sales and Peak Demand
Regardless of whether the overall forecast is subjective or produced
by a model, or whether the peak demand is assumed or derived,conclusions
about peak demand are crucial to estimating capital needs. In most cases,
the rate of growth in peak demand is either assumed or it is derived from
an assumption or estimate of electric sales growth. 20 In those cases
where peak is estimated on the basis of projected sales, the conversion
usually depends on an assumption that load factors will continue at
historic levels~ Of the forecasters discussed in this report, only the
Electrical World estimates electric sales and peak demand separately.
EW, along with BTC, also predicts a deterioration in the load factor
over time. I-48

EVen though the more recent forecasts incorporate peak demand growth
rates which are significantly below those of earlier forecasts, some of
these estimates of peak demand may still be too high. If peak demand
grows more slowly than anticipated, capital needs the utilities
will be reduced and reserve margins will nue to increase. In the
short run, this could further delay plants in progress, or even result
in some projects being abandoned. In the longer run, projects on the
drawing boards might be postponed if not cancelled.
A recent study of the economic impact of alternative energy supply
and demand assumptions by the Congressional Research Service of the
Library of Congress indicates that 5 percent growth in electric sales
and peak demand is the most that can be reasonably expected through
1990. 21 Estimates of more probable rates of future growth range between
4.1 and 4.3 percent per year, depending on assumptions about conservation,
and oil prices, and availability. This conclusion is roughly consistent
with the growth in peak demand projected by the more recent forecasts
which range between 3 and 5 percent. Despite this general consensus,
however, there is still considerable debate over the rate of future
demand growth, with one side predicting an increase from the current
"depressed" levels back toward 5 percent per year or more, and the
other predicting growth rates between 3 and 4 percent. So long as high
growth rates are expected, generation capacity will be increased to meet
expected demand regardless of today's actual need. In all probability,
these plants will then be brought on line regardless of actual demand.
B. Plant Mix
Another major determinant of differences in recent capital needs
forecasts is the assumed mix of new generation plant between conventional
1-49

and nuclear facilities. Of the studies reported here, the most thorough
analysis of plant mix was done by BJK and DOE, although all of the estimates
are heavily influenced by announced plans and work in progress. Table
13 summarizes the forecasts of nuclear generation capacity in service
for several of the included studies. The b~pakdown ;s shown for only
one of the older studi.es eTBS) to provide a means of gauging the impact
of the reduced growth rates and skyrocketing nuclear construction costs.
TABLE 13
FORECASTS OF NUCLEAR GENERATION
CAPACITY AS A PERCENT OF TOTAL CAPACITY
FORECAST 1980 19-85 19.9D 19.95 2000
BJK 13 17 20 26 31
EW 11 16 20 30 na
DOE (Medium) na 19- 25 na na
DRI 11 16 20 na na
TBS 16 22 28 na na
na: not available
Source: See text.
The recent estimates are of actual capacity in service, and there
fore do not include nuclear facilities that are under construction, but
have been postponed or delayed. The similarity of the estimates through
1985 is a reflection of the reliance placed on announced plans and work
in progress in estimating additions to generation capacity. Moreover,
I-50
since the EW and DR! estimates for 1980 were completed most recently,
they therefore reflect the most recent ays, postponements and can-
cellations. 22 The DOE estimates are based on a linear program that is
economically indifferent to new coal and new ear facilities. The
arbitrary selection between these alternatives by the model reflects the
difficult real world choice of utility executives. The model, however,
unlike the executives, can fall back on announced plans in resolving the
dilemmas
In view of the recent nuclear accident at Three Mile Island,
all of the projections of future nuclear generation must be reconsidered.
All of the plants scheduled to open by 1985 are probably fully committed
although unaccounted-for construction problems could delay commisSioning.
Construction plans for 1990 and later may be more flexible. Some plants
may be cancelled completely, while it may be possible to convert others
to alternative fuels. If it is proven that the Three Mile Island accident
was caused by avoidable human error and that new safeguards can prevent
a recurrence, there may be no need to adjust present estimates. Indeed,
in response to President Carter1s energy message--it is even possible that
nuclear generation may be accelerated.
C. Reserve Margins
Other differences among the recent capital needs forecasts reflect
different notions about an appropriate target for reserve margins. Only
the OR! model allows reserve margins to vary across the regions, and to
fall as low as 15 percent. 23 As the capital needs of the electric utilities
increase, reserve margin targets of 20 percent or more for all regions
may be a luxury that the economy neither needs or can afford. As the
I-51

industry adjusts to lower margins, capital needs for generation capacity
will decrease, although capital requirements for distribution facilities
may rise. These adjustments will be more likely if rising conventional
fuel prices force increased construction of nuclear generating capacity,
which for environmental and safety reasons is generally located in remote
areas.
Reduced reserve margins do not necessarily imply reduced reliability.
EVen though the current reliability standard of one outage in ten years
may seem impractically high, in view of the increasing costs of energy, it
may be possible to maintain this standard through interties in and power
sharing arrangements. An outage in one region could be covered by excess
capacity in another in the same way i.ndividual companies and neighhoring
regions currently share power. There would undoubtedly be some risks to
such a system, but these would have to be measured against the benefits
of requiring less capital.
Finally, Table 14 summarizes the aggregate forecast of capital needs
for each of the more recent studies included in this report and briefly
characterizes them. The average annual rate of growth in peak demand is
included as a rough guide to the assumptions behind the forecast, but
should not be interpreted as the sole determinant of capital needs.
I-52

TABLE 14
SUMMARY OF FORECASTS OF CAPITAL NEEDS OF ELECTRIC UTILITIES
CAPITAL NEED RATE OF
(billions PEAK DEMAND TIME PERIOD of 1979 GROWTH FORECAST
FORECAST FORECAST do 11 ars ) (percent) CHARACTERISTICS
BJK 1979-1990 453 4. 1* A
BTC 1979-1982 114 5.2* B
DOE 1979-1985 229 4.8* C (reference)
DRI 1979-1990 451 3.2* D
EW 1979-1990 582 5.0 E
A. Analysis of electric sector of the U.S. economy based on assumed macroeconomic trends.
B. Analysis of energy sector of the U.S. economy given assumed macroeconomic conditions.
C. Analysis of energy sector of the U.S. economy given alternative ORr macroeconomic conditions.
D. Analysis of energy sector of the U.S. economy, based on conditions generated by linked macroeconomic model.
E. Subjective analysis of electric utility sector based on independent estimates of macroeconomic conditions.
*estimates (not giv~n in study)
Source: See text.
I-53

1 .
2.
3.
4.
5.
6.
7.
8.
9.
10.
11 .
12.
FOOTNOTES
External financing refers to all funding outside of a company1s own contribution from earnings.
Jerome Hass, Edward Mitchell, and Bernell Stone, Financing the Energy Industry (~ambridge, Mass: aallingert, p. 84.
Bankers Trust Company, U.S. Energy and Capital: A Forecast 1978-82 (978), po 17 e
McGraw Hill, Electrical World, 2Sth Annual Electrical Industry Forecast, (September 15,1978). This conclusion is indicated by a comparison of the data in Table 1 on external financing and the information on external and internal financing shares reported by Bankers Trust in U.S. Energy and Capital, p. 21. As Table 2 suggests, however, since 19]2 these expenditures have increased very modestly as a share of total business expenditures for new plant and equipment.
ORIls forecast, which was made available for the purpose of this study, is not available to the public.
Electric Power in the United States: Models and Polic Anal sis Cambridge, MIT Press, forthcoming.
Energy Information Administration, Annual Report to con~ress Vol. II (Washington, D.C.: U.S. Department'ot Energy,pril 1978).
Electrical World predicts that real GNP growth will slow in 1979 from its 1978 pace, but does not anticipate a recession. Most of this slowing is a result of a decline in the rate of growth of consumer spending that is not made up by other sectors.
A previous study by Bankers Trust modeled the capital needs of energy industries-through 1990 to test the assumed capahilities of the capital markets, but did not attempt to forecast conditions as they are likely to be.
BJK have made available for use in this study a draft of Chapter ~ which discusses financing the future growth of the electric power industry.
These assumptions include an interest cost of new deQt of a 8.5 percent, an allowed rate of return on equity of 14 percent, a maximum proportion of debt allowed in the capital structure of 55 percent, and an interest coverage ratio that does not fall below 2.00.
See: Federal Energy Adminjstration, Project Independence Evaluation System, Docum~ntation: (Washington, D.C., 1976-1977), 14 Vols.
1-54

13. For a complete list of all the assumptions going into the DOE estimates, see: Energy Information Administration, Annual Report to Con ress, 1977, Volume II, A endix, Summar Data Inputs and Forecasts for 1985 and 1990 Washington, D.C.: U.S. Department of Energy, September 1978 ),pp:- 9-22.
14. For a complete list assumed load duration curves by region and other data inputs, see Ibid, . B70-B93.
15. The following capital cost assumptions are national average values whicb are assumed to be the same as DOE Region V. The estimates are designed to reflect the cost of the average plant of each type delivered on December 31, 1984. These estimates include AFUDC t8X} and labor cost increases of 6.5 percent annually in nominal terms. The values for nuclear plants are national averages and not from DOE Region V.
Nuclear Coal with Scrubber Bituminous Sub-bi tum'j nous
Coal without Scrubber Bituminous Sub-bituminous
Combined cycle Simple cycle Oi 1 Scrubber retrofit
$795
600 640
485 525 340 180 450 155
16. These results have been adjusted to 1979 dollars using the Gross National Product Implicit Price deflator, and are shown along with an estimate of the overall rate of growth in peak demand over the relevant forecast period in order to provide a basis for comparison. The actual GNP deflator is used for 1975-78. Estimation of the 197~ deflator assumes an 8 percent rate of increase. The inclusion of this estimate of peak demand growth, however, should not be interpreted as an indication that the forecaster based the estimate of capital needs only or primarily on peak demand.
17. Hass, 2.2.- cit., p. ,.
18. At the time, the 1970 National Power Survey (NPSl was forecasting a 6.0 percent rate of growth. A 6.9 percent estimate was generally throught to be high but conceivable.
19. Hass, Q2.. cit., p. 118.
20. The DOE model achieves this distribution through an assumed load distribution curve based on historical data.
21 . Alvin Kaufman, Warren Farb and Barbara Daly~ Enerq~ and the Economy, Subcommittee on Energy and Power, lComml1>ee on Interstate and Foreign Commerce, U.S. House of Representatives, April 19.78).
I-55

22. In determining the amount of capital needed for these additions to capacity, the forecasts differ because of different assumptions about the construction cost per kilowatt hour.
23. Differences in estimates of capital need that arise from divergent reserve margins, however, would become even more significant as the forecast period is extended.
I-56
PART II - REGULATORY RESPONSE TO THE
INFLATIONARY ENVIRONMENT: SOME
COSTS AND GAINS*
*This report was prepared at the National Regulatory Research Institute at The Ohio State University. The views expressed are those of the authors, Dr. Douglas N. Jones, Professor of Regulatory Economics; w. David Duran, Economist; and Curtis Odle, Economist) and do not necessarily reflect those of the Institute.


TABLE OF CONTENTS
LIST OF TABLES AND FIGURES
I. INTRODUCTION ..... .
II. DEVICES AND PRACTICES
A. Devices
1 . Automatic Adjustment Clauses and Fuel Adjustment Clauses . .
2. Construction Work in Progress and Normalization
3.
4.
Accounting
Normalization and Flow-through; Accelerated Depreciation and Investment Tax Credit .
Rate Base Va1ua~ions and Rate-of-Return Determinations ....
B. Practices
1. Future vs. Historical Test Years.
2. Pancaking, Interim Rates, and Time Limits
3.
4.
Internalizing External Costs ...
Capital Attraction and Risk Avoidance
III. GAINS FROM COSTS .....
A. Convergence of Market Value on Book Value
B: Price-Productivity Relationships
IV. REGULATION IN A RETURN TO RELATIVE PRICE STABILITY.
A. Wage and Price Guidelines
B. The Guidelines "Applied ll •
c. Is Turnaround Fairplay?
FOOTNOTES TO PART II
II - i
. . i i
.
• 1
· 2
· 3
3
7
· 8
10
12
12
13
13
14
17
18
34
40
40
41
55
57

Table 1
LIST OF TABLES AND FIGURES
General Rate Increases and FAC Revenues in the E1 ectri c and Gas Sectors, 1974-1977 . . . . . .
Table 2 Ratio of Market to Book Value of Forty Utility
Page
5
Stocks, 1970 to 1978 Taken Annually in August ...... 19
Table 3 Percent Change in Ratio of Market to Book Value of Forty Utility Stocks, 1970-1978 Taken Annually in Augus t . . . . . . . . . . . . . . . . . .. 20
Table 4 Percent Change in Earnings per Share 22
Table 5 Percent Change in Dividends 23
Table 6 Average Pri ce- Ea rni ngs Ratio (High + Low Divided by 2) . 24
Table 7 Percent Rate of Return on Common Stock Equity ...... 25
Table 8 Percent Change in Rate of Return on Common Stock . 26
Table 9 Percent Rate of Return on Rate Base 27
Table 10 Percent Change in Rate of Return on Rate Base .... 28
Table 11 Average Annual Growth Rates in Productivity for a 11 Persons and Labor Producti vi ty in the Gas and Electric Industry .................. 35
Figure 1 Consumer Price Index, Gas and Electric Price Index and Production Worker (Gas and Electric) Output per Man Hour .................. 37
Figure 2 Consumer Price Index, Index of Output (Gas and Electric) and Employee Output per Man Hour (Gas and Electric) .............. .
Table 12 Average Annual Growth Rates of the Consumer Price Index (CPI), the Gas and Electric Price Index (GEPI), Employee Output per Man Hour in the Gas and Electric Industry (EO), and Production Worker Output per Man
. . 38
Hour in the Gas and Electric Industry (PO). . . . .. 39
Table 13 Electric and Gas Utility Rate Increases (Averages) Requested and Granted in 1977 By States. . . . . . 44
Table 14 Electric and Gas Utility Rate Increases (Averages) Pending Before State Public Utility Commissions, Dec. 1977, by States .................. 48
I I - it

Table 15 Electric and Gas Utility Rate Increases in 1977 -Actual and If the President's Anti-Inflation
Page
Guidelines Had Applied (Millions of Dollars) ...... 52
Table 16 Electric and Gas Utility Rate Increases Pending in 1977 - Requested and If the President's Anti-Inflation Guidelines Had Applied (Millions of Dollars) ......... . . . . . . . . . . . . . 54
II - iii


I. INTRODUCTION
With the posstble exceptton of the weapons acquisition process in the
national security field, no sector in the U,S. economy has been so often
characterized as "inherently cost<:"pluslJ as the public utili'ty fi'eld; nor
;'s this to be decried. Public uti'lity regulation has historically placed
great emphasis on cost, and where all legitimate business expenses are
recoverable one~for-one from essentially captive customers this preoccupation
is entirely appropriate, For this reason the current renewed attention to
costs as exemplified in legislative (e,g., the National Energy Act), regulatory
(e.g., time-variant cost determinations), utility (e.g., load management devices),
and academic (e.g., marginal costing), activities should be applauded.
Emphasis on rates (or prices) that Utrack costs'! is widely agreed to
be the right pursuit. The main alternattve--value of service pricing--
while having special occasional usefulness in public utility rate design,
carries with it special disadvantages in precision and equity. It should
be mentioned too that Ilcost-plus ll as used in describing public utility
pricing need not be a pejorative term. In an idealized world of commission
regulation, the overall revenue requirements for utilities should just cover
all allowable costs of doing business, including debt service, and a fair
return to useful capital actually (and prospectively) invested in the business.
What this requires is a toughminded scrutiny of utility costs (and especially
changes in costs) by regulatory commissions as well as a forward-looking
analytical capability for judging consumer demand and appropriate utility
company responses to meet that demand. It requires an informed balancing
of short-term and (at least) near-term interests of ratepayers and share
holders where those interests diverge and are ~on-coincident. The pejorative
use of the term comes when perc~ptions are that regulatory commissions are
11-1

merely a condutt for "passtng on U to ratepayers in an uncritical or
unexamined way all pri'ce increases asserted to be faced by the utilities
they regulate.
It is probably true that public attention to the regulated sector is
generally related to the state of the national economy~ In "'good times,1I
by which is meant rising real incomes, declining unemployment, relatively
stable price levels, and regular productivity gains, there is understand
ably less of a focus on this orderly and essential sector. But in ~bad
times,1I like the depression of the 1930's and the sustained inflation of
the last half of the 1970~s, there is great attention to the behavior of
the utility field. The regulatory response to this current period of
intense and persistent upward pressures on prices is the central subject
of this report; the possible regulatory response on the downside of price
s~/ings is a secondary subject.
The approach here is to first identify the main mechanisms and practices
that commissions (and sometimes legislatures} have devised and adopted in
response to a decade of inflation; second, to attempt to describe in a general
way the costs and gains of this response; and third, to suggest the outlines
of what the regulatory response might be when the economy returns to a period
of relative price stability,
II. DEVICES AND PRACTICES
The categorization of particular regulatory devices as occasioning costs
or gains to the several parties to the regulatory process is judgmental at
best - especially if the element of time is considered. Still more elusive,
but less consequential, is a distinction between regulatory IIdevices ll and
"practices. 11 But for our purposes the notion of costs (and gains) will be
from the vantage point of the ratepayer and the public administrator and will
11-2

lnclude both monetary and non-monetary "costs. 1I The devices that are held to
have placed the greatest near-term costs on regulation in the sense used here
are fuel adjustment clauses and other indexing arrangements (like the New
Jersey comprehensi.ve adjustment cl ause and the Ne~" Maxi co cost-of-service
index provision); construction work in progress; normalization accounting
treatment for investment tax credits and accelerated depreciation; repro
duction cost new and fair value rate base valuations (over original cost
and prudent investment methodologies); and emphasis on rate-of-return
on equity over the rate-of-return on rate base standard.
A. Devi ces
The main devices that can be fairly arrayed on "the cost sidell include
increased use of future test years in cost-of-service calculations; allowing
of pancaking of rate increases; use of i.nterim rates; compressed time limits
on commission deliberattons; a quest for near-zerq regulatory lag; internal-
izing external costs to the utility; and emphasis on the capital attraction
standard (~nd risk avoidance) in ratemaking. Other lesser devices and
practices that now characterize commisslon regulation will he discussed
as well in terms of their contribution to costs and gains in an infla-
ti.onary envi.ronment.
1. Automatic Adjustment Clauses and Fuel Adjustment Clauses (AAC's and FAC's[
Recall that definitionally an Me is a provision in a utility company's
rate schedule which allows a change i.n a particular cost item to be auto
matically (j.e., without commission hearings) reflected in the rates charged
customers. By far the most common and now most burdensome MC is that on
fuel cost changes, though utility companies continue to propose other AACls
for changes in labor, taxes, interest and other costs of doing business.

Cases on the subject date back at least to World War II. Even after that
time (ftnd until quite recent years} FAC's were generally limited to industrial
rate schedules and did not apply widely to residential consumers. That has
now changed and nearly all states have MC's and FAC's in one form or another
with the blessing of the Federal Energy Regulatory Commission (FERC). Some
125 utilities began using FACls in residential customers tariffs during
the mid-1970 ' s wi.th 63 of them starting in 19.74 alone. The main purpose of
an MC i.s to reduce so-called IIregulatory lag ll during periods when costs
are rising rapidly: the main objection is that such arrangements may be
incompatible with vigorous and effective rate regulation in the public
interest.
For the 25-year period 1948 to 1973 the rate increases granted utilities
by state and local juri.sdi.cti.ons totaled $6 billion. In the first year
after the oil embargo (1974) consumers paid $9.6 billion attributable to
general rate increases ($3.1 B) and the operation of FAC's ($6.5 billion).l
FAC revenues in 1973 accounted for $1.5 billion in revenue.
Table displays the dollar amounts 2 of general rate case increases
granted in the utility industry under state commission regulation for the
years 1974 through 1977 together with revenues attributable to the operation
of FAC's over that period (for both electric and gas). The importance of
FAC charges to utility revenues is indicated in part by the facts that
the average shown here 1S some $9 billion per year; the FAC amount is 3
times the rate i.ncrease amount f6r the period; and in one period (1976-
19]7) the amount of general rate increases declined by $0.7 billion, while
FAC amounts increased $1.4 billion. The cited survey also found that in
15 states FAC charges added more than $100 million to electric revenues
and that FAC's accounted for more than 20 percent of electric receipts in
1I-4

a dozen states~3 And this was at a time when state commissions were
granting Can average for the two-year period 1975-1977) 50 percent of the
amounts requested by utilities in rate cases, as against the two-thirds
IItypically" granted annually in recent years.
Year
1974 1975 1976 1977
TABLE 1
GENERAL RATE INCREASES AND FAC REVENUES IN THE ELECTRIC AND GAS SECTORS, 1974-1977
Totals
(In Bill i.ons of Dollarsl
Revenues Attributable to FAC's
$6.5 8~5 9.6
11 . a
$35.6
Source: Footnote 3
General Rate Increases
$3. 1 4. 1 3. 1 2.4
$12.7
The point here is simply that the proliferation and workings of fuel
adjustment clauses in utility tariffs over the past seven years have, in
general, yielded the revenue needed by the companies to maintain their
financial positions. This was the stated object of FAC's, and despite a
rocky road of consumer outcry, quarrels over what should and shouldn't be
included in FAC's, the occasional outrtght "horror story"; on-going diffi
culties in verificatton and monitorship; and legitimate questions about
the compati.bility of automatic adjustment charges with full and open
regulatory proceedings of the evidentiary variety, it seems fair to
conclude that, in a rough way, FAC's worked for this period.
A related devi.ce with similar i.ntent are several indexing schemes
that have emerged--the most widely known being the New Mexico Cost-of
Service Index (COSI) now extended into its fourth year of operation.
11-5

Recall that this mechanism focuses on returns to equity and (in the case
of Public Service of New Me.xicol is supposed to result in a 14 percent
rate of return on allocated coronon equity capital Cat book value) after
payment of all other cost of service. To achieve and maintain this net
rate of return, automatic quarterly (now annual) adjustments in all base
service rates were made to reach the nearest edge of the allowed range
of 1/2 percent either side of 14 percent. Thus a return anywhere between
13.5 and 14.5 percent requi.res no adjustment in the succeeding period; a
return above the upper limit requires a downward per kwh adjustment of
rates to the upper limit; a return below requires an upward adjustment
to the lower limit (not the middle) of the band. Importantly, fuel costs
and purchased gas adjustments operate outside of COSIo
In December 19]9., th.e New Mexico Commi.ssion concluded that, on
balance, the methodology achieved its two primary objectives--lIreduction
of capital costs and the enhancement of PNM's ability to attract capital ll•4
Accordtngly, while still viewing COSI lias an experiment,1I the Commission
extended i.t conditional on correcting some of the revealed deficiencies of
the plan; e.g., inadequacy of reporting and procedural safeguards, overly
burdensome to staff (instead of saving staff time), insufficient regulatory
oversight by too frequent adjustments, inappropriate treatment of certain
interest income and allocation factors,.5 A recently published report of
The National Regulatory Research Institute concludes:
On balance, it would appear that COSI has provided PNM with a temporary financial advantage that now seems to be past; increased, rather than decreased, regulatory costs; had no real impact on cost control or over-building; and has not resulted in PNM earning its mini'mum rate of return. It would thus appear that thgre is no advantage to the adoption of COS! by other jurisdictions.
11-6

The most recent notable wrinkle in automatic adjustment clauses
is the Michigan Indexing Method introduced in 1979. 7 The Michigan
Public Service Commission order allows a company to make an annual
(every February) automatic adjustment of operating and maintenance
expenses (other than fuel and purchased power costs) in accordance
with changes in the national Consumer Price Index, Qualifying
increases would appear as a kWh surcharge on customer bills; increases
greater than the CPI would be charged below the line. The idea is
that by making automatic revenue adjustments contingent on' retail price
changes in the economy rather than on utility-incurred costs, there may
be external pressures on company management to ilout-performll (or at
least perform as well as) the CPl. It is estimated that about two-thirds
of utility costs would be recovered under this scheme without the require
ment,of a rate hearing.
However all this may be, the fact of automatic adjustment clauses
with the support they draw from utilities and opposition from ratepayers
in the first instance and the switching of positions that des~ribes the
stances of the two parties when AAC1s are attempted to be made more
stringent (like fuel cost disclosure) indicate that at least in the near
term, such devices are a blessing to the utilities in periods of sustained
inflation.
2. Construction Work in Progress (CWIP) and Normalization Accounting
Historically the "used and useful in doing business ll test precluded
the allowance of CWIP in the rate base. At least into 1976 the Federal
Power Commission and many st~tes disallowed inclusion of CWIP in the rate
base of utilities. Instead, allowance for funds used during construction
11-7

(AFUDC) was typically the approved method. The AFUDC approach provides
a non-cash item of IIcurrent income" that the utility adds onto the cost
of a facility when it is completed; the CWIP approach allows the company
to earn on lithe assetll along the way before it ;s in service.
The argument was that AFUDC was perhaps an acceptable procedure
where the overstatement of current income (and hence cash flow) was a
relatively small proportion of reported earnings. Once AFUDC came to
represent one-third of utility net income, as had happened by 1974, the
illiquidity (and other financial) problems for the industry became acute
in the face of major, costly, continued construction.
That the FPC and subsequent state commission inclusion of CWIP in
rate base makes a great difference is evidenced by (for example) a
Library of Congress study that concluded that overall rate levels would
rise about 9 percent (by swapping AFUDC for CWIP) and an FPC economic
report that estimated the cost for the period 1975 - 1979 to be $22
billion if all states and the FPC adopted CWIP. 8
What can be said for our purposes here is that of all the arguments
of utility proponents of CWIP (the municipals and cooperatives have
generally opposed CWIP), probably the least persuasive is that rate
payers ultimately would pay less under this arrangement. CWIP is, in
fact, another regulatory response to inflation of particular helpfulness
to the utilities.
3. Normalization and Flow-through; Accelerated Depreciation and Investment Tax Credits
Normalization and flow-through are two typical methods of accounting
for the main government subsidy provisions in the Internal Revenue Code
now applied to utilities - accelerated depreciation (AD) and the invest
ment tax credit (ITC). Briefly put, under the flow-through method the
1I-8
benefits of the tax reduction deriving from AD and/or ITC are immediately
passed on to the ratepayer in the form of lower rates (since taxes as an
operating cost are reducedl. Under normalization, the benefits to the
utility are an increased cash flow through deferred tax payments while
charging the deferred cost to ratepayers.
As to the effect on rates, critics of normalization accounting argue
(among other things) that ratepayers are hurt by payi.ng rates that include
taxes all year long only to have. the utility not pay them at tax time as
the util ity· s tax 1 iabil ity is reduced--orindefinitely deferred. Proponents
assert that normalization lowers rates lIin the long run. 1I The sums involved
are very large. Electric uttlity indus.try spokesmen themselves estimate
that normalization leaves with utilities an extra $3 billion annually in
"internally generated funds. Jlg
The whole question of so-called IIphantom taxes" occurring through
use of normalization accounting applied to accelerated depreciation and
investment tax credits in determining a utility's federal income tax lia-
bility is admittedly an extremely complex one. AD and ITC were originated
by the Congress as part of a macroeconomic policy to spur the u.s. economy
forward. Their application to the public utility sector, where investment
decisions are supposed to be made primarily on need (and not on the artifi
cially created opportunity for lower cost moneyl and where state public
utility commissions hi.storically decided on what accounting methods would
be allowed utilities under their jurisdiction, was perhaps less well thought
out than it mi.ght have been. While not quite an lI afterthought,lI it is clear
that the Congress' focus was not on this sector. 10 In all events, once
the ITC and AD provisions were decided to be applied at all to public
utilities and subsequently to apply with the same full force as to the
II"'9

rest of the private sector, these devices became sources of benefits that
investor-owned utilities would understandably be slow to give up.
While it should be mentioned that at this writing the California
PUC has so far successfully struck down the combination of normalization·
with AD and ITC for utilities under its jur1sdiction, the issue is in
the appeals courts and is being carefully watched by other commissions.
Also the National Association of Regulatory Utility Commissioners recently
(March 1979) testified against normalization as Ilbad anti-inflation policy,
bad energy policy, and bad regulatory policy."ll Yet, as of 1978, the vast
majority of jurisdictions (about 40) permit utilities to keep the tax
benefits through normalization.
There seems little argument that these particular accounting and tax
features are additional devices made available as a regulatory response to
inflation, though their legislative origins were quite different from that.
4. Rate Base Valuations and Rate-of-Return Determinations
The old issue of valuing the rate base of a uti1ity by the Reproduction
(or Replacement) Cost New method or the Original-Cost-Plus-Improvements
Minus-Depreciation method is currently relatively quiet; but it should be
remembered that in periods of declining prices the utilities generally
favor the latter and periods of sharply rising prices generally advocate
the former. Actual changes in methods allowed can and do go either way-
Oh.io, for example, having recently become an Original-Cost state. Still,
it is felt by some that the new push for the use of marginal cost, over
imbedded cost, tn rate design is the current counterpart to the earlier
argument.
11-10

However this may be, it is clear that \·/here marg'inal cost is running
ahead of average cost fO'r sustained periods and sometimes at an incraasing
pace, utility revenues presently would be greater and allowable rates of
return more l~k.ely to be earned if Me pri n9 \-/as lowed instead of AC
pricing0 Indeed~ a good bit of the
to Me pricing centers on the question what
over whether or not
do about (pr how to avoid)
excess revenues~ For this reason it is. sometimes puzzling why the electric
utili.ty sector has so far been slow to embrace the marginal cost pricing
approacho
If the method of rate base valuation can be, properly characterized as
having attracted relatively less attention in recent years, surely this
cannot be said of rate-of-return on rate base or on equity in this period
·of inflation.. As to al1o't/able rates-of-return on rate base, the decade of
the 1970's has seen these percentages move steadily upward. Of the approxi
mately two hundred electric (and gas) utilities surveyed annually from 19]4
to 1978, a rising pattern is cleare 12 In 1974 the average was about 7 percent with a few at 5 percent; in 1975 the average was 8.24 percent (the
average allowable rate requested was 8.61 percent); by 1916 the average of
reporting utilities was 8~30 percent, but with 141 companies allowed 9 percent
or more and 49. utilities allowed to earn in excess of 10 percent on r'ate base ..
In that same year some utilities in four states requested allowed r.eturn on
equity of 15 to 20 percent. Finally, for 1917 the average allowed rate-of
return- reported was 9 percent. Over this period many utilities did not earn
their allowed rate, and in fact for the data series mentioned the actual rate
of-return on rate base was typically around 7 percent in 19.74 and had increased
to something over 8 percent for 1977&
11-11

Of perhaps more significance is the apparent trend of commissions to
give relatively more attention to questions of rate-of-return on equity.
This focus has long been the one argued for by the regulated utilities as
opposed to what they htstorical1y feel as undue commission preoccupation
with rate-of-return on rate base calculations. And in a period of sustained
inflation coupled with perceived needs for plant expansion, it is under
standable that utilities argue strongly for renewed attention to the "capital
attraction ll standard of ratemakinge* That commissions have generally responded
toward this different focus is another example of the regulatory response to
inflationary times.
B.. Practices
Turn nm-l to some of the more recent practi ces of conmiss ion regul ation--
a number of them legislatively or administratively imposed--that for purposes
here can be counted on the "cost side" to traditional regulation.
1. Future Vs. Historical Test Years
Traditionally comrnissions allowed only current- test years to be used
in calculating revenue requirements for utilities. This meant that only
costs actually incurred were recovered. Gradually, as persistent upward
changes in price levels set in, and under urgings of the utilities, com-
missions came to grant "trended ll cost calculations; estimated future
quarters to be rolled in and revised as each actual quarter is experienced;
and then whole future test ye~rs as the basis for revenue requirements. And
if marginal costing is adopted, the upward bias arising out of allowing future
test years is, of course, further accentuated in periods of rising prices.
Deviations of this sort from the practice of allowing recovery of costs
only for those actually experienced is clearly a practice spawned by infla
tionary times and adopted under utility arguments of regulatory and cash flm"/
difficulties.
;;:~.,Jhl1e the bvo measureS-are of course rel ated, the necessary return to common stock is only a part of the overall cost of capital component and rate-ofreturn determination.
11-12

2. Pancaking, Interim Rates, and Time Limits
At an earlier time utilities were typi ly not allowed to Ilpancake"
proposed rate increases. That is, a commission had to dispose of a current
general rate increase before another one could be requested by the utility.
Due deliberation, comprehensive and r dentiary hearings, and even
strategic de.lays were thus possible in the full playing out of the intended
regulatory process.
Again using arguments of undue regulatory lag, financial soundness of
the regulated companies, cash flow constraints, and a presumed necessary
IIdiscipline ll for the regulators, the commission process has now widely
accepted contrary practices like allowing pancaking of rate increases;
a presumpt ion in favor of proposed increas.es, la 11 ow.; ng them to go into
effect if not specifically struck down); frequent use of "interim rates ll
and lIemergency rate rel ief"; and strict (short)_ time 1 imits for commission
action to achieve almost zero regulatory delay_
From the point of view of the process and from the point of view of
the ratepayer, these practices in times of inflation must be counted on
lithe cost side. 1I
3. Internalizing External Costs
The increasingly frequent practice of internalizing to utilities
external costs deriving from their operations cannot properly he included
as part of the regulatory response to inflation. On the other hand, deci
sions to force onto the private cost functions of companies what earlier
had been picked up in our social cost functions has added substantially to
the cost of doing business--hence costs to the ratepayer--of power compan}es.
Elab.orate environmental and safety additiofls to plant, purchased and operated
11-13

often at expense, may not t neatly the traditional "used and useful"
test in matter producing ectrici ,however meritorious
the intended anci" benefit. while it is, of course, true that such
costs are real and have to somebody, the point is that they
are different ilsomehodi.es,!i dependi.ng on distribution of the burden.
4e Capital Attraction and Risk Avoidance
During per"i atively stable prices and lIordinary times, II
utilities routinely argue ~efore commissions for improved earnings commen-
surate with their perceived kines:s and forecast capital needs; commissions
respond with something less than requested; investors place money in capital
markets such that the utilities are reasonably serviced in their new
fi nance cap; ta 1 requ i rements; and 19'1 i fe goes on" in the e 1 ectri c power
sector. In times of sustained and rapid inflation, however, the story is
much different on matters of capital attraction and risk adoption.
In libad times ll of this sort with high unit costs of expansion, high
capital costs in finance markets, stock and bond markets that value utility
issues very competitively, there are special efforts made by utilities to
convince public officials of the need for liberalized earnings. This takes
many forms (including most of those devices and practices mentioned above)
and involves not only public utili.ty commissions. The Congress in its tax
writing functi.on has granted various tax preferences (e.g., AD and lTC, supra)
and has also considered underwriting utility bond issues as \:'/e11 as possibly
reactivating something like the Reconstruction Finance Corporation with
lending powers to the utilities. For their part, commissions increasingly
are sympathetic to utility arguments couched in the capital attraction
standard and this is set at the forefront of most commission deliberations.
f1-14

The other s i,de this coin is the complicated question of risk-
bearing. There is some evidence that 1n recent years degrees of risk
bearing in the utility sector seem to have shifted somewhat from share
h.olders to ratepayers. An example would seem to be the regulatory treatment
unp 1 anned p,l ant shutdowns either t.\ ear or non-nuc 1 ear vari ety.
Some distinctions must be made between cost-bearing in the case of an
Act-of-God, say a typical power outage when lightning strikes a transformer,
and a major sustained shutdovm of plant through mis-specification, mis-design,
mis-management, or construction or operating mistakes assignable to one or
another party. In 'the former case Cas well as in the case of planned shut
downs) it is clear that the ratepayer should stand these costs. in the latter
case it is a good bit less clear where, of all the parties to the process,
the ratepayer would seem to be least culpable. Some mix of burden sharing
may be best here--among ratepayers, shareholders, managers, suppliers,
insurance companies, taxpayers.
On the other hand, to count this asserted development on lithe cost
sidell of changes in regulatory practice assumes that returns to stockholders
for risk-bearing are not currently too low to begin with. In other words,
i..t would obviously be unfair for regulatory bodies not to permit rates-of
return to equity holders high enough to be commensurate with the risks
involved and then make those same shareholders bear the burden alone when
risk becomes realityo Since whether or not risk and returns are now in
equilibrium in the utility sector is not a demonstration of this part of
the report, t~e practice cited is only provisionally included here.
In addition to the II ma in devices and practices that seem to have accom
panied regulation in a period of inflation there are several others that might
be identified. Some of these have been commission-sanctioned, some legislatively
initiated, and some seem almost endemic to regulation and are not very suscepti
ble to policy resolution. 11-15

In the category shoul d placed the debate on changing the
interest rate charged on refunds paid by private power companies to
customers in adjusting for overcharges. For the wholesale market the issue
before the FERC is whether to raise the rate from 9 percent out to the
average prime rate charged by commercial ("11.5% to 11.75%); raise it
to the prime rate plus a 1 percent penalty charge (as proposed by the
American Public Power Association); or drop the rate to the 7 percent level
t · 1971 db'· t d t '1" 13 se ln , as urge Y maJor lnves or-owne u 1 ltles. The outcome
will determine if this device is counted on lithe cost side." Also in this
first category should be the debate (and outcome) on whether or not fuel cost
data of private utilities must be publicly disclosed for all to see.
In the second category could be mentioned the propensity for legislatures
to reach deeply and specifically into commission regulation altering, some
would say, the traditional concept of a contemplative, quasi-judicial,
independent body. Done in the name of II increased respons i veness, II 1 egi s-
latures now commonly pass la~l/s "forI! so-called lifeline rates or "against"
fuel adjustment charges. While commissions are, of course, creatures of
legislatures (state and national), this new development to some extent has
brought regulation full circle to the days when legislatures (and city
councils) decided very specific regulatory issues of rates and routes and
service offerings. Whether or not this practice should be counted as "a cost"
to regulation depends largely upon ones basic view of the commission concept.
For purposes here it is considered a cost; similarly with legislative
initiatives to require election of state public utility commissioners.
At least two items come to mind for that category of IIpractice" described
as containing perennial difficulties for regulation. Both of these are all
the more troublesome - and consequential - in periods of sustained inflation.
One is the problem of plant expansion decisions. In a sector where willingness
11-16

and ability to serve demand is an absolute it is not surprising that there
is a predisposition to build - \'Iith or \1ithout an i1A-J· effect. 11* And where
commissions are unable or unwilling secure independent assessments of
demand on ~"hich .utility investment decisions are based, there is a potential
for adding another practice to ilthe cost sideI/o
The other (and perhaps related) practice is that of valu"ing reliability
over p)~ice. This tendency or proposition includes not "only the issue of
gold-plating and unduly stringent outage measures, but also the demonstrated
willingness of utilities to pay a premium price for a reliable source of fuel
supply even if they do not have automatic fuel adjustment clauses in their
tariffs. 14 Hov/ever meritorious this posture might be on rc'liability ~n"'ounds, ~..&.. _ __ .......... _ .1:_.!...... .!_ 81.. :;,t::t::III::' I a II !II
III. GAINS FROM COSTS
In a regulated market it is proper that much if not most of the attention
of the parties should be on the financial performance of the industry where
service is a given. Accordingly, many (though not all) of the devices and
practices identified in the previous section as IIcostsll in a period of
inflation could as well be labeled as gains from the point of view of the
electric power industry and even from the vantage point of the ratepayer6
This last is the case where maintaining or renewing the financial soundness
of particular utilities has been the issue during a time of sharply and
persistently rising prices. In this sense the regulatory response of the
past decade could be said in a general way to be appropriate and perhaps
even sufficient ..
Some sense of this renewal (however imperfectly measured) can be gotten
from the bl/o sub-reports made by different authors that follm'l here as
Sections A and B. The first deals with the convergence of market value on
book value for representative utilities since the oi1 embargo; the second
*This refers to th~ inclination of utilities to expand rate base investment (and thus ~arnings) beyond the optimally efficient size.
11-17
presents some data on productivi changes"in the utili industry--so
closely rel to the inflation problem.
A. Convergence of Market Value on Book Value*
In the following nine tables are gathered some financial information
on thirty-one la lities and nine electric
u t i.1 i ty ho 1 companies. Table 2 shows o of market to book value
while Table 3 shows the percentage change in ratio of market to book
ue over years Tables 4 and 5 respectively show the yearly percent-
age change in earnings per share and the percentage change in dividends.
Table 6 shows the average price-earnings ratio over an eight-year period.
Tab.le 7 shm'fs the rate of return on common stock equity ovet a seven-year
period and Table 8 shows the yearly percentage change in this measure.
Finally, Tables 9 and 10 show respectively the rate of return on rate base
and percentage in the rate ,of return on rate base over a seven year
period.
The ratio of market value to book value (~hown in Table' 2} was gathered
for a nine-year period, 1970 through 1978. The book values are from the end
of the previous year and the market values are from August 26 of the year
stated or closely around this date. The thirty-one electric uti1ity com
panies are arranged alphabetically with an average given for each year. The
nine electric utility holding companies are then shown and again an average
is given for each year~
In 1970 and 1971 the ratio of market to book value was greater than
one for most firms wi.th an average of approximately (due to rounding through-
out} 1.33 in 1970 and 1.31 in 1971 for electric utilities. By 1972 this ratio
had dropped to 1.16. Much more SUbstantial drops occurred between '72 and '73
and &73 and 174 where this ratio was at low point for most of the electric
utility compani.es 'in the nine year period. In B75, D76, and f77 the ratio
*This section was prepared by Mr. W. David Duran, EconQmist and Graduate Research Associate, National Regulatory Research Instltute staff ..
11-18

TABU: ~
RATIO OF MARKET TO BOOK VALUE OF FORTY UTILITY STOCKS, 1970 TO 1978 TAKEN ANNUALLY IN AUGUST
ELECTRIC UTILITIES 1970 1971 1972 1973 1974 1975 1976 1977 1978
Arizona Public Service Co. .98 1 .04 1 .01 .88 .67 .72 .82 1 .01 .91 Baltimore Gas & Electric Co. 1.23 1 .21 1 . 12 .93 .52 .72 .87 .93 .88 Boston Edison Co. .97 .97 .90 .90 .40 .50 .53 .58 .56 Cincinnati Gas & Electric Co. 1 .52 1 .42 1 .25 1 . 13 .79 .81 .89 1.09 1 .01 Cleveland Electric Illuminating Co. 2.13 2.15 2.07 1.78 1 .23 1.34 1 .41 1 .59 .84 Commonwealth Edison Co. 1 .20 1 . 16 1 .07 .84 .59 .65 .76 .73 .66 Consolidated Edison of New York, Inc. .75 .81 .81 .70 .22 .33 .46 .55 .54 Consumer Power Co. .96 .86 .79 .67 .31 .42 .56 .64 .64 Dayton Power & Light Co. 1 .30 1 .38 1 .26 1 .07 .67 .84 .97 1 .02 .87 Detroit Edison Co. .79 .87 .82 .75 .39 .51 .60 .71 .66 Duquesne Light Co. 1 .36 1 .42 1 .31 1 .40 .82 .82 .92 .96 .81 Florida Power & Light Co. 3.43 3. 15 1 .39 1 .25 .53 .66 .68 .58 .71 Florida Power Co. 1.80 1 .43 1 .29 .99 .39 .61 .67 .89 .66 Illinois Power Co. 1 .60 1 .54 1 .23 1 .04 .70 .87 .96 .99 .86 Indianapolis Power & Light Co. 1 .23 1.28 1 .20 .98 .71 .81 .88 .98 .84 Long Island Light Co. 1 .27 1 .30 1 .25 1 .02 .60 .76 .90 .99 .97 New York State Electric & Gas Corp. 1 .51 1.65 1.46 1 .29 .87 1 .03 1 .31 .90 .B5 Niagara Mohawk Power Corp. .87 .96 .93 .86 .54 .66 .77 .94 .B4
1-1 No~thern States Power (Minn.) 1 . 14 1 . 17 1 .10 .95 .67 .76 .87 .93 .78 1-1 i Ohio Edison Co. 1 .49 1 .44 1 .38 1 .22 .84 .95 1 05 1 . 13 .99
....-I
1..0 Oklahoma Gas & Electric Co. 1 .99 1 .90 1 .77 1 .41 1 .03 .99 .90 .84 Pacific Gas & Electric Co. 1.07 1 .10 1.05 .85 .70 .73 85 .82
iladelphia Electric Co. 1 .02 1 .08 1 .08 .94 .53 .67 .95 .78 Public Service Company of Colorado 1.07 1 . 17 1 .00 .81 .54 .72 .93 .85 Public Service Electric & Gas Co. .99 1.OB .96 .85 .50 .60 .86 .80 South Carolina Electric & Gas Co. 1 .34 1 . 14 1 .10 .86 .50 .69 .79 .85 .74 Southern California Edison Co. .99 1 05 .89 .67 .56 .57 .61 .78 .74 Tampa Electric Co. 1.87 1 .70 1 .34 1 . 16 .61 .80 .82 .84 .57 Union Electric Co. 1 . 18 1 . 18 1 .07 .99 .73 .83 .96 .96 .87 Virginia Electric & Power Co. 1.20 1 .06 1 .00 .87 .45 .60 .74 .76 .71 Wisconsin Electric & Power Co. .97 .92 .92 .91 .68 .95 .99 1 .03 .92 Averages 1 .33 1 .31 1 . 16 1 . 00 .62 .74 .83 .90 .79 ELECTRIC UTILITY HOLDING COMPANIES Allegheny Power System, Inc~ 1 ,22 1 . 19 1 , 11 ,96 .70 ~71 .81 .89 .76 Amerlcan Electric Power Co. 1.33 1 u 37 1 .31 1 ~ 11 ~6l .82 ~98 1 T04 1. 00 Central & Southwestern Corp. 3~52 3.39 3.22 1.28 .77 .85 .82 .86 .78 General Public Utilities Corp. .92 1 .07 .98 .83 .47 .66 .76 .85 .73 Houston Industries 2.13 2.13 2.06 1.34 .70 .63 .76 .93 .81 Middle Southern Utilities, Inc. 1 .43 1 .36 1 .20 1 .07 .47 .61 .68 .74 .69 New England Electric System .91 .99 1 .01 .87 .48 .62 .72 .78 .75 Southern Co. 1.09 .96 .88 .72 .45 .55 .65 .74 .66 Texas Utilities Co. 4. 11 4.48 2. 11 1 .66 1 .08 .94 .96 1 .02 .96 Averages 1 .85 1 .88 1 .54 1 .09 .64 .71 .79 .87 .79

I-'l
I-'l
I N a
TABLE 3
PERCENT CHANGE IN RATIO OF MARKET TO BOOK VALUE OF FORTY UTILITY STOCKS? 1970 TO 1978 TAKEN ANNUALLY
ELECTRIC UTILITIES 70-71 71~72 72-73 73-74 74-75 75-76 76~77
Arizona Public Service Co. 6.1 - 2.9 -12.9 -23.9 7.5 13.9 23.2 Baltimore Gas & Electric Co. - 1.6 - 7.4 -17.0 -44.1 38.5 16.7 6.9 Boston Edison Co. 0.0 - 7.2 0.0 -55.6 25.0 6.0 9.4 Cincinnati Gas & Electric Co. - 6.6 -12.0 - 9.6 -30.1 2.5 9.9 22.5 Cleveland Electric Illuminating Co. 0.0 - 3.7 -14.0 -30.9 8.9 5.2 12.8 Commonwealth Edison Co. - - 3.3 - 7.8 -21.5 -29.8 10.2 16.9 - 3.9 Consolidated Edison of New York, Inc. 8.0 0.0 -13.6 -68.6 50.0 39.4 19.6 Consumer Power Co. -10.4 - 8.1 -15.2 -53.7 35.5 33.3 14.3 Dayton Power & Light Co. 6.2 - 8.7 -13.0 -37.4 25.4 15.5 5.2 Detroit Edison Co. 10.1 - 5.7 - 8.5 -48.0 30.8 17.6 18.3 Duquesne Light Co. 4.4 - 7.7 6.9 -41.4 0.0 12.2 4.3 Florida Power & Light Co. - 8.2 -55.9 -10.1 -57.6 24.5 6.1 -14.7 Florida Power Co. -20.6 - 9.8 -23.3 -60.6 56.4 9.8 32.8 Illinois Power Co. - 3.8 -20.1 -15.4 -32.7 24.3 10.3 3.1 Indianapolis Power & Light Co. 4.1 - 6.3 -18.3 -27.6 14.1 8.6 11.4 Long Island Light Co. 2.4 - 3.8 -18.4 -41.2 26.7 18.4 10.0 New York State Electric & Gas Corp. 9.3 -11.5 -11.6 -32.6 18.4 27.2 -31.3 Niagara Mohawk Power Corp. 10.3 - 3.1 - 7.5 -37.2 22.2 16.7 22.0 Northern States Power (Minn.) 2.6 - 6.0 -13.6 -29.5 13.4 14.5 6.9 Ohio Edison Co. - 3.3 - 4.7 -11.6 -31.1 13.1 10.5 7.6 Oklahoma Gas & Electric Co. - 4.5 - 6.8 -20.3 -27.0 - 3.9 -10.1 1.1 Pacific Gas & Electric Co. 2.8 - 4.5 -19.0 -17.6 4.3 2.7 13.3 Philadelphia Electric Co. 5.9 0.0 -13.0 -43.6 26.4 11.9 26.7 Public Service Company of Colorado 9.3 -14.5 -19.0 -33.3 33.3 8.3 19.2 Public Service Electric & Gas Co. - 9.0 -11.1 -11.5 -41.2 20.0 25.0 14.7 South Carolina Electric & Gas Co. -14.9 - 3.5 -21.8 -41.9 38.0 14.5 7.6 Southern California Edison Co. 6.0 -15.2 -24.7 -16.4 1.8 7.0 27.9 Tampa Electric Co. - 9.1 -21.2 -13.4 -47.4 31.1 2.5 2.4 Union Electric Co. 0.0 - 9.3 - 7.5 -26.3 13.7 15.7 0.0 Virginia Electric & Power Co. -11.7 - 5.7 -13.0 -48.3 33.3 23.3 2.7 Wisconsin Electric & Power Co. - 5.2 0.0 ... 1.1 -23.3 39.7 4 2 4.0 Averages --.-82 ... 9.2 -14.3 -41.5 22.T 13.4 -g:=j ELECTRIC UTILITY HOLDING COMPANIES Allegheny Power System, Inc. Amerlcan Electric Power Co. Central & Southwestern Corp. General Public Utilities Corp. Houston Industries Middle Southern Utilities, Inc. New England Electric System Southern Co. Texas Utilities Co. Averages
... 2.5 3.0
- 3.7 16.3 0.0
,.. 4.9 8.8
-11 .9 ... 4.9 --.2
- 6.7 - 4.4 ... 3.0 - 8.4 ... 3.3 ... 11 .8
2.0 - 8.1 -52.9 -10.7
-13.5 -15.3 -60.2 -15.3 -35.0 -10.8 -13.9 -18.2 ... 21.3 ~19.6
-27.1 -44. 1 -39.8 -43.4 -47.8 -56.1 -44.8 -37.5 -39.2 -42.2
1 .3 32.3 10.4 40.4
-10.0 29.8 29.2 22.2
-13.0 ---r5.9
4.2 19.5
- 3.5 15.2 20.6 11 .5 16. 1 18.2 2.1
rl:5
9.9 6. 1 4.9
11 .8 22.4 8.8 8.3
13.8 6.3 ~
IN AUGUST
77-78 .~ 9.9 - 5.4 - 3.4 - 7.5 -47.2 - 9.6 - 1.8
o -15.0 - 7.0 -15.6 22.4
-23.0 -13.0 -14.3 - 2.0 - 5.6 -10.6 -16. 1 -12.4 ... 6.6 - 3.5 -17.9 - 8.6 - 7.0 -12.9 - 5. 1 -32. 1 - 9.4 - 6.6 -10.7 -10.2
.. 14.6 - 3.8 - 9.3 -14. 1 -12.9 - 6.8 - 3.8 -10.8 - 5.9 =--9.1

Sources for Table 2 and Table 3 .
Standard and Poorls Industr Surve s Utilities Electric, March 30, 1978 (Section 3_ and Wall Street Journal for the dates, August 25, 1978, August 26, 1977, August 26, 1976, August 26, 1975, August 25~ 1974, August 27, 1973, August 25, 1972, August 26,1971, August 26, 1970.
11-21

TABLE 4
PERCENT CHANGE IN EARNINGS PER SHARE
ELECTRIC UTILITIES Arizona Public Service Co. Baltimore Gas & Electric Co. Boston Edison Co. Cincinnati Gas & Electric Co. Cleveland Electric Illuminating Co. Commonwealth Edison Co. Consolidated Edison of New York,Inc. Consumer Power Co. Dayton Power & Light Co. Detroit Edison Co. Duquesne Light Co. Florida Power & Light Co. Florida Power Co. Illinois Power Co. Indianapolis Power & Light Co. Long Island Light Co. New York Electric & Gas Corp. Niagara Mohawk Power Corp. Northern States Power (Minn.) Ohio Edison Co. Oklahoma Gas & Electric Co. Pacific Gas & Electric Co. Philadelphia Electric Co. Public Service Company of Colorado Public Service Electric & Gas Co. South Carolina Electric & Gas Co. Southern California Edison Co. Tampa Electric Co. Union Electric Co. Virginia Electric & Power Co. Wisconsin Electric Power Co. Averages ELECTRIC UTILITY HOLDING COMPANIES Allegheny Power System, Inc. American Electric Power Co. Central & Southwestern Corp. General Public Utilities Corp. Houston Industries Middle Southern Utilities, Inc. New England Electric System Southern Co. Texas Utilities Co.
Averages Source
70-71 0.0 0.7 6.0
- 6.0 1 .5
- 3.1 2.2
- 8.8 - 3.7 - 3.7
3.3 29.2 1 .9
-15.2 12.7 8.2
- 9.6 - 0.7
5.4 - 3.2 - 1.7
11 .3 14. 1
- 1.0 22.0
-14.0 - 8.9 -31.7 -16. 1
4.5 - 5.8 --
. 1
5.9 5.7 4.9
15.6 10.9 4.3 6.1
- 8.8 4.8
4.8
71 ... 72
31 .6 1 .4 1 . 1
15.2 5.4 9.4
-11 .9 1 . 1 3.9
15.5 6.8 5.0
12.7 - 2.9 27.8 4.3
19.5 23.1 8.3 7.3
10. 1 9.8
- 1.0 11 .7
-23.7 36.1 3.7
67.0 -16. 1 12.4 36.0 10.5
5.6 8.2 8.7
17.9 9. 1
17.9 21.4 6.2
12. 1
12.3
72-73 14.8 4.6
-18.9 ~ 4.3 - 5.9
1 .0 13.0
-11 .4 -13.0 - 18. 1
o 14.9
- 4.0 5.5
-11 .2 - 7.7 - 1.5 -23.2 - 5. 1 12.0
1 .6 7.0
- 4.3 4.5 3.9
-11 .6 5.9 2.4
16.2 2.4 9. 1
- 1.2
2.6 8.4 5.5 1 .8
- 1.6 5.6
.,. 7.8 10. 1
3. 1
4.1
73-74 - 11 .0 - 3.4 - 9.7 -15.9
20.7 - 8.9 14.5
-44.4 1 . 1
-17.5 - 1.7 -21.7 -18.8 -10.0 -26.8
o 12. 1 22.3
- 8.0 - 20. 1
2.6 1 .2
- 9.0 -20.0
6.8 - 9.7
51 .9 -12.9 -16.0 -23.9 -10.8 - 5.7
-23.6 -29.5
2.3 o
- 4.3 5.7
- 3.4 -31 .9
8.5
- 9.7
74-75 11 . 1
- 3.8 - 4.2 - 1.6 -13.9
2.4 39.6 97.8 18.5 2.7 3.0
26. 1 66.1 19.9 23.6 13.8
- 3.6 19.4 22.9 14.0
- 2.1 -18.3
2.8 29.2
- 4.3 32.3
-25.1 31 .8 29.9 20.4
- 1.2 14.6
41 .6 24.4
- 2.3 - 11 . 1 - 6.8 -23.1
9.3 60.3
- 7.3
9.3
75-76 - 5.0 13.5 9.2
- 2.1 12.7 8.5
11 .8 37.0
- 8.5 10.7
-17.7 -31 .3 -20.1 - 11 .0
6.8 8.1 6.0
-20.7 - 0.7
9.7 - 2. 1
8.6 2.7
- 9.7 2.7
- 5.7 20.5
- 2.6 4.5
- 7.7 25.6
1 .0
3.6 6.4 1 .7
10.0 47.4
7. 1 2.0
-27.0 13.4
10.0
Standard and Poors Industry Surveys Utilities Electric, Section 3, r~arch 30, 1978.
76-77 22.3
- 8.3 -24.3 52.2 22.3
-10.3 8.4
-12.4 -17.0 10.8
-10.3 59.4 50.1 26.0 32.9 2.8
- 3. 1 8.1 0.7
-12. 1 7.5 8.6
- 2. 1 ,..19.9
0.4 16.8 4.9
21 . 1 -10.2
7.8 5.3 7.5
- 9.2 - 9.0
17 . 1 11 .8 9.2
21.4 7.9
14.5 3.1
8.0
Federal Power Commission Statistics of Privately Owned Electric Utilities in the United States, 1971, 1972, 1974 and 1975.
Statistics of Privately Owned Electric Utilities in the United States, (Washington, D.C.: U.S. Department of Energy, 1976). 11-22

TABLE 5
PERCENT CHANGE IN DIVIDENDS
ELECTRIC UTILITIES
Arizona Public Service Co. Baltimore Gas & Electric Co. Boston Edison Co. Cincinnati Gas & Electric Co. Cleveland Electric Illuminatinq Co. Commonwealth Edison Co. -Consolidated Edison of New York,Inc. Consumer Power Co. Dayton Power & Light Co. Detroit Edison Co. Duquesne Light Co. Florida Power & Light Co. Florida Power Co. Illinois Power Co. Indianapolis Power & Light Co. Lonq Island Liqht Co. New-York State-Electric & Gas Corp. Ni agara MohalfJk Power Corp. Northern States Power (M nn. ) Ohio Edison Co. Oklahoma Gas & Electric Co. Pacific Gas & Electric Co. Philadelphia Electric Co. Public Service Company of Colorado Public Service Electric & Gas Co. South Carolina Electric & Gas Co. Southern California Edison Co. Tampa Electric Co. Union Electric Co. Virginia Electric & Power Co. Wisconsin Electric Power Co. Averages
ELECTRIC UTILITY HOLDING COMPANIES Allegheny Power System, Inc. American Electric Power Co. Central & Southwestern Corp. General Public Utility Corp. Houston Industries Middle Southern Utilities, Inc. New England Electric System Southern Co. Texas Utilities Co. Averages Source
70-71
0.0 - 3.5
5.9 4.0
- 1.9 0.0 0.0 0.0 2.8 0.0 0.0 4.4 3.7 7.3 0.0 3.0 0.0 0.0 3.0 0.0 6.9 7.0 0.0 2.8 0.0 5.6 1 .7
- 1.3 - 1.7
0.0 4.2 1 .9
3.0 rj '"l' L. I
5.2 0.0 7.5 6.3 5.4
.. 3.2 5.9
3.6
71-72
3.7 - 3.6
3.9 15.2 5.4 0.0 0.0 0.0 0.9 0.0 0.0 3.8 3.6 0.0 4.0 2.9 1 .0 1 .8 2.0 0.0 3.2 5.9 0.0 1.8 3.7 3.8 4.0 3.8 0.0 0.0 5.9 2.5
2.9 ") (") ':>.0
4.0 0.0 5.4 3.9 1 . 9 3.2 5.0
3.3
72-73
8.0 - 1.6
0.8 - 4.3 - 5.6
3.4 0.0 0.0 0.0 2.7 2.7 5.5 3.4 0.0 7. 1 2. 1 3.3 2.7 5.9 2.9 3.1 3.8 0.0 3.5 1 .2 3.7 0.0 3.5 0.0 4.0 7.9 2.2
2.9 JI (") 't.0
3.7 0.0 2.9 6. 1 7.2 3.1 4.0
3.9
73-74
12.4 -33.8
0.0 0.0
11 . 1 1 . 1
-52.7 0.0 0.0 0.9 0.9
14.2 8.3 0.0 9.0 6.6 1 .4 2.6 0.0 5.0 3.0 5. 1 0.0 1 . 7 0.0 3.6 5.8
72.1 0.0 1 .3 9.0 2.7
5.6 6.8 3.7
- 6.3 7.1 8.0 4.4 4.1 5.8
4.4
74-75
0.0 0.0 0.0 0.0 3.1 0.0
41 .0 0.0 0.0 0.0 0.0 8.3 1 .9 0.0 0.0 2.1 0.0 2.4 1 .4 0.9 2.9 1 .3 0.0 0.0 0.0 0.9 1 .8
31 .8 0.0 0.0 5.0 3.4
1 .3 1 .3 3.6 0.0 4.0 3.7 0.0 0.4
11 .9
2.9
75-76
2.2 4.6 0.0 0.0 3.6 3.3
33.3 0.0 0.0 0.0 0.0 8.7 7.9 0.0 0.0 3.7 9.0 2.5 4.2 0.6 2.9 0.0 0.0
11 .7 3.5 2.0 0.0
- 2.6 4.7 3.8 4.2 3.7
5.2 0.8 3.4 0.0 3.2 4.8 3.4 1 . 1 6.6
3.2
Standard and Poors Industry Surveys Utilities Electric, Section 3, March 30) 1978.
76-77
20.9 5.4 0.0
12.2 7.6 1 . 1
37.5 0.0 0.0 4.8 0.0
12.8 15.6
3.6 9.9 5.5 5.0 8.1 6. 1 5.9 6.9
14.9 9.8 9.0
10. 1 7.3
33.3 -36.8
1 .5 1 .2 5.6 7.2
6. 1 5.2
11 .7 4.8
31 .7 9.1 5.4 8.8
16.9 --11 . 1
Federal Power Commission Statistics of Privately Owned Electric Utilities in the United States, 1971, 1972, 1974 and 1975.
Statistics of Privately Owned Electric Utilities in the United States (t~ashington, D.C.: Department of Energy, 1976). 1I-23
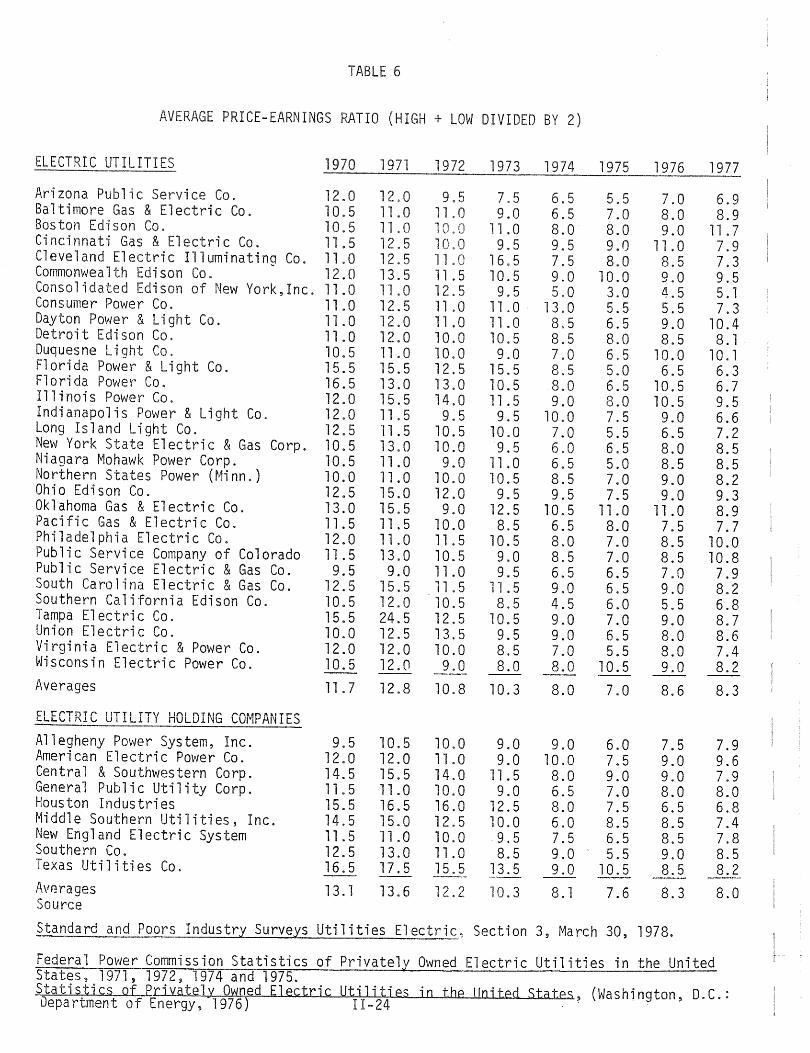
TABLE 6
AVERAGE PRICE-EARNINGS RATIO (HIGH + LOW DIVIDED BY 2)
ELECTRIC UTILITIES 1970 1971 1972 1973 1974 1975 1976 1977
Arizona Public Service Co. 12.0 12.0 9.5 7.5 6.5 5.5 7.0 6.9 Baltimore Gas & Electric Co. 10.5 11 .0 11 .0 9.0 6.5 7.0 8.0 8.9 Boston Edison Co. 10.5 11 .0 0.0 11 .0 8.0 8.0 9.0 11 .7 Cincinnati Gas & Electric Co. 11 .5 12.5 10.0 9.5 9.5 9.0 11 .0 7.9 Cleveland Electric Illuminating Co. 11 . a 12.5 11 .0 16.5 7.5 8.0 8.5 7.3 Commonwealth Edison Co. 12.0 13.5 11 .5 10.5 9.0 10.0 9.0 9.5 Consolidated Edison of New York,Inc. 11 .0 11 .0 12.5 9.5 5.0 3.0 4.5 5.1 Consumer Power Co. 11 .0 12.5 11 .0 11 .0 13.0 5.5 5.5 7.3 Dayton Power & Light Co. 11 .0 12.0 11 .0 11 .0 8.5 6.5 9.0 10.4 Detroit Edison Co. 11 .0 12.0 10.0 10.5 8.5 8.0 8.5 8.1 Duquesne Light Co. 10.5 11 .0 10.0 9.0 7.0 6.5 10.0 10. 1 Florida Power & Light Co. 15.5 15.5 12.5 15.5 8.5 5.0 6.5 6.3 Florida Power Co. 16.5 13.0 13.0 10.5 8.0 6.5 10.5 6.7 Illinois Power Co. 12.0 15.5 14.0 11 .5 9.0 8.0 10.5 9.5 Indianapolis Power & Light Co. 12.0 11 .5 9.5 9.5 10.0 7.5 9.0 6.6 Long Island Light Co. 12.5 11 .5 10.5 10.0 7.0 5.5 6.5 7.2 New York State Electric & Gas Corp. 10.5 13.0 10.0 9.5 6.0 6.5 8.0 8.5 Niagara Mohawk Power Corp. 10.5 11 .0 9.0 11 .0 6.5 5.0 8.5 8.5 Northern States Power (Minn.) 10.0 11 .0 10.0 10.5 8.5 7.0 9.0 8.2 Ohio Edison Co. 12.5 15.0 12.0 9.5 9.5 7.5 9.0 9.3 Oklahoma Gas & Electric Co. 13.0 15.5 9.0 12.5 10.5 11 .0 11 .0 8.9 Pacific Gas & Electric Co. 11 .5 11 .5 10.0 8.5 6.5 8.0 7.5 7.7 Philadelphia Electric Co. 12.0 11 .0 11 .5 10.5 8.0 7.0 8.5 10.0 Public Service Company of Colorado 11 .5 13.0 10.5 9.0 8.5 7.0 8.5 10.8 Public Service Electric & Gas Co. 9.5 9.0 11 .0 9.5 6.5 6.5 7.0 7.9 South Carolina Electric & Gas Co. 12.5 15.5 11 .5 11 .5 9.0 6.5 9.0 8.2 Southern California Edison Co. 10.5 12.0 10.5 8.5 4.5 6.0 5.5 6.8 Tampa Electric Co. 15.5 24.5 12.5 10.5 9.0 7.0 9.0 8.7 Union Electric Co. 10.0 12.5 13.5 9.5 9.0 6.5 8.0 8.6 Virginia Electric & Power Co. 12.0 12.0 10.0 8.5 7.0 5.5 8.0 7.4 Wisconsin Electric Power Co. 10.5 12.0 9.0 8.0 8.0 10.5 9.0 8.2 Averages 11 .7 12.8 10.8 10.3 8.0 7.0 8.6 8.3
ELECTRIC UTILITY HOLDING COMPANIES Allegheny Power System, Inc. 9.5 10.5 10.0 9.0 9.0 6.0 7.5 7.9 American Electric Power Co. 12.0 12.0 11 .0 9.0 10.0 7.5 9.0 9.6 Centra 1 & Southwestern Corp. 14.5 15.5 14.0 11 .5 8.0 9.0 9.0 7.9 General Public Utility Corp. 11 .5 11 .0 10.0 9.0 6.5 7.0 8.0 8.0 Houston Industries 15.5 16.5 16.0 12.5 8.0 7.5 6.5 6.8 Middle Southern Utilities, Inc. 14.5 15.0 12.5 10.0 6.0 8.5 8.5 7.4 New England Electric System 11 .5 11 .0 10.0 .9.5 7.5 6.5 8.5 7.8 Southern Co. 12.5 13.0 11 .0 8.5 9.0 5.5 9.0 8.5 Texas Utilities Co. 16.5 17.5 15.5 13.5 9.0 10.5 8.5 8.2 Av~rages 13. 1 13.6 12.2 Source
10.3 8.1 7.6 8.3 8.0
Standard and Poors Industr.z Surve.zs Utilities Electri~, Section 3, Ma rch 30, 1978.
Federal Power Commission Statistics of Privatel.z Owned EJectric Utilities in the United States, 1971, 1972, 1974 and 1975. Statistjcs~rj~atel~ O~~med E]ectrjc Utj]jtjes jn the United States, (Washington, D.C.: Oepartment of Energy, 1976) 11-24

TABLE 7
PERCENT RATE OF RETURN ON COMMON STOCK EQUITY
ELECTRIC UTILITIES 1970 1971 1972 1973 1974 1975 1976
Arizona Public Service Co. 10. 1 10.0 11 .4 11 .8 10.9 13.5 11 .2 Baltimore Gas & Electric Co. 12.2 12.0 11 .7 11 .7 11 . 1 10.5 11 . 7 Boston Edison Co. 11 .6 12.0 12.4 8.8 8.2 7.5 7~2 Cincinnati Gas & Electric Co. 15.8 13.7 15. 1 13.9 10.7 10.8 10.3 Cleveland Electric Illuminating Co. 14.5 14.2 14.4 13. 1 15.0 13. 1 13.8 Commonwealth Edison Co. 13.0 12. 1 13.3 12.0 10.6 11 .0 11 .6 Consolidated Edison of New York, Inc. 7.4 11 . 1 6.6 9.0 7.7 10.0 11 .6 Consumers Power Co. 11 .6 10.2 9.9 8.7 8.0 8.8 12. 1 Dayton Power & Light Co. 12.5 12.0 11 .7 10. 1 10. 1 12.4 11 .6 Detroit Edison Co. 9.9 9.5 10.4 9.4 7.5 7.5 7.9 Duquesne Light Co. 13.7 13.4 12.4 11 .0 10.9 10.8 8.4 Florida Power & Light Co. 11 .9 14. 1 13.5 13.3 11 . 1 13.4· 9.0 Florida Power Co. 15.0 13.7 13.8 12.2 8.4 13.4 10.5 Illinois Power Co. 17.2 13.2 12. 1 12.7 11 .3 13.2 11 .2 Indianapolis Power & Light Co. 13.9 14.1 17. 1 14.3 9.9 13.4 13.7 Long Island Light Co. 12.5 12.8 12.8 11 .2 11 .2 13.4 14.2 New York State Electric & Gas Corp. 10.4 9.2 10.7 10.7 11 . 1 1 0 ~ 9 11 .4 Niagara Mohawk Power Corp. 9.4 9.6 11 . 1 8.2 11 .6 12,2 9.7 Northern States Power (Minn.) 12.6 13.4 13.5 12.2 10.6 13.0 12.6 Ohio Edison Co. 14.2 13.6 14.7 14.9 11 .9 13.0 14.0 Oklahoma Gas & Electric Co. 17.4 15.8 15.4 14.9 13.5 12.8 12.0 Pacific Gas & Electric Co. 10.6 11 .4 11 .8 12.2 11 .4 9.7 10.2 Philadelphia Electric Co. 9.5 10.8 10.3 6.8 8.9 9.4 9.8 Public Service Co. of Colorado 12.6 12.0 12.7 12.8 9,4 12.6 11 .0 Public Service Electric & Gas Co. 10.7 12.5 10.0 10.5 12.9 9.0 11 .2 South Carolina Electric & Gas Co. 14.1 11 .0 11 .4 10.0 8.6 12.7 12.2 Southern California Edison Co. 11 .2 9.7 9.5 9.6 13.6 10.0 11 .2 Tampa Electric Co. 14.5 9.4 14.2 13.4 11 . 1 13.7 12.8 Union Electric Co. 13.4 10.8 9.0 10,6 8.4 11 .5 12.2 Virginia Electric & Power Co. 12.3 11 . 1 11 . 7 11 .4 9.7 10.5 9.7 Wisconsin Electric Power Co. 8.2 8.3 11 .9 12.6 10.2 10.0 11 .6
Averages 12.4 11 .8 12. 1 11 .4 10.5 11 .4 11 .2
Source
Standard and Poors Industr~ Surve.'[s Utilities Electric, Section 3, March 30, 1978.
Federal Power Commission Statistics of Privatel~ Owned Electric Utilities in the United States, 1971, 1972, 1974 and 1975.
Statistics of Private1~ Owned Electric Utilities in the United States, Department of Energy, 1976). .
(Washington, D.C.:
11-25

TABLE 8
PERCENT CHANGE IN RATE OF RETURN ON COMMON STOCK
ELECTRIC UTILITIES 70-71 71-72 72-73 73-74 74-75 75-76
Arizona Public Service Co. .9 14.0 3.5 - 7.6 23.9 -20.5 Baltimore Gas & Electric Co. - 1.6 - 2.5 - 2.5 - 5.1 - 5.4 11 .4 Boston Edison Co. 3.4 3.3 "~29. 0 - 6.8 - 8.5 - 4.0 Cincinnati Gas & Electric Co. -13.3 10.2 - 7.9 -23.0 .9 - 4.6
eveland Electric Illuminating Co. - 2. 1 1 .4 ~, 9.0 14.5 -19.3 5.3 Commonwealth Edison Co. - 6.9 9.9 - 9.8 -11 .7 3.8 5.5 Consolidated Edison of New York, Inc. 50.0 -40.5 36.4 -14.4 29.9 16.0 Consumers Power Co. -12. 1 - 2.9 -12.0 - 8.0 10.0 37.5 Dayton Power & Light Co. - 4.0 - 2.5 -13.7 0.0 22.8 - 6.5 Detroit Edison Co. - 4.0 9.5 - 9.6 -20.2 0.0 5.3 Duquesne Light Co. - 2.2 - 7.5 - 11 .3 .9 .9 -22.2 Florida Power & Light Co. 18.5 - 4.3 - 1.4 -16.5 20.7 -32.8 Florida Power Co. - 8.7 .7 -11 .6 -31 . 1 59.5 -21 .6 Illinois Power Co. -23.3 - 8.3 5.0 -:- 11 .0 16.8 -15.2 Indianapolis Power & Light Co. 1 .4 21.3 -16.4 -30.8 25.3 10.5 Long Island Light Co. 2.4 0.0 -12.5, 0.0 19.6 6.0 New York State Electric & Gas Corp. - 11 .5 16.3 0.0 3.7 - 1.8 4.6 Niagara Mohawk Power Corp. 2. 1 15.6 -26.1 41 .5 5.2 -20.5 Northern States Power (Minn.) 6.3 .7 - 9.6 - 13. 1 22.6 - 3.1 Ohio Edison Co. 9.9 8. 1 1 .4 -20.1 .9. 7.7 Oklahoma Gas & Electric Co. - 9.2 - 2.5 - 3.2 - 9.4 - 5.2 - 6.3 Pacific Gas & Electric Co. 7.5 3.5 3.4 - 6.6 -14.9 5.2 Philadelphia Electric Co. 13.7 - 4.6 -34.0 30.9 5.6 4.3 Public Service Co. of Colorado - 4.8 5.8 .8 -26.6 34.0 -12.7 Public Service Electric & Gas Co. 16.8 -20.0 5.0 22.9 -30.2 24.4 South Carolina Electric & Gas Co. -22.0 3.6 -12.3 14.0 47.7 - 3.9 Southern California Edison Co. -13.4 - 2.1 1 . 1 41 .7 -26.5 12.0 Tampa Electric Co. -35.2 51.0 - 5.6 -17.2 23.4 - 6.6 Union Electric Co. -19.4 -16.7 17.8 -20.8 36.9 6. 1 Virginia Electric & Power Co. - 9.8 5.4 - 2.6 -14.9 8.2 - 7.6 Wisconsin Electric Power Co. 1 .2 43.4 5.9 -19.0 - 2.0 16.0 -- --Averages -.2.3 3.5 - 5.2 - 5.3 10.0 .3
Source
Standard and Poors Industr~ Surve1s Utilities Electric, Section 3, March 30, 1978.
Federa 1 Power Commission Statistics of Privatel~ Owned Electric Utilities in the United States, 1971, 1972, 1974 and 1975 ..
Statistics of Privately Owned Electric Utilities in the United States, (Washington~ D. C. : U.S. Department of Energy, 1976).
11-26

TABLE 9
PERCENT RATE OF RETURN ON RATE BASE
ELECTRIC UTILITI 1970 1971 1972 1973 1974 1975 1976
Arizona Public Service Co. 6.8 ' 6.7 7.4 7.8 7.8 6.9 9.3 Baltimore Gas & Electric Co. 8.2 8.4 8.3 8.7 8.9 10.2 9.4 Boston Edison Co. 7.0 7 . 1 5.4 7.5 8.2 7.8 7.7 Cincinnati Gas & Electric Co. 8.9 8.7 9.0 8.9 7.5 8.4 7.7 Cleveland Electric Illuminating Co. 9.4 9.2 9.0 8.6 9.9 9.5 10.0 Commonwealth Edison Co. 7.0 7.0 7 . 1 7.1 6.7 7.0 7.8 Consolidated Edison of New York, Inc. 5.8 6. 1 6.0 6.8 7.4 8.5 8.5 Consumers Power Co. 6.6 5.9 6.0 5.6 4.3 7.5 9.0 Dayton Power & Light Co. 8.6 8.1 7.8 7.6 7.8 9.0 8.2 Detroit Edison Co. 6.5 6.9 7.5 7.4 6.5 7.2 7.7 Duquesne Light Co. 7.5 7.7 7.8 8.0 8.4 8.6 7.4 Florida Power & Light Co. 8.7 8.6 T.7 8.4 7.7 9.7 7.3 Florida Power Co. 8.1 8.1 8.6 7.6 6.4 9.0 9.0 Illinois Power Co. 8.7 7.6 7.3 8.0 7.3 8.2 7.5 Indianapolis Power & Light Co. 7.9 8.1 9.7 8.8 7.2 8.0 8.5 Long Island Light Co. 7.4 7.7 7.4 7.4 7.8 9.7 10.3 New York State Electric & Gas Corp. 6.7 6.8 6.9 6.3 7.4 8.2 DNA Niagara Mohawk Power Corp. 5.5 6.1 6.3 7.5 7.7 8.8 7.4 Northern States Power (Minn.) 8.0 8.1 8.2 7.1 7.1 7.9 8.5 Ohio Edison Co. 7.9 7.6 8.2 8.9 7.6 9.0 7.6 Oklahoma Gas & Electric Co. 9.0 8.5 8.8 8.9 8.8 8.8 8.4 Pacific Gas & Electric Co. 6.5 7.2 7.3 7.6 7.7 6.6 7.1 Philadelphia Electric Co. 7.0 7.6 8.0 7.8 6.6 7.6 DNA Public Service Company of Colorado 7.0 7.0 7.6 7.5 7.2 7.8 8.2 Public Service Electric & Gas Co. 6.8 8.0 7. 1 7.3 7.9 8.5 9.3 South Carolina Electric & Gas Co. 7.2 6.9 7.9 7.0 7.0 8.4 8.7 Southern California Edison Co. 7.3 6.6 7.0 7.2 8.7 7.3 7.7 Tampa Electric Co. 7.6 6.4 8.2 8.0 6.4 7.9 7.0 Union Electric Co. 8.0 7.2 6.5 7.6 7.1 8.3 9.2 Virginia Electric & Power Co. 7.2 7.3 7.3 8.0 7.3 9.1 8.9 Wisconsin Electric Power Co. 6.8 6.5 7.6 8.0 7.1 7.6 8.7
Averages 7.5 "7 /I "7 t: "7 "7 -, !: 8.3 8.3 I • '"t I • U I • I I • J
DNA - Data not available.
Source
Standard and Poors Industr~ Surve~s Utilities Electric, Section 3, March 30, 1978.
Federal Power Commission Statistics of Privatel Owned Electric Utilities in the United States, Washington, D.C.: U.S. Department of Energy, 1976 .
11 .. 27

TABLE 10
PERCENT CHANGE IN RATE OF RETURN ON RATE BASE
ELECTRIC UTILITIES 70-71 71-72 72-73 73-74 74-75 75-76
Arizona Public Service Co. - 1.5 1 C;. 4 5.4 0.0 -11 .5 34.8 Baltimore Gas & Electric Co. 2.4 - 1.2 4.8 2.3 14.6 - 7.8 Boston Edison Co. 1 .4 -23.9 38.9 9.3 - 4.9 - 1.3 Cincinnati Gas & Electric Co. - 2.2 - 2.2 - 1. 1 -15.7 12.0 - 8.3 Cleveland Electric Illuminating Co. - 2. 1 - 2. 1 - 4.4 15. 1 - 4.0 5.3 Commonlt/ea 1 th Edi son Co. 0.0 1 .4 0.0 - 5.6 4.f 11 .4 Consolidated Edison of New York, Inc. 5.2 - 1.6 13.3 8.8 14.9 0.0 Consumers Power Co. -10.6 1 .7 - 6.7 -23.2 74.4 20.0 Dayton Power & Light Co. - 5.8 3.7 - 2.6 2.6 15.4 - 8·9 Detroit Edison Co. 6. 1 8.7 - 1.3 -12.2 10.8 6.9 Duquesne Light Co. 2.7 1 .3 2.6 5.0 2.4 -14.0 Florida Power & Light Co. - 1. 1 -10.5 9.1 - 8.3 26.0 -14.4 Florida Power Co. 0.0 6.2 -11 .6 -15.8 40.6 0.0 Illinois Power Co. -12.6 - 3.9 9.6 - 8.4 12.3 - 8.5 Indianapolis Power & Light Co. 2.5 19.8 - 9.3 -18.2 11 . 1 6.3 Long Island Light Co. 4.1 - 3.9 0.0 5.4 24.4 6.2 New York State Electric & Gas Corp. 1 .5 1 .5 - 8.7 17.5 10.8 DNA Niagara Mohawk Power Corp. 10.9 3.3 19.0 2.7 14.3 -15.9 Northern States Power U1i nn. ) '" 1 .3 1 .2 -13.4 0,0 11 .3 7.6 Ohio Edison Co. - 3.8 7.9 8.5 -14.6 18.4 -15.6 Oklahoma Gas & Electric Co. - 5.6 3.5 1 . 1 - 1. 1 0.0 - 4.5 Pacific Gas & Electric Co. -10.8 1 .4 4.1 1 03 -14.3 7.6 Philadelphia Electric Co. 8.6 5.3 - 2.5 -15.4 15.2 DNA Public Service Company of Colorado 0.0 8.6 - 1.3 - 4.0 8.3 5. 1 Public Service Electric & Gas Co. 17.6 - 11 .3 2.8 8.2 7.6 9.4 South Carolina Electric & Gas Co. - 4.2 14.5 - 11 .4 0.0 20.0 3.6 Southern California Edison Co. - 9.6 6. 1 2.9 20.8 - 16. 1 5.5 Tampa Electric Co. -15.8 28.1 - 2.4 -20.0 23.4 -11 .4 Union Electric Co. -10.0 - 9.7 16.9 - 6.6 16.9 10.8 Virginia Electric & Power Co. 1 .4 0.0 9.6 - 8.8 24.7 - 2.2 Wisconsin Electric Power Co. - 4.4 16.9 5.3 7.0 7.0 14.5 -- -- --Averages 1 • 1 2.8 2.5 - 2.3 12.6 1 .4
DNA - Data Not Available
Source
Standard and Poors Industry Surveys Utilities Electric~ Section 3~ March 30, 1978.
Federal Power Commission Statistics of Privatel Owned El ectri c Utilities in the United Sl a te s, ( ' .. J ash i n 9 to n, D. C. : U: So. Department of Energy, 197$ .
11-28

recovered substantially for most electric utility companies boosting the
average from .62 in 1974 to in 19.77 . In 1978 ra had dropped
again for most companies loweri the average to . c
tty ies l ratio of ue common stock
followed a similar somewhat lagged nine- peri
From this information one might concl electric utilities
were in general more attractive investments in 1970 and 1 than they were
in 1973 or 1974. They were again relatively attractive in 1976 and 1977
but not as much so as the early 1970°5. However, in 1978 they appeared
to be losing ground again.
The obvious danger in this comparison is that how the entire market
was performing over this period is not included. This would be of great
consequence in judging whether the firm would want to use the common stock
option at all as it sought to obtain capital. Another danger might lie
within the ratio itself. It is generally believed that the market value
is very sensitive to a discounted stream of earnings perceived by the in
vestor. This would make the market value dependent on the income statement
which measures flows in the accounts of the fi.rm. T~e book value is obtained
from the balance sheet (assets--liabilities--preferred stock) divided by the
number of shares of common stock, which shows the levels of the accounts
at a specific point in time. Making a ratio of the two items would make
for problems in inferential analysis.
In Table 4 the percentage change in earnings per share shows a somewhat
similar financial picture for the forty firms. The typical firm increased
earnings per share between 1970-1971 and again in 1972. Between 1972 and
1973 earnings per share began to decrease slightly for the typical electric
utility and agai.n decreased more dramatically in the following two years.
However, by 1976 earni.ngs per share had recovered substantially and con
tinued to do so through 1977. Although the range of data was much larger
1I-29

in each column in the percentage change in earnings per share, it followed
roughly the same pattern as the ratio of market to book value for the
common stocks. The firms generally had increased earnings per share up
to 1972 and then began to decrease reaching a minimum in 1974 and then
increased through 1977. As might be expected, the earnings per share data
will vary much more between the companies and 11 be more erratic for each
firm over time than would the ratio of market value to book value.
In Table 5 the percentage change in dividends over the same eight '/
year period shows a somewhat different story. The general trend for the
firms was to increase dividend payout throughout the period. However, two
things should be noticed about these increases. First, the fact that most
firms increased their dividend payout between 1973 and 1974 at a time when
earnings were generally depressed, could demonstrate these firms needed to
attract equity capital and were trying to boost the market value of their
common stock. Another item of notice is the large ;,ncrease in dividend
payout between 1976 and 1977 which shows a more healthy financial picture
in this period.
An eas t1y ava i 1 ao"1 e measure of the attracti veness of common stocks
widely used by individual investors is the price-earnings ratio. Table 6
shows the average price-earnings CP-E) ratio for each year from 1970 to 1977.
Th.is was computed hy adding the high and low value for the year and dividing
b.y 2. This is obviously a very rough estimate of the value at any given
point within the year but it shows a general trend in the P-E ratio over
the eigh~year period. The early seventies saw a relatively high P-E ratio
as compared with the four years following 1973. However, between 1971 and
1975 we still see a downward trend in the P-E ratio. This shows a pattern
somewhat similar to th.e percentage cbange in earnings per share and the
II-30

ratio of market to book value the common stock. In this case~ however,
the minimum average price earnings ratio occurs in rather than 1974. This
is probab"ly e the ea~nings recovery in 1974-1 period not
be; ng fully refl in ce k. ffer-
ence is that the E ratio did not increase in 1 This could be due to
the coincidental movement of the market price the common stock and
earnings. The fact that the P-E ratio lost ground slightly could reflect
some stockholder uncertainty about the future of the industry.
One of the most comprehensive measures of financial strength of a firm
is the rate of return on common stock equity. Generally speaking this
reflects the net profit margin, the asset turnover, and the financial
leverage multiplier in the following formula:
NPAT x S x TA -S- fA CSE PROFIT ASSET FINANCIAL MARGIN TURNOVER LEVERAGE
MULTIPLIER
= NPAT CSE RATE OF RETURN ON COMMON STOCK EQUITY
where NPAT - net profit after taxes
S - sales
TA - total assets
CSE - common stock equity (I have assumed common stock equity = net worth for the financial leverage multiplier)
This data for the thirty-one electric utilities (but not for the nine
holding companies) for 1970 through 1976 is shown in Table 7. The general
trend (with the exception of 1972) was a decline between the years from 1970
to 1974 with the largest drop between 1973-1974 on average. The rate of
return on common stock equity recovered substantially by 1975 and for all
practical purposes remained the same on average for the industry in 1976.
This again shows that throughout this seven year period most firms lost
I1-31

ground and were in their poorest financial condition by 1974. After 1974
the financial strength of most firms improved and remained somewhat stable
after 1975 with smaller increases or decreases for most firms.
A measure of financial condition which is peculiar to the regulated
sector of the economy is the rate of return on rate base. Used here is the
Federal Power Commission's definition of the rate base, although what to
include or not include in the rate base is still hotly debated. Data are
for a seven-year period for the thirty-one electric utility holding
companies.
Although the rate itself fluctuates only slightly up to 1975 when it
generally increases, the average percentage change between the years reveals
a more telling story. Here a general increase in percentage change in the
rate of return occurs between the years up to 1973 when there was a decrease
for many firms. Between 1974 and 1975 there was a large percentage change
in the rate followed by a much smaller one between 1975 and 1976. The rate
of return on rate base reflects more accurately how rate relief granted to
utilities was affecting all the previous representatives of the financial
condition of the firms. The large increase in the rate of return on rate
base between 1974-1975 may have offset the decrease in the rate of return
on rate base in 1973-1974 for most firms.
Throughout this brief report the focus has been on general trends in
the financial position of these thirty-one electric utilities and nine
holding companies. Aside from the relatively strong financial position of
the southwest holding companies at the outset, this has somewhat accurately
reflected average firm movements in the time periods studied. This
appraisal has been limited almost completely to earnings and common stock
prices to show the relative attractiveness of common stocks and thus the
firms' ability to attract equity capital. Aside from some solvency problems,
II-32
this also gives a general idea of their ability to attract debt capital on
favorable terms. Both of these assumptions may lead to some danger insofar
as interpretations of the data as related to a specific historical event are
concerned. No cross industry or general comparisons have been
attempted in this report. This makes for a tentative and limited comment on
the relative attractiveness of these electric utility companies throughout
the specified time period.
With these reservations in mind, a very brief attempt to summarize and
relate the data from the Arab Oil Embargo in the 1973-1974 time period and
its effect on the ability of the firms to attract capital follows.
As we have seen, in most instances the financial conditions of the
electric utilities on average were deteriorating slightly from 1970 to 1973.
Between 1973 and 1974 most of the utilities experienced a serious decline in
their financial condition. This coincided with not only the oil embargo but
also with general increases in consumer demand in this period. This caused
the utilities to embark on large expansion programs at a time when their
relative attractiveness to an investor was lower. Since firms are naturally
hesitant to obtain capital on unfavorable terms, the utilities were in a
serious position. Therefore, at least some of the 1974 to 1976 rate increases
were needed not only to improve the financial condition of the firms but also
to stem the tide of rising consumer demand for electric power. After the
1976 rate increases, continued use of company financial plight as a reason
for increased rates may not be as valid as it was in the earlier time period.
However, if a major downturn in the national economy and in the financial
condition of the utility sector occurs in 1979-1980, this may again become
an entirely legitimate basis for further fiscal relief.
1I-33

B. Price Productivity Relationships *
Historically, U.S. industries in which productivity has lagged behind
the overall, or national productivity trend have usually been those in which
prices rose relative to the general level of prices. Economic theory sugqests
that when an industry's prices decline relative to the general price level,
productivity increases may be partly responsible,15 More efficient production
methods may lead to lower unit costs and result in a more favorable relative
price position. When an industry's products become relatively cheaper, its
sales volume is likely to expand bringing additional investment and employment
opportunities into that industry; this, in turn, may lead to even greater
productivity increases.
This relationship between productivity and prices is not absolute.
There are many determinants of an industry's relative selling price besides
productivity. These factors, among others, would include input prices which
are in part determined by the productivity levels in the input industries.
Furthermore, an absence of competition may also affect the price-productivity
relationship. As a group, factors affecting prices other than productivity
are just as important as productivity, These factors generally ~xert a
greater influence on prices over shorter (as opposed to longer) periods
of time.
Inflation introduces an uncertain element into the cause-effect relation-
ship of prices and productivity. It has been pointed out that an industry's
relative price is, in part, a function of the industry's productivity rate.
Inflation di3rupts this functional form, making it very difficult to ascertain
productivity's contribution to holding down prices.
Edwar.d Renshaw points out that from the perspective of basic dimensions
*This section was prepared by Mr. Curtis Odie, Economist and G~aduate Research Associate, National Regulatory Research Institute staff.
I1-34

of economic and technological progress such as speed, scale, new products,
natural resource scarcity, and the efficiency of converting energy into
useful effects, it is strongly suggested. that it is becoming more difficult
to invent new productive processes that are
existing products and production techniques. 16
guously superior to
It is becoming more difficult than ever to induce the rapidly rising
industry productivity rates that were recognized in the first half of this
century_ This phenomena, coupled with the inflationary climate of the last
decade and a half, suggests that the price-productivity relationship is
changing. Prices are more rigid today and less willing to decline in response
to greater production efficiency. At today's double digit rate of inflation,
productivity increases have little chance of mitigating price increases to
a noticeable extent.
Table 11 summarizes Renshaw1s comparison of (1) output per man-hour
(for all persons); and (2) labor productivity in the gas and electric utility
industry for three historical time periods. 17 Renshaw concludes that it does
not seem plausible to expect longer run rates of productivity in the gas and
electric industries to recover to the extraordinary levels of 1947-1966.
TABLE 11
AVERAGE ANNUAL GROWTH RATES IN PRODUCTIVITY FOR ALL PERSONS AND LABOR PRODUCTIVITY IN THE GAS AND ELECTRIC INDUSTRY.
1947-1953 1953-1966 1966-1973
All Persons 4.1% 3.0% 20 1 ~~
Gas and Electric 7.2% 7.0% 4.8%
Source: Edward F. Renshaw, "Productivity and the Demand for Electricity,1I Publ ic Uti1 ities Fortnightly, (May 6, 1976), p. 17.
lI-35

For the economy as a whole, output per man hour in the U.S. dropped
2.7% in 1974, the first decline since 1947. 18 Also in 1974 the consumer
,/
price index increased 10.9% over the 1973 index, which marked the beginning
of double digit price increases. The movement of prices and productivity
over the 20-year period prior to 1974 suggests that the maintenance of U.S.
economic health may in part be achieved by productivity growth surpassing
the growth of general price levels. The downturn of productivity in 1974,
therefore, may be interpreted as a violent disruption to the historical
trend.
By juxtaposing the consumer price index for all items (CPI) with the
consumer price index for gas and electricity (GEPI), definite changes in the
growth rates of both indexes were identified in 1967 and 1974 (see Figure 1).
For the period 1955-1967, the general price index grew at an average annual
rate of 1.9%. For the period 1968-1973, average annual growth rates for the
CPI and GEPI were 4.9% and 4.0% respectively. In years 1974 and 1975, the
effects of the oil embargo contributed to even sharper increases, especially
in the GEPI. The 1974 GEPI increased 15.35% over 1973 levels, while in 1975
the same index climbed 16.32% over the 1974 index. These growth rates are
summarized in Table 12 .
. Figure i shows the trend of output per man-hour for the production
worker in the gas and electric industry. This index has been growing at a
fairly brisk pace of 5.8% per year on average, while the output per man-hour
for all employees in the gas and electric industry has grown at an average
annual rate of 5.3% (see Figure 2). It is evident that for the period
1955-1972 productivity as measured by these indexes has 9rown at a faster
11-36

11-0
130
Uil
Jl~
JDt,
z
t-'I t-'I
i W '-J
FIGURE 1
Consumer Price Index, Ga~ and Electiic Price Index and Production Worker (Gas and Electric) Output per Man-Hour
[1~67=100J
...,:(-_--'1&--- _...:r-- .:t;'- -"{;--~ ., ")(--,.4(-- _,.x--- . '" --- - ..:I . // ....... . . ----~~
,-",,: / . l .............. ~
~; ;"
~ ... r-
.~
//
/r
p~f)j)\)ta·a. J
IG j-o I I
e(' 1"'"/ ~"Ii r::"?' ~<i (,rt t.t t,G. ~ar, Ill; ,e* II tH Itl HI M... --11 1;., .... "'.

d'OI
130
}l~
Ih
le~
10
1,0
$'0
~o
~o
z.
10
o
I-t I-t
I W 0::>
FIGURE 2
Consumer Price Index, Index of:Out~ut (Gas and Electric) and Employee Output per Man Hour (Gas and Electric)
[1967=100J.
EMrl'~U •. T" •. ,."V· •• <Po, PER .. •• ' • ' /. tuA< l;, 1'1 ... Il'''~ .,;:':"'- /
. ",lE'rftl~> \. .. .... /' ",,+// . +".,,, ~.
,," ..,.".. I\'- • ~~,." /7"""" .\
.... ~ ,j • ...... /' rrJ~~ +. ,_' j:..-...... ~ .01' ,',' ...... OUTP~1 " :r--- 1(,,··
• ,+." " ..... ' ., .. 5 "... , AS ~ '"t:n<T"'\~)
)ttl' ,. /1""' .
I' . _91'
I' ~"8e-'·""'.!/ .I' "t· L.
. ;( : 0" . /.t"
~ .. Of
". .
.... ----- -........ -- . -fO" ."".7'"
J""
,. . I
l;~ f"/. <'1 '~. . ) t , I t, r. L~ J Q . ~ .....
... " .... "''''-.'V(-''''' ... ~~~J. .... 1,i1Ai~;.;~il'd
C6,g$V~' l!! ,.Mtr ...... -fiN rItX'- -- 'at ,r. . ;-
~K. . . ill. it +_

rate each year than the CPI with the exception of 1969 and output per man
hour increased at a faster rate each year than the GEPI until 1970 which
marked the beginning of a reverse trend.
Table 12 also summarizes aVErage annual growth rates in labor product
ivity for the gas and electric industry for the four defined time periods.
TABLE 12
AVERAGE ANNUAL GROWTH RATES OF THE CONSUMER PRICE INDEX (CPI), THE GAS AND ELECTRIC PRICE INDEX (GEPI), EMPLOYEE OUTPUT PER MAN-HOUR IN THE GAS AND ELECTRIC INDUSTRY (EO), AND PRODUCTION WORKER OUTPUT PER MAN-HOUR IN THE GAS AND ELECTRIC INDUSTRY (PO) (1967 = 100).*
Index 1955-1967 1968-1973 1974 1975
CPI 1 . 9~b 4.9% 10.9% 9.1 %
GEPI 1 .1% 4.0% 15.3% 16.3%
EO 6.5% 4.6% -2.4% 2.6%
PO 6.9% 4.9% -0.9% 3. 3~~
* Calculations were made based upon data obtained from U.S. Dept. of Labor, Bureau of Labor, Handbook of Labor Statistics, 1977.
After 1970 the gap between the GEPI and labor productivity in gas and
electric industry began to close. In other words, advances in productivity
levels together with other factors tending to push prices down were not able
to overwhelm the inflationary price advances. How much productivity increases
contributed to dampening price increases is difficult to discern. If price
changes could be decomposed and a correct specification of the functional
form explaining price changes could be identified, then productiv;ty·s con~
tribution to holding down prices could be estimated. Kendrick suggests
various methods for accomplishing this task and points out the many difficulties
of estimating this relationship.19
11-39

Kendrick contends that productivity rates in the public utilities
sector have generally been above average. 20 In part, this is due to
the above average investment in neltl plant and equipment which has pro
moted production efficiency. Table 12 suggests that this growth in
production efficiency may have favorably affected the gas and electric
industryis relative price levels. Recent years however, have witnessed
a decline in capital input per kw.2l This suggests that inflation has
overtaken the benefits derived from productivity advances achieved through
capital investments. The gas and electric industry is experiencing low
rates of productivity in a severe inflationary climate. The implication
is that to restore reasonable productivity advances, inflation must first
be controlled.
IV. REGULATION IN A RETURN TO RELATIVE PRICE STABILITY
A. Wage and Price Guidelines
Soon after the announcement of the President'~ anti-inflation program,
the Director of The National Regulatory Research Institute wrote to the
Council on Wage and Price Stability to inquire as to the applicability
of the Counci 11 s Vol untary Standards for Non-i.nflationary Pay and Price
Behavior to the utility sector. Basically the reply was that no compelling
reason could be found to treat that sector any differently and that power
companies (and commissions) would be expected to comply. Since that time(December 1978), various positions have been taken by
companies and commissions on the issue. Some state regulators feel that
fuel-cost adjustments in utility bills won1t be held to the price guide
ltnes;23 others feel the guidelines must be addressed in rate proceedings'
with- great visibility;23 REA has told its co-op borrowers that it expects
them to meet the wage-price guidelines and to report to the Rural
II-40

Electrification Administration how the guiaelines were taken
into account in fashioning rate hikes;25 the standards are
intended to apply to municipal and other publicly owned utilities
as well as investor-owned utilities;26 and some exemptions have
emerged for purchased power costs, interest coverage, and certain
cash flow problems. 27
For its part, the National Association of Regulatory Utility
Commissioners through its President pledged Jltotal cooperation" with
I
the program;2B the New York Commission said it will expect utilities
under its jurisdiction to abide by federal wage-price guidelines when
requesting higher rates, as have the Colorado and the Iowa Commissions.29
In order to get some sense of the implications of the application
of the guidelines to the electric and gas sectors, it is helpful to
take a retrospective look at what would have been the circumstance if
the present guidelines were applied in hindsight over the general rate
requests of the utilities for 1977.
B. The'Guidelines "Applied"*
President Carter's new anti-inflation program of October 24, 1978
has as its goal to reduce the nation's inflation rate to between 6% and
c h:% .:~ 1""""7"" 30 u.~o III I':JI':J. This new attack on the inflation rate called for an
"economy-wide ll ceiling of 5.75% for price increases.
The way in wh i ch such a program as i nt roduced by governmenta'1
authorities actually impacts on various sectors of the economy is some-
times difficult to know ahead of time. A clear understanding of the
manner in which guidelines such as those recently proposed by the
President are best applied to particular sectors is necessary before a
conscious contribution to governmental objectives can be made. This
*This section was prepared by Mr. Curtis Odie, Economist and Graduate Research Associate, NRRI staff.
11-41

is particularly true of the regulated sector, e.g., transportation, tele
communications, and power. Regulators and gas and electric utility
executives alike, must be aware of the intended application of the
President's proposed guidelines to rate adjustments. A proper concern
of these parties was exactly how the President's guidelines apply to
proposed utility rate increases. This was substantially (and subsequently)
clarified by issuance of the IIRevised Wage and Price Standards ll on
December 13, 1978.
It would seem instructive and useful in thinking about the prob1em
fo illustrate some of the effects of the guideline1s IIcore ll standards
Cas opposed to subsequent revisions) had they applied to rate increases
before state regulatory commissions in calendar year 1977. That is,
what would the picture be if the President's program and these standards
had applied to ~ and electric rate increases IIrequested ll i,n 19]7,
IIgrantedll in 1977 and IIpendingll before state regulatory commissions on
December 31, 1977.
This exercise makes the provisional assumption that other things
are being held constant. If the voluntary wage and price program had
been introduced in October 1976, it is unrealistic to presume that the
actual results would be the same as those presented below. This restric
tion should be kept in mind in examining the following findings.
Under the new guidelines, the maximum price increase allowed for
an individual firm is one half of one percentage point below the average
annual rate of price increases during 1976-1977 31 However, the program's
stipulated ceiling on 19]9 price hikes is ~.5%. Therefore, if a firm had
raised its prices an average of 5% during 1976-1977, it would be constrained
to a 4.5% increase in 1979. However, if the 1976-1977 average price increase
was 12%, the firm would be restricted to the 9.5% price increase ceiling in
1979 in lieu of 11.5% (12.0-0.5).
II-42
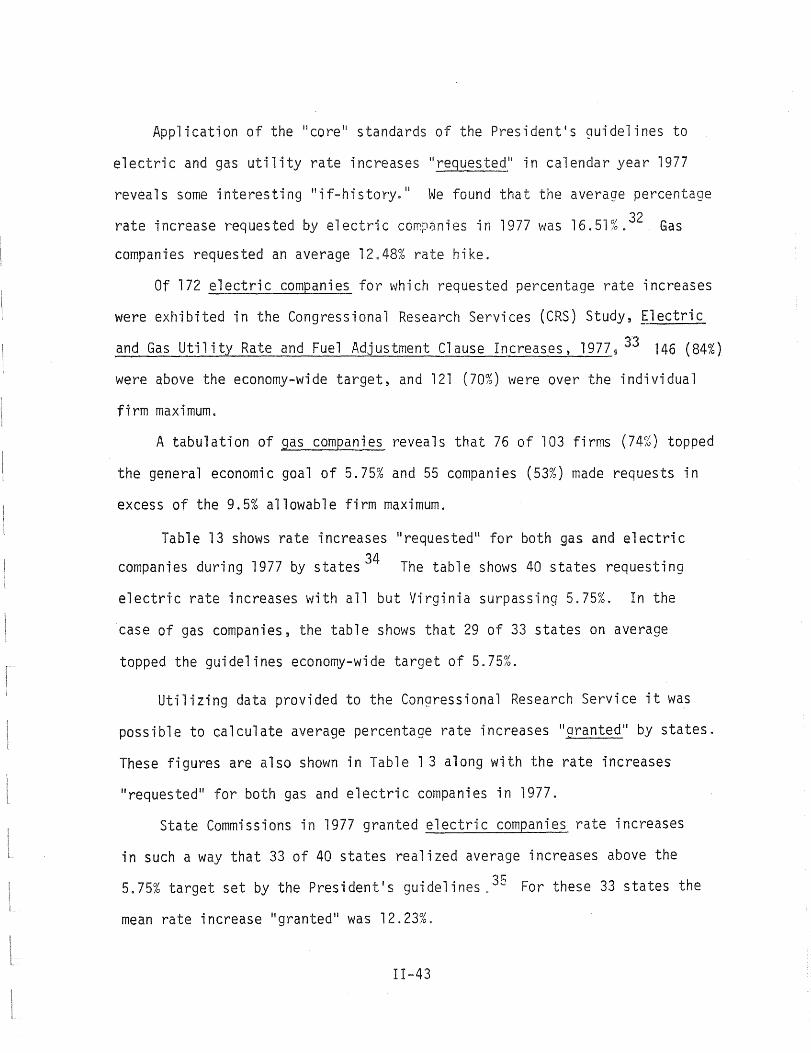
Application of the "core" standards of the President's guidelines to
electric and gas utility rate increases IIrequested'l in calendar year 1977
reveals some interesting tlif-historYoll We found that the average percentage
rate increase requested by electric companies in 1977 was 16.51%.32. Gas
companies requested an average 12.48% rate hike.
Of 172 electric companies for which requested percentage rate increases
were exhibited in the Congressional Research Services (CRS) Study, Ilectric
and Gas Utility Rate and Fuel Adjustment Clause Increases~ 1977 i 33 146 (84%)
were above the economy-wi de target, and 121 (70~n \'Jere over the i ndi vi dua 1
firm maximum.
A tabulation of gas companies reveals that 76 of 103 firms (74%) topped
the general economic goal of 5.75% and 55 companies (53%) made requests in
excess of the 9.5% allowable firm maximum.
Table 13 shows rate increases IIrequested ll for both gas and electric
companies during 1977 by states 34 The table shows 40 states requesting
electric rate increases with all but Virginia surpassing 5.75%. In the
case of gas companies, the table shows that 29 of 33 states on average
topped the guidel ines economy-wide target of 5. 75~s.
Utilizing data provided to the Congressional Research Service it was
possible to calculate average percentage rate increases Ilarantedll by states.
These figures are also shown in Table 1 3 along with the rate increases
"requestedll for both gas and electric companies in 1977.
State Commissions in 1977 granted electric companies rate increases
in such a way that 33 of 40 states realized average increases above the
5.75% target set by the President's guidelines ,35 For these 33 states the
mean rate increase "granted ll was 12.23%.
II-43

TABLE 13
ELECTRIC AND GAS UTILITY RATE INCREASES (Averages) REQUESTED AND GRANTED IN 1977 BY STATES
Electric Gas
% Increase (a) °L Increase (b) % Inc re a s e (a) 0/ Increase (b) ,0 /0
Reguested Granted Reguested Granted
Alabama 26.62 11 .81
Alaska 38.16 35.40
Arizona 23.00 18.69 12.00 18.61
Arkansas 8.92 6.10 9.93 0.10
California 31.70 14.21 17.90 7.01
Co 1 orado 13.55 11 .39 12.60 11 .61
Connecticut 16.10 5.97 7.20 2.93
De 1 a\AJa re 17.90 17.90 14.57 11.94
Dist. of Columbia None None
Florida 19.48 10.48 18.10 13.59
Georgi a 17.48 15.44 4.90 3.54
Hawaii 15.00 10.29
Idaho 23.02 10. 11 2.90 2.13
III i noi s 16.34 11 . 12 7.32 5.21
Indiana 'Jh /If'\ , t:: II 0 '-..,).'"'tv IV.'"'tO
Iowa 6.60 4.49 6.60 5.51
Kansas 17.06 7.96 9.01 3.85
Louisiana 17.95 0.57 19.55 8.37
~1a i ne 10.56 6.54 None
~1aryl and 14.72 12.57 5.82 5.45
r1as sachusetts 15.33 11 .55 16.45 8.00
Michigan 10.00 5.00 7.80 2.56
t·1i nnesota 14.41 11 .78 7.74 5.66
11-44

TABLE 13 Continued
Electric Gas
% Increase (a) % Increase (b) % Increase (a) % Increase (b) Reguested Granted Requested Granted
Mississippi None ':" None
Missouri 16.67 8.41 9.61 5.32
Montana 28.00 12.25 30.00 23.39
New Hampshire 7. i 3 7.13 9.36 8.77
New Jersey 18.50 8.80 10.00 4.01
New York 8.88 5.59 12.51 10.22
No. Carolina 13.94 10.95 6~96 2.80
No. Dakota 15.61 11 .80 7.76 6.60
Ohio 21.00 12.90 20.54 15.93
Oregon 22.32 19.65 7.53 4~48
Pennsylvania
Puerto Rico None ~!one ":"
Rhode Island 6.95 5.14 11 ~ 60 3.76
So. Carolina 13.25 9.54 None
So. Dakota 15.86 5.01 20.35 6.99
Tennessee None 7.00 2.57
Texas None ~
Utah 15.39 12.30 ':"'
Vermont 16.47 16. 11 None
Virginia 3.28 2~64 3~90 3.90
Vi y'g; n Is 1 ands None None ':"
Washington
West Virginia 13.58 7.95 32.87 29.30
Wisconsin 7.92 8.52 2.56 1 .54
Wyoming 16.70 11 .51 39.00 10.05
11-45

Notes:
Ca} These figures were found by calculating the average rate increase "requested" for each state from company data provided in the CRS study.
(b) These averages were calculated by finding the rate revenues before the rate increase was granted for each firm within the state. The percentage rate increase for each firm in the state was then calculated and the average was then computed.
Source: U~S~ Senate, Electric and Gas Utility Rate and Fuel Adjustment Clause Increases, 1977, Subcommittee on Intergovernmental Relations and the Subcommittee on Energy, Nuclear proliferation and Federal Services of the Committee on Governmental Affairs, U.S, Senate, by the Economics Division, Congressional Research Service, Ltbrary of Congress; Sept. 1978, Appendix Table B-V, PPt CRS 41 - CRS 59.
1I-46

For the 39 states "requesting" increases in excess of 5.75%, the
average increase II gran ted'i was 11.01%, 5~ percentage points above the
target. The mean increase "granted" for all 40 states was 10.80~b.
Turning to the gas companies, we fQund that 15 of the 33 states were
granted rate increases on average in excess of 5.75%. The mean increase
IIgranted" in these 15 states was 12.69%.
Of the 29 states I'requestingll increases above 5.75%, the mean increase
IIgrantedll was 8.49%. For all 33 states the average "granted" rate increase
was 7.80%.
Electric and gas utility rate increases IIpendinq'l before State Public
Utility Commissions in December 1977 is shown in Table 14. From the data
provided by the Congressional Research Service, avera~e percentage rate
increases "requested" were calculated for each state listed. Ninety six (96)
electric companies and ninety seven (97) gas companies were identified as
having rate increases pending in December 1977. 36/
In the case of electric companies, 33 of 34 states with rate hikes
lIpendingll were in excess of the 5.75% target. The average rate increase
pending before commissions in all 34 states was 16.06%, 10 percentaqe
points over the target.
In the case of gas companies, 24 of 27 states were above the target
with an average rate boost of 12.76% requested by all 27 states.
Furthermore, 21 states and D.C. had both gas and electric rate
increases pending before State Commissions in excess of the guideline's
target.
II-47

TABLE 14
ELECTRIC AND GAS UTILITY RATE INCREASES (Averages) PENDING BEFORE STATE PUBLIC UTILITY COMMISSIONS
DEC. 1977, BY STATES*
Electric Gas % Increase % Increase
State Reg ues t~sL- Requested
Alabama None None
Alaska 23.21 None
Arizona None None
Arkansas 12. 17 5.80
Cal ifornia 15.09 20.65
Colorado 14.39 12.82
Connecticut None 11 .49
Delaware 17.57 None
Dist. of Columbia 15.90 12.56
Florida 8.40 None
Georgia None None
Hawai i 19.47 10.10
Idaho 36.84 5.60
Illinois 13.40 7.90
Indiana 6.00 '1', __ ._
14.03 5.99 iowa
Kansas 18.57 25.99
Louisiana 20.00 None
Maine 9.11 None
Maryland 7.60 None
Massachusetts 8.49 None
Michigan 19.00 l1.83
Minnesota 16.20 10.80
11-48

TABLE 14 Continued
Electric Gas
% Increase 0/ Increase 10
State Reguested Reguested
Mississippi None None
Mi ssouri 24.10 7.5
Montana 33.60 60.95
New Hampshire 8.25 9.60
New Jersey 15.24 19.00
New York 14.88 7.15
No. Carol ina 18.09 9.73
No. Dakota None 4.60
Ohio 21.83 18.08
Oregon 6.89 None
Pennsylvania 17.22 9.97
Puerto Rico None None
Rhode Island 4.50 15.80
So. Caro 1 ina
So. Dakota
Tennessee 8.00 10.00
Texas None
Utah 11 .42
Vermont 17.62 10.00
Virginia 11 .83 8.71
Virgin Islands None None
Washington 28.00 5.80
West Virginia 20.22 None
II-49
Note: *These figures were found by calculating the average rate increase "requested" for each state from company data provided by the CRS study.
Source: u.s. Senate, Electric and Gas Utility Rate and Fuel Adjustment Clause Increases, 1977, Subcommittee on Intergovernmental Relations and the Subcommittee on Energy, Nuclear Proliferation and Federal Services of the Committee on Governmental Affairs, U.S. Senate, by the Economics Division, Congressional Research Service, Library of Congress; Sept. 1978, Appendix Table B-VI, pp. CRS 6l-CRS 73.
II-50

By focusing on individual companies, it was found that 86 (89%) of the
96 identified electric companies in the CRS study were above the economy
wide target, and 68 firms (70%) requested hikes in excess of the allowable
firm maximum. In the case of gas companies, 70 of the 97 firms (72%)
requested increases over the 5.75% standard and 45 firms (46%) climbed
beyond the 9.5% ceiling.
Therefore, the "core" standards of the inflation-fighting scheme
promulgated by the White House would have required at least 70% of the
electric firms submitting rate increases for approval to adjust requests
downward in their attempt to boost rates above the 9.5% ceilin9. And at
least 46% of the gas utilities would have been required to make downward
adjustments in their requests had ~ompanies complied with the newly
proposed guidelines.
Table 15 shows the total dollar amount of electric and gas rate increases
actually "granted" in 1977 and the total rat~ increase had the President's
guidelines applied.
Column (1) shows the total rate increases actually granted in 1977.
Column (2) shows the total rate increase which would have resulted if those
companies granted increases in excess of the economy~wide target had been
restricted to the 5.75% goal. Similarly, Column (4) shows the total rate
increase if those companies granted increases above the 9.5% maximum had
been restricted to this ceiling.
I I-51

~
~
I 01 N
TABLE 15
ELECTRIC AND GAS UTILITY RATE INCREASES IN 1977 - ACTUAL AND IF THE PRESIDENTiS ANTI-INFLATION GUIOELINES HAD APPLIED (MILLIONS OF DOLLARS)
(1 ) a
Total Rate Increases Actually Granted in 1977
(2)b (3)
If 5.75% Maximum Difference Target had Applied Col.(1)-Col.(2)
(4)c
If 9.5% Max. had Applied
(5)
Difference Co 1 . (1 ) - Co 1 . (4)
Electric $1 ,924.2 $1,193.1 $731.1 $1,678.5 $245.7
Gas
Total
Notes:
(a) This total the Virgin
(b) Column (2) in the CRS
292.9 212. 1 80.8 256.3 36.6
$2,217.1 $1 ,405.2 $811 .9 $1 ,934.8 $282.3
represents rate increases granted in45 states, the District of Columbia Puerto Rico, and Islands, as reported in Appendix Table B-V of the CRS study.
shows the estimated total dollars of rate increases if all of the commissions represented study had res tri cted rate increases to 5.75%",
(c) Column (4) shows the estimated total dollars of rate increases if all of the commissions represented in the CRS study had restricted rate increases to 9.5%.
Source: Author1s calculations derived from data available in the U.S. Senate's, Electric and Gas Utility Rate and Fuel Adjustment Clause Increases, 1977, Subcommittee ori Interqovernmental Relations and the Subcommittee on Energy, Nuclear Proliferation and Federal Services of the Committee on Governmental Affairs, U.S. Senate, by the Economics Division, Congressional Research Service, Library of Congress; Sept. 1978, Appendix Table B-V.

The table reveals that had the guidelines applied in 1977 with each
firm being restricted to a 5.75% rate increase, total electric rate increases
would have been reduced by $731.1 million (Col. 3). Total ~ rate increases
would have been reduced by $80.8 million resulting in a total reduction for
both gas and electric rate hikes of $811.9 million.
Had each firm been restricted to a 9.5% rate increase, electric
rate hikes would have been $245.7 million less than were actually
granted (Col. 5). Gas rate increases would have been reduced by $36.6
million resulting in a total r~duction of $282.3 million from the level
of rate increases actually granted in 1977.
Table 16 shows the total dollar amount of electric and gas rate
increases "pending" before State Commissions in December 1977 and the total
ra te increase whi ch woul d have been II pendi ng II if the Pres i dent IS gui de 1 i nes
had applied.
Column (1) shows the total rate increase requested by companies in
1977. Column (2) shows the total rate increase which would have been
"requested" by companies had all firms restricted their rate increase
"requests" to 5.75%. Column (4) shows the requested increase had all
companies restricted their proposed rate hikes to 9.5%.
The table reveals that had the guidelines applied with each firm being
restricted to a 5.75% rate increase, total electric rate increases "pending"
before State Commissions in December 1977 would have been $1,101.1 million
less than the amount actually pending (Col. 2). Requested ~ rate
increases would have been reduced by $494.4 million, resulting in a
$1,595.5 million reduction in rate increase requests.
Had each firm restricted its request to a 9.5% rate hike, electric
rate increases pending would have declined by $1,680.5 million (Col. 4).
Gas rate increases pending would have been reduced by $754.8 million
resulting in a total reduction of $1,069.8 million.
II-53

I-i
I-i
I (J1
..f-:::.
Electric
Gas
Total
Notes:
TABLE 16
ELECTRIC AND GAS UTILITY RATE INCREASES PENDING IN 1977 - REQUESTED AND IF THE PRESIDENT1S ANTI-INFLATION GUIDELINES HAD APPLIED (MILLIONS OF DOLLARS)
(l)a (2)b (3) (4)c Total Rate Increases If 5.75% Maximum Difference If 9.5% Max. Actually Requested Target had Applied Co 1 . (1 ) - Co 1 . (2) had Applied
$2,373~4 $1,101.1 $1,272.3 $1,680.5
1,131.7 494.4 637.3 754.8
$3,505.2 $1.595.5 $1.909.6 $2.435.3
(5)
Difference Co 1 . (1 ) - Co 1 . ( 4 )
$692.9
376.9
$1 ,069.8
(a) This total represents rate increases granted in 45 states, the District of Columbia, Puerto Rico, and the Virgin Islands as reported in Appendix Table B-VI of the CRS study.
(b) Column ~)shows the estimated total dollars of rate increases "requested " if all companies had restricted their requests to 5.75%.
(c) Column (4) shows the estimated total dollars of rate increase IIrequests" if all companies had restrir.ted their requests to 9.5%.
Source: Author's calculations derived from data available in the U.S. Senate's, Electric and Gas Utility Rate and Fuel Adjustment Clause Increases, 1977, Subcommittee on Intergovernmental Relations . the Subcommittee on Energy, Nuclear Proliferation and Federal Services of the Committee on Governmental Affairs, U.S. Senate, by the Economics Division, Congressional Research Service, Libra~y of Conqress; Sept. 1978~ ADoendix Table B-VI.

C. Is Turnaround Fair Play?
Unless one believes that the U.S. economy has an inexorable and
endless upward bias in price levels, i.e. that the economy ;s permanently
assigned to inflation, there will be 3. time in lithe cycle ll where prices
stabilize or even turn down. What then might be the outline of the
regulatory response to a resumption of relative price level stability?
Other parts of this report have traced the regulatory response
on the upswing as involving the adoption of various devices and practices
to accommodate to the inflationary circumstance. But if public utility
regulation is to be something more than merely "accounting for inflation,1I
it should have a planned regulatory response for the downswing.
In some respects a IIswitching of sides" can be expected to take
place. One might find utilities anxious to get fuel adjustment clauses
and indexing arrangements off their books; replacement cost accounting
and marginal cost pricing might be less attractive to them as might the
use of future test years in estimating revenue needs. Even regulatory
delay might be valued as helpful, requiring full evidentiary hearings
to lower rates and revenues
From the commission point of view in a period of sustained price
level stability, the pressures and rationale for allowing CWIP in the
rate base, normalization accounting, preoccupation with rate-of-return
on equity rather than rate base, interim rates, and time constraints
on commission deliberations would presumably be less strong. State
legislatures could be expected to be less prone to intervene on economic
issues, like so-called lifeline provisions, and the Congress in a fiscal
policy swing might reduce the Investment Tax Credit and Accelerated
Depreciation preferences available to utilities under the federal tax code.
II-55

Should some or much of this eventuate in the post-inflationary
period described, the central task of state commission regulation
would then be a clear-headed new appraisal of the capital needs of
the industry; a reassessment upward of the actual riskiness of the
industry; and a fairminded determination of allowable returns commen
surate with these conclusions. Improved and effective commission
regulation for all parties is more likely to come in this setting than
when regulation is cluttered with gadgets and gimmicks that at best
were improvisations of the moment and at worst clouded the focus of
regulators for a decade.
II-56

FOOTNOTES TO PART II
1. U.S. Congress, Committee Prints, Electric and Gas Utility Rate and Fuel Adjustment Clause Increases, 1976 (and committee prints~ same title, for 1977, 1975, and 1974), Senate Committee in Governmental Affairs, prepared by the Economics Di sion, Congressional Research Service, Library of Congress, July 1977, p. ~.
2. Some of these amounts also include a fuel component; i.e., not all fuel-related costs are represented by the FAC totals.
3. Ibid. (1977 Committee Print), p. vii.
4. Public Service Company of New Mexico, Decision and Order, NMPSC, Case No. 1419, Dec. 29, 1979} p. 62.
5. Ibid., pp. 56, 63-68.
6. National Regulatory Research Institute report, The New Mexico Cost-ofService Index: An Effort in Regulatory Innovation, by A. Kaufman and R. Profozich, May, 1979.
7. Consumers Power Company, 25 P.U.R. 4th 167 (Mich. PSC 1978), appeal pending, Kelley v. PSC, Ingham County Circuit Court, No. 78-22142 AA (filed August 30, 1978).
8. Library of Congress, Congressional Research Service, Economics Division, Memorandum Report to Congressman John E. Moss, Regarding Cost of Including Construction Work in Progress in Rate Base as Proposed by the Federal Power Commission, December 20, 1974; and Federal Power Commission, Office of Economics, An Analysis of the Electric Utility Industry's Financial Requirements, 1974.
9. Testimony of Gordon Corey, Vice Chairman, Commonwealth Edison for his company and Edison Electric Institute before U.S. House Ways and Means Oversight Committee as reported in Electrical Week, April 2, 1979, p. 4.
10. For a thorough analysis of the issue including its legislative, see Occasional Paper No.1, of the National Regulatory Research Institute, Accelerated Depreciation and the Investment Tax Credit in the Public Utility Industry: A Background Analysis, by Donald W. Kiefer, April 1979.
11. Testimony before the U.S. House Ways and Means Oversight Committee as reported in Electrical Week, April 2, 1979, p. 2.
12. U.S. Congress, Committee Print, Electric and Gas Utility Rate and Fuel Adjustment Clause Increases, OPe cit.
13. Public Power Weekly, Newsletter, March 19, 1979, American Public Power Association, Washington, D.C., p. 1.
II-57

FOOTNOTES TO PART II (Cont'd)
14. Bureau of National Affairs, Energy Users Report, January 1978, p. 10, reporting on Federal Trade Commission staff report dated December 28, 1977.
15. Solomon Fabricant. A Primer on Productivity, New York, N.Y. Random House (1969), Chapter 9. Much of the discussion that follows draws on this theoretical foundation.
16. Edward F. Renshaw~ IIProductivity and the Demand for Electricity,1I Pub 1 i cUt i 1 i tie s Fort n i 9 h t 1 y (May 6) 1 976), P P • 17 - 2 ° .
17.. Ibid.
18. Calculations presented here were based upon data obtained from the Handbook of L~por Statistics, U.S~ Dept. of Labor, Bureau of Labor Statistics, 1977.
190 For an extensive treatment of the subjects see John W. Kendrick, . Productivit Times in the United States, Princeton, N.J.: Princeton University Press 1961 .
20.. Ibid.
21.. Renshaw,2£.. cit.
22. Mailgram of November 22, 1978 from Dr. Douglas N. Jones, Director, NRRI, to the Honorable Alfred E. Kahn, Chairman, Council on Wage and Price Stability and Dr. Kahn's reply letter of December 26, 1978.
23. Electrical Week (February 19, 1979), p. 3
24. NARUC Bulletin (March 5, 1979), p. 6.
25. Jan. 26, 1979 Memorandum of Robert Feragen, Administrator, Rural Electrification Administration.
26. Public Power Weekly, Newsletter, (Washington, D.C.: American Public Power Association, March 26, 1979), p. 1.
27 " Pub 1 i c Power Weekly, News 1 etter, (Was hi ngton, D. C.: Ameri can Pub 1 i c .~ Power Association, March 5, 1979), p. 2.
28. NARUC Bulletin, 2£. cit.
29. Colorado Public Utilities Commission, "Statement Regarding Federal Anti~ Inflation Program,1I March 20, 1979.
30 .. Wall Street Journal, Column 1 (Oct. 25, 1978), p. 3 (continued).
II-58

FOOTNOTES TO PART II (Cont'd)
31. Ibid.
32. Electric and Gas Utility Rate and Fuel Adjustment Clause Increases, 1977, prepared for the Subcommittee on Intergovernmental Relations and the Subcommittee on Energy, Nuclear' Proliferation and Federal Services of the Committee on Governmental Affairs, U.S. Senate, by the Economics Division, Congressional Research Service, Library of Congress; September 1978. See Appendix Table B-V, pp. CRS 41 - CRS 59.
33. Ib i d.
34. The CRS study, Appendix Table B-V, shows data for 45 states, the District of Columbia, Puerto Rico, and the Virgin Islands. Table lists each state and percentage rate increases.
35. Electric and Gas Utility Rate and Fuel Adjustment Clause Increases, 1977, .QQ. cit.
36. Ibid., see Appendix Table B-VI, pp. CRS 61 - CRS 73.
I I-59


PART III - ANALYZING RATES OF RETURN IN
REGULATED AND NONREGULATED INDUSTRIES*
*This report was prepared for the National Regulatory Research Institute at The Ohio State University. The views expressed are those of the authors, R. J. Krasniewski and R. J. Murdock, Academic Faculty of Accounting, The Ohio State University, and do not necessarily reflect those of the Institute.


TABLE OF CONTENTS
LIST OF TABLES . .
I. INTRODUCTION .
A. Purpose of Thi s Study . . . . . . . B. A Brief Look at the Major Components
of This Study .......... .
II. REGULATIONIS EFFECTS UPON RATES OF RETURN
A. Definitional, Theoretical, and Policy Related Issues .... .
B. Summary ......... .
III. METHODOLOGY AND DATA AI~ALYSIS
A. Calculating Rates of Return .... B. Nonregulated IIIndustries: 1I The Three
Barriers-to-Entry Groups ...... . C. Sample Selection ........... . D. Ten-Year Time Period ......... . E. Testing Hypotheses: Statistical Comparisons
of the Rates of Return . . ... F. Summa ry . . 0 • • • • • • • • •
IV. RELAXING THE ASSUMPTIONS ..
A. Risk and Rates of Return. B. Marginal Cost Pricing . C. Rate Base Inflation .. D. Summary . . . . . . . .
v. RATES OF RETURN BY REGULATORY JURISDICTION
i i
1
1
4
4
4 18
22
22
28 29 30
31 48
50
50 54 54 55
56
A. Comparisons Solely Within the Regulated Sector. 56 B. Summary . . . . .. .... 57
APPEND ICES . . . . . . . . . . . . . . . . . . . . . . . 69
111-;

Figure 1
Table 1
Table 2
Table 3
Table 4
Table 5
Table 6
Table 7
Table 8
Table 9
Table 10
LIST OF TABLES AND FIGURES
The Economic Impact of Regulation Upon a Utility with Increasing Costs
Five-Year Results for Company A .
Five-Year Results for Company B .
Effects of Rate Base Inflation and Financial Leverage .. 0 ••
Flow-Through Electric Companies vs. Normalized Electric Utilities (1967-1976) Comparisons of Risk and Returns .....
Comparison of Risk and Return for Normalized Electric Utilities and Entry Groups (1967-1976) .....
Comparison of Risk and Return for Flow-Through Electric Utilities and Entry Groups (1967-1976) .....
Summary of Tests Performed in Section III
Student T Statistics for Risk Comparisons .
Comparison of Risk and Returns for Normalized Electric Utilities and Airlines (1967-1976) ..... .
Comparison of Risk and Return for Flow-Through Electric Utilities and Airlines (1967-1976) ....
111-i1
7
15
16
19
33
37
43
49
52
58
61

I. INTRODUCTION
A. Purpose of This Study Several critical contemporary problems confront the complex society
of Twentieth-Century America. Consisting issues (e.g., inflation and unemployment) which threaten to modify current lifestyles substantially tif they have not already done so), today's agenda offers very few easy choices. Relying frequently on appeals to emotion rather than to sensibility, the public discussions on some of these topics resemble verbal ping-pong matches in which the participants, acting out of self-interest and mutual distrust, fail to appreciate the interdependent nature of their relationship. Popular rhetoric exacerbates the situation. Allegations such as IIBusiness is irresponsible ll or IILabor is greedy" or "Consumers are wasteful II simply promote further suspicion and antagonism.
No issue is more heatedly debated than energy. In particular, the battle lines are well drawn when utility rates are discussed. With their advocates challenging virtually every proposed rate increase, consumers seek stable energy prices. Citing the requirement for fair and reasonable profit levels, utilities defend their requests by pointing to large increases in the cost of providing service and to the need to maintain a competitive position in the capital markets. If their securties are not kept attractive to the investment community, expansion to meet future demand is impossible.
The Regulatory Commission is the arena where these conflicts are resolved. Each side offers evidence to support its position. The two sets of IIfacts ll contain conflicting data. On the one hand, the utility is just trying to IIrip off" the consumer as much as possible. On the other, the utility is just trying to be "responsi.ve to the needs" of the corrmunity it serves and to its owners as well. The compromise decision reached by the commission leaves everyone unhappy.
This study's principal purpose is to shed some light on the Ilappro
priateness" of utility profit levels and thereby elevate the current public debate. With the data currently available, what can be said about public
1I1-1

utility rates of return? What observable effects does regulation have? Comparative information, developed as objectively as possible, is the major product of this research effort. Although relying upon data compiled originally by the uti.l ity industry (i .e., the financial statements presented in annual reports to stockholders and in registration statements filed with the Securities and Exchange Commission}, this study is by no means sponsored by it. Although written and read by . utility customers, it is not intended to support the position of any consumer group. All the adjustments to reported data and all the statistical tests are made in the spirit of achieving the highest attainable degree of comparability.
In accord with most empirical research, this study also points to those areas where its principal purpose is difficult to accomplish. How are the comparative analyses performed here affected by the limitations inherent in the data? What can1t be said aoout public utility rates of return? Perhaps more important than the comparisons themselves, these "negative" results are considered at appropriate junctures throughout the report. They offer some insight into the types of information which, if available, could address the unanswered questions, and they document the need for further research.
1. Comparing Profitability Measures for Regulated: and Nonregulated Industries
One frequently mentioned purpose of regulation is to ensure that utility profits are no greater than what they would be if the companies were forced to compete. The comparisons analyzed in this section are empirical tests of the degree to which this purpose is achieved. These tests cannot be made solely with reference to utility financial data. Although such an approach would permit conclusions as, "Utility X has a higher rate of return than Utility Y," it fai.ls to relate utilities to competitive sectors of the economy. Thts type of relationship requires comparisons of utilities with firms in nonregulated industries. Using relative difficulty of entry as a surrogate for the degree of competition
II1-2

existing in an industry, this study compares utility profits with those in three industrial classifications.
Although this extension beyond a mere examination of utility rates of return permits the types of comparisons most relevant to the research question considered here, it also increases level of complexity inherent in the analysis. Several adjustments to account for the differences between regulated and nonregulated enterprises must be made before any comparisons are performed. The concept of "rate of return!! must also be unambiguously defined. Reported financial information prepared in accordance with divergent accounting principles must be reconciled. The degrees of risk associated with utility and nonutility investments must be examined to determine their effects on profit~levels.
Finally, consideration must be given to efficiency differences between regulated and nonregulated businesses and to the pricing practices which result from the usual regulatory process.
2. Comparing Rates of Return Allowed by Various Regulatory Authorities A second major type of comparative analysis is directed toward
assessing the degree of uniformity in utility profit levels across jurisdictional lines. Again, the intent is to provide information. Using uniform or equal rates of return for all public utilities as a benchmark (in a manner similar to a "national average ll
), this approach enables a regulatory body to see "where it stands" in relation to its counterparts throughout the country. Although intrastate activity is not subject to direct scrutiny from Washington, federal officials, desiring some amount of similarity and consistency in the regulatory process, may use the data developed here to determine their future course of action. Several types of comparisons (e.g., State by State, "Flow-Through" States and "Normalized ll
States, etc.,) are presented.
Because the analysis here is limited to utility financial data, methodological issues differ somewhat from those mentioned in the preceding
section. However, utility accounting practices must still be reconciled,
I I 3
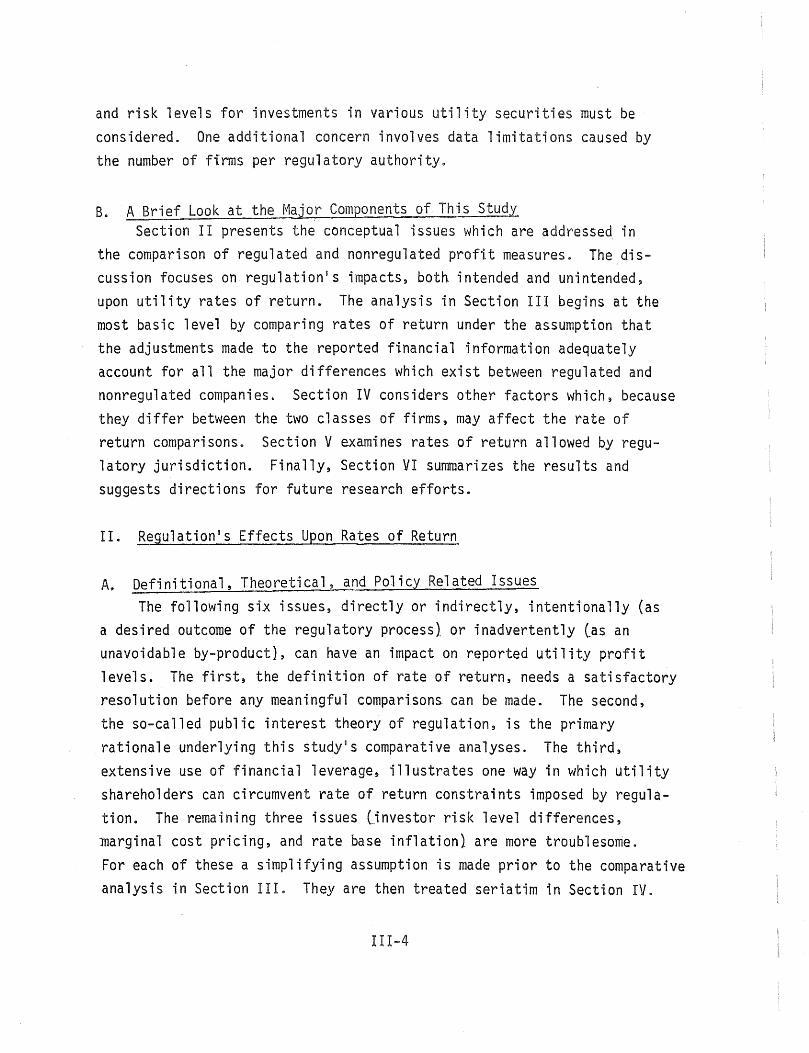
and risk levels for investments in various utility securities must be considered. One additional concern involves data limitations caused by the number of firms per regulatory authority.
B. A Brief Look at the Major Components of This Study Section II presents the conceptual issues which are addressed in
the comparison of regulated and nonregulated profi.t measures. The discussion focuses on regulation's impacts, both intended and unintended, upon utility rates of return. The analysis in Section III begins at the most basic level by comparing rates of return under the assumption that the adjustments made to the reported financial information adequately account for all the major differences which exist between regulated and nonregulated companies. Section IV considers other factors which, because they differ between the two classes of firms, may affect the rate of return comparisons. latory jurisdiction.
Section V examines rates of return allowed by reguFinally, Section VI summarizes the results and
suggests directions for future research efforts.
II. Regulation's Effects Upon Rates of Return
A. Definitional, Theoretical, and Policy Related Issues The following six issues, directly or indirectly, intentionally (as
a desired outcome of the regulatory process). or inadvertently Cas an unavoi dabl e by-product}, can have an impact on reported uti 1 i ty profi t levels. The first, the definition of rate of return, needs a satisfactory resolution before any meaningful comparisons can be made. The second, the so-called public interest theory of regulation, is the primary rationale underlying this study·s comparative analyses. The third, extensive use of financial leverage, illustrates one way in which utility shareholders can circumvent rate of return constraints imposed by regulation. The remaining three issues (jnvestor risk level differences, marginal cost pricing, and rate base inflation) are more troubleso~e. For each of these a simplifying assumption is made prior to the comparative analysis in Section III. They are then treated seriatim in Secti.on IV.
1II-4

1. Definition of Rate of Return Nothing is more fundamental to this study than the meaning of rate
of return. On the surface there does not seem to be much confusion concerning this term. For example, an eight percent rate of return simply means that for every SlOG invested,- $8 is earned. However, at least two major ambiguities occur when this concept is applied simultaneously to utilities and nonregulated businesses.
In general, for a company not subject to regulation, rate of return in an accounting sense means the quotient obtained when net income is dtvided by total assets (total resources}. A measure with the identical name in the utility industry has both its numerator and its denominator determined differently. Fi.rst, II re turn" in the regulatory accounting sense includes interest charges along with net income. This is done because of the high degree of financial leverage (~he ratio of debt to equityl found in the typical publ ic util ity. Second, because a util tty is not allowed to earn a return from current ratepayers on construction work in progress CCWIP), Urate basell replaces total assets. Roughly akin to the excess of total assets over CWIP, the rate base, depending upon the regulatory jurisdiction, may i.nvolve several other adjustments to total assets.
To reconcile these differences in this report, whenever a rate of return on total assets is calculated, interest charges are included in the numerator. This is applied universally, for utilities and non-utilities alike. Interest is also included in all rates of return on total productive assets (~here total productive assets are defined as total assets minus CWIP 1. 1 Cal cul ated in the same manner for every company Cincl udi ng those which are not regulatedt, this rate of return on total productive assets 'is the closest approxi.mation in this study to th.e utility notion of rate of return on rate base.
In addition to the rates on total assets and on total productive. assets, two other series of profitability measures are developed. Constttuting returns to common shareholders, both exclude interest from
I1I-5

their numerators since interest is the II return li to debt holders. In a parallel manner to the previous discussion, the denominator used to compute the rate of return on common shareholders' productive assets also excludes CWIP.
Thus, rate of return as defined in this study is not the same as a utility's !Irate of return," nor is it identical to Urate of return·1I as the term is conventionally used in the nonregulated sector. Instead it is a compromise measure which captures the essence of both concepts and facilitates comparisons. Finally, to make the data for IIFlow Through" and IINormalized ll utilities comparable, all rates of return are computed before deducting Federal Income Tax. Section III· elaborates on this and other methodological issues.
2. From the Public Interest Theory of Regulation: Regulation Should Place a "Ceilingll on a Utility1s Rate of Return
This prescription serves as one well-known foundation for regulation's role in utility rate-setting. As a guardian of the public interest, the regulator permits th.e regulatee only a IInormal profit, II thereby removing any opportunity to follow monopoly pricing policies. The presumption is that an operation with as many monopolistic attributes as a public uti.lity would, if not subjected to regulatory authority, seek to maximize its profits by restricting output and raising prices.. A IInormal profit ll
is that level of earnings which would prevail in a competitive product market. Considered from an investment viewpoint, it is the amount necessary to attract and retain the resources employed in the industry.2 Conventional economic analysis includes normal profit as a component of a firm's cost curves.
Figure 1 depi.cts the revenue and cost functions for a util ity characterized by increasing costs Ci.e., the situation where the incremental cost of providing more output is risingl. 3 D is the demand schedule (~ssumed to have an elasticity coefficient greater than zero) and MR its related marginal revenue curve. ATC is its average total cost curve, and MC is th.e marginal cost curve. The firm earns a normal profit when, for a given level of output, the rate charged equals average total cost.
111-6

RATE
o
FIGURE 1 THE ECONOMIC IMPACT UF REGULATION
UPON A UTILITY WITH INCREASING COSTS
Q1
OUTPUT
III-7

If unregulated and allowed to maximize profits, the utility equates marginal revenue with marginal cost, produces and sells Q, at rate R4, and earns lI above normal" profits equal to the area of R1R4AB. Regulation must now remove the "monopoly profit."
One approach is to require the utility to se1' Q, at a rate of.R," Since this combination is a point on its average total cost curve, the firm would receive only a normal profit. But the havoc resulting from the excess demand Cat Rl quantity demanded is Q41 would create a rationing system at best and a "black market ll at worst.. Since consumers are willing to pay R4 for Ql' those fortunate enough to purchase some output will easily be able to make sUbstantial profits on subsequent re-sale.
Instead, the regulator attempts to determine that output where demand equals average total cost. In Figure 1 the desired output is Q3.4
Here normal profits are earned, and no excess demand exists. As long as demand is not perfectly inelastic, the quantity consumed in the regulatory solution exceeds the amount provided by the unregulated monopolist. The rate charged must be lower.
Wi.th this directive from economi.c theory as a norm, Section III proceeds with empirical tests--comparisons of utility profit levels with those in other industrial groups classified by a surrogate for relative degree of competitiveness. Utility rates of return should approximate those in perfectly competitive industries. Other than a utility subject to the regulatory process described bere, only firms in perfect competition have market equil i:brta located on theiT average total cost curves. Any fi rm operat ing i.n an imperfect ma rket is able to 'ea rn some amount of above normal proftt.. Therefore, since none of the three industrial classifications employed in Section III is perfectly competitive, utilities, if they are regulated in accord with the economic theory discussed here, should have lower rates of return than any of the industrial categories.
III-8

3. From the Rate-Setting Process Itself: A Utility is Induced to Use Financial Leverage to Increase Returns to its Common Shareholders
One of the primary reasons for calculating rates of return on shareholders' assets is to determine the effects of financial leverage. With its emphasis placed on the rate of return allowed to be earned on a utility's rate base, regulation may still permit relatively high profit levels on those assets liowned" by the company's conmon stockholders. The incentive created for rate base increases financed through borrowing is illustrated in the following example.
Assume that a public utility!s capital structure is:
Amount 8% Long-Term Debt $ 50 Common Stock 50 Total Capitalization $100
Assume further that the utility's total capitalization equals its total assets which in turn equal its rate base. The regulatory authority allows a nine percent rate of return. Finally, assume that the company is planning a major plant expansion. Its current rate of return measures are:
On total assets: 9 = 9%; and 100
On common shareholders' assets: 9 - 4 _ 5 _ 100-50 - 50 - 10%.
Suppose the entity wishes to increase the rate of return for its common stockholders as it builds its new facilities. This can be accomplished by borrowing the necessary construction funds at eight percent. To take an extreme case, assume that the new plant has a cost of $100 and that debt is used exclusively. The capital structure becomes:
Amount 8% Long-Term Debt $150 Common Stock 50 Total Capitalization $200 --
I1I-9

With the commission still allowing nine percent, rates of return are:
On total assets: 18_ 200 - 9%.
On common shareholders' assets: 2~~ - l~~ = 5~ = 12%.
The utility has "leveraged" higher profit levels for its owners. It can improve returns to shareholders by augmenting its rate base through assets acquired with funds borrowed at interest rates which are lower than its allowable rate of return. The results of this leveraging process suggest that returns on utility stockholders· assets may violate the axioms of the risk-return relationship.5 Further, even though a regulator acting in the public interest imposes a ceiling on a utility's rate of return on total productive assets (rate basel, a regulated company can still provide relatively high profits for its common shareholders. 6
Regulated public utilities constitute some of the most highly leveraged 7 companies in the country.
4. From Investment Theory: Because RegUlation Removes Most of the Risk Associated with an Investment in Utility Securities, Utility Rates of Return Should be Relatively Low
The ceiling imposed by regulation on a company·s rate of return also becomes a IIfloor.1l Assuming good estimates of all the variables used in rate-setting Cor relatively short II regu1atory lag" if the estimates prove inaccurate), utilities are guaranteed a specified level of profit. Premised on the idea that investors are risk averse, investment theory postulates a direct relationship between risk level and rate of return. 8 Risk is a "bad ll which, if borne by the investor, must provide compensation in the form of higher anticipated profit levels.
Acting as a form of insurance policy, the regulatory process itself removes much of the potential risk associated with investment in utility securities. 9 Further, because revenues are virtually assured, utilities can engage in much more financial leverage than nonregulated enterprises.
111-10

Although used more appropriately as a predictor of returns to shareholders than of returns on total assets, risk-return theory points in the same direction as the public interest theory of regulation: utility rates of return should be relatively low. 10
5. From Welfare Economics: A Utility Should Promote Societal Efficiency by Using Marginal Cost Pricing
The regulatory IInormal profit ll outcome occurs when the rate charged to customers equals the utility's average cost of producing output. As Figure 1 illustrates, regulation results in the utility supplying quantity 03 at a rate of R2. But R2 is also the firm's average total cost per unit when output level 03 is attained. Since average total cost includes an allowance for normal profit, this equilibrium position, accomplished through lIaverage cost pricing," keeps utility profits from exceeding those in competitive industries.
Although generally an effective curb on monopolistic pricing practices, average cost pricing may result in an inefficient allocation of society's resources. The issue here centers on the benefits and costs of supplying utility services. The demand schedule reflects the benefits received by consumers. The value placed on the incremental unit purchased is the maximum price a consumer is willing to pay for it.l1 In other words, the demand function can also be labeled the marginal valuation schedule or the marginal benefit curve. In this context, assuming no lI externalities" on either side of the market, the socially optimal result occurs when, for the last unit of utility service produced and consumed, marginal benefit and marginal cost are equal. With average cost pricing, this outcome can happen in only the rarest of situations. 12 Thus, another rate-setting procedure merits attention, "marg inal cost pricing," a system which attempts to transmit accurate signals to the customer about the cost of resources consumed in providing utility output.
The differences between the two approaches are illustrated in Figure 1. The marginal cost of the last unit purchased at output Q3 (as determined from the marginal cost curve) exceeds its marginal benefit (as
III-II

reflected in the demand curvel. In removing from the utility the opportunity for "above normal profit,1I regulation based on average cost pricing also causes, from a societal viewpoint, "excessive" amounts of resources devoted to utility service because the price charged is Iitoo low." On the other hand, without any specific concern for utility profit levels, marginal cost pricing results in a socially efficient quantity (Q2) by charging a rate of R3· 13 ,14
If marginal cost pricing does prevail in the utility industry, the results of the comparative analyses in this study are difficult to anticipate. Unlike the earlier discussion where the removal of monopolistic opportunities and the existence of low risk levels led to the conclusion that utility rates of return on total productive assets should be low, a marginal cost pricing policy means that utility profit levels should exceed those found in perfectly competitive industries. 15 But, since no industrial group considered here is perfectly competitive, no prediction can be made about the relationship between rates of return for utilities using marginal cost.pricing and nonutility businesses. 16 Utility profits for justifiable societal reasons could be very high. 17
6. From the Rate-Setting Process Itself: Rate Base Inflation A public utility attempting to increase its total profits can pursue
ei"tner Cor bothl of the following strategies: Ca) Convince its regulatory commission to increase the rate of
return allowed on its rate base; or (b) Augment its rate base.
In many situations, the latter alternative may be preferable from the. utility's viewpoint. Since it places the company in the undesirable position of drawing attention to its rate of return, the first option may not be politically expedient. The second approach, which mayor may not involve "rate base inflation,1I effectively increases profits without exposing the utility to as much public criticism.
111-12

Thus, the regulatory process contains an inducement for augmenting the rate base. As used in this study, the term II base inflation ll
means any lIimproperli increase in a utility1s rate base. In a world of ilperfect" regulation, no rate base inflation would exist. However, because
it may be difficult to discern, rate base inflation looms as a possibility for virtually every rate-setting s A utility can accomplish it in two general ways: (l) Accumulate unnecessary plant and equipment (i.e., inefficient use of resources); and (2) Treat cost-of-service items as fixed assets for regulatory accounting purposes (i.e., IIcapitalize the paper clipsll). The effects of these two tactics on the rate of return calculations are considered in the following discussion.
a. Accumulation of Unnecessary Assets in the Rate Base Implicit in the behavior of nonregulated industry is the assumption
that each firm, acting in its own self-interest, strives to operate as efficiently as possible. Producing any level of output at its minimum possible cost is a necessary (albeit not a sufficientt condition for profit maximization. Requiring use of the most up-to-date technology, this concept of efficiency is impounded in the usual microeconomic theory of the firm.
However, net income is determined differently in the regulated sector. Prohibiting the public utility from maximizing its profit as a monopolist, regulation instead allows the firm to earn a fair and equitable return on its rate base. Starting with the.contribution of Averch and Johnson,18 a substantial amount of literature has evolved concerning the inefficient use of inputs by regulated entities. 19 Overcapitalization, the so-called IIA-J Effect,1I occurs as regulation encourages the substitution of capital for labor. The overall impact of this "build up the
rate basel! tactic on the comparative analyses performed in this study is difficult to assess. The efficiency or resource utilization issue (i.e., the built-in regulatory incentive for employing IItoo manyll assets) is not reflected in the rate of return on total productive assets. All assets included in the rate base--those actu~11y needed and the lIaxcess"-earn the same rate of return. However, though unobservable in a
111-13
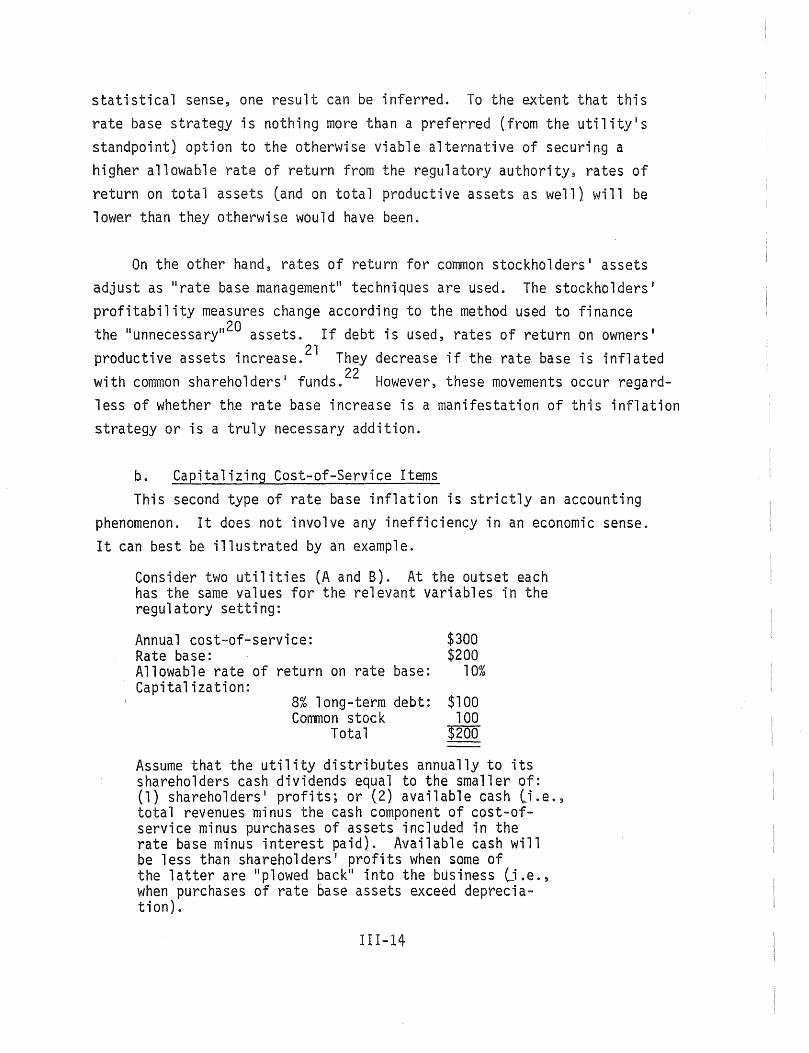
statistical sens.e, one result can be inferred. To the extent that this
rate base strategy is nothing more than a preferred (from the utility's standpoint) option to the otherwise viable alternative of securing a higher allowable rate of return from the regulatory authority, rates of return on total assets (and on total productive assets as well} will be lower than they otherwise would have been.
On the other hand, rates of return for common stockholders' assets adjust as Urate base management" techniques are used. The stockholders' profitability measures change according to the method used to finance the lIunnecessaryll20 assets. If debt is used, rates of return on owners'
productive assets increase. 2l Tbey decrease if the rate base is inflated with common shareholders' funds. 22 However, these movements occur regardless of whether the rate base increase is a manifestation of this inflation strategy or is a truly necessary addition.
b. Capitalizing Cost-of-Service Items This 'second type of rate base inflation is strictly an accounting
phenomenon. It does not involve any inefficiency in an economic sense. It can best be illustrated by an example.
Consider two uti.lities CA and B). At the outset each has the same values for the relevant variables in the regul atory setting:
Annual cost-of-service: Rate base: Allowable rate of return on rate base: Capitalization:
8% long-term debt: Common stock
Total
$300 $200
10%
$100 100
$200
Assume that the utility distributes annually to its shareholders cash dividends equal to the smaller of: (1) shareholders' profits; or (2) available cash (i.e., total revenues minus the cash component of cost-ofservice minus purchases of assets included in t~e rate base minus interest paid). Available cash will be less than shareholders' profits when some of the latter are "plowed back" into the business (j .e., when purchases of rate base assets exceed deprecia-t ion) .
111-14

1-1 1-1 1-1 I
»--I' U1
, I
Year
1
2
3
4
5
Total 5-Year
Average
TABLE 1
FIVE-YEAR RESULTS FOR CorvtPANY A
Common
10% Shareholders'
Return .' Received on Cost-
Rate Rate of- Total Total Cash Base Base Service Revenues Interest Profits Dividends
$200 $20 $300 $320 $8 $12 $12
200 20 300 320 8 12 12
200 20 300 320 8 12 12
200 20 300 320 8 12 12
200 20 300 320 8 12 12 I -
$1,000 $100 $1,500 $1,600 $40 $60 $60
$ 200 $ 20 $ 300 $ 320 $ 8 $12 $12
Source: Author's hypothetical calculations.
-----------
Rate of Return On Common
Share-On Total holders l
Productive Productive Assets Assets
10% 12%
10% 12%
10% 12%
10% 12%
10% 12%
- -
10% 12% _____ L __ ~_~ ____
-,

t.--t r---i r---i I I-' en
Year
1 2 3
4 5
-- _._.-
Total
5-Year Average
~-- - ~
TABLE 2
FIVE-YEAR RESULTS FOR COMPANY B
Common Shareholders'
10% Return Cost -
Rate Received of - Total Total Cash Base* On
Rate 'BasE Service Revenues Interest Profits Dividends
$209 $20.9 $292 $312.9 $8 $12.9 $4.9 216 21.6 294 315.6 8 13.6 7.6 221 22. 1 296 318. 1 8 14. 1 10. 1
224 22.4 298 320.4 8 14.4 12.4 225 22.5 300 322.5 8 14.5 14.5
$1,095 $109.5 . $1 ,480 $1,589.5 $40 $69.5 $49.5
$ 219 $ 21. 9 $ 296 $ 317.9 $ 8 $ 13.9 $ 9.9 ~--- -----.- ._---- ----- -
~ __ J _____ -~ -
*Average of beginning-af-year and end-of-year amounts.
Source: Author's hypothetical calculations.
--
Rate of Return On Common
Share-On Total holders '
Productive Productive Assets Assets
10% 11.83% 10% 11 .72% 10% 11.65%
10% 11.61% 10% 11.60%
- -
10% 11 .68% j ,-- --_ ......... __ ._-
~---. - ------ ---------
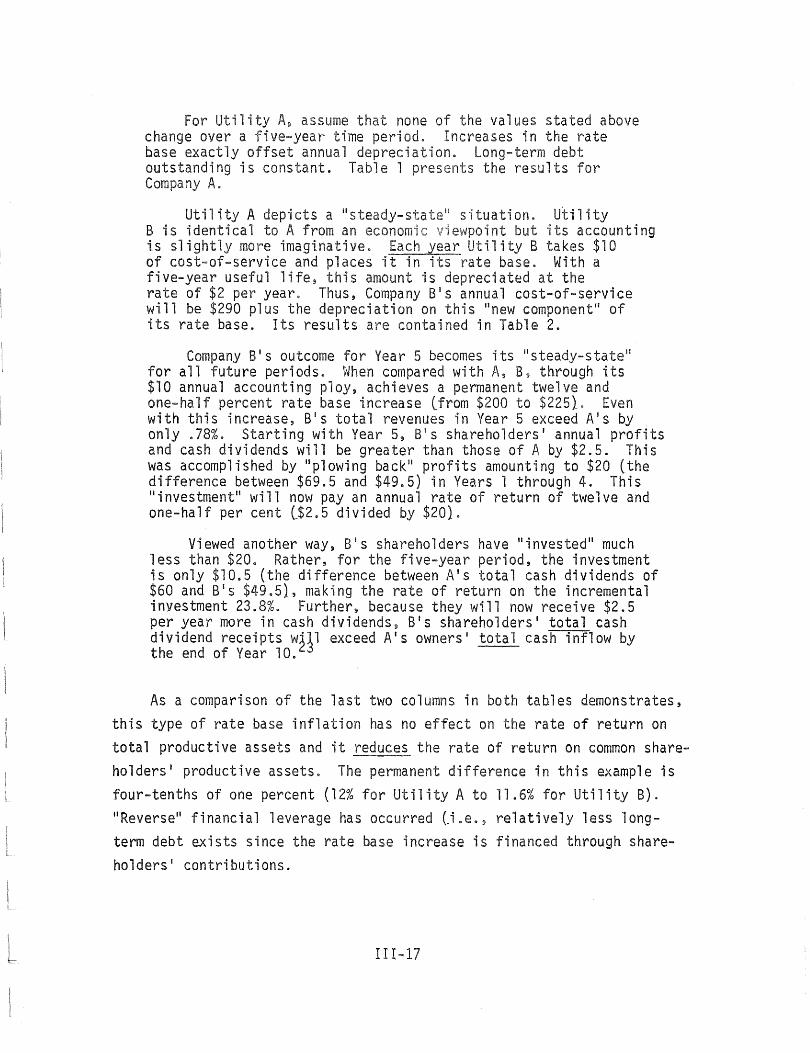
For Utility A, assume that none of the values stated above change over a five-year time period. Increases in the rate base exactly offset annual depreciation. Long-term debt outstanding is constant. Table 1 presents the results for Company A.
Utility A depicts a "steady- situation. Utility B is identical to A from an economic ewpoint but its accounting is slightly more imaginative. Utility B takes $10 of cost-of-service and places n rate base. With a five-year useful life, this amount is depreciated at the rate of $2 per year. Thus, Company B's annual cost-of-service will be $290 plus the depreciation on this II new component" of its rate base. Its results are contained in Table 2~
Company 81 s outcome for Year 5 becomes its "steady-statel! for all future periods. When compared with A, B, through its $10 annual accounting ploy, achieves a permanent twelve and one-half percent rate base increase (from $200 to $2251. Even with this increase, Bls total revenues in Year 5 exceed A's by only .78%. Starting with Year 5, S's shareholders' annual profits and cash dividends will be greater than those of A by $2.5. This was accomplished by liplowing back" profits amounting to $20 (the difference between $69.5 and $49.5) in Years 1 through 4. This lIinvestment" will now pay an annual rate of return of twelve and one-half per cent ($2.5 divided by $20).
Viewed another way, Bls shareholders have "invested ll much less than $20. Rather, for the five-year period, the investment is only $10.5 (the difference between A1s total cash dividends of $60 and Bls $4ge51, making the rate of return on the incremental investment 23.8%. Further, because they will now receive $2.5 per year more in cash dividends, S's shareholders' total cash dividend receipts w~11 exceed A's owners· total cash inflow by the end of Year 10.
As a comparison of the last two columns in both tables demonstrates, this type of rate base inflation has no effect on the rate of return on total productive assets and it reduces the rate of return on common shareholders' productive assets. The permanent difference in this example is four-tenths of one percent (12% for Ut il i ty A to 11.6% for Ut i 1 ; ty B). "Reversel! financial leverage has occurred (J .e., relatively less 10ngterm debt exists since the rate base increase is financed through shareholders' contributions.
111-17

c. Rate Base Inflation and Financial Leverage The following table summarizes the relevant relationships between
rate base inflation and financial leverage. In each situation a utility capitalized with both debt and common stock (with the interest rate lower than the allowable rate of return on rate basel has increased its rate base. The company has not requested its regulator to approve any change in its allowable rate of returno The results presented in the table are based on the presumption that "perfect regulation iB discerns proper and improper rate base increaseso
Sttuation 1 combines 'rate base inflation with increased financial leverage. If, in this case, the regulator would not have allowed any increase in the rate of return on the uninflated rate base, the rate of return on total productive assets as calculated in this study is not affected by rate base inflation. But the increased rate of return on common shareholders l productive assets caused by the additional borrowing would not have been achieved.
One example of Situation 2 is the accounting stratagem of including a cost-of-service item in the rate base. This causes the computed rate of return on shareholders' productive assets to decrease, although with proper accounting (an important aspect of IIperfect regulation") it should either remain unchanged or increase (through regulatory approval of a higher allowable rate of return).
Involving no rate base inflation, Situations 3 and 4 demonstrate the effects of changing a utility·s capitalization proportions. The rate of return computations in this study re~lect such changes and therefore are "correctll for these two cases. Like Situation 2, Situation 4 is an example of IIreverseli financial leverage where the seemingly inconsistent combination of higher total profits and lower rates of return on common shareholders' productive assets occurse
B. Summary With the definition of rate of return altered somewhat to permit
its consistent application to all companies included in this study, the comparisons in the following section are directed toward ascertaining the degree to which the prescription from the public interest theory of regulation is fulfilled. Is the utility industry able to earn above normal profits or does regulation limi.t earnings to levels existing in more competitive sectors? However, the outcomes of the analysis can be
I 11-18

I--i
I--<
!-i I I-' t..O
TABLE 3
EFFECTS OF RATE BASE INFLATION AND FINANCIAL LEVERAGE
Effect of Rate Effect of Rate Base Increase on Base Increase Rate of Return
Was the Effect of Rate on Rate of on Common Rate Base Base Increase Return -on Total Shareholders! Increase on Total Profits Productive Assets Productive Assets
Was the Financed Rate Base Through t'Ji th As Computed With As Computed With
Increase Add it i ona"1 II Perfect in this II Perfect in this Ii Perfect tuation . '. Proper? 80 rrowi n 9 '? Actual Re g u 1 at i on II 1 Study Regulation ll1 Study Regulation!!l
1 N02 YES3 INCREASE INCREASE4 NONE INCREASE4 INCREASE INCREASE4
2 N02 NO INCREASE INCREASE4 NONE INCREASE4 DECREASE INCREASE4
3 YES YES 3 INCREASE INCREASE NONE NONE INCREASE INCREASE 4 YES NO INCREASE INCREASE NONE NONE DECREASE DECREASE
lliPerfect regulation ll disallows all improper rate base increases. Regulator mayor may not in the utility1s allowable rate of return on its uninflated rate base.
t an increase
2Rate base inflation exists.
3Increased amount of financial leverage occurs.
40nly to the extent that the regulator would have permitted rate of return on uninflated rate base to increase. If no such permission would have been granted, IINONE II becomes the correct entry in the table.
Source: See Tables 1 and 2 and text.

interpreted as evidence that the regulatory process has several other effects. The statistical results may have occurred because regulation emphasizes something other than removing monopoly profits or because it elicits (perhaps unintentionallyl certain types of behavior from the businesses it oversees.
First, regulation may induce a utility to engage in a substantial amount of financial leverage. As long as the interest rate on its debt is less than its rate of return allowed by the regulator, borrow-ing to augment the rate bas.e will increase returns on common Shareholders' assets. Thus, a relatively low rate of return on total assets may be accompanied by a high profit level on owners· assets. Some evidence that this leverage phenomenon does occur has already been provided.?5
Second, regulation may be attempting to ensure that utility rates of return are in line with the level of risk borne by. utility investors. In general, the amount of such risk should be small. Thus, both the public interest theory of regulation and the risk-return relationship suggest relatively low rates of return on utility shareholders· assets.
Third, regulation may be seeking optimal societal resource allocation through marginal cost pricing. Because profit levels are only of incidental importance with this policy, it can be consistent with virtually any rate of returno If regulated firms have increasing average total costs, margi.nal cost pricing permits them to achieve higher profit levels than perfectly competitive entities.
Finally, regulation may inadvertently encourage "rate base inflation," a technique which provides higher total profits without requiring the regulator to allow an increase in the rate of return on rate base. To the extent that, in lieu of obtaini.ng such an increase, a utility acquires "unnecessaryll assets, its rate of return on total productive assets will be lower than it otherwise would have been. If rate base inflation is accomplished through additional borrowing, rates of return on shareholders l assets will reflect the financial leverage effect previously
111-20

discussed. However, rate inflation and increased financial leverage are essentially two different tactics. Each can exist independently of the other. A related strategy involves including in the rate base an outlay which more appropriately would be classified as a component of cost-of-service. More of an accounting ploy than an intentional failure to seek a higher allowable rate of return, this approach can be used even in a situation where the propriety of the actual expenditure is unimpeachable. 26 Assuming that no additional borrowing occurs, a type of IIreverse" financial leverage takes place. When contrasted with the IIproperll accounting treatment (i.e., recovery through cost-of-service), this results in higher total profits but lower rates of return on common shareholders' assets. Although the effects of rate base inflation on the rate of return measures analyzed in this study can be determined at the conceptual level, they are unobservable in the actual statistical comparisons. This occurs for two reasons: 01 the increase in the utilityls rate of return which would have been allowed hy the regulator on the uninflated rate base is unknown; and l21 rate base inflation itself is unobservable.
As this discussion demonstrates, there will likely be competing explanations for the results of the rate of return comparisons. After a treatment of methodological issues, the next section proceeds with statistical tests solely as they relate to this study's primary research issue: How do utility profitability measures compare with those of nonregu1ated industries? Underlying this analysis are three assumptions: (1) risk levels for investments in regulated and nonregulated companies are the same; l21 utilities employ average cost pricing; and (3t rate base inflation does not exist. The effects of rel~xing these assumptions are considered in a suhsequent section of this report.
III-21

III. Methodology and Data Analysis A. Calculating Rates of Return
As mentioned previously,27 for each company analyzed in this study, interest charges are added back to reported net income for two of the four rate of return measures. This is done so that rates of return on total assets and on total productive assets are computed in a manner similar to that employed in the regulatory process. Four other iss.ues related to the rate of return computations are treated in the following discussion.
1. Adding Back Federal Income Tax Besides interest, federal income tax is also added back to reported
net income. This facilitates the comparisons involving IIflow-through ll
utilities. According to the flow-through concept of regulation, a company must immediately pass on to its customers the income tax savings associated with accelerated depreciation and the investment tax credit. 28
Only income taxes actually paid or currently payable lnet of all current investment tax credits). may be recovered as part of cost-of-service. Accordingly, an income statement for a flow-through utility will report this amount as income tax expense.
Flow-through is an accounting method which is found most often in regulated industry. With regard to the tax savings derived from accelerated depreciation, generally accepted accounting principles preclude nonregulated businesses from using flow-through. 29 However, because of Congressional legislation, the accounting profession may not recommend an appropriate treatment for the investment tax credit. 3D
IINormalization" (frequently called "Deferral ll or IITax Allocation" outside the regulatory sector}, the other principal accounting method, permits a utility to recover in its cost-of-service the income tax which would have been paid if th.e company's reported net income was also the amount currently subject to income tax.. Since the tax return's accelerated depreciation normally exceeds the annual report1s straight-line
111-22

depreciation, a deferred tax liability accounts for that part of the utility's tax expense which is not currently payable. The investment tax credit is considered a reduction in the cost of an asset and is reflected in lower depreciation expense throughout the asset1s useful life. The following example illustrates potential distortions to the rate of return comparisons caused by the fferences between flow-through and normalization accounting.
Assume that two public utilities are identical in all respects except that one (Company N) is allowed to normalize the tax difference caused by accelerated'depreciation while the other (Company F) must flow-through this amount to its customers. Both are required to use straight-line depreciation for rate-making purposes. Each companyls relevant data are:
Rate Base Operating Expenses Lother
than depreciation and taxesl Straight-line Depreciation Accelerated Depreciation Interest on Long-Term Debt Allowed Return (10% of Rate Basel Tax Rate
$ 300
50 30 45 12 30 50%
Revenue Requirements for N(RRN) would be:
RRN = 50 + 30 + .5(RRN - 50 - 30 - 121 + 30
.5 RRN = 64
RRN = 128
For F, Revenue Requirements (RRF) would be:
RRF = 50 + 30 + .5(RRF - 50 - 45 - 121 + 30
.5 RRF = 56.5
RRF = 113
Assuming that all actual amounts equal the corresponding estimates made during rate-setting, the Income Statements for the two utilities would be:
111-23

N F
Revenues $ 128 $ 113 Operating Expenses (50) (50) Depreciation (30) (30) Federal Income Taxes ~ (3 ) Operating Income 30 $ 30 Interest Charges (J 2) (12 ) Net Income $ 18 $ 18
The use of net income (or net income plus interest charges) will result in the two utilities having identical rate of return measures. But this result occurs only because Company N reports as expense both current and deferred income taxes while Company F's report includes only current income taxes. If both companies account for income taxes in the same manner, N's after tax income will exceed F's by $7.5. Since the nonregulated firms use N's reporting method, F is transformed into a normalized utility. F's fi.nancial statement now includes income taxes of $10.5, the appropriate normalized expense on its before tax income of $21 (Fevenues of $113 less expenses--including interest--of $921. F's after tax operating income falls to $22.5, and the comparison with N's $30 reflects the $7.5 difference. 31
As compared with attempting to "normalize ll the flow-through utilities, the approach employed in this study, adding back reported income tax expense for all companies, accomplishes the desired objective in a simpler fashion. All rates of return are based on II pre-tax" income data. In the previous example, with taxes added back, N's "income ll ($48) exceeds F IS ($33) by $15, th.e di.fference in revenues caused by N IS abi.l i.ty to normalize. Th.i.s is consistent wi.th the $7.5 after tax difference discussed earl ier. By adding back taxes aberrati.ons resulting from the manner in which a company accounts for its tax payments to the Federal Government do not affect the rate of return measures. 32
2. Subtracting Allowance for Funds Used During Construction to Determi.ne the Return to Productive Assets
To design the analysis as closely as possible to the regulatory
setting, two of the rate of return series relate income to productive
111-24

assets. As discussed earlier, this concept of productive assets [total assets minus construction work in progress leWIP}J, roughly approximates regulation's rate base computation. 33 Besides the reduction in the asset base for CWIP, a utility's allowance for funds used during construction (AFUDC) is subtracted from reported income in the numerator of all rates of return on productive assets.
Unique to regulated industry, AFUDC is the net cost during the period of construction of borrowed funds used for construction purposes and a reasonable rate on other funds when so used. 34 By capitalizing interest and an imputed amount of income on equity funds~ a utility is able to lIearn a return ll on assets being constructed. Although this method, especially its imputation of earnings on owner-provided capital, is a violation of generally accepted accounting principles applicable to nonregulated entities, regulatory accounting rules permit it as a sUbstitute for including CWIP in the utility1s rate base.
The increase in reported income resulting from this practice is considered necessary for a utility to maintain a competitive position in the capital markets. This is especially true in recent times when many regulated firms have substantial amounts committed to currently "unproductive ll assets. Potential investors in utility securities understand that AFUDC accounting will enhance.operating proflts once construction is deemed complete. 35 Any rate of return solely on productive assets would not include AFUDC. Thus, reported income is reduced appropriately for all such profitability measures computed in this study.
3. Measuring Returns to Common Shareholders' Assets In a manner similar to a settlement in liquidation, a Ilresidual
claims ll approach is used to calculate the two sets of profitab.ility measures on common shareholders· assets. 36 'To derive the earnings applicable to total common stockholders' assets, pre-tax reported net income is reduced by dividends on preferred stock. The assets available to common shareholders are those which r8main after the II cl aims" of all other investors and creditors have been IIsettled ll li .e., total assets,
111-25

less liquidating value of preferred stock, less 10ng-term debt, less current liabilities). The resulting rate of return on total common shareholders' assets in many instances approximates the familiar !Irate of return on equity. II However, all the profitabil tty measures computed in this study are rates of return on assets. In no case is a rate of return computed by dividing some amount of income by part or all of the stockholders· equity reported on the balance sheet.
Although the computation of this first profitability measure on common shareholders' assets is fairly straight-forward, some philosophical issues exist concerning the measurement of the rate of return on common stockholders' productive assets. The fundamental question is: Who has IIclaims" on the CWIP? Consistent with the method for deriving the rate of return on total productive assets, the approach used involves removing AFUDC from the numerator and CWIP from the denominator of the rate of return on total corrmon shareholders' assets. Since all other claims have already been satisfied, this method is based on the premise that all CWIP IIbelongsli to the comnon shareholders. With CWIP likely categorized among the company's least desirable assets, this is a highly probable outcome of a residual-claim liquidation settlement. 31
4. An Algebraic Representation of the Four Rate of Return Measures The four rates of return which emerge from the methodology discussed
above can be expressed with the following algebraic notation. In all cases the subscript lIitll means "for company i in year t.1I Let
lit = After-tax net income;
Tit = Income tax expense;
INTit = Interest expense;
AFUDCit = Allowance for funds used during construction;
PDit = Dividends on preferred stock;
TAit = Average total assets; .
CWIP it = Average construction work in progress;
LIQPFit = Average liquidating value of preferred stock;
LTDit = Average long-term debt; and
CL it = Average current liabilities.
111-26

a. Measure 1:
lit + Tit + INTit Rl it ::: TAit
Rlit = Accounting Rate of Return on Total Assets
This measure is the reported pre-interest and pre-tax accounting rate of return on total assets.
b. Measure 2:
R2 lit + Tit + INTit AFUDC it it::: -.::.-..:..-----=-:...---.--.::....:.....----...:-TAit - CWIP it
R2it = Accounting Rate of Return on Total Productive Assets
This measure can be viewed as the pre-interest and pre-tax accounting rate of return on total productive assets which would have been reported by utilities if they were required to employ the accounting procedures of the nonregulated sector (i.e., if utilities were not allowed to increase reported income by AFUOC). Also, since AFUDC is not available, Measures 1 and 2 will be identical for all nonregulated companies with no CWIP. If a nonregulated entity has some CWIP, its Measure 2 will always exceed its Measure 1.
c. Measure 3:
I .... ..I. T.; ... - PO .... R3. 11..' I I.. 1 ...
lt = TAit - LIQPFit - LTOit - CL it R3 it = Accounting Rate of Return on Total Common Shareholders'
Assets
This measure is the pre-tax rate of return on common shareholders' total assets. It is developed according to the generally accepted notion that common stockholders have a residual claim to their company's resources.
111-27

d. Measure 4:
lot + Tot - POo t - AFUOC' t R40 = 1 1 1 1 lt TAit - LlQPFit - LTOit - CL it - CWIP it
R40t = Accounting Rate of Return on Common Shareholders' 1 Productive Assets
Measure 4 defines the common shareholders' pre-tax rate of return on their share of the company's productive assets. This rate of return is based on the assumption that partially co~pleted, specifically designed assets (i.e., CWIP) are the least desirable in any liquidation settlement and are therefore left in their entirety to the common shareholders. 38
Also, just as with Measures 1 and 2, a nonregulated company with no CWIP will have identical Measures 3 and 4. If such a firm has CWIP, its Measure 4 wi 11 a 1 ways exceed i. ts Measure 3.
B. Nonregulated "Industries": The Three Barrier-to-Entry Groups The utility rates of return are compared with corresponding measures
for seventy-one nonregulated companies partitioned into three groups according to relative difficulty of entry. Each group contains leading representatives from several relatively concentrated industries. Thus, each firm has the attributes associated with the olfgopolistic form of market structure.
Relative difficulty of entry is a frequently used surrogate for the degree of competitiveness existing wi.thi.n an industry.39. The conventional analysis is based on the assumption that diffi.culty of entry and degree of competition vary inversely. Thus, the most competitive set of firms is the "low barrier-to-entryll group. A lesser degree of competition exists in the "medium barrier-to-entry" category, and the least competitive fi.rms are placed in the IIhigh barrier-to-entry" group.
As menttoned throughout this report, the results of the statistical te.sts will indicate the "position" of the regulated firms in relation
111-28

to the barrier-to-entry categories. If regulation removes all opportunity for above normal profit, utility rates of return will be less than the corresponding measures for all three barrier-to-entry groups. Even the low barrier group cannot be considered perfectly competitive. On the other hand, utility returns approximating those in any of the three groups (especially medium barrier or the high barrier group) indicate that regulated companies are able to achieve profit levels in excess of those existing in the more competitive sectors of the economy.
C. Sample Selection The firms analyzed in this study were chosen as follows: 1. Initial Reguirements
a. Electric Utilities
Inclusion on the Utility COMPUSTAT tape40 was the first criterion for selection of the electric utilities. This guarantees the availability of data items unique to regulated industry (e.g., AFUDC).
b. Nonregulated Companies To the greatest extent possible, Mannis sample of firms comprlslng
the three barrier-to-entry groups was replicated. 4l Thus, the first selection of nonregulated businesses was based on two conditions: (1) Availability on the general CO~1PUSTAT tape; and (2) Membership in
Mannis sample. As Sullivan1s study42 demonstrated, some of Mannis firms have been merged out of existence. Further, not all of MannIs "surviving" companies meet the criteria for inclusion on the COMPUSTAT tape. Accordingly, firms ava il abl e on COMPUSTAT were chosen as repl acements for most' of these "missingll companies. In each case the substitute firm was selected from the same industry as the company it replaced.
2. Further Reguirements After the original selection of company names as above, the
following additional information was necessary for inclusion in the final sample: 0) Availability on the COMPUSTAT tape of all data items
being analyzed for the entire ten-year period 1967-1976; and (2) Existence
111-29

of stock price data for at least sixty consecutive months during this tenyear period, a requirement for the estimation of shareholder risk.
For the rate of return comparisons the following number of firms were actually used:
Number Normalized Electric Utilities 82 Flow-through Electric Utilities 30 Low Barrier-to-Entry Companies 28 Medium Barrier-to-Entry Companies 24 High Barrier-to-Entry Companies 19
D. Ten-Year Time Period To provide useful, unbiased results, each company's rate of return
measures are examined over the ten-year period 1967-1976. This is a long
enough period to ensure that one- or two-year aberrations in the data
caused by economic factors (i.e., inflation) or company-specific timing differences (i.e., regulatory lag) do not have an undue influence on ~he rates of return. 43 Conversely, a ten:year period is of short enough duration to allow the study's data and comparisons to reflect permanent economic changes. In addition to the 1973-74 oil embargo, the specific time period studied contains periods of peace and war, inflation and stable prices, expensive and inexpensive energy_ This diversity should greatly enhance the generalizability of the study's conclusions.
In order to perform the statistical tests, the ten-year average rates of return for every fi.rm in each of the five classifications (e.g., flow-through utilities, medium barrier-to-entry companies, eteoL are further combined into unweighted means. The lIaveragell rate of return on total assets, then, for any group of regulated or nonregulated firms is:
RT = -n 1 10
10 l
1=1 t=l
III-3~

where all variables are ned as before and n = the number of firms in this particular category. Thus, each group of companies has four Bloverall average il rates of return. Each of these measures is the unweighted mean of the appropriate es of ten-year averages for every firm in the group. Each group's four rates of return are then statistically compared with the correspondi measures one or more of the four other sets of companies.
E. Testing Hypotheses: Statistical Comparisons of the Rates of Return Beginning with an examination of profitability measures for nor-
malized and ow-through utilities, the statistical comparisons proceed to test hypotheses concerning rates of return for regulated and nonregulated entities. These hypotheses are directed toward determining whether or not a statistically significant difference exists between one or more of the overall average rates of return for one group of firms and the corresponding measure(s) for another category of companies. As mentioned at the conclusion of Section lI,44 three assumptions underly this analysis: III risk levels for investments in regulated and nonregulated businesses are the same; (2) utilities employ average cost pricing; and (3) rate' base inflation does not exist. The effects of relaxing these assumptions are discussed in Section IV.
1. Normalized and Flow-Through Electric Utilities As mentioned previously,45 in some regulatory jurisdictions, (i.e.,
the IINormalized" States} a utility is allowed to recover through cost-ofservice the entire income tax expense (including the amount deferred due to the use of accelerated depreciation for tax purposes) that would arise by applying the set of statutory rates to its reported pre-tax net income. Conversely, other authorities (e.g., the IIFlow-Through ll States) determine a utility's rate structure including only those income taxes currently paid. Since these two views on the amount of recoverable costs naturally lead to different allowable revenues,46 accounting rates of return within the util ity industry could easily be affected by this philosophical spl it over income tax expense. To determine if ta-x recovery policy has a significant impact on utility profit levels and, in fact, to determine if all
1II-31

subsequent statistical tests must consider the two views of regulation separately (thereby partitioning the sample of regulated firms into the normalized and the flow-through groups}, the following hypotheses were tested:
Rates of return within the electric utility industry are the same regardless of the income tax recovery policy used by the regulator; and
Rates of return within the electric utility industry differ significantly according to the income tax recovery policy used by the regulator.
These hypotheses can be stated in a more formal, mathematical manner as follows:
HO: TIl = U2; and HA: TIl r U2;
where TIl = vector of the four overall ave.rage rates of return for normalized utilities; and
uz = vector of the four overall average rates of return for flowthrough utilities.
To overcome the problems inherent with repeated pair-wise comparisons of the profitability measures, the above hypotheses advocate a simultaneous test of all the rates of return. Thus, the Hotelling T2 test47 is used. Conceptually, this is a simultaneous comparison of the significance of the Student T test48 for each rate of return measure. Rejection of the null hypothesis is interpreted as meaning that the two vectors of profitability measures differ t at the prespecified level of significancel. In other words, one or more of the rates of return in one vector differ significantly tin a statistical sense} from the corresponding measl.lreCsl in the other vector.
The complete results of the above test as applied to rates of return for normalized and flow-through utilities are presented in Table 4. The null hypotheses was rejected at the .01 level of significance. An i.nterpretation of this result is that there is only one chance in one hundred lon the average) that the return measures examined come from the same
111-32

TABLE 4
COMPARISON OF RISK AND RETURN FOR NORMALIZED UTILITIES AND FLOW-THROUGH ELECTRIC
UTILITIES (1967-1976)
Flow-Through Utility
(Gr'1~"HI:r'/ l;i~fii~
~lLEGHENY POWER SYSTEM CENTRAL VERMONT PUP SEPV CObJ.:.H!i f:1.:J:~: :::,! SQUTHERi=..! OH 10 CONCD?D ELECTRIC CO GREEN MOUNTAIN POWER CORP l':iE\!AfJA PO',dEP CO NORTH~~iT UTILITIES OH 10 EI)I :=;:Ot:-l CD PENNSYLVANIA POWER ~ LIGHT r;:'!JF:'TL Ant) Ii?Ei:iERAL ELECTR I C CO F' U B lIe :;: E P I·i ICE I~:O 0 F' n H F'Ui:;ET -~:!JI.:.InD POI . .lEP }~-: L I (;H.1' ?OUTHEPN CALIF EgISO~ CO UNIT~D ILLUMINATING CO ARIZDNA PUBLIC SERVICE CO C~MTRAL HUDSON GAS & ELEC C I f:1G: I t:ii':4~ T I I':; A:;: :~; ELECTP I [: ~ONSnLIgRTED EDISON OF N.Yd D~YTG~ POWER t LIGHT II~LNrlF"i'lrt POl.d~R go: L I I:;HT LONG ISLAND LIGHTIN~ n~h~ 'y'CPI< STATE ELEC t~- t:;AS: f:·j I Hi~P~A t'1lJ~Ahn.( r;·Oi.dEP Q?RNGE ~ ~OCKLRHD UTILITIES PRCIFIC GAS & ELECTRIC ;;'RC T FI ;:;:: F'QlliEP :~-: L I(~HT RDCHEST~R GAS & ELECTRIC ?~~ PI~GC GAS & ELE(TPIC TU(::~:G~:t I~Ft:~: t· ELECTP I C-1.,IFr~:H I r'h:;TON !,.1ATEP ;:;'OhIEF' A \.1 E F.: A(:; E ,
Normalized Utility
Hi"-:E;f: i CF!t: i El.Ef:TF· Ie POhiEF.' liTh.AnT I;2 C. I T'y' ELECTF: I C B~NG9R HYTIRO-ELEC CO f:l:..ACK HILi:.::':: j:;'OtdEP t.- L I I;~n CO "f.:OS'TOt:1 Ell I :~:Dn CO E:~:rl·:=:C~t:~ l Tli .... Cl H CH~~[q.:._ I Hr~ F'ObIEP ;~,: L I !:;HT (~;:-iT;:::'Hi:..:~-: SOt.!TH !dE:;:T COI?F' CE,:.ITPAl. t'1R I r·iE F·01.dEP CO :::l.E',r'ELf1i:1II ELEI~:TF: I C I LLI.Jt'1 i::[iI'!iqOr:HtfEP.L TH E Ii I :~:O~:i COt1lf,it;r'i I T'"i' F'I,;.I:BL I I:;:: :~:EF:V ICE lIE T"FO T T E'II I :~:gr;~ CO
}IUOUE:;:r:iF.: L I ::::;HT 1~:tJ
E~r~:TEFnt U T J LIT I ES R::;SDC
1 (! '" (I §)
0 011 (I"
0 .. 011 Od (I",
011 (I" 0 .. 0. 0 .. 0" (14
0" 0& (I ..
~I o!
(I",
0 .. (I ..
nd (I.e
0 .. (101
~I tI
0" (I"
(I"
(If?.:~: 0" ~l~.,? (I >II
~!;i~ ~1 (I d
~1;::3 (I d
~)73 ~l
(1:~:5 ~! "
~176 ~I " 099 o. O;::~tr. Or! ~=l :~; t!, 0" j.):~::~: (I.,
07:~: ~) '" (l7:~: (I,!
O~~:2 O~
07CZi ~i d
~=I:~: ~I ~) .rl
1 (11 o. (I;f, 4 (i ..
~)92 (101
~1:~:5 ~I r!
(r:~:5 0", 07:~: ~) " Of.:=: Or! ~)7E, o. OSO ~i •
(174 ~J d
~)?7 (I r!
1.)79 (1,;-
~),.? (I ~I ..
~I::?::-~: 0" ~181 (I ..
2 (1;:::9
~'EQ:=! ~)82
0:32 ~1t:.7
O:~ ~)
OG9 (196 (1:::2 O:?f, (I:::: (I
072 077 (I:~: (I
(175 £177 ~19?
fl~, 1 I.):::'::~;
07':;;+ (1:~;4
(17~.
~lf,4
(i7~~:
(iiB 07 fl (175 (178 (i:~:7
fl:~ 1 ~173
Return f.1easure
:3 4 ~).t 1 7' (I ~I A 1 E. 4 (I" (i9:~;· ~) dO:::::!:: (! d 1 4:3 (! .. 225 ~) d 1 4 (I (! of 1 :!:: 9 ~) d 114 (I <l 096
C' .,;.1
(j d 154 0", Ot:?' 0 .. 121 (I r;l 1 ::!:::~: ~} d t;,19:?
F: I ~~:I.-:.II' - -_. ~ ~J .. ~JC::.:.I
(I st" li, t:. t fl" ~O:!:: uA
~I.. 1 27 (I 01 1 (2 9 ~I ~ ~! 9 2 ~J " 6:.~; ~} 0 .. 120 9dl0@ 0 .. 091 0~582
0.172 0.206 0,,147 0,,422. Qj159 001199 0 .. 133 0,,441 0.131 Od187 0 .. 110 Od44~ 0,,146 0.144 0~129 D~56~ 0d113 0.126 0~103 0.476 0.129 0,,138 0~122 0.382 Od156 O~394 O~138 0.412 ~) A 1 2 5 ~l m 1 E.~, fi d 11 1 (i " 4 'it 1 Od143 0.138 O~125 0~480 0 .. 193 0 .. 200 Odlfo 0.284 Od093 0~088 0,,080 O.~~~ 0~171 001178 0.153 0.479 O~143 Od134 0~118 0 .. 472 O~156 Q~187 0.135 001530 04131 g~140 0.119 81534 O,,109 0.107 0~091 0.490 0 .. 1 2 :i: £I" 11 9 0 d 1 1:3 (I .. E, 3 7 Od133 0.132 O~118 O~240 9~117 0.115 OdO?9 Qd487 O~126 0,,122 0,,114 0 .. 606 0.124 Od127 0 .. 113 0.511 Q~152 O~155 Od128 0 .. 532 0~147 0.145 0.142 0.282 0.137 0.153 0~119 0.524
Return Measure
I 2. .:5 i..t 5" . 'i? l S "-(I ii ~r :~! ':! (1,,~) -; t:' ~! l! 1 :!! ~ ~I:I 1 :!! 1 ~l ~ ~) -:; ';:+ (I .. 5 1.::, : 0 .. 085 D~081 9rilS? Qd182 8.133 0~555 0.ij?9 O~g78 0.148 0.147 0~143 g.~24: 0.092 0.094 0.155 0.191 e~153 0d428 i
Od084 gd075 0.123 0.102 g~093 O~525' 0.078 0.073 0.073 O~065 04065 0.614 DdO?1 06086 0.151 041~9 G.112 ~.609 0.121 0.122 Dd211 0d~~~ 0.209 0.383 0.090 0.099 O~160 0.164 0~156 04310 (l~ 1 ~I'~~ ~)d 1 ~Il ~I.r 1::::::: Od ~t~I::!:: ~l" lE.t!, (lA :~:;::;4
0.09S 0.091 8.1G8 0.168 Dd15Q O~307
0dD99 gd~99 ~177 0.176 D~175 O~4?5 0~078 0d072 d118 0.102 0.093 g.714 (!" O:i::~: (I .. (I:;:: ~l ~ 14:::: ~I" 16 (I (I .. 1 ~)f, i-J.~, 1 c: (I" (I 9 ;i~ n" ~I ~~; 9 .. 1~. 9 ~)" 1 9? ~) d 1";' f. (I. 5 f.-' ~
Od08~ 0.085 .139 O~236 0.122 0.761
I11-33

TABLE 4 (CONTINUED)
Norma.l i zed Uti 1 i ty
NEhl ENGLAND ELECTRIC SYSTEM ~~083
GKLR~QMq GR~ & ElECTRIG 0~110 OTTER TF; I l POI.tlE:R r!J ~I,; 09:3 PQTQ~1Fh~: ElEI~.TR Ie F'QI.,IER ~L ~17G
PUB~IC ~ERVI~E CO Q~ IND g~112
?UBliG ;ERVIGE CD OF N ME~' Qdl03
1I1-34
Od146 0.135 0.533, 0.239 0.210 0~3421 0.614 0.170 0.281 0.168 0.1~~ 0d4~g O~233 0.198 0.423 0.201 O~171 0.592

population of companies. Thus, at least with respect to the rates of return calculated in this study, the ectric utility industry must be viewed as consisting two distinct types of firms. The statistical comparisons of rates of return for regulated and nonregulated entities must be separately the normalized and the flow-through utilit-ies.
2. Generalized Hypotheses
All other statistical comparisons discussed in this section involve testing the following sets of hypotheses.
a. One
HO: u;- ;: D2; and
HA: u;- i- U2;
where u;- ;: vector of the four overall average rates of return for one set of firms in the electric utility industry (i.e., either normalized or flow-through); and
~ ;: vector of the four overall average rates of return for one group of nonregulated companies (i.e., either low, medium or high barrier-to-entry).
b. Two
HO: Y-, ;: y 2; and
HA: Yl t Y2; where Yl ;: vector of the two overall average rates of return on common
shareholders' assets (1'1Ieasures 3 and 4) for one set of firms in the electric utility industry; and
y 2
c.
where Pl
;: vector of the two overall average rates of return on common shareholders' assets (Measures 3 and 41 for one group of nonregulated companies.
Three
HO: Pl ;: P2; and
HA: P, t- P2;
;: overall average rate of return on common shareholders' total assets (Measure 3) for one set of firms in the electric utility industry; and
P2;: overall average rate of return on common shareholders' total assets (Measure 31 for one group of nonregulated companies.
11I-35

To ensure simultaneous comparison of the rates of return, the Hotelling T2 test is used for the first two sets of hypotheses described above. Because it considers the differences between utilities and nonutilities for only one of the overall average return measures, the third set of hypotheses requires no simultaneous testing. Accordingly, the Student T test suffices in this situationQ
3. Comparing Rates of Return for Regulated and Nonregulated Companies Each of the six regulated/nonregulated comparisons involves a separate
set of tests of the three generalized hypotheses. For each test, primary attention is focused on the null hypothesis (i.e., the one designated as tlO}' If it is rejected (i.e., if the related T2 or T statistic is significant), then the two rate of return vectors (or, with the third set of hypotheses, the two rates of return} under analysis are considered to be different. If the null hypothesis is not rejected (j .e., if the related T2 of T statistic is insignificant), then the two rate of return vectors (or the two ,rates of return) are not considered to be different (i.e., in a statistical sense the two rate of return series likely come from the same population of firms).
a. Normalized Utilities and Low Barrier-to-Entry Companies The detailed numerical results of this comparison are presented in
Part A of Table 5. Test of null hypothesis one yields a T2 statistic which is significant at the .01 level, while the T2 statistic for the test of null hypothesis two is insignificant. The T statistic for the test of null hypothesis three is almost zero and, of course, is insignificant. Thus, since the results from testing hypotheses two and three demonstrate that rates of return on shareholders· assets for the two groups are not statistically different, the rejection of null hypothesis one implies that the normalized utilities· rates of return on total assets and on total productive assets are significantly less than corresponding measures for the low barrier-to-entry firms. 49
1I1-36
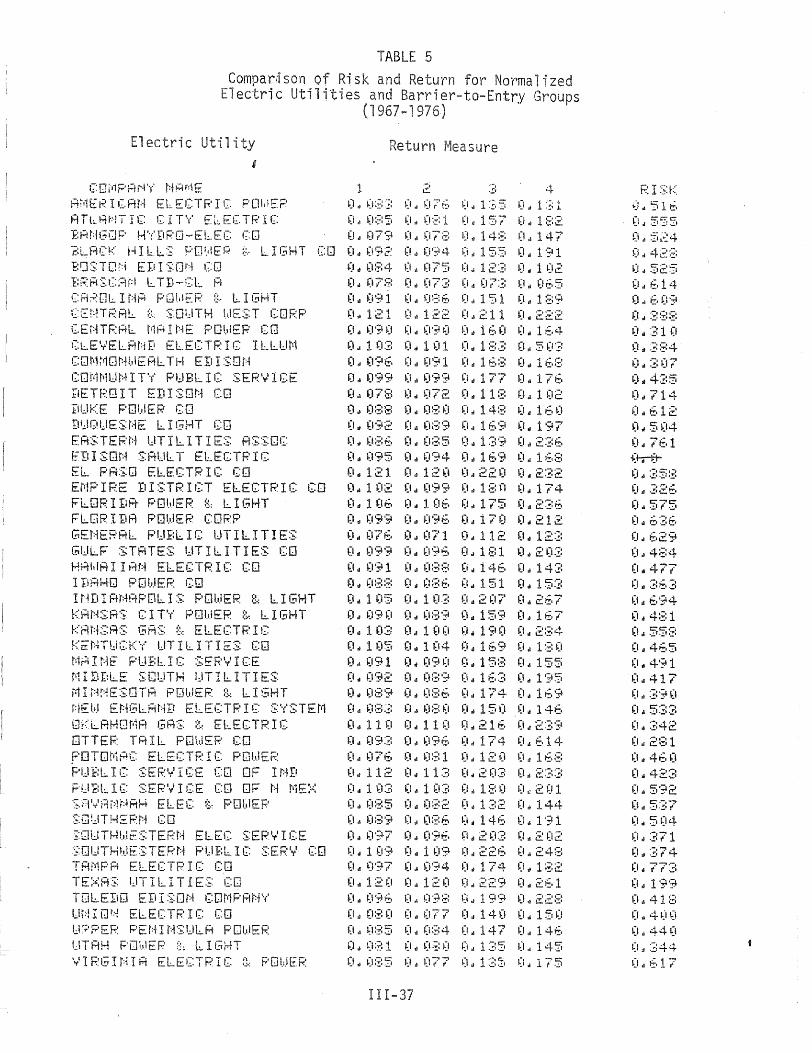
TABLE 5
Comparison of Risk and Return for Normalized ectric Utilities and Barrier-to-Entry Groups
(1 1976)
ectric 1 ity I
1:;::Di'1r:;:'Ar~\' t:iRhiE FfliE~: I CAt:1 EL ECTF.' I C F'OI.!E;:· AT l:.. HHT I C I~: I T'l E LEe T F.' I C FANGOP HYDRO-ELEe (0 ~:L.f7iCK HI Ll:.S P01.dEP !:!., L I I!-iHT CD f:J]:S:TQi:i EII I '~:on CO }:;;;:A:~:C:~r=l L TD..".CL A C;;~:lll. I r=lH POhlEP :~., lIGHT CE~TRAL ~ SOUTH WEST CORP CEi':iTF.:AL t!tA I NE POblEP CO CLEVELAND ELECTRIC ILLUM COtI1i'iOt:HulEAL TH EII I son COMMUNITY PUBLIC SERVICE nETROIT EDISON co IIIJKE F'Dl.dEP. CD D~QUESME LIGHT CO E~STERN UTILITIES RSSOC EDISON SAULT ELECTRIC EL PASO ELECTRIC CD EMPIRE DISTRICT ELECTRIC CO Fi:..OR I riA- POhlER g.: I.:.. I I:;;HT FLORI~A POWER CORP GENER~L PUBLIC UTILITIES GULF STATES UTILITIES CD HHldA I I AN ELECTR I C CO I Iif~HO POI.I.IEP CIJ INDIANAPDLI~ POWER & LIGHT KANSRS CITY POWER & LIGHT KAN~AS GAS & ELECTRIC K~NTWCKY UTILITIES CO M~IM~ PUBLIC S~RVICE NIDDl.E :S:CI.JTH IJTllITIES MINNESOTA POWER & lIGHT r:iEt..1 Er:1(~l.Mt:iII ELEGTR I C ::;:YSTEt'l QKLAHOMA GAS & ELECTRIC OTTER TAIL PDW~R CO POTOMAC ELECTRIC POWER PUBLIC SERVlrE co OF IND F·U~:l:.. Ie ::;:EF.'V I CE CO OF t:i t'1E::.:: ·~.;::~'",';·71r:·!r:1Ht4 ElEC t, POhlEP :;:i.J!.:.ITHERf.i CO ~OUTHW~STERN ElEC SERVICE SOUTHWESTERN PUBLIC SERY CO TRMPA ELECTRIC CD TEXAS UTILITIES CO TOLEDO EDISON COMPANY UNIO~ ELECTRIC CO U9PER PENINSULA POWER UTAH PLlldEP ;~: L:.. I t;HT VIRGINIA ELECTRIC t POWER
1 (I ~ ~);::3 (I ..
(I d O:~:5 0 .. ~I ~ ~17'~ 0.1 0" (i9C:~ f! .I
(I" (1::;=:4 ~L
0 .. (17:~: (I~
(I .. (i'?l (I"
~I .. 121 004 011 ~190 (I.
0 .. 1 (13 (I" (I. (l'?lf. (I"
001 09'? 0 .. ~I d 07:!:: ~J " i.] " (I:~:8 (I ..
Oot (192 (\ .. ~) " (I:~:E, 0& (I .. (1'?5 0 .. (I. 121 011 ~) 01 1 02 001 (I .. 1 013 001
~I ul (199 (lo!!
Osl 07f. ~I " (I" (199 (I"
o~ 091 0 .. (I" (I:=!:~: o~
(III 1 (i5 0 .. (I" (19(1 001 (I .. 1 03 0 .. (I" 1 (15 0 .. 0 .. (191 O~
(I" 092 0 .. (t" Og9 (I" (Io! (183 0" (I" 1 1 (I I) .II
(101 O'~3 o. (101 07f. 0111 (I", 112 (I"
~) . 1 (13 (I ..
(I d ~!:~:5 (I.
(I" (1::;::9 ~I d
(I" 097 (I" ~) . 1 09 \.)"
~I " ~197 (I",
~) .a 120 (I" j.) • (l9E, (I"
0 .. OgO 0.01 0'\ ~J~~!5 (\" ~l d ~);?1 ~I '"
Om! ~):!!5 o.
I1I-37
Measure
.', .-4 t!, .,!)
(I 7 ~~. ~I ~ 1 :~,5 0 .. 1 :'~; 1 (I::: 1 Od 1 C:'-:" .. :.t f (1,// 1 :::2 ~)f~;:: O~ 14::;:: (101 147 ~1'?4 O.JI 1~~ (Jill 191 ~!T5 0 .. 1'-"-' c:..!l 0 .. 1 02 (173 ~l ~ (I?:!: ~l d ~)E.5
~!:=;6:. (I d 151 ~) " 1 :~:.? 122 o~ 21 1 ~I "
'-1'-1'-' ~L:.~
(I'? (I (I" 1 If. (I (i" 1 t!.4 1 \.)1 0", 1 ;:;:.:: (I~ 5(13 (191 (I el 1 ~.:!: (\ .. 1 E.::: (199 0 .. 177 ~) ~ 17~, (1('2 (I .. 1 1:3 (101 1 (12
fl:~:O ~) " 148 I-L 1 E· (I (1:~:9 o. 1 f.,? O~ l'~-:V o· r
085 ~! " 139 (/" 2:!!G 1-)94 ~I " 1 E.9 0. lE.S 120 (I of 221-) o. ·-:·-.'-t c:..!:.,c:. (199 (101 l:::fi (I" 174 i (If. (I oJ 175 0 .. .-,,-,.'-c:..p",,..,...
09€, 0 .. 170 0 .. 212 071 (l. 1 12 (I" 1'-"-' :::. . ..!:I
(19f. (I" U~:l 0" 20:3 O:=:::=-: O~ i4E. 0. 14:~: OBf. ~! " 151 (I" is:!! 1 03 (I III 2(17 (10\ 21f.7 0:39 (Is 159 o. lE,? 1 0(1 0" 190 (I"
.-.,-. ·i t!:1:!.a...r
1 04 o. If.9 OJ! 1;~:(I
090 0 .. 15::: o. 15~; Og9 (I .. 1 E.;3 (\" 195 08f. ~I ~ 174 o. 1E,';? (I::: (I Oul 150 (I" 14E. 1 1 (I ~I m! 21E. (i" 239 (!9f. (I" 174 0. E·14 0::: 1 (I", 12(1 (I" 1 E.:=: 1 1'-' . .:;:, (I ~ 20:~: (I ..
. -,,-,.-,
.::...~l.!'
1 O:!: ~I .. U::~I (I ~ 2(11 O:~:2 O~ 1:!:2 0 .. 144 (1:36 (I" 14E. 0" 1 'jli (196 ~I d 2 (i:!! 0" 2(12 1 09 (I d 226 (I" 24;:: 094 ~) " 174 (I" 1 ;~;2 12(1 ~) " 22';& (loll 26:.1 ~i9:~: ~i " 199 (I Ii ·-t·-" -c:. c:.. ~;:. (177 0" 140 (I" 15(1 (i:!::4 0>1 147 (I aI 14f. (I;~: (I ~) d 135 (101 145 e77 (I" 1 :;::71 J.) " 175
R IS:~::: i.=l .. 51 ti, OJ ::::r:-t:::'"
. ..:,1 '~! • .:...
~=i d ~5~'::4
~l ,j 42:;:: ~) 4
c'-Ie . .;.It!, . ..;.i
~I ~ f.14 (1.1 E. (;9 O~ '~I'-ll-t .!:o":!:''''!.
~) 01 31 (I
0" :~;:::'::4 (101 ::!:(17 (I" 4:!:5 (I" 714 (I. E.12 (I", 5(14 (I d 7E,l {+-;rtt-
t) d :~!5:!~
0 .. .~:2~. (I .. &::"-:V&::"
..;.1 f . .:.' 0 .. ~l:~:~t (I ~ ~,2'~
(101 4:~:4
(1 .. 477 0 .. :~:~~:~:
(I .. €.94 (I .. 4:~:1
(I" t:"'t:::"'-l -.:.} . ..:."!"
(I ;I 4f'~1 o. 491 (I II 417 (I .. :~:9(1
~) " C"·-t·-, • .:.,S.":I.!1
I) • ::!:42 o. 2:~:1 0 .. 4f.(1 0. 42:~: 0" 592 (I. £::".-.-;>"
. ..:,I.!;..",
~) .. 5~14 ~I d 371 ~I" 374 0" 773 (I" 199 (I" 41 ::;:: (I,; 4(1 ~l
~) . 44(1 (I" :~;44
(I .. ~.17

TABLE 5 (CONTINUED)
Electric Utility
B~LTIMDRE GAS ~ ELECTRIC CENTRRL ILLINOIS LIGHT CENTRAL ILL ~UPLIC SERVICE CDt:1:~:I.Jt'1ER$: POI.,IEF.' CO FITCHBURG GAS ~ ELEC LIGHT ILL.. It:iO I S PiJl.alEP CD INTERSTATE POWER to I Ol.alA ELECTF.~ I C: l I ':;HT :~,: F'l.dF.~ IOWA-ILLINOIS GA~ t ELEC IOWA POWER & LIGHT IOldA F'I.Jf:L Ie S:EF:'yl I CE CO I QI,I18 '~:OI.JTf.JEF'r:1 l.:,iT I LIT I E:~: CD
Return Measure
OdD96 0~g94 O~175 O~368 005095 Q,,094 0~165 Od201 (I" 1 (I 1 (I" 1 (I ~~! (I d U~: '9 (I Ii 2 (! 3 0,,085 O~081 O~137 0,,136 0"Q83 0d082 0.11 Q O~117 0.108 0,,106 0~205 Od209 0,,089 0,,089 Od190 0.239 Od084 u.078 Od140 Od118 0&100 Od094 O~120 0.169 O~g92 0d092 0~177 Od191 0.098 0~095 Od175 Od178 (I ~ 11 g (I ~ 1 1 ::: (I j 2 ~) f. 0 d 2 1 7
kHf:l:~:AS: POldEF.: g,: L I GiHT !o). 1 (I:~: ~I. 1 ~J7 -~J:"u;;:? ~J .. 1 ::<2 L. H ~::' E s: I.J PEP T C F.' fl I :~: T POI) I E ~: ,~: 0 fI 01 ~I.:; 5 ~! ~ ~l :~; t.:, ~J ~ l:=i :';: ~i.; 1 !::. ~i L GU I ~S:I,r' I LLE I:; ri S: g,~ ELECTP I (: rr~;:~DI,~:iJr; ':'FI~: :~,: ELE'::TPIC CO, r'1 I '~' ~:O')~' I PI.:If.;L I C: :~:E~'I.,.' I CE CD MCMTA~A ?OWER (0 l:iE1.lJ fa:H;l. At:-lIi GiA:~: :~.: ELECTF.' I C
'NOPTHEF.'M rNPI~NA PUBLIC SERV NORTH~RM STATES POWER N9RTHW~STERN PUBLIC SERV CO PHILADELPHIA ELECTRIC CD PUBLIC SERVICE CO OF COLO PU2lIC SERVICE ElEC & GAS Sf JOSEPH lIGHT t POWER ~IE?RA PACIFIC POWER CO SOUTH CAROLINA ELEC & GAS ~OUTHERN IMDIANA GAS & ElEC ~IS(DMSIN ELECTRIC POWER t.11 I :~:G:Or:1:~: I r:i PDI.tIEF.: 8" L I !~HT I,ll I S:CDt:t~: I n PI.JBl:.. I G: SER''l'' I CE MONTRN~-~AKOTA UTILITIES
~I" 1 2 0 ~i" 1 2 5 q" (I;~:g 0" ~):~;6:.
~!. (19 (I ~I" ~J:~:f.
0,,111 ~ldl11
fl. 087 ~) d (I:~:5
(I d 1 (I f. (J d 1 05 (I .. 09:3 0" ~):~;7 (I. 0'3:3 I) II 093 (I" 0:::::5 ~I" 0:::: 1 (I ~ (1:3 I) ~I" (; 7 ? (I. 079 0" (175 (I .. 095 (I. (1'?4
(I. ~I 7 '? (I.. (I 7 6:.
0" 1 2 (I (I" 1 1 l (I" 1 ~I (t (I .. 099 (I If lOB (1.1 1 (I S ~) If 1 (I~. O. 1 (1"5 (I d o'?;~ (I .. ~)9 9 o d (195 (I" (19!;
1II-38
(I II 2 1 t, ~) • 244-(;" 1 41 (I o! ~: (17 o a 1 :~: ? ~'!" 1 '1 1 (101 1"('9 (I. 184 (i Ii 1 4~, (I" 1 4 7 o d 2 (r~! ~I d 225 (1.1 1 :=~ 2 0" 1 :::;: 4 (I" 1 t::. -;. (I of :':::3? I) .. 13~i I) .. leo (I d 1 42 (I Ii 1 4 Eo (I ~ 1 2 ~5 (I tI 1 :~: f. (i II 1 7 '? ~) II 1::=: 7 0 .. 120 (1,,116 ~I.. 1 45 (I" 1~. :';: (1.220 0" 215 0 .. U::5 ~llI 1::::5'
~I" ~ ~l'~ \~I. ~:~? 1:.1.. c: 1 1:,1 :J,.; i:::: :,:; C:: (I. 1 5~. ~:! ~ 1 5 (I (I" 1 f· 7 '; ~I II 1 95
."~" - >-
0.42 (I (I d 4:i;7 (I aI 5f.? ({ J 711 ~I J :!::~: 7 (I" 49'/ (1,,43':. 0 .. 713 (I" 734
(I" :~:04
~)" 511 (I" 2:31 (I,; ::=:15 (I" 4:!:f. (I" :!:~. 7 ~) d if. 3 .1 (I II :~: 11 (I II 529
(1,,477 ' I '" 0.392
0.4::::::::: I) d ::!:!f.5 (I. E.09 (i d S'?'? (I d 5(12 (I" B41 9 .. 445 0" 140 (I II 41'3' (I d 291
J2:~~~

TABLE 5 (CONTINUED)
PART A COMPARISON WITH LOW BARRIER-TO-ENTRY GROUP (1967-1976) ~
Company Name
CWE~S-ILlINOIS INC RNCHOR ~OCKING CORP GnD~YE~p TIPE & RUBBER CO FIRESTONE TIRE & RUBBER CD U~ITED BANKS OF COLORADO GOODRICH (B~F.) CD I fiTEPI::O I r"iC ·BPOI.r1j"-1 GF.'OU;:' I t"iC U :S: SHOE CO;:~F'
I::;Et"1E:~:CD I r"iC CElFtNE:SE COF;'F' U :S: G\'F':::Ut'1 CO NATIONRL GYPSUM CO CF'C I t"iTL I ,'-Ie STOKELY-VAN CAMP INC E:S:t;tA~'I< I t'1C GENERAL MILLS INC PI LL:S:BUF.' ',,' CD Af;iER I CAt:-! CAt:t CO cOrr: I j:ie:r:1TAl (;k:DUF' ANHEUSER-BU~CH INC PABST BREWING CO
---.- -. '" :~:CHL I TZ (,.:JO:~:E~'H) f;F.:El.d I t:il:; ,. p,;;1E:P I CHi;~ f:AKEF.: I ES CD
F: t J ;.:;' l ! r:~ I::; T [] n I t:~ Ii I.:! :~: T F' I E :~: J t:i C ~TEVEM2 (J~P~) & CO (:[H:lE td ILLS COF.'P Tl8r:f r-;' I ',/EP I r:lc
Return Measure
1 ,-, &:.::. 4 ,-,
.!.'
(l ~ 1 (j'~: (I ~ 1 ~!~. ~).. 1~. 2 (t 01 1 7 1 04177 Ocl177 001244 001244 ~.121 O~125 0.192 Od207 I).. 1 1 '3 0 p i 1 ':.+ (I a 1 ::: E: C.. 1 ::: L::' I) oi I)::: 7 0 ~ (137 (I ~ (I 1 (I (1 ~ I) 1 0 O~076 0.077 0.093 0.095 0.172 0.172 0.273 0.274 0~173 0.173 0.240 0.240 0.151 0.152 8.251 0.252 0.. 1 (I :::: I) II 1 0 :::: (:" 1 7 4 (I" 1 t' (
0.090 0.094 0.155 0.171 I) .. 11 I) 0" 112 I) .. 139 I)" 142 1) .. 1011) .. 1010 .. 122 0 .. 122 0.154 0.160 0.235 0.251 0.105 0.105 0.135 0.137 0.091 0.093 0.142 0.147 0.166 0.168 0.364 0.370 0.127 0.127 gd231 001231 (I d 1 I) '? (I" 1 1 (i ~) ~ 1 fA (I.; 1~, '? (J • 1 3 4 ~)" 1 4 (I ~\ ~ 1';' t5 ,~l 01 2 1 1 0,,18$ g~198 001262 001291 04182 O,,188 0,,221 O,,229 0~202 001216 0,,277 Od~12 0.036 g~037 g~045 O,,046 (I" 1 1 ,;. (I rl 1;~ 1 ~!" 1 :~:;::: (I" 1 :~: f. Od083 0~D84 0.112 g~114 001103 0.103 D~129 001129 0.054 Od054 0.044 0.044
PI:~:K
(I <4 t.!.1 ;::: (I" f'36 0", 70:~: Our::=:4 0.572 0 .. 79:::: 0 .. 953 (I" 7::::5 I) u '342 1 d 3-;:"3 ~I. 561 (I .. :::;30 0 .. :::::39 O .. 51? I) .. 6:34· 0 .. 473· ' 0 .. E,03 ~I" 717 (I ~ :~: 1 :"!: ~)d:31"1
~) .I 534
0 .. :~:41 " ,.' 0 .. :~:71 ; (I d :3:~;'?
~l" 74 ~ .. ! 0 .. 744 1),,912
-"-O-;TZI-""--C'~ /2 D--- --;;; il'~",-j---;"--I-;-;;;:Z--r t.,.' .. 1 /" l/· -;;'·,r
T2 Statistic Normalized Ut.ilities Vs. Low Barrier Group (1) All Measures Simultaneously (2) Return Measures 3 & 4
T Statistic Return Measure 3 T Statistic Risk Level l Significant at .01 Level
I1I-39
136.193 Y 3.767 0.503
33.523 Y
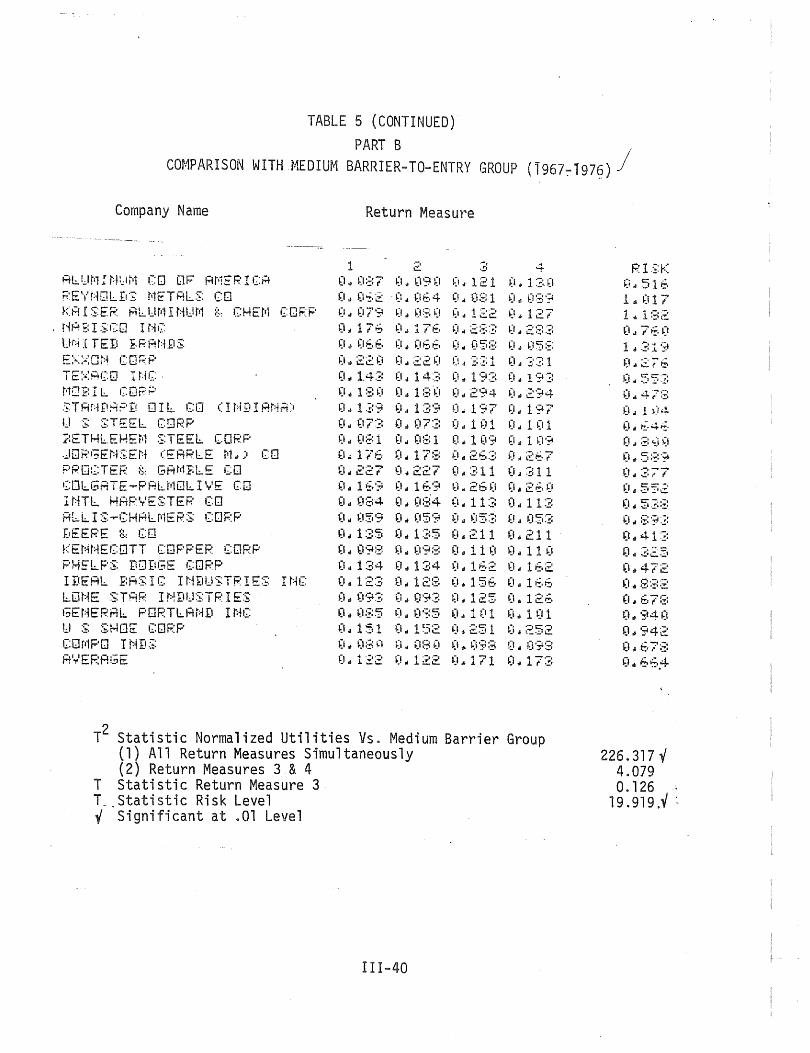
TABLE 5 (CONTINUED)
PART B
Cm·1PARISON WITH ~1EDIU~1 BARRIER-TO-ENTRY GROUP (T967:-197~) j
Company Name
FH:..!.Jr'1 I i:IU,'1 CO OJ;" A111EF.' I CH REY~OlD? METRLS CO KAISER AlUMINUM t CHEM ~QRP riP. E: I .:;:(:0 I riC Ur:-i.c TEII ~,F.·At:ifIS
E::..;;:'::Oi:t COr.;:p TE::.::':;CO I riC tll!J~:! L cop;:.:' STANP~PD OIl CO (IN9IAN~)
U :; S:TEEl. ClJ~~P
~ETHLEH~M STEEL CORP JORGENSEN (EARl.E M~) CO PRO~T~R & GAMBl£ CO COLGRTE-PRLMOLIVE CO IMTL HARVESTER CO RLlIS-GHALMERS CORP I,EEF.'E g.: CD KENNECOTT COPPER CORP PHELPS ~QDGE CORP ID~Rl. BASIC IN~USTRIES INC LONE STAR IMDUSTRIES GENERAL PORTl.A~D INC 1.:.1 S ::;:HO~ CQRP COrI1F'O I t:1 I! .:;: A'·/EF.:FH;~
Return Measure
1 (I .. 0:=:7 (I. 0-:.2 (I .. ~179
(I,,17tS
.-. -, .-4
.:::.. • .!;' "..
~I" (19 ~I ~) d 1 2 1 0 sI 1 3 0 0~064 0,,081 0~08S ~).. ~I :;:; ~) ~I d 1;,:: i:::: ~!" 1 2 7
Q,,066 0~066 D~058 0.~58 0.220 O .. ~~~ OJ3?1 0.331 0.143 0~143 0.193 0~lq~ O.18D O.18~ 0~294 0~294 (I" 1.!: 9 ~I d 1 :~: 9 0 ti 1 97 (J _ 1 '? 7 0.073 0,,073 0~101 0 .. 101 £i 01 ~) ::=: 1 (I d ~I :!: 1 e" 1 (I 9 ~I" 1 (I '? O~176 0.178 0.263 g~267 0,,227 9 .. 227 0 .. 311 OA311 Q.l~q 0.169 0~260 0.260 Q"OS4 0.Og4 0~113 0.113 Q~g~9 0"OS9 0dOS3 0,,053 0~135 O~135 0.211 0.211 Q .. 098 g~098 Q .. I10 0.110 0d134 0.134 0.162 0 .. 162 0 .. 123 0.129 0.156 0.166
0.085 0.0S5 0 .. 101 0 .. 101 0.151 0 .. 152 0~251 0~252 g~08~ D~080 O~Q9a 9 .. 098 0.122 0,,122 0.171 0.173
T2 Statistic Normalized Utilities Vs. Medium Barrier Group (1) All Return Measures Simultaneously (2) Return Measures 3 & 4
T Statistic Return Measure 3 T_.Statistic Risk Level y Significant at .01 Level
111-40
PI.~:K
~i" 51 E. 1 .. 017 1 .. 1 :32 (I .. 7~,(!
1 d :~: ~ '9 ~1 .. 2(G ~I .. 553 ~)'" 4?:::: ~l .. 1 ~)4 ~). t!~4':.
(I" ;z;: ~i9
0 .. 5:~:'~ (I 01 ~: 77 0 .. 552 ~I" 5::;:~:
~I. 89~!:
O.41:~:
(1 .. 472
(I. f.7:z;! (I" 94~! 0 .. 942
226.317 Y 4.079 O. 126 .
19.919.V ~

TABLE 5 (CONTINUED)
PART C
COMPARISON WITH HIGH BARRIER-TO-ENTRY GROUP (1967-1976)
Company Name
GENERAL MOTORS rORP FOPI) r'10TDP I~:O
CHP'/SLEP CORP I .. !F.' II:!1lE'/ (hi I LL I Rili) . .;.IF: CD REYNOLDS (RdJ~) INLS AMERICAN BRANDS INC L. I (3,:5ETT GF.DUF' PHILIP MORRIS INC 1'1EPCK t.: CO pr; T ZE.R It:1(: '::;:CHER I t"H3-F'LDUGH ABBOTT LABORATORIES .S:EAGRAt'1 CO L TIl NATIONAL DISTIlLE~: tCHEMICl t.dALr<ER (H I F:rAf'1) I~OOIJF.IH!f1 ;~., '-dOF.~T
TE::-::A:~:I:3ULF InC REEPOPT MINERALS CO PPG INDUSTRIES INC l:. I f:BE\' ..... OI.,!~t:tS: ..... j:;OF.'D CO. AI.H=:KA-&~
Return Measure
1 .-, t.!.
-::.. 4 0~197 0~2Q0 0.279 ~~286 (I.t 1 1 1 (I,j 1 1 :~; ~) ~ 1 E,5 (1.2 1 7 (I
0.064 0.066 Od097 0dl00
0.253 Od258 0.363 'O~373 0.158 0.158 Od270 0.272 Ow 12'3 0 .. 129 0 .. 191 0 .. 191 0.166 0.172 0.330 O~359 0.34~ 0.256 0.472 Od492 0~169 0.174 0.250 0.264 0.320 0.332 0.433 0.456 0.163 0.165 0.242 0.247 (I.. 1 I) 1 (I. 1 (12 (I.. 1:3 4 (I.. 1 :~' 5 o rI 11 7 (I.. 1 1 9 (I.. 1 ;:: 1 0 D 1 S 7 0.lS7 0.189 0.240 0.242 0.168 0.168 0.225 0.225
O. 1 3 I) (I. 1 :~: (I (I s 1 47 (I.. 1 47 0.107 0.112 0.143 0.154 0.183 0.1S7 0.310 0d329 Od174'-ij~178 0.251 O~26D
T2 Statistic Normalized Utilities Vs. High Barrier Group (1) All Return Measures Simultaneously (2} Return Measures 3 & 4 157 .007 ~
45.042 y
41.378"; 3.536
T Statistic Return Measure 3 T Statistic Risk Measure i Significant at .01 Level
III-41
F: I :~:K j,J,,'::·19 (I" 57~,
1 " :~: 1 f!. (/ ~ 475 0 .. 46:::: 0 .. 516 0 .. 61 ~3 0 .. 273 OoB 2~,4
0 .. 211 0 .. 274 (I .. S·? (t (I .. Sf.S 0 .. 654 0 .. :341 0 .. 695
0 .. 465 0.701 ~) • :::' ! f·

b. Normalized Utilities and Medium Barrier-to-Entry Companies The results of this comparison are reported in Part B of Table 5.
The T2 and T statistics for this set of tests have exactly the same significant/insignificant labels as they had in the previous comparison. Thus, the statistical relationships are identical to the ones eXisting between rates of return for normalized utili as and the low barrierto-entry group. Even though the utility profitability measures are significantly lower_when the four overall average rates of return are compared simultaneously, the common shareholders of the normalized utilities earn a rate of return on their ownership claims which does not differ from that enjoyed by the common shareholders of the medium barrierto-entry firms.
c. Normalized Utilities and High Barrier-to-Entry Companies The results of this comparison are contained in Part C of Table 5.
The T2 statistics for the tests of both null hypothesis one and null hypothesis two are significant at the .01 level. Further, the T test rejected null hypothesis three at the .01 level. Thus, the rates of return for normalized utilities are all significantly less than the corresponding measures for the high barrier-to-entry groupe Since this set of nonregulated firms represents the most IImonopolisticli companies analyzed in this study, the results of these tests provide evidence that regulation removes the potential for monopoly profits.
d. Flow-Through Utilities and Low Barrier-to-Entry Companies Part A of Table 6 presents the results for this comparison~ The T2
statistic for the test of null hypothesis one is significant at the .01 level. However, the T2 for the test of null hypothesis two and the T for the test of null hypothesis three are also significant but ~ at the .05 level. Depending upon the significance level required to reject the null hypothesis (an issue upon which statisticians differ), two interpretations of these results are possible. First, with strict adherence to the .01 level, the rate of return relationships between flow-through utilities and lc~ harrier companies are exactly the same as those between normalized utilities and the low barrier-to-entry group.
11I-42

TABLE 6
COMPARISON OF RISK AND RETURN FOR FLOW-THROUGH ELECTRIC UTILITI~S AND BARRIER-TO-ENTRY GROUPS (1967-1976)
Company Name
A~LEGHENY POWER SYSTEM CENTPRl 1¥IEPtI10t:iT F'UB ·:;:EF.:V COLUMBUS & SOUTHERN OHIO (ON~ORD ElECTRIC CO r;REEH tI10I.:Jr:iTR I t:-I POI.t!EF.~ COFP t·iE\,'fL[lA F'Ol.dE P [:0 NORT~EAST UTlbITIE~
or·n IJ EII I SDt;~ G:O PENt·i:~:·""LVP.t:i I R POi.IIEF.' :~.: l I (;HT PORTLAND GE~ERRl ElECTRIC CO FUB~IC SERVICE CO OF N H PUGET SOUND POWER & lIG~T SOUTHERN C~llF EDISON CD UNITED IlLUMINATING CD ARIZDNA PUBLIC ~ERVICE CO CEMTRPL ~UDSDN GAS & ElEC CINCINNATI GAS & El.:..ECTRIC C (] t:{ S: g L I II ATE II E III :~: [] r:~ 0 F (! d 'y' d
DAYTON POWER & LIGHT DEL~~PVA POW~R & lIGHT lONG ISlAND LIGHTING 4EW YORK STATE ELEC & GSS NIRG~RA MOHAWK POWER ORAMGE & ROCKlAND UTIlITIES PACIFIC GRS & ELECTRIC PAC! FI C ~'OI..!ER :~.: 1:. I I~HT ROG~ESTEP GAS ~ ElECTRIC SAN DI~GO GAS & ElECTRIC TU~SON GAS t ELECTRIC ".!Fr~-H I t:11:;T0 r:-l l.dATER PDI.lj~p
H'· ... EPHt:.E
Return Measure
1 ~I d (I'~:;: (I. (!;::9 (I.. ~I f, l (1 ~ (I 6 :~: (I d (I :~; ~5 (I ~ ~j :::: 2 (I ~ ~!;::::::: (I" (1:::2 (I ~ (17::: (!.. (I~. 7 (1.1 O::::i (I .. ~i::~ (I
0.. (17':, (I >I (I E. 9 (I. 099 (I. (19~.
(I d (I :;:: ~, (! d (I ::; 2 (I .. ~I:::;;f, ~I d ~):~:f,
(l d ~):!::::: (I" (I:::~)
(14 (173 (I d ~172
(I d ~)7e (I d ~)77
0 .. (1:::2 ~I d (I;:: (I
(101 075 (I d (175 (I" (!:~:~! (I .. (177 ~) • 1 (I 1 ~l 01 (197 (I" (lEA (I ~ 061 (i" 09~' 0" (I:;::::::: (! d (I ::: 5 ~I >I (1"7 9 (I ~ o::;~, (I a (!:::4 (1 d (I 7 ::: (! a ~J 7 E, ~14 ~)E,::: (I .. (1t;!:.4
(1 oi 07" E. (I" (I 7 .~; (I" (Ig (I (I d 07:;:: (I.! (17 4 (I" 0 7 (I
(I .. ([77 (101 (175 (tol 079 (I. (17:::;: (I 01 (I'~ (I (I d ~i~~:?
-.,!,
o d 17(1 (I d (19::!:: ~). 14 ::;:: 0414(1
(101114 ~L 127 001 120 ~!" 172 (I d 159 ('" 1 :~: 1 (101 14t=.i:, (I" 113 (101 129 ~L 156:. 001125 ~) ~ 14·:;:: ~-!" 1 ,?:~:
(i. 1 71 ~l ~ 143 o d 15~,
(I .. 131 ~)d 1 ~)9 (I d 12::: (I d 1 :!::~: (I ~ 11 7 (i" 12t::. (I d 124
4 (I d 1 ~:4 (I d (I :=: ::: ~I d 225 (; ~ 1 :::9 ~I ~ (I '? t, (I d 12 ':?
(I d ;;:: (I I~,
(! oJ 1 ;'? (I. 1 ::::? 0,,144 (i .. 12t=.i:, (! d 1 .~:::: 0. :~:94 0 .. 1 ;,t;, (I d 1 ::.::!!
(I d (I;~;::::
(I" 17:=: 0 .. 134-(! d 1 :!:-? (Id140 0,,107 (I. 119 ~J .. 1 ::=: ,::
0 .. 115 0 .. 122 (I d 127 O"lC;C::;
(I 01 ~) :::: :;: (I 01 (; ::! 1 d 1 4 7 (! d 1 4 c::;
(I" (I ::: 1 (I.. (I?:3 oj 1 .::i t" (! 01 1 ;:: :;
111-43
F.'I :~:I<
(I 01 7t:1~'>
(I 0I~. (1:3
1 .. (I~,.~:
(I d t~. 5 ~) . (I " ~,;:: i.~
I)" 4~:,:'
~) .. 441" (I. 4"t~
(I d 0+ -/ t;- .
(I" :3 ::' ~: . 0 .. 412· ~) .. 491 (I d 4:::: ~_:
0 .. 2:~:4 o ~ :::;: (12·
~)d 479
001 5:::t.i (I d 5:::4-
0" 2 4 ~:r (I ~ 4:::7' (! 01 r!' (!~r o A ':~ 11'

TABLE 6 (CONTINUED)
PART A
COMPARISON WITH LOW BARR1ER-TO-ENTRY GROUP (1967-1976)
Company Name
OI.IIE t:~S ..... I!.:. L I f:i!J I ::;: I r:~C At:iCHOF: HOCK I t:iG G:OF:F' GOODYEAR TIRE & R~BBER CD FIRESTCNE TIRE & RWPEER CD UNITEti BA~KS OP COLORADO GOODRICH (B~F,,) CD I ::iTE"RCO INC f:PQ/.t.!r:-! (;F'OIJP I t:4G: U S: SHOE COPP GEt;iESG:[J I !:117.: CElAt:1ESE CDPF' U S: 1:;\'P:~:iJN CO ~ATIONRL GYPSUM CO I~:PC I NTL I i:iC ?TOKELY~YAN CAM? JN~
GE~ERAL MILLS INC P ll:.L:~:f.:I.JF.:·'" CQ Hf,1Ef;;' I CAl:-! CRn CO SONTIMENT~L GROUP Fit:iH~U:~E~~"" F:i.:.lSCH I He PABST BREWING ~n ::;:CHL I TZ ('.JrJSEPH) f:~'E!.d I NG RMERICAN BRKERIE~ CO BURLINGTON I~DUSTRIES INC STEVENS (J~P.)& CD COr:!E ti1 ILL::;: (OF'F' I1 r-=t [:1 R I '-t' =: F? I i:i C
Return
1 0"
of (13 J.
(I" 1'"":''"'':' _ f t
(I" 121 (\ .. 1 19 ~I " O:!:7
0" ~)7G o. 172 o. 173 0" 151 0 .. '" 03 .l
(I .. 09(1 (I" 1 1 ~) 0" 1 01 (I" 154 0 .. 1 O~I 0" (1':;'1 (I .. 1 E,f. (! • 1'-''"'':' i::..f
(ld 1 fi9 0 .. 1::!:4 0 .. 1 ~!:5 Od 1 ::=:2 0" ~: ~1;:' 0. 030::. (1 01 '1 19 (I .. (1:;::3 (i" 1 (I:::: 0 .. \.)54
G.I 1.7, I.
Measure
.-, .-. c:. . .!I
~I" 1 ~lE ~) . lE·2 (I"
1 ...... -... . f' t' (I" 244
~i 01 125 (I" 1 s:.';~ I)", 1 19 (1,& 1 ,-,.-, ,::.c: ~I .. O:~:7 (Ja\ ~) 1 ~i 9 .. (!77 (I" ~)I;;:~~
~1 " 172 0 .. -."""';1 .. -. c:.. f .~#
o. 1 -,.-, t .,:.. (I .. 24fl o. 152 (101 2~1 (I" 1 OS ~i '" 174 (I. 094 (I"
'let::" J. .~I.~I
0" 1 1'-' :::. ~I " 1 ~:.3t 0 .. 1 01 (I", 12~~ o. lE.O (I. 2:~:~
~I " 1 05 (I of 135 t! " 09:3 0 .. 142 (I" l~t:!: (!" :!:~,4
~I" 127 0" 2:31 (ld 1 1 (i o. If.4 ~I .. 1 .i (! -t ~_, 0 .. 195 (/" 19::: 0 .. c~E,2 ~) " 1 :~::? (/" 221 (i ~ 21 If, ~i " E~~~7
~J Ii (I:~:7 0", (145 0 .. 121 fl .. 1;~;2 0 .. ~Y::4 ~I ... 1-' .1 .l. L..
0 .. 1 iJ3 0 .. of -1.-1
.L t-:' .::'
~) d 054 (\ .. ~144 o. l?-t.( 0. l 77
r2 Statistic Flow-through Utilities Vs. Low Barrier Group (11 All Return Measures Simultaneously (2) Return Measure 3 & 4
T Statistic Return Measure 3 Statistic Risk Measure Significant at .01 Level J
* Significant at .05 Level
111-44
4 i~) 01 171" (I", 244-(I,. 2~J7
~I " .. !-t--. J. I::' (!:~ ~
\')" ~) 1 ~}
(I" ~)95' 0 .. -,-:- .i-
.:!:.r''"1'
~I .. 24~1-
0 .. 252 0 .. 1-:0-'
J. t "
0 .. 171 (i .. 142 o. 1 .-,.-,
c:.~ ..
001 251-(I" 1:~:7
(I" 147-(I" :370 0:6 2:31 (I d 1 E.'? (t .. 21 ~ ~ ~) " 291 0 .. &-".-:J~ a::.c:.3"
(/. :~:12
(i" (i4E:. 0 .. l:~:E,.
(! ..; 1 14 0 .. 12·~· 0 .. 1·)44-
D.rb-f
76.241i 8.125* 6.152*
10.529"
RT';-"''-: '. J. • .!:. r •.. ,
(I A f~.1 :;:': ~J .- 7:~:t~.
o. 70:~: (I. 7::::4
0" z=:-:-.-• .,;.1 t t::.
(I. 7t~:~:
(I .. 9§:~;i
(I .. 7:~:5
(I .. 94:::: 1 " ~~f1':~:1 0 .. 5~,1: o. ::!'!:~:O:
0.83:1 (1.51 r-(I .. E.~~:~.~
(I. 47:~:
o. E·(l::::·
0" 717 I
(1" .. - ..... -" . .:..~ .,:..:
0 .. ~31 -:o! f
O .. 3:34 i
.- t::".- ·-.1 ;OJ oJ • ..:.11:: • .::. :
(14 ,-... 1 ..;: ,::,,-;-1.
0 .. :~:71 (I .. :=::=:'~
(I" 74(1 (I .. 744 o. 912;
O!_7i7._:
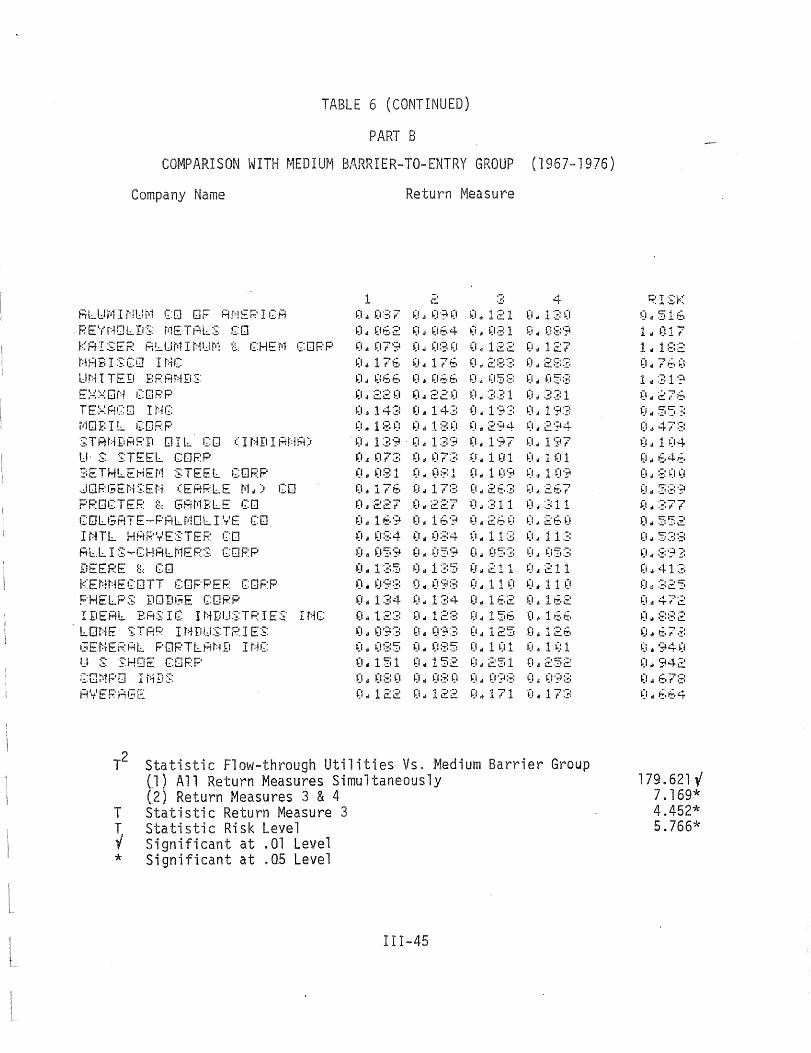
TABLE 6 (CONTINUED)
PART B
COMPARISON WITH MEDIUM BARRIER-TO-ENTRY GROUP (1967-1976)
Company Name
ALI.:J111 It:11.J1'1 I~:D OF Rt!!~F.' I eFt . REYNOlDS METALS CO KRISER A~UMINUM t CHEM CORP t:·tHti I :~:CD I t:-lC UN 1 TED f:f:;;:~;,:iII:~:
E::.::::'::0 t:-/ C:OF.'p TE::.;:ACO I r:'lc lliOE: I h. C:OFP STAN1APP OIL CO (INDIPN~) 1.:.1, S: ::;:TEEl CDPP 3ETHLEHEM STEEL CORP JORGENSEN (EARLE MJ) CO PROCTER t GAMBLE CO COLGRTE-PALMOlIVE CO IMTl HARVESTER CD Ab.lIS~CHAlMERS CORP I)EERE 8.; CD KEt:+t:iECOTT CO~'PEF.: I~:OF.:P
PHELPS DODGE CORP IDEAL BASIC INDUSTRIES INC lonE ':;:TH~' I t:1rIU:~:TP I E:~: GENERAL PORTLAND INC 1.;.1 :S: S:HO~ CORP CC~11PO I 1:1.D:~: A',/EF.'H(;E
1 o d O:~:?
(I. (I~,2
o. ~17·? ~I D 17€, (I d ~I~.~.
~I d 220 (1 111 14:!:
Return Measure
~! d ~l9 (I
~!" ~)f.4
(I d (1:;:: (I
(I" 1 7£ (! of 06:.~.
001220 (i 01 14.~:
:!: 4 (I.. 1 2 1 ~) d 1 :~: ~I (i" o;::~ 1 ~i ~ O:!:9 ~I ~ 1 22 (I m 1 27
(! d ~!:; :=: ~)" (15 ;~:
(I,; :!! .!; 1 0 i :!::3 1 (I ~ 1 9:: (I 4 1 q :-;~
0,,180 001180 0,,294 0.294 Od139 OA139 0.197 Dd1?7 D4073 OJ073 OdlDl 0~lg1 (I" ~) ::: 1 (I 01 (I ;~: 1 D of 1 (19 (I d 1 (19 Dd176 0.178 Dd2S3 0,,267 0.227 0~227 D~311 0d311 Ddl~q Odl~9 0.260 O~260 001084 0,,084 9~113 Od113 0,,059 0~059 Oj053 001053 0.135 O"l~~ O~211 0,,211 (I 01 (19 !;:: 0" (19::; (1.1 1 1 (I (I d 11 (!
0~134 Od134 0,,162 0~162
Od123 Od128 Od156 0.166 OdD93 0.093 Od125 Dd12S (I D (I B 5 (I" (l ::i:: 5 (I.. 1 (I 1 (1" 1 (: 1 0 .. 151 0,,152 D~251 0~252
0.080 0~080 0~O?8 O~098 Dd122 04122 001171 0.173
T2 Statistic Flow-through Utilities Vs. Medium Barrier Group (J) All Return Measures Simultaneously (2) Return Measures 3 & 4
T Statistic Return Measure 3 Statistic Risk Level Significant at .01 Level i
* Significant at .05 Level
11I-45
~~'I ::;:K ~I" 51f . 1 Ii 017
0. 27~. (1.55':: (I,. 47:~:
001 1 (14
~l. f.4~,
(I" :~:~) (I
o d 3:=:9 ~1 .. :~:77
1-)01552 0 .. 53:3 0" :!~9!: 001 41:3
0 .. 67;~: ~J. 94 (I ~I .. 942 0 .. f.7B 0 .. ~,tf.4
179.621 V 7. 169·* 4.452* 5.766*

TABLE 6 (CONTINUED)
PART C
COMPARISON WITH HIGH BARRIER-TO-ENTRY GROUP {1967-1976)
Company Name Return Measure
1 . -. .-. 4 c:. .!I
I=~ E r:1 E F' H l t11!J TOP :~: CDPr;:' (I. 197 ~I .. 2~1j.) (1.1279 (I .. 2:!:~,
FORII 1'1DT [J F.~ CD o. 1 1 1 0 .. 1 i .-. .~I (I of iE.S (I" 17~1
CHF''l:~:lEP COFF' (I .. OE.4 001 Of.E. 0 .. ~197 (I" 1 00 ld~t I I:;LE\' (hi I II I At,1) . .:.IP CO (I .. ;Z:40 (I .. 242 (I. 2'~:~: o. 3~12 PE\'r:fDLII:~: (~' " -.:.I .. ) I t:il)::; (I .. •· .. tC"'·-r
~ . .;,.l.!l (I .. 2~;!3 (I d :~!f,:!~ (I t! .-,-:r.-, • .::, of .::'71
H:;1t!:R I C:At:~ 1:: P H t:t ~) :~: I t:i;~: (I" 1 ~5::: (I" 1 :iB ~I " 270 (I .. 272 l I I:;!:;ETT ':;PDIJP (I .. 1 :; .. ~ ~I 01 12'? (I .. 191 (101 1'?1 PhillIP t110F.'P I :s: I r:4C (I" 1~.~ (I" 172 (I" :~:3(1 (I .. :~:5,?
r:~EPI~:I< g.: CO (I" ::!:4'? j.) " :!:5!~: 0" 4-;'·' fL:. 0 .. 492 F'~ IZEP I t:1C (I" 1 E.'? 0 .. 174 Ot!2S(1 0 .. 2 Ii· 4 :~:CHEF.' I r:H; .... r;'lOUI::;H (1,,320 ~) .. .-,.-.. -. • .!':a • .!,c=. 0 .. 433 ~) " 45f. A}!:F:OTT lABOPATOP I ES: (I" 1f.:!: O. If,S (I. 242 (I"
.-.... ""7 L!:.."Tf
:~: E A ,:; F.: FHI1 CO l TIl 0 .. 1 (11 ~I 01 1 ~)2 (I .. 1:~:4 (I" 1:~:5 nhiT IOr:iAl II I :~:T} lLEf::~:S t·:CHEt'1 I CL I) .. 1 1 7 0 .. 1 19 (I" 1 :~: 1 ~i " 187 J.
bJRi.:..t<ER (H I S;'Hi+1) I;OOIIF.:H,li .:s ,~~: lrJOF.:T ~loI 1 :~:7 ~! .. 1 :~:t;' (I" 24(1 0 .. 242
T E ::":A :~: I:;U l F INC 0 .. 1 tf,!:: o. 1 E.:;:: (j" .-.. -.C'" c:.c:. .. ;) (l" 225
::;~'EEP[JPT 111 I NEPRI.:. :~: CD 0 .. l:~:O o. 1 :!:O (I .. 147 0 .. 147 PF'I:; I t;1DIJ:~:T~: IE::;: INC 0 .. 1 07 (I. 1 12 (I" 14:~: (I" 154 LIEBEY-OWENS-FOPD CO o. 133 (I .. "I ,-,-;'
.L I!' f (I d 31 (I (1.329-;~ l./ E F.' i:;; I-;E 0 .. 174 ~).. 17:=: (! of 251 o. 2r::.1)
T2 Statistic Flow-through Utilities Vs. High Barrier Group (ll All Return Measures Simultaneously (2) Return Measures 3 & 4
T Statistic Return Measure 3 T Statistic Risk Level ~ Significant at .01 Level
I1I-46
RI::;:~::
(i .. E·l'? 0 .. t::' -:> .-
.:.' f '=' 1 d :31 ~. o. 475 (101 4~,: ... :
(I" 516 (i d 61 ~~: (101
-,,,,,,,:,,.-, .:. t .!1
0 .. 2E,4 0 .. 21 1 Ot!274 o. 5'?~i 0 .. 5~.5 0 .. f.54 Ot! 341 (I. E·';'5 (I t! 4,::.5 (/. 7~) 1 0 .. :=: 1 E. 0 ... 549
94.987Y 38.675Y 35.721v' 0.467

The rates of return on common sha cantly. However, a gni cant measures are analyzed at the same rates than the
on ated low
assets
ders! assets not differ signifi-fference occurs when all four profitability
me, thereby implying that flow-through on total productive assets are less
return. 50
Alternatively, if .05 is the Ii ficance level, the rates of return for flow-through utili es are significantly lower in each statistical comparison. Flow-through companies~ common shareholders are unable to achieve the same rate of return on their ownership claims as that earned by the residual equity holders of low barrier-to-entry firms. Since the comparison of normalized utilities with the low barrier-to-entry group does not permit such a statement (at any level of significance), flow-through accounting, with its stricter definition of recoverable income taxes, results in lower rates of return than does normalization. 51
e. Flow-Through Utilities and Medium Barrier-to-Entry Companies Part B of Table 6 reports the results of this comparison. They are
identical to those obtained when flow-through firms are compared with the low barrier-to-entry groupo The T2 statistic from testing null hypothesis one is significant at the .01 level. Null hypotheses two and three are also rejected but only at the .05 level. Thus, the entire discussion of the preceding comparison could be repeated here.
f. flow-Through Utilities and High Barrier-to-Entry Companies Part C of Table 6 contains the detailed results of this comparison.
The test statistics for ail three null hypotheses are significant at the .01 level. In accord with the results of the earlier comparison i.nvolving the normalized utilities, the bigh barrier-to-entry group is able to achieve rates of return which significantly exceed those earned by the flow-through companies.
lII-47
F. Summary All profitability measures analyzed in this study are rates of return
on assets. To promote comparability, reported after-tax net income ;s subjected to a few adjustments in deriving the four rate of return series. Adding back interest charges makes the rates of return on total assets and on total productive assets more congruent with regulatory practice. Adding back reported income taxes incorporates the differences between flow-through and normalized utilities. Removing the allowance for funds used during construction and construction work in progress permi.ts the computation of rates of return on common shareholders' productive assets and on total productive assets, this study's closest approximation to the utility concept of rate of return on rate base. A residual claims/liquidation settlement approach forms the basis for determining rates of return on common shareholders' assets.
Whether or not utilities are able to earn above normal profits is assessed through rate of return comparisons with nonregulated companies. Oligopolistic in nature and leaders in their respective industries, the nonregulated companies are partitioned into three categories according to relative difficulty of entry, a surrogate for profit levels ranging from nearly monopolistic (the high barrier-to-entry grouPL to almost competitive (the set of low barrier-to-entry firms}. The sample of nonregulated businesses is selected so as to coincide as closely as possible with companies analyzed in previous industrial concentration/barrier-toentry research. Electric utilities with financial data available on the Utility COMPUSTAT tape form the sample of regulated firms. Average annual rates of return for the ten-year period 1967-76 constitute the data for the statistical comparisons.
Table 7 summarizes the results from testing a series of hypotheses which point toward four conclusions. First, there is no statistical evidence that utilities achieve the IImonopolistic" rates of return·of the high barrier-to-entry companies. Regulation removes the opportunity for monopoly profits. Second, utility rates of return on total assets
11I-48

!--j
1--1
1--1
TABLE 7
sur,1~1ARY OF TESTS PERFORr1ED IN SECTION I I I
Groups Compared
ow-
lized Electric Utilities Vs. High Barrier- Entry Companies
'*
i Electric lities Medium Barrier-to-Entry Companies
ized E1 c Utilities Vs. Low Barrier-to-Entry Companies
Electric Utilities Vs. High Barrier-to-Entry Companies
ectric Utilities Vs. Med;,um Barrier-to-Entry Companies
E1 c lities Vs. Low Barrier-to-Entry Companies
fference significant at .01 level difference significant at .05 level
u, Vs U2
.V
I difference is not statistically significant at either .01 or .05 level
Hypothesis
y
I
I
*
'*
p Vs p 2
I
I
*

and on total productive assets are significantly lower than corresponding measures for the low barrier-to-entry group. This conclusion implies that regulation permi.ts something close to a competitive rate of return on total productive assets (j .e., II rate base"}. Third, at least for the normalized utilities (and, if the .05 significance level is unsatisfactory, for the flow-through utilities as well), rates of return on common shareholders· assets do not differ significantly from corresponding measures for both the low barrier and the medium barrier companies. One explanation for this result has already been offered. Uti.lities obtain higher than competitive earnings for their owners through financial leverage. 52 On the other hand, comparable levels of investor risk may explai.n the similarity between utility and nonutili.ty rates of return on common shareholders' assets. This i.s examined in the next section. Finally, at the .05 significance level, flow-through utilities have lower rates of return on common stockholders' assets than do the medium barrier and the low barrier firms.
IV. RELAXING THE ASSUMPTIONS A. Risk and Rates of Return
The preceding rate of return comparisons between regulated and nonregulated businesses are based on the assumption that no difference exists between the levels of risk borne by each group's owners. However, as di.scussed previously,53 regulation may consider relative risk in the ratemaking process. In accord with the postulated relationshi.p between risk and return, relative risk levels should be cOlllTlensurate with anticipated profi.ts. Rates of return on common shareh.olders I assets are the most appropriate profitahility measures to contrast with the market-based estimates of investor risk used in th.i.s analysis. If regulation does incorporate risk, the lack of a significant difference between rates of return on common shareholders' assets for all uti.lities Cor, with the .05 significance level, just for the normalized utilitiesl and for two of the three sets of nonregulated companies (i.e., low barrier and' medium barrier firms} means that no significant investor risk level differences exist among these groups. If the ~"esul ts of an empirical
III-50
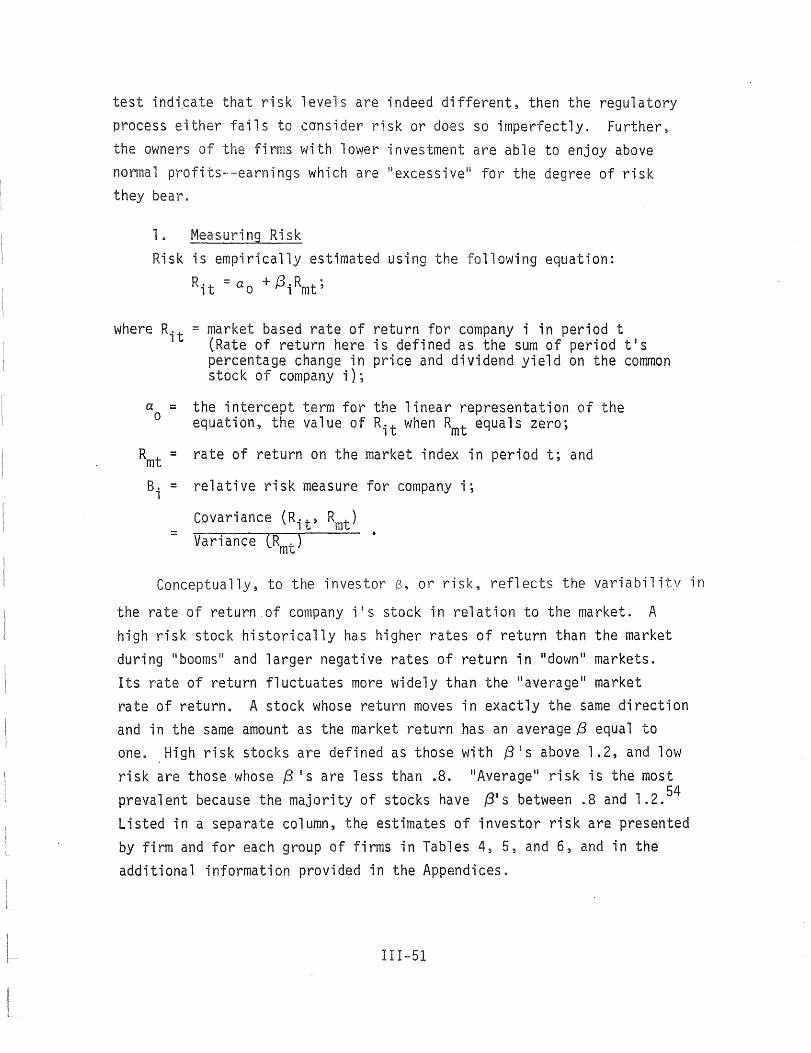
test indi~ate that risk levels are indeed different, then the regulatory process either fails to consider risk or does so imperfectly. Further, the owners of the firms with lower investment are able to enjoy above normal profits--earnings which are iiexcessivell for the degree of risk they bear.
1. Measuring Risk Risk is empirically estimated using the lowing equation:
R it:::: a 0 + /3 i Rmt ;
where Rit :::: market based rate of return for company i in period t (Rate of return here is defined as the sum of period tIs percentage change in price and dividend yield on the common stock of company i);
a 0
Rmt B.
1
::::
::::
::::
::::
the intercept term for the linear representation of the equation, the value of Rit when Rmt equals zero;
rate of return on the market index in period t; and
relative risk measure for company i;
Covariance (Rit , Rmt ) Variance (Rmt )
Conceptually, to the investor B, or risk, reflects the variability in
the rate of return of company iiS stock in relation to the market. A high risk stock historically has higher rates of return than the market during IIboomsll and larger negative rates of return in IIdown ll markets. Its rate of return fluctuates more widely than the "average ll market rate of returnc A stock whose return moves in exactly the same direction and in the same amount as the market return has an average 8 equal to one. High risk stocks are defined as those with 8 I S above 1.2, and low risk are those whose /3 IS are less than .8. "Average" risk is the most prevalent because the majority of stocks have ~IS between .8 and '.2. 54
Listed in a separate column, the estimates of investor risk are presented by firm and for each group of firms in Tables 4, 5, and 6, and in the additional information provided in the Appendices.
III-51

2. Comparing Risk Levels To determine the relationships between levels of investor risk for
the five groups of companies analyzed in this study, a fourth set of hypotheses is tested for each of the comparisons performed in the preceding section:
Ho: /31= /32; and
where ~l = average investor risk estimated by the market model attributable to one of the five sets of companies; and
/32 = average investor risk estimated by the market model attributable to a second set of companies.
Since the hypotheses involve a comparison of only one datum for each of the two groups of firms, the Student's T test is appropriate. Table 8 summarizes the test results, which, in terms of significant statistics, are completely converse to those obtained when rates of return on common shareholders' assets are similarly analyzed. When compared to the high barrier to entry group, utilities have no significant risk differences. However, their risk levels are significantly lower than those for the other two sets of nonregulated companies. With the flow-through utilities the .05 significance level must again be employed--this time in only one instance--to derive these resultso
TABLE 8
STUDENT T STATISTICS FOR RISK COMPARISONS
Groups Compared Normalized Utilities and Flow-Through Utilities Normalized Utilities and Low Barrier-to-Entry Companies Normalized Utilities and Medium Barrier-to-Entry Companies Normalized Utilities and High Barrier-to-Entry Companies Flow Through Utilities and Low Barrier-to-Entry Companies Flow Through Utilities and Medium Barrier-to-Entry Companies Flow Through Utilities and High Barrier-to-Entry Companies
V Significant at the .01 level * Significant at the .05 level
III-52
T Statistic 1 .351
33. 523 ~ 19.919 ., 3.536
lO.529.Y 5.766 * 0.467

3. Using Risk as an Explanation of the Results of the Rate of Return Comparisons
When the risk level and the !ate of return comparisons are considered together, their combined results are consistent with the riskreturn relationship in one case and inconsistent with it in two others. The situations where the conceptual onship between risk and return is violated offer evidence that the latory process does not lIappropriately" incorporate risk into rate-setting.
First, the comparisons between utilities and high barrier-to-entry companies provide results for the regulated firms in accord with the riskreturn relationship. Even though risk levels do not differ Ci.e., the risk associated with investment in utility stock is not significantly different from that existing for equity ovmership in the most "monapo1 istic" firms analyzed in this report), rates of return on common shareholders l assets are significantly lower for the regulated companies than for the high barrier to entry group. Thus, regulation prevents monopoly profits by keeping rates of return more in line with the low levels of risk borne by utility investors. 55
But the absence of monopoly rates of return does not ensure competitive or normal profits. The comparisons between normalized utilities lor, at the .01 significance level, all utilitiesl and the medium and low barrier-to-entry firms illustrate a situation which is not consistent with the risk-return relationship. Although investor risk for the utilities is significantly lower, the rates of return on common stockholders' assets are not significantly different. Thus, with regard to risk, regulation does not go far enough. For the level of risk borne by their owners, regulated businesses are able to earn "above normal ll rates of return on shareholders I assets.
The second violation of the risk-return relationship arises solely within the utility sector. The two groups of regulated firms are analyzed separately because, per the first set of stati ica1 tests, flow-through
III-53

rates of return are significantly lower than normalized profitability measures. But this result cannot be justified on risk grounds since there is no significant difference in investor risk between the two sets of utility companies.
B.. ~11ARGINAL COST PRICING
None of the statistical evidence supports the existence of a marginal cost pricing policy in the regulated sector. With costs increasing throughout this study's ten-year period, pricing based on marginal cost would likely result in relatively high utility profit levels. The high rates of return on total assets and especially on total productive assets associated with such earnings are not reflected in the data. Regulation places its primary emphasis on preventing monopoly profits through average cost pricing. Besides adding new dimensions to the regulatory process, the advent of marginal .cost pricing would probably cause substantial changes in the pre-tax rate of return relationships between regulated and nonregulated firms.
c. Rate Base Inflation As mentioned earlier,56 rate base inflation is unobservable with
the rates of return computed in this study. If it exists due to regulator unwillingness to permit an increase in the utility·s allowable rate of return, profitability measures for shareholders' productive assets are either overstated (if the rate base increase is financed through additional borrowing} or understated lif no increase in borrowing occurs, as when a cost-of-service expenditure ;s capitalizedL. If it is truly a substitute for successfully securing a higher allowable rate of return, rate base inflation understates profitability measures on total productive assets. To assess rate base inflation, research must focus directly on the rate base, not on rates of return.
Reliance must be placed on the regulatory authority for the prevention of rate base inflation. However, the political nature of the rate-making process raises questions concerning the wisdom of such
III-54

reliance. The fact that a utility can augment its total profits by increasing either its allowabJe rate of return or its rate base is obvious but by no means trivial. The self-interest of both the utility and its regulator may best be served by higher aggregate earnings through rate base increases. Neither side in the regulatory process has much motivation for attempting to raise the Ii IS allowable rate of return. Increasing the base is much easier, less observable and consequently less susceptible to puhlic criticism. Of course, even if
tacitly approved by the regulator, rate base inflation creates distortions in utility rate of return data, thereby weakening the validity of this report's statistical comparisons.
D. S'ummary A 1 though investor ri.s k may be a factor in the determi na t i on of a
utility1s allowable rate of return, regulation does not force profitability measures on common shareholders' assets to be commensurate with the low risk levels borne by the utility1s owners. Monopoly profits are prevented but above normal profits (i.e., rates of return equivalent to those attainable in the nonregulated sector only by accepting a higher degree of risk) do exist. Large amounts of financial leverage (made possible at least in part hy the absence of substantial amounts of risk} permit util ities to ach.ieve such profit level s for their stockholders.
The rate of return data in this study offer no discernable evidence that utilities practice marginal cost pricing.
Research is needed to identify and measure rate base inflation. The effects of this tactic to increase total profits, if it does exist, are impounded in the utility rate of return data. Thus, regardless of whether or not it receives regulator approval, a substantial amount of rate base inflation would likely alter some of this study's conclusions.
III-55

v. RATES OF RETURN BY REGULATORY JURISDICTION
A. Comparisons Solely Within the Regulated Sector Using the utility profitability measures already discussed as well
/ /
,I
as those for another group. of regulated companies (the airline industry), this section attempts to discern the impact of differing regulatory practices on rates of return. One such comparison (i .. e., IINormal ized ll
states and IIFlow-Throughll states).has already been performed. A further breakdown of utilities into a state-ny-state grouping is also presented. Even though state sovereignty'prevails, tbese types of analyses may be useful to federal officials seeking. some degree of national uniformity in the regulatory process. In addltion, a state commission is able to determine IIwhere it stands" in relation to its counterparts throughout the country. Finally, the utlllties are compared with a sample of firms from the airline industry. Here the analysis crosses not only jurisdictional boundaries but also level.s of government and market structures (since the federally regulated airlines operate in a much more competitive environment than the p~blic utilities). In all cases, rates of return are determined in exactly the same manner as described in Section II'I.
1. "Normalized" States and "Flow-Tbrough ll States The numerical results of this comparison are found elsewhere in
this report. 57 Although risk levels are not significantly different, rates of return for normalized companies are higher than those for flowthrough utilities. Thus, regulation in flow-through states generally is "stricter" than that existing in normalized jurisdictions.
2. State-by~State
Appendix 5 arrays the sample of electric uti.l ities on a state-bystate basis. Companies suDject to regulation in more than one state are listed at the end of the appendix. In many cases a state is represented by only one utility. Thus, the data are provided strictly for information purposes. An expanded sample of regulated businesses is needed to perform any stati.stical comparisons by state.
III-56

3. Electric Utilities and Airlines Tables 9 and 10 present the comparisons between airlines and normalized
utilities and flo'N-through utilities respectively. The results of the two sets of statistical tests are similar. The utilities have Significantly lower risk levels and significantly higher (at the .01 level) rates of return.
At least two explanations exist for the relatively low profitability measures and the high amounts of investor risk existing in the airline industry. First, the federal government may be a much more stringent regulator than the state commissions. Second, intense competition, rather than federal regulation, may cause the airlines' financial results. Regardless of which explanation is IIcorrect," the statistical comparisons offer additional evidence for two of the previous conclusions. Utilities are able to achieve profit levels which are both higher than those in more competitive industries and "excessive!' for the level of risk borne by their owners.
B. Summary The comparisons discussed in this section illustrate three ways in
which the rate of return data for regulated businesses can be analyzed. As demonstrated previously, utilities fare better in normalized states than in flow-through jurisdictions. Electric companies also compare very favorably with airlines, thereby offering further support for the conclusion that utility regulation by the state commissions does not result in perfectly competitive profit levels. Additional statistical comparisons of utility rates of return by state are not performed in this study because of data limitations. Instead, a state-by-state grouping of profitability measures is presented for information purposes.
III-57
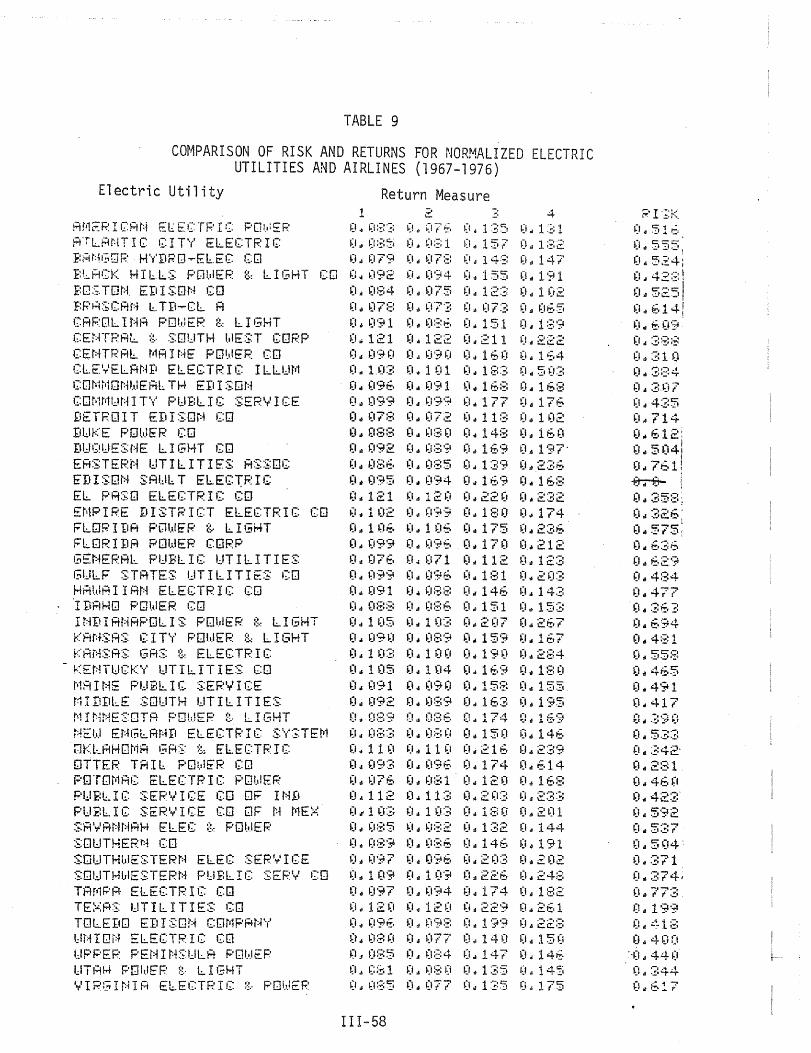
TABLE 9
COMPARISON OF RISK AND RETURNS FOR NORMALIZED ELECTRIC UTILITIES AND AIRLINES (1967-1976)
Electric Utility
Ai'ir:F.~ I 1~:Hi:·i El.:: EC TP I C j:'OI.I::::P ATL~H:1T I G.' C I T\' ELECTP I G: B~NGORHYDRO-ElEC CD f:LFtCK HI I.:..L:S: PDI.sIEF.: g: L II:;HT CO PO~TO~ EDISON CO BP~SCAN ~TD-CL A CAROLINA POWER & LIGHT CEnTF.~Rl:.. ::~.: S:O!.JTH l.tlE::;:T G:ORP CEHTRAL MAINE POWER CD CLEVELANP ELECTRIC ILLUM CO~MONWEAlTH EDISON COMMUNITY PYBLIC SERYICE 9ETROIT EDISD~ CO III.:.II<"E PlJb.lER CO DUQUESNE LIGHT CO EASTERN ~TILITIES ASSDC EDISON SAULT ELECrRIG EL PRSO ELECTRIC CD EMPIRE DISTRICT ELECTRIC CD FLQPIDA PQWER & LIG~T FLORIDA POWER CORP G~NERAl PUBLIC UTILITIE~ GULF STATES UTILITIES CD H~WAIIAN ELECTRIC CD I :DRHQ r;'[JI.t.lER CD It:~I! I At:iRPDL I S PrJhIEF.· g.: L I ,:;HT KAMSAS CITY POWER & LIGHT KA~SAS GAS & ELECTRIC
-KENTUCKY UTILITIES CO MAINE PUBLIG SERYICE MIDDLE SOUTH UTIlITIES Mr~NESOT~ POW~P t LIGHT NEW ~NG~RND ELECTRIC SYSTEM DKlRHQM~ GA? & E~ECTRIC lJTTEF.~ TFt I l PO!"IE"P (lJ PQTlJi,1RG: ELECTP I C POb!ER P~B~IG: SERVICE GO OF IND P~£lI( SERYICE CO OF N MEX SRVRNNAH E~EC ~ POWER SOI.:JTHEF.:t:-i CD SOUTHWESTERN ELEC SERYICE ::;:[]I.JTHI.,IESTERt:i PUf:l! G: :~:ERt,,·' I~:O
TAMPR EL~CTRIG CO TEXAS UTILITIES CO TOLEDO EDI~ON COMPANY !:IN I 01:1 ELEG:TR I C CO UPPER PENINSULA POWER UTHt-.4 PDhlE"R g. I.:... I !~HT YIRGINIA ElECTRIC ~ POWER
Return Measure 1
~I ~ ~1:~:·3
~I aI ~l ::! ::i (I" ~179
(l ~ (lg4 ~III ~17:::
0 .. (191 0 .. 121
-, .::.
~! d t!7~,
0,. O:~: 1 0" 07::: ~i.t (i'~4
~I. 075 011 O?·!! ~I" oe~,
(I .. 122 (I d ~) 91-) (I d ~i 9 ~I (1,,1(13 0 .. 1(11 (I .. 09f. 0 .. ~)91 0 .. (199 (I" 09'~
(I" ~178 ~I" ~)72 (I" (1:38 (I .. ~):!; (I
0" (192 ;:)" (1:~:9
(I II ~Igf. 0" (1:::::5 0" (195 (I,,~) 9 4 (/" 121 0 .. 12~) ~I .. 1 (12 (I. I) '? 9 (I" 1 (If. ~)" 1 (IS (I" 099 (I" O·?~.
0>1 07f. 0.1 071 0. 099 ~l. O'~6 0. 091 (10\ (I:::B
-.::. 4-(! d 1 :!;:I ~) d 1 :i:: 1 (I .a 1 51 (I 01 1 ::: 2 (I 01 1 4 ::: ~! d 1 4 7 (I.. 1 55 (I.. 1 '? 1 (I 01 1 2 :::: 0 01 1 ~) 2 (1.1 (17:3 ~! 01 Of.S (III 1 5 1 (I" 1 ::: 9 (t ~ 2 11 (I " 222 0 .. 16(1 0.1':':.4 ~I.. 1 ::: 3 ~J .. 5 ~(~: (101 1 f.:~: (I .. 16:3 ~I" 1 7 7 (I" 1 7 IS ~)" 1 1 ::!; ~) II 1 (12 (I.. 1 4:::: (I.; 1 E. (I (I" 1 E,9 (I " I'??'
~)" 1~: (I ~J" 1 74 0 .. 175 0" 2~:6 (I" 170 (I" 212 (101 112 J.)" 12:~: (1;1 1:;::1 (I" 2(13 ~) .. 146 (Iii 14:~:
0 .. 088 0 .. 086 0>1151 (1.153 0 .. 105 0 .. 1(13 0,,207 001267 (I.09D 01089 (1,,159 (1,,1&7 0 .. 103 0>1100 0.190 0>1284 0 .. 105 0.104 0 .. 169 0 .. 180 0.091 0~090 0 .. 158 (1.155 0.092 0.089 0 .. 163 001195 0.089 0 .. 086 0,,174 0 .. 169 0.083 0,,080 0.150 0.146 Od110 0.110 0>1216 0.239 0.093 0 .. 096 0.174 0.614 0 .. 076 0,,081 0.120 0.168 0.112 0,,113 001203 0,,233 0.103 0 .. 103 0.180 0,,201 0,,085 0,,082 0.132 0.144 0.089 0,,086 0,,146 0.191 0 .. 097 0d096 0~203 0 .. 202 0.109 0~10? 0.226 O~24g 0~(l97 0.094 0.174 0.,182 0.120 Od120 O~229 0,,261 0~096 0~~98 0.19Q 0.228 0.090 0.077 0~140 0.150 0.085 0~084 0.147 D.14G O~C81 0.080 0.135 g~145 0.085 O~077 OJ1~~ Od175
III-58
;:,:' I ';:i< ~I .. 51 e, O.555! ~I. 524: 0" 42:i:! 0,,5251 (I"tf.14/ 0" tr. ~i'?
~)" :~:2E< (I. 575~ 0 .. f·:36 0" E·2'~ (I" 4:=:4 0.477
O"E·94 (I" 4:::: 1
(I" 4f.5 0.491 0,,417
(1,,342' 001 2:=:1 0" 4f.~1 0" 42:~:' (111592 (1.5::::7 (I .. 5(14:
0 .. :371 0.374, 0 .. 77:3. 0.199
(I" 4 (H)
:{Id 440 0 .. :~:44 O .. S!7

TABLE 9 (CONTINUED)
Electric Utility
~ALTIMORE GAS & ELECTRIC CENTRAL ILLINOIS LIGHT ~EMTRRL ILL PUBLIC SERVICE (ONSUMERS POWER CO ~ITCHBUPG GAS & ELEC LIGHT I L~. I riO I ::;: POI,.lE"F.' CO I riTEF;-::;:TATE ~'DhIEF.' co T 01.118 EL ECTR I ell I~HT t· PblF' I Old A..,.. T Ll I r:~c I :~: I~H:~: t: E:LEC
IOi.dH PI.:J:£:L I C :~:Ef:::\·' I CE CO I O!..IH :~:01.JTHEpr;4 I.:JT I LIT I E:~: CO KANSAS ?OWER ~ LIGHT LRVE :~:I.:.IPEF.' I OF.' III :S:T POI.tIER CO LOUISVILLE GA& & ELECTRIC M~~ISO~ GAS & ELECTRIC CO MTSSOU~I ~UBLIC SERVICE CO
~'~'~ 1;':'': >·;J.E;:: ;::1 ':; T M ;- ~;: F 0,' • .1 r:~'
r:: ::~ .:: .. ;- : . .,.: ii' ~,~ T E;:';' H s: I j F LIe ::;E ~d'r; CO PH:LA0~LPHIA ELECTRIC co ~0~~I( SERVICE ~~ QF COLO .:,;_: ~:,~ I C ·~:~~'I ... I I G'E EL EC t: ,:;t;:;: ~:r .JJ:~·EF'H 1.:..: (;HT ::;.: PDt.:iE~·
.,:. I ~Fr.;·H PHI:: I t;" I C PlJblER CO :~~G.lu :'H CAF.'OL I riM ElEe :~.: I!iA:~:
?OUTYERN INDIANA GAS ~ ELEC ;,\ I SCOt:1::;~ In El.ECTF' I C POI,liEF.' h: I :~:(;::O!:f~: I n ~'[Jbif~' :<. L. I fid·4T i.11 I :~:G:O(:~:~: I t:.; P;.~If.;L.I C SEF'V I CE
Return Measure
0~Q96 0~g9d 0 .. 175 O.3S8 0.0?5 0~094 0.165 O~201 0.101 0~lQ0 0.189 0.203 ~I III (1::::5 ~L ~i:31 (I d 1~: 7 (I of 1 :~:b (I I (I :~;:3 (I 01 ~l :~: 2 ~)" 1 1 9 (I ~ 1 1 7 0.108 0~10G 0.205 0.209 0,,089 0.099 0,,190 0 .. 239 0,,084 Q~D78 OJ140 0,,118 0.100 0~094 0.180 O,,169 0 .. 092 0,,092 0.177 0.191 9~098 0,,095 0 .. 175 0~178 0,,118 0.118 Od2D~ 0.217 0,,108 0.107 0~lS7 001192 0,,085 Od086 Odl~~ 0.160 0.120 0 .. 125 0 .. 216 0 .. 244 0.088 0.086 0.141 0.207 o 01 09 (I (I.. (I :~:~. (I ~ 1:::: 7 0 d 1 7 1 (I" 11 1 O.t 1 1 1 £I" 1 7 9 (I" 1 :=: 4 ~I. (187 ~).t 1 (16
0 .. (I'~-:::
(I" ~):=:~!
(I" ~):~; (I
~I" ~l?'? (i 01 ~)9~;
~I. ~17·?l
(i" (I :~: :=: 0.120 001 1 (H)
(I. 1 (L::: 0. 1 Of.
III-59
~I" OSI:) 1-:J. 1 (15
(I" (I:::? ~I .. ~1,?3
(I d ~):~: 1 (I .. (ll7 ~J of ~1?5
(i .. (l'j!4
(I" (I ;~: '£i (I. 11? 0.099 (I. 1 (Ii?'
~ 1 (15
(I d 14E· (I" 2 ~L!: ~l 01 1.=:'::: (I d. 1 ~. 'i' (I .. 1 :~:5 (1,,142 (! 4 12~i
(I" 1 "f'? ~I d 12 (I (I d 145
(! ~ 1 ::: ~i ~J .. 146 (I II 1 :!~f. ~I .. U~:7
001 l1f· (I ~ 1 ;:.3 ~i.l 215
~: d 42 ~i ~Iol 4:~:7
(101 5i!.7 (I" 711 0" :3:::;:7 (I" 497 ~)" 4~:~.
(I d 713 (1:1 7:~:4
0" :!:04 (1.571 (I II 2:=:1 O~315 o. 4:~:~. ~I .. :3'; 7 o. €.~: 1 (I d ::! 11 0.529
~) .. 4-?7 (I" :~:'92
o. 43;::
(I" 4-t"5 0.140 (I" 41 '? (1.1 291

,A L88' 09l f L9S· LZ f 88l • l£ f [S17· £17l
fiJi r t :~:2t- II l .t.. T '3 f' (;
':;:"-:-"':' , T .-"-~'-. .. 0~6·6
L6~~t
Oge"I 69t P t lfl"! SG~·l ~6fFl
£;:~:6 P!)
:::2::: I' (1
ell"l 0121't ~!~-!
l661'O ~2~PG
L!~~~ .. t '32,: .. (1
"t1~l'l
66~"! '3l2"1 '36 r 4'l t-'~~ I' l ){S I;:j
09-111
laAal lO' a4+ +e +ueJ~J~uB~S ~ laAal ~S!~ J~+s~+e+s 1
£ a~nseaw uJn+a~ J!+s~+e+s 1 17 ~ £ saJnseaw uJn+a~ (Z)
Alsnoaue+lnilllS saJnseaw uJn+a~ llV (l) sau ~ l4Hf . sA sa ~+ ~ l ~+n paz~ l euuoN J!+s ~+e+s Z1
'3'30 f' (1 'j'3(i" i) jI'?(1 I' (1 .:.v'3(1 P (1
i:-?i'O t21"O lLG'01LOI'O ~O ~ "(1 tOt~(1 Lll)PG ~lOPO 26A'(1 0601'0 2lG PO ttf:! 'C1 2LG'(1 2lC P (1 t£0'O t£OFO L0C P 0 860'6 2€O'O 2SC'O e~l'C t£tPO 160'(1 160'Ij 6£0'6 6£0"0 l£O·O L~OPO !60"!) 161)1'0 S90·0 S~OPO 9L0FO-890~O-ltO~0 lfO'O Glb'G 0l0'6 ~90"0 t~O"O T '3 (1 P 13 T '3 ij , (I 3 '3 13 I' 13 2: '313 I' 0 6101'6 6tO P 0 2E0'O 2€O"(1 ::.::~: t ~ I) 1 :~: ~ f 13 1) (1 t "(1 Cll~ 1: I' (1
80!'0 011'0 ~80PO b86'O SSt F 0 021·0 S60'G 260'0 2201'0 220ro aEO'O 8S0'O ego"o 290 P O 290'0 r '3(1 "(1
SOG'O t00"O 620P~ 6S~"0 tt2"O 11~P0 8~tP0 ttT'O i-, ,~. (1 ' (1 t '31) "13 t '~~(i ~ I) (I '30 I' (1
26~P~ 260'0 2l0"O 2l0"O 221'0 021'0 086"6 ~aol'o
0S0"O GeorG 2€O"C 2€0 P 0 t£OP0-t£OF0-t~OPO ~~0r0
F :~: .... '-- t
aJns-eaw uJn+a~
3~H::Id3l·!t.:l
::n';J I S ,.I" i:i P'k:! I d (:I 1,j C f'i i::I.:=f~: t:i ·'ll.:i ,~l e-l ~;t3 I j'fl •
j~:H S3~:H '1 d I 1::1 ~:Jd31S3!'1 J~:J I '~~fl
S3~Ildl~ tlldDM SN8~1 ~~HDI1~Nd31NI ~3S11
--S3NI~dI~ dl~O~ crddDa~3S
JWI ~DIl~IA~ INDWB3Id S,.I·,l::If'"Jd I tj !jl;~OI" t:Jf3:::J I d3-t;~l::I t:~bd
:.:H:J I ~ :~' '=/ JNI S3Wll ~I~ ~~~ZU
SA~MdI8 ~~NDII~N S~3Sd3AO I
:)~:~ I :~:3H I ld I t:1 lS :?:W'IH.LdDI:J ,or,
JNI S3NIldl~ ll::ldlN3J HldBN j
J \.:J I :~::3 ~:J I "1;j I ~ ""11=/ t:J D I JJ':i l:~
S3NIldI~ HJIAff l~hOd Wl~
Jt:J I S3t:J Ild I 1:::1 t:it:! I I !:'jrl!~!"'l S3NI~ dI~~d31S~3
JNI S3NIl dI~ ~~~3cr JNI S3NIl did l81N3NIl~OJ
:S:,J·,i::Il'ld I ti lIt:) I 101 I.:::I:.l::1 dd03 ~lNI ~~I~~dcr
JNI S3NI1dI~ N~Jld?W~ ::Il-:H S3t:Jl 1;= I I:::i )..i:43H~13-'1 ~y
saU~lJ~V
(03nNIINOO) 6 318Vl

TABLE 10
COMPARISON OF RISK AND RETURN FOR FLOW-THROUGH ELECTRIC UTILITIES AND AIRLINES
Electric Utility
HLL fl;ME_f.~·/ ~'Oi).lEP :~:\::~:TEt'i
i~' E r.t T k' 8 t: I'f' !; F' r!1 [1 !':i T P 1:J f.: :~: E ~. 'v!
COLWMB0~ ~ SOUTHERN JHID . (C~CO~D EL~CTRIC CO . (;PEF-t:i l'iO')f:iTA H;1 PObIEF.~ COr::'P
I:lt'; i.,.'r:DM POttlE F: CO NORTHE~~T UTILITIES
F'Et:1n~:\'L I".' Mf:lI A ~'QbIEF: :~.: l I (9HT F Q (~' T L AI:t Ii (9 E r:i EP ALE lEe T PIG: CO PUBLIC ~ERVICE CO OF N H F'l):~ET :~:[l'Jt;iII F'ObIEF.: K L I ,;HT -;;.lJi.:ITl,15:F.'ri CAI.~,_ I F Ell I SOi;~ CO i.Y:~ I TED I LLUf'l I t:iAT I ni!i (;::0 R?IZDNA PUBlIC SERVICE CO :::Ej:~TF.'AL HI:JIrS:Ot:i I:;A:~: :~-: ELEI~:
CINCINNPTI GPS & ELECTRIC (8~SQl!DATED EDISON OF N4Yd :D;:':;\'TOq PQi.dEP g.: LIGHT DELMARVA POWER & lIGHT LQNG ISLRNn LIGHTING t'~EI)! ·lOR.K ::;TATE ELEC t I:;A:~:
t·.; I ~\'';;~~'H t'10H~bir::: F'O i..! EF.· ORANGE ~ RDCKLAN~ UTIlITIES PACIFIC GAS ~ ELECTRIC PACIFIC POWEP & bIGHT R8~H~STER GAS & ELECTRIC ::;:l:;ir:~ I! I EI:;O I:3R:~: g. ELEC'TF:' Ie T:J::::;:0 r:-j I;P:~: g. Fl.: E:~:TP Ie u~-i.;':H r t:i I:; T 0(1 I . .JR rE~~ PDldER
1 0" (14
(I" (I d
0 .. 0 .. 0" ~) 01
(I.-
~I ..
0" 0" 0 .. o. (I d
(I ..
~i" (I"
(I" (I"
0 .. 0" 0 .. (i ,.
o. 0" 0" (I ~
o~ (I ..
~I "
Return Measure
-, c:. ,~; 4
~I ';:. ~! rid ~)!=!9 ~I ~ -I 7 ~! ~) d 1 f.4 .I.
O~.? ~). (I~.:·~; (I" ~).? :~; (I. (I:~:? (1:::5 (I~ (1:~;2 ~L 14:3 ~) d 225 (J:=::~: ~I tI (!!~~~: 0" 14 (I 001 139 073 (I" (lIS 7 f.1 d 1 14 (I" (190::' ~)S5 o. O:~: (t o. 1 -,"":,
.l.c:.t (i .. 129 ~) 7 Ii. o. ~1r=!·9 ~I .. 12~J (I" 1 (i:::: (19;~ (I. (l9lf. 0" 172 0 .. 2 (iE. (I:~:f, ~) II (1::;::2 (I .. 159 (I .. 199 O:3::E. (I .. O:;::E. 0 .. 1:~:1 0 .. 1 ~::7 ~t:!::!! (I .. (1::;::0 (I" 14E. (I" 144 ~17:~: 0 .. 072 001 1 1 --. • .1:,. fl. 12G 078 ~I " 077 (I" 1 ::;,,~ .... -' 0 .. 13;!: O:~:2 o. 08 (I ~) " 15~. (I .. :~:94
07~ ~) .. (175 (I d 1~~5 (I" 1E·f. O:?' (I 0. (if'7 0 .. 14:!: (I" 1 :!:::~! 1 01 0" 097 ~) 01 193 0" 2~jO (If.4 001 ~lf.1 (I .. 09'~: (I .. ~):~!~~:
0'92 0.1 ~I:::S (I" 171 (I" 17::; (1:3~i 0 .. 07':" o. 143 ~I " 134 0:::5 ~I .. (1:::4 ~) .. 15f. 0" 1 :~!7 07::: o~ (l7E. (I" 1:31 (I d 14~)
Oti:,::: ~J d (If. 4 0 .. 1 09 Od 1 ~17 071S (I .. 07:3 o. 12~:! 0" 1 19 (I:::: ~I 0" 078 (I d 1'-"-' .! .. !I (I" 1'-"-' .~r~
074 (I d ~17 (I (I d 1 17 (\. 1 lC" • .:..1
(177 (I" (1f'5 (I eI 12f. (I" 1'-"-' c:.:::.. ~)79 (I d ~)7!~: (ld 124 (I. 1-'-:< ~t
09~) (I .. (1::;;:7 ~=i " 132 (I d 1~;5 (1::;::::=: (I. ~);=: 1 (I d 147 (I" 145 (I~:;:: 1 o. ~:: 7~=: (I d 1'-'-" .: .. f (I ~ 117;:7.:
111-61
PI;I< (I. ::f.25 ~)d7S~::·
(I i E. 9.~: .~-~
111 (IE:, .;~
~)01 E;50 (I" 5:~:2
(loI4:!:2 (I" 441 0 .. 444 (I" 5E.4 (I" 47E.
(I" 412 (I" 491 (I .. 4::;(1 (1",2;:::4 0.1 B(12 (I .. 479 ~I" 472 0 .. 5:!: (I
0 .. 24(1
(I" E. (it:. 0 .. 511 (1.5:!:2 (I .. 2::!2

TABLE 10 (CONTINUED)
Airlines
ALL~GHE:t:rl ~i I Pl I j:iE::;: I i"-iC R~ERIS~N AIRLIMES INC BRA~I~F INTL CORP CRPITOL INT~ AIRW~YS CD~TI~~NTA~ RIR LINES INC DFLTR AIR lIM~S INC E~STERN AIR LINES MAW~IIAM AIRLINES INC K~M PQY8L ~~TCH AIRlINES NATION~L AIRLINES INC NORTH [~NTRAL AIRLINES INC nGPTHI"iE:~:T q I PI.:.. I t:1E:~: I t:·!C D''t'E;';;':S'Er:f~: t:t~T I Dt:iA!.:.. .~ I F.'\.eIH'-j'::;: OZ~RV AIR LINES INS ~ •. :;: ~t I r:~ G: FAr:·! RtI1EJ;:~ I CAt:-t hl[lF'b_rl R I F.'I.,1A "(,S
PIEDMONT AVIRTIQN INC . ;E~FQAPP WQRLD ~IRLI~ES
T I I!iEP I r:~TEF.'t:iRT IOt:IAI:.. TF.'t~i·:l:~· 1; 1 0;"1.:.. II A I Pl I t:iES
~ESTERN AIR LINES INC :.1.1 I Ei:-i Fi I F: RLH:~:KA
1 MJ e L D f.'11 ~~ 1.,.1 H \' :~: I t:11~:
Return Measure
1 -. c:.. 4 0~0~4 0~Q44-9d051-0~051 0.032 0i0J2 0~g30 0~030 0.~80 OdOS0 0d130 0.132 (I ~ 072 ~I ~ (IE. ~I (101147 (I" ~r!:9 0 .. (If. 1
(!. (1'~2
(I .. 084 (I .. 10(1 I)" 0::::2 0" Of,2 (I" (lEA
(I" (101 ~) d
o. (I" (I ..
(I ~
(i ..
(I"
(101
0 ..
~I "
fl72 (I"
OE.1 ~I ~
14:z: (I ..
0::;:9 001 (16:,2 (It!
O:!:S I~I ~
(193 ~) " (i:~:4 (I ..
1 (I (I ~) 11
(r!:i!: 0 .. Of.2 (I ~
(If,4 (i"
092 ~." 092· (1~.4 (101 (IE.4 ·-t; c:..L 1 (I" 214 O~)4 (101 003 ~IE·2 (I .. Of·3 022 (I" 022 1 :!; (I (! .I 1'-"-' .":t.!)
1 1 ~I O~ ~ 0:::; .L
1 :::! 1 ~) til 1:!::3 (119 ~I • 01'? Of,l (I vi OE.l 07~) I) .I 07(!
O,,017 O .. 017-0.068~O"g76 0.063 0t1063 0,,091 (1,,091 0,,057 0.057 Odg~9 g~059 001091 0.091 0~151 ~tl153 g~032 Otl032 O~008 0 .. 007 0.054 0 .. 054 0~072 0.072 0.071 ~d072 0.090 0 .. 092 0,,076 0 .. 077 0 .. 101 0.105 O~071' 0.071 0 .. 124 ~.124 0,,06S 0,,065 0.OG6 (1,,066
T2 Statistic Flow-through Utilities Vs. Airlines . (1) All Return Measures Simultaneously
(?, Dot"rn Me'" 5""" .... 5 ., & 4 107 .878~ 29.956\1 28.847~ 58.328 v
\.'- I "I;; I.A I I'l a I.A I I; ..;
T Statistic Return Measure 3 T Statistic Risk Level \I Significant at .01 Level
1II-62
F.: I ~:K 1.564 11119G
·1.276 1,,~99
1" ~11
(I .. E.2i!. (101 997 1~415 1. 21 ~) 1 .. 113 O,,32:~: . 0 .. 9::::5 1. :394 1 " !fr (r~: 1 .. 7:::: 1 1,,469 1 .. (I':~~)
(I If 94 (I 1 d 233 (I" f.il 1 If 4 -=::::! 1 .. 1~·~

FOOTNOTES
la Additional complications for those public utilities which capitalize interest on funds used during construction. See Section III, Part A, for a complete discussion.
2. In an opportuni cost foregone by not pursuing the actiono
3. Much of this discussion can of regulation. See, for example, J Applications (Englewood Cliffs, N.J.:
is the amount course of
any microeconomic treatment hleifer, Price Theory and
ce=Hall, 1976), pp. 288-290.
4$ The estimation of demand plays a critical role in the rate-setting process. If it is underestimated, the utility will recover its original projected amounts for cost-of-service and allowable profit. But, in an increasing cost situation, the excess revenues generated by the difference between actual and expected demand will fall short of the rise in costs, thereby necessitating a rate increase to achieve normal profit.
If demand is overestimated, the utility will not recover the total of its cost of service and allowable profit. To the extent that they are variable, some costs will be lower than projected (due to smaller output). But in all likelihood, since many of its costs are fixed, the utility will be forced to seek a rate increase to arrive at normal profit. Hence, a regulatory anomaly ;s that overly effective energy conservation causing lower demand than anticipated pushes rates up even more.
5. See the following discussion of the risk-return relationship.
6. Thus~ some evidence may be found that at least for this attribute~ a regulated public utility is able to retain a characteristic of an unregulated monopolist. See footnote 10.
7. For the 113 electric utilities analyzed in this report, the average (unweighted mean) ratio of total long-term debt to total equity is .43. The same statistic for the 73 unregulated fi rms is. 19.
8; See Irwin Friend and James L. Bicksler (eds~), Risk and Return in Finance, Volumes I and II (Cambridge, Mass: Ballinger Publishing Company, 1977).
9. Of course, utility investments would not be very IIriskyli even in the absence of regulation. See footnote 10.
10. One exception to the risk-return relationship occurs for an unregulated monopoly Cpr for the firms in an oligopolistic industry with substantial entry barriers}. Although the risk level is very low, profits may still be high. The lack of competition in the product market provides the i the opportunity to enjoy a high rate of return while only a minimal amount of risk. Regulation's function in this context can be viewed as reducing the rate of return so as to make it "appropriate" for the level of risk assumed.
III

11. Because a single price or rate usually prevails in a market, a consumer is able to reap a ."surplus" on all those units purchased whose incremental value exceeds price. The last unit bought will have its marginal value equal to price.
12. When the demand curve intersects the average total cost curve at its low point.
13. Hirshleifer, ~ cit. The analysis points in a different direction if the utility is confronted wi-th continually decreasing average total cost as output expands.
14. The principal policy trade-off Between these two alternatives is apparent. Optimal resource allocation with marginal cost pricing enables a utility to enjoy an lI a50ve normal profit. 1I In Figure 1 this amounts to the area of R1R~CO. In accord with President Carter's proposal which accompanies the deregulation of oil prices, an excess profits tax could 5e applied to a public utility practicing marginal cost pricing.
15. Only in the perfectly competitive model do marginal cost pricing and average cost pricing havefdentical results.
16. Of course, if utility rates of return (especially on total assets and on total productive assetsL are substantially below corresponding measures in each of tne fndustria 1 groups, strong (but not conclusive) evidence would exist that utilities employ average cost pricing.
17. The concept of marginal cost pricing may be difficult to operationalize in a rate-making setting. A suBstitute such as "replacement cost pricingll may be easier to implement in a practical situation.
18. H. Averch, and L.L. Johnson,' "Beriavior of the Firm Under Regulatory Constraint, liThe American Economic Review, Vol. 52, No.5 (December 1962), pp. 1053-106S.
19. See, for example, H.J. Baumol and A.K. Klevorick, "Inout Choices and Rate of Return Regulation: An Overview of the oi'scussion," The Be 11 Journa 1 of Economics and i~ana ement Sf,: i ence, VA 1. 1, No.2 Autumn 1970 , pp. 162-l9D; Courvflle, L., Regulatlon and Efficiency
i.n the E1 ectri c Uti 1 i. ty Industry, II The. Bell Journa 1 of Economi cs and Management Science, Vol. 5, No.1 (Spring 1974}, pp. 53-74; and Spann, R.M., "Rate of Return Regulat'fon and Efficiency in Production: An Empi rica 1 Test of the Avercfi-JoFmson Thes is, II The Be 11 Journa 1 of Economics and Management Sci"ence, Vol. 5, No.1 (Spring 1974), pp. 38-52.
111-64

20. Besides including resources that the utility will never really need, lIunnecessaryil is also given a time dimension . A temporary, more suBtle form of rate base inflation occurs when-ever a utility acquires assets wnich, though needed some future , end up included in rate base prior to that time. Obviously, some value judgments are i to resolve this issue in the regulatory setting. The va nature of their env; ronment land the fact that, un "I i'l ; ties, they a re not able to earn a return on "unnecessaryH } virtually precludes thi s type of beha vior for most nonregul ated fi rms.
21. See the previous discussion of the effects pages 9-10.
financial leverage,
22.
23
24.
25.
26.
27.
28.
29.
30.
See the example in the next section.
Utility B may still be concerned about the advisability of this strategy because of lower dividend distributions in Years 1, 2, and 3 (i. e., du r; ng the period when most of the ra te base i nfl at; on occurs). To overcome this, an obvious tactic would be short-term borrowing to pay dividends. Although the interest on such debt would slightly reduce tfie total return to shareholders for a·few years, the need to borrow for dividend payments would likely evoke public sympathy for the utility's financial plight and constitute further evidence that its profits are not excessive.
The problem, of course, is the inability to distinguish Situation 3 from Situation 1 and Situati"on 4 from Situation 2. Although its effects are impounded in the reported financial data, rate base inflation is essentfally unobservable in this study's profitability measures.
See footnote 7.
In this case the llinefficiencylB which inflates the rate base is strictly an accounting phenomenon.
See page 5.
For an in-depth treatment of normal izati.on and flow-through, see D.vI .. Kiefer, IIAccelerated Depreciation and the Investment Tax Credit in the Public Utility Industry: A Background Analysis," lColumbus, Ohio: National Regulatory Research Institute, 1979).
Accounting Principles Board, "Accounting for Income Taxes,iI Opinion Number 11 (New York: American Institute of Certified Public Accountants, Inc., 19.611-.
A provision in the Revenue Act of 1911 sti ates that no taxpayer is required to use any particular method accounting for the investment tax credit in reports ect to the jurisdiction of any federal agency. Rules regarding the accounting for the credit by public utilities contain additional complications. See Kiefer, .9£.. cit.
I1I-65

31. Here the transformation of F into a normalized utility stops with the adjustment to income tax expense. However, if F were truly subject to normalization, the dynamics of the rate-setting process would likely continue. With taxes at $10.5 the results indicate that regulation did not permit F to earn its allowable return on rate base. Accordingly, Fwould seek some sort of lIemergency" rate increase. A $15 increase in revenue would, after the application of the 50% tax, bring Fls reported operating income back up to $30, thus allowing F to acnieve reported results identical to N.
32. The data in the example can illustrate a potential incongruous result from f1ow-througb accounti:ng. Since Company F cannot "keep" any of the tax savings,ft has little motivation for using accelerated depreciation on its tax return. Thus, it switches to the straight-line method, thereby increasing current tax expense and revenue requirements) by $15. F's income statement is now exactly the same as N1s. Both companies have the same rate of return measures. N st ill has tn,e advantage of deferri ng $7.5 of its income taxes while F must pay the full $18 currently. The switch to straight-line depreciation for tax purposes simply makes Fis customers pay $15 more to the utility which it then remits to the Internal Revenue Service. Utility F's action would undoubtedly be censured by its Regulatory Authority.
33. See pages 5-6.
34. For an in-depth treatment ofthfs issue, see Lawrence S. Pomerantz and James E. Suelflow, Allowance for Funds Used During Construction (East Lansing, Michigan: Mfchfgan State Unfversity Institute of Public Utilities, 19751-.
35. This treatment of AFUDC has two favorable results. First, once the CWIP is placed in operation, capitalized AFUDC is recoverable as depreciation over the asset's useful life. Although not increasing profits, this augments cash flow and permits, contrary to the typical rate-making process, recovery of interest and "earnings" on equity funds as part of cost-of-servtce.
Second, AFUDC allows th.e rate base to exceed actual out-of-pocket costs, thereby i.ncreasing total profits. This is another example of Urate base i.nflationll discussed earli.er to the extent that the tota 1 amount placed i'n the rate base exceeds the pri ce wh i ch the utility would have paid to acquire a similar asset, fully constructed and financed (pri.or to its completionl. with nonutility funds.
36. The IIshareholders ll on whose assets rates of return are calculated are defi.ned as the owners of the majority interests of the corporations analyzed i.n th.is study. Accordingly, an adjustment not di.scussed In the body of tne report is the removal from all consoli.dated financial -~~tements of the income and assets attributed to any minority incerest.
111-66
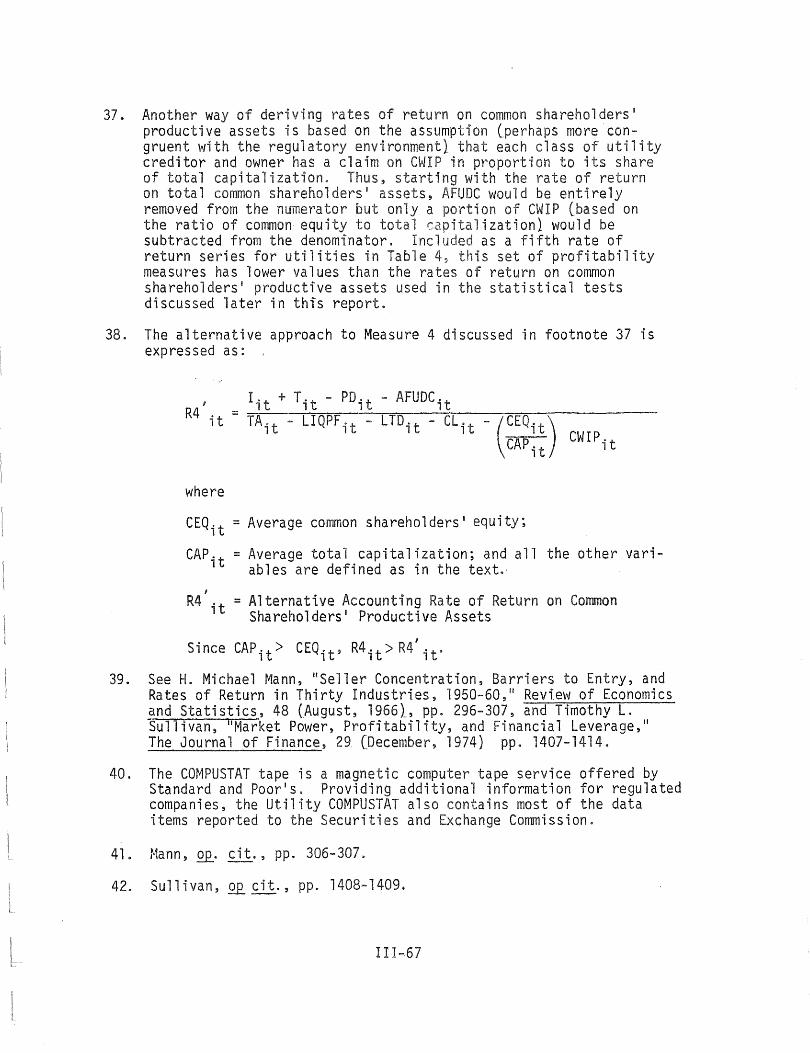
37. Another way of deriving rates of return on common shareholders' productive assets is based on the assumption (perhaps more congruent with the regulatory envtronmentl that each class of utility creditor and owner has a claim on CWIP in proportion to its share of total capitalization. Thus, starting with the rate of return on total common shareholders I assets, AFUDC would be entirely removed from the numerator but only a on of CWIP (based on the ratio of common equity to total italization} would be subtracted from the denominator. Incl as a fifth rate of return series for utilities in Table 45 is set of profitability measuY'es has lower va 1 ues than the rates of return on common shareholders· productive assets used in the statistical tests discussed later in this report.
38. The alternative approach to Measure 4 discussed in footnote 37 is expressed as:
where
CEQit = Average common shareholders· equity;
CAP' t = Average total capitalization; and all the other vari-1 ables are defined as in the text.
I
R4 it = Alternative Accounting Rate of Return on Common Shareholders' Productive Assets
Sin ceCA Pit> CEQ it' R4 it> R 4 'it·
39. See H. Mi chae 1 Mann, II Sell er Concentrat ion, Barr; ers to Entry, and Ra tes of Return in Thi rty Indus tri es, 1950-60, Ii Revie\1/ of Economi cs and Statistics, 48 (August, 19661, pp. 296-307, and Timothy L. Sullivan, IIMarket Power, Profitability, and Financial Leverage,1I The Journal of Finance, 2~ (December, 1974) pp. 1407-1414.
40. The COMPUSTAT tape is a magnetic computer tape service offered by Standard and Poor's. Providing additional information for regulated companies, the Utility COMPUSTAT also contains most of the data items reported to the Securities and Exchange Commission.
41. ~1ann,.QQ.. cit., pp. 306-307.
42~ Sullivan,.Q£. cit., pp. 1408-1409.
1II-67

44.
45.
46.
47 a
48.
49.
50.
51 .
52.
53.
54.
55.
56.
57.
In a very few instances obvious outliers were removed, thereby creating eight or nine-year averages for some companies. These occur in the computation of Measure 4 where the subtracti.on of CWIP makes the denominator very small (causing the annual rate of return to exceed 100%) or slightly negative (making the return measure a very large negative number).
See page 21$
See pages 22-24.
See the numerical example on page 23.
For a full explanation of Hotelling T2 test, see Bolch, Ben W. and Cliff J. Huang, Multivariate Statistical Methods for Business and Economics (Prentice Hall; International Series in Management, Englewood Cliffs, New Jersey, 1974)
C.E. Weatherburn, A First Course in Mathematical Statistics (Cambridge University Press, London, 1968)
This conclusion is confirmed in a separate T2 test involving vectors comprised of the rates of return on total assets and on total productive assets (i.e., Measures 1 and 21. The null hypothesis is rejected at the .01 level.
Using data for flow-through rather than normalized utilities, the test described in footnote 49 also results in rejection of the null hypothesis at the .01 level.
The previous comparison involving flow-through and normalized utilities also reflects this. See pages 31-35 and Table 4.
See pages 9-10.
See pages 10-11.
A listing of risk measures in large U.S. firms may be found in Security Risk Evaluation (Merri1, Lynch, Pierce Fenner & Smith, New York, August 19781.
See footnote 10.
See pages 12-18.
See pages 31;...35.
11I-68
APPENDIX 1
Ten-Year Returns for All Electric Utilities In Study
III .. 69

CCMPAt.y !'i.HE RISK
TABLE NC ... 1.1 RATE OF RETURN MEASURE
1968 1969 1<;10 1971' 1 <;12 1973 1<;74 Hi 75 1976 AVERAGE
AI f E''''Ht:I\Y OO\"jcg Sy(lFM 0 525 C COA a D9" 0 .JaR C CAe Q C83 q eel n 090 .1 ,~8C C 1C8 ,., 111\ q ('53
AMERICAN ELECTRIC FChER 0.516 O.CSl 0.090 0.084 0.C81 0.077 0.075 0.060 0.071 C.CE4 0.091 0.CH3 ATLA~T[C CITY ELEC1RIC 0.555 C.C86 0.087 0.OE3 0.C16 0.072 0.Ca5 0.082 o.ce, C.(~6 0.100 c.ces BANGOR HYCRC-ELEC C( 0.524 C .. 102 0.095 0.087 0.C18 0.C66 J.085 v0061 0.C6S C.Le9 0.004 O.C7~
&G~~~/~blgoN'Cf' r 'tGHT CC 8JH t.8~j 8.6~~· td~~ 8.3?J gjH g.62~ g.57~ ~.S~~ S.C~~ ~.=~l 3.~~t BRASCAN L1C-Cl A 0.614 G.012 0.012 0.012 C.C14 0.C85 C.C;2 0.100 0.CH4 C.(6S J.C(6 0.C78 CA~CLINA FC~ER £ LIGHT 0.609 C.096 0.099 0.091 0.066 0.078 0.C99 J.J3Z J.C7: (.IC2 J.ll~ O.~~l C c I~j r R r\ !. r S C! 1 T H L ~ SIr C 9 0 Q 3 a 8 ell 7 a] 23 a 1 29 Q! ., 3 ell s !) I? 5 j) I~) 5 0 1 2 C ( 1 1 .., ,'" J J :"'1 1'1 1'" I
CE:ITRAL M4INE PChE~ CC 0.310 (.C9a 0.096 0.091 0.C94 0.C84 a.C~6 J.090 0.G71 C.CE4 J.U~3 J.~~C CENTR4L VERMO~T PLE SER~ 0.766 C.C76 0.010 0.061 0.C62 0.051 0.C64 0.032 0.C64 c.eSl O.JQl 0.067 CLEVELA~D ELECTPIC ILLU~ 0.384 0.128 C.129 0.117 0.lC3 0.C91 a.C93 0.086 J.CSt C.CEd 0.092 0.103 CO C I ' ! \a ti" ! c: r SOt J e h 9 r, ( b reo 6 Q 3 C I 0 J Q 0 G 7 DOg Cae 17 C (" 6 S 0 G 76 f) t) d 1 !l C 6 ~ C 1 C ) ) II;; 3 ., Q 5 COM~ONWEALTH ECISC~ 0.307 C.114 0.113 0.LC2 0.C91 0.C84 0.e90 J.J92 J.CdS C~(~2 0.J94 0.09t CGMMUNIT~ PU~tlC SEFvICE 0.435 C.Ca5 0.089 0.097 C.l02 0.lC4 C.IJ9 0.107 G.Cse (.(96 J.I07 a.~S9 CCNtORO ELECTRIC C( 0.000 C.064 0.080 0.017 0.C76 0-C75 0.094 0.013 O.C~1 C.110 0.106 0.Od3 DeTECT! EcrSQb CO a 114 C eel Q eM] Q 1~8~ Q 073 ! 7? n C79 l'i s
J )1b I) (7'": ,,74 ! )Zt J '-'7r:
OUKE POwER CO 0.612 C.I08 0.L05 0.094 0.C66 0.011 0.C69 0.077 0.05: (.(S8 0.111 J.Ud~ OUQUESNE LIGHT CG 0.504 C.105 0.lV2 0.093 0.C82 0.a91 0.C89 a.036 O.CSE C.C~7 O.O&R 0.09l EASTE~N U1IliliES 'SSCC 0.761 C.l06 0.097 0.J83 0.078 G.C86 0.C86 a.USB O.CdS C.C80 O.C97 J.JB6 eOISlti SA!!! E' E(!PC Q 'JOO C II< 0 114 0 lO! 0 09'~ IJ 08 CPO ,) ")84 ~ lee c C~, ) !'8' ,'1,5 El PA50 ELECTRIC CC 0.358 C.125 0.130 0.133 0.121 0.122 0.125 0.L18 C.LCE C.lC7 0.113 0.121 E~PIRE OISTRICl ELECtRIC CO 0.326 C.lll 0.115 0.104 0.lC9 0.097 0.C;4 0.094 0.C94 c~csa 0.102 0.lG2 FLORIOA PCwER S LIG~T 0.575 C.IlO 0.116 0.114 0.103 0.lC8 0.C9~ 0.105 O.C;1 C.116 0.094 0.106 F'QRTQ4 prlfteR crRP 0636 '103 0 Fa c!le 0 10 2 C C9S C 100 ) ,'C.) ,I CH C 10 ... 1"0 " C59 GENERl~ PLBLIC LTILITIES 0.629 C.075 0.012 0.062 U.058 0.C6; 0.C78 G.Old 0.C84 C.Cci7 a.~9~ J.u76 GREEN ~CU~TA(~ PC~E~ CeRP 1.063 C.016 0.015 0.07~ 0.075 0.03~ C.C60 0.061 0.C81 (.CSC 0.089 0.073 GULF ST6TES UTI1Il!£S en 0.484 C.103 0.105 0.103 0.098 0.CS5 U.C99 0.097 0.102 C.(S3 0.092 0.099 1-1»,101 fH EI Ecru!e cc J 41] C O~2 Q C91 COS? 'J ass 0 CHb 0 cab ) 'lag ) eCI ( ICC ,) I'" .J I~Gl I~AHC prWER CC 0.363 C.074 0.081 0.087 0.092 0.096 a.og~ 0.000 J.CSf C.C~l J.SS3 O.Gbd YNDIA~APOLIS PC~E~ & LIGHT 0.694 C.llb 0.114 0.IC9 0.103 0.lC4 O.llS 0.103 D.CSf c.eS7 0.105 0.105 KANSAS CITY PCWER t LIGHT J.481 C.C~6 J.OSS 0.094 o.osa 0.C8S 0.CS7 0.081 O.CSt c.eSl 0.094 0.090
~J~fJlK~'tTiL~~f£~C~~ g.:~~ ~.117 g.t}~ g.ll~ 8.lb? g.b;: g.g~~ J.3~$ S.g;: ~.l~~ J.bS~ 9.lS~ ~AINE PUBLIC SE~VICE 0.491 C.079 0.078 0.086 O.CGl 0.07S 0.C83 0.097 U.ICE C.(S4 0.110 C.GSl Ht90LE SCLT~ LTILlllES 0.417 C.C88 0.094 0.098 0.C97 C.C94 0.C~5 0.J92 O.CSE C.CS4 J.06d O.OGZ "'1'wFsrro PC! eo· ( 'IC!:! 0 )9') C CBS ;J eS6 0)90 ,~ en Q caA " cae ,) 105 0 CQC. C lCJ jl ["I, " CQ't NEVAO~ PC~E~ CC 0.650 C.CB7 0.093 0.J91 C.C87 0.C24 c.c~a 0.07ti 0.C82 C.CIC J.Cd5 J.CtS N~W E~GLA~D ELECTRIC SYST~~ 0.533 C.081 0.078 0.073 0.C74 0.075 C.C84 0.079 o.ca~ (.eS7 C.IOU 0.C83 NORTHEAST UTILITIE~ 0.582 C.OE6 0.C31 0.019 0.C63 0.C69 0.C76 0.076 O.C7~ C.(72 O.C8L 0.076 "HIQ ~OISCI\; it: 0 432 C 124 t' [2 4 Q J18 a JC2 C ,~cl 0 CiV 11)<;11 jl ("74 r cp, (. ("39 ) ,'SS
~KLAHC~A GAS & ElE(TR[C 0.342 C.I05 0.105 C.116 0.12C 0.115 C.lla 0.117 0.10, C.iel 'J.CS2 C.110 'CTTfP. TAIL PO"ER C( 0.281 C.C86 0.079 0.087 0.C90 0.lC5 C.I03 0.099 0.G9~ c.eSt C.leS O.O~] PENNSYLVA~IA PC~E~ £ lIGHT 0.441 c.caa 0.084 0.v78 0.C65 0.076 0.CB6 0.091 v.CSE C.C9~ 0.095 0.G36 DCPTt ,,\ND GENERAl E' eClaIr (~ C 444 c oeo {f C7(' 0 CS4 q c8 1 n cGb J ('3? 'I 'as ) '''~r (lSI" 0 jlC:J a (}~6 POTOMAC ELECTRIC F(~EP 0.4~O C.076 0.014 0.063 0.C66 0.067 0.077 O.ua3 U.CdE e.C67 0.U~4 0.U76 PUBLIC SEPVICE (C CF IhO 0.423 C.l15 0.119 0.116 0.lC1 0.C<;3 O.lOa J.116 G.IIC C.IC6 ).131 0.112 PUeLIC SERVICE CC CF ~ r 0.564 C.C83 0.088 0.J89 0.C84 U.C72 C.070 0.072 U.Cg2 C.ICe Q.J~3 0.083 011!)'!C SERVICE co fF!:' loin 0592 ell? 0 lL4 0104 0]1'5 C lce 0113 ) 115 I) 'is! r 1CJ ,) iHS " 1C~ PUGET SCU~O PC~ER i LIGHT U.476 C.06C 0.063 0.061 0.C63 0.066 0.C73 0.07~ 0.091 C.C~2 J.U~l 0.073 SAVANNAH ELEC E P[~ER 0.537 C.C8~ C.OS) 0.091 0.C86 0.C75 0.C70 0.073 c.ce! (.C~8 C.G4~ 0.CB5 SOUTHERh CALIF EOrSC~ CC 0.382 C.C7~ 0.073 0.C72 0.C75 0.071 0.C73 0.013 0.IC5 C.C79 0.053 0.07d SOUTHERN CC 0.504 C.C8A 0.C92 O.OG6 O.C~l O.CDC 0.082 O.OH4 0.C71 (.IC4 0.093 0.C8~ SGUTH~ESTERN ELEC SER~ICE 0.371 C~CHl 0.OB3 0.091 0.C97 0.C99 0.100 O.lOl U.lG~ C.IC4 J.I03 0.097 SGUTH~ESTERN PU8LIC SERV CO 0.374 (.093 0.102 0.lC6 0.110 O.ll~ C.le8 0~108 U.12C C.ICS J.119 0.109 TA~PA ELECTRIC CC 0.173 C.I06 0.101 0.104 0.CS8 0.C75 0.09~ 0.096 0.C79 C.104 C.1CS U.CS7 It'" Y 'S ! I TIl I T I :: Sic Q l? 9 C I Z " C 1 2 8 C! 34 0 '" C Q 1 1 8 O! 2 1 ) 1 1 5 (), ] 'l C 1 C 5 ,... " j' " 1 2 r TGLEDO EDlSC~ CC~F~~~ 0.418 C.I07 0.110 C.IC~ G.I00 0.093 0.C93 0.091 J.Cle G.CS4 0.C3S 0.096 UNrnN ELECTRIC CC 0.400 c.cal 0.082 0.083 0.ca7 0.072 0.C65 0.074 O.Ct~ c.c~c C.tQ9 0.080 UNITED ILLL~!hAII~( CC 0.412 G.09t 0.G8S 0.094 0.C85 U.063 U.095 0.068 0.083 C.C76 0.074 0.C82 "DPER PEP.!l"",)!!!' pr,ER Q 44·'" c Ca7 0 0):)7 COef Q c75 0 \7) 0 095 ) ,)<jy n n1C r C76 ... I,sa J) C"'S Ul~H PCWE~ & LIGHT 0.344 C.080 0.080 0.076 0.075 0.076 0.C82 0.077 0.C74 C.C55 0.lU7 C.C81 VIRG1NIA ELECTRIC ~ PChER J.617 C.096 0.097 0.OS3 0.C84 0.076 0.C14 J.079 0.C6G C.CeB O.JQU 0.C85 ~RIZG~A PLOLIC ~=R\IC~ CO 0.491 C.061 0.067 0.073 0.076 0.069 0.C14 U.Otil v.07f C.(&9 ~.J~6 0.075 9 'I TI '4" 0::: G U , <: t. EC JQ I cal;: 'J C II 2 C 11"3 0 I 12 0 1 O? C " ~ 5 ') P 9 tl J H 9 () C1 4 C C 5"3 C " C j' 0 ,"''' Q CENTRAL HLOSC~ GAS [ ElEC 0.4HQ C.O~l 0.082 0.078 C.061 0.C83 o.C~O 0.083 0.C6~ C.C~6 a.J42 0.0HO CENTRAL llLINCIS LI(rT Q.4a7 C.10C 0.099 0.101 0.105 0.102 a.C99 0.u87 O.C7S C.C7~ 0.094 0.O~5 CENTRAL ILL PUBLIC ~E~VICE 0.561 C.IL3 0.115 0.114 0.lC7 0.lC5 0.0~2 0.ud7 u.CBS C.CS4 0.091 O~IOl CINcItj"'h!l ~oS f' J:IFcTRIi' Q ';"4 C 12"1 fl 113 1"'1 1'8 ~ lOA a c'-"6 .J 10 2 ,) )99 ') eWe C (Q) .) !~"3 rJ 101 CONSOLIDATED EClSC~ CF N.Y. O.Q02 £.C59 0.061 0.058 0.051 0.C55 O.JSS O.05~ o.e71 c.(a2 J.0~2 0.C64 CONSUMERS POWER CC 0.111 C.I05 0.099 0.093 0.C89 0.077 G.C76 0.013 0.C5E c.cao 0.v95 0.085 DAYTON PG"ER ~ LIG~l 0.419 C.ll7 0.109 0.J91 0.C86 0.Ca3 0.C81 0.070 D.C7l C.CS6 0.O~7 0.0;2 DE' Y"9'1' pQ1JeO r , IGbT " (7., C ICC 0 ]03 C 0 97 C C7S 0 '''80 0 Call) "S'l f) roi;)'1 C '74 ,., r-,·.., ? ce~
~L[r~~V~GFg~~REc~LEC LIGHT 8:!~t ~:~~~ g:I~~ g:t~~ g:1~~ 8:165 3:8~~ ~:g~r g:~~~ ~:~~~ 3:g~~ g:~~~ INTERSTATE PO"ER CC 0.436 C.090 0.091 0.093 0.088 C.C88 D.Cd9 U.081 U.C8E G.CBB U.088 0.U89 IOjJO 5' FCIRlc I It;HT t' 0'.0 a 71) C G91 f' esc 11 ,)88 a CBS C C75 Q CHu ) 066 0 C64 C -E) " ,'g" ,., Cd l ,
IOWA-ILLI~C[S GAS & ELEC 0.734 C.113 0.105 0.099 O.CdS 0.C75 C.l10 0.095 O.CSE C.1C5 C.IIZ 0.100 IOWA POWER & LIGHT 0.353 C.C95 0.C93 O.OgO 0.078 C.CS4 C.C~3 0.097 0.~9C C.l~6 J.102 D.C~2 reWA PUBLIC SER~ICE CC 0.304 C.l03 0.110 0.103 0.093 0.10C v.Cd7 0.J84 0.OS7 (.le2 0.lU6 0.098
,TC:,,' ~Q'fTbEON I'll' IIIG'S CO Q 5 7 1 C l'~ O'1 e C 12 G , .... '2 8 Q ',4 O'2id 1) III 0 '''f C ]r7 ," 1("9 ,'" 1]8 K~NSAS PO~ER & lIGrT 0.281 C.103 0.111 0.118 0.119 0.118 0.113 0.113 0.CS5 C.CS~ 0.095 O.l~d LAKE SUP~RIOR OIS1 FC~ER CO 0.315 C.OBC 0.088 0.077 0.013 0.C82 0.092 0.085 o.ca~ C.(S7 C.OR8 0.G85 LONG ISlA~O LIGrTI~( 0.530 C.085 0.084 O.OSO 0.CB6 0.086 J.C81 U.u7B 0.C17 C.C90 J.096 o.oa~ Irllr~'\/rllC= ~~S. r CIEele!C 0 ?..,& ~ '12 1'\ l'te C it2 ·1 J~2 Q ]23 J il? ) JOg ('", CI.i; ( III' ,-. ]06 "'2rJ
NIAGARA ~C~AWK PCftE~ 0.490 (.016 0.064 0.064 O.G5Q 0.062 0.069 0.U5d 0.C61 C.CE4 0.075 C.068 NORTHERN I~CIANA PLELIC SERV 0.337 C.117 0.116 0.114 C.12C 0.lC4 0.104 0.098 u.Cd5 C.(9~ Q.I01 0.lC6 IJCRTHERN SBUS POER 0 477 C 089 0 ass C das 0 caa 0 CB9 0 095 d 086 ,) C91 r 1'5 !! 10 Q 053 NORTHWESTERN PUSlIC SERV CO 0.392 C.CSS 0.C8a 0.093 0.C97 0.103 0.C9S o.o~o V.CBE C.eE3 0.C96 0.093 ORANGE & PGCKLA~O llILITIES J.637 C.079 v.016 0.072 0.C11 0.055 C.C67 0.075 0.C7C 0.C92 0.099 0.076 PACiFIC GAS & ELEC7pIC 0.240 C.C84 0.084 0.083 0.077 C.086 0.C84 J.083 o.cac (.C70 0.013 o.oac ,OCCI EIC peWEe f I 'e ... I a L,a7 c 06:: C C67 Q 116 8 0 "'7(' G '''78 n cd' n ,)77 ,) 07 t C '7 8 Q 1\82 ;" ,'74
PHILAOELPhlA ELEC1~lC CC 0.438 C~CSl 0.084 0.082 0.C74 0.C83 (.C84 0.083 0.C83 c.ce~ O.C93 0.Od5 PUdLIC SERVICE CC CF eeLO 0.365 C.082 0.085 0.084 0.082 0.075 0.076 0.07u 0.06E C.C87 C.J82 o.ceo PU~LIC SERVICE ELEe ~ GAS 0.609 C.OB5 0.08~ 0.082 C.C7C 0.C82 O.CIG 0.067 U.074 C.C79 0.094 0.C79 RccHFSI;::O i:"5 .(' t:1 ECTRI( Q 606 C 035 11 Q7 8 0 ')14 ("' Qln Q CbS] 1)71 " '"'bS ,) Cf..S C Ci"' 1 (' .... 6 ,) .177
ST JOSE~H LIGHT & FC~ER 0.599 (.C83 0.094 0.089 0.095 0.106 0.105 0.J94 O.CES C.CS2 J.097 0.0;5 SAN DIEGO GAS & ELfCTRIC 0.511 C.C87 0.088 0.092 C.C34 0.078 0.C69 0.U69 o.cal C.(59 0.084 0.079 SIERRA PACIFIC FC~E~ CC 0.502 0.C68 0.070 0.068 0.C73 0.074 C.C1d 0.J83 o.cas c.ces C.IOI 0.079 S(lilry CaRC! I~I\ E' Fe r G)S Q 94J C l~i8 Q to? Q 1154 C "'3
' 0 0 75 C !~al ,) 1)76 J '"'se C' rsg ,"" 095 C oa~
SOUTHERN I~DIA~A GA~ & ElEC 0.445 (.113 v.117 0.lL9 0.12C 0.114 0.126 0.130 0.115 C.lIY 0.128 G.ll0 TUCSCN GAS & ELEC1~TC 0.532 C.O~6 O.OS6 0.OS9 0.100 0.084 J.C~3 U.07d 0.C7l C.eS3 a.l00 O.e90 WASHrNGTC~ ~ATEP FC~E~ 0.282 C.073 0.080 G.08C 0.C81 G.C82 c.oac v.081 u.ca~ C.Ce7 3.049 0.083 ~o~l~s~c~;~·~~J~~~I~~~~~c~W~E~~~?~1~C-L~1~G~.~~T~R~------~g-.·l~t~9--~2-.~i~I~I~~o~1.~1~'i~~ --~~-.~!;~n~S~~g~.~~~~~~~·---g~.~3~~~~---8.tQ~~---J~.~1~6~f~~~~·-.~~lQ~~--~f-.~1~2~1~--~~.-1~!~~~·---u+?-.~~~~~J--------WISCO~SIN PUBLIC SEFvICE 0.291 C.I06 0.097 O.US~ 0.C91 0.C86 0.C99 0.105 O.lCe C.127 0.147 0.106 H~NTAN~-OAKCTA LTIL1TIES 0.262 0.063 O.OYl 0.094 0.099 0.G95 0.C93 0.080 U.C34 C.CS4 0.105 0.092

CCMPA1\'I' IliAI'e
"t FGHrNY pfj'&EO SY(JE·"" A~FRICAN ELECTRIC F(~ER ~Tl~NTrC CITY ELEC1~IC SANG~R HYCRO-ElEC cr .:;)t ,eli HillS oct"t:g r I IrHI co
CE~TRAL ~AI~F ?(~f~ CC (,F.rHR..\l VEtl"Ci\T PLE S(;kl,t CLi=VELAW) ELECTf.iIC IllU"1 '-r! I· ... ··,,'~ f SCI TI-':~~ [I.·ta ~(M~CNWEJLT~ EOiSC~ CO~MUNITV PUrlLIC SE~~rCe CC~CORO ELECTRIC CC v:r"r[T eCIS;)\! cr JUKf f'[]\.j FReel ~UOUESNE LIGHT CC EAST<;;R~ 'JTlll TIES llSSCC E -, ! So !' ' ! S" I TEL Eel e I C El PASJ ELECTRIC C( E~?IR~ ~[SrRICT ELECTRIC CO FL8~rJA PCwCR & LIGrT Elr~r~\ P[~ER cr~c
GENFRAL PLdLIC LIIllTIES GREEN ~CU~T~I~ FC~EF CCRP GULF 5 T ~ H S II TIll TIES C C H"'; " I [ t\ ~ r I • C 13 r C (C IDAHO PC"ER CC IN0iANAPnLIS P(~E~ & LIGHT ~A~SA$ CITY PC~Eq £ LIGHT V"'')''S ,'" t FI E(HIC K~NTUCKY LTIlll1ES CC ~Al~E PUSLI~ SE~VICE '41i),)lE SGtH! LTILIIIES 'lI'j' F')I:Li PC!,,-C'R 0 '1t:I-T ~IF.I/ A J~ ~ C" ERe C 'lEA E'~';UI\C ELECTflIC S'tSTEM ~CRTHEAST UTI.LITlE! r H! c, "J I S ('.' C C GKL~HG~A CAS ~ ELECTRIC OTTER TAll DC~E~ CC P~~~SYLVA~l~ PC~ER E LIGHT P ( Ei I! 'l ",! ,.... t""': ~'i r R ,} 1 Elf ( I Q r err PGTC~AC ELECTRIC FC~EA PUBLIC SERVICE CO r.r I~C PU3LIC SE~ViCE CC (F ~ ~ 01 19 I T C Sf" ItT C f ( C Cf f\ ~ <: 'f
PUG~T SCU~J PC~EP ( LIGHT S~VANN~H EL~C & PC~E~ SOUTHERN CALIF EOtS(~ CC SLIJTHE:~.'i C': SG~TH~ESTE~N ELfC SE~~ILE 5GUTH~ESTEMN FUEllC SE~~ LO T~MP4 ELECTRIC CC f"'illS tilT! ITP'S '-'" ,11LF;)G E~ ISeN CC~PJl"Y UNlrN ELECT~tC CC u~!TE~ IllU~I~AT1~( CC . 0 '.) ~ 9 P E" ! ~' 5 I I' Apr t, E 9 UT~H PO~Ek ~ LIGHT VIRGINIA ELECTRIC [ PC~FR ~rlZ0N4 PLBLIC SEP\ICE CO 3'!Tp"n'E ,..,(" r E' Four CeNTRAL HLDSO~ GAS E ELEC C~~TQAL lLlINCI! lIG~l CE~TRaL ILL ?L&LIC !E~vICE Cl'C!t.'N"TI r5C: r E'ECJgrc CG~SC1ICAIE) ECISC~ CF ~.Y. cn~SU~ERS PGWER CC JAYTO~ POhE1 & L[C~l Ott .· .. 49,,1\ ;Jr",tEB ; I 'Gb 1
FITCH~URG GAS ~ ELEC LIGHT ILllNClS FC~ER CC INTERSTATE ~C~ER CC r C'J ~ F! fC TR [I" ! ! p- J f: 0 k R
rO~A-ILLI~CIS G~S € tlcC IG~4 ?CWER & LIGHT IOWA PU~LIC SEA~ICE CC 10'tA 'OllrHEtiN IjTT I IllES Ct",
KANSAS POhFR & LIGrT LAKE SUPE~ICR 0151 ~(~ER ~O LO~G [SLA~C LIGhTl~C , i"l' T <:: \} f' ,>= .~ A <: r E! ~ C YO ! I"
MAQISGN GAS & ~LEC1~1( i.8 MISSOURI PUcillC SEFvlCE co :-1i.JNT I\NA PC\~ER CC bl!:;;'J E'IGI'"'' G'5 (ElECTRIC NE~ YORK STATE ELEC & GAS NllGARA MtHh~K FC~E~ .'1CRTHERN INOI ~NA "Let IC SERV NO R T H E P t;; q 1\ T E 5 0 r '. c p NURTH~ESTERN P~2LIC SERV LJ ORANGE & ROCKLA~G LTILITIES PACIFIC GAS ~ ELEC1~IC ~.jCIE!e P (".01 es I: !TGt-T PhILAOFLP~IA ELECT~IC CC PURL!C S~PVlCE CC CF ceLD iJURLlC SFRVICE EL~C !: G4S ;we H E sr E R r:\ S ~ ;:! F CJ P T ( ST JOSEPH LIGHT & FC~ER SA~ DIEGO G~S & ELEC1PIC SIERRA PACIFIC FC~E~ CC Sr.'ITH C AIJrt f\' FI FC r. G1S SCUTHE\.(/I, 1~IHM..t! Gt! ~ E:LCe TUCSON G~S & ~lECT~IC WASHINGTOIIi W4TEA P(~ER ;..!src'J$l" e1 fCTtjIC FC'eER WISCCNSlh PC~ER & lIG~T WISCC~SIN PUBLIC SfFVICE .'4QNT.\NA-OtI<.DTt. \.1ILIiIES
RISK
a 5 2 5 :,).516 0.555 0.524 o 423 0.5~5 0.61'::' 0.60',1 Q "i 0 a 0.310 0.766 .J. )P'4 a bQ~
0.3')7 o .43 ~ O.OCO Q 7 I (,
O. ')12 0.:;;)4 0.7"'1 ., 'J , .• (J. 35 ~ 0.326 0.575 11 636
O. '+65 C.4~l 0.417 ~. 3 e O 0.65J 0.'533 J.Sil2 iJ I • .,'Z J.3,+2 O.2~i. 0.441 ., 44 /• 0.460 J.423 ').564 a 50?
0.,+70 0.537 0.39(: 0.504 'J.371 C.3H 0.771 J 19 9
0.344 0.617 O.4'il n !') 1J.4dJ 0.437 0.567 ) ')14
0.387 0.497 0.436 'J 71 3 ;).734 0.353 0.304 ,~ 57 i 0.29L 0.315 0.530 .-L L...~~
0.367 0.631 0.311
I 5' '-J 0 .. 534 C.49C Q. 33 7 ) 471 O.39~ 0.63.7 0.24J ) 4,)7
u.'t3b 0.365 0.6J9 ,) j,fl·., 0.5'1'1 0.511 0 .. 502 t) 541
O.4H 0.291 :).262
TABLE /IIc.12 RATE Or RETuRN MEASURE 2
1 S67
C C93 C..G8!) C.Od4 C.1CC C " 13 C.1:89 C.Cb':; C.O<;O C 11 r: 1:.0";7 C.C74 C.l26 C .... S9 C.lll C.G83 C.Li63 C CSt C .. 104 C. llll C.104 C 11 3 (.123 C .1lC C.110 C 101 C.C6S C.074 C. Le C C tHl C.008 C.ll 0 C. C<;4 C L(' 5 ( .121 C.07S C.CIj3 C C84 C.C82 C .G79 0.08; C 11 S C. IJ 3 c. CI'J5 C.Cil:!! C ("77
C .076 C .112 C .077 C I'" 6 C.G,Cl C. C8 5 C.C76 C.CI:l5 C.ObO C .C92 C. laC c I ~ ".\
C.lu3 C.076 C.OHA ,. c86 C.C7d c.ess C.Cbo ( ] 1 ;' C .. C74 (.C'15 C.112 C 12" C.057 (.104 C .124 C .95 (' •• G78 0.126 C.086 C 11&4 C.lua C.C94 C.102 C I,", 6 C.102 C.080 C.082 r " 1 ~,?
C.076 C.GB3 ( .116 C Cij~
C.CiiB C.C78 C.GSC e C64 C.C80 (.07e; C.Ce3 c Q6' (.OLC C.Cf:le (I.ObS C PeS C.ll ::l C.G'l2 C.CD C c97 C.llC C.l05 C.Cb2
1968
n 088
O.OI.D 0.C85 0.093 n 1"\8 ~ C.GES O.ulC 0.094 " 1 Z 1 ·J.0<;5 0.064 0.1~3 n DC? 0.10~ (J.~8'i1 0.Un o J"I('!
U.096 0.0'18 0.0<:;<;
11 /• J.LL3 J .113 0.116 n lOr:
\J.Oel 0.107 O.0~2 " L l f' 0.121 iJ.077 i).egc J OGl. O.0t37 J.u73 0.075 , 1 t 8
1.1.1 I,) 1 ;).07'> V.077 .' 0"7 ·J.074 (';.115 0.0&4 r 1)98 0.0&1 C.0'}3 0.069 o.'Jes 'J.0!:!2 0.098 0.098 ? 1?5 0.lC6 0.077 0.C79 o 086 0.076 \;.0'11 0.062
I 111 -:'.000 0.096 O.ll '5 D lid ll.057 O •. egb v.lOZ .., ace O.iHI7 0.1o!3 0.0";0 n t'8 7 O.0~8 0.091 0.10; ) J 1 2
0.11 C 0.087 O.Cbl ..., 1l..I"
0.077 0.0613 0.111 ,) r: H 1 u.077 a.051 v.l12 n 085 0.087 0.071 O.Cal j1 11 6 5 0.;)82 0.080 'J. 08 2 Q 1'6 C Ll.0~9 0.0'l7 0.065 ;1 cog \) .lle 1)'.0'14 0.078 C C"5 0.10C; 0.0'14 O.OSC
o ?PC 0.·)72 0.\)77 0.083 o :)76 c.vaa U.06e; 0.J85 o 12" G.·J9C 0.057 0.le7 J DB3 0.0C74 a.Ogo 0.076 Q f'p 1
0.-382 O.Ja3 O.J79 Q 1 .... 1 0.1.28 G. AS! 0.114 [) 10-1
U.iJ52 0.063 0.0<;5 Q )SC
0.117 o.oar; 0.0<;4 n '88 0.JB5 C.0t:7 G.17G !, 1 ]r::: 0.112 0.086 C.nl a 1 ~ ~
0.J6; C .. IIC J. 0 at, e !les O •. 1eO 0.U87 0.066 C .on 0 • .]<;1 O.ICe 0.0<;6 a J -:; ,'"
0.t07 O.J75 o •. J<;:; a '){4 ( ..
0.075 0.083 0.')7C o t ," 7
(;.070 C. J9'1 0.t13 C ' 1 C
0.0~4 C.OS8 O.J!!8 o )9 0
0.083 0.117 0.:)<:)3 C ,""I e 7 0.Ja8 C.087 O.lCe o 1 2 S
0.114 <:.075 0.J86 11 Il.."
0.J!:i4 C.OB 0 .. 128 (' ~'S1 ~
O.Q61 0.057 a.tt2 Q j"'Q 2
0.J'12 0.06'1 O.Oal Q .166 U.~iS 0.0(12 0.077 a 062 0.J85 O.J'B 0.067 o !ltlt 0.113 0.G<;4 C.079 I"" , 8 6 U. :)'19 0.094 0.Q<;4
1 <;70
0 .. 060 0.067 0.072 o ""77
0.C91 0.C52 O.OQ2 L "'67
0.e5C O. C67 0.072 o ""19 0.L24 G. l(.J1 0.le3 () eS6 0.C5C O. C(:.4 0.C88 o 1"'14
0.091 C.lee 0.C85 o 1 "7
C.e'>7 o.e<;e 0.091 C C7S O. C 74 C .07l 0.051 t' .... 97
o ell':' 0.e9C 0.C56 C C7q 0.0(:6 C.1\J2 0.078 C ! Q 2
C.Cct C.07e 0.1J7G 0.C84 0.C96 O.l C7 0.087 Q '1, C.CS6 o. a 77 C.C~5 o ~ 74 0.C69 0.C70 C.C75 C Cg4 0.C57 U.ICC 0.102 n c54 0.045 c.caz C .077 c Q7C c.ca3 C.lle 0.C:l6 C CBC O. C74 0.C76 v.Ca7 [) 1?7
o .1lC 0.012 G.C81 1". 1',,)
0.070 0 .. C8Q C. 127 Q 083 C.067 0.C54 0.116 C j1711 0.0'16 0.073 (j. C 12 Q 063 0.C64 0.07d C.C62 C (\6'3 0.C<;5 O. C82 C.C6<; \"" ('69 0.112 O.C'1a 0.C79 C .c 76 i).Gsa 0.C85 O.C<;7
111-71
o \~ '4 O.Ctd C.C6C 0.C66 ," CC; Q
G.G56 C.Cd2 C.064 c, LI 6 C .. C:l2 C.C4C C.C'iC /"1 C6 1
0.071 O.lC3 0.0 13 o p (':.. r~
O.HB 0.':;'76 O.CS7 a (Jas o.ese; o.o;n D.Cd7 C C tl4 Q.C.,5 O.C9e; 0.082 C ,"5 Z C.OSC 0.U76 0.087 0) 0 7 ; 0.U7'5 (.; .OC 0.C58 ,~ ~ d 3 0.111 0.1;;:)3 0.063 OJ'S' o .C6 7 C.C88 O.C6d o lj'~ 7
0.C62 C.C6! 0.066 C.C7C O.C'1d 0.111 C.C72 t" 1 1 C
C.C85 0.C62 O.06j c,en C.C6"; c.e56 C.C66 {) !~3'
C.u7: O.OSl 0.C<;5 C 0 7 C.048 C.Cc6 O.C 77 a Cf?4 o.oa2 C.CS5 C .OtHI a c65 0.C03 0.C34 o.esc Q 1)3 O.1l3 0.C82 O.CH Q 1'"l,
0.<,)66 O.C 77 C.l2.2 o C'3\l 0.063 0.C5a 0.101 r. C76 O.lce 0.046 C.CSC a j'67 C.l.6S O. <':6S O.07C r ('69 C.LG6 0.074 C.e6S (l ,""65 C.IC8 O. C 77 0.077 (1. C ::13 !.l.eB3 C.G7b C.C94
1<;72
.~ CB'1 0.C6C C. C1Q 0.;:;:;5 ,'" 1 (' ,
0.040 a.c.'!o 0.C80 ? 1) 2 0.Cq6 0.C55 0.Od4 " Cb6 O.u7d J.103 J.C"':: 1-' '6 '
C.120 0.C93 0.C83 Cj i Q4 J.C65 C.C50 c.oqa !~ C;, 1
0.090 0.107 0. C77 ) t S t
l:.114 J. C<; 7 0.e70 I C ,Q "3
"::.en 0.103 C.C6.! Q 1,' 3 V.C7C C.C60 'J.C71 '=.C70 C.C9Y J.t";7 0.e92 o 11 5
G.C77 0.C49 0.06d C 1' 6 9 C. C 77 0.G91 c.ee.:: r '-C2
C.C"6 0.Cb5 O. C 74 (1 ['65
0.C83 iJ.Cd7 0.G98 C c7J w.C<;o ~oi.i32 C.CSu o 127
J.l13 0.091 J.073 '" 11" 0.061 0.Cel2 0.118 C ~d] O. C 7l 0.062 0.C'l6 Q 0')
U.1:6ci v.Cbd O.C56 C C 7j' 1,,).102 a.C6S 0.C76 c CZ! 0.1 U C.07i) C. (74 a ) D!
1973
• obS 0.071 J.076 J.061 ) 1C 5
J.090 v. 'J.H 0.Jb::> ) )77
'J.JbS 0. ,.ltd u .0:-'-t
J.U3 J.u~j 0.1{H ) J ~t)
·J.OE!4 1.1 • ,)tl 0 J • .Jlu ) ,7'; J. ,;'1 ~ J.W:;' 0.\)9J ) " 76 J.JB 00076 0.J7J
! q<t ,i
J.lL;; J.1J£ u.007 ) ;,; 2
v.J71 J. J6T U .J73 O.JO!:> ;).l03 v.llJ 0.J94 ) I jC"
J.0·,)6 J.072 \).J67 !, )G7
J.0I:h) \).J",-j J.JI:!7
! '97
0.095 J.100 v.0t?5 ) ! 15 v.112 J.Oo'1 u .u77 :) , 15 J.0'71 0.080 0.118 ) ilHI 0.076 0.054 0.096 " "75 0.U9L u.J7't J.J5J n )76 J.J 77 \).Jl0 v.u5" Ii ,j',!,
0.122 0.u6'1 (.;.08l tl I).,
'J. 1 \.iJ J.l05 0.077
1<;74
;) C ~ (
o.en lioC:]l 0.07(.
d.~~l v.C72-O. C 7::
"I 12 E
0.C3 4 J.CS; J.C:3:: I) 1 eli J. 1 l/:: ;). C'74 J.O.,ii ,) r 1 ~
U. 1 C i v. L22 J.Cd'1 ,'" C S 7 u.r.S(; O.Cd; o .1l1 0.C7i; u. 1C: u. t2 4 J.C7S
! ! C
v.en 0.C6e ~.:: II;. J ('" 1 C
0.CO':: O.Cde o.e.:;) q C~I:
U.C74 <J.es.; O.C<;( !l (62 lJ.C9E J.GC;:,! u.CgS ) J 1 i
(;. c<; 3 u. es 7 u.CH
1 C c v.lOC 0.G<;4 C. IC 4 a rOf J.C84 o ""f.. O:CgC .. C3 7 J.CS<; (J.C7 2 v. C.'l;: I) C 7 I v.cat U.Q7C 0.e74 lJ .~ 7 C
O. Lv 1 \.l.llS O.GH
r I 11
C a C. ';c C.tcl C.112 ( :~ /.
C.ldD C.C':; .. C.C<;r.. CI13 c • C <; '5 C • C <;6 C.l1J ( ,..,:. s t. 1(; 1 ( • 11.:. ':.(7<; c c .... "<
C • III C.CSd C.l':!:! ( !!) C.C<;l CotS 1 C.lCC r ! C 1
C.Ce.:. C.IC; C.CS') C 11 1 C.llb ( .1. C; 3 Co C2 7 ~ I'" I. .Cd S • (S:i ... (eo C (51
C.Hl (;.1C4 C • !l.l \ J r l
C.Ci'l C.11'; C.le 1 ( 1! 4 c.csz C.1C3 c.te} C.117 C .1C':' C.116 C. IlJ C ) I' C .11:; c. CS3 C .(74 f C 74 C. ( E7 C.C";o ~.(S6 C 1 ( '3 C.Ld:.; C.Ced c.esc; c c ,~ '" C • C i:j C.Ce4 C .10a C I" 7 E:
C • C 02 C.llG C.CS3 C (u"'t
C.1C4 C. t C8 C.1C2 c ! C 7
C.I0L c.es" C.CS4 C 1?' c • 124 C.ICJ C.CSl C '7S C.C8J· C. CE6 C .1(3 C ! 1 ! C.(Sl C.C<;2 c • ( 1'1 (" C7S c. (So C.C8<; C.C/:4 r (s:.5 C.C";6 C.C:fl C.(S4 ( ! C6
C.122 C.ICl C • C E g C ! Ii" C .1;6 (.13:3 C.CSl
1<;76
a 117 ..; .'.) ')3 c. t It J.')63 ) ,'?
J. 117 ".103 c. h7 C' llr.:.
J. idOl O. J'1J 0. 1 ~10 -, J,'I' j oC'·5 .::.12J 'J. 1 C4 \ 1 16
'.'.101 J.103 ,j olCC ) 1 (IS
U.U'-1Z \.J .. 1 :;3 '; • ..:87 0.1(,;1 tJ.103 1.1.121 J.t13
~.~t~
i) .Oy:; C.leo J.102
('''' 1
J.114 u.10'i -';.110 r I!)
0.1n J.C119 J.107
J ':'9
0.116 0.111 0.074 ., ] 03 :).1..089 0.073 O.lG7 ) !! 7
J.1n O.Odt C.le7
~ .I~~ ~ :J.J8~ J.101 tJ l,"'f 0.133 J.112 0.0<;3 ] ! 2 J
AVSRAGE
C.J'3v J. ~d'; 0.Ce5 ., '9' o. UC O.C<;<; J.lt.:6 o !'S ~
J. lC4 J~Cl.1G C.Ca9 C C .-:;"
Ll.CciO C.CS0 ;). ";6',
1S/.
~J • L 1 J ~.CC;tJ 0.082 (' (':);"
,) • .; e 1 0.1 U J.0ciJ j1 1 '"' 3
J.09d J.071 U.CSQ IJ r84 O.'Jt:J 0.u77 0.(;75 (''I (94 0.077 ~.094 O.lCO o tSl ].061 a.G8l 0.08d " C7G 0.0132 0.106 O.C8'=i o 173 Ll.094 0.C92 0.093 a 11 il o. Lll 7 V.ue6 o.ca:. ,'\ 12 5 0.066 0.086 0.111 () t'85 0.Li76 0.064 C.I05 a 00 7 0.J<;3 0.073 0.078 ,.., 07i'
J.01:3l J.077 G.075 !l "75
::l.117 0.087 0.081 .'\ ~ 9-1 a .l(;d o. lO 5 0.:]<;0

RATE OF RETURN ~EASURE 3
RISK 1969 1970 11911 1972 1913 1974 IS7S .\VERAGE
'HI'GHe::.y pl"kell 'i't(JE¥ C 5 2 5 C 20t. () 19 1 0176 0151 a 136 ,) 156 ,') 15 1 n I?; C 'r] " )," "17Q ~~EkICAN ELECTRIC FChER 0.516· C.IH3 0.177 0.153 0.133 0.123 O.11~ 0.120 U.C82 C~lld 0.141 0.135 ~TLAN1IC CITY ELE('~IC 0.555 C.l~C 0.197 0.176 0.139 D.12C 0.148 a.l~7 0.122 (.lf7 O.l~S 0.157 aANGOR HYCRG-ELEC CC 0.524 C.213 0.lS2 O.llb 0.145 C.l11 0.16S 0.100 C.lIE C.173 0.C79 Q.14d '3IHK !-tll!S pemEO f 1 !,'e! co J 4?f! C 143 Q 147 0 Ph Q 122 i1 172 01711 ,j 170 11!6S C lU "1"';' G 155
C~~TRAL ~AINE PChF~ CC 0.310 C.1S1 0.186 0.L76 0.114 0.144 0.174 0.153 0.111 (.136 0.14~ G.loU CENTR~l VER~O~T PlE StRV 0.76b C.le4 0.131 C.llC O.ObC 0.051 0.C86 -0.004 O.C6~ C.131 0.L35 C.OS3 CLEVELA~u ELECTRIC ILLUM 0.384 C.22~ 0.238' Oa221 0.190 0.172 0.169 0.145 O.17~ (.141 J.153 0.183 CCI·I·~tll'S f SGIHEP" one a 6CP Q <01 <1193 C 17" C 128 a C57 Q 122 Ii 12t 11 rs" C Illl "\ J~/* Q )43
UUKE POWER CC 0.612 C.216 0.216 0.186 0.093 0.1G9 J.091 0.113 J.lll C.152 0.1d6 C.14d DUQUESNE LIGHT CC 0.504 C.244 O.73f 0.2C8 0.154 0.173 0.156 0.132 0.12f C.14a J.lib 0.169 EASTEPN UTILITIeS ,ssec 0.761 C.209 0.L86 0.146 0.13C C.159 0.164 J.05l 0.C81 c.eS7 C.l~4 0.139 ~~~C~I~~~~~1~IO~S~E~'~lE~I·+t=T~~~T~~~r-~~c~~~!~c-----------g~.~~~;~~~~g~.-~~~~2~2--~~~.~~~2~l~--~g-.~~~5~l~~a~~-.~~~~~~~~g-~'.-ii'~j--~~~.~~~~~O~·--~3-:~!~r~2~--·~J~.~t~~~~~--c~c_.+i~:~~--~~~:~-1~1~~:~~--~;~:~~~~~5~-----E~PIRE DISTRICT ElEC1RIC CU 0.326 C.2U9 Oei2I Oe2CQ 0.209 0.l7e 0.161 0.153 0.14; C.l~c O.lc5 G.ISQ FLO~IJA PCWeR & LI(~T 0.575 C.181 0.203 0.194 0.17l C.Ld3 0.164 0.L78 0.L3! e.2C~ ~.LJ4 0.175 EIOHT:J' PC-MER ccgp C 636 C 1<;;2 "206 0 no 0 183 c 17 1 1']74 I) 141 I, I~Si1 C !f.e " lj5 I 17\ GE~ERlL PLBLIC lTILITtES 0.629 C.ll5 C.124 0.089 G.Of4 0.096 0.117 O.lil J.llt C.122 0.143 G.ll2 GKEEN ~CU~TAI~ FC~EF Ccpp 1.063 C.163 0.150 0.136 0.C95 0.U03 o.csa a.04~ O.13~ C.l!5 0.166 0.114 GULF STATES UTILITIES en 0.484 C.216 O.Zil 0.205 0.188 C.163 0.17d 0.172 C.l7E C.l!2 J.l45 0.181 ~r!t\N EICCTRiC (C a 477 C ]4' Q 16 3 a '62 Q ]47 C;'35 0 1;9 ') 13? [' 13' ()"'B ,"\ '5" C 146
IDAHG PCWER (C 0.363 C.131 0.148 0.160 0~169 0.19C 0.174 U.147 Q.141 C.ill J.143 J.151 IN~IA~APClIS PChER E lIGHT 0.694 (.247 0.246 0.238 0.213 . 0.~09 0.239 0.194 O.13f C.16~ C.IEO 0.207 KANSA~ CITY PC~ER ~ LIGHT 0.481 C.IH2 D.Ise 0.176 0.156 0.155 0.143 0.131 0.143 C.152 J.l~l J.15~
J::. 4 ~J co A) ,..., 5 r ::! E C T Gte 0 5 5 M C 1"" 2 0 OJ? J Q 2 ~ 6 Q 2 1 4 Q I t3 C. ., 1 7 t1 ,)] 4 i () 1 3 4 (] s ., ") i:; --} (~J S " KENTUCKY LTILITIES CC 0.465 (.~03 0.204 0.207 0.178 C.160 J.l49 0.155 J.Ioe C.l~2 J.l~H C.16Q MAINE PU~LIC SERVlcr 0.491 C.144 0.135 0.154 0.155 0.124 C.137 0.173 0.2(2 C.lt2 J.19C G.15d ~rD~Le SC~TH LTILI1IES 0.417 C.169 J.185 0.194 C.18S C.16S 0.174 0.165 O.13f C.124 0.133 0.163
~~~d3ypE"E~wa f LtCbT 8.658 ~.i59 J.l62 g.lg o.lH 2.11; 8.1;1 ci.i3~ j.bj~ E.ln ~.iit S.1l9
NE~ ENGLA~O ELECTRIC SYSTEM 0.53J C.16C 0.148 0.128 0.128 0.138 0.169 0.133 0.143 C.113 0.177 C.IS0 NOkTHEAST UTILIIIE~ 0.582 C.171 0.155 0.144 0.086 0.lC5 0.125 0.11U 0.C91 C.C96 J.121 J.120 'H{'-" ;]15[" C r ' a '32 r )41 0 236 0 '?&:; (, 185 015H Q It;,3 "115'= (. I"'~ ( 1(7 ., 1'{~ 172 OKLAHO~A GAS & ELEC1R[( 0.342 C.226 Q.230 C.259 C.260 0.217 0.229 0.l21 ~.ltit C.lt~ J.l~4 J.2lt DTTER TAll PO~E~ C( 0.2al C.17) 0.152 0.168 0.173 0.212 0.203 0.184 0.136 [.152 0.187 0.174 PEN~SYlVA~tA PChER ~ LIGHT 0.441 C.1~9 J.1Hl 0.154 0.099 C.13C 0.156 0.160 G.ldC C.177 0.153 O.L5i ~§~E~'¥~6~,M~~~~C~I~C=E~~~~~~~T~~~f~t~~~+t~t~E~J~R~r~!~(~Q~--~~-.~t~%~t~--g~.+1~i~4--~d~.-1~!~~3~~--~2~.~O~~~§~--~2-.~b~~~1--~c~1-.~O~4~§--~ci~.~1~~~}--~3-.~i~L~~L---0~)-.+i~~~~~~~~.tti·~' --~\~1-.~1~;~Y--~;~.-1~]~0~!-------PUBLIC SERVICE CC CF IkO 0.423 (.21C 0.223 0.217 0.205 0.165 0.196 C.205 0.1~~ C.l~C 0.232 0.2C3 PU~LIC Sf.QV!CE CC (F ~ H 0.56~ C.165 C.l65 C.l92 0.166 0.118 0.116 0.104 J.te! (.112 0.142 0.146 OLIS! Ie SER\tTCF (C CF b 1-Ir:', Q 59? C 2'6 '12 0., '" ]5 7 ..., 1y' C 17 6 Q 1,5 Q 1G5 .J 13; C 't(~ \' 12ft .... Ion P~GE' SCU~C PCWER [ LIGHT 0.476 C.U96 0.101 0.09G O.CA7 0.095 0.115 J.IU5 ~.151 C.151 0.142 0.113 S~V4N~4H ELeC & pe~E~ 0.537 C.162 0.183 0.173 0.153 O.ILi ~.C99 U.Ol~ G.C93 C.137 C.118 0.132 S~lJrHER~ CALIF EDI5C~ CC 0.382 C.143 0.125 0.l20 0.123 0.lC9 0.ll2 0.111 ~.l~j (.123 J.127 ~.129 SCUTHERI\ CC 0.504 C.175 0.17'; C .. ler; O.lel C .. 121 0.123 C.U2 J.C7E C.17:3 C.Dt C.146 srUTH~ESrERh ElEe SER~!CE 0.371 C.l80 0.183 0.208 0.218 C.212 0.210 0.~1) J.21C C.~C5 0.190 O.20j SeUTH~ESTERN PUBLIC SERV CO 1.374 C.199 0.2L9 0.23C 0.238 0.239 U.209 O.~l~ J.24E C.~17 C.245 0.226 T~MP4 EL~CT~IC en 0.773 C.228 C.203 0.198 0.18C 0.118 0.179 0.170 O.les C.17~ 0.171 0.174 TeXf'S !lITI IllES cr 0 199 C 25 7 Q "'loS a 277 0 26 1 C 2)5 lJ '33 n 11·' () 'Si I" 1;] ., 196 a 225
Tl'lfDU EDISON C(.'.qPA"Y 0.418 C.241 0.251 0.250 0.221 0.202 0.202 0.17d O.lli C.167 0.147 C.19., lJt heN ELECTqIC CC 0.400 C.1H 0.163 C.164 0.161 C.llC o.ceo J.110 O.C!lt C.156 :).1I:l7 C.140 U~ITEJ ILlU~I~ATI~C CC 0.412 C.205 0.lb6 C.20~ 0.174 0.107 0.213 0.11~ u.14~ C.ll1 0.102 0.156 ~ '& 0 r. g ;> E ~ J 1\: 5 I 'I 6. P r » F 6 Q 44 Q C 1 t? 8 0 J e £. C J c: 7 0 l' 23 a 1 2 1 ) J 76 'J 1 75 I ~ ,"'\ H c; C J 1 5 C' E 2 n \ 4 7
UTAH PO~ER & LiGHT 0.344 C.l~3 0.151 Q.Lla 0.129 0.ll7 0.143 0.115 J.Cgf C.125 C.172 0.135 VIRGINIA ELECTRIC e PChER 0.617 C.193 0.189 0.175 0.150 0.114 C.I06 0.111 0.e7~ C.12C 0.124 0.135 A~IZONA P~BLIC SE~\IC( cn 0.491, C.I02 w.l2C 0.134 0.143 0.124 0.124 0.131 0.1C: C.140 0.117 0.125 "'il rr:.lCGF GAS f' CI F(lRl'- ,J 421 C nl~ (' 2,,7 11 238 !l 146 0 173 ~ 1511 1 1."0' ,J C'"E C 1G3 C 1(,) .Q 175 CfNTR4L H~OSC~ GAS e ELEe 0.4g0 C.17C 0.171 0.152 0.ca9 0.163 0.183 0.142 0.C6e C.11e 0.1~4 0.143 CENTRAL llLlNe15 LIGhT 0.4R7 C.la? 0.186 C.192 0.203 0.167 e.11? 0.141 0.lL2 C.III v.l53 0.165 CENT~AL ILL PUULIC SEPV1CE 0.567 C.245 0.245 O.23~ 0.208 C.198 O.ISa 0.145 0.145 C.15S 0.145 0.189 C!'CHI'IATI ellS & F! FerRIC Q 23· C 255 jJ 2<;8 C"'46 C 214 Q 164 C 2111 I 'a g 'J 134 ,. 127 "I~;:; "lSJ CGr~SOLIOATEJ EGlSC~ CF N.Y. 0.d02 C.09S 0.102 c.ose 0.C59 0.C6S J.C63 O.vlZ O.C~i C.130 0.150 O.O~j CCNSUMEPS PCWER CC v.71t C.198 0.186 0.l7e 0.157 0.121 0.115 J.I07 0.C55 C.114 C.t5C 0.137 9AYTON PGftER ~ LIG~l 0.479 C.217 0.236 0.212 O~L61 0.154 0.142 0.103 0.~Sc C.166 J.160 0.171 Obi '" J,l \1 \ g c: ;;? ( !. 1 (; 1=1 ') 4 n C;Z Q a Q :n f.a Q 1 V Q 1 :Hi C 1. Bel n J 1" '" iJ' 1 i (' ;; " 'rl t; 2 ," 1 4 ~ FITCH6URG GAS & ELfC LIGHT 0.387 C.133 0.151 0.126 0.116 O.lll 0.12, 0.099 0.071 C.ll, 0.141 0.119 IlLINCIS PCWER CC 0.4Q7 C.274 0.274 0.27C 0.244 0.186 0.165 0.164 0.143 C.179 0.151 0.2C5 INTERSTATE PQWE~ CC 0.436 C.204 0.201 O.lOS 0.189 0.l9C 0.1~3 O.19~ u.lee C.179 0.156 0.190 1[IJ4 E'EC1BIC I J'"";bT r o'eR 0 71 3 C 1·'& ,,74 C '(7 C tr.;6 C 12Q .) 16'" ,) '3J ) ,"41: C 1]6 ., 148 !~ 14C
rC~A-ILLI~OIS GAS E ELEe 0.734 C.215 0.207 0.196 0.157 C.l2C 0.214 0.156 O.16~ C.181 0.187 O.IBO YOWA POWER ~ lIG~T 0.353 C.206 0.Z02 C.lSe 0.145 C.16C e.150 J.185 0.154 C.l~S C.178 0.177 IOWA PUBLIC SER\ICE CC 0.304 C.2JO 0.213 0.IS1 0.169 0.186 0.147 0.13~ 0.153 C.IB0 0.168 0.175 IPbj¢ SOIITbr::RN !·ll' IllES C~ 0 5 71 C "r~2 .123' D 24 5 Q '3D Q )JA Q 72" '11'jb Q 17J. C 171 ) 16~ 0 '(6 KANSAS POflER & llG~T 0.281 e.l~O 0.202 0.~11 C.217 0.211 0.194 O.IGb U.14E C.16G 0.151 0.ld7 LAKE SUPERIGR erST ~C~ER LG 0.31j e.149 0.169 0.l40 0.124 0.141 C.174 0.155 J.15f C.175 0.141 0.153 LUNG [SLA~D LIGhTI~G 0.530 C.118 0.171 O.lBa 0.168 0.167 0.143 0.L29 O.ll~ (.146 ~.154 0.156 I (;\! I S \l r t 'C ,... 6 S f E t Fe T? T'" Q 4 'l 6 r? 4 7 Q 263 (1 2 t. 7 Q 0' 4 ," c'" "' 3 0] 9 d I"' 1 H 3 f) 1 &: ~ C 1 C;? ., 1 0 '* "} 1 6 ~4UISGN GAS & ELECTRIC eu 0.367 C.11S U.122 0.14C 0.117 C.l2S 0.L19 0.L60 Q.i3E C.l~7 J.171 0.141 MISSCURI PUBLIC SE~\lCE CG 0.631 C.215 0.194 0.1~4 0.201 0.161 0.186 J.144 0.17: (.lSC C.216 0.L87 MONT4NA PCWER CC 0.311 C.200 0.19C 0.221 0.213 0.203 0.194 0.187 0.154 C~139 0.094 0.179 "1£\ t;i'l"bHJ GAS & HECT\lF ? 'i;!'i' C lH I' 16~ C ltd? Q 1)8 C lSS 'J 144 oj U6 ') 161 C It) ~ '72 Q 1'6 NEW YORK STATE ELEe & GAS O.5i4 C.178 0.168 G.i4C 0.120 0.094 C.ii7 0.123 J.12~ C.114 O.ll( 0.13l NIAGARA MCHAWK FC~EF 0.490 C.153 0.115 0.115 0.094 0.10C 0.120 0.014 O.CSl C.130 0.098 0.10S NORTHER~ I~nIAN~ PLEltC SERV 0.317 C.247 0;241 0.231 0.240 0.197 0.200 0.181 O.l3t C.164 a.lQl 0.l03 NOOIHFRt> ST:\TFS grM"FA 0471 (199 o.,n2 C 1£1 Q 179 C 176 t1 !yo ,) 151 n 144 C ]52 )" 1ft ? a lQ?
NORTHWESTERN p~eLIC SERV CO 0.392 C.176 0.173 O.lSL 0.192 0.208 0.196 0.1~7 0.131 C.ICl 0.168 0.169 ORANGE £ ROCKLA~O LllLITIES 0.637 C.177 U.169 0.139 0.158 C.050 0.C82 O.IOa 0.082 C.141 C.169 0.128 PACIFIC GAS & ELEC1~[C O.24J C.161 0.158 0.154 0.L31 0.149 0.1~2 0.135 0.12e C.CS6 0.J00 0.133 paCIFIC RCMER £. LIGk! ,) 43 7 C l')8 0 1 13 C 114 0112 C 13 7 a J M? {) )"5 Q ecc ell? "117 (] 117 PHILADELPHIA ELE(T~!C CO 0.438 C.175 0.154 0.143 0.113 0.137 0.134 0.125 0.114 C.127 C.l30 0.135 PUBLIC S~RVrCE CC Cf eCLO 0.365 (.158 00165 0.161 0.L5C 0.128 0.134 O.12~ O.C~4 C.153 0.141 0.142 PwBLIC SERVICE flEC & GAS 0.609 C.15S 0.160 0.142 0.104 0.l3C O.OB~ 0.083 O.lu: C.120 0.161 0.125 Rcr~fESTE'1 G6S f F'FcTiJtC Q 60 6 C 17c 01 4'1 C 12Q Q 'ee c 11~6 Q 112 fl '5] I) r .. 11 C J")(') ,., 1")7 Q 126
ST JOSEPH LIGHT & FC~ER 0.599 C.179 0.209 0.175 0.187 C.22C 0.Z05 O.L5d C.L4E C.154 0.153 0.179 SA~ DIEGO GAS & ELEC1A!C 0.511 C.1h5 Q.169 0.178 0.147 C.129 O.ogo 0.081. D.IIC (.L42 0.125 0.L24 SIERRA P6CIFIC FC~EF CC 0.502 0.114 0.ll3 0.104 0.IC3 C.l~C J.121 J.l26 C.L2E C.118 0.163 0.120 s..ClfTH C>'RC' IVA E,er f ~\S Q >141 C '94 e "'06 Q l~O Q '35 C 1('6 11 115 () '0 1 ,) JIJE C 1(,,5 ' 144= 0) '4S SGUTHER~ INDIANA G~! & ELEC J.445 (.218 0.231 0.232 0.227 0.214 C.2Jo 0.236 O.l~1 C.l~8 0.213 C.220 TtJCSG,\j GAS & HECHIC 0.532 C.1SC 0.179 0.lE3 C.185 0.144 ,0.13Q O.la 0 .. C63 (.153 0.166 1).152 W~SHrNGTC~ ~ATER PC~ER J.282 C.135 0.156 0.156 0.146 0.144 C.137 0.137 0.l42 C.149 0.173 0.147 l,:rscitNS1bl !:IFCTRTC 'CItEii' Q lIt] C ]'17 Q 'SC, 017C 0146 Q !58 ,17,""9 .) )39 I' JCC C 153 ) 197 Q 185
WlSCCNSIN PCWER E LIGhT 0.419 t.225 0.234 0.224 0.213 0.177 G.lla 0.180 J.l03 C.23~ 0.264 0.209 ~ISCCNSIN PUBLIC SEF~!CE 0.291 C.232 0.213 0.196 G.199 0.154 O.la~ 0.194 U.183 (.~48 C.295 0.210 MONTA~A-CAKOTA Ll!LITlfS 0.2bL C.150 0.167 0.l70 0.174 C.16e 0.156 Q.ll~ O.12~ e.153 0.179 0.156
111-72

RATE Cf RETURN ~EASURE 4
CC;-';PAfl.Y NAI'E RiSK 1<;61 1968 1969 1970 1.<;72 1<;14 l'i7'5 lq6 AVEf\AGE
1IIrGdEi'Y Pr>:'E3 <::'t<J"'''' a 95 C 141 \) 177 C 1"1 0 127 0 lIe ,., 124 il J44 \) 12t (;:~r ) IS" "16':'
EL PAsa FLECTRI( CC Q.358 C.228 U.230 U.243 0.226 0.213 G.21~ U.21~ O.~7C (.~4~ J.l2~ 0.232 EMPIRE JiST~ltT ELECTRIC LO 0.326 U.207 0.215 U.172 C.186 O.16~ 0.160 0.152 J.14'i C.15B 0.171 0.174 FLORIDA P(W[R & LIG~T 0.S15 C.le7 0.203 0.L94 0.l71 0.155 0.1.24 0.193 0.222 (.tSS ~.~12 0.236
_ F! r.p !:) l tJ [ ",;: 8 f" cP F J 63 6 C 1 59 n I C 7 a! 9 2 C! 6 S 0 J 44 !l 1 '3 l J 1" ., t! 6 Ie.; 4 :, \' f.'" It .J 2J; GE~ERAL PL3LIC LIIL1IIFS 0.629 C.lle 0.102 0.059 0.C39 0.063 J.L75 J.C~) 0.171 (.IS5 C.2~7 C.123 G~EEN MCU~T~IfI. PC~EF CCKP 1.063 C~lS5 0.126 0.JG5 G.055 -G.045 C.C3S O.U~? 0.142 C.163 C.17S 0.096 GULF STATES UTILITIES CC 0.434 C.lOl 0.201 0.183 0.159 0.144 J.156 J.loi J.253 C.~tl C.2d3 O.ZOj HI hi 'I r \!\, F! F" TR Ie (C C 47 7 C 1 4 G 11 l'? 6 cJ 1 cq C P 1 C! 2!' .J 1 1 tj \ 1 3' " J 3t CIt 6 I' 1 6 1 n 1<:13 i~4HO PC~ER CC 0.363 0.113 U.147 0.15~ 0.16<; C.17B J.164 J.170 u.152 C.ll~ C.1S~ 0.1S] INDIANAPOLIS Pt~ER E LIGHT J.6~4 C.2jl 0.225 0.21e 0.204 0.lS2 0.2C; 0.l~6 0.l7~ C.~29 C.711 0.267 KANSAS CITY PO~ER [ LIGHT 0.431 C.177 0.171 0.165 0.148 O.14C C.121 u.l~5 C.l6t C.IS~ J.~5q 0.167 0( 4 11"') G···<: '" f'EfJ6JC J 5t;3 C '/10 0 ";,-, 0 ")")1 G 19 S C 15~ ," J)(. \ 1, r' J4' ( ~11 1 III I] )84
KE~TUCKY UTILITIES CC 0.465 C.L03 C.701 0.196 0.15~ 0.141 C.129 J.l~Z 0.14t C.23L J.21~ G.1HC '~AI'IE PU9UC SEJ:\lICE 0.491 <':.1.,,3 0.133 0.153 0.153 0.123 C.13o J.l71 G.iSe; C.151 J.l:)l 0.155 ~IDOLE SOuTH UTILITIES 0.417 C.156 0.175 0.183 0.168 0.148 J.144 U.l~~ 0.2C7 (.~C4 J.3h5 O.lSS '''IN~ICCCTj DC·tiER r lIGb! (. ~<)O I' )1.6 ,119r "178 Q 157 I' 1 .. 6 ! Jill ) j;'j 111,7 C ;?:. ) 1"5 I) Ib'J
S~jSNNAH ELEC , OChER 0.537 C.16C 0.181 0.162 C.l27 C.~75 0.C66 J.J5~ J.14C C.~7; J.191 0.144 S'~THERN CALIF EDI~[~ CC 0.382 (.136 0.115 0.103 G.IOB C.CS6 0.106 0.l1Q 0.25? C.lfC 0.183 J.13d 5,'HH"RI>. CC ,).504 C.167 0.171 0.175 U.142 0.GS5 C.Cad ").145 O.lOS C.S28 ;).280 0.191 ~UTH~EST~R~ FLEC SE~VICE 0.371 C.178 U.181 0.207 0.211 C.21C C.2eS J.211 O.2eS C.~C4 a.iRe 0.~C2 SrUTHWESTERN PLBLIC S~RV CO 0.374 C.194 0.2US 0.227 0.23C G.2Zf O.2e6 0.Z34 0.3Ct C.312 G.333 O.24d T~~P~ ELECTRIC CC 0.773 C.210 0.l~4 C.176 0.149 C.I09 G.l60 v.17d O.ll~ C.~S5 0.229 O.ld2
~¥~~~~c~~~a~O~!!~t~~~\~i~[~.l~jE~C~'~C~;~~~~~~~y~--------~g~.~L~i~§~·--~§-.~~~;~7~--~8~.~;~t~t~~§~.~2~'t~3--~C~.~~~1~~i~;~~L-~L~~~.7i~6~4~~J7.~3~?~f~;--~4~j~~~.~~--~t~:~.~2~~ t~.~4~1~f~~;~.~:u·~~5~I~b.~lr.~~~ u~lnN ELECTRIC CC 0.400 C.154 0.148 0.13~ C.134 C.CSl C.C59 0.107 O.IO? C.~57 O.~21 J.1SJ ~~IT~J ILLU~l~~T!~C CC 0.41l C.182 0.154 C.201 0.173 0.104 C.202 J.l~6 2.52t G.14j J.112 J.3S4 .DO'-2 OC:-'P,SIIII1 OCHG l440 elf" Q ]f.? t I"t G 1'" ellS 0174 ) 172 '1 "'BE C 114 I' Ipe:; 0146
UTAH ?O~EF & LIGHT 0.344 C.149 Q.141 0.135 0.114 0.lJ6 J.l~l J.llS O.lJ~ C.152 0.2~1 0.145 VIKGI';I~ ElECT~IC E PC~ER 0.617 C.leg 0.175 0.149 C.IC8 C.C55 0.033 J.J86 0.C54 C.38L 0.515 0.175 A~IZONA PG~LIC SEP~iCE CO O.4~1 C.O~o 0.104 0.12~ 0.139 C.ll' 0.106 J.14~ u.16~ C.~74 C.2~4 C.i66
--3J,! T r"CSf G.\S r, CJ FCIdC :1 42,J C 24C '[1 24" Q U3 \~ 174 0 P" 0 CS5 ) I ~'" I "·if C 1.,0 ! <61 ,1 3~8 CE~r~AL HLJSC~ G'S [ ElfC O.4a0 C.l~l 0.165 0.146 0.C75 C.134 ~.138 0.169 C.CbC C.161 0.184 J.13d C.E"lTKAl llLl'IUS lIGI-'T 0.l,ti7 0.174 0.177 0.ld1 0.1'11 0.158 0.153 :].163 OdS;: C.::76 0.2:'1 ;),201 CENTRAL ILL PLaLIC ~EPVICE O.5bl C.242 0.243 0.235 0.1~7 C.lll 0.132 J.149 O.11'i C.~34 J.251 0.203 r pIC UFB II j" A S f q f C T ere J 2:1 4 C'" 4 9 (1" 4 5 r 2?" C 1 e" ('! 5 1 J! n I / 1 i! D I 'i 2 C 1 77 0 i ,. 4 ,) n <} CCNSOllCATEG ECISC~ CF ~.Y. 0.~02 C.CS4 0.091 0.077 0.C41 0.047 0.C36 0.063 0.12~ C.143 0.169 o.~~a CC~SUMERS POWER CC 0.711 C.193 0.178 0.158 0.136 C.C~S G.Cd7 J.1UL 0.CS5 C.14Y 0.206 0.136 uAYTCt. PC~ER ~ LIGrT 0.479 C.209 U.218 0.186 0.132 C.135 a.l~l J.I03 J.Lle (.(4~ 0.254 C.178 C}fl':l!\O\(4 FC',IER ~! l(l"! ? 412 C ZOI l' ;:06 n 11" C 111 Q ,'Qb a (7<'; 1112 O!SC C 1C6 ., '89 J '3"
-I
F1TCHtiU~G G~S & ELEe LIGnT 0.3~7 C.l31 0.149 0.125 0.114 0.111 C.ll9 0.096 O.C61 C.ll1 0.150 J.ll7 ilLINCrS PCWER CC 0.497 C.27Q 00,65 C.24e 0.223 0.173 0.145 U.16R G.181 (.22S C.1Q7 0.209 INTERSTATE ?O~ER CC O.43b C.190 0.198 0.207 0.1&4 0.18S C.190 0.203 0.213 C.~a3 0.538 0.239 !;i\JA E, C rT}1TC '{":I=J F: pl)R ,'"' 7 1 "3 C 16C .) 166 0164 0143 G ('55 f't frtb ;) 1,,0 -,) r,e (lId 11 14d Q 11~3
ICWA-!LLI~CIS G~S ( ELFC 0.734 (.205 0.19C 0.162 0.115 C~Co2 J.ldu 0.163 u.lal C.l~6 0~211 v.Ltg rC~A PO~ER & LIGHt 0.353 C.205 O.l~= G.lel 0.139 O.15~ 0.14d J.L12 G.ld1 C.~41 0.247 O.l~l IOWA PUBLIC StRV!CE CC J.304 C.l~9 J.21C O.18~ 0.154 0.162 O.lLa 0.144 O.lal C.~C5 0.~06 0.178 J[l',H Sj"I!IbP'1 l'If! rITES cO 0 57l (2'-'G Q 214 (' 243 C 228 0 217 !l 21t! ] ?l'1 ~ 2t;1 C 2C4 j"1 175 i~ 217
-I 1 MADISON GAS & ELECIFIC CO 0.307 C.115 C.LlS C.L31 L.ICO c.eaa C.J7Q J.221 ~.7~'i C.3eD J.221 0.ze7
~[SsaURI FU~LIC SE~~ICE cu 0.631 C.ld4 0.126 C.L2S C.l~2 C.153 J.175 Q.L42 J.ld~ C.~C3 0.226 0.171 MONTANA PC~ER CC 0.311 C.195 0.183 O.21~ 0.213 0.201 0.191 0.19& O.l~' (.164 0.096 0.184 'I E lj C ~I G J A!\ 0 r AS r Fie ( T? I ( ') 5" 9 C 1 49 !l 1 3 c Q 1 3 c () 1;;' S iJ 1;. SOl 3 b ,) 't 1 3 1 ,"'\ J 4 1 C 1 3:'; '] 2 1 Q (1 J 47 NE~ YCRK ST4TE EL(C £ GAS 0.534 C.172 O.l4~ 0.lC9 0.L05 G.C87 C.l09 J.12~ 0.t54 (.152 0.232 04140 NIAGARA MCHA~K PG~EF 0.490 C.140 0.095 O.J9J 0.077 O.CdS O.C9b 0.063 0.111 C.lel 0.122 0.107 NCRTHERN l~DIA~~ FLELIC SERV 0.331 C.237 O.23C 0.224 0.23C 0.188 C.179 J.L16 0.223 C.267 0.25~ 0.225 !\lOaTHERN qj,TES POFF Q t.71 C IH2 () 161 0 In () 147 C 133 0 141 0 1;3 il IHt C <51 r, '63 0 IIl4 NORTHwESTERN PL2LIC SERV CO 0.392 C.174 0.17G 0.179 O.ldS C.2CC 0.175 0.2~0 1.451 C.~SC G.2Ub 0.337 ORANGE £ RGCKLA~O lllLITIES 0.637 C.17i 0.148 0.122 0.141 O.C2e O.C48 0.11l 0.C91 C.155 0.163 0.119 PACIFIC GAS & ELE(l~[C 0.240 (.149 0.151 0.147 0.119 0.133 O.lZO 0.138 0.154 (.(sa 0.108 0.132
~6~Lg;t~\~EU~1C GC 8.~~~ f.igi 2.iZ2 g:13~ 8.S~6 8j~; 8.6~6 3.E~ 8.1U ~.1g 3Jtz t188 PIJ811C SERVICE CO CF CCLO 0.3h5 C.14<; 0.152 0.L57 C.139 D.llG 0.108 J.llS w.l2e c.ng '0.1<;1 0.14t PUqllC SERVIce ELEC £ GAS 0.60~ C.152 0.149 G.13C C.C81 0.096 0.e4S 0.058 O.14f C.18~ 0.316 0.136 RC{'Y~ST~R r;4S e E' FCIRlf Q 6i16 C lSS f) 1?? a ·"01 Q CBS 0 li,A Q J·"Y ,) 1,9 o,"g;; C J4C .~ '6''1 " ,..,.., ST JOSEPH LIGhT & FC~FR O.S~~ C.lod G.1ge O.ltC C.184 0.219 v.ISS J.170 0.1g~ C.l~2 J.i~9 0.1~7 SAN D!EGC G~S ~ ELECTRIC 0.511 C.162 0.166 0.174 C.142 0.117 C.CdO J.072 J.12~ C.C2J 0.213 0.127 SIERRA PACIFIC FG~E~ CC 0.502 C.lu5 u.O~R 0.10C 0.C93 O.CSS C.114 O.l~~ 0.12i (.llg 0.173 0.116 SillTH CAO(! PI" El FC t' l~jS 11 =<41 C Ijlb 0 197 0 157 G c9S 0 C78 .',1'89 ) )83 j) 124 C ~56 .) 361 t 16 3 SOUTHER~ I~Jr~~A G'5 & ELEC 0.445 C.il? 0.228 u.Zla 0.209 G.l~7 O.l~~ O.ill O.20S (.210 0.240 0.215 TUCSON G~S ~ ELECTFIC 0.532 C.loS 0.172 D.l7e 0.176 0.124 Q.C97 O.lld -u.~7~ C.~S5 C.JC4 0.155 W4SHINGTO~ ~ATE~ FC~E~ 0.232 (.135 0.151 0.152 0.138 0.131 C.110 0.1~7 U.l~~ C.153 J.185 0.145 ~ '; S I '. ~! r: C1 RIC • F C I. ~ C, ,., , ! l I' C! ,37 ". <; <: 0' '" 5 C J (3 C) !. 4 !' 1) 1 Q: 4} i'; I ; c;' ) 3 "., 1 3 ." I ii 5
WiSCONSIN PO~ER ~ LIGhT O.4r~ C.223 u.226 0.2CC C.19S 0.141 ~.ljd J.l~6 J.ill C.~24 0.340 O.2J6 ~rSCChSIN PUDLIC SE~~ICE 0.291 C.22S ,).203 0.L14 ~.11S C.llS 0.145 J.25~ J.34E C.~25 0.344 C.232 ~G~TANA-OAKJTa LTILITIES O.2~2 C.14S 0.165 0.170 0.17C G.1S? 0.150 J.lla 0.112 C.142 0.176 0.150
III

RATE GF RETURN MEASURE 5
CCMPANY N~"E RISK J.968 1969 1<;70 1.971 1972 1973 1<;74 1 "IS 1916 AVERASE
A~EQItAN EtECT~IC FC~Ek 0.516 .0.113 0.157 a.ll~ 0.089 0.C73 O.Cb7 0.06d J.G13 C.C~4 J.13~ J.JS9 ATLANTIC CITY ELECT~IC 0.555 C.ld7 0.188 0.160 0.11C C.C78 U.1Ul J.OYd 0.C81 (.ltC C.I10 C.133 SANGCR HYCRC-ELEC CC 0.524 (.210 0.188 0.165 0.128 C.ll1 0.169 0.100 u.12( C.17~ 0.067 0.143 AI:}(K HIli 5 DCqR f ! [GHI cd 0 429 C 143 \ 143 Q 122 0 PZ Q 171 r; lIe .) IV n l1 c ,1"1 ) 154 J 153
4!I=GH(fSy pr".E;R C:YCJPJ Q 525 r 191 11 171 0 151 a 127 Q lIe 0 124 0.135 0 1]':1 C co C 210 ,., '%
deSTON ~nlSO~ cc 0.S25 0.156 0.157 0.L33 D.ce5 0.C48 O.Old 0.J6R O.C6E C.CSci O.J~S 0.J9J 8KASUN LTD-CL ~ 0.614 C.C68 0.068 0.-365 0.C65 C.e73 0.C72 0.0Jo 0.C61 t,t43 :J.tJ47 C.065 CAROLINA PCWER £ LIGhT 0.609. C.173 0.187 0.151 0.052 0.C76 0.121 0.054 -0.GlC C.l~2 0.1q] 0.112 CE~JTR~I r ~ol!lH »!Oq 'ceRP a 3g'3 C?!2 0223 Q 234 021'3 C '55 f') 213 ) ?17 C,?t C CIS'! ., jl? 2,(" CE~TRAL MAINE P(wE~ CC 0.310 C.1Yl U.lb5 0.111 0.166 C.llS 0.174 0.1S3 O.llf (.133 0.L23 0.156 CENTRAL VER~n~r PlE SERV 0.766 (.158 0.111 C.077 C.C3C 0.018 0.C59 -O.CUS U.C6~ t.133 0.131 C.C7~ CLEVELAND ELECTRIC !LlU~ 0.384 0.224 0.225 0.198 C.164 0.154 C.144 U.l3~ O.17e C.lld O.12d 0.106 CCI!!\I"I!$ i S"\:H'FRII. cHc 'J 6,''\3 r 194 Q )tll' 0 15& r 098 a a6S a CH8 ,J \ilo n (')4 (I];: I' 116 Q !.'1 CG~~ONWEAlTh EOIS(~ 0.3J1 0.212 U.203 0.172 0.136 O.lGD 0.126 0.137 J.127 C.141 J.142 0.150 tO~~UNITY PUBLIC SE~~ICE 0.435 [.158 0.173 O.ld6 0.184' O.lS5 C.200 J.l~l U.142 C.15C J.179 0.175 CUNCORO ELECTRIC CC 0.000 C.097 0.136 0~127 0.119 ~.t2C 0.139 J.102 0.132 C.219 G.IBo 0.138 ~iPf.n ~ b w ~ S 1 ~w C C g ; n 1 E = 1 t2 g .t ~ i g: 1 Z ~ g : g j; a . Jfr-...Jg":.'-..... "=§~i~~:------;)J..,) .""Jd-
I
4,,-7 ==-~--':g~.""2::-c¥~.;~! --':~-."':1-"2~~-· -~o.&.'j -.... [J:,;,~..;{-....... f)J,..) -./..{:..~..3g ___ _ DUQUES~E LIGHT CO O.50~ C~231 0.222 0.114 G.1C3 0.139 0.116 J.I07 O.ll~ (.1'6 C.l06 0.146 EASTERN UTILITIES a!scc 0.761 (.204 0.lS0 0.136 C.I1C 0.139 0.151 0.02b U;C3f C.[~2 C.lS~ 0.i2l
-~~~~t~~t~~~!~~~:o~5~~~L~~~~~T~~~r~c~t~C~t~E4!~C----------~g-.~j~~~~~--~E-.~~~~~8~~C~:]~2~~~~--~8~~~1~4~5---"8!~o~~~~~z~--~8-6~1~f~~~--fr;~t~ ~6-.4J~i~§~~o~J-.~~~8~~~~l~.~1~~~ci--~g~.~th~~;~'--~~-.~~~i~§~----EMPIRE DISTRiCT ELECT~iL CO U.326 C.207 0.~15 0.172 0.186 0.16~ C~160 J.l~l O~14i C.156 ~.166 0.173 FLORIDA PCwER & LIC~l 0.575 (;187 0.203 0.194 0.111 0.155 0.124 0.163 U.12C C.221 C.IGS 0.165 F!!l!U'J$ O('..r: Q ergo 0 636 C!il9 C 197 a 192 Q lt5 a 144 a 133 '1 094 ;) C14 C ).1,6 0 157 a 14-; GENERAL PUBLIC LTltITI~S 0.62~ C.12C 0.102 O.05S C.039 0.C63 0.C75 0.067 o.cae C.te2 0.133 0.0~4 G~EEN MC~~TAI~ FChEF CORP 1.063 C.155 0.126 0.C~5 C.C55 -0.C45 0.C39 0.048 0.134 C.157 0.167 J.093 GJLF STATES uTilITIES CC 0.484 C.201 0.201 0.183 0.159 0.144 0.156 0.15~ 0.114 ~.143 0.133 0.166 HIl'../IITI4N EICCTRIC CC n 477 (14;' Q 156 a 157 C 137 C I2B a 118 d 1(3 I' J22 .- 1"'5 ,ISJ 11 135 [DAHO PCWER CC 0.363 C.113 0.147 0.159 0.169 0.178 0.164 0.129 ~.111 C.112 8.143 ).143 INDIANAPOLIS RC~ER E LIGHT 0.694 C.231 0.225 O.llO 0;204 C.192 0.209 0.176 0.131 C.156 0.111 0.190 KANSAS CITY PChEP fLIGHT O.4dl C.177 0.171 0.165 C.148 0.14~ 0.121 U.ll1 U.14~ C.147 0.151 0.149 K AN S A 5 r 6 S rEI E C T r; J C f) 55 a c, , CD" 2 r Q 2' 1 r 1 9 9 r J 5 8 C J") 0 0 i 1 ':., !) 1;\ ( elF 5 r'"' 1 7 Q Q t 1 74, KENTUCKY LTILITIFS cr 0.465 C.2C3 C.~Ul 0.196 C.155 0.141 0.129 0.142 J.ICl C.IF9 0.146 0.161 MAr~E PU3LIC SE~VICE 0.491 C.143 0.133 0.153 0.153 0.123 0.136 J.111 J.19~ C.157 O.ldl 0.155 ~I~OLE SCLTH UTILllIES O.4L7 [.156 0.175 0.133 0.168 C.148 0.144 0.144 0.10~ C.ICC 0.112 0.143 'lINNE,)!JH OQWFi> r \ 1Gb! a ."go C 166 !' 15+0 (\ J7Q C '5] C 148 a 101 i' 125 ,) l /.e: (Iq '1 18" Q lAG N~VAOA PO~ER CC 0.650 C~143 0.152 0.146 C.103 C.I04 0.129 J.u60 G.C3~ -C.C~6 O.O~8 0.092 NE~ ENGlA~D ELFCTqIC SYSTEM 0.533 C.153 0.133 O.lCa 0.l17 0.1~C 0.143 O.ll~ J.llf C.171 0.175 O.lj5 NORTHEAST UTILITIES 0.582 C.104 0.138 C.116 0.C46 0.C6S C.CSl J.075 O.~64 C.(51 0.103 O.C91 DHIO FD'$CN CC Q lop (2'3C !l 724 C 2lQ C 173 0 )',6 Q 1)'.7 .J 140 J CH C en 1 1~'i5 !' '47 CKL~HO~A GAS & (LEC1RIC 0.342 C.2le 0.213 0.248 C.242 0.226 0.218 0.224 0.1~~ (.175 0.136 0.210 OrTER TAIL ~u~E~ CC 0.281 C.l7i 0.151 0.L66 0.172 a.2ce 0.186 J.119 0.123 [.ISS J.189 0.170 PENNSYL~A~I~ PC~ER i LIGHT 0.441 C.lOl 0.158 0.13C 0.C6~ C.Cd4 0.120 0.140 0.173 (.150 0.122 0.133
~~~C~'¥~6~~~2~~~y~f;~E+[~t~2~~~2~r~'~~~~~(~~~~~l~RuIuC~C~O~--~8~.~4~6~3~--~b·e+l~i~2~~8~.~1~13~lfj--~8~.u~~~~J5~~--~2~o~6~4~2~~2~.±C~9~5--~~~.~!~lL~'6~7--~~~.~1~;~:~,--~~ri~ 2.~~g J.l~t 8.t!b FJ9LIC SERVICE CC (f INO 0.423 C.203 0.214 0.204 0.181 0.152 0.183 0.l~6 0.2CC C.1EB C.~J~ C.198 f'qBLIC SERVICE CO Cf !'. ... 0.564 C.147 0.173 0.181 0.146 0.104 u.092 \).0&7 0.037 C.1b4 0 .. 126 0.129 F'I3! Ie S~RvrCE ((' CF tJ lAD Q 592 r "'5 I' 1&6 C leI a P5 C l6a (1171 r 17\ t1 14< r IV ,J l?5 .' J71 PJ~ET SCU~O PO~ER E LIGHT 0.476 C.09C 0.094 0.0H1 C.GSO 0.Cd5 C.I05 U.09b O.14f C.12~ ~.12a C.I03 (AVANNAH ELEC ~ PC~ER 0.531 (.16C 0.181 0.162 0.127 0.075 C.C66 O.J4b a.Gs: C.IC3 J.084 0.106
.SGUTHERN CALIF EDIS(~ CC 0.38l C.136 J.ll5 0.103 0.108 C.G~6 ).106 0.109 O.~Cl C.121 ).120 0.122 S0UTHEP~ CO 0.504 [.167 0.171 0.17! 0.142 C.C95 O.CHS 0.102 0.(32 C.lt3 0.106 0.124 S~UTH~ESTERN ELEC SE~~ICE 0.371 C.11H 0.181 0.207 0.217 C.21~ O.20S 0.211 C.20e C.~C3 O.lSd a.~Ol SlUTHWESTERN puetle SERV CO 0.314 [.194 0.209 0.227 C.230 0.226 0.206 ~.,12 Q.25~ [.222 C.Z37 C.222 T~~P4 ELECTRIC CC 0.773 C.2IC ·0.194 0.176 0.149 0.109 C.16G J.158 O.CRE C.181 0.187 0.161 r':us llTI! TIlES rc' a 199 C '252 ,,258 a 266 C 246 C 2M P 216 j! )Or, () 2M (119 !~ 1~t5 .~ 22) T',LEDO EOISCN C01P;lf\Y 0.41d C.237 0.244 0.243 0.21C 0.176 u.l04 '').135 G.:]:.7 C.133 0.11.:3 0.l.69 0~IUN ELECTRIC CC 0.400 C.154 0.148 C.13S 0.134 O.Cal C.CSg 0.095 U.G7C C.141 0.198 0.122 U~ITEO rLLU~IhATI~C CC 0.412 C.182 0.154 0.201 0.173 0.104 0.202 0.u96 a.lO~ C.(74 0.C90 C.138 'IPPER pEUI\;IJ!J\ pneR " 44Q C 165 jl 11'2 Q 1"6 Q 121 a 115 a 174 0 170 \) \Q~ C lC6 Q!fiO "144 UTAH PO~~R & LIGHT 0.344 C.149 J.141 0.135 C.114 C.I06 0.131 J.IUU a.Jd[ C.lld C.15~ O.ILl VIRGINIA ELECTRIC & P(~ER 0.617 C.lag 0.175 0.14~ O.lua 0.C55 0.C33 J.06J O.Ole C.(S2 Q.GS4 a.C~7 AR!lCNA PLBLIC 5EP~ICE CO 0.491 C.098 0.104 0.122 0.139 0.lL5 0.106 J.ll8 O.Cd3 C.135 ~.J91 0.111 341 Tl':\CRC ""$ ~ ElfCTfiJC Q 42" ( 24C 0 )43 Q 22< a 174 C 133 "C:i5 1115· 11 ')5E C 113 C !4<J !1 157 C~NTRAL H~JSON GAS E ELEC 0.480 C.l51 G.loS 0.146 0.075 0.134 0.138 0.115 O.03E (.139 0.152 C.125 CE~TRAL ILLINCI5 LIChT 0.481 C.174 0.171 0.L81 0.191 0.158 0.153 0.137 C.lC( C.C~5 0.146 O.15Z CE~TRAl ILL PUaLIC SERVrCE 0.567 C.242 0.243 0.235 0.191 C.l7L 0.132 0.141 0.141 C.151 0.135 0.17S C!WTi'"NATI '~A" E: ElECTRIC i1234 C?4S '1 '45 0 ?2" C 185 C 157 a 172 j1 176 n pc C J]5 " 119 j1 176 CONSClICATE0 EC[SC~ CF N.Y. 0.~02 0.094 0.091 0.077 0.041 0.C47 J.Cj6 J.O~l o.cat C.122 0.154 0.080 CONSU~ERS PQWER CC 0.711 C.1S3 0.178 0.15~ 0.138 0.095 0.OB7 O.Od9 J.C3~ C.IC4 C.143 0.122 J~VTCN PO~ER & LIGrl 0.479 C.269 0.213 0.186 0.132 0.13: 00121 J.OB7 C.C7E (.159 G.15e 0.153 ,JEI ... I\BVA PO'IIER t! !GbT Q 47) !' 211 Q 2Q6 0175 a III OlB6 ,:) 075 1 ;H6 I) 101 C (74 '10.<6 0113 FtTCH5JRG GAS & fLEe LIGhT 0.387 [.131 0.14~ 0.125 0.114 C.lll 0.119 O.Jb3 0.(43 C.C67 C.137 C.1IO ILLiNOIS PGwER CO 0.497 [.27e 0.265 0.248 0.223 0.173 0.145 0.L53 0.l4[ C.l~Z 0.153 0.195 INTERSTATE pn~ER C( 0.436 C.190 0.1~8 0.207 O.lg4 0.189 0.190 O.i~5 0.19i C.18C 0.L32 0.185 rnW4 EIECEdC I fGb] [; o .... p Q 7J'j \' It-Q Q 1·,6 !l lt4 Q 143 0 ('55 W 1;'16 1 tiP -,) enc C ll'j "l146 J 112 10W~-ILLI~CIS GAS i ELEe 0.134 C.205 0.19C 0.162 0.115 0.C~2 0.1bU J.154 G.1St C.lle ).161 0.160 IOWA PO~ER & LIGHT 0.353 C.2U5 0.195 0.181 G.13S 0.15S O.14d 0.191 0.15C C.19~ 0.la3 0.115 IOWA PUSlIC SER~ICE CC 0.304 C.IS9 0.21C O.lES 0.154 0.162 a.lza 0.137 J.15t C.169 0.164 O.lt6 rowM SP!ITI:lPN 11111 PIES ((1 Q 571 c;pC il 214 Q ?4~ 0 228 a 211 Q j'lo '\ 'n IIId? (Itt ,] 166 [) 2"'2 KANSAS PC~E~ & lrG~T 0.281 C.lSl 0.200 0.204 O.ISS C.19S 0.194 0.187 0.144 C.159 J.141 0.182 LAKE SUPERIOR OIST FC~ER CO 0.315 C.149 O.16~ 0.135 0.123 0.141 C.170 0.162 D.l72 C.179 0.143 0.155 LONG ISLA~C LIG~TI~G 0.530 C.166 0.162 0.181 0.152 0.143 0.118 0.117 U.Cg2 (.IC7 0.117 O~135 IOllfSV!!!F 1'4$ f: EucrE!C 0 4 36 C. 747 n 263 Q UJ C?ltC C 22'3 '19'3 d "0 0 .1 167 C 218 0 ?~4 Q 225 ~AOrSGN GAS & ELECl~IC to 0.367 C.l15 0.119 0.131 C.100 0.Oa8 0.010 0.1~1 G.124 C.211 O~ldO O.l~7 MISSCURI PUBLIC SE~~ICF CO 0.631 (.164 0.126 0.129 0.192 0.153 0.175 0.13q u.l11 (.1~1 0.218 0.168 MO~TANA PC~ER CC 0.311 (.195 0.183 0.218 C.213 0.201 0.191 0.1a9 0~15~ [.130 0.v87 0.176 N~'d E!\'f:l AbO CAS Ii' F' EClRY( 0 5"29 , .. '4 c Q 139 0 '3~ C 12 9 0 145 0 1'6 I) 1)1 0 'OE , (57 {) 181 Q 135 ~EW YORK STATE ELEC £ GAS 0.5]4 C.172 0.149 O.les 0.lC5 0.ca7 O.lO~ 0.119 u.122 C.ICG 0.115 0.119 NiAGARA ~GHAWK fC~E~ 0.490 C.l~O 0.095 0.093 0.077 c.cas o.e96 0.049 C.G6e C.115 C.088 0.091 NORTHERN INOIAN' PlBLIC SERV 0.337 C.237 0.230 0.224 0.230 C.las 0.179 0.164 0.124 C.152 0.169 0.190 NOgTHERN SUIES POER a 477 C 18 2 0,181 Q 173 0 14] Q 133 () 143 () lOB 0 124 C 190 Q 196 0 ISS NCRrH~ESTERN PUElIC SEAV co Q.392 C.17~ C.17e 0.179 O.ISS C.2~C J.11S 0.135 c.cae C.C18 0.164 0.154 ORANGE £ ROCKLA~O LT!LITIES 0.637 C.ll1 0.148 0.122 0.14L 0.020 0.048 0.097 U.07f 0.142 a.la6 0.113 PACIFIC GAS £ tLEC1FIC 0.240 C.149 0.151 0.147 C.119 C.133 J.12e 0.12U 0.10e c.ees 0.071 0.118 P4,CIETC PCWr-R E: , IGt-T Q 4az C 106 0 1"9 Q lOB Q 0'13 0 '03 0 1'17 I )J', 0 ~6f C (']7 0.103 Q 099 PHILAOELP~IA ELECT~lC CC 0.43d C.166 0.146 0.130 O.Cse C.CS5 ~oCd6 0.0B4 Q~C74 C.ICU 0.106 U.lu7 PUBLIC SE~VICE CC CF COLO 0.365 C.149 0.152 0.157 0.139 C.ILC 0.108 0.103 0.Od2 C.lSI 0.140 0.129 PIJ'3LIt SERVICE EU[ & GAS 0.609 C.152 0.149 C.DC O.cel 0.C;6 J.C49 0.G43 C.C7<.i C.111 0.171 O.lUll R \'C H C ST E P (a:) S r. J: I F CI 9 ! C a 6:J 6 C! 59 0 I 22 a 091 Oed Q Q! Q 4 D! jl9 Q J 52 0 C 8 " C) , " .,! 14 ,) I! 4 ST JOSEPH LIGHT & FChER 0.599 C.168 O.l~C 0.160 0.184 0.219 0.195 U.145 C.l54 C.151 C.148 0.172 SAN DIEGO GAS & ELEC1RIC 0.511 t.t62 0.l6e 0.174 0.142 0.117 G.ose 0.067 0.104 C.Cle 0.l05 0.113 SIERRA P4ClfIC FGAER CO 0.502 0.105 0.09A C.IOO 0.C~3 0.095 0.114 0.116 0.106 C.lll J.lS8 0.110 S[l'lTH C)!)rfl~16 (II=C r I~:\S a 84L r 'of 'J ICJ7 Q1C:;1 C e92 Q e 7 F It rSQ ) 079 n ]['1 (It(\ (' 12b I) 121 SCUIHER~ INOIAN~ GAS & ELEC O.4~5 (.217 0.228 0.218 C.2C9 C.IS? 0.199 J.LlS 0.2J( C.~Cl J.218 0.210 TUCSON GAS & ELECT~IC 0.532 C.169 0.172 0.l7C 0.116 0.l~4 C.CS7 0.064 -0.02C C.15~ J.L7) 0.12H ~ASHINGTON WATER PC~ER 0.282 C.135 C.l~l 0.152 C.138 0.131 0.120 O.lj~ O.llS C.146 0.170 0.142
~~~l~g~~~g~N~!g~~~~~~~~t~~~E~~~g~~~c~l~1~G~~~~~g~------~g-.~4~t~S~~C~.~~~2~1--~3~2~~~:~--~~-.~2~~~;~~g~.+1~~~~--~~~.-~~4~i~--~§-.~I~j~8~~J~)-.~~~~~I--~0~'.-1~26~C~i--~~~.~£~6~~~I--~8-.~2~~~~~~S~)-.+~~a+l-----~ISCONSIN PUBLIC SEF~rCE 0.291 C.229 0.203 Q iry6 0.179 a ll~ O.14~ 0.175 C.lgc C.~73 0.314 G.2ca ~ONTANA-DAKOTA LTILITIES 0.262 C.14S O.lb5 o.Lle C.l1e C.l57 0.L50 0.110 0.112 C.142 0.116 0.150
III-74

APPENDIX 2
Ten-Year Returns for Low Barrier-To-Entry Group
111-75

CC)JPANY Nft"E
O· .. ;t::iS-iLLll\iJlS iNC ANC~GR ~CCKING CCRF r.O~DYtAR TI~E ~ RLEEER CO E 1 R C S 1'1 'I E II K E E R! P E E3 C n UN1TEJ SA~~5 CF C[L(~.CC GOODRICH (e.F.I CC INH'«O 1M. tl,Qn t' ,~DC! P ! t\e U S SHCE CCRP GENESCO It-C CELAN2SE CCi-/P " S r,Y~)SI!'" co N4TICNAl G~~SL~ CC C:>C I Nfl I1I.C STOKFlV-Vft~ CAI"F !f>C E S 'lll" .< ! t.;( Gl:'Io..I~RAL "'ILLS II\C P'ILLSBI)R'f CO AMEc I CA~' (AN e.C .cr~IT! NPt>! 41 C" Ret Q
A~H[USEq-eUSCH I~C PA!3ST 3f{ElooINC CC CCO>:S (Af1CLPH) CC sr:-l! I It ! tr S E PHI i' a E;. TN \~ A~E~[C~N eAKEAIES (( BURLINGTC~ iNC~STRles I~C 5 T EVE I, 5 (..; • ?) ~ (C C Q AJ co 'A r I , seD R 0
J·\'I ;< l V E R ! i\C
'k r) O~E~S-llll~CIS I~C MIChOf< I-CCKI~G CC~F GGOUYEA~ TIRE & RLEEER CO Fr9r)Tf~'\lr" TIRE r' 9' eoe~ (fj
UNIT~J ~A~KS CF CClCf<tCC GOOCKIC~ le.F.) CC I \TERC[J II\C ., 9 0 '.J ~j 1- 0 (q 2 ,1\ C
U S SHCE: CCRP GE NE seQ He CELANESE CIT,P !I ;; GytJS!t~ in MATION~L GYPS~~ CC CPC INTL If',C STOKELY-IIAN CA/'F lH c <:: -.I,'\, R K r~!,.
Gc~jER<\L /IIILLS lllC PILlS8URY CO AM~R lCAN CAN CC C!""t'P"' "lE"IJAt GRe! 0 ANHEUSER-BuSCh I~C Pl\AS T BREA LNG CC COO~S (ACClPH) CC SCHI ITl I lC'EP!-<l 0fiEY,ING AMERICAM e6KfRIES CC ,&URLI~GTQ~ INC~51AIES INC STEVE~S (J.P.) !: ce «"''Ie: "! I I <: CCRP JAN R [VCR iNC
RISK
7.3 0.610 Oe 736 0.703 o 734 0.572 0.793 0.953 o 735 0.942 1.373 0.561 C QJO Q .81;' O.5L7 0.c:>3't Q 473 1J.h03 ,).717 0.313 .J 1) 7
0.53':' U. '562 u.iJO,] 1 d4 1
RISK
73
0.613 0.736 O.7'B o 7,\.~
;).572 0.793 0 .. 953 o 735 0.942 1.373 O. 5b 1 " 83 1
0.8)'1 0.517 0.634 o 4]'1 0.603 O. 7L 7 0.313 Q 3 17
0.534 0.562 0.000 !l 84 1 O.Btl 0.889 0.740 () 744 0.912.
RATE OF ~ETURN "fASURF 1
1<;67
r .. ?
C.CC!S (.146 C.126 ( I', p (.031 C .. CbB C.132 r 23f' C.leC C.145 C.\.)02 C J ?6 C.Cd6 C.143 C.113 C '-13 C. 16 1 C.122 C.135 C !" 5
C.GS3 C.122 C.C7<; C C61 C. CoS
1968
1J.032 O.lOC 0.15S I' 242 0.1'11 <.:.104 ,).103 ,J Pi!
C.156 0.125. 0.12C; C ! 6"1 0.20C 0.Z47 c.Qce n 20 9 0.C63 0.166 O.llS Q CAS U .G7l
1969
! ! 3 o~ l<:.Fl 0.258 0.1'38 C ! 3 ... 0.03 /t Oeu85 C.15C j1 lEA o. H:2 O .. t4E 0.111 i1. I C B c. LO 1 0.151 0.0<;2 o ObG o e LSI:! 0.14C; 0.lC8 C 17 c: O .. ld6 0 .. 1t;7 c.occ o 213
-0.01<; O.14CJ 0.102 n '-'52
TABI.E NG.2.2
1<;70
1 J 1 G 0.116 0.2C6 0.le7 C 1 C2 0.C35 0.C49 O.I:C Q 1 Be \.).134 0.121 O. C72 Ii CbB U.063 0.147 O.lCl Q rS9 0 .. 153 O. C'19 0.111 C J 48 0.221 C.189 c.cce Q 214 0.C64 C.1Z9 0.037 r' C68
\.. .-CZC
RATE CF ~E1URN ~EASURE 2
1"07
C.";88 C.146 C.126 C 138 C.C.H C.C6B C .. 132 C ?'lC
C.IH C.145 (.CH2 C '2 t C.Otle C.143 C.lL 3 {' ('73
C.161 C.122 C.135 C 1 5 ~ C. 171 C.221 C.CJO <: 17S
C.093 C.122 (.C7<; C C67 C.C6S
1968
0.101 0.22C 0.146 t" 1 5 8 0.032 O.ICe 0.159 :, ""42
O.i'>l 0.164 0.lC3 o 128 0.104 0.152 0.091 .) ,)1:.0 (l.15t 0.125 0.12e; C 168 0.200 0.247 0.000 o 209 0.C63 0.lb6 0.119 q C45 0.071
C.l% 0.258 0.142 C '3 4
0.034 0.087 O.l';C o 1 e~ 0.16Z 0.148 0.114 o 11 J
0.101 0.1:3 0.OCl3 Q ('149
0.158 0.14<; O .. lCe; Q 18} 0.196 0.214 o.ooe Q 22C
-0 .. 01<; 0.151 0.10l o ,) 5"7 0 • .:133
1<;70
Ii 1 J
G.U9 0.20f: 0.113 C ] C' 0.035 C.C51 C.15e o 190 0.134 0.122 0.C76 C o7J 0.063 0.153 0.102 Q C89 () .153 C.C99 0 .. 114 C 15 7
0.243 0.204 O.COO C 241 0.C65 0.132 0.C37 Q cOA 0.020
j. 4 0.il"7 0.180; C .13C !l 113 (.).C34 0.C14 C.148 a I pc 0.128 o .lli C.CeS \' \2 j C.C:;6 Oe123 G.CS1 c rq7 0.151 C .LL2 0.(lS2 G 1 P6 0.227 0.20S a.ccc a 215 0.007 0.01l1 0.C1.6 C 08] U.C1C
] 1 3 L
O.lCC 0.10 c; 0.136 Q 1 t 3 C.034 C.C76 C .148 o 'S c C.129 O.llZ 0.0.,3 a 127
C.CS6 C.127 0.098 Q. c8 7
0.157 0.U2 0.C84 a 1 t3 0.245 0.21C G.OOO C '34 o.cca 0.C82 0.016 Q OS! 0.CI0
I1I-76
1"72
UoC04 .),,185 0.129 n ]' Ii
0.1.38 0 .. (71 (). C 7'5 Q J 4d 0.1.32 O.14l 0.114 n ,'84 0.17'7 (lol17 0.Gao; ,) 10 9 C.226 0.204 C.COO C 741 0.C17 0.Ca6 0.C59 .) (' 8 7
C.CSC
1<;72
: J, ;
0.C97 v.185 u.l36 C IZC 0.035 iJ.C94 G.174 {] J 69 0.139 J. e72 0.C1' C 154 J.134 0.146 C.115 C rS4 0.177 Je 117 0.C86 ) 1 I tl 0.240 0.208 C.COO o ~45
u.01B O.Cad 0.C60 ,) GHZ C .. 05()
1973
J.lod J.152 0.122 .J 1 ")q
J.J4J 0.10\') U.i.~5 II 1 (,6 0.1" 7 0.J78 J. 1 J f Il 1 41 u.LH J.15, U .122 ) t 02
:.).178 O. i.ll C. LJl 1\ J 2" u. 1:30 0.153 0.00J
! Jb 3 -,) . .)..)';:
0.125 O.LJ I ') "n! iJ.U'1?
1973
J ! l'
\,).128 J.07d o .ll" J J ft'* 0.132 0.157 0.12)
J.ln J.l'l 0.103 I) ! 3! 0.1'19 0.159 0.000 o O?
-\.l.033 0 .. 1.27 0.108 '", ;)9 1 0.0<;0
1<;74
u.C4~ J.C'!c C.l <; l: ) !? c:
U. 1 C c d. 164 0.131 (, 1; E
0.15; J.lel, :J.C\lC ') 19"
) ( 1 J
U .10 C 0.12.i: C.ll 7 ,) 11 t: 0.C4<; (J.C8e C.llie q 1 2 ~
C.IlS O.lC': C. 12; .) raf. (Joles \".172 0.13':: 'I i 3 1
u.Le L (l.lll 0.12e; D 144 1l .. 17~ l.i. 1 C i G.eec jl 22&
-', CC c ~: 13 ~ (J .131 ) 14k v.C7;
!' l t I L.(S6 C .1:~ C. I C6 r lC'1 c. CiS C • C 55 C." 14 C C,,"l c. L!L (.C3G <..(61 l' C17 C.Cd2 C.l~6 C .10 C ! 2" ( • 1 e 1 C .153 I: • (So ( 1] (' 6 c • 17b C.122 C .4;) C It? c.etC:; C .en LC72 ! J 7/.t
1<;75
- C ([7 C.lOl C.l:8 C.111 C '59 C .0<; C • C 55 C.~15 C cq C .133 C.(3C C .us C (77
(.CE2 ( • 1 <;3 C .1C4
~ .i~~ C.153 C.(<;9 ,. 1 l' C. 190 e.125 C.4<;& C J"! (.(SO C.CeS C.C 13 C , 174 C.CC9
1<170
!J.te4 (J.142 0.112 ,~ 1 1 3 v.LCo a.! 77 U.245 11 162 .:l.u,,\,) Q. l:i3 J .11') ,) i '3 {). t G6
G ·'65 ,).1') 7 C.i55 u.C93 ," I' S 2 J.C3'1 C.049 C.210 C ' ~ 2 0.212 0.105 I.J.GlJ9 Q ""'g9 0.1'16 0.196 J.uaz C J /7
J.191 u.142 J.1l5 '1 ] 23 0.114 0.Ul3 0.273 o 1112 0.092 0.135 0.116 ,. 223
AVERAGE
3 j F J.1U3 u.177 iJ. l2! rI 1 IS J. C,jl 0.016 o. l 7 2 {) j 7 i
0.11:6 0.1,,7 (J.IOg C 1"2/+
0.J.85 0.182 0.06d I' <I) 2 0.C36 a .L19 0.CE3 r) 103 J.C54
AVERAGE
C.IG6 0.17"1 0.125 '1 J 19 o .l.:37 :J. e77 0.l72. " i 73 J.152 O.lOti U.C94 a 112 O. Hi1 o .leO 0.105 o OS3 0.l6d 0.1.21 O.llO o 140 0.1.98 0.188 O. e77 o 216 0.C37 O.lll 0.084 .1 103 0.C54

TAr:LE NC.t3
RATE OF ~ETURN ~EASURE 3
CCP4PAf\Y fIIHE RISK 1.967 1968 1969 1970 1973 1 <; 7 4' J Ii 75 1,,76 AVE~AGE
G~~ESCO I~C l.373 C.219 0.294 0.270 0.206 0.20G J.CS3 J.L5~ 0.1~[ -(.(;4 1,.~2_ 0.174 CEL~~fSE ceqp 0.561 C.154 C.1S2 0.212 C.l2C 0.151 J.ll~ J.170 ~.2C3 C.C~5 G.l~l J.155
-,1~~7,\-2-i7! -:=8!-:'K~' ~'-iEM\J..:! ~:-,y:-,~~C'::-s .,...I...,-;,'ol--::c-::c:--------~g-t-"-. a~fl ~;~4---';~~ ..... ~~, S;:-a*"! --';i8:--.~1-";1~k~-G~_: ..... +i~]-:;;~:--'8+-..... 0~i *1 ~-,,-_g_:-H~i-----';~.'-!-l ~::l..' -9-ij----':3L...'-!1,..:Zu4:.-.--..J.J ..... -!-i.1.~....;~!-: ---'::-~ ~.-'::~-?~--:zL-........,,~+; ~. +-l.,l~J,!j-----;~!--') .~l!-I 2::-' .;:-~ -----(PC I~TL I~C J.517 C.217 ~.24l 0.236 0.225 0.176 C.213 0.23J U.251 C.2~2 J.276 8.235 ST0KELY-VA~ CA~F l~( J.~~4 C.16~ O.lLC O~lOC 0.128 C.126 J.154 J.lb4 J.173 C.l~l U.LS6 0.l35
:~~g~1l!~~LLS l~C 8.~3~ ~.lg1 j.2~1 g.~51 g.1;Z g.~~~ ~.1~8 J.1e~ s.~~~ f.~~~ ~.~J~ 8.~%Z
PA~ST SRf~I~G CC 0.562 C.277 0.2St 0.23t C.228 0.254 C.24i J.l~~ G.12~ (.147 8.216 0.22L CLUPS (ACClPHI CC 0.000 -(.GGC -0.uoe -o.OOC -o.oce -O.OCG -C.CCO -J.000 -J.CS( (.!34 0.297 o.~aJ 5 r-:~ I r r 7 I J C <: r c h I i'r:: F '0 11\-; 0 24 I ( .2! 5 a 2 b f. 0 • Z R 2 0 Z 5 7 O. 29 S Q' 42 Q. -3 7, 1 J • ? :; ) C • J t: S )"" 3 0 i 77 A~E~I~\~ eAKF~lES (( 0.871 C.15~ C.Q~6 -0.072 0.C98 -0.C21 -C.CC0 -J.131 -O.eSE C.~14 0.,04 C.G~5 BJ4LI;~GTCI\ H~CUrr.:IES I"C J.88'1 1:.191 0.274 0.245 0 • .203 O.lle G.120 0.1'-J5 C.2Si (.eE2 C.191 0.182 STfVF~S {J.~.J ~ (( 0.748 C.1US 0.176 0.1~2 0.027 -0.ce2 0.C72 J.l57 0.Ld7 (.(Ea J.168 C.112 rr-"l~ Urlt<: "'el<:> \' 744 (' esc 11 O':t8 n 042 C 07e ;1 leI' \) l)h } II, C ]'j( r :;4:' C' "")·If r] 1/9
');.E'4S-llL 1~,CI S INC lINCHOR ~CCKING CCRF GCC)YEA~ lIRE & AlEEER CO FIDI"'STO"f. TlSF r .)1 QQEs CC UNlTFJ B~~~S CF CCl(~tCC GODORICH !9.F.1 CC I:\jTE:~CO If\C BRDe!:.: rRC)'O II\C J S SHOS CO,p Gc~j~SCO ! f\C CELANESE e(R? l! S r;yn$!!fJ CC NATIGNAl GYPSL~ CC CPC INTL Ir-.C STfJKELY-V~''1 CA1"F [H E $ ','!\ rI K !~' C GENeRAL :-'ILLS If'.(. ?ILlSoURY CO AMER IUr-.: CAN ec C PH I )J PH III G R C! P ~~HEUSER-euS(~ I~C PARST ~Pt\\I~G C( COORS (ACCLPHI CC SCdl lIZ [ICsrpH I Pf:q,I1\G ~~ERI~~N BAKERIES CC fllJRl H,GTO'" INC\..STR IES INC STEVENS (J.p. I (. C( CC"d.2. "'{I! 0:: rC;S1J 04N RIVER INC
~lSK
J '7 Q
O.hl? 0.736 0.703 ('l 1j4
0.512 0.793 0.953 ,) 73'; 0.942 1.373 0.561 o 8311 U.8]9 0.517 0.b34 " 473 0.603 0.717 0.313 ,) ':II 7
0.534 0.562 G.OOO j). P41 0.871 (l.~89 C.740 jJ 74'+ .l.912
T A tl LEN C -2.4
RATt OF RE1URN ~EASURE 4
1':707
C l' 5 C.131 C.:.:l C C.204 " ?)6 1.:.(;12 C.O~C C.221 r,'{)8 C.2~1. C.21S C.154 C 14) f' _ ,1," d C:zi7 c. l65 ( ! (1! C. 4d.3 C.198 C.202 C ) IS C.263 C.271
-C.COC C 215 C.150 C.191 C.IOS C :lijQ C.0<;6
e 1 ( 7 v.i70 0.314 G.247 il 21... 7
0.324 0.294 J.l92 ,) 16,)
c.11 iJ C.241 C.lle o 061 0.422 0.212 0.191 o 236 G.313 0.296 -o.cce Q.Z6t: 0.0':76 0.274 C.176 () ;118 v.CEB
o • .:!llj 0.365 0.247 Q ., 13
C.')13 0.114 0.27<; o 237 0.272 O • .nZ 0.22S o 135 G.12G 0.243 0.102 II ! C 1 U.3HZ 0.268 O. H 1 o ~"? 0.3C5 0.260
-O.OCO 0.256
-0.073 0.249 u.144 o .)42
-O.JCB
lS70
o 152 0.2vl 0.2eO C.192 C ! 49 O. Cll U.039 0 • .182 11' 237 C.22e G.21C 0 .. 135 C CR3 O. tJ 7l U.24C 0.131 o 137 0.354 C.152 0.170 C 2"jC 0.374 0.250 -o.coe 0.':157 O.lOC 0.212 0.027 o 070
-C.C2S
10;71
0.24<; 0.242 o ! 3" o.Ctc O.lel C.26C a 24<; C .no 0.2Ct 0.172 G 164 OilllS 0.190 0.127 Q 13 7 0.j55 C.19C 0.11 c; o ! 65 C.354 0.255
-O.OOC C.-42
-C .. C21 0.ll4
-0.CC2 () I J1C
-0.C42
111-77
lS12
J. iE u.242 0.241; :1 J q<. o .ell J.139 0.269 J 245 J • .Do 0.C9;' 0.136 q /u 8
C.356 0.218 0.126 Q P4 O.3.ld 0.255
-C.COO 0.1';il
-C.C00 C.LL4 0.073 11 J J6
J .lllt .l.lH 0.192 ,1 !-l7 J.1 bb 0 • .i:.46 J.l:'? ) ! 69 J.344 J • .l.H J.1b1 o 211 0.201 U. 1 ':i2
-1).000 n 39f)
-J .130 0.2u0 O. l60 Q ) J 1
1 <;7 4
! 117 oJ.l7t 0.151 J.174 ) 17E U.CC? 0. L 1 C J.27? jl ! 7 '" ';.2Cf
'0.1<; 3 ~.23(: C I:~ i;
u.l3: O. Z7l, 0.171 r, 22 f u.28~ (l.i5C (j. 21 = .1 2 3 ~ 0.234 0.13 C -\.l.cee ii e 3 -1 c
-(l.lC ~ v.21~ C.LS! J 1 Sf IJ. C 7(
1<;i5
C.(~6 C.C45 C.~So ( 1-· 4
C • ~ to -C.CS5
C.lel c (55
C.:::46 c • ! 12 C • 152 ( 176 C.:('''7 C.152 C.t.40 C .;;.:, 9 C.22'1 C.CE4 C .O:S (' ; 45
-C.Cd
1 <; 76
C.l L. (.;.23C ~. 136 " I)?
~.Q~a v4Iv;,4 C.2~5 , ?4C O. :;71 0.230 0.167 i' , 'I 0.1 :n G.311 u.O'1d [' 164 O.J47 J.278 0.19Q o ! 5b 0.162 0.225 0.341 0.303 0.2l3 0.201 0.172 :""' 3 rJ (, (;.151
lIVERAGE
;; ;;50 0.11l 0.244 0.207 1""'\ IE? C.OIG 0.095 0 .. 27~ Q ?4J
0.252 0.1. 77 O.lH Q ! 42 0.122 0.251 v. 13 7 Q 1:.z 0.37U 0.231 0.16~ o 1 I I a.2<;1 0.22<; 0.096 0.312 0.C46 0.1t!6
.0.114 '1 ! -'9 J.C44

\
APPENDIX 3
Ten-Year Returns for Medium Barrier-To-Entry Group
/
111-78
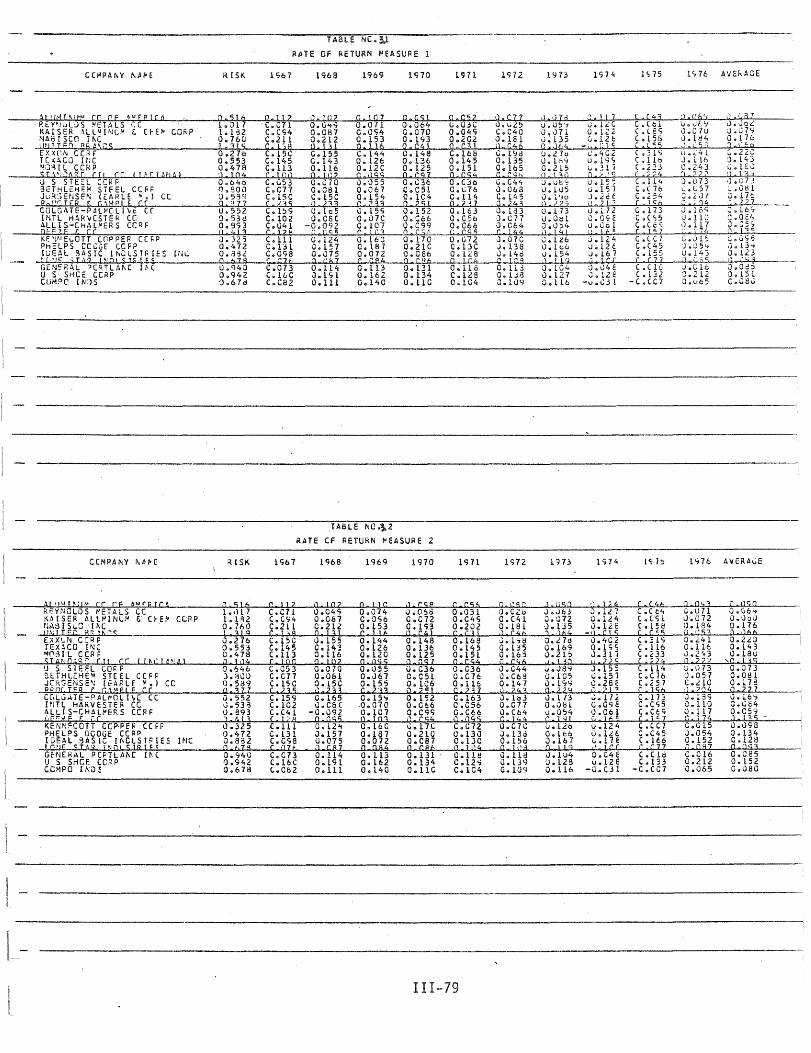
RATE OF RETURN ~EASURE 1
RISK 1969 lc.i70 l'i 7l. 1<;72 1973 1<;74 J':75 1'>76 AVER-AGE
~I'!.'!T!\'t:" CC OF ~""PIU 0 SIb Q JJ2 Ll.lIl2 G 107 Q cst Q C52 Q C17 d .17j :'ell7 ((43 '1 ('69 j) ,87
TABLE NO .;'2
KATE CF RETUKN I'EASURE 2
C.CMPtl NY I\,o/VE RiSK 1<;61 lq68 1969 1970 l'H1 1<;72 l~B 1';74 1<; 7S 1976 AVERAGE
4.1 IP·i I r-'!V C,. eF AIiJEFIC¢ 0 516 C ! 1 2 0 102 0 I Ie j) rse C C56 II \"'1 (i ) ','10 ,) ] 24 C (46 r) 0-.3 !~ IJ9Q f{~YIWLD S IIETALS CC l.,lL 7 C. C71 0.049 0.014 i).ObS 0.031 O.C2.iJ J.J63 J.U1 C • C tit C.U7l 0.06'9 KA [SER ALU'1NL.~ & Cl-E/' e.GRP 1.1"12 C.C'74 0.0&7 C.OC;6 C.C72 0.C4e; 0.C41 0.872 0.lL4 C.C<;l 0.072 O.OOlU rIA:3rS~C -{fl.C 0.7AO C.2l1 C.l1Z 0.L53 0.1<;3 0.202 0.181 ").135 0.1.?!: C.l:!! 0.1S4 0.176
...Ll.h.!I,-r ;.p ·t\'~S 1 319 C J ,s 0 13 ! C 11{: 0 C4! C nl ,) C4b J ,)64 -I) C 1 c C C=5 n "5"1 0 ,)66 ExX'.Jl'l CCRP v.276 C.150 0.155 0.144 0.148 0.168 J.i-;tj 0.2. 7d 0.4C;1 C.~!S 0.241 0.2;::0 TtXJ.CO INC 0.553 C.145 C.14; 0.126 0.136 o .l45 0.135 0.169 0.19 r; C .116 0.116 0.1.43 "Ir31 L CCfn U.478 C .113 0.116 0.120 0.125 0.151 0.165 0.21, J .. 3L; C.~33 u.2't3 o.l.au oM,OdS ,.. [II cc r T ~ ,- J C~' ,\ I 0 1 \)4 C 10" 0 102 a IlSS Q n9 7 C C54 r: C'j6 ) I ;0 \. 22 c ( j24 ;1 22) >0 DS lJ S S 1 E f:L cal' p 0.646 C.C53 0.07Q 0.055 U.C36 0.036 v.044 v.J89 J.15: C • 114 :;.073 0.073 t'..£THL[HE~ STE EL CCH J.ROO C. C77 0.061 0.J67 0.C51 o .C76 U.C6:! 0.lG5 1].151 C.C76 0.057 0.081 Jl'KSENSE"i IEARLf r..'.) CC 0.539 C. 1'; C O. L5C 0.L55 0.lC6 a • 1 16 0.147 U .1<;<; C.28E Co': 51 C.2.10 O. U8 pane I~R r Gl"fIF iC 0 377 C 235 " 233 C P3 jl 2 C t c 2'7 11 24] 0 22'1 Q ? 1 ~ C ISh ) 2"4 Q 227 CGL~ATE-PAL~OLI\[ (C 0.552 C.159 0.l65 0.15'7 0.152 C.l63 v.ltd J.1/3 0.17;1 C.l D 0 .. 1.39 0.l6'7 HITL HARVESTER CC 0.53'3 C.102 (Joese 0.070 0.C66 C.056 O.e77 Q.Jesl 0.0ge C.C'iS 0.110 0.';04 ALLr S-CHAlI'ERS CCRF 0.893 C. C41 -0.092 0.107 O.Cg'7 0.C6e 0.Cb4 u.0.,4 0.C61 (.cce; 0.117 0.C59
-,-,~",.;l E !: ;- C " I· 1 ." ( l? B Q as' a iD, j'" 154 11 095 C ;4 4 Q J!ii 1J I;"" C it;] C 174 !1 1~5
KENNFCOTT CCPPH COl' 0.325 C.lll 0.124 0.16C .;" 17C C.072 U.C7C v.l2t> () .12 4 C.( C7 C.015 0.0<;8 PHEl!>S DODGE COP 0.472 C.131 J .. 151 0 .. 187 0.210 0.130 J.13d O.Lbo Ucla C .C4S J.054 0.134 IDEAL 9ASIC If\CLSlPIES INC 0.832 C.0<;8 0.015 0.072 0 .. C87 0.130 0.156 J.l67 i...1H C. I t6 0.152 0.128 ! r.'IE SIB ., ,,'n! 5 J R IF ( oJ t,V3 C Cl7t ') c8 7 Q 084 Q ce6 ,~ 1,'1, Q J j' d Q , ] 9
"
1 C c r [77 ~ 0'l7 0 OS3 GfNERAL PCPTLMC HC 0.940 C.C73 0.114 0.1.13 0.131 0.111: a.11l;1 J.IU4 O. C4 e ( .elti C.016 O.CSS U S SHGE eCRP 0.942 C.' tbC 0.191 0.162 0.134 C.12':> 0.139 u.128 u. 12 e C .133 0.212 0.152 CCMPO II\L)~ 0.678 (;.C02 0.111 0.140 O.llC C .. 1C4 O. H19 0.116 -0.01 -C.Ce7 0.065 0.080
111-79

CCMPAI'IY f\HE
I ""TN;!'" rc "'e l\"'FR fC5 [YUOUS "'ETALS CC AISER ~L~~I~U~ & CFE~ CO~P Adl'iCG II\C ~IIf''j <l><CI\rS xxei'd Cr.,,? EXACC I!\C C31 L CCPF IIl.NC48" Cft CC I!HICNAl
S STEEL CCRP tTHLEHE~ STfEL CC~F (PGEfIlS[N (EAPLE 1'.) en pnc FE! r "H't' , E C C CLGATE-PAL~rll~F CC NTL rlA~VEST[R Cr: LLIS-~HAl~ERS CCP~ ""I"'f' E l' C C b~~EC01T C[PFE~ CCF? HELPS I~CCGE CCflP eJE.!L f1ASIC IJl.OLSH!ES !I,( r..J~ ')TAR Ti\If".!:STHlf{
[NfR~L ?C~TL~Jl.C r~( S SHOE CCRP o~~o IN:)S
CC/"PAI\Y f\ Ii~ £
\ I! 1! \I! '. C erE :\" 1= E I r • EY~Ol1S ~ETALS CC ,ArSE:~ ALU"lNLI' I: CI-E" COR? IAdISl,O If\C !'lIT"] BR\N1S '<XCN CCRF
'::X.:l.c'U n:c 1(;13 I L eCR 1= J .),.,~ 0 " p n C f , C r (I bel, hi , I
I S STEI'L CORP ETHLEHF~ STfEL CC~F
!QI{GENSE'" {SARLE M.l CC I? nc T E R ~ {"' ¥ M t.f FCC GLGATE-PAL~~Ll\E (( "lTL HARVESTER CO ILU S-CHALi'ER S CCF ~ 'f=~e,. F )' C C
,E'I"l~COTT CCPPER COP 'HELPS DCOGE CCRP JE~L BASIC I~DLS1~lES INC eMF <'Ui P'D'SlRIE<
,cNERAL PCRTLAI\C He I S SHOE CCRt> ,CMPC INDS
RISK
o 516 l.Ol 7 L.1a2 u.76J 1 319
0.552 0.5313 O.~93 i) 413 0.3.:'.5 ,1.472 ,'). S '32 ') i) 7 '3
RISi<
,) 5 1 6 l.:)17 1.182 'J.76'J 1 3 J -i 0.276 0.553 0.478 ,) 104 1.646 'J.800 0.539 o U7
0.552 0.530 O.t;93 ;1 4] , 0.325 0.472 0.832 11 6B 0.940 0.942 0.678
RATE OF RET~RN ~EASURE 3
C 1]3 C .. 1l3 C .. 173 C.31.C C 164 C:2Q4 ( .. 19 L C .15 7 Cit" C .. 074 C.102 0 .. 246 C '2C C.248 C .. 144 O.C14 C 1," C.l~O C.1.51 (.126 C 'D) C.1.)8" eelSl C.109
1968
C 155 0.056 O.lSe 0 .. 322 n ! 55 ' 0.;:;15 0.184 0.162 C 12S O.lOC 0.113 0.232 'j "! 5 0 .. 2;6 O .. lOa
-0 .. 274 () J 36 0.141 C.I77 0.093 I) 1 (6 o. L4C 0.324 0.161
19(::'1
Q 164 0.lC6 0.161 0.236 C 1/.e
C.076 0.0<;2 0.236 C ';!., 0.247 c.oas 0.11<; ,.. !fd O.lO';! 0.226 0.085 Q !] 8' 0.133 0.272 O.lCS
TABL E NC .1.4
1<;70
o 131 o .C86 0.106 0.2<;7 Q CIS 0.209 00171 o. L 81 r J 23 0.043 0.C63 0.141 Q 0137 0.2,H O.C76 0.092 G 121 O.2D 0.265 O.lC<; C 111
RATE OF RETURN MEASURE 4
lS67
a 17-3 0.113 C .. l73 c.:nc {', ! 64 C.204 C.191 C.l57 C J OJ 5 C.C74 (.102 C.24d c· j 2 C
C.248 C.144 C.C14 C I c.S (.12 G C.!51 C.126 i 102 C.GH'" (.251 C.109
1968
'1 155 u.056 0.150 (l.322 11 J1::5 von = 0.1(34 (;.102 ."' ] 29 C.IOO (l.113 0.232 f) 3'5 0.256 J.ID8
-0.27't J 1"6 C.141 0.177 0.093' ]1 1 U: 0.14C 0.324 0.161
11 J 74 1).11 Jl 0.17C C.236 o '4 r o.zel C.159 O.lH o 1 2 <:
0.J76 0.0<;2 o.n~ C 3 1 3 0.247 0.0!:!1.i 0.11<; o 147
0.202 0.226 o. 'JuS o I] 8 0.133 0.272 0.205
FHO
o ! 0:;1
O.le! O. Ll2 0.2<;7 Q C'9 (J .. 209 0 .. 111 O.Ull I'" 123
0.C43 0.C63 0.144 o 337 0.231 0.C76 0.C<;2 C '?' 0.213 0.265 0.110 Q 117
0.155 0.22e 0.152
1971
Q '~5 5 iJ.Ct.;2 0.052 0.322 Q !':HI
0.241 C.li.l5 0.230 (j to I2C CIDC4u 0.1 U 1 0.156 C 316
c. C?7 0.160 0.171 (] 139 C.L56 G.214 0.152
1<;71
" Cf4 0.CC3 0.G5.2 C.~22 c nQ>!
0.241 0.135 G.23C a 12C C.C4C O.lCl C .16 C C 316 0.24'i 0.C5<; 0.042 o Ip 0.C17 O.16~ 0.175 C ! 3 A
C.156 0.216 0.152
1 <.i7 2
-oJ.Cll U.C2.6 oJ.2S; 1 ['44 O.d:6 0.175 .].;.:56 C ] 25
\.l~2aJ G.1(';<; Q.C4i:! j) 235 G. \j 77 J,,167 1.).1<;3 1"\ J 49
1 <;72
-.J. C 13 (J.e21 0.2<;5 ,oJ C4;' C.2Oo 0.175 J.'56 ,~ 12 5 0.C52 IJ. CB& 'J .. 216 \) ~ 29 C.2iiO 1].109 u .. C4d ,~ n s IJ.C77 0.167 C.207 cJ )49 O.lSt 0.2313 0~182
o ./t l6 0.225 0.347 \I. 192
0.2(;0 l,). J. 1.3 Ll.064 I ~ 2 1
J.1;;'1 O.l i 7 :J.l'i5 ) 175 0.1'06 J.n;;: 0.135
1'~7 j
0.416 0.2.;;::> 'J • .347 tl 'd \J.127 J.144 0.'::91 '1 31<. 0.2.66 ll.l.lJ J.uo4 1l ? 1 u.1Sl J.217 0.21t1 ) 17:' 0.140 :.1.214 0 .. 185
1<; 14
II I 7 ~ i,;~ ZCt: u.2.::! C. 21 1
_,"l !! t
J.2:lc S • .:2 <; iJ.4Si \,' 294
(). 14;? v .16 E C.211 C l' f.
1 ! SF U.231: U.233 J. 2.!l
-'J I 'F o !l>c4 4 u.28E G. 561 ,J '347
O.ZeS O.LH i.l.Cd1 ,) ) 6 r U.142 0.16 a 0.23 C '\ 1:3 e u.GSC li.2Ct
-0.17 2
1<;75
C.C? "1 C.!44 (.,,22 ICC; r
C.lt:; C.C S7 (.376 C ;; 7 C
C .d;'> ( .ld C.114 (' ;'4!
- c • C 1(: C",C35 C.l<;7 C (S ,
-c .CC6 c.~Co
- c • (<; 1
1<;75
r p7 C.Cii4 C .153 C .as c cc:n C .:: 1 7 l.lD C .4-'1 C ~ ,'5 ( • .ltd C.CS7 C.3t:3 C :79
-C.C16 C .05 C.217 C CS;4
-~.CC6 C.'lu
-(.CSI
1<;76
-~: 70 o. 90
1<,76
) 1 ;4
0.37':1 Joll5 0.450 () \47
U.itlB O~175 0.228 ., ., ,q,+
-G.,)10 C.OSO C.ZOO C 1 C3
-0.v04 0.:511 0.u90
... 121 G.CdJ. 0.122 ,) .2 B 3 ! '" ~ 0.3j1 \.:.1'>3 0.294
in
" 'JeJ :5:113 C.C5J o .,! 1
C. 11 J 0.162 0.156 \1 i? 5 v.lG1 0.251 0.J9d
A\lE~t.GE
t1 1<) O.OS'1 0.127 0.'<::63 ,) ,5 a 0.331 O.19J C.2S .. o I.;,] C. 10 L 0.109 0.267 n '! 1
0.26u 0.113 0.053
211 O.Hu 0.162 0.166 o L2b 0.1\]1 0.252 0.0<;8
------------------------------------------------------------------------"---------------------------------------------------------
111-80
APPENDIX 4
Ten-Year Returns for High Barrier-To-Entry Group
III ... 81
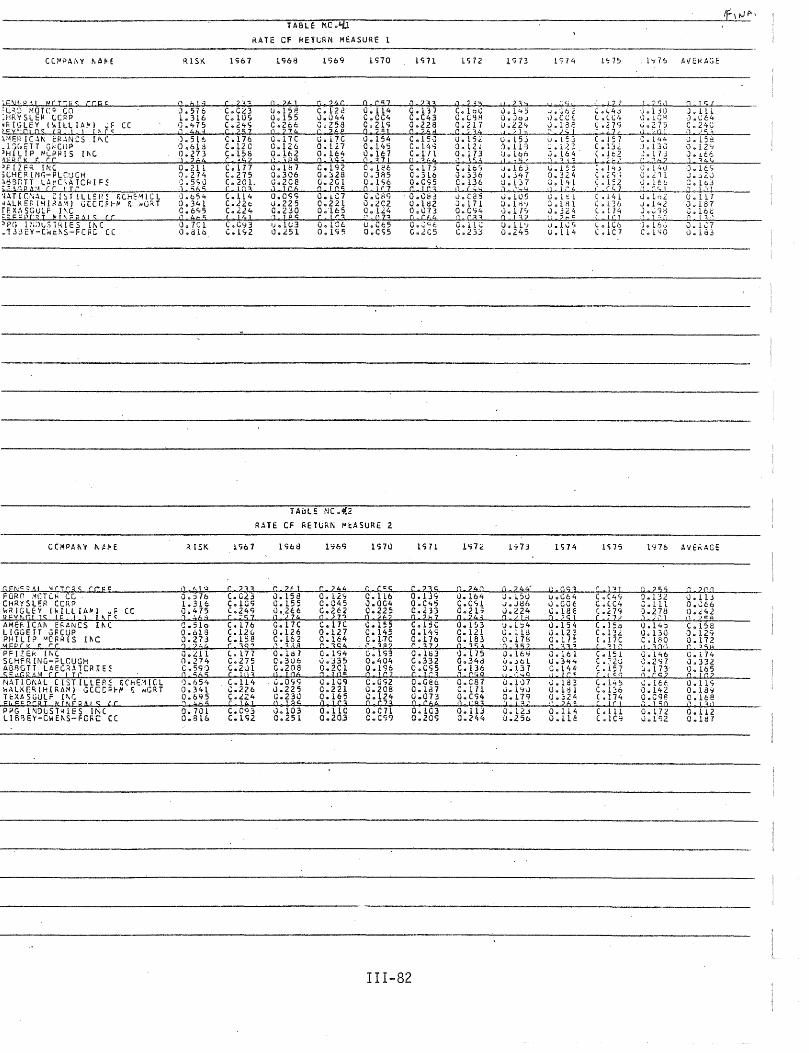
RATE CF ~ETGRN MEASURE 1
C(I-!PAI\Y 1'.A~E ~lSK 1967 1<:;70 1 'in 1<;72
'~: E;..,,~~.~":-/~~~b-::T~C-':R~r~~~~~s;,.....iC,-CL...t:f,8-"'------'-3 J H Co g; C. £t ~ c .i ~ 2 3 .1 ~ r 8 .1 n c.1 ~ 6 :HRYSlEP CCRP 1.316 C~lOS 0.155 uo044 C.CC4 C.C43 c.egR ~RIGlEY 1~ILlIA~) ~F CC 0.475 C.Z4S C.266 C.Z58 C.21<:; 0.228 C.217 ~C:y.ICIO' lSi ] ) r!\r~ ( .. 46' C 257 n 274 ('268 0 2=1 C 'br! C ;:3'* ~~ERIC~I\ ER~NCS I~C 0.5l6 C.176 C.l7C D.l7C 0.154 C.150 U.l5~ _I:.(,cTT Gi<ClIP 'J.bld C.120 0.126 0.1.27 0.145 C.14'1 Ool2! )HlLIP ~CPRIS !I\C 0.273 C.155 0.lb2 0.164 0.167 C.lll 0.173 1c or K riC r) '6' .. C ':'5% ,'\ ;SQ 0 4\53 n 771 (I "'64 0. 3~,
)FIZF~ INC 0.21l C.177 O.lb7 C.1<;2 D.leo C.l1S C.16~ iCH[RING-PLCUCH 0.274 C.275 0.306 0.328 0.385 C.316 0.336 ~~9GTl LA~C~ATCRIF! C.5~O C.201. o.zes O.ZGI O.IS6 0.C95 0.136 :; ,~ :), r: P 11'1 C C ! I,'" .J 565 r! r 3 ,J 1 C 6 a! "'" Q! f' 7 C J C 3 t1 c:, '" 1ATICN~L CISTILLER! £ChE~lCL 0.054 C.L14 O.C~~ 0.ie7 c.oag 0.083 J.C2S ~~LME~(~IRA~) G(CCF~~ & ~G~T 0.341 C.22e J.22S 0.221 O.2C2 O.IHZ J.il1 fEXASGULF I~C C.6~5 C.Z24 C.230 0.'165 0.l24 0.073 0.C~4
~~?~;~G~F~i~f:~,j~c~~~~~4~\~lg~~~~~1~K~c~(~C------------~S~.~4~7c~G~i--~(~'.~b~~~·1~--~2-.~1~G~·~~--~g~.+1~~~6~~~~·-.(~~~b~;--~g~·.w[~,~~17~,--~8:iTt _1laEY-C~e~5-FCRC cc O.dlb ~.1~2 G.lSl O.1~5 O.CS5 G.~C5 C.233
FORO :-;CTCt< CC CHRY SLf:R CCIIP w~IGlEY (~ILLIA~) w~ CC R enO!'5 'F ! I I~C~ AMERICA~ E~ANCS I~( L IGGE TT GFCUP PHILIP MCPR[S I~C 'lEU I( r C C PF IlEk If,C SCHfR[NG-i=lCUGH AC8GTT LAF.C~A1CRIE~ S::uGR4M cc 'Il~
NATIONAL CISTILLER~ £ChE~ICl ~ALKE~(HIRA~J G[CCF~~ & ~CRT TEXAS\.iUlF I~C F k "to p ("' R T /! r .' F R ?I! S (r PJJG INal;Sl~lES [h( LIB~EY-CWE~S-FC~C CC
RISK
11 L.]q
0.376 1.316 0.475 :1 :'6'l C.SIo 0.613 0.273 ? 164 a.LIL 0.274 C .59·J o 565 1).654 0.341 0.695 I] 4=65 0.701 0.8l6
1967
C 23".1 C .. CL3 C.loe; (.249 c "57 C.176 C.12(' (.158 C 39" C. 17 7 C.275 C.2"') 1 C i () 3 C .114 (;.226 C • .:!24 [ 141
C.C9;; C.1'12
TAtJLE Nc.402
R~TE CF RETURN ~tASURE 2
1968
C 2f! J. 158 C.l55 iJ.2C6 0")74 C.17C 0.126 C.162 " ~ 38 O.ld 1 0.306 G.20a (} '06
C.O'1e; 0.225 0.230 {) 'as
C 244 o. l2S C.045 C.2C2 n )7"<
C.17C 0.127 0.164 C 354 C.l<;4 0.335 O.2et o 10"' C.IG9 0.221 0.l65 Q 1c3 O.lle 0.203
IS70
C (es C.l1.6 il.C04 C.225 Q ?6? 0.155 0.145 C .1-7C ," "l e? 0.193 0.404 0.196 Q IC7 C.092 C.208 C .124 Q C7 3
ISH
C 23S 0.1.3'1 0.C'I5 C.233 Q 20 7 C.lse O.lIiS 0.176 Q "H)
0.103 C.332 0.C<:;5 C 1 j' 3 o.cet 0.la7 0 .. 073 o c64 0.103 0.20C;
111-82
C 24(' 0 .. 164 C.CSl C.21'] o '43 0.153 C.l2I 0.183 o "l'i:S 'J. 17 5 O.34d C.136 .1 Crj9 0.ca7 C.ll1 0.C94 n 1'83,
1 ~73
II 23" 0.1'+:; O.Jo.) U .22'-;
I :. J ~
0.15,j ;1.113 (J.lon ,'I )? j
~.16j J. j4 1 ~.D7 o ":rl,J
J.105 (J.id':! ,J. if'; Q ) 3? U. 1 J.'j 0.245
'J.l::4 G.llo 0.178 '0 352 J.16"; 0 • .)oi 0.137 IJ .'~3~
o. LU u.25b
1 S7 4
'I "'1! .J ,.'~ b d d.CCf... J.131.: • ., ;;.., 1
1.;.1 ~ J
0.324 J. 14 I .J J;' {,
G. 1>: l :J.l~l J.324 !! 2 t:: u.l";C; u.ll""
1S74
I' !lS3 0.C64 (J.COt C.leE Q 25 1
0.154 <.J.12'; C.17 ~ !~ '33"
0.114 G.ilE
1 ~ 75
! I J 2 1
C.i.4.::l C .ev. e • ~ 7<;
<7~ ( • I: 7 C.132. ( .1 t2 r <f:/ C. 14 ~ ( .2 <; '; ( • 1: Z ! cq c .14 1 C.13& C • 114 ( ! I" I l.lC6 ( .1 C 7
1<;75
r PJ C.C4S C .CU. (.;'79 C -V C. I;,,? C.Lt. C.I7C ( "'l J (>0
(.151 C.:'20 (.157 C (C]
C. 145 C.l::6 (.114 c ! C ,
C .111 C G 1 C"
1':; 76
1 7, r: ,J j.lJ0 \1 $ i C ~~ ~G275 ,) ·n J
G.l4 4
J.13.J J. 173 (' -'62
1'176
0.14:' 0.130 C.IBO " 3"'(1 G .146 0.2S7 :';.173 ,'\ C52 ";.lU: 0.142 o.Cge " ) 50
AVEKAGE
(J. 117 J.187 C.l6c r l:l, ~
J.1L7 V.ld3
AVE"AGE
C.158 0.12'1 0.172 C "'J5H G.174 0.332 0.165 ,., I G2
0.11<; O.18~ a .ll: e (' 13 r )
0.il2 Oolti7
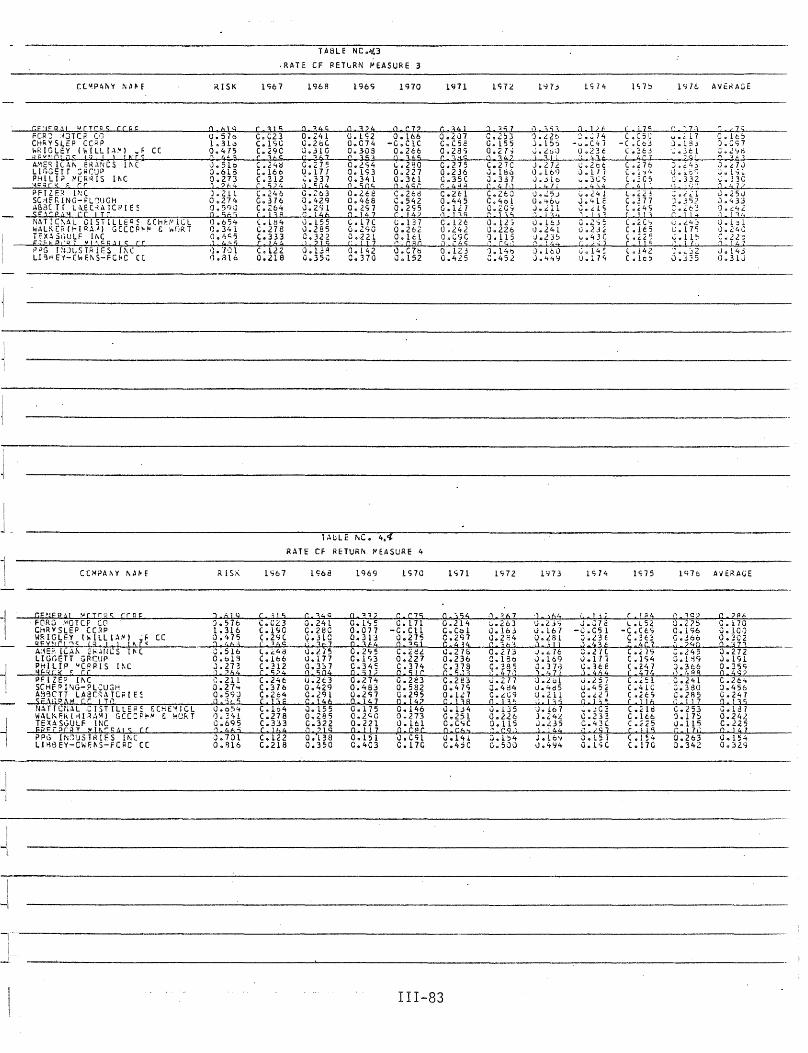
~----
G F 'J co R .) , V C T r C c:: C r Q C FeR J :~:JTC i< en CHI< Y SLEP CC<P wRIGLEY (\.rLllA~l wF CC REv"IQ',,<"" (:) 1 ) If\'rs AMEQI(4~ fRANCS I~C L1r;GETT ~RC'jP PHILI~ ~CRRIS l~C '=Iqr"L( !; cr PFTlF.R INC SC.;fR.ING-j:V:!UGH .. sacrr L<\EC"'ATePIE~ S " , ,.. P ,i" rei T'" N~TIC~AL CISTILlEQ! &Ch~~lCL I1ALK[Fd!-'tqA~) GceCPr'" I: ~flRT H'Xl51;UlF [!I.e F:"!t.t;P,'OI tlI",t:::R.lIS rr t'DG r ~u L S T R 1 E S 1:\ C LI 3M EV-(w EJI.S-FOC C(
eCI-1?A~Y "HE
GPJER)1 ~CTr<os ceq FORO IrlOTCF CO CI1RV SLEP COP WRIGLEY (\\1LLI~"') ';r ec (IEY"'C!'~<: 13 I ) fe-r<: A;~EP. IC,i,f\ 2R ... r"CS I'" ( LI GGETT GRellP PHILIP vepPIS I~e \lr.scj< ~ CC PFlZE? If\C SCHfP I "lG-PLCU~H A~9CTT LABC~ATC~IE~ SFVjOAi'4 cr I Ii' N.l,TTC~L.),L CISTIllEI': £CHE'~ICL WALKFk!~!KAM! G[CCF~~ & ~UkT TEX:I.SGULF INC E2 C E:l['fn vU-'-r:,}1 S cr PPG IN~US1RIES INC LI~~EY-CWF."S-FCRC CC
RISK
a 6' 9 0.516 1. 31.., 0.475 Q 41.3 0.510 0.613 0.273 'I ?64 J.211 0.274 O.5QO o 56'1 0.654 1).341 O.6C,5 1 4.:..5 \). 'TQ 1 0.816
RISK
.J 619 0.576 1.316 0.475 :1 46:\ 0.516 0.019 J.27:! ) ='64
C.211 0.27'+ 0.59:) n ,;/,r;
0.o5/t 1)~341 8.695 'J 465 0.701 0.B16
TABLE NC.ot3
,RATE CF RET~RN ~EASURE 3
1 <;61
r 31<;
C.e23 C.1S!; C.29C c '6 c C.2<i!:l C.160 C.312 r 5)4 C.246 G.376 C.<:64 ( ! 3;< (.I.H4 C. 27 8 (.333 C r 64 C.l22 0.218
1 <;67
C.C23 C.lc;O (. lCi C ( "J69 L.~4d C.166 C.:H2 C 524 C.246 C.316 C.264 ( 1 -j (3 C.164 L278 C.333 C ) 64 C.122 C.21S
196R
o 'lLtc; 0.1:41 C.2eC G .31 G (' "l6 7
G.Z63 0.42'1 0.291 'I 146 0.155 0.285 0.322 ,) ?IS
O.UR u.3SC
196<;
o "l24
U.1S2 0 .. C74 0.],08 C 3<:1 C.l<;4 o. is 3 0.341 Q soc, 0.2te 0.4t8 0.297 o } 4 7 ('.17C 0.<:<;0 0.221 t' ! 17 0.142 C.370
1910
11 e72 0.166
-G.C1C 0.266 q 3 e 5 1.:.220 0.227 0.3tl Q 4<';t
C.2£::8 C.542 0.2S5 C ! 4) (;.137 0.262 O.ld ('I C HO
0.C7b 0.152
TAbLE r-.C. 43 RATE CF RETUR~ ~EASURE 4
1<:68
,'" 34C
0.24L C.28C 0.310 (. 3t 7 u.2.75 u.l17 0.3:;7 Q 504 0.20 0.429 0.291 C J 46 J.155 0.285 0.322 o ?J 9 0.138 0.350
1 '169
G.L<,5 0.071 0.313 a V4 0.2ti5 C.1<;3 C.345 Q 5]; 0.274 0.483 U.2<;1 o 147 0.175 C~2C,C 0.221 Q 117 0.151 0.403
1S70
C C75 C.l71
..,c. ell 0.21'5 o "lSI C.2!lL 0.227 C.314 Q 51l' C.U3 0.582 G.295 a ! 42 0.146 O~273 0.L61 Q r~c \.J.C<;l C .170
1971
C 34 1
0 • .201 c.ese O.ZBS c 3~s
C .275 0.236 C.35C C 4~8 C.Ul 0.445 G .1L 1 oJ 1 ::s C.126 0.242 O.C9C tJ ('to 5 0.123 G.4.25
1 <;71
0.214 C. Cll 1 0.2<;7 C 434 1,).276 0.236 C.378 C ~ 13 C.283 0.41<; 0.141 C 138 U .U4 0.251 O.C'iC a C6" U .l4l 0.4jC
111-83
C.2,3 C. 155 0.2 h il '14"' C.27C 0.186 J.337 C It 7) C "6 ~ C:40l O.ZC'1 " 1 3 'i O. 12 ; 0.226 'J.llS ;" c s.'~ 'J.141) i::.452
1 C172
., ~ 6 7 ''';.26) 0.163 0.224 " -:. b "j. C.273 0.190 c. ~8 5 .J '1],J J.271 0.4il4 C • .i:C9 a 13" 0.135 0.226 0.115 -- ['9.1
D 35-:1 J • .:!26 j.15~ J. '::0,) ) 3!!
J.2.72-0.169 J • .;llc 1 it Ii 'J. ":5J O.'t6v J."ll J 1'14 \).163 IJ.241 d.2J' :' 'It":'"
1'173
<J.Zjlj U. 167 C.LSI. ,J ;, J ! J.",76 0.169 J. 3 7,) ] '+7!
i C; 74
;.;.2cc 1,).17 7 ",.3(<;
4 )4
C. 14 ; U.17 <;
1<;74
iJ Ii;
G.ne 0.17; C.3tE ,1 464
J. L 5 i O.ltiC
r 17<: C • C 5 i;
-C .Cd C.;t3 (' 4 r 7
C •. db C. 1 -,/t ( • ~ C 5 C 4 1 0
C.~C7 C .1 e 5 (4~25 C 1 J '" ( .142 C • Ie?
1<;75
L.L52 -C.Ces C.;O I 4C 7 c..: i<;, C.1S4 ( .247 r 47'_ c.,,: I (.41C c.~t<; C 1 J 6 C • ~ 1 tl C .IH (.;<,,5 C ! J 5 C .1:4 C .17e
J: §~ ". tl
9{
L ~ ., 5;:>
&3 ]-1
c; a 4'""1 C. 7~ v. 1,
l .J2 5: ::5
1<;76
'J. Z2S C.l <;6 G.366 -, 2<t r l
C.241 0.360 0.2A5
117 G.253 'J.17'.J !J.115 C ! ZI' 0.263 0.342
AVtKAGE
J.<:70 U CI 1"; ~ ~ 0) ; 3C jl 4U 0.250 0.433 :J.242. ,1 1 i/j
G.hi ,J.24C C.22:: I 1 4 7
J.143 O.31J
AIIERAGE
C. l70 0.100 0.::02 Q OJ 73 0.272 0.1'11 0.35'1 Q 457 C.26 .... ~.456 C.247 Q 135 G.ld7 O.24l C.225 a ) 47 0 .. 15':' 0.3.29

APPENDIX 5
Ten-Year Returns for Electric Utilities On A State-By-State Basis
II1-84

R~TE GF RETURN. MEASURE 1 -----------------------------
RISK 1961 1968 1970 1971
ST~T~S R~G~LATl~G l~E UTilITIES 6ELC~ A~E 4~IZO~A PLtilIC Sf~\IC~ CC 0.4Sl C.061
~-e
0.C76 0.06<; TUCSU\l GAS". (LECTf11C :).532 C.096 o 100 0.C84
1913
0.081 o .07d
1<;74
C.CE9 c.eS3
1976 AVERAGE
0.G75 0.090
surES I«ECuLArl~G HE LTILlTIES :3ELC... .e- """'e"" PACIFlr G~5 & ElEC1~!C 0.240 0.C77 C.CB6 0.C84 0.083 G.GSC C.C70 0.073 G.C8C SAN 91EGO GAS & FLECTqlC O.5l1 0.084 0.078 G.C69 0.069 0.C81 0.C59 0.084 G.e7g 5('1' IT H: 3 /, C A) 1 E E'i I ~ [!\ c:.L"---ll...J, .... B ... ;>_---" ......... '-'-''----''' ....... '-'-'--..."...>.W!W.'-'-'' __ --l.Q'-'.wCw7l...'''--~~Lt_.2."..il.~J,t.J.c":;O~~---->C ... "u.{..l7..::l9:...--"'Q'-".cl.Qu;fl'""".,'----"Q'-'.u.Ow7..;.,s'--__ _
ST.HES PFGlJLATHG HE LTIUrHS SHO. PURLIC ~EPV[CE CC CF CCLG 0.365 0.015 o. C'I6 U. u16 G.CBO
~TATf:S FEGUUT[/IG H-E UTILITIES 3ELCw UNlrf~ ILl~~I~A1I~( CC 0.412
~§~.~t~3~~--~8:0~g ~---~~~.+1~l~~--~8~.~1~aJ~--~g~."t~~@~~-------(.G98 0.096 O.C7S G.1C4 0.105 O.O~7
--~§fI~eALr~~,~~~~~AE~~~~~~~~~~I~~~&~~~cJa~I~~-UI;lTLILIL!LILl£E~s~oa:t~~~~1~w-AA£,C£:~O~d~5---~1~~0~.~g~i)~;a~&~O=.~0~9~1=1~'~0=.~O~8~6~~~~O·.~C~775--~C-.~G~7~O---~O-.~O~7~3---~O-.~C~8~5--~C-.~C7S~8--~O-.~0~9~a---~o-.nO~8c5--------
SBP'S sr:G!!!o.ra(' HE !!TlttTl"'S 3"::.L.Jllo<.J~E ilUdLIC SERVICE CC IF [i':D 0.423 C.1.15 ~O~THCRN lNJIA~A ?l8LIC SERV 0.337 C.l17 INDJA\APCLIS FC~~~ E LIGHT O.6~4 C.116
STATES RfGUl~rr~G 1~E UILLITIE~ aELC~ AFt lil~A PO~fF ~ LIGhl 0.353 C.J95 IOWt. :;'OUTt-ER'J lilILITIES C,J G.571 C.116
STATr:S QEGULATIi'G l~E UTILlTlES ~t:LC\o. "HE K5NSlS pr~ER & llG~l O.2dl C.103 ~~NS~S GAS ~ ELECTR[C 0.558 C.IIC
~b6I~~lt[~U~1~I~cEl~ET~ItlITIEso~~~~~ A~~132 STATES ~EGulATt~S l~E UTILITIES gELCw A~E CENTRAL MAINE PC~EF CC 0.310 C.C~d
M-!.\Au,)f!,'l 0 0 0.091 0,097 O.CSB C.QSt
IWbl~~~* .~n=~,,~~~-,rt~,_~,,~,-.~""---,"'~~~~~~~,_~,_~,_~,_-------J.llg C.IJ6 0.10<; 0.CS3 O.lea 0.116 O.lIC C.l(6 O.l~l C.tll 0.116 0.114 0.12J 0 104 0.L04 0.098 G.OS! (.csa J.107 0.106 O.l14 0.le9 0.103 0.1C4 C.ll~ 0.103 o.cae (.CS7 C.I05 C.lC5
[6t,gJ~ e---~ u.OQ3 0.090 0.078 0.119 0.129 0.128
~Al 0 e -j 0.111 0.118 0.119 0.111 0.118 C.ll3
J.140 0.142 6
C.132
M~L~E. ..:\.e---"f"Io---~O
0.C84 0.124
C.ltB 0.lC3
0.123
u.Osc 0.091 O.CS4 O.C84
0.CS3 0.121:1
0.113 o.oo;a
0.112
0.097 J.l.lle
0.109
C.CSC ;';"lOt:
c.CS!: (,l.OdS
0.C<;1
C. 1 Ct C.l C 7
C • c S" C.1C5
C .llO
C.I02 0.109
0.095 0.102
0.106
C.CS2 0.118
O.lCS 0.103
. Q. 120
.j -
MAINE PUBLIC SERVICE 0.491 C.C79
SIHES ~"r:lil A1!l'Iij 11-'" nIl IIP:S "''''"I [I.. 41;E BOSTON EOISGN CC 0.525 C.OS]
J.078 0.086 0.091 0.079
MA5'SM~~Hs u.(';'i3 G.;;8S C.C78
0.C84 o.C h 0.C83
C.C6-i 0.Cd6
o. 0 73 (,) .077
o.en C. to I::
C.eE9 C .c E6
C.093 0.110
J.091 0.095
0.090 0.0<;0
(,l.OE3 0.083
i FITCHoU~G GAS & ELEC LIGHT 0.387 C.OlS
STATES g~r;I'I AIj\'= '1-1': 1111 rIlES 3"1 r." HE EDISON SAlLT (LECT~IC 0.0 C.114 DETROIT ECISC\ CO J.714 C.O~l UPPER P~NINSUlA ~C~EP 0.44J C.087 .cr,tl$'l"EU5 pral:R rr 1.711 C.le5
STATES RCGUL~TlhG l~E UTILITIES 8EL~~ A~E ~[~NESOTA POWER & LIG~T 0.390 C.Cti5
STATES PfGULATI~G l~E UTILITIES 3ElCW A~E MlSSOJRI P~~lIC ie~\ICE co C.631 C.C92 5T JOSEPH LIGHT & FC~ER 0.599 C.083
~J~Igi ~~~~bAl~~G l~t UTILITIESO~~~S~ A~~C87
e~~~N~JtlE~aHar(t!=F tiTfI !TlFSo~b\ Co At:C64
J.OS7 0.:184
fiJ~cfi't'84\,G C • 1 C 1 J.087 0.J85 0.G87 0.086 O. Q <)9 a. ,) S"1
l~t!H !.S,~lU'i~ J.C84 0.0S8 0.094 0.J89
0.e9G 0.073 0.C75 o.eeg
(3 C.CSl OeQ95
ST'lTES :).fGULATHG lH: UT!U Tl ES BELC'w APE 1i!~ YCTI( Q 0
c~ 078 C.072 0.073 Q. C 77
0.0<34
o .. C7<1 0.106
C.Cd() 0.,C79 0.C95 0.C76
C.080
0.05
ll.094 0.076 0.099 V.073"
0.085
0.081 ,).094
0.078
0,,013
O.Q'V
G. 10 E 0.C72 C .CH o,ese
0.C8:
u. CS4 J.CSt;
Q.C82
oj. CI:l I
8:§H
C.C5d e.(74 C .06 e.G EO
L1CO
C.(C;5 C .en
C .ne
(".l 9
0.082 0.076 o.oga J.095
0.104
C .110 O.C'77
Q.1QQ 0.094
O.GSS O.U78 0.C85 C.O!:l4
c.esc 0.094
0.085
Q.Q95 0.Ci9
lGNG ISLA~D LIG~TI~G 0.530 C.C85" 0.084 0.J90 0.066 0.CB6 G.CHI 0.078 0.e71 c.esc 0.096 0.095 Nf!!,!lq MCH1'jl( pn'_ER Q t.qj' C 076 :J 06" O.JM 0 059 ~ 1'.62 Q cog :J il"lb Q 1'61 C Cf4 0075 Q aba
ARE C. 129
011 f: EOISCN CO 0.':'32 CCLU~6US ~ S~UT~Eq~ C~IC J.603 TCLC)C E~ISCN CC~P.~~ 0.4il:l CP!Cf\'NATI fi;) r r:qfT8!r 0.?H4 JAYTlJil pellER f. LlGl-T 0.479
SiATES REGULATI~G IrE ~TILIT!F.S BELC~ APE P(lBTI fl~r GDP1H E! [(JIHC en Q 444 C GRC
0.124 0.091 O. L 1 C IL·IZ3 J.109
C 0 0.117
o Q.103 o .le2 0.017 0.100 Q J 04
0 .. C51 0 .... S9 0.C76 0.Cg3 Q .lQ2
Q G.S2
8. 986
i.l.v 0
Q.J95
O.06~ O.CH 0.[«2 0.07l
O.osc
CeCes (.cs~ C.1CI C.C'>4 C • UJ? C.CSo
(.(50
0.Q92
iJ. OS I
0·('92
Q .lQ3 Q"Ugg 0.OS5 0.0% 0.1 Q)
Q.066
STAT ~S riEr,ULA TI ~G lH UTI L I TI ES BELew .4P-E JleA\.t\~'iIIA~ N\JIi a 0 PE~NSYlVANIa PO~EQ E LIGHT 0.441 C.CB8 J.O!4 0.076 0.C65 O.Ol~ C.CB6 0.091 o.c,>e (.[S8 C.095 e.eEt
-=~~u':':'!h~L~g~~~~':"'.:k,.;,;n'""t~\:-'~"'"rl.,-t1"..'.,.JC"-l" §~T,-,r;;..lwr--:"r..;.I',-! ---~g!-".-.;;5!'-:!~i-':2'----\2~.'"':!~'-" 3~~'----,;J~.'-":~'"';:' 6!-':2;-.......,3!-".~g~~!-!~:--~§ :%H--~I g : § ~ t -~3 .... :""!8""'!~-fi-~g'"":..Iig~g~~-~tu:~l~~~}:---'!g,...:~8'4j~J'-~g!-".~g~~~]:----SIHES "':GULATI:'IG l~E UiILITIi:5BFLCIo. AilE ~\.., ~Qoh~ 0
__ -.>-> .... '" ' ..... JI..u;J..H ........ C -"!.'>J;:..t ';"'CJ..! ... I ";'~:"",;-:;;~J.,\ .;;;i'.le,( ....... ' • ....:.J.'lLl.U.LS ___ J.L,r'l .0..<.;.(14:::...<.,1 _--"'C ....... ( ... l;J.Y,\;l8 _--'LQ ......... l ... Q ... ?_-l.LG ........ ? ..",'i:::z.!'t _-,,-0 .0..1. Q.8.L.....JI...Ja5.. ._f'",-"-,, C~\U",,--_J>l.L' ',,-) J.,7 6>Ol-_;LOJ&," .... C .>,;.8 .;.(_...l..C .... .J,.C.;z.S.;z.9_--'>i.Q ........ 0.;z.9...i.S_-.\elQ .... ..l<C-"'e.:"tB ___ .
sn T E") RFGUU T! ~G ll-E LTI LX TI ES BELC'" Af.lE· ~~5 a 0 0 SCUTH~ESTER~ PUELfC SEAV CO 0.374 C.093 0.l02 0.106 O.llC O.llt: 0.106 J.l0e 0.12e C.les 0.ll9 0.109 SCUf HIIE SUI< N ':! ~( 0" R Y I cr: ~,_--'"C ..... ""'!)'"""d!...ll~ ........ \21-.O ..... !)u,;B ..... 3. ~~~.....l.Q.~:.LQ .... .J..l:.LJ../.3_-.l.!Q.Ji, • ..I.l ... e_C_~( ... , ... 1 ... C.:l4_-..'.tQ-"""-I,l,;,J,Q ... 3_-:.IQ:.Jip..J.jCw9'-f,1 ___ _
suns PEGLLATII-G l~E UTILITIES :lHC:" Il.H 4\lUl"ll'\~ a 0 . GREEN ~CL~T4!~ PChE~ CG~P 1.C63 (.C76 0.075 C.074 0.075 C.CJ~ 0 .. 06), Cl.C8i (.eso a.e89 0.073
III 85
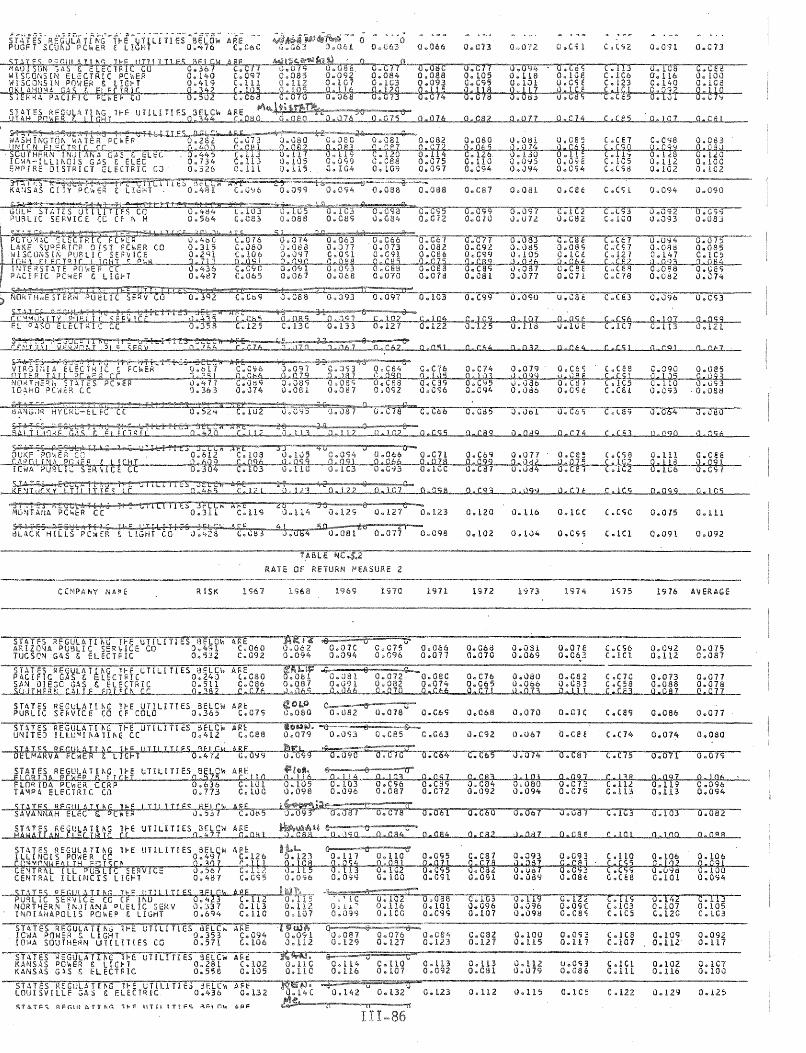
RATE OF RETURN ~EASURE 2
RISK 1;10
fTATES REGULATI~G H'E UTI un ES a ~~~9W AFlt: U"b G-_· a -LLI Ne!:; POWER cc c~ 126 o~ 121 (Lll1 0.110
E~~~r~~E~LI~ ~~I'~~ Q 'IE f'~~~ Da OP! 'HR~,L ILL Pt;3>L: SERVICE' 0.567 G~112 0.11 0.113 0.10
CENTRAL lLUNCIS LIGH 0.487 (; .. (;'i 5 0.096 D~09q 0.100
1971
a 0.095 Q .. Q7! o.cc;s O.OSl
1'.112
C~CB7 Q C18 Q"caz 0,,091
0.113 O.C8l
0.H2
00093 0.093 ,).0 8 , c.ceJ O.UO 0.C<;3 Ii.Od9 0 .. 08(:
1<;15
C .110 (.~S5
c" "" c.cca
C.IC1 C .Ill
C.1.22
1976 AVERAGE
0.106 g.! 92 .09d
0.101
O.l02 0.H6
0.100 go09!
"LOO 0.094
0.lC7 0.100

SHTES ilEGLiLd.Tlf\G H .. E UTIUTH .. S ,'1Et..C\,> ARE :AJ~.O""71--e Pf..'J'ISYLIJ;llld' PCl-.f R C tIGHT 0.441 C.Cri3 0.J71 P'-'iI '.1''''1 PHI' "I ;::J.:ll!C in Q ""1 C ibB J.GS? ') !lB JUI:iU[S"IE 1l,~HT I.e v.5U 1t (.101 J.C9ci \.l.aB]
t) tr 0.056 Q,064 0.06i
STll.rtS REGlJLt1PG H-F. l.TlUTIES JELf.1- AFE ~.(!., G=--""""'!O--~'-;C""'"
a~ en a C62 o. cn 0.056 C.C10 C C71 0.G46
o. (16 ll.Q6fj 0.C15
o. \l71 I) 054
0.070 J.J14 0.090 J d',l iJ.Y:'o
__ --''-''5 ..... [..,1 ''"'-T.;..H ........ C .... A''".):..J'..,.j!'--'-'! ,_ ..... :j ......,t;...E ..... I ..... "..\.c---"~-..l.lr;"'<l'-'s'--___ ..... O .... A .... o...:4x...!'---_ ..... C ........ 1' ..... 9 ..... 5_--"")'""-1.1, ..... 9'-'9'----''' ... , ..:Q""-'s ...... c"'--_"'-O ......... CJ.i6.cJ.9_--""OL..a...\,I'UI 6'-5<--.--'0 ......... C ..... 1..<...1..) _->1 ;] 70
STATes ~=GULATI~G 1rE UfILITr~s 8tLC~ A~E snUTHwESTFRN PUELIC SERIJ CO 0.374 C.092
"'0'---0- a 0.lU6 0.101
SCIITl-i'-j::STE3'J i=! EC qqrfCE '1 371 COliC o 191 0.096
STHES REGUlATlf\G !f .. E lJilUTIf:S i)ELGI. ARF 4J~f' GREFN ~CU~TAr~ FC~E~ (SRP 1.063 (.C74 0.068
~0a~¥Ss~b~~L~6~~g irtl~~tL!TIESo~~~~~ A~~C58 ~
.. n:r.
I
C .111 (L C58
0.027
0.062
C.C61 o. caz 0,,076
0.107 0.C99
C.C5C
O.e7G
o. C 17
c.c<;o OoC62
O~C77 0.C91 00(86
(),Qo5---...Q.Oll 0.CB8 0.C8d 0.061 0.069
0.110 Li. 10-3
v.061
0.078
J.095 iJ~Joo
J.090 u .. 01:l9 v~ 105 'l. QIl o.Jat! 0.016
·).068 Q I,)J I,).U75 G.084
o .oS o 06(. \.l.C84 (l.Ol:! O.C 7C Q (';.2
O"C7~
,). Of!;;
a ~ 12" Q. J IJ"
a.oaE
O.G<;'
o.cas
(,. l C S 'J tl) CB it
0.1(':1 0.091 C.ll € Q.Q62 IJ. or;; C 0 .. 011
a .C6e ~-) 1 Q 3 G.cal iJ.v9C
C.('74 ceRA (.u:c C.C<;2 c.ces c (8'1 c. CE3
C.let C""J96 C. l! 2
C.lC6
C.1l6 C 104
(.(<;2
(.(<;5
(.IG'.] Co lel
C.CEl C.CS'} C.138 1: ... '82 C.CS3 C .05
C.(S6 r 1 co. C .111 C.Ca3
0.107 '1 072 Ll.eB9 O.lOv o.oee ;) JQ4 J.lh5
C.I00 ) In 0.US5
() 106
C.121 O.lIl1
0.104
0.100 0.094-
0.110 0.089 C .156 'J. Qq] 0.0<;3 0.083
0.101 (j,105
Q Oil5
0.109 J [)96
0.066
0.Q81 o,ap 0.117 0.0<;4 0.OS9
0.089
O.OSb 0.080
---
a.c-a-l-0.086 O~l05 Q an O.08't \).070
0.077 Q jlS6

0 .... 105 o~ L02 0.0<)4
RATE OF PETURN ~EASURE 3
RISK 1 %1 1<;72 1913 H75 1976 AVERAGl
UTILITIES GELCW ARE ~I ~G------~----~e ____ ~~~~~~~~~~~----------~Q~~~9~4~~O~1~7~1--~a~!~d~3~~Q~1~6~4~~Q~·~1~7~g~~O~)~3~C __ ~C~(~C~5~~O~.~1~3~4~~O~,~J~7
O~636 C.1YZ 0.206 0.210 0.133 0.171 C.174 U.147 w.e9l C.lb~ 0.155 u.11 0.773 C.228 0.203 0.198 O.lac 0.118 C.179 0.170 O.lOS C.179 0.!71 0.17
!6re ~. 0.G99 0.07a C.137 o.ua 0.131
1~27'4 OO.27G oj Ow24} G.180 0.105 u.L64 0.143 C.179 0.151 0.205 -tj-.:L-:!g'----,::S"" .-:!2"'::j~~~~g:-,· .'-!1:-;8:-:ri'--,:g~.~l-,,!~!-!jt;--':§"'.-!1-'!~~1:----"'J"'.-!1~~I.:!;'----l..Uw..-!i"":4W:;;--Iz"".-'1~5~~;..-~6~) .>...Ii:..=:t!-!gf---'-3L..'-+1"* 0.186 0.l92 O.2C3 0.187 0.175 0 141 O.Ll~ C.ll1 0.153 0.16
:iT '1T 'i J':~~S ':T 1 I ! r I c.s......l.f..J...L:.l,...~~----'_""~ -~-=--.,--:::----".--------------:c--:--.,------,.--:-----::-r\Jf-ILrC SE:l<VICE (U U l"r: ].4.:3 c.nG .).223 0.217 C.205 C.165 0.1'16 0.205 G.IS3 ColEe 0.232 C.ZC N8qTHfR~ lNOI~~6 PL~LIC SCRV 0.337 C.247 0.241 0.231 0.240 0.197 C.200 J.iSt O.l3t C.164 0.191 O.20~ r~DIA~l?~L!S PC~ER ( LI~HT C.6Q4 C.247 0.246 0.238 0.213 0.208 0.23S Q.1S4 O.lle C.16S C.180 C.2e7
Sl~TES REGUllTI~~ l~F utILITIES G~LC~ AP[ IGwA PG~~~ ( LICHT 0.353 C.208 lOw~ SOUT~eKN U1ILIT!ES Cu 0.571 C.222
1~:2~2~~~O=,.=1=~=C~;=O=.=-~~4~5~--0-.-1-6-C----C-.-1-5-0----J-e-i-~-'5----0-.-1-5-4----C--.l-~-9----Q-.-L-7-8-----0.17 0.230 U.245 0.230 0.218 0.222 0.18u O.L7l C.174 0.163 0.20
ST~TES ~EGUlATI~d l~E UllLITl~S BELC~ ARE KANSAS PG~E~ & LIC~l 0.281 C.lga K~NSAS G~S & SLEClktC O.SS8 C.222
ST4lES RcG~L~TI.G l~E ~TILITIES dElC~ ARE LOUISVILLE GAS & ELECTRIC 0.4]6 C.247
AA u.Z02 0.221
ST:\TES Q;:GULATI~G 1I-E UTIUTiES '3F.LCw ARE M.ve. CE~TRAl ~AI~E FCAE~ CC O.jlO C.l~l 0.IB6 ~AI~E PU~L!C SERVICE ~.4g1 C.144 0.135
STHES ";::r:1" ".,.!~r 11-~' "T!I [TriOS DEI em ,q;, M5:.
Co-- 0 f).Zll 0.236
-6-- 0 0.267
0.176 O.t54
:3 C' S TeN E'1 I S U! C CO. 5;:: 5 Co 1 0 7 0 • 16 8 0 • 1 5 ., FITCH3U~~ G~S & ElEe LIGrlT O.3~7 C.l33 J.ISl 0.l26
II 0 .. 217 0&214
o 0.174 0.155
0.126 o .11e
0.223
0.144 0.124
C.l"4 0.l70
0.191:3
0 .. 174 0.13 7
O.C<;l 0.125
Oe188 0.143
0.188
0.153 0.173
O.CSc v.OH
C .16 C (.1'53
L136 C .H2
C • 115 r,. LlS
o .lSi 0.183
06184
0.145 0.19C
C.110 0.141
0.187 Oe 1';0
0.12 o .ll
ST\IES Q=~l!! ATI&G l~TIES 3clr~ 4'E ~~~ ~~~~l~~~~~~~~~~~~,~~~~ __ ~~~~~~,~~~~~~~~~~~~~_ E~ISr~ S~LLr ELECTRIC 0.0 C.l32 D.llS 0.1"2 O.16C 0.130 0.136 O.lCD 0.191 [.13~ 0.l16 0.103 ~ErROIT EC!SO~ co O.71~ (.160 0.155 O.tS3 D.118 0.107 0.121 J.103 0.084 C.Cfa 0.OS8 O.llB UP?[R PE\l~SUL~ PC~EP 0.440 C.16~ 0.164 0.151 0.l23 0.l21 0.116 O.i7S, O.CBE C.115 0.1~2 0.147 C ! '\I S "\1= :< 5 ;:1 r '" q err) ]I 1 C 19.8...........~L~ .... a ....... )'-'2:;.Jl'--'O ........ 1....j!..;;5'----l.!11--.l! .... rW! z;........--I.tl ...... "..;;";...;";........--lC ......... lwlw4'--___ i'........,Jb..,;5..,,:''''---A.L..C ".Ll
ST\TE5 P=GulATI~G irE UTILITIES ~ELC~ A~E MINNESOTA POWER & lIG~T 0.390 C.170
STATES RCGULATI~G l~E UTILITIES JELCW A~[ MISSOURI PU~LIC SE~\ICE C~ J.631 C.lIS SI JOSEPH LIGHT & PC~E~ 0.599 C.119
$UTE~ ce.;;'U! OTI;r H·<= "TI!..1I!t:S d(1 rl.j AH CGNCO~D ELECT~IC CC 0.0 C.IOC Q. LiB
.. , "l'
o 0.201 0.187
0.115
0.128
0 .. 122 0 .. 126
C.16i
0.186 0.205
0.153
0.142
0.156
0.144 0.15d
0.103
O.15e
0 .. 133
(.ISS
C.(58
(.,,20
0 .. 184
0.216 0.153
0 .. 111
C.188
Q. L87 0.17'"
0 .. 12
ST~HS RE(;ULt.HI\G H"E ijjiUHES 3ELC\.ti.RE NY IJ.- (}------Q-
~0kC~'ll§F.S~ftEEEt~e~lcGAS 3.6Qa §:l;~~~g-.+l~I~~--~g-:~l~~~:--~g~.~l~~~g--~g-.~b~~~~--~8~.+b~~+X--~3-.. ~1~a~~--~~,~.-!1~2~6--~g-.+1~%~i--~g-:+t~~ __ ......I:5,,-,T,,",,1 ~u.1....jy..!,,~.-;~>.1;~;.;,~Uih'->l' y.J..~...I:~:.-I...\~..:.~,;..,~ ..J,1...l~'-r:..:;~ .... L...:~:.J;!;...!i'-I_T_I_E_S-\,o ..... ~,.;;§,..~,..( ~;...W_' _A..I.E_E .... ~i..!I'""6'-_M.J..!) .... M-"2..!,,(Jf,.,;3 ........ +-..I.O:.:l:S:Z::v'F"'_ --\,O:.-,.,JI.:s:2:v:--J.O..,.-.ll,..Jl;.;;;ol----".I-O ...l.9.5-_·-\,o ...... ,.J1...::9L:5'----l.O,\.o...Jl\..,;3~-L. _".JC ....... lw6:uC"'----"O,.l." .... JI-<2;;..:S"---"'c ... ' ~1t-<8:u.QJ-.
OHIO EDISCh CC 0.4]2 C.24l 0.236 0.225 0.L85 G.lSd O.l~J 0.1~9 0.103 C.127 0.131 0.17 COLU~BUS & SnUT~ER~ ChiC 0.S03 C.201 0.193 0.175 0.12S a.C~7 C.122 0.126 0.055 C.181 0.154 0.143 TGLEDn EOIsrN C(M~d~Y 0.413 C.247 0.257 O.25C 0.221 0.202 0.202 0.178 0.111 (.167 0.147 0.199 S U;~ O~" n! 1=; 'l ~ I ~ ~ FBI r ~ • ~ .; ~"--+j n -g~, -: 2~2 3'::-<; 09-9 --b':t1
-: 2;,;-2 l7't":"Z -"""*8~. 'for -!-b'!-I -~g-. -!=l ~~ 4':"'4 -~3 -. f-1 ~':'-! 2~1 _...Jg~. -:-1 O~3~'-...J~':'-) -.. ";-~' ~:!-j "!-t -~2 .... +l-:-g ~l-"'""':!-g-. -:-1 ".'-b ~6 --0;:.0 -. -:-1 ~~;;;-;
STATES Rt=GUlATI~G l~E UTILITIES RELCW AR~ P[;'I~ISYLVAf\T,; POEP ~ L[GI-lT 0.441 C.19S ~~ ::1 t:crpIC.f.C 0 433 C 175
DU1UES~E LI~HT CCO.S04 C.244
ST\TES R~GLLATI~3 l~E UTILITIES JELS~ ARE snUTHweSTER~ ~U~L[C SE~V CC 0.374 C.199
__ --"-S ... C' .... IHfel!':SIE8'i rj FC eFO'dCE" 'i "71 C 1':0
ST~TE~ ~~GUlATI~G GRE~N ~CU~r4!~ PC~
UTrLITI~S a~LCw ~~E COpp 1.Ob3 C.163
Pe. \J. 1 e 1 o ) 54 O.23C
I
o.ze9 C.210
0.C1:l8 0.049
C.217 C ;;C;
( .1:'')
Q .. 245 0 .. 190
0.226 l] .. .2Jl'
Q .11

STATES REGULAHI\':; nE UTIUTIES SELOW ARE Willi>. 0- 0 0 PUGET SCU~D PCwER ~ LIGHT 0.416 C.096 0.101 o.oqO 00061 0.095
SHIES REG!" !\JTI\G HoE !!TTl P'ES SFl CW MA01SCN GAS & EL~C1FI( CO 0.367 WISCONSI~ ELECTRIC FO~EP 0.L40 WISCONSIN POWER & LIG~T 0.419 OK! lloJr".q G"S r E! FCU IC 0 342 SIERRA ~ACIFIC FG~EF CO 0.502
&J ; T E j , .r 3 oJ t 1 1 I ,.. 11 ~ "lIe j J i L.. ~ .J ELl,.; )', WASHI~GTC~ ~ATEP PC~ER 0.2~2 "NIC'~ E! err: 1;- cc a 40"
. SCUTHERN 11\:)1 ~I'iA US "ElEC G .. 44~ [r~A-[LLI~CIS GAS g ELEC 0.734 EMolRE nISTRICT ELECTRIC CO 0.326
ARE c. US C.187 C.225 G 226
C ! 53
!lPt C~135 C 171 C.218 C.215 CoZ09
~:!%fES ( c~r::~T!J'..) IF ... I.JliLili .... ~ 3""ct.~ KANSAS CITY PG~ER E L[GHT 0.481 C.182
O.4iJ4 0.%4
s +a. ..,.,;;, - .....! b .... ~ r'" i' F hli d Z:-i-; : PCT()iJAC ELECTRIC f'(:1d::P LAKF SUPERlrR 0lS1 pr~ER CO ~ISCCNSI~ ?UGLIC SEF~ICE r C '44 I" I U T D I C ,! I, b 1 r. r \, E. INTF~STlTE ~C~E~ C[ PACIFIC PCW~R & LIGrT
o. t.3 6 0.487
SI1~r' , : j . ~l' !~T-:~ fCb-NOATH~EsrEkN pueLIC SCRV CU 0.392
C'I)TC:S rlt:.-t'L'TE'- 1'* l'T1LITI:S -.'.-'''-:; t" n ~A \t ! , "! j I Y Pi! f~ I I I"< < F F \/ t C r.: J .::, 3 5
S;loT_J ,i!3ut,..,i,!C{; ii-I": ulLLlllc:) :Ji.:tLX V'~CINI' ELeCTRIC E P(hE~ J.617
i g t C.216 C.l05
C.144 C.l .. 9 C.23" r 176 C.204 C.lOe
F 0.176
:!;i<E C # J b 2 C. 232
,",itl C 1, 4
4~~ iS3
0.122 O.14C 0.111 0.155 0.170 0.146 0.234 0.224 0.213 o 230 Q 2~9 Q 260
tJ.156 Q 1 Q'l
0.231 0.207 0 .. 221
0.2'21 0 .. 185
0.1'56 n lH
0.205 0.192
0.146 o 16] 0.227 0 .. 157 0.209
0 .. 188 0 .. 166
C.128 0.158 0.177 Q 231 0 .. 110
a 1?7
C.144 Q 11 C 0.214 0.12e 0.170
0.155
0.163 O. US
0.133 0.169 O.n3 Q 174
0.J95 0.141: 0.124 0.147
0.20 l 0.113
G"lS6 o 167 0.20e; 0.J.i4
l== £7 C 0.173 0.181
, ? ;n it ?i. p.;, 11 1 ~8 0.246 0.254
J<.. j'" t 1 C
'+c .,,3 .. 8 0.175
0.199 a~!'54 o J 56 Q 126
o O.ln
o C CM
~ O. t 5 C
0.208
C 1 '37
(;.119 0 .. 209 O.l1d Q 229
C 143
0,,148
0 .. 178 0.116
0.1<;3 0.142
0.30
o C86
0.105
0.160 0.239 0.180 Q. 2 21
(}.! ! 5
0.137 a 1 J!l 0.236 0.158 J .153
0 .. 131
0.172 J.1IJ"
0.140 0.155 0.19 ft ) 13" 0.1<.,14 O.12S
0.157
) 193 J.212
-0 1)0 4
,O.UE 0.190; 0.16; o ! ill: i1.12E
C CSt
O. l-j 7 C.16" 0.141
J.1 H J .1C!:
0.143 0.15t: O. U3 D (4" O.lac C .. C'H
G.l)1
11 J "''' O.lSH:
C .151
C .118
C 12"
C.lsa C.lE 1 C.156
C .152
c.cn C.175 C."48 c !) b
C .179 C.112.
C.1C7
(' 151 C.Ho
C 131
0 .. 1.42
c. ill 0..197 0.264 o 144 G.163
(' 172
0.151
0.145 0.142
O.L'i9 iJ .14l 0 .. 295 () 148 0.156 0.117
0.168
:) ) 79 ').bO
11 135
0.113
C.141 0.185 C.209 o 2If. G.128
a 1'15
0.147 C 14iJ tJ.22'J C.IBO 0.180
0.159
C.182 0.146
0.12C G.153 0.210 t 140 c. ! 90 0.117
0.169
8Ji$
1!--1.lTFR Ti)!! .:>r"ER rr 02"'1 C J7et C.199 C.131
0.189 1~ J 52 o 168
0.197 0.L6u
o 1]4 0.179 0.16'1
C .114 o )J 2 0.176 O.HO
C.I06 a 2'13 o.l=';C 0.174
0.111 l ! ,,4
C.12C C 15? C.l'.i2 C .112
0.124 <l 11-17
0.135 o 174 0.162 0.151
.. -
~nRrHE~~ ST~TES P[~Ek 0.477 I')6.HO PO'.ER r.C 0.363
0.202 0.148
I C ,.. uJZ=$dsi 3 ," ~~~GOq HY~~D-ELEC cc :t'Hr(i : dJ:..n 1'; 11.- \. 1. L1
IOWA ~U3Lrc SERvICE CC 0.304 C.2JO
M1~T4h~ P(~ER CC 0.311 C.luG
""' ..... E .,.IV 2u aL~CK HILLS ~C~ER 1:. lIt 3 0.136
. C 196
Q
21 0.122
0.111
Q In
O.l\l'i Q 1(4 0.188
( ! be
0.203
TABL E NO .5'14 RATE Of RETURN ~EASURE 4
RISK 196 7
Si~T~S REGGLATI~G l~E UTILITIES SClCW ARc AKIZO~A °L9LIC S~R~ICF. CO 0.49l 0.098 TUCSC~ GAS & ELECT~IC U.532 C.loe;
STllES REGULATI~r, l~E ul!LIT[ES dflC~ AFE PACIFIC G~S & ~LfC1FlC 0.240 C.149 SA~ DIEGO GAS & EL[lT~[C 0.511 C.162 $c'ITH=R N C\1 1 E En 1 cr ... cr n "id2 C! "6
L968
!:T04 0.172
fl~ v.151 0.166 o II 5
1909
&' a 0.122 O.17C
1910
O. UC; 0 .. 176
\j
1971
0.1.15 0.124
"'0.147 C O• 1l9v 0.133 0.174 0.142 0.117 o 1e3 Q lOS C C96
STlTE'S REGULATIflG HE UTlUTlES Sl-Le" AflEf!o r;:.. a G PUBLIC SfKViCE CC CF CCLO Oe365 Ce149 0.152 0.157 Q.13S G~llC
ST~TCS ~EGULATl~G lrE ~TILITIES 3ELOw A~E U~ITEO ILLU~l~ATI~C rc Q.412 0.lS2
!~UAH\I~1i'~8L&~I ~'"L 1G~T"TIl.I U "SO~~!7~M A~:201
FLOkIJ~ PCWER CCAP 0.636 C.189 U'IPA ELECHIC CC 0.773' C.2l0
0.154
~I 0.206
rl Q ZIP
0.197 0.194
$BJES ";::~I'l !lTa~ lI-F liTTI JIIcs SFI rio "liE !l:rt!'! )A\I<\Nr,AH ELi.:C & PC .... l:R 0.537 C.16e O.lal
8rQJH .. ~EW~HHf n E (;TILITlESQt3f1~W A~E)/"Q ~3-J56
d 0.2e1
c C.115
O.ln 0.176
0.162
a 0.173 0.le4
0.111 0.086
o 171 0.l69 0.149
0.127
..-
a o 137
o 1 t:Gi
0.1.44 0.10'i
0.015
o 128
0.169
Q 150
0.147
jl 149
1972
0.106 0.097
0.120 O.OdO o 1)6
0.15L D.hi
o 148
J.l13 () 115 0.139
Q 155
0.1&1
0.l7U
1973
0.149 J .118
0 .. L30 v.01L Q 'J 3
0= laB O.11d
0.202
0 .. C79
Q J 24 0.l33 C .. 160
C .. e66
Q J J 8
0.146
a 193 0.155 0.178
u.OS'i
o 132
" cse
0.121 ) oet O.15~
C 1 CC
0.154
v.16S
lC;14
0.164 -0.012
0 .. 154 O.lL~ C 2<;,
C.12e
0.13 C
o 2?j 0.061 \).12 !:
0.14C
Q 13f
C .178
C.l:2 C 1 t1 C .180
CIS 2
(.13'1
C.162
]0;15
c.cc;a C.C23 C l,fO
C.143
C.le6
C He! C.446 C.2'iS
C 166
C.192 0.143
C.C79
C 140
0.1813 Q 1:.)5 O.led
a 148
0.154
0.14ci
Q' 1 7 r:
0.148 q J"? 0.175
C ! 6S
0.179
0 .. 154
1976 AVERAGE
0.284 0.304
0.108 0.213 11 183
a.lett
0.112
Q 212 ' 0.434 0.229
0.191
Q 161
0.le5 0.155
0.1.32 0.127 ,1 ! 39
0 .. 146
0 .. 394
0.236 0.212 0.182
0.144
Q 143
~IeT~gI~E~~~~~I~8 TrE UTILITIESO~~~9A A~;l10 'S:265 ~0.249 0 0.2236
0.173 0.145 0.168 0.181 C.225 0.197 0.209 !%----~C~~~!N~~~C~l~t~E~~~Lc~H~p~U~i~[~~~C~t-.~~E~KV~IC~-E~--~g-.+gb~0~t--~C~.~~~L~2~-u.8~.~~Z~j~~G~.~1~j~§--~S~&~1~4~9~~3-.+i*7~t--~g~.~1~3~2~-'~d~.)~L4~'~~~g~.~1~9~~~-c~C~.2~!~~t~~J-.~2~5+r--~g~.~1~~~~
CENTRAL ILLINCIS LIC~l 0.487 C.174 0.177 C.187 O.lSl 0.158 0.153 0.163 D.1Sf C.116 C.231 0.2Cl
SHIES !.IcCI!! c.1!F HE. I'T!! f HE> 9,,1 n"., PUBLI(' SERV1C!: CC CF I\O :).42., NnqHE~N iNDIANA PlP.L1C SERV 0.337 IND1ANAPCLIS PC~ER E LIGHT 0.694
C.203 C.231 C.231
STlTES REGULATI~G Ire LTILIT[ES ~ELOW A~E IOWA POWE~ & LIGHT 0.353 C.205 IOWA SOUTHE~N UliLI1IES CO 0.571 0.200
STATES ReGULATI~G l~E LTILITIES SELC~ A~E KANSAS PC~~P ~ LIGrl 0.281 C.187 KlNSAS G4S & ElECTFIC 0.558 C.210
ST4TF.S PtGULhTI~~ l~t UTiliTies 3ELC~ ARE L~JlSVILLE GAS & ElECTRI' 0.436 0.247
<;TATI"; PI"r.11! ,U.TfI(. HF liP' ITIF,\ HFI rio ARF
i~ 0.214 0.230 U.22'i
tAO O.zOC o.ao
eo- u 0.1131 0 .. 243
C.ZC4 0 0.231
0.152 0.18d 0.192
l¥."263 °0.267 C O.240u
0.223
~~~r~--~----~----~o
III
0.183 0.179 0.209
0 .. 14<3 0 .. 2L8
o. L94 C.120
O.19tl
0.24,) v.2 Lo v.LSa
0.212 iJ .. 209
J.1a7 0.123
0.217
0.12C 0.223 O .. 17t
0.181 0 .. 261
0.144 0.14 C;
O.lEe
C .. :i4l C.2C4
C .174 C.317
C.326 0.254 0.711
0.232 1.111
0.333
0.233 0.22:> 0.267
C.191 o.n7
0.1<; 2 0.28">
0.244

1'(\>vEP CC-' ---" --o:ji5" CIs SERVICE 0.491 Oe
o. C ..
o. o.
0.123 0.19<;
G 155 (.157
0.182 0.18L
0.164 0.155
__ ~~~~,a~.lAII~C leE 1'J.~~~S~~~==7~=\~~=~~;;;n~~~~--~~~~--~~~---~~~--~~~--~~~ __ ~~~ __ ___ aUSTUN EJISCN ~C 0.525 C.156 ·0.151 0.l3) 0.085 O.C~H 0.C18 J.07d 0.103· (.131 0.114 O.tel FITCH3U~G ;AS ~ ELEC LIGHT 0.387 C.lll 0.149 0.125 0.114 0.111 0.119 O.09a U.061 C.l1l 0.150 0.l17
SIll T "i, a"'" j I! ¢ 1 1 Hi n E ! I J I! J II E... rl ELO t. '" R E t!l f c.b EDTSGN S~LLT [LEC1~IC 0.0 C.ZL9 0.224 OET~OIT EDISON CO 0.714 C.149 0.141 UPPEQ PE~INSUlA PC~ER O.~40 0.165 0.162 Cf"JSd'\ECS e,c', CEl cr Il 711 C 193 Q 118
STATFS PfGULAT!~G l~E UTILITIES BELOW ARE ~IN~~SOTA FC~ER & LIG~T 0.390 0.166
STHES Pf.:GULA1HG 1l-f LTlLlTIES tlELO" Ai<i. 'IISSOdP[ PUBLIC SEF\ICE CG 0.631 C~U:l4 ST JOSEPH L!r.HT & ~C~~R 0.599 0.168
STAT=S ~~GUlArT~G 1~E lTIL1TiES GELCW r'j;:\'E!)',') E![CII.>!C 111 11" 11 ];'>4
GHll EUIS[,l (C 0.432 C' J L U '1'.3 U S 1'. S L UTI- E C ~ C H C I) • 60 .3 rnL c 10 CrISC~ C[~Fd~Y 0.418 CT\',-I'ltl,)Ti ·· .. ,.S f ~1.i:ftR!r ) ?..,j.;.
C.129 0.073 O.ll.'> o G95
0.148
0.136 0.018 0.114 C CAl
0.107
0.168 0.01:15 o. t 72 Q I!lJ
0.128
0.142 O.L70
0.2G2 o.oac O.C8~ ) C5"
0.151
( 127 C. (7<; C .114 C. t 45
C.;:24 ·0.229
C.;!C3 C.1<;2
Q.226 o. J. 99
0.161:1 O.lel 0.146 IJ ) 3'.
0.168
0.171 0.187
0.219 O.lEc 0.132 0.13: 0.121 O.10j w.itE (.249 0.254 O.L7S
STH5S DF.GL:LATlI\G HE UTILITieS qeLC" i\PE ~ e c --;) .....e- -0- (hI" P r. S T! ;" 'J '" r.", F- Q \ I :- I '" r T R [( ,- C ... ,;.,...::<.:."" ... ""4'---'-C.......lJ."').J,.O'--~)!.......ll-lJ_lj:....--.>.OL>-i'...:33,.;,"':....--..l.{'"", -I1...Jl...;;5L-.-..l.ql..Ul...:;;'u:2~---,-JL.....Jl-ll..J::.61..---'-1)L.....JI....;]~4,--.-..4"""""""'~· o:::-r:-U~:....-..-,w=:e""'~d-::':e:· ':I::::----LOL...t6l.J)L.::5L.-~~=-==:L.-__
ST.ifES '<EGUlLIni\:; 11-~ LTLLlTIf5 !-1F.LC',.; AH ~ 9"'\f PHJ':SYL"4:\I~ pC.'.EP ~ lli..;,-!T IJ.44l Ccl'31 0.158 G.13C 0.Cb8 0.C34 C.120 0.167 iJ.32<; C:;';6 0.3<71 0.198 ~~,1,IJ~ ~ ~ ~ ~ I[ &H ~! ~ ~ H LC .. J_~----+,~......I::tc"':-!:1'<::j.s.;t-~3~.-!:~.:::~-'!~--':!gc...-:l-=i:-'"~~~g .... -,:,I~.£.:~..!?~---'.:!d""'.-':"~~j-=~-......I::S ..... ..l:'!"'?fJ:lg'--'-'G"".-!-1~~L.:l0'-~31...>.~JL1:ij~~'--..I,~,.... • ....:~~1~§'---:.:gLa • ...;l1:.!Jt:.=!t'---I§: 1 ~ q
STlTFS Rf3UlATI~G l~E UTILITISS HELa~ APE S1UT~~ESrf~~ FUELIC S~~V CG 0.374 C.L94 'iCIITH',ESFrI\J [;l Fe. '1');';1,'" ,) 371 (' 178
;,,;·«(e.: ".:J\ .. l~i&h\J 1Ft: ClrCijl .... ~ 5l~Io.oi-/'t
~ ~~~:~: ~~~y P~~ER £ LIGHT 0.481
~ GULF ~r~TES JTIlITIES CC '1 PU8LTC SFRVICE CG (F r- H
I~TERST~TE ?D~ER CC PACI FIC PCi'iEP 1: L IGl"T ,..,. NORTHRESTEKN PUBLIC SERV CO
[). '.8 ... 0.564
0.46J 0.315 0.291 Q 713 0.436 0.487
\!if' C.1l5 0.1&7 C.223 ( zr C.l0S
c. 20 7 '0.147
C.144 C.14<; C.229 o loQ C.1<JG C.I06
C.l74
ffi~ !j.~ r T $ '" 3 h ~ r I ;. G " ; ~ e ,;; f I L [ T 1 c!i 11 J £ ~ <i" A \. t 1 < R
EL PASO ELECTR!C CC 0.3~a C.228
.,s.;;: « , E j ,_ "' uC" I • f\ 13 1 ~ E lj f! tI i 1 t..S ..l H .... " VIRGt~IA EL~CTRIC f FC~cR 0.617 nITeR Btl :>e,ER rc Q 2Hl NORTH[RN ST~TES PC~ER 0.471 IOA~C PCWER CC 0.363
HYCf'Jl-CLEC CC 0.524
Ar;E ( .. 189 .' 171 c. B-2 C .. 113
C.21Ll
te..v.. 0.209 " J a !
-.J O• Z21 U o ?Gl
0.23C (j 21 7
C.226 G 21 C
o. ceo v-;. cas
0.119 0.131 C.ICO 0.155 0.155 0.123 0.7.26 0.2CO 0.199 o 2)9 a 24~ Q 24'
(;.201 0.173
0.13 3 0.165 0.203 o 166 0 .. 198 0.109
iJ,! 73 0.230
",6 0.175 ,; 15!
31
0.183 0.181
0.v<;; 0.135 0.174 Q 164 0.207 0.lC8
0.119
0.243
33 48 0.14" ;l 166 C.l73 O.L59
0.159 0.146
0.C'14 0.123 0.119 Q. I 43 0.184 0.093
o 0.108 o J72 0.147 0.169
C.GSc o. L44 0.141 o 226 0,,095
Q 106
0.1.44 0.104
C.C':;; 0.147 0.119 Q c55 0 .. lU9 0 .. 103
C.llle
0 .. C55 o '06 0.133 0.178
0.121-1 0.111
,<C'H:wq I Iii I n ce (t" ! 46; r }:13 ) 2DJ ) 196 Q 155 Q 141
S+<!\f .3 '. ;.;ce .. i Ilf'tI 0.103 J.218 C.213 0.2e1
f.) .143 0.L22 0.122 0.171
1II-90
Q C>-I9
0.206 Q ZC9
C.C39
c. 105
C.C7Q G.I97 i)'13d Q ?J d
Q 131
0.l21
C.L56 0.09;":
iJ. 127 0 .. 170 0 .. 145 Q 106
8:13¥ 0.175
C.C33 Q H6 0.143 0 .. 164
a 129
0.170
n 083
0.234 Q 21)
0.049
0.lU7
0.132
o 125
v.ltli 0.094
O.ld~ O.Lal 0.2.5'1 jl 106 O.2U3 J. l..3l
0.240
Q 192 0.219
J.U'; 0.170
0.102
n. PI?
Ll. L 7'.,
0.124
O.3Cc U 2CS
0.14,
0.21<;
~o7C<; 0.2141 0.32 i o 251 0.12 ;
C.IO"
0.2S3 0.1.2 ;
c.:;!); o.zoe 0.34 E -c ,~2 ~
1..451
Q" 14"l O.27C
u.18l: 0.152
0.124
J,.l4f
0.194
C 256
C.312 C 264
(.1(:8
(.,,16
c.::co C." D c.:: 2<7 C.;"'8 C.ll <;
( 152
c .. ;: t 1 (.IS5
C.16B C.les C .325 ( 1 Pi ( .'(E3 C .135
(.280
C 1" 1 (.245
c..:S 1 C .118
(.lSO
C.164
C.257
iJ·36!
0.333 G.JB9
0 .. 175
0 .. 176
0.113
Q 291
0.259
0.2B3 0 .. 184
0.2<79 0.147 0.344 0.148 0.538 0.146
0.206
Q 186 0.225
Q It..l __
0.248 Q tQ!
0.207 0.185 0.236 Q 239 0.110
0.167
0.203 O.l.~4
0.167 0.160 0.232 t) !! 8 0.23<; 0 .. 115
0.337
0.1 U; 0.232
(1 1,<,' r: r:p""
0.515 Q 212 0 • .263 G.155
0 .. 081
o ?14
J.372
0.174 o 6)" O.l84 C .152
0.147
Q J 80
0.184
0.190

APPENDIX 6
Ten-Year Returns for Airlines
11I-91

RISK 1967
TABLE NO .. ,,'
RATE OF RETURN MEASURE
1968 1969 197a... 1,S71 1913 1SH IS 75 1976 AVERAGE
'I Sf' '19'0'[5 PC ! ;aJS ""L£l§ C 179 Q oe'" G'as CPS 0 C7J 3371 :S: .... I7C e.lC5::::=:£t .... l:l3==::S::;;::£fr:9; ALLEGHENY 4IRL!~ES I~C 1.564 C.038 o.ooa 0.020 0.055 v.03b 0.e73 0.068 0.C6S C.CCB Oc064 OeO~4 AMERICA~ AIRLI~ES I~C 1.196 o.oao 0.056 0.057 -~.002 0.C26 c.e24 -0.015 0.034 -(.(e2 0.058 0.032 BRANIFF I~TL CCRP 1.276 C.G50 0.071 0.058 0.026 0.C11 0.C94 0.112 0.126 (.eso O.G99 0.G80
--~~"".:~~N:±~-!:I-'\-I~-!"k~Nc!t~~..J.[-l.! -A....,i~i-l'R~t~1~F~~>-::s:--::1::-I\-::c---~1 ... :-:§~1'-71'-----'!g~;~f~*~~;-----'!g ..... "".!6~!~g!-----'!g~.'""':g~~'-!E~-"-~g!-<:~g~L ... ~~-==-~g~.~g~;~i~---Ig-!-<.,....Ig,..c%:/-.:~~---J.g~.,.l,g~§~~,~-"-"-l,g~:,....Ig,!-l1~~;------'-.r~ :t~ ~ 8 J; f g : g r ~ DELTA AIR LINES I~C 0.726 C.281 0.113 0.156 0.149 0.081 0.107 0.156 O~lac c.cse 0.102 0.147 EASTERN AIR LINES 1.587 C.068 0.018 0.034 0.046 0.C42 c.e56 -O.Olu O.CSt c.ceJ 0.011 0.C39 -;'9'!I!EP 'lA' PH 1'£ I lll=i=h~20 o.en 0..a12 3 ~?9 A Cl? 0 1 2 '3 Pc 017t ',!"Ho=Q 1<15 ; .,>1=====' HAWAIIAN A!RLC~ES l~C 0.626 C.C17 C.057 -O.OC6 0.024 O.Cel OeC95 0.104 O.14C (.CI0 0.112 C~C61 KLM ROYAL OUTCH AI~LI~ES 0.997 C.075 0.091 O.OIS 0.056 -0.C24 0.C07 0.006 0.OC3 (.C20 0.065 C.038 NATIONAL A[qLINES I~C 1.415 C.173 0.167 0.132 0$C39 a.CC2 0.094 0.095 O.13~ (.(:4 0.030 0.C92
---liQC!TH Cr:NTBO! I\IPI T1\fS TNC J?lO C (,60 a 040 Q 011 a,Cd5 C.oc'! 0]28 1),117 (I 167 C C61 0,100 0."8" NORTHWEST AIRLI~ES I~C 1.113 C.253 0.178 0.122 0.C61 0.e27 O.e27 Oe070 O.lC~ C.e56 0.096 O.lCO OVERSEAS ~ATICNAL Alk~AYS 0.328 C.ll3 0.l03 0.035 0.022 0.C25 -0.008 -0.073 0.C61 C.(44 -0.003 0.032 OZARK AIR LINES I~( 0.985 C.C46 0.033 -o.ooa 0.C22 C.ICa 0.083 0.037 0.12~ (.(45 0.129 00062 PSI INC ] 394 C egg 0, 07 3 0 all 0 095 0 085 C,cgl 0 046 0 ~'s -c '4' 0.076 0.064
WESTERN AIR LI~ES !~C 1.238 C.126 0.068 -0.035 0.036 0.C57 0.C81 0.127 O.llE C.(33 0.079 0.C71 wrEN AIR ALASKA 0.617 C.C6B 0.028 C.053 0.C47 G.G44 0.038 0.062 0.183 C.138 0.093 0.076 WORLD AIR~AYS l~C 1.428 C.206 0.152 0.092 0.037 0.076 0.C43 0.008 0.C3! (.CC6 -0.006 0.C71
ceMPA"''!' NAfoE
----At, S K a \ 1 @ J 1 r r r
ALLEGHENY AIR t. {liES I/\C AMERIC4/\ AIRLI~ES I~C 8R~NIFF [I\TL COP (OOITO' t~T' bI9~C)C cONTrNENr~L AlA ll~ES INC DELTA ~IR LINES I~( E4STERN AIR lINES !Q""JT![? '"PR' It rs ItS HAnAIIAN AIRL!~ES I~C KLM ROYAL OUTCH AI~lI~ES NATIONAL ,11RLIIliES Ille NCRTH CENIg>! 61R! nEe: TNC NORTHwEST A[RlHES IIIC OVERSEAS ~ATIC~AL ~IR"AYS OZARK AIR LINES I~C 2<;.$ INi PAN AMERICAN weRle tlrwA¥S PIEDMONT AVIATlCN Ir-C SEABOARD kCRLO AIRlIIIES ' .. 'SR' 'I""5 PC S8UTilRESl Ai!<lHE:: TIGER I~TEA~ATI(NAl TRANS WORLD AIRlI~ES IIi\! INC WESTERN AIR LI~ES I~C IHEN A[R ALASKA WORLD ArRhAYS I~C
lASL E NO. ,."-
RATE CF RETUR~ MEASURE 2
RISK ISo?
1 ! 5 j
1.564 C,,(38 1.196 c.cac 1 .. 276 C .C50 1 599 C,Z6Z 1.511 C.14S 0 .. 726 C.281 1.587 e.C68 ..... =7 C 02-0.626 C.OU 0.997 C.075 1.415 e.173 L.21 0 C ('60 l.lU C.253 0.328 C.113 0.985 C.046 1 394 C C99 1.503 C.l06 1.731 0.C81 1.469 C .. OBa S '$===£- EH a.sao c.cse 1.050 0.096 1.597 C.072 0,94,1 C C99 1.23B C .. 126 0.617 C.068 1 .. 428 C.206
1968
lH C~008 0.056 0.071 o ]46 0.C45 0.173 0.C1e e 2 - L C.057 0.C91 0.167 o 040
0.178 0.103 0.033 C.e n 0.072 0.032 0.C63 Q a .. !' a.aes 0.018 0.036 a 069 0.C6a 0.028 0 .. 152
1969
a :: 0 .. 020 C.05a 0.058 0.031 C.040 0.157 C.034 S on
-O.OOc 0.079 0.135 o O! 1 0.123 0.035
-0.OC8 0,077
-0.001 0.014 0 .. 029 '3 "$oJ,
-0.035 0.053 0.0'92
1'370
: • . ~ 1 0.055
-0 .. 002 0.026
_0 012 0.045 0.150 0.C47 p e 83 0.C24 0 .. 056 0.042 f) 087 0.C62 Qe022 0.C22 o 095
-0.C06 0.033 0.043 I;! ; ( 3 8.C8e 0 .. 12!
-0 .. C39 o 003 0 .. 036 0.041 Q.037
1971
: ]' J
0.036 O .. C27 O.e12
-0 C45 0.058 0.C82 0.C43 C C JZ
0.G27 0.C25 0 .. 1C<; o C85
-0 .. 00J. 0.C56 0.C<;4 & .. ~ll S.ISb 0.132 0.03C o C?4 0.057 0.045 0 .. 076
111-92
O .. C73 0 .. 024 0.095 C Cb3 Co065 0 .. 108 0 .. 057 , 12 ' 0.C95 0.C07 0.C96 a 123 0 .. C28
-0.008 0 .. C83 O. Cf!' 0.C03 0.079 c.e90 ,., Cii' 8. CbEl 0.114 0.055 o 041 '0. C82 O.C39 0.043
1973
19 0.068
-0.015 0 .. 113 Q,055 0 .. 03,9 0.159
-0 .. 010 ., I? .) 0.104 0.006 0.098 a 117 0.071
-0.073 0.037 o 046 0.014 0 .. 083 0.063 g ';1"'4 9 .. S6& 0 .. 116 0 .. 060 Q 0 69 0 .. 128 0 .. 063 0.008
l'i74
a 1]: O.G6E 0.034 0 .. 12 'j o ee" O.OH 0 .. 182 0.C5t: ) ll'l G .. lH 0.OC3 Ci.13(; o 16"1 O.U C 0.C61 0 .. 1.2! Q.ol,,$
-0.C4'.i 0 .. 11 'i O.CH " 11';; e a2l! O .. CH 0 .. 021 Q lP
.1<;75
e I c.cca -C.Ce2
c.eso c CS6 (.(27 C .. CS8 C.CC3 £::;;:J;:2::'
c..C56 C .. C44 (.(45
-c '44 -C.CCI
C.C45 C .(19 C !§C C.z:;:; c .. cao
-C.(l<; c '21 C .(34 C .l41 C.C66
1976 AVERAGE
B ! 7-' 0 .. 064 0 .. 058 0 .. 099 0.132 0.062 0 .. 102 0 .. 071 Q 1 -0 .. 113 0 .. 065 0 .. 030 0.10 0
0.096 -0.003
0.129 a 016 0 .. 030 O.OBS 0.013 ;J Q" 0.22'1 0.079 0 .. 066 o 034
B :n 0.044 0 .. C32 O.OSO 0,1"'1] 0 .. 061 0 .. 148 0.C39 J ; 7
O .. lCO 0 .. 032 0.C62 o 064 O .. OH 0 .. 063 0 .. 057 d '"'I ',.1
3:g~'i 0.032 0,Q54 O.C72 0 .. 071 0 .. 071