
Download (18.43 MB) - EuroGOOS 2021
574
-
Upload
khangminh22 -
Category
Documents
-
view
0 -
download
0
Transcript of Download (18.43 MB) - EuroGOOS 2021


Edited by: Vicente Fernández, Ana Lara-López, Dina Eparkhina, Lucie Cocquempot, Corine Lochet and Inga Lips

4 ADVANCES IN OPERATIONAL OCEANOGRAPHY
Published by:
EuroGOOS AISBL 29 Rue Vautier
1000 Brussels
Belgium
www.eurogoos.eu
To be quoted as follows: Proceedings of the 9th EuroGOOS International Conference
‘Advances in Operational Oceanography:
Expanding Europe’s Observing and Forecasting Capacity’.
3 – 5 May 2021
V. Fernández, A. Lara-López, D. Eparkhina, L. Cocquempot, C. Lochet, I. Lips (Eds)
EuroGOOS. Brussels, Belgium. 2021.
DOI: 10.13155/83160

5ADVANCES IN OPERATIONAL OCEANOGRAPHY EXPANDING EUROPE’S OBSERVING AND FORECASTING CAPACITY
CONFERENCE ORGANISERS
Programme Committee
George Petihakis EuroGOOS Chair, HCMR Greece
Enrique Álvarez Fanjul Puertos del Estado, Spain
Vanessa Cardin OGS, Italy
Holger Brix Helmholtz-Zentrum Hereon, Germany
Ghada El-Serafy Deltares, The Netherlands
Patrick Farcy Ifremer, France
Sebastian Legrand RBINS, Belgium
Julien Mader AZTI, Spain
Manuel Ruiz Villareal IEO, Spain
Jari Happala FMI, Finland
Rosalia Santoleri CNR, Italy
Jun She DMI, Denmark
Henning Wehde IMR, Norway
Organising Committee
Lucie Cocquempot Ifremer, France
Emilie Le Guellec Ifremer, France
Marie-Françoise Lalancette SHOM, France
Corine Lochet SHOM, France
Inga Lips EuroGOOS Office, Belgium
Dina Eparkhina EuroGOOS Office, Belgium
Ruxandra Bosilca EuroGOOS Office, Belgium
Ana Lara-Lopez EuroGOOS Office, Belgium
Vicente Fernández EuroGOOS Office, Belgium

6 ADVANCES IN OPERATIONAL OCEANOGRAPHY
TABLE OF CONTENTS
Statements from the Conference 13
Ocean Health 17
Phytobs French national service of observation program for phytoplankton 18 in coastal waters Maud Lemoine and Pascal Claquin
Entering in the BGC-ARGO Era: improvements of the Mediterranean Sea 21biogeochemical operational system Laura Feudale, Gianpiero Cossarini, Giorgio Bolzon, Paolo Lazzari, Cosimo Solidoro, Anna Teruzzi , Elena Terzic and Stefano Salon
An instrument intercomparison exercise in the Skagerrak allows extending the 30 Ferrybox pCO2 observational coverage across the Central and Southern North sea Vlad A. Macovei, Yoana G. Voynova, Meike Becker, Jack Triest and Wilhelm Petersen
FAIR Data 35
HIDROGRAFICO + a contribution to the knowledge of the ocean 36Sara Almeida and Paulo Nunes
Sensorthings API and the OGC API family of standards: A new generation of 43interoperability standards for research data infrastructures to further improve the sharing of Ocean Observation DataSimon Jirka, Christian Autermann, Jan Speckamp and Matthes Rieke
MELOA Catalogue and Geoportal: a modern approach for open access and 51 visualization of in situ drifter data Félix Pedrera, João Andrade, João Matos, Enoc Martínez, José Joaquín Rojas, Pedro Gonçalves, Carlos Almeida), Marc Lucas, Rita Esteves, Joaquín del Rio and Rogério Chumbinho
International coordination of the in situ Met-ocean Observing Networks 59Mathieu Belbéoch, Long Jiang, Martin Kramp, Magali Krieger, Anthonin Lizé, Emanuela Rusciano and Victor Turpin
SeaDataCloud data products for the European marginal seas and the Global Ocean 70Simona Simoncelli, Christine Coatanoan, Volodymyr Myroshnychenko, Örjan Bäck, Helge Sagen, Serge Scory, Paolo Oliveri, Kanwal Shahzadi, Nadia Pinardi, Alexander Barth, Charles Troupin, Reiner Schlitzer, Michèle Fichaut and Dick Schaap
Data management for the European fleet of research vessels in Eurofleets+ 78Thomas Vandenberghe, Susana Diez Tagarro, Dick Schaap, Guillaume Clodic, Juan Luis Ruiz, Christian Autermann and Simon Jirka
Making sense of seabed data re-use to increase societal value using the integrated 84geospatial information framework to describe the process from planning todistribution to multiple users. A journey from the perspective of a hydrographic office Ellen Vos
7ADVANCES IN OPERATIONAL OCEANOGRAPHY EXPANDING EUROPE’S OBSERVING AND FORECASTING CAPACITY
Regional Observatories 89
A decade of observations and achievements of the Moose Observatory in 90 the Northwestern Mediterranean Sea Anthony Bosse, Laurent Coppola, Pierre Testor, Dominique Aubert, François Carlotti, Pascal Conan, Xavier de Madron, Fabrizio D’Ortenzio, Wolfgang Ludwig, Laurent Mortier and Patrick Raimbault
ILICO – a French research infrastructure for coastal ocean and seashore observations 94Lucie Cocquempot, Joanne Burden, Christophe Delacourt, Jérôme Paillet, Patrick Raimbault, Guillaume Charria, François Schmitt, Serge Planes, Xavier Bertin, Stephane Bertin, Laurent Coppola, Pierre Testor, Maud Lemoine, Pascal Claquin, Régis Hocdé, Jérôme Aucan,Sylvie Fiat, Nicolas Savoye, Pascal Conan, Laurent Testut, Médéric Gravelle, G. Woppleman, Vincent Bouchet and Nicolas Desroy
Stronger together: developing the framework for a sustainable national research 100infrastructure EirOOS (Irish Ocean Observing System) as an effective component of the European Ocean Observing System (EOOS) Paul Gaughan, Glenn Nolan, Caroline Cusack, Rob Thomas, Alan Berry, Guy Westbrook, Conall O Malley, Adam Leadbetter, Deirdre Fitzhenry, Mick Gilooly and Kieran Lyons
Investigating the capability of Argo floats to monitor shallow coastal areas of 110the Mediterranean Sea Dimitris Kassis, Giulio Notarstefano, Inmaculada Ruiz-Parrado, Vincent Taillandier, Lara Díaz-Barroso, Esterine Evrard, Romain Cancouët and Luca Arduini Plaisant
Al Hoceima launches its first functional marine observatory in North Africa 118Houssini Nibani, Karim Hilmi, Asma Damghi, Laurent Berguery, Orens De Fommervault and Zouhair Amhaouach
Observing Baltic Sea exchanges: presenting a new multi-platform autonomous 124 observatory Bastien Y. Queste, Sebastiaan Swart, Louise C. Biddle, Olle Petersson, Aleksandra K. Mazur and Marcus Melin
Extreme events and hazard forecasting 137
Oil spill risk assessment for an oil terminal at the port of Taranto (Southern Italy) 138Svitlana Liubartseva, Ivan Federico, Giovanni Coppini and Rita Lecci
Multidisciplinary expertise of historical information for the characterization of 147 water levels during storm and coastal flooding eventsNathalie Giloy and members of the Working Group ‘Historic Storms and Floodings’
Assessing long-term sea level evolution: the historical sea level data rescue approach 154Alexa Latapy, Yann Ferret, Claire Fraboul and Nicolas Pouvreau
Improving storm surge and wave forecasts from regional to nearshore scales 162Audrey Pasquet, Héloïse Michaud, Léo Seyfried, Rémy Baraille, Laurie Biscara, Yann Krienand Didier Jourdan
CMEMS and CYCOFOS assessing the pollution risk from the Leviathan Offshore 169Platform in the Eastern Mediterranean Sea George Zodiatis, Svitlana Liubartseva, Loizos Loizides, Marco Pellegatta, Giovanni Coppini, Robin Lardner, George Kallos, Christina Kalogeri, Roberto Bonarelli, Antonio Augusto Sepp Neves, Panicos Nikolaides and Avigdor Brillant
8 ADVANCES IN OPERATIONAL OCEANOGRAPHY
Ocean Observing Technologies 179
Autonomous technologies a new approach to the development of hydrography 180Petrica Popov, Emanuela Mihailov and Lucian Dumitrache
JERICO-S3 integrated innovative technologies for coastal monitoring 186 Eric Delory, Simone Marini, Jérôme Blandin, Catherine Boccadoro, Dominique Durand, Andrés Cianca, Joaquin Tintore, Jay Pearlman, Miguel Charcos, Miguel Ángel Alcalde, Juan Gabriel Fernandez and Laurent Delauney
EUROFLEETS: fostering links to industry in the advancement of equipment 193 innovations for deep sea operations from research vessels Niamh Flavin, Aodhán Fitzgerald, Arturo Castellon Masalles, David Waage, Lars JørgensenJan Kjærstad and Jarle Sigurd Ødegård
Regional local and coastal models 203
The BOOS Modelling Programme (BMP) – activities, working groups and plans 204Thorger Brüning, Jens Murawski, Joanna Staneva, Vilnis Frishfelds, Adam Nord and Jun She
Recent developments in the forecasting chain at arpae-simc for the 208Emilia-Romagna (Northeast Italy) coastal areas Luis Germano Biolchi, Silvia Unguendoli, Lidia Bressan and Andrea Valentini
SHOM Operational Regional Ocean Forecasting System 216 Stéphanie Louazel, Sophie Casitas, Stéphanie Corréard, Yann Ferret, Victor Quilfen and Guillaume Voineson
Recent progress in downscaled local ocean forecast models for Irish maritime users 223Hazem Nagy, Kieran Lyons, Joseph McGovern, Diego Pereiro, Ioannis Mamoutos, Glenn Nolan and Tomasz Dabrowski
Seasonal stratification and biogeochemical turnover in the freshwater reach of 230 a partially mixed dredged estuary Johannes Pein, Annika Eisele, Tina Sanders, Ute Daewel, Emil V. Stanev, Justus E. E. van Beusekom, Joanna Staneva and Corinna Schrum
New coupled forecasting system for the Baltic Sea area 238 Adam Nord, Tuomas Kärnä, Anja Lindenthal, Patrik Ljungemyr, Ilja Maljutenko, Saeed Falahat, Ida M. Ringgaard, Vasily Korabel, Hedi Kanarik, Svetlana Verjovkina, Simon Jandt with support of the whole BAL MFC team.
COASTAL CRETE: A high-resolution operational forecasting system for 245 the coastal area of Crete, Eastern Mediterranean Katerina Spanoudaki, George Zodiatis, Nikos Kampanis, Maria-Luisa Quarta, Marco Folegani, George Galanis, Marios Nikolaidis and Andreas Nikolaidis
Copernicus Marine Products and Services 255
The Arctic marine forecasting center in the first Copernicus period 256 Laurent Bertino, Ali, A., Carrasco, A., Lien V.S. and Melsom, A.
Improving the accuracy of the Black Sea physics analysis and forecasting system in 264 the framework of Copernicus Marine ServiceStefania A. Ciliberti, Eric Jansen, Diana Azevedo, Mehmet Ilicak, Murat Gunduz, Marius Matreata, Leonardo Lima, Ali Aydodgu, Salvatore Causio, Laura Stefanizzi, Sergio Creti’, Rita Lecci, Elisaveta Peneva, Simona Masina, Giovanni Coppini, Nadia Pinardi and Atanas Palazov

9ADVANCES IN OPERATIONAL OCEANOGRAPHY EXPANDING EUROPE’S OBSERVING AND FORECASTING CAPACITY
The Copernicus Marine Service Ocean Forecasting System for the Mediterranean Sea 272 Giovanni Coppini, Emanuela Clementi, Gianpiero Cossarini, Gerasimos Korres, Massimiliano Drudi, Carolina Amadio, Ali Aydogdu, Paola Agostini, Giorgio Bolzon, Sergio Cretì, Dimitra Denaxa, Valeria Di Biagio, Romain Escudier, Laura Feudale, Anna Chiara Goglio, Alessandro Grandi, Paolo Lazzari, Rita Lecci, V Vladyslav Lyubartsev, Simona Masina, Francesco Palermo, Nadia Pinardi, Jenny Pistoia, Stefano Salon, Michael Ravdas, Cosimo Solidoro, Anna Teruzzi and Anna Zacharioudaki
Intercomparison of stand-alone and two-way nested models for CMEMS 280 Downstream Service Vilnis Frishfelds, Jens Murawski and Jun She
The Multi Observations Thematic Assembly Centre of the Copernicus Marine 284Environment Monitoring Service Stéphanie Guinehut, B. Buongiorno Nardelli, T. Chau, F. Chevallier, D. Ciani, H. Claustre, H. Etienne, M. Gehlen, E. Greiner, S. Jousset, S. Mulet, R. Sauzède and N. Verbrugge
REEFTEMPS the Pacific insular coastal water observation network 292Régis Hocdé, Sylvie Fiat, David Varillon and Jérôme Aucan
New developments of the operational biogeochemical model component in the 296Copernicus Marine Service (CMEMS) for the Baltic Sea Ina Lorkowski, Fabian Schwichtenberg, Anja Lindenthal, Ilja Maljutenko and Lena Spruch with support of the whole BAL MFC team
CMEMS Black Sea Monitoring and Forecasting Centre: an overview on 302 service and scientific developments in 2016-2021and future perspectives Atanas Palazov, Stefania A. Ciliberti, Rita Lecci, Marilaure Grégoire, Joanna Staneva, Elisaveta Peneva, Marius Matreata, Eric Jansen, Leonardo Lima, Diana Azevedo, Ali Aydogdu, Simona Masina, Giovanni Coppini, Luc Vandenbulcke, Arthur Capet, Arno Behrens,Marcel Ricker, Gerhard Gayer, Sergio Creti’, Laura Stefanizzi, Francesco Palermo, Salvatore Causio, Mehmet Ilicak, Murat Gunduz, Nadia Pinardi, Veselka Marinova, Nadezcha Valcheva and Paola Agostini
New global vertical distribution of gridded particulate organic carbon and 313 chlorophyll-a concentration using machine learning for CMEMS Raphaëlle Sauzède, Hervé Claustre, Pannimpullath Remanan Renosh, Julia Uitz and Stéphanie Guinehut
The operational CMEMS IBI-MFC service today: review of major achievements 321 along the Copernicus-1 Service Phase (2015-2021) Marcos Garcia Sotillo, Cailleau S., Aznar R., Aouf L., Barrera E., Dabrowski T., Rey P., Lorente P., Levier B., Amo-Baladrón A., Reffray G., Toledano C., Gutknecht E., Pascual A., Dalphinet A., Guihou K., McGovern J., Rodríguez A., Renaud R., Bowyer P., Ghantous M., García L., Benkiran M., Álvarez-Fanjul E.
Data management and metrology 331
Transnational access to metrology laboratories and validation facilities: 332the example of SHOM in the Minke project Marc Le Menn
Building a reliable and standardized long-term data set of surface coastal ocean 338 currents from the European HF Radars Anna Rubio, Lohitzune Solabarrieta, Lorenzo Corgnati, Carlo Mantovani, Emma Reyes, Paz Rotllan-García, Antonio Novellino, Patrick Gorringe, Annalisa Griffa and Julien Mader

10 ADVANCES IN OPERATIONAL OCEANOGRAPHY
Encoder-decoder machine learning approach for meteo-oceanographic 347time-series prediction Gianina Chirosca, Maria-Emanuela Mihailov, Maria-Ionela Tomescu-Chivu and Alecsandru Chirosca
DYNALIT: a research and observation service monitoring coastal morphodynamics 351in metropolitan and overseas FranceStéphane Bertin and Xavier Bertin
European Research Infrastructures 357
EMSO ERIC, the Pan-European infrastructure of seafloor and water-column 358observatories around the European seas, extends its coverage to the Arctic Juan José Dañobeitia, Paolo Favali, Laura Beranzoli, Alan Berry, Jérôme Blandin, Mathilde Cannat, Mafalda Carapuço, Ayoze Castro), Laurent Coppola, Eric Delory, Joaquin del Rio Fernandez, Davide Embriaco, Ilker Fer, Bénédicte Ferré, Maria I. Fredella,Andrew Gates, Alessandra Giuntini, Susan Hartman, Nadine Lantéri, Giuditta Marinaro, Paola Materia, George Petihakis, Vlad Radulescu, Ivan Rodero, Pierre-Marie Sarradin andZuzia Stroynowski
EUROFLEETS RI – an alliance of organizations and research vessels to strengthen 366 integrated and sustained observations in the ocean and support innovative new technology validation to further advance observing competencies and capabilitiesAodhán Fitzgerald, Bernadette Ni Chonghaile, Giuseppe Magnifico, Lorenza Evangelista, Niamh Flavin, Olivier Lefort and Per Wilhelm Nieuwejaar
Extension of Argo in shallow coastal areas and expansion of the regional communities 375(Euro-Argo Rise Project) Giulio Notarstefano, Dimitris Kassis, Atanas Palazov, Laura Tuomi, Waldemar Walczowski, Birgit Klein, Matthew Donnelly and Romain Cancouët
RID: the European information catalogue of marine research infrastructures 382Sandra Sá, Sérgio Bryton and Ruth Higgins
User-oriented Products 391
An enhanced ARIMA model for sea level forecast for the North-Western Black Sea coast 392Maria Emanuela Mihailov, Petrica Popov, Lucian Dumitrache, Florin Constantinoiu, Lucian Dutu, Gabriel Ganea, Alecsandru Vladimir Chirosca and Gianina Chirosca
The CMEMS Ocean Monitoring Indicator portfolio for the Iberian Biscay Irish 401(IBI) Waters: essential variables operationally monitored and future prospects Álvaro de Pascual-Collar, B. Levier, M. G. Sotillo, R. Aznar, C. Toledano, L. Aouf, M. García-León, E. Gutknecht, J. V. McGovern, J. M. García-Valdecasas, P. Lorente, T. Dabrowski, A. Amo-Baladrón, K. Guihou and E. Álvarez-Fanjul
The ‘Sub-regional Mediterranean Sea indicators’ tool in support to the sustainable 410 management of the oceanMélanie Juza and Joaquín Tintoré
Development of an application to track missing persons at sea 414Diego Pereiro, Kieran Lyons, Achref Othmani, Rob Fuller, Glenn Nolan and Tomasz Dabrowski

11ADVANCES IN OPERATIONAL OCEANOGRAPHY EXPANDING EUROPE’S OBSERVING AND FORECASTING CAPACITY
Development of coastal marine services for tackling coastal risks in the Atlantic area: 420 the value of regional cooperation Manuel Ruiz-Villarreal, Julien Mader, Pablo Carracedo, Ricardo Torres, Mike Bedingto, Pedro Montero, Tomasz Dabrowski, Joe McGovern, Luz García-García, Alejandro Gallego and MyCOAST partners (AZTI, IEO, INTECMAR, IMI, USC, SHOM, PdE, Ifremer, CEFAS, IST, PML, Marine Scotland, MeteoGalicia, IH)
Data assimilation and numerical techniques 429
Changes in heat exchange between the North Sea and adjacent seas due to the 430 assimilation of satellite sea surface temperatureWei Chen, Johannes Schulz-Stellenfleth, Sebastian Grayek and Joanna Staneva
Partitioning ocean dynamical patches using modelled essential and derived ocean 438variables and data mining in the Northwestern Mediterranean SeaVictor Quilfen, Marie Cachera, François Gaudin, Martial Boutet and Emilie Tew-Kai
Assimilation of satellite total surface current velocities in global ocean 447 forecasting systems Jennifer Waters, Matthew Martin, Elisabeth Remy, Isabelle Mirouze, Lucile Gaultier, Clement Ubelmann, Robert King and Craig Donlon
New trends in ocean observing 457
The wavy drifters and their role in ocean observation 458Rogério Chumbinho, José Pinto, Raquel Silva, Joaquín del Rio, Pedro Gonçalves, Alexandre Sousa, Félix Pedrera, Marc Lucas, Nuno Almeida, Ricardo Neta, Artur Rocha, Sara Gomes, Diego Lozanoand António Jorge da Silva
The EuroGOOS High Frequency Radar Task Team: a success story of collaboration. 467To be kept alive and made growingLorenzo Corgnati, Carlo Mantovani, Anna Rubio, Emma Reyes, Paz Rotllan, Antonio Novellino, Patrick Gorringe, Lohitzune Solabarrieta, Annalisa Griffa and Julien Mader
The Ocean Observers Initiative 475 Emanuela Rusciano, Claire Gourcuff, Esterine Evrard and Marine Bollard
How ocean literate are students attending schools of arts? 481 A case study from a greek middle school Panayota Koulouri, Athanasios Mogias, Giulia Realdon, Maria Cheimonopoulou, Melita Mokos, Theodora Boubonari and Monica Previati
KOSTASystem, a coastal videometry technology: development and applications 485Pedro Liria, Irati Epelde, Iñaki de Santiago, Roland Garnier, Aritz Abalia and Julien Mader
Autonomous observing systems on board fishing and cargo vessels 492A. Miguel Piecho-Santos, Teresa L. Rosa, Carlos Guedes Soares, Roberto Vettor, Miguel Hinostroza, Anabela J. Carvalho, Isabel Sousa Pinto and António C. Oliveira
New technology improves our understanding of changes in the marine environment 500Gabriele Pieri, Manolis Ntoumas, Michela Martinelli, Eva Chatzinikolaou, Flavio Martins, Antonio Novellino, Natali Dimitrova, Konstatin Keller, Andrew King, Andy Smerdon, Marco Mazza, Damien Malardé, Michele Cocco, Armindo Torres, George Triantafyllou, Sandra Sá, Maria João Bebianno, Stefania Sparnocchia, Trond Kristiansen and Amy Lusher

12 ADVANCES IN OPERATIONAL OCEANOGRAPHY
Coastal Forecasting and Ocean Modelling 511
The new Met Office global ocean forecast system at 1/12° resolution 513Ana Barbosa Aguiar, Jennifer Waters, Martin Price, Gordon Inverarity,Christine Pequignet, Jan Maksymczuk, Kerry Smout-Day, Matthew Martin, Mike Bell,Robert King, James While, Daniel J. Lea and John Siddorn
Tide in Gironde estuary 520Gwenaële Jan, Florent Lyard, Damien Allain, Michel Tchilibou and Jarred Penney
A global ocean eddying forecasting system at 1/16° 524Simona Masina, Andrea Cipollone, Doroteaciro Iovino, Stefania Ciliberti, Giovanni Coppini, Rita Lecci, Sergio Creti, Francesco Palermo, Fabio Viola, Vladyslav Lyubartsev, Fabrizio Baordo, Francesco Trotta and Nadia Pinardi
GCOAST Regional Ocean Predicting System: impact of coupling of waves, 532circulation and atmosphere models Joanna Staneva, Sebastian Grayek Arno Behrens, Marcel Ricker, Anne Wiese, Wolfgang Kochand Corinna Schrum
An integrated system of wind and wave forecasts verified with data from the marine 540observation system in the southern Baltic region Patryk Sapiega and Tamara Zalewska
Marine Climate Services 545
EMODNET preliminary highresolution temperature and salinity climatologies for 546the Northern Adriatic SeaDamiano Delrosso, Simona Simoncelli, Paolo Oliveri, Antonio Guarnieri and Antonio Novellino
Develop EuroGOOS marine climate service with a seamless earth system approach 554Jun She, Uldis Bethers, Vanessa Cardin, Kai Håkon Christensen, Tomasz Dabrowski, Frank Janssen, Haapala Jari, Arneborg Lars, Sebastien Legrand, Vidar Lien, Inga Lips, Marie Maar, Julien Mader, Sara Morucci, Antonio Novellino, Alejandro Orfila, George Petihakis, Manuel Ruiz-Villarreal, Joanna Staneva and George Triantafyllou
New climate services to coastal communities in Galicia (NW Spain) 562Juan Taboada, Manuel Ruiz and MarRisk Group
List of EuroGOOS Members 570
13ADVANCES IN OPERATIONAL OCEANOGRAPHY EXPANDING EUROPE’S OBSERVING AND FORECASTING CAPACITY
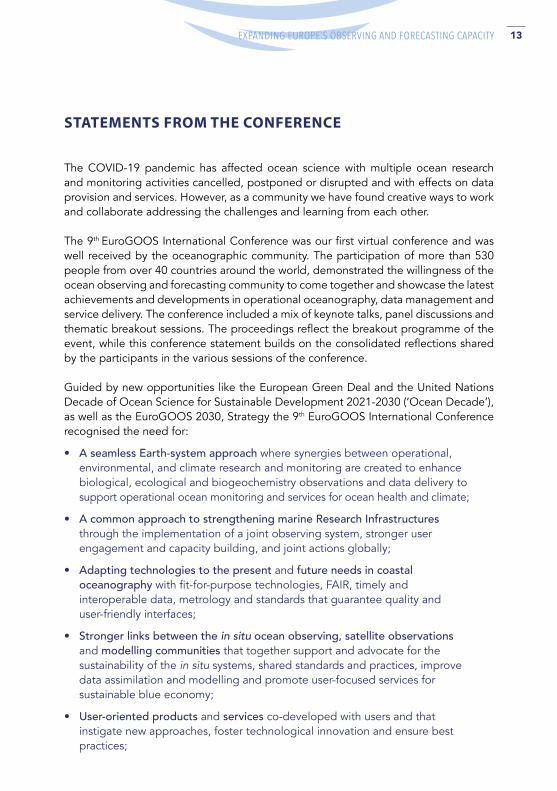
STATEMENTS FROM THE CONFERENCE
The COVID-19 pandemic has affected ocean science with multiple ocean research and monitoring activities cancelled, postponed or disrupted and with effects on data provision and services. However, as a community we have found creative ways to work and collaborate addressing the challenges and learning from each other.
The 9th EuroGOOS International Conference was our first virtual conference and was well received by the oceanographic community. The participation of more than 530 people from over 40 countries around the world, demonstrated the willingness of the ocean observing and forecasting community to come together and showcase the latest achievements and developments in operational oceanography, data management and service delivery. The conference included a mix of keynote talks, panel discussions and thematic breakout sessions. The proceedings reflect the breakout programme of the event, while this conference statement builds on the consolidated reflections shared by the participants in the various sessions of the conference.
Guided by new opportunities like the European Green Deal and the United Nations Decade of Ocean Science for Sustainable Development 2021-2030 (‘Ocean Decade’), as well as the EuroGOOS 2030, Strategy the 9th EuroGOOS International Conference recognised the need for:
• A seamless Earth-system approach where synergies between operational, environmental, and climate research and monitoring are created to enhance biological, ecological and biogeochemistry observations and data delivery to support operational ocean monitoring and services for ocean health and climate;
• A common approach to strengthening marine Research Infrastructures through the implementation of a joint observing system, stronger user engagement and capacity building, and joint actions globally;
• Adapting technologies to the present and future needs in coastal oceanography with fit-for-purpose technologies, FAIR, timely and interoperable data, metrology and standards that guarantee quality and user-friendly interfaces;
• Stronger links between the in situ ocean observing, satellite observations and modelling communities that together support and advocate for the sustainability of the in situ systems, shared standards and practices, improve data assimilation and modelling and promote user-focused services for sustainable blue economy;
• User-oriented products and services co-developed with users and that instigate new approaches, foster technological innovation and ensure best practices;

14 ADVANCES IN OPERATIONAL OCEANOGRAPHY
• Well defined plans to handle Big Data and to take advantage of the Artificial Intelligence (AI) developments, including FAIR data management plans and best practices to handle Big Data and enable the AI use in transdisciplinary analyses. Collaborations between environment and computer scientists to develop capacity in machine learning and programming;
• Linking European ocean observing networks, stakeholders, and initiatives under the EOOS Framework. A sustained, coordinated and integrated European Ocean Observing System that is co-designed by our diverse community, through synergies across disciplines and interfaces between national, pan-European and global ocean observing management.
New technological developments, inter-disciplinary research and modelling approaches, and progress in the integration of observing systems in Europe will enable transformative knowledge generation that contributes to the Ocean Decade. European ocean research is in a good position to make this important contribution with the tools and knowledge base needed to make this transformative change and help achieve a healthy, safe and resilient ocean for Sustainable Development by 2030.

15ADVANCES IN OPERATIONAL OCEANOGRAPHY EXPANDING EUROPE’S OBSERVING AND FORECASTING CAPACITY
https://eurogoos-conference.ifremer.fr/ #EuroGOOSConference
JOIN US AND
DISCOVER
Registration includes possibility to present activities via the Conference Exhibition
CUTTING-EDGESCIENCE
INSIGHTFUL POSTER SESSIONS
INSPIRING PLENARY TALKS
ENGAGING SIDE EVENTS
EXHIBITION & NETWORKING
JOIN US AND
DISCOVER
https://eurogoos-conference.ifremer.fr/ #EuroGOOSConference
CONFERENCE PROGRAMME
DAY 1 – 3 MAY08:30
WELCOME COFFEE AND NETWORKING IN THE WONDER.ME VIRTUAL SPACE
09:00OPENING• George Petihakis, EuroGOOS Chair• Patrick Vincent, Deputy General Manager, Ifremer, France • Laurent Kerléguer, General Manager, SHOM, France • Pierre Karleskin, Member of the European Parliament
INTRODUCING THE CONFERENCE FORMAT• Master of Ceremony: George Petihakis, EuroGOOS Chair
09:40PLENARY SESSION 1: SETTING THE SCENE• UN Decade of Ocean Science for Sustainable Development –
Vladimir Ryabinin, Executive Secretary of IOC-UNESCO• Ocean observing supporting the EU Green Deal –
Andreea Strachinescu, Head of Unit at European Commission, DG MARE• The science revolution of operational oceanography –
Nadia Pinardi, Full Professor, University of Bologna• Launching the EuroGOOS 2030 Strategy –
George Petihakis, EuroGOOS Chair
00:00BREAK
10:40PLENARY SESSION 2: EXPANDING EUROPE’S OCEAN OBSERVING AND FORECASTING CAPACITY• The Earth System approach to ocean observing and monitoring –
Jun She, Danish Meteorological Institute (DMI)• Towards Integrated and Sustained European Ocean Observing System –
Inga Lips, EuroGOOS Secretary General
Panel discussion, Moderator: George Petihakis, EuroGOOS Chair
• Vanessa Cardin, Head of Experimental Oceanography Group, OGS, EuroGOOS Regional Operational Oceanographic Systems (ROOS)
• Sylvie Pouliquen, Program Manager, Ifremer, France, EuroGOOS Working Groups • Julien Mader, Head of Marine Technologies, AZTI, Spain
EuroGOOS networks of observing platforms (Task Teams)• Toste Tanhua, GEOMAR, Germany/EuroSea Coordinator• Pierre Bahurel, Director of Mercator Ocean International/Copernicus Marine Service • Jan-Bart Calewaert, Head of EMODnet Secretariat
00:00BREAK
11:50PLENARY SESSION 3: CONNECTING THE OCEAN OBSERVING AND FORECASTING SYSTEMS GLOBALLYPanel discussion (Moderator: Albert Fischer, IOC GOOS)
• Henning Wehde, EuroGOOS Vice-Chair• Michelle Heupel, Director of IMOS, Australia• Carl Gouldman, Director of US IOOS• Maria Hood• Ralph Rayner, Industry Outreach and Liaison at NOAA IOOS
13:00
CONFERENCE PROGRAMME AT A GLANCE• Lucie Cocquempot, Ifremer, France, Conference Organizing Committee
00:00LUNCH BREAK & POSTER SESSION 1
DAY 2 – 4 MAY08:30
WELCOME COFFEE AND NETWORKING IN THE WONDER.ME VIRTUAL SPACE
09:00
00:00BREAK
10:20BREAKOUT SESSIONSSession 5Copernicus MarineProducts and Services(Part I)
Session 6Ocean ObservingTechnologies (Part I)
Session 7Regional, Coastal and Local Models (Part I)
00:00BREAK
11:40BREAKOUT SESSIONSSession 5Copernicus MarineProducts and Services(Part II)
Session 6Ocean ObservingTechnologies (Part II)
Session 7Regional, Coastal and Local Models (Part II)
00:00BREAK
12:40PLENARY SESSION 4: ACHIEVING EVIDENCE-BASED POLICYMAKING THROUGH SCIENCE-SOCIETY-POLICY INTERFACE• Rick Stuart-Smith, Reef Life Survey President and Co-founder,
University of Tasmania, Australia• Jaume Piera, Institut de Ciències del Mar (ICM) of the Spanish
National Research Council (CSIC), Spain• Johannes Karstensen, Ocean Best Practices System (OBPS)
13:10LUNCH BREAK & POSTER SESSION 2
DAY 3 – 5 MAY08:30
WELCOME COFFEE AND NETWORKING IN THE WONDER.ME VIRTUAL SPACE
09:00
00:00BREAK
10:20
00:00BREAK
11:30PLENARY SESSION 5: FORWARD LOOK IN EUROPEANOCEANOGRAPHY• Big Data in Marine Science: Supporting the European Green Deal, and
the EU Biodiversity, Sheila Heymans, Executive Director of European Marine Board (EMB)
• Award ceremony for the EuroGOOS Kostas Nittis medal to early career researchers
Moderator: Inga Lips, EuroGOOS
• New trends in observing technologies, Andrew King, Co-Chair of EuroGOOS FerryBox Task Team
• Improved knowledge on Ocean Health and Climate, Jun She, Chair of EuroGOOS Science Advisory Working Group
• Advancement and synergies of European Research Infrastructures, Vanessa Cardin, Chair of EuroGOOS MONGOOS
• Integration and management of ocean data, Sylvie Pouliquen, Chair of EuroGOOS DataMEQ Working Group
• Advancements in ocean modelling, Ghada El Serafy, Co-Chair of EuroGOOS Coastal Working Group
• Improved services and products, Enrique Alvarez, EuroGOOS Executive Directors Board Member
9th EuroGOOS Conference statement, George Petihakis, EuroGOOS Chair
15:00SIDE EVENT: COOPERATION FRAMEWORKBETWEEN MARINE RESEARCH INFRASTRUCTURES
BREAKOUT SESSIONSSession 1Ocean Health
Session 2FAIR Data
Session 3RegionalObservatories
Session 4Extreme Eventsand HazardForecasting
BREAKOUT SESSIONSSession 8DataManagementand Metrology
Session 9EuropeanResearchInfrastructures
Session 10User-OrientedProducts(Part I)
Session 11DataAssimilationand NumericalTechniques
BREAKOUT SESSIONSSession 10User-OrientedProducts(Part II)
Session 12New Trends inOceanObserving
Session 13CoastalForecastingand GlobalModelling
Session 14Marine Climate Services
13:00
00:00
00:00
00:00
00:00 00:00
00:0000:00
00:00
00:00 17:00

SESSION 1
OCEAN HEALTH

18 ADVANCES IN OPERATIONAL OCEANOGRAPHY
PHYTOBSFRENCH NATIONAL SERVICE OF OBSERVATION PROGRAM FOR PHYTOPLANKTON IN COASTAL WATERS Maud Lemoine (1) and Pascal Claquin (2)
(1) IFREMER, rue de l’Ile d’Yeu BP 21105 44311 Nantes Cedex 03, [email protected](2) Laboratoire BOREA – UMR CNRS-8067, MNHN, IRD, Sorbonne Université, UA, UniCaen, BP49,
54, rue du Docteur Charcot – 14530 Luc-sur-Mer, [email protected]
Abstract PHYTOBS is a French national network of microphytoplankton monitoring deployed along the French coast in many sites and supported by Ifremer, CNRS and Universities. PHYTOBS is part of the French national federative Research Infrastructure for coastal ocean and seashore observations ILICO.
Keywords: Observation infrastructure, Coastal observatory, phytoplankton, Environmental time series, FAIR data, ILICO
1. What? Phytobs within the French ILICO RIThe PHYTOBS network studies microphytoplankton diversity in the hydrological context along French coasts under anthropogenic pressures.
It provides the scientific community and stakeholders with validated and qualified data, in order to improve knowledge regarding biomass, abundance and composition of marine microphytoplankton in coastal and lagoon waters in their hydrological context.The PHYTOBS network plays also a key role for the scientific community networking allowing dissemination of knowledge and strengthening of skills. Workshops and scientific meetings are organized every year involving PHYTOBS partners.
It is part of the French national federative Research Infrastructure for coastal ocean and seashore observations ILICO (Cocquempot et al., 2019) which allows interactions between PHYTOBS and other environmental monitoring networks.

19ADVANCES IN OPERATIONAL OCEANOGRAPHY EXPANDING EUROPE’S OBSERVING AND FORECASTING CAPACITY
2. Why?The PHYTOBS network allows to analyse the responses of phytoplankton communities to environmental changes at various scales, to assess the quality of the coastal environment through indicators, to define ecological niches, to detect variations in bloom phenology, and to support any scientific question by providing data since 1987 for the longest dataset.
3. Where?PHYTOBS monitors 25 sites in the Channel, in the Atlantic coast and in the Mediterranean. It relies on two original networks. The historical REPHY supported by Ifremer since 1984 (French Observation and Monitoring program for Phytoplankton and Hydrology in coastal waters – https://wwz.ifremer.fr/envlit/Surveillance-du-littoral/Phytoplancton-et-phycotoxines) and the SOMLIT supported by INSU-CNRS since 1995 (French Coastal Monitoring Network – http://www.somlit.fr/). The monitoring started in 1987 on some sites and later in others.
4. How?A common protocol is applied for sampling, analysis, identification and taxonomic classification. Physicochemical parameters associated to each sample, acquired by Ifremer or by the SOMLIT, are available on the database.
Work has been conducted to obtain taxonomic groups called ‘taxon labellisé’ corresponding to the best shared identification expertise within the community of analysts. This means that in a given group, all the analysts are able to identify to the given level (eg Genus), even if some analysts are able to go deeper (eg species).
5. DataThe PHYTOBS dataset includes long-term time series on marine microphytoplankton, since 1987, along the whole French metropolitan coast. Microphytoplankton data cover microscopic taxonomic identifications and counts. The whole dataset will soon be available online, it includes 25 sampling locations.
Results are stored in two databases: PELAGOS (supported by Abîms-Biological Station of Roscoff) and Quadrige (Ifremer) for results from Universities/CNRS sampling site and from Ifremer sampling sites respectively. An online platform is being developed (www.phytobs.fr – in progress) to access to all results with graphs for each labelled taxon and with downloadable files.
20 ADVANCES IN OPERATIONAL OCEANOGRAPHY
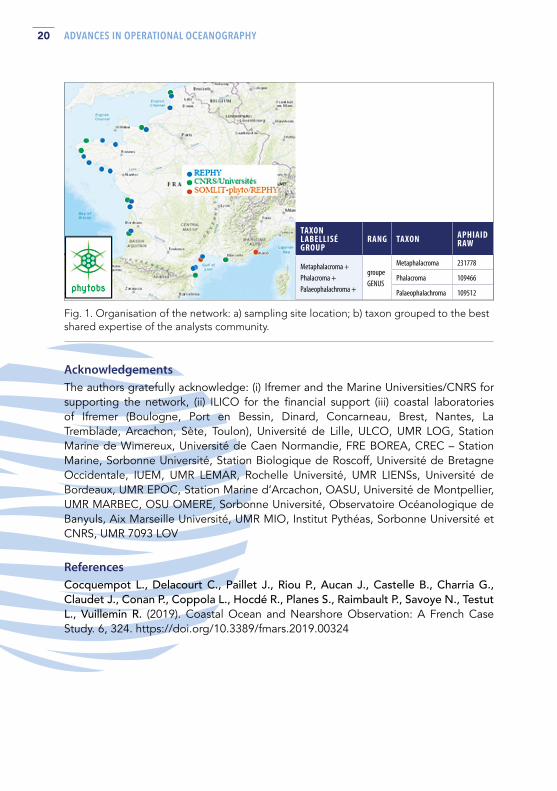
Fig. 1. Organisation of the network: a) sampling site location; b) taxon grouped to the best shared expertise of the analysts community.
TAXON LABELLISÉ GROUP
RANG TAXON APHIAID RAW
Metaphalacroma +Phalacroma +Palaeophalachroma +
groupe GENUS
Metaphalacroma 231778
Phalacroma 109466
Palaeophalachroma 109512
AcknowledgementsThe authors gratefully acknowledge: (i) Ifremer and the Marine Universities/CNRS for supporting the network, (ii) ILICO for the financial support (iii) coastal laboratories of Ifremer (Boulogne, Port en Bessin, Dinard, Concarneau, Brest, Nantes, La Tremblade, Arcachon, Sète, Toulon), Université de Lille, ULCO, UMR LOG, Station Marine de Wimereux, Université de Caen Normandie, FRE BOREA, CREC – Station Marine, Sorbonne Université, Station Biologique de Roscoff, Université de Bretagne Occidentale, IUEM, UMR LEMAR, Rochelle Université, UMR LIENSs, Université de Bordeaux, UMR EPOC, Station Marine d’Arcachon, OASU, Université de Montpellier, UMR MARBEC, OSU OMERE, Sorbonne Université, Observatoire Océanologique de Banyuls, Aix Marseille Université, UMR MIO, Institut Pythéas, Sorbonne Université et CNRS, UMR 7093 LOV
ReferencesCocquempot L., Delacourt C., Paillet J., Riou P., Aucan J., Castelle B., Charria G., Claudet J., Conan P., Coppola L., Hocdé R., Planes S., Raimbault P., Savoye N., Testut L., Vuillemin R. (2019). Coastal Ocean and Nearshore Observation: A French Case Study. 6, 324. https://doi.org/10.3389/fmars.2019.00324

21ADVANCES IN OPERATIONAL OCEANOGRAPHY EXPANDING EUROPE’S OBSERVING AND FORECASTING CAPACITY
ENTERING IN THE BGC-ARGO ERA: IMPROVEMENTS OF THE MEDITERRANEAN SEA BIOGEOCHEMICAL OPERATIONAL SYSTEM Laura Feudale, Gianpiero Cossarini, Giorgio Bolzon, Paolo Lazzari, Cosimo Solidoro, Anna Teruzzi , Elena Terzic, Stefano Salon
National Institute of Oceanography and Applied Geophysics - OGS, Borgo Grotta Gigante 42/c Sgonico (TS) Italy, [email protected]
Abstract Biogeochemical Argo floats (BGC-Argo) provide an unprecedented availability of high-resolution biogeochemical and optical vertical profiles at near real time. The integration of biogeochemical and optical observations with marine ecosystem models allows to improve the model capability to describe marine ecosystem dynamics at different spatial and temporal scales, also resulting in an increase of the model skill.
Recent advancements and future upgrades of the Copernicus Marine Environment Monitoring Service (CMEMS) Mediterranean Sea biogeochemical modelling system include the use of BGC-Argo data for validation and assimilation of both biogeochemical and optical components.
The focus of this work is to present the upgrade of the BGC-Argo data stream quality check for the CMEMS Mediterranean Sea biogeochemical modelling system workflow and to discuss a novel skill assessment framework oriented to evaluate key biogeochemical processes and ecosystem dynamics (e.g. deep chlorophyll maximum depth, nitracline depth, minimum oxygen depth) and optical characteristics (bbp700 converted data) that benefit from the particularly rich and high quality level of the BGC-Argo network in this semi-enclosed sea.
Keywords: Biogeochemical Argo floats, Mediterranean Sea, biogeochemical quality assessment, process-based skill metrics

22 ADVANCES IN OPERATIONAL OCEANOGRAPHY
1. IntroductionMonitoring the ocean biogeochemistry and the marine ecosystems, providing reliable present-state evaluations, short-term forecasts and long-term scenarios is an impelling challenge in a changing ocean. Ocean modeling and operational ocean forecasting systems have been widely recognized as important assets to increase our understanding of ecosystem processes and monitor the state of the ocean provided that the uncertainty level of model results are assessed by a proper validation framework and communicated. The BGC-Argo network, which has rapidly grown in recent years (Johnson and Claustre, 2016) contributed to solve the paucity of biogeochemical data in the global ocean, and allows to investigate the ocean interior status of biogeochemical variables and to assess several key physical processes impacting biogeochemistry. Thus, BGC-Argo can be effectively used in operational modeling frameworks and validation (Le Traon et al., 2017). The Mediterranean Sea has one of the first BGC-Argo networks with a sufficient density of floats to operationally implement BGC data assimilation systems (Cossarini et al., 2019). Furthermore, several studies based on BGC-Argo data enlightened vertical structures and dynamics of the biogeochemistry of this semi enclosed sea (Lavigne et al., 2015; D’Ortenzio et al., 2020). The present work aims to present some recent advancements of the introduction of the BGC-Argo high quality level dataset into the Mediterranean Sea biogeochemical modelling system embedded in the European Copernicus Marine Service (CMEMS) by devising an innovative validation scheme for evaluating biogeochemical processes along the water column. These developments benefit from the achievements carried out in the frame of two CMEMS Service Evolution projects (MASSIMILI and BIOPTIMOD), following the CMEMS continuous improvement philosophy.
2. Data and MethodsThe biogeochemical analysis and forecasts for the Mediterranean Sea at 1/24° of horizontal resolution (ca. 4 km) are produced for the CMEMS programme by means of the MedBFM model system (see Salon et al., 2019, for details and references), which includes the transport model OGSTM coupled with the biogeochemical flux model BFM and the variational data assimilation module 3DVAR-BIO (see details in Teruzzi et al., 2018, and Cossarini et al., 2019). Operating within the biogeochemical CMEMS Mediterranean Sea Monitoring and Forecasting Centre (Med-MFC BIO), MedBFM is off-line coupled with the NEMO-OceanVar model and produces seven days of analysis every week and ten days of forecast daily for a total of 14 biogeochemical variables (Feudale et al., 2021).
23ADVANCES IN OPERATIONAL OCEANOGRAPHY EXPANDING EUROPE’S OBSERVING AND FORECASTING CAPACITY
2.1 Real Time and Delayed Mode of BGC-Argo float data
BGC-Argo has two data streams: ‘real-time’ (‘RT’) and ‘delayed-mode’ (‘DM’). The ‘RT’ stream has a latency requirement of 24 hours between profile termination and data availability, and is expected to be free of gross outliers with an automated quality control and data checks. ‘DM’ data, typically expected within 6 – 12 months (Bittig et al., 2019), include more sophisticated data adjustment and quality control procedures, involving sometime manual inspection, and provide the best quality data. During ‘DM’ assessment (done usually after 5 – 10 cycles), any derived data adjustments (gain, drift, offset) can be fed back into the incoming ‘RT’ stream, producing Real-Time Adjusted data (‘A’).
While the use of ‘DM’ data sounds safe, handling near real time (NRT) data for assimilation and validation in operational biogeochemical systems requires dedicated checks and procedures to ensure that only good data are integrated in model simulations. Considering the Med-MFC BIO operational system, the preliminary check on availability of ‘A’ mode is combined with further check and corrections to deal with anomalous data and the presence of drift in time of sensor measurements. So far, chlorophyll (Chl) is the BGC-Argo float variable with the best ‘RT’ Quality Control (Bittig et al., 2019): its adjusted mode already includes the quenching correction, recalibration at depth and a tuning correction of the manufacturer calibration fluorometer. Even if BGC-Argo oxygen (OXY) reports the largest improvement with currently 80% of all profiles adjusted and a large part of them passed in DM during 2020, the NRT use of oxygen data is still problematic. Our NRT oxygen quality check is done comparing the oxygen surface value with oxygen at saturation (Garcia and Gordon, 1992), and a threshold of 10 mmol/m3 is used to discharge profiles. At NRT, the internal quality check of NO3 includes: the discharge of ‘RT’ mode and the correction of ‘A’ mode nitrate based on availability of good quality oxygen data. Indeed, if good quality (‘DM’ or ‘A’) oxygen data are available, the nitrate correction is performed with the CANYON-B neural network results (Bittig et al., 2018), calculating the offset at 900m depth and applying a linear shift by this offset to the surface. In the case of no good quality oxygen data available, the offset at 600 – 1000 m is computed from the Word Ocean Atlas 2018. Then, surface values are forced being at least 0.05 mmol/m3. Optical data from Bbp700 sensor onboard the BGC-Argo are computed following the relationship of Bellacicco et al., (2019) to retrieve carbon biomass of phytoplankton (PhyC), and the 500 – 600 m average off-set is removed from the profiles. For all variables, a further internal check is performed considering a threshold between model and observation misfit which is intended to spot observations that, even if good, cannot be handled by the model.

24 ADVANCES IN OPERATIONAL OCEANOGRAPHY
3. RESULTS
3.1 Process oriented metrics based on biogeochemical and optical BGC-Argo measurements
A key element to establish a necessary confidence in the recent Med-MFC system improvements (Clementi et al., 2021) was to develop a validation framework that can evaluate both the quality of the biogeochemical variables values and the consistency of physical and biogeochemical processes. Thus, novel skill metrics have been implemented to monitor the quality of the products and validate the consistency of the ecosystem products with the physical ones (Salon et al., 2019), also considering the seasonality of ecosystem processes and highlighting the model capability to reproduce key elements of the vertical dynamics.
Model-float direct comparison is useful for verifying the model capability to predict the spatial-temporal distribution of oceanographic properties, critical for forecasting. For each BGC-Argo float, the vertical profiles of Chl, NO3, OXY and PhyC are matched-up with the model output at the same position and date, producing time series of paired profiles. Hovmoeller plots of model-float profiles highlight the time evolution of vertical biogeochemical processes involved in the euphotic layer and just underneath (e.g. see the top panels of Figure 1). This direct comparison is published weekly in the medeaf.inogs.it website for the analysis of the previous week. From the match-up, a series of statistical metrics can be derived to evaluate state variables and emerging biogeochemical properties (i.e., deep chlorophyll maximum, nitracline, oxygen maximum), spotting ecosystem dynamics and physical-biogeochemical coupling processes. Regarding Chl, two seasonal metrics identifies the most important vertical modes of phytoplankton dynamics (Lavigne et al., 2015): (1) BIAS and root mean square of the difference (RMSD) between model and float of the deep chlorophyll maximum (DCM) depth and of its corresponding Chl value, and (2) BIAS and RMSD of the winter bloom layer (WBL) depth (details of DCM and WBL are in Salon et al., 2019).
Considering the photic layer, the BIAS and RMSD of the 0 – 200 m vertical average (INTG) of Chl, NO3, OXY and PhyC provide the assessment of model consistency to simulate the ecosystem productivity, biomass accumulation and oxygen balance. The productivity of the system is also assessed by the BIAS and RMSD of the depth of the oxygen maximum which spots the super-saturation condition occurring in the layer of maximum photosynthesis production.
The vertical transport of nutrients into the photic layer is highlighted by BIAS and RMSD of the depth of the nitracline, defined as the depth (1) where the nitrate concentration is 2 mmol/m3 (NITRCL1) and (2) corresponding to the maximum nitrate vertical gradient (NITRCL2).

25ADVANCES IN OPERATIONAL OCEANOGRAPHY EXPANDING EUROPE’S OBSERVING AND FORECASTING CAPACITY
Fig. 1. Examples of Hovmoller diagrams of NO3 (left) and OXY (right) of BGC-Argo floats (2nd panel) and model outputs (3rd panels) matched-up with float position (top) for year 2019. Left: time series of NO3 indicators based on model and BGC-Argo floats comparison (4th-7th panel): NO3 concentration at surface (SURF), 0 – 350 m vertically averaged concentration (INTG), correlation between profiles (CORR), depth of the nitracline (NITRACL1/2). Right: Time series of OXY indicators based on model and BGC-Argo floats comparison (4th-7th panel): OXY concentration at surface (SURF) and OXY saturation from float (O2sat), 0 – 200 m vertically averaged concentration (INTG), correlation between profiles (CORR), depth of the OMZ and of OXY maximum. Trajectories of the BGC-Argo floats are reported in the upper panels (red dots), with deployment position (blue cross).
ChL PhyC NO3 OX Y
RMSD 0-200 m
MEAN [mg/m3]
RMSD DCM
DEPTH [m]
RMSD WBL
DEPTH [m]
RMSD 0-200 m
MEAN [mgC/m3]
RMSD 0-200m
MEAN [mmol/m3]
RMSD NITRCL1
depth [m]
RMSD 0-200M
MEAN [mmol/m3]
RMSD MAX O2 depth
[m]
SWM 0.04 9 42 1.70 - - 8.48 10
NWM 0.04 10 30 1.07 0.46 9 7.27 9
ION 0.03 27 18 0.52 0.26 11 3.18 25
LEV 0.02 17 17 0.43 0.32 36 7.93 5
Table I. Selection of multivariate skill metrics comparing model outputs and BGC-Argo floats data in the period January-December 2019 for south-western Mediterranean (SWM), north-western Mediterranean (NWM), Ionian Sea (ION) and Levantine basin (LEV).

26 ADVANCES IN OPERATIONAL OCEANOGRAPHY
Furthermore, for OXY we identify: (1) BIAS and RMSD between model and float of the OXY maximum depth identified in the layer 0 – 200 m, and (2) BIAS and RMSD between model and float of the oxygen minimum zone (OMZ) depth identified in the layer 200 – 600 m.
Correlation (CORR) between each couple of Chl, NO3, OXY vertical profiles from model and float provide an estimation of the consistency of vertical transport and biogeochemical processes simulated by the model. Results of the novel validation framework are reported as pseudo-lagrangian metrics following the BGC-Argo trajectories (Figure 1) and then summarized in sub-basin statistics (Table. I) in the specific product documentation available in CMEMS catalogue (Feudale et al., 2021).
3.2 Process-oriented metrics linking the impact of transport on biogeochemical vertical structure
Among BGC-Argo sensors, nitrate remains more limited due to high cost of sensors and technology limitations. However, inorganic nitrate is one of the important macronutrients for oceanic phytoplankton dynamics: it varies over timescales ranging from weekly to interannual and due to both physical and biological processes, and its vertical distribution and dynamics is paramount for understanding the new component of primary production and the ocean biological pump. Particular interest falls on possible relationships with physical processes from which might be possible to ‘extrapolate’ its distribution (‘process-oriented metric’). In particular, previous studies have revealed a relationship between density and nitrate distribution in the vertical (Johnson et al., 2010; Omand and Mahadevan, 2013; Ascani et al., 2013).
Taking advantage of 2013 – 2021 BGC-Argo floats equipped with nitrate and CTD sensors (Argo, 2020), profile correlation indexes are computed to characterize the density-nitrate relationship in four selected Mediterranean sub-regions, covering the zonal nitrate gradient and reproducing the deepening of the nutricline (Figure 2, upper panels). The analysis focuses on the summer season (here defined as from April to September), when stratification and dynamics of the nutricline drives the DCM. Results of the analysis show the presence of different physical-biogeochemical regimes in the different regions. Indeed, nitrate profile shapes are different in the four areas, from the shallower nutricline depth in the West and steeper slope (thinner nutricline thickness), and a nitrate pool at depth higher in the West, related to the well known oligotrophic West-East gradient.

27ADVANCES IN OPERATIONAL OCEANOGRAPHY EXPANDING EUROPE’S OBSERVING AND FORECASTING CAPACITY
Fig. 2. Scatter plots of DCM [m] on the upper left and Nitracline [m] on the upper right based on BGC-Argo data of the 2013 – 2021 period. Multipanels below show from left to right, the vertical profiles of Chlorophyll, Nitrate, Potential Density (solid black thicker lines are the mean, dotted black lines are the standard deviation) and the correlation between nitrate with density (black) and isopycnals (blue) computed BGC-Argo float data. Last plot on the right of each panel shows the correlation between modelled nitrate and density. Analysis is repeated for the four sub-regions.
Based on float data, nitrate correlation with potential density (computed following Ascani et al., 2013) is weak at surface where biogeochemical processes and near-surface variability might dominate, but increases with depth reaching values of 0.9 around 200 m depth. The shape of correlation profile differs in the four regions: it is constant and high till 500 m in the eastern sub-region, while it linearly decreases in the western area. In the two mid-west and mid-east sub-regions the correlation remains higher till 600 m showing a consistent physical-biogeochemical dynamics far below the nutricline depth. Same calculations made with model output matching float trajectories are reported in the fifth plot referring to each sub-region. Results show that the model is consistently reproducing the physical biogeochemical coupled dynamics in all sub-regions but mid-East. In the mid-East region, the discrepancy between profile correlation of model and float might highlight possible model failure in reproducing the mixing and vertical position of different water masses in this complex area, where modified Atlantic water, Levantine intermediate water and outflow dense Adriatic water interact and are characterized by a different nutrient content.

28 ADVANCES IN OPERATIONAL OCEANOGRAPHY
4. ConclusionsThe present work aims to highlight the benefits of the introduction of the high quality level dataset of the BGC-Argo network into the Copernicus Mediterranean Sea biogeochemical modelling system. Beside the improvements in the data assimilation component (Cossarini et al., 2019), a novel metrics framework based on singular status parameters is defined evaluating emerging properties. Additionally, correlation metrics between nitrate and density at particular depths can be a promising validation technique in order to capture the nature of the physical processes which may influence the evolution of biogeochemical processes as well. Further, these relations, by spotting the dynamical coupling between transport and biogeochemical vertical profiles, could be adopted as a possible strategy in generating ‘synthetic’ nitrate profiles where only physical variables are known, overtaking the problem of nitrate data paucity.
ReferencesArgo (2020). Argo float data and metadata from Global Data Assembly Centre (Argo GDAC). SEANOE. https://doi.org/10.17882/42182.
Ascani, F., Richards, KJ., Firing, E., Grant, S., Johnson, KS., Jia, Y., Lukas, R. and Karl, D.M. (2013). Physical and biological controls of nitrate concentrations in the upper subtropical North Pacific Ocean,, Deep Sea Research Part II: Topical Studies in Oceanography, Volume 93, Pages 119-134, ISSN 0967-0645, https://doi.org/10.1016/j.dsr2.2013.01.034.
Bellacicco, M., Vellucci, V., Scardi, M., Barbieux, M., Marullo, S. and D’Ortenzio, F. (2019). Quantifying the impact of linear regression model in deriving Bio-Optica relationships: the implications on the ocean carbon estimations. Sensors, 19, 3032.
Bittig, HC., Steinhoff, T., Claustre, H., Fiedler, B., Williams, NL., Sauzède, R., Körtzinger, A. and Gattuso, J-P. (2018). An Alternative to Static Climatologies: Robust Estimation of Open Ocean CO2 Variables and Nutrient Concentrations From T, S, and O2 Data Using Bayesian Neural Networks. Front. Mar. Sci. 5:328. doi: 10.3389/fmars.2018.00328.
Bittig, H. C., Maurer, T. L., Plant, J. N., Schmechtig, C., Wong, A. P., Claustre, H. and Xing, X. (2019). A BGC-Argo guide: Planning, deployment, data handling and usage. Frontiers in Marine Science, 6, 502.
Clementi, E., Coppini, G., Aydogdu, A., Escudier, R., Pistoia, J., Drudi, M., Lecci, R., Cossarini, G., Salon, S., Teruzzi, S., Korres, G., Ravdas, M. and Zacharioudaki, A. (2021). Mediterranean MFC. Synthesis of Achievements during CMEMS 1. submitted to Mercator Ocean Journal.
Cossarini, G., Mariotti, L., Feudale, L., Teruzzi, A., D’Ortenzio, F., Tallandier, V. and Mignot, A. (2019). Towards operational 3D-Var assimilation of chlorophyll Biogeochemical-Argo float data into a biogeochemical model of the Mediterranean Sea, Ocean Model., 133, 112–128.
29ADVANCES IN OPERATIONAL OCEANOGRAPHY EXPANDING EUROPE’S OBSERVING AND FORECASTING CAPACITY
D’Ortenzio, F., Taillandier, V., Claustre, H., Prieur, LM., Leymarie, E., Mignot, A., Poteau, A., Penkerch, C. and Schmechtig, CM. (2020). Biogeochemical Argo: The Test Case of the NAOS Mediterranean Array. Front. Mar. Sci. 7:120. doi: 10.3389/fmars.2020.00120.
Feudale, L., Bolzon, G., Lazzari, P., Salon, S., Teruzzi, A., Di Biagio, V., Coidessa, G., and Cossarini, G. (2021). Mediterranean Sea Biogeochemical Analysis and Forecast (CMEMS MED-Biogeochemistry, MedBFM3 system) (Version 1) [Data set]. Copernicus Monitoring Environment Marine Service. https://doi.org/10.25423/CMCC/MEDSEA_ANALYSISFORECAST_BGC_006_014_MEDBFM3.
Garcia, H. and Gordon, L. I. (1992): Oxygen solubility in seawater: Better fitting equations. Lim. and Ocean. 37, 6, 1307-1312.
Johnson, K.S., Riser, S.C. and Karl, D.M. (2010). Nitrate supply from deep to near-surface waters of the north pacific sub- tropical gyre. Nature, 465, 1062–1065, https://doi.org/10.1038/ nature09170.
Johnson, K.S. and Claustre, H. (2016). Bringing biogeochemistry into the Argo age. Eos 97. https://doi.org/10.1029/2016EO062427.
Lavigne, H., D’ortenzio, F., d’Alcalà, M. R., Claustre, H., Sauzède, R., and Gacic, M. (2015). On the vertical distribution of the chlorophyll a concentration in the Mediterranean Sea: a basin-scale and seasonal approach, Biogeosc., 12, 5021–5039.
Le Traon, P.Y., et al., (2017). The Copernicus marine environmental monitoring service: main scientific achievements and future prospects. Spec. Issue Mercat. Océan J. #56. https://doi.org/10.25575/56.
Omand, M. M., and Mahadevan, A. (2013). Large scale alignment of oceanic nitrate and density, J. Geophys. Res. Oceans, 118, 5322– 5332, doi:10.1002/jgrc.20379.
Teruzzi, A., Bolzon, G., Salon, S., Lazzari, P., Solidoro, C., and Cossarini, G. (2018). Assimilation of coastal and open sea biogeochemical data to improve phytoplankton modelling in the Mediterranean Sea, Ocean Model., 132, 46–60, https://doi.org/10.1016/j.ocemod.2018.09.007.
Salon, S., Cossarini, G., Bolzon, G., Feudale, L., Lazzari, P., Teruzzi, A., Solidoro, C., and Crise, A. (2019). Novel metrics based on Biogeochemical Argo data to improve the model uncertainty evaluation of the CMEMS Mediterranean marine ecosystem forecasts, Ocean Sciences, 15, 997–1022, https://doi.org/10.5194/os-15-997-2019.
30 ADVANCES IN OPERATIONAL OCEANOGRAPHY
AN INSTRUMENT INTERCOMPARISON EXERCISE IN THE SKAGERRAK ALLOWS EXTENDING THE FERRYBOX pCO2 OBSERVATIONAL COVERAGE ACROSS THE CENTRAL AND SOUTHERN NORTH SEAVlad A. Macovei (1), Yoana G. Voynova (1), Meike Becker (2), Jack Triest (3),
Wilhelm Petersen (1)
(1) Institute of Coastal Ocean Dynamics, Helmholtz-Zentrum Hereon, Geesthacht, Germany, [email protected](2) Geophysical Institute, University of Bergen, and Bjerknes Centre for Climate Research, Bergen,
Norway(3) 4H-Jena Engineering GmbH, Kiel, Germany
AbstractThe partial pressure of carbon dioxide (pCO2) in surface seawater is an important biogeochemical variable, influencing the direction of air–sea carbon dioxide exchange. Large-scale observations of pCO2 are facilitated by Ships-of-Opportunity (SOOP-CO2) equipped with underway measuring instruments that are becoming more autonomous. Here we performed a comparison between a FerryBox-integrated membrane-based sensor and a showerhead equilibration sensor installed on two SOOP-CO2 between 2013 and 2018. We identified time- and space-adequate crossovers in the Skagerrak Strait, where the two ship routes often crossed. We found a mean total difference of 1.5 ± 10.6 μatm and a root mean square error of 11 μatm. The pCO2 values recorded by the two instruments showed a strong linear correlation with a coefficient of 0.91 and a slope of 1.07 (± 0.14), despite the dynamic nature of the environment and the difficulty of comparing measurements from two different vessels. We showed the strength of having a sensor-based network with a high spatial coverage that can be cross-checked against conventional SOOP-CO2 methods. Validating membrane-

31ADVANCES IN OPERATIONAL OCEANOGRAPHY EXPANDING EUROPE’S OBSERVING AND FORECASTING CAPACITY
based sensors and using the expanded coverage and higher frequency measurements they provide can enable a thorough characterization of pCO2 variability in both open oceans and dynamic coastal seas.
Keywords: pCO2, carbonate system, ship-of-opportunity, instrument intercomparison, North Sea
1. IntroductionThe contribution of the coastal ocean to atmospheric carbon dioxide uptake is difficult to estimate due to the heterogeneity of coastal seawater partial pressure of carbon dioxide (pCO2) and the limited number of observations available (Roobaert et al., 2019). Ships-of-Opportunity equipped with instruments measuring the carbonate system parameters (SOOP-CO2) have been used to increase our observational coverage. Showerhead equilibrator-style (SHS) instruments remain the ‘gold standard’ due to their small measurement uncertainty (Pierrot et al., 2009). More recently, membrane-based sensors (MBS) that require less frequent and less costly maintenance have been developed to simplify the measuring process.
In this study, we perform a crossover investigation between pCO2 measurements taken by a MBS integrated with a FerryBox and a conventional SHS on two long-term data sets in a dynamic coastal environment. The FerryBox dataset features a higher temporal and spatial resolution in the study area and these advantages are explored. By validating this new data set, we are increasing our observational capacity, in line with operational oceanography recommendations.
2. MethodsThe MBS and SHS instruments used in this study are a HydroC-FT (4H-Jena Engineering) installed on the C/V Lysbris Seaways and GO-8050 (General Oceanics) installed on the M/V Nuka Arctica respectively. The ship routes often overlapped in the Skagerrak Strait (Figure 1a). We selected valid crossovers when the two ships passed within 24 h of each other through five small sub-regions and did not show an unusually large variability.
3. ResultsDuring the five study years, 14 valid crossovers were identified with a mean difference (MBS − SHS) of 1.5 ± 10.6 µatm and a range between −16.9 and 25.0 µatm (Figure 1b). This is similar to other intercomparison experiments in the literature in spite of this study being done on two different ships, over a long period and in a dynamic coastal environment. For a full description of the methodology, results and comparisons with
32 ADVANCES IN OPERATIONAL OCEANOGRAPHY
previous studies, and a highlight on how the higher FerryBox sampling frequency is advantageous in identifying short-lived heterogeneous coastal biogeochemical events, we direct the reader to the full-length published manuscript (Macovei et al., 2021).
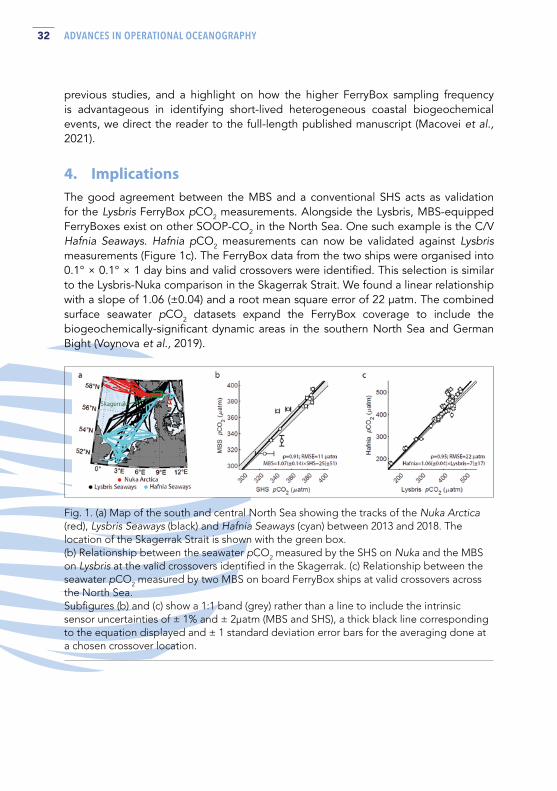
4. ImplicationsThe good agreement between the MBS and a conventional SHS acts as validation for the Lysbris FerryBox pCO2 measurements. Alongside the Lysbris, MBS-equipped FerryBoxes exist on other SOOP-CO2 in the North Sea. One such example is the C/V Hafnia Seaways. Hafnia pCO2 measurements can now be validated against Lysbris measurements (Figure 1c). The FerryBox data from the two ships were organised into 0.1° × 0.1° × 1 day bins and valid crossovers were identified. This selection is similar to the Lysbris-Nuka comparison in the Skagerrak Strait. We found a linear relationship with a slope of 1.06 (±0.04) and a root mean square error of 22 µatm. The combined surface seawater pCO2 datasets expand the FerryBox coverage to include the biogeochemically-significant dynamic areas in the southern North Sea and German Bight (Voynova et al., 2019).
Fig. 1. (a) Map of the south and central North Sea showing the tracks of the Nuka Arctica (red), Lysbris Seaways (black) and Hafnia Seaways (cyan) between 2013 and 2018. The location of the Skagerrak Strait is shown with the green box. (b) Relationship between the seawater pCO2 measured by the SHS on Nuka and the MBS on Lysbris at the valid crossovers identified in the Skagerrak. (c) Relationship between the seawater pCO2 measured by two MBS on board FerryBox ships at valid crossovers across the North Sea. Subfigures (b) and (c) show a 1:1 band (grey) rather than a line to include the intrinsic sensor uncertainties of ± 1% and ± 2µatm (MBS and SHS), a thick black line corresponding to the equation displayed and ± 1 standard deviation error bars for the averaging done at a chosen crossover location.

33ADVANCES IN OPERATIONAL OCEANOGRAPHY EXPANDING EUROPE’S OBSERVING AND FORECASTING CAPACITY
ReferencesMacovei, V. A., Voynova, Y. G., Becker, M., Triest, J., & Petersen, W. (2021). Long-term intercomparison of two pCO2 instruments based on ship-of-opportunity measurements in a dynamic shelf sea environment. Limnology and Oceanography: Methods, 19(1), 37-50. doi:10.1002/lom3.10403
Pierrot, D., Neill, C., Sullivan, K., Castle, R., Wanninkhof, R., Luger, H., … Cosca, C. E. (2009). Recommendations for autonomous underway pCO2 measuring systems and data-reduction routines. Deep-Sea Research Part II-Topical Studies in Oceanography, 56(8-10), 512-522. doi:10.1016/j.dsr2.2008.12.005
Roobaert, A., Laruelle, G. G., Landschutzer, P., Gruber, N., Chou, L., & Regnier, P. (2019). The Spatiotemporal Dynamics of the Sources and Sinks of CO2 in the Global Coastal Ocean. Global Biogeochemical Cycles. doi:10.1029/2019gb006239
Voynova, Y. G., Petersen, W., Gehrung, M., Aßmann, S., & King, A. L. (2019). Intertidal regions changing coastal alkalinity: The Wadden Sea-North Sea tidally coupled bioreactor. Limnology and Oceanography, 64(3), 1135-1149. doi:10.1002/lno.11103


SESSION 2
FAIR DATA
36 ADVANCES IN OPERATIONAL OCEANOGRAPHY
HIDROGRAFICO + A CONTRIBUTION TO THE KNOWLEDGE OF THE OCEAN Sara Almeida (1) and Paulo Nunes (2)
(1) Instituto Hidrográfico, Rua das Trinas, 49, 1249-093 Lisboa, Portugal.
[email protected](2) Instituto Hidrográfico, Rua das Trinas, 49, 1249-093 Lisboa, Portugal
AbstractThe Ocean Decade promoted by United Nations leads ocean knowledge to international community top priority, and puts the spot lights in all marine geospatial data and knowledge producers.
The Portuguese Hydrographic Institute (IH) as public organization and marine data and knowledge producer keeps his data management processes in line with national and European data policies. To address the geospatial data needs IH starts to build a new Marine Spatial Data Infrastructure through the Hidrográfico + project who granted funding from SAMA2020 program (POCI-02-0550-FEDER-035422).
This paper presents the Hidrografico + Marine Spatial Data Infrastructure as an important asset for ocean decade.
Keywords: Marine Spatial Data Infrastructure, INSPIRE, Geographic Information Systems, Geospatial Webservices.
1. IntroductionPortuguese Hydrographic Institute (IH) is a public body involved in marine science activities. Since 80s it works in close cooperation with regional entities keeping and managing a network of permanent observations that includes tide gauges, moored buoys, coastal weather stations to support oceanographic activities and more recently, high frequency radars.
Complementing the operational oceanography component (monitoring, data management and forecasting), IH has participated in several scientific research projects, that have enabled the contribution to the knowledge of the marine environment.
37ADVANCES IN OPERATIONAL OCEANOGRAPHY EXPANDING EUROPE’S OBSERVING AND FORECASTING CAPACITY
The digital society rises new needs for users and data providers. In order to improve data management process and data availability, IH started to develop a new Infrastructure for Marine Spatial Data through the Hidrografico + project, funded by the SAMA2020 program (POCI-02-0550-FEDER-035422). This article presents the construction process of the Marine Spatial Data Infrastructure, Hidrografico+, which represents an important tool for the next decade of knowledge of the oceans.
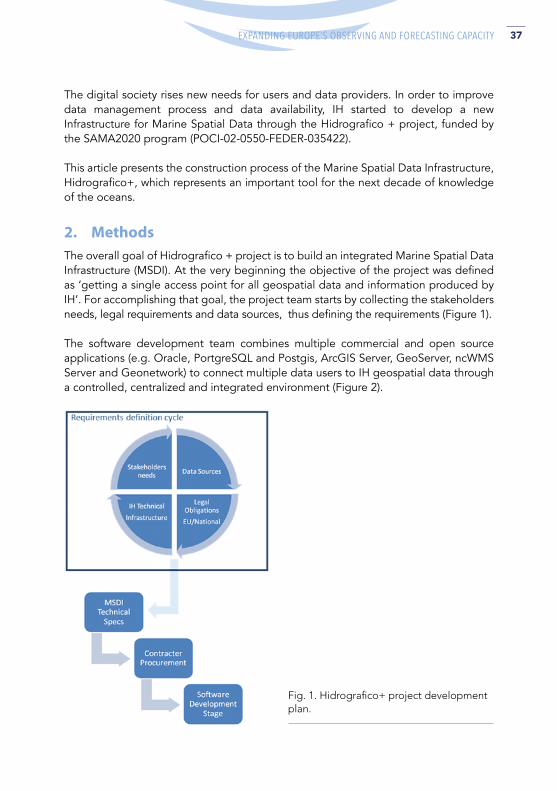
2. MethodsThe overall goal of Hidrografico + project is to build an integrated Marine Spatial Data Infrastructure (MSDI). At the very beginning the objective of the project was defined as ‘getting a single access point for all geospatial data and information produced by IH’. For accomplishing that goal, the project team starts by collecting the stakeholders needs, legal requirements and data sources, thus defining the requirements (Figure 1).
The software development team combines multiple commercial and open source applications (e.g. Oracle, PortgreSQL and Postgis, ArcGIS Server, GeoServer, ncWMS Server and Geonetwork) to connect multiple data users to IH geospatial data through a controlled, centralized and integrated environment (Figure 2).
Fig. 1. Hidrografico+ project development plan.

38 ADVANCES IN OPERATIONAL OCEANOGRAPHY
Fig. 2. Functionalities from the MDSI.
3. ResultsThe Hidrográfico+ MSDI started the software development phase in 12 of December 2019. Since first of August 2020 the MSDI portal is online accessible at URL – https://geomar.hidrografico.pt.
The MSDI has a central geoportal (Figure 2) where users can look for, visualize and access the geospatial datasets. Humans and machines users could access directly to data services by linking their applications to the OGC webservices endpoints. IH wants to provide a good level of service to their MSDI users. The level of service is continuously monitored by a built in analytics and metrics system.
The MSDI is now online with numerous data layers accessible and several capabilities still under development. It encompasses, in the different components, the monitoring of the ocean, the operational forecasts products and the users services.
As national hydrographic office, the infrastructure provides bathymetry, access to the chart catalogue, either nautical, electronic or fishing series charts, base maps for digital models and bathymetric model for the Portuguese EEZ including Azores and Madeira (Figures 3 and 4).

39ADVANCES IN OPERATIONAL OCEANOGRAPHY EXPANDING EUROPE’S OBSERVING AND FORECASTING CAPACITY
Fig. 3. Example of Nazare bathymetry.
Fig. 4. Details and link to the metadata catalogue.
This MSDI presents the network of permanent observing platforms, regarding tide gauges, moored buoys and HF Radars (Figure 5), where it is possible to access to near real time data.

40 ADVANCES IN OPERATIONAL OCEANOGRAPHY
Fig. 5. Screenshot of near real time data from Lisbon HF Radar stations.
At the same point it is possible to do the comparison between tide gauges’ data and predictions, checking the deviation and view graphically or tabulate the series (Figure 6). An option of download is available with different outputs‘resolution.
Fig. 6. View of Setúbal tide gauge and predictions.

41ADVANCES IN OPERATIONAL OCEANOGRAPHY EXPANDING EUROPE’S OBSERVING AND FORECASTING CAPACITY
One of the main purposes of this project was to publish validated datasets findable and accessible. In the next stage, the goal will be the harmonization process to convert the current dataset models to INSPIRE data models. This will require a new specific project but the most important step was to get datasets well documented available and accessible since now. The MSDI is based on open source technology and has been developed in a modular approach. This requirement potentials the evolution of the infrastructure and giving the possibility to insert or remove data services in an easy way.
4. ConclusionWith this new portal, Portuguese Hydrographic Institute is actively committed to contributing to the Decade of the Oceans, meeting the end-users needs and providing the stakeholders with new products and several services.
AcknowledgementsThe ‘Hidrográfico +’ project gets funding from FEDER -POCI-02-0550-FEDER-035422.Authors acknowledge to all the Portuguese Hydrographic Institute and Deimos Eng. colleagues that give a contribution to the Hydrographic + Project.
ReferencesInternational Oceanographic Data and Information Exchange (2016) Guidelines for a Data Management Plan. Paris, France, UNESCO, 16pp. (Intergovernmental Oceanographic Commission Manuals and Guides;73).
http://hdl.handle.net/11329/275
http://ioc-unesco.org/ (on 2021-03-08)
https://www.oceanbestpractices.org/ (on 2021-04-01)
NERC Vocabulary Server, https://www.bodc.ac.uk/resources/products/web_services/vocab/ (on 2021-03-31)
OHI. (2020). S-100 Universal Hydrographic Data Model Retrieved from https://iho.int/en/s-100-universal-hydrographic-data-model.

42 ADVANCES IN OPERATIONAL OCEANOGRAPHY
Soares, C. V. (2020). O Conhecimento científico do Oceano. Instituto Hidrográfico, conhecer o mar para que todos o possam usar. Cadernos Navais (57).
Wilkinson, Mark D. et al., – The Fair Guiding Principles for scientific data management and stewardship. DOI:10.1038/sdata.2016.18

43ADVANCES IN OPERATIONAL OCEANOGRAPHY EXPANDING EUROPE’S OBSERVING AND FORECASTING CAPACITY
SENSORTHINGS API AND THE OGC API FAMILY OF STANDARDS:A NEW GENERATION OF INTEROPERABILITYSTANDARDS FOR RESEARCH DATA INFRASTRUCTURES TO FURTHER IMPROVE THE SHARING OF OCEAN OBSERVATION DATA Simon Jirka (1), Christian Autermann (2), Jan Speckamp (3) and Matthes Rieke (4)
(1) 52°North GmbH, Münster, Germany, [email protected] (2) 52°North GmbH, Münster, Germany, [email protected](3) 52°North GmbH, Münster, Germany, [email protected](4) 52°North GmbH, Münster, Germany, [email protected]
AbstractThis article discusses the potential of standards such as the OGC SensorThings API and the new OGC API family of standards to develop a new generation of marine Sensor Web systems. While standards such as the OGC Sensor Observation Service were already used within several projects, the new generation of OGC standards promises several advantages such as more lightweight interfaces and encodings. Thus, combining the results and experiences of previous projects and established systems with more lightweight standards (i.e., OGC SensorThings API and the different modules of the OGC API framework) is a chance to further increase the adoption of interoperability standards within marine research data infrastructures. In this paper, the potential changes as well as the challenges that need to be resolved are discussed.
Keywords: Sensor Web, Interoperability, Research Data Infrastructures, Observation Data, Standardisation

44 ADVANCES IN OPERATIONAL OCEANOGRAPHY
1. IntroductionOver the last years, several projects have addressed the challenge to ensure interoperability when sharing (in situ) ocean observation data within research data infrastructures. Most of these activities were centred around established standards such as those of the Open Geospatial Consortium’s (OGC) Sensor Web Enablement (SWE) framework: Sensor Observation Service (SOS), Sensor Model Language (SensorML), as well as Observations and Measurements (O&M).
Based on these standards, different best practices to improve syntactic and semantic interoperability were achieved. However, due to the rather complex nature of these standards, the efficient development of client applications remains a challenge.
The existing specifications are now being complemented by a new generation of standards: the emerging OGC API standards with several specifications for sharing geographic information as well as the OGC SensorThings API which is gaining more and more attention. As these new specifications are especially designed to facilitate application development through the use of more lightweight technologies, they have a significant potential to further enhance the value of research data to users.
Consequently, this contribution is intended to discuss the opportunities associated with the new generation of interoperability standards. Specific consideration will be given to potential pathways on how to integrate these new approaches with the achievements that resulted from the Sensor Web-related activities that were conducted during the last years.
2. Marine Sensor Web DeploymentsThe ideas presented within this article were developed as part of the JERICO-S3 (Joint European Research Infrastructure of Coastal Observatories: Science, Service, Sustainability) project. This project aims to provide a state-of-the-art research infrastructure for high-quality data on European coastal and shelf seas. Among other aspects, also the use of Sensor Web interoperability standards will be one foundation for the infrastructure development. However, there is a broad range of further projects which demonstrated or are demonstrating the use of Sensor Web standards to facilitate the exchange of marine observation data.
For example, the European ODIP II (Ocean Data Interoperability Platform) project has developed best practice recommendations on how to apply the OGC Sensor Web Enablement standards for marine data (https://github.com/ODIP/MarineProfilesForSWE). Special emphasis during this project was put on ensuring semantic interoperability by using on vocabularies to reference to the meaning of specific concepts and elements (Kokkinaki et al., 2016).

45ADVANCES IN OPERATIONAL OCEANOGRAPHY EXPANDING EUROPE’S OBSERVING AND FORECASTING CAPACITY
Projects such as NeXOS (Next generation, Cost-effective, Compact, Multifunctional Web Enabled Ocean Sensor Systems Empowering Marine, Maritime and Fisheries Management, https://www.nexosproject.eu/) have developed approaches how to use Sensor Web standards to handle to full path of data flows between sensor (platforms) and end user applications. This has included both, approaches for facilitating the data integration but also for data download, processing and visualisation (Del Rio et al., 2019). As part of the BRIDGES project (Bringing together Research and Industry for the Development of Glider Environmental Services, http://www.bridges-h2020.eu/) it was further explored how such a technological approach can be applied to ocean gliders.
Finally, projects such as SeaDataCloud (https://www.seadatanet.org/) and EMODnet Ingestion (https://www.emodnet-ingestion.eu/) have applied Sensor Web standards in order to facilitate the integration of (near real-time) observation streams into research data infrastructures. This has resulted in components such as dedicated ingestion and viewing services (Jirka and Autermann, 2018). In cooperation between the EMODnet Ingestion and the EUROFLEETS+ (https://www.eurofleets.eu/) projects it was shown how Sensor Web standards may be used to handle, deliver and explore tracking data of research vessels (Autermann et al., 2021).
3. The OGC sensorthings API and the OGC API family of standards
This section is intended to provide an overview of the different Sensor Web standards of the OGC which are available or are in development. This overview shall serve as a baseline to subsequently discuss the opportunities provided by the new generation of Sensor Web specifications.
3.1 OGC Sensor Web Enablement (SWE)
The original standards of the OGC Sensor Web Enablement (SWE) framework comprise a series of interface and data model/encoding standards (Bröring et al., 2011). Especially the following standards need to be considered when working with marine observation data:
• Sensor Model Language (SensorML) (Botts and Robin, 2014): A data model and encoding standard to provide a broad range of metadata to describe the whole chain through which measurements were generated. This also includes descriptions of the involved sensor hardware as well as the platforms to which sensors are attached;
46 ADVANCES IN OPERATIONAL OCEANOGRAPHY
• Observations and Measurements (O&M) (Cox, 2011) (ISO TC 211, 2011): A data model and encoding for observation data itself. This standard defines the necessary properties (e.g., time stamps, spatial reference, etc.) that need to be included in order to provide meaningful measurements;
• Sensor Observation Service (SOS) (Bröring et al., 2012): An interface standard that enables Remote Procedure Call (RPC)-based access to sensor data and the corresponding metadata. The SOS standard defines a set of operations and their query parameters to provide this access functionality.
These standards can be considered as a baseline, which has been applied in a broad range of projects over the last years (see section 2). In the next subsection the OGC SensorThings API (STA) is introduced as a complementary element of the SWE framework, which is currently gaining more and more acceptance.
3.2 OGC SensorThings API
The OGC SensorThings API (STA) standard (Liang et al., 2016) provides a more lightweight addition to the SWE framework. While the standards introduced in section 3.1 are mostly relying on XML-based encodings, the STA introduces technologies such as JSON and REST into the SWE framework. On the one hand, this results in encodings which are often easier to handle by client developers. On the other hand, the RESTful interface of the STA makes it easier to explore and query the data offered by an STA server. In addition, the approach of relying on the OData protocol adds additional query and data retrieval options which make the interface more flexible.
Furthermore, the STA offers dedicated support of event-based data flows, primarily relying on the Message Queuing Telemetry Transport (MQTT) (https://mqtt.org/) protocol. Based on this protocol, it becomes possible to establish push data flows from devices into STA servers. At the same time, the MQTT protocol can also be used to directly deliver data from STA servers to subscribers in order to immediately deliver the latest published observation data.
3.3 OGC API Family of standards
A further development that needs to be considered is the OGC API family of standards (https://ogcapi.ogc.org/). This family of standards can be seen as a new generation of the OGC baseline architecture. Based on mainstream technologies such as OpenAPI, this set of standards will provide a coherent and modular framework comprising the functionality currently offered by typical OGC Service such as Web Map Server, Web Feature Service, Catalog, etc. However, due to its more mainstream oriented approach, it can be expected that the OGC API standards will achieve a higher degree of adaption than the currently existing standards.

47ADVANCES IN OPERATIONAL OCEANOGRAPHY EXPANDING EUROPE’S OBSERVING AND FORECASTING CAPACITY
As part of the OGC API family, especially the Environmental Data Retrieval (EDR) API (https://ogcapi.ogc.org/edr/) might be relevant for sharing marine observation data. Because this API will provide functionality for accessing environmental data in a way that is aligned to the overall OGC API approach, a special value of the EDR API might be to provide observation data closely linked to other geographic information provided via other modules of the OGC API (e.g., feature data containing information about sensor stations or data about investigation areas).
4. Chances offered by the new generation of standardsThe new generation of OGC standards to share observation data offers several potential advantages. An overview of important new features and opportunities will be provided in this section.
While the previous generation of SWE standards already provides very powerful and comprehensive data models for sensor data (O&M) and the corresponding metadata (SensorML), the mostly XML-based encoding has some drawbacks. Also, the interfaces such as the SOS specification offer important functionality to enable reliable data flows. However, at the same time these interfaces are not optimised to develop lightweight client applications to explore and visualise observation data. This issue is addressed by the new generation of standards relying on efficient RESTful interfaces with powerful query options and developer-friendly JSON encodings.
A further useful aspect is the support of MQTT data streams by the STA specification. This enables the efficient push-delivery of observation data from devices into data repositories but also further on to end-user applications. As a result, the latency of the data provision can be significantly reduced. Furthermore, a push-based delivery mechanism has the potential to supply larger numbers of clients with up-to-date data while ensuring a good scalability.
Finally, the new OGC API family of standards and its modular structure will facilitate the interlinking between different types of resources. For example, it will be possible to access observation data as well as the corresponding geographic base data relying on the same interaction patterns and communication flows.
5. Open challengesWhile the new generation of interoperability standards offers a high potential to further improve the provision of observation data in marine research data infrastructures, several challenges will need to be addressed in order to make use of the potential of these standards. This section introduces a set of selected challenges which need to be addressed in a mid-term perspective.

48 ADVANCES IN OPERATIONAL OCEANOGRAPHY
Projects such as ODIP II and SeaDataCloud have put significant efforts into the development of marine SWE profiles. In order to transfer the conceptual achievements of these projects to the new generation of OGC standards, it will be necessary to define how the developed concepts shall be represented within the new data models and encodings. For example, it will be necessary to transfer the SensorML profiles for providing metadata about marine observations into corresponding JSON-based representations.
Furthermore, within the SWE framework several dedicated observation types that can be used for marine observations were established. An important example are the specialised observation types proposed as part of the European INSPIRE framework (INSPIRE MIG sub-group MIWP-7a (2016). For these data types it would be important to create corresponding equivalents that can be used to define the outputs of STA implementations for marine observation data.
Also, for the use of MQTT as a data delivery protocol, it would be necessary to further specify the corresponding payloads. While the STA specification already offers guidance on how to transmit the observation data itself, further types of payload would be necessary to enable more automated data flows (e.g., enabling the (self-)registration of new sensing devices, etc.).
Besides this, further work will need to be invested in order to improve the link to existing vocabularies in order to increase semantic interoperability. Another aspect is the addition of fine-grained access control mechanisms into the new data access protocols for making specific data sets available only to selected user groups. Furthermore, it will be necessary to enhance the existing SWE best practice documentation for marine applications to the new generation of standards.
6. ConclusionIn summary, the new generation of OGC standards, especially the OGC API standards and the OGC SensorThings API offer valuable enhancements and improvements to further increase the adoption of interoperable Sensor Web applications. Through the provision of more developer friendly interfaces and encoding as well as the enablement of event-driven push data flows, new opportunities arise. Also, the improved linkage to other geospatial data has a high potential.
In addition, there are still several open challenges which should be addressed in order to provide the necessary extensions and profiles to consider the specifics of marine observation data and research data infrastructures. However, by addressing these challenges in future projects, it can be expected that the adoption of OGC standards in the marine community will further increase.
49ADVANCES IN OPERATIONAL OCEANOGRAPHY EXPANDING EUROPE’S OBSERVING AND FORECASTING CAPACITY
AcknowledgementsThis publication was created as part of the JERICO-S3 project. This project has received funding from the European Commission’s Horizon 2020 Research and Innovation programme under grant agreement N° 871153.
ReferencesAutermann, C., Jirka, S., and Schaap. D. (2021). Interoperable Provision of Research Vessel Tracking Data via OGC SensorThings API and Sensor Observation Service. IMDIS 2021 – International Conference on Marine Data and Information Systems.
Botts, M., and Robin, A. (2014). OGC Implementation Specification: Sensor Model Language (SensorML) 2.0.0 (12-000). Open Geospatial Consortium Inc., Wayland, MA, USA.
Bröring, A., Echterhoff, J., Jirka, S., Simonis, I., Everding, T., Stasch, C., Liang, S., and Lemmens, R. (2011). New Generation Sensor Web Enablement. Sensors 11 (3): 2652–99.
Bröring, A., Stasch, C., and Echterhoff, J. (2012). OGC Implementation Specification: Sensor Observation Service (SOS) 2.0 (12-006). Open Geospatial Consortium Inc., Wayland, MA, USA.
Cox, S. (2011). OGC Implementation Specification: Observations and Measurements (O&M) – XML Implementation 2.0 (10-025r1). Open Geospatial Consortium Inc., Wayland, MA, USA.
Del Rio, J., Toma, D. M., Martínez, E., Jirka, S., and O’Reilly, T. (2019). From Sensor to User – Interoperability of Sensors and Data Systems. Challenges and Innovations in Ocean In Situ Sensors. Elsevier, Amsterdam, The Netherlands, 289–337.
INSPIRE MIG sub-group MIWP-7a (2016). Guidelines for the Use of Observations & Measurements and Sensor Web Enablement-Related Standards in INSPIRE - Version 3.0.
ISO TC 211 (2011). ISO 19156:2011 – Geographic Information – Observations and Measurements – International Standard. International Organization for Standardization, Geneva, Switzerland.
Jirka, S., and Autermann, C. (2019). Facilitating the Publication of Real-Time Marine Observation Data: The SeaDataCloud SWE Ingestion Service. IMDIS 2018 –International Conference on Marine Data and Information Systems – Book of Abstracts. Istituto Nazionale di Oceanografia e di Geofisica Sperimentale, 217-218.
Kokkinaki, A., Darroch, L., Buck, J., and Jirka, S. (2016). Semantically Enhancing SensorML with Controlled Vocabularies in the Marine Domain. Proceedings of the Geospatial Sensor Webs Conference 2016. CEUR Workshop Proceedings (CEUR-WS.Org).

50 ADVANCES IN OPERATIONAL OCEANOGRAPHY
Liang, S., Huang, C.-Y., and Khalafbeigi, T. (2016). OGC Implementation Specification: SensorThings API Part 1: Sensing 1.0 (15-078r6). Open Geospatial Consortium Inc., Wayland, MA, USA.
Rieke, M., Bigagli, L., Herle, S., Jirka, S., Kotsev, A., Liebig, T., Malewski, C., Paschke, T., and Stasch, C. (2018). Geospatial IoT – The Need for Event-Driven Architectures in Contemporary Spatial Data Infrastructures. ISPRS International Journal of Geo-Information, 7, 3
51ADVANCES IN OPERATIONAL OCEANOGRAPHY EXPANDING EUROPE’S OBSERVING AND FORECASTING CAPACITY
MELOA CATALOGUE AND GEOPORTAL: A MODERN APPROACH FOR OPEN ACCESS AND VISUALIZATION OF IN SITU DRIFTER DATA
Félix Pedrera (1), João Andrade (2), João Matos (2), Enoc Martínez (3), José Joaquín Rojas (1), Pedro Gonçalves (4), Carlos Almeida (5), Marc Lucas (6), Rita Esteves (7), Joaquín del Rio (3), Rogério Chumbinho (8)
(1) Deimos Space, Ronda de Poniente, 19, 28760 Tres Cantos, Spain, [email protected]
(2) Deimos Engenharia, Lisbon, Portugal(3) SARTI-MAR Research Group Universitat Politècnica de Catalunya, Vilanova i la Geltrú, Spain(4) Instituto de Sistemas e Robótica. Department of Electrical and Computer Engineering.
University of Coimbra, Portugal(5) INESC Technology and Science, Porto, Portugal(6) Collecte Localisation Satellites, Toulouse, France(7) Instituto Hidrografico, Lisbon, Portugal(8) BlueWise Marine, Galway, Ireland
Abstract The MELOA H2020 project proposes to develop a low-cost, easy-to-handle, wave resilient, multi-purpose, multi-sensor, extra light surface drifter for use in all water environments: The WAVY drifters. The data products generated by the MELOA project are openly accessible through standard-based Catalogue and Geoportal to promote the availability of the data to other communities such as GEOSS or Copernicus.
MELOA will provide an effective way to monitor surface currents and surface dynamic features and temperature at different levels. A complete Software Ecosystem is developed in MELOA to manage the transmission of data from the WAVY drifters, raw files collection, campaigns operation and data curation and consolidation of data products to make the data openly accessible through the Catalogue and Geoportal.
Driven by FAIR (findable, accessible, interoperable and re-usable) data principles and state-of-the-art data visualization technologies, the following components are described: 1) A Data Catalogue to make WAVYs data and metadata accessible in standard formats such as Comma-separated values (CSV), Observations & Measurements (O&M), Data Catalogue Vocabulary (DCAT); allowing interoperability

52 ADVANCES IN OPERATIONAL OCEANOGRAPHY
with other Earth Observation (EO) catalogues. 2) A Data Geoportal, exposing interoperable Web Services such as Open Geospatial Consortium’s (OGC) Web Feature Service and OGC’s Sensor Web Enablement (SWE) services and effective data visualization taking advantage of Vector Tiles technology.
Keywords: Open data, Interoperability, in situ measurements, GEOSS, Sensor Web Enablement, SensorThings API, Sensor Observation Service, Web Feature Service, Web Map Services, Vector Tiles
1. Introduction The MELOA (Multi-purpose/Multi-sensor Extra Light Oceanography Apparatus) H2020 project purpose is to provide an effective way to monitor sea surface currents and surface dynamic features and temperature at different levels. To achieve this objective, MELOA is developing low-cost, easy-to-handle, wave resilient, multi-purpose, multi-sensor, extra light surface drifters for use in all water environments: The WAVY drifters.
The main attributes of the WAVYs are:
• Small sized, making the WAVY very easy-to-handle;
• Optimized buoyancy, reducing the WAVY vulnerability to direct wind effect;
• Minimized pendular motion, facilitating the WAVY position detection.
The WAVY family will range from small drifters suitable for beach and surf zone studies, to somewhat larger drifters tailored for coastal and long-term open ocean observations.
MAIN FEATURES MAIN FEATURES
Basic GNSS, GPRS, 1 thermistor (near sea-surface temperature)
Littoral GNSS, adjustable ballast module, 2 thermistors (near sea-surface temperatures), satellite communications, IMU.
Ocean GNSS, adjustable ballast module, 2 thermistors (near sea-surface temperatures), satellite communications (Argos), IMU, solar panels
Ocean-plus GNSS, adjustable ballast module, 2 thermistors (near surface sea-temperatures), satellite communications (Argos), IMU, solar panels and wave energy harvesting
Ocean-atmoEquatorial floating (wind exposure), GNSS, adjustable ballast module, 4 thermistors (near surface sea and air temperatures), atmospheric pressure, satellite communications (Argos), IMU, solar panels and wave energy harvesting
Table I. MELOA WAVY family and features

53ADVANCES IN OPERATIONAL OCEANOGRAPHY EXPANDING EUROPE’S OBSERVING AND FORECASTING CAPACITY
A complete Software Ecosystem is developed in MELOA to manage the transmission of data from the WAVY drifters (Argos, GPRS; Wi-Fi), raw files collection (WavyHub App), campaigns operation and data curation (WAVY Operation SW); and consolidation of data products (L1 Processor) to make the data accessible through the Catalogue and Geoportal and facilitate the development and sharing of applications and value added data products, such as wave parameters data products, WAVY recovery applications, etc.
Fig. 1. MELOA SW Ecosystem.
Driven by FAIR data principles and state-of-the-art data visualization technologies, the following components are described in this article: 1) A Data Catalogue to make WAVYs data and metadata openly accessible in standard formats such as CSV, O&M, DCAT, GeoDCAT; allowing interoperability and connection with other EO catalogues. 2) A Data Geoportal and associated standard data services, exposing interoperable Web Services such as OGC WFS and OGC SOS/SensorThings and effective end-user data visualization taking advantage of Vector Tiles technology.
2. MELOA Catalogue The MELOA Catalogue (http://catalogue.ec-meloa.eu/) solution is based on CKAN, a tool for making open data systems, by helping the management and publishing of data collections. It is used by national and local governments, research institutions, and other organizations who collect lots of data. Once the data is published, users can use its faceted search features to browse and find the data they need, and preview it using maps, graphs and tables - whether they are developers, journalists, researchers, NGOs.

54 ADVANCES IN OPERATIONAL OCEANOGRAPHY
It uses Apache Solr, a search server based on Lucene, that provides a distributed, multitenant capable full text search engine with a REST interface and schema free JSON documents. The main capabilities for MELOA are:
• Flexible Harvesting Engine that will allow catalogue lots of Data provided by the MELOA WAVYs;
• RESTful API to query and access metadata and geospatial Capabilities, geospatial features, covering data preview, search, and discovery;
• Intuitive Web Interface, with a set of important features to search and visualize geographic and non-geographic data products;
• Flexible Search Engine, rich search experience which allows for quick ‘Google-style’ keyword search as well as faceting by tags and browsing between related datasets.
The main purpose of the Catalogue is to enable search and discovery of the data and metadata from the observations of the WAVYs in order to enable federation and data sharing with other data catalogues and communities such as GEOSS or Copernicus. Currently, MELOA data is also available through the NextGEOOS Catalogue (https://catalogue.nextgeoss.eu/) which is harvesting the metadata directly from the MELOA Catalogue.
The data ingestion in the Catalogue is driven by the L1 processor, a piece of software that retrieves WAVY data from the WAVY Operations Software and also from Argos systems and transform the data into a higher-level product with variables available in scientific units. The latest and optimal standards and recommendations for publishing geolocated sensor open data like OGC O&M (SOS/SensorThings) data models have been taken into consideration in the definition of these products. L1 Processor has two interfaces with different APIs and formats: WAVY Operation Software (in CSV format for all types of WAVYs) and Argos server (in binary messages for WAVY ocean types). The L1 Processor then decodes the messages creating the corresponding product that is uploaded into the MELOA Catalogue, properly classified in terms of metadata. The L1 Processor is responsible also for harvesting CMEMS resources metadata on the MELOA Catalogue in order to make relevant CMEMS collections available for Catalogue users and integrations such as the Geoportal.
3. MELOA Geoportal The MELOA Geoportal (https://geoportal.ec-meloa.eu) is an online, map based, data visualization tool for the public data stored in the WAVY’s online Catalogue.
The main purpose of the MELOA Geoportal is to enable end-users the exploration and visualization of WAVYs data in an easy-to-use way, targeting diverse audiences: From marine scientists to citizens and general public. The usability and user experience have

55ADVANCES IN OPERATIONAL OCEANOGRAPHY EXPANDING EUROPE’S OBSERVING AND FORECASTING CAPACITY
been one of the main objectives to be addressed, bringing user experience research methods to the design process to provide a user-centered perspective during software development. Based on these premises, the following use cases were defined for the MELOA geoportal:
• To be able to search WAVY data from the metadata stored in the catalogue: campaign data, serial number, date, geographic region, WAVY model, etc;
• Dynamically display not only trajectory data, but also data from individual observations of scientific variables such as surface temperature;
• Display value-added products such as wave parameters or spatial aggregations of scientific variables, time series, etc;
• Being able to compare observation data with other data sources such as CMEMS (models, satellite observations, etc.) or WMS services.
The MELOA Geoportal is based on software components used for Spatial Data Infrastructures such as a spatial database (PostreSQL/PostGIS), a map server (Geoserver) and a cache layer (GeoWebCache). The Geoportal UI and frontend are built using state-of-the art technologies such as HTML5, CSS, Angular framework and JavaScript.
The Vector Tiles technology is introduced as a new layer of the SDI of the MELOA Geoportal, in order to provide effective data visualization, interactivity and dynamic capabilities. The efficient management and visualization of the number of measurements and datasets that may generated on each WAVYs campaign due to the high sampling rate has been also a key factor for choosing Vector Tiles technology in the view layer.
Vector Tiles enable dynamic map styling from large feature datasets because vector data are sent to the UI frontend directly (Agafonkin, 2019). On the other side, in order to take advantage of its capabilities, it requires a transformation process that needs to be well-designed for the specific use cases to be addressed. Vector Tiles are already a standard in dominant web map platforms such as Google, Esri, or Microsoft and evaluated by the Open Geospatial Consortium (Meek, 2019), but still has not been widely adopted in research or scientific geoportals where interoperability needs condition the use of more established technologies such as Web Map Services (WMS) or Web Map Tiled Services (WMTS).
The MELOA Geoportal stack for the Vector Tiles layer is based on Tippecanoe for the transformation of the datasets into Mapbox Vector Tile format (MVT) and Tileserver GL as a tile server. A cache layer based on Apache web server, mod_cache_socache module and Memcached is used to increase the rendering performance on the frontend side.

56 ADVANCES IN OPERATIONAL OCEANOGRAPHY
4. MELOA OGC Data Services Besides of the User Interface frontend for data visualization, the Geoportal provides OGC Web Services for interoperability and integration in GIS programs: Web Map Service (WMS), Web Feature Service (WFS), Sensor Observation Service (SOS) and SensorThings API. Due to the characteristics of the features being managed, sensor observations, the main interfaces are SOS and SensorThings, but WMS and WFS are also offered in order to provide standard view and download services compliant with most Geospatial Information Systems (GIS) applications.
4.1 Web Map Services
A Web Map Service has been deployed as part of the MELOA SE to provide georeferenced maps of the relevant measurements grouped by campaign or WAVY identifiers. Styles are defined according to aggregated campaign/wavy data and available are available through the standard GetCapabilities request https://geoportal.ec-meloa.eu/geoserver/wms?REQUEST=GetCapabilities. This interface if offered for compatibility with GIS applications, but the MELOA Geoportal frontend uses Vector Tiles for better performance and interactivity.
4.2 Web Feature Services
A Web Feature Service is deployed to provide standard download services for the relevant measurements collected by the WAVYs, with support to time parameters and other capabilities supported by WFS. https://geoportal.ec-meloa.eu/geoserver/wfs?REQUEST=GetCapabilities. Through this interface user are able to integrate MELOA datasets in their GIS applications.
4.3 Sensor Observation Service
The lack of standardization and data harmonization across scientific domains and data infrastructures has been the driving force for the OGC to propose the Sensor Web Enablement framework (SWE) (Bröring, 2011). This framework is a set of standards that provides data models, encodings and common interfaces which aim to provide the building blocks for interoperable Sensor Web infrastructures. In this context, the concept of the Sensor Web refers to a set of Web accessible sensor networks and their collected sensor data/metadata that can be discovered and accessed using standard protocols and interfaces.
A Sensor Observation Service (SOS) has been deployed as a part of the MELOA SE (Bröring, 2012). SOS is a central piece of the SWE framework, providing a set of operations to manage sensor data and metadata. These operations include registration, injection, archival and access within a data/metadata repository. SOS uses the Observations and Measurements (O&M) data model to encode WAVY observations

57ADVANCES IN OPERATIONAL OCEANOGRAPHY EXPANDING EUROPE’S OBSERVING AND FORECASTING CAPACITY
and their contextual information, providing strong semantic relationships within all the elements involved in the sampling process. Regarding sensor metadata, WAVY descriptions encoded using the Sensor Model Language (SensorML) are also available via the SOS. This standard provides unambiguous, semantically-robust and machine-actionable sensor descriptions, significantly enhancing data traceability.
4.4 Sensor Things Service
The SensorThings API is also an OGC standard providing an open and unified framework to interconnect sensing devices, data, and applications over the Web (Liang, 2016). Like SOS, it is a standard specification under the OGC SWE standards suite. However, it has a strong focus on the Internet of Things (IoT) and uses an easy-to-use REST-like style. Although it has better performance and it is more user-friendly than SOS, its data model is less restrictive, resulting in weaker semantic relationships.
A SensorThings API has been deployed within the MELOA’s, providing an easy, flexible and efficient way access WAVY data and metadata compliant with the O&M data model.
5. Conclusions and future work The MELOA Catalogue and Geoportal are developed and described as a modern approach for data sharing and visualization of marine in situ drifter data, using open standards for data sharing, search and display, focusing on open data communities and efficient data visualization for diverse audiences. MELOA in situ data are available in the NextGEOSS catalogue and further work is ongoing during the MELOA H2020 project in order to provide in situ data from relevant scientific variables (temperatures, wave parameters) to CMEMS and EMODNet. Calibration, annotations and quality check mechanisms are being researched and developed to ensure the quality of the data being delivered. Using SWE services such as SOS and SensorThings data is discoverable and accessible through standardized interfaces widely used in the oceanography domain. Furthermore, these services provide a robust data/metadata model based on the O&M and SensorML standards, ensuring syntactic and semantic interoperability with other data infrastructures.

58 ADVANCES IN OPERATIONAL OCEANOGRAPHY
AcknowledgementsThis work was supported by the project MELOA from the European Commission’s Horizon 2020 research and Innovation program under Grant Agreement N°. 776280. This work uses the EGI research infrastructure with dedicated support for MELOA.
ReferencesAgafonkin, V., Firebaugh, J., Fischer E., Käfer K., Loyd C., MacWright T., Pavlenko A., Springmeyer D., Thompson B. Mapbox Vector Tile Specification (2014). github.com/mapbox/vector-tile-spec.
Meek S., Open Geospatial Consortium, OGC Vector Tiles Pilot: Summary Engineering Report (2019). docs.opengeospatial.org/per/18-086r1.html
Bröring, A., Echterhoff, J., Jirka, S., Simonis, I., Everding, T., Stasch, C., ... & Lemmens, R. (2011). New generation sensor web enablement. Sensors, 11(3), 2652-2699.
Bröring, A., Stasch, C., & Echterhoff, J. (2012). OGC Sensor Observation Service Interface Standard, Version 2.0.
Liang, S., Huang, C. Y., & Khalafbeigi, T. (2016). OGC SensorThings API Part 1: Sensing, Version 1.0. OGC Standard
Fig. 2. MELOA Catalogue and Geoportal screenshots.

59ADVANCES IN OPERATIONAL OCEANOGRAPHY EXPANDING EUROPE’S OBSERVING AND FORECASTING CAPACITY
INTERNATIONAL COORDINATION OF THE IN SITU MET-OCEAN OBSERVING NETWORKS Mathieu Belbéoch (1), Long Jiang (2), Martin Kramp (1), Magali Krieger (1), Anthonin Lizé (1), Emanuela Rusciano (1), Victor Turpin (1)
(1) OceanOPS, 1625 Route de Sainte-Anne, 29280 Plouzané, France, [email protected](2) OceanOPS, 7bis Avenue de la Paix, 1202 Geneva – Switzerland, [email protected]
Abstract For the last 20 years, OceanOPS (formerly JCOMMOPS) has been providing vital services in coordinating, monitoring, and integrating data and metadata, across an expanding network of met-ocean observing communities.
OceanOPS monitors and reports on the status of the GOOS to support efficient operations, to ensure the transmission and timely exchange of high-quality metadata, and to assist free and unrestricted data delivery to users.
OceanOPS tracks over 100,000 observations a day coming from profiling floats, moored/drifting buoys, ocean time series reference stations, gliders, research vessels, ships of opportunity, sea level gauges and HF radars, and provides monitoring services and support to emerging networks, regional systems, and third-party projects to help the observing system implementation.
In the context of OceanOPS 5-year Strategic Plan, the GOOS 2030 Strategy and implementation plan, the new earth system approach of the WMO, the UN Ocean Decade, and in close collaboration with European initiatives, OceanOPS ensures andpromotes metadata standardization, integration, and interoperability across and within the global ocean observing networks, as well as develops web tools and metrics to analyse trends and to assess the current and future state of the GOOS.
Keywords: Global Ocean Observing System, In situ ocean observations, Metadata, International coordination

60 ADVANCES IN OPERATIONAL OCEANOGRAPHY
1. IntroductionEighty-six countries are involved in ocean observations with about 10 000 in situ ocean observing platforms and 170 satellites continuously monitoring the global ocean and atmosphere. The analyses, forecasts and products based on ocean observations are the bedrock of decisions across a swath of socio-economic sectors, especially in marine transportation, coastal communities, climate, agriculture and ocean health. Society’s need for ocean information is increasing, in response, the Global Ocean Observing System (GOOS) is gaining in complexity, scope and coverage. Strong coordination is required within and amongst communities of observers from around the world to ensure delivery and cost efficiency from observations through to data management systems and information services. For 20 years, OceanOPS (formerly named JCOMMOPS) has been supporting efficient observing system operations to ensure the transmission and timely exchange of high-quality metadata and assisting with the provision of free and unrestricted data delivery to all users. OceanOPS has also been developing tools and metrics to analyse the observing networks and system trends and reporting back to stakeholders to encourage performance improvement and cost efficiency. OceanOPS’ core activity is the harmonization of metadata for each observing network, individually and across the ocean observing system collectively. This will vastly increase data usability and global monitoring capacity. Since the beginning of the Argo Program, OceanOPS has been maintaining network specific services critical to ocean observing systems implementation, such as the IOC/UNESCO warning and notification system for floats approaching Coastal States waters. OceanOPS also has responsibility for allocating unique WMO identifiers to all met-ocean platforms and for providing integrated ocean metadata to the WMO OSCAR system. The WMO Governance Reform placed OceanOPS within the larger Earth System monitoring approach to develop synergies with cryosphere and hydrology. OceanOPS has long believed that there is a great potential to develop collaboration with third parties – civil society and the private sector – to contribute to the GOOS. The recent 2020 Vendée Globe Race offers a great example (more information on WMO bulletin). During the race, seven meteorological buoys and three profiling floats, operated respectively by Météo-France and Argo France, were deployed by the IMOCA skippers at agreed positions in the Atlantic Ocean. Four skippers also carried onboard equipment to measure essential ocean variables – such as sea surface salinity, temperature, CO2, atmospheric pressure – and measuring the microplastics pollution at sea. The data collected during the Vendée Globe were shared in real-time in an international open source database.
Recently, OceanOPS has proposed the ‘Odyssey project’ for UN Decade of Ocean Science for Sustainable Development to frame these contributions and find solutions to distribute these datasets. Pilot projects are underway to develop an international data exchange service for non-institutional data, including with the WIS 2.0 of the WMO.
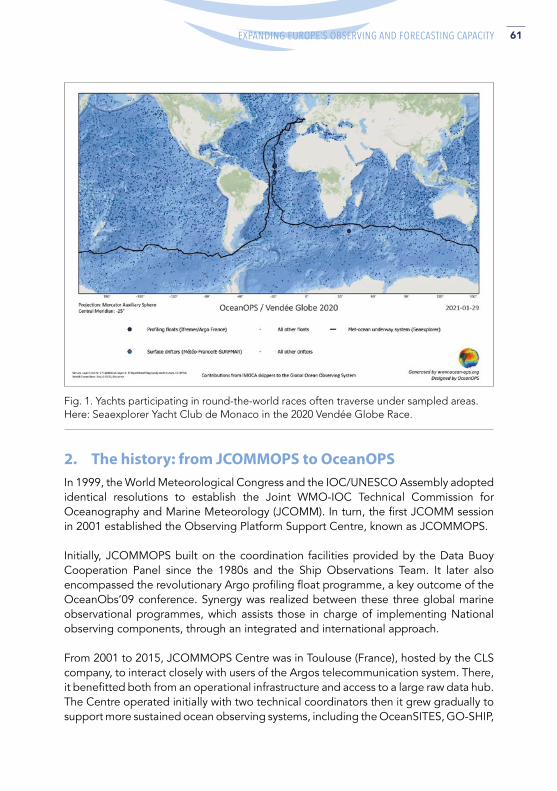
61ADVANCES IN OPERATIONAL OCEANOGRAPHY EXPANDING EUROPE’S OBSERVING AND FORECASTING CAPACITY
2. The history: from JCOMMOPS to OceanOPS In 1999, the World Meteorological Congress and the IOC/UNESCO Assembly adopted identical resolutions to establish the Joint WMO-IOC Technical Commission for Oceanography and Marine Meteorology (JCOMM). In turn, the first JCOMM session in 2001 established the Observing Platform Support Centre, known as JCOMMOPS.
Initially, JCOMMOPS built on the coordination facilities provided by the Data Buoy Cooperation Panel since the 1980s and the Ship Observations Team. It later also encompassed the revolutionary Argo profiling float programme, a key outcome of the OceanObs’09 conference. Synergy was realized between these three global marine observational programmes, which assists those in charge of implementing National observing components, through an integrated and international approach.
From 2001 to 2015, JCOMMOPS Centre was in Toulouse (France), hosted by the CLS company, to interact closely with users of the Argos telecommunication system. There, it benefitted both from an operational infrastructure and access to a large raw data hub. The Centre operated initially with two technical coordinators then it grew gradually to support more sustained ocean observing systems, including the OceanSITES, GO-SHIP,
Fig. 1. Yachts participating in round-the-world races often traverse under sampled areas. Here: Seaexplorer Yacht Club de Monaco in the 2020 Vendée Globe Race.

62 ADVANCES IN OPERATIONAL OCEANOGRAPHY
OceanGliders, GLOSS and some emerging networks of the JCOMM Observations Coordination Group (OCG) such as the animal-based measurements (AniBOS).
The Centre developed several innovative services for real-time monitoring of the global networks’ performance and to assist implementers on a day-to-day basis, including in their operations at sea. The small JCOMMOPS team pioneered the web and Geographic Information System (GIS) technologies to track the ocean observing networks and offer a useful toolbox to scientists, program managers and to the GOOS/JCOMM governance (www.ocean-ops.org).
The team opportunistically chartered a 20-metre sailing ship, Lady Amber, to assist Argo and Data Buoy Cooperation Panel (DBCP) implementers in filling gaps in the global arrays and demonstrate that low cost and low footprint solutions could find their place amongst the fleet of merchant and research vessels. The vessel did an equivalent of two circumnavigations, in the South Atlantic and Indian Ocean, seeding close to hundred instruments. This success story led to the establishment of a ship coordinator at JCOMMOPS to support the Ship Observations Team (SOT) and the Global Ocean Ship-based Hydrographic Investigations Program (GO-SHIP) and to act on all cross networks ship issues, including with civil society, non-governmental organizations (NGOs), sailing explorers and races.
In 2015, the Centre and staff moved to Brest (France), within the Institut Français de Recherche pour l’Exploitation de la Mer (Ifremer), to be closer to implementers in a worldwide ocean pole and with strong support from regional authorities. Its information system remained in Toulouse in the operational CLS cloud, with a 5-staff team in the Brest office. After years of preparation, a full revamp of the original information system and web-based applications was undertaken in 2015. It integrated the monitoring dashboard for GOOS and provided network specific tools and indicators, all fuelled by a growing diversity of metadata and real-time pulses from the platforms.
2.1 Ocean Observing System Report Card
Since 2017, OceanOPS has been in charge of the coordination and publication of the Ocean Observing System Report Card (www.ocean-ops.org/reportcard). The Report is a major publication achievement for the Observations Coordination Group and the Network experts. The annual publication communicates on the societal values of the observing system and encourages international collaboration, new partners, Members and Member States to join the challenge of building an integrated, sustained, innovative, globally implemented observing system that meets the growing demand for ocean services and science. It also helps the networks to raise their standards to meet integrated goals.
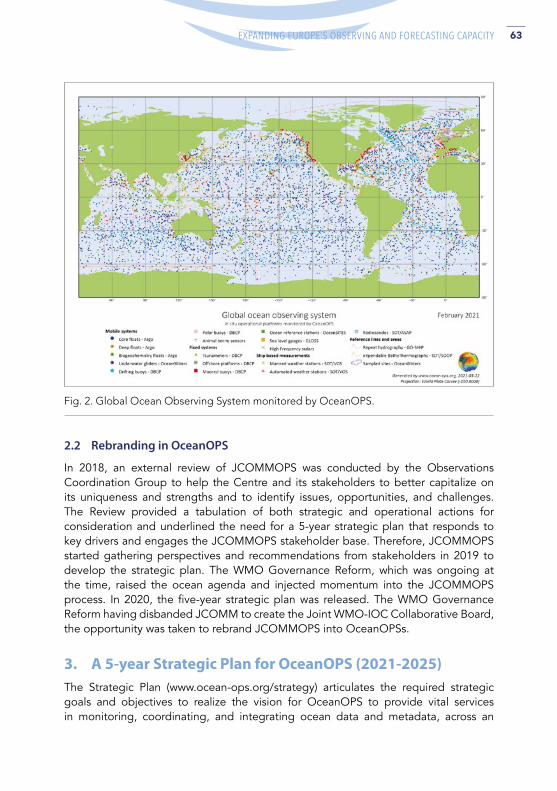
63ADVANCES IN OPERATIONAL OCEANOGRAPHY EXPANDING EUROPE’S OBSERVING AND FORECASTING CAPACITY
2.2 Rebranding in OceanOPS
In 2018, an external review of JCOMMOPS was conducted by the Observations Coordination Group to help the Centre and its stakeholders to better capitalize on its uniqueness and strengths and to identify issues, opportunities, and challenges. The Review provided a tabulation of both strategic and operational actions for consideration and underlined the need for a 5-year strategic plan that responds to key drivers and engages the JCOMMOPS stakeholder base. Therefore, JCOMMOPS started gathering perspectives and recommendations from stakeholders in 2019 to develop the strategic plan. The WMO Governance Reform, which was ongoing at the time, raised the ocean agenda and injected momentum into the JCOMMOPS process. In 2020, the five-year strategic plan was released. The WMO Governance Reform having disbanded JCOMM to create the Joint WMO-IOC Collaborative Board, the opportunity was taken to rebrand JCOMMOPS into OceanOPSs.
3. A 5-year Strategic Plan for OceanOPS (2021-2025) The Strategic Plan (www.ocean-ops.org/strategy) articulates the required strategic goals and objectives to realize the vision for OceanOPS to provide vital services in monitoring, coordinating, and integrating ocean data and metadata, across an
Fig. 2. Global Ocean Observing System monitored by OceanOPS.

64 ADVANCES IN OPERATIONAL OCEANOGRAPHY
expanding network of global oceanographic and marine meteorological observing and service communities in support of improved services and capabilities. Based on input gathered from a variety of stakeholders, including major global ocean observing systems as well as WMO and IOC/GOOS, the articulation of a vision, mission, strategic goals and objectives in this Plan will improve the integration, cost-effectiveness, quality, and usefulness of ocean observations.
3.1 OceanOPS Vision
To be the international hub and center of excellence that provides vital services in monitoring, coordinating, and integrating data and metadata, across an expanding network of global oceanographic and marine meteorological observing communities.
3.2 OceanOPS Mission
To monitor and report on the status of the global ocean observing system and networks, to use its central role to support efficient observing system operations, to ensure the transmission and timely exchange of high-quality metadata, and to assist free and unrestricted data delivery to users across, operational services, climate and ocean health.
3.3 OceanOPS Goals & Objectives
Five high level goals were identified for OceanOPS to achieve its vision over the next 5 years. These goals focus on the core functions of OceanOPS, address the evolving needs of the ocean and marine meteorological observing communities, and identify the internal evolution needed to achieve this vision.

65ADVANCES IN OPERATIONAL OCEANOGRAPHY EXPANDING EUROPE’S OBSERVING AND FORECASTING CAPACITY
GOAL 1: Monitoring for the improvement of global ocean observing system performance
Objectives:
(1) Develop analysis tools and metrics for all OCG networks;
(2) Analyze networks trends and report to the different stakeholders;
(3) Implement and report ‘system level’ metrics for monitoring the adequacy of the system versus requirements and applications.
GOAL 2: Lead metadata standardization and integration across the global ocean observing networks
Objectives:
(1) Set and disseminate the standards and best practices for metadata harmonization across the OCG networks;
(2) Develop the web services required for machine-to-machine metadata exchange and access;
(3) Provide a harmonized and high-quality standard of metadata across all OCG networks;
(4) Assist users on data access and available data services;
(5) Connect OceanOPS services with IOC and WMO international data systems.
Fig. 3. OceanOPS structure and functioning to deliver metadata harmonization.

66 ADVANCES IN OPERATIONAL OCEANOGRAPHY
GOAL 3: Support and enhance the operations of the global ocean observing system
Objectives:
(1) Encourage and support the planning of observing networks implementation to enable synergies and opportunities;
(2) Develop partnerships and pilot projects to facilitate deployments/retrieval of instruments, including with civil society and industry;
(3) Promote Standards and Best Practices on instruments (installation, deployment, recovery, metadata, exclusive economic zones issues, etc.);
(4) Maintain appropriate (web-based) services to facilitate routine platform operations, including in areas under national jurisdiction.
Fig. 4. Argo float entering a coastal state Exclusive Economic Zone and triggering a warning report for the implementer.

67ADVANCES IN OPERATIONAL OCEANOGRAPHY EXPANDING EUROPE’S OBSERVING AND FORECASTING CAPACITY
GOAL 4: Enable new data streams & networks
Objectives:
(1) Provide basic services to emerging networks, and systems operating at the boundary of global networks under the guidance of the OCG;
(2) Pilot supporting third-party projects (civil society/industry) to help augment networks and Member States implementation.
Fig. 5. OceanOPS supports emerging networks and enable new data streams. Here: the new Animal Borne Ocean Sensors (AniBOS).

68 ADVANCES IN OPERATIONAL OCEANOGRAPHY
GOAL 5: Shape OceanOPS infrastructure for the future
Objectives:
(1) Develop agreements with OCG networks, emerging networks, and other end-users for the system to set boundaries and expectations for OceanOPS;
(2) Strengthen infrastructure in host country, workforce, and budget towards sustainability;
(3) Evolve the business model, team structure, and associated funding approaches towards integration, simplification, and robustness;
(4) Enhance communications to foster community understanding and engagement.
4. OceanOPS and GOOS challenges ahead Based on its historical experience at the heart of the observing systems, OceanOPS has identified several challenges that GOOS will have to overcome to build a globally integrated, sustainable, and fully implemented observing system. Some are geographical: the opportunities to deploy autonomous instruments in the Southern Ocean are rare and most funding countries are in the North. While others are political: it is difficult to gain access to coastal states’ waters to complete the implementation of the GOOS. GOOS needs to reduce its fragmentation through an integrated and dimensioned design and an efficient governance. An unprecedented communication effort is needed to demonstrate its societal value to Member States to boost their support.
5. Conclusions Over the past 20 years, OceanOPS has grown in visibility and demonstrated its expertise in monitoring the ocean observing system. Many activities and services have been successfully implemented and OceanOPS has become crucial for the coordination of a complex enterprise, composed of a high diversity of networks and many observing communities from around the world.
Now, OceanOPS must move to a more diverse and stable funding platform, thereby enabling it to focus on its strategic goals and allow sustainable growth to meet new needs. Additionally, the management of OceanOPS must evolve internally and externally, encouraging alignment of OceanOPS activities with this Strategic Plan, and strengthening its contributions to sponsors and stakeholders. The recent successes of OceanOPS have demonstrated the value and criticality of centralized support, coordination, and system monitoring for the global ocean observing enterprise. The 5-Year Strategic Plan for OceanOPS (2021 – 2025) provides the guide for OceanOPS activities to continue that success towards a more efficient and integrated system that delivers data and information necessary for an increased range of services and research.

69ADVANCES IN OPERATIONAL OCEANOGRAPHY EXPANDING EUROPE’S OBSERVING AND FORECASTING CAPACITY
AcknowledgementsOceanOPS expresses its deepest thanks to all countries supporting us to the challenge of developing an efficient integrated innovative and fit for purpose global ocean observing system that delivers the essential information needed for climate studies, operational services, and monitor ocean health. OceanOPS also wishes to thank the host country France, the Brittany local authorities, Ifremer and CLS for their support.

70 ADVANCES IN OPERATIONAL OCEANOGRAPHY
SEADATACLOUD DATA PRODUCTS FOR THE EUROPEAN MARGINAL SEAS AND THE GLOBAL OCEANSimona Simoncelli (1), Christine Coatanoan (2), Volodymyr Myroshnychenko (3), Örjan Bäck (4), Helge Sagen (5), Serge Scory (6), Paolo Oliveri (1), Kanwal Shahzadi (7), Nadia Pinardi (7), Alexander Barth (8), Charles Troupin (8), Reiner Schlitzer (9), Michèle Fichaut (2) and Dick Schaap (10)
(1) Istituto Nazionale di Geofisica e Vulcanologia, Sezione di Bologna, via Franceschini 31, 40128 Bologna, Italy, [email protected]
(2) Ifremer Centre de Bretagne, Plouzané, Brest, France(3) METU, Turkey(4) SMHI, Sweden(5) IMR, Norway(6) RBINS, Belgium(7) University of Bologna, Bologna, Italy(8) University of Liege, Liege, Belgium(9) Alfred Wegener Institute, Bremerhaven, Germany(10) MARIS, The Netherlands
Abstract Data products, based on in situ temperature and salinity observations from SeaDataNet infrastructure, have been released within the framework of SeaDataCloud (SDC) project. The data from different data providers are integrated and harmonized thanks to standardized quality assurance and quality control methodologies conducted at various stages of the data value chain. The data ingested within SeaDataNet are earlier validated by data providers who assign corresponding quality flags, but a Quality Assurance Strategy has been implemented and progressively refined to guarantee the consistency of the database content and high quality derived products. Two versions of aggregated datasets for the European marginal seas have been published and used to compute regional high resolution climatologies. External datasets, the World Ocean Database from NOAA and the CORA dataset from the Copernicus Marine Service in situ Thematic Assembly Center, have been integrated with SDC data collections to maximize data coverage and minimize the mapping error. The products are available through the SDC catalogue accompanied by Product Information Documents containing the specifications about product’s generation, characteristics and usability. Digital Object Identifiers are assigned to products and relative documentation to
71ADVANCES IN OPERATIONAL OCEANOGRAPHY EXPANDING EUROPE’S OBSERVING AND FORECASTING CAPACITY
foster transparency of the production chain, acknowledging all actors involved from data providers to information producers.
Keywords: data value chain, aggregated datasets, climatologies, quality assurance, co-production
1. Introduction Data products, based on in situ temperature and salinity observations distributed by the SeaDataNet infrastructure (SDN https://www.seadatanet.org), have been released within the framework of SeaDataCloud (SDC) project (2016-2020). SDN is a distributed Marine Data Infrastructure that connects more than a hundred professional data centers in Europe. The nodes of this Pan-European network are interoperable and provide on-line integrated databases of standardized quality, thanks to the adoption of common standards and the use of common technologies developed within the SeaDataCloud project and its precursors. The data and their full associated metadata description are integrated and harmonized thanks to standardized Quality Assurance and Quality Control (QA/QC) methodologies conducted at various phases of the data value chain.
The data ingested within SDN have been prior quality checked by data providers who submit the data with their corresponding Quality Flags (QF). During the ingestion process all formats and standards are harmonized and checked. The data can thus be accessed by users through the SDN data access service, selected and downloaded for further use, but in order to guarantee the consistency of the database content, the internal Quality Assurance Strategy (QAS) has been implemented. The QAS is an iterative procedure (Simoncelli et al., 2019), which involves many experts at various stages that work in a collaborative framework and, it permits to enhance the overall quality of the database content at each iteration. The QAS starts harvesting all temperature and salinity data and full metadata description contained in SDN system. The files and parameters are then aggregated using Ocean Data View software (ODV, Schlitzer 2002, https://odv.awi.de/) and the obtained ODV collection is then split into regional collections, one per each EU marginal sea. The regional collections are then quality checked by regional experts to verify their completeness and consistency. The experts identify data and metadata anomalies, defined as data flagged as good but that present undetected quality issues, and change the corresponding QFs thanks to ODV functionality. The QAS loop ends with the reporting of the detected anomalies to the corresponding data provider, thanks to the ODV logs which record all adjustments by unique station identifier and the provider’s EDMO code (https://www.seadatanet.org/Metadata/EDMO-Organisations) which identify the data originator. The data center inspects the list of data anomalies and applies the proposed corrections if approved, updating the data and metadata in the database.
72 ADVANCES IN OPERATIONAL OCEANOGRAPHY
The purpose of the QAS is also to deliver validated data products, whose quality increases at each QA/QC loop. The SDC team of regional experts has in fact the twofold task of conducting data QC and generating derived data products. Temperature and salinity regional aggregated datasets for the EU sea basins are the first level of data products released from SDN infrastructure. The regional datasets are then used to produce climatologies through DIVAnd mapping tool (Barth et al., 2014) and further develop new data products to serve a diverse user community.
Section 2 presents the aggregated datasets, Section 3 the climatologies and Section 4 introduces the new SDC data products. Products’ documentation and access is described in Section 5, together with the main conclusions.
2. Aggregated Datasets for the European Marginal Seas Two versions of SDC aggregated datasets of temperature and salinity have been released in 2018 and 2020 for the North Atlantic Ocean (NAT), North Sea (NS), Baltic Sea (BAL), Arctic (ARC), Mediterranean Sea (MED) and Black Sea (BLS). The aim was to provide to the users a delay mode quality checked data collections enriched with extensive metadata and characterized by high data quality.
Basic QC steps are applied by visual inspection to: analyze spatial and temporal data distribution and coverage; inspect temperature and salinity data distributions through scatter plots (spikes, outliers); identify stations falling on land or wrong/missing data; and compute statistics about Quality Flags (QF). The checks are conducted per specific areas having similar hydrodynamics, layers (surface, intermediate, bottom), time periods, according to the specific characteristics of each basin. QF assigned by the data centers are modified by the regional products’ leaders when/if a data anomaly is detected. Many ODV functionalities have been exploited to further inspect temperature and salinity data, such as the spatial distribution at specific depths or isosurfaces (i.e. potential density anomaly) or to filter data according to the many different metadata. Analysis by instrument type or by data providers are examples that allowed to identify omission (data existing in literature but not publicly shared) within the infrastructures and systematic errors (format, flagging) at the data center level. All the validation results are included in a Product Information Document (PIDoc) annexed to each dataset, which provides also important usability instructions by the experts and acknowledges all data originators.
Table I presents statistics from the two SDC datasets versions. The number of stations and samples increased from version 1 (V1) to version 2 (V2) in all sea regions. The largest percentages of station increase (i.e. ARC, MED, BAL) are due to the availability of underway data, characterized by one station per measurement along the track. The sample statistics in these cases provide the best indicator of SDN database population.

73ADVANCES IN OPERATIONAL OCEANOGRAPHY EXPANDING EUROPE’S OBSERVING AND FORECASTING CAPACITY
3. Climatologies for the European Marginal Seas and the Global Ocean
Two versions of SDC climatologies have been released for the EU marginal seas and the global ocean. The first release was designed with a harmonized approach to cover the time period 1955-2017, adopting the World Ocean Atlas (WOA, Garcia et al., 2019) vertical discretization and decadal fields definition ans using WOA for the final validation/consistency analysis. Two major achievements were (1) the adoption of DIVAnd mapping tool (5 over 7 products) and, (2) the integration of external sources of data, such as World Ocean Database (Boyer et al., 2019) from NOAA and Coriolis Ocean Dataset for ReAnalysis (CORA, Szekely et al., 2019) distributed from the CMEMS in situ TAC. The production of the second version aimed at improving the workflow making it more efficient, in particular: to ameliorate QC during the data integration process, tracking external data through unique station identifier in order to report anomalies and duplicates. Efforts have been made to improve the duplicates detection/removal, to optimize DIVAnd parameters, to improve the consistency analysis versus WOA. A SDC climatology for Global Ocean has been created for the first time and improved with two different time coverages (see Table II) using data from the WOD, since the spatial coverage of SDN data at the global scale is still too sparse, but in the future all data sources should be integrated as done in the other regions. A Non-linear Quality Control has been developed and implemented in the global domain (Shahzadi et al., 2021) eliminating less than 15% of input data per month, mainly outliers and non-representative data, not suitable to estimate the large scale climatology. This procedure could be extended and adapted to all regions in the next production cycle.
PRODUC T V1 V2 % INCREASE(STATIONS)
% INCREASE(SAMPLES)
ARC 731286 1392366 +90% +4%
BAL 14038820 14753042 +5%
BLS 137723 162656 +18% +21%
MED 739784 1003258 +36% +8%
NAT 9091769 10119755 +11%
NS 742828
Table I. Summary of stations in the SeaDataCloud regional data collections from V1 to V2 version and the percentage of data increase, in terms of stations or samples. In the NS region only V1 was released.
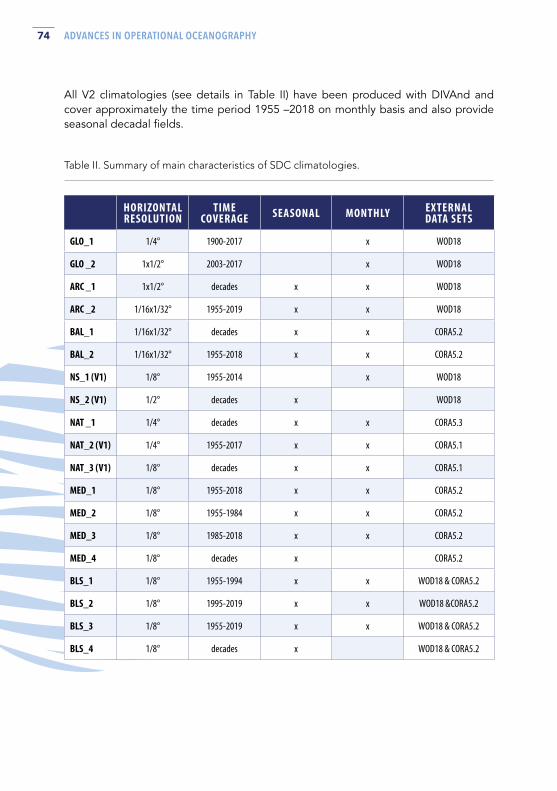
74 ADVANCES IN OPERATIONAL OCEANOGRAPHY
All V2 climatologies (see details in Table II) have been produced with DIVAnd and cover approximately the time period 1955 –2018 on monthly basis and also provide seasonal decadal fields.
HORIZONTAL RESOLUTION
TIME COVERAGE SEASONAL MONTHLY EXTERNAL
DATA SETS
GLO_1 1/4° 1900-2017 x WOD18
GLO _2 1x1/2° 2003-2017 x WOD18
ARC _1 1x1/2° decades x x WOD18
ARC _2 1/16x1/32° 1955-2019 x x WOD18
BAL_1 1/16x1/32° decades x x CORA5.2
BAL_2 1/16x1/32° 1955-2018 x x CORA5.2
NS_1 (V1) 1/8° 1955-2014 x WOD18
NS_2 (V1) 1/2° decades x WOD18
NAT _1 1/4° decades x x CORA5.3
NAT_2 (V1) 1/4° 1955-2017 x x CORA5.1
NAT_3 (V1) 1/8° decades x x CORA5.1
MED_1 1/8° 1955-2018 x x CORA5.2
MED_2 1/8° 1955-1984 x x CORA5.2
MED_3 1/8° 1985-2018 x x CORA5.2
MED_4 1/8° decades x CORA5.2
BLS_1 1/8° 1955-1994 x x WOD18 & CORA5.2
BLS_2 1/8° 1995-2019 x x WOD18 &CORA5.2
BLS_3 1/8° 1955-2019 x x WOD18 & CORA5.2
BLS_4 1/8° decades x WOD18 & CORA5.2
Table II. Summary of main characteristics of SDC climatologies.
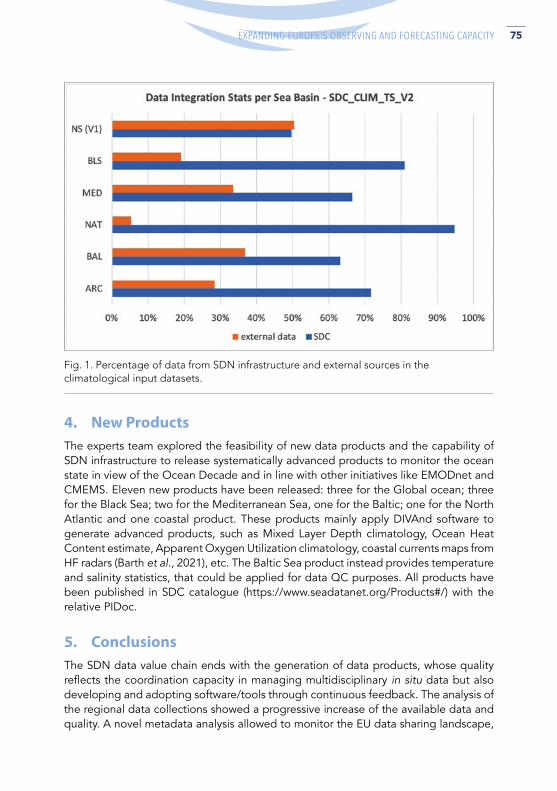
75ADVANCES IN OPERATIONAL OCEANOGRAPHY EXPANDING EUROPE’S OBSERVING AND FORECASTING CAPACITY
Fig. 1. Percentage of data from SDN infrastructure and external sources in the climatological input datasets.
4. New Products The experts team explored the feasibility of new data products and the capability of SDN infrastructure to release systematically advanced products to monitor the ocean state in view of the Ocean Decade and in line with other initiatives like EMODnet and CMEMS. Eleven new products have been released: three for the Global ocean; three for the Black Sea; two for the Mediterranean Sea, one for the Baltic; one for the North Atlantic and one coastal product. These products mainly apply DIVAnd software to generate advanced products, such as Mixed Layer Depth climatology, Ocean Heat Content estimate, Apparent Oxygen Utilization climatology, coastal currents maps from HF radars (Barth et al., 2021), etc. The Baltic Sea product instead provides temperature and salinity statistics, that could be applied for data QC purposes. All products have been published in SDC catalogue (https://www.seadatanet.org/Products#/) with the relative PIDoc.
5. Conclusions The SDN data value chain ends with the generation of data products, whose quality reflects the coordination capacity in managing multidisciplinary in situ data but also developing and adopting software/tools through continuous feedback. The analysis of the regional data collections showed a progressive increase of the available data and quality. A novel metadata analysis allowed to monitor the EU data sharing landscape,
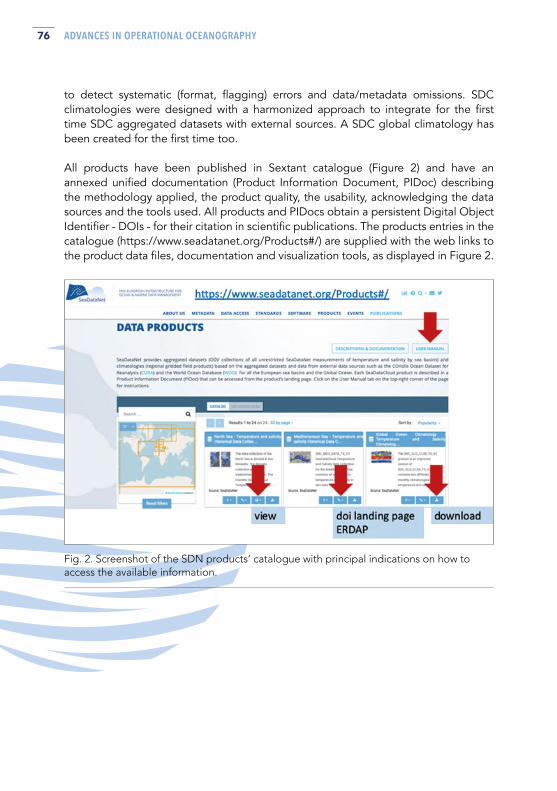
76 ADVANCES IN OPERATIONAL OCEANOGRAPHY
Fig. 2. Screenshot of the SDN products’ catalogue with principal indications on how to access the available information.
to detect systematic (format, flagging) errors and data/metadata omissions. SDC climatologies were designed with a harmonized approach to integrate for the first time SDC aggregated datasets with external sources. A SDC global climatology has been created for the first time too.
All products have been published in Sextant catalogue (Figure 2) and have an annexed unified documentation (Product Information Document, PIDoc) describing the methodology applied, the product quality, the usability, acknowledging the data sources and the tools used. All products and PIDocs obtain a persistent Digital Object Identifier - DOIs - for their citation in scientific publications. The products entries in the catalogue (https://www.seadatanet.org/Products#/) are supplied with the web links to the product data files, documentation and visualization tools, as displayed in Figure 2.
77ADVANCES IN OPERATIONAL OCEANOGRAPHY EXPANDING EUROPE’S OBSERVING AND FORECASTING CAPACITY
AcknowledgementsThis project has received funding from the European Union Horizon 2020 and Seventh Framework Programmes under grant agreement number 730960 SeaDataCloud.
ReferencesBarth, A., Beckers, J.M., Troupin, C., Alvera-Azcárate, A., Vandenbulcke, L., (2014). divand-1.0: n-dimensional variational data analysis for ocean observations. Geoscientific Model Development 7, 225–241. doi:10.5194/gmd-7-225-2014.
Barth, A., Troupin, C., Reyes, E. et al., Variational interpolation of high-frequency radar surface currents using DIVAnd. Ocean Dynamics 71, 293–308 (2021). https://doi.org/10.1007/s10236-020-01432-x
Boyer, T.P., O.K. Baranova, C. Coleman, H.E. Garcia, A. Grodsky, R.A. Locarnini, A.V. Mishonov, C.R. Paver, J.R. Reagan, D. Seidov, I.V. Smolyar, K. Weathers, M.M. Zweng, (2018): World Ocean Database 2018. A.V. Mishonov, Technical Ed., NOAA Atlas NESDIS 87. https://www.ncei.noaa.gov/sites/default/files/2020-04/wod_intro_0.pdf
Garcia H.E., T.P. Boyer, O.K. Baranova, R.A. Locarnini, A.V. Mishonov, A. Grodsky, C.R. Paver, K.W. Weathers, I.V. Smolyar, J.R. Reagan, D. Seidov, M.M. Zweng (2019). World Ocean Atlas 2018: Product Documentation. A. Mishonov, Technical Editor.
Schlitzer, R. (2002). Interactive analysis and visualization of geoscience data with Ocean Data View. Computers & Geosciences, 28(10), 1211-1218
Shahzadi, K., Pinardi, N. and Lyubartsev, V., 2021, A Non-linear Quality Control Procedure for Representativeness errors in Ocean Historical Datasets, International Conference on Marine Data and Information Systems (IMDIS) 2021. https://imdis.seadatanet.org/files/IMDIS2021_119_abstract.pdf and https://imdis.seadatanet.org/files/IMDIS2021_poster_119.pdf
Simoncelli, S., Fichaut, M., Schaap, D., Schlitzer, R., Barth, A., and Fratianni, C. (2019). ‘Marine Open Data: a way to stimulate ocean science through EMODnet and SeaDataNet initiatives,’ In: INGV Workshop on Marine Environment, Vol. 51, eds L. Sagnotti, L. Beranzoli, C. Caruso, S. Guardato, and S. Simoncelli (Rome), 1126. https://doi.org/10.13127/misc/51
Szekely, T., Gourrion, J., Pouliquen, S., and Reverdin, G.: The CORA 5.2 dataset for global in situ temperature and salinity measurements: data description and validation, Ocean Science, 15, 1601–1614, https://doi.org/10.5194/os-15-1601-2019,
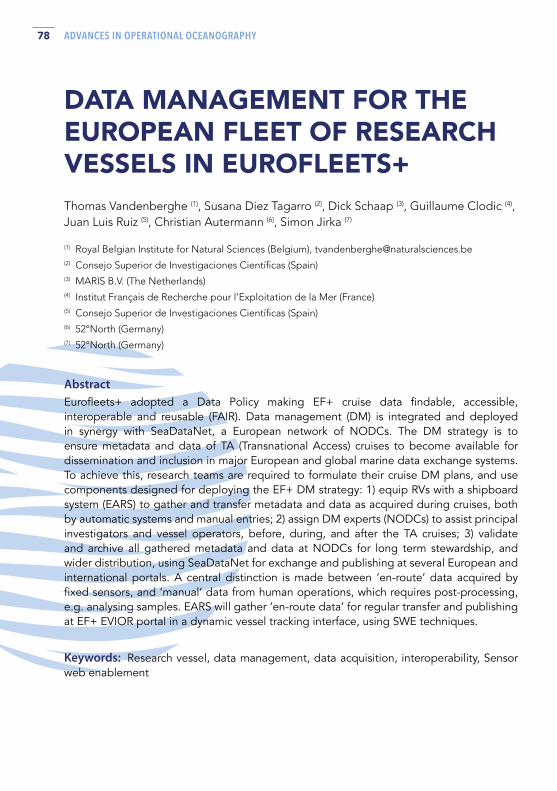
78 ADVANCES IN OPERATIONAL OCEANOGRAPHY
DATA MANAGEMENT FOR THE EUROPEAN FLEET OF RESEARCH VESSELS IN EUROFLEETS+Thomas Vandenberghe (1), Susana Diez Tagarro (2), Dick Schaap (3), Guillaume Clodic (4), Juan Luis Ruiz (5), Christian Autermann (6), Simon Jirka (7)
(1) Royal Belgian Institute for Natural Sciences (Belgium), [email protected](2) Consejo Superior de Investigaciones Científicas (Spain)(3) MARIS B.V. (The Netherlands)(4) Institut Français de Recherche pour l’Exploitation de la Mer (France)(5) Consejo Superior de Investigaciones Científicas (Spain)(6) 52°North (Germany)(7) 52°North (Germany)
Abstract Eurofleets+ adopted a Data Policy making EF+ cruise data findable, accessible, interoperable and reusable (FAIR). Data management (DM) is integrated and deployed in synergy with SeaDataNet, a European network of NODCs. The DM strategy is to ensure metadata and data of TA (Transnational Access) cruises to become available for dissemination and inclusion in major European and global marine data exchange systems. To achieve this, research teams are required to formulate their cruise DM plans, and use components designed for deploying the EF+ DM strategy: 1) equip RVs with a shipboard system (EARS) to gather and transfer metadata and data as acquired during cruises, both by automatic systems and manual entries; 2) assign DM experts (NODCs) to assist principal investigators and vessel operators, before, during, and after the TA cruises; 3) validate and archive all gathered metadata and data at NODCs for long term stewardship, and wider distribution, using SeaDataNet for exchange and publishing at several European and international portals. A central distinction is made between ‘en-route’ data acquired by fixed sensors, and ‘manual’ data from human operations, which requires post-processing, e.g. analysing samples. EARS will gather ‘en-route data’ for regular transfer and publishing at EF+ EVIOR portal in a dynamic vessel tracking interface, using SWE techniques.
Keywords: Research vessel, data management, data acquisition, interoperability, Sensor web enablement

79ADVANCES IN OPERATIONAL OCEANOGRAPHY EXPANDING EUROPE’S OBSERVING AND FORECASTING CAPACITY
1. Introduction Eurofleets+ (EF+) is a consortium of 42 research vessel (RV) operators aiming to provide access to ship-time for high-quality marine campaigns, including equipment and remote sampling access. From the start, the project has given data management a central place. The data management strategy in Eurofleets+ entails: 1) the equipment of RVs with a shipboard system (EARS) to gather and transfer metadata and data as acquired during cruises, both by automatic systems and manual entries; 2) assign data management experts (Reference Data Centres) to assist principal investigators and vessel operators, before, during, and after the TA cruises; 3) validate and archive all gathered metadata and data at NODCs for long term stewardship and wider distribution using SeaDataNet for publishing at several international data portals.
Eurofleets+ is a 4-years H2020-funded project (2019 – 2023). For Eurofleets 2 (2013 – 2017), it was difficult to provide a centralized view on the generated data and metadata. For the Eurofleets+ proposal, the gaps in achieving this have been filled by: 1) the procurement of a data management plan (DMP) as a mandatory evaluation criterion, to assure data provision, and 2) the assignment of dedicated data management organisations to assist principal investigators and vessel operators, to ensure data dissemination of EF+ cruises.
2. Data Management Additionally, DMPs are a requirement of all H2020 projects. The DMP template takes the form of a forked DMP Road map web application (created by the UK Digital Curation Centre and the University of California Curation Center) and contains a number of questions adapted for EF+ from the H2020 Open Research Data Pilot. The DMP website (http://dmp.ef-ears.eu) also provides the data management guidelines.A distinction is made between en-route data and manual data. ‘Manual’ data (sample-derived) will be posted by the Principal Investigator on the EMODnet Data Ingestion Platform and data managed by three reference data centres, i.e. HCMR, OGS and BMDC. These take care of the dissemination of both en-route and manual data by publishing it in global directories (SeaDataNet and thence to EurOBIS, EMODnet, GEOSS, IOC-IODE portal) but also on a dedicated EF+ dataset catalogue, providing persistent links (DOIs) to the actual data, accessible through the project website and the ‘European Virtual Infrastructure in Ocean Research’ portal (EVIOR). Specific attention is paid to 1) meteorological data, 2) ‘Essential Ocean Variables’ (e.g. sea temperature, salinity, currents, oxygen, nutrients, carbon, plankton biomass,...) 3) 3.5 kHz or Chirp light seismic; and 4) multi-beam bathymetry, as these are underrepresented and have a high potential.

80 ADVANCES IN OPERATIONAL OCEANOGRAPHY
3. Introduction In due time before the Eurofleets+ campaign leaves, the RVs are equipped with the Eurofleets Automated Reporting System (EARS). This provides software and services for en-route data acquisition, recording cruise and event metadata, and transforming it into the necessary European and global marine data standards. Currently version 3 is being trialled on the RV Sarmiento de Gamboa (CSIC), RV Dallaporta (CNR) and RV SOCIB (SOCIB).
The EARS server distribution is based on docker and available on GitHub as open source software, together with guidelines on installation. A ready-made virtual machine is also available for EF+ partners. EARS is primarily an event logger that runs on top of the RV’s native acquisition system. It optionally also assists in real time en route data dissemination to an on-shore data repository. To bridge the native acquisition system to EARS, the latest version of TechSAS is included in the distribution. TechSAS provides real data visualisation via configurable draggable widgets (charts, graphs, data tables of any sensor). A copy of the acquisition data is then stored in the local EARS database. All data is accessible through web services.
Fig. 1. The complete project data workflow.

81ADVANCES IN OPERATIONAL OCEANOGRAPHY EXPANDING EUROPE’S OBSERVING AND FORECASTING CAPACITY
The EARS data acquisition groups data in the following categories. Each has its own comma-separated datagram format:
• Navigation data: longitude/latitude, heading, speed, depth, course over ground, speed over ground;
• Meteorological data: wind mean velocity, wind gust, wind direction, air temperature, humidity, solar radiation, atmospheric pressure;
• Thermosalinometry data: salinity, water temperature, raw fluorometry, density (Sigma-t).
Events are composed of 5 semantic components: tool categories; tools (sensors, instruments or any device); subjects; processes; actions, and optionally any number of properties. Valid combinations of each of these are stored in a centralised semantic backbone as ‘linked data’, with links to the NERC vocabularies (L05, L06, L22, etc.). Events can be either created by using a desktop client application or a web application. The desktop application provides a tree overview of the semantic backbone, that can be used to create events and that can be edited and stored centrally. The web application is mobile-friendly and provides event logging by a push on a button: users build their own portfolio of events, based on the combinations provided in the central semantic backbone. The events are stored and accessible in a database via a REST API. When submitted, the event is associated with all available en-route information for easy later retrieval. This API also manages cruise and program information. The database has been modelled to capture all information required for the SeaDataNet Cruise Summary Report (CSR), and furthermore the API can produce complete CSRs, including navigation tracks. The API also translates the events (for instance ‘operation-start’, or ‘calibration-start’of a single device instance to SensorML history event elements. Work to address fundamental SensorML information in EARS such as sensor identifiers (PIDs and serial numbers), installation dates and contacts is planned as well.
4. Vessel to shore transport via OGC Sensorthings API and sensor observation service
Optionally, RV operators can allow that the EARS server sends the en route data to shore, for reporting in a central data hub. This central hub is a 52° North SOS instance with the Helgoland viewer, specifically adapted to handle near real-time flows of research vessel data. The central Eurofleets+ data hub is available at http://eurofleets.utm.csic.es/dashboard. Alternatively, the central data hub can read existing web services or csv http endpoints that expose the en-route data (in NRT or delayed mode). For this purpose, a feeder application inside the SOS server continuously checks the HTTP endpoints for new ship data. If new data is available, it is downloaded and forwarded via a lightweight MQTT stream to an OGC SensorThings API server.
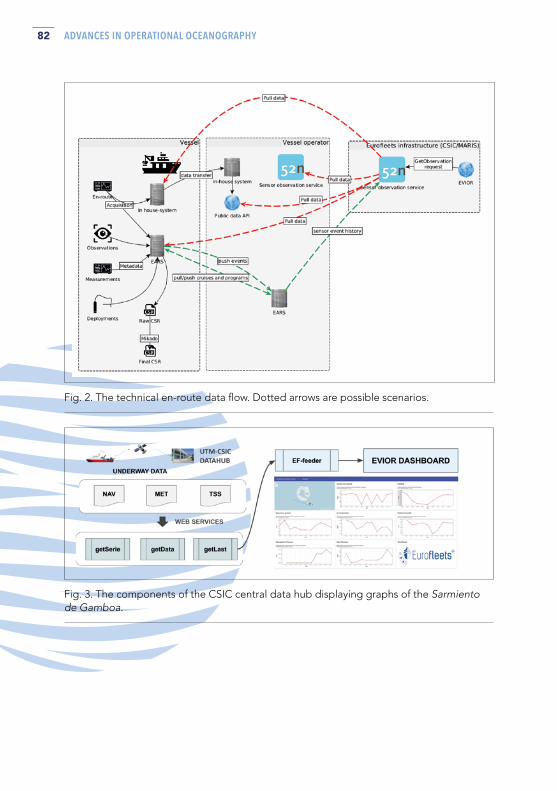
82 ADVANCES IN OPERATIONAL OCEANOGRAPHY
Fig. 2. The technical en-route data flow. Dotted arrows are possible scenarios.
Fig. 3. The components of the CSIC central data hub displaying graphs of the Sarmiento de Gamboa.
83ADVANCES IN OPERATIONAL OCEANOGRAPHY EXPANDING EUROPE’S OBSERVING AND FORECASTING CAPACITY
The SensorThings API server acts as a sink for the MQTT streams delivering the different types of ship data and metadata. After receiving new data via MQTT, the SensorThings API server takes care of ingesting the collected vessel data into a central Sensor Web database (in this case a relational PostgreSQL database). From there on, the data is made available via interoperable interfaces (OGC Sensor Observation Service and OGC SensorThings API).
On top of the SensorThings API, a Web viewer application is deployed. This Web viewer, based on the 52°North Helgoland Sensor Web viewer, allows users to view the current positions and data of the included research vessels. In addition, also historic data of the ships (e.g. trajectories of past journeys) can be discovered and visualised. The EVIOR portal has also integrated this Helgoland viewer and connects to the OGC SensorThings API of the CSIC data hub.
The ideal situation would be that each RV operator operates its own Sensor Observation Service installed on-shore to provide acquisition data and metadata. In this scenario the EVIOR portal (and others) would serve as a federation across different SOS servers.Besides establishing the necessary data flows and visualisation tools based on technologies previously developed and enhanced in projects such as SeaDataCloud, the modelling of the research vessel data was a second major task during the design process. In this case, a consistent mapping of the different entity types to the OGC Sensor Observation Service and SensorThings API data models had to be established.
Core elements of this model include: The collected data is modelled as so called SpatialFilteringProfile measurements as defined by the OGC Sensor Observation Service standard. This means that the latest navigation data is merged with the corresponding thematic observation data into individual observations. The tracks of the research vessel are considered as so-called Features of Interest which are dynamically updated with each new message containing ship navigation data.
5. Conclusion The Eurofleets+ project has adopted established and developed new components and procedures in order to reconstruct data management of operational oceanography from the ground up. The single purpose campaigns of a research programme such as Eurofleets are perfectly suited to test novel procedures. In this way it functions as a testbed for future projects and a template for new research vessels.

84 ADVANCES IN OPERATIONAL OCEANOGRAPHY
MAKING SENSE OF SEABED DATA RE-USE TO INCREASE SOCIETAL VALUE USING THE INTEGRATED GEOSPATIAL INFORMATION FRAMEWORK TO DESCRIBE THE PROCESS FROM PLANNING TO DISTRIBUTION TO MULTIPLE USERS. A JOURNEY FROM THE PERSPECTIVE OF A HYDROGRAPHIC OFFICE
Ellen Vos
Hydrographic Service of the Royal Netherlands Navy. [email protected]
Abstract The need for overview over and insight in ocean observations like seabed data, is growing at different managerial levels. At a global level this need is expressed by the Seabed2030 initiative. The UN-GGIM developed an Integrated Geospatial Information Framework (IGIF) that can function as a guide to improve business-IT alighnment. It connects data management policy with integral management. As an exploration the framework is applied to the example of the value chain of seabed data from the perspective of the Hydrographic Service of the Royal Netherlands Navy.
Keywords: GOOS, Seabed2030/GEBCO, European Commission, IGIF, data management architecture
1. Introduction The need for overview over and insight in ocean observations, is growing at different managerial levels. The need for seabed data in particular is expressed at the global (GOOS, Seabed2030/GEBCO (McMichael-Phillips, 2021)), European (EMODnet, INSPIRE, MFSD), regional (Regional Hydrographic Commissions) and national level in the Netherlands. Recently DG MARE addressed this issue in the initiative ‘Ocean observation – sharing responsabilities’, referring to ocean observation as essential for the knowledge base of the European Green Deal (European Commission, 2020).
85ADVANCES IN OPERATIONAL OCEANOGRAPHY EXPANDING EUROPE’S OBSERVING AND FORECASTING CAPACITY
1.1 Integrated Geospatial Information Framework (IGIF)Re-use of seabed data for a different purpose than the data were collected for contributes to (governmental) efficiency, which is valuable for society because of the high costs involved in ocean observation. At the same time the demand for ocean data is increasing around SDG14, the upcoming UN Decade of Ocean science (Pendleton et al., 2019), for the purpose of monitoiring climate change and for Maritime Spatial Planning ((Ehler & Douvere, 2009) e.g. for planning of Renewable Energy at sea) to name a few.
An exploration is made from the perspective of the Dutch Hydrographic Office to draw the picture about seabed observations using the Integrated Geospatial Information Framework (UN-GGIM, 2020). This IGI Framework was developed under the UN-GGIM, aimed at a common approach to reach the Sustainable Development Goals.
It can be seen as a guide combining a policy on data with a data- and knowledge based policy to reach the Sustainable Development Goals.
2. Applying IGIF to Dutch Seabed mapping This journey to draw the picture (Figure 1) visualising the value chain of seabed mapping on the Dutch Continental Shelf, includes the planning process, as well as the process from ping (of the multi-beam echo sounder) to chart, the partners involved during the process, the end users and (data management) standards. These standards also provide insight in the semantics used within data silos and in the professional language used in the community involved.
This picture is meant to help (changes in) cooperation and to improve harmonization. In this way it facilitates the discours between partners on joining data collection efforts for different purposes at different scales.
The picture immediately invoked positive response when shared with some colleagues from other departments, including suggestion for additions to the picture. The insight in the value chain gives room for new discussions about overall efficiency, increasing quality along the value chain and innovation in the collection (e.g. satellite derived bathymetry or crowd sourced bathymetry) and application of the data.
The overview over the value chain is valuable both at the organisational level, and at the national, regional (North Sea basin) and global level.

86 ADVANCES IN OPERATIONAL OCEANOGRAPHY
3. Conclusion Shared language is needed for cooperation in any context, let alone to reach consensus while crossing different disciplines, management levels and international boundaries. The Integrated Geospatial Information Framework provides common denominators for the different aspects of marine data management. In this case from the Netherlands, the shared need for an overview at different managerial levels is illustrated, applying different elements from IGIF as shown in Figure 2.
In this way the framework could also contribute to the Decade of Ocean Science as it speeds up shared understanding between partners, by connecting existing silos between different disciplines and communities (policy, science and ongoing operations, e.g. Hydrographic Offices providing navigational charts for the purpose of safe navigation). To conclude this specific exploration: an overview at the organisational level of the Dutch Hydrographic Office using the terminology of IGIF, also contributes to the needed overview at the global level as expressed by Seabed2030.
Fig. 1. Different (IGIF) elements around the process of Seabed mapping on the (Dutch) Continental Shelf.

87ADVANCES IN OPERATIONAL OCEANOGRAPHY EXPANDING EUROPE’S OBSERVING AND FORECASTING CAPACITY
Fig. 2. Elements mapped to the Integrated Geospatial Information Framework.
ReferencesEuropean Commission. (2020). Ocean observation – sharing responsibility: INCEPTION IMPACT ASSESSMENT. https://ec.europa.eu/info/law/better-regulation/have-your-say/initiatives/12539-Ocean-observation-sharing-responsibility_en
Ehler, C., & Douvere, F. (2009). Marine Spatial Planning, a step by step approach toward Ecosystem-based management (IOC/2009/MG/53). http://unesdoc.unesco.org/images/0018/001865/186559e.pdf
McMichael-Phillips, J. (2021). Inspiring a Transparent and Accessible Ocean for All. ECO Magazine. http://cdn.coverstand.com/9890/707374/4da135424b1cb4be555afa3059b00b57b4041d8d.10.pdf
Pendleton, L., Visbeck, M., & Evans, K. (2019). Accelerating Ocean Science for a Better World: The UN Decade of Ocean Science for Sustainable Development 2021–2030. Ocean Decade. https://oceandecade.org/resource/34/Accelerating-Ocean-Science-for-a-Better-World-The-UN-Decade-of-Ocean-Science-for-Sustainable-Development-2021-2030
UN-GGIM. (2020). Integrated Geospatial Information Framework (IGIF) > Overview. UN Statistics Division. http://ggim.un.org/IGIF/overview/

89EXPANDING EUROPE’S OBSERVING AND FORECASTING CAPACITY
SESSION 3
REGIONAL OBSERVATORIES

90 ADVANCES IN OPERATIONAL OCEANOGRAPHY
A DECADE OF OBSERVATIONS AND ACHIEVEMENTS OF THE MOOSE OBSERVATORY IN THE NORTHWESTERN MEDITERRANEAN SEAAnthony Bosse (1), Laurent Coppola (2), Pierre Testor (3), Dominique Aubert (4),François Carlotti (1), Pascal Conan (5), Xavier de Madron (4), Fabrizio D’Ortenzio (2),Wolfgang Ludwig (4), Laurent Mortier (5), Patrick Raimbault (1)
(1) Aix Marseille Univ., Universite de Toulon, CNRS, IRD, MIO UM 110, Marseille, FR(2) Sorbonne Université, CNRS, UMR 7093, Laboratoire d’Océanographie de Villefranche,
Villefranche/mer, FR(3) Sorbonne Université, CNRS-IRD-MNHN, UMR 7159, Lab. d’Océeanographie et de Climat,
IPSL, Paris, FR(4) Laboratoire CEFREM - UMR 5110 CNRS-UPVD 52, avenue Paul Alduy, Perpignan, FR(5) Sorbonne Université, UMR 7621, Lab. d’Océanographie Microbienne, Obs. Océanologique,
Banyuls/mer, FR(6) ENSTA-Paristech, Palaiseau, FR
Abstract MOOSE is a multi-disciplinary integrated Ocean observing system part of the French national Research Infrastructure for coastal ocean and seashore observations (ILICO-RI). It was established in 2010 to monitor the Northwestern Mediterranean Sea in the context of rapid climate change and its impacts on marine ecosystems.
Keywords: Ocean Observing System, Western Mediterranean Sea, Climate Change, Time series, Autonomous platforms, FAIR data

91ADVANCES IN OPERATIONAL OCEANOGRAPHY EXPANDING EUROPE’S OBSERVING AND FORECASTING CAPACITY
1. Introduction Considered as a ‘hot spot’ of climate change, marine biodiversity and human activities, the Mediterranean Sea shows trends toward drier and extreme weather causing important human and economic losses. The Mediterranean Sea undergoes important physical and biogeochemical modifications, eventually impacting the health of its unique ecosystems.
Established in 2010, the Mediterranean Ocean Observing System for the Environment(MOOSE, https://www.moose-network.fr/, Coppola et al., 2019) maintains long-term time series of essential oceanic variables in the Northwestern Mediterranean Sea in order to quantify present changes, anticipate future ones and assess their impacts for the benefit of society.authorities. Project results supported implementation of MSFD in Bulgarian marine waters for the benefit of coastal population, marine industry, tourism, marine research and marine spatial planning.
Fig. 1. Surface chlorophyll-a observed by satellite in February 2013 during a deep convection event (the dilution of phytoplankton is visible in purple). The MOOSE network: rivers and atmospheric deposit time series (blue/white dots on land), high-frequency radars (barred area), fixed mooring sites (yellow pins), surface meteorological buoys (ODAS triangles), autonomous platforms (endurance glider lines in orange, profiling floats drifting with currents) and ship-board surveys (black dots: yearly basin-scale cruise; white dots: monthly stations). LION, ANTARES & DYFAMED moorings are integrated in EMSO ERIC.
92 ADVANCES IN OPERATIONAL OCEANOGRAPHY
2. An integrated network from the coast to the deep ocean MOOSE monitors long-term environmental trends, defines effective health and climatic indicators. It is based on a multi-disciplinary network of platforms maintained by the cooperation and coordination of national institutions and collaborators. This includes (Figure 1): river monitoring of the Rhône and Têt, particulate deposits at 3 sites (Cap Béard, Frioul and Cap Ferrat), physical and biogeochemical variables sampled by research vessels (yearly basinscale cruise MOOSE-GE and monthly open-sea stations at MOLA, ANTARES and DYFAMED), fixed-point observatories by deep moorings (EMSO-Ligure nodes: DYFAMED, ANTARES, LION) and coastal moorings deployed in the canyons (LACAZE and PLANIER), ODAS meteorological buoys (AZUR, LION), high-frequency radars off Toulon and Nice to map surface currents, as well as autonomous profiling platforms with two glider endurance lines (T00: Nice-Calvi and T02: Marseille-Menorca) and regular supply of Argo floats (including BGC-Argo) from EURO-ARGO ERIC.
3. Data Management and European Integration MOOSE has significantly increased the data flow of essential oceanic variables in the region. The procedures and protocols have been homogenized following international best practices from sensor preparation to delayed-mode data quality control before these data are archived and released to the end-users with a digital object identifier via the Sea Scientific Open Data Edition repository (https://www.seanoe.org/). Data from MOOSE are available via the ODATIS ocean and coastal data cluster of the French DATA TERRA RI (Schmidt et al., 2020). The MOOSE community contributed to and benefited from several EU programs: EuroSea (carbon audit, best practices), JERICO-s3 (NW MedSea coastal SuperSite), GROOM-II (glider community) and MONGOOS the regional alliance for the Mediterranean Sea of the Global Ocean Observing System (GOOS). MOOSE is part of the French ILICO-RI for coastal ocean and nearshore observations (Cocquempot et al., 2019). It serves as reference deployment site for EURO-Argo floats and the development of new machine learning methods, fixed-point climatic trends (EMSO ERIC), description of biological diversity of plankton assemblages (EMBRC ERIC), air-sea CO2 fluxes (ICOS ERIC). It also contributes to the GOOS’s programs OceanGliders (endurance lines) and OceanSites (eulerian observatories).
4. Scientific breakthroughs and perspectives By achieving a decade of multi-disciplinary observations, MOOSE has documented the recent decrease in deep water renewal to abrupt warming and salinification of intermediate waters, trends in ocean acidification and ventilation, as well as regional plankton community and coupling with atmospheric deposition and river inputs. In the future, MOOSE will sustain the ongoing long-term time series and tackle the challenge of integrating new variables (eg, genomic, pH), it will reinforce its interactions with
93ADVANCES IN OPERATIONAL OCEANOGRAPHY EXPANDING EUROPE’S OBSERVING AND FORECASTING CAPACITY
the EU partners (eg. Med-Ship) and the modelling community for the development of ocean climatic and ocean health indicators (CMEMS). It will serve as a benchmark for the development of new methodology applied to oceanography (eg, machine learning), as well as support and integrate the development of National and European Research Infrastructures (EOOS).
ReferencesCocquempot L.et al., (2019). Coastal Ocean and Nearshore Observation: A French Case Study. Frontiers in Marine Science, 6, 324. https://doi.org/10.3389/fmars.2019.00324
Coppola, L., P. Raimbault, L. Mortier, and P. Testor (2019). Monitoring the environment in the northwestern Mediterranean Sea, Eos, 100. https://doi.org/10.1029/2019EO125951
Schmidt S. et al., (2020). Streamlining Data and Service Centers for Easier Access to Data and Analytical Services: The Strategy of ODATIS as the Gateway to French Marine Data. Frontiers in Marine Science, 7, 548126. https://doi.org/10.3389/fmars.2020.548126

94 ADVANCES IN OPERATIONAL OCEANOGRAPHY
ILICO – A FRENCH RESEARCH INFRASTRUCTURE FOR COASTAL OCEAN AND SEASHORE OBSERVATIONS
Lucie Cocquempot (1), Joanne Burden (2), Christophe Delacourt (3), Jérôme Paillet (1), Patrick Raimbault (4), Guillaume Charria (1), François Schmitt (5), Serge Planes (6), Xavier Bertin (7), Stephane Bertin (2), Laurent Coppola (8), Pierre Testor (9), Maud Lemoine (10), Pascal Claquin (11), Régis Hocdé (12), Jérôme Aucan (13), Sylvie Fiat (13), Nicolas Savoye (14), Pascal Conan (15), Laurent Testut (16), Médéric Gravelle (16), G. Woppleman (16), Vincent Bouchet (17), Nicolas Desroy (18)
(1) Ifremer, Plouzané, France, [email protected]
(2) CNRS, Plouzané, France (3) Université de Bretagne Occidentale, Plouzané(4) CNRS, Marseille, France(5) CNRS ; Wimereux, France(6) CNRS, Perpignan, France(7) CNRS, La Rochelle, France (8) Sorbonne Université, Villefranche-sur-mer,
France
(9) Sorbonne Université, Paris, France(10) Ifremer, Nantes, France(11) Université de Caen, Luc-sur-Mer, France(12) IRD, Montpellier, France(13) IRD, Nouméa, France(14) Université de Bordeaux, Bordeaux, France(15) Sorbonne Université, Banyuls-sur-mer(16) Université de La Rochelle, La Rochelle(17) Université de Lille, Wimereux, France(18) Ifremer, Dinard, France
Abstract: ILICO, a French Research Infrastructure (RI) for Coastal Ocean and Nearshore Observations is a notable example of national and pan-institutional efforts to expand knowledge of the complex processes at work within the critical coastal zone in line with the European Ocean Observing System perspective. Providing a forum for its community to work together on priority issues is a challenge, and ILICO’s organizational structure and governance is designed accordingly. Future challenges for this RI include the question of whether France’s original model of combining both land and nearshore in its study of the coastal domain is transferable to the pan-European context and how far we can go in integrating overseas and ultramarine issues.
Keywords: French national research infrastructure, coastal ocean and seashore, multidisciplinary observation

95ADVANCES IN OPERATIONAL OCEANOGRAPHY EXPANDING EUROPE’S OBSERVING AND FORECASTING CAPACITY
1. Introduction ILICO, a French Research Infrastructure for Coastal Ocean and Nearshore Observations is a notable example of national and pan-institutional efforts to expand knowledge of the complex processes at work within the critical coastal zone in line with the European Ocean Observing System perspective. At the interface between land and sea, ILICO is necessarily multiscale and pluri-disciplinary. It federates complementary distributed observation services (networks) monitoring coastline dynamics, sea level evolution, physical and biogeochemical water properties, coastal water dynamics, phytoplankton and benthos composition and coral reef health in order to address a wide range of scientific questions. Each network is accredited and receives funding from the French Ministry for Higher Education, Research and Innovation and national public research institutions. In addition to the sustained and long-term nature of its time-series data, ILICO’s observation sites have unique geographical coverage spanning both metropolitan coastlines and those of overseas national territories. Significantly, although its scope is not strictly limited to coastal marine systems, ILICO is the French-node of the Joint European Research Infrastructure for Coastal Marine systems (JERICO-RI) led by France. Here we present ILICO’s latest advances to (1) federate networks to maximize the return on investment for the community across sites and disciplines (2) foster scientific interactions and integration of its overseas and metropolitan observation practices through the development of multiple-network instrumented sites (3) develop an open data policy, aggregating multisource data to ensure optimal access and re-use by the scientific community, for operational ocean observing and forecasting, and by public authorities and citizens.
ILICO federates nine established observation networks, and these are the essential building blocks of our response strategy.

96 ADVANCES IN OPERATIONAL OCEANOGRAPHY
The success of the accreditation process was adopted by other national research organisms and is a pan-institutional process. ILICO’s main partners include Ifremer, IRD, SHOM, IGN, MNHN and many French universities (not extensive list).
The co-localisation of sampling sites from a number of different networks yields a more holistic picture of local and nested processes at work in the environments ILICO targets to understand. A noteworthy example is the north west Mediterranean region. Not only is the MOOSE regional integrated network focusing observations in this area, but all of ILICO’s other metropolitan networks are present in the area.
ILICO is actively fostering the organization of regionally integrated sites.
Another example is ongoing overseas. ILICO’s objective for the Hermitage lagoon site on Réunion Island is to design a multi-network integrated site. Three networks (Sonel, Reeftemps and Dynalit) collaborate to equip the site with the goal of understanding the impacts of extreme events. The Hermitage pilot site is a keystone of ILICO’s cross-cutting action focusing on Overseas challenges.
NETWORK ESTABLISHED ESTABLISHED
COAST-HF 2016 Physico-chemical, nutrients, high frequency
CORAIL 1985 Biodiversity (corals, fish…), Physico-chemical (South Pacific) – regional network
DYNALIT 2014 Coastal bathymetry, topography, shoreline position
MOOSE 2008 Bio-physico-chemical, surface currents… (NW Mediterranean) – regional network
PHYTOBS 2016 Phytoplankton diversity
REEFTEMPS 2010 Temperatures (6 to 60m depth) (Pacific, Indian ocean) – regional network
SOMLIT 1996 Bio-physico-chemical parameter
SONEL 2003 Sea level, levelling height
BENTHOBS Network in incubation (preparing 2022 accreditation) Benthic macroinvertebrate diversity
Table I. ILICO’s nine complementary distributed observation networks, 8 accredited as National Observation Systems (‘SNO’) through a peer-reviewed evaluation process led by the CNRS (France’s national agency for basic research) since 1990s.

97ADVANCES IN OPERATIONAL OCEANOGRAPHY EXPANDING EUROPE’S OBSERVING AND FORECASTING CAPACITY
Fig. 1. The north west mediterrenean is a hotspot for ILICO network sampling sites and activities. As well as the dedicated MOOSE network, all other ILICO metropolitan netwrorks have sampling sites in the region.
Fig. 2. Hermitage lagoon site, one of ILICO’s overseas integrated multiple instrumented pilot sites involving SONEL, DYNALIT and REEFTEMPS networks. Discussions and planning to integrate other networks (such as SOMLIT and CORAIL) are ongoing.

98 ADVANCES IN OPERATIONAL OCEANOGRAPHY
The long-term data series produced facilitate another of ILICOs missions which is to foster interactions between our in situ observation community with members of other communities such as modelling, remote sensing, experimental approaches. ILICO’s pluri-disciplinary research community, and its members are distributed in over 50 French research laboratories in Metropolitan France and overseas. Providing a forum for its community to work together on priority issues is a challenge, and ILICO’s organizational structure and governance is designed accordingly. The strength of this network is to feed scientific synergy and drive 10 working groups on cross cutting priority actions.
Fig. 3. Organizational structure and governance of the ILICO Research Infrastructure detailing federated observation networks and priority cross cutting actions.

99ADVANCES IN OPERATIONAL OCEANOGRAPHY EXPANDING EUROPE’S OBSERVING AND FORECASTING CAPACITY
ILICO is the French node of the ESFRI candidate JERICO-RI – the joint European research infrastructure for coastal observatories. ILICO’s capacity to integrate a diversity of players and to secure long term resources for observation have helped drive the JERICO initiative. ILICO’s principal contributions to JERICO-RI include sharing best practices with other National Research Infrastructures on:
• Integrating a diversity of players;
• Addressing common Key Scientific Challenges;
• Allocating long-term resources to observation.
Further perspectives include the question of whether France’s original model of combining both land and nearshore in its study of the coastal domain is transferable to the pan-European context and how far we can go in integrating overseas and ultramarine issues.
ReferencesCocquempot L, Delacourt C, Paillet J, Riou, J. Aucan, B. Castelle, G. Charria, J. Claudet, P. Conan, L. Coppola, R. Hocdé, S. Planes, P. Raimbault, N. Savoye, L. Testut and R. Vuillemin (2019) Coastal ocean and nearshore observation: a French case study. Front Mar Sci 6: 324.
100 ADVANCES IN OPERATIONAL OCEANOGRAPHY
STRONGER TOGETHER: DEVELOPING THE FRAMEWORK FOR A SUSTAINABLE NATIONAL RESEARCH INFRASTRUCTURE EIROOS (IRISH OCEAN OBSERVING SYSTEM) AS AN EFFECTIVE COMPONENT OF THE EUROPEAN OCEAN OBSERVING SYSTEM (EOOS)
Paul Gaughan, Glenn Nolan, Caroline Cusack, Rob Thomas, Alan Berry, Guy Westbrook, Conall O Malley, Adam Leadbetter, Deirdre Fitzhenry, Mick Gilooly, Kieran Lyons
Marine Institute, Rinville, Oranmore, Co. Galway, Ireland
AbstractIreland occupies a unique location in the NE Atlantic - an important carbon sink and an area most vulnerable to changes in Atlantic circulation. Ireland has actively participated in European ocean observation projects from the EC Sixth Framework Programme through to Horizon 2020 leading to the development of ocean and climate observing systems from the coast to open ocean. However, infrastructure gaps remain which impact the capability to address scientific questions of national and global importance. Ireland’s longstanding scientific interaction at a European level coupled with significant state investments in ocean observation infrastructures has led to the development of EirOOS (the Irish Ocean Observing System). We demonstrate how EirOOS has developed, at a national level, into a key Research Infrastructure to further develop scientific and technical research capacity in sea level science, ocean circulation, and carbon sequestration to understand the connection between Ireland, its coastal seas and the Atlantic. The data infrastructure underpinning EirOOS is discussed and how it links the disparate elements of the distributed infrastructure together through harmonisation and interoperability of its data platforms.
The multi-level interaction and cooperation between EirOOS and other key marine European Research infrastructures like EMSO, EuroArgo and JERICO RI in terms of developing cohesive and impactful science, user and business cases for EirOOS to ensure it is delivering services and outputs defined by its stakeholders is discussed. Finally, the role of EirOOS as an effective and sustainable component in a distributed European Ocean Observing System with a description of the framework for integration is considered.

101ADVANCES IN OPERATIONAL OCEANOGRAPHY EXPANDING EUROPE’S OBSERVING AND FORECASTING CAPACITY
Keywords: Observing, coastal, shelf, ocean, climate, marine infrastructure, carbon cycle, sea level, sustainability, resilience, adaptation, technology, collaboration
1. Introduction
1.1 Overview The EirOOS (Irish Ocean Observing System) is a distributed Research Infrastructure operated by the Irish Marine Institute that provides ocean and climate observation data via a range of marine platforms to address key national scientific requirements and support enhanced Irish participation in European and International marine research.
EirOOS represents a culmination of ocean observation efforts in the NE Atlantic and Irish coastal waters over many years through the integration of a range of existing ocean observation infrastructures and a series of significant government funded upgrades of the national ocean and climate observing infrastructure. Key gaps in our understanding of the state and variability of the NE Atlantic Ocean include inter-annual variability of water masses, the sub-polar gyre and Atlantic Meridional Overturning Circulation (AMOC), ocean carbon dioxide uptake and regional sea level budget. Systematic observations of oceanographic processes in the Atlantic are needed to investigate ocean ecosystems and biogeochemistry changes and help assess the potential future climate change impacts in Irish waters.
1.2 Strategic drivers of EIROOSForecasting Ocean and Climate Change is a key strategic focus area for Ireland to develop an integrated multidisciplinary understanding of the structure, functioning and dynamics of the ocean and its ecosystems. It is a priority for Ireland to work with international partners through active participation in Research Infrastructures to observe and understand how our ocean is changing and determine how to respond to current and future patterns of change that impact Ireland’s economy and people. The Scientific advice and services underpin the societal goals of achieving a sustainable ocean economy, protecting and managing marine ecosystems and meeting EU obligations, e.g., Marine Strategy Framework Directive, OSPAR and ICES assessments.
Ireland’s first Statutory National Adaptation Framework (DECC, 2018) sets out the national strategy to reduce the vulnerability of the country to the negative effects of climate change especially the impact of extreme weather events and to avail of any positive impacts. The role of maintaining marine observation networks (including EIROOS) are identified as a contributor to Climate Change Adaptation research.
Accurate and reliable scientific advice and services underpin the societal goals of achieving a sustainable ocean economy, protecting and managing marine ecosystems and meeting EU obligations.

102 ADVANCES IN OPERATIONAL OCEANOGRAPHY
EirOOS will stimulate and develop the Irish ocean and climate research community, attracting international scientific and technical expertise. EirOOS offers considerable scope for enhanced industry engagement in provision of data to support industry and opportunities for small to medium enterprises (SMEs) and provide innovative new solutions addressing ocean and climate observing challenges. Combining different observing technologies, e.g., gliders, ship-based observations, moorings and tide gauges will provide the basic data requirements to constrain ocean forecasts and projections of future climate in Ireland.
1.3 Government Policy Enhanced National observational capacity in ocean and climate observation and research is supported in key Government Policy documents such as:
(1) Harnessing Our Ocean Wealth – An Integrated Marine Plan for Ireland (Government of Ireland, 2012), sets out the Irish Government’s vision, high-level goals and key enabling actions to put in place the appropriate policy, governance and business climate to enable Ireland’s marine potential to be realised;
(2) The National Marine Research & Innovation Strategy (Government of Ireland, 2017) which identified the need to increase opportunities for researchers in Ireland to access national infrastructure and facilities to carry out marine research, and test equipment in situ, as a key implementing action.
1.4 Scientific DriversThe EirOOS distributed infrastructure significantly enhances Irelands’ national capacity for monitoring and observing Essential Ocean Variables (EOVs) and Essential Climate Variables (ECVs) contributing to the European in situ ocean observing system (EOOS) and providing state-of-the-art research platforms for the Irish and international research communities.
• EirOOS infrastructure aims to enhance our basic scientific understanding of how the ocean works by collecting systematic high quality ocean observations from a variety of locations from the coast to the open ocean;
• Enhancement of observational and research platforms to support, and facilitate, greater participation in Horizon Europe Infrastructures, the developing European Ocean Observing System, and Copernicus Marine Environment Monitoring Service;
• Platforms for collection of long-term climate data to support climate vulnerability and impact assessment and adaptation planning to several government departments and local authorities including Department of Agricultural, Food and Marine;

103ADVANCES IN OPERATIONAL OCEANOGRAPHY EXPANDING EUROPE’S OBSERVING AND FORECASTING CAPACITY
• Enhanced carbon cycle monitoring will facilitate development of existing and growing Irish biogeochemical research community thereby increasing opportunities for European and international collaborations;
• Maintain and expand key marine observations for essential climate variables, endorsed by the UNFCCC Global Climate Observing system (GCOS), and support improved regional climate modelling, scenario development, forecasting and climate impact risk assessment;
• The EirOOS infrastructure is designed to facilitate new research opportunities by creating synergies between public bodies and higher education institutes. This has resulted in collaborative scientific cruise activities and joint deployments of ocean observing infrastructure underpinning worldclass scientific publications and reports.
1.5 Socio-economic Drivers The EirOOS Irish Ocean Observing System is defined as a distributed National Research Infrastructure (OECD 2020) to provide ocean and climate monitoring and research platforms to address key national needs and support enhanced Irish participation in European and international research.
• Provision of additional data for the calibration and validation of operational models for downstream services including Harmful Algal Bloom warning system, fisheries resource assessment, safety at sea, and search & rescue;
• Improved performance of buoy network to provide greater reliability for marine weather parameters and support collection of long-term climate information;
• Enhancement of national water level /wave data and other observational data to support coastal and surge flood forecasting;
• Support collaboration with industry;
• Provision of high-resolution Wave Data at Ocean Energy test sites to support Renewable Energy development.
104 ADVANCES IN OPERATIONAL OCEANOGRAPHY
2. Components of the EIROOS System
2.1 Physical Infrastructure Description EIROOS system comprises of a range of multi-platform marine infrastructures which have developed over the last 20 years and originating from disparate oceanographic research and monitoring programmes and activities. It comprises of the following platforms.
• Irish Marine Data Buoy Observation Network (IMDBON – Established 2001; previously known as the Irish weather buoy network): A network of 5 offshore buoys providing hourly meteorological measurements of air temperature, humidity, atmospheric pressure, wind speed and direction and, sea surface temperature, wave height and wave period;
• Irish Tide Gauge Network (ITGN – Established 2006): Near-real-time data delivery network of water level monitoring tide gauges around the coastline of Ireland. This network includes 3 GLOSS standard gauges and associated cGPS capability;
• Irish Glider programme (Established 2009): A fleet of Slocum S3 gliders offering cost-effective autonomous and adaptive observations of physical and biogeochemical ocean parameters;
• Seabed Lander Programme (Established 2018): Six seabed landers with associated moorings and instrumentation to observe shelf and shelf-edge currents;
• SmartBay Cabled Observatory (Established 2015): Shallow Water Subsea observatory supporting marine technology research;
• Irish Wave Buoy Network (Established 2006): Near-realtime data delivery network of high frequency wave monitoring platforms;
• Irish Coastal Buoy Network (Established 2008).
The infrastructure is supported and maintained by the National Research Vessel fleet which includes the RV Celtic Voyager and RV Celtic Explorer, state-of-the-art technical support facility and a purpose built cyber-infrastructure to acquire, process, integrate and analyse the disparate data feeds.
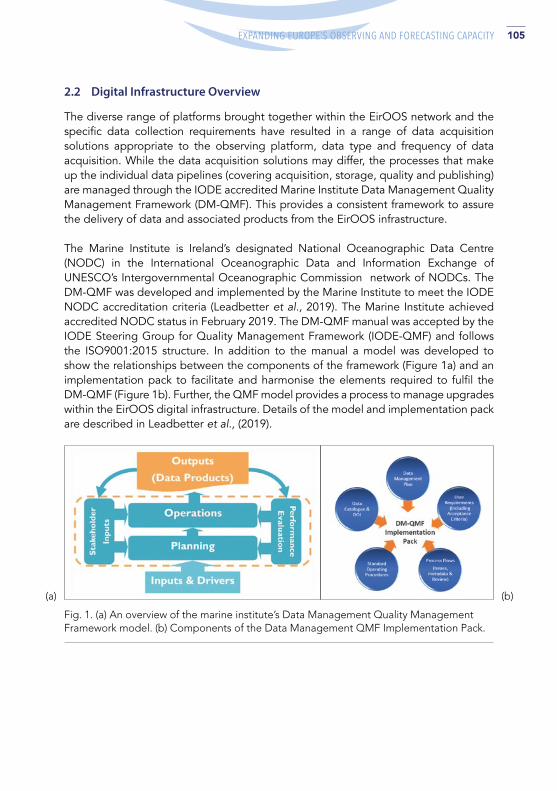
105ADVANCES IN OPERATIONAL OCEANOGRAPHY EXPANDING EUROPE’S OBSERVING AND FORECASTING CAPACITY
2.2 Digital Infrastructure Overview
The diverse range of platforms brought together within the EirOOS network and the specific data collection requirements have resulted in a range of data acquisition solutions appropriate to the observing platform, data type and frequency of data acquisition. While the data acquisition solutions may differ, the processes that make up the individual data pipelines (covering acquisition, storage, quality and publishing) are managed through the IODE accredited Marine Institute Data Management Quality Management Framework (DM-QMF). This provides a consistent framework to assure the delivery of data and associated products from the EirOOS infrastructure.
The Marine Institute is Ireland’s designated National Oceanographic Data Centre (NODC) in the International Oceanographic Data and Information Exchange of UNESCO’s Intergovernmental Oceanographic Commission network of NODCs. The DM-QMF was developed and implemented by the Marine Institute to meet the IODE NODC accreditation criteria (Leadbetter et al., 2019). The Marine Institute achieved accredited NODC status in February 2019. The DM-QMF manual was accepted by the IODE Steering Group for Quality Management Framework (IODE-QMF) and follows the ISO9001:2015 structure. In addition to the manual a model was developed to show the relationships between the components of the framework (Figure 1a) and an implementation pack to facilitate and harmonise the elements required to fulfil the DM-QMF (Figure 1b). Further, the QMF model provides a process to manage upgrades within the EirOOS digital infrastructure. Details of the model and implementation pack are described in Leadbetter et al., (2019).
Fig. 1. (a) An overview of the marine institute’s Data Management Quality Management Framework model. (b) Components of the Data Management QMF Implementation Pack.
(a) (b)

106 ADVANCES IN OPERATIONAL OCEANOGRAPHY
For data set discovery the Marine Institute manages a data catalogue (https://data.marine.ie), which includes records for the EirOOS infrastructure, sensors, deployments and data collections. For more details of the modular structure of the data catalogue see Leadbetter et al., (2020). The catalogue publishes INSPIRE compliant metadata, which is harvested for incorporation into national data catalogues (Irish Spatial Data Exchange, data.gov.ie), and publishes Schema.org metadata for harvesting by Google Dataset search. Schema.org is a metadata ontology used by the major search engine providers and expands to cover environmental datasets (Leadbetter et al., 2018).
EirOOS metadata and data are published to relevant standards (ISO19139, ISO19156 & OGC) as appropriate and use the SeaDataNet vocabularies published on the NERC Vocabulary Server. The data catalogue records are used in the DOI publication process and act as the DOI landing page. Links to the data download options are provided from the catalogue records.
EirOOS data are provided through a single publication layer (https://erddap.marine.ie). Despite the different platforms, data acquisition systems, processing pipelines, technologies and storage media (SQL databases, noSQL databases, ASCII files, binary files, images) that have been adopted to meet the needs of each of the EirOOS components. This was achieved using NOAA’s Erddap data server. The Erddap software also enables a user to select their preferred download format and carry out basic visualisations of the data prior to download. Erddap is accessible through a common RESTful API for scripted machine-to-machine interactions or by a user accessing the GUI to filter or subset a dataset. At a European level, near-real-time data are harvested daily by EMODnet Physics and Copernicus Marine Environmental Monitoring Services (CMEMS) from the Marine Institute Erddap server. The use of Erddap also provides the functionality for EirOOS datasets to be federated for inclusion on another organisational servers (e.g., the SmartBay datasets are also available through http://erddap.emso.eu/erddap/index.html) without the need for data replication, synchronisation or duplication of storage. In addition, the Marine Institute actively contributes data to the European SeaDataNet data management infrastructure after delayed mode Quality Control is carried out. Making data available to SeaDataNet allows the use of these data into the various data products generated by EMODnet and projects such as SeaDataCloud (e.g., temperature and salinity climatologies). EirOOS data are also available through Ireland’s Digital Ocean web portal (https://digitalocean.ie). The web portal provides data visualisations through platform specific data dashboards (Figure 2) making the data accessible to all. Ireland’s Digital Ocean and associated data dashboards access the underlying data from the Erddap server.
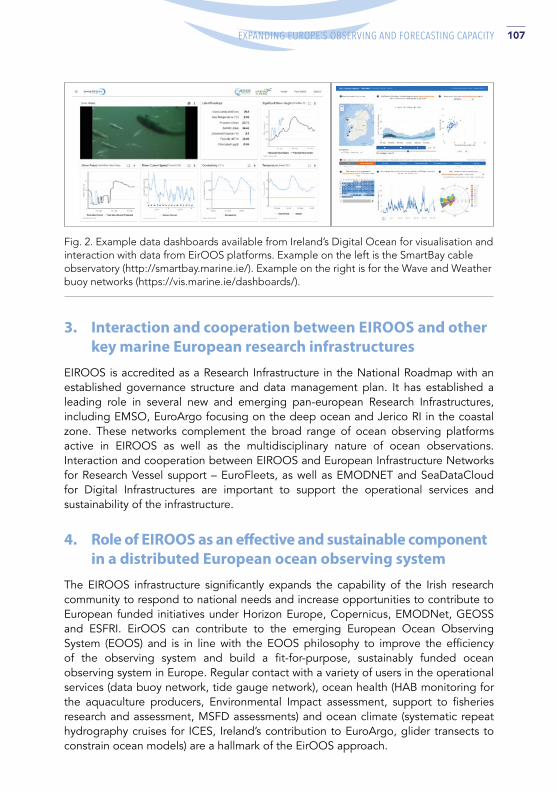
107ADVANCES IN OPERATIONAL OCEANOGRAPHY EXPANDING EUROPE’S OBSERVING AND FORECASTING CAPACITY
Fig. 2. Example data dashboards available from Ireland’s Digital Ocean for visualisation and interaction with data from EirOOS platforms. Example on the left is the SmartBay cable observatory (http://smartbay.marine.ie/). Example on the right is for the Wave and Weather buoy networks (https://vis.marine.ie/dashboards/).
3. Interaction and cooperation between EIROOS and other key marine European research infrastructures
EIROOS is accredited as a Research Infrastructure in the National Roadmap with an established governance structure and data management plan. It has established a leading role in several new and emerging pan-european Research Infrastructures, including EMSO, EuroArgo focusing on the deep ocean and Jerico RI in the coastal zone. These networks complement the broad range of ocean observing platforms active in EIROOS as well as the multidisciplinary nature of ocean observations. Interaction and cooperation between EIROOS and European Infrastructure Networks for Research Vessel support – EuroFleets, as well as EMODNET and SeaDataCloud for Digital Infrastructures are important to support the operational services and sustainability of the infrastructure.
4. Role of EIROOS as an effective and sustainable component in a distributed European ocean observing system
The EIROOS infrastructure significantly expands the capability of the Irish research community to respond to national needs and increase opportunities to contribute to European funded initiatives under Horizon Europe, Copernicus, EMODNet, GEOSS and ESFRI. EirOOS can contribute to the emerging European Ocean Observing System (EOOS) and is in line with the EOOS philosophy to improve the efficiency of the observing system and build a fit-for-purpose, sustainably funded ocean observing system in Europe. Regular contact with a variety of users in the operational services (data buoy network, tide gauge network), ocean health (HAB monitoring for the aquaculture producers, Environmental Impact assessment, support to fisheries research and assessment, MSFD assessments) and ocean climate (systematic repeat hydrography cruises for ICES, Ireland’s contribution to EuroArgo, glider transects to constrain ocean models) are a hallmark of the EirOOS approach.

108 ADVANCES IN OPERATIONAL OCEANOGRAPHY
While the fitness for purpose of the EirOOS system is well established through regular feedback from the users, challenges remain around the sustainability of some EirOOS infrastructure elements. Activities related to the national data buoy network and systematic annual repeat hydrography cruises enjoy a degree of continuous long-term support. Others, including Argo, glider deployments and tide gauge networks are funded on a more opportunistic basis, with efforts ongoing at national level to secure longer-term funding streams. EirOOS can contribute to the EOOS implementation plan and benefit from the EOOS unified voice of the key operators and users of ocean observing infrastructure at national and European level. The EOOS activity is aligned with implementation of the GOOS 2030 strategy (Tanhua et al., 2019) and the emerging UN Decade of Ocean Science for Sustainable Development.
By facilitating the potential for a wide range of physical and biogeochemical oceanographic and climate research, EirOOS offers the research community an opportunity to address key scientific and societal challenges.
5. ConclusionsThe establishment of long term, sustainable, multidisciplinary, fit-for-purpose ocean observing infrastructure is a key ambition for Ireland to bridge historical shortcomings and gaps in observed EOVs/ECVs, spatial and temporal resolution and data quality and volume. The expanded marine infrastructure capabilities provided by EirOOS, coupled with harnessing the power of state-of-the-art digital infrastructures and modelling tools, to bridge these gaps provides the basis and knowledge for the oceanographic ‘community of users’ to investigate and address ocean and coastal processes that impact society.
AcknowledgementsEirOOS is supported in part by Science Foundation Ireland under Grant N°. 18/RI/5731
ReferencesGovernment of Ireland, Department of the Environment, Climate and Communications 2018. National Adaptation Framework. Planning for a Climate Resilient Ireland https://www.gov.ie/en/publication/fbe331-national-adaptation-framework/
Government of Ireland (2012), Inter-Departmental Marine Coordination Group (MCG), Harnessing Our Ocean Wealth - An Integrated Marine Plan (IMP) for Ireland, July 2012.Government of Ireland (2017), The National Marine Research & Innovation Strategy 2017-2021
Leadbetter, A., Carr, R., Flynn, S., Meaney, W., Moran, S., Bogan, Y., Brophy, L., Lyons, K., Stokes, D. & Thomas, R. Implementation of a Data Management Quality Management Framework at the Marine Institute, Ireland. Earth Science Informatics (2019). https://doi.org/10.1007/s12145-019-00432-w

109ADVANCES IN OPERATIONAL OCEANOGRAPHY EXPANDING EUROPE’S OBSERVING AND FORECASTING CAPACITY
Leadbetter, A., Meaney, W., Tray, E., Conway, A., Flynn, S., Keena, T. Kelly, C. and Thomas, R. (2020). A modular approach to cataloguing marine science data. Earth Science Informatics. https://doi.org/10.1007/s12145-020-00445-w
Leadbetter, A., Thomas, R., Shepherd, A., Fils, D. and O’Brien, K. (2018). The place of Schema.org in Linked Ocean Data. Bolletino di Geofisica teorica ed applicata, v.59, 2018, p.133-135.
OECD, Optimising the operation and use of national research infrastructures (oecd-ilibrary.org) (2020) OECD Science, Technology And Industry Policy PAPERS, August 2020 N°. 91
Tanhua, Toste & McCurdy, Andrea & Fischer, Albert & Appeltans, Ward & Bax, Nic & Currie, Kim & Deyoung, Brad & Dunn, Daniel & Heslop, Emma & Glover, Linda & Gunn, John & Hill, Katherine & Ishii, Masao & Legler, David & Lindstrom, Eric & Miloslavich, Patricia & Moltmann, Tim & Nolan, Glenn & Palacz, Artur & Wilkin, John. (2019). What We Have Learned From the Framework for Ocean Observing: Evolution of the Global Ocean Observing System. Frontiers in Marine Science. 6. 10.3389/fmars.2019.00471.
Wilkinson, M., Dumontier, M., Aalbersberg, I. et al., (2016). The FAIR Guiding Principles for scientific data management and stewardship. Scientific Data. https://doi.org/10.1038/sdata.2016
110 ADVANCES IN OPERATIONAL OCEANOGRAPHY
INVESTIGATING THE CAPABILITY OF ARGO FLOATS TO MONITOR SHALLOW COASTAL AREAS OF THE MEDITERRANEAN SEADimitris Kassis (1), Giulio Notarstefano (2), Inmaculada Ruiz-Parrado (3),
Vincent Taillandier (4), Lara Díaz-Barroso (3), Esterine Evrard (5), Romain Cancouët (5) and Luca Arduini Plaisant (5)
(1) Institute of Oceanography, Hellenic Centre for Marine Research, PO Box 712 Anavyssos, Attica GR-190 13, Greece, [email protected]
(2) National Institute of Oceanography and Applied Geophysics - OGS, Borgo Grotta Gigante 42/C 34010 - Sgonico (TS), Italy, [email protected]
(3) Balearic Islands Coastal Observing and Forecasting System - SOCIB, Parc Bit, 07121 Palma, Spain, [email protected], [email protected]
(4) Sorbonne Université, CNRS, UMR 7093, Laboratoire d’Océanographie de Villefranche, Villefranche/mer, France, [email protected]
(5) Euro-Argo ERIC, Campus Ifremer - Technopole Brest Iroise 1625 Route de Sainte-Anne 29280 Plouzané – France, [email protected], [email protected],
Abstract The extension of Argo float coverage to the European marginal seas is one of the strategic targets of the Euro-Argo European Research Infrastructure Consortium (ERIC). Under this general framework, the Argo capability to monitor the shallow coastal shelf remains an open question. In the Euro-Argo RISE H2020 project, targeted deployments have been undertaken to investigate this potential. In this study, we present the experience and outcomes from 4 such deployments in areas of the Mediterranean Sea with intrigue coastlines and complex bathymetry (north Aegean, north Adriatic, south Palma, and Gulf of Lions). We focus on the floats’ configuration settings and the monitoring tools/software that have been utilized to follow the floats’ performance. Our results show that certain configuration parameters such as the drifting depth, and the sampling frequency, play a significant role in the floats’ performance. Technological advances both on the floats’ characteristics and on the monitoring-controlling tools can lead to significant improvements of similar missions in the near future. The fact that all floats achieved successful missions and acquired data showing important hydrographic features, highlights the importance of Argo expansion in targeted shallow coastal areas where Argo can be a complementary part of an integrated oceanographic monitoring system for the Mediterranean Sea.

111ADVANCES IN OPERATIONAL OCEANOGRAPHY EXPANDING EUROPE’S OBSERVING AND FORECASTING CAPACITY
Keywords: Drifting Profilers, Argo Profiles, Argo Trajectories, Coastal Monitoring, Marginal Seas
1. Introduction The operational oceanographic monitoring of the coastal waters of the European Marginal Seas (EMS) has lately been a top priority because of the anthropogenic pressures and climatic variability that affect their hydrography and ecosystems with important socio-economic impacts. However, the establishment of an adequate and cost-effective integrated observation system remains a challenging task which will require international cooperation and synergies between different oceanographic platforms. For the global Argo system, which during the last two decades has been providing unprecedented amounts of cost effective and high spatiotemporal resolution data from the global ocean (Riser et al., 2016), the extension into regions that were previously under sampled, such as the ice-covered regions and the marginal seas, is ongoing (Jayne et al., 2017). Regarding the EMS, the Euro-Argo European Research Infrastructure Consortium (Euro-Argo ERIC) has timely adopted a plan for Argo expansion which is described in its strategic targets (Euro-Argo ERIC, 2017). This has resulted in an increasing number of float coverage in the Nordic, Baltic, Mediterranean, and Black Seas that has produced enhanced datasets and allowed better oceanographic monitoring during the last years. During the last decade, the systematic use of Argo floats has initiated a new era of oceanographic monitoring in the Mediterranean’s different sub-basins (Figure 1) revealing important hydrological features, and strongly variable climatic signals (Kassis and Korres, 2020).
Under the Euro-Argo RISE H2020 project, the further extension of Argo deployments along the Mediterranean’s coastal sub-basins is investigated. In this study we focus on the preliminary results from four standard CTD Argo float deployments in specific targeted areas (Kassis et al., 2021 D6.2). We present a summary of the floats’ performance in conjunction with the various configuration schemes used in each test case. We attempt to assess the available operational monitoring tools used by the floats’ operators in order to provide recommendations on similar future activities. The outcomes of the missions are promising and highlight the important complementary role Argo floats have on the integrated monitoring system of the Mediterranean’s coastal zone.

112 ADVANCES IN OPERATIONAL OCEANOGRAPHY
Fig. 1. Interannual variability of float population in the Mediterranean Sea.
2. Methods and tools
2.1 Floats’ configuration and deploymentAll floats were deployed between late-2019 and mid-2020 at specific targeted locations identified by the operators (Table I). The floats integrated the standard CTD sensors and were equipped with the Iridium bi-directional telemetry system. Operators pre-configured them with slightly different mission parameters according to the characteristics of each area and the target of each mission. More specifically, the float deployed in the North Aegean by HCMR was configured to perform 2-day cycles, drift and perform profiles at 800 m depth. The high frequency sampling and the deep drifting depth were chosen in order for the float to remain in the relatively deep trench after the shelf-break. A similar configuration albeit modified for a shallower plateau, was used for the float deployed by OGS in the North Adriatic where both parking and profiling depths were set to 200 m. The cycling period in that case was initially set to 2 days and changed early to 5 days. For the Ligurian Sea experiment (SU), the parking and profiling depths were set deeper (1000 m) and the cycling period was set to 3 days. For the Palma Bay case the float deployed by SOCIB was set to drift at 100 m and profile at 1000 m depth at a cycle period of 24 hours, changed to 5 days some months later.

113ADVANCES IN OPERATIONAL OCEANOGRAPHY EXPANDING EUROPE’S OBSERVING AND FORECASTING CAPACITY
2.2 Monitoring of the floats’ performance Through the recently updated Euro-Argo monitoring tool (https://fleetmonitoring.euro-argo.eu/dashboard), a variety of parameters were made available regarding the floats’ mission (Figure 2). This generic tool provides information regarding technical and functional parameters of the floats’ performance allowing the float operator to make timely decisions for new configuration settings if needed. In addition to this system, customized tools have been tested, such as automatic email alert systems that provide the float position and the depth of the sea at the float location almost in real time (Notarstefano et al., 2020 D6.1). Thus, with the combination of such tools the float operator was provided with graphical representations of the floats’ metadata, along with technical parameters and alerts for malfunction and detection of early failures.
FLOAT T YPE WMO DEPLOYMENT
DATEDEPLOYMENT LOCATION
LAST STATION DATE
C YCLES PERFORMED
APEX 11 6903288 9 February 2020 North Aegean Lat: 40.42 N, Lon: 25.42 E 5 October 2020 120
ARVOR I 6903783 31 July 2020 North Adriatic Lat: 44.05 N, Lon: 13.7 E 6 February 2021 40
PROVOR III 6902899 12 November 2019 Ligurian Sea Lat: 43.35 N, Lon 7.90 E 13 April 2021 165
ARVOR I 6901278 12 March 2020 Palma Bay Lat: 39.38 N, Lon: 2.52 E 10 April 2021 130
Table I: Floats’ deployment information
Fig. 2. Latest location of Euro-Argo RISE floats (yellow – active, grey – inactive) provided by the Euro-Argo monitoring tool (https://fleetmonitoring.euro-argo.eu/dashboard).
114 ADVANCES IN OPERATIONAL OCEANOGRAPHY
3. Results The floats’ missions were successful since floats managed to operate for a long time in the targeted areas (2 of the floats are still operational), providing an adequate number (Table I) of good quality profiles. In the North Aegean, the float managed to sample in high frequency for 8 months providing a large number of good quality profiles for the first time in this area. The total number of 120 profiles acquired by the float largely exceeds the average profile number per float in the area which was until now approximately 90. This fact can be assigned to the high sampling frequency and to the relatively deep parking depth that prevented the float from drifting along the coastline. Regarding the North Adriatic case, the configuration used seemed adequate for the float to explore this shallow plateau. The operators were able to control the float’s drift by limiting the displacements in a small area around the deployment location whilst the programmed grounding at every cycle did not have any particular impact on the float’s behaviour. Regarding the Ligurian Sea mission, the initial strategy of setting the drifting depth deeper than the core of the Liguro-Provençal current along with the relatively high cycling frequency, provided a characterization of the current during the winter period of 2019 – 2020. This first attempt of float programming proposes a compromise between monitoring the current in a pure Lagrangian point of view and increasing the residence time in this dynamically intense circulation feature. For the Palma Bay mission, it was shown that strong surface currents could make the float drift on the surface farther than intended. Such conditions were revised from the weather forecasts and the numerical models beforehand in order to make the surfacing time shorter trying to avoid the surface drift or to make the float drift to the desired direction at the surface. The experiment showed that if the float is maintained deeper, it would be kept in the area of interest.
Apart from the mission assessment under a technical point of view, the floats’ operations provided interesting oceanographic information based on both the acquired profiles and performed trajectories. Such an example is the longitudinal gradient of both temperature and salinity at the deep layers of the North Aegean (Figure 3) observed between the eastern and the western part of the sub-basin. This is expressed by colder and fresher deep water masses towards the west and may reflect the result of variable dense water formation mechanisms in the area.
4. Discussion and future recommendations Certain configuration settings seem to have played a significant role in the previously described operations. The ‘deep’ parking depth, in the sense that this is either close or even identical to the profiling depth parameter, has been proved advantageous to the missions. In all cases it is shown that this setting prevented the float from drifting away from the targeted area. More specifically, in the operations of South Palma and Ligurian Sea, deep parking was chosen since the strong surface and subsurface currents are identified as the main factor for the float’s drift. In the North and Central Adriatic

115ADVANCES IN OPERATIONAL OCEANOGRAPHY EXPANDING EUROPE’S OBSERVING AND FORECASTING CAPACITY
and North Aegean cases, the parking depth was set close to the sea-bed or deep enough so as the float to remain ‘trapped’ in depression plateaus and deep trenches. Moreover, the fact that the floats often grounded on the bottom did not seem to have any particular impact on their behaviour. Another common strategy followed was the high frequency sampling. The operators’ choice to set profiling cycles that varied between 1 and 5 days was also proven advantageous. It has provided a large number of profiles in important and highly variable areas, but also acted as a preventing factor for the floats to drift in long distances between two consequent profiles especially in areas where strong deep currents prevail. Furthermore, the high sampling frequency provided trajectory data of valuable information regarding the near bottom current activity.
Although still in a preliminary phase, the operational use of Argo floats in shallow coastal areas can potentially be an important part of an integrated oceanographic monitoring system in the Mediterranean Sea. The experience we gained from the presented deployments highlights the added value of Argo through the provision of high quality, and spatiotemporally dense datasets in areas that were previously under-sampled. Either being autonomous, or acting complementary to other monitoring platforms such as gliders and moorings, coastal Argo missions can lead to enhanced monitoring and investigation of variable and transitional areas being a valuable source of information regarding the hydrography and ecosystem functioning. This will however require a well-planned monitoring strategy and will rely on the ability of the float operators to control the floats and alternate their missions in near real-time. Operational tools (Figure 4) and additional information such as estimations of the currents activity, weather conditions and forecasts, hydrodynamic data from numerical models, will be crucial for the float operators. Such advanced monitoring tools can lead to significantly improved missions in the near future whilst, given the special characteristics of such missions, the possibilities of early recoveries and redeployments should also be explored in order to minimize the cost of early float losses.
Fig. 3. Hovmöller diagrams of temperature (left), and practical salinity (right) from the first 55 profiles transmitted by the 6903288 in the North Aegean Sea.
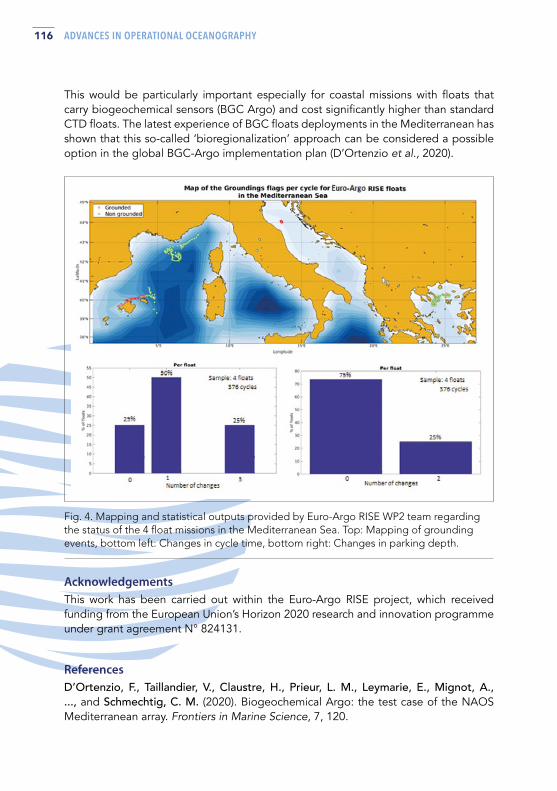
116 ADVANCES IN OPERATIONAL OCEANOGRAPHY
This would be particularly important especially for coastal missions with floats that carry biogeochemical sensors (BGC Argo) and cost significantly higher than standard CTD floats. The latest experience of BGC floats deployments in the Mediterranean has shown that this so-called ‘bioregionalization’ approach can be considered a possible option in the global BGC-Argo implementation plan (D’Ortenzio et al., 2020).
Fig. 4. Mapping and statistical outputs provided by Euro-Argo RISE WP2 team regarding the status of the 4 float missions in the Mediterranean Sea. Top: Mapping of grounding events, bottom left: Changes in cycle time, bottom right: Changes in parking depth.
AcknowledgementsThis work has been carried out within the Euro-Argo RISE project, which received funding from the European Union’s Horizon 2020 research and innovation programme under grant agreement N° 824131.
ReferencesD’Ortenzio, F., Taillandier, V., Claustre, H., Prieur, L. M., Leymarie, E., Mignot, A., ..., and Schmechtig, C. M. (2020). Biogeochemical Argo: the test case of the NAOS Mediterranean array. Frontiers in Marine Science, 7, 120.
117ADVANCES IN OPERATIONAL OCEANOGRAPHY EXPANDING EUROPE’S OBSERVING AND FORECASTING CAPACITY
Euro-Argo ERIC, 2017: Strategy for evolution of Argo in Europe. EA-2016-ERIC STRAT.
https://doi.org/10.13155/48526
Notarstefano, G., Pacciaroni, M., Kassis, D., Palazov, A., Slabakova, V., Tuomi, L.,
Siiriä, S., Walczowski, W., Merchel, M., Allen, J., Ruiz, I., Diaz, L., Taillandier, V., Arduini-Plaisant, L., and Cancouët, R. (2021) Tailoring of the controlling and monitoring tools for operations in shallow coastal waters, Euro-Argo RISE H2020 project Deliverable 6.1, under EC review.
Jayne, S. R., Roemmich, D., Zilberman, N., Riser, S. C., Johnson, K. S., Johnson, G. C., and Piotrowicz, S. R. (2017). The Argo program: present and future. Oceanography, 30(2), 18-28.
Kassis, D., and Korres, G. (2020). Hydrography of the Eastern Mediterranean basin derived from argo floats profile data. Deep Sea Research Part II: Topical Studies in Oceanography, 171, 104712.
Kassis, D., Notarstefano, G., Taillandier, V., Ruiz, I., Diaz, L., Cancouet, R., Evrard, E., and Arduini Plaisant, L. (2021). Preliminary results of shallow coastal float operations in the Mediterranean Sea Euro-Argo RISE H2020 project Deliverable 6.2, under EC review.
Riser, S. C., Freeland, H. J., Roemmich, D., Wijffels, S., Troisi, A., Belbéoch, M., ... and Jayne, S. R. (2016). Fifteen years of ocean observations with the global Argo array. Nature Climate Change, 6(2), 145-153.

118 ADVANCES IN OPERATIONAL OCEANOGRAPHY
AL HOCEIMA LAUNCHES ITS FIRST FUNCTIONAL MARINE OBSERVATORY IN NORTH AFRICAHoussini Nibani (1), Karim Hilmi (2), Asma Damghi (3), Laurent Beguery (4),
Orens Fommervault (4) and Zouhair Amhaoauch (5) (1) Association de Gestion Intégrée des Ressources (AGIR) & Moroccan ODYSSEA Observatory Leader
188 Rue Mbarek Albekkay 32000, Al Hoceima, Morocco, [email protected](2) Vice President of the Intergovernmental Oceanographic Commission of UNESCO (IOC/UNESCO),
7 Place de Fontenoy, Paris, France (3) Abdelmalek Essaadi University Tetouan, Avenue Hassan 1er MARTIL, Tetouan, Morocco(4) Alseamar, 60 Avenue Olivier Perroy, 13790 Rousset, France(5) Direction de la Lutte Contre la Désertification et la Protection de la Nature, DEF,
Rue Haroun Errachid, Agdal, Rabat, Morocco
Abstract In the framework of the European project ODYSSEA, the Moroccan Association leader of the Marine Observatory of Al Hoceima AGIR, has successfully performed two glider missions in the South Alboran Sea. The vehicle was a SeaExplorer glider (manufactured and commercialized by ALSEAMAR, France) equipped with a CTD probe (GPCTD, seabird) and a novel microplastic sensors (LEITAT). These glider missions, permitted the acquisition of hydrological parameters at an unprecedented high spatio-temporal resolution for the area, and to fill a huge data gap. The first glider mission was mainly dedicated to the sampling of the western gyre of the Alboran Sea (WAG), a major dynamical structure of the area. During this mission the glider dived following a typical sawtooth trajectory within the water-column, from the surface and up to 500 m-depth. Glider data revealed the vertical structure of the WAG and provided an interesting insight of its dynamics (water-currents, variability, etc.), supplementing information obtained by satellite. To our knowledge, this pioneer work is among on the first oceanographic survey entirely dedicated to the study of the WAG.
Keywords: western Alboran Sea; gyre; underwater glider; thermocline; isopycnal vertical excursions; autonomous mechanical system
1. Introduction The association AGIR, Moroccan partner of the ODYSSEA Project funded by the European Union, has successfully deployed SeaExplorer (Alseamar, France) underwater gliders in the south Alboran Sea. Underwater gliders are autonomous buoyancy-controlled UUV that move through the water column by changing their density, coming periodically to the surface for data transmission (Rudnick et al., 2004). These vehicles are beginning to prove

119ADVANCES IN OPERATIONAL OCEANOGRAPHY EXPANDING EUROPE’S OBSERVING AND FORECASTING CAPACITY
their large potential in modern oceanography and have an increasingly important place in ocean monitoring studies. Two marine prospection missions were achieved. The first mission took place in late fall, from November 10 to December 11, 2020 (30 days). During this 1-month mission the glider performed a total of 753 cycles. The second mission occurred in late winter – early spring, from February 11 to March 23, 2021 (40 days, 873 cycles).
The glider was equipped with novel microplastic sensor developed in the framework of the ODYSSEA project and a typical GPCTD probe that allow for the measurement of pressure (P), temperature (T) and conductivity. GPCTD data were adjusted from thermal lag effect and processed according the procedure described in Garau et al., 2011. Salinity (S) was derived from raw conductivity measurements and the density was approximated with the 48-term function of T, S and P (TEOS-10). GPCTD data are acquired with a 4s sampling period and subsampled to 30s for real-time data transmission by Iridium.
In this paper, only measurements acquired during the first mission by the GPCTD are presented. Data from the second period and from the microplastic sensor are still being analyzed and will not be discussed hereafter.
2. Mission design A large part of the first glider mission (17 days, November 10-27) was devoted to monitor offshore Moroccan Mediterranean waters (Figure 1) and, more precisely, the Western Alboran Gyre (WAG) that is one of the largest and most persistent features in the Alboran Sea (e.g. Brett et al., 2020). The last 10 days of the mission aimed to focus on coastal areas of interest along the Moroccan coast (Figure 1), namely the Al Hoceima Marine Park, the Xauen Bank and the Tofino Bank, which are proposed as future MPAs.
Fig. 1. Map showing the route and cycles of the Glider during the first mission.
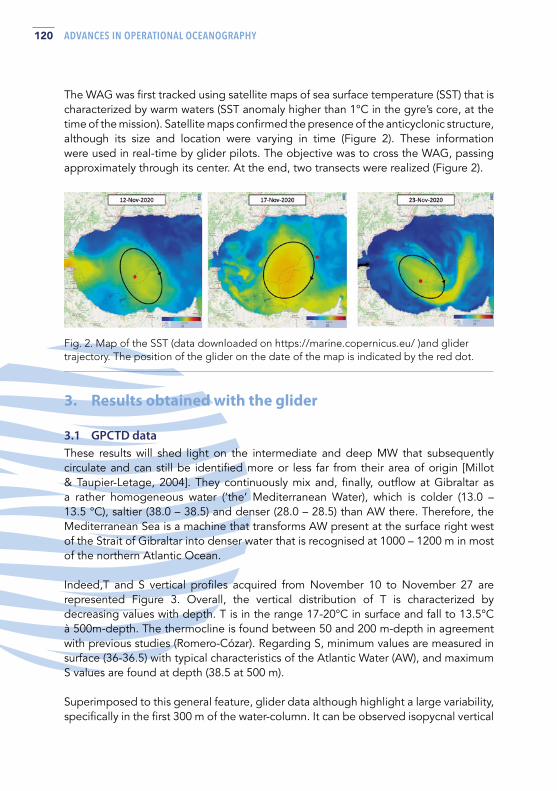
120 ADVANCES IN OPERATIONAL OCEANOGRAPHY
Fig. 2. Map of the SST (data downloaded on https://marine.copernicus.eu/ )and glider trajectory. The position of the glider on the date of the map is indicated by the red dot.
The WAG was first tracked using satellite maps of sea surface temperature (SST) that is characterized by warm waters (SST anomaly higher than 1°C in the gyre’s core, at the time of the mission). Satellite maps confirmed the presence of the anticyclonic structure, although its size and location were varying in time (Figure 2). These information were used in real-time by glider pilots. The objective was to cross the WAG, passing approximately through its center. At the end, two transects were realized (Figure 2).
3. Results obtained with the glider
3.1 GPCTD dataThese results will shed light on the intermediate and deep MW that subsequently circulate and can still be identified more or less far from their area of origin [Millot & Taupier-Letage, 2004]. They continuously mix and, finally, outflow at Gibraltar as a rather homogeneous water (‘the’ Mediterranean Water), which is colder (13.0 – 13.5 °C), saltier (38.0 – 38.5) and denser (28.0 – 28.5) than AW there. Therefore, the Mediterranean Sea is a machine that transforms AW present at the surface right west of the Strait of Gibraltar into denser water that is recognised at 1000 – 1200 m in most of the northern Atlantic Ocean.
Indeed,T and S vertical profiles acquired from November 10 to November 27 are represented Figure 3. Overall, the vertical distribution of T is characterized by decreasing values with depth. T is in the range 17-20°C in surface and fall to 13.5°C à 500m-depth. The thermocline is found between 50 and 200 m-depth in agreement with previous studies (Romero-Cózar). Regarding S, minimum values are measured in surface (36-36.5) with typical characteristics of the Atlantic Water (AW), and maximum S values are found at depth (38.5 at 500 m).
Superimposed to this general feature, glider data although highlight a large variability, specifically in the first 300 m of the water-column. It can be observed isopycnal vertical

121ADVANCES IN OPERATIONAL OCEANOGRAPHY EXPANDING EUROPE’S OBSERVING AND FORECASTING CAPACITY
Fig. 3. Temperature and salinity data acquired during the first part of the mission. The black lines are the isopycnal levels and the white dashed line is the depth of the mixed layer (density criterion of 0.003 kg.m3). The red dots are related to the same profile as in Figure 2.
3.2 Water-current dataEstimating water-current was of particular interest. On a hand it can help to understand the hydrodynamic context in which the glider mission take place. On the other hand, this provides useful information for piloting purpose. In particular, the winter period of the Glider deployment coincided with a very strong long temporal in the Alboran Sea generating strong currents that made sea operations and glider navigation tricky.
excursions (black lines on Figure 3) that are directly related to position of the glider relative to the WAG. At the time when the glider is located within the WAG, surface waters are warm (>20°C) and relatively fresh (<36.5), up to about 150 m-depth. This results in the deepening of isothermal layers of several tens meters. Conversely, when the glider is outside the structure (e.g. the 16-17th November 2020, Figure 1 et 2), isopycnal are the shallowest with cold and salty deep-waters reaching almost the surface.

122 ADVANCES IN OPERATIONAL OCEANOGRAPHY
From the glider it is possible to assess water-currents using additional information:
• In surface, currents can be obtained by the glider drift and GPS fixes, each time the glider surfaces;
• Within the water-column, vertically averaged values can be estimated by comparing the dead-reckoned displacement (theoretical glider displacement in a quiescent ocean) and the observed glider position at surface.
Results are shown in Figure 4. First, it is interesting to observe that the surface velocities are strongly related to the subsurface (geostrophic) flow. Indeed, the variations of surface currents and vertically averaged currents are observed simultaneously in intensity and direction. At the surface, the measured velocities are high even offshore, and can reach up to 1 m.s1, confirming very strong current during the mission, as it can be expected for the season. In the subsurface, the average value of the current in the 0-500 m layer is in the range 0.05-0.3 m.s1 which is quite high challenging for the glider navigation (one can compare these values with the horizontal speed of the glider ~0.2-0.3 m.s1).
Fig. 2. Map of (left) average current from dead-reckoned track and (right) surface current estimated from GPS position. The color bar indicates bathymetry (EMODnet).
The rotating structure of the current again confirms the presence of the WAG. This pattern is particularly apparent during the first transect, i.e. when the structure was rather stationary. This confirms that WAG play a key role in dynamic of the whole the area. Another interesting feature of the area is the strong westward coastal current observed at low bathymetry, when the glider approached the coast.
In addition, further micro-analyses of the in-situ data provided by the two missions, could possibly provide additional elements to contribute to the clarification of circulation problems, currently posed within the Mediterranean [Millot & Taupier-Letage, 2004]; and enrich the debate on the major characteristics of the circulation in the western basin. Indeed, for the first time these two missions from the Al Hoceima

123ADVANCES IN OPERATIONAL OCEANOGRAPHY EXPANDING EUROPE’S OBSERVING AND FORECASTING CAPACITY
Observatory in the southern Al Boran Sea, will reinforce the intensive experiments involving numerous and sophisticated instruments, as well as theoretical and numerical studies, conducted in the Western Basin from the main laboratories were from the riparian (northern) countries, so that the general characteristics are better described and known.
4. Conclusion This glider mission, as such, can be considered of huge interest considering the amount of new data collected and the overall historical data scarcity in the south Alboran Sea. This mission can also be considered as one of the very few works done on the WAG using in-situ measurements. Glider data provided crucial information that complement satellite observations and revealed the vertical structure of the WAG at an unprecedented spatio-temporal resolution. These results are a preliminary analysis. Further work is needed to fully investigate the mechanism involved, to highlight the suspected role of the WAG in homogenizing the freshwater masses of the Atlantic jet with the warmer and saltier water masses of the Mediterranean, or the WAG rule to increase the resilience of the Alboran marine ecosystem to the effects of climate change. This mission also shows the great potential of using gliders in integrated, multi-platform marine observatories.
ReferencesBrett, G. J., Pratt, L. J., Rypina, I. I., & Sánchez-Garrido, J. C. (2020). The Western Alboran Gyre: An analysis of its properties and its exchange with surrounding water. Journal of Physical Oceanography, 50(12), 3379-3402.
Jeanette Romero-C´ozar a, Jamal Chioua b , Marina Bolado-Penagos a , Julio Reyes-Pérez a , Juan Jesús G´omiz-Pascual a , ´Agueda V´azquez a , Sara Sirviente a , Miguel Bruno a (2020). Tidally-induced submesoscale features in the atlantic jet and Western Alboran Gyre. A study based on HF radar and satellite images, AI ,9-13.
Garau, B., Ruiz, S., Zhang, W. G., Pascual, A., Heslop, E., Kerfoot, J., & Tintoré, J. (2011). Thermal lag correction on Slocum CTD glider data. Journal of Atmospheric and Oceanic Technology, 28(9), 1065-1071.
Rudnick, D. L., Davis, R. E., Eriksen, C. C., Fratantoni, D. M., & Perry, M. J. (2004). Underwater gliders for ocean research. Marine Technology Society Journal, 38(2), 73-84.

124 ADVANCES IN OPERATIONAL OCEANOGRAPHY
OBSERVING BALTIC SEA EXCHANGES: PRESENTING A NEW MULTI-PLATFORM AUTONOMOUS OBSERVATORYBastien Y. Queste (1), Sebastiaan Swart (1), Louise C. Biddle (1, 2), Olle Petersson (2), Aleksandra K. Mazur (2) and Marcus Melin (2)
(1) Department of Marine Sciences, University of Gothenburg, Gothenburg, Sweden(2) Ocean Knowledge, Foundation Voice of the Ocean, Skeppet Arans Vag 3, 42671 Vastra Frolunda,
Sweden
Abstract The Skagerrak and Kattegat are narrow and shallow channels separating the North Sea and Baltic Sea. This highly dynamic area plays a key role in transforming water masses which flow into and oxygenate deep regions of the Baltic. This site is also a region of important carbon export, through advection down into and out of the Norwegian Trench. This rich and productive ecosystem is strained by intensive human activity and shows strong coupling between biological and physical processes at a range of scales. We present preliminary data from a new autonomous observatory funded by the Voice of the Ocean Foundation along with an outline of the technical infrastructure and innovations of the Voice of the Ocean observatories and how to access its open data.
Keywords: Baltic Sea, gliders, autonomous vehicles, open data
1. Introduction Over the last 100 years, we have seen a dramatic decline in ecosystem health and an expansion of anoxic zones within the Baltic Sea. The decline and sensitivity of the Baltic is accentuated by its complex bathymetry and the complex interaction of oceanographic processes that occur across multiple spatial and temporal scales. Its circulation is similar to estuarine dynamics: strong horizontal and vertical buoyancy gradients constrain energetic fluxes throughout the basin and limit supply of oxygen to deep basins. This is especially true of the exchanges between the North Sea and the Baltic, which occur via the Skagerrak, Kattegat and through the Danish Straits. Oceanic (i.e. high salinity and oxygen) water occupies most of the water column in the Skagerrak, but its high density is such that it is confined to deeper regions of the Baltic Proper, where low-density surface waters exhibit significant riverine influence (i.e. low salinity).
125ADVANCES IN OPERATIONAL OCEANOGRAPHY EXPANDING EUROPE’S OBSERVING AND FORECASTING CAPACITY
Sporadic (approximately one per decade), unpredictable, large-scale oceanic inflows are of fundamental importance to the region’s physics, biogeochemistry and ecology, and are the principal driver of change in deep regions of the Baltic. Oceanic inflows have a profound effect on the hydrography of the deep Baltic, causing abrupt increases in oxygen and salinity. These inflows regulate deep-water residence times, the strength of stratification and are the primary source of oxygen to bottom waters. The chemistry and biology of the Baltic respond to the hydrographic changes caused by the inflows and to the oxygen they deliver to the deep.
The timing and forcing of oceanic inflows are poorly understood. Similarly, the pathways taken by oceanic water through the Danish Straits, the processes that control this transit, and the effect of water mass transformation processes during this transit are poorly understood. Furthermore, there is evidence of intermittent small-scale inflows – ‘leakages’ of oceanic water from the North Sea to the Baltic – which cannot be properly resolved by existing mooring networks (low spatial resolution) or monthly ship cruises (low temporal resolution); note the near-bottom layer of high-salinity water visible in Figure 1, that ‘spills over’ bathymetric sills. The small spatial and temporal scales on which oceanic inflows, leakages and water mass transformation processes operate cannot be adequately captured by existing observation networks. Given the importance of oceanic inflows to the hydrography of the Baltic, understanding the small-scale physical processes that control inflows of oceanic water is crucial to understanding future perspectives for the ecologically and economically significant anoxic region of the Baltic.
The Baltic Sea is surrounded by nine countries that depend on it for fisheries, energy generation and tourism. The EU Marine Strategy Framework Directive requires member states to ensure ‘good environmental status’ for their territorial waters, providing significant regulatory pressure to advance our knowledge of conditions in the Baltic and to disseminate knowledge to policy makers. Ensuring good environmental status requires long-term monitoring to establish baseline conditions; ship surveys are frequently conducted in the Baltic, and they provide excellent understanding of baseline conditions and large-scale changes when combined with mooring networks. But scientists and policy makers also need an appreciation of high-frequency variability in baseline conditions, the better to separate natural variability from anthropogenic change and resolve processes which may change under future climate scenarios, further tipping the balance.
To address this, we must embrace new tools for ocean observation which can bridge the gap between sparse, long time-series and intense, high resolution but localised process studies. The Voice of the Ocean Foundation (VOTO) currently funds the ‘Smart Autonomous Monitoring of the Baltic Sea’ project (SAMBA) which aims to collect high resolution long-term datasets using autonomous underwater vehicles in proximity to existing monitoring infrastructure to complement and extend spatial and temporal coverage, as well as collect additional variables to better resolve Baltic Sea ecosystem functioning.

126 ADVANCES IN OPERATIONAL OCEANOGRAPHY
2. Voice of the Ocean Foundation The purpose of VOTO, founded in 2019, is to conduct, support and promote science, education, information and communication regarding the sea, marine ecosystems, and the marine environment as well as the interaction between humans and the sea, historically, in the present and in the future. VOTO wants to further knowledge, curiosity, and care for the oceans. They strive for a future where the interest and knowledge of marine ecology and history among the general public promotes a sustainable co-existence between humankind and the sea. VOTO aims to influence people’s perspectives through knowledge; that is why the foundation seeks to aid in the collection, creation, and dissemination of marine knowledge.
The Ocean Knowledge division of VOTO aims to help scientists understand the sea as a system. This is done through the collection of data useful for research. Ocean Knowledge works along two different timelines: (1) collection of data for current scientific research projects, and (2) establishing long-term observatories to develop our understanding of long term processes and with the aim of helping science in the future (10 years and beyond) to answer questions that may arise over time. Ocean Knowledge wishes to measure baseline conditions in the present for comparison in the future.
One central aim for the foundation is to provide information which can contribute to sound management of the Baltic Sea. VOTO Ocean Knowledge has the equipment and infrastructure to generate data and support the scientific community in addressing current questions about Baltic Sea functioning. Ocean Knowledge works along the following lines: engaging young researchers to use and publish data collected by VOTO infrastructure; encouraging applications to use our fleet of autonomous vehicles in scientific projects; creating a scientific advisory board with international
Fig. 1. North-south glider sections within the Kattegat during preliminary instrument trials.
127ADVANCES IN OPERATIONAL OCEANOGRAPHY EXPANDING EUROPE’S OBSERVING AND FORECASTING CAPACITY
standing for peer-review of applications; developing best practices and methods for autonomous measuring systems in shallow and dynamic environments; supporting the development of true autonomy for data collection at sea; supporting the development of robust autonomous systems for collection of data over time; and inviting scientists from different fields for cross-disciplinary work to understand the Baltic Sea and its status.
As a first goal, VOTO Ocean Knowledge works towards quantifying a sub-seasonal budget of the horizontal and vertical fluxes of oxygen, salt and nutrients in the Baltic Sea within a five-year period. Data collected by the Ocean Knowledge division at Voice of the Ocean is made available publicly and will soon be available via EMODnet. Further details are available on http://voiceoftheocean.org/knowledge/.
3. The Samba Project
3.1 Research aimsSAMBA, or ‘Smart Autonomous Monitoring of the Baltic Sea’, is a collaboration between VOTO Ocean Knowledge and researchers at the Department of Marine Science at the University of Gothenburg. The project seeks to fundamentally change the landscape of ocean observation in the Baltic Sea by collecting the largest, and highest resolution, physical, biological and chemical dataset of the Baltic Sea to date through a series of observatories continuously surveyed by autonomous vehicles. These observatories will be distributed along the Baltic to monitor conditions and circulation from the North Sea to the upper reaches of the Baltic Sea. Currently, four observatories are planned (Figure 2), from the Skagerrak, the Bornholm Basin, the Gotland region, to the Åland Sea. Both the Skagerrak and Bornholm Basin observatories began March 2021. The following two sites are planned to begin in 2022. These observatories are planned with a minimum 5 year lifetime.
The first two observatories specifically aim to investigate inflows of North Sea water into the Baltic Proper. The Baltic Sea exhibits large expanses of anoxic water at depth which are sporadically, and briefly, reoxygenated by full column overturning or denser water inflow into the Baltic from the North Sea, through the Skagerrak and Kattegat. The currents controlling the surface inflow and outflow of waters between the North Sea and Baltic Sea have been previously described as baroclinic flows, driven primarily by the density gradient of the Kattegat-Skagerrak front and linked to surface wind forcing. However, these studies mostly rely on data collected before 1995, when sampling stations were sparsely positioned with limited resolution, and have little resolution of the processes occurring below the halocline. The Skagerrak-Kattegat front has an influence on the transfer of water masses from north to south, but the temporal and spatial variability of the front, and what drives this variability, is not well understood. The changes that this frontal movement can induce in water mass properties will also have impacts on local biology, with linkages to eel grass meadows, deep coral propagation and fish community structures amongst others.

128 ADVANCES IN OPERATIONAL OCEANOGRAPHY
These observatories do not seek to answer these aims on their own, but to build on existing ocean monitoring infrastructure by expanding the spatial and temporal coverage with high resolution observations. These observations will help to build a base from which the larger scale project objectives can be achieved over a 5 year timeline:
1. What is the variability of water mass properties and transport across the Danish Straits, and how do these influence both small and large scale Baltic inflows?
2. How do physical processes affect rates of primary production, export of organic matter and remineralisation at depth across the Baltic?
3. How is the upper ocean impacted by heat and momentum fluxes, and how do these affect oxygenation of Baltic deep water?
4. In addition to these scientific questions, the project provides an opportunity to develop best practices for long-term monitoring of shelf seas through the use of autonomous platforms.
3.2 The Skagerrak and Bornholm Basin observatoriesThe Skagerrak survey line will consist of a right-angled triangle. Its longest leg will capture in- and outflows into the Kattegat while the other two legs extend into the Norwegian Trench to capture the spatial and temporal variability of the Kattegat-Skagerrak front. The survey line coincides with two Baltic Operational Oceanographic System (BOOS) stations (Å14 and Å17) for cross-calibration and reference. The survey
Fig. 2. The location of the four planned SAMBA Project observatories.

129ADVANCES IN OPERATIONAL OCEANOGRAPHY EXPANDING EUROPE’S OBSERVING AND FORECASTING CAPACITY
line is approximately 89 km long, with a maximum depth of 375 m, and is surveyed in 4 to 5 days on average by a glider.
The Bornholm Basin survey line is a V-shape, extending outwards from the deepest point to the edges of the basin on either side of the eastern sill. The survey line passes through one BOOS station (BY5) for cross-calibration and reference. The line is 85 km long (one way), with a max depth of 93 m, and is surveyed in 4 to 5 days by a glider.
Fig. 3. Detailed view of the two established observatories along with existing monitoring infrastructure, ship track density maps and national borders.
3.3 InfrastructureEach observatory will be surveyed by the same arrangement of autonomous vehicles: two autonomous underwater gliders (SeaExplorer, ALSEAMAR, France), one with a biogeochemical sensor suite and one with a physical sensor suite, as well as an autonomous surface vehicle (SailBuoy, Offshore Sensing AS, Norway). The SAMBA project runs a fleet of ten SeaExplorer gliders (ALSEAMAR, France). These are equipped with rechargeable batteries and interdisciplinary sensor payloads: RBR Legato temperature and salinity sensors; RBR Coda or JFE Rinko AROD-FT oxygen sensors; Wetlabs Triplet ECOpucks for chlorophyll a, phycocyanin and optical backscatter; SeaBird OCR504i 4-channel PAR sensors; Nortek 1MHz ADCP. The gliders are accompanies by four Sailbuoy surface vehicles (Offshore Sensing AS, Norway). These are equipped with combinations of N.Brown G-CTD, Aanderaa 4319, or RBR Legato temperature and salinity sensors, Airmar 200WX meteorology, FT Technologies FT7 wind sensor, Datawell wave recorder, EK80 WBT mini echosounder, Aanderaa DCPS current profiler.

130 ADVANCES IN OPERATIONAL OCEANOGRAPHY
Fig. 4. A Sailbuoy and two SeaExplorers at the VOTO Ocean Knowledge facility in Nya Varvet, Sweden.
SeaExplorers use changes in buoyancy to drive vertical motion while changing pitch and roll to generate lift from wings which propel the vehicle forward. A glider travels 15 to 20 km a day and profiles the water column at approximately 10 cm per second. For each study site, both gliders will be equipped with temperature and salinity sensors and an oxygen optode. One glider will also measure chlorophyll a and phycocyanin fluorescence, optical backscatter at 700 nm and irradiance at four wavelengths (380, 490, 532 nm, and PAR). The other glider is equipped with a dual-channel chlorophyll a and backscatter sensor and a Nortek Signature 1MHz ADCP for measuring small-scale ocean currents. Sailbuoys on the other hand, stay on the surface, powered using renewable solar panels. The Sailbuoys are equipped to measure surface temperature and salinity, wind speed and direction, air temperature and barometric pressure continuously; the Bornholm Sailbuoy vehicle will also be equipped with an experimental downward-facing ADCP. All vehicles are serviced at approximately monthly intervals and are piloted by VOTO Ocean Knowledge staff, including a team of Masters students employed by the foundation to ensure 24 hour coverage. Together, these platforms provide continuous monitoring across key regions, providing much greater spatial coverage than moorings, greater resolution than Argo floats and longer temporal coverage than ship surveys, at a fraction of the cost.
131ADVANCES IN OPERATIONAL OCEANOGRAPHY EXPANDING EUROPE’S OBSERVING AND FORECASTING CAPACITY
The autonomous vehicle fleet is supported by VOTO Ocean Knowledge’s rapid science vessels. The foundation is going to invest in replacing its current fleet with two to three 22m vessels to aid with logistics on both the east and west coasts of Sweden. The aim is to design an agile vessel capable of performing other tasks along with the vehicle servicing such as oceanographic sampling, smaller surveys with remotely operated vehicles (ROV) and towing equipment. Specifications are geared towards creating a larger open deck space to fit gilders and autonomous vehicles while still having space for a smaller lab and accommodating scientists and crew for up to 72h missions. Between servicing the autonomous fleet the vessels will be available as a resource for oceanographers and scientists around the Baltic.
These vessels serve to quickly and easily service and maintain the autonomous vehicle. The SAMBA project has shown that such infrastructure can be used efficiently in single day missions. Day trips are sufficient to recover the instruments, recharge the batteries, clean the instruments, download the data and redeploy. The additional CTD and rosette configuration that the foundation is adding to the vessels will permit in situ sampling for optimal calibration of the autonomous vehicles. This ability to perform rapid services is crucial to minimising data gaps and ensuring the safety of the autonomous vehicle fleet due to the scarcity of long and clear weather windows, particularly in the winter months.
3.4 Strengths and challengesPersistent deployments of autonomous vehicles are challenging anywhere in the world. This is particularly true in the Baltic Sea as the vehicles are sensitive to strong density gradients, fast currents, shipping and fishing activity. VOTO Ocean Knowledge seeks to develop Best Practices allowing for easier, more cost-effective monitoring of the Baltic Sea. VOTO, SAMBA and the platform manufacturers have been working together to optimise glider capabilities in this regions Incremental increases in capabilities are being made available to other users through collaborative work in the region. The partnership of academia, industry and the VOTO foundation is a cornerstone of the project and key to future success.
A key challenge and success of SAMBA was demonstrating a sustainable presence in regions of strong currents and density gradients. As underwater gliders use buoyancy as their driving force, they are constrained to a maximum density gradient and their battery consumption is directly tied to the gradients they must overcome. The gliders deployed at the Skagerrak/Kattegat confluence are often affected by the northward, fresh, Swedish coastal current (Figure 6). In this region, the gliders overcame density gradients of 14 kg m3. This gradient is far greater to that advertised as the limit by the most commonly used gliders’ manufacturers. Despite the extreme gradients, battery consumption showed estimated mission durations of a month while sampling all sensors at 1Hz and the ADCP at 0.1Hz.

132 ADVANCES IN OPERATIONAL OCEANOGRAPHY
Fig. 6. Example transect of the Swedish coastal current observed by a SeaExplorer highlighting the strong density gradients in the región.
Many cargo ships use the shipping channel past Skagen (Denmark) and down through the Denmark Straits. In addition to these large freighters, close to the Bohuslan coastline there are numerous fishing vessels and pleasure craft which may not always have an AIS signature. To minimize the risk of collision, waypoints are selected to be out of the main shipping channel, so that crossing times are reduced. By having waypoints in ‘safe zones’, the Sailbuoy will hold position after finishing a transect in a relatively safe location before being directed to the next waypoint. Gliders are often programmed to transit with the top inflection of their dive below the surface (forming a dive profile similar to a W), especially in regions with high currents and high vessel presence.
Near coastal deployments present greater risks from greater human presence, more dynamic processes and strong currents. The availability of pilots 24 hours a day is a necessity. Both the Sailbuoy and the SeaExplorer were selected for their ease of piloting, allowing the foundation to build a large pool of pilots with no prior experience for sustained piloting autonomous vehicles. Several students from the University of Gothenburg are employed during the Masters programme; these pilots are rotated in and out as they start and end their programmes. This provides valuable experience, a welcome supplement to their income, and an exciting way to engage with new oceanographers. The student piloting team has been very succesful and beneficial to both the scientists and the foundation.

133ADVANCES IN OPERATIONAL OCEANOGRAPHY EXPANDING EUROPE’S OBSERVING AND FORECASTING CAPACITY
4. Conclusions Initial data from the Skagerrak and Bornholm Basin observatories show a wealth of interesting features, many occurring at small temporal and spatial scales hard to resolve through existing means. Figure 7 shows a collection of plots from the first 40 days of the Bornholm Observatory. These figures are composites of 5876 individual profiles, sampled at vertical resolutions of ~10 cm. The observatories are still new, and we do not yet exploit the full capability of the gliders in terms of endurance or resolution. Piloting in such conditions is challenging and significant effort is dedicated to optimising flight to increase endurance. As is always the case in science, a luck component is ever present, and the first glider turnaround at this location occurred during the peak of the spring bloom.
We plan to make all SAMBA data accessible and visible online by the end of the year. Information will be provided on the VOTO website and over @VOTO_Knowledge’s twitter. SAMBA’s current research component is led by Bastien Queste and Sebastiaan Swart at the University of Gothenburg, Sweden. The SAMBA project will however collect a huge amount of data and welcomes collaborations on all topics. VOTO Ocean Knowledge’s remit is to foster international collaboration and this extends to SAMBA. The high resolution observations at these sites can reveal new insights into short term, patchy and submesoscale processes, but real step changes in our understanding of the Baltic will come from combined use of existing long-term infrastructure, new technological developments and collaboration with experts from around the world.
Acknowledgements
We wish to acknowledge the hard work and insight of the pilots, Estel Font, Hanna Rosenthal, Johan Edholm, and Stina Wahlgren. It’s easy to pilot a glider, but it’s hard to do it in a way that collects good data. We wish to thank Carl Douglas, Ola Oskarsson, and the Voice of the Ocean Foundation for their support and dedication to this project.
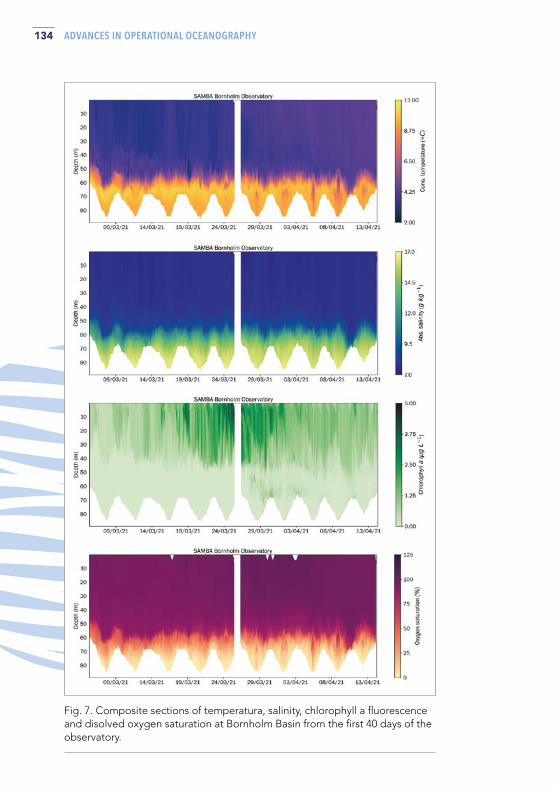
134 ADVANCES IN OPERATIONAL OCEANOGRAPHY
Fig. 7. Composite sections of temperatura, salinity, chlorophyll a fluorescence and disolved oxygen saturation at Bornholm Basin from the first 40 days of the observatory.

135ADVANCES IN OPERATIONAL OCEANOGRAPHY EXPANDING EUROPE’S OBSERVING AND FORECASTING CAPACITY


SESSION 4
EXTREME EVENTS AND HAZARD FORECASTING

138 ADVANCES IN OPERATIONAL OCEANOGRAPHY
OIL SPILL RISK ASSESSMENT FOR AN OIL TERMINAL AT THE PORT OF TARANTO (SOUTHERN ITALY)Svitlana Liubartseva, Ivan Federico, Giovanni Coppini and Rita Lecci
Ocean Predictions and Applications Division, Centro Euro-Mediterraneo sui Cambiamenti Climatici, Italy, [email protected]
Abstract Stochastic simulations of hypothetical oil spills are performed to assess risk of oil pollution originated from a single-point buoy mooring and subsea pipeline operated at the Port of Taranto. The MEDSLIK-II oil spill model is coupled to a high-resolution hydrodynamic model implemented in the framework of the unstructured-mesh finite element method at a high resolution and run in operational forecasting mode. The hypothetical oil spill scenario is based on a historical pipeline rupture at the Port of Genoa, 2016. Around 15,000 spills are simulated randomly sampling over the meteo-oceanographic conditions 2018 – 2020. Under the combined transport by highly variable currents, wind, and turbulent mixing, the released oil drifts mainly southwesterly towards the outlet to the open sea. Due to multiply strandings and washing-offs from the concrete constructions in the port, oil is dispersed almost isotropically over the Mar Grande, indicating a rather moderate level of concentrations. The most probable first beaching times vary 7 – 17 hours determining the timescale of the required response. The results obtained can be applied to develop strategic response and mitigation plans, environmental protection and cleanups.
Keywords: accidental pollution, single-point buoy mooring, subsea pipeline, Lagrangian oil spill modeling, high-resolution unstructured-grid hydrodynamic modeling
1. Introduction Despite the increased focus on maritime safety in ports and harbors, possible oil leaks during loading or discharging operations remains a cause of concern at European ports. The consequences may be aggravated in the semi-enclosed basins. The Port of Taranto is located in the semi-enclosed area of the limited water exchange with the open sea.

139ADVANCES IN OPERATIONAL OCEANOGRAPHY EXPANDING EUROPE’S OBSERVING AND FORECASTING CAPACITY
During the past decade, stochastic or probabilistic oil spill modeling has been widely developed as a tool for various management tasks, including response and mitigation plans, environmental protection and cleanup activity. The methodology is based on a statistical analysis of model outputs composed of a variety of individual oil spill trajectories. These trajectories represent the hypothetical spill scenarios from the different start locations and time sampled randomly over a relatively long-time window. Start locations and/or start time of each spill are regarded as random variables. Each spill is exposed to different environmental conditions, leading to various spatio-temporal distributions of oil concentration.
Several studies have focused on the statistical analysis of large ensembles of oil spill simulations at different scales, ranging from the overall basin ones (e.g., French McCay et al., 2017, Ji and Johnson, 2017, Sepp Neves et al., 2020) to ultra-fine scales of harbors and ports (e.g., Azevedo et al., 2017, Morell Villalonga et al., 2020).
In the present work, some preliminary results of stochastic oil spill modeling are reported to predict statistically spatio-temporal behavior of possible oil spills at the Port of Taranto.
To this end, we (1) couple the MEDSLIK-II oil spill model (De Dominicis et al., 2013) to a high resolution hydrodynamic model SANIFS (Southern Adriatic Northern Ionian coastal Forecasting System) run on unstructured grid in operational forecasting mode (Federico et al., 2017); (2) compute around 15,000 hypothetical oil spills randomly sampling them from a single-point buoy mooring and along a subsea pipeline over a two-year set of the meteo-oceanographic conditions 2018–2020; (3) describe the results statistically, focusing on spatial distributions and timing the possible spill.
2. Method
2.1 Study areaThe Port of Taranto is an essential strategic hub of the European logistic chain located in the southern part of Italy, on the north-eastern coast of the Taranto Gulf in the Ionian Sea. The study area consists of two connected basins called the Mar Grande and the Mar Piccolo (Figure 1). The latter is composed of the two embayments. The Mar Grande represents a shallow semi-enclosed basin with an average depth of 12 m confined by the islands and breakwaters almost on all the sides. Two outlets provide the water exchange with the open sea, and other two ones connect the Mar Grande with the Mar Piccolo. The circulation is mainly controlled by estuarine dynamics (De Pascalis et al., 2016), though some reverses between the two opposite vertical circulation cells can occur during the year (Federico et al., 2017).
In the vicinity of the Port, a densely populated urban area coexists with a large industrial cluster, naval shipyards, unique ecosystems, mussel farms, and recreation zones.

140 ADVANCES IN OPERATIONAL OCEANOGRAPHY
2.2 Stochastic MEDSLIK-II simulationsThe oil spill model MEDSLIK-II (De Dominicis et al., 2013) is a freely available community model (http://medslik-ii.org) successfully used for nearly 10 years to simulate the transport and fate of oil spills in deterministic and stochastic mode. Each Lagrangian parcel moves due to currents, wind, and waves, data on which are provided by external atmospheric and oceanographic models. The oil weathering processes include the viscous-gravity spreading, evaporation, natural dispersion, and the formation of water-in-oil emulsion. Randomized turbulent mixing is applied to account for the sub-grid processes.
MEDSLIK-II is forced by the 6-hour wind datasets provided by the European Centre for Medium-Range Weather Forecasts (ECMWF) at a horizontal resolution of 1/8° (~12.5 km), and hourly fields of currents and sea surface temperature produced by SANIFS (http://sanifs.cmcc.it).
SANIFS (Southern Adriatic Northern Ionian coastal Forecasting System (Federico et al., 2017)) is based on SHYFEM (System of Hydrodynamic Finite Element Modules (Umgiesser et al., 2004, Ferrarin et al., 2020, Trotta et al., 2021)), which is a three-dimensional fully-baroclinic finite-element hydrodynamic model solving the primitive equations under the hydrostatic and Boussinesq approximations. The model follows the unstructured-grid approach with variable horizontal resolution, particularly suitable for coastal applications with complex geometry and bathymetry, while not neglecting also large-scale processes.
In this work, SANIFS has been specifically improved in terms of spatial resolution to better represent the study area. Concretely, the horizontal resolution ranges from 3 km in the open sea, through 100 m in the coastal waters, to 20 m at the Port of Taranto. With this high resolution, an accurate representation of irregular coastal boundaries is achieved, now resolving tiny straits, small islands, as well as the Port constructions and facilities: wharfs, marinas, narrow breakwaters, and revetments.
The bathymetry data at a resolution of 1/8 arc minutes (~230 m) obtained from the EMODNET Portal for the open sea and coastal waters has been combined with the high-resolution bathymetry at the Taranto Port provided by the Italian Navy Hydrographic Institute. The model levels are uniformly distributed along the vertical axis from the sea surface to 90 m with a step of 2 m and then, they increase down to the seabed up to a maximum layer thickness of 200 m. Atmospheric fields with a horizontal resolution of ~12.5 km and 3-hour frequency delivered by ECMWF are used for atmospheric forcing.
The latest release of Mediterranean Forecasting System (Clementi et al., 2019) with a horizontal resolution of 1/24° (~4 km) is used for a parent model initialization and imposing the lateral open boundary conditions. A total of 8 tidal components are imposed at the open boundaries of the parent model. Tidal data are taken from the OTPS tidal model (Egbert and Erofeeva, 2002).
141ADVANCES IN OPERATIONAL OCEANOGRAPHY EXPANDING EUROPE’S OBSERVING AND FORECASTING CAPACITY
To run the stochastic MEDSLIK-II simulations a hypothetical oil spill scenario is defined as follows:
• Randomly sampled start locations: 50% from the single-point buoy mooring and 50% along the subsea pipeline;
• Uniformly distributed start times with an interval of 2 hours from 1 July 2018 to 30 June 2020;
• Crude oil type with a density of 856 kg m3 at 16°C (API = 33.8);
• Continuous release of 600 tons of oil with a spill duration of 2 hours;
• Each spill is represented by the 100,000 Lagrangian parcels;
• Simulation length of 48 hours;
• Bin size of 50 m;
• Integration time step of 5 min.
The oil spill scenario is based on a real oil spill accident caused by a catastrophic pipeline failure at the Port of Genoa on April 17th 2016 (Vairo et al., 2017).
In the coupled MEDSLIK-II and SANIFS model, some modifications are made (Liubartseva et al., 2020) in comparison with the default Mediterranean applications (De Dominicis et al., 2013) to adapt to the small-scale features in the study area. Firstly, the coastline types are updated to comply with the Mediterranean Integrated Geographical Information System on Marine Pollution Risk Assessment and Response (MEDGIS-MAR) developed by REMPEC. In the Port Taranto area, concrete wharfs and seawalls dominate followed by sandy beaches and then, by the rocky shore type. Secondly, the horizontal diffusivity coefficient is set 0.2 m2 s1. To integrate the model displacement equations, the forward Euler scheme with a 5-minute time step was used. To reduce the computation time, a 1% windage coefficient was applied instead of the JONESWAP parametrization of the Stokes drift (Liubartseva et al., 2015), which is a rather first-order approximation.
The MEDSLIK-II simulation results are represented by an ensemble composed of ~15,000 hypothetical oil spills.

142 ADVANCES IN OPERATIONAL OCEANOGRAPHY
3. Results and discussion Maps of the ensemble mean oil concentrations1 provide an overview of potential impacts at the sea surface and on the coastlines of the study area (Figure 1). Within the first hours after the start of the release, the highest sea surface concentration values (up to 12 ton km2) are expectedly found in the vicinity of the sources: the buoy site and along the pipeline. After that, the area of elevated values gradually drifts in the southwestern direction to the open sea. More specifically, almost the whole Mar Grande is found to be contaminated in 12 hours after the possible accident (Figure 1). The highest sea surface concentrations of around 5 ton km2 can be seen near the widest outlet to the open sea. Oil in notable concentrations starts also to be transported to the West Port area, and the Mar Piccolo. The local bands of elevated concentrations surround almost the entire internal perimeter of the Mar Grande, including the Port wharfs and the breakwaters.
These peculiarities can be explained by the low absorbing ability of the concrete wharfs and sea walls that dominate the study domain. The majority of hypothetical oil spills move southeastward, which is consistent with the averaged 2018–2020 surface flow direction. The islands and breakwaters prevent the West Port from penetration of oil. Looking at the concentration maps on the coastline, we note that oil pollution growths over time gradually capturing the shores. In 12 hours (Figure 1), not only all the coastlines of the Mar Grande are found to be contaminated, but also some parts of the West Port. The concentrations peak at the Port berths and on the tips of the breakwaters. Nevertheless, the shores of the Mar Piccolo are hardly affected.
Fig. 1. Ensemble mean oil concentration maps at the sea surface (on the left) and on the coastlines (on the right) in 12 hours after the start of the release.
1 http://plastics.cmcc.it/files/Taranto_oil_LiubartsevaEtAl_2021.mp4
143ADVANCES IN OPERATIONAL OCEANOGRAPHY EXPANDING EUROPE’S OBSERVING AND FORECASTING CAPACITY
The analysis of the first 48-hour oil drift simulations shows that oil is advected by highly variable currents and waves, and is thus exposed to multiple reflections strandings and washing-offs from the concrete constructions in the study domain. Consequently, the oil tends to be dispersed almost isotropically over the Mar Grande, indicating a rather moderate level of concentrations. The breakwaters, that were originally constructed to protect the Port and city from wind-generated waves, influence the circulation patterns, which affects the pollutant transport. Interestingly, the breakwaters can reduce to some extent the number of oil landings in the Port and urban areas.
Information about timing the drift of oil and its arrival at the coastline leads to strengthened spill preparedness and to define response priorities. To this end, the probability distribution of the first beaching time is studied primarily. As shown in Figure 2, the maximum probability of 3.9%–4.3% is found in the time interval of 7–17 hours after the start of the release, which determines the timescales of the required response. Around 0.9% of spills demonstrate the fastest beaching that takes less than 0.4 hours. Remarkably, around 5% of simulated spills do not show any beaching of oil during the 48-hour drift. The majority of them leaves the Mar Grande through the widest outlet. Analyzing the Cumulative Distribution Function (CDF) we conclude that 50% of spills will reach the coastline within the first 14 hours after the start of the release, 75% will strand in 21 hours, and 90% – within 32 hours.
According to an oil mass balance diagram, approximately 48% of oil evaporate within the first 10 hours, which is typical of the crude oil. After that, evaporation almost stops. Natural dispersion remains steady with a mean value that does not exceed 3% at the end of the 48th hour simulation. As a consequence, starting from the 11th hour, the beaching overtakes dispersion, and starts to play a key role in the oil mass balance, demonstrating an almost linear increase of the beached oil mass in both the mean values and standard deviations.

144 ADVANCES IN OPERATIONAL OCEANOGRAPHY
4. Conclusion Stochastic model simulations have been conducted to predict the statistical footprint of oil contamination associated with the potential spill from the single-point buoy mooring and subsea pipeline at the Port of Taranto. To this end, the MEDSLIK-II oil spill model (De Dominicis et al., 2013) has been coupled to the Southern Adriatic Northern Ionian coastal Forecasting System (Federico et al., 2017) run on the unstructured grid, which provides high resolution. The hypothetical spill scenario is based on the real case occurred at the Port of Genoa in April 2016 (Vairo et al., 2018). Around 15,000 hypothetical spill simulations are carried out randomly sampling over the environmental conditions 2018 – 2020.
The main oil drift is found to be directed southwesterly towards the outlet to the open sea. Under the combined transport by highly variable currents, waves, and turbulent mixing, the oil released from the buoy and pipeline is exposed to multiply strandings and washing-offs from sea walls and concrete wharfs that dominate at the Port. Consequently, the pollution tends to be dispersed almost isotropically in the Mar Grande, indicating the moderate level of the oil concentrations. The first oil beaching is predicted to occur within 7 – 17 hours after the start of the release. Simulated oil spill mass balance shows that after the rapid evaporation of ~48%, oil tends to be re-distributed between the sea surface and coastline with gradually growing the latter component.
Fig. 2. Histogram showing the probability distribution of the first beaching hour. Time interval of 7 – 17 hours after the start of the release indicates the highest probabilities of 3.9% – 4.3% highlighted in red.

145ADVANCES IN OPERATIONAL OCEANOGRAPHY EXPANDING EUROPE’S OBSERVING AND FORECASTING CAPACITY
The methodology is applicable to any domain and potential oil spill sources providing decision-makers with an overview of potential impacts and timing as well as a guidance for the strategic spill response, which is of particular interest at European ports and harbors.
AcknowledgementsThis work is performed in the framework of the IMPRESSIVE project (#821922) co-funded by the European Commission under the H2020 Programme.
ReferencesAzevedo, A., Fortunato, A.B., Epifânio, B., Den Boer, S., Oliveira, E.R., Alves, F.L., De Jesus, G., Gomes, J.L., and Oliveira, A. (2017). An oil risk management system based on high-resolution hazard and vulnerability calculations. Ocean & Coastal Management, 136, 1-18.
Clementi, E., Pistoia, J., Escudier, R., Delrosso, D., Drudi, M., Grandi, A., Lecci, R., Cretí, S., Ciliberti, S., Coppini, G., Masina, S., and Pinardi, N. (2019). Mediterranean Sea Analysis and Forecast (CMEMS MED-Currents, EAS5 system) [Data set]. Copernicus Monitoring Environment Marine Service (CMEMS). https://doi.org/10.25423/CMCC/MEDSEA_ANALYSIS_FORECAST_PHY_006_013_EAS5.
De Dominicis, M., Pinardi, N., Zodiatis, G., and Lardner, R. (2013). MEDSLIK-II, a Lagrangian marine surface oil spill model for short-term forecasting – Part 1: Theory. Geoscientific Model Development, 6, 1851-1869.
De Pascalis, F., Petrizzo, A., Ghezzo, M., Lorenzetti, G., Manfè, G., Alabiso, G., and Zaggia, L. (2016). Estuarine circulation in the Taranto Seas. Environ. Environmental Science & Pollution Research, 23, 12515-12534.
Egbert, G., and Erofeeva, S. (2002). Efficient inverse modeling of barotropic ocean tides. Journal of Atmospheric and Oceanic Technology, 19, 183-204.
Federico, I., Pinardi, N., Coppini, G., Oddo, P., Lecci, R., and Mossa, M. (2017). Coastal ocean forecasting with an unstructured grid model in the southern Adriatic and northern Ionian seas. Natural Hazards and Earth System Sciences, 17, 45-59.
Ferrarin, C., Bajo, M., and Umgiesser, G. (2020). SHYFEM set-up for model driven optimization of the tide gauge monitoring network in the Lagoon of Venice. [Data set]. https://doi.org/10.5281/zenodo.3770173.
French McCay, D.P., Balouskus, R., Ducharme, J., Schroeder Gearon, M., Kim, Y., Zamorski, S., Li, Z., Rowe, J., Perham, C., and Wilson, R. (2017). Potential oil trajectories and surface oil exposure from hypothetical discharges in the Chukchi and Beaufort Seas. Proceedings of the 40th AMOP Technical Seminar, Environment and Climate Change Canada, Ottawa, ON, 660-693.

146 ADVANCES IN OPERATIONAL OCEANOGRAPHY
Ji, Z.G., and Johnson, W.R. (2017). Oil spill risk analysis for assessing environmental contact probabilities in the Gulf of Mexico. Proceedings of the International Oil Spill Conference, USA, California, 1931-1949.
Liubartseva, S., Coppini, G., Pinardi, N., De Dominicis, M., Lecci, R., Turrisi, G., Creti, S., Martinelli, S., Agostini, P., Marra, P., and Palermo, F. (2016). Decision support system for emergency management of oil spill accidents in the Mediterranean Sea. Natural Hazards and Earth System Sciences, 16, 2009-2020.
Liubartseva, S., Federico, I., Coppini, G., and Lecci, R. (2020). Oil spill modeling for the Port of Taranto (SE Italy). EGU General Assembly 2020, online, 4-8 May 2020, EGU2020-2946.
Morell Villalonga, M., Espino Infantes, M., Grifoll Colls, M., and Mestres Ridge, M.(2020). Environmental management system for the analysis of oil spill risk using probabilistic simulations. Application at Tarragona Monobuoy. Journal of Marine Science and Engineering, 8, 277.
Sepp-Neves, A.A., Pinardi, N., Navarra, A., and Trotta, F. (2020). A general methodology for beached oil spill hazard mapping. Frontiers in Marine Science, 7, 65.
Trotta, F., Federico, I., Pinardi, N., Coppini, G., Causio, S., Jansen, E., Iovino, D., and Masina, S. (2021). Relocatable ocean modeling platform for downscaling to shelf-coastal areas to support disaster risk reduction. Frontiers in Marine Science, 8, 317.
Umgiesser, G., Canu, D.M., Cucco, A., and Solidoro, C. (2004). A finite element model for the Venice lagoon: Development, set up, calibration and validation. Journal of Marine Systems, 51, 123-145.
Vairo, T., Magrì, S., Quagliati, M., Reverberi, A.P., and Fabiano, B. (2017). An oil pipeline catastrophic failure: accident scenario modelling and emergency response development. Chemical Engineering Transactions, 57, 373-378.
147ADVANCES IN OPERATIONAL OCEANOGRAPHY EXPANDING EUROPE’S OBSERVING AND FORECASTING CAPACITY
MULTIDISCIPLINARY EXPERTISE OF HISTORICAL INFORMATION FOR THE CHARACTERIZATION OF WATER LEVELS DURING STORM AND COASTAL FLOODING EVENTS Nathalie Giloy (1) and members of the Working Group ‘Historic Storms and Floodings’ (2)
(1) SHOM, French Hydrographic and Oceanographic Service,13, Rue du Châtellier CS 92803 - 29228 Brest CEDEX 2, France, [email protected]
(2) IRSN, BP17 92262 Fontenay-aux-Roses, France
Abstract Characterization of coastal water level reached during extreme events is a strong societal concern for a better coastal risk management. Historical archives related to storms and floodings are still not often considered whereas they could be used to improve knowledge on extreme sea levels. In this context, the French Working Group (WG) ‘Historical Storms and Floodings’ performs a multidisciplinary expertise of historical information.
A big challenge in such an approach is the management of information coming from various scientific contexts and practices, e.g. historical tide gauge observations, local press, scientific essays, eye-witness testimonies. These issues and the way there are addressed within this working group are presented.
The database (DB) ‘Historical Storms and Floodings’ aims at inventorying qualitative and quantitative information on extreme events that occurred on the Channel and Atlantic coastlines. Currently, over 1500 sources describing more than 750 events are outlined for the period from the 16th century up to now, the DB is continuously enriched by new information.
Water and surge levels are important variables of interest for the WG members. Often not directly available in historic sources, a multidisciplinary expertise of the information is performed to estimate levels reached. For this purpose, the information in the

148 ADVANCES IN OPERATIONAL OCEANOGRAPHY
database is expanded with complementary data, such as historical city maps, profiles of the flooded dikes etc. This data is then used to reconstruct historical levels and resumed in storm sheets.
Keywords: storm, coastal flooding, extreme events, multidisciplinarity, historical documents, data base
1. Introduction Characterization of coastal water level reached during extreme events is a strong societal concern for a better coastal risk management. These extreme water levels, which can lead to major coastal flooding, occur most of the time during storms and windy conditions. During the last decade, storms such as Xynthia in February 2010, the winter storm series of 2013-2014 or Eleanor or Carmen in 2018 caused remarkable damages and are often considered as ‘never seen seen before’. However, a look into the past, and often into recent past such as the 20th century, shows that these extreme events are not as rare as it may seem. To compare these events and to adapt coastal risk management, these events need to be compared and common variables need to be established. Therefor the height of the sea level during an event as well as the skew surge are commonly used (Bulteau et al., 2015; Frau et al., 2018; Hamdi et al., 2018). Sea levels are obtained by tide gauges; a skew surge is defined as the difference between the maximum observed water level and the maximum astronomical tidal level during a tidal cycle (Haigh et al., 2015). France has a long history of tide gauge recording, some stations lasting for more than 150 years such as Brest or Saint-Nazaire (Ferret, 2016; Pouvreau et al., 2006). To answer the recommendations of GLOSS (Global Sea Level Observing System) on recovery of forgotten sea level measurements, historic tide gauge data is currently rescued, digitized and analyzed at the French Hydrographic and Oceanographic Service (SHOM (Latapy et al., 2021) and directly used in extreme value analysis on skew surges. Still, despite those efforts, systematic data series may be of short duration or may have gaps of observation due to maintenance or failure during an extreme event. They may include an outlier, a value that is very different from the rest of the values. In complement, for the estimation of high return periods such as the 100- or 1000-year return level the short durations and outliers are a problem, as they lead to high confidence intervals. For some years, researchers investigate the benefit of historic data in extreme value analysis, as they may contain precious information on extreme events that happened before the recording of systematic data or during gaps of observations (Hosking & Wallis, 1986; Ouarda et al., 1998). Still, this data is not easy to find or analyze and precautions must be taken when using them.
This paper is structured as follows: as a starting point the French working group ‘Historic Storms and Floodings’ will be introduced, the tools and methods used in this multidisciplinary group are outlined and finally conclusion and perspectives will be presented.

149ADVANCES IN OPERATIONAL OCEANOGRAPHY EXPANDING EUROPE’S OBSERVING AND FORECASTING CAPACITY
2. Working Group ‘Historic Storms and Floodings’ During the REFMAR conference in February 2016, different organizations working on storms and storm surges highlighted their interest in forming a multi-disciplinary working group on these topics. Since then, oceanographers, statisticians, historians and geographers are meeting on a regular basis to exchange on this topic of interest and have put in common different methodologies and tools. The focus was initially set on collecting information on storm and flood events and develop a method to quantify water levels and skew surges from historic data. Gradually all topics related to storms and coastal floodings will be addressed within this working group.
3. Methods, Tools and Results
3.1 Data Base As a starting point, it is important to identify past storm and flooding events and to collect information that describe these events. The information collected in scientific literature e.g. (Breilh et al., 2014), in technical reports e.g. (Daubord et al., 2014; Roche et al., 2014) but also in historical archives is stored in a DB called ‘Historic Storms and Floodings’ which is managed by IRSN (French national public expert in nuclear and radiological risks). Created in 2015, the database has been developed as a PostgreSQL database (Giloy et al., 2018). In its third version, it is currently composed of 14 tables, including five spatial tables, allowing a cartographic representation of the information contained in the data base (Figure 1).
Fig. 1. Structure of the data base on Historical Storms and Floodings.

150 ADVANCES IN OPERATIONAL OCEANOGRAPHY
In spring 2021, the DB contains more than 800 events that occurred between 1500 and today on French Atlantic and Channel Coastlines, as well as on coastlines of neighboring countries (Figure 2). It is important to note that the increase of event is not necessarily related to climate change, but more probably due to the fact that the more recent event is, the easier is it to find testimonies of it. Old historic data may have been destroyed or events may not have been recorded in written form.
3.2 Characterization of Water Levels As mentioned beforehand, the interest in quantified information is very high as these quantified levels can directly be used in studies of extreme value analysis for instance. It is therefore important to have clear and transparent methodology that allows users to understand the reconstructed value and probable associated uncertainties. Work initiated by (Giloy et al., 2019) proposed an analysis and reconstruction in three steps. Step 1 is data quality control, step 2 covers the combination of different documents for the reconstruction highlighting assumptions made and step 3 allows re-contextualization of the reconstructed levels in its geo-historical context. This methodology has been discussed in the WG and significant improvements have been made concerning two points: data quality control and tidal predictions. The initial method of data quality control is not consistent enough with standards used by historians. To make up for this, a more precise evaluation has been elaborated (Athimon, 2020): Their method which proposes a complete and detailed analysis resulting in a final score of reliability for each historic document will be added to the data base and subsequently taken into consideration for the reconstruction of a water level. Most of the time, information in historic data are not freestanding, which means that complementary data, such as sketches of dikes, location maps etc. are necessary to perform the reconstruction. Often, assumptions have to be made regarding the
Fig. 2. Timeline of events listed in the data base. Flooding: events where marine flooding is associated. Storms: events where no mention of marine flooding is given.

151ADVANCES IN OPERATIONAL OCEANOGRAPHY EXPANDING EUROPE’S OBSERVING AND FORECASTING CAPACITY
exact location of the flooding or when using multiple documents that are not exactly contemporary. These assumptions are traced using labels. Once this water level reconstructed, tidal predictions are necessary to estimate skew surges.
The second improvement concerns tidal predictions. In fact, to estimate those, tidal components are used, which are obtained by harmonic analysis on sea level observations. Still, the older the events analyzed, the smaller are the chances to have series of sea level observations contemporary with the event. Two methods are proposed (André et al., 2020). If tide gauge observations contemporary with the event are available to do a fair harmonic analysis, the tidal components estimated should be used for the assessment of tidal predictions. When no contemporary observations are accessible, the use of current tidal components, available at French Hydrographic and Oceanographic Service (SHOM) is recommended in combination with a correction of mean sea level, to take into account the recent mean sea level changes. Finally, skew surges can be estimated. Figure 3 presents the methodology of reconstructing historic water and surge levels, from historic data. Results of this methodology are traced in storm sheets.
Fig. 3. From historical sources to quantified water and surge levels.

152 ADVANCES IN OPERATIONAL OCEANOGRAPHY
4. Conlusion and Perspectives Within five years of existence, the WG ‘Historic Storms and Floodings’ has been able to initiate different multidisciplinary projects. Information on these marine extreme events have been integrated in the DB ‘Historic Storms and Floodings’. This data base covers so far only the French Atlantic and Channel coastlines and the period from 1500 to today, but spatial and temporal extensions are currently discussed. Major events are analysed and historic sources’ contents are used to reconstruct historic water and surge levels and presented in storm sheets. Within this reconstruction, different important steps have been enhanced: an efficient and objective data quality control has been developed and the estimation of tidal predictions has been improved by members of the WG. The future work of the WG will be focusing on documenting the different kind of data types that describe these extreme events and continuing to be a platform of exchange between different research and experts.
AcknowledgementsThe author would like to thank the members of the working group ‘Historic Storms and Floodings’.
ReferencesAndré, G., Ferret, Yann, & Pouvreau, Nicolas. (2020). Prédiction de marée dans le passé pour l’estimation des surcotes historiques. Wébinaire sur les Tempêtes et Submersions historiques.
Athimon, E. (2020). Etablir la fiabilité des sources historiques: une nouvelle méthode accessible aux non-initées. Wébinaire sur les Tempêtes et Submersions historiques.
Breilh, J.-F., Bertin, X., Chaumillon, É., Giloy, N., & Sauzeau, T. (2014). How frequent is storm-induced flooding in the central part of the Bay of Biscay? Global and Planetary Change, 122, 161-175. https://doi.org/10.1016/j.gloplacha.2014.08.013
Bulteau, T., Idier, D., Lambert, J., & Garcin, M. (2015). How historical information can improve estimation and prediction of extreme coastal water levels: application to the Xynthia event at La Rochelle (France). Natural Hazards and Earth System Sciences, 15(6), 1135-1147. https://doi.org/10.5194/nhess-15-1135-2015
Daubord, C., Goirand, V., André, G., & Jan, G. (2014). Niveaux et surcotes extrêmes sur le littoral Atlantique-Manche. Caractérisation des évènements marquants de l’automne-hiver 2013-2014. 889-896. https://doi.org/10.5150/jngcgc.2014.098
Ferret, Y. (2016). Reconstruction de la série marégraphique de Saint-Nazaire (27 SHOM/DOPS/HOM/MAC/NP). http://refmar.SHOM.fr/documents/10227/194658/Reconstruction+serie+maregraphique+Saint-Nazaire+par+Yann+Ferret+2016.pdf
Frau, R., Andreewsky, M., & Bernardara, P. (2018). The use of historical information for regional frequency analysis of extreme skew surge. Natural Hazards and Earth System Sciences, 18(3), 949-962. https://doi.org/10.5194/nhess-18-949-2018

153ADVANCES IN OPERATIONAL OCEANOGRAPHY EXPANDING EUROPE’S OBSERVING AND FORECASTING CAPACITY
Giloy, N., Duluc, C.-M., Frau, R., Ferret, Y., Bulteau, T., Mazas, F., & Sauzeau, T. (2018). La base de données TEMPETES : un support pour une expertise collégiale et interdisciplinaire des informations historiques de tempêtes et de submersions. 823-832. https://doi.org/10.5150/jngcgc.2018.093
Giloy, N., Hamdi, Y., Bardet, L., Garnier, E., & Duluc, C.-M. (2019). Quantifying historic skew surges: an example for the Dunkirk Area, France. Natural Hazards, 98(3), 869-893. https://doi.org/10.1007/s11069-018-3527-1
Haigh, I. D., Wadey, M. P., Gallop, S. L., Loehr, H., Nicholls, R. J., Horsburgh, K., Brown, J. M., & Bradshaw, E. (2015). A user-friendly database of coastal flooding in the United Kingdom from 1915–2014. Scientific Data, 2(1). https://doi.org/10.1038/sdata.2015.21
Hamdi, Y., Garnier, E., Giloy, N., Duluc, C.-M., & Rebour, V. (2018). Analysis of the risk associated with coastal flooding hazards: a new historical extreme storm surges dataset for Dunkirk, France. Natural Hazards and Earth System Sciences, 18(12), 3383-3402. https://doi.org/10.5194/nhess-18-3383-2018
Hosking, J. R. M., & Wallis, J. R. (1986). Paleoflood Hydrology and Flood Frequency Analysis. Water Resources Research, 22(4), 543-550. https://doi.org/10.1029/WR022i004p00543
Latapy, A., Ferret, Yann, Fraboul, Claire, & Pouvreau, Nicolas. (2021). Assessing long-term sea level evolution: the historical sea level data rescue approach.
Ouarda, T. B. M. J., Rasmussen, P. F., Bobée, B., & Bernier, J. (1998). Utilisation de l’information historique en analyse hydrologique fréquentielle. Revue des sciences de l’eau, 11, 41-49. https://doi.org/10.7202/705328ar
Pouvreau, N., Martin Miguez, B., Simon, B., & Wöppelmann, G. (2006). Évolution de l’onde semi-diurne M2 de la marée à Brest de 1846 à 2005. Comptes Rendus Geoscience, 338(11), 802-808. https://doi.org/10.1016/j.crte.2006.07.003
Roche, A., Baraer, F., Le Cam, H., Madec, T., Gautier, S., Jan, G., & Goutx, D. (2014). Projet VIMERS : une typologie des tempêtes bretonnes pour prévoir l’impact des tempêtes à venir et mieux s’y préparer. 925-932. https://doi.org/10.5150/jngcgc.2014.102

154 ADVANCES IN OPERATIONAL OCEANOGRAPHY
ASSESSING LONG-TERM SEA LEVEL EVOLUTION: THE HISTORICAL SEA LEVEL DATA RESCUE APPROACH Alexa Latapy* , Yann Ferret, Claire Fraboul and Nicolas Pouvreau
SHOM, French Hydrographic and Oceanographic Service,13, Rue du Châtellier CS 92803 - 29228 Brest CEDEX 2, France
Abstract In coastal areas, the characterization of sea-level rise and variations of sea level due to extreme weather events (e.g. storm surges) remains a strong societal concern. The analysis of long historical water level records proved to be an ideal way to provide relevant arguments regarding the observed long-term sea-level evolution. In France, many systematic sea level observations performed by mechanical tide gauge were carried out since the mid-1800s. Despite this rich history, long water-level data sets digitally available are still scarce: historical water level measurements need to be digitized. In this context, an extensive work in sea level data rescuing is undertaken at SHOM. This time-demanding effort aims at recovering the French scientific and cultural heritage on sea level observations and providing researcher community with new datasets to analyze. This initiative responds to the recommendations of the Global Sea Level Observing System program (GLOSS) on the recovery of forgotten sea level measurements.
More than 60,000 documents have been identified and accurately inventoried at SHOM and about 50% have already been scanned, but thousands of documents still remain to carefully inventory and scan. These measurements mainly concern French ports (~300 sites) and also overseas sites (~240 sites). Time series duration span time periods ranging from few days to several decades. Longest time series can be directly use to assess long term sea level evolution (SONEL) and shorter dataset could be used to quantify historical storm surges, allowing the improvement of estimation and prediction of extreme coastal water levels (French Working Group ‘Historical Storms and Floodings’).
Keywords: Sea-level, data rescue, long-term, digitalization
* Corresponding author: [email protected]

155ADVANCES IN OPERATIONAL OCEANOGRAPHY EXPANDING EUROPE’S OBSERVING AND FORECASTING CAPACITY
1. Introduction The study of global climate change and its influence on sea level variations on different time scales, whether in terms of mean sea level changes or variation in extreme events, is a major challenge for human societies today. Since the 1990s, satellite altimetry data have provided a global view of these changes and reveal the spatial heterogeneity of sea level variations (Cazenave & Llovel, 2009). The technologies used to carry out these studies, and the processing applied to the data are constantly improving, but it is still necessary to cross these measurements with observations from tide gauges, particularly in coastal areas (Cipollini et al., 2017). Measurements made with tide gauges are basically the only available archive providing information on the evolution of the historical sea level, on the scale of past decades or even centuries. A minimum of 60 years of record is considered reliable for estimating current eustatic variations and filtering out cyclic and irregular contributions from the tide gauge signal (Douglas, 1991), hence the need for the longest possible tide gauge series.
Since the middle of the 19th century, water level has been measured systematically and continuously at many sites along the French coast using tide gauges. A review of these historical sea level data shows that most of them are still in paper form and are therefore not used (Pouvreau, 2008).
In this context, and like many foreign institutions (Hogarth et al., 2020; Talke & Jay, 2017), an important work is undertaken at SHOM to rescue the many historical data still in paper format. These projects aim to perpetuate all historical documents stored in its archives in order to improve knowledge of changes in mean sea level. This initiative is part of a more international approach and responds to the recommendations of the Global Sea Level Observing System (GLOSS) program led by the Intergovernmental Oceanographic Commission (IOC) of UNESCO, on the valorization of ‘archaeological’ water level observations (Bradshaw et al., 2015).
The objective of this article is to present the current achievements at SHOM in terms of sea level data rescue in order to illustrate the strong scientific potential of paper archives.
2. The Data Rescue Process
2.1 Inventory The first essential step of this data rescue process is to realize the most exhaustive inventory as possible (place of measurement, period, type of documents/data …) of all the available data, in order to allow the estimation of their scientific potential.
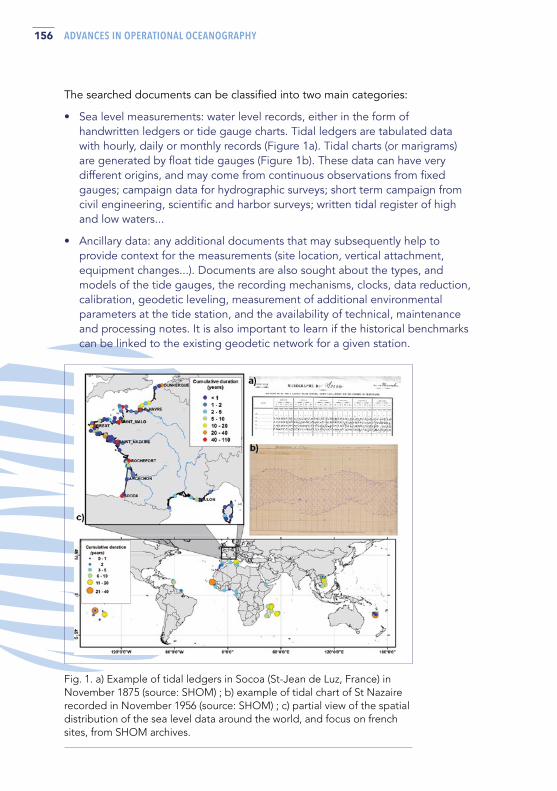
156 ADVANCES IN OPERATIONAL OCEANOGRAPHY
The searched documents can be classified into two main categories:
• Sea level measurements: water level records, either in the form of handwritten ledgers or tide gauge charts. Tidal ledgers are tabulated data with hourly, daily or monthly records (Figure 1a). Tidal charts (or marigrams) are generated by float tide gauges (Figure 1b). These data can have very different origins, and may come from continuous observations from fixed gauges; campaign data for hydrographic surveys; short term campaign from civil engineering, scientific and harbor surveys; written tidal register of high and low waters...
• Ancillary data: any additional documents that may subsequently help to provide context for the measurements (site location, vertical attachment, equipment changes...). Documents are also sought about the types, and models of the tide gauges, the recording mechanisms, clocks, data reduction, calibration, geodetic leveling, measurement of additional environmental parameters at the tide station, and the availability of technical, maintenance and processing notes. It is also important to learn if the historical benchmarks can be linked to the existing geodetic network for a given station.
Fig. 1. a) Example of tidal ledgers in Socoa (St-Jean de Luz, France) in November 1875 (source: SHOM) ; b) example of tidal chart of St Nazaire recorded in November 1956 (source: SHOM) ; c) partial view of the spatial distribution of the sea level data around the world, and focus on french sites, from SHOM archives.

157ADVANCES IN OPERATIONAL OCEANOGRAPHY EXPANDING EUROPE’S OBSERVING AND FORECASTING CAPACITY
Because of its history, the SHOM has an important technical and historical heritage, especially in the field of tide gauges (since the beginning of the 19th century). The set of measurements kept in the SHOM archives mainly concerns French ports (~300 sites), but also, in a more punctual way, sites located in the different seas of the world (~240 sites) (Figure 1c). In recent years, a major effort has been made to valorize these forgotten documents, in particular through funding from the French Ministry of Ecological Transition (MTE/DGPR) and under SONEL activities. The inventory of existing historical records is available online (http://refmar.SHOM.fr/dataRescue/index_en.html). At this time, more than 60,000 documents have been identified and accurately inventoried (Figure 1c) and about 50% have already been scanned but thousands of documents still remain to carefully inventory and scan. In addition, the SHOM was not the only institution performing tide observations over historical time period, the inventory effort needs to be extending to more archives centers to get a more exhaustive inventory as possible.
2.1 Digitalization and validation process Once the documents have been identified, they must be digitized in order to extract the information and the tidal signal contained in the paper documents. This digitization process varies according to the type of document considered (Figure 2). Tidal ledgers are manually digitized while marigrams are semi-automatically digitized using the NUNIEAU software developed and made freely available by CEREMA (Ullmann et al., 2005) in order to extract water level data as a function of time.
After being digitized, these data must be validated. The objectives of this step are to make the reconstructed series consistent in time (expressed in UTC) and in height (expressed according to the same datum, in our case here in France, the chart datum) and to perform data quality checks (Figure 2). In the validation process, it is necessary to take into account all the ancillary data related to the tide gauge measurements available (Figure 2). Procedures are adapted or developed to detect and correct/remove anomalies in the measurements (peaks, vertical offsets, phase shift…).
The data qualification is a necessary step before any further analysis. This action can be done by comparing the observations with the tidal predictions obtained over the same time periods. By making the difference between the observed water levels for a given high or low water (HW/LW) and those predicted for the same HW/LW. Residuals obtained allow the identification of vertical jumps or temporal shifts present in the reconstructed data. When possible, inter-series comparisons are also made. Indeed, nearby stations are regularly subjected to the same large-scale atmospheric conditions, which normally induce a good correlation of daily and monthly sea level variations observed at these different sites. Thus, this allows highlighting periods for which the quality of the digitized data is potentially suspect.

158 ADVANCES IN OPERATIONAL OCEANOGRAPHY
In addition, for some observatories, meteorological measurements were made in parallel with tide gauge measurements, if these measurements are also found, they can be digitized. The use of atmospheric pressure measurements allows the estimation of the inverse barometer effect and the identification of storms: it helps to confirm or invalidate the reconstructed tide observations.
3. Applications From the new reconstructed and validated data sets, many applications are possible. Sea level data rescue can help the research and engineering communities to better understand long-term trends, resulting in better risk assessment and ultimately more robust design of new infrastructure and adaptation of existing ones.
It is possible to determine daily, monthly and annual mean sea levels. The extended data series provide a much richer view of long-term trends in local sea level (Ferret, 2016; Shoari Nejad et al., 2020). Historical tide data can help inform how tidal characteristics such as High Water and Low Water have changed. Similarly, analyses of the evolution of harmonic components can also be performed to study the evolution of tidal characteristics (I. D. Haigh et al., 2020; Harker et al., 2019).
In addition, new data series also allows the rediscovery of historical storms. Taking into account these extreme values, not quantified until now, allows improving the
Fig. 2. Sea-level data rescue process: from paper documents to digital sea-level data.
159ADVANCES IN OPERATIONAL OCEANOGRAPHY EXPANDING EUROPE’S OBSERVING AND FORECASTING CAPACITY
estimates of extreme levels (Bulteau et al., 2015). The identified storm events can be integrated into the French Data Base on Historical Storms and Floodings in Working Group ‘Historical Storms and Floodings’ whose objective is to collect all types of information on historical storm and flooding events (Giloy et al., 2021). Moreover, numerical models combined with tidal data can be used to assess whether local engineering or other long-term changes have influenced storm surge risk. (I. Haigh et al., 2010; Idier et al., 2017).
In France, many data rescue projects have been initiated to support public policies for the prevention of marine submersion in the context of Flood Action Programs (PAPI) (Saint-Malo, Bourcefranc-le-Chapus) (Guillier, 2016) and erosion risks in coastal areas (Socoa, EZPONDA FEDER Project).
4. ConclusionsThe SHOM has a large volume of historical sea level observation, the oldest of which date back to the early 19th century. The rescue of these old measurements is essential: a better assessment of the past can help us better understand the present and better plan for the future. Recently, great efforts are being made to enhance the value of these scientific archives with a major project on the inventory and online diffusion of the existing data. Reconstruction projects are also progressively initiated to scan, digitize and validate the new data.
This article details efforts to find, catalog and perpetuate historical tide data. These newly available sea level data can help to understand how the oceanic changes or local anthropogenic changes have altered system properties over the past historical period. The systematic reconstruction of these sea level series will also allow the identification of surge events that have not been quantified until now and thus provide essential elements for the secular study of extreme levels. This information is essential for a better management of coastal areas.
AcknowledgementsThe authors wish to thank the French Ministry of Ecological Transition (hazard prevention direction) for its involvement in the data rescue activities. The authors also thank SONEL for having contributed to the data rescue activities (purchase of a scrolling A0 scanner, financing of a vectorisation prestation of about 8,000 documents, …).

160 ADVANCES IN OPERATIONAL OCEANOGRAPHY
ReferencesBradshaw, E., Rickards, L., & Aarup, T. (2015). Sea level data archaeology and the Global Sea Level Observing System (GLOSS). GeoResJ, 6, 9-16. https://doi.org/10.1016/j.grj.2015.02.005
Bulteau, T., Idier, D., Lambert, J., & Garcin, M. (2015). How historical information can improve estimation and prediction of extreme coastal water levels: Application to the Xynthia event at La Rochelle (France). Natural Hazards and Earth System Sciences, 15(6), 1135-1147. https://doi.org/10.5194/nhess-15-1135-2015
Cazenave, A., & Llovel, W. (2009). Contemporary Sea Level Rise. Annual Review of Marine Science, 2(1), 145-173. https://doi.org/10.1146/annurev-marine-120308-081105
Cipollini, P., Calafat, F. M., Jevrejeva, S., Melet, A., & Prandi, P. (2017). Monitoring sea level in the coastal zone with satellite altimetry and tide gauges. Integrative Study of the Mean Sea Level and Its Components, 35-59.
Douglas, B. C. (1991). Global sea level rise. Journal of Geophysical Research: Oceans, 96(C4), 6981-6992. https://doi.org/10.1029/91JC00064
Ferret, Y. (2016). Reconstruction de la série marégraphique de Saint-Nazaire (27 SHOM/
DOPS/HOM/MAC/NP). SHOM. http://refmar.SHOM.fr/documents/10227/194658/Reconstruction+serie+maregraphique+Saint-Nazaire+par+Yann+Ferret+2016.pdf
Giloy, N. & members of the Working Group « Historical Storms and Floodings ». (2021). Multidisciplinary expertise of historical information for the characterization of water levels during storm and coastal flooding events. Proceedings of the 9th
EuroGOOS International Conference. 3-5 May, Brest, France. EuroGOOS 2021, Brest, France.
Guillier, F. (2016). Flood Action Programs (PAPI): Rating the flood’s collective vulnerability through the implementation of an integrated public policy tool. 7, 08006.
Haigh, I. D., Pickering, M. D., Green, J. A. M., Arbic, B. K., Arns, A., Dangendorf, S., Hill, D., Horsburgh, K., Howard, T., Idier, D., Jay, D. A., Jänicke, L., Lee, S. B., Müller, M., Schindelegger, M., Talke, S. A., Wilmes, S.-B., & Woodworth, P. L. (2020). The Tides They Are a-Changin’: A comprehensive review of past and future non-astronomical changes in tides, their driving mechanisms and future implications. Reviews of Geophysics, n/a(n/a). https://doi.org/10.1029/2018RG000636
Haigh, I., Nicholls, R., & Wells, N. (2010). Assessing changes in extreme sea levels : Application to the English Channel, 1900–2006. Continental Shelf Research, 30(9), 1042-1055. https://doi.org/10.1016/j.csr.2010.02.002
Harker, A., Green, J. A. M., Schindelegger, M., & Wilmes, S.-B. (2019). The impact of sea-level rise on tidal characteristics around Australia. Ocean Science, 15(1), 147-159. https://doi.org/10.5194/os-15-147-2019
161ADVANCES IN OPERATIONAL OCEANOGRAPHY EXPANDING EUROPE’S OBSERVING AND FORECASTING CAPACITY
Hogarth, P., Hughes, C. W., Williams, S. D. P., & Wilson, C. (2020). Improved and extended tide gauge records for the British Isles leading to more consistent estimates of sea level rise and acceleration since 1958. Progress in Oceanography, 184, 102333. https://doi.org/10.1016/j.pocean.2020.102333
Idier, D., Paris, F., Cozannet, G. L., Boulahya, F., & Dumas, F. (2017). Sea-level rise impacts on the tides of the European Shelf. Continental Shelf Research, 137, 56-71. https://doi.org/10.1016/j.csr.2017.01.007
Pouvreau, N. (2008). Trois cents ans de mesures marégraphiques en France : Outils, méthodes et tendances des composantes du niveau de la mer au port de Brest [PhD thesis, Université de La Rochelle]. https://tel.archives-ouvertes.fr/tel-00353660/document
Shoari Nejad, A., Parnell, A. C., Greene, A., Kelleher, B. P., & McCarthy, G. (2020). Recent sea level rise on Ireland’s east coast based on multiple tide gauge analysis. Ocean Science Discussions, 1-26. https://doi.org/10.5194/os-2020-81
Talke, S., & Jay, D. (2017). Archival Water-Level Measurements: Recovering Historical Data to Help Design for the Future. Civil and Environmental Engineering Faculty Publications and Presentations. https://pdxscholar.library.pdx.edu/cengin_fac/412
Ullmann, A., Pons, F., & Moron, V. (2005). Tool kit helps digitize tide gauge records. Eos, Transactions American Geophysical Union, 86(38), 342-342. https://doi.org/10.1029/2005EO380004

162 ADVANCES IN OPERATIONAL OCEANOGRAPHY
IMPROVING STORM SURGE AND WAVE FORECASTS FROM REGIONAL TO NEARSHORE SCALES Audrey Pasquet (1), Héloïse Michaud (1), Léo Seyfried (1), Rémy Baraille (1), Laurie Biscara (2), Yann Krien (1), Didier Jourdan (1)
(1) SHOM, Antenne de Toulouse, BP 45017 – 31032 Toulouse, France. [email protected](2) SHOM, 13 rue du Chatellier, 29200 Brest, France.
Abstract Submersion risks assessment requires different tools and methods from regional to coastal scales. The SHOM’s strategy relies on numerical modelling and observational systems applied in a challenging multi-scale context. At regional scales, storm surge and wave models Hycom and Wavewatch III, bathymetric digital terrain models (DTMs) and observational tide/buoy networks used within the operational national storm surge service (Homonim project with Météo-France) are presented, as well as their applications in climatological 40-year hindasts. At coastal scales, coupling between models at decametric resolutions is required for better forecasting of coastal processes (currents/levels and wave interactions). The aim is to improve knowledge of marine hazards locally, and to develop infra-departmental warning systems based on real time flooding forecasts or statistical risk management tools. The development of such tools requires fine scale topo-bathymetric DTMs and dedicated oceanographic campaigns for model validation.
To combine regional to coastal scales and improve numerical performance, the modelling strategy will soon be based on a new numerical model from the TOLOSA library (TOols Library for unstructured Ocean models and Surge Applications). This state-of-the-art numerical code, that handles many types of numerical schemes, physical formalisms and meshes, should lead to ultra-high resolution forecasting capacities, allowing for finer processes studies and forecasts (wave setup, port oscillations, infragravity waves, estuarine dynamics, overflows).
Keywords: waves, storm surge, forecasting, measurement, risks
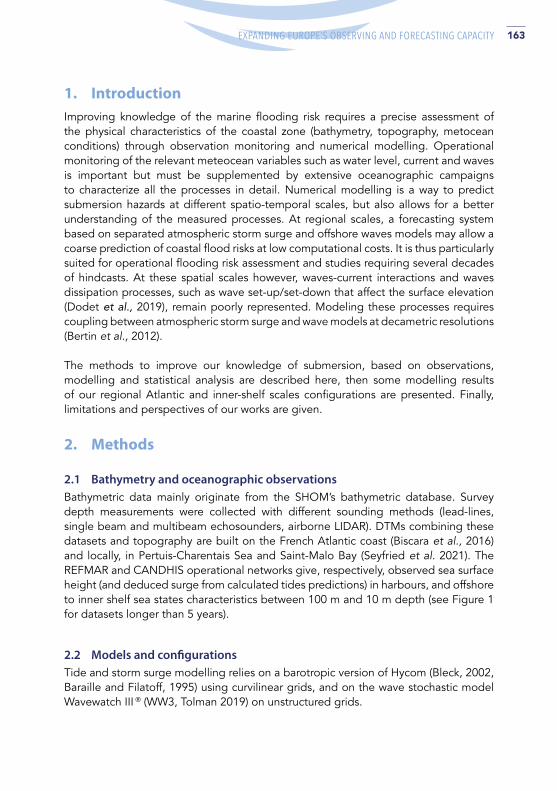
163ADVANCES IN OPERATIONAL OCEANOGRAPHY EXPANDING EUROPE’S OBSERVING AND FORECASTING CAPACITY
1. Introduction Improving knowledge of the marine flooding risk requires a precise assessment of the physical characteristics of the coastal zone (bathymetry, topography, metocean conditions) through observation monitoring and numerical modelling. Operational monitoring of the relevant meteocean variables such as water level, current and waves is important but must be supplemented by extensive oceanographic campaigns to characterize all the processes in detail. Numerical modelling is a way to predict submersion hazards at different spatio-temporal scales, but also allows for a better understanding of the measured processes. At regional scales, a forecasting system based on separated atmospheric storm surge and offshore waves models may allow a coarse prediction of coastal flood risks at low computational costs. It is thus particularly suited for operational flooding risk assessment and studies requiring several decades of hindcasts. At these spatial scales however, waves-current interactions and waves dissipation processes, such as wave set-up/set-down that affect the surface elevation (Dodet et al., 2019), remain poorly represented. Modeling these processes requires coupling between atmospheric storm surge and wave models at decametric resolutions (Bertin et al., 2012). The methods to improve our knowledge of submersion, based on observations, modelling and statistical analysis are described here, then some modelling results of our regional Atlantic and inner-shelf scales configurations are presented. Finally, limitations and perspectives of our works are given.
2. Methods
2.1 Bathymetry and oceanographic observations Bathymetric data mainly originate from the SHOM’s bathymetric database. Survey depth measurements were collected with different sounding methods (lead-lines, single beam and multibeam echosounders, airborne LIDAR). DTMs combining these datasets and topography are built on the French Atlantic coast (Biscara et al., 2016) and locally, in Pertuis-Charentais Sea and Saint-Malo Bay (Seyfried et al. 2021). The REFMAR and CANDHIS operational networks give, respectively, observed sea surface height (and deduced surge from calculated tides predictions) in harbours, and offshore to inner shelf sea states characteristics between 100 m and 10 m depth (see Figure 1 for datasets longer than 5 years).
2.2 Models and configurations Tide and storm surge modelling relies on a barotropic version of Hycom (Bleck, 2002, Baraille and Filatoff, 1995) using curvilinear grids, and on the wave stochastic model Wavewatch III ® (WW3, Tolman 2019) on unstructured grids.
164 ADVANCES IN OPERATIONAL OCEANOGRAPHY
French Atlantic regional configurations (HR systems) were developed and calibrated as part of the HOMONIM research project (Jourdan et al., 2020) to meet the requirements of the operational numerical forecast capacity for the French storm surge warning system (e.g. forced by Météo-France atmospheric and wave models, HR-MF). They allow a sub-kilometric (500 m to 1 km) representation of atmospheric storm surge and wave parameters. A 40-year surge/current/waves hindcast (forced by hourly, 30km resolution ERA5 atmospheric reanalysis, HR-ERA5 in the following) ran with these configurations is also presented here.
At inner shelf scales, higher resolutions are reached by coupling Hycom and WW3 using the OASIS coupler (Michaud et al., 2015) and allow the representation of nearshore processes such as the wave set-up. The physical performance of this system is discussed here through the results of two ~30m resolution configurations on the Pertuis-Charentais (THR-Charentes) and Saint-Malo (THR-Malo) areas.
2.3 Extremes values analysis An extreme value analysis is performed to evaluate the ability of the model to represent the extreme events. The extreme events are identified by applying the Peak Over Threshold (POT) method. The exceedance events were modelled according to the Generalized Pareto Distribution (Coles 2001). Return levels are calculated from this analysis, which is performed on both modelled and observed skew surge (difference between maximum sea level and tide for each tide cycle), as well as significant wave heights (Hs).
Fig. 1. 100-year return levels for Skew Surge observations (left), 100-year return levels for Hs observations (center) and 100-year return level errors for Skew Surge and Hs (right).

165ADVANCES IN OPERATIONAL OCEANOGRAPHY EXPANDING EUROPE’S OBSERVING AND FORECASTING CAPACITY
3. Results
3.1 Regional modelling The HR-ERA5 configurations are able to well represent the extreme values of skew surge and Hs (Figure 1). The highest return levels of skew surges and Hs are observed, respectively, in the eastern part of the English Channel and at La Rochelle, (up to 1.4 m) and in front of Brest (les Pierres Noires buoy, 15 m). The largest model errors occur along Nouvelle Aquitaine coasts (from La Rochelle to Bayonne) for skew surge and at Belle-Ile for Hs.
Those errors (mainly underestimation) can partly be attributed to ERA5 forcings, and could be reduced using more accurate atmospheric and boundary forcings, such as Météo-France atmospheric and wave models. As an example, for Xynthia and Eleanor storms that have induced coastal floodings in Pertuis Charentes Sea (Bertin et al., 2012) and Saint-Malo Bay, it significantly improves the amplitudes of waves and storm surge (Figure 2, HR-MF compared to HR-ERA5 results), although a slight over estimation of storm surge can be observed for Xynthia storm.
Fig. 2. Time Series for Xynthia storm in La Rochelle (left) et Eleanor storm at Saint-Malo (right). Simulations HR-ERA5, HR-MF and THR configurations are compared to tide gauge measurements at La Rochelle (left) and Saint Malo (right), and to buoys measurements at Oleron buoy (buoy #01703, west of La Rochelle, left) and Bréhat (buoy #02204, north of Saint Malo, right).

166 ADVANCES IN OPERATIONAL OCEANOGRAPHY
3.2 Inner shelf scales modelling Additional precision of prediction can still be achieved using the decametric coupled modelling system in these two coastal areas. Several improvements resulting from the coupling effect on the enhanced representation of dynamical processes, as well as the finer resolution of the coastline itself, are obtained considering storm surge levels (Figure 2). In the Pertuis Charentais area during Xynthia, currents and water levels on foreshore or shallow depths stations such as La Cotinière are more accurate (not shown), which allows for finer, more precise tide and surge levels prediction. Wave effects on the water level (Figure 3) can locally reach 20 cm on wave-exposed coasts (Ré and Oleron islands) to lower at -10 cm before the waves breaking zone.
As expected as this could be regarding theory and literature (Bertin et al, 2012), but these results need to be compared to measurements to really estimate the contribution of very high resolution coupling. Apart from La Rochelle tide gauge, where the wave setup is negligible due to the sheltered location, acquired measurements during Xynthia are too scarce.
In macrotidal regions such as Saint-Malo (tidal range can reach 14 m) wave-currents effects on the water level may significantly depend on tide amplitudes. During Eleanor storm (Figure 3), it hardly reaches 5 cm during high tides. When arriving at Saint-Malo dike during high tides, waves are still well formed and have not yet broken, so only a set-down is generated. Numerous photos and videos of these events show wave breaking on the dike and overtopping. These processes cannot be modeled by decametric phase-averaged coupled systems.
Fig. 3. Map of wave set-up (in meter) on Pertuis Charentais (left) during Xynthia storm (28 February 2010 at 3 a.m.) and Saint-Malo bay (right) during Eleanor storm (3 January 2018 at 7 a.m.). Tidal operational stations are reported in capital letters. Moorings deployed during PAPI Saint-Malo oceanographic campaigns are represented (right).
167ADVANCES IN OPERATIONAL OCEANOGRAPHY EXPANDING EUROPE’S OBSERVING AND FORECASTING CAPACITY
4. Conclusions and perspectives The wave and surge modelling system at regional and inner-shelf scales are presented. Improving the atmospheric forcing, resolution and the physics by coupling waves and levels models, allow a better representation of the processes near the coastline. The lack of operational tidal and wave observations limits the validation process. To raise this obstacle, dedicated extensive oceanographic campaigns were conducted in Saint-Malo bay in winter 2018 – 2019 (Seyfried et al., 2021, see Figure 3 for the location of some of the 38 instruments) and Ré Island in winter 2020-2021 (in progress). This will provide datasets to further evaluate the capacity of numerical models to represent flooding processes at decametric, and then even finer, metric scales. Increasing the model resolution is no longer the only bottleneck when modeling highly nonlinear coastal processes. Spectral wave models are not the dedicated tools to represent wave transformation nearshore. The coupling system between wave and surge models offers only a simplified parameterization of the real interactions. To take up the challenge of the accurate assessment of flooding, the unstructured surge model Tolosa-sw (Couderc et al., 2017) which is destined to replace Hycom for operational forecasts, will thus be completed nearshore by a non-hydrostatic module (Richard, 2020; Durand et al., 2020).
AcknowledgementsThis study is supported by the French Ministry of Ecology and Sustainable Development, as well as Saint-Malo, Saint-Malo Agglomération, Conseil Départemental d’Ille et Vilaine (CD35) and Brittany region. We are also grateful to CEREMA for providing buoy measurements. This research is also supported by the research program PROTEVS funded by DGA.
ReferencesBertin X., Bruneau N., Breilh J.-F., Fortunato A.B., Karpytchev M., (2012). Importance of wave age and resonance in storm surges: The case Xynthia, Bay of Biscay. Ocean Modelling 42(2012) 16-30.
Biscara L., Maspataud A. and Schmitt T., (2016). Coastal risk assessment: generation of bathymetric digital elevation models along French coasts. Hydro International, September 2016, 26-29. https://www.hydro-international.com/content/article/coastal-risk-assessment
Baraille R., Filatoff N. (1995). Modèle shallow-water multicouches isopycnal de Miami. Technical Report. 003/95.
Bleck R. (2002). An oceanic general circulation model framed in hybrid isopycnic-Cartesian coordinates. Ocean Modelling, Vol. 4(1), pp 55–88. http://dx.doi.org/10.1016/S1463-5003(01)00012-9

168 ADVANCES IN OPERATIONAL OCEANOGRAPHY
Coles, S. (2001). An Introduction to Statistical Modeling of Extreme Values. Springer Series in Statistics. Springer Verlag London. 208p
Couderc F., Duran A., Vila J-P. (2017). An explicit asymptotic preserving low Froude scheme for the multilayer shallow water model with density stratification. Journal of Computational Physics, 343: 235–270.
Dodet, G., Melet, A., Ardhuin, F., Bertin X., Idier D. and Almar R., 2019. The Contribution of Wind-Generated Waves to Coastal Sea-Level Changes. Surveys in Geophysics 40, 1563–1601. https://doi.org/10.1007/s10712-019-09557-5
Duran A, Vila J-P, Baraille R. (2020). Energy-stable staggered schemes for the shallow water equations. Journal of Computational Physics. 401:109051, https://doi.org/10.1016/j.jcp.2019.109051
Jourdan D., Paradis D., Pasquet A., Michaud H., Baraille R., Biscara L., Dalphinet A., Ohl P., (2020). La phase-3 du projet HOMONIM : définition et contenu (pp 779-788) - DOI:10.5150/jngcgc.2020.087
Michaud H., Pasquet A., Baraille R., Leckler F., Aouf L., Dalphinet A., Huchet M., Roland A., M. Dutour-Sikiric M., Ardhuin F., Filipot J.F. (2015). Implementation of the new French operational coastal wave forecasting system and application to a wave-current interaction study. 14th International Workshop on Wave Hindcasting and Forecasting Systems, Key West, USA. 2015.
Seyfried L., Biscara L., Leckler F., Pasquet A. and Michaud H. (2021). Topo-bathymetric and oceanographic datasets for coastal flooding risk assessment: French Flooding Prevention Action Program of Saint-Malo. To be submitted to Earth System Science Data.
Richard G.L. (2020). Depth-averaged equations for compressible shallow-water flows and tsunamis. hal-02959509, European Journal of Mechanics - B/Fluids. 2020.
Tolman et al., (2019), User manual and system documentation of WAVEWATCH III R version 6.07. Tech. Note 333, NOAA/NWS/NCEP/MMAB, College Park, MD, USA, 465 pp. + Appendices

169ADVANCES IN OPERATIONAL OCEANOGRAPHY EXPANDING EUROPE’S OBSERVING AND FORECASTING CAPACITY
CMEMS AND CYCOFOS ASSESSING THE POLLUTION RISK FROM THE LEVIATHAN OFFSHORE PLATFORM IN THE EASTERN MEDITERRANEAN SEA George Zodiatis (1, 9), Svitlana Liubartseva (2), Loizos Loizides (1), Marco Pellegatta (3), Giovanni Coppini (2), Robin Lardner (1, 7), George Kallos (5), Christina Kalogeri (5), Roberto Bonarelli (2), Antonio Augusto Sepp Neves (4), Panicos Nikolaides (6) and Avigdor Brillant (8)
(1) ORION- Research Institution, Nicosia, Cyprus(2) CMCC Italia s.r.l - Centro Euro-Mediterraneo sui Cambiamenti Climatici, Bologna, Italy(3) HPC Italia s.r.l. - Harress Pickel Consult, Milano, Italy(4) UoB - University of Bologna, Bologna, Italy(5) We-Met - Weather Marine Engineering Technologies P.C, Athens, Greece(6) Nikolaides & Ass Associates ltd- Civil and Environmental Engineers & Scientists, Nicosia, Cyprus(7) Simon Fraser University, British Columbia, Canada(8) Council of ZichronYa’akov, ZichronYa’akov, Israel(9) CRL-IACM-FORTH- Coastal & Marine Research Laboratory, Institute of Applied and
Computational Mathematics, Foundation for Research and Technology, Heraklion Greece
Abstract This research is an assessment and risk analysis of the potential pollution from the Leviathan offshore platform operation and malfunction events and from a pipe rupture which connects the Leviathan offshore platform Pressure Reducing & Metering Stations (PRMS) output to the ‘Shore Reception Station’, located at 10 km and 1 km respectively from the Israeli shoreline. The research simulates spills of condensate and diesel fuel. For the spill simulations met-ocean data from the CMEMS Med MFC, CYCOFOS, SKIRON and ECMWF which are covering the time period of 2015-2018 were used. Robust statistics were estimated by performing 5,844 spill simulations for condensate leakage and by having additional 5,844 spill simulations for the diesel-oil, both spills are from the Leviathan offshore platform. For having the pipe line rupture the robust statistics was calculated from 104 spill simulations for the condensate. The main conclusions obtained from the spill simulations for the Leviathan offshore platform, show that the first oil arrival at the Israeli coast is predicted to be within 8 hours after start of the spillage in winter, and within 11 hours in summer. The first

170 ADVANCES IN OPERATIONAL OCEANOGRAPHY
impacted area is the coast between Zichron-Ya’akov/Dor and Atlit, located south of Haifa. In winter time, in average, it is predicted that 17% of the condensate spillage is beached, while in summer the amount of landed oil is doubled. Similarly, the pipe rupture condensate spillage shows that the first impact on the coast is predicted within 5−6 hours in winter, and within 3−4 hours in summer. The coast of Zichron-Ya’akov is estimated with the highest condensate deposition, up to a maximum of 15 tons/km, regardless the season. Due to the proximity of the pipe rupture to the shore, it is predicted that 38−40% of the condensate beached to the nearby shore without any significant seasonal or monthly variability. The condensate spillage from the Leviathan offshore platform will affect mostly the Hadera desalination plant. The results of the current study employing thousands of spill simulations is compared against results of a total of 12 spill simulations which were carried out in the frame of previous studies of the Leviathan energy project.
Keywords: oil spill modeling, condensate, CMEMS, CYCOFOS, Leviathan offshore platform
1. Introduction The risk for major potential oil leakages in the Eastern Mediterranean nowadays is high, due to the recent increase of the hydrocarbon exploration and exploitation activities in the Levantine Basin, the increase of the maritime traffic following the enlargement of the Suez Canal and the EC approval to proceed the East-Med gas pipeline crossing the region. The risks associated with the installation and operation of offshore platforms led the riparian Mediterranean countries to adopt the Protocol for the protection of the sea from potential pollution from the exploration and exploitation of the seabed, known as the Offshore Protocol, which constitute one of the Protocols of the Barcelona Convention1. The Barcelona Offshore Protocol encourages the parties to develop Impact Damage Assessments process taking into account the elements that can affect the marine and coastal environment, due to the deployment and operation of offshore platforms. In order to assess the consequences of oil leakage from existing or planned offshore platforms, the Impact Damage Assessment should be based on oil spill simulations too.
One of the largest discoveries of hydrocarbons in the Eastern Mediterranean Sea during the last decade is the Leviathan field, which constitutes a large-scale energy program of the State of Israel. Gas and condensate from the Leviathan well, located 130 km from the Israeli coast, are transferred via a pipeline to an offshore platform located 10 km from the shoreline, and from there via a pipeline to the coastal Leviathan energy installation (Figure 1). The local Councils of the Israeli communities are concerned from the pollution implications that might occur in case of a major spillage from the Leviathan offshore platform.
* www.unep.org/unepmap/who-we-are/barcelona-convention-and-protocols

171ADVANCES IN OPERATIONAL OCEANOGRAPHY EXPANDING EUROPE’S OBSERVING AND FORECASTING CAPACITY
Fig. 1. Map with the Leviathan field and the Leviathan offshore platform with their connecting pipeline in the EEZ of Israel.
Therefore, there was a request among other tasks to: a) perform spill simulations for condensate, diesel and grey water from the Leviathan offshore platform located at 10 km from the shoreline, b) perform spill simulations for condensate from a pipe rupture located 1 km from the shoreline, c) examine the spillages impact to the desalination plans and other sensitive infrastructure, d) review previous spill simulations for the same offshore platform and e) perform evaporation simulations that eventually generates a vapor cloud which is resulting from the condensate spillage.
Generally, the application of oil spill models for risk assessment of offshore platforms provides answers to the following key questions: where the oil spill will move, how soon it will create the first impact on the coast, duration of drift, time of arrival and location, which sensitive resources and installations will be threatened and what will be the state of the spilled oil when it arrives.

172 ADVANCES IN OPERATIONAL OCEANOGRAPHY
Fig. 2. The domains of CMEMS Med MFC and of the nested CYCOFOS downscaled models, the data of which were used in MEDSLIK and MEDSLIK-II spillages simulations for the Leviathan offshore platform in the EEZ of Israel.
The first 3 questions concerning the transport and the diffusion of the oil spillage are the most critical for having an effective support of the response agencies, and depend completely on reliable sea currents, winds, and wave’s data, while the 4th question depends on reliable fate algorithms concerning the evaporation, emulsification, dispersion, viscosity change, coastal impact.
The current paper presents only the condensate and diesel spill simulations from the Leviathan platform, attributes briefly the pipe rupture condensate spill simulations, and refer to the most high risk sensitive coastal infrastructure along the Israeli shoreline.
2. Methodology and data used The MEDSLIK-II oil spill model (De Dominicis et al., 2013) was applied to assess the potential pollution risk from the Leviathan offshore platform according to the following leakage scenarios for condensate and diesel spillages (Table I) by using the CMEMS Med MFC data, while for the pipe rupture, located 1km from the Israeli shore, the MEDSLIK oil spill model (Lardner et al., 1998; Zodiatis et al., 2017) was applied by using the downscaled CYCOFOS hydrodynamical and wave models (Figure 2) data and the high frequency SKIRON winds. Both models use the same fate and advection diffusion algorithms to address the risk assessment questions mentioned in the introduction. For the Leviathan offshore platform, 5,844 spill simulations were carried for condensate and another 5,844 for diesel, where each simulation is initiated every 6 hours for 10 days ahead during 2015-2018, using the CMEMS Med MFC hind-cast data. Similarly, for the pipe rupture with condensate located 1 km from the shore, 104 spill simulations were initiated every 15 days for 20 days ahead during 2015-2018, using the CYCOFOS hind cast data (Table I).

173ADVANCES IN OPERATIONAL OCEANOGRAPHY EXPANDING EUROPE’S OBSERVING AND FORECASTING CAPACITY
PARAMETER VALUES
Location of spillages: Leviathan platformpipe rupture
32° 35’ 55.76’’ N ; 34° 48’ 21.55’’ E32° 36’ 02.7’’ N ; 34° 54’ 18.8’’ E
Oil type Condensate: API=43.2 (SG=809.9 kg/m3)Diesel: API=36.4 (SG=843.0 kg/m3)
Spilled volume: Leviathan platformpipe rupture
Condensate: 5,300 bbls ; Diesel: 250 bblsCondensate: 3,000 bbls
Spill duration Near instantaneous: 24 hrs
Simulation length: Leviathan platform 10 days ahead every 6 hours for 4 years; 2015–2018
5,844 simulations for each type of oil spill
pipe rupture 20 days ahead every 15 days for 4 years; 2015–2018104 simulations for each type of oil spill
Hydrondynamic fields: Leviathan platformpipe rupture
CMEMS Med MFC ; hourly ; 1/16 degree (6.5 km)CYCOFOS Levantine ; 6 hourly ; (1.8 km)
Wind fields: Leviathan platformpipe rupture
ECMWF ; 6 hourly ; 0.125 degree (~12.5 km)SKIRON ; hourly ; (10 km)
Number of parcels used 90,000
Table I. The Leviathan condensate and diesel spill simulations setup summary.
3. Results and Discussion The results for the condensate spillage from the Leviathan offshore platform show that up to 40% of the spill was evaporated within less than 24 hrs, the maximum level of evaporation was up to 59.7% and occurred after 48 hrs, while the remained condensate spill beached within 10 days. The condensate spill simulations from the Leviathan platform show that the first impact on the coast is predicted to be within 8 hours in winter and within 11 hours in summer, while the first impacted area is the coastline between Zichron/Dor and Atlit, south from Haifa. In winter it is predicted that 17% of the spillage is beached, while in summer the amount of landed oil is double (Figure 3). Most affected area with maximum spill concentrations (>3ton/km) is the coast of Zichron/Dor and Atlit and from Atlit to Haifa (Shikmona) and the coast between Zichron/Dor and Hadera, regardless of the season. The deposition of the condensate spills in the shoreline of the Hadera desalination plant is estimated to be the highest among the five desalination plants examined. During winter seasons the condensate depositions on the coastline extended northern than Tire in Lebanon, while during summers seasons extended southern than Gaza (Figure 4).

174 ADVANCES IN OPERATIONAL OCEANOGRAPHY
Fig. 3. Left: The maps with the surface average condensate concentrations (in tons/km) after: 24, 48, 72 and 240 hours. Right: The averaged percentages of the evaporated condensate within 240 hours. Both, after leakage from the Leviathan platform.
Fig. 4. Winter and summer evolution of the average concentrations (tons/km) of condensate beached after: 24, 48, 72 and 240 hours, after the spillage from the Leviathan offshore platform.

175ADVANCES IN OPERATIONAL OCEANOGRAPHY EXPANDING EUROPE’S OBSERVING AND FORECASTING CAPACITY
The diesel spillage simulation shows that up to 40% of the spill is evaporated within less than 8 hrs, while the maximum evaporated level reaches is up to 45.7% within less than 30 hrs. Part of the remained surface condensate spill is beached and dispersed in the water column. The diesel spill simulations from the Leviathan platform show that the first impact on the coast is predicted after 21 hours, but not earlier than 16 hours in winter, at 24 hours in transit seasons (spring and autumn) but not earlier than 20 hours and at 33 hours during summer seasons, but not earlier than 24 hours, while the first impacted area is the coastline of Atlit (Figure 5).
In winter in average, it is predicted that 15% of the spillage is beached, while in summer as high as up to 45%. Most affected area with maximum spill concentrations (> 0.1 ton/km) is the coastlines between Zichron/Dor – Atlit, and between Atlit and Haifa (Shikmona) and between Zichron/Dor – Hadera. The deposition of the diesel spillage in the Hadera desalination plant coastline is estimated to be the highest among the five desalination plants examined (Figure 6).
Fig. 5. Left: The maps with the surface average diesel concentrations (in tons/km) after: 24, 48, 72 and 240 hours. Right: The averaged percentages of the evaporated diesel within 240 hours. Both, after spillage from the Leviathan offshore platform.

176 ADVANCES IN OPERATIONAL OCEANOGRAPHY
Fig. 6. Winter, Summer and Transit seasonal spatial-temporal evolution of average concentrations (tons/km) of diesel beached after: 72 and 240 hrs of simulation, after the condensate spillage from the Leviathan offshore platform.
4. Conclusions Long term oil spill simulations from the Leviathan offshore platforms using CMEMS and CYCOFOS downscaled data are important to identify vulnerable coastal areas potentially affected. The first impacted area from the Leviathan offshore platform condensate spill simulations is the coastline between Zichron-Ya’akov/Dor and Atlit at 8 hours in winter and at 11 hours in summer. In winter 17% of the spillage is beached, while in summer the amount of landed oil is doubled.
In case of the pipe rupture causing a condensate spill, the coast of Zichron-Ya’akov is predicted to be the epicenter of the condensate deposition up to 15 tons/km, while 38−40% of the condensate will be beached to the shore nearby, regardless the season. The deposition of the condensate in the coast of the Hadera desalination plant is estimated to be the highest among the five desalination plants examined. The previous spillage scenarios had underestimated by an order of magnitude the content per design itself (1,000 bbls vs. 5,300 bbls) and the documentation of permits. Similarly, the pipe rupture spillage scenarios underestimated by half order of magnitude (1,200 bbls vs. 3,000 bbls). Therefore, the current simulations predicted larger spillage quantities, compared to previous simulations. Moreover, in order to gain stable statistics, the number of simulations has to be high and thereby generating large sample. Large sample is essential in order to obtain statistical inference without artifacts bias according to the law of large numbers.

177ADVANCES IN OPERATIONAL OCEANOGRAPHY EXPANDING EUROPE’S OBSERVING AND FORECASTING CAPACITY
References De Dominicis M., Pinardi N., Zodiatis G., and Lardner R. (2013). MEDSLIK-II, a Lagrangian marine surface oil spill model for short-term forecasting – Part 1: Theory. Geosci. Model Dev., 6, 1851-1869, doi:10.5194/gmd-6-1851-2013,
Lardner, R., Zodiatis, G., Loizides, L., Demetropoulos, A., (1998). An operational oil spill model for the Levantine Basin (Eastern Mediterranean Sea). In: International Symposium on Marine Pollution.
Zodiatis, G., Lardner, R., Alves, T., Krestenitis, Y., Perivoliotis, L., Sofianos, S., (2017). Oil spill forecasting (prediction) Journal of Marine Research 75 (6), 923-953.


SESSION 6
OCEAN OBSERVING TECHNOLOGIES

180 ADVANCES IN OPERATIONAL OCEANOGRAPHY
AUTONOMOUS TECHNOLOGIES A NEW APPROACH TO THE DEVELOPMENT OF HYDROGRAPHY
Petrica Popov, Emanuela Mihailov, Lucian Dumitrache
Romanian Maritime Hydrographic Directorate, Constanța, Romania, [email protected]
Abstract Through their role, hydrography and oceanography contribute to the safety of civilian and military vessels, by constantly monitoring routes and navigation areas and mapping the body of water’s depth, the shape and patterns of the coastline, physical characteristics, and possible navigational hazards posed by submerged bodies. At the same time, it plays an important role in guiding all of the important actors involved in the maritime industry, area management, coastal engineering, commercial fishing, dredging projects, and many other activities. Real-time data from sensors installed in the marine environment or obtained as a result of hydrographic surveys, represent an important support for the specific product development such as navigation charts or different types of forecasts.
In this context, hydrography through national hydrographic offices plays a key role in maritime security and operational oceanography. For the North-Western Black Sea shelf, the Romanian Maritime Hydrographic Directorate (MHD), as a national authority in oceanography and hydrography, follows the implementation of innovative procedures and techniques to increase the regional autonomous capabilities. To comply with the international regulations, MHD is permanently upgrading its infrastructure to perform hydrographic and oceanographic surveys to provide high-resolution data. In addition to the use of these data in specific activities, in most cases, they could also represent a national contribution to major projects developed at the regional or global level.
Keywords: autonomous technologies, maritime security, hydrography, Romanian Maritime Hydrographic Directorate

181ADVANCES IN OPERATIONAL OCEANOGRAPHY EXPANDING EUROPE’S OBSERVING AND FORECASTING CAPACITY
1. Introduction The methods and procedures underlying the activity of hydrographic services are characteristic of public service and are different from those of research institutes whose various objectives are generally oriented towards research projects that are usually carried out over a short period. At the same time, it can be said that the relevance of hydrographic and oceanographic data can only increase insofar as they come from surveys that involve their systematic collection in a certain area, over a long period. The permanent production and updating of nautical charts with data from hydrographic surveys have a positive impact on the economic development of the coastal area, stimulating trade, and the development of port facilities of that state. Also, the drawing of the charts and their permanent updating allowed the protection of coastal areas as large ships or those carrying dangerous goods used the wide routes on these charts, thus protecting the coastal zone from the effects of pollution, developing tourism, and other local businesses. (*IHO, 2008).
For maritime defense, national Navies are the main users of nautical charting products for surface, submarine, anti-submarine, mine-hunting, and air-sea naval operations. Chart coverage must be comprehensive and accurate to provide freedom of maneuver for warships and control the sea space when necessary. For this purpose, hydrographic data and information provided by national hydrographic services support a variety of products used in naval operations (*IHO, 2008).
In Romania, the national hydrographic service, known as Maritime Hydrographic Directorate (MHD), supports safe and efficient navigation, fosters national maritime development, facilitates the protection of the marine environment. As the authority in the field of maritime hydrography, MHD also supports national security and maritime defense through hydrographic surveys that support submarine operations or mine clearance. These include the creation of high-resolution sea bottom or bathymetric charts that can later be used to identify mines or other threats hidden on the seabed. (Grecu e Bujor, 2018). Also, in terms of military activities, MHD ensure METOC information at the national level. This information is relevant to battlespace and must be available from the early stage of planning, to provide relevant information to the command team and to set up the necessary steps for reaching the objectives.
The technique of remote sensing implies a higher level of error for the survey data in the area, this being compared to locally acquired data, but means of correcting imply a large database for the area of interest. (Dumitrache e Gavrila, 2018).
182 ADVANCES IN OPERATIONAL OCEANOGRAPHY
2. Development of autonomous hydrography technologies in MHD
To expand its database and obtain a sufficient amount of data, for improving the process of designing and providing hydrographic and oceanographic products, MHD follows the requirements of national and international standards and has set as the main objective, the development of a new efficient method of obtaining relevant data. Regarding today’s conditions and associated risks, autonomous technologies are of high interest, so that a reconsideration of how some missions are carried out, including those of hydrographic surveys, is necessary.
Autonomous and unmanned surface or underwater platforms (Autonomous Surface Vehicle – ASV, Unmanned Surface Vehicle – USV, Autonomous Underwater Vehicle -AUV) offer a variety of design solutions in the construction of the hull and propulsion: single hull, double hull with a screw or screwless propulsion with a small draft (Romano e Duranti, 2012). Modern technologies have allowed for the development of small-size vehicles with a lower build cost allowing the deployment of more units for a single mission, in a relatively short period.
Bathymetric surveys being part of hydrographic measurements that aim at measuring the seabed topography require a high positioning accuracy (**IHO, 2008). Hence the use of unmanned boats in hydrography can now be regarded as the beginning of a new era in this field (C. Specht et al., 2017). In this regard, the International Hydrographic Bureau - IHO suggests that hydrography will provide tests for the proper use of these technologies, as well as increase the coverage of properly supervised areas. Taking into account the advantages deriving from the use of autonomous technologies, MHD will develop a new autonomous operative component by adopting the following directions:
• Supplying the departments in charge of survey planning and data collection, with autonomous equipment, to expand the research areas and to acquire a large volume of relevant data. So, for the next two years, at the MHD level, the implementation of an extensive endowment plan has started, which includes the following elements: underwater glider fleet, unmanned hydrographic survey boat systems, autonomous underwater vehicle (AUV), and combined sonar system.

183ADVANCES IN OPERATIONAL OCEANOGRAPHY EXPANDING EUROPE’S OBSERVING AND FORECASTING CAPACITY
A complex training program for MHD specialists will also be considered since the autonomous systems require skilled personnel. Also, a great advantage in the operation of these systems is the fact that MHD has its capabilities to produce high-resolution electronic charts. As a result, the acquired data will benefit from a high-quality reference. The deployment and operation of the autonomous systems will be done onboard the Research Hydrographic Vessel ‘Cpt. Cdor. Al. Cătuneanu’ and the other three hydrographic boats (Figure 1).
Fig. 1. RHV ‘Cpt. Cdor Al. Cătuneanu’ and hydrographic boats.
Fig. 2. Launch and recovery systems.

184 ADVANCES IN OPERATIONAL OCEANOGRAPHY
These specialized vessels have facilities in terms of installing launch and recovery systems, maintenance facilities, and communications, for their safe and effective operation (Figure 2):
• Development of autonomous boats, that will later be equipped with hydrographic and oceanographic sensors, together with partner universities and research centers. Thus, through its Research - Development and Innovation Center, MHD in partnership with universities and research centers will initiate research projects that will aim to develop USV and AUV marine platforms with improved characteristics;
• Involvement at the national level, in joint projects and missions, of the institutions that have such technologies, to carry out activities that impose a high degree of risk. Here, it is taken into consideration: discovery, identification, and classification of submerged objects, that constitute potential dangers for navigation.
Simultaneously with the implementation of new autonomous technologies, MHD will go through the stages of harmonization and development of its own hydrographic and oceanographic database, to achieve WEB-GIS operational services to improve METOC, ASW, and MCM products, necessary for Navy specific missions.
3. Conclusions Autonomous systems have a great potential to improve the efficiency of hydrographic surveying, also, the low costs required to carry out hydrographic surveys in certain hard-to-reach areas (shallow depths or with navigation obstructions), are an important criterion to take into account.
Likewise, obtaining a large volume of data in the conditions of using a small number of specialists is the main goal of using autonomous technologies. Starting with the clear definition of the elements involving specific procedures and risk management, it is expected that the activities of oceanographic and hydrographic data collection will be done in the most efficient way possible. At the same time, the corresponding structure of the database, in which the collected data will be found, will allow the efficiency of obtaining specific products even in the conditions of exceptional cases, through the online communication of all parties involved.
AcknowledgementsThis paper had as references, elements from the ‘Research-Development and Innovation strategy of the Romanian Maritime Hydrographic Directorate, for 2020 - 2025’.
185ADVANCES IN OPERATIONAL OCEANOGRAPHY EXPANDING EUROPE’S OBSERVING AND FORECASTING CAPACITY
References* The need for national hydrographic services, (June 2018) published by the International
Hydrographic Services, version 3.0.7.
Grecu, S., Bujor, G. (2018) - Marine research in the exclusive economic zone of Romania - Legal aspects and trends, Strategies XXI, ‘CAROL I’ National Defence University Publishing House, Bucharest, Romania, 2018
Dumitrache, L., Gavrilă, V. (2018) – METOC information relevance for naval operation, Strategies XXI, ‘CAROL I’ National Defence University Publishing House, Bucharest, Romania
Romano A., Duranti P. (2012), Autonomous Unmanned Surface Vessels for Hydrographic Measurement and Environmental Monitoring, Proceedings of the FIG Working Week, Rome
** IHO (2008), IHO Standards for Hydrographic Surveys, Special Publication N°. 44, 5th Edition.
Specht, C., Świtalski, E., Specht, M. (2017) - Application of an autonomous/unmanned survey vessel (ASV/USV) in bathymetric measurements, Polish Maritime Research 3 (95) Vol. 24; pp. 36-44.

186 ADVANCES IN OPERATIONAL OCEANOGRAPHY
JERICO-S3 INTEGRATED INNOVATIVE TECHNOLOGIES FOR COASTAL MONITORING Eric Delory (1), Simone Marini (2), Jérôme Blandin (3), Catherine Boccadoro (4), Dominique Durand (7), Andrés Cianca (1), Joaquin Tintore (5), Jay Pearlman (6), Miguel Charcos (5), Miguel Ángel Alcalde (5), Juan Gabriel Fernandez (5), Laurent Delauney (3)
(1) Oceanic Platform of the Canary Islands (PLOCAN), Ctra de Taliarte s/n, TELDE 35200, Spain; [email protected]
(2) CNR, Italy; Institute of Marine Sciences, Forte Santa Teresa, Pozzuolo di Lerici, LERICI 19032, [email protected]
(3) IFREMER, France; 1625, Route de Sainte Anne, PLOUZANE 29280, [email protected]
(4) NORCE, Norway; Nygardscaten 112, BERGEN 5838, [email protected] (5) SOCIB, Spain; Edificio Naorte S/N, Bloque A, planta 2, puerta 3, PALMA 07121,
[email protected] (6) IEEE, France; rue de la Tour, 14, PARIS, 75016, [email protected] (7) COVARTEC AS, Norway, Bjørgefaret 22, FYLLINGSDALEN 5141, [email protected]
Abstract
JERICO RI, the Joint European Research Infrastructure for Coastal Observatories is an integrated pan-European multidisciplinary/multiplatform research infrastructure dedicated to an interdisciplinary appraisal of the coastal marine system environment. It is the coastal component of the future European Ocean Observing System. This Research Infrastructure is designing the future of coastal observation technology for harmonization and interoperability, advanced functionalities, cost efficiency and reliability. The technological developments of the JERICO-S3 EU project aim to strengthen and expand the infrastructure of the European network of coastal observatories. This objective will be achieved with new observing systems and platforms equipped with new technologies for interoperability, innovative sensor packages for multidisciplinary ecosystem monitoring, coupling physics, chemistry and biology. The planned technological developments consist in adapting interoperability standards, inter alia from the NeXOS and EMSODev European projects, developing on-board and on-server smart solutions for adaptive sampling, integrating technologies into dedicated sensor packages, further developing a capacity for high-frequency measurement of low trophic-level biological diversity and contaminants; hence filling critical gaps in the observation of the coastal ocean. An e-infrastructure is being developed and proof tested to integrate digital components (tools), best practices

187ADVANCES IN OPERATIONAL OCEANOGRAPHY EXPANDING EUROPE’S OBSERVING AND FORECASTING CAPACITY
and documentation, from observation data and data products, to methods and coastal observation services.
Keywords: Ocean, Sensors, Interoperability, Artificial Intelligence, Integration, Systems, Infrastructure, Coastal, Environment, Essential Ocean Variables, MSFD
1. Introduction Recent updates in the definition of essential ocean variables (EOVs) and advances in technological solutions set new challenges and opportunities for coastal observations. Regional efforts are taking place at different paces throughout the world, using techniques ranging from ship-based sampling campaigns to autonomous systems, the resulting observations being then published with different degrees of interoperability, a requirement for seamless discovery, access and use of observations (a.k.a FAIRness principles). New solutions are addressed (section 2), with a particular focus on real-time services and a coastal generic instrumentation module (cEGIM), which in turn would enable so-called ‘awareness’, faster and more automated decision making based on observations (section 4). Improving our understanding of how marine ecosystems work, from micro to macro-organisms through finer spatio-temporal resolution or scales of observations, lead to the development of more autonomous acquisitions and processing capabilities, in response to the breadth and granularity of the problem. New sensor capabilities are a step towards this global objective (section 3). Section 5 addresses the integration of JERICO RI core virtual resources, from data to data products, training and best practices under a common environment.
2. Progress in Interoperability and Modularity – the Coastal Egim
The EGIM (EMSO Generic Instrument Module, see Figure 1) concept was developed in the EMSOdev project to meet the requirement of measuring consistently and continuously the same set of Essential Ocean Variables (EOVs) in a number of open ocean locations (Lantéri et al., 2019). Building on this concept, JERICO-S3 is developing a long-term observation module able to measure a set of common coastal EOVs on the one hand and to integrate different sensor packages adapted to particular fields of study (e.g. Plankton variability, BGC Eutrophication) on the other hand.
This module, named coastal EGIM or cEGIM, is adapted to the harsh coastal environment constraints. The module is based on the Communication and Storage Front-end (COSTOF2), a platform developed by Ifremer and able to accommodate twelve sensors by providing them controlled power, a common time base, large data storage capacity, communication channels with local or remote users as well as an active anti-biofouling protection. The platform is able to work in a very low power environment.

188 ADVANCES IN OPERATIONAL OCEANOGRAPHY
In the course of JERICO-S3, emphasis is given on the cEGIM ability to process sensor outputs in order to make appropriate decisions, such as triggering sensor acquisition (on or off), tuning acquisition parameters and sending alerts. The cEGIM will be first prototyped, tested then demonstrated in different representative environments. It will be operable up to 200 m water depth on the seabed, attached to a mooring line or aboard coastal surface buoys. Data will be delivered through a common format including Web Services based on open standards, and made accessible from the Jerico e-infrastructure. In the long run, it is hoped that a wide adoption of the same observation platform within the coastal observing community will favour interoperability.
3. Enabling Ecosystem Observing with new sensors Coastal oceans are characterised by complex interactions and couplings between physical, chemical and biological processes. Such complex processes are often only investigated through dedicated short-term cruises, hence limiting the possibility to apprehend the high-frequency dynamics of the system. This is also limiting the current capability to appropriately model these coastal coupled processes and to catch and simulate their variabilities. In JERICO-S3, we have been mapping out recent sensor developments dedicated to biological diversity and pollutants, to be combined with well established sensor technologies into integrative multisensor packages focussing on the integration of crucial physical, chemical and biological data, and dedicated to continuously observing coastal variables in a way they provide consistent datasets on coastal processes and their natural and anthropogenic variability. Innovative
Fig.1. EMSO Generic Instrumentation Module (EGIM).

189ADVANCES IN OPERATIONAL OCEANOGRAPHY EXPANDING EUROPE’S OBSERVING AND FORECASTING CAPACITY
ecosystem sensors and sensor packages seek to integrate recent developments and novel technologies developed/tested in the course of the JERICO-Next project (2015 – 2019), as well as from Ocean-of-Tomorrow projects, into a common platform and data collection/analytics. Sensors are currently assessed in terms of their technology readiness level and requirements for integration into existing platforms and observing/sampling strategies. Several pelagic and benthic sensor packages adapted to specific environmental scientific and environmental questions are planned to be designed. One benthic multisensor package (ACOBS including video camera, SPI, oxygen microprofilers and eddy covariance system) is under development. One pelagic sensor package focussing on observing plankton dynamics (including hydrodynamic, hydrology, geochemistry and biology) will be integrated into the intelligent automated platform for data collections/analytics (cEGIM). To enable the integration of biological data for which sensors have not yet reached the required level of maturity or to be routinely integrated into in situ automated platforms, JERICO-S3 will develop a water sampling and preservation unit based on recent technologies, aiming at a future integration into sensor platforms and triggered through the cEGIM (see sections 2 & 4), to collect, filter and preserve diverse contaminants (heavy metal, plastics, pharmaceuticals) and the DNA from seawater samples for later laboratory analysis of microorganism communities (algae blooms, microbial species), and biological diversity (omics for targeted functional genes and molecular pathways, metabarcoding, eDNA).
4. Enabling Self-Assessment through artificial intelligence Underwater observatories are a remarkable case of data-rich environments, as a consequence data science and artificial intelligence approaches are gaining a growing consensus in the marine science and technology community. Autonomous platforms will create an important increase in the production of data (European Marine Board, 2020) and the need for novel and effective technologies, creating a paradigm shift from the traditional vessel-assisted, time-consuming and high-cost sampling surveys (Farcy 2019, Aguzzi 2019). Data science and artificial intelligence methodologies studied in JERICO-S3 are aimed at improving the observing capabilities of the infrastructure by defining and implementing both a set of intelligent services for the coastal EGIM, and a set of data processing tools accessible or deployed on the JERICO-S3 virtual access eInfrastructure. The intelligent services may be executed on board the coastal EGIM or in a land laboratory after the data have transferred from the module. The coastal EGIM will be equipped with an embedded processing unit allowing for the onboard execution of specifically developed data processing algorithms that will be the basis for the automated intelligent services. According to the observed environmental conditions, the proposed services will identify and select relevant information from the acquired data and, based on the analysis of such information, will be capable of activating sensors and samplers, and adaptively change their configurations (e.g. sampling frequency, resolution). The effectiveness of such services will be demonstrated in an application context mainly dealing with plankton dynamics. Algorithms for multivariate time series analysis (e.g. gap filling, change point

190 ADVANCES IN OPERATIONAL OCEANOGRAPHY
detection, feature detection, multivariate modeling), will be combined with algorithms for cytometry, active and passive fluorimetry data analysis.
5. Integrating virtual resources under a common environment: eJERICO / JERICO CORE
e-JERICO expands the capabilities of JERICO by providing a comprehensive catalog of inter-related coastal resources to facilitate web access to a wide range of data, tools, software, BP and documentation. This coastal observing resource environment is critical to provide the different users and stakeholders with the appropriate information and tools for their needs. The conceptual design of e-JERICO accounts for the current scenario of JERICO where resources are distributed among partners and non-JERICO systems. The core of the system, illustrated in Figure 2, is built on adaptation of the EPOS operating system adapted for the coastal marine infrastructure and resources.
Fig. 2. e-JERICO conceptual design.
6. Demonstration Objectives In situ demonstrations will bring the developments described in the above sections to an end-to-end field demonstration. The demonstration plan initially performs several tests which will take place at PLOCAN facilities in the Canary Islands (Spain). PLOCAN will perform on-shore and coastal tests of the cEGIM before engaging in costly and more risky field operations. System functionalities will first be tested in a seawater

191ADVANCES IN OPERATIONAL OCEANOGRAPHY EXPANDING EUROPE’S OBSERVING AND FORECASTING CAPACITY
tank, then in the waters of Taliarte Port, connected by cable (estimated test duration is about a week). The cEGIM will then be moved to PLOCAN marine test site, moored in 50 m depth (estimated deployment time is one month). Interoperability, new sensors and methods (automated sampling), and the coupling of multi-compartment measurements (physics, biogeochemistry, biology) will be tested. Once the cEGIM has been functionally tested at PLOCAN facilities, it will be moved to a regional site, as selected for the demonstration according to scientific and technical criteria (e.g. impact and logistics). Results of the demonstration will be made accessible from the eJERICO infrastructure (Section 5).
7. Summary The coastal marine environment is complex. Yet many resources for human well being come from the coast as well as risks for coastal communities. JERICO RI is focused on providing a foundation for applications and informed policy and decision making. Advances in observation technology and access to data and information are key to provide a comprehensive and trusted resource. This paper addressed steps evolving under the JERICO-S3 project, from sensor and data interoperability, addressing the biological dimension from autonomous sensors and adaptive sampling, and the integration of all resources to advance knowledge under a common environment, connected with external data brokers, services, and users.
Acknowledgements JERICO-RI is the European coastal observing research infrastructure established and structured through JERICO-FP7 and JERICO-NEXT, JERICO-S3 and JERICO-DS projects. JERICO-FP7 is the European 7th framework project named JERICO under Grant Agreement N° 262584. JERICO-NEXT is a European Horizon-2020 project under Grant Agreement N°. 654410. JERICO-S3 is a European Horizon-2020 project under Grant Agreement N°. 871153. JERICO-DS is a European Horizon-2020 project under Grant Agreement N°. 951799. EMSOdev is a European Horizon-2020 project under Grant Agreement N°. 676555. NeXOS is a European FP7 project funded under Grant Agreement N°. 614102.
ReferencesAguzzi, J., Chatzievangelou, D., Marini, S., Fanelli, E., Danovaro, R., Flögel, S., Lebris, N., Juanes, F., De Leo, F.C., del Rio, J., Thomsen, L., Costa, C., Riccobene, G., Tamburini, C., Lefevre, D., Gojak, C., Poulain, P.-M., Favali, P., Griffa, A., Purser, A., Cline, D., Edgington, D., Navarro, J., Stefanni, S., D’Hondt, S., Priede, I.G., Rountree, R., Company, J.B. (2019) New High-Tech Flexible Networks for the Monitoring of Deep-Sea Ecosystems. Environmental Science and Technology, 53 (12), pp. 6616-6631

192 ADVANCES IN OPERATIONAL OCEANOGRAPHY
European Marine Board – Working Group on Big Data in Marine Science (2020). Big Data in Marine Science. European Marine Board IVZW Future Science Brief 6, April 2020. https://www.marineboard.eu/publications/big-data-marine-science
Farcy, P., Durand, D., Charria, G., Painting, S.J., Tamminem, T., Collingridge, K., Grémare, A.J., Delauney, L., Puillat, I. (2019) Toward a European coastal observing network to provide better answers to science and to societal challenges; the JERICO research infrastructure. Frontiers in Marine Science, 6 (SEP), art. no. 529
Lantéri N., Legrand J., Ruhl H., Blandin J., Cannat M., del Rio Fernandez J., Gates A., Lagadec J.R., Moreau B., Pagonis P., Sarradin P.M. (2019) The EGIM, EMSO Generic Instrument Module, step towards standardization. European Geosciences Union General Assembly, 7-12 April 2019, Vienna, Austria.

193ADVANCES IN OPERATIONAL OCEANOGRAPHY EXPANDING EUROPE’S OBSERVING AND FORECASTING CAPACITY
EUROFLEETS: FOSTERING LINKS TO INDUSTRY IN THE ADVANCEMENT OF EQUIPMENT INNOVATIONS FOR DEEP SEA OPERATIONS FROM RESEARCH VESSELS Niamh Flavin (1), Aodhán Fitzgerald (1), Arturo Castellon Masalles (2), David Waage (3), Lars Jørgensen (4), Jan Kjærstad, Jarle Sigurd Ødegård (5)
(1) Marine Institute, Galway, Ireland(2) Agencia Estatal Consejo Superior De Investigaciones Cientificas – Unidad De Tecnologia
Marina, Barcelona (CSIC) Spain(3) Hampidjan, Reykjavik, Iceland(4) MacArtney AS, Esbjerg, Denmark(5) SEAONICS, Ålesund, Norway
Abstract
Eurofleets is a key research infrastructure, essential for collecting in situ marine data sets from global oceans, regional seas and coastal waters. Research vessels carry and operate shipborne observation equipment and facilitate deployment and handling of a large range of observing and sampling instruments. The infrastructure is also evolving, with fixed ocean seafloor observation and mobile surface and subsea autonomous technologies presenting challenges to the existing fleet to deploy and maintain. Meeting the complex end user needs of European scientists across disciplines and geographic locations is an expensive and complex exercise requiring coordination at national and international levels, and the use of common standards and approaches.To meet the expected challenges, Eurofleets+ (An alliance of European marine research infrastructure to meet the evolving needs of the research and industrial communities) project is undertaking Joint Research Activities (JRA) with key industry partners. Specifically, the objective of JRA 3.2 led by CSIC, with the Marine Institute and industry partners Hampidjan, MacArtney AS and SEAONICS is the study and conceptual development of equipment for deep sea operations from research vessels co-designed by research and industry partners.
Improving interoperability of Large Exchangeable Instrumentation (LEXI) is a primary aim of Eurofleets+, especially in terms of improvement and standardisation of tools/rigging for more efficient operations.
The collaborative approach aims to develop a new deep-sea winch design, a multipurpose crane/handling system for deep water operations and a dual mode handling system designed for the deployment and recovery of research tools through moon-pools or/and over the side.

194 ADVANCES IN OPERATIONAL OCEANOGRAPHY
Keywords: Research Vessels, Deep Sea, Collaboration, Industry, Interoperability
1. Introduction Eurofleets+ (An alliance of European marine research infrastructure to meet the evolving needs of the research and industrial communities) Joint Research Activities (JRA) focus on three topics of interest to marine science and marine exploration in general, with all three focusing directly on equipment and software used on research vessels and in other marine fields.
Exploration of the deep sea is a major challenge and opportunity in marine research. Rigs and related technologies are fundamental to the study of the sea, as they are needed to deploy equipment. Eurofleets2 Deliverable 11.2 Guidelines and recommendations for ship design on work deck installation and operations for scientific equipment (Eurofleets2 Consortium, 2015) outlined that the safe handling of larger and more complex instruments in high sea states means that handling equipment is critical. Consequently, Eurofleets+ is conducting investigations relating to deep sea research from vessels aiming to achieve interoperability of rigs to facilitate deployment of different equipment, enabling installation of mobile equipment when needed, and facilitating sharing and installation of equipment across different ships.
Task 3.2 focuses on Equipment innovations for deep sea operations from vessels and more specifically on deck rigs and equipment such as winches and cranes or davits with their essential accessories such as cables. Oceanographic vessels perform a broader spectrum of different manoeuvres and deployments with very sophisticated equipment and a limited budget and so they have evolved and advanced to become multidisciplinary to meet users’ needs. These vessels therefore have become more and more multipurpose, where different operations are increasingly heavy and complex requiring ever more specialized technical support teams. As a result, the vessels have become progressively more adaptable over time. This provides an opportunity to develop deck equipment that is more interoperable to facilitate its use on different vessels, either from the same operator or on third party ships. Some equipment such as ROVs and AUVs have been developed with this in mind and are installed and uninstalled on ships and come complete with their own deployment and recovery systems (LARS). They are therefore portable and interchangeable. This makes rigging and unrigging the vessel much easier and saves time and money. For the ship’s own equipment, an attempt is also made to optimize the operations and rigging so as to avoid duplication, allowing space savings on the work deck, where space is at a premium.
Research vessels (or European marine research organizations and their fleets) also share equipment such as ROVs, AUVs, submarines, seismic equipment, ultra-clean winches, etc. which have been outlined in Project Deliverable 3.2 ‘Overview of Interoperability
195ADVANCES IN OPERATIONAL OCEANOGRAPHY EXPANDING EUROPE’S OBSERVING AND FORECASTING CAPACITY
between Eurofleets+ Research Vessels and Marine Equipment’. Therefore, ships need interoperable equipment for their operations or, at a minimum, be able to adapt existing ones to facilitate equipment exchange. Having interchangeable winches for different ships in the fleet is therefore an immediate need and not a long-term goal.
Currently, for economic reasons, the sector is moving towards medium sized Oceanic Research Vessels with Deep-sea capabilities that modern day development in synthetic fibre rope technology has made possible as they are more fuel efficient and require less energy to operate due to the low weight and better tension properties. This has led industry to focus on the development of winches and cables with a reduced footprint on deck as well as increased loads.
Eurofleets+ therefore see that one of the challenges in the design of both Research Vessels, deck operations and rigging is to reduce and/or reuse the equipment already present on the deck. Our goal is to develop solutions to achieve interoperability of rigs to be able to deploy different equipment, and also to have mobile equipment that can be installed on board only when necessary. Also, interoperable and mobile equipment could be shared and installed on different ships, offering practical, flexible, and more cost-effective solutions. There are three solutions under development with industry partners including (i) portable winches for Deep-sea for operations, (ii) a multipurpose crane/handling system for deep water operations and (iii) the use of a Moonpool for use for deployment and recovery of research tools.
2. Fostering links to industry The European Marine Board Position Paper 25 ‘Next Generation European Research Vessels’ (Nieuwejaar et al., 2019) recommended a strategic view and closer collaboration of all stakeholders to ensure that research vessels continue to support the study of the ocean into the future. They advised that this recommendation must include collaboration with the Marine Technology Industry, for the research vessel fleet to remain capable and fit-for-purpose. The same paper suggests that to achieve this, both the fleet and its scientific equipment and instruments should be renewed and developed as a matter of urgency.
There has been an impetus to encourage and incentivize this type of co-development approach in both the H2020 funding programme and in the new Horizon Europe Programme. Various funded innovation actions aimed at producing plans and arrangements or designs for new, altered or improved products, processes or services have encouraged industry to partner with both user organisations and academia to further strengthen and accelerate innovations across Europe and internationally. Eurofleets has throughout each iteration of the project focused efforts

196 ADVANCES IN OPERATIONAL OCEANOGRAPHY
on further engaging industry through various activities such as workshops, stakeholder engagement and direct contact, strengthening ties with each project. The collaborative approach taken by Eurofleets combines several activities, which have a primary aim, of delivering a better user experience for all stakeholders. The Eurofleets+ consortium includes 9 industrial partners, who are central to the three major areas of joint research being undertaken focused on innovative solutions to support marine research and to optimise the services offered by the fleet.
3. Equipment innovations for deep sea operations
3.1 New Deep Sea Winch Design
The design of a new deep sea winch to be interoperable and portable for deep sea operations, using the latest cable technology suitable for use on ocean and regional vessels has been undertaken. With the principle aim of minimising the size and footprint of the winch to ensure a truly portable and interoperable unit. This development will facilitate the utilisation of smaller Ocean class and the larger Regional vessels for the support of deep ocean activities. Detailed requirements’ analysis was conducted in order to identify key considerations. These include; consideration of maximum weight, depths, types of securing system and necessity to fit in a 20’ shipping container for portability. Following collation of all requirements MacArtney Underwater Technology Group developed the Eurofleets Electric Winch. The winch which will be named EFs+ MERMAC RCRA AHC Winch has been designed with the aim of being flexible, modular and transportable.
Key specifications:
• 20’ container footprint;
• Welded steel structure;
• Right angle level wind for optimized deck space;
• Optional davit, for stand-alone applications;
• Modular build;
• Swappable drum;
• Optional Active Heave Compensation;
• Optional Constant Tension functions.

197ADVANCES IN OPERATIONAL OCEANOGRAPHY EXPANDING EUROPE’S OBSERVING AND FORECASTING CAPACITY
Fig. 1. EFs+ MERMAC RCRA AHC Winch.
The winch is proposed as a right angle level-wind type, shown above with an optional davit, for operations straight over the side. The right angle level wind is chosen, to allow for a more flexible winch capable of being mobilised in narrow deck spaces. The interchangeable drum allows flexibility for changing ropes. Optional heave compensation may be added and will fit within the 20’ container. The modular build allows for the main winch frame, motors and level wind to be shipped together in a 20’ container with the drum shipped separately. The swappable drum allows for shipping in parts and for more than one preconfigured drum, with rope or umbilical and the drum is prepared for electrical/optical slipring.
3.2 Multipurpose crane handling system for deep water innovations
Knuckle-jib cranes are common on-board research vessels. They are used for the loading of material and its transfer and location on the deck of the vessels. The possibility of using such cranes for the deployment of heavy equipment over the side with supports is currently under review. The deployment by means of two cables (traction and coax) and of different material -steel and fiber ropes- is being explored also. This potential multi-functionality would reduce rigging and loading on the working deck of smaller vessels. A conceptual design and specification is being developed for a multifunction crane for handling deep-water research equipment including corers, TV-Grabs, cameras and deployment of sea equipment. Ideally, the crane will be designed for use with a portable winch and suited to larger regional and Ocean Vessels.
There are two options under consideration for this study which is a collaborative effort between CSIC and FERRI SA, winch and deck handling equipment specialists. The first is to use a conventional knuckle-jib crane and make minor modifications to it for
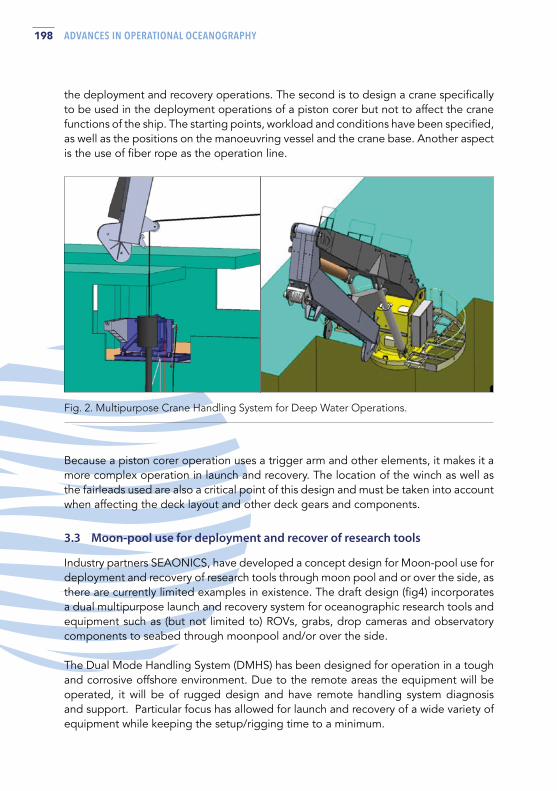
198 ADVANCES IN OPERATIONAL OCEANOGRAPHY
Fig. 2. Multipurpose Crane Handling System for Deep Water Operations.
the deployment and recovery operations. The second is to design a crane specifically to be used in the deployment operations of a piston corer but not to affect the crane functions of the ship. The starting points, workload and conditions have been specified, as well as the positions on the manoeuvring vessel and the crane base. Another aspect is the use of fiber rope as the operation line.
Because a piston corer operation uses a trigger arm and other elements, it makes it a more complex operation in launch and recovery. The location of the winch as well as the fairleads used are also a critical point of this design and must be taken into account when affecting the deck layout and other deck gears and components.
3.3 Moon-pool use for deployment and recover of research tools
Industry partners SEAONICS, have developed a concept design for Moon-pool use for deployment and recovery of research tools through moon pool and or over the side, as there are currently limited examples in existence. The draft design (fig4) incorporates a dual multipurpose launch and recovery system for oceanographic research tools and equipment such as (but not limited to) ROVs, grabs, drop cameras and observatory components to seabed through moonpool and/or over the side.
The Dual Mode Handling System (DMHS) has been designed for operation in a tough and corrosive offshore environment. Due to the remote areas the equipment will be operated, it will be of rugged design and have remote handling system diagnosis and support. Particular focus has allowed for launch and recovery of a wide variety of equipment while keeping the setup/rigging time to a minimum.

199ADVANCES IN OPERATIONAL OCEANOGRAPHY EXPANDING EUROPE’S OBSERVING AND FORECASTING CAPACITY
The umbilical winch will be equipped with active heave compensation and has all required functionality for safe and efficient lifting operations, with the possibility to rout the umbilical winch to both over side and moonpool systems. The system will accept other winches (oceanographic) than the dedicated umbilical winch. Operation of the system can either be performed from the operator cabinet located in the operation room or from a remote control on deck. Emergency operations are performed from emergency panels placed on the various components. The drives on the umbilical winch are electric motors operated by frequency converters. There is one hydraulic power unit utilized for the brakes, the level winder of the winch and the over side frame. Electric power is fed from the vessel.
Full Hazard and Operability Study (HAZOP)/ Hazard Identification Studies (HAZID)/ Failure Mode, Effects & Criticality Analysis (FMECA) is planned to validate the design.
Fig. 3. Dual Mode Handling System.
200 ADVANCES IN OPERATIONAL OCEANOGRAPHY
4. Conclusion Through fostering links to industry in the advancement of equipment innovations for deep sea operations from research vessels, versatile, modular, and implementable solutions are being created. There are clear demonstrable advantages for all stakeholders including research vessel users, through the increased capacity of research vessels both Regional and Ocean vessels. Building strong sustainable links through partnership and co-creation will provide long-lasting solutions into the future.
Acknowledgements Eurofleets+ has received funding from the EU H2020 research and innovation programme under Grant Agreement N° 824077.
ReferencesEurofleets2 Consortium (2015). D11.2 Guidelines and recommendations for ship design on work deck installation and operations for scientific equipment
Nieuwejaar, P., Mazauric, V., Betzler, C., Carapuço, M., Cattrijsse, A., Coren, F., Danobeitia, J., Day, C., Fitzgerald, A., Florescu, S., Ignacio Diaz, J., Klages, M., Koning, E., Lefort, O., Magnifico, G., Mikelborg, Ø., Naudts, L. (2019) Next Generation European Research Vessels: Current Status and Foreseeable Evolution. Heymans, JJ., Kellett, P., Viegas, C., Alexander, B., Coopman, J., Muñiz Piniella, Á. [Eds.] Position Paper 25 of the European Marine Board, Ostend, Belgium. 140pp. ISBN: 978-94-92043-79-5 DOI: 10.5281/zenodo.3477893

201ADVANCES IN OPERATIONAL OCEANOGRAPHY EXPANDING EUROPE’S OBSERVING AND FORECASTING CAPACITY

SESSION 7
REGIONAL, LOCAL AND COASTAL MODELS
204 ADVANCES IN OPERATIONAL OCEANOGRAPHY
THE BOOS MODELLING PROGRAMME (BMP) – ACTIVITIES, WORKING GROUPS AND PLANS
Thorger Brüning (1), Jens Murawski (2), Joanna Staneva (3), Vilnis Frishfelds (4), Adam Nord (5), Jun She (2)
(1) Federal Maritime and Hydrographic Agency (BSH), Bernhard-Nocht-Straße 78, 20359 Hamburg, Germany, [email protected]
(2) Denmarks Meteorological Institute (DMI), Lyngbyvej 100, 2100 København Ø, Denmark, [email protected], [email protected]
(3) Institute of Coastal Systems Analysis and Modeling, Helmholtz Zentrum Hereon, Max-Planck-Straße 1, 21502 Geesthacht, Germany, [email protected]
(4) University of Latvia (UL), Raiņa bulvāris 19, Centra rajons, Rīga, LV-1586, Latvia, [email protected]
(5) Swedish Meteorological and Hydrological Institute (SMHI), Folkborgsvägen 17, 60176 Norrköping, Sweden, [email protected]
Abstract The BOOS modelling program (BMP) has recently undergone the effort to update and define new research and development priorities as a community. As an association of operational and research institutes in the Baltic Sea Region, BMP works on enhancing and integrating operational modelling capacities. On a goodwill basis, the institutes support and inform each other on their operational ocean modelling activities, exchange know-how and tools. Communities networking activities and programs have been either established or strengthened. The operationalization of research will be intensified through interactions with external research groups (e.g. through workshops). One of the main objectives of the BMP is the scientific coordination of modelling activities under the BOOS and connected advancement of methodologies, such as coastal downscaling, coupling between different model compartments, data assimilation. Under the umbrella of BOOS, now joint working groups and projects have been formed on various future-relevant topics (e.g. coastal modelling, marine plastics, region-specific NEMO model development, data assimilation, validation and multi-model ensemble). The BMP activities’ outcomes are primarily thought to support operational model developments of the BOOS/Eurogoos Strategic Agenda. We will present the BMP in general and the individual working groups and their future plans in particular.
Keywords: operational modelling, Baltic Sea, BOOS, international cooperation, networking

205ADVANCES IN OPERATIONAL OCEANOGRAPHY EXPANDING EUROPE’S OBSERVING AND FORECASTING CAPACITY
1. Introduction In response to a HELCOM (Helsinki convention on the Protection of the Marine Environment of the Baltic Sea Area) recommendation regarding the development of an oil drift model in the Baltic, Federal Maritime and Hydrographic Agency (BSH) and Swedish Meteorological and Hydrological Institute (SMHI) developed a High Resolution Operational Model for the Baltic (HIROMB). As a result, the HIROMB cooperation for the joint development of operational modelling was formed, which was contractually fixed in the mid-1990s and which was joined by other institutes in the following years. The main task was to provide a state-of-the-art operational, basin-wide forecast for all partners.
In 2015, the cooperation moved under the umbrella of the Baltic operational oceanographic Service (BOOS, She et al., 2020) and had since been called BOOS modelling programme (BMP). Today the BMP consists of 17 partner institutes from all nine Baltic Sea countries. Since the availability of a state-of-the-art operational basin-wide forecast is now ensured by the marine Copernicus service (CMEMS), the BMP concentrates on coordinating and improving national operational modelling capacities and has recently undergone efforts to update and define research and development priorities supporting the strategic objectives of BOOS and EuroGOOS (Capet et al., 2020). It works towards enhancing and integrating seamless marine system modelling capacity from open sea to coastal-estuary continuum and from near-real time to climate scale. On a voluntary basis, the partners support and inform each other on modelling activities, exchange know-how, methods and tools, whereby the BMP has either established working groups (Figure 1) or strengthened networking activities.
Fig. 1. The BMP in the BOOS structure.
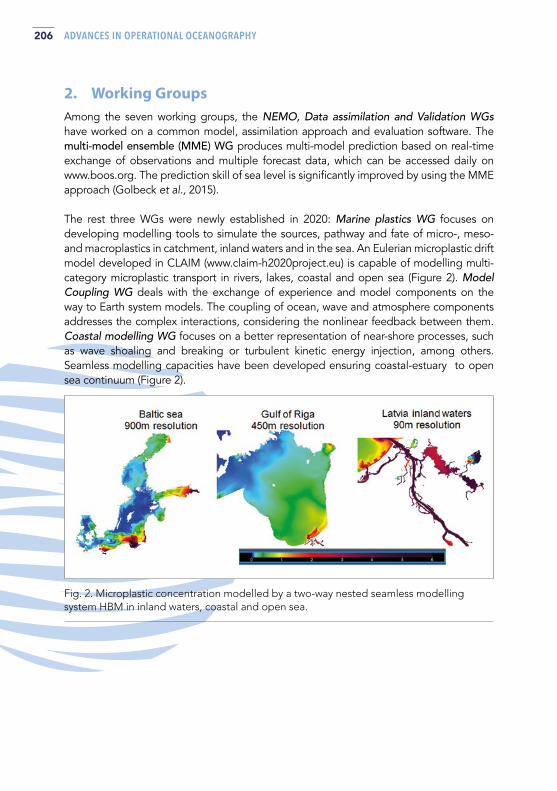
206 ADVANCES IN OPERATIONAL OCEANOGRAPHY
2. Working Groups Among the seven working groups, the NEMO, Data assimilation and Validation WGs have worked on a common model, assimilation approach and evaluation software. The multi-model ensemble (MME) WG produces multi-model prediction based on real-time exchange of observations and multiple forecast data, which can be accessed daily on www.boos.org. The prediction skill of sea level is significantly improved by using the MME approach (Golbeck et al., 2015).
The rest three WGs were newly established in 2020: Marine plastics WG focuses on developing modelling tools to simulate the sources, pathway and fate of micro-, meso- and macroplastics in catchment, inland waters and in the sea. An Eulerian microplastic drift model developed in CLAIM (www.claim-h2020project.eu) is capable of modelling multi-category microplastic transport in rivers, lakes, coastal and open sea (Figure 2). Model Coupling WG deals with the exchange of experience and model components on the way to Earth system models. The coupling of ocean, wave and atmosphere components addresses the complex interactions, considering the nonlinear feedback between them. Coastal modelling WG focuses on a better representation of near-shore processes, such as wave shoaling and breaking or turbulent kinetic energy injection, among others. Seamless modelling capacities have been developed ensuring coastal-estuary to open sea continuum (Figure 2).
Fig. 2. Microplastic concentration modelled by a two-way nested seamless modelling system HBM in inland waters, coastal and open sea.
207ADVANCES IN OPERATIONAL OCEANOGRAPHY EXPANDING EUROPE’S OBSERVING AND FORECASTING CAPACITY
References
Capet, A., Fernández, V., She, J., Dabrowski, T., Umgiesser, G. Staneva, J., Mészáros, L. Campizano, F. Ursella, L., Nolan, G. and El Serafy, G. (2020). Operational Modeling Capacity in European Seas – An EuroGOOS Perspective and Recommendations for Improvemenat. Frontiers in Marine Science, 7:129, doi: 10.3389/fmars.2020.00129.
Golbeck, I., Li, X., Janssen, F, Brüning, T. and Nielsen, J.W. (2015). Uncertainty estimation for operational ocean forecast products – a multi-model ensemble for the North Sea and the Baltic Sea. Ocean Dynamics 65, 1603-1631, doi: 10.1007/s10236-015-0897-8
She, J., Meier, H.E.M., Darecki, M., Gorringe, P., Huess, V., Kouts, T., Reissmann J.H.,
Tuomi, L. (2020). Baltic Sea Operational Oceanography – A Stimulant for Regional Earth System Research. Frontiers in Earth Science, 8:7, doi: 10.3389/feart.2020.00007.

208 ADVANCES IN OPERATIONAL OCEANOGRAPHY
RECENT DEVELOPMENTS IN THE FORECASTING CHAIN AT ARPAE-SIMC FOR THE EMILIA-ROMAGNA (NORTHEAST ITALY) COASTAL AREASLuis Germano Biolchi*, Silvia Unguendoli, Lidia Bressan and Andrea Valentini
Hydro-Meteo-Climate Service of the Agency for Prevention, Environment and Energy of Emilia-Romagna, Arpae-SIMC (Italy)
Abstract The Hydro-Meteo-Climate Service of the Agency for Prevention, Environment and Energy of Emilia-Romagna (Arpae-SIMC) implemented and constantly updates its operational forecasting chain to provide the regional Civil Protection Agency daily forecasts. Previous publications have described the operational procedures with the current work contributing presenting the recent oceanographic and coastal modelling developments. The forecasting chain begins with two implementations of a meteorological model (COSMO-5M and COSMO-2I), with the outputs forcing the oceanographic (ROMS) and sea-state (SWAN) applications. Outputs in terms of sea level and wave parameters are then used to run the morphodynamic model XBeach that provides an estimation of flooding conditions through Storm Impact Indicators (SIIs). New advancements involve a coupled oceanographic-wave model (Adriac) nested in the Copernicus Mediterranean Forecasting System (MFS) and multi-model ensemble outputs forcing XBeach on a (semi-)probabilistic approach. Results of the new oceanographic model improved mostly the tidal residues in the Adriatic basin. The (semi-)probabilistic approach for the coastal modelling component allowed for more simulations to be conducted and an incipient estimation of forecast uncertainties for two 1-D profiles in the region’s littoral. Hitherto, updates towards state-of-the-art numerical modelling applications have been proven fundamental on ameliorating forecasting outcomes.
Keywords: operational oceanography, physical oceanography, ensemble modelling, morphodynamic modelling, coupled models, early warning systems
* Corresponding author: [email protected]

209ADVANCES IN OPERATIONAL OCEANOGRAPHY EXPANDING EUROPE’S OBSERVING AND FORECASTING CAPACITY
1. Introduction Future scenarios indicate increasing trends for both coastal storms (Oppenheimer et al., 2019), in terms of magnitude and frequency, and number of seaside communities (Neumann et al., 2015). With more people settling along the shores, risks tend to augment as a consequence of more hazards associated with a higher exposure. Hence, the development and constant updating of Early Warning Systems (EWSs) assume a fundamental role as Decision Supporting Systems (DSSs) on decision-making processes involving operational forecasting centers and civil protection agencies.
In the littoral of the Emilia-Romagna Region (Northeast Italy), tourism is determinant for the local economy mostly during summertime and it reinforces the necessity of forecasting systems able to appropriately simulate incoming hazardous conditions. Therefore, the current work intends to briefly present the updates conducted in the last few years regarding oceanographic forecasts for the Adriatic sea as well as a new approach for the morphodynamic modeling that covers specific transects along the region’s coast.
2. Study Area The Emilia-Romagna region is located in the Northeast part of the Italic Peninsula, facing the Adriatic Sea, and comprehends a coastline approximately 130 km long. Microtidal conditions (maximum range of about 80 cm during spring tides) and waves shorter than 1.25 m during 95% of the time characterize the regional shallow water regime occasionally disrupted by coastal storms. Two wind patterns are known to be the most damaging in the region: Bora and Scirocco. The former refers to winds coming from the Northeast with increased velocities as they funnel and propagate downhill in the mountainous areas of the Croatian coast. High, steep waves with a relatively short period result from those winds blowing over the shorter axis of the Adriatic sea. On the other hand, Scirocco happens when southerly winds rush over the longer axis of the sea, pilling up water in Northern Italy and generating high storm surges. As the events have varied meteo-marine characteristics and, consequently, impact differently the shorelines, it is of great importance to accurately predict their occurrence.
2.1 Arpae-SIMC Forecasting Chain A regional operational forecasting chain is already implemented and maintained by the Hydro-Meteo-Climate Service of the Agency for Prevention, Environment and Energy of Emilia-Romagna (Arpae-SIMC) (Russo et al., 2013). Daily forecasts begin with different atmospheric simulations (varying in terms of resolution, forecasting range, and approaches – deterministic or probabilistic) of the COSMO model (Steppeler et al., 2003; http://www.cosmo-model.org/), with the outputs used to force sea state (Valentini et al., 2007)and ocean (Chiggiato & Oddo, 2008) models.
The sea state model is referred to as SWAN-MEDITARE and comprehends nested grids starting with a coarse MEDiterranean domain (25 km), increasing the resolution

210 ADVANCES IN OPERATIONAL OCEANOGRAPHY
towards the ITAlian surrounding seas (8 km) followed by REgional applications (e.g. Emilia-Romagna region – 800 m). AdriaROMS is the name of the Adriatic Regional Oceanographic Modelling System (ROMS) that has been operational since 2005 providing daily +72h forecasts preceded by a -24 h to 0 h spin-up simulation.
As a final step and until January, 2021, the outputs of SWAN-MEDITARE and AdriaROMS in terms of wave parameters and sea level, respectively, were used as boundary conditions to the morphodynamic model XBeach (Roelvink et al., 2009) implemented as part of the FP7 MICORE project (https://www.micore.eu/). This final step provided an indication of flooding waters through the usage of Storm Impact Indicators (SIIs) (Harley et al., 2016) for 22 cross-shore profiles along the regional coast.
In the last few years, newly implemented systems and/or approaches intended to ameliorate the forecast skills aiming to improve the ability to predict incoming hazards both temporally and spatially. The following subchapter focuses on the alterations recently conducted for the ocean and coastal modelling components and some of their results.
3. Recent updates in the Forecasting Chain and results
3.1 From AdriaROMS to Adriac AdriaROMS refers to the implementation of ROMS for the Adriatic Sea while the newborn Adriac (Bressan et al., 2017) involves a two-way coupled ocean-wave system that interacts every 30 minutes with its oceanographic boundary connected to the Mediterranean and the values given by the CMEMS Med-Currents. The coupled system has been developed by Warner et al., (2010)and is referred to as COAWST.
Among the technical differences between Adriac and AdriaROMS, some of the most important consist of an updated bathymetry with a higher domain resolution (2 km in AdriaROMS and 1 km in Adriac) and 30 sigma levels (instead of 20), a higher resolution wind forcing (COSMO-2I, 2.2 km h.r.) for the first 48h and a lower resolution for the following 24h (COSMO-5M, 5 km h.r.), and the addition of four tidal components to the existing four used by AdriaROMS. Furthermore, every two weeks Adriac runs an analysis recovery using boundary conditions from CMEMS Med-Currents (involving their assimilated results) and atmospheric analysis to prevent the model from drifting away. Hence, a refreshing of Adriac is done biweekly to bring it to a state closer to reality. This approach is followed as Adriac does not internally assimilate data.
As part of the validation and inter-comparison experiments, the performance of both models was assessed with special emphasis on the high sea levels between December 1st and 11th, 2020. The meteorologically induced high waters severely damaged specific sites of the regional coastline and were substantially underpredicted by AdriaROMS. Adriac was still in a testing/development phase and the results shown in Figure 1 were
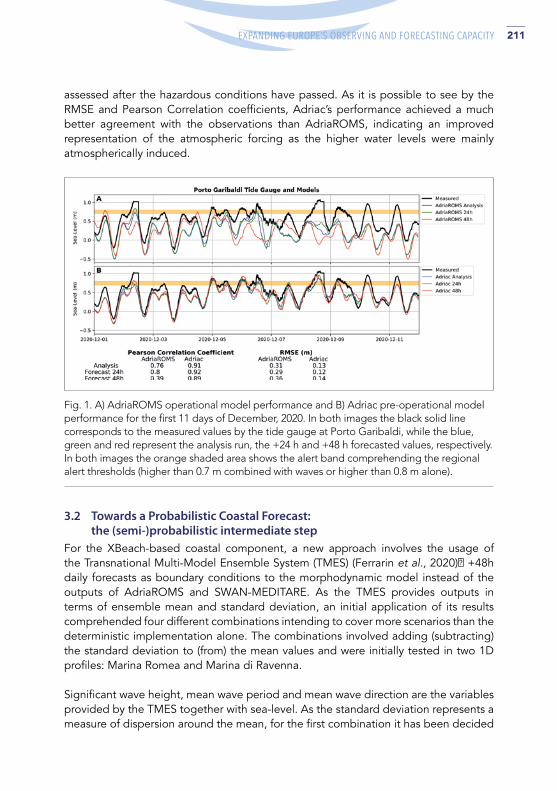
211ADVANCES IN OPERATIONAL OCEANOGRAPHY EXPANDING EUROPE’S OBSERVING AND FORECASTING CAPACITY
Fig. 1. A) AdriaROMS operational model performance and B) Adriac pre-operational model performance for the first 11 days of December, 2020. In both images the black solid line corresponds to the measured values by the tide gauge at Porto Garibaldi, while the blue, green and red represent the analysis run, the +24 h and +48 h forecasted values, respectively. In both images the orange shaded area shows the alert band comprehending the regional alert thresholds (higher than 0.7 m combined with waves or higher than 0.8 m alone).
assessed after the hazardous conditions have passed. As it is possible to see by the RMSE and Pearson Correlation coefficients, Adriac’s performance achieved a much better agreement with the observations than AdriaROMS, indicating an improved representation of the atmospheric forcing as the higher water levels were mainly atmospherically induced.
3.2 Towards a Probabilistic Coastal Forecast: the (semi-)probabilistic intermediate step For the XBeach-based coastal component, a new approach involves the usage of the Transnational Multi-Model Ensemble System (TMES) (Ferrarin et al., 2020) +48h daily forecasts as boundary conditions to the morphodynamic model instead of the outputs of AdriaROMS and SWAN-MEDITARE. As the TMES provides outputs in terms of ensemble mean and standard deviation, an initial application of its results comprehended four different combinations intending to cover more scenarios than the deterministic implementation alone. The combinations involved adding (subtracting) the standard deviation to (from) the mean values and were initially tested in two 1D profiles: Marina Romea and Marina di Ravenna.
Significant wave height, mean wave period and mean wave direction are the variables provided by the TMES together with sea-level. As the standard deviation represents a measure of dispersion around the mean, for the first combination it has been decided

212 ADVANCES IN OPERATIONAL OCEANOGRAPHY
to add two standard deviations to each variable, while the other two combinations involved adding one and subtracting one standard deviation to/from all variables, respectively. The results of the 1D-simulations were assessed in terms of the SII Building Waterline Distance (BWD) that refers to the horizontal space between the water level and the reference building in the profile calculated for each forecasted timestep (15 min). After running the forecasts with the TMES combinations as boundary conditions, the results were compared to the already implemented deterministic approach.
Fig. 2. Output of the (semi-)probabilistic coastal forecasting system. The green solid line represents the output of the deterministic approach (SWAN-MEDITARE and AdriaROMS as boundary conditions), while the dotted line represents the forecast using the TMES mean values. The upper limit of the green shaded area consists of the forecast using the TMES mean minus one standard deviation while the lower limit presents the foecast using the TMES mean plus two standard deviations. At the very bottom, the orange and red dashed lines depict the regional medium and high alert threshold values, respectively.
In Figure 2, the forecast results for Marina Romea (profile name: marrom) are shown for the 25th of March, 2020. It is possible to see that the deterministic forecast presents a higher variation than any single member of the (semi-)probabilistic implementation. However, the spread of the ensemble shows how the BWD varies within each time step and provides an initial assessment of the uncertainty in the system. For instance, during the peak conditions between hours 18:00 (25th) and 0:00 (26th), the minimum BWD

213ADVANCES IN OPERATIONAL OCEANOGRAPHY EXPANDING EUROPE’S OBSERVING AND FORECASTING CAPACITY
among the TMES forecasts reached a value around 45 m, while the maximum distance was approximately 79 m. Hence, variations in water level and wave parameters within an acceptable range led to horizontal water displacements different 35 m for that given profile. Important to stress here that XBeach runs with a dynamic morphology that varies as the profile erodes during events that disturb the system’s equilibrium.
3.3 Final Chain with the New Developments As a result from the new updates, one major alteration in the forecasting chain will take place as soon as Adriac fully replaces AdriaROMS as the operational oceanographic model. As by now, both models provide daily +72h forecasts as shown in Figure 3.
Moreover, XBeach no longer runs in deterministic mode using the sea-level from AdriaROMS but using Adriac outputs instead. Also, the previous configuration involving 22 profiles has been modified to 16 profiles that are better distributed along the coast covering a wider range of morphological- hydrodynamic settings.
Besides the oceanographic, wave and coastal models, the new developments improve the modelling ability for on demand services. Increased resolutions and better resolved physical parameterizations tend to provide better outputs for specific, highly technical applications such as near-real time oil spill modelling or bathing water quality.
Fig. 3. The updated forecasting chain currently running as part of Arpae-SIMC daily operations.

214 ADVANCES IN OPERATIONAL OCEANOGRAPHY
4. Conclusions The implementation of Adriac as the oceanographic modelling system has already shown its advantages based on the results obtained during the high water levels that hit the coast of Emilia-Romagna in the first fortnight of December, 2020. An increment in the astronomical tide components associated with higher domain and wind forcing resolutions tends to provide better agreement with observed conditions and improve the forecasting skill. Another important factor is the coupling with a wave model that, during coastal storms, might provide even more reliable representations as the waves importantly affect coastal sea-level conditions and increase storm surge heights.
As for the coastal forecast (semi-)probabilistic implementation, higher water levels emphasized the necessity of an uncertainty assessment as the nearshore processes and slight variations in water levels might strongly influence the development, horizontal and vertical excursion of storm surges. This intermediate step has been proven fruitful and offered great perspectives for a full-operational application using a broader range of combinations from the TMES outputs.
The forecasting chain has been constantly updated since its initial implementation following scientific developments and the availability of new technologies. Accordingly, the constant exchange of information and resources (both human and physical) with other environmental agencies, hydro-meteo-services and research centers and universities is fundamental to always keep the systems up to date.
ReferencesBressan, L., Valentini, A., Paccagnella, T., Montani, A., Marsigli, C. and Tesini, M.S. (2017). Sensitivity of sea-level forecasting to the horizontal resolution and sea surface forcing for different configurations of an oceanographic model of the Adriatic Sea. Advances in Science and Research, 14, 77-84.
Chiggiato, J., and Oddo, P. (2008). Operational ocean models in the Adriatic Sea: a skill assessment. Ocean Science, 4(1), 61–71. https://doi.org/10.5194/os-4-61-2008
Ferrarin, C., Valentini, A., Vodopivec, M., Klaric, D., Massaro, G., Bajo, M., Pascalis, F.D., Fadini, A., Ghezzo, M., Menegon, S. and Bressan, L. (2020). Integrated sea storm management strategy: the 29 October 2018 event in the Adriatic Sea. Natural Hazards and Earth System Sciences, 20(1), 73-93.
Harley, M. D., Valentini, A., Armaroli, C., Perini, L., Calabrese, L., and Ciavola, P. (2016). Can an early-warning system help minimize the impacts of coastal storms? A case study of the 2012 Halloween storm, northern Italy. Natural Hazards and Earth System Sciences, 16(1), 209–222. https://doi.org/10.5194/nhess-16-209-2016
Neumann, B., Vafeidis, A. T., Zimmermann, J., and Nicholls, R. J. (2015). Future coastal population growth and exposure to sea-level rise and coastal flooding – A global assessment. PLoS ONE, 10(3). https://doi.org/10.1371/journal.pone.0118571

215ADVANCES IN OPERATIONAL OCEANOGRAPHY EXPANDING EUROPE’S OBSERVING AND FORECASTING CAPACITY
Oppenheimer, M., Glavovic, B.C., Hinkel, J., van de Wal, R., Magnan, A.K., Abd-Elgawad, A., Cai, R., Cifuentes-Jara, M., DeConto, R.M., Ghosh, T., Hay, J., Isla, F., Marzeion, B., Meyssignac, B., Sebesvari, Z. (2019). Sea Level Rise and Implications for Low-Lying Islands, Coasts and Communities, in: Pörtner, H.-O., Roberts, D.C., Masson-Delmotte, V., Zhai, P., Tignor, M., Poloczanska, E., Mintenbeck, K., Alegría, A., Nicolai, M., Okem, A., Petzold, J., Rama, B., Weyer, N.M. (Eds.), IPCC Special Report on the Ocean and Cryosphere in a Changing Climate, 321–445.
Roelvink, D., Reniers, A., van Dongeren, A., van Thiel de Vries, J., McCall, R., and Lescinski, J. (2009). Modelling storm impacts on beaches, dunes and barrier islands. Coastal Engineering, 56(11–12), 1133–1152. https://doi.org/10.1016/j.coastaleng.2009.08.006
Russo, A., Coluccelli, A., Carniel, S., Benetazzo, A., Valentini, A., Paccagnella, T., Ravaioli, M. and Bortoluzzi, G. (2013). Operational models hierarchy for short term marine predictions: the Adriatic Sea example. In 2013 MTS/IEEE OCEANS-Bergen, IEEE, 1-6.
Steppeler, J., Doms, G., Schättler, U., Bitzer, H. W., Gassmann, A., Damrath, U., and Gregoric, G. (2003). Meso-gamma scale forecasts using the nonhydrostatic model LM. Meteorology and Atmospheric Physics, 82(1–4), 75–96. https://doi.org/10.1007/s00703-001-0592-9
Valentini, A., Delli Passeri, L., Paccagnella, T., Patruno, P., Marsigli, C., Cesari, D., Deserti, M., Chiggiato, J. and Tibaldi, S. (2007). The sea state forecast system of ARPA-SIM. Bollettino di Geofisica Teorica e Applicata, 48(3), 333-350.
Warner, J. C., Armstrong, B., He, R., and Zambon, J. B. (2010). Development of a Coupled Ocean–Atmosphere–Wave–Sediment Transport (COAWST) Modeling System. Ocean Modelling, 35(3), 230–244. https://doi.org/10.1016/j.ocemod.2010.07.010

216 ADVANCES IN OPERATIONAL OCEANOGRAPHY
SHOM OPERATIONAL REGIONAL OCEAN FORECASTING SYSTEMStéphanie Louazel (1), Sophie Casitas (2), Stéphanie Corréard (2), Yann Ferret (1), Victor Quilfen (1) and Guillaume Voineson (1)
(1) SHOM, 13 rue du Chatellier CS 92803 29228 BREST, Cedex 2, France, [email protected]
(2) SHOM, Météopole 42 avenue G. Coriolis, F-31057 Toulouse, France
Abstract SHOM has developed its own operational regional ocean forecasting system. The purpose is to provide 3D oceanographic data for both civil and military uses over SHOM areas of interest. Currently, the operational system covers the Bay of Biscay and the Mediterranean Sea. The SHOM north-western Indian Ocean model should integrate the operational system by the end of 2021. All these regional models are based on the HYCOM community code (www.hycom.org) optimized by SHOM for its regional/coastal needs. First, these three models, involving many different processes (thermal fronts, tide and internal tide, eddy dynamics, density currents), are briefly described. The second part deals with the military use of these forecasts via SOAP which is the SHOM operational system that provides defence products. The third part deals with the civil use of the forecasts. In particular, the oceanographic forecast services offered through SHOM web portal (http://data.SHOM.fr) are presented.
Keywords: operational oceanography, regional modelling, oceanographic products and services
1. Introduction SHOM must provide the Ministry of Armed Forces with oceanographic forecasts (3D current, temperature, salinity) at global and regional scales. On the one hand, CMEMS forecasts are used for global and offshore needs. On the other hand, SHOM has developed its own regional models over the French Navy areas of interest. So, the range of SHOM modeling activities goes from research to operational systems. The SHOM operational regional ocean forecasting system is also used to meet the requirements of maritime civil stakeholders.Currently, the operational system covers the Bay of Biscay and the Mediterranean Sea. The SHOM north-western Indian Ocean model should integrate the operational system by the end of 2021.
217ADVANCES IN OPERATIONAL OCEANOGRAPHY EXPANDING EUROPE’S OBSERVING AND FORECASTING CAPACITY
2. Operational models
2.1 SHOM HYCOM code All these regional models are based on the HYCOM community code (www.hycom.org) optimized by SHOM for its regional/coastal needs. In particular, tidal modelling was introduced: barotropic and baroclinic tides and wetting and drying are represented.
SHOM is currently testing other developments for its coastal needs, not used in the operational 3D model yet. For instance, it is exploring different approaches for mesh refinement using nested grids or curvilinear grids. Some developments have also been done to couple the model with the sea state Wavewatch III code
2.2 The operational system The system is run daily from D-1 to D+5. Météo-France data are used for the meteorological forcing of the Bay of Biscay and the Mediterranean models. ECMWF data are used for the meteorological forcing of the Indian model. CMEMS global outputs and tidal forcing are used as open boundary conditions. Real rivers outflows from the SCHAPI are prescribed for French rivers and climatological ones are used for other rivers.
2.3 Bay of Biscay model The operational Bay of Biscay model covers the area going from 43°N to 51°N and from 15°W to 3°E. The horizontal resolution is about 1.8 km and 40 layers are vertically used. This area is characterized by a complex bathymetry with a wide shelf and a steep slope. It is also characterized by the presence of many processes: thermal fronts, surges, tide and internal tide, solitons, eddy dynamics, slope currents, river plumes. Figure 1 represents the Bay of Biscay model bathymetry.
2.4 Mediterranean model The operational Mediterranean model covers the area going from 30°N to 46°N and from 7°W to 36°E. The horizontal resolution is about 1.8 km and 32 layers are vertically used. This area is characterized by specific processes such as the Northern Mediterranean Current and deep convection. Eddy dynamics, surges, rivers plumes are also important processes of the area. Figure 2 represents the Mediterranean model bathymetry.

218 ADVANCES IN OPERATIONAL OCEANOGRAPHY
Fig. 1. Bay of Biscay model bathymetry.
Fig. 2. Mediterranean model bathymetry.
2.5 Indian model The future Indian operational model will cover north-western Indian Ocean, from 5°N to 30°N and from 33°E to 77°E. The horizontal resolution is about 5 km and 40 layers are vertically used. Eddy dynamics are important in this area. Moreover, two density currents take place: one from the Red Sea through Bab el Mandeb strait and the other one from the Persian Gulf through Hormuz strait. Figure 3 represents the Indian model bathymetry.

219ADVANCES IN OPERATIONAL OCEANOGRAPHY EXPANDING EUROPE’S OBSERVING AND FORECASTING CAPACITY
Fig. 3. Indian model bathymetry.
3. Real time defence products The operational HYCOM system outputs can be used as inputs of SOAP, the SHOM operational system which provides real time defence products from model outputs and observations. Different levels of products are generated. First, raw products include temperature, salinity, celerity horizontal maps and also observed and forecast profiles. Then, derived products include derived parameters dedicated to underwater warfare and navigation such as mixed layer depth, minimum celerity depth, geometric or acoustical products. Finally, analyzed products include mesoscale activity map, thermal fronts analysis, forecast oceanic and acoustic reports that are edited and validated by SHOM operators. A SOAP schematic view is shown in Figure 4.
Fig. 4. SOAP schematic view.
220 ADVANCES IN OPERATIONAL OCEANOGRAPHY
4. Civil uses
4.1 Specific uses SHOM regional model outputs are used for different specific purposes in support of government policies. For example, within the context of the Marine Strategy Framework Directive (MSFD), outputs of the Bay of Biscay and the Mediterranean models in the French Exclusive Economic Zone (EEZ) are used to calculate not only Essential Ocean Variables (EOVs) as defined by the Global Ocean Observing System (GOOS) but also additional added-value variables in order to generate the EEZ’s seascapes.
Currents simulated by the different regional models are also used in the framework of several drift studies or projects. On this topic, SHOM collaborates with Météo-France, IRSN (French public expert in nuclear and radiological risks), Cedre (expert in accidental water pollution) and the French maritime authorities.
4.2 Data.SHOM.fr web portal SHOM has developed an innovative online platform data.SHOM.fr to provide access to SHOM data, describing the maritime environment. In the framework of the Mersure project (CPER Bretagne) and also the ROEC (CPER Bretagne), PROTEVS (Ministry of Armed Forces) and HOMONIM (Ministries of Ecology and of the Interior) projects, SHOM and its partners have developed the oceanographic forecasts part of this platform for the visualisation, exploitation and analysis of the SHOM and Météo-France forecasts along the French coasts (English Channel, Bay of Biscay and North West Mediterranean Sea). The main goal is to offer online oceanographic forecasts freely available in order to democratise and encourage the use of meteo-oceanographic forecasts: the planning of professional or recreative water-based activities is facilitated.
3D HYCOM forecasts are vertically interpolated on a z-level grid along the French coasts and are available under the ‘Oceanographic forecast’ tab. Data.SHOM.fr users can access to hourly surface currents, sea temperature and salinity and daily means of sea temperature, salinity and currents along the water column. Under this tab, other forecasts are also available: waves (height, direction, period), sea level (total height, storm surge) and meteorology (wind, atmospheric pressure).
Three ways of visualizing the forecasts are proposed. First the platform enables to access to forecast maps (examples in Figure 5) through the SHOM forecast catalogue to focus on the areas of interest. It also enables to access to oceanogram tabs (example in Figure 6) by clicking on the map at any location to get in one page all the available forecasts at this specific point. Finally, the platform enables to download the oceanographic forecast files directly from data.SHOM.fr in NetCDF format, and analyse them with its own tools.

221ADVANCES IN OPERATIONAL OCEANOGRAPHY EXPANDING EUROPE’S OBSERVING AND FORECASTING CAPACITY
Fig. 5. Examples of data.SHOM.fr web portal forecast maps: (a) sea surface current, (b) sea temperature at a depth of 100 m.
(a) (b)
Fig. 6. Example of data.SHOM.fr web portal oceanogram tab.
Thanks to web technologies, oceanographic forecasts can be displayed and analysed directly online in an interactive way. Moreover, they can be combined with SHOM products in order to help interpreting the results: backdrop maps, high resolution bathymetries, tide current maps, legal boundaries or areas of interest and other products.
Today, data.SHOM.fr users are coming from all sectors of activity either for public or private purposes: maritime safety, natural coastal hazards, pollution, marine renewable energy, public marine policy, coastal zone management, water sports. This web portal is an active online service: during the year 2020, the oceanographic forecasts application had more than 25,000 unique visitors and, in average, around 8,000 oceanographic forecast files have been weekly downloaded from data.SHOM.fr.

222 ADVANCES IN OPERATIONAL OCEANOGRAPHY
For more information:
• E-mail to [email protected]
• Youtube SHOM tutorials:- Analysing oceanographic forecasts https://www.youtube.com/
watch?v=rpTCmz2cf0E
- Generating oceanograms https://www.youtube.com/watch?v=h_83AQKSiX8
- Downloading forecast files https://www.youtube.com/watch?v=NCZJVsKF-6s

223ADVANCES IN OPERATIONAL OCEANOGRAPHY EXPANDING EUROPE’S OBSERVING AND FORECASTING CAPACITY
RECENT PROGRESS IN DOWNSCALED LOCAL OCEAN FORECAST MODELS FOR IRISH MARITIME USERS Hazem Nagy (1, 2), Kieran Lyons (1), Joseph McGovern (1), Diego Pereiro (1) , Ioannis Mamoutos (3, 4), Glenn Nolan (1), Tomasz Dabrowski (1)
(1) Marine Institute, Oranmore, Co Galway, Ireland; [email protected](2) Oceanography Department, Faculty of Science, Alexandria University, Alexandria, 21500,
Egypt [email protected](3) Hellenic Centre for Marine Research, Institute of Oceanography, Operational Oceanography
group, Greece
(4) Department of Marine Sciences, School of the Environment, University of the Aegean, 81100 Mytilene, Greece
Abstract This study will give an overview of high-resolution Irish local scale models. The Irish Marine Institute implemented the Regional Ocean Modelling System (ROMS) to coastal waters on the west coast of Ireland. Out of the six models, details of three are presented. The models are: Connemara, Galway Bay and Bertraghboy Bay with most recent developments including the implementation of wetting/drying algorithm. Implementation of a realistic bathymetry for Connemara and Galway models wetting/drying algorithm has resulted in better validation against acoustic Doppler current profilers (ADCPs). The models implemented with a wetting and drying algorithm have shown better agreement against ADCPs.
Keywords: Irish, ROMS, Connemara, Galway, wetting/drying
1. Introduction The Irish Marine Institute (IMI) implemented the Regional Ocean Modelling System (ROMS) to coastal waters on the west coast of Ireland. The IMI six models cover the North East Atlantic area, Southwest Ireland, Connemara, Bantry Bay, Galway Bay and Bertraghboy Bay as shown in Figure 1. Details of the set-up of Connemara, Galway Bay and Bertraghboy model configuration, as regards the forcing functions, the choice of boundary conditions, atmospheric forcing, will be presented. The authors report on the findings in terms of the computational efficiency and the changes to all models skill. The observational platforms comprise of tide gauges and ADCPs as presented in Figure 1.

224 ADVANCES IN OPERATIONAL OCEANOGRAPHY
2. Data and Methods of analysis
2.1 The Connemara ROMS model The Regional Ocean Modelling System (ROMS) as described in Shchepetkin and McWilliams, (2005) has recently been applied to coastal waters on the west coast of Ireland. The Connemara model has c.200 m horizontal resolution and has 20 vertical sigma levels and stretches from 10.8°W to 8.9°W and from 52.95°N to 53.73°N Figure 1. It has three open ocean boundaries in the north, south and west, and the boundary conditions are obtained from the IMI North East Atlantic Model (Nagy et al., (2020)). Several rivers are included at the head of Galway Bay. Most recent developments include the implementation of a wetting/drying algorithm with a critical depth of 0.25 m. We have validated both models, the wet/dry and the operational for Sea Surface Height (SSH) representation using observed time series from the tide gauges at Inishmore Island and Galway Bay, as shown in Figure 1. Three acoustic Doppler current profilers (ADCPs) were deployed in Galway Bay at the locations shown in Figure 1. Both the wet/dry and the operational models been validated against ADCP-measured barotropic velocity by means of root mean square error (RMSE) differences and correlations with data collected during June 2018.
2.2 The Galway ROMS model The Galway Bay model has been developed in the framework of the H2020 FORCOAST project to provide environmental assessment to the oyster farming sector in the region. It is based on a ROMS offline nesting application inside the Connemara Operational
Fig. 1. Downscaled local ocean forecast models for Irish Maritime users. Bathymetry of the Connemara, Galway Bay, and Bertraghboy Bay models in meters with main tide gauges sites and ADCP locations.

225ADVANCES IN OPERATIONAL OCEANOGRAPHY EXPANDING EUROPE’S OBSERVING AND FORECASTING CAPACITY
model. It is a refinement of the latter by a factor of three, resulting in 336 x 283 grid cells and a horizontal resolution of less than 70 meters. It covers the innermost part of the Galway Bay (Figure 1) and has 8 vertical sigma layers.
Surface forcing is obtained from the hourly 0.1º ECMWF atmospheric fields. At the open boundaries, clamped boundary conditions have been imposed for 3-D momentum and tracers, whilst a combination of Flather (1976) and Chapman (1985) conditions have been applied for the free-surface and the barotropic velocity. Heat fluxes are calculated from the bulk formulae and surface freshwater fluxes are obtained from the prescribed rainfall rates and the evaporation rates computed by the model. In addition, a wetting and drying scheme has been introduced to allow for proper representation of intertidal areas.
2.3 The Bertraghboy Bay ROMS model The Bertraghboy Bay ROMS model was established to support research and development activities in the Marine Institute pertaining to Integrated Multitrophic Aquaculture (IMTA), as part of the Horizon 2020 TAPAS project. The concept of IMTA is to deploy and harvest complementary aquaculture species at the same site, such that one or more species offset the benthic and pelagic environmental impacts of other species. High resolution biogeochemical modelling is required to quantify the environmental benefit of IMTA. To meet this need, a coupled ROMS NPZD-IMTA model was developed for the Lehanagh pool site in Bertraghboy. The model domain spans the waters between (53°26’13.20’N, 9°57’43.20’W) and (53°19’30’N, 9°46’48’W). The grid has a horizontal resolution of 50x50 m, with 10 vertical sigma layers. The time step is 5 seconds with 5 barotropic steps for stability.
The model bathymetry (Figure 1) is a combination of LIDAR data from the INFOMAR database and admiralty chart 2709; admiralty data was necessary to fill gaps in the INFOMAR dataset in deeper waters (>20m) between the inside and the outside of the mouth of the bay.
Boundary and initial conditions for the model are taken from the operational MI Connemara hydrodynamic model (200x200 m grid resolution), which itself is nested in the operational MI North East Atlantic hydrodynamic model (1.1 x 1.1 km approx. grid resolution). The model is forced using three-hourly ECMWF atmospheric data comprising wind and thermal fluxes. Flow estimates for each river were derived from a rainfall-runoff regression model which was derived based on daily rainfall data from Met Éireann’s weather station at Mace Head and flow measurements from the OPW. An expression was derived to relate flow percentiles from flow percentiles for each of the five rivers, based on data made available from the Irish EPA Hydrotools service EPA Maps. Estimated flow time series for the five rivers discharging to Bertraghboy Bay were consequently generated. The model was validated against three 300khz RDI Workhorse Sentinel ADCPs located in the outer (23 m deep, 53°22’9.66’N, 9°54’46.32’W) and middle bay (20 m deep, 53°22’48.24’N, 9°52’20.10’W), and at Lehanagh pool in the inner bay (14 m deep, 53°23’58.32’N, 9°49’14.28’W).

226 ADVANCES IN OPERATIONAL OCEANOGRAPHY
3. Results
3.1 Validation of Connemara wet/dry model against tide gauges The tidal harmonic analysis for the tide gauges and both models (wet/dry & operational) demonstrated that the tidal signal in the Sea Surface Height (SSH) data was dominated by three semi-diurnal constituents (M2, S2, N2,) and three diurnal constituents (K1 O1 and Q1) as presented in Table I. Good agreement have been found between tide gauges and both models in terms of amplitudes and phase angles as presented in Table I.
TIDAL CONSTITUENT
GALWAY PORT GAUGE CONNEMARAOPERATIONAL
CONNEMARA WET/DRY
AMP (M)
PHASE (DEG)
AMP (M)
PHASE (DEG)
AMP (M)
PHASE (DEG)
M2 1.52 139 1.59 136 1.59 136
S2 0.58 175 0.61 170 0.6 170
N2 0.32 114 0.33 117 0.33 116
O1 0.07 322 0.06 323 0.06 320
Q1 0.02 245 0.02 245 0.02 242
K1 0.01 69 0.01 72 0.01 72
M2 1.47 140 1.49 136 1.49 136
S2 0.58 175 0.57 170 0.56 170
N2 0.30 113 0.31 117 0.32 116
O1 0.07 321 0.06 322 0.06 320
Q1 0.02 248 0.02 249 0.02 245
K1 0.01 67 0.01 74 0.01 73
Table I. The amplitudes and phases for six of the principal tidal constituents calculated, for the measured and modelled data
3.2 Validation of Galway Bay and Connemara wet/dry models against ADCPs During late spring - early summer 2018, three ADCP moorings where deployed in the Galway Bay (Figure 1), current components (u and v) observations were compared with both the Galway Bay model, Connemara wet/dry and the Connemara Operational model (Table II). The validation of the models against ADCPs current components have shown a very good agreement, as shown in Table II. The highest correlation coefficients were recorded for the u-component between models and ADCPs. The new Galway Bay configuration performs slightly better at locations A and C. Based

227ADVANCES IN OPERATIONAL OCEANOGRAPHY EXPANDING EUROPE’S OBSERVING AND FORECASTING CAPACITY
on the ARMAE values, except for the v-component of ADCP-C (for which no model performs well), it is always a wetting and drying configuration the one that performs the best (either Connemara Wet/Dry or Galway Bay). The modelled meridional current speed (v-component) is much weaker than the observed value, which may be the reason behind its (poor/bad) ARMAE score. Improved, performance could be related to the implementation of a wetting and drying algorithm, which presents advantages in a shallow water configuration with large intertidal areas like in Galway Bay.
3.3 Validation of Bertraghboy Bay model against ADCPs The validation of Bertraghboy Bay model against ADCPs current components are summarised in Table III. A collection of relevant statistics of the depth integrated u and v direction currents from the model validation at each ADCP locations as shown in Figure 1. The model performance is categorised as excellent determined by the current magnitude ARMAE score.
Excellent Good Reasonable Poor Bad
CONNEMARA OPERATIONAL CONNEMARA WET & DRY GALWAY BAY
CORR RMSE STDN ARMAE CORR RMSE STDN ARMAE CORR RMSE STDN ARMAE
ADCP A (u)
0.955 0.031 1.097 0.182 0.956 0.028 1.027 0.160 0.962 0.026 0.974 0.127
ADCP A (v)
0.757 0.031 2.194 0.973 0.714 0.035 2.328 1.155 0.771 0.027 1.966 0.732
ADCP B (u)
0.951 0.031 1.060 0.186 0.944 0.032 0.924 0.182 0.951 0.030 0.971 0.173
ADCP B (v)
0.066 0.029 0.329 0.583 0.292 0.027 0.218 0.522 0.289 0.027 0.369 0.519
ADCP C (u)
0.930 0.066 1.356 0.443 0.939 0.099 1.707 0.748 0.963 0.036 1.105 0.191
ADCP C (v)
-0.222 0.031 1.537 1.186 -0.036 0.035 1.950 1.340 -0.115 0.026 1.247 0.856
Table II. ADCP vs. Connemara (left) and Galway Bay (right). CORR: correlation, RMSD: Root Mean Square Difference, STDN: Normalized Standard Deviation, ARMAE: Adjusted Relative Mean Absolute Error (Sutherlandet al., 2004); u: u-component, v: v-component,) set out the ARMAE categorisation as follows: [ARMAE < 0.2] Excellent, [0.2 < ARMAE < 0.4] Good, [0.4 < ARMAE < 0.7] Reasonable, [0.7 < ARMAE < 1.0] Poor, [ARMAE > 1] Bad.

228 ADVANCES IN OPERATIONAL OCEANOGRAPHY
BERTRAGHBOY BAY MODEL
ADCP OUTER
ROMS OUTER
ADCP MIDDLE
ROMS MIDDLE
ADCP INNER
ROMS INNER
U| Mean 0.12 0.169 0.12 0.15 0.016 0.025
|U| Std. Dev. 0.12 0.16 0.1 0.14 0.014 0.02
U RMSD 0.108 0.08 0.03
U Correlation 0.92 0.93 0.2
|V| Mean 0.15 0.23 0.11 0.15 0.02 0.04
|V| Std. Dev. 0.1 0.18 0.1 0.13 0.02 0.03
V RMSD 0.16 0.09 0.05
V Correlation 0.9 0.89 -0.16
Current magnitude ARMAE 0.092 0.018 0.018
Table III. ADCP vs. Bertraghboy Bay model, mean, RMSD: Root Mean Square Difference, std.Dev: Standard Deviation, ARMAE: Adjusted Relative Mean Absolute Error (Sutherland et al., 2004); u: u-component, v: v-component, and current magnitude
4. Conclusions A good agreement has been found between tide gauges and Connemara models (operational and wet/dry) in terms of amplitudes and phase angles. The IMI downscaled models showed a good validation results against ADCPs. The validation results present an advantage in implementing a wetting and drying algorithm in shallow water models with large intertidal areas like Connemara and Galway Bay. Output data from the Irish system models provides services to numerous stakeholders, e.g. the aquaculture (HAB warning https://www.marine.ie/Home/site-area/data-services/interactive-maps/weekly-hab-bulletin, weather window tool https://www.digitalocean.ie/Home/WeatherWindow), search and rescue, oyster restoration efforts.
ReferencesChapman, D. C. (1985). Numerical treatment of cross-shelf open boundaries in a barotropic coastal ocean model, J. Phys. Oceanogr., 15, 1060--1075.
Flather, R. A. (1976). A tidal model of the northwest European continental shelf. Memoires de la Societe Royale de Sciences de Liege, 6, 141-164.
Nagy, H., Lyons, K., Nolan, G., Cure, M., Dabrowski, T. (2020). A Regional Operational Model for the North East Atlantic: Model Configuration and Validation. J. Mar. Sci. Eng. 2020, 8(9), 673. https://doi.org/10.3390/jmse8090673

229ADVANCES IN OPERATIONAL OCEANOGRAPHY EXPANDING EUROPE’S OBSERVING AND FORECASTING CAPACITY
Shchepetkin, A.F. and McWilliams, J.C. (2005). The Regional Ocean Modeling System (ROMS): A split-explicit, free-surface, opography following coordinates ocean model. Ocean Model, 9, 347–404.
Sutherland, J., Walstra, D.J.R., Chesher, T.J., van Rijn, L.C., Southgate, H.N. (2004).
Evaluation of coastal area modelling systems at an estuary mouth. Coast. Eng. 51:119-142. doi:10.1016/j.coastaleng.2003.12.003
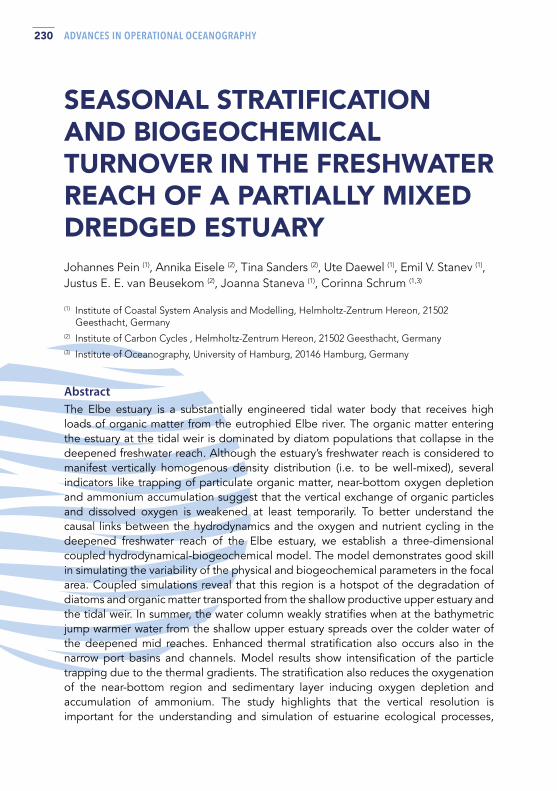
230 ADVANCES IN OPERATIONAL OCEANOGRAPHY
SEASONAL STRATIFICATION AND BIOGEOCHEMICAL TURNOVER IN THE FRESHWATER REACH OF A PARTIALLY MIXED DREDGED ESTUARYJohannes Pein (1), Annika Eisele (2), Tina Sanders (2), Ute Daewel (1), Emil V. Stanev (1), Justus E. E. van Beusekom (2), Joanna Staneva (1), Corinna Schrum (1,3)
(1) Institute of Coastal System Analysis and Modelling, Helmholtz-Zentrum Hereon, 21502 Geesthacht, Germany
(2) Institute of Carbon Cycles , Helmholtz-Zentrum Hereon, 21502 Geesthacht, Germany(3) Institute of Oceanography, University of Hamburg, 20146 Hamburg, Germany
Abstract The Elbe estuary is a substantially engineered tidal water body that receives high loads of organic matter from the eutrophied Elbe river. The organic matter entering the estuary at the tidal weir is dominated by diatom populations that collapse in the deepened freshwater reach. Although the estuary’s freshwater reach is considered to manifest vertically homogenous density distribution (i.e. to be well-mixed), several indicators like trapping of particulate organic matter, near-bottom oxygen depletion and ammonium accumulation suggest that the vertical exchange of organic particles and dissolved oxygen is weakened at least temporarily. To better understand the causal links between the hydrodynamics and the oxygen and nutrient cycling in the deepened freshwater reach of the Elbe estuary, we establish a three-dimensional coupled hydrodynamical-biogeochemical model. The model demonstrates good skill in simulating the variability of the physical and biogeochemical parameters in the focal area. Coupled simulations reveal that this region is a hotspot of the degradation of diatoms and organic matter transported from the shallow productive upper estuary and the tidal weir. In summer, the water column weakly stratifies when at the bathymetric jump warmer water from the shallow upper estuary spreads over the colder water of the deepened mid reaches. Enhanced thermal stratification also occurs also in the narrow port basins and channels. Model results show intensification of the particle trapping due to the thermal gradients. The stratification also reduces the oxygenation of the near-bottom region and sedimentary layer inducing oxygen depletion and accumulation of ammonium. The study highlights that the vertical resolution is important for the understanding and simulation of estuarine ecological processes,

231ADVANCES IN OPERATIONAL OCEANOGRAPHY EXPANDING EUROPE’S OBSERVING AND FORECASTING CAPACITY
because even weak stratification impacts the cycling of nutrients via modulation of the vertical mixing of oxygen, particularly in deepened navigation channels and port areas.
Keywords: Estuarine circulation, Stratification, Eutrophication, Oxygen depletion
1. Introduction Estuaries around the globe, which are shaped by human intervention, suffer from similar environmental issues like sedimentation in dredged fairways, eutrophication and oxygen depletion. The primary scientific and management perception of these is two-dimensional or barotropic, neglecting processes in the water column that might affect both physics and biogeochemical turnover. Using an unstructured grid three-dimensional coupled physical-biogeochemical model of the Elbe estuary, an estuary shaped by human intervention for centuries, this study reveals a coupling between temperature-induced stratification in the dredged limnic reach and biogeochemical turnover. We show that the simplification made by depth-averaged modelling is not justified in heavily dredged estuaries as dynamical stratification can significantly affect water quality, e.g in terms of near-bottom oxygen concentrations. Our simulations further demonstrate that the dynamical stratification controls the region and quantity of trapping of biogenic particles emphasising the advantage of high-resolution three-dimensional models for simulating the accumulation of organic matter and nutrients (eutrophication) in the deepened estuarine freshwater reach. This outcome is a novelty in the field because traditionally estuarine particle transport has been explained by processes in the salinity front and the tidal current asymmetry. Here we show an additional factor, temperature-induced stratification, that is strongly connected to the history of human intervention (dreding, rectification) but that for the same reason can be used for the development of managing strategies (beyond the scope of this paper).
In this case study, we argue that the prevalent picture of the Elbe as a well-mixed estuary (Muylaert and Sabbe, 1996; Amann et al., 2012) deserves to be revised. Hydrodynamic modelling studies have shown that buoyancy-driven density gradients induce periodic stratification in the brackish reaches (Burchardt et al., 2004; Stanev et al., 2019). We extent the focus of the 3D modelling into the freshwater-dominated reach using a coupled hydrodynamical-biogeochemical model. Earlier coupled modelling made use of Lagrangian (Schroeder, 1997) and idealised 2D models (Holzwarth and Wirtz, 2018) to simulate the dynamics of primary production and oxygen along the estuarine freshwater reach. While these works explained well the transition from autotrophy to heterotrophy in the port region, they did not elucidate why the zones of the oxygen minimum, biogenic particle sedimentation and ammonium accumulation linger close to the bathymetric jump (instead of being flushed downstream by river flow). In this study, we establish a coupled hydrodynamical-biogeochemical model validated for the freshwater and low-saline reaches of the Elbe estuary, aiming to i) identify spatio-
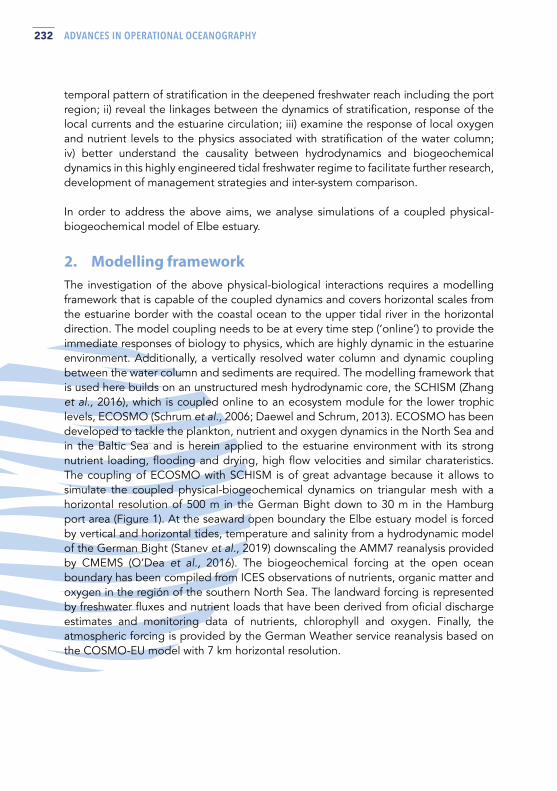
232 ADVANCES IN OPERATIONAL OCEANOGRAPHY
temporal pattern of stratification in the deepened freshwater reach including the port region; ii) reveal the linkages between the dynamics of stratification, response of the local currents and the estuarine circulation; iii) examine the response of local oxygen and nutrient levels to the physics associated with stratification of the water column; iv) better understand the causality between hydrodynamics and biogeochemical dynamics in this highly engineered tidal freshwater regime to facilitate further research, development of management strategies and inter-system comparison.
In order to address the above aims, we analyse simulations of a coupled physical-biogeochemical model of Elbe estuary.
2. Modelling frameworkThe investigation of the above physical-biological interactions requires a modelling framework that is capable of the coupled dynamics and covers horizontal scales from the estuarine border with the coastal ocean to the upper tidal river in the horizontal direction. The model coupling needs to be at every time step (‘online’) to provide the immediate responses of biology to physics, which are highly dynamic in the estuarine environment. Additionally, a vertically resolved water column and dynamic coupling between the water column and sediments are required. The modelling framework that is used here builds on an unstructured mesh hydrodynamic core, the SCHISM (Zhang et al., 2016), which is coupled online to an ecosystem module for the lower trophic levels, ECOSMO (Schrum et al., 2006; Daewel and Schrum, 2013). ECOSMO has been developed to tackle the plankton, nutrient and oxygen dynamics in the North Sea and in the Baltic Sea and is herein applied to the estuarine environment with its strong nutrient loading, flooding and drying, high flow velocities and similar charateristics. The coupling of ECOSMO with SCHISM is of great advantage because it allows to simulate the coupled physical-biogeochemical dynamics on triangular mesh with a horizontal resolution of 500 m in the German Bight down to 30 m in the Hamburg port area (Figure 1). At the seaward open boundary the Elbe estuary model is forced by vertical and horizontal tides, temperature and salinity from a hydrodynamic model of the German Bight (Stanev et al., 2019) downscaling the AMM7 reanalysis provided by CMEMS (O’Dea et al., 2016). The biogeochemical forcing at the open ocean boundary has been compiled from ICES observations of nutrients, organic matter and oxygen in the región of the southern North Sea. The landward forcing is represented by freshwater fluxes and nutrient loads that have been derived from oficial discharge estimates and monitoring data of nutrients, chlorophyll and oxygen. Finally, the atmospheric forcing is provided by the German Weather service reanalysis based on the COSMO-EU model with 7 km horizontal resolution.

233ADVANCES IN OPERATIONAL OCEANOGRAPHY EXPANDING EUROPE’S OBSERVING AND FORECASTING CAPACITY
3. ResultsThe model has been integrated for two years, covering the period of 2012 and 2013. Validation of the model simulation against observed variability of sea level, horizontal currents, salinity, temperature as well as the key state variabiles of the coupled nitrogen and oxygen cycles are given in the complete paper currently under submission at Frontiers in Marine Science. In order to answer the research questions formulated in the Introduction, we focus in the following on the analyses of the model dynamics during May to September, 2012. During summer 2012 average Elbe discharge was approximately 400 m³ s1 which is well below the long-term average of 712 m³ s1. In recent years, summer discharges have been even lower and the low discharge of summer 2012 is far from an extreme. The competition between the stratification and mixing in the deepened freshwater reach is illustrated an along-channel profile of the gradient Richardson number, compiled from the simulated density and horizontal currents (Figure 2a). The area downstream of the bathymetric jump, that separates the shallow and the deepened freshwater reach, demonstrates enhanced stability of the flow. This region is of particular importance for the estuarine ecosystem because the bathymetric jump also separates the flood-dominated deepened reach from the ebb-dominated shallow reach. The current asymmetry (not shown) is associated with a mixing asymmetry (Figure 2b) favoring the upstream (downstream) transport of particulate matter from the deep (shallow) part toward the sloping region. The same region reveals enhanced vertical temperature anomalies illustrating the termal stratification in the port area (Figure 2c). The vertical anomalies of the longitudinal currents show a pattern similar to the well-known estuarine circulation suggesting enhanced particle trapping in the vicinity of the bathymetric jump (Figure 2c). Also the ecosystem dynamics respond clearly to the abrupt bathymetric change (Figure 4). Simulated chlorophyll and disolved oxygen decrease from surface to bottom (Figure 4a, c). Detritus, silicate and nitrate increase towards the channel bed (Figure 4b, e, f). Ammonium shows largely the same pattern but the vertical gradient is negative downwards around km 626 (Figure 4d). Some of the vertical variability may be explained by the inherent properties of the illustrated variables. Chlorophyll, for example, decreases towards the channel bed in the deepened reach because of the aphotic conditions in the deep water. Detritus is a sinking tracer and thus accumulates at the channel bottom. On the other hand, the vertical variability of ecological tracers may be enhanced by the physical stratification. In order to test this hypothesis, the water temperature has been set constant in the equation of state in a separate modelling experiment. In this modelling experiment the density variability is thus independent from the temperature variability. Here we are interested in the effect of this experiment in the area of the (slightly) stratified during summer freshwater reaches (Figure 3a). The comparison of the model experiment and the reference run for the period of May to September 2012 reveals enhanced mixing along the deepened freshwater reach (Figure 3b). Also, the vertical temperature anomaly and the estuarine circulation are weakened (Figure 3c). In consequence of the changed currents and vertical mixing, the particulate organic matter (detritus) decreases in the port area and
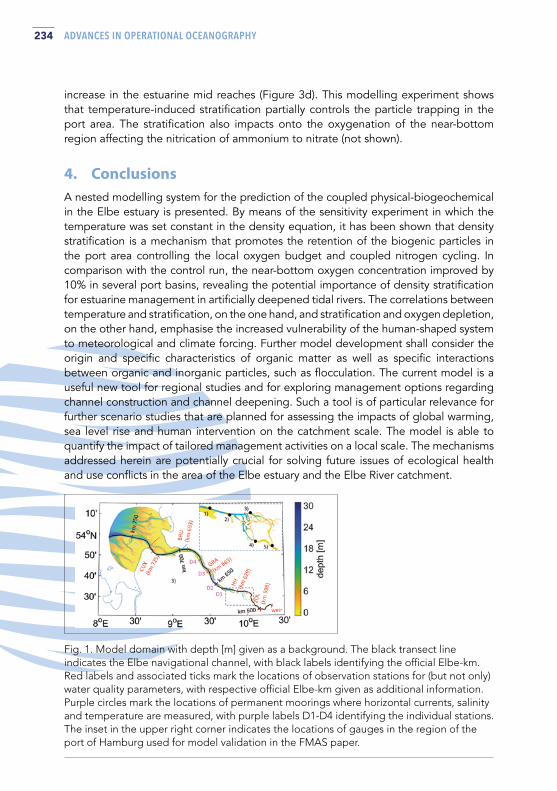
234 ADVANCES IN OPERATIONAL OCEANOGRAPHY
increase in the estuarine mid reaches (Figure 3d). This modelling experiment shows that temperature-induced stratification partially controls the particle trapping in the port area. The stratification also impacts onto the oxygenation of the near-bottom region affecting the nitrication of ammonium to nitrate (not shown).
4. ConclusionsA nested modelling system for the prediction of the coupled physical-biogeochemical in the Elbe estuary is presented. By means of the sensitivity experiment in which the temperature was set constant in the density equation, it has been shown that density stratification is a mechanism that promotes the retention of the biogenic particles in the port area controlling the local oxygen budget and coupled nitrogen cycling. In comparison with the control run, the near-bottom oxygen concentration improved by 10% in several port basins, revealing the potential importance of density stratification for estuarine management in artificially deepened tidal rivers. The correlations between temperature and stratification, on the one hand, and stratification and oxygen depletion, on the other hand, emphasise the increased vulnerability of the human-shaped system to meteorological and climate forcing. Further model development shall consider the origin and specific characteristics of organic matter as well as specific interactions between organic and inorganic particles, such as flocculation. The current model is a useful new tool for regional studies and for exploring management options regarding channel construction and channel deepening. Such a tool is of particular relevance for further scenario studies that are planned for assessing the impacts of global warming, sea level rise and human intervention on the catchment scale. The model is able to quantify the impact of tailored management activities on a local scale. The mechanisms addressed herein are potentially crucial for solving future issues of ecological health and use conflicts in the area of the Elbe estuary and the Elbe River catchment.
Fig. 1. Model domain with depth [m] given as a background. The black transect line indicates the Elbe navigational channel, with black labels identifying the official Elbe-km. Red labels and associated ticks mark the locations of observation stations for (but not only) water quality parameters, with respective official Elbe-km given as additional information. Purple circles mark the locations of permanent moorings where horizontal currents, salinity and temperature are measured, with purple labels D1-D4 identifying the individual stations. The inset in the upper right corner indicates the locations of gauges in the region of the port of Hamburg used for model validation in the FMAS paper.
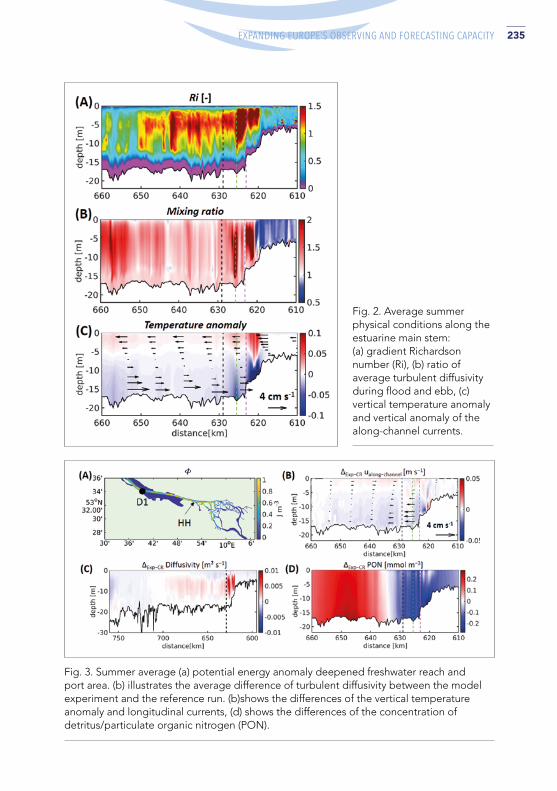
235ADVANCES IN OPERATIONAL OCEANOGRAPHY EXPANDING EUROPE’S OBSERVING AND FORECASTING CAPACITY
Fig. 2. Average summer physical conditions along the estuarine main stem: (a) gradient Richardson number (Ri), (b) ratio of average turbulent diffusivity during flood and ebb, (c) vertical temperature anomaly and vertical anomaly of the along-channel currents.
Fig. 3. Summer average (a) potential energy anomaly deepened freshwater reach and port area. (b) illustrates the average difference of turbulent diffusivity between the model experiment and the reference run. (b)shows the differences of the vertical temperature anomaly and longitudinal currents, (d) shows the differences of the concentration of detritus/particulate organic nitrogen (PON).

236 ADVANCES IN OPERATIONAL OCEANOGRAPHY
Fig. 4. Time-averaged vertical anomalies of (a) chlorophyll, (b) detritus, (c) dissolved oxygen, (d) ammonium, (e) silicate, and (f) nitrate concentrations are given for the main channel between km 610 and km 640 of the Elbe estuary. The time averages represent the simulation during the period of May to September 2012. The dashed black, green and purple lines mark the positions of station Seemannshöft (‘HH’, see Figure 1), the confluence of the northern and southern channel branches, and station Sankt Pauli (see inset in Figure 1), respectively.
AcknowledgementsThis project is a contribution to theme ‘C3: Sustainable Adaption Scenarios for Coastal Systems’ of the Cluster of Excellence EXC 2037 ‘CLICCS - Climate, Climatic Change, and Society’ – Project Number: 390683824 funded by the Deutsche Forschungsgemeinschaft (DFG, German Research Foundation) under Germany‘s Excellence Strategy. This contribution was funded by the Helmholtz-Gemeinschaft Deutscher Forschungszentren (HGF) in the framework of the CLICCS-HGF networking project.
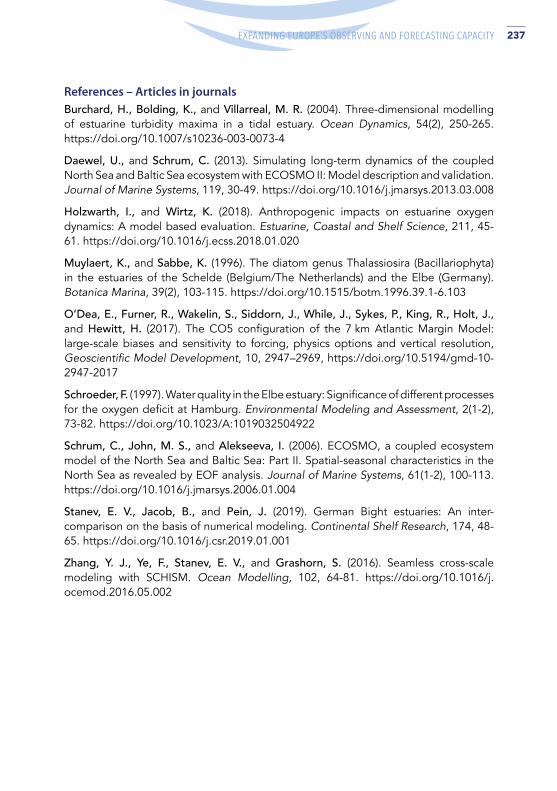
237ADVANCES IN OPERATIONAL OCEANOGRAPHY EXPANDING EUROPE’S OBSERVING AND FORECASTING CAPACITY
References – Articles in journalsBurchard, H., Bolding, K., and Villarreal, M. R. (2004). Three-dimensional modelling of estuarine turbidity maxima in a tidal estuary. Ocean Dynamics, 54(2), 250-265. https://doi.org/10.1007/s10236-003-0073-4
Daewel, U., and Schrum, C. (2013). Simulating long-term dynamics of the coupled North Sea and Baltic Sea ecosystem with ECOSMO II: Model description and validation. Journal of Marine Systems, 119, 30-49. https://doi.org/10.1016/j.jmarsys.2013.03.008
Holzwarth, I., and Wirtz, K. (2018). Anthropogenic impacts on estuarine oxygen dynamics: A model based evaluation. Estuarine, Coastal and Shelf Science, 211, 45-61. https://doi.org/10.1016/j.ecss.2018.01.020
Muylaert, K., and Sabbe, K. (1996). The diatom genus Thalassiosira (Bacillariophyta) in the estuaries of the Schelde (Belgium/The Netherlands) and the Elbe (Germany). Botanica Marina, 39(2), 103-115. https://doi.org/10.1515/botm.1996.39.1-6.103
O’Dea, E., Furner, R., Wakelin, S., Siddorn, J., While, J., Sykes, P., King, R., Holt, J., and Hewitt, H. (2017). The CO5 configuration of the 7 km Atlantic Margin Model: large-scale biases and sensitivity to forcing, physics options and vertical resolution, Geoscientific Model Development, 10, 2947–2969, https://doi.org/10.5194/gmd-10-2947-2017
Schroeder, F. (1997). Water quality in the Elbe estuary: Significance of different processes for the oxygen deficit at Hamburg. Environmental Modeling and Assessment, 2(1-2), 73-82. https://doi.org/10.1023/A:1019032504922
Schrum, C., John, M. S., and Alekseeva, I. (2006). ECOSMO, a coupled ecosystem model of the North Sea and Baltic Sea: Part II. Spatial-seasonal characteristics in the North Sea as revealed by EOF analysis. Journal of Marine Systems, 61(1-2), 100-113. https://doi.org/10.1016/j.jmarsys.2006.01.004
Stanev, E. V., Jacob, B., and Pein, J. (2019). German Bight estuaries: An inter-comparison on the basis of numerical modeling. Continental Shelf Research, 174, 48-65. https://doi.org/10.1016/j.csr.2019.01.001
Zhang, Y. J., Ye, F., Stanev, E. V., and Grashorn, S. (2016). Seamless cross-scale modeling with SCHISM. Ocean Modelling, 102, 64-81. https://doi.org/10.1016/j.ocemod.2016.05.002

238 ADVANCES IN OPERATIONAL OCEANOGRAPHY
NEW COUPLED FORECASTING SYSTEM FOR THE BALTIC SEA AREAAdam Nord (1), Tuomas Kärnä (2), Anja Lindenthal (3), Patrik Ljungemyr (1), Ilja Maljutenko (4), Saeed Falahat (1), Ida M. Ringgaard (5), Vasily Korabel (5), Hedi Kanarik (2), Svetlana Verjovkina (4), Simon Jandt (3) with support of the whole BAL MFC team
(1) Swedish Meteorological and Hydrological Institute, Sweden, [email protected], [email protected], [email protected]
(2) Finnish Meteorological Institute, Finland, [email protected], [email protected](3) Bundesamt für Seeschifffahrt und Hydrographie, Germany, [email protected],
[email protected](4) Department of Marine Systems at Tallinn University of Technology, Estonia,
(5) Danish Meteorological Institute, Denmark, [email protected], [email protected]
Abstract The Copernicus Marine Environment Monitoring Service (CMEMS) is providing operational data products for the European Seas. During the current phase of CMEMS, Baltic Monitoring Forecasting Centre (BAL MFC) has been developing a brand new coupled forecasting system for the Baltic Sea area. With the latest update in December 2020 the products of the new model system for near real-time became operationally available in the CMEMS catalogue. The system consists of four parts – Nucleus for European Modelling of the Ocean (NEMO), Ecological Regional Ocean Model (ERGOM), the Wind Wave Model (WAM) and the Parallel Data Assimilation Framework (PDAF). The most notable difference between the new system and its predecessor is the change of the physical model to NEMO 4.0 instead of HBM (Hiromb Boos Model), resulting in an improvement in the representation of the physical parameters. NEMO 4 and ERGOM are one-way online coupled and runs at the same production unit. In addition, NEMO and WAM are offline coupled in both directions. These two models are produced at two different production units. WAM uses ice conditions and currents from NEMO to increase the quality of the wave forecast. In return WAM provides NEMO with stokes drift, mainly to improve the extreme sea level events. We present the components of the forecasting system focusing on the implementation and effects of the coupling.
Keywords: CMEMS, BAL MFC, Nemo-Nordic, ERGOM, WAM

239ADVANCES IN OPERATIONAL OCEANOGRAPHY EXPANDING EUROPE’S OBSERVING AND FORECASTING CAPACITY
1. Introduction Baltic Monitoring Forecasting Center (BAL MFC) is part of the Copernicus Marine Environment Monitoring Service (CMEMS) which is providing operational data products for the European Seas. The consortium consists of five institutes surrounding the Baltic Sea area; Bundesamt für Seeschifffahrt und Hydrographie (BSH), Germany, Danish Meteorological Institute (DMI), Denmark, Department of Marine Systems at Tallinn University of Technology (TalTech), Estonia, Finnish Meteorological Institute (FMI), Finland and Swedish Meteorological and Hydrological Institute (SMHI), Sweden.
The main objective for the BAL MFC consortium is to provide users with both physical and biogeochemical data from a state of the art forecasting system for the Baltic Sea area with a high and well documented quality. This includes both operational near real time forecasts and reanalysis products dating back from 1993. During the past years a new coupled model system has been developed within the consortium. In December 2020 this new system went operational for near real time forecasts and was included under the CMEMS product portfolio. The data can be accessed via CMEMS product catalog at http://marine.copernicus.eu.
Fig. 1. Map covering the Baltic Sea area and all institutes within the BAL MFC consortium.
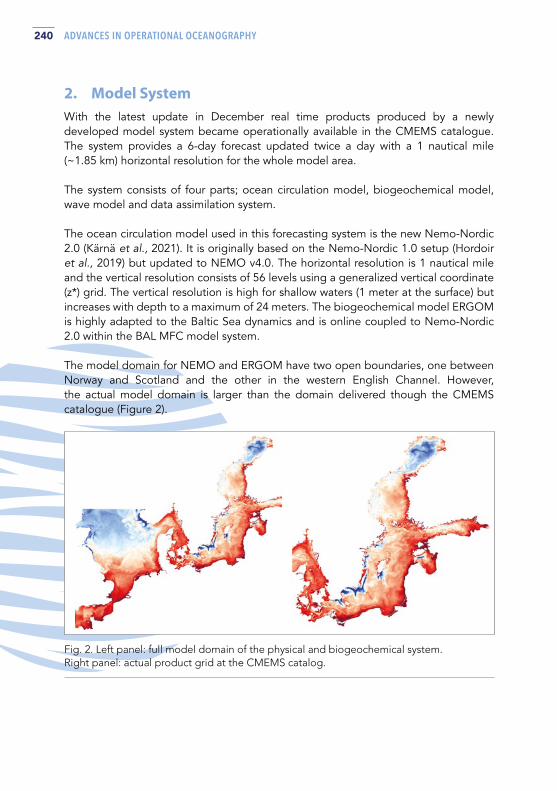
240 ADVANCES IN OPERATIONAL OCEANOGRAPHY
2. Model System With the latest update in December real time products produced by a newly developed model system became operationally available in the CMEMS catalogue. The system provides a 6-day forecast updated twice a day with a 1 nautical mile (~1.85 km) horizontal resolution for the whole model area.
The system consists of four parts; ocean circulation model, biogeochemical model, wave model and data assimilation system. The ocean circulation model used in this forecasting system is the new Nemo-Nordic 2.0 (Kärnä et al., 2021). It is originally based on the Nemo-Nordic 1.0 setup (Hordoir et al., 2019) but updated to NEMO v4.0. The horizontal resolution is 1 nautical mile and the vertical resolution consists of 56 levels using a generalized vertical coordinate (z*) grid. The vertical resolution is high for shallow waters (1 meter at the surface) but increases with depth to a maximum of 24 meters. The biogeochemical model ERGOM is highly adapted to the Baltic Sea dynamics and is online coupled to Nemo-Nordic 2.0 within the BAL MFC model system. The model domain for NEMO and ERGOM have two open boundaries, one between Norway and Scotland and the other in the western English Channel. However, the actual model domain is larger than the domain delivered though the CMEMS catalogue (Figure 2).
Fig. 2. Left panel: full model domain of the physical and biogeochemical system. Right panel: actual product grid at the CMEMS catalog.

241ADVANCES IN OPERATIONAL OCEANOGRAPHY EXPANDING EUROPE’S OBSERVING AND FORECASTING CAPACITY
The BAL MFC wave system is offline coupled to the Nemo-Nordic-ERGOM model and it is based on the wind wave model WAM cycle 4.6.2 (Komen et al., 1994). The model domain is not the same but instead more similar to the product grid (Figure 2, right panel). It covers the Baltic Sea with 1 nautical mile horizontal resolution with an open boundary in the Skagerrak. Special features of the Baltic are accounted for by using grid obstruction fields (Tuomi et al., 2014) and sea ice concentration threshold of 30% (Tuomi et al., 2011). WAM uses hourly averages of surface currents and ice concentrations from the Nemo-Nordic-ERGOM model and reciprocally provides hourly values of Stokes drift as an input to Nemo-Nordic-ERGOM.
In the current system data assimilation for Sea Surface Temperature (SST) is implemented by using the PDAF framework developed by AWI. The CMEMS satellite observations covering the North Sea, Baltic sea area (SST_BAL_SST_L3S_NRT_OBSERVATIONS_010_032) are assimilated daily by using the Local Ensemble Square Root Transform Kalman Filter (LESTKF). The assimilation is done by a univariate SST assimilation scheme.
3. Effects of coupling The offline coupling between Nemo-Nordic 2.0 and WAM did not have a large impact on the physical results in general. For storm situations the Stokes drift pay a more important role and can, in some situations, effect the results quite significantly (Figure 3).
Fig. 3. Sea level at the Danish tide gauge station Rödvig during a winter storm. The Stokes drift increased the peak value by several centimeters. Note that the result from this model simulation is from an earlier version of the system.

242 ADVANCES IN OPERATIONAL OCEANOGRAPHY
The wave system was improved with the offline coupling to surface currents and ice concentration. Overall, the effects of coupling to the wave field were small, but have some advantages. Using the ice concentration field from Nemo-Nordic 2.0 enables the use of hourly data and accounts for changes in the ice condition during the forecast period. Also, the coupling to surface currents can result in a quite substantial difference in the wave fields for certain situations (Kanarik et al., 2021). Figure 4 shows the effect of wave-current interaction to the significant wave height during storm Toini. Strong coastal currents refracted waves from the coast to more open sea areas increasing the significant wave height in the northern Baltic proper where the increase was locally intensified by opposing currents.
The univariate SST scheme improves the temperature for the top layers, this also has an effect on the sea ice extent and lowers the bias mentioned in Kärnä et al., 2021 (Figure 5).
Fig. 4. Shows a situation during storm Toini on 12 Jan 2017, (5 am). Left panel shows the surface currents from the Nemo model, the middle panel shows the significant wave height of the reference run (with no current refraction) and the right one shows the changes in the significant wave height when current fields are introduced to the model. (Kanarik et al., 2021).

243ADVANCES IN OPERATIONAL OCEANOGRAPHY EXPANDING EUROPE’S OBSERVING AND FORECASTING CAPACITY
Fig. 5. Total ice extent for the product version V202012 (based on Nemo-Nordic 2.0), version V201804 (based on HBM, previous BAL MFC model) and ice chart observations for a two year period.
4. Conclusion and outlook The new coupled model system developed within the Marine Copernicus service for operational use in the Baltic Sea has shown to produce high quality forecast. The effects of the wave coupling is highly situational but help to improve the model at the extreme events. Further development is possible, both with respect to the different components in the system but the coupling part can also be extended even more. Possible development would lean towards adding a nested grid by using AGRIF, generation of an ensemble forecast and using more observations types and parameters in the data assimilation system. Furthermore BAL MFC will keep abreast of the news and updates from the NEMO-consortium.
AcknowledgementsThe Copernicus Marine Environment Monitoring Service (CMEMS) is acknowledged for their support and funding to BAL MFC.
244 ADVANCES IN OPERATIONAL OCEANOGRAPHY
ReferencesHordoir, R., Axell, L., Höglund, A., Dieterich, C., Fransner, F., Gröger, M., Liu, Y., Pemberton, P., Schimanke, S., Andersson, H., Ljungemyr, P., Nygren, P., Falahat, S., Nord, A., Jönsson, A., Lake, I., Döös, K., Hieronymus, M., Dietze, H., Löptien, U., Kuznetsov, I.,Westerlund, A., Tuomi, L., and Haapala, J. (2019) Nemo-Nordic 1.0: a NEMO-based ocean model for the Baltic and North seas – research and operational applications, Geoscientific Model Development, 12, 363–386, https://doi.org/10.5194/gmd-12-363-2019
Kanarik, H., Tuomi, L., Björkqvist, J-V. and Kärnä, T. (2021) Improving Baltic Sea wave forecasts using modelled surface currents. Ocean Dynamics doi: 10.1007/s10236-021-01455-y
Komen G.J., Cavaleri L., Donelan M., Hasselmann K., Hasselmann S., Janssen P. (1994) Dynamics and modelling of ocean waves. Cambridge University Press, Cambridge. doi: 10.1017/CBO9780511628955
Kärnä, T., Ljungemyr, P., Falahat, S., Ringgaard, I., Axell, L., Korabel, V., Murawski, J., Maljutenko, I., Lindenthal, A., Jandt-Scheelke, S., Verjovkina, S., Lorkowski, I., Lagemaa, P., She, J., Tuomi, L., Nord, A., and Huess, V. (2021). Nemo-Nordic 2.0: Operational marine forecast model for the Baltic Sea. Geoscientific Model Development Discussions (forthcoming)
Tuomi, L., Kahma, K.K. and Pettersson, H. (2011) Wave hindcast statistics in the seasonally ice-covered Baltic Sea. Boreal Environment Research 16:451–472. http://hdl.handle.net/10138/232826
Tuomi, L., Pettersson, H., Fortelius, C., Tikka, K., Björkqvist, J-V. and Kahma, K.K. (2014) Wave modelling in archipelagos. Coastal Engineering 83:205–220. doi: 10.1016/j.coastaleng.2013.10.011

245ADVANCES IN OPERATIONAL OCEANOGRAPHY EXPANDING EUROPE’S OBSERVING AND FORECASTING CAPACITY
COASTAL CRETE: A HIGH-RESOLUTION OPERATIONAL FORECASTING SYSTEM FOR THE COASTAL AREA OF CRETE, EASTERN MEDITERRANEAN Katerina Spanoudaki (1), George Zodiatis (1), (2), Nikos Kampanis (1), Maria-Luisa Quarta (3), Marco Folegani (3), George Galanis (4), Marios Nikolaidis (2), (5) and Andreas Nikolaidis (5)
(1) Foundation for Research and Technology-Hellas, Institute of Applied and Computational Mathematics, Coastal and Marine Research Laboratory, Crete, Greece, [email protected]. [email protected]
(2) ORION Research, Cyprus, [email protected] (3) Meteorological and Environmental Earth Observation – MEEO S.r.l., Italy, [email protected],
[email protected] (4) Mathematical Modelling and Applications Laboratory, Section of Mathematics, Hellenic Naval
Academy, Greece, [email protected] (5) Mare Investigatiorum Studia Ltd, Cyprus, [email protected],
Abstract A high-resolution operational ocean forecasting system, namely COASTAL CRETE, has been developed for the coastal area of Crete. COASTAL CRETE implements advanced numerical hydrodynamic and sea state models, nested in CMEMS Med MFC products and produces 5-day hourly and 6-hourly averaged forecasts of important marine parameters, such as sea currents, temperature, salinity and waves. The COASTAL CRETE high-resolution (~ 1km) hydrodynamic model is based on a modified POM novel parallel code implemented by CYCOFOS in the East Med and the Levantine Basin, while for wave forecasts, the ECMWF CY46R1 parallel version has been implemented with a resolution of ~1.8 km. The hydrodynamic model has been evaluated against its parent model and with satellite Sea Surface Temperature data with good statistical estimates. Similarly, the wave model is calibrated with in-situ data provided from the HCMR buoy network operating in the area. Nested, finer grid (~250 m) hydrodynamic and wave models are also implemented to provide on demand information and services to local end users. COASTAL CRETE products are made available through ADAM (Advanced geospatial Data Management platform) developed by MEEO S.r.l. (https://explorer-coastal-crete.adamplatform.eu/).
Keywords: operational oceanography, Cretan Sea, wave model, WAM cycle 4

246 ADVANCES IN OPERATIONAL OCEANOGRAPHY
1. Introduction The island of Crete is known to be at the crossroads of the Eastern Mediterranean Sea routes that served as conveyors of trade, knowledge and culture, linking some of the world’s earliest civilizations, while nowadays attracts millions of tourists and cruise passengers. Currently, in view of the oil/gas exploration in the broader coastal sea area of Crete, the approved by EU EastMed gas pipeline layout that will cross Crete offshore and the enlargement of the Suez canal that will increase the maritime traffic in the area, the National and local authorities in Crete, like ports and the coast guard, who are involved in maritime safety, the tourism industry and the policy makers, are key end users who can benefit from high spatial and temporal resolution forecasting products and information to support their offshore activities. To support local end users and response agencies to strengthen their capacities in maritime safety and marine conservation, the high-resolution, operational forecasting system COASTAL CRETE has been developed for the coastal area of Crete. COASTAL CRETE implements advanced numerical hydrodynamic and sea state models, nested in CMEMS Med MFC products and provides high-resolution forecasts of important marine parameters, such as sea currents, temperature, salinity and wave characteristics. The COASTAL CRETE hydrodynamic model has been evaluated against its parent model at various depth levels and with satellite Sea Surface Temperature data with good statistical estimates. Similarly, the wave model is calibrated with in-situ data provided from the HCMR buoy network operating in the area. The downscaled high-resolution COASTAL CRETE forecasts are used to deliver on demand services to local end users, particularly for oil spill and floating objects/marine litter predictions. Nested, very fine grid hydrodynamic and wave models are also implemented to provide information for day-to-day operation of ports, such as the Port of Heraklion.
2. Methods The development and implementation of COASTAL CRETE operational forecasting system consists of downscaling from regional to coastal scale, nesting fine resolution models within regional configurations. COASTAL CRETE integrates Copernicus Marine Service Analysis and Forecast model products, satellite data and in-situ observations to produce short-term (5-days) hourly and 6-hourly-averaged high-resolution forecasts of sea temperature, salinity, currents and wave parameters – which are updated on a daily basis – for local authorities, scientists and business users, strengthening their maritime safety capabilities. The COASTAL CRETE high-resolution (~1km) hydrodynamic model, nested in CMEMS Med MFC products, is based on a modified POM (Princeton Ocean Model, http://www.ccpo.odu.edu/POMWEB/) novel parallel code, previously implemented by the CYCOFOS in the Eastern Mediterranean and the Levantine Basin (Zodiatis et al., 2016), while for wave forecasts, the latest ECMWF CY46R1 parallel version (ECMWF, 2019) including a number of new features, a state-of-the-art wave analysis and prediction model with high accuracy in both shallow and deep waters has been implemented with a spatial resolution of ~1.8 km. Atmospheric forcing for

247ADVANCES IN OPERATIONAL OCEANOGRAPHY EXPANDING EUROPE’S OBSERVING AND FORECASTING CAPACITY
Fig. 1. The COASTAL CRETE computational domain.
the hydrodynamic and sea state models is provided by SKIRON modelling system (https://forecast.uoa.gr/en/forecast-maps/skiron) developed by the Atmospheric Modeling and Weather Forecasting Group (AM&WFG) of the Department of Physics of National and Kapodistrian University of Athens (NKUA). The area of interest is shown in Figure 1.
An initial evaluation of the COASTAL CRETE hydrodynamic model has been performed with the comparison of the produced temperature, salinity and sea current fields against the hourly produced CMEMS Med MFC model products. Bias and RMSE statistical values have been estimated. It should be noted that for the estimation of statistical metrics, COASTAL CRETE model results have been interpolated to the resolution of CMEMS Med MFC products. Comparison of results produced at 09:00 UTC for the COASTAL CRETE hydrodynamic model and 09:30 UTC for CMEMS Med MFC model on October 3rd, 2020 for the surface layer (~ 1 m) and at the depth level of 300 m shown in Figure 2-7.
The comparison between COASTAL CRETE and CMEMS Med MFC hydrodynamic models’ results shows similar hydrodynamic features. Differences at the surface and the near surface (up to 50 m depth) levels are observed as anticipated and are gradually reduced with depth increase. These are due to: the more detailed bathymetry of the higher resolution COASTAL CRETE model, which causes significant variations in the flow filed; models’ output is sampled with a half an hour difference; the CMEMS Med MFC data used for downscaling are daily averaged, while the CMEMS Med MFC data used for comparison are hourly; different meteorological forcing is used for the CMEMS Med MFC and the COASTAL CRETE hydrodynamic models.

248 ADVANCES IN OPERATIONAL OCEANOGRAPHY
Fig. 2. CMEMS Med MFC and COASTAL CRETE model temperature for the surface layer (~ 1 m) and at the depth level of 300 m on October 3rd, 2020.
Fig. 3. CMEMS Med MFC and COASTAL CRETE model currents magnitude and direction for the surface layer (~ 1 m) and at the depth level of 300 m on October 3rd, 2020.
The COASTAL CRETE hydrodynamic model has been calibrated and validated mainly with Sea Surface Temperature (L3) satellite data (SST_MED_SST_L3S_NRT_OBSERVATIONS_010_012). Figure 4 shows the comparison between model results and satellite data for the period August 2020 – November 2020 for 2 randomly selected points in the computational domain.
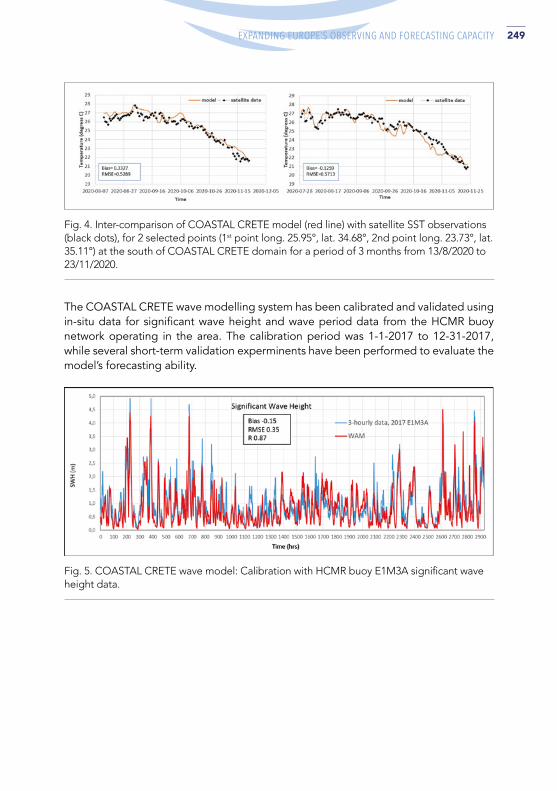
249ADVANCES IN OPERATIONAL OCEANOGRAPHY EXPANDING EUROPE’S OBSERVING AND FORECASTING CAPACITY
Fig. 4. Inter-comparison of COASTAL CRETE model (red line) with satellite SST observations (black dots), for 2 selected points (1st point long. 25.95°, lat. 34.68°, 2nd point long. 23.73°, lat. 35.11°) at the south of COASTAL CRETE domain for a period of 3 months from 13/8/2020 to 23/11/2020.
Fig. 5. COASTAL CRETE wave model: Calibration with HCMR buoy E1M3A significant wave height data.
The COASTAL CRETE wave modelling system has been calibrated and validated using in-situ data for significant wave height and wave period data from the HCMR buoy network operating in the area. The calibration period was 1-1-2017 to 12-31-2017, while several short-term validation experminents have been performed to evaluate the model’s forecasting ability.
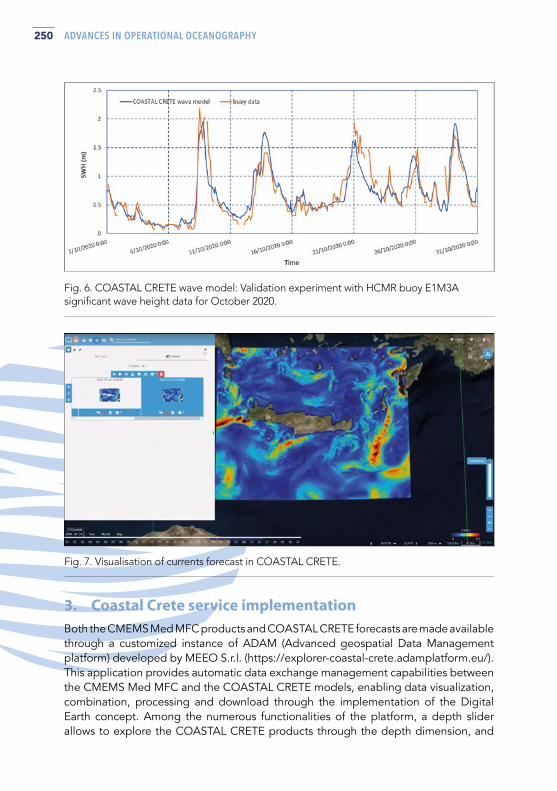
250 ADVANCES IN OPERATIONAL OCEANOGRAPHY
Fig. 6. COASTAL CRETE wave model: Validation experiment with HCMR buoy E1M3A significant wave height data for October 2020.
Fig. 7. Visualisation of currents forecast in COASTAL CRETE.
3. Coastal Crete service implementation Both the CMEMS Med MFC products and COASTAL CRETE forecasts are made available through a customized instance of ADAM (Advanced geospatial Data Management platform) developed by MEEO S.r.l. (https://explorer-coastal-crete.adamplatform.eu/). This application provides automatic data exchange management capabilities between the CMEMS Med MFC and the COASTAL CRETE models, enabling data visualization, combination, processing and download through the implementation of the Digital Earth concept. Among the numerous functionalities of the platform, a depth slider allows to explore the COASTAL CRETE products through the depth dimension, and
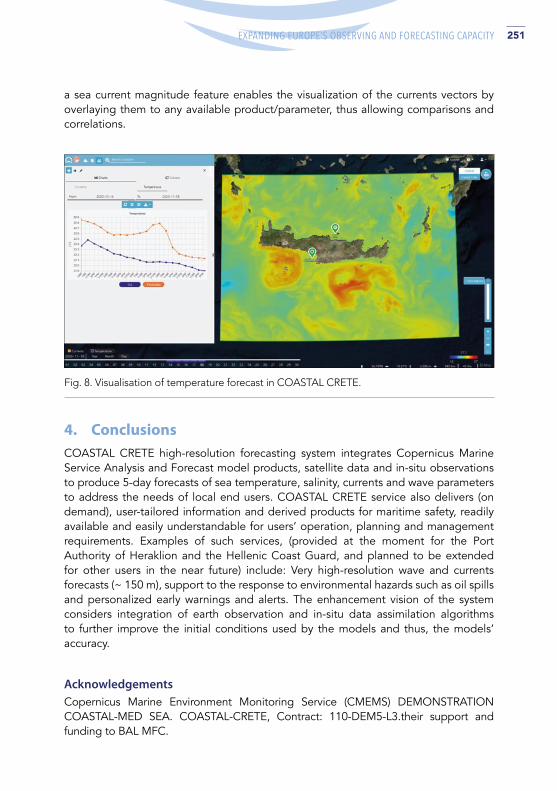
251ADVANCES IN OPERATIONAL OCEANOGRAPHY EXPANDING EUROPE’S OBSERVING AND FORECASTING CAPACITY
Fig. 8. Visualisation of temperature forecast in COASTAL CRETE.
4. Conclusions COASTAL CRETE high-resolution forecasting system integrates Copernicus Marine Service Analysis and Forecast model products, satellite data and in-situ observations to produce 5-day forecasts of sea temperature, salinity, currents and wave parameters to address the needs of local end users. COASTAL CRETE service also delivers (on demand), user-tailored information and derived products for maritime safety, readily available and easily understandable for users’ operation, planning and management requirements. Examples of such services, (provided at the moment for the Port Authority of Heraklion and the Hellenic Coast Guard, and planned to be extended for other users in the near future) include: Very high-resolution wave and currents forecasts (~ 150 m), support to the response to environmental hazards such as oil spills and personalized early warnings and alerts. The enhancement vision of the system considers integration of earth observation and in-situ data assimilation algorithms to further improve the initial conditions used by the models and thus, the models’ accuracy.
AcknowledgementsCopernicus Marine Environment Monitoring Service (CMEMS) DEMONSTRATION COASTAL-MED SEA. COASTAL-CRETE, Contract: 110-DEM5-L3.their support and funding to BAL MFC.
a sea current magnitude feature enables the visualization of the currents vectors by overlaying them to any available product/parameter, thus allowing comparisons and correlations.

252 ADVANCES IN OPERATIONAL OCEANOGRAPHY
ReferencesZodiatis, G., Radhakrishnan H., Galanis G., Nikolaidis A., Emmanouil G., Nikolaidis G., Lardner R., Sofianos S., Stylianou S. and Nikolaidis M. (2016). The CYCOFOS new forecasting systems at regional and sub-regional scales for supporting the marine safety. Geophysical Research Abstracts, Vol. 18, EGU2016-13807, EGU General Assembly, Vienna, 17 – 22 April.
EMWF (2019). IFS DOCUMENTATION – Cy46r1Operational implementation 6 June 2019. PART VII: ECMWF WAVE MODEL. DOI: http://dx.doi.org/10.21957/21g1hoiuo

253ADVANCES IN OPERATIONAL OCEANOGRAPHY EXPANDING EUROPE’S OBSERVING AND FORECASTING CAPACITY


SESSION 5
COPERNICUS MARINE PRODUCTS AND SERVICES

256 ADVANCES IN OPERATIONAL OCEANOGRAPHY
THE ARCTIC MARINE FORECASTING CENTER IN THE FIRST COPERNICUS PERIODLaurent Bertino, (1), Ali, A. (2), Carrasco, A. (3), Vidar Lien (4), Arne Melsom (5)
(1) Nansen Environmental and Remote Sensing Center, Thormøhlensgate 47, 5006 Bergen, Norway. [email protected]
(2) MET Norway, Allegaten 70, 5007 Bergen, Norway, [email protected] (3) MET Norway, Henrik Mohns Plass 1, 0371 Oslo, Norway, [email protected] (4) Institute of Marine Research, Nordnesgaten 50, 5005 Bergen, Norway, [email protected] (5) MET Norway, Henrik Mohns Plass 1, 0371 Oslo, Norway, [email protected]
Abstract The period 2015-2021 has diversified the portfolio of modeling products dedicated to the Arctic. The addition of waves, tides and ocean carbon variables satisfy more adequately the users in the industry, academia and public sectors. Many validation metrics have also been introduced, providing more intuitive measures of the quality of the forecast. The resolution of several products has increased, particularly the horizontal resolution of the sea ice forecasts thanks to a stand-alone sea ice model based on a novel rheology. At the end of the Copernicus 1 period, physical and biogeochemical products come from different configurations of the TOPAZ model system, plus a stand-alone sea ice forecast from the neXtSIM model and forecast and hindcast from an Arctic configuration of the WAM wave model.
Keywords: Arctic, ocean forecasting, sea ice model, wave model, biogeochemical model, data assimilation
1. Introduction At the start of the Copernicus Services, the Arctic Monitoring and Forecasting Center (ARC MFC) was offering four products with forecasts and reanalyses of the physical and biogeochemical variables. These were all based on the TOPAZ system, which used the Ensemble Kalman Filter data assimilation to assimilate satellite ocean observations (Sea surface heights and temperature), sea ice observations (concentration and drift) and in situ T/S profiles (from Argo and Ice-Tethered Profilers) in a coupled physical-biogeochemical model. The use of such an advanced assimilation system in operational settings was unique and still is today. The HYbrid vertical coordinate Ocean Model HYCOM was the ocean model, coupled to the CICE sea ice model using an Elasto-
257ADVANCES IN OPERATIONAL OCEANOGRAPHY EXPANDING EUROPE’S OBSERVING AND FORECASTING CAPACITY
Viscous-Plastic rheology and coupled online to the Norwegian Ecosystem Model (NORWECOM) for the biogeochemical model as well. All products had a resolution of 12.5 km or coarser - interpolated to a polar stereographic projection – and 28 hybrid z-isopycnic layers, interpolated to the 12 ‘Levitus’ vertical levels. None of the Arctic MFC models was nested into the Global MFC system.
2. Main Developments
2.1 Waves A pan-Arctic operational wave forecast product (see the overall domain on Figure 1) has been first setup using the WAM model code from the MyWave FP7 project. The code has been modified by MET Norway to allow wave propagation under the sea-ice (Sutherland et al., 2019). The sea ice concentration, ice thickness and surface currents are all taken from the ARC MFC physical forecast. In 2019, the model horizontal resolution was increased from 8 km to 3 km and two forecasts were run each day, alternatively for 5 days and 10 days horizon. A wave hindcast was later added to the CMEMS catalogue at 3 km resolution with an updated version of the WAM code. It included new physics, a reformulation of the mean wavenumber and mean frequency as well as a new formulation for detecting freak waves. The code has been modified as well by correcting the growth of the waves in very high winds and by allowing propagation of waves under the sea ice as in the forecast. A sub-grid scale parametrization of ‘obstructions’ is used. At the surface the model is forced by hourly winds merged between winds from the ERA5 reanalysis and a downscaled 2.5 km non-hydrostatic convection-permitting atmospheric model Harmony-Arome hindcast for the region around Norway, shown as the rectangle in Figure 1. The wave products are used for navigation purposes, support to offshore operations and downscaling to coastal wave models, among other uses. The 3 km products have high enough resolution to fill the mandate of Norwegian preparedness services (search and rescue, oil spill response) and have replaced pre-existing national systems.
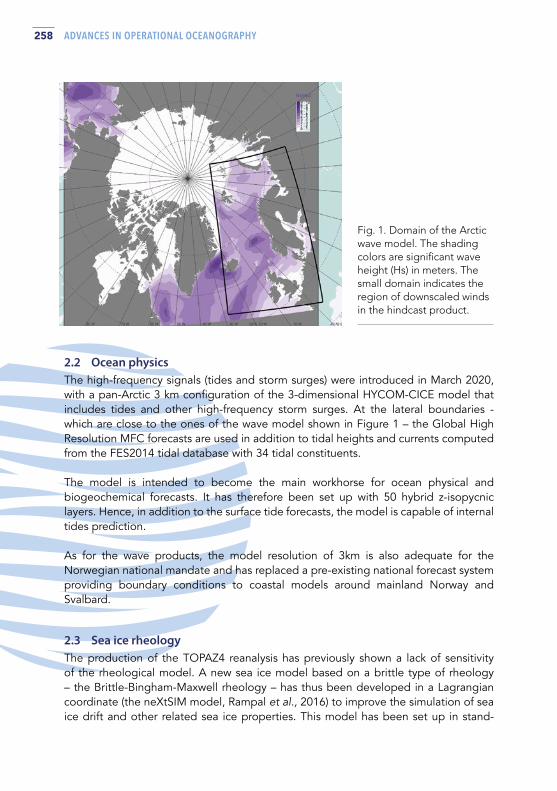
258 ADVANCES IN OPERATIONAL OCEANOGRAPHY
2.2 Ocean physics The high-frequency signals (tides and storm surges) were introduced in March 2020, with a pan-Arctic 3 km configuration of the 3-dimensional HYCOM-CICE model that includes tides and other high-frequency storm surges. At the lateral boundaries - which are close to the ones of the wave model shown in Figure 1 – the Global High Resolution MFC forecasts are used in addition to tidal heights and currents computed from the FES2014 tidal database with 34 tidal constituents. The model is intended to become the main workhorse for ocean physical and biogeochemical forecasts. It has therefore been set up with 50 hybrid z-isopycnic layers. Hence, in addition to the surface tide forecasts, the model is capable of internal tides prediction. As for the wave products, the model resolution of 3km is also adequate for the Norwegian national mandate and has replaced a pre-existing national forecast system providing boundary conditions to coastal models around mainland Norway and Svalbard.
2.3 Sea ice rheology The production of the TOPAZ4 reanalysis has previously shown a lack of sensitivity of the rheological model. A new sea ice model based on a brittle type of rheology – the Brittle-Bingham-Maxwell rheology – has thus been developed in a Lagrangian coordinate (the neXtSIM model, Rampal et al., 2016) to improve the simulation of sea ice drift and other related sea ice properties. This model has been set up in stand-
Fig. 1. Domain of the Arctic wave model. The shading colors are significant wave height (Hs) in meters. The small domain indicates the region of downscaled winds in the hindcast product.

259ADVANCES IN OPERATIONAL OCEANOGRAPHY EXPANDING EUROPE’S OBSERVING AND FORECASTING CAPACITY
2.4 Biogeochemical modeling The biogeochemical model coupled to the ocean model has been updated twice in the course of the Copernicus 1.0 period. The first upgrade in April 2016 has replaced NORWECOM with ECOSMO (Dæwel and Schrum 2013), which parameters were re-tuned to avoid an excessive amplitude of the Spring bloom. In a second upgrade planned for May 2021, several changes are brought to ECOSMO: a doubling of both horizontal and vertical resolution (6 km and 50 hybrid layers) and the simple assimilation of satellite surface Chlorophyll data (Uitz et al., 2006), the inclusion of the carbon cycle, of light transmission through sea ice and improvements of the model inputs (rivers discharge from the Arctic-HYPE model, atmospheric deposition of nutrients from the EMEP model and lateral boundary conditions from the Global MFC model PISCES). The Framework for Aquatic Biogeochemical Models (FABM) software now couples ECOSMO to HYCOM. When compared to independent Chlorophyll profiles from the BGC-Argo buoys in the Nordic Seas, the assimilation alone reduces drastically the errors (Figure 3). The improved accuracy of the primary production is an important prerequisite for the simulation of the carbon cycle and thereby provide up to date information about the ocean carbon pump and ocean acidification.
alone forecast mode for the Central Arctic including a nudging term to daily satellite sea ice concentrations. The neXtSIM-F forecasts show much more detailed sea ice features than TOPAZ4 (Figure 2, where in particular the leads and landfast ice are not visible in TOPAZ4) and their motions are as well more accurately forecasted, with drift distance errors cut from 8 to 4 km per day. The sea ice forecasts are used in navigation services.
Fig. 2. Sea ice thickness on the 12th March 2021 from the TOPAZ4 system and the recently introduced neXtSIM-F forecast (right).
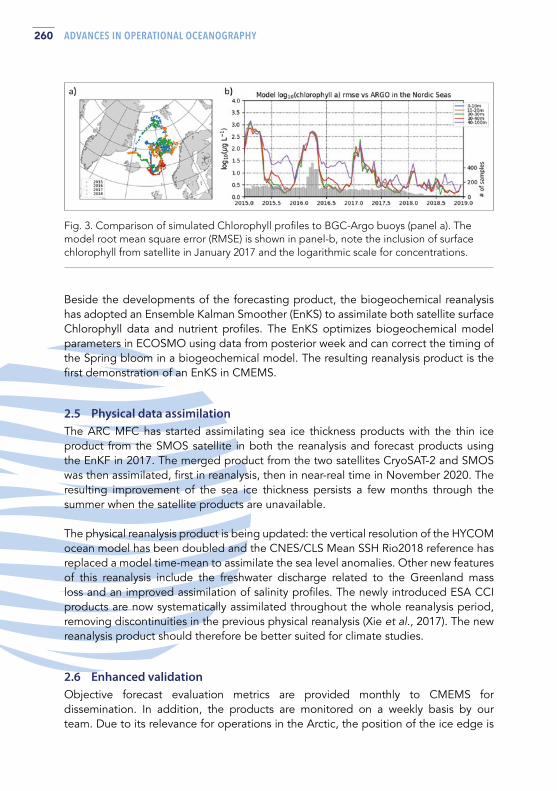
260 ADVANCES IN OPERATIONAL OCEANOGRAPHY
Beside the developments of the forecasting product, the biogeochemical reanalysis has adopted an Ensemble Kalman Smoother (EnKS) to assimilate both satellite surface Chlorophyll data and nutrient profiles. The EnKS optimizes biogeochemical model parameters in ECOSMO using data from posterior week and can correct the timing of the Spring bloom in a biogeochemical model. The resulting reanalysis product is the first demonstration of an EnKS in CMEMS.
2.5 Physical data assimilation The ARC MFC has started assimilating sea ice thickness products with the thin ice product from the SMOS satellite in both the reanalysis and forecast products using the EnKF in 2017. The merged product from the two satellites CryoSAT-2 and SMOS was then assimilated, first in reanalysis, then in near-real time in November 2020. The resulting improvement of the sea ice thickness persists a few months through the summer when the satellite products are unavailable. The physical reanalysis product is being updated: the vertical resolution of the HYCOM ocean model has been doubled and the CNES/CLS Mean SSH Rio2018 reference has replaced a model time-mean to assimilate the sea level anomalies. Other new features of this reanalysis include the freshwater discharge related to the Greenland mass loss and an improved assimilation of salinity profiles. The newly introduced ESA CCI products are now systematically assimilated throughout the whole reanalysis period, removing discontinuities in the previous physical reanalysis (Xie et al., 2017). The new reanalysis product should therefore be better suited for climate studies.
2.6 Enhanced validation Objective forecast evaluation metrics are provided monthly to CMEMS for dissemination. In addition, the products are monitored on a weekly basis by our team. Due to its relevance for operations in the Arctic, the position of the ice edge is
Fig. 3. Comparison of simulated Chlorophyll profiles to BGC-Argo buoys (panel a). The model root mean square error (RMSE) is shown in panel-b, note the inclusion of surface chlorophyll from satellite in January 2017 and the logarithmic scale for concentrations.

261ADVANCES IN OPERATIONAL OCEANOGRAPHY EXPANDING EUROPE’S OBSERVING AND FORECASTING CAPACITY
particularly scrutinized using two metrics, the integrated ice edge error (IIEE) and the fractions skill score (FSS). Melsom et al., (2019) have reviewed these metrics. The validation of wave parameters uses satellite altimeter data (Bohlinger et al., 2019) for both the forecast and multiyear products. This has increased dramatically the spatial representativity of the validation activity in view of the very small number of wave buoys available in the Arctic.
2.7 Ocean Monitoring Indicators The Nordic Seas is an area for key climatic processes in the North Atlantic. The ARC MFC has therefore established two sets of Ocean Monitoring Indicators that monitor North Atlantic - Arctic Ocean exchanges through the Nordic Seas. First the exchange of water across the straits that separate the two basins and where the exchanges of North Atlantic and Arctic waters with their characteristic temperature and salinity are monitored by moorings. Then, the sea ice export from the central Arctic to the south was later also included since it represents an important part of the sea ice budget in the Arctic. The ocean monitoring indicators thus make highly valuable data accessible to many users interested in the Arctic, without requiring them to download discouraging amounts of data.
3. Conclusion and Perspectives The Arctic MFC now offers twice as many products as initially and now include waves, tides and the ocean carbon variables. The new products have up to 4 times higher resolution than six year ago, both horizontally and vertically and adhere to the CMEMS standard naming conventions. The products offered at the end of Copernicus 1.0 have improved performance, more targeted quality checks and easy access to important monitoring indicators, which make them better suited to user needs.
After having introduced a few independent products, it will be necessary to improve their mutual consistency. The first step should be to provide the physical forecast at higher horizontal and vertical resolution. A second step will be to synchronize the slow variability of the tidal model to the data assimilative ocean forecast model. The consistency between the waves and the ocean model can also be improved using wave input terms into the ocean model (Ali et al., 2019).
The ocean forecasts also need improved bathymetry data around Greenland and near-real-time forecasts of river discharge as from the Arctic-HYPE hydrological model. The ocean reanalysis should increase its spatial and temporal resolution, to be more suitable for downscaling near the coast, and as well enhance its accuracy by assimilating sea level anomalies from the SWOT mission, sea surface salinities from
262 ADVANCES IN OPERATIONAL OCEANOGRAPHY
the SMOS mission as prepared in the ESA Arctic+ Salinity project. The stand-alone sea ice model should also include the assimilation of sea ice deformations from Sentinel-1 SAR ice drift as well as the breaking of sea ice by waves in the marginal ice zone (Boutin et al., 2021). When available, the ocean and sea ice data from the High-Priority Copernicus Missions CIMR and CRISTAL should be assimilated too.
We also plan to distribute the ensemble forecasts from the TOPAZ system, and improve their uncertainty estimates by matching them to ensemble predictions from the ECMWF. The quality monitoring of sea ice forecasts can also be further enhanced (Palerme et al., 2019). Ocean biogeochemistry products would benefit from a longer (3 decades) multiyear time series. The ECOSMO model would be improved by using a more advanced sinking scheme developed in the SE project ZOOMBI and should include a sea ice biogeochemistry model.
Besides the HYCOM applications, a non-assimilative NEMO configuration for the Arctic which exhibits encouraging oceanographic properties for the study of the Atlantification of the Arctic (Lind et al., 2018), this NEMO prototype should also include wave terms and online coupling to a biogeochemical model.
AcknowledgementsThe authors acknowledge all the Arctic MFC team members who have contributed to our products, their quality evaluation and monitoring, including A. Samuelsen, J. Xie, T. Wakamatsu, V. Ç. Yumruktepe, M. Müller, T. Williams, R. P. Raj, P. Bohlinger, A. Burud, M. Øiestad, H. Berge, M. Svanevik, J. A. Johannessen and R. Hordoir. We also thank the anonymous reviewers who helped improve this manuscript.
ReferencesAli, A., Christensen, K. H., Breivik, Ø., Malila, M., Raj, R. P., Bertino, L., et al., (2019). A comparison of Langmuir turbulence parameterizations and key wave effects in a numerical model of the North Atlantic and Arctic oceans. Ocean Modelling, 137, 76–97, https://doi.org/10.1016/j.ocemod.2019.02.005
Bohlinger, P., Breivik, Ø., Economou, T. and Müller, M. (2019) A novel approach to computing super observations for probabilistic wave model validation, Ocean Modelling, 139 (May), 101404, doi:10.1016/j.ocemod.2019.101404.
Boutin, G., Williams, T., Rampal, P., Olason, E., and Lique, C.: Wave–sea-ice interactions in a brittle rheological framework, The Cryosphere, 15, 431–457, https://doi.org/10.5194/tc-15-431-2021, 2021.

263ADVANCES IN OPERATIONAL OCEANOGRAPHY EXPANDING EUROPE’S OBSERVING AND FORECASTING CAPACITY
Daewel, U., & Schrum, C. (2013). Simulating long-term dynamics of the coupled North Sea and Baltic Sea ecosystem with ECOSMO II: Model description and validation. Journal of Marine Systems, 119–120, 30–49. https://doi.org/10.1016/J.JMARSYS.2013.03.008
Lind S., Ingvaldsen RB., Furevik T. (2018). Arctic warming hotspot in the northern Barents Sea linked to declining sea ice import. Nat Climate Change, doi:10.1038/s41558-018-0205-y
Melsom A., Palerme C., Müller M. (2019). Validation metrics for ice edge position forecasts. Ocean Science, 15, 615-630. doi:10.5194/os-15-615-2019
Palerme C., Müller M., Melsom A. (2019). An intercomparison of skill scores for evaluating the sea ice edge position in seasonal forecasts. Geophysical Research Letters, 46, 4757-4763. doi:10.1029/2019GL082482
Rampal, P., Bouillon, S., Ólason, E., and Morlighem, M. (2016) neXtSIM: a new Lagrangian sea ice model, The Cryosphere, 10, 1055–1073, https://doi.org/10.5194/tc-10-1055-2016
Sutherland, G., Rabault, J., Christensen, K. H., & Jensen, A. (2019). A two layer model for wave dissipation in sea ice. Applied Ocean Research, 88, 111-118. DOI:10.1016/J.APOR.2019.03.023
Uitz, J., Claustre, H., Morel, A., Hooker, S.B., 2006. Vertical distribution of phytoplankton communities in open ocean: an assessment based on surface chlorophyll. Journal of Geophysical Ocean 111, C08005 (doi:10.1029/2005JC003207).
Xie, J., Bertino, L., Counillon, F., Lisæter, K. A. and Sakov, P. (2017) Quality assessment of the TOPAZ4 reanalysis in the Arctic over the period 1991–2013, Ocean Science, 13(1), 123–144, doi:10.5194/os-13-123-2017.

264 ADVANCES IN OPERATIONAL OCEANOGRAPHY
IMPROVING THE ACCURACY OF THE BLACK SEA PHYSICS ANALYSIS AND FORECASTING SYSTEM IN THE FRAMEWORK OF COPERNICUS MARINE SERVICEStefania A. Ciliberti (1), Eric Jansen (1), Diana Azevedo (1), Mehmet Ilicak (2), Murat Gunduz (3), Marius Matreata (4), Leonardo Lima (5), Ali Aydodgu (5), Salvatore Causio (1), Laura Stefanizzi (1), Sergio Creti’ (1), Rita Lecci (1), Elisaveta Peneva (6), Simona Masina (5), Giovanni Coppini (1), Nadia Pinardi (1, 7), Atanas Palazov (8)
(1) Ocean Predictions and Applications Division, Centro Euro-Mediterraneo sui Cambiamenti Climatici, Italy
(2) Eurasia Institute of Earth Sciences, Istanbul Technical University, Turkey(3) Dokuz Eylul University, Izmir, Turkey(4) National Institute of Hydrology and Water Management, Romania(5) Ocean Modeling and Data Assimilation Division, Centro Euro-Mediterraneo sui Cambiamenti
Climatici, Italy(6) Sofia University ‘St. Kliment Ohridski’, Bulgaria(7) Department of Physics and Astronomy, University of Bologna, Italy(8) Institute of Oceanology - Bulgarian Academy of Sciences, Bulgaria
Abstract This study will present the evolution of the Black Sea model physics in the framework of the Copernicus Marine Environment Monitoring Service, from EAS3 (current operational system) to EAS4 (operational from May 2021). EAS4 has been greatly improved thanks to new core model (based on NEMO v4.0), improved bathymetry and representation of rivers, revision of the spatial domain at higher resolution (2.5 km and 121 z-star-levels) to include the Marmara Sea box for the provision of the lateral open boundary conditions. For the optimal interface between Mediterranean and Black Sea though boundary conditions, a new high-resolution unstructured grid-based model has been developed for the Marmara Sea. Evolution in terms of modelling framework and prediction capacity will be detailed, describing the main results and skill score metrics.
Keywords: Black Sea, Numerical Ocean Modelling, Physics, Ocean Dynamics, Data Assimilation, Operational Forecasting

265ADVANCES IN OPERATIONAL OCEANOGRAPHY EXPANDING EUROPE’S OBSERVING AND FORECASTING CAPACITY
1. Introduction Reconstructing and predicting the Black Sea ocean state is a challenging objective that primarily concerns the development of the numerical hydrodynamics to simulate the complex dynamics of this large estuarine basin. This is part of the scientific and operational activities carried on within the Black Sea Monitoring and Forecasting Center (BS-MFC) in order to provide high quality forecasting products and support monitoring of sea state in the Black Sea region. Since 2016, the Black Sea Physical Near Real Time system (BS-PHY NRT) provides, every day analysis and 10-days forecast for the essential variables in the Black Sea, such as 3D temperature, salinity and currents and 2D sea surface height, mixed layer depth and bottom temperature. It operates with its own Production Unit, developed and maintained operational at Centro Euro-Mediterraneo sui Cambiamenti Climatici (CMCC, Italy), for the delivery of hourly/daily/monthly means datasets to the Copernicus Marine Environment and Monitoring Service (CMEMS).
The aim of this contribution is to provide a general overview of the most recent achievements in the modelling framework, which will enter in operation starting from May 2021, and to assess the quality of the upgraded BS-PHY NRT, EAS4 system, with respect to the previous one, EAS3 system, and by comparing against in situ and satellite observational dataset provided by CMEMS Thematic Assembly Centers (TACs).
2. The Black Sea physical NRT system
2.1 Processing chain The system is producing every day (J) 10-days forecast (J to J+9) following two main cycles – a daily one based on 3 days analysis (J-4 to J-2) and 1-day simulation, a weekly one based on 14-days analysis (J-15 to J-2) and 1-day simulation. The operational strategy follows the one implemented for BS-PHY EAS3 (Ciliberti et al., 2020). Weekly cycle is performed to ingest the highest number of high quality observations collected in the past 2 weeks for providing the best initial condition for the forecasting run.
Fig. 1. BS-PHY EAS4 spatial domain and bathymetry (in meters), including the distribution of the main river inputs (in cyan the minor ones, in dark blue we locate the main ones – Danube, Dneister, Dniepr, Rioni, KizilIrmak, Sakarya.

266 ADVANCES IN OPERATIONAL OCEANOGRAPHY
2.2 Circulation model and data assimilation The BS-PHY EAS4 system is based on NEMO ocean general circulation model (Nucleus for European Modelling of the Ocean, Madec et al., 2019), implemented in the Black Sea basin (Figure 1) at the horizontal resolution of 1/40° and 121 unevenly spaced vertical levels, with time step of 200 sec. The model covers the whole basin except the Azov Sea: it includes a portion of the Marmara Sea as in Gunduz et al., 2020, in order to optimally interface the Black Sea with the Mediterranean Sea through the Marmara Sea and, consequently, provide a solution for the Bosporus Strait dynamics.
The bathymetric source is provided by gridded GEBCO 30’ horizontal resolution (https://www.gebco.net/) combined with a high-resolution dataset for the Marmara Sea box – Bosporus Strait – Bosporus Exit (Gürses, 2016) and interpolated at the BS-PHY spatial grid. Coastline has been revised to account for the main coastal peculiarities and structures by using the NOAA shoreline dataset (https://www.ngs.noaa.gov/CUSP/). A total number of 72 rivers are accounted for and distributed as shown in Figure 1: for each river inflow, monthly climatological discharge values from SESAME project (Ludwig et al., 2009) with imposed zero salinity have been used. The Danube River deserved a more dedicated study in order to improve its representation: it uses a distributed freshwater source to proper represent the main branches – the Chilia, the Sulina and the St. George arms – accounting for river discharge interannual historical dataset as provided by the NIHWM (partner of the BS-MFC consortium). For the major rivers, imposed non zero salinity is accounted for, considering monthly climatological values as provided by SeaDataNet for the Black Sea at the closest river mouth location. The model has been initialized in simulation mode using 3D January climatological temperature and salinity provided by SeaDataNet starting from Jan 1st
2014. The model is forced by momentum, water and heat fluxes interactively computed by bulk formulation as used in the Med-PHY system (Pettenuzzo et al., 2010), using ECMWF atmospheric forcing (including precipitation) at the highest resolution at today available – 0.01° in horizontal and 1-3-6 hours frequency in time. The EAS4 system implements Lateral Open Boundary Conditions (LOBC) at the Marmara Sea box: 3D temperature, salinity, currents and 2D sea surface height are provided by the new Unstructured Turkish Straits System (U-TSS), a Shyfem-based model implemented for the Dardanelles-Marmara Sea-Bosporus (Ilicak et al., 2021).
LOBC are provided as monthly climatological ocean fields from U-TSS, using Orlanski’s scheme for tracers and velocity and the Flather’s condition for the barotropic component.
The data assimilation system for BS-PHY EAS4 is based on OceanVar, a 3D variational scheme developed by CMCC (Dobricic and Pinardi, 2008; Storto et al., 2011). The background covariance matrix is modelled using a set of empirical orthogonal functions (EOF) that provides a variable transformation to precondition the cost function minimization. The system uses a spatially varying set of 45 EOFs to describe

267ADVANCES IN OPERATIONAL OCEANOGRAPHY EXPANDING EUROPE’S OBSERVING AND FORECASTING CAPACITY
the covariance of sea surface height and temperature and salinity in the water column. The EOFs are derived from a 10-year integration of the hydrodynamical core without DA. To account for seasonal variability the EOFs have a monthly time dependence. Horizontal correlations are modelled through a third-order recursive filter (Farina et al., 2015), specified as a function of the distance from coast, ranging approximately from 9 to 27 km.
The observational error covariance matrices are spatially varying and include a depth and (monthly) time dependence where appropriate. The matrices have been calculated by a series of experiments in which the error is iteratively updated using the method of Desroziers et al., 2015. BS-PHY EAS4 assimilates insitu T,S profiles, SST and SLA, operationally provided by CMEMS INS, SST and SLA TACs. The assimilation of SLA imposes local hydrostatic adjustments as multivariate balance between the sea level innovation and vertical profiles of temperature and salinity (Storto et al., 2011). The DA system runs with a daily frequency and uses a 24-hour assimilation time window.
3. Validation The preoperational EAS4 system has been run starting from Jan 1st 2017, using a restart of the long simulation as described in Section 2. We evaluated the quality of the analysis over a pre-qualification period of 1 year (2019) by using a quasi-independent validation according to standards inherited from GODAE/OceanPredict and MERSEA/MyOcean. In particular, Estimated Accuracy Numbers (EANs), consisting on bias and root mean squared difference (RMSD) are provided in order to evaluate the model performance and error with respect to given observation at a specific location/time.
3.1 Temperature and SalinityBy looking at the 2019 averaged values of bias and RMSD at specific reference layers (expressed in m) for temperature T and salinity S, shown in Table I, the new EAS4 is characterized by higher quality than EAS3. The comparison uses in situ T and S profiles from ARGO. RMSD ranges from a maximum of 1.8°C around the thermocline (10-30m) to below 0.1°C for depths greater than 100m. The temperature bias is quite good below 0.1°C, with a maximum of 0.27°C between 20 and 30 m. The RMSD for salinity is approximately 0.15 PSU at the upper levels, reaching a maximum of 0.25 PSU between 50 and 100 m depth. It is significantly improved with respect to EAS3. Below 200m, it is less than 0.03 PSU. Bias values are generally slightly negative but never larger than 0.05 PSU. Considering sea surface temperature (SST), compared against L3 satellite data, EAS4 and EAS3 have quite similar behaviour (Figure 2a). The spatial distribution of the SST error over 2019 shows higher error (up to 0.3°C) in the Eastern basin, in the area of the Batumi gyre, and along the Bulgarian-Romanian coastline. The lowest error is located along the Turkish coastline and Synop peninsula as well as in the Crimean peninsula and the Russian Eastern coastline (Figure 2b).

268 ADVANCES IN OPERATIONAL OCEANOGRAPHY
3.2 Sea surface heightSea surface height (SSH) is evaluated by comparing the sea level anomaly (SLA) from the model analysis to satellite altimetry data. The comparison is performed along the tracks of the satellite and uses an unbiasing procedure that removes the mean value along the track. The RMSD values for SLA are relatively stable throughout the year and fluctuate between approximately 1.9 and 2.4 cm with an average of 2.16 cm. As shown in Figure 3, SLA RMSD from EAS4 is significantly improved with respect to EAS3, with an absolute gain of almost 1 cm.
TEMPERATURE (°C) SALINIT Y (PSU)
BIAS RMSD BIAS RMSD
EAS3 EAS4 EAS3 EAS4 EAS3 EAS4 EAS3 EAS4
SST 0.11 0.12 0.54 0.48 - - - -
5-10 -0.13 -0.016 1.10 0.99 -0.08 0.006 0.30 0.17
10-20 -0.04 0.169 1.84 1.82 -0.05 0.004 0.25 0.15
20-30 0.05 0.276 1.59 1.67 0.00 0.000 0.24 0.13
30-50 0.02 0.007 0.91 0.97 0.10 0.003 0.29 0.16
50-75 0.02 -0.065 0.31 0.33 0.08 -0.008 0.38 0.25
75-100 -0.02 -0.040 0.17 0.16 0.02 0.010 0.37 0.26
100-200 0.03 0.001 0.09 0.08 -0.02 -0.020 0.22 0.15
200-500 -0.02 -0.016 0.04 0.03 -0.01 -0.024 0.08 0.04
500-1000 -0.01 -0.002 0.02 0.01 0.00 -0.011 0.02 0.02
Table I. EANs for T and SST (°C) and S (PSU) corresponding to the comparison between daily model analysis and in situ T and S profiles for the pre-qualification period 2019.
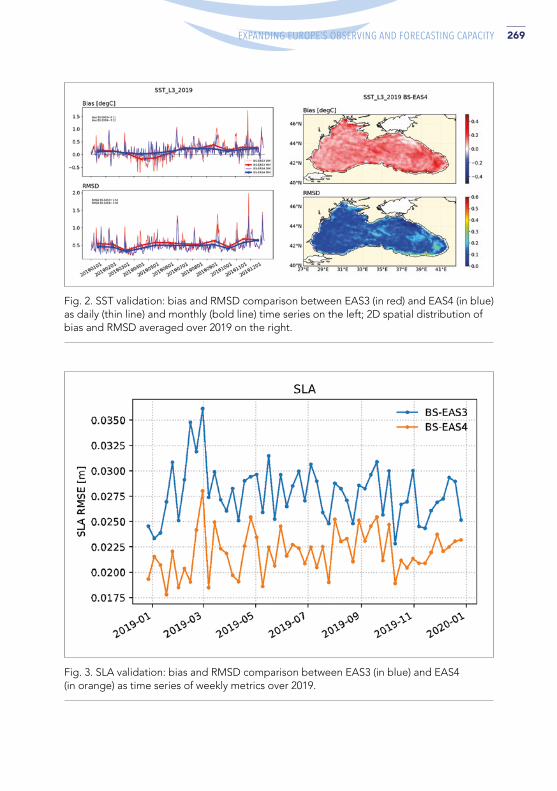
269ADVANCES IN OPERATIONAL OCEANOGRAPHY EXPANDING EUROPE’S OBSERVING AND FORECASTING CAPACITY
Fig. 2. SST validation: bias and RMSD comparison between EAS3 (in red) and EAS4 (in blue) as daily (thin line) and monthly (bold line) time series on the left; 2D spatial distribution of bias and RMSD averaged over 2019 on the right.
Fig. 3. SLA validation: bias and RMSD comparison between EAS3 (in blue) and EAS4 (in orange) as time series of weekly metrics over 2019.

270 ADVANCES IN OPERATIONAL OCEANOGRAPHY
4. Conclusions Within CMEMS, a new forecasting system for the Black Sea, BS-PHY EAS4 (Ciliberti et al., 2021), is being developed and made available to users from May 2021. It is able to provide more accurate analysis and forecast products thanks to improvements in spatial resolution, boundary conditions and data assimilation. It is based on a new numerical hydrodynamics model which is capable for the first time to better resolve the exchange with the Marmara Sea at the Bosporus Strait and the river runoff. It is characterized by a horizontal resolution of 1/40º and 121 levels, higher than the previous EAS3, provided at 1/36º x 1/27º horizontal resolution and 31 levels. The differences among the 2 systems include a) an update from NEMO v3.4 to NEMO v4.0, b) z-star time varying vertical coordinates, c) updated data assimilation scheme and d) the open boundary conditions at the Marmara Sea box for improving the model solution at the Bosporus Strait and consequently at basin scale. The optimal interface with the Mediterranean Sea is achieved thanks to the new U-TSS model for the Turkish Straits, that in the future will provide operational LOBCs at daily frequency. A pre-operational run, from January 2017 to December 2020, has been performed: the pre-qualification here presented includes skills for 2019, demonstrating the significant improvement of EAS4 for SST and S compared to EAS3 as well as for SLA. Future developments include the use of the forecast data for the Danube River at daily frequency, operationally provided by NIHWM, the upgrade to daily LOBC from U-TSS, the inclusion of tides and ensemble forecasting. The quality of the model and the products is strictly connected to the real time observing network and to larger computational resources available at CMCC.
AcknowledgementsThis work was supported by CMEMS BS-MFC (Copernicus Marine Environment and Monitoring Service – Black Sea Monitoring and Forecasting Center).
ReferencesCiliberti, S. A., Peneva, E. L., Jansen, E., Martins, D., Cretí, S., Stefanizzi, L., Lecci, R., Palermo, F., Daryabor, F., Lima, L., Coppini, G., Masina, S., Pinardi, N., & Palazov, A. (2020). Black Sea Analysis and Forecast (CMEMS BS-Currents, EAS3 system) (Version 1) [Data set]. Copernicus Monitoring Environment Marine Service (CMEMS). https://doi.org/10.25423/CMCC/BLKSEA_ANALYSIS_FORECAST_PHYS_007_001_EAS3.
Ciliberti, S. A., Jansen, E., Martins, D., Gunduz, M., Ilicak, M., Stefanizzi, L., Lecci, R., Cretí, S., Causio, S., Aydogdu, A., Lima, L., Palermo, F., Peneva, E. L., Coppini, G., Masina, S., Pinardi, N., & Palazov, A. (2021). Black Sea Physical Analysis and Forecast (CMEMS BS-Currents, EAS4 system) (Version 1) [Data set]. Copernicus Monitoring Environment Marine Service (CMEMS). https://doi.org/10.25423/CMCC/BLKSEA_ANALYSISFORECAST_PHY_007_001_EAS4.
271ADVANCES IN OPERATIONAL OCEANOGRAPHY EXPANDING EUROPE’S OBSERVING AND FORECASTING CAPACITY
Desroziers, G., Berre, L., Chapnik, B., and Poli, P. (2005). Diagnosis of observation, background and anal-ysis-error statistics in observation space. Quarterly Journal of Royal Meteorology Society, 131:3385-3396, https://doi.org/10.1256/qj.05.108.
Dobricic, S., and Pinardi, N. (2008). An oceanographic three-dimensional variational data assimilation scheme. Ocean Modelling, 22, 89-105.
Farina, R., Dobricic, S., Storto, A., Masina, S., & Cuomo, S. (2015). A revised scheme to compute horizontal covariances in an oceanographic 3D-VAR assimilation system. Journal of Computational Physics, 284:631-647.
Gunduz, M., Ozsoy, E., Hordoir, R. (2020). A model of Black Sea circulation with strait exchange (2008-2018). Geoscientific Model Development, 13, 121-138, https://doi.org/10.5194/gmd-13-121-2020.
Gürses, Ö. (2016). Dynamics of the Turkish Straits System - A Numerical Study with a Finite Element Ocean Model Based on an Unstructured Grid Approach (Doctoral dissertation, PhD Thesis).
Ilicak, M., Federico, I., Barletta, I., Pinardi, N., Ciliberti, S. A., Clementi, E., Coppini, G., Lecci, R., and Mutlu, S.: Evaluation of the new high resolution unstructured grid Marmara Sea model, EGU General Assembly 2021, online, 19–30 Apr 2021, EGU21-7194, https://doi.org/10.5194/egusphere-egu21-7194.
Ludwig, W., Dumont, E., Meybeck, M., Heussner, S. (2009). River discharges of water and nutrients to the Mediterranean Sea: Major drivers for ecosystem changes during past and future decades? Progress in Oceanography, 80, 199-217.
Madec and the NEMO System Team (2019). NEMO ocean engine. Notes du Pôle de modélisation de l’Institut Pierre-Simon Laplace (IPSL): (27), 10.5281/zenodo.3878122.
Pettenuzzo, D., Large, W.G., Pinardi, N. (2010). On the corrections of ERA-40 surface flux products consistent with the Mediterranean heat and water budgets and the connection between basin surface total heat flux and NAO. Journal of Geophysical Research, 115, C06022, doi:10.1029/2009JC005631.
Storto, A., Dobricic, S., Masina, S., Di Pietro, P. (2010). Assimilating along-track altimetric observations through local hydrostatic adjustment in a global ocean variational assimilation system. Monthly Weather Review, 139(3), 738-754.
272 ADVANCES IN OPERATIONAL OCEANOGRAPHY
THE COPERNICUS MARINE SERVICE OCEAN FORECASTING SYSTEM FOR THE MEDITERRANEAN SEA Giovanni Coppini (1), Emanuela Clementi (2), Gianpiero Cossarini (3), Gerasimos Korres (4), Massimiliano Drudi (1), Carolina Amadio (3), Ali Aydogdu (2), Paola Agostini (1), Giorgio Bolzon (3), Sergio Cretì (1), Dimitra Denaxa (4), Valeria Di Biagio (3), Romain Escudier (2, 5), Laura Feudale (3), Anna Chiara Goglio (2), Alessandro Grandi (1), Paolo Lazzari (3), Rita Lecci (1), V Vladyslav Lyubartsev (1), Simona Masina (2), Francesco Palermo (1), Nadia Pinardi (1, 6), Jenny Pistoia (2), Stefano Salon (3), Michael Ravdas (4), Cosimo Solidoro (3), Anna Teruzzi (3), Anna Zacharioudaki (4)
(1) Ocean Predictions and Applications Division, Centro Euro-Mediterraneo sui Cambiamenti Climatici, Italy
(2) Ocean Modeling and Data Assimilation Division, Centro Euro-Mediterraneo sui Cambiamenti Climatici, Italy
(3) National Institute of Oceanography and Applied Geophysics (OGS), Italy(4) Hellenic Centre for Marine Research (HCMR), Greece(5) Mercator Ocean International, France(6) Department of Physics and Astronomy, University of Bologna, Italy
Abstract
The Mediterranean Monitoring and Forecasting Center (Med-MFC) is part of the Copernicus Marine Environment Monitoring Service (CMEMS) and operationally produces analysis, forecast and reanalysis products for the Mediterranean Sea hydrodynamics, waves and biogeochemistry. The modelling systems are based on state-of-the-art community models, assimilate observational in situ and satellite observations and are forced by high resolution atmospheric fields. Improvements and functioning of the Med-MFC systems are based on the full consistency among the three components which are jointly upgraded and include a continuous amelioration of the accuracy of the products. The focus of this work is to present the Med-MFC modelling systems and the available products, their skill assessment, main recent achievements and future upgrades.
Keywords: Mediterranean Sea, numerical modelling, hydrodynamics, biogeochemistry, wavesoperationally

273ADVANCES IN OPERATIONAL OCEANOGRAPHY EXPANDING EUROPE’S OBSERVING AND FORECASTING CAPACITY
1. Introduction The CMEMS (https://marine.copernicus.eu/) Med-MFC is a consortium adopting the state-of-the-art knowledge in scientific modelling developments and implementing since 2015 an operational service to produce Near Real Time (NRT) and Reanalysis (RAN) products for the Mediterranean Sea dynamics, from currents (Med-PHY) to waves (Med-WAV), and biogeochemistry (Med-BIO). These three components are fully consistent in terms of horizontal resolution (1/24° in the horizontal and 141 vertical levels), bathymetry (GEBCO), atmospheric forcing fields (European Centre for Medium-range Weather Forecasts, ECMWF, analysis and forecast fields at 1/10° resolution and ERA5 reanalysis fields at 1/4° resolution), moreover the wave and biogeochemical systems are forced by the Med-PHY physical fields.
The modelling systems are jointly upgraded and maintain a continuous improvement of the accuracy of the products. The major NRT systems’ evolutions are provided in Figure 1 showing the improvements of the numerical models and data assimilation systems since 2015.
2. MED-MFC Physical Systems The Mediterranean Analysis and Forecasting Physical System, MedFS, is composed by the hydrodynamic model NEMO (Nucleus for European Modelling of the Ocean) 2-way coupled with the wave model WaveWatchIII (Clementi et al., 2017) and forced by ECMWF high resolution atmospheric fields. The system is coupled with a 3D
Fig. 1. Med-MFC NRT systems evolutions from 2015 to 2021.

274 ADVANCES IN OPERATIONAL OCEANOGRAPHY
variational data assimilation system, OceanVar (Dobricic and Pinardi, 2008; Storto et al., 2015), which daily assimilates Sea Level Anomaly (SLA) along track altimetry data and insitu vertical profiles of temperature and salinity. Moreover a heat flux correction is performed using satellite Sea Surface Temperature (SST) data. The system has lateral open boundaries in the Atlantic Sea where it is nested in the CMEMS Global analysis and forecasting daily fields and in the Dardanelles strait; moreover 39 land river inputs are imposed by means of climatological runoff values (Delrosso, 2020). The system has been recently (May 2021) upgraded (Clementi et al., 2021) by including tidal waves, so that the tidal potential is calculated across the domain for the Mediterranean Sea 8 major constituents: M2, S2, N2, K2, K1, O1, P1, Q1. The skill of the NRT system is continuously monitored by means of comparison with respect to insitu and satellite observations (available on the https://medfs.cmcc.it/ website and on the CMEMS https://marine.copernicus.eu/ Product Quality web-page). Figure 2 shows the temperature and salinity Root Mean Square Error (RMSE) in the first 900 m averaged in the whole basin in the period 2018-2021. The temperature error presents a seasonal signal, with larger values during summer around 30 to 60 m depths. The basin is in fact characterized by seasonal variations of the upper-ocean temperature with highly stratified waters in the sub-surface layers during summer and early fall, while during winter the water column is unstratified due to intense vertical mixing processes. The salinity mean error presents larger values (around 0.2 PSU) in the upper layers decreasing below 150 m.
Fig. 2. Hovmoller (Depth-Time) diagrams of weekly mean RMSE of temperature (left) and salinity (right) along the water column averaged in the whole Mediterranean Sea.

275ADVANCES IN OPERATIONAL OCEANOGRAPHY EXPANDING EUROPE’S OBSERVING AND FORECASTING CAPACITY
A new Mediterranean physical reanalysis timeseries (Escudier et al., 2020) has been recently (December 2020) released with the same NRT system resolution (1/24° horizontal; 141 vertical levels), forced by ECMWF ERA5 (1/4° horizontal, 1-hour temporal resolution) atmospheric fields. The system is nested in the Atlantic within the global reanalysis C-GLORSv5 (Storto and Masina, 2016), is forced by 39 river inputs, also the Dardanelles strait inflow is parameterized as a river. The system assimilates reprocessed SLA satellite tracks and historical temperature and salinity in situ profiles. SST nudging is also activated as in the NRT system. The new reanalysis presents an overall increased skill with respect to the previous one (Simoncelli et al., 2019) with a reduced error for all the variables at all the depths when compared to observations (more details in the product QUID: http://marine.copernicus.eu/documents/QUID/CMEMS-MED-QUID-006-004.pdf).
3. MED-MFC Biogeochemical Systems The biogeochemical Analysis and Forecast System (MedBFM, Salon et al., 2019) is composed by the BFM biogeochemical model coupled to the OGSTM transport model and includes the 3DVarBio assimilation scheme. The MedBFM is off-line coupled with the physical component and includes a Z* parameterization, 39 rivers, open boundary conditions at the Gibraltar and Dardanelles straits and atmospheric forcing for nitrogen and phosphorus deposition and CO2 exchanges (Salon et al., 2019). The BFM model describes the biogeochemical cycles of 5 chemical compounds (carbon, nitrogen, phosphorus, silicon and oxygen) through the dissolved inorganic, living organic (4 phyto- and 4 zoo-plankton groups and one bacteria) and non-living organic compartments (Lazzari et al., 2016), and includes the carbonate system (Cossarini et al., 2015). The 3DVarBio assimilation scheme is based on a variational scheme that decomposes the background error covariance matrix using a sequence of operators that account separately for vertical, horizontal and biogeochemical covariance (Teruzzi et al., 2018) and assimilate the surface chlorophyll retrieved by satellite sensors and chlorophyll and nitrate from BGC-Argo float (Cossarini et al., 2019). The system produces 7-day of analysis every week and 10-day forecast every day for 12 ocean variables that includes nutrients (nitrate, ammonia, phosphate and silicate), oxygen, carbonate system variables (pH, surface pCO2, DIC and alkalinity), chlorophyll, biomass of zooplankton and phytoplankton and 2 ecosystem processes (surface CO2 flux and primary production). Depending on the availability of observations (e.g., Emodnet, Socat, WOA, CMEMS OC TAC), the Med-bio products can be validated at three different levels: (1) model capability to reproduce basin wide spatial gradients based on GODAE Class1 metrics; (2) model capability to reproduce the variability due to mesoscale and daily dynamics based on GODAE Class4 metrics and (3) model capability to reproduce key biogeochemical processes based on specific metrics (Salon et al., 2019). As an example of process-based metrics, Figure 3 shows the benefit of using BGC-Argo data to validate modelled chlorophyll dynamics during winter vertical mixed conditions and summer stratified ones.
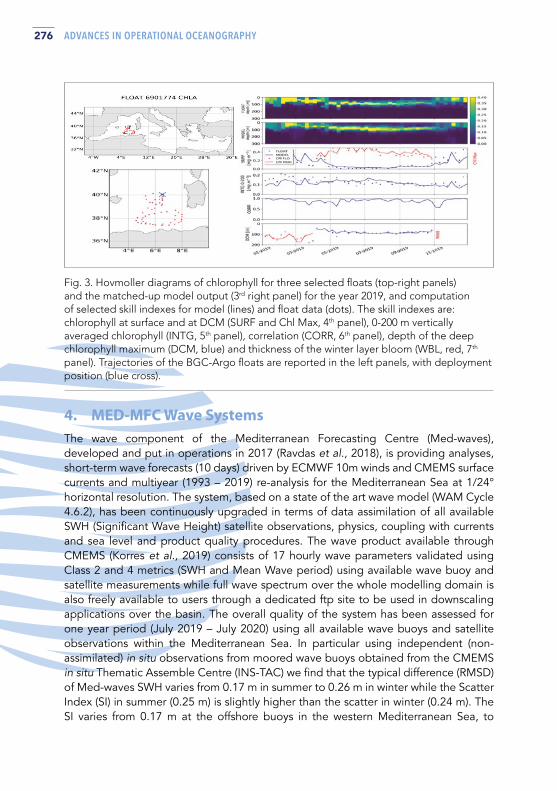
276 ADVANCES IN OPERATIONAL OCEANOGRAPHY
Fig. 3. Hovmoller diagrams of chlorophyll for three selected floats (top-right panels) and the matched-up model output (3rd right panel) for the year 2019, and computation of selected skill indexes for model (lines) and float data (dots). The skill indexes are: chlorophyll at surface and at DCM (SURF and Chl Max, 4th panel), 0-200 m vertically averaged chlorophyll (INTG, 5th panel), correlation (CORR, 6th panel), depth of the deep chlorophyll maximum (DCM, blue) and thickness of the winter layer bloom (WBL, red, 7th panel). Trajectories of the BGC-Argo floats are reported in the left panels, with deployment position (blue cross).
4. MED-MFC Wave Systems The wave component of the Mediterranean Forecasting Centre (Med-waves), developed and put in operations in 2017 (Ravdas et al., 2018), is providing analyses, short-term wave forecasts (10 days) driven by ECMWF 10m winds and CMEMS surface currents and multiyear (1993 – 2019) re-analysis for the Mediterranean Sea at 1/24° horizontal resolution. The system, based on a state of the art wave model (WAM Cycle 4.6.2), has been continuously upgraded in terms of data assimilation of all available SWH (Significant Wave Height) satellite observations, physics, coupling with currents and sea level and product quality procedures. The wave product available through CMEMS (Korres et al., 2019) consists of 17 hourly wave parameters validated using Class 2 and 4 metrics (SWH and Mean Wave period) using available wave buoy and satellite measurements while full wave spectrum over the whole modelling domain is also freely available to users through a dedicated ftp site to be used in downscaling applications over the basin. The overall quality of the system has been assessed for one year period (July 2019 – July 2020) using all available wave buoys and satellite observations within the Mediterranean Sea. In particular using independent (non-assimilated) in situ observations from moored wave buoys obtained from the CMEMS in situ Thematic Assemble Centre (INS-TAC) we find that the typical difference (RMSD) of Med-waves SWH varies from 0.17 m in summer to 0.26 m in winter while the Scatter Index (SI) in summer (0.25 m) is slightly higher than the scatter in winter (0.24 m). The SI varies from 0.17 m at the offshore buoys in the western Mediterranean Sea, to

277ADVANCES IN OPERATIONAL OCEANOGRAPHY EXPANDING EUROPE’S OBSERVING AND FORECASTING CAPACITY
Fig. 4. Med-MFC multi-year reanalysis SWH evaluation against wave buoy observations of SWH at individual wave buoy locations, for the period 1993-2018.
SCATTER INDEX RELATIVE BIAS
0.41 and 0.53 m at the coastal buoys in the Gulf of Trieste and the North Adriatic Sea respectively. In general, SI values above the mean value for the whole Mediterranean Sea (0.24 m) are obtained at wave buoys located near the coast (e.g. coastal Spanish buoys), particularly if these are sheltered by land masses on their north-northwest (e.g. western French coastline), and/or within enclosed basins characterized by a complex topography.
Until 2020, the multi-year wave product of the Med-MFC has been a 13-year wave hindcast covering the period February 2006 – December 2019 (Korres et al., 2019). Since 2021 the multi-year wave product of Med-MFC is a 27-year wave reanalysis covering the period January 1993 – December 2019. It has been produced using the same setup of the NRT system, ERA5 reanalysis hourly winds, reanalysis surface currents and all available SWH satellite observations for the period that are assimilated into the system. Figure 4 maps the statistics of the comparison of Med-MFC reanalysis SWH with wave buoy observations of SWH at individual wave buoys, for the period 1993-2018. SI values above the mean value for the whole Mediterranean Sea (0.27 m) are obtained at wave buoys that are sheltered by land masses on their west north-west (e.g. western French coastline and eastern coastline of Italy), are near the coast (e.g. coastal Spanish buoys) and/or are surrounded by complex topography (e.g. Adriatic and Aegean Seas). BIAS is mainly negative with positive BIAS found mostly at Greek buoys and at the coastal buoys of the Balearic Islands.
The two multi-year products (hindcast 2006 – 2019 and reanalysis 1993 – 2019), have been intercompared for an overlapping period of 11 years (2007-2017) using independent wave buoy observations merged over the Mediterranean Sea and showed that the skill of the Med-waves multiyear production system in the different seasons is well preserved between the two products (hindcast vs reanalysis). Studies that are underway using the 1993 – 2019 reanalysis data set reveal statistically significant increasing trends of extreme waves in the east and south east Levantine at rates of 2-3 cm/yr.

278 ADVANCES IN OPERATIONAL OCEANOGRAPHY
5. Conclusions This work presents the CMEMS Mediterranean operational modelling systems, the available products, the recent modelling upgrades and their quality. During the last 6 years, the CMEMS Med-MFC systems have been substantially improved with regard to: increased resolution, improved physical, biogeochemical and wave representations thanks to modelling and data assimilation upgrades. All the systems are now aligned in terms of grid resolution (1/24°), bathymetry and share the same atmospheric and river forcing fields. The quality of the products is continuously monitored by means of comparison with respect to available in situ ad satellite observations and the validation assessment is published in Quality Information Documents complementing the available products and on dedicated validation websites. The improved validation framework (i.e., novel observing systems and metrics) contributed to the increase of the quality of the model results and their reliability for CMEMS user needs.
AcknowledgementsThis work was supported by the European CMEMS Med-MFC (Copernicus Marine Environment Monitoring Service – Mediterranean Marine Forecasting Centre), Mercator Ocean International Service.
ReferencesClementi, E., Oddo, P., Drudi, M., Pinardi, N., Korres, G., Grandi A. (2017). Coupling hydrodynamic and wave models: first step and sensitivity experiments in the Mediterranean Sea. Ocean Dynamics. https://doi.org/10.1007/s10236-017-1087-7.
Clementi, E., Aydogdu, A., Goglio, A. C., Pistoia, J., Escudier, R., Drudi, M., Grandi, A., Mariani, A., Lyubartsev, V., Lecci, R., Cretí, S., Coppini, G., Masina, S., Pinardi, N. (2021). Mediterranean Sea Analysis and Forecast (CMEMS MED-Currents, EAS6 system) (Version 1) [Data set]. Copernicus Monitoring Environment Marine Service. https://doi.org/10.25423/CMCC/MEDSEA_ANALYSISFORECAST_PHY_006_013_EAS6.
Cossarini, G., Mariotti, L., Feudale, L., Mignot, A., Salon, S., Taillandier, V., Teruzzi, A., D’Ortenzio F. (2019). Towards operational 3D-Var assimilation of chlorophyll Biogeochemical-Argo float data into a biogeochemical model of the Mediterranean Sea. Ocean Modelling, 133, pp. 112-128.
Delrosso, D. (2020). Numerical modelling and analysis of riverine influences in the Mediterranean Sea. Dissertation thesis, Alma Mater Studiorum Università di Bologna. Dottorato di ricerca in Geofisica, 32 Ciclo. DOI 10.6092/unibo/amsdottorato/9392.
Dobricic, S. and Pinardi, N. (2008). An oceanographic three-dimensional variational data assimilation scheme. Ocean Modelling, 22 (3-4) 89-105.
279ADVANCES IN OPERATIONAL OCEANOGRAPHY EXPANDING EUROPE’S OBSERVING AND FORECASTING CAPACITY
Escudier, R., Clementi, E., Omar, M., Cipollone, A., Pistoia, J., Aydogdu, A., Drudi, M., Grandi, A., Lyu-bartsev, V., Lecci, R., Cretí, S., Masina, S., Coppini, G., Pinardi, N. (2020). Mediterranean Sea Physi-cal Reanalysis (CMEMS MED-Currents) (Version 1) [Data set]. Copernicus Monitoring Environment Marine Service (CMEMS). https://doi.org/10.25423/CMCC/MEDSEA_MULTIYEAR_PHY_006_004_E3R1.
Korres, G., Ravdas, M., Zacharioudaki, A. (2019). Mediterranean Sea Waves Analysis and Forecast (CMEMS MED-Waves) [Data set]. Copernicus Monitoring Environment Marine Service (CMEMS). https://doi.org/10.25423/CMCC/MEDSEA_ANALYSIS_FORECAST_WAV_006_017
Korres, G., Ravdas, M., Zacharioudaki, A. (2019). Mediterranean Sea Waves Hindcast (CMEMS MED-Waves) [Data set]. Copernicus Monitoring Environment Marine Service (CMEMS). https://doi.org/10.25423/CMCC/MEDSEA_HINDCAST_WAV_006_012
Lazzari, P., Solidoro, C., Salon, S., Bolzon, G. (2016). Spatial variability of phosphate and nitrate in the Mediterranean Sea: a modelling approach. Deep Sea Research I, 108, 39-52.
Ravdas, M., Zacharioudaki, A. and Korres, G. (2018). Implementation and validation of a new operational wave forecasting system of the Mediterranean Monitoring and Forecasting Centre in the framework of the Copernicus Marine Environment Monitoring Service. Nat. Hazards Earth Syst. Sci., 18(10), 2675–2695, doi:10.5194/nhess-18-2675-2018.
Simoncelli, S., Fratianni, C., Pinardi, N., Grandi, A., Drudi, M., Oddo, P., Dobricic, S. (2019). Mediterranean Sea Physical Reanalysis (CMEMS MED-Physics) (Version 1) [Data set]. Copernicus Monitoring Environment Marine Service (CMEMS). https://doi.org/10.25423/MEDSEA_REANALYSIS_PHYS_006_004.
Storto, A., Masina, S., Navarra, A. (2015). Evaluation of the CMCC eddy-permitting global ocean physical reanalysis system (C-GLORS, 1982-2012) and its assimilation components. Quarterly Journal of the Royal Meteorological Society, 142, 738–758, doi:10.1002/qj.2673.
Storto, A, and Masina, S. (2016). C-GLORSv5: an improved multipurpose global ocean eddy-permitting phys-ical reanalysis. Earth Syst. Sci. Data, 8, 679–696, doi:10.5194/essd-8-679-2016
Salon, S., Cossarini, G., Bolzon, G., Feudale, L., Lazzari, P., Teruzzi, A., Solidoro, C., Crise, A. (2019). Marine Ecosystem forecasts: skill performance of the CMEMS Mediterranean Sea model system. Ocean Science, 15, 997-1022.
Teruzzi, A., Bolzon, G., Salon, S., Lazzari, P., Solidoro, C., Cossarini, G. (2018). Assimilation of coastal and open sea biogeochemical data to improve phytoplankton simulation in the Mediterranean Sea. Ocean Modelling, 132, 46-6.
280 ADVANCES IN OPERATIONAL OCEANOGRAPHY
INTERCOMPARISON OF STAND-ALONE AND TWO-WAY NESTED MODELS FOR CMEMS DOWNSTREAM SERVICEVilnis Frishfelds (1, 2), Jens Murawski (1) and Jun She (1)
(1) Danish Meteorological Institute(2) Institute of Numerical Modelling, University of Latvia
Abstract Prediction of hydrographic conditions e.g., sea level, temperature, salinity and currents in coastal-estuary continuum is the basis for climate change adaptation and mitigation and ecosystem-based management in coastal waters. In this study, we compare and develop two strategies: either use stand-alone Limfjord setup with boundary conditions from CMEMS or extend the CMEMS Baltic Monitoring Forecasting Centre (BAL-MFC) set-up with a nested Limfjord domain. The resolution of Limfjord domain in about 185 m horizontal resolution. This domain is not covered by CMEMS, despite its importance for sea shipping, aquaculture and mussel fisheries. The ocean model that is applied is the BAL-MFC HBM model (HIROMB-BOOS Model). The results show that both approaches are able to provide high quality sea level forecast for storm surge warning, temperature, salinity and currents with reasonably good quality for ecosystem-based management both for nested an stand-alone models. The models are able to handle the shallow thermoclines in summer as well as the strong tidal and wind driven transport through narrow straits in autumn and winter. Nested models usually have better performance and do not depend on possible change of CMEMS model that supplies boundary conditions. Nevertheless, stand-alone setup is attractive as it requires much less computational resources, can be tuned more effectively, less limits for increasing the resolution.
Keywords: coastal estuary modelling, two-way nesting, CMEMS downscaling, Limfjord
1. Introduction Coastal estuaries and inlets are of critical importance as ecological corridors connecting terrestrial, riverine and marine ecosystems. The Limfjord is the largest Danish fjord system and extends across the Jutland peninsula from the North Sea in the west to the Kattegat in the east. HBM model with atmospheric forcing by DMI Harmonie model
281ADVANCES IN OPERATIONAL OCEANOGRAPHY EXPANDING EUROPE’S OBSERVING AND FORECASTING CAPACITY
(2.5 km resolution) allows for seamless transition from large scale to coastal scale by using dynamic two-way nesting [1, 2]. Nested setup [1] of Limfjord involves 4 domains, see Figure 1. The stand-alone setup has only Limfjord domain with the same resolution and boundary conditions (sea level, temperature, salinity) derived from CMEMS North Sea (west) and Baltic Sea (east) models. Nested models usually have better performance [2]. Nevertheless, stand-alone setup is attractive as it requires much less computational resources, can be tuned more effectively, less limits for increasing the resolution, etc. In order to mimick inflows at western and eastern boundaries, sea level at both sides is linearly up-scaled to increase its variation in stand-alone setup: by 20%, 3% at the western, eastern boundaries, respectively. Boundary tuning it the key factor for stand-alone setup. Untuned stand-alone model based on CMEMS boundary condition would lead to fast decline of salinity, insufficient inflows and worse performance in sea level.
2. Results Sea level performance is comparable in both nested [1] and tuned stand-alone HBM setups, see Figure 1. In western part, stand-alone setup has even an advantage due to adjustment of sea level variation at the boundary. Nested setup has an advantage in middle part of Limfjord because of better inflows through narrows of Oddesund and Sallingsund. Stand-alone setup handles better situations with low sea level as the boundary sea level is slightly increased in tunes setup leading to better performance in eastern stations.
Dynamics of salinity is governed by inflows from North sea and Baltic sea, and fresh water inflows [3]. Nested setup uses fresh water inflow by E-hype [4], but the stand-alone setup uses 62% of that value corresponding to run-off observations in Limfjord catchment in 2018-2019. Results are compared to profile observations of ODA database [3] in 22 stations, see Figure 2. Stand-alone setup results in worse performance in middle part of Limfjord due to insufficient inflows through Oddesund and Sallingsund. Both stand-alone and nested setups provide rather good temperature forecasts with bias and central RMSD of less than 1 degree for the 3 year period. Good thermodynamics is a key factor for applications like oyster farming in Limfjord. Stratification is rather weak in western part of Limfjord both in observations and HBM model with 23 vertical layers due to intense tidal and wind forcing.

282 ADVANCES IN OPERATIONAL OCEANOGRAPHY
Fig. 1. Centralized Root-Mean-Square-Deviation [cm] (RMSD) of DMI’s nested model (light blue, upper number) and tuned stand-alone model (dark blue, lower number) in 2017.07.01-2020.03.01. The shading shows the modelled 5 year mean sea-level. Lower-right - domains of the nested setup: North sea – Baltic sea (3 nm), Wadden sea (1 nm), Danish straits (0.5 nm) and Limfjord (185 m).
Fig. 2. RMSD of depth averaged salinity [PSU] in period 2017.07.01-2020.03.01 as comapred to ODA observations. Nested model (light blue, upper number) and tuned stand-alone model (dark blue, lower number). Main rivers and lakes of Limfjord catchment are shown as blue. Colormap shows distribution of depth averaged salinity in August 6, 2017.
283ADVANCES IN OPERATIONAL OCEANOGRAPHY EXPANDING EUROPE’S OBSERVING AND FORECASTING CAPACITY
AcknowledgementsWe are grateful to be supported by EU-H2020 project FORCOAST. VF is thankful to support by project lzp-2018/1-0162.
References[1] Murawski, J., She, J., Mohn, C., Frishfelds, V. and Nielsen, J.W. (2021) Front. Mar.
Sci., doi: 10.3389/fmars.2021.657720
[2] Frishfelds, V., Sennikovs, J., Bethers, U., Murawski, J. and Timuhins, A. (2021) Front. Mar. Sci., doi.org/10.3389/fmars.2021.657721
[3] https://odaforalle.au.dk/
[4] https://hypeweb.smhi.se/explore-water/forecasts/seasonal-forecasts-europe/
284 ADVANCES IN OPERATIONAL OCEANOGRAPHY
THE MULTI OBSERVATIONS THEMATIC ASSEMBLY CENTRE OF THE COPERNICUS MARINE ENVIRONMENT MONITORING SERVICEStéphanie Guinehut (1), B. Buongiorno Nardelli (2), T. Chau (3), F. Chevallier (3), D. Ciani (4), H. Claustre (5), H. Etienne (1), M. Gehlen (3), E. Greiner (1), S. Jousset (1), S. Mulet (1), R. Sauzède (5 and N. Verbrugge (1)
(1) Collecte Localisation Satellites, Environment and Climate, Ramonville Saint-Agne, France, [email protected]
(2) Consiglio Nazionale delle la Ricerche, Istituto di Scienze Marine, Naples, Italy(3) Laboratoire des Sciences du Climat et de l’Environnement, Institut Pierre-Simon Laplace,
CEA-CNRS-UVSQ, Gif sur Yvette Cedex, France(4) Consiglio Nazionale delle la Ricerche, Istituto di Scienze Marine, Rome, Italy(5) Laboratoire d’Océanographie de Villefranche, Institut de la Mer de Villefranche, CNRS-INSU,
Sorbonne Université, Villefranche-Sur-Mer, France
Abstract Complementary to ocean state estimates provided by modelling/assimilation systems, a multi observations-based approach is available through the MULTI OBSERVATIONS (MULTIOBS) Thematic Assembly Center (TAC) of the European Copernicus Marine Environment Monitoring Service (CMEMS). CMEMS MULTIOBS TAC provides multi-observation-based ocean products at global scale derived from the combination of two or more different sensors from satellite and in situ, and using state-of-the-art data fusion techniques. These products cover the blue ocean for physics and the green ocean for the carbonate system and biogeochemical variables. MULTIOBS products are available in Near-Real-Time (NRT) or as Multi-Year Products (MYP) for the past 25 to 35 years with regular temporal extensions. MULTIOBS TAC provides also associated Ocean Monitoring Indicators (OMIs). It uses mostly inputs from other CMEMS TACs.
Keywords: in situ, satellite, multi observations, data fusion techniques, CMEMS

285ADVANCES IN OPERATIONAL OCEANOGRAPHY EXPANDING EUROPE’S OBSERVING AND FORECASTING CAPACITY
1. Introduction MULTIOBS TAC products are available through CMEMS catalogue (https://marine.copernicus.eu/). They consist of global ocean state-estimates of variables still currently critically under-sampled at most of the major scales, take advantage of the strength of the Global Ocean Observing System (in situ and satellite), stay close to the observations, resolve mesoscale structures at the right place (when eddy permitting) and provide long, stable time series enhancing ocean climate and ocean health monitoring capabilities. MULTIOBS TAC delivers 4 physical, 1 carbon and 2 biogeochemical products and 3 associated OMIs which are first described. Some perspectives are then listed below.
2. MULTIOBS TAC products
2.1 SSS/SSD CNR produces a global 2D sea surface salinity (SSS) and sea surface density (SSD) L4 product by interpolating in situ SSS and SSD data with the multidimensional OI technique originally introduced by Buongiorno Nardelli (2012). This method is able to extract information on the surface patterns from satellite Sea Surface Temperature (SST) L4 data, increasing the effective resolution of the interpolated fields. The technique, originally developed to interpolate SSS, has been modified by Droghei et al. (2016) to provide dynamically consistent SSD field. It has been further modified to ingest satellite fields from SMOS. The product is provided on a 1/4° regular grid at weekly sampling (monthly averaged fields are also available) from 1993 onward (MULTIOBS_GLO_PHY_S_SURFACE_MYNRT_015_013).
2.2 ARMOR3D ARMOR3D which is developed by CLS provides on a 1/4° horizontal grid at weekly sampling (monthly averaged fields are also available) 3D global fields of temperature, salinity, geopotential heights and geostrophic currents down to the bottom on 50 vertical levels and 2D global fields of mixed layer depth. This L4 product is available as a multi-year time series since 1993 and in near-real time (MULTIOBS_GLO_PHY_TSUV_3D_MYNRT_015_012). It is obtained by combining satellite (sea level anomaly (SLA), geostrophic currents, SST and SSS) and in situ (T/S profiles) observations through statistical methods (multiple linear regression, optimal interpolation, thermal wind equation: Guinehut et al., 2012; Mulet et al., 2012). ARMOR3D is used together with 4 global reanalyses (GREP) and the in situ gridded field CORA (COriolis Re-Analysis) to monitor global ocean warming through a specific Ocean Monitoring Indicator for the Global Cumulative Trend of zonal mean Subsurface Temperature. Estimation of the robustness of the indicator is provided from a multi-product approach. From ARMOR3D solution, confirmed by all solutions, the warming is obvious in almost all part of the ocean and at depths of up to 800 m depth (Figure 1).

286 ADVANCES IN OPERATIONAL OCEANOGRAPHY
Fig. 1. ARMOR3D Depth/Latitude global mean temperature cumulative trend over 1993-2019 (in °C).
2.3 OMEGA3D A new multiyear product called OMEGA3D (MULTIOBS_GLO_PHY_W_3D_REP_015_007) and developed by CNR provides observation-based 3D quasi-geostrophic vertical and horizontal ocean currents over 75 levels from the surface to 1500 m depth, at 1/4° horizontal resolution, for the period January 1993 to December 2018. The current velocities are obtained by solving a Q-vector formulation of the Omega equation, including diabatic forcing terms (Buongiorno Nardelli, 2020). This product is based on the combination of the fields of temperature, salinity and geostrophic currents provided by ARMOR3D and ERA-Interim surface fluxes.
2.4 Copernicus-Globcurrent Surface and near-surface current Although it is well recognized that surface currents in the ocean are not the simple addition of different current components, a simple approximation of ocean currents can be made by adding the geostrophic currents derived from the altimeter Absolute Dynamic Topography fields and an estimate of the Ekman response to wind forcing. Based on the work by Rio et al., (2014), CLS produces total velocity fields (zonal and meridional) at 0 m and 15 m depth and at 6 h frequency in near-real time (MULTIOBS_GLO_PHY_NRT_015_003) and at 3 h frequency for the multi-year time series (MULTIOBS_GLO_PHY_REP_015_004). Daily and monthly means are also available. The multi-year time series currently covers the 1993-May 2020 period and is extended in the near-real time.
The geostrophic currents are calculated through the geostrophic approximation applied to the sum of altimeter SLA and a mean dynamic topography (MDT), both coming from CMEMS Sea Level TAC. The Ekman currents are computed at two depths (0 m and 15 m) applying an empirical Ekman model updated from Rio et al., (2014) to ECMWF wind stress fields. The parameters of the empirical Ekman model are

287ADVANCES IN OPERATIONAL OCEANOGRAPHY EXPANDING EUROPE’S OBSERVING AND FORECASTING CAPACITY
computed using in situ observations from Argo drifts at the surface, SVP-type drifters at 15 m and an estimation of the ocean stratification coming from the mixed-layer depth of ARMOR3D.
2.5 CMEMS-FFNN Surface Carbon The surface carbon multiyear product includes air-sea flux of CO2 (fgco2), partial pressure of CO2 (spco2) and pH (MULTIOBS_GLO_BIO_CARBON_SURFACE_REP_015_008). The model called CMEMS-FFNN is inherited from the EU H2020 AtlantOS project and is developed by LSCE. It relies on the implementation of feed-forward neural network models (FFNN) for the interpolation of sparse carbon system measurements to basin-wide maps on a 1° horizontal resolution grid at a monthly period (Denvil-Sommer et al., 2019). This method establishes non-linear relationships between chosen drivers or ‘predictors’ such as SST, SSS, chlorophyll, mixed layer depth, surface height, pCO2 climatology, and the target, here surface ocean pCO2 measurements from SOCAT (https://www.socat.info/). Reconstructed variables (fgco2, spco2, pH) are distributed with associated uncertainties derived from the 100-member CMEMS-FFNN ensemble. Related OMIs for ocean carbon sink (i.e. global yearly integrated air-sea flux of CO2) and ocean acidification (i.e. global mean sea water pH) are also available. CMEMS-FFNN air-sea CO2 flux product contributes since 2019 to the yearly assessment of the Global Carbon Budget (Friedlingstein et al., 2020).
2.6 CANYON Nutrient profiles The so-called method CANYON-B (CArbonate system and Nutrients concentration from hYdrological properties and Oxygen using a Neural-network) is inherited from the EU H2020 AtlantOS project and R.Sauzède PHD thesis and is developed by LOV/IMEV. It relies on a neural-network method to derive, from ‘simple’ and cost-effective measured parameters from Biogeochemical-Argo (BGC-Argo) profiling floats, some more complex biogeochemical measurements, not yet easily or cost-effectively amenable to robotic detection (Sauzède et al., 2017; Bittig et al., 2018). CANYON-B uses measurements of temperature, salinity, pressure, and oxygen together with sampling latitude, longitude, and date to retrieve the concentrations of three nutrients including nitrates (NO3
-), phosphates, (PO43−) and silicates (Si(OH)4).
It has been trained on high quality nutrient data collected over the last 30 years and made available through the GLODAPv2 database. It is then applied to all available delayed-mode qualified BGC-Argo profiling floats equipped with an oxygen sensor. Nearly 100 000 profiles are currently available in CANYON product (MULTIOBS_GLO_BIO_NUTRIENTS_PROFILES_REP_015_009).
The example along Argo float WMO 6901467 trajectory located in the North Western Mediterranean Sea shows winter mixing in the input fields (temperature, salinity, oxygen) in February/March 2013 and associated uplift of reconstructed nutrients (Figure 2).
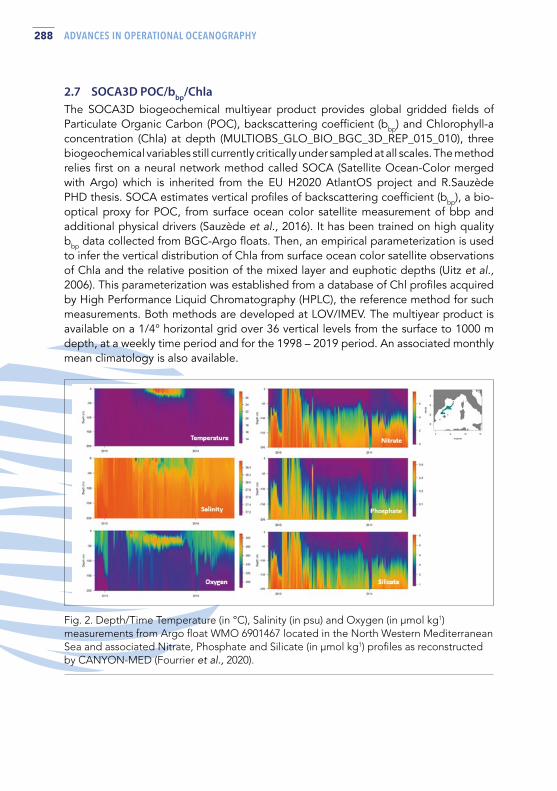
288 ADVANCES IN OPERATIONAL OCEANOGRAPHY
Fig. 2. Depth/Time Temperature (in °C), Salinity (in psu) and Oxygen (in µmol kg1) measurements from Argo float WMO 6901467 located in the North Western Mediterranean Sea and associated Nitrate, Phosphate and Silicate (in µmol kg1) profiles as reconstructed by CANYON-MED (Fourrier et al., 2020).
2.7 SOCA3D POC/bbp/Chla The SOCA3D biogeochemical multiyear product provides global gridded fields of Particulate Organic Carbon (POC), backscattering coefficient (bbp) and Chlorophyll-a concentration (Chla) at depth (MULTIOBS_GLO_BIO_BGC_3D_REP_015_010), three biogeochemical variables still currently critically under sampled at all scales. The method relies first on a neural network method called SOCA (Satellite Ocean-Color merged with Argo) which is inherited from the EU H2020 AtlantOS project and R.Sauzède PHD thesis. SOCA estimates vertical profiles of backscattering coefficient (bbp), a bio-optical proxy for POC, from surface ocean color satellite measurement of bbp and additional physical drivers (Sauzède et al., 2016). It has been trained on high quality bbp data collected from BGC-Argo floats. Then, an empirical parameterization is used to infer the vertical distribution of Chla from surface ocean color satellite observations of Chla and the relative position of the mixed layer and euphotic depths (Uitz et al., 2006). This parameterization was established from a database of Chl profiles acquired by High Performance Liquid Chromatography (HPLC), the reference method for such measurements. Both methods are developed at LOV/IMEV. The multiyear product is available on a 1/4° horizontal grid over 36 vertical levels from the surface to 1000 m depth, at a weekly time period and for the 1998 – 2019 period. An associated monthly mean climatology is also available.

289ADVANCES IN OPERATIONAL OCEANOGRAPHY EXPANDING EUROPE’S OBSERVING AND FORECASTING CAPACITY
2.8 Quality assessment All products are fully validated applying a methodology defined and agreed with CMEMS, inheriting the long experience of MyOcen and MERSEA series of projects (Hernandez et al., 2018). A dedicated QUID (QUality Information Document) is associated with each product/OMI and is available through the generic address: https://resources.marine.copernicus.eu/documents/QUID/CMEMS-MOB-QUID-015-XXX.pdf (XXX to be replaced by the number of the product).
3. Perspectives Perspectives include to remain at the state-of-the art in terms of methods and upstream data for which continuous monitoring is performed. New/improved products from CMEMS TACs (Sea Level, SST, Ocean Color, Wind, in situ) will be incorporated and tested as well as products currently outside of CMEMS, such as SSS from Aquarius/SMAP and from the future ESA-CIMR (Copernicus Imaging Microwave Radiometer) mission. Perspectives include also the improvement of the information content of the products by increasing resolution in space (horizontal & vertical) and in time for all MULTIOBS products, starting with the physical ones. Higher resolution (L3/L4) products from CMEMS TACs are thus required. OMEGA3D, nutrient profiles and 3D POC/Chla products currently available only as multi-year time series could be extended to the near-real-time, providing fully consistent multi-year and near-real time series for almost all MULTIOBS products. The representation of physical processes such as ageostrophic component (wind-driven, stokes), higher frequency processes (e.g. tides) as well as mesoscale processes (e.g. vertical extension of eddies) will be improved. New variables such as phytoplankton functional types, total primary production, or vertical profiles of carbonate chemistry (alkalinity, pH, DIC) will be added. Derived quantities such as Ocean Heat Content (ECV) could be easily provided. Efforts will be made to provide uncertainties estimate for all variables for both direct use, validation purposes and data assimilation.
AcknowledgementsThis work has been funded by the European ‘Copernicus Marine Environment Monitoring Service’ under contract 83-CMEMS-TAC-MOB.

290 ADVANCES IN OPERATIONAL OCEANOGRAPHY
ReferencesBittig, H. C., Steinhoff, T., Claustre, H., Fiedler, B., Williams, N. L., Sauzède, R., Körtzinger, A. and Gattuso, J.-P., 2018: An Alternative to Static Climatologies: Robust Estimation of Open Ocean CO2 Variables and Nutrient Concentrations From T, S, and O2 Data Using Bayesian Neural Networks. Frontiers in Marine Science, 5, 328, doi:10.3389/fmars.2018.00328.
Buongiorno Nardelli, B., 2012: A Novel Approach for the High-Resolution Interpolation of In situ Sea Surface Salinity. Journal of Atmospheric and Oceanic Technology, 29, 867–879, doi:10.1175/JTECH-D-11-00099.1.
Buongiorno Nardelli, B., 2020: A Multi-Year Timeseries of Observation-Based 3D Horizontal and Vertical Quasi-Geostrophic Global Ocean Currents. Earth System Science Data, N°. 12, 1711–1723. https://doi.org/10.5194/essd-12-1711-2020.
Denvil-Sommer, A., Gehlen, M., Vrac, M., and Mejia, C., 2019: LSCE-FFNN-v1: a two-step neural network model for the reconstruction of surface ocean pCO2 over the global ocean. Geosci. Model Dev. 12, 2091–2105. doi: 10.5194/gmd-12-2091-2019.
Droghei, R., B. Buongiorno Nardelli, and R. Santoleri, 2016: Combining in situ and satellite observations to retrieve salinity and density at the ocean surface. Journal of Atmospheric and Oceanic Technology, doi:10.1175/JTECH-D-15-0194.1.
Fourrier, M., L. Coppola, H. Claustre, F. D’Ortenzio, R. Sauzède and J.-P. Gattuso, 2020: A regional neural network approach to estimate water-column nutrient concentrations and carbonate system variables in the Mediterranean Sea: CANYON-MED. Frontiers in Marine Science, https://doi.org/10.3389/fmars.2020.00620.
Friedlingstein P., M. O’Sullivan, M. W. Jones, R. M. Andrew, J. Hauck, A. Olsen, G. P. Peters, W. Peters, J. Pongratz, S. Sitch, C. Le Quéré, J. G. Canadell, P. Ciais, R. B. Jackson, S. Alin, L. E. O. C. Aragão, A. Arneth, V. Arora, N. R. Bates, M. Becker, A. Benoit-Cattin, H. C. Bittig, L. Bopp, S. Bultan, N. Chandra, F. Chevallier, L. P. Chini, W. Evans, L. Florentie, P. M. Forster, T. Gasser, M. Gehlen, D. Gilfillan, T. Gkritzalis, L. Gregor, N. Gruber, I. Harris, K. Hartung, V. Haverd, R. A. Houghton, T. Ilyina, A. K. Jain, E. Joetzjer, K. Kadono, E. Kato, V. Kitidis, J. Ivar Korsbakken, P. Landschützer, N. Lefèvre, A. Lenton, S. Lienert, Z. Liu, D. Lombardozzi, G. Marland, N. Metzl, D. R. Munro, J. E. M. S. Nabel, S-I. Nakaoka, Y. Niwa, K. O’Brien, T. Ono, P. I. Palmer, D. Pierrot, B. Poulter, L. Resplandy, E. Robertson, C. Rödenbeck, J. Schwinger, R. Séférian, I. Skjelvan, A. J. P. Smith, A. J. Sutton, T. Tanhua, P. P. Tans, H. Tian, B. Tilbrook, G. van der Werf, N. Vuichard, A. L. P. Walker, R. Wanninkhof, A. J. Watson, D. Willis, A. J. Wiltshire, W. Yuan, X. Yue, and S. Zaehle, 2020 : Global Carbon Budget 2020. Earth System Science Data, 12, 3269–3340, DOI: 10.5194/essd-12-3269-2020.
Guinehut S., A.-L. Dhomps, G. Larnicol and P.-Y. Le Traon, 2012: High resolution 3D temperature and salinity fields derived from in situ and satellite observations. Ocean Science, 8, 845-857, doi:10.5194/os-8-845-2012
291ADVANCES IN OPERATIONAL OCEANOGRAPHY EXPANDING EUROPE’S OBSERVING AND FORECASTING CAPACITY
Hernandez, F., G. Smith, K. Baetens, G. Cossarini, I. Garcia-Hermosa, M. Drévillon, J. Maksymczuk, A. Melet, C. Régnier and K. von Schuckmann, 2018: Measuring performances, skill and accuracy in operational oceanography: New challenges and approaches. In ‘New Frontiers in Operational Oceanography’, E. Chassignet, A. Pascual, J. Tintoré, and J. Verron, Eds. GODAE OceanView, 759-796, doi:10.17125/gov2018.ch29.
Mulet, S., M.-H. Rio, A. Mignot, S. Guinehut and R. Morrow, 2012: A new estimate of the global 3D geostrophic ocean circulation based on satellite data and in situ measurements. Deep-Sea Research II, 77-80, 70-81, doi:10.1016/j.dsr2.2012.04.012.
Rio M.-H., S. Mulet and N. Picot, 2014: Beyond GOCE for the ocean circulation estimate: Synergetic use of altimetry, gravimetry, and in situ data proceeds new insight into geostrophic and Ekman currents. Geophysical Research Letter, 41, doi :10.1002/2014GL061773.
Sauzède, R., Bittig, H. C., Claustre, H., de Fommervault, O. P., Gattuso, J.-P., Legendre, L. and Johnson, K. S.: Estimates of water-column nutrient concentrations and carbonate system parameters in the global ocean, 2017: A novel approach based on neural networks. Frontiers in Marine Science, 4(128), doi:10.3389/fmars.2017.00128.
Sauzède, R., Claustre, H., Uitz, J., Jamet, C., Dall’Olmo, G., D’Ortenzio, F., Gentili, B., Poteau, A. and Schmechtig, C., 2016: A neural network-based method for merging ocean color and Argo data to extend surface bio-optical properties to depth: Retrieval of the particulate backscattering coefficient. Journal of Geophysical Research Ocean, 121(4), 2552–2571, doi:10.1002/2015JC011408.
Uitz, J., Claustre, H., Morel, A. and Hooker, S. B., 2006: Vertical distribution of phytoplankton communities in open ocean: An assessment based on surface chlorophyll, Journal of Geophysical Research Ocean, 111(C8), C08005, doi:10.1029/2005JC003207.
292 ADVANCES IN OPERATIONAL OCEANOGRAPHY
REEFTEMPSTHE PACIFIC INSULAR COASTAL WATER OBSERVATION NETWORK
Régis Hocdé (1), Sylvie Fiat (2), David Varillon (3) and Jérôme Aucan (4)
(1) MARBEC, Univ Montpellier, CNRS, Ifremer, IRD, Montpellier, France, [email protected] (2) ENTROPIE, IRD, Univ. La Réunion, CNRS, Ifremer, Univ. Nouvelle-Calédonie, Noumea,
New-Caledonia, [email protected] (3) US IMAGO, IRD, Noumea, New-Caledonia, [email protected] (4) Pacific-Community-SPC, Noumea, New-Caledonia, [email protected]
Abstract ReefTEMPS is a sensor network which is part of the French national federative Research Infrastructure for coastal ocean and seashore observations ILICO.
Keywords: Observation infrastructure, Coastal observatory, Wave measurements, Pacific Islands, Environmental time series, Sensor Observation Service, FAIR data, ILICO
1. ReefTEMPS within the French ILICO RI ReefTEMPS is a coastal monitoring network initiated in 1958 in the South and West Pacific. It is part of the French national federative Research Infrastructure for coastal ocean and seashore observations ILICO (Cocquempot et al., 2019) and feeds the ODATIS ocean cluster of the DATA TERRA RI (Schmidt et al., 2020) with observation data.
2. From difficult and remote access to sensor platforms… to a fair data dissemination
ReefTEMPS monitors 7 physical parameters (temperature, pressure, salinity…) on a hundred platforms covering 14 countries of the Pacific region, including the three French territories. Some stations require autonomous solutions due to very remote and difficult access. Data is acquired at rates from 1 sec to 30 mn. As of today, a total of 200 sensors record around 350 million measurements per year. According to open data and FAIR principles (Wilkinson et al., 2016 ; Sansone et al., 2019), all ReefTEMPS data are openly accessible via web services for visualization, access and download: www.reeftemps.science/en/data/ under a Creative Commons licence ‘Attribution-Share alike’ (CC BY-SA). A dataset containing all available time series is also published semi-annually in the SEANOE data portal: https://doi.org/10.17882/55128.

293ADVANCES IN OPERATIONAL OCEANOGRAPHY EXPANDING EUROPE’S OBSERVING AND FORECASTING CAPACITY
3. Range of observable events within the ReefTEMPS Network
3.1 Pressure: extreme wave events and long term wave climate, occasional tsunamis
Fig. 1. Significant wave height recorded in New-Caledonia a) of 10.5 m on March 15, 2020 during the tropical cyclone GRETEL, b) of 7.1 m during the Tropical Cyclone NIRAN on March 6, 2021 with a real time Wave Buoy and c) water height anomalies during the post-earthquake tsunami from Chile on September 16, 2015.
3.2 Temperature: global warming by long trend monitoring, heat waves potentially lead to coral bleaching
Fig. 2. a) Over 60 years of acquired data in New-Caledonia, b) Effects of La Niña and El Niño on maximum weekly temperatures.
294 ADVANCES IN OPERATIONAL OCEANOGRAPHY
4. R for Reusable The data documents the local impact of climate change and El Niño phenomenon, the rapid appearance, at day scale, of cold water upwelling along reef barriers, in relation to winds and ocean thermal and biological structures. ReefTEMPS is also a support to the validation of lagoon models and coastal numerical simulations, finally it helps in the calibration for the reconstitution of past series from coral analysis.
AcknowledgementsThe authors gratefully acknowledge: (i) IRD, University of New-Caledonia, University of the South Pacific and Pacific-Community-SPC, for the operational support of sub-networks, (ii) IRD, ILICO, AllEnvi, the French Ministry for Overseas Territories (‘Le Fonds Pacifique’) and by the French Ministry of Higher Education, Research and Innovation (MESRI), for the financial support and (iii) the IMAGO service unit, the OSU OMP, and the GEOAZUR, ENTROPIE, LEGOS and MARBEC joined research units for the support received more widely.
ReferencesCocquempot L. et al., (2019). Coastal Ocean and Nearshore Observation: A French Case Study. Frontiers in Marine Science, 6, 324. https://doi.org/10.3389/fmars.2019.00324
Fiat S., Aucan J. & Hocdé R. (2021). ReefTEMPS, FAIRs access to Reef ecosystem environmental measurements [Poster]. IMDIS 2021, Virtual.
Fiat S., Varillon D., Pelletier B., Aucan J., Hocdé R. (2020). ReefTEMPS, Network of coastal oceanic sensors, Open access data portal [Poster]. Research Data Alliance, RDA’s 15th Plenary Meeting, Melbourne (Australia).
Fiat S., and Hocdé R. (2019). Critical Success Factors of the ReefTEMPS sensors-oriented environmental information system for a real operationality. Geospatial Sensing Conference 2019, Münster (Germany).
Hocdé R., and Fiat S. (2013). Le système d’information du ‘ réseau de capteurs de température des eaux côtières dans la région du Pacifique Sud et Sud-Ouest ‘. Netcom, Special issue ‘ Les données environnementales en libre accès: politiques, expériences, usages ‘ 170–173. https://doi.org/10.4000/netcom.1294
Schmidt S. et al., (2020). Streamlining Data and Service Centers for Easier Access to Data and Analytical Services: The Strategy of ODATIS as the Gateway to French Marine Data. Frontiers in Marine Science, 7, 548126. https://doi.org/10.3389/fmars.2020.548126
Wilkinson M.D. et al., (2016). The FAIR Guiding Principles for Scientific Data Management and Stewardship. Scientific Data, 3, 160018. https://doi.org/10.1038/sdata.2016.18

295ADVANCES IN OPERATIONAL OCEANOGRAPHY EXPANDING EUROPE’S OBSERVING AND FORECASTING CAPACITY
Sansone S.A. et al., (2019). FAIRsharing as a Community Approach to Standards, Repositories and Policies. Nature Biotechnology, 37(4), 358–67. https://doi.org/10.1038/s41587-019-0080-8

296 ADVANCES IN OPERATIONAL OCEANOGRAPHY
NEW DEVELOPMENTS OF THE OPERATIONAL BIOGEOCHEMICAL MODEL COMPONENT IN THE COPERNICUS MARINE SERVICE (CMEMS) FOR THE BALTIC SEAIna Lorkowski (1), Fabian Schwichtenberg (1), Anja Lindenthal (1), Ilja Maljutenko (2), Lena Spruch (1) with support of the whole BAL MFC team
(1) Federal Maritime and Hydrographic Agency (BSH), Germany, [email protected](2) Department of Marine Systems at Tallinn University of Technology, Estonia
Abstract The Copernicus Marine Service is providing operational data products for the European Seas. Within the CMEMS framework, the Baltic Monitoring and Forecasting Center (BAL MFC) is developing and delivering model data products for the Baltic Sea. With the latest update in December 2020, the products of a new model system for the near-real time in the Baltic Sea area became operationally available in the CMEMS catalogue. The biogeochemical component of the model system is ERGOM, which was coupled to NEMO 4.0 during the current phase of CMEMS. In addition to the large task of coupling NEMO and ERGOM, several new developments were implemented in ERGOM. A carbon cycle was included to be able to answer questions related to increasing anthropogenic CO2 emissions and ocean acidification. As a result, two new parameters were added to the catalogue, delivering now gridded pH and pCO2 data sets. The calculation of Secchi depth and Net Primary Production was added to the model system output, which can be used to monitor water quality for the Marine Strategy Framework Directive. The biogeochemical products are carefully validated within a validation framework that allows a comparison of model results with observational data from different sources. We will present details about the implementation of the new variables and show result from the validation and calibration work.
Keywords: CMEMS, BAL MFC, ERGOM, NEMO, carbon cycle

297ADVANCES IN OPERATIONAL OCEANOGRAPHY EXPANDING EUROPE’S OBSERVING AND FORECASTING CAPACITY
1. Introduction The Baltic Sea is an important area for public, economic and touristic uses. Therefore, it is of special importance to provide reliable information about the physical and biogeochemical status of the Baltic Sea. The Baltic Monitoring and Forecasting Center (BAL MFC) is providing validated and quality controlled model products for physical and biogeochemical parameters in near real time and as a reanalysis (see https://marine.copernicus.eu/). These products can be used to monitor, manage and understand the Baltic Sea area. Critical issues in the Baltic Sea ecosystem, which are driven by anthropogenic CO2 emissions and nutrient input from surface waters, are oxygen deficiency zones, eutrophication and acidification. To improve monitoring and understanding of these issues the BAL MFC product catalogue was extended in the past years to include pH, pCO2, Secchi depth and net primary production. The new set of variables were validated with the products of the previous operational system and various observational data.
2. ERGOM Developments ERGOM (Ecological Regional Ocean Model), the biogeochemical component of the BAL MFC model system, was originally developed to model the bio-geo-chemical cycles in the Baltic Sea (Neumann, 2000; Neumann et al., 2002). The model describes the basic nitrogen and phosphorus cycle through 15 main state variables: three different functional phytoplankton species, two respective groups of zooplankton and detritus, labile dissolved organic nitrogen, total alkalinity (TA), dissolved inorganic carbon (DIC), ammonium, nitrate, phosphate, silicate and oxygen. Additionally, primary production, chlorophyll, Secchi depth, pH and pCO2 are calculated diagnostically (Doron et al., 2013; Neumann et al., 2015). The sediment is not vertically resolved and consists of two nutrient state variables.
Since the beginning of CMEMS in 2015, the ERGOM version used by BAL MFC has been extended. To be able to calculate the Secchi depth as a diagnostic output, a new optical module has been added, including labile dissolved organic nitrogen as a new state variable. This allows for a more detailed calculation of turbidity (Neumann et al., 2015). Furthermore, net primary production was implemented as additional diagnostic variable, which provides valuable information about the biogeochemical state of the Baltic Sea.
The most relevant new module in the BAL MFC biogeochemical model system is the carbon cycle. The implementation follows Kuznetsov and Neumann (2013) and Zeebe and Wolf-Gladrow (2001). The calculation of total alkalinity (TA) and dissolved inorganic carbon (DIC) was implemented to consider the influence of biogeochemical processes on the carbonate system (Schwichtenberg et al., 2020). Both TA and DIC are required for the calculation of the two new parameters pH and pCO2. The carbonate system also includes exchange with annually increasing and seasonally variable atmospheric CO2 concentrations (Figure 1).

298 ADVANCES IN OPERATIONAL OCEANOGRAPHY
Fig. 1. Overview of state variables and their interaction in ERGOM.
3. Coupling NEMO 4.0 and ERGOM To harmonize the BALMFC CMEMS products, the biogeochemical model ERGOM was linked to the ocean model NEMO (release 4.0) for the first time. The online-coupling option was applied to the ERGOM model components using the TOP (Aumont, 2019) module, which gives a well-defined infrastructure to link biogeochemical models to the ocean dynamics (OCE). The developed interface routine passes (one-way) the oceanic variables temperature, salinity, velocity, wind speed and short wave radiation to ERGOM on advection time step level. ERGOM core routines are updating nutrients, oxygen, carbon, phytoplankton, zooplankton concentrations and photosynthetic light availability, whereas advection and diffusion processes are later resolved by the passive tracer transport component (TRP). The 4th order advection Flux corrected Transport scheme (FCT) is applied via configuration settings for temperature, salinity and the biogeochemical tracer, respectively. Since the previous near real time operational system based on HBM, parts of the water column model ERGOM had to adapt the array based structure of NEMO. Both physical and biogeochemical model components are using the same grid configuration (horizontal resolution of 1 nm and a vertical resolution of 56 layers). The NEMO-Nordic 2.0 model set up development by the BALMFC Team (Kärnä, 2021), which covers the North and Baltic Sea, was extended by the required surface, costal and open boundary conditions for bio tracers.

299ADVANCES IN OPERATIONAL OCEANOGRAPHY EXPANDING EUROPE’S OBSERVING AND FORECASTING CAPACITY
4. Validation To assess the quality of the biogeochemical products we apply a validation framework that includes the statistical analysis of model results in comparison to observational data from multiple sources and the results from the previously operational HBM-ERGOM system. Within the validation framework, we use observational data from multiple sources: profile data from monitoring stations and moorings, 2D data from along track ferrybox measurements and satellite observations. Validated variables are dissolved oxygen, nitrate, ammonium, phosphate, chlorophyll a, Secchi depth, pH and pCO2. For the quality assessment of these variables, we consider a two-year period from 10/2014 to 10/2016. The complete validation results for all products are available at the BOOS website. Here we focus on the validation of pH and Secchi depth with observational data from monitoring stations. The validation results for pH (Figure 2) suggest a reasonable agreement between model results of the NEMO-ERGOM model system. The time-profile at a station in the Baltic Proper (Figure 2, bottom right) shows that the model reproduces the general temporal and vertical patterns of pH in the water column. The statistical analysis (Figure 2, top right) indicates that the model simulates pH values at the surface better than in deeper layers, as bias increases with depth at all monitoring stations.
Figure 3 summarises the validation of Secchi depth with measurement at monitoring stations (Figure 3). The results indicate that the typical seasonal dynamics of Secchi depth are captured by the NEMO-ERGOM model system (Figure 3, bottom right). However, the negative bias at the majority of monitoring stations (Figure 3, top right) indicates that Secchi depth tends to be underestimated by the model.
5. Conclusion and Outlook A new model system with Nemo coupled to ERGOM has been developed for operational use in the Baltic Sea within the first phase of the Marine Copernicus Service. The system has proven to be able to simulate the relevant process in the Baltic Sea with good agreement with observations. Currently, the NEMO ERGOM system is used for the near real time production, but it will also be used in the next new release of the Multi-Year Product for the Baltic Sea. Future development is needed to add data assimilation for the biogeochemical component (Goodliff et al., 2019). Several possibilities for development and service evolution can be seen by adding a bio-optical module, including phytoplankton functional types and improving the benthic pelagic coupling.

300 ADVANCES IN OPERATIONAL OCEANOGRAPHY
Fig. 2. Overview of the validation results for pH at six monitoring stations in the Baltic Sea. Left: Snapshot of 2D model results for pH in the surface layer (noon values on 30/09/2014) and locations of the monitoring stations considered in the validation. Top right: Bias and cRMSD averaged over the time for the surface layer (blue dots) and the bottom layer (black triangle) at the respective monitoring stations. Bottom right: Time profile of pH at monitoring station BMPJ1. Background shows model results and coloured squares represent measurements of pH.
Fig. 3. Overview of the validation results for Secchi depth at nine monitoring stations in the Baltic Sea. Left: Snapshot of 2D model results for Secchi depth (noon values 30/09/2014) and locations of the monitoring stations considered in the validation. Top right: Bias and cRMSD averaged over the time for the surface layer (blue dots) at the respective monitoring stations. Bottom right: Time series of Secchi depth at monitoring station BMPJ1 (blue line: model results, black dots: measurements).

301ADVANCES IN OPERATIONAL OCEANOGRAPHY EXPANDING EUROPE’S OBSERVING AND FORECASTING CAPACITY
ReferencesAumont, O., Éthé,C., Lovato,T., Mouchet,A., Nurser,G., Palmiéri,J., Yool, A., 2019. Tracers in Ocean Paradigm (TOP) The NEMO passive tracers engineVersion 4.0.1 Scientific Notes of Climate ModellingCenter.
Doron, M., Brasseur, P., Brankart, J.-M., Losa, S.N., Melet, A., 2013. Stochastic estimation of biogeochemical parameters from Globcolour ocean colour satellite data in a North Atlantic 3D ocean coupled physical–biogeochemical model. Journal of Marine Systems 117-118, 81-95.
Goodliff, M., Bruening, T., Schwichtenberg, F., Li, X., Lindenthal, A., Lorkowski, I., Nerger, L., 2019. Temperature assimilation into a coastal ocean-biogeochemical model: assessment of weakly and strongly coupled data assimilation. Ocean Dynamics 69, 1217-1237.
Kärnä, T., Ljungemyr, P., Falahat, S., Ringgaard, I., Axell, L., Korabel, V., Murawski, J., Maljutenko, I., Lindenthal, A., Jandt-Scheelke, S., Verjovkina, S., Lorkowski, I., Lagemaa, P., She, J., Tuomi, L., Nord, A., and Huess, V., 2021. Nemo-Nordic 2.0: Operational marine forecast model for the Baltic Sea. Geoscientific Model Development (submitted).
Kuznetsov, I., Neumann, T., 2013. Simulation of carbon dynamics in the Baltic Sea with a 3D model. Journal of Marine Systems 111, 167-174.
Neumann, T., 2000. Towards a 3D-ecosystem model of the Baltic Sea. Journal of Marine Systems 25, 405-419.
Neumann, T., Fennel, W., Kremp, C., 2002. Experimental simulations with an ecosystem model of the Baltic Sea: A nutrient load reduction experiment. Global Biogeochemical Cycles 16, 7-1-7-19.
Neumann, T., Siegel, H., Gerth, M., 2015. A new radiation model for Baltic Sea ecosystem modelling. Journal of Marine Systems 152, 83-91.
Schwichtenberg, F., Pätsch, J., Böttcher, M.E., Thomas, H., Winde, V., Emeis, K.-C., 2020. The impact of intertidal areas on the carbonate system of the southern North Sea. Biogeosciences 17, 4223-4245.
Zeebe, R.E., Wolf-Gladrow, D., 2001. CO2 in seawater: Equilibrium, Kinetics, Isotopes, 1st ed. ELSEVIER.

302 ADVANCES IN OPERATIONAL OCEANOGRAPHY
CMEMS BLACK SEA MONITORING AND FORECASTING CENTRE: AN OVERVIEW ON SERVICE AND SCIENTIFIC DEVELOPMENTS IN 2016-2021 AND FUTURE PERSPECTIVES Atanas Palazov (1), Stefania A. Ciliberti (2), Rita Lecci (2), Marilaure Grégoire (3), Joanna Staneva (4), Elisaveta Peneva (5), Marius Matreata (6), Eric Jansen (2), Leonardo Lima (7), Diana Azevedo (2), Ali Aydogdu (7), Simona Masina (7), Giovanni Coppini (2), Luc Vandenbulcke (3), Arthur Capet (3), Arno Behrens (4), Marcel Ricker (4), Gerhard Gayer (4), Sergio Creti’ (2), Laura Stefanizzi (2), Francesco Palermo (2), Salvatore Causio (2), Mehmet Ilicak (8), Murat Gunduz (2, 9), Nadia Pinardi (2,10), Veselka Marinova (1), Nadezcha Valcheva (1), Paola Agostini (2)
(1) Institute of Oceanoology - Bulgarian Academy of Sciences, Bulgaria(2) Ocean Predictions and Applications Division, Centro Euro-Mediterraneo sui Cambiamenti
Climatici, Italy (3) University of Liege, Belgium(4) Helmholtz-Zentrum Geesthacht Centre for Materials and Coastal Research, Germany(5) Sofia University ‘St. Kliment Ohridski’, Bulgaria(6) National Institute of Hydrology and Water Management, Romania(7) Ocean Modeling and Data Assimilation Division, Centro Euro-Mediterraneo sui Cambiamenti
Climatici, Italy(8) Eurasia Institute of Earth Sciences, Istanbul Technical University, Turkey(9) Dokuz Eylul University, Izmir, Turkey(10) Department of Physics and Astronomy, University of Bologna, Italy
Abstract
Copernicus Marine Service (CMEMS) includes the Black Sea Monitoring and Forecasting Center (BS-MFC) for the provisioning of high-quality forecast products and past reconstruction of the ocean state in the Black Sea. The BS-MFC is implemented by an international consortium since 2016, led by IO-BAS (Bulgaria) and including CMCC (Italy), ULiege (Belgium), HZ Hereon (Germany), USOF (Bulgaria), NIHWM (Romania), together with expertise from University of Bologna (Italy), ITU (Turkey) and DEU (Turkey). For each Production Unit – Physics, Biogeochemistry and Waves – an operational service and scientific evolution plans have been implemented. Every day, BS-MFC delivers analysis and 10-days forecast products for essential variables, including biogeochemistry and waves, at the spatial resolution of about 3 km. NRT
303ADVANCES IN OPERATIONAL OCEANOGRAPHY EXPANDING EUROPE’S OBSERVING AND FORECASTING CAPACITY
systems are forced by ECMWF IFS atmospheric forcing, at 12.5 km horizontal resolution and 3-6 hours frequency in time. Twice per year, BS-MFC delivers MY products (reanalysis) starting from 1992 (1979 for BS-WAV). Systems are forced by ECMWF ERA5 atmospheric forcing, at 30 km horizontal resolution and 1-hour frequency in time. Scientific plans for the next generation of the BS-MFC systems put in top priority coupling strategy, ensemble forecasting, data assimilation capability and river runoff representation to support downstream services and applications, climate monitoring and coastal community.
Keywords: Black Sea, CMEMS, Physics, Biogeochemistry, Waves, Product Quality, Operational Oceanography, Forecast, Reanalysis, Ocean Monitoring, Data Assimilation, Observations
1. Introduction The Black Sea Monitoring and Forecasting Center (BS-MFC) provides analysis, 10-days forecast and reanalysis for the blue and green ocean state in the Black Sea region as part of the Copernicus Marine Environment and Monitoring Service (CMEMS). Its operational systems and service started to work in late 2016 and at today it includes 6 main products for the relevant components – Physics, Biogeochemistry and Waves – with a number of 72 online datasets, operationally updated and accessible through https://marine.copernicus.eu/. They include Near Real Time and Multi-Year products. BS-MFC systems implement state-of-the-art ocean modelling and data assimilation techniques: they guarantee also service standards, efficiency in operations, and users support through its Local Service Desk. Continuous developments of the modelling systems are performed through dedicated service evolution actions in order to improve the accuracy and the quality of the BS-MFC products.
2. BS-MFC Service and operational systems
2.1 High Level Architecture Organization BS-MFC consists of 3 Production Units (PU), one for each modelling component (BS-PHY for physics, BS-BIO for biogeochemistry and BS-WAV for waves), responsible for the operational production and delivery of the Black Sea analysis and forecast products: BS-PHY is run at CMCC, BS-BIO is run at University of Liege, BS-WAV is run at HZG. Each PU implements its own Archiving Unit (AU) to host superseded products and Backup Unit (BU) which runs in case of technical incidents and planned service outage, to guarantee the continuity of the service. Additionally, PUs are connected to data providers (e.g., CMEMS, ECMWF through CMCC) for the access to insitu and satellite observations as well as atmospheric forcing for running operational systems. A Local Service Desk (LSD, maintained by CMCC and IO-BAS) supports production units for the operational maintenance and monitoring of products availability as well as

304 ADVANCES IN OPERATIONAL OCEANOGRAPHY
users. A Technical Team is responsible for setting and evolving operational interfaces between PUs and CMEMS Dissemination Unit. Service evolution activities are run by each PU development teams with the collaboration of Sofia University ‘St. Kliment Ohridski’ (USOF) and the National Institute of Hydrology and Water Management (NIHWM) experts. A representation of the BS-MFC high level architecture is presented in Figure 1.
Fig. 1. BS-MFC high level architecture.
2.2 Black Sea Physical Systems The nominal product for the BS-PHY NRT is 007_001 (Ciliberti et al., 2020) while for the BS-PHY MY is 007_004 (Lima et al., 2020). They provide (hourly for NRT) daily and monthly means for the following list of variables: 3D temperature, salinity and currents and 2D sea surface height, mixed layer depth and bottom temperature. The core model is based on the hydrodynamical model NEMO (v3.4 for the NRT, v3.6 for the MY system, Madec et al., 2014) online coupled to OceanVar scheme (Dobricic and Pinardi, 2008; Storto et al., 2014) for the assimilation of temperature and salinity in situ profiles and along track sea level anomaly; only the NRT system assimilates sea surface temperature (SST) satellite data, whereas NRT and MY systems apply SST relaxation towards the SST optimal interpolation product (Buongiorno Nardelli et al.,

305ADVANCES IN OPERATIONAL OCEANOGRAPHY EXPANDING EUROPE’S OBSERVING AND FORECASTING CAPACITY
2013). It is solved on a spatial grid of 1/36ºx1/27º horizontal resolution and 31 vertical levels with partial steps over the Black Sea basin (the Azov is not included). Current systems have a closed boundary condition at the Bosporus Strait: in order to improve the representation of the warmer and saltier Mediterranean waters that inflow into the Black Sea, the MY system implements since December 2020 a damping to temperature and salinity profiles from high resolution model (Aydogdu et al., 2018) in the area of the Bosporus exit. The NRT system is forced by ECMWF IFS atmospheric forcing at 12.5 km/3-6 hours frequency and has an operational timeseries from Jan 2019 (at AU level, it starts in January 2014); the MY one is forced by ECMWF ERA5 atmospheric reanalysis, with a timeseries from January 1993 to December 2019 and it is operationally extended twice per year up the Y-1. From May 2021 (Ciliberti et al., 2021) a new NRT system – version EAS4 – will enter into service: it has been upgraded to last version of NEMO (v4.0), with higher resolution in vertical (up to 121 vertical levels) and improved representation of the Danube River, with distributed sources of freshwater flux using historical interannual dataset as provided by the NIHWM. Another important upgrade of the NRT system is related to the Bosporus Strait, that will work as open boundary condition through the Marmara Sea box, as in Gunduz et al., 2020: a new Unstructured model for the Marmara Sea and the Turkish Straits (U-TSS, Ilicak et al., 2021) has been developed with the scope to provide, for this version, monthly climatological temperature, salinity, sea surface height, zonal and meridional currents to the Marmara Sea box. An operational product quality dashboard and bulletin visualization is provided at https://bsfs.cmcc.it/: it shows 2D maps of relevant essential variables at prescribed depth and root mean square error misfits of model analysis and observations at weekly frequency for temperature, salinity and sea level anomaly. Water mass properties are well represented by BS-PHY NRT EAS4 system in the period 2017-2020: Figure 2 shows the cold intermediate layer (CIL) persistency and perforation in the recent period, while Figure 3 shows salinity stratification as described also in Stanev et al., 2019.
2.3 Black Sea Biogeochemistry Systems The nominal product for the BS-BIO NRT is 007_010 (Grégoire et al., 2020a) while for the BS-BIO MY is 007_005 (Grégoire et al., 2020b). They provide daily and monthly means for the following list of variables: chlorophyll, phytoplankton, dissolved oxygen, nitrate, phosphate, surface pressure of carbon dioxide, pH, surface downward mass flux of carbon dioxide, net primary production, sea water alkalinity and concentration of dissolved inorganic carbon in seawater. The core model is based on the hydrodynamical model NEMO (v3.6) online coupled to BiogeochemicAl Model for Hypoxic and Benthic Influenced areas (BAMHBI) (Grégoire et al., 2008; Grégoire and Soetaert, 2010; Capet et al., 2016). It is solved on the same grid as the BS-PHY. Since Jul 2020, the NRT system is also assimilating chlorophyll satellite L3 data as provided by the CMEMS OC TAC by using Ocean Assimilation Kit (OAK, Vandenbulcke and Barth, 2015). The NRT system, forced by ECMWF analysis and forecast atmospheric fields, solves and delivers also variables related to the carbonate system (i.e, pCO2,

306 ADVANCES IN OPERATIONAL OCEANOGRAPHY
pH, DIC, CO2 flux, alkalinity) and since May 2021 it will include also new optical products (Gregoire et al., 2021). The MY system has been also recently upgraded in the modelling component (e.g., NEMO online coupled to BAMHBI), forced by ECMWF ERA5 reanalysis without data assimilation, to provide a simulation for the past reconstruction of the biogeochemical ocean state in the Black Sea: the timeseries starts from January 1992 to December 2019 and it automatically extended twice per year as the BS-PHY MY one. Figure 4 shows chlorophyll concentration obtained from the model and BGC ARGO highlighting the oxycline position and the injection of high oxygen filaments towards the deep part. Table 1 compares the model and satellite L3 chlorophyll concentration for the period 2017-2018 over different regions of the Black Sea. Regions 1 – 3 correspond to the open sea, regions 4 – 5 correspond to the North-Western Shelf (NWS), and region 7 is the transition region between the NWS and the open sea. The other regions are the remaining coastal areas. Compared to BS-BIO NRT V201907, the bias is very strongly reduced. This is expected, as at BS-BIO NRT V202007, satellite surface chlorophyll observations are assimilated in the model (Table 1). In the open sea, bias is almost zero; whereas in the river-influenced regions, it reaches values between 0.1 and 0.36 mg.m3.
2.4 Black Sea Wave Systems The nominal product for the BS-WAV NRT is 007_003 (Staneva et al., 2020a) while for the BS-WAV MY is 007_006 (Staneva et al., 2020b). They provide hourly instantaneous for the most relevant wave variables such as significant wave height, wave mean period, wave direction, Stokes drifts, wind wave significant height, wind wave mean period and direction, primary and secondary swell among the main ones. At the beginning of the CMEMS, the inclusion of wave products in the catalogue represented a novelty: the BS-MFC, even the relatively short story, was able to provide state-of-the-art wave modelling solutions (analysis, forecast and reanalysis) as the other MFCs since 2016. The model is solved on the same grid and uses the same atmospheric forcing as the BS-PHY and BS-BIO. Since Dec 2020, the BS-WAV systems have been upgraded to state-of-the-art WAM Cycle 6.0, which includes new dissipation terms parameterizations of Ardhuin et al., (2010) and ECMWF (2020). The NRT system is offline coupled to BS-PHY NRT product, using hourly means sea surface currents and water depths.
The MY system, instead, provides a reanalysis for the past reconstruction of the wave climate in the Black Sea region, starting from Jan 1979: the modelling component is similar to the NRT ones, accounting for wave breaking and also assimilation of significant wave height and wind speed as provided by AVISO using Optimal Interpolation scheme (OI). Figure 5a shows the time series of maximum significant wave heights derived from the combined Jason satellite measurements and from BS-WAM MYP, while Figure 5b shows the scatter plots showing Sentinel 3a satellite measurements versus BS-WAV NRT significant wave heights for Q4 2018. Distribution

307ADVANCES IN OPERATIONAL OCEANOGRAPHY EXPANDING EUROPE’S OBSERVING AND FORECASTING CAPACITY
Fig. 2. BS-PHY NRT EAS4 Hovmoller diagram for temperature in the period 2017-2019.
Fig. 3. BS-PHY NRT EAS4 Hovmoller diagram for salinity in the period 2017-2019.
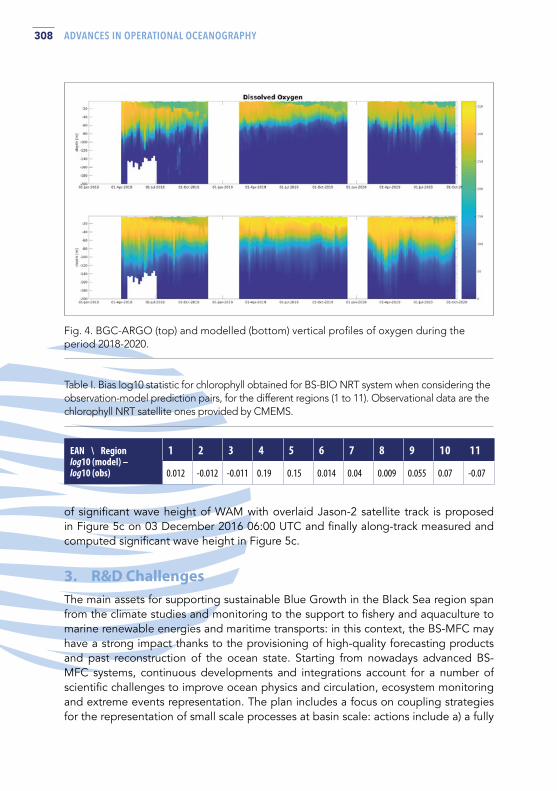
308 ADVANCES IN OPERATIONAL OCEANOGRAPHY
Fig. 4. BGC-ARGO (top) and modelled (bottom) vertical profiles of oxygen during the period 2018-2020.
EAN \ Regionlog10 (model) – log10 (obs)
1 2 3 4 5 6 7 8 9 10 11
0.012 -0.012 -0.011 0.19 0.15 0.014 0.04 0.009 0.055 0.07 -0.07
Table I. Bias log10 statistic for chlorophyll obtained for BS-BIO NRT system when considering the observation-model prediction pairs, for the different regions (1 to 11). Observational data are the chlorophyll NRT satellite ones provided by CMEMS.
of significant wave height of WAM with overlaid Jason-2 satellite track is proposed in Figure 5c on 03 December 2016 06:00 UTC and finally along-track measured and computed significant wave height in Figure 5c.
3. R&D Challenges The main assets for supporting sustainable Blue Growth in the Black Sea region span from the climate studies and monitoring to the support to fishery and aquaculture to marine renewable energies and maritime transports: in this context, the BS-MFC may have a strong impact thanks to the provisioning of high-quality forecasting products and past reconstruction of the ocean state. Starting from nowadays advanced BS-MFC systems, continuous developments and integrations account for a number of scientific challenges to improve ocean physics and circulation, ecosystem monitoring and extreme events representation. The plan includes a focus on coupling strategies for the representation of small scale processes at basin scale: actions include a) a fully
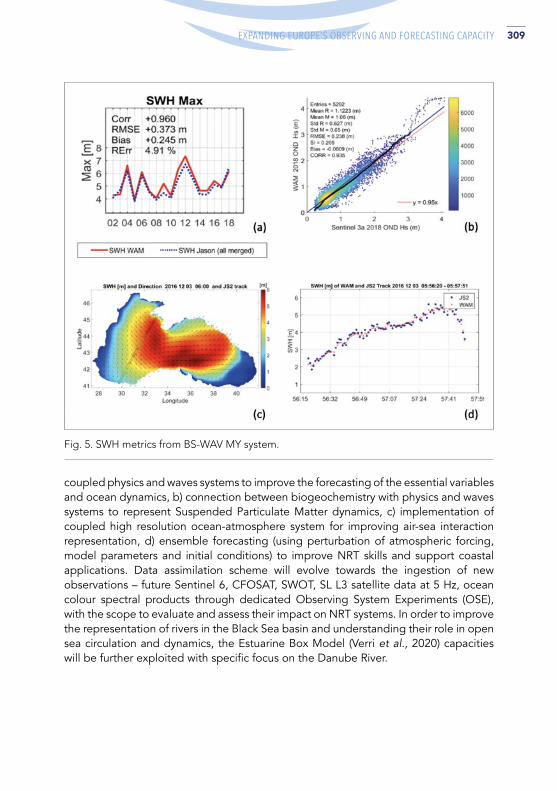
309ADVANCES IN OPERATIONAL OCEANOGRAPHY EXPANDING EUROPE’S OBSERVING AND FORECASTING CAPACITY
Fig. 5. SWH metrics from BS-WAV MY system.
coupled physics and waves systems to improve the forecasting of the essential variables and ocean dynamics, b) connection between biogeochemistry with physics and waves systems to represent Suspended Particulate Matter dynamics, c) implementation of coupled high resolution ocean-atmosphere system for improving air-sea interaction representation, d) ensemble forecasting (using perturbation of atmospheric forcing, model parameters and initial conditions) to improve NRT skills and support coastal applications. Data assimilation scheme will evolve towards the ingestion of new observations – future Sentinel 6, CFOSAT, SWOT, SL L3 satellite data at 5 Hz, ocean colour spectral products through dedicated Observing System Experiments (OSE), with the scope to evaluate and assess their impact on NRT systems. In order to improve the representation of rivers in the Black Sea basin and understanding their role in open sea circulation and dynamics, the Estuarine Box Model (Verri et al., 2020) capacities will be further exploited with specific focus on the Danube River.
310 ADVANCES IN OPERATIONAL OCEANOGRAPHY
AcknowledgementsThis work was supported by CMEMS BS-MFC (Copernicus Marine Environment and Monitoring Service – Black Sea Monitoring and Forecasting Center), Mercator Ocean International.
ReferencesAydoğdu, A., Pinardi, N., Özsoy, E., Danabasoglu, G., Gürses, Ö., and Karspeck, A. (2018). Circulation of the Turkish Straits System under interannual atmospheric forcing, Ocean Science, 14, 999-1019, https://doi.org/10.5194/os-14-999-2018.
Ardhuin, F., Rogers, E., Babanin, A., Filipot, J.-F., Magne, R., Roland, A., Van Der Westhuysen, A., Queffeulou, P., Lefevre, J.-M., Aouf, L., Collard, F. (2010). Semi-empirical dissipation source functions for ocean waves: Part I, definition, calibration and validation. Journal of Physical Oceanography, 40, 1917–1941.
Buongiorno Nardelli B., Tronconi, C., Pisano, A. and Santoleri R. (2013). High and Ultra-High resolution processing of satellite Sea Surface Temperature data over Southern European Seas in the framework of MyOcean project, Rem. Sens. Env., 129, 1-16, https://doi.org/10.1016/j.rse.2012.10.012.
Capet, A., Meysman, F.J.R., Akoumianaki, I., Soetaert, K., Grégoire, M. (2016). Integrating sediment biogeochemistry into 3D oceanic models: A study of benthic-pelagic coupling in the Black Sea. Ocean Modelling, 101, 83-100.Ciliberti, S. A., Peneva, E. L., Jansen, E., Martins, D., Cretí, S., Stefanizzi, L., Lecci, R., Palermo, F., Daryabor, F., Lima, L., Coppini, G., Masina, S., Pinardi, N., & Palazov, A. (2020). Black Sea Analysis and Forecast (CMEMS BS-Currents, EAS3 system) (Version 1) [Data set]. Copernicus Monitoring Environment Marine Service (CMEMS). https://doi.org/10.25423/CMCC/BLKSEA_ANALYSIS_FORECAST_PHYS_007_001_EAS3.
Ciliberti, S. A., Jansen, E., Martins, D., Gunduz, M., Ilicak, M., Stefanizzi, L., Lecci, R., Cretí, S., Causio, S., Aydogdu, A., Lima, L., Palermo, F., Peneva, E. L., Coppini, G., Masina, S., Pinardi, N., & Palazov, A. (2021). Black Sea Physical Analysis and Forecast (CMEMS BS-Currents, EAS4 system) (Version 1) [Data set]. Copernicus Monitoring Environment Marine Service (CMEMS). https://doi.org/10.25423/CMCC/BLKSEA_ANALYSISFORECAST_PHY_007_001_EAS4.
Dobricic, S. and Pinardi, N. (2008). An oceanographic three-dimensional variational data assimilation scheme. Ocean modelling, 22(3-4), 89-105. https://doi.org/10.1016/j.ocemod.2008.01.004.
ECMWF (2020). IFS Documentation CY47R1, Book Chapter, ECMWF, https://www.ecmwf.int/.
Grégoire, M., Vandenbulcke, L., & Capet, A. (2020a). Black Sea Biogeochemical Analysis and Forecast (CMEMS Near-Real Time BLACKSEA Biogeochemistry) (Version 1) [Data set]. Copernicus Monitoring Environment Marine Service (CMEMS).

311ADVANCES IN OPERATIONAL OCEANOGRAPHY EXPANDING EUROPE’S OBSERVING AND FORECASTING CAPACITY
https://doi.org/10.25423/CMCC/BLKSEA_ANALYSIS_FORECAST_BIO_007_010_BAMHBI.
Grégoire, M., Vandenbulcke, L., & Capet, A. (2020b). Black Sea Biogeochemical Reanalysis (CMEMS BS-Biogeochemistry) (Version 1) [Data set]. Copernicus Monitoring Environment Marine Service (CMEMS). https://doi.org/10.25423/CMCC/BLKSEA_REANALYSIS_BIO_007_005_BAMHBI.
Grégoire, M., Raick, C., Soetaert, K. (2008). Numerical modeling of the deep Black Sea ecosystem functioning during the late 80’s (eutrophication phase). Progress in Oceanography, 76(9), 286-333.
Grégoire, M., and Soetaert, K. (2010). Carbon, nitrogen, oxygen and sulfide budgets in the Black Sea: A biogeochemical model of the whole water column coupling the oxic and anoxic parts. Ecological Modelling, 15.
Gunduz, M., Ozsoy, E., Hordoir, R. (2020). A model of Black Sea circulation with strait exchange (2008-2018). Geoscientific Model Development, 13, 121-138, https://doi.org/10.5194/gmd-13-121-2020.
Ilicak, M., Federico, I., Barletta, I., Pinardi, N., Ciliberti, S. A., Clementi, E., Coppini, G., Lecci, R., and Mutlu, S.: Evaluation of the new high resolution unstructured grid Marmara Sea model, EGU General Assembly 2021, online, 19–30 Apr 2021, EGU21-7194, https://doi.org/10.5194/egusphere-egu21-7194.
Lima, L., Aydogdu, A., Escudier, R., Masina, S., Ciliberti, S. A., Azevedo, D., Peneva, E. L., Causio, S., Cipollone, A., Clementi, E., Cretí, S., Stefanizzi, L., Lecci, R., Palermo, F., Coppini, G., Pinardi, N., & Palazov, A. (2020). Black Sea Physical Reanalysis (CMEMS BS-Currents) (Version 1) [Data set]. Copernicus Monitoring Environment Marine Service (CMEMS). https://doi.org/10.25423/CMCC/BLKSEA_MULTIYEAR_PHY_007_004.
Madec, G., and the NEMO System Team (2014). NEMO Ocean Engine, Notes du Pôle de modélisation de l’Institut Pierre-Simon Laplace (IPSL):(27), 1288-1619 (ISSN), https://doi.org/10.5281/zenodo.1475234.
Stanev, E.V., Peneva, E., Chtirkova, B.: Climate Change and Regional Ocean Water Mass Disappearance: Case of the Black Sea, Journal of Geophysical Research: Oceans, 124, 4803–4819, https://doi.org/10.1029/2019JC015076.
Staneva, J., Behrens, A., Ricker, M., & Gayer, G. (2020a). Black Sea Waves Analysis and Forecast (CMEMS BS-Waves) (Version 2) [Data set]. Copernicus Monitoring Environment Marine Service (CMEMS). https://doi.org/10.25423/CMCC/BLKSEA_ANALYSISFORECAST_WAV_007_003.
Staneva, J., Behrens, A., Ricker, M., & Gayer, G. (2020). Black Sea Waves Reanalysis (CMEMS BS-Waves) (Version 2) [Data set]. Copernicus Monitoring Environment Marine Service (CMEMS). https://doi.org/10.25423/CMCC/BLKSEA_MULTIYEAR_WAV_007_006.

312 ADVANCES IN OPERATIONAL OCEANOGRAPHY
Storto, A.; Masina, S. and Dobricic, S. (2014) Estimation and impact of non-uniform horizontal correlation length-scales for global ocean physical analyses. Journal of Atmospheric and Oceanic Technology, 31, 2330–2349. https://doi.org/10.1175/JTECH-D-14-00042.1.
Vandenbulcke, L., and Barth, A. (2015). A stochastic operational forecasting system of the Black Sea: Technique and validation. Ocean Modelling, 93, 7-21.
Verri, G., Pinardi, N., Bryan, F., Tseng, Y., Coppini, G., Clementi, E. (2020). A box model to represent estuarine dynamics in mesoscale resolution ocean models. Ocean Modelling, 148, https://doi.org/10.1016/j.ocemod.2020.101587.

313ADVANCES IN OPERATIONAL OCEANOGRAPHY EXPANDING EUROPE’S OBSERVING AND FORECASTING CAPACITY
NEW GLOBAL VERTICAL DISTRIBUTION OF GRIDDED PARTICULATE ORGANIC CARBON AND CHLOROPHYLL-A CONCENTRATION USING MACHINE LEARNING FOR CMEMS Raphaëlle Sauzède (1), Hervé Claustre (2), Pannimpullath Remanan Renosh (2), Julia Uitz (2) and Stéphanie Guinehut (2)
(1) Institut de la Mer de Villefranche, CNRS-INSU, Sorbonne Université, Villefranche-Sur-Mer, France
(2) Laboratoire d’Océanographie de Villefranche, CNRS-INSU, Sorbonne Université, Villefranche-Sur-Mer, France
(3) Collecte Localisation Satellites, Environment and Climate, Ramonville Saint-Agne, France
Abstract
As part of Copernicus Marine Environmental Monitoring Service (CMEMS), the multi-observations thematic assembly center aims to provide products based on observations and data fusion techniques (Guinehut et al., 2021). Sauzede et al., (2016) have demonstrated the potential of using hydrological measurements and ocean color satellite observations to infer the vertical distribution of backscattering coefficient, a proxy for the stock of particulate organic carbon (POC). The ‘Satellite Ocean-Color merged with Argo data to infer bio-optical properties to depth’ (SOCA) method is a neural-network-based method trained using the Biogeochemical-Argo database. SOCA has been upgraded to improve the POC retrieval and additionally retrieve the chlorophyll-a concentration (Chl). Using this method with CMEMS hydrological and satellite products, weekly 3-dimensional fields of POC and associated uncertainty were retrieved for the 1998-2018 period and made available from the CMEMS online portal since July 2020. The 3-dimensional products of SOCA-retrieved Chl will be made available by the end of 2021. Both of these products will be updated yearly as new input data become available. These new CMEMS products represent a most valuable source of data useful not only for supporting the quality control of Biogeochemical-Argo float observations but also for data assimilation and initialization/validation of biogeochemical models.

314 ADVANCES IN OPERATIONAL OCEANOGRAPHY
Keywords: Particulate organic carbon, Chlorophyll-a concentration, Machine learning, Multi-observations, CMEMS
1. Introduction Phytoplankton is a central component as well as a regulator of marine biogeochemical cycles and ecosystems. It indeed largely influences the magnitude of the so-called biological carbon pump, which results from the sinking and sequestration to the deep oceans of part of the photosynthetically produced Particulate Organic Carbon (POC) stock. Furthermore, phytoplankton is the first link of the marine food chains with the magnitude of photosynthesis being an important driver of fish standing stocks. A better mechanistic understanding of phytoplankton dynamics with respect to its fate (food chain, export at depth) is essential in the problematic of societal relevance like climate change or fisheries management.
Climate change (i.e. warming, CO2 uptake), which impacts on surface physico-chemical forcing (i.e. enhanced stratification, reduced upward nutrient fluxes, acidification), deeply influences the magnitude of phytoplankton photosynthesis, the phytoplankton communities and hence marine ecosystems. The development of predictive modeling capabilities to quantitatively address future climate change effects on carbon sequestration or on fisheries management requires a better understanding of key biogeochemical processes in the upper oceanic layer.
For a long time, most in situ measurements used for the characterization of upper ocean biogeochemical processes were acquired through ship-based observations with the obvious consequence of critical under-sampling and associated observational gaps. Some of these measurements can now be addressed remotely/autonomously either through in situ robots or ocean color satellites. In particular, the recently launched Biogeochemical-Argo (BGC-Argo) program (Claustre et al., 2020) opens the new perspective of rapidly acquiring bio-optical proxies of key biogeochemical variables at pertinent observation scales.
POC can be addressed through the estimation of the particulate backscattering coefficient (bbp) (e.g. Cetinić et al., 2012), which is an ocean color product as well as a reference measurement of the BGC-Argo program. Chlorophyll-a concentration (Chl), which is a key proxy for phytoplankton biomass can be also measured by both ocean color remote sensing and autonomous measurements of fluorescence, a proxy for Chl. Combining Chl and POC both avaialble from satellite and float observations offers great potential for deriving 3D/4D fields of biogeochemical products. A machine learning-based method has already been developed with this aim, the so-called SOCA2016-BBP method (for Satellite Ocean Color merged with Argo data to infer the vertical distribution of bbp; Sauzède et al., 2016).

315ADVANCES IN OPERATIONAL OCEANOGRAPHY EXPANDING EUROPE’S OBSERVING AND FORECASTING CAPACITY
The success of SOCA2016-BBP motivated the effort to create depth-resolved global proxy of POC with higher space-time resolution, a prerequisite for improving the characterization and quantification of export carbon fluxes. Thus, in the context of the European Copernicus Marine Environment Monitoring Service (CMEMS), one of the challenges of the MULTIOBS Thematic Assembly Center (TAC) was dedicated to improve SOCA2016-BBP to obtain high-level 4D gridded global products of POC (with associated estimation errors), and to develop SOCA for Chl in support of biogeochemical model data requirements. In particular, the resulting Chl products benefit the biogeochemical modeling community for the initialization and validation of biogeochemical models.
2. Machine learning-based methods to infer the vertical distribution of biogeochemical variables
2.1 Particulate Organic Carbon SOCA2016-BBP proposed a novel method that merges satellite ocean color bio-optical products with Argo temperature-salinity profiles to infer the vertical distribution of bbp (Sauzède et al., 2016). This neural-network-based method used three main input components: 1) ocean color satellite-based surface estimates of bbp and Chl matched up in space and time with 2) depth-resolved physical properties derived from temperature-salinity profiles measured by Argo profiling floats (i.e. 4 density values over the euphotic layer and the Mixed Layer Depth, MLD) and 3) the day of the year of the considered satellite-Argo matchup. The developed neural network, more specifically a multi-layer perceptron (MLP), was trained and validated using a database including ~5,000 simultaneous profiles of temperature-salinity and bio-optical properties collected by BGC-Argo floats, with concomitant satellite-derived products.
Recently, the SOCA2016 method has been upgraded to SOCA2020 to obtain the CMEMS high level 3D gridded products. Specifically, SOCA2020 includes several improvements: (1) SOCA2020 relies on a much larger BGC-Argo database than SOCA2016, owing to the new data acquired since 2016 (i.e. 6 times more data and a dataset with less geographical bias of sampling compared to SOCA2016); (2) it includes additional input information such as the satellite-based sea level anomaly (SLA) which gives information about mesoscale processes possibly impacting the vertical distribution of phytoplankton biomass (e.g. McGillicuddy, 2016); (3) it uses as input ocean color remote sensing reflectance (Rrs) at five wavelengths instead of the satellite-based Chl and bbp used in SOCA2016, in order to avoid additional errors due to ocean color algorithms; (4) the representation of the temperature-salinity inputs has been improved by replacing the 4 values of density in the euphotic layer by the first most significant components of the Principal Component Analysis (PCA) of the whole temperature and salinity profiles; (5) the vertical resolution of the bbp output products
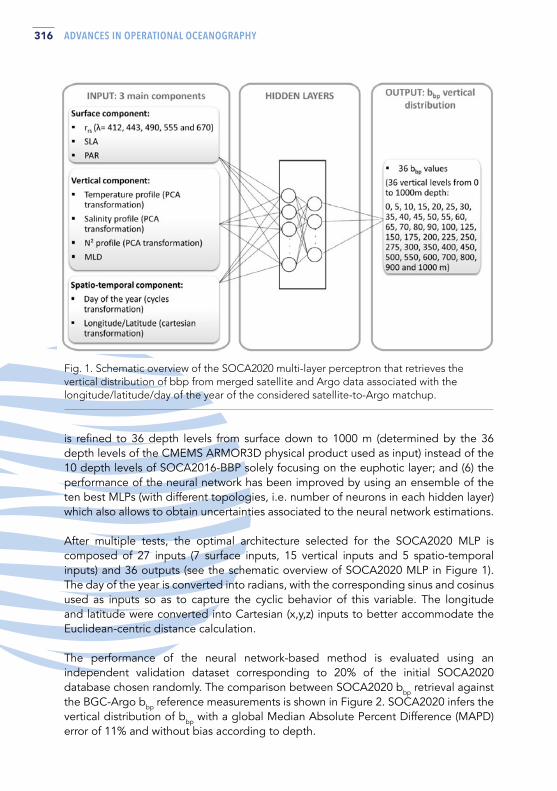
316 ADVANCES IN OPERATIONAL OCEANOGRAPHY
Fig. 1. Schematic overview of the SOCA2020 multi-layer perceptron that retrieves the vertical distribution of bbp from merged satellite and Argo data associated with the longitude/latitude/day of the year of the considered satellite-to-Argo matchup.
is refined to 36 depth levels from surface down to 1000 m (determined by the 36 depth levels of the CMEMS ARMOR3D physical product used as input) instead of the 10 depth levels of SOCA2016-BBP solely focusing on the euphotic layer; and (6) the performance of the neural network has been improved by using an ensemble of the ten best MLPs (with different topologies, i.e. number of neurons in each hidden layer) which also allows to obtain uncertainties associated to the neural network estimations.
After multiple tests, the optimal architecture selected for the SOCA2020 MLP is composed of 27 inputs (7 surface inputs, 15 vertical inputs and 5 spatio-temporal inputs) and 36 outputs (see the schematic overview of SOCA2020 MLP in Figure 1). The day of the year is converted into radians, with the corresponding sinus and cosinus used as inputs so as to capture the cyclic behavior of this variable. The longitude and latitude were converted into Cartesian (x,y,z) inputs to better accommodate the Euclidean-centric distance calculation.
The performance of the neural network-based method is evaluated using an independent validation dataset corresponding to 20% of the initial SOCA2020 database chosen randomly. The comparison between SOCA2020 bbp retrieval against the BGC-Argo bbp reference measurements is shown in Figure 2. SOCA2020 infers the vertical distribution of bbp with a global Median Absolute Percent Difference (MAPD) error of 11% and without bias according to depth.
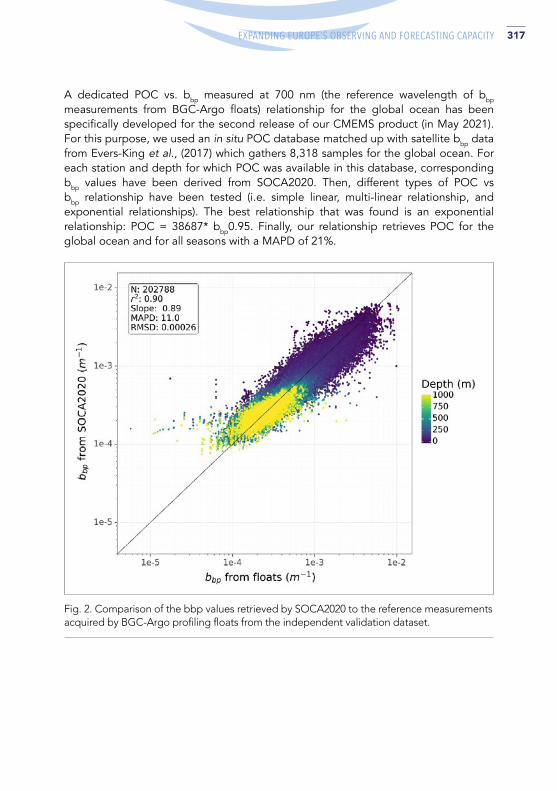
317ADVANCES IN OPERATIONAL OCEANOGRAPHY EXPANDING EUROPE’S OBSERVING AND FORECASTING CAPACITY
Fig. 2. Comparison of the bbp values retrieved by SOCA2020 to the reference measurements acquired by BGC-Argo profiling floats from the independent validation dataset.
A dedicated POC vs. bbp measured at 700 nm (the reference wavelength of bbp
measurements from BGC-Argo floats) relationship for the global ocean has been specifically developed for the second release of our CMEMS product (in May 2021). For this purpose, we used an in situ POC database matched up with satellite bbp data from Evers-King et al., (2017) which gathers 8,318 samples for the global ocean. For each station and depth for which POC was available in this database, corresponding bbp values have been derived from SOCA2020. Then, different types of POC vs bbp relationship have been tested (i.e. simple linear, multi-linear relationship, and exponential relationships). The best relationship that was found is an exponential relationship: POC = 38687* bbp0.95. Finally, our relationship retrieves POC for the global ocean and for all seasons with a MAPD of 21%.

318 ADVANCES IN OPERATIONAL OCEANOGRAPHY
Fig. 3. Comparison of the Chl values retrieved by SOCA2020 to the reference measurements acquired by: a) BGC-Argo profiling floats from the independent validation dataset (left panel) and b) HPLC from MAREDAT database and LOV-IMEV database (right panel)
As for SOCA2020-BBP, the performance of the method is evaluated using an independent validation dataset (i.e. 20% of the initial SOCA2020 database chosen randomly), through the comparison between SOCA2020 Chl retrieval against the BGC-Argo Chl measurements (Figure 3 left panel). SOCA2020-CHL infers the vertical distribution of Chl with a global MAPD error of 29% and without systematic bias according to the depth of retrieval.
2.2 Chlorophyll-a concentration In the same way as we developed SOCA2020 for bbp, we are currently developing SOCA2020-CHL to retrieve the vertical distribution of Chl from satellite data merged with Argo temperature-salinity data. The main difference between SOCA2020-BBP and SOCA2020-CHL is the normalization of the Chl profiles with respect to depth. A dimensionless depth is introduced and calculated as the actual (physical) depth divided by the depth of the productive layer (i.e. the maximum between euphotic and mixed layer depths). Scaling the Chl profiles with respect to the productive layer depth enables to merge all profiles regardless of their vertical shape and range of Chl variation, simultaneously accounting for their variability. Indeed a typical profile of deep winter-mixing conditions in subpolar latitudes is highly different from a profile with a Deep Chlorophyll Maximum (DCM) characteristic of low-latitude permanently stratified systems.

319ADVANCES IN OPERATIONAL OCEANOGRAPHY EXPANDING EUROPE’S OBSERVING AND FORECASTING CAPACITY
The SOCA2020-CHL method is further evaluated against Chl determined by High Performance Liquid Chromatography (HPLC), used as reference measurements for Chl. The comparison between SOCA2020 Chl retrieval against the HPLC Chl reference measurements from a global database gathering MAREDAT data (Peloquin et al., 2013) and additional data from the Laboratoire d’Océanographie de Villefranche (LOV) / Institut de la Mer de Villefranche (IMEV) database (total of ~1,700 stations at the global scale) is shown in Figure 3 (right panel). SOCA-CHL retrieves the Chl with an error of 40% compared to reference HPLC Chl estimations.
3. Global 3D gridded product of POC and Chl The global 3D gridded product of POC and Chl is available from CMEMS portal (MULTIOBS_GLO_BIO_BGC_3D_REP_015_010 product). This product provides data on a regular spatial grid (0.25°x0.25°) with two different temporal resolutions, i.e. weekly fields from January 1998 to December 2018 (2019 for the next CMEMS release of May 2021) and multi-year monthly climatological fields. Note that the Chl in the CMEMS product retrieved from SOCA-CHL will be available at the end of the year 2021.
4. Conclusion The conjoint use of the POC and Chl fields offers a new path to examine the variability in the phytoplankton carbon-to-Chl relationship within vertical dimension. This represents a great opportunity for a better understanding of light and nutrient control of phytoplankton biomass and physiological status at a global scale. This is a crucial step for improving the characterization of the distribution and variability in ocean primary production and carbon export. Moreover, the new proposed gridded CMEMS products represent a most valuable source of synthetic data useful not only for supporting the quality control of BGC-Argo float observations but also for data assimilation and initialization/validation of biogeochemical models.
AcknowledgementsThe BGC-Argo data were collected and made freely available by the International Argo Program and the national programs that contribute to it (http://www.argo.ucsd.edu, http://argo.jcommops.org/). The satellite data used in this study are freely distributed by CMEMS. This work has been funded by the European ‘Copernicus Marine Environment Monitoring Service’, the European Research Council (ERC) under the ERCAdG-2010 remOcean project (grant agreement 246577) and ERCAdG-2019 REFINE project (grant agreement 834177) and by the BlueCloud project (European Union’s Horizon Programme call BG-07-2019-2020, topic: [A] 2019 – Blue Cloud services; grant agreement 862409).

320 ADVANCES IN OPERATIONAL OCEANOGRAPHY
ReferencesCetinić, I., Perry, M. J., Briggs, N. T., Kallin, E., D’Asaro, E. A., and Lee, C. M. (2012). Particulate organic carbon and inherent optical properties during 2008 North Atlantic Bloom Experiment. Journal of Geophysical Research: Oceans, 117(C6).
Claustre, H., Johnson, K. S., and Takeshita, Y. (2020). Observing the global ocean with biogeochemical-Argo. Annual review of marine science, 12, 23-48.
Evers-King, H., Martinez-Vicente, V., Brewin, R. J., Dall’Olmo, G., Hickman, A. E., Jackson, T., Kostadinov, T. S., Krasemann, H., Loisel, H., Röttgers, R., Roy, S., Stramski, D., Thomalla, S., Platt, T. and Sathyendranath, S. (2017). Validation and intercomparison of ocean color algorithms for estimating particulate organic carbon in the oceans. Frontiers in Marine Science, 4, 251.
McGillicuddy Jr, D. J. (2016). Mechanisms of physical-biological-biogeochemical interaction at the oceanic mesoscale. Annual Review of Marine Science, 8, 125-159.
Guinehut, S., Buongiorno Nardelli, B., Chau, T., Chevallier, F., Ciani, D., Claustre, H., Etienne, H., Gehlen, M., Greiner, E., Jousset, S., Mulet, S., Sauzède, R., and Verbrugge, N. (2021): The MULTI OBSERVATIONS Thematic Assembly Center of the Copernicus Marine Environnement Monitoring Service. Proceedings of 9th EuroGOOS conference.
Peloquin, J., Swan, C., Gruber, et al., and Wright, S. (2013). The MAREDAT global database of high performance liquid chromatography marine pigment measurements. Earth System Science Data, 5(1), 109-123.
Sauzède, R., Claustre, H., Uitz, J., Jamet, C., Dall’Olmo, G., d’Ortenzio, F., Gentili, B., Poteau, A., and Schmechtig, C. (2016). A neural network based method for merging ocean color and Argo data to extend surface bio optical properties to depth: Retrieval of the particulate backscattering coefficient. Journal of Geophysical Research: Oceans, 121(4), 2552-2571.

321ADVANCES IN OPERATIONAL OCEANOGRAPHY EXPANDING EUROPE’S OBSERVING AND FORECASTING CAPACITY
THE OPERATIONAL CMEMS IBI-MFC SERVICE TODAY: REVIEW OF MAJOR ACHIEVEMENTS ALONG THE COPERNICUS-1 SERVICE PHASE (2015-2021) Marcos Garcia Sotillo (1, 7), Cailleau S. (1), Aznar R. (2, 7), Aouf L. (3), Barrera E. (4) , Dabrowski T. (5), Rey P. (6), Lorente P. (2, 7), Levier B. (1), Amo-Baladrón A. (2, 7), Reffray G. (1), Toledano C. (2, 7), Gutknecht E. (1), Pascual A. (2, 7), A. Dalphinet (3), Guihou K. (2), McGovern J. (5), Rodríguez A. (6), Renaud R. (3), Bowyer P. (5), Ghantous M. (3), García L. (4), Benkiran M. (1), Álvarez-Fanjul E. (7)
(1) Mercator Ocean International(2) Nologin(3) Meteo-France(4) AEMET(5) Marine Institute(6) CESGA(7) Puertos del Estado
Abstract The CMEMS IBI-MFC (Iberia-Biscay-Ireland Monitoring & Forecasting Centre) delivers daily ocean model forecasts, analysis and reanalysis of different physical and biogeochemical parameters for the Atlantic façade, supporting all kind of marine applications. Along Copernicus-1, this IBI operational service has continuously evolved, upgrading both its forecast capabilities (in 2015, only a circulation forecast in place; today, 3 operational services, including waves and biogeochemical forecasts) and its multi-Year production (covering altimetric era with ocean and wave reanalysis products, together with a non-assimilative biogeochemical hindcast). The main IBI-MFC operational achievements and product upgrades are here reviewed. An overview of main IBI service milestones, in terms of both operational production (with inclusion of new variables, increase of product resolution and temporal frequency, extension of forecast horizons and reanalysis coverages) and product quality enhancement is provided. The IBI model applications are routinely validated through meaningful skill scores and a wide range of statistical metrics computed to quantitatively assess the quality and reliability of these model solutions. The CMEMS IBI-MFC delivers today a reliable operational service, meeting user needs for a widespread end-user community (with strong IBI-ROOS connections and marked by a high number of ‘regular’ operational users linked to downstream services). The IBI-MFC service is expected to

322 ADVANCES IN OPERATIONAL OCEANOGRAPHY
be upgraded, already in a Copernicus-2 context, and major guidelines of the roadmap are here outlined.
Keywords: CMEMS, IBI, operational oceanography, ocean forecasting, ocean models, reanalysis, biogeochemistry, waves
1. The CMEMS IBI-MFC Mission The CMEMS IBI-MFC (Iberia-Biscay-Ireland Monitoring & Forecasting Centre) offers a comprehensive portfolio of regular and systematic regional information on the state of the ocean for the European Atlantic façade, supporting all kind of marine applications. The mission of this IBI-MFC is to provide operational Near-Real-Time (NRT) short-term forecasts (plus analysis) and multi-year (MY) reanalysis/hindcast products for the so called IBI area, covering the Blue (physics and waves) and Green (biogeochemical) ocean components. To this aim, different IBI high-resolution model applications (to run forecasts), together with data assimilation schemes (to integrate observations in IBI regional NRT analyses and MY reanalyses) have been developed and evolved along Copernicus-1 (2015-2021) and are today the base of the IBI-MFC operational service, here described. The IBI-MFC is managed by a consortium of centres, coordinated by Mercator Ocean International, and that includes Nologin, Météo-France, the Galician Supercomputing Centre (CESGA), the Spanish Met Office (AEMET), and the Irish Marine Institute (IMI).
2. The IBI-MFC Service today (at the end of Copernicus-1) The IBI-MFC routinely delivers data products for a diversity of ocean variables of the three ocean components: physics (PHY), biogeochemistry (BIO) and waves (WAV). The NRT forecast/analysis products (with horizontal resolution ranging from 2.5 to 5 km resolution) are updated on daily to weekly basis, providing up to + 10 days of forecast ahead, together with a historical catalogue composed of analysis/hindcast for a 2-year period. On the other hand, the IBI MY reanalyses (for circulation and waves) and non-assimilative hindcast (for biogeochemistry) products cover from 1993 till present time and are updated twice a year. In 2021, the IBI-MFC delivers 6 products (those corresponding to the short-term forecast/analysis: PHY-NRT, BIO-NRT, and WAV-NRT; and those for the long-term MY production: PHY-MY, BIO-MY, and WAV-MY), accounting for 20 datasets (with a wide range of temporal frequencies: i.e., 15-minute data, together with hourly, daily, and monthly means) that currently include 37 variables for ocean physics (temperature, salinity, currents, sea level, etc.), waves (significant wave height, peak period, etc.) and biogeochemistry (chlorophyll, oxygen, nutrients, etc.). Further details and references on the IBI-MFC portfolio are provided in Table I.
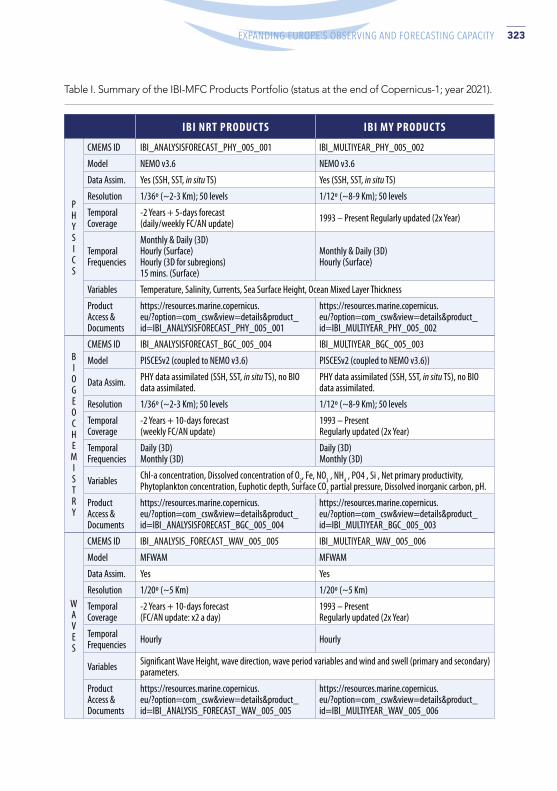
323ADVANCES IN OPERATIONAL OCEANOGRAPHY EXPANDING EUROPE’S OBSERVING AND FORECASTING CAPACITY
IBI NRT PRODUC TS IBI MY PRODUC TS
PHYSICS
CMEMS ID IBI_ANALYSISFORECAST_PHY_005_001 IBI_MULTIYEAR_PHY_005_002
Model NEMO v3.6 NEMO v3.6
Data Assim. Yes (SSH, SST, in situ TS) Yes (SSH, SST, in situ TS)
Resolution 1/36º (~2-3 Km); 50 levels 1/12º (~8-9 Km); 50 levels
Temporal Coverage
-2 Years + 5-days forecast(daily/weekly FC/AN update) 1993 – Present Regularly updated (2x Year)
Temporal Frequencies
Monthly & Daily (3D)Hourly (Surface)Hourly (3D for subregions)15 mins. (Surface)
Monthly & Daily (3D) Hourly (Surface)
Variables Temperature, Salinity, Currents, Sea Surface Height, Ocean Mixed Layer Thickness
Product Access & Documents
https://resources.marine.copernicus.eu/?option=com_csw&view=details&product_id=IBI_ANALYSISFORECAST_PHY_005_001
https://resources.marine.copernicus.eu/?option=com_csw&view=details&product_id=IBI_MULTIYEAR_PHY_005_002
BIOGEOCHEMISTRY
CMEMS ID IBI_ANALYSISFORECAST_BGC_005_004 IBI_MULTIYEAR_BGC_005_003
Model PISCESv2 (coupled to NEMO v3.6) PISCESv2 (coupled to NEMO v3.6))
Data Assim. PHY data assimilated (SSH, SST, in situ TS), no BIO data assimilated.
PHY data assimilated (SSH, SST, in situ TS), no BIO data assimilated.
Resolution 1/36º (~2-3 Km); 50 levels 1/12º (~8-9 Km); 50 levels
Temporal Coverage
-2 Years + 10-days forecast (weekly FC/AN update)
1993 – Present Regularly updated (2x Year)
Temporal Frequencies
Daily (3D) Monthly (3D)
Daily (3D) Monthly (3D)
Variables Chl-a concentration, Dissolved concentration of O2, Fe, NO3 , NH4 , PO4 , Si , Net primary productivity, Phytoplankton concentration, Euphotic depth, Surface CO2 partial pressure, Dissolved inorganic carbon, pH.
Product Access & Documents
https://resources.marine.copernicus.eu/?option=com_csw&view=details&product_id=IBI_ANALYSISFORECAST_BGC_005_004
https://resources.marine.copernicus.eu/?option=com_csw&view=details&product_id=IBI_MULTIYEAR_BGC_005_003
WAVES
CMEMS ID IBI_ANALYSIS_FORECAST_WAV_005_005 IBI_MULTIYEAR_WAV_005_006
Model MFWAM MFWAM
Data Assim. Yes Yes
Resolution 1/20º (~5 Km) 1/20º (~5 Km)
Temporal Coverage
-2 Years + 10-days forecast (FC/AN update: x2 a day)
1993 – Present Regularly updated (2x Year)
Temporal Frequencies Hourly Hourly
Variables Significant Wave Height, wave direction, wave period variables and wind and swell (primary and secondary) parameters.
Product Access & Documents
https://resources.marine.copernicus.eu/?option=com_csw&view=details&product_id=IBI_ANALYSIS_FORECAST_WAV_005_005
https://resources.marine.copernicus.eu/?option=com_csw&view=details&product_id=IBI_MULTIYEAR_WAV_005_006
Table I. Summary of the IBI-MFC Products Portfolio (status at the end of Copernicus-1; year 2021).

324 ADVANCES IN OPERATIONAL OCEANOGRAPHY
Each IBI product is built upon an operational suite that carries out four main tasks: 1) the acquisition of the best upstream data available to force the models and assimilate observations, 2) the running of models and post-processing procedures for generating the products, 3) the validation of the modelling solutions based on comparisons against all available observational data and 4) the timely delivery to users of the final IBI products. Using internal monitoring tools, the IBI team routinely oversees the correct functioning of all operational chains, checking the status of the operations, managing the HPC & storage resources, and controlling the product dissemination. The rigorous design, control, and management of the suites and all the related incidents ensure a highly reliable, robust, and fully monitored IBI-MFC service, with timeliness always higher than 94% along the Copernicus-1 (2015-2021) service period. On top of it, the IBI-MFC counts with a Service Desk, responsible of maintaining a communication channel with users to inform about any operational incident occurred, programed service outages, products updates, and to respond to any user question on the IBI products and services. The MY and NRT products provide a complete picture of the complex processes taking place in the IBI region, and they can help to characterize extreme events (Sotillo et al., 2021). The IBI-MFC uses the combination of both approaches to provide a quick look of the current and past state of the ocean. In the context of CMEMS, the development of Ocean Monitoring Indicators (OMIs) aims to summarize data by delivering simplified, research-based information about relevant oceanographic processes. The IBI-MFC currently produces (with a periodic update) 4 OMIs, including a Coastal Upwelling Index, an index to monitor variability of the Mediterranean Outflow Water (MOW) in intermediate levels of the Northeast Atlantic and two indicators on extreme events of temperature and wave height. Additionally, there are two IBI OMIs, currently under development: one to characterize variability of stormy periods in the IBI domain, and a second one focused on the algae bloom phenology, derived from chlorophyll anomaly. Further details about all these IBI OMIs are provided in Pascual et al., 2021. The IBI-MFC aims at providing high quality verified state-of-the-art ocean model products. The continuous improvement of the service, and the implementation of a service evolution strategy ensure that the best operational oceanography products are disseminated. To carry this out, the IBI-MFC performs: 1) routine (online near-real-time and delayed-mode) product validation through the IBI-MFC NARVAL validation tool (Lorente et al., 2019a); 2) dedicated assessment of the IBI MY products; 3) pre-operational qualification of any new or upgraded future IBI released systems (see in Figure 2, an example of the product quality enhancement achieved through different IBI-PHY-NRT product releases); 4) the required Product Quality documentation requested by CMEMS to be issued for each product delivered, and 5) specific research to design new product quality metrics and to evaluate the quality of the IBI-MFC products (see Lorente et al., 2019b and Gutcknecht et al., 2019 for examples on the physical and biogeochemical IBI products, respectively).

325ADVANCES IN OPERATIONAL OCEANOGRAPHY EXPANDING EUROPE’S OBSERVING AND FORECASTING CAPACITY
Fig. 1. Example of IBI Product Quality enhancement: SST differences between IBI-PHY-NRT solutions and satellite observations (CMEMS L3 satellite product 010_009a) for Summer (JAS) 2014. IBI data from (left panel) the 2015 system version (with periodic sequential forecast re-initialization from the CMEMS Global solution) and (right panel) the 2018 system version (already with data assimilation scheme included).
Fig. 2. IBI product users: Temporal evolution in the number of IBI users (occasional and regular/operational ones) and in the data amount downloaded (central panels); information on the number of users per product line (left panels); Information on the type of end-users (right panels).
326 ADVANCES IN OPERATIONAL OCEANOGRAPHY
Finally, emphasize that the IBI-MFC delivers a service always devoted to meet the requirements of an ever-growing community of end-users (from 178 users in 2014 to more than 500 ones in 2020; half of them operational regular users that get IBI products at least twice a week). The increasing interest in using IBI-MFC products is reflected by the fact that almost 100 TB of IBI physics, biogeochemistry and waves data were downloaded in 2020 by users coming mainly from academia, private companies, and public sector organizations (further details on IBI users in Figure 2).
3. The IBI-MFC Service evolution (along Copernicus-1) and future roadmap
The IBI-MFC provides a service in constant evolution since 2015. Its service evolution roadmap is fully aligned with the general CMEMS scientific objectives and it also responds, as main driver, to meet identified end-users needs. Along Copernicus-1 (2015 – 2021), the following IBI-MFC service improvements (see Table II for further details) have been achieved:
• Delivery of a complete product portfolio (today, the IBI-MFC delivers NRT forecasts and MY products for the 3 ocean components, i.e. PHY, WAV, BIO; to this aim, new WAV and BIO NRT operational forecast suites were developed);
• Enhancement of IBI products, increasing their spatial and temporal resolutions (thus, the currently delivered IBI NRT and MY WAV products has duplicated their spatial resolution and the PHY NRT product counts with new higher frequency datasets such as the 3D hourly and surface 15-min data);
• Extension of forecast horizon and temporal coverages (today, the IBI NRT WAV and BIO forecasts deliver up to +10 days leading times and all the IBI MY products covered back to 1993);
• Inclusion of Data Assimilation schemes (IBI analyses and reanalyses products are today delivered for the PHY and WAV components);
• Continuous improvement of model set-ups (including periodic upgrade of IBI model codes and the use of best available forcings, with special attention to the atmospheric one);
• Enhancement of system interactions through model coupling (the IBI PHY and BIO NRT and MY model applications are on-line coupled; additionally, the IBI NRT PHY and WAV forecast systems have been recently off-line coupled).

327ADVANCES IN OPERATIONAL OCEANOGRAPHY EXPANDING EUROPE’S OBSERVING AND FORECASTING CAPACITY
Maturity of the IBI-MFC operational service is a reality today. Nevertheless, the IBI-MFC service will continuously evolve in the Copernicus-2 framework. The research and development actions planned to evolve the post-2021 IBI service are aimed at:
• Ensuring service continuity: keeping as up to now NRT forecast updates – mostly in daily basis – and bringing MY product updates closer to present time (monthly update planned through the implementation of new ‘Interim’ reanalysis streams);
• Enhancing homogeneity in services: specially, increasing analogy between NRT and MY IBI products (using same grids to deliver same variables at same temporal frequencies);
• Making IBI products more coastal-oriented. Most IBI-MFC end-users are interested in coastal areas. Thus, the IBI-MFC put a good deal of effort into IBI products to get a better representation of ocean scales driving the coastal ocean, including eddie mesoscale, sub-mesoscale features (such as fronts) and a general better reproduction of high frequency processes. Enhancement of the IBI model capacities on shelf and coastal environments will foster further IBI downstreaming by coastal stakeholders.
C-1 START (2015) C-1 PHASE 2 (2018) COPERNICUS-2 (2021)
IBI-PHY-NRT- 1/36º NEMO3.4 App.- Sequential Periodic restart- ATM: ECMWF-1/8º (3-h)
- NEMO3.6- Data Assimilation - ATM: 1-h ECMWF.
- IBI Wave coupling - New tidal forcing
IBI-BIO-NRT
- 1/36º PISCES3.6- No permanent burial - Improved carbon cycle- Carbon vars distributed
- Revised inputs from rivers - Permanent burial- Improved OBC/IC (CMEMS GLO)
IBI-WAV-NRT - 1/10º MFWAM App - 1/20º MFWAM + DA - IBI Currents inputs
IBI-PHY-MY- 1/12º NEMO3.2 (ERA-Int)- DA (SST, SSH, InSitu TS) - Coverage: 2002-2011
- 1/12º NEMO 3.6 - Coverage: back to 1993
- ATM: ECMWF ERA5- improved DA - New OBS (OSTIA SST)
IBI-BIO-MY- 1/12º PISCES 3.2- Non-assimilative hindcast- Coverage: 2002-2011
- 1/12º PISCES 3.6- No permanent burial - Improved carbon cycle- Carbon vars distributed - Coverage: back to 1993
- Revised inputs from rivers - Permanent burial- Improved OBC/IC (CMEMS GLO)
IBI-WAV-MY - 1/10º MF-WAM- Winds: ERA-int- OBC: ECMWF
- 1/20º MFWAM + DA- Winds: ERA5- OBC: CMEMS GLO- IBI Currents inputs
Table II. Evolution of the IBI-MFC product lines. Main milestones achieved from 2015 (start of Copernicus-1) up to 2021 (situation at the start of next Copernicus-2).

328 ADVANCES IN OPERATIONAL OCEANOGRAPHY
ReferencesGutknecht, E., Reffray, G., Mignot, A., Dabrowski, T., and Sotillo, M. G. (2019) Modelling the marine ecosystem of Iberia–Biscay–Ireland (IBI) European waters for CMEMS operational applications, Ocean Science, 15, 1489–1516, https://doi.org/10.5194/os-15-1489-2019.
Lorente, P., Sotillo, M.G., Amo-Baladrón, A., Aznar, R., Levier, B., Aouf, L., Dabrowski, T., de Pascual, Á., Dalphinet, G.R.A., Toledano, C., Rainaud, R., et al., (2019a) The NARVAL Software Toolbox in Support of Ocean Models Skill Assessment at Regional and Coastal Scales. In: Computational Science—ICCS 2019, Lecture Notes in Computer Science; Eds.; Springer: Cham, Switzerland, Volume 11539. pp 315-328, ISBN 978-3-030-22746-3 https://doi.org/10.1007/978-3-030-22747-0_25
Lorente, P., Sotillo, M., Amo-Baladrón, A., Aznar, R., Levier, B., Sánchez-Garrido, J.C., Sammartino, S., de Pascual-Collar, Á., Reffray, G., Toledano, C., Álvarez-Fanjul, E. (2019b) Skill assessment of global, regional, and coastal circulation forecast models: Evaluating the benefits of dynamical downscaling in IBI (Iberia–Biscay–Ireland) surface waters. Ocean Science, 15, 967–996, doi:10.5194/os-15-967-2019.
Sotillo, M.G., Mourre, B., Mestres, M., Lorente, P., Aznar, R., García-León, M., Liste, M., Santana, A., Espino, M., Álvarez, E. (2021) Evaluation of the operational CMEMS and coastal downstream ocean forecasting services during the storm Gloria (January 2020). Frontiers in Marine Science, 8, 300
Pascual-Collar A., B. Levier, M. G. Sotillo, R Aznar, C. Toledano, L. Aouf, M.
García-León, E. Gutknecht, J. V. McGovern, J. M. García-Valdecasas, P. Lorente, T. Dabrowski, A. Amo-Baladrón, K. Guihou, E. Álvarez-Fanjul. (2021) The CMEMS Ocean Monitoring Indicator portfolio for the Iberian Biscay Irish (IBI) waters: Essential variables operationally monitored and future prospects. 9th EuroGOOS Conference Proceeding.

329ADVANCES IN OPERATIONAL OCEANOGRAPHY EXPANDING EUROPE’S OBSERVING AND FORECASTING CAPACITY


SESSION 8
DATA MANAGEMENT AND METROLOGY

332 ADVANCES IN OPERATIONAL OCEANOGRAPHY
TRANSNATIONAL ACCESS TO METROLOGY LABORATORIES AND VALIDATION FACILITIES: THE EXAMPLE OF SHOM IN THE MINKE PROJECT Marc Le Menn
Service Hydrographique et Océanographique de la Marine (SHOM), 13 rue du Chatellier, CS 92803, 29228 Brest Cedex 2. [email protected]
Abstract
MINKE or Metrology for Integrated marine maNagement and Knowledge-transfer nEtwork, is a recent UE project. It aims to integrate key European marine metrology research infrastructures, to coordinate their use and development and to provide an innovative ‘ocean data quality’ framework for the various European actors in charge of monitoring and managing marine ecosystems. One of its tasks is to provide access to metrology laboratories and validation facilities through well-established EC Trans National Access (TNA) instruments.
SHOM has decided to open its facilities for current-meters calibration, temperature/salinity/pressure calibration and the pigments dosage.
The calibration of current-meters can be carried out in direction on a platform built in a controlled magnetic environment and in velocity using a laboratory method to determine deviations by measuring the Doppler effect.
The masterpiece of the instruments calibration and testing in temperature/salinity is an 800 litre bath filled with seawater that can be stabilised to better than 1 mK in a short time. This bath allows for the testing of large volume instruments. It is complemented by salinometers and an automated pressure balance.
The laboratory can also carry out tests of phytoplankton pigments in large quantities with a HPLC device.
Keywords: transnational access, calibration, current-meter, temperature, salinity, phytoplankton

333ADVANCES IN OPERATIONAL OCEANOGRAPHY EXPANDING EUROPE’S OBSERVING AND FORECASTING CAPACITY
1. Introduction Networking and cooperation in oceanography concern observation, modelling, data management, ocean services to society. European research infrastructures in marine metrology were missing. One of the objectives of the MINKE project is to develop networking and cooperation in metrology for oceanographic applications. In fact, MINKE, or Metrology for Integrated marine maNagement and Knowledge-transfer nEtwork, is a recent EU project. It aims to integrate key European marine metrology research infrastructures, to coordinate their use and development and to provide an innovative ‘ocean data quality’ framework for the various European actors in charge of monitoring and management the marine ecosystems.
Data quality is the key element in ocean & coastal observing systems to provide reliable measurements for evidence-based environmental policy making. Improving data quality involves improving accuracy, which means measurements must be metrologically referenced with the lower uncertainty, developing reliable and cost-effective technologies to increase the spatial resolution of measurement points, and using data fusion methods to extract the most useful information from large volumes of data from multiple sources. About networking, MINKE will enable better use of existing research infrastructures (RIs) and stimulate collaboration between research fields. For this purpose, a transnational and virtual access (TNA-VA) will be developed. MINKE will promote key EU marine calibration, experimental facilities and participatory platforms to provide effective and convenient access to the 16 MINKE key research infrastructures for marine observation. It will reach out to new users by widely publicizing calls for access and promoting equal opportunities between countries. It will select TNA-VA applications on the basis of their excellence, feasibility and scientific priorities, respecting the principles of transparency, fairness and impartiality.
In this context, SHOM decided to open its facilities to current-meter calibration, temperature/salinity calibration and pigments dosage, through well-established European Commission Trans National Access instruments.
2. The calibration of currentmeters Marine currents are one of the ECVs or Essential Climate Variables defined by the Global Climate Observing System (GCOS) (GCOS – 195, 2015). Oceanic measurements of subsurface ocean velocity provide the data needed to estimate ocean transport of mass, heat, freshwater and other properties on basin-wide to global scales. Rotor current-meters have been replaced a decade ago by acoustic Doppler current-meters and profilers. In recent years, the calibration or simply the testing of these instruments has been an unadressed problem in oceanographic institutions. At SHOM, a platform was built and put into service in 2012 (Le Menn et al., 2014), to calibrate the electronic compasses and the tilt sensors with which they are equipped in their instrumental configuration. These compasses are used to retrieve the directions

334 ADVANCES IN OPERATIONAL OCEANOGRAPHY
of the profilers with respect to magnetic North, their three transducers being used to retrieve the direction of the currents in the instrument reference frame. This platform is located in an area where the magnetic field has been mapped and has very weak anomalies. The current profilers can be placed in instrumented mooring cages during their calibration, to take into account errors induced by the instrumental configuration. This platform can also be used for drones or AUVs.
Researchers have yet found a method for determining the trueness of velocity measurements. For rotor current-meters, this calibration has been carried out in open test tanks or hydrodynamic channels, but usually at a maximum speed of 1 m/s. For Doppler current-meters, the low particle concentration of these facilities is a problem, and due to the profiling range of the profilers, this method can no longer be applied. There is still the possibility of inter-comparisons at sea, but these are expensive, difficult to organise and only allow testing of a part of the velocity range of the instruments.
To solve this issue, a test using an acoustic transducer placed successively on the profiler transducers was set up at SHOM (Le Menn et Morvan, 2020). Connected to a frequency generator, the transducer allows the simulation of echoes received by the profiler. By exploiting the Doppler effect formula and the velocities captured by the instrument, a method for testing the instrument’s measurement channels and a calibration bed were set up. This platform and this test bed are unique in Europe.
Fig. 1. Picture of the calibration platform for compass and tilt sensors. Current-meters and current profilers can be calibrated with their instrumented mooring cages to take into account the instrumental error.
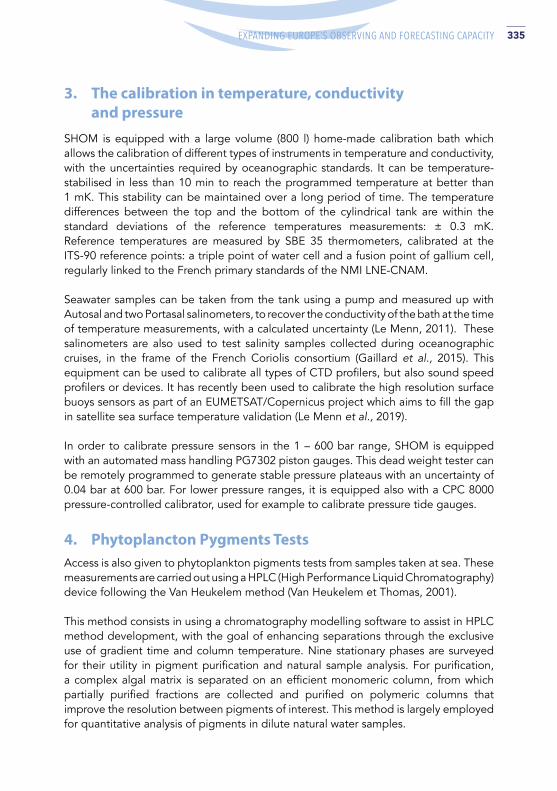
335ADVANCES IN OPERATIONAL OCEANOGRAPHY EXPANDING EUROPE’S OBSERVING AND FORECASTING CAPACITY
3. The calibration in temperature, conductivity and pressure
SHOM is equipped with a large volume (800 l) home-made calibration bath which allows the calibration of different types of instruments in temperature and conductivity, with the uncertainties required by oceanographic standards. It can be temperature-stabilised in less than 10 min to reach the programmed temperature at better than 1 mK. This stability can be maintained over a long period of time. The temperature differences between the top and the bottom of the cylindrical tank are within the standard deviations of the reference temperatures measurements: ± 0.3 mK. Reference temperatures are measured by SBE 35 thermometers, calibrated at the ITS-90 reference points: a triple point of water cell and a fusion point of gallium cell, regularly linked to the French primary standards of the NMI LNE-CNAM. Seawater samples can be taken from the tank using a pump and measured up with Autosal and two Portasal salinometers, to recover the conductivity of the bath at the time of temperature measurements, with a calculated uncertainty (Le Menn, 2011). These salinometers are also used to test salinity samples collected during oceanographic cruises, in the frame of the French Coriolis consortium (Gaillard et al., 2015). This equipment can be used to calibrate all types of CTD profilers, but also sound speed profilers or devices. It has recently been used to calibrate the high resolution surface buoys sensors as part of an EUMETSAT/Copernicus project which aims to fill the gap in satellite sea surface temperature validation (Le Menn et al., 2019).
In order to calibrate pressure sensors in the 1 – 600 bar range, SHOM is equipped with an automated mass handling PG7302 piston gauges. This dead weight tester can be remotely programmed to generate stable pressure plateaus with an uncertainty of 0.04 bar at 600 bar. For lower pressure ranges, it is equipped also with a CPC 8000 pressure-controlled calibrator, used for example to calibrate pressure tide gauges.
4. Phytoplancton Pygments Tests Access is also given to phytoplankton pigments tests from samples taken at sea. These measurements are carried out using a HPLC (High Performance Liquid Chromatography) device following the Van Heukelem method (Van Heukelem et Thomas, 2001).
This method consists in using a chromatography modelling software to assist in HPLC method development, with the goal of enhancing separations through the exclusive use of gradient time and column temperature. Nine stationary phases are surveyed for their utility in pigment purification and natural sample analysis. For purification, a complex algal matrix is separated on an efficient monomeric column, from which partially purified fractions are collected and purified on polymeric columns that improve the resolution between pigments of interest. This method is largely employed for quantitative analysis of pigments in dilute natural water samples.
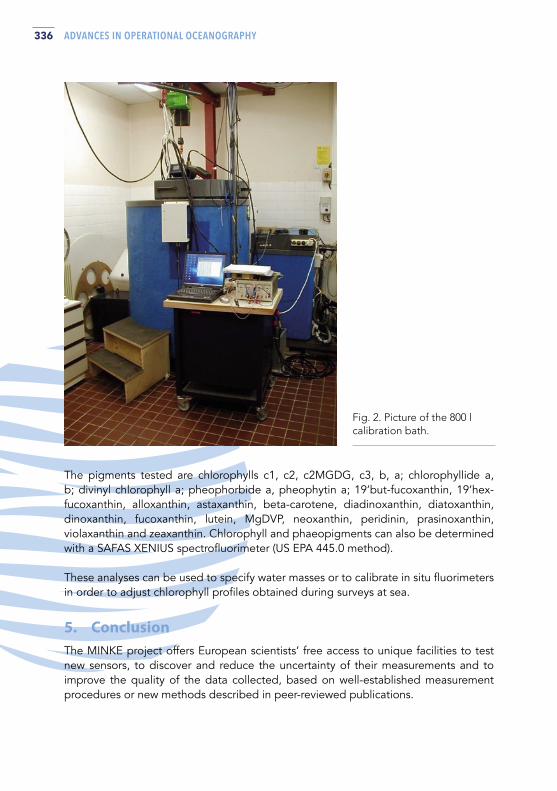
336 ADVANCES IN OPERATIONAL OCEANOGRAPHY
The pigments tested are chlorophylls c1, c2, c2MGDG, c3, b, a; chlorophyllide a, b; divinyl chlorophyll a; pheophorbide a, pheophytin a; 19’but-fucoxanthin, 19’hex-fucoxanthin, alloxanthin, astaxanthin, beta-carotene, diadinoxanthin, diatoxanthin, dinoxanthin, fucoxanthin, lutein, MgDVP, neoxanthin, peridinin, prasinoxanthin, violaxanthin and zeaxanthin. Chlorophyll and phaeopigments can also be determined with a SAFAS XENIUS spectrofluorimeter (US EPA 445.0 method).
These analyses can be used to specify water masses or to calibrate in situ fluorimeters in order to adjust chlorophyll profiles obtained during surveys at sea.
5. Conclusion The MINKE project offers European scientists’ free access to unique facilities to test new sensors, to discover and reduce the uncertainty of their measurements and to improve the quality of the data collected, based on well-established measurement procedures or new methods described in peer-reviewed publications.
Fig. 2. Picture of the 800 l calibration bath.

337ADVANCES IN OPERATIONAL OCEANOGRAPHY EXPANDING EUROPE’S OBSERVING AND FORECASTING CAPACITY
AcknowledgementsThe author thanks Jaume Piera and the entire MINKE coordination team.
ReferencesGaillard, F., Diverres, D., Jacquin, S., Gouriou, Y., Grelet, J., Le Menn, M., Tassel, J., Reverdin, G. (2015). Sea Surface Temperature and Salinity from French research Vessels, 2001-2013. Nature, Scientific Data, 2:150054. DOI: 10.1038/sdata.2015.54.
GCOS-195 (2015). Status of the Global Observing System for Climate. Full report. October 2015. https://library.wmo.int/doc_num.php?explnum_id=7213
Le Menn, M. (2011). About uncertainties in practical salinity calculations. Ocean Science, 7, 1-9. https://doi.org/10.5194/os-7-651-2011
Le Menn, M., Lusven, A., Bongiovanni, E., Le Dû, P., Rouxel, D., Lucas, S., Pacaud, L. (2014). Current profilers and currentmeters compass and tilt sensors errors and calibration. Measurement Science and Technology, 25, 085801 (6pp). https://dx.doi.org/10.1088/0957-0233/25/8/085801
Le Menn, M., Poli, P., David, A., Sagot, J., Lucas, M., O’Carroll, A, Belbeoch, M., Herklotz, K. (2019). Development of surface drifting buoys for fiducial reference measurements of sea-surface temperature. Frontiers in Marine Science, 6, 578. https://doi:10.3389/fmars.2019.00578
Le Menn M., Morvan, S. (2020). Velocity Calibration of Doppler Current Profiler Transducers. Journal of Marine Science and Engineering 8, 847. doi.org/10.3390/jmse8110847
Van Heukelem, L., Thomas, C. S. (2001). Computer-assisted high-performance liquid chromatography method development with applications to the isolation and analysis of phytoplankton pigments. Journal of Chromatography A, 910, 31–4. DOI: 10.1016/S0378-4347(00)00603-4
Arar, E. J. and Collins, G. B. (1997). Method 445.0 In Vitro Determination of Chlorophyll a and Pheophytin a in Marine and Freshwater Algae by Fluorescence. U.S. Environmental Protection Agency, Washington, DC.
338 ADVANCES IN OPERATIONAL OCEANOGRAPHY
BUILDING A RELIABLE AND STANDARDIZED LONG-TERM DATA SET OF SURFACE COASTAL OCEAN CURRENTS FROM THE EUROPEAN HF RADARS Anna Rubio (1), Lohitzune Solabarrieta (1), Lorenzo Corgnati (2), Carlo Mantovani (2), Emma Reyes (3), Paz Rotllan-García (3), Antonio Novellino (4), Patrick Gorringe (5), Annalisa Griffa (2), Julien Mader (1)
(1) AZTI Marine Research, Pasaia, Spain, [email protected]
(2) CNR-ISMAR, Lerici, Italy
(3) SOCIB, Palma de Mallorca, Spain
(4) ETT SpA, Genova, Italy
(5) SMHI, Norrköping, Sweden
Abstract
HF radar (HFR) is recognized as a cost-effective solution to provide high spatio-temporal resolution maps of ocean surface currents over wide coastal areas, suitable for many applications for coastal management. While the value of Near Real Time (NRT) data has been highlighted on many occasions for monitoring and predicting the surface drift of floating objects, long-term data series are key for the study of coastal ocean processes, their interplay, air sea interactions and connectivity between marine areas. To enhance the data use for these applications, the availability of reliable and standardized data sets of surface currents is crucial. Here we present the recent efforts made by the HFR community, in the framework of different projects and under the umbrella of the EuroGOOS HFR Task Team, to build the first historical European standardized HFR data set. The data quality control and processing methodology consists in five steps: (i) harvesting standardized data from the European HFR Node NRT catalogue and complementary non standardized (raw) data from HFR data providers; (ii) standardizing raw data through the European HFR Node software tools; (iii) applying Advanced Quality Control (AQC) by producing and analysing plots of time-series and maps of the current velocity, reporting number of valid data, basic QC flags and the spatio-temporal coverage 80/80 metric; (iv) disseminating the advanced QC outcomes

339ADVANCES IN OPERATIONAL OCEANOGRAPHY EXPANDING EUROPE’S OBSERVING AND FORECASTING CAPACITY
through an open access repository and (v) reprocessing data in collaboration with each HFR data provider. Following this protocol, data from 11 European networks (comprising 32 radial stations, representing almost 29% of the total) and additional networks from 5 regional nodes from US, have been processed. Long-term HFR surface current data sets from Europe and US HFRs are already available in the Copernicus Marine Service portfolio as ‘radar_total’ dataset in the INSITU_GLO_UV_L2_REP_OBSERVATIONS_013_044 product. Future work will consolidate these efforts by optimizing the tools for AQC and data processing, expanding the available data series, and adding new systems.
Keywords: High-frequency radars, quality control, standardization, time series, surface ocean current
1. Introduction High Frequency radars (HFRs) are a land-based remote sensing instruments providing synoptic, high frequency and high-resolution real-time data of several variables at the surface of the coastal ocean, such as: ocean surface currents (e.g. Paduan and Rosenfeld, 1996), waves (e.g. Wyatt, 2006, Orasi et al., 2018, Saviano et al., 2020), winds (e.g. Shen & Gurgel, 2018), tsunami (e.g. Grilli et al., 2015), and can also be used for ship detection (Dzvonkovskaya et al., 2008). Surface current fields from HFRs have become invaluable tools in the field of operational oceanography with direct applications in different sectors. Moreover, several publications showcase the use of historical data for the study of coastal ocean processes (e.g. Piedracoba et al., 2016), their interplay (e.g., Shrira & Forget, 2015), air-sea interactions (e.g., Berta et al., 2018), connectivity between marine areas (e.g. Sciascia, et al., 2018), improvement of satellite products (e.g. Caballero et al., 2020), among others (see a complete list of publications on different issues in https://www.zotero.org/groups/2601948/eurogoos_hfradar_taskteam/library).
The last inventory shows that there are 68 HFRs currently deployed and active in various coastal areas of the European seas (see live map in http://eurogoos.eu/high-frequency-radar-task-team). This number is growing with seven new HFRs installed per year (Rubio et al., 2017, Roarty et al., 2019). Table 1 lists the ones sending data in real and delayed time to the European HFR Node and being distributed in CMEMS (In Situ TAC) catalogue of May 2021. The European HFR node delivers near real-time and hourly maps of surface current velocities of these systems (11 European HFR networks – built by 30 radar sites) and of 5 US HFR networks. It also collects and processes historical data for advanced QA/QC, acting as the focal point for the European HFR data providers and ensuring the data flow from the data providers to the CMEMS In Situ TAC Global Production Unit.

340 ADVANCES IN OPERATIONAL OCEANOGRAPHY
Taking in account the importance of high-quality historical HFR datasets for the previously indicated studies, this paper showcases the process from raw data towards standardized data and the ongoing set up of a long-term data set of surface currents from HFRs.
2. Process towards reliable and standardized HFR historical data
Figure 1 (on the next page) shows the main steps, inside the European HFR Node, of the dataflow from raw data to standardized historical datasets. The detail of the steps is provided in the following subsections.
NETWORK NAME (N)
DATES OF AVAILABLE HISTORICAL DATA SERIES
ROOS* INSTITUTION
HFR-COSYNA (3) 12/2019-07/2020NOOS
Helmholtz-Zentrum Geesthacht
HFR-MATROOS 01/2020- 07/2020 Rijkswaterstaat
HFR-EUSKOOS (2) 01/2009- 07/2020
IBIROOS
EUSKALMET-AZTI
HFR-Galicia (4)06/2015- 07/2020 Puertos del Estado
INTECMAR06/2015- 07/2020
HFR-Lisboa (2) 04/2012- 07/2020 Instituto Hidrografico
HFR-South (4) 02/2016- 07/2020 Puertos del Estado
HFR-Vigo (2) 02/2010- 05/2016 Universidad de Vigo
HFR-Gibraltar (4) 12/2019- 07/2020IBIROOS / MONGOOS
Puertos del Estado
HFR-Ibiza (2) 06/2012- 07/2020 SOCIB
HFR-DeltaEbro (3) 12/2019- 02/2020 Puertos del Estado
HFR-TirLig (4) 08/2016- 07/2020 MONGOOS CNR-ISMAR
HFR-US-Alaska/EastGulfCoast/Hawaii/PuertoRicoVirginIslands/WestCoast 01/2019- 07/2020 GOOS US HFR National Network
Table I. European/non-European HFR networks connected to the European Node and dates of data series included in the last CMEMS (In Situ TAC) portfolio. N: Number of radial stations processed. * ROOS: Regional Operational Oceanographic Systems (Note that for HFR-MATROOS and US HFR National Network, only totals are processed).

341ADVANCES IN OPERATIONAL OCEANOGRAPHY EXPANDING EUROPE’S OBSERVING AND FORECASTING CAPACITY
Fig. 1. Schema summarizing the main processing steps from standardized (from the European HFR node) and raw data (from the HFR operators) to the advanced quality controlled historical standardized datasets.
2.1 Data Harvesting
The European HFR Node shares all the processing tools (https://github.com/LorenzoCorgnati/HFR_Node__Historical_Data_Processing/) with the data providers but also provides the data processing service, adapting to the needs of all the data providers. The collection of HFR dataflow, similar as the NRT data flow described in Corgnati et al., 2021, is structured as follows:
• If the data provider can generate HFR historical data series according to the defined data format and QC standards, the node only collects and analyses the data and re-processes the time series just if needed (always in exchange with the providers);
• If the data provider cannot generate HFR data according to the defined data format and QC standards, the HFR Node harvests the raw data from the provider, harmonizes, quality-controls, formats the data and re-processes the time series if needed (always in agreement with the providers).
2.2 Data Standardization
A set of shared software tools uses all that information for processing native HFR data for quality control and enables their conversion to the standard format for distribution. This strategy guarantees that, whatever the workflow, the NRT and REP data are processed by the same software tools. The European HFR Node checks the validity of the HFR files and applies the NRT QC in compliance with the European common data and metadata Standard for HFR surface current data. The mandatory QC tests performed on HFR radial and total current data are summarized in Table II (Please refer to Corgnati et al, 2018 and Mantovani et al., 2020, for additional information).

342 ADVANCES IN OPERATIONAL OCEANOGRAPHY
For most of the tests, HFR operators will need to select the best thresholds and specify them in the European HFR node webform. Since a successful QC effort is highly dependent upon selection of the proper thresholds, this choice is not straightforward, and requires trial and error before final selections are made (they are not to be determined arbitrarily but based on historical knowledge or statistics derived from historical data).
2.3 Advanced Quality Control (AQC) Reporting and Dissemination
Data series are organized in a standard system/time folder tree. The following plots are produced by year and system:
I) Time series of the spatial average of the current velocity module, its standard deviation, and the total coverage (see example in Figure 2);
II) Time series of the QC flags for all the grid nodes with data;
III) Maps of the mean value of QC flags for the target year and maps of mean velocity module and its standard deviation for the target year;
IV) Spatial (x-axis) vs. temporal (y-axis) coverage 80/80 annual. It allows to check if the system reached the goal of providing surface currents over the 80% of the area during 80% of the time (Figure 3);
V) Map of the mean velocity field in the area of 80% temporal coverage (Figure 3).
T/R T/R T/R
Syntax T, R Ensures proper formatting and the existence of all the necessary fields within the total NetCDF file);
Data Density Threshold T Ensures total velocity vectors with a number of contributing radials bigger than the threshold
Velocity Threshold T, R Ensures velocity vectors module under a maximum velocity threshold
Variance Threshold T, R Ensures total vectors temporal variance is smaller than a maximum threshold; test only applicable to
Beam Forming (BF) systems
Temporal Derivative T, R Ensures the differences between the current hour velocity vector compared with previous and next
hour are smaller than a threshold.
GDOP Threshold T Ensures the Geometrical Dilution Of Precision is smaller than a maximum threshold
Over water R Ensures velocity vectors lie on water
Median Filter R Ensures difference between the vector's velocity and the median velocity (computed within a given radius and angular distance from the source vectors position and bearing) is smaller than a threshold
Average Radial Bearing R Ensures average radial bearing of all the vectors lies within a specified margin around the expected
value of normal operation
Radial Count R Ensures entire data file having a number of radial velocity vectors bigger than the threshold
Table II. Summary of the QC tests applied to the HFR radial (R) and total (T) data.

343ADVANCES IN OPERATIONAL OCEANOGRAPHY EXPANDING EUROPE’S OBSERVING AND FORECASTING CAPACITY
Fig. 2. (from top to bottom) Time series of the spatial average of the current velocity module, its standard deviation and the number of grid points of the total coverage for the HFR-EUSKOOS system in 2018. Black dots are the values obtained considering all the data in the domain, in green those considering only data with QC flag =1 (good data).
Fig. 3. (left) Map of the % of availability of data in each grid point and contour showing the area of temporal availability >80%. (right) Spatial (x-axis) vs. temporal (y-axis) coverage 80/80 annual metric recommended by Roarty et al., 2012. Example for HFR-EUSKOOS system in 2018.
Based on the screening of the previous plots a AQC report by system is produced, where the performance is analysed year by year, and periods for reflagging (expert but subjective analysis) are proposed. In addition, possible changes in the processing of the data (namely in the thresholding strategy) are proposed too.

344 ADVANCES IN OPERATIONAL OCEANOGRAPHY
Once the report is generated, it is sent to the HFR data provider for its validation and agreement or feedback on the comments and the reflagging/reprocessing proposed. After the providers feedback changes in the original data series (reflagging or reprocessing) are indicated. A final version of the report is produced and shared in a public repository (http://dspace.azti.es/) and through CMEMS in situ TAC documentation. The reprocessed historical standardized HFR data are available at the main European marine data portals.
3. Way forward Future work will consolidate all the previously mentioned efforts by:
• Optimizing the tools for AQC and data processing, by the improvement of the scripts for the processing of historical data, the automatic generation of the AQC reports and of the data series through exchanges with data providers;
• Expanding the available data series, by collecting, standardizing, and analysing data from new systems and data from historical repositories;
• Developing standards, protocols, and tools to build similar long-term data sets from other data products (like gap-filled current maps or waves).
Acknowledgments
This work was partially undertaken in the framework of EUROSEA project (funded by the European Union’s Horizon 2020 research and innovation programme, under grant agreement N°. 862626) and JERICO-RI projects (Joint European Research Infrastructure network for Coastal Observatory – JERICO-NEXT and JERICO-S3, funded by the European Union’s Horizon 2020 research and innovation programme, under grant agreements N°. 654410 and N°. 871153 respectively), for the activities of HFR data harmonization and standardization. The distribution of the data has been carried on in the framework of the of the In Situ Thematic Assembly Centre (INSTAC) of the Copernicus Marine Environmental Monitoring Service (CMEMS) and all datasets are available in the CMEMS portfolio.
ReferencesBerta, M., Bellomo, L., Griffa, A., Magaldi, M.G., Molcard, A., Mantovani, C., Gasparini, G.P., Marmain, J., Vetrano, A., Béguery, L., others, 2018. Wind-induced variability in the Northern Current (northwestern Mediterranean Sea) as depicted by a multi-platform observing system. Ocean Science 14, 689–710.

345ADVANCES IN OPERATIONAL OCEANOGRAPHY EXPANDING EUROPE’S OBSERVING AND FORECASTING CAPACITY
Caballero, A., Mulet, S., Ayoub, N., Manso-Narvarte, I., Davila, X., Boone, C., Toublanc, F., Rubio, A., 2020. Integration of HF Radar Observations for an Enhanced Coastal Mean Dynamic Topography. Front. Mar. Sci. 7, 588713. https://doi.org/10.3389/fmars.2020.588713
Corgnati, L.; Mantovani, C.; Novellino, A.; Rubio, A. and Mader, J. (2018) Recommendation Report 2 on improved common procedures for HFR QC analysis. JERICO-NEXT WP5-Data Management, Deliverable 5.14, Version 1.0. Brest, France, IFREMER, 82pp, (JERICO-NEXT-WP5-D5.14-V1.). DOI: http://dx.doi.org/10.25607/OBP-944
Corgnati, L., Mantovani, C., Rubio, A., Reyes, E., Rotllán, R., Novellino, A., Gorringe, P., Solabarrieta, L., Griffa, A., and Mader, J., (2021). The EuroGOOS High Frequency Radar Task Team: a success story of collaboration. To be kept alive and made growing. XXX Proceedings 9th EuroGOOS Conference (Volume XX) Elsevier Oceanography Series
Dzvonkovskaya, A., Gurgel, K. W., Rohling, H., & Schlick, T. (2008). Low power high frequency surface wave radar application for ship detection and tracking. In 2008 International Conference on Radar (pp. 627-632)
Mantovani, C.; Corgnati, L.; Horstmann, J,; Rubio, A.; Reyes, E.; Quentin, C,; Cosoli, S.; Asensio, J.L.; Mader, J. and Griffa, A. (2020) Best Practices on High Frequency Radar Deployment and Operation for Ocean Current Measurement. Frontiers in Marine Science, 7:210, 21pp. DOI: 10.3389/fmars.2020.00210
Orasi, A., M. Picone, A. Drago, F. Capodici, A. Gauci, G. Nardone, R. Inghilesi, et al., (2018). ‘HF Radar for Wind Waves Measurements in the Malta-Sicily Channel’. Measurements 128: 446–454.
Paduan, J. D., Rosenfeld, L. K. (1996). Remotely sensed surface currents in Monterey Bay from shore based HF radar (Coastal Ocean Dynamics Application Radar). J Geophys Res-Oceans, 101(C9), 20669-20686.
Piedracoba, S., Rosón, G., Varela, R.A., 2016. Origin and development of recurrent dipolar vorticity structures in the outer Ría de Vigo (NW Spain). Continental Shelf Research 118, 143–153. https://doi.org/10.1016/j.csr.2016.03.001
Roarty, H., M. Smith, J. Kerfoot, J. Kohut and S. Glenn, 2012 Automated quality control of High Frequency radar data,Oceans, Hampton Roads, VA, 2012, pp. 1-7.
Roarty, H., Cook, T., Hazard, L., Harlan, J., Cosoli, S., Wyatt, L., Fanjul, E. A., Terrill, E., Otero, M., Largier, J., Glenn, S., Ebuchi, N., Whitehouse, B., Bartlett, K., Mader, J., Rubio, A., Corgnati, L. P., Mantovani, C., Griffa, A., … Matta, K. S. (2019). The global high frequency radar network. Frontiers in Marine Science, 6(MAR). https://doi.org/10.3389/fmars.2019.00164
346 ADVANCES IN OPERATIONAL OCEANOGRAPHY
Rubio, A., Mader, J., Corgnati, L., Mantovani, C., Griffa, A., Novellino, A., Quentin, C., Wyatt, L., Schulz-Stellenfleth, J., Horstmann, J., Lorente, P., Zambianchi, E., Hartnett, M., Fernandes, C., Zervakis, V., Gorringe, P., Melet, A., & Puillat, I. (2017). HF Radar activity in European coastal seas: Next steps toward a Pan-European HF Radar network. Frontiers in Marine Science, 4(JAN), 1–20. https://doi.org/10.3389/fmars.2017.00008
Saviano, S., De Leo, F., Besio, G., Zambianchi, E. and Uttieri, M. (2020) HF radar measurements of surface waves in the Gulf of Naples (Southeastern Tyrrhenian Sea): comparison with hindcast results at different scales. Front. Mar. Sci., 7, 492. doi: 10.3389/fmars.2020.00492
Sciascia, R., et al., 2018. Linking sardine recruitment in coastal areas to ocean currents using surface drifters and HF radar: a case study in the Gulf of Manfredonia, Adriatic Sea. OCEAN SCIENCE. https://doi.org/10.5194/os-14-1461-2018
Shen, W.; Gurgel, K.W. Wind Direction Inversion from Narrow-Beam HF Radar Backscatter Signals in Low and High Wind Conditions at Different Radar Frequencies. Remote Sens. 2018, 10, 1480.
Shrira, V.I., Forget P. (2015). On the nature of near-inertial oscillations in the uppermost part of the ocean and a possible route toward HF radar probing of stratification. J. Phys. Oceanogr., 45, 2660–2678
Wyatt, L.R., Green, J.J., Middleditch, A., Moorhead, M.D., Howarth, J., Holt, M., Keogh, S. (2006). Operational wave, current and wind measurements with the Pisces HFR. IEEE J. of Ocean Eng., 31.

347ADVANCES IN OPERATIONAL OCEANOGRAPHY EXPANDING EUROPE’S OBSERVING AND FORECASTING CAPACITY
ENCODER-DECODER MACHINE LEARNING APPROACH FOR METEO-OCEANOGRAPHIC TIME-SERIES PREDICTION Gianina Chirosca (1), Maria-Emanuela Mihailov (2)*, Maria-Ionela Tomescu-Chivu (3), Alecsandru Chirosca (1)
(1) Faculty of Physics - University of Bucharest, Atomistilor Street no.. 405, Magurele, Ilfov, Romania, [email protected]
(2) Maritime Hydrographic Directorate, Fulgerului Street no.1, Constanta, Romania, [email protected]
(3) National Meteorological Administration - Regional Meteorological Centre of Dobrogea, Mamaia Blvd. 300, Constanta, Romania, [email protected]
Abstract
Environmental state evaluation through its dynamic parameters plays a key role in assessment procedures to apply prediction models for early anomaly detection. This work presents the implementation of a Machine Learning Encoder-Decoder pattern used to environmental in situ data (air and seawater temperature and wind speed) measured at Gloria offshore drilling platform - Romanian Black Sea Shelf. The station was chosen because there are no boundary interactions with the coastal region which enables the development of the multivariate, unidirectional time-series prediction algorithm. The model provided less than 5% mean absolute error (MAE) for 7 data points (months) forecast requiring the last 10 data points as input. The model accuracy enables the anomaly identification for meteo-oceanographic monthly average data. Future evolution of the seawater temperature extends the model for coastal areas with a less than 5% additional accuracy reduction. This model was developed mainly using available open-source frameworks permitting the integration with most of the visualisation platforms available today.
Keywords: Environmental health assessment, machine-learning prediction, environmental modelling, machine learning, time-series prediction
1. Introduction With a long history, since 1959, when the first models were proposed by (Samuel A.L. 1959), Machine Learning or ML discipline continues to grow into a robust collection of

348 ADVANCES IN OPERATIONAL OCEANOGRAPHY
algorithms widely used in data science and modelling projects. Our goal is to develop and apply ML models for air and seawater temperature correlated wind speed allowing us to implement a specialised model to predict all seasons measured at Gloria offshore drilling platform-Romanian Black Sea Shelf.
2. Data and Methods The current study is based on in situ observations (air and seawater temperature and wind speed), recorded at Gloria Platform (44.52°N, 29.57°E), 30 km offshore Romanian Black Sea coast at 50 m bathymetric line. The wind measurements are performed at the 36 m height above the sea level. Our approach is to build the prediction models using the available datasets cover five years of continuous measurements (2005 to 2010) with a recording interval at every 6 hours. Data was split into training and testing datasets (the training dataset contains the last 700 datapoints within the multivariate timeseries.
We applied open source Data Science Tools for machine learning using the Python language for the model development, thus allowing for a better data evaluation and visualisation. We start implementing the machine learning models starting with a multivariate data containing 3 variables (wind speed, air temperature and water temperature) with a lookback of 12 values and a forward prediction of 3 values. We built several models and obtained the best results using a 4x4 model (the encoder has a depth of 4 LSTM layer, and the decoder is the same with four layers interconnected to the respective encoder layers). Using an iterative approach, we found that the overfitting occurs above epoch 60 and chooses a total epoch size of 50 steps. The training parameters include 200 neurons for each LSTM layer.
Fig. 1. Machine Learning process loss for up to 50 epochs.

349ADVANCES IN OPERATIONAL OCEANOGRAPHY EXPANDING EUROPE’S OBSERVING AND FORECASTING CAPACITY
3. Results and discussion Model training can be analysed using the loss function plot for both the training and testing dataset. Overfitting will increase testing loss (compared to the actual value in the specific dataset) while the training loss decreases, as Figure 1.
After the model training, we evaluated the results using the remainder 10% of the data (the testing data). Our first parameter, the wind speed, provides an estimation for the potential energy transferred to the water masses. This parameter is considered as input for our model. As is shown in Figure 2, the wind speed prediction appears to be accurate (within an absolute mean error-MAE of 2.09 m/s). An accurate prediction model with an MAE of 1.11°C was developed for the air temperature. The main output parameter, the water temperature, shows an MAE of 0.28°C for the testing dataset.
Fig. 2. Machine Learning Model prediction for testing data (last 10% of the recorded data) using an 6 hours step. Predicted values present the model accuracy for future points prediction.

350 ADVANCES IN OPERATIONAL OCEANOGRAPHY
4. Conclusion This model acts like a proof of concept for ML based environmental data prediction system. Our model uses wind speed, water and air temperature with no exogenous variables. The mean absolute error for the main parameter (the water temperature) provides an estimate for Machine Learning Recurrent Neural Network designs tuned for specific complex issues. For future data, not seen by the model, we expect an increase in prediction accuracy within 10% leading to an accurate prediction model using Machine Learning techniques. The model can be extended for area prediction using another multivariate parameter encoding the station (position on the map). The authors recommend continuing to use the machine learning models and their derivatives.model with an MAE of 1.11°C was developed for the air temperature. The main output parameter, the water temperature, shows an MAE of 0.28°C for the testing dataset.
Acknowledgments
This research has been carried out, with financial support, from the Sectorial Research-Development Plan of the Romanian Ministry of National Defence 2020 and 2021.
ReferencesQian, Q. F., Jia, X. J., & Lin, H. (2020). Machine learning models for the seasonal forecast of winter surface air temperature in North America. Earth and Space Science, 7, e2020EA001140. https://doi.org/10.1029/2020EA001140
Reichstein, M., Camps Valls, G., Stevens, B., Jung, M., Denzler, J., & Carvalhais, N. (2019). Deep learning and process understanding for data driven Earth system science. Nature, 566(7743), 195–204
Cohen, J., Coumou, D., Hwang, J., Mackey, L., Orenstein, P., Totz, S., & Tziperman, E. (2019). S2S reboot: An argument for greater inclusion of machine learning in subseasonal to seasonal forecasts. Wiley Interdisciplinary Reviews: Climate Change, 10(2), e00567.
351ADVANCES IN OPERATIONAL OCEANOGRAPHY EXPANDING EUROPE’S OBSERVING AND FORECASTING CAPACITY
DYNALIT: A RESEARCH AND OBSERVATION SERVICE MONITORING COASTAL MORPHODYNAMICS IN METROPOLITAN AND OVERSEAS FRANCE Stéphane Bertin (1), Xavier Bertin (2)
(1) UMR 6538 Laboratoire Géosciences Océan, Univ. Brest-CNRS, Institut Universitaire Européen de la Mer, Rue Dumont d’Urville, 29280 Plouzané, France
(2) UMR 7266 Littoral, Environment and Societies, CNRS-Univ. La Rochelle, 17000 La Rochelle, France
Abstract DYNALIT is a research-based observatory on coastal morphodynamics. Created in 2014 from existing and new monitoring programs, recognised ‘Service National d’Observation’ by CNRS-INSU and member of Research Infrastructure ILICO, the observatory integrates over 30 sites in metropolitan and overseas France.
Keywords: Coastal monitoring, morphodynamics, topography, remote sensing, long-term coastal evolutions
1. IntroductionCoastal zones are among the most dynamic environments on Earth. Coastal zones are also home of a growing population and provide many eco-systemic services, while storms, accelerating sea-level rise and anthropogenic pressure put this environment at threat. Coastal observations at representative sites and time scales are needed to better understand the physical processes at play and hence to help adapting coastal planning strategies to future changes.
DYNALIT is part of the French Research Infrastructure (RI) ILICO for coastal ocean and nearshore observations (Cocquempot et al., 2019). Data from DYNALIT are available using services provided by the ODATIS ocean and coastal data cluster of the French DATA TERRA RI (Schmidt et al., 2020).

352 ADVANCES IN OPERATIONAL OCEANOGRAPHY
2. From at-a-site data acquisition … to fair data dissemination Field sites monitored span different coastal systems: beaches, cliffs and estuary mouths, located across five oceanic facades (Figure 2). Variables measured comprise the subaerial topography through repeated surveys (frequency is monthly to annual) using GNSS and remote-sensing techniques such as LiDAR and photogrammetry. Surveys are generally conducted during spring low tides to maximise surface coverage. The sediment load represented by turbidity is measured at the estuary sites.
The continuously updated dataset can be accessed at: http://www.dynalit.fr/. It incorporates historical data as well as continuous monitoring from the 2000s, resulting in over 1000 beach profiles, 500 topographic point clouds and DEMs, orthophotos as well as bathymetric DEMs georeferenced to legal reference systems and distributed under an open licence. The data are readily usable with a variety of GIS and programming software and enable online access and visualisation.
3. Field data of coastal morphological evolution over yearly and decadal timescales
Observations of coastal morphological evolution indicate complex behaviour over a wide range of scales in time and space. Of particular practical and scientific interests are timescales of years and decades (Figure 1). Datasets produced in the framework of DYNALIT typically encompass time series of topographic surveys (one- or two-dimensional in space), possibly with some simultaneous measurements of the forcing (e.g., wind, waves, and currents).
AcknowledgementsDYNALIT acknowledges funding from the French National Centre for Scientific Research (CNRS), as well as the French Ministry of Higher Education, Research and Innovation (MESRI) and AllEnvi via the RI-ILICO for coastal ocean and nearshore observations. DYNALIT could not exist without the tremendous work of research teams involved in the monitoring program. The authors wish to thank Stevenn Lamarche for help with database curation and figure preparation.

353ADVANCES IN OPERATIONAL OCEANOGRAPHY EXPANDING EUROPE’S OBSERVING AND FORECASTING CAPACITY
Fig. 2. Field sites monitored and data acquisition methods.
Fig. 1. Time-series using the datasets of Oléron and Truc Vert beaches. Decadal shoreline changes at Saint Trojan beach (Oléron) identified using shoreline mapping (top left) and topographic profiles (bottom left). (Right) (a) 3-hourly Hs (black) and 2-month moving average of Hs (thick green) using wave hindcast data. Red bubbles are storm events (Hs > Hs95%), whereby the size of the bubbles is proportional to storm duration. Beach-dune volume above mean sea level (b), and mean (black) and longshore standard deviation (grey) of the 6-m elevation shoreline (c), determined using topographic quad-mounted GNSS DEM surveys. Adapted from Castelle et al., (2019) and Chaumillon et al., (2019).

354 ADVANCES IN OPERATIONAL OCEANOGRAPHY
ReferencesCastelle, B. et al., (2019). Alongshore-variable beach and dune changes on the timescales from days (storms) to decades along the rip-dominated beaches of the Gironde Coast, SW France. In: Castelle, B. and Chaumillon, E. (eds.), Coastal Evolution under Climate Change along the Tropical Overseas and Temperate Metropolitan France. Journal of Coastal Research, Special Issue N°. 88, pp. 157–171.
Chaumillon, E. et al., (2019). Controls on shoreline changes at pluri-annual to secular timescale in mixed-energy rocky and sedimentary estuarine systems. In: Castelle, B. and Chaumillon, E. (eds.), Coastal Evolution under Climate Change along the Tropical Overseas and Temperate Metropolitan France. Journal of Coastal Research, Special Issue N°. 88, pp. 135-156.
Cocquempot L. et al., (2019). Coastal Ocean and Nearshore Observation: A French
Case Study. Frontiers in Marine Science, 6, 324.
Schmidt S. et al., (2020). Streamlining Data and Service Centers for Easier Access to Data and Analytical Services: The Strategy of ODATIS as the Gateway to French Marine Data. Frontiers in Marine Science, 7, 548126.

355ADVANCES IN OPERATIONAL OCEANOGRAPHY EXPANDING EUROPE’S OBSERVING AND FORECASTING CAPACITY

SESSION 9
EUROPEAN RESEARCH INFRASTRUCTURES

358 ADVANCES IN OPERATIONAL OCEANOGRAPHY
EMSO ERIC, THE PAN-EUROPEAN INFRASTRUCTURE OF SEAFLOOR AND WATER-COLUMN OBSERVATORIES AROUND THE EUROPEAN SEAS, EXTENDS ITS COVERAGE TO THE ARCTIC Juan José Dañobeitia (1, 2), Paolo Favali (1, 3), Laura Beranzoli (1, 3), Alan Berry (1, 4), Jérôme Blandin (1, 5), Mathilde Cannat (1, 6), Mafalda Carapuço (1, 7), Ayoze Castro (1, 8), Laurent Coppola (1, 9), Eric Delory (1, 8), Joaquin del Rio Fernandez (1, 10), Davide Embriaco (1, 3), Ilker Fer (1, 11), Bénédicte Ferré (1, 12), Maria I. Fredella (1), Andrew Gates (1, 13), Alessandra Giuntini (1, 3), Susan Hartman (1, 13), Nadine Lantéri (1, 5), Giuditta Marinaro (1, 3), Paola Materia (1, 3), George Petihakis (1, 14, 15), Vlad Radulescu (1, 16), Ivan Rodero (1), Pierre-Marie Sarradin (1, 5), Zuzia Stroynowski (1, 7)
(1) EMSO ERIC, Rome, Italy (2) Marine Tech. Unit-CSIC, Barcelona,
Spain (3) INGV, Rome, Italy(4) Marine Institute, Galway, Ireland (5 IFREMER, Brest, France (6) IPGP-CNRS, Paris, France (7 IPMA, Lisbon, Portugal (8) PLOCAN, Telde, Spain
(9) CNRS, Villefranche-sur-Mer, France(10) OBSEA-UPC, Barcelona, Spain(11) Bergen University, Bergen, Norway(12) Tromsø University, Tromsø, Norway(13) NOC, Southampton, United Kingdom(14) HCMR, Athens, Greece(15) EuroGOOS, Brussels, Belgium(16) GeoEcoMar, Bucharest, Romania
Abstract
EMSO is a distributed Research Infrastructure currently comprising nine Regional Facilities (RFs) and three shallow water test sites, strategically located all the way from the southern entrance of the Arctic Ocean across to the North Atlantic through the Mediterranean to the Black Sea. Since the beginning of 2021 Norway has been integrated as a new EMSO ERIC member, extending the geographical coverage to the Nordic Sea and the Arctic. EMSO’s extension will benefit from an experienced team managing moored observatories, ocean gliders and the Mohn Ridge Seafloor and Water Column Observatory.

359ADVANCES IN OPERATIONAL OCEANOGRAPHY EXPANDING EUROPE’S OBSERVING AND FORECASTING CAPACITY
Keywords: European Research Infrastructure, ocean observation systems, interdisciplinarity, deep seafloor and water column
1. Introduction The European Multidisciplinary Seafloor and water column Observatory (EMSO) European Research Infrastructure Consortium (ERIC) distributed infrastructure, currently comprises of 9 Regional Facilities (RFs) and three shallow water test sites, strategically located all the way from the southern entrance of the Arctic Ocean across to the North Atlantic through the Mediterranean to the Black Sea (Figure 1). Since the beginning of 2021 Norway has been integrated as a new of EMSO ERIC member, extending the geographical coverage to the Nordic Sea and the Arctic. Other three RFs are going to be added soon, two in Italian waters and one in Greek waters. EMSO’s expansion will benefit from an experienced team managing moored observatories, ocean gliders and the Mohn Ridge Seafloor and Water Column Observatory.
EMSO ERIC is in transition to implement the full operation of all services, which will be completed in 2022, with the goal to harmonize quality-controlled data, to achieve interoperability across the infrastructure and easy access for data aggregators, in the EOOS framework; to extend the infrastructure and strengthen international collaboration with special emphasis on Polar observations; to establish strong links with key marine industries.
EMSO aims at stimulating new technologies and knowledge that will promote European excellence in marine research. It sets the perspective for the position and role that EMSO ERIC must achieve in the coming years to ensure long-term sustainability of the infrastructure operations and the continuous update of its cutting-edge technology. Overall EMSO infrastructure offers scientists a powerful new tool for understanding ocean dynamics driving Earth’s ecosystems and the complex forces controlling climate on a global scale, and observing natural risks such as earthquakes, tsunamis and steep-slope sliding (Ruhl et al., 2011; Favali et al., 2015).
2. EMSO DISTRIBUTED infrastructure around European Seas
EMSO ERIC RFs include open-ocean, water column and seafloor observatories in water depths from a few meters down to 4,850 m, and shallow-water test bed sites in the North East Atlantic and the Mediterranean Sea (Best et al., 2016). Although each observatory provides essential services and products on an individual basis, but as a distributed infrastructure, EMSO has the potential to increase data availability and continuity throughout the European seas, and address broader questions. Furthermore, the integrated observatory infrastructure can enhance collaboration among the nodes to provide wider-reaching and higher-impact services.on a global scale, and observing natural risks such as earthquakes, tsunamis and steep-slope sliding (Ruhl et al., 2011; Favali et al., 2015).

360 ADVANCES IN OPERATIONAL OCEANOGRAPHY
2.1 Atlantic coverage
EMSO is moving towards site specialization at the RFs as an efficient and beneficial advance that provides added value. In the Atlantic Ocean from North to South EMSO covers key environmental areas like the newest incorporation of Norway that will fill the gap in the Nordic Seas (Figure 2), as the gate to the Arctic and a key environmental site to understand the climate system and global ocean circulation better.
Fig. 2. Norwegian Nordic-seas RF component made up of three main components: (a) ocean gliders (tracks in red), (b) deep-sea moorings (white circles), and the Mohn deep-sea observatory (triangles) (Barreyre, Fer and Ferré, 2020).
Fig. 1. EMSO Regional Facilities deep-sea observatories (empty circles) and shallow water depth test sites (solid circles).
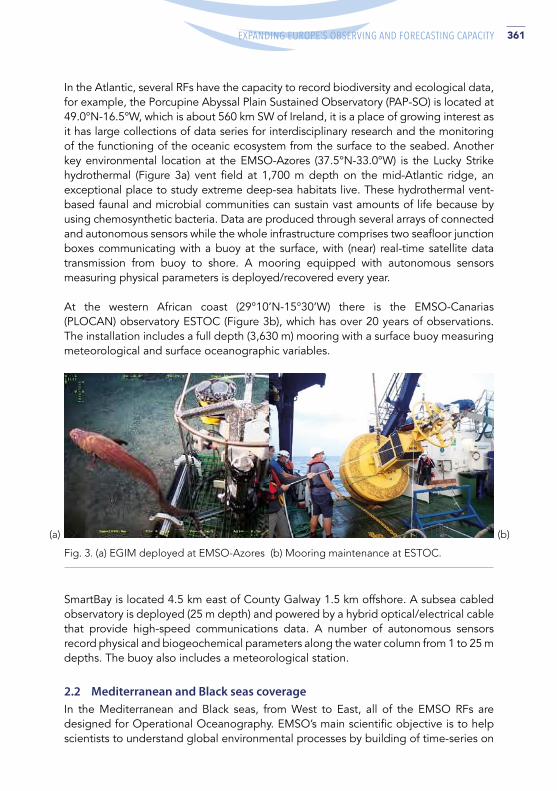
361ADVANCES IN OPERATIONAL OCEANOGRAPHY EXPANDING EUROPE’S OBSERVING AND FORECASTING CAPACITY
In the Atlantic, several RFs have the capacity to record biodiversity and ecological data, for example, the Porcupine Abyssal Plain Sustained Observatory (PAP-SO) is located at 49.0°N-16.5°W, which is about 560 km SW of Ireland, it is a place of growing interest as it has large collections of data series for interdisciplinary research and the monitoring of the functioning of the oceanic ecosystem from the surface to the seabed. Another key environmental location at the EMSO-Azores (37.5°N-33.0°W) is the Lucky Strike hydrothermal (Figure 3a) vent field at 1,700 m depth on the mid-Atlantic ridge, an exceptional place to study extreme deep-sea habitats live. These hydrothermal vent-based faunal and microbial communities can sustain vast amounts of life because by using chemosynthetic bacteria. Data are produced through several arrays of connected and autonomous sensors while the whole infrastructure comprises two seafloor junction boxes communicating with a buoy at the surface, with (near) real-time satellite data transmission from buoy to shore. A mooring equipped with autonomous sensors measuring physical parameters is deployed/recovered every year.
At the western African coast (29°10’N-15°30’W) there is the EMSO-Canarias (PLOCAN) observatory ESTOC (Figure 3b), which has over 20 years of observations. The installation includes a full depth (3,630 m) mooring with a surface buoy measuring meteorological and surface oceanographic variables.
SmartBay is located 4.5 km east of County Galway 1.5 km offshore. A subsea cabled observatory is deployed (25 m depth) and powered by a hybrid optical/electrical cable that provide high-speed communications data. A number of autonomous sensors record physical and biogeochemical parameters along the water column from 1 to 25 m depths. The buoy also includes a meteorological station.
2.2 Mediterranean and Black seas coverage In the Mediterranean and Black seas, from West to East, all of the EMSO RFs are designed for Operational Oceanography. EMSO’s main scientific objective is to help scientists to understand global environmental processes by building of time-series on
Fig. 3. (a) EGIM deployed at EMSO-Azores (b) Mooring maintenance at ESTOC.
(a) (b)

362 ADVANCES IN OPERATIONAL OCEANOGRAPHY
EOVs and stimulating new technologies and knowledge by adopting of standards in sensors and measurement methodologies increasing interoperability (Dañobeitia et al., 2020). EMSO RFs offer a wide variety of oceanographic data services as detailed in the previous section. EMSO temperature and salinity time-series data are key in the context of deep ocean processes, climate variability, at regional (Mediterranean Sea), European and global scale. Changes have been documented in the last decades in Mediterranean Sea providing evidence that the deep ocean is accumulating heat. Understanding the underlying dynamics is crucial in defining future climate variability scenarios.
Geophysical data from different type of sensors are collected at several EMSO RFs. Geo-hazards include earthquakes, tsunamis, volcanic eruptions, and landslides. These geological hazards can have a significant socio-economic impact. Most of Europe’s geographical hazard data available in Europe are collected in terrestrial environments by Geological Surveys or National Geophysical Institutions. EMSO with its distributed RFs can augment with unique information in the ocean and fill the gap by developing methodologies to detect the trigger of geo-hazards and improve the capacity of early warning to mitigate the impact. The shallow water EMSO-OBSEA provides real-time seismic data, and deliver on near-real time to the National and Regional Seismic Networks. The EMSO-Ligurian cabled observatory is composed of three main locations with two cabled in open sea at Western Ligurian (2,400 m) and coastal at Eastern Ligurian (near Nice), together with a stand-alone mooring (DYFAMED).
The EMSO Western Ionian Sea (Figure 4a) is a cabled observatory that splits in two branches at 20 km off the Eastern Sicily coast down at ~2,100 m depth. The North branch hosts the geophysical and oceanographic station SN1, managed by INGV, while the South branch hosts a tetrahedral antenna of hydrophones, managed by INFN.
Fig. 4. (a) EMSO Western Ionian Sea, (b) EMSO Hellenic Arc location.
(a) (b)

363ADVANCES IN OPERATIONAL OCEANOGRAPHY EXPANDING EUROPE’S OBSERVING AND FORECASTING CAPACITY
The EMSO Hellenic Arc is located in the South East Ionian Sea (Figure 4b), offshore Peloponnese, at a depth of 1670 m. It comprises of three major parts:
1. An open sea surface buoy with a 1000 m water column component;
2. An autonomous seabed platform with hydro acoustic relay to the surface buoy;
3. A cabled multidisciplinary seafloor observatory.
The EMSO Black Sea is located in a geological complex area, where three major tectonic plates (Eurasian, Anatolian, Arabian) interact. Geo-hazards, such as earthquakes, submarine landslide, displacement along active faults, are present and are possible triggers of tsunami, potential gas eruptions from sea bottom sediments. Today the system consists of three offshore moored observatories, each including underwater modules. The offshore observatories are moored 160 km from the Romanian coast at about 90 m water depth. EMSO RF delivers near real-time data on geophysical processes for scientific research purposes to databases for purposes of earthquake monitoring and academic studies. EMSO bottom pressure data, acquired at the Western Ionian and Ligurian Seas, Azores, Hellenic arc and the Black Sea, can contribute to tsunami warning systems, particularly in the Mediterranean region. However, efforts are still requested to achieve this objective.
3. EMSO deliver services from a multinode approach A key objective of the EMSO ERIC is to provide stakeholders with data quality with FAIR principles, based on continuous and sustained monitoring of environmental processes, and physical and virtual access to RFs. Stakeholders include marine scientists and engineers, policy makers, marine industries and the wider public. The EMSO ERIC conceptual workflow and value chain in providing high-quality multidisciplinary environmental data is shown in Figure 5.
Despite the technological developments in ocean observations, significant challenges still exist as described in OceanObs’19 white paper (Speich et al., 2019). EMSO ERIC has participated in the scientific and engineering community’s efforts to better establish future ocean observation requirements for future ocean observation, in particular in respect to the GOOS EOVs (Miloslavich et al., 2018). Moreover, in the framework of EMSO-Link project work has focused on best practices in ocean observation (Pearlman et al., 2019). EMSO ERIC has established plans for Geo-hazards, Oceanography and Climate, and Environmental Indicators workflows to support its RFs to deliver complex services and products.

364 ADVANCES IN OPERATIONAL OCEANOGRAPHY
Fig. 5. EMSO ERIC conceptual workflow.
Acknowledgements
This is supported by EC projects EMSO-link (Ref. 731036, 2017-2020) and ENVRI-FAIR (Ref. 8249068).
ReferencesBest, M.M.R., Favali, P., Beranzoli, L., Blandin, J., Çağatay, N.M., Cannat, M., Dañobeitia, J.J., Delory, E., de Miranda, J.M.A., Del Rio Fernandez, J., de Stigter, H., Gillooly, M., Grant, F., Hall, P.O.J., Hartman, S., Hernandez-Brito, J., Lantéri, N., Mienert, J., Oaie, G., Piera, J., Radulescu, V., Rolin, J.-F., Ruhl, H.A., Waldmann, C., and all the contributors to the EMSO Consortium (2016). The EMSO ERIC Pan-European Consortium: Data benefits and lessons learned at the legal entity forms. Marine Technology Society Journal, 50(3), 8-15.
Barreyre, T., Fet, Il., and Ferré, B. (2020). NorEmso-The Norwegian node for the European Multidisciplinary Seafloor and water column Observatory. (2020). 22nd EGU General Assembly, 4-8, 7248.
Dañobeitia, J.J., Pouliquen, S., Johannessen, T., Basset, A., Cannat, M., Pfeil, B.G.,
Fredella, M.I., Materia, P., Gourcuff, C., Magnifico, G., Delory, E., del Rio Fernandez, J., Rodero, I., Beranzoli, L., Nardello, I., Iudicone, D., Carval, T., Gonzalez Aranda, J.M., Petihakis, G., Blandin, J., Kutsch, W.L., Rintala, J.-M., Gates, A.R., and Favali,

365ADVANCES IN OPERATIONAL OCEANOGRAPHY EXPANDING EUROPE’S OBSERVING AND FORECASTING CAPACITY
P. (2020). Toward a Comprehensive and Integrated Strategy of the European Marine Research Infrastructures for Ocean Observations. Frontiers in Marine Science, 7,180, doi: 10.3389/fmars.2020.00180.
Miloslavich, P., Bax, N.J., Simmons, S.E., Klein, E., Appeltans, W., Aburto-Oropeza, O., Andersen Garcia, M., Batten, S.D., Benedetti-Cecchi, L., Checkley, D.M., Chiba, S., Duffy, J.E., Dunn, D.C., Fischer, A., Gunn, J., Kudela, R., Marsac, F., Muller-Karger, F.E., Obura, D., Shin, Y.-J. (2018). Essential ocean variables for global sustained observations of biodiversity and ecosystem changes. Glob. Chang. Biol. 24, 2416–2433.
Pearlman, J., Bushnell, M., Coppola, L., Karstensen, J., Buttigieg, P.L., Pearlman. F., Simpson, P., Barbier, M., Muller-Karger, F.E., Munoz-Mas, C., Pissierssens, P., Chandler, C., Hermes, J., Heslop, E., Jenkyns, R., Achterberg, E.P., Bensi, M., Bittig, H.C., Blandin, J., Bosch, J., Bourles, B., Bozzano, R., Buck, J.J.H., Burger, E.F., Cano, D., Cardin, V., Llorens, M.C., Cianca, A., Chen, H., Cusack, C., Delory, E., Garello, R., Giovanetti, G., Harscoat, V., Hartman, S., Heitsenrether, R., Jirka, S., Lara-Lopez, A., Lantéri, N., Leadbetter, A., Manzella, G., Maso, J., McCurdy, A., Moussat, E., Ntoumas, M., Pensieri, S., Petihakis, G., Pinardi, N., Pouliquen, S., Przeslawski, R., Roden, N.P., Silke, J., Tamburri, M.N., Tang, H., Tanhua, T., Telszewski, M., Testor, P., Thomas, J., Waldmann, C., and Whoriskey, F. (2019). Evolving and Sustaining Ocean Best Practices and Standards for the Next Decade. Frontiers in Marine Science, 6,277, doi: 10.3389/fmars.2019.00277.
366 ADVANCES IN OPERATIONAL OCEANOGRAPHY
EUROFLEETS RI – AN ALLIANCE OF ORGANIZATIONS AND RESEARCH VESSELS TO STRENGTHEN INTEGRATED AND SUSTAINED OBSERVATIONS IN THE OCEAN AND SUPPORT INNOVATIVE NEW TECHNOLOGY VALIDATION TO FURTHER ADVANCE OBSERVING COMPETENCIES AND CAPABILITIES Aodhán Fitzgerald (1), Bernadette Ni Chonghaile (2), Giuseppe Magnifico (3), Lorenza Evangelista (4), Niamh Flavin (5), Olivier Lefort (6), Per Wilhelm Nieuwejaar (7)
(1) Marine Institute (MI), Galway, Ireland, [email protected](2) Marine Institute (MI), Galway, Ireland, [email protected](3) National Research Council (CNR), Rome, Italy, [email protected](4) National Research Council (CNR), Rome, Italy, [email protected](5) Marine Institute (MI), Galway, Ireland, [email protected](6) French Research Institute for Exploitation of the Sea (IFREMER), Brest, France,
[email protected](7) Institute of Marine Research (IMR), Bergen, Norway, [email protected]
Abstract
Built on the two previous FP7 grants Eurofleets (2009-2013) and Eurofleets 2 (2013-2017) and within the on-going H2020 Eurofleets+ project, the under-discussion Eurofleets RI aims at strengthening the role of the European Research Vessel Fleet in collecting marine data from global oceans, regional seas and coastal waters, deploy and service observing systems, so providing a vital platform for other European RIs. Eurofleets+ provides transnational access to a unique fleet of research vessels through a robust call management and evaluation process. Joint research activities in the project aims at advancing data management, improving interoperability of rigs for deployment of different equipment, facilitating installation of mobile equipment across different vessels and validating new innovations for intelligent exploration. Active dialog with stakeholders ensures that marine research vessels including associated equipment are coordinated, designed and operated optimally to meet scientific user’s requirements in addition to providing training activities to support the next generation of marine scientists. Fostering innovation through the management of exploitable results is

367ADVANCES IN OPERATIONAL OCEANOGRAPHY EXPANDING EUROPE’S OBSERVING AND FORECASTING CAPACITY
supported through collaboration with industrial partners. A business plan and strategic roadmap are under development for Eurofleets RI, while extensive dissemination and communication activities to raise awareness of the essential role of the European Research Vessel Fleet are ongoing.
Keywords: pan-European research infrastructures, marine science, research vessels, transnational access, observing systemsinterdisciplinarity, deep seafloor and water column
1. Introduction Ocean science has become ‘big science’, involving sophisticated and costly equipment, such as research vessels, fixed-point platforms (e.g. seabed observatories, buoys or moorings) and mobile units (e.g. ROVs, AUVs, USVs, gliders, Argo floats), remote sensing tools (e.g. high-frequency radars, satellites, aeroplanes or drones), land-based facilities (e.g. marine stations) and e-infrastructure (UNESCO, 2017). Research vessels are key Research Infrastructures (RIs) offering vital access to our Seas and global Oceans for conducting marine science and ocean observing (European Marine Board, 2013). Research vessels are essential in ocean observation as they are used to collect a wide variety of data and samples from the atmosphere, the ocean surface, the water column, the seabed, and the ground below it, as well as facilitating exploration of the vast expanses of relatively unexplored and unobserved ocean areas. Their work ranges from fisheries surveys to seafloor mapping, and from climate studies to deep-water/ocean observations. In addition, research vessels are critical for ocean observing stationary installations on the ocean floor, in the water column or on the surface as they deploy, recover and service them, as well as providing ground-truthing for satellites/AUV/gliders/etc. data.
Driven by the need to understand the inevitable impacts of climate and other global changes, based on ‘the best available scientific knowledge’ according to the Paris Agreement on Climate Change, the demand for sea and ocean data provided by research vessels is higher than ever. This demand for new data is not only for scientific needs, but also in response to current European Directives. For example, in support of the Marine Strategy Framework Directive (MSFD), the Water Framework Directive (WFD), the INSPIRE Directive and Data Collection Framework (DCF), Member States are required to conduct regular monitoring and observations in their own waters.
At a global level, the UN Sustainable Development Goals (SDG’s), and especially SDG14 (Life below water) place added political pressure on countries to understand ocean health status within their national waters and to recognise the potential impacts of management decisions.
These collected data and metadata contribute not only to the research purposes of the scientific cruises, but also add significantly to the presence and availability of ocean
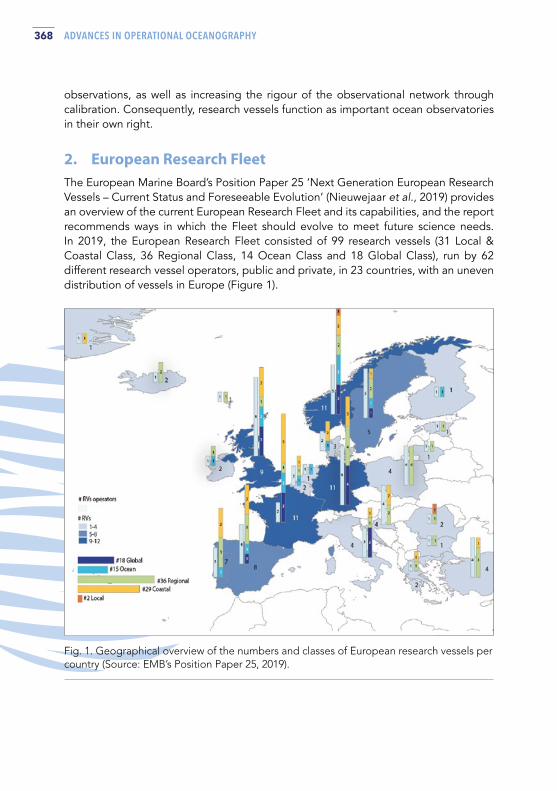
368 ADVANCES IN OPERATIONAL OCEANOGRAPHY
observations, as well as increasing the rigour of the observational network through calibration. Consequently, research vessels function as important ocean observatories in their own right.
2. European Research Fleet The European Marine Board’s Position Paper 25 ‘Next Generation European Research Vessels – Current Status and Foreseeable Evolution’ (Nieuwejaar et al., 2019) provides an overview of the current European Research Fleet and its capabilities, and the report recommends ways in which the Fleet should evolve to meet future science needs. In 2019, the European Research Fleet consisted of 99 research vessels (31 Local & Coastal Class, 36 Regional Class, 14 Ocean Class and 18 Global Class), run by 62 different research vessel operators, public and private, in 23 countries, with an uneven distribution of vessels in Europe (Figure 1).
Fig. 1. Geographical overview of the numbers and classes of European research vessels per country (Source: EMB’s Position Paper 25, 2019).

369ADVANCES IN OPERATIONAL OCEANOGRAPHY EXPANDING EUROPE’S OBSERVING AND FORECASTING CAPACITY
The current European research vessel fleet is highly capable to support all kinds of marine science, is able to provide excellent support to European marine science and wider scientific research and can take the lead on the world stage. However, with a typical functional life expectancy of a research vessel of 30 years, the fleet is ageing and urgently requires further investment and reinvestment to continue to be as efficient and capable as the scientific community expects and requires. The capabilities of the fleet have increased considerably since 2007 (Binot et al., 2007), and vessels have kept up with fast-paced technological developments. The demand for complex and highly capable vessels will continue, and research vessel designs and outfitting, and the European research vessel fleet as a whole will need to keep pace in order to remain fit-for-purpose and continue to be a key player globally. There is huge diversity in vessel types and designs in terms of capabilities and equipment, management structures and processes, and training possibilities. While it would not be possible or appropriate to highlight any one approach as the only one to use, a growing trend in collaboration through community groups, agreements, legal entities and funded projects now enables more strategic thinking in the development of these vital infrastructures. However, some issues remain in enabling equal access to research vessel time for all researchers across Europe regardless of country, and regardless of whether or not that country owns a suitable research vessel for their scientific needs.
3. Eurofleets+ Project Over the years, the European Commission (EC) has strongly supported the opening-up of existing national research infrastructures at a European level. Within research projects granted under EU funding programmes (e.g. FP7 and H2020), Transnational Access (TA) to key infrastructures is viewed as a key enabler of research and innovation to address global environmental, social and economic challenges. In addition, long-term sustainability of research infrastructures has been repeatedly highlighted as one of the main challenges for the overall research and innovation system in Europe. Long-term sustainability of research infrastructures has been recognized as mandatory to remain at the forefront of science and technology, and to stay competitive in the global knowledge-based economy.
The H2020 funded project Eurofleets+ (An alliance of European marine research infrastructure to meet the evolving needs of the research and industrial communities) is an Advanced Community with a high degree of coordination and networking, attained through Integrating Activities awarded in two previous FP7 grants, Eurofleets and Eurofleets 2. The Eurofleets+ project provides TA to a unique fleet of state-of-the-art, modern research vessels and arrange that these are optimally used for excellent science, leading to high level scientific publications and exploitation by European and international researchers through a robust call management and evaluation process. The Eurofleets+ Joint Research Activities (JRA) are aimed at advancing data management, improving and advancing the interoperability of rigs to be able to deploy different equipment, enabling installation of mobile equipment when needed,

370 ADVANCES IN OPERATIONAL OCEANOGRAPHY
facilitating sharing and installation of equipment across different vessels and validating new innovations for intelligent exploration, mapping and control using cooperative navigation. Active dialog with stakeholders and user communities ensures that the relevant marine research infrastructures are coordinated, designed and operated optimally for user’s challenging requirements while training and education activities to support early stage researcher’s careers and train the next generation of marine scientists and activities to promote ocean literacy to all. Fostering innovation through the capture and management of exploitable results, in particular those with a strong scientific, economical and/or environmental protection potential will be supported through collaboration with key industrial partners. A strategic roadmap, business case and business plans are under development for the coordination and integration of the European research vessel fleet, and practical guidelines produced to ensure sustainability beyond the project lifetime, while all of this activity is widely disseminated and communicated to raise awareness of the role of the European Research Vessel Fleet in advancing our knowledge of marine processes and resources and thereby our management of the ocean.
4. Peculiarities of research vessel operators models Management of research vessels is usually not centralized per country, but rather by institutions, universities or government bodies focusing on environmental monitoring and/or marine research. The most striking and recent example of centralized fleet management is in France, where the French Oceanographic Fleet has been managed by one single operator, IFREMER, since 2018. In Spain, an agreement for the creation of a joint management unit called FLOTPOL65 was signed between CSIC and IEO in 2013 in order to strengthen collaboration and optimize the operation of the research vessels and equipment owned and operated by these two institutions. In other countries where several research vessels are operated, three and even up to eight operators can be identified, such as three different operators managing five (Italy) or seven (Portugal) research vessels. In Norway, the Institute of Marine Research (IMR) operates seven research vessels that are owned and co-owned by five different public institutions belonging to four different ministries.
Funds to operate research vessels mainly come from the national governments although the funding schemes differ between countries. Some countries have a fully funded RI, where all costs associated with the vessel(s) and the science conducted on board are covered. In other countries, part or all of the costs other than the vessel’s fixed operating costs, such as transportation of equipment to be used on the cruise, travel for the science party to/from the vessel etc. have to be covered by the scientific users.
Other significant characteristics with regards to research vessels are the high investment cost in the order of 10 – 15 M€ for a coastal research vessel, 20 – 40 M€ for a regional research vessel and 50 – 150 M€ for an ocean class or global class research vessel,
371ADVANCES IN OPERATIONAL OCEANOGRAPHY EXPANDING EUROPE’S OBSERVING AND FORECASTING CAPACITY
and the high annual running cost which can be in the order of 0,5 – 1 M€ for a coastal vessel, 3 – 4 M€ for a regional vessel and 5 – 10 M€ for a ocean/global vessel. Given a lifetime of 30 – 40 years, the decision to invest in a research vessel is substantial, requires a long-term financial commitment from the owner(s) and must be based on a solid user need analysis and a sustainable scientific strategy.
Co-ownership at an international level is not a common management model for European research vessels. This is mainly due to issues that arise concerning the legal status of the vessel. A vessel can only fly one unique national flag, generally the national flag of the owner, hence if it is jointly owned by several countries, it is not obvious which flag it should fly. The national flag also makes research vessels highly visible at a national level and hence they are considered as national assets.
5. From EUROFLEETS+ Project to EUROFLEETS RI The European research vessel operators’ community is less well developed in comparison with European marine science communities that have evolved towards pan-European initiatives for the coordination of Research Infrastructures, such as ERICs EMSO, EPOS, EURO-ARGO, ICOS, LifeWatch, EMBRC and AISBLs EUFAR, EuroGOOS, IAGOS, SeaDataNet and EOSC. Regular networking activities amongst the European research vessel operators exist mainly through the European Research Vessel Operators (ERVO) Group, which, however, has an informal nature, with no legal status or financial support.
The establishment of a long-term sustainable coordination system (Eurofleets RI) constitutes a fundamental strategic achievement for the Eurofleets+ project, consolidating a strategic and coherent vision of the European Research Vessel Fleet outlining the future research infrastructure developments of an alliance of coordinated organizations and research vessels, unique in the EU-Research Infrastructure landscape. Eurofleets RI will have the ability to handle TA to research vessels and Large EXchangeable Instruments (LEXIs) in Europe, together with strengthening the sharing of knowledge, experience, best practices and collaboration among research vessels and/or LEXI operators and various stakeholders across Europe (Figure 2).

372 ADVANCES IN OPERATIONAL OCEANOGRAPHY
Eurofleets RI will have the primary task to manage the TA calls, including the publication of the calls, recruitment of members for scientific and logistical panels, organising network meetings, money transfer from the EC to the Principal Investigators and the research vessels operators, collection and publication of results, etc. Eurofleets RI will also accommodate and nurture the following:
I) Long-term coordination activities in liaison with the ERVO Group (with potential role as its permanent secretariat), the OFEG (Ocean Facilities Exchange Group), the IRSO (International Research Ship Operators) Group and the UNOLS (University-National Oceanographic Laboratory System);
II) Coordination of fleets for JPI-style initiatives, EU projects and pan-European distributed RIs such as ERICs EMSO, Euro-Argo, ICOS Marine, LifeWatch and EMBRC;
III) Technical groups for the exchange of best practices and shared developments, such as the operation of vessels and scientific instruments and equipment, software, acquisition standard coordination in liaison with SeaDataNet, EuroGOOS, etc.;
IV) Maintaining and validating the European vessel and equipment database, e.g. the Research Infrastructure Database (RID) currently managed by EurOcean, and establishing a coordinated renewal plan for European Research Fleets by consolidating and optimising national renewal plans as much as possible.
V) Temporary working groups on topics such as long coring, icebreakers, training for RV managers and instrument technicians, updates of EMB Position Paper 25, etc.
Fig. 2. Concept of the EUROFLEETS RI objectives.

373ADVANCES IN OPERATIONAL OCEANOGRAPHY EXPANDING EUROPE’S OBSERVING AND FORECASTING CAPACITY
5. From EUROFLEETS+ Project to EUROFLEETS RI The European research vessel operators’ community is less well developed in comparison with European marine science communities that have evolved towards pan-European initiatives for the coordination of Research Infrastructures, such as ERICs EMSO, EPOS, EURO-ARGO, ICOS, LifeWatch, EMBRC and AISBLs EUFAR, EuroGOOS, IAGOS, SeaDataNet and EOSC. Regular networking activities amongst the European research vessel operators exist mainly through the European Research Vessel Operators (ERVO) Group, which, however, has an informal nature, with no legal status or financial support.
The establishment of a long-term sustainable coordination system (Eurofleets RI) constitutes a fundamental strategic achievement for the Eurofleets+ project, consolidating a strategic and coherent vision of the European Research Vessel Fleet outlining the future research infrastructure developments of an alliance of coordinated organizations and research vessels, unique in the EU-Research Infrastructure landscape. Eurofleets RI will have the ability to handle TA to research vessels and Large EXchangeable Instruments (LEXIs) in Europe, together with strengthening the sharing of knowledge, experience, best practices and collaboration among research vessels and/or LEXI operators and various stakeholders across Europe (Figure 2).
Acknowledgements
Eurofleets+ has received funding from the EU H2020 research and innovation programme under Grant Agreement N° 824077.
ReferencesBinot, J., Danobeita, J., Muller, T., Nieuwejaar, P. W., Rietveld, M. J., Stone, P., ... Veenstra, F. (2007). European Ocean Research Fleets. In N. Connolley, A. Carbonniere, J. Binot, T. Muller, P. W. Nieuwejaar, M. J. Rietveld, & P. Stone (Eds.), EMB Position Paper 10.
European Marine Board. (2013). Navigating the Future IV. In N. McDonough, J.-B. Calewaert, A. Carbonniere, N.-C. Chu, D. Eparkhina, M. Evrard, & K. Larkin (Eds.), EMB Position Paper 20.
Nieuwejaar, P., Mazauric, V., Betzler, C., Carapuço, M., Cattrijsse, A., Coren, F., Danobeitia, J., Day, C., Fitzgerald, A., Florescu, S., Ignacio Diaz, J., Klages, M., Koning, E., Lefort, O., Magnifico, G., Mikelborg, Ø., Naudts, L. (2019) Next Generation European Research Vessels: Current Status and Foreseeable Evolution. Heymans, JJ., Kellett, P., Viegas, C., Alexander, B., Coopman, J., Muñiz Piniella, Á. [Eds.] Position Paper 25 of the European Marine Board, Ostend, Belgium. 140pp. ISBN: 978-94-92043-79-5 DOI: 10.5281/zenodo.3477893
374 ADVANCES IN OPERATIONAL OCEANOGRAPHY
UNESCO. (2017). Global Ocean Science - The Current Status of Ocean Science around the World (L. Valdés, K. Isensee, A. Cembella, A. C. Santamaria, M. Crago, L. Horn, ... M. Schaaper, eds.).

375ADVANCES IN OPERATIONAL OCEANOGRAPHY EXPANDING EUROPE’S OBSERVING AND FORECASTING CAPACITY
EXTENSION OF ARGO IN SHALLOW COASTAL AREAS AND EXPANSION OF THE REGIONAL COMMUNITIES (EURO-ARGO RISE PROJECT) Giulio Notarstefano (1), Dimitris Kassis (2), Atanas Palazov (3), Laura Tuomi (4), Waldemar Walczowski (5), Birgit Klein (6), Matthew Donnelly (7), Romain Cancouët (8)
(1) National Institute of Oceanography and Applied Geophysics - OGS, Borgo Grotta Gigante 42/C - 34010 - Sgonico (TS) - Italy, [email protected]
(2) Hellenic Centre for Marine Research, Street Address 46.5 km Athens-Sounio Ave., PO Box 712 Anavyssos, Attica, GR-190 13, Greece, [email protected]
(3) Institute of Oceanology – Bulgarian Academy of Sciences, 40 Parvi May Str., Varna, Bulgaria, [email protected]
(4) Finnish Meteorological Institute, - Erik Palménin aukio 1, FI-00560 Helsinki - Finland, [email protected]
(5) Institute of Oceanology of the Polish Academy of Sciences, Powstańców Warszawy 55, 81-712 Sopot, Poland, [email protected]
(6) Federal Maritime and Hydrographic Agency, Bernhard-Nocht-Str. 78, 20359 Hamburg - Germany, [email protected]
(7) British Oceanographic Data Centre, National Oceanography Centre - Joseph Proudman Building 6 Brownlow Street Liverpool L3 5DA - United Kingdom, [email protected]
(8) Euro-Argo ERIC, Campus Ifremer - Technopole Brest Iroise 1625 Route de Sainte-Anne 29280 Plouzané – France, [email protected]
Abstract The recent technological advances of the autonomous oceanographic monitoring platforms has allowed observations of unknown regions and dynamic processes that play a key role in the physical environment and marine ecosystem functioning. Under this context Euro-Argo RISE project aims towards the investigation of Argo extension in shallow coastal areas of European marginal seas (Black Sea, the Baltic Sea and the Mediterranean Sea) as well as the seasonally ice-covered areas of the high latitudes (Arctic Ocean). Different float configurations are tested whilst the development and implementation of operational systems to control the platforms are performed. Test deployments under Euro-Argo RISE have provided indications for the best settings, the optimization of float missions and the improvement of the life expectancy and the sampling efficiency in shallow coastal areas. In addition,
376 ADVANCES IN OPERATIONAL OCEANOGRAPHY
guidelines and best practices for operating floats in seasonally ice-covered areas are provided. The reinforcement and expansion of the Argo infrastructure at a regional scale is performed by approaching the regional research community (also through the organization of workshops and political events) with the aim of: promoting Argo data, cooperation at sea, collaboration in technical activities, sharing best practice, knowledge and expertise.
Keywords: Argo float, Euro-Argo RISE, shallow-coastal areas, ice-covered areas
1. Introduction In the framework of the European H2020 Euro-Argo Research Infrastructure Sustainability and Enhancement (Euro-Argo RISE) project the potential of Argo profiling floats to operate in shelf areas is investigated. The aim is to close the gap between open-ocean and shallow/coastal waters (Euro-Argo ERIC, 2017), with a focus on three European Marginal Seas (EMS) (Mediterranean, Black and Baltic Seas). The project additionally aims towards the investigation of Argo extension in the seasonally ice-covered areas of the high latitudes. These extensions will assure an improved Argo dataset that is essential for climate assessment studies and operational oceanography services to provide the most reliable ocean state analysis and forecasting. Many aspects are considered and in particular the test of the platforms, mission configurations, monitoring tools and the involvement of human resources.
Another important target planned in the framework of the Euro-Argo RISE project is the strengthening and expansion of the Euro-Argo research infrastructure at regional scale. Regional research communities, scientists of the EMS riparian countries have been approached. Collaborations and initiatives were proposed and set up, the Euro-Argo ERIC and Argo data were promoted, cooperation for activities at sea and technical aspects, sharing best practice, knowledge and expertise have been put in place.
2. Methodology The expansion of Argo in such targeted areas is challenging since platforms are designed to perform in the open ocean whilst areas of marginal seas can be characterized by complex coastlines and bathymetry, shallow water, small archipelagos, narrow basins, shelf and shelf-break zones and ice coverage.
Argo float mission configurations in such areas can require quicker cycle time periods, shallower drift parking depths, and will to keep the floats in a targeted area. Moreover, float operators must rely on accurate monitoring systems to track their floats and change their configurations, if needed. Indeed, the aim is to prevent floats from stranding events, getting stuck at the sea bottom, and collision with ice/shore in some

377ADVANCES IN OPERATIONAL OCEANOGRAPHY EXPANDING EUROPE’S OBSERVING AND FORECASTING CAPACITY
areas. The eventual goal is to achieve the best float settings, and an improved life expectancy.
Altogether, eight Euro-Argo RISE floats (Figure 1) and some national platforms have been deployed in targeted areas of the Black Sea, the Baltic Sea and the Mediterranean Sea and the number of floats in the Arctic Ocean is increasing. The Euro-Argo RISE profilers used are manufactured by NKE (Arvor I model) and Teledyne Webb Research (Apex model) and are equipped with a standard Seabird Conductivity - Temperature - Depth (CTD) SBE 41CP sensor. The telemetry is performed by the Iridium bi-directional telemetry system.
Fig. 1. Euro-Argo RISE Argo float locations (green and red/black dots for active and inactive floats, respectively) as of 23rd March 2021, in the Mediterranean and Black Sea (right panel) and in the Baltic Sea (left panel).
Different configurations were tested according to the area of deployment and the target of the missions.
Several controlling and monitoring tools were used and designed to check the floats’ behavior and to send warnings and alerts. The Euro-Argo monitoring tool is a powerful tool to control the fleet and provides a set of predefined alerts and graphs. In addition to the Euro-Argo monitoring tool, the Ocean-OPS AIC tool presents a large set of statistics that permits to better assess the fleet. Home-made tools were also developed for the quick decoding of the SDB data and the provision of notifications in near real time (for platform location, bathymetry, distance from coastline, maximal depth, grounding events). These tools were utilized in conjunction with the generic tools, together with sea and atmospheric conditions systems.
Interaction with floats is much higher than the one needed for operations of Argo floats in the open ocean. Whilst the latter usually require few human activity, operations in shallow/coastal water of EMS and ice-covered areas need a more accurate monitoring and interaction with platforms on a basis mainly linked to the cycle period of the float (about 1 to 7 days). This is needed to change the configuration parameters, as the float moves to a different area (Figure 2).
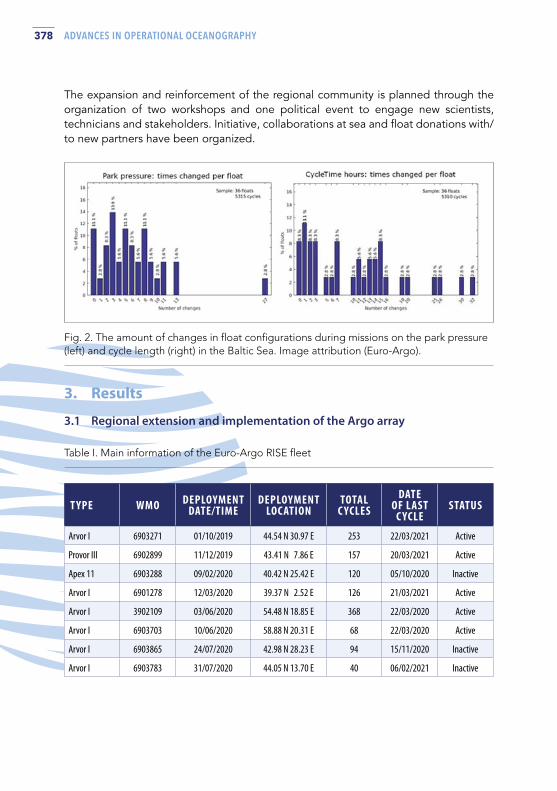
378 ADVANCES IN OPERATIONAL OCEANOGRAPHY
Fig. 2. The amount of changes in float configurations during missions on the park pressure (left) and cycle length (right) in the Baltic Sea. Image attribution (Euro-Argo).
3. Results
3.1 Regional extension and implementation of the Argo array
T YPE WMO DEPLOYMENT DATE/TIME
DEPLOYMENT LOCATION
TOTAL C YCLES
DATE OF LAST
C YCLESTATUS
Arvor I 6903271 01/10/2019 44.54 N 30.97 E 253 22/03/2021 Active
Provor III 6902899 11/12/2019 43.41 N 7.86 E 157 20/03/2021 Active
Apex 11 6903288 09/02/2020 40.42 N 25.42 E 120 05/10/2020 Inactive
Arvor I 6901278 12/03/2020 39.37 N 2.52 E 126 21/03/2021 Active
Arvor I 3902109 03/06/2020 54.48 N 18.85 E 368 22/03/2020 Active
Arvor I 6903703 10/06/2020 58.88 N 20.31 E 68 22/03/2020 Active
Arvor I 6903865 24/07/2020 42.98 N 28.23 E 94 15/11/2020 Inactive
Arvor I 6903783 31/07/2020 44.05 N 13.70 E 40 06/02/2021 Inactive
Table I. Main information of the Euro-Argo RISE fleet
The expansion and reinforcement of the regional community is planned through the organization of two workshops and one political event to engage new scientists, technicians and stakeholders. Initiative, collaborations at sea and float donations with/to new partners have been organized.

379ADVANCES IN OPERATIONAL OCEANOGRAPHY EXPANDING EUROPE’S OBSERVING AND FORECASTING CAPACITY
The most important parameters that play a crucial role for success are cycle length and parking depth. Some floats were used as virtual moorings by setting the parking depth at the bottom or close to the seabed and one of them was used as a virtual mooring using a fishing line with neutral buoyancy. Other strategies consisted of setting a parking depth well below the surface and subsurface currents in regions characterized by high dynamic. Cycle length was set up in terms of hours or one day typically at the beginning of the mission in order to check the float behavior. Higher profiling frequency is also used in challenging areas where quick configuration adjustments based on observations are needed. Cycle length is then lengthened up to 5 or 7 days to keep the floats in the targeted area and hence to minimize their displacement from the deployment location and their drifting towards critical zones (Figure 3).
A more intense monitoring activity of the fleet and more human-platform interactivity were needed for Argo operations in shallow coastal waters of EMS. Hence, the project partners developed some home-made tools to be used in conjunction with Euro-Argo and the Ocean-OPS monitoring systems. In particular, procedures to anticipate the float decoding were developed since this might be crucial in critical times of shallow/coastal Argo operations in EMS. Implementation of notification/warning/alert systems to take into consideration crucial parameters of the floats’ missions has been set up. Weather, forecasting systems, maritime traffic, detailed bathymetry tools were used to consult the most up-to-date information useful to achieve the best float mission (Notarstefano et al., 2021).
3.2 Expansion of the regional Argo community
Project partners regularly attended meetings organized by regional communities to present the Euro-Argo RISE activities and the extension of Argo in shallow/coastal water of EMS and in ice-covered areas of the Arctic Ocean. Successful cooperations were established for operation at sea (floats deployments and recoveries) by many partners with countries interested in joining Argo for activities in EMS. In particular, Morocco, Russia, Sweden, Romania were contacted. Other Research Infrastructures in the marine domain (ICOS OTC, DANUBIUS, EMSO) were approached with the aim of sharing the best practice and knowledge and for joint activities.
Two workshops have been organized to pursue and foster the above targets. One workshop is focused on the Mediterranean and Black Seas whilst the other is dedicated to the Arctic Ocean and Baltic Seas. The main objectives are focused on the scientific use and the technical aspects of Argo. Moreover, the role of Argo towards addressing environmental policies and operational monitoring for the society is also highlighted.A political event for decision-makers and stakeholders is planned within the Euro-Argo RISE project. The aim of this event is to show the importance of Argo for the environment and society in the EMS. It will address the Argo program and the UN Decade of Ocean Science for Sustainable Development, present the Euro-Argo ERIC framework and its services to users, and highlight activities and benefits of the Argo program in EMS.

380 ADVANCES IN OPERATIONAL OCEANOGRAPHY
Fig. 3. Left Panel: displacement (km) of the float from the area of deployment (top) and cycle period of the platform (bottom). Right panel: Hovmöller diagram of temperature for the Euro-Argo RISE float (WMO 6903783). Grounding events are highlighted as red boxes.
4. Conclusion The tests performed with the Euro-Argo RISE floats were promising and provided the basis for the expansion of Argo in shallow coastal areas of EMS. The mission configuration used seems adequate to explore shallow and small-sized seas and we were often able to control the float drift by limiting the displacements in a small area around the deployment location. These kinds of operations require a higher level of interactivity between the operator and the floats in order to reach a consistent life expectancy. Monitoring tools are fundamental to control the Argo platforms and a set of suggestions to try to improve the Euro-Argo and the Ocean-OPS monitoring systems were provided, together with indications on other tools and systems that might be useful to use in support of the monitoring activity.
Several new scientists and institutes were approached and introduced to Argo. Most of the riparian countries of the three EMS, regional communities, European Marine Research Infrastructures that have an interest in the regional context, were contacted and invited at the two planned scientific and technical workshops. This will help in enlarging the Argo regional community, building collaboration, sharing activities and strengthening the already existing partnerships. The Argo Regional Centers (ARCs) play a crucial role in such a context since they foster collaboration in a broad spectrum between countries working in the same region. Indeed, a good ARCs’ management can help in supporting such an activity carried on in the framework of the Euro-Argo RISE project.
We would like to increase the visibility of Argo through initiatives like the political event and to make the policy makers and stakeholders aware of the role that the Argo data have in marine environment protection and services to society.
381ADVANCES IN OPERATIONAL OCEANOGRAPHY EXPANDING EUROPE’S OBSERVING AND FORECASTING CAPACITY
Acknowledgements
The authors would like to thank the Euro-Argo RISE Work Package 2, 5 and 6 partners that provided a fundamental contribution in this work: Massimo Pacciaroni, Lara Diaz, John Allen, Inmaculada Ruiz, Joaquín Tintoré, Vincent Taillandier, Fabrizio D’Ortenzio, Pedro Velez Belchi, Violeta Slabakova, Simo Siiriä, Malgorzata Merchel, Ingrid Angel Benavides, Edouard Leymarie, Kjell Arne Mork, Kamila Walicka, Brian King, Luca Arduini Plaisant and Estérine Evrard (Project Manager).
ReferencesEuro-Argo ERIC (2017). Strategy for evolution of Argo in Europe. EA-2016-ERIC STRAT. https://doi.org/10.13155/48526
Kassis, D., Notarstefano, G., Taillandier, V., Ruiz, I., Diaz, L., Cancouet, R., Evrard, E., and Plaisant, L. A. (2021). Preliminary results of shallow coastal float operations in the Mediterranean Sea. Euro-Argo RISE H2020 project Deliverable 6.2
Notarstefano, G., Pacciaroni, M., Kassis, D., Palazov, A., Slabakova, V., Tuomi, L., Siiriä, S-M, Walczowski, W., Merchel, M., Allen, J., Ruiz, I, Diaz, L., Taillandier, V., Arduini Plaisant, L., and Cancouët, R. (2021). Tailoring of the controlling and monitoring tools for operations in shallow coastal waters. Euro-Argo RISE H2020 project Deliverable 6.1
Palazov, A., Slabakova, V., Notarstefano, G., and Cancouët, R. (2021). Preliminary results of shallow coastal float operations in the Black Sea. Euro-Argo RISE H2020 project Deliverable 6.3
Siiriä, S-M, Merchel, M., Walczowski, W., Tuomi, L., and Arduini Plaisant, L. (2020). Preliminary results of shallow coastal float operations in the Baltic Sea. Euro-Argo RISE H2020 project Deliverable 6.4
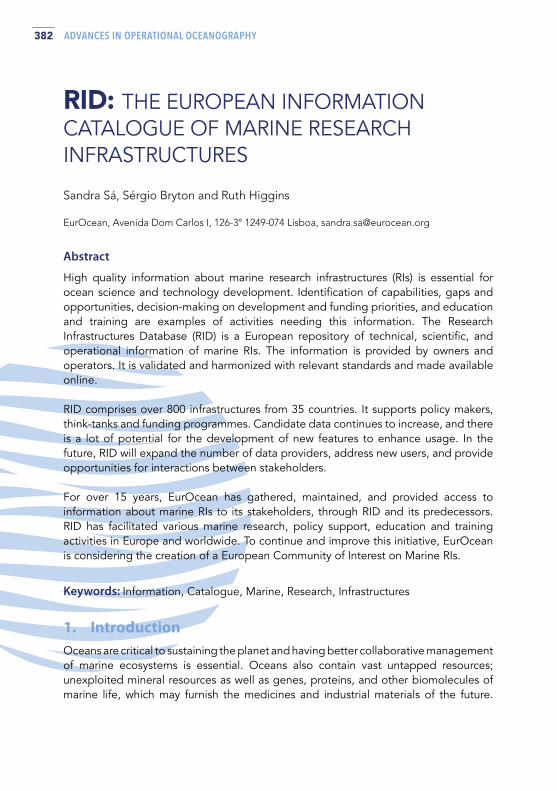
382 ADVANCES IN OPERATIONAL OCEANOGRAPHY
RID: THE EUROPEAN INFORMATION CATALOGUE OF MARINE RESEARCH INFRASTRUCTURES Sandra Sá, Sérgio Bryton and Ruth Higgins
EurOcean, Avenida Dom Carlos I, 126-3° 1249-074 Lisboa, [email protected]
Abstract
High quality information about marine research infrastructures (RIs) is essential for ocean science and technology development. Identification of capabilities, gaps and opportunities, decision-making on development and funding priorities, and education and training are examples of activities needing this information. The Research Infrastructures Database (RID) is a European repository of technical, scientific, and operational information of marine RIs. The information is provided by owners and operators. It is validated and harmonized with relevant standards and made available online.
RID comprises over 800 infrastructures from 35 countries. It supports policy makers, think-tanks and funding programmes. Candidate data continues to increase, and there is a lot of potential for the development of new features to enhance usage. In the future, RID will expand the number of data providers, address new users, and provide opportunities for interactions between stakeholders.
For over 15 years, EurOcean has gathered, maintained, and provided access to information about marine RIs to its stakeholders, through RID and its predecessors. RID has facilitated various marine research, policy support, education and training activities in Europe and worldwide. To continue and improve this initiative, EurOcean is considering the creation of a European Community of Interest on Marine RIs.
Keywords: Information, Catalogue, Marine, Research, Infrastructures
1. Introduction Oceans are critical to sustaining the planet and having better collaborative management of marine ecosystems is essential. Oceans also contain vast untapped resources; unexploited mineral resources as well as genes, proteins, and other biomolecules of marine life, which may furnish the medicines and industrial materials of the future.

383ADVANCES IN OPERATIONAL OCEANOGRAPHY EXPANDING EUROPE’S OBSERVING AND FORECASTING CAPACITY
Smart management of these natural assets requires knowledge, as do our efforts to ensure oceans’ ongoing species richness and their critical function in maintaining the Earth system. In particular, new technologies will allow us to more carefully study and exploit deep-sea environments and discover the vast reserve of still unexplored natural resources.
Marine research infrastructures are essential to develop the necessary knowledge to better manage the marine environment. In the first status report on global ocean science capacity, the United Nations Educational Scientific and Cultural Organization (UNESCO) concludes that ‘Research vessels are an essential component of ocean research infrastructure, as they provide access to both the open Ocean and coastal areas. Evolving science needs, cost pressures and newer technologies, such as advances in autonomous underwater vehicles (AUVs) and remotely operated vehicles (ROVs), have changed ocean science infrastructure. However, this has not lessened the reliance on well-equipped ships. In fact, research vessels (RV) are fundamental to deploy and recover new observing technologies and to explore the vast areas of the ocean poorly observed to date.’ (IOC-UNESCO, 2017).
High quality information about marine research infrastructures is essential for ocean science and technology development. Identification of capabilities, gaps and opportunities, decision-making on development and funding priorities, and education and training are examples of activities needing that type of information.
The development and update of comprehensive publicly available online inventories of a wide array of marine research infrastructures is one of EurOcean´s core tasks. This information was previously stored in four separate databases: the Marine Data Research Infrastructures Database (RID 1.0), the European Research Vessels Infobase (RV), the European Large Exchangeable Instruments Infobase (LEXI), and the European Aquaculture Experimental and Research Facilities Infobase (AF). The development of one consolidated database was very much needed for various reasons. Designed as a modular system, and more coherent, in terms of accessibility for all stakeholders in the marine sciences community, RID 2.0. emerged as the evolution of all those databases.
The present RID version (2.0) was developed: 1) to be a harmonized and integrated system; 2) to be compatible with standards and vocabularies developed by oceanographic organizations; 3) to streamline the data update process; 4) to improve the filtering and displaying functions, and 5) to improve the easiness of future developments. Presently, RID displays technical, scientific and operational information about marine RIs, mostly from Europe. This information is provided by infrastructure owners and operators, made compliant with relevant standards, and validated by EurOcean, as depicted in the figure on the following page.

384 ADVANCES IN OPERATIONAL OCEANOGRAPHY
Fig. 1. RID’s evolution.
Fig. 2. Process for updating Eurocean’s Research Infrastructures Database (RID).
The landscape of marine research infrastructures is complex. To obtain an overview of the convergence issues, of the technical requirements, and of the detailed specifications of the proposed integrated system, EurOcean established, over time, collaborations with relevant networks, projects an initiatives. Among others, EurOcean has established long-lasting relationships with the research vessels operators community (i.a. ERVO, OFEG, and IRSO). In addition, by resorting to its members and broader network, EurOcean was able to benefit from their expertise, in specific areas of knowledge, thus having created the most complete catalogue of marine research infrastructures available in Europe so far.

385ADVANCES IN OPERATIONAL OCEANOGRAPHY EXPANDING EUROPE’S OBSERVING AND FORECASTING CAPACITY
2. Information available RID comprises over 800 infrastructures, of 15 different categories, from 35 countries. This includes detailed information on over 160 Research Vessels and 100 Large Exchangeable Instruments.
RID allows to search not just for Infrastructures, but for type of Institutions owning the infrastructures. Advanced filtering allows for specifying search for categories (e.g. for the Research Vessels it is possible to search for length, activity type and technical capacity), additionally it is possible to search by Area of Activity and Associated Projects.
Each of the Infrastructures will have more robust information on the website, as well. In addition to the information you already have access to, we’ll also be providing you with different modules of Technical and Scientific Information depending on specific categories of infrastructures, you will also be able to use forms to contact directly the infrastructure and request more information.
Candidate data continues to increase, new infrastructures are built and deployed, others have significant upgrades, and some became decommissioned. As such, this database is designed to be continuously updated. The most recent inputs resulted from a collaboration with the EUMarineRobots H2020 project, and a collaboration with EMBREC is currently being discussed.
Fig. 3. Distribution of RIs by category.

386 ADVANCES IN OPERATIONAL OCEANOGRAPHY
The new version of RID is conceived to be part of an evolving system, and there is a lot of potential for the development of new features to enhance usage. The subsequent steps for enhancing RID will comprise more user-friendly features, which will improve not only the usability of the database, but also its content. The next set of upgrades will focus on:
• Inclusion of specialized modules, in connection with other European initiatives (similar to the ones already available for Research Vessels, Aquaculture Facilities and Large Exchangeable Instruments);
• Generation of tailored reports, including knowledge creation;
• Natural Language Processing searches;
• Improvements on usability in general.
The outlook for RID is to expand the number of data providers, address new end-users and provide opportunities for interactions between stakeholders. In addition, EurOcean will also pursue the following opportunities, to further develop RID:
• European funded RIs projects, especially in the scope of the clustering foreseen under the Horizon Europe Programme;
• Engage with other owners of infrastructures, which are not yet in the database (e.g. less represented European countries, and international infrastructures).
3. Impact For over 15 years, EurOcean has gathered, maintained, and provided access to information about marine research infrastructures to its stakeholders, through its databases. RID, and its predecessors, have facilitated various marine research, policy support, education and training activities, in Europe and worldwide. RID supported the identification of capabilities, gaps and opportunities, decision-making on development and funding priorities, and education and training, on behalf of various activities, as depicted in the following figure.
3.1 Marine research
EurOcean has supported the scientific community by identifying opportunities for transnational access to RIs, namely through its participation on EUROFLEETS and MariNET2 projects. Additionally, RID has been contributing to initiatives aiming to streamline access to ocean science information. This is the case of the H2020 project CatRIs, that aims to be an open, trusted and user-friendly portal to a harmonized, and aggregated catalogue of services and resources provided by RISs and Core Facilities (CF) across Europe. RID is playing a relevant role in the project, namely by allowing the users of the CatRIs portal to access the catalogue of Europe’s marine RIs. More recently, RID started to contribute to the Ocean InfoHub project (OIH), coordinated

387ADVANCES IN OPERATIONAL OCEANOGRAPHY EXPANDING EUROPE’S OBSERVING AND FORECASTING CAPACITY
Fig. 4. Main activities that benefitted from EurOcean’s RID.category.
by the IOC Project Office for IODE. The OIH will establish and anchor a network of regional and thematic nodes that will improve online access to and synthesis of existing global, regional and national data, information and knowledge resources. EurOcean will provide RID’s information on European Research Vessels to the network.
3.2 Policy support
RID is often used to support policy making. In 2020, RID became one of the 200+ layers of the European Atlas of the Seas, and it was elected the Map of the Week and the Map of the Month. In the same year, RID supported the development of the European Marine Board Report: ‘Next Generation European Research Vessels: Current Status and Foreseeable Evolution’, with information from European Research Vessels. Already in 2021, RID provided information about marine research infrastructures owners and operators to European Commission Directorate General for Maritime Affairs and Fisheries (DG MARE).
3.3 Education and training
Education and training activities are also often supported by RID. For example, in 2020, RID was used to elaborate H2020 proposals for funding, aiming the development of capacity building, through training, of scientific and technical staff, to deal with and operate RIs. Another example is the collaboration established with the European Atlas of the Seas, through which RID is contributing for ocean literacy actions.

388 ADVANCES IN OPERATIONAL OCEANOGRAPHY
4. Conclusions What we now know as RID, is the result of a long lasting commitment from EurOcean, more precisely since 2006, to collect, organize and make available information about European marine research infrastructures. RID’s development and maintenance are performed with the support of EurOcean’s members, partnerships, and of the operators and owners of the research infrastructures it contains.
The amount and diversity of information available in RID is quite considerable, which explains why RID is often described as the most comprehensive database in Europe of the genre. It is a living database, continuously used around the world, by relevant and demanding users that frequently require new functionalities and data.
Over the last 15 years, RID has been leaving a meaningful footprint on marine research, policy making, and education and training. In this regard, RID has contributed to various European research projects and to the work of outstanding organizations, such as European Commission’s Directorate General for Maritime Affairs and Fisheries and the European Marine Board.
In the future, we foresee the expansion of this platform to accommodate more users, include new functionalities and more information, most notably provided by entities not yet represented in the database and stemming from international vessels operators and owners. The new research programme Horizon Europe is also a good opportunity to further develop RID, in line with the characteristics and results of the programme. In addition, EurOcean is considering the creation of a European Community of Interest on Marine RIs, which can contribute with new ideas and with more and better information to RID.
ReferencesCatRIs. 2021. Catalogue of Research Infrastructure Services Website.https://project.catris.eu/
EUROCEAN. 2019. Research Infrastructures Database. https://rid.eurocean.org
EUROFLEETS. 2021. https://www.eurofleets.eu/
European Atlas of the Seas. 2021. https://ec.europa.eu/maritimeaffairs/atlas/maritime_atlas/
IOC-UNESCO. 2017. Global Ocean Science Report - The current status of ocean science around the world. L. Valdés et al., (eds), Paris, UNESCO Publishing.
MariNET2. 2021. Marine Renewable Infrastructure Network for Enhancing Technologies 2 Website. http://www.marinet2.eu/

389ADVANCES IN OPERATIONAL OCEANOGRAPHY EXPANDING EUROPE’S OBSERVING AND FORECASTING CAPACITY
Nieuwejaar, P. et al., 2019. Next Generation European Research Vessels: Current Status and Foreseeable Evolution. Position paper 25. European Marine Board, Belgium. DOI: 10.5281/zenodo.3477893
OIH. 2021. Ocean Infohub project. https://oceaninfohub.org/
U. do Porto, ‘EUMarineRobots: Marine robotics research infrastructures network.’ [Online]. Available: https://www.eumarinerobots.eu. [Accessed: 04-Apr-2021].


SESSION 10
USER-ORIENTED PRODUCTS

392 ADVANCES IN OPERATIONAL OCEANOGRAPHY
AN ENHANCED ARIMA MODEL FOR SEA LEVEL FORECAST FOR THE NORTH-WESTERN BLACK SEA COAST Maria Emanuela Mihailov (1), Petrica Popov (1), Lucian Dumitrache (1), Florin Constantinoiu (1), Lucian Dutu (1), Gabriel Ganea (2), Alecsandru Vladimir Chirosca (3) and Gianina Chirosca (3)
(1) Maritime Hydrographic Directorate, Fulgerului Street n°.1, Constanta, Romania, [email protected]
(2) National Institute for Marine Research and Development ‘Grigore Antipa’ Constanta, Mamaia Blvd. 300, Romania, [email protected] (3) Faculty of Physics - University of Bucharest, Atomistilor Street n°. 405, Magurele, Ilfov, Romania,
Abstract
The assessment of sea-level evolution during several decades and the implementation of accurate prediction models represents an important issue in oceanography to provide an overview of environmental health and extreme events evaluation within their occurrence in a short time period. This paper proposes a solution for data preparation and shows the implementation for a short-term prediction model using the Python language with open-source visualisation and algorithms. A data-driven approach to obtain near-term (about 2 years) regional sea-level prediction using historical observations from local tidal monitoring stations was established. Starting with the historical data, several missing points were identified and a non-linear approximation was performed, taking into account 2 value points before and after the missing data point. For such cases, a polynomial regression model was performed for the 4 data points and thus is obtained the analytical function used to interpolate missing data leading to a complete data series for the entire interval allowing it to be analysed within the proposed model. Quantitative comparisons of monthly sea-level forecasts developed from the Seasonal Autoregressive integrated moving average (SARIMA) model while other common statistical techniques such as trend analysis methods were applied. It is shown that the model has higher fitting and forecasting accuracy for short-term projections than exponential smoothing, and is more reliable than other common statistical techniques and can compete favourably with existing techniques for the sea-level or tidal prediction. The study is necessary to facilitate environmental engineering applications, navigation, and coastal bathymetry representation.
Keywords: sea-level, SARIMA, prediction model, Black Sea

393ADVANCES IN OPERATIONAL OCEANOGRAPHY EXPANDING EUROPE’S OBSERVING AND FORECASTING CAPACITY
1. Introduction The sea level, an essential indicator for the coastal environment’s state, presents spatiotemporal dynamics features. These characteristics are determined by a series of general or local hydrodynamic factors. In coastal areas, it is estimated that 50% of people live in this narrow interface that is a crucial point for a range of economic, touristic and strategic activities. While the future sea-level rise is recognised to be a significant threat to coastal areas, sea-level rise related information currently available is not customised to the practice of coastal adaptation, which requires services tailored to users’ needs. Services should provide complete details on uncertainties, high-end estimates, accurate storm and flood modelling, shoreline change projections and suitable adaptation options within the context of current practices.
Nowadays, it requires information on sea or river levels for environmental studies and navigation purposes. Predictive model developments are essential for sea level surveillance mainly due to coastal stations’ scarce distribution. Predictive tools enable policymakers and researchers to project future occurrences of extreme events or other events that may affect the coastal area and act proactively. One approach is to develop sea level predictive models such as statistical methods (e.g., generalised linear models and Seasonal Autoregressive Integrated Moving Average - SARIMA- models). SARIMA principle and application have been well known for many years and have been proposed and developed for many time-series analysis and modelling assignments. SARIMA approach can exhibit temporal trends (e.g., seasonality). High-frequency noise in the data is eliminated by autocorrelation (Chatfield, 2003). However, few studies have focused on estimating sea-level changes using seasonal autoregressive integrated moving average (SARIMA). Liu et al., (2021) evaluated seasonal ARIMA capability and derived models’ efficiency in estimating sea-level variability based on satellite altimetry and concluded the ability to take all seasonal fluctuation of sequence into complete account.
Sea level measurements started in Romania in 1856, at the European Danube Commission initiative resulting in the oldest data (first record in 1858) on the Black Sea water level at Sulina station (at the mouth of one of the Danube Delta distributary). For the Romanian Black Sea-level oscillation, extensive studies were performed with different results (Banu, 1961; Bondar, 1963, 1993; Vespremeanu et al., 2004; Panin and Popescu, 2007; Malciu, 2013; Mihailov et al., 2018). The paper aims to harmonise long-term historical data from different open sources and establish a predictive temporal model forecast of the sea level’s monthly mean values to two years ahead forecasting method using seasonal autoregressive integrated moving average (SARIMA). In addition, forecasting values for hydrographic conditions based on accurate in situ data, following new International Hydrographic Office (IHO) S-100 standards, is essential for analysing the time-series in this paper.

394 ADVANCES IN OPERATIONAL OCEANOGRAPHY
2. Data and Methods
2.1 Study area and data collection The Romanian shore is positioned in the North-Western Black Sea corner, from the Chilia branch (Ukrainian border) to Vama Veche (Bulgarian border) with a 244 km coastline length. In the northern part, the Romanian Black Sea coast is characterised by a deltaic shore of the Danube River, and the southern part covers three port areas, touristic beaches and resort belts. Twenty years of sea level data (1990 - 2010) are used for analysis on the Western Black Sea coast, originated from available IOC Sea Level Station Monitoring Facility (http://www.ioc-sealevelmonitoring.org/station.php?code=csta), Permanent Service for Mean Sea Level (https://www.psmsl.org/), available papers (Malciu, 2013; Mihailov et al., 2018), and Maritime Hydrographic Directorate in situ data. In addition, we used Global Mean Sea Level data to complete and fill the data sets gaps (https://sealevel.nasa.gov/data).
2.2 Building Sarima Model This paper presents time decomposition and forecasting of one-dimensional harmonised time-series (described in 2.1) of sea-level conditions using SARIMA modelling, one of the most effective methods for time-series forecasting. The main objective of time-series modelling is to carefully analyse and rigorously process the time-series’ past observations to develop an appropriate model that describes the inherent structure of the series. It makes it possible to explain the data in such a way as to simplify prediction, monitoring, or control.
The classical ARIMA (p, d, q) model has been identified as an effective and valuable forecasting tool for time-series with an absence of seasonality. The parameters for SARIMA (p,d,q) x (P,D,Q,s) model are as follows: a) p and seasonal P as lags of the stationeries series (number of autoregressive terms); b) d and seasonal D: differencing to be realised to stationary series; c) q and seasonal Q: lags of the forecast errors, and d) s: seasonal length in the data.
We choose to perform computational estimations using Python (Van Rossum, G., & Drake Jr, F. L.,1995) as the leading programming language for the field of this work, allowing users for easy collaboration, visualisation and collaboration using the web framework Jupyter Notebook (Kluyver et al., 2016). To correctly evaluate the data, several packages (commonly available) we used, such as NumPy (Harris et al., 2020) for array and numerical computations, scikit (Pedregosa et al., 2011) and statsmodels (Seabold and Perktold, 2010). for statistical functions and model definitions. The exported graphs are implemented using the matplotlib (Hunter, 2007) framework. As a convenience, we choose the measurement data to be estimated in meters with a reference value of 0 meters to be the base reference level recorded in 1933 (http://www.ioc-sealevelmonitoring.org/station.php?code=csta).
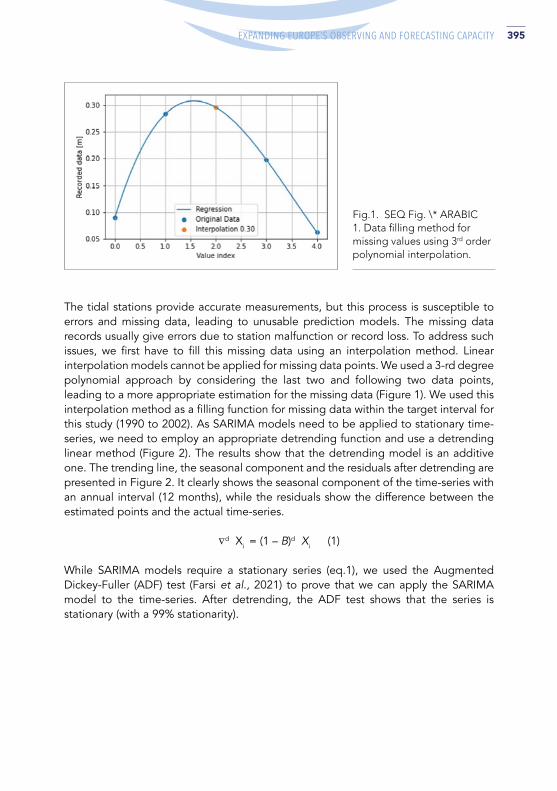
395ADVANCES IN OPERATIONAL OCEANOGRAPHY EXPANDING EUROPE’S OBSERVING AND FORECASTING CAPACITY
The tidal stations provide accurate measurements, but this process is susceptible to errors and missing data, leading to unusable prediction models. The missing data records usually give errors due to station malfunction or record loss. To address such issues, we first have to fill this missing data using an interpolation method. Linear interpolation models cannot be applied for missing data points. We used a 3-rd degree polynomial approach by considering the last two and following two data points, leading to a more appropriate estimation for the missing data (Figure 1). We used this interpolation method as a filling function for missing data within the target interval for this study (1990 to 2002). As SARIMA models need to be applied to stationary time-series, we need to employ an appropriate detrending function and use a detrending linear method (Figure 2). The results show that the detrending model is an additive one. The trending line, the seasonal component and the residuals after detrending are presented in Figure 2. It clearly shows the seasonal component of the time-series with an annual interval (12 months), while the residuals show the difference between the estimated points and the actual time-series.
∇d Xi = (1 – B)d Xi (1)
While SARIMA models require a stationary series (eq.1), we used the Augmented Dickey-Fuller (ADF) test (Farsi et al., 2021) to prove that we can apply the SARIMA model to the time-series. After detrending, the ADF test shows that the series is stationary (with a 99% stationarity).
Fig.1. SEQ Fig. \* ARABIC 1. Data filling method for missing values using 3rd order polynomial interpolation.
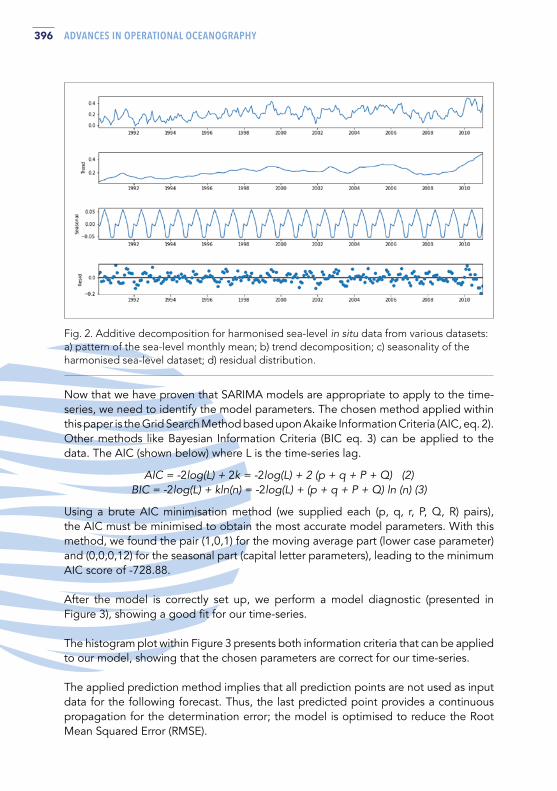
396 ADVANCES IN OPERATIONAL OCEANOGRAPHY
Fig. 2. Additive decomposition for harmonised sea-level in situ data from various datasets: a) pattern of the sea-level monthly mean; b) trend decomposition; c) seasonality of the harmonised sea-level dataset; d) residual distribution.
Now that we have proven that SARIMA models are appropriate to apply to the time-series, we need to identify the model parameters. The chosen method applied within this paper is the Grid Search Method based upon Akaike Information Criteria (AIC, eq. 2). Other methods like Bayesian Information Criteria (BIC eq. 3) can be applied to the data. The AIC (shown below) where L is the time-series lag.
AIC = -2log(L) + 2k = -2log(L) + 2 (p + q + P + Q) (2) BIC = -2log(L) + kln(n) = -2log(L) + (p + q + P + Q) ln (n) (3)
Using a brute AIC minimisation method (we supplied each (p, q, r, P, Q, R) pairs), the AIC must be minimised to obtain the most accurate model parameters. With this method, we found the pair (1,0,1) for the moving average part (lower case parameter) and (0,0,0,12) for the seasonal part (capital letter parameters), leading to the minimum AIC score of -728.88. After the model is correctly set up, we perform a model diagnostic (presented in Figure 3), showing a good fit for our time-series.
The histogram plot within Figure 3 presents both information criteria that can be applied to our model, showing that the chosen parameters are correct for our time-series. The applied prediction method implies that all prediction points are not used as input data for the following forecast. Thus, the last predicted point provides a continuous propagation for the determination error; the model is optimised to reduce the Root Mean Squared Error (RMSE).
397ADVANCES IN OPERATIONAL OCEANOGRAPHY EXPANDING EUROPE’S OBSERVING AND FORECASTING CAPACITY
Fig. 3. SEQ Fig. \* ARABIC 3. SARIMA statistical model.
3. Results and Discussion Once we obtain the model, we can use it to perform estimation for the prediction. To get such behaviour, we choose a training period containing 85% from the measurement dataset leading to a split date of 2007-September-30.
Our SARIMA constructed model leads to a Root Mean Squared Error of 7.11, which is appropriate for our proposed predictions for the evaluation period. Therefore, the grey area within Figure 4 is the estimated error for short term predictions, while the orange line represents the predicted values.
Environmental prediction models are one key factor in estimating the climate state through anomaly detection. While standard statistical models prove limited while describing complex systems (like the environmental ones), Seasonal Auto-Regressive, Integral Moving Average models provide an accurate deterministic model for such systems.
trend = 0.074t+12.164 (4)
The trend line analysis allows for an estimated impact on the Black Sea for the global warming phenomena. Figure 5 clearly shows a linear ascending trend that can be estimated (through linear regression analysis) and provides an assessment by the straight line represented by eq. 4, where t is the time in months using a standard deviation of 6.04 within the evaluated period (2009-2002).

398 ADVANCES IN OPERATIONAL OCEANOGRAPHY
Fig. 4. Observed sea level data and model forecasting results with forecast standard deviation from 2008 to 2010. One step ahead means that each step is forecasted from the last points (predicted) for each step. Due to the incertitude multiplication, the errors (displayed in the grey between the predicted values - orange - and the actual data - blue) appear to slightly increase from 25 at the beginning of estimation to 40 for the last estimations. Error assessment was performed using the RMSE algorithm.
Fig.5. SEQ Fig. \* ARABIC 5 Estimated global warming impact on the Black Sea level can be estimated using a basic linear trend analysis algorithm.

399ADVANCES IN OPERATIONAL OCEANOGRAPHY EXPANDING EUROPE’S OBSERVING AND FORECASTING CAPACITY
4. Conclusions This paper showed that the SARIMA forecast model is a valuable tool with the potential for early environmental warning and early detection in the North-western Black Sea coast. We have shown that time-series SARIMA models can model and forecast the sea level in the study area. The identified Seasonal ARIMA (1, 1, 1) and (0,0,0,12) has proved to be adequate for a forecast for at least two years.
AcknowledgementsThis study has been carried out with financial support from the Sectorial Research-Development Plan of the Romanian Ministry of National Defence 2020 and 2021.
ReferencesBanu, A. C. (1961). Observaţii şi măsurători asupra oscilaţiilor actuale şi seculare ale apelor Mării Negre la ţărmul românesc. Hidrobiologia, Vol.II, Bucureşti. (in romanian)
Bondar, C. (1993). Secular evolution of some components of the hydrological Danube regime and of the mean level of the Black Sea. Proceedings World Coast Conference, 891-893.
Bondar, C. and Filip, M. (1963). Contribuţie la studiul nivelurilor Mării Negre. Studii de hidrologie, Vol. IV, Bucureşti.
Chatfield, C. (2003). The Analysis of Time Series: An Introduction. Chapman and Hall/CRC; 6th edition. 352 pp.
Farsi, M., Hosahalli, D., Manjunatha, B.R., Gad, I., Atlam, E.-S., Ahmed, A., Elmarhomy, G., Elmarhoumy, M., and Ghoneim, O.A. (2021) Parallel genetic algorithms for optimising the SARIMA model for better forecasting of the NCDC weather data Alexandria Engineering Journal, 60 (1), 1299-1316
Harris, C. R., Millman, K. J., van der Walt, S. J., Gommers, R., Virtanen, P., Cournapeau, D., and Oliphant, T. E. (2020). Array programming with NumPy. Nature, 585, 357–362.
Hunter, J. D. (2007). Matplotlib: A 2D graphics environment. Computing in Science & Engineering, 9(3), 90–95.
Kluyver, T., Ragan-Kelley, B., Fernando Perez, Granger, B., Bussonnier, M., Frederic, J., and Willing, C. (2016). Jupyter Notebooks – a publishing format for reproducible computational workflows. In F. Loizides & B. Schmidt (Eds.), Positioning and Power in Academic Publishing: Players, Agents and Agendas, 87–90.
Liu, X., Lin, Z., and Feng, Z. (2021). Short-term offshore wind speed forecast by seasonal ARIMA - A comparison against GRU and LSTM, Energy, 227, 120492
Malciu, V. (2013). Sea level oscillations and methodological implications in coastal dynamics assessments. Cercetari marine - Recherches marines. INCDM, 43, 148-161.

400 ADVANCES IN OPERATIONAL OCEANOGRAPHY
Mihailov, M.E., Buga, L., Spînu, A.D., Dumitrache, L., Constantinoiu, L.F., and Tomescu-Chivu, M.I. (2018). Interconnection between Winds and Sea Level in the Western Black Sea Based on 10 Years Data Analysis from the Climate Change Perspective. Revista Cercetări Marine - Revue Recherches Marines - Marine Research Journal, 48(1), 171-178.
Panin, N. and Popescu, I. (2007). The northwestern Black Sea: climatic and sea-level changes in the Late Quaternary. In: Yanko-Hombach V., Gilbert A.S., Panin N., Dolukhanov P.M. (eds) The Black Sea Flood Question: Changes in Coastline, Climate, and Human Settlement. Springer, 387 – 404.
Pedregosa, F., Varoquaux, Gael, Gramfort, A., Michel, V., Thirion, B., Grisel, O., et al., (2011). Scikit-learn: machine learning in python. Journal of machine learning research, 2825–2830
Seabold, S., and Perktold, J. (2010). statsmodels: Econometric and statistical modeling with python. In 9th Python in Science Conference.
Van Rossum, G., and Drake Jr, F. L. (1995). Python reference manual. Centrum voor Wiskunde en Informatica Amsterdam.
Vespremeanu, E., Vespremeanu-Stroe, A., and Constantinescu, S. (2004). The Black Sea level oscillations in the last 150 years. Analele Universităţii Bucureşti–seria Geografie, 3, 9-76.

401ADVANCES IN OPERATIONAL OCEANOGRAPHY EXPANDING EUROPE’S OBSERVING AND FORECASTING CAPACITY
THE CMEMS OCEAN MONITORING INDICATOR PORTFOLIO FOR THE IBERIAN BISCAY IRISH (IBI) WATERS: ESSENTIAL VARIABLES OPERATIONALLY MONITORED AND FUTURE PROSPECTS Álvaro de Pascual-Collar (1, 2), B. Levier (3), M. G. Sotillo (1), R. Aznar (1, 2),
C. Toledano (1, 2), L. Aouf (4), M. García-León (1, 5), E. Gutknecht (3), J. V. McGovern (6), J. M. García-Valdecasas (1, 2), P. Lorente (1, 2), T. Dabrowski (6), A. Amo-Baladrón (1, 2), K. Guihou (1, 2) and E. Álvarez-Fanjul (1)
(1) Puertos del Estado, Avda. del Partenón 10, 28042, Madrid Spain(2) Nologin Consulting S.L., Avda. de Ranillas 1D, 50018 Zaragoza, Spain(3) Mercator Ocean, 8-10 rue Hermès, 31520, Ramonville Saint-Agne, France(4) Meteo-France, 8-10 rue Hermes, 31520 Ramonville St-Agne, France(5) Universitat Politècnica de Catalunya, Campus Nord, Carrer de Jordi Girona 1, 08034,
Barcelona, Spain(6) Marine Institute, Rinville West, Rinville, Co. Galway, H91 R673, Ireland
Abstract
The increase of computational resources along with the surge of observational networks and modelling products generates a vast increment of data, that are routinely produced by operational oceanographic services. However, a massive offer of data often entails a difficulty of interpretation along with a blurred perception of the panoramic picture of the marine environment.
In order to transform ocean data into tailored oceanographic information, the Copernicus Marine Environment Monitoring Service (CMEMS) produces Ocean Monitoring Indicators (OMIs). The development of OMIs aims to summarize data by delivering simplified, research-based information about relevant oceanographic processes, which is easily interpretable by end-users. Under the current climate change scenario, OMIs not only provide a conceptual framework to unveil the evolution of the ocean state and health but also facilitate policy-making, informed decisions and an effective coastal management.
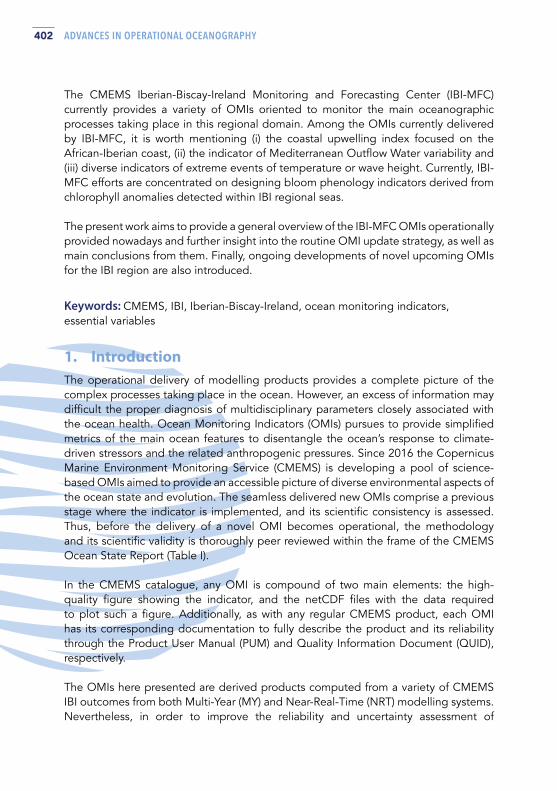
402 ADVANCES IN OPERATIONAL OCEANOGRAPHY
The CMEMS Iberian-Biscay-Ireland Monitoring and Forecasting Center (IBI-MFC) currently provides a variety of OMIs oriented to monitor the main oceanographic processes taking place in this regional domain. Among the OMIs currently delivered by IBI-MFC, it is worth mentioning (i) the coastal upwelling index focused on the African-Iberian coast, (ii) the indicator of Mediterranean Outflow Water variability and (iii) diverse indicators of extreme events of temperature or wave height. Currently, IBI-MFC efforts are concentrated on designing bloom phenology indicators derived from chlorophyll anomalies detected within IBI regional seas. The present work aims to provide a general overview of the IBI-MFC OMIs operationally provided nowadays and further insight into the routine OMI update strategy, as well as main conclusions from them. Finally, ongoing developments of novel upcoming OMIs for the IBI region are also introduced.
Keywords: CMEMS, IBI, Iberian-Biscay-Ireland, ocean monitoring indicators, essential variables
1. Introduction The operational delivery of modelling products provides a complete picture of the complex processes taking place in the ocean. However, an excess of information may difficult the proper diagnosis of multidisciplinary parameters closely associated with the ocean health. Ocean Monitoring Indicators (OMIs) pursues to provide simplified metrics of the main ocean features to disentangle the ocean’s response to climate-driven stressors and the related anthropogenic pressures. Since 2016 the Copernicus Marine Environment Monitoring Service (CMEMS) is developing a pool of science-based OMIs aimed to provide an accessible picture of diverse environmental aspects of the ocean state and evolution. The seamless delivered new OMIs comprise a previous stage where the indicator is implemented, and its scientific consistency is assessed. Thus, before the delivery of a novel OMI becomes operational, the methodology and its scientific validity is thoroughly peer reviewed within the frame of the CMEMS Ocean State Report (Table I).
In the CMEMS catalogue, any OMI is compound of two main elements: the high-quality figure showing the indicator, and the netCDF files with the data required to plot such a figure. Additionally, as with any regular CMEMS product, each OMI has its corresponding documentation to fully describe the product and its reliability through the Product User Manual (PUM) and Quality Information Document (QUID), respectively.
The OMIs here presented are derived products computed from a variety of CMEMS IBI outcomes from both Multi-Year (MY) and Near-Real-Time (NRT) modelling systems. Nevertheless, in order to improve the reliability and uncertainty assessment of

403ADVANCES IN OPERATIONAL OCEANOGRAPHY EXPANDING EUROPE’S OBSERVING AND FORECASTING CAPACITY
products, the development of multi-product OMIs is favoured by including, whenever is possible, any available CMEMS product (Tables I and II). Therefore, the resulting product is a combination of modelling, observational and reprocessed data.
This work is organized as follow: Section 2 gives a description of current IBI OMI portfolio as well as a summary of the main results derived from them. Section 3 focuses on describing the future roadmap of IBI OMI evolutions; it includes a summary of the upcoming products under development and the strategy to deliver OMIs in a monthly basis.
IBI OMI OSR REFERENCE CMEMS OMI IDENTIFIER
USED CMEMS PRODUC TS
Coastal Upwelling Index OSR#1: Sotillo et al., 2016 IBI_OMI_CURRENTS_cui (Updated quarterly)
IBI-PHY-NRTIBI-PHY-MY
Mediterranean Outflow Water OSR#2: Pascual et al., 2018 IBI_OMI_WMHE_mow
(Updated quarterly)
IBI-PHY-NRTIBI-PHY-MY
GLO-PHY-MYCORA ARMOR
Variability of SST extremes
OSR#3: Álvarez Fanjul, et al., 2019
OMI_TEMPSAL_extreme_var_tem (Updated annually)
IBI-PHY-NRT IBI-PHY-MY
Variability of SWH extremes
OSR#3: Álvarez Fanjul, et al., 2019
OMI_SEASTATE_extreme_var_swh
(Updated annuallly)
IBI-WAV-NRT IBI-WAV-MY
Stormy events OSR#4: de Pascual Collar et al., 2020
Not operational (Launch in 2021)
IBI-WAV-NRT IBI-WAV-MY
Algal bloom OMI under development
IBI OMI PRODUC T T YPE CMEMS ID
IBI-PHY-MY Model Multy-Year IBI_MULTIYEAR_PHY_005_002
IBI-PHY-NRT Model Near-Real Time IBI_ANALYSISFORECAST_PHYS_005_001
IBI-WAV-MY Model Multy-Year IBI_MULTIYEAR_WAV_005_006
IBI-WAV-NRT Model Near Real Time IBI_ANALYSIS_FORECAST_WAV_005_005
GLO-PHY-MY Model Multy-Year GLOBAL_REANALYSIS_PHY_001_030
CORA Observations INSITU_GLO_TS_REP_OBSERVATIONS_013_002_b
ARMOR Reprocessed observations MULTIOBS_GLO_PHY_TSUV_3D_MYNRT_015_012
Table I. List of IBI OMI products currently operational or under development.
Table II. List of CMEMS products used on OMI computation and acronyms used in text.

404 ADVANCES IN OPERATIONAL OCEANOGRAPHY
2. The IBI operational OMIs
2.1 Coastal Upwelling Index
Wind-driven coastal upwelling processes have been extensively studied along the eastern edges of the world’s major ocean basins as it has relevant implications on biogeochemical activity and global fisheries production, with direct societal concerns. Along-shore equatorward winds modulate an offshore Ekman transport of surface waters that is compensated by the uplift of denser and richer deep cold waters, injecting nutrients into the near-surface euphotic zone and fostering high marine productivity (Lachkar and Gruber, 2011). The IBI domain hosts the region known as the Canary Current Upwelling System. It is composed by three adjacent regions covering from Southern Senegal (11ºN) up to Cape Finisterre (~43ºN), being one of the world’s largest boundary upwelling ecosystems.
An operational indicator entitled Coastal Upwelling Index (CUI) was published in the first issue of OSR (Sotillo et al., 2016). In this work, a SST-based upwelling index computed from the IBI-PHY products were compared against the traditional wind-derived index based on estimations of cross-shore Ekman transport. Results revealed that the IBI CUI product provides a reliable representation of the upwelling intensity and variability in the study region. The current IBI CUI product can be found on the CMEMS catalogue and it is updated on a quarterly basis. It is computed for the IBI continental façade from 27ºN to 42ºN, including the western African and Iberian Peninsula coasts. The CUI index is defined at each latitudinal point as the difference between the maximum and minimum surface temperatures, ranging from the coastline up to 3.5º westward.
The product delivered (Figure 1) combines the results computed from IBI-PHY-MY and IBI-PHY-NRT products. It includes the Hovmöller diagram of the index as well as the trend analysis estimated zonally.
The index shows the evolution of the upwelling activity in the IBI continental shelf. Two independent upwelling subdomains are clearly differentiated in the entire region separated by the presence of the Gulf of Cadiz, the southern one (27ºN – 34ºN) corresponding to the North West African (NWA) region, and to the north (37ºN – 42ºN) the West Iberian Peninsula (WIP) region. Both regions show remarkable seasonality with few periods of upwelling intensification. The trend analysis in the period 1993-2019 evidences a significant positive trend of the upwelling index in the WIP northern latitudes, in accordance with previous works that have reported an increased upwelling activity in the west coast of USA (García-Reyes and Largier, 2010).

405ADVANCES IN OPERATIONAL OCEANOGRAPHY EXPANDING EUROPE’S OBSERVING AND FORECASTING CAPACITY
2.2 Variability of Mediterranean Outflow Water
One of the distinctive features of the IBI region is the formation and spreading of the water mass known as Mediterranean Outflow Water (MOW). MOW is a saline and warm water mass principally occupying the intermediate depths of eastern North Atlantic, which is generated by the outflow of subsurface Mediterranean water through the Strait of Gibraltar. MOW is widely recognized as a water mass involved in relevant oceanographic processes at diverse timescales such as the heat and salt transport into the inner North Atlantic and Nordic Seas (Reid, 1979, van Aken, 2000) and mixing processes with the surrounding water masses such as the Labrador Sea Water, Antarctic intermediate Water, and North Atlantic Central Water. Therefore, the establishment of a long-term monitoring program of MOW to elucidate its spatiotemporal variability remains as a priority to deep our understanding of the climate system and its evolution.
The IBI MOW index was presented in the second issue of the CMEMS OSR (Pascual et al., 2018). On this study the IBI-PHY-MY product was used to investigate the spatial distribution of MOW as well as its seasonal and interannual variability in six different subregions. The salinity anomalies monitoring in few selected IBI subdomains provided a reliable representation of MOW variability. Nowadays, the IBI MOW product can be found on the CMEMS catalogue and it is updated on a quarterly basis. It is defined as the practical salinity anomaly averaged in four monitoring boxes in the IBI region (Figure 2). The product is computed as an ensemble product including the two IBI
Fig. 1. Left: Zonal Hovmöller diagram of the IBI Coastal Upwelling Index. The index is computed in a daily basis from IBI-PHY-MY (for the 1993–2019 period) and from the IBI-PHY-NRT (for the period 2020 onwards). The vertical white dotted line indicates the use of both datasets. Right: Trend of the Coastal Upwelling Index (solid black line) estimated zonally from IBI-PHY-MY over the period 1993-2019. Dashed grey lines provide the 99% confidence interval of the trend estimate.
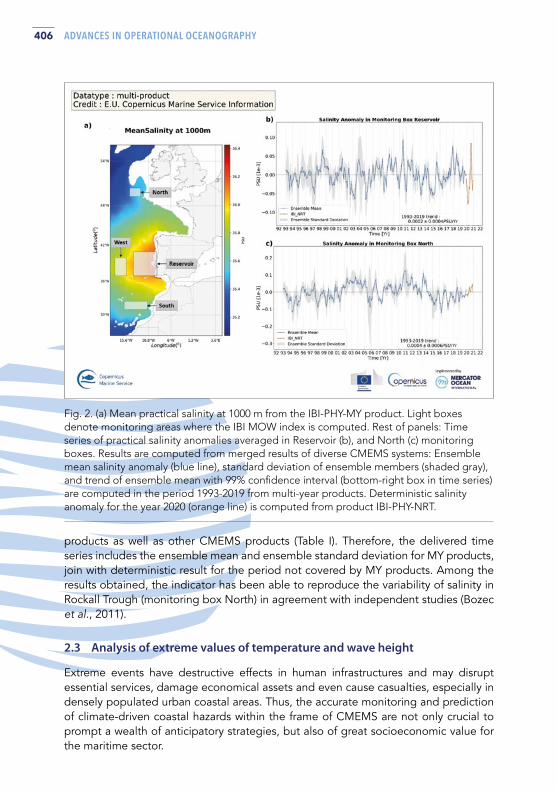
406 ADVANCES IN OPERATIONAL OCEANOGRAPHY
products as well as other CMEMS products (Table I). Therefore, the delivered time series includes the ensemble mean and ensemble standard deviation for MY products, join with deterministic result for the period not covered by MY products. Among the results obtained, the indicator has been able to reproduce the variability of salinity in Rockall Trough (monitoring box North) in agreement with independent studies (Bozec et al., 2011).
2.3 Analysis of extreme values of temperature and wave height
Extreme events have destructive effects in human infrastructures and may disrupt essential services, damage economical assets and even cause casualties, especially in densely populated urban coastal areas. Thus, the accurate monitoring and prediction of climate-driven coastal hazards within the frame of CMEMS are not only crucial to prompt a wealth of anticipatory strategies, but also of great socioeconomic value for the maritime sector.
Fig. 2. (a) Mean practical salinity at 1000 m from the IBI-PHY-MY product. Light boxes denote monitoring areas where the IBI MOW index is computed. Rest of panels: Time series of practical salinity anomalies averaged in Reservoir (b), and North (c) monitoring boxes. Results are computed from merged results of diverse CMEMS systems: Ensemble mean salinity anomaly (blue line), standard deviation of ensemble members (shaded gray), and trend of ensemble mean with 99% confidence interval (bottom-right box in time series) are computed in the period 1993-2019 from multi-year products. Deterministic salinity anomaly for the year 2020 (orange line) is computed from product IBI-PHY-NRT.

407ADVANCES IN OPERATIONAL OCEANOGRAPHY EXPANDING EUROPE’S OBSERVING AND FORECASTING CAPACITY
Fig. 3. IBI OMI on extreme variability of SST: Map of the 99th mean percentile computed from the IBY-PHY-MY system (left panel) and anomaly of the 99th percentile in 2020 computed from the IBI-PHY-NRT system (right panel).
Since the first steps of OSR, there is a section in OSR devoted to the analysis of extreme event variability. In the third issue of OSR (Álvarez Fanjul et al., 2019), the IBI-MFC joined such initiative by participating with the annual analysis of extremes variability for sea level, Sea Surface Temperature (SST) and Significant Waves Height (SWH). Such contribution has eventually turned into two operational IBI OMI products annually updated in the CMEMS catalogue. Both share the same methodology and are focused on monitoring the variability of extreme events computed from IBI model data. However, they are applied to different variables (SST and SWH) and are computed from different IBI systems. Thus, the OMI on extreme variability of SST is computed from IBI-PHY-MY and IBI-PHY-NRT systems, and the OMI on extremes of SWH is computed from IBI-WAV-MY and IBI-WAV-NRT systems.
The current IBI OMIs on extreme variability are based on the computation of the annual 99th percentile of the corresponding variable (SST or SWH) from NRT and MY model data (Figure 3). It provides the climatic mean computed from the MY system (mean percentile) and the annual anomalies of the last year computed from the NRT system (percentile anomaly of a target year) and referenced to the MY system. Thus,

408 ADVANCES IN OPERATIONAL OCEANOGRAPHY
the mean percentile corresponds to the temporal average of 99th percentile computed on an annual basis from the MY product. On the contrary, the percentile anomaly is computed by subtracting the mean percentile from the 99th percentile of the target year computed from IBI NRT outcomes.
3. On-going actions and future chalenges IBI OMI products are aimed at operationally delivering a variety of monitoring diagnostics of the ocean state. Thus, OMIs are in constant evolution to expand its application to cover a broader range of ocean processes and end-user demands. One of the main work lines faced in the incoming years encompasses the launch of novel OMIs, derived from all IBI modelling systems. In this regard, it is planned the delivery of an OMI focused on monitoring the variability of stormy events. This OMI is fully described in the fourth OSR issue (de Pascual Collar et al., 2020). It computes the temporal variability of stormy period in three IBI subregions and results will provide a routine monitoring of anomalous stormy periods of the last decades. Additionally, a new OMI for the BIO component is currently under development, that provides an indicator of algae blooms derived from anomalies of chlorophyll concentration. This OMI is still at an early stage, so its definition and first results are currently under analysis.
Since OMIs are derived products, they evolve following the developments of the main IBI products. Thus, they must adapt their evolution to the development of new IBI products. In this way, one of the major forthcoming changes corresponds to the launch of new INTERIM systems that will routinely update MY products on a monthly basis. Such change will be translated into OMI products by replacing the current use of NRT products to provide the analysis of the last months/year using INTERIM products instead. Thus, the use of NRT products will be removed, fostering the use of IBI MY and INTERIM systems exclusively. This change would not only homogenize the systems used to compute OMI timeseries, but also allow the monthly update of OMI products.
ReferencesÁlvarez Fanjul, E., Pascual Collar, A., Pérez Gómez, B., de Alfonso, M., García Sotillo, M., Staneva, J., Clementi, E., Grandi, A., Zacharioudaki, A., Korres, G., Ravdas, M., Renshaw, R., Tinker, J., Raudsepp, U., Lagemaa, P., Maljutenko, I., Geyer, G., Müller, M., Çağlar Yumruktepe, V. (2019). Sea level, sea surface temperature and SWH extreme percentiles: combined analysis from model results and in situ observations, Section 2.7, p:31. In: von Schuckmann et al., (2019). Copernicus Marine Service Ocean State Report, Issue 3, Journal of Operational Oceanography, 12:sup1, S1-S123, DOI: 10.1080/1755876X.2019.1633075
Bozec, A., Lozier, M.S., Chassignet, E.P., Halliwell, G.R. (2011). On the variability of the Mediterranean outflow water in the North Atlantic from 1948 to 2006. Journal of Geophysical Research, 116:C09033. DOI: 10.1029/2011JC007191.

409ADVANCES IN OPERATIONAL OCEANOGRAPHY EXPANDING EUROPE’S OBSERVING AND FORECASTING CAPACITY
de Pascual Collar, A., Levier, B., Aznar, R., Toledano, C., García-Valdecasas, J.M., García León, M., García Sotillo, M., Aouf, L., Álvarez, E. (2020). Monitoring of wave sea state in the Iberian-Viscay-Ireland regional seas. In: von Schuckmann et al., (2020). Copernicus Marine Service Ocean State Report Issue 4. Journal of Operational Oceanography, 13:sup1, S1-S172, DOI: 10.1080/1755876X.2020.1785097
García-Reyes, M., and Largier, J. (2010). Observations of increased wind-driven coastal upwelling off central California. Journal of Geophysical Research. Oceans, 115, C04011.
Lachkar, and Z., Gruber, N. (2011). What controls biological production in coastal upwelling systems? Insights from a comparative modelling study. Biogeosciences, 8, 2961–2976.
Pascual, A., Levier, B., Sotillo, M., Verbrugge, N., Aznar, R., Le Cann, B. (2018). Characterization of Mediterranean Outflow Water in the Iberia-Gulf of Biscay-Ireland region. In: von Schuckmann et al., (2018) The Copernicus Marine Environment Monitoring Service Ocean State Report, Journal of Operational Oceanography, 11:sup1, S1-S142, DOI: 10.1080/1755876X.2018.1489208
Reid, J.L. (1979). On the contribution of the Mediterranean Sea outflow to the Norwegian-Greenland Sea. Deep Sea Research. 26(11):1199–1223. DOI: 10.1016/0198-0149(79)90064-5.
Sotillo, M.G., Levier, B., Pascual, A., Gonzalez, A. (2016). Iberian-Biscay-Irish Sea. In: von Scuckmann et al., (2016) The Copernicus Marine Environment Monitoring Service Ocean State Report, Journal of Operational Oceanography, 9:sup2, s235-s320, DOI: 10.1080/1755876X.2016.1273446

410 ADVANCES IN OPERATIONAL OCEANOGRAPHY
THE ‘SUB-REGIONAL MEDITERRANEAN SEA INDICATORS’ TOOL IN SUPPORT TO THE SUSTAINABLE MANAGEMENT OF THE OCEAN Mélanie Juza (1) and Joaquín Tintoré (1, 2)
(1) SOCIB, Spain, [email protected] (2) IMEDEA (CSIC-UIB), Spain, [email protected]
Abstract The ‘Sub-regional Mediterranean Sea Indicators’ tool is a visualization system that monitors multivariate ocean indicators in the Mediterranean Sea at sub-regional scale. These indicators are an integral part of an operational product that provides continuous information about the ocean state and variability from daily to interannual scales. They allow to detect specific events in real time (e.g. marine heat wave). Sub-regional long-term variations, in response to climate change, are also estimated. An interactive portal has been implemented to monitor, visualize and transfer ocean information that is relevant for a wide range of sectors, applications and regional end-users, thus contributing to respond to societal and environmental challenges.
Keywords: sub-regional ocean indicators, extreme events, climate change, visualization tool, Mediterranean Sea
1. Introduction In line with international initiatives (e.g. UN Decade of Ocean Science for Sustainable Development, UN SDG 14, OceanObs’19), the Balearic Islands Coastal Observing and Forecasting System (SOCIB) provides reliable oceanographic data and added-value ocean products to respond to science and society needs. In particular, SOCIB is developing a comprehensive set of multivariate and sub-regional indicators in the Mediterranean Sea from past to present (Juza and Tintoré, 2021), with a specific interest in the Balearic Islands region and its adjacent basins (Figure 1). An interactive portal (https://apps.socib.es/subregmed-indicators) has been developed to inform continuously on the ocean state and sub-regional variability from daily to interannual scales in a simple way to be consulted by a wide range of ocean stakeholders (e.g.

411ADVANCES IN OPERATIONAL OCEANOGRAPHY EXPANDING EUROPE’S OBSERVING AND FORECASTING CAPACITY
scientific community, education and environmental agencies). This interactive tool is being extended to give access to further information on sub-regional marine heat spike (MHS) and marine heat wave (MHW), providing both daily bulletin and long-term evolution of characteristics (intensity, duration, and frequency) over the last four decades.
2. Data and Methodology Ocean indicators provide estimations of the state and temporal evolution of Essential Ocean Variables (as defined by GOOS and IOC-UNESCO, Tanhua et al., 2019) and key (regional) derived quantities. In this study, two categories of (sub-) regional indicators are being processed using satellite products and in situ observations: (1) surface ocean indicators: ocean temperature (sea surface temperature (SST), MHS and MHW following the methodology from Hobday et al., 2016), ocean health (chlorophyll-a concentration), ocean currents (geostrophic velocities, total kinetic energy), sea level anomaly, and wind, and (2) vertically integrated quantities: ocean heat and salt contents, mixed layer properties and water mass transports in key sections. User-friendly diagnostics (2D maps and time series) are provided and automatically updated in real time at various time scales: (1) daily mean monitoring (last ocean weather and remarkable event detection), (2) monthly/seasonal mean monitoring (seasonal variability) and (3) annual mean monitoring (interannual variability and long-term trend). Figure 1 illustrates the daily and annual monitoring for ocean temperature including the MHW detection and long-term variations in the Balearic Islands region in response to global warming.
3. Results and Conclusions These ocean indicators allow characterizing the sub-regional ocean variability in the Mediterranean Sea of which the strong spatial variations require specific consideration. Quantitative estimations are provided for extreme events (e.g. MHW, mesoscale eddy, deep convection) and sub-regional trends (e.g. ocean warming rates oscillating between 0.025 and 0.06ºC/year over 1982-2020 and sea level rise exceeding 0.5 cm/year in the eastern Mediterranean). As consequences of climate change with harmful impacts on the marine ecosystem, MHWs are increasing substantially in both frequency, duration and intensity in the Mediterranean. All sub-regions experience positive trends over the period 1982-2020 in annual total days (128-238 days/100yr), mean amplitude (0.6-1ºC/100yr), maximum intensity (2.5-4.6ºC/100yr), mean duration (7-15 days/100yr) and frequency (13-21 events/100yr). The multivariate and multi-scale approach can also help to establish the possible link between the different components of the ocean, thus to better understand the ocean variations in this region. This visualization tool is expected to be evolutive (extending to all sub-regions in the Mediterranean and Marine Protected Areas, adding ocean datasets such numerical simulations and coastal observations, processing additional indicators) considering end-user requests and feedbacks. Giving access to relevant information on ocean

412 ADVANCES IN OPERATIONAL OCEANOGRAPHY
health and climate change at sub-regional scale and transferring knowledge to diverse ocean stakeholders through environmental monitoring tools will benefit the society strengthening its engagement and transdisciplinary collaborations, increasing the knowledge and public awareness, and supporting the ocean management and policy at national level.
Fig. 1. Daily SST monitoring (in ºC): 2D maps of SST (A) and MHS (B) on March 31, 2021, and time series of daily SST in the Balearic Islands region since 2018 with detected MHS (C). Annual SST monitoring: 2D maps of mean SST (in ºC) in 2020 (D) and trend (ºC/year) over 1982-2020 (E), and time series of annual mean SST since 1982 in the Balearic Islands region (F). MHW annual total days: 2D maps of total days in 2020 (G) and trend over 1982-2020 (H), and time series of annual total days since 1982 in the Balearic Islands region (I).
Acknowledgements The ocean indicators of this study are produced using free, open access and quality-controlled data distributed by CMEMS, Met-Office and SOCIB. Part of this work is supported by the JERICO-S3 and EuroSea projects. These projects have received funding from the European Union’s Horizon 2020 research and innovation programme under grant agreement N° 871153 and N° 862626, respectively.
ReferencesHobday, A.J., Alexander, L.V., Perkins, S.E., Smale, D.A, Straub, S.C:, Oliver, E.C.J. et al., (2016). A hierarchical approach to defining marine heatwaves. Progress in Oceanography, 141, 227-238, doi:10.1016/j.pocean.2015.12.014.
Juza, M., and Joaquin, J. (2021). Multivariate sub-regional Mediterranean Sea Indicators: from event detection to climate change estimations. Frontiers in Marine Science, 8, doi:103389/fmars.2021.610589.

413ADVANCES IN OPERATIONAL OCEANOGRAPHY EXPANDING EUROPE’S OBSERVING AND FORECASTING CAPACITY
Tanhua, T., McCurdy, A., Fischer, A., Appeltans, W., Bax, N., Currie, K. et al., (2019). What we have learned from the framework for ocean observing: evolution of the global ocean observing system. Frontiers in Marine Science, 6:471, doi:103389/fmars.2019.00471.

414 ADVANCES IN OPERATIONAL OCEANOGRAPHY
DEVELOPMENT OF AN APPLICATION TO TRACK MISSING PERSONS AT SEA Diego Pereiro (1), Kieran Lyons (1), Achref Othmani (1), Rob Fuller (2), Glenn Nolan (1), Tomasz Dabrowski (1)
(1) Marine Institute, Rinville West, Rinville, Co. Galway; [email protected] (2) Gno Beo Limited, 5 Woodlands Avenue, Renmore, Co. Galway
Abstract
Particle-tracking models can simulate the drift of floating objects in the ocean, and provide a valuable tool for search and rescue operations at sea. The choice of model parameters has a big impact on the prediction, and can greatly affect the success of the search and rescue operations. In particular, the way in which windage is introduced into the model largely determines the dispersion and final distribution of the numerical floats.
The Marine Institute has conducted several experiments with OpenDrift, which have proven to be useful to help in search and rescue operations and to investigate the important connection that exists between people missing from the coast of Ireland and being found on the Welsh coast. This has culminated in the implementation of a new version of an OpenDrift-based, web application called ADRIFT, which allows to select between a range of different objects with specific leeway properties.
Keywords: particle-tracking, search and rescue, windage, OpenDrift, ADRIFT
1. Introduction Cases of people going missing in the sea require a rapid response in order to maximize the chances of succeeding in finding the body. A common approach consists of using a combination of ocean and atmospheric forecasts together with a particle-tracking model. Since a rapid response is necessary, an operational system is highly advisable, allowing end users to readily introduce the time and location where the person was last seen, run the particle-tracking simulation, and finally obtain a visualization of the prediction as a time-varying probability distribution, showing the areas where finding the person is most likely.

415ADVANCES IN OPERATIONAL OCEANOGRAPHY EXPANDING EUROPE’S OBSERVING AND FORECASTING CAPACITY
The prediction can be greatly influenced by the choice of model parameters. More specifically, the way in which windage is prescribed into the model largely affects the dispersion and final distribution of the numerical floats. Here, the term windage is used to refer to the drift caused by the direct effect of wind on the overwater section of a floating object. One example of an operational system oriented to search and rescue operations, and providing a user-friendly interface to run particle-tracking simulations is ADRIFT, developed by the Marine Institute. The system is linked to 3-day ocean forecasts obtained from the operational, ROMS-based, hydrodynamic models run by the Marine Institute: the Northeast Atlantic model (NEATL, see Nagy et al., 2020a), the Connemara model (Nagy et al., 2020b) and the Galway Bay model (http://milas.marine.ie/thredds/catalog.html). Until recently, the associated particle-tracking model used in ADRIFT has been Ichthyop (Lett et al., 2008). Latest developments include a replacement of Ichtyop with OpenDrift (Dagestad et al., 2018), which offers a submodule specific for tracking different types of floating bodies, including missing persons.
This work presents this transition of the ADRIFT software, highlighting the importance of a proper windage parameterization when simulating the drift of missing persons at the ocean surface. Section 2 provides different experiments that demonstrate the role of windage when tracking floating bodies in the sea surface. Section 3 presents a brief summary of the tests carried out with OpenDrift in the Marine Institute so far. Finally, section 4 provides an overview of the new ADRIFT.
2. The importance of Windage
2.1 Experiments with drifters
A series of experiments with surface and fully submerged drifters were carried out in the waters west of Ireland in 2019. Surface drifters (iSPHERE), designed for oil spill contingency operations (Price et al., 2006), consisted of a drifting sphere that sticks to the surface and is exposed to direct wind drag due to the equal cross-section areas between the air-water interface. On the other hand, fully submerged drifters (iSLDMB), had a cross-shaped drogue following the ocean current movement within the top 0.7 m of the water column, which minimizes the influence of winds and waves.
The paths followed by both groups of drifters were simulated using current fields from NEATL and ECMWF winds. Different wind drag coefficients were tested for each group, adding from 0% to 7% of the wind velocity to obtain the total float velocity. Particle-tracking model performance was assessed using the Liu and Weisberg (2011) skill score. Adding windage does not affect the ability of the model to track the iSLDMB drifters, but the performance is greatly affected when tracking the iSPHERE drifters: best results are obtained when a 2% wind drag coefficient is used (Figure 1). This experiment highlights the importance of considering the wind effect when tracking floating bodies in the ocean surface, such as missing persons.

416 ADVANCES IN OPERATIONAL OCEANOGRAPHY
2.2 The August-2020 Galway Bay case
Two people went paddle boarding at Furbo beach in the Galway Bay at 9 pm (BST) on the 12th of August 2020 and shortly after were swept out to sea by a northerly breeze. They were rescued on the 13th of August 2020 south of Inis Oirr Island at around 12:30 pm (BST).
The OpenDrift software was used with the Connemara model forecast and ECMWF winds to model the transport of the people in the water. The OpenDrift model has a leeway module for operational search and rescue. The distinguishing feature of this module is that there is a library of object classes, which have specific leeway, downwind, and crosswind coefficients. The user selects the object that is most pertinent to the current scenario and the simulation is carried out using the coefficients for that object.
A hundred numerical floats were released at Furbo Beach at 20:30 (UTC) on the 12th of August 2020 and they were tracked for 15 hours. A number of Leeway object classes were trialled to see which if any came close to matching the real-world scenario. Four examples are listed here: (1) person in water in unknown state; (2) person in water deceased; (3) surf board with person; (4) no-ballast life-raft without a drogue.
Figure 2 shows results of each of these experiments. For the person in water in unknown state (Figure 2a), the floats were soon scattered as the simulation developed. This is down to the large uncertainty associated with this object, since the person is in an unknown state. However, some floats almost arrived to Inis Oirr, in agreement with the observed trajectories. For the deceased person (Figure 2b), the particles were not as scattered and there is strong trend towards the west-southwest with quite a number
Fig. 1. Skill scores for the iSPHERE drifters (buoy deployments named here as D1, D3, D5). The wind drift-factor is varied between 0% and 7% at intervals of 1%.

417ADVANCES IN OPERATIONAL OCEANOGRAPHY EXPANDING EUROPE’S OBSERVING AND FORECASTING CAPACITY
of particles apparently about to strand on the Aran Islands. For the surf board (Figure 2c), although some particles are heading for the area between Inis Oirr and the Clare coast, they have not travelled far enough in the allotted time. Finally, for the no-ballast life-raft (Figure 2d), this simulation comes closest to predicting the end position of the two people, with some floats stranding in the Aran Islands. Again, this set of experiments reveals the importance of selecting appropriate windage parameters when simulating the drift of floating bodies in the sea surface.
3. Recent Opendrift Test Cases Since the August 2020 case, the Marine Institute has conducted several experiments with OpenDrift, which have proven to be useful to help in search and rescue operations around Ireland and to investigate the important connection that exists between people missing from the coast of Ireland and being found on the Welsh coast. In this
Fig. 2. August 2020 Galway Bay case OpenDrift trials. (a) person-in-water unknown state, (b) person-in-water deceased, (c) surf board with person, (d) no-ballast life-raft without drogue. Starting location (green circle) at Furbo beach and end location (red circle) at Inis Oirr Island are shown.

418 ADVANCES IN OPERATIONAL OCEANOGRAPHY
experiment, 100,000 floats were released at 20 sources along the eastern coast of Ireland at regular intervals between 01-January-2017 and 01-July-2019, and tracked used ECMWF winds and NEATL surface currents. It was found that, for a MP drowning at the east coast of Ireland and remaining in the surface of the ocean, there is a high probability that their body crosses the Irish Sea and arrives at the western shores of Great Britain. In particular, the Welsh regions of Gwynedd (probability of 12.80%) and Dyfed (probability of 5.36%) would be the most likely locations to find the body in Great Britain (Figure 3). On the other hand, the vast majority of the floats are washed ashore along the east coast of Ireland.
Fig. 3. Number of floats moving from sources (rows) to sinks (columns).
4. The New ADRIFT After the experiments presented in Section 2 and the encouraging results from the test cases in Section 3, this has culminated in the implementation of a new version of an OpenDrift-based, web application called ADRIFT, which allows to select between a range of different objects with specific leeway properties. This software provides a user-friendly graphical interface which allows the user to rapidly run a particle-tracking simulation, and it is expected to help is search and rescue operations (Figure 4). The most important modifications with respect to the previous version of ADRIFT are: (a) inclusion of windage and (b) possibility to select among different object types with different windage parameters, including persons in water and several types of boats.

419ADVANCES IN OPERATIONAL OCEANOGRAPHY EXPANDING EUROPE’S OBSERVING AND FORECASTING CAPACITY
Fig. 4. Graphical interface of the new ADRIFT version. User can select starting position and time, duration of the simulation, initial dispersion radius and object type.
ReferencesDagestad, K.-F., Röhrs, J., Breivik, Ø., Ådlandsvik, B. (2018). OpenDrift v1.0: a generic framework for trajectory modelling. Geoscientific Model Development, 11, 1405-1420
Lett, C., Verley, P., Mullon, C., Parada, C., Brochier, T., Penven, P., Blanke, B. (2008). A lagrangian tool for modelling ichthyoplankton dynamics. Environmental Modelling & Software, 23 (9), 1210-1214.
Liu, Y., Weisberg, R.H. (2011). Evaluation of trajectory modelling in different dynamic regions using normalized cumulative Lagrangian separation. Journal of Geophysical Research, 116, C09013.
Nagy, H., Lyons, K., Nolan, G., Cure, M., Dabrowski, T. (2020a). A Regional Operational Model for the North East Atlantic: Model Configuration and Validation. Journal of Marine Science and Engineering, 8 (9), 673.
Nagy, H., Lyons, K., Dabrowski, T. (2020b). A Regional Operational and Storm Surge Model for the Galway Bay: Model Configuration and Validation. Ocean Sciences Meeting 2020. San Diego, CA, USA, 16-21 February 2020
Price, J. M., Reed, M., Howard, M. K., Johnson, W. R., Ji, Z.-G., Marshall, C. F., Guinasso N. L. Jr., Rainey, G. B. (2006). Preliminary assessment of an oil-spill trajectory model using satellite-tracked, oil-spill-simulating drifters. Environmental Modelling & Software, 21, 258–270.

420 ADVANCES IN OPERATIONAL OCEANOGRAPHY
DEVELOPMENT OF COASTAL MARINE SERVICES FOR TACKLING COASTAL RISKS IN THE ATLANTIC AREA: THE VALUE OF REGIONAL COOPERATION Manuel Ruiz-Villarreal (1), Julien Mader (2), Pablo Carracedo (3), Ricardo Torres (4), Mike Bedington (4), Pedro Montero (5), Tomasz Dabrowski (6), Joe McGovern (6), Luz García-García (1), Alejandro Gallego (7) and MyCOAST partners (AZTI, IEO, INTECMAR, IMI, USC, SHOM, PdE, Ifremer, CEFAS, IST, PML, Marine Scotland, MeteoGalicia, IH)
(1) Instituto Español de Oceanografía (IEO), Spain (2) FUNDACIÓN AZTI, Spain (3) Meteogalicia, Spain(4) Plymouth Marine Laboratory (PML), UK(5) INTECMAR, Spain(6) Marine Institute, Ireland(7) Marine Scotland, UK
Abstract The MyCOAST project (http://mycoast-project.org/) is an INTERREG Atlantic Area project designed to demonstrate that marine services for tackling coastal risks can be jointly developed. The main innovation and originality of the project stems from the implementation of transferable tools able to improve the risk management systems operated in the Atlantic Area. A successful outcome was achieved by identifying mature existing tools and selecting those that could be further developed by partners during the project duration. Demonstration of the tools in pilot actions showed that they are effective in supporting end users and relocatable among different regions in the Atlantic Area.
Keywords: marine services, coastal risks, joint development, transferable tools, coastal observatories, Atlantic Area

421ADVANCES IN OPERATIONAL OCEANOGRAPHY EXPANDING EUROPE’S OBSERVING AND FORECASTING CAPACITY
1. The MyCOAST Project Operational oceanography relies on a cooperative effort towards ocean observing systems providing data and modeling products to support end users in the marine sector. In recent years, the IBIROOS community1 has demonstrated the value of marine services in different topics (HABs, oil spill, chemical pollution, search and rescue, support to MFSD implementation, marine spatial planning…) through regional cooperation with support of different EU and Interreg projects. Europe has funded large scale initiatives to protect, secure and sustain marine and coastal environments. At the same time several regional coastal ocean observatories have been implemented along the North Atlantic Coast with the aim of complementing existing networks and to cover near-shore areas with higher spatial resolution observations and forecasts, e.g. RAIA, LOREA, the Western Channel Observatory, SCObs, SmartBay, HOSEA or OCASO. MyCoast is an Atlantic Area Interreg project that aims to fill the gap between large scale products and end-users whilst addressing a transnational cooperation of coastal observatories. During the time of the project, effective member cooperation in the support of the observing system and the dissemination of data has resulted in the joint development and demonstration of improved and novel marine services.
2. MyCOAST tools for coastal risks: joint development and demonstration
MyCOAST has focused on the development of tools to address the requirements and risks from extreme events/flooding (2.1), coastal pollution (2.2), search and rescue (2.3), oil and chemicals (2.4) and maritime safety (2.5). The task sequence in the project was designed to obtain ready to use tools that could be demonstrated in different sitesites in the Atlantic Area during the time of the project:
• Review of the state of the art: A state-of-the-art technical report reviewing the existing tools was used to select tools that were mature enough to advance their development during the time of the project;
• Tool development: Major efforts were applied in improving the software for efficient use by different partners and in upgrading it for ingestion of different model data outputs in standard interoperable Open Geospatial Consortium (OGC) services;
• Tool demonstration: A quick guide was prepared and distributed to MyCOAST partners in order to foster the application of tools in different areas forced by models developed in different coastal observatories.
1 https://eurogoos.eu/roos/ireland-biscay-iberia-regional-operational-oceanographic-system-ibiroos/

422 ADVANCES IN OPERATIONAL OCEANOGRAPHY
COASTAL RISK MYCOAST TOOL MODELS USED FOR INPUT
Flood Flood tool ROMS (tide), SWAN (wave)
Pollution MyCOASTLCS FVCOM, MOHID, ROMS, NEMO
Search and rescue ADRIFT ROMS, FVCOM
HNS & Oil Spill Forecast LI4MOHID MOHID
Maritime safety tool Weather Window tool SWAN
Table I. MyCoast tools for coastal risks
2.1 Flood risk Tool: Floodtool
This flood risk tool entails plugins and Python code for the open source Geographical Information System QGIS, which processes met-ocean data to forecast whether or not historical flooding thresholds will be exceeded. The Floodtool platform is built on free software and is characterized by its flexibility and the possibility of extending the software, which is achieved by means of algorithms, models and plugins. The flood risk tool is intended to support municipalities in different regions.
Fig. 1. FloodTool applied to the coastal town of A Coruña (Galicia, Spain)
423ADVANCES IN OPERATIONAL OCEANOGRAPHY EXPANDING EUROPE’S OBSERVING AND FORECASTING CAPACITY
2.2 Pollution Tool: MyCOASTLCS
MyCOASTLCS has been developed to enable the visualisation, identification and quantification of pollution hot spots of non-reactive, buoyant, slow diffusing and short-lived substances. These assumptions can approximate the behaviour of plastic debris as well as sewage waste over the time scale of a few days. The tool specifically calculates the spatial distribution and time evolution of Finite Time Lyapunov Exponent (FTLE) fields, extracts Lagrangian Coherent Structures (LCS) and estimates spatially discretised time-evolving concentrations and residence times. This coastal risk tool takes MyCOAST partners’ hydrodynamic model outputs (so far FVCOM, MOHID and ROMS and any Arakawa-A grid model such as those in the CMEMS catalogue), runs point-source Lagrangian particle releases and ensembles of gridded particle releases using PyLag, and computes the Finite Time Lyapunov Exponent which indicates a Lagrangian coherent structure, in the post-processing. The tool helps to identify the source of pollutants using backward tracking, and homogeneous flow zones.
2.3 Search and Rescue Tool: ADRIFT
ADRIFT was originally developed by the Marine Institute for the local RNLI (Royal National Lifeboat Institution) station in Galway, Ireland to aid them in marine search and rescue operations in Galway Bay. The system is based on the Ichthyop Lagrangian particle tracking software (https://www.ichthyop.org/) and a tailor-made web tool. Recently the Marine Institute has adapted ADRIFT to run with OpenDrift (Pereiro et al., this conference). The existing tool can accept gridded ocean data simulated by a number of models including ROMS, NEMO and FVCOM.
Fig. 2. MyCOASTLCS demonstrations in Plymouth Sound (UK) with FVCOM model and Galician Rias de Vigo and Pontevedra (Spain) with MOHID model.

424 ADVANCES IN OPERATIONAL OCEANOGRAPHY
2.4 Hazardous and Noxious Substances (HNS) & Oil Spill Forecast Tool: LI4MOHID
A plug-in called LI4MOHID was developed for QGIS in order to run and visualize the results of a marine pollutant dispersion model. The Lagrangian module of the MOHID hydrodynamic model (http://www.mohid.com/) is used in a version that optimizes the CPU time of the program. The oil and chemical spill toolkit provides pre-processing and post-processing tools to adapt partners’ model data to the open-source MOHID HNS and oil spill model.
Fig. 3. ADRIFT demonstrations in Galway Bay (Ireland) with ROMS model and Devon Coast (UK) with FVCOM model.
Fig. 4. LI4MOHID tool demonstrations in the Ria de Arousa (Galicia, Spain).

425ADVANCES IN OPERATIONAL OCEANOGRAPHY EXPANDING EUROPE’S OBSERVING AND FORECASTING CAPACITY
2.2 Pollution Tool: MyCOASTLCS
The primary objective of the maritime safety tool is to identify the appropriate weather window to facilitate safe operations and maintenance, especially of offshore renewable energy and offshore aquaculture operators. End users can view the relevant met-ocean parameters provided by operational wave and circulation models run at partner coastal observatories and establish the suitability of met-ocean conditions with respect to relevant thresholds. The Weather Window Tool was initially developed by the Marine Institute under the AtlantOS project (Dale et al., 2018) and provides a user-friendly interface of short-term wave forecasts; plots two time series, one of significant wave height and another of mean wave period and wave direction. The user specifies a personally preferred cut-off significant wave height; considered as the maximum accepted to ensure safe operations, and the time series of safe windows of opportunity appear highlighted in green. It is currently hosted at [http://www.digitalocean.ie/Home/WeatherWindow] and demonstrates the support for planning of operations at different sites including aquaculture sites in Ireland (7 sites), Galicia (28 mussel raft polygons) and the Basque Country (Mendexa site), ocean-meteo buoys (PML Western Channel E1 and L4, IEO AGL and Xunta de Galicia buoys) and also pilot sites for locating marine renewable energy devices.
Fig. 5. Weather Window demonstrations in Clew Bay (aquaculture site in W Ireland) and IEO AGL Oceanographic Buoy off Santander (N Spain). The existing tool processes SWAN model forecast data for a five day window.
MyCOAST tools for tackling coastal risks are summarised in Table I. Tools were demonstrated in a first phase (see results in previous sections) to show the transferability and interoperability of existing tools between different coastal observatories in the Atlantic Area. These pilot demonstrations and case studies resulted in recommendations for the improvement of tools and are expected to contribute to the design of associated policies and risk management and prevention systems.

426 ADVANCES IN OPERATIONAL OCEANOGRAPHY
Another MyCOAST objective was to demonstrate that tools can support authorities responsible to manage actual risks. A trans-boundary pollution response exercise to test the operational products developed under MyCOAST project was performed on 21 September 2020 in the Galician-Northern Portugal boundary between the latitudes of Vigo (Spain) and Porto (Portugal). Several drifting buoys were launched in the outer shelf and near the coast. MyCOAST tools (LI4MOHID, ADRIFT) and the Galician administration tool CAMGAL were used to forecast the trajectories of the buoys. Agencies responsible for marine operations like the Harbour Master´s Offices of Caminha, Viana and Póvoa de Varzim in Portugal, the Galician Coastguard and the SASEMAR (Spanish Maritime Safety Agency) were involved in the exercise.
Demonstration of the tools in pilot actions showed that MyCOAST tools are effective in supporting end users and transferable among different regions and coastal observatories in the Atlantic Area (Spain, Portugal, UK, Ireland). All tools are intended to be distributed in software repositories at the end of the project. The IBIROOS community will work towards finding ways to maintain and develop these tools after the end of MyCOAST.
Acknowledgements This work has been funded by the European Union’s Interreg Atlantic Area project MyCOAST (EAPA_285/2016, http://mycoast-project.org/).
ReferencesDale, T., Cusack, C., Ruiz Villarreal, M., Leadbetter, A., Lyons, K., Burke, N., Smyth, D., Dabrowski, T., O’Rourke, E. and Gonzalez-Nuevo, G. (2018). Aquaculture operation Bulletin: Weather window nowcast/forecast Bulletin tool for offshore aquaculture operators. AtlantOS Deliverable 8.8, 18 pp. doi:10.3289/AtlantOS_D8.8.
Pereiro, D. et al., Development of an Open-Access Application to Track Missing Persons at Sea, this conference.
Fig. 6. Drifters deployed during the Caminha exercise (left). Trajectory forecasts with Mycoast oil spill tool (red), Mycoast ADRIFT tool (blue) and CAMGAL tool (gray).

427ADVANCES IN OPERATIONAL OCEANOGRAPHY EXPANDING EUROPE’S OBSERVING AND FORECASTING CAPACITY
ReferencesDale, T., Cusack, C., Ruiz Villarreal, M., Leadbetter, A., Lyons, K., Burke, N., Smyth, D., Dabrowski, T., O’Rourke, E. and Gonzalez-Nuevo, G. (2018). Aquaculture operation Bulletin: Weather window nowcast/forecast Bulletin tool for offshore aquaculture operators. AtlantOS Deliverable 8.8, 18 pp. doi:10.3289/AtlantOS_D8.8.
Pereiro, D. et al., Development of an Open-Access Application to Track Missing Persons at Sea, this conference.


SESSION 10
DATA ASSIMILATION AND NUMERICAL TECHNIQUES
430 ADVANCES IN OPERATIONAL OCEANOGRAPHY
CHANGES IN HEAT EXCHANGE BETWEEN THE NORTH SEA AND ADJACENT SEAS DUE TO THE ASSIMILATION OF SATELLITE SEA SURFACE TEMPERATURE Wei Chen, Johannes Schulz-Stellenfleth, Sebastian Grayek and Joanna Staneva
Institute of Coastal Systems-Analysis and Modeling, Helmholtz-Zentrum Hereon, Max-Planck-Strasse, 1 21502 Geesthacht Germany, [email protected]
Abstract
This study investigated the modelled lateral heat transports across the shelf edge and into the Baltic Sea with/without applying data assimilation (DA) of satellite sea surface temperature. The assimilation scheme, i.e., a 3D variational (3DVAR), adopted model error correlations that depend on the water mixing layer thickness derived from a coupled circulation-wave model. The analysis showed, besides the direct change in heat transport due to the DA of water temperature, the indirect change in heat transport due to the significant hydrodynamic response to DA of the model. The largest DA impact was found in the Norwegian Channel, where the dominant process is Eulerian transport, followed by tidal pumping and wind pumping. It is demonstrated that, due to the DA of the water temperature, the along-shelf current at the northern edge of the North Sea is accelerated. This decreased the horizontal pressure gradient from the Atlantic to the North Sea and reduced the Eulerian transport of heat outward the North Sea through the Norwegian Channel.
Keywords: heat budget, advective transport, data assimilation, mechanism analysis
1. Introduction The interest of the research communities on the ocean temperature has increased with the rising concern of global warming (Dye et al., 2013). The variation (both in space and time) of the seawater temperature has a large relevance to fishery management, coastline protection, ecological balance maintenance, and weather predictions (Kjellstrom et al., 2005; Kirby et al., 2007, Fallmann et al., 2017). To improve the seawater temperature prediction, a data assimilation scheme was often applied to

431ADVANCES IN OPERATIONAL OCEANOGRAPHY EXPANDING EUROPE’S OBSERVING AND FORECASTING CAPACITY
combine data from observations, such as from satellites, in situ measurements, and that from numerical model simulations (Anna and Hargreaves, 1999, Liu et al., 2009, Fu et al., 2011). Meanwhile, other studies focused on the DA technique itself, developed various DA methods with implementing sophisticated mathematical disciplines (Losa et al., 2012, 2014). However, the efforts invested in the impacts of DA on physical processes and the secondary effect of DA are insufficient. This study, in contrast, analyzed the influence of DA on heat transport in the North Sea. Specifically, it explored ‘How does the assimilation of SST observations change the different components of the simulated North Sea heat budget, and what are the secondary effects of temperature assimilation on the remaining prognostic model variables that are relevant for the heat budget?’
In this study, a 3-D numerical couple model system NEMO-WAM was employed to assimilate OSI SAF SST satellite measurements. Wave coupling applied in this model resolved the role of turbulent mixing in simulating vertical mixed layer thickness. The latter, which varies over time and space, is an important parameter further applied in the 3-D variational DA analysis technique as the model error covariance matrix. Finally, a harmonic analysis was performed and identified the physical processes that govern the advective heat transport between the North Sea and adjacent seas.
2. Materials and Methods
2.1 Model and observations
The study applied an ocean circulation (NEMO version 3.6, Madec & the NEMO team, 2016) and wave (WAM, the Wamdi Group, 1988) coupled model of the Geesthacht Coupled cOAstal model SysTem (GCOAST, Staneva et al., 2019). The model domain, between −19.89°E and 30.16°E and 40.07°N and 65.93°N, covers the Northwest European Shelf, the North Sea, the Danish Straits, the Baltic with a resolution of 3.5 km (Figure 1). The model was spined up and ran for more than three years to reach a relatively balanced state (January 1, 2017). Subsequently, the model ran without DA for one year (denoted as the Free Run). Then the model was restarted on January 1, 2017, and ran with DA for a year. This experiment was denoted as the DA Run.
The modelled seawater temperature was analyzed with OSI SAF SST data. The number of available points of this data changed at different locations due to varying cloud conditions. The SST measurements were compared with Match up Data Bases (MDB) of in situ measurements, and only data of high quality were collected for the DA.
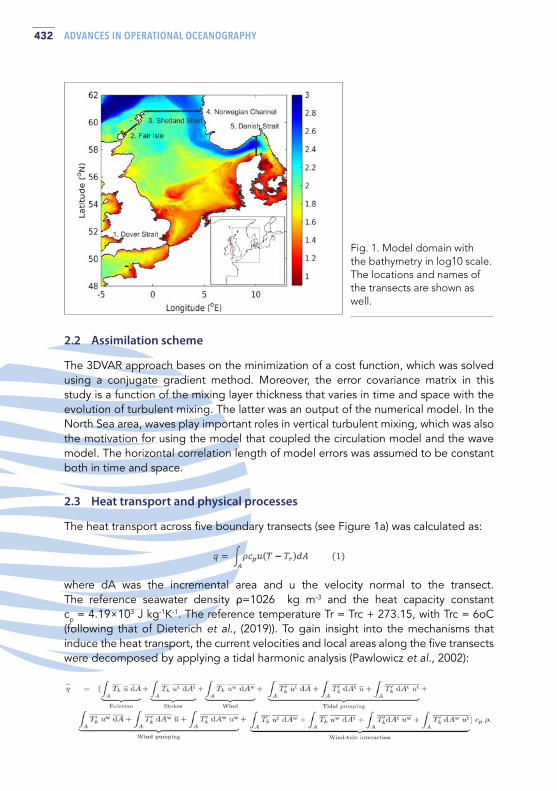
432 ADVANCES IN OPERATIONAL OCEANOGRAPHY
Fig. 1. Model domain with the bathymetry in log10 scale. The locations and names of the transects are shown as well.
2.2 Assimilation scheme
The 3DVAR approach bases on the minimization of a cost function, which was solved using a conjugate gradient method. Moreover, the error covariance matrix in this study is a function of the mixing layer thickness that varies in time and space with the evolution of turbulent mixing. The latter was an output of the numerical model. In the North Sea area, waves play important roles in vertical turbulent mixing, which was also the motivation for using the model that coupled the circulation model and the wave model. The horizontal correlation length of model errors was assumed to be constant both in time and space.
2.3 Heat transport and physical processes
The heat transport across five boundary transects (see Figure 1a) was calculated as:
where dA was the incremental area and u the velocity normal to the transect. The reference seawater density ρ=1026 kg m-3 and the heat capacity constant cp = 4.19×10³ J kg-1K-1. The reference temperature Tr = Trc + 273.15, with Trc = 6oC (following that of Dieterich et al., (2019)). To gain insight into the mechanisms that induce the heat transport, the current velocities and local areas along the five transects were decomposed by applying a tidal harmonic analysis (Pawlowicz et al., 2002):

433ADVANCES IN OPERATIONAL OCEANOGRAPHY EXPANDING EUROPE’S OBSERVING AND FORECASTING CAPACITY
Fig. 2. Annual mean heat transport through the five selected transects. Positive/negative denotes into/out the North Sea.
(2) Here, the overbar represented an annual average and superscripts ‘t’ and ‘w’ indicated harmonic quantity and wind-induced quantity. The temperature Tk was obtained from the model runs.
3. Results The heat transport at the five selected transects was calculated using eq.1 for the year 2017 (Figure 2). It was found that the North Sea gains heat through advective heat transport at the Dover Strait, the Fair Isle, and the Shetland Shelf, and loses heat at the Norwegian Channel. The heat transport at the Danish Strait was negligible. In total, the North Sea gained 18.32 TW (17.78 TW) of heat and lost 16.32 TW (15.04 TW) in the Free Run (DA Run). In 2017, a net heat content accumulated in the North Sea through the advective heat transport, with a value of 2.02 TW in the Free Run and 2.74 TW in the DA Run.
Contributions at each transect to the total heat transport were related to the amount of water volume through the transects (not shown). For instance, in the Free Run, the net volume transports were 0.09 SV at Dover Strait, 0.04 Sv at the Danish Strait, 0.48 Sv at the Fair Isle and the Shetland Shelf, and -1.27 Sv at the Norwegian Channel. These values were consistent with the finding of earlier observations and model studies (Prandle et al., 1996; Otto et al., 1990; Hjollo et al., 2009).
Figure 2 further showed that the main difference between the Free Run and the DA Run occurred at the Norwegian Channel. Through this transect, the heat transport reduced from the North Sea to the Atlantic after DA. To gain further insight into the DA impact, the physical processes that dominate heat transport were investigated (see section 2.3) in more detail. As shown in Figure 3, the features of the heat transport at each open boundary were different. At the west side (Dover Strait), the Eulerian transport and the Stokes transport were two mechanisms at the dominant order. At

434 ADVANCES IN OPERATIONAL OCEANOGRAPHY
the north boundary, i.e., Fair Isle, Shetland Shelf, and Norwegian Channel, the major heat transport was the Eulerian term. At the east side (Danish Strait), tidal pumping and wind pumping of heat acted as the dominant process for the advective heat transport. Moreover, it was worth noting that the Norwegian Channel transect and the Danish Strait transect were both inside the Norwegian Trench. Hence, they shared some similarities in transport mechanisms, i.e., tidal pumping and wind pumping also played a role at the Norwegian Channel transect.
When comparing the Free Run and the DA Run, Figure 3 revealed the Eulerian transport as the main changed term, implying a reduced outward volume transport through the Norwegian Channel. Figure 4 illustrated a mean current field of one month (hence, the dominant tidal components were removed, e.g., M2). The pattern in other months was similar and thus not shown. The contours indicated the relative difference in the dynamic energy between the DA Run and the Free Run per unit water mass, i.e., ε=0.5(ua
2- uf2)/0.5( ua
2+ uf2). When ε= 1, the water current was generated by
the DA, whereas ε=−1 DA removed the water current locally. The case ε= 0 implied that DA does not change the local velocity field. The larger change of the vertical mean current due to DA occurred in the area with deeper water depth. The largest dynamic changes occurred inside the Norwegian Channel and outside of the shelf sea. Current velocities in the Atlantic were enhanced along the northern side of the North Sea shelf because of DA. As a result, the branch-current along the western side of the Norwegian Channel increased, and in consequence compensated the net outward current of the North Sea.
Fig. 3. Annual mean heat transport due to different physical processes through the five selected transects for the Free Run (left column) and the DA Run (right column). Positive/negative denotes into/out the North Sea.

435ADVANCES IN OPERATIONAL OCEANOGRAPHY EXPANDING EUROPE’S OBSERVING AND FORECASTING CAPACITY
4. Conclusions The study investigated the impact of the satellite SST assimilation on the modeling of heat transport in the North Sea. The DA scheme implemented a 3DVAR with model errors correlated with the length of the mixing layer. It was demonstrated that DA not only affected the heat transport through the direct change of seawater temperature but also affected the heat transport through the secondary impact on the current velocity. The largest secondary impact of the DA was at the Norwegian Channel, where the lateral heat transport outward decreased from 16.32 TW to 15.04 TW.
Further decomposition of the heat transport with a harmonic analysis revealed that the dominant mechanism of the heat transport at the Norwegian Channel was the Eulerian transport, followed by tidal pumping and wind pumping at a higher order of magnitude. The decreased outward heat transport through the Norwegian Channel was due to the decreased Eulerian volume transport. Further analysis revealed an acceleration of the along-shelf current at the northern edge of the North Sea due to DA, which compensated the outward currents, in consequence, decreased the flux from the North Sea to the Atlantic.
Fig. 4. Vertical mean current averaged over a one month period in 2017. Arrows are velocities of the DA Run, and the contours denote the relative changes in dynamic energy from the Free Run to DA Run. Positive/Negative values represent the increasing/decreasing energy due to DA. Blue solid (dotted) line indicate the sea bottom 250 m (500 m).
Acknowledgements The study is supported by the Advanced Earth System Modelling capacity project (ESM). The authors gratefully acknowledge the Julich Supercomputing Centre (JSC) for providing computing. J. Schulz-Stellenfleth and J. Staneva acknowledge support from the Project ‘OceanCurrents’ (N° 03F0822A) funded by the Federal Ministry of Education and Research (BMBF). S. Grayek acknowledges H2020 Project IMMERSE.
436 ADVANCES IN OPERATIONAL OCEANOGRAPHY
ReferencesAnnan, J. D. and Hargreaves, J. C. (1999). Sea surface temperature assimilation for a three-dimensional baroclinic model of shelf seas. Continental Shelf Research, 92419, 1507-1520.
Dieterich, C., Wang, S., Schimanke, S., Gröger, M., Klein, B., Hordoir, R., … others (2019). Surface heat budget over the North Sea in climate change simulations. Atmosphere, 10, 272.
Dye, S., Hughes, S. L., Tinker, J., Berry, D. I., Holliday, N. P., Kent, E. C., … others (2013). Impacts of climate change on temperature (air and sea). MCCIP Secretariat.
Fallmann, J., Lewis, H., Castillo, J. M., Arnold, A. and Ramsdale, S. (2017). Impact of sea surface temperature on stratiform cloud formation over the North Sea. Geophysical Research Letters, 44, 4296–4303.
Hjøllo, S. S., Skogen, M. D. and E., S. (2009). Exploring currents and heat within the North Sea using a numerical model. Journal of Marine Systems, 78, 180-192.
Kirby, R. R., Beaugrand, G., Lindley, J. A., Richardson, A. J., Edwards, M. and Reid, P. C. (2007). Climate effects and benthicpelagic coupling in the North Sea. Marine Ecology Progress, 330, 31–38.
Kjellström, E., Döscher, R., and Meier, H. M. (2005). Atmospheric response to different sea surface temperatures in the baltic sea: coupled versus uncoupled regional climate model experiments. Hydrology Research, 36, 397–409.
Liu, Y., Zhu, J., She, J., Zhuang, S., Fu, W. and Gao, J. (2009). Assimilating temperature and salinity profile observations using an anisotropic recursive filter in a coastal ocean model. Ocean Modelling, 30, 75–87.
Losa, S. N., Danilov, S., J., S., Nerger, L., Maßmann, S. and Janssen, F. (2012). Assimilating NOAA SST data into the BSH operational circulation model for the North and Baltic Seas: Inference about the data. Journal of Marine Science, 105-108, 152-162.
Losa, S. N., Danilov, S., Schröter, T., Jens and Janji ́c, Nerger, L. and Janssen, F. (2014). Assimilating NOAA SST data into BSH operational circulation model for the North and Baltic Seas: Part 2. Sensitivity of the for ecast’s skill to the prior model error statistics. Journal of Marine Systems, 129, 259–270.
Madec, G. and the NEMO team. (2016). Nemo ocean engine, note du pole de modélisation. France: Institut Pierre-Simon Laplace (IPSL). 27.
Otto, L., Zimmerman, J. T. F., Furnes, G. K., Mork, M., Sætre, R. and Becker, G. (1990). Review of the physical oceanography of the North Sea. Netherlands Journal of Sea Research, 26, 161-238.
Pawlowicz, R., Beardsley, B. and Lentz, S. (2002). Classical tidal harmonic analysis including error estimates in matlab using T-TIDE. Computers and Geosciences, 28, 929-937.

437ADVANCES IN OPERATIONAL OCEANOGRAPHY EXPANDING EUROPE’S OBSERVING AND FORECASTING CAPACITY
Prandle, D., Ballard, G., Flatt, D., Harrison, A. J., Jones, S. E., Knight, P. J., … Tappin, A. (1996). Combining modelling and monitoring to determine fluxes of water, dissolved and particulate metals through the Dover Strait. Continental Shelf Research, 16, 237-257.
The Wamdi Group. (1988). The WAM Model—A Third Generation Ocean Wave Prediction Model. Journal of Physical Oceanography, 18, 1775–1810.
438 ADVANCES IN OPERATIONAL OCEANOGRAPHY
PARTITIONING OCEAN DYNAMICAL PATCHES USING MODELLED ESSENTIAL AND DERIVED OCEAN VARIABLES AND DATA MINING IN THE NORTHWESTERN MEDITERRANEAN SEA Victor Quilfen (1), Marie Cachera (1), François Gaudin (1), Martial Boutet (2) and Emilie Tew-Kai (1)
(1) SHOM, 13 rue de Châtellier, 29200 Brest, France, [email protected], [email protected], [email protected], [email protected]
(2) CNRS, M2C, 24 rue des Tilleuls, 14000 Caen, France, [email protected]
Abstract
The study aims at developing new oceanographic products in order to define seascapes describing synthetic abiotic patches. HYbrid Coordinate Ocean Model (HYCOM) outputs were used in the French Mediterranean Sea Exclusive Economic Zone (EEZ), to calculate Essential Oceanic Variables (EOVs) and derived EOVs. A partitioning method was then applied on EOVs in order to find dynamic regional structures and generate a dynamical mosaic of the EEZ’s environmental conditions. An example of these products defining Geographic Units under the European Union Marine Strategy Framework Directive (MSFD) French assessment of marine waters is presented.
Keywords: Patch, Operational Coastal Ocean Model, EOV, MSFD, clustering
1. Introduction Marine policies like Marine Strategy Framework Directive (MSFD) need to produce ecosystem-based indicators on the current state of the marine environment, and more precisely of a given marine sub-region. To this end, it is crucial to subdivide such large marine regions into smaller areas using relevant ecosystemic properties. On the one hand, in recent years, the concept of marine seascapes, i.e. relevant marine units based on several biotope and/or biocenosis characteristics, has clearly emerged

439ADVANCES IN OPERATIONAL OCEANOGRAPHY EXPANDING EUROPE’S OBSERVING AND FORECASTING CAPACITY
notably through the works of Pittman (Pittman, 2017). Based on this concept, the multidisciplinary field of ‘seascape ecology’ appears to be necessary to understand the complexity and spatio-temporal dynamics of marine environments, and thus to provide tools for management of maritime and coastal spaces. On the other hand, within the field of oceanography, Operational Coastal Ocean (OCO) modelling appears as an important tool to generate data of coastal circulation at both spatial and temporal high-resolutions. It indeed allows to calculate important oceanographic variables, including Essential Oceanic Variables (EOVs) as defined by the Global Ocean Observing System (GOOS), and complementary derived variables calculated from EOVs (hereinafter referred to as ‘subEOVs’), particularly dynamics ones related to sea surface height, current velocities, temperature and salinity.
In this study, EOVs and subEOVs are calculated based on the results of hindcast numerical simulations with the 3D HYbrid Coordinate Ocean Model (HYCOM), over a multi-year period. These oceanographic products and the result of clustering pipeline to partition water masses based on their physical properties, following the same method as that undertaken for the French Atlantic EEZ area by Tew-Kaï et al., (2020), are presented. Assuming that oceanographic features can be used as a proxy for biological information in order to classify marine habitats, the aim was to categorize physical patches characterized by specific oceanographic properties and to constitute a mosaic of patches including their spatio-temporal dynamics in order to define Geographic Units for MSFD assessment of marine waters.
2. Materials and Methods
2.1 Model set-up
The 3D HYCOM model developed by the French Service Hydrographique et Océanographique de la Marine (SHOM) was used. Details can be found in Tew-Kai et al., (2020). The specificities of the Mediterranean model are described below. It is configured on a spatial extent covering the whole Mediterranean Sea, between 30.2°N and 45.8°N latitude, and between 7° W and 36.2 °E longitude (Figure 1). The bathymetry was extracted from a SHOM digital elevation model with a resolution of 500 m. The horizontal grid resolution was set to 1/60° (~1.8 km in longitude and varies in latitude from 1.3 km to 1.4 km) for a total of 2595 x 936 cells. The vertical dimension was discretized over 32 layers. The forcing current velocities field included a geostrophic component calculated from the densities extracted from operational PSY4V3 products at 1/12° resolution provided by the CMEMS (Lellouche et al., 2018), and a tidal component calculated from the COMAPI atlas (Cancet et al., 2010) using nine tidal constituents: Q1, O1, P1, K1, N2, M2, S2, K2 et M4.
Vertical turbulent mixing was modelled using the K-Profile Parametrization (KPP) of Large et al., (1994). Bottom friction was distributed over a 10 m thick layer of water using an algorithm similar to KPP with a quadratic law and a constant coefficient equal to 2.5e-3. Atmospheric forcings (wind, precipitation, atmospheric pressure and bulk
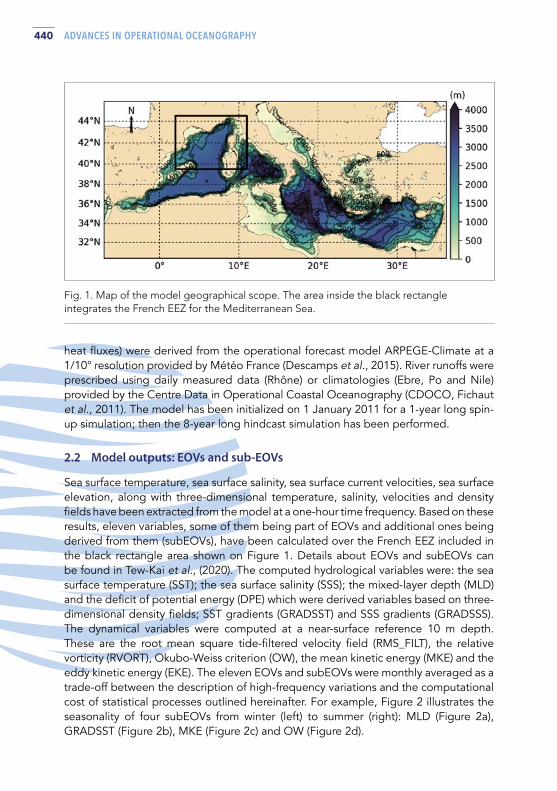
440 ADVANCES IN OPERATIONAL OCEANOGRAPHY
heat fluxes) were derived from the operational forecast model ARPEGE-Climate at a 1/10° resolution provided by Météo France (Descamps et al., 2015). River runoffs were prescribed using daily measured data (Rhône) or climatologies (Ebre, Po and Nile) provided by the Centre Data in Operational Coastal Oceanography (CDOCO, Fichaut et al., 2011). The model has been initialized on 1 January 2011 for a 1-year long spin-up simulation; then the 8-year long hindcast simulation has been performed. 2.2 Model outputs: EOVs and sub-EOVs
Sea surface temperature, sea surface salinity, sea surface current velocities, sea surface elevation, along with three-dimensional temperature, salinity, velocities and density fields have been extracted from the model at a one-hour time frequency. Based on these results, eleven variables, some of them being part of EOVs and additional ones being derived from them (subEOVs), have been calculated over the French EEZ included in the black rectangle area shown on Figure 1. Details about EOVs and subEOVs can be found in Tew-Kai et al., (2020). The computed hydrological variables were: the sea surface temperature (SST); the sea surface salinity (SSS); the mixed-layer depth (MLD) and the deficit of potential energy (DPE) which were derived variables based on three-dimensional density fields; SST gradients (GRADSST) and SSS gradients (GRADSSS). The dynamical variables were computed at a near-surface reference 10 m depth. These are the root mean square tide-filtered velocity field (RMS_FILT), the relative vorticity (RVORT), Okubo-Weiss criterion (OW), the mean kinetic energy (MKE) and the eddy kinetic energy (EKE). The eleven EOVs and subEOVs were monthly averaged as a trade-off between the description of high-frequency variations and the computational cost of statistical processes outlined hereinafter. For example, Figure 2 illustrates the seasonality of four subEOVs from winter (left) to summer (right): MLD (Figure 2a), GRADSST (Figure 2b), MKE (Figure 2c) and OW (Figure 2d).
Fig. 1. Map of the model geographical scope. The area inside the black rectangle integrates the French EEZ for the Mediterranean Sea.
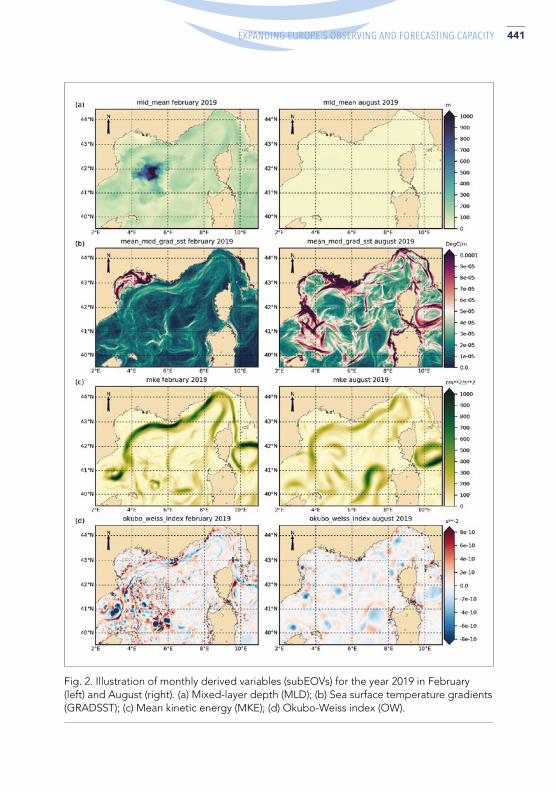
441ADVANCES IN OPERATIONAL OCEANOGRAPHY EXPANDING EUROPE’S OBSERVING AND FORECASTING CAPACITY
Fig. 2. Illustration of monthly derived variables (subEOVs) for the year 2019 in February (left) and August (right). (a) Mixed-layer depth (MLD); (b) Sea surface temperature gradients (GRADSST); (c) Mean kinetic energy (MKE); (d) Okubo-Weiss index (OW).
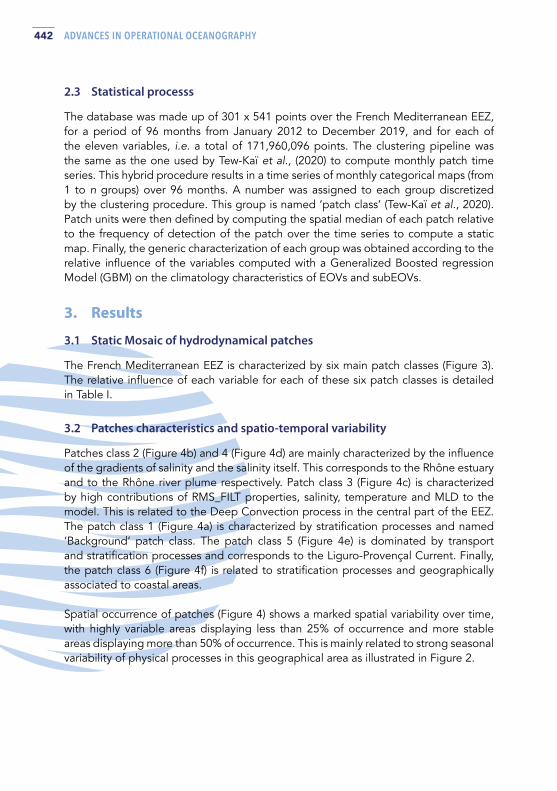
442 ADVANCES IN OPERATIONAL OCEANOGRAPHY
2.3 Statistical processs
The database was made up of 301 x 541 points over the French Mediterranean EEZ, for a period of 96 months from January 2012 to December 2019, and for each of the eleven variables, i.e. a total of 171,960,096 points. The clustering pipeline was the same as the one used by Tew-Kaï et al., (2020) to compute monthly patch time series. This hybrid procedure results in a time series of monthly categorical maps (from 1 to n groups) over 96 months. A number was assigned to each group discretized by the clustering procedure. This group is named ‘patch class’ (Tew-Kaï et al., 2020). Patch units were then defined by computing the spatial median of each patch relative to the frequency of detection of the patch over the time series to compute a static map. Finally, the generic characterization of each group was obtained according to the relative influence of the variables computed with a Generalized Boosted regression Model (GBM) on the climatology characteristics of EOVs and subEOVs.
3. Results
3.1 Static Mosaic of hydrodynamical patches
The French Mediterranean EEZ is characterized by six main patch classes (Figure 3). The relative influence of each variable for each of these six patch classes is detailed in Table I.
3.2 Patches characteristics and spatio-temporal variability
Patches class 2 (Figure 4b) and 4 (Figure 4d) are mainly characterized by the influence of the gradients of salinity and the salinity itself. This corresponds to the Rhône estuary and to the Rhône river plume respectively. Patch class 3 (Figure 4c) is characterized by high contributions of RMS_FILT properties, salinity, temperature and MLD to the model. This is related to the Deep Convection process in the central part of the EEZ. The patch class 1 (Figure 4a) is characterized by stratification processes and named ‘Background’ patch class. The patch class 5 (Figure 4e) is dominated by transport and stratification processes and corresponds to the Liguro-Provençal Current. Finally, the patch class 6 (Figure 4f) is related to stratification processes and geographically associated to coastal areas.
Spatial occurrence of patches (Figure 4) shows a marked spatial variability over time, with highly variable areas displaying less than 25% of occurrence and more stable areas displaying more than 50% of occurrence. This is mainly related to strong seasonal variability of physical processes in this geographical area as illustrated in Figure 2.

443ADVANCES IN OPERATIONAL OCEANOGRAPHY EXPANDING EUROPE’S OBSERVING AND FORECASTING CAPACITY
4. Discussion and Conclusions In this work, the seascape computational process was the same as that used by Tew-Kai et al., (2020) but transposed to the Northwestern Mediterranean Sea. The objective was to define coherent geographical areas as geographic units in the marine domain to help define indicators for marine policies such as the MSFD, integrating their spatio-temporal variability.
Fig. 3. Static patch classes resulting from the spatial median of each patch relative to the frequency of detection of the patch over the time series (96 months) in the French EEZ. (Top: on the whole area.)
Fig. 4. Spatial occurrence of the six hydrodynamical patches over the 96 months experiment. Black line represents the 50% of occurrence. (a) Background; (b) Rhône estuary, (c) Deep Convection, (d) Rhône plume, (e) Liguro-Provençal Current, (f) Coastal zone.
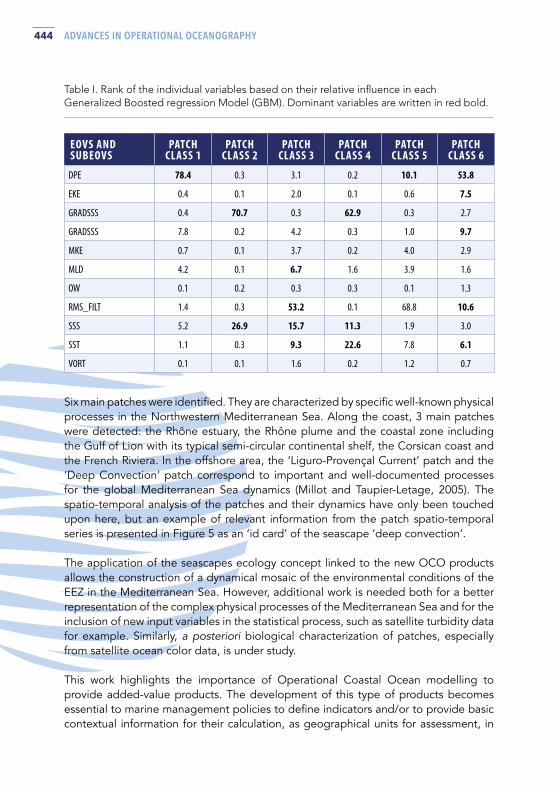
444 ADVANCES IN OPERATIONAL OCEANOGRAPHY
EOVS AND SUBEOVS
PATCH CLASS 1
PATCH CLASS 2
PATCH CLASS 3
PATCH CLASS 4
PATCH CLASS 5
PATCH CLASS 6
DPE 78.4 0.3 3.1 0.2 10.1 53.8
EKE 0.4 0.1 2.0 0.1 0.6 7.5
GRADSSS 0.4 70.7 0.3 62.9 0.3 2.7
GRADSSS 7.8 0.2 4.2 0.3 1.0 9.7
MKE 0.7 0.1 3.7 0.2 4.0 2.9
MLD 4.2 0.1 6.7 1.6 3.9 1.6
OW 0.1 0.2 0.3 0.3 0.1 1.3
RMS_FILT 1.4 0.3 53.2 0.1 68.8 10.6
SSS 5.2 26.9 15.7 11.3 1.9 3.0
SST 1.1 0.3 9.3 22.6 7.8 6.1
VORT 0.1 0.1 1.6 0.2 1.2 0.7
Table I. Rank of the individual variables based on their relative influence in each Generalized Boosted regression Model (GBM). Dominant variables are written in red bold.
Six main patches were identified. They are characterized by specific well-known physical processes in the Northwestern Mediterranean Sea. Along the coast, 3 main patches were detected: the Rhône estuary, the Rhône plume and the coastal zone including the Gulf of Lion with its typical semi-circular continental shelf, the Corsican coast and the French Riviera. In the offshore area, the ‘Liguro-Provençal Current’ patch and the ‘Deep Convection’ patch correspond to important and well-documented processes for the global Mediterranean Sea dynamics (Millot and Taupier-Letage, 2005). The spatio-temporal analysis of the patches and their dynamics have only been touched upon here, but an example of relevant information from the patch spatio-temporal series is presented in Figure 5 as an ‘id card’ of the seascape ‘deep convection’. The application of the seascapes ecology concept linked to the new OCO products allows the construction of a dynamical mosaic of the environmental conditions of the EEZ in the Mediterranean Sea. However, additional work is needed both for a better representation of the complex physical processes of the Mediterranean Sea and for the inclusion of new input variables in the statistical process, such as satellite turbidity data for example. Similarly, a posteriori biological characterization of patches, especially from satellite ocean color data, is under study.
This work highlights the importance of Operational Coastal Ocean modelling to provide added-value products. The development of this type of products becomes essential to marine management policies to define indicators and/or to provide basic contextual information for their calculation, as geographical units for assessment, in
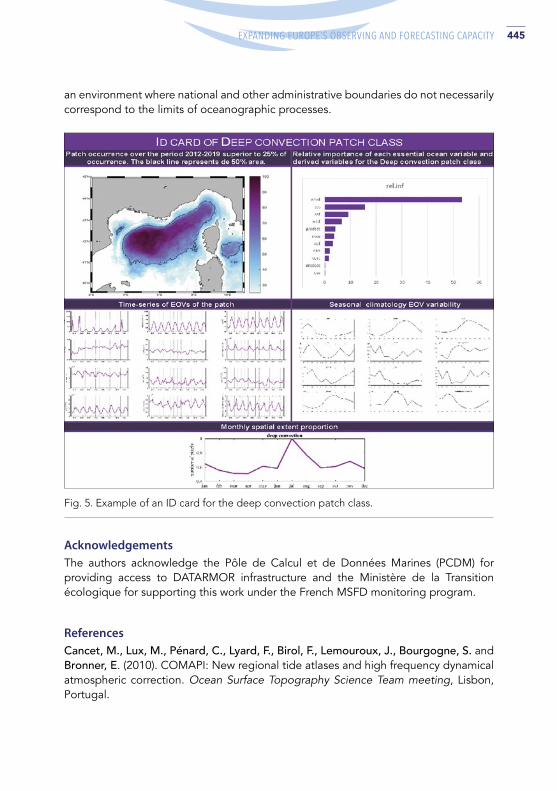
445ADVANCES IN OPERATIONAL OCEANOGRAPHY EXPANDING EUROPE’S OBSERVING AND FORECASTING CAPACITY
an environment where national and other administrative boundaries do not necessarily correspond to the limits of oceanographic processes.
Fig. 5. Example of an ID card for the deep convection patch class.
Acknowledgements The authors acknowledge the Pôle de Calcul et de Données Marines (PCDM) for providing access to DATARMOR infrastructure and the Ministère de la Transition écologique for supporting this work under the French MSFD monitoring program.
ReferencesCancet, M., Lux, M., Pénard, C., Lyard, F., Birol, F., Lemouroux, J., Bourgogne, S. and Bronner, E. (2010). COMAPI: New regional tide atlases and high frequency dynamical atmospheric correction. Ocean Surface Topography Science Team meeting, Lisbon, Portugal.
446 ADVANCES IN OPERATIONAL OCEANOGRAPHY
Descamps, L., Labadie, C., Joly, A., Bazile, E., Arbogast, P., Cébron, P. (2015). PEARP, the Météo-France short-range ensemble prediction system. Quarterly Journal of the Royal Meteorological Society, 141, 1671–1685.
Fichaut, M., Bonnat, A., Carval, T., Lecornu, F., Le Roux, J., Moussat, E., Nonnotte, L.,
Tarot, S. (2011). Data Centre for French Coastal Operational Oceanography. Mediterr. Marine Science, 12, 70–79.
Large, W.G., McWilliams, J.C., Doney, S.C. (1994). Oceanic vertical mixing: A review
and a model with a nonlocal boundary layer parameterization. Reviews of Geophysics, 32, 363–403
Lellouche, J. M., Greiner, E., Galloudec, O. L., Garric, G., Regnier, C., Drevillon, M., Benkiran, M., Testut, C.-E., Bourdalle-Badie, R., Gasparin, F., Hernandez, O., Levier, B., Drillet, Y., Remy, E. & Traon, P. Y. L. (2018). Recent updates to the Copernicus Marine Service global ocean monitoring and forecasting real-time 1∕ 12° high-resolution system. Ocean Science, 14(5), 1093-1126
Millot, C., and Taupier-Letage, I. (2005). Circulation in the Mediterranean Sea:
Updated description and schemas of the circulation of the water masses in the whole Mediterranean Sea. A. Saliot. The Mediterranean Sea (5-K), Springer, pp.29-66.
Pittman, S. J. (2017). Seascape ecology. John Wiley & Sons.
Tew-Kai, E., Quilfen, V., Cachera, M., & Boutet, M. (2020). Dynamic Coastal-Shelf Seascapes to Support Marine Policies Using Operational Coastal Oceanography: The French Example. Journal of Marine Science and Engineering, 8(8), 585.

447ADVANCES IN OPERATIONAL OCEANOGRAPHY EXPANDING EUROPE’S OBSERVING AND FORECASTING CAPACITY
ASSIMILATION OF SATELLITE TOTAL SURFACE CURRENT VELOCITIES IN GLOBAL OCEAN FORECASTING SYSTEMS Jennifer Waters (1), Matthew Martin (1), Elisabeth Remy (2), Isabelle Mirouze (3), Lucile Gaultier (4), Clement Ubelmann (5), Robert King (1) and Craig Donlon (6)
(1) Met Office, UK(2) Mercator Ocean International, France (3) Cap Gemini, France(4) OceanDataLab, France(5) OceanNext, France(6) European Space Agency/ESTEC, Netherlands
Abstract
Observations of ocean velocities are currently limited and are not routinely assimilated in global operational ocean forecasting systems. This may change with proposed new satellite missions designed to observe ocean surface velocities. The ESA Assimilation of Total Surface Current Velocity (A-TSCV) project will use observing system simulation experiments to investigate the assimilation of total surface current velocities in operational global forecasting systems. Synthetic observations of the standard observing network along with synthetic observations of new satellite total surface current velocities are being generated from a high-resolution nature run. The assimilation of these observations will be tested in the Met Office FOAM and the Mercator Ocean forecasting systems.
Keywords: Assimilation, velocities, OSSE, global ocean
1. Introduction The ocean total surface current velocity (TSCV) is the Lagrangian mean velocity at the instantaneous sea surface (Marié et al., 2020). Accurate forecasting of the ocean TSCV is important for applications such as search and rescue, tracking marine plastic and for coupled ocean/atmosphere/sea-ice/wave forecasting. Direct measurements of the TSCV are currently not available with global coverage. Various satellite missions are being proposed to measure TSCV globally such as SKIM (Ardhuin et al., 2019)

448 ADVANCES IN OPERATIONAL OCEANOGRAPHY
and WaCM (Rodriguez et al., 2019). These satellite missions could provide new opportunities for assimilation of velocities into global forecasting systems in the future.
The ESA Assimilation of TSCV (A-TSCV) project1 aims to investigate the design, implementation and impact of assimilating synthetic TSCV data in global ocean forecasting systems. The project will use observing system simulation experiments (OSSEs) to test the assimilation methodology and provide feedback on the observation requirements for future satellite missions. Synthetic observations are being generated for all standard data types as well as the new observations expected from SKIM-like satellite missions. Two operational global ocean forecasting systems are being developed to assimilate these data in a set of coordinated OSSEs: the FOAM system run at the Met Office (Blockley et al., 2014) and the Mercator Ocean system (Lellouche et al., 2018). In section 2 we present a description of the OSSE experiment design, in section 3 we show preliminary results demonstrating the assimilation of TSCV and in section 4 some work exploring the velocity forecast error covariances.
2. Observing System Design OSSEs are used to test the impact of proposed new observations on forecast systems through the assimilation of synthetic observations. The synthetic observations are generated by sampling from a Nature Run which represents the true ocean state for the experiments. For the A-TSCV project the chosen Nature Run is the 1/12° global ocean simulation with the Mercator Ocean real time system model configuration without assimilation. The model, NEMO, was forced by 3 hourly atmospheric fields from the ECMWF Integrated Forecasting System. The same Nature Run was used for the H2020 AtlantOS project for the in situ network design experiments and full details are provided in Gasparin et al., (2019). A detailed comparison of the Nature Run to observation products is provided by Gasparin et al., (2018) and verifies the realism of the simulation.
2.1 Simulated observations
The simulated sea ice concentration (SIC), Sea Surface Temperature (SST) and in situ temperature (T) and salinity (S) observations are the same observations used in the H2020 AtlantOS project (Gasparin et al., 2019; Mao et al., 2020). Simulated Sea Level Anomaly (SLA) data will sample a constellation of 4 satellites: Jason-3, Sentinel-3a, Sentinel-3b and Cryostat-2. Observations are generated from daily (for SST, SIC, T and S) and hourly (for SLA) mean fields from the Nature Run. Realistic observations errors are added through unbiased white noise perturbations and for SST and in situ profiles representation error is simulated by randomly shifting the data within ± 3days.
The simulated SKIM TSCV data is generated from hourly Nature Run fields using the open source SKIMulator tool (Gaultier et al., 2019). The L2c SKIM product contains
1 https://oceanpredict.org/science/cross-cutting-projects/a-tscv

449ADVANCES IN OPERATIONAL OCEANOGRAPHY EXPANDING EUROPE’S OBSERVING AND FORECASTING CAPACITY
Eastward and Northward total surface current components of the SKIM swath and this simulated product type will be used for the data assimilation experiments. Figure 1 shows an example of the L2c SKIM data coverage for one day. We plan to initially use data with simple error characteristics, and then explore the impact of more complicated errors on the performance of the data assimilation.
2.2 Forecasting Systems
The assimilation of TSCV data will be tested in two different operational global ocean forecasting systems, the Met Office FOAM system and Mercator Ocean International (MOI) system, to ensure robustness of the results. It is important to realistically represent the differences between the real ocean and forecast systems in our OSSE experiments. This is achieved by using a lower spatial resolution of ¼ degree in our OSSE experiments, using different initial conditions to the Nature Run and different forcings to represent atmospheric uncertainties. We plan to use the ERA-5 fluxes in both the FOAM and MOI systems, both of which use the NEMO model at version 3.6. While there are some similarities in the two global forecasting systems, they differ significantly in their data assimilation approach, see Table I for a summary.
Fig. 1. Example plot of daily SKIM coverage. The speed (m/s) of the simulated TSCV is shown for 20/12/2011.

450 ADVANCES IN OPERATIONAL OCEANOGRAPHY
3. Idealised Observation Experiments Idealised observation experiments have been performed to demonstrate the assimilation increments produced by a single TSCV observation. In both systems TSCV innovations of 0.5 m/s in the zonal and meridional direction are assimilated at the same locations. The experiments are configured slightly differently for the two forecast systems due to technical differences. In FOAM only the TSCV observations are assimilated. In the MOI system two experiments are performed with all the standard observations and with and without the TSCV observations: the increments due to the TSCV data are calculated from the differences in the assimilation increments between the two experiments. Results for a location in the Mid-Atlantic are presented in Figure 2. The increments for the two systems look very different. The velocity increment is larger for the MOI system and there is a large corresponding sea surface salinity (SSS) increment but very small increments in sea surface height (SSH) and temperature. Conversely, there is no SSS increment in FOAM and larger increments in SSH and temperature. The differences in the increments reflects the differences in the forecast error covariance specification and multivariate balance between the two systems.
FOAM MOI
Assimilation scheme NEMOVAR 3D-VAR FGAT (Waters et al., 2015)
SEEK filter with a fixed basis (Lellouche et al., 2018)
Assimilation window 1 day 7 days
Forecast error covariances
Spatially and seasonally varying error variances at the surface and flow-dependent parameterisation for the sub-surface error variances.Combination of two length-scales for the horizontal error correlations while vertical error correlations are based on the mixed-layer depth.
Defined through an ensemble of model anomalies from an historic model run. Spatially and weekly varying error covariances following the model ‘climatology’.
Multivariate BalanceMulti-variate relationships defined through linearised physical balances (Weaver et al., 2005)
Model covariance matrix based on a reduced basis of multivariate model anomalies.
Table I. A summary of key differences between the FOAM and MOI systems.

451ADVANCES IN OPERATIONAL OCEANOGRAPHY EXPANDING EUROPE’S OBSERVING AND FORECASTING CAPACITY
4. Velocity Error Covariances FOAM forecast error covariances are prescribed through a set of variances, length-scales and balance relationships, see Table I for more details. For the assimilation of TSCV data, new error variances and length-scales are required for the unbalanced components of zonal (U) and meridional (V) velocities. The velocity balance in NEMOVAR is geostrophic so the unbalanced component represents the ageostrophic velocity component. We have used the NMC method (Parrish and Derber, 1992) to estimate the forecast error covariances from a previous two-year run of the 1/4° FOAM system. The NMC method used 48 hour and 24 hour forecast difference fields, valid at the same time, as a proxy for the forecast error. To produce an estimate of the unbalanced velocity covariances we applied the inverse of the NEMOVAR balance operator to the forecast difference fields to remove the balanced (geostrophic) component. Figure 3 shows the zonally averaged horizontal forecast error correlations for September-October-November for U and V. Two horizontal length-scales are estimated for each variable. The short scales for U and V vary between around 40 km at high latitudes, 70 km at mid latitude and 100 km in the tropics. The short U length scales have longer scales in the x-direction by 10-20 km at most latitudes, while the short V length scales are fairly isotropic except near the equator. The longer scales vary between approximately 200 km in the mid latitudes to 400 km near the equator. Long correlations are seen in the x-direction corresponding to the latitudes of the North and South equatorial currents. Interestingly the correlation scales are higher in the y-direction in the mid-latitudes which could be due to the boundary currents.
Fig. 2. Surface increments for speed, temperature, salinity and SSH. From MOI (top) and FOAM (bottom).
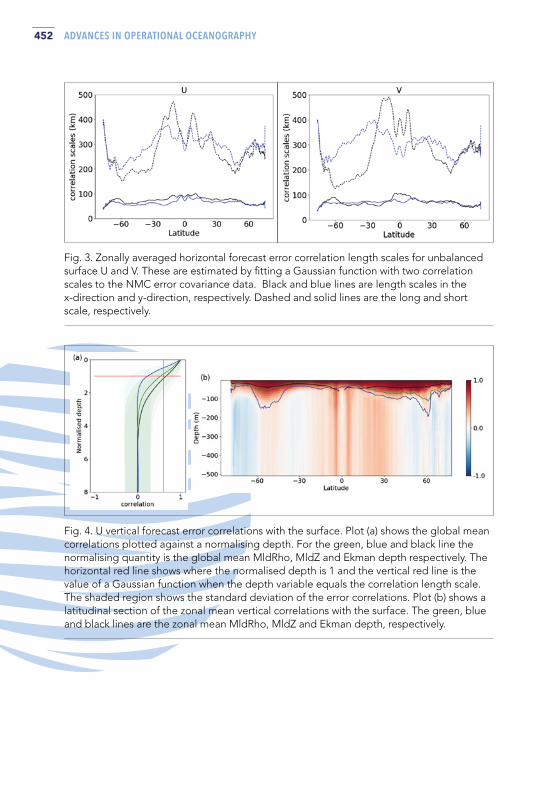
452 ADVANCES IN OPERATIONAL OCEANOGRAPHY
Fig. 3. Zonally averaged horizontal forecast error correlation length scales for unbalanced surface U and V. These are estimated by fitting a Gaussian function with two correlation scales to the NMC error covariance data. Black and blue lines are length scales in the x-direction and y-direction, respectively. Dashed and solid lines are the long and short scale, respectively.
Fig. 4. U vertical forecast error correlations with the surface. Plot (a) shows the global mean correlations plotted against a normalising depth. For the green, blue and black line the normalising quantity is the global mean MldRho, MldZ and Ekman depth respectively. The horizontal red line shows where the normalised depth is 1 and the vertical red line is the value of a Gaussian function when the depth variable equals the correlation length scale. The shaded region shows the standard deviation of the error correlations. Plot (b) shows a latitudinal section of the zonal mean vertical correlations with the surface. The green, blue and black lines are the zonal mean MldRho, MldZ and Ekman depth, respectively.

453ADVANCES IN OPERATIONAL OCEANOGRAPHY EXPANDING EUROPE’S OBSERVING AND FORECASTING CAPACITY
Vertical forecast error correlations for U are shown in Figure 4 and are compared to an Ekman depth (calculated from the model’s vertical eddy viscosity) and two mixed layer depths. The MldZ mixed layer depth is defined as the depth at which the density has increased equivalent to a temperature difference of 0.8 degrees at the surface, the MldRho mixed layer depth is the shallowest depth where density increases by 0.01 kgm3 relative to 10 m density. The latitude section plot shows how the vertical correlations vary with latitude. In the profile plot, the global mean error correlations are compared to a normalised depth. When the normalising depth (Ekman depth or Mixed layer depth) is a good approximation to the correlation length scale, the correlation profile passes close to the red line intersect. From Figure 4, MldZ (which is the mixed layer depth used to parameterise the Temperature and Salinity vertical forecast error correlations in FOAM) significantly over-estimates the U vertical forecast error correlations with the surface, while MxlRho and the Ekman depth appear to provide a good approximation to the correlation scales. We plan to test both the MxlRho and Ekman depth as a method for parameterising the vertical forecast error correlations in FOAM.
5. Future Work The preliminary development of the assimilation of TSCV data described above will form the basis of a set of one year OSSEs for both FOAM and MOI systems. Reference runs will be carried out where only the standard observation network is assimilated followed by a second set of experiments where the standard observation network plus TSCV observations are assimilated. The impact of the assimilation of TSCV data will be assessed in terms of its ability to improve the accuracy of the model’s surface current forecasts in different regions using standard metrics, and also using simulated Lagrangian drift assessments. The impact on the velocity at depth, and other model variables, will also be assessed. These assessments will form the basis of a new set of requirements from the operational ocean forecasting community for future satellite missions measuring surface ocean currents.
ReferencesArdhuin F. et al., (2019). SKIM, a Candidate Satellite Mission Exploring Global Ocean Currents and Waves. Frontiers in Marine Science. 6:209. doi: 10.3389/fmars.2019.00209
Blockley, E. W. et al., (2014). Recent development of the Met Office operational ocean forecasting system: an overview and assessment of the new Global FOAM forecasts, Geoscience Model Development, 7, 2613-2638, doi:10.5194/gmd-7-2613-2014.
Gasparin, F., et al., (2018). A large-scale view of oceanic variability from 2007 to 2015 in the global high resolution monitoring and forecasting system at Mercator Océan, Journal of Marine Systems, 187, https://doi.org/10.1016/j.jmarsys.2018.06.015.
454 ADVANCES IN OPERATIONAL OCEANOGRAPHY
Gasparin F., et al., (2019). Requirements for an Integrated in situ Atlantic Ocean Observing System From Coordinated Observing System Simulation Experiments. Frontiers in Marine Science, 6, https://doi.org/10.3389/fmars.2019.00083
Gaultier, L., (2019). SKIMulator source code https://github.com/oceandatalab/skimulator
Lellouche, J.-M., et al., (2018). Recent updates to the Copernicus Marine Service global ocean monitoring and forecasting real-time 1∕12° high-resolution system, Ocean Science., 14, 1093–1126, https://doi.org/10.5194/os-14-1093-2018, 8.
Mao C., et al., (2020). Assessing the Potential Impact of Changes to the Argo and Moored Buoy Arrays in an Operational Ocean Analysis System. Frontiers in Marine Science 7:588267. doi: 10.3389/fmars.2020.588267
Marié, L. et al., (2020). Measuring ocean total surface current velocity with the KuROS and KaRADOC airborne near-nadir Doppler radars: a multi-scale analysis in preparation for the SKIM mission, Ocean Science, 16, 1399–1429, https://doi.org/10.5194/os-16-1399-2020,
Parish, D.F. and Derber, J.C., (1992). The National Meteorological Center’s spectral statistical interpolation analysis system. Monthly Weather Review, 120(8), pp.1747-1763.
Rodríguez E., et al., (2019). The Winds and Currents Mission Concept. Frontiers in Marine Science 6:438. doi: 10.3389/fmars.2019.00438
Waters, J., et al., (2015). Implementing a variational data assimilation system in an operational ¼ degree global ocean model. Quarterly Journal of the Royal Meteorological Society, 141(687), pp.333-349.
Weaver, A.T., et al., (2005), A multivariate balance operator for variational ocean data assimilation. Quarterly Journal of the Royal Meteorological Society., 131: 3605-3625. doi:10.1256/qj.05.119

455ADVANCES IN OPERATIONAL OCEANOGRAPHY EXPANDING EUROPE’S OBSERVING AND FORECASTING CAPACITY

SESSION 12
NEW TRENDS IN OCEAN OBSERVING

458 ADVANCES IN OPERATIONAL OCEANOGRAPHY
THE WAVY DRIFTERS AND THEIR ROLE IN OCEAN OBSERVATION Rogério Chumbinho (1), José Pinto (10), Raquel Silva (3), Joaquín del Rio (4), Pedro Gonçalves (5), Alexandre Sousa (8), Félix Pedrera (2), Marc Lucas (7), Nuno Almeida (3), Ricardo Neta (9), Artur Rocha (6), Sara Gomes (3), Diego Lozano (2), António Jorge da Silva (3)
(1) BlueWise Marine, Galway, Ireland, [email protected](2) Deimos Space, Tres Cantos, Spain(3) Deimos Engenharia, Lisbon, Portugal(4) SARTI-MAR Research Group Universitat Politècnica de Catalunya, Vilanova i la Geltrú, Spain(5) Instituto de Sistemas e Robótica. Department of Electrical and Computer Engineering,
Coimbra, Portugal(6) INESC Technology and Science, Porto, Portugal(7) Collecte Localisation Satellites, Toulouse, France(8) OceanScan Marine Systems and Technologies, Leça da Palmeira, Portugal(9) Composite Solutions, Vagos, Portugal(10) Instituto Hidrográfico, Lisbon, Portugal
Abstract
The WAVY family of drifters, developed in the EU H2020 project MELOA, range from small drifters, suitable for beach and surf zone studies, to somewhat larger drifters, tailored for coastal and long-term open ocean observations, and consists of five members, namely the WAVYs Basic (WB), Littoral (WL), Ocean (WO), Ocean-plus (WP) and Ocean-Atmo (WA). The main characteristics of all WAVY drifters are their small size and weight, their optimized buoyancy, minimizing the vulnerability to direct wind effect; and the internal mass distribution, that minimizes the pendular motion. Other characteristics, such as wave measurement ability and energy management, will be presented.
The WB and WL are currently at TRL 8, having been validated and used in real operational environments in a series of demonstrative use cases; the WOs are currently at TRL6 and undergoing use cases designed to bring them to TRL8.
MELOA also developed a suite of user-oriented data and SW products, accessible to anyone, that not only facilitate the interface with the drifters, but also allow easy handling and dissemination of both the raw and processed data acquired by the drifters to central ocean data repositories and even creation or use of custom software.
Keywords: Ocean currents, Ocean waves, Sea Surface Temperature, Ocean observation, Lagrangean current meters, surface drifters, near real-time in situ data, data validation

459ADVANCES IN OPERATIONAL OCEANOGRAPHY EXPANDING EUROPE’S OBSERVING AND FORECASTING CAPACITY
1. Introduction Since the kick-off in December 2017, the partnership of the MELOA (Multi-purpose/Multi-sensor Extra Light Oceanography Apparatus) H2020 project has been working on the WAVY family of drifters, a set of low-cost, easy-to-handle, wave resilient, multi-purpose, multi-sensor, extra light surface drifters for use in all water environments. The main attributes of the WAVYs are their small size and low weight, optimized buoyancy to reduce the wind ‘sail effect’ and minimized pendular motion, to keep the communications and positioning antennae as much as possible above water.
The following table presents the WAVY family range, their sensors, and possible applications.
WAVY MODEL MAIN FEATURES SUGGESTED APPLICATIONS
Basic (WB) GNSS, GPRS, 1 thermistor (near sea-surface temperature)
Nearshore studies, citizen-science projects, fresh water inland applications
Littoral (WL) GNSS, GPRS, Inertial Motion Unit (IMU)Nearshore and littoral studies, wave-induced currents, surf zone studies, citizen-science applications, coastal studies, river and estuarine studies
Ocean (WO)GNSS, adjustable ballast module, 2 thermistors (near sea-surface temperatures), satellite communications (Argos), IMU, solar panels
Global ocean circulation studies, regional or global ocean wave studies, satellite data validation, GOC model validation, air-sea interaction studies
Ocean-plus (WP)
GNSS, adjustable ballast module, 2 thermistors (near sea-surface temperatures), satellite communications (Argos), IMU, solar panels and wave energy harvesting
Global ocean circulation studies, regional or global ocean wave studies, satellite data validation, GOC models validation, air-sea interaction studies
Ocean-Atmo (WA)
Equatorial floating (wind exposure), GNSS, adjustable ballast module, 4 thermistors (near surface sea and air temperatures), atmospheric pressure, satellite communications (Argos), IMU, solar panels and wave energy harvesting
Global ocean circulation studies, regional or global ocean wave studies, satellite data validation, climate models validation, air-sea interaction studies
Table I. The MELOA WAVY family, features and potential applications.
The development was done in phases, starting with an initial WL that is an improved version of the original WAVY developed in the ‘RAIA.co’ Interreg project (Jorge da Silva et al., 2016) for nearshore applications, and then advancing to the new WAVY Ocean designed for longer-term deployments in the open ocean.
In terms of hardware and the contributions to the measurement of ocean variables by drifting instruments, the research and development was focused on solving three main goals: the sturdiness of the casing to allow applications in rough environments, such as those in rugged coasts and beaches; the implementation of an inertial motion sensor, to measure accelerations and, from these, compute wave parameters, and finally energy harvesting, for extended battery life at sea. Other challenges had to

460 ADVANCES IN OPERATIONAL OCEANOGRAPHY
be addressed as well, such as resistance to shock of the internal components of the drifters, the balance between autonomy and weight (when considering the weight of batteries), the placement of the required antennae versus the desired behaviour of the spherical drifter (minimizing the wind exposed surface), the minimization or elimination of electromagnetic interference between internal components, the balance of on-board computing power and data storage capacity, the development of communication protocols and periodicity that would not compromise the power budget, among other minor issues.
In addition to the above, a significant body of work was done on the software and firmware of the drifters and MELOA data system. These are described elsewhere and presented in this conference (Pedrera et al., 2021, Session 2 of the conference).
As it can be appreciated from the suggested applications listed in Table I, the WAVY family of drifters has an immense potential as a valid and important contributor to Ocean Observation efforts; in consequence, the MELOA team is developing considerable effort to bring the drifters to near-commercial TRL by the end of the project, at the same time that work targeting instrument validation and build-up of user confidence also progresses. Among the factors influencing the acceptance of a new instrument by the ocean observing community are the ability of the instrument to acquire accurate and precise ocean data, added to its price (capital investment) and the total cost of ownership in the different use cases. These two latter issues are the subject of current work in the project with the development of business models for the drifters and their data products; to this purpose, the partnership has published an user and market assessment questionnaire still open for replies, available in the following web address: https://forms.office.com/Pages/ResponsePage.aspx?id=HrdKicjsD0OYZ7-HaDzuzvetsKBtJqVIpoBKKUbMSelUNllVNTlaQVI0UEoyOTg0RjNXWFZTN1lBWi4u
The present paper and accompanying presentation focus on the issue of reliability of the WAVY drifters (precision of measurements) and of their scientific robustness (accuracy of measurements), presenting the work done in this area and covering the main features of the drifters: tracking of surface currents; measurement of waves; measurement of near-surface sea temperatures.
2. Observation of surface currents The ability of the WAVY drifters to correctly track surface currents has been demonstrated many times, mostly in the Raia.co project (Jorge da Silva, 2016) but also during the field campaigns carried out in the MELOA project. Figure 1 below illustrates the trajectories observed by WL in the nearshore and coastal waters off Portugal and Ireland. Figure 2 shows trajectories of WL in a beach in Vilanova i la Geltrú, Spain, as seen in the WAVY Operation Software, the tool developed to manage campaigns and deployments and available to all users.
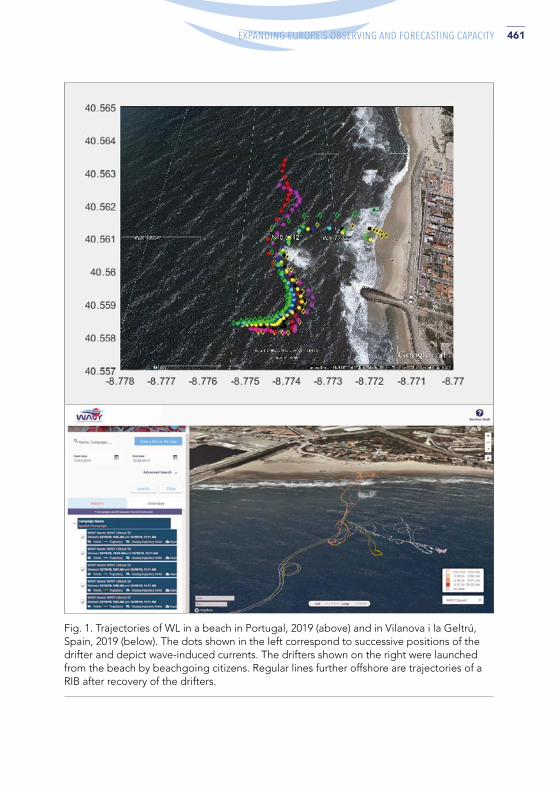
461ADVANCES IN OPERATIONAL OCEANOGRAPHY EXPANDING EUROPE’S OBSERVING AND FORECASTING CAPACITY
Fig. 1. Trajectories of WL in a beach in Portugal, 2019 (above) and in Vilanova i la Geltrú, Spain, 2019 (below). The dots shown in the left correspond to successive positions of the drifter and depict wave-induced currents. The drifters shown on the right were launched from the beach by beachgoing citizens. Regular lines further offshore are trajectories of a RIB after recovery of the drifters.

462 ADVANCES IN OPERATIONAL OCEANOGRAPHY
Of course, to validate these results it is not enough to assess whether the observed trajectories match the expected circulation in the area of the deployments, it is also necessary to compare the observed trajectories (lagrangian) with other synoptic current measurements. This can be achieved by either direct comparison with drifters from other manufacturers in the vicinity (as currently going on off the Algarve coast in Portugal, where direct drifter comparisons are being made between WO and iSphere drifters under the Global Drifter Programme), or by comparison of the computed velocities with Eulerian velocities in the area (which is the case of Galway Bay, where the velocities observed by the drifter is comparable with ADCP velocities observed at the Cabled Underwater Observatory in the exact location of the deployments).
3. Observation of Ocean Wind Waves This is one of the innovations in the WAVY drifter family. All but the Wavy Basic are equipped with an inertial sensor (IMU), thus these drifters acquire data from which wave information can be extracted. This is done by double integration of the accelerations. The resulting displacements are used as input to a ‘Wave Extraction algorithm’. In the WL, the wave parameters are computed from the raw data downloaded once the drifter is recovered after a deployment in the nearshore, littoral or coastal ocean. In the WO series, the wave parameters are computed on-board and transmitted in the satellite data payload. The computations performed in the Wavy Operation Software use both the upward zero-crossing method and the spectral method to determine common and well-known parameters, such as maximum, average and significant height, and mean and peak period, for instance; the computations in the WO also use both methods.
The wave extraction algorithm faces some non-trivial challenges, both hardware related and processual. Although the mass distribution in the WAVY drifters is arranged in such a way as to minimize or cancel pendular motion while at sea, forced by waves, slight deviations during manufacture may induce pendular motion and spurious accelerations, which must be filtered; fortunately, these oscillations have frequencies that can be filtered out without major effects in the range of frequencies typical of surface gravity waves at sea. Another aspect to take into consideration is the misalignment between the drifter’s vertical axis, as determined by its weight distribution, and the IMU axes. This is in principle easy to correct for as long as the misalignment is known, which requires a precise positioning of the IMU sensor on the board and in the drifter during assembly; however, slight deviations introduced during manufacture may induce unrecoverable errors in this correction. Finally, the IMU itself requires calibration to address any systematic error. The MELOA team developed a once-off calibration procedure that should account for misalignment and systematic sensor errors, and work is currently ongoing to further study the sensitivity of the drifter to these effects.
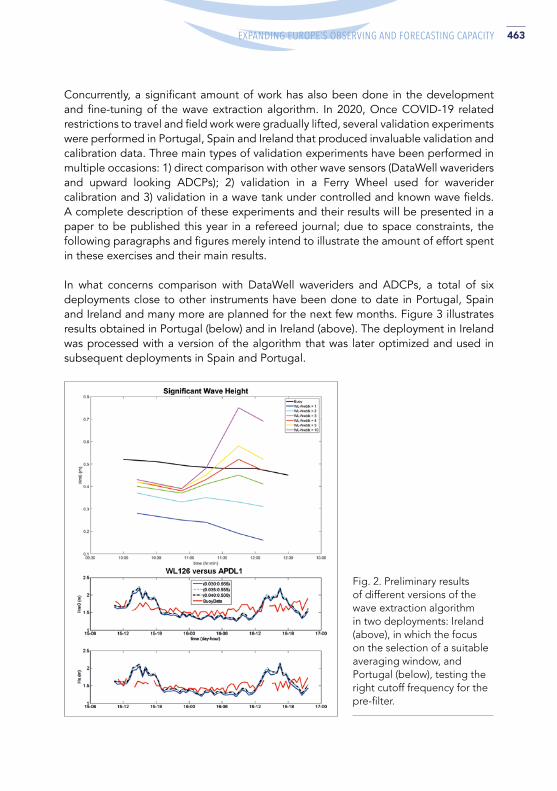
463ADVANCES IN OPERATIONAL OCEANOGRAPHY EXPANDING EUROPE’S OBSERVING AND FORECASTING CAPACITY
Concurrently, a significant amount of work has also been done in the development and fine-tuning of the wave extraction algorithm. In 2020, Once COVID-19 related restrictions to travel and field work were gradually lifted, several validation experiments were performed in Portugal, Spain and Ireland that produced invaluable validation and calibration data. Three main types of validation experiments have been performed in multiple occasions: 1) direct comparison with other wave sensors (DataWell waveriders and upward looking ADCPs); 2) validation in a Ferry Wheel used for waverider calibration and 3) validation in a wave tank under controlled and known wave fields. A complete description of these experiments and their results will be presented in a paper to be published this year in a refereed journal; due to space constraints, the following paragraphs and figures merely intend to illustrate the amount of effort spent in these exercises and their main results.
In what concerns comparison with DataWell waveriders and ADCPs, a total of six deployments close to other instruments have been done to date in Portugal, Spain and Ireland and many more are planned for the next few months. Figure 3 illustrates results obtained in Portugal (below) and in Ireland (above). The deployment in Ireland was processed with a version of the algorithm that was later optimized and used in subsequent deployments in Spain and Portugal.
Fig. 2. Preliminary results of different versions of the wave extraction algorithm in two deployments: Ireland (above), in which the focus on the selection of a suitable averaging window, and Portugal (below), testing the right cutoff frequency for the pre-filter.
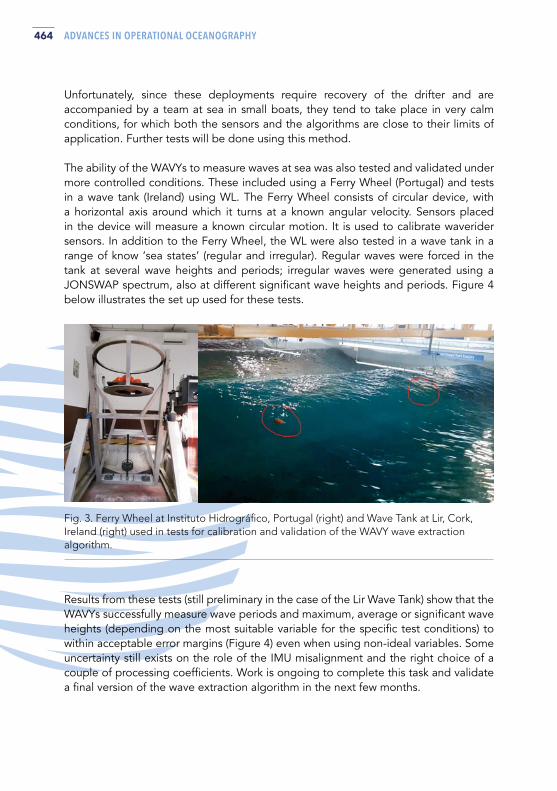
464 ADVANCES IN OPERATIONAL OCEANOGRAPHY
Unfortunately, since these deployments require recovery of the drifter and are accompanied by a team at sea in small boats, they tend to take place in very calm conditions, for which both the sensors and the algorithms are close to their limits of application. Further tests will be done using this method.
The ability of the WAVYs to measure waves at sea was also tested and validated under more controlled conditions. These included using a Ferry Wheel (Portugal) and tests in a wave tank (Ireland) using WL. The Ferry Wheel consists of circular device, with a horizontal axis around which it turns at a known angular velocity. Sensors placed in the device will measure a known circular motion. It is used to calibrate waverider sensors. In addition to the Ferry Wheel, the WL were also tested in a wave tank in a range of know ‘sea states’ (regular and irregular). Regular waves were forced in the tank at several wave heights and periods; irregular waves were generated using a JONSWAP spectrum, also at different significant wave heights and periods. Figure 4 below illustrates the set up used for these tests.
Results from these tests (still preliminary in the case of the Lir Wave Tank) show that the WAVYs successfully measure wave periods and maximum, average or significant wave heights (depending on the most suitable variable for the specific test conditions) to within acceptable error margins (Figure 4) even when using non-ideal variables. Some uncertainty still exists on the role of the IMU misalignment and the right choice of a couple of processing coefficients. Work is ongoing to complete this task and validate a final version of the wave extraction algorithm in the next few months.
Fig. 3. Ferry Wheel at Instituto Hidrográfico, Portugal (right) and Wave Tank at Lir, Cork, Ireland (right) used in tests for calibration and validation of the WAVY wave extraction algorithm.

465ADVANCES IN OPERATIONAL OCEANOGRAPHY EXPANDING EUROPE’S OBSERVING AND FORECASTING CAPACITY
Fig. 4. Results of tests in the Ferry Wheel, exploring different data averaging parameters (above, where the black lines are the reference height and period) and preliminary results at the Lir Wave Tank (below; the black dots are the wave conditions set in the tank, the coloured dots represent Hz and Tz measured by the WLs. Note that reflections in the tank invalidated the tests with 1 m high waves).
4. Observation of Temperatures All WAVYs carry at least one thermistor. Two major challenges in the design and operation of drifters carrying temperature sensors are how to ensure that the instrument is taking measurements with the accuracy and resolution required in oceanography (see, for example, JPOTS, 1991), and that the temperatures observed are indeed those of seawater and are not affected by either internally produced heat or by exposing the sensor to the atmosphere. Caution must also be taken in the regular calibration of the resistance thermometer (thermistor), for which a proper procedure must be set up.
In the WAVYs, by design, there must be a balance between the response time of the thermistors used and the behaviour of the drifter, in which most of the drifter’s surface – but not all – is supposed to remain permanently under water. The sensor head is positioned in this portion of the drifter.
Protection of the sensor from internally generated heat is achieved by thermally insulating the sensing head from the main internal components, and by maximizing the contact with the exterior of the drifter. Since the WAVYs are fully encapsulated by a hard plastic shell, the solution adopted involves embedding the sensor in a metal

466 ADVANCES IN OPERATIONAL OCEANOGRAPHY
screw, which is in turn in contact with seawater. The thermal conductivity of the metal affects the measurement, but the calibration procedure should be enough to account for an accurate retrieval of the sea temperature. Work is currently progressing to deal with the determination of a suitable calibration procedure that will yield the required accuracy.
5. Conclusions The MELOA WAVY family of drifters is reaching the final stages of development and are getting close to becoming a fully validated product. A considerable amount of effort is being placed in fine-tuning the performance of the drifters with respect to validating their measurements of important ocean variables: surface velocities, sea state, (near) sea surface temperatures. Once validated, these instruments will have a high potential to substantially contribute to ocean observation worldwide.
Acknowledgements This work was supported by the project MELOA from the European Commission’s Horizon 2020 research and Innovation program under Grant Agreement N°. 776280.
ReferencesPedrera F., Andrade J., Matos J., Martínez E., Rojas J.J., Gonçalves P., Almeida C., Lucas M., Esteves R., del Rio J. and Chumbinho R., ‘MELOA Catalogue and Geoportal: A modern approach for open access and visualization of in situ drifter data’, 9th EuroGOOS Conference, 2021.
Jorge da Silva A., Mendes D., Pinto J., Loureiro B., Oliveira M. and Rocha A. ‘Observation of the nearshore circulation with lagrangian drifters developed by the RAIA Coastal Observatory’, Actas das 4as Jornadas de Engenharia Hidrográfica, 455-458, Instituto Hidrográfico, Lisboa, Portugal, 21-23 June 2016.
Joint Panel on Oceanographic Tables and Standards (JPOTS), ‘Processing of Oceanographic Station Data’, ISBN 978-92-3-102756-7, UNESCO, 1991.

467ADVANCES IN OPERATIONAL OCEANOGRAPHY EXPANDING EUROPE’S OBSERVING AND FORECASTING CAPACITY
THE EUROGOOS HIGH FREQUENCY RADAR TASK TEAM: A SUCCESS STORY OF COLLABORATION. TO BE KEPT ALIVE AND MADE GROWING Lorenzo Corgnati (1), Carlo Mantovani (1), Anna Rubio (2), Emma Reyes (3), Paz Rotllan (3), Antonio Novellino (4), Patrick Gorringe (5), Lohitzune Solabarrieta (2), Annalisa Griffa (1), Julien Mader (2)
(1) CNR-ISMAR, Lerici, Italy - [email protected](2) AZTI Marine Research, Pasaia, Spain(3) SOCIB, Palma de Mallorca, Spain(4) ETT SpA, Genova, Italy(5) SMHI, Norrköping, Sweden
Abstract High Frequency Radar (HFR) is the unique land-based remote sensing technology capable to map ocean surface currents and waves over wide coverages with high spatial and temporal resolution. HFR gained relevance in the integrated management of coastal zones and thus rapidly expanded in Europe (7 new systems per year since 2016), with over 68 sites currently running and 15 in the planning stage. In 2015, EuroGOOS launched the HFR Task Team (HFR-TT) with the aim of promoting HFR in Europe. This was the cornerstone of a fruitful and still ongoing path towards the coordinated development of HFR technology and the full exploitation of its potential. In fact, many initiatives in Europe followed up, aiming at building an operational HFR European network based on coordinated data management. The HFR-TT actions played an important role in the growth of operational installations in Europe, which were up to then managed in research-specific contexts and without a strong identity in the marine observation landscape. The achievements are promising: (i) the European HFR community took shape, (ii) a European operational HFR Node, best practices and operational tools were created for the production and distribution of standardized and quality-controlled data, and (iii) HFR data have been included in the main marine data portals (CMEMS-In situ TAC, SeaDataNet and EMODnet Physics). The European HFR Node was established in 2018 by AZTI, CNR-ISMAR and SOCIB, coordinated by the EuroGOOS HFR-TT, as the focal point in Europe for HFR data management and distribution, also ensuring the connection with the Global HFR network. The Node is fully operational since December 2018 and is now managing data from 15 European HFR networks and integrates and delivers US HFR network data.
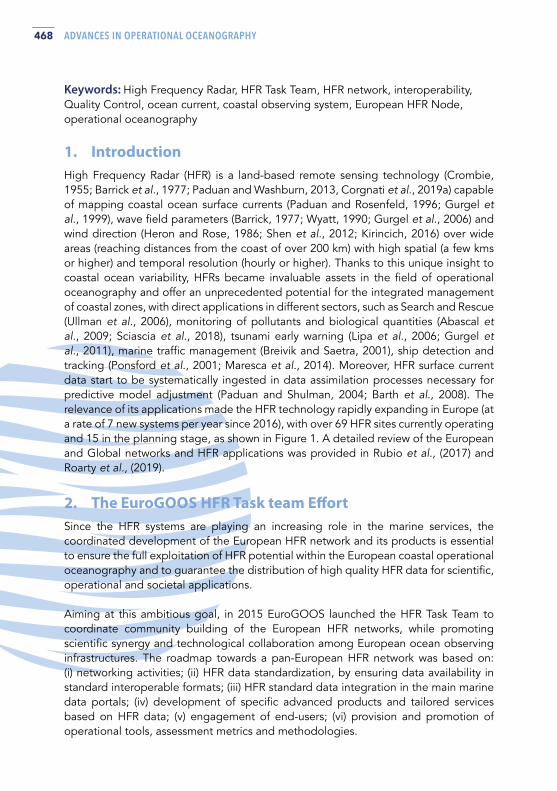
468 ADVANCES IN OPERATIONAL OCEANOGRAPHY
Keywords: High Frequency Radar, HFR Task Team, HFR network, interoperability, Quality Control, ocean current, coastal observing system, European HFR Node, operational oceanography
1. Introduction High Frequency Radar (HFR) is a land-based remote sensing technology (Crombie, 1955; Barrick et al., 1977; Paduan and Washburn, 2013, Corgnati et al., 2019a) capable of mapping coastal ocean surface currents (Paduan and Rosenfeld, 1996; Gurgel et al., 1999), wave field parameters (Barrick, 1977; Wyatt, 1990; Gurgel et al., 2006) and wind direction (Heron and Rose, 1986; Shen et al., 2012; Kirincich, 2016) over wide areas (reaching distances from the coast of over 200 km) with high spatial (a few kms or higher) and temporal resolution (hourly or higher). Thanks to this unique insight to coastal ocean variability, HFRs became invaluable assets in the field of operational oceanography and offer an unprecedented potential for the integrated management of coastal zones, with direct applications in different sectors, such as Search and Rescue (Ullman et al., 2006), monitoring of pollutants and biological quantities (Abascal et al., 2009; Sciascia et al., 2018), tsunami early warning (Lipa et al., 2006; Gurgel et al., 2011), marine traffic management (Breivik and Saetra, 2001), ship detection and tracking (Ponsford et al., 2001; Maresca et al., 2014). Moreover, HFR surface current data start to be systematically ingested in data assimilation processes necessary for predictive model adjustment (Paduan and Shulman, 2004; Barth et al., 2008). The relevance of its applications made the HFR technology rapidly expanding in Europe (at a rate of 7 new systems per year since 2016), with over 69 HFR sites currently operating and 15 in the planning stage, as shown in Figure 1. A detailed review of the European and Global networks and HFR applications was provided in Rubio et al., (2017) and Roarty et al., (2019).
2. The EuroGOOS HFR Task team Effort Since the HFR systems are playing an increasing role in the marine services, the coordinated development of the European HFR network and its products is essential to ensure the full exploitation of HFR potential within the European coastal operational oceanography and to guarantee the distribution of high quality HFR data for scientific, operational and societal applications.
Aiming at this ambitious goal, in 2015 EuroGOOS launched the HFR Task Team to coordinate community building of the European HFR networks, while promoting scientific synergy and technological collaboration among European ocean observing infrastructures. The roadmap towards a pan-European HFR network was based on: (i) networking activities; (ii) HFR data standardization, by ensuring data availability in standard interoperable formats; (iii) HFR standard data integration in the main marine data portals; (iv) development of specific advanced products and tailored services based on HFR data; (v) engagement of end-users; (vi) provision and promotion of operational tools, assessment metrics and methodologies.
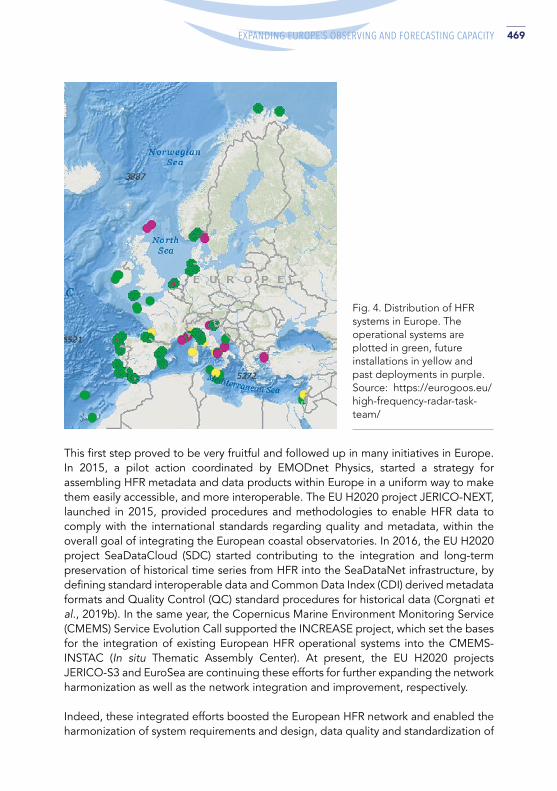
469ADVANCES IN OPERATIONAL OCEANOGRAPHY EXPANDING EUROPE’S OBSERVING AND FORECASTING CAPACITY
Fig. 4. Distribution of HFR systems in Europe. The operational systems are plotted in green, future installations in yellow and past deployments in purple. Source: https://eurogoos.eu/high-frequency-radar-task-team/
This first step proved to be very fruitful and followed up in many initiatives in Europe. In 2015, a pilot action coordinated by EMODnet Physics, started a strategy for assembling HFR metadata and data products within Europe in a uniform way to make them easily accessible, and more interoperable. The EU H2020 project JERICO-NEXT, launched in 2015, provided procedures and methodologies to enable HFR data to comply with the international standards regarding quality and metadata, within the overall goal of integrating the European coastal observatories. In 2016, the EU H2020 project SeaDataCloud (SDC) started contributing to the integration and long-term preservation of historical time series from HFR into the SeaDataNet infrastructure, by defining standard interoperable data and Common Data Index (CDI) derived metadata formats and Quality Control (QC) standard procedures for historical data (Corgnati et al., 2019b). In the same year, the Copernicus Marine Environment Monitoring Service (CMEMS) Service Evolution Call supported the INCREASE project, which set the bases for the integration of existing European HFR operational systems into the CMEMS-INSTAC (In situ Thematic Assembly Center). At present, the EU H2020 projects JERICO-S3 and EuroSea are continuing these efforts for further expanding the network harmonization as well as the network integration and improvement, respectively.
Indeed, these integrated efforts boosted the European HFR network and enabled the harmonization of system requirements and design, data quality and standardization of

470 ADVANCES IN OPERATIONAL OCEANOGRAPHY
HFR data access and tools (Mantovani et al., 2020). The European common data and metadata model for real-time surface current HFR data was defined and implemented (Corgnati et al., 2018), compliant with Climate and Forecast Metadata Convention version 1.6 (CF-1.6), OceanSITES convention, CMEMS-In situ TAC requirements and INSPIRE directive. The list of the QC tests to be applied to HFR data was defined according to the DATAMEQ working recommendations on real-time QC and building on the Quality Assurance/Quality Control of Real-Time Oceanographic Data (QARTOD) manual produced by the US Integrated Ocean Observing System (IOOS).
Finally, the inclusion of HFR data into CMEMS-In situ TAC (Verbrugge et al., 2020), EMODnet Physics and SDC Data Access (Corgnati et al., 2019b) was decided to ensure the improved management of several related key issues as Marine Safety, Marine Resources, Coastal & Marine Environment, Weather, Climate & Seasonal Forecast, as showcased in many published Use Cases (e.g., https://marine.copernicus.eu/services/use-cases).
3. The European HFR Node CMEMS-In situ TAC, EMODnet Physics and SDC operate through a decentralized architecture based on National Oceanographic Data Centres (NODC), Production Units (PUs) organized by region for the global ocean and the six European seas and a Global Distribution Unit (DU). HFR data are in situ gridded data in time (big data), therefore the standard in situ data management infrastructures must be organized and adapted to allow INSTAC PUs, other CMEMS Thematic Centres (TAC) and Marine Forecasting Centers (MFC) to efficiently manage this type of data. Given the importance of HFR data type and the diversity with the already available data streams and quality check procedures, the implementation of the HFR data stream must come together with the development of a centralized European competence and assembly centre.
To face these challenges, the European HFR Node was established in 2018 by AZTI, CNR-ISMAR and SOCIB, under the coordination of the EuroGOOS HFR Task Team, as the focal point and operational asset in Europe for HFR data management and dissemination, also ensuring the connection with the Global HFR network. The mission of the Node is: (i) to be a data management centre dedicated to link all the available data providers and collect HFR data; (ii) to develop and share the software tools for HFR data harmonization, documentation and best practices for HFR operations; (iii) to apply data processing, both in real time and delayed mode, and create catalogs of HFR data compliant with the requirements of CMEMS-In situ TAC, EMODnet Physics and SDC. Its implementation is based on a hierarchical infrastructure to facilitate management and integration of any potential data provider according to a simple and highly effective rule: if the data provider can set up the data flow according the defined standards, the HFR central node only checks and distributes the data. If the data centre cannot setup the data flow (because of lack of experience, technical capacity, etc.), the HFR node harvests the data from the provider, harmonizes and

471ADVANCES IN OPERATIONAL OCEANOGRAPHY EXPANDING EUROPE’S OBSERVING AND FORECASTING CAPACITY
formats these data and makes them available. In fact, the architecture of the Node is based on a centralized database, fed and updated by the providers (supported by the Node) via a webform (http://150.145.136.36). The database contains updated metadata of the HFR networks and the needed information for processing/archiving the data. The guidelines on how to set the data flow from HFR providers to the EU HFR Node are thoroughly described in Reyes et al., (2019).
The EU HFR Node became fully operational in December 2018 by providing tools and support for standardization to the HFR operators and in distributing standardized and quality-controlled Near Real Time (NRT) and delayed-mode HFR radial and total current data towards the major European Marine Data Portals. In the European framework, the EU HFR Node is now managing data from 12 HFR networks (built of 42 HFR sites, representing almost 40% of the European Network), as shown in Figure 2, belonging to 8 countries included in 3 different ROOSes (i.e., MONGOOS, NOOS and IBIROOS), from two diverse HFR system types (i.e., Direction Finding and Phased Array), being most of them permanent installations. By end 2021, it is expected to manage 20 networks (i.e., 50 HFR sites). Additionally, the EU HFR Node implements since June 2020 the integration and distribution of Global data on the aforementioned platforms, using the US network as a pilot case (see Figure 2).
Fig. 4. Distribution of HFR systems managed by the European HFR Node.
ReferencesAbascal, A. J., Castanedo, S., Medina, R., Losada, I. J., and Álvarez-Fanjul, E. (2009). Application of HF radar currents to oil spill modelling. Mar. Pollut. Bull. 58, 238–248. doi: 10.1016/j.marpolbul.2008.09.020
D. E. Barrick, ‘Extraction of wave parameters from measured HF radarsea-echo Doppler spectra,’ Radio Sci., vol. 12, no. 3, pp. 415–424,1977
Barrick, D. E., Evans, M. W., and Weber, B. L. (1977). Ocean surface currents mapped by radar. Science 198, 138–144. doi: 10.1126/science.198.4313.138

472 ADVANCES IN OPERATIONAL OCEANOGRAPHY
Barth, A., Alvera-Azcárate, A., and Weisberg, R. H. (2008). Assimilation of high-frequency radar currents in a nested model of the West florida shelf. J. Geophys. Res. 003113, C08033. doi: 10.1029/2007JC004585
Breivik, O., and Saetra, O. (2001). Real time assimilation of HF radar currents into a coastal ocean model. J. Mar. Syst. 28, 161–182. doi: 10.1016/s0924-7963(01)00002-1
Corgnati, L.; Mantovani, C.; Novellino, A.; Rubio, A. and Mader, J. (2018) Recommendation Report 2 on improved common procedures for HFR QC analysis. JERICO-NEXT WP5-Data Management, Deliverable 5.14, Version 1.0. Brest, France, IFREMER, 82pp, (JERICO-NEXT-WP5-D5.14-V1.). DOI: http://dx.doi.org/10.25607/OBP-944
Corgnati, L., Mantovani, C., Griffa, A., Berta, M., Penna, P., Celentano, P., Bellomo, L., Carlson, D.F., D’Adamo, R. (2019a). Implementation and Validation of the ISMAR High-Frequency Coastal Radar Network in the Gulf of Manfredonia (Mediterranean Sea). IEEE Journal of Oceanic Engineering, vol. 44, no. 2, pp. 424-445. doi: 10.1109/JOE.2018.2822518.
Corgnati, L.; Mantovani, C., Novellino, A., Jousset, S., Cramer, R. N., and Thijsse (2019b). SeaDataNet data management protocols for HF Radar data, WP9 - Deliverable D9.12. Version 1.6. SeaDataNet, 83pp. DOI: http://dx.doi.org/10.25607/OBP-1011
Crombie, D. D. (1955). Doppler Spectrum of Sea Echo at 13.56 Mc./s. Nature 175, 681–682. doi: 10.1038/175681a0
Gurgel, K.-W., Antonischki, G., Essen, H.-H., and Schlick, T. (1999). Wellen radar WERA: a new ground-wave HF radar for ocean remote sensing. Coast. Eng. 37, 219–234. doi: 10.1016/S0378-3839(99)00027-7
Gurgel, K.-W., Essen, H.-H., and Schlick, T. (2006). An empirical method to derive ocean waves from second-order bragg scattering: prospects and limitations. IEEE J. Ocean. Eng. 31, 804–811. doi: 10.1109/JOE.2006.886225
Gurgel, K.-W., Dzvonkovskaya, A., Pohlmann, T., Schlick, T., and Gill, E. (2011). Simulation and detection of Tsunami signatures in ocean surface currents measured by HF radar. Ocean Dyn. 61, 1495–1507. doi: 10.1007/s10236-011-0420-9
Heron, M., and Rose, R. (1986). On the application of HF ocean radar to the observation of temporal and spatial changes in wind direction. J. Oceanic Eng. 11, 210–218. doi: 10.1109/JOE.1986.1145173
Kirincich, A. (2016). Remote sensing of the surface wind field over the coastal ocean via direct calibration of HF radar backscatter power. J. Atmos. Oceanic Technol. 33, 1377–1392. doi: 10.1175/JTECH-D-15-0242.1
Lipa, B. J., Barrick, D. E., Bourg, J., and Nyden, B. B. (2006). HF radar detection of Tsunamis. J. Oceanogr. 62, 705–716. doi: 10.1007/s10872-006-0088-9

473ADVANCES IN OPERATIONAL OCEANOGRAPHY EXPANDING EUROPE’S OBSERVING AND FORECASTING CAPACITY
Mantovani, C., Corgnati, L., Horstmann, J., Rubio, A., Reyes, E., Quentin, C., Cosoli, S., Asensio, J.L., Mader, J. and Griffa, A. (2020). Best Practices on High Frequency Radar Deployment and Operation for Ocean Current Measurement. Front. Mar. Sci. 7:210. doi: 10.3389/fmars.2020.00210
Maresca, S., Braca, P., Horstmann, J., and Grasso, R. (2014). Maritime surveillance using multiple high-frequency surface-wave radars. IEEE Trans. Geosci. Remote Sens. 52, 5056–5071. doi: 10.1109/tgrs.2013.2286741
Paduan, J. D., and Rosenfeld, L. K. (1996). Remotely sensed surface currents in Monterey bay from shore-based HF radar (coastal ocean dynamics application radar). J. Geophys. Res. Oceans 101, 20669–20686. doi: 10.1029/96JC01663
Paduan, J. D., and Shulman, I. (2004). HFR Data Assimilation in the Monterey Bay Area. J. Geophys. Res. 109:C07S09. doi: 10.1029/2003JC001949
J. D. Paduan and L. Washburn, ‘High-Frequency radar observations ofocean surface currents,‘ Annu. Rev. Mar. Sci., vol. 5, pp. 115–136, 2013.
Ponsford, A. M., Sevgi, L., and Chan, H. C. (2001). An integrated maritime surveillance system based on high-frequency surface-wave radars. Operational status and system performance. Antennas Propag. Mag. 43, 52–63. doi: 10.1109/74.979367
Reyes, E., Rotllán-García, P., Rubio, A., Corgnati, L., Mader, J., and Mantovani, C. (2019). Guidelines on how to sync your High Frequency (HF) radar data with the European HF Radar node (Version 1.2), Balearic Islands Coastal Observing and Forecasting System, SOCIB, doi:10.25704/9XPF-76G7, 2019.
Roarty, H., Cook, T., Hazard, L., George, D., Harlan, J., Cosoli, S., et al., (2019). The global high frequency radar network. Front. Mar. Sci. 6:164. doi: 10.3389/fmars.2019.00164
Rubio, A., Mader, J., Corgnati, L., Mantovani, C., Griffa, A., Novellino, A., et al., (2017). HF radar activity in european coastal seas: next steps toward a pan-European HF radar network. Front. Mar. Sci. 4:8. doi: 10.3389/fmars.2017.00008
Sciascia, R., Berta, M., Carlson, D. F., Griffa, A., Panfili, M., La Mesa, M., Corgnati, L., Mantovani, C., Domenella, E., Fredj, E., Magaldi, M. G., D’Adamo, R., Pazienza, G., Zambianchi, E., and Poulain, P.-M.: Linking sardine recruitment in coastal areas to ocean currents using surface drifters and HF radar: a case study in the Gulf of Manfredonia, Adriatic Sea, Ocean Sci., 14, 1461–1482, https://doi.org/10.5194/os-14-1461-2018, 2018.
Shen, W., Gurgel, K. W., Voulgaris, G., Schlick, T., and Stammer, D. (2012). Wind-speed inversion from HF radar first-order backscatter signal. Ocean Dyn. 62, 105–121. doi: 10.1007/s10236-011-0465-9

474 ADVANCES IN OPERATIONAL OCEANOGRAPHY
Ullman, D. S., O’Donnell, J., Kohut, J., Fake, T., and Allen, A. (2006). Trajectory prediction using HF radar surface currents: monte carlo simulations of prediction uncertainties. J. Geophys. Res. 111:C12005. doi: 10.1029/2006jc003715
Verbrugge, N., Etienne, H., Boone, C., Mader, J., Corgnati, L., Mantovani, C., Reyes, E., Rubio, A., Rotllan, P., Asensio, J.L., Carval, T. (2020). Copernicus in situ NRT current product user manual (PUM). CMEMS-INS-PUM-013-048. https://doi.org/10.13155/73192
Wyatt, L. R. (1990). A relaxation method for integral inversion applied to HF radar measurement of the ocean wave directional spectrum. Int. J. Remote Sens. 11, 1481–1494. doi: 10.1080/01431169008955106
475ADVANCES IN OPERATIONAL OCEANOGRAPHY EXPANDING EUROPE’S OBSERVING AND FORECASTING CAPACITY
THE OCEAN OBSERVERS INITIATIVE Emanuela Rusciano (1), Claire Gourcuff (2), Esterine Evrard (3), Marine Bollard (4)
(1) OceanOPS, 1625 Route de Sainte-Anne, 29280 Plouzané, France, [email protected](2) EuroArgo ERIC, 1625 Route de Sainte-Anne, 29280 Plouzané, France, [email protected](3) EuroArgo ERIC, 1625 Route de Sainte-Anne, 29280 Plouzané, France,
[email protected](4) EuroArgo ERIC, 1625 Route de Sainte-Anne, 29280 Plouzané, France,
Abstract
The Ocean Observers is an international educational network of ocean scientists, teachers and educational authorities, marine communicators, sailing community and other stakeholders who are willing to share marine science educational resources and experiences for exploring the possibilities to establish new international collaborative activities.
Marine science popularisation and outreach are becoming more and more important to raise awareness among the communities that a healthy ocean is vital for the well-being of generations to come. The existing outreach activities focused on in situ ocean observations are isolated and lack national, European and international visibility. The Ocean Observers network attempts to bring together different actors involved in marine science outreach activities to do a review of the existing ocean observing outreach initiatives, favour discussions and collaboration between people engaged in marine science outreach programmes in link with in situ ocean observations as well as to federate a community around a coordinated project.
An international working group was created after the 1st Ocean Observers educational workshop co-organised by Euro-Argo ERIC and OceanOPS (formerly named JCOMMOPS) in Brest in June 2017, with the aim to coordinate the initiative. As part of the Euro-Argo RISE H2020 European Union project, a second Ocean Observers workshop will be organised by the end of 2021.
Keywords: in situ ocean observations, educational activities, outreach, ocean literacy

476 ADVANCES IN OPERATIONAL OCEANOGRAPHY
1. Introduction The Ocean is one of the most important components of the climate system and observing the ocean is necessary to predict the climate evolution of our planet. In today’s society there is a need for a bigger effort to disseminate the importance of observing and preserving the ocean. Marine science vulgarization and outreach arebecoming more and more important to raise awareness among the communities that a healthy ocean is vital for the well-being of generations to come.
The Ocean Observers initiative brings together ocean scientists, educational authorities and teachers, marine communicators, sailing community and other stakeholders (public, policymakers, etc.), who are willing to share marine science educational resources and experiences for exploring the possibilities to establish new international collaborative activities. A key focus of the initiative is to gather and share experience on educational activities related to in situ ocean observations, to be able in the longerterm, to assemble all educational materials in a unique repository. The repository will be free and will help to build a global ocean observation learning platform.
The Ocean Observers is jointly led by OceanOPS (World Meteorological Organisation (WMO) – Intergovernmental Oceanographic Commission (IOC) Joint Centre for Oceanography and Marine Meteorology in situ Observations Programmes Support) and the European contribution to the Argo Program (EuroArgo ERIC).
2. 1st Ocean Observers workshop In June 2017, the 1st Ocean Observers workshop was organized in Brest (France) by OceanOPS and EuroArgo ERIC with the support from the LabexMER, Océanopolis, and the Campus Mondial de la Mer in Brest.
Fig.1. Flyer invitation 1st workshop in Brest.

477ADVANCES IN OPERATIONAL OCEANOGRAPHY EXPANDING EUROPE’S OBSERVING AND FORECASTING CAPACITY
The international workshop gathered about 70 persons interested in ocean observation educational activities. 7 countries were represented, though around 3/4 of the participants came from France, with a wide repartition between people from diverse sectors. The workshop was very well welcomed by the participants and the feedback after the two days was globally positive. During the meeting, two main discussions were animated, at the start of the second day and at the end of the workshop. The simultaneous translation, in English and French, organized during the entire workshop was very appreciated from all participants who actively participated and contributed during the discussions.
Fig. 2. 1st Ocean Observers workshop attendees.
Fig.3. Origin of workshop attendees. Fig.4. Background of workshop attendees.

478 ADVANCES IN OPERATIONAL OCEANOGRAPHY
2.1 First workshop motivations and objectives
The ocean observing communities are more and more aware that marine science popularisation and outreach activities are fundamental to raise awareness that a healthy ocean is vital for the well-being of generations to come. This concept was also the fundament for the organization of the 1st Ocean Observers workshop. After the first brainstorming between the two organizers teams, the necessity to expand the workshop to all in situ ocean observing networks was clear; many educational activities focused on in situ ocean observations exist today, but they are frequently isolated and lack national and international visibility. On these bases, the Ocean Observers workshop attempted for the first time to bring together different actors involved in marine science outreach activities to:
a. Do a review of the existing initiatives;
b. Support discussions and collaboration between people engaged in marine science outreach programmes;
c. Give educators marine science information they could apply to their unique environments to raise awareness of the importance of the ocean for human life among school children and local communities;
d. Engage ‘new’ schools, educators and private associations in ocean observing outreach activities;
e. Give scientists (researchers and PhD students) tools and suggestions to share and make their results understandable by the public at large;
f. Federate a community around a coordinated project.
2.2 First workshop outcomes
The main idea that emerged during the workshop was the necessity to establish an international Working Group with representatives of each type of background (some of the participants already volunteered during the workshop to be part of such a team). It was foreseen that the Working Group should meet (via web conferences) once every two-three months, for the project to move forward. The main consensus about the 1st Ocean Observers workshop was that if progress were made within the next few months, the workshop could then be renewed. Even if the technical aspects of the second workshop organisation would be eased by the first edition, a deep reflection to renew the content and the format should be engaged. In particular, the objectives of the 2nd Ocean Observers workshop would indeed be different, as the review of existing initiatives was already made in the first workshop. Regarding the format, the 2nd workshop should be more interactive, with work in small groups, games, and concrete actions carried on during the workshop, as suggested by participants. Future workshops could be organised in different countries, thus allowing the engagement
479ADVANCES IN OPERATIONAL OCEANOGRAPHY EXPANDING EUROPE’S OBSERVING AND FORECASTING CAPACITY
of a bigger community, in the educational sector, with an easier involvement of local representatives.
A questionnaire was issued during the workshop. The 15 filled out questionnaires recovered were very useful to compile a list of next actions and to draw the conclusions of the 1st Ocean Observers workshop. The questionnaires are also very useful to improve the organization of the next workshop. Globally, participants much appreciated:
a. The presence of people from diverse backgrounds;
b. The nice opportunity to discuss with new people and to make contacts and collaborations;
c. The opportunity to learn on what exists on the in situ observations educational activities;
d. To get a view of differences in countries and ideas on how to address this subject with students.
PARTICIPANTS LESS APPRECIATED:a. The time allowed to speakers was too short;
b. Not enough time was kept for discussions.
3. Ocean Observers Working Group As suggested after the 1st workshop an international Working Group was established to move forward with the initiative. The scope, objectives and expectations of the Working Group were defined as follows:
SCOPE OF THE WORKING GROUP:An informal grouping of people interested in educational activities focused on ocean observations that provides for its members to share information, expertise, materials related to ocean observations.
OBJECTIVES OF THE WORKING GROUP:1. Keep the community alive;
2. Have regular on-line meetings to inform the group about the educational activities around ocean observations at regional level;
3. Define the content of future Ocean Observers Workshops.
CRITERIA FOR PARTICIPATION IN THE WORKING GROUP:The group is open to anyone who works in marine science communications and education with an interest in ocean observations.

480 ADVANCES IN OPERATIONAL OCEANOGRAPHY
MEMBERS OF THE WORKING GROUP ARE EXPECTED TO:1. Actively participate in the group activities to meet the objectives;
2. Represent the Ocean Observers outside the community.
4. 2nd Ocean Observers workshop As part of the Euro-Argo RISE H2020 European Union project, a second Ocean Observers workshop will be organised by the end of 2021. The working group is currently virtually meeting and discussing once a month to define the content and structure of the workshop.
The second workshop was originally planned to be held on the Balearic Islands in November 2020 but due to the Covid-19 restrictions it was postponed, and the Working Group agreed to organize it as a virtual event.
The 2nd Ocean Observers workshop will be as far as possible interactive with live sessions and few recorded hands-on experiences led by teachers and students. These recordings will be then uploaded on the Ocean Observers website (www.oceanobservers.org) with English subtitles and a list with the necessary material to carry on the experiments. The workshop language will be English, based on the nationality of attendee’s, simultaneous translations and subtitles will be defined and arranged. The workshop will last 3 days with short sessions of 2 hours in the morning and 2 in the evening trying to cover different time zones.
The Working Group is still working to define the field and topic for each day (preliminary proposals were climate change, sea level rise, ocean acidification, technology). All sessions will focus on these topics during the day, with a short introduction on the topic by scientists, followed by talks by educators and the recorded hands-on activities, and a virtual poster ‘room’ will be organized during virtual coffee-breaks.
The Working group is also working to rebrand the Ocean Observers initiative with a new logo, and a new website which will serve as a repository for all educational activities and materials collected.
Acknowledgements We thank everyone who made possible the realization of the 1st workshop and the upcoming 2nd Ocean Observers workshop, with particular thanks to our supporters and sponsors: Mon Océan et Moi, LabexMER, Oceanopolis, Campus Mondial de la Mer. The second workshop has received funding from the European Union’s Horizon 2020 research and innovation programme under grant agreement N°824131 (Euro-Argo RISE project). We also wish to thank all people who inspired us during these last years for the finalization of the workshops’ content.

481ADVANCES IN OPERATIONAL OCEANOGRAPHY EXPANDING EUROPE’S OBSERVING AND FORECASTING CAPACITY
HOW OCEAN LITERATE ARE STUDENTS ATTENDING SCHOOLS OF ARTS? A CASE STUDY FROM A GREEK MIDDLE SCHOOL Panayota Koulouri (1), Athanasios Mogias (2), Giulia Realdon (3), Maria Cheimonopoulou (4), Melita Mokos (5), Theodora Boubonari (2), Monica Previati (6)
(1) Hellenic Centre for Marine Research, Gournes Pediados, 71500, Iraklio, Crete, Greece; [email protected]
(2) Democritus University of Thrace, Nea Chili, 68100, Alexandroupolis, Greece; [email protected], [email protected]
(3) University of Camerino, Via Gentile III Da Varano, 62032, Camerino, Italy; [email protected]
(4) Hydrobiological Station of Pella, Pasa Tsair, 58200, Edessa, Greece; [email protected](5) University of Zadar, Trg kneza Viseslava 9, 23000, Zadar, Croatia; [email protected](6) Underwater Bio-Cartography, Via San Siro 6 int. 1, 16124, Genova, Italy; [email protected]
Abstract To achieve the Sustainable Development Goal (SDG) 14 focusing on the ocean, people need to understand the role and function of the ocean and be aware of issues concerning protection and sustainable use of its resources. The Ocean Literacy Framework is now being used worldwide for both formal (schools, universities) and non-formal (e.g. research institutes, aquaria) education settings. The present pilot study aims to this direction by evaluating ocean sciences content knowledge of students attending a middle school of Arts in Greece. A structured questionnaire was administered to 162 students, while the influence of certain demographics on students’ knowledge level was also investigated. The results of the study revealed moderate knowledge, which is in line with the limited relevant literature regarding both knowledge gains and misconceptions, and the need for integration of relevant concepts in education to ensure sustainability of the ocean.
Keywords: Ocean Literacy, SDG 14, marine science education, Mediterranean region, secondary school students
482 ADVANCES IN OPERATIONAL OCEANOGRAPHY
1. Introduction The Ocean Literacy Framework consisting of 7 essential principles and 45 fundamental concepts is now accepted worldwide for use in both formal (schools, universities) and non-formal (e.g. research institutes, aquaria) education settings to empower citizens to use knowledge of the ocean and awareness of its issues and therefore to communicate about the marine environment in a meaningful way and make informed and responsible decisions. The present pilot study aims to this direction by evaluating ocean sciences content knowledge of students attending a middle school of Arts in Greece.
2. Methodology In total, 162 students comprised the sample of the study (36% grade 7, 35.4% grade 8, 28.6% grade 9). Females comprised 66% percent of the participants. The majority of students (85.7%) stated that they have participated in environmental education projects, while they receive relevant information mostly from the internet (88.3%). A structured questionnaire was designed according to previous research (see Mogias et al., 2019), consisting of a demographics section, and a section including a content knowledge scale with 16 multiple choice questions, and a short beliefs scale with 4 statements. Data analysis involved descriptive (frequencies, mean values, and standard deviations) and inferential statistics (t-tests for independent samples and one-way analyses of variance)., All statistics were performed using the Statistical Package for Social Sciences (SPSS, v. 23); significance level was set at a probability value of 0.05.
3. Results & discussion Middle school students were found to possess moderate level of ocean sciences content knowledge, as the mean relative frequency of correct answering among students was 45.9% (Table 1), and positive beliefs (mean value: 3.79) toward ocean stewardship (Table 2). Regarding background factors, no significant differences were revealed. The results showed an interesting pattern in correct answering, regarding the most difficult and the easiest questions, revealing that they are in line with other findings from the existing literature (Mogias et al., 2019; Realdon et al., 2019; Mokos et al., 2020). Topics such as connectedness of the ocean basins (q1 and q8), origin of the atmospheric oxygen (q9), and global water cycle (q5) were failed to be addressed by the majority of the students’ sample, revealing the existence of misconceptions, as well as either lack of assimilation of new or already existing concepts. Along with assessment of students’ knowledge, attitudes and behaviour, European Blue Schools network has been recently launched and inter-disciplinary collaborations are enhanced through specific initiatives such as projects (e.g. ERASMUS+) and networks (e.g. EuroGOOS, EMSEA, EU4Ocean Coalition) in order to achieve the SDG 14 focusing on the ocean and create an ocean-literate society.
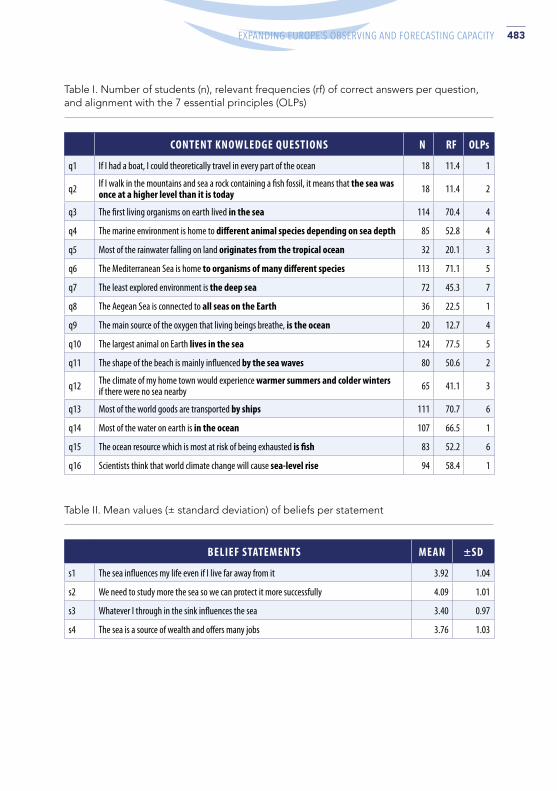
483ADVANCES IN OPERATIONAL OCEANOGRAPHY EXPANDING EUROPE’S OBSERVING AND FORECASTING CAPACITY
CONTENT KNOWLEDGE QUESTIONS N RF OLPs
q1 If I had a boat, I could theoretically travel in every part of the ocean 18 11.4 1
q2 If I walk in the mountains and sea a rock containing a fish fossil, it means that the sea was once at a higher level than it is today 18 11.4 2
q3 The first living organisms on earth lived in the sea 114 70.4 4
q4 The marine environment is home to different animal species depending on sea depth 85 52.8 4
q5 Most of the rainwater falling on land originates from the tropical ocean 32 20.1 3
q6 The Mediterranean Sea is home to organisms of many different species 113 71.1 5
q7 The least explored environment is the deep sea 72 45.3 7
q8 The Aegean Sea is connected to all seas on the Earth 36 22.5 1
q9 The main source of the oxygen that living beings breathe, is the ocean 20 12.7 4
q10 The largest animal on Earth lives in the sea 124 77.5 5
q11 The shape of the beach is mainly influenced by the sea waves 80 50.6 2
q12 The climate of my home town would experience warmer summers and colder winters if there were no sea nearby 65 41.1 3
q13 Most of the world goods are transported by ships 111 70.7 6
q14 Most of the water on earth is in the ocean 107 66.5 1
q15 The ocean resource which is most at risk of being exhausted is fish 83 52.2 6
q16 Scientists think that world climate change will cause sea-level rise 94 58.4 1
BELIEF STATEMENTS MEAN ±SD
s1 The sea influences my life even if I live far away from it 3.92 1.04
s2 We need to study more the sea so we can protect it more successfully 4.09 1.01
s3 Whatever I through in the sink influences the sea 3.40 0.97
s4 The sea is a source of wealth and offers many jobs 3.76 1.03
Table I. Number of students (n), relevant frequencies (rf) of correct answers per question, and alignment with the 7 essential principles (OLPs)
Table II. Mean values (± standard deviation) of beliefs per statement

484 ADVANCES IN OPERATIONAL OCEANOGRAPHY
Acknowledgements
We would like to cordially thank the teachers and students of a middle school of Arts from Greece for their substantial assistance in the participation of the research.
ReferencesMogias, A., Boubonari, T., Realdon, G., Previati, M., Mokos, M., et al., (2019). Evaluating Ocean Literacy of Elementary School Students: Preliminary Results of a Cross-Cultural Study in the Mediterranean Region. Frontiers in Marine Science, 396, https://doi.org/10.3389/fmars.2019.00396
Mokos, M., Realdon, G., Zubak Čižmek, I. (2020). How to Increase Ocean Literacy for Future Ocean Sustainability? The Influence of Non-Formal Marine Science Education. Sustainability, 12, 10647.
Realdon, G., Mogias, A., Fabris, S., Candussio, G., Invernizzi, C. et al., (2019). Assessing Ocean Literacy in a sample of Italian primary and middle school students. Rendiconti Online della Società Geologica Italiana, 49, 107–112

485ADVANCES IN OPERATIONAL OCEANOGRAPHY EXPANDING EUROPE’S OBSERVING AND FORECASTING CAPACITY
KOSTASYSTEM, A COASTAL VIDEOMETRY TECHNOLOGY: DEVELOPMENT AND APPLICATIONS Pedro Liria (1), Irati Epelde (1), Iñaki de Santiago (1), Roland Garnier (1), Aritz Abalia (1), Julien Mader (1)
(1) AZTI Marine Research, Basque Research and Technology Alliance (BRTA), Pasaia, Spain, [email protected]
Abstract
This contribution describes the KOSTASystem technology. This line of work started in 2007 and is currently implemented in 20 operational stations distributed along the 100 km of the Basque Coast (Spain). The monitored areas include urban beaches, port protection structures as well as natural coastal stretches. The aim of this technology is to generate basic information for coastal management applications, covering different time scales. The main hardware-related breakthrough is the development of stand-alone photovoltaic stations. Concerning the software, several image processing tools have been developed for the calibration and restoration of the images and for the extraction of the information used in the different applications. For long-term applications and climate change studies, KOSTASystem is essentially used for the monitoring of beach morphology. The network also works in operational mode to detect extreme wave emergency situations by monitoring wave overtopping and flooding. It is eventually used for daily beach management during the summer season, for safety purpose through a rip current prediction tool, and providing information about beach users density. For this last application, KOSTASystem has shown its benefit in the COVID19 context to coastal managers and beach users and helped in ensuring and implementing the social distancing recommendations. Finally, this good practice of videometry implementation opens up perspectives for European collaboration, harmonisation, and integration in the coastal observing network.
Keywords: Coastal videometry, Observing network, Beach morphology, Wave impact, Rip Currents, Beach occupancy, Image processing
1. Introduction The coastal systems play an essential role for human life. The variety and uniqueness of the ecosystems that come together in this area encompass environmental, socio-economic, cultural, and educational values of great importance. The Basque Coast is highly

486 ADVANCES IN OPERATIONAL OCEANOGRAPHY
populated and exposed to wave action which increases its vulnerability. This, together with the challenges associated to climate change adaptation deserve special attention. The management of coastal systems needs to deal with a wide range of spatial and temporal scales. As such, video remote sensing techniques represent an efficient monitoring tool as they can provide useful data with high spatial and temporal resolutions and large coverage areas. In this line AZTI has developed the KOSTASystem technology and is working in different products that transform the images into information for effective coastal management for long-term and near real-time (NRT) applications. The KOSTASystem station located in Mundaka has been capturing images of the Oka estuary mouth since 2007. Over 20 stations have been installed and put into operation along the Basque Coast since, covering different coastal systems and key infrastructures.
2. Hardware and Software The KOSTASystem technology started in 2005 as the outcome of a collaboration between AZTI and LaSAGeC (Anglet, Université de Pau et Pays de l’Adour, France) when the first version of the calibration and rectification codes and the hardware requirements were set. Since then, AZTI has been working in the improvement of the codes, the development of image analysis algorithms and the optimization of the hardware. One of the most important advances in hardware has been the design and implementation of photovoltaic autonomous stations that simplify installation, reduce costs and streamline administrative procedures. These stations are assembled in the workshop and transported ready to be mounted on the top of a mast that is the only infrastructure necessary.
Fig. 1. KOSTASystem coastal videometry stations. From left to right, Zarautz station, and two views of a photovoltaic autonomous station in Saturraran.

487ADVANCES IN OPERATIONAL OCEANOGRAPHY EXPANDING EUROPE’S OBSERVING AND FORECASTING CAPACITY
For camera calibration and orthorectification the method proposed by Holland et al., 1997 is used. This methodology is based on a two-step calibration (intrinsic and extrinsic) and allows the orthorectification of the images on a uniform z plane or in a predefined digital terrain model grid. The most used products in coastal videometry are those derived from the temporal processing of images. For this purpose, the open-source SIRENA software is used (Nieto et al., 2010). SIRENA creates 4 types of images: snap (instantaneous images), timex (average images), var (variance images) and timestack images (defined profile images). Usually, cycle duration is set to 10 or 20 minutes and frequency is 1 or 2 Hz, depending on the application. Then, specific algorithms and image analysis methods have been developed by AZTI and collaborators for the different services proposed.
3. Coastal Videometry Stations on the Basque coast The first stations of the Basque Coast were installed in Mundaka and Zarautz. Both are still operational and have been the pilot stations in which all the different coastal services using coastal videometry have been developed and tested. The Provincial Council and the Port of Bilbao have supported the implementation of stations in seven beaches of the Bizkaia region. The long-term morphological monitoring of the beaches is the aim of these stations but also swimmer safety and user density services, which have been developed for the Provincial Council of Bizkaia. The Environment Department of the Provincial Council of Gipuzkoa, has also created its own coastal videometry network, based on KOSTASystem technology. This network covers 14 beaches, with 12 stations. The aim of this network is to generate basic coastal management information, covering different time scales.
Fig. 2. Map of the coastal videometry stations operating in the Basque Country, Spain.

488 ADVANCES IN OPERATIONAL OCEANOGRAPHY
Fig. 3. Left: definition of beach morphology indicators. Right: evolution of the mean seasonal supratidal beach area and cumulative monthly wave energy in Zarautz.
4.2 NRT wave overtopping and flooding monitoring
Timestack images are used to monitor the wave run up and overtopping along different transects. An automatic overtopping detection tool has been developed using the intensity signal evolution on different barriers of the timestack. This information is used by the Directorate of Emergencies of the Basque Government to monitor the impact of the storms on the coast.
4.3 NRT rip current detection and forecast
A rip current risk assessment and prediction tool have been developed to improve beach safety during the summer season. The orthorectified timex images of the beach are sent to a web app that is operated by the lifeguards, to have a better monitoring of the breaking zone and associated sand bar morphology. These images are also used to obtain the bathymetry of the shallow areas of the beach which is used to forecast the circulation patterns using numerical models.
4. Coastal services
4.1 Long term and climate change context
For this application, monthly representative timex images of mean low tide and high tide are selected. From these images, the coastline position is digitalized, and two indicators are derived: i) the beach width (estimated as the distance between a baseline reference and the shoreline) at low and high tide and, ii) the intertidal and supralittoral beach areas. These indicators are used to characterize the morphological evolution of the beaches and to analyse the trends and variability in relation with marine climate variables (e.g., wave energy). The indicators are also used for the validation of morphological models that can be used to analyse the future scenarios and associated evolution of the beaches in response to sea level rise.
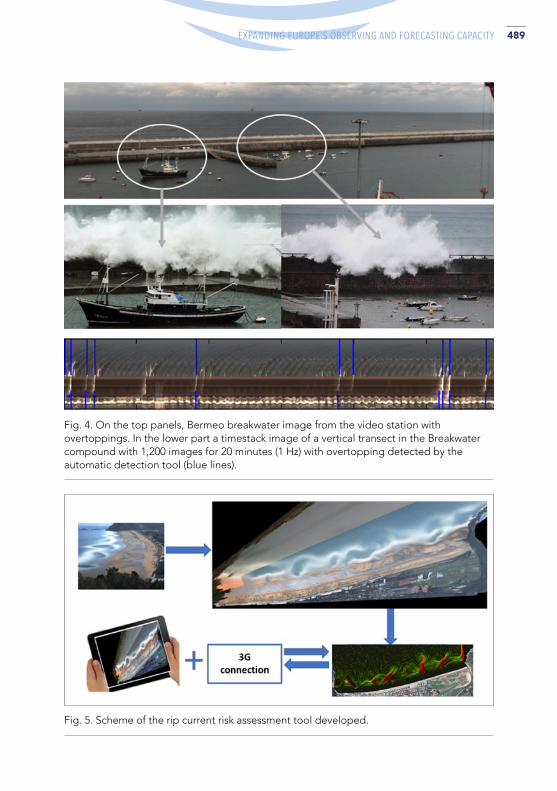
489ADVANCES IN OPERATIONAL OCEANOGRAPHY EXPANDING EUROPE’S OBSERVING AND FORECASTING CAPACITY
Fig. 4. On the top panels, Bermeo breakwater image from the video station with overtoppings. In the lower part a timestack image of a vertical transect in the Breakwater compound with 1,200 images for 20 minutes (1 Hz) with overtopping detected by the automatic detection tool (blue lines).
Fig. 5. Scheme of the rip current risk assessment tool developed.

490 ADVANCES IN OPERATIONAL OCEANOGRAPHY
4.4 User density NRT monitoring and annual reporting
A beach occupation density tool has been developed using machine learning, providing information about beach users attendance patterns during the summer season. For the COVID-19 context, the network has been adapted to provide real time information about beach occupation to ensure complying with the recommended social distancing (Epelde et al., 2021). The solution consists of an automated algorithm that measures the occupation level in real time from the images of the videometry network and displays the information through a mobile app (Nik Hondartzak). The information is simultaneously sent to the beach managers, who control the beach access to ensure the recommended occupation levels.
Fig. 6. A snapshot of the Nik Hondartzak app on the left. Centre, an image captured and on the right the result of the detection algorithm on Santiago-Zumaia beach, on 20 July 2020. The analysed region is in black.
5. Way Forward AZTI is coordinating, along with different partners, further developments on hardware and software to improve the capabilities and efficiency of the KOSTASystem technology (optimized housing, use of InfraRed cameras, detection of river floating litters). Also, ongoing work on the integration of the videometry data with modelling tools are opening new forecasting capabilities both with long-term and short-term applications. Finally, the perspectives of implementation of the videometry for a wide range of coastal services rise the interest of setting up a European coordination. This would make possible the harmonisation of data within the coastal community. EuroGOOS could play a major role for the integration of this technology in a sea-land continuum observing network.

491ADVANCES IN OPERATIONAL OCEANOGRAPHY EXPANDING EUROPE’S OBSERVING AND FORECASTING CAPACITY
ReferencesEpelde, I., Liria, P., de Santiago, I., Garnier, R., Uriarte, A., Picón, A., Galdrán, A., Arteche, J.A., Lago, A., Corera, Z., Puga, I., Andueza, J.L., Lopez, G. (2021). Beach carrying capacity management under Covid-19 era on the Basque Coast by means of automated coastal videometry. Ocean & Coastal Management, Volume 208, 105588, ISSN 0964-5691.
Holland, K.T., Holman, R.A., Lippmann, T.C., Stanley, J., Plant, N. (1997). Practical use of video imagery in nearshore oceanographic field studies. IEEE J. Ocean. Eng. 22 (1), 81–92.
Nieto, M.A., Garau, B., Balle, S., Simarro, G., Zarruk, G.A., Ortiz, A., Tintoré, J., Álvarez-Ellacuría, A., Gómez-Pujol, L., Orfila, A. (2010). An open source, low cost video-based coastal monitoring system. Earth Surf. Process. Landforms 35 (14), 1712–1719.

492 ADVANCES IN OPERATIONAL OCEANOGRAPHY
AUTONOMOUS OBSERVING SYSTEMS ON BOARD FISHING AND CARGO VESSELS A. Miguel Piecho-Santos (1, 2), Teresa L. Rosa (1, 3), Carlos Guedes Soares (3), Roberto Vettor (3), Miguel Hinostroza (3), Anabela J. Carvalho (1), Isabel Sousa Pinto (4) and António C. Oliveira (5)
(1) IPMA-Portuguese Institute for the Oceans and Atmosphere, Lisboa, Portugal [email protected]; [email protected]; [email protected]
(2) CCMAR-Centre of Marine Sciences Univ. Algarve, Faro, Portugal; [email protected] (3) CENTEC-Centre for Marine Technology and Ocean Engineering/IST-ID, Lisboa, Portugal
[email protected]; [email protected]; [email protected]
(4) CIIMAR-University of Porto, Porto, Portugal; [email protected] (5) Transinsular-Transportes Marítimos Insulares, S.A. (Grupo E.T.E.), Lisboa, Portugal [email protected]
Abstract
The large extension of the Portuguese EEZ bring many opportunities for the exploitation of marine resources and an increase in economic activities related to the sea, but also great challenges for the management, monitoring and sustainable use of these marine ecosystems, which must be supported by a deep knowledge of the whole Portuguese Sea. This knowledge will only be possible with long-term ocean observation systems, which will require great operational capacity and financial effort. We will described the development of a Autonomous Ocean Observing Systems (AOOS) to be used in Vessels of Opportunity (VOO) for collecting in situ atmospheric, oceanic and biogeochemical data. The use of AOOS can provide the opportunity for highly refined oceanographic data and improved derived data estimation, for local, regional or global scales studies. The ocean observing system will be totally autonomous and integrate several meteorological and oceanographic sensors. The system should allow high-resolution in situ monitoring and spatial coverage of the ocean and coastal areas. The data acquired from this system will support the development of new products for more safe and efficient maritime operations, to support fishing activities, and an integrated management of the marine ecosystems.
Keywords: ocean, observing systems, vessels, fisheries, cargo

493ADVANCES IN OPERATIONAL OCEANOGRAPHY EXPANDING EUROPE’S OBSERVING AND FORECASTING CAPACITY
1. Introduction The Sea is one of the main vectors of national development and fundamental importance for sustainable smart economic growth, in which one of the objectives is the creation of jobs.
The great extent of the Portuguese Sea, with an EEZ of more than 1.7 million km2 and a recent increase of about 2.1 million km2 of the proposal submitted for the extension of the continental legal platform, makes Portugal have jurisdiction over about 3.8 million km2 of immersed territory (Figure 1). This will bring many opportunities for the exploitation of marine resources and an increase in economic activities related to the sea, but also great challenges for the management, monitoring and sustainable use of these marine ecosystems, which must be supported by in-depth knowledge of this entire Portuguese Sea. This knowledge will only be possible with long-term ocean observation systems, which will require great operational capacity and financial effort. The Portuguese effort to implement the Marine Strategy Framework Directive (MSFD) is the highest in the European Union, being around 16 ha/inhabitant (the average value of EU coastal states is around 1.3 ha/inhabitant ).
In the Portuguese Sea, there are several seamounts, which are extremely important areas for biodiversity. Seamounts are threatened and/or declining habitats according to the OSPAR convention. Therefore, Portugal intends to create several Marine Protected Areas (MPA) in the sea of its jurisdiction. Specifically, in the MSFD Measures Programme, the creation of two large MPAs is foreseen, one to the south of the Azores (Great Meteor MPA) and another between the Madeira Archipelago and the Iberian Coast (Madeira-Tore MPA). The first with 123,000 km2 and the second with 132,000 km2 (Figure 1). However, information on these areas is scarce, especially with regards to the characterization of its pelagic ecosystem and its temporal variability, as well as its biodiversity.
The different Evaluation Reports of the Intergovernmental Panel on Climate Change (IPCC) have made a clear mention of the lack of time series of observations of the marine environment, in the assessment of climatic impacts, in comparison with other areas of the Earth System (e.g., cryosphere). The enormous changes that are expected in the coming years in terms of climatic conditions (e.g., wind patterns, the temperature of the atmosphere and the ocean, and the increase in the frequency of extreme events) will lead to important changes in the base of the marine food chain and its productivity, as well as in the distribution and abundance of the higher trophic levels (e.g., fish, sea mammals and seabirds). These changes are already evident in indicators, such as, for example, seawater temperature, nutrient balance ratios and productivity, planktonic composition and distribution, with emphasis on the expected anomalous growth of some harmful native species and the occurrence of exotic ones, which until now had only developed in tropical regions. Predicting the extent to which new evidence of climate change will affect the resources and biological diversity of the
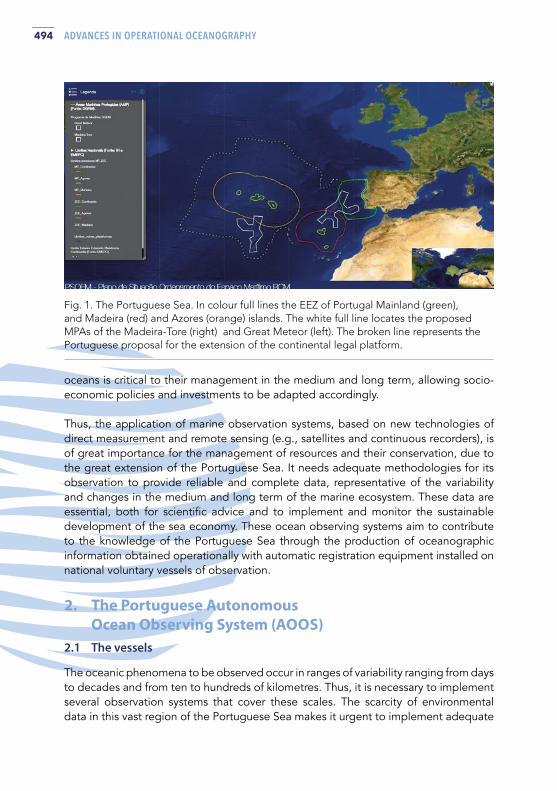
494 ADVANCES IN OPERATIONAL OCEANOGRAPHY
Fig. 1. The Portuguese Sea. In colour full lines the EEZ of Portugal Mainland (green), and Madeira (red) and Azores (orange) islands. The white full line locates the proposed MPAs of the Madeira-Tore (right) and Great Meteor (left). The broken line represents the Portuguese proposal for the extension of the continental legal platform.
oceans is critical to their management in the medium and long term, allowing socio-economic policies and investments to be adapted accordingly.
Thus, the application of marine observation systems, based on new technologies of direct measurement and remote sensing (e.g., satellites and continuous recorders), is of great importance for the management of resources and their conservation, due to the great extension of the Portuguese Sea. It needs adequate methodologies for its observation to provide reliable and complete data, representative of the variability and changes in the medium and long term of the marine ecosystem. These data are essential, both for scientific advice and to implement and monitor the sustainable development of the sea economy. These ocean observing systems aim to contribute to the knowledge of the Portuguese Sea through the production of oceanographic information obtained operationally with automatic registration equipment installed on national voluntary vessels of observation.
2. The Portuguese Autonomous Ocean Observing System (AOOS)
2.1 The vessels
The oceanic phenomena to be observed occur in ranges of variability ranging from days to decades and from ten to hundreds of kilometres. Thus, it is necessary to implement several observation systems that cover these scales. The scarcity of environmental data in this vast region of the Portuguese Sea makes it urgent to implement adequate

495ADVANCES IN OPERATIONAL OCEANOGRAPHY EXPANDING EUROPE’S OBSERVING AND FORECASTING CAPACITY
Fig. 2. The main routes of Transinsular´s cargo vessels involved in the OBSERVA.PT project.
observation systems to fill this gap and to complement each other. Cargo vessels, which carry routes that cross over these seas with great regularity, are the ideal platforms for the installation of the ocean observing equipment, allowing a relatively high temporal regularity and an acceptable spatial coverage. At the same time, fishing vessels are another way to make long-term sustainable scientific measurements since fishing vessels ply coastal seas at all times of the year and in almost all weather conditions. Thus, with these two types of platforms we can cover spatially both coastal and open ocean waters. More specifically, cargo vessels from Transinsular (the main Portuguese shipping company), en route from Mainland to Madeira, Azores and Cape Verde Islands (Figure 2), will be equipped with ocean observing systems and meteorological stations (see below).
2.2 The equipment
The oceanographic measurements will be done using a multi-sensor FerryBox type device - the UNDERSEE_water system - developed by Matereospace Lda., Portugal1. The system will measure continuously on ship routes. The UNDERSEE system is a compact and easy to install in situ water data acquisition system (UNDERSEE_water) and a user-friendly cloud platform (UNDERSEE_cloud) (Figure 3).
1 http://periscope-network.eu/spotlight/undersee-multi-sensor-fusion-system-water-quality-
monitoring-0

496 ADVANCES IN OPERATIONAL OCEANOGRAPHY
Fig. 3. The UNDERSEE_water device and UNDERSEE_cloud (adapted from http://undersee.io/).
The sensors installed in the acquisition system make automated measurements of core water quality parameters, as temperature, conductivity (salinity), chlorophyll-a, pH, dissolved oxygen, oxidation-reduction potential (ORP) and turbidity.
Additionally, to these systems, standard meteorological stations are installed in each cargo and fishing vessel to measure pressure, air temperature and humidity, and wind direction and speed in accordance to the EUMETNET Surface Marine Programme (E-SURFMAR) protocols. In the fishing vessels a gyrocompass is installed to provide ship motions, like true-heading, roll, pitch, yaw, heave, surge, sway, rates of turn and accelerations (i.e. 6-DOF: 3 angular rates and 3 linear acceleration) even in highly volatile environments. The ship motion measurements will allow the estimation of the characteristics of the wave exciting the motion, based on different analysis methods (Pascoal and Guedes Soares, 2008, 2009).
2.3 The projects
These activities are conducted mainly in the frame of two projects coordinated by IPMA: (i) ‘OBSERVA.PT - Observations on board national commercial ships to support the conservation of marine biodiversity in the Portuguese Seas’ (MAR-01.04.02-FEAMP-0002)2 funded by the European Union (EU) and the Portuguese Government under the Mar2020 Programme; and (ii) ‘OBSERVA.FISH – Autonomous Observing Systems in Fishing Vessels for the Support of Marine Ecosystem Management’ (PTDC/CTA-AMB/31141/2017; SAICT-45-2017-02-FEDER-031141)3 funded by the EU and Portuguese Science and Technology Foundation (FCT) under the Portugal2020 Programme (Lisboa2020 and Algarve2020).
2 https://www.researchgate.net/project/OBSERVAPT-Observations-on-board-national-commercial-
ships-to-support-the-conservation-of-marine-biodiversity-in-the-Portuguese-Seas3 https://www.researchgate.net/project/OBSERVAFISH-Autonomous-Observing-Systems-in-Fishing-
Vessels-for-the-Support-of-Marine-Ecosystem-Management

497ADVANCES IN OPERATIONAL OCEANOGRAPHY EXPANDING EUROPE’S OBSERVING AND FORECASTING CAPACITY
OBSERVA.PT aims to implement appropriate marine environment monitoring technologies (satellites and continuous automatic recording equipment) for the production of operational oceanographic and meteorological information. Whaling watching will be another activity of the project and will be based on the observations by observers onboard the cargo vessels. More specifically the project will ensure long term monitoring activities in the open ocean (e.g. oceanic MPAs), build time series and map their spatiotemporal variability to support the adaptive management of marine ecosystems, assess their biodiversity, and improve the climate characterization in this region and the meteorological forecasts for maritime activities. These observations will contribute to the baseline information for MSFD’s descriptors of biodiversity (D1), non-indigenous species (D2), marine food web (D4; plankton, dolphins and whales) and the eutrophication (D5) classification of the Portuguese Seas. Furthermore, the project intends to extend the Portuguese contribution to international organizations and programmes (e.g., EuroGOOS, Argo/Euro-Argo and JCOMM).
The main objective of OBSERVA.FISH is the development of a totally autonomous system (no human action) prototype that could be install onboard of all types of fishing vessels (trawlers, purse-seiners, longliners). Specific goals are: (i) to develop more cost effective observing platforms with a large coverage and improved long term capabilities; (ii) to build consolidated data sets from all underway measurements that will be used to validate satellite-derived charts, and hydrodynamic and atmospheric models outputs; (iii) to produce advisory products for the support of fishing operation and the management of marine ecosystems; (iv) to support forecast and decision making regarding harmful algae blooms (support Bivalves Monitoring National Programme that covers all Portuguese coast); and (v) to raise awareness among and knowledge transfer to the fishing industry for the acquisition and use of ocean observations and added value products. In addition to the meteorological and oceanographic observations, the project monitor vessel motions and measures the loads in the crane of the fishing vessel. The operational environment tests are being carried out on several IPMA’s research vessels (RV) and it is proposed that the system achieve a Technological Readiness Level (TRL) 7. The data collected operationally are being validated and integrated into a wider observational programme that includes other in situ platforms, satellites and models. The analysis will support the development of new products for more safe and efficient maritime operations, and to support fishing activities and an integrated management of the marine ecosystems.
3. Tests and first results The first tests were conducted in Tagus river estuary and adjacent coastal areas (Bay of Cascais off Lisbon), between October 15th and 30th, 2020, within daily campaigns, using IPMA’s RV Diplodus simulating an artisanal fishing vessel. The tests focused on equipment performance, data acquisition and transmission/reception of information. Initial tests allowed the detection of problems in the UNDERSEE_water system input flow, which was below the desirable limit for sampling and in data land reception because

498 ADVANCES IN OPERATIONAL OCEANOGRAPHY
of inadequate positioning of the GPS and 3G antennas. Since the vessel docked at every end of each day, the problems detected were fixed and at the end of the campaign the system was fully operational. The next tests will be performed at the end of next May onboard IPMA’s RV Mário Ruivo simulating a fishing trawler.
All measurements are integrated with date, time and GPS position to produce single raw data points that can be send to the UNDERSEE_cloud and visualized in near real-time as presented in Figure 5. All raw data collected are accessed online by IPMA, the designated data receiving coordinator centre onshore and require quality control and processing before its free dissemination and use.
Fig. 4. The UNDERSEE_water device (right) installed on the deck of IPMA’s RV Diplodus (left) (adapted from Rosa et al., 2021).
Ocean data collected by the Un-dersee box are subject to preliminary real-time processing, which includes removal unreal spikes and series smoothing, since data are acquired with a sample rate equal to 12 seconds (see Figure 5).
Fig. 5. UNDERSEE_cloud interface (left) and example of preliminary processing data (right) (from Rosa et al., 2021).

499ADVANCES IN OPERATIONAL OCEANOGRAPHY EXPANDING EUROPE’S OBSERVING AND FORECASTING CAPACITY
Acknowledgements
These activities are being made under the projects OBSERVA.FISH (PTDC/CTA-AMB/31141/2017) funded by FCT, Lisboa2020 and Algarve2020, and OBSERVA.PT (MAR-16-01-04-FMP-002) funded by the EU and the Portuguese Government under the Mar2020-Fisheries Operational Programme. This is a contribution to the Strategic Research Plan of CENTEC and CCMAR which are funded by FCT under contract UIDB/UIDP/00134/2020 and UIDB/04326/2020.
ReferencesPascoal, R., and Guedes Soares, C. (2008). Non-Parametric Wave Spectral Estimation Using Vessel Motions. Appl. Ocean Res., 30, 46-53.
Pascoal, R., and Guedes Soares, C. (2009). Kalman Filtering of Vessel Motions for Ocean Wave Directional Spectrum Estimation. Ocean Eng., 36, 477-488.
Rosa, T.L., Piecho-Santos, A.M., Vettor, R., and Guedes Soares, C. (2021). Review and Prospects for Autonomous Observing Systems in Vessels of Opportunity. Journal of Marine Science and Engineering, 9(4), 366, https://doi.org/10.3390/jmse9040366

500 ADVANCES IN OPERATIONAL OCEANOGRAPHY
NEW TECHNOLOGY IMPROVES OUR UNDERSTANDING OF CHANGES IN THE MARINE ENVIRONMENT Gabriele Pieri (1), Manolis Ntoumas (2), Michela Martinelli (3), Eva Chatzinikolaou (4), Flavio Martins (5), Antonio Novellino (6), Natali Dimitrova (7), Konstatin Keller (8), Andrew King (9), Andy Smerdon (10), Marco Mazza (11), Damien Malardé (12), Michele Cocco (13), Armindo Torres (14), George Triantafyllou (2), Sandra Sá (15), Maria João Bebianno (5), Stefania Sparnocchia (16), Trond Kristiansen (9) and Amy Lusher (9)
(1) Institute of Information Science and Technologies - National Research Council of Italy, [email protected]
(2) Hellenic Centre for Marine Research, Institute of Oceanography (IO), [email protected]; [email protected]
(3) Institute of Marine Biological Resources and Biotechnologies – National Research Council of Italy, [email protected]
(4) Hellenic Centre for Marine Research, Institute of Marine Biology, Biotechnology and Aquaculture, [email protected]
(5) University of Algarve, [email protected], [email protected](6) ETT S.p.A., [email protected](7) Europroject Ltd., [email protected](8) SubCtech GmbH, [email protected](9) Norwegian Institute for Water Research (NIVA), andrew.king; amy.lusher; trond.kristiansen;
@niva.no(10) Aquatec Group Ltd, [email protected](11) iPrint Institute, University of Applied Sciences - Western Switzerland, marco.mazza@hefr,ch(12) nke Instrumentation, [email protected](13) EdgeLab s.r.l., [email protected](14) CEiiA, [email protected](15) EurOcean, [email protected](16) Institute of Marine Sciences - National Research Council of Italy,
501ADVANCES IN OPERATIONAL OCEANOGRAPHY EXPANDING EUROPE’S OBSERVING AND FORECASTING CAPACITY
Abstract
Existing European observation tools and services have the potential to take advantage of cutting-edge technologies to obtain a wide range of data at a much higher spatial resolution and temporal regularity and duration. The EU-funded NAUTILOS project will develop a new generation of sensors and samplers for physical, chemical, and biological essential ocean variables in addition to micro- and nano-plastics. The project will improve our understanding of environmental variations and anthropogenic impacts connected with aquaculture, fisheries, and marine litter. The project will integrate recently advanced marine technologies into different observing platforms and deploy them through innovative and cost-effective methods in a wide range of key environmental settings and EU policy-related applications. The project aims to complement and expand existing European observation instruments and services and further enable and democratise the monitoring of the marine environment for both traditional and non-traditional data users.
Keywords: ocean observations, sensors, samplers, fisheries, ocean modelling, data management
1. Introduction The H2020 NAUTILOS project aims to fill in existing marine observation and modelling gaps, through the development of new technologies and their deployment onto different observing platforms promoting innovative and cost-effective methods in a wide range of crucial environmental settings and EU policy-related applications.
NAUTILOS will develop a new generation of cost-effective sensors and samplers for physical (salinity, temperature), chemical (inorganic carbon, nutrients, oxygen), and biological (phytoplankton, zooplankton, marine mammals) essential ocean variables in addition to micro-/nano-plastics. Newly developed technologies will be integrated with different observing platforms (e.g., platforms of opportunity such as commercial vessels, aquaculture plants, fixed stations, animal routes, AUVs etc.) and deployed through novel approaches in a broad range of key environmental settings (e.g., from shore to deep-sea deployments) and EU policy-relevant applications. The impact of the project will be assessed through numerical models. Data products will be made FAIR available to further European and international Ocean Data integrators. Synergies with relevant initiatives, Citizen Science campaigns and capacity building courses will be also organised to reach all relevant stakeholders and users.
2. Materials
2.1 Newly developed technologies and monitored variables
These activities are conducted mainly in the frame of two projects coordinated by Two work packages are dedicated to developing instruments for biogeochemical and

502 ADVANCES IN OPERATIONAL OCEANOGRAPHY
biological observations and for physical, chemical, and microplastics observations, respectively. In sum, there are thirteen types of sensors and samplers from these two work packages, and they are related to 21 Essential Ocean Variables and 9 Marine Strategy Framework Directive descriptors (Figure 1). The first part of developments will include sensors and samplers such as dissolved oxygen (DO) and fluorometric sensors based on optical technologies (fluorescence decay measurement), hyperspectral and downward-facing laser-induced fluorescence imagers, passive acoustic sensors, active multi-frequency bioacoustics water column profiling sensors, and phytoplankton and other suspended matter samplers.
The second part of the developments will involve cost-effective sensing technologies in response to marine chemistry and deep-sea physics measurement needs. Ocean carbonate/acidification system sensors, electrochemical sensors measuring silicates in the water column, deep ocean CTDs based on MEMs technology, samplers for micro- and nano-plastics, and a novel LIBS-based microplastics sensor will be developed. Through these developments, we will target the variables: CO2, pH, silicate, microplastics in seawater, conductivity, temperature and depth, and marine radioactivity.
2.2 Observational platforms and Integration
A truly diverse set of vehicles and platforms are envisaged for integrating the different sensors developed in NAUTILOS to enable the testing and demonstration of the sensors as well as the collection of data in representative situations to prove the concept and feed the data models in preparation for wider use beyond the project.
Fig. 1. NAUTILOS technologies covering EOVs and MSFD descriptors.

503ADVANCES IN OPERATIONAL OCEANOGRAPHY EXPANDING EUROPE’S OBSERVING AND FORECASTING CAPACITY
Besides, an innovative exercise is planned where multi-platform and vehicle cooperation, between an Autonomous Surface Vehicle (ASV), Lander platform and an Autonomous Underwater Vehicle (AUV) will operate as a type of network. This exercise will make use of marine communication solutions to simulate situations where automation could be a future benefit for data collection and marine monitoring. Given the exponential increase in the need for in situ data for broader and higher quality models, automation can be a key enabler to achieve this cost-effectively. Therefore, an enhanced UW communication network will be established to allow an increased data exchange capability between sensors and sea platforms. It will be based on two modem links (acoustic and optical) of a new conception to be installed on AUV, ASV and Lander.
In terms of moveable vehicles and platforms, the project will use a UUV and its characteristics, the fluorometric and DO sensors will be integrated into an existing AUV platform (a modified AUV U_Tracker®) as well as the passive broadband acoustic recording sensor for noise monitoring. Similarly, on the ASV the same passive acoustic recording sensor will be installed with the addition of a passive acoustic event recorder as well as a carbonate system/ocean acidification sensor and a nano- and micro-plastics sampler in addition to other standard equipment of the vehicle. Finally, an Unmanned Aerial Vehicle (UAV) will be installed with a downward-looking hyper/multispectral camera and flight-tested in Portugal in preparation for further demonstrations.
In terms of sensor integration onto ships of opportunity, there are two main approaches covered, the integration of sensors and samplers on fishing vessels and FerryBox. Ships of opportunity will perform in-field validations of DO and fluorescence sensors in cruises in the Adriatic Sea in conjunction with traditional oceanographic tools and samples of water to allow comparison with traditional methodologies. This activity will lead to integrating these sensors on the Fishery and Oceanography Observing System (FOOS) device for testing during an experimental fishing cruise. Concerning the FerryBoxes activity, a variety of different sensors will be integrated on ships for later use in aquaculture and coastal and shelf-sea-related demonstration activities.
Further integrations of sensors will be performed on floats, buoys and landers to additionally cover a variety of available marine platforms that can also be tested and used for demonstrations to materialise the final objectives. Silicate sensors will be integrated into a new generation of profiling float CTS5 with a careful balance of energy, power consumption, hardware and software packages. The integration of sensors in buoys located at the Cretan Sea (POSEIDON HCB observatory and M3A open sea site (Petihakis et al., 2018)) and in the South Tyrrhenian Sea, will be performed to achieve different locations and depths of water for analysing the performance of the sensors. Finally, the Lander platform will be used to integrate and test the active acoustic profiling and deep ocean low-level radioactivity sensors, as well as the deep ocean CTD and oxygen sensor package at various sites for demonstration activities.

504 ADVANCES IN OPERATIONAL OCEANOGRAPHY
With regards to the animal-borne instruments activity, a collaborative effort to investigate the use of DO sensors in two different animal tagging systems to help better understand the animals, their habitats and the marine ecosystem in general, via their uniquely valuable in situ data returned from the oceans. The first type of system is specially designed to be towed by forward-moving species in a non-invasive and low drag manner.
3. Methods
3.1 Data Management and sharing
NAUTILOS aims to provide freely accessible marine data by allowing and enabling data flow towards existing globally accepted infrastructures and integrators (e.g., CMEMS, EMODnet, SDC – SeaDataCloud – SeaDataNet, etc.). An essential aspect of data management will be processing the acquired environmental data to a format that meets widely accepted data standards such as MEDIN discovery metadata standard, INSPIRE data specification, etc.
The project will be acting as the integrator by connecting different data sources so that ocean data can be used, reused, stored and integrated. The interoperability necessary to coordinate the scattered data management of ocean observing systems will be achieved through standardisation of formats, distribution protocols and metadata. A minimum number of metadata elements will be applied, to provide users with information identifying a collection of files as a thematic/coherent dataset. It will support the search through that collection using keywords and spatio-temporal coordinates and will provide information on or links to the processing history of the observations (i.e., source, version, quality assessment and control, sensors).
To facilitate the data harmonisation and to operate as an integrator and data translator for facilitating data use and interoperability, the project data management will adopt ERDDAP as the core solution for data management. The goal is to make it easier for users to access the project scientific data, as well as provide Thematic Data Assembly Centres (TACs) with a machine-to-machine interface to find, access, use and reuse the newly collected and high valuable NAUTILOS data.
3.2 Data Modelling
The new ocean observations made possible by NAUTILOS are expected to significantly improve model performance through data assimilation. To evaluate this outcome, simulation experiments will be performed in three distinct geographic areas using different modelling approaches: in the Mediterranean basin, a coupled hydrodynamic, biogeochemical and carbonate model with a 5 km mesh resolution will be used (Tsiaras et al., 2017). The hydrodynamic model is based on the Princeton Ocean Model (POM),

505ADVANCES IN OPERATIONAL OCEANOGRAPHY EXPANDING EUROPE’S OBSERVING AND FORECASTING CAPACITY
while the biogeochemical model is based on European Regional Seas Ecosystem Model (ERSEM) and is equipped also with a carbonate chemistry module (Blackford and Gilbert, 2007). Additionally, a Lagrangian Individual-Based Model (IBM), coupled with the hydrodynamic model, will be used to simulate the distributions of floating plastics, originating from major source inputs. In the SW Iberia Coast, the high-resolution SOMA operational model with a 1 km mesh resolution will be used. The hydrodynamic system is based on the MOHID model and uses a generic vertical coordinate approach (Janeiro et al., 2017). In the Hardangerfjord, Norway, the ROHO800 modelling system, which is based on the ROMS model for the hydrodynamics and in the ERSEM model for the biogeochemical processes and adapted to Nordic plankton species will be used. A methodology based on the Observing System Simulation Experiments (OSSE) concept will be explored to evaluate the impact produced by new sensors and observation strategies defined in NAUTILOS. Additionally, results will be useful to define optimal observation strategies in terms of types of ocean variables and observation distribution both in time and in space.
4. Testing and Demonstration
4.1 Laboratory calibration and field validation
Sensors and samplers developed within NAUTILOS (described in section 2.2) will be calibrated and validated to demonstrate their functionality in end-user specific environments for eventual use in field demonstration activities described in section 4.2.
The controlled laboratory calibration and validation activities will utilize certified reference materials, measurements by reference instruments, and other calibration techniques to provide metrics that can be used to characterize sensor/sampler performance including, for instance, accuracy, precision, and range of the target measurements. When appropriate, tests will also control the impact of temperature, pressure, and salinity variability on sensor performance. For some instruments, including some samplers and above water sensors, large test tanks (>800 m3) will be used for calibration and validation by manipulating the test tanks with model particles and/or organisms. Data generated during the calibration and validation experiments will be collected for evaluating the expected performance (and limitations) of a given instrument under controlled environments. This will be used to inform field demonstration activities as well as to serve as a baseline for comparison with post-field demonstration campaign sensor/sampler assessments of reliability and repeatability.The controlled scenario testing of platforms and sensors, joint operations of multiple platforms with integrated sensors and existing observatories, will be carried out in several deployment sites. Sensors/platforms integration and deployment will be tested under different environmental scenarios to offer valuable technical information and feedback since each sensor/platform will be operated close to their environmental parameter threshold condition. Moreover, joint operations will be organized between lander, ASV and buoys with novel equipment such as acoustic sensors, sonar and
506 ADVANCES IN OPERATIONAL OCEANOGRAPHY
cameras being used for key seabed habitat mapping. Cross-evaluation will be conducted by a comparable assessment performed by divers. A controlled scenario will be carried out in a station in Capo Tirone, in the South Tyrrhenian Sea integrating three data collecting systems (AUV, boat and a buoy). Verification and preparatory flights with the UAV platform and integrated sensors to be carried out in Portugal.
4.2 On-field Demonstration activities
Especially within the last 2 years of the project, demonstration activities involving the use of the sensors and samplers developed within NAUTILOS, will be carried out in several European regions. Demonstrations will also aim to develop new multidisciplinary and more comprehensive observational approaches involving the use of a wide range of conventional and non-conventional platforms and exploiting innovative and cost-effective methods to monitor key environmental settings and provide data for EU policy-related applications. Deployments and operations of the system will take place from shallow coastal waters to open and deep-sea sites, providing complete datasets for studying the marine ecosystem functions and advanced data products and tools. To improve the emerging approach of ‘Fisheries Observing Systems’ (Van Vranken et al., 2020), in the Adriatic Sea and the Bay of Biscay, the use of new generation specific sensors for key environmental variables related to fishery resources and specifically designed to be mounted on commercial fishing vessels will be demonstrated. A novel integrated ‘Aquaculture Observing System’ approach will be trailed in coastal regions of Norway and Greece, based on sensors deployment within mariculture and fish farm plants but also FerryBoxes and fishery research vessels operating in the areas. The data stream from underway sensor operations will be used to enable real-time event detection with an adaptive machine learning approach. New acoustic marine mammals monitoring systems will be deployed with the help of commercial fishermen in the Swedish Sound/Kullaberg/Lysekil waters and additional demonstrations will be carried out in the Portofino MPA cetaceans’ sanctuary.
A network of FerryBoxes infrastructures operating in Coastal Norway, the Gulf of Finland and the Aegean Sea, covering a wide range of environmental parameters will be available for the demonstration of the sensors through the project and will also be used in combination unmanned aerial vehicles (UAVs) to apply data stream mining and concept change detection, leading towards automated, AI-based event- and anomaly-detection and comparisons with satellite data (phytoplankton bloom measurements/detection and other ocean colour related variables).
To demonstrate novel approaches to observe the ocean with multiple platforms combined operations and new technologies for augmented observatories, landers and autonomous vehicles equipped with the developed sensors will be deployed and tested in the POSEIDON integrated ocean observing infrastructure at the eastern Mediterranean (Perivoliotis et al., 2017). To enhance the monitoring of the oceans in regions undergoing deoxygenation, a new generation of silicate sensors will be

507ADVANCES IN OPERATIONAL OCEANOGRAPHY EXPANDING EUROPE’S OBSERVING AND FORECASTING CAPACITY
implemented onto ARGO profiling floats and demonstrated in the Mediterranean Sea.To help better understand the animals’ ecology, their habitats and the marine ecosystem in general, new animal-borne instruments (e.g., new DO sensors included in non-invasive animal tagging systems) will be demonstrated on sharks and manta rays in the Archipelago of the Azores and also outside of Europe on elephant seals in the Valdes Peninsula, Argentina. Hence, data collected in distinct regions will be shared with the wider community, such as via AniBOS.
Some of the products developed such as microplastics sensors and samplers and other tools and approaches, will also be demonstrated and applied in the context of Citizen Science Campaigns involving tourists, divers, volunteers, high school students etc.
5. Conclusions
5.1 Communication, dissemination and exploitation activities
Dissemination and communication activities focused on increasing the visibility of the project and its opportunities to science and industry will expand the reach and impact of the project in developing cross-disciplinary interactions.
NAUTILOS Project aims to establish synergies and collaborations for the European Strategy for Plastics in a Circular Economy (ESPCE) with current and past projects, initiatives, networks and relevant stakeholders. The ESPCE is one of the main blocks of the European Green Deal agenda and will also contribute to the Sustainable Development Goals (SDGs) of the 2030 EU Agenda. A series of Citizen Science activities planned in different countries will raise awareness and offer knowledge to society members willing to act as citizen scientists and participate actively in the monitoring and elimination of plastics. Field campaigns for the collection and identification of micro- and macro-plastics using traditional (e.g., sieving, filtering, density separation) and innovative methods (e.g., smartphone NIR scanner) will be organised. The Citizen Science data will be uploaded in graphical maps indicating locations and respective quantities of plastic litter data. Furthermore, the microplastic sensors and samplers that will be developed during the project will be presented during school campaigns and will also be the subject of Capacity Building Learning Labs focusing on early-career scientists and marine technicians. Concerning the exploitation strategy, the Key Exploitable Results (KERs) identified for the project will be closely monitored and incentivized with the support of the exploitation plan and the 10-year open access marine instrumentation roadmap to be developed during the project. Also, environmental and socio-economic impact assessments will help ensure sustainable and socially conscious development of the project activities.

508 ADVANCES IN OPERATIONAL OCEANOGRAPHY
Acknowledgements
This document is part of a project that has received funding from the European Union’s Horizon 2020 research and innovation programme under grant agreement N°. 101000825 (NAUTILOS).
ReferencesJaneiro, J., Neves, A., Martins, F. and Relvas, P. (2017). Integrating technologies for oil spill response in the SW Iberian coast. Journal of Marine Systems, 173, 31-42, https://doi.org/10.1016/j.jmarsys.2017.04.005,
Blackford, J.C., and F.J. Gilbert. (2007). pH variability and CO2 induced acidification in the North Sea. Journal of Marine Systems, 64. 1-4:229-241.
Tsiaras, K.P., Hoteit, I., Kalaroni, S., Petihakis, G., Triantafyllou, G. (2017). A hybrid ensemble-OI Kalman filter for efficient data assimilation into a 3-D biogeochemical model of the Mediterranean. Ocean Dynamics, 67, 673–690.
Perivoliotis, L., Petihakis, G., Korres, M., Ballas, D., Frangoulis, C., Pagonis, P., Ntoumas, M., Pettas, M., Chalkiopoulos, A., Sotiropoulou, M., Bekiari, M., Kalampokis, A., Ravdas, M., Bourma, E., Christodoulaki, S., Zacharioudaki, A., Kassis, D., Potiris, M., Triantafyllou, G., Papadopoulos, A., Tsiaras, K., and Velanas, S. (2017). The POSEIDON system, an integrated observing infrastructure at the Eastern Mediterranean as a contribution to the European Ocean Observing System. Serving Sustainable Marine Development, 8th EuroGOOS Conference, 3-5 October, 2017 Bergen, Norway, pp. 53-61
Petihakis, G., Perivoliotis, L., Korres, G., Ballas, D., Frangoulis, C., Pagonis, P., Ntoumas, M., Pettas, M., Chalkiopoulos, A., Sotiropoulou, M., Bekiari, M., Kalampokis, A., Ravdas, M., Bourma, E., Christodoulaki, S., Zacharioudaki, A., Kassis, D., Potiris, E., Triantafyllou, G., Tsiaras, K., Krasakopoulou, E., Velanas, S., and Zisis, N. (2018). An integrated open-coastal biogeochemistry, ecosystem and biodiversity observatory of the Eastern Mediterranean. The Cretan Sea component of POSEIDON system. Ocean Science, Special Issue: Coastal marine infrastructure in support of monitoring, science, and policy strategies. Ocean Science, 14, 1223-1245 DOI:10.5194/os-14- 1223-2018.
Van Vranken, C.H., Vastenhoud, B.M., Manning, J.P., Plet-Hansen, K.S., Jakoboski, J., Gorringe, P., Martinelli, M. (2020). Fishing Gear as a Data Collection Platform: Opportunities to Fill Spatial and Temporal Gaps in Operational Sub-Surface Observation. Frontiers in Marine Science, 7: Article 485512. https://doi.org/10.3389/fmars.2020.485512

509ADVANCES IN OPERATIONAL OCEANOGRAPHY EXPANDING EUROPE’S OBSERVING AND FORECASTING CAPACITY

SESSION 13
COASTAL FORECASTING AND OCEAN MODELLING

512 ADVANCES IN OPERATIONAL OCEANOGRAPHY
THE NEW MET OFFICE GLOBAL OCEAN FORECAST SYSTEM AT 1/12° RESOLUTION Ana Barbosa Aguiar, Jennifer Waters, Martin Price, Gordon Inverarity, Christine Pequignet, Jan Maksymczuk, Kerry Smout-Day, Matthew Martin, Mike Bell, Robert King, James While, Daniel J. Lea, John Siddorn
Met Office, FitzRoy Road, Exeter EX1 3PB, UK, [email protected]
Abstract
The Met Office has recently upgraded its operational Forecasting Ocean Assimilation Model (FOAM) from an eddy permitting 1/4° tripolar grid (ORCA025) to the eddy resolving 1/12° ORCA12 configuration. FOAM-ORCA12 uses NEMOv3.6 (GO6 configuration) coupled to CICE (GSI8.1 configuration) for the ocean and sea-ice components, respectively. It assimilates observations of sea surface temperature (SST), temperature and salinity profiles, altimeter sea level anomaly and sea ice concentration, via NEMOVAR which is a multivariate incremental 3DVar scheme that runs over a 1-day time window. Qualitatively FOAM-ORCA12 better represents the details of mesoscale features in SST and surface currents. Traditional statistical verification methods suggest that the new system performs similarly or slightly worse than the equivalent 1/4° system. However, it is known that comparisons of models running at different resolutions suffer from a double penalty effect, whereby higher-resolution models are penalised more than lower-resolution models for features that are offset in time and space. Results are shown from neighbourhood verification methods which use common spatial scales for a fairer comparison between configurations of different resolutions, applied to SST. We show that, as neighbourhood sizes increase, ORCA12 consistently has lower Continuous Ranked Probability Scores than ORCA025.
Keywords: Ocean model, eddy-resolving, ORCA12, neighbourhood verification methods
1. Introduction The Forecasting Ocean Assimilation Model (FOAM) system (Blockley et al., 2014) uses the hydrodynamic model Nucleus for European Modelling of the Ocean (NEMO) (Madec, 2016) for the ocean component and the Community Ice CodE (CICE) (Hunke et al., 2015) for the sea-ice component. In September 2018, the system was updated to the UK Global Ocean configuration version 6 which uses NEMO v3.6 (GO6, Storkey

513ADVANCES IN OPERATIONAL OCEANOGRAPHY EXPANDING EUROPE’S OBSERVING AND FORECASTING CAPACITY
et al., 2018) coupled to CICE (GSI8.1 configuration, Ridley et al., 2018). Initially, the adopted model grid was ORCA025 (approximately 1/4° horizontal resolution) but in December 2020, the model grid was upgraded to ORCA12 and the global ocean forecast system became eddy-resolving with 1/12° horizontal resolution. At the surface, the system is forced by boundary conditions provided by the Met Office Unified Model: 3-hourly heat and freshwater fluxes, and 1-hourly winds. The river run-off is prescribed by climatological seasonally varying estimates.
The configuration uses NEMOVAR for data assimilation (DA) over a 24 hour time-window with a 3DVar-FGAT (first guess at appropriate time) scheme and a state vector consisting of temperature, salinity, sea surface height (SSH), horizontal velocities and sea ice concentration. The assimilation includes observation bias correction schemes for sea surface temperature (SST; While and Martin, 2019) and SSH (Lea et al., 2008). A diffusion operator is used to efficiently model spatial correlations in the background errors, and multivariate relationships are specified through physical balances (Weaver et al., 2005). An Incremental Analysis Update (IAU) step is used to slowly add the assimilation increments into the model. Despite the 1/12° resolution of the underlying physical model, the data assimilation scheme runs at 1/4° in the present version of FOAM-ORCA12. It is common in operational systems to perform the assimilation at a lower resolution than the model run (e.g. Oke et al., 2013; Lellouche et al., 2018).
In order to assess the impact of changing the resolution of the model, we have carried out experiments with the 1/12° and 1/4° versions of the global FOAM system, both assimilating the same datasets, forced by the same atmospheric fields, and with the same model, with the only difference being its resolution. In the next sections we describe the experiments and an overview of the results, concluding with a summary.
2. Experiments Two assimilation experiments have been carried out over the period 1st January 2017 to 31st December 2018. The experiment at ¼° resolution is referred to as ‘FOAM-ORCA025’ and the experiment at 1/12° resolution, is referred to as ‘FOAM-ORCA12’. These share the same version of model and data assimilation, are forced by the same atmospheric fields and river inputs and assimilate the same observations. The only differences between the runs are the resolution of the model, some model parameter settings which are resolution-specific, and the initial conditions (which come from previous spin-up runs at the appropriate resolution which included data assimilation). The observations come from various sources. Satellite sea-ice concentration data from SSMI/S sensors are provided by EUMETSAT. Satellite SST data are obtained from the Group for High Resolution SST (GHRSST) and includes data from AVHRR sensors on NOAA and MetOp satellites, the SEVIRI sensor on the MSG satellite, the SLSTR sensor on Sentinel-3 satellites, the AMSR2 sensor on GCOMW1 satellite and the VIIRS sensor on the Suomi NPP satellite. Along-track SLA data come from CMEMS (Copernicus

514 ADVANCES IN OPERATIONAL OCEANOGRAPHY
Marine Environment Monitoring Service). The in situ SST data are received via the Global Telecommunication System, while in situ temperature and salinity profiles are from the EN4 reprocessed dataset (Good et al., 2013).
The hindcast trials were run over a period of two years, but here we show mainly results from the last six-months (July-December 2018). For this period, every day, we ran an analysis followed by five days of forecast.
3. Results
3.1 Surface currents
The modelled and observed surface Agulhas current, time-averaged over July-August-September 2017 is shown in Figure 1. The retroflection of the Agulhas current appears to be more coherent in FOAM-ORCA12 than in FOAM-ORCA025, and the higher resolution configuration provides a better match to the observations in terms of magnitude and meandering path followed.
Fig. 1. Surface current [m/s] off South Africa, in the Agulhas current region. Model fields at the top with FOAM-ORCA025 on the left and FOAM-ORCA12 on the right, observed fields at the bottom with OSCAR on the left and GlobCurrent on the right.
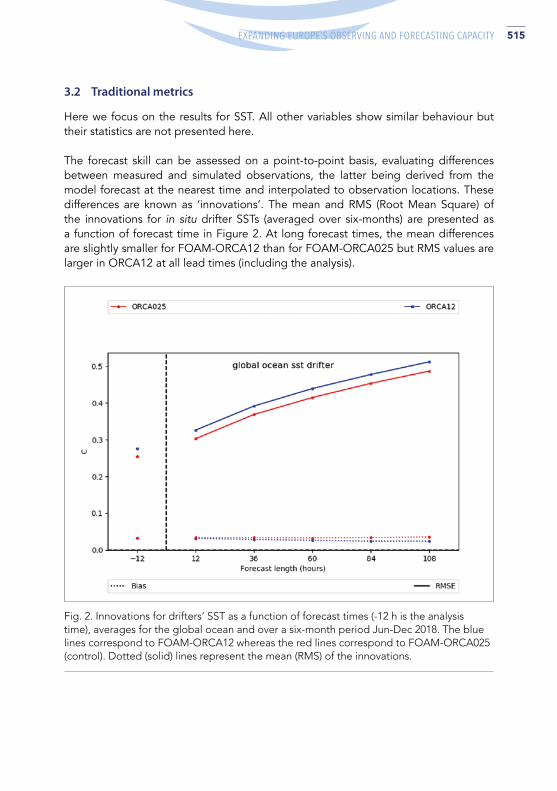
515ADVANCES IN OPERATIONAL OCEANOGRAPHY EXPANDING EUROPE’S OBSERVING AND FORECASTING CAPACITY
3.2 Traditional metrics
Here we focus on the results for SST. All other variables show similar behaviour but their statistics are not presented here.
The forecast skill can be assessed on a point-to-point basis, evaluating differences between measured and simulated observations, the latter being derived from the model forecast at the nearest time and interpolated to observation locations. These differences are known as ‘innovations’. The mean and RMS (Root Mean Square) of the innovations for in situ drifter SSTs (averaged over six-months) are presented as a function of forecast time in Figure 2. At long forecast times, the mean differences are slightly smaller for FOAM-ORCA12 than for FOAM-ORCA025 but RMS values are larger in ORCA12 at all lead times (including the analysis).
Fig. 2. Innovations for drifters’ SST as a function of forecast times (-12 h is the analysis time), averages for the global ocean and over a six-month period Jun-Dec 2018. The blue lines correspond to FOAM-ORCA12 whereas the red lines correspond to FOAM-ORCA025 (control). Dotted (solid) lines represent the mean (RMS) of the innovations.
516 ADVANCES IN OPERATIONAL OCEANOGRAPHY
The time-series of the SST innovations for the different days of forecast (not shown) indicate that, although the error varies significantly over time, the RMS for FOAM-ORCA12 remains higher than RMS for FOAM-ORCA025 most of the time. For SLA (not shown) the degradation is slightly worse in FOAM-ORCA12 and the underlying cause is being investigated.
These results suggest that overall errors are larger in the higher resolution configuration. This counter-intuitive result arises from the fact that, when resolving finer scales, there is more chance of a time and space mismatch between simulated and observed features. Therefore, traditional point-to-point verification methods are not the most appropriate for comparing systems with very distinct resolutions.
3.3 Neighbourhood verification metrics
The High-Resolution Assessment (HiRA) method (Mittermaier and Csima, 2017) is applied here to the two resolution ocean model forecasts, following Crocker et al., (2020). This makes use of ensemble and probabilistic scores to equitably compare models with regards to their accuracy and predictive skill. HiRA uses increasing size neighbourhoods to generate a pseudo ensemble which can then be compared to an observed value. It assumes that a verifying observation is the true value at its location and also representative of the characteristics of a surrounding area. For example, nine grid-cells of ORCA12 can fit in a single grid-cell of ORCA025, therefore this is the smallest neighbourhood size where a comparison of results from either configuration is valid.
Figure 3 shows the SST Continuous Ranked Probability Scores (CRPS) at different neighbourhood sizes for the two configurations. Matching line styles represent the equivalent neighbourhood sizes that should be compared. At the grid scale (neighbourhood size 1), CRPS is equivalent to mean absolute error. CRPS decreases (meaning a better forecast) with increasing neighbourhood size, suggesting that some spatial mismatches exist. Overall, the higher resolution ORCA12 consistently has lower errors than ORCA025 when equivalent neighbourhood extents are compared.
4. Summary and Future Outlook Qualitatively, FOAM-ORCA12 better represents the details of mesoscale features. However, traditional statistical verification methods suggest that the FOAM-ORCA12 system performs similarly or slightly worse than the previous FOAM-ORCA025 system. Neighbourhood verification methods have been used to make a fairer comparison using a common spatial scale for both models and it can be seen that FOAM-ORCA12 consistently has lower CRPS than FOAM-ORCA025. CRPS measures the accuracy of the pseudo-ensemble created by the neighbourhood method and generalises the mean absolute error measure for deterministic forecasts, with lower scores indicating better forecasts.

517ADVANCES IN OPERATIONAL OCEANOGRAPHY EXPANDING EUROPE’S OBSERVING AND FORECASTING CAPACITY
Fig. 3. Left y-axis: CRPS for drifters’ SST as a function of forecast (lead) times, averages for the global ocean and over a six-month period Jun-Dec 2018. The red lines correspond to FOAM-ORCA12 whereas the blue lines correspond to FOAM-ORCA025 (control). Matching line-styles correspond to same neighbourhood lengthscales. Right y-axis: The bars represent the difference in scores ‘ORCA12 minus ORCA025’ and thus negative means ORCA12 is better (has a lower error). The colours correspond to different neighbourhood sizes.
Further improvements to the FOAM system are being worked on, including an update of the background-error covariances used for data assimilation (Carneiro et al., 2021). In 2022, the Met Office will upgrade its main deterministic and ensemble Numerical Weather Prediction (NWP) configurations to use fully coupled atmosphere/land/ocean/sea-ice forecast systems. The ocean/sea-ice component of these will be based initially on FOAM-ORCA025 but the expectation is that this will be upgraded for the deterministic forecast model to FOAM-ORCA12 within the next few years.
Acknowledgements Two surface current observational products were used here: 1. OSCAR (Ocean Surface Current Analysis Real-time) 5-day-averages at 1/3° resolution https://www.esr.org/research/oscar/oscar-surface-currents/; 2. GlobCurrent monthly-means at 1/4° resolution. https://resources.marine.copernicus.eu/?option=com–csw&task=results?option=com_csw&view=details&product_id=MULTIOBS_GLO_PHY_REP_015_004
This work was conducted through the Weather and Climate Science for Service Partnership (WCSSP) India, a collaborative initiative between the Met Office, supported by the UK Government’s Newton Fund, and the Indian Ministry of Earth Sciences (MoES).

518 ADVANCES IN OPERATIONAL OCEANOGRAPHY
ReferencesBlockley, E. W., Martin, M. J., McLaren, A. J., Ryan, A. G., Waters, J., Lea, D. J., Mirouze, I., Peterson, K. A., Sellar, A., and Storkey, D. (2014). Recent development of the Met Office operational ocean forecasting system: an overview and assessment of the new Global FOAM forecasts, Geoscientific Model Development, 7, 2613-2638, https://doi.org/10.5194/gmd-7-2613-2014
Carneiro, D. M., King, R., Martin, M., Aguiar, A. (2021). Short-range ocean forecast error characteristics in high resolution assimilative systems. Met Office Weather Science Technical Report number 645.
Crocker, R., Maksymczuk, J., Mittermaier, M., Tonani, M., and Pequignet, C. (2020). An approach to the verification of high-resolution ocean models using spatial methods, Ocean Science, 16, 831–845. https://os.copernicus.org/articles/16/831/2020/os-16-831-2020.pdf
Good, S. A., Martin, M. J. & Rayner, N. A. (2013). EN4: quality controlled ocean temperature and salinity profiles and monthly objective analyses with uncertainty estimates. Journal of Geophysical Research: Oceans, 118, 6704-6716.
Hunke, E. C., Lipscomb, W. H., Turner, A. K., Jeffery, N., and Elliott, S. (2015) CICE: the Los Alamos Sea Ice Model Documentation and Software User’s Manual Version 5.1, LA-CC-06-012, Los Alamos National Laboratory, Los Alamos, NM
Lea, D. J., J.-P. Drecourt, K. Haines, M. J. Martin (2008). Ocean altimeter assimilation with observational- and model-bias correction. Quarterly Journal of the Royal Meteorological Society, 134:1761-1774.
Lellouche, J.-M., Greiner, E., Le Galloudec, O., Garric, G., Regnier, C., Drevillon, M., Benkiran, M., Testut, C.-E., Bourdalle-Badie, R., Gasparin, F., Hernandez, O., Levier, B., Drillet, Y., Remy, E. & Le Traon, P.-Y. (2018), Recent updates to the Copernicus marine service global ocean monitoring and forecasting real-time high-resolution system. Ocean Science, 14(5), 1093-1126.
Madec, G. (2016) NEMO Ocean Engine. Tech. Rep. 27, Pole de modelisation de IPSL. https://www.nemoocean.eu/AboutNEMO/Referencemanuals/NEMO_book_3.6_STABLE
Mittermaier, M. P., & Csima, G. (2017). Ensemble versus deterministic performance at the kilometer scale, Weather and Forecasting, 32(5), 1697-1709.
Oke, P. R., Sakov, P., Cahill, M. L., Dunn, J. R., Fiedler, R., Griffin, D. A., Mansbridge, J. V., Ridgway, K. R. and Schiller, A. (2013). Towards a dynamically balanced eddy-resolving ocean reanalysis: BRAN3. Ocean Modelling, 67, 52-70.
Ridley, J.K., Blockley, E.W., Keen, A.B., Rae, J.G.L., West, A.E. and Schroeder, D. (2017). The sea ice model component of HadGEM3 GC3.1. Geoscientific Model Development. 11, 713–723. https://doi.org/10.5194/gmd_11_713_2018

519ADVANCES IN OPERATIONAL OCEANOGRAPHY EXPANDING EUROPE’S OBSERVING AND FORECASTING CAPACITY
Storkey, D., Blaker, A.T., Mathiot, P., Megann, A., Aksenov, Y., Blockley, E.W., Calvert, D., Graham, T., Hewitt, H.T., Hyder, P., Kuhlbrodt, T., Rae, J.G.L. and Sinha, B. (2018) UK Global Ocean GO6 and GO7: a traceable hierarchy of model resolutions. Geoscientific Model Development, 11, 3187– 3213. https://doi.org/10.5194/gmd_2017 263
Weaver, A.T., Deltel, C., Machu, E., Ricci, S. and Daget, N. (2005) A multivariate balance operator for variational ocean data assimilation. Quarterly Journal of the Royal Meteorological Society, 131, 3605 – 3625. https://doi.org/10.1256/qj.05.119
While, J., Martin, M. J. (2019). Variational bias correction of satellite sea surface temperature data incorporating observations of the bias. Quarterly Journal of the Royal Meteorological Society, 145: 2733– 2754. https://doi.org/10.1002/qj.3590

520 ADVANCES IN OPERATIONAL OCEANOGRAPHY
TIDE IN GIRONDE ESTUARY Gwenaële Jan (1), Florent Lyard (2), Damien Allain (2), Michel Tchilibou (2) and Jarred Penney (2)
(1) SHOM, 13 rue du châtelier, 29200 Brest, France, [email protected](2) CNRS/LEGOS, 14 avenue Édouard Belin, Toulouse, France
Abstract
The study investigates the dynamics of the Gironde estuary in order to improve the tidal wave deformation modelling in a constrained environment. The need has been highlighted by statistics over high and low tides and surges, upstream of Fort Medoc (Figure 1) (SHOM & Grand Port Maritime de Bordeaux project, 2013). A numerical model has been configured and supplemented by a multi-sensor in situ measurement campaign. The challenge is to separate the part of the physics explicitly solved by the model from what cannot be solved and must consequently be parameterized with physical resolution ranging, here, from 10 m to 1 km. The results show the improvement in reproducing the deformation of tidal wave, disturbed by river flow and atmospheric stress. From the analysis at tide gauge stations, the mean standard deviation of the amplitude difference between model and observations is now close to 0.03 m, which is an improvement of the score previously obtained (0.10 up to 1.0 m, depending on river flow and atmospheric conditions). Navigation safety along the Gironde River and the risk of flooding camp the motivations of the present study. The expectation of infrastructure for navigation in the estuary is acute.
Keywords: numerical modelling of tidal wave distortion, water level measurement, river dynamics and environmental key points
1. Introduction The project consists in studying the dynamics of tide in the Gironde Estuary with the aim of understanding the deformation of the tidal wave that occurs as well as establishing choices of parameters likely to control its propagation (e.g. slope of the river bed, bottom friction, river flow, bathymetry and boundary conditions). Standard deviation of tide amplitude and its error have be lower than 0.10 m with a phase lag less than 10 minutes. This is why the study aims to reproduce the observed accentuation of water level asymmetry between rising and falling tides and thus, to predict more realistically the tide shape of high and low tide. Through a numerical development of a river with variable flow, several simulations with variable roughness length led to an automated calibration of the model. The development of a method to characterize the tide in an estuary has allowed to define tidal wave decay coefficients and to classify different

521ADVANCES IN OPERATIONAL OCEANOGRAPHY EXPANDING EUROPE’S OBSERVING AND FORECASTING CAPACITY
estuarine regimes. The refinement of the methods developed can tend to reduce the phase shift in the prediction of high and low tides.
2. Method Starting from the statement that the strong non-linearity of estuaries makes the harmonic tidal analysis method fail, barotropic, shallow water tidal model has been identified as a preliminary step necessary to progressively advance in the parameterization of tidal dynamics in this constrained environment. A configuration has been developed and adjusted for this study (T-Ugom, Lyard F. et al., 2020). The friction coefficient (Cd) synthesizes the vertical diffusive effects and the bottom friction effects. The transposition of a 2-dimensional Cd to realistic dynamics remains a complex question. In order to provide some insights to the question of the representativeness of the adjusted Cd, several friction coefficients were tested from spectral simulations. Sequential simulations were run, then, and brought the development of a method to characterize the tide in an estuary and classify different estuarine regimes.
The evaluation of the model is done by comparison with synchronous in situ measurements. In complement, an accurate vertical datum is a key to the project due to the applications related to water level and requirement on tide prediction uncertainty. The realistic tidal modelling is based on a measurement campaign prepared for this study, then carried out in a cooperation with Cnes and partners which greatly enlarged the scope of the deployed instruments, notably, in the framework of the SWOT space mission project (Cnes, Nasa) and its CalVal-related requirements (Ayoub N. et al., 2019, Picot N. et al., 2020). The set of in situ data is made of (a) radar tide gauges from Grand Port Maritime de Bordeaux, from SHOM and from DREAL Aquitaine who provided also river flux; radar gauge onboard (Insu prototype), (b) GNSS floating carpet (La Rochelle University, operated by Insu and Syrte); fixed buoys; (c) GPS-GNSS land network. These data are the validators of the numerical simulation. A Lidar campaign has been carried out, with the sensor and airborne means of the University of Caen. Results from Lidar will lead to a precise information the river surface topography. For this study, the sensitivity of tidal wave propagation to the disturbance from river flow is approached by water elevation time series under different rising and falling tides.
3. Result and Concluson From method of bottom friction (Cd) calibration, numerical experiment combined with the analysis of in situ data from campaign 2018, significantly decreases the water height difference between model and observation (e.g. M2 tidal harmonic from 197 mm to 31 mm (Figure 1, Figure 2)). Several terms responsible for the noted damping of waves and the generation of higher harmonics have been calibrated. The results are presented in poster with a first report on numerical simulation validation under weak tidal condition, in particular for Bordeaux where the phasing of tide is improved (Figure 2).

522 ADVANCES IN OPERATIONAL OCEANOGRAPHY
Fig. 1. M2 amplitude (Complex, m) over Gironde and M2 amplitude. Difference model – tide gauge (circle size in cm) (MarEst Project, SHOM, Legos).
Fig. 2. Water height (m) at Bordeaux tide gauge (Grand Port Maritime de Bordeaux), relative to the mean level of the study. Modelled (orange curve) and observed (blue curve) (MarEst Project and partners of CalNaGironde2018 campaign (Cnes, DT Insu, Legos, SHOM, Syrte, et al.,).

523ADVANCES IN OPERATIONAL OCEANOGRAPHY EXPANDING EUROPE’S OBSERVING AND FORECASTING CAPACITY
Acknowledgements
DGA for financial support: PROTEVS upstream study, piloted by SHOM in the MarEst project; CNES; DT INSU (C. Brachet, C. Drezen, L. Fichen, A. Guillot, E. Poirier, B. Blanke), Energie de la Lune (C. Giry), Grand Port Maritime de Bordeaux; DREAL Aquitaine; Syrte, Obs. de Paris (P. Bonnefond); University of La Rochelle for GNSS carpet; UniCaen, Circle.
ReferencesAyoub, N. et al., (2019). Gironde Campaign, October 2018; CalVal OST-ST meeting.
Lyard, F. et al., (2020). FES2014 global ocean tides atlas: design and performances. Ocean Science Special Issue: Developments in the science and history of tides (OS/ACP/HGSS/NPG/SE inter-journal SI) MS os-2020-9
Picot, N. et al., (2020). CalNaGironde: The Gironde Experiment. 12th COASTAL ALTIMETRY ESA WORKSHOP.

524 ADVANCES IN OPERATIONAL OCEANOGRAPHY
A GLOBAL OCEAN EDDYING FORECASTING SYSTEM AT 1/16° Simona Masina (¹), Andrea Cipollone (¹), Doroteaciro Iovino (¹), Stefania Ciliberti (2), Giovanni Coppini (2), Rita Lecci (¹), Sergio Creti (2), Francesco Palermo (2), Fabio Viola (2), Vladyslav Lyubartsev (2), Fabrizio Baordo (¹), Francesco Trotta (3) and Nadia Pinardi (3)
(1) Ocean Modeling and Data Assimilation Division, Euro-Mediterranean Center on Climate Change Foundation, Italy
(2) Ocean Predictions and Applications Division, Euro-Mediterranean Center on Climate Change Foundation, Italy
(3) Department of Physics and Astronomy, University of Bologna, Italy, Bologna, Italy
Abstract The Global Ocean Forecast System GOFS16 is an operational global ocean analysis and forecast system that runs daily at the Euro-Mediterranean Center on Climate Change (CMCC) since early 2017. GOFS16 produces 7-day forecasts of the state of the global ocean and sea ice (three-dimensional ocean temperature, salinity and currents, as well as sea ice thickness, concentration and drift). The system is based on a NEMO platform configured in a global eddying ocean at 1/16° horizontal resolution. To compute the initial conditions for the ocean forecasting, in situ observations of temperature, salinity, altimeter data, satellite sea surface temperature and sea ice concentration are jointly assimilated each day over a 1-day observation window using a 3DVar data assimilation scheme which has been recently parallelized to deal with the global high-resolution grid at 1/16°. Statistics of the differences between the model forecasts and observations are routinely produced. This paper introduces the first version of the GOFS16 system and details all its components. A validation procedure, including online web service, has been developed and here described.
Keywords: global ocean forecasting, eddy-resolving models, data assimilation
1. Introduction The unique capability of satellite altimetry to observe the global ocean in near-real-time at high resolution and the deployment of Argo buoys were essential to the development of global operational oceanography. Such an integrated approach (satellite and in situ observations) has been fundamental and fostered a series of major achievements in oceanography since the 1990s. At the same time, the ocean modelling community started to deal with the challenges that the need to resolve

525ADVANCES IN OPERATIONAL OCEANOGRAPHY EXPANDING EUROPE’S OBSERVING AND FORECASTING CAPACITY
complex mesoscale dynamics poses. Thanks to recent advances in computational resources, in the recent years, the ocean forecast community is investing a growing effort towards the prediction of mesoscale processes and day-by-day variability at global and regional scales using eddy-permitting and eddy-resolving modelling capabilities. New high-resolution global and regional simulations are able to resolve mesoscale structures in large parts of the domains. However, despite the significant improvements in modelling and computational capacity, and the increased availability of observations during the last two decades, one among the initial plans of the global operational community has not been reached yet, that is the eddy-resolving capacity in the continental shelf regions and at high polar latitudes. Furthermore, a realistic representation of mesoscale variability is triggered by the capability of the assimilation schemes to efficiently ingest the increasing number of observations available. In order to realistically represent the full dynamics and life cycle of baroclinic eddies in the majority of the global ocean, at CMCC we developed GOFS16, a global eddying configuration of the ocean and sea ice system which operates on a daily basis since mid 2017. Every day, terabytes of data are produced, manipulated and validated, with highly parallelized software designed at CMCC, to provide the three-dimensional state of the global ocean circulation at a pioneering resolution of roughly 6 km. In January 2021, GOFS16 joined the OceanPredict intercomparison project (ex GODAE OceanView) that gathers and compares different global prediction systems at different resolutions. The 6-day forecast products of GOFS16 have hourly/daily frequency for the ocean temperature, salinity, sea surface height and meridional/zonal velocities, together with sea ice concentration and thickness. The chain consists of daily production of a 6-day-long forecast, initialized by a former (daily) analysis. Each daily production (say production of day T) starts with a first integration of the sole model between T-48h and T-24h. Corrections are then calculated by the DA system and applied to a second model integration of the same day. This leads to the best initial conditions at T-24h that are used to generate the nowcast (T-24,T) and a 6-day-long forecast. Maps of GOFS16 forecasts are available from the following webpage http://gofs.cmcc.it/ in almost near-real-time (daily update). A validation tool of the analysis fields is also available online at http://evalid.cmcc.it/evaluation/gofs/, where in situ temperature and salinity profiles from Copernicus Marine Environment Monitoring Service (CMEMS) catalogue are compared with model equivalent values. In Section 2, we present the GOFS16 in its three components (model, data assimilation and assimilated observations), while Section 3 illustrates the validation matrix used to monitor the forecast skills of the system and a synthesis of the same skills.

526 ADVANCES IN OPERATIONAL OCEANOGRAPHY
2. GOFS16 Description The global ocean forecasting system includes:
a. The NEMO ocean model, configured in a global configuration at about 1/16° horizontal resolution, 98 vertical levels and coupled to the LIM2 sea ice model;
b. A three-dimensional variational (3DVar) data assimilation scheme that assimilates in situ Temperature and Salinity and satellite Sea Level Anomaly (SLA) and Sea Surface Temperature (SST) observations;
c. a nudging scheme that uses space-borne sea surface temperature observations and sea ice concentration (Reynolds et al., 2007) supplied by NOAA, and sea surface salinity (Good et al., 2013).
The GOFS16 analysis and forecasting numerical core is based on NEMO ocean/ice model (version 3.4, Madec and the NEMO team, 2012). The configuration (described in Iovino et al., 2016) is a global, eddying configuration of the ocean and sea ice system with a horizontal resolution of 1/16º at the Equator, corresponding to 6.9 km, that increases poleward as cosine of latitude, leading to 5762 × 3963 grid points horizontally, and roughly 3 km in the polar regions. Ocean and sea ice are on the same horizontal mesh, a non-uniform tripolar grid, computed at CMCC following the semi-analytical method of Madec and Imbard (1996). The vertical coordinate system is based on fixed depth levels and consists of 98 vertical levels with a grid spacing increasing from approximately 1 m near the surface to 160 m in the deep ocean. The bathymetry is generated from three distinct topographic products: ETOPO2 (US Department of Commerce, 2006) is used for the deep ocean, GEBCO (IOC, IHO and BODC, 2003) for the continental shelves shallower than 300 m, and Bedmap2 (Fretwell et al., 2013) for the Antarctic region, south of 60º S. The ocean component OPA is a finite difference, hydrostatic, primitive equation ocean general circulation model, with a free sea surface. The NEMO code solves the primitive equations using as prognostic variables: 3D temperature, salinity, meridional and zonal velocities and 2D sea-surface height. In the current version a linearized free-surface formulation is used (Roullet and Madec, 2000) and a free-slip lateral friction condition is applied at the lateral boundaries. Tracer advection follows a total variance dissipation (TVD) scheme, while vertical mixing is achieved using the turbulent kinetic energy (TKE) closure scheme (Blanke and Delecluse, 1993). The model interactively computes air-surface fluxes of momentum, mass, and heat. Forcing fields are provided by the NOAA operational system with 0.25º spatial resolution. The surface boundary conditions are computed using the bulk formulation by Large and Yeager (2004). The turbulent variables are applied at a 6 hourly frequency and radiative and freshwater fluxes are daily fields. The water balance is computed as evaporation minus precipitation and runoff. The evaporation is derived from the latent heat flux, precipitation is provided by NCEP as daily averages, while the river runoff is added at the surface along the land mask as a monthly climatology (Dai and Trenberth 2009). The ocean component is coupled to

527ADVANCES IN OPERATIONAL OCEANOGRAPHY EXPANDING EUROPE’S OBSERVING AND FORECASTING CAPACITY
the sea ice module LIM2 that includes the representation of both the thermodynamic and dynamic processes. The ice dynamics are calculated according to external forcing from wind stress, ocean stress, and sea surface tilt and internal ice stresses using C grid formulation. The elastic–viscous–plastic formulation of the sea ice rheology is used.
OceanVar is a three-dimensional variational (3Dvar) data assimilation scheme originally developed for the Mediterranean Sea (Dobricic and Pinardi, 2008), later extended to the global ocean (Storto et al., 2011) and recently massively parallelized in a hybrid MPI-OpenMP environment to deal with global high-resolution grid (Cipollone et al., 2020). The background-error covariance matrix accounts for vertical covariances (modeled through the use of multivariate EOFs) and horizontal correlations (through the application of recursive filters). Horizontal correlation length-scales have been scaled to the 1/16º mesh from the reference 1/4º resolution configuration to maximise the impact of dense satellite datasets such as SLA and SST, improving the ocean initial condition for the short-term forecast. Observation processing includes background quality checks, thinning of dense datasets, spatial (statistical) unbiased for SLA and the removal of diurnal SST retrievals. In addition to the 3Dvar assimilation, GOFS16 uses a nudging scheme for surface temperature, salinity and sea ice concentration. The assimilated data includes: near-real-time SLA L3 observations (from Jason3, Sentinel 3a, Sentinel 3b and Altika satellites) provided by CMEMS; near-real-time in situ observations coming from moorings, Argo floats, Expand-able Bathy Termographs (XBTs), and Conductivity-Temperature-Depth (CTDs) gathered together in the CMEMS catalog; near real time SST data: Advanced Very High-Resolution Radiometer (AVHRR) from NOAA and Advanced Microwave Scanning Radiometer 2 (AMSR2) from NASA. The analysis of GOFS16 includes a nudging scheme to correct the heat and freshwater surface fluxes using gridded SST analyses provided by NOAA (Reynolds et al., 2007) and the sea-surface salinity objective analyses from the UK MetOffice EN4 (v4.2.1), respectively. As an important step forward for the prediction of sea and sea-ice states at high latitudes, GOFS16 implements a data assimilation scheme to ingest sea-ice concentration observations from satellites. The sea-ice analysis uses in particular data from the SSM-I instruments on board the DMSP constellation (F-15 and F-17) processed by NCEP and the assimilation scheme consists of nudging to the sea-ice analysis with an 8-hour relaxation time-scale.
The GOF16 assimilation system is designed to share the same grid of the model at 1/16º resolution at any step. This brought several benefits starting from a direct ingestion of corrections into the model run without the need of extra interpolation that could lead to additional errors. Moreover, it helps the system to maximize the amount of information coming from high-resolution observational networks and to reduce the spatial correlation among observations inevitably introduced at the length scale of grid spacing. The benefits of using this approach which implies that the minimization is performed on the same grid of the ocean, versus the alternative one in which the ocean output was interpolated onto 1/4° horizontal resolution grid as first guess fields for 3Dvar has been shown in Cipollone et al., 2020.
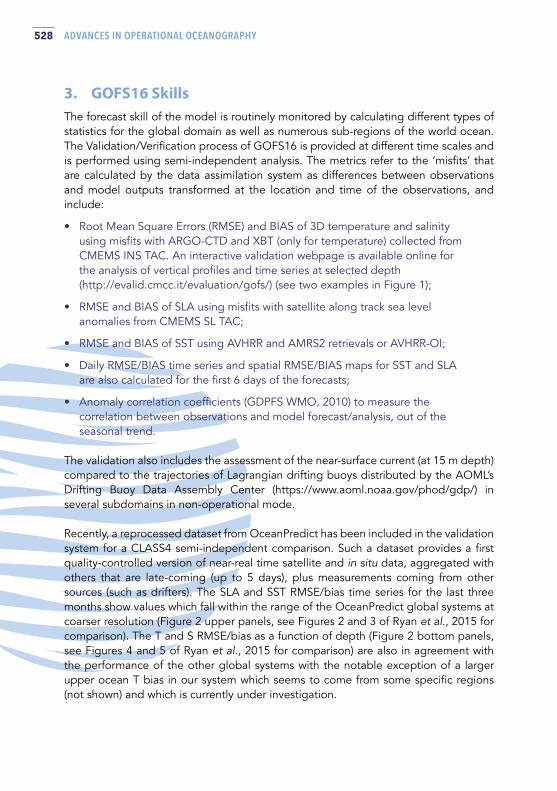
528 ADVANCES IN OPERATIONAL OCEANOGRAPHY
3. GOFS16 Skills The forecast skill of the model is routinely monitored by calculating different types of statistics for the global domain as well as numerous sub-regions of the world ocean. The Validation/Verification process of GOFS16 is provided at different time scales and is performed using semi-independent analysis. The metrics refer to the ‘misfits’ that are calculated by the data assimilation system as differences between observations and model outputs transformed at the location and time of the observations, and include:
• Root Mean Square Errors (RMSE) and BIAS of 3D temperature and salinity using misfits with ARGO-CTD and XBT (only for temperature) collected from CMEMS INS TAC. An interactive validation webpage is available online for the analysis of vertical profiles and time series at selected depth (http://evalid.cmcc.it/evaluation/gofs/) (see two examples in Figure 1);
• RMSE and BIAS of SLA using misfits with satellite along track sea level anomalies from CMEMS SL TAC;
• RMSE and BIAS of SST using AVHRR and AMRS2 retrievals or AVHRR-OI;
• Daily RMSE/BIAS time series and spatial RMSE/BIAS maps for SST and SLA are also calculated for the first 6 days of the forecasts;
• Anomaly correlation coefficients (GDPFS WMO, 2010) to measure the correlation between observations and model forecast/analysis, out of the seasonal trend.
The validation also includes the assessment of the near-surface current (at 15 m depth) compared to the trajectories of Lagrangian drifting buoys distributed by the AOML’s Drifting Buoy Data Assembly Center (https://www.aoml.noaa.gov/phod/gdp/) in several subdomains in non-operational mode.
Recently, a reprocessed dataset from OceanPredict has been included in the validation system for a CLASS4 semi-independent comparison. Such a dataset provides a first quality-controlled version of near-real time satellite and in situ data, aggregated with others that are late-coming (up to 5 days), plus measurements coming from other sources (such as drifters). The SLA and SST RMSE/bias time series for the last three months show values which fall within the range of the OceanPredict global systems at coarser resolution (Figure 2 upper panels, see Figures 2 and 3 of Ryan et al., 2015 for comparison). The T and S RMSE/bias as a function of depth (Figure 2 bottom panels, see Figures 4 and 5 of Ryan et al., 2015 for comparison) are also in agreement with the performance of the other global systems with the notable exception of a larger upper ocean T bias in our system which seems to come from some specific regions (not shown) and which is currently under investigation.

529ADVANCES IN OPERATIONAL OCEANOGRAPHY EXPANDING EUROPE’S OBSERVING AND FORECASTING CAPACITY
Fig.1. Two examples from the validation webpage of the analysis (http://evalid.cmcc.it/evaluation/gofs/) for the temperature in the global ocean (left panel) and the salinity in the Mediterranean Sea (right panel). Upper panels show the locations of available observations (yellow dots) in a selected time frame and the vertical profiles of ocean variables for one of those. Lower panels show the time series of RMSE and bias for a depth range and the time/space mean vertical profiles of RMSE and bias.
Fig. 2. RMSE/bias time series of analysis, 24h, 36h and 120h forecasts for global mean SLA (a) and SST (b). RMSE/bias and anomaly correlation as a function of depth of analysis, 24h, and 120h forecasts for global mean T (c) and S (d). The background grey represents the number of observations per day. The validation is done using the OceanPredict reference observation data set.

530 ADVANCES IN OPERATIONAL OCEANOGRAPHY
4. Conclusions The Global Ocean Forecast System GOFS16 is an operational ocean analysis and forecast system at 1/16° horizontal resolution that runs daily at the Euro-Mediterranean Center on Climate Change since early 2017. The system is based on a global eddying ocean combined with a state-of-the-art variational data assimilation system that has been massively parallelized and is capable of assimilating space-borne and conventional observing networks, including hydrographic profiles and several satellite data. In this work we presented the different components of the systems and a preliminary assessment of GOFS16 forecast skills by means of conventional error and bias analyses. Since January 2021 GOFS16 has joined the OceanPredict inter-comparison project that gathers and compares different global prediction systems at different resolutions. The routinely evaluation of the current system skills, which has gone through some bug fixing and continuous improvements since its birth, is encouraging and seems to confirm the capacity of GOFS16 to perform within the range of the other global systems. The intercomparison will help to assess its current skills with respect to more mature but coarser resolution global forecasting systems, identify its main weaknesses, and inspire possible future refinements/developments to further improve its quality.
ReferencesBlanke, B. and Delecluse, P. (1993). Variability of the tropical Atlantic Ocean simulated by a general circulation model with two different mixed-layer physics. Journal of Physical Oceanography, 23, 1363-1388.
Cipollone, A., Storto, A., and Masina, S. (2020). Implementing a parallel version of a variational scheme in a global assimilation system at eddy-resolving resolution. Journal of Atmospheric and Oceanic Technology, 37(10), 1865-1876.
Dai, A., Qian, T., Trenberth, K.E., and Milliman, J.D. (2009). Changes in continental freshwater discharge from 1948-2004. Journal of Climate, 22, 2773-2791.
Dobricic, S., and Pinardi N. (2008). An oceanographic three-dimensional variational data assimilation scheme. Ocean Modelling, 22, 89-105.
Fretwell, P., Pritchard, et al., (2013). Bedmap2: improved ice bed, surface and thickness datasets for Antarctica. The Cryosphere, 7, 375-393.
GDPFS, Global Data-processing and Forecasting System of the WMO, (2010). 485 Vol. I https://www.wmo.int/pages/prog/www/DPFS/documents/485_Vol_I_en.pdf
Good S A, Martin M.J. and Rayner N.A. (2013). EN4: quality controlled ocean temperature and salinity profiles and monthly objective analyses with uncertainty estimates. Journal of Geophysical Research:Oceans, 118, 6704–16.

531ADVANCES IN OPERATIONAL OCEANOGRAPHY EXPANDING EUROPE’S OBSERVING AND FORECASTING CAPACITY
IOC, IHO and BODC: Centenary Edition of the GEBCO Digital Atlas, published on CD-ROM on behalf of the Intergovernmental Oceanographic Commission and the International Hydrographic Organization as part of the General Bathymetric Chart of the Oceans, British Oceanographic Data Centre, Liverpool, UK, 2003.
Iovino, D., Masina, S., Storto, A., Cipollone, A., and Stepanov, V.N. (2016). A 1/16 eddying simulation of the global NEMO sea ice-ocean system. Geoscientific Model Development, 9, 2665-2684.
Large, W. and Yeager, S. (2004). Diurnal to decadal global forcing for ocean sea ice models: the data set and fluxes climatologies, Rep. NCAR/TN-460CSTR, National Center for Atmospheric Research, Boulder, Colorado, USA.
Madec, G. and the NEMO team (2012). Nemo ocean engine - version 3.4, Technical Report ISSN 1288-1619, N°. 27, Pôle de modélisation, Institut Pierre-Simon Laplace (IPSL), France.
Madec, G., and Imbard, M. (1996). A global ocean mesh to overcome the North Pole singularity. Climate Dynamics, 12(6), 381-388.
Reynolds, R. W., Smith, T. M., Liu, C., Chelton, D. B., Casey, K. S., & Schlax, M. G. (2007). Daily high-resolution-blended analyses for sea surface temperature. Journal of climate, 20(22), 5473-5496.
Ryan, A. G., Regnier, C., Divakaran, P., Spindler, T., Mehra, A., Smith, G. C., ... & Liu, Y. (2015). GODAE OceanView Class 4 forecast verification framework: global ocean inter-comparison. Journal of Operational Oceanography, 8(sup1), s98-s111.
Roulette, G. and Madec, G. (2000). Salt conservation, free surface and varying levels: a new formulation for ocean general circulation models. Journal of Geophysical Research:Oceans, 105, 23927-23942.
Storto, A., S. Dobricic, S. Masina, and Di Pietro, P. (2011). Assimilating along-track altimetric observations through local hydrostatic adjustments in a global ocean reanalysis system. Monthly Weather Review, 139, 738-754.
U.S. Department of Commerce: 2-minute Gridded Global Relief Data (ETOPO2v2), National Oceanic and Atmospheric Administration, National Geophysical Data Center, doi:10.7289/V5J1012Q, 2006.

532 ADVANCES IN OPERATIONAL OCEANOGRAPHY
GCOAST REGIONAL OCEAN PREDICTING SYSTEM: IMPACT OF COUPLING OF WAVES, CIRCULATION AND ATMOSPHERE MODELS Joanna Staneva, Sebastian Grayek, Arno Behrens, Marcel Ricker, Anne Wiese, Wolfgang Koch and Corinna Schrum
Institute for Coastal Systems Analysis and Modeling, Helmholtz-Zentrum Hereon, Max-Planck-Strasse 1, Germany, [email protected]
Abstract
The coupling of models is a commonly used approach when addressing the complex interactions between different components of the Earth system. This study presents the development of a new, high -resolution, coupled ocean and wave model system for the North Sea and the Baltic Sea, which is part of the Geestacht COAstal model SysTem GCOAST. The nonlinear feedback between strong tidal currents and wind -waves, which can no longer be ignored, in particular in the coastal zone where its role seems to be dominant. The proposed coupling parameterisations account for the feedback between the upper ocean on the atmospheric circulation by accounting for the effects of the sea level and ocean temperature and salinity. Sensitivity experiments are performed to estimate the role of different wave-ocean coupling components. The performance of the coupled modelling system is illustrated for the cases of several extreme events. For example, the inclusion of wave coupling changes sea surface temperature, the mixing and ocean circulation and the total sea-level leading to better agreement with in -situ and satellite observations. The predicted surge of the coupled model is significantly enhanced during extreme storm events when considering wave-current interaction processes. This wave-dependent approach yields a contribution of more than 30% in some coastal areas during extreme storm events. The model comparisons with data from satellite altimeter and in situ observations showed that using the fully coupled system reduces the errors, especially under severe storm conditions.
Keywords: coupled regional operational models, wave-current interactions, prediction skills, sea level, North Sea

533ADVANCES IN OPERATIONAL OCEANOGRAPHY EXPANDING EUROPE’S OBSERVING AND FORECASTING CAPACITY
1. Introduction Accurate ocean predictions remain a challenging topic in coastal flooding research, not least along the European shelf, which is characterized by vast shallow tidal flats and a large coastal population. The increased demand for improved water level forecasts requires further development and refinement of the physical processes represented by the hydrodynamical models to properly account for wave generated currents and the corresponding changes to the water level. The effect of coupling on model predictions becomes more important (Staneva et al., 2016) with increasing the grid resolution, which therefore emphasizes the need for coupling on the regional scales. Spatial and temporal changes in the wave and wave energy propagation are not yet sufficiently addressed in high-resolution regional models. Understanding the wave-current interaction processes is essential for the coupling between the ocean, atmosphere and waves in numerical models. Storm surges are meteorologically driven, typically by wind and atmospheric pressure. Waves combined with higher water levels may break dykes, cause flooding, destroy construction and erode coasts. The combined effects of wind waves can cause coastal flooding, high tides and storm surge in response to fluctuations in local and remote winds and atmospheric pressure Staneva et al., 2016). The role of these processes can be assessed by high-resolution coupled wave and circulation models. Using stand-alone ocean or atmosphere models, the wave interface that represents the boundary between them is not taken into account. This can cause bias in the upper ocean due to insufficient or, in some cases, strong mixing (Breivik et al., 2015); or because the momentum transfer is shifted in time and space compared to how the fluxes would behave in the presence of waves. The skill of wave–ocean circulation coupled model simulations has been quantified at the coastal, regional and large scale [Wu et al., 2019, Staneva et al., 2021). Sea state-dependent momentum stress impacts the ocean circulation, Lagrangian transport or biogeochemical models (Staneva et al., 2021a). Considerably enhanced momentum transfer from atmosphere to waves during young waves was shown in Janssen (1989). The wave-current interaction significantly reduces momentum flux into currents in hurricane conditions, consequently reducing subsurface currents magnitude. Surface waves can also affect model predictions of water levels and thus, storm surges through changes in the stress and upper-ocean mixing and circulation (Staneva et al., 2016, 2017, Alari et al., 2017). In growing sea states, waves extract momentum from the atmosphere so that the ocean receives less momentum from the atmosphere than if waves are not considered. The impact of ocean–wave coupling in the near-coastal German Bight region of the southern North Sea was studied in Staneva et al., (2016, 2021), showing that the predictive skill of ocean circulation and sea level could be significantly enhanced by considering wave-induced processes. In extreme storm surge conditions over the North Sea, due to the strong nonlinearity of wave–ocean–tidal interactions, wave–ocean coupling is significant for correct model predictions. During storm events, ocean stress is significantly enhanced by the wind-wave interaction, leading to an intensification of zonal velocity and an increase in the estimated storm surge, demonstrating model predictions closer to observations. In order to study the

534 ADVANCES IN OPERATIONAL OCEANOGRAPHY
complex interdisciplinary processes, coastal system models accounting for non-linear interactions between ocean circulation, tides, waves and the atmosphere is of utmost importance. The Geesthacht coupled coastal model system (GCOAST) is built upon a flexible and comprehensive coupled model system, integrating the most important key components of regional and coastal models. GCOAST encompasses: (i) atmosphere-ocean–wave interactions, (ii) dynamics and fluxes in the land-sea transition, and (iii) coupling of the marine hydrosphere and biosphere. In the present study, we used the GCOAST circulation, wave and ocean model components to investigate the role of coupling in improving ocean prediction skills.
2. Methodology NEMO (Nucleus for European Modelling of the Ocean, Madec, 2008) is a framework of ocean related computing engines, from which we use the OPA package (for the ocean dynamics and thermodynamics) and the LIM3 sea-ice dynamics and thermodynamics package. Previously, NEMO was applied to the Baltic Sea and the North Sea area in uncoupled mode Hordoir et at (2018), coupled to atmospheric models (Dietrich et al., 2011, Pham et al., 2017, Ho-Hagemann et al., 2020) and forced with a wave model (Staneva et al., 2017). For the north-western European shelf, NEMO is used as a forecasting model in the COPERNICUS Marine Services (O’Dea et al., 2012, Lewis et al., 2019). The wave model WAM (WAMDI, 1988, Staneva et al., 2021) is a third-generation wave model, which solves the action balance equation without any a priori restriction on the evolution of spectrum. It is based on the spectral description of the wave conditions in frequency and directional space at each of the active model sea grid points of the model area. The wave and the circulation model are two-way coupled with OASIS Interface. Ocean waves influence the circulation through a number of processes: turbulence due to breaking and non-breaking waves, momentum transfer from breaking waves to currents in deep and shallow water, wave interaction with planetary and local vorticity, Langmuir turbulence. The NEMO ocean model has been modified to take into account the following wave effects as described by (Breivik et al., 2015, Staneva et al., 2021): (1) The Stokes-Coriolis forcing (STCOR); (2) Sea state-dependent momentum flux, set as a scalar dependence of the flux from the atmosphere to waves and ocean (TAUDIR) or as a vector (TAUVEC); and (3) Sea state-dependent energy flux (TKE). A schematic overview of these processes is shown in Figure 1.
3. Coupled wave-ocean model system for regional scales
3.1 Impact of wave-induced forcing on sea level
To assess the relative impact of the three wave-induced processes, we will analyse the time evolution and horizontal patterns of the difference between the coupled wave-ocean simulations and the stand-alone ocean model (REFRUN – NEMO stand-alone without wave effects). It is important to mention here that the TVCSTC run is not a linear combination between the three runs considering the wave-induced processes

535ADVANCES IN OPERATIONAL OCEANOGRAPHY EXPANDING EUROPE’S OBSERVING AND FORECASTING CAPACITY
separately (TKE, STCOR and the different TAU runs), instead, the analyses identify which of them are dominant for the changes in the water level over the extreme events.
Simulated and observed surface elevation during unusual atmospheric conditions as depicted in January and February 2017 (Staneva et al., 2021) are shown in Figure 2. The south-easterly wind and long swell event from 2-4 January 2016 causes very low maximal sea-level conditions over the entire German Bight coastal area (Figure 3). Modelled sea surface heights are compared with observations from the EMOD-tide gauge database (black dots, data available on http://www.emodnet.eu).
The sea level amplitude was about one meter below the normal over this area (see also figure 3 for the spatial variability of the sea level differences). During this event, the NEMO only simulations (red line in Figure 2) overestimated the measurements for all tide gauges stations. It is clearly seen that through the wave-induced parameterisation, the simulated water level increased, leading to better agreement with the tide gauges observations. The north-westerly wind over the German Bight (on 30 January 2016) caused a higher water level that was underestimated by the NEMO stand-alone model. A closer fit to the observations is simulated by the wave experiments that include the proposed parameterisation of transfer of momentum fluxes as vector components (TAUVEC). Therefore, the added value of the newly implemented wave-induced forcing during the storm events, but also in situations with lower water level, is clearly noticeable.
3.2 Impact of coupling between waves and ocean on simulated temperature and salinity
Comparison of simulated temperature with measurements of FINO-1 stations (Stanev et al., 2016) shows that both the control run and the runs with wave effects
Fig. 1. Bathymetry of the GCOAST Model area (left panel); Wave induced processes into NEMO.

536 ADVANCES IN OPERATIONAL OCEANOGRAPHY
describe very well the vertical evolution of temperature (left patterns) and salinity (right patterns) (Figure 4). Important features of both seasonal and vertical variability are very well present in all of the simulations. It is notable that the salinity of the REFRUN runs deviates from the observational salinity. The time-evolution of salinity of the wave-induced experiments is also much better captured, and the errors are significantly reduced. Compared to REFRUN the wave runs generally yields better results for temperature as well as sudden down-bursts of salinity variations. This clearly demonstrates that the newly proposed method of introducing wave dependent sea side fluxes as vectors led to an improvement of model skills and reduction of model errors also in the whole water column.
Fig. 2. Comparison of simulated and observed surface elevations at the near-coastal tide gauge data for the German Bight coastal area during the strong swell event (left panel) and local surge conditions (right panel). The legend is given on the top of the figure.
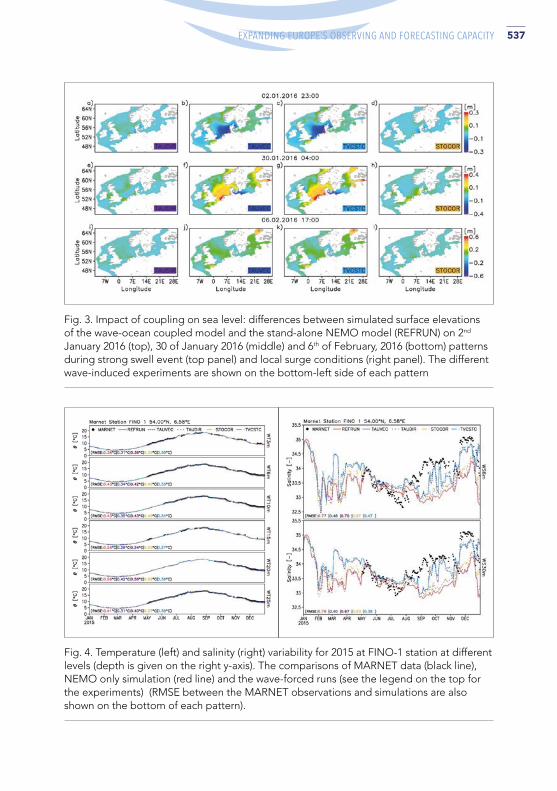
537ADVANCES IN OPERATIONAL OCEANOGRAPHY EXPANDING EUROPE’S OBSERVING AND FORECASTING CAPACITY
Fig. 3. Impact of coupling on sea level: differences between simulated surface elevations of the wave-ocean coupled model and the stand-alone NEMO model (REFRUN) on 2nd January 2016 (top), 30 of January 2016 (middle) and 6th of February, 2016 (bottom) patterns during strong swell event (top panel) and local surge conditions (right panel). The different wave-induced experiments are shown on the bottom-left side of each pattern
Fig. 4. Temperature (left) and salinity (right) variability for 2015 at FINO-1 station at different levels (depth is given on the right y-axis). The comparisons of MARNET data (black line), NEMO only simulation (red line) and the wave-forced runs (see the legend on the top for the experiments) (RMSE between the MARNET observations and simulations are also shown on the bottom of each pattern).

538 ADVANCES IN OPERATIONAL OCEANOGRAPHY
4. Conclusions We found improved skill in the predicted sea level and circulation during storm conditions when using a coupled wave-circulation model. In the periods of storm events, the ocean stress was significantly enhanced by the wind-wave interaction leading to an increase in the estimated storm surge (compared to the ocean-only integration) to values closer to the observed water level. The numerical experiments with the wave-forced NEMO model yielded an increase of and surge level in the south-eastern shallow North Sea and along the North-Frisian Wadden Sea coast for the extreme surge events. We showed that the coupling between ocean and wave models led to an improvement of model predictions. The model comparisons with data from satellite altimeter and in situ observations showed that the use of the fully coupled system, especially with the newly proposed momentum transfer reduces the errors, most noticeable under severe storm conditions. This justifies the further developments and implementation of the wave-circulation coupled model systems and its synergy with the newly available satellite observations, for both, operational and climate research and development activities.
AcknowledgementsWe gratefully acknowledge the funding by Initiative and Networking Fund of the Helmholtz Association through the project ‘Advanced Earth System Modelling Capacity (ESM)’, CMEMS-SE Project WAVEFLOWand H2020 IMMERSE Project.
ReferencesAlari V, Staneva J, Breivik Ø, Bidlot J-R., Mogensen K. and Janssen P. (2016) Surface wave effects on water temperature in the Baltic Sea: simulations with the coupled NEMO-WAM model. Ocean Dynamics 66 917–30
Breivik Ø, Janssen P. A. E. M. and Bidlot J-R. (2014) Approximate Stokes Drift Profiles in Deep Water J. Phys. Oceanogr., 44 2433–45
Cavaleri L., Abdalla S., Benetazzo A., Bertotti L., Bidlot J-R., Breivik Ø., Carniel S., Jensen R E., Portilla-Yandun J., Rogers W E., Roland A., Sanchez-Arcilla A., Smith JM., Staneva J., Toledo Y., van Vledder G. Ph. and van der Westhuysen A. J. (2018). Wave modelling in coastal and inner seas Progress in Oceanography, 167 164–233
Dietrich J. C., Zijlema M., Westerink J. J., Holthuijsen L. H., Dawson C., Luettich R. A., Jensen R. E., Smith J. M., Stelling G. S. and Stone G. W. (2011) Modeling hurricane waves and storm surge using integrally-coupled, scalable computations. Coastal Engineering, 58 45–65
Ho-Hagemann H. T. M., Hagemann S., Grayek S., Petrik R., Rockel B., Staneva J., Feser F. and Schrum C. (2020) Internal Model Variability of the Regional Coupled System Model GCOAST-AHOI. Atmosphere, 11 227

539ADVANCES IN OPERATIONAL OCEANOGRAPHY EXPANDING EUROPE’S OBSERVING AND FORECASTING CAPACITY
Hordoir R., et al., 2019 Nemo-Nordic 1.0: a NEMO-based ocean model for the Baltic and North seas – research and operational applications, Geoscientific Model Development, 12 363–86
Lewis H. W., Castillo Sanchez J. M., Siddorn J., King R. R., Tonani M., Saulter A., Sykes P., Pequignet A-C., Weedon G. P., Palmer T., Staneva J. and Bricheno L. (2019) Can wave coupling improve operational regional ocean forecasts for the north-west European shelf? Ocean Science, 15 669–90
Madec G. (2008) NEMO ocean engine Note du Pôle de modélisation, Institut Pierre-Simon Laplace (IPSL), France
O’Dea E. J., Arnold A. K., Edwards K. P., Furner R., Hyder P., Martin M. J., Siddorn J. R., Storkey D., While J., Holt J. T. and Liu H. (2012) An operational ocean forecast system incorporating NEMO and SST data assimilation for the tidally driven European North-West shelf. Journal of Operational Oceanography, 5 3–17
Pham T. V., Brauch J., Früh B. and Ahrens B. (2017) Simulation of snowbands in the Baltic Sea area with the coupled atmosphere-ocean-ice model COSMO-CLM/NEMO. Meteorologische Zeitschrift, 71–82
Stanev E. V., Schulz-Stellenfleth J., Staneva J., Grayek S., Grashorn S., Behrens A., Koch W. and Pein J. (2016) Ocean forecasting for the German Bight: from regional to coastal scales. Ocean Sci., 12 1105–36
Staneva J., Alari V., Breivik Ø., Bidlot J-R. and Mogensen K. (2017) Effects of wave-induced forcing on a circulation model of the North Sea. Ocean Dynamics, 67 81–101
Staneva, J., Ricker, M., Carrasco , R., Breivik, Ø., Schrum, C. (2021). Effects of Wave-Induced Processes in a Coupled Wave–Ocean Model on Particle Transport Simulations. Water, 13, 415. https://doi.org/10.3390/w13040415
Staneva J., Wahle K., Günther H. and Stanev E. (2016) Coupling of wave and circulation models in coastal–ocean predicting systems: a case study for the German Bight. Ocean Sci., 12 797–806
WAMDI Group T. W. (1988) The WAM Model—A Third Generation Ocean Wave Prediction Model J. Phys. Oceanogr. 18 1775–810Harvey, A.M. (1990). Factors influencing Quaternary alluvial fan development in southeast Spain. In: A.H. Rakkocki, y M.J. Church (eds.). Alluvial fans, a field approach. Wiley & Sons, New York, 247-269.
Wu L., Breivik Ø. and Rutgersson A. (2019) Ocean-Wave-Atmosphere Interaction Processes in a Fully Coupled Modeling System. Journal of Advances in Modeling Earth Systems, 11 3852–74

540 ADVANCES IN OPERATIONAL OCEANOGRAPHY
AN INTEGRATED SYSTEM OF WIND AND WAVE FORECASTS VERIFIED WITH DATA FROM THE MARINE OBSERVATION SYSTEM IN THE SOUTHERN BALTIC REGION Patryk Sapiega (1), Tamara Zalewska (2)
(1) Institute of Meteorology and Water Management- National Research Institute, Waszyngtona 42, 81-342 Gdynia, [email protected]
(2) Institute of Meteorology and Water Management- National Research Institute, Waszyngtona 42, 81-342 Gdynia, [email protected]
Abstract
The manuscript presents the combined wind and wave forecasting systems used operationally in the southern Baltic region, constituting the basis for the hydrological and meteorological protection of marine areas, which consists of the COSMO meteorological model supplying the SWAN wave model with data on wind fields. The SWAN wave model enables the forecasting of significant wave height and sea states according to the Douglas scale for 72 hours with a time step of one hour. An integral element of the system is wave measurement equipment, the data of which are used for the ongoing verification of forecasts. The real-time data from the meteorological station located on the Petrobaltic drilling platform and from three meteorological buoys located in the southern Baltic region are used for meteorological forecast verification.
Keywords: wind and wave forecasts, wave measurements system, meteorological data from marine areas
1. Introduction More frequent and extreme phenomena observed in marine areas related to climate change imply the need to develop and apply increasingly advanced forecasting and warning systems. The most optimal seems to be a system that consists of forecasting models enabling spatial information on the current and forecast meteorological and
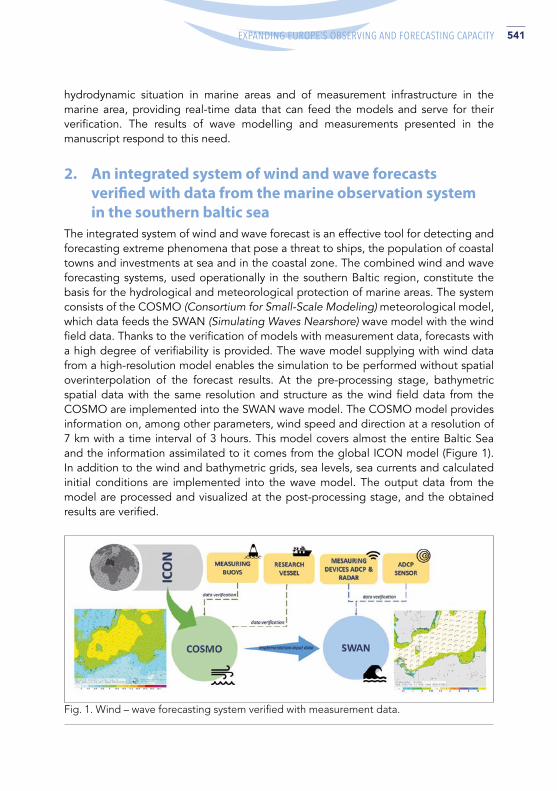
541ADVANCES IN OPERATIONAL OCEANOGRAPHY EXPANDING EUROPE’S OBSERVING AND FORECASTING CAPACITY
hydrodynamic situation in marine areas and of measurement infrastructure in the marine area, providing real-time data that can feed the models and serve for their verification. The results of wave modelling and measurements presented in the manuscript respond to this need.
2. An integrated system of wind and wave forecasts verified with data from the marine observation system in the southern baltic sea
The integrated system of wind and wave forecast is an effective tool for detecting and forecasting extreme phenomena that pose a threat to ships, the population of coastal towns and investments at sea and in the coastal zone. The combined wind and wave forecasting systems, used operationally in the southern Baltic region, constitute the basis for the hydrological and meteorological protection of marine areas. The system consists of the COSMO (Consortium for Small-Scale Modeling) meteorological model, which data feeds the SWAN (Simulating Waves Nearshore) wave model with the wind field data. Thanks to the verification of models with measurement data, forecasts with a high degree of verifiability is provided. The wave model supplying with wind data from a high-resolution model enables the simulation to be performed without spatial overinterpolation of the forecast results. At the pre-processing stage, bathymetric spatial data with the same resolution and structure as the wind field data from the COSMO are implemented into the SWAN wave model. The COSMO model provides information on, among other parameters, wind speed and direction at a resolution of 7 km with a time interval of 3 hours. This model covers almost the entire Baltic Sea and the information assimilated to it comes from the global ICON model (Figure 1). In addition to the wind and bathymetric grids, sea levels, sea currents and calculated initial conditions are implemented into the wave model. The output data from the model are processed and visualized at the post-processing stage, and the obtained results are verified.
Fig. 1. Wind – wave forecasting system verified with measurement data.
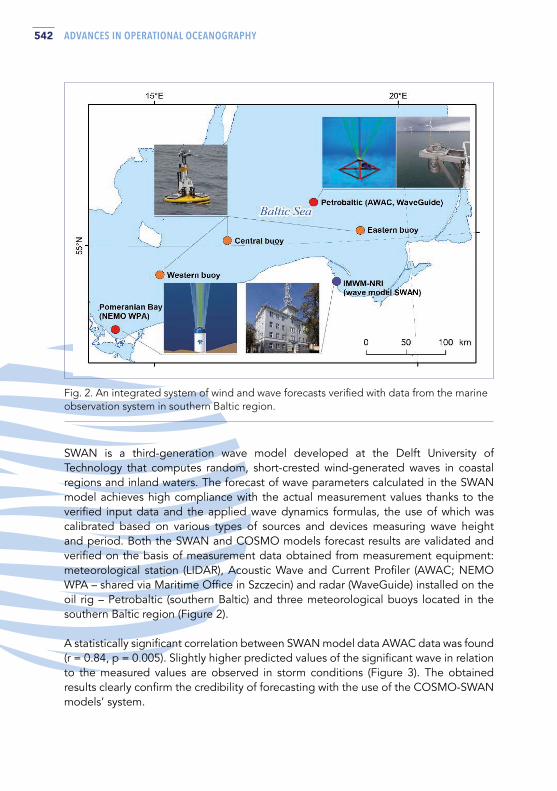
542 ADVANCES IN OPERATIONAL OCEANOGRAPHY
SWAN is a third-generation wave model developed at the Delft University of Technology that computes random, short-crested wind-generated waves in coastal regions and inland waters. The forecast of wave parameters calculated in the SWAN model achieves high compliance with the actual measurement values thanks to the verified input data and the applied wave dynamics formulas, the use of which was calibrated based on various types of sources and devices measuring wave height and period. Both the SWAN and COSMO models forecast results are validated and verified on the basis of measurement data obtained from measurement equipment: meteorological station (LIDAR), Acoustic Wave and Current Profiler (AWAC; NEMO WPA – shared via Maritime Office in Szczecin) and radar (WaveGuide) installed on the oil rig – Petrobaltic (southern Baltic) and three meteorological buoys located in the southern Baltic region (Figure 2).
A statistically significant correlation between SWAN model data AWAC data was found (r = 0.84, p = 0.005). Slightly higher predicted values of the significant wave in relation to the measured values are observed in storm conditions (Figure 3). The obtained results clearly confirm the credibility of forecasting with the use of the COSMO-SWAN models’ system.
Fig. 2. An integrated system of wind and wave forecasts verified with data from the marine observation system in southern Baltic region.

543ADVANCES IN OPERATIONAL OCEANOGRAPHY EXPANDING EUROPE’S OBSERVING AND FORECASTING CAPACITY
Fig. 3. Measurement and model results record (significant wave height) in 2020 at the measurement point – Petrobaltic.


SESSION 14
MARINE CLIMATE SERVICES

546 ADVANCES IN OPERATIONAL OCEANOGRAPHY
EMODNET PRELIMINARY HIGH-RESOLUTION TEMPERATURE AND SALINITY CLIMATOLOGIES FOR THE NORTHERN ADRIATIC SEA Damiano Delrosso (1), Simona Simoncelli (1), Paolo Oliveri (1), Antonio Guarnieri (1) and Antonio Novellino (2)
(1) Istituto Nazionale di Geofisica e Vulcanologia, Sezione di Bologna, Via D. Creti, 12, 40128 Bologna, Italy; [email protected]
(2) ETT SpA, Via Albareto, 21, 16153 Genova, Italy
Abstract
The proposed study, conducted in the framework of EMODnet - Physics, presents a preliminary high resolution climatology of temperature and salinity for the Northern Adriatic Sea. The input data are co-located temperature and salinity profiles integrated from SeaDataCloud (Simoncelli et al., 2020a and 2020b) and CORA5.2 (Szekely et al., 2019) historical datasets. The analysis was performed with the DIVAnd software (Data-Interpolating Variational Analysis in n dimensions, Barth et al., 2014) version 2.6.1.
Monthly and seasonal fields are calculated for the periods 1955-2016, 1955-1984 and 1985-2016, while seasonal fields are provided for 6 decades from 1955 to 2016. The climatological fields are computed on a regular grid of 3 km of horizontal resolution on 11 vertical layers.
The preliminary results show a significant impact of horizontal resolution on the detection of small scale patterns of temperature and salinity fields, but they also outline criticalities due to both spatial and temporal data gaps in particular along the Croatian coast and in the last decade.
Further developments will consider the integration of other datasets in order to reduce such gaps and to increase the resolution of the climatological products.
Keywords: Northern Adriatic Sea, high resolution climatologies, EMODnet, DIVAnd

547ADVANCES IN OPERATIONAL OCEANOGRAPHY EXPANDING EUROPE’S OBSERVING AND FORECASTING CAPACITY
1. Introduction The Northern Adriatic Sea is an area of strong influence of river waters, a so-called ROFI (Region Of Freshwater Influence, Sanchez-Arcilla and Simpson, 2002), typically linked to the hydrological activity of the Po river and of the main river courses that flow into the same basin. Wind is the other main driver of the circulation, which also characterizes the spreading of the river plume within the basin (Kourafalou, 1999).
Preliminary temperature and salinity monthly and seasonal high resolution climatologies have been produced for the Northern Adriatic Sea within the framework of EMODnet – Physics. The climatological fields are provided on a regular grid with a horizontal resolution of 1/36° (3 km approximately) and 11 equally spaced layers (with a vertical resolution of 5m) from the surface down to 50 m depth. Deepest layers were not considered because the measurements are too scarce at depth and it makes it difficult to produce a robust climatology.
Temperature and salinity co-located profiles with Quality Flags (QF) 1 (good) and 2 (probably good) have been extracted for the Northern Adriatic Sea from a merged data collection for the climatologies generation.
The fine resolution in the horizontal should allow to detect the small scale patterns of temperature and salinity that appear in Spring and Summer seasons as a consequence of the increased baroclinic dynamics in the basin (Artegiani et al., 1997b). The high vertical resolution should allow to better resolve the seasonal thermal cycle which characterizes the entire water column, as well as the seasonal stratification due to the fluctuations in freshwater discharge into the basin (Artegiani et al., 1997a).
2. Methodology
2.1 Input data set
The source data set (hereafter SDC-CORA5.2) used for the production of the Northern Adriatic Sea climatologies derives from the integration of two different data sets: the SDC_MED_DATA_TS_V2 data set (Simoncelli et al., 2020a), which has been obtained from the measurements contained within the SeaDataNet infrastructure and the CORA5.2 data set (Szekely et al., 2019). Duplicate check has been performed, looking for ‘quasi-perfect’ duplicates within a coordinate interval of 0.0001deg (~11m) and a temporal interval of 0.0069 days (10 minutes). The SDC version of the duplicate data has been retained in the final dataset, meaning that only complementary CORA5.2 stations to SDC ones are displayed in the following statistics.
Data have undergone additional quality control (QC) through visual inspection using OceanDataView (described in details in Simoncelli et al., 2020b), including range check, identification of outliers, stations falling on land and anomalous values flagged

548 ADVANCES IN OPERATIONAL OCEANOGRAPHY
as good but visibly wrong. This additional QC was meant to guarantee the consistency among data coming from different sources that also went through different processing. Afterwards, the data have been interpolated on WOA18 (Boyer et al., 2018) standard layers; extrapolation has been applied to observations with depth shallower than 1.5 m, which have been aggregated to the surface observations. In case of difference between the depth of an observation and the depth of the standard layer smaller than the 10% of the layer thickness, the observation has been assigned to the next standard layer.
The monthly and the annual temporal distribution of stations available in the SDC-CORA5.2 integrated data set over the time period 1955 – 2016 for the depth range 0 – 50 m is presented in Figure 1, along with the decadal spatial distribution. The data distributions show a surprisingly low number of data especially in the last decade, coinciding with the Argo data era. They are almost absent along the eastern coastal strip. Moreover, CORA5.2 provides very few additional data over the last two decades. Both considered data sources do not contain measurements later than 2016.
Fig. 1. Spatial and temporal distribution of stations in the SDC-CORA5.2 integrated dataset over the time period 1955-2016 for the depth range 0-50 m: (top-left panel) monthly distribution, (bottom-left panel) annual distribution and (right panel) decadal distribution. Blue indicates SDC stations and red denotes CORA5.2 ones.
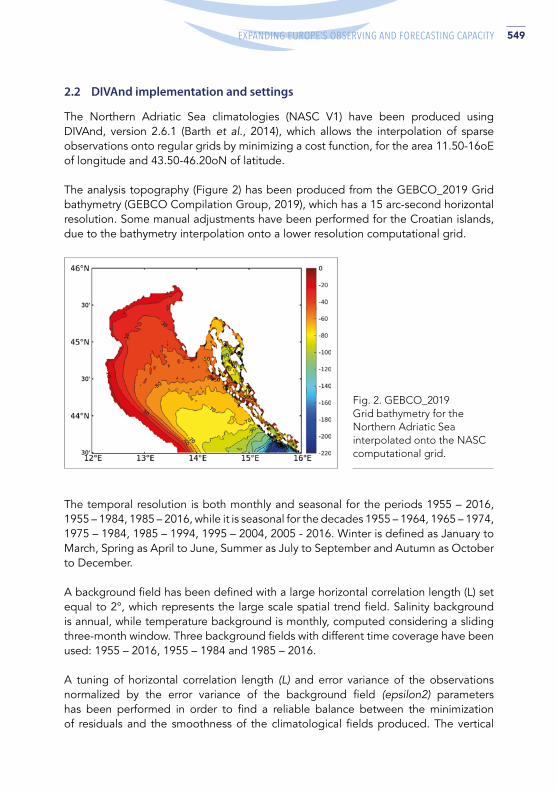
549ADVANCES IN OPERATIONAL OCEANOGRAPHY EXPANDING EUROPE’S OBSERVING AND FORECASTING CAPACITY
Fig. 2. GEBCO_2019 Grid bathymetry for the Northern Adriatic Sea interpolated onto the NASC computational grid.
2.2 DIVAnd implementation and settings
The Northern Adriatic Sea climatologies (NASC V1) have been produced using DIVAnd, version 2.6.1 (Barth et al., 2014), which allows the interpolation of sparse observations onto regular grids by minimizing a cost function, for the area 11.50-16oE of longitude and 43.50-46.20oN of latitude.
The analysis topography (Figure 2) has been produced from the GEBCO_2019 Grid bathymetry (GEBCO Compilation Group, 2019), which has a 15 arc-second horizontal resolution. Some manual adjustments have been performed for the Croatian islands, due to the bathymetry interpolation onto a lower resolution computational grid.
The temporal resolution is both monthly and seasonal for the periods 1955 – 2016, 1955 – 1984, 1985 – 2016, while it is seasonal for the decades 1955 – 1964, 1965 – 1974, 1975 – 1984, 1985 – 1994, 1995 – 2004, 2005 - 2016. Winter is defined as January to March, Spring as April to June, Summer as July to September and Autumn as October to December.
A background field has been defined with a large horizontal correlation length (L) set equal to 2°, which represents the large scale spatial trend field. Salinity background is annual, while temperature background is monthly, computed considering a sliding three-month window. Three background fields with different time coverage have been used: 1955 – 2016, 1955 – 1984 and 1985 – 2016.
A tuning of horizontal correlation length (L) and error variance of the observations normalized by the error variance of the background field (epsilon2) parameters has been performed in order to find a reliable balance between the minimization of residuals and the smoothness of the climatological fields produced. The vertical

550 ADVANCES IN OPERATIONAL OCEANOGRAPHY
correlation length has been set equal to 0, so that 2D interpolation for each layer of the grid is performed, being the 3D climatological fields produced by a combination of 2D slices. The DIVAnd settings for both the background fields and the analyses are summarized in Table I. The climatologies have been produced through an iterative process which computes the residuals first and then re-run the analysis excluding the observations with residuals larger than two standard deviations from the mean of the residuals population.
T BACKGROUND T ANALYSIS S BACKGROUND S ANALYSIS
L [°] 2 0.5 2 0.5
epsilon2 12 1 12 1
Background monthly - annual -
SDN2 V1.1 SDC V2 NASC V1
Time coverage 1900-2013 1955-2018 1955-2016
Horizontal resolution 1/8° 1/8° 1/36°
Vertical resolution 33 iode levels 92 WOA levels 11 WOA levels
Interpolation tool DIVA 4.6.9 DIVAnd 2.6.1 DIVAnd 2.6.1
Horizontal correlation length 2° analysis 10° background
2° analysis 5.5° background
0,5° analysis 2° background
Table I. DIVAnd settings for temperature and salinity background fields and analyses: L is the horizontal correlation length.
Table II. Summary of SDN2 V1.1, SDC V2 and NASC V1 products properties.
3. Results A consistency analysis has been performed to validate the first NASC results with respect to consolidated products for the considered domain: the first benchmark product is the SeaDataNet2 climatology (SDN2 V1.1, Simoncelli et al., 2015); the second product is the SeaDataCloud climatology (SDC_MED_CLIM_TS_V2, hereafter shortened to SDC V2, Simoncelli et al., 2020b). The different time coverage and the different settings of the three products (Table II) should be taken into account in the intercomparison.

551ADVANCES IN OPERATIONAL OCEANOGRAPHY EXPANDING EUROPE’S OBSERVING AND FORECASTING CAPACITY
As an example, January and May temperature and salinity climatological fields over the whole coverage period for the three products are presented in Figure 3, both at the surface and at 30 m depth.
The NASC shows a good agreement with the considered benchmark products for the sample climatological fields presented in Figure 3. The small scale structures become apparent due to the higher resolution of the NASC grid. Moreover, the Po river plume is better resolved showing a more realistic southward extension and a more realistic horizontal temperature and salinity gradient from the coast towards the interior of the basin. This is also due to the smaller horizontal correlation length used for DIVAnd setup with respect to the SDN2 V1.1 and SDC V2 products, whose target domain is the entire Mediterranean Sea basin.
Fig. 3. 2D maps for temperature and salinity climatological fields:(top row) SDN2 V1.1, (middle row) SDC V2, (bottom row) NASC V1. Each column represents a different combination of month and depth, from left to right: January at the surface, January at 30 m, May at the surface, May at 30 m. The color palette varies per column.

552 ADVANCES IN OPERATIONAL OCEANOGRAPHY
4. Conclusions Preliminary temperature and salinity monthly and seasonal high resolution climatologies have been produced for the Northern Adriatic Sea, starting from an integrated SDC-CORA5.2 data set. The NASC shows a good compliance with reference climatological products designed for the Mediterranean Sea, highlighting a more realistic topography and representation of small scale patterns, like the Po river plume, with respect to the lowest resolution climatological fields.
Nonetheless, some critical issues that decrease the reliability of the climatological product should be highlighted: the data gaps along the Croatian coast for the entire considered period, the very small number of available co-located profiles in the first decade (1955-1964), the rather small number and the uneven distribution of available observations for the last considered decade (2005-2016).
Additionally, it is important to outline the lack of measurements later than 2016.
In order to improve the quality of NASC product, additional data sources are needed and will be investigated to complement the delay mode SDC-CORA5.2 data set. The study also highlighted the critical importance of the ingestion and easy open accessibility of more existing coastal data as well as in the open and deepest sea.
More data will allow to increase the number of vertical levels and to extend the analysis at depths greater than 50 m, as well as to investigate the possibility to increase the horizontal resolution of the product. Finally, sensitivity tests with monthly salinity background will be performed to replace the annual background firstly adopted to mimic the DIVAnd setup of consolidated products which is more suitable for a ROFI region.
AcknowledgementsStudy funded in the framework of the Service Contract EASME/EMFF/2018/1.3.1.8/Lot3/SI2.810790 - EMODnet - Physics.
ReferencesArtegiani, A., Paschini, E., Russo, A., Bregant, D., Raicich, F., & Pinardi, N. (1997a). The Adriatic Sea General Circulation. Part I: Air–Sea Interactions and Water Mass Structure. Journal of Physical Oceanography, 27(8), 1492-1514.
Artegiani, A., Paschini, E., Russo, A., Bregant, D., Raicich, F., & Pinardi, N. (1997b). The Adriatic Sea General Circulation. Part II: Baroclinic Circulation Structure. Journal of Physical Oceanography, 27(8), 1515-1532.

553ADVANCES IN OPERATIONAL OCEANOGRAPHY EXPANDING EUROPE’S OBSERVING AND FORECASTING CAPACITY
Barth, A., Beckers, J.-M., Troupin, C., Alvera-Azcárate, A., and Vandenbulcke, L. (2014). DIVAnd-1.0: n-dimensional variational data analysis for ocean observations. Geoscientific Model Development, 7, 225-241.
Boyer, T. P., Garcia, H. E., Locarnini, R. A., Zweng, M. M., Mishonov, A. V., Reagan, J. R., Weathers, K. A., Baranova, O. K., Seidov, D., Smolyar, I. V. (2018). World Ocean Atlas 2018. [Mediterranean Sea]. NOAA National Centers for Environmental Information. Dataset. https://accession.nodc.noaa.gov/NCEI-WOA18.
GEBCO Compilation Group (2019). GEBCO 2019 Grid, doi:10.5285/836f016a-33be-6ddc-e053-6c86abc0788e
Kourafalou, V. H. (1999). Process studies on the Po River plume, North Adriatic Sea. Journal of Geophysical Research: Oceans, 104(C12), 29963-29985.
Sanchez-Arcilla, A. and Simpson J. (2002). The narrow shelf concept: couplings and fluxes. Continental Shelf Research, 22, 153–172.
Simoncelli, S., Schaap, D., Schlitzer, R. (2015). Mediterranean Sea – Temperature and Salinity Climatology V1.1. https://doi.org/10.12770/90ae7a06-8b08-4afe-83dd-ca92bc99f5c0
Simoncelli, S., Oliveri, P., Mattia, G., Myroshnychenko, V. (2020a). SeaDataCloud Temperature and Salinity Historical Data Collection for the Mediterranean Sea (Version 2). Product Information Document (PIDoc). https://doi.org/10.13155/77059
Simoncelli S., Oliveri P., Mattia G., Myroshnychenko V., Barth A., Troupin C. (2020b). SeaDataCloud Temperature and Salinity Climatology for the Mediterranean Sea (Version 2). Product Information Document (PIDoc). https://doi.org/10.13155/77514
Szekely, T., Gourrion, J., Pouliquen, S., and Reverdin, G. (2019). The CORA 5.2 dataset for global in situ temperature and salinity measurements: data description and validation. Ocean Science, 15, 1601–1614.
554 ADVANCES IN OPERATIONAL OCEANOGRAPHY
DEVELOP EUROGOOS MARINE CLIMATE SERVICE WITH A SEAMLESS EARTH SYSTEM APPROACH Jun She (1), Uldis Bethers (2), Vanessa Cardin (3), Kai Håkon Christensen (4), Tomasz Dabrowski (5), Frank Janssen (6), Haapala Jari (7), Arneborg Lars (8), Sebastien Legrand (9), Vidar Lien (10), Inga Lips (11), Marie Maar (12), Julien Mader (13), Sara Morucci (14), Antonio Novellino (15), Alejandro Orfila (16), George Petihakis (11), Manuel Ruiz-Villarreal (17), Joanna Staneva (18) and George Triantafyllou (19)
(1) Danish Meteorological Institute (DMI), Denmark; [email protected] (2) University of Latvia (UL), Latvia(3) Istituto Nazionale di Oceanografia e di Geofisica Sperimentale - OGS, Italy (4) MET Norway (MetNO), Norway (5) Marine Institute (MI), Ireland (6) The Federal Maritime and Hydrographic Agency (BSH), Germany (7) Finnish Meteorological Institute (FMI), Finland(8) Swedish Meteorological and Hydrological Institute (SMHI), Sweden (9) Institut Royal des Sciences Naturelles de Belgique (RBINS), Belgium (10) The Institute of Marine Research (IMR), Norway (11) European Global Ocean Observing System (EuroGOOS), Belgium (12) Aarhus University (AU), Denmark (13) FUNDACIÓN AZTI, Spain (14) Institute for Environmental Protection and Research (ISPRA), Italy(15) ETT SpA, Italy(16) IMEDEA (CSIC-UIB), Spain (17) Instituto Español de Oceanografía (IEO), Spain (18) Helmholtz-Zentrum hereon (Hereon), Germany
(19) Hellenic Centre for Marine Research (HCMR), Greece

555ADVANCES IN OPERATIONAL OCEANOGRAPHY EXPANDING EUROPE’S OBSERVING AND FORECASTING CAPACITY
Abstract
The ocean is an important pathway to a low-carbon and climate resilient society, e.g. in areas of blue carbon, green shipping, offshore renewable energy, aquaculture, fishery and coastal adaptation. Currently, 26 EU member states have made their National Adaptation Strategy (NAS) and/or National Strategy Plan (NAP) which needs a strong climate information service. European Global Ocean Observing System (EuroGOOS) has a strategy to expand existing operational marine service to climate change in 2020-2030. As focal points of national marine, climate and/or weather services, ROOS (Regional Sea Operational Oceanographic System) members have extensive experiences in working with citizens, stakeholders and decision-makers at national, regional and municipality levels. This paper will review current marine climate service capacity in ROOS members, identify gaps in modelling, products and service, and propose a seamless earth system approach for developing EuroGOOS and ROOS marine climate service capacities.
Keywords: marine climate service, climate change adaptation, earth system, EuroGOOS, Green Deal
1. User needs, current service capacities and inadequacies Ocean plays a key role in tackling challenges of climate change to ensure sustainable development (Hoegh-Guldberg et al., 2019). Major ocean pathways for climate change adaptation includes, but is not limited to, enhancing carbon storage by benthic vegetation in the ocean (blue carbon), reducing emissions of shipping (green shipping), enhancing off-shore wind, solar and wave energy production (blue energy) and utilization of marine resources in a sustainable manner. Ongoing climate change is already calling society now to consider also how to adapt to global sea level rise, increased erosion, marine heat waves and other marine extreme events which impact on coastal infrastructures and livelihood. Marine climate information service is essential for supporting the implementation of the ocean pathways for climate change adaptation and mitigation. Citizens, stakeholders and decision-makers will have different needs on marine information and related adaptation options and solutions when they adapt to the low-carbon and climate resilient future. The required information also evolves in the planning and implementation phases of the adaptation measures. In the planning phase, for improving the resilience, governmental and inter-governmental decision-makers at EU, regional sea, national and municipal levels, will need to know in their geographic areas the evolution, the diagnostic, the forecast, and projections of the environmental and ecosystem variables. Some of the questions that need to be addressed are: what is the impact of the change? What are the most affected (high risk) areas? What are the potential solutions in terms of reducing risks and improving resilience? For decarbonisation, the decision-makers will need to implement Marine Spatial Planning (MSP) to know which spatial areas are feasible for different low-carbon solutions in terms of cost and benefit. The information provided

556 ADVANCES IN OPERATIONAL OCEANOGRAPHY
from the climate service has to address relevant geographic scales with wide temporal spectra (physical, biogeochemical, biological and socioeconomic) with the required resolution to resolve local response. Citizens, on the other hand, will need to know: how the future climate will affect their daily life, for example, flooding risks and coastal erosion in the local areas. For the implementation phase, the governmental bodies, mainly at the municipality, region and sectoral level, will need climate information on detailed indicators, e.g. for building a dam, extreme sea level statistics with different return period is needed; the sector operators and citizens need to have information to support their daily actions, e.g. to reduce fuel consumption and greenhouse gas (GHG) emission, ship owners want to know the best sailing route according to daily meteo-ocean conditions, citizens need forecasts on a hazardous meteo-ocean state to avoid multi-risks for their houses and working places. They will also have to react to climate change and risks in the coming months to decades. EuroGOOS community aims to expand the marine service from the current operational scale to the climate scale, as defined in EuroGOOS 2030 strategy (EuroGOOS, 2021). Currently, some member states (Denmark, Germany, Spain etc.) have initiated national marine climate service programs (Lange et al., 2020). High-resolution marine climate projections have been developed by some ROOS members (Table I). At regional level, research projects have been funded to investigate future climate change and impacts on the marine environment and ecosystems, e.g., in the Baltic Sea, HELCOM (Helsinki Committee on Protecting Baltic Sea Environment) and Baltic Earth community are preparing a climate indicator service for member countries. At the EU level, EURO-CORDEX has provided atmospheric scenario projections for European Seas; Copernicus Marine Environmental Monitoring Service (CMEMS) has supplied regional sea reanalysis products for physical and biogeochemical (BGC) parameters; several C3S (Copernicus Climate Change Service) marine and coastal sectoral service projects have been carried out. The European Environmental Agency (EEA) Climate-Adapt Platform provides pan-European marine climate service for a few indicators (https://climate-adapt.eea.europa.eu/).
WAVES OCEAN(-ICE) BGC HIGH TROPHIC
EU Arctic MET.No (Nordic Seas) IMR (Barents Sea)
Baltic-North Sea HZG DMI, HZG, SMHI, BSH SMHI, HZG
North-East Atlantic HZG, MET.no, MI (SW Ireland),
HZG, IEO (NW Iberia) and MI (SW Ireland) HZG
Mediterranean CSIC CSIC, OGS OGS
Table I. Existing high resolution marine climate projections produced by EuroGOOS partners.

557ADVANCES IN OPERATIONAL OCEANOGRAPHY EXPANDING EUROPE’S OBSERVING AND FORECASTING CAPACITY
However, the existing information service capacity is far from the required by the member states, with several major inadequacies. The first is the lack of ensemble datasets of high-resolution (sub-km to km grid) marine system projections covering Essential Ocean Variables (EOVs) for ocean-ice, wave, biogeochemistry (BGC) and biology. As shown in Table I, the number of high-resolution marine projections available is still quite limited. Until now, there are no coordinated efforts at the European level to produce downscaled marine projections. Without such datasets, many of the marine climate service developments will be hampered and the existing best practices from national, regional and EU projects cannot be integrated and scaled up to pan-European seas. The second inadequacy is that the uncertainties in existing ocean projections have not been sufficiently evaluated and minimized, partly due to lack of enough ensembles and partly because the projections were made mainly for national purposes, thus the models are calibrated mainly for the national waters. As a consequence, uncertainties in the projections should be quantified before they are used for other countries. The third is the lack of a critical mass of research and coordination for developing a European marine climate service. Individual member states only have a small team working on a national marine climate service project, which is far from sufficient to address the entire value chain of marine climate change adaptation, ranging from end user needs, model and product development to service delivery and evaluation. The fourth is that current best practices on marine adaptation are local and fragmented, which require integration and upscaling to address the challenge across the scales.
2. Solutions: Concept and Methodology A seamless, pan-European marine climate information service is needed to support end users (i.e. citizens, stakeholders and decision-makers) in all scales to address the above issues when planning and implementing the marine climate adaptation measures. Such a service must be robust, quality assured and developed through the following steps: (i) generating ocean climate projections with sufficient resolution and uncertainty quantification to identify potential marine climate change and related impacts; (ii) identifying adaptation options and solutions addressing regional and local scale user needs and (iii) developing end user products and delivering services. This procedure has been adopted by some EU member states in establishing national marine climate service (e.g. Denmark and Germany).
Such a pan-European service fits nicely into national, ROOS and EuroGOOS strategies on providing marine climate information service. As focal points of the national ocean, climate and/or weather services, ROOS members have extensive experience in working with citizens, stakeholders and decision-makers at national, regional and municipality levels. They have successfully collaborated on developing operational oceanographic service in the last two decades, mainly based on a volunteer basis. Marine climate service has evolved as a service area by ROOS members and some of them have developed high-resolution downscaling ocean-ice-wave-biogeochemical projections

558 ADVANCES IN OPERATIONAL OCEANOGRAPHY
for national ‘Green Transition’ and adaptation activities. ROOS members have a strong wish to form a critical mass on developing marine climate service capacity to fill the current gaps and integrate our existing best practices. Currently, marine service for the future climate is urgently needed at the member state level, something that is not available from the existing pan-European Copernicus service. Considering ROOS members have already initiated marine climate adaptation service at the national level, while still lacking critical mass to address major challenges in the area, it is timely to establish a public, sustainable marine climate service to address marine adaptation options and pathways for national and sectoral users. At the same time, European capacity on marine climate service will be built up by integrating and further developing existing member states best practices.
Seamless, co-design and integration are keywords: seamless is the service concept while ‘co-design with users’ and ‘integration of best practices’ are methodologies for the implementation. Here a ‘seamless’ service has several meanings: in time, it means a service ranging from forecasts in days to projections in decades; in spatial, it means a service in all EU regional seas and resolving from open sea to coastal-estuary continuum with high-resolution local information; in parameter spectra, it means a service addressing meteo-ocean-wave-ice-biogeochemical-biological variables and human activities, i.e. the entire earth system; in sector, it means a service addressing major ocean climate adaptation and mitigation pathways for low-carbon and climate resilient future, e.g. blue carbon in coastal waters, green shipping, offshore renewable energy, aquaculture and fishery and coastal adaptation. The methodology to develop the proposed service is illustrated in Figure 1, including five major modules: gap-filling and data integration, user engagement and service co-design, product and service development, information service platform, service delivery and user evaluation. Gap-filling and data integration: the purpose of this module is to establish a seamless database including high-resolution ocean-ice-wave-BGC-biological projections, which is a basis for building up the marine climate service. High-resolution modelling capacity developed in operational applications for the open sea-coastal-estuary area can be used for producing marine climate projections (She and Murawski et al., 2018). Data integration aims to quantify uncertainties in hindcast models and projection products by inter-comparing model products and observations and between multiple models.
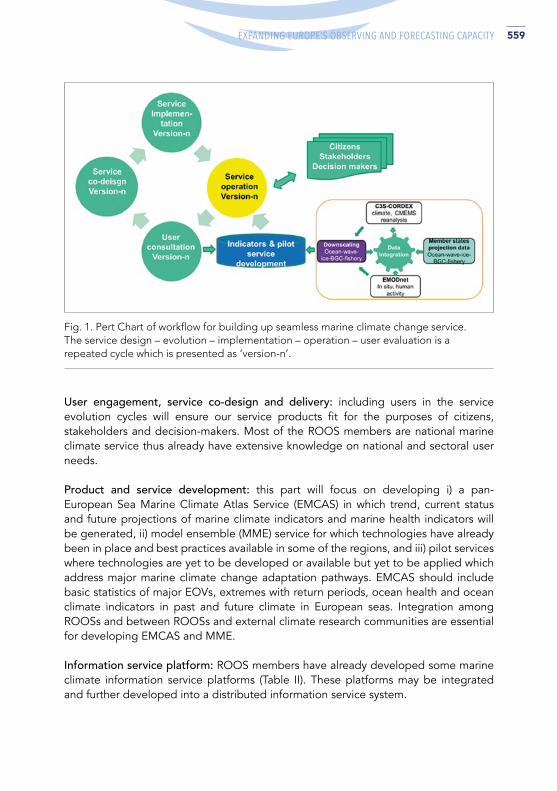
559ADVANCES IN OPERATIONAL OCEANOGRAPHY EXPANDING EUROPE’S OBSERVING AND FORECASTING CAPACITY
User engagement, service co-design and delivery: including users in the service evolution cycles will ensure our service products fit for the purposes of citizens, stakeholders and decision-makers. Most of the ROOS members are national marine climate service thus already have extensive knowledge on national and sectoral user needs. Product and service development: this part will focus on developing i) a pan-European Sea Marine Climate Atlas Service (EMCAS) in which trend, current status and future projections of marine climate indicators and marine health indicators will be generated, ii) model ensemble (MME) service for which technologies have already been in place and best practices available in some of the regions, and iii) pilot services where technologies are yet to be developed or available but yet to be applied which address major marine climate change adaptation pathways. EMCAS should include basic statistics of major EOVs, extremes with return periods, ocean health and ocean climate indicators in past and future climate in European seas. Integration among ROOSs and between ROOSs and external climate research communities are essential for developing EMCAS and MME. Information service platform: ROOS members have already developed some marine climate information service platforms (Table II). These platforms may be integrated and further developed into a distributed information service system.
Fig. 1. Pert Chart of workflow for building up seamless marine climate change service. The service design – evolution – implementation – operation – user evaluation is a repeated cycle which is presented as ‘version-n’.

560 ADVANCES IN OPERATIONAL OCEANOGRAPHY
Main scientific and technological challenges for implementing the above solutions include, but not limited to, effective methods to quantify and reduce uncertainties of climate models and projection products; efficient climate modelling such as high performance computing, high resolution earth system models resolving effectively open sea-coastal sea-estuary waters, especially their ecological dimension and methods to quantify compound extremes with different return periods in the future climate considering both non-stationarity and multi-variate, spatiotemporal covariates.
SERVICE & PROVIDER WEBSITE
Aqua-farm siting tool https://au-bios-model.shinyapps.io/MYTIGATE/
Ecological Assessment and Maritime Spatial Planning Tool https://azti.shinyapps.io/VAPEM-tool/
Wave Energy Converters Ecological Risk Assessment Tool https://azti.shinyapps.io/wec-era/
BOOS multi-model ensemble forecast service http://www.boos.org/multi-model-ensemble-of-forecast-products/
Leisure boat service SINDBAD https://www.sindbad-liguria.it/Mapviewer2/#/portale
Beach erosion climate service https://ideib.caib.es/impactes_costa_canvi_climatic/
Klimaatlas coastal flooding service https://www.dmi.dk/klima-atlas/data-i-klimaatlas/ ?L=¶mtype=sea&maptype=kyst
Beach and coastal operational service http://playas.ieo.es/
Table II. Some of the existing web-services related to marine climate adaptation currently maintained by ROOS members.
3. Coordination and Organization The development of integrated marine climate services cannot successfully be accomplished without a strong and efficient coordination and organization. It is essential that marine climate change service development in the EuroGOOS and ROOS community should be designed and implemented in a coordinated way, including the sharing of technology as well as the expertise and best practices. It is recommended that working groups should be established to facilitate such an effort, as shown in Figure 2. The four working groups are coordinated by EuroGOOS-ROOSs. WG1 works on user engagement, user needs identification, service co-design and user evaluation. WG2 is responsible for filling gaps in the marine climate projections, developing EMCAS and MME products. WG3 coordinates information system development and WG4 develops pilot marine climate service for the marine pathways of climate change adaptation, e.g., blue carbon, green shipping, clean ocean energy, sustainable aquaculture and fisheries and resilient coasts and infrastructures. A successful implementation of EuroGOOS marine climate service will need external funding to support the coordination and joint research and development. Coordination and synergies with CMEMS, C3S, ESA Digital Earth, regional conventions and regional climate and earth system research community are essential when developing EuroGOOS marine climate service.
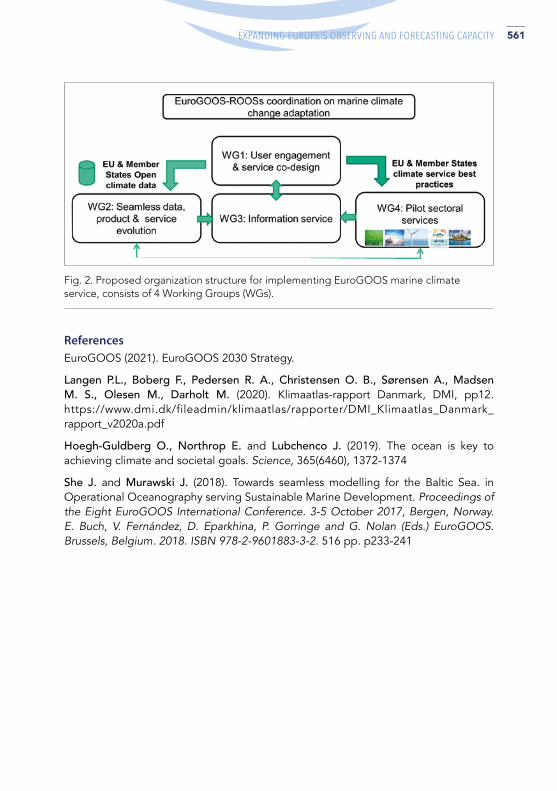
561ADVANCES IN OPERATIONAL OCEANOGRAPHY EXPANDING EUROPE’S OBSERVING AND FORECASTING CAPACITY
Fig. 2. Proposed organization structure for implementing EuroGOOS marine climate service, consists of 4 Working Groups (WGs).
ReferencesEuroGOOS (2021). EuroGOOS 2030 Strategy.
Langen P.L., Boberg F., Pedersen R. A., Christensen O. B., Sørensen A., Madsen M. S., Olesen M., Darholt M. (2020). Klimaatlas-rapport Danmark, DMI, pp12. https://www.dmi.dk/fileadmin/klimaatlas/rapporter/DMI_Klimaatlas_Danmark_rapport_v2020a.pdf
Hoegh-Guldberg O., Northrop E. and Lubchenco J. (2019). The ocean is key to achieving climate and societal goals. Science, 365(6460), 1372-1374
She J. and Murawski J. (2018). Towards seamless modelling for the Baltic Sea. in Operational Oceanography serving Sustainable Marine Development. Proceedings of the Eight EuroGOOS International Conference. 3-5 October 2017, Bergen, Norway. E. Buch, V. Fernández, D. Eparkhina, P. Gorringe and G. Nolan (Eds.) EuroGOOS. Brussels, Belgium. 2018. ISBN 978-2-9601883-3-2. 516 pp. p233-241

562 ADVANCES IN OPERATIONAL OCEANOGRAPHY
NEW CLIMATE SERVICES TO COASTAL COMMUNITIES IN GALICIA (NW SPAIN) Juan Taboada (1), Manuel Ruiz (2) and MarRisk Group (3)
(1) MeteoGalicia – Xunta de Galicia. Rúa Roma, 6. Santiago de Compostela, Spain(2) Instituto Español de Oceanografía. IEO. Centro Oceanográfico de A Coruña. Spain(3) MeteoGalicia, IEO, Intecmar, Cetmar, Uvigo, IIM-CSIC, Uminho, Uaveiro, Ipma, APA, IH,
CIIMAR, InescTec
Abstract Adaptation to climate change requires the implementation of services that translate scientific knowledge into practical results, so that policymakers and stakeholders can understand the risks and increase their resilience. In the coast those risks are related to flooding, erosion or physico-chemical changes of seawater. The main aim of MarRisk project was to generate this type of services for the NW of the Iberian Peninsula, relying on the experience of a coastal oceanographic observatory (RAIA). These services have been developed based on indicators and models, through a process of co-creation. Thus, a resilience index for harbours or estimations of physical-chemical changes of seawater that can impact sectors such as fishing or aquaculture have been generated. Moreover we have calculated maps of vulnerable areas to flood and erosion. As a conclusion we highlight that the elaboration of a set of indicators together with the expertise of modelization of climate change is not enough to help coastal communities to adapt to climate change. The interaction with different stakeholders is also a needful step to create climate services.
Keywords: Erosion, Flood, Resilience, Climate Services
1. Introduction RAIA Observatory is a consolidated transnational coastal observatory which provides marine data services and products (marnaraia.org) in the NW of the Iberian Peninsula (Eurorregion Galicia-Spain and N of Portugal) initiated in 2009 with the support of Interreg-Poctep Spain-Portugal projects such as RAIA, RAIAco, RAIAtec and recently MarRISK.
In particular MarRISK focuses on developing climate services and early warning forecasts for coastal populations in the Eurorregion. Floods, intensification of extreme events, episodes of toxic algae or coastal erosion are examples of risks analyzed in Marrisk for improving the resilience of traditional economic sectors (aquaculture) and
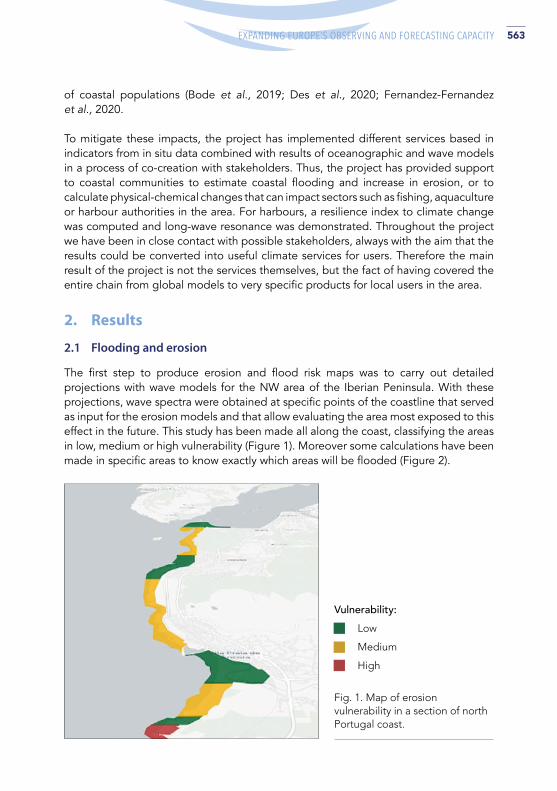
563ADVANCES IN OPERATIONAL OCEANOGRAPHY EXPANDING EUROPE’S OBSERVING AND FORECASTING CAPACITY
of coastal populations (Bode et al., 2019; Des et al., 2020; Fernandez-Fernandez et al., 2020.
To mitigate these impacts, the project has implemented different services based in indicators from in situ data combined with results of oceanographic and wave models in a process of co-creation with stakeholders. Thus, the project has provided support to coastal communities to estimate coastal flooding and increase in erosion, or to calculate physical-chemical changes that can impact sectors such as fishing, aquaculture or harbour authorities in the area. For harbours, a resilience index to climate change was computed and long-wave resonance was demonstrated. Throughout the project we have been in close contact with possible stakeholders, always with the aim that the results could be converted into useful climate services for users. Therefore the main result of the project is not the services themselves, but the fact of having covered the entire chain from global models to very specific products for local users in the area.
2. Results
2.1 Flooding and erosion
The first step to produce erosion and flood risk maps was to carry out detailed projections with wave models for the NW area of the Iberian Peninsula. With these projections, wave spectra were obtained at specific points of the coastline that served as input for the erosion models and that allow evaluating the area most exposed to this effect in the future. This study has been made all along the coast, classifying the areas in low, medium or high vulnerability (Figure 1). Moreover some calculations have been made in specific areas to know exactly which areas will be flooded (Figure 2).
Fig. 1. Map of erosion vulnerability in a section of north Portugal coast.
Vulnerability: Low
Medium
High

564 ADVANCES IN OPERATIONAL OCEANOGRAPHY
With these results and the classification we are able to estimate which areas of the coast may be affected by floods in the coming decades, even if storm surge does no change in the future, simply due to rising sea levels. As an example, we show the results obtained in the medium scenario (RCP4.5) for the middle of the century in a coastal area of north Portugal. We can clearly see how large areas, some of them populated, would be subject to flooding in the future in situations of coastal storm surge. In the near future we will build up a near operational system that will be able to calculate floods with several days in advance.
In addition, during the project, the costs/benefits of three different adaptation strategies have also been calculated: Defense, accommodation and withdrawal. The result obtained indicates that in the long run the withdrawal strategy is the one that generally obtains the best score. This is because the other strategies involve annual maintenance that ends up being more expensive.
Fig. 2. Example of flooded area taking into account a wave storm in 2050 in RCP4.5 scenario.

565ADVANCES IN OPERATIONAL OCEANOGRAPHY EXPANDING EUROPE’S OBSERVING AND FORECASTING CAPACITY
2.2 Resilience index for harbours
To help harbours adapt to climate change, within the MarRisk project a resilience index was developed following the methodology known as Delphi in which several independent experts judge the importance of different parameters. In this case, this evaluation by experts consisted of two parts. In the first, the connection of different physical parameters (waves, wind, rain ...) with different aspects of harbour operations was evaluated. In the second round the relationship of these risk scenarios with different adaptation factors was investigated. Taking into account current performance and grouping adaptation factors, a resilience index can be calculated.
where βFR is the importance given by the experts for each of the adaptation factors and FR is the actual performance.
Having this index in mind, each harbour can improve its index and therefore its resilience to climate change, taking actions that increase the performance of adaptation factors. For example, governance can be improved; early warning systems implemented and any other weaknesses covered by this analysis can be addressed.
2.3 Long-wave resonance
Harbours located on coasts exposed to wind and wave storms, such as those located on the northwestern coast of the Iberian Peninsula, are exposed to many meteorological risks. One of the most dangerous and with a lower level of predictability is that of long-wave resonance. Within the MarRisk project we have addressed the implementation of an early warning system for these phenomena in one of these ports, specifically in Malpica.To use this early warning system we need a high resolution wave model outside the port. With the spectrum of this model, the long wave is obtained and the they are finally propagated inside the dock (Figure 3).
Fig. 3. Long wave spectra generated with Swan model are propagated to the inner part of the harbour.

566 ADVANCES IN OPERATIONAL OCEANOGRAPHY
Results (Figure 4) show a good agreement between measured oscillations of sea level inside the harbour and modelled with the early warning system that takes as input operational wave models.
Fig. 4. Oscillation of sea level inside Malpica Harbour. Measured (blue points) and modelled (red points).
This system is now in a pre-operational phase. It is being tested by the harbours agency of Galicia. In the next year will pass to operational phase and the methodology could be extended to other harbours.
2.3 Coastal risks for aquaculture in the Eurorregion
One of the services for predicting and mitigating coastal risks in aquaculture and fisheries in the Eurorregion which has been advanced in Marrisk are HAB-risk forecasts in the Eurorregion. A demonstration of the usefulness of HAB early warning tools for managing authorities and aquaculture producers was performed in the European FP7 ASIMUTH project (Applied Simulations and Integrated Modelling for the Understanding of Toxic and Harmful Algal Blooms) (Maguire et al., 2016). The early warning developments in Marrisk rely on the use of Marrisk hydrodynamic models that predict the possible transport of HAB causing advection of phytoplankton species, combined with satellite data and in situ HAB data from the monitoring of Marrisk partners in Galicia (INTECMAR) and Portugal (IPMA). During the project, it has been demonstrated that development of web services support the ingestion of forecast model results into early warning prototypes as well as the efficient exchange of in situ HAB data and toxins from the monitoring agencies, which increases the capacity of processing information integrated in the EuroRegion from two different national monitoring programs.

567ADVANCES IN OPERATIONAL OCEANOGRAPHY EXPANDING EUROPE’S OBSERVING AND FORECASTING CAPACITY
Fig. 5. An example of the Marrisk HAB services in Portugal and Galicia for supporting coastal communities. On the left, the IPMA web page showing HAB phytoplankton species distribution in bivalve production areas (https://www.ipma.pt/pt/bivalves/fito/index-map-dia-chart.jsp). On the right, an example of the model forecasts in the Galician risk assessment pilot bulletin.
3. Conclusions In the framework of the MarRisk project we have been able to demonstrate some climate services that could be useful to make the coastal communities more resilient to climate change. In the next years those services will be extended to other areas of the coast and finally, the exploitation of results of the dynamic downscallings of climate projections with wave and biogeochemical models will allow the building of new services for providing climate advice to final users: in order to help them in the design of mitigation and adaptation plans.
AcknowledgementsThis work was supported by European Union MarRISK project: ‘Adaptaciónn costera ante el Cambio Climático: conocer los riesgos y aumentar la resiliencia’ (0262 MarRISK 1 E), through EP-INTERREG V A Espa˜na-Portugal (POCTEP) program. www.poctep.eu/es/2014-2020/marrisk
ReferencesBode, A., Álvarez, M., Ruíz-Villarreal, M. et al., Changes in phytoplankton production and upwelling intensity off A Coruña (NW Spain) for the last 28 years. Ocean Dynamics 69, 861–873 (2019).
Des M., Gómez-Gesteira M., deCastro M., Gómez-Gesteira L., Sousa M.C. (2020) How can ocean warming at the NW Iberian Peninsula affect mussel aquaculture?, Science of The Total Environment, Vol. 709, 20 March 2020, 136117, p: 1-10.

568 ADVANCES IN OPERATIONAL OCEANOGRAPHY
Fernández-Fernández, S.; Silva, P.A.; Ferreira, C.C., and Carracedo-García, P.E., 2020. Longshore sediment transport estimation at Areão Beach (NW Portugal) under climate change scenario. In: Malvárez, G. and Navas, F. (eds.), Global Coastal Issues of 2020. (Seville, Spain). Journal of Coastal Research, Special Issue N°. 95, pp. 479-483.
Maguire, J., Cusack, C., Ruiz-Villarreal, M., Silke, J., McElligott, D., Davidson, K., (2016). Applied simulations and integrated modelling for the understanding of toxic and harmful algal blooms (ASIMUTH): Integrated HAB forecast systems for Europe’s Atlantic Arc. Harmful Algae 53, 160–166

569ADVANCES IN OPERATIONAL OCEANOGRAPHY EXPANDING EUROPE’S OBSERVING AND FORECASTING CAPACITY

570 ADVANCES IN OPERATIONAL OCEANOGRAPHY
Belgium• Agency for Maritime and Coastal
Services (MDK), Coastal Division• Royal Belgian Institute of Natural
Sciences (RBINS), OD NATURE
Croatia• Croatian Meteorological and
Hydrological Service (DHMZ)• Croatian Institute of Oceanography and
Fisheries (IZOR)
Denmark• Danish Meteorological Institute (DMI)• Defence Centre for Operational
Oceanography (FCOO)
Estonia• Tallinn University of Technology, Marine
Systems Institute
Finland• Finnish Meteorological Institute (FMI)
France• SHOM• Ifremer• Mercator Ocean International
Germany• Federal Maritime and Hydrographic
Agency (BSH)• Helmholtz-Zentrum hereon GmbH
Greece• Hellenic Centre for Marine Research
(HCMR)
Ireland• Marine Institute (MI)
Italy• Euro-Mediterranean Center on Climate
Change (CMCC)• National Research Council of Italy (CNR)• Italian National Agency for new
technologies, energy and sustainable economic development (ENEA)
• National Institute of Geophysics and Volcanology (INGV)
• Italian National Institute for Environmental Protection and Research (ISPRA)
• National Institute of Oceanography and Experimental Geophysics (OGS)
Netherlands• Deltares• Royal Netherlands Meteorological
Institute (KNMI)• Rijkswaterstaat
Norway• Norwegian Institute for Water Research
(NIVA)• Institute of Marine Research (IMR)• Norwegian Meteorological Institute
(MET Norway)• Nansen Environmental and Remote
Sensing Center (NERSC)
Poland• Institute of Meteorology and Water
Management (IMGW-PIB)• Institute of Oceanology, Polish Academy
of Sciences (IO PAN)• Maritime Institute in Gdansk (MIG)
List of EuroGOOS
MEMBERS (May 2021)

571ADVANCES IN OPERATIONAL OCEANOGRAPHY EXPANDING EUROPE’S OBSERVING AND FORECASTING CAPACITY
Portugal• Hydrographic Institute• Portuguese Institute for the Ocean and
Atmosphere (IPMA)
Slovenia• Slovenian Environment Agency• National Institute of Biology (NIB)
Spain• Balearic Islands Coastal Observing and
Forecasting System (SOCIB)• Oceanic Platform of the Canary Islands
(PLOCAN)• AZTI• Spanish Institute of Oceanography (IEO)• Puertos del Estado
Sweden• Swedish Meteorological and
Hydrological Institute (SMHI)
United Kingdom• Centre for Environment, Fisheries and
Aquaculture Science (Cefas)• National Oceanography Centre (NOC)• UK Met Office
EUROGOOS CONFERENCE 2021
The 9th EuroGOOS International Conference was the first virtual conference of EuroGOOS and was well received by the oceanographic and forecasting community. The participation of more than 530 people from over 40 countries around the world demonstrated the willingness of the ocean observing community to come together and showcase the latest achievements in operational oceanography, data management, and service delivery.
www.eurogoos.eu

CHAIR: GEORGE PETIHAKIS EDITORS: VICENTE FERNÁNDEZ, ANA LARA-LÓPEZ,DINA EPARKHINA, LUCIE COCQUEMPOT,CORINE LOCHET & INGA LIPS
EUROGOOS 2021. BRUSSELS. BELGIUM

European Global Ocean Observing SystemEuroGOOS AISBL29 rue Vautier, 1000 Brussels, Belgium
www.eurogoos.eu


![Download [ 1.61 MB ] - e-Gyanagar - OSOU](https://static.fdokumen.com/doc/165x107/6326c5af5c2c3bbfa803da68/download-161-mb-e-gyanagar-osou.jpg)
![Download [ 12.18 MB ] - e-Gyanagar](https://static.fdokumen.com/doc/165x107/632776a96d480576770d498f/download-1218-mb-e-gyanagar.jpg)


![Download [ 2.34 MB ] - e-Gyanagar](https://static.fdokumen.com/doc/165x107/63275f63cedd78c2b50d8b0d/download-234-mb-e-gyanagar.jpg)


