DOWET SECTION - Postal Regulatory Commission
39
DOWET SECTION BEFORE THE fiECEIVElI POSTAL RATE COMMISSION WASHINGTON. D.C. 20268-0001 DCT I 4 47 PH '37 POSTAL RATE AND FEE CHANGES, 1997 i NOTICE OF UNITED STATES POSTAL Docket No. R97-1 SERVICE OF INCORPORATION OF LIBRARY REFERENCE H-106 MATERIAL INTO THE DIRECT TESTIMONY OF WITNESS CHARLES L. CRUM (USPS-T-28) (October 1, 1997) The United States Postal Service hereby gives notice of the incorporation of the attached Exhibit K into the Direct Testimony of Charles L. Crum, USPS-T-28. The Exhibit consists of material that had been filed as pages 2 through 17 of Library Reference H-108, Standard Mail (A) Unit Costs by Shape, with changes to reflect its incorporation into witness Crum’s testimony.’ In addition to this material, the Exhibit contains additional breakdowns of Table 3, of the type which had been requested by participants.’ Also attached are a revised Listing of Exhibits (page iii of witness Crum’s testimony); revisions to pages 10 through 12 of his testimony, changing references to Library Reference H-108 to Exhibit K; and revised introductory pages for Library Reference H-108, which replace current pages 1 through Al. ’ Appendix A to the Library Reference, describing and providing the computer runs used in the analysis, remains in the Library Reference as background information. Revised introductory pages to the Library Reference are also being filed herewith. These pages incorporate the existing introduction to Appendix A (page Al) and include the material that comprised paragraphs 3, 4, and 5 of the Volume ,Estimates section on pages 2 and 3, which are not included in Exhibit K because they relate to the computer documentation remaining in the Library Reference. ’ The spreadsheets presenting these breakdowns, which are contained on the CD- ROM version of the Library Reference, but were not in the hard copy, are included for the convenience of all participants, inasmuch as the witness has referred to some of these spreadsheets in several interrogatory answers.
-
Upload
khangminh22 -
Category
Documents
-
view
2 -
download
0
Transcript of DOWET SECTION - Postal Regulatory Commission

DOWET SECTION
BEFORE THE fiECEIVElI
POSTAL RATE COMMISSION WASHINGTON. D.C. 20268-0001
DCT I 4 47 PH '37
POSTAL RATE AND FEE CHANGES, 1997 i
NOTICE OF UNITED STATES POSTAL
Docket No. R97-1
SERVICE OF INCORPORATION OF LIBRARY REFERENCE H-106 MATERIAL INTO THE DIRECT TESTIMONY OF
WITNESS CHARLES L. CRUM (USPS-T-28) (October 1, 1997)
The United States Postal Service hereby gives notice of the incorporation of the
attached Exhibit K into the Direct Testimony of Charles L. Crum, USPS-T-28. The
Exhibit consists of material that had been filed as pages 2 through 17 of Library
Reference H-108, Standard Mail (A) Unit Costs by Shape, with changes to reflect its
incorporation into witness Crum’s testimony.’ In addition to this material, the Exhibit
contains additional breakdowns of Table 3, of the type which had been requested by
participants.’ Also attached are a revised Listing of Exhibits (page iii of witness
Crum’s testimony); revisions to pages 10 through 12 of his testimony, changing
references to Library Reference H-108 to Exhibit K; and revised introductory pages
for Library Reference H-108, which replace current pages 1 through Al.
’ Appendix A to the Library Reference, describing and providing the computer runs used in the analysis, remains in the Library Reference as background information. Revised introductory pages to the Library Reference are also being filed herewith. These pages incorporate the existing introduction to Appendix A (page Al) and include the material that comprised paragraphs 3, 4, and 5 of the Volume ,Estimates section on pages 2 and 3, which are not included in Exhibit K because they relate to the computer documentation remaining in the Library Reference.
’ The spreadsheets presenting these breakdowns, which are contained on the CD- ROM version of the Library Reference, but were not in the hard copy, are included for the convenience of all participants, inasmuch as the witness has referred to some of these spreadsheets in several interrogatory answers.

-2-
Witness Crum is qualified to adopt this material as his testimony, as he indicated
in response to NDMSIUSPS-T28-1 (b):
I personally supervised both the planning and conduct of the studies described in LR-H-108. I produced and/or assisted with the separate analyses to varying degrees. I completely reviewed the printed version of the library reference, other than the computer documentation.
In addition, witness Crum has already answered a number of interrogatories about
the Library Reference. See NDMSIUSPS-T28-2, 3, 6-l 1 8. 18; PSAKJSPS-T28-I,
4 8 5; and DMAIUSPS-T28-I, 4 8. 9. Incorporation of this material will provide the
Commission a firm foundation on which to recommend the proposed Standard Mail
(A) residual-shape surcharge and allow the issue to be litigated on its substantive
merits without further procedural controversy.
Respectfully submitted,
UNITED STATES POSTAL SERVICE
By its attorneys:
Daniel J. Foucheaux. Jr. Chief Counsel, Ratemaking
Scott L. Reiter
CERTIFICATE OF SERVICE
I hereby certify that I have this day served the foregoing document upon all participants of record in this proceeding in accordance with section 12 of the Rules of Practice.
475 L’Enfant Plaza West, S.W. Washington, D.C. 20260-1137 (202) 268-2999; Fax -5402 October 1, 1997
-..

REVISIONS TO USPS-T-28

Revised 1011197
LISTING OF EXHIBITS
Exhibit A Window Service and Platform Costs
Exhibit B Volume of Parcel Post Pieces Entered Upstream of a BMC/ASF
Exhibit C Outgoing Mail Processing Costs at Non-BMC Facilities Avoided by DBMC Parcel Post
Exhibit D BMC Presort Parcel Post Cost Savings
Exhibit E Costs Avoided by Depositing Inter-BMC Parcels at the Origin BMC with Presort to the Destination BMC
Exhibit F Destination BMC Mail Processing Costs Avoided by Parcel Post Deposited at Destination SCFs or Delivery Units
Exhibit G Avoided Mail Processing Costs of DSCF Parcel Post at SCFs and Delivery Units
Exhibit H Mail Processing Costs Avoided by Carrier Route Presorted Bound Printed Matter
Exhibit I Revenue, Pieces, and Weight (RPW) Volume Summary - Government Fiscal Year 1996
Exhibit J BMC Presorted Parcel Post Cost Per Piece
Exhibit K Standard Mail (A) Unit Costs by Shape

Revised 1011 I97
1
2
3
4
5
6
7
8
9
10
11
12
13
14
15
16
17
18
19
20
21
22
23
24
25
26
27
28
VIII. STANDARD MAIL (A) NONLETTER COST DIFFERENCES
A. BACKGROUND
In 1990, the Postal Service took the first step towards recognizing the effects of
shape in Standard Mail (A) (then third-class) when witnesses Moeller and Shipe
produced studies showing shape-based cost differences between letters and
nonletters (Docket No. R90-1, USPS-T-9 and USPS-T-lo). This cost distinction was
supported by the models presented in Docket No. MC951. Though the rate
distinction has always been limited by low “passthroughs,” this concept still is
integral to current Standard Mail (A) rates. My testimony will further distinguish
costs on the basis of shape by showing the additional shape-based cost differences
within nonletters, between flats and parcels.
The following table presents total bulk Standard Mail (A) volume shares based on
Tables 1 and 2 of Exhibit K.
FY 1996 VOLUME SHARES
if!& Parcels
58.5% 40.1% 1.4%
While the relative volume of parcels is low, the absolute volume is not and there is
sufficient data to separate parcels from flats in Standard Mail (A). This effort to
more closely align rates with costs will help reduce the rate averaging that currently
exists within Standard Mail (A).

Revised 10/1/97
1 B. INTRODUCTION
2
3 My testimony uses the volumes and costs by shape presented in Exhibit K
4 to show the cost differences within Standard Mail (A) nonletters between
5 parcels and flats. Volumes by shape and rate category within third-class Bulk Rate
6 (now Standard Mail (A) Regular/Nonprofit and Enhanced Carrier Route) are derived
7 from the PermitIBravis system and tied to official Revenue, Pieces, and Weight
8 (RPW) totals. Volume variable costs are based on the In-Office Cost System
9 (IOCS) and the Cost and Revenue Analysis (CRA) report and its associated
10 workpapers where possible. Several studies supply additional data as necessary.
11 Total volume variable unit costs by shape are found by dividing costs by volumes in
12 each category.
13
14 c. ANALYSIS AND PRESENTATION
15
16
17
18
19
20
21
22
23
24
25
26
27
28
29
30
I combine Regular and Enhanced Carrier Route as well as Commercial and
Nonprofit costs and volumes for the purposes of my analysis. The following table
summarizes fiscal year 1996 cost per piece data from Table 3 of Exhibit K.
FY 1996 STANDARD MAIL (A) COSTS BY SHAPE
Cost oer Piece (cents)
Parcels 51.6
Flats ‘Il.3
Difference 40.3
To find the FY 1998 test year cost difference per piece, I multiply the 40.3 cents
described above by the test year/base year wage rate adjustment factor of 1.053
11

1
2
3
4
5
6
7
8
9
IO
11
12
13
14
15
16
17
18
19
20
21
22
23
24
Revised IO/l/97
(described in Library Reference H-146). This yields 42.4 cents as my estimate of
the FY 1998 test year cost difference between parcels and flats in bulk Standard
Mail (A).
The degree of presort and depth of dropshipment can each have an impact on
costs. Standard Mail (A) flats are somewhat more finely presorted and deeply
dropshipped than parcels. I have adjusted the parcel/flat cost difference to
account for this. Table 7 of Exhibit K shows that .3 cents of the 42.4 cent cost
difference is due to the deeper entry of flats and 7.0 cents is due to the finer
presort of flats. This leaves 35.1 cents per piece as my estimate of the FY 1998
shape-related volume variable cost difference between Standard Mail (A) parcels
and flats.
D. SUMMARY
My testimony has identified cost differences between flats and parcels within
Standard Mail (A). I have been quite conservative and backed out the portion of the
cost differences due to differing levels of dropship and presort. As previously
stated, my purpose is to support witness Moeller’s proposed 10 cent surcharge of
nonletter, nonflat-shaped mail. My costs and volumes cover the same full range
(Regular Rate and Nonprofit. Regular and ECR) of pieces that witness Moeller’s
surcharge will impact. On the basis of my analysis I estimate the adjusted FY 1998
test year cost difference between flats and parcels within bulk Standard Mail (A)
nonletters to be 35.1 cents per piece.
ADDITION TO USPS-T-28 (NEW EXHIBIT K)
EXHIBIT K - STANDARD MAIL (A) UNIT COSTS BY SHAPE
Introduction
This exhibit describes an analysis which estimates the unit attributable costs for flats and
parcels in Standard Mail (A). In this analysis, the existing Cost and Revenue Analysis (CRA)
mail volume and cost estimates for third-class bulk regular rate mail in Base Year (BY) 1996
were separated into estimates for letters, flats and parcels. Mail volumes for each shape and
subclass were derived from the PERMIT and BRAVIS data systems and the Revenue, Pieces
and Weight system (RPW) Attributable costs were developed primarily from the In-Office
Cost System (IOCS) and the BY CRA and its workpapers. The unit cost for each shape and
rate category was then calculated by dividing the attributable cost by the mail volume.
Throughout this document the name Standard Mail (A) will be used in the place of third-class,
with the understanding that part of the data used for this analysis was collected when
Standard Mail (A) was still called third-class mail.
Volume Estimates
The PERMIT and BRAVIS data systems were used as the source of Standard Mail (A)
volumes by shape. These systems recorded mailing statement information from each bulk
mail transaction at approximately 1,680 offices in FY 1996, covering 93 percent of the revenue
in Standard Mail (A) for that year. The information recorded from the mailing statement
includes the shape, the indicia, and the revenue, pieces, and weight by detailed rate category
of mail. Christensen Associates collected this information for the Postal Service in the form of
data tapes for the PERMIT systems, and diskettes for BRAVIS.
The general approach used to estimate mail volumes by shape was to group all offices
accepting Standard Mail (A) into strata based upon their National Consolidated Trial Balance
(NCTB) revenue for permit imprint Standard Mail (A) bulk regular mail and then to inflate
PERMIT and BRAVIS revenue reported in each stratum to the stratum revenue total. A
general description of this process and detailed documentation appear in Library Reference H-
108. Tables 1 and 2 of this exhibit include commercial and nonprofit volume by shape
estimates respectively.
1

CRA costs
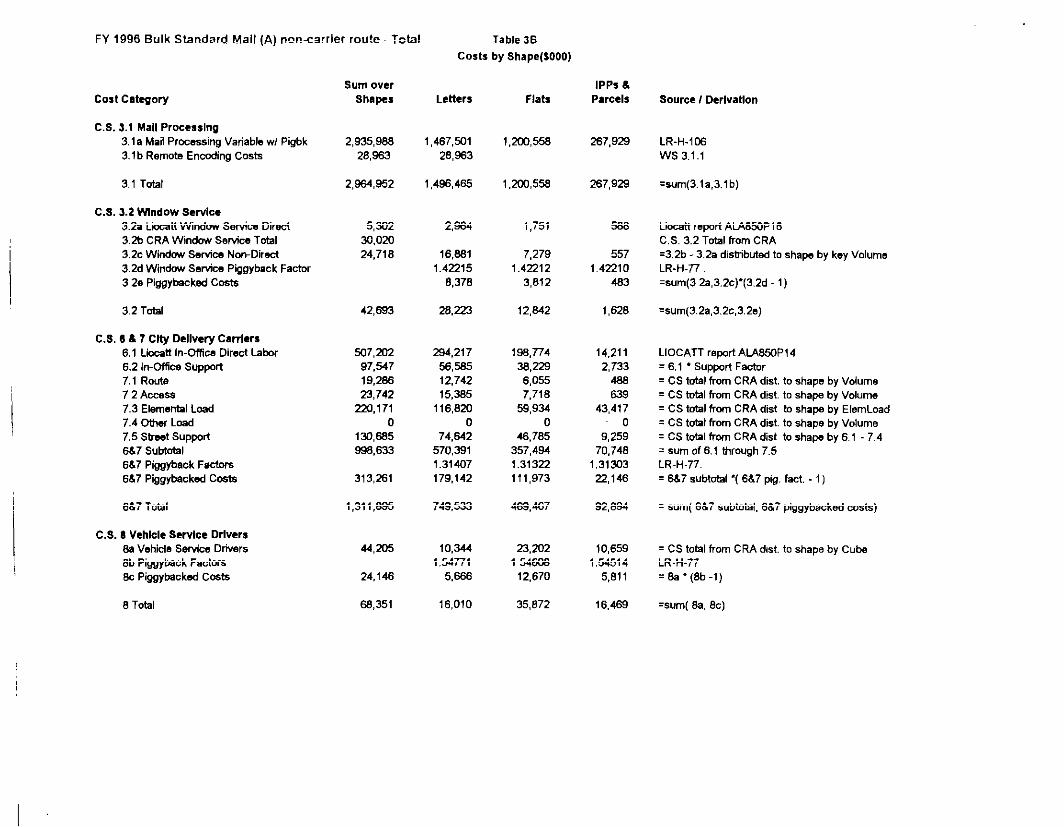
Shape specific costs were also estimated for bulk Standard Mail (A). These costs were
estimated explicitly for six cost segments of the CRA: mail processing, window service, city
delivery carriers, vehicle service drivers, rural delivery carriers, and transportation. The
remaining cost segments were accounted for by the use of piggyback factors and a final
control to CRA totals. Table 3 displays the construction of the cost estimates by shape.
Tables 4 through 6 show the construction of various distribution keys used in this process.
Mail processing costs were estimated by summing the variable mail processing costs by shape
with the remote encoding costs. Mail processing costs were taken from the variable mail
processing cost development by shape shown in Library Reference H-106. These costs
include the worksheet adjustments, premium pay adjustments, and piggyback factors. The
remote encoding costs were attributed entirely to letter-shaped mail.
Window service costs were estimated in two pans. Window service direct costs from LIOCAlT
(Report ALA850p16, Basic Function Total) were used without modification. The balance of
cost segment 3.2 was distributed in proportion to the mail volume. The sum of direct and other
costs was multiplied by the window service piggyback factor to calculate piggybacked window
service costs.
City carrier in-office direct labor costs come from IOCS LlOCAlT (Report ALA860P14 -
Schedule K&L City Carrier Cost - Basic Function Total) , and were multiplied by the in-office
support factor to yield in-office support costs. City carrier street time costs from segments 7.1
(Route), 7.2 (Access), and 7.4 (Other Load) were distributed to shape by the proportion of mail
volume. Cost segment 7.3 (Elemental Load) was distributed to shape using the distribution
key elemental load. This key was constructed from the CRA workpapers for city carriers and is
shown in Table 5. Cost segment 7.5 was distributed in proportion to the sum of the distributed
costs for all other city carrier in-office and street cost components. Costs piggybacked on city
delivery carriers were estimated by multiplying the sum of the distributed costs for city carriers
by the piggyback factor from library reference H-77.
Vehicle service driver costs were distributed in proportion to estimated cubic volume, and
piggybacked costs estimated by multiplying the distributed costs by the piggyback factors.
2
..-.-.. ~~-..-__-

Cubic volume was calculated by dividing the weight by an estimate of the density of each
shape of mail. The density estimate for letters and flats was obtained from Docket No. MC95
1, USPS-LR-MCR-13, Supplement 1. The density estimate for parcels was developed in the
study described in Appendix C of Docket No. MC97-2, Library Reference PCR-38.
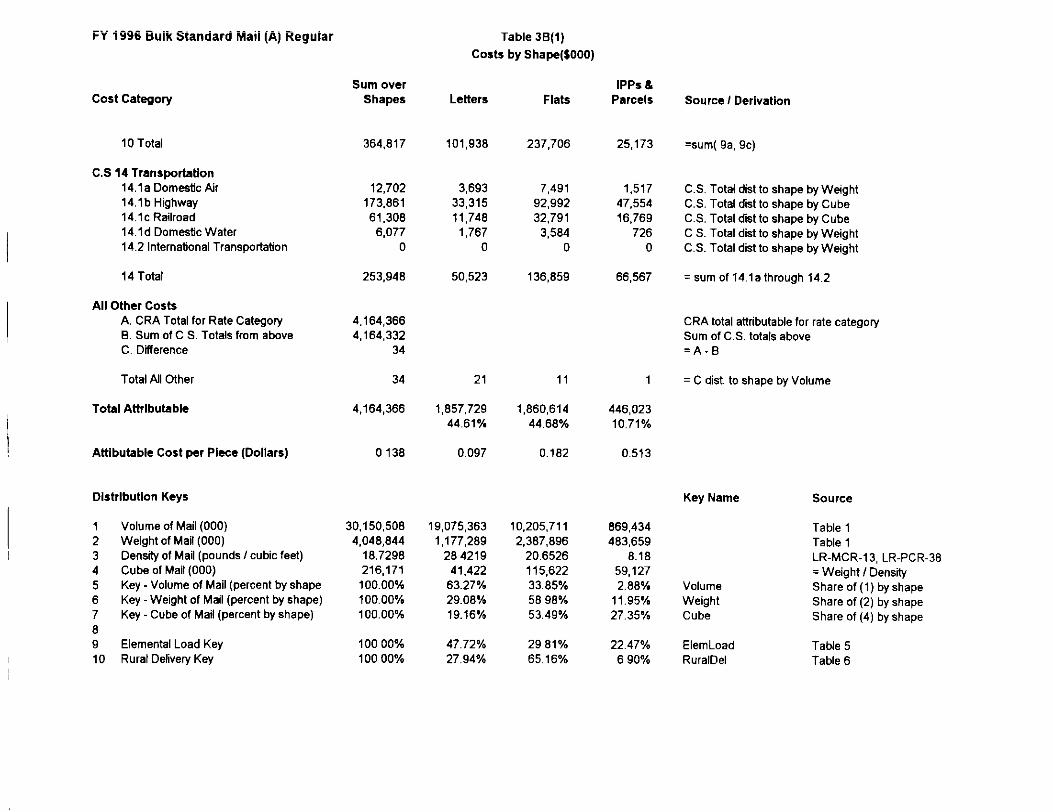
Total rural delivery carrier costs were distributed by the key rural delivery. This key was
developed in Table 6 from the evaluated route workpapers for the CRA. Costs piggybacked
on rural carrier costs were estimated by multiplying the distributed costs by the piggyback
factor. Costs for domestic air and domestic water transportation were distributed in proportion
to weight by shape. Costs for highway and rail transportation were distributed in proportion to
estimated cubic volume.
The resulting costs were summed and subtracted from the total attributable cost for each rate
category. The residual cost was distributed to shape in proportion to mail volume. The sums
of the distributed costs are shown in the row titled “Total Attributable” on page 2 of Table 3.
These costs were divided by the mail volume estimate to estimate unit attributable cost.
To examine the potential cost differences between flats and parcels due to factors other than
shape, differences in the use of destination entry and presort were analyzed. This calculation
is shown in Table 7. The result of this analysis is that 7.3 cents of the cost difference between
flats and parcels in Bulk Standard Mail (A) can be explained by differences in destination entry
and presort level.
3

Table 1
FY 1996 Bulk Standard Mail (A) Commercial Rate
PERMIT Estimate Controlled to GFY RPW Letters
Basic RfX?“M PleCeS Weight Revenue Pieces Weight
I 501,423 2.161.886 124,867 1 499,923 2.147.361 125.566 Basic ZIP+4 and BC 294,592 1,503.105 87,256 293.710 1.493.006 87.759 3/5-DIgit 1,023.843 5,580.969 372,252 1,020,7aO 5,543,472 374,395 3/5 DIgit ZIP+4 and BC 1,628.741 9,958.430 586,173 1,623,86a 9,891,523 589.548 Garner Route 1,381,484 10,063,117 648,127 1.387.705 10.090,942 676,543 High Density 10,359 81,164 6.889 10,406 81,389 7,191 saturation 323,062 2.628,568 172,071 1 324,517 2.635,836 179,615 Total Letters I 5.163,503 31.977,240 1.997.635 1 5,160,910 31 ,aa3.530 2.040.638
315 D& ZIP+4 and BC 1,452,014 6.503.836 1,552,762 1,447.670 6:460:139 1,561:704 Carrier Route 1,456,642 8.268,106 1,781,047 1.463.202 8.290.968 1,859.133 High Density 112,480 740,174 134.252 112.986 742.221 140.136 Saturalion 984,277 7,249.871 1.184,821 988,710 7.269.917 1.236.767 Total Flak 5.042.350 26,532.894 5,474,343 5.046.404 26.508.816 5.623,935
IPPs and Parcels
Basic Revenue Pieces Weight Rl?Ve”Ue PI%- Weight
I 131.961 268.253 140.873 I 131.587 266.451 141.685 Basic ZIP+4 and BC 3/5-Digit 3/5 Digit ZIP+4 and BC Carrier Route High Densiiv
273.042 607.062 340,016 272,225 602,983 341,974
8,818 54,338 8,966 6,857 54,468 9.360 342 1.810 532 343 1.815 555
sa-turation 1,764 13,125 2,025 ) 1,792 13,161 2,114 Total IPPs and Parcels I 415.967 944.587 492,413 1 414.805 938,898 495,688
All Shapes
BaSlC Revenue Pieces Weight Revenue Pieces Weight
I 1.017.336 3.616.340 532,629 1 1.014,295 3.592.043 535,696 Basic ZIP+4 and BC 345.306 1,666.413 129,200 344,273 1,655.217 129,944 3/5-Digrl 1,899,174 8.609.429 1.224,897 1,893.492 8,551,586 1,231,951 3/5 Digit ZIP+4 and BC 3.080,755 16.462.266 2,138,935 3.071,539 16.351.662 2,151.253 Carrier Route 2.846.943 18.385,561 2.438.140 2.859,764 18.436.398 2,545.036 High Densitv 123.181 823.148 141.673 123,736 825.424 147,885 Sat”rab0” 1,309,124 9,691.564 i,358,917 1 1,315,020 9,9ia,914 1.418.496 Total All Shapes 1 10,62l,a21 59.454,721 7.964,391 1 10,622.119 59.331.244 a.160.261
GFY RPW Total I
Basic and 3/5-Digit Carrier Route
Revenue Piece Weight 6.323.599 30,150.508 4.046,844 4.298,520 29,180,737 4,111,416
10.622.119 59.331,244 8,160,261
GFY RPW Factors I
Basic and 3/5-Digit Garner Route
Revenue Pieces Weight 0.99701 0.99328 1.00576 1.00450 1.00277 1.04384

Table 2
FY 1996 Bulk Standard Mail (A) Nonprofit Rate
PERMIT Estimate Controlled to GFY RPW Letters
Revenue PleCeS Weight Revenue PiEG+S Weight BaSlC 177,935 1.442,931 62,600 175,394 1,394,463 60,593 Basic ZIP+4 and BC 63,465 596,780 30,352 62,558 576,734 29,379 315.Dioti 284.748 2.757.622 114.293 280.681 2.664.994 110.628 315 D,;ti ZIP+4 and BC I 292,641 3,157.261 166;550 288,461 3.051.2oa 161,210 Carrier Route 145,165 1.932,918 85,798 139,491 1.850,970 83,996 High Density saturation Total Letters I
30,566 463,079 23.987 29,372 443,446 23,463 994,520 10,350,590 483,579 [ 975,957 9,96i,ai5 469,288
Flats
Basic Bmc ZIP+4 and BC 315.Dlgit 3/5 Digit ZIP+4 and BC Carrier Route High Density saturation Total Flats
Revenue PMXS Weight Revenue Pieces Weight I 75,736 387.740 69.190 74.654 374.716 66.972
4.303 26,249 4,456 4,241 25,366 4,313 100,534 606.797 92.115 99,099 586,414 89,162
89,202 604,515 94,257 87,928 584,210 91,235 55.284 449,512 62,274 53,124 430,455 60.966
509 4,418 585 489 4.231 572 18,973 178.126 23.120
338.507 2,ia3,5i9 336,340
IPPs and Parcels I I
Bmc Basic ZIP*4 and BC
Revenue 5,075
Pieces I a.895
Weight 7,198
Revenue 5,002
Pl%ff 18,260
Weight 6,967
3/5-Digit 315 DIgit ZIP+4 and BC Carder Route
6,320 24,938 10,296 6,230 24,100 9,966
155 1,146 242 149 1,099 237 High Densvty 0 0 0 0 0 0 satura+Jon 30 303 29 29 290 29 Total IPPs and Parcels 11,580 45,283 17.766 11,410 43,749 17.199
All Shapu
Revenue Pieces Weight Revenue Pieces Weight BaSlC 258.746 1.849.566 138.988 255.051 1.787.439 134~532 Bmc ZIP+4 and BC 3/5-DIgit 3/5 Digti ZIP+4 and BC Gamer Route Hiah Densitv Sat”rabo” Total All Shapes
67:768 '623:029 34:aoe 66:aoo 391,602 3,389,356 216.704 386.009 381.642 3,761.776 260.807 376,389 200,605 2,383.578 148,314 192,764
509 4.418 565 489
‘602:lOZ .~ ~~
33,692 3.275,506 209,756 3,635,418 252,445 2.282,525 145,199
4.231 572 50,341 649:393 47,632 1 48,373 621,862 46,632
1.351.413 12.661,117 847,038 ] i .325.874 12,209.084 822,827
GFY RPW Total I
‘Basic and 3/5-Dlgrl Garner Route
Revenue Pieces Weight 1 ,oa4,24a 9,300,466 630,424
241,626 2,908,617 192,403 1.325.874 12,209,oa4 822,827
GFY RPW Factors
‘Basic and 3/5-Dlgit Carrier Route
I 1 Revenue Pieces Weight
0.98572 0.96641 0.96794 0.96091 0.95760 0.97900

Table 3
FY 1996 Bulk Standard Mall (A)
Cork by Shape ($000)
cost category Sum over
Shapes Ldters Flats IPPS a
Pmcelr source I Derlvatlon
C.S. 5.1 Mall Proccsslng 3.la Mail Processing Variable w/ Pigbk 3.1 b Remote Encoding Costs
3,388.933 33.696
3,422,631
1,692.471 33.698
i,417.869 278.593 LR-H-106 ws 3.1.1
3.1 Total 1,7x,169 1,417,669 276,593 =sum(3 la.3 lb)
C.S. 5.2 Mndow Sctvlcc 3.2~ Lti Window SeNice Direct 3.2b CRA Window Service Total 3.2~ Window Service Non-Direct 3 2d Wit&w Service Piggyback Factor 3.2s Piggybacked C&s
5,997 36,627
w630
3,386 2,024 588
19.802 10,259 569 1.4222 1.4222 1.4221
9,790 5.166 466
L!!tt report ALA65OP16 C.S. 3 2 Total from CRA q 3.2b -3.2a disbibuted to shape by key Volume LR-H-77 : Cost wghtd avg of Std A subclasses. =sum(3.2a.3.2c)‘(3.2d 1)
3.2 T&al 52.091 32.978 17,468 1,645 =sum(3 Zs,3.2c,3.2e)
C.S. 6 a 7 City Dcllvcry cmrlcrr 6.1 Liccalt In-Oftice Direct Labor 6 2 In-Dfi?cs support 7.1 Route 7.2 Access 7.3 Elemental Load 7.4 Other Load 7.5 street suppxl 6&7 SubhMal 6&7 Piggyback Factcis 667 Piggybacked Costs
614,403 447,766 346,088 156,629 86,116 66.531
40,197 22,160 17,500 63,045 35,614 31,492
449,685 =.=a 177.711
123,310 96.9.94 937.807 736,334
1 3109 I,3095 231.584 227,907
LIOCAlT rsport AlA650P14 = 6.1 * Support Factor 0.1923 = CS total from CRA dist. to shape by Volume = CS total from CRA dist. to shape by Volume = CS total horn CRA dist. to shape by ElemLoad = CS total from CRA dist to shape by Volume = CS total from CRA dist to shape by 6 1 7 4 = sum of 6.1 through 7.5 LR-H-77 : Cost wghtd avg o, Std A subclasses~ = 667 subtotal ‘( 667 pig, fact - 1)
667 Total
231,632 1,760,591
546,443
2,307.033 1,229.390 964,241
20,547 3,952
537 739
49.333
11,339 86,450 1.3116 26,952
113,401 = sum( 667 subtotal, 667 piggybacked costs)
C.S. 6 Vchlclc Servlcc Drivers 6a Vehicle Senrice Drivers 6b Piggyback Factors 8c Piggybacked Costs
64575
46,365
130.940
17,424 55,933 ii.218 = CS total from CRA dist. to shape by Cube 1.5490 1.5465 1 s454 LR-H-77 : Cost wghtd avg of Std A subclasses.
9,565 30.661 6,116 = Ba * (6b -1)
a Total 26,989 86,615 17,337 =sum( aa, SC)

Table 3
FY 1996 Bulk Standard Mail (A)
Costs by Shape ($600)
Sum over cost category Lenerr Flats
IPPS & Parcel
C.S. 10 Rural Dellvery Carrlcrr IOa Rural Delivsv Carriers lob Piggyback Factors IOC Pipgybscked Costs
IO Total
647,876
128.621
776,497
176.721 446,783 22,373 1.1985 1 1965 1.1965 35,480 mm 4.441
214,201 535.482 26.814
= CS total from CRA dist to shape by RuralDel CR-H-77 Cmt wghtd avg of Std A subclasses :9a’(9b-1)
=sunq 9a. 9.2)
C.S 14 Transportatfon 14.la Dome&Air 14 lbttiihway 14.1~ Railroad 14.1 d Domestic Watei 14.2 International Tnnsportation
19.598 7.029 10,938 1.661 247,899 57.028 141,180 49,691
84,846 19,897 47,278 17.471 8.618 2.661 4,992 765
C,S Total dist to shape by Weight C .S Total dist to shape by Cubs C.S. Total dist to shape by Cube C S. Total dist to shape by Weight C.S. Total dist to shape by Weight
14 Total 3JZ0.761 86.615 204.358 69,589 = sum of 14.la through 14.2
All Other Costs A CRA Total for Rate Catsgory 6. Sum of C.S. Totals from above c. LMferenca
7,092,586 7.049.953
42,635
42,635
7,092,588
CRA total atbibuiable for rate category Sum of C.S. totals above =A-6
Total All Omer 17,099 25,456 80 = C dist. to shape by Volume
Total Atbibutablc 3.333,641 3,251,4.%3 507,459 47.00% 45.84% 7 15%
Attlbutablc Cost per Plecc (Dollars) 0.099 0080 0113 0.516
Dlrblbutlon Keys Key Name Source
1 Volume of Mail (MXI) 2 Weight of Mail (Ooo) 3 Density of Mail (pounds/cubic feet) 4 Cub8 of Mail (OM)) 5 Key -Volume of Mail (percent by shape) 6 Key Weight of Mail (percent by shape) 7 Key-Cube of Mail (percent by shape) a 9 Elemental Load Key 10 Rural Dslivery Key
71,540,326 6.983.068
20.4 440.059
41,865,345 28,692,335 982,647 2,509,926 5,960,275 512.887
26 4 20.7 8.1 88,310 288,597 63,152
585% 40.1% 14% 27.9% 66 3% 5.7% 201% 65 6% 14.4%
Table 1 8 2 Table 1 & 2
Volume Weight cub-3
MC951, LR-MCR-13, Supp. 1 = Weight I Density Share of (1) by shape Share of (2) by shape Share of (4) by shape
49.5% 39.5% 11 Osb ElemLoad Table 5 27,6% 69.0% 3,5% RuralDel Table 6
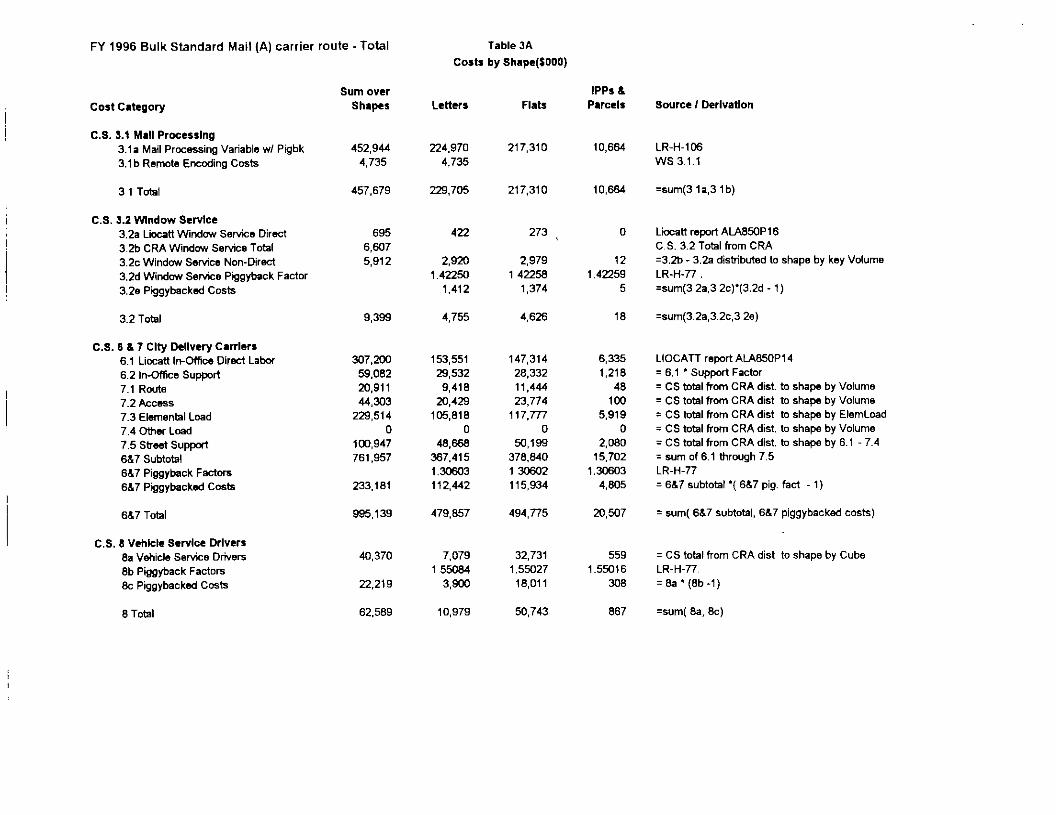
FY 1996 Bulk Standard Mail (A) carrier route -Total
cost category
C.S. 3.1 Mall Pracsrlng 3.1s Mail Processing Variable wl Pigbk 3.1 b Rsmots Encoding Costs
Sum over Shapes Ldterr Flab
iPPS a Parcclr Source I Derlvallon
31Total
452,944 4,735
457,679
224.970 4,735
217,310 10,664 LR-H-106 ws 3.1.1
223.705 217,310 10,664 =sum(3 la,3 1 b)
C.S. 5.2 Nlndow SetvIce 3.2a Lioutt Window Sefvics Direct 3~2b CRA Window Sewice Total 3.2~ Window Setics Non-Direct 3.2d Window Service Piggyback Factor 3.2e Piggybacked Costs
695 6,W7 5,912
422 273 / 0
2.9m 2,979 12 I.42250 142258 1.4259
1,412 1,374 5
Liccatt report ALA850P16 C,S. 3.2 Total from CRA -3.2b - 3.2a disbibtied to shape by ksy Volume LR-H-77 =sum(3 2a.3 2c)‘(3.2d - 1)
3.2 T&l 9,399 4.755 4,626 18 =sum(3.2a,3.2c,3 2e)
C.S. 0 a 7 Clly LkllVCry carders 6.1 Liccatt IwOffice Direct Laba 6.2 In-CMcs Support 7.1 Route 7.2 Access 7.3 Elemental Load 7.4 Other Load 7.5 Sbsd supput 687 Subtotal 667 Piggyback Factors 6&7 Piggybacked Costs
307.2w 59.082 m.91 I 44,303
229,514 0
100,947 761,957
153,551 147,314 6,335 29,532 28,332 1,218
9,418 11,444 48 20.429 23,774 100
lc5.818 117.777 5,919 0 0 0
48.668 50.193 2.080 367.415 378.840 15.702 1.3D303 13cs302 1.30@33 112,442 115,934 4.805
LIOCATT report AlA850P14 = 6.1 ’ Support Factor = CS total from CRA dist. to shape by Volume = CS total from CRA dist to shape by Volume q CS total from CRA dist to shape by ElemLcad = CS total from CRA dist. to shape by Volume = CS total from CRA dist. to shape by 6.1 7.4 = sum of 6.1 through 7,5 LR-t-77
667 Total
233.181
995,139 479,857 494,775 m,w7
= 667 subtotal ‘( 667 pig. fact 1)
= sum( 6&7 subtotal. 6&7 piggybacked costs)
C.S. 8 Vchlck Scr.4cc Drlvcrs 8a Vehicle Service Drivers 8b Piggyback Factors & Piggybacked Costs
8 T&l
40,370
22.219
62,589
7,079 155x4
3,900
10,979
32,731 559 I.55027 I.55016
18,011 308
= CS total horn CRA dist to shape by Cube LR-H-77, =8a’(Bb-1)
50,743 867 =s”m( Ba, 8~)
Table 3A
Costa by Shapc(S000)

FY 1996 Bulk Standard Mall (A) carria :oute -TOM
cost cstcgory Sum over
Shapes Letters IPPS h
Parcels Source I Derlvrtton
C.S. 10 Rural Dellvery Cwlcrs lOa Rural Delivery Carriers IOb Piggyback Factors IOC Piggybacked Costs
273,474
54.295
327,769
62,426 210,527 1.19853 I,19853
12,394 41,798
74,819 252,326
521 = CS total from CRA dist to shape by RuralDel 1.19853 LR-H-77
103 = Sa * (9b -1)
lOTotal 624 =sum( 9a, 92)
C.S 14 Tnnsportltlon 14.la Domestic Air 14.lb Hbhway 14.1~ Railroad 14.ld Domes& Water 14.2 lnternstimsl Tnnsporbtion
1,728 333 1,352 5 C.S Total dist to shaps by Weight 41.309 7.601 32,955 553 C.S. T&l dist to shape by Cube 11.862 2.570 9.145 147 C.S. Total dist to shape by Cube
1,210 330 877 3 C.S. Total dist to shape by Weight 0 0 0 0 C.S. Total dist to shape by Weight
14Tofal 56,107 Il.069 44,330 708 = sum of 14.1s through 14.2
All Dthcr Costa A. CRA Total for Rate C&gory 6. Sum of C.S. T&Is from stave c. Dflsrsnce
CRA MaI atbibtible for rate category Sum of C.S. totils above =A-0
Total All OtJwr
I.=,= 1,508,681
49.821
49,821
1.958.502
23,045 26,663
834,229 1.090,773 42.60% 55.69%
112 = C dist. to shape by Volume
Total Attrtbutablc ~.~ 1.71%
Attlbutable Cost per Plecc (Dollars)
Dlsblbutlon Keys
1 Volume of Mail (CC0)
2 Weight of Mail (Ooo)
3 Cube of Mail (KU)
0.081
32,089,354 4,303,8rn
197,704
Tabk 3A
Costs by Shapc(S000)
0.055 0,064 0.473
Key Name Source
15.102.594 16.915.917 70,853 Tables 1 and 2 970.828 3.320,697 12,295 Tables 1 and 2
34.158 160,788 2,759 Sum of carrier route
FY 1996 Bulk Standard Ma!l (A) nor?carr!er rau!e - Teta! Table 36
Cask by Shape(S000)
cost Catsgory Sum over
Shapes Letters Flak IPPS h
Parcels Source I Dcrlvatlon
C.S. 3.1 Mall Proccsslng 3.la Mail Processing Variable wl Pigbk 3.1 b Remote Encading Costs
2,935,988 1,467+X1 28,963 28,963
1.200,5% 267,929 LR-H-106 ws 3.1.1
3.1 Total 2.934952 1.496,465 1,2a,558 267,929 =sum(3.la.3.lb)
C.S. 3.2 Mndow Scrvlcc 3.2a Liccatt Window Setics Direct 3.B CRA Wind-w Senrice Tokl 3.2~ Window Service Non-Dir& 3.2d Wtndow Service Piggyback Factor 3 20 Piggybacked Cask
5,302 worn 24.718
2.964 1,751 5.38
16,881 7,279 557 1.42215 1.42212 1.42210
6,378 3,812 483
Liocatt report AMBSOP16 C.S. 3.2 Total from CRA =3.2b - 3.2a disbibukd to shape by key Volume LR-H-77. =sum(3 2a,3.2c)*(3.2d - 1)
3.2 Total 42,693 26.223 12,842 1,628 =sum(3.2a,3.2c.3.2s)
C.S. 6 6 7 Clty Dcllvcty Canlcrs 6.1 Lixatt In-Office Direct Labor 6.2 In-Office Support 7.1 Route 72Access 7.3 Elemsnkl Load 7.4 OOw, Load 7.5 Sbwt Support 667 Subtotal 667 Piggyback Fsctors 6h7 Piggybacked Cmk
507,202 97,547 19.286 23,742
220.171 0
130,685 998.633
294.217 198.774 14.211
56,585 58.229 2,733 12.742 6,055 488 15,385 7.718 839
116,820 59,934 43,417 0 0 0
74.642 46,785 9,259 570,391 357,494 70.748 1.31407 1.31322 1.31303 179,142 111,973 22,146
LIOCATT report ALA850P14 = 6.1 * Support Factor = CS total from CRA dist. to shape by Volume = CS tvkl from CRA dist. to shape by Volume = CS total from CRA dist to shape by ElemLoad = CS tokl from CRA dist. to shape by Volume = CS tokl horn CRA dist to shape by 6.1 - 7.4 = sum of 6.1 through 7.5 LR-H-77
6&7 Tokl
313,281
1.311.895 749,533 469.467 92,894
= 667 subtotal ‘( 667 pig. fact. 1)
= sum( 6&7 subtokl. 6&7 piggybacked costs)
C.S. 8 Vchlck Scrvlcc Drlvcrr 6a Vshicls Selvica Drivers 8b Piggyback Factors 8c Piggybacked Costs
M,Z05
24.148
68,351
10,344 23.202 10,659 1 s4771 154608 1.54514
5,686 12.670 5,811
= CS total from CRA dust. to shape by Cube LR-H-77 -8a*(bb-1)
8 Total 16,010 35,872 16.469 =sum( 8a, 8~)
I

FY 1996 Bulk Standard Mail (A) noncarrier route -Total Table 36
Cost, by Shapc(S000)
cost category Sum over
Shapes tdtcra Flak IPPS a
Parcels Source I Dcrfvrfton
C.S. IO Rural Delivery Carders lh Rural Delivery Carriers IOb Piggyback Factors 10~ Piggybacknd Cask
10 Total
374,402
74,325
448,727
116,295 236,255 21,852 119852 1 19852 1.19.9.52
23,087 46.931 4.333
139,392 293.156 26,190
= CS total from CRA dist. to shape by RuralDel LR-H-77 = 9a * (9b -1)
=sum( 9a, 9c)
C.S 14 Transportation 14 1 a Domestic Air 14.lb Highway 14.1~ Railroad 14.ld Dome& Water 14.2 ltismaiional Transportation
17,872 6,661 9,555 I.656 C.S. Total dist to shape by Weight
206,590 49,227 108,225 49,139 C S. Total dist to shape by Cube 72,784 17,327 38.133 17.324 C S. Total dist to shape by Cubs
7.40.9 2,531 4,115 762 C.S. Total dist to shape by Weight 0 0 0 0 C.S. Tokl dist to shape by Weight
14 Tokl 3c4.654 75,745 1 60.029 68,eai =sumofl4lathrough14,2
All Dtbcr Cosk A. CRA Total for Rats Category 6. Sum of C.S. Totals from above c. Dierence
5.134.086 CRA total attributable for rate category 5.141.272 Sum of C.S totals above
-7.186 =A-0
Total All OIher
Total Amlbukblc
-7.186
5.134.oSS
-5,946
2,499,412 4.668%
-1,208 -32 = C dist. to shape by Volume
2.160.715 42.09%
473,959 9.23%
0.5M Attlbttkblc Cost per Plccc (Dollars) 0.130 0.093 0.183
DlsWbutMn Keys Key Name SOUPX
1 Vdums of Mail (OM)) 39,450.974 X,762,761 ll.T16,419 911,794 Tables 1 and 2 2 Weight of Mail (Ooo) 4.679.263 1,539,096 2,639,57.3 5cn.592 Tables 1 and 2 3 Cube of Mail (Doe) 242,355 54.152 127,808 60.394 Sum of noncarder route

FY 1996 Bulk Standard Mai: (A) E-I I haitccd Cairiei Roliie Tabie 3Aji j
Costs by Shape ($000)
cost Category Sum over
Shapes Letter5 Flats IPPS a
Parcels Source I Derivation
C.S. 3.1 Mall Processing 3.la Mail Processing Variable w/ Pigbk 3.lb Remote Encoding Costs
406.076 4,735
412,610
192.382 4,735
205,540 10,154 LR-H-106 ws 3.1.1
3.1 Total 197,116 205.540 10,154 =sum(3.la,3.lb)
C.S. 3.2 Wlndow Service 3.2a Liocatt Window Setice Direct 3 2b CRA Window Service Total 3.2~ Window Se&e Non-Direct 3.2d Window Service Piggyback Factor 3.2ePiggybackedCosts
695 5,677 4.982
422 273 0
2.167 2,763 12 142261 1.42261 142261
1,103 1,292 5
Liocatl reportALA650P16 C.S. 3,2 Total from CRA =3 2b - 3 2a distributed to shape by key Volume LR-H-77. =sum(3.2a,3,2c)'(3 2d- 1)
3.2 Total 6,076 3,712 4,346 17 =sum(32a.3.2c,3.2e)
C.S. B 6 7 City Dellvery Carders 6.1 Liocattln-Oflice Direct Labor 6.2 In-Office Support 7.1 Route 7.2 Access 7.3 Elemental Load 7.4 Other Load 7.5 street support 687 Subtotal 687 Piggyback Factora 687 Piggybacked Costs
266,643 55,167 20,226 41,494
216,510 0
94.758 714.998
LIOCATT reportALABSOPl4 = 6 1 * Support Factor 0.192 = CS total from CRA dist. to shape by Volume = CS total from CRA dist to shape by Volume = CS total from CRA dist. to shape by ElemLoad = CS total from CRA dist. to shape by Volume = CS total from CRA dist. to shape by 6.1 - 7.4 = sum of 6.1 through 7 5 LR-H-77.
687 Total
216.604
933.601
136,071 142.465 6,266 26,554 27,403 1,209
6,076 11.300 46 16.213 23.162 99 97,109 114,296 5,105
0 0 0 44,126 46,665 1,946
332,951 367,351 14.695 1.30602 1.30602 1.30602 101,890 112,417 4,497 = 687 subtotal ‘( 687 pig. fact. - 1)
434,641 479.768 19,192 = sum( 687 subtotal. 687 piggybacked costs)
C.S. 6 Vehicle Service Drivers 6a Vehicle Service Drivers 6b Piggyback Factors 6c Piggybacked Cask
6.150 31,724 554 1.55010 1.55010 1.55010
3,363 17,452 304
= CS total from CRA dust. to shape by Cube LR-H-77. = 6a'@b-1)
6 Total
36,426
21,139
59,567 9,533 49,176 656 =sum( 6a, 6~)
C.S. IO Rural Delivery Carriers 10a Rural Delivery Carriers IOb Piggyback Factors 10~ Piggybacked Costs
259,640
51.552
57,257 201,916 466 = CS total from CRA dist. to shape by RuralDel 1.19855 1.19655 1.19655 LR-H-77.
11.366 40,091 93 = 9a * (9b -1)

FY 1996 Bulk Staiidx; Mai; (A; Enhanced Carrier Rate Table 3Ajlj
Costs by Shape ($000)
cost category Sum over
Shapes Letters Flats IPPS *
Parcels Source I Derivation
10 Total 311,192 66,626 $42.007 559 =s”m( 9a, 9c)
C.S 14 Transport&Ion 14.la Domestic Air 14.1 b Highway 14.1 c Railroad 14.1 d Domestic Water 14.2 International Transportation
1,706 37,571
9,753 993
0
14 Total
359 6,013 1,561
209 0
6.141
1,344 31,017
6.052 762
0
50,025 41,194
5 541 140
3 0
690
C.S Total dist to shape by Weight C.S. Total dist to shape by Cube C.S. Total dist to shape by Cube C.S. Total dist to shape by Weight C S Total dist to shape by Weight
= sum of 14.la through 14.2
All Other Costs A. CRA Total for Rate Category 6. Sum of C.S. Totals from above C. DAerence
1.621,927 CRA total attributable for rate category 1.775,471 Sum of C S. totals above
46,456 =A-B
Total All Other 46,456
Total Attributable 1.621.927
20,391 25,954 111 = C dist. to shape by Volume
742,360 1.047.967 31.560 40.75% 57.52% 1.73%
Attlbutable Cost per Piece (Dollars) 0.062 0.058 0.064 0 455
Dlstrlbutlon Keys Key Name Source
1 2 3 4 5 6 7 8 9 10
Volume of Mail (000) 29,180.737 12,606,167 16,303,105 69,464 Weight of Mail (000) 4.111,416 863,349 3,236,036 12,029 Density of Mail (pounds/cubic feet) 21.6619 28.4219 20.6526 4,4 Cube of Mail (000) 169,799 30,376 156.669 2,734 Key - Volume of Mail (percent by shape 100.00% 43.89% 55.67% 0 24% Key - Weight of Mail (percent by shape) 100.00% 21.00% 76.71% 0.29% Key - Cube of Mail (percent by shape) 100.00% 16.00% 62.56% 1.44%
Elemental Load Key 100.00% 44.65% 52.79% 2.36% Rural Delivery Key 100.00% 22.05% 77.77% 0.16%
Table 1 Table 1
Volume Weight Cube
ElemLoad RuralDel
LR-MCR-13. LR-PCR-36 = Weight I Density Share of (1) by shape Share of (2) by shape Share of (4) by shape
Table 5 Table 6

FY 1996 Bulk Standard Mail (A) Regular
cost Category Sum over
Shapes Letters Flats IPPs 6
Parcels Source I Derlvatlon
C.S. 3.1 Mall Processlng
3.la Mail Processing Variable wl Pigbk 3.lb Remote Encoding Costs
2.372,166 24.186
2,396.352
1.089,837
24,186 1.030,093 252,236 LR-H-106
ws 3.1.1
3.1 Total 1,114.024 1.030.093 252,236 =s”m(3.la,3.lb)
C.S. 3.2 Wlndow Service 3.2a Liocatt Window Service Direct 3.2b CRA Window Service Total 3.2~ Window Service Non-Direct 3.2d Window Setice Piggyback Factor 3.2e Piggybacked Costs
3.716 22,022 18.306
1,571 1,557 588
11,582 6,197 528 1.42210 1.42210 1.42210
5,552 3,273 471
Liocatt report ALA850Pl6 C S. 3.2 Total from CRA =3.2b 3.2a distributed to shape by key Volume LR-H-77. =sum(3.2a,3.2c)‘(3.2d - I)
3.2 Total 31,317 18,704 11,027 1,586 =sum(3.2a,3.2c,3.2e)
C.S. 6 & 7 Clty Dellvery Carders 6.1 Liocatt In-Wee Direct Labor 6 2 In-Office Support 7.1 Route 7 2 Access 7.3 Elemental Load 7.4 Other Load 7.5 Street Support 687 Subtotal 687 Piggyback Factors 687 Piggybacked Costs
411,386 79,119 16,498 21,862
172,709 0
105,645 807.220
LIOCATT report ALA850Pl4 = 6 1 * Support Factor 0.192 = CS total from CRA dist. to shape by Volume = CS total from CRA dist. to shape by Volume = CS total from CRA dist. to shape by ElemLoad = CS total from CRA dist. to shape by Volume = CS total from CRA dist to shape by 6 1 7.4 = sum of 6.1 through 7.5 LR-H-77.
687 Total
252.216
1,059,435
222,276 175,672 13,439 42,749 33,786 2,585 10.438 5.564 476 13,831 7.400 630 82,419 51.482 38,808
0 0 0 55,973 41.248 ‘3,423
427,686 315,173 64,360 1.31245 1.31245 1.31245 133,630 98,476 20.109
561,316 413,649 84.470
= 687 subtotal ‘( 687 pig fact. 1)
= sum( 687 subtotal, 687 piggybacked costs)
C.S. 8 Vehicle SetvIce Drivers 8a Vehicle Service Drivers .6b Piggyback Factors 8c Piggybacked Costs
37,843
20,620
58.463
7,251 20,241 10,351 1.54487 1.54407 1 54487
3,951 11,029 5,640
= CS total from CRA dist to shape by Cube LR-H-77. =8a’(8b-1)
0 Total 11,202 31,269 15,991 =sum( Ba, SC)
C.S. IO Rural Dellvery Carriers 10a Rural Delivery Carriers IOb Piggyback Factors 10~ Piggybacked Costs
304,392
60,425
85.054 198,334 21,003 1.19851 1.19851 1.19851
16.884 39.371 4,169
= CS total from CRA dist to shape by RuralDel LR-H-77. = 9a’(9b -1)
Table JB(1)
Cork by Shape(S000)
-.. _ _ - - I-Y 19% UUIK Standarfl Mall (A) Reguiar Table 38(l)
Costs by Shape(S000)
cost category
10 Total 364.817 101,938 237,706 25,173 =sum( Qa. Qc)
C.S 14 Transportation 14.la Domestic Air 14.lb Highway 14.1~ Railroad 14.ld Domestic Water 14.2 International Transportation
12,702 3,693 173.861 33,315 61.308 11.748
6,077 1,767 0 0
7,491 1,517 92,992 47,554 32,791 16,769
3.584 726 0 0
136,859 66,567
C.S. Total dist to shape by Weight C.S. Total dist to shape by Cube C.S. Total dist to shape by Cube C S. Total dist to shape by Weight C.S. Total dist to shape by Weight
14 Total 253.948 50,523 = sum of 14.la through 14.2
All Other Costs A. CRA Total for Rate Category B. Sum of C S. Totals from above c. Difference
4,164,366 CRA total attributable for rate category 4.164,332 Sum of C.S. totals above
34 =A-6
Total All Other 34 21 11 1 = C dist. to shape by Volume
Total Attributable 4,164,366 1.857.729 44.61%
1.860,614 44.68%
446,023 10.71%
Attibutable Cost per Plece (Dollars) 0138 0.097 0~182 0.513
Dlstrlbutlon Keys
1 Volume of Mail (000) 2 Weight of Mail (000) 3 Density of Mail (pounds I cubic feet) 4 Cube of Mail (000) 5 Key - Volume of Mail (percent by shape 6 Key-Weight of Mail (percent by shape) 7 Key - Cube of Mail (percent by shape) a 9 Elemental Load Key 10 Rural Delivery Key
Sum over Shapes
30.150,508 4.048,844
18.7298 216,171 100.00% 100.00% 100.00%
100 00% 100 00%
Letters
19,075,363 1,177,289
28 4219 41,422
63.27% 29.OaX 19.16%
47.72% 27.94%
Flats
10.205.711 2.387,896
20.6526 115,622 33.85% 5a 98% 53.49%
29 81% 65.16%
IPPS h Parcels
869,434 483,659
8.18 59.127 2.88%
11.95% 27.35%
22.47% 6 90%
Source I Derivation
Key Name SOUK%
Table 1 Table 1
Volume Weight Cube
ElemLoad RuralDel
LR-MCR-13, LR-PCR-3a = Weight / Density Share of (1) by shape Share of (2) by shape Share of (4) by shape
Table 5 Table 6

FY 1996 Bulk Standard Mail (A) Nonprofit Enhanced Carrier Route Table JA(2)
cost Category Sum ever
Shapes Letters Flats IPPS 6
Parcels Source I Derivation
C.S. 3.1 Mall Precesslng 3.la Mail Processing Variable wl Pigbk 3.lb Remote Encoding Costs
44.869 0
44,869
32.588 0
11,770 510 LR-H-106 ws 3 1.1
3.1 Total 32,588 11,770 510 =sum(3.la,3.lb)
C.S. 3.2 Wlndow Service 3.2a Liocatt Window Service Direct 3.2b CRA Window Service Total 3.2~ Window Senice Non-Direct 3.2d Window Service Piggyback Factor 3.2.~ Piggybacked Costs
0 930 930
0 0 0
734 196 0 1.42213 142213 1.42213
310 a3 0
Liocatt reportAtAa50Pl6 C S 3.2 Total from CRA =3.2b - 3.2a distributed to shape by key Volume LR-H-77 =s”m(3.2a.3.2c)‘(3 2d 1)
3.2 Total 1,323 1,043 279 1 =s”m(3.2a.3.2c.3.2e)
C.S. 6 6 7 Clty Dellvery Carders 6.1 Liocatt In-Once Direct Labor 6.2 In-Oflice Support 7.1 Route 7.2 Access 7.3 Elemental Load 7.4 Other Load 7.5 Street Support 687 Subtotal 687 Piggyback Factors 687 Piggybacked Costs
20,357 3,915
685 2,809
13,004 0
6.189 46,960
15.480 4.829 49 2,977 929 9
540 144 0 2,216 592 1 a.709 3.481 al4
0 0 0 4,542 1,514 133
34,464 11.489 1,007 130617 1.30617 130617
10.552 3.518 308
LIOCATT report ALAa50Pl4 = 6.1 * Support Factor 0.192 = CS total from CRA dist. to shape by Volume = CS total from CRA diit. to shape by Volume = CS total from CRA dist. to shape by ElemLoad = CS total from CRA dist. to shape by Volume = CS total from CRA dist. to shape by 6.1 7.4 = sum of 6.1 through 7.5 LR-H-77.
687 Total
14.378
61,337 45.016 15,006 1,315
= 687 subtotal ‘( 6a7 pig. fact, 1)
= sum( 687 subtotal, 687 piggybacked cask)
C.S. 6 Vehicle Service Drivers aa Vehicle Service Drivers ab Piggyback Factors ac Piggybacked Costs
929 1,007 6 1.55577 1.55577 1.55577
516 560 3
= CS total from CRA dist. to shape by Cube LR-H-77.
a Total
1,942
1,079
3,021 1,445 1,567
= aa*(ab-1)
=sum( aa, ac)
C.S. 10 Rural Dellvery Carrlers IOa Rural Delivery Carders lob Piggyback Factors IOc Piggybacked Costs
13,834
2,744
5.16B a,61 1 1.19834 1.19834
1,025 1,708
9
55 1.19834
11
= CS total from CRA dist. to shape by RuralDel LR-H-77. =Qa’(Qb-1)

FY i336 Bulir Siandard iviaii (A; Nonpioiit inhanicd Caiiiei Route Tabie 3Ajij
Costs by Shapc(SOO0)
Sum over cost Category
10 Total 16,578 6,193 10,319 66 =sum( Qa. Qc)
C.S 14 Transportation 14 la Domestic Air 14,lbHighway 14.1~ Railroad 14.ld Domestic Water 14.2 International Transportation
la 3.738 2,109
217 0
IO a 0 I ,788 1.938 11 1,009 1,094 6
121 95 0 0 0 0
2.928 3,135 ia
C.S. Total dist to shape by Weight C S Total dist to shape by Cube C.S. Total dist to shape by Cube C.S. Total dist to shape by Weight C.?. Total dist to shape by Weight
14 Total = sum of 14.la through 14.2
All Other Costs A CRA Total for Rate Category B. Sum of C.S. Totals from above C. Difference
136,575 CRA total attributable for rate category 133,210 Sum of C S. totals above
3,365 =A-B
Total All Other 3,365 2,655 709 2 = C dist. to shape by Volume
Total Attributable 136,575 91,869 42.786 67.27% 31.33%
1,920 1.41%
Attlbutable Cost per Piece (Dollars) 0 047 0 040 0.070 1.382
Dlstrlbutlon Keys
1 Volume of Mail (000) 2 Weight of Mail (000) 3 Density of Mail (pounds/cubic feet) 4 Cube of Mail (000) 5 Key - Volume of Mail (percent by shape 6 Key -Weight of Mail (percent by shape) 7 Key. Cube of Mail (percent by shape) a 9 Elemental Load Key IO Rural Delivery Key
Shapes Letters Flats
2,908,617 2.294,417 192,403 107,479 24.3399 26.4219
7,905 3,782 100 00% 78.88% 100.00% 55.86% 100.60% 47 84%
100 00% 100.00%
66.97% 26.77% 37.36% 62 25%
612.811 84.658
20,6526 4,099
21.07% 44.00% 51.B6K
IPPS 6 Parcels
I ,389 266
11.03 24
0.05% 0.14% 0.31%
6.26% 0.40%
Source I Derivation
Key Name Source
Table 2 Table 2
Volume Weight Cube
ElemLoad RuralDel
LR-MCR-13. LR-PCR3a = Weight / Density Share of (1) by shape Share of (2) by shape Share of (4) by shape
Table 5 Table 6

FY 1336 Bulk s:an:ai: Mail (Ai Nonpioiii - racJ,e 3e(q
Cork by Shape(SOO0)
cost Category
C.S. 3.1 Malt Processing 3.la Mail Processing Variable w/ Pigbk 3.1 b Remote Encoding Costs
3 1 Total
C.S. 3.2 Wlndow Servtce 3.2a Liocatt Window Service Direct 3.2b CRA Window Setice Total 3.2~ Window Setice Non-Direct 3.2d Window Service Piggyback Factor 3.2e Piggybacked Costs
3.2 Total
C.S. 6 6 7 City Dellvery Carriers 6.1 Liocatt In-DftIce Direct Labor 6.2ln-Ofike Support 7.1 Route 7.2 Access 7.3 Elemental Load 7.4 Other Load 7.5 Street Support 687 Subtotal 687 Piggyback Factors 687 Piggybacked Costs
687 Total
C.S. a Vehicle Service Drivers aa Vehicle Service Ortvars ab Piggyback Factors ac Piggybacked Costs
a Total
C.S. 10 Rural Delivery Carriers IOa Rural Delivery Carriers IOb Piggyback Factors IOc Piggybacked Costs
Sum over Shapes
563.823 4,777
568,600
1,586 7,998 6.412
11.375
95,816 18.428 2,788 1.~80
47,462 0
25,040 191,414
61,046
252,459
6,362
3,527
9.889
70.010
13,900
Letters Flats IPPS h
Parcels Source I Dertvatlon
377,664 4,777
170,466 15,693 LR-H-106 ws3.1.1
382.441 170,466 15,693 =sum(3.la.3.lb)
1,393
5,300 1.42225
2,826
Liocatt report ALAa50Pl6 C S. 3.2 Total from CRA =3.2b - 3.2a distributed to shape by key Volume LR-H-77. =sum(3.2a,3.2c)^(3,?d 1)
9.518
193 0
1,083 29 1.42225 1.42225
539 12
1.815 42
71,942 13.836 2,304 1,554
34,401 0
18,668 142,705 1.31892 45,512
LIOCATT report AtAa50Pl4 = 6.1 *Support Factor 0.192 = CS total from CRA dist. to shape by Volume = CS total from CRA dist to shape by Volume = CS total from CRA dist. to shape by ElamLoad = CS total from CRA dist. to shape by Volume = CS total from CRA dist. to shape by 6 1 - 7 4 = sum of 6.1 through 7 5 LR-H-77. = 687 subtotal ‘( 687 pig. fact. - 1)
188,217
23,102 773 4,443 149
471 13 318 9
a.451 4.610 0 0
5,536 836 42.321 6.388
1.31892 1.31892 13,497 2,037
55.818 a,425 = sum( 687 subtotal, 687 piggybacked costs)
3,093 1 55437
1,715
2,961 308 1.55437 155437
1,641 171
4,602 479
= CS total from CRA dist to shape by Cube LR-H-77. =aa*(ab-1)
4,808 =sum(aa,Bc)
31,241 37,921 a48 = CS total from CRA dust. to shape by RuralDel 1 19855 1.19855 1.19855 LR-H-77
6,203 7,529 16B = Qa * (Qb -1)

FY 1996 Bulk Standard Mail (A) Nonprofit
cost Category Sum over
Shapes Letters Flats IPPS a
Parcels Source I Derivation
IO Total 63.910 37,443 45,450 1,017 =sum( Qa. Qc)
c.s 14 Tranrportatlon 14 la Domestic Air 14.1 b Highway 14.lcRailroad 14.ld Domestic Water 14.2 International Transportation
5,170 32,729 11,476
1,331 0
14 Total 50,706
2,967 2,064 139 15,912 15,233 1,564
5,579 5,341 556 764 531 36
0 0 0
25,222 23,169 2,314
CS Total dist to shape by Weight C.S. Total dist to shape by Cube C S Total dist to shape by Cube C.S. Total dist to shape by Weight C.S. Total dist to shape by Weight
q sum of 14.la through 14.2
j
All Other Costs A CRA Total for Rate Category B. Sum of C.S. Totals from above c. DHlerence
969,720 CRA total attributable for rate category 976,940 Sum of C S. totals above
-7.220 =A-B
Total All Other i
-5,967 -1,219 -33 = C dist. to shape by Volume
Total Attributable
-7,220
969,720 641,663 300,101 27,936 66.17% 30.95% 2.66%
Attlbutable Cost Per Piece (Dollars) 0.104 0.063 0.191 0,659
Dlstrlbutlon Keys Key Name SOUK.2
1 Volume of Mail (000) 9.300.466 7.687.399 1.570.706 42,360 2 Weight of Mail (000) 630.424 361.610 251.661 16,933 3 Density of Mail (pounds/cubic feet) 24.0766 26.4219 20.6526 13.36 4 Cube of Mail (000) 26.164 12,730 12,166 1,267 5 Key-Volume of Mail (percent by shape 100.00% 62.66% 16.69% 0.46% 6 Key - Weight of Mail (percent by shape) 100.00% 57.39% 39 92% 2.69% 7 Key -Cube of Mail (percent by shape) 100.00% 46.62% 46.54% 4 64%
Table 2 Table 2
Volume Weight Cube
ElemLoad RuralDel
LR-MCR-13. LR-PCR-36 = Weight / Density Share of (1) by shape Share of (2) by shape Share of (4) by shape
Table 5 Table 6
a 9 Elemental Load Key 10 Rural Delivery Key
I
100.00% 72.40% 17.61% 9.71% 100.00% 44.62% 54.17% 121%
Table 38(Z)
Costs by Shape(S000)
,

Table 4 Derivation of In-Office Support Factor
Volume Variable Source
CS 6.1 Direct Labor 2.760.173 a. CS 6.2 In Office Support 536,232 a.
Support Factor 0.1923 = (6.1 + 6.2) I6.1
a. Development of Cost by Segment and Component (USPS lo-4730.ALA430P1, Page 26)

\

I able 5
Construction of FY 1996 Elemental Load Key
Line No. Class Letters Flats Parcels Accountables Collected
Third-Class Mail: 16 Single Piece Rate
Bulk Rate-Reg !? Car Presort 16 Other 19 Total Regular(Br)
Bulk Rate-Nonprofit 20 Car Presort 21 Other 22 Total Nonprofit 23 Total Third
22
53,663 3!.531 !.565 42,031 12.047 11,995 93,914 44.378 13,560
4,556 1.069 415 16,249 1,939 561 20.607 3.026 976
114,743 47,419 14,757
13 221
Source: W/S 7.0.6.6 W/S 7.0.6.6 W/S 7.0.6.6 W/S 7.0.6.6 W/S 7.0 6.6 (Co1 6) (Co1 9) (CO1 10) (Co1 11) (Co1 12)
C6.7 ELEMENTAL LOAD-LETTER ROUTES-MIXED/BUS STOPS
Line No. Class Letters Flats Parcels Accountables Collected
Third-Class Mail: 16 Single Piece Rate
Bulk Rate-Reg 17 Car Presort 16 Other 19 Total Regular(Br)
Bulk Rate-Nonprofit 20 Car Presort 21 Other 22 Total NonprofIt 23 Total Third
2 0 59
639 141 93 2.695 334 1726 3,534 475 1619
196 6 4 944 41 142
1,140 47 146 4,676 522 2024
11
0 0 0
0 0 0
11
Source: W/S 7 0.6.7 W/S 7.0.6.7 W/S 7.0 6 7 WIS 7.0.6.7 W/S 7.0.6 7 (Co1 6) (Co1 9) (Co1 10) (Cd 11) (Co1 12)

Tabie 5
Construction of FY 1996 Elemental Load Key
TOTAL ELEMENTAL LOAD COSTS BY SHAPE OF MAIL
(1) (2) (3) (4) Line No. Class Letters Flats Parcels Other
Third-Class Mail, !6 Single Piece Ra!e 5s 73 666 0
Bulk Rate-Reg 17 Car Presort 89.423 105,249 4,701 0 18 Other 79,703 49.786 37,529 0 19 Total Regular(Br) 169,126 155,035 42,230 0
Bulk Rate-Nonprofit 20 Car Presort 6.131 3,250 760 0 21 Other 32,942 8,093 4,414 0 22 Total Nonprofit 41,073 11,343 5,174 0 23 Total Third 210,255 166,451 48.290 0
Carrier Presort 97,554 108.499 5,461 0 Other 112,645 57,079 41,943 0
Source: C6.5+C6 6+ C6.5+C6.6+ C6.5+C6.6+ C6.l+C6.3+ C6.7 C6 7 C6.7+C6.2 C6.4
Distribution Key:
(5) (6) Total Lenet73
!.015 5.52%
199,373 44 85% 167,016 47 72% 366,391 46.16%
12,141 66 97% 45,449 72.46% 57,590 71.32%
424.996 49.47%
211,514 46.12% 212.467 53.02%
(7) Flats
7 :9%
52.79% 29.61% 42.31%
26 77% 17.61% 19.70% 39 17%
51.30% 27.24%
(8) ” Parcels
67 29%
2.36% 22.47% 11.53%
6 26% 9 71% 8.98%
11.36%
2.56% I sum row’s 17 & 20 19.74% /sum rows 16821
=[(I) + (1) / =[(2) + (2) / =[(3) + (3) /
wW),W.(3 sum((lLP),(3 wN(lW).(V (4)1/ (5) (4)1/(5) (4)1/ (5)
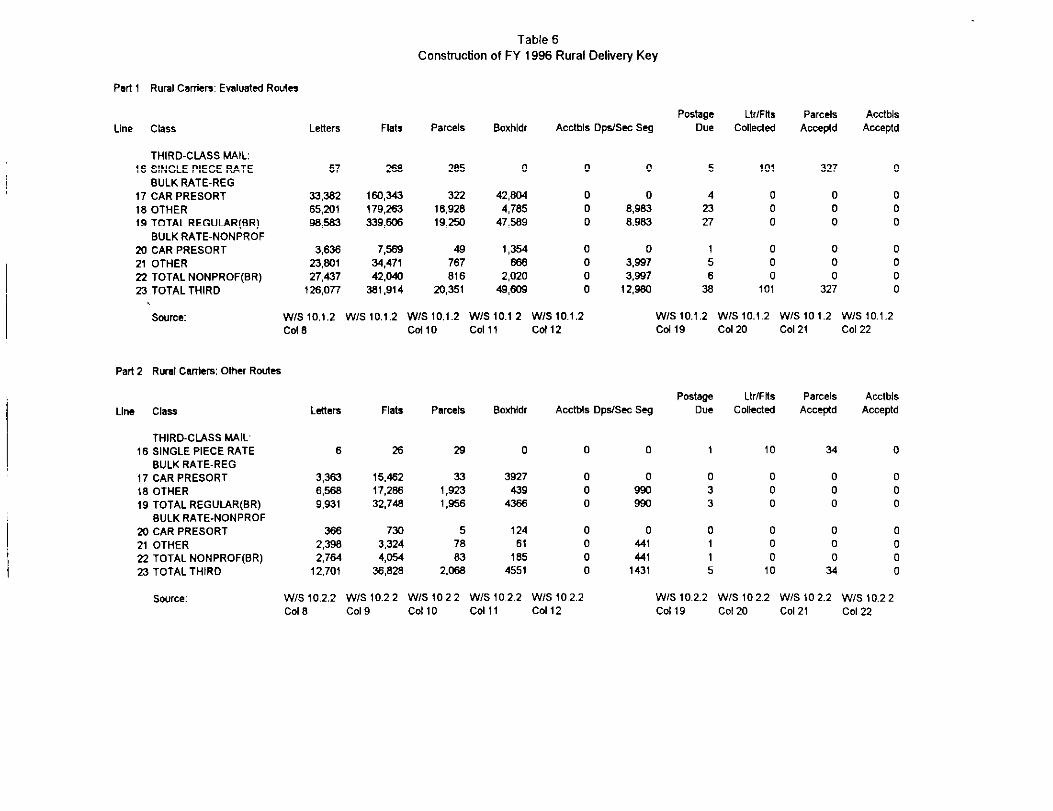
Table 6
Construction of FY 1996 Rural Delivery Key
Pad 1 Rural Carders: Evaluated Rotin
Line ChSS
THIRD-CLASS MAIL: 16 SINGLE PIECE RATE
BULK RATE-REG 17 CAR PRESORT 16 OTHER 19 TOTAL REGULAR(BR)
BULK RATE-NONPROF 20 CAR PRESORT 21 OTHER 22 TOTAL NONPROF(BR) 23 TOTAL THIRD
LMMS
57 265 0
33,362 160,343 322 42,664 65,201 179,283 16.926 4,765
98,583 339,.X6 19,250 47,509
3.636 7.569 49 I.354 23,601 54.471 767 666 27,437 42.040 616 2,M0
126.077 361.914 20,351 @,m
0 0 5 101
0 0 4 0 0 6,963 23 0 0 6,963 27 cl
0 0 1 0 0 3,997 5 0 0 3.997 6 0 0 12.960 38 101
POStaQC LtrlFHs Parcels Acctbls Due COkled Accepld Accepld
source: w,s 10.1.2 w/s 10.1.2 WIS 101.2 WIS 10.1 2 w/s 10.1.2 w/s 10.1.2 w/s 10.1.2 w/s 10 1.2 w/s 10.1.2 Co, 6 Cdl0 COIII co112 Cd 19 co, 20 co, 21 co, 22
Par, 2 Rural Canlm: Other Reties
postage LWFk PWXk Acctbls
LlM ChSS Leilem Flats Parcels Botildr Acctbls DpJ/Sec Sq D”e Collected Acceptd Acceptd
THIRD-CLASS MAIL 16 SINGLE PIECE RATE 6 25 29 0 0 0 1 10 34 0
BVLK RATE-REG 17 CAR PRESORT 3,363 15.462 33 3927 0 0 0 0 0 0 16 OTHER 6,568 17.266 1,923 439 0 990 3 0 0 0 19 TOTAL REGUlAR(ElR) 9,931 32,746 1.956 4366 0 990 3 0 0 0
BULK RATE-NONPROF 20 CAR PRESORT 366 750 5 124 0 0 0 0 0 0 21 OTHER 2.398 3,324 76 61 0 441 1 0 0 0 22 TOTAL NONPROF(BR) 2,764 4,051 63 165 0 441 1 0 0 0 23 TOTAL THIRD 12,701 36,628 2.068 4551 0 1431 5 10 34 0
source: w,s10.2.2 w,s,o.22 WIS1022 W/SlO,2.2 WISlO,2.2 WIS10.2.2 WIS 102.2 WIS102.2 w,s 10.22 Cd 6 Cal 9 COIIO Cdl1 co,12 Cdl9 co, 20 co, 21 Cd 22
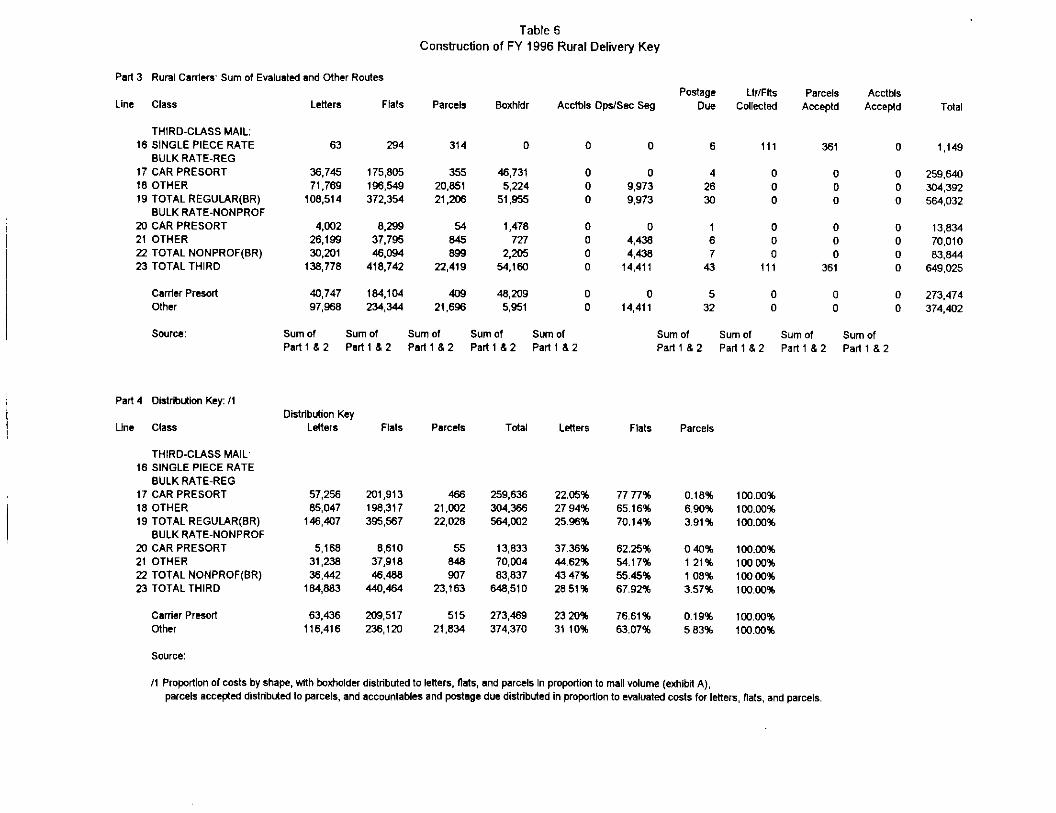
Table 5
Consf~uction of FY 1996 Rural C&lively Key
Part 3 Rural Carderv Sum of Evalualed and Other Routes
Line Cl%* Letter* Fhk Par&S Boxhldr Acctbls DpJSec Seg
THIRD-CLASS MAIL: 16 SINGLE PIECE RATE
BULK RATE-REG 17 CAR PRESORT 16 OTHER 19 TOTAL REGULAR(M)
BULK RATE-NONPROF 20 CAR PRESORT 21 OTHER 22 TOTAL NONPROF(BR) 23 TOTAL THIRD
carder Pru.nl Other
source
Part 4 Distribution Key: /I
LhlC Class
THIRD-CLASS MAIL’ 16 SINGLE PIECE RATE
BULKRATE-REG 17 CAR PRESORT 16 OTHER 19 TOTAL REG”LAR(BR)
BULK RATE-NONPROF 20 CAR PRESORT 21 OTHER 22 TOTAL NONPROF(BR) 23 TOTAL THIRD
FM5 PWC& T&l LMIWS Fhk
57.256 201.913 465 259,636 22.05% 77 77% 65,047 198,317 21.002 304.356 27 94% 65.16%
146,407 395,667 22,026 Ss4.w2 25.96% 70.14%
5,166 6,610 55 13,633 37.36% 62.25% 31,236 37.916 646 7o,w4 4462% 5417% 35,442 46.486 907 63.637 43 47% 55.45%
164,663 440.464 23.163 648,510 2851% 67.92%
carrier Presort 63,436 209,517 515 273.469 23,X?% 76.61% Other 116.416 ZJS,lM 21.634 374.370 3l,lO% 63.07%
source:
63 294 314 0 0
36,745 175,605 355 46.731 0 71,769 196,549 20.651 5,224 0
106.514 372,354 21,206 51,955 0
4.002 8.299 54 1.476 0 26.199 37,795 645 727 0 30.201 46.094 693 u35 0
138,776 416.742 22,419 54.I.W 0
40,747 164,104 409 48,209 0 97,968 234,344 21.696 5,951 0
sum Of sum 0, sum 0, Sum of Sum of Pall 1 6 2 Part I h 2 Part 1 8 2 ParI I 6 2 Pai 1 6 2
0
0 9.973 9,973
0
4,438 4,436
14,411
0 14,411
Postage LtrlFk Parcels Acctbls DW COlleded Aneptd Accepld
6 111
4 0 26 0 JO 0
1 0 6 0 7 0
43 111
5 0 32 0
361
0 0 0
0 0 0
361
0 0
0 1,149
0 259.640 0 304,392 0 554,032
0 13,634 0 70,010 0 63.&u 0 649,025
0 273.474 0 374.402
Sum of sum 0, Sum of sum Of Pali 1 8 2 Part 18 2 Part 1 8 2 Pall 1 8 2
0.16% IW.W% 6.90% IW.W% 3.91% lW.W%
040% lW.W% 121% lWW% 1 06% lWW% 3.57% 1 W.W%
0.19% IW.W% 5 63% lW.W%
II Proportion of costs by shape, Mth barholder disbibtied to letters. flats, and parcels In proportion to mail volume (exhibd A), parcels acceplec distribtied to parcels, and accounlables and postage due dislribtied in proportion lo evaluated costs for IeWs flats. and parcels

Table 7 Calculation of Cost Difference Due to Differences in Presorting and Drop Shipment
FY 1996 Bulk Standard Mail (A)
1) Weight by Entry Discount (Appendix A)
None BMC
Flats 1,415,393 1,403,515 Parcels 365,493 108,056
2) Cost Avoidance S/lb (LR-H-111)
None BMC
0 0.0904
3) Avoided Costs (= (1) * (2))
None BMC
Flats 0 126,676 Parcels 0 9,766
SCF DDU
2.166.316 970,603 37,195 2.106
SCF
0.1105
DDU
0.1379
SCF DDU
239,599 4,110
133.074 291
4) Pieces by Presort Level (Table 1 and Table 2)
Basic 315 Digit Carrier
Flats 1,740,525 10,035,693 6,721,423 Parcels 264,711 627.063 55,567
125 Walk
746,451 1.615
5) Presort Cost Avoidances S I pc (Exhibit USPS-T-ZBC)
Basic 315 Digit Carrier 125 Walk
0 0.062227 0.160176 0.16690
Total
5,958.027 512,655
Average Avoided
Total Cost/Piece
500,350 0.017 (3a) = (3) to 14,169 0.014 (3b) = (3) to
Saturation Total
7.446,043 26.692,335 13,451 962.647
Saturation
0.202025

Table 7 Calculation of Cost Difference Due to Differences in Presorting and Drop Shipment
FY 1996 Bulk Standard Mail (A)
6) Avoided Costs (= (4) * (5)) Average Avoided
Basic 315 Digit Carrier 125 Walk Saturation Total Cost/ Piece
Flats 0 625,221 1.396.963 139,514 1.504,691 3,666,389 0.135 Parcels 0 51,563 6,904 339 2.717 63,524 0.065
7) Cost Difference Due to Differences in Entry and Presort Profile
Flats
9 3
7C)
0.003 $ I piece saved due to entry profile relative to parcels. (= (3a) - (3b)) 0.070 $ I piece saved cue to presort profile relative to parcels. (= (6a) - (6b))
0.073 d / piece of difference in average costs of flats and parcels are explained by differences in presorting and entry profiles. (= va) + (7b))

REVISION TO USPS-LR-H-108
(Replace Pages 1 through Al
with attached pages 1 through 3)

Revised 10/l/97
LR-H-108: Standard (A) Commercial and Nonprofit Rate Mail Volume Estimates
Table of Contents
Introduction .................................................................................. 2
General Description of Process.. ...................................................... .2
Data Processing.. .......................................................................... .3
3

Introduction
Revised 10/l/97
This document desuibes the methods used to produce volume estimates by rate, weight
and shape for Standard (A) commercial rate and nonprofit rate mail. This report is divided into four
sections. The first provides an overview of the stmtitication and control process. The second
describes the methods used in the handling of PERMIT and BRAVIS data. The third describes the
methods used to summarize the data by entry/presort and shape. The fourth section describes
how volumes are controlled to RPW values. The same methodology is used in nonprofit rate
estimation. Nonprofit program listings follow regular rate programs.
Several miscellaneous tables appear here as well. Table A-l contains the weight by entry
discount used in USPS-T-28, Exhibit K, Table 7. Tables A-2 and A-3 contain detailed rate data
used in the construction of the unit cost benchmarks in library reference H-103 Table A-4 contains
share of parcels data used by witness Moeller.
General Description of Process
The general approach used to estimate mail volumes by shape was to group all offices
accepting Standard Mail (A) into strata based upon their National Consolidated Trial Balance
(NCTE) revenue for permit imprint Standard Mail (A) bulk regular mail and then to inflate
PERMIT and BRAVIS revenue reported in each stratum to the stratum revenue total.
The strata were formed by sorting all offices recording Standard Mail (A) commercial
rate revenue in the NCTB in descending order by magnitude of revenue. These offices were
grouped into 20 strata of equal revenue sums. The motivation for this initial stratification was
based upon the theory that offices with approximately the same revenue totals would have
mail of similar characteristics. Thus the first stratum is comprised of only a few offices with
very large revenue totals, and the last stratum contains many offices, each with a small
amount of revenue. The initial 20 strata were further collapsed into 3 final strata by comparing
the billing determinants for each of the 20 strata and combining similar adjacent strata.
Once the 3 strata were defined, the sum of the NCTB revenue for each stratum and
Postal fiscal quarter was computed. The mailing statement data for each stratum and quarter
were summed and then multiplied by the ratio of NCTB strata revenue divided by the mailing
statement strata revenue for permit imprint mail. This ratio was applied to both permit imprint
and stamped and meter mailing statement data. When this was completed for every stratum,
the sum of the revenue for both permit imprint and stamped and metered mail was calculated.
A final control factor of RPW revenue for the quarter divided by this sum was applied to all the
2
--

Revised 10/l/97
mailing statement information for the quarter.
A summary of the resulting estimates by shape and subclass for Postal Fiscal Year
(PFY) 1996 commercial rate Standard Mail (A) appears in USPS-T-26, Exhibit K, Table 1, and
for nonprofit mail in Table 2. For the purposes of this analysis the resulting piece and weight
estimates were controlled by subclass to the official Government Fiscal Year (GFY) 1996 RPW
totals as shown in the tables.
Data Processing
Acquisition of Data
Each quarter Christiansen Associates receives two tapes from the San Mateo Data Center
containing the PERMIT System Transaction records. BRAVIS records are sent on disk from the
various BRAVIS sites throughout the country. The BRAVIS system was completely replaced by the
PERMIT system as of AP 09 1997
PERMIT Data
Translation of PERMIT Records from VAX Format
The tiles that we receive are in a VAX variable length record format, with padded blocks
This is not compatible with our operating system (variable length records span blocks), so it is
necessary to translate each block of data to Data General format by stripping each block of the
padding characters.
Unpack, Translate Data and Remove Reversals - PERMIT Records
Records for non-mail transactions (deposits, refunds, etc.) are skipped. Unused information,
such as clerk’s initials, supervisor’s initials and account balance information, are removed from the
lEc0f-C.
3