
Dosimetric evaluation of a “virtual” image-guidance alternative to explicit 6 degree of freedom...
35
Elsevier Editorial System(tm) for Practical Radiation Oncology Manuscript Draft Manuscript Number: Title: Dosimetric Evaluation of a "Virtual" Image Guidance Alternative to Explicit 6 Degree of Freedom Robotic Couch Correction Article Type: Basic Original Report Corresponding Author: Dr. Bill J Salter, Ph.D. Corresponding Author's Institution: University of Utah First Author: Vikren Sarkar, Ph.D. Order of Authors: Vikren Sarkar, Ph.D.; Brian Wang, Ph.D.; Jacob Hinkle, B.S.; Victor J Gonzalez, M.D.; Ying J Hitchcock, M.D.; Prema Rassiah-Szegedi, Ph.D.; Sarang Joshi, Ph.D.; Bill J Salter, Ph.D. Abstract: Purpose: Clinical evaluation of a "virtual" methodology for providing 6 Degree of Freedom (6DOF) patient setup corrections and comparison to corrections facilitated by a 6DOF robotic couch. Methods and Materials: A total of 55 weekly in-room image guidance CT scans were acquired using a CT on Rails for 11 pelvic and head-and-neck cancer patients treated at our facility. Fusion of the CT-of-the-day to the simulation CT allowed prototype VIRTUAL 6DOF correction software to calculate the translations, single couch yaw, and beam-specific gantry and collimator rotations necessary to effectively reproduce the same corrections as a 6DOF robotic couch. These corrections were then used to modify the original treatment plan beam geometry and this modified plan geometry was applied to the CT-of-the-day to evaluate the dosimetric effects of the VIRTUAL correction method. This VIRTUAL correction dosimetry was compared to calculated dosimetric results for an EXPLICIT 6DOF robotic couch correction methodology through collection of relevant dosimetry metrics. Results: For a total of 470 dosimetric metrics (i.e. max, min, mean dose statistics for all relevant structures) compared for all 55 image guidance sessions, the mean dose difference for these metrics between the plans employing the VIRTUAL corrections and the EXPLICIT corrections was -0.12% with a standard deviation of 0.82%; 97.9% of all metrics were within 2%. Conclusions: The results show that the VIRTUAL corrections yielded dosimetric distributions that were essentially equivalent to those obtained when 6DOF ROBOTIC corrections were used. This suggests that for the patient datasets studied here, highly effective image guidance corrections could be made without the use of a robotic couch.
-
Upload
independent -
Category
Documents
-
view
0 -
download
0
Transcript of Dosimetric evaluation of a “virtual” image-guidance alternative to explicit 6 degree of freedom...

Elsevier Editorial System(tm) for Practical Radiation Oncology Manuscript Draft Manuscript Number: Title: Dosimetric Evaluation of a "Virtual" Image Guidance Alternative to Explicit 6 Degree of Freedom Robotic Couch Correction Article Type: Basic Original Report Corresponding Author: Dr. Bill J Salter, Ph.D. Corresponding Author's Institution: University of Utah First Author: Vikren Sarkar, Ph.D. Order of Authors: Vikren Sarkar, Ph.D.; Brian Wang, Ph.D.; Jacob Hinkle, B.S.; Victor J Gonzalez, M.D.; Ying J Hitchcock, M.D.; Prema Rassiah-Szegedi, Ph.D.; Sarang Joshi, Ph.D.; Bill J Salter, Ph.D. Abstract: Purpose: Clinical evaluation of a "virtual" methodology for providing 6 Degree of Freedom (6DOF) patient setup corrections and comparison to corrections facilitated by a 6DOF robotic couch. Methods and Materials: A total of 55 weekly in-room image guidance CT scans were acquired using a CT on Rails for 11 pelvic and head-and-neck cancer patients treated at our facility. Fusion of the CT-of-the-day to the simulation CT allowed prototype VIRTUAL 6DOF correction software to calculate the translations, single couch yaw, and beam-specific gantry and collimator rotations necessary to effectively reproduce the same corrections as a 6DOF robotic couch. These corrections were then used to modify the original treatment plan beam geometry and this modified plan geometry was applied to the CT-of-the-day to evaluate the dosimetric effects of the VIRTUAL correction method. This VIRTUAL correction dosimetry was compared to calculated dosimetric results for an EXPLICIT 6DOF robotic couch correction methodology through collection of relevant dosimetry metrics. Results: For a total of 470 dosimetric metrics (i.e. max, min, mean dose statistics for all relevant structures) compared for all 55 image guidance sessions, the mean dose difference for these metrics between the plans employing the VIRTUAL corrections and the EXPLICIT corrections was -0.12% with a standard deviation of 0.82%; 97.9% of all metrics were within 2%. Conclusions: The results show that the VIRTUAL corrections yielded dosimetric distributions that were essentially equivalent to those obtained when 6DOF ROBOTIC corrections were used. This suggests that for the patient datasets studied here, highly effective image guidance corrections could be made without the use of a robotic couch.

March 4, 2011
Dr. Robert Lee
Editor
Practical Radiation Oncology
Dear Dr. Lee,
We are pleased to submit our original article entitled “Dosimetric Evaluation of a
“Virtual” Image Guidance Alternative to Explicit 6 Degree of Freedom Robotic Couch
Correction” for consideration for publication by PRO. This work evaluates a novel
method for a beam centric patient repositioning strategy from a dosimetric point of view
and we are confident the work is relevant to your target audience.
We note that all authors have contributed to the work and have all agreed to the contents
of the manuscript.
Please do not hesitate to contact us should you have any questions.
Sincerely,
Vikren Sarkar
Cover Letter
Title
Dosimetric Evaluation of a “Virtual” Image Guidance Alternative to Explicit 6 Degree of
Freedom Robotic Couch Correction
Authors
V. Sarkar1, B. Wang
1, J. Hinkle
2, V. J. Gonzalez
3, Y. J. Hitchcock
1, P. Rassiah-Szegedi
1,
S. Joshi1,2
and B. J. Salter1
1Department of Radiation Oncology, University of Utah, Salt Lake City, Utah
2Scientific Computing and Imaging Institute, University of Utah, Salt Lake City, Utah
3Department of Radiation Oncology, University of Arizona, Tucson, Arizona
Corresponding Author
Bill Salter
Department of Radiation Oncology
Huntsman Cancer Hospital
1950 Circle of Hope
Salt Lake City, UT 84112
Tel: (801) 587 4343
Fax: (801) 581 2995
Email : [email protected]
Running Title
Alternative to 6DOF patient positioning
Acknowledgements
We wish to acknowledge funding support for this work by Siemens. Some of this work
was also presented in an oral presentation at the 52nd Annual Meeting of the American
Society for Radiation Oncology (ASTRO) in San Diego, CA.
*Title Page (With Author Details)

1 2 3 4 5 6 7 8 9 10 11 12 13 14 15 16 17 18 19 20 21 22 23 24 25 26 27 28 29 30 31 32 33 34 35 36 37 38 39 40 41 42 43 44 45 46 47 48 49 50 51 52 53 54 55 56 57 58 59 60 61 62 63 64 65
Conflict of Interest Notification
None
*Blinded Manuscript
1 2 3 4 5 6 7 8 9 10 11 12 13 14 15 16 17 18 19 20 21 22 23 24 25 26 27 28 29 30 31 32 33 34 35 36 37 38 39 40 41 42 43 44 45 46 47 48 49 50 51 52 53 54 55 56 57 58 59 60 61 62 63 64 65
Abstract
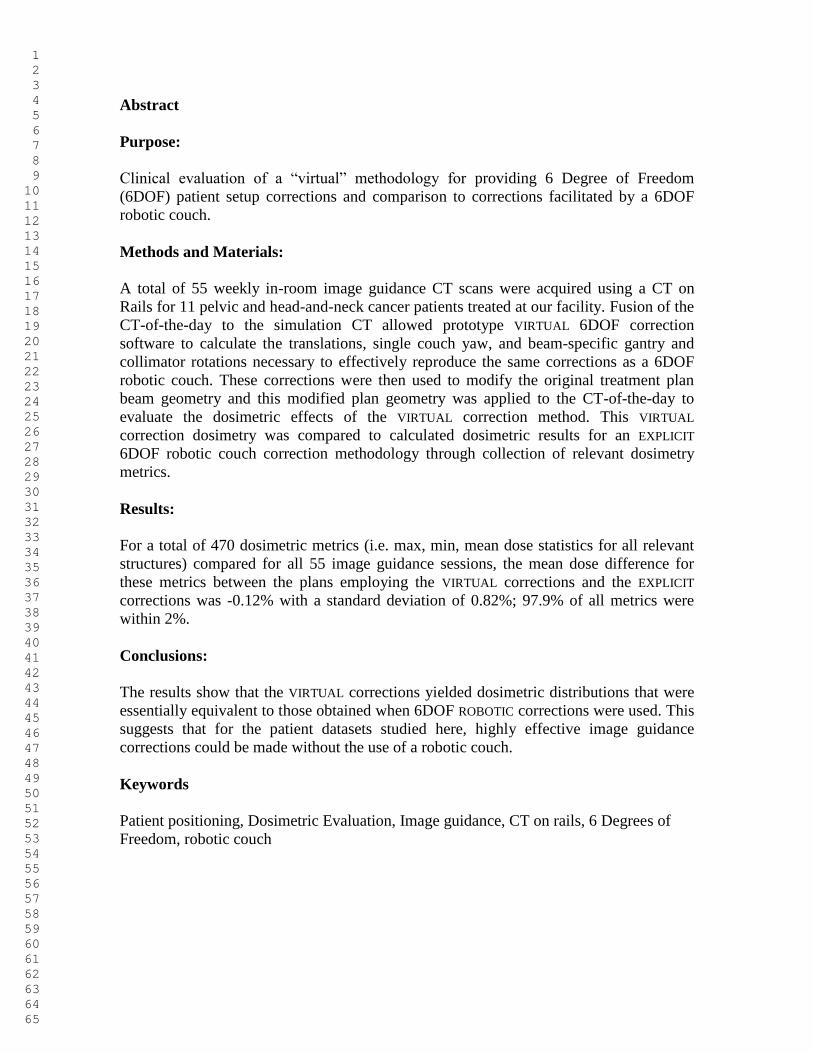
Purpose:
Clinical evaluation of a “virtual” methodology for providing 6 Degree of Freedom
(6DOF) patient setup corrections and comparison to corrections facilitated by a 6DOF
robotic couch.
Methods and Materials:
A total of 55 weekly in-room image guidance CT scans were acquired using a CT on
Rails for 11 pelvic and head-and-neck cancer patients treated at our facility. Fusion of the
CT-of-the-day to the simulation CT allowed prototype VIRTUAL 6DOF correction
software to calculate the translations, single couch yaw, and beam-specific gantry and
collimator rotations necessary to effectively reproduce the same corrections as a 6DOF
robotic couch. These corrections were then used to modify the original treatment plan
beam geometry and this modified plan geometry was applied to the CT-of-the-day to
evaluate the dosimetric effects of the VIRTUAL correction method. This VIRTUAL
correction dosimetry was compared to calculated dosimetric results for an EXPLICIT
6DOF robotic couch correction methodology through collection of relevant dosimetry
metrics.
Results:
For a total of 470 dosimetric metrics (i.e. max, min, mean dose statistics for all relevant
structures) compared for all 55 image guidance sessions, the mean dose difference for
these metrics between the plans employing the VIRTUAL corrections and the EXPLICIT
corrections was -0.12% with a standard deviation of 0.82%; 97.9% of all metrics were
within 2%.
Conclusions:
The results show that the VIRTUAL corrections yielded dosimetric distributions that were
essentially equivalent to those obtained when 6DOF ROBOTIC corrections were used. This
suggests that for the patient datasets studied here, highly effective image guidance
corrections could be made without the use of a robotic couch.
Keywords
Patient positioning, Dosimetric Evaluation, Image guidance, CT on rails, 6 Degrees of
Freedom, robotic couch

1 2 3 4 5 6 7 8 9 10 11 12 13 14 15 16 17 18 19 20 21 22 23 24 25 26 27 28 29 30 31 32 33 34 35 36 37 38 39 40 41 42 43 44 45 46 47 48 49 50 51 52 53 54 55 56 57 58 59 60 61 62 63 64 65
Introduction
An ever increasing emphasis on conformal, hypo-fractionated delivery schemes
continues to focus attention on the importance of high precision Image Guided delivery
techniques. Over the past decade, many capable Image Guided approaches have emerged,
including stereotactic ultrasound guidance1, stereoscopic planar imaging
2, 3, in-room CT
on Rails (CTOR)4-7
, on-board cone beam CT imaging8-15
, 3D video surface rendering16
and electromagnetic tracking of embedded transponders17-19
. All of these guidance
techniques share a single, simple goal of facilitating accurate repositioning of the targeted
volume to account/correct for inter- or intra-fractional target motion.
Each of the previously mentioned methods can use in-room-acquired spatial
information about the target location to derive the 3 translations and 3 rotations required
to return the target to the originally simulated position and orientation on which the
treatment plan is based. Following derivation of the required 6 degree of freedom (6DOF)
corrections, the clinical user is tasked with implementing the corrective changes using
translational shifts of the treatment couch and, if possible, rotational corrections, as well.
Because typically equipped treatment couches only posses the ability to perform 1 of the
3 rotational components of 6DOF corrections (i.e. couch „yaw‟, or coronal plane
rotation), typical users are currently forced to choose between correcting for the 6 degrees
of error using less than 6 degrees of correction, or some users are now upgrading their
treatment couches to 3rd
party add-on “robotic” couches that have recently become
available with 6DOF correction capability20-22
. In addition to translational error
correction, these 6DOF robotic couches are typically capable of correcting for angular
errors on the order of 3 degrees or less in pitch (i.e. sagittal plane rotation), roll (i.e. axial

1 2 3 4 5 6 7 8 9 10 11 12 13 14 15 16 17 18 19 20 21 22 23 24 25 26 27 28 29 30 31 32 33 34 35 36 37 38 39 40 41 42 43 44 45 46 47 48 49 50 51 52 53 54 55 56 57 58 59 60 61 62 63 64 65
plane rotation) and yaw orientations. Upgrades entail replacement of the linac treatment
couch top assembly with a robotically driven couch top assembly and cost for such
upgrades typically range between $250,000 and $500,000. Because of the limited
availability of funds for such major equipment upgrades, it is not surprising that only a
small subset of available clinical linear accelerators have been upgraded with 6DOF
robotic correction capability to date.
Recently, an interesting new idea for 6DOF image guided correction was
presented by Bose et al23
. The strategy they presented entailed corrections applied not to
the patient, but to the treatment beam orientation; as defined by gantry rotation,
collimator rotation and treatment couch yaw rotation. Perhaps the most attractive aspect
of this proposal is that, if viable, such a strategy would make 6DOF corrective strategies
available to virtually all clinical users, without the need for major hardware upgrades,
since nearly all commercially available linear accelerators possess the inherent ability to
perform such corrections. In their original work Bose et al23
described and demonstrated
the mathematical methodology that could be used to calculate the three couch translations
and beam-specific gantry and collimator rotations, in combination with a single couch
yaw, necessary to correct for patient misalignment and mis-orientation, and they
presented a proof of principle clinical example.
While the methodology and proof of principle work presented by Bose et al23
are
quite interesting and, potentially, of significant clinical value, the only way to assess the
true viability of this “virtual” 6DOF correction would be to explore/test numerous clinical
examples in an image guided environment.

1 2 3 4 5 6 7 8 9 10 11 12 13 14 15 16 17 18 19 20 21 22 23 24 25 26 27 28 29 30 31 32 33 34 35 36 37 38 39 40 41 42 43 44 45 46 47 48 49 50 51 52 53 54 55 56 57 58 59 60 61 62 63 64 65
In this work, we use 3D fan beam CT image guided data sets acquired using an
in-room CT On Rails (CTOR) system (SOMATOM Sensation 40, Siemens Healthcare,
Erlangen, Germany) to explore the clinical viability of the VIRTUAL 6DOF correction
proposed by Bose et al23
We investigate 55 different CTOR image guided data sets from
11 different patients with either Head and Neck (H&N) or Pelvic disease sites. We use
these 55 CT „data sets of the day‟ to calculate the dose distributions that would have been
delivered had the VIRTUAL 6DOF correction method been employed to correct for image
guidance errors, and we compare this to the calculated dose distributions that would have
been achieved if a 6DOF EXPLICIT correction had been employed by using a robotic
couch. We perform dose volume histogram analysis and dosimetric comparison of both
approaches and, in doing so, we assess the clinical viability of this potentially important
new image guidance correction strategy, relative to the current standard of EXPLICIT
correction via robotic couch.
Materials and Methods
Experiment design overview
We evaluated the viability of the “VIRTUAL” 6DOF image guidance correction strategy
described by Bose et al23
(i.e. 3 translations plus rotational correction by adjustment of
gantry, collimator and single couch yaw rotation(s)) by comparing it to the results that are
achieved when using an “EXPLICIT” 6DOF spatial correction strategy achieved with a
6DOF robotic couch. Rather than comparing the geometry of relevant structures, we
chose to compare the post-correction dose distributions and dose volume histograms, as
we believe these to be the most relevant metrics for comparison. The overall

1 2 3 4 5 6 7 8 9 10 11 12 13 14 15 16 17 18 19 20 21 22 23 24 25 26 27 28 29 30 31 32 33 34 35 36 37 38 39 40 41 42 43 44 45 46 47 48 49 50 51 52 53 54 55 56 57 58 59 60 61 62 63 64 65
experimental design was to use in-room CTOR data sets acquired for image guidance of
individual patients, taken immediately prior to a particular treatment fraction, and
calculate the isodose distributions that would be achieved after corrective shifts were
implemented using each of the two described correction strategies. We then compared the
dosimetry obtained using each of the two methods to determine whether the VIRTUAL
correction strategy yielded dosimetric results that were comparable to the current
standard of EXPLICIT robotic couch correction.
Patient data set selection.
A total of eleven patient image guided data sets were retrospectively chosen for
this study, 5 with H&N disease and 6 with pelvic malignancies. All patients had been
imaged on our in-room 40 slice, large-bore Siemens CT-on-rails immediately prior to
treatment, with at least five different CTOR image guidance sessions performed during
the course of each patient‟s treatment. For purposes of this study, the first five
consecutive CT-on-rails image guidance data sets for each patient were selected, for a
total of 55 unique CT-on-rails image guidance data sets.
6DOF image registration process and determination of explicit 6DOF corrections
The first step typically performed in determining image guided EXPLICIT 6DOF
corrections (i.e. X,Y,Z translations and couch Pitch, Roll and Yaw rotations) is to register
the „image set of the day‟ taken immediately prior to treatment, to the reference image set
(e.g. CT simulation data set). As mentioned previously, we used fan beam CT data sets
acquired on an in-room CTOR system for acquisition of all image guidance data sets used
here and we registered these to the CT data sets generated at time of simulation on our 16
slice GE LightSpeedRT scanner (GE Health Care, Waukesha, WI). CTOR datasets were

1 2 3 4 5 6 7 8 9 10 11 12 13 14 15 16 17 18 19 20 21 22 23 24 25 26 27 28 29 30 31 32 33 34 35 36 37 38 39 40 41 42 43 44 45 46 47 48 49 50 51 52 53 54 55 56 57 58 59 60 61 62 63 64 65
acquired using a slice thickness of 2mm and pixel dimension 0.98mm x 0.98mm and GE
LightSpeed data sets were acquired using a slice thickness of 2.5 mm and pixel
dimension 0.98 mm x 0.98 mm. For purposes of image registration we used the Siemens
Adaptive Targeting II software (AT II), which is a new, preclinical version of the
currently released Adaptive Targeting I software (AT I). The rationale for using the pre-
clinical AT II software was that the AT I software only allows for a 3-dimensional,
translation-only registration, while the newer AT II software allows the user to perform a
full 6-dimensional registration that includes the three translations and also the three
rotations that best align the image guidance data set to the simulation (reference) CT data
set. The AT II software is meant to run at the linac treatment console system and
subsequently reports the 6DOF corrections that are required to achieve the just-performed
image registration. We note that because the AT II system has not yet been released by
the vendor for clinical use, we confirmed that the system performs accurate 6DOF
registrations by testing it under situations of precisely known image guidance errors in a
phantom environment.
To perform 6DOF image registrations, the simulation CT and structures, along
with the treatment plan were sent as DICOM objects to the AT II station. Prior to the
acquisition of the daily image guidance images, the patient was positioned to the
treatment isocenter. For purposes of CT visualization of the setup isocenter location,
three 1 mm BB‟s were placed in triangulation on the patient for treatment isocenter
localization and the CTOR data set was acquired. This is analogous to the methodology
reported previously by Shiu et al5. The location of the BBs was then used within the AT
II software to identify the imaging isocenter in the CTOR image guidance dataset, and

1 2 3 4 5 6 7 8 9 10 11 12 13 14 15 16 17 18 19 20 21 22 23 24 25 26 27 28 29 30 31 32 33 34 35 36 37 38 39 40 41 42 43 44 45 46 47 48 49 50 51 52 53 54 55 56 57 58 59 60 61 62 63 64 65
this imaging isocenter represented the “origin” about which all rotational and
translational corrections were reported by the software. All fusions were carefully
reviewed for accuracy by the responsible physician, and the 6DOF spatial correction
parameters reported by the AT II software were recorded for later use in calculating the
isodose distributions that would have resulted from use of an EXPLICIT 6DOF correction
strategy via robotic couch.
Determination of virtual 6DOF corrections
The AT II software also includes a new module that allows for calculation of the
optimal X,Y,Z translations along with gantry, collimator and single couch yaw rotation(s)
as described for VIRTUAL 6DOF correction by Bose et al23
. This module was employed to
calculate and record the required VIRTUAL 6DOF corrections (i.e. 3 translations and
gantry, collimator and single couch yaw rotation(s)) for later use in calculating dose
distributions that would have resulted from the VIRTUAL 6DOF correction strategy
Calculation of isodose distributions for 6DOF explicit correction strategy
To calculate the dose distributions that would result from an EXPLICIT robotic
couch correction we would need to either perform the EXPLICIT spatial corrections in the
treatment room using a robotic couch, and then re-image the patient, or we could use the
CT image-set-of-the-day obtained prior to correction, and then digitally rotate and
translate the data set as if the spatial corrections had been performed. As we do not
currently have a robotic couch that can perform the rotational corrections in the vault and
because, even if we did have a robotic couch the former approach would require
administration of additional, unneeded imaging dose, we chose the latter „digital‟
approach.

1 2 3 4 5 6 7 8 9 10 11 12 13 14 15 16 17 18 19 20 21 22 23 24 25 26 27 28 29 30 31 32 33 34 35 36 37 38 39 40 41 42 43 44 45 46 47 48 49 50 51 52 53 54 55 56 57 58 59 60 61 62 63 64 65
In order to perform a rigid transformation of the CT scan, a C++ program was
written using the ITK library (http://www.itk.org). The DICOM CTOR series was read
as a 3D volume, and rotation of the 3D volume was implemented using tri-linear
interpolation. The resulting volume was then output as a DICOM series using ITK. So
that dose volume histogram (DVH) analysis could later be performed, the attending
physician who originally delineated target and critical structures on the original treatment
planning (simulation) CT data set also contoured relevant structures on each CTOR data
set of the day. For the pelvic cases, bladder, rectum and small bowel were contoured.
Because the node-based target volume was believed to be constant throughout the
treatment course, the original PTV was copied forward to the image- set-of-the-day after
appropriate fusion of the two data sets was performed. For the HN cases, because the
target volume is known to change throughout treatment, we did not include the target
volume in our analysis. Structures that were re-contoured for the HN cases included the
spinal cord, the left and right parotids and the mandible. These anatomical structures
were also transformed for 6DOF rotation by representing the structures as 2D polygons
corresponding to contours at slices in the associated CT scan. In order to implement
rotation of the structures, it was necessary to produce a set of contours which represented
the same enclosed volume but at the re-sampled CT slice locations. This was
accomplished through another C++ program written using the VTK library
(http://www.vtk.org). The algorithm read the structure file format and used the list of
contours for each structure to create a triangular mesh representation of the entire
structure. This structure was then transformed by rotating the associated vertices and
triangle‟s normal vectors. The transformed structure was then „re-sliced‟ at all the re-

1 2 3 4 5 6 7 8 9 10 11 12 13 14 15 16 17 18 19 20 21 22 23 24 25 26 27 28 29 30 31 32 33 34 35 36 37 38 39 40 41 42 43 44 45 46 47 48 49 50 51 52 53 54 55 56 57 58 59 60 61 62 63 64 65
sampled slice locations and the resulting polygons were exported as contours. The
resulting structures could then be imported back into the treatment planning software
(Eclipse version 8.8, Varian Medical Systems, Palo Alto, CA) along with the rotated CT
scan to accurately represent the patient and relevant contours in rotated orientation; as if
the 6DOF corrections had been applied and the patient re-imaged. The entire
methodology was tested in phantom to confirm accurate representation of the rotated CT
and contour data sets.
Once the 6DOF-EXPLICIT rotated CT data sets with structures were imported into
the Eclipse treatment planning system, the originally designed, unmodified treatment
beams were applied to the plan and isodose distributions which would result from
employing an EXPLICIT image guidance position correction strategy were calculated.
Calculation of isodose distributions for 6DOF VIRTUAL correction strategy
In order to calculate isodose distributions for the VIRTUAL correction strategy we
imported the un-corrected CT-of-the-day dataset along with previously described,
physician defined relevant structures into the Eclipse treatment planning system. The
originally designed treatment plan parameters were then applied to the CT-of-the-day, but
with isocenter modified to correct for X, Y, Z translations and beam specific gantry
angle, beam specific collimator angle and single couch yaw modified to correct for
rotations, as determined by the previously described Bose et al23
VIRTUAL correction
module contained in the AT II software.
Additional calculated treatment plans
For the purposes of added context or reference, we also calculated treatment plan
isodose distributions representing a situation wherein no image guided corrective shifts

1 2 3 4 5 6 7 8 9 10 11 12 13 14 15 16 17 18 19 20 21 22 23 24 25 26 27 28 29 30 31 32 33 34 35 36 37 38 39 40 41 42 43 44 45 46 47 48 49 50 51 52 53 54 55 56 57 58 59 60 61 62 63 64 65
were applied (ZERO CORRECTION STRATEGY), and treatment plan isodose distributions
representing the situation wherein only 3 translational (X,Y,Z) corrections were made
(TRANSLATION ONLY CORRECTION STRATEGY). These isodose distributions were both
calculated on the CT-image-set-of-the-day with either no modification to the original
plan parameters (ZERO CORRECTION STRATEGY) or with isocenter relocated according to
the 3 translational shifts recorded from the AT II software (see section 2.3) for 6DOF
spatial correction (TRANSLATION ONLY CORRECTION STRATEGY). Thus, 4 total isodose
distributions were calculated: a) ZERO CORRECTION STRATEGY b) TRANSLATION ONLY
CORRECTION STRATEGY c) EXPLICIT CORRECTION STRATEGY (i.e. robotic couch
correction) and d) VIRTUAL CORRECTION STRATEGY (i.e. Bose et al23
methodology).
Plan evaluation
Treatment plans for EXPLICIT, VIRTUAL, ZERO CORRECTION and TRANSLATION
ONLY correction strategies were directly compared through dosimetric statistics including
the maximum, minimum and mean doses to all delineated structures, as well as through
comparison of the dose volume histograms for all structures. For the pelvic cases, this
entailed evaluation of tumor coverage as well as dose to the bladder, rectum and small
bowel. For the H&N cases, dose to the left and right parotids, mandible and spinal cord
were compared.
Results
Comparison of VIRTUAL corrections against EXPLICIT corrections

1 2 3 4 5 6 7 8 9 10 11 12 13 14 15 16 17 18 19 20 21 22 23 24 25 26 27 28 29 30 31 32 33 34 35 36 37 38 39 40 41 42 43 44 45 46 47 48 49 50 51 52 53 54 55 56 57 58 59 60 61 62 63 64 65
Table 1 summarizes the mean and maximum shifts calculated from full 6DOF
registrations done on the AT II system as well as the mean and maximum rotations
performed while applying the VIRTUAL corrections.
Table 2 shows the percent differences between the dosimetric parameters
calculated for the EXPLICITLY corrected 6DOF plan compared to the VIRTUALLY corrected
6DOF plan for the H&N cases, while Table 3 shows the analogous results for the pelvic
cases. All differences are as a percentage of the prescribed target dose, with differences
greater than 2% being highlighted. The metrics evaluated in this study include maximum
and mean doses for relevant critical structures and PTV. The tables show that, even with
a very tight tolerance threshold of 2% applied, there are only 10 statistical metrics out of
a total of 470 where the difference exceeded 2%. The mean difference across all patients
and all image guidance sessions was -0.12% ±0.82%, thus indicating that the VIRTUAL
Correction Strategy yielded dosimetric results that were similar to an EXPLICIT Correction
Strategy. The maximum difference across all patients, all structures and all image
guidance sessions was -5.5% for the small bowel mean dose, for fraction 4 of pelvic
patient 6.
In order to present a more complete representation of the dose distributions that
resulted from each approach, DVHs are presented in Figures 1 and 2. For each patient,
the DVHs from the fraction with the worst agreement between EXPLICIT and
VIRTUAL corrections are shown in Figure 1 while Figure 2 depicts DVHs for each
patient for the fraction where the agreement was closest to the mean (i.e.”Typical”).
1 2 3 4 5 6 7 8 9 10 11 12 13 14 15 16 17 18 19 20 21 22 23 24 25 26 27 28 29 30 31 32 33 34 35 36 37 38 39 40 41 42 43 44 45 46 47 48 49 50 51 52 53 54 55 56 57 58 59 60 61 62 63 64 65
Comparison of plans using TRANSLATION ONLY and ZERO CORRECTION plans
against those with Explicit corrections.
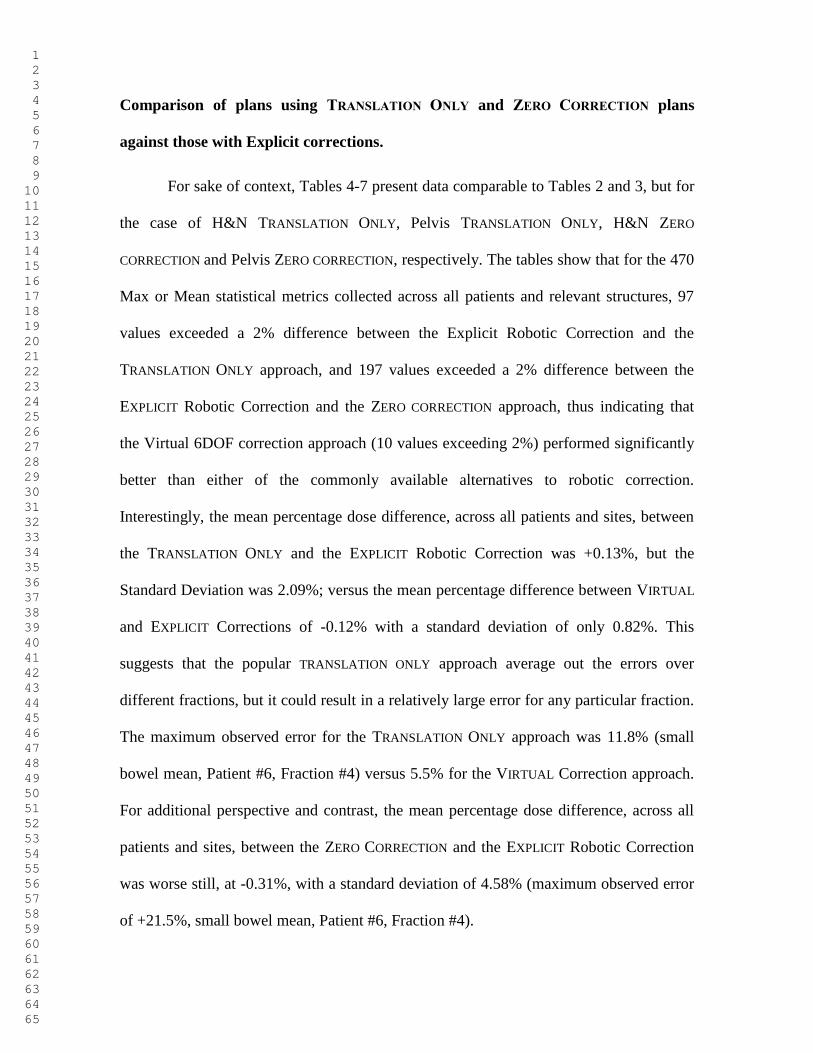
For sake of context, Tables 4-7 present data comparable to Tables 2 and 3, but for
the case of H&N TRANSLATION ONLY, Pelvis TRANSLATION ONLY, H&N ZERO
CORRECTION and Pelvis ZERO CORRECTION, respectively. The tables show that for the 470
Max or Mean statistical metrics collected across all patients and relevant structures, 97
values exceeded a 2% difference between the Explicit Robotic Correction and the
TRANSLATION ONLY approach, and 197 values exceeded a 2% difference between the
EXPLICIT Robotic Correction and the ZERO CORRECTION approach, thus indicating that
the Virtual 6DOF correction approach (10 values exceeding 2%) performed significantly
better than either of the commonly available alternatives to robotic correction.
Interestingly, the mean percentage dose difference, across all patients and sites, between
the TRANSLATION ONLY and the EXPLICIT Robotic Correction was +0.13%, but the
Standard Deviation was 2.09%; versus the mean percentage difference between VIRTUAL
and EXPLICIT Corrections of -0.12% with a standard deviation of only 0.82%. This
suggests that the popular TRANSLATION ONLY approach average out the errors over
different fractions, but it could result in a relatively large error for any particular fraction.
The maximum observed error for the TRANSLATION ONLY approach was 11.8% (small
bowel mean, Patient #6, Fraction #4) versus 5.5% for the VIRTUAL Correction approach.
For additional perspective and contrast, the mean percentage dose difference, across all
patients and sites, between the ZERO CORRECTION and the EXPLICIT Robotic Correction
was worse still, at -0.31%, with a standard deviation of 4.58% (maximum observed error
of +21.5%, small bowel mean, Patient #6, Fraction #4).
1 2 3 4 5 6 7 8 9 10 11 12 13 14 15 16 17 18 19 20 21 22 23 24 25 26 27 28 29 30 31 32 33 34 35 36 37 38 39 40 41 42 43 44 45 46 47 48 49 50 51 52 53 54 55 56 57 58 59 60 61 62 63 64 65
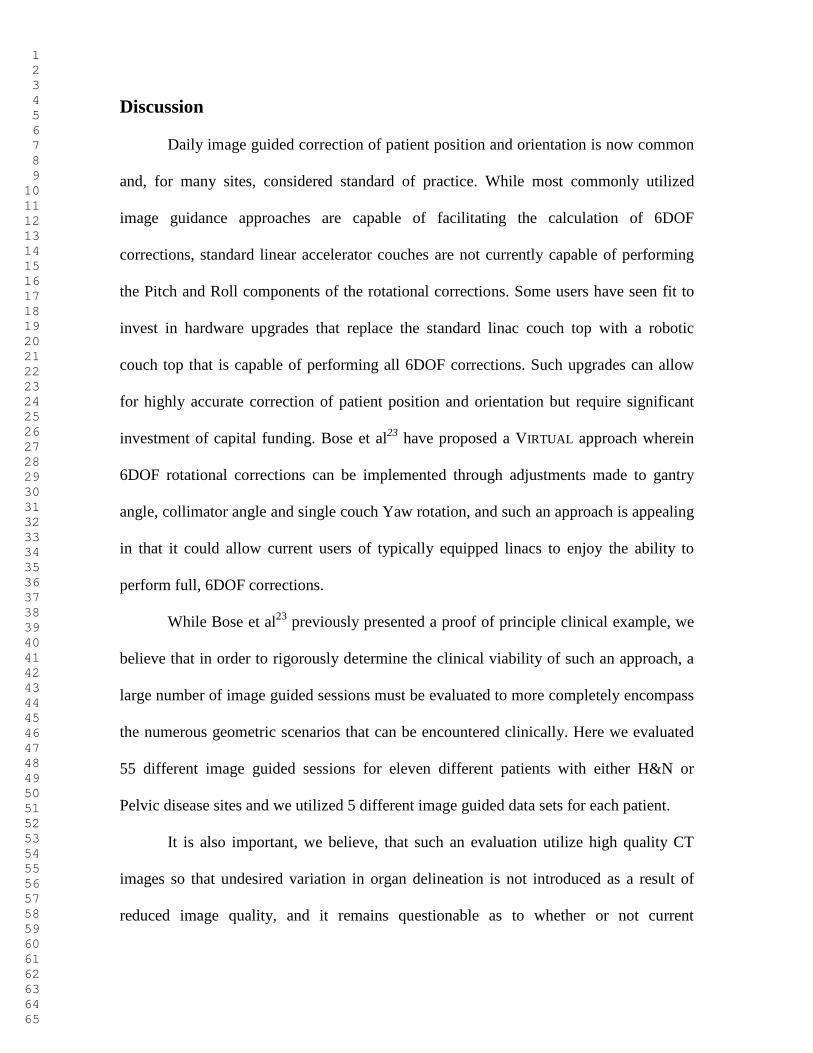
Discussion
Daily image guided correction of patient position and orientation is now common
and, for many sites, considered standard of practice. While most commonly utilized
image guidance approaches are capable of facilitating the calculation of 6DOF
corrections, standard linear accelerator couches are not currently capable of performing
the Pitch and Roll components of the rotational corrections. Some users have seen fit to
invest in hardware upgrades that replace the standard linac couch top with a robotic
couch top that is capable of performing all 6DOF corrections. Such upgrades can allow
for highly accurate correction of patient position and orientation but require significant
investment of capital funding. Bose et al23
have proposed a VIRTUAL approach wherein
6DOF rotational corrections can be implemented through adjustments made to gantry
angle, collimator angle and single couch Yaw rotation, and such an approach is appealing
in that it could allow current users of typically equipped linacs to enjoy the ability to
perform full, 6DOF corrections.
While Bose et al23
previously presented a proof of principle clinical example, we
believe that in order to rigorously determine the clinical viability of such an approach, a
large number of image guided sessions must be evaluated to more completely encompass
the numerous geometric scenarios that can be encountered clinically. Here we evaluated
55 different image guided sessions for eleven different patients with either H&N or
Pelvic disease sites and we utilized 5 different image guided data sets for each patient.
It is also important, we believe, that such an evaluation utilize high quality CT
images so that undesired variation in organ delineation is not introduced as a result of
reduced image quality, and it remains questionable as to whether or not current

1 2 3 4 5 6 7 8 9 10 11 12 13 14 15 16 17 18 19 20 21 22 23 24 25 26 27 28 29 30 31 32 33 34 35 36 37 38 39 40 41 42 43 44 45 46 47 48 49 50 51 52 53 54 55 56 57 58 59 60 61 62 63 64 65
generation, on-board cone beam CT imaging systems are capable of providing such
image quality. Fortunately, for this work we were able to utilize diagnostic quality fan
beam CT images obtained from the in-room CTOR unit we routinely use for image
guided alignment of conformally treated patients in our clinic. By utilizing such high
quality image sets we ensured that relevant structures were delineated on image guidance
CT image sets that were of equivalent quality to the original CT simulation data sets, and
we took care to require that the physician who contoured the relevant structures on the
CT simulation data set also contoured the structures on the CTOR „image sets of the day‟.
It is clear from data presented in Tables 2 and 3 and Figures 1 and 2, that post-
correction dose distributions calculated for a so-called VIRTUAL correction approach are
essentially equivalent to those calculated for an EXPLICIT robotic correction approach. Of
the 470 Max or Mean data statistics collected across all patients and relevant structures,
only 10 values exceeded a 2% difference between the two methods. Mean difference
across all alignments, across all patients was -0.12% with a standard deviation of 0.82%;
again, indicating that the VIRTUAL correction approach was essentially equivalent to the
EXPLICIT robotic approach for the 55 image guided sessions studied here. Tables 2 and 3
show that the largest difference for any structure, across all patients, was -5.5% for the
small bowel mean dose for fraction 4 of pelvic patient 6.
Figure 3 makes clear why this discrepancy occurred. The arrow in Figure 3a
(EXPLICIT Robotic correction approach) points to the region where the 35% isodose line
barely touches a small section of small bowel (purple). The actual volume of small bowel
at or above 35% of RX dose is 0.2 cc. This slight encroachment of the 35% isodose line
onto the small bowel occurs for the gold standard robotic approach, following 6DOF

1 2 3 4 5 6 7 8 9 10 11 12 13 14 15 16 17 18 19 20 21 22 23 24 25 26 27 28 29 30 31 32 33 34 35 36 37 38 39 40 41 42 43 44 45 46 47 48 49 50 51 52 53 54 55 56 57 58 59 60 61 62 63 64 65
robotic correction. The arrow in Figure 3b points to the same region of the plan which
used the VIRTUAL correction approach, and it is clear from this figure that the 35%
isodose line is encroaching slightly more into the small bowel than for the robotic
Explicit correction approach. The actual volume of small bowel at or above 35% of RX
dose is 3.2 cc, versus 0.2 cc for the EXPLICIT robotic plan. This is because the VIRTUAL
correction approach was not able to completely correct for patient Pitch error by using
only the gantry, collimator and couch Yaw rotations inherent to this approach. It is
notable, however, that for this worst case scenario, the difference in actual volume of
small bowel receiving the 35% dose level is only 3 cc, a very small percentage of the
total small bowel volume.
Data presented in Tables 4-7 provide context for the relatively small differences
observed between the EXPLICIT robotic approach and the VIRTUAL Correction method
investigated here. The VIRTUAL Correction method‟s 10 out of 470 instances of doses
deviations greater than 2% is significantly better than the 97 deviations for the commonly
employed TRANSLATION ONLY method and better still than the 197 deviations greater
than 2% for the NO CORRECTION method. While the VIRTUAL correction method does not
perfectly replicate the dose delivery performance of an EXPLICIT robotic correction, it
comes within -0.12% ± 0.82%, on average, for all 470 relevant dose metrics explored
here, and this suggests that the method is both viable, and potentially valuable in a typical
clinical setting.
It should also be pointed out that, while Yue et al have previously published 24
on
a method that allows for an exact solution for a 6DOF correction by using a different
couch position for each beam, the strength of the currently employed VIRTUAL correction

1 2 3 4 5 6 7 8 9 10 11 12 13 14 15 16 17 18 19 20 21 22 23 24 25 26 27 28 29 30 31 32 33 34 35 36 37 38 39 40 41 42 43 44 45 46 47 48 49 50 51 52 53 54 55 56 57 58 59 60 61 62 63 64 65
methodology is apparent when we consider the fact that a single couch correction is
employed for all beams here. Beam-specific couch rotations would very likely decrease
patient throughput, with treatment technologists having to repeatedly go in and out of the
room to move the couch between beams. Alternatively, the approach studied here
requires only one couch position for the entire treatment, with the gantry and collimator
changes implemented automatically as the machine moves from one beam position to the
next.
Conclusion
A VIRTUAL Image Guidance Correction method which utilizes beam-specific
gantry and collimator rotations along with a single couch Yaw rotation to correct for
patient Pitch, Roll and Yaw rotations was compared to the gold standard robotic couch
EXPLICIT Correction method. Calculated dose distributions using each of the two methods
were compared and the VIRTUAL approach was seen to perform within -0.12% ± 0.82%
of the EXPLICIT robotic approach, for 55 different image guided sessions, for eleven
different Pelvic and H&N patients explored here. The method appears to represent a
clinically viable and potentially significant opportunity for typical linac users to avail
themselves of 6DOF correction capability, without the need to upgrade to robotic couch
top technology.

1 2 3 4 5 6 7 8 9 10 11 12 13 14 15 16 17 18 19 20 21 22 23 24 25 26 27 28 29 30 31 32 33 34 35 36 37 38 39 40 41 42 43 44 45 46 47 48 49 50 51 52 53 54 55 56 57 58 59 60 61 62 63 64 65
References
1. Lattanzi J, McNeeley S, Donnelly S, et al. Ultrasound-based stereotactic guidance in
prostate cancer--quantification of organ motion and set-up errors in external beam
radiation therapy Comput Aided Surg 2000; 5:289-295
2. Geinitz H, Zimmermann FB, Kuzmany A and Kneschaurek P Daily CT planning
during boost irradiation of prostate cancer. Feasibility and time requirements
Strahlenther Onkol 2000; 176:429-432
3. Weiss E, Vorwerk H, Richter S and Hess CF Interfractional and intrafractional
accuracy during radiotherapy of gynecologic carcinomas: a comprehensive
evaluation using the ExacTrac system Int J Radiat Oncol Biol Phys 2003; 56:69-
79
4. Wong JR, Cheng CW, Grimm L and Uematsu M Clinical implementation of the
world's first primatom, a combination of CT scanner and linear accelerator, for
precise tumor targeting and treatment. Physica Medica 2001; 17:271-276
5. Shiu AS, Chang EL, Ye JS, et al. Near simultaneous computed tomography image-
guided stereotactic spinal radiotherapy: an emerging paradigm for achieving true
stereotaxy Int J Radiat Oncol Biol Phys 2003; 57:605-613
6. Ma CM and Paskalev K In-room CT techniques for image-guided radiation therapy
Med Dosim 2006; 31:30-39
7. Ahunbay EE, Peng C, Holmes S, et al. Online adaptive replanning method for prostate
radiotherapy Int J Radiat Oncol Biol Phys 2010; 77:1561-1572
8. Siewerdsen JH and Jaffray DA A ghost story: spatio-temporal response characteristics
of an indirect-detection flat-panel imager Med Phys 1999; 26:1624-1641
9. Siewerdsen JH and Jaffray DA Cone-beam computed tomography with a flat-panel
imager: effects of image lag Med Phys 1999; 26:2635-2647
10. Jaffray DA and Siewerdsen JH Cone-beam computed tomography with a flat-panel
imager: initial performance characterization Med Phys 2000; 27:1311-1323
11. Siewerdsen JH and Jaffray DA Cone-beam computed tomography with a flat-panel
imager: magnitude and effects of x-ray scatter Med Phys 2001; 28:220-231
12. McBain CA, Henry AM, Sykes J, et al. X-ray volumetric imaging in image-guided
radiotherapy: the new standard in on-treatment imaging Int J Radiat Oncol Biol
Phys 2006; 64:625-634
13. Sorcini B and Tilikidis A Clinical application of image-guided radiotherapy, IGRT
(on the Varian OBI platform) Cancer Radiother 2006; 10:252-257
14. Gayou O and Miften M Commissioning and clinical implementation of a mega-
voltage cone beam CT system for treatment localization Med Phys 2007;
34:3183-3192
15. Song WY, Kamath S, Ozawa S, et al. A dose comparison study between XVI and
OBI CBCT systems Med Phys 2008; 35:480-486
16. Bert C, Metheany KG, Doppke K and Chen GT A phantom evaluation of a stereo-
vision surface imaging system for radiotherapy patient setup Med Phys 2005;
32:2753-2762
17. Balter JM, Wright JN, Newell LJ, et al. Accuracy of a wireless localization system for
radiotherapy Int J Radiat Oncol Biol Phys 2005; 61:933-937

1 2 3 4 5 6 7 8 9 10 11 12 13 14 15 16 17 18 19 20 21 22 23 24 25 26 27 28 29 30 31 32 33 34 35 36 37 38 39 40 41 42 43 44 45 46 47 48 49 50 51 52 53 54 55 56 57 58 59 60 61 62 63 64 65
18. Su Z, Zhang L, Murphy M and Williamson J Analysis of Prostate Patient Setup and
Tracking Data: Potential Intervention Strategies Int J Radiat Oncol Biol Phys
2010;
19. Tanyi JA, He T, Summers PA, et al. Assessment of planning target volume margins
for intensity-modulated radiotherapy of the prostate gland: role of daily inter- and
intrafraction motion Int J Radiat Oncol Biol Phys 2010; 78:1579-1585
20. Guckenberger M, Meyer J, Wilbert J, et al. Precision of image-guided radiotherapy
(IGRT) in six degrees of freedom and limitations in clinical practice
Strahlentherapie und Onkologie 2007; 183:307-313
21. Takakura T, Mizowaki T, Nakata M, et al. The geometric accuracy of frameless
stereotactic radiosurgery using a 6D robotic couch system Physics in Medicine
and Biology 2010; 55:1-10
22. Wilbert J, Meyer J, Baier K, et al. Tumor tracking and motion compensation with an
adaptive tumor tracking system (ATTS): System description and prototype testing
Medical Physics 2008; 35:3911-3921
23. Bose S, Shukla H and Maltz J Beam-centric algorithm for pretreatment patient
position correction in external beam radiation therapy Med Phys 2010; 37:2004-
2016
24. Yue NJ, Knisely JP, Song H and Nath R A method to implement full six-degree
target shift corrections for rigid body in image-guided radiotherapy Med Phys
2006; 33:21-31

1 2 3 4 5 6 7 8 9 10 11 12 13 14 15 16 17 18 19 20 21 22 23 24 25 26 27 28 29 30 31 32 33 34 35 36 37 38 39 40 41 42 43 44 45 46 47 48 49 50 51 52 53 54 55 56 57 58 59 60 61 62 63 64 65
Figure Legends
Figure 1 – DVHs for each patient from the fraction with the „worst‟ agreement between
EXPLICIT and VIRTUAL corrections. The solid lines show the DVHs from the plan
with VIRTUAL corrections while dashed lines show DVHs from the plans with
EXPLICIT corrections. For pelvic patients, the PTV is shown in red, the rectum in
brown, the bladder in blue and the small bowel is depicted in green. For the HN cases, the
left parotid is shown in red, the right parotid in brown, the mandible in blue and the
spinal cord in green. Even for these “worst case” scenarios, the VIRTUAL method DVH‟s
can be seen to agree quite well with the EXPLICIT method.
Figure 2 – DVHs for each patient from the fraction where the agreement between
EXPLICIT and VIRTUAL corrections was the closest to the mean for all fractions (i.e.
„Typical‟). The solid lines show the DVHs from the plan with VIRTUAL corrections
while dashed lines show DVHs from the plans with EXPLICIT corrections. For pelvic
patients, the PTV is shown in red, the rectum in brown, the bladder in blue and the small
bowel is depicted in green. For the HN cases, the left parotid is shown in red, the right
parotid in brown, the mandible in blue and the spinal cord in green.
Figure 3 - Comparison of isodose lines from four plans for Pelvic Patient 6 (FX4). The
image on the left (A) shows the isodose distribution for the EXPLICITLY corrected plan
while the image on the right (B) shows the corresponding slice for the VIRTUALLY
corrected plan. The blue isodose line is the 20% dose level, the yellow shows the 35%
isodose level and the red line is the 50% isodose level. The arrow on each figure shows a
small bowel loop that is crossed by the 35% isodose level in the VIRTUALLY corrected
plan but not in the EXPLICITLY corrected plan, explaining the larger than usual
disparity of 5.5% in the mean small bowel dose between the two plans.
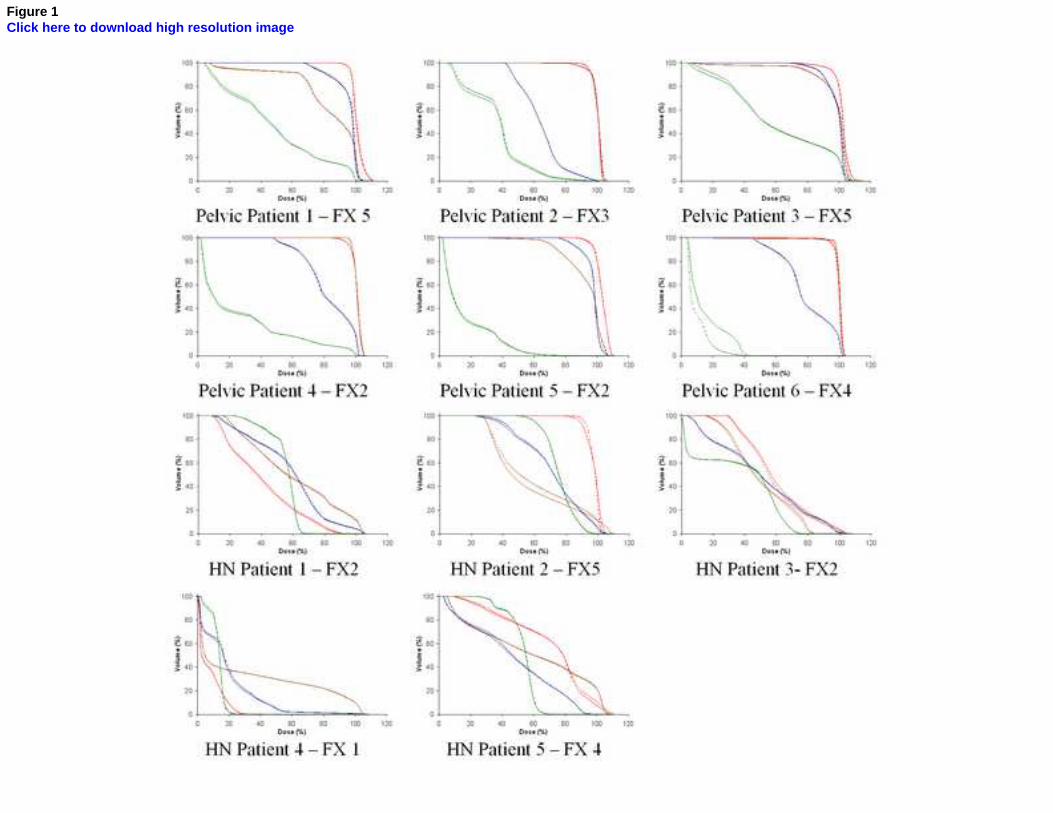
Figure 1Click here to download high resolution image

Figure 2Click here to download high resolution image

Figure 3Click here to download high resolution image
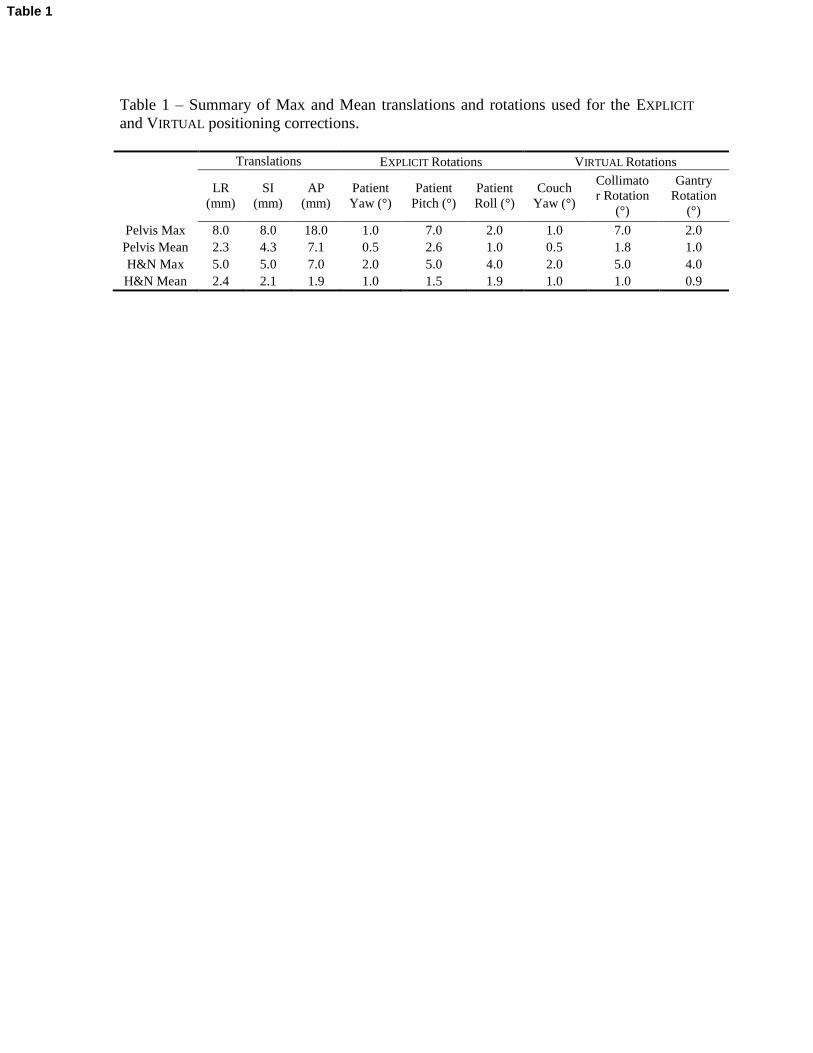
Table 1 – Summary of Max and Mean translations and rotations used for the EXPLICIT
and VIRTUAL positioning corrections.
Translations EXPLICIT Rotations VIRTUAL Rotations
LR
(mm)
SI
(mm)
AP
(mm)
Patient
Yaw (°)
Patient
Pitch (°)
Patient
Roll (°)
Couch
Yaw (°)
Collimato
r Rotation
(°)
Gantry
Rotation
(°)
Pelvis Max 8.0 8.0 18.0 1.0 7.0 2.0 1.0 7.0 2.0
Pelvis Mean 2.3 4.3 7.1 0.5 2.6 1.0 0.5 1.8 1.0
H&N Max 5.0 5.0 7.0 2.0 5.0 4.0 2.0 5.0 4.0
H&N Mean 2.4 2.1 1.9 1.0 1.5 1.9 1.0 1.0 0.9
Table 1
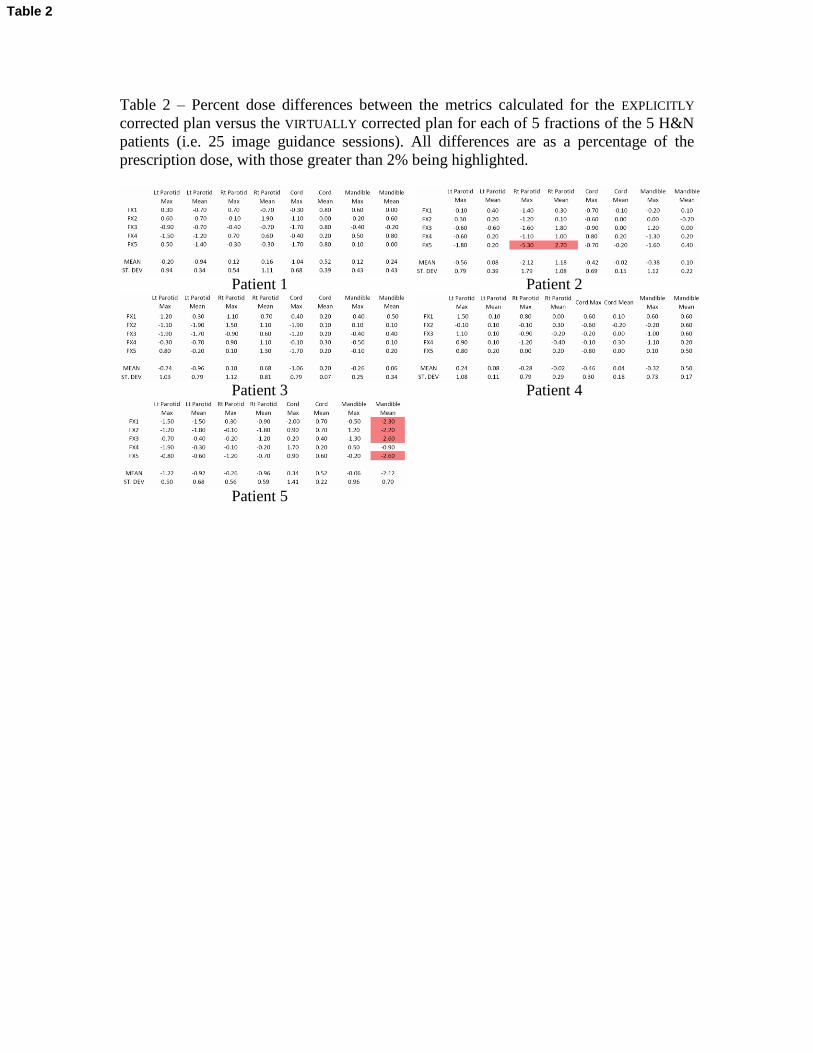
Table 2 – Percent dose differences between the metrics calculated for the EXPLICITLY
corrected plan versus the VIRTUALLY corrected plan for each of 5 fractions of the 5 H&N
patients (i.e. 25 image guidance sessions). All differences are as a percentage of the
prescription dose, with those greater than 2% being highlighted.
Patient 1 Patient 2
Patient 3 Patient 4
Patient 5
Table 2

Table 3 – Percent dose differences between the metrics calculated for the EXPLICITLY
corrected plan versus the VIRTUALLY corrected plan for each of 5 fractions of the 6 pelvic
patients (i.e. 30 image guidance sessions). All differences are as a percentage of the
prescription dose, with those greater than 2% being highlighted.
Patient 1 Patient 2
Patient 3 Patient 4
Patient 5 Patient 6
Table 3

Table 4 – Percent dose differences between the metrics calculated for the explicitly
corrected plan versus the TRANSLATION ONLY plan for each of 5 fractions of the 5 H&N
patients (i.e. 25 image guidance sessions). All differences are as a percentage of the
prescription dose, with those greater than 2% being highlighted.
Patient 1 Patient 2
Patient 3 Patient 4
Patient 5
Table 4

Table 5 – Percent dose differences between the metrics calculated for the explicitly
corrected plan versus the TRANSLATION ONLY plan for each of 5 fractions of the 6 pelvic
patients (i.e. 30 image guidance sessions). All differences are as a percentage of the
prescription dose, with those greater than 2% being highlighted.
Patient 1 Patient 2
Patient 3 Patient 4
Patient 5 Patient 6
Table 5

Table 6 – Percent dose differences between the metrics calculated for the explicitly
corrected plan versus the UNCORRECTED plan for each of 5 fractions of the 5 H&N
patients (i.e. 25 image guidance sessions). All differences are as a percentage of the
prescription dose, with those greater than 2% being highlighted.
Patient 1 Patient 2
Patient 3 Patient 4
Patient 5
Table 6
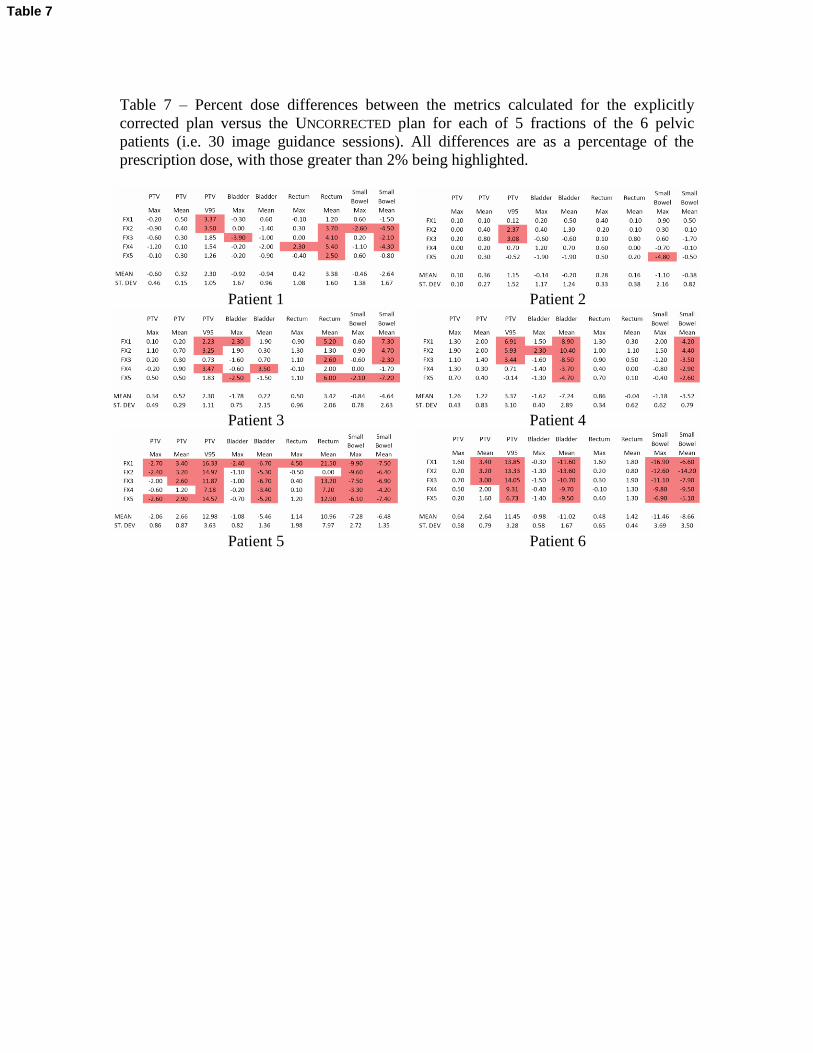
Table 7 – Percent dose differences between the metrics calculated for the explicitly
corrected plan versus the UNCORRECTED plan for each of 5 fractions of the 6 pelvic
patients (i.e. 30 image guidance sessions). All differences are as a percentage of the
prescription dose, with those greater than 2% being highlighted.
Patient 1 Patient 2
Patient 3 Patient 4
Patient 5 Patient 6
Table 7

*Uniform Disclosures FormClick here to download Uniform Disclosures Form: coi_disclosure1.pdf