Foodborne botulism in southwest Romania during the post-communism period 1990–2007
Upload
independentCategory
view
1download
0
www.elsevier.com/locate/ijfoodmicro
International Journal of Food Mic
Dose response modelling of Escherichia coli O157 incorporating
data from foodborne and environmental outbreaks
Norval J.C. Strachana,T, Michael P. Doyleb, Fumiko Kasugac,
Ovidiu Rotariua, Iain D. Ogdend
aSchool of Biological Sciences, University of Aberdeen, Cruickshank Building, Aberdeen, AB24 3UU, UKbCenter for Food Safety, University of Georgia, Griffin, Georgia, USA
cDivision of Biomedical Food Research, National Institute of Health Sciences, Kamiyoga 1-18-1, Setagaya-ku, Tokyo 158-8501, JapandApplied Food Microbiology Group, Department of Medical Microbiology, School of Medicine, University of Aberdeen,
Foresterhill, Aberdeen, AB25 2ZD UK
Received 28 May 2004; received in revised form 30 August 2004; accepted 25 November 2004
Abstract
A human dose response model for Escherichia coli O157 would enable prediction of risk of infection to humans following
exposure from either foodborne or environmental pathways. However, due to the severe nature of the disease, volunteer human
dose response studies cannot be carried out. Surrogate models from Shigella fed to humans and E. coli O157 to rabbits have
been utilised but are significantly different to one another. In addition data obtained by animal exposure may not be
representative for human beings. An alternative approach to generating and validating a dose response model is to use
quantitative data obtained from actual human outbreaks. This work collates outbreak data obtained from global sources and
these are fitted using exponential and beta-Poisson models. The best fitting model was found to be the beta-Poisson model using
a beta-binomial likelihood and the authors favour the exact version of this model. The confidence levels in this model
encompass a previously published Shigella dose response model. The potential incorporation of this model into QMRAs is
discussed together with applications of the model to help explain foodborne outbreaks.
D 2005 Elsevier B.V. All rights reserved.
Keywords: Dose response; E. coli O157; Food outbreaks; Environmental outbreaks; Risk assessment; Markov Chain Monte Carlo; Metropolis
algorithm; Epidemiology
0168-1605/$ - see front matter D 2005 Elsevier B.V. All rights reserved.
doi:10.1016/j.ijfoodmicro.2004.11.023
T Corresponding author. Tel.: +44 1224 272699; fax: +44 1224
272703.
E-mail address: [email protected] (N.J.C. Strachan).
1. Introduction
Escherichia coli O157 is a widespread pathogen
causing severe human infection which can be either
foodborne (e.g., cooked and raw meats, dairy prod-
ucts, vegetables etc.), waterborne (e.g., drinking or
robiology 103 (2005) 35–47

N.J.C. Strachan et al. / International Journal of Food Microbiology 103 (2005) 35–4736
swimming water), environmental (e.g., direct contact
with farm animals or contaminated pasture) or by
human to human transmission. The infectious dose for
this organism is estimated to be low (b10 viable cells
(Griffin and Tauxe, 1991) and ba few hundred (Doyle
et al., 2001)) and the sequelae can be severe,
particularly among children. For example it has been
reported (Locking et al., 2001) that in a study of 183
E. coli O157 cases in Scotland, 44% were in children
under 10 years of age, 77% of cases reported bloody
diarrhoea, 57% were admitted to hospital and 8%
developed haemolytic uraemic syndrome (HUS). This
high reporting rate among children may be influenced
by under reporting of adult cases. A number of large
outbreaks have occurred, e.g., the Central Scotland
outbreak in 1996 where the consumption of contami-
nated meat led to the direct death of 17 elderly people
and more than 500 falling ill (Cowden et al., 2001), a
hamburger outbreak in Washington State 1992–1993
where 501 cases were reported, including 151
hospitalisations, 45 cases of HUS and 3 deaths (Bell
et al., 1994), and an outbreak in school-age children in
Osaka, Japan, in 1996 which eventually resulted in
7966 reported cases including 3 deaths (Michino et
al., 1999).
A number of dose response models have been used
in quantitative microbiology to describe the relation-
ship between the level of microbial exposure (i.e., the
dose or number of organisms ingested) and the
likelihood of occurrence of an adverse consequence
(i.e., illness (Holcomb et al., 1999)). The most
commonly used models are single hit models, where
only one organism ingested is required to cause
infection even though the probability of this occurring
may be very small. The simplest form of this model is
the exponential model (Haas et al., 1999) which
assumes that the number of organisms ingested takes
the form of a Poisson distribution and that each micro-
organism has an equal and independent survival
probability of causing infection to the host which
can be calculated from the binomial distribution.
However, each individual host may respond differ-
ently to a given pathogen and this variation can be
incorporated into the dose response model by describ-
ing the survival probability of the pathogen by a
probability distribution. The most commonly used
distribution used to describe this variability is a beta
distribution, though it must be noted that any
unimodal distribution could potentially be used
(Johnson et al., 1995). This beta-Poisson dose
response model can be approximated by a simple
equation (see Eq. (4)) and in most cases provides a
statistically significant improvement in fit over the
exponential model (Crockett et al., 1996).
Fitting of these models to data is usually performed
using a maximum likelihood technique with the
likelihood derived from the binomial distribution.
However, overdispersion can occur when the variation
between replicate individuals is greater than expected.
This is likely to happen in outbreaks where individ-
uals of a wide range of susceptibilities (e.g., from
relatively low susceptibility healthy adults to higher
susceptibility in the elderly and infants) may be
exposed to the pathogen. Haas et al., (1999) demon-
strates that overdispersion can be described using a
beta-binomial likelihood.
Quantitative microbiological risk assessments
(QMRAs) have been performed to determine the risk
of E. coli O157 infection both from foods (Cassin et
al., 1998) and the environment (Strachan et al., 2002).
These types of risk assessment are particularly useful
in proposing mitigation strategies for reducing risk of
infection. However, microbiological risk assessments
require validated dose response models to ensure
accuracy and assess uncertainty. Validation is ideally
performed using data obtained from outbreaks (e.g.,
as developed for Salmonella (Fazil et al., 2001)).
Surrogate dose response models have been used in E.
coli O157 QMRAs but have yet to be fully validated
with outbreak data. These include a surrogate Shigella
beta-Poisson model based on feeding studies in
humans formulated by Crockett et al. (1996) which
was chosen because Shigella infections can be
foodborne and the toxins produced are similar to
those of E. coli O157 (Doyle et al., 2001). This model
pooled experimental data from Shigella flexneri and
dysenteriae strains and was shown to be statistically
indistinguishable from separate dose response models
of each species, suggesting its potential to represent
the Shigella species. Haas et al. (2000) proposed a
dose response model for E. coli O157 from rabbits
inoculated through an oral catheter. The two models
are considerably different with the Haas version
requiring approximately 500 times as many organisms
to infect 50% of animals exposed compared to the
Crockett model. Strachan et al. (2001) demonstrated
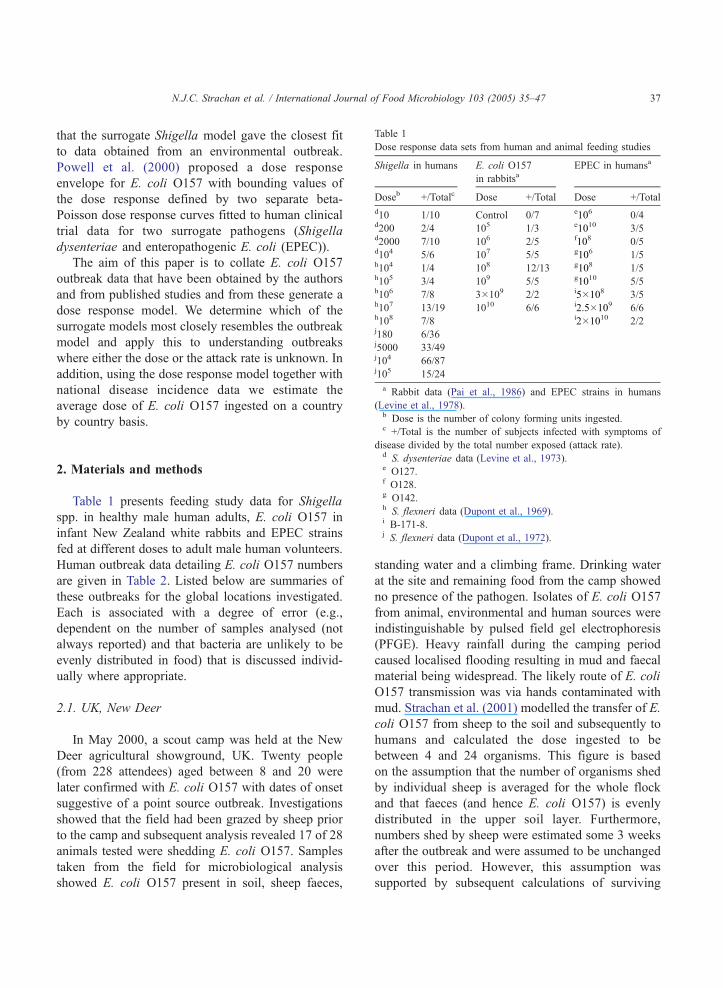
Table 1
Dose response data sets from human and animal feeding studies
Shigella in humans E. coli O157
in rabbitsaEPEC in humansa
Doseb +/Totalc Dose +/Total Dose +/Tota
d10 1/10 Control 0/7 e106 0/4d200 2/4 105 1/3 e1010 3/5d2000 7/10 106 2/5 f108 0/5d104 5/6 107 5/5 g106 1/5h104 1/4 108 12/13 g108 1/5h105 3/4 109 5/5 g1010 5/5h106 7/8 3�109 2/2 i5�108 3/5h107 13/19 1010 6/6 i2.5�109 6/6h108 7/8 i2�1010 2/2j180 6/36j5000 33/49j104 66/87j105 15/24
a Rabbit data (Pai et al., 1986) and EPEC strains in humans
(Levine et al., 1978).b Dose is the number of colony forming units ingested.c
N.J.C. Strachan et al. / International Journal of Food Microbiology 103 (2005) 35–47 37
that the surrogate Shigella model gave the closest fit
to data obtained from an environmental outbreak.
Powell et al. (2000) proposed a dose response
envelope for E. coli O157 with bounding values of
the dose response defined by two separate beta-
Poisson dose response curves fitted to human clinical
trial data for two surrogate pathogens (Shigella
dysenteriae and enteropathogenic E. coli (EPEC)).
The aim of this paper is to collate E. coli O157
outbreak data that have been obtained by the authors
and from published studies and from these generate a
dose response model. We determine which of the
surrogate models most closely resembles the outbreak
model and apply this to understanding outbreaks
where either the dose or the attack rate is unknown. In
addition, using the dose response model together with
national disease incidence data we estimate the
average dose of E. coli O157 ingested on a country
by country basis.
+/Total is the number of subjects infected with symptoms odisease divided by the total number exposed (attack rate).d S. dysenteriae data (Levine et al., 1973).e O127.f O128.g O142.h S. flexneri data (Dupont et al., 1969).i B-171-8.j S. flexneri data (Dupont et al., 1972).
2. Materials and methods
Table 1 presents feeding study data for Shigella
spp. in healthy male human adults, E. coli O157 in
infant New Zealand white rabbits and EPEC strains
fed at different doses to adult male human volunteers.
Human outbreak data detailing E. coli O157 numbers
are given in Table 2. Listed below are summaries of
these outbreaks for the global locations investigated.
Each is associated with a degree of error (e.g.,
dependent on the number of samples analysed (not
always reported) and that bacteria are unlikely to be
evenly distributed in food) that is discussed individ-
ually where appropriate.
2.1. UK, New Deer
In May 2000, a scout camp was held at the New
Deer agricultural showground, UK. Twenty people
(from 228 attendees) aged between 8 and 20 were
later confirmed with E. coli O157 with dates of onset
suggestive of a point source outbreak. Investigations
showed that the field had been grazed by sheep prior
to the camp and subsequent analysis revealed 17 of 28
animals tested were shedding E. coli O157. Samples
taken from the field for microbiological analysis
showed E. coli O157 present in soil, sheep faeces,
l
f
standing water and a climbing frame. Drinking water
at the site and remaining food from the camp showed
no presence of the pathogen. Isolates of E. coli O157
from animal, environmental and human sources were
indistinguishable by pulsed field gel electrophoresis
(PFGE). Heavy rainfall during the camping period
caused localised flooding resulting in mud and faecal
material being widespread. The likely route of E. coli
O157 transmission was via hands contaminated with
mud. Strachan et al. (2001) modelled the transfer of E.
coli O157 from sheep to the soil and subsequently to
humans and calculated the dose ingested to be
between 4 and 24 organisms. This figure is based
on the assumption that the number of organisms shed
by individual sheep is averaged for the whole flock
and that faeces (and hence E. coli O157) is evenly
distributed in the upper soil layer. Furthermore,
numbers shed by sheep were estimated some 3 weeks
after the outbreak and were assumed to be unchanged
over this period. However, this assumption was
supported by subsequent calculations of surviving

Table 2
E. coli O157 outbreak data
Outbreak number and reference Outbreak site Vehicle Estimated
dose
Total number
of subjects
Number of
subjects infecteda
1 (Strachan et al., 2001) UK, New Deer Sheep faeces/soil 14 228 20
2 (Nauta et al., 2001;
Shinagawa et al., 1997)
Japan, Morioka Salad/seafood sauce 31 871 215
3 (Keene and Sazie, 1997) USA, Oregon Deer jerky 10000 12 10
4 (Uchimura et al., 1997) Japan, Kashiwa Melon 1100 71 32
5 (Bell et al., 1994; Tuttle et al., 1999;
The National Academy
of Sciences 2002)
USA, Washington Hamburger 23 5634 398
6 (Tilden et al., 1996) USA, California /
Washington
Salami 23 2778 17
7 (Warrner et al., 1995) USA, Illinois Water 75b 2350 12
8 (Anon. 1997) UK, Wyre Cheese 380 360 2
a Secondary cases have been removed.b Estimated from total E. coli counts.
N.J.C. Strachan et al. / International Journal of Food Microbiology 103 (2005) 35–4738
numbers in soil using accepted environmental decay
rates (Wang et al., 1996). The mass of soil likely to be
ingested during camping is based on a dry weight
estimation (van Wijnen et al., 1990). Our figures are
based on wet weight and may therefore slightly
overestimate the bacterial load ingested.
2.2. Japan, Morioka
In September 1996, an outbreak of E. coli O157
occurred after a school lunch which infected 208
children and 7 adults (Nauta et al., 2001; Shinagawa
et al., 1997). The exposed population was determined
as 828 pupils and 43 teachers. Among 153 frozen-
stored samples of raw food materials and cooked
dishes, E. coli O157 was isolated from pumpkin salad
and seafood sauce by immunomagnetic separation.
No E. coli O157 was detected in the raw ingredients
of the salad and sauce which suggests that contam-
ination occurred during the preparation of the meal.
Pathogen numbers were estimated by the most
probable number method at 4-18 E. coli O157/100
g, a relatively narrow range which might suggest an
even distribution throughout the food. The average
dose ingested was estimated to be approximately 31
organisms per person.
2.3. USA, Oregon
In November 1995, 11 cases (6 confirmed and 5
presumptive) of gastroenteritis among members of
three households and two friends (12 in total) in an
Oregon community were associated with consumption
of contaminated homemade venison jerky (Keene and
Sazie, 1997). All but one of the cases (an infant that
was presumably infected by person-to-person trans-
mission) had eaten the jerky with some individuals
consuming N500 g over a period of several days. The
deer used to prepare the jerky was shot and
eviscerated in the field, hung outdoors at ambient
temperatures (1 8C to 16 8C) for 5 days, and
dismembered on the family’s band saw. Meat
(approximately 10 kg) was cut into thin strips and
marinated in a refrigerator, then dried in several
batches in a food dehydrator at 51.7 8C to 57.2 8C for
12–14 h per batch. E. coli O157 was isolated from
two leftover pieces of jerky and were indistinguish-
able by PFGE from human isolates. Counts of E. coli
O157 in the jerky specimens were 3–93 cfu/g (mean
of approximately 50/g) and we estimated an average
of 200 g consumed resulting in a dose of 10,000
organisms.
2.4. Japan, Kashiwa
During the summer of 1997, an outbreak of E. coli
O157 occurred at a daycare centre where a total of 71
people ate contaminated melon and 28 children and 4
adults were identified as infected (Uchimura et al.,
1997). Frozen foods eaten on the premises and
microbiological swabs taken from the kitchen were
analysed. Melon served at lunch was found to contain

N.J.C. Strachan et al. / International Journal of Food Microbiology 103 (2005) 35–47 39
E. coli O157 and isolates from both patients and
melon were all VT1 and VT2 positive and had
identical RAPD-PCR patterns. The implicated food
was found to contain 43 cfu/g E. coli O157 and it was
estimated that approximately 1.1�103organisms were
ingested by each person in a 25-g melon piece served
per child.
2.5. USA, Washington
Between November 1992 and February 1993, an
outbreak of E. coli O157 involving more than 700
cases occurred in the western USA and was
associated with eating undercooked ground beef
patties at restaurants of a major fast-food chain
(Bell et al., 1994; Tuttle et al., 1999). Bell et al.
(1994) designated 398 primary cases in Washing-
ton. Isolates of E. coli O157 obtained from recalled
ground beef patties epidemiologically associated
with the outbreak were indistinguishable by PFGE
from those isolated from patients. Seventy-six of
the ground beef patties were assayed quantitatively
for E. coli O157:H7 using the most probable
number method. Contamination of uncooked patties
ranged from b0.3 to 15 E. coli O157/g (median 1.5
organisms/g). Each patty weighed 45 g, hence the
number of E. coli O157 per patty ranged from
b13.5 to 675 (median 67.5 organisms/patty). It was
calculated (Powell et al., 2000) that the median
number of E. coli O157 in the served undercooked
burgers was approximately 23 organisms. Errors in
bacterial numbers in this case would also include
those associated with inactivation due to cooking.
The USDA risk assessment of E. coli O157 in
ground beef (The National Academy of Sciences,
2002) when considering this outbreak estimated the
number of contaminated patties to be 5634 when
taking into account under-reporting.
2.6. USA, California/Washington
In November 1994, an outbreak of 17 cases of
E. coli O157:H7 infection in California and the
state of Washington was associated epidemiologi-
cally with consumption of pre-sliced, dry, fermented
salami (Tilden et al., 1996). The salami was
produced at a single facility in California in 310-
lb (approximately 141 kg) batches. E. coli O157:H7
was isolated from intact packages of the implicated
salami obtained at retail stores, with isolates from
patients and the salami having indistinguishable
PFGE profiles. Enumeration of E. coli O157:H7 in
implicated salami samples by most probable num-
ber determination revealed uniformly low-level
contamination, ranging from 0.3 to 0.4 cfu/g. The
estimated quantity of salami consumed by four case
patients ranged from 6 to 113 g (we assumed 50-g
portions in the model which equates to an exposure
of 2778 people), with the calculated number of E.
coli O157:H7 organisms consumed ranging from 2
to 45 bacteria (with an average of 23).
2.7. USA, Illinois
During the summer of 1995 there was an outbreak
of E. coli O157 in Rockford, Illinois, where 12 people
were infected (Warrner et al., 1996). Epidemiological
investigations revealed no common food source, but it
was established that those ill had visited a lake
swimming beach on June 24–25th. Between 2200
and 2500 people were estimated to have visited the
beach area on these days but subsequent analysis of
water samples, taken after the lake had been closed to
the public, failed to find E. coli O157. However,
routine E. coli tests from two water samples collected
4 days before the outbreak were found to contain
levels of 600 and 900 per 100 ml respectively (mean
750 per 100 ml). Retrospective testing (July 10th)
showed E. coli levels at N500 per 100 ml. No E. coli
O157 were isolated from the faeces of waterfowl
roosting on the lake and there were no cattle farms or
sewage outlets nearby suggesting the source of E. coli
O157 could be bathing humans themselves. It is our
experience that humans rarely excrete pure cultures of
E. coli O157 and faeces usually include other
coliforms and non-pathogenic E. coli. We estimate
for this outbreak that a proportion (10%) of the
commensal E. coli in the lake were serotype O157,
based on personal observations from clinical samples
of human E. coli O157 infections. We also assume
that the quantity of water ingested whilst swimming
was of the order of 100 ml per person bathing (Haas et
al., 2000). Hence, estimated number of E. coli O157
ingested per person is 75 (0.1�750). Our estimates are
quite clearly stated as such, and are backed by
personal experience within medical microbiology.

Table 3
Beta-Poisson model parameterisation for previous dose response
studies
Model a b Y Points
Shigella human 0.162 15.86 24.0 13
E. coli O157 rabbit 0.487 1.81�105 3.1 8
EPEC human 0.221 3.11�106 11.2 9
Fig. 1. Beta-Poisson dose response models for animal/human-
feeding studies with outbreak data superimposed ([1] UK, New
Deer, [2] Japan, Morioka, [3] USA, Oregon, [4] Japan, Kashiwa, [5]
USA, Washington, [6] USA, California /Washington, [7] USA
Illinois and [8] UK,Wyre).
N.J.C. Strachan et al. / International Journal of Food Microbiology 103 (2005) 35–4740
2.8. UK, Wyre
During October/November 1997, five cases of
gastroenteritis in N.W. England were linked with the
consumption of cheese made from unpasteurised
milk. Two cases had consumed the same brand of
cheese manufactured by a local producer. Micro-
biological testing revealed both had E. coli O157,
with the same genetic profile (PFGE) as strains
isolated from the cheese. In addition, the same strain
was found in a rectal swab from an animal housed on
one farm supplying milk for this particular type of
cheese. The organism was isolated from 10 out of 11
samples taken from two truckles (9-kg cheeses)
produced in late August 1997. Numbers estimated
by MPN were 5–10 E. coli O157/g (Anonymous,
1997). Although three more human cases in N.W.
England were infected with E. coli O157 at this time,
there was no proven link to buying or eating the
suspect cheese. The number of people who consumed
the contaminated cheese was 360 (18 kg (two 9 kg
cheeses)/50 g eaten) and for this study it was
estimated that 25–50 g portions are consumed per
person per meal and that the two 9 kg cheeses were
evenly contaminated.
In order to fit the outbreak data to the dose
response models these data were normalised by giving
1/8 th weight to each of the 8 outbreaks. This ensures
that the large outbreaks do not dominate the likelihood
function and hence fitting of the dose response
parameters. This approach is the same as that used
for a Salmonella outbreak dose response model (Fazil
et al., 2000).
2.9. Dose response modelling
The exponential dose response model is a bsinglehitQ model where only one organism is required to
cause infection and all organisms are independent.
Given a dose of D organisms with a Poisson
distribution and given that each organism has a
probability pm of surviving to cause infection then
the probability (pI) of the host becoming infected can
be calculated from:
pI ¼ 1� e�pmD ð1Þ
Heterogeneity between the pathogen and the host can
be incorporated using a beta distribution B(a, b)
pI ¼ 1�Z 1
0
e�pmDB a; bð Þdpm ð2Þ
Integrating out pm in the above equation results in a
confluent hypergeometric function. This model is the
exact beta-Poisson model:
pI D; a; bð Þ ¼ 1�1 F1 a; a þ b; � Dð Þ ð3Þ
An approximation to this model holds when bNN1 andabbb and this is known as the approximate beta-
Poisson model.
pI ¼ 1� 1þ D
b
� ��a
ð4Þ
The maximum likelihood method is used to fit dose
response data to the models described above by mi-
nimising the deviance (Y) (see Appendix 1). Ap-
propriate confidence intervals can be generated by
Markov Chain Monte Carlo methods (see Appendix
1). All calculations were performed using Mathema-
tica (Version 5.0, Wolfram Research, Canada).
,

N.J.C. Strachan et al. / International Journal of Food Microbiology 103 (2005) 35–47 41
Prior work (Crockett et al., 1996; Haas et al., 2000;
Powell et al., 2000), using a binomial likelihood
function have demonstrated that the approximate beta-
Poisson dose response model provides a suitable fit to
the human- and animal-based feeding study data
presented in Table 3 and Fig. 1.
Here, we determine the fit of the exponential, exact
and approximate beta-Poisson dose response models
to the E. coli O157 outbreak data using both binomial
and beta-binomial likelihood functions.
3. Results and discussion
Figs. 2 and 3 and Table 4 give the results of fitting
the dose response models to these outbreak data. A
best fit (i.e., minimum deviance) model was not found
for the approximate and exact beta-Poisson using the
binomial likelihood. Similar problems in fitting the
approximate beta-Poisson model using a binomial
likelihood to foot and mouth disease data have been
reported by French et al. (2002).
Best fit models were obtained for the exponential
model for both formats of the likelihood. These
models are similar but with the beta-binomial like-
lihood having slightly broader confidence intervals.
Although the best fits were not significant, when
comparing the deviance with the critical values of the
v2 distribution, the application of the beta-binomial
likelihood considerably reduced the deviance (from
1604 to 56) compared with using a binomial like-
lihood. Similarly, both the exact and approximate
beta-Poisson models had considerable reductions in
the best fit deviance values for the beta-binomial
compared with the binomial likelihood.
The overall best fit is the exact beta-Poisson with
beta-binomial likelihood. Figs. 2 and 3 demonstrate
that the approximate version of this model is virtually
identical to it. This exact model has a significant
reduction in deviance compared with its exponential
counterpart but is still not a statistically significant fit
(best fit YNcritical v2). However this must be
reconciled with the following: the variation in micro-
bial data obtained from outbreaks will certainly be
larger than in controlled feeding studies due to the use
of differing enumeration methods, each with different
sensitivities; uneven distribution of the pathogen
within the food; the actual numbers of E. coli O157
in a sample may change prior to consumption due, for
example, improper storage at high temperatures or to
partial cooking and numbers of E. coli O157 in food
and the exact quantity of food ingested can usually not
be definitively calculated.
Comparing the exact beta-Poisson beta-binomial
outbreak model with the previously used surrogate
dose response models for E. coli O157, it is apparent
that the Shigella model is contained within the
confidence intervals. In fact the Shigella model is
very similar to the median model. This is in contrast
with the E. coli O157 rabbit model which under-
estimates the risk of illness for doses b105 and the
EPEC model which underestimates the risk for doses
b107. The dose response envelope proposed by
Powell et al. (2000) with the lower band limit
represented by the Shigella model and the upper
band by EPEC appears to underestimate the lower
band (at doses b103) and overestimates the upper
band. However, further outbreak data points are
required to verify this. The current data points
represent those outbreaks where data have been
collected and made available. The authors see no
reason why these data may be biased (e.g., to more
virulent strains of the pathogen). This can only be
assessed when future data become available.
A number of outbreaks have occurred where either
the attack rate or pathogen numbers are unknown and
it is useful for epidemiological purposes to calculate
the missing co-ordinate using the outbreak dose
response model. For example, an unusually large
number of cases of E. coli O157 in a NE Scotland
primary school arose in June 1999 (Grampian Health
Board, 2000). Cheese from unpasteurised goats’ milk
was suspected, made for a school project where small
amounts (b30 g) were consumed in the classroom. As
all the cheese was eaten, none remained for pathogen
detection or enumeration although the attack rate was
estimated with some accuracy in the confined
community. Laboratory investigations isolated strains
of E. coli O157 from a number of animals at the farm
including the goat. Isolates had the same PFGE
pattern as the patients. Of the 28 people who ate the
cheese (restricted to one school class), only one was
not infected and of the five who refused the cheese,
none became unwell. Six children were asymptomatic
which gave an attack rate of 0.75. The exact beta-
Poisson model predicts a median dose with order of

Fig. 2. Deviance plotted against dose response parameters for each of the following dose response models generated from the outbreak data.
Exponential dose response model with (a) binomial likelihood (2-D graph with deviance Y plotted against the dose response parameter pm) and
(b) beta-binomial likelihood (contour graph of deviance Y plotted against dose response parameter pm and likelihood overdispersion parameter
h). Exact beta-Poisson dose response model with (c) binomial likelihood (contour graph of deviance Y plotted against dose response parameters
a and b) and (d) beta-binomial likelihood (contour graph of deviance Y plotted against dose response parameters (a) and (b) plotted at best fit
value of h). Approximate beta-Poisson dose response model with (e) binomial likelihood (contour graph of deviance Y plotted against dose
response parameters a and b) and (f) beta-binomial likelihood (contour graph of deviance Y plotted against dose response parameters (a) and (b)
and plotted at best fit value of h).
N.J.C. Strachan et al. / International Journal of Food Microbiology 103 (2005) 35–4742
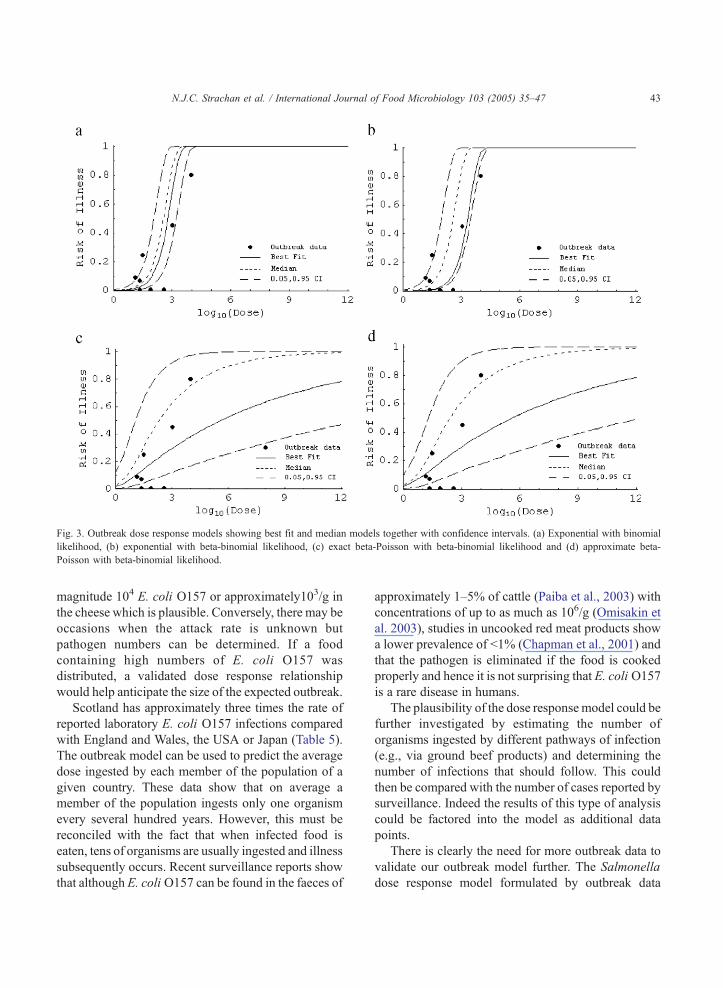
Fig. 3. Outbreak dose response models showing best fit and median models together with confidence intervals. (a) Exponential with binomial
likelihood, (b) exponential with beta-binomial likelihood, (c) exact beta-Poisson with beta-binomial likelihood and (d) approximate beta-
Poisson with beta-binomial likelihood.
N.J.C. Strachan et al. / International Journal of Food Microbiology 103 (2005) 35–47 43
magnitude 104 E. coli O157 or approximately103/g in
the cheese which is plausible. Conversely, there may be
occasions when the attack rate is unknown but
pathogen numbers can be determined. If a food
containing high numbers of E. coli O157 was
distributed, a validated dose response relationship
would help anticipate the size of the expected outbreak.
Scotland has approximately three times the rate of
reported laboratory E. coli O157 infections compared
with England and Wales, the USA or Japan (Table 5).
The outbreak model can be used to predict the average
dose ingested by each member of the population of a
given country. These data show that on average a
member of the population ingests only one organism
every several hundred years. However, this must be
reconciled with the fact that when infected food is
eaten, tens of organisms are usually ingested and illness
subsequently occurs. Recent surveillance reports show
that although E. coli O157 can be found in the faeces of
approximately 1–5% of cattle (Paiba et al., 2003) with
concentrations of up to as much as 106/g (Omisakin et
al. 2003), studies in uncooked red meat products show
a lower prevalence of b1% (Chapman et al., 2001) and
that the pathogen is eliminated if the food is cooked
properly and hence it is not surprising that E. coli O157
is a rare disease in humans.
The plausibility of the dose responsemodel could be
further investigated by estimating the number of
organisms ingested by different pathways of infection
(e.g., via ground beef products) and determining the
number of infections that should follow. This could
then be compared with the number of cases reported by
surveillance. Indeed the results of this type of analysis
could be factored into the model as additional data
points.
There is clearly the need for more outbreak data to
validate our outbreak model further. The Salmonella
dose response model formulated by outbreak data

Table 4
Dose response model fits to outbreak data
Model Likelihood Best fit
parameters
Median fit
parameters
Critical v2,a Deviance, Y
(best fit)
Exponential Binomial pm=0.00113 pm=0.00208 14.07 1604.45
Beta- pm=0.000332 pm=0.00155 12.59 56.35
Binomial h=0.119 h=0.479Exact Beta Binomial No solution
Poisson Beta- a=0.0565 a=0.1635 11.07 44.49
Binomial b=2.5487 b=4.3682h=0.3758 h=0.5890
Approximate Binomial No solution
Beta Beta- a=0.0571 a=0.2241 11.07 44.47
Poisson Binomial b=2.2183 b=4.8807h=0.3750 h=0.5971
a The deviance is required to be less than the critical v2 for a statistically significant fit.
N.J.C. Strachan et al. / International Journal of Food Microbiology 103 (2005) 35–4744
(Fazil et al., 2001) has been greatly assisted by the
directive in Japan which instructs large-scale cooking
facilities to freeze 50-g portions of both raw food
materials and cooked dishes for more than 2 weeks for
possible future examination in the case of a food-
poisoning incident. Moreover, it is interesting to note
that kitchens with social responsibilities in Japan (e.g.,
schools and hospitals) have voluntarily adopted this
scheme. This directive was released after the critical
review of large outbreaks of E. coli O157 which
occurred in Japan in 1996, when food samples were not
stored resulting in the inability to detect and enumerate
causative agents. If this directive was repeated world-
wide, which may be feasible for large-scale suppliers of
food, dose response outbreak data would become
available not only for E. coli O157 but for the other
Table 5
National incidence rates 2001 (except USA–2000) and predicted range of
exact beta-Poisson outbreak model with beta-binomial likelihood using M
Country E. coli O157 infections per
100,000 persons per year
D
p
USA 1.7a 4
Japan 1.3b 3
England and Wales 1.5c 4
Scotland 4.6d 1
a (Anonymous, 2002a).b (Anonymous, 2002b).c (Anonymous, 2002c).d (Cowden et al., 2001).
major foodborne pathogens as well. Of course,
consideration would have to be made when storing
these food samples to try and minimise the effects of
the possible non-uniform distribution of the pathogen
within a large batch of food.
The dose response models developed here will be
of value in quantitative microbiological risk assess-
ment and in particular those that utilise Monte Carlo
simulation. For example the parameters given in Table
4 could be inserted into QMRA packages such as
@RISK, Crystal Ball etc. If variation in the dose
response data needs to be incorporated, it can be
included by using a different set of the Metropolis
generated dose response parameters for each Monte
Carlo iteration. In addition the overdispersion (repre-
sented by h) in the beta-binomial likelihood can also
daily doses of E. coli O157 ingested per person calculated from the
arkov Chain Monte Carlo samples of a, b and h
aily risk per
erson per day
Outbreak dose response model predicted
daily person intake Median with 95%
confidence interval in brackets
.7�10�8 1.1�10�6 (1.80�10�7, 7.70�10�6)
.6�10�8 8.3�10�7 (1.35�10�7, 5.90�10�6)
.1�10�8 9.4�10�7 (1.55�10�7, 6.80�10�6)
.3�10�7 3.0�10�6 (4.90�10�7, 2.50�10�5)

N.J.C. Strachan et al. / International Journal of Food Microbiology 103 (2005) 35–47 45
be included so that outbreak situations can be
simulated where, for example, a cohort of individuals
have been exposed to a particular dose from a
foodstuff. The dose response parameter sets, together
with an example showing implementation of over-
dispersion can be obtained from the authors by
request.
4. Conclusion
This paper has demonstrated that dose response
data from E. coli O157 outbreaks are most similar
to the beta-Poisson dose response model developed
for Shigella (Crockett et al., 1996). However, more
outbreak data are required for further validation and
the authors recommend that other countries follow
the lead set by Japan in directing large-scale
cooking establishments to store food portions for
subsequent analysis in the event of food-poisoning
outbreaks.
Acknowledgements
The authors would like to thank Dr. David
Wareing, Public Health Laboratory, Preston, UK,
for providing data from the Wyre outbreak. The
authors also thank Dr. Kunihiro Shinagawa, Iwate
University, Japan, and Dr. Masako Uchimura,
Chiba Prefectural Laboratory, Japan, for providing
data from the Morioka and Kashiwa outbreaks,
respectively, and Dr Peter Teunis (RIVM, The
Netherlands) for providing useful comments on this
work.
Appendix A. Applying the maximum likelihood
method to fit a model to dose response data
Given a set of t dose response data points where kiof ni subjects are infected after ingesting a dose di.
We can define pi0=(ki)/(ni) and can calculate the
predicted response of the model pi=pI(di; H), where
H are the set of dose response parameters. Derived
below are the likelihood and deviance functions
assuming that the dose response data are (i) binomial
and (ii) beta-binomial distributed.
A.1. Binomial
The binomial likelihood is
S ¼ j8i
ni!
ki! ni � kið Þ! pið Þki 1� pið Þni�ki ð5Þ
this can be compared with the binomial likelihood
supremum
S sup ¼ j8i
ni!
ki! ni � kið Þ! p0i
� �ki1� p0
i
� �ni�ki ð6Þ
The best fit is obtained by minimising the deviance
Y ¼ � 2lnS
S sup
� �ð7Þ
substituting Eqs. (5) and (6) into Eq. (7) yields
Y ¼ � 2Xti¼1
kilnpi
p0i
� �þ ki � nið Þln 1� pi
1� p0i
� �� �
ð8Þ
A.2. Beta-binomial
The beta-binomial likelihood is
S ¼ j8i
ni!
ki! ni � kið Þ!
b ki þpi
h; ni � ki þ
1� pi
h
� �
bpi
h;1� pi
h
� �
ð9Þ
Where b() is the mathematical beta function and h is a
parameter which represents the degree of overdisper-
sion. The likelihood can be compared with the
likelihood supremum and from this the deviance can
be determined using Eq. (9).
Y ¼ � 2Xti¼1
½ln b ki þpi
h; ni � ki þ
1� pi
h
� �
bpi
h;1� pi
h
� �
� ki ln p0i
� �þ ki � nið Þln 1� p0
1
� � ð10Þ

N.J.C. Strachan et al. / International Journal of Food Microbiology 103 (2005) 35–4746
The minimum deviance for each model was deter-
mined using a Markov Chain Monte Carlo minimising
model. Median dose response models and confidence
intervals were generated using an algorithm based on
the Metropolis Markov Chain Monte Carlo method
(Metropolis et al., 1953).
References
Anonymous, 1997. Report of an E. coli O157 Outbreak Associated
with the Consumption of Cheese. Environmental Health Service
Unit, Wyre Borough Council, UK.
Anonymous, M., 2002a. Centers for Disease Control and Preven-
tion. Summary of notifiable diseases—United States, 2000.
MMWR Morb. Mortal. Wkly. Rep. 49, 1–17.
Anonymous, 2002b. Enterohemorrhagic E. coli infection. Infect.
Agents Surv. Rep. (Japan) 23, 137–138.
Anonymous, 2002c. Vero cytotoxin producing E. coli O157: 2001.
CDR Wkly 12, 2–3.
Bell, B.P., Goldoft, M., Griffin, P.M., Davis, M.A., Gordon, D.C.,
Tarr, P.I., Bartleson, C.A., Lewis, J.H., Barrett, T.J., Wells, J.G.,
Baron, R., Kobayashi, J., 1994. A. multistate outbreak of E. coli
O157:H7-associated bloody diarrhea and hemolytic uremic
syndrome from hamburgers. JAMA 272, 1349–1353.
Cassin, M.H., Lammerding, A.M., Todd, E.C., Ross, W., McColl,
R.S., 1998. Quantitative risk assessment for Escherichia coli
O157:H7 in ground beef hamburgers. Int. J. Food Microbiol. 41,
21–44.
Chapman, P.A., Malo, A.T.C., Ellin, M., Ashton, R., Harkin, M.A.,
2001. Escherichia coli O157 in cattle and sheep at slaughter, on
beef and lamb carcasses and in raw beef and lamb products in
South Yorkshire, UK. Int. J. Food Microbiol. 64, 139–150.
Cowden, J.M., Ahmed, S., Donaghy, M., Riley, A., 2001.
Epidemiological investigation of the Central Scotland outbreak
of Escherichia coli O157 infection, November to December
1996. Epidemiol. Infect. 126, 335–341.
Crockett, C.S., Haas, C.N., Fazil, A., Rose, J.B., Gerba, C.P., 1996.
Prevalence of shigellosis in the U.S.: consistency with dose–
response information. Int. J. Food Microbiol. 30, 87–99.
Doyle, M.P., Beuchat, L.R., Montville, T.J., 2001. Food Micro-
biology, Fundamentals and Frontiers, 2nd ed. Am. Soc. for
Microbiol. Press, Washington, DC, USA.
Dupont, H.L., Hornick, R.B., Dawkins, A.T., Snyder, M.J., Formal,
S.B., 1969. The response of man to virulent Shigella flexneri.
Iia. J. Infect. Dis. 119, 296–299.
Dupont, H.L., Hornick, R.B., Snyder, M.J., Libonati, J.B., Formal,
S.B., Gangarosa, E.J., 1972. Immunity in shigellosis: II.
Protection induced by oral live vaccine or primary infection.
J. Infect. Dis. 125, 12–16.
Fazil, A., Lammerding, A., Morales, R., Vicari, A.S., Kasuga, F.
Hazard Identification and Hazard Characterisation of Salmonella
in Broilers and Eggs. Prelim. Joint FAO/WHO, MRA 00/03.
Fazil, A., Lammerding, A.M., Kasuga, F., Ebel, E., Kelly, L.,
Anderson, W., Snary, E., 2001. Risk Characterization of
Salmonella in Broilers and Eggs. FAO/WHO, MRA 01/02.
French, N.P., Kelly, L., Jones, R., Clancy, D., 2002. Dose–response
relationship for foot and mouth disease in cattle and sheep.
Epidemiol. Infect. 128, 325–332.
Grampian Health Board, 2000. Report on the Outbreak of E. coli
O157 in Children Attending MacDuff Primary School, Aber-
deenshire June 1999.
Griffin, P.M., Tauxe, R.V., 1991. The epidemiology of infection
caused by Escherichia coli O157 and other enterohaemorrhagic
E. coli and the associated haemolytic uraemic syndrome.
Epidemiol. Rev. 13, 60–98.
Haas, C.N., Rose, J.B., Gerba, C.P., 1999. Quantitative Microbial
Risk Assessment. John Wiley, New York.
Haas, C.N., Thayyar-Madabusi, A., Rose, J.B., Charles, C.P., 2000.
Development of a dose–response relationship for Escherichia
coli O157: H7. Int. J. Food Microbiol. 56, 153–159.
Holcomb, D.L., Smith, M.A., Ware, G.O., Hung, Y., Brackett, R.E.,
Doyle, M.P., 1999. Comparison of six dose–response models for
use with food-borne pathogens. Risk Anal. 19, 1091–1100.
Johnson, N.L., Kotz, S., Balakrishnan, N., 1995. Continuous
Univariate Distributions, Second edition. Wiley, New York,
p. 589.
Keene, W.E., Sazie, E., 1997. An outbreak of E. coli O157: H7
infections traced to jerky made from deer meat. JAMA 277,
1229–1232.
Levine, M.M., Dupont, H.L., Formal, S.B., 1973. Pathogenesis
of Shigella dysenteriae (Shiga) dysentry. J. Infect. Dis. 127,
261–269.
Levine, M.M., Berquist, E.J., Nailin, D.R., Waterman, D.H.,
Hornick, R.B., Young, C., Sotman, S., 1978. Escherichia coli
strains that cause diarrhea but do not produce heat labile or
heat-stable enterotoxins and are non invasive. Lancet 1 (8074),
1119.
Locking, M.E., O’Brien, S.J., Reilly, W.J., Campbell, D.M.,
Browning, L.M., Wright, E.M., Coia, J.E., Ramsay, J.E.,
2001. Risk factors for sporadic cases of Escherichia coli
O157 infection: the importance of contact with animal excreta.
Epidemiol. Infect. 127, 215–220.
Metropolis, N., Rosenbluth, A.W., Rosenbluth, M.N., Teller, A.H.,
Teller, E., 1953. Equation of state calculations by fast computing
machines. J. Chem. Phys. 21 (6), 1087–1092.
Michino, H., Araki, K., Minami, S., 1999. Massive outbreak of
Escherichia coli O157: H7 infection in schoolchildren in Sakai
City, Japan, associated with consumption of white radish
sprouts. Am. J. Epidemiol. 150, 787–796.
Nauta, M.J., Evers, E.G., Takumi, K., Havelaar, A.H., 2001. Risk
Assessment of Shiga-toxin Producing E. coli O157 in Steak
Tartare in the Netherlands. RIVM Rep. 257851003, PO Box 1,
3720 BA Bilthoven, The Netherlands.
Omisakin, F., MacRae, M., Ogden, I.D., Strachan, N.J.C., 2003.
Concentration and prevalence of Escherichia coli O157 in cattle
feces at slaughter. Appl. Environ. Microbiol. 69, 2444–2447.
Pai, C.H., Kelly, J.K., Meyers, G.L., 1986. Experimental infection
of infant rabbits with verotoxin producing E. coli. Infect.
Immun. 51, 16–23.
Paiba, G.A., Giddens, J.C., Pascoe, S.J.S., Kidd, S.A., Byrne, C.,
Ryan, J.B.M., Smith, R.P., McLaren, I.M., Futter, R.J., Kay,
A.C.S., Jones, Y.E., Chappell, S.A., Willshaw, G.A., Cheasty,

N.J.C. Strachan et al. / International Journal of Food Microbiology 103 (2005) 35–47 47
T., 2003. Faecal carriage of verocytotoxin-producing Escher-
ichia coli O157 (VTEC) in cattle and sheep at slaughter in Great
Britain. Vet. Rec. 150, 593–598.
Powell, M.R., Ebel, E., Schlosser, W., Walderhaug, M., Kause, J.,
2000. Dose response envelope for E. coli O157: H7. Quant.
Microbiol. 2, 141–163.
Shinagawa, K., Hu, D.Y., Yoshida, S., 1997. Correspondence
and problem for enterohemorrhagic E. coli O157 outbreak
in Morioka city, Iwate. Bull. Natl. Inst. Public Health 46,
104–112 (in Japanese).
Strachan, N.J.C., Fenlon, D.R., Ogden, I.D., 2001. Modelling the
vector pathway and infection of humans in an environmental
outbreak of Escherichia coli O157. FEMS Microbiol. Lett. 203,
69–73.
Strachan, N.J.C., Dunn, G.M., Ogden, I.D., 2002. Quantitative risk
assessment of human infection from Escherichia coli O157
associated with recreational use of animal pasture. Int. J. Food
Microbiol. 75, 39–51.
The National Academy of Sciences Escherichia coli O157:H7 in
ground beef, 2002. Review of a Draft Risk Assessment. The
National Academies Press, Washington, DC, USA.
Tilden, J., Young, W., MacNamara, A.M., 1996. A new route of
transmission for Escherichia coli: infection from dry fermented
salami. Am. J. Pub. Health 86, 1142–1145.
Tuttle, J., Gomez, T., Doyle, M.P., Wells, J.G., Zhao, T., Tauxe,
R.V., Griffin, P.M., 1999. Lessons from a large outbreak of
Escherichia coli O157: H7 infections: insights into the
infectious dose and method of widespread contamination of
hamburger patties. Epidemiol. Infect. 122, 185–192.
Uchimura, M., Kishida, K., Yoda, K., 1997. An outbreak of
enterohemorrhagic E. coli O157: H7 in a daycare—Chiba
Prefecture. Infect. Agents Surv. Rep. 18, 309–310 (in Japanese
including title).
van Wijnen, J.H., Clausing, P., Brunekreef, B., 1990. Estimated soil
ingestion by children. Environ. Res. 51, 147–162.
Wang, G., Zhao, T., Doyle, M.P., 1996. Fate of enterohemorrhagic
Escherichia coli O157: H7 in bovine feces. Appl. Environ.
Microbiol. 62, 2567–2570.
Warrner, M., Kuo, K., Williams, L., Ruden, R., 1996. Lake
associated outbreak of E. coli O157: H7. MMWR Morb.
Mortal. Wkly. Rep. 45, 437–439.
Copyright © 2022 FDOKUMEN