Dose-dependent transcriptional effects of lithium ... - UiO - DUO
8
Progress in Neuropsychopharmacology & Biological Psychiatry 112 (2022) 110408 Available online 25 July 2021 0278-5846/© 2021 The Authors. Published by Elsevier Inc. This is an open access article under the CC BY license (http://creativecommons.org/licenses/by/4.0/). Dose-dependent transcriptional effects of lithium and adverse effect burden in a psychiatric cohort Florian Krull a, * , Ibrahim Akkouh a, b , Timothy Hughes b , Francesco Bettella a , Lavinia Athanasiu a , Olav B. Smeland a , Kevin S. O'Connell a , Hans-Richard Brattbakk c , Vidar M. Steen c , Nils Eiel Steen a, d , Srdjan Djurovic b, c, 1 , Ole A. Andreassen a, d, *, 1 a NORMENT, Institute of Clinical Medicine, University of Oslo, Oslo, Norway b Department of Medical Genetics, Oslo University Hospital, Oslo, Norway c NORMENT, Department of Clinical Science, University of Bergen, Bergen, Norway d Division of Mental Health and Addiction, Oslo University Hospital, Oslo, Norway A R T I C L E INFO Keywords: Lithium Gene expression Bipolar disorder Microarray analysis Psychiatric disorders ABSTRACT Lithium is the first-line treatment for bipolar disorder (BD), but there is a large variation in response rate and adverse effects. Although the molecular effects of lithium have been studied extensively, the specific mechanisms of action remain unclear. In particular, the molecular changes underlying lithium adverse effects are little known. Multiple linear regression analyses of lithium serum concentrations and global gene expression levels in whole blood were carried out using a large case-control sample (n = 1450). Self-reported adverse effects of lithium were assessed with the “Udvalg for Kliniske Undersøgelser” (UKU) adverse effect rating scale, and regression analysis was used to identify significant associations between lithium-related genes and six of the most common adverse effects. Serum concentrations of lithium were significantly associated with the expression levels of 52 genes (FDR < 0.01), largely replicating previous results. We found 32 up-regulated genes and 20 down- regulated genes in lithium users compared to non-users. The down-regulated gene set was enriched for several processes related to the translational machinery. Two adverse effects were significantly associated (p < 0.01) with three or more lithium-associated genes: tremor (FAM13A-AS1, FAR2, ITGAX, RWDD1, and STARD10) and xerostomia (ANKRD13A, FAR2, RPS8, and RWDD1). The adverse effect association with the largest effect was between CAMK1D expression and nausea/vomiting. These results suggest putative transcriptional mecha- nisms that may predict lithium adverse effects, and could thus have a large potential for informing clinical practice. 1. Introduction Bipolar disorder (BD) is a severe mental disorder with lifetime risk of more than 1% (Grande et al., 2016). Early age at onset and chronicity make the global disease burden high (Collins et al., 2011; Gore et al., 2011). One of the major burdens of BD is an increase in all-cause mor- talities, suicide being the leading single cause of excess death rates (Grande et al., 2016; Osby et al., 2001). Mood stabilizers are the mainstay treatment of BD, and lithium is the most frequently recom- mended first-line treatment in clinical practice guidelines and the leading treatment for prevention of relapse (Tondo et al., 2019) and suicide (Cipriani et al., 2013). Lithium has superior efficacy in long-term maintenance treatment of BD; however, only one third of patients are characterized as full responders (Cruceanu et al., 2009; Rybakowski, 2011). Importantly, treatment response may be influenced by non- compliance (Maj et al., 1998), in part due to adverse effects (Gitlin, 2016). While some of these are dose-dependent, their sizeable variation in severity and type (Gitlin, 2016) suggests underlying differences in pharmacological mechanisms between individuals. The variability in response to and adverse effects of long-term lithium treatment is poorly understood and remains a clinical chal- lenge (Gitlin, 2016; Alda, 2017; Hui et al., 2019). Lithium dose is an important aspect of individualizing treatment and avoiding adverse ef- fects (Gitlin, 2016). Guidelines recommend serum levels between 0.4 * Corresponding authors at: NORMENT, Institute of Clinical Medicine, University of Oslo, Oslo, Norway. E-mail addresses: fl[email protected] (F. Krull), [email protected] (O.A. Andreassen). 1 Equal contribution. Contents lists available at ScienceDirect Progress in Neuropsychopharmacology & Biological Psychiatry journal homepage: www.elsevier.com/locate/pnp https://doi.org/10.1016/j.pnpbp.2021.110408 Received 8 April 2021; Received in revised form 21 July 2021; Accepted 22 July 2021
-
Upload
khangminh22 -
Category
Documents
-
view
4 -
download
0
Transcript of Dose-dependent transcriptional effects of lithium ... - UiO - DUO

Progress in Neuropsychopharmacology & Biological Psychiatry 112 (2022) 110408
Available online 25 July 20210278-5846/© 2021 The Authors. Published by Elsevier Inc. This is an open access article under the CC BY license (http://creativecommons.org/licenses/by/4.0/).
Dose-dependent transcriptional effects of lithium and adverse effect burden in a psychiatric cohort
Florian Krull a,*, Ibrahim Akkouh a,b, Timothy Hughes b, Francesco Bettella a, Lavinia Athanasiu a, Olav B. Smeland a, Kevin S. O'Connell a, Hans-Richard Brattbakk c, Vidar M. Steen c, Nils Eiel Steen a,d, Srdjan Djurovic b,c,1, Ole A. Andreassen a,d,*,1
a NORMENT, Institute of Clinical Medicine, University of Oslo, Oslo, Norway b Department of Medical Genetics, Oslo University Hospital, Oslo, Norway c NORMENT, Department of Clinical Science, University of Bergen, Bergen, Norway d Division of Mental Health and Addiction, Oslo University Hospital, Oslo, Norway
A R T I C L E I N F O
Keywords: Lithium Gene expression Bipolar disorder Microarray analysis Psychiatric disorders
A B S T R A C T
Lithium is the first-line treatment for bipolar disorder (BD), but there is a large variation in response rate and adverse effects. Although the molecular effects of lithium have been studied extensively, the specific mechanisms of action remain unclear. In particular, the molecular changes underlying lithium adverse effects are little known. Multiple linear regression analyses of lithium serum concentrations and global gene expression levels in whole blood were carried out using a large case-control sample (n = 1450). Self-reported adverse effects of lithium were assessed with the “Udvalg for Kliniske Undersøgelser” (UKU) adverse effect rating scale, and regression analysis was used to identify significant associations between lithium-related genes and six of the most common adverse effects. Serum concentrations of lithium were significantly associated with the expression levels of 52 genes (FDR < 0.01), largely replicating previous results. We found 32 up-regulated genes and 20 down- regulated genes in lithium users compared to non-users. The down-regulated gene set was enriched for several processes related to the translational machinery. Two adverse effects were significantly associated (p <0.01) with three or more lithium-associated genes: tremor (FAM13A-AS1, FAR2, ITGAX, RWDD1, and STARD10) and xerostomia (ANKRD13A, FAR2, RPS8, and RWDD1). The adverse effect association with the largest effect was between CAMK1D expression and nausea/vomiting. These results suggest putative transcriptional mecha-nisms that may predict lithium adverse effects, and could thus have a large potential for informing clinical practice.
1. Introduction
Bipolar disorder (BD) is a severe mental disorder with lifetime risk of more than 1% (Grande et al., 2016). Early age at onset and chronicity make the global disease burden high (Collins et al., 2011; Gore et al., 2011). One of the major burdens of BD is an increase in all-cause mor-talities, suicide being the leading single cause of excess death rates (Grande et al., 2016; Osby et al., 2001). Mood stabilizers are the mainstay treatment of BD, and lithium is the most frequently recom-mended first-line treatment in clinical practice guidelines and the leading treatment for prevention of relapse (Tondo et al., 2019) and suicide (Cipriani et al., 2013). Lithium has superior efficacy in long-term
maintenance treatment of BD; however, only one third of patients are characterized as full responders (Cruceanu et al., 2009; Rybakowski, 2011). Importantly, treatment response may be influenced by non- compliance (Maj et al., 1998), in part due to adverse effects (Gitlin, 2016). While some of these are dose-dependent, their sizeable variation in severity and type (Gitlin, 2016) suggests underlying differences in pharmacological mechanisms between individuals.
The variability in response to and adverse effects of long-term lithium treatment is poorly understood and remains a clinical chal-lenge (Gitlin, 2016; Alda, 2017; Hui et al., 2019). Lithium dose is an important aspect of individualizing treatment and avoiding adverse ef-fects (Gitlin, 2016). Guidelines recommend serum levels between 0.4
* Corresponding authors at: NORMENT, Institute of Clinical Medicine, University of Oslo, Oslo, Norway. E-mail addresses: [email protected] (F. Krull), [email protected] (O.A. Andreassen).
1 Equal contribution.
Contents lists available at ScienceDirect
Progress in Neuropsychopharmacology & Biological Psychiatry
journal homepage: www.elsevier.com/locate/pnp
https://doi.org/10.1016/j.pnpbp.2021.110408 Received 8 April 2021; Received in revised form 21 July 2021; Accepted 22 July 2021

Progress in Neuropsychopharmacology & Biological Psychiatry 112 (2022) 110408
2
and 1.2 mmol/L (Severus et al., 2008). However, these recommenda-tions are mainly based on clinical effects, and few studies investigated the molecular mechanisms associated with serum levels. It would be beneficial to identify biomarkers associated with response to and adverse effects of lithium. This may facilitate personalized treatment, give better effect/adverse effect ratio, improve long-term management and prognosis of individuals with BD, and reduce the risk of suicidal behavior (Goodwin et al., 2003).
Although several studies aimed at identifying molecular mediators of lithium efficacy, the precise mechanisms responsible for clinical response and adverse effects in BD remain unclear (Haggarty et al., 2020). Initially, most studies used the candidate gene/protein approach and focused on relevant mechanisms and cellular processes with pre- established evidence of association with lithium treatment, including monoamine (dopamine, norepinephrine, serotonin) neurotransmission, intracellular inositol signaling, the GSK3β pathway, and BDNF-related neuroplasticity (Malhi et al., 2013; Pisanu et al., 2016). However, these studies have uncovered limited evidence of association between the expression of specific genes and lithium treatment. More recently, hypothesis-free and transcriptome-wide gene expression approaches have been increasingly applied to investigate the mechanisms of action of the drug (Chetcuti et al., 2008; McQuillin et al., 2007; Plant et al., 2009; Seelan et al., 2008; Sun et al., 2004; Anand et al., 2016; Beech et al., 2014; Fries et al., 2017; Lowthert et al., 2012; Sugawara et al., 2010). Although these studies have demonstrated that the molecular effects of lithium are widespread and complex, and have also identified promising associations between specific gene expression alterations and lithium response in BD, replication are in general poor (Toker et al., 2012).
Most of the aforementioned studies used relatively small samples and did not account for large variation in serum levels or include analysis of adverse effects of lithium. Here, we first examined a large sample of healthy controls (n = 528) and patients with severe mental disorders (n = 922) to investigate the relationship between lithium serum concen-trations and mRNA expression levels in blood, controlling for a range of confounders. We then investigated which significant changes in gene expression were associated with the severity of relevant lithium adverse effects.
2. Materials and methods
2.1. Participants
This study is part of the Thematically Organized Psychosis (TOP) study, an ongoing research program in Oslo, Norway. Participants were recruited from psychiatric inpatient and outpatient units at the major hospitals in the Oslo area. These hospitals cover the main part of Oslo's total population, are located in different parts of the city, and are representative of the city's variation in sociodemographic characteris-tics. Eligible participants met the inclusion criteria of a DSM-IV diag-nosis of schizophrenia spectrum disorder or bipolar spectrum disorder, age between 18 and 65, and ability to give written informed consent. Exclusion criteria were presence of cognitive deficit (IQ < 70), severe somatic illness, history of severe head injury, and not speaking a Scan-dinavian language. Healthy controls were randomly selected from the population of the same catchment area and age range, based on records from Statistics Norway (https://www.ssb.no/en).
2.2. Clinical assessments
All patients underwent a clinical examination that included diag-nostic interviews with the Structured Clinical Interview for DSM-IV axis I Disorders (SCID-1) and structured assessments of clinical symptoms using the Global Assessment of Functioning symptom scale (GAF-s) (Pedersen et al., 2007), the Positive and Negative Syndrome Scale (PANSS, total score) (Kay et al., 1987), the Inventory of Depressive
Symptomatology-Clinician Rated (IDS-C) (Trivedi et al., 2004), and the Young Mania Rating Scale (YMRS) (Young et al., 1978). All patients were also subjected to a physical examination performed by a physician.
2.3. Medication data
Information on present use of psychotropic drugs was collected from medical records and by interviews with the participants. Type of drug(s), dosage, and duration of use were recorded. Analyses were based on use of lithium, antiepileptic drugs, antipsychotics, antidepressants, hyp-notics, central stimulants, and anticholinergics, and the patients were grouped according to their psychotropic medication use. Polypharmacy was recorded and controlled for in the analyses. Compliance was eval-uated using serum concentration measurements according to standard protocols (Jonsdottir et al., 2013).
2.4. Assessment of adverse effects
The “Udvalg for Kliniske Undersøgelser” (UKU) side-effect rating scale (Lingjaerde et al., 1987) was used to measure type and severity of adverse effects. For more details, see reference (Iversen et al., 2018). A global assessment item of overall adverse effect burden was performed separately by the patient and the investigator. This general item was scored from 0 to 3, 0 indicating no adverse effects and scores 1–3 indi-cating adverse effects with increasing interference with the patient's functioning, from mild to severe. For analyses of global adverse effect burden, patients were compared across these scores. In this study, we included a selection of relevant adverse effects from three of the main UKU scale domains: neurologic, autonomic and other adverse effects. Adverse effect items were scored without judgement of causality. Par-ticipants were asked whether the specific symptoms had been present the past seven days unless otherwise specified in the manual. From the 48 items in the UKU scale, we choose six well-known adverse effects of lithium treatment (tremor, xerostomia, nausea/vomiting, weight gain, polyuria/polydipsia, and diarrhea). Hypercalcemia, being a known consequence of lithium use, we added calcium levels to the six self- reported adverse effects.
2.5. Blood sampling, RNA isolation, serum concentration measurements
Blood was drawn from the antecubital vein before the clinical as-sessments. The patients met fasting, and had been instructed not to take their morning medication. Serum concentrations of lamotrigine were analyzed with a liquid chromatography–mass spectrometry (LC–MS) method described elsewhere (Reimers et al., 2005). Serum concentra-tions of valproate, lithium and calcium were analyzed with commer-cially available kits using a Cobas Integra 400 plus system (Roche Diagnostics, Rotkreutz, Switzerland). Serum concentrations of the an-tipsychotics olanzapine, aripiprazole, quetiapine, and risperidone were analyzed with LC-MS methods. The LC-MS system used was an Agilent MSD 1100 (Agilent, Palo Alto, CA, USA) consisting of a G1379A degasser, a G1311A quaternary pump, a G1313A autosampler, a G1316A column oven and a G1946A mass spectrometer. For detailed descriptions of the methods, see previous publications (Castberg et al., 2007; Castberg and Spigset, 2007; Castberg et al., 2009). The analysis of clinical chemistry parameters was performed at the Department of Medical Biochemistry, Oslo University Hospital, Oslo, Norway. Total RNA was isolated from whole blood collected in Tempus Blood RNA Tubes using the Tempus 12-Port Isolation kit (Applied Biosystems, Austin, TX). The tubes were stored at − 80 ◦C.
2.6. Global microarray-based transcriptome analysis and data processing
Microarray-based gene expression analysis was performed at the Genomics Core Facility, University of Bergen, Bergen, Norway, using Illumina Human HT-12 bead arrays (Illumina Inc., San Diego, CA),
F. Krull et al.

Progress in Neuropsychopharmacology & Biological Psychiatry 112 (2022) 110408
3
which covers more than 47,000 probes. A total of n = 1891 samples, divided into two batches of 1195 and 696, passed the initial quality control. After quantile normalization, batch adjustment and further quality control, 63 outliers, 158 time-series and duplicates, 142 samples with missing information, and 85 samples with ambiguous information were removed. We initially analyzed samples from the two batches separately and found highly similar results in the two runs. All samples were therefore merged for the rest of the analyses.
We removed participants with high CRP levels (>20 mg/L) to avoid bias deriving from the presence of ongoing infection (Reponen et al., 2020; Mørch et al., 2017). Extreme values of serum levels of psycho-pharmacological agents were set to missing (two outliers were found for lithium serum levels). In total, we analyzed expression data from 47,324 probes from 1450 participants.
2.7. Statistical analyses
We first compiled a list of genes whose mRNA expression levels were significantly associated with the serum levels of lithium. To identify genes that were potentially regulated or indirectly affected by lithium, we fitted linear models of the expression levels, using lithium serum levels as the explanatory variable. All individuals, irrespective of diag-nostic status, were included in these analyses. The diagnostic status was controlled for in the linear models alongside any other medication prescribed to the participants (in the form of individual serum levels; see Suppl. Table 1 for a full list), as well as age, sex and cell count of leu-cocytes, red blood cells, and thrombocytes. We corrected for multiple testing using false discovery rate (FDR < 0.01). Whenever multiple probes for the same gene were significantly associated with the serum level, we reported only the probe with the highest expression level.
For the genes with expression showing evidence of association with lithium serum levels in the primary analysis, we computed fold changes in gene expression levels between lithium users and non-users. Log2 fold-changes were obtained by fitting the linear model described pre-viously, with the lithium serum level explanatory variable replaced by a categorical variable. Participants were deemed to be lithium-users
whenever lithium was prescribed and the lithium serum concentration was above zero, non-users otherwise.
To identify groups of genes with related biological functions, enrichment analyses were conducted with the over-representation analysis tool clusterProfiler (Yu et al., 2012) using the 52 significant lithium-associated genes as input, analyzing up- and down-regulated genes separately. Annotations were based on Gene Ontology (GO) terms (The Gene Ontology C, 2019) using the “Biological Processes” ontology, and a GO term was considered significantly over-represented if the FDR was <0.10.
In order to test whether lithium adverse effects could be related to gene expression, we computed the association between self-reported adverse effects plus calcium levels and the expression levels for the gene set resulting from our primary analysis. A linear model of gene expression levels was fitted with the adverse effects plus calcium levels, in turn, as explanatory numerical variables. Again¸ diagnostic status, age and sex were controlled for.
We compared the incidence of adverse effect associations for the gene set resulting from our primary analysis with the incidence of such associations for random sets of genes. Here, we counted the number of associations with one of the six adverse effects with a p-value<0.05. We took the n genes with the largest response in expression level to lithium treatment (as described for the analysis of fold-changes above) and obtained a p-value by comparing their number of associations to a dis-tribution of the number of associations for 106 random gene sets.
In order to rule out the possibility that the effect of lithium serum levels on gene expression were driven by different cell compositions in different groups, we first estimated the abundances of 21 cell types (Suppl. Table 2) based on expression levels using the computational deconvolution tool CIBERSORT (Chen et al., 1711) with default settings. We then assessed the extent to which cell type composition mediated the association between lithium serum levels and gene expression levels in mediation analyses. The mediation models included the same covariates as the models we fitted in the primary analysis.
All statistical analyses were carried out in R. Differences in gene expression levels were computed using the limma (Ritchie et al., 2015) software package. R's corrplot (Wei et al., 2017) software package was used to visualize the correlation matrix of gene expression levels. The mediation analyses were carried out using R's mediation (Tingley et al., 2014) package.
3. Results
All analyses were performed on a sample consisting of 1450 partic-ipants with gene expression data and a clinical profile; 66 of them were lithium users and 1384 were non-users. The sample included mainly individuals with BD or schizophrenia spectrum disorder, as well as 528 healthy individuals (Table 1). The average age was 34 and 32 years, with a male/female ratio of 42/58% and 57/43% in the lithium users and non-users groups, respectively. Most of the patients received antipsy-chotic treatment, but antidepressants and antiepileptic drugs were also used. Many of the sample characteristics were significantly different between lithium users and non-users (Table 1), so the corresponding variables were controlled for in the regression analyses.
3.1. Association between lithium serum levels and gene expression
The regression analyses between lithium serum levels and gene expression identified 52 significantly associated genes (FDR < 0.01; Suppl. Table 3). Of these, 32 genes were positively associated and 20 genes were negatively associated with lithium serum levels, corre-sponding to up- and down-regulated genes in the lithium user vs non- user groups, respectively (Fig. 1A; Suppl. Figs. 1-2). The associations between gene expressions and serum levels of other types of medications are reported in Suppl. Table 4. In order to rule out possible confounding due to case-control differences in assessment or sampling procedures,
Table 1 Demographic and clinical characteristics of the study sample.
Lithium users
Non-users Test statistic
P-value
Participants, n 66 1384 Bipolar disorder, n (%) 54 (81.8%) 246
(17.8%) 20.75 9.46e-
28* Schizophrenia spectrum, n
(%) 12 (18.2%) 481
(34.8%) 0.42 4.97e-
3* Major depressive disorder,
n (%) 26 (1.9%)
Other psychosis, n (%) 103 (7.4%)
Healthy controls, n (%) 528 (38.2%)
Medication, n (%) Antipsychotics 48 (80.0%) 633
(45.7%) 3.16 2.14e-
5* Antidepressants 27 (45.0%) 271
(19.6%) 2.84 1.20e-
4* Antiepileptics 16 (26.7%) 190
(13.7%) 2.01 2.80e-2
Other 9 (15.0%) 90 (6.5%) 2.27 3.99e-2 Sex, n (%)
Male 28 (42.4%) 783 (56.6%)
0.57 3.03e-2
Female 38 (57.6%) 601 (43.4%)
1.77 3.03e-2
Age (years), mean (SD) 34.0 (10.9) 31.9 (9.8) 0.15
For age, the Wilcoxon Rank Sum test statistic is reported, for all other variables, the Fisher Exact test statistic is reported. *p < 0.01. Half of the lithium users with schizophrenia spectrum disorders had a schizoaffective disorder diagnosis.
F. Krull et al.

Progress in Neuropsychopharmacology & Biological Psychiatry 112 (2022) 110408
4
we repeated the analysis twice, once after removing healthy control samples and once keeping only samples from individuals with bipolar disorder. On both occasions, we found highly consistent effects on the transcripts of the top 52 genes (Suppl. Fig. 4).
Gene Ontology (GO) enrichment test of the significant lithium- associated genes yielded no significant results when all 52 genes were used as input. When up- and down-regulated genes were analyzed separately, the down-regulated gene set was significantly enriched (FDR
Table 2 Associations between expression levels of lithium-associated genes and adverse effect burden.
Gene Lithium log FC Tremor Xerostomia Vomiting Weight gain Polyuria/Polydipsia Diarrhea Calcium levels
ANKRD13A +0.25 +0.01 +0.03 ** +0.01 +0.01 +0.01 +0.00 − 0.00 CAMK1D +0.43 +0.03 * +0.04 * +0.07 ** +0.02 +0.04 +0.02 +0.19 FAM13A-AS1 +0.77 +0.06 ** +0.06 * +0.06 * − 0.00 +0.05 +0.03 +0.72 ** FAR2 +0.59 +0.04 ** +0.06 ** +0.04 * +0.02 +0.01 +0.03 +0.16 ITGAX +0.43 +0.04 ** +0.01 − 0.00 +0.00 − 0.02 +0.00 − 0.02 LAMTOR1 − 0.30 +0.01 − 0.01 − 0.00 − 0.04 ** +0.01 +0.00 +0.02 MYADM +0.41 +0.03 * +0.03 * +0.04 ** +0.01 +0.02 +0.01 +0.20 RPS8 − 0.36 − 0.01 − 0.04 ** − 0.01 − 0.02 − 0.01 − 0.01 − 0.10 RWDD1 − 0.21 − 0.02 ** − 0.03 ** − 0.02 − 0.00 − 0.01 − 0.01 − 0.13 STARD10 +0.40 +0.04 ** +0.01 +0.02 − 0.00 +0.01 +0.03 +0.27 ◦
TMEM35B − 0.28 − 0.01 − 0.02 ◦ − 0.01 − 0.01 − 0.01 − 0.02 − 0.29 **
Numbers in columns 2–8 represent regression coefficients for correlations between self-reported adverse effects (most common lithium adverse effects as assessed with the UKU scale) or calcium levels and expression levels of lithium-associated genes. Data for all genes with at least one significant association (p < 0.01) are displayed. For the complete list, see supplementary table 5. Uncorrected p-values are displayed. **p ≤ 0.01, *p ≤ 0.05, ◦p ≤ 0.1.
Fig. 1. Association between serum concentrations of lithium and peripheral gene expression levels. A) Volcano plot of lithium-associated genes with corresponding effect sizes (regression coefficients) and p-values. The six top genes with the largest effect sizes (lithium use vs. non-use) are labeled. B) Expression level distributions of the top six lithium genes with the strongest response lithium treatment (FC > 1.5 or FC < 1/1.5). Distributions are shown for participants with non-zero lithium serum levels (purple) and for controls (cyan). C) Replication analysis based on the significantly associated lithium genes identified by Anand et al. (Anand et al., 2016). The plot shows the FDR-corrected p-values from our linear regressions for all lithium-associated genes reported by Anand et al. that had an overlap with our set of 47,324 probes (coverage: 55 out of 56). Cyan: same direction of effect (37 genes). Purple: opposite direction of effect (18 genes). (For interpretation of the references to colour in this figure legend, the reader is referred to the web version of this article.)
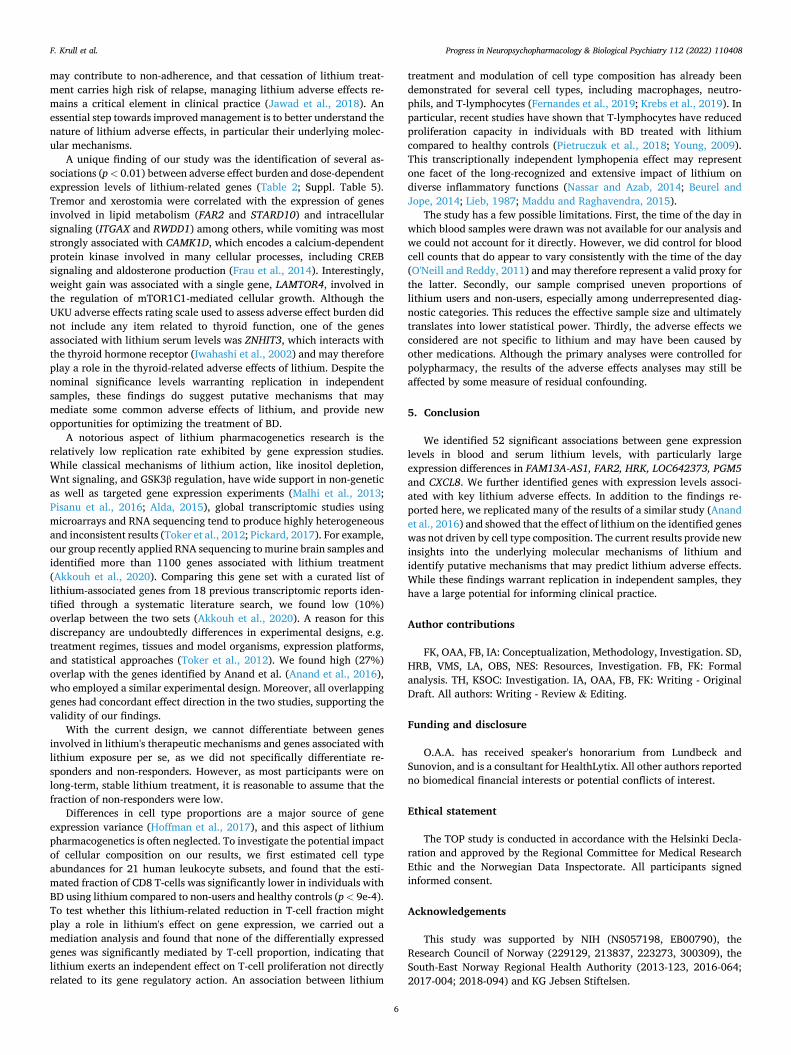
Fig. 2. Effect of lithium on cell type composition. A) Fractions of CD8 T-cells in lithium (lith.) users, non- users and controls as estimated by computational deconvolution. CD8 T-cell abundance was signifi-cantly decreased in lithium users compared to both patients with no lithium use and healthy controls. Estimates for the remaining cell types are reported in supplementary table 2. B) Mediation effect and 95% confidence intervals of estimated cell type abun-dances for the six genes with the largest response in expression level to lithium treatment. None of the differentially expressed lithium genes was signifi-cantly mediated by the CD8 cell type fraction. CXCL8 is down-regulated, the others are up-regulated. ***p ≤ 0.001, **p ≤ 0.01, *p ≤ 0.05, ◦p ≤ 0.1.
F. Krull et al.

Progress in Neuropsychopharmacology & Biological Psychiatry 112 (2022) 110408
5
< 0.05) for 16 GO terms mostly related to the translational machinery but also signaling pathways and the cell cycle (Suppl. Fig. 3).
Subsequently, we focused the analysis on the genes with the stron-gest change in expression levels (Fig. 1A; Suppl. Fig. 2). Among the 52 significantly associated genes, we identified six genes with expression fold changes (FC) >1.5 or < 1/1.5. Five genes (FAM13A-AS1, FAR2, HRK, LOC642373, PGM5) were up-regulated and CXCL8 was down- regulated in the presence of lithium. Fig. 1B shows the distribution of expression levels of these six genes in participants using lithium confirmed with serum measurements, compared to participants without detectable serum levels. The corresponding fold changes are displayed in Suppl. Fig. 5 with 95% confidence intervals.
3.2. Association between gene expression and adverse effects plus calcium levels
We then tested whether the 52 lithium-associated genes identified in the primary analysis were related to six key adverse effects of lithium treatment plus calcium levels, and identified several associations be-tween gene expression and self-reported adverse effect burden (Table 2; Suppl. Table 5). In particular, tremor, xerostomia, nausea/vomiting, and weight gain were associated with expression levels of lithium genes. Comparing the incidence of adverse effect associations in random sets of genes to that observed for the genes singled out by our primary analysis suggests that the latter is unlikely to occur by chance (Suppl. Fig. 6). Calcium levels were associated with FAM13A-AS1 and TMEM35B and their effects on gene expression is generally concordant with the up- / down-regulation observed in the presence of lithium (Suppl. Table 5).
3.3. Replication of previous findings
To assess the extent to which we were able to replicate previous findings, we compared our results with the results from a recent analysis by Anand et al. (Anand et al., 2016), who employed an experimental design similar to ours and identified 56 genes that responded to lithium exposure, 55 of which were covered by our microarray probes after filtering. When applying the strict significance threshold of FDR < 0.01 used in our study, 5 out of the 55 genes (9%) were significant in both reports (Fig. 1C). However, when applying the more common threshold of FDR < 0.1 used by Anand et al., 15 out of 55 genes (27%) were shared by the two studies, and all genes were concordant with respect to the direction of effect (Fig. 1C).
3.4. Mediation analysis of blood cell types
We used a computational deconvolution tool to estimate cell type abundances of 21 peripheral blood cell populations and found that the fraction of CD8 T-cells was significantly lower in individuals with BD using lithium compared to both non-users with BD and healthy controls (Fig. 2A; Suppl. Table 2). To investigate whether the effects of lithium serum concentration on gene expression might have been mediated by differences in CD8 T-cell abundance, a mediation analysis for the top six genes was performed. None of these genes were significantly associated (defined as p < 0.001) with CD8 T-cell abundance (Fig. 2B).
4. Discussion
In the present study, we investigated the relationship between serum concentrations of lithium and gene expression levels in blood in a large case-control sample (n = 1450). We identified 52 genes that were significantly correlated with lithium levels, of which 32 were up- regulated and 20 were down-regulated in lithium users compared to non-users. The strongest effects were seen in five up-regulated genes (FAM13A-AS1, FAR2, HRK, LOC642373, PGM5) and one down- regulated gene (CXCL8). We also identified several significant associa-tions (p < 0.01) between adverse effects and dose-dependent expression
levels of lithium-related genes. These findings implicate novel genes and molecular pathways related to lithium treatment and adverse effects.
Among the top six lithium-regulated genes with the largest effect sizes were CXCL8 and HRK (Fig. 1A,B). CXCL8 encodes the chemokine interleukin-8 (IL-8), a key component of the innate immune system that contributes to the inflammatory response by recruiting neutrophils to the inflammation site (Harada et al., 1994; Dmitrzak-Weglarz et al., 2021). The significant repression of CXCL8 expression by lithium thus supports the potential anti-inflammatory action of the drug (Nassar and Azab, 2014). HRK encodes a member of the Bcl-2 protein family, most notable for its involvement in activating or inhibiting apoptosis. Mem-bers of this family control apoptosis by regulating mitochondrial outer membrane permeabilization (MOMP), a key step in the apoptotic pathway (Kale et al., 2018). The encoded protein promotes apoptosis by interacting with the apoptotic inhibitors Bcl-2 and Bcl-X(L). Up-regu-lation of Bcl2, and hence inhibition of apoptosis, has long been considered a well-established mechanism of lithium action (Beech et al., 2014; Lowthert et al., 2012; Manji et al., 2000). This mechanism has further been interpreted as underlying the drug's neuroprotective properties (Dwivedi and Zhang, 2014; Machado-Vieira et al., 2009). The apparent inconsistency between a pro-apoptotic up-regulation of HRK and an anti-apoptotic up-regulation of BCL2 by lithium may have several reasons. Besides recent findings raising doubts about the precise rela-tionship between lithium exposure and BCL2 expression (Odeya et al., 2018), it is important to note that Bcl-2 function is not restricted to preventing apoptosis. In the endoplasmic reticulum (ER), Bcl-2 is a potent inhibitor of autophagy (Levine et al., 2008), a vital cellular process shown to be augmented by lithium (Sarkar et al., 2005). Up- regulation of HRK may therefore reflect lithium's Bcl-2-mediated involvement in autophagy rather than apoptosis. Moreover, cell fate is governed by a complex interplay of numerous members of the Bcl-2 family, and the final outcome depends not only on the precise in-teractions involved but also on the affinity and relative abundance of Bcl-2 proteins (Kale et al., 2018). Thus, even though a single pro- apoptotic gene is activated by lithium, the net effect may still be in favor of apoptotic repression.
The 20 genes down-regulated in lithium users were significantly enriched for several biological processes, especially related to the translational machinery. The main drivers of this enrichment were the three ribosomal genes RPS8, RPL12, and RPS14, all of which encode distinct protein components of both subunits of the translational appa-ratus. The down-regulation of these genes suggests an inhibitory effect of lithium on protein synthesis, a finding replicated in several model organisms (Kerr et al., 2018; Sofola-Adesakin et al., 2014). Since ribo-some and protein synthesis are major metabolic events controllig cellular growth and proliferation, repression of protein translation is indicative of reduced proliferation capacity (Vadivel Gnanasundram and Fahraeus, 2018). However, a general reduction in cell proliferation does not seem to be the final outcome of the lithium-mediated down-regu-lation of ribosomal genes in our study because the total leukocyte count was greater in lithium users than in non-users (data not shown). Rather, this ribosomal effect may reflect lithium's involvement in maintaining protein homeostasis by balancing protein synthesis and degradation, an essential process for normal cell functioning (Kerr et al., 2018) that could partly explain lithium's neuroprotective properties.
Despite its universal acceptance as gold standard for long-term maintenance treatment in BD, lithium is associated with a wide range of adverse effects (Gitlin, 2016). Furthermore, the presence of adverse effects seems to play a role in lithium non-adherence, which, according to some studies, is around 50% over a 12 month period (Jawad et al., 2018). Among the most common adverse effects are polyuria, poly-dipsia, xerostomia, nausea/vomiting, and tremor; weight gain and cognitive impairments as well as adverse effects on kidneys, thyroid gland, and parathyroid glands may also occur (Gitlin, 2016; Ryba-kowski, 2013). Importantly, many of these adverse effects have been shown to be dose-dependent (Gitlin, 2016). Given that adverse effects
F. Krull et al.
Progress in Neuropsychopharmacology & Biological Psychiatry 112 (2022) 110408
6
may contribute to non-adherence, and that cessation of lithium treat-ment carries high risk of relapse, managing lithium adverse effects re-mains a critical element in clinical practice (Jawad et al., 2018). An essential step towards improved management is to better understand the nature of lithium adverse effects, in particular their underlying molec-ular mechanisms.
A unique finding of our study was the identification of several as-sociations (p < 0.01) between adverse effect burden and dose-dependent expression levels of lithium-related genes (Table 2; Suppl. Table 5). Tremor and xerostomia were correlated with the expression of genes involved in lipid metabolism (FAR2 and STARD10) and intracellular signaling (ITGAX and RWDD1) among others, while vomiting was most strongly associated with CAMK1D, which encodes a calcium-dependent protein kinase involved in many cellular processes, including CREB signaling and aldosterone production (Frau et al., 2014). Interestingly, weight gain was associated with a single gene, LAMTOR4, involved in the regulation of mTOR1C1-mediated cellular growth. Although the UKU adverse effects rating scale used to assess adverse effect burden did not include any item related to thyroid function, one of the genes associated with lithium serum levels was ZNHIT3, which interacts with the thyroid hormone receptor (Iwahashi et al., 2002) and may therefore play a role in the thyroid-related adverse effects of lithium. Despite the nominal significance levels warranting replication in independent samples, these findings do suggest putative mechanisms that may mediate some common adverse effects of lithium, and provide new opportunities for optimizing the treatment of BD.
A notorious aspect of lithium pharmacogenetics research is the relatively low replication rate exhibited by gene expression studies. While classical mechanisms of lithium action, like inositol depletion, Wnt signaling, and GSK3β regulation, have wide support in non-genetic as well as targeted gene expression experiments (Malhi et al., 2013; Pisanu et al., 2016; Alda, 2015), global transcriptomic studies using microarrays and RNA sequencing tend to produce highly heterogeneous and inconsistent results (Toker et al., 2012; Pickard, 2017). For example, our group recently applied RNA sequencing to murine brain samples and identified more than 1100 genes associated with lithium treatment (Akkouh et al., 2020). Comparing this gene set with a curated list of lithium-associated genes from 18 previous transcriptomic reports iden-tified through a systematic literature search, we found low (10%) overlap between the two sets (Akkouh et al., 2020). A reason for this discrepancy are undoubtedly differences in experimental designs, e.g. treatment regimes, tissues and model organisms, expression platforms, and statistical approaches (Toker et al., 2012). We found high (27%) overlap with the genes identified by Anand et al. (Anand et al., 2016), who employed a similar experimental design. Moreover, all overlapping genes had concordant effect direction in the two studies, supporting the validity of our findings.
With the current design, we cannot differentiate between genes involved in lithium's therapeutic mechanisms and genes associated with lithium exposure per se, as we did not specifically differentiate re-sponders and non-responders. However, as most participants were on long-term, stable lithium treatment, it is reasonable to assume that the fraction of non-responders were low.
Differences in cell type proportions are a major source of gene expression variance (Hoffman et al., 2017), and this aspect of lithium pharmacogenetics is often neglected. To investigate the potential impact of cellular composition on our results, we first estimated cell type abundances for 21 human leukocyte subsets, and found that the esti-mated fraction of CD8 T-cells was significantly lower in individuals with BD using lithium compared to non-users and healthy controls (p < 9e-4). To test whether this lithium-related reduction in T-cell fraction might play a role in lithium's effect on gene expression, we carried out a mediation analysis and found that none of the differentially expressed genes was significantly mediated by T-cell proportion, indicating that lithium exerts an independent effect on T-cell proliferation not directly related to its gene regulatory action. An association between lithium
treatment and modulation of cell type composition has already been demonstrated for several cell types, including macrophages, neutro-phils, and T-lymphocytes (Fernandes et al., 2019; Krebs et al., 2019). In particular, recent studies have shown that T-lymphocytes have reduced proliferation capacity in individuals with BD treated with lithium compared to healthy controls (Pietruczuk et al., 2018; Young, 2009). This transcriptionally independent lymphopenia effect may represent one facet of the long-recognized and extensive impact of lithium on diverse inflammatory functions (Nassar and Azab, 2014; Beurel and Jope, 2014; Lieb, 1987; Maddu and Raghavendra, 2015).
The study has a few possible limitations. First, the time of the day in which blood samples were drawn was not available for our analysis and we could not account for it directly. However, we did control for blood cell counts that do appear to vary consistently with the time of the day (O'Neill and Reddy, 2011) and may therefore represent a valid proxy for the latter. Secondly, our sample comprised uneven proportions of lithium users and non-users, especially among underrepresented diag-nostic categories. This reduces the effective sample size and ultimately translates into lower statistical power. Thirdly, the adverse effects we considered are not specific to lithium and may have been caused by other medications. Although the primary analyses were controlled for polypharmacy, the results of the adverse effects analyses may still be affected by some measure of residual confounding.
5. Conclusion
We identified 52 significant associations between gene expression levels in blood and serum lithium levels, with particularly large expression differences in FAM13A-AS1, FAR2, HRK, LOC642373, PGM5 and CXCL8. We further identified genes with expression levels associ-ated with key lithium adverse effects. In addition to the findings re-ported here, we replicated many of the results of a similar study (Anand et al., 2016) and showed that the effect of lithium on the identified genes was not driven by cell type composition. The current results provide new insights into the underlying molecular mechanisms of lithium and identify putative mechanisms that may predict lithium adverse effects. While these findings warrant replication in independent samples, they have a large potential for informing clinical practice.
Author contributions
FK, OAA, FB, IA: Conceptualization, Methodology, Investigation. SD, HRB, VMS, LA, OBS, NES: Resources, Investigation. FB, FK: Formal analysis. TH, KSOC: Investigation. IA, OAA, FB, FK: Writing - Original Draft. All authors: Writing - Review & Editing.
Funding and disclosure
O.A.A. has received speaker's honorarium from Lundbeck and Sunovion, and is a consultant for HealthLytix. All other authors reported no biomedical financial interests or potential conflicts of interest.
Ethical statement
The TOP study is conducted in accordance with the Helsinki Decla-ration and approved by the Regional Committee for Medical Research Ethic and the Norwegian Data Inspectorate. All participants signed informed consent.
Acknowledgements
This study was supported by NIH (NS057198, EB00790), the Research Council of Norway (229129, 213837, 223273, 300309), the South-East Norway Regional Health Authority (2013-123, 2016-064; 2017-004; 2018-094) and KG Jebsen Stiftelsen.
F. Krull et al.

Progress in Neuropsychopharmacology & Biological Psychiatry 112 (2022) 110408
7
Appendix A. Supplementary data
Supplementary data to this article can be found online at https://doi. org/10.1016/j.pnpbp.2021.110408.
References
Akkouh, I.A., Skrede, S., Holmgren, A., Ersland, K.M., Hansson, L., Bahrami, S., et al., 2020. Exploring lithium’s transcriptional mechanisms of action in bipolar disorder: a multi-step study. Neuropsychopharmacology 45 (6), 947–955.
Alda, M., 2015. Lithium in the treatment of bipolar disorder: pharmacology and pharmacogenetics. Mol. Psychiatry 20 (6), 661–670.
Alda, M., 2017. Who are excellent lithium responders and why do they matter? World Psychiatry 16 (3), 319–320.
Anand, A., McClintick, J.N., Murrell, J., Karne, H., Nurnberger, J.I., Edenberg, H.J., 2016. Effects of Lithium Monotherapy for bipolar disorder on gene expression in peripheral lymphocytes. Mol. Neuropsychiatr. 2 (3), 115–123.
Beech, R.D., Leffert, J.J., Lin, A., Sylvia, L.G., Umlauf, S., Mane, S., et al., 2014. Gene- expression differences in peripheral blood between lithium responders and non- responders in the lithium treatment-moderate dose use study (LiTMUS). Pharm. J. 14 (2), 182–191.
Beurel, E., Jope, R.S., 2014. Inflammation and lithium: clues to mechanisms contributing to suicide-linked traits. Transl. Psychiatry 4, e488.
Castberg, I., Spigset, O., 2007. Effects of comedication on the serum levels of aripiprazole: evidence from a routine therapeutic drug monitoring service. Pharmacopsychiatry 40 (3), 107–110.
Castberg, I., Skogvoll, E., Spigset, O., 2007. Quetiapine and drug interactions: evidence from a routine therapeutic drug monitoring service. J. Clin. Psychiatr. 68 (10), 1540–1545.
Castberg, I., Westin, A.A., Spigset, O., 2009. Does level of care, sex, age, or choice of drug influence adherence to treatment with antipsychotics? J. Clin. Psychopharmacol. 29 (5), 415–420.
Chen, B., Khodadoust, M.S., Liu, C.L., Newman, A.M., Alizadeh, A.A., 1711. Profiling tumor infiltrating immune cells with CIBERSORT. Methods Mol. Biol. 2018, 243–259.
Chetcuti, A., Adams, L.J., Mitchell, P.B., Schofield, P.R., 2008. Microarray gene expression profiling of mouse brain mRNA in a model of lithium treatment. Psychiatr. Genet. 18 (2), 64–72.
Cipriani, A., Hawton, K., Stockton, S., Geddes, J.R., 2013. Lithium in the prevention of suicide in mood disorders: updated systematic review and meta-analysis. BMJ 346, f3646.
Collins, P.Y., Patel, V., Joestl, S.S., March, D., Insel, T.R., Daar, A.S., et al., 2011. Grand challenges in global mental health. Nature 475 (7354), 27–30.
Cruceanu, C., Alda, M., Turecki, G., 2009. Lithium: a key to the genetics of bipolar disorder. Genom. Med. 1 (8), 79.
Dmitrzak-Weglarz, M., Szczepankiewicz, A., Rybakowski, J., Kapelski, P., Bilska, K., Skibinska, M., et al., 2021. Transcriptomic profiling as biological markers of depression–a pilot study in unipolar and bipolar women. World J. Biol. Psychiatr. 1–13.
Dwivedi, T., Zhang, H., 2014. Lithium-induced neuroprotection is associated with epigenetic modification of specific BDNF gene promoter and altered expression of apoptotic-regulatory proteins. Front. Neurosci. 8, 457.
Fernandes, M.S., Barbisan, F., Azzolin, V.F., PAS, Do Prado-Lima, Teixeira, C.F., da Cruz Jung, I.E., et al., 2019. Lithium is able to minimize olanzapine oxidative- inflammatory induction on macrophage cells. PLoS One 14 (1) e0209223.
Frau, F., Zaninello, R., Salvi, E., Ortu, M.F., Braga, D., Velayutham, D., et al., 2014. Genome-wide association study identifies CAMKID variants involved in blood pressure response to losartan: the SOPHIA study. Pharmacogenomics 15 (13), 1643–1652.
Fries, G.R., Colpo, G.D., Monroy-Jaramillo, N., Zhao, J., Zhao, Z., Arnold, J.G., et al., 2017. Distinct lithium-induced gene expression effects in lymphoblastoid cell lines from patients with bipolar disorder. Eur. Neuropsychopharmacol. 27 (11), 1110–1119.
Gitlin, M., 2016. Lithium side effects and toxicity: prevalence and management strategies. Int. J. Bipolar Disord. 4 (1), 27.
Goodwin, F.K., Fireman, B., Simon, G.E., Hunkeler, E.M., Lee, J., Revicki, D., 2003. Suicide risk in bipolar disorder during treatment with lithium and divalproex. JAMA 290 (11), 1467–1473.
Gore, F.M., Bloem, P.J., Patton, G.C., Ferguson, J., Joseph, V., Coffey, C., et al., 2011. Global burden of disease in young people aged 10-24 years: a systematic analysis. Lancet 377 (9783), 2093–2102.
Grande, I., Berk, M., Birmaher, B., Vieta, E., 2016. Bipolar disorder. Lancet 387 (10027), 1561–1572.
Haggarty, S.J., Karmacharya, R., Perlis, R.H., 2020. Advances toward precision medicine for bipolar disorder: mechanisms & molecules. Mol. Psychiatry 26 (1), 168–185.
Harada, A., Sekido, N., Akahoshi, T., Wada, T., Mukaida, N., Matsushima, K., 1994. Essential involvement of interleukin-8 (IL-8) in acute inflammation. J. Leukoc. Biol. 56 (5), 559–564.
Hoffman, G.E., Hartley, B.J., Flaherty, E., Ladran, I., Gochman, P., Ruderfer, D.M., et al., 2017. Transcriptional signatures of schizophrenia in hiPSC-derived NPCs and neurons are concordant with post-mortem adult brains. Nat. Commun. 8 (1), 2225.
Hui, T.P., Kandola, A., Shen, L., Lewis, G., Osborn, D.P.J., Geddes, J.R., et al., 2019. A systematic review and meta-analysis of clinical predictors of lithium response in bipolar disorder. Acta Psychiatr. Scand. 140 (2), 94–115.
Iversen, T.S.J., Steen, N.E., Dieset, I., Hope, S., Morch, R., Gardsjord, E.S., et al., 2018. Side effect burden of antipsychotic drugs in real life - impact of gender and polypharmacy. Prog. Neuro-Psychopharmacol. Biol. Psychiatry 82, 263–271.
Iwahashi, H., Yamagata, K., Yoshiuchi, I., Terasaki, J., Yang, Q., Fukui, K., et al., 2002. Thyroid hormone receptor interacting protein 3 (trip3) is a novel coactivator of hepatocyte nuclear factor-4alpha. Diabetes 51 (4), 910–914.
Jawad, I., Watson, S., Haddad, P.M., Talbot, P.S., McAllister-Williams, R.H., 2018. Medication nonadherence in bipolar disorder: a narrative review. Ther. Adv. Psychopharmacol. 8 (12), 349–363.
Jonsdottir, H., Opjordsmoen, S., Birkenaes, A.B., Simonsen, C., Engh, J.A., Ringen, P.A., et al., 2013. Predictors of medication adherence in patients with schizophrenia and bipolar disorder. Acta Psychiatr. Scand. 127 (1), 23–33.
Kale, J., Osterlund, E.J., Andrews, D.W., 2018. BCL-2 family proteins: changing partners in the dance towards death. Cell Death Differ. 25 (1), 65–80.
Kay, S.R., Fiszbein, A., Opler, L.A., 1987. The positive and negative syndrome scale (PANSS) for schizophrenia. Schizophr. Bull. 13 (2), 261–276.
Kerr, F., Bjedov, I., Sofola-Adesakin, O., 2018. Molecular mechanisms of lithium action: switching the light on multiple targets for dementia using animal models. Front. Mol. Neurosci. 11, 297.
Krebs, C.E., Ori, A.P.S., Vreeker, A., Wu, T., Cantor, R.M., Boks, M.P.M., et al., 2019. Whole blood transcriptome analysis in bipolar disorder reveals strong lithium effect. Psychol. Med. 1–12.
Levine, B., Sinha, S.C., Kroemer, G., 2008. Bcl-2 family members: dual regulators of apoptosis and autophagy. Autophagy 4 (5), 600–606.
Lieb, J., 1987. Lithium and immune function. Med. Hypotheses 23 (1), 73–93. Lingjaerde, O., Ahlfors, U.G., Bech, P., Dencker, S.J., Elgen, K., 1987. The UKU side effect
rating scale. A new comprehensive rating scale for psychotropic drugs and a cross- sectional study of side effects in neuroleptic-treated patients. Acta Psychiatr. Scand. Suppl. 334, 1–100.
Lowthert, L., Leffert, J., Lin, A., Umlauf, S., Maloney, K., Muralidharan, A., et al., 2012. Increased ratio of anti-apoptotic to pro-apoptotic Bcl2 gene-family members in lithium-responders one month after treatment initiation. Biol. Mood Anxiety Disord. 2, 15.
Machado-Vieira, R., Manji, H.K., Zarate Jr., C.A., 2009. The role of lithium in the treatment of bipolar disorder: convergent evidence for neurotrophic effects as a unifying hypothesis. Bipolar Disord. 11 (Suppl. 2), 92–109.
Maddu, N., Raghavendra, P.B., 2015. Review of lithium effects on immune cells. Immunopharmacol. Immunotoxicol. 37 (2), 111–125.
Maj, M., Pirozzi, R., Magliano, L., Bartoli, L., 1998. Long-term outcome of lithium prophylaxis in bipolar disorder: a 5-year prospective study of 402 patients at a lithium clinic. Am. J. Psychiatry 155 (1), 30–35.
Malhi, G.S., Tanious, M., Das, P., Coulston, C.M., Berk, M., 2013. Potential mechanisms of action of lithium in bipolar disorder. Current understanding. CNS Drugs 27 (2), 135–153.
Manji, H.K., Moore, G.J., Chen, G., 2000. Lithium up-regulates the cytoprotective protein Bcl-2 in the CNS in vivo: a role for neurotrophic and neuroprotective effects in manic depressive illness. J. Clin. Psychiatr. 61 (Suppl. 9), 82–96.
McQuillin, A., Rizig, M., Gurling, H.M., 2007. A microarray gene expression study of the molecular pharmacology of lithium carbonate on mouse brain mRNA to understand the neurobiology of mood stabilization and treatment of bipolar affective disorder. Pharmacogenet. Genomics 17 (8), 605–617.
Mørch, R., Dieset, I., Faerden, A., Hope, S., Aas, M., Nerhus, M., et al., 2017. Persistent increase in TNF and IL-1 markers in severe mental disorders suggests trait-related inflammation: a one year follow-up study. Acta Psychiatr. Scand. 136 (4), 400–408.
Nassar, A., Azab, A.N., 2014. Effects of lithium on inflammation. ACS Chem. Neurosci. 5 (6), 451–458.
Odeya, D., Galila, A., Lilah, T., 2018. The observed alteration in BCL2 expression following lithium treatment is influenced by the choice of normalization method. Sci. Rep. 8 (1), 6399.
O’Neill, J.S., Reddy, A.B., 2011. Circadian clocks in human red blood cells. Nature 469 (7331), 498–503.
Osby, U., Brandt, L., Correia, N., Ekbom, A., Sparen, P., 2001. Excess mortality in bipolar and unipolar disorder in Sweden. Arch. Gen. Psychiatry 58 (9), 844–850.
Pedersen, G., Hagtvet, K.A., Karterud, S., 2007. Generalizability studies of the global assessment of functioning-split version. Compr. Psychiatry 48 (1), 88–94.
Pickard, B.S., 2017. Genomics of Lithium action and response. Neurotherapeutics 14 (3), 582–587.
Pietruczuk, K., Lisowska, K.A., Grabowski, K., Landowski, J., Witkowski, J.M., 2018. Proliferation and apoptosis of T lymphocytes in patients with bipolar disorder. Sci. Rep. 8 (1), 3327.
Pisanu, C., Melis, C., Squassina, A., 2016. Lithium Pharmacogenetics: where do we stand? Drug Dev. Res. 77 (7), 368–373.
Plant, K.E., Anderson, E., Simecek, N., Brown, R., Forster, S., Spinks, J., et al., 2009. The neuroprotective action of the mood stabilizing drugs lithium chloride and sodium valproate is mediated through the up-regulation of the homeodomain protein Six1. Toxicol. Appl. Pharmacol. 235 (1), 124–134.
Reimers, A., Helde, G., Brodtkorb, E., 2005. Ethinyl estradiol, not progestogens, reduces lamotrigine serum concentrations. Epilepsia 46 (9), 1414–1417.
Reponen, E.J., Dieset, I., Tesli, M., Mørch, R.H., Aas, M., Vedal, T.S., et al., 2020. Atherogenic lipid ratios related to myeloperoxidase and c-reactive protein levels in psychotic disorders. Front. Psychiatr. 11.
Ritchie, M.E., Phipson, B., Wu, D., Hu, Y., Law, C.W., Shi, W., et al., 2015. limma powers differential expression analyses for RNA-sequencing and microarray studies. Nucleic Acids Res. 43 (7) e47.
Rybakowski, J.K., 2011. Lithium in neuropsychiatry: a 2010 update. World J. Biol. Psychiatr. 12 (5), 340–348.
F. Krull et al.

Progress in Neuropsychopharmacology & Biological Psychiatry 112 (2022) 110408
8
Rybakowski, J.K., 2013. Genetic influences on response to mood stabilizers in bipolar disorder. CNS Drugs 27 (3), 165–173.
Sarkar, S., Floto, R.A., Berger, Z., Imarisio, S., Cordenier, A., Pasco, M., et al., 2005. Lithium induces autophagy by inhibiting inositol monophosphatase. J. Cell Biol. 170 (7), 1101–1111.
Seelan, R.S., Khalyfa, A., Lakshmanan, J., Casanova, M.F., Parthasarathy, R.N., 2008. Deciphering the lithium transcriptome: microarray profiling of lithium-modulated gene expression in human neuronal cells. Neuroscience 151 (4), 1184–1197.
Severus, W.E., Kleindienst, N., Seemuller, F., Frangou, S., Moller, H.J., Greil, W., 2008. What is the optimal serum lithium level in the long-term treatment of bipolar disorder–a review? Bipolar Disord. 10 (2), 231–237.
Sofola-Adesakin, O., Castillo-Quan, J.I., Rallis, C., Tain, L.S., Bjedov, I., Rogers, I., et al., 2014. Lithium suppresses Abeta pathology by inhibiting translation in an adult Drosophila model of Alzheimer’s disease. Front. Aging Neurosci. 6, 190.
Sugawara, H., Iwamoto, K., Bundo, M., Ishiwata, M., Ueda, J., Kakiuchi, C., et al., 2010. Effect of mood stabilizers on gene expression in lymphoblastoid cells. J. Neural Transm. (Vienna) 117 (2), 155–164.
Sun, X., Young, L.T., Wang, J.F., Grof, P., Turecki, G., Rouleau, G.A., et al., 2004. Identification of lithium-regulated genes in cultured lymphoblasts of lithium responsive subjects with bipolar disorder. Neuropsychopharmacology 29 (4), 799–804.
The Gene Ontology C, 2019. The gene ontology resource: 20 years and still GOing strong. Nucleic Acids Res. 47 (D1). D330-D38.
Tingley, D., Yamamoto, T., Hirose, K., Keele, L., Imai, K., 2014. Mediation: R package for causal mediation analysis. J. Stat. Softw.
Toker, L., Belmaker, R.H., Agam, G., 2012. Gene-expression studies in understanding the mechanism of action of lithium. Expert. Rev. Neurother. 12 (1), 93–97.
Tondo, L., Alda, M., Bauer, M., Bergink, V., Grof, P., Hajek, T., et al., 2019. Clinical use of lithium salts: guide for users and prescribers. Int. J. Bipolar Disord. 7 (1), 16.
Trivedi, M.H., Rush, A.J., Ibrahim, H.M., Carmody, T.J., Biggs, M.M., Suppes, T., et al., 2004. The inventory of depressive symptomatology, clinician rating (IDS-C) and self- report (IDS-SR), and the quick inventory of depressive symptomatology, clinician rating (QIDS-C) and self-report (QIDS-SR) in public sector patients with mood disorders: a psychometric evaluation. Psychol. Med. 34 (1), 73–82.
Vadivel Gnanasundram, S., Fahraeus, R., 2018. Translation stress regulates ribosome synthesis and cell proliferation. Int. J. Mol. Sci. 19 (12).
Wei, T., Simko, V., Levy, M., Xie, Y., Jin, Y., Zemla, J., 2017. Package ‘corrplot’. Statistician 56 (316), e24.
Young, W., 2009. Review of lithium effects on brain and blood. Cell Transplant. 18 (9), 951–975.
Young, R.C., Biggs, J.T., Ziegler, V.E., Meyer, D.A., 1978. A rating scale for mania: reliability, validity and sensitivity. Br. J. Psychiatry 133, 429–435.
Yu, G., Wang, L.G., Han, Y., He, Q.Y., 2012. clusterProfiler: an R package for comparing biological themes among gene clusters. OMICS. 16 (5), 284–287.
F. Krull et al.