Doing what we know best. Research. - BSE
100
Doing what we know best. Research.
-
Upload
khangminh22 -
Category
Documents
-
view
6 -
download
0
Transcript of Doing what we know best. Research. - BSE

Doing what we know best.Research.
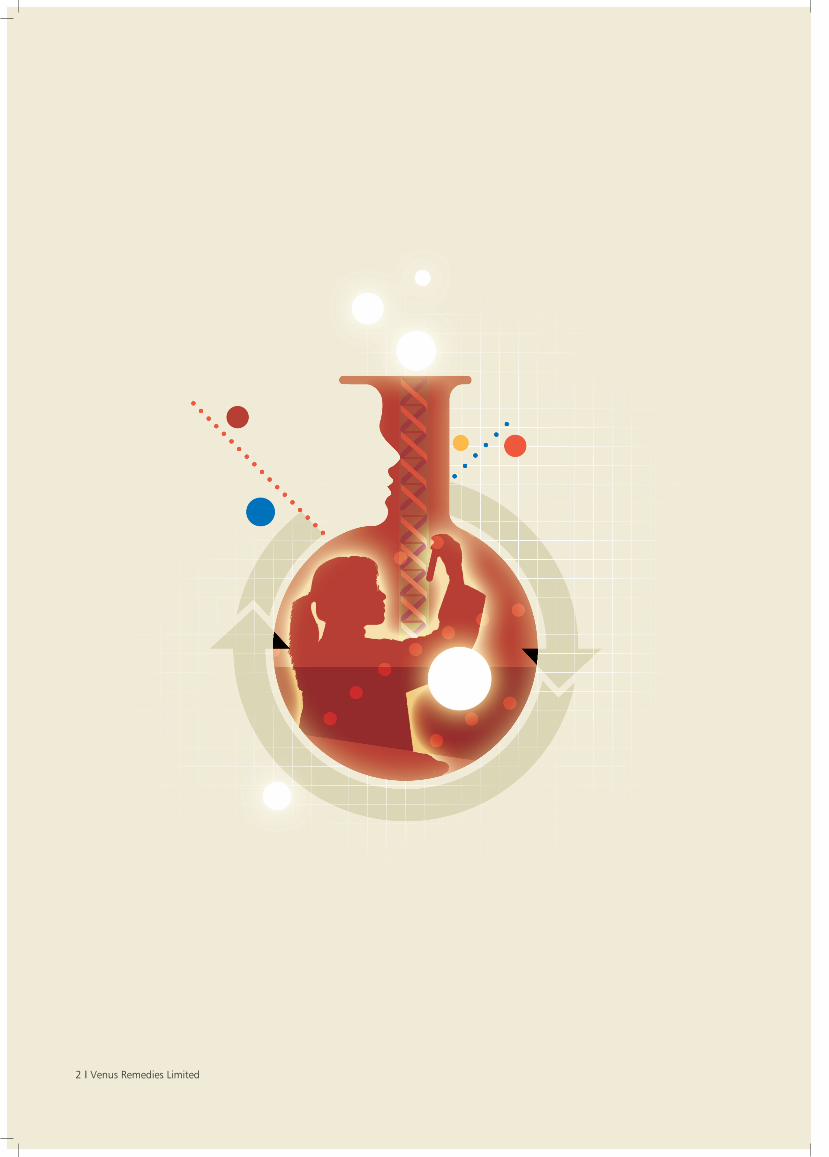
2 I Venus Remedies Limited
Annual Report 2009-10 I 3
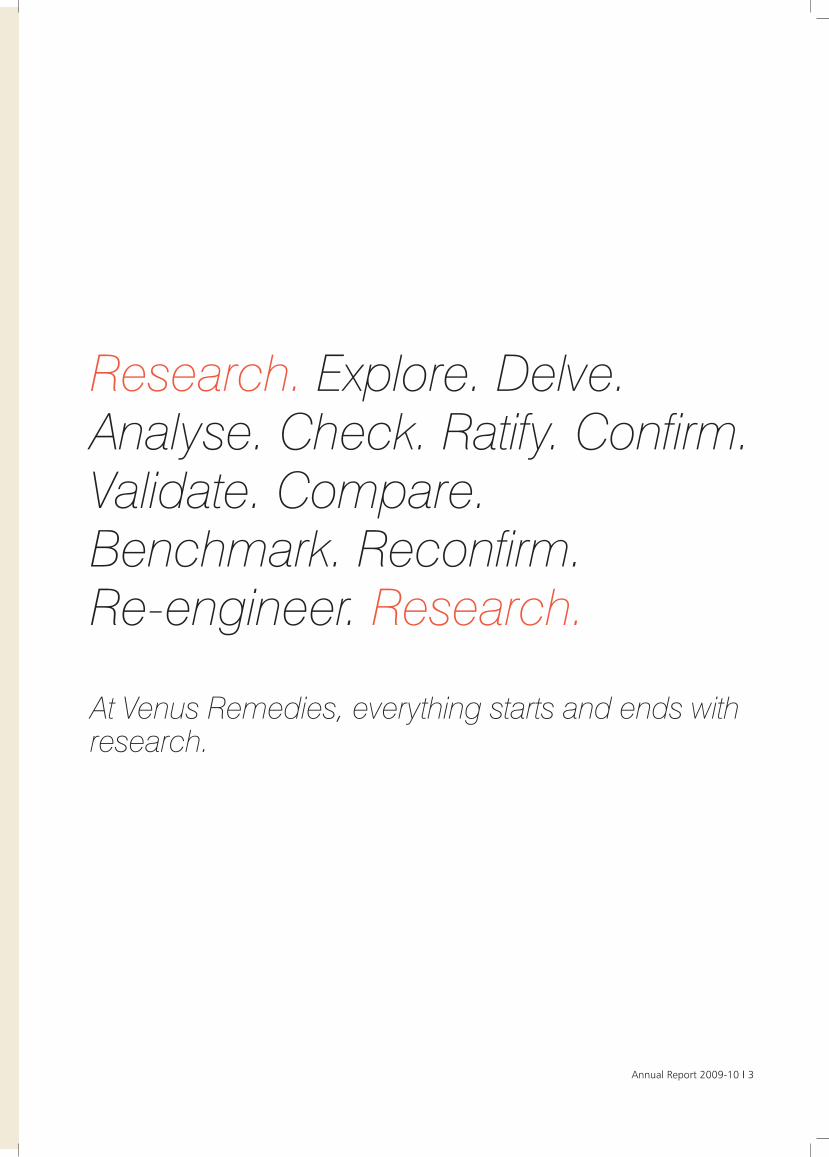
Research. Explore. Delve.Analyse. Check. Ratify. Confirm.Validate. Compare.Benchmark. Reconfirm. Re-engineer. Research.
At Venus Remedies, everything starts and ends withresearch.
4 I Venus Remedies Limited
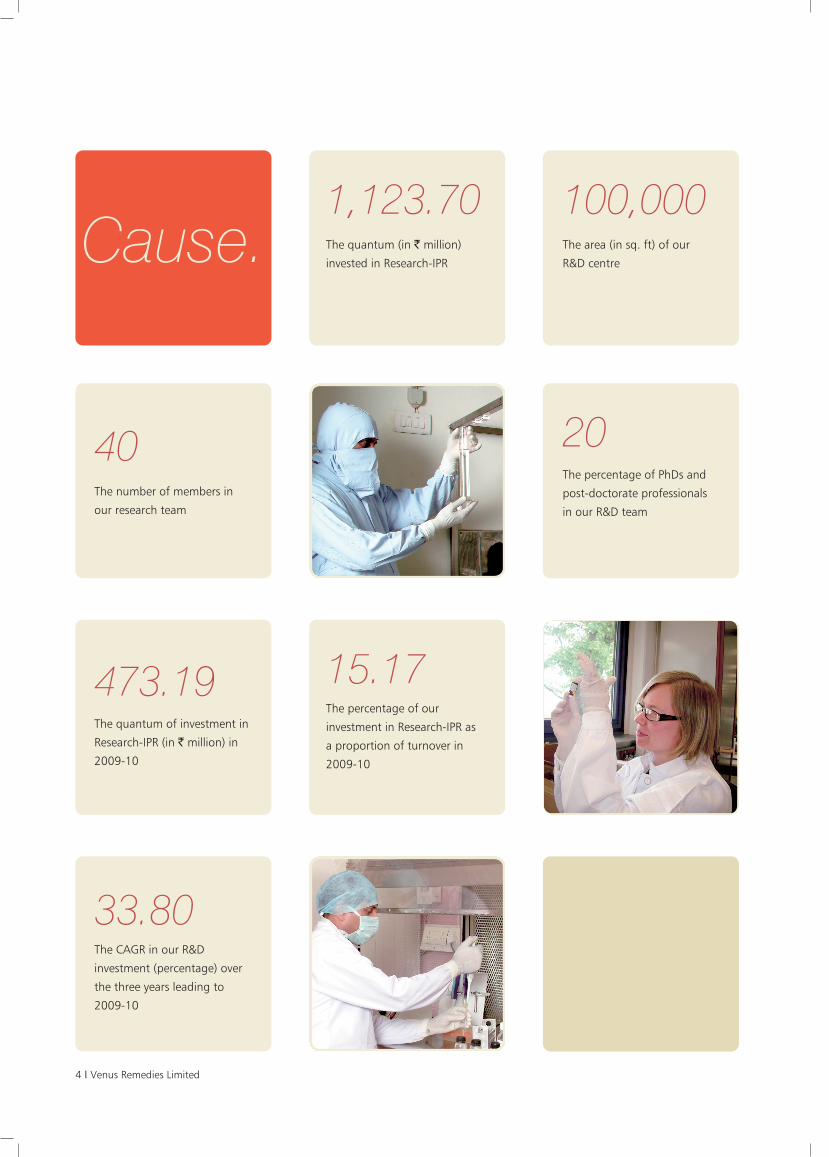
100,000 The area (in sq. ft) of our
R&D centre
20The percentage of PhDs and
post-doctorate professionals
in our R&D team
Cause.
33.80The CAGR in our R&D
investment (percentage) over
the three years leading to
2009-10
15.17 The percentage of our
investment in Research-IPR as
a proportion of turnover in
2009-10
473.19 The quantum of investment in
Research-IPR (in ` million) in
2009-10
40The number of members in
our research team
1,123.70The quantum (in ` million)
invested in Research-IPR
Annual Report 2009-10 I 5
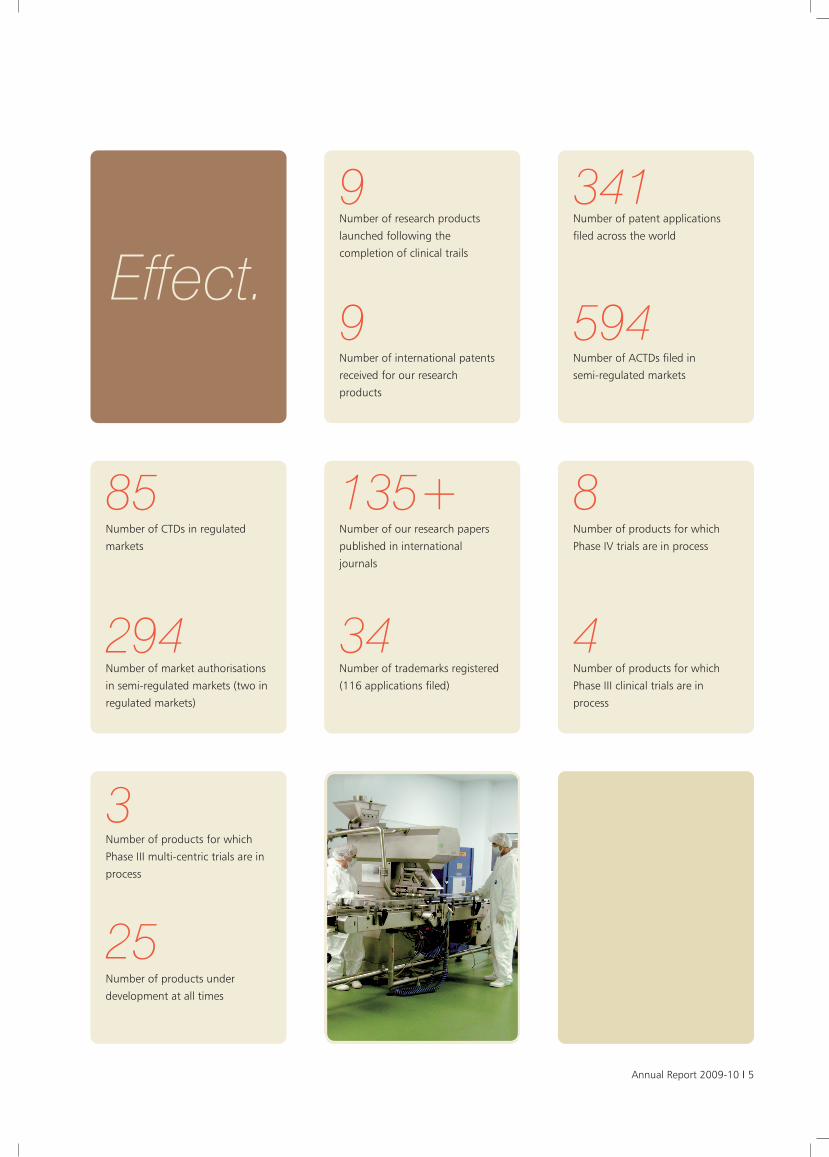
9Number of research products
launched following the
completion of clinical trails
9Number of international patents
received for our research
products
341Number of patent applications
filed across the world
594Number of ACTDs filed in
semi-regulated markets
135+ Number of our research papers
published in international
journals
34Number of trademarks registered
(116 applications filed)
85Number of CTDs in regulated
markets
294Number of market authorisations
in semi-regulated markets (two in
regulated markets)
3Number of products for which
Phase III multi-centric trials are in
process
25Number of products under
development at all times
8Number of products for which
Phase IV trials are in process
4Number of products for which
Phase III clinical trials are in
process
Effect.

6 I Venus Remedies Limited
Venus Remedies features among the 10leading fixed- dosage injectablemanufacturers in the world. And India’sonly manufacturer in this space.
Venus Remedies commenced
operations in 1991 as an
intravenous infusion
manufacturing company.
Today, the Company is present
in a number of high-growth
therapeutic segments (anti-
infective, oncology,
cardiovascular and neurology,
primarily through injectibles).
Venus Remedies possesses a
portfolio of over 75 products.
The Company’s functions are
managed by 1,375 members
(as on March 31, 2010)
headed by Mr. Pawan
Chaudhary, Chairman cum
Managing Director.
Venus Remedies is
headquartered in Panchkula
(India) and possesses three
manufacturing units
(Panchkula and Baddi in India;
Werne in Germany). Its
research and development
centre is located in Baddi.
Venus Remedies enjoys a
marketing footprint across 60
countries supported by eight
overseas marketing offices
including the US and Germany.
Venus Remedies
manufacturing units are ISO
9001, ISO 14001, ISO 18001
and OHSAS 18001 certified.
The Company also received
approvals from EUROPEAN-
GMP and WHO-GMP, among
others.
Venus Remedies’ is ranked
104 in the pharmaceutical
sector in Asia and is among
the top 50 pharmaceutical
companies in India.
Venus Remedies’ shares are
listed on the Bombay Stock
Exchange and the National
Stock Exchange. The
promoters hold a 25.41%
share in the Company’s equity
as on March 31, 2010; foreign
holding was 20.19% as on
that date.
WHAT WE ARE
Awards■ Ampucare: Gold Medal ‘INDIA INNOVATION PROGRAM-2010’ organised by
Lockheed Martin (USA), FICCI and DST (India).
■ Best SMB Award 2008: Government of India
■ Emerging SME 2007: Awarded by Dr. Manmohan Singh, Prime Minister of India
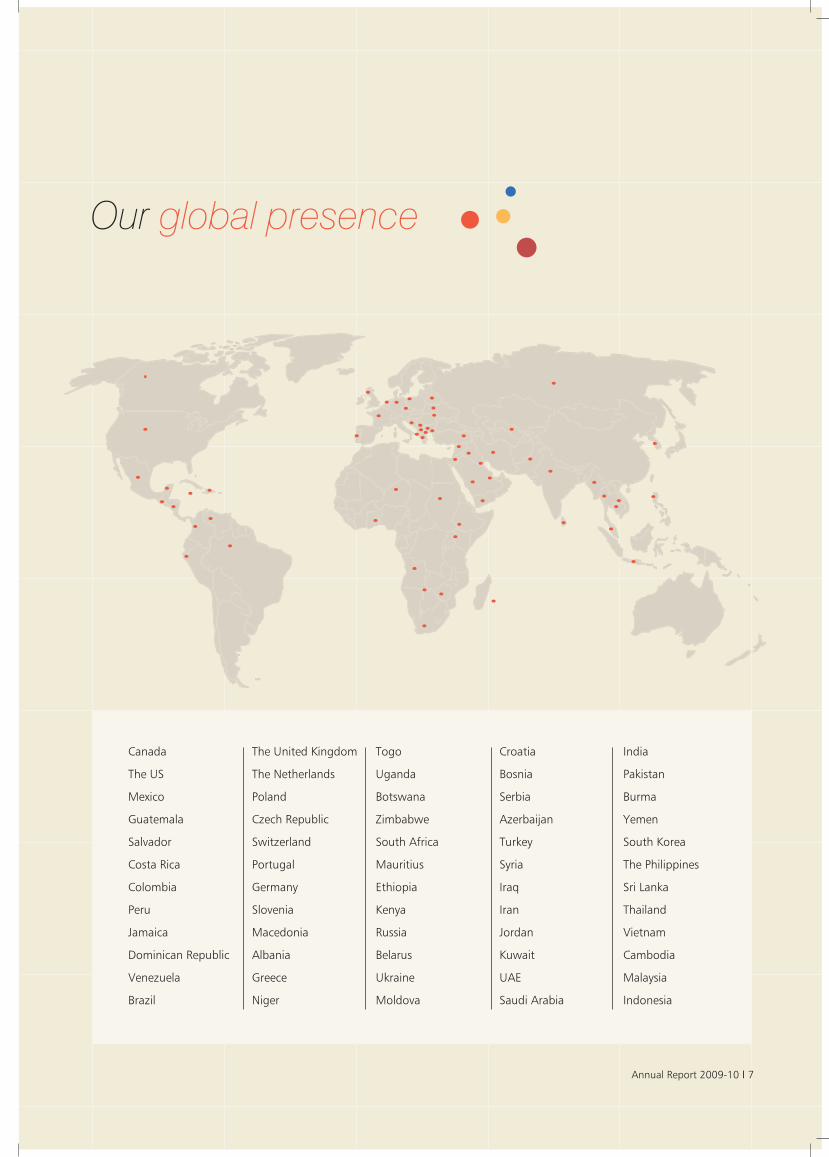
Our global presence
Canada
The US
Mexico
Guatemala
Salvador
Costa Rica
Colombia
Peru
Jamaica
Dominican Republic
Venezuela
Brazil
The United Kingdom
The Netherlands
Poland
Czech Republic
Switzerland
Portugal
Germany
Slovenia
Macedonia
Albania
Greece
Niger
Togo
Uganda
Botswana
Zimbabwe
South Africa
Mauritius
Ethiopia
Kenya
Russia
Belarus
Ukraine
Moldova
Croatia
Bosnia
Serbia
Azerbaijan
Turkey
Syria
Iraq
Iran
Jordan
Kuwait
UAE
Saudi Arabia
India
Pakistan
Burma
Yemen
South Korea
The Philippines
Sri Lanka
Thailand
Vietnam
Cambodia
Malaysia
Indonesia
Annual Report 2009-10 I 7
8 I Venus Remedies Limited
At Venus, research is not an expense. But an investment generating growing returns.
Revenue (` million)
1,41
2.20
06-0
7
07-0
8
08-0
9
09-1
0
2,13
6.02
2,64
5.15
3,11
9.30
EBIDTA (` million)
383.
5106
-07
07-0
8
08-0
9
09-1
0
550.
76
645.
57
745.
97
Profit after tax (` million)
287.
4406
-07
07-0
8
08-0
9
09-1
0
385.
17
455.
32
410.
49
Cash profit (` million)
375.
9806
-07
07-0
8
08-0
9
09-1
0
519.
96
564.
73
605.
83
R&D expenses (` million)
Earning per share
2009-10
` 48.45
Book value per share
2009-10
` 211.13
EBIDTA margin
2009-10
23.91%
Return on net worth
2009-10
22.95%
Return on capitalemployed
2009-10
20.48%
88.3
006
-07
07-0
8
08-0
9
09-1
0
264.
33
386.
18
473.
19
Net block (` million)
508.
3606
-07
07-0
8
08-0
9
09-1
0
1,19
2.80
1,71
0.28
2,11
6.95
Net worth (` million)
533.
2506
-07
07-0
8
08-0
9
09-1
0
897.
85
1,40
8.62
1,78
8.98
Capital employed (` million)
1,40
4.45
06-0
7
07-0
8
08-0
9
09-1
0
1,89
6.84
2,78
4.50
3,35
8.66
Annual Report 2009-10 I 9
Highlights, 2009-10
Financials■ Revenues grew 17.93% from
`2,645.15 million in 2008-09
to `3,119.30 million
■ EBIDTA grew 15.55% from
`645.57 million in 2008-09 to
`745.97 million
■ Profit after tax de-grew
9.85% from `455.32 million
in 2008-09 to `410.49 million
Operations■ Invested `88.09 million in
the automation of
manufacturing facilities
■ Invested `24.60 million in
upgrading the R&D
infrastructure
Marketing ■ Extended footprint across
seven nations
■ Launched five new products
in India
■ Launched four new products
in the global markets
■ Launched two research-
based products
Filings■ Filed 74 CTDs and 44 ACTDs
■ Filed 294 product
registrations
Patent approvals ■ Received a product patent
from the Korean Intellectual
Property Office (KIPO) for
Potentox
■ Received a product patent
from the Republic of South
Africa for Sulbactomax (to
combat beta-lactamase-
generated drug resistance)
■ Received a product patent
from the Republic of South
Africa for Potentox, a unique
super-speciality product
indicated for the treatment of
hospital-acquired pneumonia,
community-acquired
pneumonia and febrile
neutropenia
■ Received a product patent
from the Republic of South
Africa for Tobracef, which is
indicated for the treatment of
complicated mixed bacterial
infection
■ Received the first-ever
injectible FDC product patent
issued by the Indian Patent
Office (IPO), Government of
India, for Potentox
■ Received a product patent
from the Intellectual Property
Office, Government of India,
for Sulbactomax
Certifications ■ Received Good
Manufacturing Practices
approval from Ethiopia’s Drug
Administration and Control
Authority for four facilities
(oncology liquid, oncology
lyophilised, dry powder
cephalosporin and dry powder
carbapenems)
■ Received Good
Manufacturing Practices
approval from Botswana’s
drug regulatory unit for
oncology liquid, oncology
lyophilised, dry powder
cephalosporin and dry powder
carbapenems facilities
10 I Venus Remedies Limited
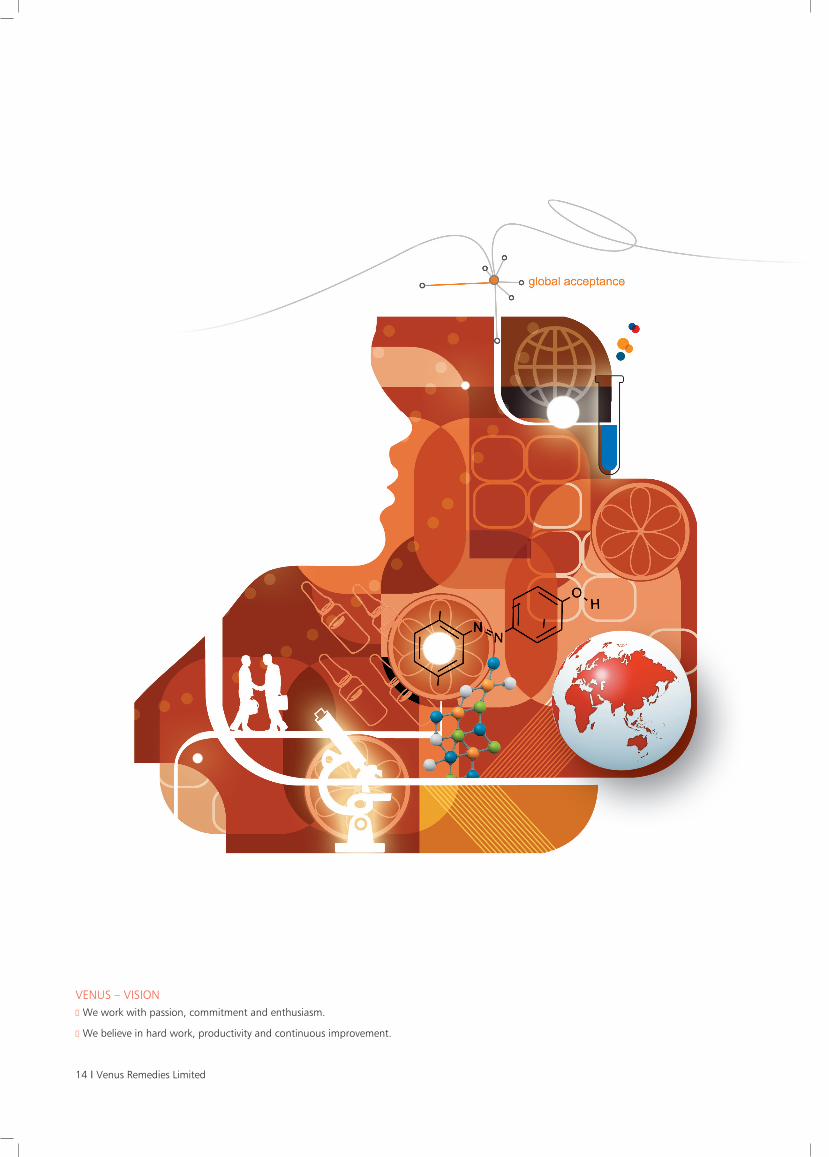
VENUS – VISION■ We are in the business of preserving and improving humanlife through innovation
■ We exist to provide value to our customers.
Annual Report 2009-10 I 11
We are engaged in doing so
through novel solutions that
fill the vast gap between
challenging ailments and
available molecules.
This is what we have to show
for our intent:
■ Launched eight novel
research-based products over
the last five years which fill
solution gaps in high-growth
segments, namely antibiotics,
oncology and neurology
■ Launched a unique wound
healing therapy, Ampucare
which possesses 11 essential
modes for wound healing
therapy; it prevents graft
rejection – a problem for
plastic surgeons as it has a
very wide bacterial coverage.
A first-of-its-kind product for
the Indian market; this therapy
is designed to cure all wounds
(even critical wounds suffered
by a diabetic patient) and
avoid amputation
■ Launched Mebatic, an
infusion therapy based on the
combination of ofloxacin and
ornidazole, for the treatment
of dysentery and
gastroenteritis. The Company
combined an aerobic with an
anaerobic molecule by using a
special chemical vector. This
reduced the treatment time
from 10-15 days to 5 days and
removed the adverse effects
caused by drugs
■ Launching Aceclofenac, a
controlled and sustained
release injectable; the dosage
remains effective for 24 hours
as against the conventional
dose of three injections of
Diclofenac which are required
to be administered every eight
hours. This is the first instance
of a controlled release pain
killer injection in India; the
Company received a product
patent from the Indian Patent
Office, Government of India
■ Working on a number of
first-of-its-kind products: a
target-based drug for breast
and ovarian cancer where
90% of the drug will go to the
affected area; the rest would
spread across the whole body,
resulting in minimal side
effects; it would significantly
enhance the efficacy of the
drug, resulting in reduced
dosage requirement and
reducing treatment cost
IN DOING SO, we expect to
capitalise on a `5,000-million
opportunity in the domestic
market and a US$1,000-
million global market
opportunity.
Research at Venus.
Making innovations happen.AT VENUS REMEDIES, WE DO NOT MERELY MANUFACTURE FORMULATIONS. WE BELIEVE WE ARE IN THE BUSINESS OF
RELIEVING PEOPLE’S FROM SUFFERING.
Venus Remedies was bestowed with the “Best
Innovation Award” in for its wound-healing solution
‘Ampucare’ by the Indo-USA Joint Science and
Technology Forum.
Innovator – globally pronounced

12 I Venus Remedies Limited
VENUS – VISION■ We ensure product quality, safety, reliability and excellence.
■ We manufacture medicines for patients and not for profits; profits follow.
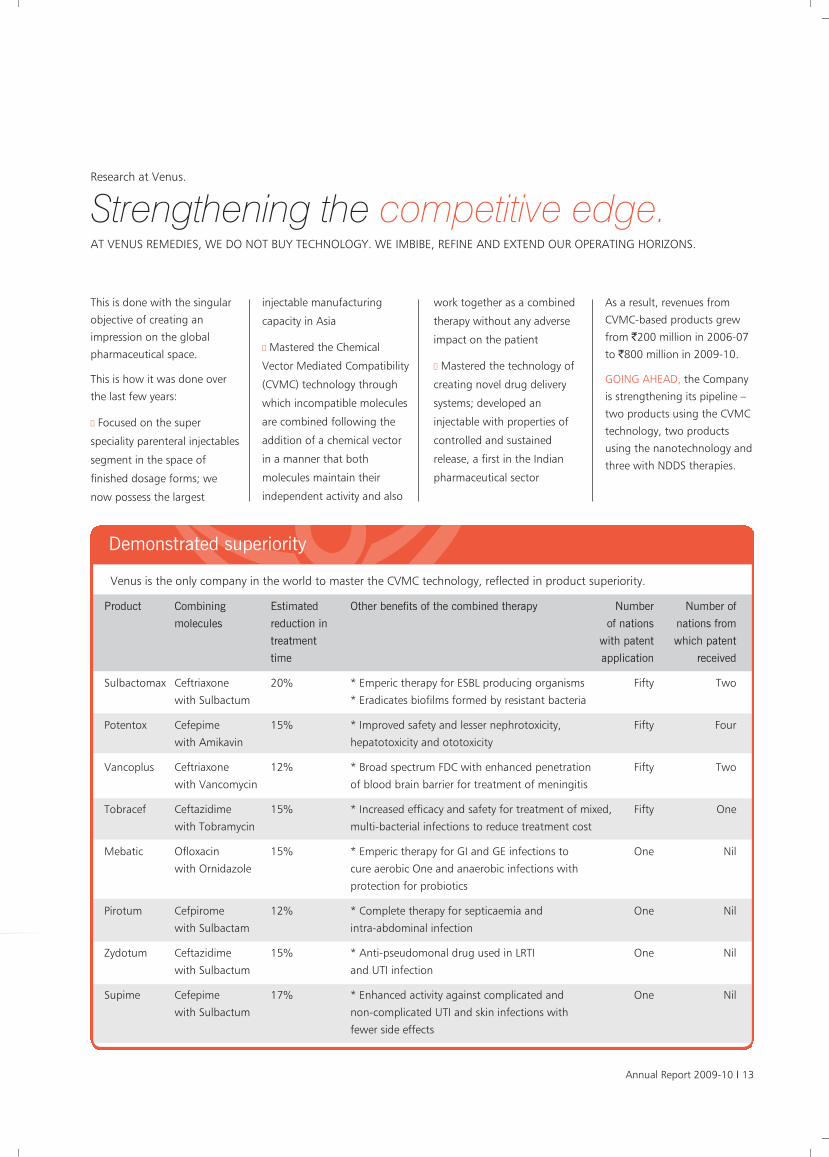
This is done with the singular
objective of creating an
impression on the global
pharmaceutical space.
This is how it was done over
the last few years:
■ Focused on the super
speciality parenteral injectables
segment in the space of
finished dosage forms; we
now possess the largest
injectable manufacturing
capacity in Asia
■ Mastered the Chemical
Vector Mediated Compatibility
(CVMC) technology through
which incompatible molecules
are combined following the
addition of a chemical vector
in a manner that both
molecules maintain their
independent activity and also
work together as a combined
therapy without any adverse
impact on the patient
■ Mastered the technology of
creating novel drug delivery
systems; developed an
injectable with properties of
controlled and sustained
release, a first in the Indian
pharmaceutical sector
As a result, revenues from
CVMC-based products grew
from `200 million in 2006-07
to `800 million in 2009-10.
GOING AHEAD, the Company
is strengthening its pipeline –
two products using the CVMC
technology, two products
using the nanotechnology and
three with NDDS therapies.
Research at Venus.
Strengthening the competitive edge.AT VENUS REMEDIES, WE DO NOT BUY TECHNOLOGY. WE IMBIBE, REFINE AND EXTEND OUR OPERATING HORIZONS.
Venus is the only company in the world to master the CVMC technology, reflected in product superiority.
Product Combining Estimated Other benefits of the combined therapy Number Number of
molecules reduction in of nations nations from
treatment with patent which patent
time application received
Sulbactomax Ceftriaxone 20% * Emperic therapy for ESBL producing organisms Fifty Two
with Sulbactum * Eradicates biofilms formed by resistant bacteria
Potentox Cefepime 15% * Improved safety and lesser nephrotoxicity, Fifty Four
with Amikavin hepatotoxicity and ototoxicity
Vancoplus Ceftriaxone 12% * Broad spectrum FDC with enhanced penetration Fifty Two
with Vancomycin of blood brain barrier for treatment of meningitis
Tobracef Ceftazidime 15% * Increased efficacy and safety for treatment of mixed, Fifty One
with Tobramycin multi-bacterial infections to reduce treatment cost
Mebatic Ofloxacin 15% * Emperic therapy for GI and GE infections to One Nil
with Ornidazole cure aerobic One and anaerobic infections with
protection for probiotics
Pirotum Cefpirome 12% * Complete therapy for septicaemia and One Nil
with Sulbactam intra-abdominal infection
Zydotum Ceftazidime 15% * Anti-pseudomonal drug used in LRTI One Nil
with Sulbactum and UTI infection
Supime Cefepime 17% * Enhanced activity against complicated and One Nil
with Sulbactum non-complicated UTI and skin infections with
fewer side effects
Demonstrated superiority
Annual Report 2009-10 I 13
14 I Venus Remedies Limited
VENUS – VISION■ We work with passion, commitment and enthusiasm.
■ We believe in hard work, productivity and continuous improvement.
Annual Report 2009-10 I 15
We have done so to enhance
our global recognition and
visibility:
■ Received a product patent
from the Korean Intellectual
Property Office (KIPO) for
Potentox, an instant remedy
for hospital/community-
acquired pneumonia, which
can be fatal for any patient
undergoing treatment in
intensive-care
■ Received a product patent
from the Companies and
Intellectual Property
Registration Office (CIPRO) of
South Africa for Sulbactomax,
combating beta-lactamase-
generated drug resistance
■ Received a product patent
from CIPRO in South Africa for
Potentox within five months of
its first grant in South Korea
■ Received a product patent
for Tobracef involving the
treatment of complicated
mixed bacterial infection of
acute pulmonary
exacerbations/cystic
fibrosis/chronic obstructive
pulmonary disease from CIPRO
in South Africa
■ Received the first-ever
injectable FDC product patent
issued by the Indian Patent
Office, Government of India,
for Potentox; also received a
product patent for
Sulbactomax from the
Intellectual Property Office
(IPO), Government of India
Venus’ novel research-based
products cater to a US$200-
million opportunity in these
nations across 12 years. The
Company filed two patent
applications in 2009-10 for
two products, an antibiotic
fixed dose combination and a
therapy for the cure of
arthritis.
Research at Venus.
Providing global acceptance.AT VENUS, WE PRIDE OURSELVES IN THE FACT THAT WE HAVE NOT CLUTTERED OUR PORTFOLIO WITH ME-TOO BRANDS.
WE HAVE DEVELOPED UNIQUE PHARMACEUTICAL SOLUTIONS.
Venus Pharma GmbH, Germany, received the marketing
authorisation for meropenem, a carbapenem injection, in
the European Union through a registration in Portugal.
Venus emerged among only three EU-GMP
manufacturers of carbapenem antibiotics in the world
and is capable of marketing this drug in Europe.
Meropenem has a market size of about Euro 150 million
in Europe. The registration of meropenem is expected in
17 other European countries by March 2011.
One in three

16 I Venus Remedies Limited
VENUS – VISION■ We encourage and respect individual initiative, ability andcreativity to develop people as the source of our strength.
■ We practice honesty, integrity and ethics in all aspects of businessand strive to be the best corporate citizen.
Annual Report 2009-10 I 17
This win-win proposition
forms the bedrock of our
approach.
We achieved this through the
following initiatives:
■ Tied-up with IMTECH, a
renowned research centre of
the Council of Scientific and
Industrial Research (CSIR) and
the Department of
Microbiology, Punjab
University, to develop a
typhoid diagnostic kit,
expected to reduce disease
detection time from 48 hours
(through the conventional
Vidal test) to a few minutes.
Venus’ kit (expected to be
launched by 2013) is likely to
reduce typhoid-led mortality –
nearly 600,000 – through
early detection
■ In-licensed the technology
for solid tumour detection
from the University of Illinois,
Chicago, which will facilitate
the early detection and
staging of solid tumours using
conventional modes; Venus
developed a formulation for
this technology
■ Out-licensed Sulbactomax to
a renowned South Korean
pharmaceutical company,
enabling it to capitalise on a
US$25 million opportunity
■ Granted permission to
conduct Phase III clinical trials
on a novel injectable
Aminoglycoside, in-licensed
from a Chinese innovator
company and is expected to
be completed in the current
year; Venus possesses the
exclusive marketing rights for
this product in India, a market
size estimated at `6,000
million and growing at 8%
annually
IN DOING SO, Venus created a
robust foundation for
sustained growth.
Research at Venus.
Facilitating partnerships.AT VENUS, WE DO NOT MERELY PARTNER WITH COMPANIES WITH THE OBJECTIVE TO GROW OUR BUSINESS. WE ENTER INTO
RELATIONSHIPS THAT LEVERAGE NOVEL IDEAS AND PROJECTS AND SOLUTIONS THAT ENHANCE MUTUAL VISIBILITY.
Venus is in advanced discussion stages with two
large MNCs for out-licensing two patented research
products.
Royalty
18 I Venus Remedies Limited
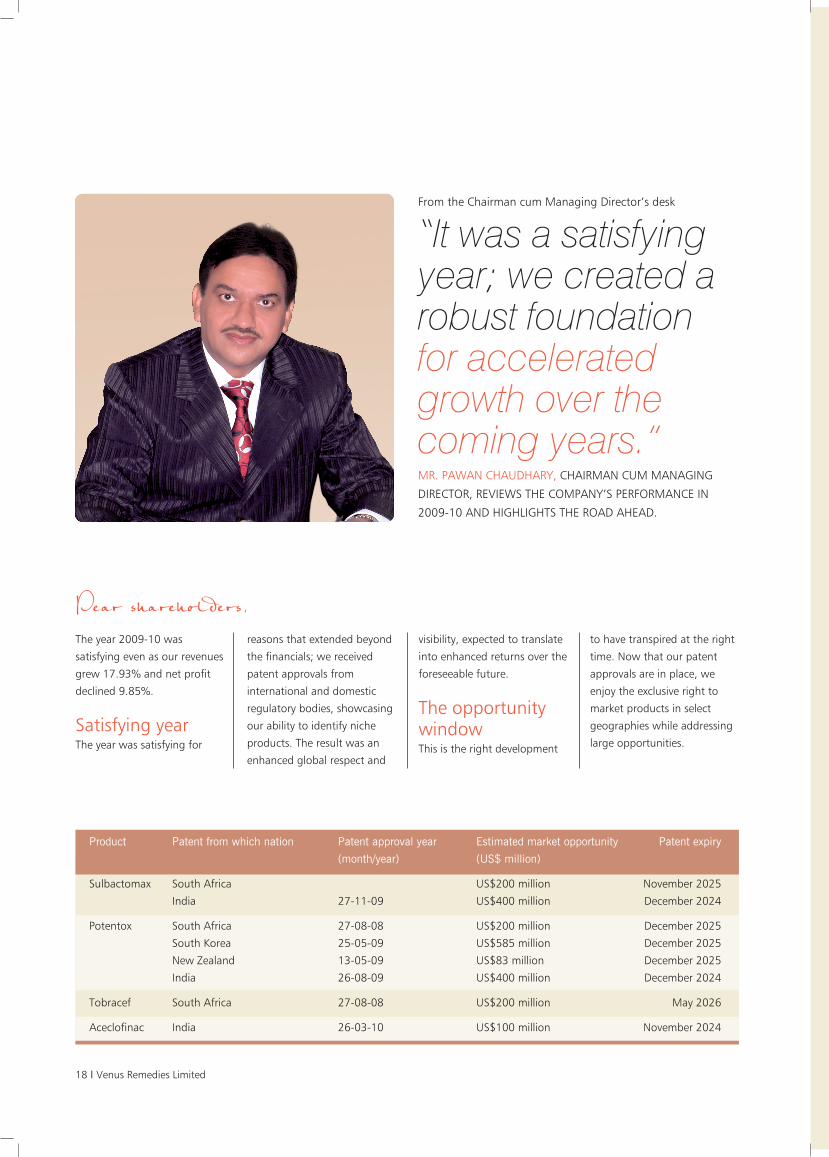
The year 2009-10 was
satisfying even as our revenues
grew 17.93% and net profit
declined 9.85%.
Satisfying yearThe year was satisfying for
reasons that extended beyond
the financials; we received
patent approvals from
international and domestic
regulatory bodies, showcasing
our ability to identify niche
products. The result was an
enhanced global respect and
visibility, expected to translate
into enhanced returns over the
foreseeable future.
The opportunitywindowThis is the right development
to have transpired at the right
time. Now that our patent
approvals are in place, we
enjoy the exclusive right to
market products in select
geographies while addressing
large opportunities.
From the Chairman cum Managing Director’s desk
“It was a satisfyingyear; we created arobust foundationfor acceleratedgrowth over thecoming years.”MR. PAWAN CHAUDHARY, CHAIRMAN CUM MANAGING
DIRECTOR, REVIEWS THE COMPANY’S PERFORMANCE IN
2009-10 AND HIGHLIGHTS THE ROAD AHEAD.
Product Patent from which nation Patent approval year Estimated market opportunity Patent expiry
(month/year) (US$ million)
Sulbactomax South Africa US$200 million November 2025
India 27-11-09 US$400 million December 2024
Potentox South Africa 27-08-08 US$200 million December 2025
South Korea 25-05-09 US$585 million December 2025
New Zealand 13-05-09 US$83 million December 2025
India 26-08-09 US$400 million December 2024
Tobracef South Africa 27-08-08 US$200 million May 2026
Aceclofinac India 26-03-10 US$100 million November 2024
Annual Report 2009-10 I 19
VENUS – VISION■ We acknowledge our responsibility towards our customer, ouremployees, the society at large and last but not the least our shareholders.
■ We shall build Venus as a Nation
It would be pertinent to
communicate that we do not
just have our patents in place,
but have a holistic strategy to
capitalise on a significant
industry opportunity.
One, we expect to capitalise
on the industry opportunity by
out-licensing our patented
products to large
pharmaceutical companies in
these geographies.
Two, we are leveraging our
research-led visibility in
entering into an agreement
with a renowned South
Korean pharmaceutical
company for Sulbactomax (to
be supplied from our Baddi
unit) accredited with multiple
international GMPs.
Commercial supplies are
expected to begin early 2012.
Three, our product registration
is in process in 60 countries;
we are at an advanced stage
of filing the Common
Technical Document for
Sulbactomax in Europe, which
once approved, will open the
continent for our research
product.
Four, we filed patents for
Sulbactomax in 50 countries
including the US, Europe,
Australia, Japan and Latin
America.
Five, we entered into a
dialogue with pharmaceutical
companies to conclude similar
agreements for two other
patent-approved research
products with attractive
revenue potential of the
present US$585 million
Korean cephalosporin market.
We filed around 341 patent
applications over the six years
leading to 2009-10 and hope
to receive a number of
product patent approvals that
will strengthen our global
presence.
Global innovator The fiscal 2009-10 was
memorable for another
milestone. We received the
Best Innovation Award by
Indo-US Science and
Technology Forum in
collaboration with Lockheed
Martin Foundation, FICCI and
DST (Government of India) for
our research product
Ampucare, a wound-healing
solution containing 11 healing
properties, effective even on
diabetic patients, preventing
amputation.
This product is relevant for an
important reason – graft
rejection is a recurring
problem in plastic surgery
caused by bacterial infection
and is not curable by
traditional medicinal
procedures. Ampucare,
developed by Venus, prevents
graft rejection as it possesses a
wide bacterial coverage. We
marketed this product
successfully on a pan-India
basis, generating `20.30
million in revenue in
2009-10, exported the
product to a number of
countries and expect to extend
our global reach in the coming
years.
In the US, the world’s largest
pharmaceutical market, we
plan to leverage the assistance
of Lockheed Martin
Foundation and establish this
product as a medical device,
subsequently graduating it to
a drug (enjoying 50-fold
realisations). The Foundation
will assist us in finding a
suitable partner to market the
product in that country and
generate attractive revenues.
Another steptowardsglobalisationThe other important 2009-10
event was that the Company’s
wholly-owned subsidiary
Venus Pharma GmbH,
Germany, received the
Marketing Authorisation of
Meropenem (carbapenem
injection) in European Union
countries through a
registration in Portugal.
Venus Pharma GmbH is the
primary centre for Venus’
business in 27 EU countries,
EEA members and Gulf
countries. We are now among
the only three EU-GMP
manufacturers of carbapenem
antibiotics in the world,
capable of marketing this drug
in Europe. We expect to be
only the second company to
20 I Venus Remedies Limited
launch this generic product in
the market.
Meropenem’s European
market size is about Euro 150
million. We expect to market
the product in Portugal from
the second quarter of the
current year and register it in
17 other European countries
by March 2011, strengthening
profitability over the coming
years.
Growing the team Our people are our top priority
in the organisation owing to a
basic understanding: it is the
people who conduct the
business and help it grow.
Over the last two decades, we
created 176 teams, each with
a clearly identified goal. The
best performing teams are
awarded at the Annual Day
function in recognition of their
efforts.
We expect to strengthen the
team – from 1,375 (March 31,
2010) to about 4,000
members by 2015 – to
effectively capitalise on
business opportunities. Our
goal is not just to increase
numbers, but to build a
creative, trained and dedicated
team. We are focused on
growing the learning curve of
our members to create
knowledgeable persons and a
learned organisation.
Consequently, we
institutionalised a system by
which 1% of the
organisational man-hours are
invested in training on various
technical aspects and soft skills
for the complete grooming of
the individual. We are working
to raise this number to 5%
within the next two years on
an increased base.
We set an ambitious goal in
our Mission 2015, wherein we
wish to make every
department an independent
profit centre. As a first step in
that direction, we launched
the ‘Entrepreneur
Programme’. Under this
programme, each department
will charge a fee for the
service rendered to other
departments. This will
highlight utilisation of
manpower and resources of
each department and other
inefficiencies in the
department which can be
resolved at the department
level. We expect that marginal
improvements by the
departments will go a long
way in improving the overall
performance of the
organisation.
Strengthening ourcapabilityManufacturing: Our nine
dedicated injectable
manufacturing units represent
the largest capacity in Asia,
making us a leading global
player. In view of the large
unfolding opportunities, we
invested `2,000 million in
capacities and capabilities in
the five years leading to 2008-
09. This resulted in enhanced
recognition: we possess 53
international GMP
certifications for our nine
super speciality injectable
manufacturing facilities.
In 2009-10, we increased
automation within our
operating facilities to minimise
human intervention and
enhance quality consistency, a
critical factor in infusion
therapy.
We received our GMP
approval from Ethiopia’s Drug
Administration and Control
Authority (DACA) for four
facilities (oncology liquid,
oncology lyophilised, dry
powder cephalosporin and dry
powder carbapenem). This
operational recognition will
allow us to tap the large
African market.
Research: In 2009-10, we
invested in `24.60 million in
our R&D infrastructure. We
installed sophisticated
equipment, reducing
operational time and diverting
precious person-hours
towards research on novel
therapeutic solutions. We
installed equipment with RRLC
technology which reduced
testing time to under an hour
against four hours taken by
the conventional HPLC
equipment.
During the year under review,
we applied for GLP and NABL
certification. Of the two audits
mandated for GLP
certification, one was
successfully completed in
2009-10. They recommended
upgradation of certain
technologies; we plan to
invest
`12.50 million in a state-of-
the-art sampling machine
which can accurately analyse
200 samples; currently, our
equipment manages about 10
samples. This will facilitate
improved product
management and ensure GLP
compliance.
Road aheadWe expect to reinforce our
industry position through the
following initiatives:
■ Out-license patented
products (up to March 31,
2010) to large MNC
pharmaceutical companies
and generate sizeable
resources to re-invest in
research
■ Generate an IPR wealth of
US$1 billion by 2015
■ Grow our marketing team
from 700 to 3,000 members
■ Marketing presence across
60 nations
In doing so, we expect to
grow our business by about
15% annually over the next
three years and graduate from
the top 50 to the top 25
pharmaceutical companies in
India.
Regards
PAWAN CHAUDHARY
Annual Report 2009-10 I 21
Segment presenceThe Company, present in the
relatively uncluttered fixed
dosage injectables space,
possesses Asia's largest
injectable manufacturing
capacity.
TherapeuticsegmentsThe Company is present in the
high-value, high-growth
therapeutic segments of
oncology, anti-infective and
neurology.
Research anddevelopmentThe Company's state-of-the-art
100,000-sq. ft research and
development centre complies
with GLP standards and is
accredited by the Department
of Scientific & Industrial
Research, Government of
India.
PatentsThe Company received nine
patents from global and
domestic authorities out of
341 patents filed in over 50
countries.
FacilitiesThe Company's three
manufacturing facilities (two
in India and one in Germany)
received national and
international GMP
certifications.
ReachThe Company's footprint spans
60 nations (regulated and
semi-regulated) and has a
strong export presence in over
22 nations, supported by eight
overseas offices.
DistributionnetworkThe Company has a strong
marketing team of 41
distributors, 700 professionals,
1,500 stockists, 35,000
chemists and 100,000
doctors, among others.
PartneringThe Company established
strategic marketing alliances
with leading pharmaceutical
companies like Elder
Pharmaceuticals, IPCA
Laboratories, Lupin, Glenmark
Pharmaceuticals and Piramal
Healthcare, among others.
GearingThe Company's attractive debt-
equity ratio of 0.84 as on
March 31, 2010, provides
adequate scope for mobilising
resources to fund growth.
Tax coverThe Company's manufacturing
unit in Baddi enjoys a tax
holiday of 10 years. The R&D
centre’s DSIR approval
provides a weighted tax
benefit of 200% on revenue
and capital expenditure,
enabling the Company to
import R&D material and
equipment at zero-duty.
Our competitive advantage
22 I Venus Remedies Limited
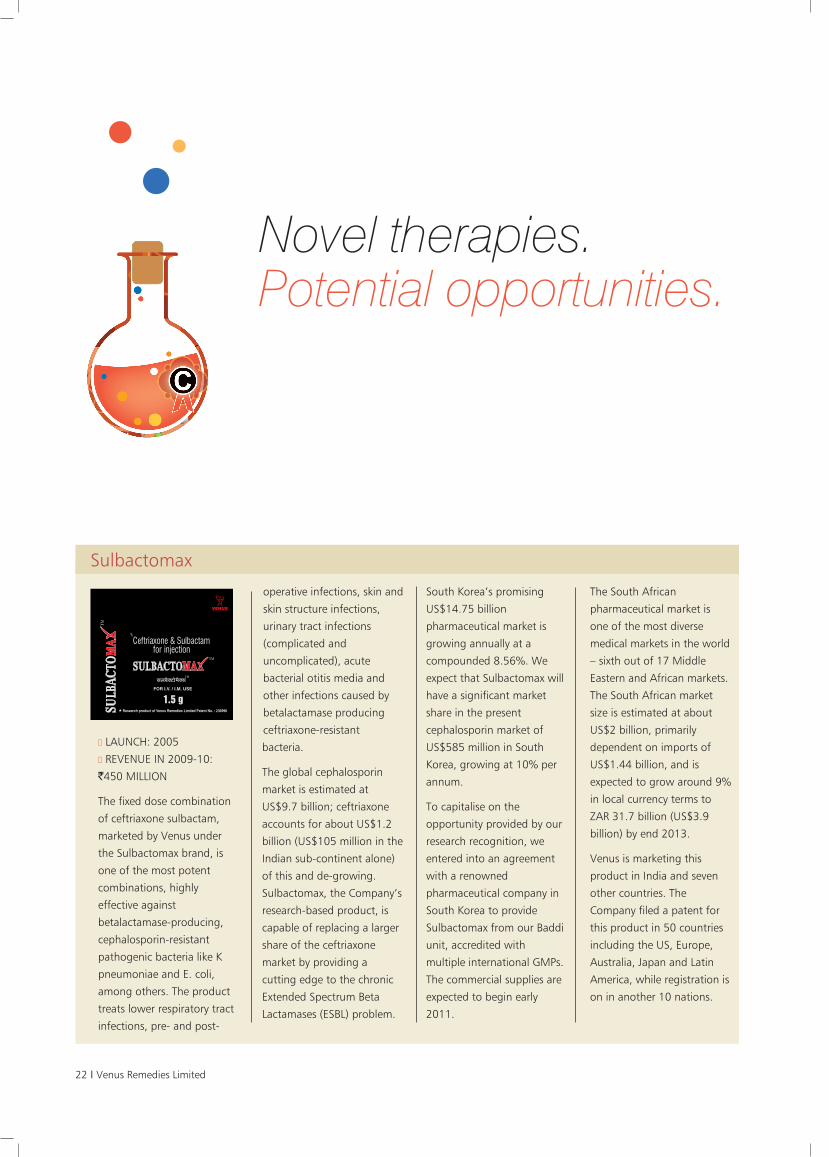
Novel therapies.Potential opportunities.
■ LAUNCH: 2005■ REVENUE IN 2009-10:
`450 MILLION
The fixed dose combination
of ceftriaxone sulbactam,
marketed by Venus under
the Sulbactomax brand, is
one of the most potent
combinations, highly
effective against
betalactamase-producing,
cephalosporin-resistant
pathogenic bacteria like K
pneumoniae and E. coli,
among others. The product
treats lower respiratory tract
infections, pre- and post-
operative infections, skin and
skin structure infections,
urinary tract infections
(complicated and
uncomplicated), acute
bacterial otitis media and
other infections caused by
betalactamase producing
ceftriaxone-resistant
bacteria.
The global cephalosporin
market is estimated at
US$9.7 billion; ceftriaxone
accounts for about US$1.2
billion (US$105 million in the
Indian sub-continent alone)
of this and de-growing.
Sulbactomax, the Company’s
research-based product, is
capable of replacing a larger
share of the ceftriaxone
market by providing a
cutting edge to the chronic
Extended Spectrum Beta
Lactamases (ESBL) problem.
South Korea’s promising
US$14.75 billion
pharmaceutical market is
growing annually at a
compounded 8.56%. We
expect that Sulbactomax will
have a significant market
share in the present
cephalosporin market of
US$585 million in South
Korea, growing at 10% per
annum.
To capitalise on the
opportunity provided by our
research recognition, we
entered into an agreement
with a renowned
pharmaceutical company in
South Korea to provide
Sulbactomax from our Baddi
unit, accredited with
multiple international GMPs.
The commercial supplies are
expected to begin early
2011.
The South African
pharmaceutical market is
one of the most diverse
medical markets in the world
– sixth out of 17 Middle
Eastern and African markets.
The South African market
size is estimated at about
US$2 billion, primarily
dependent on imports of
US$1.44 billion, and is
expected to grow around 9%
in local currency terms to
ZAR 31.7 billion (US$3.9
billion) by end 2013.
Venus is marketing this
product in India and seven
other countries. The
Company filed a patent for
this product in 50 countries
including the US, Europe,
Australia, Japan and Latin
America, while registration is
on in another 10 nations.
Sulbactomax
Annual Report 2009-10 I 23
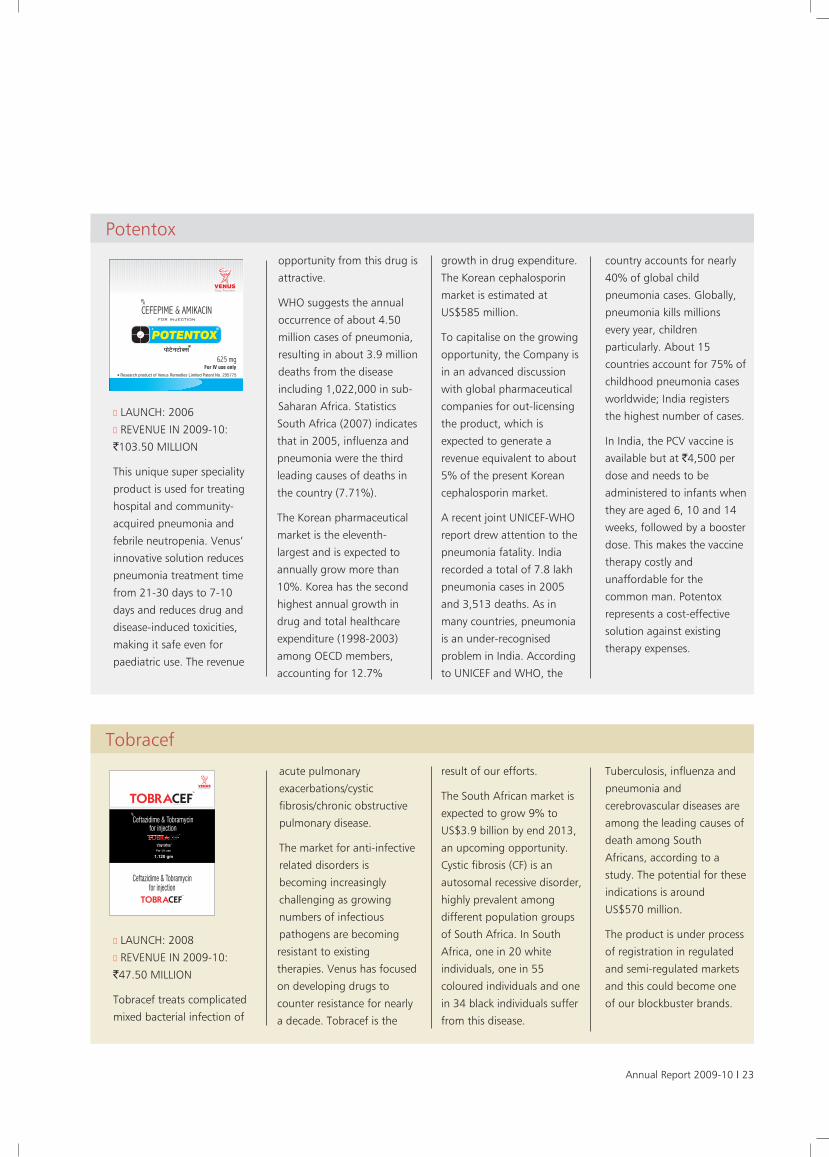
■ LAUNCH: 2006■ REVENUE IN 2009-10:
`103.50 MILLION
This unique super speciality
product is used for treating
hospital and community-
acquired pneumonia and
febrile neutropenia. Venus’
innovative solution reduces
pneumonia treatment time
from 21-30 days to 7-10
days and reduces drug and
disease-induced toxicities,
making it safe even for
paediatric use. The revenue
opportunity from this drug is
attractive.
WHO suggests the annual
occurrence of about 4.50
million cases of pneumonia,
resulting in about 3.9 million
deaths from the disease
including 1,022,000 in sub-
Saharan Africa. Statistics
South Africa (2007) indicates
that in 2005, influenza and
pneumonia were the third
leading causes of deaths in
the country (7.71%).
The Korean pharmaceutical
market is the eleventh-
largest and is expected to
annually grow more than
10%. Korea has the second
highest annual growth in
drug and total healthcare
expenditure (1998-2003)
among OECD members,
accounting for 12.7%
growth in drug expenditure.
The Korean cephalosporin
market is estimated at
US$585 million.
To capitalise on the growing
opportunity, the Company is
in an advanced discussion
with global pharmaceutical
companies for out-licensing
the product, which is
expected to generate a
revenue equivalent to about
5% of the present Korean
cephalosporin market.
A recent joint UNICEF-WHO
report drew attention to the
pneumonia fatality. India
recorded a total of 7.8 lakh
pneumonia cases in 2005
and 3,513 deaths. As in
many countries, pneumonia
is an under-recognised
problem in India. According
to UNICEF and WHO, the
country accounts for nearly
40% of global child
pneumonia cases. Globally,
pneumonia kills millions
every year, children
particularly. About 15
countries account for 75% of
childhood pneumonia cases
worldwide; India registers
the highest number of cases.
In India, the PCV vaccine is
available but at `4,500 per
dose and needs to be
administered to infants when
they are aged 6, 10 and 14
weeks, followed by a booster
dose. This makes the vaccine
therapy costly and
unaffordable for the
common man. Potentox
represents a cost-effective
solution against existing
therapy expenses.
Potentox
■ LAUNCH: 2008■ REVENUE IN 2009-10:
`47.50 MILLION
Tobracef treats complicated
mixed bacterial infection of
acute pulmonary
exacerbations/cystic
fibrosis/chronic obstructive
pulmonary disease.
The market for anti-infective
related disorders is
becoming increasingly
challenging as growing
numbers of infectious
pathogens are becoming
resistant to existing
therapies. Venus has focused
on developing drugs to
counter resistance for nearly
a decade. Tobracef is the
result of our efforts.
The South African market is
expected to grow 9% to
US$3.9 billion by end 2013,
an upcoming opportunity.
Cystic fibrosis (CF) is an
autosomal recessive disorder,
highly prevalent among
different population groups
of South Africa. In South
Africa, one in 20 white
individuals, one in 55
coloured individuals and one
in 34 black individuals suffer
from this disease.
Tuberculosis, influenza and
pneumonia and
cerebrovascular diseases are
among the leading causes of
death among South
Africans, according to a
study. The potential for these
indications is around
US$570 million.
The product is under process
of registration in regulated
and semi-regulated markets
and this could become one
of our blockbuster brands.
Tobracef
24 I Venus Remedies Limited
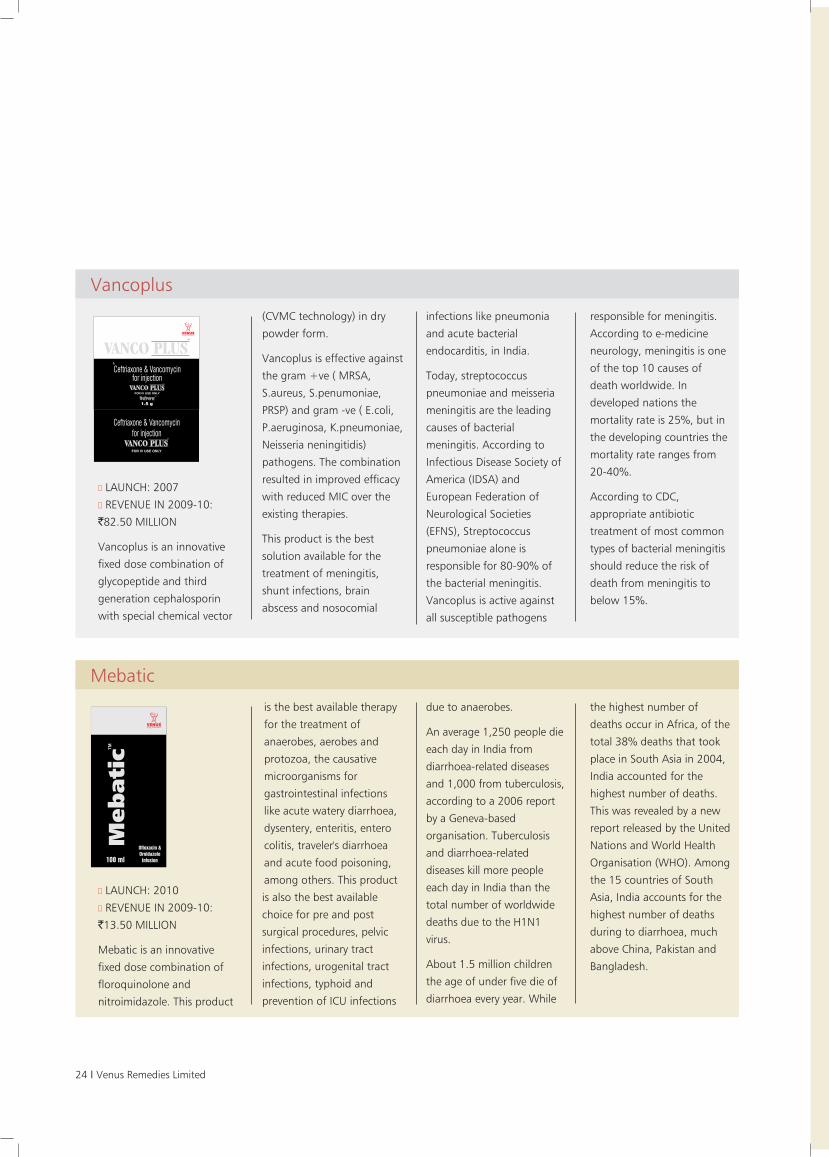
■ LAUNCH: 2007■ REVENUE IN 2009-10:
`82.50 MILLION
Vancoplus is an innovative
fixed dose combination of
glycopeptide and third
generation cephalosporin
with special chemical vector
(CVMC technology) in dry
powder form.
Vancoplus is effective against
the gram +ve ( MRSA,
S.aureus, S.penumoniae,
PRSP) and gram -ve ( E.coli,
P.aeruginosa, K.pneumoniae,
Neisseria neningitidis)
pathogens. The combination
resulted in improved efficacy
with reduced MIC over the
existing therapies.
This product is the best
solution available for the
treatment of meningitis,
shunt infections, brain
abscess and nosocomial
infections like pneumonia
and acute bacterial
endocarditis, in India.
Today, streptococcus
pneumoniae and meisseria
meningitis are the leading
causes of bacterial
meningitis. According to
Infectious Disease Society of
America (IDSA) and
European Federation of
Neurological Societies
(EFNS), Streptococcus
pneumoniae alone is
responsible for 80-90% of
the bacterial meningitis.
Vancoplus is active against
all susceptible pathogens
responsible for meningitis.
According to e-medicine
neurology, meningitis is one
of the top 10 causes of
death worldwide. In
developed nations the
mortality rate is 25%, but in
the developing countries the
mortality rate ranges from
20-40%.
According to CDC,
appropriate antibiotic
treatment of most common
types of bacterial meningitis
should reduce the risk of
death from meningitis to
below 15%.
Vancoplus
■ LAUNCH: 2010■ REVENUE IN 2009-10:
`13.50 MILLION
Mebatic is an innovative
fixed dose combination of
floroquinolone and
nitroimidazole. This product
is the best available therapy
for the treatment of
anaerobes, aerobes and
protozoa, the causative
microorganisms for
gastrointestinal infections
like acute watery diarrhoea,
dysentery, enteritis, entero
colitis, traveler's diarrhoea
and acute food poisoning,
among others. This product
is also the best available
choice for pre and post
surgical procedures, pelvic
infections, urinary tract
infections, urogenital tract
infections, typhoid and
prevention of ICU infections
due to anaerobes.
An average 1,250 people die
each day in India from
diarrhoea-related diseases
and 1,000 from tuberculosis,
according to a 2006 report
by a Geneva-based
organisation. Tuberculosis
and diarrhoea-related
diseases kill more people
each day in India than the
total number of worldwide
deaths due to the H1N1
virus.
About 1.5 million children
the age of under five die of
diarrhoea every year. While
the highest number of
deaths occur in Africa, of the
total 38% deaths that took
place in South Asia in 2004,
India accounted for the
highest number of deaths.
This was revealed by a new
report released by the United
Nations and World Health
Organisation (WHO). Among
the 15 countries of South
Asia, India accounts for the
highest number of deaths
during to diarrhoea, much
above China, Pakistan and
Bangladesh.
Mebatic
Annual Report 2009-10 I 25
Management discussionand analysisGlobalpharmaceuticalsectorThe global pharmaceutical
industry is undergoing a major
change: an increasing focus
on generic products, a shift
from the developed to
developing world on the back
of a rise in population and
reduction in poverty levels,
leading to higher medical
penetration. The global
pharmaceutical market grew
at 4-6% in 2010 compared
with 7% at US$837 billion in
2009; it is expected to grow
by about US$300 billion over
the next five years to reach
US$1.1 trillion in 2014 at a
CAGR of 4.4% [Source: IMS
Health].
The emerging pharmaceutical
markets (Brazil, Russia, China,
India, Turkey, Mexico and
Indonesia) are projected to grow
at a CAGR of around 14.7%
during 2009-2012,
characterised by rapid
urbanisation, government
support, patent expiries and
low-cost operations, among
other factors [Source: RNCOS –
December 2009].
The developed nations,
namely the US, the EU and
Japan, are expected to report
subdued growth following
rising healthcare costs owing
to demographic changes,
patent expiries and increased
generic acceptance by medical
professionals.
Global researchand developmentA general decline in success
rates for new drugs took its
toll on productivity, evident in
the doubling of phase III
terminations in the period
2007-2009, compared with
those in 2004-2006. Further,
less than one in 10 drugs
reaching ‘first toxicity dose’ is
expected to be successfully
launched.
Highlights, 2009-10■ The global R&D expenditure
stood at 6.3% in 2009
compared with 6.6% in 2008.
■ Around 26 new molecule
entities (NME) were launched
in the global market, an
increase from 21 in 2008.
■ An estimated 17.9% of the
global R&D was allocated to
anti-cancer drugs, receiving
the largest proportion of R&D
investments.
[Source: Thomas Reuters,
CMR International, June 28,
2010]
Road aheadThe BRIC nations are expected
to dominate R&D investment,
overshadowing developed
economies like Europe and
Japan where R&D growth is
projected to be 3-5% [Source:
By Martin Grueber, Research
Leader, Battelle, Cleveland,
Ohio and Tim Studt, Editor in
Chief, Advantage Business
Media, December 22, 2009,
rdmag.com].
IndianpharmaceuticalindustryOverviewIndia's pharmaceutical sector is
the world’s third largest by
volume and 14th by value
(`1,00,611 crore) with a
turnover of US$21.04 billion
between September 2008 and
Nations 2008 2009 2010
Americas 39.9% 39.4% 39.2%
The US 35.4% 35.0% 34.8%
Asia 32.0% 33.5% 34.6%
Japan 13.2% 12.5% 12.3%
China 9.1% 11.1% 12.2%
India 2.4% 2.5% 2.9%
Europe 24.9% 24.0% 23.2%
Rest of world 3.2% 3.1% 3.0%
Share of global R&D spending
[Source: Battelle, R&D Magazine]
Deaths owing to cancer were estimated at 562,340
in 2009, over 1,500 deaths a day; an expected
1,479,350 new cancer cases were diagnosed.
In 2009 and counting…
26 I Venus Remedies Limited
September 2009.
The domestic formulation
industry registered a CAGR of
14% during FY2003-08 from
around US$3.9 billion to
US$7.7 billion, outpacing the
global pharma industry
growth rate of 7%. The
industry is typically growing at
around 1.5-1.6 times the
country's GDP growth.
Socio-economic factors such
as rising income levels,
increasing affordability,
gradual penetration of health
insurance and rising incidence
of chronic diseases could grow
the Indian formulations
market to US$13.7 billion by
2013 with a CAGR of 12.2%
over the period 2008-2013
[Source: The Financial Express,
October 5, 2009]. By 2015,
India is expected to rank
among the top 10 global
pharmaceutical markets.
India emerged as one of the
world’s prominent quality
generic drug suppliers, with
the potential of capturing up
to a 10% share of the global
market by 2015 (US$2 billion).
The country’s growing success
can be attributed to the
increasing recognition of
process patents over the last
three decades (Source: The
Financial Express October 5,
2009).
India’s outsourcing sector
grew 43%, with the drug
discovery and development
segment growing at 65%,
over three times the global
average. India expects to
emerge as one of the world’s
top five innovator countries by
2020 [Source: Report by Ernst
& Young, September, 2009].
The organised pharmaceutical
retail market grew at 20-25%
annually; it has the potential
to grow from US$4.5 billion in
2009 to US$9 billion by 2011.
The Indian pharmaceutical
industry’s research spending
was about 5% of revenues,
lower than the equivalent of
14-18% in developed
countries (Source: Hindu
Business Line, June 23, 2009).
To encourage R&D spending,
the Indian government
proposed (in March 2009) to
invest up to `2,500 crore in
one of the biggest R&D
initiatives, matched by a
similar amount from private
sector players. The
government plans to mobilise
investments of over a billion
dollars across five years to
promote innovation (Source:
Business standard March 2,
2009).
ExportsA majority of India’s revenues
are derived from the
international markets (mainly
the US and Europe). Indian
pharmaceutical exports stood
at `244 billion (US$5.48
billion) in 2009-10 and are
expected to grow to `593
billion (US$13.31 billion) by
2011-2012 [Source: RNCOS],
owing to a number of factors:
low manufacturing cost,
consistent quality and skilled
intellectual capital, among
others. It is estimated that
India’s drug manufacturing
costs are up to 50% lower than
in established markets like the
US and the costs in India’s US
Food and Drug Administration
(FDA or US FDA)-approved
plants are 30-50% lower.
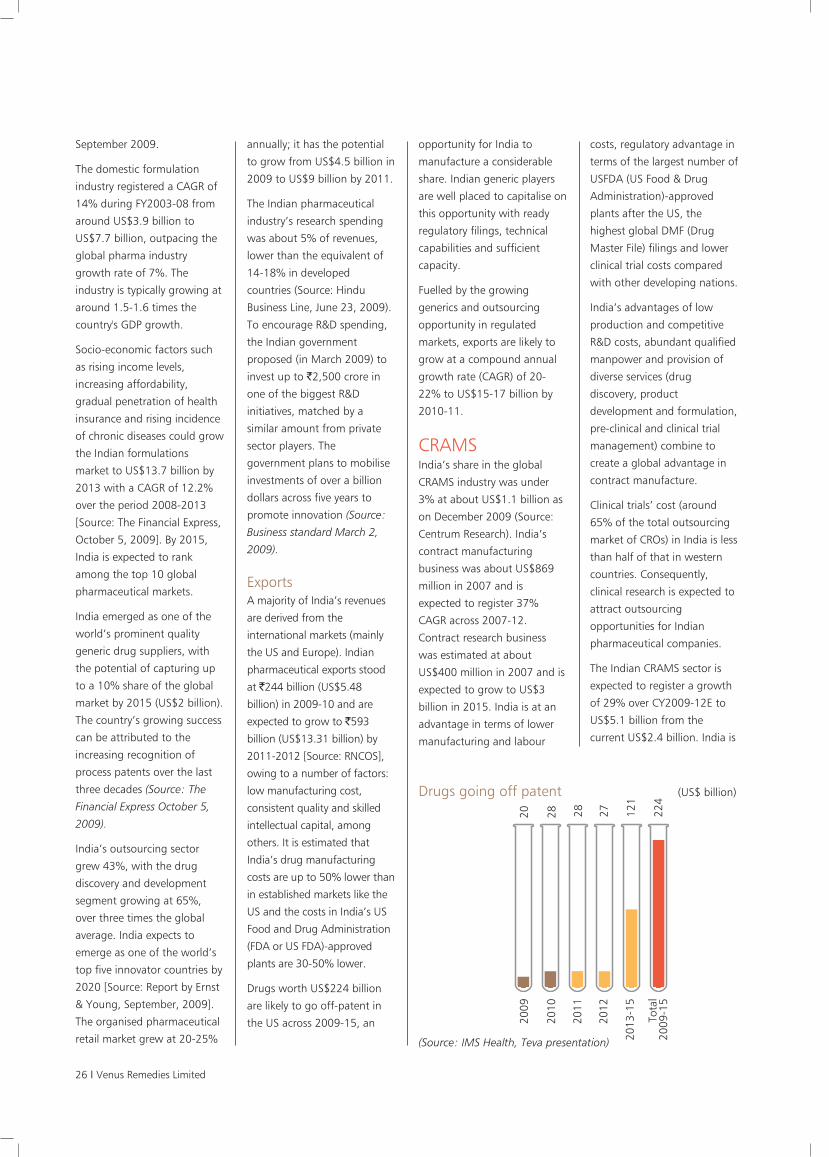
Drugs worth US$224 billion
are likely to go off-patent in
the US across 2009-15, an
opportunity for India to
manufacture a considerable
share. Indian generic players
are well placed to capitalise on
this opportunity with ready
regulatory filings, technical
capabilities and sufficient
capacity.
Fuelled by the growing
generics and outsourcing
opportunity in regulated
markets, exports are likely to
grow at a compound annual
growth rate (CAGR) of 20-
22% to US$15-17 billion by
2010-11.
CRAMSIndia’s share in the global
CRAMS industry was under
3% at about US$1.1 billion as
on December 2009 (Source:
Centrum Research). India’s
contract manufacturing
business was about US$869
million in 2007 and is
expected to register 37%
CAGR across 2007-12.
Contract research business
was estimated at about
US$400 million in 2007 and is
expected to grow to US$3
billion in 2015. India is at an
advantage in terms of lower
manufacturing and labour
costs, regulatory advantage in
terms of the largest number of
USFDA (US Food & Drug
Administration)-approved
plants after the US, the
highest global DMF (Drug
Master File) filings and lower
clinical trial costs compared
with other developing nations.
India’s advantages of low
production and competitive
R&D costs, abundant qualified
manpower and provision of
diverse services (drug
discovery, product
development and formulation,
pre-clinical and clinical trial
management) combine to
create a global advantage in
contract manufacture.
Clinical trials’ cost (around
65% of the total outsourcing
market of CROs) in India is less
than half of that in western
countries. Consequently,
clinical research is expected to
attract outsourcing
opportunities for Indian
pharmaceutical companies.
The Indian CRAMS sector is
expected to register a growth
of 29% over CY2009-12E to
US$5.1 billion from the
current US$2.4 billion. India is
Drugs going off patent (US$ billion)
2020
09
2010
2011
2012
2013
-15
Tota
l20
09-1
5
28 28 27 121
224
(Source: IMS Health, Teva presentation)
Annual Report 2009-10 I 27
expected to account for over
7% of the global CRAMS
market by 2013.
Other advantage forCRAMS business ■ Quality indicator: India has
the highest number (about
100) of USFDA-approved
plants outside the US.
■ Regulator compliance
indicator: India leads the race
in filing drug master files
(DMFs), with a 46% share in
global DMFs.
TherapeuticsegmentsOncologyCancer is a leading cause of
death worldwide. Annual
global cancer deaths number
about 7.6 million and are
expected to surge to 17
million by 2030 [Source:
WHO]. Breast cancer is the
second most common type of
cancer; more than one million
new cases of breast cancer are
registered every year
worldwide. Global cancer
drugs sales are expected to
grow at a 12-15% CAGR,
reaching US$75 to US$80
billion by 2012 [Source: IMS
Health]. India’s oncology
market is estimated at US$225
million (`900 crore) and
expected to reach US$850
million (`3,350 crore) by
2012, growing at a CAGR of
nearly 30%.
CardiovascularHeart diseases emerged as the
number one killer in urban
and rural areas. If all age
groups are included, heart
diseases account for about
19% of all deaths.
Consequently, the
cardiovascular segment in
India is expected to register a
14.7% CAGR, higher than the
industry average growth rate
of 12% [Source: CRISIL].
AntibioticsAccording to a report by
Datamonitor, the market for
high-end antibiotics in Indian
hospitals was worth `33
billion (US$685.8 million) in
2009-10, an annual growth of
49.8%. The market is
estimated to grow to about
`89 billion by 2014-15 at a
compounded rate of 21.8%.
Indian market totreble in a decadeThe Indian pharmaceutical
sector is well-placed to
capitalise on a growing
generic space, marked by
rising generic penetration
(over 20% of world’s generics
are produced in India [Source:
RNCOS]), larger-selling drugs
going off-patent,
governmental push for
cheaper generic drugs and
innovator-generic
partnerships.
India is expected to rank
among the top 10 global
pharmaceutical markets by
2015, likely to touch `2.2
trillion (US$50 billion) and
open up a probable US$8
billion market for MNCs selling
expensive drugs by 2015. This
will make it a lucrative clinical
trial destination for global
giants [Source: McKinsey
Report].
The growing incidence of
lifestyle disorders (diabetes,
cancer, cardiovascular
ailments and neuropsychiatry)
will catalyse the growth of
speciality and super-speciality
therapies. India’s speciality
and super-speciality therapies
are likely to account for 45%
of the market by 2015 (35.9%
in 2006) as a per a McKinsey
report.
Socio-economic factors like
rising incomes, increasing
affordability, gradual health
insurance penetration and a
rise in chronic diseases could
see the Indian formulations
market grow to US$13.7
billion by 2013, at a CAGR of
12.2% (Source: The Financial
Express). By 2015, India is
expected to rank among the
top 10 global pharmaceutical
markets, with the industry
growing at around 1.6 times
the country's GDP growth
(Source: The Financial
Express).
According to a FICCI-E&Y study, India is a preferred destination for contract research and clinical trials because of its cost
advantage (a clinical trial in India costs around 60% lower than in developed markets).
The industry-sponsored Phase II and III clinical trial study sites in India grew 116% from April 2008 to June 2009, as the
country graduated from rank 18 to 12 among the world’s 60 most active countries. India participates in 7% of the global
Phase III trials and 3.2% of the Phase II trials with industry-sponsored trials; India ranks second in Asia after Japan in the
number of industry-sponsored Phase II and III trial studies (Source: Business Standard, August 10, 2009).
India, a preferred clinical trial destination
■ Cancer accounts for 7.4 million deaths worldwide(around 13% of all deaths)
■ Around 10,000 new cancer cases are detected in Indiaannually, the total victims adding up to about 2.5million cumulatively.
(Source: WHO)
Killer at work
■ Three of every 1,000 Indians suffer a stroke intheir life time.
■ Urban cardiovascular patients are expected toincrease at a compounded 7.3% (2005-2015).
(Source: Asia Times, 2008)
Stroke after stroke
28 I Venus Remedies Limited
OverviewThe Company has threemanufacturing units (two inIndia, one in Germany) whichare integrated and networkedfor timely production andproduct despatch. TheCompany’s competence lies inquality assurance, qualitycontrol, in-process controlguidelines and training.
Panchkula unit: This was theCompany’s first unit,renovated in accordance withWHO-GMP and ISO9001:2008 standards. Itpossesses an annualmanufacturing capacity of7.50 million bottles. Thelocation is unique in terms ofmanufacturing strategicproducts like antibiotics andplasma expender, amongothers, with the assistance ofworld-class equipment andstrict manufacturingconditions. A parenteral facilityfor super speciality intravenousfluids was established withstate-of-the-art laboratories.The key productsmanufactured at this unitcomprise Mebatic, Calridol,Moximicin, Neurotol andGlutapep, among others.
Baddi unit: The unitmanufactures high-end novelformulations across eightfacilities for oncology liquidinjections, oncologylyophilised, lyophilisedinjections, pre-filled syringes,
cephalosporins, carbapenems,cardiology injections andliquid vials. It possesses astate-of-the-art lyophiliser withSIP/CIP provision enabling it tomanage these formulations.The unit has a warehousingcapacity of 1,900 pallets. Thisunit is accredited with some ofthe world’s most stringentGMPs – GMP Europe, GMPColombia (INVIMA), GMPUkraine, GMP Kenya, GMPUganda, GMP Ethiopia, GMPSudan, GMP Zimbabwe, GMPSyria, GMP Yemen, GMP Iran,GMP Botswana and GMPWHO. Some of the key brandsmanufactured at this facilityinclude Doxol, Paxol, Citabol,Epirol, Ronem, Immunox,Pimcef, Fejet IV., Parin-E,Vanconex CP, Potentox,Lastinem, Dobutacard,Sulbactomax, Supime,Tobracef and Pirotum.
Germany unit: This unit (undera wholly-owned subsidiaryVenus Pharma GmbH)engages in out-licensing CTDs,site variation projects, testingand batch release for Europeand warehousing and logisticsupport. The unit is situated inthe heart of Europe, ageographical advantage tocater to European markets.The unit is accredited with EUGMP and possesses worldclass QA, QC laboratories. Thefacility possesses awarehousing capacity of3,000 pallets under controlled
temperature, a batch releasefacility for local manufacturersand pharma exporters andfour dedicated packagingsections, customising productsinto local languages.
Key features ofplants Proper ventilation systemscoupled with HVAC forcontrolling dust accumulationand cross contamination in theprocessing areas and dedicatedAHUs were developed in criticalareas. Besides, in unclassifiedareas, ventilation and exhaustsystems (5 micron to 20 micronfilters) were made available.Sufficient ventilation provisionswere provided for warehousesand subsidiary areas. Alloperations are carried outunder Luminar Air Flow workstation to provide 100%assurance of product quality.
For aseptic filling and terminalsterilisation, the Companyinterlocks lines along withautomatic controls anddesigns. The Companycircumvents the probability ofcontamination and cross-contamination by providingsuitable facilities like changerooms, pass boxes andairlocks, among others.
Besides, it maintains anintegrated vial and ampoulelines for tunnel sterilisation,filling, washing, externalcleaning and sealingoperations.
Its facilities were awardedcertifications on national levellike WHO GMP, ISO 9001, ISO14001 and ISO 18001 andEUROPEAN-GMP, OHSAS18001, Latin American GMP(INVIMA), Ukrainian GMP,Zimbabwe GMP, UgandaGMP, Syrian GMP, ColumbianGMP, Kenya GMP, YemenGMP, Saudi Arabian GMP,Iranian GMP Ethiopia GMPand Sudan GMP, on aninternational level.
Highlights, 2009-10■ Grew productionsignificantly at all the threefacilities
■ Invested `88.09 million instrengthening the automationat its operating units
■ Received GoodManufacturing Practices(GMP) approval fromEthiopia’s Drug Administrationand Control Authority (DACA)for four facilities, namelyoncology liquid, oncologylyophilised, dry powdercephalosporin and dry powdercarbapenem
■ Received GoodManufacturing Practicesapproval from Botswana’sdrug regulatory unit foroncology liquid, oncologylyophilised, dry powdercephalosporin and dry powdercarbapenems facilities
BUSINESS OPERATIONS
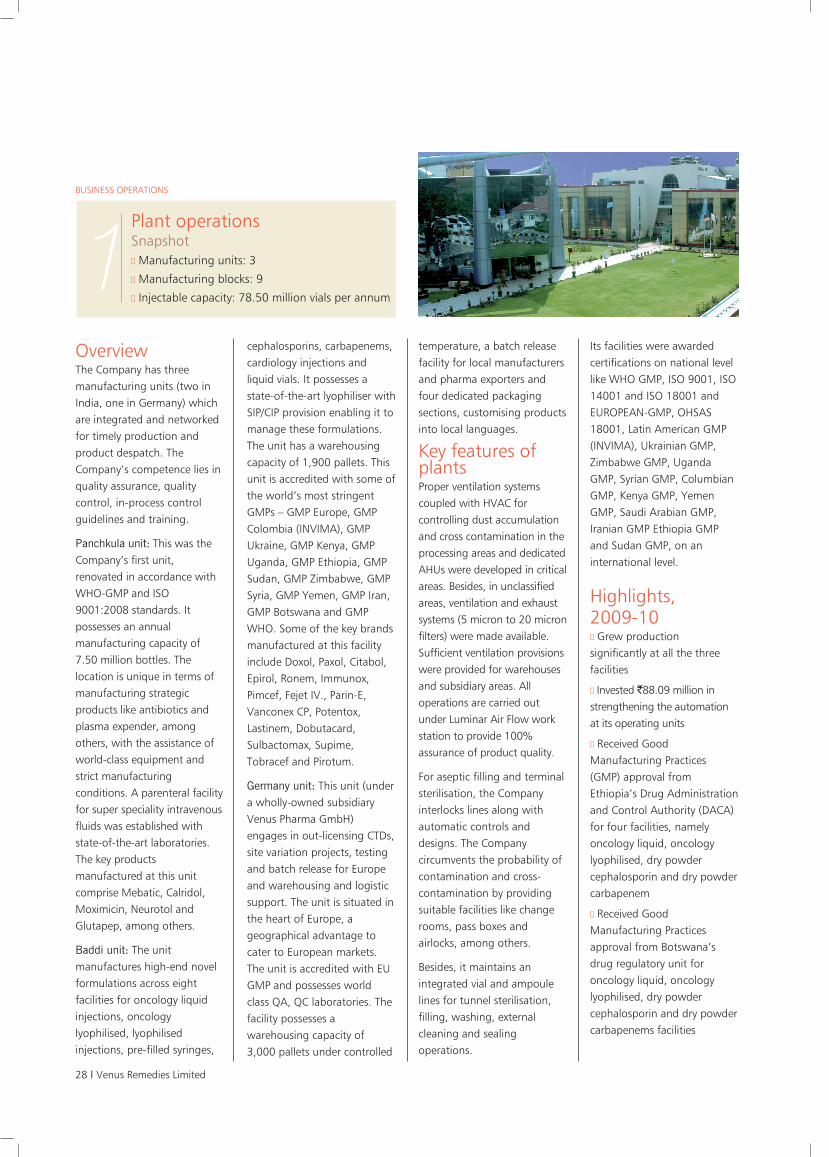
1Plant operations Snapshot■ Manufacturing units: 3■ Manufacturing blocks: 9■ Injectable capacity: 78.50 million vials per annum
Annual Report 2009-10 I 29
OverviewVenus adheres to the
requirements of various
regulatory authorities by
following stringent quality
control measures. The quality
assurance team monitors and
maintains the desired quality
at all levels. Besides, the
quality control and analytical
laboratory carries out stringent
analytical tests across the
entire operational value chain,
from the procurement of raw-
materials and ingredients to
in-process and finished
products. To monitor critical
systems like clean rooms,
personnel flow, material flow,
water systems and utilities, the
quality control department is
facilitated with sophisticated
instruments.
Stability studies are held at its
stability chambers at different
environmental parameters as
per ICH guidelines. Quality
control computers are used for
data acquisition from HPLC
and integration. As an
element of water and
environmental monitoring
program and for
microbiological testing such as
microbial limit testing,
bacterial endotoxin testing
and sterility testing, among
others, the microbiology
laboratory was established.
Quality control computers are
used for data acquisition from
HPLC and integration. The
different incubators are
maintained at around 35°C
and 25°C. Quality control
chromatographic instruments
are sustained by reliable
validated software which
follows 21 CFR.
To detect residual product in
formulation tanks and product
contact equipment, analytical
development scientists
rigorously build and validate
cleaning methods. Venus’s
quality assurance system
follows a divisional
organisational structure,
defined responsibilities,
updated processes, standard
operating procedures and
cyclic training, among others.
Monitoring and analysing data
in context to testing, analysis,
manufacture, in-process
controls and any other
monitoring (process, process
conditions, services and
utilities including water
system, environment, hygiene
and HVAC system, among
others) used in medicinal
product manufacture, is
conducted by the quality
control department.
Audit plans: To ensure quality
management system
enforcement, the Company
conducts periodic audits
through its internal and
external teams.
Constant surveillance: The
Company follows strict
surveillance by fitting cameras
in critical areas like
manufacturing and
warehouse, recorded by the
control room and accessible to
authorised parties worldwide
from the Company’s website.
Systems and automation: The
Company developed in-house
software (SPINE) to integrate
its entire departments through
local area networks. According
to the job profile, each user
can access it. A regular data
backup system is maintained,
reviewed at the time of batch
review. Product availability is
possible at every stage
through package, yield
reconciliation, stock ledgers,
batch wise stock, party wise
stock, receiving and
distribution records. The
master batch is fed in
packages; requisitions are
generated automatically
following the receipt of
schedules and the stock
position is updated
automatically.
Standards: Venus follows a
roadmap via the Validation
Master Plan (VMP) to address
the validation and
qualification strategy. To verify
that the quality of all
manufactured products is in
accordance with the
international benchmark, VMP
mentions and coordinates
entire qualification/validation
activities. Besides, it specifies
the responsibilities for
validation and assists in
planning important actions.
Any facet which may affect
product quality is validated; all
critical systems and facilities
are validated under VMP
procedures.
Highlights, 2009-10■ Complete development of
man, money, material and
machine module of SPINE,
which are interlinked and
provide all data at a click of
the mouse
■ Implementation of a unique
state-of-the-art CRM software
■ Mapping and monitoring of
material across India
BUSINESS OPERATIONS
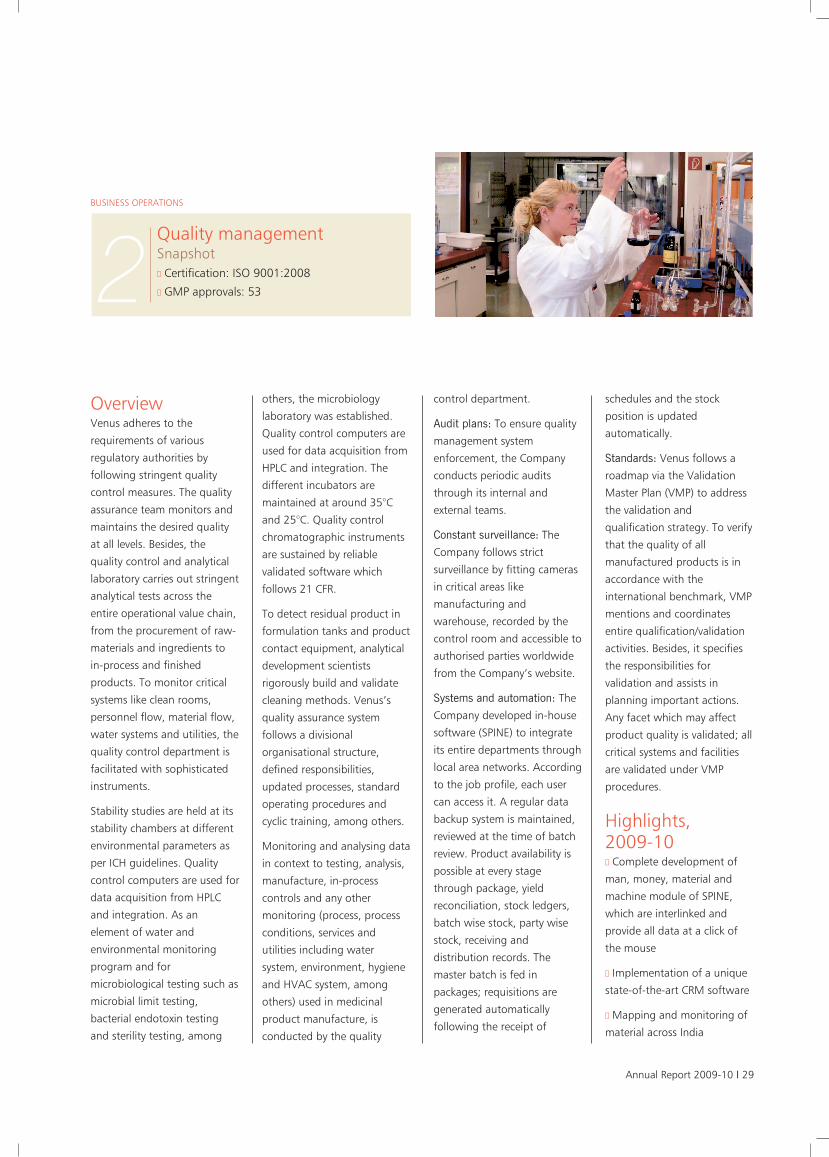
2Quality management Snapshot■ Certification: ISO 9001:2008■ GMP approvals: 53
30 I Venus Remedies Limited
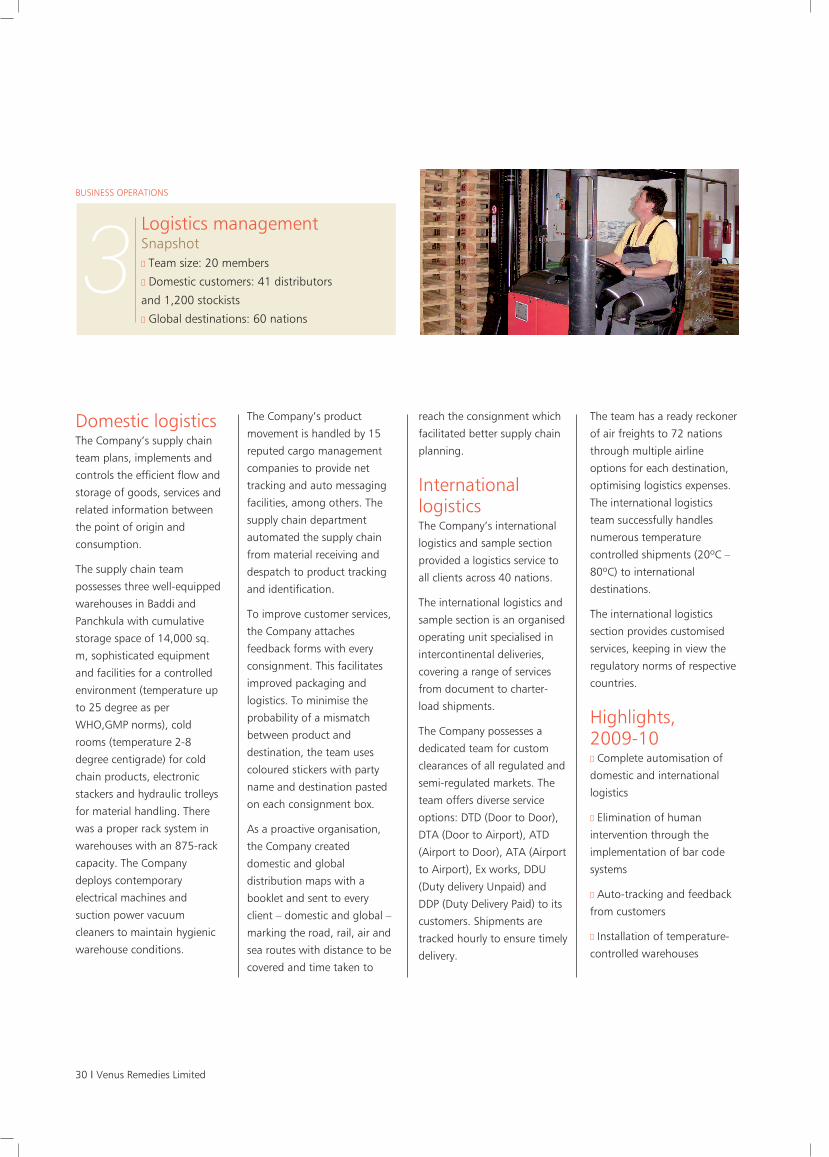
Domestic logistics The Company’s supply chain
team plans, implements and
controls the efficient flow and
storage of goods, services and
related information between
the point of origin and
consumption.
The supply chain team
possesses three well-equipped
warehouses in Baddi and
Panchkula with cumulative
storage space of 14,000 sq.
m, sophisticated equipment
and facilities for a controlled
environment (temperature up
to 25 degree as per
WHO,GMP norms), cold
rooms (temperature 2-8
degree centigrade) for cold
chain products, electronic
stackers and hydraulic trolleys
for material handling. There
was a proper rack system in
warehouses with an 875-rack
capacity. The Company
deploys contemporary
electrical machines and
suction power vacuum
cleaners to maintain hygienic
warehouse conditions.
The Company’s product
movement is handled by 15
reputed cargo management
companies to provide net
tracking and auto messaging
facilities, among others. The
supply chain department
automated the supply chain
from material receiving and
despatch to product tracking
and identification.
To improve customer services,
the Company attaches
feedback forms with every
consignment. This facilitates
improved packaging and
logistics. To minimise the
probability of a mismatch
between product and
destination, the team uses
coloured stickers with party
name and destination pasted
on each consignment box.
As a proactive organisation,
the Company created
domestic and global
distribution maps with a
booklet and sent to every
client – domestic and global –
marking the road, rail, air and
sea routes with distance to be
covered and time taken to
reach the consignment which
facilitated better supply chain
planning.
Internationallogistics The Company’s international
logistics and sample section
provided a logistics service to
all clients across 40 nations.
The international logistics and
sample section is an organised
operating unit specialised in
intercontinental deliveries,
covering a range of services
from document to charter-
load shipments.
The Company possesses a
dedicated team for custom
clearances of all regulated and
semi-regulated markets. The
team offers diverse service
options: DTD (Door to Door),
DTA (Door to Airport), ATD
(Airport to Door), ATA (Airport
to Airport), Ex works, DDU
(Duty delivery Unpaid) and
DDP (Duty Delivery Paid) to its
customers. Shipments are
tracked hourly to ensure timely
delivery.
The team has a ready reckoner
of air freights to 72 nations
through multiple airline
options for each destination,
optimising logistics expenses.
The international logistics
team successfully handles
numerous temperature
controlled shipments (20ºC –
80ºC) to international
destinations.
The international logistics
section provides customised
services, keeping in view the
regulatory norms of respective
countries.
Highlights, 2009-10■ Complete automisation of
domestic and international
logistics
■ Elimination of human
intervention through the
implementation of bar code
systems
■ Auto-tracking and feedback
from customers
■ Installation of temperature-
controlled warehouses
BUSINESS OPERATIONS
3Logistics management Snapshot■ Team size: 20 members■ Domestic customers: 41 distributors
and 1,200 stockists■ Global destinations: 60 nations
31
OverviewResearch is a critical thrustarea at Venus, forming thefoundation for every strategicinitiative undertaken by theCompany over its two decadeexistence.
Vision: To establish Venus asan innovator companyworldwide by developing andcommercialising products thatprovides a complete solutionfor serious or life-threateningmedical conditions
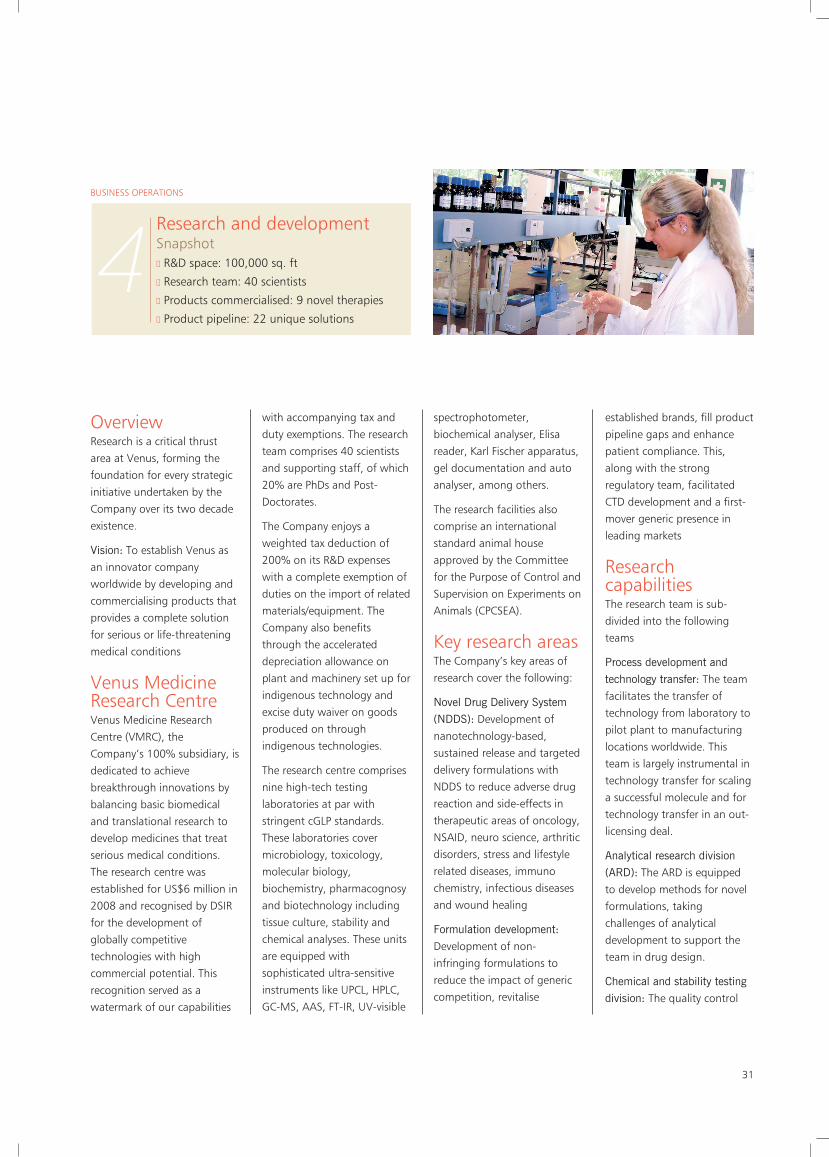
Venus MedicineResearch CentreVenus Medicine ResearchCentre (VMRC), theCompany’s 100% subsidiary, isdedicated to achievebreakthrough innovations bybalancing basic biomedicaland translational research todevelop medicines that treatserious medical conditions.The research centre wasestablished for US$6 million in2008 and recognised by DSIRfor the development ofglobally competitivetechnologies with highcommercial potential. Thisrecognition served as awatermark of our capabilities
with accompanying tax andduty exemptions. The researchteam comprises 40 scientistsand supporting staff, of which20% are PhDs and Post-Doctorates.
The Company enjoys aweighted tax deduction of200% on its R&D expenseswith a complete exemption ofduties on the import of relatedmaterials/equipment. TheCompany also benefitsthrough the accelerateddepreciation allowance onplant and machinery set up forindigenous technology andexcise duty waiver on goodsproduced on throughindigenous technologies.
The research centre comprisesnine high-tech testinglaboratories at par withstringent cGLP standards.These laboratories covermicrobiology, toxicology,molecular biology,biochemistry, pharmacognosyand biotechnology includingtissue culture, stability andchemical analyses. These unitsare equipped withsophisticated ultra-sensitiveinstruments like UPCL, HPLC,GC-MS, AAS, FT-IR, UV-visible
spectrophotometer,biochemical analyser, Elisareader, Karl Fischer apparatus,gel documentation and autoanalyser, among others.
The research facilities alsocomprise an internationalstandard animal houseapproved by the Committeefor the Purpose of Control andSupervision on Experiments onAnimals (CPCSEA).
Key research areasThe Company’s key areas ofresearch cover the following:
Novel Drug Delivery System(NDDS): Development ofnanotechnology-based,sustained release and targeteddelivery formulations withNDDS to reduce adverse drugreaction and side-effects intherapeutic areas of oncology,NSAID, neuro science, arthriticdisorders, stress and lifestylerelated diseases, immunochemistry, infectious diseasesand wound healing
Formulation development:Development of non-infringing formulations toreduce the impact of genericcompetition, revitalise
established brands, fill productpipeline gaps and enhancepatient compliance. This,along with the strongregulatory team, facilitatedCTD development and a first-mover generic presence inleading markets
ResearchcapabilitiesThe research team is sub-divided into the followingteams
Process development andtechnology transfer: The teamfacilitates the transfer oftechnology from laboratory topilot plant to manufacturinglocations worldwide. Thisteam is largely instrumental intechnology transfer for scalinga successful molecule and fortechnology transfer in an out-licensing deal.
Analytical research division(ARD): The ARD is equippedto develop methods for novelformulations, takingchallenges of analyticaldevelopment to support theteam in drug design.
Chemical and stability testingdivision: The quality control
BUSINESS OPERATIONS
4Research and development Snapshot■ R&D space: 100,000 sq. ft■ Research team: 40 scientists ■ Products commercialised: 9 novel therapies■ Product pipeline: 22 unique solutions
32 I Venus Remedies Limited
department enhance productquality through stability testsas per ICH guidelines as wellas timely, cost-effective,validated analytical services forresearch, enabling Venus tomeet international quality andregulatory requirements.
Pre-clinical division (PCD):PCD handles all pre-clinicaltrials and toxicological studiesunder GLP environment. Vetpathologists assist the PCDteam in preparing requisitedisease models in-vivo byensuring a compliance withOECD guidelines.
Natural product research: Thisteam specialises in screeningnatural products and drugdevelopment as perpharmacopoeial and medicinestandards.
Office of research support(ORS): This wing bridges thegap between research andmarketing throughinteractions with the fieldforce, training of marketingteams, reply to queries raised
by the PMT team and designof experiments for researchvalue-addition.
Clinical research services: Thisteam accelerates the deliveryof safe and effectivetherapeutics to patients and isinvolved in Phase-I, II, III, IVand BA/ BE studiesmonitoring, as per GCP, for itsresearch products.
Investment inResearch-IPRThe Company invested 14% ofits turnover in Research-IPR onaverage across the last threeyears. Of the total R&Dinvestment, about 70% wasused for creating intellectualproperty, the rest for routineexpenses. In 2009-10, theCompany invested `24.08million to strengthen its R&Dcapability. It invested in asophisticated testing machine,which is expected reducetesting time.
Importantinnovations ■ Developed medicines basedon medical transcriptionknowledge
■ Sustained release NSAIDformulation in injectable form
■ Developed nano technology-based formulations fortreatment of arthritic disorders
■ Developed nano emulsion fortreatment and prevention ofacne and related disorders
■ Developed solvent system toovercome drug and diseaseinduced toxicities
Highlights, 2009-10■ Launched two novelresearch-based therapies
■ Completed Phase I clinicaltrial while Phase II is inprogress following permissionfrom DCGI for novel cancerdetection molecule
■ Initiated the Phase III clinicaltrial of a novel Aminoglycosideinjection following permissionfrom the DCGI
■ Organised an internationalconference “MANTHAN 2010”on current advances in noveland parenteral drug deliveryon January 14, 2010 alongwith two workshops on GLPand HPLC techniques
■ Compiled the first 100research publication in thePRAYAS magazine launchedon March 24, 2010, the 19thraising day of Venus
Road ahead ■ Emerge among the handfulIndian pharmaceuticalcompanies with a GLPcertification for the pre-clinical, analytical, stability andmicro-biological fields; the GLPand NABL certifications are at
advanced approval stages; ofthe two audits required for theGLP approval, one wascompleted and thecertification is expected in thecurrent year
Intellectualproperty To protect the R&D work, theIPR wing at Venus is activelyengaged in filing, procuringand maintaining trademarks,copyrights and patents(nationally andinternationally). The team isalso involved in in-licensingnew innovative technologiesand out-licensing theCompany’s research productsto regulated markets. Thispainstaking commitmentenriched the Company’s IPR(depicted below):
Patents: The team filed 341patents globally, of which ninewere granted and 33 are atadvanced stages of approval.The patents cover 51 countriesacross Europe, North America,the Far East, Australia, SouthAmerica, Africa and theASEAN.
Trademarks: The team filed formore than 150 trademarks, ofwhich 44 were registered and106 were under various stagesof registration.
Copyrights■ Seven copyrights for packageinserts of seven researchproducts
■ Four new copyrights underprocess (Venus Army logo,TNT, Venus song and lyrics)
Research publicationsThe intellectual scientificdivision is engaged in valueaddition to research productsfor market support by
Research products
Product Combination molecules Dosage form
Sulbactomax Ceftriaxone and sulbactam Injection
Venco plus Ceftriaxone and vancomycin Injection
Potentox Cefepime and amikacin Injection
Tobracef Ceftazidime and tobramycin Injection
Zydotum Ceftazidime and sulbactam Injection
Supime Cefepime and sulbactam Injection
Pirotum Cefpirome and sulbactam Injection
Neurotol Mannitol and glycerine Infusion
Mebatic Ofloxacin and Ornidazole Infusion
2007-08 2008-09 2009-10
Investment in Research-IPR 264.33 386.18 473.19
(`million)
Annual Report 2009-10 I 33
publishing research papers invarious journals. A total 140research papers werecommunicated in variousnational and internationaljournals of repute such asCurrent Drug Therapy(Netherland), Asian Journal ofBiochemistry (the US), CurrentDrug Safety (the US),Experiment Lung Research (theUK) Current ClinicalPharmacology (Netherland),Journal of Pharmacology &Toxicology (the US), CurrentEnzyme Inhibition (Scotland)and International Journal ofBiomedical Sciences (the US),of which 100 were published,eight accepted and 32communicated.
In-licensing■ The Company in-licensed a
novel aminoglycoside(antibiotic) with patent rightsfrom an innovator company inChina.
■ The Company in-licensed thetechnology for solid tumourdetection from University ofIllinois (US), helping in earlydetection and staging of solidtumours using conventionalmodes. Venus developed theformulation for thistechnology, protected by IPR.
Out-licensing The IPR department out-licensed its patented researchproduct Sulbactomax to arenowned pharmaceuticalcompany in South Korea.Besides, the IPR departmententered into a discussion withtwo large pharmaceuticalMNCs for out-licensing two
patented research products.
Technicalcollaboration/jointresearchVMRC and its IPR departmentplayed a pivotal role in forgingresearch collaborationagreements with institutes ofnational and internationalrepute to collaborate in jointresearch, technicalcollaborations and highereducation of VMRC memberswith the objective of bridgingthe gap between industry andacademia, extending researchto consumers. Some keyagreements were entered intowith the following:
■ IMTECH and PU(Chandigarh) to developtyphoid detection kits
■ University of Illinois, Chicago
■ National Institute ofPharmaceutical Education andResearch (NIPER), India
■ Guru Jambeshwar Universityof Science and Technology,Hissar
Key milestones■ Ampucare was awarded theBest Innovation of 2010 byLockheed Martin Foundation,FICCI, DST and Indo-USScience and TechnologyForum.
■ Outlicensed CTDs in Europeand South Africa
■ Conducted the internationalconference “MANTHAN 2010”on current advances in noveland parenteral drug deliverywith delegates and speakersfrom the US, Canada,Switzerland and Saudi Arabia
Product name/ code Category status
VRC 001 Anti inflammatory, analgesic Launch Plan : August 2010
VRG 003 Hepatoprotective Launch Plan : August 2010
VRT-001 TPN Launch Plan: November 2010
VRT-002 TPN Launch Plan: November 2010
VRA-002 NSAID Launch Plan: December 2010
VRP1007 Anti-acne Launch Plan: February 2011
VRN Neuro surgery CT permission from DCGI awaited
P001 Antibiotic CT permission from DCGI awaited
P002 Antibiotic CT permission from DCGI awaited
P003 Antibiotic CT permission from DCGI awaited
VRE-001 Antibiotic In Phase III CT
VRP1008 Arthritis and rheumatic disorders In Phase III CT
VRP 1620 Cancer detection In Phase II CT
VRP 007 Target based oncology drug for breast and ovarian cancer Under development
VRP 2009 Oncology FDC Under development
VRP 008 Antibiotic FDC Under development
VRP-0010 Immune booster Under development
VRP 0011 Oral cancer Under development
VRP 0012 Anti-viral Under development
VRP 0013 Detoxifying Under development
VRP 1009 Stroke Under development
VRP-1010 Anti-obesity Under development
Current R&D pipeline
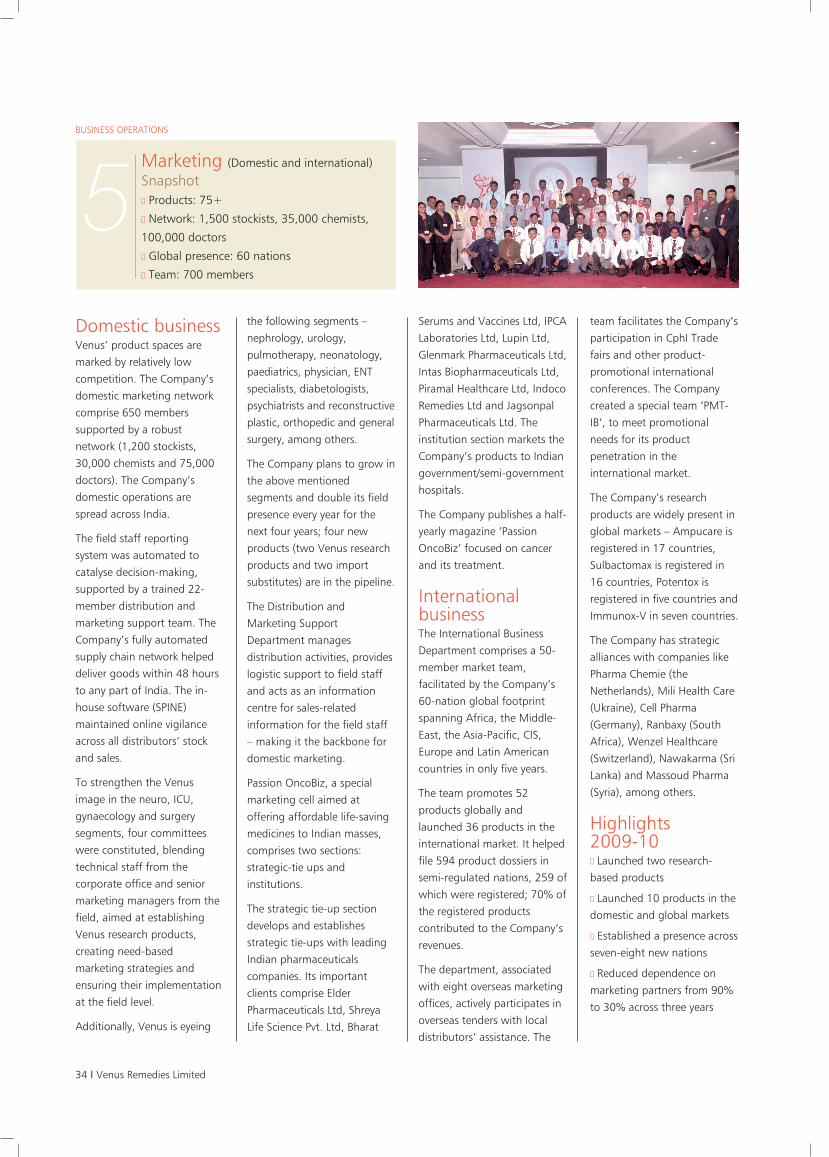
34 I Venus Remedies Limited
BUSINESS OPERATIONS
5Marketing (Domestic and international)
Snapshot■ Products: 75+■ Network: 1,500 stockists, 35,000 chemists,
100,000 doctors ■ Global presence: 60 nations■ Team: 700 members
Domestic business Venus’ product spaces aremarked by relatively lowcompetition. The Company’sdomestic marketing networkcomprise 650 memberssupported by a robustnetwork (1,200 stockists,30,000 chemists and 75,000doctors). The Company’sdomestic operations arespread across India.
The field staff reportingsystem was automated tocatalyse decision-making,supported by a trained 22-member distribution andmarketing support team. TheCompany’s fully automatedsupply chain network helpeddeliver goods within 48 hoursto any part of India. The in-house software (SPINE)maintained online vigilanceacross all distributors’ stockand sales.
To strengthen the Venusimage in the neuro, ICU,gynaecology and surgerysegments, four committeeswere constituted, blendingtechnical staff from thecorporate office and seniormarketing managers from thefield, aimed at establishingVenus research products,creating need-basedmarketing strategies andensuring their implementationat the field level.
Additionally, Venus is eyeing
the following segments –nephrology, urology,pulmotherapy, neonatology,paediatrics, physician, ENTspecialists, diabetologists,psychiatrists and reconstructiveplastic, orthopedic and generalsurgery, among others.
The Company plans to grow inthe above mentionedsegments and double its fieldpresence every year for thenext four years; four newproducts (two Venus researchproducts and two importsubstitutes) are in the pipeline.
The Distribution andMarketing SupportDepartment managesdistribution activities, provideslogistic support to field staffand acts as an informationcentre for sales-relatedinformation for the field staff– making it the backbone fordomestic marketing.
Passion OncoBiz, a specialmarketing cell aimed atoffering affordable life-savingmedicines to Indian masses,comprises two sections:strategic-tie ups andinstitutions.
The strategic tie-up sectiondevelops and establishesstrategic tie-ups with leadingIndian pharmaceuticalscompanies. Its importantclients comprise ElderPharmaceuticals Ltd, ShreyaLife Science Pvt. Ltd, Bharat
Serums and Vaccines Ltd, IPCALaboratories Ltd, Lupin Ltd,Glenmark Pharmaceuticals Ltd,Intas Biopharmaceuticals Ltd,Piramal Healthcare Ltd, IndocoRemedies Ltd and JagsonpalPharmaceuticals Ltd. Theinstitution section markets theCompany’s products to Indiangovernment/semi-governmenthospitals.
The Company publishes a half-yearly magazine ‘PassionOncoBiz’ focused on cancerand its treatment.
InternationalbusinessThe International BusinessDepartment comprises a 50-member market team,facilitated by the Company’s60-nation global footprintspanning Africa, the Middle-East, the Asia-Pacific, CIS,Europe and Latin Americancountries in only five years.
The team promotes 52products globally andlaunched 36 products in theinternational market. It helpedfile 594 product dossiers insemi-regulated nations, 259 ofwhich were registered; 70% ofthe registered productscontributed to the Company’srevenues.
The department, associatedwith eight overseas marketingoffices, actively participates inoverseas tenders with localdistributors’ assistance. The
team facilitates the Company’sparticipation in CphI Tradefairs and other product-promotional internationalconferences. The Companycreated a special team ‘PMT-IB’, to meet promotionalneeds for its productpenetration in theinternational market.
The Company’s researchproducts are widely present inglobal markets – Ampucare isregistered in 17 countries,Sulbactomax is registered in16 countries, Potentox isregistered in five countries andImmunox-V in seven countries.
The Company has strategicalliances with companies likePharma Chemie (theNetherlands), Mili Health Care(Ukraine), Cell Pharma(Germany), Ranbaxy (SouthAfrica), Wenzel Healthcare(Switzerland), Nawakarma (SriLanka) and Massoud Pharma(Syria), among others.
Highlights 2009-10■ Launched two research-based products
■ Launched 10 products in thedomestic and global markets
■ Established a presence acrossseven-eight new nations
■ Reduced dependence onmarketing partners from 90%to 30% across three years
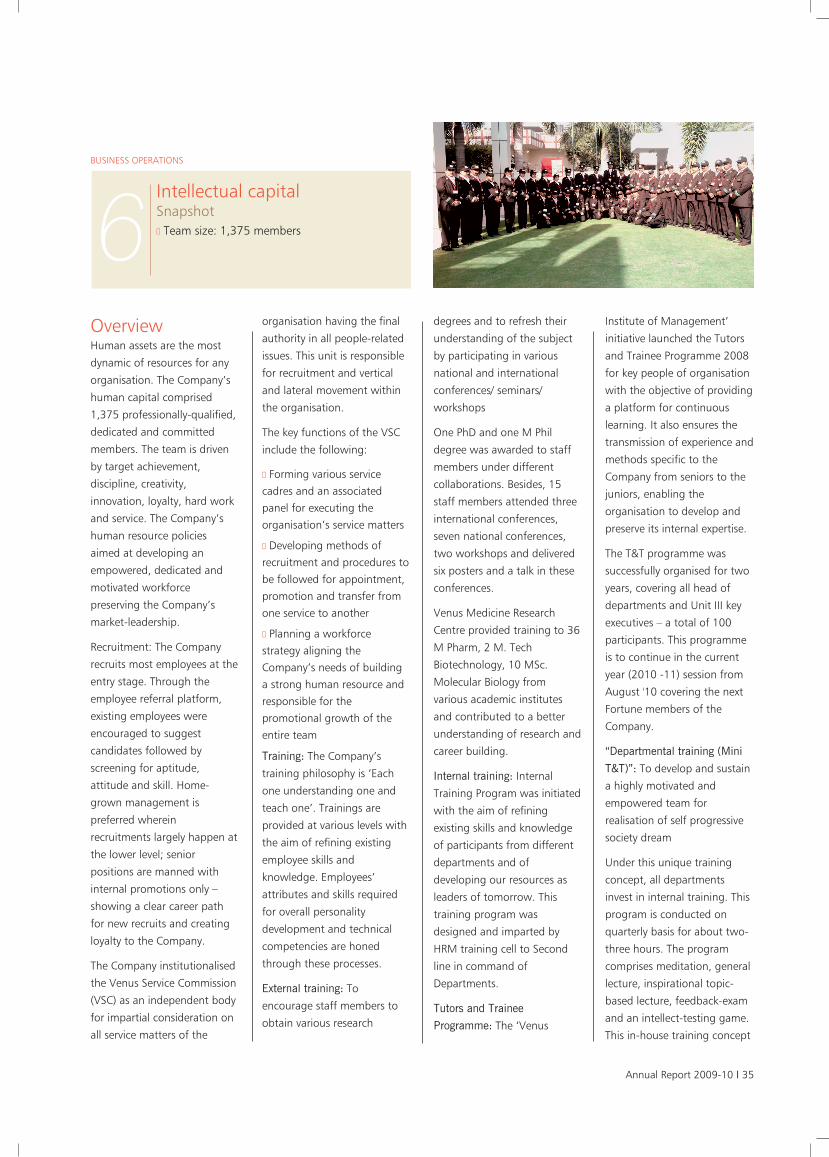
Annual Report 2009-10 I 35
BUSINESS OPERATIONS
6Intellectual capital Snapshot■ Team size: 1,375 members
OverviewHuman assets are the most
dynamic of resources for any
organisation. The Company’s
human capital comprised
1,375 professionally-qualified,
dedicated and committed
members. The team is driven
by target achievement,
discipline, creativity,
innovation, loyalty, hard work
and service. The Company’s
human resource policies
aimed at developing an
empowered, dedicated and
motivated workforce
preserving the Company’s
market-leadership.
Recruitment: The Company
recruits most employees at the
entry stage. Through the
employee referral platform,
existing employees were
encouraged to suggest
candidates followed by
screening for aptitude,
attitude and skill. Home-
grown management is
preferred wherein
recruitments largely happen at
the lower level; senior
positions are manned with
internal promotions only –
showing a clear career path
for new recruits and creating
loyalty to the Company.
The Company institutionalised
the Venus Service Commission
(VSC) as an independent body
for impartial consideration on
all service matters of the
organisation having the final
authority in all people-related
issues. This unit is responsible
for recruitment and vertical
and lateral movement within
the organisation.
The key functions of the VSC
include the following:
■ Forming various servicecadres and an associatedpanel for executing theorganisation’s service matters
■ Developing methods ofrecruitment and procedures tobe followed for appointment,promotion and transfer fromone service to another
■ Planning a workforcestrategy aligning theCompany’s needs of buildinga strong human resource andresponsible for thepromotional growth of theentire team
Training: The Company’s
training philosophy is ‘Each
one understanding one and
teach one’. Trainings are
provided at various levels with
the aim of refining existing
employee skills and
knowledge. Employees’
attributes and skills required
for overall personality
development and technical
competencies are honed
through these processes.
External training: To
encourage staff members to
obtain various research
degrees and to refresh their
understanding of the subject
by participating in various
national and international
conferences/ seminars/
workshops
One PhD and one M Phil
degree was awarded to staff
members under different
collaborations. Besides, 15
staff members attended three
international conferences,
seven national conferences,
two workshops and delivered
six posters and a talk in these
conferences.
Venus Medicine Research
Centre provided training to 36
M Pharm, 2 M. Tech
Biotechnology, 10 MSc.
Molecular Biology from
various academic institutes
and contributed to a better
understanding of research and
career building.
Internal training: Internal
Training Program was initiated
with the aim of refining
existing skills and knowledge
of participants from different
departments and of
developing our resources as
leaders of tomorrow. This
training program was
designed and imparted by
HRM training cell to Second
line in command of
Departments.
Tutors and Trainee
Programme: The ‘Venus
Institute of Management’
initiative launched the Tutors
and Trainee Programme 2008
for key people of organisation
with the objective of providing
a platform for continuous
learning. It also ensures the
transmission of experience and
methods specific to the
Company from seniors to the
juniors, enabling the
organisation to develop and
preserve its internal expertise.
The T&T programme was
successfully organised for two
years, covering all head of
departments and Unit III key
executives – a total of 100
participants. This programme
is to continue in the current
year (2010 -11) session from
August '10 covering the next
Fortune members of the
Company.
“Departmental training (Mini
T&T)”: To develop and sustain
a highly motivated and
empowered team for
realisation of self progressive
society dream
Under this unique training
concept, all departments
invest in internal training. This
program is conducted on
quarterly basis for about two-
three hours. The program
comprises meditation, general
lecture, inspirational topic-
based lecture, feedback-exam
and an intellect-testing game.
This in-house training concept
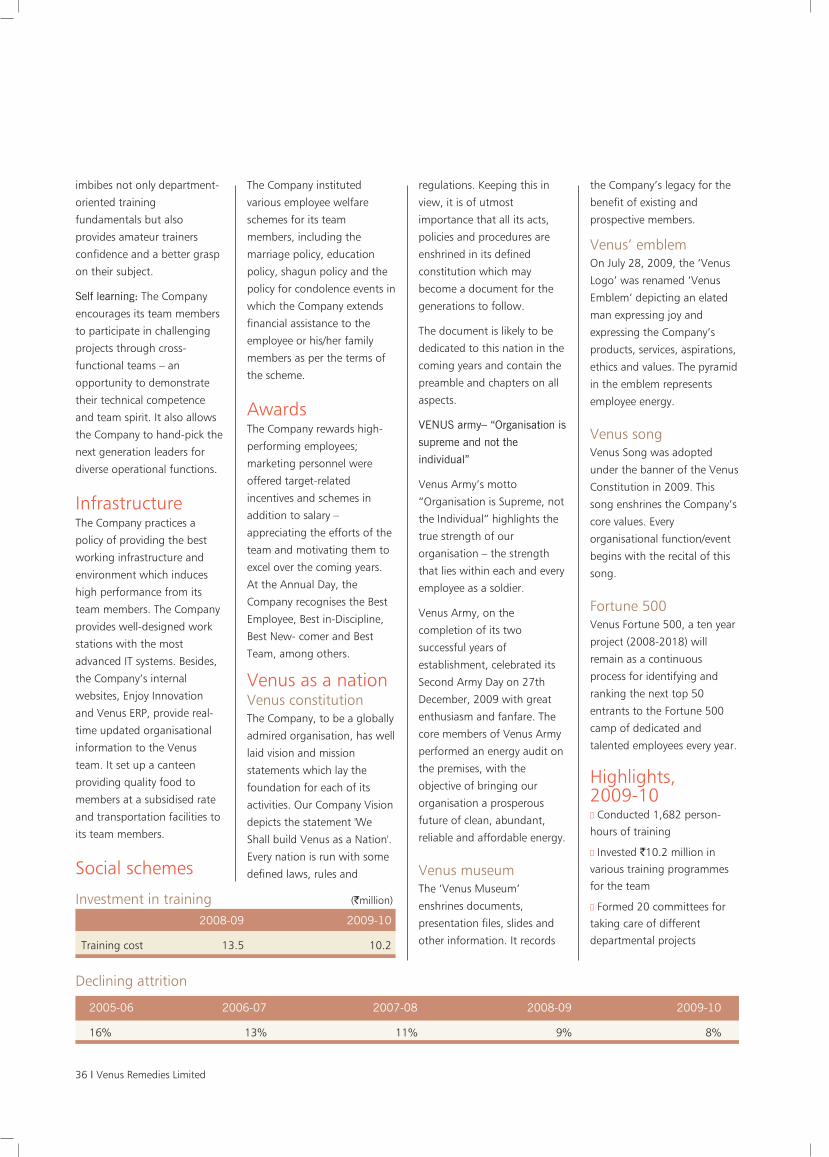
36 I Venus Remedies Limited
imbibes not only department-
oriented training
fundamentals but also
provides amateur trainers
confidence and a better grasp
on their subject.
Self learning: The Company
encourages its team members
to participate in challenging
projects through cross-
functional teams – an
opportunity to demonstrate
their technical competence
and team spirit. It also allows
the Company to hand-pick the
next generation leaders for
diverse operational functions.
InfrastructureThe Company practices a
policy of providing the best
working infrastructure and
environment which induces
high performance from its
team members. The Company
provides well-designed work
stations with the most
advanced IT systems. Besides,
the Company’s internal
websites, Enjoy Innovation
and Venus ERP, provide real-
time updated organisational
information to the Venus
team. It set up a canteen
providing quality food to
members at a subsidised rate
and transportation facilities to
its team members.
Social schemes
The Company instituted
various employee welfare
schemes for its team
members, including the
marriage policy, education
policy, shagun policy and the
policy for condolence events in
which the Company extends
financial assistance to the
employee or his/her family
members as per the terms of
the scheme.
AwardsThe Company rewards high-
performing employees;
marketing personnel were
offered target-related
incentives and schemes in
addition to salary –
appreciating the efforts of the
team and motivating them to
excel over the coming years.
At the Annual Day, the
Company recognises the Best
Employee, Best in-Discipline,
Best New- comer and Best
Team, among others.
Venus as a nationVenus constitution The Company, to be a globally
admired organisation, has well
laid vision and mission
statements which lay the
foundation for each of its
activities. Our Company Vision
depicts the statement 'We
Shall build Venus as a Nation'.
Every nation is run with some
defined laws, rules and
regulations. Keeping this in
view, it is of utmost
importance that all its acts,
policies and procedures are
enshrined in its defined
constitution which may
become a document for the
generations to follow.
The document is likely to be
dedicated to this nation in the
coming years and contain the
preamble and chapters on all
aspects.
VENUS army– “Organisation is
supreme and not the
individual”
Venus Army’s motto
“Organisation is Supreme, not
the Individual” highlights the
true strength of our
organisation – the strength
that lies within each and every
employee as a soldier.
Venus Army, on the
completion of its two
successful years of
establishment, celebrated its
Second Army Day on 27th
December, 2009 with great
enthusiasm and fanfare. The
core members of Venus Army
performed an energy audit on
the premises, with the
objective of bringing our
organisation a prosperous
future of clean, abundant,
reliable and affordable energy.
Venus museumThe ‘Venus Museum’
enshrines documents,
presentation files, slides and
other information. It records
the Company’s legacy for the
benefit of existing and
prospective members.
Venus’ emblemOn July 28, 2009, the ‘Venus
Logo’ was renamed ‘Venus
Emblem’ depicting an elated
man expressing joy and
expressing the Company’s
products, services, aspirations,
ethics and values. The pyramid
in the emblem represents
employee energy.
Venus songVenus Song was adopted
under the banner of the Venus
Constitution in 2009. This
song enshrines the Company’s
core values. Every
organisational function/event
begins with the recital of this
song.
Fortune 500Venus Fortune 500, a ten year
project (2008-2018) will
remain as a continuous
process for identifying and
ranking the next top 50
entrants to the Fortune 500
camp of dedicated and
talented employees every year.
Highlights, 2009-10■ Conducted 1,682 person-hours of training
■ Invested `10.2 million invarious training programmesfor the team
■ Formed 20 committees fortaking care of differentdepartmental projects
2008-09 2009-10
Training cost 13.5 10.2
Investment in training (`million)
2005-06 2006-07 2007-08 2008-09 2009-10
16% 13% 11% 9% 8%
Declining attrition
Annual Report 2009-10 I 37
OverviewInformation technology plays
a pivotal role in a knowledge-
driven industry, converging
data from diverse sources and
processing it into critical
information. The Company
invested in cutting-edge
technology for its IT systems in
keeping with increasing
business complexity and
growing scale. It reinforced its
competent IT and
communication team to
upgrade the system software,
communication equipment
knowhow and application
software, reducing
outsourcing.
Venus’s unique state-of-the-
art software (SPINE) fulfils all
FDA requirements. The
software facilitates
automation, locational
integration and provisions.
Besides, the Company’s
marketing field operation is
also automated via SPINE;
pan-India distributor sales and
stock information is monitored
in real time; the field staff
operations are connected
through SPINE to enhance
productivity. Based on the
client-server model, it
centralises data storage and
processing with distributed
data entry system to minimise
duplication, manual errors and
reconciliation.
Niche■ Open source technology
strengthened integrity,
security and portability
■ Fully automatic PLC-
controlled equipment was
installed at all plants,
integrated with SPINE through
an in-house designed
supervisory control and data
acquisition (SCADA) system.
SPINE captured data from
every machine, processed the
same and highlighted
important production and
productivity data (batch wise
production, machine working
hours, output per machine,
machine breakdown and
efficiency, among others)
An auto bar-code
identification and pallet
identification system
monitored materials pan-
India.
BUSINESS OPERATIONS
7Information technology Snapshot■ IT team: 22 members■ IT investment: `39.19 million (over three
years ending 2009-10)
The Company introduced an
integrated internal control
system in line with the nature
and size of the business. The
internal auditors ensured that
the Company complied with
all statutory requirements and
implementation of corporate
policies. Within departments,
the monthly audit reports
were discussed to bridge
discrepancies if noted. To look
after the various development
projects (including human
resource development), 20
committees were formed in
2009-10. The minutes of the
monthly committees meetings
were delivered to the
management to acquaint
them with the plans and
developments. Increasing
productivity and accuracy was
achieved through a new ERP.
Suggestions by the statutory
auditors, the Audit Committee
of the Board and above
mentioned committees were
taken into account.
BUSINESS OPERATIONS
8Internal audit and control
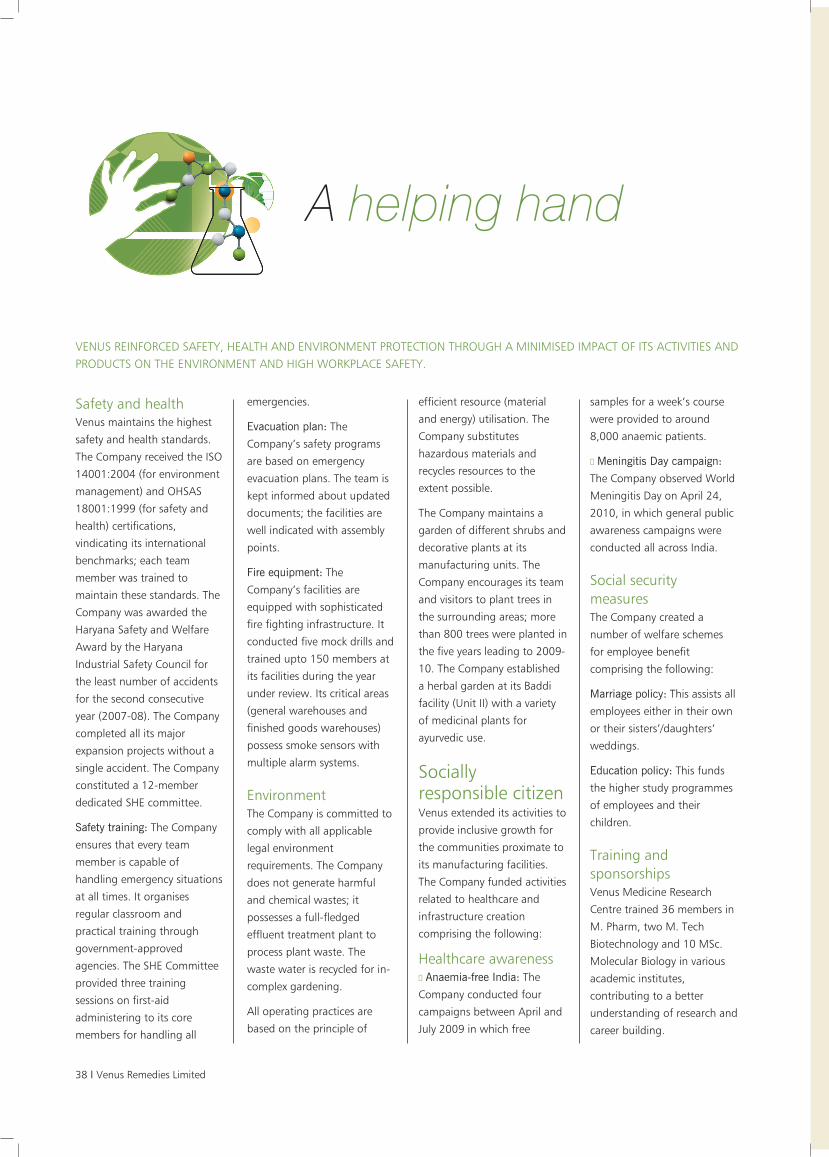
38 I Venus Remedies Limited
Safety and healthVenus maintains the highest
safety and health standards.
The Company received the ISO
14001:2004 (for environment
management) and OHSAS
18001:1999 (for safety and
health) certifications,
vindicating its international
benchmarks; each team
member was trained to
maintain these standards. The
Company was awarded the
Haryana Safety and Welfare
Award by the Haryana
Industrial Safety Council for
the least number of accidents
for the second consecutive
year (2007-08). The Company
completed all its major
expansion projects without a
single accident. The Company
constituted a 12-member
dedicated SHE committee.
Safety training: The Company
ensures that every team
member is capable of
handling emergency situations
at all times. It organises
regular classroom and
practical training through
government-approved
agencies. The SHE Committee
provided three training
sessions on first-aid
administering to its core
members for handling all
emergencies.
Evacuation plan: The
Company’s safety programs
are based on emergency
evacuation plans. The team is
kept informed about updated
documents; the facilities are
well indicated with assembly
points.
Fire equipment: The
Company’s facilities are
equipped with sophisticated
fire fighting infrastructure. It
conducted five mock drills and
trained upto 150 members at
its facilities during the year
under review. Its critical areas
(general warehouses and
finished goods warehouses)
possess smoke sensors with
multiple alarm systems.
EnvironmentThe Company is committed to
comply with all applicable
legal environment
requirements. The Company
does not generate harmful
and chemical wastes; it
possesses a full-fledged
effluent treatment plant to
process plant waste. The
waste water is recycled for in-
complex gardening.
All operating practices are
based on the principle of
efficient resource (material
and energy) utilisation. The
Company substitutes
hazardous materials and
recycles resources to the
extent possible.
The Company maintains a
garden of different shrubs and
decorative plants at its
manufacturing units. The
Company encourages its team
and visitors to plant trees in
the surrounding areas; more
than 800 trees were planted in
the five years leading to 2009-
10. The Company established
a herbal garden at its Baddi
facility (Unit II) with a variety
of medicinal plants for
ayurvedic use.
Sociallyresponsible citizenVenus extended its activities to
provide inclusive growth for
the communities proximate to
its manufacturing facilities.
The Company funded activities
related to healthcare and
infrastructure creation
comprising the following:
Healthcare awareness ■ Anaemia-free India: The
Company conducted four
campaigns between April and
July 2009 in which free
samples for a week’s course
were provided to around
8,000 anaemic patients.
■ Meningitis Day campaign:
The Company observed World
Meningitis Day on April 24,
2010, in which general public
awareness campaigns were
conducted all across India.
Social securitymeasuresThe Company created a
number of welfare schemes
for employee benefit
comprising the following:
Marriage policy: This assists all
employees either in their own
or their sisters’/daughters’
weddings.
Education policy: This funds
the higher study programmes
of employees and their
children.
Training andsponsorshipsVenus Medicine Research
Centre trained 36 members in
M. Pharm, two M. Tech
Biotechnology and 10 MSc.
Molecular Biology in various
academic institutes,
contributing to a better
understanding of research and
career building.
A helping hand
VENUS REINFORCED SAFETY, HEALTH AND ENVIRONMENT PROTECTION THROUGH A MINIMISED IMPACT OF ITS ACTIVITIES ANDPRODUCTS ON THE ENVIRONMENT AND HIGH WORKPLACE SAFETY.
Annual Report 2009-10 I 39
Analysis of ourfinancial statements
The Company registered
reasonable growth in business
but profitability was
depressed. This was largely
owing to interest payment to
FCCB holders, increase in the
rate of Minimum Alternate Tax
(MAT) and depreciation,
which impacted the
Company’s bottomline.
Profit and lossaccountRevenue The Company’s net sales
increased 17.93% from
`2,645.15 million in 2008-09
to `3,119.30 million in 2009-
10. This was largely owing to
the launch of new products
and entry into new
geographies during the period
under review. Moreover,
products launched in 2008-09
and deepened reach in
existing geographies
contributed to the revenue
growth.
The domestic market accounts
for a lion’s share of the
revenue basket at 68.01% in
2009-10 (72.67% in 2008-
09). Revenue from the
domestic market grew 10.36%
from `1,922.29 million in
2008-09 to `2,121.44 million
in 2009-10 – largely on
account of new products
launched in India and deeper
market penetration. Exports
grew 38% from `722.85
million in 2008-09 to `997.86
million in 2009-10 – largely on
account of entering into new
geographies.
Cost analysisThe Company’s total cost
increased 18.61% from
`2,002 million in 2008-09 to
`2,374.49 million in 2009-10,
following enhanced
operations. Total operating
cost, as a proportion of net
sales, stood at 76.12% in
2009-10 against 75.69% in
2008-09.
Material cost: This cost
increase was a result of
enhanced production and
widening of the Company’s
product range (especially
research-based products).
Further, cost-push inflation
also contributed to the
increase in material cost in
2009-10. The material cost, as
a proportion of net sales,
declined from 79.21% in
2008-09 to 76.73% in 2009-
10, reflecting efficient
resource utilisation and value-
addition to the materials used.
Manufacturing cost: The
increase in manufacturing
expenses was consequent to
the increase in the operational
scale. Despite a sizeable
increase in absolute costs, its
proportion in the total cost
remained at the previous
year’s level, indicating
manufacturing efficiency and
stringent cost discipline.
Employee expenses: The
increase in the wage bill is
primarily owed to two reasons
1) increase in the team size –
the Company added 25
members in 2009-10, and 2)
annual salary increase.
Efficiency of the workforce is
Highs Lows
Revenue grew 17.93% Expenses increased 18.61%
EBIDTA grew 15.55% Interest liability increased 49.49%
Cash profit grew 7.28% Profit after tax declined 9.85%
Earning per share declined 10.04%
Highs and lows
2009-10 2008-09 Y-o-y growth
Amount Proportion of total Amount Proportion of total (%)
(` in million) operating cost (%) (` in million) operating cost (%)
Material consumed 1,822.00 76.73 1,585.69 79.21 14.90
Manufacturing expenses 41.68 1.76 35.14 1.75 18.61
Employee expenses 150.51 6.34 112.06 5.60 34.31
Other expenses 249.52 10.50 191.70 9.57 30.16
R&D expenses 110.78 4.67 77.41 3.87 43.11
TOTAL 2,374.49 100.00 2,002.00 100.00
Break up of key cost components
40 I Venus Remedies Limited
reflected in an increase in
average revenue per person
from `1.96 million in 2008-09
to `2.27 million in 2009-10.
Other expenses: This head
includes the administrative,
selling and distribution
expenses. The administrative
expenses increased marginally,
while the selling and
distribution expenses
increased significantly in line
with the Company’s effort for
an expansive reach in the
domestic and international
markets.
R&D expenses: R&D expenses
increased more than 40% over
the previous year’s level,
largely owing to the
Company’s research thrust.
This increase was largely
owing to an increase in the
team size and material used in
the development of new
products.
MarginsWhile the Company received
global recognition for its
research efforts, its operations
were marginally depressed.
This resulted in a drop in the
EBIDTA margin from 24.38%
in 2008-09 to 23.91% in
2009-10. Net profit margin
declined from 17.20% in
2008-09 to 13.15% in 2009-
10 – a drop of about 425 bps
– on account of payment of
interest to FCCB holders,
increase in MAT rate and
depreciation.
Balance sheet Capital employed The capital employed in the
business increased 20% from
`2,784.50 million as on March
31, 2009 to `3,358.66 million
as on March 31, 2010. This
was largely owing to an
increase in reserves and debt
portfolio. The Company’s
return on capital employed
(ROCE) moderated from
25.03% in 2008-09 to
20.48% in 2009-10, following
a `524.41-million capex in
2009-10, the impact of which
will be progressively reflected
in the coming years.
Net worthShareholders’ funds (net
worth) increased 27% from
`1,408.62 million as on March
31, 2009 to `1,788.97 million
as on March 31, 2010,
attributed to an increase in
reserves and surplus arising
out of surplus plough-back.
Consequently, book value per
share strengthened from
`166.63 as on March 31,
2009 to `211.13 as on March
31, 2010.
Equity capital: The Company’s
equity capital comprised
8,473,291 equity shares of
`10 each. The promoters held
25.41% of the Company as on
March 31, 2010.
Reserve and surplus: Reserves
represent zero-cost funds,
aggregating over the years
and representing a buffer
against contingencies and for
initiating growth initiatives.
Reserves and surplus increased
27.27% from `1,347.28
million as on March 31, 2009
to `1,714.73 million as on
Highs Lows
Book value per share Return on net worth
increased 5.10% declined 28.99%
Debt-equity ratio Return on capital
improved 9.68% employed declined 18.18%
Highs and lows
As on March 31, 2010 As on March 31, 2009 Y-o-y change
Amount Percentage Amount Percentage (%)
(` in million) of the total (` in million) of the total
Equity capital 84.73 2.51 84.53 3.01 0.24
Share application money 0.19 0.01 0.20 0.01 (5.53)
Reserves and surplus 1,714.73 50.89 1,347.28 47.98 27.27
Debt funds 1,493.90 44.34 1,315.95 46.87 13.52
Deferred tax liability 75.79 2.26 59.93 2.13 26.45
Total 3,369.32 100.00 2,807.89 100.00
Sources of fund
The Company ploughed back `380.75million of operational surplus in 2009-10as against `425.65 million in 2008-09.
Annual Report 2009-10 I 41
March 31, 2010. The
Company ploughed back
`380.75 million of operational
surplus in 2009-10 as against
`425.65 million in 2008-09.
Free reserves comprised 100%
of the reserve balance,
providing a robust foundation
for growth.
External fundsThe Company’s reliance on
external funds increased from
`1,315.95 million as on March
31, 2009 to `1,493.90 million
as on March 31, 2010. This
increase was largely owing to
term loans and working
capital arrangements with
banks. The secured loan
portfolio increased from
`698.06 million as on March
31, 2009 to `916.65 million
as on March 31, 2010.
Unsecured loans declined
from `617.89 million as on
March 31, 2009 to `577.25
million as on March 31, 2010,
owing to the partial retirement
of FCCBs. The increase in debt
was accompanied by an equal
increase in net worth. As a
result, the debt-equity ratio
strengthened from 0.93 as on
March 31, 2009 to 0.84 as on
March 31, 2010.
Interest outflow increased
49% from `93.35 million in
2008-09 to `139.55 million in
2009-10 due to interest
payment to FCCB holders and
some additional debt taken
during the year under review.
Fixed assetsThe Company’s gross block
represents its competitive
edge in terms of scalability.
Over the years, the Company
invested continuously to
create a sizeable asset base.
The Company invested
`524.41 million into its gross
block in 2009-10 against
`580.98 million in 2008-09.
This investment was largely for
the automation of these
facilities. Patents and IPR
accounted for more than 30%
of the net block as on March
31, 2010 – the Company
added `401.72 million to this
asset category in 2009-10
owing to patent approvals
received during the year.
Other key additions were
made to the building,
computer and IT-related asset
classes.
The Company provided
depreciation in line with the
Straight Line Method. In
2009-10, the provision for
depreciation stood at `116.87
million against `59.64 million
in 2008-09. This increase was
largely on account of the
significant investment in the
gross block.
InvestmentsThe investment portfolio
comprised the Company’s
investment in its subsidiary
Venus Pharma GmbH.
Working capital Dispersed operations make it
imperative for the Company to
efficiently manage daily
operations. Net current assets
increased from `826.33
million as on March 31, 2009
to `993.81 million as on
March 31, 2010. Net current
assets, as a proportion of
capital employed, increased
marginally from 29.43% as on
March 31, 2009 to 29.50% as
on March 31, 2010.
As on March 31, 2010 As on March 31, 2009 Y-o-y change
Amount Percentage Amount Percentage (%)
(` in million) of the total (` in million) of the total
Fixed assets 2,108.36 62.58 1,701.70 60.60 23.90
Capital work-in-progress 8.59 0.25 8.57 0.31 0.19
Investments 247.89 7.36 247.89 8.83 -
Net current assets 993.81 29.50 826.33 29.43 20.27
Miscellaneous expenditure 10.67 0.31 23.40 0.83 (54.38)
Total 3,369.32 100.00 2807.89
Application of funds
Patents and IPR accounted for more than30% of the net block as on March 31,2010 – the Company added `401.72
million to this asset category in 2009-10
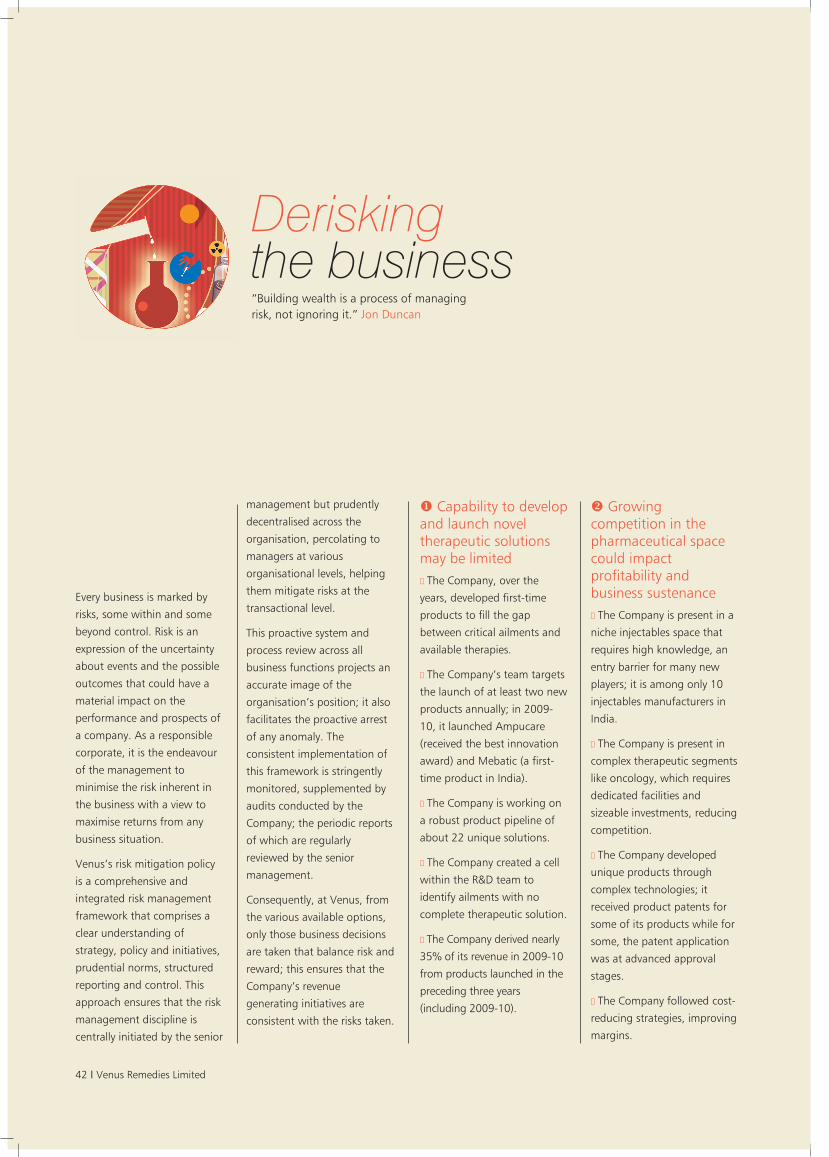
42 I Venus Remedies Limited
Deriskingthe business“Building wealth is a process of managingrisk, not ignoring it.” Jon Duncan
Capability to developand launch noveltherapeutic solutionsmay be limited■ The Company, over the
years, developed first-time
products to fill the gap
between critical ailments and
available therapies.
■ The Company’s team targets
the launch of at least two new
products annually; in 2009-
10, it launched Ampucare
(received the best innovation
award) and Mebatic (a first-
time product in India).
■ The Company is working on
a robust product pipeline of
about 22 unique solutions.
■ The Company created a cell
within the R&D team to
identify ailments with no
complete therapeutic solution.
■ The Company derived nearly
35% of its revenue in 2009-10
from products launched in the
preceding three years
(including 2009-10).
Growingcompetition in thepharmaceutical spacecould impactprofitability andbusiness sustenance ■ The Company is present in a
niche injectables space that
requires high knowledge, an
entry barrier for many new
players; it is among only 10
injectables manufacturers in
India.
■ The Company is present in
complex therapeutic segments
like oncology, which requires
dedicated facilities and
sizeable investments, reducing
competition.
■ The Company developed
unique products through
complex technologies; it
received product patents for
some of its products while for
some, the patent application
was at advanced approval
stages.
■ The Company followed cost-
reducing strategies, improving
margins.
Every business is marked by
risks, some within and some
beyond control. Risk is an
expression of the uncertainty
about events and the possible
outcomes that could have a
material impact on the
performance and prospects of
a company. As a responsible
corporate, it is the endeavour
of the management to
minimise the risk inherent in
the business with a view to
maximise returns from any
business situation.
Venus’s risk mitigation policy
is a comprehensive and
integrated risk management
framework that comprises a
clear understanding of
strategy, policy and initiatives,
prudential norms, structured
reporting and control. This
approach ensures that the risk
management discipline is
centrally initiated by the senior
management but prudently
decentralised across the
organisation, percolating to
managers at various
organisational levels, helping
them mitigate risks at the
transactional level.
This proactive system and
process review across all
business functions projects an
accurate image of the
organisation’s position; it also
facilitates the proactive arrest
of any anomaly. The
consistent implementation of
this framework is stringently
monitored, supplemented by
audits conducted by the
Company; the periodic reports
of which are regularly
reviewed by the senior
management.
Consequently, at Venus, from
the various available options,
only those business decisions
are taken that balance risk and
reward; this ensures that the
Company’s revenue
generating initiatives are
consistent with the risks taken.
Annual Report 2009-10 I 43
Operating withconventionaltechnology couldimpair creativecapability■ The Company mastered the
Chemical Vector Mediated
Compatibility (CVMC)
technology through which
incompatible molecules of a
therapeutic segment were
combined without adverse
impact on the patient,
emerging as the only company
in the world to do so.
■ The Company’s team
extended the frontier of nano-
technology by becoming the
first to develop a wound
healing product using this
technology.
■ The Company, in the NDDS
space, developed an injectable
with combined properties of
controlled and sustained
release, a first in the Indian
pharmaceutical sector.
Operationalinefficiency (wheneverthat happened) couldaffect production andquality■ The Company invested
significantly in enhancing
capacity and automation.
■ The Company’s facilities were
accredited with EU GMP (valid
for Europe, South Africa and
Canada) and another 13
international GMPs.
■ The Company entered into
an out-licensing agreement
with a renowned global South
Korean pharmaceutical
company; the products are to
be supplied from the
Company’s Baddi facilities.
Inconsistent qualitycould lead to clientattrition and businessclosure■ The Company is in the
infusion space (the dosage
goes directly into the patient’s
bloodstream) where
consistently high product
quality cannot be
compromised.
■ The Company’s dedicated
quality control and quality
assurance team constantly
check quality conformance.
■ The Company conducts an
audit of facilities and
encourages audits by external
agencies, clients and
regulatory authorities.
■ The Company’s analytical
laboratory team performs tests
across all stages in the
operations cycle, from raw
materials and ingredients to
work-in-process and finished
products.
■ The Company maintains
adequate systems for quality
conformance through process
validation, self-inspection,
in-process testing, stability
studies, vendor development
and audits, handling
complaints, failures and
deviations and training,
among others.
Inability to effectivelymarket products couldimpact growth andprofitability ■ The Company’s marketing
team comprises over 700
professionals.
■ The Company’s robust
marketing network comprises
41 distributors, 1,500
stockists, 35,000 chemists and
100,000 doctors; besides, its
marketing tie-ups with leading
Indian pharmaceutical
corporates provides a wider
product reach.
■ The Company has a wide
global footprint across 60
nations; exports comprised
31.99% of revenues in 2009-
10.
■ The Company entered into
an out-licensing agreement
with a Korean pharmaceutical
company to generate
adequate returns for patented
products; it is at an advanced
stage of discussion with other
global pharmaceutical
companies for other out-
licensing agreements.
Inability to attractand retain intellectualcapital could impactbusiness growth ■ The Company has strong
human capital of 1,375
experts. It follows a sound
people management policy
including recruitment,
retention and nurturing,
resulting in reduced attrition
from 16% in 2005-06 to 8%
in 2009-10.
■ The Company earned global
recognition, strengthening
brand recall and attracting
talent.
■ The Company provided
training to team members to
grow their learning curve.
■ The Company provided
amenities like loans for
marriage, medical treatment
and education to employees.
Inadequate fundflow for operating andcapex activities coulddent growth■ The Company’s free reserves
stood at `1,714.73 million as
on March 31, 2010.
■ The Company strengthened
its debt-equity ratio from 0.93
as on March 31, 2009 to 0.84
as on March 31, 2010.
■ The Company enjoyed
working capital facilities from
four banks; it utilised 94% of
the sanctioned limit, creating
an adequate buffer to meet
working capital requirements
in case of a spike in scale.
44 I Venus Remedies Limited
Directors’ Report
of Venus Remedies Limited,
It gives us great pleasure to present the 21st annual report
together with audited statement of accounts for the year
ended March 31, 2010
Financial highlights
OperationsDuring the period under review, the Company has capitalised
on its ability to constantly develop innovative products, add
more patents from various countries to its vast IPR basket and
secure international GMP accreditations for its manufacturing
facilities. The revenue recorded a growth of approximately
17.93% last year.
This growth in general can be attributed to the following
driving factors:
■ The pan-India coverage and recognition of Venus among
75,000 doctors by the giant network of 650 field personnels,
41 distributors and 1,200 stockists covering 30,000 chemists,
provide the most innovative products in the market.
■ Creation of history in the Indian pharmaceutical industry with
the introduction of MEBATIC in the product basket, which is a
research product of the Company.
■ Market authorisation granted for Meropenem in Portugal
(EU).
■ Launching 7 new speciality products during the year
■ Greater market penetration for research products, launched
by the Company
Management discussion and analysisA detailed report on the management discussion and analysis
is provided as a separate section in the annual report.
DividendThe Board has recommended a dividend @ 30% ( ` 3/- per
share) for its shareholders for the year 2009 -10
Fixed depositsYour Company has not accepted any fixed deposits within the
meaning of Section 58A of the Companies Act, 1956, and the
rules made there-under.
(` in millions)
2009-10 2008-09
Sales & Other Income 3,120.46 2,647.57
Operating Surplus 745.97 645.57
Finance Charges 139.55 93.35
Depreciation 116.87 59.64
Profit before Tax 489.54 492.57
Provision for Tax 79.04 37.25
Profit After Tax (PAT) 410.49 455.32
Provision for Dividend 29.74 29.67
Profit Transferred to General Reserve 250.00 250.00
Annual Report 2009-10 I 45
Conservation of energy, technologyabsorption, foreign exchange earningsand outgoThe prescribed particulars as required under section 217(2)(e)
of the Companies Act, 1956 read with Companies (disclosure
of particulars in the Board of Directors’ report) rules, 1988, are
set out in the annexure forming a part of this report.
Disclosures under SEBI (employees stockoption scheme and employees stockpurchase scheme) guidelines, 1999The particulars are set out in the annexure forming a part of
this report.
Particulars of employeesThe particulars of the employees are covered as contemplated
by section 217(2A) of the Companies Act, 1956 and the
Companies (particulars of employees) rules, 1975 are as per
annexure forming a part of this report.
Directors’ responsibility statementYour Directors pursuant to section 217(2AA) of the
Companies Act, 1956 state as follows:
(i) that in the preparation of the annual accounts, the
applicable accounting standards had been followed along
with proper explanation relating to material departures;
(ii) that the Directors had selected such accounting policies
and applied them consistently and made judgments and
estimates that are reasonable and prudent so as to give a true
and fair view of the state of affairs of the Company at the end
of the financial year and of the profit or loss of the Company
for that period;
(iii) that the Directors had taken proper and sufficient care for
the maintenance of adequate accounting records in
accordance with the provisions of this Act for safeguarding
the assets of the Company and for preventing and detecting
fraud and other irregularities;
(iv) that the Directors had prepared the annual accounts on a
going concern basis.
DirectorsMr. Jagdish Chander, Mr. Peeyush Jain and Mr. Ashutosh Jain
retire at the ensuing Annual General Meeting and have
offered themselves for re-appointment. The details of the
appointment are mentioned in the notice of the meeting.
AuditorsThe statutory auditors, M/S. J. K. Jain & Associates retire at the
forthcoming Annual General Meeting and being eligible, have
offered themselves for re-appointment. The Audit Committee
has also recommended their re-appointment. The notes to the
accounts referred to in the auditor’s report are self explanatory
and therefore do not require further explanation.
Corporate governanceYour Company believes that Good Corporate Governance
Practices are an essential part of a growing business strategy
and has been ensuring due compliance of the requirements of
Clause 49 of the Listing Agreement. The initiatives taken by
your Company for ensuring transparency in all dealings has
further strengthened its governance practices. One of these
was the introduction of the Model Code for Insider Trading for
the concerned, which has been religiously followed by all the
concerned personnel. Also, a Model Code of Conduct, as
applicable to Directors and Senior Management personnel,
has been put in place by your Company. The details of the
other necessary compliance are encoded in separate report on
Corporate Governance annexed hereto.
Audit committee The audit committee, comprising of two independent
Directors and the Managing Director met on regular basis to
review the financial performance of the Company. The
Company had been operating under complete ERP
environment which has been migrated to newer and most
advanced version of ERP namely “SPINE”. The committee
reviews the adequacy of Internal Controls from time to time.
AcknowledgementsThe Board takes this opportunity to express its gratitudes
towards the dedicated services rendered by its employees at all
levels and also acknowledge the support and wise counsel
extended to us by the analysts, bankers, government agencies,
shareholders and investors at large, the advisers on our panel,
all concerned regulatory authorities, our business associates,
suppliers, the medical fraternity, patients and last but not the
least, our shareholders’ families for their constant faith,
support and guidance .
For and on behalf of the Board of Directors
Place: Panchkula (Pawan Chaudhary)
Date: 31.07.2010 Chairman & Managing Director
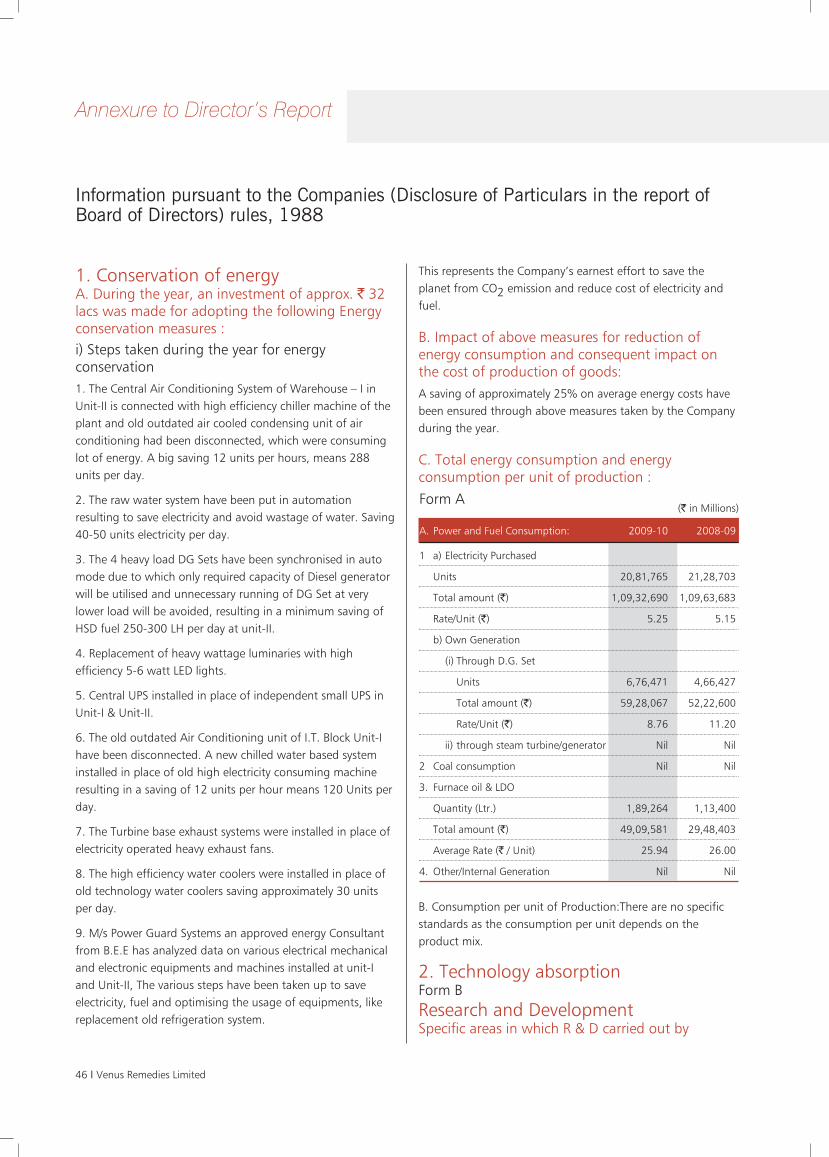
46 I Venus Remedies Limited
Annexure to Director’s Report
Information pursuant to the Companies (Disclosure of Particulars in the report ofBoard of Directors) rules, 1988
1. Conservation of energyA. During the year, an investment of approx. ` 32lacs was made for adopting the following Energyconservation measures :i) Steps taken during the year for energyconservation1. The Central Air Conditioning System of Warehouse – I inUnit-II is connected with high efficiency chiller machine of theplant and old outdated air cooled condensing unit of airconditioning had been disconnected, which were consuminglot of energy. A big saving 12 units per hours, means 288units per day.
2. The raw water system have been put in automationresulting to save electricity and avoid wastage of water. Saving40-50 units electricity per day.
3. The 4 heavy load DG Sets have been synchronised in automode due to which only required capacity of Diesel generatorwill be utilised and unnecessary running of DG Set at verylower load will be avoided, resulting in a minimum saving ofHSD fuel 250-300 LH per day at unit-II.
4. Replacement of heavy wattage luminaries with highefficiency 5-6 watt LED lights.
5. Central UPS installed in place of independent small UPS inUnit-I & Unit-II.
6. The old outdated Air Conditioning unit of I.T. Block Unit-Ihave been disconnected. A new chilled water based systeminstalled in place of old high electricity consuming machineresulting in a saving of 12 units per hour means 120 Units perday.
7. The Turbine base exhaust systems were installed in place ofelectricity operated heavy exhaust fans.
8. The high efficiency water coolers were installed in place ofold technology water coolers saving approximately 30 unitsper day.
9. M/s Power Guard Systems an approved energy Consultantfrom B.E.E has analyzed data on various electrical mechanicaland electronic equipments and machines installed at unit-Iand Unit-II, The various steps have been taken up to saveelectricity, fuel and optimising the usage of equipments, likereplacement old refrigeration system.
This represents the Company’s earnest effort to save theplanet from CO2 emission and reduce cost of electricity andfuel.
B. Impact of above measures for reduction ofenergy consumption and consequent impact onthe cost of production of goods:A saving of approximately 25% on average energy costs havebeen ensured through above measures taken by the Companyduring the year.
C. Total energy consumption and energyconsumption per unit of production :
B. Consumption per unit of Production:There are no specificstandards as the consumption per unit depends on theproduct mix.
2. Technology absorptionForm BResearch and DevelopmentSpecific areas in which R & D carried out by
A. Power and Fuel Consumption: 2009-10 2008-09
1 a) Electricity Purchased
Units 20,81,765 21,28,703
Total amount (`) 1,09,32,690 1,09,63,683
Rate/Unit (`) 5.25 5.15
b) Own Generation
(i) Through D.G. Set
Units 6,76,471 4,66,427
Total amount (`) 59,28,067 52,22,600
Rate/Unit (`) 8.76 11.20
ii) through steam turbine/generator Nil Nil
2 Coal consumption Nil Nil
3. Furnace oil & LDO
Quantity (Ltr.) 1,89,264 1,13,400
Total amount (`) 49,09,581 29,48,403
Average Rate (` / Unit) 25.94 26.00
4. Other/Internal Generation Nil Nil
(` in Millions)Form A
Annual Report 2009-10 I 47
Company:a. Research is a critical thrust area for us because it is thefoundation upon which our strategy of wealth creation,penetration in multiple markets, new products and qualityproducts stands. Department of Scientific & IndustrialResearch (DSIR),Govt of India approved R & D Center whichknown by Venus Medicine Research Centre (VMRC) has beenset up with an investment of $6 million, and spreads over1,00,000 sq. feet area with world class infrastructure.
Modern Research Infrastructure■ 8 dedicated Pilot Plants for sterile products handling
■ Well Developed Animal House approved by Committee forthe Purpose of Control and Supervision on Experiments onAnimals (CPCSEA)
■ Current Team of 40 Scientists & supporting staff
■ 9 High-tech Testing Laboratories of International standardfollowing cGLP
■ Well Equipped E-Library
The R & D Centre is working on developing formulations in theoncology segments, Broad spectrum antibiotics and NSAIDs.
The Major area of Research work includes:
1) NDDS (Novel Drug Delivery System):Development of nanotechnology based, sustained releasedand targeted delivery formulations with NDDS to reduceAdverse drug reaction and side effects in therapeutic
2) Formulation DevelopmentF&D deals with development of non infringing formulations todiffuse the impact of generic competition, revitaliseestablished brands, fill gaps in product pipelines, and enhancepatient compliance. This along with strong Regulatory teamhelps in CTD development and to be the first generic inleading markets.
3) Process Development and Technology TransferFacilities exist to transfer technology from lab to pilot plant tomanufacturing locations worldwide ,through technologytransfer cell.
4) Analytical Research DivisionARD is fully equipped to develop methods for novelformulations, taking challenges of analytical development andto support team in drug designing.
5) Chemical and Stability Testing Division
Known as Quality Control of VMRC, this department focuseson the best quality of Products by conducting stability as perICH guidelines. Its objective is to provide timely, cost effective,validated analytical services for research, enabling Venus tomeet international quality and regulatory requirements.
6) Pre-Clinical DivisionPCD handles successfully all Pre-Clinical Trials, Toxicologicalstudies under GLP environment. Vet Pathologists assist PCDteam in preparing requisite disease model in vivo by ensuringcompliance to OECD guidelines.
7)Natural Product ResearchNPRL specialises in screening natural products, drugdevelopment as per pharmacopeial and medicine standards.
8) ORS: Office of Research SupportThis wing enables to bridge the gap between research andmarketing. They interact with field force, conduct SMEs, trainmarketing teams, reply to queries raised by PMT team andbased on feedback design experiments for value addition ofresearch products.
Venus Clinical Research ServicesVCRS accelerates the delivery of safe and effective therapeuticsto the patients and is involved in Phase-I, II, III, IV and BA/ BEstudies monitoring, as per GCP for its research products.
b. Benefits derived as a result of the above R & D.
■ With the approval of VMRC from DSIR the Company cannow avail the weighted tax deduction of 200% on its R & Dexpenses alongwith complete exemption of duties on importof materials / equipments and machines for R&D purpose
■ Grant of patents for its research products
■ Commercialisation of new products
■ Modification of existing manufacturing processes for someof the products and significant savings in cost of production
■ Modification of existing manufacturing processes to reducethe time cycle
■ More Patents filings for protection of Intellectual Propertygenerated during R&D
c. Future plan of actionVMRC is going to be GLP and NABL accredited in coming year.This recognition will put Venus amongst the list of a fewselected Pharmaceutical Companies having Internationalstandards of R&D. Commercialisation of new products for
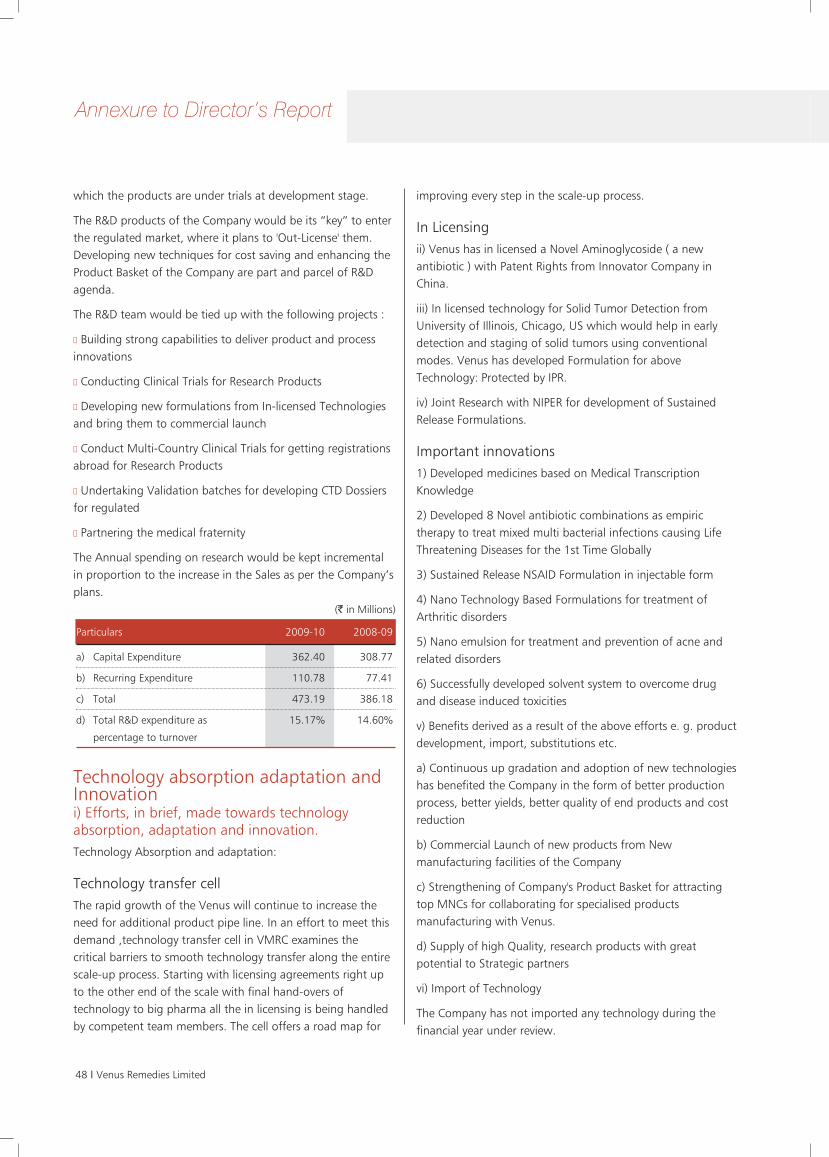
48 I Venus Remedies Limited
which the products are under trials at development stage.
The R&D products of the Company would be its “key” to enterthe regulated market, where it plans to 'Out-License' them.Developing new techniques for cost saving and enhancing theProduct Basket of the Company are part and parcel of R&Dagenda.
The R&D team would be tied up with the following projects :
■ Building strong capabilities to deliver product and processinnovations
■ Conducting Clinical Trials for Research Products
■ Developing new formulations from In-licensed Technologiesand bring them to commercial launch
■ Conduct Multi-Country Clinical Trials for getting registrationsabroad for Research Products
■ Undertaking Validation batches for developing CTD Dossiersfor regulated
■ Partnering the medical fraternity
The Annual spending on research would be kept incrementalin proportion to the increase in the Sales as per the Company’splans.
Technology absorption adaptation andInnovationi) Efforts, in brief, made towards technologyabsorption, adaptation and innovation.Technology Absorption and adaptation:
Technology transfer cellThe rapid growth of the Venus will continue to increase theneed for additional product pipe line. In an effort to meet thisdemand ,technology transfer cell in VMRC examines thecritical barriers to smooth technology transfer along the entirescale-up process. Starting with licensing agreements right upto the other end of the scale with final hand-overs oftechnology to big pharma all the in licensing is being handledby competent team members. The cell offers a road map for
improving every step in the scale-up process.
In Licensingii) Venus has in licensed a Novel Aminoglycoside ( a newantibiotic ) with Patent Rights from Innovator Company inChina.
iii) In licensed technology for Solid Tumor Detection fromUniversity of Illinois, Chicago, US which would help in earlydetection and staging of solid tumors using conventionalmodes. Venus has developed Formulation for aboveTechnology: Protected by IPR.
iv) Joint Research with NIPER for development of SustainedRelease Formulations.
Important innovations1) Developed medicines based on Medical TranscriptionKnowledge
2) Developed 8 Novel antibiotic combinations as empirictherapy to treat mixed multi bacterial infections causing LifeThreatening Diseases for the 1st Time Globally
3) Sustained Release NSAID Formulation in injectable form
4) Nano Technology Based Formulations for treatment ofArthritic disorders
5) Nano emulsion for treatment and prevention of acne andrelated disorders
6) Successfully developed solvent system to overcome drugand disease induced toxicities
v) Benefits derived as a result of the above efforts e. g. productdevelopment, import, substitutions etc.
a) Continuous up gradation and adoption of new technologieshas benefited the Company in the form of better productionprocess, better yields, better quality of end products and costreduction
b) Commercial Launch of new products from Newmanufacturing facilities of the Company
c) Strengthening of Company's Product Basket for attractingtop MNCs for collaborating for specialised productsmanufacturing with Venus.
d) Supply of high Quality, research products with greatpotential to Strategic partners
vi) Import of Technology
The Company has not imported any technology during thefinancial year under review.
Particulars 2009-10 2008-09
a) Capital Expenditure 362.40 308.77
b) Recurring Expenditure 110.78 77.41
c) Total 473.19 386.18
d) Total R&D expenditure as 15.17% 14.60%
percentage to turnover
(` in Millions)
Annexure to Director’s Report
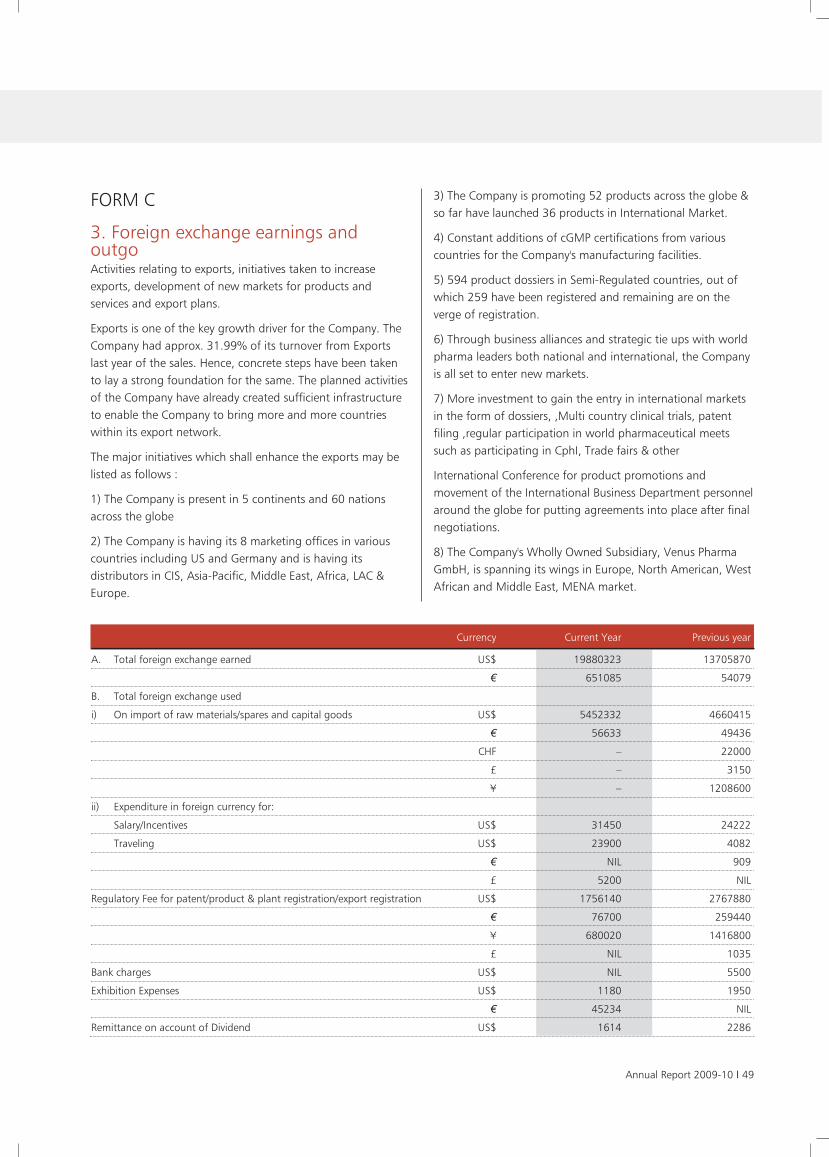
Annual Report 2009-10 I 49
FORM C
3. Foreign exchange earnings andoutgoActivities relating to exports, initiatives taken to increaseexports, development of new markets for products andservices and export plans.
Exports is one of the key growth driver for the Company. TheCompany had approx. 31.99% of its turnover from Exportslast year of the sales. Hence, concrete steps have been takento lay a strong foundation for the same. The planned activitiesof the Company have already created sufficient infrastructureto enable the Company to bring more and more countrieswithin its export network.
The major initiatives which shall enhance the exports may belisted as follows :
1) The Company is present in 5 continents and 60 nationsacross the globe
2) The Company is having its 8 marketing offices in variouscountries including US and Germany and is having itsdistributors in CIS, Asia-Pacific, Middle East, Africa, LAC &Europe.
3) The Company is promoting 52 products across the globe &so far have launched 36 products in International Market.
4) Constant additions of cGMP certifications from variouscountries for the Company's manufacturing facilities.
5) 594 product dossiers in Semi-Regulated countries, out ofwhich 259 have been registered and remaining are on theverge of registration.
6) Through business alliances and strategic tie ups with worldpharma leaders both national and international, the Companyis all set to enter new markets.
7) More investment to gain the entry in international marketsin the form of dossiers, ,Multi country clinical trials, patentfiling ,regular participation in world pharmaceutical meetssuch as participating in CphI, Trade fairs & other
International Conference for product promotions andmovement of the International Business Department personnelaround the globe for putting agreements into place after finalnegotiations.
8) The Company's Wholly Owned Subsidiary, Venus PharmaGmbH, is spanning its wings in Europe, North American, WestAfrican and Middle East, MENA market.
Currency Current Year Previous year
A. Total foreign exchange earned US$ 19880323 13705870
€ 651085 54079
B. Total foreign exchange used
i) On import of raw materials/spares and capital goods US$ 5452332 4660415
€ 56633 49436
CHF – 22000
£ – 3150
¥ – 1208600
ii) Expenditure in foreign currency for:
Salary/Incentives US$ 31450 24222
Traveling US$ 23900 4082
€ NIL 909
£ 5200 NIL
Regulatory Fee for patent/product & plant registration/export registration US$ 1756140 2767880
€ 76700 259440
¥ 680020 1416800
£ NIL 1035
Bank charges US$ NIL 5500
Exhibition Expenses US$ 1180 1950
€ 45234 NIL
Remittance on account of Dividend US$ 1614 2286
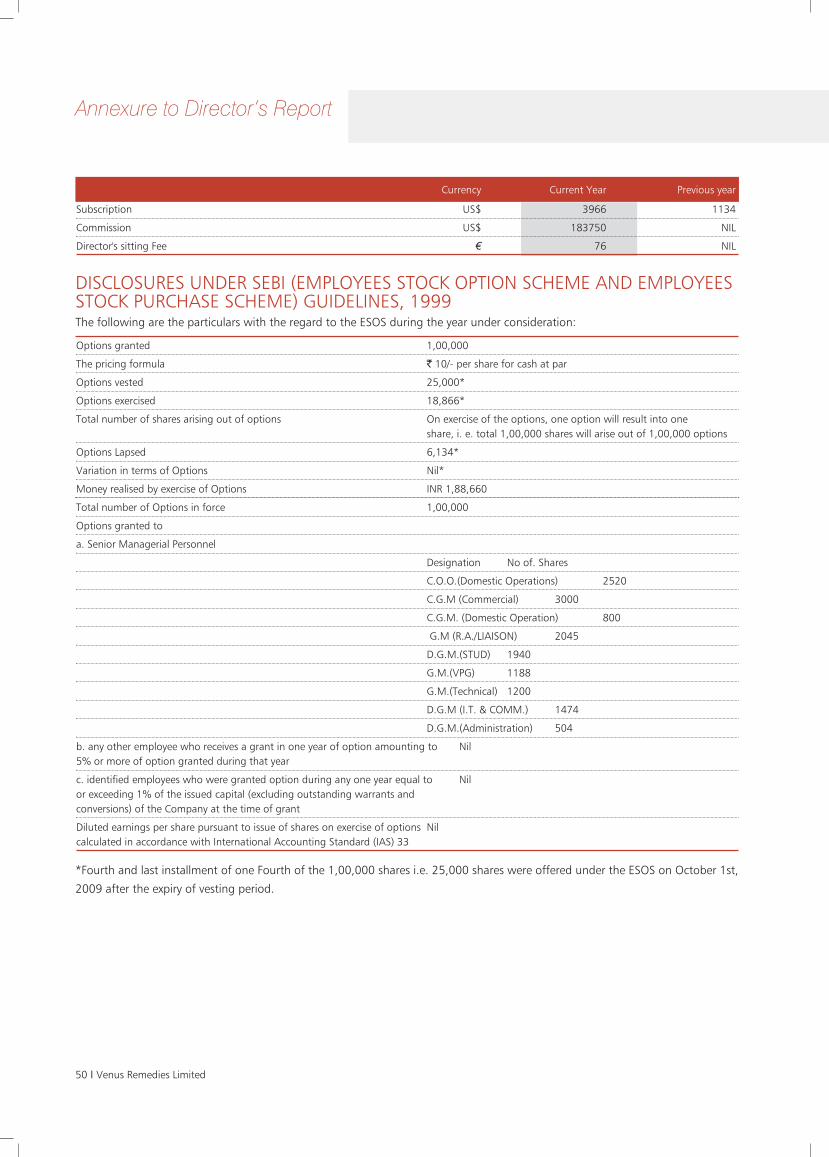
50 I Venus Remedies Limited
Currency Current Year Previous year
Subscription US$ 3966 1134
Commission US$ 183750 NIL
Director's sitting Fee € 76 NIL
DISCLOSURES UNDER SEBI (EMPLOYEES STOCK OPTION SCHEME AND EMPLOYEESSTOCK PURCHASE SCHEME) GUIDELINES, 1999The following are the particulars with the regard to the ESOS during the year under consideration:
*Fourth and last installment of one Fourth of the 1,00,000 shares i.e. 25,000 shares were offered under the ESOS on October 1st,
2009 after the expiry of vesting period.
Options granted 1,00,000
The pricing formula ` 10/- per share for cash at par
Options vested 25,000*
Options exercised 18,866*
Total number of shares arising out of options On exercise of the options, one option will result into one share, i. e. total 1,00,000 shares will arise out of 1,00,000 options
Options Lapsed 6,134*
Variation in terms of Options Nil*
Money realised by exercise of Options INR 1,88,660
Total number of Options in force 1,00,000
Options granted to
a. Senior Managerial Personnel
Designation No of. Shares
C.O.O.(Domestic Operations) 2520
C.G.M (Commercial) 3000
C.G.M. (Domestic Operation) 800
G.M (R.A./LIAISON) 2045
D.G.M.(STUD) 1940
G.M.(VPG) 1188
G.M.(Technical) 1200
D.G.M (I.T. & COMM.) 1474
D.G.M.(Administration) 504
b. any other employee who receives a grant in one year of option amounting to Nil5% or more of option granted during that year
c. identified employees who were granted option during any one year equal to Nilor exceeding 1% of the issued capital (excluding outstanding warrants and conversions) of the Company at the time of grant
Diluted earnings per share pursuant to issue of shares on exercise of options Nilcalculated in accordance with International Accounting Standard (IAS) 33
Annexure to Director’s Report
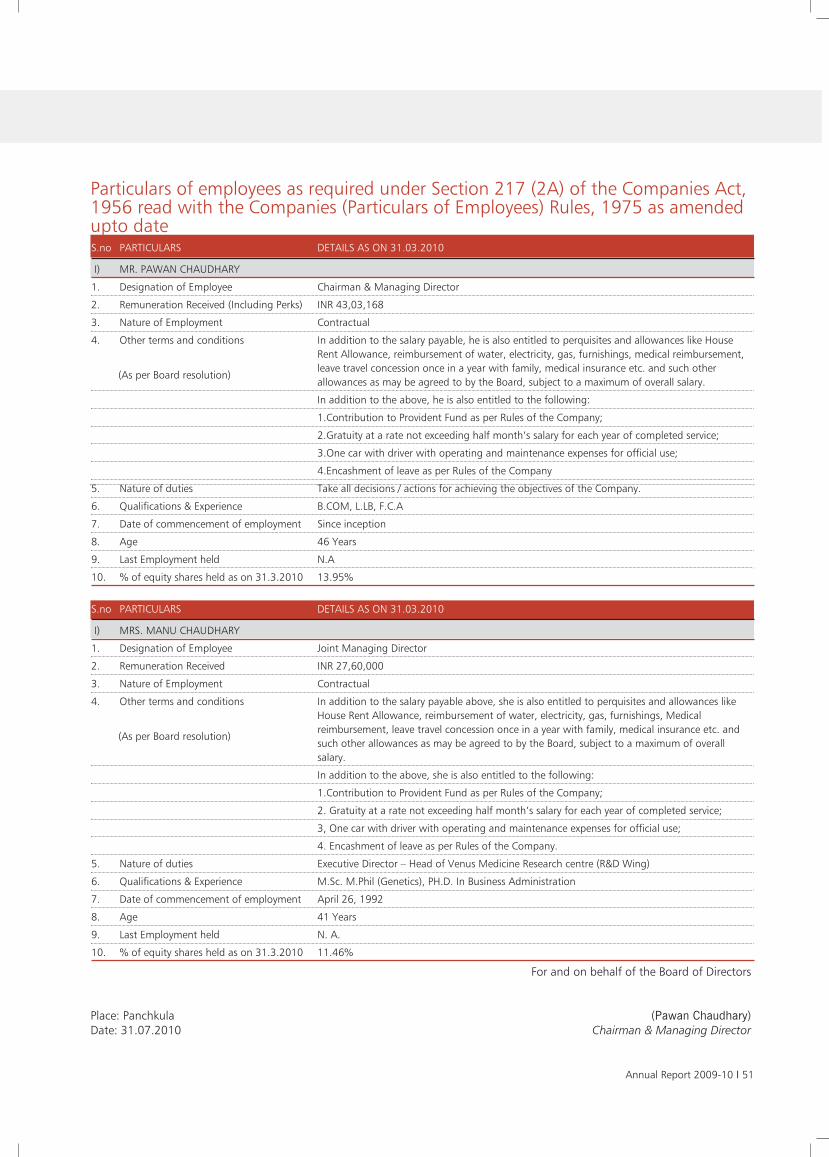
Annual Report 2009-10 I 51
Particulars of employees as required under Section 217 (2A) of the Companies Act,1956 read with the Companies (Particulars of Employees) Rules, 1975 as amendedupto dateS.no PARTICULARS DETAILS AS ON 31.03.2010
I) MR. PAWAN CHAUDHARY
1. Designation of Employee Chairman & Managing Director
2. Remuneration Received (Including Perks) INR 43,03,168
3. Nature of Employment Contractual
4. Other terms and conditions In addition to the salary payable, he is also entitled to perquisites and allowances like HouseRent Allowance, reimbursement of water, electricity, gas, furnishings, medical reimbursement,leave travel concession once in a year with family, medical insurance etc. and such otherallowances as may be agreed to by the Board, subject to a maximum of overall salary.
In addition to the above, he is also entitled to the following:
1.Contribution to Provident Fund as per Rules of the Company;
2.Gratuity at a rate not exceeding half month’s salary for each year of completed service;
3.One car with driver with operating and maintenance expenses for official use;
4.Encashment of leave as per Rules of the Company
5. Nature of duties Take all decisions / actions for achieving the objectives of the Company.
6. Qualifications & Experience B.COM, L.LB, F.C.A
7. Date of commencement of employment Since inception
8. Age 46 Years
9. Last Employment held N.A
10. % of equity shares held as on 31.3.2010 13.95%
(As per Board resolution)
S.no PARTICULARS DETAILS AS ON 31.03.2010
I) MRS. MANU CHAUDHARY
1. Designation of Employee Joint Managing Director
2. Remuneration Received INR 27,60,000
3. Nature of Employment Contractual
4. Other terms and conditions In addition to the salary payable above, she is also entitled to perquisites and allowances likeHouse Rent Allowance, reimbursement of water, electricity, gas, furnishings, Medicalreimbursement, leave travel concession once in a year with family, medical insurance etc. andsuch other allowances as may be agreed to by the Board, subject to a maximum of overallsalary.
In addition to the above, she is also entitled to the following:
1.Contribution to Provident Fund as per Rules of the Company;
2. Gratuity at a rate not exceeding half month’s salary for each year of completed service;
3, One car with driver with operating and maintenance expenses for official use;
4. Encashment of leave as per Rules of the Company.
5. Nature of duties Executive Director – Head of Venus Medicine Research centre (R&D Wing)
6. Qualifications & Experience M.Sc. M.Phil (Genetics), PH.D. In Business Administration
7. Date of commencement of employment April 26, 1992
8. Age 41 Years
9. Last Employment held N. A.
10. % of equity shares held as on 31.3.2010 11.46%
(As per Board resolution)
For and on behalf of the Board of Directors
Place: Panchkula (Pawan Chaudhary)Date: 31.07.2010 Chairman & Managing Director
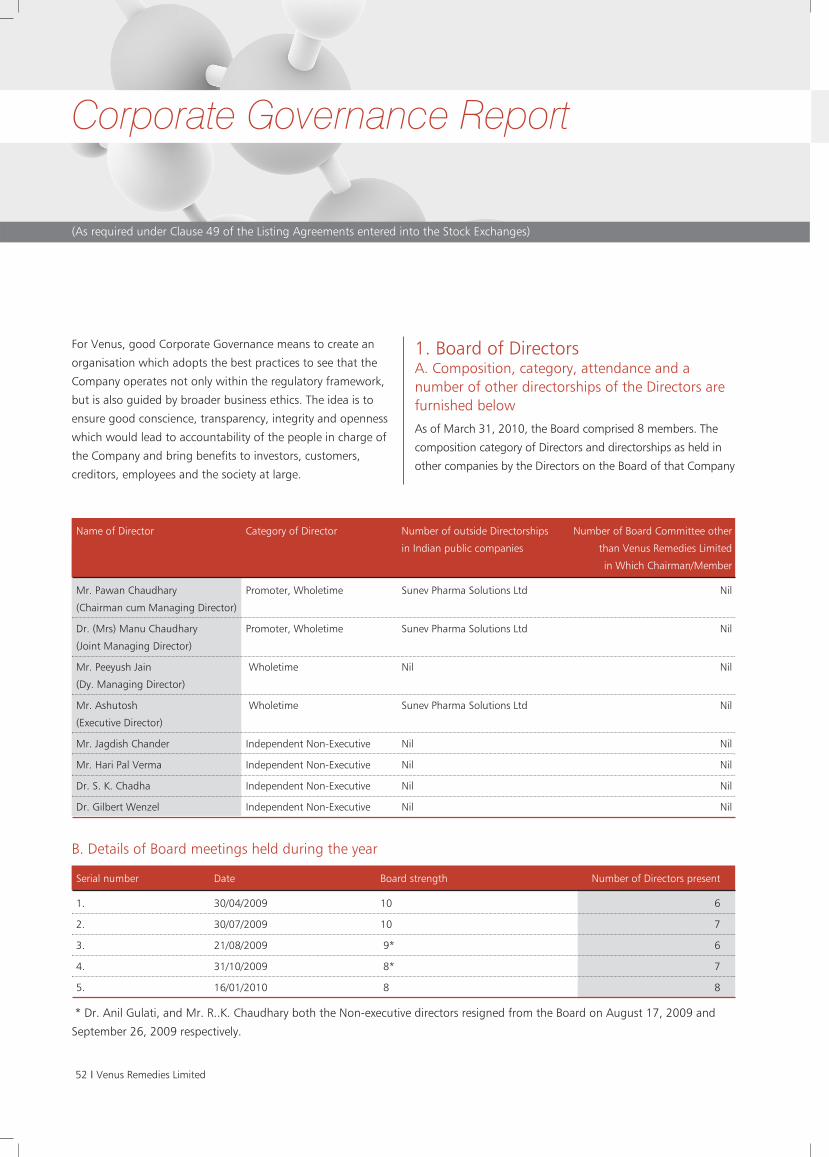
52 I Venus Remedies Limited
Corporate Governance Report
(As required under Clause 49 of the Listing Agreements entered into the Stock Exchanges)
For Venus, good Corporate Governance means to create an
organisation which adopts the best practices to see that the
Company operates not only within the regulatory framework,
but is also guided by broader business ethics. The idea is to
ensure good conscience, transparency, integrity and openness
which would lead to accountability of the people in charge of
the Company and bring benefits to investors, customers,
creditors, employees and the society at large.
1. Board of DirectorsA. Composition, category, attendance and anumber of other directorships of the Directors arefurnished below
As of March 31, 2010, the Board comprised 8 members. The
composition category of Directors and directorships as held in
other companies by the Directors on the Board of that Company
Name of Director Category of Director Number of outside Directorships Number of Board Committee other
in Indian public companies than Venus Remedies Limited
in Which Chairman/Member
Mr. Pawan Chaudhary Promoter, Wholetime Sunev Pharma Solutions Ltd Nil
(Chairman cum Managing Director)
Dr. (Mrs) Manu Chaudhary Promoter, Wholetime Sunev Pharma Solutions Ltd Nil
(Joint Managing Director)
Mr. Peeyush Jain Wholetime Nil Nil
(Dy. Managing Director)
Mr. Ashutosh Wholetime Sunev Pharma Solutions Ltd Nil
(Executive Director)
Mr. Jagdish Chander Independent Non-Executive Nil Nil
Mr. Hari Pal Verma Independent Non-Executive Nil Nil
Dr. S. K. Chadha Independent Non-Executive Nil Nil
Dr. Gilbert Wenzel Independent Non-Executive Nil Nil
B. Details of Board meetings held during the year
* Dr. Anil Gulati, and Mr. R..K. Chaudhary both the Non-executive directors resigned from the Board on August 17, 2009 and
September 26, 2009 respectively.
Serial number Date Board strength Number of Directors present
1. 30/04/2009 10 6
2. 30/07/2009 10 7
3. 21/08/2009 9* 6
4. 31/10/2009 8* 7
5. 16/01/2010 8 8
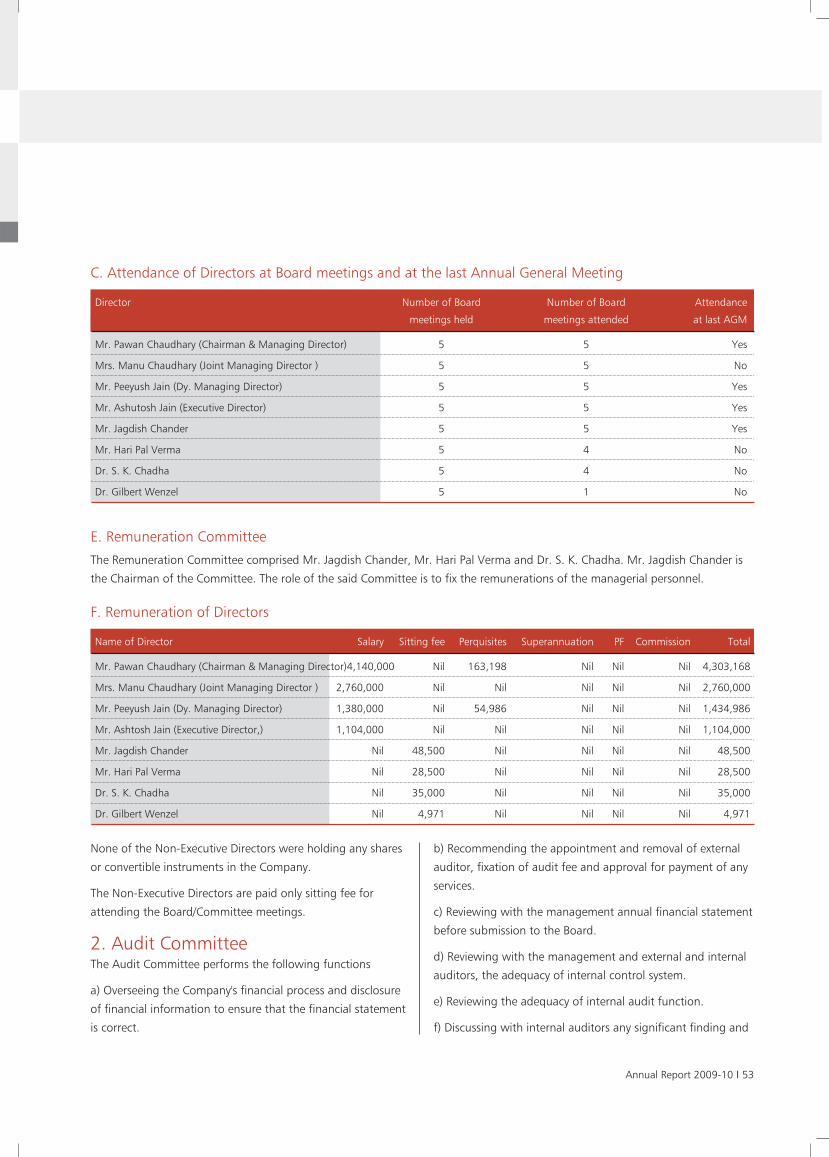
Annual Report 2009-10 I 53
C. Attendance of Directors at Board meetings and at the last Annual General Meeting
E. Remuneration Committee
The Remuneration Committee comprised Mr. Jagdish Chander, Mr. Hari Pal Verma and Dr. S. K. Chadha. Mr. Jagdish Chander is
the Chairman of the Committee. The role of the said Committee is to fix the remunerations of the managerial personnel.
Director Number of Board Number of Board Attendance
meetings held meetings attended at last AGM
Mr. Pawan Chaudhary (Chairman & Managing Director) 5 5 Yes
Mrs. Manu Chaudhary (Joint Managing Director ) 5 5 No
Mr. Peeyush Jain (Dy. Managing Director) 5 5 Yes
Mr. Ashutosh Jain (Executive Director) 5 5 Yes
Mr. Jagdish Chander 5 5 Yes
Mr. Hari Pal Verma 5 4 No
Dr. S. K. Chadha 5 4 No
Dr. Gilbert Wenzel 5 1 No
F. Remuneration of Directors
None of the Non-Executive Directors were holding any shares
or convertible instruments in the Company.
The Non-Executive Directors are paid only sitting fee for
attending the Board/Committee meetings.
2. Audit CommitteeThe Audit Committee performs the following functions
a) Overseeing the Company's financial process and disclosure
of financial information to ensure that the financial statement
is correct.
b) Recommending the appointment and removal of external
auditor, fixation of audit fee and approval for payment of any
services.
c) Reviewing with the management annual financial statement
before submission to the Board.
d) Reviewing with the management and external and internal
auditors, the adequacy of internal control system.
e) Reviewing the adequacy of internal audit function.
f) Discussing with internal auditors any significant finding and
Name of Director Salary Sitting fee Perquisites Superannuation PF Commission Total
Mr. Pawan Chaudhary (Chairman & Managing Director)4,140,000 Nil 163,198 Nil Nil Nil 4,303,168
Mrs. Manu Chaudhary (Joint Managing Director ) 2,760,000 Nil Nil Nil Nil Nil 2,760,000
Mr. Peeyush Jain (Dy. Managing Director) 1,380,000 Nil 54,986 Nil Nil Nil 1,434,986
Mr. Ashtosh Jain (Executive Director,) 1,104,000 Nil Nil Nil Nil Nil 1,104,000
Mr. Jagdish Chander Nil 48,500 Nil Nil Nil Nil 48,500
Mr. Hari Pal Verma Nil 28,500 Nil Nil Nil Nil 28,500
Dr. S. K. Chadha Nil 35,000 Nil Nil Nil Nil 35,000
Dr. Gilbert Wenzel Nil 4,971 Nil Nil Nil Nil 4,971
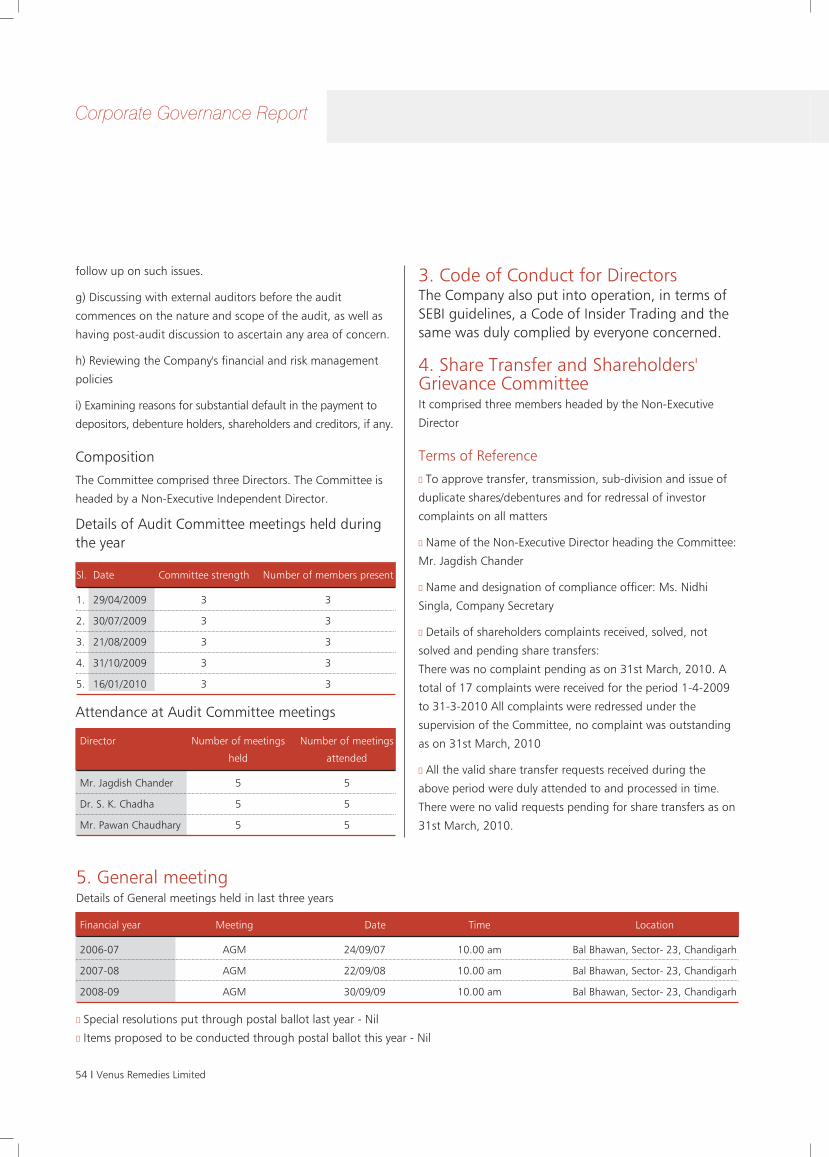
54 I Venus Remedies Limited
Corporate Governance Report
Financial year Meeting Date Time Location
2006-07 AGM 24/09/07 10.00 am Bal Bhawan, Sector- 23, Chandigarh
2007-08 AGM 22/09/08 10.00 am Bal Bhawan, Sector- 23, Chandigarh
2008-09 AGM 30/09/09 10.00 am Bal Bhawan, Sector- 23, Chandigarh
■ Special resolutions put through postal ballot last year - Nil■ Items proposed to be conducted through postal ballot this year - Nil
5. General meetingDetails of General meetings held in last three years
follow up on such issues.
g) Discussing with external auditors before the audit
commences on the nature and scope of the audit, as well as
having post-audit discussion to ascertain any area of concern.
h) Reviewing the Company's financial and risk management
policies
i) Examining reasons for substantial default in the payment to
depositors, debenture holders, shareholders and creditors, if any.
Composition
The Committee comprised three Directors. The Committee is
headed by a Non-Executive Independent Director.
Details of Audit Committee meetings held duringthe year
Attendance at Audit Committee meetings
3. Code of Conduct for DirectorsThe Company also put into operation, in terms ofSEBI guidelines, a Code of Insider Trading and thesame was duly complied by everyone concerned.
4. Share Transfer and Shareholders'Grievance CommitteeIt comprised three members headed by the Non-Executive
Director
Terms of Reference■ To approve transfer, transmission, sub-division and issue of
duplicate shares/debentures and for redressal of investor
complaints on all matters
■ Name of the Non-Executive Director heading the Committee:
Mr. Jagdish Chander
■ Name and designation of compliance officer: Ms. Nidhi
Singla, Company Secretary
■ Details of shareholders complaints received, solved, not
solved and pending share transfers:
There was no complaint pending as on 31st March, 2010. A
total of 17 complaints were received for the period 1-4-2009
to 31-3-2010 All complaints were redressed under the
supervision of the Committee, no complaint was outstanding
as on 31st March, 2010
■ All the valid share transfer requests received during the
above period were duly attended to and processed in time.
There were no valid requests pending for share transfers as on
31st March, 2010.
Sl. Date Committee strength Number of members present
1. 29/04/2009 3 3
2. 30/07/2009 3 3
3. 21/08/2009 3 3
4. 31/10/2009 3 3
5. 16/01/2010 3 3
Director Number of meetings Number of meetings
held attended
Mr. Jagdish Chander 5 5
Dr. S. K. Chadha 5 5
Mr. Pawan Chaudhary 5 5
Annual Report 2009-10 I 55
6. Means of communicationa) Publication of quarterly results: Wide publicity is
given in print media.
b) Management discussion and analysis: Published as
a part of the annual report under Director's report
c) Shareholders’ information section: Published as part
of annual report under Corporate Governance Report
d) Company Website : The Company has its own websites
viz. www.venusremedies.com,
www.venusmedicineresearchcentre.com,
www.venuspharma.de where information relating to financial
results, launch of new results and official releases to the news
agencies are made available.
e) Information to stock exchange: All the information
about the material developments in the Company is informed
to stock exchanges where the shares of the Company are
listed.
7. Disclosuresa) There are no materially significant related party transactions
made by the Company with its Promoters, Directors or
Management, their relatives, its subsidiaries etc that may have
potential conflict with the interest of the Company at large.
Transactions with related parties during the period are
disclosed in Note No. B-8 of Schedule V to the Accounts.
b) Details of non-compliance by the Company, penalties and
strictures imposed on the Company by Stock
Exchanges/SEBI/statutory authorities on matters related to
Capital Markets during the last three years:
During the last three years no penalty or stricture has been
imposed on the Company by Stock Exchanges/SEBI/Statutory
authorities on matters related to Capital Markets.
8. Disclosure of the compliance withadoption/non-adoption of the non-mandatory requirements as perAnnexure ID1. The Board - Adopted
2. Remuneration Committee – Adopted
3. Shareholder Rights - Not adopted
4. Audit Qualifications - Adopted ( The financial statements
are unqualified)
5. Training of Board Members - Adopted
6. Mechanism for evaluating non-executive Board Members -
Not Adopted
7. Whistle Blower Policy - Adopted
9. General shareholders information :A. AGM details :
Date : September 27,2010
Venue : Bal Bhawan, Sector- 23, Chandigarh
Time : 10 A.M.
Book Closure Dates : From September 25, 2010 to September
30th, 2010 (both days inclusive)
B. Financial calendar
Financial year : 1st April 2010 to 31st March 2011
of the Company
First quarter results : On or before July 31, 2010
Second quarter results : On or before October 31, 2010
Third quarter results : On or before January 31, 2011
Fourth Quarter results : On or before April 30, 2011
C. Share transfer system
The Company appointed Link Intime India P Ltd (formerly
known as Intime Spectrum Registry Ltd) as Registrar and Share
Transfer Agents.
D. Registered office
SCO 857, 2nd Floor, Cabin No. 10, NAC Manimajra,
Chandigarh
E. Corporate office
51-52, Ind. Area, Ph.-I, Panchkula (Haryana)
E.mail : corpsec @venusremedies.com, info
@vensuremedies.com
F. Plant Locations
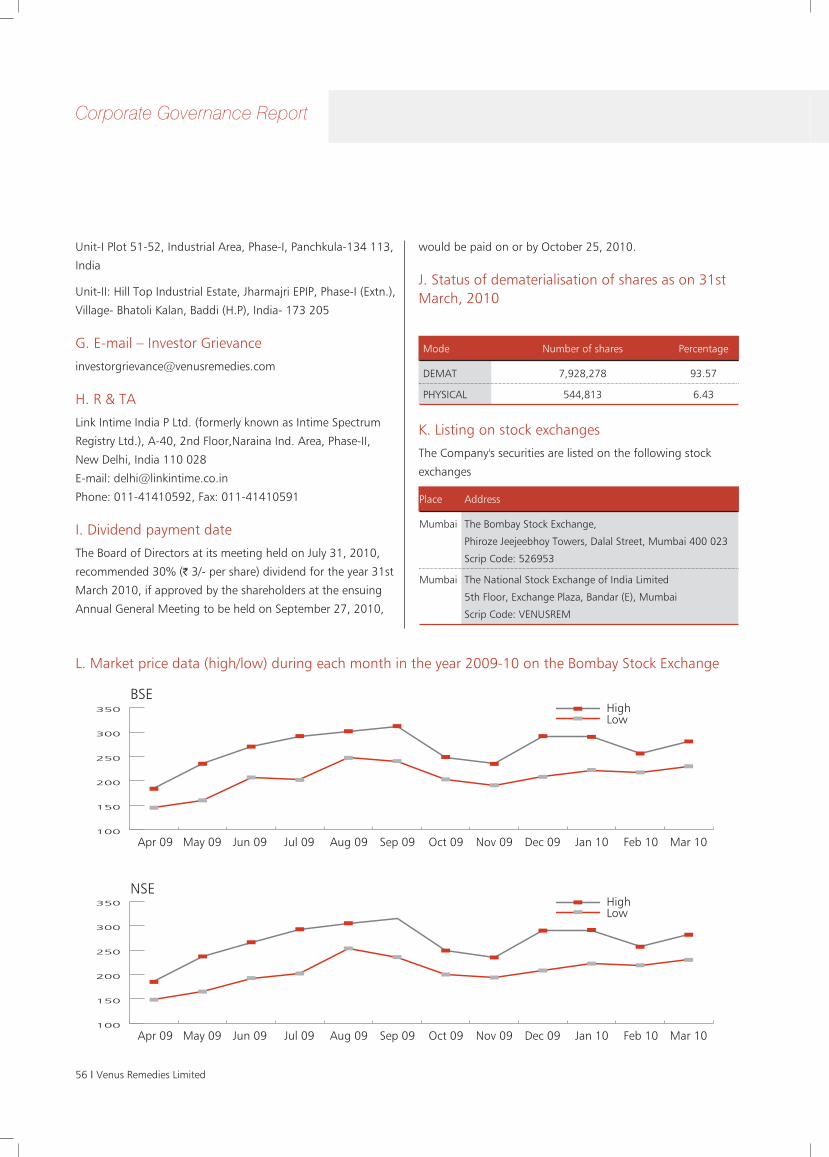
56 I Venus Remedies Limited
Corporate Governance Report
Unit-I Plot 51-52, Industrial Area, Phase-I, Panchkula-134 113,
India
Unit-II: Hill Top Industrial Estate, Jharmajri EPIP, Phase-I (Extn.),
Village- Bhatoli Kalan, Baddi (H.P), India- 173 205
G. E-mail – Investor Grievance
H. R & TA
Link Intime India P Ltd. (formerly known as Intime Spectrum
Registry Ltd.), A-40, 2nd Floor,Naraina Ind. Area, Phase-II,
New Delhi, India 110 028
E-mail: [email protected]
Phone: 011-41410592, Fax: 011-41410591
I. Dividend payment date
The Board of Directors at its meeting held on July 31, 2010,
recommended 30% (` 3/- per share) dividend for the year 31st
March 2010, if approved by the shareholders at the ensuing
Annual General Meeting to be held on September 27, 2010,
would be paid on or by October 25, 2010.
J. Status of dematerialisation of shares as on 31stMarch, 2010
K. Listing on stock exchanges
The Company's securities are listed on the following stock
exchanges
L. Market price data (high/low) during each month in the year 2009-10 on the Bombay Stock Exchange
Mode Number of shares Percentage
DEMAT 7,928,278 93.57
PHYSICAL 544,813 6.43
Place Address
Mumbai The Bombay Stock Exchange,
Phiroze Jeejeebhoy Towers, Dalal Street, Mumbai 400 023
Scrip Code: 526953
Mumbai The National Stock Exchange of India Limited
5th Floor, Exchange Plaza, Bandar (E), Mumbai
Scrip Code: VENUSREM
100
150
200
250
300
350
Apr 09
HighLow
May 09 Jun 09 Jul 09 Aug 09 Sep 09 Oct 09 Nov 09 Dec 09 Jan 10 Feb 10 Mar 10
NSE
BSE
100
150
200
250
300
350
Apr 09
HighLow
May 09 Jun 09 Jul 09 Aug 09 Sep 09 Oct 09 Nov 09 Dec 09 Jan 10 Feb 10 Mar 10
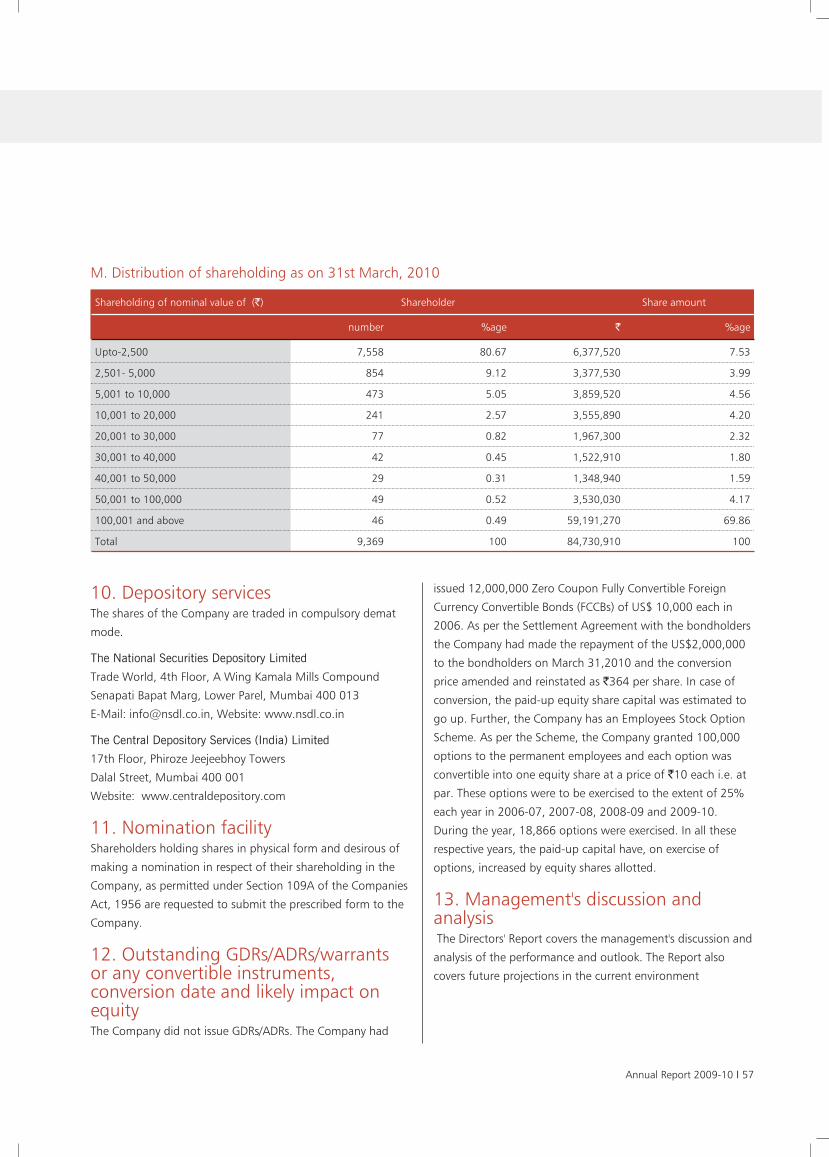
Annual Report 2009-10 I 57
M. Distribution of shareholding as on 31st March, 2010
Shareholding of nominal value of (`) Shareholder Share amount
number %age ` %age
Upto-2,500 7,558 80.67 6,377,520 7.53
2,501- 5,000 854 9.12 3,377,530 3.99
5,001 to 10,000 473 5.05 3,859,520 4.56
10,001 to 20,000 241 2.57 3,555,890 4.20
20,001 to 30,000 77 0.82 1,967,300 2.32
30,001 to 40,000 42 0.45 1,522,910 1.80
40,001 to 50,000 29 0.31 1,348,940 1.59
50,001 to 100,000 49 0.52 3,530,030 4.17
100,001 and above 46 0.49 59,191,270 69.86
Total 9,369 100 84,730,910 100
10. Depository servicesThe shares of the Company are traded in compulsory demat
mode.
The National Securities Depository Limited
Trade World, 4th Floor, A Wing Kamala Mills Compound
Senapati Bapat Marg, Lower Parel, Mumbai 400 013
E-Mail: [email protected], Website: www.nsdl.co.in
The Central Depository Services (India) Limited
17th Floor, Phiroze Jeejeebhoy Towers
Dalal Street, Mumbai 400 001
Website: www.centraldepository.com
11. Nomination facilityShareholders holding shares in physical form and desirous of
making a nomination in respect of their shareholding in the
Company, as permitted under Section 109A of the Companies
Act, 1956 are requested to submit the prescribed form to the
Company.
12. Outstanding GDRs/ADRs/warrantsor any convertible instruments,conversion date and likely impact onequityThe Company did not issue GDRs/ADRs. The Company had
issued 12,000,000 Zero Coupon Fully Convertible Foreign
Currency Convertible Bonds (FCCBs) of US$ 10,000 each in
2006. As per the Settlement Agreement with the bondholders
the Company had made the repayment of the US$2,000,000
to the bondholders on March 31,2010 and the conversion
price amended and reinstated as `364 per share. In case of
conversion, the paid-up equity share capital was estimated to
go up. Further, the Company has an Employees Stock Option
Scheme. As per the Scheme, the Company granted 100,000
options to the permanent employees and each option was
convertible into one equity share at a price of `10 each i.e. at
par. These options were to be exercised to the extent of 25%
each year in 2006-07, 2007-08, 2008-09 and 2009-10.
During the year, 18,866 options were exercised. In all these
respective years, the paid-up capital have, on exercise of
options, increased by equity shares allotted.
13. Management's discussion andanalysisThe Directors' Report covers the management's discussion and
analysis of the performance and outlook. The Report also
covers future projections in the current environment
58 I Venus Remedies Limited
To the Board of Directors,I, Pawan Chaudhary, CEO & Managing Director, certify that :
(a) I have reviewed financial statements and the cash flowstatement for the year ended March 31, 2010, and that to thebest of my knowledge and belief :
(i) These statements do not contain any materially untruestatement or omit any material fact or contain statements thatmight be misleading;
(ii) These statements together present a true and fair view of theCompany's affairs and are in compliance with existing AccountingStandards, applicable laws and regulations.
(b) There are, to the best of our knowledge and belief, notransactions entered into by the Company during the year whichare fraudulent, illegal or violative of the Company's Code ofConduct.
(c) We accept responsibility for establishing and maintaininginternal controls for financial reporting and have evaluated the
effectiveness of internal control systems of the Companypertaining to financial reporting and we have disclosed to theauditors and the Audit Committee, deficiencies in the design oroperation of such internal controls, if any, of which we are awareand the steps we have taken or propose to take to rectify thesedeficiencies.
(d) I have indicated to the Auditors and the Audit Committee that:
(i) there has not been any significant changes in internal controlover financial reporting during the year under reference;
(ii) there has not been any significant changes in accountingpolicies during the year requiring disclosure in the notes to thefinancial statements;
(iii) and there has not been any instances during the year ofsignificant fraud of which we had become aware and theinvolvement therein, if any, of the management or an employeehaving a significant role in the Company's internal control systemover financial reporting.
Place: Panchkula (Pawan Chaudhary)
Date: 31.07.2010 CEO and Managing Director
CEO Certificate
To the Members of the Board,
Venus Remedies LimitedWe have examined the compliance of conditions of CorporateGovernance by Venus Remedies Limited for the year ended 31stMarch, 2010, as stipulated in Clause 49 of the Listing Agreementof the said company, with Stock Exchanges.
The compliance of conditions of corporate governance is theresponsibility of the management. Our examination has beenlimited to a review of procedures and implementation thereof,adopted by the Company for ensuring the compliance of theconditions of corporate governance as stipulated in the saidclause. It is neither an audit nor an expression of opinion on thefinancial statements of the Company.
In our opinion and to the best of our information and accordingto the explanations given to us by the Directors and theManagement, we certify that the Company has complied with theconditions of corporate governance stipulated in Clause 49 of theabove mentioned Listing Agreement.
Based on the certificate received from Share Transfer Agent andthe minutes of the Share Transfer and Shareholders' GrievanceCommittee, we state that no investor grievance is pending for aperiod exceeding six months.
We further state that such compliance is neither an assurance asto the future viability of the Company nor of the efficiency oreffectiveness with which the management has conducted theaffairs of the Company.
For J.K. Jain & Associates
Chartered AccountantsFirm Registration No. 004025N
(J. K. Jain)
Panchkula Partner
Date: 31.07.2010 Membership No. 083140
Auditors certificate on Corporate Governance
1. We have examined the attached Balance Sheet of M/sVenus Remedies Limited as at 31st March 2010, Profit &Loss Account and the Cash Flow Statement for the yearended on that date annexed thereto. These financialstatements are the responsibility of the company'sManagement. Our responsibility is to express an opinion onthese financial statements based on our audit.
2. We have conducted our audit in accordance with auditingstandards generally accepted in India. These standardsrequire that we plan and perform the audit to obtainreasonable assurance about whether the financialstatements are free of material misstatement. An auditincludes examining, on a test basis, evidence supportingthe amounts and disclosures in the financial statements.An audit also includes assessing the accounting principlesused and significant estimates made by the Managementas well as evaluating the overall financial statementpresentation. We believe that our audit provides areasonable basis for our opinion.
3. As required by the Companies (Auditor's Report) Order,2003 as amended by Companies (Auditor's Report)(Amendment) order, 2004 issued by the Company LawBoard in terms of Section 227 (4A) of the Companies Act,1956, we annex hereto a statement on the mattersspecified in paragraphs 4 and 5 of the said order.
4. Further to our comments in the Annexure referred to inParagraph (3) above, we report that:-
i) We have obtained all the information and explanationswhich to the best of our knowledge & belief werenecessary for the purpose of audit;
ii) In our opinion, proper Books of Accounts as required bylaw have been kept by the company so far as it appearsfrom our examination of those books:
iii) The Balance Sheet, Profit & Loss Account and Cash FlowStatement referred to in this Report are in agreementwith the Books of Accounts.
iv) In our opinion, the said Balance Sheet, Profit & LossAccount and Cash Flow Statement dealt with by thisreport comply with the requirements of the accountingstandards referred to in Sub Section (3C) of Section 211of the Companies Act, 1956 except otherwise stated inthe Notes to the Accounts.
v) Pursuant to the provisions of sub section (1) (g) ofsection 274 of the Companies Act 1956, we report asunder :-
On the basis of confirmations received from theDirectors and taken on record by the Board of Directors,we report that none of the Directors is disqualified ason 31st March, 2010 from being appointed as aDirector of the company in terms of Clause (g) of subsection (1) of section 274 of the Companies Act, 1956.
vi) In our opinion and to the best to our information andaccording to the explanation given to us, the saidstatements of account read together with theSignificant Accounting Policies and Notes thereon, givethe information required by the Companies Act, 1956in the manner so required and give a true and fair view.
a) in the case of the Balance Sheet of the state ofaffairs of the company as at 31st March, 2010,
b) in the case of Profit & Loss Account of the Profit forthe year ended on that date and
c) in the case of the Cash Flow Statement, of the cashflow for the year ended on that date.
For J.K. Jain & AssociatesChartered Accountants
Firm Registration No. 004025N
J.K. JainPlace: Panchkula PartnerDate: July 31, 2010 Membership No. 083140
To
The Members of
VENUS REMEDIES LIMITED
PANCHKULA
Auditors’ Report
Annual Report 2009-10 I 59
(Referred to in Para (3) of our report of even date)
i) a) The company has maintained proper records showing
full particulars including quantitative detail & situation
of fixed assets.
b) According to information and explanations given to
us, the company has a system of physical verification
of all its fixed assets once in a year, which in our
opinion is reasonable having regard to the size of the
company and the nature of its assets. No serious
discrepancies were noticed on such verification.
c) During the year company has not disposed off any
substantial/ major part of fixed assets.
ii) a) As explained to us, the stock of stores, spare parts,
raw material and finished goods have been physically
verified by the management at regular intervals during
the year .
b) In our opinion and according to the information &
explanations given to us, the procedure of physical
verification of stocks followed by the management are
reasonable & adequate in relation to the size of the
company and the nature of its business.
c) In our opinion & according to the information &
explanations given to us and on the basis of our
examination of the records of inventory, the company
is maintaining proper records of its inventory. The
discrepancies noticed on physical verification of stock
of store, spare parts, raw material and finished goods
were not significant in relation to the operation of the
company and the same have been properly dealt with
in the books of accounts.
iii) According to the information and explanation given to us,
the company has not granted / taken any loan, secured or
unsecured to / from the companies, firm & other parties
listed in the register maintained under section 301 of the
Companies Act, 1956.
iv) In our opinion and according to the information and
explanations given to us, there are adequate internal
control procedures commensurate with the size of the
company and its nature of business for purchase of stores,
raw materials including components, plant & machinery,
equipment and other assets and for the sale of goods.
v) In respect of transactions to be entered in the register
maintained in pursuance of section 301 of the Companies
Act, 1956 :-
a) To the best of our knowledge and belief and
according to the information and explanations given
to us, company doesn't have any transaction that
needed to be entered into the register.
b) According to the information and explanations
given to us, there is no transactions exceeding
` 5,00,000/- (Rupees five lacs only).
vi) The company has not accepted any public deposits during
the previous year.
vii) In our opinion and to the best of our knowledge & belief,
internal audit system followed by the management is
commensurate with the size of the company and nature
of its business.
viii) The Company is required to maintain cost records under
section 209 (1) (d) of the Companies Act, 1956 for the
products of the company and according to the
information & explanations given to us, the company has
maintained the records as prescribed by the Central
Government but we have not carried out the examination
of these records.
ix) a) According to the information & explanations given to
us, and the records of the company examined by us,
the company has been regular in depositing
undisputed statutory dues of Provident Fund,
Annexure to the Auditors’ Report
60 I Venus Remedies Limited
Employees' State Insurance, Income Tax, Sales Tax,
Wealth Tax, Custom Duty, Excise Duty, Cess, Fringe
Benefit Tax, Labour Welfare Fund, Investor Education
Protection Fund and other statutory dues applicable to
it. We are informed that there are no undisputed
statutory dues as at the year end outstanding for a
period of more than six months from the date they
became payable.
There were no dues on account of cess under section
441A of the Companies Act, 1956, since the date
from which the aforesaid Section comes into force has
not yet been notified by the Central Government.
x) The company does not have any accumulated losses as at
the end of the financial year March 31, 2010.
xi) According to the records of the company examined by us
and the information and explanation given to us, the
company during the year has not defaulted in repayment
of dues to financial institution or banks.
xii) According to the information & explanations given to us,
the company has not granted any loans or advances on
the basis of security by way of pledge of shares,
debentures and other securities.
xiii) The provisions of any special statute as specified under
paragraph 4 of the Order are not applicable to the
Company.
xiii) In our opinion and according to the information and
explanations given to us the company has maintained
proper records of the transactions relating to dealing in
shares, securities & other investments & also entries have
been made therein timely. Also all the shares, securities
etc. have been held by the company in its own name.
xiv) In our opinion and according to the information &
explanations given to us, the company has not given any
guarantee during the year for loans taken by others from
banks or financial institutions.
xv) In our opinion and according to the explanations given to
us, the term loans taken during the year have been
applied for the purpose for which they were obtained.
xvi) According to the information & explanations given to us
and on overall examination of the balance sheet of the
company, we report that short term funds have not been
used to finance long term investments and vice versa.
xvii) During the year the company has not made any
preferential allotment of shares to parties and companies
covered in the register maintained under section 301 of
the Companies Act, 1956.
xviii) During the year since the company has not raised any
debentures, paragraph 4 of the Order is not applicable.
xix) During the year since the company has not raised any
money by way of public issue, paragraph 4 (xx) of the
order is not applicable.
xx) Based upon the audit procedures performed and
information & explanations given by the management,
we report that no fraud on or by the company has been
noticed or reported during the course of our audit for the
year ended March 31, 2010.
For J.K. Jain & AssociatesChartered Accountants
Firm Registration No. 004025N
J.K. JainPlace: Panchkula PartnerDate: July 31, 2010 Membership No. 083140
Annual Report 2009-10 I 61
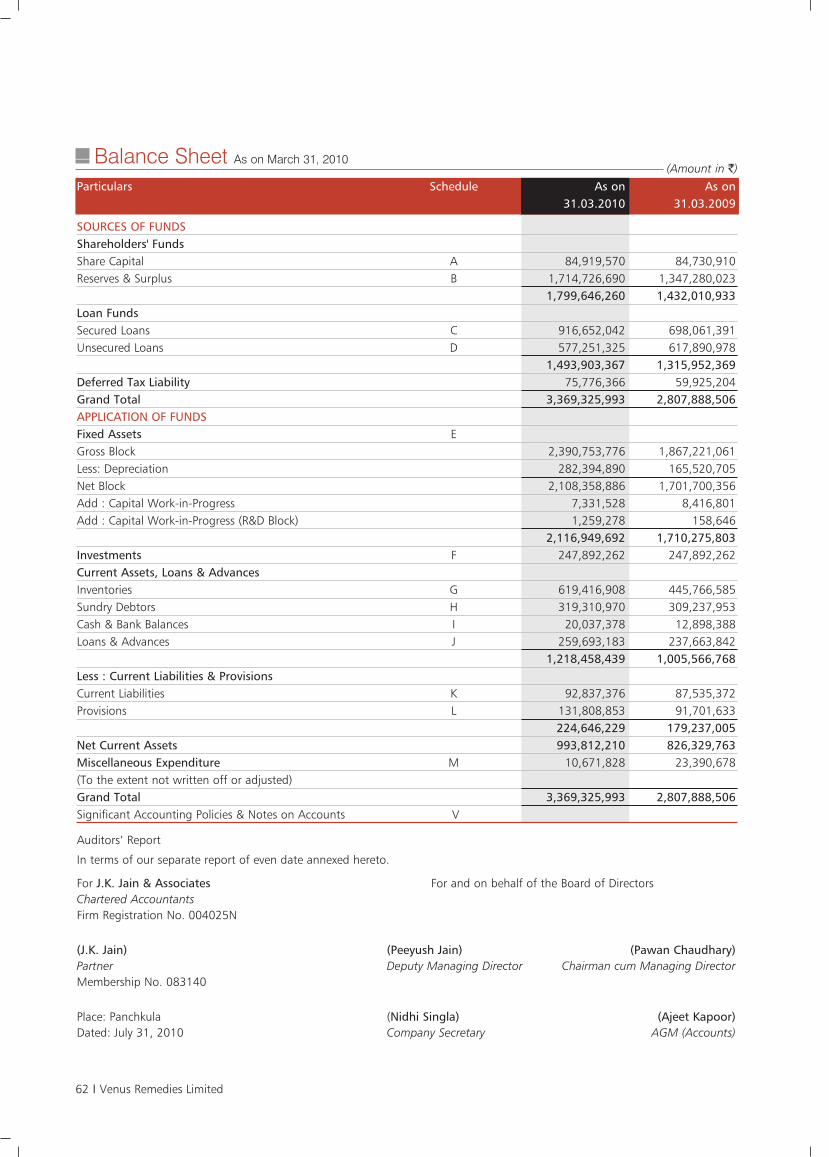
(Amount in `)
Auditors’ Report
In terms of our separate report of even date annexed hereto.
For J.K. Jain & Associates For and on behalf of the Board of DirectorsChartered AccountantsFirm Registration No. 004025N
(J.K. Jain) (Peeyush Jain) (Pawan Chaudhary)Partner Deputy Managing Director Chairman cum Managing DirectorMembership No. 083140
Place: Panchkula (Nidhi Singla) (Ajeet Kapoor)Dated: July 31, 2010 Company Secretary AGM (Accounts)
Particulars Schedule As on As on31.03.2010 31.03.2009
SOURCES OF FUNDSShareholders' FundsShare Capital A 84,919,570 84,730,910 Reserves & Surplus B 1,714,726,690 1,347,280,023
1,799,646,260 1,432,010,933 Loan FundsSecured Loans C 916,652,042 698,061,391Unsecured Loans D 577,251,325 617,890,978
1,493,903,367 1,315,952,369Deferred Tax Liability 75,776,366 59,925,204Grand Total 3,369,325,993 2,807,888,506 APPLICATION OF FUNDSFixed Assets EGross Block 2,390,753,776 1,867,221,061 Less: Depreciation 282,394,890 165,520,705Net Block 2,108,358,886 1,701,700,356 Add : Capital Work-in-Progress 7,331,528 8,416,801Add : Capital Work-in-Progress (R&D Block) 1,259,278 158,646
2,116,949,692 1,710,275,803Investments F 247,892,262 247,892,262 Current Assets, Loans & AdvancesInventories G 619,416,908 445,766,585Sundry Debtors H 319,310,970 309,237,953Cash & Bank Balances I 20,037,378 12,898,388 Loans & Advances J 259,693,183 237,663,842
1,218,458,439 1,005,566,768Less : Current Liabilities & ProvisionsCurrent Liabilities K 92,837,376 87,535,372 Provisions L 131,808,853 91,701,633
224,646,229 179,237,005 Net Current Assets 993,812,210 826,329,763Miscellaneous Expenditure M 10,671,828 23,390,678 (To the extent not written off or adjusted) Grand Total 3,369,325,993 2,807,888,506 Significant Accounting Policies & Notes on Accounts V
Balance Sheet As on March 31, 2010
62 I Venus Remedies Limited
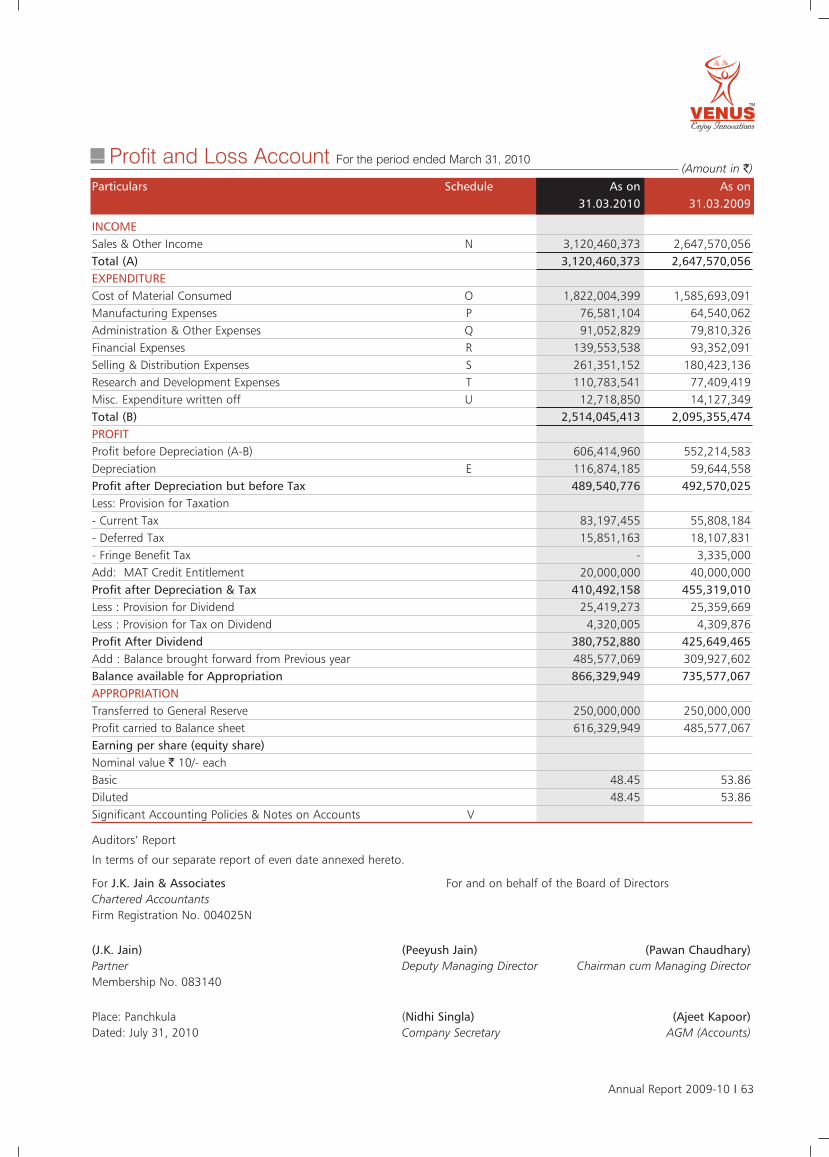
Auditors’ Report
In terms of our separate report of even date annexed hereto.
For J.K. Jain & Associates For and on behalf of the Board of DirectorsChartered AccountantsFirm Registration No. 004025N
(J.K. Jain) (Peeyush Jain) (Pawan Chaudhary)Partner Deputy Managing Director Chairman cum Managing DirectorMembership No. 083140
Place: Panchkula (Nidhi Singla) (Ajeet Kapoor)Dated: July 31, 2010 Company Secretary AGM (Accounts)
(Amount in `)Particulars Schedule As on As on
31.03.2010 31.03.2009
INCOMESales & Other Income N 3,120,460,373 2,647,570,056 Total (A) 3,120,460,373 2,647,570,056 EXPENDITURECost of Material Consumed O 1,822,004,399 1,585,693,091 Manufacturing Expenses P 76,581,104 64,540,062 Administration & Other Expenses Q 91,052,829 79,810,326 Financial Expenses R 139,553,538 93,352,091 Selling & Distribution Expenses S 261,351,152 180,423,136 Research and Development Expenses T 110,783,541 77,409,419 Misc. Expenditure written off U 12,718,850 14,127,349 Total (B) 2,514,045,413 2,095,355,474 PROFITProfit before Depreciation (A-B) 606,414,960 552,214,583 Depreciation E 116,874,185 59,644,558 Profit after Depreciation but before Tax 489,540,776 492,570,025 Less: Provision for Taxation- Current Tax 83,197,455 55,808,184 - Deferred Tax 15,851,163 18,107,831 - Fringe Benefit Tax - 3,335,000 Add: MAT Credit Entitlement 20,000,000 40,000,000 Profit after Depreciation & Tax 410,492,158 455,319,010 Less : Provision for Dividend 25,419,273 25,359,669 Less : Provision for Tax on Dividend 4,320,005 4,309,876 Profit After Dividend 380,752,880 425,649,465 Add : Balance brought forward from Previous year 485,577,069 309,927,602 Balance available for Appropriation 866,329,949 735,577,067 APPROPRIATIONTransferred to General Reserve 250,000,000 250,000,000 Profit carried to Balance sheet 616,329,949 485,577,067 Earning per share (equity share)Nominal value ` 10/- eachBasic 48.45 53.86 Diluted 48.45 53.86 Significant Accounting Policies & Notes on Accounts V
Profit and Loss Account For the period ended March 31, 2010
Annual Report 2009-10 I 63
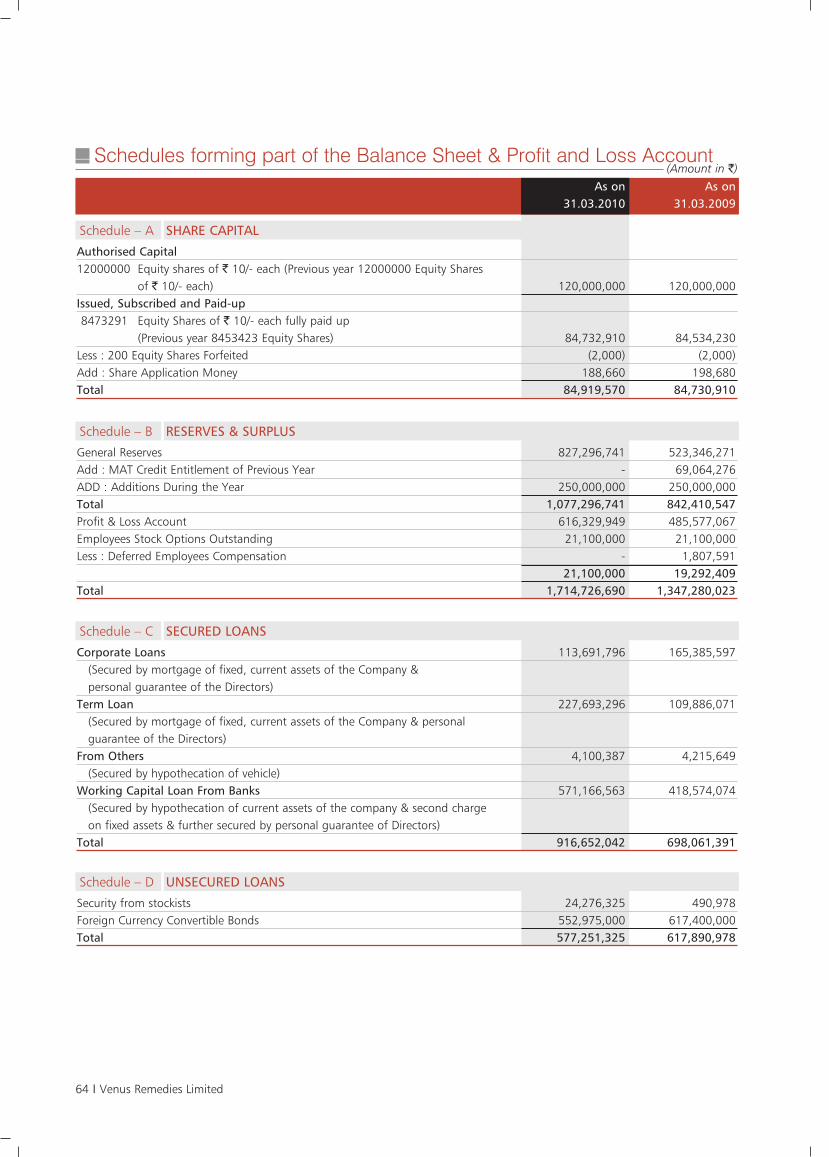
(Amount in `)
Authorised Capital12000000 Equity shares of ` 10/- each (Previous year 12000000 Equity Shares
of ` 10/- each) 120,000,000 120,000,000 Issued, Subscribed and Paid-up8473291 Equity Shares of ` 10/- each fully paid up
(Previous year 8453423 Equity Shares) 84,732,910 84,534,230 Less : 200 Equity Shares Forfeited (2,000) (2,000)Add : Share Application Money 188,660 198,680 Total 84,919,570 84,730,910
As on As on31.03.2010 31.03.2009
Schedule – A SHARE CAPITAL
General Reserves 827,296,741 523,346,271 Add : MAT Credit Entitlement of Previous Year - 69,064,276 ADD : Additions During the Year 250,000,000 250,000,000 Total 1,077,296,741 842,410,547 Profit & Loss Account 616,329,949 485,577,067 Employees Stock Options Outstanding 21,100,000 21,100,000 Less : Deferred Employees Compensation - 1,807,591
21,100,000 19,292,409 Total 1,714,726,690 1,347,280,023
Schedule – B RESERVES & SURPLUS
Security from stockists 24,276,325 490,978 Foreign Currency Convertible Bonds 552,975,000 617,400,000 Total 577,251,325 617,890,978
Schedule – D UNSECURED LOANS
Corporate Loans 113,691,796 165,385,597 (Secured by mortgage of fixed, current assets of the Company & personal guarantee of the Directors)
Term Loan 227,693,296 109,886,071 (Secured by mortgage of fixed, current assets of the Company & personal guarantee of the Directors)
From Others 4,100,387 4,215,649 (Secured by hypothecation of vehicle)
Working Capital Loan From Banks 571,166,563 418,574,074(Secured by hypothecation of current assets of the company & second charge on fixed assets & further secured by personal guarantee of Directors)
Total 916,652,042 698,061,391
Schedule – C SECURED LOANS
Schedules forming part of the Balance Sheet & Profit and Loss Account
64 I Venus Remedies Limited
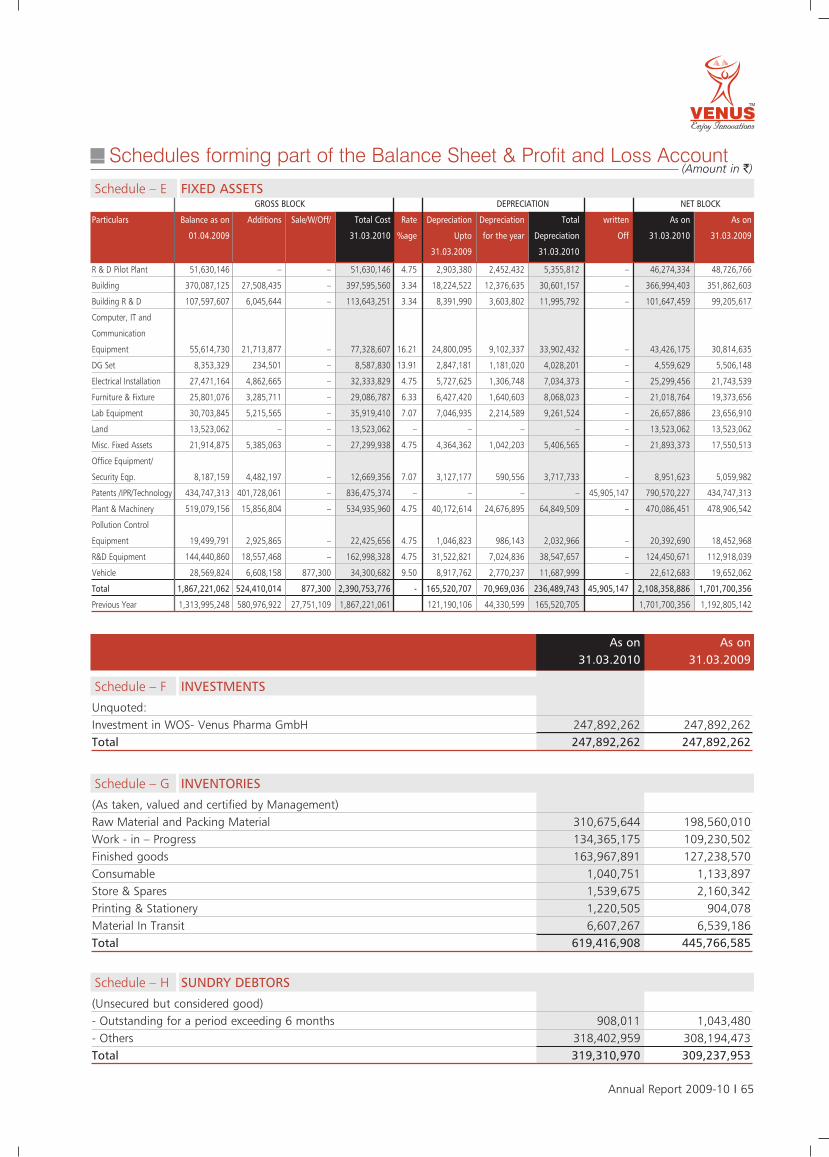
Unquoted:Investment in WOS- Venus Pharma GmbH 247,892,262 247,892,262 Total 247,892,262 247,892,262
As on As on31.03.2010 31.03.2009
Schedule – F INVESTMENTS
(Unsecured but considered good)- Outstanding for a period exceeding 6 months 908,011 1,043,480 - Others 318,402,959 308,194,473 Total 319,310,970 309,237,953
Schedule – H SUNDRY DEBTORS
(As taken, valued and certified by Management)Raw Material and Packing Material 310,675,644 198,560,010 Work - in – Progress 134,365,175 109,230,502 Finished goods 163,967,891 127,238,570 Consumable 1,040,751 1,133,897 Store & Spares 1,539,675 2,160,342 Printing & Stationery 1,220,505 904,078 Material In Transit 6,607,267 6,539,186 Total 619,416,908 445,766,585
Schedule – G INVENTORIES
(Amount in `)
GROSS BLOCK DEPRECIATION NET BLOCK
Particulars Balance as on Additions Sale/W/Off/ Total Cost Rate Depreciation Depreciation Total written As on As on
01.04.2009 31.03.2010 %age Upto for the year Depreciation Off 31.03.2010 31.03.2009
31.03.2009 31.03.2010
R & D Pilot Plant 51,630,146 – – 51,630,146 4.75 2,903,380 2,452,432 5,355,812 – 46,274,334 48,726,766
Building 370,087,125 27,508,435 – 397,595,560 3.34 18,224,522 12,376,635 30,601,157 – 366,994,403 351,862,603
Building R & D 107,597,607 6,045,644 – 113,643,251 3.34 8,391,990 3,603,802 11,995,792 – 101,647,459 99,205,617
Computer, IT and
Communication
Equipment 55,614,730 21,713,877 – 77,328,607 16.21 24,800,095 9,102,337 33,902,432 – 43,426,175 30,814,635
DG Set 8,353,329 234,501 – 8,587,830 13.91 2,847,181 1,181,020 4,028,201 – 4,559,629 5,506,148
Electrical Installation 27,471,164 4,862,665 – 32,333,829 4.75 5,727,625 1,306,748 7,034,373 – 25,299,456 21,743,539
Furniture & Fixture 25,801,076 3,285,711 – 29,086,787 6.33 6,427,420 1,640,603 8,068,023 – 21,018,764 19,373,656
Lab Equipment 30,703,845 5,215,565 – 35,919,410 7.07 7,046,935 2,214,589 9,261,524 – 26,657,886 23,656,910
Land 13,523,062 – – 13,523,062 – – – – – 13,523,062 13,523,062
Misc. Fixed Assets 21,914,875 5,385,063 – 27,299,938 4.75 4,364,362 1,042,203 5,406,565 – 21,893,373 17,550,513
Office Equipment/
Security Eqp. 8,187,159 4,482,197 – 12,669,356 7.07 3,127,177 590,556 3,717,733 – 8,951,623 5,059,982
Patents /IPR/Technology 434,747,313 401,728,061 – 836,475,374 – – – – 45,905,147 790,570,227 434,747,313
Plant & Machinery 519,079,156 15,856,804 – 534,935,960 4.75 40,172,614 24,676,895 64,849,509 – 470,086,451 478,906,542
Pollution Control
Equipment 19,499,791 2,925,865 – 22,425,656 4.75 1,046,823 986,143 2,032,966 – 20,392,690 18,452,968
R&D Equipment 144,440,860 18,557,468 – 162,998,328 4.75 31,522,821 7,024,836 38,547,657 – 124,450,671 112,918,039
Vehicle 28,569,824 6,608,158 877,300 34,300,682 9.50 8,917,762 2,770,237 11,687,999 – 22,612,683 19,652,062
Total 1,867,221,062 524,410,014 877,300 2,390,753,776 - 165,520,707 70,969,036 236,489,743 45,905,147 2,108,358,886 1,701,700,356
Previous Year 1,313,995,248 580,976,922 27,751,109 1,867,221,061 121,190,106 44,330,599 165,520,705 1,701,700,356 1,192,805,142
Schedule – E FIXED ASSETS
Schedules forming part of the Balance Sheet & Profit and Loss Account
Annual Report 2009-10 I 65
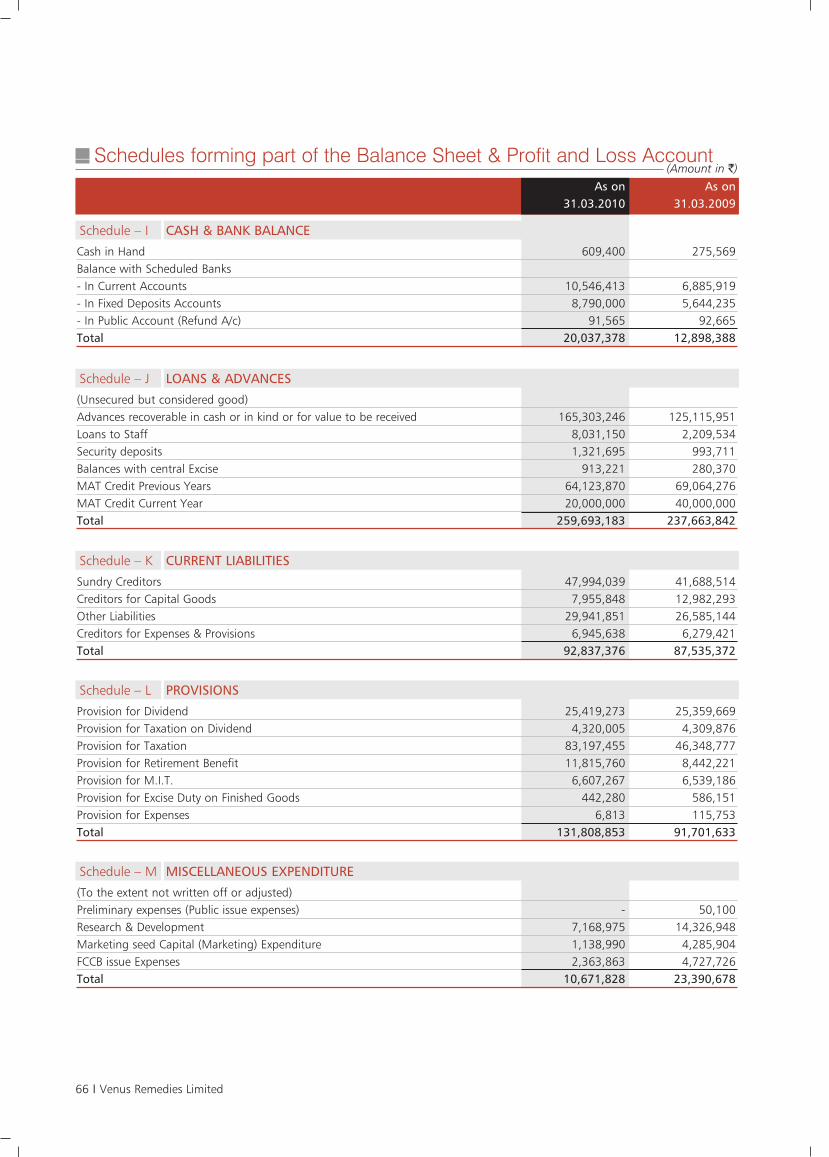
(Amount in `)
Cash in Hand 609,400 275,569 Balance with Scheduled Banks- In Current Accounts 10,546,413 6,885,919 - In Fixed Deposits Accounts 8,790,000 5,644,235 - In Public Account (Refund A/c) 91,565 92,665 Total 20,037,378 12,898,388
As on As on31.03.2010 31.03.2009
Schedule – I CASH & BANK BALANCE
(Unsecured but considered good)Advances recoverable in cash or in kind or for value to be received 165,303,246 125,115,951 Loans to Staff 8,031,150 2,209,534 Security deposits 1,321,695 993,711 Balances with central Excise 913,221 280,370 MAT Credit Previous Years 64,123,870 69,064,276 MAT Credit Current Year 20,000,000 40,000,000 Total 259,693,183 237,663,842
Schedule – J LOANS & ADVANCES
Sundry Creditors 47,994,039 41,688,514 Creditors for Capital Goods 7,955,848 12,982,293 Other Liabilities 29,941,851 26,585,144 Creditors for Expenses & Provisions 6,945,638 6,279,421 Total 92,837,376 87,535,372
Schedule – K CURRENT LIABILITIES
Provision for Dividend 25,419,273 25,359,669 Provision for Taxation on Dividend 4,320,005 4,309,876 Provision for Taxation 83,197,455 46,348,777 Provision for Retirement Benefit 11,815,760 8,442,221 Provision for M.I.T. 6,607,267 6,539,186 Provision for Excise Duty on Finished Goods 442,280 586,151 Provision for Expenses 6,813 115,753 Total 131,808,853 91,701,633
Schedule – L PROVISIONS
(To the extent not written off or adjusted)Preliminary expenses (Public issue expenses) - 50,100 Research & Development 7,168,975 14,326,948 Marketing seed Capital (Marketing) Expenditure 1,138,990 4,285,904 FCCB issue Expenses 2,363,863 4,727,726 Total 10,671,828 23,390,678
Schedule – M MISCELLANEOUS EXPENDITURE
Schedules forming part of the Balance Sheet & Profit and Loss Account
66 I Venus Remedies Limited
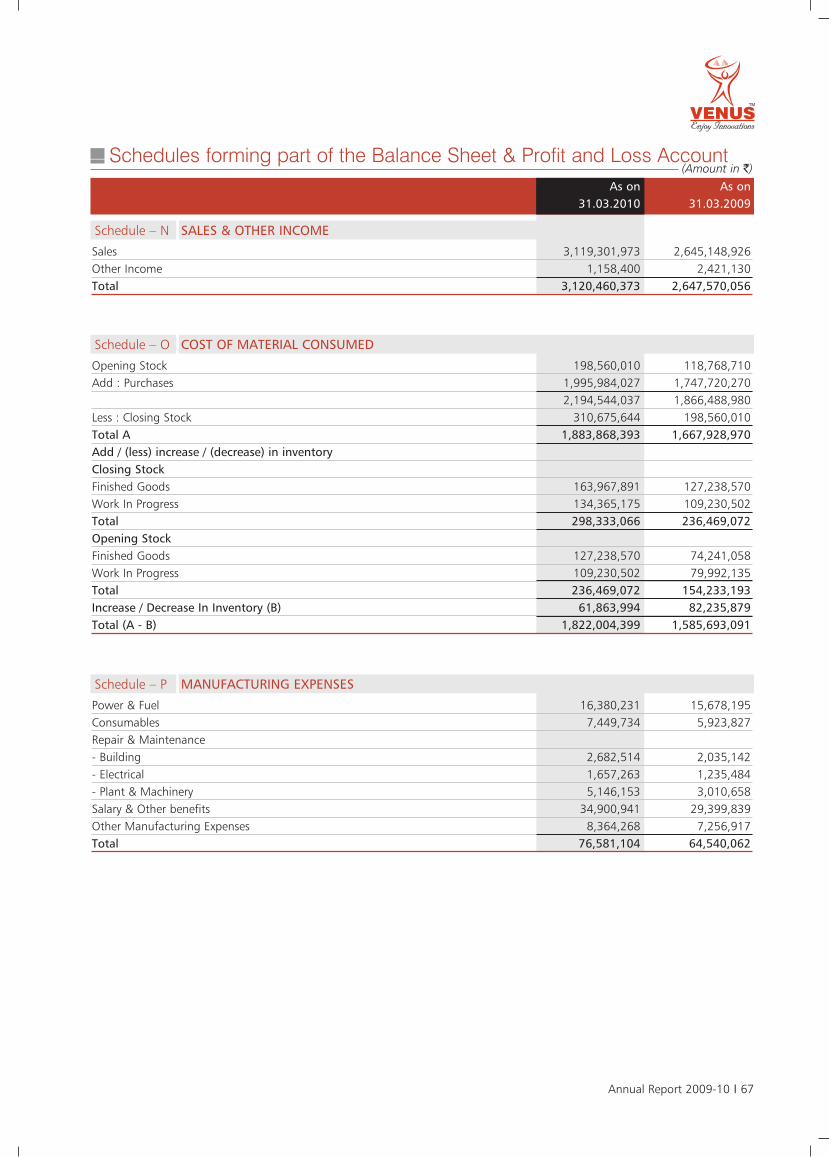
(Amount in `)
Sales 3,119,301,973 2,645,148,926 Other Income 1,158,400 2,421,130 Total 3,120,460,373 2,647,570,056
As on As on31.03.2010 31.03.2009
Schedule – N SALES & OTHER INCOME
Opening Stock 198,560,010 118,768,710 Add : Purchases 1,995,984,027 1,747,720,270
2,194,544,037 1,866,488,980 Less : Closing Stock 310,675,644 198,560,010 Total A 1,883,868,393 1,667,928,970 Add / (less) increase / (decrease) in inventoryClosing StockFinished Goods 163,967,891 127,238,570 Work In Progress 134,365,175 109,230,502 Total 298,333,066 236,469,072 Opening StockFinished Goods 127,238,570 74,241,058 Work In Progress 109,230,502 79,992,135 Total 236,469,072 154,233,193 Increase / Decrease In Inventory (B) 61,863,994 82,235,879 Total (A - B) 1,822,004,399 1,585,693,091
Schedule – O COST OF MATERIAL CONSUMED
Power & Fuel 16,380,231 15,678,195 Consumables 7,449,734 5,923,827 Repair & Maintenance- Building 2,682,514 2,035,142 - Electrical 1,657,263 1,235,484 - Plant & Machinery 5,146,153 3,010,658 Salary & Other benefits 34,900,941 29,399,839 Other Manufacturing Expenses 8,364,268 7,256,917 Total 76,581,104 64,540,062
Schedule – P MANUFACTURING EXPENSES
Schedules forming part of the Balance Sheet & Profit and Loss Account
Annual Report 2009-10 I 67
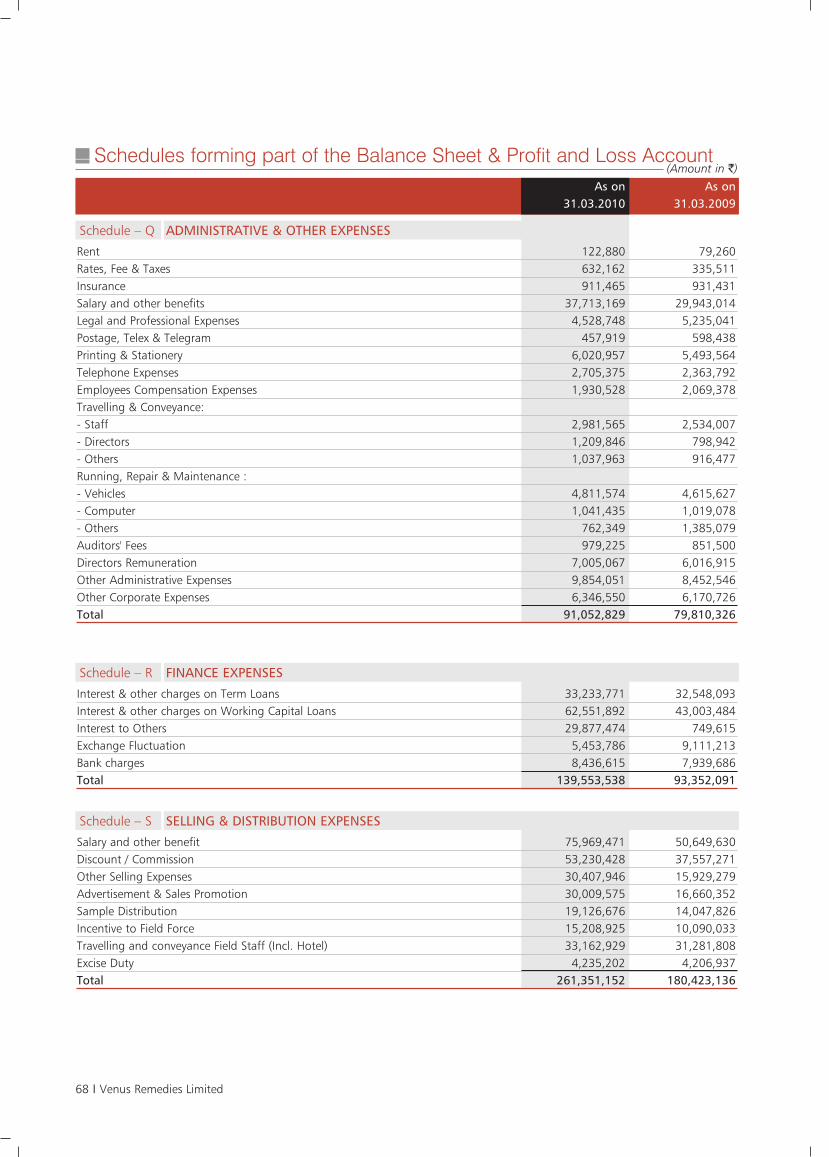
(Amount in `)
Rent 122,880 79,260 Rates, Fee & Taxes 632,162 335,511 Insurance 911,465 931,431 Salary and other benefits 37,713,169 29,943,014 Legal and Professional Expenses 4,528,748 5,235,041 Postage, Telex & Telegram 457,919 598,438 Printing & Stationery 6,020,957 5,493,564 Telephone Expenses 2,705,375 2,363,792 Employees Compensation Expenses 1,930,528 2,069,378 Travelling & Conveyance:- Staff 2,981,565 2,534,007 - Directors 1,209,846 798,942 - Others 1,037,963 916,477 Running, Repair & Maintenance :- Vehicles 4,811,574 4,615,627 - Computer 1,041,435 1,019,078 - Others 762,349 1,385,079 Auditors' Fees 979,225 851,500 Directors Remuneration 7,005,067 6,016,915 Other Administrative Expenses 9,854,051 8,452,546 Other Corporate Expenses 6,346,550 6,170,726 Total 91,052,829 79,810,326
As on As on31.03.2010 31.03.2009
Schedule – Q ADMINISTRATIVE & OTHER EXPENSES
Interest & other charges on Term Loans 33,233,771 32,548,093 Interest & other charges on Working Capital Loans 62,551,892 43,003,484 Interest to Others 29,877,474 749,615 Exchange Fluctuation 5,453,786 9,111,213 Bank charges 8,436,615 7,939,686 Total 139,553,538 93,352,091
Schedule – R FINANCE EXPENSES
Salary and other benefit 75,969,471 50,649,630 Discount / Commission 53,230,428 37,557,271 Other Selling Expenses 30,407,946 15,929,279 Advertisement & Sales Promotion 30,009,575 16,660,352 Sample Distribution 19,126,676 14,047,826 Incentive to Field Force 15,208,925 10,090,033 Travelling and conveyance Field Staff (Incl. Hotel) 33,162,929 31,281,808 Excise Duty 4,235,202 4,206,937 Total 261,351,152 180,423,136
Schedule – S SELLING & DISTRIBUTION EXPENSES
Schedules forming part of the Balance Sheet & Profit and Loss Account
68 I Venus Remedies Limited
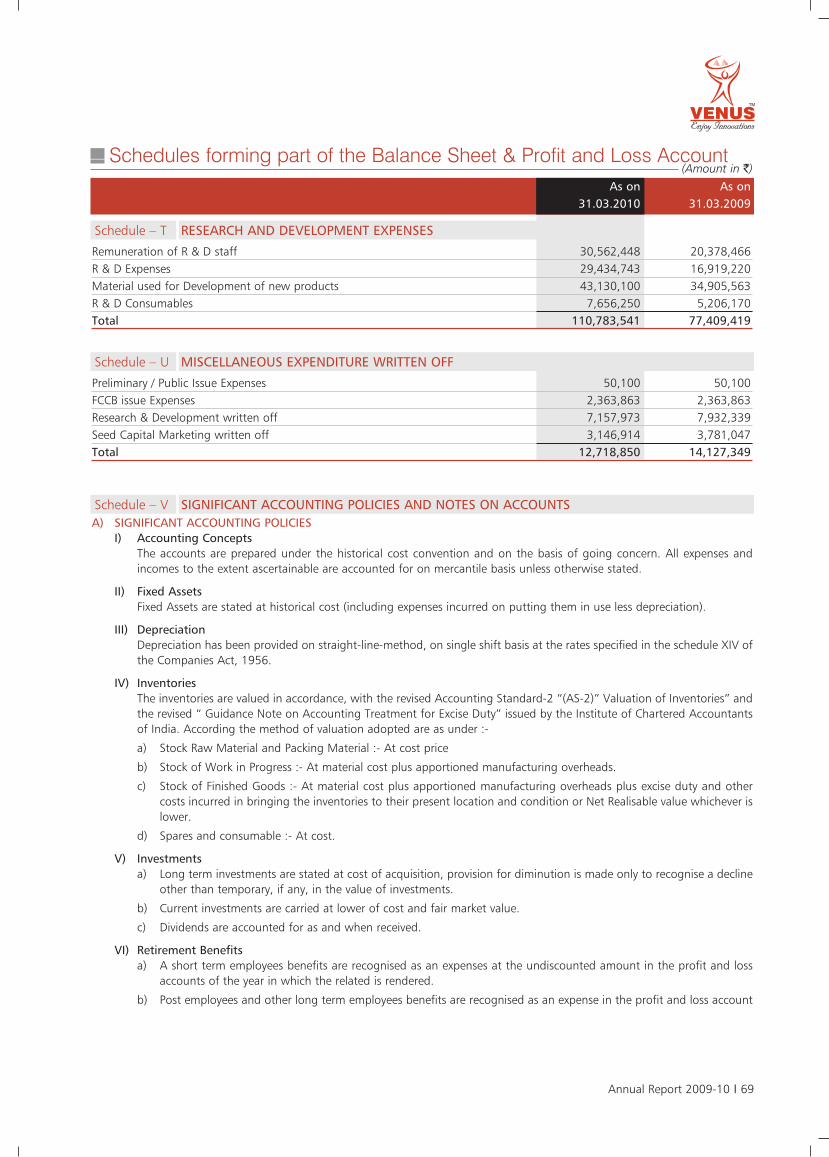
(Amount in `)
Remuneration of R & D staff 30,562,448 20,378,466 R & D Expenses 29,434,743 16,919,220 Material used for Development of new products 43,130,100 34,905,563 R & D Consumables 7,656,250 5,206,170 Total 110,783,541 77,409,419
As on As on31.03.2010 31.03.2009
Schedule – T RESEARCH AND DEVELOPMENT EXPENSES
Preliminary / Public Issue Expenses 50,100 50,100 FCCB issue Expenses 2,363,863 2,363,863 Research & Development written off 7,157,973 7,932,339 Seed Capital Marketing written off 3,146,914 3,781,047 Total 12,718,850 14,127,349
Schedule – U MISCELLANEOUS EXPENDITURE WRITTEN OFF
A) SIGNIFICANT ACCOUNTING POLICIESI) Accounting Concepts
The accounts are prepared under the historical cost convention and on the basis of going concern. All expenses andincomes to the extent ascertainable are accounted for on mercantile basis unless otherwise stated.
II) Fixed AssetsFixed Assets are stated at historical cost (including expenses incurred on putting them in use less depreciation).
III) DepreciationDepreciation has been provided on straight-line-method, on single shift basis at the rates specified in the schedule XIV ofthe Companies Act, 1956.
IV) InventoriesThe inventories are valued in accordance, with the revised Accounting Standard-2 “(AS-2)” Valuation of Inventories” andthe revised “ Guidance Note on Accounting Treatment for Excise Duty” issued by the Institute of Chartered Accountantsof India. According the method of valuation adopted are as under :-
a) Stock Raw Material and Packing Material :- At cost price
b) Stock of Work in Progress :- At material cost plus apportioned manufacturing overheads.
c) Stock of Finished Goods :- At material cost plus apportioned manufacturing overheads plus excise duty and othercosts incurred in bringing the inventories to their present location and condition or Net Realisable value whichever islower.
d) Spares and consumable :- At cost.
V) Investmentsa) Long term investments are stated at cost of acquisition, provision for diminution is made only to recognise a decline
other than temporary, if any, in the value of investments.
b) Current investments are carried at lower of cost and fair market value.
c) Dividends are accounted for as and when received.
VI) Retirement Benefitsa) A short term employees benefits are recognised as an expenses at the undiscounted amount in the profit and loss
accounts of the year in which the related is rendered.
b) Post employees and other long term employees benefits are recognised as an expense in the profit and loss account
Schedule – V SIGNIFICANT ACCOUNTING POLICIES AND NOTES ON ACCOUNTS
Schedules forming part of the Balance Sheet & Profit and Loss Account
Annual Report 2009-10 I 69
Schedule – V SIGNIFICANT ACCOUNTING POLICIES AND NOTES ON ACCOUNTSfor the year in which the employees has rendered services. The expenses is recognised at the present value of theamount payable determined using actuation techniques. Actuarial gains and losses in respect of post employmentand other long term benefits are charged to profit and loss account.
c) In respect of Employees Stock Option, the excess of fair price on the date of grant over the exercise price is recognisedas deferred compensation cost amortised over period.
VII) Revenue RecognitionSales of goods and services are recognised upon passage of the title to the customer, which generally coincides with thedelivery. Sale is net of sale returns but includes excise duty.
VIII)Research and Development Costsa) Capital Expenditure on assets for research and development is included in cost of fixed assets.
b) The revenue expenditure incurred on research & development up to research phase comprising cost of materialsconsumed, salary & wages and other related costs, as identified have been charged to Profit & Loss account andexpenditure on development phase in which the activity converts the results to a marketable product doesn't resultin to any intangible assets so expenses incurred are not capitalised but otherwise charged to Profit & Loss accountin accordance with as -26 (Accounting Standard on Intangible Assets).
IX) Borrowing CostsBorrowing costs that are attributable to the acquisition or construction of fixed assets are capitalised as part of costs ofsuch assets till such time as the assets is ready for its intended use. All other borrowing costs are recognised as an expensein the period in which incurred.
X) Translation of Foreign Exchange Transactionsa) Foreign exchange transactions in respect of import payments are stated at the exchange rate prevailing at the time
of transaction and variation, if any, accounted for on the date of payment is squared during the same accountingyear.
b) Monetary items denominated in foreign currencies remaining unsettled at the year end if not covered by forwardexchange contracts are translated at year end rates.
c) Any income / expense arising from foreign currency transactions is dealt in the profit and loss account for the yearexcept in cases where they relate to acquisition of fixed assets in which case they are adjusted in the carrying cost ofsuch assets.
XI) Income Taxa) Current Tax : Provision is made for income tax based on the liability as computed after taking credit for allowance
and exemptions. Adjustments in books are made only after the completion of the assessment.
b) Deferred Tax : Consequent to the Accounting Standard 22 “Accounting for taxes on income” the differences thatresult between the profit offered for income tax and the profit as per the financial statement are identified andthereafter a deferred tax liability is recorded for timing differences, namely the differences that originate is oneaccounting period and reverse in another. The tax effect is calculated on the accumulated timing difference at theend of an accounting period based on prevailing enacted regulations. Deferred tax assets are recognised only if thereis reasonable certainty that they will be realised and are reviewed for the appropriateness of their respective carryingvalue at each balance sheet date.
c) MAT : Minimum Alternative Tax payable under the provisions of the income tax Act, 1961 is recognised as an assetin the year in which credit becomes eligible and is set off in the year in which the Company becomes liable to payincome taxes at the enacted tax rates and shall be reversed in the year in which it lapses.
XII) Amortisation of Intangible Assets and Miscellaneous Expenditurea) Public issue expenses, Bond issue expenses and preliminary expenses are amortised over a period of five years.
b) Seed Marketing Expenses incurred during the year are written off equally in the subsequent five years. Seed marketingexpenses comprises of expenses relating to marketing and launching of new products, development of new products,development of new market and area, the benefits of which in the option of the opinion of the management, willaccrue to the company over the next five years.
c) Expenses relating to Patents & Trademarks are written off in ten subsequent years.
XIII) Provisions, Contingent Liabilities and Contingent AssetsProvisions involving substantial degree of estimation in management are recognised when there is present obligation asa result of past events and it is probable that there will be an outflow of resources. Contingent Liabilities are not
Schedules forming part of the Balance Sheet & Profit and Loss Account
70 I Venus Remedies Limited
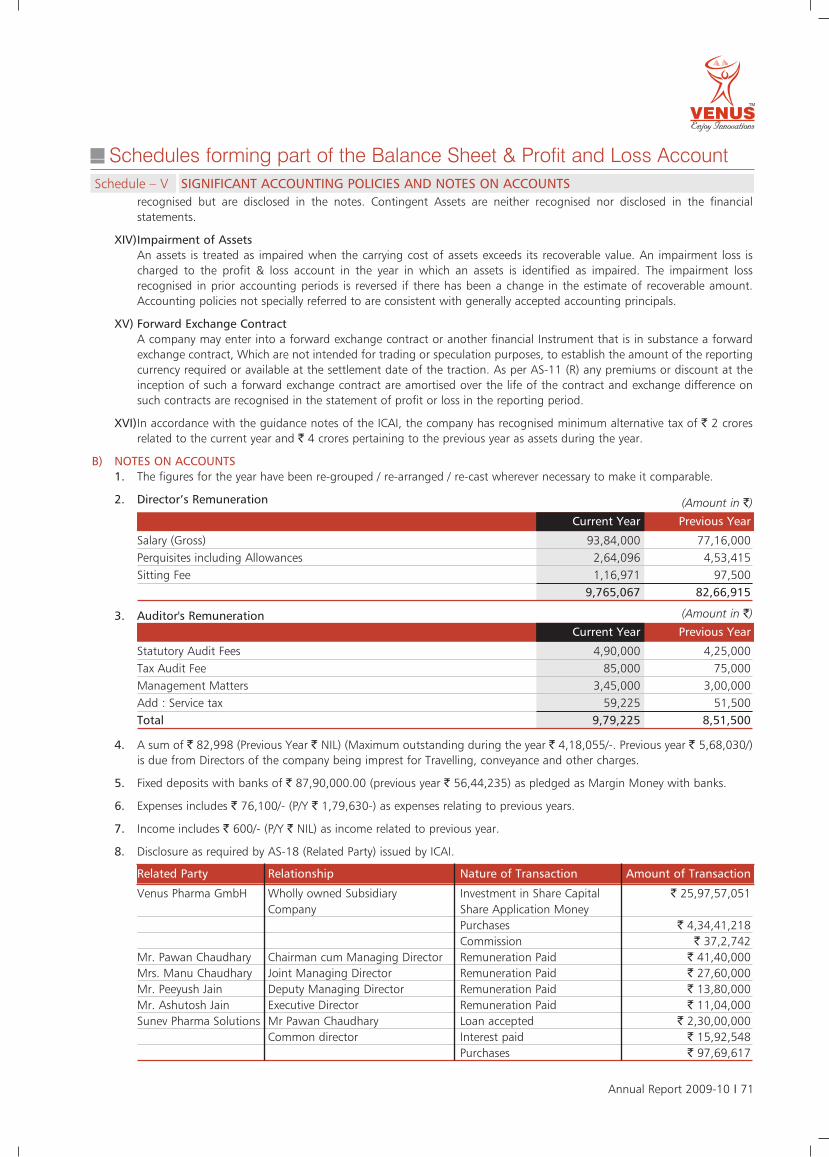
Schedule – V SIGNIFICANT ACCOUNTING POLICIES AND NOTES ON ACCOUNTSrecognised but are disclosed in the notes. Contingent Assets are neither recognised nor disclosed in the financialstatements.
XIV)Impairment of AssetsAn assets is treated as impaired when the carrying cost of assets exceeds its recoverable value. An impairment loss ischarged to the profit & loss account in the year in which an assets is identified as impaired. The impairment lossrecognised in prior accounting periods is reversed if there has been a change in the estimate of recoverable amount.Accounting policies not specially referred to are consistent with generally accepted accounting principals.
XV) Forward Exchange ContractA company may enter into a forward exchange contract or another financial Instrument that is in substance a forwardexchange contract, Which are not intended for trading or speculation purposes, to establish the amount of the reportingcurrency required or available at the settlement date of the traction. As per AS-11 (R) any premiums or discount at theinception of such a forward exchange contract are amortised over the life of the contract and exchange difference onsuch contracts are recognised in the statement of profit or loss in the reporting period.
XVI)In accordance with the guidance notes of the ICAI, the company has recognised minimum alternative tax of ` 2 croresrelated to the current year and ` 4 crores pertaining to the previous year as assets during the year.
B) NOTES ON ACCOUNTS1. The figures for the year have been re-grouped / re-arranged / re-cast wherever necessary to make it comparable.
2. Director’s Remuneration
4. A sum of ` 82,998 (Previous Year ` NIL) (Maximum outstanding during the year ` 4,18,055/-. Previous year ` 5,68,030/)is due from Directors of the company being imprest for Travelling, conveyance and other charges.
5. Fixed deposits with banks of ` 87,90,000.00 (previous year ` 56,44,235) as pledged as Margin Money with banks.
6. Expenses includes ` 76,100/- (P/Y ` 1,79,630-) as expenses relating to previous years.
7. Income includes ` 600/- (P/Y ` NIL) as income related to previous year.
8. Disclosure as required by AS-18 (Related Party) issued by ICAI.
(Amount in `)
Current Year Previous Year
Salary (Gross) 93,84,000 77,16,000Perquisites including Allowances 2,64,096 4,53,415Sitting Fee 1,16,971 97,500
9,765,067 82,66,915
(Amount in `)
Current Year Previous Year
Statutory Audit Fees 4,90,000 4,25,000Tax Audit Fee 85,000 75,000Management Matters 3,45,000 3,00,000Add : Service tax 59,225 51,500Total 9,79,225 8,51,500
Related Party Relationship Nature of Transaction Amount of Transaction
Venus Pharma GmbH Wholly owned Subsidiary Investment in Share Capital ` 25,97,57,051Company Share Application Money
Purchases ` 4,34,41,218Commission ` 37,2,742
Mr. Pawan Chaudhary Chairman cum Managing Director Remuneration Paid ` 41,40,000Mrs. Manu Chaudhary Joint Managing Director Remuneration Paid ` 27,60,000Mr. Peeyush Jain Deputy Managing Director Remuneration Paid ` 13,80,000Mr. Ashutosh Jain Executive Director Remuneration Paid ` 11,04,000Sunev Pharma Solutions Mr Pawan Chaudhary Loan accepted ` 2,30,00,000
Common director Interest paid ` 15,92,548Purchases ` 97,69,617
3. Auditor's Remuneration
Schedules forming part of the Balance Sheet & Profit and Loss Account
Annual Report 2009-10 I 71
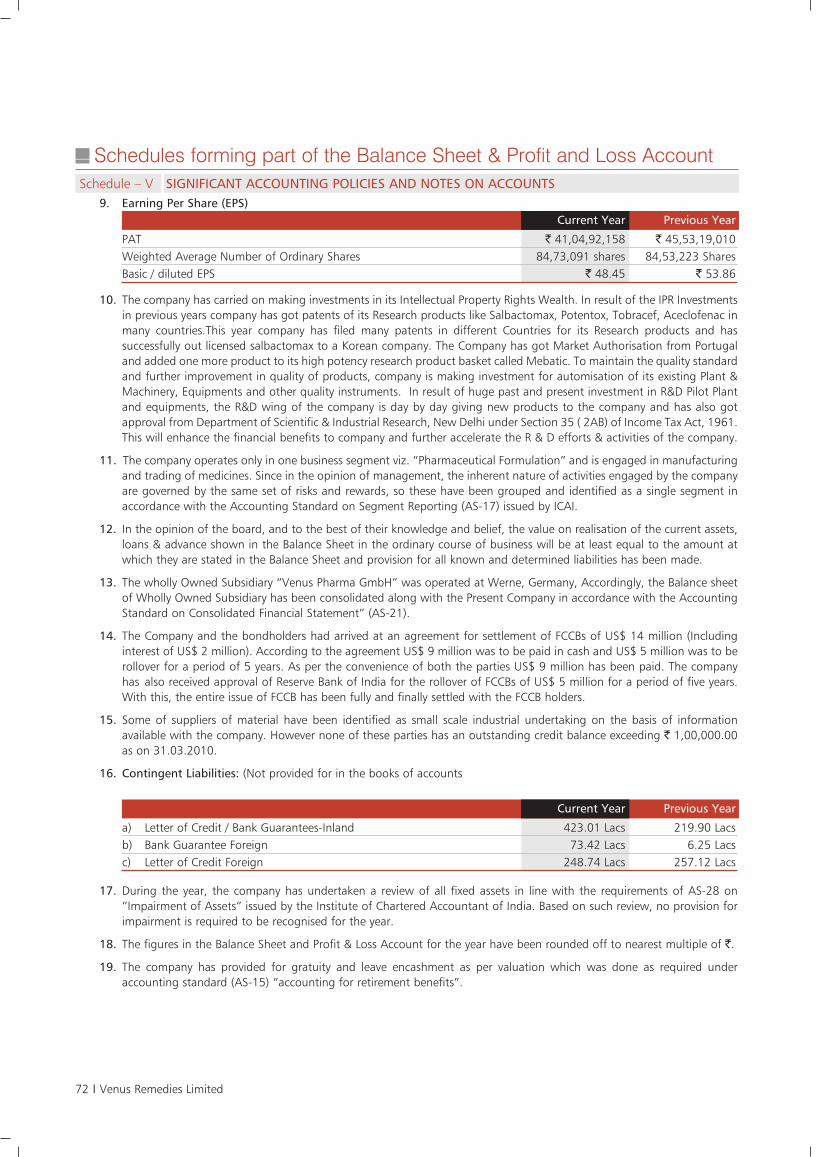
Schedule – V SIGNIFICANT ACCOUNTING POLICIES AND NOTES ON ACCOUNTS
Current Year Previous Year
PAT ` 41,04,92,158 ` 45,53,19,010Weighted Average Number of Ordinary Shares 84,73,091 shares 84,53,223 SharesBasic / diluted EPS ` 48.45 ` 53.86
9. Earning Per Share (EPS)
Current Year Previous Year
a) Letter of Credit / Bank Guarantees-Inland 423.01 Lacs 219.90 Lacsb) Bank Guarantee Foreign 73.42 Lacs 6.25 Lacsc) Letter of Credit Foreign 248.74 Lacs 257.12 Lacs
10. The company has carried on making investments in its Intellectual Property Rights Wealth. In result of the IPR Investmentsin previous years company has got patents of its Research products like Salbactomax, Potentox, Tobracef, Aceclofenac inmany countries.This year company has filed many patents in different Countries for its Research products and hassuccessfully out licensed salbactomax to a Korean company. The Company has got Market Authorisation from Portugaland added one more product to its high potency research product basket called Mebatic. To maintain the quality standardand further improvement in quality of products, company is making investment for automisation of its existing Plant &Machinery, Equipments and other quality instruments. In result of huge past and present investment in R&D Pilot Plantand equipments, the R&D wing of the company is day by day giving new products to the company and has also gotapproval from Department of Scientific & Industrial Research, New Delhi under Section 35 ( 2AB) of Income Tax Act, 1961.This will enhance the financial benefits to company and further accelerate the R & D efforts & activities of the company.
11. The company operates only in one business segment viz. “Pharmaceutical Formulation” and is engaged in manufacturingand trading of medicines. Since in the opinion of management, the inherent nature of activities engaged by the companyare governed by the same set of risks and rewards, so these have been grouped and identified as a single segment inaccordance with the Accounting Standard on Segment Reporting (AS-17) issued by ICAI.
12. In the opinion of the board, and to the best of their knowledge and belief, the value on realisation of the current assets,loans & advance shown in the Balance Sheet in the ordinary course of business will be at least equal to the amount atwhich they are stated in the Balance Sheet and provision for all known and determined liabilities has been made.
13. The wholly Owned Subsidiary “Venus Pharma GmbH” was operated at Werne, Germany, Accordingly, the Balance sheetof Wholly Owned Subsidiary has been consolidated along with the Present Company in accordance with the AccountingStandard on Consolidated Financial Statement” (AS-21).
14. The Company and the bondholders had arrived at an agreement for settlement of FCCBs of US$ 14 million (Includinginterest of US$ 2 million). According to the agreement US$ 9 million was to be paid in cash and US$ 5 million was to berollover for a period of 5 years. As per the convenience of both the parties US$ 9 million has been paid. The companyhas also received approval of Reserve Bank of India for the rollover of FCCBs of US$ 5 million for a period of five years.With this, the entire issue of FCCB has been fully and finally settled with the FCCB holders.
15. Some of suppliers of material have been identified as small scale industrial undertaking on the basis of informationavailable with the company. However none of these parties has an outstanding credit balance exceeding ` 1,00,000.00as on 31.03.2010.
16. Contingent Liabilities: (Not provided for in the books of accounts
17. During the year, the company has undertaken a review of all fixed assets in line with the requirements of AS-28 on“Impairment of Assets” issued by the Institute of Chartered Accountant of India. Based on such review, no provision forimpairment is required to be recognised for the year.
18. The figures in the Balance Sheet and Profit & Loss Account for the year have been rounded off to nearest multiple of `.
19. The company has provided for gratuity and leave encashment as per valuation which was done as required underaccounting standard (AS-15) “accounting for retirement benefits”.
Schedules forming part of the Balance Sheet & Profit and Loss Account
72 I Venus Remedies Limited
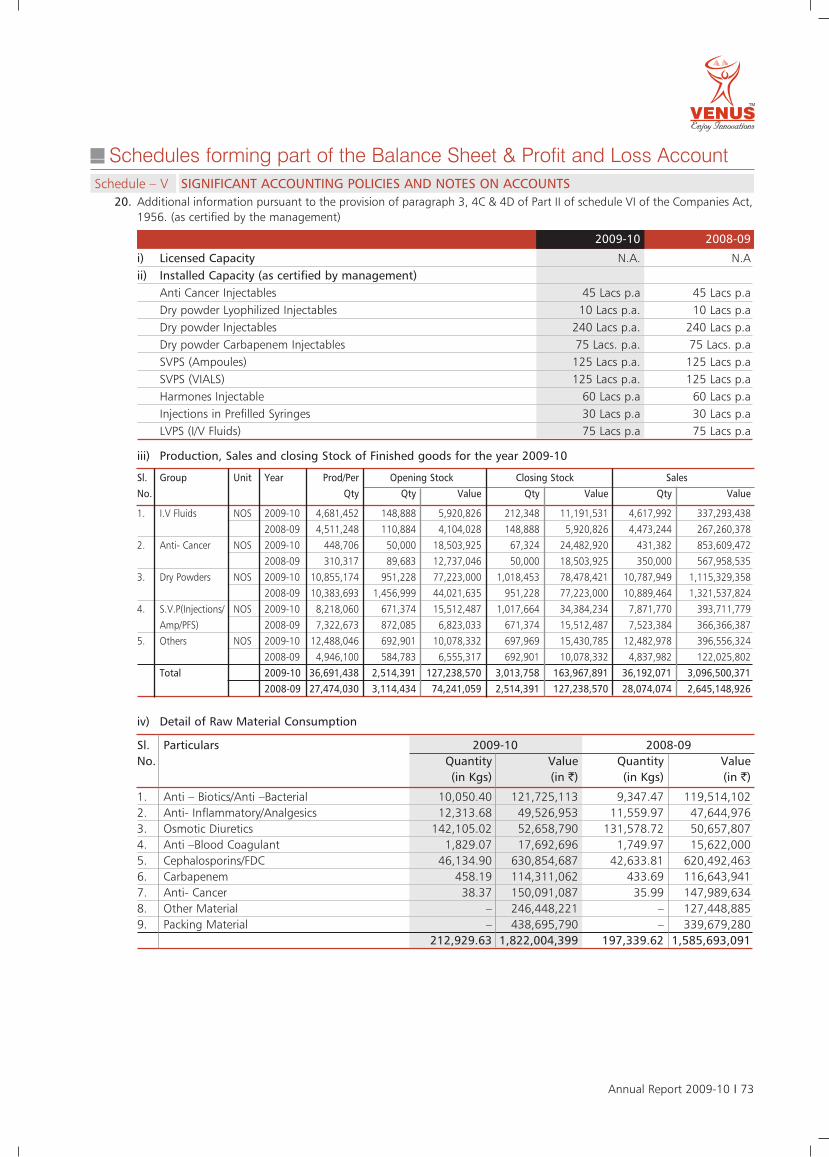
2009-10 2008-09
i) Licensed Capacity N.A. N.Aii) Installed Capacity (as certified by management)
Anti Cancer Injectables 45 Lacs p.a 45 Lacs p.aDry powder Lyophilized Injectables 10 Lacs p.a. 10 Lacs p.aDry powder Injectables 240 Lacs p.a. 240 Lacs p.aDry powder Carbapenem Injectables 75 Lacs. p.a. 75 Lacs. p.aSVPS (Ampoules) 125 Lacs p.a. 125 Lacs p.aSVPS (VIALS) 125 Lacs p.a. 125 Lacs p.aHarmones Injectable 60 Lacs p.a 60 Lacs p.aInjections in Prefilled Syringes 30 Lacs p.a 30 Lacs p.aLVPS (I/V Fluids) 75 Lacs p.a 75 Lacs p.a
Schedule – V SIGNIFICANT ACCOUNTING POLICIES AND NOTES ON ACCOUNTS20. Additional information pursuant to the provision of paragraph 3, 4C & 4D of Part II of schedule VI of the Companies Act,
1956. (as certified by the management)
iii) Production, Sales and closing Stock of Finished goods for the year 2009-10
Sl. Group Unit Year Prod/Per Opening Stock Closing Stock SalesNo. Qty Qty Value Qty Value Qty Value
1. I.V Fluids NOS 2009-10 4,681,452 148,888 5,920,826 212,348 11,191,531 4,617,992 337,293,438
2008-09 4,511,248 110,884 4,104,028 148,888 5,920,826 4,473,244 267,260,378
2. Anti- Cancer NOS 2009-10 448,706 50,000 18,503,925 67,324 24,482,920 431,382 853,609,472
2008-09 310,317 89,683 12,737,046 50,000 18,503,925 350,000 567,958,535
3. Dry Powders NOS 2009-10 10,855,174 951,228 77,223,000 1,018,453 78,478,421 10,787,949 1,115,329,358
2008-09 10,383,693 1,456,999 44,021,635 951,228 77,223,000 10,889,464 1,321,537,824
4. S.V.P(Injections/ NOS 2009-10 8,218,060 671,374 15,512,487 1,017,664 34,384,234 7,871,770 393,711,779
Amp/PFS) 2008-09 7,322,673 872,085 6,823,033 671,374 15,512,487 7,523,384 366,366,387
5. Others NOS 2009-10 12,488,046 692,901 10,078,332 697,969 15,430,785 12,482,978 396,556,324
2008-09 4,946,100 584,783 6,555,317 692,901 10,078,332 4,837,982 122,025,802
Total 2009-10 36,691,438 2,514,391 127,238,570 3,013,758 163,967,891 36,192,071 3,096,500,3712008-09 27,474,030 3,114,434 74,241,059 2,514,391 127,238,570 28,074,074 2,645,148,926
iv) Detail of Raw Material Consumption
Sl. Particulars 2009-10 2008-09No. Quantity Value Quantity Value
(in Kgs) (in `) (in Kgs) (in `)
1. Anti – Biotics/Anti –Bacterial 10,050.40 121,725,113 9,347.47 119,514,1022. Anti- Inflammatory/Analgesics 12,313.68 49,526,953 11,559.97 47,644,9763. Osmotic Diuretics 142,105.02 52,658,790 131,578.72 50,657,8074. Anti –Blood Coagulant 1,829.07 17,692,696 1,749.97 15,622,0005. Cephalosporins/FDC 46,134.90 630,854,687 42,633.81 620,492,4636. Carbapenem 458.19 114,311,062 433.69 116,643,9417. Anti- Cancer 38.37 150,091,087 35.99 147,989,6348. Other Material – 246,448,221 – 127,448,8859. Packing Material – 438,695,790 – 339,679,280
212,929.63 1,822,004,399 197,339.62 1,585,693,091
Schedules forming part of the Balance Sheet & Profit and Loss Account
Annual Report 2009-10 I 73
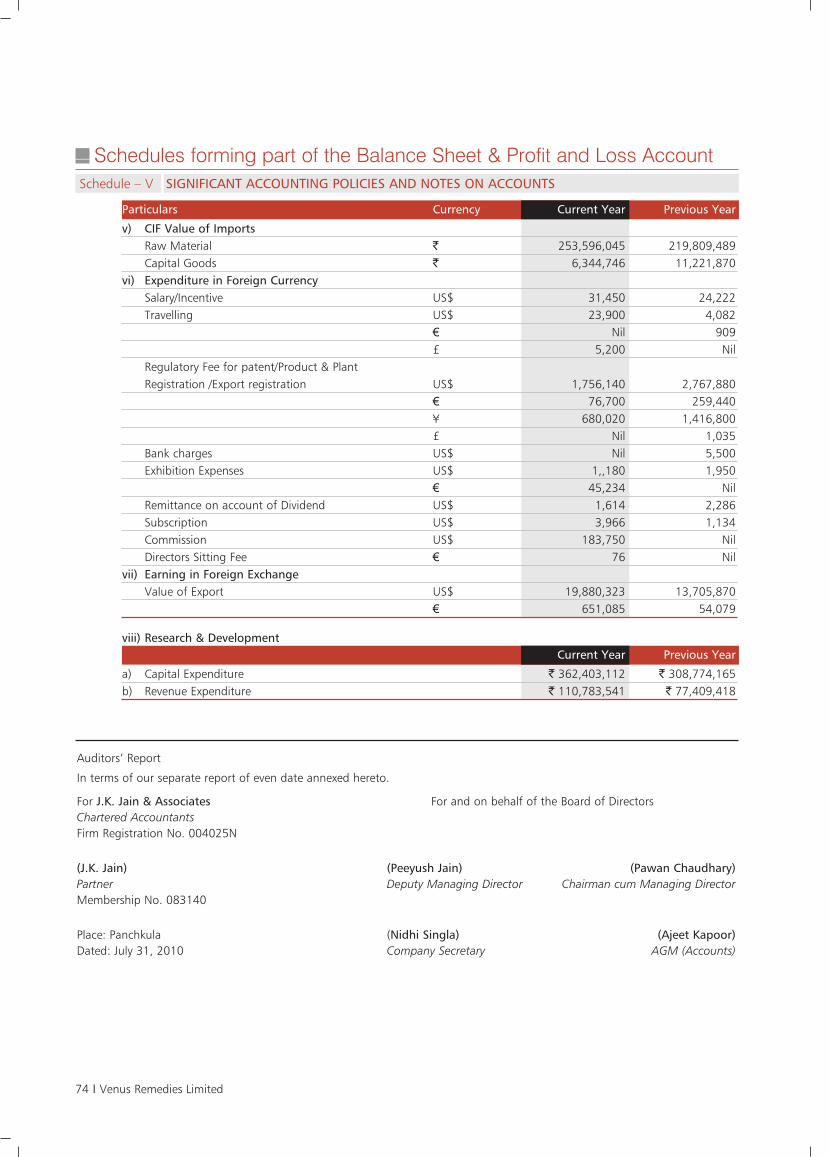
Schedule – V SIGNIFICANT ACCOUNTING POLICIES AND NOTES ON ACCOUNTS
Particulars Currency Current Year Previous Year
v) CIF Value of ImportsRaw Material ` 253,596,045 219,809,489Capital Goods ` 6,344,746 11,221,870
vi) Expenditure in Foreign CurrencySalary/Incentive US$ 31,450 24,222Travelling US$ 23,900 4,082
€ Nil 909£ 5,200 Nil
Regulatory Fee for patent/Product & Plant Registration /Export registration US$ 1,756,140 2,767,880
€ 76,700 259,440¥ 680,020 1,416,800£ Nil 1,035
Bank charges US$ Nil 5,500Exhibition Expenses US$ 1,,180 1,950
€ 45,234 NilRemittance on account of Dividend US$ 1,614 2,286Subscription US$ 3,966 1,134Commission US$ 183,750 NilDirectors Sitting Fee € 76 Nil
vii) Earning in Foreign ExchangeValue of Export US$ 19,880,323 13,705,870
€ 651,085 54,079
Current Year Previous Year
a) Capital Expenditure ` 362,403,112 ` 308,774,165b) Revenue Expenditure ` 110,783,541 ` 77,409,418
viii) Research & Development
Auditors’ Report
In terms of our separate report of even date annexed hereto.
For J.K. Jain & Associates For and on behalf of the Board of DirectorsChartered AccountantsFirm Registration No. 004025N
(J.K. Jain) (Peeyush Jain) (Pawan Chaudhary)Partner Deputy Managing Director Chairman cum Managing DirectorMembership No. 083140
Place: Panchkula (Nidhi Singla) (Ajeet Kapoor)Dated: July 31, 2010 Company Secretary AGM (Accounts)
Schedules forming part of the Balance Sheet & Profit and Loss Account
74 I Venus Remedies Limited
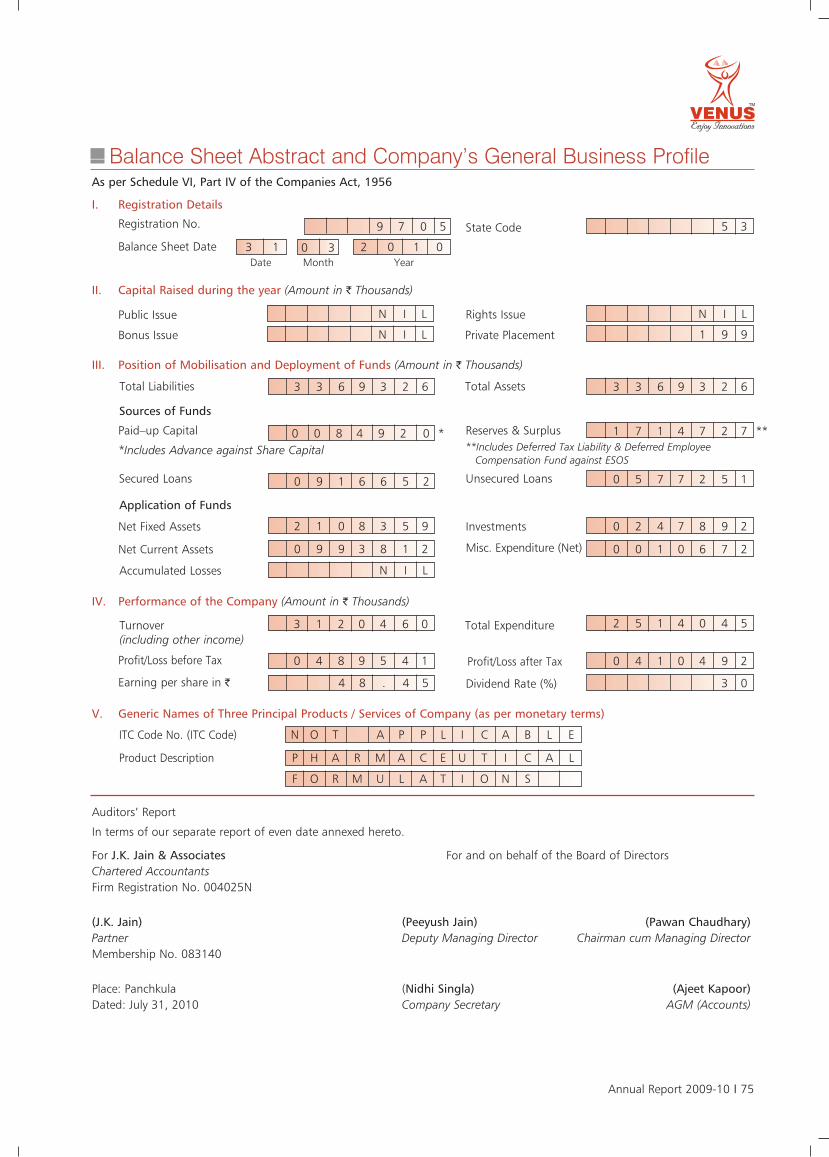
As per Schedule VI, Part IV of the Companies Act, 1956
Public Issue
Bonus Issue
3 1 0 3
Registration No.
Balance Sheet Date
I. Registration Details
II. Capital Raised during the year (Amount in ` Thousands)
Total Liabilities
III. Position of Mobilisation and Deployment of Funds (Amount in ` Thousands)
2 0 1 0Date Month Year
Private Placement
Paid–up Capital
*Includes Advance against Share Capital
Sources of Funds
Total Assets
Reserves & Surplus**Includes Deferred Tax Liability & Deferred Employee
Compensation Fund against ESOS
IV. Performance of the Company (Amount in ` Thousands)
ITC Code No. (ITC Code)
Product Description
V. Generic Names of Three Principal Products / Services of Company (as per monetary terms)
Net Fixed Assets
Turnover (including other income)
Profit/Loss before Tax
Total Expenditure
Profit/Loss after Tax
Application of Funds
3 3 6 9 3 2 6
9 7 0 5
0 0 8 4 9 2 0 *
3 1 2 0 4 6 0
0 4 8 9 5 4 1
2 5 1 4 0 4 5
0 4 1 0 4 9 2
Earning per share in ` Dividend Rate (%)4 8 . 4 5
N O T A P P L I C A B L E
P H A R M A C E U T I C A L
F O R M U L A T I O N S
3 0
2 1 0 8 3 5 9 0 2 4 7 8 9 2
Net Current Assets Misc. Expenditure (Net)0 9 9 3 8 1 2 0 0 1 0 6 7 2
Accumulated Losses N I L
1 9 9
Rights Issue N I L
State Code 5 3
N I L
N I L
3 3 6 9 3 2 6
1 7 1 4 7 2 7 **
Secured Loans Unsecured Loans
Investments
0 9 1 6 6 5 2 0 5 7 7 2 5 1
Auditors’ Report
In terms of our separate report of even date annexed hereto.
For J.K. Jain & Associates For and on behalf of the Board of DirectorsChartered AccountantsFirm Registration No. 004025N
(J.K. Jain) (Peeyush Jain) (Pawan Chaudhary)Partner Deputy Managing Director Chairman cum Managing DirectorMembership No. 083140
Place: Panchkula (Nidhi Singla) (Ajeet Kapoor)Dated: July 31, 2010 Company Secretary AGM (Accounts)
Balance Sheet Abstract and Company’s General Business Profile
Annual Report 2009-10 I 75
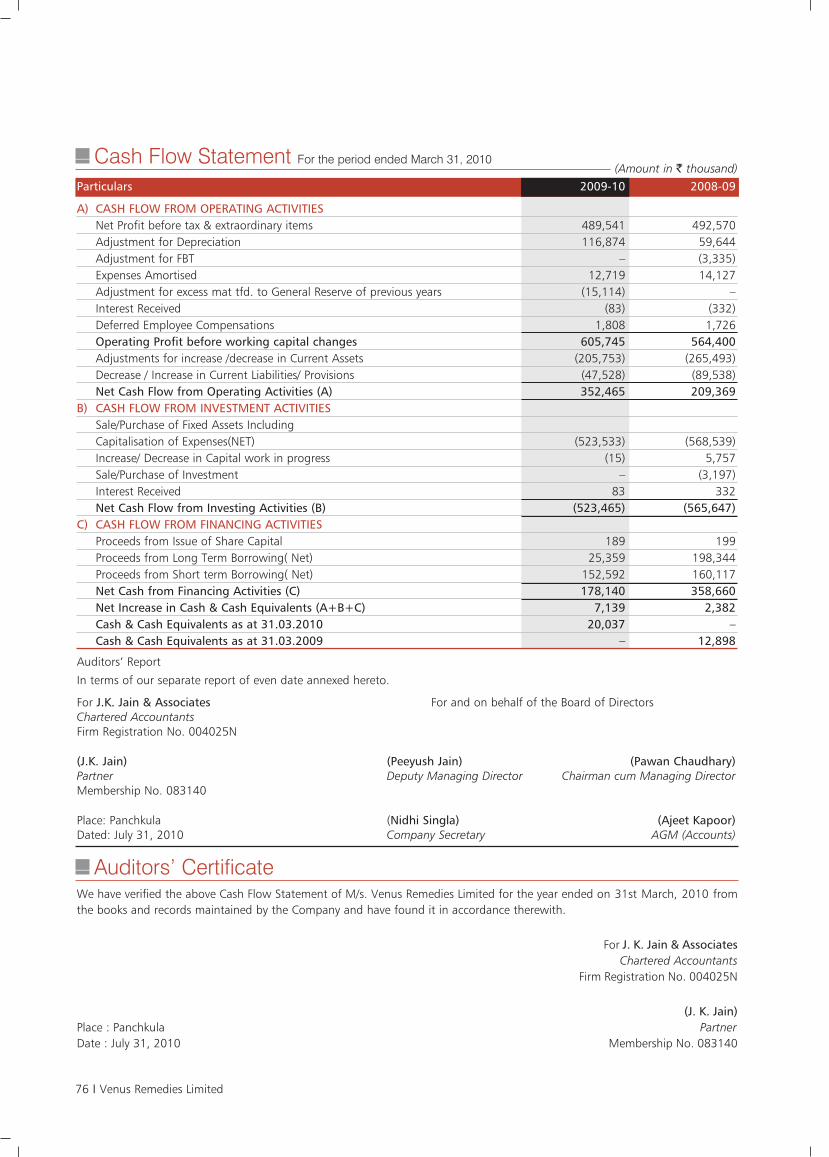
Auditors’ Certificate
(Amount in ` thousand)
Auditors’ Report
In terms of our separate report of even date annexed hereto.
For J.K. Jain & Associates For and on behalf of the Board of DirectorsChartered AccountantsFirm Registration No. 004025N
(J.K. Jain) (Peeyush Jain) (Pawan Chaudhary)Partner Deputy Managing Director Chairman cum Managing DirectorMembership No. 083140
Place: Panchkula (Nidhi Singla) (Ajeet Kapoor)Dated: July 31, 2010 Company Secretary AGM (Accounts)
We have verified the above Cash Flow Statement of M/s. Venus Remedies Limited for the year ended on 31st March, 2010 fromthe books and records maintained by the Company and have found it in accordance therewith.
For J. K. Jain & AssociatesChartered Accountants
Firm Registration No. 004025N
(J. K. Jain)Place : Panchkula PartnerDate : July 31, 2010 Membership No. 083140
Particulars 2009-10 2008-09
A) CASH FLOW FROM OPERATING ACTIVITIESNet Profit before tax & extraordinary items 489,541 492,570 Adjustment for Depreciation 116,874 59,644 Adjustment for FBT – (3,335)Expenses Amortised 12,719 14,127 Adjustment for excess mat tfd. to General Reserve of previous years (15,114) –Interest Received (83) (332)Deferred Employee Compensations 1,808 1,726 Operating Profit before working capital changes 605,745 564,400 Adjustments for increase /decrease in Current Assets (205,753) (265,493)Decrease / Increase in Current Liabilities/ Provisions (47,528) (89,538)Net Cash Flow from Operating Activities (A) 352,465 209,369
B) CASH FLOW FROM INVESTMENT ACTIVITIESSale/Purchase of Fixed Assets Including Capitalisation of Expenses(NET) (523,533) (568,539)Increase/ Decrease in Capital work in progress (15) 5,757 Sale/Purchase of Investment – (3,197)Interest Received 83 332 Net Cash Flow from Investing Activities (B) (523,465) (565,647)
C) CASH FLOW FROM FINANCING ACTIVITIESProceeds from Issue of Share Capital 189 199 Proceeds from Long Term Borrowing( Net) 25,359 198,344 Proceeds from Short term Borrowing( Net) 152,592 160,117 Net Cash from Financing Activities (C) 178,140 358,660 Net Increase in Cash & Cash Equivalents (A+B+C) 7,139 2,382 Cash & Cash Equivalents as at 31.03.2010 20,037 –Cash & Cash Equivalents as at 31.03.2009 – 12,898
Cash Flow Statement For the period ended March 31, 2010
76 I Venus Remedies Limited
It gives us great pleasure to present the fifth annual report of
the Company together with the Audited Statement of
Accounts for the year ended March 31, 2010.
Financial highlights(Amount in € Thousands)
Particulars 2009-10 2008-09
Sales and Other Income 1472.89 1023.55
Operating Deficit (174.50) (114.47)
Finance Charges 18.96 2.88
Depreciation 129.18 116.42
Net Loss in Operations (322.64) (233.76)
OperationsVenus Pharma GmbH, the wholly-owned subsidiary of Venus,
India has a EU-GMP manufacturing facility located in the heart
of Germany with a vision to enhance Global presence of the
parent Company. It has world-class quality assurance and
quality control laboratories. The Company provides,
manufacturing, logistics, and quality-control support and was
a high capacity warehouse which handles the logistical needs
of storage and distribution of goods for various clients under
controlled conditions to whole of the Europe. It is engaged in
the out-licensing of CTD, site variation projects, marketing
associates, testing and batch release for Europe, warehousing
and logistical support
Some of the major highlights are as follows :
A) Received marketing authorisation for its product
Meropenem, a carbapenem injection from the EU country,
Portugal
B) Provided full coordination and support in establishing anti-
cancer and anti-infective markets in the European Union
C) Developed a CTD dossier for patented research product
Sulbactomax, ready to enter European and regulated
markets
D) Provided all possible guidance and technical support in the
registration of 3 CTD dossiers filed in Europe by Venus
India, 2 are in process
E) Promoted research products in Syria and Wes-African
countries, thereby playing a major role in brand-building
F) Developed two CTD dossiers for Docetaxel and Topotecan
for big European companies.
G) Provided all support and arrangements to ensure successful
participation at CPhI-2009 in Madrid and various
international meets by the Company.
Management discussion and analysisIndustry structure and development: Overview
Germany is the third-largest pharmaceutical market in the
world and the largest in Europe.
As per the report of “German Pharma Sector Analysis” most of
the growth in the sector will be driven by new and innovative
product launches and increasing exports to the Asian and
Eastern European markets. At present, exports dominate the
overall market and the same trend is expected to continue in
the future as well. The country's pharmaceutical market is
estimated to have generated revenues of over € 23 Billion (US$
32.2 Billion) in 2009, and a consistent and strong growth is
anticipated in the market for the next few years.
Opportunities
Germany is one of the largest pharmaceutical markets in the
world. Most of the pharma companies in Germany are focused
on research, which has led the country to become one of the
most advanced pharma markets in the world.
Venus Pharma GmbH is the primary centre for the European
business of Venus in 27 EU and EEA and Gulf countries. This
German Unit, backed up by quality-innovative products from
EU GMP approved units, over 341 patent applications globally
and about 550 product registration dossiers filed throughout
the world and has the perfect time to take off. With this long
leap Venus is currently among the only three EU-GMP
Directors’ Report
Annual Report 2009-10 I 77
To
The members of
VENUS PHARMA GmbH
manufacturers of Carbapenem Antibiotics in the World,
capable of marketing this drug in Europe.
Threats
In the opinion of the management, the Company does not
foresee any immediate threat to its plans. The Company is
working with the vision to enhance the global presence of the
parent company in a planned manner.
Segment-wise performance:
The sales and other income increased by 43.90% in comparison
with 2008-09 while the manufacturing expenses reduced by
around 28.66%. Overall, the Company improved its financial
performance. It is providing full coordination and support in
establishing anti-cancer and anti-infective markets in European
Union .
Venus Pharma GmbH is spanning its wings in European, North
American, West African and Middle Eastern markets. It has
already received marketing authorisation of Meropenem, a
carbapenem injection, in a European Union country, through
the registration in Portugal.
Directors
Mr. Pawan Chaudhary, Chairman and Managing Director,
represents the present Board of Directors of the Company that
includes Mrs. Manu Chaudhary as Joint Managing Director, Mr.
Peeyush Jain as Deputy Managing Director, Mr. Ashutosh Jain
as Executive Director and Chief Executive Officer .
Auditors
The Statutory Auditors, M/s J.K. Jain & Associates, who are also
Statutory Auditors for the parent company, retire at the
forthcoming Annual General Meeting and being eligible, offer
themselves for reappointment. The notes to the accounts
referred to in the Auditor’s Report are self explanatory and
therefore do not require further explanation.
For and on behalf of Board of Directors
For VENUS PHARMA GmbH
Place: Panchkula (Pawan Chaudhary)
Date: July 31, 2010 Chairman cum Managing Director
78 I Venus Remedies Limited
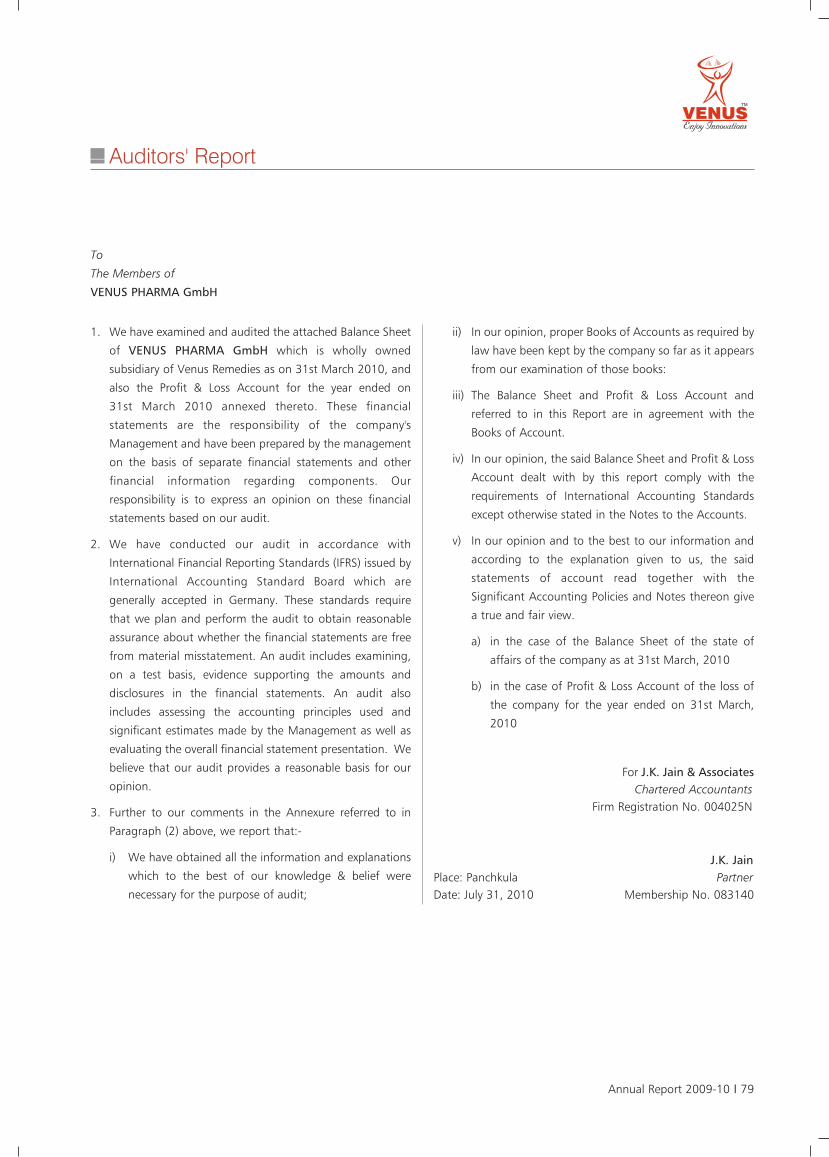
1. We have examined and audited the attached Balance Sheet
of VENUS PHARMA GmbH which is wholly owned
subsidiary of Venus Remedies as on 31st March 2010, and
also the Profit & Loss Account for the year ended on
31st March 2010 annexed thereto. These financial
statements are the responsibility of the company's
Management and have been prepared by the management
on the basis of separate financial statements and other
financial information regarding components. Our
responsibility is to express an opinion on these financial
statements based on our audit.
2. We have conducted our audit in accordance with
International Financial Reporting Standards (IFRS) issued by
International Accounting Standard Board which are
generally accepted in Germany. These standards require
that we plan and perform the audit to obtain reasonable
assurance about whether the financial statements are free
from material misstatement. An audit includes examining,
on a test basis, evidence supporting the amounts and
disclosures in the financial statements. An audit also
includes assessing the accounting principles used and
significant estimates made by the Management as well as
evaluating the overall financial statement presentation. We
believe that our audit provides a reasonable basis for our
opinion.
3. Further to our comments in the Annexure referred to in
Paragraph (2) above, we report that:-
i) We have obtained all the information and explanations
which to the best of our knowledge & belief were
necessary for the purpose of audit;
ii) In our opinion, proper Books of Accounts as required by
law have been kept by the company so far as it appears
from our examination of those books:
iii) The Balance Sheet and Profit & Loss Account and
referred to in this Report are in agreement with the
Books of Account.
iv) In our opinion, the said Balance Sheet and Profit & Loss
Account dealt with by this report comply with the
requirements of International Accounting Standards
except otherwise stated in the Notes to the Accounts.
v) In our opinion and to the best to our information and
according to the explanation given to us, the said
statements of account read together with the
Significant Accounting Policies and Notes thereon give
a true and fair view.
a) in the case of the Balance Sheet of the state of
affairs of the company as at 31st March, 2010
b) in the case of Profit & Loss Account of the loss of
the company for the year ended on 31st March,
2010
For J.K. Jain & AssociatesChartered Accountants
Firm Registration No. 004025N
J.K. JainPlace: Panchkula PartnerDate: July 31, 2010 Membership No. 083140
To
The Members of
VENUS PHARMA GmbH
Auditors' Report
Annual Report 2009-10 I 79
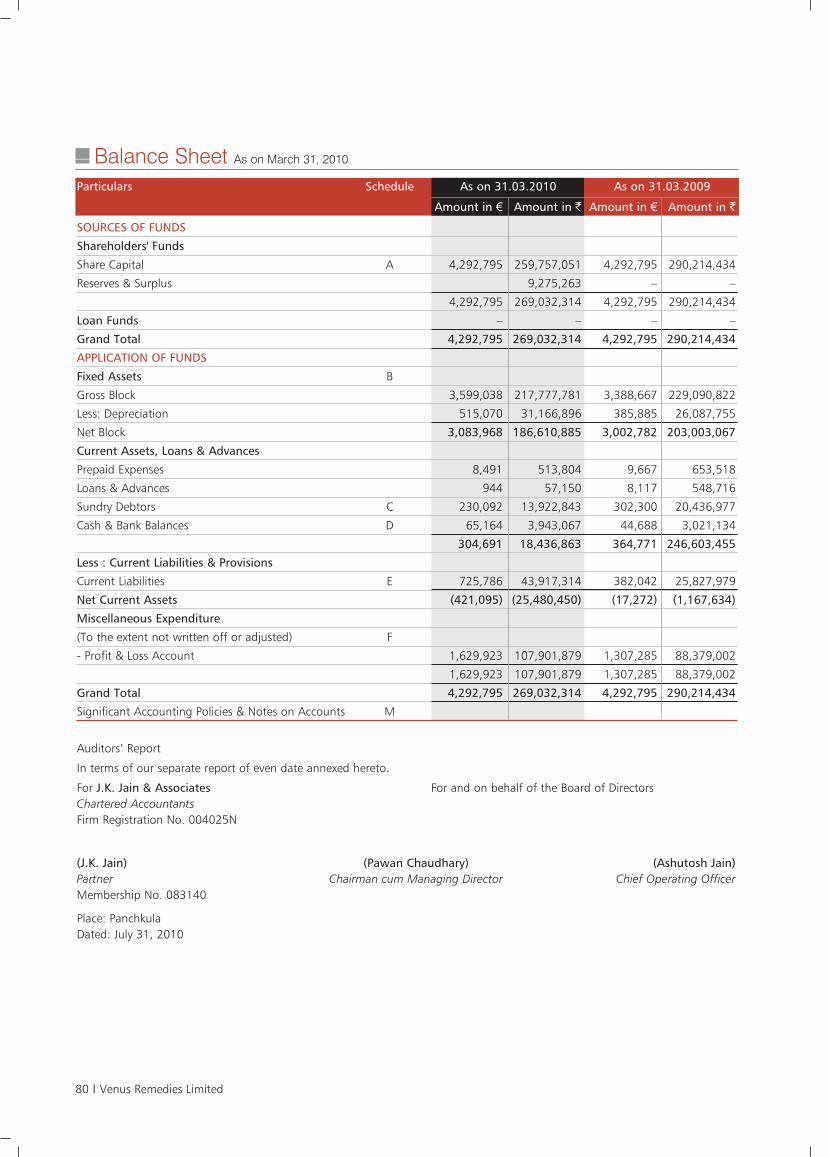
Auditors’ Report
In terms of our separate report of even date annexed hereto.
For J.K. Jain & Associates For and on behalf of the Board of DirectorsChartered AccountantsFirm Registration No. 004025N
(J.K. Jain) (Pawan Chaudhary) (Ashutosh Jain)Partner Chairman cum Managing Director Chief Operating OfficerMembership No. 083140
Place: PanchkulaDated: July 31, 2010
Particulars Schedule As on 31.03.2010 As on 31.03.2009
Amount in € Amount in ` Amount in € Amount in `
SOURCES OF FUNDS
Shareholders' Funds
Share Capital A 4,292,795 259,757,051 4,292,795 290,214,434
Reserves & Surplus 9,275,263 – –
4,292,795 269,032,314 4,292,795 290,214,434
Loan Funds – – – –
Grand Total 4,292,795 269,032,314 4,292,795 290,214,434
APPLICATION OF FUNDS
Fixed Assets B
Gross Block 3,599,038 217,777,781 3,388,667 229,090,822
Less: Depreciation 515,070 31,166,896 385,885 26,087,755
Net Block 3,083,968 186,610,885 3,002,782 203,003,067
Current Assets, Loans & Advances
Prepaid Expenses 8,491 513,804 9,667 653,518
Loans & Advances 944 57,150 8,117 548,716
Sundry Debtors C 230,092 13,922,843 302,300 20,436,977
Cash & Bank Balances D 65,164 3,943,067 44,688 3,021,134
304,691 18,436,863 364,771 246,603,455
Less : Current Liabilities & Provisions
Current Liabilities E 725,786 43,917,314 382,042 25,827,979
Net Current Assets (421,095) (25,480,450) (17,272) (1,167,634)
Miscellaneous Expenditure
(To the extent not written off or adjusted) F
- Profit & Loss Account 1,629,923 107,901,879 1,307,285 88,379,002
1,629,923 107,901,879 1,307,285 88,379,002
Grand Total 4,292,795 269,032,314 4,292,795 290,214,434
Significant Accounting Policies & Notes on Accounts M
Balance Sheet As on March 31, 2010
80 I Venus Remedies Limited
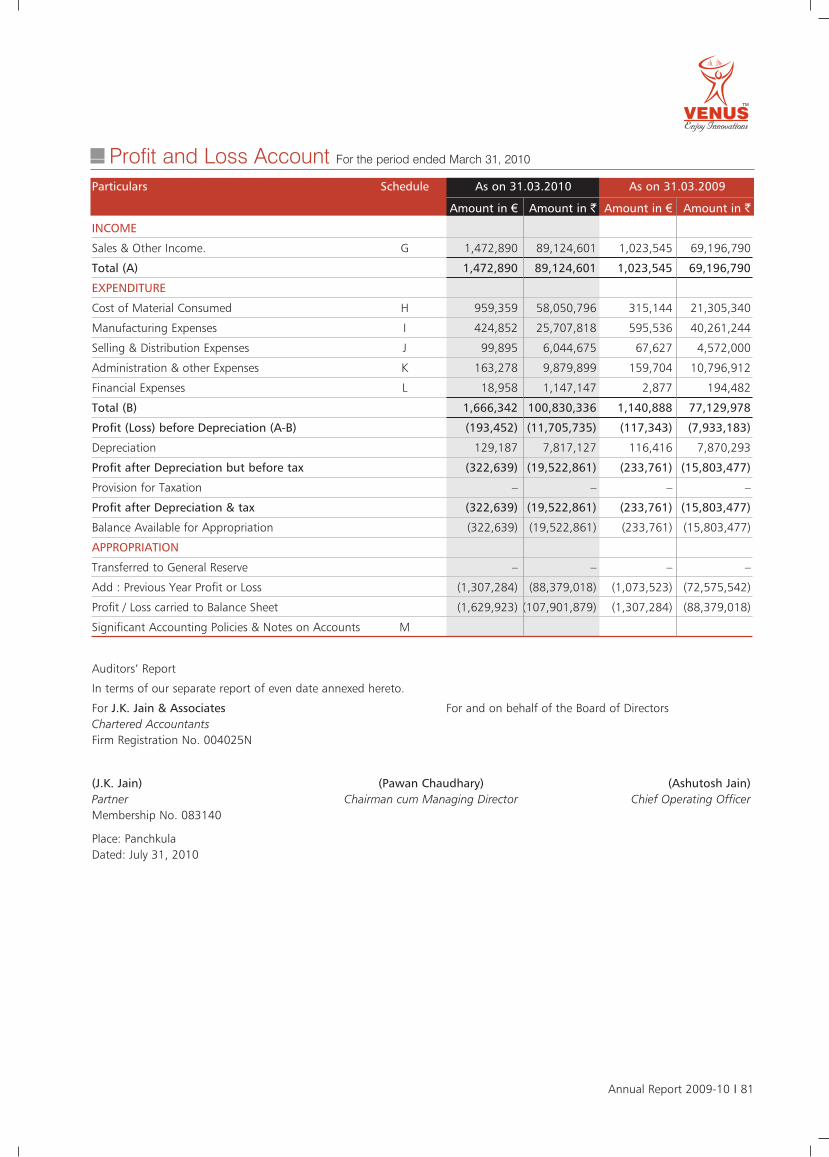
Auditors’ Report
In terms of our separate report of even date annexed hereto.
For J.K. Jain & Associates For and on behalf of the Board of DirectorsChartered AccountantsFirm Registration No. 004025N
(J.K. Jain) (Pawan Chaudhary) (Ashutosh Jain)Partner Chairman cum Managing Director Chief Operating OfficerMembership No. 083140
Place: PanchkulaDated: July 31, 2010
Particulars Schedule As on 31.03.2010 As on 31.03.2009
Amount in € Amount in ` Amount in € Amount in `
INCOME
Sales & Other Income. G 1,472,890 89,124,601 1,023,545 69,196,790
Total (A) 1,472,890 89,124,601 1,023,545 69,196,790
EXPENDITURE
Cost of Material Consumed H 959,359 58,050,796 315,144 21,305,340
Manufacturing Expenses I 424,852 25,707,818 595,536 40,261,244
Selling & Distribution Expenses J 99,895 6,044,675 67,627 4,572,000
Administration & other Expenses K 163,278 9,879,899 159,704 10,796,912
Financial Expenses L 18,958 1,147,147 2,877 194,482
Total (B) 1,666,342 100,830,336 1,140,888 77,129,978
Profit (Loss) before Depreciation (A-B) (193,452) (11,705,735) (117,343) (7,933,183)
Depreciation 129,187 7,817,127 116,416 7,870,293
Profit after Depreciation but before tax (322,639) (19,522,861) (233,761) (15,803,477)
Provision for Taxation – – – –
Profit after Depreciation & tax (322,639) (19,522,861) (233,761) (15,803,477)
Balance Available for Appropriation (322,639) (19,522,861) (233,761) (15,803,477)
APPROPRIATION
Transferred to General Reserve – – – –
Add : Previous Year Profit or Loss (1,307,284) (88,379,018) (1,073,523) (72,575,542)
Profit / Loss carried to Balance Sheet (1,629,923) (107,901,879) (1,307,284) (88,379,018)
Significant Accounting Policies & Notes on Accounts M
Profit and Loss Account For the period ended March 31, 2010
Annual Report 2009-10 I 81
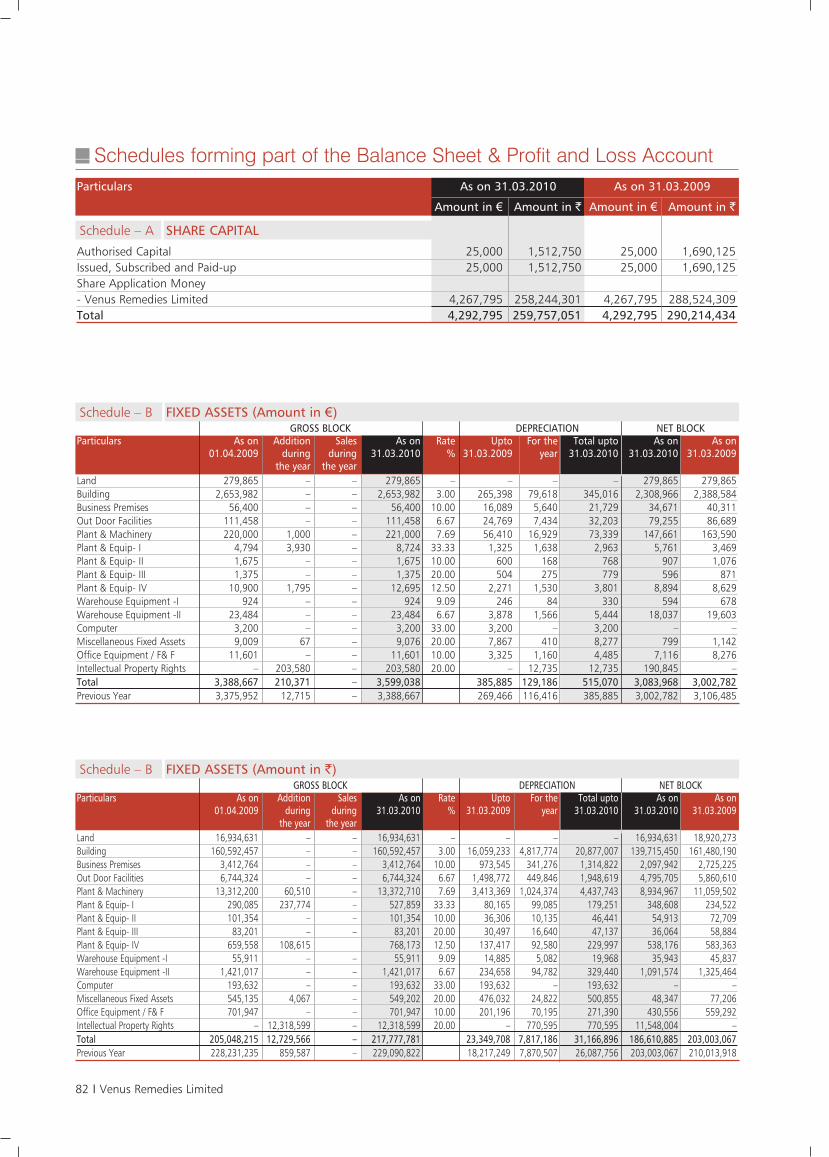
Particulars As on 31.03.2010 As on 31.03.2009
Amount in € Amount in ` Amount in € Amount in `
Authorised Capital 25,000 1,512,750 25,000 1,690,125 Issued, Subscribed and Paid-up 25,000 1,512,750 25,000 1,690,125 Share Application Money- Venus Remedies Limited 4,267,795 258,244,301 4,267,795 288,524,309 Total 4,292,795 259,757,051 4,292,795 290,214,434
Schedule – A SHARE CAPITAL
GROSS BLOCK DEPRECIATION NET BLOCK Particulars As on Addition Sales As on Rate Upto For the Total upto As on As on
01.04.2009 during during 31.03.2010 % 31.03.2009 year 31.03.2010 31.03.2010 31.03.2009the year the year
Land 279,865 – – 279,865 – – – – 279,865 279,865 Building 2,653,982 – – 2,653,982 3.00 265,398 79,618 345,016 2,308,966 2,388,584 Business Premises 56,400 – – 56,400 10.00 16,089 5,640 21,729 34,671 40,311 Out Door Facilities 111,458 – – 111,458 6.67 24,769 7,434 32,203 79,255 86,689 Plant & Machinery 220,000 1,000 – 221,000 7.69 56,410 16,929 73,339 147,661 163,590 Plant & Equip- I 4,794 3,930 – 8,724 33.33 1,325 1,638 2,963 5,761 3,469 Plant & Equip- II 1,675 – – 1,675 10.00 600 168 768 907 1,076 Plant & Equip- III 1,375 – – 1,375 20.00 504 275 779 596 871 Plant & Equip- IV 10,900 1,795 – 12,695 12.50 2,271 1,530 3,801 8,894 8,629 Warehouse Equipment -I 924 – – 924 9.09 246 84 330 594 678 Warehouse Equipment -II 23,484 – – 23,484 6.67 3,878 1,566 5,444 18,037 19,603 Computer 3,200 – – 3,200 33.00 3,200 – 3,200 – – Miscellaneous Fixed Assets 9,009 67 – 9,076 20.00 7,867 410 8,277 799 1,142 Office Equipment / F& F 11,601 – – 11,601 10.00 3,325 1,160 4,485 7,116 8,276 Intellectual Property Rights – 203,580 – 203,580 20.00 – 12,735 12,735 190,845 – Total 3,388,667 210,371 – 3,599,038 385,885 129,186 515,070 3,083,968 3,002,782 Previous Year 3,375,952 12,715 – 3,388,667 269,466 116,416 385,885 3,002,782 3,106,485
Schedule – B FIXED ASSETS (Amount in €)
GROSS BLOCK DEPRECIATION NET BLOCK Particulars As on Addition Sales As on Rate Upto For the Total upto As on As on
01.04.2009 during during 31.03.2010 % 31.03.2009 year 31.03.2010 31.03.2010 31.03.2009the year the year
Land 16,934,631 – – 16,934,631 – – – – 16,934,631 18,920,273Building 160,592,457 – – 160,592,457 3.00 16,059,233 4,817,774 20,877,007 139,715,450 161,480,190Business Premises 3,412,764 – – 3,412,764 10.00 973,545 341,276 1,314,822 2,097,942 2,725,225Out Door Facilities 6,744,324 – – 6,744,324 6.67 1,498,772 449,846 1,948,619 4,795,705 5,860,610Plant & Machinery 13,312,200 60,510 – 13,372,710 7.69 3,413,369 1,024,374 4,437,743 8,934,967 11,059,502Plant & Equip- I 290,085 237,774 – 527,859 33.33 80,165 99,085 179,251 348,608 234,522Plant & Equip- II 101,354 – – 101,354 10.00 36,306 10,135 46,441 54,913 72,709Plant & Equip- III 83,201 – – 83,201 20.00 30,497 16,640 47,137 36,064 58,884Plant & Equip- IV 659,558 108,615 768,173 12.50 137,417 92,580 229,997 538,176 583,363Warehouse Equipment -I 55,911 – – 55,911 9.09 14,885 5,082 19,968 35,943 45,837Warehouse Equipment -II 1,421,017 – – 1,421,017 6.67 234,658 94,782 329,440 1,091,574 1,325,464Computer 193,632 – – 193,632 33.00 193,632 – 193,632 – –Miscellaneous Fixed Assets 545,135 4,067 – 549,202 20.00 476,032 24,822 500,855 48,347 77,206Office Equipment / F& F 701,947 – – 701,947 10.00 201,196 70,195 271,390 430,556 559,292Intellectual Property Rights – 12,318,599 – 12,318,599 20.00 – 770,595 770,595 11,548,004 –Total 205,048,215 12,729,566 – 217,777,781 23,349,708 7,817,186 31,166,896 186,610,885 203,003,067Previous Year 228,231,235 859,587 – 229,090,822 18,217,249 7,870,507 26,087,756 203,003,067 210,013,918
Schedule – B FIXED ASSETS (Amount in `)
Schedules forming part of the Balance Sheet & Profit and Loss Account
82 I Venus Remedies Limited
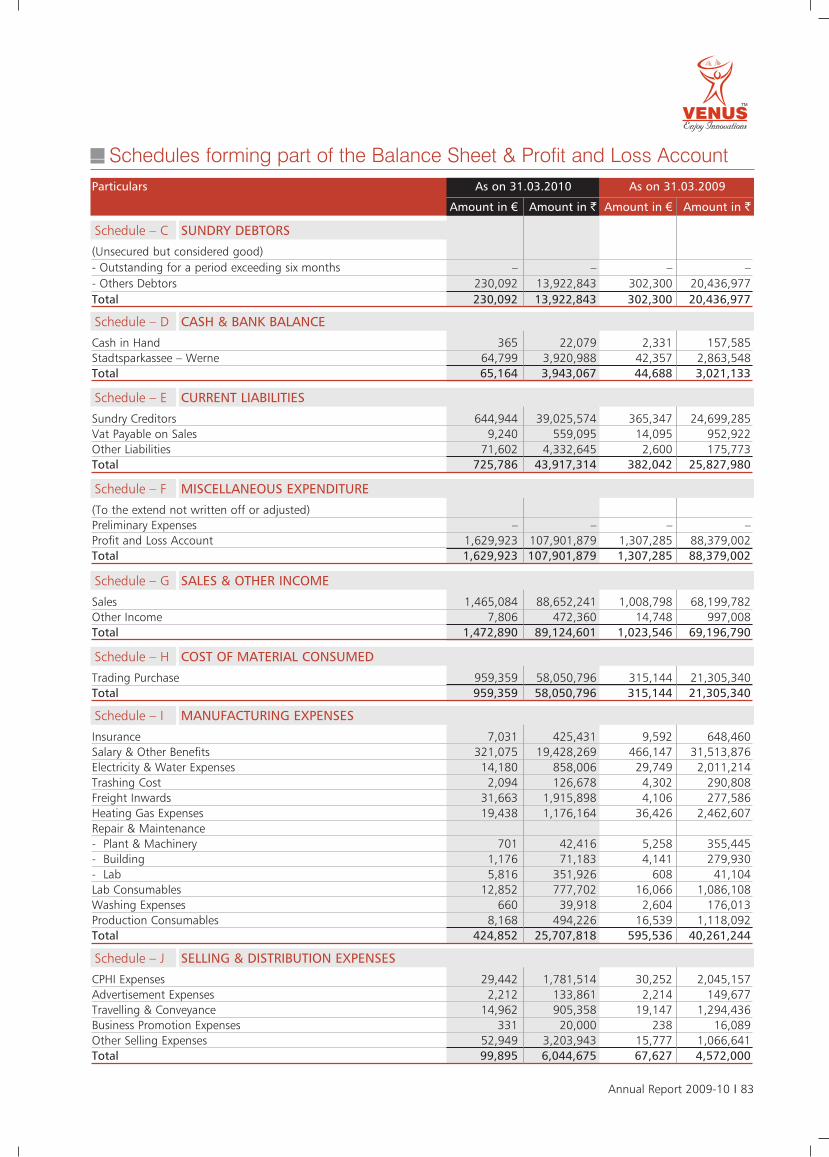
Particulars As on 31.03.2010 As on 31.03.2009
Amount in € Amount in ` Amount in € Amount in `
(Unsecured but considered good)- Outstanding for a period exceeding six months – – – – - Others Debtors 230,092 13,922,843 302,300 20,436,977 Total 230,092 13,922,843 302,300 20,436,977
Schedule – C SUNDRY DEBTORS
Sundry Creditors 644,944 39,025,574 365,347 24,699,285 Vat Payable on Sales 9,240 559,095 14,095 952,922 Other Liabilities 71,602 4,332,645 2,600 175,773 Total 725,786 43,917,314 382,042 25,827,980
Schedule – E CURRENT LIABILITIES
(To the extend not written off or adjusted)Preliminary Expenses – – – – Profit and Loss Account 1,629,923 107,901,879 1,307,285 88,379,002 Total 1,629,923 107,901,879 1,307,285 88,379,002
Schedule – F MISCELLANEOUS EXPENDITURE
CPHI Expenses 29,442 1,781,514 30,252 2,045,157 Advertisement Expenses 2,212 133,861 2,214 149,677 Travelling & Conveyance 14,962 905,358 19,147 1,294,436 Business Promotion Expenses 331 20,000 238 16,089 Other Selling Expenses 52,949 3,203,943 15,777 1,066,641 Total 99,895 6,044,675 67,627 4,572,000
Schedule – J SELLING & DISTRIBUTION EXPENSES
Sales 1,465,084 88,652,241 1,008,798 68,199,782 Other Income 7,806 472,360 14,748 997,008 Total 1,472,890 89,124,601 1,023,546 69,196,790
Trading Purchase 959,359 58,050,796 315,144 21,305,340 Total 959,359 58,050,796 315,144 21,305,340
Schedule – H COST OF MATERIAL CONSUMED
Insurance 7,031 425,431 9,592 648,460 Salary & Other Benefits 321,075 19,428,269 466,147 31,513,876 Electricity & Water Expenses 14,180 858,006 29,749 2,011,214 Trashing Cost 2,094 126,678 4,302 290,808 Freight Inwards 31,663 1,915,898 4,106 277,586 Heating Gas Expenses 19,438 1,176,164 36,426 2,462,607 Repair & Maintenance - Plant & Machinery 701 42,416 5,258 355,445 - Building 1,176 71,183 4,141 279,930 - Lab 5,816 351,926 608 41,104 Lab Consumables 12,852 777,702 16,066 1,086,108 Washing Expenses 660 39,918 2,604 176,013 Production Consumables 8,168 494,226 16,539 1,118,092 Total 424,852 25,707,818 595,536 40,261,244
Schedule – I MANUFACTURING EXPENSES
Schedule – G SALES & OTHER INCOME
Cash in Hand 365 22,079 2,331 157,585 Stadtsparkassee – Werne 64,799 3,920,988 42,357 2,863,548 Total 65,164 3,943,067 44,688 3,021,133
Schedule – D CASH & BANK BALANCE
Schedules forming part of the Balance Sheet & Profit and Loss Account
Annual Report 2009-10 I 83
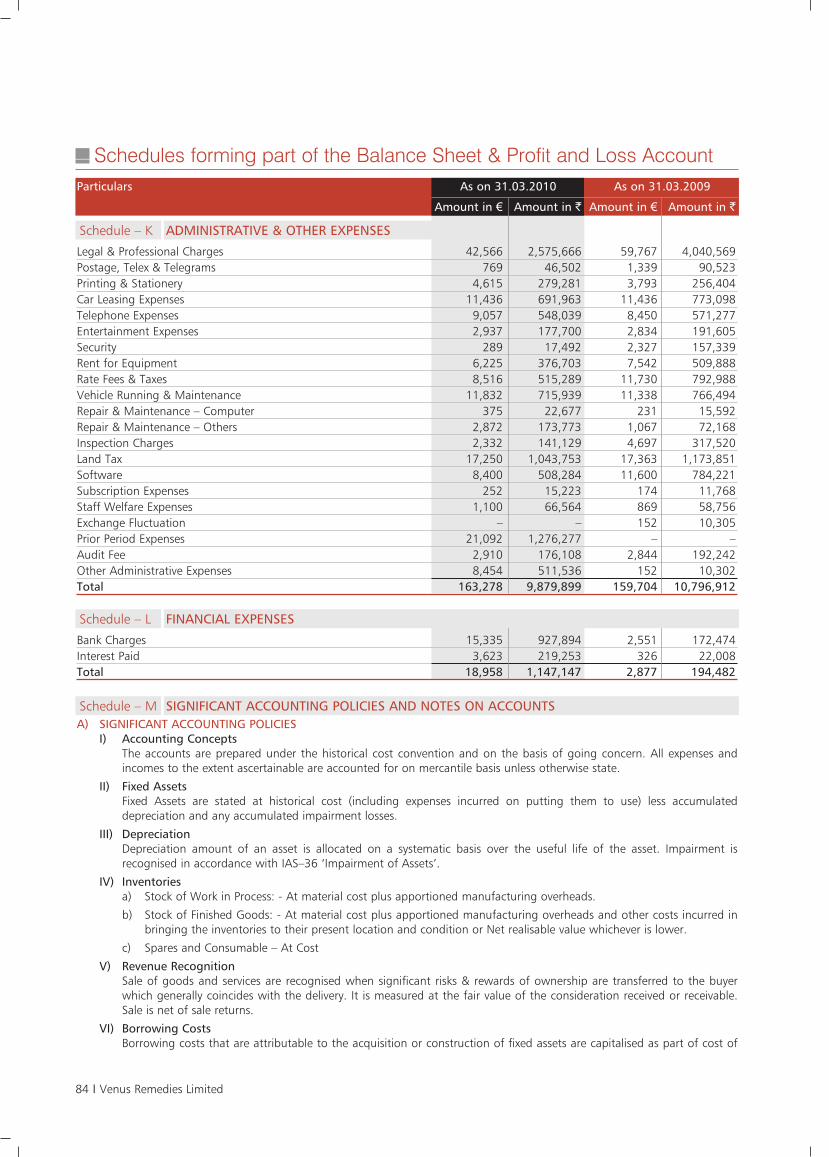
Particulars As on 31.03.2010 As on 31.03.2009
Amount in € Amount in ` Amount in € Amount in `
Legal & Professional Charges 42,566 2,575,666 59,767 4,040,569 Postage, Telex & Telegrams 769 46,502 1,339 90,523 Printing & Stationery 4,615 279,281 3,793 256,404 Car Leasing Expenses 11,436 691,963 11,436 773,098 Telephone Expenses 9,057 548,039 8,450 571,277 Entertainment Expenses 2,937 177,700 2,834 191,605 Security 289 17,492 2,327 157,339 Rent for Equipment 6,225 376,703 7,542 509,888 Rate Fees & Taxes 8,516 515,289 11,730 792,988 Vehicle Running & Maintenance 11,832 715,939 11,338 766,494 Repair & Maintenance – Computer 375 22,677 231 15,592 Repair & Maintenance – Others 2,872 173,773 1,067 72,168 Inspection Charges 2,332 141,129 4,697 317,520 Land Tax 17,250 1,043,753 17,363 1,173,851 Software 8,400 508,284 11,600 784,221 Subscription Expenses 252 15,223 174 11,768 Staff Welfare Expenses 1,100 66,564 869 58,756 Exchange Fluctuation – – 152 10,305 Prior Period Expenses 21,092 1,276,277 – – Audit Fee 2,910 176,108 2,844 192,242 Other Administrative Expenses 8,454 511,536 152 10,302 Total 163,278 9,879,899 159,704 10,796,912
Schedule – K ADMINISTRATIVE & OTHER EXPENSES
Bank Charges 15,335 927,894 2,551 172,474 Interest Paid 3,623 219,253 326 22,008 Total 18,958 1,147,147 2,877 194,482
Schedule – L FINANCIAL EXPENSES
A) SIGNIFICANT ACCOUNTING POLICIESI) Accounting Concepts
The accounts are prepared under the historical cost convention and on the basis of going concern. All expenses andincomes to the extent ascertainable are accounted for on mercantile basis unless otherwise state.
II) Fixed AssetsFixed Assets are stated at historical cost (including expenses incurred on putting them to use) less accumulateddepreciation and any accumulated impairment losses.
III) DepreciationDepreciation amount of an asset is allocated on a systematic basis over the useful life of the asset. Impairment isrecognised in accordance with IAS–36 ‘Impairment of Assets’.
IV) Inventoriesa) Stock of Work in Process: - At material cost plus apportioned manufacturing overheads.
b) Stock of Finished Goods: - At material cost plus apportioned manufacturing overheads and other costs incurred inbringing the inventories to their present location and condition or Net realisable value whichever is lower.
c) Spares and Consumable – At Cost
V) Revenue RecognitionSale of goods and services are recognised when significant risks & rewards of ownership are transferred to the buyerwhich generally coincides with the delivery. It is measured at the fair value of the consideration received or receivable.Sale is net of sale returns.
VI) Borrowing CostsBorrowing costs that are attributable to the acquisition or construction of fixed assets are capitalised as part of cost of
Schedule – M SIGNIFICANT ACCOUNTING POLICIES AND NOTES ON ACCOUNTS
Schedules forming part of the Balance Sheet & Profit and Loss Account
84 I Venus Remedies Limited
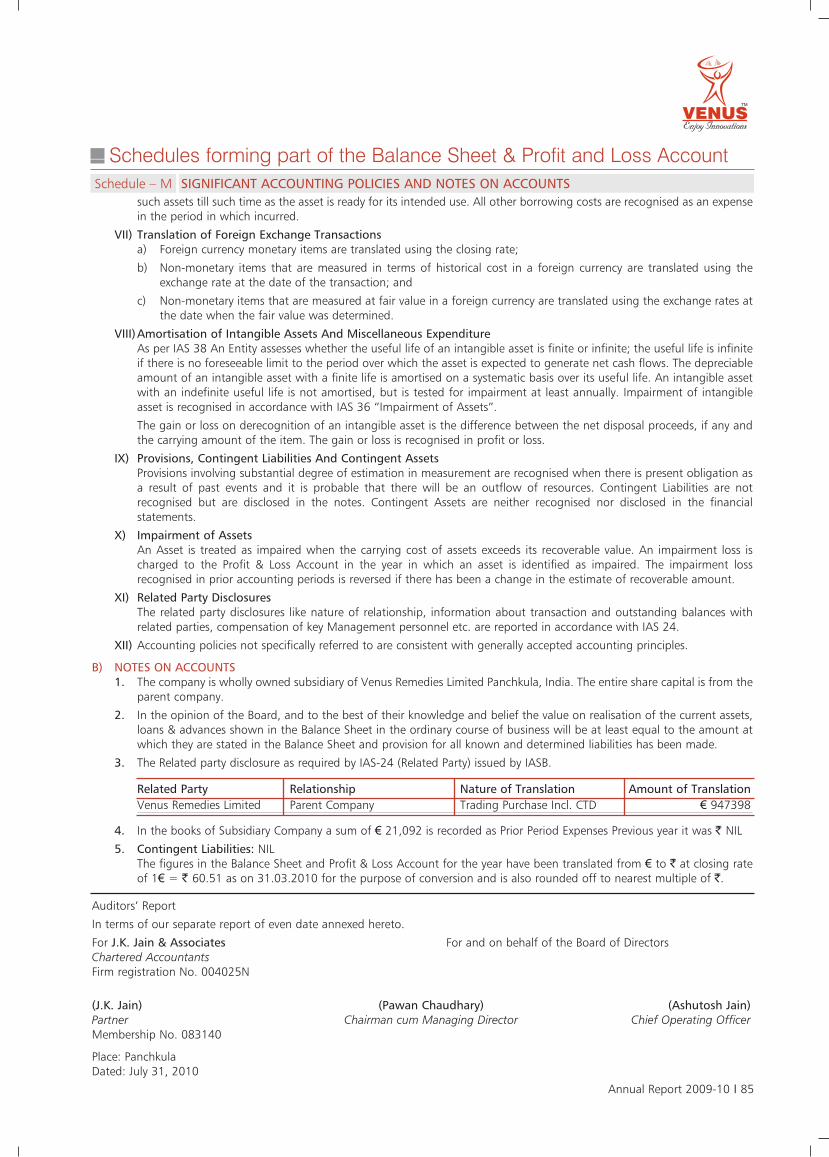
such assets till such time as the asset is ready for its intended use. All other borrowing costs are recognised as an expensein the period in which incurred.
VII) Translation of Foreign Exchange Transactionsa) Foreign currency monetary items are translated using the closing rate;
b) Non-monetary items that are measured in terms of historical cost in a foreign currency are translated using theexchange rate at the date of the transaction; and
c) Non-monetary items that are measured at fair value in a foreign currency are translated using the exchange rates atthe date when the fair value was determined.
VIII)Amortisation of Intangible Assets And Miscellaneous ExpenditureAs per IAS 38 An Entity assesses whether the useful life of an intangible asset is finite or infinite; the useful life is infiniteif there is no foreseeable limit to the period over which the asset is expected to generate net cash flows. The depreciableamount of an intangible asset with a finite life is amortised on a systematic basis over its useful life. An intangible assetwith an indefinite useful life is not amortised, but is tested for impairment at least annually. Impairment of intangibleasset is recognised in accordance with IAS 36 “Impairment of Assets”.
The gain or loss on derecognition of an intangible asset is the difference between the net disposal proceeds, if any andthe carrying amount of the item. The gain or loss is recognised in profit or loss.
IX) Provisions, Contingent Liabilities And Contingent AssetsProvisions involving substantial degree of estimation in measurement are recognised when there is present obligation asa result of past events and it is probable that there will be an outflow of resources. Contingent Liabilities are notrecognised but are disclosed in the notes. Contingent Assets are neither recognised nor disclosed in the financialstatements.
X) Impairment of AssetsAn Asset is treated as impaired when the carrying cost of assets exceeds its recoverable value. An impairment loss ischarged to the Profit & Loss Account in the year in which an asset is identified as impaired. The impairment lossrecognised in prior accounting periods is reversed if there has been a change in the estimate of recoverable amount.
XI) Related Party Disclosures The related party disclosures like nature of relationship, information about transaction and outstanding balances withrelated parties, compensation of key Management personnel etc. are reported in accordance with IAS 24.
XII) Accounting policies not specifically referred to are consistent with generally accepted accounting principles.
B) NOTES ON ACCOUNTS1. The company is wholly owned subsidiary of Venus Remedies Limited Panchkula, India. The entire share capital is from the
parent company.
2. In the opinion of the Board, and to the best of their knowledge and belief the value on realisation of the current assets,loans & advances shown in the Balance Sheet in the ordinary course of business will be at least equal to the amount atwhich they are stated in the Balance Sheet and provision for all known and determined liabilities has been made.
3. The Related party disclosure as required by IAS-24 (Related Party) issued by IASB.
Schedule – M SIGNIFICANT ACCOUNTING POLICIES AND NOTES ON ACCOUNTS
4. In the books of Subsidiary Company a sum of € 21,092 is recorded as Prior Period Expenses Previous year it was ` NIL
5. Contingent Liabilities: NILThe figures in the Balance Sheet and Profit & Loss Account for the year have been translated from € to ` at closing rateof 1€ = ` 60.51 as on 31.03.2010 for the purpose of conversion and is also rounded off to nearest multiple of `.
Related Party Relationship Nature of Translation Amount of TranslationVenus Remedies Limited Parent Company Trading Purchase Incl. CTD € 947398
Schedules forming part of the Balance Sheet & Profit and Loss Account
Annual Report 2009-10 I 85
Auditors’ Report
In terms of our separate report of even date annexed hereto.
For J.K. Jain & Associates For and on behalf of the Board of DirectorsChartered AccountantsFirm registration No. 004025N
(J.K. Jain) (Pawan Chaudhary) (Ashutosh Jain)Partner Chairman cum Managing Director Chief Operating OfficerMembership No. 083140
Place: PanchkulaDated: July 31, 2010
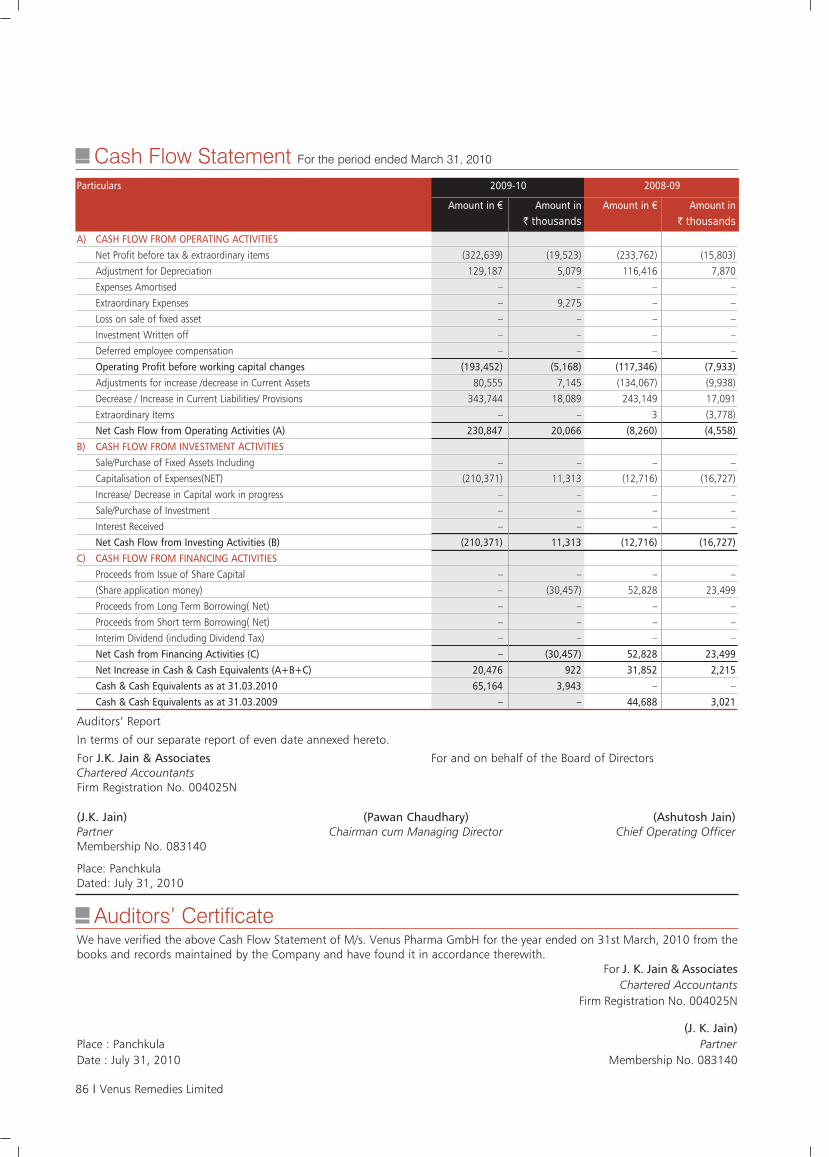
Auditors’ Report
In terms of our separate report of even date annexed hereto.
For J.K. Jain & Associates For and on behalf of the Board of DirectorsChartered AccountantsFirm Registration No. 004025N
(J.K. Jain) (Pawan Chaudhary) (Ashutosh Jain)Partner Chairman cum Managing Director Chief Operating OfficerMembership No. 083140
Place: PanchkulaDated: July 31, 2010
Particulars 2009-10 2008-09
Amount in € Amount in Amount in € Amount in` thousands ` thousands
A) CASH FLOW FROM OPERATING ACTIVITIESNet Profit before tax & extraordinary items (322,639) (19,523) (233,762) (15,803)
Adjustment for Depreciation 129,187 5,079 116,416 7,870
Expenses Amortised – – – –
Extraordinary Expenses – 9,275 – –
Loss on sale of fixed asset – – – –
Investment Written off – – – –
Deferred employee compensation – – – –
Operating Profit before working capital changes (193,452) (5,168) (117,346) (7,933)Adjustments for increase /decrease in Current Assets 80,555 7,145 (134,067) (9,938)
Decrease / Increase in Current Liabilities/ Provisions 343,744 18,089 243,149 17,091
Extraordinary Items – – 3 (3,778)
Net Cash Flow from Operating Activities (A) 230,847 20,066 (8,260) (4,558)B) CASH FLOW FROM INVESTMENT ACTIVITIES
Sale/Purchase of Fixed Assets Including – – – –
Capitalisation of Expenses(NET) (210,371) 11,313 (12,716) (16,727)
Increase/ Decrease in Capital work in progress – – – –
Sale/Purchase of Investment – – – –
Interest Received – – – –
Net Cash Flow from Investing Activities (B) (210,371) 11,313 (12,716) (16,727)C) CASH FLOW FROM FINANCING ACTIVITIES
Proceeds from Issue of Share Capital – – – –
(Share application money) – (30,457) 52,828 23,499
Proceeds from Long Term Borrowing( Net) – – – –
Proceeds from Short term Borrowing( Net) – – – –
Interim Dividend (including Dividend Tax) – – – –
Net Cash from Financing Activities (C) – (30,457) 52,828 23,499 Net Increase in Cash & Cash Equivalents (A+B+C) 20,476 922 31,852 2,215 Cash & Cash Equivalents as at 31.03.2010 65,164 3,943 – –Cash & Cash Equivalents as at 31.03.2009 – – 44,688 3,021
Auditors’ CertificateWe have verified the above Cash Flow Statement of M/s. Venus Pharma GmbH for the year ended on 31st March, 2010 from thebooks and records maintained by the Company and have found it in accordance therewith.
For J. K. Jain & AssociatesChartered Accountants
Firm Registration No. 004025N
(J. K. Jain)Place : Panchkula PartnerDate : July 31, 2010 Membership No. 083140
Cash Flow Statement For the period ended March 31, 2010
86 I Venus Remedies Limited
1. We have examined and audited the attached Consolidated
Balance Sheet of M/s Venus Remedies Limited and its
wholly owned subsidiary Venus Pharma GmbH as at
31st March 2010, and also the consolidated Profit & Loss
Account and the consolidated Cash Flow Statement for the
year ended on the date annexed thereto. These financial
statements are the responsibility of the company's
Management and have been prepared by the management
on the basis of separate financial statements and other
financial information regarding components. Our
responsibility is to express an opinion on these financial
statements based on our audit.
2. We have conducted audit of Venus Remedies Limited in
accordance with auditing standards generally accepted in
India and also we have conducted audit of subsidiary,
Venus Pharma GmbH according to generally accepted audit
standards in Germany i.e “International Accounting
Standards”. These standards require that we plan and
perform the audit to obtain reasonable assurance about
whether the financial statements are free of material
misstatement. An audit includes examining, on a test basis,
evidence supporting the amounts and disclosures in the
financial statements. An audit also includes assessing the
accounting principles used and significant estimates made
by the Management as well as evaluating the overall
financial statement presentation. We believe that our audit
provides a reasonable basis for our opinion.
3. We report that the consolidated financial statements have
been prepared by the Company in accordance with the
requirements of Accounting Standard (AS) 21,
“Consolidated Financial Statements”, issued by the Institute
of Chartered Accountants of India and on the basis of the
separate audited financial statements of the Company and
its subsidiary included in the consolidated financial
statements.
4. On the basis of the information and explanations given to
us and on the consideration of the separate audit reports
on individual audited financial statements of the Company
and its subsidiary, we are of the opinion that the said
consolidated financial statements give a true and fair view
in conformity with the accounting principles generally
accepted in India;
a) in the case of the Consolidated Balance Sheet of the
consolidated state of affairs of the company and its
subsidiary as at 31st March, 2010,
b) in the case of Consolidated Profit & Loss Account, of the
Consolidated Profit of the company and its subsidiary
for the year then ended and
c) in the case of the Consolidated Cash Flow Statement, of
the consolidated cash flow of the company and its
subsidiary for the year then ended.
For J.K. Jain & AssociatesChartered Accountants
Firm Registration No. 004025N
J.K. JainPlace: Panchkula PartnerDate: July 31, 2010 Membership No. 083140
The Board of Directors
VENUS REMEDIES LIMITED
PANCHKULA
Auditor's Report on Consolidated Financial Statements of Venus Remedies Limited and its wholly ownedSubsidiary Venus Pharma GmbH.
Consolidated Auditors' Report
Annual Report 2009-10 I 87
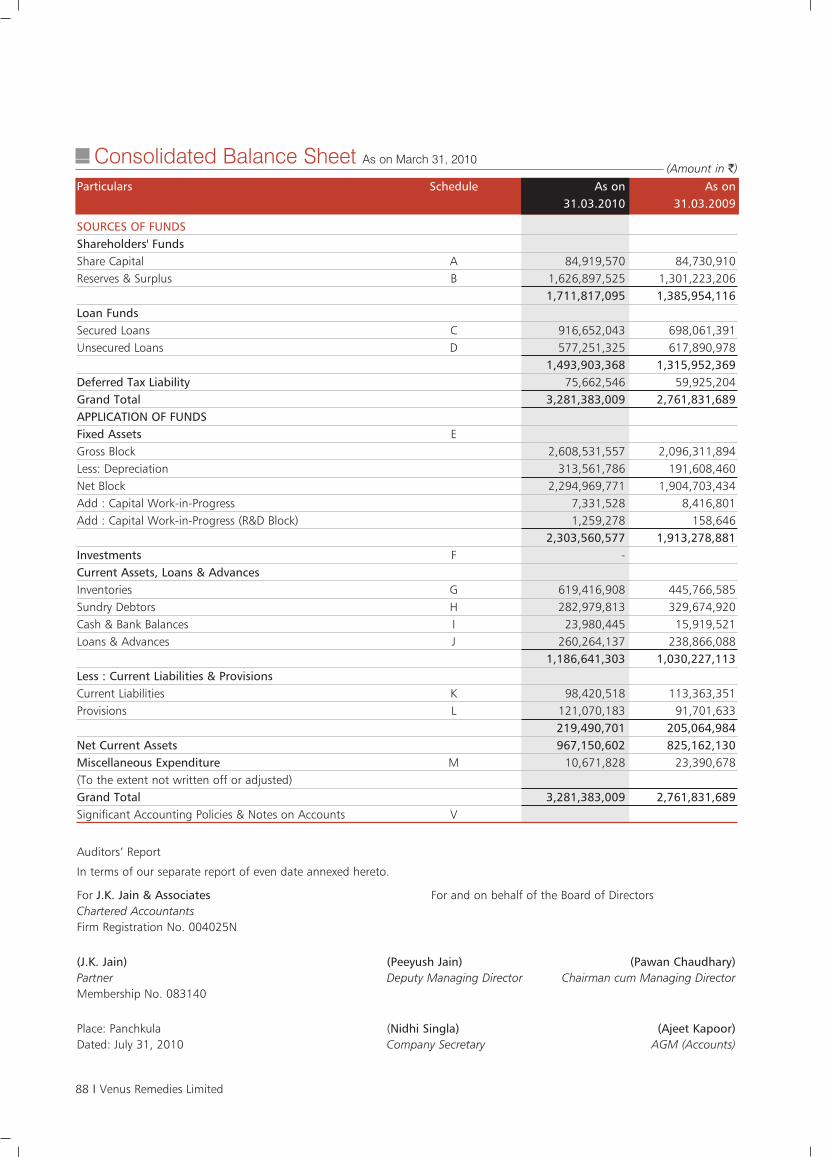
(Amount in `)
Auditors’ Report
In terms of our separate report of even date annexed hereto.
For J.K. Jain & Associates For and on behalf of the Board of DirectorsChartered AccountantsFirm Registration No. 004025N
(J.K. Jain) (Peeyush Jain) (Pawan Chaudhary)Partner Deputy Managing Director Chairman cum Managing DirectorMembership No. 083140
Place: Panchkula (Nidhi Singla) (Ajeet Kapoor)Dated: July 31, 2010 Company Secretary AGM (Accounts)
Particulars Schedule As on As on31.03.2010 31.03.2009
SOURCES OF FUNDSShareholders' FundsShare Capital A 84,919,570 84,730,910 Reserves & Surplus B 1,626,897,525 1,301,223,206
1,711,817,095 1,385,954,116Loan FundsSecured Loans C 916,652,043 698,061,391 Unsecured Loans D 577,251,325 617,890,978
1,493,903,368 1,315,952,369 Deferred Tax Liability 75,662,546 59,925,204 Grand Total 3,281,383,009 2,761,831,689 APPLICATION OF FUNDSFixed Assets EGross Block 2,608,531,557 2,096,311,894 Less: Depreciation 313,561,786 191,608,460 Net Block 2,294,969,771 1,904,703,434 Add : Capital Work-in-Progress 7,331,528 8,416,801 Add : Capital Work-in-Progress (R&D Block) 1,259,278 158,646
2,303,560,577 1,913,278,881Investments F -Current Assets, Loans & AdvancesInventories G 619,416,908 445,766,585 Sundry Debtors H 282,979,813 329,674,920 Cash & Bank Balances I 23,980,445 15,919,521 Loans & Advances J 260,264,137 238,866,088
1,186,641,303 1,030,227,113Less : Current Liabilities & ProvisionsCurrent Liabilities K 98,420,518 113,363,351 Provisions L 121,070,183 91,701,633
219,490,701 205,064,984Net Current Assets 967,150,602 825,162,130Miscellaneous Expenditure M 10,671,828 23,390,678 (To the extent not written off or adjusted)Grand Total 3,281,383,009 2,761,831,689 Significant Accounting Policies & Notes on Accounts V
Consolidated Balance Sheet As on March 31, 2010
88 I Venus Remedies Limited
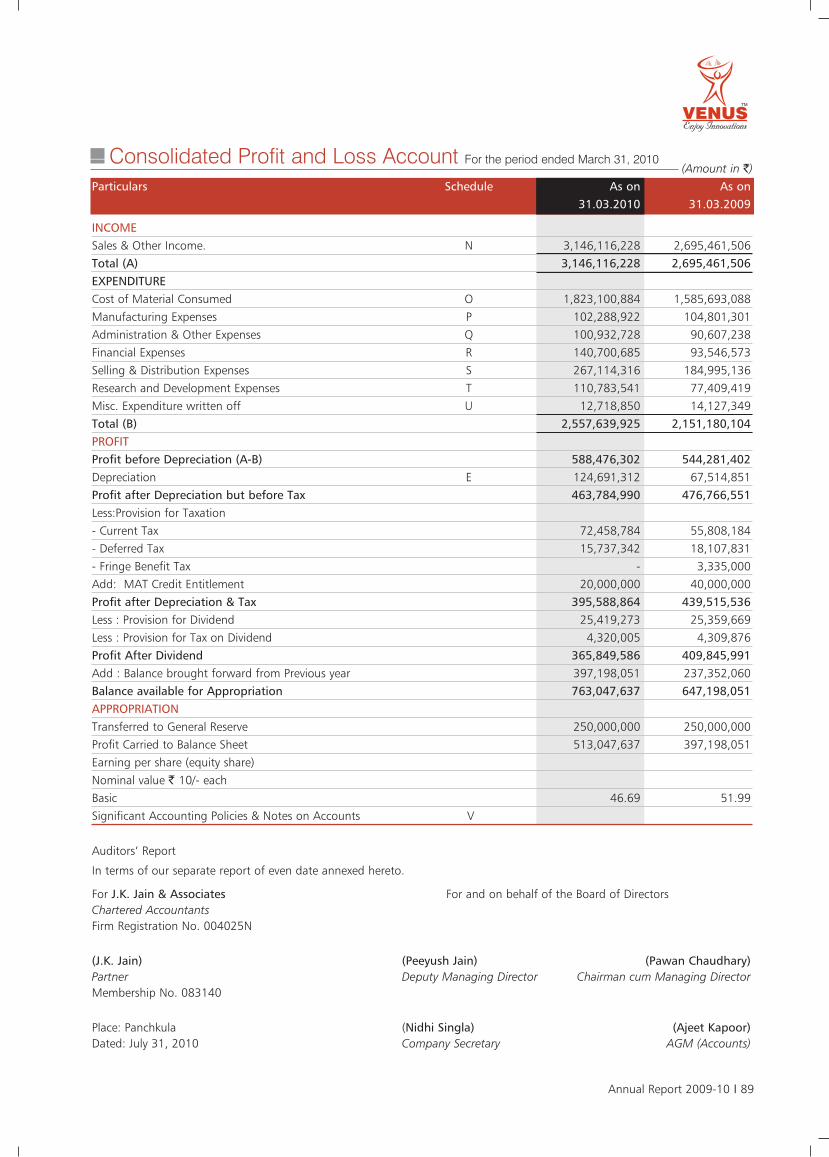
(Amount in `)
Auditors’ Report
In terms of our separate report of even date annexed hereto.
For J.K. Jain & Associates For and on behalf of the Board of DirectorsChartered AccountantsFirm Registration No. 004025N
(J.K. Jain) (Peeyush Jain) (Pawan Chaudhary)Partner Deputy Managing Director Chairman cum Managing DirectorMembership No. 083140
Place: Panchkula (Nidhi Singla) (Ajeet Kapoor)Dated: July 31, 2010 Company Secretary AGM (Accounts)
Particulars Schedule As on As on31.03.2010 31.03.2009
INCOMESales & Other Income. N 3,146,116,228 2,695,461,506 Total (A) 3,146,116,228 2,695,461,506 EXPENDITURECost of Material Consumed O 1,823,100,884 1,585,693,088 Manufacturing Expenses P 102,288,922 104,801,301 Administration & Other Expenses Q 100,932,728 90,607,238 Financial Expenses R 140,700,685 93,546,573 Selling & Distribution Expenses S 267,114,316 184,995,136 Research and Development Expenses T 110,783,541 77,409,419 Misc. Expenditure written off U 12,718,850 14,127,349 Total (B) 2,557,639,925 2,151,180,104 PROFITProfit before Depreciation (A-B) 588,476,302 544,281,402 Depreciation E 124,691,312 67,514,851 Profit after Depreciation but before Tax 463,784,990 476,766,551 Less:Provision for Taxation- Current Tax 72,458,784 55,808,184 - Deferred Tax 15,737,342 18,107,831 - Fringe Benefit Tax - 3,335,000 Add: MAT Credit Entitlement 20,000,000 40,000,000 Profit after Depreciation & Tax 395,588,864 439,515,536 Less : Provision for Dividend 25,419,273 25,359,669 Less : Provision for Tax on Dividend 4,320,005 4,309,876 Profit After Dividend 365,849,586 409,845,991 Add : Balance brought forward from Previous year 397,198,051 237,352,060 Balance available for Appropriation 763,047,637 647,198,051 APPROPRIATIONTransferred to General Reserve 250,000,000 250,000,000 Profit Carried to Balance Sheet 513,047,637 397,198,051 Earning per share (equity share) Nominal value ` 10/- each Basic 46.69 51.99 Significant Accounting Policies & Notes on Accounts V
Consolidated Profit and Loss Account For the period ended March 31, 2010
Annual Report 2009-10 I 89
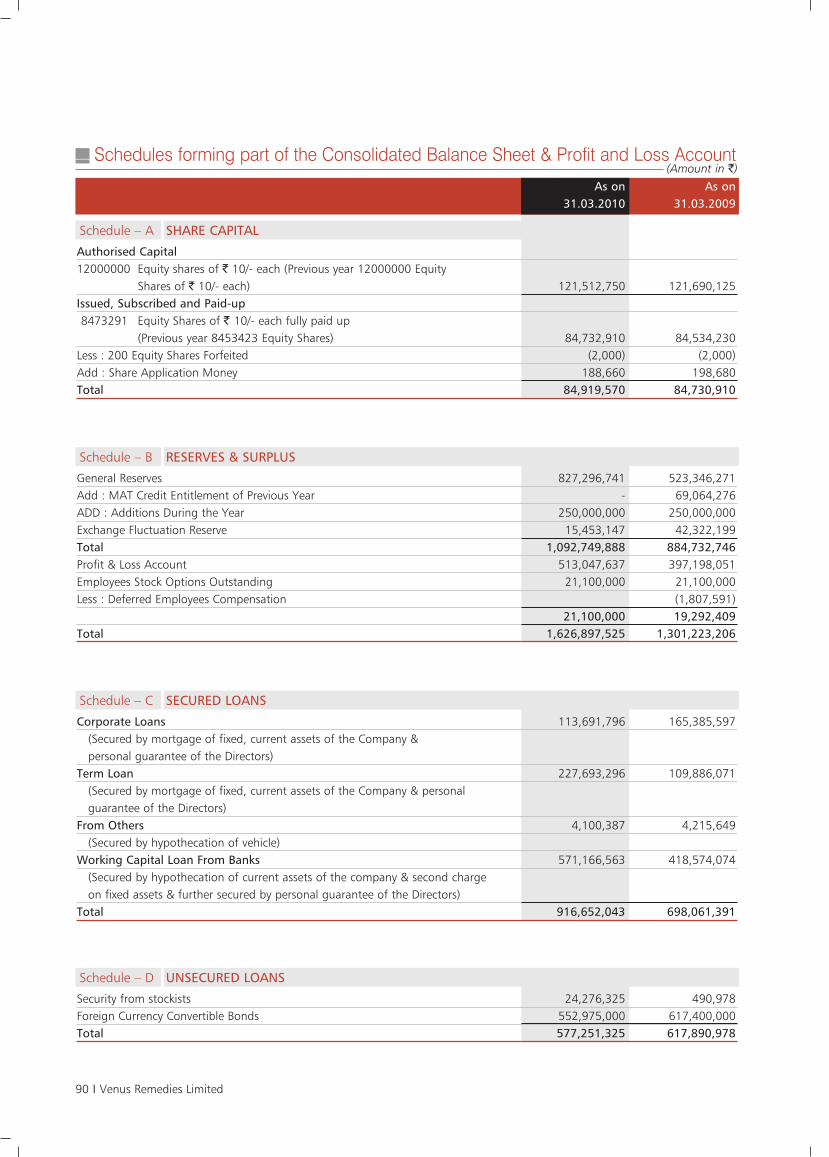
(Amount in `)
Authorised Capital12000000 Equity shares of ` 10/- each (Previous year 12000000 Equity
Shares of ` 10/- each) 121,512,750 121,690,125 Issued, Subscribed and Paid-up8473291 Equity Shares of ` 10/- each fully paid up
(Previous year 8453423 Equity Shares) 84,732,910 84,534,230 Less : 200 Equity Shares Forfeited (2,000) (2,000)Add : Share Application Money 188,660 198,680 Total 84,919,570 84,730,910
As on As on31.03.2010 31.03.2009
Schedule – A SHARE CAPITAL
General Reserves 827,296,741 523,346,271 Add : MAT Credit Entitlement of Previous Year - 69,064,276 ADD : Additions During the Year 250,000,000 250,000,000 Exchange Fluctuation Reserve 15,453,147 42,322,199 Total 1,092,749,888 884,732,746 Profit & Loss Account 513,047,637 397,198,051 Employees Stock Options Outstanding 21,100,000 21,100,000 Less : Deferred Employees Compensation (1,807,591)
21,100,000 19,292,409 Total 1,626,897,525 1,301,223,206
Schedule – B RESERVES & SURPLUS
Security from stockists 24,276,325 490,978 Foreign Currency Convertible Bonds 552,975,000 617,400,000 Total 577,251,325 617,890,978
Schedule – D UNSECURED LOANS
Corporate Loans 113,691,796 165,385,597 (Secured by mortgage of fixed, current assets of the Company & personal guarantee of the Directors)
Term Loan 227,693,296 109,886,071 (Secured by mortgage of fixed, current assets of the Company & personal guarantee of the Directors)
From Others 4,100,387 4,215,649 (Secured by hypothecation of vehicle)
Working Capital Loan From Banks 571,166,563 418,574,074(Secured by hypothecation of current assets of the company & second charge on fixed assets & further secured by personal guarantee of the Directors)
Total 916,652,043 698,061,391
Schedule – C SECURED LOANS
Schedules forming part of the Consolidated Balance Sheet & Profit and Loss Account
90 I Venus Remedies Limited
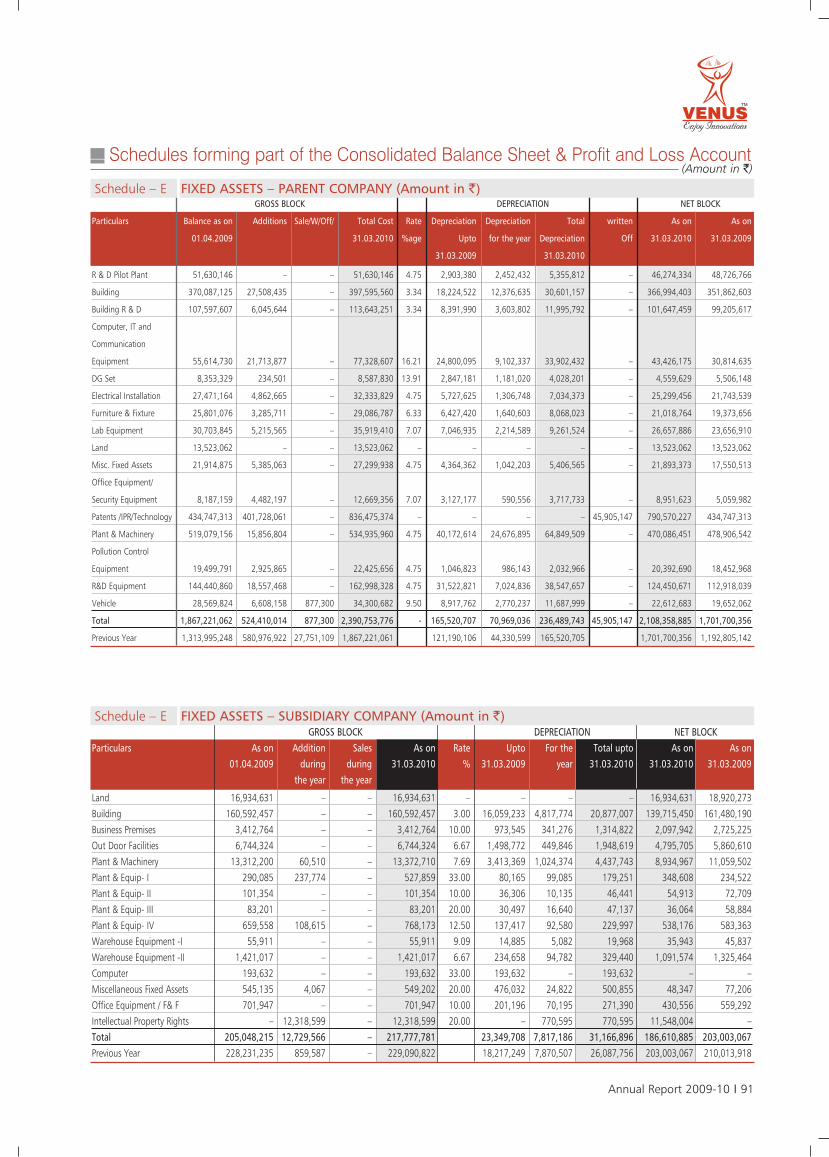
(Amount in `)
GROSS BLOCK DEPRECIATION NET BLOCK
Particulars Balance as on Additions Sale/W/Off/ Total Cost Rate Depreciation Depreciation Total written As on As on
01.04.2009 31.03.2010 %age Upto for the year Depreciation Off 31.03.2010 31.03.2009
31.03.2009 31.03.2010
R & D Pilot Plant 51,630,146 – – 51,630,146 4.75 2,903,380 2,452,432 5,355,812 – 46,274,334 48,726,766
Building 370,087,125 27,508,435 – 397,595,560 3.34 18,224,522 12,376,635 30,601,157 – 366,994,403 351,862,603
Building R & D 107,597,607 6,045,644 – 113,643,251 3.34 8,391,990 3,603,802 11,995,792 – 101,647,459 99,205,617
Computer, IT and
Communication
Equipment 55,614,730 21,713,877 – 77,328,607 16.21 24,800,095 9,102,337 33,902,432 – 43,426,175 30,814,635
DG Set 8,353,329 234,501 – 8,587,830 13.91 2,847,181 1,181,020 4,028,201 – 4,559,629 5,506,148
Electrical Installation 27,471,164 4,862,665 – 32,333,829 4.75 5,727,625 1,306,748 7,034,373 – 25,299,456 21,743,539
Furniture & Fixture 25,801,076 3,285,711 – 29,086,787 6.33 6,427,420 1,640,603 8,068,023 – 21,018,764 19,373,656
Lab Equipment 30,703,845 5,215,565 – 35,919,410 7.07 7,046,935 2,214,589 9,261,524 – 26,657,886 23,656,910
Land 13,523,062 – – 13,523,062 – – – – – 13,523,062 13,523,062
Misc. Fixed Assets 21,914,875 5,385,063 – 27,299,938 4.75 4,364,362 1,042,203 5,406,565 – 21,893,373 17,550,513
Office Equipment/
Security Equipment 8,187,159 4,482,197 – 12,669,356 7.07 3,127,177 590,556 3,717,733 – 8,951,623 5,059,982
Patents /IPR/Technology 434,747,313 401,728,061 – 836,475,374 – – – – 45,905,147 790,570,227 434,747,313
Plant & Machinery 519,079,156 15,856,804 – 534,935,960 4.75 40,172,614 24,676,895 64,849,509 – 470,086,451 478,906,542
Pollution Control
Equipment 19,499,791 2,925,865 – 22,425,656 4.75 1,046,823 986,143 2,032,966 – 20,392,690 18,452,968
R&D Equipment 144,440,860 18,557,468 – 162,998,328 4.75 31,522,821 7,024,836 38,547,657 – 124,450,671 112,918,039
Vehicle 28,569,824 6,608,158 877,300 34,300,682 9.50 8,917,762 2,770,237 11,687,999 – 22,612,683 19,652,062
Total 1,867,221,062 524,410,014 877,300 2,390,753,776 - 165,520,707 70,969,036 236,489,743 45,905,147 2,108,358,885 1,701,700,356
Previous Year 1,313,995,248 580,976,922 27,751,109 1,867,221,061 121,190,106 44,330,599 165,520,705 1,701,700,356 1,192,805,142
Schedule – E FIXED ASSETS – PARENT COMPANY (Amount in `)
GROSS BLOCK DEPRECIATION NET BLOCK Particulars As on Addition Sales As on Rate Upto For the Total upto As on As on
01.04.2009 during during 31.03.2010 % 31.03.2009 year 31.03.2010 31.03.2010 31.03.2009the year the year
Land 16,934,631 – – 16,934,631 – – – – 16,934,631 18,920,273
Building 160,592,457 – – 160,592,457 3.00 16,059,233 4,817,774 20,877,007 139,715,450 161,480,190
Business Premises 3,412,764 – – 3,412,764 10.00 973,545 341,276 1,314,822 2,097,942 2,725,225
Out Door Facilities 6,744,324 – – 6,744,324 6.67 1,498,772 449,846 1,948,619 4,795,705 5,860,610
Plant & Machinery 13,312,200 60,510 – 13,372,710 7.69 3,413,369 1,024,374 4,437,743 8,934,967 11,059,502
Plant & Equip- I 290,085 237,774 – 527,859 33.00 80,165 99,085 179,251 348,608 234,522
Plant & Equip- II 101,354 – – 101,354 10.00 36,306 10,135 46,441 54,913 72,709
Plant & Equip- III 83,201 – – 83,201 20.00 30,497 16,640 47,137 36,064 58,884
Plant & Equip- IV 659,558 108,615 – 768,173 12.50 137,417 92,580 229,997 538,176 583,363
Warehouse Equipment -I 55,911 – – 55,911 9.09 14,885 5,082 19,968 35,943 45,837
Warehouse Equipment -II 1,421,017 – – 1,421,017 6.67 234,658 94,782 329,440 1,091,574 1,325,464
Computer 193,632 – – 193,632 33.00 193,632 – 193,632 – –
Miscellaneous Fixed Assets 545,135 4,067 – 549,202 20.00 476,032 24,822 500,855 48,347 77,206
Office Equipment / F& F 701,947 – – 701,947 10.00 201,196 70,195 271,390 430,556 559,292
Intellectual Property Rights – 12,318,599 – 12,318,599 20.00 – 770,595 770,595 11,548,004 –
Total 205,048,215 12,729,566 – 217,777,781 23,349,708 7,817,186 31,166,896 186,610,885 203,003,067Previous Year 228,231,235 859,587 – 229,090,822 18,217,249 7,870,507 26,087,756 203,003,067 210,013,918
Schedule – E FIXED ASSETS – SUBSIDIARY COMPANY (Amount in `)
Schedules forming part of the Consolidated Balance Sheet & Profit and Loss Account
Annual Report 2009-10 I 91
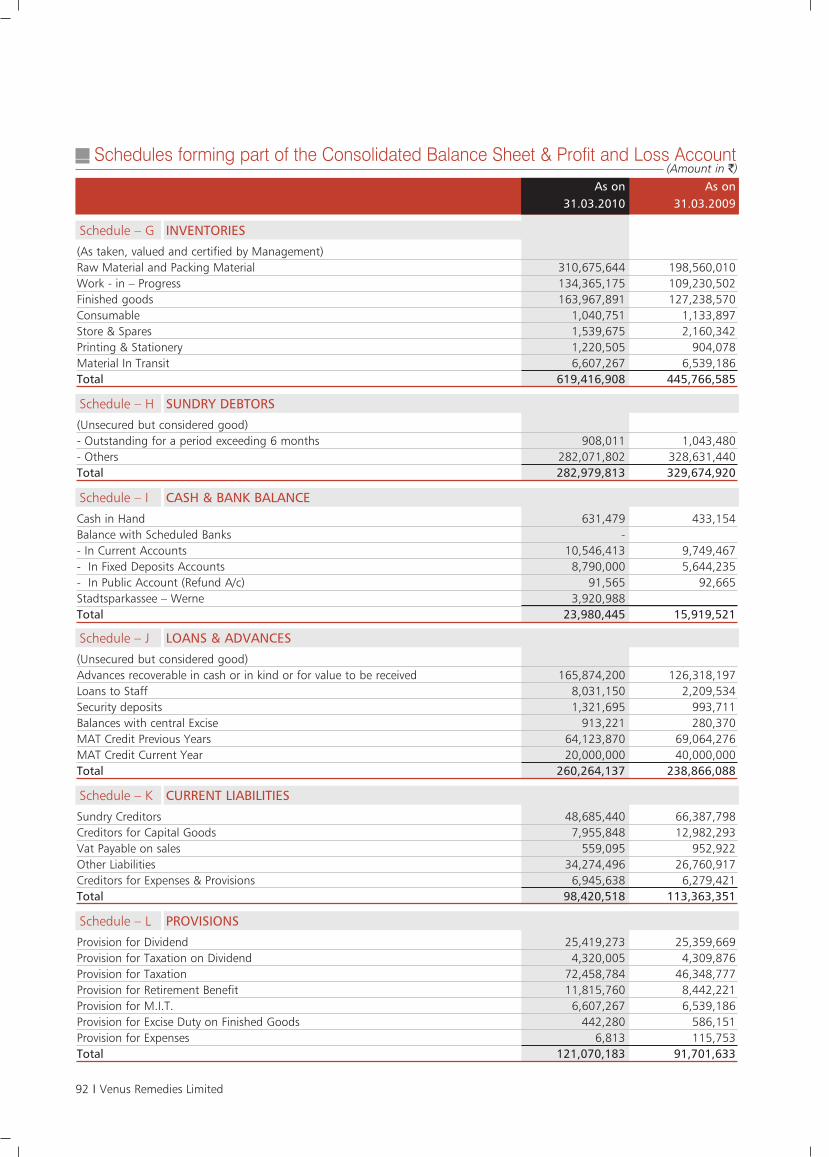
(Amount in `)
(As taken, valued and certified by Management) Raw Material and Packing Material 310,675,644 198,560,010 Work - in – Progress 134,365,175 109,230,502 Finished goods 163,967,891 127,238,570 Consumable 1,040,751 1,133,897 Store & Spares 1,539,675 2,160,342 Printing & Stationery 1,220,505 904,078 Material In Transit 6,607,267 6,539,186 Total 619,416,908 445,766,585
As on As on31.03.2010 31.03.2009
Schedule – G INVENTORIES
(Unsecured but considered good)Advances recoverable in cash or in kind or for value to be received 165,874,200 126,318,197 Loans to Staff 8,031,150 2,209,534 Security deposits 1,321,695 993,711 Balances with central Excise 913,221 280,370 MAT Credit Previous Years 64,123,870 69,064,276 MAT Credit Current Year 20,000,000 40,000,000 Total 260,264,137 238,866,088
Schedule – J LOANS & ADVANCES
Provision for Dividend 25,419,273 25,359,669 Provision for Taxation on Dividend 4,320,005 4,309,876 Provision for Taxation 72,458,784 46,348,777 Provision for Retirement Benefit 11,815,760 8,442,221 Provision for M.I.T. 6,607,267 6,539,186 Provision for Excise Duty on Finished Goods 442,280 586,151 Provision for Expenses 6,813 115,753 Total 121,070,183 91,701,633
Schedule – L PROVISIONS
Cash in Hand 631,479 433,154 Balance with Scheduled Banks -- In Current Accounts 10,546,413 9,749,467 - In Fixed Deposits Accounts 8,790,000 5,644,235 - In Public Account (Refund A/c) 91,565 92,665 Stadtsparkassee – Werne 3,920,988 Total 23,980,445 15,919,521
Schedule – I CASH & BANK BALANCE
Sundry Creditors 48,685,440 66,387,798 Creditors for Capital Goods 7,955,848 12,982,293 Vat Payable on sales 559,095 952,922 Other Liabilities 34,274,496 26,760,917 Creditors for Expenses & Provisions 6,945,638 6,279,421 Total 98,420,518 113,363,351
Schedule – K CURRENT LIABILITIES
(Unsecured but considered good)- Outstanding for a period exceeding 6 months 908,011 1,043,480 - Others 282,071,802 328,631,440 Total 282,979,813 329,674,920
Schedule – H SUNDRY DEBTORS
Schedules forming part of the Consolidated Balance Sheet & Profit and Loss Account
92 I Venus Remedies Limited
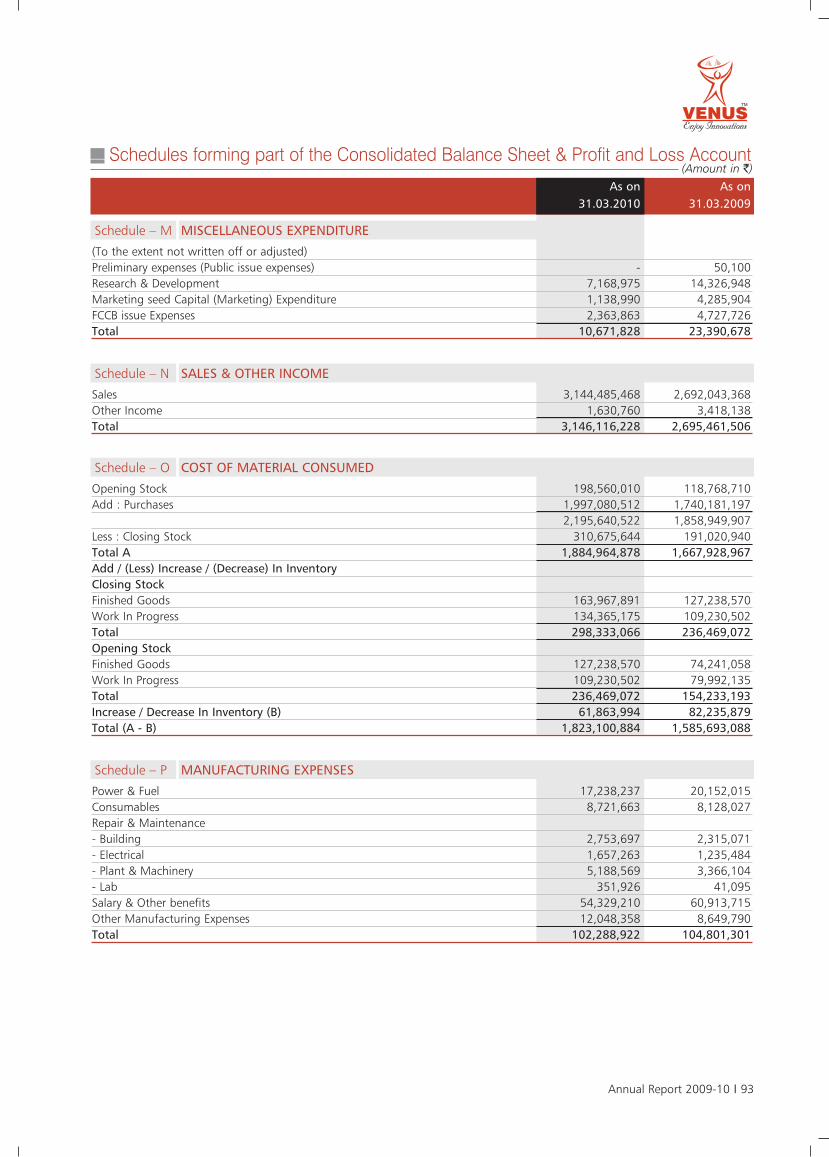
(Amount in `)
(To the extent not written off or adjusted)Preliminary expenses (Public issue expenses) - 50,100 Research & Development 7,168,975 14,326,948 Marketing seed Capital (Marketing) Expenditure 1,138,990 4,285,904 FCCB issue Expenses 2,363,863 4,727,726 Total 10,671,828 23,390,678
As on As on31.03.2010 31.03.2009
Schedule – M MISCELLANEOUS EXPENDITURE
Sales 3,144,485,468 2,692,043,368 Other Income 1,630,760 3,418,138 Total 3,146,116,228 2,695,461,506
Schedule – N SALES & OTHER INCOME
Opening Stock 198,560,010 118,768,710 Add : Purchases 1,997,080,512 1,740,181,197
2,195,640,522 1,858,949,907 Less : Closing Stock 310,675,644 191,020,940 Total A 1,884,964,878 1,667,928,967 Add / (Less) Increase / (Decrease) In Inventory Closing Stock Finished Goods 163,967,891 127,238,570 Work In Progress 134,365,175 109,230,502 Total 298,333,066 236,469,072 Opening Stock Finished Goods 127,238,570 74,241,058 Work In Progress 109,230,502 79,992,135 Total 236,469,072 154,233,193 Increase / Decrease In Inventory (B) 61,863,994 82,235,879 Total (A - B) 1,823,100,884 1,585,693,088
Schedule – O COST OF MATERIAL CONSUMED
Power & Fuel 17,238,237 20,152,015 Consumables 8,721,663 8,128,027 Repair & Maintenance - Building 2,753,697 2,315,071 - Electrical 1,657,263 1,235,484 - Plant & Machinery 5,188,569 3,366,104 - Lab 351,926 41,095 Salary & Other benefits 54,329,210 60,913,715 Other Manufacturing Expenses 12,048,358 8,649,790 Total 102,288,922 104,801,301
Schedule – P MANUFACTURING EXPENSES
Schedules forming part of the Consolidated Balance Sheet & Profit and Loss Account
Annual Report 2009-10 I 93
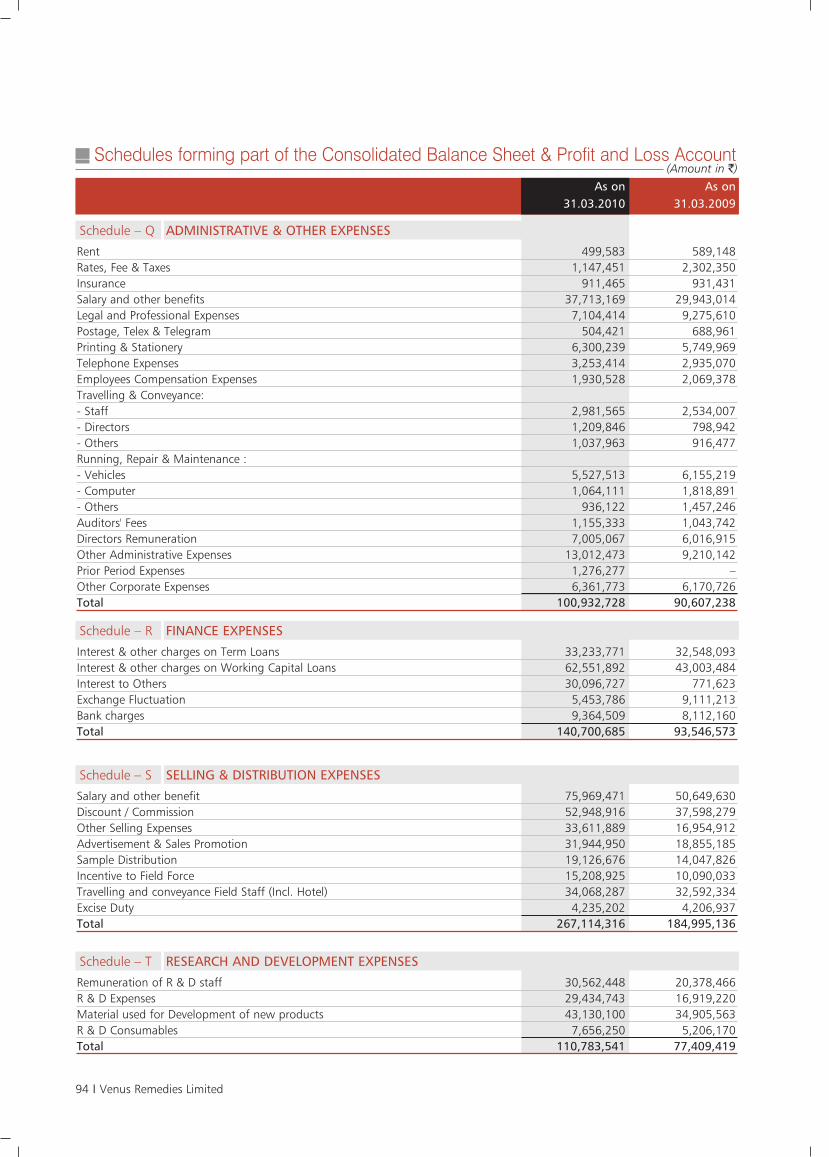
(Amount in `)
Rent 499,583 589,148 Rates, Fee & Taxes 1,147,451 2,302,350 Insurance 911,465 931,431 Salary and other benefits 37,713,169 29,943,014 Legal and Professional Expenses 7,104,414 9,275,610 Postage, Telex & Telegram 504,421 688,961 Printing & Stationery 6,300,239 5,749,969 Telephone Expenses 3,253,414 2,935,070 Employees Compensation Expenses 1,930,528 2,069,378 Travelling & Conveyance: - Staff 2,981,565 2,534,007 - Directors 1,209,846 798,942 - Others 1,037,963 916,477 Running, Repair & Maintenance : - Vehicles 5,527,513 6,155,219 - Computer 1,064,111 1,818,891 - Others 936,122 1,457,246 Auditors' Fees 1,155,333 1,043,742 Directors Remuneration 7,005,067 6,016,915 Other Administrative Expenses 13,012,473 9,210,142 Prior Period Expenses 1,276,277 –Other Corporate Expenses 6,361,773 6,170,726 Total 100,932,728 90,607,238
As on As on31.03.2010 31.03.2009
Schedule – Q ADMINISTRATIVE & OTHER EXPENSES
Remuneration of R & D staff 30,562,448 20,378,466 R & D Expenses 29,434,743 16,919,220 Material used for Development of new products 43,130,100 34,905,563 R & D Consumables 7,656,250 5,206,170 Total 110,783,541 77,409,419
Schedule – T RESEARCH AND DEVELOPMENT EXPENSES
Interest & other charges on Term Loans 33,233,771 32,548,093 Interest & other charges on Working Capital Loans 62,551,892 43,003,484 Interest to Others 30,096,727 771,623 Exchange Fluctuation 5,453,786 9,111,213 Bank charges 9,364,509 8,112,160 Total 140,700,685 93,546,573
Schedule – R FINANCE EXPENSES
Salary and other benefit 75,969,471 50,649,630 Discount / Commission 52,948,916 37,598,279 Other Selling Expenses 33,611,889 16,954,912 Advertisement & Sales Promotion 31,944,950 18,855,185 Sample Distribution 19,126,676 14,047,826 Incentive to Field Force 15,208,925 10,090,033 Travelling and conveyance Field Staff (Incl. Hotel) 34,068,287 32,592,334 Excise Duty 4,235,202 4,206,937 Total 267,114,316 184,995,136
Schedule – S SELLING & DISTRIBUTION EXPENSES
Schedules forming part of the Consolidated Balance Sheet & Profit and Loss Account
94 I Venus Remedies Limited
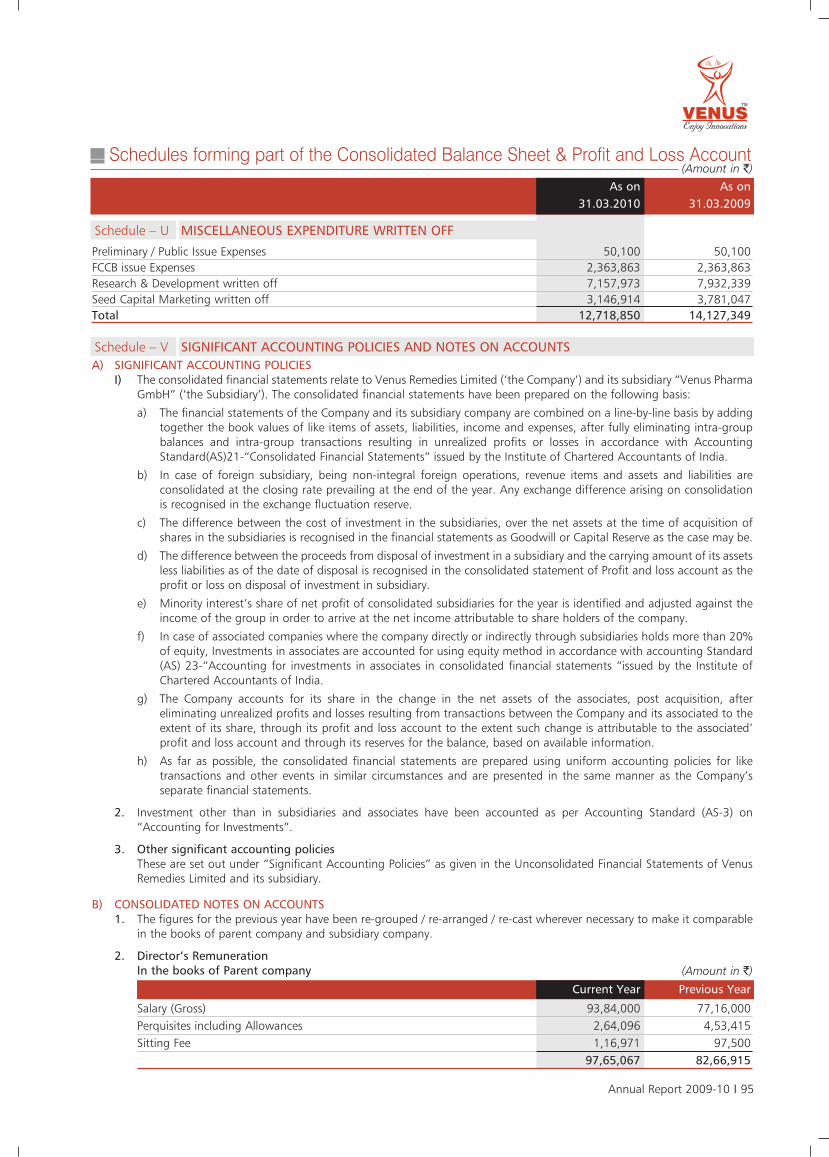
(Amount in `)
Preliminary / Public Issue Expenses 50,100 50,100 FCCB issue Expenses 2,363,863 2,363,863 Research & Development written off 7,157,973 7,932,339 Seed Capital Marketing written off 3,146,914 3,781,047 Total 12,718,850 14,127,349
As on As on31.03.2010 31.03.2009
Schedule – U MISCELLANEOUS EXPENDITURE WRITTEN OFF
A) SIGNIFICANT ACCOUNTING POLICIESI) The consolidated financial statements relate to Venus Remedies Limited (‘the Company’) and its subsidiary “Venus Pharma
GmbH” (‘the Subsidiary’). The consolidated financial statements have been prepared on the following basis:
a) The financial statements of the Company and its subsidiary company are combined on a line-by-line basis by addingtogether the book values of like items of assets, liabilities, income and expenses, after fully eliminating intra-groupbalances and intra-group transactions resulting in unrealized profits or losses in accordance with AccountingStandard(AS)21-“Consolidated Financial Statements” issued by the Institute of Chartered Accountants of India.
b) In case of foreign subsidiary, being non-integral foreign operations, revenue items and assets and liabilities areconsolidated at the closing rate prevailing at the end of the year. Any exchange difference arising on consolidationis recognised in the exchange fluctuation reserve.
c) The difference between the cost of investment in the subsidiaries, over the net assets at the time of acquisition ofshares in the subsidiaries is recognised in the financial statements as Goodwill or Capital Reserve as the case may be.
d) The difference between the proceeds from disposal of investment in a subsidiary and the carrying amount of its assetsless liabilities as of the date of disposal is recognised in the consolidated statement of Profit and loss account as theprofit or loss on disposal of investment in subsidiary.
e) Minority interest’s share of net profit of consolidated subsidiaries for the year is identified and adjusted against theincome of the group in order to arrive at the net income attributable to share holders of the company.
f) In case of associated companies where the company directly or indirectly through subsidiaries holds more than 20%of equity, Investments in associates are accounted for using equity method in accordance with accounting Standard(AS) 23-“Accounting for investments in associates in consolidated financial statements “issued by the Institute ofChartered Accountants of India.
g) The Company accounts for its share in the change in the net assets of the associates, post acquisition, aftereliminating unrealized profits and losses resulting from transactions between the Company and its associated to theextent of its share, through its profit and loss account to the extent such change is attributable to the associated’profit and loss account and through its reserves for the balance, based on available information.
h) As far as possible, the consolidated financial statements are prepared using uniform accounting policies for liketransactions and other events in similar circumstances and are presented in the same manner as the Company’sseparate financial statements.
2. Investment other than in subsidiaries and associates have been accounted as per Accounting Standard (AS-3) on“Accounting for Investments”.
3. Other significant accounting policiesThese are set out under “Significant Accounting Policies” as given in the Unconsolidated Financial Statements of VenusRemedies Limited and its subsidiary.
B) CONSOLIDATED NOTES ON ACCOUNTS1. The figures for the previous year have been re-grouped / re-arranged / re-cast wherever necessary to make it comparable
in the books of parent company and subsidiary company.
2. Director’s RemunerationIn the books of Parent company
Schedule – V SIGNIFICANT ACCOUNTING POLICIES AND NOTES ON ACCOUNTS
(Amount in `)
Current Year Previous Year
Salary (Gross) 93,84,000 77,16,000Perquisites including Allowances 2,64,096 4,53,415Sitting Fee 1,16,971 97,500
97,65,067 82,66,915
Schedules forming part of the Consolidated Balance Sheet & Profit and Loss Account
Annual Report 2009-10 I 95
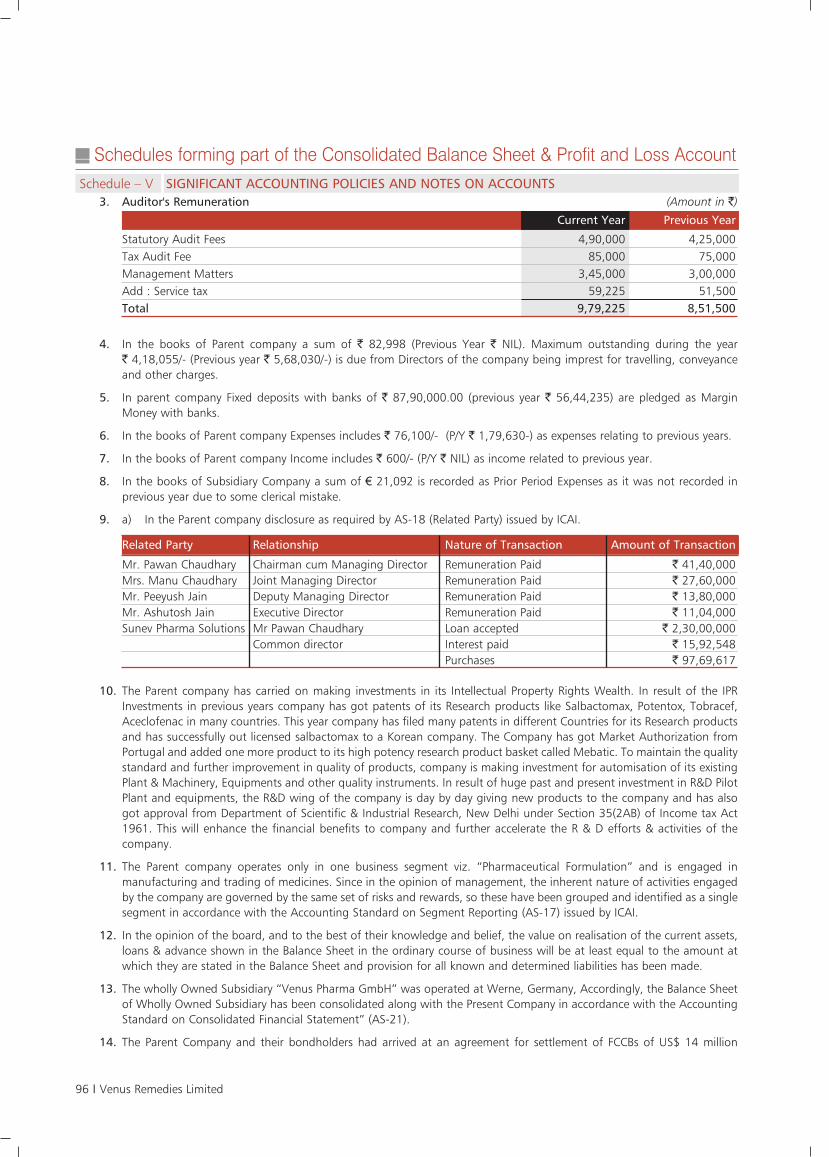
Schedule – V SIGNIFICANT ACCOUNTING POLICIES AND NOTES ON ACCOUNTS
10. The Parent company has carried on making investments in its Intellectual Property Rights Wealth. In result of the IPRInvestments in previous years company has got patents of its Research products like Salbactomax, Potentox, Tobracef,Aceclofenac in many countries. This year company has filed many patents in different Countries for its Research productsand has successfully out licensed salbactomax to a Korean company. The Company has got Market Authorization fromPortugal and added one more product to its high potency research product basket called Mebatic. To maintain the qualitystandard and further improvement in quality of products, company is making investment for automisation of its existingPlant & Machinery, Equipments and other quality instruments. In result of huge past and present investment in R&D PilotPlant and equipments, the R&D wing of the company is day by day giving new products to the company and has alsogot approval from Department of Scientific & Industrial Research, New Delhi under Section 35(2AB) of Income tax Act1961. This will enhance the financial benefits to company and further accelerate the R & D efforts & activities of thecompany.
11. The Parent company operates only in one business segment viz. “Pharmaceutical Formulation” and is engaged inmanufacturing and trading of medicines. Since in the opinion of management, the inherent nature of activities engagedby the company are governed by the same set of risks and rewards, so these have been grouped and identified as a singlesegment in accordance with the Accounting Standard on Segment Reporting (AS-17) issued by ICAI.
12. In the opinion of the board, and to the best of their knowledge and belief, the value on realisation of the current assets,loans & advance shown in the Balance Sheet in the ordinary course of business will be at least equal to the amount atwhich they are stated in the Balance Sheet and provision for all known and determined liabilities has been made.
13. The wholly Owned Subsidiary “Venus Pharma GmbH” was operated at Werne, Germany, Accordingly, the Balance Sheetof Wholly Owned Subsidiary has been consolidated along with the Present Company in accordance with the AccountingStandard on Consolidated Financial Statement” (AS-21).
14. The Parent Company and their bondholders had arrived at an agreement for settlement of FCCBs of US$ 14 million
4. In the books of Parent company a sum of ` 82,998 (Previous Year ` NIL). Maximum outstanding during the year ` 4,18,055/- (Previous year ` 5,68,030/-) is due from Directors of the company being imprest for travelling, conveyanceand other charges.
5. In parent company Fixed deposits with banks of ` 87,90,000.00 (previous year ` 56,44,235) are pledged as MarginMoney with banks.
6. In the books of Parent company Expenses includes ` 76,100/- (P/Y ` 1,79,630-) as expenses relating to previous years.
7. In the books of Parent company Income includes ` 600/- (P/Y ` NIL) as income related to previous year.
8. In the books of Subsidiary Company a sum of € 21,092 is recorded as Prior Period Expenses as it was not recorded inprevious year due to some clerical mistake.
9. a) In the Parent company disclosure as required by AS-18 (Related Party) issued by ICAI.
(Amount in `)
Current Year Previous Year
Statutory Audit Fees 4,90,000 4,25,000Tax Audit Fee 85,000 75,000Management Matters 3,45,000 3,00,000Add : Service tax 59,225 51,500Total 9,79,225 8,51,500
Related Party Relationship Nature of Transaction Amount of Transaction
Mr. Pawan Chaudhary Chairman cum Managing Director Remuneration Paid ` 41,40,000Mrs. Manu Chaudhary Joint Managing Director Remuneration Paid ` 27,60,000Mr. Peeyush Jain Deputy Managing Director Remuneration Paid ` 13,80,000Mr. Ashutosh Jain Executive Director Remuneration Paid ` 11,04,000Sunev Pharma Solutions Mr Pawan Chaudhary Loan accepted ` 2,30,00,000
Common director Interest paid ` 15,92,548Purchases ` 97,69,617
3. Auditor's Remuneration
Schedules forming part of the Consolidated Balance Sheet & Profit and Loss Account
96 I Venus Remedies Limited
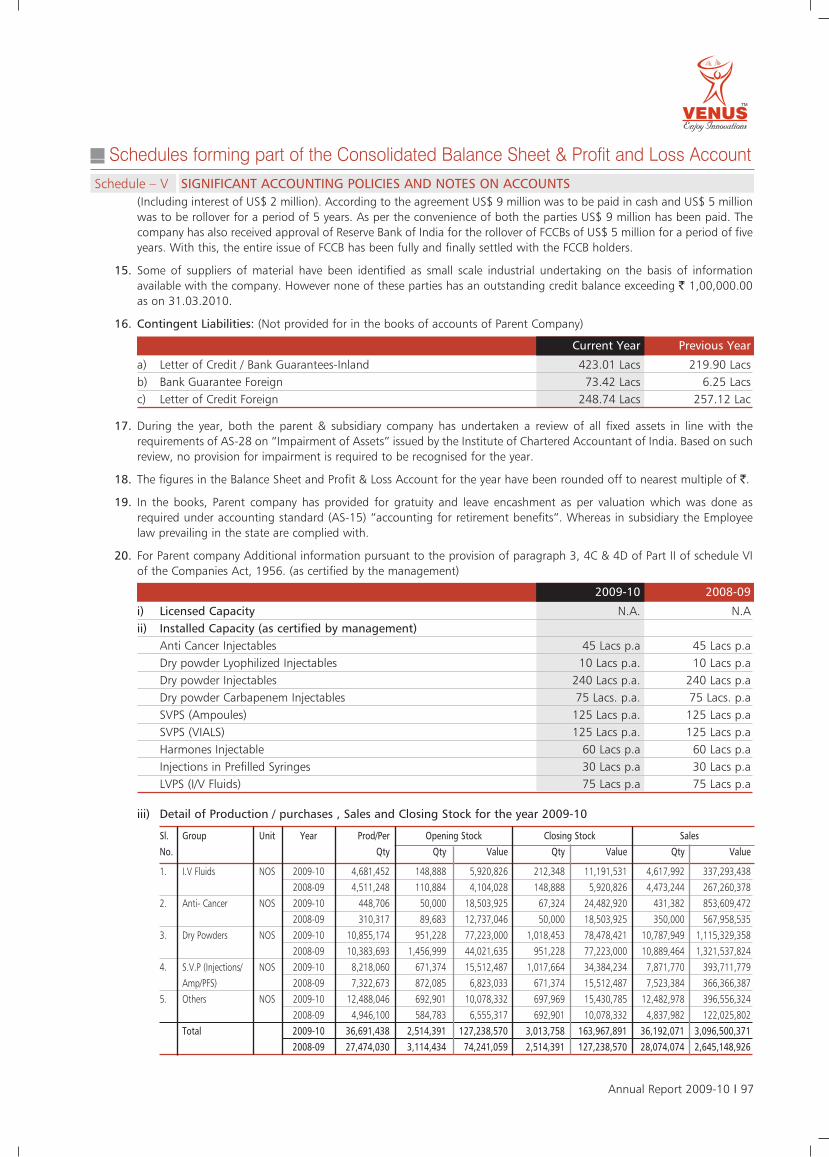
Schedule – V SIGNIFICANT ACCOUNTING POLICIES AND NOTES ON ACCOUNTS(Including interest of US$ 2 million). According to the agreement US$ 9 million was to be paid in cash and US$ 5 millionwas to be rollover for a period of 5 years. As per the convenience of both the parties US$ 9 million has been paid. Thecompany has also received approval of Reserve Bank of India for the rollover of FCCBs of US$ 5 million for a period of fiveyears. With this, the entire issue of FCCB has been fully and finally settled with the FCCB holders.
15. Some of suppliers of material have been identified as small scale industrial undertaking on the basis of informationavailable with the company. However none of these parties has an outstanding credit balance exceeding ` 1,00,000.00as on 31.03.2010.
16. Contingent Liabilities: (Not provided for in the books of accounts of Parent Company)
Current Year Previous Year
a) Letter of Credit / Bank Guarantees-Inland 423.01 Lacs 219.90 Lacsb) Bank Guarantee Foreign 73.42 Lacs 6.25 Lacsc) Letter of Credit Foreign 248.74 Lacs 257.12 Lac
17. During the year, both the parent & subsidiary company has undertaken a review of all fixed assets in line with therequirements of AS-28 on “Impairment of Assets” issued by the Institute of Chartered Accountant of India. Based on suchreview, no provision for impairment is required to be recognised for the year.
18. The figures in the Balance Sheet and Profit & Loss Account for the year have been rounded off to nearest multiple of `.
19. In the books, Parent company has provided for gratuity and leave encashment as per valuation which was done asrequired under accounting standard (AS-15) “accounting for retirement benefits”. Whereas in subsidiary the Employeelaw prevailing in the state are complied with.
20. For Parent company Additional information pursuant to the provision of paragraph 3, 4C & 4D of Part II of schedule VIof the Companies Act, 1956. (as certified by the management)
2009-10 2008-09
i) Licensed Capacity N.A. N.Aii) Installed Capacity (as certified by management)
Anti Cancer Injectables 45 Lacs p.a 45 Lacs p.aDry powder Lyophilized Injectables 10 Lacs p.a. 10 Lacs p.aDry powder Injectables 240 Lacs p.a. 240 Lacs p.aDry powder Carbapenem Injectables 75 Lacs. p.a. 75 Lacs. p.aSVPS (Ampoules) 125 Lacs p.a. 125 Lacs p.aSVPS (VIALS) 125 Lacs p.a. 125 Lacs p.aHarmones Injectable 60 Lacs p.a 60 Lacs p.aInjections in Prefilled Syringes 30 Lacs p.a 30 Lacs p.aLVPS (I/V Fluids) 75 Lacs p.a 75 Lacs p.a
iii) Detail of Production / purchases , Sales and Closing Stock for the year 2009-10
Sl. Group Unit Year Prod/Per Opening Stock Closing Stock SalesNo. Qty Qty Value Qty Value Qty Value
1. I.V Fluids NOS 2009-10 4,681,452 148,888 5,920,826 212,348 11,191,531 4,617,992 337,293,438
2008-09 4,511,248 110,884 4,104,028 148,888 5,920,826 4,473,244 267,260,378
2. Anti- Cancer NOS 2009-10 448,706 50,000 18,503,925 67,324 24,482,920 431,382 853,609,472
2008-09 310,317 89,683 12,737,046 50,000 18,503,925 350,000 567,958,535
3. Dry Powders NOS 2009-10 10,855,174 951,228 77,223,000 1,018,453 78,478,421 10,787,949 1,115,329,358
2008-09 10,383,693 1,456,999 44,021,635 951,228 77,223,000 10,889,464 1,321,537,824
4. S.V.P (Injections/ NOS 2009-10 8,218,060 671,374 15,512,487 1,017,664 34,384,234 7,871,770 393,711,779
Amp/PFS) 2008-09 7,322,673 872,085 6,823,033 671,374 15,512,487 7,523,384 366,366,387
5. Others NOS 2009-10 12,488,046 692,901 10,078,332 697,969 15,430,785 12,482,978 396,556,324
2008-09 4,946,100 584,783 6,555,317 692,901 10,078,332 4,837,982 122,025,802
Total 2009-10 36,691,438 2,514,391 127,238,570 3,013,758 163,967,891 36,192,071 3,096,500,3712008-09 27,474,030 3,114,434 74,241,059 2,514,391 127,238,570 28,074,074 2,645,148,926
Schedules forming part of the Consolidated Balance Sheet & Profit and Loss Account
Annual Report 2009-10 I 97
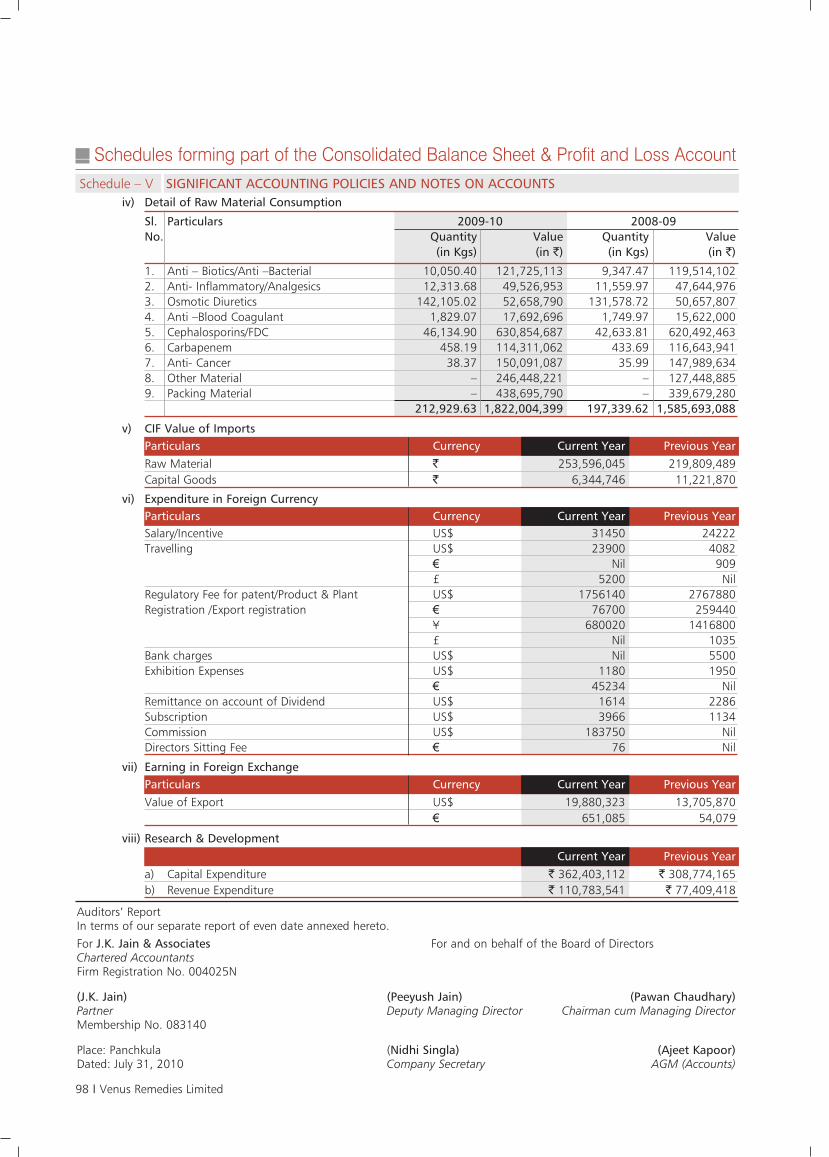
Schedules forming part of the Consolidated Balance Sheet & Profit and Loss Account
98 I Venus Remedies Limited
Schedule – V SIGNIFICANT ACCOUNTING POLICIES AND NOTES ON ACCOUNTSiv) Detail of Raw Material Consumption
v) CIF Value of Imports
Sl. Particulars 2009-10 2008-09No. Quantity Value Quantity Value
(in Kgs) (in `) (in Kgs) (in `)
1. Anti – Biotics/Anti –Bacterial 10,050.40 121,725,113 9,347.47 119,514,1022. Anti- Inflammatory/Analgesics 12,313.68 49,526,953 11,559.97 47,644,9763. Osmotic Diuretics 142,105.02 52,658,790 131,578.72 50,657,8074. Anti –Blood Coagulant 1,829.07 17,692,696 1,749.97 15,622,0005. Cephalosporins/FDC 46,134.90 630,854,687 42,633.81 620,492,4636. Carbapenem 458.19 114,311,062 433.69 116,643,9417. Anti- Cancer 38.37 150,091,087 35.99 147,989,6348. Other Material – 246,448,221 – 127,448,8859. Packing Material – 438,695,790 – 339,679,280
212,929.63 1,822,004,399 197,339.62 1,585,693,088
Particulars Currency Current Year Previous YearRaw Material ` 253,596,045 219,809,489Capital Goods ` 6,344,746 11,221,870
vi) Expenditure in Foreign CurrencyParticulars Currency Current Year Previous YearSalary/Incentive US$ 31450 24222Travelling US$ 23900 4082
€ Nil 909£ 5200 Nil
Regulatory Fee for patent/Product & Plant US$ 1756140 2767880Registration /Export registration € 76700 259440
¥ 680020 1416800£ Nil 1035
Bank charges US$ Nil 5500Exhibition Expenses US$ 1180 1950
€ 45234 NilRemittance on account of Dividend US$ 1614 2286Subscription US$ 3966 1134Commission US$ 183750 NilDirectors Sitting Fee € 76 Nil
Auditors’ ReportIn terms of our separate report of even date annexed hereto.For J.K. Jain & Associates For and on behalf of the Board of DirectorsChartered AccountantsFirm Registration No. 004025N
(J.K. Jain) (Peeyush Jain) (Pawan Chaudhary)Partner Deputy Managing Director Chairman cum Managing DirectorMembership No. 083140
Place: Panchkula (Nidhi Singla) (Ajeet Kapoor)Dated: July 31, 2010 Company Secretary AGM (Accounts)
vii) Earning in Foreign ExchangeParticulars Currency Current Year Previous YearValue of Export US$ 19,880,323 13,705,870
€ 651,085 54,079
viii) Research & DevelopmentCurrent Year Previous Year
a) Capital Expenditure ` 362,403,112 ` 308,774,165b) Revenue Expenditure ` 110,783,541 ` 77,409,418
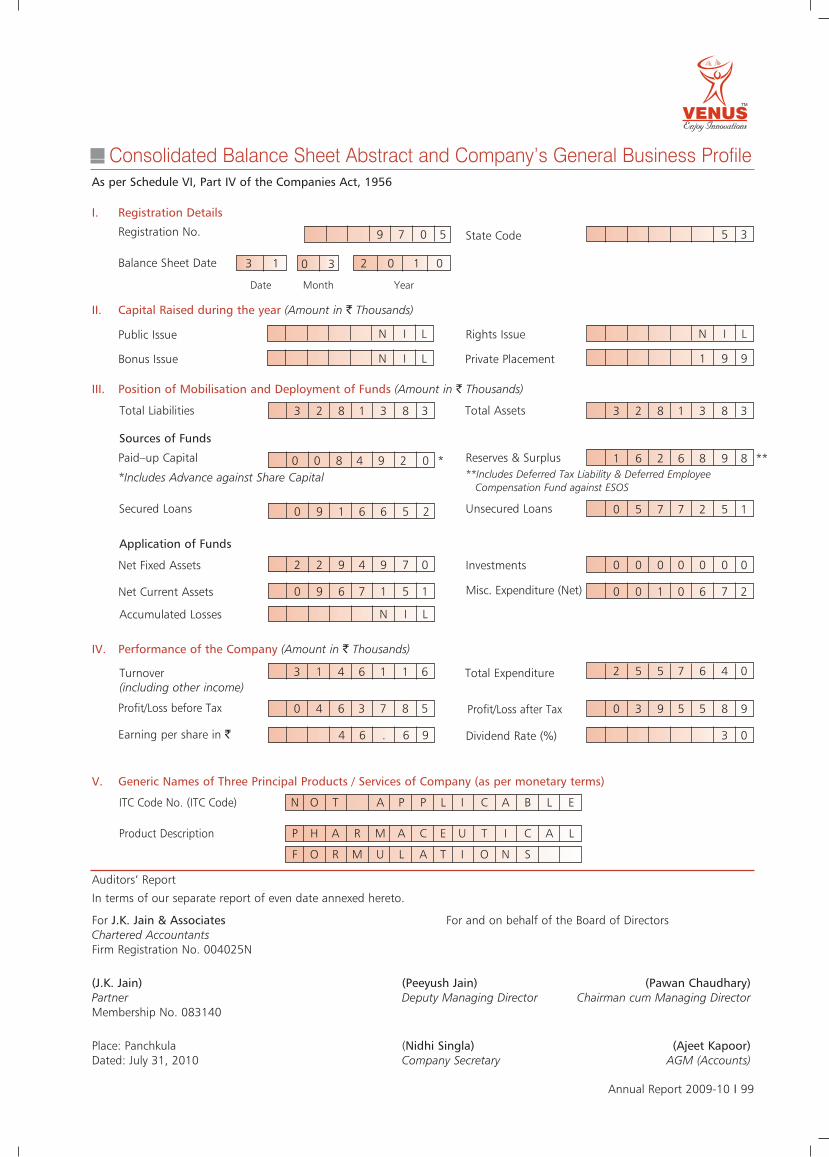
Consolidated Balance Sheet Abstract and Company’s General Business ProfileAs per Schedule VI, Part IV of the Companies Act, 1956
Public Issue
Bonus Issue
3 1 0 3
Registration No.
Balance Sheet Date
I. Registration Details
II. Capital Raised during the year (Amount in ` Thousands)
Total Liabilities
III. Position of Mobilisation and Deployment of Funds (Amount in ` Thousands)
2 0 1 0
Date Month Year
Private Placement
Paid–up Capital
*Includes Advance against Share Capital
Sources of Funds
Total Assets
Reserves & Surplus**Includes Deferred Tax Liability & Deferred Employee
Compensation Fund against ESOS
IV. Performance of the Company (Amount in ` Thousands)
ITC Code No. (ITC Code)
Product Description
V. Generic Names of Three Principal Products / Services of Company (as per monetary terms)
Net Fixed Assets
Turnover (including other income)
Profit/Loss before Tax
Total Expenditure
Profit/Loss after Tax
Application of Funds
3 2 8 1 3 8 3
9 7 0 5
0 0 8 4 9 2 0 *
3 1 4 6 1 1 6
0 4 6 3 7 8 5
2 5 5 7 6 4 0
0 3 9 5 5 8 9
Earning per share in ` Dividend Rate (%)4 6 . 6 9
N O T A P P L I C A B L E
P H A R M A C E U T I C A L
F O R M U L A T I O N S
3 0
2 2 9 4 9 7 0 0 0 0 0 0 0 0
Net Current Assets Misc. Expenditure (Net)0 9 6 7 1 5 1 0 0 1 0 6 7 2
Accumulated Losses N I L
1 9 9
Rights Issue N I L
State Code 5 3
N I L
N I L
3 2 8 1 3 8 3
1 6 2 6 8 9 8 **
Secured Loans Unsecured Loans
Investments
0 9 1 6 6 5 2 0 5 7 7 2 5 1
Auditors’ Report
In terms of our separate report of even date annexed hereto.
For J.K. Jain & Associates For and on behalf of the Board of DirectorsChartered AccountantsFirm Registration No. 004025N
(J.K. Jain) (Peeyush Jain) (Pawan Chaudhary)Partner Deputy Managing Director Chairman cum Managing DirectorMembership No. 083140
Place: Panchkula (Nidhi Singla) (Ajeet Kapoor)Dated: July 31, 2010 Company Secretary AGM (Accounts)
Annual Report 2009-10 I 99
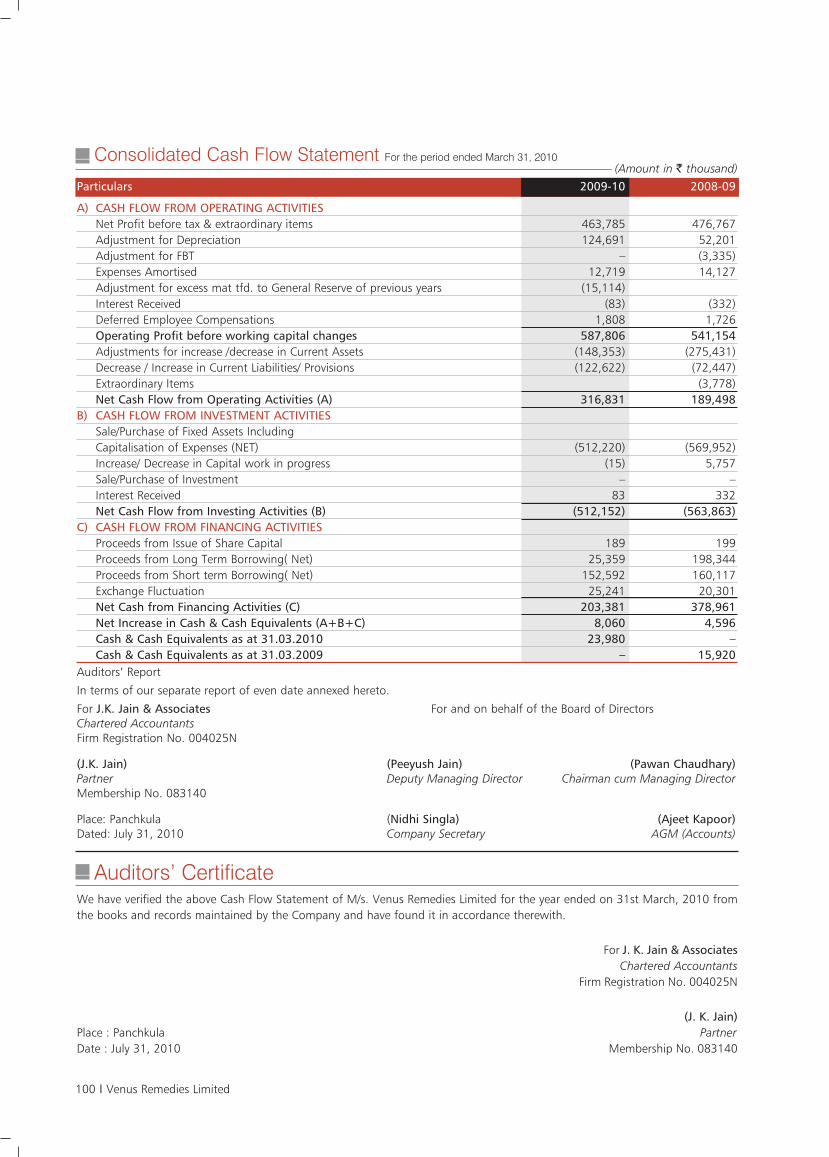
Consolidated Cash Flow Statement For the period ended March 31, 2010
100 I Venus Remedies Limited
Auditors’ Certificate
(Amount in ` thousand)
Auditors’ Report
In terms of our separate report of even date annexed hereto.
For J.K. Jain & Associates For and on behalf of the Board of DirectorsChartered AccountantsFirm Registration No. 004025N
(J.K. Jain) (Peeyush Jain) (Pawan Chaudhary)Partner Deputy Managing Director Chairman cum Managing DirectorMembership No. 083140
Place: Panchkula (Nidhi Singla) (Ajeet Kapoor)Dated: July 31, 2010 Company Secretary AGM (Accounts)
We have verified the above Cash Flow Statement of M/s. Venus Remedies Limited for the year ended on 31st March, 2010 fromthe books and records maintained by the Company and have found it in accordance therewith.
For J. K. Jain & AssociatesChartered Accountants
Firm Registration No. 004025N
(J. K. Jain)Place : Panchkula PartnerDate : July 31, 2010 Membership No. 083140
Particulars 2009-10 2008-09
A) CASH FLOW FROM OPERATING ACTIVITIESNet Profit before tax & extraordinary items 463,785 476,767 Adjustment for Depreciation 124,691 52,201 Adjustment for FBT – (3,335)Expenses Amortised 12,719 14,127 Adjustment for excess mat tfd. to General Reserve of previous years (15,114)Interest Received (83) (332)Deferred Employee Compensations 1,808 1,726 Operating Profit before working capital changes 587,806 541,154 Adjustments for increase /decrease in Current Assets (148,353) (275,431)Decrease / Increase in Current Liabilities/ Provisions (122,622) (72,447)Extraordinary Items (3,778)Net Cash Flow from Operating Activities (A) 316,831 189,498
B) CASH FLOW FROM INVESTMENT ACTIVITIESSale/Purchase of Fixed Assets Including Capitalisation of Expenses (NET) (512,220) (569,952)Increase/ Decrease in Capital work in progress (15) 5,757 Sale/Purchase of Investment – – Interest Received 83 332 Net Cash Flow from Investing Activities (B) (512,152) (563,863)
C) CASH FLOW FROM FINANCING ACTIVITIESProceeds from Issue of Share Capital 189 199 Proceeds from Long Term Borrowing( Net) 25,359 198,344 Proceeds from Short term Borrowing( Net) 152,592 160,117 Exchange Fluctuation 25,241 20,301 Net Cash from Financing Activities (C) 203,381 378,961 Net Increase in Cash & Cash Equivalents (A+B+C) 8,060 4,596 Cash & Cash Equivalents as at 31.03.2010 23,980 – Cash & Cash Equivalents as at 31.03.2009 – 15,920