Does an Improved Urban Bus Service Affect House Values?
27
This article was downloaded by: [Université Du Québec à Montréal] On: 29 June 2011, At: 07:18 Publisher: Taylor & Francis Informa Ltd Registered in England and Wales Registered Number: 1072954 Registered office: Mortimer House, 37-41 Mortimer Street, London W1T 3JH, UK International Journal of Sustainable Transportation Publication details, including instructions for authors and subscription information: http://www.tandfonline.com/loi/ujst20 Does an Improved Urban Bus Service Affect House Values? François Des Rosiers a c , Marius Thériault b c , Marion Voisin b c & Jean Dubé b c a Faculty of Business Administration, Laval University, Quebec City, Canada b École supérieure d'aménagement et de développement (ÉSAD), Laval University, Quebec City, Canada c École Land Planning Research Center, CRAD (Centre de recherche en aménagement et développement), Laval University, Quebec City, Canada Available online: 15 Apr 2010 To cite this article: François Des Rosiers, Marius Thériault, Marion Voisin & Jean Dubé (2010): Does an Improved Urban Bus Service Affect House Values?, International Journal of Sustainable Transportation, 4:6, 321-346 To link to this article: http://dx.doi.org/10.1080/15568310903093362 PLEASE SCROLL DOWN FOR ARTICLE Full terms and conditions of use: http://www.tandfonline.com/page/terms-and-conditions This article may be used for research, teaching and private study purposes. Any substantial or systematic reproduction, re-distribution, re-selling, loan, sub-licensing, systematic supply or distribution in any form to anyone is expressly forbidden. The publisher does not give any warranty express or implied or make any representation that the contents will be complete or accurate or up to date. The accuracy of any instructions, formulae and drug doses should be independently verified with primary sources. The publisher shall not be liable for any loss, actions, claims, proceedings, demand or costs or damages whatsoever or howsoever caused arising directly or indirectly in connection with or arising out of the use of this material.
-
Upload
independent -
Category
Documents
-
view
2 -
download
0
Transcript of Does an Improved Urban Bus Service Affect House Values?

This article was downloaded by: [Université Du Québec à Montréal]On: 29 June 2011, At: 07:18Publisher: Taylor & FrancisInforma Ltd Registered in England and Wales Registered Number: 1072954 Registeredoffice: Mortimer House, 37-41 Mortimer Street, London W1T 3JH, UK
International Journal of SustainableTransportationPublication details, including instructions for authors andsubscription information:http://www.tandfonline.com/loi/ujst20
Does an Improved Urban Bus ServiceAffect House Values?François Des Rosiers a c , Marius Thériault b c , Marion Voisin b c &Jean Dubé b ca Faculty of Business Administration, Laval University, Quebec City,Canadab École supérieure d'aménagement et de développement (ÉSAD),Laval University, Quebec City, Canadac École Land Planning Research Center, CRAD (Centre de rechercheen aménagement et développement), Laval University, Quebec City,Canada
Available online: 15 Apr 2010
To cite this article: François Des Rosiers, Marius Thériault, Marion Voisin & Jean Dubé (2010): Does anImproved Urban Bus Service Affect House Values?, International Journal of Sustainable Transportation,4:6, 321-346
To link to this article: http://dx.doi.org/10.1080/15568310903093362
PLEASE SCROLL DOWN FOR ARTICLE
Full terms and conditions of use: http://www.tandfonline.com/page/terms-and-conditions
This article may be used for research, teaching and private study purposes. Anysubstantial or systematic reproduction, re-distribution, re-selling, loan, sub-licensing,systematic supply or distribution in any form to anyone is expressly forbidden.
The publisher does not give any warranty express or implied or make any representationthat the contents will be complete or accurate or up to date. The accuracy of anyinstructions, formulae and drug doses should be independently verified with primarysources. The publisher shall not be liable for any loss, actions, claims, proceedings,demand or costs or damages whatsoever or howsoever caused arising directly or indirectlyin connection with or arising out of the use of this material.

Does an Improved Urban Bus Service
Affect House Values?
Francois Des Rosiers,1,3 Marius Theriault,2,3 Marion Voisin,2,3 and Jean Dube2,31Faculty of Business Administration, Laval University, Quebec City, Canada2Ecole superieure d’amenagement et de developpement (ESAD), LavalUniversity, Quebec City, Canada,3Ecole Land Planning Research Center, CRAD (Centre de recherche enamenagement et developpement), Laval University, Quebec City, Canada
ABSTRACT
This study aims at testing whether, and to what extent, the overall quality in thesupply of an urban bus service translates into higher house values for propertieslocated along the lines; Quebec City, Canada, is used as a case study. The studyrelies on a database provided by the former Quebec Urban Community Asses-sment Division and, once filtered, includes 11,291 detached and attachedsingle-family house sales that took place in Quebec City between January 1993and February 1997. In addition to sale prices and conditions, property specifics,local amenity and taxation, time trend as well as socioeconomic and overall accessi-bility attributes, the database also includes mass transit (MT) network quality attri-butes accounting for bus frequency, route diversity and bus stop accessibility.Three bus service levels are considered—namely regular routes, the Metrobusand the Express—while four mutually exclusive buffer zones are used for measur-ing house value impacts. All information is handled through a regional geographicinformation system (GIS). The hedonic approach is resorted to in order to assessthe magnitude and direction of MT-related externalities for properties locatedalong bus routes and in the vicinity of bus stops.
Findings suggest that increasing regular bus frequencies results, by and large, inlower house values for properties located in the vicinity of regular routes; and thereverse is true for Express lines, which exert a substantial, positive influence onprices. Thus, by offering a more direct and efficient (fewer stops) as well as morecomfortable mode than both the regular and Metrobus services, the Expressactually proves to be a convenient substitute to the private car for suburban
Received 19 January 2007; revised 26 June 2008; accepted 1 June 2009.Address correspondence to Francois Des Rosiers, Urban & Real Estate Management, LavalUniversity, Quebec City, Canada, G1K 7P4. E-mail: [email protected]
International Journal of Sustainable Transportation, 4:321–346, 2010Copyright # Taylor & Francis Group, LLCISSN: 1556-8318 print=1556-8334 onlineDOI: 10.1080/15568310903093362
321
Dow
nloa
ded
by [
Uni
vers
ité D
u Q
uébe
c à
Mon
tréa
l] a
t 07:
18 2
9 Ju
ne 2
011

homeowners with a regular working schedule. Findings also suggest that a greaterdestination choice for homeowners, expressed as the number of routes availablewithin a five-minute walk from home, affects property values upward. Finally, thenumber of bus stops available at a distance of between 100 and 400 meters fromhome drives house prices down by a factor that lessens with distance. Thus, theadditional noise and traffic disturbances thereby generated seem to prevail overan easier access to the MT network.Key Words: accessibility, property values, public transport, urban externalities
1. OBJECTIVE AND CONTEXT OF RESEARCH
This study aims at testing whether, and to what extent, the overall quality in thesupply of an urban bus service translates into higher house values for single-familyproperties located along the lines. Hedonic modelling is used to compare threetypes of urban bus services, assessing the internalization of linked externalities(noise and accessibility) in the single-family housing market of Quebec City,Canada.
Located 150miles east of Montreal, Quebec City, with a population of roughly560,000 [683,000 for the Quebec Metropolitan Area (QMA) according to the2001 Canadian Census], is used as a case study. Among its characteristics, QuebecCity [Quebec Urban Community (QUC)], which extends over 549 squarekilometres (212 square miles), offers an extensive highway network which greatlyfacilitates motorized movements and prevents most congestion problems. At thesame time though, low residential density in most neighborhoods makes any masstransit system increasingly difficult to support financially, since competition withthe private car is harsher than ever. As a consequence, the modal share of publictransport (essentially the bus service) has decreased over time.1
Operated under the Reseau de Transport de la Capitale (RTC)2, Quebec City’sbus network is composed of three types of routes:
i. In operation eighteen hours a day from 6:00 am till half past midnight, sevendays a week, the regular service offers 54 routes with frequent stops serving thewhole territory using the local street network;
ii. Introduced in 1992, the Metrobus system was designed at improving the sup-ply of public transport where most needed (high-trip densities) and operateson two additional routes, half of which are with bus lanes. Essentially, thisimprovement consisted in an increased vehicle frequency coupled with fewerbus stops along main street and road sections of the agglomeration alreadyserved by a regular service, thereby linking more efficiently downtown areas
1For instance, while the public transport modal share still amounted to 16.1% of all motorizedtrips in 1991, it had dropped to around 9.3% by 2001, recovering at 10.1% in 2006.2Until January 1st, 2002, when all 13 municipalities on the north shore of the Saint-LawrenceRiver were amalgamated into Quebec City, the RTC was operating under the responsibility ofthe Quebec Urban Community (CUQ), an administrative structure designed at managingregional issues.
F. Des Rosiers et al.
322 International Journal of Sustainable Transportation Vol. 4, No. 6, 2010
Dow
nloa
ded
by [
Uni
vers
ité D
u Q
uébe
c à
Mon
tréa
l] a
t 07:
18 2
9 Ju
ne 2
011

with eastern (Beauport), northern (Charlesbourg) and western (Ste-Foy) sub-urbs during rush hours (7:00 am–6:00 pm). In 1993, the public transitimprovement program was further strengthened by the introduction of theMetrobus Plus, which provides an even more intensive service level betweensuburban locations and Laval University, located in Ste-Foy3;
iii. Finally, the Express service insures a direct link, with few stops, betweenresidential areas and major employment and activity centers in the city.In operation on weekdays only and during rush hours (7:00–9:00 am and3:30–6:00 pm), the Express serves Laval University and Ste-Foy shoppingcenters (17 routes) as well as downtown areas (21 routes) using motorwaysin order to shorten time to destination.
Figure 1 displays the major components of Quebec City’s bus network, as of 1996.According to the Canadian Center for Sustainable Transportation (http://cst.
uwinnipeg.ca/), a sustainable transportation system should, among other things,
3The Metrobus network now extends over some 70 kilometers (roughly 44miles), more thanhalf of which being served by bus lanes – also used by taxis, and has 163 stops – of which 143are covered shelters. With an average distance of 430meters (roughly 1,400 feet) betweenMetrobus shelters, bus frequency stands at 5–10 minutes intervals during peak hours(7.5–15 minutes intervals during summer time, on evenings and during week-ends).
Figure 1. Regular, Express andMetrobus Service Routes, Quebec City, as of 1996.
Urban Bus Service and House Values
International Journal of Sustainable Transportation Vol. 4, No. 6, 2010 323
Dow
nloa
ded
by [
Uni
vers
ité D
u Q
uébe
c à
Mon
tréa
l] a
t 07:
18 2
9 Ju
ne 2
011

be affordable and efficient in meeting the basic access needs of individuals whileoffering the choice of transport mode and supporting the local economy. Whileroughly 86 percent of all motorized trips in Quebec City are car-based, supportinga high quality mass transit (MT) service ultimately depends on how it improvesaccessibility to jobs and urban services. In turn, a better accessibility should beexpected to translate into higher property values. Hence the relevance of the issueaddressed in this paper, in which the price impacts of bus frequency for variouslevels of service, route choice diversity and proximity to MT services are assessed.
However, it should be stressed that, due to data availability, this study focuses onthe single-family housing market in spite of the fact that larger impacts may beexpected for multi-family, rented properties. Nevertheless, this paper aims atassessing the potential internalization of a better accessibility to various types ofMT services in low-density residential settlements such as those which clearlyprevail within nearly all North-American cities, thereby identifying externalitiesand property value returns pertaining to sustainable transportation strategies atthe municipal level.
2. LITERATURE REVIEW
From an analytic point of view, land and property prices are a combination ofexternality effects and location rents (Krantz et al. 1982; Hickman et al. 1984;Shefer 1986; Yinger et al. 1987; Strange 1992; Can 1992; Dubin 1998). Hochand Waddell (1993) point out that the overlapping of access and neighborhoodcharacteristics leads to highly complex influences on rent levels and values. Asshown by Des Rosiers et al. (2000), accessibility factors impact differently onlocation rents depending on whether they operate at a regional or local level.The influence that accessibility exerts on house prices will also vary with the typeof urban amenity considered. In their recent study on car accessibility in QuebecCity, Theriault et al. (2007) find that households put more emphasis on access toschools than to the labor market, which, in turn, outclasses shopping facilities intheir home purchase decision. Moreover, measuring accessibility to urban servicesinvolves both objective and subjective dimensions linked to household structureand individual mobility behavior (Theriault et al. 2005a). Finally, the overlap ofaccess and proximity influences is mirrored in the non-monotonicity of some ofthe distance functions which requires that specific transformations be appliedbefore they can be adequately captured (Des Rosiers et al. 1996, 2001).
A number of studies have looked at the effects of noise and road traffic onhouse prices and estimated the willingness-to-pay for such negative externalities(Pollakowski 1982; Hughes and Sirmans 1992, 1993; Powe et al. 1995; Haiderand Mille 2000; Nijland et al. 2003; Theebe 2004), particularly in cities where noisemeasurement observatories have been implemented (Schade 2003). By and large,studies suggest that a noise level below 55 dBA does not affect prices while eachadditional decibel deteriorates property values by 0.4 percent to 0.6 percent(Palmquist 1992). Lake et al. (1998) showed that a view on a road resulted in a2.5 percent drop in house price with each incremental decibel beyond a 68 dBAthreshold adding a 1.1 percent discount. In his study on a suburb of Stockholm,
F. Des Rosiers et al.
324 International Journal of Sustainable Transportation Vol. 4, No. 6, 2010
Dow
nloa
ded
by [
Uni
vers
ité D
u Q
uébe
c à
Mon
tréa
l] a
t 07:
18 2
9 Ju
ne 2
011

Wilhelmsson (2000) found that noisy neighborhoods could drive house pricesdown by as much as 30 percent. Finally, a study prepared for the Quebec UrbanCommunity Transport Commission previous to the introduction of the Metrobussystem concludes that the latter is likely to affect negatively the acoustic environ-ment of some areas of the city, with each bus running by a house increasing thenoise level by 0.5 to 1.5 dB (Abonce and Weixiong 1992).
Most of the academic research reporting on the effect of mass transportation onproperty values or rents deals with either heavy or light rail systems. Such researchincludes Dewees (1976), Bajic (1983), Voith (1993), Gatzlaff and Smith (1993),Benjamin and Sirmans (1996), McDonald and Osuji (1995), Baum-Snow and Kahn(2000), Pagliaro and Preston (2003) and, more recently, McMillen and McDonald(2004). The literature review by Smith and Gihring (2004) on value capture finan-cing provides a quite extensive picture of international related experiences:although the extent of the impacts varies from place to place, the implementationof a new rail transit system generally results in significant rises in both residentialand commercial property values, mainly around railway or metro stations. Thereare reports, though, of price drops for dwellings adjacent to such stations.
Very few studies have been found that address the impact issue in relation to theimplementation or improvement of a bus service. So et al. (1997) examined theimportance of transport on house prices in Hong Kong. As do the vast majorityof authors, they use hedonic modelling to control for various internal attributesand environmental characteristics, measuring transport accessibility as the distanceto nearest stop on the mass transit railway (MTR), bus or minibus route. Dummyvariables are also used to account for dwellings located within a 10-minute walkfrom a transport node. While results reveal an insignificant explanatory powerfor bus routes, accessibility to minibuses emerges as the most influential effecton house prices. In Brisbane, Australia, a study by the Real Estate Institute ofQueensland (2001) shows that the median house price of properties located insuburbs both directly alongside and near the South East Busway rose, on average,by a percentage of 10.1 percent between June and September 2000, as opposed to3.0 percent elsewhere, thereby suggesting that commuters tend to place moreemphasis of an easy access to the central business district (CBD).
Several factors seem to condition the use of urban public transport. According toTheriault et al. (2005b), the changes in the professional status of women over thepast decades and the ensuing growth in female car ownership result in long distancebus services having less influence on the house location choice process. The evolv-ing competition among shopping and leisure alternatives in urban areas also actsupon modal choices by individual and households (Biba et al. 2004; Theriaultet al. 2005c). Finally, preliminary findings from a recent research by Des Rosierset al. (2006) on Quebec City’s Metrobus service suggest that the rise in the localmass transit modal share over time impacts positively on house prices. Moreover,houses centrally located in neighborhoods where the MTshare rose benefited froman additional premium following the introduction of the Metrobus service while thelatter was detrimental to properties located in the extended corridors – i.e., in thesuburban areas of the city. This suggests that extending the Metrobus service toperipheral areas of the city has turned into a negative externality for local residentsfor whom mass transit is not an adequate alternative to the car.
Urban Bus Service and House Values
International Journal of Sustainable Transportation Vol. 4, No. 6, 2010 325
Dow
nloa
ded
by [
Uni
vers
ité D
u Q
uébe
c à
Mon
tréa
l] a
t 07:
18 2
9 Ju
ne 2
011

Quite understandably, the vast majority of studies dealing with urban accessi-bility and related mobility and centrality concepts emphasize the private car as atransportation mode while access to workplaces has long been the main targetto focus on (Ball 1974). In Quebec City, which fits the definition of a rather typicalNorth-American metropolitan area characterized by pronounced urban sprawl,mass transit amenities should not be expected to exert as important an impacton prices as that of either the private car or other determinants (e.g., living area,building age, etc.). Nevertheless, they meet the needs of a substantial portion ofthe population and it is thus relevant to assess whether, and to what extent, thequality of a bus service is capitalized into property values, particularly in light ofthe relative scarcity of past research on the subject and of the growing concernfor sustainable development of cities. In that respect, Quebec City offers an idealcase to investigate.
3. MODELLING PROCEDURE
3.1. Analytical Approach
Considering the focus of this paper, particular emphasis is laid upon structuringmass transit attributes designed at testing whether, and to what extent, bus servicequality affects residential values. Detailed information on the local bus network isprocessed through a regional GIS and includes: bus routes and type of service(Regular, Metrobus and Express), bus stop and shelter locations, bus lanes, servicefrequency attributes (number of vehicles and hours of operations) as well as theperiod considered (weekdays, Saturday and Sunday). Data on service supply weregathered from the MT operator, the Reseau de Transport de la Capitale (RTC). Aseries of buffers along the routes and around stops are used in order to isolateaccessibility from proximity effects.
The hedonic approach is used to assess the magnitude and direction of MT-related externalities for single-family properties located along bus routes and in thevicinity of bus stops. In order to do so, three series of indices were initially designedfor capturing both the level and quality of the bus service provided to homeowners:
i. Bus Frequency Index: This index measures the frequency, or supply density, ofthe bus service directly available to local residents and is expressed as the numberof buses stopping by within each of the four residential buffer zones. Distinctvariables are computed for each type of MT service, namely the Regular (R),the Metrobus (M) and the Express (E) routes. In the first case, the index isexpressed as the summation of all buses in operation over the weekend, thatis from Saturday, 6:30 am to Monday, 12:30 am.4 With respect to Metrobusroutes, the total number of buses stopping by between 7:00 am and 6:00 pmon a normal week day remains the best indication of the service level availableto local residents. For Express routes finally, morning and late afternoonpeak-hour frequencies, namely between 7:00 am and 9:00 am and between
4While the regular bus service offers a relatively constant-quality service throughout theweek, 18 hours a day, frequencies are slightly lower on weekends; hence the use of weekendfrequencies as an indication of the minimum service level.
F. Des Rosiers et al.
326 International Journal of Sustainable Transportation Vol. 4, No. 6, 2010
Dow
nloa
ded
by [
Uni
vers
ité D
u Q
uébe
c à
Mon
tréa
l] a
t 07:
18 2
9 Ju
ne 2
011
3:30 pm and 6:00 pm, serve as the supply density index. While the busfrequency index is meant at capturing accessibility influences, it may alsoreflect negative proximity influences that are generated by noise and trafficcongestion. Thus, regression coefficients derived from it should be interpretedas the net contribution to house value of the local supply quality level of MTservice over the proximity nuisance effect.
ii. Route Diversity Index: Even where the daily frequency of buses serving a specificneighborhood is high, the variety of destination choices any potential MT userhas access to from his home might still be limited. The second set of dummyvariables, expressed as the number of routes available from local bus stops at increas-ing distances from any residential location, is meant at capturing the routediversity locally available.
iii. Effective Accessibility Index: The third set of indices measures the actual accessi-bility of the MT network for local residents whose propensity to use it may beassumed to increase with physical proximity to bus stops. The index is expressedas the total number of bus stops reachable from home within each buffer zone.
3.2. Database Organization and Description
This study relies on a major residential property database provided by theformer Quebec Urban Community Assessment Division. In this paper, onlyattached and detached single-family house sales5 that took place in Quebec Citybetween January 1993 and February 19976 are considered. The database containsreliable information on sale prices and conditions, precise unit location andproperty characteristics, among which: building size, age and condition (buildingquality index7), number of stories (as a proxy for unit type), lot area, number ofbathrooms, interior quality descriptors, presence of a fireplace, a swimming poolor a garage, etc. The local effective tax rate, whose differentials are partly capita-lized in house prices (Yinger et al. 1987), is also accounted for, as are access to localservices (water and sewage systems) and time trend (house monthly appreciation).Socioeconomic and accessibility dimensions are considered as well. Factor scoresderived from a principal component analysis (PCA) performed on both census-based socioeconomic attributes and car distance-time (computed using TransCADGIS on a regional road network) variables are used for that purpose (Des Rosierset al. 2000; Theriault et al. 2003). Accessibility to jobs and urban services isaccounted for using two mutually independent factors which mirror accessibilityto regional and local services.
Finally, a series of nuisance variables are designed to capture the detrimentaleffect of home proximity to heavy-traffic, noise generating roads which bus routes
5Single-family detached units include ‘‘bungalows,’’ defined as single-storey units, and ‘‘town-cottages,’’ defined as multi-storey units; attached units include semi-detached and row houses.6While house sales in this study extend from January 1993 to February 1997, monthcalculation as reported in Table 1a descriptive statistics (NbMONTH) uses December1985 as the reference date.7The building quality index is a rank variable designed by professional appraisers andreflecting the quality of building materials used; it ranges from �3 to þ3, with the averagehouse being set at zero.
Urban Bus Service and House Values
International Journal of Sustainable Transportation Vol. 4, No. 6, 2010 327
Dow
nloa
ded
by [
Uni
vers
ité D
u Q
uébe
c à
Mon
tréa
l] a
t 07:
18 2
9 Ju
ne 2
011

are likely to follow, a major dimension to control for in the context of this study.In the absence of any direct noise magnitude measurement, nuisance dummyvariables are designed following the road classification system of the Ministry ofTransport of Quebec which is composed of five hierarchical levels—apart fromlocal streets that serve here as the reference category—namely arterial roads, con-nector roads, main roads, urban boulevards as well as highways. Several bufferzones were tested for each level in order to best distinguish detrimental, proximityeffects from positive, accessibility influences. On such grounds, and based on thespecific characteristics of Quebec City’s urban fabric, nuisance variables reportedin the analysis use a 100meters buffer for central and peripheral arterial roadsand main roads while both 100 and 200meters buffers are applied for urbanboulevards. Finally, highway proximity buffers are set at 100 and 250meters.
The initial database has been filtered for modelling purposes in order to discardany inconsistent information, in particular with respect to sale price, living areaand lot size. Sale prices are confined within the $35,000 to $250,000 range whileliving area and lot size range from 35 to 500m2 and from 50 to 10,000m2, respect-ively. Furthermore, Cook’s distances were computed so as to spot undulyinfluential data in the regression (Belsley et al. 1980; Cook and Weisberg 1982);consequently, 19 cases were removed from the analysis. Once filtered, the databaseincludes 11,291 valid cases.
The operational definition of variables used in the modelling process is detailedin Appendix 1 while descriptive statistics for both basic (building, local service,fiscal, time trend, accessibility and nuisance) characteristics and mass transitattributes are reported in Tables 1a and 1b and discussed below.
As can be seen from Tables 1a and 1b, sale price (mean: $93,256) distributionapproaches normality. In spite of that, and as will be discussed in the next sectionof the paper, the dependent variable will undergo a logarithmic transformation soas to generate a multiplicative model. A similar transformation will also be appliedto living area (104m2) whose regression coefficient will thus be expressed as anelasticity coefficient. Other descriptors are markedly skewed to the right whiledisplaying a high kurtosis. This is the case for lot size (516m2) whose distributionis severely distorted by the presence of a few properties sold with a very largelot; consequently, a logarithmic transformation on lot size is most appropriate.Finally, outbuildings (garages, terrace and swimming pool) and local services alsoexhibit highly skewed and concentrated distributions. Sampled properties are, onaverage, 13 years old and mostly consist of one-story units (bungalows). In the caseof dummy descriptors, mean values show the percentage of houses which have thepertaining attribute: for instance, 42 percent of them are equipped with a finishedbasement, 50 percent have high-quality wooden floors while less than two percentdo not have access to Quebec City’s water and sewage networks. From the number ofmonths variable it can be deducted that most sales have occurred between June1993 and August 1995. Finally, roughly 23 percent of all sampled houses arelocated within 100 meters of an arterial road, a connector road or a main road whileproperties located within 200 meters of an urban boulevard and within 250 metersof a highway account for 3.8 percent and 6.7 percent of all sales, respectively.Consequently, two-thirds of properties considered in this study are located on localstreets.
F. Des Rosiers et al.
328 International Journal of Sustainable Transportation Vol. 4, No. 6, 2010
Dow
nloa
ded
by [
Uni
vers
ité D
u Q
uébe
c à
Mon
tréa
l] a
t 07:
18 2
9 Ju
ne 2
011

Table 1a. Descriptive statistics – building, local services, fiscal, trend,
socioeconomic, accessibility & nuisances attributes.
Variable Minimum Maximum Mean Std. Dev. Skewness Kurtosis
SALEPRICE ($) 35,057 248,000 93,256 33,807 1.509 3.020LIVAREA (sq. meters) 35 416 104 34 1.633 5.139LOTSIZE (sq. meters) 50 9,765 516 470 6.285 72.933APPAGE (years) 0 83 13 12.386 .809 �.030STOREY 1 4 1.301 .471 1.044 �.427QUALITY �2 2 .021 .398 2.048 17.542WASHRMTOT 1 6 1.582 .548 .280 �.273FINBASEMENT 0 1 .417 .493 .338 �1.886BRICK51% 0 1 .235 .424 1.249 �.441FIREPLACE 0 6 .214 .435 1.928 4.890HIQUALFLOOR 0 1 .496 .500 .018 �2.000HARDWDSTAIR 0 1 .148 .355 1.982 1.928INFLUMINOS 0 1 .154 .361 1.916 1.673SGLATTGAR 0 1 .036 .187 4.965 22.655SGLDETGAR 0 1 .063 .242 3.611 11.043DBLATTGAR 0 1 .016 .125 7.753 58.121DBLDETGAR 0 1 .031 .173 5.439 27.583TERRACE 0 1 .013 .115 8.445 69.328EXCPOOL 0 1 .029 .169 5.563 28.951WATERSEWER 0 1 .983 .128 �7.535 54.783LOCTAXRATE ($=100$of appraisal value)
0 7.35 2.281 .477 .143 4.020
NBMONTH 85 134 104.575 12.760 .380 �.996SOCIOECO_STATUS(PCA Factor Scores:þHigh income, �Lowincome)
�2.64 2.95 .116 1.089 .185 �.232
LOC_ACCESS (PCAFactor Scores:þHighaccessibility, �Lowaccessibility)
�8.01 1.46 �.116 .959 �1.911 6.892
REG_ACCESS (PCAFactor Scores:þHighaccessibility, �Lowaccessibility)
�2.56 2.06 �.369 .874 .265 �.514
ARTERIAL_RD<100 0 1 .208 .406 1.440 .074CONNECTOR_RD<100
0 1 .018 .133 7.256 50.662
MAIN_RD<100 0 1 .002 .040 24.989 622.556BLVRD<100 0 1 .014 .116 8.388 68.363BLVRD<200 0 1 .038 .192 4.802 21.066HIGHWAY<100 0 1 .012 .108 9.051 79.943HIGHWAY<250 0 1 .067 .251 3.449 9.895
Urban Bus Service and House Values
International Journal of Sustainable Transportation Vol. 4, No. 6, 2010 329
Dow
nloa
ded
by [
Uni
vers
ité D
u Q
uébe
c à
Mon
tréa
l] a
t 07:
18 2
9 Ju
ne 2
011

Apart from a few cases, mass transit attributes are not normally distributed:since they too display very high skewness and kurtosis statistics, a logarithmictransformation is, here again, most appropriate. As expected, mass transit ameni-ties are not homogeneously distributed through space but tend to concentratewithin specific corridors linking Quebec City’s residential areas with employmenthubs, that is where demand is most pronounced. This is quite obvious from therather large standard deviations affecting the variable means. Having said that,the average weekend bus frequency for the regular service stands at 10 buses within50 meters from home and reaches 45 buses in the fourth buffer (200–400m). Putanother way, some 95 regular bus passages are recorded on weekends within 400meters of any sampled property.8 The average number of vehicles passing by within400 meters of homes reaches 26 in the case of the Metrobus (weekdays, 7:00 amto 6:00 pm) as opposed to 9 for the Express service (weekdays, morning andafternoon peak hours). Turning to route diversity descriptors, it can be seen thatdestination choices are substantially raised within the third (100–200m) andfourth (200–400m) buffers, with some 19 bus routes being overall available to
Table 1b. Descriptive statistics – mass transit attributes (hundreds of buses,
routes and stops).
Variable Minimum Maximum Mean Std. Dev. Skewness Kurtosis
Bus FrequencyREGULAR_50 0 7.45 .104 .333 5.489 52.371REGULAR_100 0 7.69 .122 .411 5.974 52.664REGULAR_200 0 8.83 .272 .627 3.894 22.107REGULAR_400 0 9.48 .449 .825 2.971 12.230METROBUS_50 0 4.4 .013 .215 17.730 332.655METROBUS_100 0 4.4 .025 .290 12.686 171.087METROBUS_200 0 4.4 .079 .508 6.988 50.911METROBUS_400 0 4.4 .142 .678 5.102 26.320EXPRESS_50 0 .67 .010 .033 5.494 44.460EXPRESS_100 0 1.09 .012 .044 8.585 128.106EXPRESS_200 0 1.09 .027 .070 5.481 45.813EXPRESS_400 0 .96 .044 .090 3.908 21.352Route DiversityBUSROUTES_50 0 .16 .002 .010 5.914 44.420BUSROUTES_100 0 .29 .008 .020 3.622 20.847BUSROUTES_200 0 1.21 .036 .054 4.692 61.379BUSROUTES_400 0 2.51 .140 .132 3.536 36.477Effective AccessibilityBUSSTOP_50 0 .04 .001 .004 4.024 15.845BUSSTOP_100 0 .07 .004 .008 2.229 4.963BUSSTOP_200 0 .13 .015 .018 1.103 .947BUSSTOP_400 0 .31 .058 .042 .695 .921
8This figure is obtained by adding together frequencies obtained under all four inde-pendent buffers.
F. Des Rosiers et al.
330 International Journal of Sustainable Transportation Vol. 4, No. 6, 2010
Dow
nloa
ded
by [
Uni
vers
ité D
u Q
uébe
c à
Mon
tréa
l] a
t 07:
18 2
9 Ju
ne 2
011

homeowners within 400 meters. As for effective accessibility finally, Table 1b resultssuggest that bus stops do not suffer from as severe a distributional flaw as do theother descriptors: by and large, Quebec City residents can access roughly 8 busstops within a reasonable walking distance from home (400 meters, or a 10-minutewalk).
Table 2a. Model B2: SAR-ERR – mass transit model, non-MT regression
coefficients.
Model overall performance
Adj. R-Square¼ .785 Standard Error of Estimate¼ .1525 Akaike info criterion¼�9,764.84Nb. Of Independent Variables: k¼ 52 Sample Size: N¼ 11,291
Regression coefficients and statistical tests�
Variable B coeff. (Unstdzd.) Std. Error T Value Sig. VIF
(Constant) 8.2289 0.0408 201.4569 0.0000LN_LIVAREA 0.7019 0.0079 89.3209 0.0000 2,626LN_LOTSIZE 0.0585 0.0029 20.3045 0.0000 2,198APPAGE �0.0074 0.0001 �49.9006 0.0000 1,622STOREY �0.1291 0.0047 �27.6783 0.0000 2,286QUALITY 0.0983 0.0039 24.9686 0.0000 1,162WASHRMTOT 0.0502 0.0035 14.3679 0.0000 1,770FINBASEMENT 0.0614 0.0038 16.3649 0.0000 1,650BRICK51% 0.0436 0.0038 11.3929 0.0000 1,274FIREPLACE 0.0344 0.0037 9.3312 0.0000 1,241HIQUALFLOOR 0.0470 0.0034 14.0063 0.0000 1,351HARDWDSTAIR 0.0415 0.0048 8.6225 0.0000 1,416INFLUMINOS �0.0379 0.0045 �8.3405 0.0000 1,302SGLATTGAR 0.1133 0.0081 14.0041 0.0000 1,106SGLDETGAR 0.0628 0.0063 10.0418 0.0000 1,113DBLATTGAR 0.1136 0.0118 9.6237 0.0000 1,058DBLDETGAR 0.0457 0.0086 5.3321 0.0000 1,064TERRACE 0.0664 0.0127 5.2247 0.0000 1,038EXCPOOL 0.0786 0.0088 8.9586 0.0000 1,071WATERSEWER 0.2534 0.0119 21.2970 0.0000 1,120NBMONTH 0.0002 0.0001 2.1217 0.0339 1,034LOCTAXRATE �0.2463 0.0033 �75.2702 0.0000 1,094SOCIOECO_STATUS 0.0028 0.0018 1.5552 0.1199 1,418LOC_ACCESS 0.0199 0.0040 4.9949 0.0000 1,486REG_ACCESS 0.0147 0.0055 2.6910 0.0071 1,602ARTERIAL_RD< 100 �0.0051 0.0042 �1.2185 0.2230 1,330CONNECTOR_RD< 100 0.0258 0.0115 2.2347 0.0254 1,050MAIN_RD< 100 0.0369 0.0371 0.9958 0.3193 1,022BLVRD< 100 0.0170 0.0158 1.0758 0.2820 1,610BLVRD< 200 �0.0433 0.0099 �4.3656 0.0000 1,665HIGHWAY< 100 �0.0087 0.0153 �0.5699 0.5688 1,306HIGHWAY< 250 0.0131 0.0074 1.7776 0.0755 1,537
Urban Bus Service and House Values
International Journal of Sustainable Transportation Vol. 4, No. 6, 2010 331
Dow
nloa
ded
by [
Uni
vers
ité D
u Q
uébe
c à
Mon
tréa
l] a
t 07:
18 2
9 Ju
ne 2
011

4. FUNCTIONAL FORM, MODELLING PROCEDURE ANDRESEARCH HYPOTHESES
4.1. Functional Form and Modelling Procedure: AddressingSpatial Autocorrelation
Considering the dependent variable’s distribution, a semi-log functional form isused here, as is generally the case with hedonic models. A major advantage ofusing a semi-log functional form is that regression coefficients derived from itare expressed as relative—rather than absolute—implicit prices, thereby allowingfor a more flexible interpretation of the marginal contribution of housingattributes to price changes over time. Moreover, some independent variables(living area and lot size) are also applied a logarithmic transformation, whichresults in their parameter estimates being expressed as elasticity coefficients. A similartransformation is also applied to MT attributes whose distribution is markedlyskewed.
Table 2b. Model B2: SAR-ERR – mass transit model, coefficients of MTattributes.
Regression coefficients and statistical tests�
Variable B coeff. (Unstdzd.) Std. Error T Value Sig. VIF
Bus FrequencyLN_REGULAR_50 �0.0110 0.0096 �1.1431 0.2530 1,714LN_REGULAR_100 �0.0246 0.0084 �2.9224 0.0035 1,640LN_REGULAR_200 �0.0156 0.0060 �2.5957 0.0094 1,616LN_REGULAR_400 �0.0155 0.0048 �3.2177 0.0013 1,583LN_METROBUS_50 �0.0134 0.0166 �0.8087 0.4187 1,085LN_METROBUS_100 �0.0054 0.0124 �0.4358 0.6630 1,137LN_METROBUS_200 �0.0120 0.0073 �1.6396 0.1011 1,183LN_METROBUS_400 0.0057 0.0057 1.0101 0.3124 1,205LN_EXPRESS_50 �0.0333 0.0617 �0.5393 0.5897 1,592LN_EXPRESS_100 0.0432 0.0499 0.8663 0.3863 1,596LN_EXPRESS_200 0.0705 0.0328 2.1517 0.0314 1,598LN_EXPRESS_400 0.1102 0.0251 4.3936 0.0000 1,535Route DiversityLN_BUSROUTES_50 0.0047 0.3351 0.0139 0.9889 5,181LN_BUSROUTES_100 �0.1200 0.1706 �0.7035 0.4818 5,009LN_BUSROUTES_200 0.2643 0.0736 3.5933 0.0003 5,979LN_BUSROUTES_400 0.0452 0.0353 1.2799 0.2006 6,148Effective AccessibilityLN_BUSSTOP_50 �0.5856 0.7889 �0.7424 0.4579 4,931LN_BUSSTOP_100 0.2337 0.3991 0.5856 0.5581 4,661LN_BUSSTOP_200 �0.5819 0.1768 �3.2918 0.0010 4,604LN_BUSSTOP_400 �0.1951 0.0821 �2.3771 0.0174 4,814SPATIAL 0.9217 0.0257 35.8747 0.0000
Dependent Variable: LN_SALEPRICE.�Bold italic characters indicate coefficients are significant at the 0.05 level.
F. Des Rosiers et al.
332 International Journal of Sustainable Transportation Vol. 4, No. 6, 2010
Dow
nloa
ded
by [
Uni
vers
ité D
u Q
uébe
c à
Mon
tréa
l] a
t 07:
18 2
9 Ju
ne 2
011

The general formulation of the hedonic functionmay thus be expressed as follows:
Y ¼eB0þB1iBldgþB2iServþB3iTrendþB4iFiscþB5iSocioþB6iAccessþB7iNuisanceþB8iLnMTransþe; ð1Þ
where:
Y¼ Sale priceBldg¼Building specificsServ¼Local ServicesTrend¼Time TrendFisc¼ Fiscal variableSocio¼ Socioeconomic factorAccess¼Accessibility factorsNuisance¼Nuisance attributesMTrans¼Mass Transit attributes
This, in turn, can be put as:
Ln Y ¼ B0 þ B1i �Bldgþ B2i �Servþ B3i �Trendþ B4i �Fiscþ B5i �Socioþ B6i �Accessþ B7i �Nuisanceþ B8i �LnMTransþ e
ð2Þ
In order to generate reliable estimates of the effect of mass transit attributes on pro-perty values, a three-step modelling procedure is resorted to. In Step 1, an OLS basemodel (Model A1, not reported here) is designed, which includes building speci-fics, local services, time trend and fiscal variables, socioeconomic and accessibilityfactors as well as nuisance attributes. Considering the nature of the phenomenonunder analysis, testing for spatial autocorrelation (SA) is an essential step to pro-ceed with (Can 1992; Dubin 1998).
The presence of spatial autocorrelation in the sale price and in the OLS basemodel residuals, as revealed by Moran’s I statistics displayed in Table 3, requiresthat a spatial autoregressive (SAR) technique be applied to handle the problem(Anselin 1988; Anselin, Syabri, and Kho 2006). The Lagrange Multiplier (LM) stat-istics was used in order to determine whether a spatial lag (LAG) or a spatial error(ERR) model should be used, the Robust LM statistic providing an indication ofthe probability for spatial lag and spatial error to co-occur when either is con-trolled for. In this case, the problem mostly lies with the spatial error component(4,811.47> 44.61). Consequently, Step 2 consists in building a SAR-ERR model
Table 3. Measuring global spatial autocorrelation using moran’s I � 3,000m
kernel.
Variable/Model Global Moran’s I Significant at the .05 level
Sale Price $ (Natural Logarithm) .0831 <.001OLS Base Model – Residuals .0382 <.001SAR-ERR Base Model – Residuals .0000 .537SAR-ERR Mass Transit Model – Residuals .0000 .564
Urban Bus Service and House Values
International Journal of Sustainable Transportation Vol. 4, No. 6, 2010 333
Dow
nloa
ded
by [
Uni
vers
ité D
u Q
uébe
c à
Mon
tréa
l] a
t 07:
18 2
9 Ju
ne 2
011

using the base descriptors (Model A2, not reported here). The general SAR-ERRequation thus writes:
Ln Y ¼ B0 þ B1i �Bldgþ B2i �Servþ B3i �Trendþ B4i �Fiscþ B5i �Socioþ B6i �Accessþ B7i �Nuisanceþ B8i �LnMTransþ k Spatialþ t
; ð3Þ
where k is the regression coefficient of the spatial error component (SPATIAL)derived from the SAR-ERR procedure.
In Step 3, finally, mass transit attributes are added in and both the OLS (ModelB1, not reported here) and SAR-ERR (Model B2, Tables 2a and 2b) procedures areapplied for comparative purposes. Remaining patterns of local SA in the modelresiduals can be visualized in Figure 2, where average residuals computed for250-meter-side hexagonal cells are reported.
4.2. Research Hypotheses
Based on the previously defined MT supply quality indices, four researchhypotheses are to be tested in relation with the objective of this paper:
. Hypothesis H1: By and large, a higher bus frequency positively impactssingle-family house values, although properties located in the immediatevicinity (i.e., within 50meters) of a bus route experience negative, proximityeffects that drive prices down;>
. Hypothesis H2: With respect to bus frequencies, the strongest, positive,impacts on prices are obtained for the Metrobus and Express services;
. Hypothesis H3: A greater diversity of routes providing homeowners with moredestination choices, positively impacts house prices;
. Hypothesis H4: Better, more effective access to the bus network, as measuredthrough the number of bus stops within reach, also positively impacts housevalues, except for nearby properties where negative proximity effects prevail.
5. MAIN FINDINGS AND DISCUSSION – MASS TRANSIT SAR-ERR MODEL
For simplicity reasons, and considering that regression results obtained withboth base and MT SAR-ERR models are similar with respect to non-MT coeffi-cients, only findings derived from Model B2, which yields optimal results,9 arereported in Tables 2a and 2b and discussed here. As discussed earlier, a logarithmictransformation is applied on all MT descriptors so as to obtain elasticity coeffi-cients. As can be seen, the model performs quite well, with an adjusted R-Squareof 0.785 and a prediction error which, in spite of the large range in sale prices,remains reasonable at slightly above the 15 percent threshold.10 Moreover, multi-collinearity is not a major issue here, although higher Variance Inflation Factor
9According to the Akaike information criterion (AIC) obtained with Model B2 (�9,764.84).10Once transformed using the antilog, the .1525 SEE (Standard Error of Estimate) figureobtained turns into a 16.5% coefficient of variation (CV). This should be kept in mindfor the rest of the paper while, for simplicity purposes, regression coefficients obtained withthe semi-log form will be assumed to be equivalent to percentage variations.
F. Des Rosiers et al.
334 International Journal of Sustainable Transportation Vol. 4, No. 6, 2010
Dow
nloa
ded
by [
Uni
vers
ité D
u Q
uébe
c à
Mon
tréa
l] a
t 07:
18 2
9 Ju
ne 2
011

(VIF) values are obtained for MT variables that measure route diversity andeffective accessibility: thus, most VIFs stand well below 2 while the maximum valuereaches 6.15.11 Finally, the robustness of property descriptors’ coefficients isassessed based on their t value.12
5.1. Building Specifics and Outbuildings
As expected, living area proves to be by far themost significant descriptor (t value:89.3) in the model. Its regression coefficient—also an elasticity coefficient—indicates that any 10 percent increase in the property size translates into a 7.0percent rise in value. Although much smaller, the positive influence of lot size
Figure 2. Local Indicators of Spatial Autocorrelation (LISAs) for Mass Transit
Model – 3,000m Kernel – Average residuals aggregated by 250-meter-
side hexagonal cells (LISAs significant at 0.05 threshold).
11According to Neter et al. (1985), severe multicollinearity induces biased regression coeffi-cients only where VIFs exceed the 10 value threshold.12The Beta standardized coefficients, which are currently used for ranking independentvariables’ relative importance, are not reported in this paper. Indeed, according to Bring(1994), the latter present some inconsistency in the way they are defined and should becomputed using the partial, rather than the ordinary, standard deviations of the variablesin order to adequately reflect variable ranking.
Urban Bus Service and House Values
International Journal of Sustainable Transportation Vol. 4, No. 6, 2010 335
Dow
nloa
ded
by [
Uni
vers
ité D
u Q
uébe
c à
Mon
tréa
l] a
t 07:
18 2
9 Ju
ne 2
011
remains highly significant (20.3): thus, doubling the lot size results in a 5.9 percentprice rise. Not surprisingly, apparent age also emerges as a major attribute – (49.9),its parameter estimate displaying, as expected, a negative sign: every year of agereduces the property price by roughly 0.7 percent. The substantial, highly signifi-cant and negative contribution of the STOREY variable confirms the prevalenceof single-family, one-story detached houses in the preference map of Quebec City’shouseholds. Building quality emerges as a major determinant of values (25.0); find-ings suggest that a top quality property sells at roughly 10 percent more than a stan-dard quality house. An additional washroom adds 5 percent to value, while houseswith a finished basement, a fireplace or a hardwood floor or stair sell at a premiumof between 3 to 6 percent; in contrast, those with a below-average luminosity sell at a4 percent discount. Outbuildings, finally, also contribute to house prices, withmarket premiums assigned to a garage, a terrace and a swimming pool ranging from5 to 11 percent.
In summary, all building-related regression coefficients display signs and magni-tudes that are consistent with expectations and in line with previous findings.
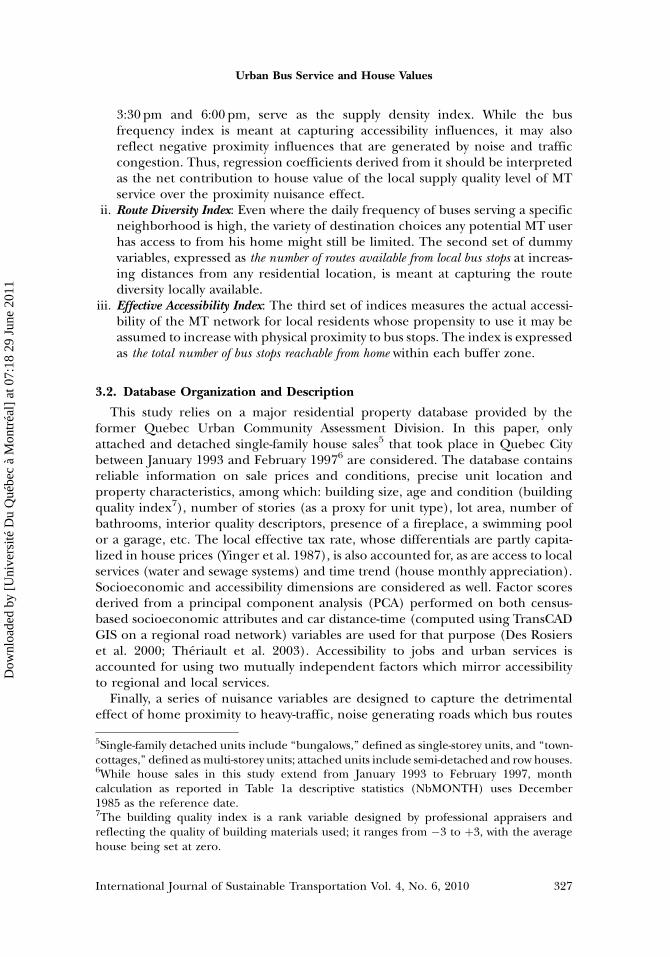
5.2. Local Services, Time Trend, Fiscal, Socioeconomic andAccessibility Attributes
Having direct access to the municipal aqueduct and sewage networks (t value:21.3) commands a market premium of around 25 percent over houses that donot. With respect to the time trend variable (NBMONTH), findings suggest thathouses prices almost stagnated in Quebec City over the period of analysis, in theturmoil of the property crash of the early nineties. Local tax differentials—interna-lized, at least partially—in house prices (Yinger et al. 1987) exert a most significantinfluence on values as shown by the very high t value (�75.3). According to find-ings, each percentage point increase in the local tax rate leads to a 25 percent dropin value.13 The magnitude of the fiscal variable coefficient suggests that part of thesocioeconomic influences affecting the neighborhood is captured by the former;hence the weak, non significant, contribution of the socioeconomic status. Finally,it turns out that accessibility to both local and regional amenities exerts a signifi-cant, positive impact on property prices, with local accessibility prevailing overregional accessibility.
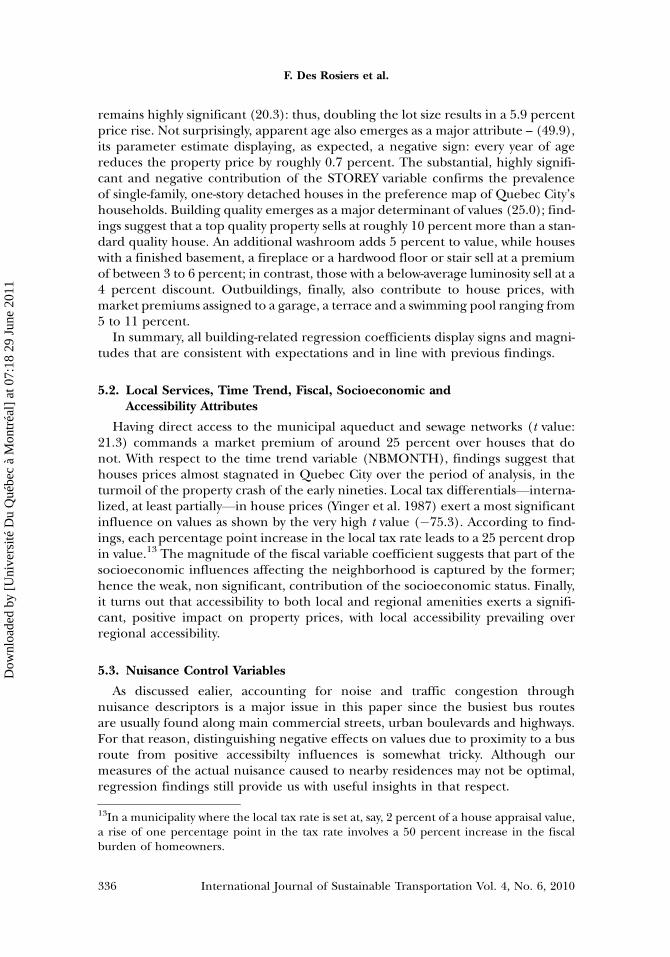
5.3. Nuisance Control Variables
As discussed ealier, accounting for noise and traffic congestion throughnuisance descriptors is a major issue in this paper since the busiest bus routesare usually found along main commercial streets, urban boulevards and highways.For that reason, distinguishing negative effects on values due to proximity to a busroute from positive accessibilty influences is somewhat tricky. Although ourmeasures of the actual nuisance caused to nearby residences may not be optimal,regression findings still provide us with useful insights in that respect.
13In a municipality where the local tax rate is set at, say, 2 percent of a house appraisal value,a rise of one percentage point in the tax rate involves a 50 percent increase in the fiscalburden of homeowners.
F. Des Rosiers et al.
336 International Journal of Sustainable Transportation Vol. 4, No. 6, 2010
Dow
nloa
ded
by [
Uni
vers
ité D
u Q
uébe
c à
Mon
tréa
l] a
t 07:
18 2
9 Ju
ne 2
011

Firstly for homes located in the near vicinity (i.e., within 100 meters) of the roadnetwork—whatever the level—no firm conclusion can be drawn considering thehighly unstable coefficients obtained, as reflected in their low statisticalsignificance. This being said, such findings suggest that, by and large, locationadvantages derived from easy access to local services are being offset by the detri-mental proximity effects of noise and congestion. As for the positive, and signifi-cant, impact obtained for the immediate proximity to a connector road, it canbe explained by the fact that such relatively low-traffic roads are essentially foundin less densely developed areas of the city served by scattered services, which trans-lates into a 2.6 percent market premium for nearby houses.
A positively signed coefficient—although not significant at the 0.05 level—is alsoobtained for properties located further away from highways, thereby suggestingthat easy access to regional amenities through the highway network rather actsas an advantage to households. This is not surprising in light of previous research(Des Rosiers et al. 2000; Theriault et al. 2007) enlightening the prominent impor-tance of freely accessing jobs as well as educational and shopping facilities in acar-dominated agglomeration such as the QMA. Most interestingly though,regression findings provide us with a clear indication that being located within200meters of an urban boulevard—that is at a distance where noise and conges-tion effects still prevail—is detrimental to house values, with a market discountof 4.3 percent being assigned to such properties.
5.4. Mass Transit Attributes
In the following section, the marginal contribution of mass transit attributes onresidential values is discussed according to our three series of indices. It should bekept in mind that the logarithmic transformation performed on MT attributesyields parameter estimates that are expressed as elasticity coefficients, whoseinterpretation can be more easily generalized to other urban contexts.
While MT attributes do not contribute much to explaining price variationsoverall,14 several variables still emerge as highly significant, which capture specificneeds and preferences of Quebec City residents.
5.4.1. Bus Frequency Index
The first set of indices generates several statistically significant coefficients. Ascan be seen, regression coefficients pertaining to the regular service are all nega-tive in sign while only one (LN_REGULAR_50) does not emerge as significant(prob.: .253). All three others do at the 0.01 level with elasticity coefficientsranging from �.025 to �.016 and decreasing with distance. Thus, a high bussupply density emerges, by and large, as being detrimental to house values as aconsequence of increased traffic and noise: doubling bus frequency in the neigh-borhood results in a 1.6 to 2.5 percent decrease in market prices. Turning to theMetrobus service, findings are not as conclusive as with the regular service: whilethree out of four coefficients turn out to be negative, thereby suggesting that
14The introduction of MT attributes in the regression equation slightly improves both theadjusted R-Square (.785) and the prediction error (.1528) over the SAR-ERR base model.
Urban Bus Service and House Values
International Journal of Sustainable Transportation Vol. 4, No. 6, 2010 337
Dow
nloa
ded
by [
Uni
vers
ité D
u Q
uébe
c à
Mon
tréa
l] a
t 07:
18 2
9 Ju
ne 2
011
the overall effect of the Metrobus is also detrimental to property values, none issignificant at the 0.05 level.
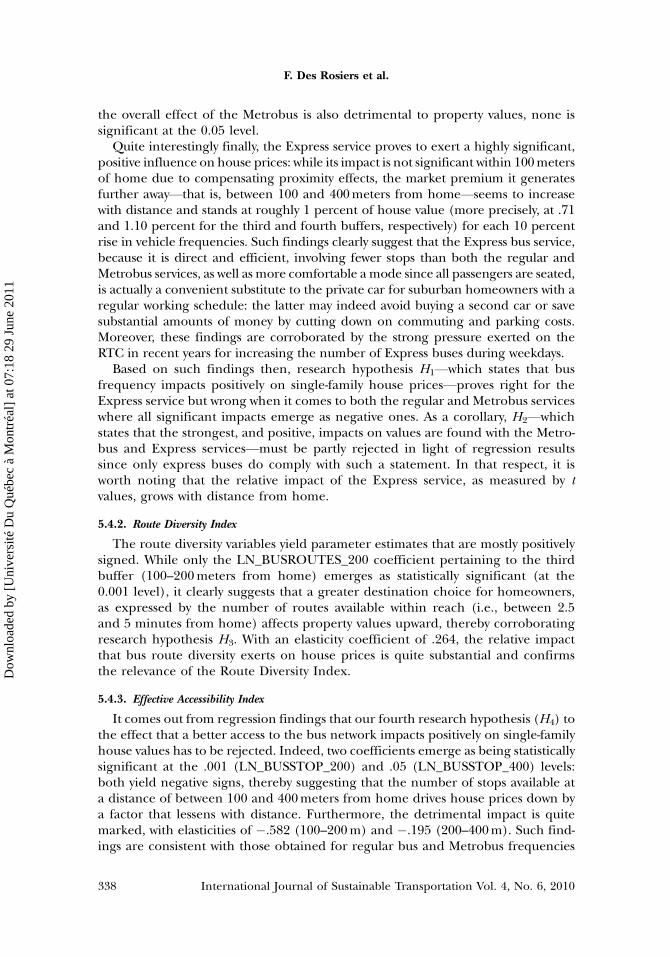
Quite interestingly finally, the Express service proves to exert a highly significant,positive influence on house prices: while its impact is not significant within 100metersof home due to compensating proximity effects, the market premium it generatesfurther away—that is, between 100 and 400meters from home—seems to increasewith distance and stands at roughly 1 percent of house value (more precisely, at .71and 1.10 percent for the third and fourth buffers, respectively) for each 10 percentrise in vehicle frequencies. Such findings clearly suggest that the Express bus service,because it is direct and efficient, involving fewer stops than both the regular andMetrobus services, as well as more comfortable a mode since all passengers are seated,is actually a convenient substitute to the private car for suburban homeowners with aregular working schedule: the latter may indeed avoid buying a second car or savesubstantial amounts of money by cutting down on commuting and parking costs.Moreover, these findings are corroborated by the strong pressure exerted on theRTC in recent years for increasing the number of Express buses during weekdays.
Based on such findings then, research hypothesis H1—which states that busfrequency impacts positively on single-family house prices—proves right for theExpress service but wrong when it comes to both the regular and Metrobus serviceswhere all significant impacts emerge as negative ones. As a corollary, H2—whichstates that the strongest, and positive, impacts on values are found with the Metro-bus and Express services—must be partly rejected in light of regression resultssince only express buses do comply with such a statement. In that respect, it isworth noting that the relative impact of the Express service, as measured by tvalues, grows with distance from home.
5.4.2. Route Diversity Index
The route diversity variables yield parameter estimates that are mostly positivelysigned. While only the LN_BUSROUTES_200 coefficient pertaining to the thirdbuffer (100–200meters from home) emerges as statistically significant (at the0.001 level), it clearly suggests that a greater destination choice for homeowners,as expressed by the number of routes available within reach (i.e., between 2.5and 5 minutes from home) affects property values upward, thereby corroboratingresearch hypothesis H3. With an elasticity coefficient of .264, the relative impactthat bus route diversity exerts on house prices is quite substantial and confirmsthe relevance of the Route Diversity Index.
5.4.3. Effective Accessibility Index
It comes out from regression findings that our fourth research hypothesis (H4) tothe effect that a better access to the bus network impacts positively on single-familyhouse values has to be rejected. Indeed, two coefficients emerge as being statisticallysignificant at the .001 (LN_BUSSTOP_200) and .05 (LN_BUSSTOP_400) levels:both yield negative signs, thereby suggesting that the number of stops available ata distance of between 100 and 400meters from home drives house prices down bya factor that lessens with distance. Furthermore, the detrimental impact is quitemarked, with elasticities of �.582 (100–200m) and �.195 (200–400m). Such find-ings are consistent with those obtained for regular bus and Metrobus frequencies
F. Des Rosiers et al.
338 International Journal of Sustainable Transportation Vol. 4, No. 6, 2010
Dow
nloa
ded
by [
Uni
vers
ité D
u Q
uébe
c à
Mon
tréa
l] a
t 07:
18 2
9 Ju
ne 2
011

and mirror the net effect of the bus service on nearby residential values while con-trolling for traffic nuisance. Based on mean statistics relative to the two buffer zonesinvolved (Table 1b), a 10 percent increase in the number of bus stops reachable at a100–400m distance from home results in a market discount of roughly 2.8 percentof property values.15 Finally, it is worth noting that the second buffer variable(LN_BUSSTOP_100) yields a positive, although highly unstable, coefficient.
In short, highest elasticities are obtained for Express frequencies (.071 and.110), number of bus routes (.264) and number of bus stops (�.582 and �.195).
5.5. Handling Spatial Autocorrelation
Spatial autocorrelation statistics reported in Table 3 clearly show that the SAR-ERRprocedure is most successful at controlling for the SA present in sale prices and inthe OLS model residuals. Once captured by the spatial error term generated bythe SAR procedure, the SA remaining in the residuals is almost null (global Moran’sI: .0000) and statistically non-significant (prob.: .564). In order to provide furtherinsight into how SA is structured at the local level, local indicators of spatial autocor-relation (LISAs) significant at the .05 threshold are computed forModel B2 residualsbased on a 3,000meters kernel, using GeoDa, v. 0.9.5-i (Anselin 1988; Anselin and LeGallo 2006). Resulting LISAs are mapped in Figure 2, where high-high (dark greyhexagons) and low-low (dark grey, textured hexagons) cases identify spatial clustersof positive SA,16 with property values being either underestimated (HH) or overesti-mated (LL) by the model. As can be seen, 72.6 percent of sampled properties gen-erate residuals that are free from any SA: this is a substantial improvement over thenumber of significant LISAs found with the original OLS, global model whereSA-affected cases amounted to 77.5 percent of all residuals (map not shown here).
This being said, 27.4 percent of ensuing residuals are still affected by significantSA, of which 13.3 percent by positive SA namely clustered in the north-western por-tion of the territory. This area corresponds to Val-Belair, an outlying former munici-pality of Quebec City characterized by a marked split between sectors of relativelylow-price country cottages and newly developed, single-family house neighborhoods.It is assumed that the proximity of the Valcartier military base, which acts as a majorlocal employer providing high-salary jobs, exerts an upward pressure on Val-Belairhouse prices, thereby causing the model to underestimate market values while leav-ing some positive SA in the residuals unaccounted for by the SAR-ERR procedure.
6. SUMMARY OF FINDINGS AND CONCLUSION
6.1. Summary of Findings
This study aims at testing whether, and to what extent, the overall quality in the sup-ply of an urban bus service translates into higher house values for properties locatedalong the lines; Quebec City is used as a case study. While roughly 86 percent of allmotorized trips in Quebec City are car-based, supporting a high quality mass transit
15Weighting factors of .2055 and .7945 are applied to 100–200m and 200–400m buffers’elasticities obtained with Model B2, based on the mean number of bus stops accessiblewithin each buffer zone, as reported in Table 1b.16Positive SA refers to residuals that present similarities over space.
Urban Bus Service and House Values
International Journal of Sustainable Transportation Vol. 4, No. 6, 2010 339
Dow
nloa
ded
by [
Uni
vers
ité D
u Q
uébe
c à
Mon
tréa
l] a
t 07:
18 2
9 Ju
ne 2
011

(MT) service ultimately depends on how it improves accessibility to jobs and urbanservice; this, in turn, should by and large translate into higher property values, pro-vided though that accessibility effects still prevail over negative, proximity impacts.
In this study, the hedonic approach is applied to some 11,291 attached anddetached single-family house sales that took place in Quebec City between January1993 and February 1997. Apart from basic property specifics, local services, timetrend as well as fiscal, socioeconomic, accessibility and nuisance attributes, threeseries of indices are generated which capture both the quantity and the qualityof the bus service provided to homeowners: the Bus Frequency Index, the RouteDiversity Index and the Effective Accessibility Index. In the first case, distinct esti-mations are made for the three types of services available, namely regular routes,the Metrobus and the Express. Moreover, four mutually exclusive buffer zones aredefined for each index to help sorting out proximity and accessibility influences.
Findings, first suggest that increasing bus frequencies result, by and large, inlower house values for properties located in the vicinity of either regular or Metro-bus routes due to the prevalence of negative, proximity effects (traffic, noise andpollution) over the benefits of an abundant supply in mass transit amenities. How-ever, it is the reverse for Express lines which exert a substantial, positive influenceon prices, with a market premium that can reach between 0.7 and 1.1 percent ofmean house value for each 10 percent increment in vehicle frequencies. Thus, byoffering more direct and efficient (fewer stops) as well as a more comfortablemode than both the regular and Metrobus services, the Express actually provesto be a convenient substitute to the private car for suburban homeowners with aregular working schedule.
Findings also suggest that a greater destination choice for homeowners,expressed as the number of routes available within reach (i.e., between 2.5 and 5minutes from home), affects property values upward. Finally, the number of busstops available at a distance of between 100 and 400meters from home drives houseprices down by a factor that lessens with distance. As with bus frequencies on eitherregular or Metrobus routes then, the additional noise and traffic disturbances gen-erated by more bus stops seem to prevail over an easier access to the MT network.
6.2. Conclusion and Suggestion for Further Research
This paper addresses a strategic issue which has both economic and socialimplications and should therefore interest urban planners as well as localdecision-makers and politicians. Indeed, the provision of an adequate supply ofmass transit facilities remains a major concern for an important part of the urbanpopulation. For some people, urban buses offer an efficient transportation meansfor their daily commuting as well as an adequate, and relatively cheap, alternativeto the car; for others, the non-motorized ones, it is an absolute necessity. Thisbeing said, the provision of a decent mass transit service has long been challenged,in most western-world cities but particularly in North-America, by ever-increasingoperating costs combined with a tottering demand as a consequence of demo-graphics, rising incomes and evolving consumers’ habits and preferences. Theoverwhelming domination of the private car, far more comfortable and flexiblethan public vehicles, is further strengthened by urban sprawl which reduces anymass transit network’s efficiency, hence desirability. On the other hand, social
F. Des Rosiers et al.
340 International Journal of Sustainable Transportation Vol. 4, No. 6, 2010
Dow
nloa
ded
by [
Uni
vers
ité D
u Q
uébe
c à
Mon
tréa
l] a
t 07:
18 2
9 Ju
ne 2
011

awareness of the greenhouse effect and the need to counter our costly dependencyon oil puts urban mass transit at the forefront of the public debate about the pathto sustainable transportation policies.
With such a challenge to meet, it is all the more important that mass transitinvestment decisions be optimized. Two major conclusions stem from this study:firstly, the flexibility of the MT network, as mirrored in the diversity of availableroutes, is more valued than the mere abundance of vehicles in operation, whichrather acts as a negative externality for homeowners. Secondly, improving masstransit facilities in an urban context may be economically profitable from bothhomeowners and local authority standpoints provided the right clientele is beingtargeted and in as much as mass transit amenities fit users’ needs and preferences.While the Metrobus service addresses primarily the needs of high-density neigh-borhoods’ residents, Express routes are meant at serving ‘‘car-addict,’’ suburbanpopulations requiring a direct and efficient bus service which can bring them tomajor employment hubs in the morning and back home after the job. Forsingle-family homeowners at least, it seems that the latter option is preferred overthe first one. In light of this study’s findings, the decision of the RTC, in 2007, toadd 60 Express buses on the streets of Quebec City seems an enlightened one.
A major limitation of this research is to focus solely on single-family housingunits, while a major segment of Quebec City’s public transport system clienteleis still to be found among low and medium-income tenants. It is therefore reason-able to wonder whether our conclusions would still hold in a multi-family housing(either condos or rental units) setting. This issue is about to be addressed in aforthcoming research paper that precisely deals with that issue.
ACKNOWLEDGMENT
This research was funded by the Canadian Social Sciences and HumanitiesResearch Council (SSHRC) under the Team Grants program and by the Fondsquebecois de recherche sur la societe et la culture (FQRSC). Authors are gratefulto the Quebec City Assessment Division for giving access to the assessment role andhome transactions data, as well as to the Ministry of Transport of Quebec and theReseau de Transport de la Capitale (RTC) for giving access to mass transit-relatedinformation. Finally, authors wish to thank reviewers for their relevant commentsand suggestions that allowed improving the quality standard of this paper.
REFERENCES
Abonce R, Weixiong W. 1992. Etude de l’impact acoustique de l’implantation du nouveaureseau Metrobus de la CTCUQ. Centre de Recherche en Amenagement et Developpe-ment (CRAD), Laboratoire d’acoustique, study prepared for the Quebec UrbanCommunity Transport Commission.
Anselin L. 1988. Spatial Econometrics: Methods and Models. Boston: Kluwer AcademicPublishers, p. 284.
Anselin L, Le Gallo J. 2006. Interpolation of air quality measures in hedonic house pricemodels: Spatial aspects. Spatial Economic Analysis 1(1):31–52.
Anselin L, Syabri I, Kho Y. 2006. GeoDa: An introduction to spatial data analysis. GeographicalAnalysis 38:5–22.
Urban Bus Service and House Values
International Journal of Sustainable Transportation Vol. 4, No. 6, 2010 341
Dow
nloa
ded
by [
Uni
vers
ité D
u Q
uébe
c à
Mon
tréa
l] a
t 07:
18 2
9 Ju
ne 2
011

Bajic V. 1983. The effects of a new subway line on housing prices in metropolitan Toronto.Urban Studies 20:147–158.
Ball M. 1974. The determinants of relative house prices: A reply. Urban Studies 11:231–233.Baum-Snow N, Kahn M. 2000. The effects of new public projects to expand urban rail tran-
sit. Journal of Public Economics 77:241–263.Belsley DA, Kuh E, Welsch RE. 1980. Regression Diagnostics: Identifying Influential Data
and Sources of Collinearity. New York: John Wiley & Sons, Inc., 292.Benjamin JD, Sirmans GS. 1996. Mass transportation, apartment rent and property values.
The Journal of Real Estate Research 12(1):1–8.Biba G, Des Rosiers F, Theriault M, Villeneuve P-Y. 2004. Big Boxes Versus Traditional Shop-
ping Centers: Looking at Households’ Shopping Trip Patterns – A Canadian Case Study.Journal of Real Estate Literature 14:175–202.
Bring J. 1994. How to standardize regression coefficients. The American Statistician 48(3):209–213.
Can A. 1992. Specification and estimation of hedonic housing price models. RegionalScience and Urban Economics 22:453–474.
Cook RD, Weisberg S. 1982. Residuals and Influence in Regression. London: Chapman andHall, p. 228.
Des Rosiers F, Lagana A, Theriault M. 2001. Size and proximity effects of primary schools onsurrounding house values. Journal of Property Research 18(2):149–168.
Des Rosiers F, Lagana A, Theriault M, Beaudoin M. 1996. Shopping centers and house values:An empirical investigation. Journal of Property Valuation and Investment 14(4):41–63.
Des Rosiers F, Theriault M, Dib P, Dube J. 2006. Public Transit Improvement and PropertyValues – A Canadian Case Study, Paper presented at the ARES 22nd Annual Meeting, KeyWest, Fla., April 19–22, 24 pages.
Des Rosiers F, Theriault M, Villeneuve PY. 2000. Sorting out access and neighborhoodfactors in hedonic price modelling. The Journal of Property Investment and Finance18(3):291–315.
Dewees D. 1976. The effect of a subway on residential property values in Toronto. Journal ofUrban Economics 3:357–369.
Dubin RA. 1998. Predicting house prices using multiple listings data. The Journal of RealEstate Finance and Economics 17(1):35–60.
Gatzlaff D, Smith M. 1993. The impact of the Miami metrorail on the value of residencesnear station locations. Land Economics 69:54–66.
Hickman EP, Gaines JP, Ingram FJ. 1984. The influence of neighborhood quality on residen-tial values. The Real Estate Appraiser and Analyst 50(2):36–42.
Hoch I, Waddell P. 1993. Apartment rents: Another challenge to the monocentric model.Geographical Analysis 25(1):20–34.
Hughes Jr. WT, Sirmans CF. 1992. Traffic externalities and single-family house prices. Jour-nal of Regional Science 32(4):487–500.
Hughes Jr. WT, Sirmans CF. 1993. Adjusting the house prices for intra-neighborhood trafficdifferences. The Appraisal Journal 61(4):533–538.
Krantz DP, Waever RD, Alter TR. 1982. Residential tax capitalization: Consistent estimatesusing micro-level data. Land Economics 58(4):488–496.
Lake I, Lovett A, Bateman IJ, Langford I. 1998. Modelling environmental influences onproperty prices in an urban environment. Computer, Environment and Urban Systems22(2):121–136.
McDonald J, Osuji C. 1995. The effects of anticipated transportation improvements onresidential land values. Regional Science and Urban Economics 25:261–278.
McMillen DP, McDonald J. 2004. Reaction of house prices to a new rapid transit line:Chicago’s midway line, 1983–1999. Real Estate Economics 32(3):463–486.
F. Des Rosiers et al.
342 International Journal of Sustainable Transportation Vol. 4, No. 6, 2010
Dow
nloa
ded
by [
Uni
vers
ité D
u Q
uébe
c à
Mon
tréa
l] a
t 07:
18 2
9 Ju
ne 2
011

Miller EJM. 2000. Effects of transportation infrastructure and locations on residential real estatevalues: Application of spatial autoregressive techniques. Transportation Research Record1722, p. 8.
Neter J, Wasserman W, Kutner MH. 1985. Applied Linear Statistical Models, 2nd ed. Home-wood, IL: R. D. Irwin, pp. 391–392.
Nijland HA, Van Kempen EEMM, Van Wee GP, Jabben J. 2003. Costs and benefits of noiseabatement measures. Transport Policy 10:131–140.
Pagliaro F, Preston J. 2003. The Impact of Transport on Residential Location, Final Report.Oxford, England: Transport Studies Unit, University of Oxford, March, p. 24.
Palmquist RB. 1992. Valuing localized externalities. Journal of Urban Economics 31:59–68.Pollakowski HO. 1982. Urban Housing Markets and Residential Location. Lexington, MA:
Lexington Books, p. 141.Powe NA, Garrod GD, Willis KG. 1995. Valuation of urban amenities using a hedonic
pricemodel. Journal of Property Research 12:137–147.Real Estate Institute of Queensland. 2001. Busway Suburbs’ Property Values Jump, February
14, 1 page.Schade W. 2003. Le bruit du transport: un defi pour la mobilite durable. Revue internatio-
nale des sciences sociales 176:311–328.Shefer D. 1986. Utility changes in housing and neighborhood services for households mov-
ing into and out of distressed neighborhoods. Journal of Urban Economics 19:107–124.Smith JJ, Gihring TA. 2004. Financing Transit Systems Through Value Capture – An Anno-
tated Bibliography. Victoria, Canada: Victoria Transport Policy Institute.So H, Tse R, Ganesan S. 1997. Estimating the influence of transport on house prices:
Evidence from Hong Kong. Journal of Property Valuation and Investment 15(1):40–47.Strange W. 1992. Overlapping neighborhoods and housing externalities. Journal of Urban
Economics 32:17–39.Theebe Marcel AJ. 2004. Planes, Trains, and Automobiles: The impact of traffic noise on
house prices. Journal of Real Estate Finance and Economics 28:209–234.Theriault M, Des Rosiers F, Joerin F. 2005a. Modelling accessibility to urban services using
fuzzy logic: A comparative analysis of two methods. Journal of Property Investmentand Finance 23(1):22–54.
Theriault M, Villeneuve P, Vandersmissen MH, Des Rosiers F. 2005b. Home-working,Telecommuting and Journey to Workplaces: Are Differences among Genders andProfessions Varying in Space? Proceedings of the 45th Congress of the EuropeanRegional Science Association (ERSA), August 23–27, Amsterdam, Netherlands, CD-ROM,15 pages.
Theriault M, Des Rosiers F, Biba G. 2005c. Analyzing Competition among ShoppingAlternatives Within the Quebec Metropolitan Area: How GIS Can Further Modellingof Consumer’s Destination Choice Behaviour. Proceedings of the PROCESSUS-ILUTE2005 International Colloquium, June 12–15, Toronto, CD-ROM.
Theriault M, Des Rosiers F, Dube J. 2007. Testing the temporal stability of accessibility valuein residential hedonic prices. Scienze Regionali 6(3):5–46.
Theriault M, Des Rosiers F, Villeneuve PY, Kestens Y. 2003. Modelling interactions oflocation with specific value of housing attributes. Property Management 21(1):25–62.
Voith R. 1993. Changing capitalization of CBD-oriented transportation systems: Evidencefrom Philadelphia. Journal of Urban Economics 30:360–372.
Wilhelmsson M. 2000. The impact of traffic noise on the values of single family houses.Journal of Environmental Planning and Management 43(6):799–815.
Yinger JH, Bloom HS, Borsch-Supan A, Ladd HF. 1987. Property Taxes and House Values:The Theory and Estimation of Intrajurisdictional Property Tax Capitalization. Studiesin Urban Economics. Princeton, NJ: Academic Press, Princeton Univ., p. 218.
Urban Bus Service and House Values
International Journal of Sustainable Transportation Vol. 4, No. 6, 2010 343
Dow
nloa
ded
by [
Uni
vers
ité D
u Q
uébe
c à
Mon
tréa
l] a
t 07:
18 2
9 Ju
ne 2
011

Appendix 1. Operational definition of variables.
Variable Operational definition Type�
Dependent VariableLN_SALEPRICE Natural logarithm of sale price NBuilding SpecificsLN_LIVAREA Natural logarithm of the living area (m2) NLN_LOTSIZE Natural logarithm of lot size (m2) NAPPAGE Apparent age of the property at the time of sale (years) NSTOREY Number of stories NQUALITY Building quality index of the property, varying from �3
toþ 3 (0¼ average)R
WASHRMTOT Total number of washrooms in the property(bathrooms and toilets)
N
FINBASEMENT The property has a finished basement DBRICK51% At least 51% of exterior walls are made of brick DFIREPLACE Number of fireplaces in the property NHIQUALFLOOR The property has high quality (hard wood) floors DHARDWDSTAIR The property has a hardwood interior stairway DINFLUMINOS The property has a lower-than-average indoor
luminosityD
SGLATTGAR The property has a single attached garage DSGLDETGAR The property has a single detached garage DDBLATTGAR The property has a double attached garage DDBLDETGAR The property has a double detached garage DTERRACE The property has a terrace DEXCPOOL The property has an excavated pool DWATERSEWER The property is served by the water and sewage
networksD
NBMONTH Number of months elapsed between December 1985and sale date
N
Fiscal, Socioeconomic and Accessibility FactorsLOCTAXRATE Local, non-standardized global tax rate expressed as a
percentageN
SOCIOECO_STATUS PCA-derived socioeconomic status computed fromCanada’s 1996 census data; well-educated,high-income persons located mainly in the uppertown (positive values) as opposed to low-educated,low-income persons living in the lower town(negative values)
N
REG_ACCESS PCA-derived accessibility to regional services,computed after the 1988 regional road network;close to regional services (positive values), far awayfrom regional services (negative values)
N
LOC_ACCESS PCA-derived accessibility to local, neighborhoodservices, computed after the 1988 regional roadnetwork; close to local services (positive values), faraway from local services (negative values)
N
(Continued )
F. Des Rosiers et al.
344 International Journal of Sustainable Transportation Vol. 4, No. 6, 2010
Dow
nloa
ded
by [
Uni
vers
ité D
u Q
uébe
c à
Mon
tréa
l] a
t 07:
18 2
9 Ju
ne 2
011

Appendix 1. Continued.
Variable Operational definition Type�
Nuisance VariablesARTERIAL_RD<100 The property is located within 100 meters of an arterial
roadD
CONNECTOR_RD<100 The property is located within 100 meters of aconnector road
D
MAIN_RD<100 The property is located within 100 meters of a mainroad
D
BLVRD<100, <200 The property is located within 100 meters or 200meters of a boulevard
D
HIGHWAY<100, <250 The property is located within 100 meters or 250meters of a highway
D
Mass Transit Variables (Expressed as hundreds of vehicles, routes and stops)Bus FrequencyRegular Service Operating all week long, including on weekends (from
Saturday, 6:30 am to Monday, 0:30 am)REGULAR_50 Stopping-by vehicles operating within 50m of home NREGULAR_100 Stopping-by vehicles operating at a 50–100m distance
from homeN
REGULAR_200 Stopping-by vehicles operating at a 100–200m distancefrom home
N
REGULAR_400 Stopping-by vehicles operating at a 200–400m distancefrom home
N
Metrobus Service(Intensive Service)
Operating on weekdays only, from 7:00 am to 6:00 pm
METROBUS_50 Stopping-by vehicles operating within 50m of home NMETROBUS_100 Stopping-by vehicles operating at a 50–100m distance
from homeN
METROBUS_200 Stopping-by vehicles operating at a 100–200m distancefrom home
N
METROBUS_400 Stopping-by vehicles operating at a 200–400m distancefrom home
N
Express Service (DirectService)
Operating on weekdays only, during peak hours (from7:00 am to 6:00 pm & from 3:30 pm to 6:00 pm
EXPRESS_50 Stopping-by vehicles operating within 50m of home NEXPRESS_100 Stopping-by vehicles operating at a 50–100m distance
from homeN
EXPRESS_200 Stopping-by vehicles operating at a 100–200m distancefrom home
N
EXPRESS_400 Stopping-by vehicles operating at a 200–400m distancefrom home
N
Route DiversityBUSROUTES_50 Bus routes, all service categories, available within 50m
of homeN
BUSROUTES_100 Bus routes, all service categories, available at a50–100m distance from home
N
(Continued )
Urban Bus Service and House Values
International Journal of Sustainable Transportation Vol. 4, No. 6, 2010 345
Dow
nloa
ded
by [
Uni
vers
ité D
u Q
uébe
c à
Mon
tréa
l] a
t 07:
18 2
9 Ju
ne 2
011

Appendix 1. Continued.
Variable Operational definition Type�
BUSROUTES_200 Bus routes, all service categories, available at a100–200m distance from home
N
BUSROUTES_400 Bus routes, all service categories, available at a200–400m distance from home
N
Effective AccessibilityBUSSTOPS_50 Number of total bus stops available within 50m of
homeN
BUSSTOPS_100 Number of total bus stops available at a 50–100mdistance from home
N
BUSSTOPS_200 Number of total bus stops available at a 100–200mdistance from home
N
BUSSTOPS_400 Number of total bus stops available at a 200–400mdistance from home
N
�Type: N: Metric, D: Dummy, R: Rank.
F. Des Rosiers et al.
346 International Journal of Sustainable Transportation Vol. 4, No. 6, 2010
Dow
nloa
ded
by [
Uni
vers
ité D
u Q
uébe
c à
Mon
tréa
l] a
t 07:
18 2
9 Ju
ne 2
011