Document Title: The Campus Sexual Assault (CSA) Study
111
The author(s) shown below used Federal funds provided by the U.S. Department of Justice and prepared the following final report: Document Title: The Campus Sexual Assault (CSA) Study Author(s): Christopher P. Krebs, Ph.D. ; Christine H. Lindquist, Ph.D. ; Tara D. Warner, M.A. ; Bonnie S. Fisher, Ph.D. ; Sandra L. Martin, Ph.D. Document No.: 221153 Date Received: December 2007 Award Number: 2004-WG-BX-0010 This report has not been published by the U.S. Department of Justice. To provide better customer service, NCJRS has made this Federally- funded grant final report available electronically in addition to traditional paper copies. Opinions or points of view expressed are those of the author(s) and do not necessarily reflect the official position or policies of the U.S. Department of Justice.
Transcript of Document Title: The Campus Sexual Assault (CSA) Study

The author(s) shown below used Federal funds provided by the U.S. Department of Justice and prepared the following final report: Document Title: The Campus Sexual Assault (CSA) Study
Author(s): Christopher P. Krebs, Ph.D. ; Christine H. Lindquist, Ph.D. ; Tara D. Warner, M.A. ; Bonnie S. Fisher, Ph.D. ; Sandra L. Martin, Ph.D.
Document No.: 221153
Date Received: December 2007
Award Number: 2004-WG-BX-0010 This report has not been published by the U.S. Department of Justice. To provide better customer service, NCJRS has made this Federally-funded grant final report available electronically in addition to traditional paper copies.
Opinions or points of view expressed are those
of the author(s) and do not necessarily reflect the official position or policies of the U.S.
Department of Justice.

October 2007
The Campus Sexual Assault (CSA) Study
Final Report
NIJ Grant No. 2004-WG-BX-0010
Performance Period:
January 2005 through December 2007
Prepared for
National Institute of Justice 810 Seventh Street, NW Washington, DC 20001
Prepared by
Christopher P. Krebs, Ph.D. Christine H. Lindquist, Ph.D.
Tara D. Warner, M.A. RTI International
3040 Cornwallis Road Research Triangle Park, NC 27709
Bonnie S. Fisher, Ph.D. University of Cincinnati
Sandra L. Martin, Ph.D. University of North Carolina at Chapel Hill
RTI Project Number 0209487
This document is a research report submitted to the U.S. Department of Justice. This report has not been published by the Department. Opinions or points of view expressed are those of the author(s)
and do not necessarily reflect the official position or policies of the U.S. Department of Justice.

The Campus Sexual Assault (CSA) Study
Final Report
NIJ Grant No. 2004-WG-BX-0010
Performance Period: January 2005 through December 2007
Prepared for
National Institute of Justice 810 Seventh Street, NW Washington, DC 20001
Prepared by
Christopher P. Krebs, Ph.D. Christine H. Lindquist, Ph.D.
Tara D. Warner, M.A. RTI International
3040 Cornwallis Road Research Triangle Park, NC 27709
Bonnie S. Fisher, Ph.D. University of Cincinnati
Sandra L. Martin, Ph.D. University of North Carolina at Chapel Hill
*RTI International is a trade name of Research Triangle Institute.
This document is a research report submitted to the U.S. Department of Justice. This report has not been published by the Department. Opinions or points of view expressed are those of the author(s)
and do not necessarily reflect the official position or policies of the U.S. Department of Justice.

Table of Contents
Section Page
Abstract: vii
EXECUTIVE SUMMARY viii
1. Introduction 1-1
1.1 A Typology of Sexual Assault ................................................................... 1-3 1.1.1 Incapacitated Sexual Assault.......................................................... 1-4
2. Background 2-1
2.1 Prevalence Estimates for Sexual Assault Victimization.................................. 2-1
2.2 The Context of Campus Sexual Assault...................................................... 2-3
2.3 Risk Factors Associated with Sexual Assault ............................................... 2-5 2.3.1 Prior Victimization ........................................................................ 2-5 2.3.2 Substance Use ............................................................................. 2-6 2.3.3 Age and Year of Study .................................................................. 2-7 2.3.4 Race/Ethnicity.............................................................................. 2-7 2.3.5 Residential Status ........................................................................ 2-7 2.3.6 Sorority Membership..................................................................... 2-7 2.3.7 Dating Violence History ................................................................. 2-8 2.3.8 Consensual Sexual Experiences ...................................................... 2-8 2.3.9 Attitudinal Characteristics .............................................................. 2-8
2.4 Reporting of Sexual Assault ..................................................................... 2-9
2.5 Perpetration of Campus Sexual Assault.....................................................2-11
3. Research Methods 3-1
3.1 Data Collection ...................................................................................... 3-1 3.1.1 Sampling .................................................................................... 3-2 3.1.2 Recruitment Procedures and Response Rates.................................... 3-2 3.1.3 Web Site and Survey Design and Content ........................................ 3-2 3.1.4 Incentive Redemption ................................................................... 3-5
3.2 Data Handling........................................................................................ 3-6
iii
This document is a research report submitted to the U.S. Department of Justice. This report has not been published by the Department. Opinions or points of view expressed are those of the author(s)
and do not necessarily reflect the official position or policies of the U.S. Department of Justice.

3.2.1 Data Preparation and Cleaning ....................................................... 3-6 3.2.2 Response Bias Analyses ................................................................ 3-7
3.3 Data Analysis .......................................................................................3-10 3.3.1 Descriptive Analyses ....................................................................3-10 3.3.2 Risk Factors for Sexual Assault......................................................3-13
4. Study Sample 4-1
4.1 Women................................................................................................. 4-1
4.2 Men ..................................................................................................... 4-1
5. Findings 5-1
5.1 Sexual Assault Victimization .................................................................... 5-1 5.1.1 Prevalence Estimates .................................................................... 5-1 5.1.2 Risk Factors Associated with Sexual Assault Among University
Women....................................................................................... 5-6 5.1.3 Context......................................................................................5-14 5.1.4 Reporting and Nonreporting ..........................................................5-21 5.1.5 Consequences.............................................................................5-26
5.2 Sexual Assault Perpetration ....................................................................5-27
6. Conclusion and Recommendations 6-1
6.1 Summary of Findings.............................................................................. 6-1
6.2 CSA Study Implications........................................................................... 6-3
6.3 CSA Study Limitations ............................................................................ 6-6
6.4 Conclusion ............................................................................................ 6-7
7. Future Directions 7-1
References 1
iv
This document is a research report submitted to the U.S. Department of Justice. This report has not been published by the Department. Opinions or points of view expressed are those of the author(s)
and do not necessarily reflect the official position or policies of the U.S. Department of Justice.

List of Exhibits
Exhibit Page
1-1. Basic Sexual Assault Typology ...................................................................... 1-7
3-1. Diagram of Sampling Frames, Sampling Subframes, Samples, and Respondents .............................................................................................. 3-3
3-2. Sexual Assault Prevalence Measures .............................................................3-12
4-1. Descriptive Data on CSA Sample of Undergraduate Women, Weighted Percentages (n = 5,446)a ............................................................................. 4-2
4-2. Descriptive Data on CSA Sample of Undergraduate Men, Weighted Percentages (n = 1,375)a ............................................................................. 4-4
5-1. Prevalence Estimates for the Sexual Assault Measures for Women, Unweighted Frequencies, Weighted Percentages .............................................. 5-2
5-2. Percentage of Undergraduate Women Who Report Being a Victim of Forced and Incapacitated Sexual Assault Before and Since Entering College................... 5-3
5-3. Percentage of Victims of Physically Forced and Incapacitated Sexual Assault Who Experienced Sexual Battery Only and Rape .............................................. 5-4
5-4. Prevalence Estimates for the Sexual Assault Measures for Men, Unweighted Frequencies, Weighted Percentages ............................................................... 5-6
5-5. Prevalence of Various Measures of Sexual Assault Within Demographic and Behavioral Factors for Undergraduate Women (n = 5,361)a............................... 5-8
5-6. Logistic Regression Models of Four Sexual Assault Measures (n = 4,646)a ..........5-11 5-7. Percentage of Victims (by Sexual Assault [SA] Type) Reporting Various
Victimization Contextual Factors, Unweighted Frequencies, Weighted Percentagesa .............................................................................................5-15
5-8. Reporting of Sexual Assault (SA), by Assault Type, Unweighted Frequencies, Weighted Percentagesa ...............................................................................5-22
5-9. Consequences of Sexual Assault (SA), by Assault Type, Unweighted Frequencies, Weighted Percentagesa .............................................................5-27
v
This document is a research report submitted to the U.S. Department of Justice. This report has not been published by the Department. Opinions or points of view expressed are those of the author(s)
and do not necessarily reflect the official position or policies of the U.S. Department of Justice.

This document is a research report submitted to the U.S. Department of Justice. This report has not been published by the Department. Opinions or points of view expressed are those of the author(s)
and do not necessarily reflect the official position or policies of the U.S. Department of Justice.

ABSTRACT:
THE CAMPUS SEXUAL ASSAULT (CSA) STUDY
Sexual assault is a public health and public safety problem with far-reaching implications.
Although a substantial body of research on sexual assault exists, additional data are needed
to help document the current magnitude of the problem, the extent to which certain
subpopulations are impacted, the consequences and reporting (or nonreporting) of
victimization incidents, and strategies for preventing and reducing the risk of sexual assault
and effectively responding to victims.
One subpopulation that is often believed to be at elevated risk for sexual assault is college
students. RTI International (RTI) was funded by the National Institute of Justice (NIJ) to
conduct the Campus Sexual Assault (CSA) Study, which is a study of various types of sexual
assault experienced by university students. This study has one primary research objective.
1. To examine the prevalence, nature, and reporting of various types of sexual assault experienced by university students in an effort to inform the development of targeted intervention strategies.
In addition, the CSA Study has two service-oriented objectives, the success towards which
were not measured and are thus not the subject of this final report. These objectives are,
however, worth mentioning.
2. To educate students about various types of sexual assault, how they can maximize their safety, and what they can do if they or someone they know has been victimized.
3. To provide students with information about the campus and community resources that are available should they need assistance or have any concerns or questions.
RTI has been working with two large, public universities on the CSA Study. Data were
collected using a Web-based survey from over 6,800 undergraduate students (5,466 women
and 1,375 men). Data indicate that 13.7% of undergraduate women had been victims of at
least one completed sexual assault since entering college: 4.7% were victims of physically
forced sexual assault; 7.8% of women were sexually assaulted when they were
incapacitated after voluntarily consuming drugs and/or alcohol (i.e., they were victims of
alcohol and/or other drug- [AOD] enabled sexual assault); 0.6% were sexually assaulted
when they were incapacitated after having been given a drug without their knowledge (i.e.,
they were certain they had been victims of drug-facilitated sexual assault [DFSA]). Detailed
data were collected on the context, reporting, and consequences of sexual assault. Self-
reported rates of sexual assault victimization and perpetration among males were very low.
The primary implications of the CSA Study are the relative rarity of cases of DFSA and the
need to incorporate alcohol and drug messages into sexual assault prevention and risk
reduction programming.
vii
This document is a research report submitted to the U.S. Department of Justice. This report has not been published by the Department. Opinions or points of view expressed are those of the author(s)
and do not necessarily reflect the official position or policies of the U.S. Department of Justice.
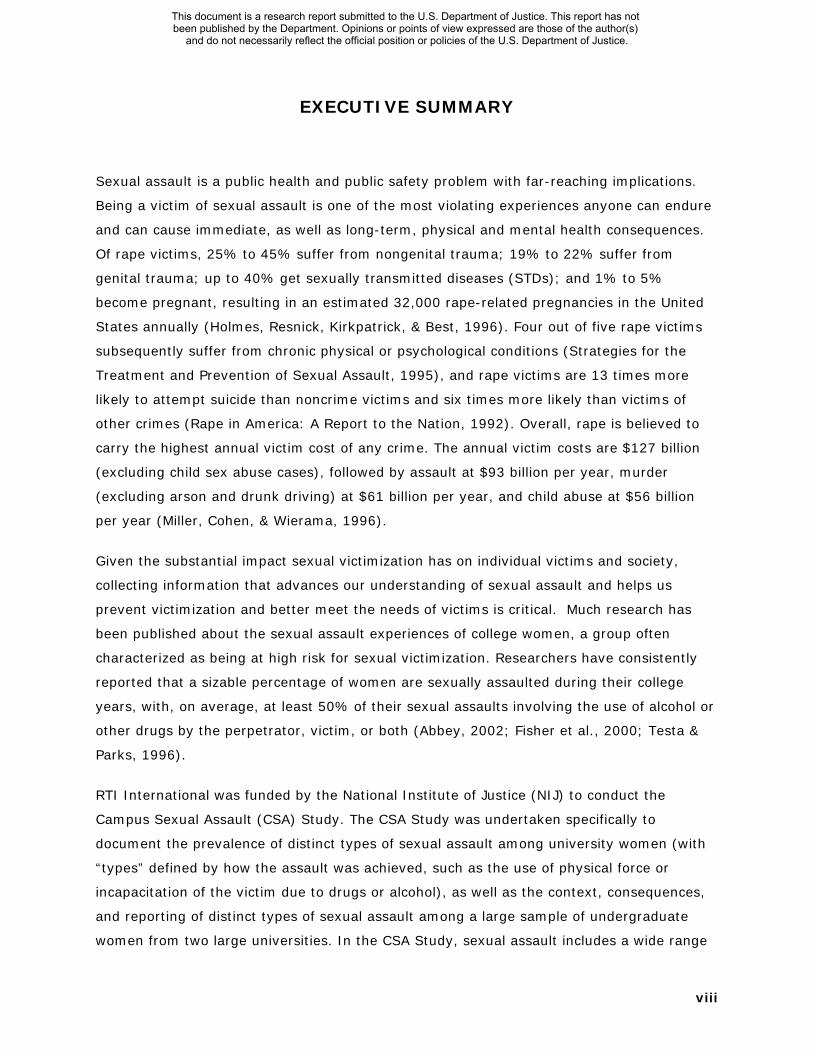
EXECUTIVE SUMMARY
Sexual assault is a public health and public safety problem with far-reaching implications.
Being a victim of sexual assault is one of the most violating experiences anyone can endure
and can cause immediate, as well as long-term, physical and mental health consequences.
Of rape victims, 25% to 45% suffer from nongenital trauma; 19% to 22% suffer from
genital trauma; up to 40% get sexually transmitted diseases (STDs); and 1% to 5%
become pregnant, resulting in an estimated 32,000 rape-related pregnancies in the United
States annually (Holmes, Resnick, Kirkpatrick, & Best, 1996). Four out of five rape victims
subsequently suffer from chronic physical or psychological conditions (Strategies for the
Treatment and Prevention of Sexual Assault, 1995), and rape victims are 13 times more
likely to attempt suicide than noncrime victims and six times more likely than victims of
other crimes (Rape in America: A Report to the Nation, 1992). Overall, rape is believed to
carry the highest annual victim cost of any crime. The annual victim costs are $127 billion
(excluding child sex abuse cases), followed by assault at $93 billion per year, murder
(excluding arson and drunk driving) at $61 billion per year, and child abuse at $56 billion
per year (Miller, Cohen, & Wierama, 1996).
Given the substantial impact sexual victimization has on individual victims and society,
collecting information that advances our understanding of sexual assault and helps us
prevent victimization and better meet the needs of victims is critical. Much research has
been published about the sexual assault experiences of college women, a group often
characterized as being at high risk for sexual victimization. Researchers have consistently
reported that a sizable percentage of women are sexually assaulted during their college
years, with, on average, at least 50% of their sexual assaults involving the use of alcohol or
other drugs by the perpetrator, victim, or both (Abbey, 2002; Fisher et al., 2000; Testa &
Parks, 1996).
RTI International was funded by the National Institute of Justice (NIJ) to conduct the
Campus Sexual Assault (CSA) Study. The CSA Study was undertaken specifically to
document the prevalence of distinct types of sexual assault among university women (with
“types” defined by how the assault was achieved, such as the use of physical force or
incapacitation of the victim due to drugs or alcohol), as well as the context, consequences,
and reporting of distinct types of sexual assault among a large sample of undergraduate
women from two large universities. In the CSA Study, sexual assault includes a wide range
viii
This document is a research report submitted to the U.S. Department of Justice. This report has not been published by the Department. Opinions or points of view expressed are those of the author(s)
and do not necessarily reflect the official position or policies of the U.S. Department of Justice.

Section 1 — Introduction
of victimizations, including rape and other types of unwanted sexual contact (e.g., sexual
battery).
The typology that guides the classification of sexual assault in the CSA Study is based on
how the assault (or attempted assault) was achieved. Virtually all sexual assault research
distinguishes between assaults occurring as a result of physical force (or threats of physical
force) from assaults that do not involve the use or threat of force; the CSA Study similarly
considers physically forced sexual assault as a distinct category of assault. Another means
through which sexual assault is achieved is incapacitation of the victim. Legal definitions of
sexual assault factor in one’s ability to provide consent, and individuals who are
incapacitated because of the effects of alcohol or drugs (or otherwise incapacitated, such as
when they are unconscious or asleep) are incapable of consenting. In the CSA Study, we
consider as incapacitated sexual assault any unwanted sexual contact occurring when a
victim is unable to provide consent or stop what is happening because she is passed out,
drugged, drunk, incapacitated, or asleep, regardless of whether the perpetrator was
responsible for her substance use or whether substances were administered without her
knowledge. We break down incapacitated sexual assault into four subtypes. The first two
subtypes pertain to sexual assaults achieved when the victim is given—without her
knowledge or consent—a substance that physically incapacitates her and makes her
incapable of providing consent. DFSA (drug-facilitated sexual assault) is defined as
unwanted sexual contact occurring when the victim is incapacitated and unable to provide
consent after she had been given a drug without her knowledge or consent. Incidents
classified as DFSA are those in which the victim is certain that she had been drugged. In
contrast, SDFSA (suspected drug-facilitated sexual assault) is defined as incapacitated
sexual assault occurring after the victim suspects that she had been given a drug without
her knowledge or consent. The third type of incapacitated sexual assault considered in the
CSA Study is termed alcohol and/or other drug- (AOD-) enabled sexual assault. This
subtype includes unwanted sexual contact occurring when the victim is incapacitated and
unable to provide consent because of voluntary consumption of alcohol or other drugs.
Finally, to distinguish between incapacitation due to the effects of AOD (administered either
coercively or voluntarily) and other types of incapacitation, we include a fourth type of
incapacitated sexual assault in our typology. Other incapacitated sexual assaults capture the
remaining, and likely uncommon, situations in which a victim can be incapacitated, such as
by being asleep or unconscious.
ix
This document is a research report submitted to the U.S. Department of Justice. This report has not been published by the Department. Opinions or points of view expressed are those of the author(s)
and do not necessarily reflect the official position or policies of the U.S. Department of Justice.

The Campus Sexual Assault (CSA) Study
The CSA Study builds upon previous research and makes a number of contributions to the
field. The CSA Study is one of the first to generate estimates of the prevalence of drug-
facilitated sexual assault (DFSA) among a college sample. The concept of DFSA has received
widespread attention from the media and a variety of stakeholders, including prevention
and risk reduction specialists, treatment providers, law enforcement, and university
administrators, but empirical data on the prevalence and nature of this phenomenon have
yet to appear in the literature. In addition, the CSA study explores the extent to which risk
factors vary by type of assault. We believe this is the first study to find that the type of
sexual assault a woman has experienced in the past puts her at risk for experiencing that
same type, but not another type, of sexual assault in the future. A finding like this may help
prevention and service providers tailor their efforts and take into account what type of
sexual assault a woman has experienced or may be at risk of experiencing.
METHODS
The CSA Study involved conducting a Web-based survey of random samples of
undergraduate students at two large public universities, one located in the South (University
1) and one located in the Midwest (University 2). The CSA Survey was administered in the
Winter of 2006, and a total of 5,446 undergraduate women and 1,375 undergraduate men
participated. Because the male component of the study was exploratory, the data and
results presented in this summary represent women only. The CSA Study was reviewed
and approved by RTI’s Institutional Review Board (IRB), as well as the university IRBs.
We drew random samples of students aged 18-25 and enrolled at least three-quarters’ time
at each university to participate in the CSA Study. Sampled students were sent an initial
recruitment e-mail that described the study, provided a unique CSA Study ID#, and
included a hyperlink to the CSA Study Web site. During each of the following weeks,
students who had not completed the survey were sent follow-up e-mails and a hard-copy
letter encouraging them to participate. The overall response rates for survey completion for
the undergraduate women sampled at the two universities were 42.2% and 42.8%,
respectively.
A nonresponse bias analysis was conducted to create sample weights. We compared
respondents and nonrespondents on the administrative data elements provided by the
universities, which included age, university, race/ethnicity, and year of study. Although little
nonresponse bias was detected, weights adjusting for non-response were developed using a
Generalized Exponential Model (Folsom & Singh, 2000) to reduce nonresponse bias and
x
This document is a research report submitted to the U.S. Department of Justice. This report has not been published by the Department. Opinions or points of view expressed are those of the author(s)
and do not necessarily reflect the official position or policies of the U.S. Department of Justice.

Section 1 — Introduction
increase sample representativeness. Cohen’s effect size was used as a measure of the
magnitude of the bias, and weights were added for university, gender, year of study, and
race/ethnicity, which reduced the bias to negligible levels (Cohen, 1988). All prevalence
estimates and multivariate models were computed using weighted data.
The survey was administered anonymously (students did not enter their CSA Study ID # to
take the survey) and was designed to be completed in an average of 15 minutes. The
survey was divided into six modules. Background Information which included survey
items on demographics, school classification (year of study, year of enrollment, transfer
status), residential characteristics, academic performance, and school involvement.
Alcohol and Other Drug Use generated a number of measures of alcohol and drug use,
and related substance use behaviors. Dating included items on sexual orientation, dating,
consensual sexual activity, and dating violence. The Experiences module was developed
after extensive reviews of past surveys of sexual assault1 and generated information on
physically forced sexual assault and incapacitated sexual assault. Sexual assault included
forced touching of a sexual nature, oral sex, sexual intercourse, anal sex, and/or sexual
penetration with a finger or object For both physically forced and incapacitated sexual
assault, information was collected on completed and attempted assaults experienced before
entering college and since entering college. For completed sexual assaults, a series of
follow-up questions enabled us to define the assault as sexual battery (i.e., sexual assault
that entailed sexual touching only) and/or rape (i.e., sexual assault that entailed oral,
vaginal, or anal penetration). For male respondents, a Behaviors module asking about the
perpetration of the same types of sexual assault covered in the Experiences module was
included. The final module of the survey covered attitudes about sexual assault
(respondents were given seven scenarios and asked to classify them as rape) and attitudes
about the survey (the degree of honesty they employed when answering the survey
questions).
After the last survey question was answered, respondents were presented with an
informational module on sexual assault (e.g., sexual assault definitions, prevention advice,
legal consequences of giving someone a drug without their knowledge or consent, signs of
drug ingestion, and links and telephone numbers to local, state, and national resources for
sexual assault victims). In addition, respondents were provided with a survey completion
1Previous studies reviewed included, but were not limited to, the National College Women Survey
(Koss et al. 1987), the College Alcohol Study (Mohler-Kuo et al., 2004), the National Violence Against Women Survey (Tjaden & Thoennes, 2000), and the National College Women Sexual Victimization Survey (Fisher et al. 2000).
xi
This document is a research report submitted to the U.S. Department of Justice. This report has not been published by the Department. Opinions or points of view expressed are those of the author(s)
and do not necessarily reflect the official position or policies of the U.S. Department of Justice.

The Campus Sexual Assault (CSA) Study
code that, when entered with their CSA Study ID# at a separate website, enabled them to
obtain a $10 Amazon.com gift certificate.
RESULTS
We used a variety of descriptive, bivariate, and multivariate techniques to analyze the CSA
data. Essentially, these analyses helped us 1) generate prevalence estimates of different
types of sexual assault, 2) identify factors associated with being a victim of different types
of sexual assault, and 3) describe the contexts, consequences, and reporting of different
types of sexual assault.
The majority (66.9%) of the undergraduate women who participated in the CSA Study were
white, although a sizeable proportion of them were black (16.2%) or in the “other” category
(14.0%) which includes Asians, Native Hawaiians/Other Pacific Islanders, American
Indians/Alaska Natives and respondents of multiple races. Only 3.0% of the sample was
Hispanic. The majority of the sample was 18 to 20 years of age (63%). There were larger
percentages of freshman (29.9%) and seniors (26.6%) than sophomores (22.8%) and
juniors (20.7%) in the sample. This distribution reflected the distribution at the
participating universities since the data were weighted for year of study.
Prevalence Estimates of Sexual Assault Before and Since Entering College
Of the 5,446 women, 28.5% reported having experienced an attempted or completed
sexual assault either before or since entering college. Figure 1 presents the estimates for
the various types of sexual assault experienced by the women. Nearly 16% of the 5,446
women experienced attempted or completed sexual assault before entering college (box 1).
Almost equal percentages experienced attempted sexual assault before college (10.1%, box
2) and completed sexual assault before college (11.3%, box 3). Of course, some women
(5.5%) experienced both attempted and completed sexual assault before entering college
(i.e., the women represented in box 2 and box 3 are not mutually exclusive). Similar
percentages of women experienced completed physically forced assault (6.4%, box 4) and
incapacitated sexual assault (7.0%, box 5) before entering college. Note that 2.1% of the
study women experienced both physically forced and incapacitated sexual assault before
entering college (i.e., the women represented in box 4 and box 5 are not mutually
exclusive).
xii
This document is a research report submitted to the U.S. Department of Justice. This report has not been published by the Department. Opinions or points of view expressed are those of the author(s)
and do not necessarily reflect the official position or policies of the U.S. Department of Justice.

Section 1 — Introduction
Nineteen percent of the women reported experiencing completed or attempted sexual
assault since entering college (box 6), a slightly larger percentage than those experiencing
such incidents before entering college (box 1). Since entering college, slightly more women
experienced completed sexual assault (13.7%, box 8) than attempted sexual assault
(12.6%, box 7), with 7.2% of the women experiencing both completed sexual assault and
attempted sexual assault during college (i.e., the women represented in box 7 and box 8
are not mutually exclusive).
Figure 1. The Prevalence of Different Types of Sexual Assault Before and Since Entering College (Unweighted Frequencies, Weighted Percentages)
Nearly 5% of the total sample was forcibly sexually assaulted since college entry (4.7%, box
9). More than three percent of the women (3.4%) experienced forced rape since entering
college (box 11) and 1.4% experienced forced sexual battery since entering college (box
10). Approximately 11% of the women experienced sexual assault while incapacitated since
entering college (box 12), with a higher percentage of women being victims of incapacitated
rape than incapacitated sexual battery since entering college (8.5%, box 14 compared to
2.6%, box 13, respectively). It is important to note that AOD-enabled sexual assault was
xiii
This document is a research report submitted to the U.S. Department of Justice. This report has not been published by the Department. Opinions or points of view expressed are those of the author(s)
and do not necessarily reflect the official position or policies of the U.S. Department of Justice.

The Campus Sexual Assault (CSA) Study
experienced by 7.8% of the women since entering college (box 15). In contrast, smaller
percentages of women experienced drug-facilitated sexual assault that they were certain
happened (0.6%, box 16), that they suspected happened (1.7%, box 17), or some other
type of incapacitated sexual assault (1.0%, box 18).
Risk Factors for Sexual Assault Since Entering College
Three multivariate models were used to identify how prior sexual victimization, substance
use, lifestyle activities, and demographic characteristics were associated with women’s risk
of experiencing physically forced sexual assault only, incapacitated sexual assault only, or
both physically forced and incapacitated sexual assault since entering college. Results from
each of the three models are presented in Figure 2. Overall, the findings suggested that
although several risk factors were consistently associated with all types of sexual assault,
there were also some clear differences by sexual assault type.
Physically Forced Sexual Assault. Women who experienced physically forced sexual assault
before entering college had almost 7 times the odds of experiencing forced sexual assault
since entering college (OR = 6.6) compared to other women. However, experiencing sexual
assault when incapacitated before college was not significantly associated with experiencing
forced sexual assault since entering college.
None of the five measures of substance use since entering college were statistically
associated with being a victim of forced sexual assault during college. The number of sexual
partners women had since entering college was significantly and positively associated with
an increased risk of forced sexual assault (OR = 1.4). In addition, women who had been
threatened/humiliated and/or physically hurt by a dating partner since entering college had
just over 7 times the odds of experiencing forced sexual assault since entering college (OR
= 7.4) compared to other women.
Regarding demographics, no racial/ethnic differences emerged. Years in college was
positively associated with experiencing physically forced sexual assault since entering
college (OR = 1.2). This finding is not surprising given that the more years a woman has
been in college, the more exposure she has had to potentially being assaulted since
entering college. However, upon examining when sexual assault is most likely to occur (by
restricting the analyses to sexual assaults occurring within the past 12 months, or since
entering college for freshmen), the risk was greater for freshmen and sophomores than for
juniors and seniors (data not shown).
xiv
This document is a research report submitted to the U.S. Department of Justice. This report has not been published by the Department. Opinions or points of view expressed are those of the author(s)
and do not necessarily reflect the official position or policies of the U.S. Department of Justice.

Section 1 — Introduction
Incapacitated Sexual Assault. A rather different set of risk factors was associated with
incapacitated sexual assault. Experiencing incapacitated sexual assault before college
increased the odds of experiencing incapacitated sexual assault since entering college more
than three-fold (OR = 3.7); however, experiencing physically forced sexual assault before
college was not significantly associated with experiencing incapacitated sexual assault since
entering college.
All but one of the substance use measures were significantly and positively associated with
the likelihood of experiencing incapacitated sexual assault since entering college. The
frequencies with which women reported getting drunk since entering college increased the
odds of being an incapacitated sexual assault victim (OR = 1.7), as did marijuana use (OR
= 1.5); however, voluntary use of other illicit drugs was not associated with experiencing
incapacitated sexual assault since entering college. The frequency with which women
reported being drunk during sex also increased the odds of being a victim of incapacitated
sexual assault (OR = 1.5), and having been given a drug without one’s knowledge or
consent since entering college increased the odds of being a victim of incapacitated assault
since entering college (OR = 2.8).
The frequency with which women attended fraternity parties since entering college was
positively associated with being a victim of incapacitated sexual assault (OR=1.4). Women
who were humiliated or hurt by a dating partner had just over 2 times the odds of being a
victim of incapacitated sexual assault since entering college (OR = 2.2), compared to other
women. As seen in the analysis of physically forced sexual assaults, the more years a
woman has been in college, the greater the odds that she experienced incapacitated
assault.
Both Physically Forced and Incapacitated Sexual Assault. Victims of forced sexual assault
before college had higher odds (OR = 3.7) of experiencing both types of sexual assault
since entering college. The same was true for victims of incapacitated sexual assault before
college (OR = 2.1). Also interesting is that when the individual indicators for physically
forced sexual assault before college and incapacitated sexual assault before college were
replaced with a single combined indicator for experienced both physically forced and
incapacitated sexual assault before college, those women who experienced both types of
prior victimizations (n=109) had almost 8 times the odds of experienced both physically
forced and incapacitated sexual assault during college, compared to other women (OR =
7.8, analyses not shown).
xv
This document is a research report submitted to the U.S. Department of Justice. This report has not been published by the Department. Opinions or points of view expressed are those of the author(s)
and do not necessarily reflect the official position or policies of the U.S. Department of Justice.

The Campus Sexual Assault (CSA) Study
The frequency with which women reported getting drunk since entering college was
positively associated with being a victim of both physically forced and incapacitated assault
(OR = 1.7). In addition, having been given a drug without one’s knowledge or consent since
entering college was strongly associated with experiencing both types of assault during
college (OR = 6.7). The number of sexual partners a woman has had since entering
college increased the risk of being a victim of both types of sexual victimization since
entering college (OR= 1.3). As in the models of women’s experiences with physically forced
sexual assault or incapacitated sexual assault, the model of both physically forced sexual
assault and incapacitated sexual assault indicated that the measure of women’s experiences
with dating partner violence was strongly associated with experiencing both types of sexual
assault (OR = 5.2). Only one demographic variable was significantly associated with
experiencing both physically forced and incapacitated sexual assault during college. Women
in the “other” race category, compared to being white, had an increased odds of
experiencing both physically forced and incapacitated sexual assault since entering college
(OR = 2.0).
Context, Consequences, Reporting of Sexual Assault Since Entering College
Based on the extensive follow-up questions asked of women who reported experiencing
sexual assault, several findings related to the context of sexual assault were generated from
the study. Regarding characteristics of the assailant, few victims reported being assaulted
by someone they had never seen or talked to before, with victims of physically forced
sexual assault much more likely than incapacitated assault victims to be assaulted by
someone they had never seen or talked to (23% vs. 12%, respectively), or by a former
intimate partner (20% vs. 9%, respectively). Over a quarter of incapacitated sexual assault
victims reported that the assailant was a fraternity member at the time of the incident; this
proportion is significantly higher than that reported by victims of physically forced sexual
assault (28% vs. 14%, respectively). Not surprisingly, the vast majority of incapacitated
sexual assault victims (89%) reported drinking alcohol, and being drunk (82%), prior to
their victimization. This is much higher than the proportion of physically forced victims who
reported drinking (33%) and being drunk (13%) prior to their assault. Drug use was
relatively low among both groups, although a slightly higher proportion of incapacitated
sexual assault victims reported having voluntarily used drugs before the incident (8% vs.
2%). A surprisingly large number of respondents reported that they were at a party when
the incident happened, with a significantly larger proportion of incapacitated sexual assault
victims reporting this setting (58% compared with 28%). The majority of sexual assault
xvi
This document is a research report submitted to the U.S. Department of Justice. This report has not been published by the Department. Opinions or points of view expressed are those of the author(s)
and do not necessarily reflect the official position or policies of the U.S. Department of Justice.

Section 1 — Introduction
victims of both types reported that the incident had happened off campus (61% of
incapacitated sexual assault victims and 63% of physically forced sexual assault victims). A
low proportion of victims reporting that sustaining injuries in the assault, although more
physically forced sexual assault victims (18%) reported being injured than incapacitated
sexual assault victims (3%).
Several findings regarding the informal and formal reporting of the event are also of
interest. The majority of victims of both types of assault (70% of physically forced victims
and 64% of incapacitated sexual assault victims) reported that they told someone such as a
family member, friend, roommate, or intimate partner. A very small percentage of victims
reported that they contacted a victim’s, crisis, or health care center after the incident. This
type of disclosure was more prevalent among physically forced sexual assault victims (16%)
than incapacitated sexual assault victims (8%). A similarly small proportion of victims of
both types of sexual assault stated that they reported the incident to a law enforcement
agency, with incapacitated sexual assault victims once again being less likely to report the
incident (2% vs. 13%). Of the victims who did not report the incident to law enforcement,
the most commonly reported reasons for non-reporting were that they did not think it was
serious enough to report (endorsed by 56% of physically forced sexual assault victims and
67% of incapacitated sexual assault victims), that it was unclear that a crime was
committed or that harm was intended (endorsed by just over 35% of both types of victims),
and that they did not want anyone to know about the incident (endorsed by 42% of
physically forced sexual assault victims and 29% of incapacitated sexual assault victims).
Victims were asked about other actions they took as a result of the incident and
consequences received by the assailant. Beyond avoiding or trying to avoid the assailant
(reported by about two-thirds of victims of both sexual assault types), respondents were
unlikely to report action stemming from the assault. Twenty-two percent of physically forced
sexual assault victims and 6% of incapacitated sexual assault victims reported that they
sought psychological counseling, a statistically significant difference. Not surprisingly, given
the very low percentage of victims who reported the incident to law enforcement, a very
small number of victims of either type of sexual assault reported that they pursued any
action against the assailant, including seeking a restraining order, filing civil charges,
pursuing criminal charges, or filing a grievance or initiating other disciplinary action with
university officials. A very small number of victims reported that the assailant received any
disciplinary action from the university or that the assailant was arrested, prosecuted, or
convicted by the criminal justice system.
xvii
This document is a research report submitted to the U.S. Department of Justice. This report has not been published by the Department. Opinions or points of view expressed are those of the author(s)
and do not necessarily reflect the official position or policies of the U.S. Department of Justice.

The Campus Sexual Assault (CSA) Study
CONCLUSIONS AND RECOMMENDAITONS Sexual assault is clearly an issue in need of attention by the campus community given its
high prevalence and adverse consequences, and the CSA Study results carry many social
and policy-oriented implications. One out of five undergraduate women experience an
attempted or completed sexual assault during their college years, with:
the majority of sexual assaults occurring when women are incapacitated due to their
use of substances, primarily alcohol;
freshmen and sophomores at greater risk for victimization than juniors and seniors;
and
the large majority of victims of sexual assault being victimized by men they know
and trust, rather than strangers.
It is important that sexual assault prevention strategies and messages be designed such
that undergraduates are educated (and as soon after enrollment as possible) about these
facts. Programs should focus on both primary prevention for women who have not
experienced sexual assault and secondary prevention in an effort to prevent re-victimization
(although more research is needed to guide the development of effective secondary
prevention programming).
Sexual assault prevention programs for women could:
Provide accurate information on legal definitions of sexual assault, the extent and
nature of sexual assault among college women, and risk factors for sexual assault
(e.g., risky sexual behaviors, multiple sex partners, the role of substances);
Combine sexual assault prevention education with alcohol and drug education
programming (e.g., education concerning how levels of alcohol consumption and use
of different drugs, and their interactions, affect cognitive functions; harm reduction
messages; education about the impact of alcohol and drug use, especially heavy
episodic drinking, has on cognitive functions, which reduces one’s ability to detect
dangerous cues and threats, and one’s ability to effectively resist unwanted advances
that can arise in common college social situations);
Stress that even though many sexual assaults involves substance use by the victim,
this does not imply that women are to blame for their sexual assault. Victimization is
xviii
This document is a research report submitted to the U.S. Department of Justice. This report has not been published by the Department. Opinions or points of view expressed are those of the author(s)
and do not necessarily reflect the official position or policies of the U.S. Department of Justice.
Section 1 — Introduction
committed by the perpetrator, and therefore the sole responsibility for the assault
lies with the perpetrator;
Educate women about different types of sexual assault, especially since there
appears to be continuity in the type of sexual assault experienced over time
(physically forced or incapacitated sexual assault);
Teach effective sexual assault resistance strategies to reduce harm, particularly with
respect to strategies for protection from men that women know and trust;
Educate women about how to increase their assertiveness and self-efficacy;
Convey knowledge about how to report to police or school officials, the availability of
different types of services on and off campus;
Stress the importance of reporting incidents of attempted and completed sexual
assault to mental and/or physically health service providers and security/law
enforcement personnel, and the importance to seeking services, especially given the
well-documented negative impacts sexual assault can have on psychological and
physical functioning.
In addition, programs for men to prevent sexual assault perpetration could:
Provide accurate information on legal definitions of and legal penalties for sexual
assault;
Inform men that they are ultimately responsible for determining (1) whether or not a
women has consented to sexual contact, and (2) whether or not a women is capable
of providing consent; and
Educate men that an intoxicated person cannot legally consent to sexual contact and
that having sexual contact with an intoxicated or incapacitated person is
unacceptable.
All of these prevention programs should be tailored to include risk factors that both college
women and men encounter in common college social interactions/situations. Moreover, the
programs should be designed as continuing educational curriculums rather than brief, “one
shot” doses since research suggests that the former approach is more helpful.
xix
This document is a research report submitted to the U.S. Department of Justice. This report has not been published by the Department. Opinions or points of view expressed are those of the author(s)
and do not necessarily reflect the official position or policies of the U.S. Department of Justice.

The Campus Sexual Assault (CSA) Study
Sexual assault is a serious social, public safety, and public health problem that affects men
and women across the country. The CSA Study data suggest women at universities are at
considerable risk for experiencing sexual assault, especially sexual assault occurring after
the voluntary consumption of alcohol, and that a number of personal and behavioral factors
are associated with increased risk. It is our hope that universities can take the information
produced by the CSA Study and use it to reduce the prevalence of sexual assault, as well as
improve the resources for and response to sexual assault victims.
xx
This document is a research report submitted to the U.S. Department of Justice. This report has not been published by the Department. Opinions or points of view expressed are those of the author(s)
and do not necessarily reflect the official position or policies of the U.S. Department of Justice.

1. INTRODUCTION
Sexual assault is a public health and public safety problem with far-reaching implications.
Being a victim of sexual assault is one of the most violating experiences anyone can endure
and can cause immediate, as well as long-term, physical and mental health consequences.
Of rape victims, 25% to 45% suffer from nongenital trauma; 19% to 22% suffer from
genital trauma; up to 40% get sexually transmitted diseases (STDs); and 1% to 5%
become pregnant, resulting in an estimated 32,000 rape-related pregnancies in the United
States annually (Holmes, Resnick, Kirkpatrick, & Best, 1996). Victims of sexual assault
report increasing their visits to physicians by 18% the year of the assault, by 56% the year
after the assault, and by 31% 2 years after the assault (Koss, 1993). Four out of five rape
victims subsequently suffer from chronic physical or psychological conditions (Strategies for
the Treatment and Prevention of Sexual Assault, 1995), and rape victims are 13 times more
likely to attempt suicide than noncrime victims and six times more likely than victims of
other crimes (Rape in America: A Report to the Nation, 1992). An estimated 25% to 50% of
rape and child sexual abuse victims receive some sort of mental health treatment as a
result of the victimization (Miller, Cohen, & Wierama, 1996). Overall, rape is believed to
carry the highest annual victim cost of any crime. The annual victim costs are $127 billion
(excluding child sex abuse cases), followed by assault at $93 billion per year, murder
(excluding arson and drunk driving) at $61 billion per year, and child abuse at $56 billion
per year (Miller, Cohen, & Wierama, 1996).
Given the substantial impact sexual victimization has on individual victims and society,
collecting information that advances our understanding of sexual assault and helps us
prevent victimization and better meet the needs of victims is critical. Although a substantial
body of research exists, additional data are needed to help document the current magnitude
of the problem, the extent to which certain subpopulations are impacted, the consequences
and reporting (or nonreporting) of victimization incidents, and strategies for preventing
perpetration and reducing victims’ risk of sexual assault and effectively respond to victims.
One subpopulation that is often believed to be at elevated risk for sexual assault is college
students. Although methodological variation renders comparisons difficult to make, some
previous studies suggest that university women are at greater risk than women of a
comparable age in the general population (Fisher, Cullen, & Turner, 2000; DeKeseredy &
Kelly, 1993; Koss, Gidycz, & Wisniewski, 1987). This pattern is likely due to the close daily
interaction between men and women in a range of social situations experienced in university
settings (Fisher, Sloan, Cullen, & Lu, 1988), as well as frequent exposure to alcohol and
other drugs.
The risk of sexual assault related to alcohol and/or other drug consumption is particularly
high among university women. The relationship between substance use and sexual assault
experienced by university women has been well documented (Mohler-Kuo, Dowdall, Koss, &
1-1
This document is a research report submitted to the U.S. Department of Justice. This report has not been published by the Department. Opinions or points of view expressed are those of the author(s)
and do not necessarily reflect the official position or policies of the U.S. Department of Justice.

The Campus Sexual Assault (CSA) Study
Wechsler; 2004; Tyler, Hoyt, & Whitbeck, 1998; Koss & Dinero, 1989; Koss, Gidycz, &
Wisniewski, 1987; Muehlenhard & Ma, 1987). Specifically, previous researchers have: 1)
identified high levels of “pre-assault” alcohol use (i.e., alcohol use at the time of the
incident) among both victims and perpetrators of sexual assault (Hindmarch & Brinkmann,
1994; Koss & Dinero, 1989; Muehlenhard & Ma, 1987), 2) established that general drinking
behavior (i.e., not limited to pre-assault) on the part of college women is risk factor for
subsequent sexual assault victimization (Fisher, Cullen, and Turner, 2000; Greene and
Navarro 1998; Mohler-Kuo et al., 2004), and 3) documented that substance abuse is a
consequence of sexual assault (Kaysen, Neighbors, Martell, Fossos, and Larimer, in press;
Gidycz, Hanson, & Layman, 1995; Kilpatrick, Acierno, Resnick, Saunders, & Best, 1997).
However, the role of alcohol and drugs in achieving sexual assault is not well understood,
and the nature of this relationship can take several forms. For example, some assaults are
directly facilitated by coercive or nonconsensual drug ingestion, and others are enabled by
the victim being incapacitated through voluntary alcohol or drug use. Developing a typology
of sexual assault and understanding the frequency and context of each type of assault could
have important prevention, risk reduction, and response implications.
RTI International was funded by the National Institute of Justice (NIJ) to conduct the
Campus Sexual Assault (CSA) Study. The CSA Study was undertaken specifically to
document the prevalence of distinct types of sexual assault among university women, as
well as the context, consequences, and reporting of distinct types of sexual assault among a
large sample of undergraduate women from two large universities. In the CSA Study, sexual
assault includes a wide range of victimizations, including rape and other types of unwanted
sexual contact (e.g., sexual battery). Consistent with previous research and most legal
definitions, we define rape as unwanted sexual penetration (vaginal, anal, oral, or object
penetration by an offender) achieved either through physical force, threat of force, or
incapacitation of the victim.
The CSA Study builds upon previous research and makes a number of contributions to the
field. First, the CSA Study is one of the first to generate estimates of the prevalence of
drug-facilitated sexual assault (DFSA), which is when a woman is sexually assaulted when
she is incapacitated after having been given a drug without her knowledge or consent,
among a college sample. The concept of DFSA has received widespread attention from the
media and a variety of stakeholders, including prevention and risk reduction specialists,
treatment providers, law enforcement, and university administrators, but empirical data on
the prevalence and nature of this phenomenon have yet to appear in the literature. Second,
we collected the CSA data using a Web-based survey. This methodology is incredibly
efficient and allowed respondents to answer the CSA survey questions on their own time
and in complete privacy. We documented that it is possible to collect these data using a
Web-based survey, which is important since collecting data using a computerized, self-
administered surveys has proven to increase the quality and validity of data (Turner, et al.
1-2
This document is a research report submitted to the U.S. Department of Justice. This report has not been published by the Department. Opinions or points of view expressed are those of the author(s)
and do not necessarily reflect the official position or policies of the U.S. Department of Justice.

Section 1 — Introduction
1998). Many interviewer-administered or group-administered modes that have been used in
the past to collect these data introduce threats to validity and human subjects-related
concerns. Third, we explore some potential risk factors for sexual assault with more
specificity than have previous researchers. For example, we explore whether risk factors
vary by type of assault and we believe this is the first study to find that the type of sexual
assault a woman has experienced in the past puts her at risk for experiencing that same
type, but not another type, of sexual assault in the future. A finding like this may help
prevention and service providers tailor their efforts and take into account what type of
sexual assault a woman has experienced or may be at risk of experiencing.
1.1 A Typology of Sexual Assault
Researchers in the field of sexual victimization have long recognized that the variability in
the types of sexual assaults suggests the need to classify incidents into distinct types. For
example, one commonly used classification is based on the relationship between the
perpetrator and the victim, distinguishing between stranger rapes and acquaintance rapes
(with the latter category often further classified into date rapes and acquaintance rapes).
This classification is based on the recognition that the various assault types occur under
different circumstances and that these circumstances sometimes differentially impact the
victim and related outcomes (e.g., likelihood of reporting). Although useful in informing the
content of prevention programs, the fact that the vast majority of sexual assaults (both in
the general population and among university women) are committed by individuals known
to the offender limits the utility of this classification (when employed in isolation).
Another typology, and one that guides the classification of sexual assault in the CSA Study,
is based on how the assault was achieved. Virtually all sexual assault research distinguishes
between assaults occurring as a result of physical force or threats of physical force from
assaults that do not involve the use or threat of force. In the CSA Study, we consider
physically forced sexual assault as a distinct category of assault. Many studies also attempt
to capture unwanted sexual contact achieved by the use of verbal or emotional coercion.
This type of sexual encounter, although unwanted or regretted, is often not classified as
sexual victimization or sexual assault. In the CSA Study, we measure unwanted sexual
contact resulting from verbal/emotional coercion but do not include it as a type of sexual
assault. A third means through which sexual assault is achieved is incapacitation of the
victim. Legal definitions of sexual assault factor in one’s ability to provide consent, and
individuals who are incapacitated because of the effects of alcohol or drugs (or otherwise
incapacitated, such as when they are unconscious or asleep) are incapable of consenting.
Unlike sexual contact achieved by physical force or verbal/emotional coercion, previous
research on incapacitated sexual assault has not been approached with consistency from
either a conceptual or measurement perspective. Because a primary goal of the CSA Study
is to contribute to the knowledge about incapacitated sexual assault (with incapacitated
1-3
This document is a research report submitted to the U.S. Department of Justice. This report has not been published by the Department. Opinions or points of view expressed are those of the author(s)
and do not necessarily reflect the official position or policies of the U.S. Department of Justice.

The Campus Sexual Assault (CSA) Study
sexual assault treated as a distinct type of sexual assault in the CSA Study, with several
subtypes identified), the manner in which previous research has approached this type of
assault is discussed in some detail below. Before beginning this discussion, however, it is
important to point out that, although the preceding discussion has outlined three primary
means by which sexual assault is achieved as the first level of a typology of assault types,
we recognize that in actuality a single assault could be achieved by more than one means.
For example, a woman who is extremely drunk (incapacitated) could be forcibly held down
and raped—in which case the assault could be classified as both physically forced and
incapacitated rape.
1.1.1 Incapacitated Sexual Assault
The general relationship between substance use and sexual assault has been well
documented, especially with respect to research focusing on university samples (Mohler-
Kuo, Dowdall, Koss, & Wechsler; 2004; Tyler, Hoyt, & Whitbeck, 1998; Koss & Dinero,
1989; Koss, Gidycz, & Wisniewski, 1987; Muehlenhard & Ma, 1987). Substance use can
incapacitate a victim or make it difficult for her to consent to or refuse sexual activity. It
may also decrease a perpetrator’s sense of responsibility or awareness of his behavior, lead
to the misinterpretation of cues, diminish the victim’s ability to prevent an assault, or lead
to women taking risks they might otherwise avoid (Testa, Livingston, & Collins, 2000;
Abbey, Ross, & McDuffie, 1994; Abbey, 1991).
Numerous studies have addressed the relationship between substance use and sexual
assault by considering substance use as a contextual factor associated with sexual assault.
For example, several studies have reported that over half of the victims and perpetrators of
sexual assault among college students had been drinking alcohol prior to the assault
(Hindmarch & Brinkmann, 1994; Koss & Dinero, 1989; Muehlenhard & Ma, 1987). In their
national study of college women, Koss (1988) found that 55% of rape victims and 74% of
rape perpetrators had been drinking alcohol. In the National College Women Sexual
Victimization (NCWSV) study, 43% of the sexual victimization incidents involved alcohol
consumption by victims and 69% involved alcohol consumption by the perpetrator (Fisher,
Daigle, Cullen, & Turner, 2003). Other estimates of drug and/or alcohol use based on
victims’ reports suggest that 20% of victims and 63% of perpetrators were drinking or using
drugs prior to the assault (Ulman & Breklin, 2000).
These findings clearly demonstrate that a strong relationship exists between substance use
and sexual assault. However, they do not identify sexual assault incidents that occurred
because of victim incapacitation. Many students drink without becoming incapacitated, and
it would be inappropriate to assume that any incidents in which the victim was drinking
could be classified as incapacitated sexual assaults. Findings illustrating that large
proportions of victims and perpetrators engage in substance use simply help document
1-4
This document is a research report submitted to the U.S. Department of Justice. This report has not been published by the Department. Opinions or points of view expressed are those of the author(s)
and do not necessarily reflect the official position or policies of the U.S. Department of Justice.

Section 1 — Introduction
substance use as a potential risk factor for both victimization and perpetration of sexual
assault.
Part of the reason that incapacitated sexual assault has been approached inconsistently by
previous researchers is lack of agreement on whether this type of sexual assault ought to be
restricted to incidents in which the perpetrator was responsible for the victim’s
incapacitation. Some studies have been designed to only “count” as incapacitated assaults
those in which the perpetrator was responsible for the victim’s incapacitation. For example,
in the original Sexual Experiences Survey (SES - Koss, Gidycz, & Wisniewski, 1997),
respondents were asked “Have you had sexual intercourse when you didn’t want to because
a man made you intoxicated by giving you alcohol or drugs?” Based on this measure, 45%
of the rape incidents experienced by women in Koss et al.’s national study of college women
were reported to have occurred subsequent to the intentional administration of alcohol
and/or drugs (Koss, Gidycz, & Wisniewski, 1987). Because of the increasing media attention
and anecdotal reports of drugs being administered clandestinely to immobilize victims,
impair memory, and facilitate rape, some researchers attempted to further distinguish
incapacitated sexual assault in which the perpetrator was responsible for the victim’s
incapacitation in a manner that was unknown to her. For example, Testa, Livingston, and
Vanzile-Tamsen (2003) modified the SES item on assailant-administered alcohol or drugs by
adding “without your knowledge” to the end of the item. This type of incapacitated sexual
assault involves coercion on the part of the perpetrator and is often known as drug-
facilitated sexual assault (DFSA).
In the CSA Study, we consider as incapacitated sexual assault any unwanted sexual contact
occurring when a victim is unable to provide consent or stop what is happening because she
is passed out, drugged, drunk, incapacitated, or asleep, regardless of whether the
perpetrator was responsible for her substance use or whether substances were administered
without her knowledge. This is consistent with the work of Testa et al., who, focusing
exclusively on rape, considered incapacitated rape to include unwanted sexual intercourse
when the victim was incapacitated because of alcohol or drugs, regardless of whether the
substance(s) had been consumed voluntarily or not (Testa, Livingston, & Vanzile-Tamsen,
2003).
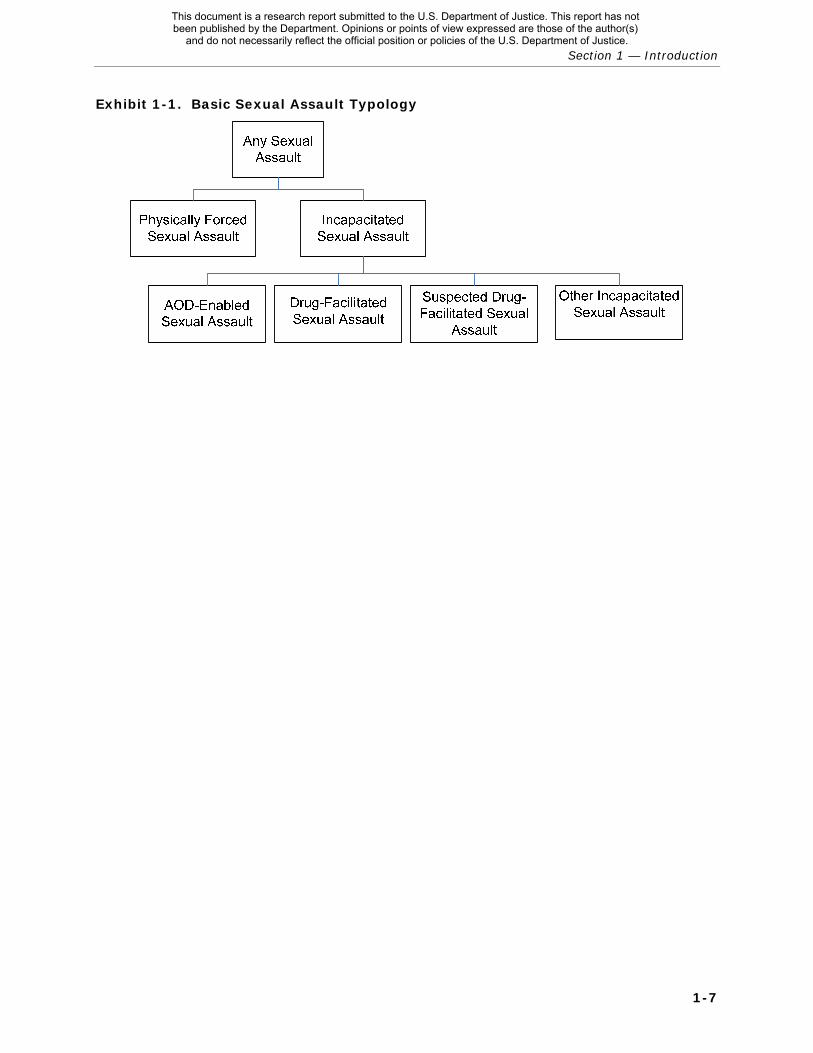
However, in the CSA Study, we further break down incapacitated sexual assault into four
subtypes. The first two subtypes pertain to sexual assaults achieved when the victim is
given—without her knowledge or consent—a substance that physically incapacitates her and
makes her incapable of providing consent. DFSA (drug-facilitated sexual assault) is defined
as unwanted sexual contact occurring when the victim is incapacitated and unable to
provide consent after she had been given a drug without her knowledge or consent.
Incidents classified as DFSA are those in which the victim is certain that she had been
drugged. In contrast, SDFSA (suspected drug-facilitated sexual assault) is defined as
incapacitated sexual assault occurring after the victim suspects that she had been given a
1-5
This document is a research report submitted to the U.S. Department of Justice. This report has not been published by the Department. Opinions or points of view expressed are those of the author(s)
and do not necessarily reflect the official position or policies of the U.S. Department of Justice.

The Campus Sexual Assault (CSA) Study
drug without her knowledge or consent. Our conceptualization of DFSA is consistent with
other definitions (for example, the American Prosecutors Research Institute [1999] defines
DFSA as sexual assault facilitated by the administration of “anesthesia-type” drugs, which
physically incapacitate the victim and make her incapable of giving or withholding consent);
however, we do not restrict the categorization to “anesthesia-type” drugs only. Although
drugs commonly reported in association with DFSA include Rohypnol (flunitrazepam),
gamma hydroxybutyrate (GHB), Ketamine (a general anesthetic), MDMA (ecstasy), and
Soma (carisoprodol) (LeBeau et al., 1999; U.S. Department of Justice, 2003), any drug can
be administered without the victim’s knowledge.2
The third type of incapacitated sexual assault considered in the CSA Study is termed alcohol
and/or other drug- (AOD-) enabled sexual assault. We recognize that most women who
drink or use drugs do so voluntarily and that the vast majority of situations in which a
woman is incapacitated because of the effects of alcohol or drugs are not caused by coercive
or clandestine action on the part of another individual. However, if a woman experiences
unwanted sexual contact when she is incapacitated and unable to provide consent because
of voluntary consumption of alcohol or other drugs, a sexual assault has nonetheless
occurred. We consider the assault to be directly enabled by the use of alcohol or other
drugs. Although it is important to distinguish between DFSA and sexual assault occurring
after voluntary substance abuse, we believe that both are clear instances of incapacitated
sexual assault and classify them accordingly.
To distinguish between incapacitation due to the effects of AOD (administered either
coercively or voluntarily) and other types of incapacitation, we include a fourth type of
incapacitated sexual assault in our typology. Other incapacitated sexual assaults capture the
remaining, and likely uncommon, situations in which a victim can be incapacitated, such as
by being asleep or unconscious. The basic components of this typology of sexual assault are
presented in Exhibit 1-1.
2Even alcohol could be administered without the victim’s knowledge. For example, a victim could be
told that a drink contains no alcohol.
1-6
This document is a research report submitted to the U.S. Department of Justice. This report has not been published by the Department. Opinions or points of view expressed are those of the author(s)
and do not necessarily reflect the official position or policies of the U.S. Department of Justice.
Section 1 — Introduction
Exhibit 1-1. Basic Sexual Assault Typology
1-7
This document is a research report submitted to the U.S. Department of Justice. This report has not been published by the Department. Opinions or points of view expressed are those of the author(s)
and do not necessarily reflect the official position or policies of the U.S. Department of Justice.

This document is a research report submitted to the U.S. Department of Justice. This report has not been published by the Department. Opinions or points of view expressed are those of the author(s)
and do not necessarily reflect the official position or policies of the U.S. Department of Justice.

2. BACKGROUND
This section summarizes previous research on the prevalence of sexual assault among
university women, including risk factors for sexual assault among university women, the
context in which campus sexual assault occurs, consequences of sexual assault, and the
reporting of sexual assault. Previous literature on prevalence, risk factors, consequences,
and reporting are presented within the context of the typology presented above wherever
possible. Finally, we include a brief summary of the research conducted on sexual assault
perpetration by university men, focusing on prevalence estimates and risk factors for
perpetration.
2.1 Prevalence Estimates for Sexual Assault Victimization
In 2002, the National Crime Victimization Survey (NCVS) identified 247,730 incidents of
rape or sexual assault, with the highest rates reported among 16- to 19-year-old (10.4 per
1,000) and 20- to 24-year-old women (5.4 per 1,000) (DOJ, BJS Web site, 2004). Although
methodological variation makes comparisons difficult, some previous studies suggest that
university women are at greater risk than women of a comparable age in the general
population (Fisher, Cullen, & Turner, 2000; DeKeseredy & Kelly, 1993; Koss, Gidycz, &
Wisniewski, 1987), probably because of the close daily interaction between men and women
in a range of social situations experienced in university settings (Fisher, Sloan, Cullen, & Lu,
1988). Using items similar to the NCVS, the NCWSV study—a telephone survey with a
national sample of 4,446 college women—found that 2.8% of college women had
experienced a completed and/or attempted rape during the current academic year3 and
estimated that between 20% and 25% of women will experience a completed and/or
attempted rape during their college career (Fisher, Cullen, & Turner, 2000). A prior study of
a national sample of more than 6,000 students enrolled in 32 colleges and universities
reported that 27% of the women had experienced attempted (12%) or completed (15%)
rape in their lifetime (Koss, Gidycz, & Wisniewski, 1987).
In addition to generating estimates of attempted and/or completed rape, much of the
existing research has also explored the prevalence of sexual victimization at a general level.
For example, in the NCWSV, 15.5% of college women reported being sexually victimized
during the academic year in which the data were collected (Fisher, Cullen, & Turner, 2000).
Koss (1988) found that 44% of the college women in her sample reported some type of
sexual victimization within a 1-year period. A single-site, longitudinal study of 100 college
women found that 29% of the sample reported being sexually victimized (including sexual
contact, sexual coercion, attempted rape, or rape) by a dating partner in the 32 months
since entering college (Himelein, 1995). The prevalence of lifetime sexual victimization by a
3However, because the survey was conducted from February to May 1997, the average time period
about which study participants responded was only 7 months.
2-1
This document is a research report submitted to the U.S. Department of Justice. This report has not been published by the Department. Opinions or points of view expressed are those of the author(s)
and do not necessarily reflect the official position or policies of the U.S. Department of Justice.

The Campus Sexual Assault (CSA) Study
dating partner was 52%, with 38% having been sexually victimized in dating situations prior
to entering college (Himelein, 1995).
With respect to the prevalence of the distinct types of sexual assault introduced previously
(physically forced and incapacitated sexual assault, with incapacitated assault further
classified as DFSA, AOD enabled, and other incapacitated sexual assault), studies conducted
with university women have shown that incidents achieved by using physical force are less
common than those not involving physical force (Fisher, Cullen, & Turner, 2000). Few
previous studies have examined incapacitated sexual assault using a definition similar to the
one employed in the CSA Study. However, the Harvard School of Public Health College
Alcohol Study (CAS) specifically asked about sexual intercourse when the victim was so
intoxicated that she was unable to provide consent. In 2001, the prevalence of this type of
rape was 3.2% and accounted for 72% of all rapes (Mohler-Kuo, Dowdall, Koss, & Wechsler,
2004). Although the current review focuses primarily on sexual assault experienced by
university women, a community-based study conducted by Testa et al. is relevant due to its
distinction between forcible rape and incapacitated rape. Among a community-based sample
of women aged 18 to 30, 9.4% reported experiencing nonconsensual sexual intercourse
since the age of 14 when incapacitated (Testa, Livingston, Vanzile-Tamsen, & Frone, 2003).
This classification includes women who reported they were incapacitated because of their
use of alcohol or drugs and were not able to prevent unwanted sexual intercourse from
taking place (8.4%), as well as women who reported having sexual intercourse when they
did not want to because a man made them intoxicated by giving them alcohol or drugs
without their knowledge (3.1%). Interestingly, the prevalence of incapacitated rape (9.4%)
was roughly equivalent to the prevalence of forcible rape (10.7%). However, in this study,
incapacitated rape was limited to situations in which the victim was passed out or unaware
of what was happening. An expanded definition of incapacitation (such as the one employed
in the CSA Study) would likely have generated a substantially higher prevalence estimate
for incapacitated rape.
Although research such as the Testa et al. (2003) study indicates that the prevalence of
DFSA is very low (in their study, 3.1% of the sample reported having unwanted sexual
intercourse because they were given a substance without their knowledge), it is extremely
difficult to confirm the true prevalence of DFSA, primarily because victims may not know
with certainty that they were administered a substance or whether they were sexually
assaulted. “Date rape drugs,” if they are administered, have properties that make them
particularly difficult to detect. Most are colorless and odorless, and can rapidly (i.e., within
20 minutes for Rohypnol, GHB, and Ketamine) induce sleep or sedation and an inability to
recollect events (anterograde amnesia); these depressive effects are magnified when used
with alcohol (LeBeau et al., 1999). In addition, detection is difficult because the drugs have
a short half-life (e.g., GHB can only be detected within 12 hours of ingestion, and the
psychomotor impairments it causes last a few hours [Smith, 1999]), and some of these
2-2
This document is a research report submitted to the U.S. Department of Justice. This report has not been published by the Department. Opinions or points of view expressed are those of the author(s)
and do not necessarily reflect the official position or policies of the U.S. Department of Justice.

Section 2 — Background
substances (e.g., Ketamine) cannot be detected or may be extremely difficult to detect
because of limitations in existing testing methods (Pope & Shouldice, 2001).
These methodological challenges make it extremely difficult to generate prevalence
estimates of DFSA. Several forensic toxicology laboratories have developed estimates, but
these figures are of limited utility because they are based solely on cases in which a
potential victim has come forward, DFSA is suspected, and analyses have been conducted to
confirm DFSA. For example, Slaughter (2000) reported that 61% of urine specimens from
rape victims suspected by a rape treatment center examiner of containing drugs were found
to contain alcohol and/or drugs, with alcohol present in 63% of the positive samples,
marijuana present in 30%, and GHB and Rohypnol in less than 3%. Similarly, ElSohly and
Salamone (1999) reported that 60% of urine samples submitted by law enforcement
agencies, emergency rooms, and rape crisis centers (and provided by individuals claiming to
have been sexually assaulted when drug use was suspected) were positive for drugs (41%
tested positive for alcohol, 18.5% for marijuana, 8.2% for benzodiazepines, 8.2% for
cocaine, 4.3% for amphetamine, 4.1% for GHB, 2.1% for opiates, 2.1% for propoxyphene,
and 1% for barbiturates). These estimates are difficult to interpret, however, because they
are based on data collected from victims who (1) suspected they were drugged,
(2) reported the incident to a medical center or law enforcement agency, and (3) reported
their victimization soon enough after the incident for authorities to make the decision to
take a sample and test for measurable traces of a substance (i.e., within 48 to 72 hours of
ingestion). It is virtually impossible to use these “confirmation” studies to calculate DFSA
prevalence because limited data exist on the proportion of sexual assault victims who
suspect they were victims of DFSA following “unknown” or nonconsensual ingestion.
McGregor et al. (2003) reported that 12% of cases presenting at a hospital-based
emergency service over a 7-year period were identified as suspected DFSA (based either on
the victim’s own suspicion or the examiner’s opinion). Similarly, a recent Australian study
found that of 434 adult sexual assault cases over a 12-month period, DFSA was suspected
in 17.5% (n = 76) of these cases, although “covert” administration was suspected in only
22 cases (and confirmed through toxicological evidence in only 15 cases) (Hurley, Parker, &
Wells, 2006).
2.2 The Context of Campus Sexual Assault
In the vast majority of sexual assaults experienced by university women, the perpetrator
and victim know each other in some way. In the National Survey of College Women, 93% of
sexual assault victims reported that they knew the perpetrator (Ullman, Karabatsos, & Koss,
1999). Similarly, the NCWSV study revealed that among the college women who
experienced completed and/or attempted rape, the perpetrator (most commonly a
classmate, friend, boyfriend or ex-boyfriend, or acquaintance) was known to the victim in
nearly 90% of cases (Fisher, Cullen, & Turner, 2000). Interestingly, it has been suggested
2-3
This document is a research report submitted to the U.S. Department of Justice. This report has not been published by the Department. Opinions or points of view expressed are those of the author(s)
and do not necessarily reflect the official position or policies of the U.S. Department of Justice.

The Campus Sexual Assault (CSA) Study
that in sexual assaults involving substance use, the perpetrator and victim are less likely to
be intimately acquainted than sexual assaults in which substance use is not involved (Abbey
et al., 1996; Koss et al., 1988; Ullman & Brecklin, 2000).
In the NCWSV, victims were on a date with the perpetrator in 12.8% of completed rapes
and 35% of attempted rapes (Fisher, Cullen, & Turner, 2000). In the National College
Women’s Study, nearly 40% of women experiencing sexual victimization were on a date
with the perpetrator (Ullman, Karabatsos, & Koss, 1999). The NCWSV study also showed
that respondents reported that the perpetrator was of the same race as the victim in nearly
80% of the incidents (Fisher, Daigle, Cullen, & Turner, 2003).
The NCWSV study identified several other contextual factors associated with sexual assault.
Just over half of the completed rapes took place after midnight (with 36.5% occurring
between 6 p.m. and midnight and only 12.8% occurring between 6 a.m. and 6 p.m.) and
most took place in living quarters. For all types of sexual victimizations, it was more
common for students to be victimized off campus (66% of completed rapes occurred off
campus) than on campus4 (Fisher, Cullen, & Turner, 2000).
In the NCWSV, the majority of victims reported employing some type of protective action—
typically using physical force against the perpetrator. However, victims of attempted rape
were more likely to take protective action (particularly using physical force) than victims of
completed rape, which may suggest the effectiveness of such action at preventing the
attempt from being successful (Fisher, Cullen, & Turner, 2000). The National College
Women’s Study also reported high levels of victim resistance (91%), yet the relationship
between degree of victim resistance and the outcome of the assault was the opposite of that
observed in the NCWSV; women who resisted more during the assault (with resistance
measured on a scale ranging from less forceful verbal resistance to more forceful physical
resistance) reported greater severity of sexual victimization (with completed rape being the
highest severity outcome). This pattern was more pronounced for victims who had not been
drinking prior to the assault than for those who had been drinking (Ullman, Karabatsos, &
Koss, 1999).
In the National College Women’s Study, the assailant had a weapon in only 1.9% of sexual
victimizations (Ullman, Karabatsos, & Koss, 1999). With respect to victim injury, NCWSV
data show that the victim reported experiencing an injury in about 20% of the completed
and/or attempted rape incidents, with the most common injury reported being “bruises,
black-eye, cuts, scratches, swelling, or chipped teeth” (Fisher, Cullen, & Turner, 2000).
Fewer respondents reported injuries from the other types of sexual victimization. Some
4The pattern of living on campus being a risk factor and most assaults occurring off campus is slightly
counterintuitive; however, students who live on campus clearly participate in social activities off campus. In addition, living on campus may be a proxy for year of study, given that other studies have found sexual assault more common among freshmen and sophomores (Meilman & Haygood-Jackson, 1996).
2-4
This document is a research report submitted to the U.S. Department of Justice. This report has not been published by the Department. Opinions or points of view expressed are those of the author(s)
and do not necessarily reflect the official position or policies of the U.S. Department of Justice.

Section 2 — Background
studies have observed that victim injury is more likely when perpetrators had been using
alcohol or other drugs prior to the incident (Coker et al., 1988; Martin & Bachman, 1998;
Ullman & Brecklin, 2000) but others have not (Brecklin & Ullman, 2001, 2002). Testa,
Vanzile-Tamsen, and Livingston (2004) found that the relationship between perpetrator
intoxication and increased likelihood of victim injury was specific to incidents in which the
victim was sober. This interaction effect may be explained by either the possibility that
sober women may resist more strongly, which may increase their chances of injury
(although ultimately may reduce the severity of the sexual assault), or that perpetrators
resort to force when the victim is not more vulnerable or susceptible as a result of
intoxication (Testa, Vanzile-Tamsen, & Livingston, 2004). In one of the few studies to
consider physically forced rape and incapacitated rape as distinct types of rape, Testa,
Livingston, Vanzile-Tamsen, and Frone (2003) found that injury as a result of rape was
significantly less likely to occur in incapacitated rape than forcible rape. Specifically, in their
community-based sample of 18- to 30-year-old women, 33% of victims of incapacitated
rape were injured during the assault compared with 57% of victims of forcible rape.
2.3 Risk Factors Associated with Sexual Assault
Given the high prevalence of sexual assault experienced by university women, much of the
previous research has attempted to identify risk factors for sexual assault. It is important to
note that such efforts should not be construed as victim-blaming or as attempts to attribute
responsibility for the incident to the victim. It is extremely important for the purposes of
better targeting prevention programming to know as much as possible about factors that
place certain individuals at greater risk for victimization.
2.3.1 Prior Victimization
One of the strongest predictors of sexual assault is prior victimization. In the NCWSV, 10%
of the sample reported being raped prior to the start of the academic year in which the
study was conducted; 11% reported a prior attempted rape (Fisher, Cullen, & Turner,
2000). Women who had experienced a prior sexual assault were shown to have an
increased risk of sexual victimization during the current academic year (Fisher, Cullen, &
Turner, 2000). Adolescents who experienced a completed or attempted rape are twice as
likely to experience a subsequent sexual assault during their college years (Hanson &
Gidycz, 1993). Himelein’s (1995) longitudinal study of college women found that women
who had experienced sexual victimization by a dating partner prior to entering college were
significantly more likely to be victimized during college, with prior victimization being the
strongest predictor of victimization during college. In Himelein’s study, although precollege
victimization by a dating partner strongly predicted victimization during college, childhood
sexual abuse did not. In Gidycz, Hanson, and Layman’s (1995) longitudinal study, women
who had been victimized during the first time period of the study were three time more
likely than nonvictims to be revictimized during the second observation period.
2-5
This document is a research report submitted to the U.S. Department of Justice. This report has not been published by the Department. Opinions or points of view expressed are those of the author(s)
and do not necessarily reflect the official position or policies of the U.S. Department of Justice.

The Campus Sexual Assault (CSA) Study
Several factors may mediate the relationship between previous and subsequent sexual
assault including low self-esteem, depression, and poor psychological adjustment, all of
which may increase vulnerability for revictimization. For example, Himelein suggested that
“a tendency to internalize blame suggests that victimization would exacerbate existing self-
doubts, making future attempts at assertion in sexual situations more difficult” (1995, p.
44). Another explanation posited for the greater risk of revictimization among adolescents
and young adults who have been sexually abused is that sexual and physical abuse
contribute to the use of alcohol and other drugs, which can in turn place a previous victim at
risk for future victimization (Watts & Willis, 1993; Dembo, Williams, Wothke et al., 1992).
Researchers have, in fact, documented that heavy drinking may be a means of coping with
the psychological distress following sexual assault (Grayson & Nolen-Hoeksema, 2005;
Miranda, Meyerson, Long, Marx, & Simpson, 2002). Several studies among college students
have identified increased alcohol consumption and a greater number of drinking-related
negative consequences in sexual assault victims compared with nonvictims, using both
cross-sectional (Corbin, Bernat, Calhoun, McNair, & Seals; 2001; Larimer, Lydum,
Anderson, & Turner, 1999; Marx, Nichols-Anderson, Messman-Moore, Miranda, & Porter,
2000; Koss & Dinero, 1989) and longitudinal (Kaysen, Neighbors, Martell, Fossos, and
Larimer, in press; Gidycz, Hanson, & Layman, 1995; Kilpatrick, Acierno, Resnick, Saunders,
& Best, 1997) designs.
2.3.2 Substance Use
Regardless of prior victimization status, alcohol consumption by the victim is a major risk
factor for sexual assault. In the NCWSV, women who frequently drank enough to get drunk
were at greater risk of sexual victimization than those who did not (Fisher, Cullen, & Turner,
2000). Mohler-Kuo et al. (2004) found that heavy episodic drinking was the strongest
predictor of both rape when intoxicated and other types of rape (physically forced rape and
rape due to threats of force); high school heavy episodic drinking patterns were also
significantly associated with the risk of rape while in college. The Harvard College Alcohol
Study also found that drug use was associated with an increased risk of rape (including rape
when intoxicated and other types) (Mohler-Kuo, Dowdall, Koss, & Wechsler, 2004).
Similarly, Greene and Navarro (1998) showed that heavy alcohol use predicted later sexual
assault over the course of an academic year among college women. Interestingly, the
severity of the outcome also appears to be affected by alcohol and/or drug use by the victim
and perpetrator. In the National College Women’s Study, victims who reported getting
drunk more often also reported more severe sexual victimization than victims who got
drunk less often (Ullman, Karabatsos, & Koss, 1999). Studies examining incapacitated
sexual assault have found that early age of onset of drinking and frequency of alcohol
consumption are associated with greater risk of incapacitated sexual assault and penetration
(Testa, Livingston, & Leonard, 2003; Tyler, Hoyt, & Whitbeck, 1998).
2-6
This document is a research report submitted to the U.S. Department of Justice. This report has not been published by the Department. Opinions or points of view expressed are those of the author(s)
and do not necessarily reflect the official position or policies of the U.S. Department of Justice.

Section 2 — Background
2.3.3 Age and Year of Study
Freshmen and sophomore women appear to be at greater risk of being victims of sexual
assault than are upperclassmen. A recent study employing a convenience sample of
university women found that 84% of the women who reported sexually coercive experiences
experienced the incident during their first four semesters on campus (Gross, Winslett,
Roberts, & Gohm, 2006). Age itself may be a related risk factor. In the CAS, underage
women were more likely to report being raped (including rape when intoxicated) than
women 21 or older (Mohler-Kuo, Dowdall, Koss, & Wechsler, 2004).
2.3.4 Race/Ethnicity
The role of race/ethnicity as a risk factor for campus sexual assault or rape has not been
well studied, primarily because of the small number of minorities included in previous
research. In Koss et al.’s (1987) National College Women Survey, Native American college
women reported the highest incidence of rape, and white women had higher rates than
African American, Hispanic, and Asian women. However, the role of race/ethnicity as a risk
factor for sexual assault may differ depending on the type of assault. For example, the
Harvard College Alcohol Study found that white undergraduate females were more likely to
report experiencing rape when intoxicated than women of other races5 (Mohler-Kuo et al.,
2004), which is likely due to the pattern of heavy alcohol use being more common among
white college students (Wechsler et al., 1994, 2000, 2000; Caetano et al., 1998). In the
same study, white women were less likely to report experiencing other types of rape (which
included physically forced rape and threats of force) than women of other races (Mohler-Kuo
et al., 2004). Similarly, in a study conducted in a single Southeastern university, Gross,
Winslett, Roberts, and Gohm (2006) found significantly higher rates of physically forced
sexual intercourse (and emotional coercion) for African American women compared with
white women.
2.3.5 Residential Status
The Harvard College Alcohol Study found that students who resided in sorority houses and
on-campus dormitories were more likely to report experiencing rape than students residing
off campus (Mohler-Kuo et al., 2004). In the NCWSV, women who resided on campus had
an increased risk for sexual victimization occurring on campus (Fisher, Cullen, & Turner,
2000).
2.3.6 Sorority Membership
Sorority membership itself has been identified as a risk factor for sexual assault, including
being a victim of alcohol or drug coercion (Tyler, Hoyt, & Whitbeck, 1998; Mohler-Kuo et al.,
2004; Copenhaver & Grauerholz, 1991; Kalof, 1993). This finding is probably due to the
5Although approximately 25% of the CAS sample was nonwhite, the breakdown of nonwhite students
into specific racial/ethnic categories was not reported in the article.
2-7
This document is a research report submitted to the U.S. Department of Justice. This report has not been published by the Department. Opinions or points of view expressed are those of the author(s)
and do not necessarily reflect the official position or policies of the U.S. Department of Justice.
The Campus Sexual Assault (CSA) Study
pattern of sorority women being more likely to drink (Tyler, Hoyt, & Whitbeck, 1998) and to
associate with fraternity men, who have been identified as being more likely to perpetrate
sexual assault or sexual aggression than nonfraternity men (Tyler, Hoyt, & Whitbeck, 1998;
Lackie & deMan, 1997). Not surprisingly, previous research has documented that students
who are members of Greek organizations drink more frequently and heavily than
nonmembers (Kilmer et al., 1999; Cashin, Presley, & Meilman, 1988), and it is questionable
whether Greek affiliation is associated with sexual assault once alcohol consumption is
controlled for analytically.
2.3.7 Dating Violence History
Although less well researched than many of the other factors discussed in this section,
dating violence may be a risk factor for sexual assault. The American College Health
Association-National College Health Assessment (NCHA) study found that women who were
physically abused by a dating partner in any year were more likely to be sexually assaulted
that year (American College Health Association, 2004).
2.3.8 Consensual Sexual Experiences
Engaging in consensual sexual activity is a risk factor for sexual assault (Tyler, Hoyt, &
Whitbeck, 1998). A positive association between sexual assault and both the number of
sexual partners and an earlier age of initiation of sexual activity has been identified (Gidycz,
Hanson, & Layman, 1995; Koss & Dinero, 1989).
2.3.9 Attitudinal Characteristics
The role of victim attitudinal characteristics as a risk factor for sexual victimization has also
been explored by previous studies, with very few significant relationships identified. For
example, Koss and Dinero (1989) compared victims and nonvictims on rape-supportive
beliefs and did not find major differences. A study conducted among a convenience sample
of precollege women also did not find differences in rape-supportive belief scales or sexual
conservativism between victims and nonvictims but found only a minimal association
between acceptance of interpersonal violence and victimization (Vogel & Himelein, 1995).
Adversarial sexual beliefs were significantly higher among victims in the Vogel and Himelein
(1995) study, and in another cross-sectional study, university women with sexually
permissive attitudes were at higher risk for several types of sexual coercive strategies
(Tyler, Hoyt, & Whitbeck, 1998).
However, it is widely acknowledged that unless these relationships are examined
longitudinally, attitudes can be viewed as either a precursor to, or consequence of, sexual
victimization. In a longitudinal study involving 100 women followed for 32 months, Himelein
found that sexual conservatism (which encompasses traditional, restrictive beliefs about
sexual behaviors) was negatively associated with college sexual victimization; women who
entered college with more sexually conservative attitudes were less likely to be sexually
2-8
This document is a research report submitted to the U.S. Department of Justice. This report has not been published by the Department. Opinions or points of view expressed are those of the author(s)
and do not necessarily reflect the official position or policies of the U.S. Department of Justice.

Section 2 — Background
victimized during college. The other attitudinal measures examined, including adversarial
sexual beliefs, acceptance of interpersonal violence, and rape myth acceptance, did not
significantly predict the likelihood of college sexual victimization (Himelein, 1995).
2.4 Reporting of Sexual Assault
Among the general population, approximately half of the rapes/sexual assaults reported in
the 2002 NCVS were reported to the police (BJS, 2003). Because date and acquaintance
rapes are less likely to be reported than stranger rapes (Lott, Reilly, & Froward, 1982), the
likelihood of reporting sexual assault is lower on college campuses. In the NCWSV study,
completed and/or attempted rapes were reported to law enforcement officials in less than
5% of cases (Fisher, Daigle, Cullen, & Turner, 2003).
Several barriers to reporting were identified by victims: (1) not having proof that the
incident occurred, (2) fear of retaliation by the perpetrator, (3) fear of hostile treatment by
the authorities, (4) uncertainty that the authorities would consider the incident serious
enough, (5) not knowing how to report the incident, and (6) desire to prevent family and
others from learning about it (Fisher, Cullen, & Turner, 2000). Among victims included in
the NCWSV, the most frequently cited reason for not reporting incidents to the police was
because victims believed the event would not considered serious enough by authorities. In
42.1% of the incidents, victims did not report the incident because they were not sure a
crime or harm was attended, and in 30% of the incidents, victims believed the police would
not think the incident was serious enough (Fisher, Daigle, Cullen, & Turner, 2003). For rape
victims in particular, a commonly cited reason for not reporting the incident to any police
agencies is not wanting family members and others to know about the victimization (38.9%
of rape victims in the NCWSV cited this as a reason for failing to report the event).
From the perspective of campus administrators, some policies may discourage victims from
reporting, such as campus policies on drug and alcohol use (victims who had been drinking
may be concerned about reprisal for violating such policies) and policies requiring victims to
participate in adjudication (Karjane, Fisher, & Cullen, 2005). Factors that encourage
reporting (according to administrators) include victim services, written law enforcement
response protocols, coordination between campus and community, new student
orientations, campus-wide publicity about past crimes, having sexual assault peer
educators, and policies allowing confidential and anonymous reporting (Karjane, Fisher, &
Cullen, 2005). Although 84% of the institutions studied offered confidential reporting, less
than half (46%) offered anonymous reporting (Karjane, Fisher, & Cullen, 2005).
Reluctance to report sexual assault may also be related to the victim’s perceptions of the
event. The NCWSV study found that, of the college women who experienced unwanted
2-9
This document is a research report submitted to the U.S. Department of Justice. This report has not been published by the Department. Opinions or points of view expressed are those of the author(s)
and do not necessarily reflect the official position or policies of the U.S. Department of Justice.

The Campus Sexual Assault (CSA) Study
completed penetration6 by force or the threat of force, only 46.5% of the victims reported
that they considered the incident to be a rape (Fisher, Cullen, & Turner, 2000). In Koss et
al.’s (1988) study, only 27% of the women who reported experiencing an assault that met
the legal definition of rape the researchers use considered the incident to be rape. Students
are particularly unlikely to label the incident as “rape” when no weapon is used, no sign of
physical injury is evident, and alcohol is involved (Fisher, Cullen, & Turner, 2000). Victims
may not define the event as sexual assault or report the incident because they are
embarrassed, are reluctant to consider someone they know as a rapist, or do not
understand the legal definition of sexual assault (Pitts & Schwartz, 1993). Victimization
characteristics have indeed been associated with the likelihood of reporting sexual
victimization. In the NCWSV, the severity of the incident (i.e., use of weapons, victim
definition of the incident as rape) as associated with greater likelihood of reporting. In
addition, threats of sexual victimization and rapes were more likely to be reported than
sexual contact and sexual coercion (Fisher, Daigle, Cullen, & Turner, 2003).
Characteristics of the offender and victim have also been shown to influence the likelihood
of reporting among university women. Incidents most likely to be reported to law
enforcement are those in which the offender was a stranger and in which the victim and
offender did not share the same race/ethnicity (Fisher, Daigle, Cullen, & Turner, 2003).
Regarding victim characteristics, African American victims were more likely to report
incidents than students of other races/ethnicities (Fisher, Daigle, Cullen, & Turner, 2003).
Several contextual characteristics are associated with the likelihood of reporting. For
example, incidents occurring on campus were more likely to be reported to law enforcement
(specifically, campus police) than off-campus incidents in the NCWSV (Fisher, Daigle,
Cullen, & Turner, 2003).
A major contextual factor that influences the likelihood of reporting is the role of alcohol and
drugs. In the NCWSV, incidents in which both offenders and victims were drinking or had
taken drugs were less likely to be reported to campus authorities (Fisher, Daigle, Cullen, &
Turner, 2003). Although we are aware of no previous studies that have examined reporting
for incapacitated sexual assault or subtypes such as DFSA, one would expect even lower
reporting of DFSA because of the possibility that the victim has trouble recalling specific
events or may know that the drug may be undetectable soon after ingestion (Ledray, 2000;
Riveira & Hart, 2000).
Sexual assault victims in general, however, are likely to tell someone they know about their
victimization experiences. The NCWSV found that victims told someone other than the
police (most often friends) about their victimization in approximately 70% of the incidents
(Fisher, Daigle, Cullen, & Turner, 2003)
6Penetration included “penile-vaginal, mouth on your genitals, mouth on someone else’s genitals,
penile-anal, digital-vaginal, digital-anal, object-vaginal, and object-anal.”
2-10
This document is a research report submitted to the U.S. Department of Justice. This report has not been published by the Department. Opinions or points of view expressed are those of the author(s)
and do not necessarily reflect the official position or policies of the U.S. Department of Justice.

Section 2 — Background
2.5 Perpetration of Campus Sexual Assault
A few studies have attempted to seek further understanding of the issue of campus sexual
assault by collecting reports of sexual coercion and sexual assault perpetration among
college men. For example, Koss, Gidycz, and Wisniewski (1987) found that nearly 20% of
college-aged males reported obtaining some type of sexual contact through coercion, with
1% reporting perpetration of oral or anal penetration through the use of physical force.
Based on a small convenience sample of university men, Tyler, Hoyt, and Whitbeck (1998)
found that 3% of male respondents reported using physical force to obtain sexual
intercourse and 23% used alcohol or drugs to obtain sexual intercourse—prevalence rates
that were surprisingly similar to the victimization rates reported by the women in their
sample.
Several studies have identified risk factors for perpetration, based on both victim accounts
of the sexual assault and self-reported information from men. Not surprisingly, a risk factor
for perpetration of sexual assault is substance use. Men who reported heavy drinking are
more likely than other men to report having committed sexual assault (Abbey et al., 1994;
Koss & Dinero, 1988). In the National College Women’s Study, in which 74% of rape
perpetrators had been drinking alcohol prior to the assault, drinking prior to the assault by
the perpetrator was also associated with the severity of the sexual victimization (Ullman,
Karabatsos, & Koss, 1999).
As mentioned previously, fraternity men have been identified as being more likely to
perpetrate sexual assault or sexual aggression than nonfraternity men (Tyler, Hoyt, &
Whitbeck, 1998; Lackie & deMan, 1997). In addition, a recent study by Forbes, Adams-
Curtis, Pakalka, and White (2006) found that college men who had participated in
aggressive sports (including football, basketball, wrestling, and soccer) in high school used
more sexual coercion (along with physical and psychological aggression) in their college
dating relationships than men who had not. This group also scored higher on attitudinal
measures thought to be associated with sexual coercion, such as sexism, acceptance of
violence, hostility toward women, and rape myth acceptance (Forbes, Adams-Curtis,
Pakalka, & White, 2006).
In the general population, sexual assault perpetrators have been identified as having higher
levels of hostility toward women; lower levels of empathy; and being more likely to hold
traditional gender role stereotypes, endorse statements used to justify rape, and hold
adversarial beliefs about relationships between men and women (Seto & Barbaree, 1997).
In addition, they are more likely to have experienced abuse or violence as a child, have
engaged in adolescent delinquency, have peers who view forced sex as acceptable, and
have had early and frequent dating and sexual experiences (Seto & Barbaree, 1997).
2-11
This document is a research report submitted to the U.S. Department of Justice. This report has not been published by the Department. Opinions or points of view expressed are those of the author(s)
and do not necessarily reflect the official position or policies of the U.S. Department of Justice.

This document is a research report submitted to the U.S. Department of Justice. This report has not been published by the Department. Opinions or points of view expressed are those of the author(s)
and do not necessarily reflect the official position or policies of the U.S. Department of Justice.

3. RESEARCH METHODS
In recent years, incidents of drug facilitated sexual assault, in particular, have received
considerable media attention; however, empirical information concerning these events is
limited. The research that does exist suggests that university students are a group that may
be at high risk of experiencing sexual assault, especially drug-facilitated assaults. It is
therefore important to conduct methodologically sound research and collect valid data on
sexual assault, including drug-facilitated sexual assault, in an effort to establish a firm
foundation on which to develop effective preventive and therapeutic response strategies, as
well as legal interventions.
The CSA Study involved conducting a Web-based survey of random samples of
undergraduate students at two large public universities, one located in the South (University
1) and one located in the Midwest (University 2). Both universities are located in semi-urban
areas. University 1 has a student body of approximately 30,000 students; University 2 has
approximately 35,000 students. Approximately 10% of students at University 1 are African
American and 3% are Hispanic. About 11% of students at University 2 are African American
and 2% are Hispanic. Fifty-eight percent of students are University 1 are women and 55%
of students are University 2 are women.
The CSA Survey was administered in the winter of 2005–2006, and a total of 5,446
undergraduate women and 1,375 undergraduate men participated. The CSA Study was
reviewed and approved by RTI’s Institutional Review Board (IRB), as well as the university
IRBs. The remainder of this section of the final report presents information about the
sampling and data collection methodology and the data analysis plan. Subsequent sections
present descriptive data on the CSA survey respondents, the results of the CSA Study, and
a discussion of the CSA Study conclusions, recommendations, and future research
directions.
3.1 Data Collection
Two large public universities participated in the CSA Study. Both universities provided us
with data files containing the following information on all undergraduate students who were
enrolled in the fall of 2005: full name, gender, race/ethnicity, date of birth, year of study,
grade point average, full-time/part-time status, e-mail address, and mailing address. In
developing the sampling frame, we excluded students who were not enrolled full- or three-
quarters time or who were over the age of 25 (because of concerns about not having
sufficient statistical power to generate stable prevalence rates for the small number of
students falling into these subgroups and the likelihood that these students, by having a
longer duration of university attendance, would have an increased chance for exposure to
sexual assault that is unrelated to their status as university students). Students under the
age of 18 were also excluded to avoid having to obtain parental consent for the survey. The
3-1
This document is a research report submitted to the U.S. Department of Justice. This report has not been published by the Department. Opinions or points of view expressed are those of the author(s)
and do not necessarily reflect the official position or policies of the U.S. Department of Justice.

The Campus Sexual Assault (CSA) Study
total sampling frame from University 1 included 15,661 students (9,151 women and 6,510
men7), and the sampling frame from University 2 included 14,875 students (7,011 women
and 7,864 men).
3.1.1 Sampling
We created four sampling subframes, with cases randomly ordered within each subframe:
University 1 women, University 1 men, University 2 women, and University 2 men. We then
slightly reduced the size of the subframes (using random sampling procedures) to obtain
equal numbers of freshmen, sophomores, juniors, and seniors. The reduced sampling
subframes at University 1 and University 2 contained 14,804 students (8,912 women and
5,892 men) and 11,960 students (6,324 women and 5,636 men), respectively—a total of
26,764 students across the four subframes at the two universities.
Samples were then drawn randomly from each of the four subframes. The sizes of these
samples were dictated by response rate projections and sample size targets (4,000 women
and 1,000 men, evenly distributed across the universities and years of study). For the
female subsamples, 7,200 women were ultimately sampled from University 1 and 5,636
women were ultimately sampled from University 2 (see Exhibit 3-1).
3.1.2 Recruitment Procedures and Response Rates
To recruit the students who were sampled to participate in the CSA Study, we relied on both
recruitment e-mails and hard copy recruitment letters that were mailed to potential
respondents. Sampled students were sent an initial recruitment e-mail that described the
study, provided each student with a unique CSA Study ID#, and included a hyperlink to the
CSA Study Web site. During each of the following 2 weeks, students who had not completed
the survey were sent a follow-up e-mail encouraging them to participate. The third week,
nonrespondents were mailed a hard-copy recruitment letter. Two weeks after the hard-copy
letters were mailed, nonrespondents were sent a final recruitment e-mail. The overall
response rates for survey completion for the undergraduate women sampled at the two
universities were 42.2% and 42.8%, respectively. The response rates for males were lower.
Exhibit 3-1 depicts the response rates in relation to the sampling frames and subframes.
Procedures for addressing response bias are discussed in more detail in the analysis section.
3.1.3 Web Site and Survey Design and Content
We reviewed the extant literature on survey design and specifically Web-based survey
design and structured the CSA survey accordingly. For example, we kept the extent to
which respondents had to scroll on a given Web page to a minimum, we made the font
sufficiently large, and we used question structures that are familiar and straightforward to
7The inclusion of males was an exploratory component of the CSA Study, so many fewer male
respondents were sampled.
3-2
This document is a research report submitted to the U.S. Department of Justice. This report has not been published by the Department. Opinions or points of view expressed are those of the author(s)
and do not necessarily reflect the official position or policies of the U.S. Department of Justice.

Section 3 — Research Methods
college students. Although we would have liked to collect data on more topics or in more
detail, we believed it was necessary to keep the survey instrument as concise as possible.
Exhibit 3-1. Diagram of Sampling Frames, Sampling Subframes, Samples, and Respondents
U1 Sampling Frame: 15,661
Reduced U1 Women Frame: 8,912
Stratified by Year of Study
Randomly Ordered
U1 Women Sample 7,200
U1 Women Frame: 9,151
U1 Women Respondents: 3,035
U1 Women Response Rate: 42.2%
Reduced U1 Men Frame: 5,892
Stratified by Year of Study
Randomly Ordered
U1 Men Sample: 1,880
U1 Men Frame: 6,510
U1 Men Respondents: 615
U1 Men Response Rate: 32.7%
Reduced U2 Women Frame: 6,324
Stratified by Year of Study
Randomly Ordered
U2 Women Sample Batch 2: 5,636
U2 Women Frame: 7,011
U2 Women Respondents: 2,411
U2 Women Response Rate: 42.8%
Reduced U2 Men Frame: 5,636
Stratified by Year of Study
Randomly Ordered
U2 Men Sample Batch 2: 2,160
U2 Men Frame: 7,864
U2 Men Respondents: 762
U2 Men Response Rate: 35.3%
U2 Sampling Frame: 14,875
The survey instrument was programmed to accommodate a significant degree of
customization based on responses to specific questions (e.g., gender-specific programming,
skip patterns based on responses to “gate” questions, and fill patterns reflecting an
individual’s responses to previous questions). The survey was designed to be completed in
approximately 20 minutes, on average; however, large portions of the survey only applied
to students who answered affirmatively to any of the sexual assault gate questions. Because
of the voluntary nature of the survey, students were not forced to enter a response to each
question prior to moving through the survey. However, for key survey questions, the
instrument was programmed to display a message encouraging a response if the student
did not answer the question before advancing to the next question.
The survey was divided into six modules. Background Information included survey items
on demographics, school classification (year of study, year of enrollment, transfer status),
residential characteristics, academic performance (GPA, ever failed a course), sports and
social involvement (sports team membership, social organization membership, party
attendance), attendance at functions where alcohol is served, and attitudes toward one’s
university. Alcohol and Other Drug Use included items regarding frequency of alcohol and
drug consumption (data on 13 different classes of drugs were obtained) since entering
college, frequency of binge drinking and getting drunk, risk behaviors associated with
3-3
This document is a research report submitted to the U.S. Department of Justice. This report has not been published by the Department. Opinions or points of view expressed are those of the author(s)
and do not necessarily reflect the official position or policies of the U.S. Department of Justice.

The Campus Sexual Assault (CSA) Study
unknown drug ingestion (accepting a drink from someone unknown, leaving a drink
unattended), experiences (suspected and/or known) with unknown drug ingestion (a series
of questions were asked about both giving a drug to someone without their
knowledge/consent and being given a drug without one’s knowledge/consent), and
availability of alcohol and other drugs. Dating included items on sexual orientation,
frequency of dating, frequency of consensual sexual intercourse, AOD consumption prior to
sexual intercourse, and dating violence (questions were asked about both victimization and
perpetration of emotional and physical abuse).
The information on sexual assault victimization was included in the Experiences module,
which was developed after extensive reviews of past surveys of sexual assault.8 This
module included a series of gate questions for numerous types of nonconsensual sexual
contact experienced by the victim. Distinct gate questions were asked for the following
types of nonconsensual sexual contact, both before and since entering college: verbally
coerced sexual contact (both completed and attempted incidents), physically forced sexual
assault (both completed and attempted incidents), and sexual assault occurring when the
respondent was incapacitated (respondents were asked about incidents they were certain
happened and incidents they suspected happened). Detailed follow-up questions were asked
of respondents who reported experiencing since they began college attempted and/or
completed physically forced sexual assault and/or known and/or suspected sexual assault
occurring when the respondent was incapacitated. The follow-up questions were asked
separately for these two general types of sexual assault and included items on the number
of incidents9; the specific type of assault(s) that occurred (forced touching of a sexual
nature, oral sex, sexual intercourse, anal sex, and/or sexual penetration with a finger or
object); the number of perpetrators; the relationship between the victim and the
perpetrator(s); characteristics of the perpetrator(s); AOD use by the perpetrator(s); AOD
use by the victim; the location of the incident(s); the timing of the incident(s); the use of
weapons by the perpetrator(s); injuries sustained in the incident(s); disclosure about the
incident(s) to family/friends, victim’s crisis/health care centers, and law enforcement;
timing of reporting to victim’s crisis/health care centers and law enforcement; physical
examinations/drug tests received; drug(s) tested positive for; satisfaction with reporting;
reasons for not reporting the incident(s); other actions (both personal and academic) taken
as a result of the incident(s); legal consequences experienced by the perpetrator; and
whether the respondent considered the incident to be rape. Although the survey was 8Previous studies reviewed included, but were not limited to, the National College Women Survey
(Koss et al. 1987), the College Alcohol Study (Mohler-Kuo et al., 2004), the National Violence Against Women Survey (Tjaden & Thoennes, 2000), and the National College Women Sexual Victimization Survey (Fisher et al. 2000).
9The “number of incidents” question was used to customize the wording for the remaining follow-up questions. For respondents who had reported experiencing more than one incident of the specific type of sexual assault, the follow-up questions primarily asked about “any of the incidents.” This option was chosen over asking the victims to focus on a specific incident because we were primarily interested in the totality of each victim’s experiences rather than characteristics of a single incident.
3-4
This document is a research report submitted to the U.S. Department of Justice. This report has not been published by the Department. Opinions or points of view expressed are those of the author(s)
and do not necessarily reflect the official position or policies of the U.S. Department of Justice.

Section 3 — Research Methods
predominantly closed-ended, victims were also given the opportunity to write in (in a
narrative fashion) any additional information about the incident(s) that they wanted to
share. The Experiences section received by male respondents had the same level of detail
and content, but it was tailored to be gender-appropriate.
For male respondents, a section that paralleled the “Experiences” module was then covered.
This module, Behaviors, asked about the perpetration of the same types of sexual assault
covered in the victimization module. Respondents who answered affirmatively to the gate
questions were asked a set of follow-up questions about the number of victims, the specific
type of assault(s) that occurred, relationship to the victim, AOD use by the perpetrator,
AOD use by the victim, weapon use, injuries sustained, and whether the respondent
considered the incident(s) to be rape.
The final module of the survey covered attitudes about sexual assault (respondents were
given seven scenarios and asked to classify them as rape) and attitudes about the survey
(the degree of honesty they employed when answering the survey questions). In addition,
the final module of the survey included a question designed to enable an aggregate-level
prevalence estimate of physically forced sexual assault to be generated among the study
participants. Using an “item count” technique, survey respondents were randomly assigned
to respond to one of two questions in which a list of adverse events is provided and the
respondents simply report the number of the events they have experienced (without
indicating which events they have experienced). One list included the key event (“Someone
has had sexual contact with you by using physical force or threatening to physically harm
you”) and the other did not, enabling a prevalence estimate to be generated simply by
subtracting the average number of events experienced by the group whose list did not
include the key event from the average number of events experienced by the group whose
list did include the key event.
After the last survey question was answered, respondents were presented with an
informational module on sexual assault and DFSA (as mentioned previously, a link to this
informational module was also included on the home page of the survey). The informational
module included sexual assault definitions, prevention advice, legal consequences of giving
someone a drug without their knowledge or consent, and signs of drug ingestion. Also, on
each page of the survey, we included a link to local, state, and national resources for sexual
assault victims.
3.1.4 Incentive Redemption
The instrument was programmed to generate a “survey completion code” immediately after
the respondent scrolled through the informational module. The students were then directed
to a separate Web site (which opened up in a new window) to obtain their incentive for
completing the survey. At this Web site, the students entered their “CSA Study ID#” and
their “survey completion code.” The Web site was programmed to ensure that the ID and
3-5
This document is a research report submitted to the U.S. Department of Justice. This report has not been published by the Department. Opinions or points of view expressed are those of the author(s)
and do not necessarily reflect the official position or policies of the U.S. Department of Justice.

The Campus Sexual Assault (CSA) Study
the code were valid (and had not been previously used to obtain an incentive) prior to
issuing a $10 gift certificate code for Amazon.com and an iTunes song download. When an
incentive was issued, the sample member was identified as having received an incentive,
but no link between the identity of a sample member and their survey data was ever
created. This incentive redemption strategy fulfilled three major objectives: (1) maintaining
the anonymity of the survey data, (2) allowing us to track survey completion (so that we
could follow up with noncompleters, generate response rate estimates, and compare the
final respondents with the sampling frame), and (3) ensuring that each respondent could
only receive one incentive and that only the students sampled for the survey would be able
to receive the incentive.10
Because the survey was administered anonymously, we were not able to determine with
certainty which students in the sampling frame participated in the CSA Study and which did
not. The only way for us to determine with certainty which sampling frame members
participated was if they redeemed the incentive we offered to students (an iTunes song
download and a $10 Amazon.com gift certificate), and not all students who participated in
the CSA Study redeemed their incentives. In fact, about 84% of students who completed
the CSA survey followed through to obtain their incentives. Similarly, the identities of
sampling frame members were not attached to the survey data, so nonresponse bias
analyses and data weighting procedures that we would typically employ in a study of this
kind are not possible. Although this is a limitation of the CSA Study, we believe that
maintaining anonymity and being able to credibly claim anonymity to potential survey
participants was critical to the quality of the data and the success of the study, especially
give the sensitive nature of the survey questions.
3.2 Data Handling
3.2.1 Data Preparation and Cleaning
Throughout the 3-month period in which the survey was administered, data were
automatically saved to a data file on a secure network. Data were reviewed weekly to
ensure that the survey instrument was working properly. Several minor problems were
identified that preclude us from being able to use the data from some items, but these
items were not critical to the purpose or the success of the CSA Study.
As with any survey data, some cleaning of the CSA data was required; however, the nature
and extent of the cleaning that was necessary was limited. We have extant data on timing
(i.e., how long it took each respondent to answer a particular question or complete the
survey). We tested the survey instrument extensively and determined how quickly
respondents could credibly move through the survey, as well as how long it might take
10However, we cannot rule out the (very unlikely) possibility that some individuals sampled for the
survey provided their study identification number to a student not sampled for the survey.
3-6
This document is a research report submitted to the U.S. Department of Justice. This report has not been published by the Department. Opinions or points of view expressed are those of the author(s)
and do not necessarily reflect the official position or policies of the U.S. Department of Justice.

Section 3 — Research Methods
students who were moving through the instrument slowly or who skipped into the detailed
sections of the instrument, which would increase administration time. We were aware that
some students might move through the survey as quickly as possible without reading the
questions or response options or giving any thought to their answers in an effort to just
obtain the incentives we were offering (i.e., an iTunes song download and a $10
Amazon.com gift). We decided in advance of launching the survey that if respondents
moved through the survey so quickly that they could not have credibly read some or most
of the survey questions, we would discard their data. The range of survey administration
times was 1.65 minutes to 102.67 minutes (mean = 12.32 minutes, standard deviation =
6.88 minutes). Our testing indicated that even the fastest of respondents could not credibly
participate in the CSA Study in less than 6 minutes, a value that is a little less than 1
standard deviation below the mean, a threshold that is sometimes used to identify and
discard outlying data. We, therefore, decided to discard data from respondents who moved
through the survey in under 5.44 minutes, which is outside of 1 standard deviation from the
mean and resulted in us discarding 148 student responses. Given the large number of
respondents, discarding this many cases changed the results of the CSA Study very little, if
at all.
Additional data cleaning simply involved recording data into more reasonable or preexisting
categories. For example, on a number of survey items, we provided respondents with
response options, but we also let them choose an “other” category and type in information
that we received in the form of verbatim data. The race question is one in which this option
was afforded to survey respondents, and although some of the verbatim data are difficult to
recode into the preexisting categories (e.g., “American), other answers could be easily
recoded (e.g., “Chinese” into “Asian”). We recoded data whenever doing so was
straightforward. In situations in which recoding was not straightforward, we usually simply
left those responses in a catchall category like “other.”
3.2.2 Response Bias Analyses
Given the relatively low response rate achieved in the CSA Study, several strategies were
employed to identify and adjust for the impact of nonresponse. Although some studies
designed to capture sensitive information among university students have conducted
intensive nonrespondent analyses and found no evidence that nonresponse affects the
prevalence estimate (for example, in the Harvard School of Public Health College Alcohol
Study, an association between student nonresponse and binge-drinking rates was not
observed [Wechsler, Lee, Kuo, & Lee, 2000]), it is logical to surmise that students who did
not participate in a survey about sexual assault may differ from those who did participate,11
11However, the reasons for nonresponse could affect prevalence estimates in opposing ways. Some
nonrespondents (nonvictims) may have chosen not to participate because they felt that they had no relevant experience, whereas other respondents (victims) may have chosen not to participate because they anticipated that taking the survey might be upsetting to them.
3-7
This document is a research report submitted to the U.S. Department of Justice. This report has not been published by the Department. Opinions or points of view expressed are those of the author(s)
and do not necessarily reflect the official position or policies of the U.S. Department of Justice.
The Campus Sexual Assault (CSA) Study
which raises concerns about the accuracy of prevalence estimates generated from
respondents.
The first step in addressing nonresponse was to conduct a unit nonresponse bias analysis, in
which we compared respondents and nonrespondents on the administrative data elements
provided by the universities. These data elements included age, university, race/ethnicity,
and year of study. The results indicated that some bias existed, particularly in the
race/ethnicity category. Nonwhite students (i.e., those identified as black, Hispanic, or
other) were less likely to respond to the survey than their white counterparts. To reduce
nonresponse bias and increase sample representativeness, weights adjusting for
nonresponse were developed using a Generalized Exponential Model (Folsom & Singh,
2000). Cohen’s effect size (CES) (Cohen, 1988, Section 7.2) was used as a measure of the
magnitude of the bias, and we added weights for university, gender, year of study, and
race/ethnicity, which reduced bias to negligible levels. For example, the CES for the
race/ethnicity measure was 0.614 prior to weighting, which reflects a considerable amount
of bias (Cohen, 1988). After weighting, the CES for race/ethnicity was reduced to 0.169,
reflecting a small amount of bias. All prevalence estimates are based on weighted data;
however, for ease of presentation, unweighted sample sizes are displayed in all text, tables
and figures.
In an effort to learn more about the level and impact of nonresponse bias, we also
examined the data using a “continuum of resistance” model (Groves & Wissoker, 1999;
Curtin, Presser, & Singer, 2000). This model is based on the notion that the propensity to
respond to a survey can be viewed as a continuum and that among individuals who do
respond to the survey, their propensity to respond is at least partially associated with how
long it took them (in the recruitment process) to take the survey. Therefore, one can
examine differences between “early responders” and “late responders” and infer that the
pattern for late responders can be applied to or represent nonrespondents, because late
responders and nonrespondents are both on the far end of the propensity to respond
continuum. Another way of thinking about this issue is that late responders would have
likely been nonrespondents if we had not followed up with nonrespondents as many times
as we did or had shut down the Web survey early (note that the recruitment materials did
not specify the end date of the survey, so sampled students did not know when it would be
closed). Although this technique is not used to adjust any data, it enables us to compare
early and late responders in an effort to learn something about nonrespondents.
We divided our sample of 5,446 women respondents into quintiles in terms of when in the
recruitment process they responded. The first 20% who responded (n = 1,089) were in
quintile 1, the second 20% who responded (n = 1,089) were in quintile 2, etc. We then
compared the data from women in each of the five quintiles to determine whether
respondents in each of the quintiles differed from each other on 17 measures, including
race/ethnicity, age, year of study, alcohol use, marijuana use, illicit drug use, and a variety
3-8
This document is a research report submitted to the U.S. Department of Justice. This report has not been published by the Department. Opinions or points of view expressed are those of the author(s)
and do not necessarily reflect the official position or policies of the U.S. Department of Justice.

Section 3 — Research Methods
of measures on sexual assault victimization. We also collapsed the quintiles to represent
early responders (i.e., respondents in quintiles 1 and 2) and late responders (i.e.,
respondents in quintiles 3, 4, and 5) and made the same comparisons, both in a bivariate
and multivariate fashion (to control for the effects of potentially confounding variables). We
used the unweighted data for this comparison. Both the bivariate and multivariate analyses
demonstrated that the only variables for which there was a significant difference based on
either the five-category or two-category comparison were race/ethnicity and marijuana use.
Black respondents were significantly more likely to be “late responders” than white
respondents (67% vs. 59%), and students who reported any marijuana use since entering
college were significantly more likely to be “late responders” than those who did not report
marijuana use (62% vs. 59%). However, the differences, though statistically significant at
the .05 level, were small.
The continuum of resistance analysis, which indicates black students responded later in the
recruitment process, is supported by our unit nonresponse analysis, which indicated that
black students were less likely to respond than white students. Overall, our continuum of
resistance analysis suggests that late responders did not seem to be substantially different
from early responders on a wide range of dimensions, most importantly on our measures of
sexual assault. To the extent that nonrespondents are similar to late responders, one can
speculate that the prevalence rates generated from the study are not biased by
nonresponse.
Additional support for this speculation was found in our third approach for examining
nonresponse. We conducted a brief follow up survey with a sample of the students who had
not redeemed the incentive for the CSA survey (i.e., these students were assumed to be
those who did not respond to the original survey). A total of 2,000 nonrespondents (limited
to sophomores, juniors, and seniors due to the nonrespondent follow up survey being
conducted in fall 2006—the academic year following the fielding of the original survey) were
emailed an invitation to participate in a brief Web-based survey to determine why they
chose not to participate in the original survey. Of these, 296 responded to the survey. Once
the students confirmed that they had indeed not participated in the CSA survey12, they were
asked why they had not participated. Fourteen sample members stated that they never
received the original recruitment e-mails, and 126 students (45%) were not sure whether
they had received these e-mails. Interestingly, of those who either did not receive or were
not sure whether they received the e-mails, 71% said that they would have taken the
survey if they had received them. Among the sample members who either did receive the
e-mails and chose to not participate or said that they would not have participated if they
12As mentioned previously, because the survey was anonymous the only indicator of participation was
whether the student obtained an incentive code. We have no way to identify students who took the survey and did not obtain an incentive code. Eighty-one of the “nonrespondents” sampled for the nonrespondent follow-up survey reported that they indeed participated in the original survey, either partially or completely.
3-9
This document is a research report submitted to the U.S. Department of Justice. This report has not been published by the Department. Opinions or points of view expressed are those of the author(s)
and do not necessarily reflect the official position or policies of the U.S. Department of Justice.

The Campus Sexual Assault (CSA) Study
had received the e-mails, the most commonly reported reasons for nonparticipation were
that they did not have time (reported by about two-thirds of the sample members) or that
they never participate in Web-based surveys (reported by just over 20% of the sample
members). An extremely small number of the respondents to the nonrespondent survey
indicated that they did not participate because they had never experienced sexual assault
(n = 9, 15.0%), or because they did not want to discuss their experiences with sexual
assault victimization (n = 4, 6.7%).
Although these findings are constrained to the very small number of nonrespondents (to the
original survey) who participated in the nonresponse follow-up survey, they are encouraging
because they suggest that the reasons for not participating in the CSA study are factors that
are not associated with sexual assault. If nonresponse were associated with victimization
(such that either nonvictims were less likely to participate because they felt that they
survey was not relevant to them or that victims were less likely to participate because they
did not feel comfortable reporting their experiences), we would be less confident that the
relatively high nonresponse did not substantially bias the sexual assault prevalence
estimates developed from the data.
3.3 Data Analysis
3.3.1 Descriptive Analyses
We used a variety of descriptive analyses to familiarize ourselves with the data, assist in
data cleaning and coding, and prepare for running multivariate models. We used frequency
distributions, cross tabulations, bivariate correlations, partial correlations, chi-squares, and
t-tests to review large amounts of data, recognize patterns in the data, inform the recoding
of some variables, inform the creation of derived variables, and plan for bivariate and
multivariate analyses.
In addition to helping us understand the data and plan for more advanced analyses,
descriptive data were used extensively to describe
our survey respondents,
the victims and perpetrators of various types of sexual assault,
the context and correlates of various types of sexual assault,
the consequences of various types of sexual assault,
the reporting and nonreporting of various types of sexual assault, and
the experiences of victims of various types of sexual assault.
Generation of Prevalence Estimates
Since one of the primary purposes of the CSA Study is to generate prevalence estimates of
distinct types of sexual assault experienced by undergraduate students before and after
3-10
This document is a research report submitted to the U.S. Department of Justice. This report has not been published by the Department. Opinions or points of view expressed are those of the author(s)
and do not necessarily reflect the official position or policies of the U.S. Department of Justice.

Section 3 — Research Methods
they entered college, a detailed discussion of the methods used to classify respondents into
the relevant categories is warranted. The specific wording of all sexual assault victimization
items used to categorize victims by assault type is included in Appendix A. The first level of
classification pertains to the nature of the sexual assault. The two general types of
sexual assault captured by the Web-based survey are physically forced sexual assault and
incapacitated sexual assault (i.e., sexual assault when the victim was incapacitated and
unable to provide consent).13 As described previously, the survey asked about these two
types of sexual assault separately, with detailed follow-up questions asked for each type.
The second level of classification pertains to whether the assault was completed. For
physically forced sexual assault, data on both completed and attempted incidents were
collected separately. Because recall of the event can be problematic for incapacitated sexual
assault, we asked separately about events the respondent was certain happened and those
the respondent suspected happened. In this report, the incapacitated sexual assault
measures only include sexual assaults that the victim was certain happened.
The third level of classification pertains to incidents occurring before and since entering
college. For both physically forced and incapacitated sexual assault, data on completed and
attempted (or, for incapacitated sexual assault, suspected) incidents were collected to
reflect two time periods, before and since entering college.
A fourth level of classification pertains to the severity of the sexual assault. For
completed incidents of both types (physically forced and incapacitated), we further classified
sexual assault based on severity. Specifically, we generated subtype prevalence estimates
for sexual battery (i.e., sexual assault that entailed sexual touching only) and rape (i.e.,
sexual assault that entailed oral, vaginal, or anal penetration). This level of categorization
was achieved using responses to the follow-up questions about the specific type of sexual
contact that occurred (forced touching of a sexual nature, oral sex, sexual intercourse, anal
sex, and/or sexual penetration with a finger or object).
Given that a key objective of the current study was to contribute to the understanding of
incapacitated sexual assault, a fifth level of classification was employed for incapacitated
sexual assault to distinguish between AOD-enabled sexual assault, DFSA, Suspected
DFSA, and other incapacitated sexual assault. Using follow-up questions asked of
victims who reported experiencing sexual assault when they were incapacitated and unable
to provide consent, we further break down incapacitated sexual assault into finer categories.
Specifically, students who reported sexual assault when they were incapacitated and unable
to provide consent were asked whether they had been drinking alcohol or voluntarily been
taking or using any drugs other than alcohol just before the incident and whether they had
been given a drug without their knowledge or consent just before the incident. Based on
13As mentioned previously, the survey also gathered information on verbally coerced, unwanted sexual
contact; data on this form of unwanted sexual contact are not presented in this report.
3-11
This document is a research report submitted to the U.S. Department of Justice. This report has not been published by the Department. Opinions or points of view expressed are those of the author(s)
and do not necessarily reflect the official position or policies of the U.S. Department of Justice.

The Campus Sexual Assault (CSA) Study
these responses, we divided the victims into four subtypes: those who were victims of drug-
facilitated sexual assault (DFSA, i.e., they were sexually assaulted when they were
incapacitated after they had been given a drug without their knowledge, and were certain
about having been given a drug without their knowledge), those who were victims of
suspected drug-facilitated sexual assault (SDFSA, i.e., they were sexually assaulted while
incapacitated and suspected they had been given a drug without their consent prior to the
assault), those who were victims of AOD-enabled sexual assault (i.e., they were sexually
assaulted when they were incapacitated after voluntarily consuming drugs or alcohol), and
those who were sexually assaulted when they were otherwise incapacitated. If a student
was a victim of both AOD-enabled sexual assault and either DFSA or SDFSA, we classified
her as a DFSA victim only. The 18 prevalence measures for sexual assault are summarized
in Exhibit 3-2. All estimates presented in this report are based on weighted data.
Exhibit 3-2. Sexual Assault Prevalence Measures
3-12
This document is a research report submitted to the U.S. Department of Justice. This report has not been published by the Department. Opinions or points of view expressed are those of the author(s)
and do not necessarily reflect the official position or policies of the U.S. Department of Justice.

Section 3 — Research Methods
3.3.2 Risk Factors for Sexual Assault
Bivariate Analyses
We ran cross tabulations by four sexual assault measures and a comprehensive set of
individual characteristics and behavioral factors. Chi-squares were used to determine if the
bivariate relationship between each sexual assault measure and each variable was
statistically significant. These analyses helped us determine which variables should be
considered for insertion into multivariate models.
Multivariate Analyses
We used binary logistic regression to analyze the CSA data in a multivariate framework. In
the exploratory phase of our analyses, we used forward and backward stepwise selection
procedures to assess the relationships between an array of variables of interest and sexual
assault outcomes. Reviewing these models helped us determine whether certain variables
needed to be recoded for, removed from, or added to the multivariate models. Development
of the final models (presented in the Findings section of this report) was informed by these
procedures as well as the existing literature. Variables that we felt were important to control
for (e.g., race/ethnicity), are also included in the models.
Beyond the types of analyses we conducted to generate the CSA Study findings, it is worth
discussing the purpose of the analyses or the overall goals of the multivariate analysis plan.
Generally, the CSA Study was designed to generate data on the prevalence, nature, and
reporting of various types of sexual assault. More specifically, the CSA Study was intended
to
document the prevalence of various types of sexual assault on university campuses;
describe incidents, victims, and perpetrators of various types of sexual assault;
identify risk and protective factors for, as well as consequences of, various types of sexual assault;
describe the reporting and nonreporting of various types of sexual assault; and
document attitudes about various types of sexual assault.
To achieve these goals, numerous measures that could be associated with various types of
sexual assault were created and prepared for use in logistic regression models of various
sexual assault outcomes. The independent and dependent variables considered and used
are discussed below.
Dependent Variables. The CSA Study collected information about women’s experiences
with physically forced and incapacitated sexual assault. Within incapacitated sexual assault,
we are able to distinguish between incapacitation achieved by the perpetrator giving the
victim a drug without her knowledge or consent (DFSA and SDFSA) or the victim voluntarily
consuming alcohol and/or other drugs (AOD-enabled sexual assault). Since the large
3-13
This document is a research report submitted to the U.S. Department of Justice. This report has not been published by the Department. Opinions or points of view expressed are those of the author(s)
and do not necessarily reflect the official position or policies of the U.S. Department of Justice.

The Campus Sexual Assault (CSA) Study
majority of incapacitated sexual assaults occurred after the victim voluntarily consumed
alcohol or drugs (of the 651 women who experienced an incapacitated sexual assault, 86%
were classified as having experienced AOD-enabled assault), the multivariate analyses are
limited to victims of AOD-enabled sexual assault.
The survey design allowed a respondent to report being a victim of both forced sexual
assault and AOD-enabled sexual assault. Almost two percent of the sample (n = 101)
reported both types of sexual assault. Preliminary analyses indicated that this group was
significantly different from the women who experienced forced sexual assault only and from
the respondents who experienced AOD-enabled sexual assault only; therefore, the
multivariate models include three mutually exclusive categories of sexual assault: (1) being
a victim of forced sexual assault only, (2) being a victim of a completed AOD-enabled sexual
assault only, and (3) being a victim of both forced and AOD-enabled sexual assault, in an
effort to identify risk factors associated with each form of sexual assault. Physically forced
sexual assault includes assaults occurring when the victim was forced or threatened with
force into sexual contact. AOD-enabled sexual assault is a subset of incapacitated assaults
(assaults occurring when a victim is unable to provide consent or stop what is happening
because she is passed out, drugged, drunk, incapacitated or asleep), in which the victim’s
incapacitation was due to voluntary consumption of alcohol and/or other drugs. All models
are limited to completed assaults that occurred since the women entered college.
All sexual assault outcomes are binary coded (0 = no, 1 = yes), with women who were not
victims of any form of completed sexual assault in the reference category. In the CSA study,
sexual assault includes rape (assaults involving oral, vaginal or anal sex, or vaginal or anal
penetration with a finger or object) and sexual battery (assaults involving sexual contact
only, such as forced kissing or fondling). The decision to present the results for the more
inclusive category of sexual assault was based on supplementary analyses conducted for the
subsets of rape victims. The results from these analyses did not differ from those based on
the more inclusive measures of sexual assault, which indicates that the inclusion of sexual
battery in the dependent variable does not substantially affect or alter the relationships of
interest (results not shown). It is noteworthy that the majority of all sexual assaults
involved oral, vaginal, or anal penetration and thus met the legal definition of rape in most
states. The CSA Study collected data on verbally coerced sexual assaults; however, since
those incidents typically do not meet the legal definition of sexual assault, data on them are
not presented in the current report.
Independent Variables. A comprehensive set of individual characteristics and behavioral
factors were used in the logistic regression models as independent variables and/or to
describe the sample. The number of years the respondent has been in college is a
continuous variable ranging from 1 to 10. Race/ethnicity is dummy coded into black,
Hispanic, and other, with white as the reference category. College experiences are
measured by grade point average (GPA) (categorical), whether the respondent has ever
3-14
This document is a research report submitted to the U.S. Department of Justice. This report has not been published by the Department. Opinions or points of view expressed are those of the author(s)
and do not necessarily reflect the official position or policies of the U.S. Department of Justice.

Section 3 — Research Methods
failed a course, and whether the respondent is a member of a Greek social organization.
Frequency measures of attending fraternity parties; attending parties where alcohol was
served; and going to bars, pubs or clubs are measured as 0 = never, 1 = less than once a
month, and 2 = at least once a month.
There are several indicators of substance use. Use is dummy coded for marijuana and illicit
substances, a collapsed measure of ever using at least 1 of 12 illicit substances other than
marijuana. The frequency with which a respondent has been drunk since entering college is
coded never, less than once a month, and at least once a month. Respondents were also
asked if they suspected or knew they had ever been given a drug without their knowledge
or consent since they entered college.
Dating and sexual history are measured by number of dating partners and sexual partners
since entering college (categorical). Married respondents (n = 151) were not asked their
number of dating partners; however, to conserve cases for analyses, they were coded 0 on
this indicator. Frequency measures of being drunk or high during sex are coded as never,
less than once a month, or more than once a month. Dating violence is measured as ever
feeling threatened, humiliated, or controlled by a dating partner and ever being hit, slapped,
kicked, or physically hurt by a dating partner (1 = yes, 0 = no). Past sexual victimization is
measured as forced sexual assault and sexual assault when incapacitated before college
(1 = yes, 0 = no). Exhibit 4, which appears in the next section of the report, presents
additional sample descriptors not used in or dropped from the regression analyses. To
control for unmeasured heterogeneity between universities, a dummy variable for school
was included in analyses.
3-15
This document is a research report submitted to the U.S. Department of Justice. This report has not been published by the Department. Opinions or points of view expressed are those of the author(s)
and do not necessarily reflect the official position or policies of the U.S. Department of Justice.

This document is a research report submitted to the U.S. Department of Justice. This report has not been published by the Department. Opinions or points of view expressed are those of the author(s)
and do not necessarily reflect the official position or policies of the U.S. Department of Justice.
4. STUDY SAMPLE
4.1 Women
Descriptive data on the women in our sample are presented in Exhibit 4-1. As the data
indicate, the majority of the women are white, although a sizeable proportion of them are
black or in the other race category, which includes women who selected more than one
racial/ethnic category, as well as Asians, Native Hawaiians/Other Pacific Islanders, and
American Indians/Alaska Natives. Only 3.0% of the sample reported being Hispanic. Most of
the women reported being heterosexual (95.6%). The majority of the sample is 20 or
younger, and there are larger percentages of freshman and seniors in the sample than
sophomores and juniors, which reflects the distribution at the participating universities
(since the data are weighted for year of study).
Almost 15% of women belong to a sorority, and 26.3% reported attending fraternity parties
at least once a month, whereas 63% reported attending parties where alcohol is served and
44.4% reported going to pubs, bars, or clubs at least once a month. Most of the sample had
had at least one dating partner and at least one sexual partner since entering college. With
regard to substance use, 85.9% reported using alcohol, 33.9% reported using marijuana,
and 8.6% reported using an illicit drug (other than marijuana) since entering college. Forty-
four percent reported getting drunk at least once a month. Since entering college, 28% had
accepted a drink from a stranger (with 5.6% of the sample reporting accepting drinks from
strangers at least once a month), and 13% had consumed a drink after leaving it
unattended (with 1.9% engaging in this behavior at least once a month). Over a quarter of
the sample (26.3%) reported consuming alcohol or drugs before sex once a month since
entering college, and 20.7% reported being drunk or high during sex at least once a month
since entering college. When asked if they had been given a drug without their knowledge
or consent since entering college, 5.3% of the women responded affirmatively. The drugs
these women reported being given, in order of prevalence, were Rohypnol, GHB, cocaine,
ecstasy, LSD, marijuana, and stimulants (data not shown).
4.2 Men
Exhibit 4-2 presents descriptive data on the male sample (n = 1,375). As seen in the female
sample, the majority of males are white, but a smaller proportion of males are black ,
Hispanic, or in the other race category. Most of the men reported being heterosexual and
was 20 years old or younger, and the largest percentage is freshmen (27.0%).
Approximately 21% of the men belong to a sports team, 15.8% belong to a fraternity, and
44.9% reported attending fraternity parties at least once a month (compared with 26.3% of
females). About 70% reported attending parties where alcohol is served, and 45% reported
going to pubs, bars, or clubs at least once a month, respectively. Most of the sample has
had at least one dating partner and at least one sexual partner since entering college. With
4-1
This document is a research report submitted to the U.S. Department of Justice. This report has not been published by the Department. Opinions or points of view expressed are those of the author(s)
and do not necessarily reflect the official position or policies of the U.S. Department of Justice.

The Campus Sexual Assault (CSA) Study
Exhibit 4-1. Descriptive Data on CSA Sample of Undergraduate Women, Weighted Percentages (n = 5,446)a
Demographics
Race Attended party where alcohol served
White 66.9 Never 9.1
Black 16.2 Less than once a month 27.9
Hispanic 3.0 At least once a month 63.0
Other 14.0 Gone to pub/bar/club
Sexual orientation Never 19.9
Heterosexual 95.6 Less than once a month 35.7
Lesbian/gay 0.7 At least once a month 44.4
Bisexual 3.7 Dating partners
Ageb Zero 22.6
18 19.8 1–5 69.2
19 24.2 6–10 5.6
20 19.0 11–25 2.3
21 19.0 26 or more 0.3
22+ 17.3 Sexual partners
College Experiencesc Zero 37.2
Classification 1–5 54.1
Freshman 29.9 6–10 5.7
Sophomore 22.8 11–25 2.0
Junior 20.7 26 or more 1.1
Senior 26.6 Substance Use Since Entering College
GPA and course experiences Alcohol 85.9
GPA below 1.66 0.8 Marijuana 33.9
GPA 1.67–2.66 12.1 Illicit drugs (excluding marijuana) 8.6
GPA 2.67–3.66 64.4 Number of times gotten drunk
GPA 3.67 and above 22.6 Never 29.6
Failed a course 18.6 Less than once a month 26.4
Opinion of college At least once a month 44.0
Really like it 46.9 Consumed drink given by someone unknown
Like it 37.3 Never 72.3
Neutral about it 12.3 Less than once a month 22.1
Do not like it 3.4 At least once a month 5.6
Would choose this college again Consumed drink after leaving it unattended
No 9.5 Never 87.1
Yes 27.2 Less than once a month 11.1
Maybe 63.3 At least once a month 1.9
College socialization Consumed alcohol/drugs before sex
Belong to a sports team 16.0 Never 52.5
Belong to a Greek organization 14.7 Less than once a month 21.2
(continued)
4-2
This document is a research report submitted to the U.S. Department of Justice. This report has not been published by the Department. Opinions or points of view expressed are those of the author(s)
and do not necessarily reflect the official position or policies of the U.S. Department of Justice.

Section 4 — Study Sample
Exhibit 4-1. Descriptive Data on CSA Sample of Undergraduate Women, Weighted Percentages (n = 5,446)a (continued)
College Experiencesc (continued) Substance Use Since Entering College (continued)
Attended a fraternity party At least once a month 26.3
Never 28.6 Drunk/high during sex
Less than once a month 45.3 Never 59.2
At least once a month 26.3 Less than once a month 20.1
At least once a month 20.7 Suspected/known given drug without consent 5.3
aUnweighted sample size. bMean and standard deviation not presented because variable is a categorical measure. cData reflect since entering college.
regard to substance use, 84.9% reported using alcohol, 41.2% reported using marijuana,
and 12.1% reported using an illicit drug (other than marijuana) since entering college.
Other behaviors males reported engaging in at least once a month since entering college
include getting drunk (54.1%), accepting drinks from strangers (8.7%), consuming a drink
after it was left unattended (1.4%), consuming alcohol or drugs before sex (27.3%), and
being drunk or high during sex (21.5%). Compared with 5.3% of women, only 2.9% of men
reported having ever been given a drug without their knowledge or consent since entering
college, with the highest percentage reporting being given Rohypnol or an unknown
substance (data not shown).
4-3
This document is a research report submitted to the U.S. Department of Justice. This report has not been published by the Department. Opinions or points of view expressed are those of the author(s)
and do not necessarily reflect the official position or policies of the U.S. Department of Justice.
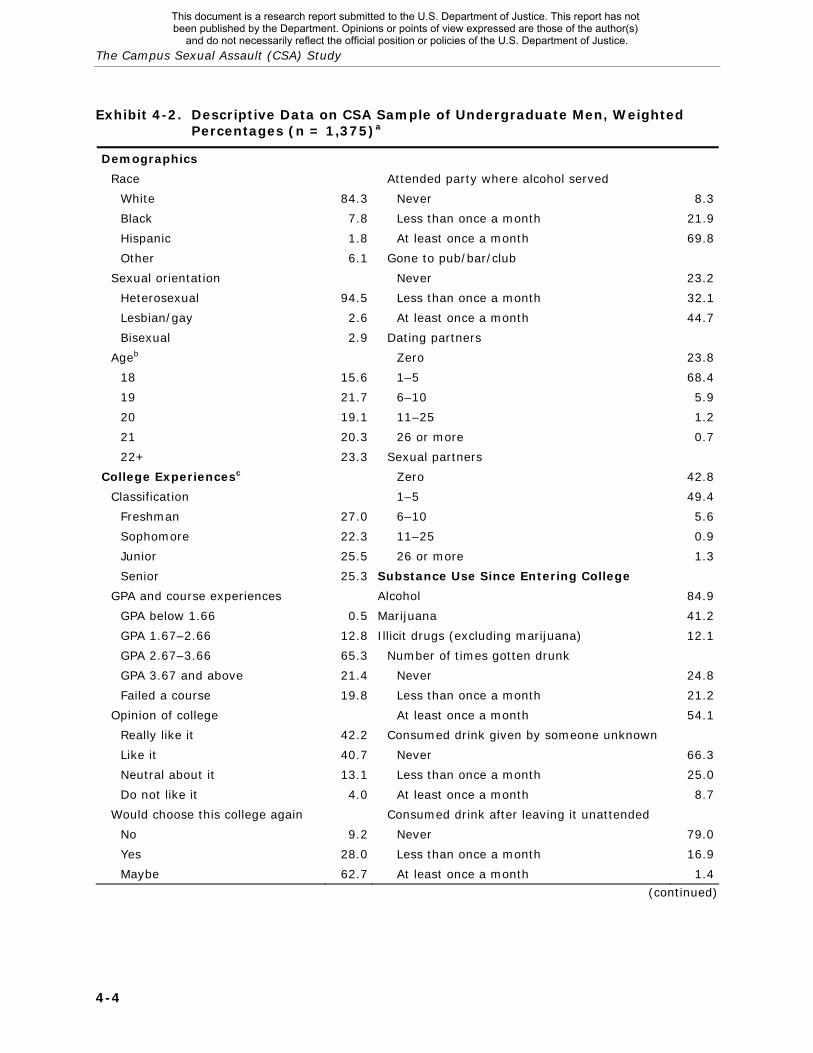
The Campus Sexual Assault (CSA) Study
Exhibit 4-2. Descriptive Data on CSA Sample of Undergraduate Men, Weighted Percentages (n = 1,375)a
Demographics
Race Attended party where alcohol served
White 84.3 Never 8.3
Black 7.8 Less than once a month 21.9
Hispanic 1.8 At least once a month 69.8
Other 6.1 Gone to pub/bar/club
Sexual orientation Never 23.2
Heterosexual 94.5 Less than once a month 32.1
Lesbian/gay 2.6 At least once a month 44.7
Bisexual 2.9 Dating partners
Ageb Zero 23.8
18 15.6 1–5 68.4
19 21.7 6–10 5.9
20 19.1 11–25 1.2
21 20.3 26 or more 0.7
22+ 23.3 Sexual partners
College Experiencesc Zero 42.8
Classification 1–5 49.4
Freshman 27.0 6–10 5.6
Sophomore 22.3 11–25 0.9
Junior 25.5 26 or more 1.3
Senior 25.3 Substance Use Since Entering College
GPA and course experiences Alcohol 84.9
GPA below 1.66 0.5 Marijuana 41.2
GPA 1.67–2.66 12.8 Illicit drugs (excluding marijuana) 12.1
GPA 2.67–3.66 65.3 Number of times gotten drunk
GPA 3.67 and above 21.4 Never 24.8
Failed a course 19.8 Less than once a month 21.2
Opinion of college At least once a month 54.1
Really like it 42.2 Consumed drink given by someone unknown
Like it 40.7 Never 66.3
Neutral about it 13.1 Less than once a month 25.0
Do not like it 4.0 At least once a month 8.7
Would choose this college again Consumed drink after leaving it unattended
No 9.2 Never 79.0
Yes 28.0 Less than once a month 16.9
Maybe 62.7 At least once a month 1.4
(continued)
4-4
This document is a research report submitted to the U.S. Department of Justice. This report has not been published by the Department. Opinions or points of view expressed are those of the author(s)
and do not necessarily reflect the official position or policies of the U.S. Department of Justice.

Section 4 — Study Sample
Exhibit 4-2. Descriptive Data on CSA Sample of Undergraduate Men, Weighted Percentages (n = 1,375)a
College Experiencesc (continued) Substance Use Since Entering College (continued)
College socialization Consumed alcohol/drugs before sex
Belong to a sports team 21.4 Never 56.1
Belong to a Greek organization 15.8 Less than once a month 16.7
Attended a fraternity party At least once a month 27.3
Never 27.0 Drunk/high during sex
Less than once a month 44.9 Never 60.7
At least once a month 28.1 Less than once a month 17.8
At least once a month 21.5
Suspected/known given drug without consent 2.9
aUnweighted sample size bMean and standard deviation not presented because variable is a categorical measure cData reflect since entering college
4-5
This document is a research report submitted to the U.S. Department of Justice. This report has not been published by the Department. Opinions or points of view expressed are those of the author(s)
and do not necessarily reflect the official position or policies of the U.S. Department of Justice.

This document is a research report submitted to the U.S. Department of Justice. This report has not been published by the Department. Opinions or points of view expressed are those of the author(s)
and do not necessarily reflect the official position or policies of the U.S. Department of Justice.

5. FINDINGS
5.1 Sexual Assault Victimization
5.1.1 Prevalence Estimates
Women
Prevalence estimates for undergraduate women and the 18 measures of sexual assault are
presented in Exhibit 5-1. Each prevalence estimate has a number in parentheses that
corresponds to the descriptive list of estimates presented in Exhibit 3-2. The first and most
inclusive set of measures we present are the number and percentage of undergraduate
women who reported being a victim of attempted or completed sexual assault of any type
before entering college (1) (n = 819, 15.9%) and since entering college (6) (n = 1,073,
19.0%). The next set of prevalence estimates breaks down attempted and completed
assaults for each time period. As shown in the figure, the prevalence of completed sexual
assault is slightly higher than that of attempted14 sexual assault for incidents occurring both
before (2 and 3) and after (7 and 8) entering college. The data are not shown, but 5.5% of
undergraduate women (when limited to experiences before college) and 7.2% of
undergraduate women (when limited to experiences since entering college) reported
experiencing both attempted and completed sexual assault.
The third set of prevalence estimates rates are breakdowns of completed sexual assault by
time period for the two primary types of assault included in this study (physically forced vs.
incapacitated sexual assault). When examining this set of prevalence estimates, an
interesting pattern is evident. The prevalence of physically forced sexual assault was
roughly equivalent for the time period reflecting experiences since entering college (9) and
those occurring before entering college (4) (4.7% vs. 6.4%, respectively). In contrast, the
prevalence of sexual assault occurring when the victim was incapacitated is higher for the
time period reflecting experiences since entering college (12) than before entering college
(5) (11.1% vs. 7.0%, respectively). Exhibit 5-2 is a graphical depiction of the pattern of
differential risk for the two main types of sexual assault by time period. The pattern shown
in Exhibit 7 suggests that, among undergraduate college women, the risk of experiencing
sexual assault when they are incapacitated is greater during college than the risk before
entering college, whereas the risk of experiencing physically forced sexual assault is roughly
similar (but slightly lower since entering college) in both time periods. A small number of
women were victimized both before and since entering college. Sixty-eight women (1.4% of
the sample) were victims of forced sexual assault both before and since entering college,
and 140 women (2.5% of the sample) were victims of incapacitated sexual assault both
before and since entering college (data not shown).
14As mentioned previously, the measure of attempted sexual assault is restricted to incidents in which
the assault was attempted but not completed.
5-1
This document is a research report submitted to the U.S. Department of Justice. This report has not been published by the Department. Opinions or points of view expressed are those of the author(s)
and do not necessarily reflect the official position or policies of the U.S. Department of Justice.

The Campus Sexual Assault (CSA) Study
Exhibit 5-1. Prevalence Estimates for the Sexual Assault Measures for Women, Unweighted Frequencies, Weighted Percentages
The fourth set of prevalence estimates show, for completed incidents since entering college,
the number and percentage of university women experiencing sexual assaults of varying
severity. Sexual battery was defined as sexual assault that entailed sexual touching only,
and rape was defined as sexual assault that entailed oral, vaginal, or anal penetration. As
shown in Exhibit 5-1, 3.4% of women reported experiencing rape that was physically forced
(11), 1.4% reported experiencing sexual battery (but not rape) that was physically forced
(10), 8.5% of the sample reported experiencing rape while they were incapacitated and
unable to provide consent (14), and 2.6% reported experiencing sexual battery (but not
rape) while they were incapacitated and unable to provide consent (13). Exhibit 5-3 shows
the breakdown of assault severity separately for the two major types of sexual assault. The
graphic depiction helps illustrate that roughly the same proportions of victims experience
rape and sexual battery for the two major types of sexual assault.
The final set of prevalence estimates included in Exhibit 5-1 further classify sexual assault
occurring when the victim was incapacitated and unable to provide consent. Specifically,
estimates are shown for AOD-enabled sexual assault (i.e., assault that happened after the
victim voluntarily consumed alcohol and/or drugs) (15), DFSA (drug-facilitated sexual
assault) (16), SDFSA (suspected drug-facilitated sexual assault) (17), and incidents that
5-2
This document is a research report submitted to the U.S. Department of Justice. This report has not been published by the Department. Opinions or points of view expressed are those of the author(s)
and do not necessarily reflect the official position or policies of the U.S. Department of Justice.

Section 5 — Findings
Exhibit 5-2. Percentage of Undergraduate Women Who Report Being a Victim of Forced and Incapacitated Sexual Assault Before and Since Entering College
4.7%
11.1%
6.4%
7.0%
0.0%
2.0%
4.0%
6.0%
8.0%
10.0%
12.0%
Before Entering College Since Entering College
Percentage
Time Period
Forced Sexual AssaultIncapacitated Sexual Assault
happened after the victim was otherwise incapacitated (typically involving situations in
which the victim was asleep) (18). A total of 466 women (7.8%) were victims of sexual
assault that was AOD-enabled, 31 women (0.6%) were victims of DFSA, 103 women (1.7%)
were victims of SDFSA, and 48 women (1.0%) reported being sexually assaulted when they
were otherwise incapacitated and unable to provide consent (i.e., their incapacitation was
not enabled by drugs or alcohol).
The data presented in this section have shown the prevalence of various measures of sexual
assault among university women in a “snapshot” in time. Overall, 19% of undergraduate
women reported experiencing attempted or completed sexual assault since entering college.
However, half (52.7%) of our sample had experienced less than 2 years of college. This
makes it difficult to predict a woman’s risk of sexual assault during her overall college
career. Therefore, another way of looking at these data is to focus on seniors, who are
theoretically in their last year of college. When subsetting to seniors, the data show that
368 women (26.3% of seniors) reported experiencing attempted or completed sexual
assault since entering college, 6.9% of seniors were victims of physically forced sexual
assault since entering college, and 16% of seniors were victims of incapacitated sexual
assault since entering college.
5-3
This document is a research report submitted to the U.S. Department of Justice. This report has not been published by the Department. Opinions or points of view expressed are those of the author(s)
and do not necessarily reflect the official position or policies of the U.S. Department of Justice.

The Campus Sexual Assault (CSA) Study
Exhibit 5-3. Percentage of Victims of Physically Forced and Incapacitated Sexual Assault Who Experienced Sexual Battery Only and Rape
1.4%
95.3%
3.4%
Non-VictimVictim of Sexual Battery OnlyVictim of Rape
72% of Victims28% of Victims
Forced Sexual Assault
88.9%
2.6%
8.5%
Non-VictimVictim of Sexual Battery OnlyVictim of Rape
23% of Victims77% of Victims
Incapacitated Sexual Assault
5-4
This document is a research report submitted to the U.S. Department of Justice. This report has not been published by the Department. Opinions or points of view expressed are those of the author(s)
and do not necessarily reflect the official position or policies of the U.S. Department of Justice.

Section 5 — Findings
It is important to note, however, that although the cumulative prevalence estimates of
sexual assault are understandably highest for seniors, the “past 12 month” prevalence
estimates of sexual assault are highest among sophomores (data not shown).15 This pattern
indicates that women who are victimized during their college career are most likely to be
victimized early during their college tenure. This finding is consistent with the literature,
including a recent study employing a convenience sample of university women, which found
that 84% of the women who reported sexually coercive experiences experienced the
incident during their first four semesters on campus (Gross, Winslett, Roberts, & Gohm,
2006).
Men
Exhibit 5-4 illustrates prevalence estimates for the 18 measures of sexual assault among
the undergraduate male sample (n = 1,375). Although the prevalence of sexual assault is
considerably lower among the male sample than the female sample, there are some
estimates worth noting. Approximately 6.1% (n = 84) of males reported experiencing
attempted or completed sexual assault since entering college (6). Half of them (n = 50,
3.7%) experienced a completed sexual assault (8). Among victims of completed sexual
assault since entering college, incapacitated sexual assault was much more prevalent (12)
(n = 45, 3.4%) than physically forced sexual assault (9) (n = 12, 0.7%). Only 0.7% of the
male sample reported experiencing physically forced sexual assault (9) (n = 12). As was the
case among the female undergraduate sample, a majority of the male victims of
incapacitated sexual assault were classified as having experienced AOD-enabled sexual
assault (i.e., assault that happened when the victim was incapacitated after voluntarily
consuming alcohol and/or drugs); the prevalence for this type of assault among males was
2.7% (15). Although male victims were asked all of the same follow-up questions as female
victims, given that very few male victims of sexual assault were identified, we are not able
to present any contextual or descriptive data on the sexual assault of males as we do for
females below.
15Although the “past 12 month” prevalence is also high among freshmen, they were excluded from
these comparisons of sexual assault prevalence because they had not experienced 12 months of college.
5-5
This document is a research report submitted to the U.S. Department of Justice. This report has not been published by the Department. Opinions or points of view expressed are those of the author(s)
and do not necessarily reflect the official position or policies of the U.S. Department of Justice.

The Campus Sexual Assault (CSA) Study
Exhibit 5-4. Prevalence Estimates for the Sexual Assault Measures for Men, Unweighted Frequencies, Weighted Percentages
5.1.2 Risk Factors Associated with Sexual Assault Among University Women
Bivariate Results
The purpose of this section of the final report is to identify risk and protective factors for
various types of sexual assault experienced by university women. These analyses were not
run for males because we had no plans of modeling sexual assault using the male sample
given the relatively small sample size and low prevalence estimates. It is important to
acknowledge that the cross-sectional nature of our data prevent a temporal understanding
of the role of these factors in increasing (or decreasing) risk for sexual assault. However,
the data are useful in understanding subgroups of the university population that appear
most likely to have experienced sexual assault. The information provides insight into the
types of sexual assault undergraduate women are at greatest risk of experiencing and what
individual characteristics and behavioral factors seemingly put them at risk for each type of
sexual assault. The results can inform the development of prevention and risk reduction
programming, campus policies, and crisis and law enforcement response strategies.
5-6
This document is a research report submitted to the U.S. Department of Justice. This report has not been published by the Department. Opinions or points of view expressed are those of the author(s)
and do not necessarily reflect the official position or policies of the U.S. Department of Justice.

Section 5 — Findings
We ran cross tabulations by four mutually exclusive outcomes experienced since entering
college: physically forced sexual assault only, AOD-enabled sexual assault only, both
physically forced and AOD-enabled sexual assault, and no sexual assault (nonvictims). Chi-
squares were used to determine if the bivariate relationship between each sexual assault
measure and each variable was statistically significant. These analyses, which are shown in
Exhibit 5-5, helped us determine which variables should be considered for insertion into
multivariate models.
Given the large sample size and the fact that the prevalence estimates for each measure of
sexual assault are not negligible, it is not surprising that the majority of the bivariate
analyses are statistically significant at the 0.05 level. As shown in Exhibit 5-5, the
prevalence of sexual assault differs by a variety of demographic and behavioral
characteristics. For the most part, students who appear at greater risk for experiencing
sexual assault have an increased risk of all types of assault. However, distributions varied
widely for some variables across sexual assault type. For example, black women comprised
a much higher percentage of physically forced only victims (23%) than any other
victimization type. Among AOD-enabled only victims, the vast majority (80%) were white.
Seniors represented the highest percentage of victims in each assault type. Interestingly,
almost a quarter of the victims of both types of sexual assault belonged to a sorority,
whereas only 14% of nonvictims were sorority members.
Attendance at fraternity parties and parties where alcohol was served was much higher
among victims of AOD-enabled and both types of sexual assault than for physically forced
victims only. Ninety percent of AOD-enabled victims reported attending a party where
alcohol was served at least once a month, compared to 57% of physically forced sexual
assault victims. Substance use was higher among victims of AOD-enabled only and both
types of sexual assault, compared to victims of physically forced sexual assault and
nonvictims. Much higher proportions of AOD-enabled only sexual assault victims report
getting drunk, accepting drinks from strangers, leaving drinks unattended, and consuming
alcohol or drugs and/or being drunk or high during sex, since entering college.
Multivariate Results
Logistic regression models were used to identify factors associated with being a victim of
three types of assault: physically forced sexual assault only, AOD-enabled sexual assault
only, or both physically forced and AOD-enabled sexual assault. In some cases, covariates
in the models reflect individual characteristics and in others represent potential behavioral
risk factors. The purpose of each model is to identify individual characteristics and
behavioral factors that are associated with being a victim of each type of assault. Although
there are certainly some similarities across the three models, there are also some notable
differences. Results of each of the models are presented in Exhibit 5-6.
5-7
This document is a research report submitted to the U.S. Department of Justice. This report has not been published by the Department. Opinions or points of view expressed are those of the author(s)
and do not necessarily reflect the official position or policies of the U.S. Department of Justice.

The Campus Sexual Assault (CSA) Study
Exhibit 5-5. Prevalence of Various Measures of Sexual Assault Within Demographic and Behavioral Factors for Undergraduate Women (n = 5,361)a
Forced SA
Only
AOD-Enabled SA Only
Both Forced
and AOD-Enabled
SA Nonvictims
% % % % Sig.
Demographics
Race
White 54.9 79.8 64.2 66.5
Black 23.4 8.1 9.8 16.8
Hispanic 7.1 2.4 1.6 2.9
Other 14.6 9.6 24.5 13.8
***
Sexual orientation
Heterosexual 89.0 95.2 88.2 96.0
Lesbian/gay 0.0 0.6 0.0 0.7
Bisexual 11.0 4.2 11.8 3.3
***
College Experiencesb
Classification
Freshman 16.6 19.0 9.1 32.0
Sophomore 20.9 20.9 26.1 23.0
Junior 22.9 21.6 31.6 20.2
Senior 39.6 38.2 33.3 24.7
***
College socialization
Belong to a Greek organization 14.1 22.3 24.1 13.9 ***
Attended a fraternity party
Never 23.3 10.0 12.2 30.7
Less than once a month 57.6 47.4 45.4 44.6
At least once a month 19.1 42.6 42.5 24.8
***
Attended party where alcohol served
Never 3.2 0.1 0.9 10.3
Less than once a month 39.6 9.9 8.3 29.5
At least once a month 57.3 90.0 90.8 60.2
***
Gone to pub/bar/club
Never 9.6 3.7 5.6 22.3
Less than once a month 36.0 26.9 29.4 36.3
At least once a month 54.5 69.5 65.0 41.4
***
Dating partners
Zero 8.7 12.8 5.2 24.6
1–5 67.2 69.8 62.1 69.2
6–10 13.3 11.5 25.7 4.3
11–25 10.2 5.0 6.3 1.8
26 or more 0.6 1.0 0.8 0.2
***
(continued)
5-8
This document is a research report submitted to the U.S. Department of Justice. This report has not been published by the Department. Opinions or points of view expressed are those of the author(s)
and do not necessarily reflect the official position or policies of the U.S. Department of Justice.

Section 5 — Findings
Exhibit 5-5. Prevalence of Various Measures of Sexual Assault Within Demographic and Behavioral Factors for Undergraduate Women (n = 5,361)a (continued)
Forced SA
Only
AOD-Enabled SA Only
Both Forced
and AOD-Enabled
SA Nonvictims
% % % % Sig.
College Experiencesb (continued)
Sexual partners
Zero 23.9 17.6 16.1 40.3
1–5 54.0 61.4 48.4 53.2
6–10 15.1 13.5 20.4 4.3
11–25 6.5 6.7 9.5 1.2
26 or more 0.6 0.8 5.7 1.0
***
Substance Use Since Entering College
Alcohol 90.7 99.9 100.0 84.1 ***
Marijuana 39.2 65.0 62.3 30.0 ***
Illicit drugs (excluding marijuana) 15.9 20.0 25.0 6.8 ***
Number of times gotten drunk
Never 30.2 0.4 3.8 33.0
Less than once a month 28.9 20.1 13.9 26.9
At least once a month 40.9 79.6 82.4 40.1
***
Consumed drink given by someone unknown
Never 65.0 46.3 38.0 75.9
Less than once a month 29.9 38.9 45.8 19.6
At least once a month 5.1 14.7 16.2 4.6
***
Consumed drink after leaving it unattended
Never 86.0 68.5 58.1 89.5
Less than once a month 13.4 24.2 37.8 9.2
At least once a month 0.6 7.4 4.1 1.3
***
Consumed alcohol/drugs before sex
Never 48.9 19.9 17.8 56.9
Less than once a month 20.6 21.3 20.5 21.0
At least once a month 30.6 58.8 61.7 22.1
***
Drunk/high during sex
Never 57.9 23.3 21.2 63.7
Less than once a month 19.2 25.7 25.1 19.4
At least once a month 22.9 51.0 53.7 17.0
***
Suspected/known given drug without consent
8.8 15.1 28.2 3.4 ***
(continued)
5-9
This document is a research report submitted to the U.S. Department of Justice. This report has not been published by the Department. Opinions or points of view expressed are those of the author(s)
and do not necessarily reflect the official position or policies of the U.S. Department of Justice.

The Campus Sexual Assault (CSA) Study
5-10
Exhibit 5-5. Prevalence of Various Measures of Sexual Assault Within Demographic and Behavioral Factors for Undergraduate Women (n = 5,361)a (continued)
Forced SA
Only
AOD-Enabled SA Only
Both Forced
and AOD-Enabled
SA Nonvictims
% % % % Sig.
Victimization Since Entering College
Threatened/humiliated by dating partner
56.0 28.3 56.9 12.8 ***
Physically hurt by dating partner 32.6 9.0 27.6 3.7 ***
Victimization Before Entering College
Any completed sexual assaultb 29.6 25.8 30.8 8.5 ***
Forced sexual assault 28.3 7.6 24.3 5.0 ***
Incapacitated sexual assault 5.9 21.3 21.1 5.0 ***
* p < 0.05, ** p < 0.01, *** p < 0.001 aUnweighted sample size; 85 cases were deleted from analyses due to DFSA victimization or missing
information (see text for additional details) bData reflect time since entering college.
We discuss the odds ratios associated with each independent variable. An odds ratio is a
statistic that conveys the risk of a particular outcome (e.g., being a victim of a certain type
of sexual assault) if a certain independent variable or factor is present. It is a relative
measure of risk, telling you how much more (or less) likely it is that someone who presents
a particular risk factor will experience a given outcome compared to someone who does not
that particular risk factor. If no relationship exists between a risk factor and the outcome,
the odds ratio will be 1.0. An odds ratio above 1.0 indicates a positive relationship between
the risk factor and the outcome (i.e., the presence of the risk factor increases the odds that
the outcome will be realized), and an odds ration below 1.0 indicates a negative relationship
between the risk factor and the outcome (i.e., the presence of the risk factor decreases the
odds that the outcome will be realized).
Being a Victim of Physically Forced Sexual Assault Only. Having been a victim of
physically forced sexual assault before entering college was significantly associated with
experiencing physically forced sexual assault since entering college. Experiencing sexual
assault when incapacitated prior to entering college did not reach statistical significance at
conventional alpha levels (e.g., 0.05). Interestingly, none of the substance use measures
were significantly associated with physically forced sexual victimization. Several variables
This document is a research report submitted to the U.S. Department of Justice. This report has not been published by the Department. Opinions or points of view expressed are those of the author(s)
and do not necessarily reflect the official position or policies of the U.S. Department of Justice.

Sectio
n 5
— Fin
din
gs
Model 1 Model 2 Model 3
Forced Sexual Assault Only
(n = 131) AOD-Enabled Sexual
Assault Only (n = 465) Forced and AOD-Enabled Sexual Assault (n = 101)
Independent Variables B Standard
Error Exp(B) B Standard
Error Exp(B) B Standard
Error Exp(B)
Intercept −5.36 0.32 0.01*** −5.49 0.27 0.00*** −7.50 0.55 0.00*** Demographics
Years in college 0.16 0.06 1.18* 0.13 0.04 1.14** 0.08 0.09 1.09 Blackb 0.35 0.25 1.43 −0.24 0.20 0.79 0.05 0.39 1.05 Hispanicb 0.70 0.41 2.01 −0.48 0.36 0.62 −0.53 0.86 0.59 Otherb −0.08 0.28 0.92 −0.44 0.19 0.64* 0.60 0.28 1.82*
Lifestyle Activities During College Attend fraternity parties 0.17 0.15 1.19 0.32 0.09 1.38*** 0.29 0.19 1.34 Number of male sexual partners 0.32 0.11 1.37** 0.06 0.08 1.06 0.30 0.12 1.35*
Substance Use Since Entering College Get drunk −0.13 0.15 0.88 0.79 0.13 2.21*** 0.71 0.25 2.24** Given drug w/out knowledge 0.68 0.360 1.98 0.85 0.18 2.33*** 1.64 0.28 5.13*** Used marijuana −0.08 0.25 0.92 0.37 0.13 1.45** −0.01 0.26 0.99 Used drugs other than marijuana 0.52 0.34 1.68 −0.07 0.16 0.94 0.06 0.31 1.06 Drunk during sex −0.33 0.17 0.72 0.44 0.09 1.55*** 0.34 0.17 1.40
Threatened/Humiliated or Physically Hurt by Dating Partner 2.00 0.19 7.38*** 0.64 0.13 1.89*** 1.66 0.23 5.25***
Prior Sexual Victimization Victim of forced sexual assault before
college 1.88 0.24 6.58*** −0.29 0.23 0.75 0.95 0.33 2.59** Victim of sexual assault when
incapacitated before college −0.81 0.42 0.44 1.28 0.16 3.58*** 0.65 0.33 1.92* Pseudo R-squarec 0.22 0.25 0.29
aUnweighted sample size; 85 cases were deleted from analyses due to DFSA victimization or insufficient information to classify their type of victimization.
cNagelkerke Psuedo R-square represents the strength of association between independent and dependent variables and should not be interpreted as a measure of model fit or the proportion of variance explained.
Exhibit 5-6. Logistic Regression Models of Four Sexual Assault Measures (n = 4,646)a
* p < .05, ** p < .01, *** p < .001 (two-tailed tests)
bReference category is white. 5-1
1
This document is a research report submitted to the U.S. Department of Justice. This report has not been published by the Department. Opinions or points of view expressed are those of the author(s)
and do not necessarily reflect the official position or policies of the U.S. Department of Justice.

The Campus Sexual Assault (CSA) Study
reflecting college experiences were associated with an increased risk of physically forced
sexual assault. The number of sexual partners a woman has had since entering college was
significantly associated with forced sexual assault only, as was the combined measure of
dating violence (been threatened/humiliated or physically hurt by a dating partner).
The more years a woman reported being in college, the greater the odds that she
experienced physically forced sexual assault. Although the odds ratio is not large (1.2), this
is a continuous measure, so a single unit increase in the number of years in college is
associated with a significant increase in the odds that a woman has been a victim of
physically forced sexual assault since entering college. This finding is not surprising given
that the more years a woman has been in college, the more exposure she has had to
potentially being assaulted since entering college. However, when examining the time point
at which sexual assault is most likely to happen (by restricting the analyses to sexual
assaults occurring within the past 12 months), the risk is greater for sophomores than for
juniors and seniors (data not shown).16
Being a Victim of AOD-Enabled Sexual Assault Only. Slightly more variables were
significantly associated with experiencing AOD-enabled sexual assault than were evident in
Model 1. Having been a victim of incapacitated sexual assault before entering college
increased the likelihood of experiencing incapacitated sexual assault since entering college,
whereas prior physically forced victimization did not.
Most of the substance use measures were significantly associated with AOD-enabled sexual
assault. The frequencies with which women reported getting drunk since entering college
was positively associated with being a victim of AOD-enabled sexual assault, as was
marijuana use. Interestingly, voluntary use of other drugs was not a significant risk factor
for any of the three categories of assault. The frequency with which women reported being
drunk during sex was also associated with being a victim of AOD-enabled sexual assault.
Having been given a drug without one’s knowledge or consent since entering college was
strongly associated with being a victim of AOD-enabled assault. The odds ratio for this
measure is sizeable (2.3); however, it is important to point out that most women who were
ever given a drug without their knowledge or consent were not subsequently sexually
assaulted—308 women in our sample (5.3%) reported being given a drug without their
knowledge or consent at some point during college, but only 31 of these women were
sexually assaulted thereafter, and these women have been excluded from the current
analyses, as discussed in the methods section. It may be that being given a drug without
one’s knowledge and being sexually assaulted are both consequences of other risk factors or
risky situations in which women sometimes find themselves. Some of the same behavioral
risk factors associated with sexual assault (e.g., frequency of getting drunk, using
16Freshmen were excluded from the analyses because the “past 12 month” measure could have
included assaults occurring prior to entering college.
5-12
This document is a research report submitted to the U.S. Department of Justice. This report has not been published by the Department. Opinions or points of view expressed are those of the author(s)
and do not necessarily reflect the official position or policies of the U.S. Department of Justice.

Section 5 — Findings
marijuana, and being drunk during sex) are also significant when the outcome of being
given a drug without their knowledge is regressed on the same set of covariates (analysis
not shown). The frequency with which women reported being drunk during sex since
entering college is positively associated with being a victim of AOD-enabled sexual assault.
Regarding the relationship between college experiences and AOD-enabled sexual assault,
the frequency with which women attended fraternity parties since entering college was
positively associated with being a victim of AOD-enabled sexual assault, as was having been
humiliated or hurt by a dating partner. Regarding demographics, years in college was
positively associated with being a victim of forced sexual assault. Also, being in the “other”
race category was negatively associated with being a victim of AOD-enabled sexual assault
only.
Being a Victim of Both Physically Forced and AOD-Enabled Sexual Assault. In the
final model, both measures of sexual victimization prior to entering college were
significantly associated with being a victim of both physically forced and AOD-enabled
sexual assault during college. Also interesting is that when the individual indicators for
physically forced sexual assault before college and incapacitated sexual assault before
college were replaced with a single combined indicator for experienced both physically
forced and incapacitated sexual assault before college, those women who experienced both
types of prior victimizations (n = 109) had 5 times the odds of experienced both physically
forced and AOD-enabled sexual assault during college, compared to other women
(OR = 5.3, analyses not shown).
In addition, the frequency with which women reported getting drunk since entering college
was positively associated with being a victim of both physically forced and AOD-enabled
assault. Having been given a drug without one’s knowledge or consent since entering
college was strongly associated with experiencing both types of assault, with an odds ratio
of 5.1. There were no relationships between marijuana or other illicit drug use and
experiencing both types of victimization, but the frequency with which women reported
being drunk during sex since entering college was positively associated with being a victim
of both forms of sexual assault.
The frequency with which women attended fraternity parties since entering college was
positively associated with a woman experiencing both types of sexual assault, although this
relationship did not quite reach significance at the 0.05 level. The number of sexual partners
a woman has had since entering college was significantly associated with being in the “both”
sexual assault category. In addition, having been threatened/humiliated or physically hurt
by a dating partner was significantly associated with being a victim of both physically forced
and AOD-enabled sexual assault. Interestingly, the dating violence measure is the only
variable that maintained significance across all three assault categories. Only one
demographic variable was significantly associated with experiencing both physically forced
5-13
This document is a research report submitted to the U.S. Department of Justice. This report has not been published by the Department. Opinions or points of view expressed are those of the author(s)
and do not necessarily reflect the official position or policies of the U.S. Department of Justice.

The Campus Sexual Assault (CSA) Study
and AOD-enabled sexual assault; being in the “other” race category was positively
associated with being a victim of both physically forced and AOD-enabled sexual assault.
Not surprisingly, prior victimization was strongly associated with victimization since entering
college. This pattern is supported by numerous studies in the literature. However, what is
evident (and unique) about our findings is that there appears to be specificity in the
relationship between prior and subsequent risk with regard to the type of sexual assault.
Specifically, being a victim of forced sexual assault before entering college was significantly
associated with being a victim of forced sexual assault since entering college but not AOD-
enabled sexual assault, in the exclusive victimization categories. The magnitude of the odds
ratio for this relationship (6.6) is extremely large—having been a victim of forced sexual
assault before entering college increases the odds that a woman will be forcibly sexually
assaulted while in college by almost seven times. Similarly, being a victim of AOD-enabled
sexual assault before entering college was significantly associated with being a victim of
AOD-enabled sexual assault but not physically forced sexual assault since entering college.
The odds ratio (3.6) for this relationship is also large. Not surprisingly, both types of prior
victimization are positively associated with experiencing both physically forced and AOD-
enabled sexual assault during college. These findings among the exclusive forced assault
and AOD-enabled assault categories clearly show that being a victim of one type of sexual
assault does not seem to put one at risk for the other type, and vice versa. This is not a
finding we have observed in the published literature on sexual assault.
5.1.3 Context
The CSA Study captured substantial information on the context in which the sexual assault
occurred. Because a primary purpose of the CSA Study was to identify differences between
physically forced sexual assault and incapacitated sexual assault on a number of dimensions
(including contextual factors), we asked separate sets of contextual questions for the two
types of sexual assault. Respondents who answered affirmatively to the gate questions on
attempted or completed physically forced sexual assault or incapacitated sexual assault for
which the respondent was certain happened or suspected happened since entering college
were asked detailed follow-up questions specific to the assault type. This report only
includes data for female victims of completed sexual assault (of both types). Exhibit 5-7
presents contextual factors associated with both types of sexual assault. Cross-tabulations
and chi-square tests were conducted comparing the contextual characteristics of the
incidents of victims of physically forced sexual assault only and victims of incapacitated
sexual assault only (victims of both types of assault were excluded from these 2 x 2
analyses). For incapacitated sexual assault, the data are presented for female victims of any
incapacitated sexual assault (which includes AOD-enabled sexual assault, DFSA, and other
incapacitated sexual assault).
5-14
This document is a research report submitted to the U.S. Department of Justice. This report has not been published by the Department. Opinions or points of view expressed are those of the author(s)
and do not necessarily reflect the official position or policies of the U.S. Department of Justice.

Section 5 — Findings
Exhibit 5-7. Percentage of Victims (by Sexual Assault [SA] Type) Reporting Various Victimization Contextual Factors, Unweighted Frequencies, Weighted Percentagesa
Forced SA Only
(n = 131)
Incapacitated SA Only
(n = 526)
Contextual Factors n % n % Sig.
Assailant Characteristics
More than one assailant involved 53 12.5 13 10.5
Assailant-victim relationship
Someone victim had never seen/talked to 30 23.3 68 11.5 ***
Someone victim had seen but not talked to 6 3.1 38 7.5 †
An acquaintance 38 27.9 178 33.9
A co-worker or employer 6 3.8 15 2.4
A classmate/fellow student 31 21.7 139 27.1
A professor or teaching assistant 1 2.0 1 0.1 *
A roommate 1 1.6 3 0.6
A friend 31 24.3 193 35.4 *
A dating partner/spouse 21 17.8 89 18.3
An ex-dating partner/ex-spouse 23 20.0 47 9.3 ***
A relative 3 2.4 0 0.0 ―
Some other person 4 2.5 28 4.9
Victim was on a date with assailant 23 19.4 84 17.1
Assailant was a fraternity member 19 14.3 152 27.5 **
Race of assailant
White 81 57.1 441 79.9 ***
Black 40 38.9 63 15.7 ***
Hispanic 5 4.6 26 5.2
Asian 4 1.7 9 2.2
Pacific Islander 2 1.2 2 0.4
American Indian 1 0.6 0 0.0 ―
Other race 5 2.8 14 2.7
Substance Use
Assailant substance useb
Assailant was drinking prior to incident ― ― 387 70.1 ―
Assailant was using drugs ― ― 2 0.7 ―
Assailant was both drinking and using drugs ― ― 56 11.5 ―
Assailant was either drinking or using drugs but could not tell which
― ― 15 2.7 ―
Assailant was not drinking or using drugs ― ― 35 8.4 ―
(continued)
5-15
This document is a research report submitted to the U.S. Department of Justice. This report has not been published by the Department. Opinions or points of view expressed are those of the author(s)
and do not necessarily reflect the official position or policies of the U.S. Department of Justice.

The Campus Sexual Assault (CSA) Study
Exhibit 5-7. Percentage of Victims (by Sexual Assault [SA] Type) Reporting Various Victimization Contextual Factors, Unweighted Frequencies, Weighted Percentagesa (continued)
Forced SA Only
(n = 131)
Incapacitated SA Only
(n = 526)
Contextual Factors n % n % Sig.
Substance Use (continued)
Victim substance use
Victim was drinking prior to incident 48 33.4 481 89.2 ***
Victim was drunk 20 13.9 446 81.9 ***
Victim voluntarily used drugs prior to incident 5 2.8 42 7.6 *
Victim given drug without knowledge/consent n/a n/a 19 4.2 ―
Location
At a party when incident happened 38 27.5 324 58.3 ***
Incident happened on-campus 49 37.0 196 39.4
Victim’s dorm/living quarters 19 41.1 85 43.0
Outside but near living quarters 4 12.7 11 4.1 *
Other person’s living quarters 17 33.6 89 48.0 †
Classroom/lab/campus building 1 4.4 1 0.2 *
Outside 6 14.6 7 2.3 ***
On-campus fraternity or sorority house 10 17.2 43 20.0
Vehicle 3 3.7 3 0.8
Other location on campus 4 6.6 10 4.3
Incident happened off-campus 82 63.0 330 60.6
Victim’s living quarters 17 25.7 67 21.2
Outside but near living quarters 2 2.3 7 1.8
Other person’s living quarters 38 46.3 164 49.4
Off-campus fraternity or sorority house 4 3.8 25 7.3
Other college campus 12 15.0 37 10.8
Building off campus 4 4.1 14 4.1
Vehicle off campus 2 3.0 5 2.3
Away from campus 10 13.1 58 17.0
Other location off campus 7 7.3 25 9.5
Timing of Incidents
Month
January 14 9.9 54 10.3
February 12 7.8 39 7.4
March 15 9.1 36 6.2
April 12 8.4 36 6.1
May 7 4.8 30 4.8
June 7 7.5 27 4.9
(continued)
5-16
This document is a research report submitted to the U.S. Department of Justice. This report has not been published by the Department. Opinions or points of view expressed are those of the author(s)
and do not necessarily reflect the official position or policies of the U.S. Department of Justice.

Section 5 — Findings
Exhibit 5-7. Percentage of Victims (by Sexual Assault [SA] Type) Reporting Various Victimization Contextual Factors, Unweighted Frequencies, Weighted Percentagesa (continued)
Forced SA Only
(n = 131)
Incapacitated SA Only
(n = 526)
Contextual Factors n % n % Sig.
Timing of Incidents (continued)
Month (continued)
July 8 6.6 31 5.4
August 14 11.3 41 7.0
September 24 18.7 75 14.2
October 23 19.5 82 16.4
November 16 12.5 77 14.6
December 13 10.5 63 11.6
Day
Monday 3 2.3 7 1.2
Tuesday 4 3.5 18 3.1
Wednesday 6 6.4 20 4.2
Thursday 8 4.3 62 10.0 *
Friday 26 21.7 134 25.7
Saturday 33 24.8 183 35.5 *
Sunday 10 8.7 15 2.7 **
Time
Midnight-6:00 a.m. 69 51.7 473 89.9 ***
6:00 a.m. to 12:00 p.m. 2 1.8 10 2.6
12:00 p.m. to 6:00 p.m. 13 10.5 3 0.4 ***
6:00 p.m. to midnight 57 44.8 64 12.6 ***
Weapon Use and Injuries
Weapon Use
Assailant had weapon 4 5.8 4 0.9 ***
Assailant claimed to have weapon 3 1.9 0 0.0 ―
Assailant used weapon 1 0.6 1 0.1
Victim sustained injuries 19 17.7 20 3.4 ***
Injury from sexual contact 12 57.2 13 64.4
Knife/stab wounds 0 0.0 1 1.7 ―
Gunshot wounds 0 0.0 1 1.7 ―
Internal injuries 0 0.0 1 4.2 ―
Knocked unconscious, bruises, black-eye, etc. 12 61.8 8 43.8
Chipped/knocked out teeth 1 5.0 1 1.7
Broken bones 0 0.0 0 0.0 ―
(continued)
5-17
This document is a research report submitted to the U.S. Department of Justice. This report has not been published by the Department. Opinions or points of view expressed are those of the author(s)
and do not necessarily reflect the official position or policies of the U.S. Department of Justice.

The Campus Sexual Assault (CSA) Study
Exhibit 5-7. Percentage of Victims (by Sexual Assault [SA] Type) Reporting Various Victimization Contextual Factors, Unweighted Frequencies, Weighted Percentagesa (continued)
Forced SA Only
(n = 131)
Incapacitated SA Only
(n = 526)
Contextual Factors n % n % Sig.
Weapon Use and Injuries (continued)
Victim sustained injuries (continued) 19 17.7 20 3.4 ***
Emotional/psychological injury 14 79.5 11 53.3 †
Other 1 7.2 2 5.3
Perception of any incidents as rape
Victim considers incident(s) rape 54 40.0 130 25.3 ***
† p < 0.10, * p < 0.05, ** p < 0.01, *** p < 0.001 aAs discussed in Section 3.0, for victims who reported experiencing more than one sexual assault of a
single type (e.g., two or more physically forced victimizations or two or more incapacitated victimizations), the contextual questions typically asked about “any of the incidents.” Therefore, the percentages contained in this table should be interpreted as the percentage of victims (of each specific assault type) who reported the particular contextual variable in the table, rather than the % of incidents for which the contextual variable was present.
bData unavailable due to programming error during survey administration.
Assailant Characteristics
The first set of contextual variables pertain to characteristics of the assailant. As shown in
the exhibit, less than 15% of physically forced and incapacitated victims were assaulted by
more than one person; however, the groups did not differ significantly. Regarding the
relationship between the victim and the assailant and keeping in mind that respondents
could select more than one category for this question, it is evident that a small proportion of
victims reported being assaulted by someone they had never seen or talked to before.
Victims of physically forced sexual assault were much more likely than incapacitated assault
victims to be assaulted by someone they had never seen or talked to (23% vs. 12%,
respectively), or by a former intimate partner (20% vs. 9%, respectively). A higher
percentage of incapacitated sexual assault victims were victimized by a friend. This
assailant-victim relationship was reported most often by incapacitated assault victims.
Interestingly, over a quarter of incapacitated sexual assault victims reported that the
assailant was a fraternity member at the time of the incident; this proportion is significantly
higher than that reported by victims of physically forced sexual assault (28% vs. 14%,
respectively). Also of interest is that a significantly higher proportion of incapacitated sexual
assault victims (80%) than physically forced sexual assault victims (57%) reported that the
assailant was white. In contract, a much higher percentage of physically forced victims
(39%) reported that the assailant was black, compared to incapacitated victims (16%).
5-18
This document is a research report submitted to the U.S. Department of Justice. This report has not been published by the Department. Opinions or points of view expressed are those of the author(s)
and do not necessarily reflect the official position or policies of the U.S. Department of Justice.

Section 5 — Findings
Substance Use
The vast majority of incapacitated sexual assault victims reported that the assailant had
been drinking and/or using drugs before the incident.17 Differences in substance use on the
part of the victim by assault type are evident in the table. Not surprisingly, the vast
majority of incapacitated sexual assault victims (89%) reported drinking alcohol, and being
drunk (82%), prior to their victimization. This is much higher than the proportion of
physically forced victims who reported drinking (33%) and being drunk (13%) prior to their
assault. Drug use was relatively low among both groups, although a slightly higher
proportion of incapacitated sexual assault victims reported having voluntarily used drugs
before the incident (8% vs. 2%). For victims of either type of sexual assault who reported
voluntary drug use, the most commonly used drugs were marijuana, cocaine,
methamphetamine, and ecstasy.
Only victims reporting incapacitated sexual assault were asked whether they had been given
a drug without their knowledge or consent immediately before the assault. A low proportion
of incapacitated sexual assault only victims (4%) reported such coercive drug ingestion. Of
these victims, the drugs reportedly used to incapacitate them were Rohypnol, GHB,
marijuana, and ecstasy, although it is worth noting that over half of incapacitated sexual
assault victims who reported coercive drug ingestion stated that they did not know which
drug they were given.
Location
A surprisingly large number of respondents reported that they were at a party when the
incident happened, with a significantly larger proportion of incapacitated sexual assault
victims reporting this setting (58% compared with 28%). The majority of sexual assault
victims of both types reported that the incident had happened off campus (61% of
incapacitated sexual assault victims and 63% of physically forced sexual assault victims). A
higher proportion of physically forced than incapacitated sexual assaults occurred outside.
The most commonly-reported locations of either type of victimization, on and off-campus,
were the victim’s or some other person’s living quarters. No other significant differences by
assault type are evident.
Timing of Incidents
Substantial variability in the time of year in which sexual assault incidents took place is
evident, with fall clearly being the most prevalent season for sexual assault. The largest
proportion of victims (of both types of sexual assault) reported being victimized in October
(20% of physically forced sexual assault victims and 16% of incapacitated sexual assault
victims). Not surprisingly, the vast majority of victims reported being victimized on
17Unfortunately, the percentage of physically forced sexual assault victims who reported assailant
alcohol and/or drug use cannot be determined, because of an error in the survey program that saved all responses as either “drinking only” or “don’t know.”
5-19
This document is a research report submitted to the U.S. Department of Justice. This report has not been published by the Department. Opinions or points of view expressed are those of the author(s)
and do not necessarily reflect the official position or policies of the U.S. Department of Justice.

The Campus Sexual Assault (CSA) Study
Saturday (25% of physically forced sexual assault victims and 36% of incapacitated sexual
assault victims) or Friday (22% of physically forced sexual assault victims and 26% of
incapacitated sexual assault victims). Also not surprising is that the majority of victims
reported being assaulted during the hours from midnight to 6:00 a.m.; the prevalence of
this is significantly higher among incapacitated assault victims. However, although victims
of both types are most likely to be assaulted from midnight to 6:00 a.m., a significantly
higher proportion of physically forced victims are assaulted during earlier hours (noon to
6:00 p.m. and 6:00 p.m. to midnight). Forty-five percent of physically forced victims,
compared to 13% of incapacitated victims, reported being assaulted between 6:00 p.m. and
midnight.
Weapon Use and Injuries
Very few victims of either type of sexual assault reported that the assailant had or claimed
to have a weapon. The proportion reporting assailant weapon possession was higher for
victims of physically forced sexual assault than incapacitated sexual assault. The proportion
of victims reporting that they had sustained injuries in the assault is relatively low,
although, not surprisingly, a greater proportion of physically forced sexual assault victims
(18%) reported being injured than incapacitated sexual assault victims (3%). Among those
who sustained injuries, the most prevalent were emotional or psychological injury;18 injury
from the sexual contact; and bruises, black-eyes, cuts, scratches, or swelling.19
Perception of Any Incidents as Rape
When asked if they considered the incident to be rape, a significantly higher percentage of
physically forced victims (40%) answered affirmatively, compared to only 25% of the
incapacitated assault victims. Because our classification of sexual assault includes both
battery (unwanted touching achieved by physical force or incapacitation of the victim) and
rape (vaginal, oral, anal, or object penetration achieved by physical force or incapacitation
of the victim), not all victims were indeed raped. When subsetting to victims who were
18Although a large proportion of victims reported experiencing emotional or psychological injury, we
anticipate that in reality, the number is substantially larger. If the gate question used to identify victims sustaining an injury had specifically referred to emotional or psychological injury, we suspect that many more victims would have answered affirmatively and then selected emotional or psychological injury in the follow-up question that asked specifically about the types of injuries sustained.
19Exhibit 5-7 includes “knocked unconscious” in the same category as “bruises, black-eye, cuts, scratches, or swelling” because of a programming error in the follow-up responses to physically forced sexual assault incidents, in which the responses to the “bruises, etc.” were saved with “knocked unconscious.” Based on the responses to incapacitated sexual assault (in which the two sets of responses were saved in the appropriate category, with only 3 respondents reporting being knocked unconscious and 22 reporting experiencing bruises, etc.), we can deduce that very few physically forced sexual assault victims were knocked unconscious and that most of the victims experienced the latter type of injury (i.e., bruises, black-eyes, cuts, scratches, or swelling).
5-20
This document is a research report submitted to the U.S. Department of Justice. This report has not been published by the Department. Opinions or points of view expressed are those of the author(s)
and do not necessarily reflect the official position or policies of the U.S. Department of Justice.

Section 5 — Findings
raped, 64.6% of physically forced rape victims and 37.8% of incapacitated rape victims
considered the incident to be rape.20
5.1.4 Reporting and Nonreporting
Victims of both types of sexual assault were asked detailed sets of questions about informal
and formal reporting of the event. Their responses were compared using chi-square tests.
The reporting data are presented in Exhibit 5-8.
Family Member or Friend
The first category of disclosure pertains to someone close to the victim. The majority of
victims of both types of assault reported that they told someone such as a family member,
friend, roommate, or intimate partner. A slightly higher proportion of physically forced
sexual assault victims (70%) than incapacitated sexual assault victims (64%) reported this
type of disclosure, although these percentages were not significantly different.
Victim’s, Crisis, or Health Care Center
A very small percentage of victims reported that they contacted a victim’s, crisis, or health
care center after the incident. Once again, this type of disclosure was more prevalent
among physically forced sexual assault victims (16%) than incapacitated sexual assault
victims (8%). Because of the small number of victims who reported contacting this type of
service agency, the data on follow-up questions pertaining to this experience should be
interpreted with caution. A significantly higher percentage of physically forced victims
reported to a crisis center or victim’s services program, or counselor or therapist not
affiliated with their university. Although physically forced sexual assault victims were most
likely to contact a counselor or therapist not affiliated with the university, incapacitated
sexual assault victims were most likely to contact a doctor’s office or medical facility
affiliated with the university. Just over three-fourths of physically forced sexual assault
victims who contacted a victim’s, crisis, or health care center reported receiving a physical
or sexual assault examination, and just half of incapacitated sexual assault victims reported
receiving such an examination. Most commonly, victims of physically forced sexual assault
contacted a victim’s, crisis, or health care center after 24 hours but within 1 week of the
incident.21 The vast majority of victims who contacted a victim’s, crisis, or health care
center were satisfied with the way their reporting was handled, but a few regretted that
they reported the incident to this type of center. Slightly more victims of incapacitated
sexual assault stated that they were satisfied with the way their reporting was handled, and
20The proportion of sexual assault or rape victims who reported that they consider the incident to be
rape is difficult to interpret for victims reporting more than one incident of a type because these victims were asked whether they considered any of the incidents to be rape.
21The time period of contact for incapacitated sexual assault victims cannot be determined because of a programming error.
5-21
This document is a research report submitted to the U.S. Department of Justice. This report has not been published by the Department. Opinions or points of view expressed are those of the author(s)
and do not necessarily reflect the official position or policies of the U.S. Department of Justice.

The Campus Sexual Assault (CSA) Study
fewer stated that they regret reporting the incident to a victim’s, crisis, or health care
center.
Exhibit 5-8. Reporting of Sexual Assault (SA), by Assault Type, Unweighted Frequencies, Weighted Percentagesa
Forced SA Only
(n = 131)
Incapacitated SA Only
(n = 526)
Reporting Variables N % N % Sig.
Family or Friends
Disclosed incident to someone close 91 68.9 350 63.7
Victim’s, Crisis, or Health Care Center
Contacted a victim’s, crisis, or health care center 20 15.8 35 7.5 **
Crisis center or victim services program affiliated with the university
5 25.8 6 22.6
Crisis center or victim services program not affiliated with the university
6 32.6 3 7.0 *
Doctor’s office or medical facility affiliated with the university
3 15.1 12 33.0
Doctor’s office or medical facility not affiliated with the university
8 43.2 9 22.0 †
Counselor or therapist affiliated with the university 7 35.4 7 33.3
Counselor or therapist not affiliated with the university 10 44.2 4 10.2 **
Women’s program or service 6 27.7 7 17.4
Given a physical or sexual assault examination 15 77.9 16 51.0 *
Time period of contactb
Less than 3 hours after incident 3 11.8 ― ― ―
Within 3 to 24 hours 2 12.3 ― ― ―
Within 1 week 10 54.0 ― ― ―
Within 1 month 3 13.0 ― ― ―
More than 1 month after incident 2 9.0 ― ― ―
Satisfaction with reporting
Satisfied with the way reporting was handled 12 70.3 29 83.6
Regret reporting the incident 3 11.4 1 0.8
Law Enforcement
Reported incident to the police or campus security 18 12.9 9 2.1 ***
Campus police or campus security 5 24.9 7 85.3 **
Municipal/local/city police/911 10 51.1 4 50.9
County sheriff 1 5.5 0 0.0
State police 0 0.0 0 0.0
5-22
This document is a research report submitted to the U.S. Department of Justice. This report has not been published by the Department. Opinions or points of view expressed are those of the author(s)
and do not necessarily reflect the official position or policies of the U.S. Department of Justice.

Section 5 — Findings
Other law enforcement 6 35.4 0 0.0
(continued)
5-23
This document is a research report submitted to the U.S. Department of Justice. This report has not been published by the Department. Opinions or points of view expressed are those of the author(s)
and do not necessarily reflect the official position or policies of the U.S. Department of Justice.

The Campus Sexual Assault (CSA) Study
Exhibit 5-8. Reporting of Sexual Assault (SA), by Assault Type, Unweighted Frequencies, Weighted Percentagesa (continued)
Forced SA Only
(n = 131)
Incapacitated SA Only
(n = 526)
Reporting Variables N % N % Sig.
Law Enforcement (continued)
Time period of contact
Less than 3 hours after incident 4 27.1 3 21.6
Within 3 to 24 hours 1 5.5 4 52.7 *
Within 1 week 6 22.6 1 9.4
Within 1 month 1 5.5 0 0.0
More than 1 month after incident 4 20.8 1 16.3
Satisfaction with reporting
Satisfied with the way reporting was handledb 6 32.1 ― ― ―
Regret reporting the incident 4 17.2 1 7.2
Reasons for not reporting to law enforcement
Did not want anyone to know 45 41.7 143 28.6 **
Afraid of reprisal by the assailant 18 17.9 55 11.7 †
Did not think it was serious enough to report 69 55.6 350 66.5 *
Unclear that it was a crime or that harm was intended 43 36.8 188 35.9
Did not have proof that the incident happened 26 23.3 79 14.9 *
Did not know how to report it 13 14.1 40 7.4 *
Did not think the police would think it was serious enough
22 20.6 58 11.9 *
Fear of being treated poorly by police or other parts of the justice system
13 13.6 24 5.6 **
Did not think anything could be done to the assailant 23 24.0 40 7.5 ***
Did not want anyone to know about alcohol or drug use
8 7.5 53 10.7
Did not remember/know what really happened n/a n/a 173 31.1 ―
Victim thought she was partially/fully responsible n/a n/a 260 49.8 ―
Other reason 20 16.9 75 15.2
(continued)
5-24
This document is a research report submitted to the U.S. Department of Justice. This report has not been published by the Department. Opinions or points of view expressed are those of the author(s)
and do not necessarily reflect the official position or policies of the U.S. Department of Justice.

Section 5 — Findings
Exhibit 5-8. Reporting of Sexual Assault (SA), by Assault Type, Unweighted Frequencies, Weighted Percentagesa (continued)
Forced SA Only
(n = 131)
Incapacitated SA Only
(n = 526)
Reporting Variables N % N % Sig.
Testing for DFSA
Blood/urine sample taken n/a n/a 3 10.5 ―
Results positive for drugs n/a n/a 1 75.4 ―
† p < 0.10, * p < 0.05, ** p < 0.01, *** p < 0.001 aAs discussed in Section 3.0, for victims who reported experiencing more than one sexual assault of a
single type (e.g., two or more physically forced victimizations or two or more incapacitated victimizations), the contextual questions typically asked about “any of the incidents.” Therefore, the percentages contained in this table should be interpreted as the percentage of victims (of each specific assault type) who reported the particular contextual variable in the table, rather than the % of incidents for which the contextual variable was present.
bData unavailable due to programming error during survey administration.
Law Enforcement
A similarly small proportion of victims of both types stated that they reported the incident to
a law enforcement agency, with incapacitated sexual assault victims once again being less
likely to report the incident to this type of agency (2% vs. 13%). However, of victims who
reported to law enforcement, a much higher proportion of incapacitated assault victims,
compared to physically forced assault victims, reported to campus police (86% vs. 25%,
respectively). The majority of incapacitated sexual assault victims contacted law
enforcement within 24 hours of the incident, whereas large proportions of physically forced
victims reported within 3 hours (27%), within one week (23%), and more than one month
after the incident (21%). Less than half of physically forced sexual assault victims stated
that they were satisfied with the way their reporting to law enforcement was handled,22 and
17% stated that they regretted reporting the incident to law enforcement.
The victims who did not report the incident to law enforcement were asked why they made
this decision. The most commonly reported response by both types of victims was that they
did not think it was serious enough to report (reported by 56% of physically forced sexual
assault victims and 67% of incapacitated sexual assault victims). The other consistently
reported reasons for not reporting were that it was unclear that a crime was committed or
that harm was intended (selected by just over 35% of both types of victims), and that they
did not want anyone to know about the incident (selected by 42% of physically forced
sexual assault victims and 29% of incapacitated sexual assault victims). Relatively large
22The proportion of incapacitated sexual assault victims cannot be determined because of a
programming error.
5-25
This document is a research report submitted to the U.S. Department of Justice. This report has not been published by the Department. Opinions or points of view expressed are those of the author(s)
and do not necessarily reflect the official position or policies of the U.S. Department of Justice.

The Campus Sexual Assault (CSA) Study
proportions of incapacitated sexual assault victims stated that they did not report the
incident because they thought they were partially or fully responsible (50%) and that they
did not remember or know what really happened (31%). These response options were only
provided as options for incapacitated sexual assault victims.
Testing for DFSA
In the reporting section of the interview, victims of incapacitated sexual assault were asked
whether anyone to whom they had reported the incident took a blood or urine sample from
them. Only three of the women who experienced incapacitated sexual assault only had a
blood or urine sample drawn. Of those three women, one’s results were positive. If we look
at all victims of incapacitated sexual assault, regardless of if they also experienced
physically forced sexual assault, seven of these incapacitated sexual assault victims had
blood or urine samples taken. Three of these victims reported that the results of the test
was positive, with all three drug tests indicating the presence of Rohypnol.
5.1.5 Consequences
Finally, sexual assault victims of both types were asked about actions they took as a result
of the incident and consequences received by the assailant. As shown in Exhibit 5-9, for the
most part victims of both types did not report taking the actions about which the instrument
asked. Beyond avoiding or trying to avoid the assailant (reported by about two-thirds of
victims of both sexual assault types), the respondents were unlikely to report action
stemming from the assault. Twenty-two percent of physically forced sexual assault victims
and 6% of incapacitated sexual assault victims reported that they sought psychological
counseling, a statistically significant difference.
Not surprisingly, given the very low percentage of victims who reported the incident to law
enforcement, a very small number of victims of either type reported that they pursued any
action against the assailant, including seeking a restraining order, filing civil charges,
pursuing criminal charges, or filing a grievance or initiating other disciplinary action with
university officials. However, a slightly higher proportion of physically forced victims
reported pursuing criminal charges. A very small number of victims reported that the
assailant received any disciplinary action from the university or that the assailant was
arrested, prosecuted, or convicted by the criminal justice system, but a higher percentage
of physically forced victims reported this latter outcome.
5-26
This document is a research report submitted to the U.S. Department of Justice. This report has not been published by the Department. Opinions or points of view expressed are those of the author(s)
and do not necessarily reflect the official position or policies of the U.S. Department of Justice.
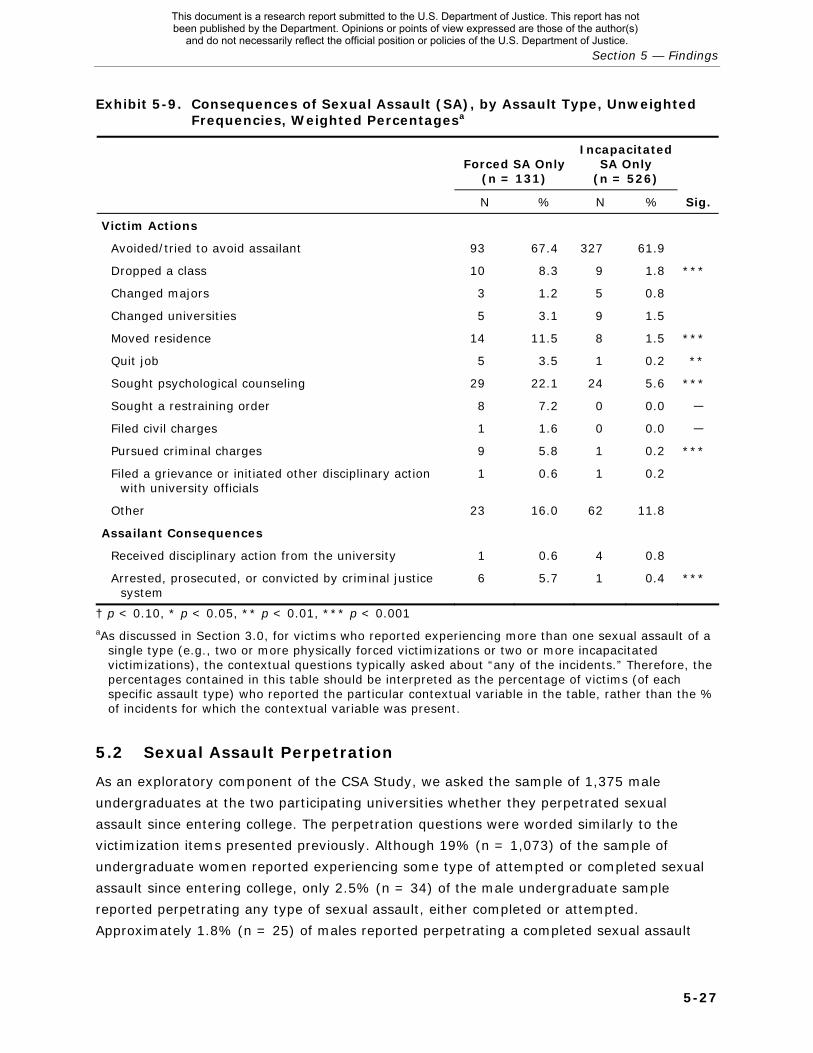
Section 5 — Findings
Exhibit 5-9. Consequences of Sexual Assault (SA), by Assault Type, Unweighted Frequencies, Weighted Percentagesa
Forced SA Only
(n = 131)
Incapacitated SA Only
(n = 526)
N % N % Sig.
Victim Actions
Avoided/tried to avoid assailant 93 67.4 327 61.9
Dropped a class 10 8.3 9 1.8 ***
Changed majors 3 1.2 5 0.8
Changed universities 5 3.1 9 1.5
Moved residence 14 11.5 8 1.5 ***
Quit job 5 3.5 1 0.2 **
Sought psychological counseling 29 22.1 24 5.6 ***
Sought a restraining order 8 7.2 0 0.0 ―
Filed civil charges 1 1.6 0 0.0 ―
Pursued criminal charges 9 5.8 1 0.2 ***
Filed a grievance or initiated other disciplinary action with university officials
1 0.6 1 0.2
Other 23 16.0 62 11.8
Assailant Consequences
Received disciplinary action from the university 1 0.6 4 0.8
Arrested, prosecuted, or convicted by criminal justice system
6 5.7 1 0.4 ***
† p < 0.10, * p < 0.05, ** p < 0.01, *** p < 0.001 aAs discussed in Section 3.0, for victims who reported experiencing more than one sexual assault of a
single type (e.g., two or more physically forced victimizations or two or more incapacitated victimizations), the contextual questions typically asked about “any of the incidents.” Therefore, the percentages contained in this table should be interpreted as the percentage of victims (of each specific assault type) who reported the particular contextual variable in the table, rather than the % of incidents for which the contextual variable was present.
5.2 Sexual Assault Perpetration
As an exploratory component of the CSA Study, we asked the sample of 1,375 male
undergraduates at the two participating universities whether they perpetrated sexual
assault since entering college. The perpetration questions were worded similarly to the
victimization items presented previously. Although 19% (n = 1,073) of the sample of
undergraduate women reported experiencing some type of attempted or completed sexual
assault since entering college, only 2.5% (n = 34) of the male undergraduate sample
reported perpetrating any type of sexual assault, either completed or attempted.
Approximately 1.8% (n = 25) of males reported perpetrating a completed sexual assault
5-27
This document is a research report submitted to the U.S. Department of Justice. This report has not been published by the Department. Opinions or points of view expressed are those of the author(s)
and do not necessarily reflect the official position or policies of the U.S. Department of Justice.

The Campus Sexual Assault (CSA) Study
since entering college. All but one of these cases were perpetrators of incapacitated sexual
assault (n = 24). A slightly higher number of males reported perpetrating either completed
or attempted incapacitated sexual assault (n = 33, 2.4%).
When subsetting to the perpetrators of completed incapacitated sexual assault, 29% (n = 6)
of perpetrators were on a date with the victim at the time of the incident. Twenty-nine
percent of these perpetrators (n = 7) reported that the victim was a member of a sorority.
None of the perpetrators reported giving the victim a drug without her consent. Over three-
quarters of the perpetrators (n = 21, 86.2%) reported that the victim was drinking before
the incident, and 81.0% of perpetrators had been drinking before the incident. Ninety-four
percent of those who had been drinking reported that they were drunk before the sexual
assault incident occurred. None of the perpetrators of incapacitated sexual assault, whether
penetration of the victim occurred or not, considered the incident to be rape.
We have concerns about the validity of the perpetration data. We suspect that some males
who have perhaps perpetrated sexual assault since entering college consciously answered
our survey questions about perpetration negatively and untruthfully. We also believe,
however, that some males answered our questions negatively and honestly in that they do
not believe what they did fit the descriptions we used in our questions. Their accounts of
what happened may differ considerably from that of the self-identified victim. This is not to
say they were not perpetrators, but it helps explain why our self-reported perpetration rates
are so much lower than our self-reported rates of sexual assault victimization. Other
possible explanations for the discrepancy between the percentage of women who reported
being victimized and the percentage of men who reported perpetrating sexual assaults
include: (1) the men who participated in the CSA survey were significantly less likely to be
perpetrators of sexual assault than men who did not participate in the CSA survey, and
(2) relatively few men sexually assault women, but those who do sexually assault many
women, which results in there being relatively few perpetrators and many victims.
5-28
This document is a research report submitted to the U.S. Department of Justice. This report has not been published by the Department. Opinions or points of view expressed are those of the author(s)
and do not necessarily reflect the official position or policies of the U.S. Department of Justice.

6. CONCLUSION AND RECOMMENDATIONS
6.1 Summary of Findings
One of the primary purposes of the CSA Study was to determine the prevalence of various
types of sexual assault. Of particular interest was the prevalence of DFSA. It is quite clear
that a sizeable proportion of undergraduate women (11.1%) have experienced sexual
assault when they were incapacitated and unable to provide consent, but the large majority
of these victims had not been given a drug without their knowledge prior to the assault. The
large majority (n = 566, 84%) of the 651 women who experienced incapacitated sexual
assault were victims of AOD-enabled, rather than drug-facilitated, sexual assault. Only 31
(0.6%) of the 5,446 undergraduate women who participated in the CSA Study reported
being sexually assaulted after being given a drug without their knowledge or consent since
entering college. There are no estimates in the literature to which this figure can be
compared, but given the attention that DFSA and “date rape drugs” have received in the
media in recent years, this estimate is almost certainly lower than some might have
expected. Clearly, undergraduate women are at much greater risk of sexual assault that
occurs in the context of voluntary consumption of alcohol and/or drugs or that is physically
forced than sexual assault that is drug facilitated.
The phenomenon of being given a drug without one’s knowledge is, however, not
necessarily rare among our sample. A total of 308 women in our sample of 5,446 (5.3%)
reported being given a drug without their knowledge or consent since entering college and
the drugs most likely to be administered were Rohypnol and GHB, which are commonly
referred to as date rape drugs. Women being given a drug without their knowledge or
consent appears be a legitimate concern for universities and students, but it is unclear
whether widespread concerns about DFSA can be justified empirically.
Another interesting finding generated by the CSA Study is that the prevalence of
experiencing sexual assault is higher since entering college (13.7%) than before entering
college (11.3%). However, our survey was done at a single point in time and during a time
period when collegiate experiences are more salient, so it may be that subjects had
difficulty recalling sexual assaults that occurred before entering college. On the other hand,
it is important to point out that our “since entering college” estimates do not reflect the
sample’s entire collegiate experience because the sample includes freshman, sophomores,
and juniors (and even seniors had not completed their senior year), which means that the
true rate of sexual assault during the entire college experience is likely higher. When
subsetting to seniors, the data show that 368 women (26.1% of seniors) reported
experiencing attempted or completed sexual assault since entering college. Ninety-two
(7.0%) seniors were victims of physically forced sexual assault since entering college, and
223 (16.0%) seniors were victims of incapacitated sexual assault since entering college. It
is important to note, however, that although the cumulative prevalence estimates of sexual
6-1
This document is a research report submitted to the U.S. Department of Justice. This report has not been published by the Department. Opinions or points of view expressed are those of the author(s)
and do not necessarily reflect the official position or policies of the U.S. Department of Justice.

The Campus Sexual Assault (CSA) Study
assault are understandably highest for seniors, the “past 12 month” prevalence estimates of
sexual assault are highest among sophomores.23 This pattern indicates that women who are
victimized during college are most likely to be victimized early on in their college tenure.
This finding is consistent with a recent study employing a convenience sample of university
women, which found that 84% of the women who reported sexually coercive situations
experienced the incident during their first four semesters on campus (Gross, Winslett,
Roberts, & Gohm, 2006).
Not surprisingly, the CSA Study found that the prevalence of sexual assault among male
college students was considerably lower than similar estimates for women. A total of 50
males (3.7%) reported being victims of completed sexual assault since entering college. The
majority of these victims (90.2%) were victims of incapacitated sexual assault. Estimates of
the sexual victimization of adult males are sparse in the literature, so it is difficult to
compare the CSA Study findings to those produced by existing research.
Our multivariate analyses identifying risk factors for sexual assault among university women
indicate that several factors are differentially associated with specific types of sexual
assault. Specifically, compared to whites, Hispanic women were more likely to be victims of
physically forced sexual assault. Years in college and the number of dating partners were
both positively associated with experiencing physically forces sexual assault and
experiencing physically forced and AOD-enabled sexual assault. Victims of AOD-enabled
assault and both types of assault more frequently attended fraternity parties, got drunk,
had ever been given a drug without their consent, and were frequently drunk during sex
since entering college. Victims of AOD-enabled sexual assault only were more likely to have
used marijuana. In contrast, none of these risk factors were significantly associated with
being a victim of forced sexual assault. Ever having been threatened, humiliated, or
physically hurt by a dating partner was a risk factor for all three measures of sexual assault.
Interestingly, having been a victim of forced sexual assault before entering college was a
risk factor for being a victim of forced (but not AOD-enabled) sexual assault since entering
college, and having been a victim of incapacitated sexual before entering college was a risk
factor for being a victim of AOD-enabled (but not forced) sexual assault since entering
college. Other studies have found that previous victimization is a risk factor for future
victimization, but this is the first study we are aware of that has determine that being a
victim of a certain type of sexual assault puts one at risk of being a victim of that type of
sexual assault, and not necessarily another type of sexual assault. In other words, the risk
posed by previous victimization is specific to the type of victimization experienced.
Descriptive analyses of the context, consequences, and reporting of sexual assault also
confirm that differences exist between forced and incapacitated sexual assault. For example,
23While the “past 12 month” prevalence is also high among freshmen, they were excluded from these
comparisons of sexual assault prevalence because they had not experienced 12 months of college.
6-2
This document is a research report submitted to the U.S. Department of Justice. This report has not been published by the Department. Opinions or points of view expressed are those of the author(s)
and do not necessarily reflect the official position or policies of the U.S. Department of Justice.

Section 6 — Conclusion and Recommendations
forced sexual assaults were more likely to involve a black perpetrator, whereas
incapacitated sexual assaults were more likely to involve a white perpetrator. Forced
assaults were also more likely to be perpetrated by a stranger to the victim or an ex-dating
partner or ex-spouse, whereas incapacitated sexual assaults were more likely to be
perpetrated by a friend or acquaintance of the victim. Additionally, more than a quarter of
incapacitated sexual assault victims were victimized by a member of a fraternity. Not
surprisingly, victims of incapacitated sexual assault were considerably more likely to have
been using alcohol before and be drunk during the assault. Incapacitated assaults were
more likely to happen at a party and between midnight and 6 a.m., whereas forced sexual
assaults were more likely to happen between noon and midnight. Victims of forced sexual
assault were more likely to be injured and to consider the incident to be rape.
Victims of forced sexual assault were more likely to report the assault to friends or family,
crisis centers, and law enforcement, but they were also less satisfied with how the report
was handled and more likely to regret reporting the assault than incapacitated sexual
assault victims who reported their assaults. Overall, victims of forced sexual assault were
also more likely to make changes in their lives in reaction to the assault, such as dropping a
class, moving, and changing majors, and were more likely to seek psychological counseling
as a result of the victimization.
6.2 CSA Study Implications
Sexual assault is clearly an issue in need of attention by the campus community given its
high prevalence and adverse consequences, and the CSA Study results carry many social
and policy-oriented implications. One out of five undergraduate women experience an
attempted or completed sexual assault since entering college. Moreover, attention must be
paid to the following facts:
the majority of sexual assaults occur when women are incapacitated due to their use of substances, primarily alcohol;
freshmen and sophomores are at greater risk for victimization than juniors and seniors; and
the large majority of victims of sexual assault are victimized by men they know and trust, rather than strangers.
It is thus critical that sexual assault prevention strategies and messages be designed such
that undergraduates are educated (and as soon after enrollment as possible) about these
facts. Most importantly, because most sexual assaults experienced by university women are
enabled by alcohol or other drugs, one clear implication is the need to address the risks of
substance use, particularly the risk of drinking to excess, in sexual assault prevention
messages presented to university students. For many students, college offers an
environment notorious for encouraging excessive drinking and experimenting with drugs.
Most students are simply unable to gauge the amount of alcohol consumed, are unaware of
6-3
This document is a research report submitted to the U.S. Department of Justice. This report has not been published by the Department. Opinions or points of view expressed are those of the author(s)
and do not necessarily reflect the official position or policies of the U.S. Department of Justice.

The Campus Sexual Assault (CSA) Study
the effects of new drugs or the mixing of drugs and alcohol, and are unfamiliar with the
point at which their cognitive ability is so impaired that they cannot protect themselves.
Students may also be unaware of the image of vulnerability projected by a visibly
intoxicated individual. Despite the link between substance use and sexual assault, it appears
that few sexual assault prevention and/or risk reduction programs address the relationship
between substance use and sexual assault. In a review of 15 university-based prevention
interventions conducted between 1994 and 1999, only three included references to alcohol
use (Bachar & Koss, 2001).
Another important implication stems from our finding of DFSA being an extremely rare
occurrence. Universities should continue to be mindful of this phenomenon and educate
students about the potential dangers and consequences of clandestinely giving someone a
drug or being given a drug. However, an overemphasis on DFSA takes attention away from
the true nature of campus sexual assault, ignoring the fact that most sexual assaults occur
after voluntary alcohol consumption by the victim and assailant. Universities must address
the dangers of voluntary alcohol consumption rather than focusing on the rare phenomenon
of coercive drug ingestion.
Finally, the very low rates of reporting sexual assault to crisis centers and law enforcement
suggest that perhaps more can be done to encourage reporting. When reports of sexual
assault are handled properly and effectively, the process can be important to the recovery
and healing of the victim, as well as the identification, punishment, and deterrence of
perpetration. Universities and law enforcement should thus seek out and implement
strategies that encourage reporting of sexual assault and ensure reports of sexual assault
are being handled properly. The fact that a large proportion of sexual assault victims had
been drinking before the incident may particularly discourage reporting, given victim
concerns about reprisal for violating campus policies on drug and alcohol use. Other studies
have suggested that university administrators believe policies allowing for confidential and
anonymous reporting encourage reporting (Karjane, Fisher, & Cullen, 2005).
In addition, even though some women experience their first sexual assault after entering
college, many women who experience sexual assault during college had been sexually
victimized before coming to college. Since women who have experienced sexual assault
before entering college have a much greater chance of experiencing sexual assault during
college, it is important that sexual assault programming reflects this reality. Programs
should focus on both primary prevention for women who have not experienced sexual
assault and secondary prevention in an effort to prevent re-victimization (although more
research is needed to guide the development of effective secondary prevention
programming).
6-4
This document is a research report submitted to the U.S. Department of Justice. This report has not been published by the Department. Opinions or points of view expressed are those of the author(s)
and do not necessarily reflect the official position or policies of the U.S. Department of Justice.

Section 6 — Conclusion and Recommendations
Sexual assault prevention programs for women could involve:
Providing accurate information on legal definitions of sexual assault, the extent and nature of sexual assault among college women, and risk factors for sexual assault (e.g., risky sexual behaviors, multiple sex partners, the role of substances);
Combining sexual assault prevention education with alcohol and drug education programming (e.g., education concerning how levels of alcohol consumption and use of different drugs, and their interactions, affect cognitive functions; harm reduction messages; education about the impact of alcohol and drug use, especially heavy episodic drinking, has on cognitive functions, which reduces one’s ability to detect dangerous cues and threats, and one’s ability to effectively resist unwanted advances that can arise in common college social situations);
Stressing that even though many sexual assaults involves substance use by the victim, this does not imply that women are to blame for their sexual assault. Victimization is committed by the perpetrator, and therefore the sole responsibility for the assault lies with the perpetrator;
Educating women about different types of sexual assault, especially since there appears to be continuity in the type of sexual assault experienced over time (physically forced or incapacitated sexual assault);
Teaching effective sexual assault resistance strategies to reduce harm, particularly with respect to strategies for protection from men that women know and trust;
Educating women about how to increase their assertiveness and self-efficacy;
Conveying knowledge about how to report to police or school officials, the availability of different types of services on and off campus;
Stressing the importance of reporting incidents of attempted and completed sexual assault to mental and/or physically health service providers and security/law enforcement personnel, and the importance to seeking services, especially given the well-documented negative impacts sexual assault can have on psychological and physical functioning.
Programs for men to prevent sexual assault perpetration could include:
Providing accurate information on legal definitions of and legal penalties for sexual assault;
Informing men that they are ultimately responsible for determining (1) whether or not a women has consented to sexual contact, and (2) whether or not a women is capable of providing consent; and
Educating men that an intoxicated person cannot legally consent to sexual contact and that having sexual contact with an intoxicated or incapacitated person is unacceptable.
All of these prevention programs should be tailored to include risk factors that both college
women and men encounter in common college social interactions/situations. Moreover, the
programs should be designed as continuing educational curriculums rather than brief, “one
shot” doses since research suggests that the former approach is more helpful.
6-5
This document is a research report submitted to the U.S. Department of Justice. This report has not been published by the Department. Opinions or points of view expressed are those of the author(s)
and do not necessarily reflect the official position or policies of the U.S. Department of Justice.

The Campus Sexual Assault (CSA) Study
6.3 CSA Study Limitations
Although the CSA Study methodology was effective and efficient, and generated many
interesting and useful findings, the study is not without limitations. First, the data are cross-
sectional in nature, which precludes us from knowing exactly how concepts relate to each
other temporally, particularly with respect to “risk factors” for sexual assault. For example,
it appears that the frequency with which undergraduate women get drunk is associated with
their risk for being victims of sexual assault; however, it is possible that victims of sexual
assault increase the frequency with which they got drunk as a result of the victimization, in
which case frequency of getting drunk is not a risk factor for, but a consequence of, being
sexually assaulted.
Another limitation of the CSA Study, inherent with Web-based surveys, is that the response
rates were relatively low. Although the response rates were not lower than what most Web-
based surveys achieve, they are lower than what we typically achieve using a different
mode of data collection (e.g., face-to face-interviewing). However, other modes of data
collection are considerably more expensive and time consuming. Additionally, other modes
would not have given respondents the same degree of anonymity and privacy and thus
could have reduced data quality. Therefore, we feel that the trade-offs associated with low
response rates are in many ways overcome by the benefits of cost-efficiency and data
quality (in terms of respondent anonymity and privacy, which are associated with more
accurate reporting of sensitive behaviors). In addition, it is important to note that the
nonresponse bias analyses that have been conducted to date have been encouraging and
that we were able to weight the data to adjust for the observed nonresponse bias. It is also
encouraging that the sexual assault prevalence rates generated from this study are
consistent with data from other university-based studies on sexual assault.
A third limitation of the CSA Study, or at least a shortcoming worth pointing out, relates to
the data we attempted to collect from males on sexual assault victimization and
perpetration. The response rates for males were disappointingly low, which creates concerns
regarding the external validity of the data. Furthermore, the self-reported rates of sexual
assault perpetration were extremely low (particularly when compared with the limited
previous studies that have explored self-reported perpetration among university men),
which makes us seriously doubt the validity of these data. Several explanations for the
extremely low self-reported rate of sexual assault perpetration exist. First, perhaps
perpetrators were much less likely than nonperpetrators to participate in the survey, which
would result in artificially deflated estimates. Second, among the males who did participate
in the survey, it is certainly possible that some did not respond honestly to the questions
about sexual assault. Actual perpetrators may not have believed the answers they provided
would remain anonymous and believed they might face serious consequences associated
with reporting their criminal behavior. This possibility is somewhat discouraging. Given that
the CSA Study methodology afforded respondents an exceptional amount of privacy and
6-6
This document is a research report submitted to the U.S. Department of Justice. This report has not been published by the Department. Opinions or points of view expressed are those of the author(s)
and do not necessarily reflect the official position or policies of the U.S. Department of Justice.

Section 6 — Conclusion and Recommendations
anonymity, the perpetration data cast some doubt on whether researchers can credibly
collect data on perpetration of sexual assault via any methodology. Finally, although we
used parallel wording for the victimization and perpetration questions, it is possible that
men and women view certain sexual encounters differently. A woman might answer
affirmatively to a question asking about whether she had experienced a particular type of
unwanted sexual contact because someone used physical force or because she was
incapacitated and unable to provide consent. In contrast, a man may view the same
encounter as consensual and answer negatively to a question asking whether he has had
sexual contact with someone by using physical force or when the person was incapacitated
and unable to provide consent.
It is also unclear whether the male data on victimization are accurate, because there is such
limited prior research with which to compare the estimates. Given that the male component
of the CSA Study was exploratory, we believe it was a worthwhile endeavor, but it is unclear
whether we can draw any meaningful conclusions from the data collected from
undergraduate males.
6.4 Conclusion
The CSA Study generated many useful data on sexual assault that have not previously been
presented in the literature. Sexual assault is a serious social, public safety, and public
health problem that affects men and women across the country. University students may be
at increased risk for sexual assault, particularly certain types of sexual assault. The CSA
Study data suggest women at universities are at considerable risk for experiencing sexual
assault, especially AOD-enabled sexual assault, and that a number of personal and
behavioral factors are associated with increased risk. Universities may be able to take
several steps to reduce the prevalence of sexual assault, as well as improve the resources
for and response to sexual assault victims, by
better educating males and females about what constitutes sexual assault, how prevalent it is, when it is most likely to happen, and subgroups who may be at greatest risk;
including information about the use and abuse of alcohol and how it can increase one’s risk for sexual assault in all prevention and education messages;
making sure all students are aware of the various resources available on and off campus to victims of sexual assault;
ensuring that crisis centers and law enforcement have appropriate protocols and staff in place to deal with victims of sexual assault; and
educating students about what they should do if they witness a sexual assault, experience a sexual assault, or have a friend who is sexually victimized.
6-7
This document is a research report submitted to the U.S. Department of Justice. This report has not been published by the Department. Opinions or points of view expressed are those of the author(s)
and do not necessarily reflect the official position or policies of the U.S. Department of Justice.

This document is a research report submitted to the U.S. Department of Justice. This report has not been published by the Department. Opinions or points of view expressed are those of the author(s)
and do not necessarily reflect the official position or policies of the U.S. Department of Justice.

7. FUTURE DIRECTIONS
Several additional steps are planned for the CSA Study. Once the analyses on sexual assault
victimization have been completed, we plan to use the CSA data for a variety of
supplemental analyses. Specifically, we plan to explore in more detail the data on dating
violence, examining gender differences in dating violence victimization and perpetration
(both emotional and physical) and identifying risk factors for dating violence among our
university sample. In addition, we anticipate that the participating universities will be
particularly interested in the data on attitudes toward sexual assault. Therefore, we plan to
identify particular subgroups of students (both male and female) who might be appropriate
targets for sexual assault prevention programming. Finally, we plan to fully explore the data
on substance use, once again for the purpose of informing prevention programs at the
participating universities.
Beyond further analyses of the existing CSA Study data, we have identified several key
future directions for our research. First, we feel that the successful implementation of the
methodology pioneered for the CSA Study justifies the expansion of the CSA Study to
additional universities. It would be of substantial value to field the CSA Study at universities
in other regions of the country, as well as other types of universities, such as private
universities (or colleges) or historically black colleges and universities (HBCUs). The low cost
and significant efficiency of the CSA Study methodology would make the replication at
additional universities extremely feasible for minimal investment. Second, we plan to use
the survey data to assist in developing sexual assault prevention programming at the
participating universities. We have begun preliminary prevention discussions with key
officials at the universities and intend to further contribute to prevention messages that are
grounded in empirical data reflecting actual experiences with sexual assault at the
participating universities. We are also interested in evaluating the prevention interventions
developed and implemented as a result of the CSA Study.
7-1
This document is a research report submitted to the U.S. Department of Justice. This report has not been published by the Department. Opinions or points of view expressed are those of the author(s)
and do not necessarily reflect the official position or policies of the U.S. Department of Justice.

This document is a research report submitted to the U.S. Department of Justice. This report has not been published by the Department. Opinions or points of view expressed are those of the author(s)
and do not necessarily reflect the official position or policies of the U.S. Department of Justice.

REFERENCES
Abbey, A. (1991). Acquaintance rape and alcohol consumption on college campuses: How are they linked? Journal of the American College of Health, 39 (4), 165–169.
Abbey, A., Ross, L.T., and McDuffie, D. (1994). Alcohol’s role in sexual assault. In R.r. Watson (Ed.), Addictive Behaviors in Women. Drug and Alcohol Abuse Reviews, vol. 5 (pp. 97–123). Totowas, NJ: Humana Press.
Abbey, A., Ross, L.T., McDuffie, D., and McAuslan, P. (1996). Alcohol and dating risk factors for sexual assault among college women. Psychol. Women Q. 20, 147–169.
American College Health Association. (2004). National College Health Assessment: Reference Group Executive Summary Spring 2004. Baltimore, MD: American College Health Association.
American Prosecutors Research Institute. (1999). The prosecution of Rohypnol and GHB related sexual assaults. Alexandria, VA: American Prosecutors Research Institute.
Bachar, K., and Koss, M.P. (2001). From prevalence to prevention: Closing the gap between what we know about rape and what we do. Pp. 117–142 in C.M. Renzetti, J.L. Edelson, and R.K. Bergen (Eds), Sourcebook of Violence on women. Thousand Oaks, CA: Sage. 2001.
Brecklin, L.R., and Ullman, S.E. (2001). The role of offender alcohol use in rape attacks: An analysis of National Crime Victimization Survey data. Journal of Interpersonal Violence. 16, 3–21.
Brecklin, L.R., and Ullman, S.E. (2002). The roles of victim and offender alcohol use in sexual assaults: Results from the National Violence Against Women Survey. Journal of Studies on Alcohol. 63, 57–63.
Caetano, R., Clark, C.L., and Tam, T. (1998). Alcohol consumption among racial/ethnic minorities: Theory and research. Alcohol Health Research World. 22, 233–241.
Cashin, J.R., Presley, C.A.., and Meilman, P.W. (1998). Alcohol use in the Greek system: Follow the leader? Journal of Studies on Alcohol. 1:63–70.
Cohen, J. (1988). Statistical power analysis for the behavioral sciences (2nd ed.). Hillsdale, NJ: Lawrence Earlbaum Associates.
Coker, A.L., Walls, L.G., and Johnson, S.E. (1998). Risk factors for traumatic physical injury during sexual assaults for male and female victims. Journal of Interpersonal Violence. 13, 605–620.
Copenhaver, S., & Grauerholz, E. (1991). Sexual victimization among sorority women: Exploring the links between sexual violence and institutional practices. Sex Roles, 24(1–2), 31–41.
Corbin, W.R., Bernat, J.S., Calhoun, K.S., McNair, L.D., & Seals, K.L. (2001). The role of alcohol expectancies and alcohol consumption among sexually victimized and nonvictimized college women. Journal of Interpersonal Violence, 16(4), 297–311.
R-1
This document is a research report submitted to the U.S. Department of Justice. This report has not been published by the Department. Opinions or points of view expressed are those of the author(s)
and do not necessarily reflect the official position or policies of the U.S. Department of Justice.

The Campus Sexual Assault (CSA) Study
Curtin, R., Presser, S., and Singer, E. (2005). Changes in telephone survey nonresponse over the past quarter century. Public Opinion Quarterly, 69, 87–98.
DeKeseredy, W., & Kelly, K. (1993). The incidence and prevalence of women abuse in Canadian University and college dating relationships. Canadian Journal of Sociology, 18, 137–59.
Dembo, R., Williams, L., Wothke, K., et al. (1992). The role of family factors, physical abuse, and sexual victimization experiences in high risk youths’ alcohol and other drug use and delinquency: a longitudinal model. Violence Vict. 7: 245.
ElSohly, M.A., & Salamone, S.J. (1999). Prevalence of drugs used in cases of alleged sexual assault. Journal of Analytical Toxicology, 23, 141–146.
Fisher, B.S., Sloan, J.J., Cullen, F.T., & Lu, C. (1998). Crime in the ivory tower: The level and sources of student victimization. Criminology, 36, 671–710.
Fisher, B.S., Cullen, F.T., & Turner, M.G. (2000). The sexual victimization of college women. Washington, DC: U.S. Department of Justice.
Fisher, B.S., Daigle, L.E., Cullen, F.T., & Turner, M.G. (2003). Reporting sexual victimization to the police and others: Results from a national-level study of college women. Criminal Justice and Behavior. 30(1):6–38.
Folsom, R.E., and Singh, A.C. (2000). The generalized exponential model for sampling weight calibration for extreme values, non-response, and post-stratification. A SA Proc Surv. Res. Meth. Sec., 598–603.
Forbes, G.B., Adams-Curtis, L.E., Pakalka, A.H., & White, K.B. (2006). Dating aggression, sexual coercion, and aggression-supporting attitudes among college men as a function of participation in aggressive high school sports. Violence Against Women, 12, 441–455.
Gidycz, C.A., Hanson, K., & Layman, M.J. (1995). A prospective analysis of the relationships among sexual assault experiences. Psychology of Women, 19, 5–19.
Grayson, C.E., and Nolen-Hoeksema, S. (2005). Motives to drink as mediators between childhood sexual assault and alcohol problems in adult women. Journal of Traumatic Stress, 19(2), 137–145.
Greene, D.M. & Navarro, R.L. (1998). Situation-specific assertiveness in the epidemiology of sexual victimization among university women. Psychol Women Q, 22, 589–604.
Gross, Allen M., Winslett, Andrea, Roberts, Miguel, and Gohm, Carol L. (2006). An Examination of Sexual Violence Against College Women. Violence Against Women, Vol. 12, 3, pp. 288–300.
Groves, R.M., and Wissoker, D. (1999). 1997 NSAF Methods Report No. 7 - Early Nonresponse Studies of the 1997 National Survey of America’s Families. Washington, D.C.: Urban Institute.
Hanson, K.A., & Gidycz, C.A. (1993). Evaluation of a sexual assault prevention program. Journal of Consulting and Clinical Psychology, 61, 1046.
R-2
This document is a research report submitted to the U.S. Department of Justice. This report has not been published by the Department. Opinions or points of view expressed are those of the author(s)
and do not necessarily reflect the official position or policies of the U.S. Department of Justice.

References
Himelein, M.J. (1995). Risk factors for sexual victimization in dating: A longitudinal study of college women. Psychology of Women Quarterly. 19:31–48.
Hindmarch, I., & Brinkmann, R. (1999). Trends in the use of alcohol and other drugs in cases of sexual assault. Human Psychopharmacology, 14, 225–231.
Holmes, M., and Resnick, H.A., Kirkpatrick, D.G., and Best, C.L. (1996). Rape-related Pregnancy: Estimates and Descriptive Characteristics from a National Sample of Women. American Journal of Obstetrics and Gynecology. 175(2), 320–325.
Hurley, M., Parker, H., and Wells, D.L. (2006). The epidemiology of drug facilitated sexual assault. Journal of Clinical forensic Medicine. 13, 181–185.
Kalof, L. (1993). Rape supportive attitudes and sexual victimization experiences of sorority and nonsorority women. Sex Roles. 29:767–780.
Karjane, H.M., Fisher, B.S., and Cullen, F.T. ( 2005). Sexual Assault on Campus: What Colleges and Universities are Doing About It. Washington, DC: U.S. Department of Justice.
Kaysen, D., Neighbors, C., Martell, J. Fossos, N., and Larimer, M.E. (in press). Incapacitated rape and alcohol use: A prospective analysis. Addictive Behaviors.
Kilmer, J.R., Larimer, M.E., Parks, G.A., Dimeff, L.A., and Marlatt, G.A. (1999). Liability management or risk management? Evaluation of a Greek system alcohol policy. Psychology of Addictive Behaviors. 13(4):269–78.
Kilpatrick, D.G., Acierno, R., Resnick, H.S., Saunders, B.E., and Best, C.L. (1997). A 2-year longitudinal analysis of the relationships between violent assault and substance use in women. Journal of Consulting and Clinical Psychology, 65(5), 834–847.
Koss, M. P., Gidycz, C. A., & Wisniewski, N. (1987). The scope of rape: Incidence and prevalence of sexual aggression and victimization in a national sample of higher education students. Journal of Consulting and Clinical Psychology, 55(2), 162–170.
Koss, M.P. (1988). Hidden rape: Sexual aggression and victimization in a national sample of students in higher education. In: Burgess, A.W. (Ed.) Rape and Sexual Assault II, new York: Garland, pp. 3–25.
Koss, M.P. (1993). The impact of crime victimization on women’s medical use. Journal of Women’s Health. 2(1), 67–72.
Koss, M.P., & Dinero, T.E. (1988a). Predictors of sexual aggression among a national sample of male college students. Annals of the New York Academy of Sciences. 528:133–147.
Koss, M.P., & Dinero, T.E. (1988b). Stranger and acquaintance rape: are there differences in the victim’s experience? Psychol. Women Q. 12, 1–24.
Koss, M.P., & Dinero, T.E. (1989). Discriminant analysis of risk factors for sexual victimization among a national sample of college women. Journal of Consulting and Clinical Psychology, 57, 242.
R-3
This document is a research report submitted to the U.S. Department of Justice. This report has not been published by the Department. Opinions or points of view expressed are those of the author(s)
and do not necessarily reflect the official position or policies of the U.S. Department of Justice.

The Campus Sexual Assault (CSA) Study
Lackie, L. & deMan, A.F. (1997). Correlates of sexual aggression among male university students. Sex Roles. 37:451–457.
Larimer, M.E., Lydum, A.R., Anderson, B.K., & Turner, A.P. (1999). Male and female recipients of unwanted sexual contact in a college student sample: Prevalence rates, alcohol use, and depression symptoms. Sex Roles, 40(314), 295–308;
LeBeau, M., Andollo, W., Hearn, W.L., Baselt, R., Cone, E., Finkle, B., et al. (1999). Recommendations for toxicological investigations of drug-facilitated sexual assaults. Journal of Forensic Science, 44, 227–230.
Ledray, L.E. (2000). Drug facilitated sexual assault issues paper. (NCJ Publication No. NCJ 188888). Washington, DC: U.S. Department of Justice, National Institute of Justice.
Lott, B., Reilly, M.E., & Froward, D.R. (1982). Sexual assault and harassment: A campus community case study. Signs: Journal of Women in Culture and Society, 8(2), 297–319.
Martin, S.E., & Bachman, R. (1998). The contribution of alcohol to the likelihood of completion and severity of injury in rape incidents. Violence Against Women. 4, 694–712.
Marx, B.P., Van Wie, V., & Gross, A.M. (1996). Date rape risk factors: A review and methodological critique of the literature. Aggression and Violent Behavior, 1, 27.
Marx, B.P., Nichols-Anderson, C., Messman-Moore, T. Miranda, J.R., and Porter, C. (2000). Alcohol consumption, outcome expectancies, and victimization status among female college students. Journal of Applied Social Psychology, 30(5), 1056–1070.
McGregor, M.J., Lipowska, M., Shah, S., Du Mont, J., & De Siato, C. (2003). An exploratory analysis of suspected drug-facilitated sexual assault seen in a hospital emergency department. Women & Health, 37(3), 71–81.
Miranda, R.J.R., Meyerson, L.A., Long, P.J., Marx, B.P., and Simpson, S.M. (2002). Sexual assault and alcohol use: Exploring the self-medication hypothesis. Violence and Victims, 17(2), 205–217.
Miller, T.R., Cohen, M.A., and Wierama, B. (1996). Victim Costs and Consequences: A New Look. U. S. Dept. of Justice, Office of Justice Programs, National Institute of Justice.
Mohler-Kuo, M., Dowdall, G.W., Koss, M.P., & Wechsler, H. (2004). Correlates of rape while intoxicated in a national sample of college women. Journal of Studies on Alcohol, 65, 37–45.
Muehlenhard, C.L., & Ma, L. (1987). Date rape and sexual aggression in dating situations: Incidence and risk factors. Journal of Counseling Psychology, 34, 186–196.
Pitts, V.L., & Schwartz, M.D. (1993). Promoting self-blame in hidden rape cases. Humanity and Society, 17(4), 383–98.
Pope, E., & Shouldice, M. (2001). Drugs and sexual assault: A review. Trauma, Violence, & Abuse, 2, 51–55.
R-4
This document is a research report submitted to the U.S. Department of Justice. This report has not been published by the Department. Opinions or points of view expressed are those of the author(s)
and do not necessarily reflect the official position or policies of the U.S. Department of Justice.
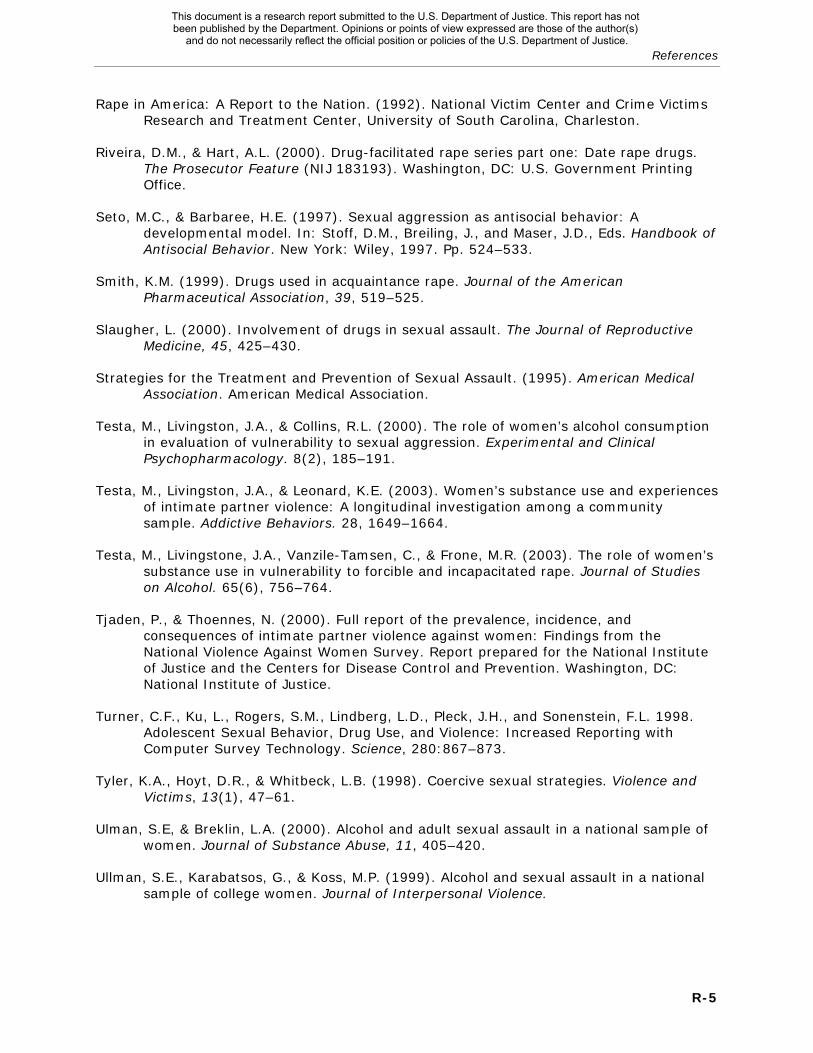
References
Rape in America: A Report to the Nation. (1992). National Victim Center and Crime Victims Research and Treatment Center, University of South Carolina, Charleston.
Riveira, D.M., & Hart, A.L. (2000). Drug-facilitated rape series part one: Date rape drugs. The Prosecutor Feature (NIJ 183193). Washington, DC: U.S. Government Printing Office.
Seto, M.C., & Barbaree, H.E. (1997). Sexual aggression as antisocial behavior: A developmental model. In: Stoff, D.M., Breiling, J., and Maser, J.D., Eds. Handbook of Antisocial Behavior. New York: Wiley, 1997. Pp. 524–533.
Smith, K.M. (1999). Drugs used in acquaintance rape. Journal of the American Pharmaceutical Association, 39, 519–525.
Slaugher, L. (2000). Involvement of drugs in sexual assault. The Journal of Reproductive Medicine, 45, 425–430.
Strategies for the Treatment and Prevention of Sexual Assault. (1995). American Medical Association. American Medical Association.
Testa, M., Livingston, J.A., & Collins, R.L. (2000). The role of women’s alcohol consumption in evaluation of vulnerability to sexual aggression. Experimental and Clinical Psychopharmacology. 8(2), 185–191.
Testa, M., Livingston, J.A., & Leonard, K.E. (2003). Women’s substance use and experiences of intimate partner violence: A longitudinal investigation among a community sample. Addictive Behaviors. 28, 1649–1664.
Testa, M., Livingstone, J.A., Vanzile-Tamsen, C., & Frone, M.R. (2003). The role of women’s substance use in vulnerability to forcible and incapacitated rape. Journal of Studies on Alcohol. 65(6), 756–764.
Tjaden, P., & Thoennes, N. (2000). Full report of the prevalence, incidence, and consequences of intimate partner violence against women: Findings from the National Violence Against Women Survey. Report prepared for the National Institute of Justice and the Centers for Disease Control and Prevention. Washington, DC: National Institute of Justice.
Turner, C.F., Ku, L., Rogers, S.M., Lindberg, L.D., Pleck, J.H., and Sonenstein, F.L. 1998. Adolescent Sexual Behavior, Drug Use, and Violence: Increased Reporting with Computer Survey Technology. Science, 280:867–873.
Tyler, K.A., Hoyt, D.R., & Whitbeck, L.B. (1998). Coercive sexual strategies. Violence and Victims, 13(1), 47–61.
Ulman, S.E, & Breklin, L.A. (2000). Alcohol and adult sexual assault in a national sample of women. Journal of Substance Abuse, 11, 405–420.
Ullman, S.E., Karabatsos, G., & Koss, M.P. (1999). Alcohol and sexual assault in a national sample of college women. Journal of Interpersonal Violence.
R-5
This document is a research report submitted to the U.S. Department of Justice. This report has not been published by the Department. Opinions or points of view expressed are those of the author(s)
and do not necessarily reflect the official position or policies of the U.S. Department of Justice.

The Campus Sexual Assault (CSA) Study
U.S. Department of Justice, Bureau of Justice Statistics. (2003). National Crime Victimization Survey, 1995–2000: Violent Victimization of College Students. Washington, DC.
U.S. Department of Justice, Bureau of Justice Statistics (BJS). Data retrieved March 11, 2004, from www.ajp.usdoj.gov/bjs/abstract/cvusst.htm.
U.S. Department of Justice. (2003). Drug facilitated sexual assault resource guide. Washington, DC: National Drug Intelligence Center.
Vogel, R.E., and Himelein, M.J. (1995). Dating and sexual victimization: An analysis of risk factors among precollege women. Journal of Criminal Justice. 23(2), 153–162.
Watts, W.D., and Willis, A.M. (1993). Sexual abuse and drinking and drug use: implications for prevention. Journal of Drug Education. 23:183.
Wechsler, H., & Kuo, M. (2003). “Watering down the drinks: The moderating effect of college demographics on alcohol use of high-risk groups.” American Journal of Public Health, 93(11), 1929–1933.
Wechsler, H., Davenport, A., Dowdall, G., Moeykens, B., and Castillo, S. (1994). Health and behavioral consequences of binge drinking at colleges: A national survey of students at 140 campuses. JAMA. 272, 1672–1677.
Wechsler, H., Lee, J.E., Kuo, M., and Lee, H. (2000). College binge drinking in the 1990s: A continuing problem. Results of the Harvard School of Public Health 1999 College Alcohol Study. Journal of American College Health. 48, 199–210.
Wechsler, H., Lee, J.E., Kuo, M., Seibring, M., Nelson, T., and Lee, H. (2002). Trends in college binge drinking during a period of increased prevention efforts: Findings from four Harvard School of Public Health College Alcohol Study Surveys 1993–2001. Journal of American College Health. 50, 202–222.
R-6
This document is a research report submitted to the U.S. Department of Justice. This report has not been published by the Department. Opinions or points of view expressed are those of the author(s)
and do not necessarily reflect the official position or policies of the U.S. Department of Justice.

Appendix A. Classification of Sexual Assault Types
Part 1. Interview Questions Used in Sexual Assault Classification This section of the interview asks about nonconsensual or unwanted sexual contact you may have experienced. When you are asked about whether something happened since you began college, please think about what has happened since you entered any college or university. The person with whom you had the unwanted sexual contact could have been a stranger or someone you know, such as a family member or someone you were dating or going out with.
These questions ask about five types of unwanted sexual contact:
o forced touching of a sexual nature (forced kissing, touching of private parts, grabbing, fondling, rubbing up against you in a sexual way, even if it is over your clothes)
o oral sex (someone’s mouth or tongue making contact with your genitals or your mouth or tongue making contact with someone else’s genitals)
o sexual intercourse (someone’s penis being put in your vagina)
o anal sex (someone’s penis being put in your anus)
o sexual penetration with a finger or object (someone putting their finger or an object like a bottle or a candle in your vagina or anus.
The questions below ask about unwanted sexual contact that involved force or threats of force against you. Force could include someone holding you down with his or her body weight, pinning your arms, hitting or kicking you, or using or threatening to use a weapon against you.
Before you began college
Since you began college
Has anyone had sexual contact with you by using physical force or threatening to physically harm you?
o Yes o No [V9]∗
o Yes o No [V3]
Has anyone attempted but not succeeded in having sexual contact with you by using or threatening to use physical force against you?
o Yes o No [V10]
o Yes o No [V4]
∗ Text in light gray is programming language and was not visible on the survey.
A-1

The next set of questions ask about your experiences with unwanted sexual contact while you were unable to provide consent or stop what was happening because you were passed out, drugged, drunk, incapacitated, or asleep. These situations might include times that you voluntarily consumed alcohol or drugs and times that you were given drugs without your knowledge or consent.
Before you began college
Since you began college
Has someone had sexual contact with you when you were unable to provide consent or stop what was happening because you were passed out, drugged, drunk, incapacitated, or asleep? This question asks about incidents that you are certain happened.
o Yes o No [V11]
o Yes o No [V5]
Have you suspected that someone has had sexual contact with you when you were unable to provide consent or stop what was happening because you were passed out, drugged, drunk, incapacitated, or asleep? This question asks about events that you think (but are not certain) happened.
o Yes o No [V12]
o Yes o No [V6]
[If V3=yes] Earlier you indicated that since you began college, someone has had sexual contact with you by using physical force or threatening to physically harm you. The questions below ask about that experience. V3b. When the person had sexual contact with you by using or threatening you with physical
force, which of the following happened? Please check all that apply.
□ Forced touching of a sexual nature □ Oral sex □ Sexual intercourse □ Anal sex □ Sexual Penetration with a finger or object
[If V5=yes] Earlier you indicated that since you began college, someone has had sexual contact with you when you were unable to provide consent or stop what was happening because you were passed out, drugged, drunk, incapacitated, or asleep. The questions below ask about that experience. V5b. [if V5=yes] When the person had sexual contact with you when you were unable to provide
consent or stop what was happening because you were passed out, drugged, drunk, incapacitated, or asleep, which of the following happened? Please check all that apply.
□ Forced touching of a sexual nature □ Oral sex □ Sexual intercourse □ Anal sex □ Sexual Penetration with a finger or object □ Don’t Know
A-2

[If V5=yes] The next questions ask more about the time since you entered college that someone had sexual contact with you when you were unable to provide consent or stop what was happening because you were passed out, drugged, drunk, incapacitated, or asleep. C27. Just prior to (the incident/any of the incidents), had you been drinking alcohol? Keep in mind
that you are in no way responsible for the assault that occurred, even if you had been drinking. o Yes o No
C27a. [if C27=yes or 99] Were you drunk?
o Yes o No
C28. Just prior to (the incident/any of the incidents), had you voluntarily been taking or using any
drugs other than alcohol? o Yes o No
C29. Just prior to (the incident/any of the incidents), had you been given a drug without your
knowledge or consent? (yes, no, don’t know) o Yes o No o Don’t Know
A-3

Part 2. Sexual Assault Classification Procedures
A-4