DOCUMENT RESUME ED 301 303 JC 880 610 AUTHOR ...
35
DOCUMENT RESUME ED 301 303 JC 880 610 AUTHOR Livieratos, Barbara B. TITLE Report on the Results of the 1988 Survey of Telecourse Students. Research Report Number 54. INSTITUTION Howard Community Coll., Columbia, MD. Office of Research and Planning. PUB DATE Aug 88 NOTE 35p. PUB TYPE Reports - Research/Technical (143) -- Tests /Evaluation Instruments (160) EDRS PRICE MF01/PCO2 Plus Postage. DESCRIPTORS Community Colleges; Educational Objectives; *Enrollment Influences; Participant Satisfaction; *Student Attitudes; *Student Characteristics; *Telecourses; Two Year Colleges; *Two Year College Students ABSTRACT In 1988, a study was conducted at Howard Community College (HCC) to determine the educational goals, viewing patterns, and level of satisfaction of telecourse students. Questionnaires were administered during the last on-campus class meeting, requesting information on students' reasons for attending college, their sources of information about the telecourse, influences on their decision to take a telecourse, their interest in using a computer and modem to communicate with the instructor, use of library tapes to view the telecourse, students' personal characteristics, and suggestions for improvement. Study findings, based on responses from 54% of the 311 students enrolled in 21 telacourses in spring 1988, included the following: (1) 76% of the respondents were female, 88% were white, 80% were under 41 years of age, and 82% were employed; (2) 53% of the respondents had never taken a telecourse before; (3) 69% were enrolled in one telecourse, 23% in two, and 8% in three or more; (4) for 49% of the respondents, their primary goal in attending HCC was to transfer to a four-year institution; (5) 36% indicated that they always recorded the course for later viewing, 22% indicated that they usually did so, and 30% said they always or usually watched the course as it was televised; (6) 38% had used the library tapes of the telecourse; (7) 53% expressed interest in using their microcomputer and modem to take exams or communicate with the instructors; and (8) 77% rated "lacked time for regular class attendance" as a "very important" reason for taking the telecourse. The survey instrument is appended. (AAZC) Reproductions supplied by EDRS are the best that can be made from the original document.
-
Upload
khangminh22 -
Category
Documents
-
view
1 -
download
0
Transcript of DOCUMENT RESUME ED 301 303 JC 880 610 AUTHOR ...

DOCUMENT RESUME
ED 301 303 JC 880 610
AUTHOR Livieratos, Barbara B.TITLE Report on the Results of the 1988 Survey of
Telecourse Students. Research Report Number 54.INSTITUTION Howard Community Coll., Columbia, MD. Office of
Research and Planning.PUB DATE Aug 88NOTE 35p.
PUB TYPE Reports - Research/Technical (143) --Tests /Evaluation Instruments (160)
EDRS PRICE MF01/PCO2 Plus Postage.DESCRIPTORS Community Colleges; Educational Objectives;
*Enrollment Influences; Participant Satisfaction;*Student Attitudes; *Student Characteristics;*Telecourses; Two Year Colleges; *Two Year CollegeStudents
ABSTRACTIn 1988, a study was conducted at Howard Community
College (HCC) to determine the educational goals, viewing patterns,and level of satisfaction of telecourse students. Questionnaires wereadministered during the last on-campus class meeting, requestinginformation on students' reasons for attending college, their sourcesof information about the telecourse, influences on their decision totake a telecourse, their interest in using a computer and modem tocommunicate with the instructor, use of library tapes to view thetelecourse, students' personal characteristics, and suggestions forimprovement. Study findings, based on responses from 54% of the 311students enrolled in 21 telacourses in spring 1988, included thefollowing: (1) 76% of the respondents were female, 88% were white,80% were under 41 years of age, and 82% were employed; (2) 53% of therespondents had never taken a telecourse before; (3) 69% wereenrolled in one telecourse, 23% in two, and 8% in three or more; (4)for 49% of the respondents, their primary goal in attending HCC wasto transfer to a four-year institution; (5) 36% indicated that theyalways recorded the course for later viewing, 22% indicated that theyusually did so, and 30% said they always or usually watched thecourse as it was televised; (6) 38% had used the library tapes of thetelecourse; (7) 53% expressed interest in using their microcomputerand modem to take exams or communicate with the instructors; and (8)77% rated "lacked time for regular class attendance" as a "veryimportant" reason for taking the telecourse. The survey instrument isappended. (AAZC)
Reproductions supplied by EDRS are the best that can be madefrom the original document.

REPORT ON THE RESULTS OF THE 1988 SURVEY OF TELECOURSE STUDENTS
RESEARCH REPORT NUMBER 54
AUGUST 1988
Office of Research and Personnel
Howard Community College
Columbia, Maryland
"PERMISSION TO REPRODUCE THISMATERIAL HAS BEEN GRANTED BY
S. K. Radcliffe
TO THE EDUCATIONAL RESOURCESINFORMATION CENTER (ERIC."
U S DEPARTMENT OF EDUCATIONOfItce of Educational Research and Improvement
EDUCATIONA:. i4 SOURCES INFORMATIONUN/MR (ERIC)
)1'his document has been reproduced asreceived from the person or organizationOriginating it
0 Minor changes have been made to imprOvereproduction quality
Ppin's of view or Opinions stated in this dOCu
r) ment do not necessarily represent official
X.IOE RI position or policy

HOWARD CONMUNITY COLLEGE
BOARD OF TRUSTEES
Dr. Frederick A. Schoenbrodt, ChairpersonDr. Edward L. Cochran, Vice ChairpersonMr. Patrick F. O'ConnorMrs. Elizabeth G.L. AuldridgeMr. Ronald H. CarlsonMr. Steven W. SachsMr. Donald L. CampbellDr. Dwight A. Burrill, Secretary-Treasurer
0

REPORT ON THE RESULTS OF THE 1988 SURVEY OF TELECOURSE STUDENTS
Project Director:
CREDITS
Virginia E. Novak
Research Design andSurvey Construction: Vladimir Marinich and
Barbara B. Livieratos
Data Analysis andReport Author: Barbara B. Livieratos
Technical Editing andComputer Graphics: Charlotte A. Monroe
LIiv
TABLE OF CONTENTS
Page
Brief Summary of Research vi
List of Tables and Graphs vii
Background 1
Telecourse Enrollees and Survey Respondents 3
Survey Respondents' Characteristics 5
Patterns of Enrollment and Viewing 7
Sources of Information 11
Reasons for Registering 13
Satisfaction Ratings 17
Course Elements 21
Respondents' Comments 23
Concluding Remarks 25
Telecourse Survey Form 27
List of Research Publications 29
5v

HOWARD COMMUNITY COLLEGEOFFICE OF RESEARCH AND PERSONNEL
BRIEF SUMMARY OF RESEARCH (RESEARCH REPORT NUMBER 54)
TITLE: REPORT ON THE RESULTS OF THE 1988 SURVEY OF TELECOURSESTUDENTS
AUTHOR: Barbara B. Livieratos, Research Analyst
PURPOSE: This report describes the findings from a survey of Howard
Community College students who were enrolled in telecoursesin the spring of 1988. The survey was conducted to determine
enrollees' goals and reasons for taking a telecourse, tolearn about their viewing patterns, and to gauge their levelof satisfaction with various elements of telecourses.Another purpose of the survey was to hP.../e repondents tell howthey found out about telecourses ana how they would prefer tofind out about them in the future.
METHODOLOGY: The structure of most telecourses includes an on-campuscourse introduction and four other class meetings with an HCC
instructor. The telecourse survey was administered at thelast class session in the spring of 1988. In addition,surveys were mailed to members of the video rental courses(these have no group meetings and are run like independentstudy courses). Overall, 54% of the telecourse enrolleescompleted the survey.
FINDINGS: The report details findings from the survey. Among its
highlights is the demographic profile of respondents:
o 76% Femaleo 88% Whiteo 87% under age 45o 82% employed
While there are many reasons for enrolling in telecourses,the most important cited by survey respondents were:
o Lack of time for regular class attendanceo Wanting to combine earning of college credits with
family responsibilitieso Minimizing travel
13
-vi-

LIST OF TABLES
Page
Table One. Telecourse Survey Respondentsand Telecourse Enrollment. 4
Table Two. Characteristics of Respondents tothe 1988 Telecourse Survey 6
Table Three. Survey Respondents' Past, Present,and Future Enrollment in Telecourses 8
Table Four. How Survey Respondents Found OutAbout Their Telecou-se and Their PreferredSource of Future Information 12
Table Five. Respondents' Ratings of Reasonsfor Registering for a Telecourse 14
Table Six. Survey Respondents' Ratings ofSatisfaction With Their Telecourse 18
Table Seven. Respondents' SatisfactionRatings With Various Course Elements 22
LIST OF GRAPHS
Graph 1. Respondents' Primary Goal in Taking Courses 10
Graph 2. Respondents' Rating of Reasonsfor Renistering for a Telecourse 15
Graph 3. Respondents' Ratings of OverallSatisfaction With Telecourse 19

REPORT ON THE RESULTS OF THE 1988 SUkVEY OF TELECOURSE STUDENTS
BACKGROUND
Howard Community College has been offering telecourses as an
alternative to courses offered in the standard course formats and timeslots since the early eighties. Interest in telecourses has beenincreasing, as evidenced by the increased enrollment in these courses.Telecourse enrollment in the spring of 1988 was 311, as compared to thefollowing figures for spring semesters for the past three years:
1988 - 3111987 - 2401986 - 181
1985 - 171
Feedback from students has been sought for planning andinformational purposes through surveys in 1981, 1983, and again in thespring of 1988. This report presents the findings from the 1988 surveyof telecourse students.
An attempt was made to have all telecourse enrollees in the springof 1988 fill out the survey by having the HCC instructor for eachcourse distribute the survey to the students at the last scheduled on-campus meeting of the telecourse participants. Some telecourses,however, are offered with a video rental option, and have no generalclass meetings. These courses are run similarly to independent studycourses. The survey was mailed to enrollees in these courses. Therewas 9reat variability by course in both the attendance at the finalsession and in the proportion of students who filled out the survey.In the tables and graphs presented in this report, all percentagefigures are only for those who completed a given survey item. In otherwords, no missing data are included in the tables and graphs.

TELECOURSE ENROLLEES AND SURVEY RESPONDENTS
Table One shows the number and percentage of students in eachcourse w o responded to the survey and the number of enrollees in eachcourse. It also shows the percentage of course enrollees who respondedto the survey. Among the table's highlights are:
Altogether there were 311 enrollees in telecourses in the
spring of 1988. Of that number, 168, or 54% completed thetelecourse survey.
Eight of the 21 telecourses had fewer than 50% of theenrollees responding to the survey. Those courses were: ArtHistory I, Principles of Marketing, Introduction to
Composition, Principles of Economics, Introduction toPhilosophy, Introduction to Sociology, Humanities Through theArts, and Japan - The Living Tradition.
The courses with the highest proportion of enrolleesrepresented in the survey were Introduction to HealthEducation (88%), English Literature II (83%), and ElementaryAstronomy (80%).
-3-

TABLE ONE. TELECOURSE SURVEY RESPONDENTS AND TELECOURSE ENROLLMENT
NUMBER OF
COURSE RESPONDENTS
PERCENT OF
RESFONDENTS
TOTAL
ENROLLMENT
PERCENT OF
COURSE ENROLLEES
Principles of Accounting 11 7% 17 65%
Art History 1 3 2% 17 18%
Intro to Business and Organization 12 7% 19 63%
Principles of Marketing 3 2% 15 20%
Introduction to Composition 6 4% 15 40%
English Literature II 5 3% 6 837.
Software Applications for Micros 4 2% 8 50%
Intro to Computer Systems 7 4% 12 58%
Principles of Economics 11 1% 23 49%
Introduction to Health Education 15 9% 17 88%
American History Since 1877 13 8% 22 59%
College and Algebra Trigonometry 9 5% 15 60%
Principles of Managenent 10 6% 18 56%
Introduction to Philosophy 4 2% 9 44%
General Psychology 11 7% 21 52%
Child Growth and Development 15 9% 24 6LZ
Elementary Astronomy 12 7% 15 80%
Introduction to Sociology 4 2% 9 44%
Oceanus: The Marine Environment 8 5% 14 57%
timardties Through the Arts 3 2% 9 33%
Japan - The Living Tradition 2 1% 6 33%
TOTAL 168 100% 311 54%
16
-4-

SURVEY RESPONDENTS' CHARACTERISTICS
Table Two shows the characteristics of those who responded to thetelecourse survey. It reveals that:
Just over three-quarters of the responding enrollees werefemale. This is somewhat higher than the overall 61% femaleenrollment for the spring 1988 semester.
Telecourse enrollees who responded mirrored the overallspring 1988 enrollment figures for age, with 80% being fortyyears old or younger. Further analysis reveals that as manyas 64% of the telecourse enrollees were between 25 and 44years of age.
Eighty-eight percent of the telecourse survey respondentswere white, a somewhat higher proportion than the 80% of allspring 1988 enrollees.
Sixty-nine percent of the responding telecourse enrollees didnot have credentials beyond a high school diploma. Among the30% who had post-secondary work, 3% had certificates, 14%
A.A. degrees, 9% Bachelors degrees, and 4% had a postgraduate degree.
Fully 82% of the enrollees who responded to the survey wereemployed - 70% full-time and 12% part-time. Only 3% of therespondents described themselves as unemployed. Among thoseemployed, 80% worked regular work hours during the day, whilethe remainder worked evenings or rotating shifts.
-5-

TABLE TWO. CHARACTERISTICS OF RESPONDENTS TO THE1988 TELECOURSE SURVEY
CHARACTERISTIC
SEX:
N %
MALE 39 24%FEMALE 122 76%
AGE:11 - 20 13 8%21 - 30 55 35%31 - 40 58 37%41 - 50 26 16%51 AND OVER 6 4%
RACE:BLACK 16 10%WHIT'. 140 88%OTHER 3 2%
CURRENT EDUCATION LEVEL:LESS THAN 12Tr: GRADE 3 2%
G.E.D. 5 3%
HIGH SCHOOL DIPLOMA 105 64%CERTIFICATE 5 3%
A.A. DEGREE 23 14%BACHELOR'S DEGREE 14 9%
POST GRADUATE DEGREE 8 4%
EMPLOYMENT STATUS:FULL-TIME 114 70%PART-TIME 20 12%
FULL-TIME STUDENT 12 7%
FULL-TIME HOMEMAKER 13 8%
NOT EMPLOYED 4 3%
WORK SCHEDULE:REGULAR DAY TIME 108 80%EARLY EVENING 3 2%
LATE EVENING 8 6%
ROTATING SHIFTS 16 12%
12
-6-

PATTERNS OF ENROLLMENT AND VIEWING
An attempt was made through the survey to understandenrollees' patterns of taking telecourses. Table Three reports results
garn red from those survey items. Among the table's highlights are:
For half of the spring 1988 enrollees wi, responded, it wasthe first time they had enrolled in a telecourse. Forty-
seven percent had taken another telecourse at HCC, while five
individuals had taken telecourses elsewhere.
A slight majority of the respondents would not have enrolledin a standard class of the same course.
Almost a quarter of the enrollees were taking one other
telecourse, for a total of two. Six percent were takingthre? or more telecourses, but most respondents (69%) wereenrolled in only one telec,urse.
Respondents were asked what other college classes they weret:king this semester. Since they could make multiple choicesfrom a list, the percentages shown for this item add up to
more than 100%. Altogether 123 respondents (73%) were taking
some type of other HCC course in addition to thetelecourse(s). Forty-seven respondents were taking no other
courses, and 11 were taking classes at another college. It
is important to note that these figures may contain someoverlap, with the same individual being countA twiceaccording to his/her course configuration.
1-7-
3

TABLE THREE. SURVEY RESFONEENTS' PAST, PRESENT, AND FUIURE EMIOLUENT IN TEIECOXISES
SURVEY TIM
HAVE TAKEN T.V. CREDIT OM= COURSE IEFORE:
YES, AT W 79 47%
Yr _A:MERE 5 3%
tr 84 53%
11WOULD HAVE BROILED IN STANOARD CLASS OF SAME COURSE:
YES 76 47%
NO 85 53%
011R TELECOURSES NOW TAKIhr:
POE 108 692
OtE 36 23%
TWO 10 6%
"IEEE CR MORE 3
OCTHER COLL= GASSES THIS MONTER:EVENING CLASS CH HOC CAMPUS 57
DAY CLASS ON HOC CAMPUS 48
NONE 47
OTHER ITTECCURSE(S) 31
CIFFCA1EUS HOC CAMPUS 14
CLASS(ES) AT ANOTHER COLLEGE 11
WEEKEND Ill CLASS 4
mom (DAL IN TAIW3 COURSES:TRANSFER TO A FOUR YEAR mulTurloo 82 492
UPLCRATICN OF NEW CAREER CR ACADEMIC AREA 29 17%
PREPARATION OF MEDIATE MIRY INTO A CAREER 18 11%
MATE SKILLS FOR A XS OATTR/TLY HELD 14 82
INTERIM AND SELF-BRICHENT 12 72
OTHER 12 7%
WOUUD TAKE AMODER TELEOZURSE:
YES 144 88%
NO 20 122
INTERFSTED IN MICRO/11I)F21 TO 034411ICATE OR TAKE EWE:
YES 85 532
NO 77 472
HAVE A MICRO AVAILABLE FOR USE:
YIE 83 51%
NO 80 49%
HAVE A MODEM AVAILABLE FCR USE:
YES 42 26%
NO 121 74%
HAVE A VCR:
YES 159 982
NO 4 22
VIDIING PATTERN:
ALWAYS RDO3W FOR LATER VIEWING 56 36%
USUALLY RECORD FOR LATER VIEWBC 34 222
USUALLY WATCH AS IT IS TELEVISED 28 182
ALWAYS WATCH AS TT IS TELEVISED 19 122
TONIWATCH CR IE03W, BUT RELY ON TEXIMOCE 17 11%
HAVE USED LI BRARY APES OF CURSE:
62 38%
1(X) 622
SATISFIED WM1 LIBRARY TAPES:
YES 60 92%
FD 5 8%
-8-14

It can be said that telecourse enrollees who responded to thesurvey were serious students with concrete goals in mind. As
shown in Gra h One, half of the enrollees had a goal oftransferring o a ur year institution, while 36% had careeror academic intentions in mind.
Eighty-eight percent of the respondents said that they wouldtake another telecourse. Specific areas of satisfaction withthe telecourses are reported in Table Six.
About half of the respondents have a micro-computer availablefor use and would be interested in using it to take exams orto communicate with telecourse instructors. Only one-fourth,however, had a modem available for use.
Fully 98% of the survey respondents had a VCR.
Fifty-eight percent usually or always recorded the telecoursesessions for later viewing, while 30% usually or alwayswatched the sessions as they were televised. Eleven percentof the respondents admitted to not watching or recording thesessions, but relying on the written materials for the class.
Library tapes of the telecourses are available, and 38% ofthe respondents said that they had used those. Ninety-twopercent of the tape users reported satisfaction with thetapes.
-9- .15

p.IIIIC
"*.m...
Imm
ilea:111111.-7a.::::::surbouno..
411111111.3a
No
n110.11111111.
11111.
mum
elamplim
:1111100.1111111;;L:11
1111111111111111,
"0.4
Icri,.....,
..7=.4.Im
o.
VIIIM
M
:
Wailii::1!;:Foiliiiiiir...11114raPir
Yinim
m
.1.:S:: al:I*
0 .
Imm
Om
mom
d.V.
.0
....1'.vow
FiErN
siiir: re.113,IM::i:::::
y y.6as........."
.11..........1::::::
liiiiiii1111145111;;...
ii::;;;;iiiiiiiii!!!!!:/!!!::::::L::1:::i
Iiilliiiiiii111111111111111i:ii!!!!!....!;11:!!!!!:iiiiFir
lEq114:11;;;;;;;;;;;giL
T:ii::::::;;;::::
.. ".7
.
"::11:.":"C .i70:10iii'...*'.........411H
iiiiiiiiiiiiiiIiiiiiiiillit!T;;;i1E
proo

SOURCES OF INFORMATION
The telecourse survey was also considered a marketing informationresource, and items asked respondents how they had found out about thetelecourse(s) in which they were enrolled and how they preferred tofind out about future telecourses. Results from this section of thesurvey are displayed in Table Four. It shows:
The schedule of classes mailed to homes was the source ofinformation cited more than any other, with 50% reportingthat they found out about their telecourse(s) that way. It
was also chosen as the preferred method of finding out aboutcourses in the future, with 87% choosing it as one of theirtop three choices.
The telecourse brochure mailed to homes was the third mostpopular manner in which respondents had received information,and it ranked second in overall choices, with 77% choosing itas one of the top three choices as a future informationsource.
Picking up a schedule of classes at HCC was the listed as aprimary source of information by 24% of the respondents. It
ranked as the third choice of information sources, with 49%listing it as one of their top three choices.
Howard County Cable was noted by 12% of the respondents asbeing one of their preferred sources of information. Picking
up a Telecourse brochure at HCC was chosen by 11%. Othersources listed on the survey were chosen by ten percent orless as preferred ways of finding out about futuretelecourses.
1?11
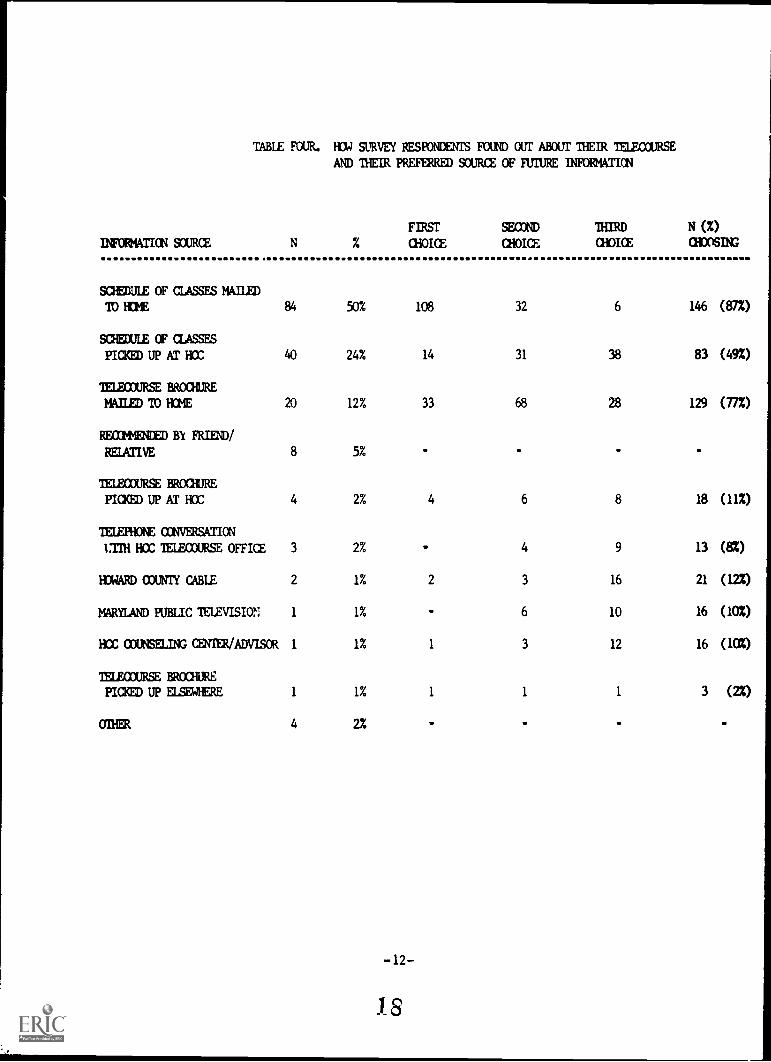
TABLE FOUR. HOW SURVEY RESPONDENTS FOUND OUT ABOUT THEIR TEUECCURSE
AND THEIR PREFERRED SOURCE OF FUTURE INFORMAIICN
INFORMATICN SOURCE
SCHEDULE OF CLASSES MAILED
FIRST
CHOICE
SEOCND
CHOICE
THIRD
CHOICE
N (%)MOOS=
TO HOME 84 50% 108 32 6 146 (87%)
SCHEDULE OF CLASSES
PICKED UP AT HOC 40 24% 14 31 38 83 (49%)
TELECOURSE BROCHURE
MAILED 10 HCME 20 12% 33 68 28 129 (77%)
RE0214RAMBY FRIEND/
RELATIVE 8 5% - - -
TELECOURSE BROGIURE
PICKED UP AT HOC 4 2% 4 6 8 18 (11%)
TELEPHONE CONVERSATION
%MU HCC TELECOURSE OFFICE 3 2% - 4 9 13 (8%)
IMAM COMY CABLE 2 1% 2 3 16 21 (12%)
MARYLAND PUBLIC TELEVISION 1 1% 6 10 16 (10%)
HOC CLUNSELING CENTER/ADVISOR 1 1% 1 3 12 16 (10M)
TELECOURSE BROOdURE
PICKED UP ELSEWHERE 1 1% 1 1 1 3 (22)
OTHER 4
12

REASONS FOR REGISTERING
It has been assumed that persons who enroll in telecourses do sofor reasons different than those who enroll in standard courses. Thissurvey of telecourse enrollees asked respondents their reasons forregistering for a telecourse. Table Five and Gra h Two present theresponses delineating the reasons or registering or a telecourse.The table and graph reveal that:
The reason listed as being very important by a higherproportion (77%) than any other is "Lacked time for regularclass attendance."
The second most important reason, described as very importantby 60% of the respondents, was "Made it possible to combinecollege course(s) with family responsibility."
Minimizing travel to and from campus was a reason thought tobe very important by 53% of the respondents.
For 45% of the respondents, the fact that telecourses alloweda heavier course load was perceived as a very importantreason for registering for a telecourse.
From the opposite perspective, the four reasons forregistering for a telecourse which were cited as important bythe lowest proportions of respondents were: handicaps, theperception that a telecourse was less difficult, theavailability of a course only as a telecourse, and the wishto try a new learning method. It should be noted thatalthough handicaps were listed as a reason for telecourseenrollment by relatively few, for the 18 people who listedthat as a reason, it may very well be an extremely importantreason.
-13- 19

TABLE FIVE. RESEONDEITS- RATINGS OF REASONS FOR REGISTERIM FOR A TELECOURSE
REASONS
VERY SCtE NOT A
IMPORTANT INFLUENCE FACTOR
N % N % N %
LACKED TIME FOR CLASS ATIMANCE 128 77% 24 15% 14 8%
POSSIBLE 0:143INE FAMILY RESPONSIBILITY 100 60% 34 20% 33 20%
MINIMIZE TRAVEL :.: 55% 45 28% 28 17%
ALINED A HEAVIER LOAD 74 45% 30 18% 60 37%
TRY A NEW LEARNING METHOD 19 12% 46 28% 98 60%
COURSE ONLY AVAILABLE AS TELECOURSE 18 11% 22 14% 122 75%
THOUGHT TELECOURSE "LESS DIFFICULT 10 6% 26 16% 124 78%
HANDICAPS MAKE TCS MORE APPEALING 6 4% 12 7% 144 89%
20-14-

100
80
80
40
20
GRAPH 2
RESPONDENTS' RATINGS OF REASONS FOR
REGISTERING FOR A TELECOURSENOT A SOME VERY
FACTOR INFLUENCE IMPORTANT
V7,372 [. ..
PERCENT OF RESPONDENTS
NO TIME COMBINETO ATTEND COLLEGE
CLASS 1c FAMILY
77%
60%
ALLOWED NEW ONLY TELECOURSE MOREMINIMIZE HEAVIER LEARNING TELECOURSE LESS APPEALING FORTRAVEL LOAD METHOD AVAILABLE DIFFICULT HANDICAPPED
55%
4.5%
11% 6%
.' .
//////// ///1
/// //1//// / ///14/
////// /////,/////// // I
HOWARD COMMUNITY COLLEGE Office of Research I Personnel 8/3/88
-15-
4%

SATISFACTION RATINGS
One important element in evaluating telecourses is the enrollees'satisfaction with the courses. The survey contained a section in whichrespondents could rate their satisfaction with five different elementsof the telecourse on a scale of one (not at all satisfied) to five(highly satisfied). Table Six shows the ratings of satisfaction withthe telecourses. AmonTEFFMdings are:
Most telecourses are scheduled with an introduction and fourother meetings with HCC instructors, and the telecourseelement in which the highest proportion of respondentsreported being highly satisfied was Instructor Contact (41%).
When the "highly satisfied" and "quite satisfied" categoriesare combined, the single element with the highest rating isthe Text/Study Guide (70%).
Graph Three shows respondents' ratings of overallsatisfaction with the telecourses. Overall satisfaction wasrated very positively by 71% of the respondents, with 32%being highly satisfied and 19% quite satisfied. A scant 3%described themselves as "not at all satisfied." The meanscore for this item was 3.9 (with a possible range of one tofive). Instructor Contact also had a mean of 3.9, and had acombined satisfaction rating of 69%.
As noted, very few respondents reported that they were "notat all satisfied." The item on presentation of materialgarnered the highest level of dissatisfaction, with 9% sayingthey were not at all satisfied.
17

TABLE SIX. SURVEY RESFCCEENTS
NOT AT ALL
RATINGS OF SATISFACTION WITH WEIR TELECOURSE
914EWHAT QUITE HIGHLY
IELEO3URSE ELDEENT SATISFIED SATISFIED SATISFIED SATISFIED SATISFIED WAN1 2 3 4 5
Instructor Contact 5% 5% 21% 28% 41% 3.9
Content of material 7% 15% 30% 32% 15% 3.3
Presentation of material 9% 14% 25% 34% 177 3.4
Text /Stud- Wide 3% 10% 17% 35% 35% 3.9
Overall Satisfaction 3% 10% 16% 39% 32% 3.9
18

1 I I I
,
.
'''''''ii::::::-..
A I
; .40 4;.' 41.
1/4.4tt ,,"' 44. 4
di
1
1
II
I
1
1

COURSE ELEMENTS
Satisfaction ratings differed among the 21 courses represented inthis study. These ratings are shown in Table Seven. The course nameshave been omitted from the table in thiiirTEInd they are not in
alphabetical order. (The information is being given to the individualcourse instructors and others responsible for telecourse planning andevaluation.) In examining the mean satisfaction ratings for thevarious course elements, it should be kept in mind that for somecourses the number of survey respondents was quite low, so that thevery strong positive or negative opinions of a few enrollees couldgreatly influence the ratings shown in the table. With that caveat inmind, it can be seen from the table that:
Using 4.5 on the five point satisfaction scale as an uppercut-off point, the courses with the highest levels of overallsatisfaction were: Course 20, Course 15, Course 17, and
Course 18. Course 21 followed closely with a mean 4.4overall satisfaction rating.
On the other hand, using ratings under 3.0 as indicating somedissatisfaction, courses with the lowest overall mean ratingswere: Course 11, Course 4, and Course 3.
Sixteen courses had mean ratings of 3.0 or higher forInstructor Contact, indicating that respondents in thesecourses were satisfied with this element of the course. Four
of those 16 courses had ratings of 4.5 or above. Fivecourses had ratings below 3.0 on this element.
Content of Material was an element for which there weresixteen courses rated at 3.0 or above, with four coursesrating at least 4.0. Five courses were below 3.0.
FiftePI courses had mean ratings of 3.0 or higher forPresentation of Material, with three at 4.0 or above. Six
were below 3.0.
The Text or Study Guide used in the courses were rated at 3.0or higher in seventeen of the courses, with eleven rating 4.0or higher. Four courses were under 3.0 on that element.
21

TABLE SEVEN. RESPONDENTS' SATISFACTION RATINGS WITH VARIOUS COURSE ELEMENTS
+
1 2
COURSEs
3 4
INSTRUCTOR CONTACT 2.7 1.0 2.8 2.5
CONTENT OF MATERIAL 2.3 3.7 3.0 1.3
PRESE"TATION OF MATERIAL 2.7 1.7 2.1 1.6
TEXTSTUDY GUIDE 2.0 1.3 2.6 3.3
OVERALL SATISFACTIONWITH COURSE 3.0 1.3 2.8 2.5
+
COURSEs- + 4. 4.
1 5+.
E+
7I
8+.
INSTRUCTOR CONTACT 3.9 2.7 3.5 1.2
CONTENT OF MATERIAL 3.2 3.0 4.0 3.2
PRESENTATION OF MATERIAL 3.4 3.0 3.5 3.1
TEXTSTUDY GUIDE 1.1 2.3 4.0 3.8
OVERALL SATISFACTIONWITH COURSE 4.0 3.3 1.0 3.9
4- + 4.
COURSE4
9 10 11 12
INSTRUCTOR CONTACT 1.3 3.8 2.7 1.1
CONTENT OF MATERIAL 3.1 2.8 2.3 3.7
PRESENTATION OF MATERIAL 3.0 2.8 2.7 3.9
TEXTSTUDY GUIDE 1.5 3.7 2.5 4.3
OVERALL SATISFACTIONWITH COURSE 1.3 3.3 2.2 1.0
COURSE+ -
13 I 16+
15 16
INSTRUCTOR CONTACT 3.7 1.0 4.7 4.3
CONTENT OF MATERIAL 2.9 3.6 3.9 3.2
PRESENTATION OF MATERIAL 2.8 3.6 3.8 3.3
TEXTSTUDY GUIDE 3.6 1.3. 4.6 3.5
OVERALL SATISFACTIONWITH COURSE 3.5 4.1 4.7 3.!
INSTRUCTOR CONTACT
CONTENT OF MATERIAL
PRESENTATION OF MATERIAL
TEXTSTUDY GUIDE
OVERALL SATISFACTIONWITH COURSE
4.
4.0
3.5
1.5
1.5+
COURSE
18 .19
1.0 3.6
3., 3.5
3., 3.5
4.1 3.,
4.5 3.7
220C3
+
!
!
+
I
I
+
4.
1 COURSE4.
20 21
3.0 4.3
1.0 4.3
1.3 4.4
4.5 4.6
4.8 1.1f

RESPONDENTS' COMMENTS
The survey concluded with two questions which elicitedrespondents' comments. The first asked what aspect of the telecoursethey liked best, and the second asked what aspect they would like tosee improved. There were far more positive responses than negativeones. While a few students said that they missed contact with aninstructor or would like more class meetings, most of the improvementssuggested were specific to the course the student had taken. Thepositive comments, on the other hand, seem to relate more totelecourses in general. A selection of comments is presented below.
P "I like the self-pace of the course and the development of self-discipline to get the job done."
"I am a single parent, I work full time and feel that this is theonly way that I can complete college."
I "It made it possible for me to carry the additional course as Idid not have the time to come to the campus."
I "I like being able to tape the classes and fit them into myschedule."
I "The telecourse fit my schedule, allowing me to have more timefor on-campus classes."
I "I was able to work at my own speed and had more time in which tofulfill other obligations. If I had not taken the telecourse, Iwould not have had time for school."
I "Televised material is high quality and enjoyable."
I "I enjoyed all aspects of the telecourse thoroughly."
27-23-/z 4

CONCLUDING REMARKS
While results of the telecourse survey cannot be generalized astrue for each and every telecourse enrollee, the fact that 54% of all
telecourse enrollees responded to the survey lends credibility to the
findings. These representative results for over half of the telecourse
enrollees provide some concrete information for program planning. The
high proportions of females, whites, those between 25 and 44 years old,
and employed persons among the survey respondents could effect
decisions made about future telecourse offerings. Another factor to
consider in designing the mix of future courses should be the serious
goals the responding enrollees indicated, with half intending ti
transfer to a four year institution and 36% having career or academic
goals. Relatively few respondents were pursuing telecourses for self-
enrichment or interest.
Almost as many respondents were new to telecourses as those who
had taken one before. Recruitment of the first-time enrollee as well
as those experienced in telecourses should therefore be balanced, with
attempts made to appeal to each group. Since 88% of the respondents
said they would take another telecourse, the potential for return
registrations is good.
Other important marketing information was garnered from thesurvey. Half of the survey respondents said that they found out aboutthe telecourse in which they enrolled through the schedule of classesmailed to their homes. Another quarter cited the schedule of classespicked up at HCC as their primary source of information. When asked
about their preferred sources of future information about telecourses,the schedule of classes and the telecourse brochure emerged as being
dominant, with a majority of the respondents preferring that thesematerials be mailed to their homes.
Additional marketing and planning information can be derived from
the respondents' ratings of the importance of various reasons forregistering for a telecourse. The lack of time to attend regular class
sessions and the desire to combine the earning of college credits with
family responsibilities topped all other reasons. Minimizing travel
and being able to carry a heavier course load were also cited asimportant reasons by many of the survey respondents. Incorporating
knowledge of these reasons int: the design of informational materialsmay yield benefits.
On the whole, student satisfaction with the telecourses was quite
high. Variation in satisfaction levels by course with the elements
measured was evident. Examination of this and other course-specific
data will be useful for those involved in planning and evaluating the
telecourses.
3-25- /.2G

HGWARD COMMUNITY COLLEGE
Survey of Telecourse Students
Course:11.5)
1. Hove you ever token a course by television for college I., ditbefore?
2. If this course had not been offered in a telecourse format, wouldyou have enrolled in a standard class of the same course thissemester?
3. In addition to this telecourse, how many other telecourses areyou taking? IDo not count this course.)
4. In addition to this telecourse, what other college classesare youattending this semester? (Chock all that apply)
5. What is your primary goal in taking college courses? ( Pleasecheck ono)
8. Prior to registration, how did you find out about the telecourse-kr are Ming? (Please chock one.)
7. Of all the information sources listed above, please list bynumberthe thr i you most prefer for learning about future telecourses.
1
Social Security Number:(6-141
- i Yes, at HCC- 2. Yes, at another institution 115)_ 3 No
1. Yes- 2. No
Telecourse&
_ 1. Other Tolecoursels)_ 2. Day class on HCC campus (Mon -Fri?- 3. Evening class on HCC campus (Mon -Fri)
4. Off-campus HCC class_ 5. Weekend HCC class
6. Classles1 at another college7. None
1. Exploration of new career or academic area_ 2 Preparation for immediate entry into a career_ 3. Transfer to a four-year institution_ 4. Update skills for a job currently held- 5. Interest and self-enrichment- 8. Other (Please specify):
____ 1 Telephone conversation with HCC Telecourse Office- 2 HCC Schedule of Classes mailed to my home_ 3 HCC Schedule of Classes picked up at HCC_ 4 Telecourse Brochure mailed to my home- 5. Telecourse Brochure picked up at HCC_ 8. Telecourse Brochure picked up at other location
(please specify):_ 7. HCC Counseling Center or advisor_ 8 Howard County Cable 8 TV_ 9. Maryland Public Telyt,;un station......-10 Recommended by friend/relative- 11. Other (please specify):
First Choice'Second ChoiceThird Choice: _
I. Whet influenced your decision to register for a telecourse? Please rate each reason as either very important, of some influence, ornot a factor in your decision.
REAS' I1. VERY
IMPORTANT2. SOME 3. NOT
INFLUENCE A FACTOR
(181
117)
(1e;1191
1201
1211
1221
(231124)
1251
12e;
1271
(281(291
Minimized travel to and from campusAllowed me to carry a heavier course loadLacked time for regular classroom attendanceWanted to try a new learning methodThought this would be less difficult/less workMade It possible to combine college coursols) with familyresponsibilityThis particular course only available as a telecourseTemporary or permanent handicaps make telecourses moreappealing
MI11.011,
111111.
111101.
-27- 2 9
BEST COPY AVAIL ABLE
c

9. Please indicate your level of satisfaction with the followingelements of this telecourse. lade am number per item.)
HIGHLY QUITE SOMEWHAT NOT AT ALLSATISFIED SATISFIED SATISFIED SATISFIED SATISFIED
Instructor contactContent of televised materialPresentation of televised materialThe text/study guideOverall satisfaction with this telecourse
555
55
44444
33333
22222
1 1381
1 1391
1 140)1 141)
1 142)
10. Wouk' you take another telecourse?
11. Would MI be interested in courses using a microcomputer andmodem et your horn* or office to communicate with your instructorand/or to take exams?
12. Do you have a microcomputer available for your use?
13. Do you have a modem available for your use?
14. Do you have a VCR?
15. Do you usually watch the telecourse es it is televised, or do yourecord it for later viewing? (Please check only one.)
16. A. Have you used the library tapes of your telecourse?
B. If yes. has this been satisfactory?
17. A. Plc indicate your employment status while you w're takingthe telecourse.
B. If employed. what schedule did you work?
16. What is your current level of education? (Check one.)
19. Please check your gender.
20. What is your age?
21. What is your race
.-1. Yes _2. No
_1. Yes _2. No
1 Yes
_1 Yes
_I Yes
-2. No
_2. No
-2. No
_1 I always watch as the course is televised_2. I usually watch as it is televised-3. I always record it for later viewing_4. 1 usually record it 1./ later viewing_5 Frankly, I don't even watch or record the programs, but
rely on the textbook
-1. YGS -2 No- I. Yes _2. No
-1. Employed full-time 130/more hours a week)-2. Employed part-time- 3. In military_4 Full-time student.-5 Full-time homemaker- 6. Not employed
_1 Regular daytime schedule- 2. Early evening schedule-3. Late evening schedule_4 Rotating shifts
___1. Less than 12th guide_2. G.E.D._3 High School Diploma
. *.artificate
_1 Male -2. Female
Years
_1 Black- 2. American Indian_3. Asian
_5. A.A. Degree_G Bachelor's Degree_7 Master's Degree_8. Doctoral Degree
_4. Hispanic_5. White-6. Other
22. What aspect of the telecourse did you Tike beet?
23. What aspect of the telecourse would you Mks to see improw,d?
BEST COPY AVAILABLE -28-
(43)
(44)
(45)
(461
(47)
148)
(49)
150)
(511
152)
153)
164)
155.56)
157)

HUARD COMMUNITY COLLEGEList of Research Publications
Livieratos, Barbara B. THE SURVEY OF EMPLOYERS OF 1986 HOWARD COMMUNITYCOLLEGE GRADUATES: A REPORT OF THE FINDINGS. Report No. 53. HowardCommunity College, July 1988.
Novak, Virginia E. FOLLOW -UP OF 1986 GRAMMES. Report No. 52. HowardCantu pity College, May 1988.
Monroe, Charlotte A., Novak, Virginia E., and Radcliffe, Susan K. HOWARDCOMMUNITY COLLEGE 1988-1989 INSITIUTIONAL INDICATORS FOR PROPOSEDOPERATING BUDGET. Report Rather 51. Howard Calamity College, April1988.
Livieratos, Barbara B. HIGHIIGHTS OF THE SURVEY OF EMPLOYERS OF 1985 HOWARDCOMMUNITY COLLEGE GRAMMES. Report Number 50. Howard CalamityCollege, February 1988.
Livieratos, Barbara B. FINDINGS FROM THE SURVEY OF EMPLOYERS OF 1984HCC GRADUATES. Report No. 49. Howard Canmunity College, December 1987.
Novak, Virginia E. and Radcliffe, Susan K. ENROLLMOT PROJECTIONS REPORT.Report No. 48. Howard Community College, December 1987.
Novak, Virginia E. and Radcliffe, Susan K. FOLLOW-UP OF 1985 GRADUATES.Report No. 47. Howard Community College, August 1987. ERICPublication Number ED 285 611.*
Office of Research and Personnel, FTE ENROLLMENT MENDS FY84 - FY87.Flash Facts Vol. III, Number 1. Howard Calamity College, August 1987.
Office of Research and Personnel, HCC STUDENT POPULATION OF HOWARD COUNTYRESIDENTS FOR 1986-87 BY COUNCIL DISTRICT. Flash Facts Vol. II,Ntmtber 3. Howard Community College, June 1987.
Monroe, Charlotte A., Novak, Virginia E., and Radcliffe, Susan K. HUARDCOMMUNITY COLLEGE 1987-1988 INSTITUTIONAL INDICATORS FOR PROPOSEDOPERATING BUDGET. Report No. 46. Howard Community College, April 1987.
Office of Research and Personnel. MINORITY POPULATION: ALL BUDGEDEMPLOYEES. Flash Facts Vol. II, Number 2. Howard Community College,December 1986.
aifice of Research and Personnel. TEN YEAR OVERVIEW OF MCC FTE ENROLLMENT:FISCAL YEAR 1977 TO FISCAL YEAR 1986. Flash Facts Vol. II, Number 1.Howard Community College, September 1986
Radcliffe, Susan K. and Novak, Virginia E. 1986 STAFF SERVICES EVAILIATION.Report No. 45. Howard COmmunity College, June 1986. ERIC PublicationNUmber ED 272 240.*
Office of Research and Personnel. PERCENT OF STUDENT POPULATION BY AGE.Flash Facts Vol. I, Number 3. Howard Community College, May 1986. ERICPublication Number ED 272 239.*
-29-

Office of Research and Personnel. THIRTEEL PERCENT OF HCC STUDENTS HAVE
EARNED PREVIOUS DEGREES. Flash Facts Vol. I, Number 2. Howard COmmunity
College, April 1986. ERIC Publication Number ED 272 239.*
Radcliffe, Susan K. and Reed, Cheryl B. FOLLOW -UP OF 1984 GRADUATES.
Report No. 44. Howard Community College, April 1986. ERIC Publication
Nwber ED 269 079.*
Radcliffe, Susan K. and Novak, Virginia E. HUARD COMMUNITY COLLEGE1986-87 INSTITUTIONAL INDICATORS FOR PROPOSED OPERATING MIDGET'.Howard Community College, April 1986. ERIC Publication Number
ED 269 080.*
Radcliffe, Susan K. and Novak, Virginia E. STUDY OF 1983 DEVELOPMENIAL
EDUCATION STUDENTS. Report No. 43. Howard Community College, February
1986.
Office of Research and Personnel. TEN YEAR OVERVIEW OF HCC FIE ENROLLMENT:
FISCAL YEAR 1976 TO FISCAL YEAR 1985. Flash Facts Vol. I, Number 1.
Howard ammunity College, November 1985. ERIC Publication Number ED 272
239.*
Radcliffe, Susan K. and Novak, Virginia E. FOLLOW-UP OF 1982 ENTRANTS.
Report No. 42. Howard Community College, October 1985.
Radcliffe, Susan K. and Novak, Virginia E. 1985 STAFF SERVICES EVAUJATION.
Report No. 41. Howard Community College, May 1985. ERIC PublicationNumber ED 256 455.*
Radcliffe, Susan K. INSTITUITONAL INDICATORS: PROPOSED OPERATING BUDGET
1985-86. Howard Community College, April 1985.
Radcliffe, Susan K. and Reed, Cheryl L.B. STATISTICAL PROFILES. ReportNo. 40. Howard Community College, March 1985.
Radcliffe, Susan K. ANALYSIS OF FALL 1984 CREDIT EIGIOLLMENE. Research
Report No. 39. Howard Comunity College, December 1984. ERICPublication Number ED 255 243.*
Radcliffe, Susan K. and Baxter, Cheryl L. FOLLOW-UP of 1982 GRADUATES.
Research Report No. 38. Howard COmmunity College, May 1984. ERICPublication Number ED 245 761.*
Radcliffe, Susan K. ACADEMIC PERFORMANCE OF HrWARD COVMUNITY ODLLEGE
=TENTS IN TRANSFER nernurioNs; PRELIMINARY FINDINGS. ResearchReport No. 37. Howard Community College, May 1984. ERIC PublicationNumber ED 244 707.*
Radcliffe, Susan K. and Baxter, Cheryl L. 117ARD COMMUNITY COLLEGE STAFFSERVICES EVALUATION, SPRING 1984. Research Report No. 36. HowardCommunity College, April 1984.
Radcliffe, Susan. ANALYSIS OF SPRING 1984 ENROLLMENT. Research Report
No. 35. Howard Community College, March 1984. ERIC Publication Number
ED 244 706.*
-30- 32

Radcliffe, Susan; Beach, Frances and Jenkins, Ellen. STATISTICAL PROFILESOF HOARD COMMUNITY COLLEGE. Research Report No. 34. Howard unityCollege, February 1984.
Radcliffe, Susan and Nespoli, Lawrence. HOWARD COUNTY EMPLOYMENT PLANNINGCOUNCILENNIOYER SURVEY. Special Research Report. Howard CommunityCollege and Howard Cbunty EMployment Planning Council, April 1984.
Nespoli, Lawrence and Radcliffe, Susan. FOLUDW-OP OF 1981 GRADUATES.Research Report No. 33. Howard Community College, May 1983. EPICPublication Number ED 231 498.*
Nespoli, Lawrence and Radcliffe, Susan. FOLLOW -UP OF 1978 ENTRANTS.Research Report No. 32. Howard Community College, Mardi 1983. ERICPublication Number ED 244 705. *
Nespoli, Lawrence and Radcliffe, Susan. STATISTICAL PROFILES OF HOW RDCOMMUNITY COLLEGE. Research Report No. 31. Howard Community College,February 1983.
Nespoli, Lawrence and Radcliffe, Susan. CENSUS ANALYSIS: A IDOK AT HCCCREDIT STUDENTS BASED a THE 1980 CENSUS. Research Report No. 30.Howard COnmunity College, January 1983. Published in =maw COLLEGEJOURNAL FOR RESEARCH AND PLANNING, Wayne III, Number 2, Fall/Winter1983.
Nespoli, Lawrence and Radcliffe, Susan. STUDENT EVALUATION OF COLLEGESERVICES. Research Report No. 29. Howard Community College, June 1982.ERIC Publication Number ED 224 541.*
Nespoli, Lawrence and Radcliffe, Susan. EMPLOYER FOLLOW-UP, 1900. ResearchReport No. 28. Howard Community College, May 1982. ERIC PublicationNumber ED 224 540.*
Nespoli, Lawrence and Radcliffe, Susan. RETENTION ANALYSIS FOR SPRING 1982.Research Report No. 27. Howard OTnunity College, April 1982. ERICPublication Number ED 224 539.*
Nespoli, Lawrence and Radcliffe, Susan. A PILOT STUDY OF EEUCAT1ONALTELEVISION STUDENTS AT HCC. Research Report No, 26. Howard CommunityCollege, April 1982.
Nespoli, Lawrence and Radcliffe, Susan. FOLUM-UP OF 1980 GRADUATES.Research Report No. 25. Howard COnnwlityCollege, February 1982. ERICPublication Number ED 224 538.*
Nespoli, Lawrence and Radcliffe, Susan. STATISTICAL PROFILES .F HOWARDGiMMUNITY COLLEGE. Research Report No. 24. Howard Community College,February 1982.
Nespoli, Lawrence and Buonaguro-Laidig, P. STAUSTICAL PROFILES OF HOWARDCOMMUNITY COLLEGE. Research Report No. 23. Howard COmmunity College,January 1981.
Nespoli, Lawrence and Buonaguro-Laidig, P. STUDENT EVALUATION OF COLLEGE
-31- i3

SERVICES. Research Report No. 22. Howard Community College, May 1980.Nespoli, Lawrence and Nair, P.C. STATISTICAL PROFILES OF HOWARD COMUMITY
COLLEGE. Research Report No. 21. Howard Community College, January1980.
Nespoli, Lawrence and Nair, P.C. EMPLOYER FOLLOW - UP, 1978. Research ReportNo. 20. Howard Community College, November 1979.
Nespoli, Lawrence. FOLLOW-UP OF 1978 GRADUATES, VOLUME II. Research ReportNo. 19A. Howard Commtaltty College, September 1979.
Nespoli, Lawrence. FOLLOW-UP OF 1978 GRADUATES, VOLUME I. Research ReportNo. 19. Howard Community College, September 1979.
Wenckowski, Charlene. STATISTICAL PROFILES OF HOWARD ccmmuNrrr COLLEGE.Research Report No. 18. Howard Community College, January 1979.
Wenckowski, Charlene. HIGH SCHOOL JUNIORS: TIMM CAREER ASPIRATIONS,EDUCATIONAL PLANS, AND PEICEETICNS OF HOWARD COMMUNITY COLLEGE. ResearchReport No. 17. Howard COmmunity College, December 1978.
Wenckowski, Carlene and Cebbs, Patricia. AEULT EEUCATIONAL MEMASSESSMENT. Researdl Report No. 16. Howard Community College, July1978.
Wenckowski, Charlene. STUDENT EVALUATION OF COLLEGE SERVICES. ResearchReport No. 15. Howard Community College, June 1978.
Wenckowski, Charlene. FOLLOW-UP OF 1977 GRADUATES. Research Report No. 14.Howard Community College, June 1978.
Wenckowski, Charlene. STATISTICAL PROFILES OF HOWARD COMMUNITY COLLEGE.Research Report No. 13. Howard COmmunity College, January 1978.
Wenckowski, Charlene. EMPLOYER FOLLOW -UP STUDY. Research Report No. 12.Howard Community College, June 1977.
Smith, James and Wenckowski, Charlene. CAREER EDUCATIONAL NEEDS OF =UTCOUNTY RESIDENTS. Research Report No. 11. Howard Community College,June 1977.
Wenckowski, Charlene. FOLLOW-UP OF 1976 GRADUATES. Research Report No. 10.Howard COmmunity Calege, April 1977.
Wenckowski, Charlene. HOWARD COMMUNITY COLLEGE GOALS INVENTORY. ResearchReport No. 9. Howard Community January 1977.
Wenckowski, Charlene. STATEWIDE FOLLOW-UP OF 1971 F1RSZ-TIME STUDENTS.Research Report No. R-A. Howard Community College June 1976.
Wenokowski, Charlene. CAREER INTERESTS AND OCCUPATICINAL PLANS OF HOWARDCOUNTY HIGH SCHOOL JUNIORS, 1976. Research Report No. 8. HowardCOmmunity College, September 1976.
Wenckowski, Charlene. CAREER INTERESTS AND COCUIATIONAL PLANS OF HUARDCOUNTY HIGH SCHOOL JUNIORS, 1976 - PRELDIIMRY REPORT. Research Report
-32-
-111111.11.1A

No. 7. Howard Community College, September 1976.Wenckowski, Charlene. CAREER INTER 'IS AND EDUCATIONAL PLANS OF HOWARD
COUNTY MGR SCHOOL JUNIORS, SPRING 1976. Sub- Report No. 1. HowardCOmmunity C011ege, February 1976.
Wenckowski, Charlene. FOLLOW-UP OF 1975 GRADUATES. Research Report No. 6.Howard Community College, July 1976.
Wenckowski, Charlene. WARD CCMJNITY =LOGE STATISTICAL PROFILFS.Research Report No. 5. Howard Cormunity College, October 1976.
Wenckowski, Charlene. CAREER INTEREST AND EDUCATIONAL PLANS OF HOWARDCOUNTY HIGH SCHCCI,JUNIORS, 1975. Research Report No. 4. HowardCommunity College, December 1975.
Wenckowski, Charlene. HCC AFFIRMATIVE ACTION PLAN, FAIL 1975. RevisedEdition. Research Report No. 3. Howard Community College, January 1976.
Wenckowski, Charlene. MERE HAVE ALL= NO SHOWS GONE? Research ReportNo. 2. Howard Community College, February 1975.
Wenckowski, Charlene. PRELIMINARY FOLLOW-UP OF 1974 GRADUATES. ResearchReport No. 1. Howard Community College, October 1974.
*An ERIC Put Number indicates that the report was published byEducational kesources Information Center (ERIC), and that it is listed Inthe resources in education index.
5IINIONOIONNINN1011~14010114444440440.440040110111+
33 ERIC Clearinghouse forJunior Colleges JAN 2 7 1989
IIMNINNOMMOININNOISONNINHOI110~10101~00114*