Lifecycle Greenhouse Gas Emissions due to Increased Biofuel ...
Upload
independentCategory
view
5download
0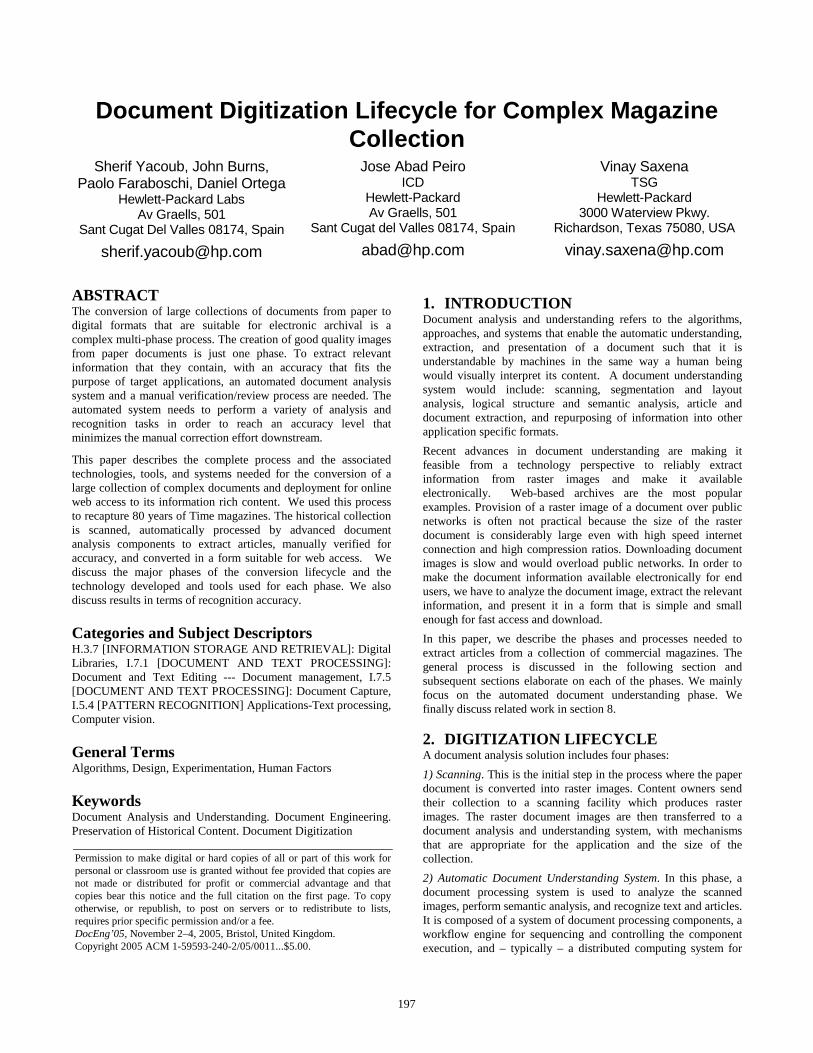
Permission to make digital or hard copies of all or part of this work for personal or classroom use is granted without fee provided that copies are not made or distributed for profit or commercial advantage and that copies bear this notice and the full citation on the first page. To copy otherwise, or republish, to post on servers or to redistribute to lists, requires prior specific permission and/or a fee. DocEng’05, November 2–4, 2005, Bristol, United Kingdom. Copyright 2005 ACM 1-59593-240-2/05/0011...$5.00.
Document Digitization Lifecycle for Complex Magazine Collection
Sherif Yacoub, John Burns, Paolo Faraboschi, Daniel Ortega
Hewlett-Packard Labs Av Graells, 501
Sant Cugat Del Valles 08174, Spain
Jose Abad Peiro ICD
Hewlett-Packard Av Graells, 501
Sant Cugat del Valles 08174, Spain
Vinay Saxena TSG
Hewlett-Packard 3000 Waterview Pkwy.
Richardson, Texas 75080, USA
ABSTRACT The conversion of large collections of documents from paper to digital formats that are suitable for electronic archival is a complex multi-phase process. The creation of good quality images from paper documents is just one phase. To extract relevant information that they contain, with an accuracy that fits the purpose of target applications, an automated document analysis system and a manual verification/review process are needed. The automated system needs to perform a variety of analysis and recognition tasks in order to reach an accuracy level that minimizes the manual correction effort downstream.
This paper describes the complete process and the associated technologies, tools, and systems needed for the conversion of a large collection of complex documents and deployment for online web access to its information rich content. We used this process to recapture 80 years of Time magazines. The historical collection is scanned, automatically processed by advanced document analysis components to extract articles, manually verified for accuracy, and converted in a form suitable for web access. We discuss the major phases of the conversion lifecycle and the technology developed and tools used for each phase. We also discuss results in terms of recognition accuracy.
Categories and Subject Descriptors H.3.7 [INFORMATION STORAGE AND RETRIEVAL]: Digital Libraries, I.7.1 [DOCUMENT AND TEXT PROCESSING]: Document and Text Editing --- Document management, I.7.5 [DOCUMENT AND TEXT PROCESSING]: Document Capture, I.5.4 [PATTERN RECOGNITION] Applications-Text processing, Computer vision.
General Terms Algorithms, Design, Experimentation, Human Factors
Keywords Document Analysis and Understanding. Document Engineering. Preservation of Historical Content. Document Digitization
1. INTRODUCTION Document analysis and understanding refers to the algorithms, approaches, and systems that enable the automatic understanding, extraction, and presentation of a document such that it is understandable by machines in the same way a human being would visually interpret its content. A document understanding system would include: scanning, segmentation and layout analysis, logical structure and semantic analysis, article and document extraction, and repurposing of information into other application specific formats.
Recent advances in document understanding are making it feasible from a technology perspective to reliably extract information from raster images and make it available electronically. Web-based archives are the most popular examples. Provision of a raster image of a document over public networks is often not practical because the size of the raster document is considerably large even with high speed internet connection and high compression ratios. Downloading document images is slow and would overload public networks. In order to make the document information available electronically for end users, we have to analyze the document image, extract the relevant information, and present it in a form that is simple and small enough for fast access and download.
In this paper, we describe the phases and processes needed to extract articles from a collection of commercial magazines. The general process is discussed in the following section and subsequent sections elaborate on each of the phases. We mainly focus on the automated document understanding phase. We finally discuss related work in section 8.
2. DIGITIZATION LIFECYCLE A document analysis solution includes four phases:
1) Scanning. This is the initial step in the process where the paper document is converted into raster images. Content owners send their collection to a scanning facility which produces raster images. The raster document images are then transferred to a document analysis and understanding system, with mechanisms that are appropriate for the application and the size of the collection.
2) Automatic Document Understanding System. In this phase, a document processing system is used to analyze the scanned images, perform semantic analysis, and recognize text and articles. It is composed of a system of document processing components, a workflow engine for sequencing and controlling the component execution, and – typically – a distributed computing system for
197
executing the components. For large collections, the system must be designed to run in automated “batch” mode, as unattended as possible to guarantee non-stop execution. The results of the recognition system are the page content described by a representation schema that is use by all components.
3) Computer assisted manual correction. The output of the automated document understanding system is not guaranteed to be 100% accurate. Hence, in cases where the application demands a higher level of accuracy than what can be achieved automatically,
Figure 1 - The overall document capture process
a manual correction process is inevitable to meet the target goals. For a large collection, this can become a very time- and resource-consuming task, so it is very important to plan the process through which the manual correction phase and the automated process interact.
4) Deployment. The deployment phase defines how the output is integrated into the final target system. For example, in a publishing application, the final output of the entire process may include:
• An article database, with article text and article metadata for web access
• PDF files containing the page images, hidden (searchable) text and other metadata information
• Indexes and classification data for fast retrieval, searches and browsing
The process in figure 1 is what we used for processing the historical collection of Time magazine. Other digitization projects [26,27] illustrate a similar lifecycle. Figure 1 illustrates the automated processing phase as well as a manual correction phase. We refer to the automated content reconstruction in this paper as the DCRM (Digital Content ReMastering) system. Our automated system reaches approximately 99.80% of word accuracy (2 errors/1000 words); if, for example, the desired target accuracy is 99.90% (1 error/1000 words), the manual correction will need to detect and correct the missing 1 error / 1000 words.
The output from the manual correction phase can be lower than 100% because of unavoidable human errors when dealing with large collections. In the following sections we discuss each of the above phases with more emphasize on the DCRM phase.
3. SCANNING PHASE A scanning facility was setup to scan the collection. Six high speed scanners with automated feeders are connected to six working stations which are in turn connected with a high speed network to a server. The server has terabytes of storage and is backed up on tapes. In the scanning facility, each magazine is de-stapled and scanned in a batch mode through the scanner feeder, which is much more efficient than page-by-page flatbed scanning. A scanned page sent to document understanding phase is usually a double page with one half from the beginning of the magazine and the other half from the end.
The paper magazine is inspected to determine if it should be scanned stapled or de-stapled. Magazine that should be scanned in stapled profile are magazines that have images that span over the centerfold, or have glued text sections. Magazines that should be de-stapled for scanning have well defined center gutters with no images or art that span the centerfold. A process was defined for managing the de-stapling process.
The scanning process had many challenges including:
1) quality control to ensure good images are produced, images were not under-exposed, the page was not folded whilece scanning, etc.
2) A process for managing scanning the stapled and de-stapled magazines.
3) Foldouts are scanned with a special process to mark them within the document page images.
It is not necessary to have the scanning facility in the same physical location as the automated document understanding system. In fact, for cost management purposes, the scanning could be outsourced to off-shore scanning facilities.
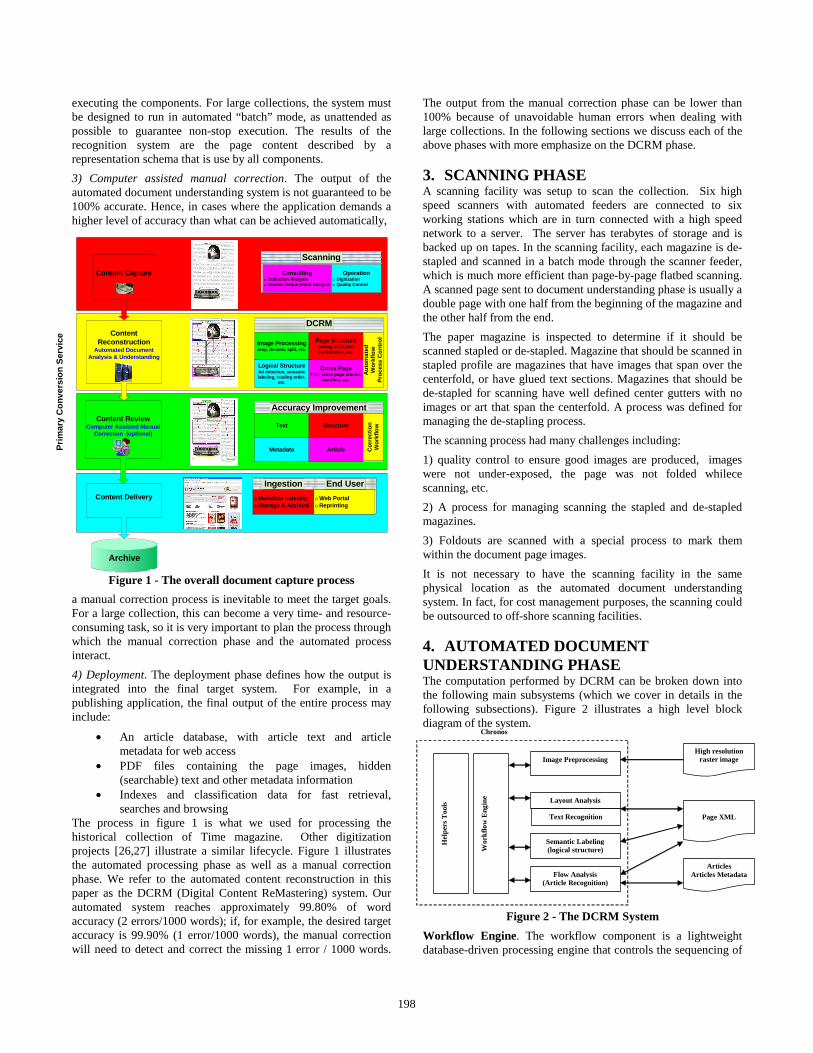
4. AUTOMATED DOCUMENT UNDERSTANDING PHASE The computation performed by DCRM can be broken down into the following main subsystems (which we cover in details in the following subsections). Figure 2 illustrates a high level block diagram of the system.
Figure 2 - The DCRM System
Workflow Engine. The workflow component is a lightweight database-driven processing engine that controls the sequencing of
Content Capture
Content ReviewComputer Assisted Manual
Correction (optional)
Content Delivery
Pri
mar
y C
on
vers
ion
Ser
vice
Scanning
Accuracy Improvement
Text Structure
Metadata Article
End User
Co
rrec
tio
n
Wo
rkfl
ow
Archive
Operation o Digitization o Quality Control
Consultingo Collection Analysiso Domain Requirement Analysis
Ingestion
oMetadata Indexing oStorage & Archival
oWeb PortaloReprinting
DCRM
Image Processingcrop, deskew, split, etc.
Page Structure zoning, OCR, text combination, etc.
Logical Structure Ad detection, semantic labeling, reading order,
etc.
Cross PageTOC, cross page articles,
manifest, etc.
Au
tom
ated
W
ork
flo
w
Pro
cess
Co
ntr
olContent
ReconstructionAutomated Document
Analysis & Understanding
Image Preprocessing
Layout Analysis
Text Recognition
Semantic Labeling (logical structure)
Flow Analysis (Article Recognition)
High resolution raster image
Page XML
Articles Articles Metadata
Chronos
Wor
kflo
w E
ngin
e
Hel
pers
Too
ls
198

the DCRM components. This includes distribution across the parallel workers, the movement of data to and from the central repository, the handling of errors and exceptions and the load balancing for performance optimization.
Image Preprocessing. In this subsystem we operate the first set of cleanup transformations based on traditional imaging analysis. The transformations include splitting, cropping, de-skewing and auto-exposing the document images.
Layout Analysis and Text Recognition. In this subsystem we use page segmentation and layout analysis to identify the zones and their types. We create the first XML page and obtain the text. Because OCR engines are normally tuned to extract text, an extra zoning component is used to identify image zones (including non-rectangular multi-vertices zones).
Semantic Annotation and Logical Structure Analysis. In this subsystem we apply document analysis algorithms to understand the meaning of zones and pages, such as techniques to identify the table of content (TOC) in the magazine. Clusters of zones in the page are created using multiple properties such as zone width, alignment, context, and background color. Most common clusters are those for rows and columns. Zones, clusters, as well as the whole page are semantically labeled accordingly. Common semantics include titles, authors, sections, captions, table of document, manifest, etc. We also implemented algorithms for advertisement detection which works at the zone, cluster, and page level.
Text Flow and Article Recognition. In this subsystem we identify articles. The reading order within clusters as well as within the page is recognized through an analysis that operates at the page level (individual pages) and at the issue level (looking at all the pages in an issue). This allows us to identify multiple articles within the same page or articles that span multiple pages.
Tools. As part of the “DCRM” system, we also developed several “accessory” tools as an aid to produce the final output. These include tools to generate PDF files with searchable text, the article text files, and the article metadata information. They also include a set of “helper” tools, such as viewers and graphical utilities for visualizing the output from various document analysis algorithms. These tools are used for debugging and tuning individual algorithms as well as quality control.
4.1 Image Preprocessing Some image preprocessing is needed to extract a single image of each magazine page in a form that is ready for segmentation and text processing. The double-page scans are cropped to the border of the page, using several criteria, which include searching for horizontal and vertical projections of straight page edges and checking the computed dimension versus a database of magazine sizes sampled throughout history. Once the double-pages are cropped, we identify the centerfold of the double page and generate the two individual pages using a splitting operation The edges found in page cropping and centerfold detection are also used to do a conservative de-skewing algorithm when they all agree on a common skew direction. Finally, the page image is automatically exposed (adjustment of contrast and brightness) by leveling its intensity based on a global histogram.
4.2 Layout Analysis and Text Recognition We perform segmentation and text recognition. We have experimented with several OCR and segmentation engines and we have implemented the system as a combination of multiple engines. We selected three commercial OCR SDKs and developed an interface to each to extract layout information and produce a document representation that is compliant with our XSD schema(schema for representing the document data). Once a single page image is produced by the image preprocessing stage, we apply a master segmentation and OCR engine, which is responsible for generating the “master” text zones for the page. Before invoking other OCR engines, we perform a quality check using the suspect rate of the text produced by the first engine. We identify pages which might still have skewing problems, may have been scanned with the wrong orientation, or have other major scanning problems. If the number of OCR suspects exceeds a pre-defined threshold, we try a more aggressive de-skewing algorithms and re-run the OCR. If the number of capture suspects diminishes, we accept the transformed page. Finally, we also run several “sanity” checks based on aggregate OCR statistics, and flag the pages that we think need to be rescanned when the estimated errors exceed a predefined “bad page” threshold.
4.3 Logical Structure Analysis In this subsystem we semantically annotate zones and pages using logical structure analysis techniques. We use a Table of Content (TOC) identification component to identify TOC pages[22]. We then use the content of the TOC pages to identify advertisements and the position of major articles. A statistical analysis component is used to collect statistics about zones, clusters of zones, and pages. A key component in the subsystem is the advertisement detector which finds full page, row, or column advertisements. The detection of interesting properties requires several steps and components in what we call the “finder-filter” cycle, i.e., some components do detection (finding) and some others do validate current assumptions as more information becomes available (filtering).
4.3.1 Table of Document Identification This component identifies position of the main articles based on TOC pages and article titles. For historical collection of documents, the TOC pages characteristics have changed over time therefore template-based TOC recognition are not applicable. We use a combination of techniques to reliably identify TOC pages. Details can be found in [22].
Selection of TOC candidate pages. The TOC pages are usually within the first several pages of a document. We select a specific number of pages as candidates; e.g., the first 15% of the pages.
Numerals extractor. A TOC page contains many numeric values (page numbers) with specific styles, corresponding to the articles that appear in the document. They are usually at the end or beginning of text lines and not in the middle of other text and have specific number of digits. Using these heuristics, we can rank the TOC candidates based on how many numbers we encounter that resemble page numbers.
Keywords. A TOC usually follows a specific style for a given group of documents, often containing specific keywords, such as sections (“Nation”, “Sports”, etc.) or “Table of Document”/“Document” printed with a different style. Using these properties, for each candidate TOC page we extract the
199

number of matches found in the candidate page and the predefined set of keywords and use this metric to rank the TOC candidates.
Matching Text. TOC pages include article titles that appear later in the document. The best TOC candidate is the one with most title matches. However, in some case the text that appears in the TOC page is not exactly the article title, so similarity metrics need to be used, once again to rank TOC candidates.
Score combiner. Finally, an overall score from the various detectors is combined to sort the TOC candidates, using a simplified weighted voting mechanism which selects the two top candidates to be passed to the remainder of the DCRM pipeline. Once top candidates are identified, we apply a set of heuristics to improve the accuracy of the detection. For example, if the top two candidates are out of sequence, and there is another page in between, then only one TOC page is preserved.
4.3.2 Statistics Component This component produces statistics about zones, clusters, and pages. Measurements taken are provided to the rest of the components for possible usage in their decision making process. We measure properties like position, size, document, and type of zones, clusters and pages. As an example, we measure text density, and rate of page surface covered. Some measurements are expressed as relative metrics, such as percentage for surface rates. Others measurements are absolute units, such as average font size for zones in the cluster of body zones. Other measurements are Boolean values, such as “page contains advertisement keyword markers.”
4.4 Advertisement Detection The advertisement detector component labels zones, clusters of zones and full pages as advertisements, according to a set of metrics. The advertisement detection component mainly relies on properties such as position, size, and document type. The position and size properties will help increase the accuracy of further rules and filtering components. For example, a logo is usually a small picture appearing out of the main body of the page, i.e., at the top, bottom or laterals of the page. Position and size related algorithms also exclude potential advertisement zones by doing detection some zone types such as footnotes, footers, headers, etc.
The component uses context information to make decision. Context information is compared to several dictionaries; e.g. a geopolitical with names of countries (and variations over the years), markers (keywords to indicate a section or page being advertisement), magazine-specific (to indicate special sections and titles) or advertisement sentences and keywords such as “call us for free.” The dictionary also contains URL information and phone numbers such as 1-800 ones to indicate a commercial purpose on zone documents. Other dictionaries containing trademarks are obviously easy to convey, but were not used.
The component also uses type-related algorithms that work on font characteristics, for example font face, family, size and some typographic design rules. Some examples of type-based rules are those using the average number of fonts, the mean font size for relevant text zones in the page, font variability, cluster legibility index, mean font family for body cluster, etc.
4.5 Inset and Layout Analysis To create clusters of zones in a page, we mainly used inset and layout (rows and columns) clustering techniques. The inset analysis component builds clusters of zones whose background color, brightness, saturation, and hue are alike. The layout analysis component detects the number of columns and rows and provides measurements for each of the clusters representing a column and a row. A third component called IllFilter is the filtering component associated to the inset and layout analysis that combines the output of these two components and taking a variety of decisions on the semantics of the zones, clusters and pages analyzed. Although these components can be considered part of the layout subsystem discussed in the previous section, we developed them as part of the logical structure analysis subsystem because of the influence they have on the decision made by the IllFilter in annotating zone semantics.
The IllFilter triggers a row-based analysis when the page has more rows than columns, but does a column-based analysis otherwise. The analysis for rows and columns is very similar since both are considered zone clusters. It mainly differs on the threshold values that hold for the rules used to semantically label the clusters.
The IllFilter measures the text area appearing in a column (row) cluster as a ratio of the total area of the column (row). Elements measured span through the set composed by the ratio of graph coverage, the percentage of empty space in a cluster, the number of fonts, the mean font size, zone density, average zone area, document keywords having been found in the cluster. The decision tree based on these elements depends on the historic date of publication of the magazine (details on the decision tree are beyond the scope of this document). In addition, the IllFilter makes usage of some heuristics after statistical analysis on set of magazines. For example, if there are 3 columns in an article page, the middle one is rarely an advertisement. Another heuristics states that one-column pages with high degrees of empty space are likely to be advertisement. We also use sections, or TOC references, or double paging methods to revalidate decisions following the finder-filter principle. A complex statistical model has been built to construct the rules and to find out the optimum values of the rules.
Figure 3 - Example of "inset" detection
An inset that has font properties and background properties different from the main article text
200

4.6 Text Flow and Article Recognition The subsystem for text flow and article recognition comprises multiple analysis methods including: punctuation and presentation analysis, language models and part of speech analysis, and semantic relationship analysis between text zones. The results from the multi-method analysis are combined to achieve reliable article identification. The approach is applied within each page and across document pages. Because of the richness and variability of the historical collection, we discarded a template-based approach, and instead developed techniques that do not make assumptions about a unique structure of each page.
4.6.1 Ordering zones This analyzer determines a set of possible reading order of the text zones using linguistic and layout rules. We first exclude all zones that do not semantically participate in the reading order solution e.g. advertisements, headers, footers, page numbers, etc. This significantly reduces the number of zones to be analyzed. We use the geometrical information obtained from the layout analysis in addition to rules about the possibility of reading order of text zones to generate a set of possible reading orders within each cluster. Example of these rules include: the English text flows from left to right and from top to bottom.
We use the Allen’s interval relationships [14] to determine relative graphical positions of the text zones. There are 13 possible relationships in Allen’s space: precedes, meets, overlaps, starts, during, finishes, equals, and their inverse. These relationships have been proven disjoint in one dimension. Applying this concept in two dimensions and considering that: (1) text zones cannot physically overlap (text would be unreadable), (2) English reading rules must be applied (top-to-bottom, left-to-right), (3) the top-leftmost zone is considered a general starting zone (this assumption does not mean that this is the start of the article, it also does not mean that this is the only starting point). Then, a zone R1 is before another zone R2 in a reading order if: R1_x precedes/meets R2_x or R1_y precedes/meets R2_y. The following figure illustrates R1 read before R2:
Figure 4 Reading order Analysis
Starting from the top left zone, a graph is generated using the above analysis, any depth traversal of the graph generates a possible reading order.
4.6.2 Punctuation Presentation Font Analysis These analyzers determine scores each of the possible flows produced by the order zone component based on text punctuation and font information. The relationship between every two consecutive zones in each text flow alternative is analyzed. Font analysis uses font type and font size to find the best candidate(s) to follow the reading order. The last character ending the last line
in the source zone is extracted and the following characteristics are checked: word hyphenation, end of sentence, absence of punctuation, existence of a quoting sign in the last characters of the source zone and in the first characters on the candidate zone. A combination of splitting and scoring flows is used to rank the reading order candidates. The presentation analyzer makes use of the fact that the “presentation” (shape, fonts, font colors, sizes and other visual features) of text zones that belong to the same article tend to be the same, considering that at this stage in the process we are analyzing the body text and not titles, headers, or footers.
4.6.3 Language Model and Topic Vector Analysis This set of analyzers determines a likely score for a flow based on various measurements assessing whether two zones belong to the same article. Some of the analyzers are used to determine sequence (language and part-of-speech), some can be used to find zones that belong to the same article (similarity) and some can be used to discard zones that are unlikely to be part of the same article (topic vector). Note that, as we experimented with all these analyzers, we found that their effectiveness was dubious compared to other analyzers such as reading order, layout, inset, and presentation and punctuation analyzers.
Language score. We can calculate a “language score” by evaluating the probability of sequence of words across the two text zones. A language model is trained on a large volume of similar textual data that can estimate the probability of n-grams, with n varying from 1 to 3. This can be done either with exiting language models and or with a custom-trained recognizer. Language score is a “positive test”: a high language score should identify zones that are likely to be consecutive parts of the same article.
Part-of-Speech (POS) score. Similar to the language model analyzer, a POS analyzer uses the output from a part-of-speech tagger to assess whether two text zones are consecutive. This requires a 3-gram of POS tags for the English language (from existing databases). From the tags, we can obtain the last partial sentence of the source zone and the first partial sentence of the target zone. The analyzer concatenates the two sentences and applies the POS tagger to the concatenated sentence. A check of the tags of the concatenation against the 3-gram frequent tags provides the basis for the computation of the score. The POS score is also a “positive test”, and zones with high POS scores are likely to be consecutive part of the same article.
Semantic (“topic vector”) score. The analyzer relies on an off-line training of a preset number of topics from a large set of documents (we used similar magazine issues that were available in digital form), using technique such as Probabilistic Latent Semantic Analysis (PLSA), or other more traditional classifiers (Bayes, Support Vector Machines, etc.). In order to compute a score, the analyzer obtains the “topic vector” from each of the two zones and measures the distance between the two vectors. The topic vector score is a “negative test”: zones with a high distance are likely not to be part of the same article, but not vice versa (e.g., two zones that both talk about sport don’t necessarily belong to the same article).
Similarity score. A correlation analyzer identifies a correlation metric between the two text blocks, based on text similarity. Similarity is again a “positive test” (blocks with high similarity – meaning many repeated words – are likely to be part of the same
201

article). However, unlike language and part-of-speech, it does not provide information about the zone sequence.
4.6.4 Cross-Page Flow Analysis Components These components analyze articles (and other properties) across multiple pages. This is necessary because magazines (as well as other document-rich documents) normally include complex articles that span beyond a single page, not consecutively, and skipping other non-relevant document, such as advertisements or insets.
Two components, DoublePager and NextPageAnalyzer, act together to establish cross-page article flows. The “DoublePager” component is able to create a new page combining every two pages of an issue while discarding advertisement pages. For each page file the “DoublePager” creates a new page file adding all zones of the first one, plus all zones of the second one shifted of pageWidth in their coordinates. The idea is to run algorithms for sequencing and clustering of zones on these special pages to see how articles flow across multiple pages
4.6.5 Decision Combiner After all the page-level and issue-level information are collected, the “decision combiner” decides on the final flows that constitute and article. The output from the analysis modules is a set of reading order alternatives ordered with likely probabilities (or simple ordering when the module is incapable of assigning a probability value). The decision combiner takes these inputs and produces the most likely reading flow order in the page. All the collected information, combined with “start of article” information extracted from the table of document is used to tag likely “start” zones. The combiner then selects the most likely flows from the “start” zones, discarding advertisements and other “junk” zones. Finally, it tries to assign “orphan” zones based on a set of different criteria.
Figure 5 - Example of some of the statistics extracted by the combination of layout/inset finders and IllFilter.
5. MANUAL CORRECTION PHASE The manual correction process is used to improve the quality of the output from the DCRM system. It is an optional process that may be required if high accuracy is to be achieved. For this project, the manual correction process included the following phases:
• Correction of zone segmentation. This is related to fixing bad zones. Bad zones are those that either have overlapping text with other zones or have had some text cut off due to poor segmentation. Although this may happen with a very low percentage, it is important to be fixed early in the process because the rest of the correction process depends on having correct zones as an input.
• Correction of page semantics. Page semantics is defined as the meaning of the page in the overall document. The following semantics are considered: table of content (TOC), advertisement, article, manifest, and section. The automated document understanding system may mistakenly recognize a page of one semantics to another (e.g. advertisement as articles, etc.). In this phase, corrections are made to each page in the document to ensure its correct semantics.
• Correction of zone semantics. The objective of zone semantic correction is to ensure that each zone in the article is correctly tagged as a title or a body of text or an advertisement, etc. There are 14 possible tags for zone semantics, each represented by the processing software as a different color (author, body, header, footer, footnote, page number, section, subsection, title, subtitle, caption, margin, date, volume). When an error is detected by a human, he has to change the color of the zone through selection from a drop down menu, which takes a few seconds.
• Correction of zone page relevance. Each zone in a page has a relevance to that page. Examples of possible zone relevance include: article, advertisement, insert, TOC, letters2editor, and manifest. Each zone is labeled with one of the above relevance. This correction phase is responsible for checking and correcting every zone in the page with the correct relevance.
• Correction of in-page zone linking (reading order or flow). This phase deals with the correction of zone linking problems, which is the most delicate aspect of article reconstruction. The correct linking of zones to reconstruct the article requires a minimum of understanding of the flow of the article, and any error can mess up the article completely. Therefore this is a crucial step in the process and the appropriate time should be devoted to it. In an average article, there are 7 or 8 zones to be linked, and there are 50 to 70 articles per issue. This means that 500 links per issues have to be checked, 100 of which turn out to be wrong.
• Correction of cross-page zone linking. Similar to in-page flow linking except that the source and the destination zones are in different pages. This correction is needed to ensure that an article that extends from one page to another is correctly extracted.
• Correction of text. Once the phases needed for article structure correction are completed, it is possible to proceed to text correction, which constitutes this phase of the manual correction process. This phase consists of comparing the characters or words
202

flagged as suspect to the original text, which the tool shows right above the text under examination. The task of the manual operator is to click through all the suspects and type in the corrected text for those that have been spotted to be wrong.
• Article generation. The last phase in the process is the generation of the articles from the document (from the page and document presentation). Then the articles are checked for competence. Proof reading is a common technique to ensure the article correctness. In addition, the metadata information about the article is also checked (title, author, section, subtitles, etc.).
To perform all these types of corrections and review, we developed an in-house tool. Existing commercial and academic tool falls behind when it comes to correction of all of the above types. Details about the correction process can be found in [23].
6. DEPLOYMENT PHASE The output from the manual correction process is a master representation of the page in XML format. The master XML contains both the content of the page and the metadata. These master XMLs serves for storing and later extracting information from the page.
The page XML is used to store information about the page: it does not store any information about the process or what follows in the document processing pipeline. We intentionally separated control information (sequence and process) from data information (page XML), so that the XML only acts as the “backboard” that is filled with page data as more document understanding components are applied, but does not embody any of the specific order in which component are executed in the workflow.
The page XML is the intermediate as well as the final representation that we use to exchange information between the components and to represent the final page after recognition. We chose this design for several reasons. It facilitates the addition of new components. Once components are ready, they can be deployed and tested while other components are being developed. A new component only needs to know the structure of the XML; which parts it needs to read and which parts it will add or update. Hence, a component developer only needs the XSD schema and its support libraries. This design also enables the “don’t call us, we’ll call you” architecture. Components don’t know about the existence of other components. The underlying framework calls the component when needed.
From the deployment perspective, the final XML page is stored as the master for each page. Using this mater, applications can use the page differently. For example, for web applications that present article to users in HTML format, the XML pages are processed by offline tools which extract the article based on the article markups already present in the master XML document. The article metadata is also extracted since the master XML file already contains metadata information about the title, author, etc. This phase does not require any additional document understanding technologies since the master XMLs already contain all the necessary information. It is simply an extraction or reformatting phase. The articles could then be inserted in a database which represents the backend of a web-portal for online access of the collection.
7. RESULTS While it is simple to estimate the accuracy through various metrics (such as the number of OCR capture suspects for text), this does not tell us anything about the real accuracy of the result. The only way in which we can really measure accuracy is by comparing it against the “ground truth”, that is a manually proof-read version of the document. In our case, fortunately, the output of DCRM did go through a set of manual correction stages to eliminate errors. Although this process is not error-prone, for the sake of our measurements, we make the assumption that it constitutes the error-free “ground truth.”
The comparison process (implemented in an accuracy meter component) works as follows: each page XML produced by DCRM is compared with the page XML resulting from the correction process. The correction process can add, remove or modify text, zones and flows; hence, comparing the two XMLs is not straightforward. The AccuracyMeter component attempts to match individual zones and flows to identify what may have changed, and individually compares each word in the two XMLs identifying which have been modified, added or removed.
In terms of accuracy, we report results for the following metrics
Page Style Accuracy. It represents whether the system correctly detected the style of a page (one of: advertisement, TOC, article, section, cover, back, editorial). Reported as percent of “correctly labeled” pages.
Zone Semantics Accuracy. It represents whether the system correctly detected the semantics of a zone (one of: author, body, header, footer, footnote, page number, section, subsection, title, subtitle, caption, margin, date, volume). Reported as percent of “correctly labeled” zones.
Flow Accuracy. It represents whether the system correctly linked two zones as part of an article. Reported as percent of “correct” flows, where a flow is correct if the two zones it links exist, and the flow has not been changed, deleted or added in the correction phase.
Text Accuracy. It represents whether the system correctly recognized a word, excluding stand-alone punctuation. Reported as percent of “correct” words (where a word is correct if it has not been changed deleted or added in the correction phase).
The following table summarizes the results of DCRM’s accuracy. It was obtained from the analysis of approximately 1,600 issues (about 30% of the entire body of TIME magazines) that had completed most of the correction phases as of the writing of this report. For each metric, we report both the average value (representing the statistical distribution), as well as the median value (representing the expected value).
Page Style Accuracy
Zone Semantics Accuracy
Flow Accuracy
Text Accuracy
Average 89.48% 89.28% 80.33% 99.72% Median 90.91% 90.51% 81.05% 99.80%
Figure 6 Accuracy summary
The system achieves excellent results across the board. Using median values, text recognition accuracy (coming from the OCR) is around 99.80%, which translates to about 2 errors every 1,000 words. Using the sample set, the expected number of word corrections per issue is approximately 100. In terms of statistical
203

distribution, Figure 7 shows that most of the word accuracy (measured per issue) is indeed between 99.70% and 99.95%, with a clear peak around 99.90%
Text Accuracy Histogram
99.0% 99.1% 99.2% 99.3% 99.4% 99.5% 99.6% 99.7% 99.8% 99.9% 100.0%
median (99.80)
average (99.72)
Figure 7 - Histogram of per-issue text recognition accuracy
If we analyze article extraction accuracy, the situation is – understandably – slightly different, mostly because this is innovative technology with respect to OCR techniques, which are fairly mature. However, we believe that the overall accuracy results undoubtedly show the promise of the DCRM algorithms. Again using median values, both page style and zone semantics accuracy approach 90% accuracy, which translate to an average of 8 page style and 300 zone type corrections per issue on the test set. We find article flow accuracy – approximately 80% – acceptable, but an area that still might use some improvements. For example, on the test set, an 80% accuracy in linking zones still implies that approximately 100 links needed to be corrected in every issue to be able to correctly identify the article flows. This is also evident from the histogram charts of Figure 8. While the shape of page style and zone semantics histograms shows a nice peak around 90%, the shape of the article flow accuracy curve is much wider and statistically significant values can be found anywhere between 65% and 95%. This means that the performance of the flow-detection algorithms is much less predictable than zone or page labeling. To be fair, the accuracy of flows in our measurement also depends on the accuracy of semantics and style, because we flag a flow error also in all cases where one of the linked zone type is wrong. Thus, if we get an error in semantics, it is automatically translated to an error in flow (in most cases) in addition to the other errors that the flow algorithm itself does.
Article Accuracy Histograms
0.5 0.55 0.6 0.65 0.7 0.75 0.8 0.85 0.9 0.95 1
pagestyle
flow
semantics
Figure 8 Histogram of article accuracy metrics
For TOC detection, the title matching approach produces extremely poor results. This can be explained as 81% of the magazines have a TOC page that is just an index of the sections without any article titles. For the remaining 19%, we found that the TOC page usually contains title text that is not the same as the one that appears later in the magazine for the article title (only few
words of overlap). For this type of commercial magazines, the title based detection method is not recommended. The performance of keyword matching detection method is better than the other two algorithms. It turns out that Time magazine has kept a consistent set of section names over the years. The combination of all methods outperforms the best engine. This is a remarkable result given the fact that no previous training was performed, one detection technique method was very poor, and the combination rules were generic. We also conducted detailed evaluation of our advertisement detection algorithms. Performance of the advertisement detection is measured in terms of precision (P), recall (R), and accuracy (Q) measurement. Figure 9 shows the results for various decades.
# Pages R % P % Q % # Zones R % P % Q %
1920s 10,235 79.32 99.67 93.83 260111 73.43 82.70 86.03
1930s 16,730 88.95 98.39 95.34 355669 75.95 96.87 88.76
1940s 22,429 94.79 99.33 97.40 340328 88.41 89.64 88.93
1950 22,402 88.68 99.24 94.29 388121 75.19 95.63 89.75
1960s 23,617 91.83 99.55 95.57 464891 75.01 93.97 92.25
Total 121654 90.06 99.32 95.42
2,383,989 77.10 92.81 89.34
Figure 9 Advertisement detection statistics per page (left table) and per zone (right table).
From these results, we can observe that precision is always higher than recall. This means that we miss some advertisements but when a decision is made that it is an advertisement, it is usually correct. Also, accuracy for full page advertisement detection is higher than zone detection, and this reflects the difficulty of assessing part of the page as an advertisement. Results are consistent over the years although the document style changed across decades. Finally, we found that the standard deviation for P is the lowest and it is higher for Q and R respectively. A lower standard deviation indicates that the rules are more accurate. Results are discussed in more details; see [25]
8. RELATED WORK The analysis and understanding of structured documents has been the topic of extensive research for many years. Systems and commercial applications for mail automation, check processing, medical form analysis, tax processing, etc. have been operational for a long time. Such systems, however, are often not suitable for unstructured data such as newspapers and magazines.
There exist systems that analyze the content of academic journals and book. For example, Lee [14] describes a system that analyzes scientific IEEE journals. Scientific journals and books have simple layout and logical structure when compared to complex commercial documents such as newspapers and magazines. Therefore such systems can not be directly applied to complex documents.
For complex multi-articles documents such as newspaper, Tsujimoto [19,20] proposed a system to process regular multi-column black and white papers, using a tree representation of the document. Four rules are used to transform a layout tree into a logical tree based on hard coded domain knowledge. The system works only for the class of documents being analyzed and is difficult to adapt to other classes.
204
Concerning the separation between domain-dependent and generic rules in document analysis systems, Klink [13] explicitly separates specific and generic knowledge to process multiple classes of documents. Fuzzy matching rules are used for classification, which make the system fairly generic. However, the system developed by Klink is not a complete document understanding system (for example, it does not address the reading order issues).
Aiello [3,2] proposed another generic system for document understanding for a broad class of documents. In that work, a document model is built to allow for complex document representation. A system is built that contains techniques based on: statistical decision trees using geometric features for zone semantic annotation, bi-grams and tri-grams for reading order detection, and Allen relations [4] in two-dimensional space. The system has the advantage of addressing various classes of documents. It integrates layout and logical structure components. However, it lacks several components and system properties that are required for large-volume processing of historical collection of documents. For example, it does not have an advertisement detection component which is essential for commercial magazines. It is a monolithic application and not a system framework for integration and document processing components. For large collection of data, automation, parallelization and resilience to failures are necessary. The system by Aiello was only tested on a few pages (623 from UW-II and 171 from MTDB) mainly from academic collections (technical journals). For example, for the Time magazine historical collection, the two techniques used by Aiello for detecting reading order (SpaRe and NLP) are not sufficient to detect articles, especially in a multi-articled page that also contains advertisements.
From a systems perspective, a document understanding application for a historical collection of documents must be a non-stop, parallel, automated system. This is necessary for processing a large volume of data. Hence, the framework for sequencing and integrating the document understanding components is as important as the components themselves.
Not many initiatives tackle the overall system aspects of the problem. The document mining group [6,7] is a consortium working on the creation of document mining framework called DocMining. The DocMining framework allows the dynamic generation of workflow by hooking components together, allows the addition of new components to the framework, and allow for visualization and manipulation of the results. All the processing workflows and results are stored, thus allowing for know-how sharing. The DocMining framework has some drawbacks. It defines the process workflow, the intermediate data produced during the workflow, as well as the data itself in one unique document which is called eDocument (as defined in the DocMining framework). Mixing control and data information in the same context is not recommendable by common software engineering practices. The papers [6,7] discuss the plan desired by the DocMining team but the status of the implementation is yet unknown.
A framework called Edelweiss [17] is being investigated in the University of Fribourg. The framework aims at extending an existing ground-truthing system called XMIllum [10] to not only enable the correction of the output from a document processing pipeline but also the generation and execution of the pipeline.
The framework lacks the ability to develop complex document processing workflows that contain branching scenarios, if-else-then conditions, etc. The repository of ground truth document and the comparative analysis of algorithms are not part of the framework. The project focuses more on the human-machine interaction part for these workflows.
9. CONCLUSION In this paper we presented a document digitization lifecycle
for recapturing content of large collections of magazines. We have presented the major phases, the operation of the system, as well as the major components and subsystems. We have shown performance and accuracy data as applied to the 80-years collection of Time magazines (Note that these results reflect the output of our system and does not reflect the output on the Time.com archive web site). The accuracy results achieved in DCRM (99.8% of text, 90% of page and zone labeling, 80% of article flow detection) are acceptable and so are the overall performance (11K pages/day) and scalability.
We believe that we have uncovered several novel techniques and methodologies which could be leveraged in other document-processing domains. For example, the way in which the components interact with the intermediate representation of document (the page XML). Likewise, the workflow engine itself and the way in which we structured the distributed processing pipeline is not tied to a specific document type or algorithm. We are investigating how to use the system as a platform for providing document understanding service to other publishers. How the system needs to be adapted (and how generic is the solution) are some of the topics of our future research.
10. REFERENCES [1] Adam, S., M. Rigamonti, E. Clavier, J.-M. Ogier, E. Trupin
and K. Tombre. DocMining: A Document Analysis System Builder. In Document Analysis Systems VI - Proceedings of 6th IAPR International Workshop on Document Analysis System, Florence (Italy), pages 472-483, Lecture Notes in Computer Science, vol. 3163, Springer Verlag, september 2004.
[2] Aiello, M., C. Monzl, L. Todoran. Combining Linguistic and Spatial Information for Document Analysis. Proceedings of the RIAO'2000 Document-Based Multimedia Information Access, Paris, France, pp.266 -275, April 2000.
[3] Aiello, M.,C. Monz, L. Todoran, M. Worring. Document understanding for a broad class of documents. International Journal on Document Analysis and Recognition. 5: 1-16, 2002.
[4] Allen, J. Maintaining knowledge about temporal intervals. Communications of the ACM, 26(11):832-843. 1983
[5] Altamura, O., F. Esposito & D. Malerba (2001). Transforming Paper Documents into XML Format with WISDOM++, International Journal of Document Analysis and Recognition, Springer Verlag, 3(2), 175-198.
[6] Clavier, E., G. Masini, M. Delalandre, M. Rigamonti, K. Tombre and J. Gardes. DocMining: A Cooperative Platform for Heterogeneous Document Interpretation According to User-Defined Scenarios. Lecture Notes in Computer Science.
205

Volume 3088 / 2004 Title: Graphics Recognition: Recent Advances and Perspectives, 5th International Workshop, GREC 2003, Barcelona, Spain, July 30-31, 2003.
[7] Clavier, E., P. Heroux, J. Gardes, E. Trupin. Ground-Truth Production and Benchmarking Scenarios Creation With DocMining. Third International Workshop on Document Layout Interpretation and its Applications (DLIA2003). August 2, 2003 Edinburgh, Scotland
[8] Couasnon, B. DMOS: A generic document recognition method. application to an automatic generator of musical scores, mathematical formulae and table structures recognition systems. In Proceedings of 6th International Conference on Document Analysis and Recognition, Seattle (USA), pages 215–220, 2001
[9] Haralick, R. Document image understanding: geometric and logical layout. IEEE conference on computer vision and document understanding. 1994.
[10] Hitz, O., L. Robadey, and R. Ingold. An architecture for editing document recognition results using XML. In Proceedings of 4th IAPR International Workshop on Document Analysis Systems, Rio de Janeiro (Brazil), pages 385–396, 2000
[11] HP Laboratory, Barcelona Research Office. Time Archive + HP. http://welcome.hp.com/country/us/en/msg/corp/htmltimearchive.html
[12] Kanungo, T., C. H. Lee, J. Czorapinski, I. Bella. TRUEVIZ: a groundtruth/metadata editing and visualizing toolkit for OCR. In Proc. of SPIE Conference on Document Recognition and Retrieval, Jan. 2001.
[13] Klink, S., A. Dengel, T. Kieninger. Document Structure Analysis Based on Layout and Textual Features. Proceedings of the 4th IAPR International Workshop on Document Analysis Systems, DAS2000, pp99-111, Brazil 2000.
[14] Lee, K., Y. Choy, S. Cho. Geometric structure analysis of document images: A knowledge approach. IEEE Transactions on PAMI, 22(11):1224-1240, 2000.
[15] Masataki, H., Y. Sgisaka. Variable-order N-gram generation byword-class splitting and consecutive word grouping, IEEE, pp. 188-191,1996.
[16] McCallum. Bow: A toolkit for statistical language modeling, text retrieval, classification and clustering. http://www.cs.cmu.edu/~mccallum/bow, 1996.
[17] Roussel, N., O. Hitz, and R. Ingold. Web-based cooperative document understanding. In Proceedings of ICDAR 2001, the 6th IEEE International Conference on Document Analysis and Recognition, pages 368-373, September 2001.
[18] Scansoft Omnipage. http://www.scansoft.com/omnipage/
[19] Tsujimoto et al. Understanding Multi-Articled Documents. Proceedings of 10th Int. Conf. on Pattern Recognition, vol. 1, pp. 551- 556, Jun. 1990
[20] Tsujimoto S. , H. Asada. Major Components of a Complete Text Reading System. Proceedings of the IEEE, 80(7):1133-1149, 1992.
[21] Yacoub, S. Automated Quality Assurance for Document Understanding Systems. IEEE Software, 20(3):76-82, May/June 2003
[22] Yacoub, S., J. Abad. Detection of Document Structure and Table of Content in Magazine Archives. 8th International Conference on Document Analysis and Recognition, Seoul Korea September 2005.
[23] Yacoub, S., V. Saxena. PerfectDoc: A Ground Truthing Environment for Complex Documents. 8th International Conference on Document Analysis and Recognition, Seoul Korea September 2005.
[24] Abbyy Fine Reader. http://www.abbyy.com/finereader7/?param=28603
[25] Yacoub, S., P. Faraboschi, J. Burns, D. Ortega, J.Abad, J.A. Sanchez. Chronos: A Document Understanding System for Historical Magazine Collections. Submitted to International Journal on Document Analysis and Recognition IJDAR.
[26] Antonacopoulos, A., D. Karatzas, H. Krawczyk, B. Wiszniewski. The lifecycle of a digital historical document: structure and content. Proceedings of the 2004 ACM symposium on Document engineering, DocEng 2004, Milwaukee, Wisconsin, USA.
[27] Nicolas, S., Th. Paquet, L. Heutte. Digitizing cultural heritage manuscripts: the Bovary project. Proceedings of the 2003 ACM symposium on Document engineering, DocEng 2003, Grenoble, France.
206
Copyright © 2022 FDOKUMEN