DNA array analysis in a windows-PC environment
12
DNA array analysis in a microsoft windows environment. Biotechniques. 32: 110-119. Revised for submission to Biotechniques August 30, 2001 DNA array analysis in a windows-PC environment Tyrrell Conway*, Barbara Kraus, Don L. Tucker, Darren J. Smalley, Angela F. Dorman, and Loretta McKibben Running Title: Array analysis Department of Botany and Microbiology, The University of Oklahoma, Norman, OK 73069- 0245 Keywords: functional genomics, DNA array, computational biology, bioinformatics * Corresponding author: Tyrrell Conway Department of Botany and Microbiology The University of Oklahoma Norman, OK 73069-0245 Voice: 405 325 1683 FAX: 405 325 7619 E-mail: [email protected]
-
Upload
independent -
Category
Documents
-
view
3 -
download
0
Transcript of DNA array analysis in a windows-PC environment
DNA array analysis in a microsoft windows environment. Biotechniques. 32: 110-119. Revised for submission to Biotechniques August 30, 2001
DNA array analysis in a windows-PC environment
Tyrrell Conway*, Barbara Kraus, Don L. Tucker, Darren J. Smalley, Angela F. Dorman, and Loretta McKibben
Running Title: Array analysis Department of Botany and Microbiology, The University of Oklahoma, Norman, OK 73069-0245 Keywords: functional genomics, DNA array, computational biology, bioinformatics * Corresponding author: Tyrrell Conway Department of Botany and Microbiology The University of Oklahoma Norman, OK 73069-0245 Voice: 405 325 1683 FAX: 405 325 7619 E-mail: [email protected]

ABSTRACT 1 2 3 4 5 6 7 8 9
10 11 12 13 14 15 16 17 18 19
Windows-based PC computers have evolved to the point that they provide sufficient computational and visualization power for robust analysis of DNA array data. In fact, smaller laboratories might prefer to carry out some or all of their analyses and visualization in a Windows environment, rather than alternative platforms such as UNIX. We have developed a series of manually-executed macros, written in Visual Basic for Microsoft Excel spreadsheets, that allows for rapid and comprehensive gene expression data analysis. The first macro assigns gene names to spots on the DNA array and normalizes individual hybridizations by expressing the signal intensity for each gene as a percentage of the sum of all gene-intensities. The second macro streamlines statistical consideration of the confidence in individual gene measurements for sets of experimental replicates by calculating probability values with the student t-test. The third macro introduces a threshold value, calculates expression ratios between experimental conditions, and calculates the standard deviation of the mean of the log ratio values. Selected columns of data are copied by a fourth macro to create a processed data set suitable for entry into a Microsoft Access database. An Access database structure is described that allows simple queries across multiple experiments and export of data into third-party data visualization software packages. These analysis tools can be used in their present form by others working with commercial E. coli membrane arrays or they may be adapted for use with other systems. The Excel spreadsheets with embedded Visual Basic macros and detailed instructions for their use are available on the Internet: http://www.ou.edu/microarray. 20
21 22 23 24 25 26 27 28 29 30 31 32 33 34 35 36 37 38 39 40 41 42 43 44 45
INTRODUCTION
With the publication of the first genome-wide expression data 6 years ago (13) the power of the DNA array was immediately evident. Since then, reviewers have predicted a revolution in the way biologists conduct their research (3-5, 12). Today the trend toward wide-spread use of DNA arrays continues. Vast amounts of DNA array data are accumulating and the need for standardized array annotation and data representation is being addressed (http://www.ebi.ac.uk/microarray/MGED/). Relational databases are being developed to handle microarray data storage in a format that facilitates data processing and visualization, allowing researchers to analyze and interpret their experiments, and disseminate the data (16). Generally, the database management software used is Oracle, web interfaces are written in JAVA or XML, and scripts used for data processing, retrieval, etc. are written in Perl, C, or other programming languages. For the common microarray user however, implementation of such a system may be beyond their budget or exceed their actual needs. For these users, a central archive is an attractive alternative for data storage. An example of this, the EcoReg Consortium (http://gobi.lbl.gov/~ecoreg/index.html), is being established as a public database for storage and manipulation of Escherichia coli microarray and proteome data. Still, it will be necessary for individual users of consortium databases to process, analyze, and format the data for submission. DNA arrays have been used to examine the genetics and physiology of the comprehensive biological model, E. coli. Some research groups have used commercial membrane-based DNA arrays (2, 17, 18), while others have employed DNA microarrays (6, 11, 19, 20) or oligonucleotide arrays (15). Several practical issues regarding the use of whole-genome arrays have been addressed and the power of this technology as a means for deducing the physiological state of the bacterial cell is now well established.
2 In our laboratory we routinely use membrane-based DNA arrays for E. coli gene
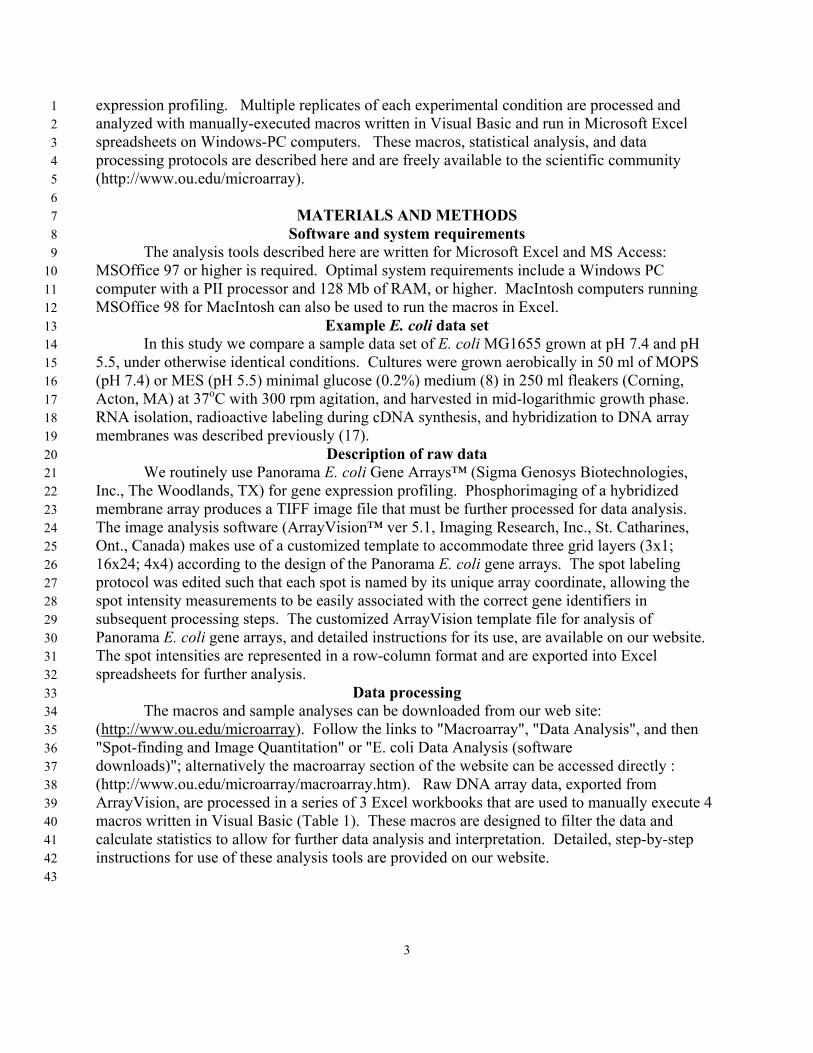
expression profiling. Multiple replicates of each experimental condition are processed and analyzed with manually-executed macros written in Visual Basic and run in Microsoft Excel spreadsheets on Windows-PC computers. These macros, statistical analysis, and data processing protocols are described here and are freely available to the scientific community (http://www.ou.edu/microarray).
1 2 3 4 5 6 7 8 9
10 11 12 13 14 15 16 17 18 19 20 21 22 23 24 25 26 27 28 29 30 31 32 33 34
MATERIALS AND METHODS
Software and system requirements The analysis tools described here are written for Microsoft Excel and MS Access:
MSOffice 97 or higher is required. Optimal system requirements include a Windows PC computer with a PII processor and 128 Mb of RAM, or higher. MacIntosh computers running MSOffice 98 for MacIntosh can also be used to run the macros in Excel.
Example E. coli data set In this study we compare a sample data set of E. coli MG1655 grown at pH 7.4 and pH
5.5, under otherwise identical conditions. Cultures were grown aerobically in 50 ml of MOPS (pH 7.4) or MES (pH 5.5) minimal glucose (0.2%) medium (8) in 250 ml fleakers (Corning, Acton, MA) at 37oC with 300 rpm agitation, and harvested in mid-logarithmic growth phase. RNA isolation, radioactive labeling during cDNA synthesis, and hybridization to DNA array membranes was described previously (17).
Description of raw data We routinely use Panorama E. coli Gene Arrays™ (Sigma Genosys Biotechnologies,
Inc., The Woodlands, TX) for gene expression profiling. Phosphorimaging of a hybridized membrane array produces a TIFF image file that must be further processed for data analysis. The image analysis software (ArrayVision™ ver 5.1, Imaging Research, Inc., St. Catharines, Ont., Canada) makes use of a customized template to accommodate three grid layers (3x1; 16x24; 4x4) according to the design of the Panorama E. coli gene arrays. The spot labeling protocol was edited such that each spot is named by its unique array coordinate, allowing the spot intensity measurements to be easily associated with the correct gene identifiers in subsequent processing steps. The customized ArrayVision template file for analysis of Panorama E. coli gene arrays, and detailed instructions for its use, are available on our website. The spot intensities are represented in a row-column format and are exported into Excel spreadsheets for further analysis.
Data processing The macros and sample analyses can be downloaded from our web site:
(http://www.ou.edu/microarray). Follow the links to "Macroarray", "Data Analysis", and then "Spot-finding and Image Quantitation" or "E. coli Data Analysis (software downloads)"; alternatively the macroarray section of the website can be accessed directly : (http://www.ou.edu/microarray/macroarray.htm). Raw DNA array data, exported from ArrayVision, are processed in a series of 3 Excel workbooks that are used to manually execute 4 macros written in Visual Basic (Table 1). These macros are designed to filter the data and calculate statistics to allow for further data analysis and interpretation. Detailed, step-by-step instructions for use of these analysis tools are provided on our website.
35 36 37 38 39 40 41 42 43
3

RESULTS AND DISCUSSION 1 2 3 4 5 6 7 8 9
10 11 12 13 14 15 16 17 18 19 20 21 22 23 24 25 26 27 28 29 30 31 32 33 34 35 36 37 38 39 40 41 42 43 44 45 46
The workbooks, macros, and subroutines used for DNA array data analysis are outlined in Table 1. The subroutines can be run in order individually, or the macro containing all relevant subroutines can be run once to execute all subroutines. In the following section we provide an overview of important statistical considerations, the specific processing steps, and outcomes.
Statistical significance Various approaches for attaching significance to DNA array data have been published,
including a simple “rule of thumb”criterion for the value of the expression ratio (2, 20). Some researchers have used the standard deviation from the mean of the expression ratios as an indicator of confidence (6, 17). Arfin et al (1) applied the student t-test to experimental replicates and considered the P value to be the most important indicator of significance. Richmond et al (11) combined a confidence interval obtained with the student t-test and a rule of thumb criterion for the expression ratio. Others prefer to consider the significance of a single experimental condition based on the coefficient of variation (18). A precedent for statistical analysis of array data has yet to be firmly established and a standard is clearly needed. Whatever statistical approach is adopted, it is essential that DNA array experiments are properly replicated and the uncertainty that lies behind individual gene measurements be considered in order to attach significance to data sets. We advocate the use of at least 2 replicates of each experimental condition. Membrane arrays typically have duplicate spots for each gene and each spot is considered to be a separate determination, providing a total of 4 determinations for the 2 replicates. Because membrane arrays are hybridized with a single labeled target mRNA and normalized independently (in effect a one-color experiment) the variation in the measurement is at the level of the raw data, not the measurement of the ratio (unlike the statistical approach that is popular with two-color microarrays and involves internal normalization of the measurements). The uncertainty that lies behind individual gene measurements can be variously calculated as the standard deviation of the determinations or the coefficient of variation. Since we are usually interested in the statistical significance of differences between an experimental condition and a control, we prefer the student t-test as a means for calculating this probability, based on the uncertainty of the replicate measurements in both conditions. The student t-test is best applied to natural log-transformed normalized data sets (7). Generally, a P value of <0.05 is chosen to indicate a 95% probability that the difference in gene expression between conditions is significant. However, it has been pointed out that with very large data sets – eg. a bacterium with 5000 genes – choosing a value of p<0.05 means that there could be up to 250 false positives in the data set (1). Thus the researcher is left with two choices: to lower the P value to a level where no false positives are expected (p<0.0002), or to consider a second statistical metric that when combined with a reasonable P value (p<0.05) is an excellent indicator of significance of a ratio value.
4
We use the standard deviation of the mean of the log ratios – within the context of the P value – to indicate significant up- or down-regulation of gene expression. This approach is meaningful where the expression level of the majority of genes does not change significantly between conditions and where the researcher is interested in genes that show substantially different expression. The standard deviation for the log ratios is calculated and only those genes that differ by more than 3 standard deviations (99.9% confidence in each tail) from the mean of the log ratio (usually zero, or no change) are considered. In practice, emphasis is placed on those genes that have expression ratios greater than 3 standard deviations from the mean and have a reasonable probability of being significantly different between the conditions, based on a P value

<0.05. Where there are 4 or more determinations for each gene, the P value can be lowered to <0.005 with little change seen in the number of genes that are considered to vary significantly between conditions.
1 2 3 4 5 6 7 8 9
10 11 12 13 14 15 16 17 18 19 20 21 22 23 24 25 26 27 28 29 30 31 32 33 34 35 36 37 38 39 40 41 42 43 44 45 46
There may also be situations when the researcher is interested in changes in gene expression that are not a full 3 standard deviations from the mean, but are still significant -- that is, where the differences in gene expression between conditions are subtle, yet meaningful. In this case the student t-test can be used as the sole measure of significance, but the P value must be adjusted to ensure that false positives are avoided. One approach for this is to apply the Bonferroni correction that describes a P value for significance in a large data set (7). Various strategies for implementing this correction factor have been described and its proper use is somewhat controversial (14). The Bonferroni correction effectively lowers the P value to a point where false positives are avoided and consideration is given only to those genes for which there is a high degree of confidence in the ratio value. In this light the Bonferroni correction seems to be a reasonable statistical tool, but may be too stringent for some considerations.
“Image data cruncher” workbook To begin the data analysis process, the raw data from an experimental replicate is copied
and pasted into a blank spreadsheet named “arvdata” in an Excel workbook named, “Image Data Cruncher” containing the macro named “AllDataCrunched6" (Fig. 1). The first subroutine in the macro, “ArvAllSort1", copies and pastes subsets from the “arvdata” spreadsheet into a second spreadsheet named “allfields” that contains information provided by the membrane manufacturer for associating the array location with a spot number that is unique to each target on the array. The second subroutine, “Nameall2" copies and pastes the data in the “allfields” spreadsheet into a third spreadsheet that associates the spot number with a unique identifier and associated genome annotation information for each gene. Differences in spot intensities between replicate experiments arise from normal experimental variation, such as differences in growth conditions, radioactive nucleotide incorporation efficiency, hybridization conditions, or image acquisition. In order to compare experimental replicates (separate cultures) or technical replicates (same culture and same RNA sample) the data from each array must be normalized. The third subroutine, “CalcPct3", normalizes arrays; if the data are not normalized, the values for replicate experiments, when plotted, will not pass through zero or be directly proportional (Fig. 2). Array experiments can be normalized by expressing each gene-specific spot relative to an internal control, if a suitable set of control spots is present on the arrays. Unfortunately, the intensities of the genomic DNA control spots on the Panorama E. coli membranes vary significantly (data not shown) and are not reliable for normalization. In the absence of an internal standard, the preferred approach for normalization is to express each gene-specific spot as a fraction of the sum of all gene spots (n = 4290), a strategy that at once considers all variables that lie behind the array image (17, 18). The “CalcPct3" subroutine normalizes the entire data set, expressing each spot as a percentage of the sum of all spots on the array.
5
The fourth subroutine, “Cleanup4", reorganizes the data to facilitate subsequent data processing steps. The fifth subroutine, “Statistics5" calculates the averages and statistics for the blank spots (empty spots between genomic DNA control spots) and null spots (empty spots within array). However, we have not found these values to offer a reliable means for establishing background on the array or for empirical determination of a threshold value and therefore do not use them (see below). The “AllDataCrunched6" macro in “Image Data Cruncher” runs all 5 subroutines at once and results in a file that contains the raw data,

normalized data, and associated genome annotation information for each gene on the array. 1 2 3 4 5 6 7 8 9
10 11 12 13 14 15 16 17 18 19 20 21 22 23 24 25 26 27 28 29 30 31 32 33 34 35 36 37 38 39 40 41 42 43 44 45 46
“2-Replicate-Stats” workbook The second workbook, “2-Replicate-Stats”, contains a macro named “AllAnalysis8" that
is used to calculate the probability that the average of the experimental (test) replicates is significantly different from the average of the control replicates (Fig. 3). The four replicate data sets are sequentially copied from the crunched data files, beginning with the first and then the second replicate of the control, followed by the first and then the second replicate of the experimental, and pasted into the "Enter Data (2 Replicates)" worksheet. The first subroutine, “OrganizebySpotNo1", sorts the 4 data sets by spot number, which aligns the gene-specific data in rows. The second subroutine, “CalculateAverages2" calculates the mean of the normalized (pct) values for the 4 spot intensities from each experimental condition (2 spots for each gene per membrane). The subroutine, “copyvaluesintoPRaw3" copies the pct values into a separate spreadsheet and the “CalculateLn4" subroutine transforms the raw pct values by the natural log while copying them to an additional spreadsheet. The subroutines, “CalculatePRaw5" and CalculatePLn6" are used to calculate the P values for the raw and log transformed data, respectively, by application of the student t-test to the 4 determinations for each of the control and experimental conditions. The last subroutine, “CopyAllValues7" reorganizes the data by pasting the data columns to be used in subsequent steps into a separate spreadsheet named “All Values”. Once the “AllAnalysis8" macro is executed the “2-Replicate-Stats” workbook serves as an archive for the raw and normalized data from the replicates being compared and contains the P values that are associated with the ratio calculations in the “Data Analysis” workbook.
“Data Analysis” workbook The third workbook, “Data Analysis” contains two macros. The first macro,
“AllAnalysis6" is used to calculate the log ratio of the expression levels in the experimental vs. the control condition (Fig. 4). The average normalized data from the “All Values” spreadsheet in the “2-Replicate-Stats” workbook are pasted into the “crunched data” spreadsheet in the “Data Analysis” workbook. The first subroutine, “SpotSort1", sorts the data by spot number such that the gene specific data are aligned in rows. The second subroutine, “DataSort2" copies the data and pastes it into the “DataAnalysis” spreadsheet to be used for ratio calculations.
6
The third subroutine, “ThresholdRatios3" is used to determine a threshold value for ratio calculation, and calculates the absolute value of the ratio of the Test/Control such that genes that are more highly expressed in the test condition are given a positive value and genes that are more highly expressed in the control are given a negative value. The threshold value is chosen to represent the limit of detection of an expressed gene -- that is, the signal intensity at which spots are considered to be significantly higher than the array background. Any spot intensity that falls below the threshold value is raised to that value in order to obtain a reasonable ratio in cases where a gene is expressed below the threshold value in at least one of the two experimental conditions. Ideally, the threshold would be determined independently for each gene, based on the local spot background and the known cross-hybridization to other expressed genes in the sample, but this is not possible because of the dense packing of some membrane arrays and the lack of prior knowledge as to the number and extent of gene expression in a given growth condition. These factors make determination of the threshold value difficult. We have chosen a conservative approximation of the threshold value corresponding to the 500th lowest expressed gene based on the average of the normalized expression levels in the two conditions. This threshold value is similar to that obtained by visual inspection of array images to determine the

faintest of gene-specific spots and is reasonable in light of the predicted number of expressed genes based on the number of mRNA species in the E. coli cell and the arrangement of genes in operons (1380 mRNAs x avg. 2.5 genes per operon = 3450 expressed genes) (9). Others have calculated threshold values as 3 standard deviations above the mean of “blank” spots (10) which corresponds to ~214 in the example data set used in this study. If desired, researchers can write alternative approaches for threshold determination into the “ThresholdRatios3" subroutine, or the threshold level can be edited as described on the web site.
1 2 3 4 5 6 7 8 9
10 11 12 13 14 15 16 17 18 19 20 21 22 23 24 25 26 27 28 29 30 31 32 33 34 35 36 37 38 39 40 41 42 43 44
The fourth subroutine, “Cleanup4", reorganizes the data and calculates the log (base 10) of the expression ratio. The fifth subroutine, “Stats5", calculates the standard deviation of the mean of the log ratios. The “AllAnalysis6" subroutine executes all 5 subroutines and results in a “DataAnalysis” spreadsheet that contains the averaged raw and normalized data, corresponding genome annotation information for each gene on the array, and the ratios. The “AllAnalysis6" macro concludes with creation of two empty columns that are used for manual pasting of the P value associated with each ratio calculation from the “2-Replicate-Stats” workbook. Finally, the “MakeDB” macro in the “Data Analysis” workbook can be executed to reorganize and paste key data columns into a separate spreadsheet that can be used for data entry into a suitable database (Fig. 5).
Database considerations It is useful to build a database when multiple time points or multiple conditions are being
compared. A sample MS Access database called “sampleDB” can be downloaded from our web site. There are 2 tables in the sample database, one populated with annotation information such as b#, array coordinate, gene, gene product, functional groupings, and accession numbers, and the other table populated with data generated by the “MakeDB” macro in the “Data Analysis” workbook. Additional tables can be created and populated by copying the table (structure only), editing the design as necessary, and pasting the appropriate data from the spreadsheets created by “MakeDB”. Queries are designed by linking tables by b#, and can be run by manipulation of the parameters in query design. The query data can be copied or exported from Access into third-party presentation software packages. There are limitations on the total number of tables and data elements supported by Access that make it impossible to query more than 20 experiments. The macros and Excel workbooks described here are also suitable for processing data for entry into more robust database programs such as MYSQL or Oracle.
Modification and adaptation of VB macros If desired, the macros described above can be modified in any number of ways to
streamline the process or to tweak the statistical parameters. This is most easily accomplished using the Microsoft Visual Basic Editor within the Excel workbook environment. For example, the threshold value can be adjusted by simply changing the “cell” location that is used for the ratio calculation, or the 4 macros described here could be combined in a single workbook containing several spreadsheets. (We have chosen not to do so because this would create a very large, complicated workbook.) More importantly, these macros can be adapted for use with membrane systems other than the one described here. An example of this is the creation of an analogous set of macros for processing of data from Clontech Atlas Mouse 1.2 arrays. These macros and associated Excel workbooks are also publicly available on our website.
Website and public access to analysis tools
7
A website has been created for users to download these analysis tools and protocols (http://www.ou.edu/microarray). The protocols on the website describe, in a simplistic way, the step-by-step implementation of the analysis tools.
45 46

Benefits of semi-automated data processing 1 2 3 4 5 6 7 8 9
10 11 12 13 14 15 16 17 18 19
Our earliest protocol for membrane array data acquisition and analysis required more than 10 man-hours for each experimental replicate (17). Thus it was important to automate the data analysis process to the greatest extent possible. By taking advantage of improvements in commercially available software, and by writing a series of macros in Visual Basic for semi-automated data processing in Microsoft Excel, the time was shortened to 5 minutes per experimental replicate. In addition, it is critical that the possibility of human error be eliminated when carrying out a large number of manipulations of massive data sets such as those involved in gene expression profiling. The macros described here effectively minimize the level of manual data processing by automating much of the process. The integration of 4 macros in 3 workbooks provides for a significant level of human supervision of an otherwise error-free, automated process.
ACKNOWLEDGEMENTS The authors wish to thank Bill Cuevas and Simon Sims for information prior to publication and helpful discussions. This work was supported by grants from the NIH, RO1 AI48945-01 and RR-01-005.
8

REFERENCES 1 2 3 4 5 6 7 8 9
10 11 12 13 14 15 16 17 18 19 20 21 22 23 24 25 26 27 28 29 30 31 32 33 34 35 36 37 38 39 40 41 42 43 44 45 46
1. Arfin, S. M., A. D. Long, E. T. Ito, L. Tolleri, M. M. Riehle, E. S. Paegle, and G. W. Hatfield. 2000. Global gene expression profiling in Escherichia coli K12. The effects of integration host factor. J Biol Chem 275(38):29672-29684.
2. Barbosa, T. M., and S. B. Levy. 2000. Differential expression of over 60 chromosomal genes in Escherichia coli by constitutive expression of MarA. J Bacteriol 182(12):3467-74.
3. Brown, P. O., and D. Botstein. 1999. Exploring the new world of the genome with DNA microarrays. Nat Genet 21(1 Suppl):33-7.
4. DeRisi, J. L., and V. R. Iyer. 1999. Genomics and array technology. Curr Opin Oncol 11(1):76-9.
5. Ferea, T. L., and P. O. Brown. 1999. Observing the living genome. Current Opinion in Genetics & Development 9(6):715-22.
6. Khodursky, A. B., B. J. Peter, N. R. Cozzarelli, D. Botstein, P. O. Brown, and C. Yanofsky. 2000. DNA microarray analysis of gene expression in response to physiological and genetic changes that affect tryptophan metabolism in Escherichia coli. Proc Natl Acad Sci U S A 97(22):12170-12175.
7. Long, A. D., H. J. Mangalam, B. Y. Chan, L. Tolleri, G. W. Hatfield, and P. Baldi. 2001. Improved statistical inference from DNA microarray data using analysis of variance and a Bayesian statistical framework. Analysis of global gene expression in Escherichia coli K12. J Biol Chem 276(23):19937-44.
8. Neidhardt, F. C., P. L. Bloch, and D. F. Smith. 1974. Culture medium for enterobacteria. J Bacteriol 119(3):736-47.
9. Neidhardt, F. C., J. L. Ingraham, and M. Schaechter. 1990. Physiology of the Bacterial Cell: A Molecular Approach. Sinauer Associates, Inc., Sunderland, MA.
10. Pomposiello, P. J., M. H. Bennik, and B. Demple. 2001. Genome-Wide Transcriptional Profiling of the Escherichia coli Responses to Superoxide Stress and Sodium Salicylate. J Bacteriol 183(13):3890-902.
11. Richmond, C. S., J. D. Glasner, R. Mau, H. Jin, and F. R. Blattner. 1999. Genome-wide expression profiling in Escherichia coli K-12. Nucleic Acids Res 27(19):3821-35.
12. Schena, M., R. A. Heller, T. P. Theriault, K. Konrad, E. Lachenmeier, and R. W. Davis. 1998. Microarrays: biotechnology's discovery platform for functional genomics. Trends in Biotechnology 16(7):301-6.
13. Schena, M., D. Shalon, R. W. Davis, and P. O. Brown. 1995. Quantitative monitoring of gene expression patterns with a complementary DNA microarray. Science 270(5235):467-70.
14. Scherf, U., D. T. Ross, M. Waltham, L. H. Smith, J. K. Lee, L. Tanabe, K. W. Kohn, W. C. Reinhold, T. G. Myers, D. T. Andrews, D. A. Scudiero, M. B. Eisen, E. A. Sausville, Y. Pommier, D. Botstein, P. O. Brown, and J. N. Weinstein. 2000. A gene expression database for the molecular pharmacology of cancer. Nat Genet 24(3):236-44.
15. Selinger, D. W., K. J. Cheung, R. Mei, E. M. Johansson, C. S. Richmond, F. R. Blattner, D. J. Lockhart, and G. M. Church. 2000. RNA expression analysis using a 30 base pair resolution Escherichia coli genome array. Nat Biotechnol 18(12):1262-8.
9
16. Sherlock, G., T. Hernandez-Boussard, A. Kasarskis, G. Binkley, J. C. Matese, S. S. Dwight, M. Kaloper, S. Weng, H. Jin, C. A. Ball, M. B. Eisen, P. T. Spellman, P. O. Brown, D. Botstein, and J. M. Cherry. 2001. The Stanford Microarray Database.

Nucleic Acids Res 29(1):152-5. 1 2 3 4 5 6 7 8 9
10 11 12 13 14 15 16
17. Tao, H., C. Bausch, C. Richmond, F. R. Blattner, and T. Conway. 1999. Functional genomics: expression analysis of Escherichia coli growing on minimal and rich media. J Bacteriol 181(20):6425-40.
18. Tao, H., R. Gonzalez, A. Martinez, M. Rodriguez, L. O. Ingram, J. F. Preston, and K. T. Shanmugam. 2001. Engineering a homo-ethanol pathway in Escherichia coli: increased glycolytic flux and levels of expression of glycolytic genes during xylose fermentation. J Bacteriol 183(10):2979-88.
19. Wei, Y., J. M. Lee, C. Richmond, F. R. Blattner, J. A. Rafalski, and R. A. LaRossa. 2001. High-density microarray-mediated gene expression profiling of Escherichia coli. J Bacteriol 183(2):545-56.
20. Zimmer, D. P., E. Soupene, H. L. Lee, V. F. Wendisch, A. B. Khodursky, B. J. Peter, R. A. Bender, and S. Kustu. 2000. Nitrogen regulatory protein C-controlled genes of Escherichia coli: scavenging as a defense against nitrogen limitation. Proc Natl Acad Sci U S A 97(26):14674-9.
10

FIGURE LEGENDS 1 2 3
Figure 2. Scatter plot view of normalized (top) and raw (bottom) data showing linearity of experimental replicates for normalized data.
4
5
6
7
8
9
10
11
11
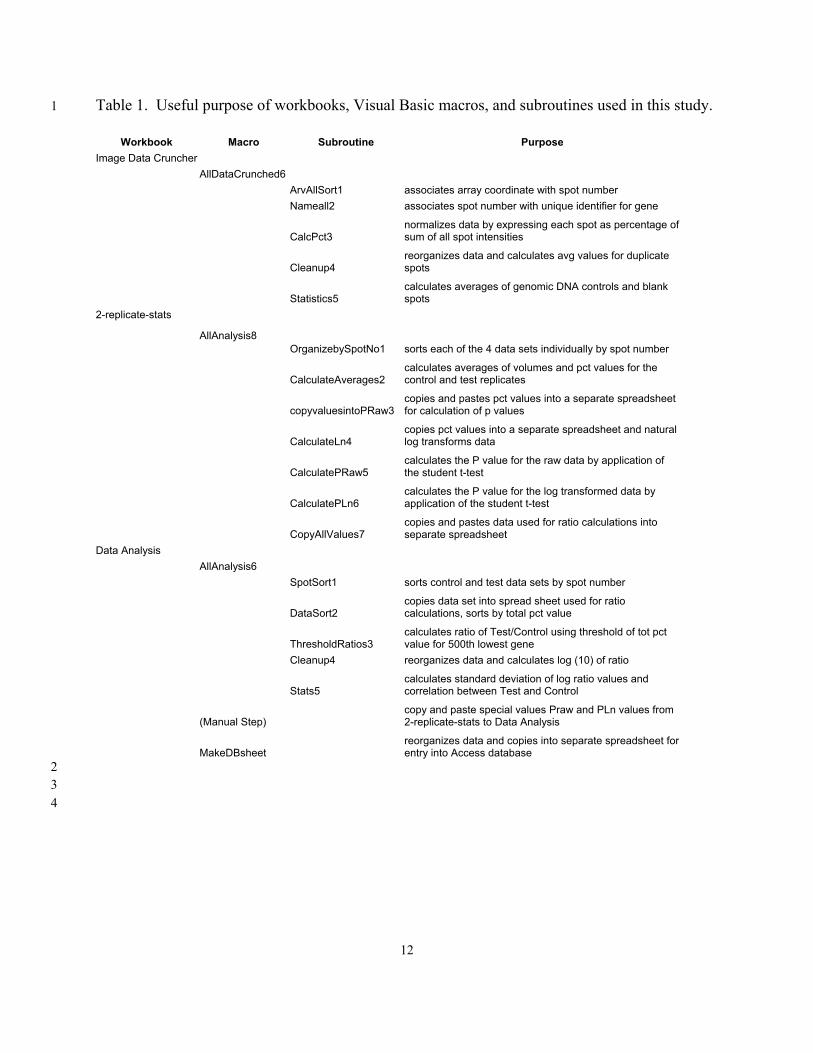
Table 1. Useful purpose of workbooks, Visual Basic macros, and subroutines used in this study. 1
2 3 4
Workbook Macro Subroutine Purpose Image Data Cruncher AllDataCrunched6 ArvAllSort1 associates array coordinate with spot number Nameall2 associates spot number with unique identifier for gene
CalcPct3 normalizes data by expressing each spot as percentage of sum of all spot intensities
Cleanup4 reorganizes data and calculates avg values for duplicate spots
Statistics5 calculates averages of genomic DNA controls and blank spots
2-replicate-stats
AllAnalysis8 OrganizebySpotNo1 sorts each of the 4 data sets individually by spot number
CalculateAverages2 calculates averages of volumes and pct values for the control and test replicates
copyvaluesintoPRaw3 copies and pastes pct values into a separate spreadsheet for calculation of p values
CalculateLn4 copies pct values into a separate spreadsheet and natural log transforms data
CalculatePRaw5 calculates the P value for the raw data by application of the student t-test
CalculatePLn6 calculates the P value for the log transformed data by application of the student t-test
CopyAllValues7 copies and pastes data used for ratio calculations into separate spreadsheet
Data Analysis AllAnalysis6 SpotSort1 sorts control and test data sets by spot number
DataSort2 copies data set into spread sheet used for ratio calculations, sorts by total pct value
ThresholdRatios3 calculates ratio of Test/Control using threshold of tot pct value for 500th lowest gene
Cleanup4 reorganizes data and calculates log (10) of ratio
Stats5 calculates standard deviation of log ratio values and correlation between Test and Control
(Manual Step) copy and paste special values Praw and PLn values from 2-replicate-stats to Data Analysis
MakeDBsheet reorganizes data and copies into separate spreadsheet for entry into Access database
12