Diversity Indices and Growth Parameters of Cyanobacteria from Three Lakes of Rajasthan
7
www.IndianJournals.com Members Copy, Not for Commercial Sale Downloaded From IP - 210.212.142.163 on dated 15-Jan-2014 377 Diversity Indices and Growth Parameters of Cyanobacteria from Three Lakes of Rajasthan Dnyaneshwar Borase, Dolly Wattal Dhar* and Nirbhay Kumar Singh 1 Centre for Conservation and Utilisation of Blue Green Algae, Division of Microbiology, Indian Agricultural Research Institute, New Delhi-110012, India. 1 Department of Microbiology, C. P. College of Agriculture, S.D. Agricultural University, S. K. Nagar 385506 India *Corresponding author Email : [email protected] INTRODUCTION Cyanobacteria are gram negative prokaryotic organisms capable of showing oxygenic photosynthe- sis and are believed to have evolved approximately 3.8 billion years ago reported by Gorl (1998). These organisms exhibit morphological diversity and unusu- al capability for cellular differentiation while their basic metabolism is fairly uniform (Schopf 2000). These are widespread in their distribution and can be found in freshwater lakes, hot and cold springs, arctic ice (Torsvik 1996), deserts (Garciapichel 2001), ocean and Antartic granite rocks (Rios 2007). The distribu- tion of these has been reported to decline due to an- thropogenic activities like habitat loss and fragmenta- tion, disturbance and pollution, construction of dams, chemical pollution and global climatic changes. The vulnerability of cyanobacteria to environmental im- pact and their possible depletion necessitated the un- derstanding of the distribution of cyanobacteria in selected aquatic sites having importance in terms of economic, recreational and religious activity. It was also considered important to characterize these organ- isms for pigment profile and N assimilatory enzymes. MATERIALS AND METHOD Isolation and maintenance of cyanobacteria Replicated random water samples were col- lected from aquatic sites namely Anasagar, Pushkar lake and Sambhar lake from Ajmer district of Raja- sthan (Western India). Cyanobacterial strains were isolated following standard enrichment culture tech- niques using BG-11 medium (Stanier, 1995) in culture room having light intensity of 52-55μmole photon/ m 2 /s with 16/8 light and dark period. The isolated colonies were picked up repeatedly, checked and puri- fied by repeated subculturing, plating and streaking on the BG-11 medium under similar cultural conditions. The purity was checked by microscopic observation at regular intervals and the strains were identified ac- cording to keys given in standard monographs Twenty three cyanobacterial strains were isolated from alkaline water samples of three aquatic sites (Anasagar, Pushkar lake and Sambhar lake) from Ajmer district of Rajasthan. Microscopic exami- nation showed one colonial, nine heterocystous and the remaining non-heterocystous filamentous forms. Genera wise distribution showed abundance of Nostoc, Phormidium and Plectonema fol- lowed by Anabaena and Westiellopsis. Microcystis and Oscillatoria were least abundant. Nostoc and Phormidium showed highest abundance in terms of CFU/mL followed by Anabaena and Plec- tonema. Pigments (chlorophyll, carotenoids and phycobilins) and N assimilatory enzymes (nitrate reductase and glutamine synthetase) differed significantly amongst the identified cyanobacterial strains. Keywords: Diversity indices, Chlorophyll, Carotenoids, Phycobilins, Cyanobacteria and N- assimilatory enzymes. Received: 26.10.2012 Revised: 19.07.2013 Accepted: 27.10.2013 Vol. 26 (2) : 377-383 (2013) VEGETOS
Transcript of Diversity Indices and Growth Parameters of Cyanobacteria from Three Lakes of Rajasthan
ww
w.In
dia
nJo
urn
als.
com
Mem
ber
s C
op
y, N
ot
for
Co
mm
erci
al S
ale
Do
wn
load
ed F
rom
IP -
210
.212
.142
.163
on
dat
ed 1
5-Ja
n-2
014
377
Diversity Indices and Growth Parameters of
Cyanobacteria from Three Lakes of Rajasthan
Dnyaneshwar Borase, Dolly Wattal Dhar* and Nirbhay Kumar Singh1
Centre for Conservation and Utilisation of Blue Green Algae, Division of Microbiology, Indian Agricultural Research Institute,
New Delhi-110012, India. 1Department of Microbiology, C. P. College of Agriculture, S.D. Agricultural University, S. K. Nagar 385506 India
*Corresponding author Email : [email protected]
INTRODUCTION
Cyanobacteria are gram negative prokaryotic
organisms capable of showing oxygenic photosynthe-
sis and are believed to have evolved approximately
3.8 billion years ago reported by Gorl (1998). These
organisms exhibit morphological diversity and unusu-
al capability for cellular differentiation while their
basic metabolism is fairly uniform (Schopf 2000).
These are widespread in their distribution and can be
found in freshwater lakes, hot and cold springs, arctic
ice (Torsvik 1996), deserts (Garciapichel 2001), ocean
and Antartic granite rocks (Rios 2007). The distribu-
tion of these has been reported to decline due to an-
thropogenic activities like habitat loss and fragmenta-
tion, disturbance and pollution, construction of dams,
chemical pollution and global climatic changes. The
vulnerability of cyanobacteria to environmental im-
pact and their possible depletion necessitated the un-
derstanding of the distribution of cyanobacteria in
selected aquatic sites having importance in terms of
economic, recreational and religious activity. It was
also considered important to characterize these organ-
isms for pigment profile and N assimilatory enzymes.
MATERIALS AND METHOD
Isolation and maintenance of cyanobacteria
Replicated random water samples were col-
lected from aquatic sites namely Anasagar, Pushkar
lake and Sambhar lake from Ajmer district of Raja-
sthan (Western India). Cyanobacterial strains were
isolated following standard enrichment culture tech-
niques using BG-11 medium (Stanier, 1995) in culture
room having light intensity of 52-55µmole photon/
m2 /s with 16/8 light and dark period. The isolated
colonies were picked up repeatedly, checked and puri-
fied by repeated subculturing, plating and streaking on
the BG-11 medium under similar cultural conditions.
The purity was checked by microscopic observation at
regular intervals and the strains were identified ac-
cording to keys given in standard monographs
Twenty three cyanobacterial strains were isolated from alkaline water samples of three aquatic sites
(Anasagar, Pushkar lake and Sambhar lake) from Ajmer district of Rajasthan. Microscopic exami-
nation showed one colonial, nine heterocystous and the remaining non-heterocystous filamentous
forms. Genera wise distribution showed abundance of Nostoc, Phormidium and Plectonema fol-
lowed by Anabaena and Westiellopsis. Microcystis and Oscillatoria were least abundant. Nostoc
and Phormidium showed highest abundance in terms of CFU/mL followed by Anabaena and Plec-
tonema. Pigments (chlorophyll, carotenoids and phycobilins) and N assimilatory enzymes (nitrate
reductase and glutamine synthetase) differed significantly amongst the identified cyanobacterial
strains.
Keywords: Diversity indices, Chlorophyll, Carotenoids, Phycobilins, Cyanobacteria and N-
assimilatory enzymes.
Received: 26.10.2012 Revised: 19.07.2013 Accepted: 27.10.2013
Vol. 26 (2) : 377-383 (2013) VEGETOS
ww
w.In
dia
nJo
urn
als.
com
Mem
ber
s C
op
y, N
ot
for
Co
mm
erci
al S
ale
Do
wn
load
ed F
rom
IP -
210
.212
.142
.163
on
dat
ed 1
5-Ja
n-2
014
378
(Desikachary 1959, Geitler 1932).
Diversity analysis
Colony forming units (CFU0 for different gen-
era were counted and their abundance was calculated
as CFU/mL and percent distribution for different loca-
tions. Diversity analysis was undertaken using stand-
ard indices namely Shannons Diversity Index (H),
Simpsons Index of Diversity (SI) and Berger-Parkers
Index (D). The diversity indices were calculated as
follows:
Shannons Diversity Index (H) = ∑i=1(pi)ln(pi)
Pi = ni/N
where ni = number of individuals in group i
N = Total number of individuals in group
Shannon’s Evenness (EH) = H/ln(s)
Where S is the species richness i.e. number of species
in the group
Simpsons Index of Diversity = ∑n (n-1)/N (N-1)
Where n = Total number of organism of particular
species
N = total number of organism of all species
Simpsons Evenness (ED) = 1-D/S Where S= species
richness
Berger – parker Index = Nmax / N
Where Nmax = Number of individual in the most abun-
dant species
N = total number of individual of all species
Margalef index (DMg) = S-1/ln(N)
Menhinick (DMn) = S/N
Where S = species richness
N = total number of individuals
Pigments and N assimilatory enzymes
Pigments and N-assimilatory enzymes (nitrate
reductase and glutamine synthetase) were studied at
15th day of incubation. Hot methanol extraction meth-
od of (McKinney 1941) was used for chlorophyll de-
termination. Carotenoids and phycobiliproteins were
extracted in acetone (Jensen 1978) and phosphate
buffer (Bennet and Bogard 1973) for their estimation.
Nitrate reductase activity was studied by diazocou-
pling method (Lowe and Evans 1964) and glutamine
synthetase activity was calculated using standard
curve of γ glutamyl hydroxamate (Shapiro and Stadt-
man 1970). The data recorded on various parameters
were subjected to statistical analysis using M-STATC
package according to factorial CRD. Duncans multi-
ple range Test (DMRT) was employed to compare the
mean performance of strains for specific parameters
which facilitated the identification of superior strains.
RESULTS
Distributional pattern, diversity indices) and abun-
dance
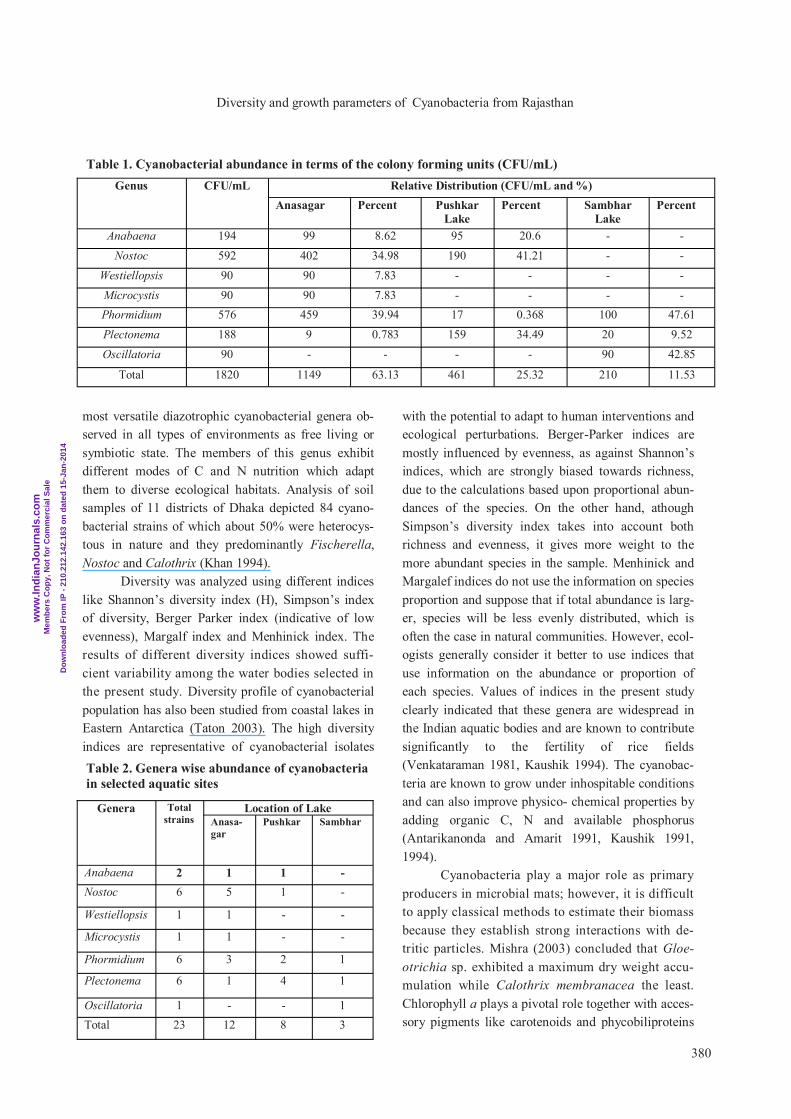
Nostoc and Phormidium showed highest per-
cent abundance in terms of CFU/mL followed by Ana-
baena and Plectonema. Percent abundance of
Westiellopsis, Microcystis and Oscillatoria were simi-
lar (90 CFU/mL). Abundance of Anabaena was more
or less similar in Anasagar and Pushkar Lake, whereas
Nostoc count was about double in Anasagar as com-
pared to Pushkar lake. Westiellopsis and Microcystis
were isolated from Anasagar only. CFU/mL of Phor-
midium was highest in Anasagar followed by Sambhar
lake and least in Pushkar lake. Plectonema showed
maximum CFU/mL in Pushkar lake, followed by
Sambhar lake (20 CFU/mL) and Anasagar (9 CFU/
mL). Oscillatoria could only be isolated from Sam-
bhar lake but not from Anasagar and Pushkar lake
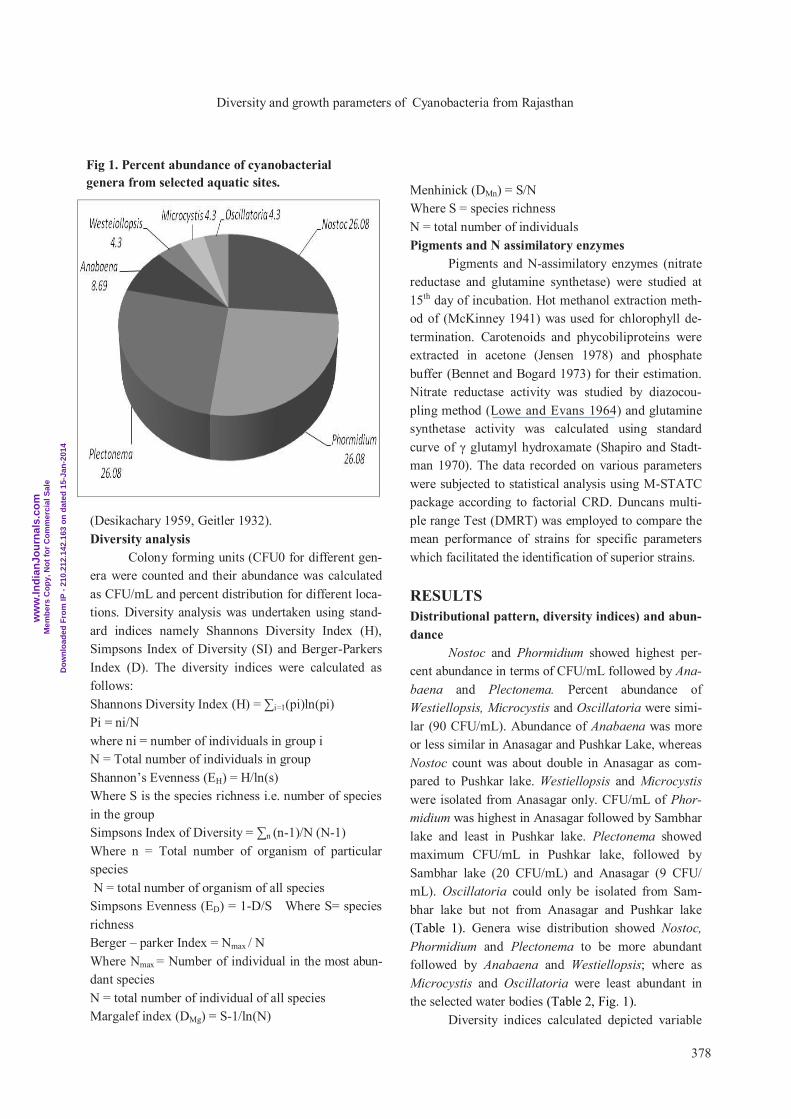
(Table 1). Genera wise distribution showed Nostoc,
Phormidium and Plectonema to be more abundant
followed by Anabaena and Westiellopsis; where as
Microcystis and Oscillatoria were least abundant in
the selected water bodies (Table 2, Fig. 1).
Diversity indices calculated depicted variable
Fig 1. Percent abundance of cyanobacterial
genera from selected aquatic sites.
Diversity and growth parameters of Cyanobacteria from Rajasthan
ww
w.In
dia
nJo
urn
als.
com
Mem
ber
s C
op
y, N
ot
for
Co
mm
erci
al S
ale
Do
wn
load
ed F
rom
IP -
210
.212
.142
.163
on
dat
ed 1
5-Ja
n-2
014
379
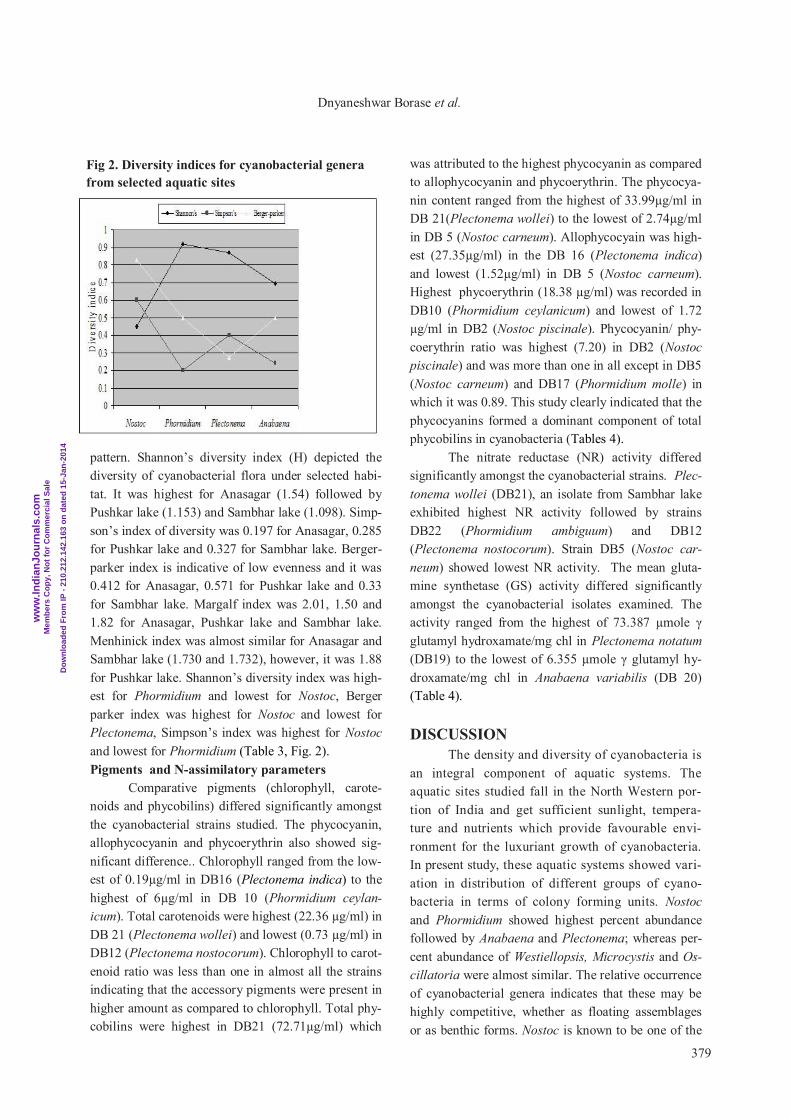
pattern. Shannon’s diversity index (H) depicted the
diversity of cyanobacterial flora under selected habi-
tat. It was highest for Anasagar (1.54) followed by
Pushkar lake (1.153) and Sambhar lake (1.098). Simp-
son’s index of diversity was 0.197 for Anasagar, 0.285
for Pushkar lake and 0.327 for Sambhar lake. Berger-
parker index is indicative of low evenness and it was
0.412 for Anasagar, 0.571 for Pushkar lake and 0.33
for Sambhar lake. Margalf index was 2.01, 1.50 and
1.82 for Anasagar, Pushkar lake and Sambhar lake.
Menhinick index was almost similar for Anasagar and
Sambhar lake (1.730 and 1.732), however, it was 1.88
for Pushkar lake. Shannon’s diversity index was high-
est for Phormidium and lowest for Nostoc, Berger
parker index was highest for Nostoc and lowest for
Plectonema, Simpson’s index was highest for Nostoc
and lowest for Phormidium (Table 3, Fig. 2).
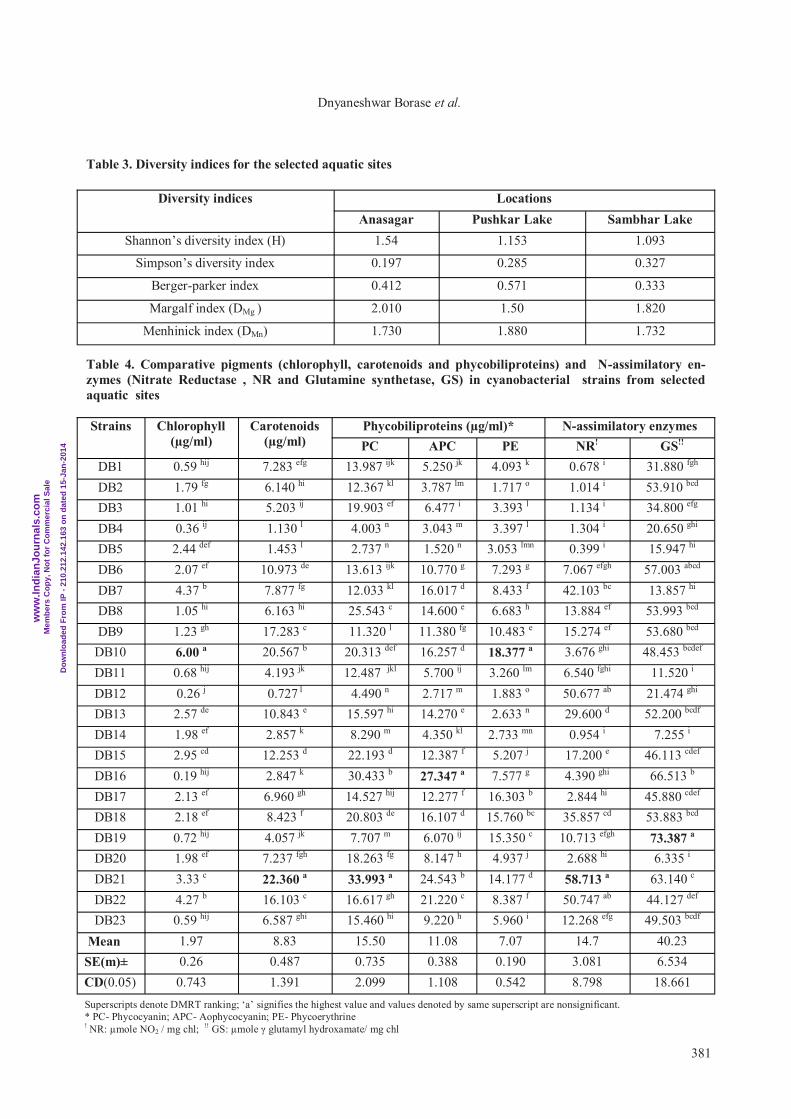
Pigments and N-assimilatory parameters
Comparative pigments (chlorophyll, carote-
noids and phycobilins) differed significantly amongst
the cyanobacterial strains studied. The phycocyanin,
allophycocyanin and phycoerythrin also showed sig-
nificant difference.. Chlorophyll ranged from the low-
est of 0.19µg/ml in DB16 (Plectonema indica) to the
highest of 6µg/ml in DB 10 (Phormidium ceylan-
icum). Total carotenoids were highest (22.36 µg/ml) in
DB 21 (Plectonema wollei) and lowest (0.73 µg/ml) in
DB12 (Plectonema nostocorum). Chlorophyll to carot-
enoid ratio was less than one in almost all the strains
indicating that the accessory pigments were present in
higher amount as compared to chlorophyll. Total phy-
cobilins were highest in DB21 (72.71µg/ml) which
was attributed to the highest phycocyanin as compared
to allophycocyanin and phycoerythrin. The phycocya-
nin content ranged from the highest of 33.99µg/ml in
DB 21(Plectonema wollei) to the lowest of 2.74µg/ml
in DB 5 (Nostoc carneum). Allophycocyain was high-
est (27.35µg/ml) in the DB 16 (Plectonema indica)
and lowest (1.52µg/ml) in DB 5 (Nostoc carneum).
Highest phycoerythrin (18.38 µg/ml) was recorded in
DB10 (Phormidium ceylanicum) and lowest of 1.72
µg/ml in DB2 (Nostoc piscinale). Phycocyanin/ phy-
coerythrin ratio was highest (7.20) in DB2 (Nostoc
piscinale) and was more than one in all except in DB5
(Nostoc carneum) and DB17 (Phormidium molle) in
which it was 0.89. This study clearly indicated that the
phycocyanins formed a dominant component of total
phycobilins in cyanobacteria (Tables 4).
The nitrate reductase (NR) activity differed
significantly amongst the cyanobacterial strains. Plec-
tonema wollei (DB21), an isolate from Sambhar lake
exhibited highest NR activity followed by strains
DB22 (Phormidium ambiguum) and DB12
(Plectonema nostocorum). Strain DB5 (Nostoc car-
neum) showed lowest NR activity. The mean gluta-
mine synthetase (GS) activity differed significantly
amongst the cyanobacterial isolates examined. The
activity ranged from the highest of 73.387 µmole γ
glutamyl hydroxamate/mg chl in Plectonema notatum
(DB19) to the lowest of 6.355 µmole γ glutamyl hy-
droxamate/mg chl in Anabaena variabilis (DB 20)
(Table 4).
DISCUSSION
The density and diversity of cyanobacteria is
an integral component of aquatic systems. The
aquatic sites studied fall in the North Western por-
tion of India and get sufficient sunlight, tempera-
ture and nutrients which provide favourable envi-
ronment for the luxuriant growth of cyanobacteria.
In present study, these aquatic systems showed vari-
ation in distribution of different groups of cyano-
bacteria in terms of colony forming units. Nostoc
and Phormidium showed highest percent abundance
followed by Anabaena and Plectonema; whereas per-
cent abundance of Westiellopsis, Microcystis and Os-
cillatoria were almost similar. The relative occurrence
of cyanobacterial genera indicates that these may be
highly competitive, whether as floating assemblages
or as benthic forms. Nostoc is known to be one of the
Fig 2. Diversity indices for cyanobacterial genera
from selected aquatic sites
Dnyaneshwar Borase et al.
ww
w.In
dia
nJo
urn
als.
com
Mem
ber
s C
op
y, N
ot
for
Co
mm
erci
al S
ale
Do
wn
load
ed F
rom
IP -
210
.212
.142
.163
on
dat
ed 1
5-Ja
n-2
014
380
most versatile diazotrophic cyanobacterial genera ob-
served in all types of environments as free living or
symbiotic state. The members of this genus exhibit
different modes of C and N nutrition which adapt
them to diverse ecological habitats. Analysis of soil
samples of 11 districts of Dhaka depicted 84 cyano-
bacterial strains of which about 50% were heterocys-
tous in nature and they predominantly Fischerella,
Nostoc and Calothrix (Khan 1994).
Diversity was analyzed using different indices
like Shannon’s diversity index (H), Simpson’s index
of diversity, Berger Parker index (indicative of low
evenness), Margalf index and Menhinick index. The
results of different diversity indices showed suffi-
cient variability among the water bodies selected in
the present study. Diversity profile of cyanobacterial
population has also been studied from coastal lakes in
Eastern Antarctica (Taton 2003). The high diversity
indices are representative of cyanobacterial isolates
with the potential to adapt to human interventions and
ecological perturbations. Berger-Parker indices are
mostly influenced by evenness, as against Shannon’s
indices, which are strongly biased towards richness,
due to the calculations based upon proportional abun-
dances of the species. On the other hand, athough
Simpson’s diversity index takes into account both
richness and evenness, it gives more weight to the
more abundant species in the sample. Menhinick and
Margalef indices do not use the information on species
proportion and suppose that if total abundance is larg-
er, species will be less evenly distributed, which is
often the case in natural communities. However, ecol-
ogists generally consider it better to use indices that
use information on the abundance or proportion of
each species. Values of indices in the present study
clearly indicated that these genera are widespread in
the Indian aquatic bodies and are known to contribute
significantly to the fertility of rice fields
(Venkataraman 1981, Kaushik 1994). The cyanobac-
teria are known to grow under inhospitable conditions
and can also improve physico- chemical properties by
adding organic C, N and available phosphorus
(Antarikanonda and Amarit 1991, Kaushik 1991,
1994).
Cyanobacteria play a major role as primary
producers in microbial mats; however, it is difficult
to apply classical methods to estimate their biomass
because they establish strong interactions with de-
tritic particles. Mishra (2003) concluded that Gloe-
otrichia sp. exhibited a maximum dry weight accu-
mulation while Calothrix membranacea the least.
Chlorophyll a plays a pivotal role together with acces-
sory pigments like carotenoids and phycobiliproteins
Table 1. Cyanobacterial abundance in terms of the colony forming units (CFU/mL)
Genus CFU/mL Relative Distribution (CFU/mL and %)
Anasagar Percent Pushkar Lake
Percent
Sambhar
Lake Percent
Anabaena 194 99 8.62 95 20.6 - -
Nostoc 592 402 34.98 190 41.21 - -
Westiellopsis 90 90 7.83 - - - -
Microcystis 90 90 7.83 - - - -
Phormidium 576 459 39.94 17 0.368 100 47.61
Plectonema 188 9 0.783 159 34.49 20 9.52
Oscillatoria 90 - - - - 90 42.85
Total 1820 1149 63.13 461 25.32 210 11.53
Table 2. Genera wise abundance of cyanobacteria
in selected aquatic sites
Genera Total
strains Location of Lake
Anasa-
gar
Pushkar Sambhar
Anabaena 2 1 1 -
Nostoc 6 5 1 -
Westiellopsis 1 1 - -
Microcystis 1 1 - -
Phormidium 6 3 2 1
Plectonema 6 1 4 1
Oscillatoria 1 - - 1
Total 23 12 8 3
Diversity and growth parameters of Cyanobacteria from Rajasthan
ww
w.In
dia
nJo
urn
als.
com
Mem
ber
s C
op
y, N
ot
for
Co
mm
erci
al S
ale
Do
wn
load
ed F
rom
IP -
210
.212
.142
.163
on
dat
ed 1
5-Ja
n-2
014
381
Table 3. Diversity indices for the selected aquatic sites
Diversity indices Locations
Anasagar Pushkar Lake Sambhar Lake
Shannon’s diversity index (H) 1.54 1.153 1.093
Simpson’s diversity index 0.197 0.285 0.327
Berger-parker index 0.412 0.571 0.333
Margalf index (DMg ) 2.010 1.50 1.820
Menhinick index (DMn) 1.730 1.880 1.732
Table 4. Comparative pigments (chlorophyll, carotenoids and phycobiliproteins) and N-assimilatory en-
zymes (Nitrate Reductase , NR and Glutamine synthetase, GS) in cyanobacterial strains from selected
aquatic sites
Strains Chlorophyll
(µg/ml)
Carotenoids
(µg/ml)
Phycobiliproteins (µg/ml)* N-assimilatory enzymes
PC APC PE NR! GS!!
DB1 0.59 hij 7.283 efg 13.987 ijk 5.250 jk 4.093 k 0.678 i 31.880 fgh
DB2 1.79 fg 6.140 hi 12.367 kl 3.787 lm 1.717 o 1.014 i 53.910 bcd
DB3 1.01 hi 5.203 ij 19.903 ef 6.477 i 3.393 l 1.134 i 34.800 efg
DB4 0.36 ij 1.130 l 4.003 n 3.043 m 3.397 l 1.304 i 20.650 ghi
DB5 2.44 def 1.453 l 2.737 n 1.520 n 3.053 lmn 0.399 i 15.947 hi
DB6 2.07 ef 10.973 de 13.613 ijk 10.770 g 7.293 g 7.067 efgh 57.003 abcd
DB7 4.37 b 7.877 fg 12.033 kl 16.017 d 8.433 f 42.103 bc 13.857 hi
DB8 1.05 hi 6.163 hi 25.543 c 14.600 e 6.683 h 13.884 ef 53.993 bcd
DB9 1.23 gh 17.283 c 11.320 l 11.380 fg 10.483 e 15.274 ef 53.680 bcd
DB10 6.00 a 20.567 b 20.313 def 16.257 d 18.377 a 3.676 ghi 48.453 bcdef
DB11 0.68 hij 4.193 jk 12.487 jkl 5.700 ij 3.260 lm 6.540 fghi 11.520 i
DB12 0.26 j 0.727 l 4.490 n 2.717 m 1.883 o 50.677 ab 21.474 ghi
DB13 2.57 de 10.843 e 15.597 hi 14.270 e 2.633 n 29.600 d 52.200 bcdf
DB14 1.98 ef 2.857 k 8.290 m 4.350 kl 2.733 mn 0.954 i 7.255 i
DB15 2.95 cd 12.253 d 22.193 d 12.387 f 5.207 j 17.200 e 46.113 cdef
DB16 0.19 hij 2.847 k 30.433 b 27.347 a 7.577 g 4.390 ghi 66.513 b
DB17 2.13 ef 6.960 gh 14.527 hij 12.277 f 16.303 b 2.844 hi 45.880 cdef
DB18 2.18 ef 8.423 f 20.803 de 16.107 d 15.760 bc 35.857 cd 53.883 bcd
DB19 0.72 hij 4.057 jk 7.707 m 6.070 ij 15.350 c 10.713 efgh 73.387 a
DB20 1.98 ef 7.237 fgh 18.263 fg 8.147 h 4.937 j 2.688 hi 6.335 i
DB21 3.33 c 22.360 a 33.993 a 24.543 b 14.177 d 58.713 a 63.140 c
DB22 4.27 b 16.103 c 16.617 gh 21.220 c 8.387 f 50.747 ab 44.127 def
DB23 0.59 hij 6.587 ghi 15.460 hi 9.220 h 5.960 i 12.268 efg 49.503 bcdf
Mean 1.97 8.83 15.50 11.08 7.07 14.7 40.23
SE(m)± 0.26 0.487 0.735 0.388 0.190 3.081 6.534
CD(0.05) 0.743 1.391 2.099 1.108 0.542 8.798 18.661
Superscripts denote DMRT ranking; ‘a’ signifies the highest value and values denoted by same superscript are nonsignificant.
* PC- Phycocyanin; APC- Aophycocyanin; PE- Phycoerythrine ! NR: µmole NO2 / mg chl; !! GS: µmole γ glutamyl hydroxamate/ mg chl
Dnyaneshwar Borase et al.
ww
w.In
dia
nJo
urn
als.
com
Mem
ber
s C
op
y, N
ot
for
Co
mm
erci
al S
ale
Do
wn
load
ed F
rom
IP -
210
.212
.142
.163
on
dat
ed 1
5-Ja
n-2
014
382
for absorption of light energy in cyanobacteria, hence
their quantification was of great importance. A signifi-
cant difference in the contentsof chlorophyll, carote-
noids and phycobiliproteins was recorded amongst the
cyanobacterial strains isolated from three aquatic sites.
Carotenoids protect the cyanobacterial cell from pho-
tooxidation damage and are found to be associated
with proteins. The variation in the patterns of carote-
noid composition was reported to be useful for species
identification of cyanobacteria (Hertzberg, 1971).
Healey (1968) reported similar carotenoid patterns for
Phormidium ectocarpi (PCC7375) and Phormidium
persicinum (CCAP 1469). The phycobiliproteins are
organized into granules (phycobilisomes) localized on
the outer surface of the thylakoids and these function
as important light harvesting components for driving
the photosynthetic reactions in cyanobacteria (Gantt
1975).
The phycocyanin, allophycocyanin and phyco-
erythrin differed significantly and phycocyanin/ phy-
coerythrin ratio was more than one which clearly indi-
cated that the phycocyanins formed a dominant com-
ponent of total phycobilins in cyanobacteria. All natu-
rally occurring cyanobacteria were found to produce
phycocyanin (Bryant 1982). In Anabaena PCC 7120
only a single set of phycocyanin related genes have
been identified which are constitutive in nature
(Sidler, 1994). In contrast, phycoerythrin is not always
found in all cyanobacteria living in either freshwater
or in soil or in marine environments (Bryant 1982).
The ranking of strains for the pigments exhibits
their potential utilization as colouring agents, phy-
coflour probes or as additives in a range of cosmetics
and pharmaceutical products (MacColl and Guard-
Friar 1987). These pigments can have tremendous
potential in the biotechnological implications i.e. in
the area of natural colours. Polyacrylamide disc gel
electrophoresis phycobiliprotein pattern of 21 cyano-
bacterial species depicted a distinct heterogeneity even
between strains assigned to the same species (Schenk
and Kuhfittig 1983).
The cyanobacterial nitrate reductase is closely
associated with photosynthetically active thylakoid
membranes and depends upon ferrodoxin as the sole
natural electron donor. Nitrate assimilation has been
studied exhaustively by a number of researchers
(Bagchi 1948). Plectonema wollei, isolated from Sam-
bhar lake reported maximum nitrate reductase activity.
Meeks et al. (1983) observed that Anabaena strains
have a high NR activity of 26-30 µ moles as compared
to an activity of 1-4 µ moles in unicellular cyanobac-
terium Synechococcus. GS/GOGAT pathway has
been shown to be the major ammonia assimilatory
route under nitrogen limiting conditions in these
organisms (Thomas 1975). Glutamine synthetase
(GS; EC 6.3.1.2) is the key enzyme of nitrogen me-
tabolism in prokaryotes and is subjected to a sophis-
ticated regulatory control. In the presence of abun-
dant carbon sources, nitrogen deficiency results in a
high level of glutamine synthetase activity and if
nitrogen is abundant, GS activity is down-regulated
(Garcia-Dominguez 1999). Glutamine synthetase
activity is also regulated at more levels namely
feedback inhibition, reversible covalent modifica-
tion, and transcriptional regulation.
Acknowledgements
The facilities provided by the Division of Mi-
crobiology and Center for Conservation and Utilisa-
tion of Blue Green Algae, IARI, New Delhi for carry-
ing out these investigations are gratefully acknowl-
edged.
REFERENCES Antarikanonda and Amarit (1991) Influence of Blue-green Algae
and Nitrogen Fertilizer on Rice Yield in Saline Soils. Kasetsart J
Nat Sci 25:18-25.
Bagchi SN and Singh HN (1984) Genetic control of nitrate reduc-
tion in cyanobacterium Nostoc muscorum. Mol Gen Genet 193: 82-
84.
Bennett A and Bogorad L (1973) Complimentary chromatic adapta-
tion in a filamentous blue-green alga. J Cell Biol 58: 419–435.
Bryant DA (1982) Phycoerythrocyanin and phycoerythrin: proper-
ties and occurance in cyanobacteria. J Gen Microbiol 128: 835-844.
Desikachary (1959) Cyanophyta, ICAR Monographs on Algae.
Indian Council of Agricultural Research, New Delhi. Pp. 686.
Gantt E (1975) Phycobilisomes: Light-harvesting pigment complex-
es. Biosci 25: 781-788.
Garcia-Pichel F (2001) Phylogenetic and morphological diversity of
cyanobacteria in soil desert crusts from the Colorado Plateau. Appl
Environ Microbiol 67: 1902–1910.
García-Domínguez M, Reyes JC and Florencio FJ (1999) Glutamine
synthetase inactivation by protein–protein interaction. Proc. Natl.
Acad Sci 96 7161–7166.
Geitler L (1932) Cyanophyceae. In: Kryptogamen flora van
Diversity and growth parameters of Cyanobacteria from Rajasthan
ww
w.In
dia
nJo
urn
als.
com
Mem
ber
s C
op
y, N
ot
for
Co
mm
erci
al S
ale
Do
wn
load
ed F
rom
IP -
210
.212
.142
.163
on
dat
ed 1
5-Ja
n-2
014
383
Deutschland. L Rabenhorst, Osterrich und der Schweiz (ed), vol
XIV, Academische Verlags, Leipzig Pp. 1-196.
Gorl M Jorg S, Baier T Forchhammer K (1998) Nitrogen starvation
induced chlorosis in Synechococcus PCC 7942: adaption to long
term survival. Microbiol 144: 2449-2458.
Healey FP (1968) The carotenoids of four blue green algae. J Phy-
col 4: 126-129.
Hertzberg S, Liaaen-Jensen S and Siegelman HW (1971) The carot-
enoids of blue-green algae. Phytochem 10: 3121-3127.
Jensen A (1978) Chlorophylls and carotenoids. In : Phycological
Methods:Physiological and Biochemical Methods (eds Hellebust, J
A and Craige J S), Cambridge University Press, Cambridge Pp. 59–
70.
Kaushik, B D (1991) Cyanobacterial response of crops in saline
irrigated with saline ground water. In : Shastree NK (ed) Cur-
rents trends in limnology, vol 1. Narendera Publishing House,
New Delhi. Pp. 201-210
Kaushik BD (1994) Algalization of rice field in salt - affected
soil. Ann Agri Res 14: 105-106.
Khan ZUM, Tahmida begum ZN and Mandal R, Hossain R
(1994) Cyanobacteria in rice soil. World J Microbiol Biotech
10:29-298
Lowe RH and Evans HJ (1964) Preparation and some properties of
a soluble nitrate reductase from Rhizobium japonicum. Bioche
Biophys Acta 85: 377-389.
MacColl R and Guard-Friar D (1987) Phycobiliproteins, CRC
Press, Bocaraton, Florida.
MacKinney G (1941) Absorption of light by chlorophyll solutions. J
Biol Chem 140: 315-322.
Meeks JC, Wycoff KL, Chapman JS and Enderlln CS (1983) Regu-
lation of expression of nitrate and dinitrogen assimilation by Ana-
baena species. Appl Environ Microbiol 45: 1351-1359.
Mishra U, Pabbi S, Dhar DW and Singh PK (2004) Floristic abun-
dance and comparative studies on some specific nitrogen fixing blue
green algae isolated from soils of J and K state. Ad Plant Sci 2: 635-
640.
Rios AD, Grube M, Sancho LG Ascaso C (2007) Ultrastructural
and genetic characteristics of endolithic cyanobacterial biofilms
colonizing Antarctic granite rock. FEMS Microbiol Ecol 59: 386-95
Schenk HEA and Kuhfittig G (1983) Elektromorphic Phycochromo-
proteid-Muster: Eine Taxonomische Identifications method for
cyanobacteria method for cyanobakterien-species. Biochem System
Ecol 11: 163-174.
Schopf WJ (2000) The fossil record: Tracing the roots of the cya-
nobacterial lineage. In: The ecology of cyanobacteria: Their diversi-
ty in time and space. BA Whitton and M Potts (eds), Dordrecht, The
Netherlands, Kluwer Academic Publishers. Pp. 13-35.
Shapiro BM and Stadtman ER (1970) Glutamine synthetase (E.
coli). In: Methods in Enzymology, vol. XVII. H Tabor and CW
Tabor (eds), Academic Press, London and New York. Pp. 910-922.
Sidler WA (1994) Phycobilisome and phycobiliprotein structures.
In: The Molecular Biology of Cyanobacteria, (ed.) Bryant DA,
Kluwer Academic, Dordrecht, Netherlands. Pp. 139-216.
Singh RN (1961) Role of blue-green algae in nitrogen economy of
Indian Agriculture. Indian Council of Agri Res, New Delhi. Pp.
170.
Stanier P, Henson JN, Moore GE and Copp AJ (1995) Genomics
26: 473–478.
Taton A, Grubisic S, Brambilla E, De Wit R and Wilmotte A (2003)
Cyanobacterial diversity in natural and artificial microbial mats of
Lake Fryxell (McMurdo Dry Valleys, Antarctica): a morphological
and molecular approach. Appl Environ Microbiol 69: 5157-5169.
Thomas J, Wolk CP, Shaffer PW, Austin SM and Galonsky A
(1975) The initial organic products of fixation of 13N-labelled nitro-
gen gas by the blue green alga Anabaena cylindrical. Biochem
Biophys Res Comm 67: 501-507.
Venkataraman GS (1981) Blue green for rice production – a manual
for its promotion. FAO soils bulletin no. 46. FAO, Rome.
Dnyaneshwar Borase et al.


![[HOFO-2016] - rsmssb@rajasthan](https://static.fdokumen.com/doc/165x107/6327c299051fac18490e6764/hofo-2016-rsmssbrajasthan.jpg)