Distribution, production, and diversity of C 3 - and C 4 -dominated communities in a mixed prairie
11
Distribution, production, and diversity of C3- and C4-dominated communities in a mixed prairie PAUL W. BARNES,' LARRY L. TIESZEN, AND DAVID J. ODE' Department of Biology, A~rgustana College, Sioux Falls, SD, U.S.A . 57197 Received June 7, 1582 BARNES, P. W., L. L. TIESZEN, and D. J. ODE. 1583. Distribution, production, and diversity of C3- and C4-dominated communities in a mixed prairie. Can. J. Bot. 61: 741 -75 1. The vegetation composition and standing crop of 44 stands, representing a diversity of topographic sites, were examined in a Northern Great Plains mixed prairie to determine the distribution, diversity, and relative production of different C3 and C4 dominated plant communities. Cluster analysis identified seven species groups at the 40% similarity level; these have been identified as seven community types: high prairie, midprairie, low prairie, meadow, depression, mud flats, and marsh. Environmental variables which showed the highest significant correlation with the three axes of a modified Bray and Curtis indirect ordination were soil moisture regime, soil potassium, and soil nitrate. Analysis of 6I3C biomass values indicate that the greatest abundance (nearly 50%) of C4 biomass occurs in low prairie with roughly one-third of meadow and high prairie biomass contributed by C4 species. C4 biomass contribution appears greatest on soils relatively low to moderate in nitrate, potassium, phosphorous, and moisture, yet C4 species cooccur with C3 species where these resources are low. Both productivity and species diversity are related to topographic features but productivity does not appear to be functionally determined by the relative proportion or contribution of C4 taxa. The greatest number of C4 species occupy upland slopes and ridges and within these habitats C3 and C4 grasses may be distributed differently depending on slope exposure. BARNES, P. W., L. L. TIESZEN et D. J. ODE. 1583. Distribution, production, and diversity of C3- and C4-dominated communities in a mixed prairie. Can. J. Bot. 61: 741-751. La vegetation et la biomasse aCrienne de 44 stations reprksentant une variCtC de sites topographiques ont CtC CtudiCes dans une prairie mixte des "Northern Great Plains," dans le but de dCterminer la repartition relative de differentes communautCs vCgCtales dominCes par des plantes en C3 et en C4. Une analyse de groupement a permis d'identifier sept groupes d'espkces au niveau de similitude de 40%. Ces sept groupes sont considCrCs comme sept types de communautCs: prairie haute, prairie moyenne, prairie base, prC, dkpression, fonds vaseux et marais. Les variables environnementales qui presentent la correlation significative la plus ClevCe avec les trois axes d'une ordination indirecte de Bray et Curtis modifiCe sont le rCgime d'humiditi du sol, le potassium du sol et le nitrate du sol. L'analyse des valeurs de biomasse 6I3C montre que la plus forte abondance (prks de 50%) de biomasse de plantes en C4 se rencontre dans la prairie basse; le tiers environ de la biomasse du prC et de la prairie haute est due a des espkces en C4. La contribution des plantes en C4 a la biomasse semble la plus ClevCe sur les sols dont la teneur en nitrate, potassium, phosphore et humidit6 est relativement faible a moyenne; cependant, des espkces en C4 cohabitent avec des especcs en C, lorsque ces ressources sont en faibles quantitks. La productivitC et la diversite spicifique sont toutes deux relikes aux caractkristiques topographiques, mais la productivitC ne semble pas dCterminCe fonctionnellement par la proportion ou la contribution relative des taxons en C4. Le nombre le plus ClevC d'espkces en C4 se rencontre sur les pentes et les cretes des hautes terres et, dans ces habitats, les graminCes en C3 et en C4 peuvent pksenter une ripartition diffkrente selon I'orientation de la pente. [Traduit par le journal] Introduction Plants possessing C3 and C4 photosynthetic systems often reveal differing response curves with respect to a number of important environmental factors. Yet the ecological importance of these differences, even in North American grasslands where they cooccur (Ode et al. 1980), is not clearly understood. C4 grasses are often characterized by high maximum rates of photosynthesis, photosaturation at high light intensities, and high temperature optima for photosynthesis and growth (Bjorkman 1975). In addition, C4 plants typically show 'present address: School of Life Sciences, University of Nebraska, Lincoln, NE, U.S.A. 68588. 'present address: South Dakota Natural Heritage Program, Division of Parks and Recreation, Pierre, SD, U.S.A. 57501. high use efficiencies for water (Downes 1969; Ludlow 1976) and nitrogen (Brown 1978). Efficient utilization for all resources might be expected simply because of their enhanced photosynthetic rates, expressed on an area, mass, chlorophyll, or protein basis. Ecologically, the C4 pathway appears advantageous in environments characterized by high light intensities, high temperat- ures, and perhaps limited soil moisture (Doliner and Jolliffe 1979; Bjorkman 1975) although some excep- tions do exist (Long et al. 1975; Caldwell et al. 1977). Where low temperatures and shsde conditions prevail, simulations by Ehleringer (1978) suggest that C3 grasses are superior to C4 grasses because of enhanced quantum yields under these conditions; however, Ludlow's (1981) data suggest that these differences in quantum yields do not apply to all species. Can. J. Bot. Downloaded from www.nrcresearchpress.com by USGS LIBRARY on 12/03/11 For personal use only.
Transcript of Distribution, production, and diversity of C 3 - and C 4 -dominated communities in a mixed prairie
Distribution, production, and diversity of C3- and C4-dominated communities in a mixed prairie
PAUL W. BARNES,' LARRY L. TIESZEN, AND DAVID J. ODE' Department of Biology, A~rgustana College, Sioux Falls, SD, U.S.A . 571 97
Received June 7, 1582
BARNES, P. W., L. L. TIESZEN, and D. J. ODE. 1583. Distribution, production, and diversity of C3- and C4-dominated communities in a mixed prairie. Can. J. Bot. 61: 741 -75 1.
The vegetation composition and standing crop of 44 stands, representing a diversity of topographic sites, were examined in a Northern Great Plains mixed prairie to determine the distribution, diversity, and relative production of different C3 and C4 dominated plant communities. Cluster analysis identified seven species groups at the 40% similarity level; these have been identified as seven community types: high prairie, midprairie, low prairie, meadow, depression, mud flats, and marsh. Environmental variables which showed the highest significant correlation with the three axes of a modified Bray and Curtis indirect ordination were soil moisture regime, soil potassium, and soil nitrate. Analysis of 6I3C biomass values indicate that the greatest abundance (nearly 50%) of C4 biomass occurs in low prairie with roughly one-third of meadow and high prairie biomass contributed by C4 species. C4 biomass contribution appears greatest on soils relatively low to moderate in nitrate, potassium, phosphorous, and moisture, yet C4 species cooccur with C3 species where these resources are low. Both productivity and species diversity are related to topographic features but productivity does not appear to be functionally determined by the relative proportion or contribution of C4 taxa. The greatest number of C4 species occupy upland slopes and ridges and within these habitats C3 and C4 grasses may be distributed differently depending on slope exposure.
BARNES, P. W., L. L. TIESZEN et D. J. ODE. 1583. Distribution, production, and diversity of C3- and C4-dominated communities in a mixed prairie. Can. J. Bot. 61: 741-751.
La vegetation et la biomasse aCrienne de 44 stations reprksentant une variCtC de sites topographiques ont CtC CtudiCes dans une prairie mixte des "Northern Great Plains," dans le but de dCterminer la repartition relative de differentes communautCs vCgCtales dominCes par des plantes en C3 et en C4. Une analyse de groupement a permis d'identifier sept groupes d'espkces au niveau de similitude de 40%. Ces sept groupes sont considCrCs comme sept types de communautCs: prairie haute, prairie moyenne, prairie base, prC, dkpression, fonds vaseux et marais. Les variables environnementales qui presentent la correlation significative la plus ClevCe avec les trois axes d'une ordination indirecte de Bray et Curtis modifiCe sont le rCgime d'humiditi du sol, le potassium du sol et le nitrate du sol. L'analyse des valeurs de biomasse 6I3C montre que la plus forte abondance (prks de 50%) de biomasse de plantes en C4 se rencontre dans la prairie basse; le tiers environ de la biomasse du prC et de la prairie haute est due a des espkces en C4. La contribution des plantes en C4 a la biomasse semble la plus ClevCe sur les sols dont la teneur en nitrate, potassium, phosphore et humidit6 est relativement faible a moyenne; cependant, des espkces en C4 cohabitent avec des especcs en C, lorsque ces ressources sont en faibles quantitks. La productivitC et la diversite spicifique sont toutes deux relikes aux caractkristiques topographiques, mais la productivitC ne semble pas dCterminCe fonctionnellement par la proportion ou la contribution relative des taxons en C4. Le nombre le plus ClevC d'espkces en C4 se rencontre sur les pentes et les cretes des hautes terres et, dans ces habitats, les graminCes en C3 et en C4 peuvent pksenter une ripartition diffkrente selon I'orientation de la pente.
[Traduit par le journal]
Introduction Plants possessing C3 and C4 photosynthetic systems
often reveal differing response curves with respect to a number of important environmental factors. Yet the ecological importance of these differences, even in North American grasslands where they cooccur (Ode et al. 1980), is not clearly understood. C4 grasses are often characterized by high maximum rates of photosynthesis, photosaturation at high light intensities, and high temperature optima for photosynthesis and growth (Bjorkman 1975). In addition, C4 plants typically show
'present address: School of Life Sciences, University of Nebraska, Lincoln, NE, U.S.A. 68588.
'present address: South Dakota Natural Heritage Program, Division of Parks and Recreation, Pierre, SD, U.S.A. 57501.
high use efficiencies for water (Downes 1969; Ludlow 1976) and nitrogen (Brown 1978). Efficient utilization for all resources might be expected simply because of their enhanced photosynthetic rates, expressed on an area, mass, chlorophyll, or protein basis. Ecologically, the C4 pathway appears advantageous in environments characterized by high light intensities, high temperat- ures, and perhaps limited soil moisture (Doliner and Jolliffe 1979; Bjorkman 1975) although some excep- tions do exist (Long et al. 1975; Caldwell et al. 1977). Where low temperatures and shsde conditions prevail, simulations by Ehleringer (1978) suggest that C3 grasses are superior to C4 grasses because of enhanced quantum yields under these conditions; however, Ludlow's (1981) data suggest that these differences in quantum yields do not apply to all species.
Can
. J. B
ot. D
ownl
oade
d fr
om w
ww
.nrc
rese
arch
pres
s.co
m b
y U
SGS
LIB
RA
RY
on
12/0
3/11
For
pers
onal
use
onl
y.

742 CAN. J . BOT. 1
Attempts to better understand the ecological signifi- cance of the C4 system in various plant groups have led to studies examining broad geographic trends in their distributions and correlated climatic conditions. Teeri and Stowe (1976) and Stowe and Teeri (1978) have shown that, in North America, C4 grasses and dicots increase in abundance at lower latitudes, and that temperature (grasses) and evaporation (dicots) are im- portant correlates. Several authors (Tieszen et al. 1979; Boutton et al. 1980) have shown that C4 species decrease in importance at upper elevations along both temperate and tropical altitudinal gradients, where interacting gradients of moisture and temperature proba- bly exist. Within the midlatitude grasslands of North America, a mixture of C3 and C4 grasses coexist. This coexistence of potentially competitive species may be achieved by the differential utilization of resources resulting from temporal displacement of growth activi- ties; C3 (cool-season) grasses are most active in spring and C4 (warm-season) grasses are most active in summer (Ode et al. 1980; Williams and Markley 1973). Recent data published by Kemp and Williams (1980) suggest that the temporal displacement exhibited by Agropyron smithii (C3) and Bouteloua gracilis (C4) in the shortgrass prairie may be attributed to their inherent differences in photosynthetic and growth responses to temperature. Reduced competition between C3 and C4 grasses could also be achieved by a spatial separation of habitat utilization. Within an area of cooccurrence Tieszen's (1970) early data suggest that C4 grasses might occupy sites favorable for efficient C4 photosyn- thesis to occur (e.g., warmer, and hence possibly drier, open sites), whereas C3 grasses might occupy cooler, more shaded sites. Few data, however, are available to verify microscale distributions and the possible segrega- tion of C3 and C4 grasses along specific, and quantified, microenvironments within the same grassland system. Although recently, Barnes and Harrison (1 982) have shown that in Sandhills prairie in Nebraska, C3 grasses tend to be more abundant on sites where early growing season soil moisture is most abundant, whereas C4 grasses are more abundant on sites where reliable summer soil moisture exists.
The work of Ode et al. (1980) documented the temporal displacement of growth activities of C3 and C4 species in a typical Northern Great Plains mixed prairie. Their study also suggested that C4 plants contributed more biomass in upland communities than in lowland communities. This study is designed to determine if cooccurring C3 and C4 species in this same prairie are indeed segregated along specific resource gradients. We have identified and characterized the major C3 and C4 plant communities in an attempt to address the following hypothesis: because of their high use efficiencies for water, nitrogen, and perhaps other resources, it is
IOL. 61. 1983
expected that C4 species might be at a competitive advantage and hence more abundant on sites where water, nitrogen, and other soil nutrients are low or limiting. In addition, we have examined general patterns of species diversity and relative productivity along a topographic - soil moisture gradient and determined important environmental variables associated with the distributions of several distinct plant communities with- in mixed prairie vegetation of the Northern Great Plains.
Methods This study was conducted on the Samuel H. Ordway Jr.
Memorial Prairie which is located in north-central South Dakota (4.5'43' N, 99'06' W), approximately 15 km west of Leola, South Dakota. The prairie is a 3076-ha contiguous preserve owned and managed by The Nature Conservancy. It is situated on the eastern edge of the Coteau du Missouri, a broad topographical highland of glacial origin, and lies within the Prairie Pothole region. Prairie potholes are glacially derived, water-holding depressions. Weaver considers the vegetation in this region to be of the northern mixed-grass type (Weaver and Albertson 1956), yet the prairie lies very near the narrow Tallgrass transition zone of Kiichler (1964). Elevation above sea level is 558-619 m with deep loamy soils developed on glacial till (Christensen 1977). Topographically, the prairie consists of rolling hills which are interrupted by numerous prairie potholes of various sizes and degrees of standing water permanence. Because of the rocky, rolling terrain most of the area has been used as rangeland and remains dominated by native prairie vegetation.
The climate at Leola is semiarid and typically continental; hot summers and cold winters are characteristic of the region. Most of the precipitation occurs during the growing season with June normally the wettest month. Long-term and 1977 patterns of air temperature and precipitation at Leola have been described by Ode et al. (1980). It is worth noting, however, that precipitation in 1977 was 30% greater than normal. Rainfall in the spring and late summer to fall contributed the most to this increase. Consequently, soil moisture levels (measured gravimetrically) remained high at both upper and lower slope sites for most of the growing season (see Ode et al. 1980).
During July 1977, 44 stands within a 259-ha enclosure of Ordway Prairie were sampled for vegetation composition. The same enclosure was utilized in the study conducted by Ode et al. (1980). Grazing by domestic livestock had not occurred at this site since 1975. Each stand was represented by four 1-m2 quadrats. At each stand, slope inclination was recorded using a ranking scale of 0-4, where 0 was no inclination, 1 was very slight (<2"), 2 slight (2-6"), 3 moderate (6-lo0), and 4 steep (>lo0). Slope aspect was also assigned based on the following designations: 0 = north facing; 90 = east facing; 180 = south facing; and 270 = west facing. A relative soil moisture index was subjectively assigned to each stand based on slope position, inclination, and apparent extent of drainage. Ascaleof 1-5 wasused with 1 = verydry, 2 = dry, 3 = moist, 4 = wet, and 5 = very wet.
Within each quadrat percent canopy cover (PC) for each species was estimated. Frequency (F) and average PC were
Can
. J. B
ot. D
ownl
oade
d fr
om w
ww
.nrc
rese
arch
pres
s.co
m b
y U
SGS
LIB
RA
RY
on
12/0
3/11
For
pers
onal
use
onl
y.
calculated for each species within the stand. A species index value employing both stand cover and frequency data, was calculated where: species index (SI) = (RC + RF)/2; RC = PC of that species X 1001total PC of all species, and RF = F of that species X 1001total F of all species. This species index was used in the ordination, the calculation of diversity indices, and the ranking of community dominants. (Detailed stand data
BARNES ET AL. 743
and ordination results are available from the first author.) A modified Bray and Curtis indirect ordination (Bray and
Curtis 1957) was employed to spatially orient the 44 stands relative to one another in three dimensions. The ordination was indirect because the stands were initially arranged in terms of abstract axes which may or may not have corresponded to environmental gradients. The three axes, defined by the most
vegetation from each stand, was then quartered into a 1116th subsample which was sorted into three components: green, 1977 dead, and old dead. Subsamples were then dried 24 h at 98°C and weighed.
dissimilar stands, were then subjected to correlations with environmental variables. These variables included slope as- pect, slope inclination, soil moisture index, 1977 stand production, total stand biomass, and 10 soil characteristics (outlined later). Variables with the largest significant correla- tion coefficients were used to represent the axes.
The similarity matrix of the species in the 44 stands, which was the basis of the ordination, was also used in the cluster analysis. The average link method of cluster analysis (Sokal and Sneath 1963) was used to generate an agglomerative, hierarchical dendrogram of the 44 stands. The clusters identified at the 40% similarity level were chosen to represent major plant community types. The constituent stands of these communities (clusters) were used to generate the diversity and species richness data as well as to derive the dominant species of the communities. The Shannon-Weaver index of general diversity (H') was calculated according to Poole (1974). All species nomenclature is according to van Bruggen (1976).
During the last 2 weeks of August 1977, aboveground biomass and soil collections were taken from 42 of the 44 stands. Biomass collections were made by clipping ten 0.1 x 1 m strips radially from a surveyor's flag which marked the location of the stand. Each sample, representing 1 m2 of
With each biomass collection two soil samples were taken at depths of 5-15 and 15-25 cm. For each of 42 stands, a pooled upper and lower soil sample was analyzed for 10 characteris- tics by the Soil Testing Laboratory at South Dakota State University, Brookings, SD. These characteristics included percent organic matter, phosphorus, potassium, pH, soluble salts (1:l dilution), soluble salts (soil paste; six stands only), soluble sodium, texture class, nitrate, and Kjeldahl nitrogen.
The procedure of quadrat sampling was conducted such that three stands which appeared similar in vegetation composition in the field were sampled in sequence. Biomass samples for 6I3C analysis were taken from one of these stands. Because of the cost of sample analysis, biomass samples from the second and third stands in this sequence were pooled for analysis. As a result, a total of 28 samples from 42 stands were analyzed. Because of the quadrat sampling scheme, all of the pooled biomass samples were from similar community types, as distinguished by the ordination, with one exception. Proce- dures for sample preparation are outlined by Ode et al. (1980).
The values of 6I3C (parts per thousand) are expressed here relative to the PDB standard (Smith and Brown 1973) where: 6I3C = [(R samplelR standard) - 11 x 1000; R = ' 3 ~ / ' 2 ~ . Values of 613c for known C3 and C4 plants at Ordway Prairie are given by Ode et al. (1980). From these values, extrapola- tions were made to determine percent stand biomass that was c4.
Results Community descriptions
A total of 309 vascular plant species have been identified at Ordway Prairie (Hertz 1976). Ode et al. (1980) identified 27 species of the 305 examined to be C4, based on Kranz anatomy. Nineteen of these 27 C4 species are in the Poaceae. In this study, 91 species were encountered or approximately 30% of the Ordway flora. Nine of the 19 C4 grasses were encountered in sampling; all but one (Echinochloa crusgalli) are native prairie grasses. Of the eight C4 dicots at Ordway, only Portulaca oleracea, an introduced agricultural weed was encountered.
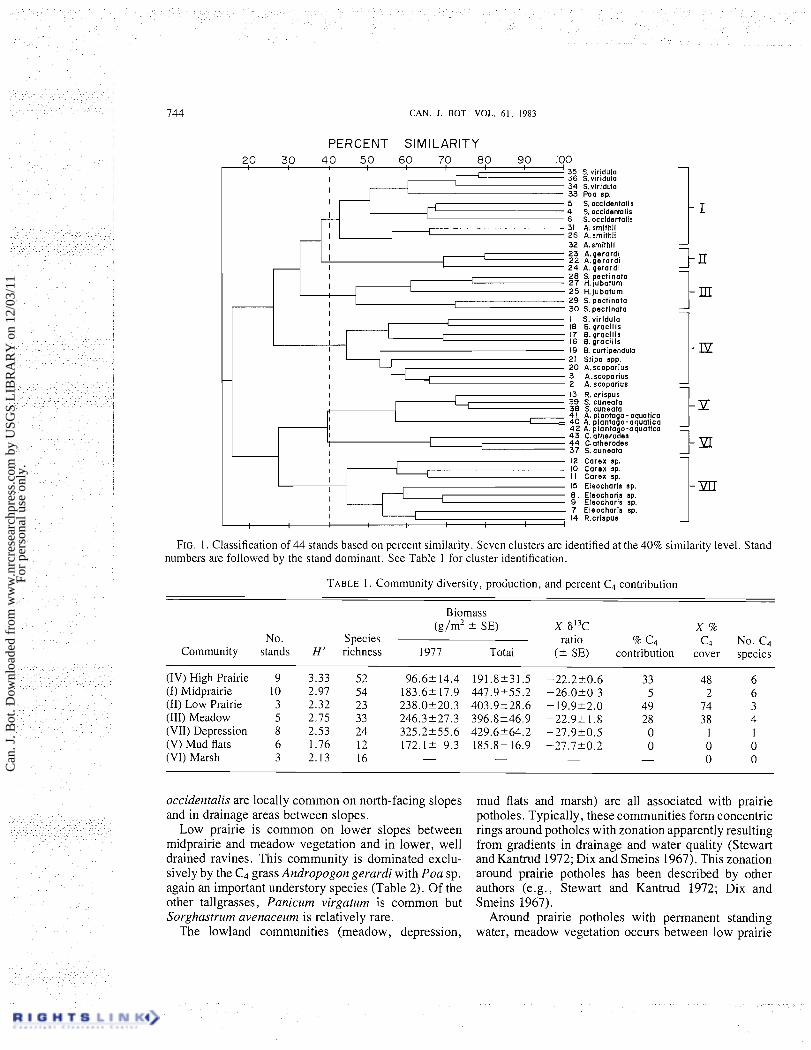
Cluster analysis of the 44 stands identified seven species groups at the 40% similarity level (Fig. 1). We have used these clusters (Table 1) to represent seven community types: high prairie, midprairie, low prairie, meadow, depression, mud flats, and marsh. Because these communities appear similar in species composi- tion to those described by Dix and Smeins (1967), for a similar area in North Dakota, we have chosen to adopt similar nomenclature. Although the number of stands per community varied (Table l ) , species area curves (Shimwell 1971) indicate adequate sampling in all but the marsh vegetation. For this reason, productivity, 613C, and adequate soil data have not been gathered for this latter community.
High prairie occupies dry, rocky hilltops and slopes where drainage is excessive and soil moisture levels are expected to be low (Table 4). The overall dominants here are Bouteloua gracilis and Andropogon scoparius, both native C4 grasses (Table 2). Within high prairie, species composition varies according to slope exposure differences (Table 2). Bouteloua gracilis is most abun- dant on dry, rocky ridges, whereas stands dominated by Andropogon scoparius, Stipa viridula, and Muhlen- bergia cuspidata appear best developed on the slopes, especially north-facing ones. On south-facing slopes, Bouteloua curtipendula is a codominant with A. scoparius.
The characteristic feature of midprairie is the codomi- nance of the C3 grasses Agropyron smithii and Stipa viridula, although Poa sp., another C3 grass, is an important understory species (Table 2). Midprairie is typical of middle and lower slopes and together with high prairie is probably the most abundant vegetation type at Ordway Prairie. Stands of Symphoricarpos
Can
. J. B
ot. D
ownl
oade
d fr
om w
ww
.nrc
rese
arch
pres
s.co
m b
y U
SGS
LIB
RA
RY
on
12/0
3/11
For
pers
onal
use
onl
y.
CAN. I. BOT. VOL. 61, 1983
PERCENT SIMILARITY 2 0 30 40 50 60 70 80 90 100
I I
I 35 S. viridula 36 S. viridula 34 S.vlrldula 33 Poa sp. 1
S. occidentalis S. occidentalis S. occldenfalls A. smlthli A. srnithli A.srnithli A.gerard[ A.gerardl A. gerardi S. pectinata H. jubatum H.jubaturn S. pectinata S. pectlnata
FIG. 1. Classification of 44 stands based on percent similarity. Seven clusters are identified at the 40% similarity level. Stand numbers are followed by the stand dominant. See Table 1 for cluster identification.
-
TABLE 1. Community diversity, prociuction, and percent C4 contribution
Biomass - (g/m' 2 SE) X 6I3c X %
No. Species ratio % C4 C4 No. C4 Community stands H' richness 1977 Total ( 2 SE) contribution cover species
(IV) High Prairie 9 3.33 52 96.62 14.4 191.8531.5 -22.220.6 33 48 6 (I) Midprairie 10 2.97 54 183.65 17.9 447.9255.2 -26.050.3 5 2 6 (11) Low Prairie 3 2.32 23 238.0220.3 403.9528.6 -19.922.0 49 74 3 (111) Meadow 5 2.75 33 246.3527.3 396.8246.9 -22.95 1.8 28 3 8 4 (VII) Depression 8 2.53 24 325.2255.6 429.6*64.2 -27.920.5 0 1 1 (V) Mud flats 6 1.76 12 172.15 9.3 185.82 16.9 -27.720.2 0 0 0 (VI) Marsh 3 2.13 16 - - - - 0 0
12 Carex sp. 10 Carex ap. I I Carex sp. 15 Eleocharia ap. 8 . 9 Eleocharis Eleocharla ap. ap.
7 Eleocharia sp. 14 R.crlspus
I
i I I S. virldula
occidentalis are locally common on north-facing slopes and in drainage areas between slopes.
Low prairie is common on lower slopes between midprairie and meadow vegetation and in lower, well drained ravines. This community is dominated exclu- sively by the C4 grass Andropogon gerardi with Poa sp. again an important understory species (Table 2). Of the other tallgrasses, Panicum virgatum is common but Sorghastrurn avenaceum is relatively rare.
The lowland communities (meadow, depression,
I
mud flats and marsh) are all associated with prairie potholes. Typically, these communities form concentric rings around potholes with zonation apparently resulting from gradients in drainage and water quality (Stewart and Kantrud 1972; Dix and Smeins 1967). This zonation around prairie potholes has been described by other authors (e.g., Stewart and Kantrud 1972; Dix and Smeins 1967).
Around prairie potholes with permanent standing water, meadow vegetation occurs between low prairie
18 0. gracilis
I I I
I 17 8. gracjlls 16 8. gracslis
I 19 0. curtipendula 21 Slipa spp
I 20 A.scoparius I 3 A.scoparius I 2 A. scoparius I I 13 R.crispus I 39 S. cuneata
1 38 S. cuneata 4 i A. plantaga- oquatica
I - 40 A. plantago-aquaiica 42 A.plantago-aquatica
I 4 3 C. atherodea I 44 C.atherodes
37 S. cuneata
Can
. J. B
ot. D
ownl
oade
d fr
om w
ww
.nrc
rese
arch
pres
s.co
m b
y U
SGS
LIB
RA
RY
on
12/0
3/11
For
pers
onal
use
onl
y.
BARNES ET AL
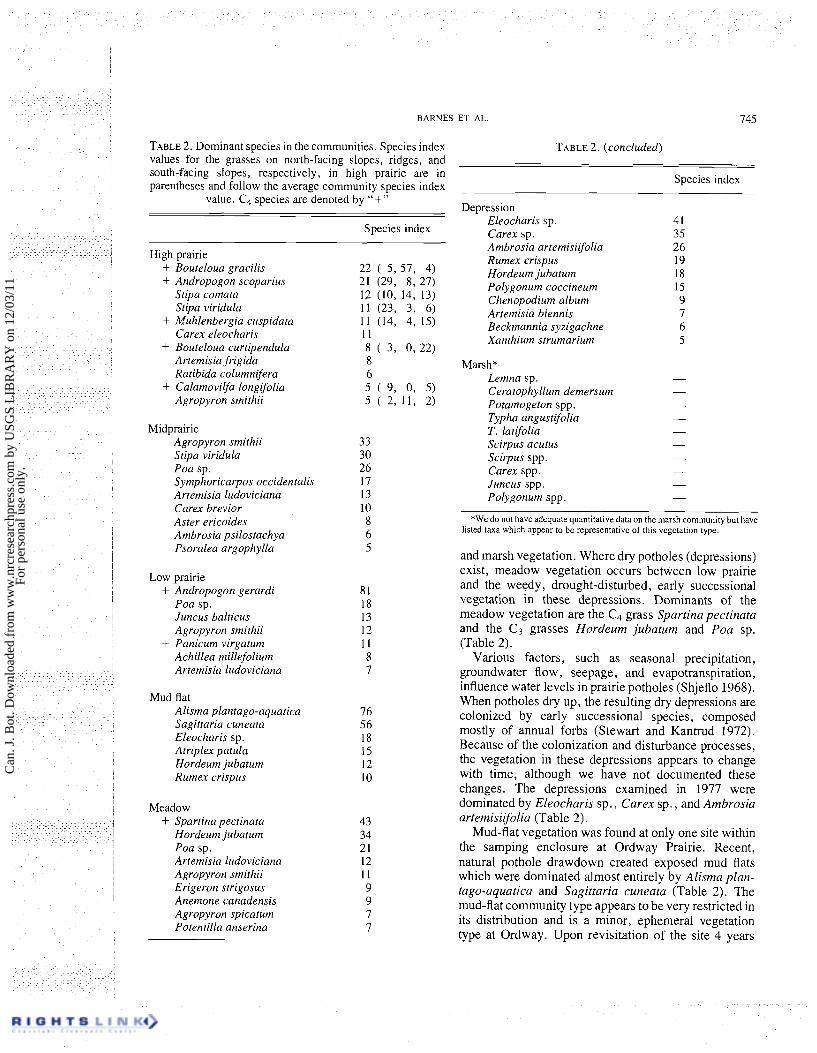
TABLE 2. Dominant species in the communities. Species index values for the grasses on north-facing slopes, ridges, and south-facing slopes, respectively, in high prairie are in parentheses and follow the average community species index
value. C4 species are denoted by "+"
Species index
TABLE 2. (concluded)
Species index
Depression Eleocharis sp. 4 1 Carex sp. 35 Ambrosia artemisiifolia 26 Rumex crispus 19 Hordeum jubatum 18
High prairie + Bouteloua gracilis + Andropogon scoparius
Stipa comata Stipa viridula
+ Muhlenbergia cuspidata Carex eleocharis
+ Bouteloua curtipendula Artemisia frigida Ratibida columnifera
+ Calamovilfa longifolia Agropyron srnithii
Polygonum coccineum 15 Chenopodium album 9 Artemisin biennis 7 Beckmannia syzigachne 6 Xanthium strumarium 5
Marsh* Lemna sp. Ceratophyllum demersum Potamogeton spp. Typha angustifolia T . latifolia Scirpus acutus Scirpus spp. Carex spp. Juncus spp. Polygonum spp.
Midprairie Agropyron smithii Stipa viridula Poa sp. Symphoricarpos occidentalis Artemisia ludoviciana Carex brevior - -
*We do not have adequate quantitative data on the marsh community but have listed taxa which appear to be representative of this vegetation type.
Aster ericoides Ambrosia psilostachya Psoralea argophylla and marsh vegetation. Where dry potholes (depressions)
exist, meadow vegetation occurs between low prairie and the weedy, drought-disturbed, early successional vegetation in these depressions. Dominants of the
Low prairie + Andropogon gerardi
Poa sp. Juncus balticus Agropyron smithii
+ Panicum virgatum Achillea millefoli~cm
meadow vegetation are the C4 grass Spartina pectinata and the C3 grasses Hordeum jubatum and Poa sp. (Table 21.
Various factors, such as seasonal precipitation, groundwater flow, seepage, and evapotranspiration, influence water levels in prairie potholes (Shjeflo 1968). When potholes dry up, the resulting dry depressions are colonized by early successional species, composed mostly of annual forbs (Stewart and Kantrud 1972). Because of the colonization and disturbance processes,
Artemisia ludoviciana
Mud flat Alisma plantago-aquatica Sagitfaria cuneata Eleocharis sp. Atriplex patula Hordeum jubatum the vegetation in these depressions appears t o change
with time, although we have not documented these changes. The depressions examined in 1977 were
Rumex crispus
dominated by Eleocharis sp., Carex sp., and Ambrosia artemisiifolia (Table 2).
Mud-flat vegetation was found at only one site within
Meadow + Spartina pectinata
Hordeum jubatum Poa sp. Artemisia ludoviciana Agropyron smithii Erigeron strigosus Anemone canadensis Agropyron spicatum Potentilla anserina
the samping enclosure at Ordway Prairie. Recent, natural pothole drawdown created exposed mud flats which were dominated almost entirely by Alisma plan- tago-aquatica and Sagittaria cuneata (Table 2). The mud-flat community type appears to be very restricted in its distribution and is a minor, ephemeral vegetation type at Ordway. Upon revisitation of the site 4 years
Can
. J. B
ot. D
ownl
oade
d fr
om w
ww
.nrc
rese
arch
pres
s.co
m b
y U
SGS
LIB
RA
RY
on
12/0
3/11
For
pers
onal
use
onl
y.
746 CAN. J. BOT. VOL. 61, 1983
later (1981), Alisma and Sagittaria were absent and the vegetation resembled that of dry depressions (e.g., + a,
0 Eleocharis sp., Polygonum sp.). .- + L
Marsh vegetation occurs in areas of standing water or Z
where drainage is nearly incomplete. This vegetation, which circumscribes prairie potholes, commonly ex- periences inundation for most or all of the growing season. Common taxa in marsh vegetation are listed in Table 2.
Diversity and productivity patterns There appears to be a significant relationship between
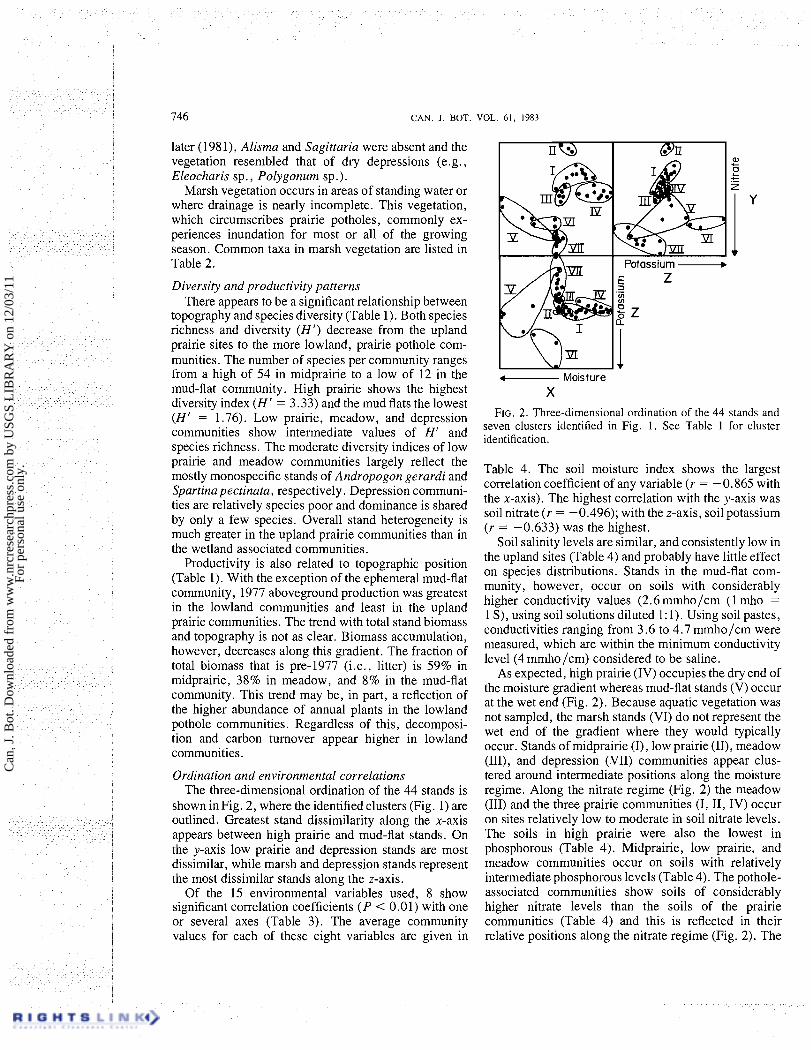
I' topography and species diversity (Table 1). Both species richness and diversity (H') decrease from the upland prairie sites to the more lowland, prairie pothole com- munities. The number of species per community ranges from a high of 54 in midprairie to a low of 12 in the Moisture mud-flat community. High prairie shows the highest X diversity index (H' = 3.33) and the mud flats the lowest (HI = 1.76). Low prairie, meadow, and depression FIG. 2 . Three-dimensional ordination of the 44 stands and
seven clusters identified in Fig. 1. See Table 1 for cluster communities show intermediate values of H' and identification, species richness. The moderate diversity indices of low prairie and meadow communities largely reflect the mostly monospecific stands of ~ n d r o ~ o g o n gerardi and Spartina pectinata, respectively. Depression communi- ties are relatively species poor and dominance is shared by only a few species. overall stand heterogeneity is much greater in the upland prairie communities than in the wetland associated communities.
Productivity is also related to topographic position (Table 1). With the exception of the ephemeral mud-flat community, 1977 aboveground production was greatest in the lowland communities and least in the upland ~rairie communities. The trend with total stand biomass and topography is not as clear. Biomass accumulation, however, decreases along this gradient. The fraction of total biomass that is pre-1977 (i.e., litter) is 59% in midprairie, 38% in meadow, and 8% in the mud-flat community. This trend may be, in part, a reflection of the higher abundance of annual plants in the lowland pothole communities. ~ e ~ a r d l e s s of this, decomposi- tion and carbon turnover appear higher in lowland communities.
Ordination and environmental correlations The three-dimensional ordination of the 44 stands is
shown in Fig. 2, where the identified clusters (Fig. 1) are outlined. Greatest stand dissimilarity along the x-axis appears between high prairie and mud-flat stands. On the y-axis low prairie and depression stands are most dissimilar, while marsh and depression stands represent the most dissimilar stands along the z-axis.
Of the 15 environmental variables used, 8 show significant correlation coefficients ( P < 0.01) with one or several axes (Table 3). The average community values for each of these eight variables are given in
Table 4. The soil moisture index shows the largest correlation coefficient of any variable (r = -0.865 with the x-axis). The highest correlation with the y-axis was soil nitrate (r = -0.496); with the z-axis, soil potassium (r = -0.633) was the highest.
Soil salinity levels are similar, and consistently low in the upland sites (Table 4) and probably have little effect on species distributions. Stands in the mud-flat com- munity, however, occur on soils with considerably higher conductivity values (2.6mmho/cm (1 mho = 1 S), using soil solutions diluted 1: 1). Using soil pastes, conductivities ranging from 3.6 to 4.7 mmho/cm were measured, which are within the minimum conductivity level (4 mmho/cm) considered to be saline.
As expected, high prairie (IV) occupies the dry end of the moisture gradient whereas mud-flat stands (V) occur at the wet end (Fig. 2). Because aquatic vegetation was not sampled, the marsh stands (VI) do not represent the wet end of the gradient where they would typically occur. Stands of midprairie (I), low prairie (II), meadow (111), and depression (VII) communities appear clus- tered around intermediate positions along the moisture regime. Along the nitrate regime (Fig. 2) the meadow (111) and the three prairie communities (I, 11, IV) occur on sites relatively low to moderate in soil nitrate levels. The soils in high prairie were also the lowest in phosphorous (Table 4). Midprairie, low prairie, and meadow communities occur on soils with relatively intermediate phosphorous levels (Table 4). The pothole- associated communities show soils of considerably higher nitrate levels than the soils of the prairie communities (Table 4) and this is reflected in their relative positions along the nitrate regime (Fig. 2). The
Can
. J. B
ot. D
ownl
oade
d fr
om w
ww
.nrc
rese
arch
pres
s.co
m b
y U
SGS
LIB
RA
RY
on
12/0
3/11
For
pers
onal
use
onl
y.
BARNES ET AL.
TABLE 3 Significant (P < 0.01) correlation coefficients among environmental variables and ordination axes Co- efficients with asterisks denote variables chosen for axes
representation
Axis
Parameter x Y z
Slope inclination 0.575 - -
Moisture index -0.865* -0.476 - Organic matter -0 482 - - Phosphorous (P) - -0.470 0.483 Potassium (K) - - -0.633* Nitrate (NO3-) - -0.496" -
Total nitrogen - - 0.370 Soluble salts -0.778 - -
depression soils show the highest phosphorous contents but the lowest potassium levels (Table 4). The prairie stands are found on soils of intermediate potassium content (Table 4). Percent organic matter does not appear to vary considerably between soils of different topographic sites and community types (Table 4), yet exposed, upland ridges of high prairie do show some- what lower organic matter fractions than do the soils of more lowland communities, especially meadow and mud-flat communities.
Distribution of C4 species and biomass Ode et al. (1980) determined the mean 613C value
(parts per thousand) of 100% known C3 and C4 species from upland communities to be -26.7 and - 12.9, respectively. Using these values, and the 613C values obtained from stand biomass samples, we have calcu- lated the percent C4 contribution in each community by extrapolation (Table 1). The overall range of 613C values was - 17.9 in one stand of low prairie to -28.9 in one depression stand. On a community basis, low prairie showed the highest mean 613C value (- 19.9) while mud flat and depression vegetation showed the lowest values (-27.7 and -27.9). It should be noted that the 613C values for the wetland C3 communities are less than the average value obtained by Ode et a1.(1980) from upland C3 plants. This difference probably results from a lower diffusional resistance component where water is abun- dant and provides field substantiation for the theoretical differences expected by Vogel (1980) and Farquhar (1980).
In no community was the C4 biomass component (determined by 613C values) greater than the C3 compo- nent (Table 1). Aboveground biomass in low prairie, which is dominated by the C4 grass Andropogon gerardi, is nearly one-half C4; the C4 fraction is about one-third in both high prairie and meadow vegetation. The principal contributing C4 species in meadow vege-
c - U X . + 2 MI) + I
V) .- c ".M 2 B -0 C m C Gi 0 . - cA .-a m I n + I C . - - 0 m U C . - Zf
M 0 a ?5 0 - V)
Lcl 0 Gi C
cA 0 . - .-a
+ I m c
m I:
m - \ a M X e, ?5 LI
E .-a X Gi 0 .-a
cA
a t I a cA 2,
I: m \ .-a M m -0 s - m .-a C a E U w C '2 g c n E .- pi tl > c e, 0 E~ X .-a . - C n 3 e, e,
4 Lrl el m
2
w
5 'z a,= a m g~ 0 c 2 - .- cA-
~ l & .- w
Can
. J. B
ot. D
ownl
oade
d fr
om w
ww
.nrc
rese
arch
pres
s.co
m b
y U
SGS
LIB
RA
RY
on
12/0
3/11
For
pers
onal
use
onl
y.
748 CAN. J. BOT. VOL. 61, 1983
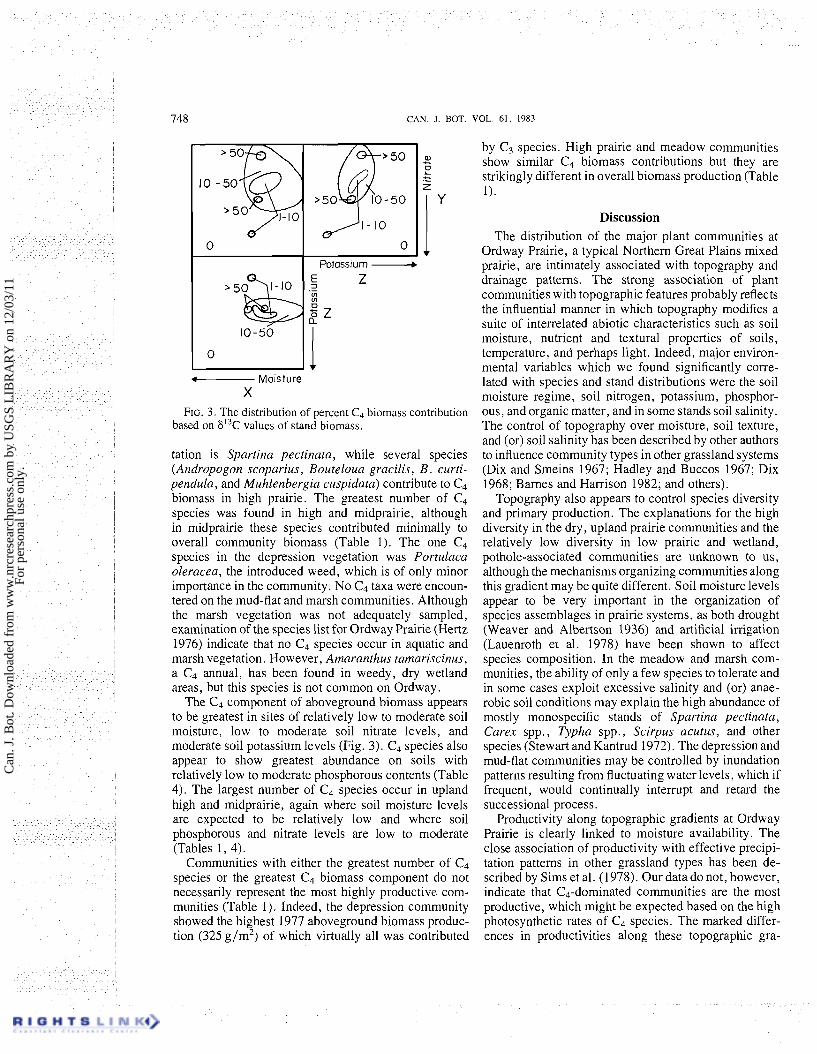
0 O I1 I Potassium
- Moisture X
FIG. 3. The distribution of percent C4 biomass contribution based on 6I3C values of stand biomass.
tation is Spartina pectinata, while several species (Andropogon scoparius, Bouteloua gracilis, B . curti- pendula, and Muhlenbergia cuspidata) contribute to C4 biomass in high prairie. The greatest number of C4 species was found in high and midprairie, although in midprairie these species contributed minimally t o overall community biomass (Table 1). The one C4 species in the depression vegetation was Portulaca oleracea, the introduced weed, which is of only minor importance in the community. No C4 taxa were encoun- tered on the mud-flat and marsh communities. Although the marsh vegetation was not adequately sampled, examination of the species list for Ordway Prairie (Hertz 1976) indicate that no C4 species occur in aquatic and marsh vegetation. However, Amaranthus tamariscinus, a C4 annual, has been found in weedy, dry wetland areas, but this species is not common on Ordway.
The C4 component of aboveground biomass appears to be greatest in sites of relatively low to moderate soil moisture, low to moderate soil nitrate levels, and moderate soil potassium levels (Fig. 3). C4 species also appear to show greatest abundance on soils with relatively low to moderate phosphorous contents (Table 4). The largest number of C4 species occur in upland high and midprairie, again where soil moisture levels are expected to be relatively low and where soil phosphorous and nitrate levels are low to moderate (Tables 1, 4).
Communities with either the greatest number of C4 species or the greatest C4 biomass component do not necessarily represent the most highly productive. com- munities (Table 1). Indeed, the depression community showed the highest 1977 aboveground biomass produc- tion (325 g/m2) of which virtually all was contributed
by C3 species. High prairie and meadow communities show similar C4 biomass contributions but they are strikingly different in overall biomass production (Table 1).
Discussion The distribution of the major plant communities at
Ordway Prairie, a typical Northern Great Plains mixed prairie, are intimately associated with topography and drainage patterns. The strong association of plant communities with topographic features probably reflects the influential manner in which topography modifies a suite of interrelated abiotic characteristics such as soil moisture, nutrient and textural properties of soils, temperature, and perhaps light. Indeed, major environ- mental variables which we found significantly corre- lated with species and stand distributions were the soil moisture regime, soil nitrogen, potassium, phosphor- ous, and organic matter, and in some stands soil salinity. The controi of topography over moisture, soil texture, and (or) soil salinity has been described by other authors to influence community types in other grassland systems (Dix and Smeins 1967; Hadley and Buccos 1967; Dix 1968; Barnes and Harrison 1982; and others).
Topography also appears to control species diversity and primary production. The explanations for the high diversity in the dry, upland prairie communities and the relatively low diversity in low prairie and wetland, pothole-associated communities are unknown to us, although the mechanisms organizing communities along this gradient may be quite different. Soil moisture levels appear to be very important in the organization of species assemblages in prairie systems, as both drought (Weaver and Albertson 1936) and artificial irrigation (Lauenroth et al. 1978) have been shown to affect species composition. In the meadow and marsh com- munities, the ability of only a few species to tolerate and in some cases exploit excessive salinity and (or) anae- robic soil conditions may explain the high abundance of mostly monospecific stands of Spartina pectinata, Carex spp., Typha spp., Scirpus acutus, and other species (Stewart and Kantrud 1972). The depression and mud-flat communities may be controlled by inundation patterns resulting from fluctuating water levels, which if frequent, would continually interrupt and retard the successional process.
Productivity along topographic gradients at Ordway Prairie is clearly linked to moisture availability. The close association of productivity with effective precipi- tation patterns in other grassland types has been de- scribed by Sims et al. (1978). Our data do not, however, indicate that C4-dominated communities are the most productive, which might be expected based on the high photosynthetic rates of C4 species. The marked differ- ences in productivities along these topographic gra-
Can
. J. B
ot. D
ownl
oade
d fr
om w
ww
.nrc
rese
arch
pres
s.co
m b
y U
SGS
LIB
RA
RY
on
12/0
3/11
For
pers
onal
use
onl
y.
BARNES ET AL. 749
dients, even within the C4 grasses, must somehow reflect evolutionary adjustments to water availability. These adjustments include not only the photosynthetic pathway but also the carbon allocation patterns (i.e., root:shoot ratios) of plants with different life history or growth form strategies.
In no community did the C4 surpass the C3 biomass component, even where the dominants were C4 species, although there were several stands dominated by Andro- pogongerardi and Spartinapectinata where the majority of the biomass was C4 derived. We cannot, however, generalize about the overall abundance and biomass contribution of C4 species at Ordway as a whole, since sampling was restricted to one pasture which represen- ted approximately 9% of the total preserve area, and no sampling was conducted in weedy or highly, nonnatur- ally, disturbed habitats where most of the C4 dicots and 5 of the 19 C4 grasses commonly occur (Ode et al. 1980). Within the seven community types examined here, the native C4 grasses appear most abundant in single species dominated lowland communities and species rich, dry upland communities. The greatest C4 component of aboveground biomass (nearly 50%) was found in low prairie where Andropogorl gerardi and Pa~zicum vir- gatum are the major contributors. Roughly one-third of the total community aboveground biomass was C4 in both meadow and high prairie. In meadow vegetation, Spartina pectinata, a known halophyte, contributes to the bulk of the C4 biomass, while several grasses (Andropogon scoparius, Bouteloua gracilis, B . curti- pendula, and Muhlenbergia cuspidata) contribute the most to C4 biomass in high prairie.
Although we have not quantified available soil mois- ture at any site, and especially at the saline areas where the osmotic conditions may limit moisture availability, it appears, on a relative basis, that C4 abundance is not the greatest in water-limited habitats. Apparently the C4 pathway is not strictly an adaptation to water stress and does not necessarily confer a competitive advantage in water-limited environments. However, we do find the greatest number of C4 grass species occupying exposed, dry, rocky ridges and upland slopes. Teeri (1979) has compiled data from Hitchcock and Chase's (1951) Manual of the United States Grasses and has shown, in a gross sense, that while both C j and C4 grasses are abundant in open and shaded habitats, and on dry and moist sites, the relative proportion of C4 grasses is greatest in open and dry (and probably warmer) sites, whereas the C3 grasses appear in greatest proportion in shaded and moister (and probably cooler) sites. Temper- ature differences between habitats may be very impor- tant in determining the distribution of C3 and C4 grasses. On a broad scale, Teeri and Stowe (1976) have shown that the decrease of C4 grasses in the flora with increasing latitude in North America correlates highly
with normal minimum July temperatures. Ehleringer and Bjorkman (1977) have shown that at low tempera- tures, C3 plants possess a higher quantum yield than C4 plants. Ehleringer (1978) utilized these differences in quantum yields in several simulations and suggested that C3 plants are superior to C4 plants under cool, shaded conditions. Furthermore, his simulations suggest that at a latitude of 45' N, C 0 2 uptake for C3 and C4 canopies should be similar. In these locations the segregation of C3 and C4 grasses along seemingly minor topographic and (or) environmental gradients might be expected. Indeed, Tieszen (1970) has found that, for a mixed prairie in southeastern South Dakota, C4 grasses occupy more open, warmer habitats while C3 grasses occupy more shaded, cooler habitats. Within the high prairie vegetation at Ordway Prairie (45'43' N) stands occupy- ing rocky ridges are dominated by Bouteloua gracilis (C4); those stands on south-facing slopes are dominated by Andropogon scoparius and Bouteloua curtipendula, both C4 grasses. North-facing slopes are also dominated by A , scoparius but Stipa viridula (C3) is also equally important. The total relative cover of C4 grasses is 55% on both ridges and south-facing slopes and drops to 38% on north-facing slopes. Conversely, the relative cover of C3 grasses is higher on north-facing slopes (24%) than on either ridges (13%) or south-facing slopes (14%). These trends indicate that within this community C3 and C4 grasses may be responding differently to slope exposure and perhaps temperature regimes.
The abundance of C4 species on soils low to moderate in nitrogen, potassium, and phosphorous may be fortui- tous and related to other interrelated factors such as moisture and internal drainage patterns. Indeed, Doliner and Jolliffe (1979) could not find a significant relation- ship between C4 occurrence and presumed soil nitrogen levels for diverse community types in California and central Europe. However, Brown (1978) has shown that C4 species exhibit higher N use efficiencies than C3 species, which apparently results from their high photo- synthetic rates and perhaps a lower leaf N content. Because of their enhanced photosynthetic rates it might also be expected that C4 species show a higher use efficiency for other nutrients as well. Consequently in habitats where nutrient availability is low C4 species might have an advantage over their C3 competitors. Indeed, there are some data in the literature supporting this hypothesis. White (1961) found infertile microridge positions in south-central South Dakota dominated by C4 grasses, whereas C3 grasses were most abundant in the more fertile, intervening microdepressions. Further- more, in a later paper, White (1971) suggested that increasing effective soil age and development would be accompanied by an increase in C3 grasses and a decrease in C4 grasses, with the exception of the C4 species Bouteloua gracilis and Buchloe dactyloides. Presuma-
Can
. J. B
ot. D
ownl
oade
d fr
om w
ww
.nrc
rese
arch
pres
s.co
m b
y U
SGS
LIB
RA
RY
on
12/0
3/11
For
pers
onal
use
onl
y.
750 CAN. J. BOT. VOL. 61. 1983
bly the better developed soils would also be more fertile, although texture changes would also affect soil moisture relationships, which might be more important in con- trolling distribution patterns (Barnes and Harrison 1982). The importance of soil nutrients in determining the distribution of C3 and C4 grasses needs to examined more thoroughly.
Acknowledgments This project was supported by grants from the United
States National Science Foundation (DEB78-19552 and URP), the William and Flora Hewlett Foundation of the Research Corporation, and the Nature Conservancy. Paul Bultsma facilitated our fieldwork, and we thank Mary Barnes, Reno Long, and Natalie Tieszen for their assistance. The ordination was performed by Patrick Webber and Dana Wiese typed the manuscript.
BARNES, P. W., and A. T. HARRISON. 1982. Species distribu- tion and community organization in a Nebraska Sandhills mixed prairie as influenced by plant/soil-water relation- ships. Oecologia (Berlin), 52: 192-201.
BJORKMAN, 0 . 1975. Environmental and biological control of photosynthesis: inaugural address. In Environmental and biological control of photosynthesis. Edited by R. Marcelle. Dr. W. Junk, The Hague. pp. 1- 16.
BOUTTON, T. W., A. T. HARRISON, and B. N. SMITH. 1980. Distribution of biomass of species differing in photosyn- thetic pathway along an altitudinal transect in southeastern Wyoming grassland. Oecologia (Berlin), 45: 287-298.
BRAY, J. R., and J. T. CURTIS. 1957. An ordination of the upland forest communities of southern Wisconsin. Ecol. Monogr. 22: 217-234.
BROWN, R. H. 1978. A difference in N use efficiency in C3 and C4 plants and its implications in adaptation and evolution. Crop Sci. 18: 93-98.
CALDWELL, M. M., C. B. OSMOND, and D. L. NOTT. 1977. C4 pathway photosynthesis at low temperature in cold tolerant Atriplex species. Plant Physiol. 60: 157- 164.
CHRISTENSEN, C. 1977. Geology and water resources of McPherson, Edmunds and Faulk counties, South Dakota. Part 1. Geology. S.D. Geol. Surv. Bull. 26.
Drx, R. L. 1968. Some slope-plant relationships in the grassland of the Little Missouri Badlands of North Dakota. J. Range Manage. 11: 88-92.
DIX, R. L., and F. E. SMEINS. 1967. The prairie, meadow, and marsh vegetation of Nelson County, North Dakota. Can. J. Bot. 45: 21-58.
DOLINER, L. H., and P. A. JOLLIFFE. 1979. Ecological evidence concerning the adaptive significance of the C4 dicarboxylic acid pathway of photosynthesis. Oecologia (Berlin), 38: 23-34.
DOWNES, R. W. 1969. Differences in transpiration rates between tropical and temperate grasses under controlled conditions. Planta, 88: 26 1-273.
EHLERINGER, J. R. 1978. Implications of quantum yield differences on the distribution of C3 and C4 grasses. Oecologia (Berlin), 31: 255-267.
EHLERINGER, J., and 0 . BJORKMAN. 1977. Quantum yields
for C 0 2 uptake in C3 and C4 plants. Plant Physiol. 59: 86-90.
FARQUHAR, G. D. 1980. Carbon isotope discrimination in plants: effects of carbon dioxide concentration and tempera- ture via the ratio of intercellular and atmospheric C 0 2 concentrations. In Carbon dioxide and climate: Australian Research, Canberra. Edited by G. I. Pearman. Australian Academy of Science, Canberra. 1980. pp. 105- 1 10.
HADLEY, E. B., and R. P. Buccos. 1967. Plant community composition and net primary production within a native eastern North Dakota prairie. Am Midl. Nat. 77: 116- 127.
HERTZ, B. L. 1976. The vascular flora at Ordway Prairie, McPherson County, South Dakota. M.S. thesis, South Dakota State University, Brookings.
HITCHCOCK, A. S., and A. CHASE. 1951. Manual of the grasses of the United States. 2nd ed. Dover Press, New York.
KEMP, P. R., and G. J. WILLIAMS 111. 1980. A physiological basis for niche separation between Agropyron smirhii (C3) and Boutelo~ia gracilis (C4). Ecology, 61: 846-858.
KOCHLER, A. W. 1964. Potential natural vegetation of the conterminous U.S. American Geographical Society, New York. Spec. Publ. No. 36.
LAUENROTH, W. K., J. L. DODD, and P. L. SIMS. 1978. The effects of water- and nitrogen-induced stresses on plant community structure in a semiarid grassland. Oecologia (Berlin), 36: 21 1-222.
LONG, S. P., L. C. INCOLL, and H. W. WOOLHOUSE. 1975. C4 photosynthesis in plants from cool temperature regions, with particular reference to Spartina townsendii. Nature (London), 257: 622-624.
LUDLOW, M. M. 1976. Ecophysiology of C4grasses. In Water and plant life. Edited by 0 . L. Lange, L. Kappen, and E.-D. Schulze. Springer-Verlag, New York, Heidelberg, Berlin.
1981. Effects of temperature on light utilization efficiency of leaves in C3 legumes and C4 grasses. Photo- synthesis Res. 2: 243-249.
ODE, D. J., L. L. TIESZEN, and J. C. LERMAN. 1980. The seasonal contribution of C3 and C4 plant species to primary production in a mixed prairie. Ecology, 61: 1304- 13 1 1.
POOLE, R. W. 1974. An introduction to quantitative ecology. McGraw-Hill, Inc., New York.
SHIMWELL, D. W. 1971. The description and classification of vegetation. University of Washington Press, Seattle.
SHJEFLO, J. B. 1968. Evapotranspiration and the water budget of prairie potholes in North Dakota. U.S. Geol. SUN. Prof. Pap. 585-B.
SIMS, P. L., J. S. SINGH, and W. K. LAUENROTH. 1978. The structure and function of ten western North American grasslands. I. Abiotic and vegetational characteristics. J. Ecol. 66: 251-285.
SMITH, B. N., and W. V. BROWN. 1973. The Kranz syndrome in the Gramineae as indicated by carbon isotopic ratios. Am. J. Bot. 60: 505-513.
SOKAL, R. R., and P. H. A. SNEATH. 1963. Principles of numerical taxonomy. W. H. Freeman and Co., San Francisco.
STEWART, R. E., and H. A. KANTRUD. 1972. Vegetation of prairie potholes, North Dakota, in relation to quality of water and other environmental factors. U.S. Geol. Surv. Prof. Pap. 585-D.
Can
. J. B
ot. D
ownl
oade
d fr
om w
ww
.nrc
rese
arch
pres
s.co
m b
y U
SGS
LIB
RA
RY
on
12/0
3/11
For
pers
onal
use
onl
y.
BARNES ET AL.
STOWE, L. G., and J. A. TEERI. 1978. The geographic distribution of C4 species of the Dicotyledonae in relation to climate. Am. Nat. 112: 609-623.
TEERI, J. A. 1979. The climatology of the C4 photosynthetic pathway. In Topics in plant population biology. Edited by 0. T. Solbrig, S. Jain, G. B. Johnson, and P. H. Raven. Columbia University Press, New York. pp. 356-374.
TEERI, J. A., and L. G. STOWE. 1976. Climatic patterns and the distribution of C4 grasses in North America. Oecologia (Berlin), 23: 1-12.
TIESZEN, L. L. 1970. Photosynthetic properties of some grasses in eastern South Dakota. Proc. S.D. Acad. Sci. 49.
TIESZEN, L. L., M. M. SENYIMBA, S. K. IMBAMBA, and J. H. TROUGHTON. 1979. The distribution of C3 and C4 grasses and carbon isotope discrimination along an altitudinal and moisture gradient in Kenya. Oecologia (Berlin), 37: 377- 350.
VAN BRUGGEN, T. 1976. The vascular plants of South Dakota. Iowa State University Press, Ames.
VOGEL, J. C. 1980. Fraction of carbon isotopes during photosynthesis. In Sitzungs-berichte der Heidelberg Aka- demie der Wissenschaften Mathematischnaturwissenschaft- liche Klasse Jahrgang 1980, 3. Abhandlung. Springer- Verlag, Berlin. pp. 1 1 1- 135.
WEAVER, J. E., and F. W. ALBERTSON. 1936. Effects of the great drought on the prairies of Iowa, Nebraska, and Kansas. Ecology, 17: 567-639.
1956. Grasslands of the Great Plains. Johnsen Pub. Co., Lincoln, NE.
WHITE, E. M. 1961. A possible relationship of Little Bluestem distribution to soils. J. Range Manage. 14: 243-247.
1971. Some soil age-range vegetation relationships. J . Range. Manage. 24: 360-365.
WILLIAMS 111, G. J. , and J. L. MARKLEY. 1973. The photosynthetic pathway type of North American shortgrass prairie species and some ecological implications. Photosyn- thetica, 7: 262-270.
Can
. J. B
ot. D
ownl
oade
d fr
om w
ww
.nrc
rese
arch
pres
s.co
m b
y U
SGS
LIB
RA
RY
on
12/0
3/11
For
pers
onal
use
onl
y.