Phylogeographic Structure of White Oaks Throughout the European Continent

NeuroImage 52 (2010) 252–262
Contents lists available at ScienceDirect
NeuroImage
j ourna l homepage: www.e lsev ie r.com/ locate /yn img
Distributed task coding throughout the multiple demand network of the humanfrontal–insular cortex
Peter Stiers a,b,⁎, Maarten Mennes c,b, Stefan Sunaert d
a Department of Neuropsychology and Psychopharmacology, Maastricht University, Universiteitssingel 40 (East), 6229 ER Maastricht, The Netherlandsb Department of Woman and Child, Section Paediatric Neurology, K.U.Leuven, Herestraat 49, B-3000 Leuven, Belgiumc Phyllis Green and Randolph Cōwen Institute for Pediatric Neuroscience at the NYU Child Study Center, New York, NY 10016, USAd MR Research Center, Department of Radiology, University Hospitals K.U.Leuven, Herestraat 49, B-3000 Leuven, Belgium
⁎ Corresponding author. Maastricht University, Facultence, Department of Neuropsychology and PsychopharMD Maastricht, The Netherlands. Fax: +31 43 388 45 6
E-mail address: [email protected]
1053-8119/$ – see front matter © 2010 Elsevier Inc. Adoi:10.1016/j.neuroimage.2010.03.078
a b s t r a c t
a r t i c l e i n f oArticle history:Received 30 December 2009Revised 26 March 2010Accepted 26 March 2010Available online 1 April 2010
Keywords:Prefrontal cortexInsulaTask-positive networkMulti-voxel pattern analysisFunctional connectivity
The large variety of tasks that humans can perform is governed by a small number of key frontal–insularregions that are commonly active during task performance. Little is known about how this networkdistinguishes different tasks. We report on fMRI data in twelve participants while they performed fourcognitive tasks. Of 20 commonly active frontal–insular regions in each hemisphere, five showed a BOLDresponse increase with increased task demands, regardless of the task. Although active in all tasks, each taskinvoked a unique response pattern across the voxels in each area that proved reliable in split-half multi-voxel correlation analysis. Consequently, voxels differed in their preference for one or more of the tasks.Voxel-based functional connectivity analyses revealed that same preference voxels distributed across allareas of the network constituted functional sub-networks that characterized the task being executed.
y of Psychology and Neurosci-macology, P.O. Box 616, 62000.(P. Stiers).
ll rights reserved.
© 2010 Elsevier Inc. All rights reserved.
In our daily lives we are capable of performing a seemingly endlessnumber of tasks. Many of these tasks require specific actions inresponse to changing circumstances, when particular environmentalconditions are satisfied. Brain structures are thought to be recursivelyengaged across such tasks, with the amount of overlap in the involvedbrain structures reflecting the overlap in cognitive demands made bythe tasks (e.g., attention, response inhibition, working memory,planning, decision making, etc.). Meta-analyses of neuroimagingstudies indicate that three larger regions in the anterior brain play acrucial role during performance of many tasks regardless of thespecific task demands: 1) medially around the anterior cingulatesulcus, 2) on the lateral surface around the inferior frontal sulcus (IFS),and 3) ventrolateral in the anterior insula (Duncan, 2010; Duncan andOwen, 2000;Mennes et al., 2006; Owen et al., 2005). These regions arefrequently reported to be jointly active in studies of cognitivefunctions (e.g., Bengtsson et al., 2009; Bor and Owen, 2007; Coleand Schneider, 2007; Dosenbach et al., 2006; Satterthwaite et al.,2007), but also in less structured situations such as listening to music(Sridharan et al., 2008), viewing natural scenes (Bartels and Zeki,2004) and even during rest (Dosenbach et al., 2007; Fox et al., 2005;Seeley et al., 2007; Sridharan et al., 2008). Non-model driven analysesof fMRI signal fluctuations during task performance and rest support
the idea that these regions work together as a network (Cole andSchneider, 2007; Sridharan et al., 2008), often referred to as the“multiple cognitive demands” (Duncan, 2006; Duncan and Owen,2000) or “central executive” network (Sridharan et al., 2008).
Despite the growing evidence for this shared network, it is notclear how the network is engaged during the execution of differenttasks (Cabeza and Nyberg, 2002). Studies that directly investigate co-activation in the same participants confirm the existence of voxelclusters that are commonly activated by different tasks within regionsof the central executive network (Blasi et al., 2006; Derrfuss et al.,2004; McNab et al., 2008; Nyberg et al., 2003). The question remains,however, whether these commonly active voxels in some waydistinguish the different tasks being executed. Animal studies showthat task conditions are distinguished in lateral prefrontal cortex bydifferent, partially overlapping groups of neurons (Hoshi et al., 2000;Johnston and Everling, 2006; Wallis and Miller, 2003; White andWise, 1999). In addition, different phases within the same task aredistinguished in prefrontal cortex by successive independent activitypatterns across the sampled neurons (Lapish et al., 2008; Sigala et al.,2008). These results suggest that performing different tasks engagesdifferent assemblies of neurons within shared prefrontal regions.
Neuron populations cannot be studied directly with fMRI. Yet,stimuli known to activate different distributed neuron populationshave been shown to induce subtle changes in the MR-signal of voxelsmonitoring these neural populations (Haynes and Rees, 2005;Kamitani and Tong, 2005). These signal changes may be too subtleto generate a significant effect in traditional univariate statistical
253P. Stiers et al. / NeuroImage 52 (2010) 252–262
analysis of single voxel data. They are, however, sufficiently reliable tobe detected by multivariate methods that compare the responsepattern of a group of voxels in a series of data samples taken fromdifferent experimental conditions (De Martino et al., 2008; Haxby etal., 2001; Norman et al., 2006). Therefore, multi-voxel pattern analysisprovides the opportunity to test whether different tasks arerepresented by different subpopulations of neurons within frontal–insular multiple demand areas (Peelen, and Downing, 2006).Moreover, an analysis of associations in response modulations overtime of voxels allows to investigate whether neuronal subpopulationsinvolved in different tasks are functional connected within and acrossthe multiple demand areas.
Before addressing these questions, we first identified the frontal–insular areas of the network in a rigorous way. In a first step wescrutinized the brain for shared activations across four cognitive tasksperformed by 12 participants during functional MR imaging. Fourtypical response control tasks were included (e.g., Duncan and Owen,2000; Dosenbach et al., 2006): Go–nogo, Response Scheme Switching,spatial Back-matching, and Gambling. They share the basic stimulus–response paradigm, but each focuses on a distinct cognitive function:response inhibition, response switching, working memory anddecision making, respectively. In addition, within each task, wemanipulated the demand on the specific cognitive function in twolevels of “task difficulty”. Overlapping task activations were studied inindividual data sets, instead of at the group level, to avoid pseudo-overlap that may arise in a group analysis due to averaging overnearby activations that slightly vary in location across differentindividuals (Brett et al., 2002; Devlin and Poldrack, 2007; Seghier etal., 2004). In the second step, we determined which of the identifiedshared activation areas showed “multiple demand” properties. Inparticular, we looked for shared areas that showed a significant signalincrease with increased task demand regardless of the specific taskbeing performed.
For the areas that met these criteria we subsequently investigatedwhether their voxels (and underlying neurons) were differentlyengaged by each task, given the fact that they were alreadysignificantly engaged by all four tasks. To this end we studied thedifferential response pattern of each area's voxels in each of the fourtasks, using both multi-voxel pattern analysis and correlationmethods.
Materials and methods
Behavioural tasks
Twelve healthy right-handed volunteers (19–45 years, 7 males)participated in this study, which was approved by the local ethicscommittee. All participants gave their informed consent to participatein the study. All participants performed four runs with each of fourtasks in the scanner, in two separate sessions. There was from 4 h to7 days between the first and second scan session. The order of runsand tasks was randomized for each participant, with the restrictionthat two runs of each task occurred in each session. A grey backgroundand black fixation cross were used in all tasks. Stimuli were presentedsynchronous with the start of a scan. Inter-stimulus intervals jitteringand a 33% addition of dummy trials were included to optimizedeconvolution of the hemodynamic response in a fast event-relatedexperimental design. Dummy trials had the same timing and jitteringas regular trials, but no stimulus was presented. Each task consisted offour conditions grouped in a 2×2 design, of which one dimension wasa manipulation of task demand (easy versus difficult).
Go–nogoParticipants should press a button with the right index finger
when a red square, but not when a red circle, was presented for 1.5 swith a varying inter-stimulus interval of 0.45–4.35 s. Nogo (red circle)
frequency alternated every 25 trials between 30% (frequent) and 15%(infrequent) in an “ABAB” order. Each run lasted 8.475 min andconsisted of 100 go/nogo trials and 50 randomly mixed dummy trials(fixation cross).
Response scheme switchingA horizontal array of five empty square-shaped boxes filled the
width of the screen. A coloured square randomly jumped either to theleft or the right from one box to the next, with 0.0–3.9 s betweenjumps. If the square was green (compatible condition), participantsshould press the button according to the side the square hadmoved. Ifthe square was red (incompatible condition), they had to press thebutton opposite to the movement direction. Additional interferencewas created in two runs by overlaying a black arrow randomlypointing left or right on the square. Each run lasted 6.435 min andcontained 66 response trials and 33 dummy trials (grey squarewithout jump).
Back-matchingA 3×3 array of empty square-shaped boxes was constantly
presented, while an “X” shaped stimulus was successively presentedin one of the 9 boxes for 1.5 s with 0.45–4.35 s inter-stimulus interval.Participants monitored successive stimulus positions and shouldpress a button with the right index finger when its current positionmatched the Nth preceding position. N, or the number of successivepositions to monitor was 1-back in two runs and 2-back in two runs.Each run lasted 6.615 min and contained 80 back-matching trials ofwhich 24 (30%) were targets and an additional 23 randomlyintermingled dummy trials (only 3×3 array shown).
Gambling (Mennes et al., 2008)In each trial a horizontal bar was presented with a proportional
division (range 0.5/0.5 to 0.05/0.95) of colour (blue-yellow) thatvaried from trial to trial. Participants had to guess which of the twocoloured sides hid a fictitious token and indicate their choice bypressing the corresponding button. They gained (from 10 to 100) orlost (from 0 to 100) points, indicated respectively above and belowthe bar, if the guess was correct or not. Participants could also decideto pass and gain 20 points without any risk. Four trials types along twodimensions were defined: 1) go versus nogo trials, depending onwhether a button was pressed or not; 2) exogenous versusendogenous trials, depending on whether the stimulus suggestedthe appropriate choice or not. Trials with 20 or less points to gain inwhich the participant passed were exogenous nogo trials; trials with0.80 or greater odds and a gain of at least 30 were exogenous go trials;all other trials (odds 0.50 to 0.75 and gain of at least 30 points) wereendogenous trials in which the participant (and not the stimulus)guided the decision to gamble or pass. The gambling stimulus waspresented 3.5 s andwas in 2/3 of the trials followed 0.4–2.35 s later byfeedback for 1.1 s indicating the outcome of the trial and updated totalscore. Inter-trial interval varied between 2.8 and 6.7 s. Each run had50 trials and lasted 8.789 min.
Although each task consisted of four conditions grouped in a 2×2design not all conditions were used in the different analysesperformed on the data. For identifying shared activations sites andfor characterizing their functional properties all four task conditions ofeach task were used (see “Region of interest identification” and“Functional properties analysis”). However, for studying task-relatedproperties of voxels within the shared activation sites only about 1/4of the trials were selected (see “Multi-voxel pattern analysis”, “Voxelpreference profiles”, and “Functional connectivity analysis”). This wasnecessary due to the fast event-related design of the tasks. Because ofthe fast succession of trials the BOLD response invoked by a particulartrial also partially reflected the cumulative signal changes invoked byimmediately preceding trials. To avoid any form of carry-overbetween trials selected for analysis, only a subset of “representative
254 P. Stiers et al. / NeuroImage 52 (2010) 252–262
trials” per task was used: the pass trials for Gambling, all nogo trialsfor Go–nogo, one-half of all incompatible trials (regardless ofinterference or not) for Switching, and one-half of all one- and two-back matching non-target trials for Back-matching. For Switching andBack-matching only every other trial was included to keep thenumber of trials comparable to the number of trials in the first twotasks. This yielded 22.5% of trials for Go–nogo, 25% for Switching and33% for Back-matching. In Gambling, where categorization of trials isalso dependent on the gambling behaviour of the participants, thenumber of trials included was around 25%. To further avoid any carry-over of signal from one trial to the next, trials were discarded if theyfollowed a previously selected trial by less than 6 s.
Image acquisition and preprocessing
Data were acquired on a 3.0-T MR system (Achieva, Philips, Best,the Netherlands) with an eight-channel phased-array head coil.Functional images were acquired using a T2*-weighted gradient echo(GE) echo planar imaging (EPI) sequence (TR 1950 ms, TE 33 ms; flipangle 90°; 28 axial slices; acquisition matrix 128×128; and voxel size1.875×1.875×4.8 mm). The number of volumes per run was 280 forGo–nogo, 220 for Switching, 225 for Back-matching and 290 forGambling. A high-resolution T1-weighted MPRAGE image was alsoobtained (TR=9.735 ms; TE=4.59 ms; flip angle=8°; voxelsize=0.651×0.651×1 mm; and 230 coronal slices). Stimuli werepresented using the Eloquence fMRI system (InvivoMDE, MRI DevicesCorporation Inc., Orlando, FL, USA).
Image processing was performed with the Statistical ParametricMapping software (SPM5; Wellcome Department of CognitiveNeurology, University College, London, UK). Preprocessing includedslice time correction, realignment, coregistration to the anatomicalimage, non-linear normalisation of the anatomical image usingdiscrete cosine transform, and finally co-normalisation of thefunctional images, including a reslicing to a 2 mm isotropic voxel grid.
Region of interest identification
A mass univariate single subject GLM analysis including all fourtasks was performed on the 6 mm FWHM Gaussian smoothed data.Each condition was modelled with eight delta functions with one TRspacing. Runs and error trials were modelled separately. Sessionspecific mean regressors were added to neutralize baseline differ-ences per run that may bias results in the tasks with conditionsmanipulated between runs (Back-matching and Switching). First,task-related effects were analysed per task. A global disjunctive F-contrast involving the four experimental conditions of the task(excluding errors, and feedback in Gambling) was defined. Thiscontrast identified for a particular task any condition effect at scans 3–5 (4 to 10 s) after trial onset. For Switching left and right stimulusjumps were pooled. This yielded per task a quantification of thestrength with which the signal in each voxel was modulated by any ofthe task's conditions. Second, a conjunction contrast involving thesefour task-specific contrasts was created to identify voxels with asignificant response in all four tasks. An FDR-corrected alpha level(Genovese et al., 2002) of 0.05 was used as a single subject wholebrain correction for multiple comparisons. Thresholded conjunctionmaps were compared between participants to identify frontal–insularclusters that showed anatomical consistency across participants.Clusters were included if they could be identified at least unilaterallyin half of the participants. This yielded 20 clusters with sharedactivation across the four tasks. Several well-known cortical areasoutside of frontal cortex were identified as control areas. Four visualprocessing areas were identified with additional fMRI data gatheredfor each participant with a fast visual mapping sequence (Stiers et al.,2006): the inferior lateral occipital area (LOi), the posterior lateralfusiform gyrus area (LFGp), the human MT/V5+ area, and the frontal
eye fields (FEF). Two parietal clusters (IPL1–2)were also included. Thehand representation in the primary motor (M1) cortex was identifiedas the local maximum closest to the lateral side of the hand knob inbrain axial slices (Yousry et al., 1997). (See Table 1 for ROI details).
Functional properties analysis
Group-wise regions of interest (ROI) analyses were performed onpercent signal change data from each task. Percent signal change datawere computed voxel-wise from the betas estimated in the singlesubject single task GLM analysis described above. The areas identifiedas having shared activity according to the procedures described in theprevious subsection were used as ROIs. Per participant and task,percent signal change data were averaged over the voxels belongingto one of the selected ROIs. This yielded per participant and task 32percent signal change values, one for each of the four conditions by8 time points of the design. These were entered into a 2-by-2conditions by 8 time points repeated measures analysis of variance,with subjects as a random factor. A separate ANOVA was performedfor each task and each ROI. Planned comparisons per time pointwere used to characterize task independent functional properties ofROIs. (1) Motor responsiveness was investigated with a contrast thatlooked for effects at scan 3 or at scan 4 after trial onset betweentrials with versus trials without a motor response, in the three tasksthat included no-response trials: Go–nogo (go85%+go70% vs.nogo15%+nogo30%), Back-matching (1-back target+2-back targetvs. 1-back no-target+2-back no-target), and Gambling (go-exoge-nous+go-endogenous vs. nogo-exogenous+nogo-endogenous). (2)A similar disjunctive contrast over scans 3–5 was defined betweenmore and less cognitively demanding conditions in three tasks:Switching (incompatible arrow+incompatible no-arrow vs. com-patible arrow+compatible no-arrow), Back-matching (2-back tar-get+2-back no-target vs. 1-back target+1-back no-target), andGambling (go-endogenous+nogo-endogenous vs. go-exogenous+nogo-exogenous). Go–nogo was not included because the 30% vs. 15%nogo frequency manipulation gave only modest BOLD responsemodulations that reached significance only in a few shared activationsites. A ROI was sensitive to motor responses and/or task difficulty ifthe respective contrasts were significant for each of the three tasks. Afive out of six threshold was used if the ROI was considered bilaterally(three tasks×two hemispheres). The significance level was set to0.05 without multiple comparisons correction, because the accumu-lation of chance was compensated by the unlikelihood of finding apositive result in three consecutive tests by chance. In five of the 20shared activation clusters the task demand contrast was significantfor all three tasks. These five clusters, which were consistentlypresent in all participants (see Table 1), are said to have the multipledemand feature. They are the regions of interest for the remainder ofthe analyses.
Multi-voxel pattern analysis
A multi-voxel pattern analysis was performed on each of the 10multiple demand clusters (5 in each hemisphere) identified asdescribed above. The analysis was performed on each participant'sdata separately. The method was based on the procedure described inHaxby et al. (2001), and consisted of splitting each participant'sdataset in two halves and establishing whether one-half of the datafrom one task correlated stronger with the other half of the same taskcompared to the other half of a different task. As outlined above, theidentification of shared activation sites was based on co-activationacross tasks and did not take into account differences in responsestrength between tasks, which are targeted in the multi-voxel patternanalysis. Therefore, the multi-voxel pattern analysis outcome is in noway determined by the voxel selection procedure. The correlationapproach of Haxby et al. was chosen above more sophisticated

Table 1Activation sites commonly active during performance of cognitive tasks across participants, with overview of their functional characteristics.
Activation sites MNI coordinates (mm) Functional characteristicsa
N subj.b X Y Z N voxels Response Motor response Task difficulty
ID Name Side Bil. Unil. M SD M SD M SD M SD direction gng bm gbl MS gng swt bm gbl TS
Prefrontal areas1 IFS1 Left 12 12 −48.0 5.3 5.6 3.4 37.9 6.1 112.3 59.6 + x x x X
Right 12 50.4 4.6 4.9 3.5 38.7 5.7 111.5 43.1 + x x x X2 IFS2 Left 12 12 −45.5 8.1 20.6 5.2 28.7 4.4 53.8 46.5 + x x x x X
Right 12 47.8 6.3 18.4 4.0 30.5 2.9 37.8 17.3 + x x x X3 IFS3 Left 6 7 −42.5 4.3 35.5 1.5 22.2 4.7 34.7 26.1 + x
Right 5 41.1 4.9 32.3 8.3 21.2 4.5 34.8 35.9 +4 PCSi Left 11 12 −54.9 7.7 11.1 3.5 16.3 7.3 41.2 31.5 + x x X
Right 11 55.3 3.7 8.7 6.4 14.7 7.2 39.7 27.9 + x x x X x5 INSa Left 12 12 −33.0 2.7 25.8 4.6 5.9 3.8 46.9 30.8 + x x x x X
Right 12 33.8 2.3 24.5 4.6 5.3 3.4 50.7 58.2 + x x x x X6 SFSa Left 12 12 −23.7 3.6 35.9 5.2 45.1 5.9 45.7 29.6 neg x
Right 10 24.3 3.9 37.1 6.7 44.4 7.9 55.5 40.8 neg x7 OFv Left 9 10 −32.6 4.6 39.6 4.7 −8.5 4.9 7.8 6.7 neg
Right 7 33.6 6.5 39.4 4.9 −9.2 4.8 10.7 7.1 neg x8 OFl Left 7 11 −26.2 9.3 54.6 5.4 17.9 8.3 41.6 42.2 + x
Right 9 25.7 6.5 55.0 4.8 22.0 9.5 33.8 30.1 + x9 OFvl Left 11 11 −48.0 4.3 33.8 5.4 5.0 4.7 58.4 40.5 neg x x
Right 9 49.2 3.8 33.3 4.4 3.1 5.4 29.1 33.0 neg x10 CGi Left 12 12 −55.7 5.0 −14.1 4.9 19.7 4.5 136.1 54.9 + x x x X
Right 12 56.7 4.5 −16.0 5.7 19.7 4.8 62.5 43.2 + x x x X11 MF7 Left 12 12 −6.9 3.1 0.0 3.5 69.1 3.5 21.7 9.3 + x x x X
Right 12 7.6 2.9 5.3 3.6 69.1 3.8 22.5 9.0 + x x x X x12 MF6 Left 9 10 −8.8 3.1 −16.5 3.6 50.2 6.0 25.0 7.9 neg x
Right 9 9.1 2.1 −18.7 4.7 51.5 3.6 24.7 10.4 neg x x13 MF5 Left 9 11 −7.4 2.7 −8.4 5.0 54.4 3.2 49.0 44.2 + x x x X
Right 9 6.0 3.7 −8.2 5.9 54.3 5.3 58.4 34.0 + x x x X14 MF4 Left 11 12 −6.0 2.4 1.3 4.9 57.5 5.5 117.5 51.9 + x x x X
Right 12 5.7 3.8 4.6 3.5 56.4 5.2 56.9 36.0 + x x x X15 MF3 Left 12 12 −6.2 2.1 11.0 3.5 51.4 6.7 89.8 65.3 + x x x x x X
Right 12 5.7 3.2 12.0 3.8 54.2 5.0 84.1 53.9 + x x x x x X16 MF2 Left 10 12 −5.7 2.0 14.8 4.8 45.6 4.5 75.9 46.8 + x x x x
Right 11 6.8 2.5 17.0 3.1 45.7 4.0 58.5 35.0 + x x x x X17 MF1 Left 7 9 −7.0 3.0 24.9 3.3 36.4 4.3 13.4 10.6 + x
Right 8 5.8 3.3 25.4 5.8 37.6 7.0 43.8 39.0 + x x18 MFa Left 7 8 −9.0 2.4 54.7 5.5 11.8 4.5 4.9 2.9 neg
Right 5 10.7 8.9 52.1 6.2 4.1 5.9 11.2 7.4 neg19 Thal Left 8 9 −10.9 3.1 −16.3 2.3 6.9 2.5 30.9 33.3 + x x
Right 4 10.9 2.2 −13.1 1.0 9.4 1.9 14.0 14.3 + x x20 nCaud Left 6 6 −21.8 2.7 −13.2 4.1 27.3 3.4 12.0 11.0 neg
Right 5 21.1 4.1 −11.4 5.9 26.4 3.5 18.8 13.0 neg x
Control areas21 IPL1 Left 11 12 −47.1 5.1 −31.1 7.0 21.6 3.5 44.5 31.3 + x
Right 12 48.2 7.7 −33.4 3.8 20.7 5.3 43.3 31.4 + x x x X22 IPL2 Left 12 12 −46.9 6.0 −63.3 7.1 35.3 7.4 88.2 59.0 neg x x x
Right 11 46.3 3.4 −67.8 5.9 33.9 6.6 57.8 65.7 neg x23 MT/V5 Left 12 12 −47.5 5.1 −64.8 6.9 6.7 4.9 99.1 40.2 +
Right 12 46.3 3.5 −64.7 5.3 5.4 4.6 134.4 48.7 + x x24 FEF Left 11 12 −28.9 5.5 −1.4 6.2 58.7 5.7 72.0 37.5 + x x x x
Right 12 26.5 3.4 −3.0 7.7 59.7 5.7 51.3 29.4 + x x25 LFGp Left 12 12 −37.4 5.7 −71.5 3.6 −14.7 3.3 144.2 65.6 + x
Right 12 37.8 4.6 −69.0 4.9 −16.5 2.2 150.0 69.7 +26 LOi Left 12 12 −40.7 5.3 −80.8 3.9 4.6 4.6 145.6 63.5 +
Right 12 38.8 4.8 −81.2 2.8 2.1 7.5 114.1 45.5 + x27 M1 Left 12 12 −37.3 5.3 −17.5 4.0 59.6 4.9 173.3 67.2 + x x x X
Right 12 41.2 5.1 −18.2 8.2 57.3 5.5 128.9 64.6 + x x x X
Note. IFS inferior frontal sulcus; PCSi precentral sulcus, inferior segment; INSa anterior insula; SFSa anterior part of superior frontal sulcus; OF orbitofrontal cortex, ‘v’ ventral, ‘l’lateral, ‘vl’ ventrolateral; PCGi inferior part of precentral gyrus; MFmedial frontal cortex, ‘a’ anterior; Thal thalamus; nCaud caudate nucleus; IPL inferior parietal lobule; MTV5medialtemporal/V5 areas; FEF frontal eye fields; LFGp posterior visual area in lateral fusiform gyrus (1); LOi inferior visual area in lateral occipital cortex (1); M1 primary motor cortex.
a Task transcending functional characteristics. Response direction = stimulus related MR-signal increase (“+”) or decrease (“neg”) consistent across tasks. Motor responsesensitivity (MS): significant main effect of motor trials over no motor trials in Go–nogo (“gng”), Back-matching (“bm”) and Gambling (“gbl”). Task difficulty sensitivity (TS):significant main effect of more over less difficult conditions for three of the four tasks, i.e., infrequent (15%) versus more frequent (30%) nogo trials for Go–nogo, incompatible versuscompatible trials for Switching (“swt”), two versus one-back trials for Back-matching, endogenous versus exogenous trials in Gambling. “x”=significant main effect; “X” =sensitivity criterion met.
b Number of individual data sets in which the shared activation side could be identified, either bilateral (Bil.) or unilateral (Unil.).
255P. Stiers et al. / NeuroImage 52 (2010) 252–262
machine learning approaches to pattern analysis, because our fastevent-related task design generated BOLD response overlap insubsequent trials. Cumulation of BOLD responses over time pointsprevents accurate estimation of the signal change invoked by a
particular trial. By averaging signal over trials, as in the correlationmethod, the “noise” invoked by a trial's prior history is randomized.For each voxel, epochswere created from the unsmoothed time-seriesdata after removing low frequency fluctuations and linear trends.

256 P. Stiers et al. / NeuroImage 52 (2010) 252–262
Epochs spanned the 3rd to 5th scan (i.e., 4–10 s) after the onset of arepresentative trial for each task as defined in the section “Beha-vioural tasks” above. A peak response value for the first and thesecond half of the trials was determined per task. To this end, the rawsignal values were averaged over the trials to yield an average epochand themaximumor peak value in the average epochwas established.Within-task correlation was computed between first and second halfvoxel peak response values obtained from the first and second half ofthe data of one task. Note that this coincides with splitting the dataaccording to the first and second data acquisition session. Between-task correlations were calculated between the peak values from thefirst half of one task and the peak values in the same voxels from thesecond half of each of the other three tasks. The frequency of thewithin-task correlation being higher than each of the between-taskcorrelations, divided by the number of comparisons (12 partici-pants×4 tasks×3 comparisons per task), yielded the identificationaccuracy for a particular activation site (Table 2).
Voxel preference profiles
Voxel preference profiles were established from the peak responsevalues in each task, averaged over all epochs. Fourteen possiblepreference profiles can be distinguished. These prototypical preferenceprofiles can be represented in a binaryway as vectorswith the positionsof ones in the vector indicatingwhich task(s) beingpreferredby a voxel:[1 0 0 0], [0 1 0 0], …, [1 0 1 0], …, [1 1 1 0], …, and [1 1 1 1]. The digitorder corresponded to Go–nogo, Switching, Back-matching, andGambling. Each voxel's observed profile of peak task response valueswas correlated with each of the 14 binary profile types and the voxelwas assigned to the type that yielded the highest correlation. The 15thprofile type [0 0 0 0], signifying no preference, was assignedwhen therewas no significant univariate response strength difference over tasks, asassessed with a global F-contrast defined on the single subject GLManalysis that integrated data from the four tasks (see also above, section“Functional properties analysis”).
Functional connectivity analysis
For the functional connectivity analysis voxel-wise time-seriesvectors were created that represented the response strength in the
Table 2Multi-voxel pattern identification and preference profile analysis in 10 activation sitesthat showed task difficulty sensitivity.
Activation sites Identificationproportiona
% voxels withsign profileb
ID name Side % corr M SD
IFS1 Left 63.2** 65.0 27.1Right 61.8* 65.0 33.1
IFS2 Left 57.6* 41.5 37.3Right 53.0 ns 56.1 44.2
INSa Left 58.3* 64.0 41.4Right 59.2* 51.0 40.5
1MF3 Left 64.6** 75.8 32.2Right 66.0** 78.4 30.8
1MF2 Left 64.2** 71.5 34.0Right 67.4** 73.7 35.2
All sites combined 87.5**
a Percentage of pair-wise within-task versus between-task comparisons, summedover tasks and participants, in which the former yielded the highest correlation.Statistics are cumulative binomial coefficients: **significant at alpha 0.005(corresponding to the Bonferroni corrected level 0.05); *significant at alpha 0.05,uncorrected.
b Average percentage of voxels within the cluster that showed a significantdifference in response amplitude in an overall voxel-wise F-contrast between therepresentative condition of each of the four tasks.
fourth scan after trial onset in the representative set of trials for aparticular task (see section “Multi-voxel pattern analysis”). For eachvoxel in the 10 shared activation sites (i.e. 5 bilateral sites) four suchvectors were created, one for each task. Voxels were included in thisanalysis based on their preference profile. In fact, we ran two separateanalyses, one for voxels with a single task preference (i.e., profiles ofthe type [1 0 0 0] or [0 1 0 0], etc.), and one for voxels preferring two ofthe four tasks (i.e., profiles of the type [1 0 1 0] or [0 1 1 0], etc.).Because both analyses yielded very similar results, only the results ofthe first analysis are presentedwith some detail in the Results section.Within each analysis the vectors of all selected voxels derived fromthe same task were cross-correlated, yielding a voxel-by-voxelcorrelation matrix for a particular task. This matrix was computedfor each task. To investigate specific hypotheses, pairs of voxels withinthese matrices were selected to create specific voxel pair groups (e.g.,same preference voxels in the same activation site, or voxel pairs withdifferent preference types during a particular task regardless of theirlocation, etc.), and the correlation strengths of the pairs were used asdependent measures in statistical tests. These tests were runseparately on individual participant data at the uncorrected 0.05significance level. Consistency of correlation patterns across partici-pants was investigated in two ways. First, the frequency of significantoutcome of a particular test across participants was obtained and itslikelihood tested given the expected proportion 0.05 with thecumulative binomial coefficient. Bonferroni correction was appliedin evaluating the significance of these frequencies. Second, theaverage correlation strengths in particular voxel pair groups foreach participant were used as dependent variables in group-wiseanalyses of variance. To evaluate the significance of an associationbetween two activation sites, voxel pairs with the same preferencelocated each in one of the activation sites were selected, and theiraverage correlation was computed. To evaluate the significance offunctional connectivity, a sample of voxel pair correlations similar tothe original data was created by computing for each voxel pairinitially selected for the analysis the correlation between timecourses during different task (as opposed to time courses from thesame task). For each evaluation of functional association the samenumber of correlations was randomly selected from this nullcorrelation sample as used in the original correlation, and theaverage correlation was computed. This was repeated 10000 timesand the frequency of finding an average correlation in the nullcorrelation sample, that was equal to or higher than the one observedin the real data was noted. If this frequency was less than 0.05, thefunctional connectivity between same preferences voxels in bothsites, and hence between the sites, was said to be significant. Datafrom one participant were excluded from connectivity analysisbecause the number of voxels with a significantly different responseacross tasks was too low to yield sufficient numbers of voxel pairs inthe various comparisons made.
Results
Identification of frontal–insular multiple demand areas
The first of two steps to identify multiple demand areas consistedof finding clusters of voxel that were activated in all four tasks. Foreach participant such voxels with shared activity across all four taskswere identified by a conjunction of four task-specific contrasts eachdepicting a significant effect in any condition of one task. Clusters infrontal–insular cortex or related subcortical structures were includedif they could be identified at least unilaterally in half of theparticipants. Twenty activation sites met this criterion (see Fig. 1and Table 1). Seven additional shared activation sites outsideprefrontal cortex were included to serve as control sites.
In the second step towards identifying multiple demand areas weasked whether the BOLD response in the shared activation sites

Fig. 1. Location of brain areas commonly active during performance of four cognitivetasks. Areas were identified in each of 12 participants. Colour coding, superimposed onanatomical template brain image (Colin brain; http://brainmap.wustl.edu:8081/sums/directory.do?id=636032; displayed using CARET software; http://brainmap.wustl.edu/caret; Van Essen et al., 2001; Van Essen, 2002) indicates for each voxel thenumber of participants in which that voxel was part of a shared activation site (lightgreen to red: shared voxel in one to six or more participants). Dots represent the centreof mass of the site averaged across participants. Red dots depict frontal–insular areas;yellow dots depict control areas (see Table 1). Each area is identified by a numberattributed in Table 1. (A) Flat map of the right hemisphere. (B) Partial inflatedreconstruction of the left hemisphere, showing a medial and a lateral view. Blackarrows indicate major sulci: CS central sulcus; PrCS precentral sulcus; CiS cingulatesulcus; SFS superior frontal sulcus; IFS inferior frontal sulcus; ITS inferior temporalsulcus; OTS occipital–temporal sulcus; CoS collateral sulcus; and IPS intraparietalsulcus.
257P. Stiers et al. / NeuroImage 52 (2010) 252–262
identified in the previous step was modulated by the task difficultylevel. For each of the shared sites average percent signal change datawere extracted per participant for each condition in each task, ateight time points (scans) after trial onset. These percent signalchange data were entered into an ANOVA for each activation site andtask separately, with 2×2 task conditions by 8 time points asbetween subject variables. This group-wise region of interest analysisrevealed that most sites exhibited consistent, task and participanttranscending, functional characteristics. Four functional subtypescould be distinguished (see Table 1, and Fig. S1 in SM): (1) positivesignal change modulated by the difficulty of the task condition (i.e.,main effect of difficult over easy conditions in Switching, Back-matching, and Gambling); (2) positive signal change modulated bythe execution of a motor response (i.e., main effect of response overno response in Go–nogo, Back-matching, and Gambling); (3)consistent negative signal change contingent upon stimulus presen-tation; and (4) positive signal change without consistent modula-tions across tasks (see Materials and methods, Functional propertiesanalysis for a characterization of these subtypes). The spatialdistribution of these functional types is shown in Fig. 2. Our currentinterest is in the core multiple demand network. Therefore, wepresent here only results on activation sites that showed a positiveresponse not dominated by the motor aspects of the tasks (i.e.,functional subtypes 1 and 4; see SM, Functional characteristics offrontal–insular shared activation sites for details on motor response
sensitivity (subtype 2) and the negative responsive activation sites(subtype 3)).
Of the 20 shared activation sites, five (i.e., 10 when bothhemispheres are considered) showed a positive BOLD response thatincreased with task demand. These were located in the anterior insula(INSa), two in the inferior frontal sulcus (IFS1 and IFS2) and two in thecingulate sulcus (MF3 and MF2) (Fig. 2). The location of these sitescorresponds well with previous reports of common activation in themedial, lateral and ventrolateral regions of frontal cortex (Derrfuss etal., 2004; Dosenbach et al., 2006; Duncan and Owen, 2000; Mennes etal., 2006; Nyberg et al., 2003) (see SM, Table S1 for a comparison withother studies). In addition, two lateral frontal sites showed a positiveresponse unaffected by motor execution (IFS3 and OFl, see Fig. 2).Because task difficulty modulation was inconsistent in these areas,they were not included as key areas. On the medial side, bilaterally,MF1 showed a somewhat unique pattern, since a significant taskdifficulty effect was found only in Gambling. Because in all other tasksthe response decision is determined exogenously by the stimulus, thisfinding suggests that MF1 is involved in endogenous decision making.This is in line with previous reports of a rostral cingulate area (see SM,Table S1) that is more active when participants make voluntarychoices compared to being instructed which task to perform(Bengtsson et al., 2009; Forstmann et al., 2006).
Multi-voxel response patterns in multiple demand sites are task selective
To address the question whether the neurons underlying sharedactivation sites exhibit a distinctive response pattern during theexecution of each task, we did a split-half correlation analysis (Haxbyet al., 2001) of multi-voxel responses in individual participant datasets. Unsmoothed data from 4 to 10 s after the onset of the trails of arepresentative condition of each task were extracted in multipledemand voxels. The trials were split in half (i.e., data from the first andsecond session separated), and for each half and task the peak value inthe average signal in the time window 4–10 s after trial start wascomputed. These peak response values from different halves of thesame task were used to calculate the within-task correlation— i.e., thecorrelation between the peak values across the voxels of a site duringthe first and second half (or session) of the same task. Next, wecompared the within-task correlation for each task with the between-task correlations of each of the three other tasks — i.e., the correlationof the voxel peak values during the first session of task A and thesecond session of task B. If a task drives a selective subgroup ofneurons in the activation site, the distributed pattern of voxel peakvalues should be characteristic for that task. Consequently, theresponses across voxels should be more similar when performingthe same task twice than when performing different tasks. Thisexpectation was clearly confirmed by our correlation analysis. In allbut one of the shared activation sites the incidence of higher within-than between-task correlation was significantly above chance (seeTable 2, middle section). Furthermore, because there was from 4 h to7 days between the first and second scan sessions, this result impliesthat the task characteristic voxel response patterns are reliable overtime.
Multiple demand voxels have reliable task preference profiles
The task-specific voxel response patterns are made directly visiblein Fig. 3. For a selection of shared activation sites and individualparticipants Fig. 3 shows the relative peak response values associatedwith each of the four tasks in successive voxels at the grey/whitematter boundary in cross sections through the clusters. The fact thateach task invoked a significant increase in BOLD signal in all voxels ofthe commonly active areas, even in voxels that did not “prefer” theparticular task at hand, indicates that neurons involved in representa-tions relevant for each separate task were scattered throughout the

Fig. 2.Distribution of functional response types in shared frontal–insular activation sites on the lateral andmedial side of the brain. Bar graphs represent the percent signal differencebetween conditions selected in each task to define a particular functional property (see Materials and methods, Functional properties analysis). Differences between conditions withvs. without a motor response are represented by blue bars. Differences between more vs. less demanding task conditions are represented by brown bars. In both cases backgroundbars represent the difference value for the left and foreground bars for the right hemisphere homologue of an activation site. Activation sites (mean centre of mass acrossparticipants) are indicated by coloured dots on the same cortical surface reconstruction as in Fig. 1. Dot colour represents functional category of activation site: orange = sites thatmeet the task difficulty criterion; blue = sites that meet the motor response sensitivity criterion; pink = endogenous decisions only site; green = sites with consistent negativesignal change across tasks and conditions; yellow = control sites with none of these functional characteristics. INSa = anterior insula; IFS = inferior frontal sulcus; MF = medialfrontal; Ofl = orbital frontal lateral; PCSi = precentral sulcus inferior; CGi = central gyrus inferior; M1 = primary motor cortex (central gyrus); and THAL=thalamus.
258 P. Stiers et al. / NeuroImage 52 (2010) 252–262
entire activated area. Fluctuations in the density of neurons involvedin each particular task are probably responsible for the stronger orweaker signal measured in different voxels in different tasks, andhence, for the observed task preference profiles of each voxel. In fact,the response strength difference of voxels to different tasks was sostrong that more than half of the voxels showed a univariatesignificant difference in response strength between tasks (seeTable 2, last two columns).
The differential responsiveness of voxels during different tasksjustified the grouping of voxels into task preference subcategoriesbased on their peak task response values as illustrated in Fig. 3. Theclassification of voxels in discreet preference classes provides theopportunity to study functional connectivity between voxels in thesame or in different preference classes (see below). Thus, a voxelpreferring Go–nogo was placed in the category [1 0 0 0], a voxelpreferring Gambling was categorized as [0 0 0 1], and a voxelpreferring both was placed in [1 0 0 1], etc. Categorization was basedon correlating a voxel's actual profile of peak task responses with eachof these category prototype vectors, and assigning the voxel to thecategory whose prototype vector yielded the highest correlation, asdetailed in the Materials and methods subsection Voxel preferenceprofiles. We used statistical cross-validation to demonstrate thereliability of these task preference categories (Baker et al., 2007). Thefirst half of the trials of each task was used to classify voxels into taskpreference profiles, while the second half was used to obtain anindependent confirmation of the statistical significance of theresponse strength difference within each profile. For the latter step
same preference voxels from all 10 shared activation sites werepooled and entered into a one-factor analysis of variance with eachtask comprising one level of the factor (separate for each participant,pb0.05 uncorrected). For all preference types the incidence ofparticipants having a significant second half response profile wasmuch higher than the 5% expected by chance, given the uncorrectedsignificance level of 0.05 (see Table 3). Fig. 4 illustrates some taskpreference profiles for some participants.
Same preference voxels show stronger functional connectivity
The fact that subregions of shared activation sites exhibit differenttask preference profiles raises the question whether same preferencevoxels are functionally connected between, as well as within areas.The strength of correlations in response amplitudes over timebetween same preference voxels provides an indication of thestrength of such functional connections. Response amplitude mea-sures in time were obtained for each voxel and task by taking thesignal strength in unsmoothed data in the 4th scan after onset of eachrepresentative trial. Only voxels with a preference for one task wereincluded (e.g., [1 0 0 0], or [0 1 0 0], etc.). For each of the selectedvoxels the response strength over time was correlated with that of allother selected voxels, yielding a complete voxel-by-voxel correlationmatrix. Next, subgroups of voxel pairs were selected from this matrixbased on task preference and site location, and their mean correla-tions were statistically comparedwithin as well as across participants.
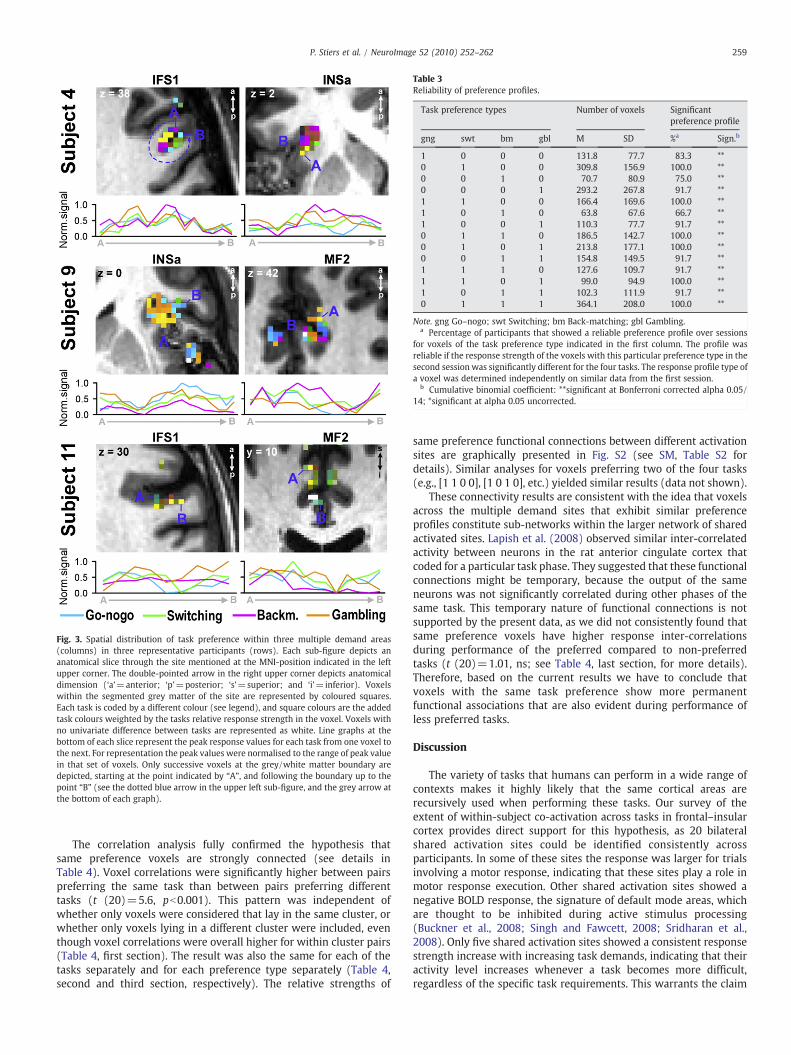
Fig. 3. Spatial distribution of task preference within three multiple demand areas(columns) in three representative participants (rows). Each sub-figure depicts ananatomical slice through the site mentioned at the MNI-position indicated in the leftupper corner. The double-pointed arrow in the right upper corner depicts anatomicaldimension (‘a’=anterior; ‘p’=posterior; ‘s’=superior; and ‘i’=inferior). Voxelswithin the segmented grey matter of the site are represented by coloured squares.Each task is coded by a different colour (see legend), and square colours are the addedtask colours weighted by the tasks relative response strength in the voxel. Voxels withno univariate difference between tasks are represented as white. Line graphs at thebottom of each slice represent the peak response values for each task from one voxel tothe next. For representation the peak values were normalised to the range of peak valuein that set of voxels. Only successive voxels at the grey/white matter boundary aredepicted, starting at the point indicated by “A”, and following the boundary up to thepoint “B” (see the dotted blue arrow in the upper left sub-figure, and the grey arrow atthe bottom of each graph).
Table 3Reliability of preference profiles.
Task preference types Number of voxels Significantpreference profile
gng swt bm gbl M SD %a Sign.b
1 0 0 0 131.8 77.7 83.3 **0 1 0 0 309.8 156.9 100.0 **0 0 1 0 70.7 80.9 75.0 **0 0 0 1 293.2 267.8 91.7 **1 1 0 0 166.4 169.6 100.0 **1 0 1 0 63.8 67.6 66.7 **1 0 0 1 110.3 77.7 91.7 **0 1 1 0 186.5 142.7 100.0 **0 1 0 1 213.8 177.1 100.0 **0 0 1 1 154.8 149.5 91.7 **1 1 1 0 127.6 109.7 91.7 **1 1 0 1 99.0 94.9 100.0 **1 0 1 1 102.3 111.9 91.7 **0 1 1 1 364.1 208.0 100.0 **
Note. gng Go–nogo; swt Switching; bm Back-matching; gbl Gambling.a Percentage of participants that showed a reliable preference profile over sessions
for voxels of the task preference type indicated in the first column. The profile wasreliable if the response strength of the voxels with this particular preference type in thesecond session was significantly different for the four tasks. The response profile type ofa voxel was determined independently on similar data from the first session.
b Cumulative binomial coefficient: **significant at Bonferroni corrected alpha 0.05/14; *significant at alpha 0.05 uncorrected.
259P. Stiers et al. / NeuroImage 52 (2010) 252–262
The correlation analysis fully confirmed the hypothesis thatsame preference voxels are strongly connected (see details inTable 4). Voxel correlations were significantly higher between pairspreferring the same task than between pairs preferring differenttasks (t (20)=5.6, pb0.001). This pattern was independent ofwhether only voxels were considered that lay in the same cluster, orwhether only voxels lying in a different cluster were included, eventhough voxel correlations were overall higher for within cluster pairs(Table 4, first section). The result was also the same for each of thetasks separately and for each preference type separately (Table 4,second and third section, respectively). The relative strengths of
same preference functional connections between different activationsites are graphically presented in Fig. S2 (see SM, Table S2 fordetails). Similar analyses for voxels preferring two of the four tasks(e.g., [1 1 0 0], [1 0 1 0], etc.) yielded similar results (data not shown).
These connectivity results are consistent with the idea that voxelsacross the multiple demand sites that exhibit similar preferenceprofiles constitute sub-networks within the larger network of sharedactivated sites. Lapish et al. (2008) observed similar inter-correlatedactivity between neurons in the rat anterior cingulate cortex thatcoded for a particular task phase. They suggested that these functionalconnections might be temporary, because the output of the sameneurons was not significantly correlated during other phases of thesame task. This temporary nature of functional connections is notsupported by the present data, as we did not consistently found thatsame preference voxels have higher response inter-correlationsduring performance of the preferred compared to non-preferredtasks (t (20)=1.01, ns; see Table 4, last section, for more details).Therefore, based on the current results we have to conclude thatvoxels with the same task preference show more permanentfunctional associations that are also evident during performance ofless preferred tasks.
Discussion
The variety of tasks that humans can perform in a wide range ofcontexts makes it highly likely that the same cortical areas arerecursively used when performing these tasks. Our survey of theextent of within-subject co-activation across tasks in frontal–insularcortex provides direct support for this hypothesis, as 20 bilateralshared activation sites could be identified consistently acrossparticipants. In some of these sites the response was larger for trialsinvolving a motor response, indicating that these sites play a role inmotor response execution. Other shared activation sites showed anegative BOLD response, the signature of default mode areas, whichare thought to be inhibited during active stimulus processing(Buckner et al., 2008; Singh and Fawcett, 2008; Sridharan et al.,2008). Only five shared activation sites showed a consistent responsestrength increase with increasing task demands, indicating that theiractivity level increases whenever a task becomes more difficult,regardless of the specific task requirements. This warrants the claim

Table 4Functional connectivity. Analysis of correlations between trial-wise response strengths in pairs of voxels in relation to task preference profiles and the tasks being executed.
Conditions Descriptive statistics Group analysisa
n M SD t df p 1− t
Preference similarity across tasks/profilesAll voxel pairs Same preference voxels 11 0.283 0.072 5.6 20 0.0000
Different preference voxels 11 0.173 0.048Within siteb voxel pairs Same preference voxels 11 0.462 0.072 7.9 20 0.0000
Different preference voxels 11 0.249 0.051Between sitesb voxel pairs Same preference voxels 11 0.224 0.073 2.6 20 0.0160
Different preference voxels 11 0.161 0.050
Preference similarity per taskGambling Same preference voxels 11 0.228 0.068 4.3 20 0.0004
Different preference voxels 11 0.131 0.063Go–nogo Same preference voxels 11 0.304 0.100 4.7 20 0.0001
Different preference voxels 11 0.192 0.091Switching Same preference voxels 11 0.327 0.110 5.5 20 0.0000
Different preference voxels 11 0.195 0.082Back-matching Same preference voxels 11 0.271 0.078 4.2 20 0.0004
Different preference voxels 11 0.175 0.067
Preference similarity per preference categoryPreference type Preference similarity[1,0,0,0] Same preference voxels 11 0.270 0.102 4.2 20 0.0004
Different preference voxels 11 0.172 0.048[0,1,0,0] Same preference voxels 7 0.187 0.065 2.4 13 0.0338
Different preference voxels 8 0.139 0.051[0,0,1,0] Same preference voxels 11 0.290 0.102 4.3 20 0.0003
Different preference voxels 11 0.176 0.047[0,0,0,1] Same preference voxels 8 0.237 0.118 2.2 16 0.0394
Different preference voxels 11 0.159 0.071
Correlation strength of same preference voxel pairs during preferred or non-preferred taskPreference type Tasks[1,0,0,0] Preferred task 11 0.244 0.123 1.2 20 0.2304
Non-preferred tasks 11 0.279 0.096[0,1,0,0] Preferred task 7 0.240 0.137 1.7 12 0.1163
Non-preferred tasks 7 0.169 0.050[0,0,1,0] Preferred task 11 0.316 0.146 1.2 20 0.2587
Non-preferred tasks 11 0.281 0.096[0,0,0,1] Preferred task 8 0.253 0.086 0.9 14 0.3602
Non-preferred tasks 8 0.232 0.140All profiles Preferred task: 11 0.296 0.114 1.0 20 0.3228
Non-preferred task: 11 0.278 0.063
a For each participant the average correlation in each condition was entered into a t-test to assess the significance of connectivity at group level. Probabilities are one-tailed.b Same comparison as the first one (i.e., pooling over tasks and preference profiles), but with inclusion only of correlations between voxels located in a the same cluster (“within
site voxel pairs”) or of correlations between voxels located in different clusters (“between site voxel pairs”).
Fig. 4. Reliability of preference profiles for three participants (participants 3, 8 and 10) and seven profile types. Voxels were categorized into preference categories from theirresponse strength in each of the four tasks during the first half of the trials of each task (see Materials and methods, Voxel preference profiles). Preference categories are indicated bya four digit vector. Each digit indicates one task: Go–nogo (GN), Switching (SW), Back-matching (BM), Gambling (GA). “1” indicated preferred and “0” indicates not preferred. Thegraphs present the average response strength recorded during the second half of the trials of the same four tasks. For visualization the response strengths were normalised to themaximum and minimum average response strength observed over response types within one participant. The graphs illustrate that the average response strength observed duringthe second half of the trials in most cases confirms the profile type attributed to the same voxels based on their response profile during the first half of the trials.
260 P. Stiers et al. / NeuroImage 52 (2010) 252–262

261P. Stiers et al. / NeuroImage 52 (2010) 252–262
that they are multiple demand areas (Duncan, 2006; Duncan andOwen, 2000). The location of these five activation sites correspondswell with the three regions of a “central executive” network (Duncanand Owen, 2000; Mennes et al., 2006; Cole and Schneider, 2007;Sridharan et al., 2008; Derrfuss et al., 2004; Dosenbach et al., 2006):one in the anterior insula, two in the lateral prefrontal cortex, and twoin the dorsal anterior cingulate cortex (dACC) (see SM, Table S1 for acomparison with other studies).
Given that the four tasks each focus on a different cognitiveprocess – i.e., inhibition of prepotent response, response schemeswitching, working memory, and endogenous decision making – themultiple demand property implies that the five areas show nospecificity for the distinctive cognitive processes targeted by each ofthe four tasks. Rather, they must be involved in the processingrequired by the basic stimulus–response control paradigm commonto the four tasks (e.g., response control functions, attentionmechanisms, interference handling, error monitoring, memoryretrieval, etc.). Since these processes are central to any form ofattentive performance it seems justified coining these activation sites“central executive” areas (Sridharan et al., 2008). What the distinctcontribution of each multiple demand area to these central executiveprocesses may be is a current topic of research (e.g. Cole andSchneider, 2007; Dosenbach et al., 2008).
Although the voxels in the five sites show a significant signalincrease in each of the four tasks, most of the co-active voxels show ahigher (or lower) signal change in one ormore of the tasks (see Fig. 3).This indicates that during execution, each task is associated with aunique distributed pattern of responses across the voxels in theshared activation site. This distributed patternwas sufficiently reliableover time to allow identifying above chance which task wasperformed based on each voxel's response amplitudes. Previousstudies showed that voxel response patterns can reliably reflect thestimulus that is currently viewed (Haynes and Rees, 2005; Kamitaniand Tong, 2005), and even what stimulus of a previously trained set isimagined (Kamitani and Tong, 2005). Recently, Haynes et al. (2007)found that voxel samples in prefrontal cortex distinguish which oftwo task options a person chooses to perform, even before s/he startsto perform. Our results show that similar encoding is also evident ineach of the multiple demand areas during actual task execution.
This finding is mirrored by recent results obtained with multiplesingle-unit recording methods in animals. These studies show thatdifferent phases of a task are represented by the distributed pattern ofresponses in the group of neurons sampled. Sigala et al. (2008)reported independent activity patterns distributed over severalhundreds of neurons recorded in the macaque monkey lateralprefrontal cortex for the cue, delay and target phase of a cue–targetassociation task. Similarly, Lapish et al. (2008) found reliably distinctpopulation activity patterns in the rat anterior cingulate cortex duringdifferent phases of a radial arm-maze task. If we depict the four tasksof the present study as different phases in an extended fMRI task, thecell recording data suggest that different, possibly overlappingsubpopulations of neurons within the multiple demand areas sustainthe distributed patterns observed for each of the four tasks.
The present data extend the results by Lapish et al. and Sigala et al.in two important ways. First, while these authors show distributedcoding of task phases independently for two cortical areas, the wholebrain approach of fMRI allowed us to establish these functionalcharacteristics at once for five multiple demand areas. Second, bycorrelating voxel time-series data across areas we showed that fine-scale functional associations exist between these areas that arestrongest for voxels with similar task preference profiles. To theextent that voxel preference profiles reflect distributions of neuronassemblies, this finding indicates that the subpopulations of neuronsthat are specifically engaged during a particular task are functionallyconnected across areas. In other words, functional neuron assembliesare not restricted to an area but extend across areas as functional sub-
networks within the large-scale network (see SM, Fig. S3 for agraphical depiction of a model that would fit our data).
The most intriguing question about the distributed encodingpatterns concerns what they actually represent. Since the patterns aretask selective, it is likely that their content is related to some of thefeatures that distinguish different tasks. This is consistent with thebiased competition model of frontal functioning (Bunge et al., 2003;Duncan, 2006; Miller, 2000; Sakai, and Passingham, 2006). Accordingto this view, frontal cortex is responsible for asserting the cognitivecontrol necessary to produce well-organized goal-directed behaviourby representing the various pieces of information (stimulus features,environmental factors, motivational states, motor responses andstimulus–response schemes) necessary to perform a particular task,and biasing signals in other brain structures in favour of theseelements. Competition between such representations initiates thedifficulty of doing several things at once. In line with this, frontalcortex has often been depicted as a working memory storage for thecomplex sets of information that bind the distributed representationsand states that make up the task.
A more cognitive version of this biased competition model may beput forward if we assume that the unique combination of cognitivefunctions needed to perform a task are also part of what makes thetask. While specific cognitive functions are implemented by special-ized structures elsewhere in the brain, sub-networks in the multipledemand areas might be responsible for the binding and coordinationof these other brain structures to successfully perform a particulartask. For instance, the need for working memory processes in aparticular task would be represented by a different neural assemblythan the need for decision processes, response preparation processes,or multiple response schemes, etc. This could explain why we foundthat functional connections are not restricted to execution of thepreferred task. In this view, cognitive processes are not (solely)associated with specialized areas within frontal cortex, but withdifferent distributed sub-networks of neurons within the multipledemand areas, combining the cognitive resources of the brain in atask-specific manner. It will be the challenge of future research toestablish whether this is the case by studying the stability of thedistributed sub-networks representing a particular task under varyingstimulus, response, task rule and task context conditions.
Acknowledgments
We thank F. De Martino and R. Goebel for their helpful commentsduring data analysis and M. Milham for the helpful comments on themanuscript.
Funding. This work was supported by the K.U.Leuven ResearchFund (K.U.Leuven Onderzoeksfonds) (grant numbers OT/01/43,PDM/03/251, IMPH/06/GHW, and IDO 05/010 EEG-fMRI) and theResearch Foundation Flanders, Belgium (grant number G.0211.03).
Appendix A. Supplementary data
Supplementary data associated with this article can be found, inthe online version, at doi:10.1016/j.neuroimage.2010.03.078.
References
Baker, C.I., Hutchison, T.L., Kanwisher, N., 2007. Does the fusiform face area containsubregions highly selective for nonfaces? Nat. Neurosci. 10, 3–4.
Bartels, A., Zeki, S., 2004. The chronoarchitecture of the human brain natural viewingconditions reveal a time-based anatomy of the brain. NeuroImage 22, 419–433.
Bengtsson, S.L., Haynes, J.-D., Sakai, K., Buckley, M.J., Passingham, R.E., 2009. Therepresentation of abstract task rules in the human prefrontal cortex. Cereb. Cortex19, 1926–1936.
Blasi, G., Goldberg, T.E., Weickert, T., Das, S., Kohn, P., Zoltick, B., Bertolino, A., Callicott,J.H., Weinberger, D.R., Mattay, V.S., 2006. Brain regions underlying responseinhibition and interference monitoring and suppression. Eur. J. NeuroSci. 23,1658–1664.

262 P. Stiers et al. / NeuroImage 52 (2010) 252–262
Bor, D., Owen, A.M., 2007. A common prefrontal–parietal network for mnemonic andmathematical recoding strategieswithinworkingmemory. Cereb. Cortex 17, 778–786.
Brett, M., Johnsrude, I.S., Owen, A.M., 2002. The problem of functional localization in thehuman brain. Nat. Rev. Neurosci. 3, 243–249.
Buckner, R.L., Andrews-Hanna, J.R., Schacter, D.L., 2008. The brain's default network:anatomy, function, and relevance to disease. Ann. N.Y. Acad. Sci. 1124, 1–38.
Bunge, S.A., Kahn, I., Wallis, J.D., Miller, E.K., Wagner, A.D., 2003. Neural circuitssubserving the retrieval and maintenance of abstract rules. J. Neurophysiol. 90,3419–3428.
Cabeza, R., Nyberg, L., 2002. Seeing the forest through the trees: the cross-functionapproach to imaging cognition. In: Zani, A., Proverbio, A.M. (Eds.), The CognitiveElectrophysiology of Mind and Brain. Academic Press, San Diego (CA), pp. 41–68.
Cole, M.W., Schneider, W., 2007. The cognitive control network. Integrated corticalregions with dissociable functions. NeuroImage 37, 343–360.
De Martino, F., Valente, G., Staeren, N., Ashburner, J., Goebel, R., Formisano, E., 2008.Combining multivariate voxel selection and support vector machines for mappingand classification of fMRI spatial patterns. NeuroImage 43, 44–58.
Derrfuss, J., Brass, M., von Cramon, D.Y., 2004. Cognitive control in the posteriorfrontolateral cortex: evidence from common activations in task coordination,interference control, and working memory. Neuroimage 23, 604–612.
Devlin, J.T., Poldrack, R.A., 2007. In praise of tedious anatomy. NeuroImage 37,1033–1041.
Dosenbach, N.U.F., et al., 2006. A core system for the implementation of task sets.Neuron 50, 799–812.
Dosenbach, N.U.F., et al., 2007. Distinct brain networks for adaptive and stable taskcontrol in humans. Proc. Natl. Acad. Sci. U.S.A. 104, 11073–11078.
Dosenbach, N.U.F., Fair, D.A., Cohen, A.L., Schlaggar, B.L., Petersen, S.E., 2008. A dual-networks architecture of top-down control. TICS 12, 99–105.
Duncan, J., 2006. Brain mechanisms of attention. Q. J. Exp. Psychol. 59, 2–27.Duncan, J., 2010. The multiple-demand (MD) system of the primate brain: mental
programs for intelligent behaviour. Trends Cogn. Sci. doi: 10.1016/j.tics.2010.01.004Duncan, J., Owen, A.M., 2000. Common regions of the human frontal lobe recruited by
diverse cognitive demands. TINS 23, 475–483.Forstmann, B.U., Brass,M., Koch, I., vonCramon,D.Y., 2006. Voluntary selection of task sets
revealed by functional magnetic resonance imaging. J. Cogn. Neurosci. 18, 388–398.Fox, M.D., Snyder, A.Z., Vincent, J.L., Corbetta, M., Van Essen, D.C., Raichle, M.E., 2005.
The human brain is intrinsically organized into dynamic, anticorrelated functionalnetworks. Proc. Natl. Acad. Sci. U.S.A. 102, 9673–9678.
Genovese, C.R., Lazar, N.A., Nicols, T., 2002. Thresholding of statistical maps infunctional neuroimaging using the false discovery rate. NeuroImage 15, 870–878.
Haxby, J.V., et al., 2001. Distributed and overlapping representations of faces andobjects in ventral temporal cortex. Science 293, 2425–2430.
Haynes, J.D., Rees, G., 2005. Predicting the stream of consciousness from activity inhuman visual cortex. Curr. Biol. 15, 1301–1307.
Haynes, J.D., Sakai, K., Rees, G., Gilbert, S., Frith, C., Passingham, R.E., 2007. Readinghidden intentions in the human brain. Curr. Biol. 17, 323–328.
Hoshi, E., Shima, K., Tanji, J., 2000. Neuronal activity in the primate prefrontal cortex inthe process of motor selection based on two behavioral rules. J. Neurophysiol. 83,2355–2373.
Johnston, K., Everling, S., 2006. Neural activity inmonkey prefrontal cortex ismodulatedby task context and behavioral instruction during delayed-match-to-sample andconditional prosaccade–antisaccade tasks. J. Cogn. Neurosci. 18, 749–765.
Kamitani, Y., Tong, F., 2005. Decoding the visual and subjective contents of the humanbrain. Nat. Neurosci. 8, 679–685.
Lapish, C.C., Durstewitz, D., Chandler, L.J., Seamans, J.K., 2008. Successful choicebehavior is associated with distinct and coherent network states in anteriorcingulate cortex. Proc. Natl. Acad. Sci. U.S.A. 105, 11963–11968.
McNab, F., Leroux, G., Strand, F., Thorell, L., Bergman, S., Klingberg, T., 2008. Commonand unique components of inhibition and working memory: an fMRI, within-subjects investigation. Neuropsychologia 46, 2668–2682.
Mennes, M., Stiers, P., Lagae, L., Van den Bergh, B., 2006. Long-term cognitive sequelaeof antenatal maternal anxiety: involvement of the orbitofrontal cortex. Neurosci.Biobehav. Rev. 30, 1078–1086.
Mennes, M., Wouters, H., Van den Bergh, B., Lagae, L., Stiers, P., 2008. ERP correlates ofcomplex human decision making in a gambling paradigm. Detection and resolutionof conflict. Psychophysiology 45, 714–720.
Miller, E.K., 2000. The prefrontal cortex and cognitive control. Nat. Rev. Neurosci. 1,59–65.
Norman, K.A., Polyn, S.M., Detre, G.J., Haxby, J.V., 2006. Beyond mind-reading: multi-voxel pattern analysis of fMRI data. TICS 10, 424–430.
Nyberg, L., et al., 2003. Common prefrontal activations during working memory,episodic memory, and semantic memory. Neuropsychologia 41, 371–377.
Owen, A.M., McMillan, K.M., Laird, A.R., Bullmore, E., 2005. N-back working memoryparadigm. A meta-analysis of normative functional neuroimaging studies. Hum.Brain Mapp. 25, 46–59.
Peelen, M.V., Downing, P.E., 2006. Using multi-voxel pattern analysis of fMRI data tointerpret overlapping functional activations. TICS 11, 4–5.
Sakai, K., Passingham, R., 2006. Prefrontal set activity predicts rule-specific neuralprocessing during subsequent cognitive performance. J. Neurosci. 26, 1211–1218.
Satterthwaite, T.D., et al., 2007. Dissociable but inter-related systems of cognitivecontrol and reward during decision making: evidence from pupillometry andevent-related fMRI. Neuroimage 37, 1017–1031.
Seeley, W.W., Menon, V., Schatzberg, A.F., Keller, J., Glover, G.H., Kenna, H., Reiss, A.L.,Greicius, M.D., 2007. Dissociable intrinsic connectivity networks for salienceprocessing and executive control. J. Neurosci. 27, 2349–2356.
Seghier, M.L., et al., 2004. Variability of fMRI activation during a phonological andsemantic language task in healthy subjects. Hum. Brain Mapp. 23, 140–155.
Sigala, N., Kusunoki, M., Nimmo-Smith, I., Gaffan, D., Duncan, J., 2008. Hierarchicalcoding for sequential task events in the monkey prefrontal cortex. Proc. Natl. Acad.Sci. U.S.A. 105, 11969–11974.
Singh, K.D., Fawcett, I.P., 2008. Transient and linearly graded deactivation of the humandefault-mode network by a visual detection task. NeuroImage 41, 100–112.
Sridharan, D., Levitin, D.J., Menon, V., 2008. A critical role for the right fronto-insularcortex in switching between central-executive and default-mode networks. Proc.Natl. Acad. Sci. U.S.A. 105, 12569–12574.
Stiers, P., Peeters, R., Lagae, L., Van Hecke, P., Sunaert, S., 2006. Mapping multiple visualareas in the human brain with a short fMRI sequence. NeuroImage 29, 74–89.
Van Essen, D.C., 2002. Windows on the brain. The emerging role of atlases anddatabases in neuroscience. Curr. Opin. Biotechnol. 12, 574–579.
Van Essen, D.C., Drury, H.A., Dickson, J., Harwell, J., Hanlon, D., Anderson, C.H., 2001. Anintegrated software system for surface based analyses of cerebral cortex. J. Am.Med. Inform. Assoc. 41, 1359–1378.
Wallis, J.D., Miller, E.K., 2003. From rule to response: neuronal processes in thepremotor and prefrontal cortex. J. Neurophysiol. 90, 1790–1806.
White, I.M., Wise, S.P., 1999. Rule-dependent neuronal activity in the prefrontal cortex.Exp. Brain Res. 126, 315–335.
Yousry, T.A., et al., 1997. Localization of the motor hand area to a knob on the precentralgyrus. A new landmark. Brain 120, 141–157.
Copyright © 2022 FDOKUMEN