Distinct cortical codes and temporal dynamics for conscious and unconscious percepts
19
elifesciences.org RESEARCH ARTICLE Distinct cortical codes and temporal dynamics for conscious and unconscious percepts Moti Salti 1,2,3,4 *, Simo Monto 1,2,5 , Lucie Charles 1,2,6 , Jean-Remi King 1,2 , Lauri Parkkonen 1,2,5 , Stanislas Dehaene 1,2,7,8 1 Cognitive Neuroimaging Unit, Institut National de la Sant ´ e et de la Recherche M´ edicale, Gif sur Yvette, France; 2 Neurospin center, Institut d’Imagerie Biom ´ edicale, Gif sur Yvette, France; 3 Department of Brain and Cognitive Sciences, Ben-Gurion University of the Negev, Beer-Sheva, Israel; 4 Zlotowski Center for Neuroscience, Ben-Gurion University of the Negev, Beer-Sheva, Israel; 5 Department of Neuroscience and Biomedical Engineering, Aalto University School of Science, Espoo, Finland; 6 Attention and Cognitive Control Lab Department of Experimental Psychology, University of Oxford, Oxford, United Kingdom; 7 Coll ` ege de France, Paris, France; 8 University of Paris-Sud, Orsay, France Abstract The neural correlates of consciousness are typically sought by comparing the overall brain responses to perceived and unperceived stimuli. However, this comparison may be contaminated by non-specific attention, alerting, performance, and reporting confounds. Here, we pursue a novel approach, tracking the neuronal coding of consciously and unconsciously perceived contents while keeping behavior identical (blindsight). EEG and MEG were recorded while participants reported the spatial location and visibility of a briefly presented target. Multivariate pattern analysis demonstrated that considerable information about spatial location traverses the cortex on blindsight trials, but that starting ≈270 ms post-onset, information unique to consciously perceived stimuli, emerges in superior parietal and superior frontal regions. Conscious access appears characterized by the entry of the perceived stimulus into a series of additional brain processes, each restricted in time, while the failure of conscious access results in the breaking of this chain and a subsequent slow decay of the lingering unconscious activity. DOI: 10.7554/eLife.05652.001 Introduction The scientific investigation of consciousness divides into two major branches (Koch, 2004; Dehaene et al., 2014). The first branch, which studies the ‘state of consciousness’, focuses on general vigilance or a person’s ability to perceive, interact, and communicate with the environment, by examining the regulation of sleep and waking, and their pathological disruption by coma, epilepsy, and sleep disorders (Laureys et al., 2004). The second branch of inquiry, which studies ‘access to consciousness’, focuses on the processes that make a specific content subjectively experienced—what differences in brain activity distinguish conscious vs unattended or subliminal stimuli (Dehaene et al., 2006). To a large extent, both endeavors rely on characterization of the neural activity that underlies the conscious state or conscious perception, and they are traditionally approached in a similar manner (Dehaene and Changeux, 2011). In order to examine the neuronal processes that underlie conscious states, the neuronal activity associated with one state of consciousness (e.g., sleep) is compared to another (e.g., awake). Similarly, in order to extract the neural correlates of conscious perception, threshold-level stimuli are presented to the subject such that they are sometimes consciously *For correspondence: motisalti@ gmail.com Competing interests: The authors declare that no competing interests exist. Funding: See page 17 Received: 08 December 2014 Accepted: 20 May 2015 Published: 21 May 2015 Reviewing editor: Heidi Johansen-Berg, University of Oxford, United Kingdom Copyright Salti et al. This article is distributed under the terms of the Creative Commons Attribution License, which permits unrestricted use and redistribution provided that the original author and source are credited. Salti et al. eLife 2015;4:e05652. DOI: 10.7554/eLife.05652 1 of 19
Transcript of Distinct cortical codes and temporal dynamics for conscious and unconscious percepts

elifesciences.org
RESEARCH ARTICLE
Distinct cortical codes and temporaldynamics for conscious and unconsciousperceptsMoti Salti1,2,3,4*, Simo Monto1,2,5, Lucie Charles1,2,6, Jean-Remi King1,2,Lauri Parkkonen1,2,5, Stanislas Dehaene1,2,7,8
1Cognitive Neuroimaging Unit, Institut National de la Sante et de la RechercheMedicale, Gif sur Yvette, France; 2Neurospin center, Institut d’Imagerie Biomedicale,Gif sur Yvette, France; 3Department of Brain and Cognitive Sciences, Ben-GurionUniversity of the Negev, Beer-Sheva, Israel; 4Zlotowski Center for Neuroscience,Ben-Gurion University of the Negev, Beer-Sheva, Israel; 5Department of Neuroscienceand Biomedical Engineering, Aalto University School of Science, Espoo, Finland;6Attention and Cognitive Control Lab Department of Experimental Psychology,University of Oxford, Oxford, United Kingdom; 7College de France, Paris, France;8University of Paris-Sud, Orsay, France
Abstract The neural correlates of consciousness are typically sought by comparing the overall
brain responses to perceived and unperceived stimuli. However, this comparison may be
contaminated by non-specific attention, alerting, performance, and reporting confounds. Here, we
pursue a novel approach, tracking the neuronal coding of consciously and unconsciously perceived
contents while keeping behavior identical (blindsight). EEG and MEG were recorded while
participants reported the spatial location and visibility of a briefly presented target. Multivariate
pattern analysis demonstrated that considerable information about spatial location traverses the
cortex on blindsight trials, but that starting ≈270 ms post-onset, information unique to consciously
perceived stimuli, emerges in superior parietal and superior frontal regions. Conscious access
appears characterized by the entry of the perceived stimulus into a series of additional brain
processes, each restricted in time, while the failure of conscious access results in the breaking of this
chain and a subsequent slow decay of the lingering unconscious activity.
DOI: 10.7554/eLife.05652.001
IntroductionThe scientific investigation of consciousness divides into two major branches (Koch, 2004; Dehaene
et al., 2014). The first branch, which studies the ‘state of consciousness’, focuses on general vigilance
or a person’s ability to perceive, interact, and communicate with the environment, by examining the
regulation of sleep and waking, and their pathological disruption by coma, epilepsy, and sleep
disorders (Laureys et al., 2004). The second branch of inquiry, which studies ‘access to
consciousness’, focuses on the processes that make a specific content subjectively experienced—what
differences in brain activity distinguish conscious vs unattended or subliminal stimuli (Dehaene et al.,
2006). To a large extent, both endeavors rely on characterization of the neural activity that underlies
the conscious state or conscious perception, and they are traditionally approached in a similar manner
(Dehaene and Changeux, 2011). In order to examine the neuronal processes that underlie conscious
states, the neuronal activity associated with one state of consciousness (e.g., sleep) is compared to
another (e.g., awake). Similarly, in order to extract the neural correlates of conscious perception,
threshold-level stimuli are presented to the subject such that they are sometimes consciously
*For correspondence: motisalti@
gmail.com
Competing interests: The
authors declare that no
competing interests exist.
Funding: See page 17
Received: 08 December 2014
Accepted: 20 May 2015
Published: 21 May 2015
Reviewing editor: Heidi
Johansen-Berg, University of
Oxford, United Kingdom
Copyright Salti et al. This
article is distributed under the
terms of the Creative Commons
Attribution License, which
permits unrestricted use and
redistribution provided that the
original author and source are
credited.
Salti et al. eLife 2015;4:e05652. DOI: 10.7554/eLife.05652 1 of 19

perceived and sometimes not. Trials are then sorted according to their subjective perception (‘Seen’
or ‘Unseen’), and the neurophysiological signatures associated with these categories are contrasted to
extract the correlates of consciousness perception.
Such paradigms have yielded convergent findings (Koch, 2004; Dehaene and Changeux, 2011;
Dehaene et al., 2014), but they have also been criticized on several grounds (Aru et al., 2012). First,
differences in neural activity may stem from physical differences in the stimuli. To control this, many
experiments now employ identical stimuli and rely on participants’ subjective reports to differentiate
seen and unseen conditions. Even then, stimuli also differ in their depth of processing: performance is
typically much higher for conscious trials (Lau and Passingham, 2006), and several operations may
only be feasible in the conscious state (Sackur and Dehaene, 2009; De Lange et al., 2011). The main
effect of seen vs unseen trials may, therefore, reveal processing differences unrelated to the actual
cerebral encoding of a conscious or unconscious stimulus, and reflecting solely, the operations that
precede follow or even coincide with conscious access (Aru et al., 2012; Pitts et al., 2012; Frassle
et al., 2014; Pitts et al., 2014).
Another limitation is that these paradigms do not isolate the brain mechanisms underlying the
conscious representation of a specific content (Haynes, 2009). The broad contrast between brain
activity on ‘seen’ vs ‘unseen’ trials may include generic processes of attention, alerting, or reporting
that should be carefully kept distinct from the more limited set of processes that represent the current
mental content. For instance, the late P3 component of event-related potentials, which is a frequent
signature of conscious perception (Dehaene and Changeux, 2011), has been proposed to reflect either
a non-specific alerting effect arising from noradrenergic neurons of the locus coeruleus (Nieuwenhuis
et al., 2005) or the activation of generic reporting processes unnecessary to conscious perception itself
(Pitts et al., 2012, 2014). To resolve this issue, it is necessary to identify which patterns of brain activity,
eLife digest Our senses constantly receive information from the world around us, but we
consciously perceive only a small portion of it. Nonetheless, even stimuli that are not consciously
perceived are registered in our brain and influence our behavior. This is known as unconscious
perception.
Researchers disagree about how brain activity differs during conscious and unconscious
perception. Some think that both consciously and unconsciously perceived objects are processed in
the same way in the brain, but that the brain is more active during conscious perception. Others think
that different neurons process the information in different types of perception.
Salti et al. have now investigated this issue. While recording participants’ brain activity, a line was
briefly presented in one of eight different possible locations on a screen. The line was masked so it
would be consciously perceived in roughly half of the presentations. Participants had to report the
location of the line and then say whether they had seen it or had merely guessed its location. Even
when they reported that they were guessing, participants identified the location of the line better
than by chance, indicating unconscious perception on ‘guess’ trials. This enabled Salti et al. to
compare how the brain encodes consciously perceived and unconsciously perceived stimuli.
Unlike previous studies in which the brain activity associated with ‘seen’ and ‘unseen’ stimuli was
compared, Salti et al. used a different approach to extract the neural activity underlying
consciousness. A classifying algorithm was trained on a subset of the data to recognize from the
recorded brain activity where on the screen a line had appeared. Applying this algorithm to the
remaining data revealed the dynamics of stimulus encoding. Consciously and unconsciously
perceived stimuli are encoded by the same neural responses for about a quater of a second. From
this point on, consciously perceived stimuli benefit from a series of additional brain processes, each
restricted in time. For unconsciously perceived stimuli, this chain of processing breaks and a slow
decay of encoding is observed.
Salti et al., therefore, conclude that conscious perception is represented differently to
unconscious perception in the brain and produces more extensive and structured brain activity.
Future work will focus on understanding these differences in neural coding and their contribution to
the interplay between conscious and unconscious perception.
DOI: 10.7554/eLife.05652.002
Salti et al. eLife 2015;4:e05652. DOI: 10.7554/eLife.05652 2 of 19
Research article Neuroscience

unique to conscious trials, faithfully encode the contents of subjective experience and to separate them
from other non-specific brain responses (Haynes, 2009).
The presence or absence of additional information is a crucial feature that separates major
theories of conscious access. Some theories propose that subjective experience emerges from
a generic pattern of brain activity without any stimulus-specific change (Lau and Rosenthal, 2011).
According to these models, the cognitive representation of a stimulus is built during unconscious
perception, and the additional activity that gives rise to consciousness tags it as ‘perceived’ but
adds no perceptual or coding benefit. Conversely, other models (Dehaene et al., 2003, 2006)
suggest that conscious perception relies on a massive amplification and cortical broadcasting of
stimulus-specific information. The Global Neuronal Workspace (GNW) model asserts that perceptual
stages may unfold identically on conscious and non-conscious trials, but that, when a stimulus gains
access to consciousness, stimulus-specific information is amplified and re-encoded in additional areas,
including a prefrontal–parietal network. This ‘workspace’ maintains the information online and
dispatches it to additional processors, thus making the stimulus reportable. This view predicts that,
ceteris paribus, additional stimulus information should be present on conscious trials. Finally, theories
that associate conscious perception with posterior visual loops (Lamme, 2006) or with the integration of
information into a coherent whole (Oizumi et al., 2014) are agnostic with respect to this issue: although
greater reverberation or integration may cause an amplification of neuronal activity, (Fahrenfort et al.,
2012) it could also, on the contrary, lead to diminished or sparser activity due to the greater
predictability of the distributed brain signals being integrated (Friston, 2005).
In summary, for both empirical and theoretical reasons, it is essential to study the temporal
propagation of conscious vs unconscious information in the brain and to probe the presence of
additional stimulus-specific cortical codes on seen trials relative to unseen trials, while excluding any
difference in perception and behavior. To fulfill this demanding agenda, we used time-resolved MEG
and EEG recordings to track the internal representation of a flashed stimulus under visible and
invisible conditions. This strategy was made possible by advances in multivariate decoding, which can
detect stimulus-specific information in brain activity, and evaluate its localization (Kamitani and Tong,
2005; Haynes and Rees, 2006; Haynes, 2009) and its time course (King and Dehaene, 2014). We
chose visual location as the decoded parameter of the stimulus, because multiple macroscopic
retinotopic maps are present throughout the human brain, including the frontal lobe (Sereno et al.,
1995; Hagler and Sereno, 2006), and therefore, the full cortical processing stream of this parameter
should be more easily decodable than other more microscopic parameters, such as object identity.
To further address the concern of differences in processing depth, we placed ourselves under
‘blindsight’ conditions by asking subjects to perform a forced-choice location task in which performance
was excellent even on subjectively invisible trials. Selecting only the correct trials allowed us to compare
visible and invisible trials with identical stimuli and responses (Lamy et al., 2009).
ResultsWe recorded Magnetoencephalography (MEG) and Electroencephalography (EEG) while presenting
the subjects with a tilted line segment at one of eight possible locations arranged circularly around the
fixation point. The target was followed by a mask whose contrast was adjusted individually for each
participant to ensure conscious perception on roughly half of the trials. In each trial, participants
provided three separate behavioral responses: 1) an immediate forced-choice localization of the
target, 2) whether their first response was correct or not, and 3) whether they saw the target or not
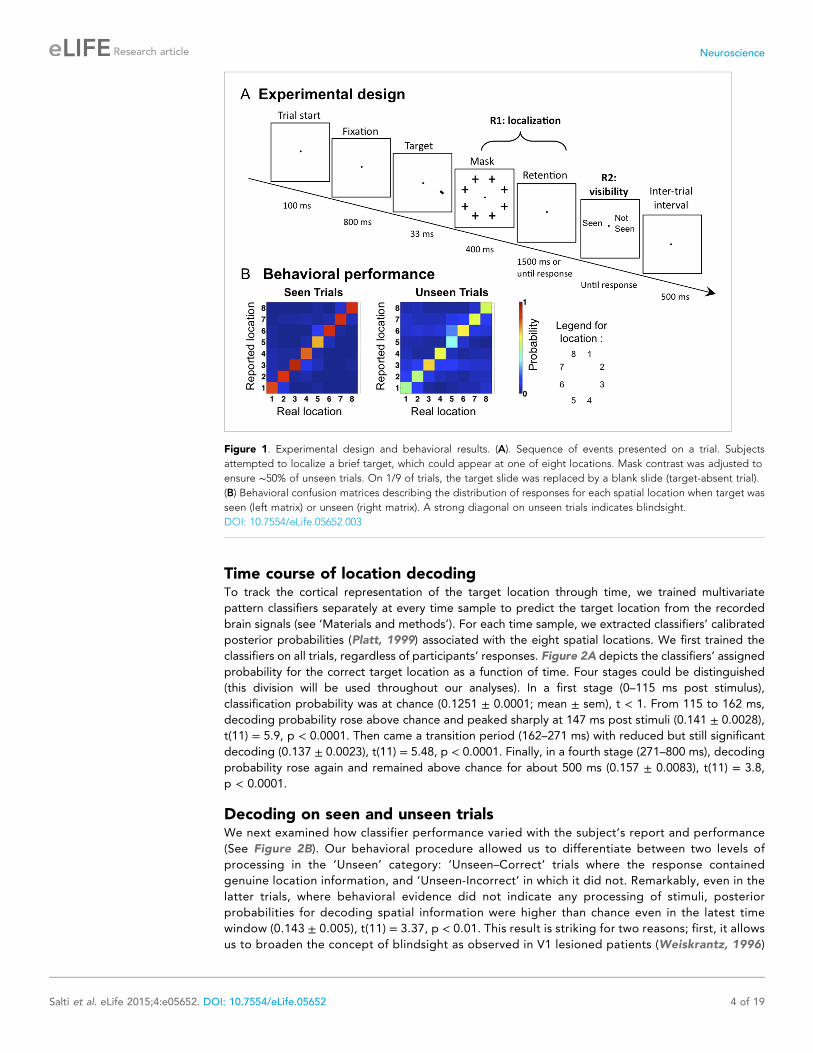
(see Figure 1A and ‘Materials and methods’). Participants were instructed to report the target as
unseen only if they had no perception at all regarding its location. If they did not see the target they
were asked to guess its location (response 1).
Behaviorally, subjects reported seeing 62.4 ± 3.62% (mean ± sem) of presented targets, and
the accuracy (i.e., reporting the correct location) in these trials was 86.6 ± 2.54%. Performance
in the unseen trials was 50.7 ± 6.4% correct, the way higher than the chance level of 12.5%
(t(11) = 5.73, p <0 0.001), indicating blindsight. At all eight stimulated locations, the dominant
response was to correctly point to that location, even on unseen trials (see Figure 1B). Those
‘unseen–correct’ trials thus provide a minimal contrast with ‘seen–correct’ trials. Mean localization
Respone Times (RTs) were 812.2 ± 44 ms. Localization RTs for different critical conditions were as
follow: 701.4 ± 35 ms for ‘Seen–Correct’ trials, 878.1 ± 78 ms for ‘Unseen–Correct’ trials, and 1110 ±101 ms for ‘Unseen-incorrect’ trials.
Salti et al. eLife 2015;4:e05652. DOI: 10.7554/eLife.05652 3 of 19
Research article Neuroscience
Time course of location decodingTo track the cortical representation of the target location through time, we trained multivariate
pattern classifiers separately at every time sample to predict the target location from the recorded
brain signals (see ‘Materials and methods’). For each time sample, we extracted classifiers’ calibrated
posterior probabilities (Platt, 1999) associated with the eight spatial locations. We first trained the
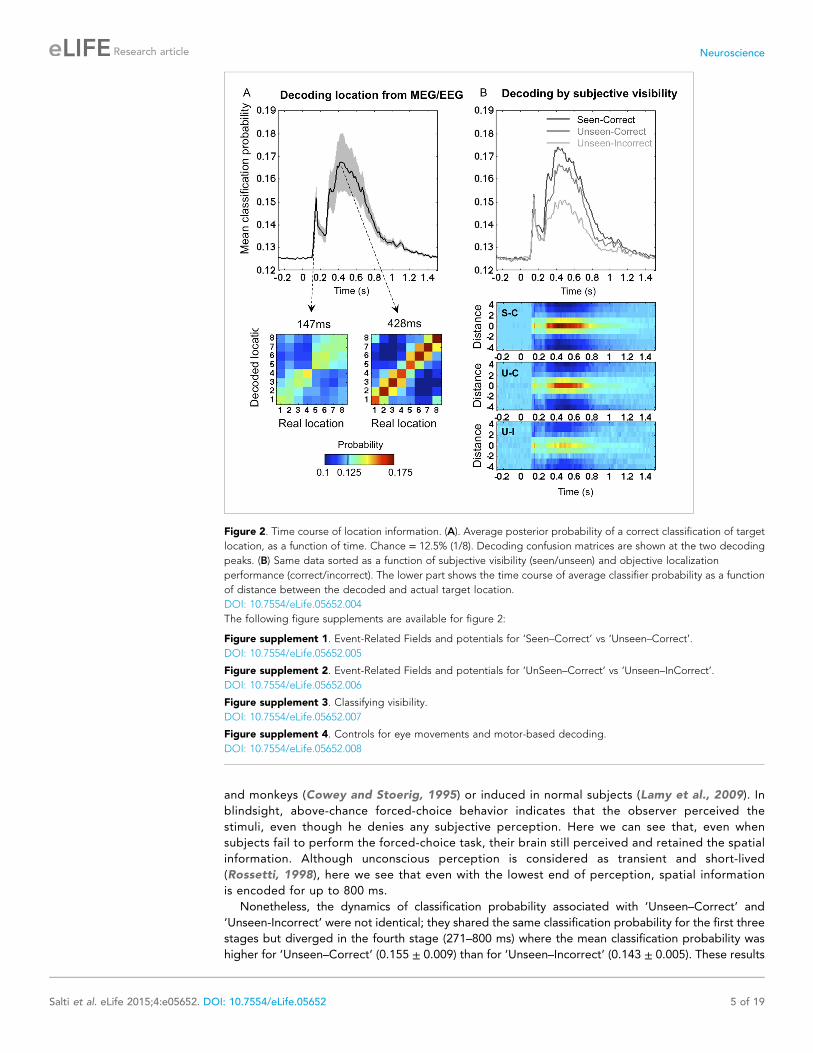
classifiers on all trials, regardless of participants’ responses. Figure 2A depicts the classifiers’ assigned
probability for the correct target location as a function of time. Four stages could be distinguished
(this division will be used throughout our analyses). In a first stage (0–115 ms post stimulus),
classification probability was at chance (0.1251 ± 0.0001; mean ± sem), t < 1. From 115 to 162 ms,
decoding probability rose above chance and peaked sharply at 147 ms post stimuli (0.141 ± 0.0028),
t(11) = 5.9, p < 0.0001. Then came a transition period (162–271 ms) with reduced but still significant
decoding (0.137 ± 0.0023), t(11) = 5.48, p < 0.0001. Finally, in a fourth stage (271–800 ms), decoding
probability rose again and remained above chance for about 500 ms (0.157 ± 0.0083), t(11) = 3.8,
p < 0.0001.
Decoding on seen and unseen trialsWe next examined how classifier performance varied with the subject’s report and performance
(See Figure 2B). Our behavioral procedure allowed us to differentiate between two levels of
processing in the ‘Unseen’ category: ‘Unseen–Correct’ trials where the response contained
genuine location information, and ‘Unseen-Incorrect’ in which it did not. Remarkably, even in the
latter trials, where behavioral evidence did not indicate any processing of stimuli, posterior
probabilities for decoding spatial information were higher than chance even in the latest time
window (0.143 ± 0.005), t(11) = 3.37, p < 0.01. This result is striking for two reasons; first, it allows
us to broaden the concept of blindsight as observed in V1 lesioned patients (Weiskrantz, 1996)
Figure 1. Experimental design and behavioral results. (A). Sequence of events presented on a trial. Subjects
attempted to localize a brief target, which could appear at one of eight locations. Mask contrast was adjusted to
ensure ∼50% of unseen trials. On 1/9 of trials, the target slide was replaced by a blank slide (target-absent trial).
(B) Behavioral confusion matrices describing the distribution of responses for each spatial location when target was
seen (left matrix) or unseen (right matrix). A strong diagonal on unseen trials indicates blindsight.
DOI: 10.7554/eLife.05652.003
Salti et al. eLife 2015;4:e05652. DOI: 10.7554/eLife.05652 4 of 19
Research article Neuroscience
and monkeys (Cowey and Stoerig, 1995) or induced in normal subjects (Lamy et al., 2009). In
blindsight, above-chance forced-choice behavior indicates that the observer perceived the
stimuli, even though he denies any subjective perception. Here we can see that, even when
subjects fail to perform the forced-choice task, their brain still perceived and retained the spatial
information. Although unconscious perception is considered as transient and short-lived
(Rossetti, 1998), here we see that even with the lowest end of perception, spatial information
is encoded for up to 800 ms.
Nonetheless, the dynamics of classification probability associated with ‘Unseen–Correct’ and
‘Unseen-Incorrect’ were not identical; they shared the same classification probability for the first three
stages but diverged in the fourth stage (271–800 ms) where the mean classification probability was
higher for ‘Unseen–Correct’ (0.155 ± 0.009) than for ‘Unseen–Incorrect’ (0.143 ± 0.005). These results
Figure 2. Time course of location information. (A). Average posterior probability of a correct classification of target
location, as a function of time. Chance = 12.5% (1/8). Decoding confusion matrices are shown at the two decoding
peaks. (B) Same data sorted as a function of subjective visibility (seen/unseen) and objective localization
performance (correct/incorrect). The lower part shows the time course of average classifier probability as a function
of distance between the decoded and actual target location.
DOI: 10.7554/eLife.05652.004
The following figure supplements are available for figure 2:
Figure supplement 1. Event-Related Fields and potentials for ‘Seen–Correct’ vs ‘Unseen–Correct’.
DOI: 10.7554/eLife.05652.005
Figure supplement 2. Event-Related Fields and potentials for ‘UnSeen–Correct’ vs ‘Unseen–InCorrect’.
DOI: 10.7554/eLife.05652.006
Figure supplement 3. Classifying visibility.
DOI: 10.7554/eLife.05652.007
Figure supplement 4. Controls for eye movements and motor-based decoding.
DOI: 10.7554/eLife.05652.008
Salti et al. eLife 2015;4:e05652. DOI: 10.7554/eLife.05652 5 of 19
Research article Neuroscience

indicate, unsurprisingly perhaps, that additional information about location is available in the brain on
trials in which subjects responded correctly than in trials in which they did not.
The main aim of this paper was to track the temporal dynamics of neuronal encoding of
consciously and unconsciously perceived spatial information, that is, the differences between
‘Seen–Correct’ and ‘Unseen–Correct’, which were strictly identical in terms of both stimuli and
responses. ‘Seen–Correct’ and ‘Unseen–Correct’ trials did not differ in classification probability
during the first three stages but diverged only during the fourth stage (see Figure 2B). Mean
classification probability between 272–800 ms was higher for ‘Seen–Correct’ trials (0.162 ± 0.009)
than for ‘Unseen–Correct’ (0.155 ± 0.009), t(11) = 2.93, p = 0.014. This difference survived
correction for correct responses produced by chance (Lamy et al., 2009) in the ‘Unseen–Correct’
condition. Classification was higher for ‘Seen–Correct’ trials (0.162 ± 0.009) than for ‘Unseen–
CorrectChanceCorrected’ (0.157 ± 0.009), t(11) = 2.93, p = 0.029 (one-tailed).
Relation to previous findings from event-related responsesOur fourth time window, where significantly improved location decoding was observed on seen
compared to unseen trials, corresponds to the timing of N2 and especially P3 event-related
potentials, which several past studies using the traditional contrast of ‘Seen’ vs ‘Unseen’ unseen trials
have associated to conscious perception (see Dehaene and Changeux, 2011 for review). To examine
whether our study replicated those findings, we compared the event related potentials (ERP) - event
related fields (ERF) signatures of our critical conditions (see Figure 2—figure supplement 1 and
Figure 2—figure supplement 2). We tracked the components by computing Global Field Power and
applied cluster analysis across channels. While the ‘Unseen–Correct’ vs ‘Unseen-Incorrect’ did not
yield any significant difference in evoked responses, the ‘Seen–Correct’ vs ‘Unseen–Correct’ did: MEG
magnetometers showed different activities in the N2 time window, while EEG electrodes showed
a difference in the P3 time window, with the appropriate topography (Figure 2—figure supplement
1). Thus, these late events again appear as correlates of conscious perception. Unsurprisingly, ERP-
ERF analysis revealed a slightly different temporal pattern than the dynamics revealed with the
multivariate classification, because the former corresponds to a search for generic brain states
allowing or not allowing content to access consciousness, while the latter corresponds to a search for
brain states encoding a specific consciously perceived content.
Training a classifier to use those event-related responses in order to separate ‘Seen–Correct’ vs
‘Unseen–Correct’ trials yielded a modest but significant classification success, again based on the late
part of the epoch (see Figure 2—figure supplement 3). Our results suggest that, in the present
experiment, M/EEG recordings are dominated by content-specific information about location, both
on seen and on unseen trials, while it is more difficult to train a generic decoder for seen/unseen trials
that cuts across all such contents. It also should be noted that this experiment was not optimally
designed for such an analysis. In order to restrict classifier to using attributes that are related
exclusively to visibility and not to stimuli location, we equated the number of trials representing
specific stimulus location in the ‘Seen–Correct’ and the ‘Unseen–Correct’ location. This reduced the
number of trials on which decoder was trained on and affected classification results.
Controls for hand and eye movementsBecause there was a fixed mapping between stimulus location and motor responses (made using
four fingers of each hand), the decoding of location could conceptually be based on conscious
motor codes. To evaluate this possibility, we performed a control analysis in which we applied the
decoder to target absent trials in which no stimulus appeared, but subjects still had to produce
a response. Classification of subjects’ responses in these trials was at chance, indicating that the
previous decoder focused strictly on stimulus-based location information (see Figure 2—figure
supplement 4). Although it remains possible that conscious response planning modulates the late
stages of location processing, several aspects of our experiments argue against a contribution of
motor codes to our results. In terms of experimental design, our main analyses focused on trials in
which the decoder was trained to extract the objective location of the target on all trials, errors
included. Thus, the above-chance extraction of the objective target location on ‘Unseen-Incorrect’
trials is not likely to reflect motor code, nor can the improved classification performance for
‘Seen–Correct’ over ‘Unseen–Correct’, since those trials involve exactly the same stimuli and
responses.
Salti et al. eLife 2015;4:e05652. DOI: 10.7554/eLife.05652 6 of 19
Research article Neuroscience

Another control analysis evaluated the role of microsaccades. Although eye movements were
carefully removed with principal component analysis (PCA), it could be suggested that residual ocular
activity in the MEG/EEG (MEEG) signal governed the classification of spatial location. Residual eye
movement artifacts, if present, should primarily affect the anterior eye channels. To test this
possibility, we examined the dynamics of classification on electro-oculograms (EOG) channels alone.
Classification revealed a different temporal pattern of classification that was observed with the full
MEEG classification: above-chance location decoding started only around 250 ms, remained much
lower that with the whole data set (∼14%, where chance = 12.5%), and crucially, did not discriminate
between the seen and unseen trials (see Figure 2—figure supplement 4), suggesting that eye
movements did not play a dominant role in the above decoding results. Source localization (see
below) is also incompatible with a single eye movement artifact.
Asymmetrical generalization of decodingOur basic analysis indicated that consciously perceived stimuli are coded more reliably than
unconscious ones, but the nature of this difference could not be completely appreciated from this
analysis. ‘Seen–Correct’ trials were more numerous than ‘Seen-incorrect’ trials, and this factor alone
could perhaps explain why they were more efficiently decoded. In this case, if conscious and
unconscious codes differ, then training specifically on unconscious trials should revert the pattern and
yield better decoding on unseen compared to seen trials. The GNW model (Dehaene et al., 2003),
however, makes a different prediction concerning the asymmetry of decoding on seen and unseen
trials. Specifically, the model predicts that all the processing stages present on unseen trials should
continue to be observed on seen trials, while the converse should not be true: on seen trials, there
should be brain activity encoding the perceived stimulus within the GNW and not present on unseen
trials.
We examined these two options by testing for cross-condition generalization: we trained the
decoder on a subset of trials (either the unseen–correct trials, or the seen–correct trials) and then
tested for generalization, either to left-out trials within the same category or to trials belonging to the
other category. One technical difficulty was that, since the experimental conditions were defined by
subjects’ responses, the number of trials at each location was no longer balanced within each of these
conditions, and this imbalance affected the pre-stimulus bias of the 8-category classifier as well as its
capacity to generalize. To address this problem, we turned to a simpler binary classifier, which was
trained to simply sort the stimuli into left-hemifield vs right-hemifield stimuli. Within each subject, we
matched the number of trials in these two classes and also selected equal numbers of seen–correct
and unseen–correct trials. Figure 3 shows that this binary decoder, now operating with a chance level
of 50%, still performed above chance with approximately the same time course as the 8-location
decoder.
The end result demonstrated the predicted asymmetry. When trained on ‘Unseen–Correct’ trials,
classification generalized identically to ‘Seen–Correct’ trials, but when trained on ‘Seen–Correct’ trials,
classification performance dropped when tested on ‘Unseen–Correct’ (Figure 3). This effect was
apparent in two time windows, the third time window (178–225 ms; average classification probability
for ‘Seen–Correct’ = 0.526 ± 0.0064; for ‘Unseen–Correct’ = 0.515 ± 0.005; t(11) = 2.8, p = 0.017),
and the fourth late time window (272–800 ms; ‘Seen–Correct’ = 0.575 ± 0.017; ‘Unseen–
Correct’ = 0.547 ± 0.016; t(11) = 2.44, p = 0.032). These analyses indicate that seen–correct trials
contained the same decodable stimulus information as unseen–correct trials, plus additional
information unique to conscious trials.
Decoding cortical sourcesThe GNW model predicts that the additional information associated with conscious representation
should be jointly encoded in a network of distributed prefrontal and parietal regions. In order to
assess the contribution of these brain areas to the encoding of consciously perceived contents, we
modeled the brain activity in 68 regions of interest covering the whole cortex (See ‘Materials and
methods’) and re-trained our decoders using just the distributed source signals from these regions.
The results with eight output classes (Figure 4—figure supplement 1) confirmed the existence of two
main stages: an early one (∼100–200 ms) where location information was essentially confined to
occipital, ventral visual, and lateral and mesial parietal regions, and a later one (>250 ms) where it
became highly distributed to multiple cortical areas, particularly in prefrontal and anterior cingulate
Salti et al. eLife 2015;4:e05652. DOI: 10.7554/eLife.05652 7 of 19
Research article Neuroscience

cortex (Figure 4—figure supplement 1). To avoid an unnecessary increase in the number of
statistical tests, we confined the subsequent analyses of seen and unseen trials, to four a priori
regions of interest covering all areas of the dorsal visual pathway containing retinotopic maps for
location (Sereno et al., 1995; Hagler and Sereno, 2006): pericalcarine, superior parietal cortex,
rostral medial frontal cortex, and superior-lateral frontal cortex. We then repeated the
generalization across conditions and procedures. This region-based decoding revealed the
activation of successive spatial codes (Figure 4): both pericalcarine and superior parietal cortices
contained decodable information as early as 115 ms post stimuli ([0.519 ± 0.005], t(11) = 3.82
p = 0.0028 and [0.516 ± 0.003], t(11) = 4.52 p < 0.0001, respectively). The two frontal areas revealed
a more delayed pattern as the curve associated with superior frontal cortex showed first above-
chance decoding only after 194 ms (0.504 ± 0.001), t(11) = 2.33 p = 0.0396 and rostral medial
frontal as late as 365 ms.
Only two of the chosen regions, superior frontal and superior parietal cortices, demonstrated the
asymmetry between seen and unseen trials obtained with sensor-based decoding. In both cases,
when trained on activity restricted to the superior frontal regions, a complete generalization
obtained when trained on ‘Unseen–Correct’ but when trained on ‘Seen–Correct’ trials, decoding
probability dropped for ‘Unseen–Correct’ in the fourth time window. Classification probability
was significantly higher for ‘Seen–Correct’ (0.552 ± 0.017) than for the ‘Unseen–Correct’ trials
(0.541 ± 0.017), t(11) = 2.35, p = 0.038. In the superior parietal cortex, when trained on
‘Unseen–Correct’ trials, asymmetry was apparent in all time windows: classifiers generalize
completely for ‘Seen–Correct’ trials (Figure 4) but when trained on ‘Seen–Correct’ trials and
tested on ‘Unseen–Correct’, posterior probabilities dropped. In the second window classification,
probability was significantly higher for ‘Seen–Correct’ (0.534 ± 0.007) than for the ‘Unseen–Correct’
trials (0.525 ± 0.006), t(11) = 2.5, p = 0.026. In the third time window, ‘Seen–Correct’ decoding
probability was higher than ‘Unseen–Correct’ ([0.537 ± 0.008] [0.523 ± 0.01], t(11) = 2.3, p = 0.036).
This pattern was kept in the fourth time window, as ‘Seen–Correct’ decoding probability (0.559 ± 0.011)
was higher than ‘Unseen–Correct’ decoding probability (0.545 ± 0.01), t(11) = 3.9, p = 0.002.
These findings go beyond the distinction of conscious and unconscious processing and allow us to
demonstrate a representation of stimulus location outside visual areas. Above-chance classification
could be achieved in all regions, including superior parietal, rostral middle frontal, and superior frontal
Figure 3. Asymmetrical cross-condition generalization. A classifier trained in one condition and then tested on new
data either from the same condition or the other condition (e.g. trained on ‘Seen–Correct’ trials and tested on new
‘Seen–Correct’ trials and ‘Unseen–Correct’ trials). To equalize the number of trials, the classifier was trained to
discriminate left- vs right-hemifield targets, hence chance = 50%.
DOI: 10.7554/eLife.05652.009
Salti et al. eLife 2015;4:e05652. DOI: 10.7554/eLife.05652 8 of 19
Research article Neuroscience
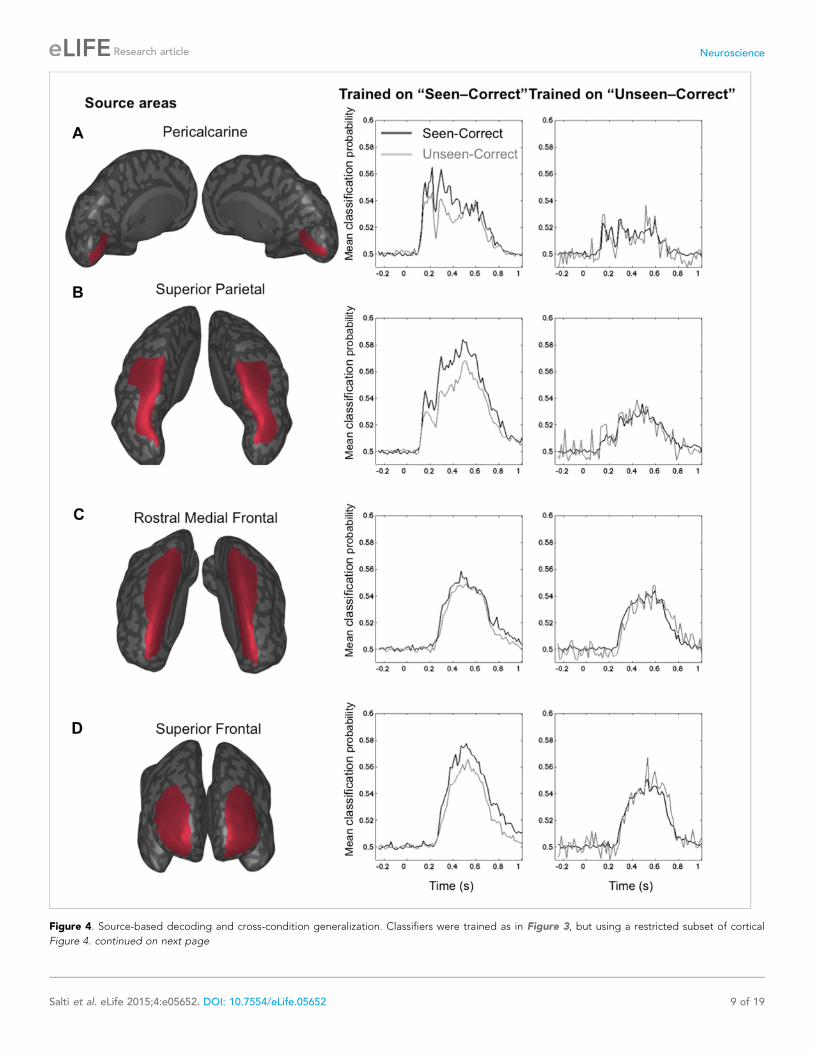
Figure 4. Source-based decoding and cross-condition generalization. Classifiers were trained as in Figure 3, but using a restricted subset of cortical
Figure 4. continued on next page
Salti et al. eLife 2015;4:e05652. DOI: 10.7554/eLife.05652 9 of 19
Research article Neuroscience
regions, supporting the prior finding that these regions contain retinotopic maps (Sereno et al., 1995;
Hagler and Sereno, 2006). Importantly, however, our results show that there is no specific region
uniquely dedicated to the encoding of consciously perceived information. Instead, a better encoding
on seen trials is obtained in the same overall sectors of the superior parietal cortex and superior
frontal cortex that also contain location information on unseen–correct trials (i.e., blindsight trials).
Again, the key difference is asymmetrical generalization, indicating the presence of superior encoding
of spatial information on seen trials, only in dorsal parietal and frontal regions. This pattern primarily
occurs in the late time window (beyond 270 ms), but it is already present at early stages of processing
in the superior parietal cortex.
Generalization across timeAccording to the GNW model, conscious access corresponds to an amplification and broadcasting of
the selected information. Conscious processing is, therefore, predicted to consist in a series of
information-processing stages, each associated with the settling of brain activity into a temporary
metastable state (stable for a duration of ∼100–300 ms), which allows the information to be flexibly
transmitted to the appropriate specialized processors (Dehaene et al., 2014). The series of
processing stages may differ as a function of task demands and may include verbal report (Frassle
et al., 2014), executive control (Van Gaal et al., 2010), or meta-cognitive evaluation (Charles et al.,
2014). On unconscious trials, the accumulation of incoming activation would fail to attain the critical
threshold level needed to trigger such a discrete series of stages (‘failed ignition’), and the
unconscious information would, therefore, decay over a period of a few hundreds of milliseconds
(Dehaene and Naccache, 2001).
To evaluate those predictions concerning the dynamics and transient stability of internal codes, we
used the temporal generalization method (King and Dehaene, 2014). This method consists in
probing if a classifier trained at a certain time point t can generalize to other time points, t′. If therepresentation is stable, the classifier should remain efficient even if applied at a different latency. If,
however, the information is successively re-encoded in a series of different brain systems, then we
should see a failure of generalization beyond a certain temporal duration (i.e., away from the diagonal
where t = t′) (King and Dehaene, 2014). We, therefore, quantified the endurance of conscious and
unconscious representations by training and testing classifiers on all pairs of time samples (t,t′). Tomeasure a classifier’s durability independently of classification efficacy, we defined Classification
Endurance (CE), as the number of samples forward and backward in time, for which decoding
performance remained above 50% of its level at the original training time (t = t′)—that is, the
decoder’s half-life time.
Matrices of temporal generalization (Figure 5) indicated that, up to 272 ms, decoding was narrowly
restricted to the diagonal for both seen and unseen trials, suggesting a fast-changing chain of
perceptual processes (King and Dehaene, 2014) consistent with a feedforward propagation of
unconscious location information. Beyond this point and up to ∼800 ms post stimulus, classifiers
generalized to a wider neighborhood of latencies, consistent with the entry of information into
evidence accumulation systems with longer time constants. The generalization pattern was examined
using an analysis of variance conducted on CE in the 272–800-ms time window with factors of Visibility
(Seen/Unseen), Direction (Forward/Backward in time), and Timeframe (5 successive time windows)
(see Figure 5—figure supplement 1 for statistics). All main effects and their interactions were
significant. On average, CE was larger for generalization forward than for generalization backward
and also increased in time. We were mainly interested in the different generalization patterns of the
‘Seen–Correct’ and ‘Unseen–Correct’ trials. Surprisingly, generalization was more extended in time
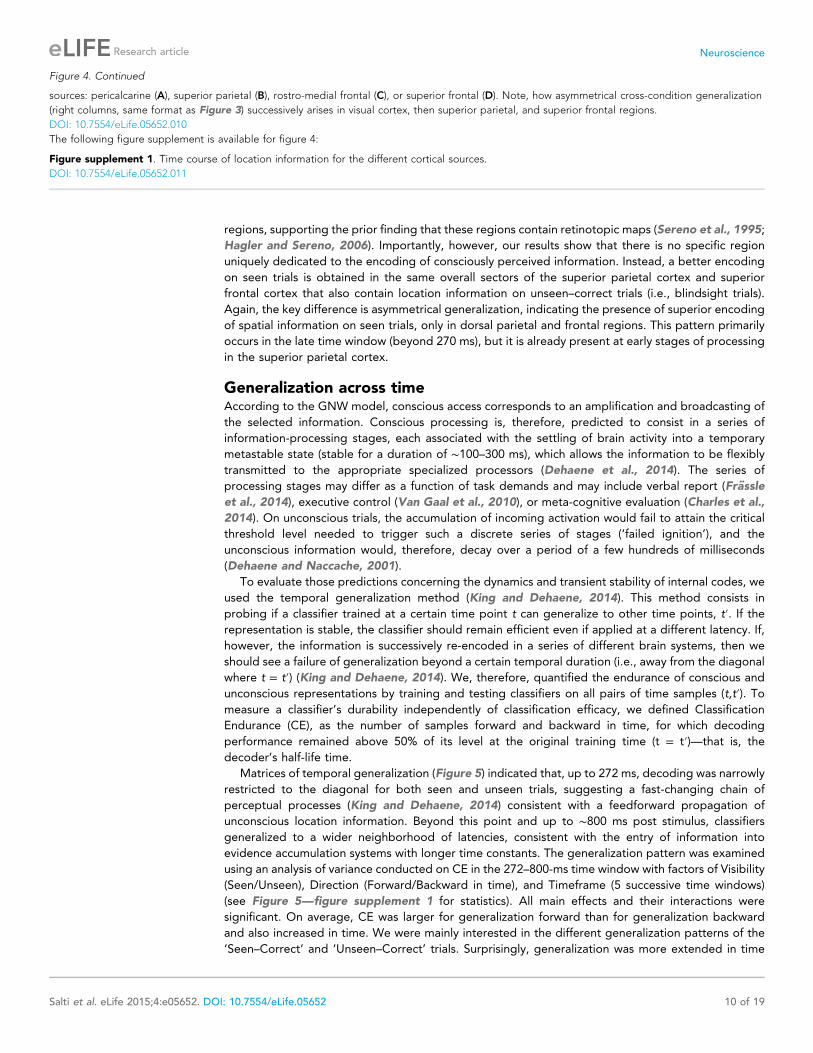
Figure 4. Continued
sources: pericalcarine (A), superior parietal (B), rostro-medial frontal (C), or superior frontal (D). Note, how asymmetrical cross-condition generalization
(right columns, same format as Figure 3) successively arises in visual cortex, then superior parietal, and superior frontal regions.
DOI: 10.7554/eLife.05652.010
The following figure supplement is available for figure 4:
Figure supplement 1. Time course of location information for the different cortical sources.
DOI: 10.7554/eLife.05652.011
Salti et al. eLife 2015;4:e05652. DOI: 10.7554/eLife.05652 10 of 19
Research article Neuroscience

Figure 5. Generalization of location decoding over time. 8-location classifiers trained at a specific time were then
tested on data from all other time points. (A) Average classification probability as a function of testing time for each
training time (the diagonal, where testing time = training time, gives the curve for classical decoder performance
over time). (B) Same information plotted as a function of temporal distance from training time (positive or negative),
with asterisks indicating the Classification Endurance (CE) measure. (C) Tentative model of a sequence of brain
activations, which could yield the observed generalization matrices.
DOI: 10.7554/eLife.05652.012
The following figure supplements are available for figure 5:
Figure supplement 1. Analysis of variance (ANOVA) on Classification Endurance (CE).
DOI: 10.7554/eLife.05652.013
Figure supplement 2. ANOVAs on CE with factors of Visibility (Seen–Correct vs Unseen–Correct) and Timeframe (5
levels), separately for forward and backward generalization.
DOI: 10.7554/eLife.05652.014
Figure supplement 3. Significance Values of the Effect of Timeframe (5 levels) for forward and backward
generalization in Seen and unseen trials.
DOI: 10.7554/eLife.05652.015
Salti et al. eLife 2015;4:e05652. DOI: 10.7554/eLife.05652 11 of 19
Research article Neuroscience
for unseen trials. Forward generalization showed a larger CE in unseen trials compared to seen trials
(mean = 382 ms vs 201 ms, p < 0.005), and the same pattern was apparent for backward
generalization to a lesser extent (mean = 159 ms vs 78 ms, p < 0.05) (see Figure 5—figure
supplement 2 for statistics). Furthermore, in the forward direction, these differences interacted with
time. Forward CE was constant in seen trials, while for the unseen trials, it was linearly decreasing with
time. Backward CE did not differ for seen and unseen trials, but increased steadily as a function of
time (see Figure 5—figure supplement 3 for statistics).
Figure 5C shows a possible theoretical interpretation consistent with those results. The high level
of decoding observed on seen trials, over a long time window of ∼270–800 ms, combined with a low
level of off-diagonal temporal generalization beyond a fixed horizon of ∼160 ms, implies that
a conscious location is successively encoded by a series of about four distinct stages, each terminating
relatively sharply after a processing duration of ∼160 ms. Conversely, the lower decoding level and longer
endurance observed for unconsciously perceived stimuli indicate that they do not enter into the same
processing chain. The square pattern of the temporal generalization matrix on unseen trials (Figure 5A)
suggests that unconscious information lingers in a single representational state, which decays slowly over
time, thus yielding a paradoxically longer endurance than on seen trials in the forward direction. All of
these findings are consistent with the above predictions as well as with earlier decoding results indicating
a chain of additional processing stages unique to conscious trials (Charles et al., 2014). They suggest that
conscious access can be described as the entry of information into a dynamic routing system (Sackur and
Dehaene, 2009; Dehaene et al., 2014) in which information is stabilized, transferred to a processor,
exploited in a determined time, and then transferred again to the next stage. As described in
accumulation-of-evidence models of decision making (Shadlen and Kiani, 2011), a failure to attain
a threshold-level activation at one of these stages cuts the process short, prevents the attainment of
a conscious-level representation, and causes the information to linger and decay.
DiscussionPrevious experiments exploring the signatures of conscious access have primarily contrasted the
overall brain activity evoked by perceived and unperceived stimuli. However, this comparison may be
contaminated by non-specific attention, alerting, performance, and reporting confounds. The quest
for brain mechanisms of consciousness implies an isolation of neural populations that encodes the
details of subjective experience (Haynes, 2009). As an effort in this direction, we applied multivariate
decoding techniques in order to track the neural encoding of a conscious or unconscious
representation of stimulus location through time. To control over stimulus and performance
confounds, we capitalized on the blindsight phenomenon and selectively analyzed a large fraction
of trials with identical stimuli and accurate responses, which differed only in subjective reports of
seeing or not seeing the stimulus.
The results revealed that (1) the location of a briefly flashed stimulus can be accurately decoded
from MEG and EEG signals for up to 800 ms, whether or not the stimulus is seen. This finding is
coherent with the existence of multiple spatial maps in occipital, parietal, and frontal cortex (Sereno
et al., 1995; Hagler and Sereno, 2006). (2) Seen and unseen stimuli are initially encoded identically,
but after ∼270 ms, the information is selectively amplified on ‘seen’ trials. This observation replicates
and extends earlier observations with seen and unseen words, digits and pictures during masking (Del
Cul et al., 2007; Fisch et al., 2009), and the attentional blink (Sergent et al., 2005). (3) Asymmetrical
generalization indicates that shared spatial codes are active on unconscious and conscious trials, but
that conscious trials also contain additional neural codes for stimulus location that are absent or
weaker on unconscious trials. Source localization traces those conscious codes to superior parietal and
superior frontal cortex. While the present method does not allow us to decide whether the difference
is quantitative (the same codes are activated more strongly) or qualitative (additional neural codes are
recruited), they are convergent with the prior observation that, of the many maps for space in the
cortex, superior parietal and frontal maps are selectively amplified by attention, while earlier
retinotopic maps are activated in an automatic manner (Saygin and Sereno, 2008). (4) The dynamics
of cortical coding, as revealed by temporal generalization matrices (King and Dehaene, 2014), also
differs on seen and unseen trials: conscious information undergoes a series of representational
transformations, such that each decoder fails to generalize beyond ∼160 ms, while unconscious
information, although weaker, generalizes over a longer period.
Salti et al. eLife 2015;4:e05652. DOI: 10.7554/eLife.05652 12 of 19
Research article Neuroscience

The latter finding fits with earlier observations that only conscious stimuli can be passed through
a series of discrete information-processing stages (Sackur and Dehaene, 2009; De Lange et al.,
2011; Charles et al., 2014). The observed characteristic peak-to-end duration of about 160 ms is also
compatible with the finding that conscious percepts tend to be locked to an ongoing theta (∼4–7 Hz)
or high delta (∼1–3 Hz) rhythm (Melloni et al., 2007; Doesburg et al., 2009; Nakatani et al., 2014;
Sitt et al., 2014), which is also the frequency range of slow positive event-related potentials, such as
the P3. Doesburg et al. found that perceptual switching in a binocular rivalry paradigm corresponds to
the emergence of synchronized gamma rhythm embedded in theta envelope (Doesburg et al., 2009).
In an attentional blink paradigm, the synchrony of fast oscillations (beta and gamma) with slow activity
(theta and high delta) increased with practice, in parallel to improved stimulus visibility (Nakatani
et al., 2014). Theta activity was also shown to be higher on visible trials compared to invisible trials in
a masking paradigm (Melloni et al., 2007) and was successfully used to classify conscious vs
vegetative patients (Sitt et al., 2014). It thus seems plausible that conscious information is able to
enter into a series of computational stages that are betrayed by a series of theta- or delta-like peaks
(Dehaene and Sigman, 2012). Conversely, unconscious information fails to be sequentially
dispatched to the successive steps of a serial task and, therefore, remains blocked within a fixed
representational state, where it slowly decays. Behavioral priming studies confirm that unconscious
information lingers at detectable levels for hundreds of milliseconds (Greenwald et al., 1996) or even
seconds (Soto et al., 2011).
Our results are incompatible with theories that postulate identical codes for conscious and
unconscious information, which would only be distinguished by second-order metacognitive tags
(Lau and Passingham, 2006). They fit with theories that postulate that a conscious episode is
distinguished by an amplification of incoming sensory information, possibly through reverberating
loops (Lamme, 2006), and its distributed representation in multiple distinct regions including parietal
and prefrontal cortices (Dehaene and Naccache, 2001; Dehaene et al., 2006). These results are
highly convergent with intracranial local-field potentials and single-neuron recordings during
binocular rivalry and continuous flash suppression (Sheinberg and Logothetis, 1997; Kreiman
et al., 2002; Panagiotaropoulos et al., 2012), which indicate that late neural discharges in higher
cortical areas reflect which of two rivaling images are subjectively perceived. In the case of object
identity, decodable neural activity is found in inferior and anterior temporal cortex (Sheinberg and
Logothetis, 1997; Kreiman et al., 2002) but also in prefrontal cortex (Panagiotaropoulos et al.,
2012) as reported here. Thus, this region appears at the confluence of conscious perception of object
identity and location, making it a primary candidate for the integrated perception of a unified
conscious scene or event (Oizumi et al., 2014).
While numerous previous studies have compared brain activity evoked by ‘seen’ and ‘unseen’
stimuli, the advantage of the present study is to specifically pursue the neural dynamics underlying
a specific conscious content (stimulus location). Figuratively speaking, one may say that previous
studies have extracted the ‘canvas’ on which conscious perception is painted, while our approach is
aimed at extracting the ‘painting’ itself. Nevertheless, this approach suffers from several limitations.
One of them is the low level of decodability achieved: single-trial EEG and MEG responses have a low
signal-to-noise ratio, which limits our inferences and would not afford, for instance, a reliable
brain–computer interface. Another limit of our design is that it reduces the rich experience associated
with conscious perception to a single feature of a very lean stimulus, presented at threshold, which is
the sole focus of attention and which is reported on every trial. Whether the present results would
generalize to broader real-life situations, especially in the absence of an overt report is an important
question for further research. Some recent experiments suggest that removing the need to report
radically reduces the neurophysiological correlates of conscious perception, including the P3b
component of event-related potentials, leaving only a posterior mid-latency component (Pitts et al.,
2012, 2014a, 2014b; Frassle et al., 2014). However, many of those experiments involved a dual task,
which is known to delay and dilute late ERPs (Sigman and Dehaene, 2008) and to distort conscious
access (Marti et al., 2010). It might be preferable to adopt a ‘passive attentive’ paradigm involving
mere attention without report. In such an auditory paradigm, late ERPs including the P3b component
were again found to contain decodable information about the conscious percept (Wacongne et al.,
2011; King et al., 2013). A correlation of late neurophysiological activity with perceptibility was also
obtained in a variety of neurophysiological studies of human visual perception (Quiroga et al., 2008;
Kouider et al., 2013) or rodent tactile perception (Manita et al., 2015). With due caution,
Salti et al. eLife 2015;4:e05652. DOI: 10.7554/eLife.05652 13 of 19
Research article Neuroscience

we, therefore, hypothesize that the neurophysiological correlates of conscious perception uncovered
here might be generalized to other experimental conditions.
Materials and methods
Participants17 right-handed healthy adults (10 men, 19–30 years of age) with no history of neurological or
psychiatric disorders participated the study. This study was ethically approved by CPP IDF 7 under the
reference CPP 08 021. All participants reported normal or corrected-to-normal visual acuity. The data
of 5 subjects were excluded due to failure in calibration, and these observers reported more than 85%
of the target trials as seen (even with maximum masking contrast). The intensity values to which
subjects were calibrated ranged from 0 to 227, mean 131.46 (SE = 19.76).
Stimuli and apparatusThe target stimulus was a line segment subtending a visual angle of 0.33˚, tilted by 45˚ to the left. On
target-present trials, the target was randomly presented at one of the eight possible locations. The
potential locations were allocated on the outline of an imaginary circle centered at the fixation point
with a radius of 2.85˚ of visual angle. Target locations were separated by radial angles of 45˚ with an
offset of 22.5˚ from the meridians. The mask comprised crosses, each subtending 0.5˚ of visual angle,
always present at all the eight possible locations. The fixation cross subtended 0.15˚ of visual angle.
On target-absent trials, only the mask was displayed. All stimuli but the mask were black on white
background; mask contrast was determined individually for each subject in a calibration phase.
Stimuli were generated offline using Matlab (MathWorks, Natick, MA), and their presentation was
controlled using the Psychtoolbox package for Matlab (Brainard, 1997). Stimuli were presented
with a Panasonic PT D7700E-K video projector (refresh rate 60 Hz) to a backprojection screen inside
the magnetically shielded at a distance of 1 m from the eyes of the subject. Behavioral responses
were collected with two 5-button cylindrical fiber optic response pads (‘fORP’; Current Designs Inc.,
Philadelphia, PA).
Experimental procedureAt the beginning of each trial, as an alerting signal, the fixation point was magnified twofold for
100 ms and then reverted to its normal size (fixation was present throughout the trial). 800 ms later,
the target was presented for 2 screen refresh cycles (∼33 ms). The mask followed immediately and
remained on the screen for 400 ms. A blank screen was presented for at least 1500 ms or until the first
response (retention period). Then, two consecutive images prompting the second and third responses
were presented until response. A new trial began 500 ms after the third response (see Figure 1).
As noted, three responses were collected on each trial. First, participants were required to produce
a speeded forced-choice response to the location of the target. The second response was a second-
order response, reporting whether the participants thought that their first response was correct or
incorrect. With the third response, participants had to indicate whether they had seen the target or
merely guessed its location.
Because of the procedure’s high task demand, the experiment was designed in a way that enabled
participants to adapt to it. We introduced responses in a gradual way, using a slide that explained the
nature of the specific response and a movie that illustrated the corresponding keys. The experiment
started with a description of the localization task, which was immediately practiced during an eight-
trial practice block. In this block, the mask contrast was set to zero, so targets were completely visible,
and participants had to correctly respond with the designated response-pad buttons. A correct
response turned the target’s color to green and an incorrect response turned it to red.
Next, participants were introduced to the second-order response and performed another training
block with three objectives: first, to continue the gradual adaptation to the task; second, to ensure
a fast, automatic response; third, to make sure that subjects complied with the task and caught their
occasional errors. In the training phase, the target was completely visible once again, and subjects had
to report its location and whether they made an error with their first response. Average localization
performance (RTs and accuracy) and average second-order report accuracy were calculated every
5 trials. If the participant localized the target correctly in all five trials, or his/hers average RT was
Salti et al. eLife 2015;4:e05652. DOI: 10.7554/eLife.05652 14 of 19
Research article Neuroscience

above 800 ms, a slide appeared before the next training block encouraging him/her to respond faster.
On the other hand, if the participant localized the target correctly in less than four trials, the slide
prompted him/her to respond slower. If participant’s second-order report was correct in less than four
of the trials, then the slide urged the participant to be more accurate with his/her second-order
report. Training ended after 16 blocks or if the average performance during the last 4 blocks had
reached specific criteria of localization performance between 85% and 95%, average RT below 800 ms
and the second-order report correct in more than 90% of trials.
Following the training, participants were introduced to the subjective visibility response and started
a calibration phase. The calibration phase was designed to determine the mask contrast that would yield
an approximately equal number of trials in which the target stimulus would be seen or not seen (a 50%
detection threshold). A trial was considered as a ‘Seen’ trial if the participant reported that he/she had
seen the target and had correctly localized it, or if he/she reported the target as seen, failed to correctly
localize it, but detected the error. We used a modified version of the threshold estimation procedure
described by Levitt (Levitt, 1971), changing mask contrast according to participant’s ‘Seen’ trials
proportion in a block. We manipulated contrast by adjusting the pixel intensity values in a unified
fashion. Initial intensity was set to 230 (range 0–255). The number of trials in each block increased as
calibration persisted, so the first two blocks comprised four trials, the third block six trials, the forth eight
trials, and from the fifth block on, all blocks comprised ten trials. The change in Red Green Blue (RGB)
values was determined by the proportion of seen trials in a block, and the number of calibration blocks
that participant had already completed. The maximal possible change after a single block was 80. This
kind of change was applied when the proportion of seen trials was either 1 or 0. However, this maximal
value decreased as the number of blocks participant has completed increased. The stopping rule for the
calibration was that RGB change was smaller than 1.5, or subjects had completed 80 trials.
After mask contrast was determined, participant started the experimental phase where the
contrast was fixed. The experimental phase was similar to the calibration phase with the following
changes: it included 540 trials divided into 6 blocks, 1/9 of these trials were catch trials.
MEG/EEG acquisitionMEG and EEG data were low-pass filtered at 330 Hz and recorded simultaneously at 1000-Hz
sampling rate with a 306-channel Elekta Neuromag MEG system (Elekta Oy, Helsinki, Finland), which
comprises 102 triple sensors (each with two orthogonal planar gradiometers and one magnetometer)
in a helmet-shaped array. Four head position indicator coils were placed on the scalp of the subject,
and their locations were digitized with respect to anatomical landmarks prior to the MEG recording.
By briefly energizing the coils, the head position was measured at the beginning of each block. EEG
signal was recorded from 60 electrodes that were referenced to the nose. The ground electrode was
on the clavicle bones. Horizontal and vertical EOG and electrocardiogram (ECG) were also recorded
for offline rejection of eye movements and cardiac artifacts.
PreprocessingAcquired data were processed with the MaxFilter software package (Elekta Oy) that implements the
Signal Space Separation (SSS) method (Taulu et al., 2004) to suppress ambient magnetic
interference. Gradiometers and magnetometers with amplitudes continuously exceeding 3000 fT/
cm and 3000 fT, respectively, were marked as bad channels and were interpolated by SSS. Eye blinks,
eye movements, and cardiac activity were detected on the EOG and ECG channels, and to suppress
these artifacts, data were averaged with respect to the onset of each artifact separately, and PCA was
used to determine the dominant components of these artifacts in the MEG/EEG signals. One to three
components were removed according to visual inspection.
Using Fieldtrip software (Oostenveld et al., 2011), continuous data were low-pass filtered at 30 Hz
and cut to 2.5-s epochs starting 500 ms before the stimulus onset. Data were downsampled to 64 Hz.
EEG data from one subject were omitted due to technical problems. Thus, data from 12 subjects were
analyzed, with one subject missing EEG data.
To combine data from MEG magnetometer and planar gradiometers as well as from EEG channels,
a normalization procedure was first applied; the baseline standard deviation was estimated for each
channel using all the trials in the experiment, and then all the samples were divided by this standard
deviation to yield a z-score, which was entered in the classification algorithm.
Salti et al. eLife 2015;4:e05652. DOI: 10.7554/eLife.05652 15 of 19
Research article Neuroscience

ClassificationWe used a multivariate classification procedure to characterize the temporal dynamics of information
processing when the stimulus was perceived consciously vs unconsciously. A distinct classifier was trained
for each subject and for each time sample, using the data from all sensors. In all analyses, we employed
a linear support vector machine (SVM) algorithm (with cost parameter C = 1) that was complemented with
a continuous output method providing for each sample tested the probability of belonging to each of the
possible classes (i.e., spatial locations) (Platt, 1999). Classification was done with the package libsvm
(Chang and Lin, 2011). The data were randomly divided into 15 non-overlapping folds; the classifier was
trained on fourteenfolds and tested on the one that was left out; this procedure was repeated 15 times for
each time sample, so all fifteenfolds were eventually used for testing.
In the first analysis, the classifier was trained on all the data (except of the test data) and eight output
classes (locations). The general classification probability for the correct location was then split according
to participants’ subjective reports of visibility and their performance in the forced-choice task.
The second analysis was aimed at examining cross-condition generalization, that is, whether the
features that are used to decode spatial location in one condition of visibility are the same as those used
in the other. Since the experimental conditions were defined by subjects’ responses, the number of trials
at each location was no longer balanced within each of these conditions, and this imbalance affected the
pre-stimulus bias of the 8-category classifier as well as its capacity to generalize. To address this
problem, we turned to a simpler binary classifier, which was trained to simply sort the stimuli into left-
hemifield vs right-hemifield stimuli. Within each subject, we matched the number of trials in these two
classes and also selected equal numbers of seen–correct and unseen–correct trials. Similarly to the
previous analysis, for each perceptual condition, the data were divided into fifteenfolds; the classifier
was trained on 14 and tested on the one left out and additionally on the converse perceptual condition.
A third analysis aimed to find out in which cortical regions the processing of seen and unseen
stimuli differed. We tested the roles of each region by running decoding analyses separately on
sources confined to this region.
We first parceled the cortex into 68 regions with FreeSurfer (Desikan–Killiany atlas). This
parcellation is based on cortical curvature patterns that are estimated from individual MRI surface
reconstructions. While these are large regions, the precision of MEG source reconstruction, combined
with the requirements of the decoding approach, does not afford a very small focus. Smaller regions
generally did not contain enough reconstructed dipoles with distinctive information to support
accurate decoding. Neuronal current sources underlying single-trial MEG and EEG signals were
estimated using linear minimum-norm estimates with fixed cortical source orientations. A three-layer
volume conductor model based on individual head geometry was used in the forward computations
(MNE-Suite [Gramfort et al., 2014] Matlab toolbox). Noise covariance was estimated from the baseline
periods of all accepted trials. We then ran an individual decoding analysis for each of the 68 regions. The
estimated current distribution within a ROI at a given latency was fed to the same SVM analyses as for
the sensor-level data. The results with eight output classes confirmed the existence of early focal and
late distributed location-coding stages (see Figure 4—figure supplement 1). To avoid an unnecessary
increase in the number of statistical tests, we confined the subsequent analyses of seen and unseen
trials, to four a priori regions of interest: pericalcarine, superior parietal cortex, rostral medial frontal
cortex, and superior-lateral frontal cortex. In the latter case, the decoder outputs were calibrated class
probabilities for ‘Seen–Correct’ and ‘Unseen–Correct’ classes after 10-fold cross-validation.
The fourth type of analysis aimed to test the stability over time. As in the first analysis, data from all
trials were used to train classifiers at each time point ranging from 200 ms before to 1500 ms after the
target and then test generalization to every other time point, as described in (King and Dehaene,
2014; King et al., 2014).
Two additional control analyses were conducted. First, we used cross-condition generalization to
ensure that the classification performance was not derived from brain activity related to response
selection but instead from neural activity related to perceptual processes. Therefore, we trained
classifiers on the perceptual conditions and tested them on catch trials where the target was absent,
but that were labeled according to the location of the participants’ responses (8 possibilities).
A second analysis was aimed to check whether superior posterior decoding probability for the
‘Seen–Correct’ correct trials rose from eye movements. To this aim, we fed the same classifier solely
with EOG data, namely horizontal and vertical electro-oculograms.
Salti et al. eLife 2015;4:e05652. DOI: 10.7554/eLife.05652 16 of 19
Research article Neuroscience
AcknowledgementsThe authors express their gratitude to the UNICOG Consciousness team (Sebastien Marti, Aaron
Schurger and Jaco Sitt) for their advice and insights and to NeuroSpin’s support teams, particularly
the LBIOM team for subject recruitment and the MEG team (Virginie van Wassenhove, Marco Buiatti,
Leila Rogeaux) for data acquisition and analysis. Supported by INSERM, CEA, College de France,
Fyssen grant to MS, DGA to JRK, an ERC grant ‘NeuroConsc’ to SD, Foundation Bettencourt-
Schueller and the Roger de Spoelberch Foundation.
Additional information
Funding
Funder Grant reference Author
Fondation Fyssen Moti Salti
European Research Council (ERC) NeuroConsc Stanislas Dehaene
Direction Generale del’Armement
Jean-Remi King
The funders had no role in study design, data collection and interpretation, or thedecision to submit the work for publication.
Author contributions
MS, Conception and design, Acquisition of data, Analysis and interpretation of data, Drafting or
revising the article; SM, J-RK, Analysis and interpretation of data, Drafting or revising the article; LC,
Acquisition of data, Drafting or revising the article; LP, SD, Conception and design, Analysis and
interpretation of data, Drafting or revising the article
Ethics
Human subjects: The study was approved by the by CPP IDF under the reference CPP 08 021. All
subjects gave written informed consent and consent to publish before participating in the study.
ReferencesAru J, Bachmann T, Singer W, Melloni L. 2012. Distilling the neural correlates of consciousness. Neuroscience andBiobehavioral Reviews 36:737–746. doi: 10.1016/j.neubiorev.2011.12.003.
Brainard DH. 1997. The psychophysics toolbox. Spatial Vision 10:433–436. doi: 10.1163/156856897X00357.Chang CC, Lin CJ. 2011. LIBSVM: a library for support vector machines. ACM Transactions on Intelligent Systemsand Technology 2:27. doi: 10.1145/1961189.1961199.
Charles L, King J-R, Dehaene S. 2014. Decoding the dynamics of action, intention, and error detection forconscious and subliminal stimuli. The Journal of Neuroscience 34:1158–1170. doi: 10.1523/JNEUROSCI.2465-13.2014.
Cowey A, Stoerig P. 1995. Blindsight in monkeys. Nature 373:247–249. doi: 10.1038/373247a0.De Lange FP, van Gaal S, Lamme VA, Dehaene S. 2011. How awareness changes the relative weights of evidenceduring human decision-making. PLOS Biology 9:e1001203. doi: 10.1371/journal.pbio.1001203.
Dehaene S, Changeux JP. 2011. Experimental and theoretical approaches to conscious processing. Neuron 70:200–227. doi: 10.1016/j.neuron.2011.03.018.
Dehaene S, Changeux JP, Naccache L, Sackur J, Sergent C. 2006. Conscious, preconscious, and subliminalprocessing: a testable taxonomy. Trends in Cognitive Sciences 10:204–211. doi: 10.1016/j.tics.2006.03.007.
Dehaene S, Charles L, King J-R, Marti S. 2014. Toward a computational theory of conscious processing. CurrentOpinion in Neurobiology 25:76–84. doi: 10.1016/j.conb.2013.12.005.
Dehaene S, Naccache L. 2001. Towards a cognitive neuroscience of consciousness: basic evidence anda workspace framework. Cognition 79:1–37. doi: 10.1016/S0010-0277(00)00123-2.
Dehaene S, Sigman M. 2012. From a single decision to a multi-step algorithm. Current Opinion in Neurobiology22:937–945. doi: 10.1016/j.conb.2012.05.006.
Dehaene S, Sergent C, Changeux JP. 2003. A neuronal network model linking subjective reports and objectivephysiological data during conscious perception. Proceedings of the National Academy of Sciences of USA 100:8520–8525. doi: 10.1073/pnas.1332574100.
Del Cul A, Baillet S, Dehaene S. 2007. Brain dynamics underlying the nonlinear threshold for access toconsciousness. PLOS Biology 5:e260. doi: 10.1371/journal.pbio.0050260.
Doesburg SM, Green JJ, McDonald JJ, Ward LM. 2009. Rhythms of consciousness: binocular rivalry reveals large-scaleoscillatory network dynamics mediating visual perception. PLOS One 4:e6142. doi: 10.1371/journal.pone.0006142.
Salti et al. eLife 2015;4:e05652. DOI: 10.7554/eLife.05652 17 of 19
Research article Neuroscience

Fahrenfort JJ, Snijders TM, Heinen K, van Gaal S, Scholte HS, Lamme VA. 2012. Neuronal integration in visualcortex elevates face category tuning to conscious face perception. Proceedings of the National Academy ofSciences of USA 109:21504–21509. doi: 10.1073/pnas.1207414110.
Fisch L, Privman E, Ramot M, Harel M, Nir Y, Kipervasser S, Andelman F, Neufeld MY, Kramer U, Fried I, Malach R.2009. Neural “ignition”: enhanced activation linked to perceptual awareness in human ventral stream visualcortex. Neuron 64:562–574. doi: 10.1016/j.neuron.2009.11.001.
Frassle S, Sommer J, Jansen A, Naber M, Einhauser W. 2014. Binocular rivalry: frontal activity relates tointrospection and action but not to perception. The Journal of Neuroscience 34:1738–1747. doi: 10.1523/JNEUROSCI.4403-13.2014.
Friston K. 2005. A theory of cortical responses. Philosophical Transactions of the Royal Society of London. Series B,Biological Sciences 360:815–836. doi: 10.1098/rstb.2005.1622.
Gramfort A, Luessi M, Larson E, Engemann D, Strohmeier D, Brodbeck C, Parkkonen L, Hamalainen M. 2014. MNEsoftware for processing MEG and EEG data. Neuroimage 86:446–460. doi: 10.1016/j.neuroimage.2013.10.027.
Greenwald AG, Draine SC, Abrams RL. 1996. Three cognitive markers of unconscious semantic activation. Science273:1699–1702. doi: 10.1126/science.273.5282.1699.
Hagler DJ, Sereno MI. 2006. Spatial maps in frontal and prefrontal cortex.Neuroimage 29:567–577. doi: 10.1016/j.neuroimage.2005.08.058.
Haynes JD, Rees G. 2006. Decoding mental states from brain activity in humans. Nature Reviews. Neuroscience 7:523–534. doi: 10.1038/nrn1931.
Haynes JD. 2009. Decoding visual consciousness from human brain signals. Trends in Cognitive Sciences 13:194–202. doi: 10.1016/j.tics.2009.02.004.
Kamitani Y, Tong F. 2005. Decoding the visual and subjective contents of the human brain. Nature Neuroscience 8:679–685. doi: 10.1038/nn1444.
King J-R, Dehaene S. 2014. Characterizing the dynamics of mental representations: the temporal generalizationmethod. Trends in Cognitive Sciences 18:203–210. doi: 10.1016/j.tics.2014.01.002.
King JR, Gramfort A, Schurger A, Naccache L, Dehaene S. 2014. Two distinct dynamic modes subtend thedetection of unexpected sounds. PLOS One 9:e85791. doi: 10.1371/journal.pone.0085791.
King JR, Faugeras F, Gramfort A, Schurger A, El Karoui I, Sitt JD, Rohaut B, Wacongne C, Labyt E, Bekinschtein T,Cohen L, Naccache L, Dehaene S. 2013. Single-trial decoding of auditory novelty responses facilitates thedetection of residual consciousness. Neuroimage 83:726–738. doi: 10.1016/j.neuroimage.2013.07.013.
Koch C. 2004. The quest for consciousness: a neurobiological approach. New York: Roberts & co.Kouider S, Stahlhut C, Gelskov SV, Barbosa LS, Dutat M, De Gardelle V, Christophe A, Dehaene S, Dehaene-Lambertz G. 2013. A neural marker of perceptual consciousness in infants. Science 340:376–380. doi: 10.1126/science.1232509.
Kreiman G, Fried I, Koch C. 2002. Single-neuron correlates of subjective vision in the human medial temporal lobe.Proceedings of the National Academy of Sciences of USA 99:8378–8383. doi: 10.1073/pnas.072194099.
Lamme VA. 2006. Towards a true neural stance on consciousness. Trends in Cognitive Sciences 10:494–501.doi: 10.1016/j.tics.2006.09.001.
Lamy D, Salti M, Bar-Haim Y. 2009. Neural correlates of subjective awareness and unconscious processing: an ERPstudy. Journal of Cognitive Neuroscience 21:1435–1446. doi: 10.1162/jocn.2009.21064.
Lau HC, Passingham RE. 2006. Relative blindsight in normal observers and the neural correlate of visualconsciousness. Proceedings of the National Academy of Sciences of USA 103:18763–18768. doi: 10.1073/pnas.0607716103.
Lau H, Rosenthal D. 2011. Empirical support for higher-order theories of conscious awareness. Trends in CognitiveSciences 15:365–373. doi: 10.1016/j.tics.2011.05.009.
Laureys S, Owen AM, Schiff ND. 2004. Brain function in coma, vegetative state, and related disorders. LancetNeurology 3:537–546. doi: 10.1016/S1474-4422(04)00852-X.
Levitt H. 1971. Transformed up-down methods in psychoacoustics. The Journal of the Acoustical Society ofAmerica 49:467–477. doi: 10.1121/1.1912375.
Manita S, Suzuki T, Homma C, Matsumoto T, Odagawa M, Yamada K, Ota K, Matsubara C, Inutsuka A, Sato M,Ohkura M, Yamanaka A, Yanagawa Y, Nakai J, Hayashi Y, Larkum ME, Murayama M. 2015. A top-down corticalcircuit for accurate sensory perception. Neuron 86:1304–1316. doi: 10.1016/j.neuron.2015.05.006.
Marti S, Sackur J, Sigman M, Dehaene S. 2010. Mapping introspection’s blind spot: reconstruction of dual-taskphenomenology using quantified introspection. Cognition 115:303–313. doi: 10.1016/j.cognition.2010.01.003.
Melloni L, Molina C, Pena M, Torres D, Singer W, Rodriguez E. 2007. Synchronization of neural activity acrosscortical areas correlates with conscious perception. The Journal of Neuroscience 27:2858–2865. doi: 10.1523/JNEUROSCI.4623-06.2007.
Nakatani C, Raffone A, van Leeuwen C. 2014. Efficiency of conscious access improves with coupling of slow andfast neural oscillations. Journal of Cognitive Neuroscience 26:1168–1179. doi: 10.1162/jocn_a_00540.
Nieuwenhuis S, Gilzenrat MS, Holmes BD, Cohen JD. 2005. The role of the locus coeruleus in mediating theattentional blink: a neurocomputational theory. Journal of Experimental Psychology. General 134:291–307.doi: 10.1037/0096-3445.134.3.291.
Oizumi M, Albantakis L, Tononi G. 2014. From the phenomenology to the mechanisms of consciousness: integratedinformation theory 3.0. PLOS Computational Biology 10:e1003588. doi: 10.1371/journal.pcbi.1003588.
Oostenveld R, Fries P, Maris E, Schoffelen JM. 2011. FieldTrip:open source software for advanced analysis ofMEG, EEG, and invasive electrophysiological data. Computational Intelligence and Neuroscience 2011:156869.doi: 10.1155/2011/156869.
Salti et al. eLife 2015;4:e05652. DOI: 10.7554/eLife.05652 18 of 19
Research article Neuroscience

Panagiotaropoulos TI, Deco G, Kapoor V, Logothetis NK. 2012. Neuronal discharges and gamma oscillationsexplicitly reflect visual consciousness in the lateral prefrontal cortex. Neuron 74:924–935. doi: 10.1016/j.neuron.2012.04.013.
Pitts MA, Martinez A, Hillyard SA. 2012. Visual processing of contour patterns under conditions of inattentionalblindness. Journal of Cognitive Neuroscience 24:287–303. doi: 10.1162/jocn_a_00111.
Pitts MA, Metzler S, Hillyard SA. 2014a. Isolating neural correlates of conscious perception from neural correlatesof reporting one’s perception. Frontiers in Psychology 5:1078. doi: 10.3389/fpsyg.2014.01078.
Pitts MA, Padwal J, Fennelly D, Martınez A, Hillyard SA. 2014b. Gamma band activity and the P3 reflect post-perceptual processes, not visual awareness. Neuroimage 101:337–350. doi: 10.1016/j.neuroimage.2014.07.024.
Platt JC. 1999. Fast training of support vector machines using sequential minimal optimization. Advances in kernelmethods: MIT press. p. 185–208.
Quiroga RQ, Mukamel R, Isham EA, Malach R, Fried I. 2008. Human single-neuron responses at the threshold ofconscious recognition. Proceedings of the National Academy of Sciences of USA 105:3599–3604. doi: 10.1073/pnas.0707043105.
Rossetti Y. 1998. Implicit short-lived motor representations of space in brain damaged and healthy subjects.Consciousness and Cognition 7:520–558. doi: 10.1006/ccog.1998.0370.
Sackur J, Dehaene S. 2009. The cognitive architecture for chaining of two mental operations. Cognition 111:187–211. doi: 10.1016/j.cognition.2009.01.010.
Saygin AP, Sereno MI. 2008. Retinotopy and attention in human occipital, temporal, parietal, and frontal cortex.Cerebral Cortex 18:2158–2168. doi: 10.1093/cercor/bhm242.
Sereno MI, Dale AM, Reppas JB, Kwong KK, Belliveau JW, Brady TJ, Rosen BR, Tootell RB. 1995. Borders ofmultiple visual areas in humans revealed by functional magnetic resonance imaging. Science 268:889–893.doi: 10.1126/science.7754376.
Sergent C, Baillet S, Dehaene S. 2005. Timing of the brain events underlying access to consciousness during theattentional blink. Nature Neuroscience 8:1391–1400. doi: 10.1038/nn1549.
Shadlen MN, Kiani R. 2011. Consciousness as a decision to engage. In: Dehaene S, Christen Y, editors.Characterizing Consciousness: From Cognition to the Clinic? Berlin Heidelberg: Springer Verlag. p. 27–46.
Sheinberg DL, Logothetis NK. 1997. The role of temporal cortical areas in perceptual organization. Proceedings ofthe National Academy of Sciences of USA 94:3408–3413. doi: 10.1073/pnas.94.7.3408.
Sigman M, Dehaene S. 2008. Brain mechanisms of serial and parallel processing during dual-task performance. TheJournal of Neuroscience 28:7585–7598. doi: 10.1523/JNEUROSCI.0948-08.2008.
Sitt JD, King J-R, El Karoui I, Rohaut B, Faugeras F, Gramfort A, Cohen L, Sigman M, Dehaene S, Naccache L. 2014.Large scale screening of neural signatures of consciousness in patients in a vegetative or minimally consciousstate. Brain 137:2258–2270. doi: 10.1093/brain/awu141.
Soto D, Mantyla T, Silvanto J. 2011. Working memory without consciousness. Current Biology 21:R912–R913.doi: 10.1016/j.cub.2011.09.049.
Taulu S, Kajola M, Simola J. 2004. Suppression of interference and artifacts by the signal space separation method.Brain Topography 16:269–275. doi: 10.1023/B:BRAT.0000032864.93890.f9.
Van Gaal S, Lamme VA, Fahrenfort JJ, Ridderinkhof KR. 2010. Dissociable brain mechanisms underlying theconscious and unconscious control of behavior. Journal of Cognitive Neuroscience 23:91–105. doi: 10.1162/jocn.2010.21431.
Wacongne C, Labyt E, van Wassenhove V, Bekinschtein T, Naccache L, Dehaene S. 2011. Evidence for a hierarchyof predictions and prediction errors in human cortex. Proceedings of the National Academy of Sciences of USA108:20754–20759. doi: 10.1073/pnas.1117807108.
Weiskrantz L. 1996. Blindsight revisited. Current Opinion in Neurobiology 6:215–220. doi: 10.1016/S0959-4388(96)80075-4.
Salti et al. eLife 2015;4:e05652. DOI: 10.7554/eLife.05652 19 of 19
Research article Neuroscience