Dissertation: A Flute Runs Through It, Sometimes... Understanding Folsom-Era Stone Tool Variation
356
A Flute Runs Through It, Sometimes… Understanding Folsom-Era Stone Tool Variation A Dissertation Presented for the Doctor of Philosophy Degree The University of Tennessee, Knoxville Robert Detlef Lassen December 2013
Transcript of Dissertation: A Flute Runs Through It, Sometimes... Understanding Folsom-Era Stone Tool Variation

A Flute Runs Through It, Sometimes… Understanding Folsom-Era Stone Tool Variation
A Dissertation Presented for the
Doctor of Philosophy
Degree
The University of Tennessee, Knoxville
Robert Detlef Lassen
December 2013

ii
DEDICATION
This dissertation is dedicated to my parents, Peter and Carol Lassen, for all their love and
support, and for their heartwarming acceptance of my beloved career choice.

iii
ACKNOWLEDGEMENTS
I must extend my heartfelt appreciation to my advisor, David Anderson, whose
knowledge, guidance, friendship, and mead made all of this possible. I am also thankful for his
eagerness to work with me despite my choosing a topic that is slightly removed from the
southeastern United States. My thanks also goes to the other members of dissertation committee:
Boyce Driskell, Gerald Schroedl, Theodore Labotka, and Michael Collins, who have provided
valuable insight and advice in the course of my studies.
All my friends at the University of Tennessee deserve acknowledgement for keeping me
sane over the years and for being willing to bounce ideas back and forth as I drifted between
hypotheses, some more silly than others. Particularly, Katie Corcoran, Thaddeus Bissett, Doug
Sain, Amanda Reinke, Bobby Braly, Erik Johanson, Jessica Dalton-Carriger, Sean Cary Gunter,
Sarah Walters, Kimberly Wren, and Katherine McMillan Barry get my thanks for all our
important and not-so-important discussions.
A big thanks goes to everyone at the Gault School of Archaeological Research. As
mentioned already, Michael Collins has been an unending source of wisdom on all things
Folsom, Midland, and beyond (not to mention bad puns). Nancy Velchoff, Clark Wernecke,
Sergio Ayala, Tom Williams, Andy Speer, Jennifer Gandy, Steve Howard, Toni Fischer, Jon
Lohse, and Ashley Lemke have all been a big help between our lab discussions and “brain trust”
meetings. A special thanks goes to Anna Gilmer for her helpful proofreading and hummus, and
another goes to Jen Boehle Anderson for compressing my artifact photos. Finally, Brit Bousman
of Texas State University provided useful suggestions for my statistical analyses.

iv
A lot of travel was required to make this dissertation possible, and every individual I
encountered was extremely gracious and accommodating. First, the folks at TARL in Austin get
my appreciation for granting me access to numerous assemblages from Texas and beyond.
Particularly Laura Nightengale, Diane Ruetz, and Carolyn Spock were instrumental in providing
me with the passes, artifacts, and documents I needed to conduct my research. Richard Rose of
Midland was kind enough to let me into his home to study the Shifting Sands assemblage, as
well as a host of other Folsom and Midland materials. Jim Warnica gave me the opportunity to
photograph his Folsom materials during my visit to Blackwater Draw. Bruce Huckell took the
time to let me visit his office at the University of New Mexico to analyze the Rio Rancho, Boca
Negra Wash, and Deann’s site materials. Sue Weissinger of the No Man’s Land Museum in
Goodwell, Oklahoma was kind enough to grant me access to the Folsom and Midland materials
from the Baker Collection. Steve Holen and Isabel Tovar were essential in helping me navigate
the collections at the Denver Museum, and our discussions were greatly appreciated. Tom
Westfall was an amazing host and allowed me to spend several days with his collection at his
home on short notice. Marcel Kornfeld, Nicole Waguespack, and George Frison managed to
squeeze me into their tight schedules to allow me to look at the Folsom materials at the
University of Wyoming. Wendi Murray and rest of the staff at the State Historical Society of
North Dakota made me feel right at home even though I was far from it. Jim Cox of Norman,
Oklahoma went well out of his way to give me the opportunity to examine his Folsom collection,
and Liz Leith was kind enough to show me around the Sam Noble Museum. Finally, Dennis
Stanford, Pegi Jodry, Joe Gingrich, and Judy Knight were all extremely helpful during my visit
to the Smithsonian, and I would have been lost without them.

v
ABSTRACT
This dissertation addresses the “Folsom-Midland Problem,” in which two distinct
varieties of stone projectile points occur together in many Folsom-age sites from the terminal
Pleistocene in North America. In order to understand why these point types co-occur, a sample
of measurements and photographs of 1,093 artifacts including points, preforms, and ultrathin
bifaces has been amassed from 27 archaeological sites and three private collections across the
Great Plains region of the United States. Analysis of the Folsom and Midland diagnostic
artifacts from the Gault site in Central Texas provides the basis of subsequent analyses of the
larger sample and indicates that the Folsom-Midland dichotomy is too simplistic to encompass
the technological variation that was present during this period. Instead, Folsom-era point forms
are subdivided into the following varieties: Folsom, Midland, unifacially fluted, pseudo-fluted,
and miniature.
Technological analyses of the total sample indicate that the five Folsom-era point types
have slightly different morphologies on average with regard to maximum width, basal width, and
edge grinding, suggesting that they may have been hafted differently. An analysis of
flintknapping skill for each of the point types indicates that Folsom points consistently emerge as
the most skillfully made on average, followed by unifacially fluted, Midland, and pseudo-fluted,
respectively. Raw materials analysis reveals that Folsom points are more often made from a
wider variety of raw materials than the other point types, while Midland points are more often
made from the most abundant raw materials than the other points. This difference appears to be
the result of Folsom preforms being carried in an unfinished state for some time before being
completed and employed as points, while the other point types are more often completed in one

vi
sitting and hafted immediately. Regional analyses show that Midland and miniature points are
more common in the southern part of the Folsom geographic range, but there is no a discernible
correlation with Folsom radiocarbon dates or faunal remains. Overall, flintknapping skill is
determined to be the most significant factor in Folsom-era projectile point variation, although
differing morphologies and raw material use also contribute to this variation.

vii
TABLE OF CONTENTS
CHAPTER 1: INTRODUCTION ................................................................................................... 1
History of Research in Folsom Technology ................................................................................ 2
The Role of Typology ................................................................................................................. 5
Organization of the Dissertation ................................................................................................. 8
CHAPTER 2: THE SAMPLE ....................................................................................................... 11
Type Descriptions ..................................................................................................................... 18
Variables.................................................................................................................................... 27
Projectile Point Variables ...................................................................................................... 27
Ultrathin Biface Variables ..................................................................................................... 33
Repositories Visited .................................................................................................................. 34
Gault School of Archaeological Research ............................................................................. 35
Texas Archeological Research Laboratory (TARL) ............................................................. 35
Midland, Texas ...................................................................................................................... 37
Maxwell Museum of Anthropology ...................................................................................... 37
No Man’s Land Historical Society ........................................................................................ 37
Denver Museum .................................................................................................................... 37
Sterling, Colorado .................................................................................................................. 37
University of Wyoming ......................................................................................................... 38
State Historical Society of North Dakota .............................................................................. 38
Norman, Oklahoma ............................................................................................................... 38
Smithsonian Institution .......................................................................................................... 39
Sites and Collections ................................................................................................................. 39
Kincaid Rockshelter .............................................................................................................. 39
Pavo Real ............................................................................................................................... 40
Blackwater Draw ................................................................................................................... 40
The Lubbock Lake Landmark ............................................................................................... 41
Plainview ............................................................................................................................... 42
Bonfire Shelter ....................................................................................................................... 42

viii
Wilson-Leonard ..................................................................................................................... 43
Scharbauer ............................................................................................................................. 44
Shifting Sands ........................................................................................................................ 47
Rio Rancho ............................................................................................................................ 49
Boca Negra Wash and Deann’s Site ...................................................................................... 50
The Baker Collection ............................................................................................................. 51
Folsom Site ............................................................................................................................ 51
Lindenmeier ........................................................................................................................... 54
Westfall Site .......................................................................................................................... 58
Krmpotich .............................................................................................................................. 58
Two Moon ............................................................................................................................. 59
Hanson ................................................................................................................................... 60
Agate Basin............................................................................................................................ 60
Hell Gap ................................................................................................................................. 62
Barger Gulch .......................................................................................................................... 63
Big Black ............................................................................................................................... 64
Bobtail Wolf .......................................................................................................................... 65
Cedar Creek ........................................................................................................................... 66
Mud Springs .......................................................................................................................... 67
CHAPTER 3: THE GAULT SITE ............................................................................................... 68
Overview of Folsom and Midland at the Gault Site.................................................................. 68
Context ...................................................................................................................................... 73
Area 2 .................................................................................................................................... 76
Area 3 .................................................................................................................................... 76
Area 4 .................................................................................................................................... 77
Area 7 .................................................................................................................................... 78
Area 8 .................................................................................................................................... 78
Area 10 .................................................................................................................................. 84
Area 12 .................................................................................................................................. 84
Area 15 .................................................................................................................................. 84
Surface ................................................................................................................................... 85
ix
Summary ................................................................................................................................ 85
Technology ................................................................................................................................ 86
Typology ................................................................................................................................... 98
Discussion ............................................................................................................................... 103
Conclusion ............................................................................................................................... 106
CHAPTER 4: TECHNOLOGICAL ANALYSIS ....................................................................... 108
Quantitative Analysis .............................................................................................................. 108
Width ................................................................................................................................... 110
Thickness ............................................................................................................................. 115
Basal Width ......................................................................................................................... 122
Edge Grinding...................................................................................................................... 130
Summary for Full-Sized Points ........................................................................................... 132
Miniature Points .................................................................................................................. 133
Qualitative Analysis ................................................................................................................ 136
Point-Preform Comparisons ................................................................................................ 137
Deviations from “Stages” of Folsom Point Production ....................................................... 140
Ultrathin Biface Variation ................................................................................................... 142
Ultrathin Bifaces and Projectile Point Manufacture ............................................................ 146
The Folsom-Midland “Hybrids” .......................................................................................... 150
Summary for Qualitative Analysis ...................................................................................... 152
Conclusions ............................................................................................................................. 153
CHAPTER 5: SKILL ANALYSIS ............................................................................................. 155
Quantitative Skill Analysis ..................................................................................................... 162
Width/Thickness .................................................................................................................. 164
Flake Scars per 10 mm ........................................................................................................ 170
Mistake Ratio ....................................................................................................................... 176
Coefficient of Variation ....................................................................................................... 183
Miniature Points .................................................................................................................. 188
Summary for Quantitative Analysis .................................................................................... 190
Qualitative Skill Analysis........................................................................................................ 190
“Extra Fine” Points .............................................................................................................. 191

x
Percussion and Pressure Thinned Midland Points ............................................................... 194
Formal and Informal Pseudo-Fluted Points ......................................................................... 199
Summary for Qualitative Analysis ...................................................................................... 201
Conclusion ............................................................................................................................... 202
CHAPTER 6: RAW MATERIALS ANALYSIS ....................................................................... 204
Analysis Procedure for this Study ........................................................................................... 213
Analysis ................................................................................................................................... 215
Blackwater Draw ................................................................................................................. 215
Shifting Sands ...................................................................................................................... 217
Scharbauer ........................................................................................................................... 217
Wyche Ranch ....................................................................................................................... 222
Rio Rancho .......................................................................................................................... 224
Lindenmeier ......................................................................................................................... 226
Krmpotich ............................................................................................................................ 227
Hanson ................................................................................................................................. 227
Agate Basin.......................................................................................................................... 228
Hell Gap ............................................................................................................................... 232
Barger Gulch ........................................................................................................................ 232
Bobtail Wolf ........................................................................................................................ 232
Cedar Creek ......................................................................................................................... 238
Sulphur River ....................................................................................................................... 238
Mud Springs ........................................................................................................................ 238
Ultrathin Bifaces ..................................................................................................................... 251
Discussion ............................................................................................................................... 254
Directionality and Distance of Dominant Raw Materials ....................................................... 261
Conclusions ............................................................................................................................. 269
CHAPTER 7: REGIONAL ANALYSES ................................................................................... 270
Latitude/Longitude Analysis of Folsom-age Point Types ....................................................... 270
Radiocarbon Analysis ............................................................................................................. 284
Comparison of Point Types and Faunal Remains ................................................................... 293
Regional Occurrences of “Extra Fine” Projectile Points and Pristine Preforms ..................... 299

xi
Conclusions ............................................................................................................................. 305
CHAPTER 8: CONCLUSIONS ................................................................................................. 307
Revisiting Gault....................................................................................................................... 308
Revisiting the Technological Analysis .................................................................................... 311
Revisiting the Skill Analysis ................................................................................................... 313
Revisiting the Raw Material Analysis ..................................................................................... 314
Tying It All Together .............................................................................................................. 315
REFERENCES ........................................................................................................................... 320
VITA ........................................................................................................................................... 336

xii
LIST OF TABLES
Table 1: List of sites and collections with artifact counts ............................................................. 13
Table 2: Projectile point counts by type for each site and collection in the sample. .................... 15
Table 3: Diagnostic Folsom-Midland artifact counts from Gault by excavation area. ................. 75
Table 4: Area 8 Folsom and Midland diagnostic artifacts and their contexts. ............................. 80
Table 5: Chi-square test comparing counts of Folsom and Midland points and preforms from the
Gault site. ...................................................................................................................................... 97
Table 6: Frequencies and percentages of the full-sized projectile point types in the research
sample. ........................................................................................................................................ 109
Table 7: Independent samples t-test comparing the widths of Folsom and Midland points. ...... 111
Table 8: Independent samples t-test comparing widths of Folsom and unifacially fluted points.
..................................................................................................................................................... 112
Table 9: Independent samples t-test comparing widths of Folsom and pseudo-fluted points. ... 113
Table 10: Independent samples t-test comparing widths of Folsom and Plainview points. ....... 114
Table 11: Independent samples t-test comparing thicknesses of Folsom and Midland points ... 116
Table 12: Independent samples t-test comparing thicknesses of Folsom and unifacially fluted
points. .......................................................................................................................................... 117
Table 13: Independent samples t-test comparing thicknesses of Folsom and pseudo-fluted points.
..................................................................................................................................................... 118
Table 14: Independent samples t-test comparing thicknesses of Folsom and Plainview points. 119
Table 15: Independent samples t-test comparing the flute thicknesses of Folsom and maximum
thickness of pseudo-fluted points................................................................................................ 121

xiii
Table 16: Independent samples t-test comparing Base Width/Max Width ratios of Folsom and
Midland points. ........................................................................................................................... 123
Table 17: Independent samples t-test comparing Base Width/Max Width ratios of Folsom and
unifacially fluted points. ............................................................................................................. 124
Table 18: Independent samples t-test comparing Base Width/Max Width ratios of Folsom and
pseudo-fluted points. ................................................................................................................... 125
Table 19: Independent samples t-test comparing Base Width/Max Width ratios of Folsom and
Plainview points. ......................................................................................................................... 126
Table 20: Independent samples t-test comparing Base Width/Max Width ratios of Midland and
unifacially fluted points. ............................................................................................................. 128
Table 21: Independent samples t-test comparing Base Width/Max Width ratios of Midland and
pseudo-fluted points. ................................................................................................................... 129
Table 22: Independent samples t-test comparing average grinding length/maximum length ratios
of Folsom and Midland points. ................................................................................................... 131
Table 23: Frequencies of miniature points in the research sample ............................................. 134
Table 24: Independent samples t-test comparing maximum thickness of finished ultrathin bifaces
and unfluted Folsom preforms. ................................................................................................... 149
Table 25: Indicators of skillful and unskilled knapping in archaeological assemblages ............ 161
Table 26: Independent samples t-test comparing the width/thickness ratios of Folsom and
Midland points. ........................................................................................................................... 165
Table 27: Independent samples t-test comparing the width/thickness ratios of Folsom and
unifacially fluted points. ............................................................................................................. 166

xiv
Table 28: Independent samples t-test comparing the width/thickness ratios of Folsom and
pseudo-fluted points. ................................................................................................................... 167
Table 29: Independent samples t-test comparing the width/thickness ratios of Midland and
unifacially fluted points. ............................................................................................................. 168
Table 30: Independent samples t-test comparing the width/thickness ratios of Midland and
pseudo-fluted points. ................................................................................................................... 169
Table 31: Independent samples t-test comparing flake scars per 10 mm of Folsom and Midland
points. .......................................................................................................................................... 171
Table 32: Independent samples t-test comparing flake scars per 10 mm of Folsom and unifacially
fluted points. ............................................................................................................................... 172
Table 33: Independent samples t-test comparing flake scars per 10 mm of Folsom and pseudo-
fluted points. ............................................................................................................................... 173
Table 34: Independent samples t-test comparing flake scars per 10 mm of Midland and
unifacially fluted points. ............................................................................................................. 174
Table 35: Independent samples t-test comparing flake scars per 10 mm of Midland and pseudo-
fluted points. ............................................................................................................................... 175
Table 36: Independent samples t-test comparing mistake ratios of Folsom and Midland points.
..................................................................................................................................................... 177
Table 37: Independent samples t-test comparing mistake ratios of Folsom and unifacially fluted
points ........................................................................................................................................... 178
Table 38: Independent samples t-test comparing mistake ratios of Folsom and pseudo-fluted
points ........................................................................................................................................... 179

xv
Table 39: Independent samples t-test comparing mistake ratios of Midland and unifacially fluted
points. .......................................................................................................................................... 180
Table 40: Independent samples t-test comparing mistake ratios of Midland and pseudo-fluted
points ........................................................................................................................................... 181
Table 41: Independent samples t-test comparing mistake ratios of Folsom and Midland preforms.
..................................................................................................................................................... 182
Table 42: Coefficients of Variation for each projectile point variant under each skill assessment
variable ........................................................................................................................................ 184
Table 43: Chi-square test comparing counts of “extra fine” and ordinary styles for Folsom,
Midland, and unifacially fluted points. ....................................................................................... 193
Table 44: Independent samples t-test comparing the width/thickness ratio, flake scars per 10 mm,
and mistake ratio of percussion thinned vs. pressure thinned Midland points. .......................... 196
Table 45: Chi-square test comparing presence and absence of flake blank remnants for
percussion and pressure thinned Midland points. ....................................................................... 198
Table 46: Independent samples t-test comparing the width/thickness ratio, flake scars per 10 mm,
and mistake ratio of formal vs. informal pseudo-fluted points. .................................................. 200
Table 47: Chi-square test comparing point types and material types for Blackwater Draw. ..... 216
Table 48: Chi-square test comparing point types and material types for Shifting Sands. .......... 218
Table 49: Chi-square test comparing point types and material types for Scharbauer. ............... 220
Table 50: Chi-square test comparing point types and material types for Wyche Ranch. ........... 223
Table 51: Chi-square test comparing point types and material types for Rio Rancho. .............. 225
Table 52: Chi-square test comparing point types and material types for Krmpotich. ................ 229
Table 53: Chi-square test comparing point types and material types for Hanson. ..................... 230

xvi
Table 54: Chi-square test comparing point types and material types for Agate Basin ............... 231
Table 55: Chi-square test comparing point types and material types for Hell Gap .................... 233
Table 56: Chi-square test comparing point types and material types for Barger Gulch ............. 235
Table 57: Chi-square test comparing point types and material types for Bobtail Wolf ............. 236
Table 58: Chi-square test comparing point types and material types for Cedar Creek. ............. 239
Table 59: Chi-square test comparing point types and material types for Sulphur River ............ 241
Table 60: Chi-square test comparing point types and material types for Mud Springs .............. 242
Table 61: Chi-square test comparing point types to occurrences of significant adjusted residual
scores from the previous analyses............................................................................................... 246
Table 62: Chi-square test comparing point types to dominant and non-dominant material types
for all applicable assemblages .................................................................................................... 249
Table 63: Chi-square test comparing ultrathin biface forms to dominant and non-dominant
material types for all applicable assemblages ............................................................................. 253
Table 64: Chi-square test comparing Folsom points and preforms to dominant and non-dominant
material types for all applicable assemblages ............................................................................. 258
Table 65: Chi-square test comparing “extra fine” and normal quality points to dominant and non-
dominant material types for all applicable assemblages ............................................................. 260
Table 66: Independent samples t-test comparing the latitudes and longitudes of Folsom and
Midland points. ........................................................................................................................... 273
Table 67: Independent samples t-test comparing the latitudes and longitudes of Folsom and
unifacially fluted points. ............................................................................................................. 274
Table 68: Independent samples t-test comparing the latitudes and longitudes of Folsom and
pseudo-fluted points .................................................................................................................... 275
xvii
Table 69: Independent samples t-test comparing the latitudes and longitudes of Folsom and
miniature points .......................................................................................................................... 277
Table 70: Independent samples t-test comparing the latitudes and longitudes of Midland and
unifacially fluted points. ............................................................................................................. 278
Table 71: Independent samples t-test comparing the latitudes and longitudes of Midland and
pseudo-fluted points .................................................................................................................... 280
Table 72: Independent samples t-test comparing the latitudes and longitudes of Midland and
miniature points .......................................................................................................................... 281
Table 73: Analysis of the correlations between latitude, longitude and age for dated Folsom sites.
..................................................................................................................................................... 288
Table 74: Folsom sites containing faunal remains from the research sample. Includes counts of
sampled Folsom and variant point types as well as counts of bison and non-bison game. ........ 295
Table 75: Chi-square test comparing occurrences of “extra fine” and ordinary point forms for
each site/collection ...................................................................................................................... 301

xviii
LIST OF FIGURES
Figure 1: Common point types sampled in this dissertation ......................................................... 17
Figure 2: Flow chart of Folsom preform reduction sequences ..................................................... 23
Figure 3: Ultrathin biface from west Texas. ................................................................................. 28
Figure 4: Map of Folsom sites sampled ........................................................................................ 36
Figure 5: Sampling strategy for the Lindenmeier assemblage at the Smithsonian ....................... 57
Figure 6: Examples of Folsom and Midland points and preforms from the Gault site. ............... 71
Figure 7: Examples of ultrathin bifaces from the Gault site ......................................................... 72
Figure 8: Layout of the excavation areas within the Gault site. ................................................... 74
Figure 9: Midland point examples. ............................................................................................... 89
Figure 10: Scatterplots comparing Midland points and preforms from Gault .............................. 92
Figure 11: Atypical points and preforms from Gault.................................................................. 101
Figure 12: Boxplots for the miniature points .............................................................................. 135
Figure 13: Scatterplots of width and thickness for points and preforms .................................... 139
Figure 14: Example of a “thick biface” from Lindenmeier. ....................................................... 144
Figure 15: Dorsal and ventral faces of a “flake biface” from Blackwater Draw ........................ 145
Figure 16: Both faces of a Folsom preform base from Shifting Sands that may have been made
from an ultrathin biface ............................................................................................................... 148
Figure 17: Scale illustrating the hypothetical relationship between skill level and Folsom-age
point types ................................................................................................................................... 156
Figure 18: Boxplots for miniature points for width/thickness, flake scars per 10 mm, and mistake
ratio variables .............................................................................................................................. 189

xix
Figure 19: Examples of “extra fine” Folsom and Midland points .............................................. 192
Figure 20: Map portraying the approximate locations of 21 Folsom sites sampled in this research.
..................................................................................................................................................... 268
Figure 21: Maps with dots representing the mean coordinates for each Folsom point variant .. 283
Figure 22: Scatterplots showing the relationship between Folsom-age radiocarbon dates and
latitude (a) and longitude (b)....................................................................................................... 287
Figure 23: Scatterplots with overlaid quadratic regression lines ................................................ 291

xx
LIST OF ATTACHMENTS
File 1: Point, point, preform, and biface measurements ..................... Lassen Folsom Measures.xls
File 2: Artifact raw material characterization .............................................. Dominant Materials.xls
File 3: Photographs of all artifacts by site ......................................................... “Photos” file folder
File 4: Chi-square test comparing point types and material types for Lindenmeier ..........................
....................................................................................................... Lindenmeier Raw Materials.xlsx

1
CHAPTER 1: INTRODUCTION
…I think just once of the moment
when the fluted chalcedony
dropped into my hand
but really
I know now
it never should have been resurrected
any more than these wheels and wings and electronic voices
should ever again be lifted
from oblivion…
-Loren Eiseley, “Flight 857”
The purpose of this dissertation is to better understand the variability in Folsom-era lithic
hunting technology. The Folsom period occurred between 10,900 and 10,200 radiocarbon years
before present (Meltzer 2006:1) and extended across much of the Great Plains in the United
States and into parts of Canada and Mexico. The Folsom period is most widely interpreted as a
cultural tradition that used distinctive fluted projectile points to hunt Bison antiquus, the more
robust ancestor of modern bison (Collins 2007:81-84). Although this interpretation applies to
many Folsom sites, not all regions appear to place the same emphasis on bison hunting (Kornfeld
2002), and many sites contain a variety of other contemporaneous projectile points in addition to
the classic fluted Folsom points (Wendorf et al. 1955; Wendorf and Krieger 1959:67). This
dissertation explores the variation of these Folsom-era projectile points, their respective
unfinished preforms, and formal “ultrathin” bifaces that comprise the most diagnostic tools in the
Folsom repertoire.
The questions that this dissertation addresses stem from what archaeologists call the
“Folsom-Midland Problem” (Judge 1970; LeTourneau 1998). This problem concerns the co-

2
occurrence of Folsom and Midland point forms across many Folsom-age sites and raises the
question of why the same groups of people would use two seemingly distinct projectile point
technologies to achieve the same apparent goal. Arguments as to why this occurs include the
idea the Midland points are simply Folsom points that turned out too thin to flute (Judge
1970:44), that Midland points are made by those who are not skilled enough to make Folsom
points (Bamforth 1991:311-314), or that Midland points are made when individuals are trying to
conserve raw materials (Hofman 1992). Each of these hypotheses is tested and discussed in this
research. The analysis begins with the heretofore unreported Folsom component of the Gault
site in central Texas and then expands to include a sample of Folsom sites and collections from
across the western United States. This research seeks to establish overall trends in the variation
of Folsom hunting tools, make note of exceptions to those trends when they occur, and to test the
aforementioned hypotheses that attempt to explain these technological variations. Until now,
research conducted on variation among Folsom bifacial tools has been confined to specific
regions and has not encompassed a broad representative sample from across most of the
geographic range (Amick 1994a, 1995, 1999, 2002; Bradley 2009; Hofman 1992; LeTourneau
2000). Additionally, the hypotheses posited to explain Folsom technological variation have not
been tested against data from such a wide cross-regional sample.
History of Research in Folsom Technology
It would be nice to think that the Folsom discovery settled the enigma surrounding the
Pleistocene presence of human beings in the Americas, but instead it merely marked the
beginning of systematic research into that period. The first in situ Folsom point exposed in 1927
among Bison antiquus remains surprised the archaeological community at the time with its

3
excellent craftsmanship (Meltzer 2006:86). Some of the earlier proposed American Pleistocene
sites, such as the Trenton gravels in New Jersey, had been designated as ancient at least partly on
the crude appearance of the artifacts (Meltzer 2006:24). The Folsom site revealed that the
Pleistocene inhabitants of the Americas were highly capable and even artistic flintknappers
(Fischel 1939:241).
One of the first apparent problems in the Pleistocene archaeology of North America was
typological in nature. Folsom points are initially recognizable by their distinctive flutes – long
flakes struck from the bases of the points and often extending to the distal tip, creating a grooved
appearance – and in the early 20th
century, all fluted points were called “Folsom,” “Folsom-like,”
or “Folsomoid,” regardless of other morphological differences (Fischel 1939:232; LeTourneau
1998). However, additional, unfluted, projectile points were found associated with extinct fauna
in blow-out sites in Yuma County, Colorado (Fischel 1939:232-234). As a result, all fluted
Pleistocene-aged points came to be called Folsom, and the unfluted specimens were named
“Yuma.” The relationship between Folsom and Yuma points was not certain (Fischel 1939:240-
241). Renaud (1937:81) proposed that Yuma points preceded Folsom points chronologically,
while Nelson (1937:320) was of the opposite opinion, considering Yuma points to represent a
longer lived technology. Other reports mentioned points that appeared to be of an unfluted
Folsom type, suggesting that the points were halfway between the Folsom and Yuma styles.
However, these points were considered anomalous and were not included in the initial
typological schemes for the Paleoindian period (Fischel 1939:238-239). Of course, this
dichotomous typological distinction was not to last, as subsequent archaeological discoveries
brought the need for further subdivisions among fluted point types and further blurred the line
between fluted Folsom and unfluted Yuma types.

4
The excavations at Blackwater Draw in New Mexico revealed that fluted points have a
greater time depth than originally assumed and some of the morphological variations in
“Folsom-like” points represent changing forms through time. In particular, Blackwater Draw
contained typical Folsom points associated with extinct bison as at the original Folsom site, but
the underlying stratum at Blackwater Draw also contained larger, slightly cruder-looking fluted
points associated with mammoth remains. These points, with a similar outline as Folsom but
with a different flaking style and shorter flutes, were named “Clovis” by Sellards (1952:17-18).
Between this recognition of chronologically distinct fluted point types and the subsequent
excavations of stratigraphically separated unfluted point types at sites like Hell Gap (Irwin-
Williams et al. 1973), the “Folsom” point form became more typologically refined, and the
“Yuma” distinction became recognized as a catch-all and fell out of use.
Moreover, the excavations at Scharbauer near Midland, Texas in 1953 gave
archaeologists their first glimpse into the close relationship between Folsom points and their
unfluted “Midland” counterparts (Wendorf et al. 1955; Wendorf and Krieger 1959:67). The
close association between the two point types has given rise to what became known as “Folsom-
Midland problem,” in which archaeologists have struggled to propose explanations for this
variation (Judge 1970; LeTourneau 1998:63-65). Some, such as Gunnerson (1987:15-16),
suggest that Midland points belong to a separate technological complex that happens to coincide
closely with Folsom in space and time. However, this assessment is based entirely on data from
the Winkler-I site in west Texas, where Midland occurs without Folsom (Blaine 1968:8) and on
the Folsom and Midland components of the Hell Gap site. At Hell Gap, Irwin-Williams et al.
(1973:44, 47) stated that Midland artifacts slightly overlie the Folsom occupation and hence are
later in time. However, the radiometric ages largely overlap, and Haynes (2009:44) later found

5
that the Folsom, Midland, and typologically similar Goshen components all belong to the same
stratum, the Goshen Paleosol in Stratum E. Additionally, Bradley (2009:259-264) found that
some of the points from the Goshen component at Hell Gap are morphologically similar to
Folsom or Midland, while some of the points from the Midland components appear to be Folsom
or Goshen, suggesting that the components are not as technologically distinct as originally
reported. Most archaeologists now consider Folsom and Midland points to have been made and
used by the same cultural groups (Meltzer 2006:294; Meltzer et al. 2006:24).
The Role of Typology
The analysis of such “types” is at the heart of this dissertation research. Categorizing
projectile points into types has been a cornerstone of Paleoindian archaeology since its inception,
because stone tools are often the only materials remaining in such ancient sites, and of those
tools, projectile points are usually the most stylistically distinctive. However, sorting points into
types is not always conducted by the scientific method, and some archaeologists (whether they
are conscious of it or not) take an impressionistic “I know it when I see it” approach to typology
(LeTourneau 1998). Krieger (1944) offers probably the most systematic explanation of
typological methods as they may apply to the study of stone projectile points. The four methods
he outlines include: 1) full descriptions of individual artifacts, 2) impressionistic types based on
unspecified criteria to reduce redundant descriptions, 3) phylogenetic outlines of artifact that
create typological “genealogies,” and 4) typologies based on stylistic traits that have
chronological significance that is archaeologically supported (Krieger 1944:272-273). The first
three of these methods represent systems that may be used to describe or organize artifacts
systematically, but they do not necessarily provide any insight into prehistoric populations. In

6
particular, outlining projectile point morphologies in a phylogenetic format forces the researcher
to emphasize some traits over others, likely pigeonholing some unrelated artifacts together into a
type, while some similar artifacts may be needlessly separated. On the other hand, the fourth
method attempts to create types that express archeological significance and reflect change across
space and time. In this scheme, any technological variation, large or small, that can be
temporally or spatially segregated deserves to be placed in its own type category (Krieger
1944:277-279). This method represents the ideal to which archaeologists now aspire when
constructing most typologies for projectile points, and this method becomes increasingly
applicable over time as archaeological investigations delineate the chronological and spatial
trends among points. The refinement of absolute dating techniques has also greatly aided in the
verification of these typologies in the absence of stratified archaeological components.
In the case of the Folsom-Midland problem, these two point types are distinct in their
flaking technology despite having a similar outline and thickness, but they are known to occur
contemporaneously and usually within the same archaeological components. According to
Krieger’s (1944:283) classification scheme, Folsom and Midland points may qualify as subtypes,
although this designation is usually considered a temporary division until further data are
gathered. Additionally, simply establishing Folsom and Midland as subtypes without explaining
why the two styles simultaneously exist is an unsatisfying proposition. In the absence of spatial
and temporal components to the Folsom and Midland types, archaeologists must instead look to
behavioral explanations. Young and Bonnichsen (1984) propose a “cognitive approach” to the
analysis of stone tools. This approach stresses the importance of variation between artifacts in
order to understand the ways in which individuals adopted the tool-making norms of their group
and integrated it into their own behaviors. The approach also applies concepts from cognitive

7
psychology and cognitive anthropology, and applies the concepts to the ways lithic tools were
hypothetically formulated in the minds of prehistoric individuals and how those mental templates
were brought into reality. The cognitive approach stresses the importance of experimental
knapping, enthnoarchaeological studies, and observations of modern groups making and using
stone tools in order to understand the thought processes and individual problem-solving
strategies that go into making various tool forms (Young et al. 1994:211).
The analyses conducted in this research utilize some, but not all, of the concepts
discussed in the cognitive approach in order to understand the decision-making process that went
into making projectile points and bifaces during the Folsom period. The points in the sample are
divided primarily into five typological categories: Folsom, Midland, unifacially fluted, pseudo-
fluted, and miniature derivations thereof. Explicit definitions of each of these types are provided
in Chapter 2. The cognitive approach stresses the subtleties that the individual contributes to the
form and function of each stone tool, but that level of analysis is not feasible in this project.
Instead, technological, skill-related, raw material, and regional trends are explored among the
sampled artifacts, and all observable variations and deviations from the norm among these types
are recorded and investigated for behavioral patterns. Classic flintknapping experiments are
referenced as necessary to provide information on Folsom tool reduction sequences, but personal
experiences in the making of Folsom points and bifaces are currently beyond my skill to provide.
However, my own flintknapping experience inevitably informs some of my observations on
Folsom-era technology. For example, the distinction between percussion-thinned and pressure-
thinned Midland points is based on personal expectations of percussion and pressure flake scar
morphologies.
8
Organization of the Dissertation
The following chapter introduces the artifact types, sites, collections, and repositories that
were examined in order to compile the sample for the subsequent analyses. Whenever possible,
a short background is given for each site sampled, and the number and kinds of artifacts analyzed
are tallied. Also, the measurement and observation variables that were taken while visiting the
repositories are listed and defined. All primary measurement data and photographs are
accompanied as attachments with the electronic copy of this dissertation via Trace, the
Tennessee Research and Creative Exchange digital repository at the University of Tennessee.
The electronic files include three Microsoft Excel spreadsheets (“Lassen Folsom Measures.xls,”
“Dominant Materials.xls,” and “Lindenmeier Raw Materials.xlsx”) and a file folder entitled
“Photos” that includes front and back photographs of every artifact in the sample, along with
grouped photographs of artifacts using longwave and shortwave ultraviolet light. These data
files and photographs are also available via the Paleoindian Database of the Americas
(http://pidba.utk.edu) and can be provided by request from the Gault School of Archaeological
Research (http://www.gaultschool.org/).
The third chapter deals specifically with the Folsom-Midland component of the Gault site
in central Texas. Although this component of Gault has been mentioned in previous publications
(Collins 2007:81-84; Waters et al. 2011:17), it has not been systematically reported. This
chapter focuses on the contexts and stratigraphic integrity of the Folsom-age diagnostic tools, the
technological variation that is observable in the making of those tools, and the typological issues
that are evident from variation among the tools. The questions that are raised by the
technological and typological discussions presented here are used to frame the analyses
conducted in the subsequent chapters of the dissertation.

9
The fourth chapter presents the technological analysis of the entire research sample. The
first portion of the chapter highlights morphological differences between Folsom, Midland,
unifacially fluted, pseudo-fluted, and miniature points and preforms, as well as contrasting their
measurements with extraneous Paleoindian point types such as Plainview. Exhaustive
definitions of each of these artifact types, as well as ultrathin bifaces, are provided in this
chapter. The second portion of the chapter analyzes more specific questions pertaining to
Folsom-era technology, including preform variation, ultrathin biface variation, and analyses of
points that bear characteristics similar to both Folsom and Midland types.
The fifth chapter represents an attempt to quantify the skill involved in flintknapping
each of the Folsom-era point types. The first section uses the width/thickness ratio, flake scar
counts, a ratio of “mistakes,” and coefficients of variation to determine whether any difference in
skill involved in making different points and preforms can be determined. The second section
looks at subdivisions within and among point types for differences in skill. In particular, the
incidences of particularly well made “extra fine” points are quantified, and variations among
Midland points as well as pseudo-fluted points are analyzed.
The sixth chapter focuses on raw materials to determine whether such considerations
played a role in determining the type of point that was made prehistorically. The first section
looks at individual sites to examine whether significant raw material differences are present
among the Folsom-era point types on a site-by-site basis. Afterwards, the raw materials from
each site and collection are classified into “dominant” and “non-dominant” categories in order to
make generalizations utilizing data from all sites at once. Finally, the directions of movement of
the dominant raw materials from source to site are traced to determine whether any patterns of
movement are observable.

10
The final analysis chapter explores a lingering series of questions that pertain to Folsom-
age materials on a regional scale. First, the occurrences of all the point variants are analyzed by
latitude and longitude to determine whether any geographic trends in point type distributions are
apparent. Then, previously published radiocarbon ages from various Folsom sites are compiled
to determine whether the point distribution trends match the dating trends, in order to discern
whether some Folsom-age point types become more prevalent over time as well as space. Third,
sites with recorded faunal assemblages are tabulated in order to compare the MNIs of game
species with the proportions of point types present in those sites to determine whether a
correlation between point types and prey types may be evident. Finally, an analysis of the
regional prevalence of “extra fine” points and pristine preforms is conducted to determine
whether the occurrences of either of these specific artifact types match the distribution patterns
observed in the larger regional analysis.
The eighth chapter concludes the dissertation and revisits each of the preceding chapters
in turn, augmenting the conclusions of those chapters with insights gained from the subsequent
analyses. Additionally, the results of all these chapters are brought together to present a scenario
of human tool-making and using behavior during the Folsom period.
11
CHAPTER 2: THE SAMPLE
This chapter provides a description of the dataset, variables, repositories, and sites used
throughout the dissertation. The first section is dedicated to a full description of the artifact
forms that are analyzed in the subsequent chapters. Point types, preform morphologies, and
ultrathin biface characteristics are discussed as completely as possible. The next section lists the
variables that have been measured and observed during the data collection and gives a short
description of each. The following section specifies the repositories that have been visited in
order to gather the dataset. These repositories include formal archaeological curation facilities,
university laboratories, museums, and private residences. The final section deals with the
archaeological sites that comprise the sample. Brief descriptions of the excavation histories and
interpretations of Folsom components are provided for each site, followed by a count of the
artifacts sampled in this research. Three sites: Scharbauer, Lindenmeier, and Folsom, are
discussed in greater detail due to their significance to the current understanding of the Folsom
period.
The total sample of bifacial tools examined in this analysis consists of 1093 artifacts.
This sample is made up of materials from 30 sites and private collections and is intended to
represent Folsom materials from across as wide a geographic extent as possible (Table 1). The
purpose of this sample is to examine technological and typological variation of Folsom-era
formal bifacial artifacts on an interregional basis to contribute to our understanding of the
Folsom-Midland problem and to address additional variation that occurs within these
assemblages. Debitage, flake tools, and other non-diagnostic artifacts are not included in this
research. Although the contribution of these artifacts to Folsom lifeways is inarguably

12
significant, including such tools in this research sample would have been problematic. Many of
the Folsom sites in this research consist of mixed cultural components, so only the diagnostic
tools could be definitively attributed to the Folsom period. Additionally, a significant portion of
the data used in this dissertation comes from personal collections in which diagnostic bifacial
artifacts are often the only materials collected. Of the artifacts sampled, 674 are Paleoindian
projectile points and 315 are preforms that are classified as Folsom, Midland, or some variant
thereof, as well as a sample of technologically similar projectile points such as Plainview and
Milnesand. A tabulation of projectile points by type is presented in Table 2. Eighty-five
artifacts fall under the ultrathin biface category, which includes a sample of bifacial tools that are
technologically similar but considerably thicker. Usually, the thicker bifaces are made of
quartzite. The final category of bifacial tools is reserved for indeterminate or unusual specimens.
These include points that are technological aberrations from Folsom and Midland to the extent
that they may not actually belong to the Folsom period or to any roughly contemporaneous
technology. They are excluded from subsequent analyses (see the “Comments” column in Table
1).

13
Table 1: List of sites and collections with artifact counts. Excluded artifacts are ones that could
not be confidently assigned to Folsom or to any other Paleoindian technology.
Site/Collection Points Preforms Bifaces Comments References
Gault, TX 17 15 7 Three points
excluded Not previously reported
Kincaid, TX 5 0 0 Collins 1990
Pavo Real,TX 4 7 2 Collins et al. 2003
Blackwater Draw,
NM 21 0 1 Hester 1972
Lubbock Lake, TX 7 0 0 Johnson and Holliday
1987a, b
Plainview, TX 19 0 0 Sellards et al. 1947
Bonfire, TX 5 0 0 Four points
excluded Dibble and Lorrain 1968
Wilson-Leonard, TX 2 0 0 One point
excluded Collins 1998b
Scharbauer, TX 27 2 0 Wendorf et al. 1955
Shifting Sands, TX 122 24 1 Hofman et al. 1990
Wyche Ranch, TX 16 1 0 Holliday 1997
Chispa Creek, TX 0 2 0 Richard Rose
collection Seebach 2004
Hot Tubb, TX 2 0 0 Richard Rose
collection Meltzer et al. 2006
Misc. Texas 5 3 1 From Richard
Rose and TARL None
Rio Rancho, NM 23 10 0 Huckell and Kilby 2002
Boca Negra Wash,
NM 0 3 0 Holliday et al. 2006
Deann's Site, NM 1 1 0 Holliday et al. 2006
Misc. New Mexico 3 0 0 Huckell's study
collection None
Baker Collection,
OK 25 0 0 No Man's Land Museum
Cedar Creek, OK 39 1 0 Hofman 1990
Sulphur River, OK 5 1 0 None
Cox Collection, OK 69 26 14 None
Folsom, NM 7 0 0 Denver Museum
study materials Meltzer 2006
Lindenmeier, CO 127 72 5 One point and
biface excluded
Wilmsen and Roberts
1978
Westfall Site, CO 2 5 0 Hofman et al. 2002
Westfall Collection,
CO 46 26 7
Two points
excluded None

14
Table 1 continued.
Site/Collection Points Preforms Bifaces Comments References
Barger Gulch, CO 15 13 3 Surovell 2009
Misc. Colorado 5 0 0 Denver Museum
isolates None
Krmpotich, WY 8 8 1 Surovell 2009
Two Moon, WY 2 0 1 One preform
excluded Finley et al. 2005
Hanson, WY 10 6 18 One point
excluded Frison and Bradley 1980
Agate Basin, WY 5 5 0 Frison 1982a
Hell Gap, WY 16 5 2
One point and
preform
excluded
Bradley 2009

15
Table 2: Projectile point counts by type for each site and collection in the sample.
Style
Total Folsom Indet Midland Miniature Plainview
Pseudo-
fluted
Unifacially
Fluted
Site Agate Basin 3 0 0 0 0 1 1 5
Baker
Collection 10 0 9 0 0 2 4 25
Barger Gulch 14 0 0 0 0 0 1 15
Big Black 12 0 0 0 0 0 0 12
Blackwater
Draw 12 0 5 0 2 0 2 21
Bobtail Wolf 10 0 3 0 0 0 0 13
Bonfire
Shelter 1 0 0 0 4 0 0 5
Cedar Creek 16 0 12 0 6 2 2 38
Cox
Collection 29 2 22 0 10 1 5 69
Deann's Site 1 0 0 0 0 0 0 1
Folsom 4 0 0 0 0 0 1 5
Gault 5 0 11 1 0 0 0 17
Hanson 5 1 4 0 0 0 0 10
Hell Gap 2 0 8 0 5 1 0 16
Kincaid 1 0 1 1 0 0 0 3
Krmpotich 7 0 0 0 0 0 1 8
Lindenmeier 69 16 12 9 0 10 9 125
Lubbock Lake 4 0 1 0 0 1 1 7
Misc.
Colorado 6 0 0 0 0 0 0 6
Misc. New
Mexico 4 0 0 0 0 0 0 4
Misc. Texas 3 0 3 0 0 0 1 7

16
Table 2 continued.
Style
Total Folsom Indet Midland Miniature Plainview Pseudo-fluted
Unifacially Fluted
Site Mud Springs, Wyoming
15 0 1 0 0 0 1 17
Pavo Real 0 0 0 4 0 0 0 4
Rio Rancho 22 0 0 0 0 1 0 23
Scharbauer 2 0 17 3 1 1 1 25
Shifting Sands
22 0 70 13 1 8 8 122
Sulphur River
1 0 1 0 1 2 0 5
Westfall Collection
32 0 7 0 0 3 4 46
Westfall Site 2 0 0 0 0 0 0 2
Wilson Leonard
0 0 2 0 0 0 0 2
Wyche Ranch
1 0 12 1 0 2 0 16
Total 315 19 201 32 30 35 42 674

17
Figure 1: Common point types sampled in this dissertation. Top row: Folsom and Folsom-
related point types. Bottom row: morphologically similar non-Folsom points.

18
Type Descriptions
To begin, definitions of the point types discussed in this research assemblage are
necessary. Assigning point types has largely been an impressionistic endeavor (Krieger
1947:273; LeTourneau 1998), and although that situation is also true of this study, the fact that
every artifact in this research has been handled and recorded personally by the author provides
some subjective consistency to the typological designations. The formal point types that
commonly appear in this study are shown in Figure 1. The typological criteria used in the data-
gathering portion of this study are as follows. First, the size of a point was gauged to determine
whether the point is full-sized or miniature. The simplest test for this determination is literally a
“rule of thumb.” Full-sized points are generally about as wide as my thumbnail (roughly 2 cm),
while miniatures are about as wide as my pinky nail (roughly 1 cm). Although a few points fall
in between these size categories, such a problem is a remarkably rare occurrence.
Next, the presence or absence of fluting was noted. Although fluting on Folsom points is
subjectively obvious in most cases, some points exhibit long basal thinning flakes that may
imitate true flutes. The distinction between a flute and a basal thinning flake is determined by
looking at a point in lateral cross section. If the thickness of a point dips inward in the middle of
the cross section, then it is fluted. Basal thinning flakes do not have such a drastic effect on the
shape of a point’s cross section. Unifacially fluted points are generally simple to identify, given
that one face is fluted and the other is not. It is also important to note whether the unfluted face
exhibits Midland-style flaking, as described below.
Identifying Midland points tends to be more complicated and subjective than identifying
fluted Folsom points. Three primary criteria are used to distinguish a Midland point from other,
similar, Paleoindian types. First is the reduction technique. Midland points are thinned by what

19
Amick (2002:177-178) calls collateral flaking. Collateral flakes are perpendicular to the lateral
edges of the point and extend across the center of the point’s surface, overlapping with collateral
flakes from the opposite edge. Ideally, this technique creates a very thin and flat point. One
source of disagreement among archaeologists is whether collateral flakes were generated by
percussion or pressure (Bradley 2009:260; Wilke 2002:358), so collateral percussion and
pressure are recorded as separate entries under the “Production Technique” variable. Collateral
percussion is defined as exhibiting flake scars that are wider than 5 mm and are somewhat
rounded in outline. Collateral pressure is defined as flake scars that are narrower than 5 mm or
are more elongated in outline. The second criterion for defining a Midland point is the presence
of regular fine pressure retouch along the edges. This fine pressure flaking is analogous to the
post-fluting pressure retouch that appears during the final stages of Folsom point production.
This retouch does not appear on all Midland points, but it does appear only on Midland points,
distinguishing it from similar unfluted Paleoindian types such as Plainview. The final criterion
for defining a Midland point is thickness. Midland points are often thinner than 4 mm, while
other unfluted Paleoindian points are thicker than 4 mm. Ideally, Midland points should also
have a flat, biplanar cross section, but some Midlands are lenticular or plano-convex. Naturally,
not every Midland point meets all the criteria, so I considered a point to be Midland if it matched
at least two out of the three criteria.
Pseudo-fluted points resemble Folsom points at first glance, but the “flute” on one face is
made up of the unmodified ventral surface of a flake blank (Amick 2002:178-179). Generally,
the only flaking that appears on this ventral surface is the fine edge trimming that appears on
most Folsom points. Some projectile points retain traces of a ventral flake blank surface but also
exhibit a few larger flake scars extending into that surface. In those cases, a point is not

20
considered pseudo-fluted if any flake scar extends into the flake blank surface beyond the
midline, except near the distal tip. The flaking on the opposite face of a pseudo-fluted point
varies. On rare occasions, the opposite face is fluted in the normal Folsom style, but more often
it is collaterally flaked like a Midland point. Also, some points can appear pseudo-fluted on both
faces if the original flake blank is thin and flat enough to require minimal modification. On the
most well made pseudo-fluted points, the ventral flake surface can be difficult to distinguish
from an actual flute. In these cases, the easiest way to distinguish an actual flute is to look at the
point in cross section and see if the thickness dips in the center relative to the margins. Pseudo-
flutes do not exhibit this characteristic.
Miniature points are highly variable, with the only unifying characteristic being their size.
A miniature point can be bifacially fluted, unifacially fluted, collaterally flaked, or pseudo-fluted.
However, the most basic distinction between miniatures is the manner of their production. Some
miniature points are made by heavily reworking larger points into a smaller size. Nearly all
fluted miniature points (and some of the unfluted ones) are made in this manner. Other
miniature points are made from very small flake blanks, including channel flakes. These
miniatures are usually pseudo-fluted and are more minimally flaked than their reworked
counterparts.
A point occasionally appears in a Folsom assemblage or collection that is full size,
unfluted, and not a Midland point. While some of these points are simply called “unfluted
Folsom,” in most cases they can be typologically assigned to another Paleoindian form. Usually
these points fall under Plainview, although the Plainview type must be explicitly defined to
prevent its becoming a catch-all, as has been the case in the past (Irwin-Williams 1973; Turner et
al. 2011:152). Here I define Plainview points based on characteristics that are complementary to

21
Midland. Plainviews exhibit midline flaking, where the thinning flakes from both edges of the
point meet in the center and create a central ridge or central thickness. As such, the points are
nearly always thicker than 4 millimeters. Plainview points tend to be either lenticular or plano-
convex in cross section. Lastly, Plainview points lack the fine edge retouch that is present on
most Folsom and Midland points. Plainview points are usually lanceolate in outline with parallel
sides, but some of the points from the original type site exhibit recurved edges. Goshen points
from the Hell Gap site are included in this research as well, but their identification is essentially
the same as Plainview (Irwin et al. 1973:46). Milnesand is a type that occasionally appears in
some Folsom collections (particularly in west Texas), despite being Late Paleoindian in age
(Turner et al. 2011:136). Milnesand points look similar to Midland and Plainview in outline, and
they may exhibit flaking patterns similar to either type, but Milnesands have a distinctive
longitudinal profile that sets them apart. Milnesand points are fairly thin at the base but increase
in thickness toward the tip, with a maximum thickness of usually 5 millimeters or more.
Additionally, basal thinning tends to be present on only one face of Milnesand points, creating a
somewhat beveled base that is wedge-shaped in profile. Lastly, any unfluted points that do not
fall into Midland, Plainview, or Milnesand categories but still resemble these types in outline are
given an “Indeterminate” type designation. If such points come from the Folsom component of
an archaeologically excavated assemblage, they are considered Unfluted Folsom.
In terms of preforms, only Folsom preforms are immediately recognizable, thanks to the
staged process involved in making Folsom points (Figure 2). The earliest stages of Folsom point
production, according to Frison and Bradley (1980:45-52), are the initial blank production and
initial shaping and thinning. These stages are not diagnostic of Folsom preforms and have not
been recorded in this analysis. The third stage involves shaping and thinning the preform to
22
create even cross sections. During this stage, the preform acquires its rectangular outline,
including a squared off and usually beveled distal end, presumably to brace the preform against
an object during fluting (Patten 2002:303). Also, the flake scars across the surfaces of the
preform should roughly align along the center of the point, although this alignment is not very
refined at this stage. The fourth stage involves evenly pressure flaking the preform
perpendicular to the edge, so that the pressure flake scars line up along the center of the
preform’s face, creating a central ridge. Usually this pressure flaking takes place one face at a
time, and the opposite face undergoes this reduction stage only after the first flute is removed,
but this is not always the case. The fifth stage involves preparing the base for the first flute by
creating a “nipple” platform at the center of the basal edge. The sixth stage is the fluting of the
first face. Modern experimentation has shown that Folsom fluting can be accomplished in a
number of ways: by direct percussion (Patten 2002), indirect percussion (Crabtree 1966), and by
pressure (Gryba 1988). The next three stages consist of the pressure flaking, basal preparation,
and fluting of the opposite face. After both faces are fluted, the final edge retouch and shaping
of the tip takes place. The edge retouch consists of small pressure flakes that do not usually
extend into the fluted surface of the point. In some cases of particularly well made Folsom
points (called “extra fine” points in subsequent chapters), these retouch flakes are remarkably
small and may have been made with a specialized tool, such as a pressure flaker made from a
beaver tooth (Collins personal communication). Finally, the lateral edges of the finished Folsom
point are ground towards the base, presumably to facilitate hafting or possibly to aid in
preventing breakage (Tunnel 1977:16; Titmus and Woods 1991). Sometimes the basal edge is
also ground, but not always.

23
Figure 2: Flow chart of Folsom preform reduction sequences. Includes alternative strategies that
account for breakages (Modified from Tunnell 1977, Figure 2).

24
Folsom preforms are readily identifiable beginning with the third stage. However, most
of the preforms left behind in Folsom assemblages are broken from manufacturing failures, and
the majority of those failures are related to fluting. The most common identifiable fluting failure
is the overshot, in which a channel flake dives down into the preform and breaks the preform in
two pieces. The proximal fragment appears fluted, except the channel flake scar that caused the
breakage has a noticeable widening towards the distal end and curls over the fracture surface.
The distal fragment retains the rounded, beveled tip of the preform, and the proximal end
exhibits a projection of the channel flake that caused the breakage. Because Folsom channel
flakes usually come off in fragments, it is extremely rare for an intact channel flake to remain
fully attached to the distal end of a broken preform. However, overshot channel flakes do not
always result in a failed preform. If the channel flake dives close to the tip of the preform, then
the tip can be discarded while the rest of the preform is finished into a Folsom point. Judge
(1970:45) considers this breakage such a necessary step in Folsom point production that he
believed that distal ends were purposely snapped off prior to finishing a point. Tunnell
(1977:19) demonstrates that such breakage was likely expected by Folsom flintknappers but was
not necessary for the creation of a useable point. In addition to fluting failures, early stage
Folsom preforms may be discarded after breaking from typical bending or perverse fractures as a
result of bifacial reduction or thinning. Finally, some complete Folsom preforms are
occasionally left behind in some assemblages for reasons unknown to modern researchers
(Frison and Bradley 1980:55-57). On some of these preforms, the flutes appear to have fallen
short of their intended length, indicating that these preforms may have been discarded due to
insufficient fluting success. In other cases, the reason for discard may be due to the flutes not

25
aligning properly in cross section. However, these inferences are speculative because finished
Folsom points that exhibit both of these characteristics also exist.
Other preforms are less well defined and involve a less formal reduction process, so they
are more difficult to identify in the archaeological record. The Midland preforms identified in
this research generally match the expectations set forth by Judge (1970:46) in that they are made
on relatively small flake blanks, particularly ones whose thinness makes them not conducive to
fluting. Midland preforms can be determined primarily by the presence of collateral flaking.
With the possible exception of the Gault assemblage, most Midland preforms in this analysis are
close to being finished, simplifying their identification. Preforms for unifacially fluted points are
exceedingly difficult to identify because they can be indistinguishable from ordinary Folsom
preforms that lack their second fluting. The only possibility for identifying unifacially fluted
preforms is by their thinness. If the preform matches the thickness of a finished Folsom point, it
is likely to have remained fluted on only one side. Pseudo-fluted preforms are rare, and
miniature preforms have not been identified, most likely due to the expediency of their
production. Additionally, since some miniature points are made by heavily resharpening larger
points, and a full sized point could hence potentially be a miniature preform. Preforms for
additional unfluted Paleoindian point types such as Plainview were either not encountered or not
identified in the course of this study.
Finally, ultrathin bifaces are identifiable based on a number of characteristics (Figure 3).
Obviously, these bifaces have a noticeable thinness for their size, with their maximum thickness
typical being 7 or 8 millimeters or less. Ultrathin bifaces have a flat, almost biplanar cross
section as a result of the way in which they are made. The reduction sequence for ultrathin
bifaces has been specified by Root et al. (1999:152-154), but Frison and Bradley (1980:31-42)

26
also note ultrathin reduction techniques in their analysis of biface reduction at the Hanson site.
Although the aforementioned authors imply that the bifaces were likely created from large flake
blanks, it is also possible that ultrathins began their reduction sequence as large bifacial cores
(Collins 1999:21-24). Large bifacial cores have not been reported from any secure Folsom
archaeological context, but some evidence does suggest their existence. “Frank’s Biface” from
the Mitchell Locality of Blackwater Draw is a large bifacial core found out of context but in an
area of substantial Folsom occupation. Also, several large flake blanks from Shifting Sands were
apparently struck from a large bifacial core (Hofman et al. 1990:226; Rose 2011:312-316).
Regardless of their origin, ultrathin preforms do not become identifiable in the archaeological
record until they begin to undergo “opposed diving flaking.” This reduction method entails
removing flakes from one edge of the biface so that they terminate in hinge fractures near the
center of the piece. Flakes removed from the opposite edge remove the hinge terminations but
leave a slight divot in the center, so that the biface is actually thinner in its center than it is
towards its edges. Opposed diving flaking enables ultrathin bifaces to be resharpened by
pressure flaking in such a way that the resharpening actually increases, rather that hindering, the
tool’s cutting ability. These bifaces tend to be found at Folsom campsites and not at initial kill
sites, suggesting that the bifaces are used for finer butchering work and not for the initial
dismemberment of prey (Jodry 1998). Some resharpened ultrathin bifaces are beveled along
their edges, suggesting that they functioned similarly to the two- and four-beveled knives found
in Toyah phase sites in central Texas (Sollberger 1971; Turner et al. 2011:222-223). The fact
that similarly shaped tools appear in two archaeological phases that emphasize bison hunting
suggests that these bifaces played a useful role in the processing of these animals. In this
analysis, a few bifaces have also been recorded that match the technological criteria of ultrathins

27
but are considerably thicker. These bifaces are typically made from quartzite, suggesting that
raw material played a role in determining a biface’s final thinness.
Variables
The analysis of the Folsom materials is divided into two broad categories:
points/preforms and ultrathin bifaces. The points/preforms category includes all Folsom points
and preforms, Midland points and preforms, other variant types related to Folsom or Midland
technology, and occasionally point types such as Plainview, Goshen, or Milnesand that are
morphologically similar but not directly related to Folsom or Midland. The ultrathin biface
category includes only bifaces that exhibit the hallmark signs of ultrathin technology, such as
opposed diving flakes, overall thinness, and decreasing thickness towards the center of the
biface. Measurements of size are expressed in millimeters (mm), and weight is expressed in
grams (g).
Projectile Point Variables
Morphological (Morpho) Type – This variable assigns general categories for projectile
points without delving into the intricacies of specific typology. Fluted point, unfluted point, and
fluted/unfluted preforms are the most common morphological types. The “miniature”
morphological type is also used for any diminutive point regardless of typological classification.

Figure 3: Ultrathin biface from west Texas.
28
: Ultrathin biface from west Texas.

29
Style Type – Specific projectile point types are entered in this variable. Folsom,
Midland, and Plainview are common entries, and additional Folsom variants such as unifacially
fluted and pseudo-fluted are also noted here. Occasionally, an artifact may be categorized as
“Folsom-Midland” if it exhibits characteristics of both technologies. This type may share some
similarities to the unifacially fluted type, but the Folsom-Midland style refers more specifically
to the presence of both Folsom and Midland reduction techniques.
Material – If the raw material of an artifact is visually identifiable, it will be entered into
this variable. For Gault and other central Texas sites, the raw material is overwhelmingly
Edwards chert. However, Alibates and indeterminate chert types also appear.
Color – This simple descriptive variable is useful for distinguishing raw materials as well
as degrees of patination, weathering, or heat treatment. Color is highly variable in chert,
particularly among Edwards chert, and may provide clues to an artifact’s post-depositional
history.
UV Long – This entry is reserved for the color that an artifact expresses under long wave
ultraviolet light. These colors are entered based on simple visual impressions because using a
specific color coding process would likely result in too many divisions among color types.
UV Short – This entry is for the color an artifact expresses under short wave ultraviolet
light. Again, these colors are entered based on simple visual inspection to prevent unnecessary
splitting.
Blank Type – This variable is often difficult to ascertain when working with formal
artifacts, but it can be useful in some instances. In reality, a blank is made from either a flake or
a core, but in the archaeological record, only flake blanks can occasionally be observed with any
30
certainty. If evidence of a flake blank is present on an artifact, it is noted in this variable.
Otherwise, the artifact is labeled as indeterminate.
Thermally Altered – The intentional heat treatment of Folsom artifacts is a topic of some
debate among archaeologists (Nami 1999:85-90; Gryba 2002; Root 2002), so the presence of
such treatment is noted here. Possible entries for this variable include none, treated, and
damaged. Artifacts labeled as treated exhibit signs that are characteristic of intentional heat
treatment such as a pink or reddish hue and/or a waxy luster. An artifact is labeled as damaged if
it shows signs of cracking, pot-lidding, or breakage due to excessive heat. This damage is more
likely to be the result of unintentional heating, such as direct exposure to a fire.
Weathering – Two forms of weathering are apparent on many artifacts from the Gault
site: patination and calcium carbonate concretions. Patination on Gault’s Edwards chert
generally occurs as either a white discoloration with occasional light blue spots or as a yellow-
orange discoloration. Other forms of patination may be less obvious unless a recent breakage of
the artifact reveals the specimen’s original underlying coloration. Concretions are made up of
naturally occurring carbonate nodules that adhere to the surface of artifacts. If the concretions
are widespread, they may prevent the accurate recording of measurements or flaking attributes.
Artifact Portion – This variable refers to which portion of the artifact is present in the
collection in the case of breakage. Entries include complete, base, distal, and medial.
Length – For projectile points, maximum length is measured from base to tip for
complete specimens, base to break for basal fragments, break to tip for distal fragments, or from
on break to the other for medial fragments. Length is generally considered more useful for
complete artifacts than for broken ones, but an analysis of length on broken points may provide
some technological information regarding hafting and use.

31
Width – This measurement is an artifact’s maximal extent that is perpendicular to the
length measurement.
Base Width – This is the width of the most proximal portion of an artifact. In the case of
many of the projectile points, this measurement is taken from the outer edge of one ear to the
other.
Thickness – This variable is perpendicular to both length and width and measures the
maximum extent of an artifact’s third dimension.
Flute Thickness – In the case of fluted points, the thickness in the fluted portion is less
than the artifacts’ maximum thickness, so a measurement is taken from the center of the fluted
portion.
Basal Depth – Basal depth is measured by carefully tracing the base of a point (without
touching the edge of the artifact) onto a sheet of paper and using a straight edge to draw a line
connecting the end of each basal ear. The distance from the straight line to the deepest part of
the concavity is then measured.
Flute Length – This measurement is the length of the flute from the proximal end to its
distal termination. Two flute length measurements may be taken (Side A and Side B) when an
artifact is fluted on both faces.
Flute Width – The maximum extent of a flute’s width (perpendicular to the length
measurement) is measured. Once again, two width measurements may be taken on a single
artifact if both faces are fluted.
Production Technique – This categorical variable records any particular flaking styles
that are visible on an artifact. Two entries are made for each artifact, one for each face. Entries
include fluted from proximal (fluted from distal is also possible), collateral flakes, parallel

32
oblique flakes, opposed diving flakes, biface thinning, basal thinning, pressure thinning, pressure
retouch, parallel transverse flakes, and pseudo-fluted ventral side.
Flakes per 10 mm – The number of flake scars per 10 mm is a method for ascertaining
the attention to detail that goes into an artifact (completed points almost universally have a
higher count than preforms, for example), and some variation is expected to be present among
different types and/or reduction techniques. To calculate this value, flake scars originating from
each edge are counted (flakes originating from the base are not counted) and added together.
Because projectile points and bifaces generally have two edges, each with two faces, a total of
four counts is taken from each artifact. The length of the artifact (in millimeters) is multiplied by
four, and the total flake count is divided by the quadrupled length. Finally, the resulting value is
multiplied by 10 to account for 10 millimeters.
Mistakes per 10 mm – This variable is calculated in the same way as the flake scars per
10 mm, except this variable only counts flake scars that end in step or hinge terminations that
would hypothetically impede the propagation of subsequent flakes. Some subjectivity is present
in determining which flake scars count as “mistakes,” and what this research defines as a mistake
may not have been interpreted as such prehistorically. However, this variable should still prove
useful as a line of evidence for ascertaining skill, as these “mistakes” appear to be uncommon in
typically well made points such as Folsom and Midland and far more common in later point
types and in my own flintknapping experience. Also, a ratio of mistakes to flake scars per 10
mm can provide a percentage value that aids in determining the level of skill that goes into
producing an artifact.

33
Breakage – If an artifact is broken, the type of breakage is noted in this variable.
Bending, impact, and thermal fractures are common, as are perverse fractures and ear snaps to a
lesser extent.
Weight – An artifact’s weight is measured to the nearest tenth of a gram.
Edge Grinding – The length of margin grinding on both edges of a finished point (Side A
and Side B) is measured in millimeters.
Ultrathin Biface Variables
Because the technology involved in producing ultrathin bifaces is just as diagnostic of the
Folsom period as the projectile point technology (Collins 1999:21-22), measurements and
observations are recorded for these artifacts as well. Many of the variables are the same and
their definitions do not need to be repeated. These include material type, color, thermal
alteration, weathering, artifact portion, length, width, thickness, flakes per 10 mm, mistakes per
10 mm, and weight. Additional variables and those with attributes that are specific to ultrathin
bifaces are elaborated below.
Center Thickness – Because ultrathin bifaces are often thinnest in the center due to the
opposed diving flaking technique, the thickness of the center is recorded in addition to the
maximum thickness. This variable is somewhat analogous to flute thickness for fluted points.
Production Technique – Although the variable itself is the same as that for projectile
points, the production techniques that are apparent on ultrathin bifaces tends to be quite different
from points. The most diagnostic technique in producing these bifaces is opposed diving flaking,
while ordinary biface thinning is also present regularly. Some overshot flaking may also appear
on unfinished bifaces, according to Frison and Bradley (1980:33).

34
Stage – Frison and Bradley (1980:31-39) organize the production of ultrathin bifaces into
a sequence of five stages. The first is blank production, and the second is initial percussion
shaping. The third stage consists of shaping and thinning flakes, which involves opposed diving
flaking. Overshot flaking may also be utilized. The fourth stage is the final biface thinning, in
which the biface is given its ovoid shape and thinness in the center. The fifth and final stage is
made up of pressure flaking along the edges, which results in acute-angled working edges.
Breakage – For the most part, this variable is the same as that for projectile points.
However, radial fractures are far more common among ultrathin bifaces and may a role in the
tools’ uselives (Root et al. 1999:161). Some ultrathin bifaces may have been intentionally struck
in their center in order to produce fractured pieces with squared off edges and acutely angled
corners for use as burins or gravers, although the fractured edges in Root et al.’s examples meet
at more acute angles than those observed at Gault.
Repositories Visited
The sample of 1093 artifacts was obtained by personally visiting a total of ten locations
ranging from Texas and New Mexico to Wyoming and North Dakota. The archaeological sites
sampled are shown on the map in Figure 4, and the artifact counts from those sites are listed in
Table 1 and 2. I was fortunate to have the opportunity to personally observe, handle, and
photograph each artifact in the sample, in order to ensure that the measurements are as consistent
as possible. All measurement data are entered into a Microsoft Excel spreadsheet, and this
spreadsheet is included in the attached files uploaded to Trace (“Lassen Folsom Measures.xls”),
has been submitted to the Paleoindian Database of the Americas (PIDBA) and is stored on the
server of the Gault School of Archaeological Research. In two cases (some of the Big Black

35
assemblage and the Cox collection), some measurements had to be obtained from photographs
due to scheduling constraints. Any artifact measurements obtained from photos are designated
by a blue font on the spreadsheet. Similarly, any measurements obtained from artifact casts
(rather than the original pieces) are designated by a red font. Casts are rarely included in this
sample and were only measured when the originals were unavailable, such as being on
permanent exhibit. The following is a description of each location visited during this research.
Gault School of Archaeological Research
Because the Gault site and its Folsom-Midland assemblage are been extensively
discussed in the next chapter, it will only be mentioned briefly here. The Gault School’s
collections were originally housed with the University of Texas at the Pickle Research Campus
and the school was an offshoot of the Texas Archeological Research Laboratory. In 2010, the
Gault School became affiliated with Texas State University and moved to San Marcos, where it
currently remains. The Gault assemblage consists of 32 points and preforms, seven ultrathin
bifaces, and three indeterminate points.
Texas Archeological Research Laboratory (TARL)
Located at the Pickle Research Campus of the University of Texas at Austin, TARL is a
repository for site information and artifacts from all over Texas. As such, it has Folsom
collections from several sites. The sites housed in TARL that were recorded for this research
include Kincaid Rockshelter, Pavo Real, Blackwater Draw, Lubbock Lake, Plainview, Bonfire
Shelter, and Wilson-Leonard. The Plainview site contains no Folsom or Midland artifacts but
was included for comparative purposes.
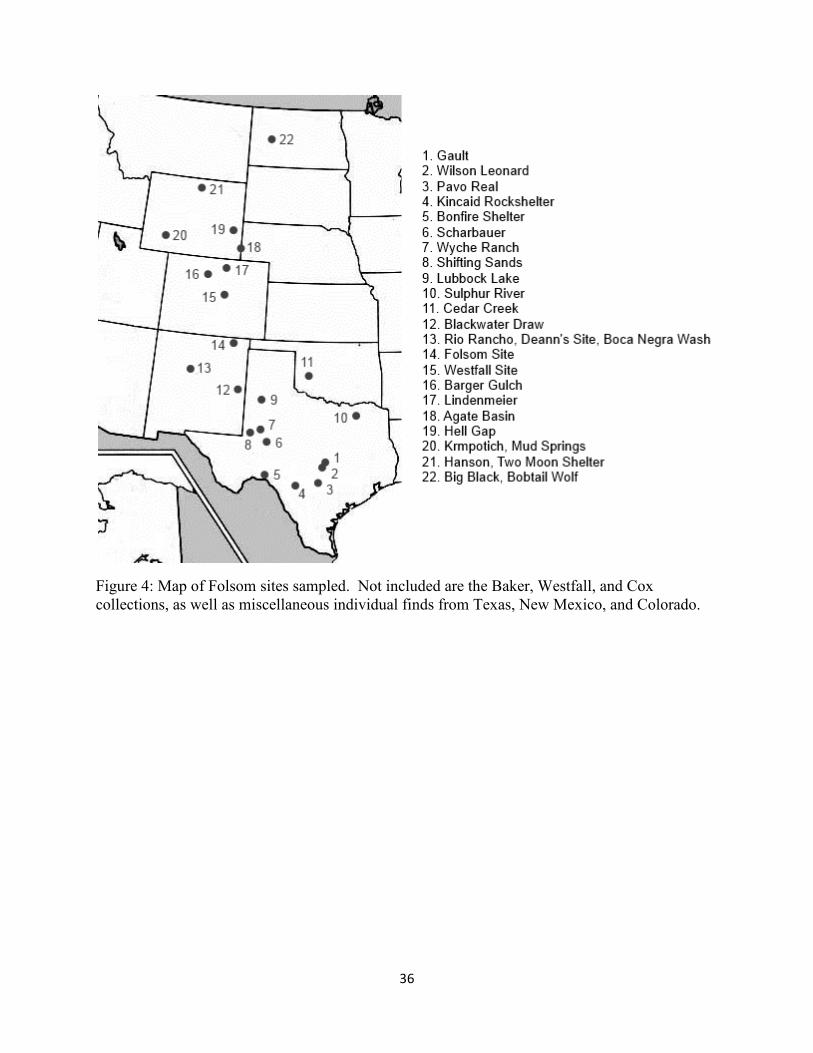
36
Figure 4: Map of Folsom sites sampled. Not included are the Baker, Westfall, and Cox
collections, as well as miscellaneous individual finds from Texas, New Mexico, and Colorado.

37
Midland, Texas
Richard Rose has been systematically collecting and documenting artifacts from sand
dune blowout sites in the area around Midland for the past three decades. The primary focus of
my research with Mr. Rose is the extensive Shifting Sands assemblage. Smaller samples from
additional sites in Rose’s collection include Scharbauer, Wyche Ranch, Chispa Creek, Hot Tubb,
and five miscellaneous surface finds not attributable to any known archaeological site.
Maxwell Museum of Anthropology
Dr. Bruce Huckell is researching three Folsom assemblages from New Mexico, and these
assemblages are under his care at the University of New Mexico in Albuquerque. The New
Mexico assemblages used in this research are from Rio Rancho, Deann’s Site, and Boca Negra
Wash. Three miscellaneous Folsom points from New Mexico were also recorded.
No Man’s Land Historical Society
Located in Goodwell, Oklahoma, the NMLHS maintains a small museum that houses the
Baker Collection. Included in the Baker Collection are 25 Folsom-era projectile points that are
used in this study.
Denver Museum
As a repository for the original Folsom site collection as well as some of the Lindenmeier
assemblage, the Denver Museum is an essential location for researching Folsom technology. In
addition, six miscellaneous Folsom points from Colorado were also recorded.
Sterling, Colorado
Tom Westfall has a substantial collection of Folsom and Midland surface finds from the
eastern Colorado/western Nebraska area. Most of the artifacts in this collection have been found
along the banks of the North Platte River, and locations are provided by county in the primary

38
database. In addition, Mr. Westfall also has the modest assemblage from the Westfall site,
excavated by Jack Hofman and himself.
University of Wyoming
The Anthropology Department at the University of Wyoming in Laramie houses a
number of Folsom assemblages that are essential for this research. The sample of sites from
Wyoming consists of Krmpotich, Two Moon, Hanson, Agate Basin, Hell Gap, and Barger
Gulch.
State Historical Society of North Dakota
The SHPO of North Dakota is headquartered in this facility, along with curated
archaeological assemblages and site information. Of particular interest for this research, the
State Historical Society holds the Folsom assemblages from the Big Black and Bobtail Wolf sites
excavated from the Knife River Flint quarry area. These sites provide a useful comparison to the
Gault assemblage and enable this research to compare Folsom-age assemblages from lithic
procurement sites in both the Northern and Southern Plains.
Norman, Oklahoma
Dr. Jim Cox has a large collection of Folsom, Midland, and other Paleoindian projectile
points, preforms, and ultrathin bifaces that he made available for this study. Although many of
the artifacts recorded came from isolated surface finds from Oklahoma and north Texas, Dr. Cox
also provided access to materials from the Cedar Creek site from Oklahoma, the Sulphur River
site from Hunt County, Texas, and Mud Springs site from Wyoming. However, Mud Springs is
underreported, having only been briefly mentioned in the first edition of Frison’s Prehistoric
Hunters of the High Plains (1978), and no archaeological references could be obtained on the
Sulphur River site.

39
Smithsonian Institution
The National Museum of Natural History in Washington, D. C. has a vast array of
Folsom assemblages, where a sample of the extensive Lindenmeier materials was analyzed. The
data provided from the Lindenmeier sample complements that from the portion of the
assemblage that is housed at the Denver Museum and enables more accurate conclusions to be
drawn from the site as a whole.
Sites and Collections
Kincaid Rockshelter
This site is located on the Sabinal River in south-central Texas. Although the site has lost
some significant information due to looting, it is to date the best example of a permanent
structure built during the Clovis period (Collins 1990). The lowest strata of the rockshelter
consist of fluvial and lacustrine sediment that was deposited by spring water dripping down the
back of the shelter. Lying atop this moist sediment is a pavement of limestone river cobbles that
is associated with Clovis artifacts and is not attributable to any natural process. A Folsom
component is also known to have existed at Kincaid, but it is more ephemeral than Clovis. The
entire Folsom assemblage consists of five projectile points found in the backdirt of looters’ holes
(Collins 1990). Dee Ann Story has hypothesized that the Folsom points had once been
associated with bison remains found in the upper portion of the Zone 4 stratum (Collins
1990:30). She suggests that Folsom hunters wounded a bison, and the bison retreated into the
shelter and died without being found by the hunters. The remaining bison bones that
archaeologists excavated on the surface of Zone 4 were articulated, but much of the skeleton had

40
been disturbed by looting. Although the association of the bison bones and Folsom points is
likely, it cannot be verified archaeologically.
Pavo Real
This is a multicomponent site that was excavated in 1979-1980 preceding an expansion
of highway FM 1604 where it crosses Leon Creek in northwestern Bexar County, Texas (Hester
2003:1). The site is located in the Balcones Canyonlands along the southeastern edge of the
Edwards Plateau. The archaeological components of Pavo Real consist of an Early to Late
Archaic zone containing three burned rock middens, a mixed Clovis and Folsom tool
manufacturing stratum, and a lower stratum containing additional lithic material that could not be
typologically assigned, although OSL dating places the component within the accepted age range
for Clovis (Collins et al. 2003:7-8). Because the Folsom occupation of Pavo Real is mixed with
Clovis material, only diagnostic artifacts (including points, preforms, bifaces, blades and blade
cores in the case of Clovis, and some reduction flakes) could be assigned to one technology or
the other. For this research, four projectile points, seven preforms, and two ultrathin biface
fragments were analyzed from Pavo Real. It should be noted that artifacts labeled as “miniature
lanceolate points” in the site report have been included in the Folsom sample here (Collins
2003:107-108, 110).
Blackwater Draw
This site is a household name among archaeologists who study the Paleoindian period
due to the fact that it is where Clovis was first recognized as a technological tradition distinct
from Folsom, and it is the first site in which multiple Paleoindian components were found in a
stratified context (Haynes and Warnica 2012:1-3; Katz 1997:12-13). The site is located on the
Llano Estacado in the headwaters of the Brazos River between the towns of Clovis and Portales,

41
New Mexico on property owned by a commercial gravel mining company. During the
Pleistocene, Blackwater Locality No. 1 was made up of lacustrine basins that were likely
attractive to large herbivores and the people who hunted them (Haynes and Warnica 2012:9-21).
The Folsom age artifacts from Blackwater Draw that were sampled for this study come from the
Texas Memorial Museum excavations (1949-1950 and 1953-1957) and are housed in TARL.
The sample consists of 21 projectile points and one possible ultrathin biface.
The Lubbock Lake Landmark
This site lies in the Southern High Plains in the northern portion of the city of Lubbock,
Texas and encompasses a bend in the Yellowhouse Draw and its surrounding valley. The
archaeological site was uncovered in 1936, when the city used Works Progress Administration
funds to dig a reservoir in Yellowhouse Draw. The first archaeological excavations were funded
by the WPA and took place in 1939, followed by the Texas Memorial Museum in the late 1940s
through the 1950s, the West Texas Museum (now the Museum of Texas Tech University) in
1959 and 1960, and finally the Lubbock Lake Project was established out of Texas Tech
University to conduct ongoing research at the site (Johnson and Holliday 1987a:4-8). The
spring-fed creek has provided water to flora, fauna, and humans throughout much of prehistory,
as well as enabling the accumulation of well-stratified sediments with which to preserve these
remains. Lubbock Lake has a rich record of Paleoindian occupation, including Clovis, Folsom,
Plainview, and Firstview components. All the Paleoindian components involve large animal
killing and/or processing, with the Clovis component focused on the processing of mammoth
remains, and the latter three dealing with bison (Johnson and Holliday 1987b:100-111). The
Folsom component consists of a bison kill/butchering locality associated with projectile points, a
uniface, a utilized flake, and caliche cobbles used as pounding stones to break bones. Seven

42
projectile points from the Texas Memorial Museum excavations have been recorded for this
research.
Plainview
This site is located on the High Plains in northwest Texas and was excavated in 1945.
The site consists of a bone bed in which about 100 bison (at the time described as Bison taylori)
were found (Sellards et al. 1947). The bones were uncovered due to a caliche mining operation
along Running Water Creek, and the discovery of the bones went unnoted until Glen Evans and
Grayson Meade encountered them in 1944. According to Sellards et al. (1947:934-935), the
bones and artifacts were possibly transported by Running Water Creek to the location of their
discovery as a result of a single fluvial event, or the bison may have been driven over a steep
cutbank along the creek, causing large numbers of individuals to accumulate in a relatively small
area. The artifacts from this site inspired the original definition of the Plainview point type,
making this assemblage extremely useful in differentiating Plainview from other unfluted
Paleoindian point types, particularly Midland. Nineteen Plainview projectile points from this site
are recorded in this research for comparative purposes.
Bonfire Shelter
This is a large rockshelter along a tributary of the Rio Grande in Mile Canyon outside of
Langtry, Texas. The site consists of three bone beds, with the general consensus being that the
latter two beds were created by driving bison over the edge of the canyon’s east rim (Bement
1986:1-2, but see Byerly et al. 2005 for an alternative hypothesis). The lowest bone bed consists
of Pleistocene fauna including mammoth, horse, and camel. Its association with cultural activity
may be indicated by an association with a possible anvil stone and bone splinters, but the
remains may have been brought into the shelter by nonhuman predators. The other two bone

43
beds are the result of human-directed bison drives and are dated to 10,230 and 2,700-2,500
radiocarbon years old, respectively. The second bone bed contains archaeological remains that
are representative of multiple Paleoindian technologies (including Plainview, Folsom, and
possibly Clovis) and consists of three superimposed kill events (Dibble and Lorrain 1968:29-30,
35-38). The uppermost stratum of Bone Bed 2 is Stratum A, which yielded charcoal for the
radiocarbon date and contains Plainview points. The underlying Stratum B/C is where a Folsom
point was found. The lowest stratum of Bone Bed 2, Stratum D, is only 3 centimeters thick, with
the only remains found definitively in this level being those of a gray fox (Bement 1986:27-35).
For this analysis, the Folsom point, six Plainview points, and the two Clovis-like distal point
fragments were examined.
Wilson-Leonard
This is a multi-component site along Brushy Creek, about 33 kilometers north-northwest
of Austin, Texas. The site is located near the intersection of three physiographic provinces: the
Lampasas Cut Plain, the Edwards Plateau, and the Black Prairie (Collins and Mear 1998:5-10).
Excavations at the site took place on two separate occasions. The site was recorded in 1973
during a Texas Department of Transportation survey for an extension of RR 1431. The first
excavations took place in 1981-1984 and consisted of preliminary test excavations in the first
year followed by extensive data recovery excavations in the following three years (Bousman et
al. 1998:33-39). A Paleoindian burial was uncovered and removed in December 1982 to January
1983. In 1991, TxDOT contracted with TARL to conduct additional excavations at Wilson-
Leonard in order to provide additional data for a comprehensive report on the site. The TARL
excavations were conducted from 1992 to 1994 (Bousman et al. 1998:41-43). The excavations
uncovered components ranging from Clovis to Late Prehistoric in a nearly complete prehistoric

44
cultural record for central Texas (Collins 1998a:55). Folsom-age projectile points at Wilson-
Leonard are sparse and only consist of a single Midland point base and the “Bone Bed Point”
(17JJ2/KK1-3) which in this research is considered a Midland as well. The Bone Bed
component overlies the site’s Clovis component and dates between 11,400 and 11,000
radiocarbon years B.P. (Collins 1998b:146-156). The bed is made up of both large, identifiable
bison bones and smaller bone fragments, along with a variety of artifacts in small numbers.
Based on analysis of the remains, at least two individual bison are present, along with a single
horse navicular and a variety of smaller mammals. The bone bed is between 10 and 70 cm thick,
although the thickest portions are likely dispersed due to bioturbation. Several bifaces and biface
fragments have been found in the bone bed, including three ultrathin biface fragments (not
analyzed here) and a likely Clovis preform that is out of context from the lower component.
Some of these biface fragments are likely Folsom preforms, although not enough of them remain
to make that designation certain. The “Bone Bed Point” matches the Midland type in terms of
thinness and collateral flaking, but it has a recurved outline that is atypical of Midlands and more
similar to Plainview or Goshen points. Additional artifacts from the bone bed include unifaces,
hammerstones, cores, gravers, an incised stone, and a limestone mano. The Bone Bed most
likely represents a single small kill event and a related short term campsite.
Scharbauer
As the type site of the Midland point, Scharbauer deserves particular attention. It was
brought to the attention of archaeologists in June of 1953 when Keith Glasscock discovered
human remains eroding from a sand dune blowout near Midland, Texas (Wendorf et al. 1955:4-
6). Professional investigations began in October that year and involved examining and
excavating the area around the human remains (Locality 1) as well as four additional areas

45
(Localities 2-5) in the vicinity of the find. The site is located in the Llano Estacado region and as
such has a similar geologic history as the Blackwater Draw site in New Mexico (Wendorf et al.
1955:11-15, 71). The five localities of the Scharbauer site lie along or near the Monahans Draw
in a dune field that would have sustained small streams and lakes prehistorically, particularly
during the Folsom period.
Two projectile points were found three or four feet to the west of the human skeletal
remains, and while one of the points does not conform to any currently known type, the other is
easily identifiable as what is now known as a Midland point (Wendorf et al. 1955:44-49). At the
time, the archaeologists noted that it superficially resembles the Plainview type, but it is
considerably thinner, flatter, and narrower. Once similar points emerged from the other localities
and the archaeologists noted other examples from Folsom sites elsewhere, the soon-to-be
Midland points were temporarily identified as “unfluted Folsom” points. The points were more
formally termed “Midland” a few years later (Wendorf and Krieger 1959:67). In addition to
these two points, Locality 1 also yielded three other Midland point fragments, as well as
scrapers, gravers, possibly burins, two groundstone tools, debitage, possible hearth stones, and a
horse femur with possible cut marks (Wendorf et al. 1955:43-52). The other localities contained
more Midland points as well as fluted Folsom points, along with additional Paleoindian types
such as Meserve and a possible Milnesand, as well as various indeterminate types including a
Late Prehistoric arrow point (Wendorf et al. 1955:52-65). It should be noted, however, that two
of the previously untyped points (Nos. 42 and 53) bear a strong resemblance to the Wilson
Paleoindian points that were identified at the Wilson-Leonard site (Dial et al. 1998:376-380).
This research sample includes 27 points and two preforms from Scharbauer, courtesy of Richard
Rose.

46
The geology of the Scharbauer site has unfortunately been a source of contention for
decades. Originally, Wendorf et al. (1955:21-35) provided a relatively simple outline for the
sand dune stratigraphy. The stratigraphy is divided into two sand formations: the Judkins, which
roughly corresponds to Pleistocene deposits; and the Monahans, which relates to more recent
Holocene dunes. The Judkins is further divided into three units. Unit 1 is white sand in a marl
matrix, Unit 2a is very pale orange mixed with white calcareous sand, Unit 2b is gray calcareous
sand, and Unit 3 is the classic Judkins red sand with moderate soil formation on its surface. The
Monahans formation is made up of two units, with Unit 4 being tan sand dunes that are stabilized
by vegetation and Unit 5 being tan sand that is actively mobile. This full sequence was only
exposed in Locality 1, however, while the other localities were only eroded down to the red sand,
presumably at the top of the Judkins Formation. Pleistocene faunal remains were noted
throughout the Judkins sands, with horse being the most abundant. Also present are bison,
camel, mammoth, and extinct antelope (Capromeryx). In Locality 1, all formal artifacts came
from either the Unit 3 red sand or the Unit 2b gray sand (Wendorf et al. 1955:43-53). The
human remains and neighboring projectile points were found in Unit 2b. However, flakes and
the cut-marked horse femur were found within the Unit 1 white sand. In Localities 2-5, all
artifacts were found lying on the surface of the Unit 3 red sand.
The human remains were originally inferred to be older than Folsom (and up to 20,000
B.P.) based on stratigraphy, chemical comparison with faunal remains, and uranium series dating
(Wendorf and Krieger 1959:67, 71-72). However, the age of the human remains has never been
certain, and Wendorf and Krieger (1959:75) noted that the 20,000 B.P. uranium series age cannot
be reconciled with an age of 13,400 ± 1,200 obtained from snail shells in the underlying Unit 1
white sand. In an effort to resolve these issues, Holliday and Meltzer (1996:764-768) revisited

47
the Scharbauer site from 1989 to 1992. By analyzing 33 cores, augers, and exposures from
Locality 1 to Locality 3, they found that the red sand of Unit 3 is actually divided into upper and
lower strata, with soil development present on both surfaces. Locality 1 is made up of fill from
Monahans Draw, from which the Unit 1 white sand and Unit 2 gray sand is derived. The lower
red sand is truncated by the gray sand in Locality 1, leaving only the upper red sand to overlie
the white and gray sands. However, Locality 3 is a blowout that has eroded down to the lower
red sand, where Folsom and Midland artifacts are present. Therefore, the human remains and
Folsom age artifacts were eroded out of the lower red sand and incorporated into the Monahans
Draw fill in Locality 1. Additionally, 234
U/238
U dating of a fragment of the human skull gave an
age of 12,300 ± 500 B.P., which was averaged with other ages to 11,600 ± 800 B.P. (Holliday
and Meltzer 1996:768, citing McKinney 1992). These ages roughly corresponded to the
calibrated calendar age of the Folsom period, indicating that the human remains likely are
associated with the Folsom-Midland component of the Scharbauer site. Other than the presence
of human teeth at the Shifting Sands site nearby (Hofman et al. 1990:234), the skeletal remains at
Scharbauer are the only incidence of human remains that are known to have survived thus far in
the Folsom archaeological record. According to Collins (personal communication), the remains
are currently in the possession of an unnamed private individual in San Antonio, Texas.
Shifting Sands
This site is also located near Midland, Texas, and has undergone very similar site
formation processes as Scharbauer. Artifacts from Shifting Sands have been systematically
mapped and collected by Richard Rose of Midland for the past three decades (Rose personal
communication). Like Scharbauer, the Folsom-Midland component of Shifting Sands has been
exposed by the movement of dunes composed of sand from the uppermost portion of the
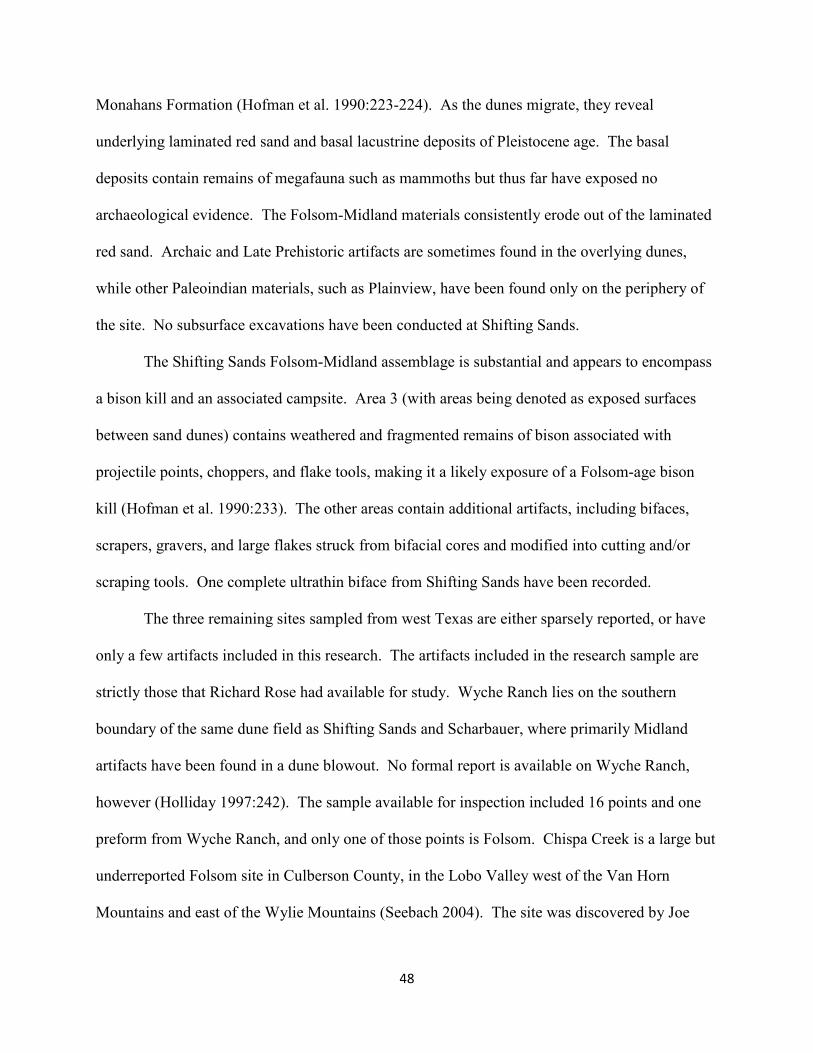
48
Monahans Formation (Hofman et al. 1990:223-224). As the dunes migrate, they reveal
underlying laminated red sand and basal lacustrine deposits of Pleistocene age. The basal
deposits contain remains of megafauna such as mammoths but thus far have exposed no
archaeological evidence. The Folsom-Midland materials consistently erode out of the laminated
red sand. Archaic and Late Prehistoric artifacts are sometimes found in the overlying dunes,
while other Paleoindian materials, such as Plainview, have been found only on the periphery of
the site. No subsurface excavations have been conducted at Shifting Sands.
The Shifting Sands Folsom-Midland assemblage is substantial and appears to encompass
a bison kill and an associated campsite. Area 3 (with areas being denoted as exposed surfaces
between sand dunes) contains weathered and fragmented remains of bison associated with
projectile points, choppers, and flake tools, making it a likely exposure of a Folsom-age bison
kill (Hofman et al. 1990:233). The other areas contain additional artifacts, including bifaces,
scrapers, gravers, and large flakes struck from bifacial cores and modified into cutting and/or
scraping tools. One complete ultrathin biface from Shifting Sands have been recorded.
The three remaining sites sampled from west Texas are either sparsely reported, or have
only a few artifacts included in this research. The artifacts included in the research sample are
strictly those that Richard Rose had available for study. Wyche Ranch lies on the southern
boundary of the same dune field as Shifting Sands and Scharbauer, where primarily Midland
artifacts have been found in a dune blowout. No formal report is available on Wyche Ranch,
however (Holliday 1997:242). The sample available for inspection included 16 points and one
preform from Wyche Ranch, and only one of those points is Folsom. Chispa Creek is a large but
underreported Folsom site in Culberson County, in the Lobo Valley west of the Van Horn
Mountains and east of the Wylie Mountains (Seebach 2004). The site was discovered by Joe
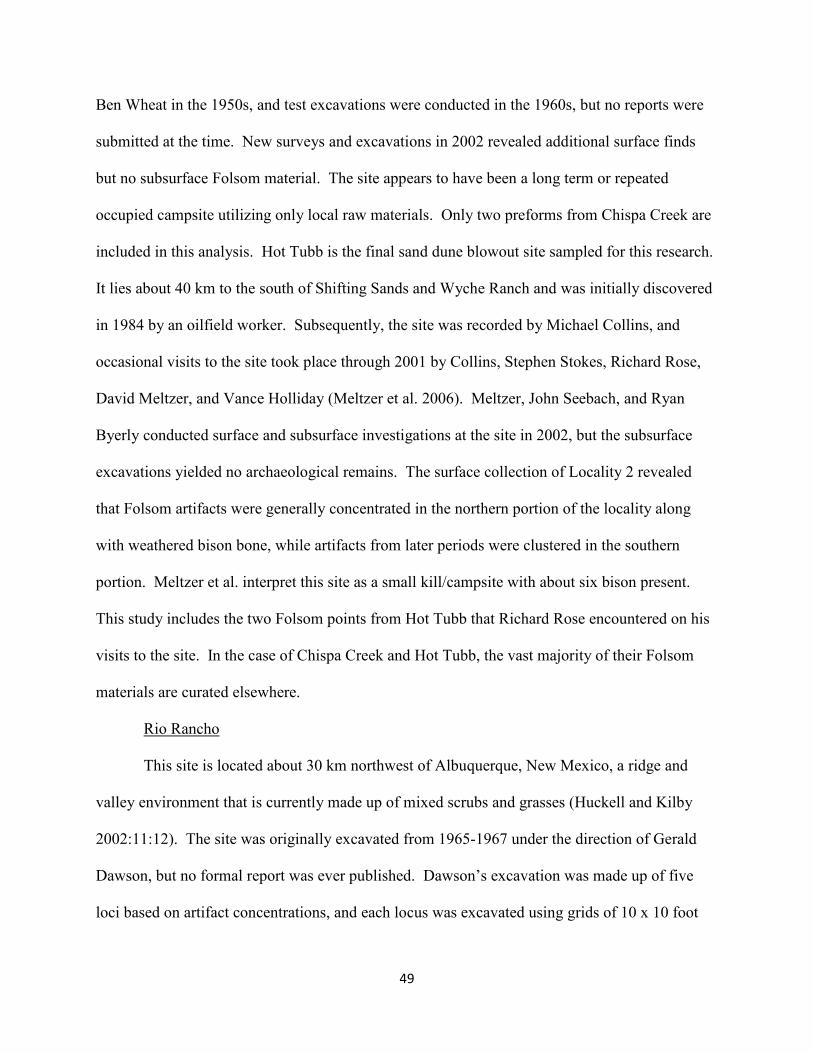
49
Ben Wheat in the 1950s, and test excavations were conducted in the 1960s, but no reports were
submitted at the time. New surveys and excavations in 2002 revealed additional surface finds
but no subsurface Folsom material. The site appears to have been a long term or repeated
occupied campsite utilizing only local raw materials. Only two preforms from Chispa Creek are
included in this analysis. Hot Tubb is the final sand dune blowout site sampled for this research.
It lies about 40 km to the south of Shifting Sands and Wyche Ranch and was initially discovered
in 1984 by an oilfield worker. Subsequently, the site was recorded by Michael Collins, and
occasional visits to the site took place through 2001 by Collins, Stephen Stokes, Richard Rose,
David Meltzer, and Vance Holliday (Meltzer et al. 2006). Meltzer, John Seebach, and Ryan
Byerly conducted surface and subsurface investigations at the site in 2002, but the subsurface
excavations yielded no archaeological remains. The surface collection of Locality 2 revealed
that Folsom artifacts were generally concentrated in the northern portion of the locality along
with weathered bison bone, while artifacts from later periods were clustered in the southern
portion. Meltzer et al. interpret this site as a small kill/campsite with about six bison present.
This study includes the two Folsom points from Hot Tubb that Richard Rose encountered on his
visits to the site. In the case of Chispa Creek and Hot Tubb, the vast majority of their Folsom
materials are curated elsewhere.
Rio Rancho
This site is located about 30 km northwest of Albuquerque, New Mexico, a ridge and
valley environment that is currently made up of mixed scrubs and grasses (Huckell and Kilby
2002:11:12). The site was originally excavated from 1965-1967 under the direction of Gerald
Dawson, but no formal report was ever published. Dawson’s excavation was made up of five
loci based on artifact concentrations, and each locus was excavated using grids of 10 x 10 foot

50
squares screened through ¼ inch mesh. Huckell and Kilby’s re-analysis of the site concentrated
the division into four loci, with three representing discrete Folsom occupations, and the last one
also containing materials from a Cody component, as well as Archaic through Historic remains.
The Folsom materials were found in eolian deposits at depths of less than 20 centimeters.
Although interpreting the purpose of Rio Rancho (and indeed whether it represents one or
multiple Folsom visitations) is difficult, the most likely site function is that of a post-kill
campsite, in which new weapons were being made to replace broken and worn out ones, and
where butchering and hide preparation took place. Evidence for this assessment consists of a
large proportion of preforms to projectile points and a substantial number of discarded end
scrapers and unifaces. The artifacts sampled for this analysis include 23 points and 10 preforms.
Boca Negra Wash and Deann’s Site
These are both located in the Albuquerque Basin of the Rio Grande Valley in New
Mexico. Boca Negra Wash was discovered in 1998 and has been excavated on a fairly regular
basis from 1999 to at least 2004 (Holliday et al. 2006:776-779). The site consists of two loci,
with Locus A on the south slope of a sand covered ridge, and Locus B located 60 meters
southwest in a more level sandy area. Excavations and surface collections at Locus A have
revealed fragmentary Folsom points, a preform, scrapers, gravers, retouched flakes, and tooth
enamel that is most likely attributed to bison. Locus B uncovered larger numbers of similar
artifacts, plus cobble tools, a core, channel flakes, a miniature point, and fragments of large
mammal bone. Deann’s site is located on the northernmost playa immediately west of a north-
south line of volcanoes in the Albuquerque Basin (Holliday et al. 2006:790-793). The site’s
stratigraphy is made up of alternating sand and mud strata overlying the basalt bedrock. Surface
collections and excavations at the site since 2001 uncovered Folsom point, channel flake, and

51
biface fragments, as well as a graver, utilized flakes, and retouched flakes. Neither Boca Negra
Wash nor Deann’s site feature prominently in this research sample, with only three Folsom
preforms from the former and a single point and a preform from the latter included in the
analysis.
The Baker Collection
This collection was assembled by Bill Baker, starting in 1922 (NMLHS exhibit
information) and is now displayed at the No Man’s Land Museum. Although he lived in
Cimarron County, Oklahoma, Baker’s collecting ranged between Oklahoma, New Mexico,
Colorado, and Kansas. The majority of his finds came from an area from 200 miles west of
Boise City to 150 miles east of Boise City, Oklahoma. Baker became particularly interesting in
Folsom and Yuma (the umbrella term for unfluted Paleoindian points at the time) artifacts after
the discovery of points associated with extinct bison at the Folsom site in 1927. As a result, his
collection includes about 500 Paleoindian projectile points of various types, although only 25 of
those points belong to the Folsom period and are included in this research. Baker’s collecting
was facilitated by the Dust Bowl crisis of the 1930s, which deflated topsoils across much of the
Great Plains, exposing previously buried Pleistocene sediments and revealing long buried
Paleoindian artifacts.
Folsom Site
The original discovery of the Folsom site is marred by conflicting accounts (Meltzer
2006:33-35), but the general consensus is that a cowboy from Crowfoot Ranch, New Mexico
named George McJunkin noticed bison bones eroding out of Wild Horse Arroyo sometime after
a 1908 flood in the area. From there, the varying accounts assume that McJunkin mentioned the
site to Carl Schwachheim, who eventually visited the site with Fred Howarth and others in

52
December 1922. In 1926, the two men visited the Colorado Museum of Natural History in
Denver to bring the site to the attention of Cook and Figgins. The scientists were once again
initially interested in the find primarily because it could provide more mountable skeletons, but
when Figgins received word in the summer of 1926 that a projectile point had been removed
from the bone beds, he stressed the importance of leaving any similar finds in situ. Finally on
August 29, 1927, a Folsom point was found and left in situ for scientists to observe (Meltzer
2006:37-39). Following Hrdlička’s recommendation, Figgins telegrammed an announcement of
the find to scholars around the country. Only after representatives from multiple institutions
observed the find was it considered legitimate evidence of the antiquity of humans in North
America, although some (including Hrdlička) remained skeptical as to how recently in prehistory
the ancient bison went extinct.
The original excavations at the Folsom site were not on par with modern archaeological
techniques (Meltzer 2006:84-93). The site straddles Wild Horse Arroyo east of Johnson Mesa,
and the first bison skull was found eroding from the south bank. Schwachheim and other
excavators used a plow and mule team to clear a 20 x 30 foot area around the bison remains,
followed by the use of picks and shovels to remove about six feet of overburden from above the
bones. Even the discovery of fluted points did little to change the pick-and-shovel methodology,
although the excavators took more care to find in situ points from then on, and the bones
themselves were exposed using ice picks and removed in plaster-coated sediment blocks. In
1928, the final year of the original excavation, the operation was expanded in order to determine
the extent of the bone bed and to remove all the bison remains. This field season also included
the first attempt to record the depth of the bones. Once the bone bed along the south bank was
deemed fully excavated, the workers moved on to the north side of the arroyo but reportedly

53
found that the bison remains only extended a few feet beyond the bank. The excavators cleared
and photographed a stratigraphic profile extending 34 feet along the north bank excavation. By
the end of the excavations, Barnum Brown estimated that 442 m2 had been removed, but
subsequent analysis of the 1928 plan map suggests that only 233.7 m2 had actually been
excavated (Meltzer 2006:92).
David Meltzer led a team of archaeologists to conduct new investigations of the Folsom
site during three field seasons from 1997 to 1999 (Meltzer 2006:99-108). The 1997 and 1998
excavations revealed that intact bison remains were still present on the western edge of the 1928
excavations of the arroyo’s south bank. After observing that the remains primarily consisted of
low utility elements, one of the primary goals of fieldwork in 1999 was to locate an associated
Folsom campsite near the bison kill. Unfortunately, no campsite was found. However, out of
the nearly 100 m2 excavated in 1997-1999, 37 m
2 contained bison bones, indicating that bison
remains may be more widely scattered about the site (particularly beyond the north bank) than
was originally thought (Meltzer 2006:108). These investigations also revealed that the bison
remains at Folsom are not articulated, which had previously been assumed, and taphonomic
processes do not account for this observation (Meltzer 2006:213-235, 240-241, 245). Folsom
butchering of the bison was fairly thorough in terms of disarticulation but focused primarily on
the “gourmet” rib slabs and did not include the processing of bone marrow. About 32 bison were
apparently killed simultaneously at the site. The known assemblage consists of 28 Folsom
projectile points and four flake tools (Meltzer 2006:291). Seven projectile points from Folsom
were available at the Denver Museum and are included in this analysis.

54
Lindenmeier
Although the Folsom site taught archaeologists to find Paleoindian sites by first locating
the remains of extinct animals (Meltzer 2006:46), the second major Folsom discovery was not
found in such a manner. The Lindenmeier site in northern Colorado was discovered by three
collectors in 1924 and first published in 1931 by E. B. Renaud as part of his survey of projectile
points in Colorado (Wilmsen and Roberts 1978:1). As the importance of the site came to be
known to the collectors, one of them (Major Roy G. Coffin) contacted the Smithsonian
Institution, bringing the site to the attention of Frank H. H. Roberts, Jr., one of the archaeologists
who visited the original Folsom discovery.
While he was initially skeptical of the site’s context, Roberts’ worries that Lindenmeier
was a mere surface scatter quickly dissipated as buried Folsom materials were found eroding out
of a recent arroyo that ran through the valley (Wilmsen and Roberts 1978:19-21). As a result,
Roberts conducted increasingly precise excavations of the site from 1934 through 1940. The
goals of his excavations also became increasingly ambitious through the field seasons.
Originally intending simply to verify the association of Folsom artifacts with extinct bison, he
subsequently sought to determine their stratigraphic position to gain an idea of the component’s
age and finally to find evidence of structures and/or human remains. Although he was successful
in his first two goals, the remaining objective of locating structures and human burials remains
elusive for most Folsom sites to this day.
The Lindenmeier excavations took place primarily in three areas (Wilmsen and Roberts
1978:2-3). Area I is the westernmost of these areas and is made up of Trench A and its
surrounding excavation squares. Trench A is a north-south line of excavation units that crosses
the site between a northern arroyo and the southern valley wall. Area II is 100 m east of Trench
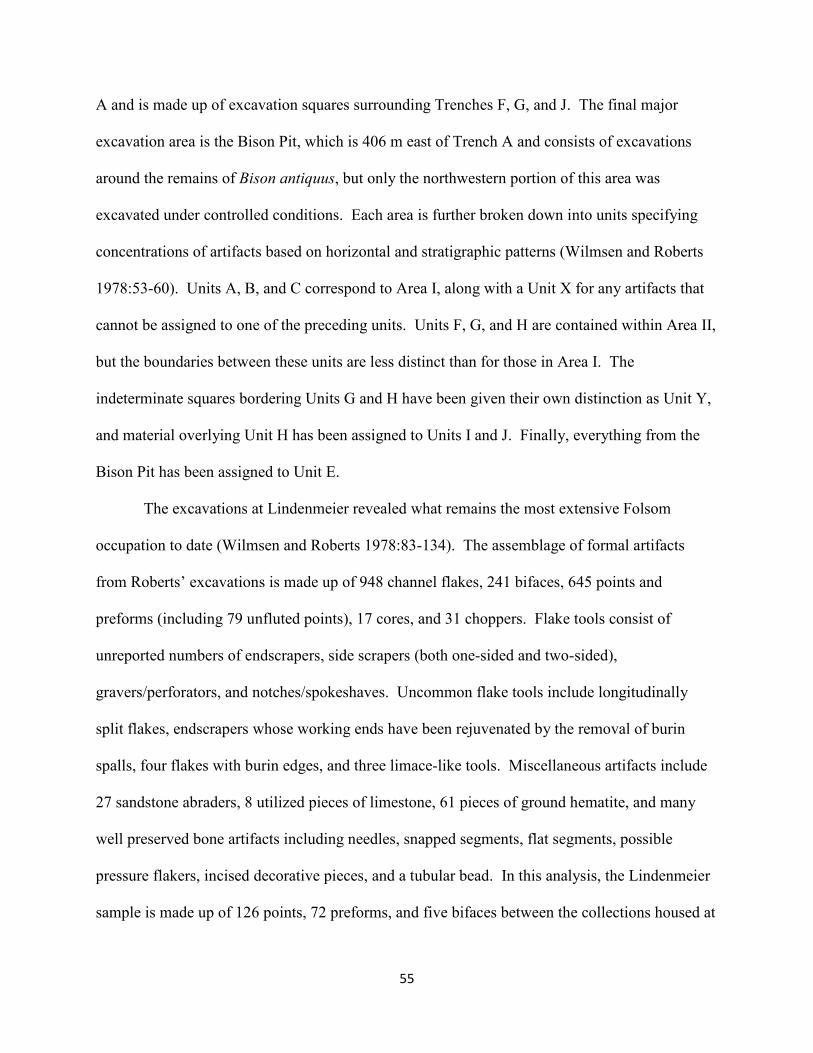
55
A and is made up of excavation squares surrounding Trenches F, G, and J. The final major
excavation area is the Bison Pit, which is 406 m east of Trench A and consists of excavations
around the remains of Bison antiquus, but only the northwestern portion of this area was
excavated under controlled conditions. Each area is further broken down into units specifying
concentrations of artifacts based on horizontal and stratigraphic patterns (Wilmsen and Roberts
1978:53-60). Units A, B, and C correspond to Area I, along with a Unit X for any artifacts that
cannot be assigned to one of the preceding units. Units F, G, and H are contained within Area II,
but the boundaries between these units are less distinct than for those in Area I. The
indeterminate squares bordering Units G and H have been given their own distinction as Unit Y,
and material overlying Unit H has been assigned to Units I and J. Finally, everything from the
Bison Pit has been assigned to Unit E.
The excavations at Lindenmeier revealed what remains the most extensive Folsom
occupation to date (Wilmsen and Roberts 1978:83-134). The assemblage of formal artifacts
from Roberts’ excavations is made up of 948 channel flakes, 241 bifaces, 645 points and
preforms (including 79 unfluted points), 17 cores, and 31 choppers. Flake tools consist of
unreported numbers of endscrapers, side scrapers (both one-sided and two-sided),
gravers/perforators, and notches/spokeshaves. Uncommon flake tools include longitudinally
split flakes, endscrapers whose working ends have been rejuvenated by the removal of burin
spalls, four flakes with burin edges, and three limace-like tools. Miscellaneous artifacts include
27 sandstone abraders, 8 utilized pieces of limestone, 61 pieces of ground hematite, and many
well preserved bone artifacts including needles, snapped segments, flat segments, possible
pressure flakers, incised decorative pieces, and a tubular bead. In this analysis, the Lindenmeier
sample is made up of 126 points, 72 preforms, and five bifaces between the collections housed at

56
the Denver Museum and the Smithsonian Institution. These counts are merely a relatively small
sample of the total points, preforms, and bifaces that have been excavated from the site,
however. Because only a fraction of the Lindenmeier materials at the Smithsonian could be
analyzed due to scheduling limitations, a sampling strategy was implemented to obtain as
representative a sample from the Smithsonian’s collection as possible. At the Smithsonian,
Lindenmeier diagnostic artifacts are organized in drawers by artifact type and raw material. The
sampling strategy for the Smithsonian Lindenmeier assemblage consisted of recorded points and
preforms from each tray column by column, so that the first column from each tray was analyzed
before moving on to the second column (Figure 5). In this manner, a presumably representative
sample of point types and raw materials was acquired.

57
Figure 5: Sampling strategy for the Lindenmeier assemblage at the Smithsonian.
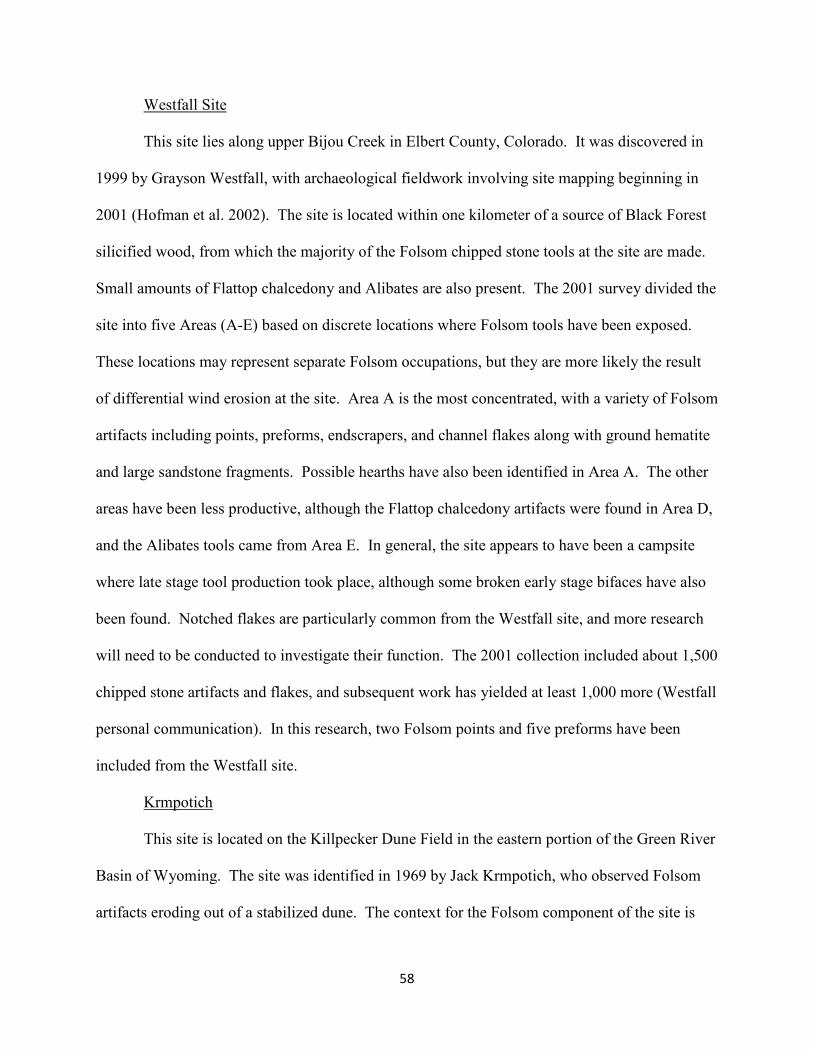
58
Westfall Site
This site lies along upper Bijou Creek in Elbert County, Colorado. It was discovered in
1999 by Grayson Westfall, with archaeological fieldwork involving site mapping beginning in
2001 (Hofman et al. 2002). The site is located within one kilometer of a source of Black Forest
silicified wood, from which the majority of the Folsom chipped stone tools at the site are made.
Small amounts of Flattop chalcedony and Alibates are also present. The 2001 survey divided the
site into five Areas (A-E) based on discrete locations where Folsom tools have been exposed.
These locations may represent separate Folsom occupations, but they are more likely the result
of differential wind erosion at the site. Area A is the most concentrated, with a variety of Folsom
artifacts including points, preforms, endscrapers, and channel flakes along with ground hematite
and large sandstone fragments. Possible hearths have also been identified in Area A. The other
areas have been less productive, although the Flattop chalcedony artifacts were found in Area D,
and the Alibates tools came from Area E. In general, the site appears to have been a campsite
where late stage tool production took place, although some broken early stage bifaces have also
been found. Notched flakes are particularly common from the Westfall site, and more research
will need to be conducted to investigate their function. The 2001 collection included about 1,500
chipped stone artifacts and flakes, and subsequent work has yielded at least 1,000 more (Westfall
personal communication). In this research, two Folsom points and five preforms have been
included from the Westfall site.
Krmpotich
This site is located on the Killpecker Dune Field in the eastern portion of the Green River
Basin of Wyoming. The site was identified in 1969 by Jack Krmpotich, who observed Folsom
artifacts eroding out of a stabilized dune. The context for the Folsom component of the site is

59
not entirely intact, as the materials have been excavated above and below a late Holocene
disconformity in the dune (Surovell 2009:38-50). The site contains numerous kinds of Folsom
artifacts, including cores, points, bifaces, gravers, and endscrapers made from various raw
materials, suggesting that the site was likely a camping location. In addition to the stone
artifacts, small fragments of bone and tooth enamel have been found across the site, some of
which are identifiable as bison. However, due to the mixed context of the site, it cannot be
determined whether the bones are actually associated with the Folsom component. Eight points,
eight preforms, and one ultrathin biface from Krmpotich were made available for this project.
Two Moon
This is a rockshelter in the Black Mountain Archaeological District along the western
foothills of the Bighorn Mountains. It is situated in Spring Creek Canyon in an area which was a
known procurement site for Phosphoria Formation chert (Finley et al. 2005). Excavations at the
site began in 1993, with 10-day excavations continuing on an annual basis at least through the
writing of Finley et al.’s preliminary report in 2005. Excavations revealed Late Archaic and
Paleoindian deposits, with the Paleoindian components consisting of Prior Stemmed, Folsom,
and a possible pre-Folsom (Clovis?) component made up of a blade-like flake and an overshot
flake. Additional Holocene occupations may have once been present, but an erosional event took
place immediately above the Prior Stemmed component and eliminated any possible evidence of
them. Based on analysis of the debitage, the Folsom component of the rockshelter appears to
have been primarily dedicated to biface reduction, with little evidence of any additional
residential activities. This research includes two projectile points and a somewhat thick,
ultrathin-like biface that were available from Two Moon rockshelter.

60
Hanson
This site is in northern Wyoming on the western foothills of the Bighorn Mountains. It is
situated on an erosional surface with two localities on either side of an intermittent drainage
(Frison and Bradley 1980:1-3). One of those localities, Area 2, may have evidence of living
surfaces based on the presence of a thin sandy “floor” along with significant amounts of red
ochre. One of the appeals of the site for people during the Folsom period may have been the
relatively close presence of a variety of lithic raw materials, with Morrison Formation cherts and
quartzites within a kilometer’s distance, as well as Phosphoria chert about 20 km away, and
Madison chert from about 40 km away, along with various local but lower quality materials from
the foothills’ drainages (Ingbar 1992:175-182). The excavations at the site, conducted in the
1970s, revealed an extensive Folsom occupation that covers over 3,000 square meters, with
excavations in the two areas covering just over 100 square meters each (Frison and Bradley
1980:8-10). Faunal preservation is poor, but weathered bison bone is still fairly abundant and
suggests a kill was likely nearby (Ingbar 1992:175). The presence of large quantities of
discarded tools along with manufacturing debris indicates that the Hanson site was a significant
Folsom tool manufacturing locality as well as a campsite (Ingbar 1992:183-186). The tool
assemblage from Hanson is extensive, but Frison and Bradley (1980:18) summarize it in stating
that the most common technologies at the site are discoidal core reduction, bifacial thinning, and
opportunistic flake production. In this analysis, ten points, six preforms, and 18 ultrathin bifaces
from Hanson were available for study.
Agate Basin
This site in northeastern Wyoming and southwestern South Dakota is a multicomponent
Paleoindian site made up of nine sections and 11 excavation areas. Some of the excavation areas

61
have been given their own site names, such as the Brewster site for Area 3, the Schultz site for
Area 8, and the Sheaman Clovis site for Area 9. Prehistoric activities for most of the excavation
areas at Agate Basin revolve around the communal procurement of bison in an arroyo (Frison
1982a:1-3). The condition and placement of this arroyo were apparently favorable enough for
multiple Paleoindian groups to have utilized the area to trap bison on multiple occasions. Agate
Basin was discovered as early as 1916 by William Spencer, but it was not excavated until the
summer of 1942 (Frison 1982a:11-20). The initial excavations took place in Areas 1 and 2, with
Area 3 begun in 1959. Large scale excavations, focusing mainly on Area 2, took place in 1961,
and test excavations opened up additional areas. Archaeological work resumed in the 1970s,
when researchers noted that the site was being extensively looted and decided that the site
needed to be studied before there was nothing left. Folsom components have been found in
several excavation areas, with intact buried components appearing in Areas 2 and 3 (Frison
1982a:37-40). Area 2 is a single component, while Area 3 has two Folsom occupations.
However, the two areas are closely related, as a channel flake from Area 3 refits to a preform
from Area 2. There is some evidence (in the form of concentrations of flakes around shallow
hearths, along with possible tent stakes made from bison ribs) to suggest that one or two
structures were present in Area 2. However, the position of these possible structures in a
seasonal floodplain indicates that they would have been temporary and likely affiliated with
bison hunting efforts, possibly as shaman structures or tool sheds (Frison and Stanford 1982:363-
364). A bone bed is also present in Area 2 and contained at least 11 bison, as well as canids,
pronghorn, and rabbits. In Area 3, the lower Folsom component contained a small pile of bison
bones and a small hearth surrounded by scattered artifacts (Frison 1982b:71-74). The upper
component contained a similar small hearth and scattered bison bones. A wide variety of

62
artifacts came from the Folsom excavations at Agate Basin, with the vast majority of them from
Area 2 (Frison 1982b:45-70). These artifacts include points, preforms, end scrapers, side
scrapers, modified flakes, gravers, bend break tools, notches, wedges, choppers, bifaces
(including one likely ultrathin), cores, and abraders. The Folsom artifacts from Agate Basin
available for this study include five points and five preforms.
Hell Gap
This is an extensive, multicomponent Paleoindian site located in a small valley in
southeastern Wyoming on the drainage of the North Platte River. The environment of the valley
and the surrounding hills of the Hartville Uplift provided prehistoric inhabitants with resources
from both High Plains and semi-montane ecosystems, along with shelter from storm systems and
fresh water from springs (Irwin-Williams et al. 1973:40). The initial investigations of the site
took place in 1959 through 1966 and were conducted by Harvard University and the University
of Wyoming. Subsequent investigations took place sporadically in the late 1960s and 1980s,
until Localities I, II, and IV were acquired by the Wyoming Archaeological Foundation
(Kornfeld and Larson 2009:9-12). Following the purchase, the University of Wyoming resumed
formal field excavations from 1990 to 1999 to better understand the site’s stratigraphy and
formation processes in preparation for a comprehensive report. The site is made up of five
localities, four of which are Paleoindian in age (Irwin-Williams et al. 1973:40). The Paleoindian
complexes present at Hell Gap include Goshen, Folsom, Midland, Agate Basin, Hell Gap,
Alberta, Cody, and Frederick, making Hell Gap the definitive site for understanding the
stratigraphic relationship between Paleoindian complexes in the High Plains. Of particular
interest for this research is the relationship between the Goshen, Folsom, and Midland
components at the site. Locality I is the most significant area for the Goshen and Folsom
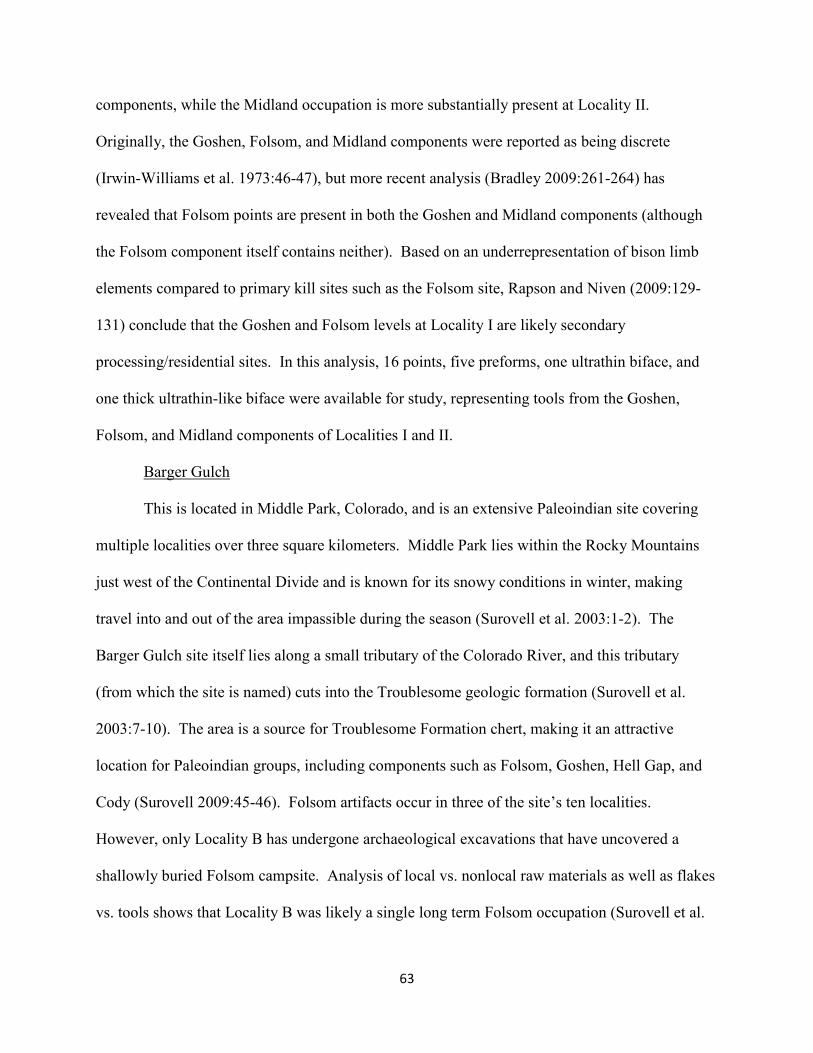
63
components, while the Midland occupation is more substantially present at Locality II.
Originally, the Goshen, Folsom, and Midland components were reported as being discrete
(Irwin-Williams et al. 1973:46-47), but more recent analysis (Bradley 2009:261-264) has
revealed that Folsom points are present in both the Goshen and Midland components (although
the Folsom component itself contains neither). Based on an underrepresentation of bison limb
elements compared to primary kill sites such as the Folsom site, Rapson and Niven (2009:129-
131) conclude that the Goshen and Folsom levels at Locality I are likely secondary
processing/residential sites. In this analysis, 16 points, five preforms, one ultrathin biface, and
one thick ultrathin-like biface were available for study, representing tools from the Goshen,
Folsom, and Midland components of Localities I and II.
Barger Gulch
This is located in Middle Park, Colorado, and is an extensive Paleoindian site covering
multiple localities over three square kilometers. Middle Park lies within the Rocky Mountains
just west of the Continental Divide and is known for its snowy conditions in winter, making
travel into and out of the area impassible during the season (Surovell et al. 2003:1-2). The
Barger Gulch site itself lies along a small tributary of the Colorado River, and this tributary
(from which the site is named) cuts into the Troublesome geologic formation (Surovell et al.
2003:7-10). The area is a source for Troublesome Formation chert, making it an attractive
location for Paleoindian groups, including components such as Folsom, Goshen, Hell Gap, and
Cody (Surovell 2009:45-46). Folsom artifacts occur in three of the site’s ten localities.
However, only Locality B has undergone archaeological excavations that have uncovered a
shallowly buried Folsom campsite. Analysis of local vs. nonlocal raw materials as well as flakes
vs. tools shows that Locality B was likely a single long term Folsom occupation (Surovell et al.

64
2003:119-123). The campsite yielded a wide variety of Folsom artifacts, including points,
bifaces, cores, gravers, endscrapers, and utilized flakes. In this analysis, 15 points, 13 preforms,
and three ultrathin bifaces are examined.
Big Black
This site is one of two Folsom sites located at the Lake Ilo National Wildlife Refuge in
Dunn County, North Dakota, and is in the western portion of the Knife River Flint Quarry area.
Archaeological interest in the Knife River Flint Quarry was sparked in 1970, and surveys of the
area took place intermittently from 1976 to 1988, primarily due to coal mining interests in that
region (William 2000:11). Big Black (32DU955C) is one of four sites subdivided out of the
“megasite” 32DU955, with Bobtail Wolf (32DU955A) the other North Dakota Folsom
assemblage sampled for this analysis, being another. Big Black is the second northernmost
subdivision of the megasite (William 2000:3-6). Archaeological investigations specifically
focused on Big Black began with a survey in 1989, in which the site was identified based on a
scatter of artifacts. The site underwent test excavations in the fall of 1990, and subsequent block
excavations took place in 1993 and 1994 (Williams 2000:15-32). The archaeological
components of Big Black consist of Folsom, Middle Plains Archaic, Late Plains Archaic, and
Late Prehistoric. Although the post-Folsom components tend to be mixed, the Folsom
component of the site is largely intact and unmixed (Williams 2000:45). The Folsom occupation
is actually the largest component at Big Black, with the combined count of points, preforms, and
channel flakes being 233. Folsom strata are present in all five of the excavation blocks
(Williams 2000:233-267). In Block 1, Folsom materials are eroding onto the surface, where they
are mixed with later components, but buried unmixed Folsom materials occur at Level 2 and
below. Flakes, tools and bones are evenly distributed throughout this block, so that individual

65
activity areas could not be discerned. Blocks 2 and 3 both contain two apparent Folsom
occupations each. All occupations in Blocks 2 and 3 represent stone tool manufacturing, with
the early occupation of Block 2 being the densest. Block 4 consists mainly of tested cobbles and
cores for flake blanks situated on a slight topographic rise upon which cobbles of Knife River
Flint would have been visible during the Folsom period. Block 5 appears to have been a short
term occupation with a relatively sparse artifact distribution. In this analysis, 11 points, 34
preforms, and 13 ultrathin bifaces are examined.
Bobtail Wolf
This is the other Folsom site from the Knife River Quarry area included in this research.
This site makes up the southernmost portion of the Lake Ilo “megasite.” Like Big Black, Bobtail
Wolf has multiple components, including Hell Gap, Cody, Archaic, and Late Prehistoric, but
only the Folsom component is occasionally buried in unmixed sediments (Root and Osborn
2000:2-10). Jerry William conducted the first test excavations at the site in 1990, when the lake
level was lowered due to concerns about the structural integrity of Lake Ilo’s dam, revealing
artifact scatters on the exposed lakebed and adjacent land. More extensive excavations were
carried out by Washington State University in 1992. These excavations encountered the Leonard
Paleosol, in which the buried Folsom component is contained. Excavations continued in 1993
and 1994 under collaboration between WSU and other groups, although constant rainfall and
flooding in 1993 complicated the efforts. Archaeologists uncovered the Leonard Paleosol along
“terraces” in the western, northeastern, and southern portions of the site, and these terraces
provided the bulk of Folsom material from secure contexts (Root 2000:363-368). The Block 2,
4, and 6 excavations, located on the western, southern, and northeastern terraces respectively,
revealed two stratified Folsom components, each made up of material from two or more

66
occupations. The primary activity at these locations appears to have been the making of new
tools and the discarding of old ones, with Block 4 also containing seven concentrations of burned
flakes that may represent hearths. Thirteen points, ten preforms, and eight ultrathin bifaces from
Bobtail Wolf have been analyzed in this research.
Cedar Creek
This site lies in Washita County, Oklahoma and is located along a tributary of the
Washita River in the plains north of the Wichita Mountains. The site is made up of several
components, including Clovis, Plainview, Dalton, and Scottsbluff, but its most prevalent
component is Folsom (Hofman 1990). However, the Folsom artifacts from Cedar Creek have
not been found in context and instead have been deposited within a three kilometer stretch along
the creek. Cedar Creek is the most prolific Folsom-age site in Oklahoma, with 40 Folsom
projectile points, nine preforms, seven channel flakes, and 14 Midland points documented by
Hofman from various collections as of 1990. The majority of the Folsom and Midland
diagnostic artifacts are made from Edwards chert, likely from over 300 km to the south. Alibates
from about 250 km to the northwest is also represented in a significant percentage of artifacts.
More exotic materials include Washington Pass chalcedony from the Chuska Mountains of
northwest New Mexico, Flattop Chalcedony from Sterling, Colorado, and Niobrara jasper from
northwest Kansas. The presence of preforms at a site so distant from any of the stone sources
suggests that unfinished tools or blanks were often transported long distances before being
turned into formal tools. The fact that Cedar Creek lies within a canyon means the site may have
been useful for trapping bison, and the reliable presence of water and wood also likely made the
location an attractive campsite. Evidence for hunting is present in the form of bison skulls and
other bones as well as impact damaged projectile points. The presence of preforms and channel

67
flakes in addition to scrapers, gravers, and flake tools suggests that various campsite-related
activities took place also.
Mud Springs
This site is located in southwest Wyoming and was exposed when sand movement
exposed Folsom points and debitage (Frison 1978:114). Little more is known about the site, as it
has not undergone any formal archaeological investigations. The 17 points, six preforms, and
one ultrathin biface from Mud Springs recorded in this study were made available by Jim Cox.

68
CHAPTER 3: THE GAULT SITE
This chapter focuses specifically on the Folsom and Midland component of the Gault site
in central Texas. Although this component has been discussed briefly in prior publications
(Collins 2007; Waters et al. 2011), it has not yet been reported in a comprehensive, systematic
manner. This chapter focuses primarily on the diagnostic artifacts that can be attributed to
Folsom-Midland technology (particularly points, preforms, and ultrathin bifaces), with additional
artifacts only noted when they can confidently be assigned to the Folsom-Midland component.
This level of stratigraphic confidence is only immediately evident at Area 3, although several
additional excavation areas may have intact but sparser components and are worth additional
analysis in the future. The analysis of technological and typological issues pertaining to the
Folsom-Midland artifacts at Gault sets the stage for the larger analyses that are conducted in the
following chapters.
Overview of Folsom and Midland at the Gault Site
Gault is a stratified, multicomponent prehistoric site in central Texas located on an
ecotone between the Edwards Plateau to the west and the Black Prairie to the east (Collins
2007:61-62). This setting enabled prehistoric groups to take advantage of the enhanced variety
of resources that was available from two contrasting regions. Moreover, the site itself lies within
an exposure of the Edwards Limestone Formation, a chert-bearing aquifer along the spring-fed
Buttermilk Creek, providing a reliable source of toolstone and spring water to its inhabitants.
Thanks to these readily available resources, the Gault site provided a consistently livable habitat
to people for over 13,000 years. The total site area covers approximately 32 hectares (Wernecke

69
and Collins 2013), generally following the Buttermilk Creek valley and its tributary channels.
The Debra L. Friedkin site, reported by Waters et al. (2012), is located on a neighboring property
about 250 meters to the east of the Gault site and may be an extension of the same site.
Gault is primarily known as a large Clovis workshop and campsite, with about 650,000
chipped stone artifacts recovered from the Clovis components (Collins 2007:59-61). An
extensive Archaic burned rock midden is also present and encompasses an area of about 800 by
200 m. In recent excavations, the site has yielded flakes, blades, and bifaces in discrete strata up
to 80 cm below the Clovis component in Area 15, suggesting a human presence at the site prior
to the Clovis period. The Folsom-Midland period is not as well represented as the Clovis and
Archaic components, but Folsom and Midland diagnostic artifacts do occur at over half of the 15
excavation areas that have been opened to date. The reduced Folsom-Midland presence
compared to Clovis is likely due to different foraging strategies between the two complexes
(Collins 2007:81). While the Clovis occupation at Gault represents a generalized foraging
strategy involving the pursuit of a variety of food options, Folsom sites are largely focused on
the hunting of bison. Because the Gault site is situated in a sheltered stream valley away from
the open plains, Folsom groups would have traveled elsewhere to procure their preferred prey
(Collins 1999:29). As such, the Folsom-Midland presence at Gault is more ephemeral than
Clovis, and their utilization of the site appears to have been primarily that of a stopover for
replacing worn out and broken stone tools before moving on to more bison-rich areas.
Diagnostic artifacts of the Folsom-Midland components at Gault include points,
preforms, channel flakes, and ultrathin bifaces (Figure 6 and Figure 7). Additional tools such as
scrapers, gravers, and utilized flakes are also present but are often difficult to unambiguously
attribute to the Folsom-Midland period due to contextual issues. The purpose of this chapter is

70
threefold. First, it provides an overview of the context of the Folsom-Midland occupations at
Gault, with specific attention given to clarifying the assumptions and overgeneralizations that
have previously been applied to the relationship between the Clovis and Folsom-Midland
occupations at the site (Waters et al. 2011:17). Second, this chapter explores the technology
involved in the production of Folsom and Midland points at Gault, with emphasis on the
variation in production techniques that are apparent. This assemblage offers a rare opportunity
to examine Midland preforms, which are not often reported in other sites. The patterns of
discard and manufacture for Folsom and Midland points are also examined. Third, this chapter
places the Gault assemblage in the larger scheme of Folsom and Midland typology based on
comparisons with artifacts from 28 other sites and collections across the geographic span of the
Folsom complex. This analysis particularly focuses on specimens that represent “hybrids” of
Folsom and Midland technology with consideration given to the regions in which they appear.
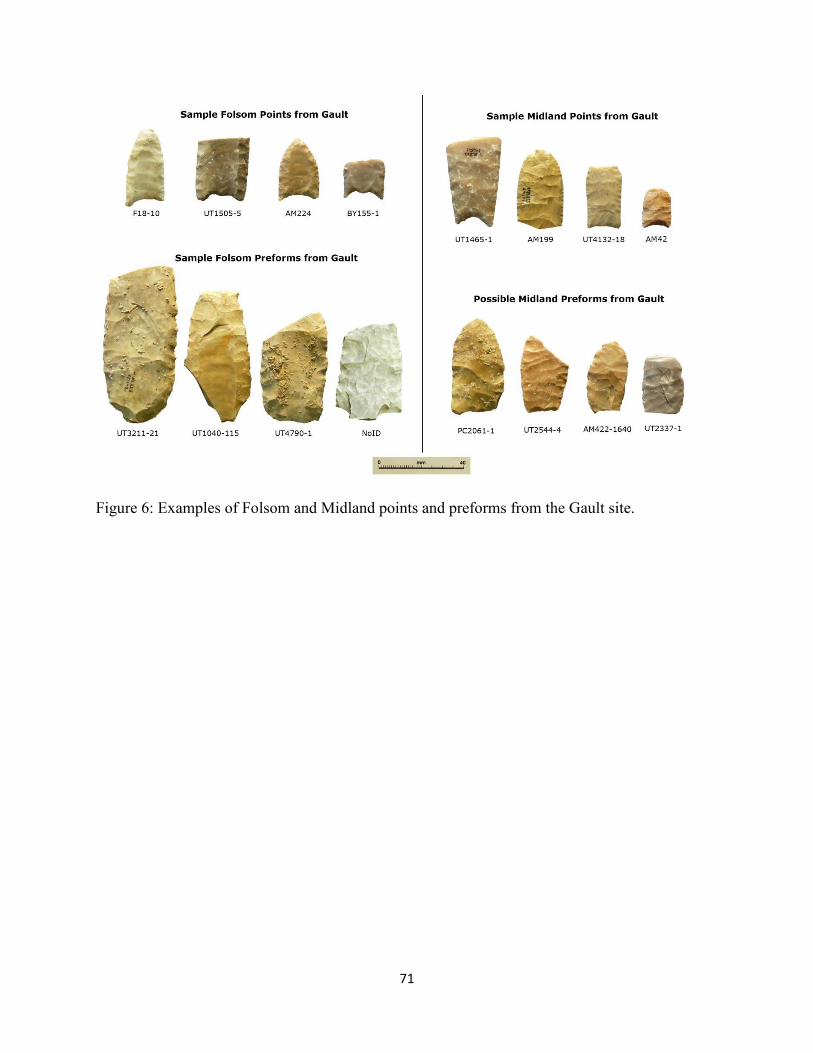
71
Figure 6: Examples of Folsom and Midland points and preforms from the Gault site.

72
Figure 7: Examples of ultrathin bifaces from the Gault site.

73
Context
Although the Gault site has been cited as one of the few sites in which Folsom age
artifacts can be found immediately overlying Clovis artifacts (Bement and Carter 2010:919;
Jennings 2012:3240), the contextual integrity of the Folsom-Midland presence at Gault is
variable depending on the excavation area in question. A total of 15 areas has been excavated to
date. Excavation Areas are numbered 1-15 and are defined as areas of the site with cohesive
excavation histories and methods that encompass multiple unit addresses (Figure 8). Of these
areas, eight of them contain Folsom and/or Midland diagnostic artifacts (Table 3). These areas
are 2, 3, 4, 7, 8, 10, 12, and 15. However, only four of these areas (3, 7, 8, and 12) have yielded
Folsom or Midland diagnostic artifacts in contexts that can be solely attributed to the Folsom
period, and only three areas (3, 4, and 12) contain Folsom-Midland diagnostic material that
consistently overlies Clovis. Each of the areas containing Folsom period diagnostic material is
described individually below. Images of all the diagnostic Folsom-Midland artifacts are
available in the “Photos” folder in the attached materials.

74
Figure 8: Layout of the excavation areas within the Gault site.

75
Table 3: Diagnostic Folsom-Midland artifact counts from Gault by excavation area.
Excavation
Area
Folsom
Points
Folsom
Preforms
Midland
Points
Midland
Preforms
Hybrid
Forms
Ultrathin
Bifaces Totals
Area 2 0 0 0 0 1 0 1
Area 3 0 1 3 0 0 0 4
Area 4 0 3 1 0 0 2 6
Area 7 0 0 0 1 0 0 1
Area 8 3 3 5 2 0 3 16
Area 10 1 0 0 0 0 0 1
Area 12 0 0 0 0 1 0 1
Area 15 1 0 0 0 0 0 1
Surface 0 2 2 1 0 2 7
Totals 5 9 11 4 2 7 38

76
Area 2
This area was excavated in the spring of 2002 and is a small 2 x 4 meter area where the
topsoil and disturbed Archaic strata were scraped off to expose intact underlying levels. It lies
south of Buttermilk Creek, on the east side of the creek’s western tributary channel, in the same
vicinity as Areas 1-5. The sole diagnostic Folsom artifact (UT4632-1) occurs in the uppermost
archaeologically excavated level. Analysis of the artifacts from Area 4 has revealed that the first
levels of the area likely contain a mixture of intact Paleoindian material and intrusive Archaic
material. This mixture is likely a result of a combination of factors, including geologic
processes, previous looting activities, and the bobcat scraping itself. As such, the debitage that
appears to be associated with the diagnostic preform in Area 2 cannot be reliably attributed to the
Folsom period. Additionally, although Clovis material occurs one level below Folsom and
appears stratigraphically intact, it is also mixed with Early Archaic material.
Area 3
This is a 1 x 8 meter mostly hand excavated trench that extends southward from Area 4
and is just west of Area 2. The surface of Area 3 was scraped prior to excavation; however, the
scraping did not extend below the disturbed Archaic levels and left the Folsom component intact.
Folsom-age diagnostic materials are found lying on top of a buried alluvial fan made up of chert
and limestone cobbles. Although some Clovis material appears in Area 3, it is relatively sparse
compared to other areas and occurs consistently below the Folsom artifacts. As such, this area
has the best potential for analyzing Folsom-age debitage and non-diagnostic tools.
Area 3 has the second highest density of Folsom-Midland diagnostic material, after Area
8. Interestingly, all four of the discarded projectile points in this area are Midland (UT4098-1,
UT4109-25, UT4132-18, and UT2892-1). However, a base of an early stage Folsom preform

77
(UT2883-2) was also found immediately overlying Clovis levels. Although this preform base
was located at an elevation about 10 to 20 centimeters lower than the Midland points, it was also
found in an excavation unit at least five meters north of the Midland finds, where all cultural
strata appear to be more deeply buried than elsewhere. Additional tools attributable to the
Folsom-Midland occupation include two endscrapers on flakes and 18 other modified flakes.
Finally, three incised cortical flakes were found in Folsom-Midland levels at Area 3. Two of
these flakes (UT4109-3,5) only have small remnants of cortex, leaving only a couple of incised
lines each, but the third (UT4102-16) exhibits a cross-hatched pattern common to other incised
stones found in Paleoindian context at Gault and elsewhere (Collins 1998:151, Hester 1972:102-
103, Wernecke and Collins 2012).
Area 4
This area is located immediately north of the Area 3 trench. It is one of the larger
excavation blocks, with a total of 73 1x1 meter squares. The grid for this area was laid out in
November of 1999, the surface was scraped down to undisturbed sediment in December of 2000,
and various field crews excavated Area 4 from November of 2000 to May of 2002. Many
Folsom-age diagnostic artifacts have been found in this area, and nearly all of them come from
the first level after the scraping. As with Area 2, the Folsom material is mixed with the remnants
of the overlying Archaic components and occasionally some of the uppermost Clovis material as
well. Six artifacts diagnostic of the Folsom-Midland period have been found in Area 4. They
consist of three Folsom point preforms (BB2135-1, UT4409-12, and UT3211-21), a medial
section of a Midland point (UT4096-39), and two fragments of ultrathin bifaces (UT3228-1 and
UT4066-8). All of these artifacts come from the first excavation level except for the Midland
fragment, which was located in the second level along with Clovis artifacts, including the distal

78
end of a bifacial preform with overshot flaking (UT4096-38). The excavation form for this level
notes that a looters’ pit appears to intrude eight centimeters in the southwest corner of the unit,
making it possible that the Midland fragment came from a recently disturbed context.
Area 7
This excavation area contains 35 1x1 meter units that were excavated near the confluence
of the two drainages that feed Buttermilk Creek from the south. It lies immediately to the west
of Area 8. The Folsom component of this area is sparse, considering the strong presence of
Folsom and Midland artifacts in the adjacent Area 8. Only one artifact that is likely diagnostic to
the Folsom period (a probable Midland preform, PC2061-1) was found in Area 7, and it was
found in a fairly reliable context below an Early Archaic level and above a Clovis level.
However, it should be noted that Clovis materials were also found in a higher elevation in the
unit immediately to the west of this find.
Area 8
This is possibly the most well known of Gault’s excavation areas. In 1998, one of the
site’s new owners, Howard Lindsey, dug a pit south of Buttermilk Creek, near the convergence
of its two small tributary channels and east of what would later be Area 7. About 2 meters below
the surface, he encountered mammoth bones in association with artifacts and contacted Michael
Collins and Tom Hester at the Texas Archeological Research Laboratory (TARL). The team
from TARL worked from August 1 to October 12 and excavated seven units, uncovering
mammoth bones, horse teeth, and Clovis artifacts. The results from this excavation compelled
the staff of TARL to negotiate a three-year excavation plan with the Lindseys. From 1999 to
2001, Area 8 was excavated by several groups, with the most notable being the University of

79
Texas and Texas A&M University. A total of 49 units and one backhoe trench were excavated
around Howard Lindsey’s original pit (Waters et al. 2011:6).
Area 8 deserves special attention for three reasons. First, this area has yielded the largest
sample of diagnostic artifacts from the Folsom-Midland period. Second, Area 8 has been the
most extensively reported excavation area to date, thanks primarily to the publication of a book
detailing Texas A&M University’s research on the area’s Clovis component (Waters et al. 2011).
Finally, Waters et al. (2011:17-18) and Jennings (2012:3245) have suggested that the Folsom-
Midland component of Area 8 reveals a small stratigraphic separation between the appearance of
Folsom and Midland points, with the former occurring slightly earlier than the latter. In order to
evaluate the accuracy of this interpretation, the contexts of all the diagnostic artifacts from the
Folsom-Midland period in Area 8 need to be examined.
Table 4 details the Folsom and Midland diagnostic artifacts found in Area 8. The surface
finds came from the area immediately surrounding the excavation. Whenever possible, the
geologic stratum in which the artifacts were found is included. The stratum designations are
based on Texas A&M inventory files currently stored at Texas State University. However, the
geologic contexts of artifacts found during the University of Texas and Texas Archeological
Society excavations are not currently available.

80
Table 4: Area 8 Folsom and Midland diagnostic artifacts and their contexts.
ID
Number
Type Northing Easting Level Elevation Stratum Context
UT3303-
31
Midland 1016.30 991.00 2 95.915 - Feature 1004,
Archaic context
UT1505-5 Folsom base 1017.222 992.157 5 95.309 - Clovis above and
below
UT2392-1 Folsom
preform base
1022 984 3 95.20-
95.10
- Clovis above and
below
UT2544-4 Midland
preform base
1021.18 985.25 6 95.05 - Mixed with Clovis
AM14 Folsom base 1013 988 7 96.00-
95.90
- Good context
AM267 Midland
medial
1016 984 22 95.12-
95.07
3b (Clovis
soil)
Good context,
but Clovis
stratum
AM199-
1644
Midland distal 1015.78 983.25 18 95.30 1 (gravel) /
4b (Bk2)
Mixed with Clovis
AM224-
1642
Folsom 1015 983 19 95.27 1 (gravel) /
4b (Bk2)
Clovis above and
below
AM422-
1640
Midland
preform?
1018 983 22 95.08 3a (Clovis
soil)
Clovis above
AM164-
934
Folsom
preform distal
1015 983 16 95.42-
95.37
1 (gravel) /
4b (Bk2)
Mixed with Clovis
AM256 Midland 1019 984 17 95.10-
95.07
3a & 3b
(Clovis soil)
Mixed with Clovis
AM42 Miniature
Midland
1017 983 9 95.83-
95.80
5b
(overbank) &
4c (Royalty
Paleosol)
Archaic context
AM1040-
115
Folsom
preform distal
- - - - Surface -
AM319-
28,30
Ultrathin
Biface refits
1017 983 23 95.07-
95.02
3a (Clovis
soil)
Mixed with Clovis
AM1040-
107
Ultrathin
Biface
preform base
- - - - Surface -
AM1040-
108
Ultrathin
Biface base
- - - - Surface -

81
The geologic strata observed in the Area 8 excavations are described in detail in Waters
et al. 2011:11-19), but a short overview is warranted here. Unit 1 lies directly on top of the
bedrock and is made up of matrix-supported gravels and limestone cobbles with no artifacts or
faunal remains. Unit 2 is also a high-energy gravel deposit that contains Pleistocene faunal
remains but no artifacts, except on its surface. Unit 3a and 3b are clay layers that underwent
some soil development and were deposited by lacustrine accumulation and overbank flooding,
respectively. These units encompass the area’s Clovis component. Unit 4 is also made up of
clays from overbank flooding but is also marked by more extensive soil development, so that the
unit is subdivided into Bk1, Bk2, and BC horizons. The Folsom-Midland component ideally
occurs at the base of this unit, with Late Paleoindian material appearing towards the top. Units 5,
6, and 7 represent additional overbank flooding episodes and contain Early, Middle, and Late
Archaic materials roughly in chronological succession.
Three points from the Folsom-Midland period (two Midland and one Folsom) are
mentioned in Waters et al. (2011:17). One of the Midland points (AM42) was found out of its
expected context and is interpreted as an artifact that was picked up by an individual during the
early Holocene. The other two (AM199-1644 and AM224-1642) comprise the evidence from
the Gault site that support the hypothesis that Midland points appeared in the latter part of the
Folsom interval. Both points were found in the expected geological stratum for Folsom
(although it is labeled Bk2 in the inventory and BC in Waters et al. 2011), and both points were
found in the same excavation unit, with the Midland point located three centimeters higher than
the Folsom point. However, a Clovis blade was also reported from the same level in which the
Midland point was found, casting some doubt on the relationship between the two points. The
presence of blade-like flakes and controlled overshot flakes often define the onset of Clovis
82
levels at Gault, but these artifacts may also be produced by chance by later groups (though in
vastly reduced quantities, see Bradley and Stanford 2006:707-710, and Bradley et al. 2010:76-
77). Therefore, there is a remote possibility that some of the “Clovis” levels that appear above
Units 3a and 3b are mislabeled.
Still, 13 additional Folsom-Midland diagnostic artifacts come from Area 8, further
complicating the stratigraphic relationship between Folsom, Midland, and Clovis. Besides
AM42, one other Midland point (UT3303-31) was found in buried context above its expected
stratum. However, this Midland point was excavated from a pit or hearth feature (Feature 1004),
and the creation of the feature may have removed the artifact from its original context.
Additionally, the distal end of a Folsom preform and two ultrathin biface fragments were found
on the surface immediately surrounding Area 8. Because it is highly likely that these artifacts
were disturbed from their original positions as a result of Howard Lindsey’s digging, their
context is not considered here.
Of the nine remaining Folsom-Midland artifacts, only one of them (AM164-934) has
been positively assigned to the lower portion of Unit 4, although it is associated with a Clovis
blade fragment (AM164-307), and only one other Folsom point (AM14) is positioned in good
context clearly above Clovis material. The rest of the artifacts have been found below Clovis
diagnostic material and/or in geological Units 3a or 3b. A Clovis blade and a blade fragment
(UT1495-1, 2) were found in the level above the Folsom base, UT1505-5. Folsom preform
UT2392-1 was found one level below a Clovis blade core and several blades (UT2385-1, 2, 3, 4,
and 12). A base of a likely Midland preform (UT2544-4) was found with an overshot flake
(UT2544-18) and blades and blade fragments (UT2544-55, 80, and 88) in the same level and at
the same elevation. AM267, a midsection of a Midland point, came from geologic Unit 3b and

83
was found at the same level as the distal fragment of a Clovis point (AM277) two meters to the
west. AM422-1640 is a small probable Midland preform that was found in geologic Unit 3a.
One intact Clovis point (AM228-E) and two point fragments (AM228-PP, ZZ) were found one
meter to the north at this level, although a sloping ground surface during the Paleoindian period
could account for this discrepancy. A Midland point, AM256, came from geologic Unit 3a/3b,
and is associated with a Clovis preform (AM256-4), a blade core (AM256-49), and multiple
blades and overshot flakes. Finally, the refit ultrathin biface fragments, AM319-28 and 30, were
found in the middle of the Clovis levels in geologic Unit 3a, along with a vast quantity of Clovis
diagnostics including two blade cores (AM319-160, 161), one of which refits to three blades.
Waters et al. (2011:100-101) acknowledges the presence of the ultrathin biface fragments in
geologic Unit 3a but interprets its apparent Folsom technology as a coincidence.
In summary, the context of the Folsom-Midland component in Area 8 is unclear at best
and mixed with both earlier and later materials at worst. Although the two points mentioned in
Waters et al. 2011:17 appear to be in the proper positions expected of Folsom-Midland material,
inferring a fine-grain chronological distinction between them requires a degree of depositional
integrity that is simply not present in this area. While one or two artifacts mixed with Clovis
material may be written off as a fluke of bioturbation or other disturbances, it becomes much
more problematic when the majority of an area’s Folsom-Midland diagnostics occur in such
contexts. Recent evidence from the Debra L. Friedkin site about 250 meters east of Gault may
indicate that Midland points come into use in the latter portion of the Folsom period (Jennings
2012:3245), but the evidence from Area 8 at the Gault site cannot support or refute such a
scenario.
84
Area 10
This area is made up of the eastern excavation block of the Brigham Young University
field school of 2000. It is located north of Buttermilk Creek and is the southwesternmost
excavation area on the north side of the creek. Nine 1 x 1 m excavation units comprise Area 10.
A single Folsom point base was found approximately one meter below the surface. No Clovis
diagnostic material was recovered in this area, although a knapping area of early stage core
flaking debris occurs 15 to 20 cm below the Folsom material and matches the elevation of a
Clovis point from an adjacent backhoe trench. Therefore, the Folsom component is likely in
secure, albeit sparse, context.
Area 12
This is one of the easternmost excavation blocks north of Buttermilk Creek. It is made
up of 41 1 x 1 m units that were excavated from February of 2001 to May of 2002 by the Gault
site staff, along with the help of a week-long Texas Archeological Society field school in June of
2001. An unusual, four square meter cobblestone “pavement” was encountered at an elevation
of 93.00 m, at or below the approximate bottom of the Clovis component. Folsom-Midland
artifacts appear to consistently overlie Clovis at this area, but diagnostics of the Folsom period
consist only of a unifacially fluted point base and a channel flake fragment.
Area 15
This most recent excavation block was opened in March of 2007 by the University of
Exeter and has remained open through the time of this writing. Multiple volunteer groups and
field schools have participated in the excavation. Area 15 is situated north of Buttermilk Creek,
west of Area 12 and is made up of 64 square meter units, with the innermost 12 square meters
extending into Paleoindian-aged strata. The Folsom-Midland component here is sparse and

85
consists of a single Folsom point found out of its original context, likely due to the construction
of a large oven during the Early Archaic period.
Surface
Multiple diagnostic artifacts attributable to the Folsom period have been found in surface
collections. A proximal section of a Folsom preform (UT4790-1) was found near Area 11, just
east of Area 15. A Midland preform that was likely made on a Folsom channel flake (UT2337-
1) was found along a trail on the south side of Buttermilk Creek. A proximal fragment of a
particularly well made Midland point (UT1465-1) was found just to the east of Area 8. Three
artifacts, consisting of a Midland point, a base of an ultrathin biface (UT4799-39), and a distal
portion of a Folsom preform (No ID) were found in unspecified surface collections. Finally, a
lateral section of an ultrathin biface (UT3225-1) appears to come from an excavated context in
Area 3, but the ID number does not match the unit number, and it is not mentioned in the unit’s
level forms, suggesting that the artifact may be mislabeled.
Summary
Overall, the contextual integrity of Folsom-Midland artifacts appears to be dependent on
an excavation area’s location relative to Buttermilk Creek. Excavation areas on the north side of
the creek have Folsom and Midland diagnostic materials that occur in their expected context
above Clovis and below Late Paleoindian or Early Archaic materials, but the occurrence of
Folsom-Midland artifacts in these areas is sparse. On the south side of Buttermilk Creek,
Folsom-Midland diagnostic material is more common, but it tends to be mixed with Clovis or
Archaic artifacts. Two excavation areas are exceptions to this rule. Area 3 lies to the south of
Buttermilk Creek and has stratigraphically intact Folsom and Midland deposits. Area 15 is

86
located on the north side of the creek, and the lone Folsom point from this excavation was
disturbed by the construction or maintenance of a burned rock oven during the Early Archaic.
Technology
Because the Gault site is a location where Edwards chert is readily available, it is a prime
location for examining the nuances of Folsom and Midland technology in central Texas. The
technology for producing Folsom points has been extensively researched (Amick 1999, Crabtree
1966, Sollberger and Patterson 1980, Gryba 1988, Clark and Collins 2002, Frison and Bradley
1980:45-52, Tunnell 1977:9-23) and has resulted in the construction of detailed reduction
sequences for producing the fluted points. The technology involved in producing Midland points
has been explored to some extent (Judge 1970; Hofman 1992; Amick 1995, Wilke 2002:357-
359; Huckell and Kilby 2002:23-27), but evidence for a specific Midland reduction sequence is
lacking, probably due to a lack of visibility or identification of Midland preforms. Finally, the
technology involved in manufacturing ultrathin bifaces was detailed nearly as soon as the artifact
type was first identified (Root et al. 2000:250-256, William 2000:220-230, Root et al. 1999).
Although the Folsom-Midland presence at the Gault site appears significantly reduced compared
to the preceding Clovis occupations, enough of these three diagnostic artifact types are present to
contribute to our understanding of Folsom, Midland, and ultrathin biface technology.
Some variation in Folsom point manufacture is evident from the preforms that were
discarded at Gault. According to Frison and Bradley (1980:45-52), Folsom preforms at the
Hanson site in Wyoming were carefully pressure flaked on each face immediately prior to
preparing the base for fluting. This pressure flaking was done in order to align the flake scars to
form a low medial ridge for the channel flake to follow when it is struck. However, evidence for

87
pressure flaking before fluting is evident only on two of the Gault Folsom preforms (UT1040-
115 and UT2392-1). The others exhibit little or no pressure flaking prior to fluting and instead
relied on percussion to prepare each face for fluting, a technique that appears to be unique to the
Gault site. Evidence for percussion shaping followed by fluting appears on three Folsom
preforms (UT4790-1, BB2135-1, and No ID). On the first two of these preforms, the flute fell
short on at least one face, possibly indicative of a learning mistake. The third preform is a distal
fragment with a lip extending down past the proximal break, indicating that the fluting attempt
dove and broke the distal end off as an overshot. The percussion thinned preforms may be
slightly thicker than the pressure thinned ones, but the Gault sample is not large enough for a
confident determination.
Only five finished Folsom points are present in the Gault Folsom-Midland assemblage,
so little variation can be observed. It may be worth noting, however, that two of them (1505-5
and BY155-1) have a remnant of the fluting nipple platform present on their bases, one of them
(AM14) has a straight basal edge between its ears, and two of them (AM224 and F18-10) have
concave bases. Additionally, although the lateral edges on all finished points are ground towards
the proximal end, the basal edges are not ground on two of the five points (BY155-1 and AM14).
For Midland points, the assemblage from the Gault site reveals a range of technological
options that seems to have gone unrecognized in other collections. Some archaeologists have
defined Midland points as being thinned by collateral percussion followed by fine pressure
retouch along the margins (Bradley 2009:260). Others have remarked that Midland points are
both thinned and subsequently retouched entirely by pressure flaking (Wilke 2002:358).
Interestingly, Midland points from the Gault site and elsewhere indicate that both reduction
strategies were employed prehistorically. Although attributing flake scars to pressure or

88
percussion is largely subjective (Andrefsky 2005:118-119, but see Takakura 2012 for an
emerging technique), two of the larger Midland points from the Gault site (UT1465-1 and
AM199-1644) have large, wide thinning flake scars suggesting they were produced by
percussion (Figure 9c, d), while the smaller Midland points have small, narrow collateral flake
scars that are more likely made by pressure flaking (Figure 9a, b). It may be possible that some
pressure thinned Midland points are reworked from larger percussion thinned points, but this
scenario is not true in all cases, as one pressure thinned Midland point (UT3303-31) still retains
traces of its original flake blank surface. The epitome of Midland percussion thinning is evident
in the Shifting Sands assemblage from west Texas, where two point fragments (3A61 and 561)
exhibit very wide, parallel transverse thinning flakes that resemble a series of flutes extending
laterally across the points’ faces (Figure 9e, f). These points appear to be the Midland equivalent
of the very thin, broadly fluted, and finely pressure flaked “extra fine” Folsom points that show
up in small numbers in numerous sites (William 2000:188, Bement 1999:139-143).

89
Figure 9: Midland point examples. From the Gault site: a. UT4132-18, b. UT2892-1, c.
UT1465-1, and d. AM199. From the Shifting Sands site: e. 3A61 and f. 561.

90
It is widely assumed that Midland points are made on flake blanks, particularly blanks
that are smaller than those used to produce Folsom points (Judge 1970:44-46, Hofman 1992:200-
208, Wilke 2002:357-359). In his examination of over 1000 Folsom artifacts from New Mexico
and Texas, Amick (1995:26, 28) finds that 15.6% of the Midland points retain evidence of being
made on flake blanks, while only 8.8% of Folsom points show evidence of a flake blank origin.
These findings hint that Midland points may indeed be made from smaller flake blanks than
Folsom, although the fluting process likely obscures any remaining flake blank surface on
Folsom points, so the evidence is not conclusive. Additionally, the presence of different forms
of reduction among Midland points indicates that a range of flake blank sizes were likely used to
create them, with larger flake blanks being thinned by percussion and smaller ones being thinned
by pressure. At the Gault site, four probable Midland preforms have been found (Figure 1).
UT2337-1 is a distal fragment of a Midland preform made on a Folsom channel flake. The
original termination of the channel flake is still present on the distal end of the preform, and the
ventral face retains the flake scars from the original Folsom preform. The ventral face, however,
has been modified with collateral, parallel oblique pressure flaking, most of which terminates in
step fractures just beyond the center line of the preform. UT2544-4 is a preform fragment
missing the distal tip that exhibits extensive collateral pressure flaking on one face but still
would have required additional thinning on the other. It closely resembles a finished Midland
point, but unlike the Midland points found at Gault, this preform has a slightly twisted cross
section, suggesting that the original blank was a small twisted flake. AM422-1640 is an unusual
Midland preform, in that it is already smaller than many finished points and has an uneven
outline. One face is thinned mostly with unpatterned pressure flaking, while the other face
remains lumpy, creating an uneven thickness. Finally, PC2061-1 is a slightly larger preform that

91
appears to make use of percussion for at least some of its thinning. It is nearly complete, just
with one ear missing, but it is unusually short for a preform. The collateral flaking on one face is
strongly suggestive of a Midland preform, while two large basal thinning flakes on the other face
are more reminiscent of St. Mary’s Hall points. However, this preform is already thinner than
the finished St. Mary’s Hall points found in the Gault excavations, so this is more likely a
Midland preform.
Although one would naturally expect preforms to be at least slightly cruder in appearance
when compared to finished points, the Midland preforms at the Gault site seem to be of a
noticeably reduced quality when compared to the finished, discarded Midland points. One of the
notable aspects of these preforms is that they appear quite small. None of them appear to be
larger than finished Midland points. Even the most formal-looking preform, PC2061-1, is
somewhat short in terms of length. Figure 10a plots the widths and thicknesses of the Midland
points and preforms from the Gault site (minus the miniature point, AM42). The small sample
size rules out the use of formal statistics, but some conjectures can be made based on the plot.
In terms of width, the Midland preforms from Gault are comparable to the wider finished
points. About half of the finished points are narrower than the preforms, however. In terms of
thickness, the proposed preforms fall on either extreme compared to the points. Two of the
preforms are thicker than nearly all the points, while the other two preforms are actually thinner.
This discrepancy raises the question of whether at least some of the preforms may actually be
learners’ or practice pieces.

Figure 10: Scatterplots comparing Midland points and preforms from Gault. a. Width (x
and thickness (y-axis). b. Mistake ratio (x
the triangles, and preforms are the squares.
92
: Scatterplots comparing Midland points and preforms from Gault. a. Width (x
axis). b. Mistake ratio (x-axis) and width/thickness ratio (y-axis). Poin
the triangles, and preforms are the squares.
: Scatterplots comparing Midland points and preforms from Gault. a. Width (x-axis)
axis). Points are

93
To test this hypothesis, two variables are examined: the width/thickness ratio and a ratio
between the average number of mistakes per 10mm and the number of flake scars per 10mm for
each artifact. For this purpose, a “mistake” is defined as a flake scar that terminates in a hinge or
step fracture that would impede subsequent flake removals of similar size. As before, a
scatterplot is used to compare the proposed Midland preforms to finished Midland points (Figure
10b). If the proposed preforms are made by novices, the artifacts should deviate from the
projectile points in these two variables. If the artifacts actually are adeptly made preforms, then
they should cluster among the projectile points.
The scatterplot comparing the width/thickness and mistake ratios reveals that two of the
Midland preforms are comparable to the points. The preform that compares most favorably to
the points is the same one that meets the expectations of a Midland preform in the previous
scatterplot (PC2061-1). The second artifact lies along the lower limit of the width/thickness ratio
for projectile points and is likely made by a novice due to its inconsistent outline (AM422-1640).
The other two proposed preforms have width/thickness ratios that are actually greater than the
points, but that result is due to the preforms being made on very thin, flat flakes. The preform
that was made from the channel flake (UT2337-1) also has a high mistake ratio, suggesting that
it was used for flintknapping practice and not necessarily intended to become a point.
Lithic procurement areas are often considered to be ideal locations for observing the
learning process among prehistoric flintknappers (Bamforth and Finlay 2008:17-18, Lohse 2010,
but see Bamforth and Hicks 2008:148-149 for a counterexample). It is possible that due to the
readily available chert at the Gault site, the more experienced flintknappers during the Folsom-
Midland interval focused on the production of fluted points, while the making of Midland points
was reserved only for those who had not attained enough skill for fluting. The discarded

94
Midland points at Gault appear more adeptly manufactured and may have been originally made
far away from lithic sources, prompting skillful flintknappers to forsake the risky fluting
technique in favor of conserving raw materials. Upon reaching the Gault site, the broken and
depleted Midland points may have been largely replaced with Folsom points.
Hofman (1992) proposes a hypothesis based on raw material conservation to explain the
prevalence of Midland points in west Texas Folsom age sites such as Shifting Sands. The
hypothesis states that if Folsom groups were highly mobile and spent significant amounts of time
away from lithic raw material sources moving from kill to kill, they needed to improvise their
projectile point technology to accommodate raw material shortages. As such, their projectile
points followed a trajectory from bifacially fluted, to unifacially fluted, to Midland, to pseudo-
fluted, and finally to miniature forms as raw materials dwindled. Therefore, in an assemblage in
which all point forms are present, bifacially fluted points should exhibit the most signs of
resharpening and the most raw material diversity compared to the others.
The fact that Midland preforms are present at a lithic procurement site like Gault, where
large pieces of quality stone are present, does cast some doubt on Hofman’s approach, but his
hypothesis should not be discarded entirely. The results of this test suggest that
Hofman’s hypothesis is at least partially accurate. At the Gault site, Midland points are
preferentially discarded and Folsom points are preferentially manufactured. However, the fact
the Midland points were still made at the site indicates that factors other than raw material
availability were also at work. The Midland preforms in the Gault sample appear overall to be
less skillfully made than the finished Midland points that were discarded at the site, suggesting
that Midland points made at the site were likely knapped by individuals who were not adept
enough to make fluted points. However, four out of the nine Folsom preforms also exhibit errors
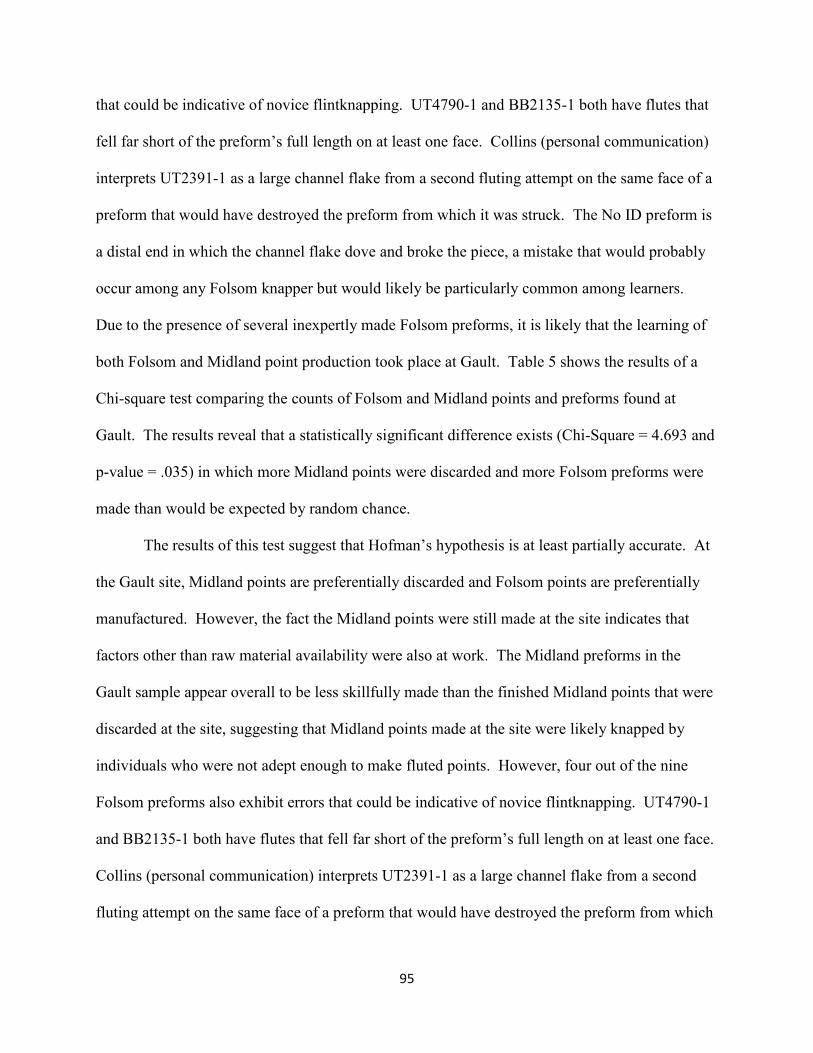
95
that could be indicative of novice flintknapping. UT4790-1 and BB2135-1 both have flutes that
fell far short of the preform’s full length on at least one face. Collins (personal communication)
interprets UT2391-1 as a large channel flake from a second fluting attempt on the same face of a
preform that would have destroyed the preform from which it was struck. The No ID preform is
a distal end in which the channel flake dove and broke the piece, a mistake that would probably
occur among any Folsom knapper but would likely be particularly common among learners.
Due to the presence of several inexpertly made Folsom preforms, it is likely that the learning of
both Folsom and Midland point production took place at Gault. Table 5 shows the results of a
Chi-square test comparing the counts of Folsom and Midland points and preforms found at
Gault. The results reveal that a statistically significant difference exists (Chi-Square = 4.693 and
p-value = .035) in which more Midland points were discarded and more Folsom preforms were
made than would be expected by random chance.
The results of this test suggest that Hofman’s hypothesis is at least partially accurate. At
the Gault site, Midland points are preferentially discarded and Folsom points are preferentially
manufactured. However, the fact the Midland points were still made at the site indicates that
factors other than raw material availability were also at work. The Midland preforms in the
Gault sample appear overall to be less skillfully made than the finished Midland points that were
discarded at the site, suggesting that Midland points made at the site were likely knapped by
individuals who were not adept enough to make fluted points. However, four out of the nine
Folsom preforms also exhibit errors that could be indicative of novice flintknapping. UT4790-1
and BB2135-1 both have flutes that fell far short of the preform’s full length on at least one face.
Collins (personal communication) interprets UT2391-1 as a large channel flake from a second
fluting attempt on the same face of a preform that would have destroyed the preform from which

96
it was struck. The No ID preform is a distal end in which the channel flake dove and broke the
piece, a mistake that would probably occur among any Folsom knapper but would likely be
particularly common among learners. Due to the presence of several inexpertly made Folsom
preforms, it is likely that the learning of both Folsom and Midland point production took place at
Gault.

97
Table 5: Chi-square test comparing counts of Folsom and Midland points and preforms from the
Gault site.

98
Finally, fragments from seven ultrathin bifaces are present in the Gault collections. All
but one of them appear to have been finished and either utilized or ready to be utilized just prior
to breaking. The unfinished ultrathin (UT1040-107) is also the largest biface in the sample and
reveals the hinge flake removal process that is characteristic of the opposite diving technique that
defines ultrathin bifaces (Root et al. 1999:152-154, William 2000:220-230). However, several
flakes hinged short of the center line, creating a flawed biface even before it broke. One biface
fragment (UT3225-1) exhibits beveling, a resharpening technique that appears on ultrathin
bifaces in numerous Folsom sites including Shifting Sands, Lindenmeier, Krmpotich, Hanson,
Barger Gulch, Bobtail Wolf, and Big Black. Three of the biface fragments (UT4799-39,
UT3225-1, and AM319-28/30) show signs of radial fracture, cited by Root et al. (1999:161) as
an intentional action used to produce burin-like tools. Of these, UT4799-39 and AM319-28/30
have slightly crushed surfaces at the center point of their fractures, strongly suggesting that a
sharp impact in the center of each artifact is the force that broke them. There are no macroscopic
signs of use after this breakage; however, microscopic usewear analysis of AM319-28/30 has
found evidence for use on hard materials along both the original and the radially fractured edges
(Waters et al. 2011:138-140, Smallwood 2006:114-116). In all, the ultrathin bifaces from the
Gault site match those described by Root et al. (1999), and it is evident that both the discard of
old bifaces and the manufacture of new ones occurred at the site.
Typology
Although evidence increasingly supports the idea that Folsom and Midland points were
used by the same groups of people at the end of the Pleistocene, they are still generally
considered to represent two distinct technologies that are used to produce points of similar size

99
and shape. At first glance, the distinction between Folsom and Midland points is intuitively
obvious: the former is fluted and the latter is not. Additional analysis, as noted in the previous
section, reveals that Folsom preforms are typically flaked laterally to produce a central ridge to
facilitate fluting, while Midland points generally have collateral flaking that overlaps across the
center to create a flattened surface without fluting. However, these technological strategies
represent idealized templates for creating typologically characteristic Folsom and Midland
points, and though these strategies appear to have been utilized to produce many or even most of
the points in Folsom-Midland assemblages, they do not account for the full variation that is
present in most Folsom age sites. Moreover, these templates do not include additional variants,
such as miniature and pseudo-fluted points.
Because Folsom and Midland points are not only closely related in time and space, but
also were likely made and used by the same groups of people, combinations of the two types are
apparent in points and preforms that contain aspects of both technologies. Various “hybrid”
points consist of points that are unifacially fluted with Midland-like collateral flaking on the
opposite face, Folsom points in which the channel flake falls short with the remainder of the
point’s length being thinned by collateral flaking, and Midland points that retain evidence of a
fluting nipple platform on the basal edge. Also, some channel flakes show evidence of collateral
flaking across their dorsal surfaces. In some cases, it appears a knapper’s decision whether to
make a Folsom or a Midland point may have been up in the air until the final shaping of a
preform, and sometimes this open-endedness resulted in these mixtures of both types. Some, but
not all, of these hybrid forms are present at Gault and are discussed below.
One unifacially fluted point and one possible unifacially fluted preform are present at the
Gault site (Figure 11a, b). The point, UT4386-1, is a basal fragment with a long but narrow flute

100
on the fluted face. The flute appears to have been truncated laterally by pressure flakes from the
right edge, but the flakes originated from the left edge were truncated by the flute. The unfluted
face has evenly spaced collateral pressure flakes extending across the center line of the point,
although the flakes did not reach a small area in the middle of the point, revealing the surface of
the original flake blank. This point was likely made on a small flake that only had enough mass
to enable fluting on one face. UT2392-1 is a medial failed preform fragment that has been
interpreted as an overly large channel flake (Collins personal communication). The dorsal
surface has a long but slightly narrow flute extending across its face, while the ventral surface is
unmodified except for a series of collateral pressure flakes near the proximal end. Although this
preform is only fluted on one face, it is already roughly equal in thickness to other Folsom points
in the Gault assemblage, probably making a fluting attempt on the ventral surface needlessly
risky. If the ventral face’s collateral flaking had extended up the entire length of the preform, it
would have become a unifacially fluted point.

101
Figure 11: Atypical points and preforms from Gault. Unifacially fluted point and preform (a.
UT4386-1, b. UT2392-1), intact Folsom preform (c. BB2135-1), and late stage collaterally
flaked preform with a fluting nipple (d. UT4632-1).

102
Another combination of Folsom and Midland projectile point technology emerges when
at least one of the flutes on a Folsom point falls short of the point’s full length, leaving the
remainder of the length to be thinned by collateral flaking. At the Gault site, no finished Folsom
points show signs of distal collateral flaking, but two preforms do have flutes that fell well short
of the artifacts’ full lengths. UT4790-1 has a full length flute on one face and a short flute on the
other. The second flute likely fell short because the second face lacks pressure thinning, and the
percussion flake scars that are present could not facilitate the propagation of a full length flute.
The distal end is broken off, so it is unlikely that the insufficient fluting was the cause of the
preform’s abandonment. However, the other preform with a short flute, BB2135-1, is complete
(Figure 11c). Only one face has a fluting attempt, and neither face shows signs of pressure
thinning. The fluting attempt on this preform resulted in a short, narrow flake that is difficult to
distinguish from a less formal basal thinning flake. A second fluting attempt could likely have
been made on this face, so it is uncertain why this preform was discarded.
Midland points are occasionally reported to exhibit fluting nipple remnants similar the
fluting platforms often found on finished Folsom points (Wendorf et al. 1955:57, Irwin-Williams
et al. 1973:47). A basal fragment of one of these points is present at the Gault site (Figure 11d).
UT4632-1 may more appropriately be called a preform because the edges lack grinding and the
fluting platform extends below the rest of the basal edge. However, the extreme thinness of the
artifact is a strong indicator that it was near completion. Both faces exhibit large collateral
percussion flakes that extend way beyond the center line. The collateral flaking combined with a
maximum thickness of 3.3 millimeters makes fluting highly unlikely, but the presence of the
nipple platform suggests that fluting was considered a possibility through much of the reduction
sequence. Some researchers consider the presence of nipple platforms on Midland points to be

103
an aesthetic decision (Irwin-Williams et al. 1973:47), but the next chapter reveals that some
Folsom channel flakes exhibit Midland-like flaking on their dorsal surfaces, indicating that the
decision to flute a point was not always known from the beginning.
In summary, although the typological distinction between ideal Folsom and Midland
point specimens is inherently obvious, the types exist within a spectrum that could be considered
“generalized Folsom-Midland projectile point technology.” Any conceivable blending of the
two types can, and likely does, exist, and several of those blends are evident at the Gault site.
When one steps back from examining only the idealized fluted points, the bigger picture of
Folsom age projectile point technology is rife with innovation and adaptation rather than strict
adherence to a specific template.
Discussion
Collard et al. (2010) propose that Folsom technology emerged in the northern Plains and
spread south from there. Based on available radiocarbon dates, their analysis shows that Hell
Gap has the oldest Folsom component out of a sample of 16 Folsom sites, with other sites in
Wyoming such as Agate Basin and Barger Gulch being only slightly younger. The youngest
Folsom component in their sample is Bonfire Shelter from west Texas, whose radiocarbon age
could be 1,000 years younger than that from Hell Gap (Collard et al. 2010:2514). However, it
should be noted that Bonfire Shelter’s date has a large standard deviation and derives from
charcoal situated immediately above the triple-layered Paleoindian bone bed, while Folsom
artifacts were only found in the lowest of these deposits (Holliday 1997:150-153). Collard et
al.’s analysis shows that some of the Folsom dates in the northern Plains overlap with terminal
Clovis dates in the same region, while there is a hiatus between the youngest Clovis and oldest

104
Folsom dates to the south, specifically below the 36°N latitude, encompassing most of New
Mexico, Oklahoma, and Texas. Although more robust radiocarbon ages are needed to verify
these findings, the results suggest that Folsom originated out of Clovis technology in the north,
but the emergence of Folsom in the south was the result of subsequent migration. This
chronology is tested further in Chapter 7.
This southern manifestation of Folsom appears to coincide with the regions in which
Midland points are also prevalent (Amick 1995:26). This coincidence may indicate that Midland
technology became increasingly common as the Folsom period progressed, culminating with the
arrival of Folsom-age groups in the southernmost Plains. Conversely, the reduced occurrence of
Midland points north of 36°N latitude appears to indicate that fluting may have been more
prevalent early in the Folsom period. Further evidence in support of this scenario may be found
in the Folsom technology of the northern Plains, in which preforms with subpar fluting but no
other discernible flaws are occasionally discarded (Bradley 1993:255-256). However, an
examination of Folsom radiocarbon ages in Chapter 7 indicates no definitive correlation with the
geographic distributions of Folsom and Midland points.
Additionally, two exceptions to this scenario go against this overall regional trend. First,
Hell Gap has a substantial Midland component in addition to its Folsom presence. Originally,
Irwin-Williams et al. (1973:47) report that the Folsom and Midland assemblages at Hell Gap are
separate components, with Folsom occurring in Locality I and Midland occurring mostly in
Locality II. Their radiocarbon dates placed the Midland component as slightly younger than the
Folsom component, although there was much overlap between the two (Folsom: 10,800-10,600
BP; Midland: 10,740-10,440 BP). However, subsequent analysis has revealed that not only does
the Midland component also contain Folsom artifacts, but the underlying Goshen component

105
does as well (Bradley 2009:261-262). The strong presence of Midland points at Hell Gap is
particularly striking when one considers that the site also has the oldest dated Folsom occupation
currently known (Collard et al. 2010:2514). This age, 10,820 ± 170, is an average of three dates
including one from the Midland component at 10,690 ± 500 (Haynes et al. 1992:94-96). The
large standard error in the radiocarbon age of the Midland component makes it difficult to
conclusively place within the Folsom chronology.
The other exception to this technological/geographical Folsom-Midland trend is the
pristine Folsom preform (BB2135-1) that was discarded at the Gault site. As stated earlier, a
fluting attempt was made on one face of the preform, but the flute fell short and the preform was
discarded, even though it has no other obvious flaws. The rejection of this preform is
reminiscent of discarded preforms from northern Plains sites such as Hanson and Agate Basin,
where the production of fluted Folsom points appears to have been strongly preferred over the
unfluted variants.
Blackwater Draw, Jake Bluff, Kincaid Rockshelter, Friedkin, and Gault are the only
known sites that reportedly contain Folsom age material stratigraphically overlying Clovis age
artifacts (Hester 1972, Bement and Carter 2010, Collins 1999:30, Jennings 2012). Although this
superposition is true for some of the excavation areas at the Gault site, it is not clear for all of
them. Area 8 is the most widely published excavation area to date, and it contains the greatest
number of Folsom and Midland diagnostic artifacts, but most of those artifacts come from the
same context as Clovis materials. In a recent usewear study, Pevny (2012) notes that selecting
Clovis tools for microscopic usewear analysis from Area 8 is problematic because the surfaces of
most of the artifacts have been worn or damaged by post-depositional movement. Such
movement may be enough to obscure the chronological boundary between Clovis and Folsom-

106
Midland periods to some extent, and it could at least account for the situations in which Clovis
artifacts appear in geologic unit 4 or Folsom-Midland artifacts appear in unit 3b. Although
vertisols have been proposed as an explanation for the downward movement for artifacts at Gault
and at the adjacent Friedkin site (Morrow et al. 2012), recent research has shown that the
vertisols in the vicinity of Friedkin and Gault displace very little soil and would rarely affect
artifact positions (Driese et al. 2013). Furthermore, vertisols cannot explain the apparent upward
movement of some Clovis artifacts into unit 4. A more likely explanation may be that an
interplay of alluvial and colluvial deposition from the nearby tributary channel and hillslope
transported Clovis and Folsom-Midland artifacts out of their original contexts and into Area 8,
where they became mixed. One final but less likely possibility to consider is that the
chronologies of Clovis and Folsom-Midland may overlap at Gault much like they do in the
northern Plains, and the seeming absence of such an overlap in the southern Plains noted by
Collard et al. (2010) is a result of a dearth of well dated Folsom-age sites in this region (Collins
1999:12).
Conclusion
This analysis of the diagnostic Folsom and Midland materials from Gault raises
significant questions that are tested in subsequent chapters of this dissertation. First, Folsom-
Midland materials from some of the excavation areas overlap with Clovis stratigraphically. This
overlap may be a result of turbation or a complex depositional system in those areas, or it could
be indicative of an actual technological/cultural overlap that is apparent from Clovis and Folsom
radiocarbon dates in the northern Plains. The lack of pressure flaking prior to fluting that is
evident on some of the Gault Folsom preforms may also represent an early manifestation of

107
Folsom technology in which the fluting process had not yet been refined, although alternately it
may represent a step in the flintknapping learning process. Technological variations in the
making of Folsom, Midland, and other contemporary points are considered more fully in Chapter
4. Moreover, the comparison of proxy variables for flintknapping skill suggests that the Midland
preforms from Gault may have been made by novices. Chapter 5 further investigates the
relationship between flintknapping skill and projectile point production for the Folsom period.
Another line of evidence to consider is that although discarded Midland points outnumber
Folsom points at the Gault site, the opposite is true for preforms. This observation indicates that
raw material availability may play a role in deciding whether to manufacture a fluted Folsom
point, an unfluted Midland, or something in between. This possible relationship is explored
more extensively in Chapter 6. Finally, the Folsom-Midland component of the Gault site appears
to conform to a regional trend in which Midland points are more common in the southern Plains
than in the north. This observation combined with the data from Collard et al.’s (2010) analysis
seems to suggest that Midland points became increasingly common over time and culminated
when Folsom-age people began to populate the Plains south of the 36°N latitude. However, the
analyses or radiocarbon dates conducted in Chapter 7 fails to support the geographic trend
indicated by Collard et al.

108
CHAPTER 4: TECHNOLOGICAL ANALYSIS
Although the technology used to produce Folsom points has been extensively explored
(Crabtree 1966; Frison and Bradley 1980:45-52; Sollberger and Patterson 1980; Amick 1999;
Clark and Collins 2002), a range of options for manufacturing viable projectile points was
known to hunter-gatherers during the Folsom period. Additional point types that are regularly
found at Folsom sites include unifacially fluted points, Midland points, pseudo-fluted points,
miniature points, and possibly a miscellaneous “unfluted Folsom” type that is distinct from
Midland. The purpose of this chapter is to compare measurements of these various point types
and their respective preforms when available. The analysis of the finished points was conducted
to determine whether similarities in size and shape exist among the finished forms of all the point
types (with the exception of the size of the miniature points), suggesting that the points were all
hafted in the same manner regardless of production technology. The analysis of the preforms
was conducted to determine whether they exhibit considerably more variation, considering the
formal staged reduction strategy for Folsom points compared to the more expedient strategies
involved in producing most of the other types.
Quantitative Analysis
The projectile points in this study consist of Folsom, Midland, unifacially fluted, pseudo-
fluted, Plainview, Goshen, Milnesand, and indeterminate. Miniature points are not included
except where specifically stated because they are also subdivided into miniature Folsom,
Midland, etc.; and their inclusion would skew the results of this analysis. Table 6 gives the
counts and percentages of each type in the sample.

109
Table 6: Frequencies and percentages of the full-sized projectile point types in the research
sample.
Frequency Percent
Folsom 321 47.8
Goshen 5 0.7
Indet 19 2.8
Midland 201 30
Milnesand 4 0.6
Plainview 44 6.6
Pseudo-fluted
35 5.2
Unifacially Fluted
42 6.3
Total 671 100

110
Because the Goshen, Milnesand, and indeterminate point types are represented by small
(n<30) sample sizes, they will not be included in statistical comparisons. While it may be logical
to lump Goshen with Plainview based on their typological similarities, further research may be
necessary to determine whether such an aggregation is valid. The few Goshen points from Hell
Gap that have been examined in this research are noticeably larger than the Plainview points,
suggesting a possible (but tenuous) typological difference.
Based on the typological definition in Chapter 2, I infer that knappers during the Folsom
period had a range of technological options for producing points that are roughly the same size
and shape (on an impressionistic level). Basically, Folsom points, Midland points, and pseudo-
fluted points initially appear to represent different means for reaching the same end. Therefore,
the null hypothesis for this analysis states that there is no size or shape difference between these
points. If this hypothesis is supported, then it can be reasoned that the point types were all likely
employed using the same hafting system or for the same purpose. If the hypothesis is rejected,
then it is likely that different hafting systems were used for different point types. Plainview
points are expected to have significantly different measurements from the other types due to their
different production technology and their contextual distinction from the Folsom period. The
variables examined in this analysis include width, thickness, basal width, and length of edge
grinding.
Width
Naturally, if all points from the Folsom period utilized the same hafts, their widths would
need to be roughly equivalent. The first comparisons (Table 7-10) are independent samples t-
tests comparing the maximum widths of Folsom points to the other types.

111
Table 7: Independent samples t-test comparing the widths of Folsom and Midland points.
Group Statistics
Style N Mean Std. Dev.
Std. Error Mean
Width Folsom 321 21.287 2.9774 .1662
Midland 201 19.795 2.1973 .1550
Independent Samples Test
Levene's Test for Equality of Variances t-test for Equality of Means
F Sig. t df
Sig. (2-
tailed) Mean Diff.
Std. Error Diff.
95% Confidence Interval of the Difference
Lower Upper
Width Equal varianceassumed
11.55 .001 6.136 520 .000 1.4924 .2432 1.0145 1.970
Equal variance not assumed
6.567 506.11 .000 1.4924 .2272 1.0459 1.938

112
Table 8: Independent samples t-test comparing widths of Folsom and unifacially fluted points.
Group Statistics
Style N Mean Std. Dev.
Std. Error Mean
Width Folsom 321 21.287 2.9774 .1662
Unifacia 42 19.683 2.0014 .3088
Independent Samples Test
Levene's Test for Equality of Variances t-test for Equality of Means
F Sig. t df
Sig. (2-
tailed) Mean
Difference Std. Error
Diff.
95% Confidence Interval of the Difference
Lower Upper
Width Equal varianceassume
4.912 .027 3.391 361 .001 1.6043 .4731 .6740 2.535
Equal variance not assume
4.575 67.46 .000 1.6043 .3507 .9044 2.304

113
Table 9: Independent samples t-test comparing widths of Folsom and pseudo-fluted points.
Group Statistics
Style N Mean Std. Dev.
Std. Error Mean
Width Folsom 321 21.287 2.9774 .1662
Pseudo-f 35 19.310 2.7373 .4627
Independent Samples Test
Levene's Test for Equality of Variances t-test for Equality of Means
F Sig. t df
Sig. (2-
tailed) Mean
Difference Std. Error
Diff.
95% Confidence Interval of the Difference
Lower Upper
Width Equal varianceassume
.009 .923 3.759 354 .000 1.9772 .5260 .9426 3.0118
Equal variance not assume
4.022 43.26 .000 1.9772 .4916 .9859 2.9685

114
Table 10: Independent samples t-test comparing widths of Folsom and Plainview points.
Group Statistics
Style N Mean Std. Dev.
Std. Error Mean
Width Folsom 321 21.287 2.9774 .1662
Plainvie 44 22.031 2.6886 .4053
Independent Samples Test
Levene's Test for Equality of Variances t-test for Equality of Means
F Sig. t df
Sig. (2-
tailed) Mean
Difference Std. Error
Diff.
95% Confidence Interval of the Difference
Lower Upper
Width Equal varianceassume
.741 .390 -1.57 363 .117 -.7437 .4734 -1.6746 .1872
Equal variance not assume
-1.70 58.45 .095 -.7437 .4381 -1.6205 .1330
115
As it turns out, comparing the maximum widths of Folsom points to other Folsom
variants, as well as Plainview, gives results that are the opposite of what was expected. With at
least 95% confidence, Folsom points are wider on average than Midland, unifacially fluted, and
pseudo-fluted points. Compared to Midland, Folsom points are about 1 to 1.9 millimeters wider,
Folsom points are 0.9 to 2.3 millimeters wider than unifacially fluted points, and they are 0.9 to 3
millimeters wider than pseudo-fluted points (equal variances are not assumed for the
Folsom/Midland and Folsom/unifacially fluted comparisons, but they are assumed for
Folsom/pseudo-fluted and Folsom/Plainview comparisons, based on the results of Levene’s test).
On the other hand, the width of Folsom points does not significantly differ from that of
Plainview points, despite the general lack of association between Folsom and Plainview points in
archaeological sites. It may be difficult to discern, however, whether a difference of 1 to 3
millimeters in width would require a separate hafting system. The difference in widths between
Folsom points and the other Folsom-age variants may instead be due to the size of the initial
blanks from which they are reduced. The widths of Midland, unifacially fluted, and pseudo-
fluted points all compare favorably with each other in their respective t-tests, and they differ
significantly from Plainview.
Thickness
Folsom points are also expected to compare favorably with the other variants in terms of
maximum thickness (Table 11-14). If these points were being employed in the same hafts, then
their thicknesses should closely match each other. Plainview points are expected to be notably
thicker, which is common sense considering that greater thickness is one of my typological
criteria for differentiating Plainview points from Midland.

116
Table 11: Independent samples t-test comparing thicknesses of Folsom and Midland points.
Group Statistics
Style N Mean Std. Dev.
Std. Error Mean
Thickness Folsom 321 4.174 .6003 .0335
Midland 201 4.149 .6153 .0434
Independent Samples Test
Levene's Test for Equality of Variances t-test for Equality of Means
F Sig. T df
Sig. (2-
tailed) Mean Diff.
Std. Error Diff.
95% Confidence Interval of the Difference
Lower Upper
Thickness Equal variance assume
1.731 .189 .468 520 .640 .0255 .0545 -.0816 .1326
Equal variance not assume
.465 416.88 .642 .0255 .0548 -.0823 .1333

117
Table 12: Independent samples t-test comparing thicknesses of Folsom and unifacially fluted
points.
Group Statistics
Style N Mean Std. Dev.
Std. Error Mean
Thickness Folsom 321 4.174 .6003 .0335
Unifacia 42 3.994 .6790 .1048
Independent Samples Test
Levene's Test for Equality of Variances t-test for Equality of Means
F Sig. t df
Sig. (2-
tailed) Mean Diff.
Std. Error Diff.
95% Confidence Interval of the Difference
Lower Upper
Thickness Equal variance assume
.531 .467 1.80 361 .072 .1805 .1001 -.0163 .3772
Equal variance not assume
1.64 49.748 .107 .1805 .1100 -.0405 .4014

118
Table 13: Independent samples t-test comparing thicknesses of Folsom and pseudo-fluted points.
Group Statistics
Style N Mean Std. Dev.
Std. Error Mean
Thickness Folsom 321 4.174 .6003 .0335
Pseudo-f
35 3.703 .8091 .1368
Independent Samples Test
Levene's Test for Equality of Variances t-test for Equality of Means
F Sig. t df
Sig. (2-
tailed) Mean Diff.
Std. Error Diff.
95% Confidence Interval of the Difference
Lower Upper
Thickness Equal variance assume
7.128 .008 4.25 354 .000 .4711 .1110 .2529 .6894
Equal variance not assume
3.35 38.189 .002 .4711 .1408 .1861 .7561

119
Table 14: Independent samples t-test comparing thicknesses of Folsom and Plainview points.
Group Statistics
Style N Mean Std. Dev.
Std. Error Mean
Thickness Folsom 321 4.174 .6003 .0335
Plainvie 44 5.573 .7928 .1195
Independent Samples Test
Levene's Test for Equality of Variances t-test for Equality of Means
F Sig. t df
Sig. (2-
tailed) Mean Diff.
Std. Error Diff.
95% Confidence Interval of the Difference
Lower Upper
Thickness Equal variance assumed
6.185 .013 -13.89 363 .000 -1.3985 .1007 -1.596 -1.201
Equal variance not assumed
-11.27 49.98 .000 -1.3985 .1241 -1.648 -1.149

120
The results of the t-tests for maximum thickness reveal that for the most part, the
expectations are correct. Folsom point thickness does not differ significantly from Midland or
unifacially fluted points, but Folsom points do differ from pseudo-fluted and Plainview points.
Folsom points are thinner than Plainview points by about 1.15 to 1.65 millimeters (equal
variances not assumed), which is an expected result based on the typological definition of
Plainview points. However, Folsom points tend to be thicker than pseudo-fluted points by 0.19
to 0.76 millimeters, with equal variances not assumed. This result is probably due to the
differing cross sections of Folsom and pseudo-fluted points. The thickest portion of Folsom
points tends to be the ridges along either side of the flutes, and this thickness compares favorably
to Midland and unifacially fluted points. However, although pseudo-fluted points can appear
fluted, they lack those ridges. Therefore, comparing the maximum thickness of pseudo-fluted
points to the mid-flute thickness of Folsom points may be necessary (Table 15).
The results of this test indicate that the fluted portion of Folsom points is actually thinner
than pseudo-fluted points at 95% significance. The difference (with equal variances not
assumed) is between 0.07 and 0.66 millimeters, roughly similar to the degree that the maximum
thickness of Folsom points is greater than pseudo-fluted. Based on these results, the average
thickness of pseudo-fluted points appears to lie halfway between the maximum thickness and
flute thickness of Folsom points.

121
Table 15: Independent samples t-test comparing the flute thicknesses of Folsom and maximum
thickness of pseudo-fluted points.
Group Statistics
Style N Mean Std. Dev.
Std. Error Mean
Thickness Folsom 321 3.262 .5342 .0298
Pseudo-f
35 3.623 .8403 .1420
Independent Samples Test
Levene's Test for Equality of Variances t-test for Equality of Means
F Sig. t df
Sig. (2-
tailed) Mean Diff.
Std. Error Diff.
95% Confidence Interval of the Difference
Lower Upper
Thickness Equal variance assume
16.050 .000 -3.55 354 .000 -.3611 .1016 -.5609 -.1613
Equal variance not assume
-2.49 37.06 .017 -.3611 .1451 -.6551 -.0671

122
Basal Width
Although the idealized versions of Folsom and Midland points have parallel sides, and
therefore their basal widths should be similar to their maximum widths, not all Folsom-age point
variants match this ideal. Many points have slightly tapered bases, and this observation seems to
be more prevalent among the unfluted Folsom variants than the fluted ones. Amick (1995:31-
33) mentions that the narrower bases on some points may be due to the shape of their original
flake blanks, with these flake blanks being smaller than fluted point preforms, making parallel
sides more difficult to produce for these points. In this analysis, a ratio of basal width to
maximum width is used to compare the point types (Table 16-19). Using this ratio controls for
artifact size and improves the validity of the analysis. It must be noted that sample sizes are
smaller than usual in this analysis because it only includes points that retain intact bases,
excluding medial, distal, and lateral fragments.

123
Table 16: Independent samples t-test comparing Base Width/Max Width ratios of Folsom and
Midland points.
Group Statistics
Style N Mean Std. Dev.
Std. Error Mean
Base DivWid
Folsom 215 .894620 0.0638 0.0044
Midland 154 .879148 0.0726 0.0059
Independent Samples Test
Levene's Test for Equality of Variances t-test for Equality of Means
F Sig. t df
Sig. (2-
tailed) Mean Diff.
Std. Error Diff.
95% Confidence Interval of the Difference
Lower Upper
Base DivWid
Equal variances assumed
5.127 .024 2.17 367 .031 0.0155 0.0071 0.001 0.030
Equal variances not assumed
2.12 302.95 .035 0.0155 0.0073 0.001 0.030

124
Table 17: Independent samples t-test comparing Base Width/Max Width ratios of Folsom and
unifacially fluted points.
Group Statistics
Style N Mean Std. Dev.
Std. Error Mean
Base DivWid
Folsom 215 .894620 0.0638 0.0044
Unifacia 31 .886998 0.0887 0.0159
Independent Samples Test
Levene's Test for Equality of Variances t-test for Equality of Means
F Sig. t df
Sig. (2-
tailed) Mean Diff.
Std. Error Diff.
95% Confidence Interval of the Difference
Lower Upper
Base DivWid
Equal variances assumed
3.307 .070 .60 244 .557 0.0076 0.0129 -0.018 0.033
Equal variances not assumed
.46 34.62 .647 0.0076 0.0165 -0.026 0.041

125
Table 18: Independent samples t-test comparing Base Width/Max Width ratios of Folsom and
pseudo-fluted points.
Group Statistics
Style N Mean Std. Dev.
Std. Error Mean
Base DivWid
Folsom 215 .894620 0.0638 0.0044
Pseudo-f
29 .872567 0.0881 0.0164
Independent Samples Test
Levene's Test for Equality of Variances t-test for Equality of Means
F Sig. t df
Sig. (2-
tailed) Mean Diff.
Std. Error Diff.
95% Confidence Interval of the Difference
Lower Upper
Base DivWid
Equal variances assumed
7.753 .006 1.66 242 .098 0.0221 0.0133 -0.004 0.048
Equal variances not assumed
1.30 32.08 .202 0.0221 0.0169 -0.012 0.057
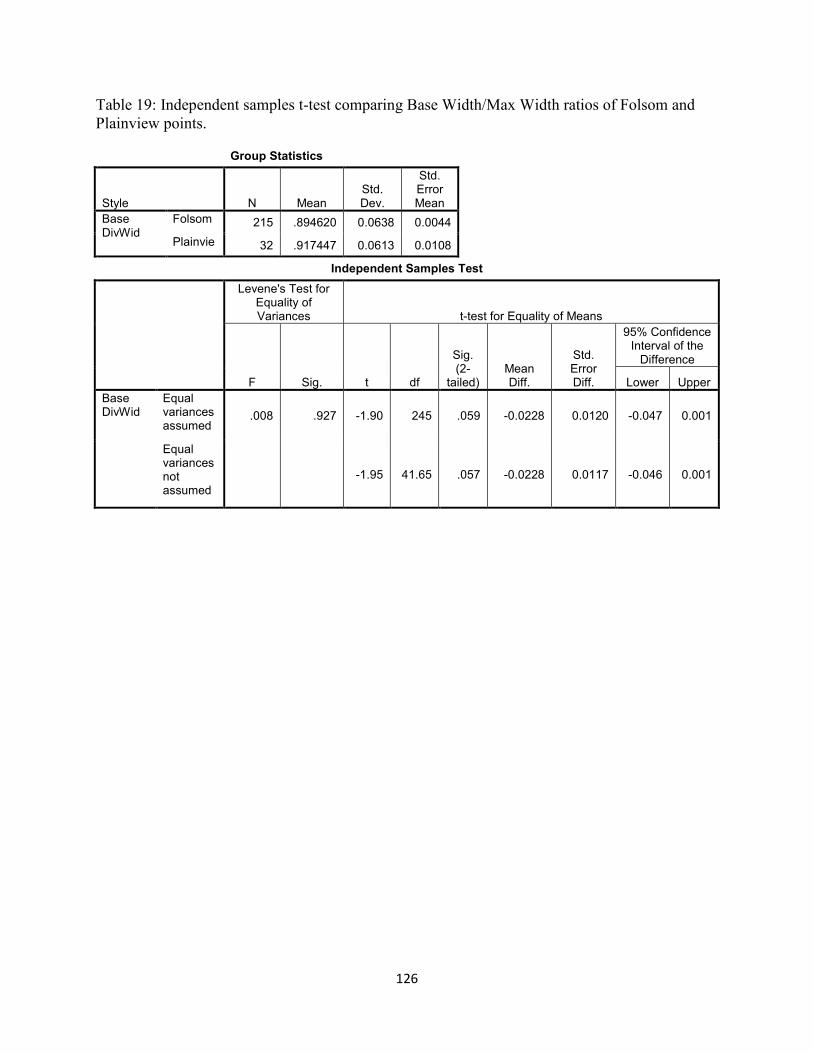
126
Table 19: Independent samples t-test comparing Base Width/Max Width ratios of Folsom and
Plainview points.
Group Statistics
Style N Mean Std. Dev.
Std. Error Mean
Base DivWid
Folsom 215 .894620 0.0638 0.0044
Plainvie 32 .917447 0.0613 0.0108
Independent Samples Test
Levene's Test for Equality of Variances t-test for Equality of Means
F Sig. t df
Sig. (2-
tailed) Mean Diff.
Std. Error Diff.
95% Confidence Interval of the Difference
Lower Upper
Base DivWid
Equal variances assumed
.008 .927 -1.90 245 .059 -0.0228 0.0120 -0.047 0.001
Equal variances not assumed
-1.95 41.65 .057 -0.0228 0.0117 -0.046 0.001

127
These results reveal that only Midland points differ significantly from Folsom points in
terms of the ratio of basal width to maximum width. The difference of the ratios is not large
(with a mean of 0.895 for Folsom and 0.879 for Midland), but it is consistent enough in these
samples to be statistically significant with 95% confidence. The fact that this difference is only
significant when Folsom is compared to Midland, and not when Folsom is compared to the other
variants (or to Plainview), indicates that initial blank size cannot solely explain the contracting
basal morphology seen in some Midland points. If blank size was the only factor, then
unifacially fluted and pseudo-fluted points should also have basal width ratios that differ
significantly from Folsom. Since this is not the case, one can only assume that the narrower
basal width of Midland points is a stylistic attribute of that point type. Such a narrowing of the
base may imply that Midland points were hafted differently from Folsom, but just as it is with
the maximum width variable, it is difficult to tell whether such a slight difference required a
different hafting system.
To further complicate matters, the following tests comparing Midland points to
unifacially fluted and pseudo-fluted points reveal no significant differences in their ratios of
basal width to maximum width (Table 20 and Table 21). These results show that unifacially
fluted and pseudo-fluted points tend to have basal widths that taper slightly more than Folsom
but slightly less than Midland, indicating that there is a spectrum of basal dimensions available to
Folsom-age projectile points, with Folsom and Midland siding on either extreme.

128
Table 20: Independent samples t-test comparing Base Width/Max Width ratios of Midland and
unifacially fluted points.
Group Statistics
Style N Mean Std. Dev.
Std. Error Mean
Base DivWid
Midland 154 .879148 0.0726 0.0059
Unifacia 31 .886998 0.0887 0.0159
Independent Samples Test
Levene's Test for Equality of Variances t-test for Equality of Means
F Sig. t df
Sig. (2-
tailed) Mean Diff.
Std. Error Diff.
95% Confidence Interval of the Difference
Lower Upper
Base DivWid
Equal variances assumed
.354 .552 -.528 183 .598 -0.0079 0.0149 -0.037 0.022
Equal variances not assumed
-.463 38.51 .646 -0.0079 0.0170 -0.042 0.027
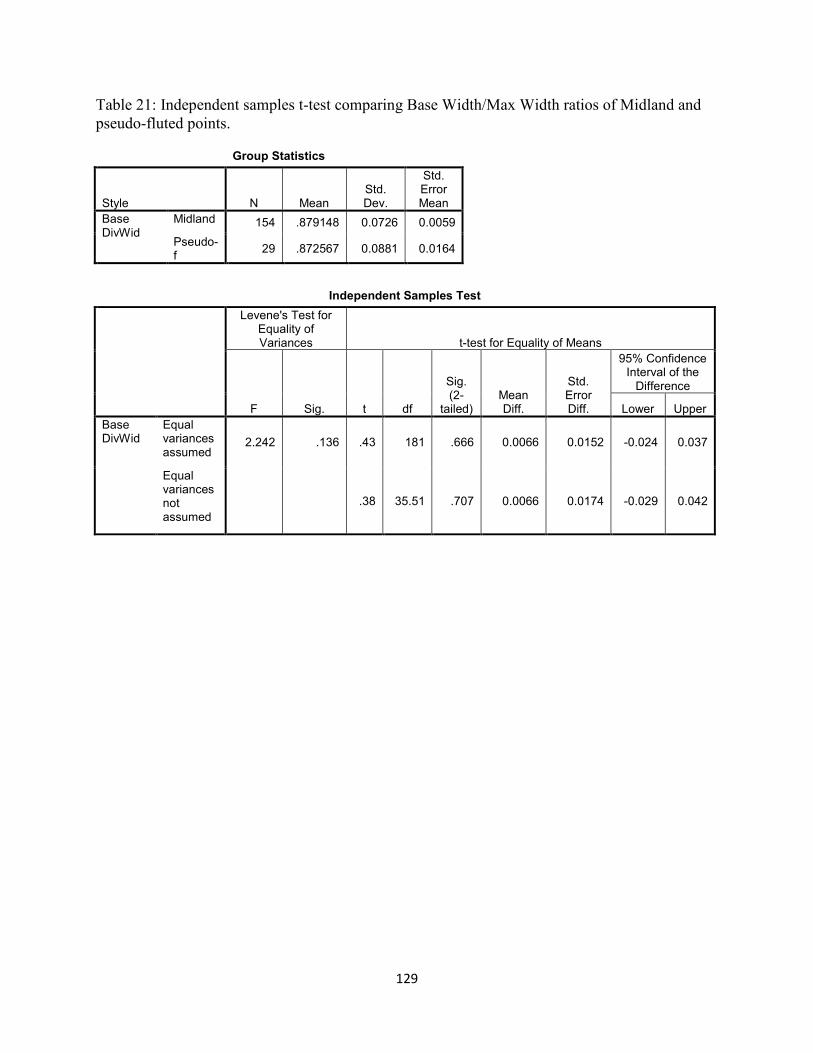
129
Table 21: Independent samples t-test comparing Base Width/Max Width ratios of Midland and
pseudo-fluted points.
Group Statistics
Style N Mean Std. Dev.
Std. Error Mean
Base DivWid
Midland 154 .879148 0.0726 0.0059
Pseudo-f
29 .872567 0.0881 0.0164
Independent Samples Test
Levene's Test for Equality of Variances t-test for Equality of Means
F Sig. t df
Sig. (2-
tailed) Mean Diff.
Std. Error Diff.
95% Confidence Interval of the Difference
Lower Upper
Base DivWid
Equal variances assumed
2.242 .136 .43 181 .666 0.0066 0.0152 -0.024 0.037
Equal variances not assumed
.38 35.51 .707 0.0066 0.0174 -0.029 0.042

130
Edge Grinding
Although not related to artifact size or shape, the length of edge grinding on a point may
provide some insight on the way it was hafted. Archaeologists generally agree that grinding on
the edges of Paleoindian points dulls the edges in order to prevent them from cutting through the
binding that secures a point in its haft (Tunnel 1977:16, but Titmus and Woods 1991 state that
grinding helps secure a point against breakage). Unfortunately, the length of edge grinding is
greatly affected by artifact breakage and resharpening, so analyzing the direct measurements is
unlikely to yield useful results. Instead, this analysis is restricted to complete, unbroken
projectile points and uses a ratio variable. This variable is made up of the average edge grinding
length of both edges of a point divided by the length of the point. The main difficulty in
analyzing edge grinding in this manner is that it greatly reduces the sample size, since most of
the points in the sample are fragmentary. Complete Folsom and Midland points number 85 and
56 respectively, while there are only 11 unifacially fluted points, 16 pseudo-fluted points, and 25
Plainview points. Therefore, only Folsom and Midland points have reliably large sample sizes
for this analysis. Table 22 compares the edge grinding ratios of complete Folsom and Midland
points (note: there is no significant difference in overall length between these two point types in
this sample).

131
Table 22: Independent samples t-test comparing average grinding length/maximum length ratios
of Folsom and Midland points.
Group Statistics
Style N Mean Std. Dev.
Std. Error Mean
Grind Length
Folsom 85 .373356 0.2388 0.0259
Midland 56 .504539 0.1915 0.0256
Independent Samples Test
Levene's Test for Equality of Variances t-test for Equality of Means
F Sig. t df
Sig. (2-
tailed) Mean Diff.
Std. Error Diff.
95% Confidence Interval of the Difference
Lower Upper
Grind Length
Equal variances assumed
8.365 .004 -3.45 139 .001 -0.1312 0.0381 -0.207 -0.056
Equal variances not assumed
-3.60 133.60 .000 -0.1312 0.0364 -0.203 -0.059

132
This test reveals that the edge grinding ratios of Folsom and Midland points are different
with a strong significance. On average, the edge grinding on Folsom points extends to just over
a third of their total length, while the edge grinding on Midland points extends to half their full
length. Neither Folsom nor Midland points significantly differ from the other variants in terms
of edge grinding, but this result is probably due to the small sample size of complete unifacially
fluted, pseudo-fluted, and Plainview points. Considering that the complete Folsom and Midland
points in this sample do not significantly differ in length, the difference in edge grinding may
indicate different hafting methods for the point types.
Summary for Full-Sized Points
The null hypothesis for this section, which states that there are no significant differences
in measurements between Folsom-era projectile point types, cannot be supported. Some
significant differences do exist, and these differences may indicate that some of the projectile
point types were hafted differently. First, Folsom points are consistently wider than Midland,
pseudo-fluted, and unifacially fluted points. On its own, this result could be interpreted as an
indication that Folsom points were not laterally thinned as much as the other types, relying
instead on the fluting process for thinning. However, the width of Folsom points is not
significantly different from that of Plainview points, despite the latter being laterally thinned.
Second, the ratio of basal width to maximum width is significantly greater for Folsom points
than for Midland, revealing that Midland points generally have more tapering bases than Folsom.
Unifacially fluted and pseudo-fluted points appear to bridge this gap, however, as their basal
width ratios are not significantly different from Folsom or Midland. Third, the ratio of edge
grinding to overall length for complete points is far greater for Midland points than for Folsom.
Assuming that edge grinding is related to the manner in which a projectile point is secured to its

133
haft, this significant difference suggests that different hafting techniques were used for Folsom
and Midland points. The sample sizes of complete unifacially fluted and pseudo-fluted points
were too small to include in this part of the analysis, however. Finally, the only variable that is
consistent for most point types is maximum thickness. Pseudo-fluted points are consistently
thinner than the rest, but they are still thicker than the mid-flute thickness of Folsom points,
suggesting that the thinness of pseudo-fluted points is related more to their production
technology than to the way they were hafted.
Miniature Points
Because miniature points are by definition a different size than ordinary Folsom-age
points, it is already reasonable to assume they were hafted differently, or at least on smaller
shafts, than the other points. While some research has interpreted miniature points as toys or
ceremonial fetishes (Bonnichsen and Keyser 1982; Storck 1991:156-158), many of the miniature
Folsom-age points in this research and elsewhere show signs of use, such as impact damage.
Amick (1994a:23-25) suggests that these miniature points may indicate the presence of bows and
arrows in North America as early as the Folsom period, but much more evidence would be
necessary to support this hypothesis. The sample of miniature points has been subdivided by
type in the same manner as their full sized counterparts, but the small sample size precludes the
use of independent t-tests to compare them (Table 23). Instead, boxplots are used to compare the
width, thickness, basal width, and edge grinding of the miniature points (Figure 12).
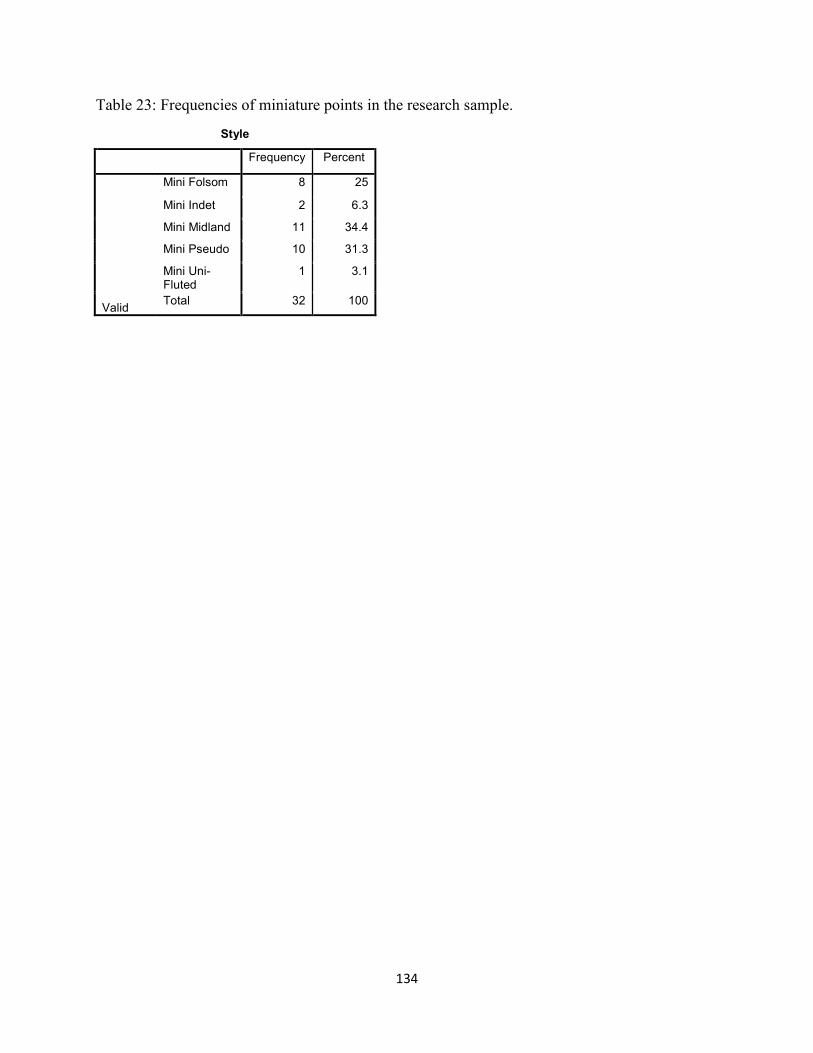
134
Table 23: Frequencies of miniature points in the research sample.
Style
Frequency Percent
Valid
Mini Folsom 8 25
Mini Indet 2 6.3
Mini Midland 11 34.4
Mini Pseudo 10 31.3
Mini Uni-Fluted
1 3.1
Total 32 100

135
Figure 12: Boxplots for the miniature points. Comparing Width, Thickness, Basal Width/Max
Width, and Grinding Length/Max Length variables for the following miniature subtypes:
Folsom, Indeterminate, Midland, Pseudo-Fluted, and Unifacially Fluted. Note: the Grinding
Length/Max Length variable only includes complete points.
136
Overall, it appears that miniature Folsom and Midland points compare favorably to each
other, while miniature pseudo-fluted points are more variable in terms of width and are often
thinner than the Folsom and Midland miniatures. No inferences can be made about the
indeterminate and unifacially fluted miniatures because their sample sizes are two and one,
respectively. The differences in measurements that distinguish full sized Folsom and Midland
points do not seem to carry over to their miniature counterparts, suggesting that the smaller
Folsom and Midland points were likely hafted and used interchangeably. The differences in
measurements between them and the pseudo-fluted miniatures are likely due to different
reduction techniques. By and large, Folsom and Midland miniatures appear to be resharpened
down from full sized points, while the pseudo-fluted miniatures are made that size from the start
using very small flake blanks. Some of the pseudo-fluted points appear to be made from channel
flakes, based on the lateral flaking of their dorsal surfaces and the orientation of the ripples on
the ventral surfaces. Two of the pseudo-fluted points from west Texas are made on cortical
flakes with some cortex remaining on their dorsal surfaces, indicating that some pseudo-fluted
miniature points are very expediently made. On the other hand, a few Folsom and Midland
miniatures show no signs of lateral resharpening and may have initially been made with the
intention of being miniature. Two Midland points of this variety are present from west Texas,
and two well made Folsom miniatures are recorded from Lindenmeier.
Qualitative Analysis
Some analyses of Folsom-age point and biface reduction technology do not involve
specific scale-level variables, and therefore their significances cannot be determined using
statistical methods. However, qualitative analyses can have meaningful information to
137
contribute to Folsom technology, and our understanding of the whole range of the technology
would be incomplete without them. Such analyses involve exploring the relationships between
the points and preforms of the various point types; pointing out the morphological variability of
ultrathin bifaces; identifying technological connections between points, preforms, and ultrathin
bifaces; understanding deviations from stage-based reduction strategies and why these deviations
might occur; and recognizing “hybrid” point types that bridge the gap between the fluted and
unfluted styles. Idealized forms and rigid reduction sequences generally dominate the published
literature, but a full understanding of Folsom point and biface technology must also allow for
variations.
Point-Preform Comparisons
Chapter 3 noted that out of the small sample of Midland points and preforms from the
site, the preforms are not proportionately wider and thicker than the points. Scatterplot A in
Figure 13 shows that Midland preforms are clustered above and below the points, with only one
in its expected position up and to the right of the points, along a general one-to-one trajectory of
width and thickness. In ideal cases, the artifacts should all fall along that trajectory, with points
towards the lower left and preforms towards the upper right. Using the full sample size, this
trajectory holds true for Folsom points and preforms (Figure 13a). Furthermore, Folsom
preforms can easily be divided into unfluted (early stage) and fluted (late stage), enhancing the
resolution of the plot (no distinction is made here between unifacially and bifacially fluted
preforms, however). Most Folsom points do appear in the lower left, most unfluted Folsom
preforms appear in the upper right, and the fluted Folsom preforms overlap between the two.
The trajectory is fairly clear for Folsom points most likely because Folsom points follow a
reduction sequence that involves many steps, making them the least expedient and most

138
standardized point type out of the variants. However, the trajectory is less clear for the whole
sample of Midland points and preforms (Figure 13b). While some Midland preforms occur to
the upper right of the points, most of the preforms are interspersed among the points. This result
is likely due to the lack of a specified reduction sequence among Midland points. The lateral
reduction technique involved in making Midlands is more straightforward than Folsom and
allows for a variety of initial blank shapes, making the widths and thicknesses of Midland
preforms more variable than expected. The plot for pseudo-fluted points and preforms has the
smallest sample size, but it appears as though some of the preforms do fall to the upper right of
the points, as expected (Figure 13c). Others are wider than the points but not thicker, which is
also expected considering pseudo-fluted points are only thinned on one face at most. The fact
that these points match the expected trajectory more than Midland points is probably due to
pseudo-fluted points being made from flake blanks of a size and shape that requires little
modification. In that respect, pseudo-fluted preforms are actually more standardized than
Midlands.

139
Figure 13: Scatterplots of width and thickness for points and preforms, a. Folsom, b. Midland,
and c. pseudo-fluted.

140
Deviations from “Stages” of Folsom Point Production
Although the idealized sequence of Folsom point production was outlined in the
beginning of this chapter, some Folsom points and preforms in the sample exhibit reduction
strategies that differ from this sequence. Some of these deviations are inconsequential and do
not greatly affect the appearance or performance of the intended finished product. On the other
hand, one of the deviations is detrimental to the making of Folsom points and is likely related to
novice flintknappers, while another can (at least in one instance) be attributed to Folsom fluting
“practice.”
The first of these out-of-sequence deviations is relatively innocuous. Most of the time,
Folsom preforms are fully prepared for fluting on one face, and then the second face is only
pressure flaked if the first flute is successful. This approach minimizes the amount of effort that
goes into making a Folsom preform in case the first flute happens to fail and break the piece.
However, some preforms in the sample were broken during the first fluting, but the second face
exhibits even pressure flaking in preparation for fluting. This deviation has been positively
identified in ten out of the 245 Folsom preforms in the sample. The number appears quite low,
especially given that pressure flaking both faces prior to fluting seems like it would depend on
the discretion of each individual knapper, but the count in this sample almost certainly
underestimates this occurrence. Other broken preforms in the sample have been fluted on one
face and pressure flaked on the other, but it could not be determined whether the flute caused the
breakage, so it is possible that the pressure flaking followed the fluting, and then the preforms
broke by some other means.
In rare cases, pre-fluting pressure flaking is skipped entirely, and a fluting attempt is
made on a Folsom preform that has only been percussion flaked. Preforms featuring this

141
reduction strategy feature most prominently at the Gault site, but isolated examples may also be
present at Big Black, Lindenmeier, Boca Negra Wash, and the Westfall collection. The most
likely explanation for the occurrence of these preforms is that they were made by novices, and
attempting to flute the preforms without sufficient preparation is a learner’s mistake. Although
skipping an important step in the Folsom production sequence seems counterintuitive, it may be
possible that the individuals who made these preforms lacked the strength for pressure flaking.
Lohse (2011:102) states that young novices may not be strong enough to successfully pressure
flake a preform, leaving them to try to work around it.
Folsom points that have been fluted from the distal end sometimes occur in Folsom
assemblages. In most cases, these points are almost certainly resharpened from larger points,
with the tip and the base reversed from the original form. Examples of this resharpening strategy
appear in Shifting Sands, Lindenmeier, and Krmpotich. More difficult to interpret are points that
have been fluted from the proximal end on one face and from the distal end on the other face.
Points exhibiting this reduction strategy occur in the Lindenmeier assemblage and the Cox
collection. One preform from Lindenmeier (440770) appears to have had a flute removed from
the opposite end on the second face because the proximal end had broken, making the distal end
easier to set up a fluting platform. Therefore, fluting one face from the distal end may represent
an attempt at salvaging a broken preform, although in this particular case the preform was still
abandoned.
The final deviation from the usual Folsom reduction sequence also appears to be a
technique for salvaging failed preforms, except this time it entails fluting a preform from both
the proximal and distal ends on the same face. This reduction technique appears most commonly
at Lindenmeier, where five of the sampled preforms and possibly one point exhibit double-ended
142
fluting. One such preform is also present from Barger Gulch, and this preform refits to an
ultrathin biface fragment, suggesting these bifaces could have served as cores. In some cases,
the flutes from both ends fell short of meeting in the middle of the preform, resulting in its
discard. It appears that this technique was either used by knappers who were inexperienced with
fluting and compensated by attempting to flute both ends, or more adept knappers may have used
the technique to correct the occasional fluting error. However, a fluted preform from Big Black
(10191) is exceptionally well made, with double flutes on both faces meeting perfectly in the
middle in a resemblance of the opposed diving technique used to make ultrathin bifaces. This
preform would not likely have resulted in a viable point because the center where the flutes meet
creates a weak point that is particularly fragile (although it possibly could have been broken into
two smaller points). This preform appears to have been made by an experienced Folsom knapper
as an eccentric piece, possibly to show off one’s skill.
Ultrathin Biface Variation
In general, ultrathin bifaces have largely the same morphology in that they are thin, flat,
ovate bifaces that were thinned by opposed diving flaking. However, a couple of subtypes
appear to be evident in this research sample and are worthy of note here. The first subtype is
termed “thick bifaces” because they have the same outline and flaking pattern as ultrathins, but
they are noticeably thicker. These bifaces are particularly noticeable from the Lindenmeier
assemblage at the Denver Museum, where these thick bifaces tend to be made from a coarse red
quartzite instead of the more fine-grained material of the regular ultrathins (Figure 14). Bifaces
from Lindenmeier assemblage at the Smithsonian were not analyzed, but a similar pattern is
likely evident in that collection as well. It may be possible that raw material, rather than

143
function, is the most significant factor in determining whether a bifacial knife will be thick or
ultrathin. This possibility is explored further in Chapter 6.
The second subtype, the “flake biface,” is rather rare but noted in a few assemblages,
particularly Blackwater Draw, Hanson, and Bobtail Wolf. These artifacts resemble ultrathin
bifaces in outline, and the dorsal flaking patterns are similar, but the ventral flake blank surface
is largely unmodified (Figure 15). These tools appear to be a more expedient form of ultrathin
biface, similar to the more expedient nature of pseudo-fluted points compared to other point
types. However, the rarity of flake bifaces (only three are in this sample) suggests that this tool
form was not preferred. It may be possible that other flake bifaces exist in Folsom assemblages
that do not match the technological or morphological criteria for an ultrathin, and as such have
not been included in this analysis.

144
Figure 14: Example of a “thick biface” from Lindenmeier.
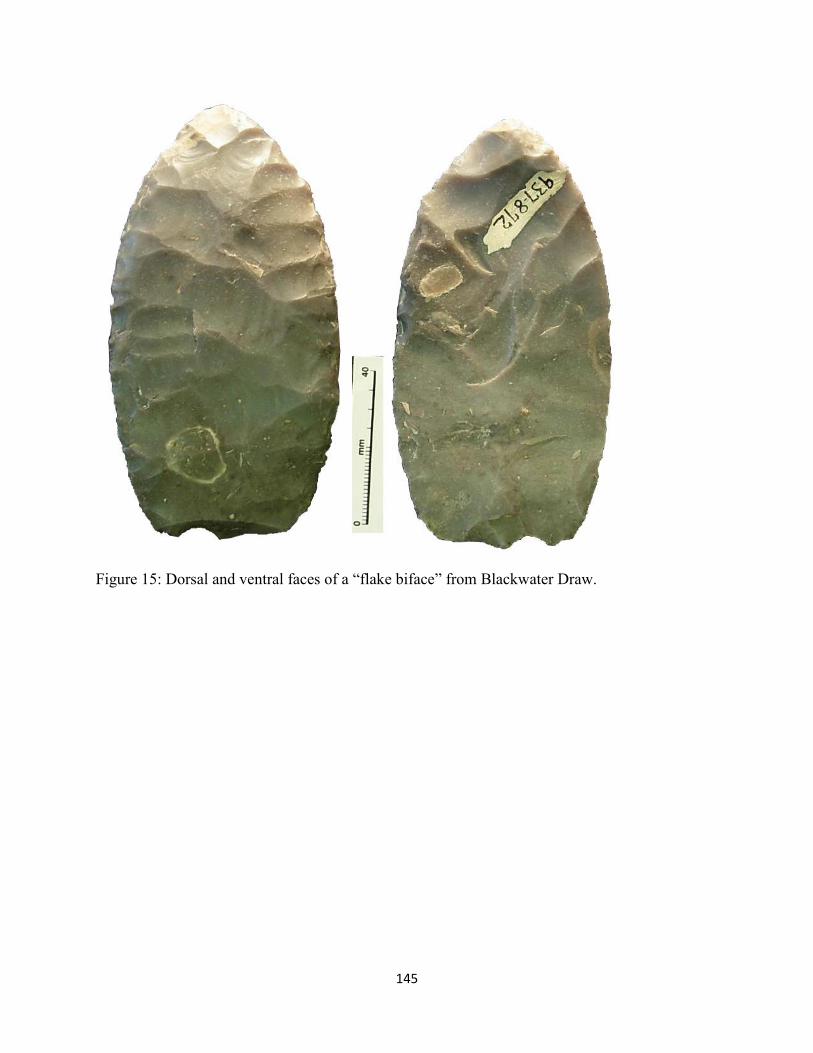
145
Figure 15: Dorsal and ventral faces of a “flake biface” from Blackwater Draw.

146
Ultrathin Bifaces and Projectile Point Manufacture
Different archaeologists have had different opinions on whether projectile points and
ultrathin bifaces follow the same reduction trajectory. On the one hand, ultrathin bifaces are
noticeably distinct from other bifaces in some Folsom assemblages in that the other bifaces are
narrower and thicker (Frison and Bradley 1980:40-42). These other bifaces are inferred to more
likely represent early stage Folsom preforms, or tools that could easily be turned into preforms.
On the other hand, ultrathin bifaces are a possible end product of bifacial core reduction (Collins
1999:21-23). In this scenario, the flakes produced from bifacial cores are the source for many
Folsom tools, including projectile points, and eventually a core may be thinned down enough to
enable opposed diving flaking to create an ultrathin biface. Finally, it may be possible that
ultrathin bifaces themselves are turned into projectile points. This scenario has been verified in
the Barger Gulch assemblage, in which the squared off distal edge of a Folsom preform refits to
an ultrathin biface fragment along its broken facet (Surovell et al. 2003). However, it is worth
noting that this Folsom preform is atypical, as noted in the preceding section. It is rather short
for a preform and is fluted both proximally and distally. Therefore, although this preform
indicates that making Folsom points from ultrathin bifaces was attempted during the Folsom
period, it does not indicate whether such a reduction strategy was common.
Another Folsom preform in my research sample may also have been made from an
ultrathin biface, but in this case the inference is much more tenuous. Preform 02 from Shifting
Sands was fluted on one face, but the channel flake dove and broke the preform, leaving only the
base (Figure 16). The other face has not been pressure flaked to prepare for fluting, leaving the
larger biface thinning flakes visible. This face is very flat, and the larger thinning flake scars
terminate in a diving fashion just off center from the middle of the preform. These flake scars

147
could be considered opposed diving, but it is not certain. The preform also expands significantly
from its base to the distal termination, which does not resemble finished Folsom points and is
more reminiscent of the distal end of an ultrathin biface. Two similar examples of widely
expanding Folsom preforms are present in the Westfall collection, but the flaking style on their
unfluted faces is unpatterned. Both Rose and Collins disagree that the Shifting Sands preform
resembles a reworked ultrathin biface (personal communication), so more definitive examples
would need to be discovered for this possible technological connection to be supported.
One test for the potential of ultrathin bifaces to be turned into Folsom preforms would be
to compare thicknesses between the two. If finished ultrathin bifaces are consistently thinner
than early stage unfluted Folsom preforms, then ultrathin bifaces could not be regularly
converted to Folsom points. However, if there is no significant difference in thickness, or
ultrathin bifaces are consistently thicker than the preforms, then converting ultrathins to Folsom
points would have at least been physically possible in general. Table 24 gives the results of a t-
test comparing the thicknesses of ultrathins and unfluted Folsom preforms, indicating that there
is no significant difference between the two, but with a p-value of 0.054, it was a close call.
However, even if the results had been significant, the ultrathin bifaces are slightly thicker than
the Folsom preforms overall (bifaces average 6.68 mm, preforms average 6.18 mm), so the
possibility of the bifaces being made into points would still have remained.
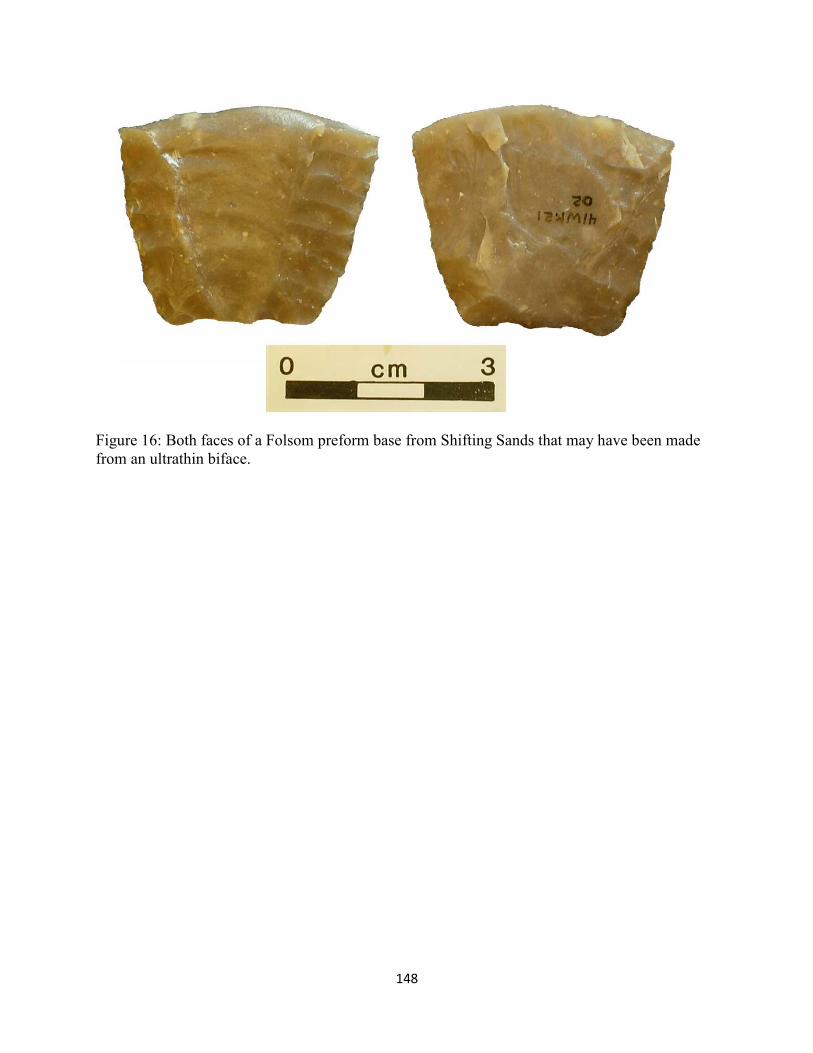
148
Figure 16: Both faces of a Folsom preform base from Shifting Sands that may have been made
from an ultrathin biface.

149
Table 24: Independent samples t-test comparing maximum thickness of finished ultrathin bifaces
and unfluted Folsom preforms.
Group Statistics
Type N Mean Std. Dev.
Std. Error Mean
Thickness Unfluted 51 6.1782 1.46486 .20512
Ultrathi 59 6.6849 1.25986 .16402
Independent Samples Test
Levene's Test for Equality of Variances t-test for Equality of Means
F Sig. t df
Sig. (2-
tailed) Mean Diff.
Std. Error Diff.
95% Confidence Interval of the Difference
Lower Upper
Thickness Equal variance assume
.873 .352 -1.95 108 .054 -0.5067 0.2598 -1.0216 0.008
Equal variance not assume
-1.93 99.36 .057 -0.5067 0.2626 -1.0278 0.014

150
In summary, there is evidence that Folsom preforms were occasionally made from
ultrathin bifaces, and an analysis of the thicknesses of the two forms reveals that such
conversions were generally possible, but there is no technological evidence that such a practice
was done commonly. The Barger Gulch preform that refits to the ultrathin fragment is not
typical of the usual Folsom projectile point reduction sequence, so it cannot attest to the
regularity of the occurrence. It is also possible and even likely that flakes from the production of
ultrathin bifaces were used to make other Folsom tools, including points. Even the opposed
diving flakes from the final stages of ultrathin production may have been used to make Midland
or pseudo-fluted points. However, testing the feasibility of this strategy would be difficult, and
might require an examination of debitage from ultrathin biface production and comparing its
morphology to Folsom-age projectile point variants.
The Folsom-Midland “Hybrids”
Chapter 3 discussed the existence of points that bear hallmarks of both Folsom and
Midland technology and noted three ways in which this overlap could occur. The first type of
hybrid is unifacially fluted points that are fluted on one face and collaterally flaked on the other,
the second is fluted points in which the channel flake falls short of the points’ full length with the
remainder being collaterally flaked, and the third is Midland points that retain traces of a basal
nipple platform that is usually intended for fluting. Although the preceding chapter mentioned
the presence of such hybrids outside the Gault site, it did not systematically document them.
This section provides more details on the occurrences of these points.
Unifacially fluted points that have Midland-style collateral flaking on their unfluted faces
are relatively common in the sample. Of the 42 unifacially fluted points in the sample, 19 of
them have collateral flaking. Assemblages that include these hybrid variants are as follows:

151
Gault (1), Lubbock Lake (1), Shifting Sands (6), Scharbauer (1), the Baker Collection (3), the
Westfall Collection (2), Krmpotich (1), and Lindenmeier (4) (see “Lassen Folsom Measures.xls”
in the attached files). This widespread occurrence indicates that this particular point form was a
regular part of Folsom technology, and although it was not as common as fully fluted Folsom
points or fully unfluted Midland points, these points were still made fairly regularly.
Bifacially fluted Folsom points with Midland-like collateral flaking past their flutes also
occur fairly often but are not as common as the unifacial variety. A total of 14 points of this
description occur in the sample, and the assemblages in which they appear are Blackwater Draw
(1), Rio Rancho (1), the Folsom site (3), the Baker Collection (1), the Westfall Collection (2),
Cedar Creek (2), the Cox Collection (2), Lindenmeier (1), and miscellaneous Colorado materials
(1) (see “Lassen Folsom Measures.xls” in the attached files). In reality, this reduction strategy
was probably more common than this research sample indicates. Of the 321 Folsom points in
the sample, 137 of them are either complete points or distal fragments. And out of those 137,
many of them were either fully fluted to the distal tip, resharpened down into the flutes, or
impact damaged, removing any evidence of collateral flaking. Observing Midland-like flaking
on unifacially fluted points is easier because they are not as affected by these issues.
Midland points with Folsom-like fluting nipple platforms are not as common as the
preceding examples, but they are widespread. A total of 10 of these points are present in the
research sample, and they come from Blackwater Draw (1), Shifting Sands (4), a surface find
from Winkler County, TX (1), Hanson (1), Hell Gap (1), and the Cox Collection (2) (see “Lassen
Folsom Measures.xls” in the attached files). As stated in Chapter 3, the existence of Folsom
channel flakes with collateral flaking across the dorsal surface suggests that some Midland-style
preforms were ultimately fluted, and some Midland points may also have retained fluting

152
platforms just in case the knapper decided to attempt to flute. Of the 49 channel flakes
photographed from the Shifting Sands assemblage, eight of them appear to have collateral
flaking on their dorsal surfaces. In other assemblages, this type of channel flake is nearly non-
existent, with only two possible examples from Rio Rancho, New Mexico, and one from eastern
Colorado. Although channel flakes were not systematically analyzed in this research, this
phenomenon appears to be rare among them, so this seeming indecisiveness among Folsom-age
point makers was probably not the norm. Additionally, the fact that only 10 points out of 154
Midland bases or complete points show signs of a fluting nipple platform further indicates the
exceptionality of this occurrence.
Summary for Qualitative Analysis
These analyses have explored some of the more subtle variations in Folsom-age projectile
point and biface technology that cannot be easily quantified. First, the comparison of reduction
strategies between Folsom, Midland, and pseudo-fluted points and preforms reveals that the
formal, staged sequence of reduction for Folsom points is not reflected in the making of Midland
and pseudo-fluted points, supporting the idea that they are more expediently manufactured from
smaller flake blanks. Next, an account of the ways in which some Folsom preforms deviate from
the typical reduction sequence reveals the ways in which innovation, compromise, the learning
process, and even personal touches can contribute to the variation in a Folsom assemblage. An
examination of ultrathin biface variants reveals that not all of them are “ultra-thin” or even fully
bifacial. Exploring the potential link between Folsom preforms and ultrathin bifaces shows that
some preforms were indeed made from ultrathins, and that most of these bifaces are thick enough
to enable them to be recycled into Folsom preforms, but there is no evidence yet to support that
this was a regular occurrence. Finally, an examination of the appearance of various Folsom and

153
Midland “hybrid” points across the sites and collections in the sample indicates that these
hybrids had wide geographic ranges and that at least the unifacially fluted Folsom/Midland
variety was somewhat common.
Conclusions
The ultimate lesson to be learned from the quantitative analysis is that Midland points
appear to have been hafted differently from Folsom. This inference is based on the two point
types’ statistically divergent widths, basal tapers, and particularly edge grinding. Of course, this
conclusion brings up more questions than answers – particularly, why were the two point types
hafted differently? One explanation may be that the fluting of Folsom points enables them to fit
more tightly into a spear haft without the need for as much binding as Midland points. Ahler and
Geib (2000:806-808) propose that the fluting of Folsom points enabled the points to be secured
snugly into a split haft, with only the tip and edges of the point exposed. The same hafting
method may not have been viable for unfluted points such as Midland. Instead, the use of extra
sinew binding to secure Midland points in their hafts may explain the tapering base and longer
edge grinding. Another possibility is that Folsom and Midland points may have been used
separately in the pursuit of different game. The viability of this explanation will be further
explored in Chapter 7.
If Folsom and Midland points were hafted differently, then what does that mean for
unifacially fluted points, pseudo-fluted points, or Folsom-Midland hybrid forms? Most likely
they could have gone either way, with some being hafted like Folsoms and others being hafted
like Midlands. This explanation may account for the lack of statistically significant differences
between unifacially fluted points and both Folsom and Midland points in terms of width and
154
basal taper. Unifacially fluted points bridge the gap between Folsom and Midland by being
hafted in either manner. The other Folsom and Midland hybrids (Folsom points with short flutes
and collateral flaking, and Midland points with basal nipple platforms) are more firmly
entrenched as either Folsom or Midland and have been statistically analyzed as such. Pseudo-
fluted points have various morphologies on their dorsal faces and can be fluted, collaterally
flaked, or expediently retouched, making them at least as versatile as unifacially fluted points.
The take home lesson from the qualitative analysis is that although the construction of
reduction sequences for Folsom points and bifaces has been extremely useful for a generalized
understanding of Folsom technology (Frison and Bradley 1980), it glosses over significant
variation that is also present in Folsom assemblages (Lohse 2011). Some knappers may take
some steps out of order, such as pressure flaking both faces of a preform prior to fluting,
indicating personal flintknapping preferences that do not affect the ultimate outcome. Some
knappers skip steps altogether, indicating that they are likely still learning the craft. Finally,
innovative distal fluting techniques occur in different situations for different reasons.
Sometimes, distal fluting shows how some knappers retool broken or worn out Folsom points.
Other times, it reveals how novice knappers compensate for a lack of fluting skill by taking
channel flakes from both ends of a preform. And in rare cases, proximal and distal fluting can be
used to show off the epitome of a Folsom knapper’s ability. The next chapter will further
explore the role that skill plays in the decision to make different types of Folsom-age projectile
points.

155
CHAPTER 5: SKILL ANALYSIS
The chapter on Gault explored variation in flintknapping skill between discarded Midland
points and Midland preforms that were made on site, and it concluded that three out of the four
Gault Midland preforms were not made with enough skill to attain the same dimensions as the
Midland points. These results may suggest that Midland points are made by relatively unskilled
knappers when large amounts of high quality toolstone are available. Conversely, the more
competent flintknappers may prefer to make fluted points whenever lithic availability is not an
issue and resort to making Midland points as stone supplies are depleted during their travels
(Hofman 1992). In addition, Bamforth (1991:311-314) proposes that Folsom-age hunters
employed skillfully made fluted points over unfluted varieties when “gearing up” for a
communal bison hunt. The reason for this preference, according to Bamforth, was likely due to
the division of labor that occurs when a large group of hunter-gatherers aggregate to accomplish
a task. In this case, the duty of making projectile points for use in the upcoming hunt falls on the
most skilled flintknappers, while other members of the group take on other responsibilities. If
both of these scenarios are accurate, then it appears that Folsom points are made using a high
level of skill, while Midland points may be indicative of a medium level of flintknapping skill, in
relative terms. In this case, “low, medium, and high” represent a scale of point-making skill
specifically during the Folsom period, by which I do not mean to imply that making Midland
points requires little skill in an absolute sense. If I expand the scale to include other point
variants, unifacially fluted points may also fall into the “medium” skill level, and pseudo-fluted
points would likely be on the lowest end of the scale (Figure 17).

156
Figure 17: Scale illustrating the hypothetical relationship between skill level and Folsom-age
point types.

157
Research into flintknapping skill in the archaeological record has received increased
attention lately (Bamforth and Bleed 1997; Bamforth and Finlay 2008; Lohse 2010). Analyses
have examined the risks versus the rewards of creating complex or simple weapon systems, the
interplay of cognitive understanding and physical ability that goes into making tools, and the role
that the learning process plays in generating lithic debris at archaeological sites. Each of these
perspectives plays a role in the examination of flintknapping skill in Folsom technology.
One of the fundamental assumptions regarding the making of Folsom points opposed to
other Folsom-age variants is that the former are more risky to produce than the latter. In this
instance, “risk” merely refers to the fact that Folsom points are prone to breakage during their
manufacture (though estimated probabilities vary, see Amick 1999:2 and Bamforth and Bleed
1997:130-131), while the other types such as Midland are less likely to break in production.
Two factors can affect the risk associated with making Folsom points: the cost of failure and the
skill of the knapper. Bamforth and Bleed (1997:117) illustrate the varying costs of failure using
the example of a tightrope walker. The walker has an equally likely chance of falling regardless
of the height of the tightrope, but a rope that is 100 feet above the ground has a much higher cost
of failure than a rope that is one foot up. In the case of Folsom knapping behavior, making
Folsom points while surrounded by plenty of knapping material assumes a low cost of failure
because the knapper can always try again if a preform breaks, but the cost becomes considerably
higher in situations where stone is at a premium. Also, a high level of flintknapping skill can
reduce the probability of failure in making Folsom points, indicating that fluted points would
only be made by highly skilled individuals if the cost of failure is high. Attaining a high level of
knapping skill requires extensive practice and may represent some degree of specialization,
requiring other members of a hunter-gatherer group to cover the knapper’s basic needs

158
(Bamforth and Bleed 1997:127). In situations where the costs of failure and of specialization are
high, individuals would be more likely to resort to knapping other Folsom variants instead of
fluted points. Of course, this inference assumes that the other point types involve less skill to
produce, and that assertion will be tested below.
The realm of “skill” itself includes two essential aspects, which Bamforth and Finlay
(2008:2-3) call connaissance and savoir-faire. Connaissance refers to the knowledge,
understanding, and problem-solving abilities – basically the know-how involved in performing a
task. Savoir-faire is the physical strength, dexterity, and coordination that go into successfully
performing a task. One achieves the greatest level of skill when both of these aspects are at an
optimum, usually while one is an able-bodied adult. In the case of flintknapping, a young child
would lack both the connaissance and the savoir-faire involved in tool making. A physically
adept individual who learns to knap as a young adult would have the savoir-faire but not the
connaissance necessary to skillfully make tools. On the other hand, an older individual who has
knapped for many years would retain the connaissance, but declining physical aptitude may
hinder the knapper’s savoir-faire, inhibiting his or her production of well made tools (Lohse
2010:158-160). Additionally, a skilled knapper should be consistent as well, meaning that the
knapper can regularly produce tools that exhibit relatively little variation in their dimensions
compared to tools produced by less proficient individuals.
The process by which individuals learn to flintknap also has an effect on the way skill is
manifested in the archaeological record. The most archaeologically distinguishable form of
learning is apprenticeships, in which the remains produced by the master flintknapper are clearly
segregated from those made by novices (Bamforth and Finlay 2008:9). However,
apprenticeships only commonly appear in complex, sedentary societies. Hunter-gatherers

159
generally do not rely on formal teaching and instead novices typically learn by doing (Hayden
and Cannon 1984). The lack of formal teaching does not mean that novices receive no help from
experts, however. Ferguson (2008) proposes that “scaffolding” is a useful learning technique
that appears in archaeological flintknapping contexts. Scaffolding involves the cooperation of an
expert and a learner in order to produce viable tools. The novice works on making a tool until he
or she encounters an insurmountable problem, and the expert corrects the problem so that the
novice may continue. In this way, the novice manages to produce viable tools that he or she
could not have made otherwise. Ferguson (2008:57-60) conducts an experiment that highlights
the effectiveness of scaffolding as a method of learning. In the experiment, he trains two groups
of novices in the making of pressure-flaked points. The first group is trained using verbal
instruction and demonstration. The second group is trained using demonstration and scaffolding.
The results reveal that by the end of the experiment, more members of the second group were
able to independently create points that closely matched the author’s original points than the first
group. Scaffolding succeeds as a learning strategy not only because it improves novices’
performance, but also because it enables more finished products to be brought into service,
minimizing waste. However, it can also obscure an archaeological analysis of flintknapping skill
that relies on preforms and finished points as the subjects of research. Scaffolding can become
apparent when debitage that exhibits signs of mistake correction, such as removal of stacks and
large hinge or step fractures, is incorporated in an analysis. When examining bifacial tools
without debitage, scaffolding may homogenize the appearance of skill in the archaeological
record and cause an inflated number of tools to appear to be of an intermediate skill level.
Because individual knappers may vary in terms of performance from tool to tool, and
because learning processes such as scaffolding may generate artifacts that are made by multiple

160
individuals of different skill levels, the unit of analysis in this study is the artifact and not the
knapper(s) who made it. For the most part, the variation observed in this analysis lies within the
physical realm of savoir faire, based on the fact that most of the points, preforms, and bifaces
follow their respective reduction sequences or flaking techniques, indicating that the knappers at
least had a cognitive understanding of the technologies involved. There are a few exceptions
(notably some of the Folsom preforms from Gault) that do not follow the usual reduction
sequence and may suggest a lack of connaissance on the part of the knappers. Additionally,
some pseudo-fluted points may represent attempts to meet the end goal of projectile point
production while failing to understand the technological processes involved. The goal of this
chapter is to determine whether significant differences in skill can be discerned between Folsom,
unifacially fluted, Midland, pseudo-fluted, and miniature points and preforms.
The first hurdle in assessing flintknapping skill is finding a way to quantify it. Bamforth
and Finlay (2008:5-6) present two tables listing attributes that are common in artifacts made by
skilled and unskilled knappers (Table 25). Some of the variables listed are not applicable for
discarded Folsom artifacts (such as large size, extreme length, or overshot flaking), and others
like platform preparation are not assessed here, but other variables can be readily operationalized
or at least observed in this sample. Among the indicators of high levels of skill, useful variables
include thinness relative to width, regularity of form, multistage reduction strategies, and
consistency in production. For the indicators of novice knappers, irregularity of form, steps and
hinge terminations, and inconsistency in production are useful variables.

161
Table 25: Indicators of skillful and unskilled knapping in archaeological assemblages. Modified
from Bamforth and Finlay (2008:5-6), Tables I and II.

162
Quantitative Skill Analysis
The quantitative assessment of flintknapping skill for this sample utilizes three variables
and two statistical techniques. The first variable is the ratio of maximum width to maximum
thickness. This ratio is often used as an assessment of skill in bifacial tools (Root et al.
1999:151-152, Callahan 1979:17-18). When thinning a biface, most flakes are removed from the
lateral edges, which gradually reduces the tool’s width. A skilled flintknapper can remove
broad, flat thinning flakes while preserving as much of the edges as possible, creating a biface
that is wide but flat. Preserving width while reducing thinness was certainly a goal in Folsom
technology, making this variable applicable to an analysis of Folsom knapping skill, but it should
be noted that bifacial thinness was not a goal of all technologies. For example, some Firstview
points are very skillfully pressure flaked to produce a thick and narrow diamond-shaped cross
section (Wheat 1972:125).
The second variable is a count of average flake scars per 10 mm for each artifact. This
variable is particularly useful for the analysis of Folsom-age projectile points, as most Folsom
and Midland points exhibit fine pressure flaking along their edges. One of the characteristics of
skillful flintknapping listed in Table 24 is “precise and regular finishing flaking,” which the final
pressure retouch on these points represents. Moreover, Lohse (2011:102) notes that consistent
pressure flaking requires strength and coordination to properly control the flake removals.
Therefore, well patterned pressure flaking represents an optimization of connaissance and savoir
faire. Folsom and Midland points that appear to be the most skillfully made (based on overall
impressions of thinness and flaking patterns) also typically exhibit very fine, parallel pressure
retouch. As a result, the points that are particularly well made tend to have high flake scar
counts. Other points that are more expediently made, such as some pseudo-fluted points, often
163
have low flake scar counts. In the case of ultrathin bifaces however, this variable becomes a less
useful measurement of skill and acts more as an assessment of resharpening.
The third variable for assessing flintknapping skill builds on the previous one. This
variable is a ratio of mistakes to flake scars per 10 mm. In this analysis, a “mistake” is defined
as any step or hinge termination that would likely impede the removal of another flake of similar
size. Mistakes per 10 mm are averaged in the same manner as flake scar counts, and then the
mistake count is divided by the flake scar count to create the ratio. The use of a ratio in this
instance controls for the overall number of flake scars, so that the measure of mistakes is not
artificially inflated for artifacts with high flake scar counts. However, this ratio is not foolproof.
Midland points are likely to have higher mistake ratios than the other Folsom variants because
they tend to have multiple lateral flake scars driven across each face, making slight mistakes
more common. The fluting on Folsom points removes any traces of such mistakes, and pseudo-
fluted points only have edge retouch on their ventral surfaces, making mistakes less likely.
Comparing Folsom and Midland preforms may be a more useful application of the mistake ratio
for this reason.
The first statistical method to quantitatively analyze Folsom point variants is the same
independent samples t-test that was used to analyze projectile point measurements in the
previous chapter. This method will compare the width/thickness ratios and mistake ratios of
finished projectile points and preforms. The second method is comparing coefficients of
variation. This method will be used to analyze the variance of flake scar counts as well as other
measurements such as width and thickness to determine the consistency with which each point
variant is made. According to Bamforth and Finlay (2008:5), coefficients of variation for any
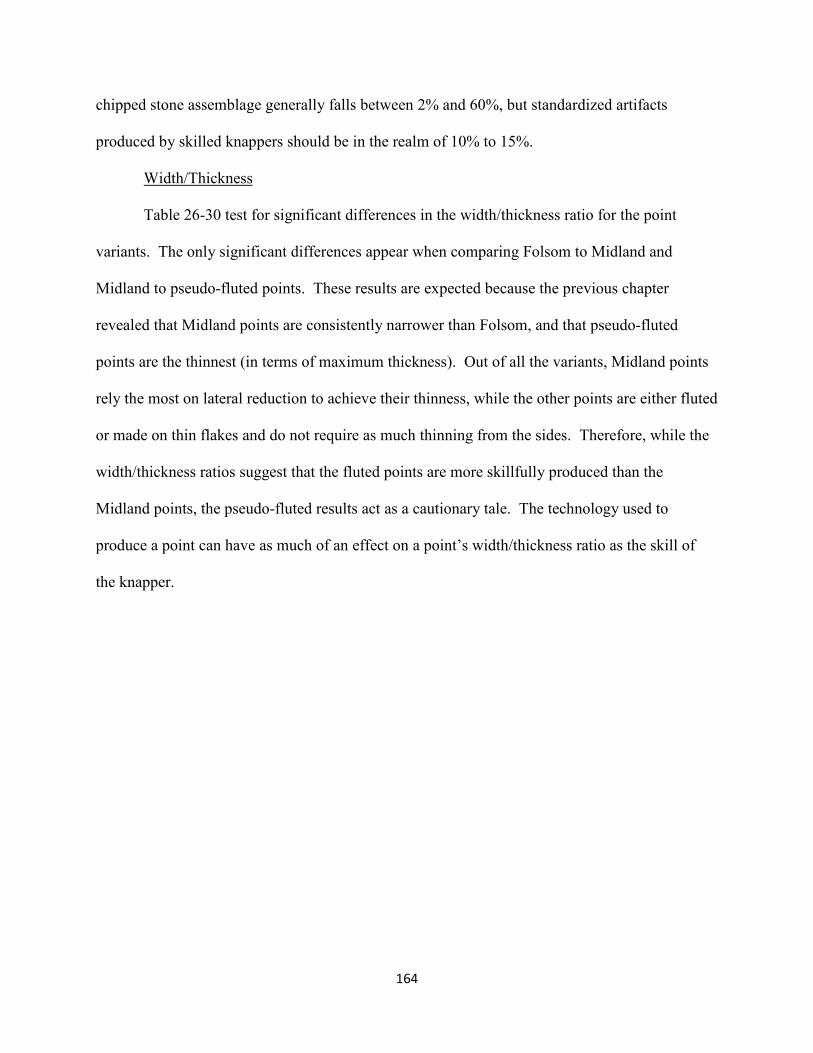
164
chipped stone assemblage generally falls between 2% and 60%, but standardized artifacts
produced by skilled knappers should be in the realm of 10% to 15%.
Width/Thickness
Table 26-30 test for significant differences in the width/thickness ratio for the point
variants. The only significant differences appear when comparing Folsom to Midland and
Midland to pseudo-fluted points. These results are expected because the previous chapter
revealed that Midland points are consistently narrower than Folsom, and that pseudo-fluted
points are the thinnest (in terms of maximum thickness). Out of all the variants, Midland points
rely the most on lateral reduction to achieve their thinness, while the other points are either fluted
or made on thin flakes and do not require as much thinning from the sides. Therefore, while the
width/thickness ratios suggest that the fluted points are more skillfully produced than the
Midland points, the pseudo-fluted results act as a cautionary tale. The technology used to
produce a point can have as much of an effect on a point’s width/thickness ratio as the skill of
the knapper.

165
Table 26: Independent samples t-test comparing the width/thickness ratios of Folsom and
Midland points.
Group Statistics
Style N Mean Std. Dev.
Std. Error Mean
Wid Thick
Folsom 321 5.1625 .80587 .04498
Midland 201 4.8356 .63904 .04507
Independent Samples Test
Levene's Test for Equality of Variances t-test for Equality of Means
F Sig. t df
Sig. (2-
tailed) Mean Diff.
Std. Error Diff.
95% Confidence Interval of the Difference
Lower Upper
Wid Thick
Equal variances assumed
4.223 .040 4.871 520 .000 .32690 .06711 .1951 .4588
Equal variances not assumed
5.134 491.83 .000 .32690 .06368 .2018 .4520

166
Table 27: Independent samples t-test comparing the width/thickness ratios of Folsom and
unifacially fluted points.
Group Statistics
Style N Mean Std. Dev.
Std. Error Mean
Wid Thick
Folsom 321 5.1625 .80587 .04498
Unifacia 42 5.0269 .76043 .11734
Independent Samples Test
Levene's Test for Equality of Variances t-test for Equality of Means
F Sig. t df
Sig. (2-
tailed) Mean Diff.
Std. Error Diff.
95% Confidence Interval of the Difference
Lower Upper
Wid Thick
Equal variances assumed
.454 .501 1.032 361 .303 .13562 .13141 -.12280 .3940
Equal variances not assumed
1.079 53.786 .285 .13562 .12566 -.11634 .3876

167
Table 28: Independent samples t-test comparing the width/thickness ratios of Folsom and
pseudo-fluted points.
Group Statistics
Style N Mean Std. Dev.
Std. Error Mean
Wid Thick
Folsom 321 5.1625 .80587 .04498
Pseudo-f
35 5.3723 .99236 .16774
Independent Samples Test
Levene's Test for Equality of Variances t-test for Equality of Means
F Sig. t df
Sig. (2-
tailed) Mean Diff.
Std. Error Diff.
95% Confidence Interval of the Difference
Lower Upper
Wid Thick
Equal variances assumed
3.686 .056 -1.43 354 .154 -.20976 .14697 -.49880 .0793
Equal variances not assumed
-1.21 39.044 .234 -.20976 .17367 -.56102 .1415
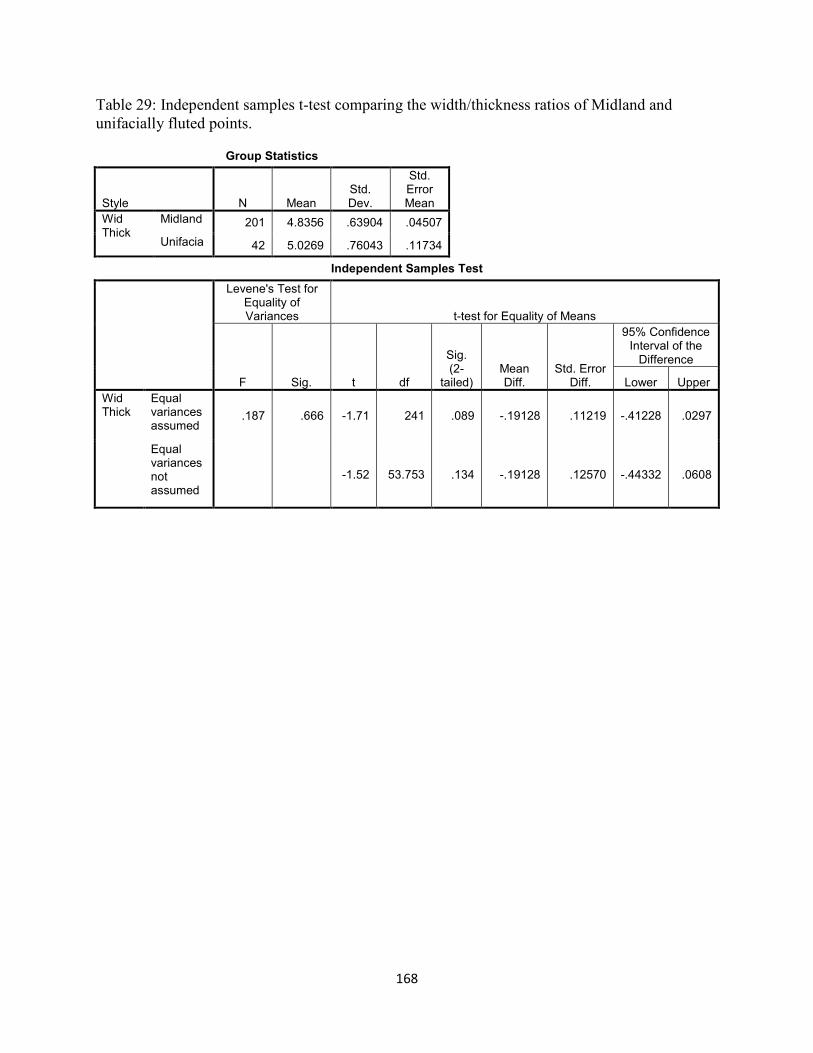
168
Table 29: Independent samples t-test comparing the width/thickness ratios of Midland and
unifacially fluted points.
Group Statistics
Style N Mean Std. Dev.
Std. Error Mean
Wid Thick
Midland 201 4.8356 .63904 .04507
Unifacia 42 5.0269 .76043 .11734
Independent Samples Test
Levene's Test for Equality of Variances t-test for Equality of Means
F Sig. t df
Sig. (2-
tailed) Mean Diff.
Std. Error Diff.
95% Confidence Interval of the Difference
Lower Upper
Wid Thick
Equal variances assumed
.187 .666 -1.71 241 .089 -.19128 .11219 -.41228 .0297
Equal variances not assumed
-1.52 53.753 .134 -.19128 .12570 -.44332 .0608

169
Table 30: Independent samples t-test comparing the width/thickness ratios of Midland and
pseudo-fluted points.
Group Statistics
Style N Mean Std. Dev.
Std. Error Mean
Wid Thick
Midland 201 4.8356 .63904 .04507
Pseudo-f
35 5.3723 .99236 .16774
Independent Samples Test
Levene's Test for Equality of Variances t-test for Equality of Means
F Sig. t df
Sig. (2-
tailed) Mean Diff.
Std. Error Diff.
95% Confidence Interval of the Difference
Lower Upper
Wid Thick
Equal variances assumed
12.594 .000 -4.18 234 .000 -.53666 .12849 -.7898 -.28352
Equal variances not assumed
-3.09 39.053 .004 -.53666 .17369 -.8880 -.18536

170
Flake Scars per 10 mm
As stated before, the points that appear to be the most skillfully produced also tend to
have high flake scar counts, primarily due to their fine pressure-flaked edge retouch. Table 31-
35 compare the flake scar counts for Folsom, Midland, unifacially fluted, and pseudo-fluted
points. The results indicate that Folsom points consistently have higher flake scar counts than
Midland and pseudo-fluted points, but not more than unifacially fluted points. Midland points
also have significantly more flake scars than pseudo-fluted points but there is no significant
difference between Midland and unifacially fluted points. The fact that pseudo-fluted points
consistently have fewer flake scars than the other variants is not surprising considering the
expedient nature of their manufacture. However, the presence of more flake scars on Folsom
points than Midland is notable, especially considering that Folsom fluting often eliminates all
flake scars except those along the edges. The flake scar counts of unifacially fluted points
apparently bridge the difference between Folsom and Midland, which makes sense considering
that many unifacially fluted points exhibit Midland-like collateral flaking on their unfluted faces.
These results reveal that Folsom points consistently had more care put into their final edge
flaking than Midland points (although there are some exceptional Midland examples), suggesting
that Folsom points may be more skillfully made than Midland points, on average.

171
Table 31: Independent samples t-test comparing flake scars per 10 mm of Folsom and Midland
points.
Group Statistics
Style N Mean Std. Dev.
Std. Error Mean
Flakes 10mm
Folsom 321 6.2368 1.39001 .07758
Midland 201 5.6990 1.29222 .09115
Independent Samples Test
Levene's Test for Equality of Variances t-test for Equality of Means
F Sig. t df
Sig. (2-
tailed) Mean Diff.
Std. Error Diff.
95% Confidence Interval of the Difference
Lower Upper
Flakes 10mm
Equal variances assumed
.475 .491 4.418 520 .000 .53780 .12172 .2987 .7769
Equal variances not assumed
4.493 447.86 .000 .53780 .11969 .3026 .7730

172
Table 32: Independent samples t-test comparing flake scars per 10 mm of Folsom and unifacially
fluted points.
Group Statistics
Style N Mean Std. Dev.
Std. Error Mean
Flakes 10mm
Folsom 321 6.2368 1.39001 .07758
Unifacia 42 5.9052 1.34232 .20712
Independent Samples Test
Levene's Test for Equality of Variances t-test for Equality of Means
F Sig. t df
Sig. (2-
tailed) Mean Diff.
Std. Error Diff.
95% Confidence Interval of the Difference
Lower Upper
Flakes 10mm
Equal variances assumed
.255 .614 1.459 361 .145 .33152 .22721 -.11530 .7783
Equal variances not assumed
1.499 53.178 .140 .33152 .22118 -.11207 .7751
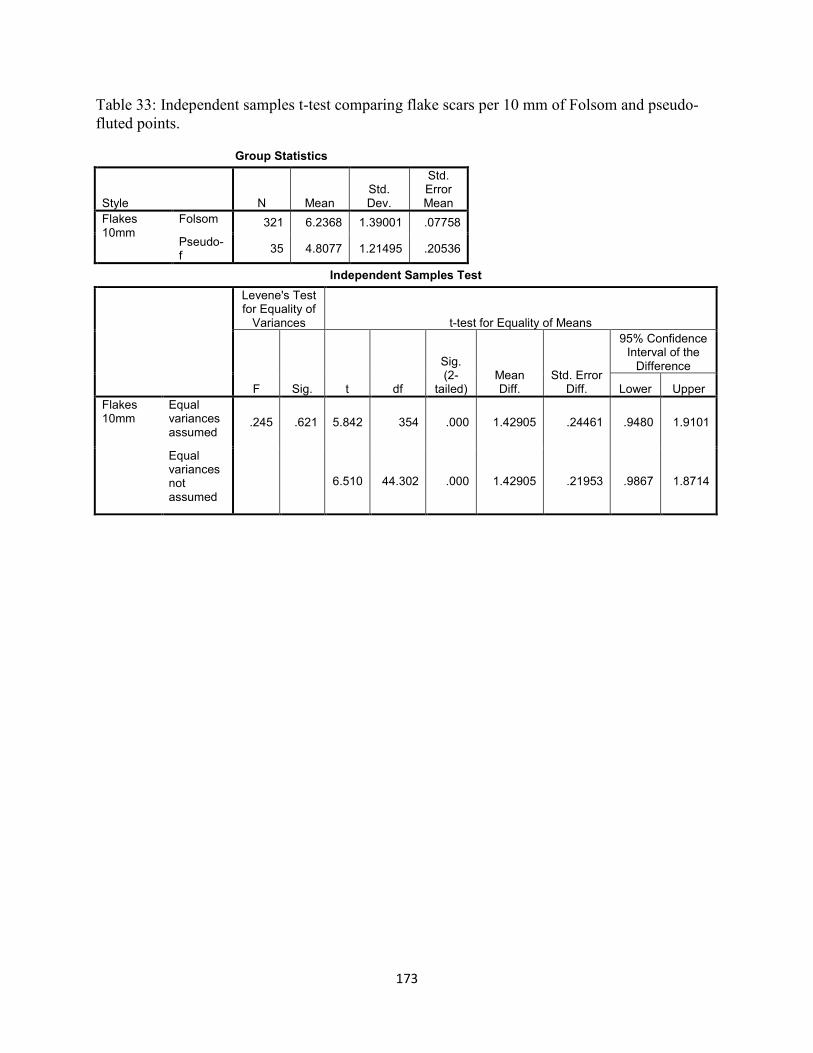
173
Table 33: Independent samples t-test comparing flake scars per 10 mm of Folsom and pseudo-
fluted points.
Group Statistics
Style N Mean Std. Dev.
Std. Error Mean
Flakes 10mm
Folsom 321 6.2368 1.39001 .07758
Pseudo-f
35 4.8077 1.21495 .20536
Independent Samples Test
Levene's Test for Equality of Variances t-test for Equality of Means
F Sig. t df
Sig. (2-
tailed) Mean Diff.
Std. Error Diff.
95% Confidence Interval of the Difference
Lower Upper
Flakes 10mm
Equal variances assumed
.245 .621 5.842 354 .000 1.42905 .24461 .9480 1.9101
Equal variances not assumed
6.510 44.302 .000 1.42905 .21953 .9867 1.8714

174
Table 34: Independent samples t-test comparing flake scars per 10 mm of Midland and
unifacially fluted points.
Group Statistics
Style N Mean Std. Dev.
Std. Error Mean
Flakes 10mm
Midland 201 5.6990 1.29222 .09115
Unifacia 42 5.9052 1.34232 .20712
Independent Samples Test
Levene's Test for Equality of Variances t-test for Equality of Means
F Sig. t df
Sig. (2-
tailed) Mean Diff.
Std. Error Diff.
95% Confidence Interval of the Difference
Lower Upper
Flakes 10mm
Equal variances assumed
.022 .882 -.935 241 .351 -.20628 .22071 -.64105 .2285
Equal variances not assumed
-.912 57.971 .366 -.20628 .22629 -.65926 .2467

175
Table 35: Independent samples t-test comparing flake scars per 10 mm of Midland and pseudo-
fluted points.
Group Statistics
Style N Mean Std. Dev.
Std. Error Mean
Flakes 10mm
Midland 201 5.6990 1.29222 .09115
Pseudo-f
35 4.8077 1.21495 .20536
Independent Samples Test
Levene's Test for Equality of Variances t-test for Equality of Means
F Sig. t df
Sig. (2-
tailed) Mean Diff.
Std. Error Diff.
95% Confidence Interval of the Difference
Lower Upper
Flakes 10mm
Equal variances assumed
.027 .869 3.798 234 .000 .89124 .23468 .4289 1.3536
Equal variances not assumed
3.967 48.395 .000 .89124 .22468 .4396 1.3429

176
Mistake Ratio
This variable basically provides a percentage of mistakes per flake scar count for each
artifact in the sample. It should be noted that many finished points lack mistakes, so the mode
for this variable’s distribution is at zero, meaning the mistake ratio is not normally distributed.
While a logarithmic function can normalize the data, it also eliminates the zero values and
greatly reduces the sample size. Therefore, these results must be interpreted with the knowledge
that the variable being analyzed is not normally distributed. Table 36-40 reveal the results of the
t-tests comparing the mistake ratios for the projectile point variants. The results indicate that
Folsom points consistently have lower mistake ratios than the other point variants. There is no
significant difference in mistake ratios between Midland, unifacially fluted, and pseudo-fluted
points. It is likely that the bifacial fluting of Folsom points eliminates many of the mistakes that
may have been present, so a comparison of preforms is also necessary. Table 41 compares the
mistake ratios of Folsom and Midland preforms. It should be noted that Midland preforms are
rarely identified in the archaeological record, so their sample size is small. Also, Folsom
preforms from all stages of production are used in this test, increasing their variance. With those
caveats in mind, the results still indicate that Folsom preforms exhibit a significantly lower ratio
of mistakes than Midland preforms. As a whole, these results appear to affirm the likelihood that
Folsom points are generally more skillfully produced than the other point variants.

177
Table 36: Independent samples t-test comparing mistake ratios of Folsom and Midland points.
Group Statistics
Style N Mean Std. Dev.
Std. Error Mean
Mistake Ratio
Folsom 321 0.0114 0.0191 0.0011
Midland 201 0.0315 0.0464 0.0033
Independent Samples Test
Levene's Test for
Equality of Variances t-test for Equality of Means
F Sig. t df
Sig. (2-
tailed) Mean Diff.
Std. Error Diff.
95% Confidence Interval of the Difference
Lower Upper
Mistake Ratio
Equal variances assumed
36.93 .000
-6.900 520 .000 -0.0201 0.0029 -0.0259 -0.0144
Equal variances not assumed
-5.848 242.77 .000 -0.0201 0.0034 -0.0269 -0.0134

178
Table 37: Independent samples t-test comparing mistake ratios of Folsom and unifacially fluted
points.
Group Statistics
Style N Mean Std. Dev.
Std. Error Mean
Mistake Ratio
Folsom 321 0.0114 0.0191 0.0011
Unifacia 42 0.0341 0.0546 0.0084
Independent Samples Test
Levene's Test for
Equality of Variances t-test for Equality of Means
F Sig. t df
Sig. (2-
tailed) Mean Diff.
Std. Error Diff.
95% Confidence Interval of the Difference
Lower Upper
Mistake Ratio
Equal variances assumed
40.01 .00 -5.390 361 .000 -0.0227 0.0042 -0.0310 -0.0144
Equal variances not assumed
-2.676 42.315 .011 -0.0227 0.0085 -0.0399 -0.0056
179
Table 38: Independent samples t-test comparing mistake ratios of Folsom and pseudo-fluted
points.
Group Statistics
Style N Mean Std. Dev.
Std. Error Mean
Mistake Ratio
Folsom 321 0.0114 0.0191 0.0011
Pseudo-f
35 0.0225 0.0314 0.0053
Independent Samples Test
Levene's Test for
Equality of Variances t-test for Equality of Means
F Sig. t df
Sig. (2-
tailed) Mean Diff.
Std. Error Diff.
95% Confidence Interval of the Difference
Lower Upper
Mistake Ratio
Equal variances assumed
19.74 .00 -3.049 354 .002 -0.0112 0.0037 -0.0184 -0.0040
Equal variances not assumed
-2.064 36.785 .046 -0.0112 0.0054 -0.0221 -0.0002

180
Table 39: Independent samples t-test comparing mistake ratios of Midland and unifacially fluted
points.
Group Statistics
Style N Mean Std. Dev.
Std. Error Mean
Mistake Ratio
Midland 201 0.0315 0.0464 0.0033
Unifacia 42 0.0341 0.0546 0.0084
Independent Samples Test
Levene's Test for
Equality of Variances t-test for Equality of Means
F Sig. t df
Sig. (2-
tailed) Mean Diff.
Std. Error Diff.
95% Confidence Interval of the Difference
Lower Upper
Mistake Ratio
Equal variances assumed
.813 .368 -.32 241 .749 -0.0026 0.0081 -0.0186 0.013
Equal variances not assumed
-.29 54.052 .774 -0.0026 0.0090 -0.0207 0.015

181
Table 40: Independent samples t-test comparing mistake ratios of Midland and pseudo-fluted
points.
Group Statistics
Style N Mean Std. Dev.
Std. Error Mean
Mistake Ratio
Midland 201 0.0315 0.0464 0.0033
Pseudo-f
35 0.0225 0.0314 0.0053
Independent Samples Test
Levene's Test for
Equality of Variances t-test for Equality of Means
F Sig. t df
Sig. (2-
tailed) Mean Diff.
Std. Error Diff.
95% Confidence Interval of the Difference
Lower Upper
Mistake Ratio
Equal variances assumed
.214 .644 1.099 234 .273 0.0090 0.0082 -0.0071 0.025
Equal variances not assumed
1.439 63.291 .155 0.0090 0.0062 -0.0035 0.021

182
Table 41: Independent samples t-test comparing mistake ratios of Folsom and Midland preforms.
Group Statistics
Style N Mean Std. Dev.
Std. Error Mean
Mistake Ratio
Folsom 242 0.0525 0.0745 0.0048
Midland 19 0.1297 0.1559 0.0358
Independent Samples Test
Levene's Test for Equality of Variances t-test for Equality of Means
F Sig. t df Sig. (2-tailed)
Mean Diff.
Std. Error Diff.
95% Confidence Interval of the Difference
Lower Upper
Mistake Ratio
Equal variances assumed
11.27 .001 -3.911 259 .000 -0.0772 0.0197 -0.116 -0.038
Equal variances not assumed
-2.138 18.65 .046 -0.0772 0.0361 -0.153 -0.002

183
Coefficient of Variation
This variable is a ratio of the standard deviation and the mean for each of the projectile
point types and each of the previous variables. Table 42 gives the CVs for the artifacts and
variables that have been analyzed thus far. Although Bamforth and Finlay (2008:5) mention that
CVs of 10-15% may represent the level of standardization that is present in skilled knapping,
they also note that experimentation is needed to support this estimate. Also, Table 42 reveals
that this range only holds true for variables based on direct measurements, while ratios and count
data have wildly different CVs. Because a single CV is calculated from sample data, t-tests
cannot be used to test for significant differences between artifact types. Instead, the results of
Levene’s Test for Equality of Variances from the previous analysis will be used to assess their
significance.

184
Table 42: Coefficients of Variation for each projectile point variant under each skill assessment
variable.
Width Thickness Base/Width Grinding/Length Flakes10mm MistakeRatio
Folsom 0.1399 0.1438 0.0713 0.6395 0.2229 1.6754
Midland 0.111 0.1483 0.0826 0.3796 0.2267 1.473
Unifacially
Fluted 0.1017 0.17 0.1 N/A 0.2273 1.6012
Pseudo-
Fluted 0.1418 0.2185 0.101 N/A 0.2527 1.3956

185
For the width variable, the CVs for each point type fall in the expected range for
skillfully made, standardized tools. However, Folsom points have a higher CV for width than
Midland and unifacially fluted points, which is unexpected considering that Folsom points
appear to have been more skillfully made than the other types based on the preceding analyses.
According to Levene’s Test, Folsom point width variation significantly differs from Midland and
unifacially fluted points (F=11.551, p=0.001, Table 7; and F=4.912, p=0.027, Table 8,
respectively) but does not differ from pseudo-fluted points. Midland point width variance is not
significantly different from that of unifacially fluted points, but it does differ from pseudo-fluted
points (F=3.916, p=0.049).
The thickness variable produces CVs that are similar to the expected results based on the
previous analyses. CVs for the thickness of Folsom and Midland points fall within the
hypothetical range of standardized tools, which the unifacially fluted and pseudo-fluted points
are just outside the range. Levene’s Test indicates no significant difference in the variation in
thickness in Folsom and Midland points, nor in Folsom and unifacially fluted points (Table 11
and 12). Folsom and pseudo-fluted points are significantly different, however (F=7.128,
p=0.008, Table 13). Variation in Midland point thickness also does not differ significantly from
that of unifacially fluted, but it does differ from pseudo-fluted (F=4.408, p=0.037). These results
make sense considering that pseudo-fluted point thicknesses are often determined by the
thickness of the flake blanks from which they are made, leading to a higher degree of variation
for this type.
Because the base width variable is a ratio of basal width and maximum width, it does not
fall in the estimated range of CVs for standardized tools. The CVs for this variable indicate that
Folsom points are the least variable, followed by Midland, unifacially fluted, and finally pseudo-

186
fluted points. These results indicate that Folsom points are the most standardized, which
corresponds to the results of the preceding analyses suggesting that Folsom points are the most
skillfully made, on average. Folsom points have significantly lower variation in basal width
ratios than Midland points with an F statistic of 5.127 and p-value of 0.024, and Folsom variation
is significantly lower than pseudo-fluted points with an F statistic 7.753 of and a p-value of 0.006
(Table 16 and 18). Oddly enough, the difference in variance between Folsoms’ and unifacially
fluted points’ basal width ratios is not statistically significant (F=3.307, p=0.07, Table 17),
despite the apparent difference in their CVs. This outcome is likely a result of the smaller
sample size for unifacially fluted points. The variance of the basal with ratio for Midland points
is not significantly different from unifacially fluted or pseudo-fluted points (Table 20 and Table
21).
The ratio of edge grinding length to maximum length requires complete points and is
only analyzed for Folsom and Midland points due to the drastically reduced sample sizes.
Folsom points have a much lower mean for their edge grinding ratio, but Midland points have a
much lower coefficient of variance. Edge grinding length is significantly more consistent for
Midland than for Folsom (F=8.365, p=0.004, Table 22), but the CVs for both are fairly high,
suggesting that the length of edge grinding is not particularly standardized for either point type.
The most likely explanation for this variance is resharpening. In particular, Folsom points that
are rebased from broken distal tips tend to exhibit very little edge grinding, contributing to the
high variance among the points.
The variable of flake scar counts per 10 mm has slightly high CVs for all point types, but
those CVs are not apparently different between the point types. The flake scar count variance is
strongly affected by the kind of finishing edge retouch on the projectile points. Final pressure

187
flaking can range from somewhat broad or sparse flake scars to very fine narrow flake scars that
can substantially increase the flake scar count. However, this spectrum of edge retouch is
present within all the Folsom point variants. According to Levene’s Test, there is no statistically
significant difference in the variance of flake scar counts for any of the point types (Table 31-
35).
The CVs for the mistake ratio variable appear unusually high because the presence of so
many zero values brings the means down dramatically (many finished points exhibit no obvious
errors). The CV for the mistake ratios of Folsom points appears higher than that of Midland and
pseudo-fluted points, but not much higher than unifacially fluted points. However, looking back
at the standard deviations from which these values derive indicates just the opposite: Midland,
unifacially fluted, and pseudo-fluted points have much higher variance than Folsom. The CVs
indicate the opposite because the other point variants also have higher mistake ratio means,
making their CVs appear lower overall. Also, Levene’s Test indicates that the variance for
Folsom point mistake ratios is significantly different from all three (compared to Midland:
F=36.927, p=0.000, Table 36; compared to unifacially fluted: F=40.011, p=0.000, Table 37,
compared to pseudo-fluted: F=19.74, p=0.000, Table 38). On the other hand, using Levene’s test
to compare the mistake ratio variance of Midland points to unifacially fluted and pseudo-fluted
points reveals no significant differences. On a population level, Folsom points have consistently
lower mistake ratios than the other point types, while the others have more widely varied mistake
ratios. These results hold true even when comparing Folsom and Midland preforms. Folsom
preforms have a mistake ratio CV of 1.419, and Midland preforms have a CV of 1.202. As
before, however, the Folsom preform CV is only higher because it has a notably lower mean
mistake ratio than that of Midland preforms. The mean and standard deviation for Folsom
188
preforms is lower than those of the Midland preforms, and Levene’s Test reveals a significant
difference in variance between the two (F=11.269, p=0.001, Table 41).
Miniature Points
As stated in the previous chapter, the sample sizes of the miniature Folsom variants are
too small for t-tests to reliably discern population differences, so boxplots are instead used to
illustrate whether any such differences may potentially exist. Figure 18 shows the boxplots for
the width/thickness, flake scars per 10 mm, and mistake ratio variables. The only difference
between the three miniature variants that appears potentially significant is the difference in
width/thickness ratios between Midland and pseudo-fluted mini points. As previously
mentioned, most of the miniature Folsom and Midland points appear to have been made by
extensively resharpening full-sized points, while pseudo-fluted miniatures are often made by
edge trimming small flake blanks. As such, the thicknesses of miniature Folsom and Midland
points are more similar to those of the larger points, while the pseudo-fluted miniatures are made
from thinner blanks, enabling the pseudo-fluted points to have a higher width/thickness ratio on
average. However, this difference does not appear significant between Folsom and pseudo-
fluted miniatures, most likely because some very finely made miniature Folsom points are
present in the Lindenmeier sample. Additionally, pseudo-fluted miniatures would probably have
the least variance in their mistake ratios, if not for two extreme outliers (out of a total of 10
pseudo-fluted mini points).

189
Figure 18: Boxplots for miniature points for width/thickness, flake scars per 10 mm, and mistake
ratio variables. Unifacially fluted and indeterminate points are not shown due to their extremely
small sample sizes.
190
Summary for Quantitative Analysis
In most variables used to quantitatively assess flintknapping skill among full sized points,
Folsom emerges as the most skillfully made projectile point among the variants. Folsom points
have a significantly higher width/thickness ratio than Midlands (but not higher than the other
variants), Folsom flake scars per 10 mm are significantly higher than all variants except
unifacially fluted points, and Folsom mistakes per 10 mm are significantly lower than all other
types (although this variable is not normally distributed). Folsom point variance is significantly
lower than the other point types for width, lower than all but unifacially fluted for the basal width
ratio, and lower than all other types for the mistake ratio. Midland points were expected to be
nearly as skillfully made as Folsom points, but in many cases the statistics suggest otherwise.
Midland points have lower width/thickness ratios, lower flake scars per 10 mm, and higher
mistake ratios. The only variable in which Midland points exceed Folsom is the variance of their
edge grinding. However, grinding the edges of a point does not require any real skill, so other
factors such as resharpening more likely determine its variance. The patterns of skill level
observed for full sized points does not appear to be reflected among the miniature points,
although the small sample size for the miniature variants makes this conclusion tentative. The
only noticeable difference that may be significant is that miniature Midlands have a higher
width/thickness ratio than miniature pseudo-fluted points.
Qualitative Skill Analysis
In many cases, assessing the skill level of a lithic artifact relies on observations or
variables that are difficult if not impossible to quantify. Evenness of outline, symmetry,
patterned flaking styles, and reduction strategies can be easily observed on an impressionistic
191
level, but operationalizing these variables would require measurements that are prohibitively
complex for large sample sizes. This section deals with those impressionistic values in terms of
presence or absence for each of the point variants. When possible, statistical tests are used to
determine whether significant differences are present among these subjective distinctions.
“Extra Fine” Points
Some points in the sample are exceedingly well made, with evenly spaced and well
patterned flake scars, wide and flat flutes with minimal rippling, very fine pressure retouch with
flake scars 1 mm wide or less, and no apparent mistakes (Figure 19). Points of this exceptional
quality have been noted at various sites (William 2000:188, Bement 1999:139-143), but thus far
they have been given only minimal attention. For the sake of expediency in this study, the
artifacts are informally termed “extra fine” points. These points occur in small numbers at most
sites, and they are predominantly Folsom, although extra fine Midland and unifacially fluted
points do exist. The presence of extra fine versions of Midland and unifacially fluted points
indicates that highly skilled flintknappers during the Folsom period did create some of the non-
Folsom variants. However, this observation leads to the question of whether extra fine points
occur in similar proportions among all three point variants in the sample. Table 43 gives the
results of a Chi-square test to determine whether any proportional difference exists. The results
indicate that a significant difference in extra fine point counts between the variants does exist,
with a Chi-square value of 16.96 and a p-value of 0.000. Folsom points have considerably more
extra fine examples than expected, Midland points have far fewer than expected, and unifacially
fluted points are close to the expected count. Therefore, although high quality versions of each
of these three point variants exist, the fact that a disproportionate number of them are Folsom
indicates that Folsom points are more often skillfully made compared to the other types.

192
Figure 19: Examples of “extra fine” Folsom and Midland points.

193
Table 43: Chi-square test comparing counts of “extra fine” and ordinary styles for Folsom,
Midland, and unifacially fluted points.
Type * Quality Crosstabulation
Quality
Total Extra Fine Ordinary
Type Folsom Count 44 277 321
Expected Count 30.2 290.8 321.0
Midland Count 6 195 201
Expected Count 18.9 182.1 201.0
Unifacial Count 3 39 42
Expected Count 3.9 38.1 42.0
Total Count 53 511 564
Expected Count 53.0 511.0 564.0
Chi-Square Tests
Value df Asymp. Sig. (2-sided)
Pearson Chi-Square
16.961 2 .000
Likelihood Ratio 19.397 2 .000
N of Valid Cases 564

194
Percussion and Pressure Thinned Midland Points
As noted in Chapter 3, the Midland type encompasses two collateral flaking techniques,
percussion and pressure. Distinguishing between percussion and pressure thinning is subjective,
with no clear flake scar morphology separating one technique from the other (Andrefsky
2005:118-119). The previous chapter defines percussion flake scars as being wider than 5 mm
and are somewhat rounded in outline. Collateral pressure is defined as flake scars that are
narrower than 5 mm or are more elongated in outline. Although ideal examples of both are
present in the research sample, there is also a considerable gray area in which the distinction
between percussion and pressure flaking is dependent on the analyst’s impression. Midland
points appear to have been made using one or both thinning techniques. In some cases, a
Midland point may exhibit collateral pressure flaking on one face (usually the more rounded
dorsal face of the original flake blank) and collateral percussion flaking on the other (usually the
flatter ventral face of the flake blank). For this research, a Midland point is defined as
“percussion” if collateral percussion flakes are present on at least one face. A point is defined as
“pressure” if collateral pressure flakes are present on at least one face, and no percussion flakes
are apparent. Table 44 tests for significant differences in the three skill assessment variables
between percussion and pressure thinned Midland points. The results indicate that a significant
difference is only present in the count of flake scars per 10 mm. While intuitively it might seem
that pressure flaked Midland points would have more flake scars than percussion flaked ones, the
results actually indicate that the opposite is true. Percussion flaked Midland points have between
0.027 and 0.762 more flake scars per 10 mm than pressure flaked points, with 95% confidence.
The difference may be significant but it is not large, and it is likely due to the fact that percussion
thinned Midland points need more fine pressure retouch to shape the edges compared to their

195
pressure thinned counterparts. Therefore, there does not appear to be any strong statistical
support for a difference in skill between percussion and pressure thinned Midland points.

196
Table 44: Independent samples t-test comparing the width/thickness ratio, flake scars per 10 mm,
and mistake ratio of percussion thinned vs. pressure thinned Midland points.
Group Statistics
Style N Mean Std. Dev.
Std. Error Mean
WidThick Percussi 77 4.9196 0.6439 0.0734
Pressure 123 4.7911 0.6298 0.0568
Flakes 10mm
Percussi 77 5.9434 1.3747 0.1567
Pressure 123 5.5489 1.2242 0.1104
Mistake Ratio
Percussi 77 0.0324 0.0492 0.0056
Pressure 123 0.0310 0.0450 0.0041
Independent Samples Test
Levene's Test for
Equality of Variances t-test for Equality of Means
F Sig. t df
Sig. (2-
tailed) Mean Diff.
Std. Error Diff.
95% Confidence Interval of the Difference
Lower Upper
WidThick Equal variances assumed
.102 .750 1.392 198 .166 0.1285 0.0923 -0.0536 0.311
Equal variances not assumed
1.385 158.80 .168 0.1285 0.0928 -0.0548 0.312
Flakes 10mm
Equal variances assumed
3.218 .074 2.114 198 .036 0.3945 0.1866 0.0265 0.763
Equal variances not assumed
2.059 147.54 .041 0.3945 0.1916 0.0158 0.773
Mistake Ratio
Equal variances assumed
.173 .678 .206 198 .837 0.0014 0.0068 -0.0120 0.015
Equal variances not assumed
.202 150.91 .840 0.0014 0.0069 -0.0123 0.015
197
One additional observation could potentially be used to test for skill differences between
percussion and pressure thinned Midland points. Some Midland points retain a trace of the
original flake blank from which they are made. In most cases, the flake blank remnant consists
of the blank’s flat, ventral surface appearing on an unmodified portion of a point’s face. In rarer
instances, the flake blank remnant can retain traces of a flake blank’s dorsal surface, in which
large flake scars that originated far beyond the current edge of the point are apparent. In extreme
cases, there can be some subjective overlap between what constitutes a flake blank remnant on a
Midland point as opposed to the ventral face of a pseudo-fluted point. In this research, a point is
considered pseudo-fluted if the majority of the ventral face is unmodified and if no lateral flake
scars cross the middle of the ventral face in the basal portion of the point (where edge grinding is
present). Otherwise, the point is simply considered to exhibit a flake blank remnant. Although
Midland and pseudo-fluted points do not have many significant quantitative differences in skill
level (Midlands have a higher flake scar count, while pseudo-fluted has a higher width/thickness
ratio), pseudo-fluted points are obviously more expediently made on an impressionistic level.
Using the same logic, Midland points that retain a trace of their original flake blank were likely
more expediently made than those that do not, and therefore those points involved less skill to
produce. In Table 45, the occurrences of Midland points that have flake blank remnants are
compared for the percussion and pressure thinned varieties. The Chi-square test reveals that
there is no significant difference between percussion and pressure thinned Midland points in
terms of flake blank remnants (Chi-square value=0.307, p-value=0.375). Once again, there does
not appear to be a difference in skill level between the two forms of Midland point production.

198
Table 45: Chi-square test comparing presence and absence of flake blank remnants for
percussion and pressure thinned Midland points.
Production * FlakeBlank Crosstabulation
FlakeBlank
Total Absent Present
Production Percussion Count 69 8 77
Expected Count 67.8 9.2 77.0
Pressure Count 107 16 123
Expected Count 108.2 14.8 123.0
Total Count 176 24 200
Expected Count 176.0 24.0 200.0
Chi-Square Tests
Value df
Asymp. Sig. (2-sided)
Exact Sig. (2-sided)
Exact Sig. (1-sided)
Pearson Chi-Square
.307 1 .579
Continuity Correction
b .110 1 .741
Likelihood Ratio .313 1 .576
Fisher's Exact Test .659 .375
N of Valid Cases 200

199
Formal and Informal Pseudo-Fluted Points
Until now, pseudo-fluted points have been implied to represent a generalized “expedient
point” category against which all the more formally produced point types are judged. However,
this generalization downplays the technological variation that is present among these points, and
this variation may also be indicative of different skill levels. For this analysis, pseudo-fluted
points are divided into “formal” and “informal” categories based on the flaking of their dorsal
surfaces. Pseudo-fluted points that are fluted, collaterally flaked, or that exhibit some kind of
patterned flaking on their dorsal surfaces are placed in the formal category. Points whose dorsal
surfaces have no reduction pattern, just edge retouch, or have a visible flake blank surface on
both faces are placed in the informal category. Informal pseudo-fluted points are more likely to
be expediently made from retouched flakes, while the formal varieties appear to have more
skillfully executed flaking on their dorsal surfaces. However, Table 46 indicates that there are
no significant differences in width/thickness ratios, flake scars per 10 mm, or mistake ratios
between formal and informal pseudo-fluted points. Mathematically, there is no obvious
difference in skill between the two. However, it should be noted that the sample size for this
analysis is fairly small. But even when miniature points and preforms are included to bolster the
sample size, no significant difference is present.

200
Table 46: Independent samples t-test comparing the width/thickness ratio, flake scars per 10 mm,
and mistake ratio of formal vs. informal pseudo-fluted points.
Group Statistics
Style N Mean Std. Dev.
Std. Error Mean
WidThick Formal 19 5.4316 1.0793 0.2476
Informal 16 5.3019 0.9080 0.2270
Flakes 10mm
Formal 19 4.7611 1.1390 0.2613
Informal 16 4.8631 1.3353 0.3338
Mistake Ratio
Formal 19 0.0235 0.0270 0.0062
Informal 16 0.0213 0.0368 0.0092
Independent Samples Test
Levene's Test for Equality of Variances t-test for Equality of Means
F Sig. t df
Sig. (2-
tailed) Mean Diff.
Std. Error Diff.
95% Confidence Interval of the Difference
Lower Upper
WidThick Equal variances assumed
.259 .614 .380 33 .706 0.1297 0.3410 -0.564 0.824
Equal variances not assumed
.386 33.00 .702 0.1297 0.3359 -0.554 0.813
Flakes 10mm
Equal variances assumed
.595 .446 -.244 33 .809 -0.1021 0.4181 -0.953 0.749
Equal variances not assumed
-.241 29.72 .811 -0.1021 0.4239 -0.968 0.764
Mistake Ratio
Equal variances assumed
.612 .440 .201 33 .842 0.0022 0.0108 -0.020 0.024
Equal variances not assumed
.196 27.03 .846 0.0022 0.0111 -0.021 0.025

201
Summary for Qualitative Analysis
This section presented statistical tests concerning sub-divisions within Folsom point
typology that are of a somewhat subjective nature. First, occurrences of very finely made “extra
fine”-style points were explored among the Folsom, Midland, and unifacially fluted types. Extra
fine points appear to represent the height of Folsom age skill in projectile point manufacture with
broad, smooth fluting and/or lateral flaking, along with evenly spaced and very narrow pressure
retouch along the edges. According to the Chi-square test, this style occurs most commonly in
Folsom and least commonly in Midland with unifacially fluted points in between, indicating that
Folsom points are more often made by highly skilled individuals than the other variants. The
second analysis focused specifically on Midland points, dividing them into percussion thinned
and pressure thinned varieties. T-tests revealed no significant differences in width/thickness
ratios or mistake ratios between the two sub-types, but percussion thinned points tend to have
slightly higher flake scar counts. Additionally, these two sub-types were examined for
occurrences of remnant flake blank surfaces (suggesting possible expedient manufacture), and
the Chi-square test revealed no significant distinction between percussion and pressure thinned
Midlands in this regard. Finally, pseudo-fluted points were divided into “formal” and “informal”
categories based on the presence or absence of patterned flaking on the dorsal surface, and the t-
tests for width/thickness, flake scar counts, and mistake ratios revealed no significant differences
between the pseudo-fluted sub-types. Ultimately, counts of extra fine-style points for each point
type provide the only qualitative distinction for skill that holds up statistically out of the methods
employed here.

202
Conclusion
When examining Folsom-age projectile points on a population level, Bamforth’s
(1991:311-314) assertion that fluted Folsom points are made by the most skilled flintknappers in
a group appears accurate. Overall, Folsom points are the most skillfully made, followed by
unifacially fluted, then Midland, and lastly pseudo-fluted points. This trend is not reflected in
the miniature versions of these point types, however. Miniature point variants are more
comparable with each other in general, suggesting that they were made (or reworked into
miniature form) with equal levels of skill regardless of type.
The presence of exceedingly well made points among the Folsom-age variants, named
“extra fine” points in this analysis for lack of a better term, is particularly noteworthy. Although
extra fine varieties of Folsom are the most common, the fact that they also appear among
Midland and unifacially fluted points indicates that highly skilled individuals did not always
adhere to the typical “Folsom” template when making projectile points. The regional analysis
chapter will explore the sites and conditions in which the various types of extra fine points occur.
Archaeologists tend to differ over whether points with complicated reduction sequences,
such as Folsom, are made by all or most members of a group or by a subset of flintknapping
specialists. Patten (2002:301) states, “For the group to flourish, everyone, no matter how
awkward or adroit, must be able to accomplish the same end.” Stepping away from the focus on
fluted Folsoms, the presence of a variety of projectile point options during the Folsom period
means that no one had to starve simply because they could not flute a point. Folsom points were
likely the ideal form, but the variety of unifacial, Midland, pseudo-fluted, and miniature options
means that individuals of varying skill levels could at least improvise weapons of similar, and

203
likely the same, effectiveness. On the other end of the spectrum, extra fine points were probably
made by specialists who had an innate talent for flintknapping (see Olausson 2008).

CHAPTER 6: RAW MATERIALS ANALYSIS
Analyzing the raw materials from which stone tools were made has been a central part of
Folsom studies, and of Paleoindian studies in general, for decades and has led to a variety of
interpretations, with the majority emphasizing the presence of “exotic” raw materials as
indicators of high mobility (Hester 1972; Kilby 2008; Bement 1999; Speth et al. 2013; Bamforth
2009). In Folsom research in particular, lithic raw material studies tend to focus on a particular
site or region without generalizing to the entire range in which Folsom artifacts appear. This
specificity is understandable, considering the ability to accurately identify and to know the
source of origin for various lithic resources takes time and experience. This study attempts a
more comprehensive understanding of Folsom-age raw material use, but as a result it involves
analyzing many raw materials with which I am not familiar.
This chapter will first discuss the important raw material studies that have been
conducted for the Folsom period in the various regions included in the sample. The subsequent
analysis of the sample artifacts, however, will primarily draw upon Hofman’s (1992) work. His
research directly pertains to the relationship between Folsom and Midland points and does not
depend significantly on knowing the distance between a site and any particular lithic outcrop,
making this approach especially applicable for the current study. This is not to say that knowing
the distances between sites and lithic sources is not immensely useful, but it would require data
that is not available at this point in time.
Hofman (1992) and Bement (1999) have studied toolstone procurement for the Folsom
period in the southern Plains. As previously described, Hofman’s approach depends on the
assumption that Folsom-age hunter-gatherers followed herds of bison regularly, leaving them

205
with only occasional opportunities to stock up on lithic raw materials. Hofman states that these
hunter-gatherers likely relied on bifacial cores to supply them with flake blanks for tool
production, and as evidence, the large flake blanks from the Shifting Sands and Lipscomb
assemblages would have been struck from such cores. Over time, the size of a bifacial core
decreases, and the flakes struck from them can no longer serve as blanks for Folsom preforms.
Instead, the smaller blanks would be used to produce the unfluted or pseudo-fluted point types
that do not require such an extensive reduction sequence as Folsom points. In addition, already
existing tools would be increasingly reworked to conserve raw materials. Hofman (1992:208)
points out that the distance between a site and a lithic source does not necessarily correlate with
the amount of stone a group has remaining to them, as the number of kill and butchery events
that take place prior to retooling plays a much greater role.
Bement’s (1999) analysis of the Cooper site, a Folsom bison kill in Oklahoma also
explores the pattern of toolstone procurement as it relates to bison subsistence in the southern
Plains. The Cooper site is composed of three separate bison kill events from the Folsom period,
all superimposed on each other in an arroyo trap. Applying the assumption that Folsom groups
prioritized bison procurement above all other needs, Bement illustrates how the Cooper site fits
the model of embedded procurement, in which lithic material is acquired and tools are made and
maintained in the course of tracking and hunting bison. According to this model, new raw
material that is picked up from a source does not immediately enter into service as formal tools
and weapons; it is instead held until after the next bison kill, and only then is new raw material
introduced to replace broken and worn out points and tools (Bement 1999:151). It should be
noted that this pattern does not appear evident at the Gault site, where worn out and broken
points are replaced during the Folsom period with thus far no evidence of an associated bison

206
kill. On the other hand, Bement’s model states that the newly acquired raw material would
comprise most of the expedient flake tools, which are made at any time as the need arises.
Philippe LeTourneau’s (2000) dissertation spans Folsom assemblages in both the
southern Plains and the Southwest. His research questions many of the assumptions of what he
calls the “Synthetic Folsom Model,” particularly the dependence on bison hunting, the long
distance movement of lithic raw materials, the high mobility of Folsom-age people that is
inferred from these materials, and the reliance on large bifacial cores for tool blanks. His
assessment of Folsom toolstone usage focuses on the proposed utilization of bifacial cores, direct
versus indirect raw material procurement, and distribution patterns of local and nonlocal
materials. Direct evidence of bifacial cores in Folsom assemblages is rare, if it exists at all, with
Hanson being a possible exception. However, the cores from the Hanson site are smaller than
expected, suggesting that they may either be exhausted larger cores or cores that were used only
to produce expedient flake tools. The only example of a large bifacial core is Frank’s Biface
from the Mitchell Locality near Blackwater Draw, but it was found on the surface and may
actually be attributable to the Clovis period. LeTourneau then examines Folsom assemblages
from Lindenmeier, Blackwater Draw, and Lubbock Lake to determine the proportion of flake
tools that were made from biface thinning flakes. He finds that biface thinning flakes make up
less than a third of the flake tools in the three sites, indicating that bifacial cores may not have
played as large a role in Folsom stone tool assemblages as previously assumed. Small bifacial
cores are present at Lindenmeier and Blackwater Draw, and they are made of nonlocal material
in contrast to the few multidirectional cores from the two sites, which are made from local stone.
LeTourneau (2000:77) applies Meltzer’s (1989:31) standard for differentiating local and
nonlocal stone, with a cutoff distance at 40 km from a site.

207
To explore the subject of direct procurement versus exchange of raw materials,
LeTourneau (2000:56-75) employs fall-off curve analysis, in which a percentage of tools made
from a particular source are plotted against the distance from that source to the site. A site made
up entirely of directly procured stone would have a sharp dropoff at the end of the curve, while a
site that has a large percentage of exchanged materials would taper down more gradually with
increasing distance. LeTourneau uses regression to fit data from Folsom assemblages to both of
these curves to determine which one provides a better match. However, this methodology failed
to produce useful results, probably because it relied on too many unfounded assumptions
(LeTourneau 2000:242-246). LeTourneau acknowledges that fall-off curves are generally
applied to sedentary societies, where raw material exchange is likely more common. Moreover,
the curves assume direct linear movement from a stone source, which is unlikely for hunter-
gatherer bands moving from resource to resource.
Bamforth (2009) provides a cautionary tale for archaeologists who rely primarily on
projectile point raw material data to trace Paleoindian mobility on the Plains. He asserts that
when local stone is available, nearly all non-projectile point tools are made of it, while points
themselves may be made from more distant materials. Therefore, focusing on projectile points
has skewed the archaeological record in their favor of distant materials. This discrepancy is
exacerbated by the fact that points are accurate chronological markers, they are often the only
artifacts present at kill sites, and non-diagnostic tools cannot be attributed to Folsom or other
periods when found out of context. Additionally, direct procurement of raw materials is usually
assumed for Paleoindians, and that would suggest that raw materials would be used up in the
order in which they are obtained. However, Bamforth asserts that many sites do not exhibit this
sequence. For example, the one complete and unresharpened Cody point from the Horner site is

208
made of the most distant raw material from the site (Bamforth 2009:150). Lake Theo provides a
Folsom-age example, in which most of the expedient tools and flakes are made from local
Tecovas jasper, while most of the projectile points are made from the more distantly acquired
Edwards chert. From this evidence, Bamforth suggests that the Tecovas jasper was obtained
directly as the entire group migrated, but the Edwards chert was likely obtained by trade or by a
special trip of a few individuals (Bamforth 2009:153-154).
Amick’s (1994a, 1995, 1999, 2002) research covers raw material use during the Folsom
period for the southern Plains and the Basin and Range regions of New Mexico. Amick’s data
collection methodology is similar to this study in that it relies on private collections in addition to
excavated materials and as such focuses primarily on Folsom-age projectile points, preforms, and
channel flakes (Amick 2002:159-160). Amick’s work has the advantage of a larger sample size
(a total of 2,148 artifacts as of 2002) but is more restricted in its geographic range, dealing
specifically with the southwestern United States. In terms of raw material, Amick finds a
notable distinction between the southern Plains and the Basin and Range Folsom assemblages in
terms of the relative abundance of Edwards chert. Edwards is the stone of choice for about 82%
of the Folsom diagnostic artifacts in the southern Plains to the exclusion of the materials used
more often in the Basin and Range (Amick 1994:18). On the other hand, Chuska and Rancheria
cherts make up most of the identifiable materials for the Albuquerque Basin, in Jornada del
Muerto mostly Rancheria chert and Socorro jasper are identifiable, and Rancheria chert makes
up almost half of the Folsom material identified in the Tularosa Basin, although various
unidentifiable materials also comprise a significant portion of Folsom artifacts in all these areas.
This stark division in raw material use between the Plains and Basin and Range has prompted

209
Jodry (1999:113-116) to suggest that the Rio Grande valley may have represented a border
between two or more neighboring groups during the Folsom period.
Reitze et al. (2012) provide a compelling counterexample to some of the arguments that
Hofman and Bamforth have put forth concerning Folsom technology and raw material use.
Their recent publication on the Martin site presents a Folsom site that was surface collected in
1955, initially reported in the MA thesis and subsequent Ph.D. dissertation of William Roosa,
and then largely forgotten until Reitze et al.’s reexamination of Folsom sites in the Rio Grande
valley of New Mexico. The site is located in the Estancia Basin, 46 km east of Albuquerque.
The Martin site stands out from the other Folsom sites in the region for two reasons. First, 95%
of the diagnostic artifacts and 90% of the other tools are made of Edwards chert from the
Callahan Divide of west central Texas. Second, nearly all of the points and preforms are of the
classic Folsom type, with 14 fragmentary points, 46 preforms, and 148 channel flakes (although
four of the points are “atypical” points made on flakes – most likely pseudo-fluted). No Midland
points are reported from this site despite the significant distance from any sources of Edwards
chert. The implications of this finding are difficult to discern and may indicate that one or more
of the previous assumptions about the relationship between Folsom and Midland points is
inaccurate (Reitze et al. 2012:254-255). On the other hand, it may simply mean that Midland
points were present but are not archaeologically visible at the site, or that the Folsom-age people
who occupied the Martin site were not running low on lithic supplies despite the distance. After
all, Hofman (1992:208) notes that it is the number of retooling events, rather than distance,
which plays the larger role in determining the types of points that are made. Next, the flake tools
from the Martin site are also predominantly made from distant Edwards chert, contra to
Bamforth’s (2009) research on the Plains which would suggest that such tools would be made

210
from more locally available materials. It is possible, however, that a group traveled from a chert
source in Texas to the Estancia Basin without encountering additional resources, prompting
nearly all their tools to be made from Edwards chert.
Jodry’s (1999) Ph.D. dissertation reports on the Folsom occupation of Stewart’s Cattle
Guard in south-central Colorado, in the San Luis Valley of the upper Rio Grande basin. Cattle
Guard is a bison kill and associated campsite with at least 49 killed and butchered bison
represented. The raw materials present in the Folsom weapons and tools at this site consist
predominantly of Black Forest silicified wood, followed by smaller proportions of Trout Creek
jasper, Cumbres chert, and hornfels (Jodry 1999:101). Black Forest silicified wood and Trout
Creek jasper both come from the north, at distances of about 190 and 140 km, respectively.
Cumbres chert and hornfels come from the San Juan Mountains and foothills, about 105 and 80
km away, respectively. Small percentages of artifacts are made from Chuska, Alibates, and
Edwards cherts. Chuska occurs to the southwest, about 400 km away, and Alibates and Edwards
are to the southeast, about 425 and 750 km away, respectively (Jodry 1999:88-98). The more
abundant raw materials were either obtained directly by a single group moving in a circular
pattern from the San Juan Mountains to what is now the Denver/Colorado Springs area, and then
back down to Cattle Guard; or two groups (one from the west and on from the north) may have
converged to participate in the Cattle Guard bison kill (Jodry 1999:87-88). The more distant
materials were likely obtained through trade or by a special task group, especially considering
their nearly non-existent contribution to the debitage percentage (Jodry 1999:103).
In his analysis of Folsom sites in the Middle Park area of Colorado, Kornfeld (2002)
makes an argument for generalized foraging (as opposed to a focus on bison procurement) for
Folsom groups living in upland areas. Middle Park lies in north-central Colorado and

211
encompasses the headwaters of the Colorado River. The terrain is more rugged and elevated
than the locations of most Folsom sites, and this geography may have played a role in the
specific adaptations in this region. Kornfeld’s analysis focuses on three Folsom sites (Lower
Twin Mountain, Barger Gulch, and Hay Gulch), supplemented with data from 23 smaller
localities in Middle Park. One of the most noteworthy aspects of these assemblages is that they
consist of artifacts made almost exclusively from local materials, primarily Troublesome
Formation chert and to a lesser extent, red jasper (Kornfeld 2002:65-66). This observation
suggests that people who lived in this area during the Folsom period did not stray far enough
away from Middle Park to acquire non-local stone for their tools. Additionally, living in Middle
Park year-round implies that Folsom-age people could not have relied on bison for the majority
of their sustenance.
Using a sample of Folsom sites (plus one Goshen site) from Colorado and Wyoming,
Surovell (2009) applies behavioral ecology to the analysis of stone tools. The sample of sites
consists of Agate Basin, Carter/Kerr-McGee, Krmpotich, Barger Gulch, and Upper Twin
Mountain. Using analyses that include ratios of bifacial to flake tools as well as local to nonlocal
materials, Surovell develops a method for determining the length of occupation of a site and for
discerning whether a site was repeatedly occupied multiple times. For the raw material portion
of his analysis, Surovell (2009:78) classifies any material available within 20 km of a site as
local, and anything from a greater distance as nonlocal. Simply put, a site that has a larger
portion of nonlocal materials than local materials is likely to be a short term occupation,
especially if the tools present are bifacial/curated, rather than more expedient flake tools. As a
result, Surovell determines that Barger Gulch was the longest occupied Folsom site in the
sample, and that it was occupied 28 times longer than the short term Carter/Kerr-McGee

212
occupation. One downside of this analysis is that the equations only work when both local and
nonlocal materials are present, which is not the case for all Folsom assemblages. It also assumes
that the full horizontal extents of the archaeological sites have been excavated. Finally, the
sample size of Folsom sites in this study is small and would need to be expanded to determine
whether Surovell’s methods and equations work on a larger regional or temporal scale.
Root et al. (2000) analyze the raw material use for the Folsom component of Bobtail
Wolf in North Dakota. Although Bobtail Wolf is a procurement site for Knife River flint with
over 90% of the tools at the site being made from the material, the site also contains a wider
sample of other raw material compared to other sites in the quarry area (Root et al. 2000:240-
245). Folsom tools from the site are made from 11 other material types in addition to Knife
River flint, and debitage is composed of 16 non-KRF materials. Most of these materials occur
within or around 100 km of the Knife River quarries, and the majority of those are from the west
or southwest. A few materials come from locales as distant as Idaho, the Black Hills, and the
Green River Basin of Wyoming; however, some are from mixed contexts with Folsom and later
groups (Root et al. 2000:248). Although Knife River flint was extensively transported to the
north into Canada and southwest into Wyoming, the materials coming into the quarry area from
west and southwest do not appear to be from nearly as great a distance.
In summary, the toolstone procurement habits of Folsom groups appear to vary greatly
depending on the region in question. In some places, particularly the southern Plains, Folsom
raw materials were often obtained from quite distant sources, although in at least some sites, only
hunting-related tools were made from these exotic materials with the flake tools made from
locally available stone. Central New Mexico provides a stark contrast between Folsom groups
that relied heavily on Edwards chert and those that used materials from elsewhere, suggesting
213
that a boundary between Folsom-age cultural groups may have existed in the region (although
the Martin site may represent an incursion of an Edwards-supplied group beyond their usual
range). The Cattle Guard site in southern Colorado represents a bison kill and campsite
containing lithic materials from multiple directions and distances, while the Middle Park region
contains local materials to the near-exclusion of any distant supplies. Finally, the Bobtail Wolf
site shows that Folsom groups did not appear to travel from great distances to obtain Knife River
flint, but KRF moved extensively after it was procured. This seeming discrepancy may provide
insights into Folsom-age trade or seasonal migration patterns.
Analysis Procedure for this Study
This analysis tests the position that raw material considerations play a role in determining
the types of projectile points that were manufactured during the Folsom period. As previously
mentioned, knowing the source of every lithic material and the distances from those sources to
their respective archaeological sites is not currently feasible. The most pertinent aspect of this
research is to distinguish different raw materials, without necessarily knowing what they are
called or where they are from. With this modicum of information, it is possible to test Hofman’s
(1992) approach to Folsom and Midland technology. Since Hofman proposes that atypical
Folsom-age points such as Midland and pseudo-fluted are made when raw material supplies are
running low, then these points should generally be made from the less abundant raw material
types at any given archaeological site. The underlying assumption in this test is that Folsom-age
hunter-gatherers obtained lithic material via direct procurement as they traversed the landscape
as a group.

214
Distinguishing raw materials is accomplished by visual inspection using natural and
ultraviolet light. UV light has been used in several Folsom analyses as an inexpensive and
expedient aid for identifying raw materials (Hofman et al. 1991; Jodry 1999; LeTourneau
2000:88-93; Reitze et al. 2012; Root et al. 2000:243). All artifacts have been photographed
under natural light as well as longwave and shortwave UV light (see the “Photos” folder in the
attached files). The photos are then examined to match specimens based on similarities in
natural appearance and UV reactions. Originally, the use of color charts (such as Munsell or
Pantone) appeared to be a useful method for eliminating subjectivity in UV color designations.
However, other factors that affect color, such as patination, makes fine-grained color analysis
excessive and unwieldy, and such specificity would result in splitting assemblages into a
multitude of divergent material types. Instead, colors are recorded under generic (but admittedly
impressionistic) colors, such as gray, orange, or green.
The sample used in this analysis consists of points and preforms from individual Folsom
sites with multiple lithic raw materials present in their assemblages. Sites such as Gault that are
made up entirely of one material and collections that have been acquired across a wide area are
not considered in this analysis. The analysis is first conducted on a site-by-site basis using Chi-
square tests to determine whether a significant difference exists in raw material usage among
Folsom, Midland, unifacially fluted, pseudo-fluted, and miniature point types for each site.
However, because the subdivisions of the artifacts by site, then type, then raw materials tend to
generate numerous cells with low observed counts, the significance of these results is open to
question. In order to improve the usefulness of these tests, adjusted residuals are displayed in the
crosstabulations to indicate which specific raw material/projectile point combinations have
significant deviations from their expected counts. Any cell with an adjusted residual that is

215
higher than the z-score of 1.96 is considered significant (Madrigal 2012:63-66, 178). Next, the
total number of points with significant differences in each type is then assessed against the total
number of points sampled to determine whether raw material considerations play a role in
Folsom-age projectile point technology overall. Finally, two analyses using generalized
dominant and non-dominant raw material categories are conducted to test whether material types
differ by point type across the sample of artifacts as a whole.
Analysis
Blackwater Draw
For the 21 points and preforms recorded from the Blackwater Draw collections at TARL,
only three are made from materials other than Edwards chert. One is Alibates, and the others are
two separate indeterminate materials. A Chi-square test does not find any significant differences
in material selection among point types (Table 47) due to the small sample size, but it may be
worth noting that 11 of the 12 Folsom points are made from Edwards chert, while two of the five
Midland points are made from non-Edwards materials. These Midland points still fall short of
having significant residual scores, however.

216
Table 47: Chi-square test comparing point types and material types for Blackwater Draw.
Style * Material Crosstabulation
Material
Total Alibates Edwards Indet A Indet B
Style Folsom Count 0 11 1 0 12
Expected Count .6 10.3 .6 .6 12.0
Adjusted Residual -1.18 .90 .89 -1.18
Midland Count 1 3 0 1 5
Expected Count .2 4.3 .2 .2 5.0
Adjusted Residual 1.83 -1.88 -.57 1.83
Plainview Count 0 2 0 0 2
Expected Count .1 1.7 .1 .1 2.0
Adjusted Residual -.33 .61 -.33 -.33
Unifacially Fluted
Count 0 2 0 0 2
Expected Count .1 1.7 .1 .1 2.0
Adjusted Residual -.33 .61 -.33 -.33
Total Count 1 18 1 1 21
Expected Count 1.0 18.0 1.0 1.0 21.0
Chi-Square Tests
Value df
Asymp. Sig. (2-sided)
Pearson Chi-Square
7.681a 9 .567
Likelihood Ratio 7.430 9 .592
N of Valid Cases 21

217
Shifting Sands
Similar to Blackwater Draw but with a larger sample in this analysis, the Shifting Sands
assemblage is almost entirely dominated by Edwards chert, with the exception of four individual
cases of other raw materials. However, in this case none of the other raw materials are present
among Folsom points or preforms. Moreover, none of the full-sized Midland points and
preforms are made from non-Edwards materials. Two pseudo-fluted points are made from
indeterminate materials, a miniature Midland point is made from quartz crystal, and a lone
Plainview point is made from Notrees chert. These points all have significant adjusted residual
scores, along with Edwards chert Midland points, which are slightly more abundant than
expected. The Chi-square test suggests that a significant difference in raw material preference
exists overall as well, but once again the non-Edwards chert point count is extremely small
(Table 48).
Scharbauer
Folsom points are uncommon among the Scharbauer sample in Rose’s collection, with
only three present. However, one of those three is made from a material other than Edwards
chert, while all but one of the 17 Midland points in the sample are Edwards chert. Additionally,
two of the three miniature points are Edwards chert, and the single pseudo-fluted and unifacially
fluted points are also both Edwards chert (Table 49). The Chi-square test does not indicate any
overall significance due to the small sample, but the miniature Midland made from Indeterminate
chert A has a significant adjusted residual score. The lone Milnesand point is also significant,
while the Folsom point of Indeterminate chert B falls just shy of a significant score.

218
Table 48: Chi-square test comparing point types and material types for Shifting Sands.
Style * Material Crosstabulation
Material
Total Edwards Indet A
Indet B Notrees
Quartz Crystal
Style Folsom Count 31 0 0 0 0 31
Expected Count 30.2 0.2 0.2 0.2 0.2 31
Adjusted Residual 1.05 -0.52 -0.52 -0.52 -0.52
Midland Count 78 0 0 0 0 78
Expected Count 75.9 0.5 0.5 0.5 0.5 78
Adjusted Residual 2.17 -1.07 -1.07 -1.07 -1.07
Mini Folsom
Count 4 0 0 0 0 4
Expected Count 3.9 0 0 0 0 4
Adjusted Residual 0.34 -0.17 -0.17 -0.17 -0.17
Mini Midland
Count 3 0 0 0 1 4
Expected Count 3.9 0 0 0 0 4
Adjusted Residual -2.77 -0.17 -0.17 -0.17 5.98
Mini Pseudo
Count 4 0 0 0 0 4
Expected Count 3.9 0 0 0 0 4
Adjusted Residual 0.34 -0.17 -0.17 -0.17 -0.17
Mini Uni-Fluted
Count 1 0 0 0 0 1
Expected Count 1 0 0 0 0 1
Adjusted Residual 0.17 -0.08 -0.08 -0.08 -0.08
Plainview Count 0 0 0 1 0 1
Expected Count 1 0 0 0 0 1
Adjusted Residual -5.98 -0.08 -0.08 12.08 -0.08
Pseudo-fluted
Count 9 1 1 0 0 11
Expected Count 10.7 0.1 0.1 0.1 0.1 11
Adjusted Residual -3.26 3.52 3.52 -0.29 -0.29

219
Table 48 continued.
Material
Total
Edwards Indet A
Indet B Notrees
Quartz Crystal
Style Unifacially Fluted
Count 12 0 0 0 0 12
Expected Count 11.7 0.1 0.1 0.1 0.1 12
Adjusted Residual 0.61 -0.3 -0.3 -0.3 -0.3
Total Count 142 1 1 1 1 146
Expected Count 142 1 1 1 1 146
Chi-Square Tests
Value df
Asymp. Sig. (2-sided)
Pearson Chi-Square
206.592a 32 0
Likelihood Ratio 30.056 32 0.565
N of Valid Cases 146

220
Table 49: Chi-square test comparing point types and material types for Scharbauer.
Style * Material Crosstabulation
Material
Total Edwards Indet A Indet B
Style Folsom Count 2 0 1 3
Expected Count 2.6 .2 .2 3.0
Adjusted Residual -1.04 -.50 1.91
Midland Count 17 0 1 18
Expected Count 15.5 1.2 1.2 18.0
Adjusted Residual 1.65 -1.87 -.36
Milnesand Count 1 1 0 2
Expected Count 1.7 .1 .1 2.0
Adjusted Residual -1.54 2.49 -.40
Mini Midland
Count 0 1 0 1
Expected Count .9 .1 .1 1.0
Adjusted Residual -2.54 3.74 -.28
Mini Pseudo
Count 2 0 0 2
Expected Count 1.7 .1 .1 2.0
Adjusted Residual .59 -.40 -.40
Plainview Count 1 0 0 1
Expected Count .9 .1 .1 1.0
Adjusted Residual .41 -.28 -.28
Pseudo-fluted
Count 1 0 0 1
Expected Count .9 .1 .1 1.0
Adjusted Residual .41 -.28 -.28
Unifacially Fluted
Count 1 0 0 1
Expected Count .9 .1 .1 1.0
Adjusted Residual .41 -.28 -.28
Total Count 25 2 2 29
Expected Count 25.0 2.0 2.0 29.0

221
Table 49 continued.
Chi-Square Tests
Value df
Asymp. Sig. (2-sided)
Pearson Chi-Square
24.940a 14 0.035
Likelihood Ratio 14.498 14 0.413
N of Valid Cases 29

222
Wyche Ranch
This sample is very similar to Scharbauer, with only Midland points being well
represented at 10 specimens. Three of those 10 Midland points are made from unknown cherts,
while the one Folsom, one miniature, and two pseudo-fluted points are all made from Edwards.
Although these results seem to imply that Midland points are more often made from less
abundant raw materials, neither the Chi-square test nor the adjusted residuals reveal statistically
significant values (Table 50).
The Folsom assemblages from Texas and eastern New Mexico suffer from an obvious
problem that likely inhibits this analysis: an overabundance of Edwards chert. Outcrops of this
chert occur across a wide area of central Texas and are extremely difficult to assign to regional
varieties (Hofman et al. 1991:297), masking much of the Folsom procurement patterns that
occurred in this region. Moreover, it must be noted that many of the sites that rely heavily on
Edwards chert have a high percentage of Midland points. A couple of possible explanations for
this observation will be explored in the following chapter.

223
Table 50: Chi-square test comparing point types and material types for Wyche Ranch.
Style * Material Crosstabulation
Material
Total Edwards Indet A Indet B
Style Folsom Count 1 0 0 1
Expected Count .8 .1 .1 1.0
Adjusted Residual .48 -.38 -.26
Midland Count 10 2 1 13
Expected Count 10.7 1.5 .8 13.0
Adjusted Residual -1.06 .84 .57
Mini Midland
Count 1 0 0 1
Expected Count .8 .1 .1 1.0
Adjusted Residual .48 -.38 -.26
Pseudo-fluted
Count 2 0 0 2
Expected Count 1.6 .2 .1 2.0
Adjusted Residual .70 -.55 -.38
Total Count 14 2 1 17
Expected Count 14.0 2.0 1.0 17.0
Chi-Square Tests
Value df
Asymp. Sig. (2-sided)
Pearson Chi-Square
1.121a 6 .981
Likelihood Ratio 1.799 6 .937
N of Valid Cases 17

224
Rio Rancho
Moving away from Texas and eastern New Mexico, two dramatic changes are
immediately noticeable, as observed by Amick (1994a:18) and Jodry (1999:113-116). First, the
prevalence of Edwards chert drastically decreases, and second, Folsom points become much
more numerous compared to the unifacially fluted or unfluted varieties. As a result, the Rio
Rancho sample suffers from basically the opposite problems as the preceding samples. Rio
Rancho has a variety of raw materials, but all but one of the 33 points and preforms are
typologically Folsom. The one remaining point is pseudo-fluted. Moreover, this pseudo-fluted
point is made from the most abundant material in the sample, which fails to support Hofman’s
hypothesis, and its inclusion in the dominant raw material makes the Chi-square test results
insignificant (Table 51).

225
Table 51: Chi-square test comparing point types and material types for Rio Rancho.
Style * Material Crosstabulation
Material
Chalcedony Chuska Indet A Indet B Indet C Indet D Obsidian
Style Folsom Count 2 2 1 1 1 1 3
Expected Count 1.9 1.9 1.0 1.0 1.0 1.0 2.9
Adjusted Residual .26 .26 .18 .18 .18 .18 .32
Pseudo-fluted
Count 0 0 0 0 0 0 0
Expected Count .1 .1 .0 .0 .0 .0 .1
Adjusted Residual -.26 -.26 -.18 -.18 -.18 -.18 -.32
Total Count 2 2 1 1 1 1 3
Expected Count 2.0 2.0 1.0 1.0 1.0 1.0 3.0
Style * Material Crosstabulation (continued)
Total
Quartzite Rancheria San
Andres Silicified Wood
Yellow & Brown Chert
Style Folsom Count 1 3 2 3 12 32
Expected Count 1.0 2.9 1.9 2.9 12.6 32.0
Adjusted Residual .18 .32 .26 .32 -1.26
Pseudo-fluted
Count 0 0 0 0 1 1
Expected Count .0 .1 .1 .1 .4 1.0
Adjusted Residual -.18 -.32 -.26 -.32 1.26
Total Count 1 3 2 3 13 33
Expected Count 1.0 3.0 2.0 3.0 13.0 33.0
Chi-Square Tests
Value df
Asymp. Sig. (2-sided)
Pearson Chi-Square
1.587a 11 1.000
Likelihood Ratio 1.911 11 .999
N of Valid Cases
33

226
Lindenmeier
Although this site contains the largest Folsom assemblage recorded thus far and boasts a
wide variety of raw materials and point types, the sample used in this analysis is still heavily
biased towards bifacially fluted Folsom points. Only a sample of the Lindenmeier points and
preforms was analyzed in this research, encompassing the 197 artifacts at the Denver Museum
and the Smithsonian available for raw material analysis. Given its size, this sample may well be
representative of the total raw materials and point types from the site. All the points and
preforms from the Denver Museum collections were recorded. At the Smithsonian, Lindenmeier
diagnostic artifacts are organized in drawers on trays, with separate trays for points and
preforms. The sampling strategy for the Smithsonian Lindenmeier assemblage consisted of
recorded points and preforms from each tray column by column, so that the first column from
every tray was analyzed before moving back to the second column of the first tray (see Figure 5).
While the sample of 197 points and preforms is more than enough for examining issues
relating to technology and skill, it falls short in the raw material analysis. This shortfall is due to
the disproportionate number of Folsom points compared to the other type variants, as well as the
wide variety of raw materials that are represented at the site. Therefore, the results suggested
here must be read with caution due to low artifact counts in individual cells. The attached file
“Lindenmeier Raw Materials.xlsx” shows the distribution of the point types sampled at
Lindenmeier relative to the raw materials that have been identified in this analysis. The most
prevalent raw materials are Chalcedony A, Flattop chalcedony, and Hartville Uplift, based on
counts of Folsom points and preforms. Additionally, adjusted residuals indicate there are
significantly more Folsom points made from Chalcedony A than expected. Proportionately, the
counts of the other point variants match the expected amounts for Flattop chalcedony and

227
Hartville Uplift, except for a higher than expected count of Midland points made from Flattop
chalcedony. Four material types: Alibates, Green River Chert B, Indet F, and oil shale are not
present among the Folsom points but are present among the other Folsom variants. Alibates and
oil shale are each represented by a single unifacially fluted point, Indet F is a Midland point, and
Green River B is present in a pseudo-fluted point. These four points may appear to lend some
credence to Hofman’s hypothesis and have significant adjusted residual scores, but they are most
likely exceptions. Additionally, there are 11 material types in which Folsom points appear to the
exclusion of all other variants: Black Forest silicified wood, heated orange chert, Indet A and E,
Jack Marrow chert, Oolitic chert A and B, Phosphoria (red jasper) A and C, Silicified Wood B,
and Tan chert B. For the most part, the proportions of other point variants in any material type
reflect a scaled down proportion of the Folsom points for that material.
Krmpotich
The diagnostic points and preforms from Krmpotich consist almost entirely of the formal
Folsom type, although one unifacially fluted point is also present. The unifacially fluted point is
made from Green River chert, which is the second most abundant raw material for the 16
projectile points at the site. Neither the Chi-square test nor the adjusted residuals are significant,
and Krmpotich cannot support Hofman’s hypothesis (Table 52).
Hanson
Folsom and Midland points and preforms from Hanson occur roughly in proportion to
each other in terms of raw materials, although there is one quartzite Midland point out of the 16
artifacts sampled that has no Folsom counterpart. This artifact could represent the last remaining
point of a dwindling raw material supply as per Hofman’s hypothesis, but this point is not
228
enough to produce significant results in the Chi-square test or in the adjusted residuals (Table
53).
Agate Basin
The point and preform sample from Agate Basin is made up of seven Folsom artifacts,
along with one example each of Midland, pseudo-fluted, and unifacially fluted. Knife River flint
and quartzite have the highest counts of Folsom artifacts, but all the other variants (and a single
Folsom point) are made from the material designated Indet B. Although these results appear to
offer some support to Hofman’s hypothesis, they are not significant according to the Chi-square
test and the adjusted residuals (Table 54), likely due to the presence of the Indet B Folsom point.

229
Table 52: Chi-square test comparing point types and material types for Krmpotich.
Style * Material Crosstabulation
Material
Total
Green River Chert Indet A Indet B
Jack Marrow Chert
Oil Shale
Oolitic Chert
Style Folsom Count 4 1 1 3 1 5 15
Expected Count 4.7 .9 .9 2.8 .9 4.7 15.0
Adjusted Residual -1.53 .27 .27 .50 .27 .70
Unifacially Fluted
Count 1 0 0 0 0 0 1
Expected Count .3 .1 .1 .2 .1 .3 1.0
Adjusted Residual 1.53 -.27 -.27 -.50 -.27 -.70
Total Count 5 1 1 3 1 5 16
Expected Count 5.0 1.0 1.0 3.0 1.0 5.0 16.0
Chi-Square Tests
Value df
Asymp. Sig. (2-sided)
Pearson Chi-Square
2.347a 5 .799
Likelihood Ratio 2.477 5 .780
N of Valid Cases
16

230
Table 53: Chi-square test comparing point types and material types for Hanson.
Style * Material Crosstabulation
Material
Total Indet Morrison Chert
Phosphoria A
Phosphoria B
Phosphoria C Quartzite
Style Folsom Count 1 2 4 1 1 0 9
Expected Count 1.1 2.3 3.9 .6 .6 .6 9.0
Adjusted Residual -.19 -.29 .06 .91 .91 -1.17
Indet Count 0 1 1 0 0 0 2
Expected Count .3 .5 .9 .1 .1 .1 2.0
Adjusted Residual -.57 .87 .19 -.39 -.39 -.39
Midland Count 1 1 2 0 0 1 5
Expected Count .6 1.3 2.2 .3 .3 .3 5.0
Adjusted Residual .61 -.31 -.20 -.70 -.70 1.53
Total Count 2 4 7 1 1 1 16
Expected Count 2.0 4.0 7.0 1.0 1.0 1.0 16.0
Chi-Square Tests
Value df
Asymp. Sig. (2-sided)
Pearson Chi-Square
4.857a 10 .901
Likelihood Ratio 5.836 10 .829
N of Valid Cases 16

231
Table 54: Chi-square test comparing point types and material types for Agate Basin.
Style * Material Crosstabulation
Material
Total
Knife River Flint Indet A Indet B Quartzite
Style Folsom Count 3 1 1 2 7
Expected Count 2.1 .7 2.8 1.4 7.0
Adjusted Residual 1.36 0.69 -2.54 1.04
Midland Count 0 0 1 0 1
Expected Count .3 .1 .4 .2 1.0
Adjusted Residual -0.69 -0.35 1.29 -0.53
Pseudo-fluted
Count 0 0 1 0 1
Expected Count .3 .1 .4 .2 1.0
Adjusted Residual -0.69 -0.35 1.29 -0.53
Unifacially Fluted
Count 0 0 1 0 1
Expected Count .3 .1 .4 .2 1.0
Adjusted Residual -0.69 -0.35 1.29 -0.53
Total Count 3 1 4 2 10
Expected Count 3.0 1.0 4.0 2.0 10.0
Chi-Square Tests
Value df
Asymp. Sig. (2-sided)
Pearson Chi-Square
6.429a 9 .696
Likelihood Ratio 7.719 9 .563
N of Valid Cases 10

232
Hell Gap
Although the sample from this site is divided into Folsom, Midland, and Goshen
components, these components are combined in this analysis due to the small sample size of
diagnostics (21 in total) in the assemblages. The Chi-square test provides no significant results
overall, although as with the other sites, the miniscule sample size for each point type by material
type makes the results uncertain (Table 55). There are several cells with adjusted residuals that
are close to significant, but the only one that is truly significant is the one containing two Folsom
points made of Hartville Uplift chert. However, it is worth noting that Hartville Uplift chert is
split from another material, termed Hartville B, which appears similar under regular light but
fluoresces differently. The same holds true with the three varieties of “Phosphoria” (possibly red
jasper) identified in this sample. When these materials are combined under one Hartville
category and one Phosphoria category, no significant adjusted residuals are present.
Barger Gulch
This site is made up almost entirely of bifacially fluted Folsom points (27), except for one
unifacially fluted point. Also, the site is heavily dominated by Troublesome Formation chert,
with the unifacially fluted point being made from this material as well. Therefore, no significant
variations in point types and raw materials are present at this site (Table 56).
Bobtail Wolf
Although this is one of the Folsom sites located within the Knife River flint quarry area, a
variety of other materials is also present in small numbers. Midland points (three in total) are
present among some of these materials in addition to Knife River flint, but every raw material is
also represented by at least one Folsom point. Therefore, both the Chi-square test and the
adjusted residuals lack any significant results (Table 57).

233
Table 55: Chi-square test comparing point types and material types for Hell Gap.
Style * Material Crosstabulation
Material
Clinker (Porcelainite) Hartville B
Hartville Uplift Indet A Indet B Indet C
Style Folsom Count 0 0 2 1 1 1
Expected Count .3 1.4 .6 .3 .6 .3
Adjusted Residual -0.65 -1.62 2.35 1.62 0.71 1.62
Goshen Count 1 2 0 0 0 0
Expected Count .2 1.2 .5 .2 .5 .2
Adjusted Residual 1.83 0.97 -0.83 -0.57 -0.83 -0.57
Midland Count 0 2 0 0 1 0
Expected Count .4 2.1 .9 .4 .9 .4
Adjusted Residual -0.89 -0.15 -1.29 -0.89 0.21 -0.89
Pseudo-fluted
Count 0 1 0 0 0 0
Expected Count .0 .2 .1 .0 .1 .0
Adjusted Residual -0.23 1.83 -0.33 -0.23 -0.33 -0.23
Total Count 1 5 2 1 2 1
Expected Count 1.0 5.0 2.0 1.0 2.0 1.0

234
Table 55 continued.
Style * Material Crosstabulation (continued)
Total Phosphoria
A Phosphoria
B Phosphoria
C Troublesome
Chert
Style Folsom Count 1 0 0 0 6
Expected Count 1.7 .3 .3 .3 6.0
Adjusted Residual -0.76 -0.65 -0.65 -0.65
Goshen Count 1 0 1 0 5
Expected Count 1.4 .2 .2 .2 5.0
Adjusted Residual -0.49 -0.57 1.83 -0.57
Midland Count 4 1 0 1 9
Expected Count 2.6 .4 .4 .4 9.0
Adjusted Residual 1.39 1.18 -0.89 1.18
Pseudo-fluted
Count 0 0 0 0 1
Expected Count .3 .0 .0 .0 1.0
Adjusted Residual -0.65 -0.23 -0.23 -0.23
Total Count 6 1 1 1 21
Expected Count 6.0 1.0 1.0 1.0 21.0
Chi-Square Tests
Value df
Asymp. Sig. (2-sided)
Pearson Chi-Square
25.916a 27 .523
Likelihood Ratio 26.992 27 .464
N of Valid Cases 21

235
Table 56: Chi-square test comparing point types and material types for Barger Gulch.
Style * Material Crosstabulation
Material
Total Hartville Uplift Indet A Indet B
Troublesome Chert
Style Folsom Count 2 1 1 23 27
Expected Count 1.9 1.0 1.0 23.1 27.0
Adjusted Residual 0.28 0.20 0.20 -0.42
Unifacially Fluted
Count 0 0 0 1 1
Expected Count .1 .0 .0 .9 1.0
Adjusted Residual -0.28 -0.20 -0.20 0.42
Total Count 2 1 1 24 28
Expected Count 2.0 1.0 1.0 24.0 28.0
Chi-Square Tests
Value df
Asymp. Sig. (2-sided)
Pearson Chi-Square
.173a 3 .982
Likelihood Ratio .314 3 .957
N of Valid Cases 28

236
Table 57: Chi-square test comparing point types and material types for Bobtail Wolf.
Style * Material Crosstabulation
Material
Chalcedony A
Chalcedony B
Clinker (Porcelainite)
Hartville Uplift Indet A
Knife River Flint
Style Folsom Count 2 1 1 1 1 10
Expected Count 2.6 .9 .9 .9 1.7 9.6
Adjusted Residual -1.12 0.40 0.40 0.40 -1.62 0.54
Midland Count 1 0 0 0 1 1
Expected Count .4 .1 .1 .1 .3 1.4
Adjusted Residual 1.12 -0.40 -0.40 -0.40 1.62 -0.54
Total Count 3 1 1 1 2 11
Expected Count 3.0 1.0 1.0 1.0 2.0 11.0
Style * Material Crosstabulation (continued)
Total
Rainy Buttes Silicified Wood
Silicified Wood A
Silicified Wood B
Yellowstone Agate
Style Folsom Count 1 1 1 1 20
Expected Count .9 .9 .9 .9 20.0
Adjusted Residual 0.40 0.40 0.40 0.40
Midland Count 0 0 0 0 3
Expected Count .1 .1 .1 .1 3.0
Adjusted Residual -0.40 -0.40 -0.40 -0.40
Total Count 1 1 1 1 23
Expected Count 1.0 1.0 1.0 1.0 23.0

237
Table 57 continued.
Chi-Square Tests
Value df
Asymp. Sig. (2-sided)
Pearson Chi-Square
4.699a 9 .860
Likelihood Ratio 4.518 9 .874
N of Valid Cases 23

238
Cedar Creek
A variety of point types and raw materials are present at Cedar Creek, with Edwards chert
and Alibates being the most plentiful of the material types. Quartzite and Tecovas jasper are
only represented by a single Midland point each, but their adjusted residuals do not indicate a
strong significance in this occurrence. Significant residual values are present for a single
Plainview point made from Indeterminate chert B, a pseudo-fluted point made from
Indeterminate chert A, and two unifacially fluted points made from Alibates (Table 58). The
Chi-square test is not significant overall, but the pseudo-fluted and unifacially fluted points may
provide some support for Hofman’s hypothesis at this site.
Sulphur River
This Folsom assemblage is very small with the six diagnostic artifacts made from various
materials, with no material type occurring among more than two artifacts. The Chi-square test is
expectedly insignificant, but a single Midland point made from Chadron chert has a significant
adjusted residual score (Table 59). However, considering that all material types except for
Edwards chert are represented by single specimens, it is uncertain to what degree this lone
Midland point supports Hofman’s hypothesis.
Mud Springs
This Wyoming site in Jim Cox’s collection has a variety of materials with no particular
one dominating the assemblage of 23 artifacts. The Chi-square test does not yield a significant
p-value, but a couple of points do have significant adjusted residual scores (Table 60). A
Midland point made of silicified wood and a unifacially fluted point made of jasper are
significant in terms of residuals and may support Hofman’s hypothesis, but it is difficult to
determine with any certainty due to the lack of any abundant material types.

239
Table 58: Chi-square test comparing point types and material types for Cedar Creek.
Style * Material Crosstabulation
Material
Total Alibates Edwards Indet A Indet B Indet C Quartzite Tecovas
Style Folsom Count 5 11 0 0 1 0 0 17
Expected Count 5.5 9.4 .4 .4 .4 .4 .4 17.0
Adjusted Residual -0.36 1.06 -0.87 -0.87 1.18 -0.87 -0.87
Midland Count 3 7 0 0 0 1 1 12
Expected Count 3.9 6.6 .3 .3 .3 .3 .3 12.0
Adjusted Residual -0.66 0.28 -0.66 -0.66 -0.66 1.55 1.55
Milnesand Count 0 1 0 0 0 0 0 1
Expected Count .3 .6 .0 .0 .0 .0 .0 1.0
Adjusted Residual -0.70 0.92 -0.16 -0.16 -0.16 -0.16 -0.16
Plainview Count 3 2 0 1 0 0 0 6
Expected Count 2.0 3.3 .2 .2 .2 .2 .2 6.0
Adjusted Residual 0.99 -1.16 -0.43 2.41 -0.43 -0.43 -0.43
Pseudo-fluted
Count 0 1 1 0 0 0 0 2
Expected Count .7 1.1 .1 .1 .1 .1 .1 2.0
Adjusted Residual -1.01 -0.15 4.41 -0.23 -0.23 -0.23 -0.23
Unifacially Fluted
Count 2 0 0 0 0 0 0 2
Expected Count .7 1.1 .1 .1 .1 .1 .1 2.0
Adjusted Residual 2.09 -1.60 -0.23 -0.23 -0.23 -0.23 -0.23
Total Count 13 22 1 1 1 1 1 40
Expected Count 13.0 22.0 1.0 1.0 1.0 1.0 1.0 40.0

240
Table 58 continued.
Chi-Square Tests
Value df
Asymp. Sig. (2-sided)
Pearson Chi-Square
37.593a 30 .160
Likelihood Ratio 24.222 30 .762
N of Valid Cases
40

241
Table 59: Chi-square test comparing point types and material types for Sulphur River.
Style * Material Crosstabulation
Material
Total Alibates Chadron Edwards Nova Chert Quartzite
Style Folsom Count 0 0 1 1 0 2
Expected Count .3 .3 .7 .3 .3 2.0
Adjusted Residual -0.77 -0.77 0.61 1.55 -0.77
Midland Count 0 1 0 0 0 1
Expected Count .2 .2 .3 .2 .2 1.0
Adjusted Residual -0.49 2.45 -0.77 -0.49 -0.49
Plainview Count 0 0 1 0 0 1
Expected Count .2 .2 .3 .2 .2 1.0
Adjusted Residual -0.49 -0.49 1.55 -0.49 -0.49
Pseudo-fluted
Count 1 0 0 0 1 2
Expected Count .3 .3 .7 .3 .3 2.0
Adjusted Residual 1.55 -0.77 -1.22 -0.77 1.55
Total Count 1 1 2 1 1 6
Expected Count 1.0 1.0 2.0 1.0 1.0 6.0
Chi-Square Tests
Value df
Asymp. Sig. (2-sided)
Pearson Chi-Square
13.500a 12 .334
Likelihood Ratio 13.183 12 .356
N of Valid Cases 6

242
Table 60: Chi-square test comparing point types and material types for Mud Springs.
Style * Material Crosstabulation
Material
Alibates
Flattop Chalcedony
Green River Chert
Indet A
Indet B
Indet C
Jack Marrow Chert Jasper
Style Folsom Count 3 2 1 1 2 4 1 0
Expected Count 2.7 1.8 .9 .9 1.8 3.7 .9 .9
Adjusted Residual 0.57 0.46 0.32 0.32 0.46 0.68 0.32 -3.31
Midland Count 0 0 0 0 0 0 0 0
Expected Count .1 .1 .0 .0 .1 .2 .0 .0
Adjusted Residual -0.40 -0.32 -0.22 -0.22 -0.32 -0.47 -0.22 -0.22
Unifacial Fluted
Count 0 0 0 0 0 0 0 1
Expected Count .1 .1 .0 .0 .1 .2 .0 .0
Adjusted Residual -0.40 -0.32 -0.22 -0.22 -0.32 -0.47 -0.22 4.80
Total Count 3 2 1 1 2 4 1 1
Expected Count 3.0 2.0 1.0 1.0 2.0 4.0 1.0 1.0
Style * Material Crosstabulation (continued)
Total Morrison Quartzite
Oil Shale
Oolitic Chert A
Oolitic Chert B Quartzite
Silicified Wood
Style Folsom Count 1 1 2 1 1 1 21
Expected Count .9 .9 1.8 .9 .9 1.8 21.0
Adjusted Residual 0.32 0.32 0.46 0.32 0.32 -2.17
Midland Count 0 0 0 0 0 1 1
Expected Count .0 .0 .1 .0 .0 .1 1.0
Adjusted Residual -0.22 -0.22 -0.32 -0.22 -0.22 3.31
Unifacial Fluted
Count 0 0 0 0 0 0 1
Expected Count .0 .0 .1 .0 .0 .1 1.0
Adjusted Residual -0.22 -0.22 -0.32 -0.22 -0.22 -0.32
Total Count 1 1 2 1 1 2 23
Expected Count 1.0 1.0 2.0 1.0 1.0 2.0 23.0

243
Table 60 continued.
Chi-Square Tests
Value df
Asymp. Sig. (2-sided)
Pearson Chi-Square
33.952a 26 .136
Likelihood Ratio 13.590 26 .978
N of Valid Cases 23

244
As previously mentioned, the assemblages from each of these sites suffer from small
sample sizes, particularly due to subdividing the points and preforms by type and raw material.
This rather substantial problem may inhibit the usefulness of these Chi-square results. With this
caveat in mind, the results appear to indicate that most of these assemblages do not support
Hofman’s model that Folsom-age knappers made non-Folsom points as their raw material
supplies grew low. However, the data should also be examined on a more comprehensive level
to determine whether this trend holds true overall. One way to perform a comprehensive
analysis is to compare the instances in which a point type has a significant adjusted residual
score with the number of times it appears in all the Chi-square crosstabulations. This
comparison does not count individual points, but instead counts unique instances of point
type/raw material combinations for each site. A new Chi-square test can then be run, with point
types on the rows and the counts significant and non-significant adjusted residuals on the
columns. Additionally, all miniature point types are combined into one group to increase their
sample size. Table 61 gives the results of this analysis. The results are highly significant and
indicate that Folsom points have an unexpectedly low count of significant residuals from the
previous analyses, while unifacially fluted and miniature points have an unexpectedly high
count. These results correspond to Hofman’s model to some extent but not perfectly. Midland
points and pseudo-fluted points have close to the expected number of significant residual scores,
placing them in the middle of a scale with Folsom points on one end and unifacially fluted and
miniature points on the other. An interpretation of these results from the perspective of
Hofman’s approach would indicate that Folsom points are made when raw material is most
abundant, followed by Midland and pseudo-fluted points as the material decreases, and finally
knappers resort to unifacially fluted and miniature points when supplies decrease further.

245
However, the inclusion of pseudo-fluted points in the middle of the scale and unifacially fluted
points on the end makes no sense from a technological perspective. Pseudo-fluted points are
generally far simpler and less risky to make and likely consume less material than unifacially
fluted points. In this respect, the results do not support Hofman’s approach very strongly.

246
Table 61: Chi-square test comparing point types to occurrences of significant adjusted residual
scores from the previous analyses.
Type * Significance Crosstabulation
Significance
Total No Yes
Type Folsom Count 92 2 94
Expected Count 81.3 12.7 94.0
Adjusted Residual 4.7 -4.7
Midland Count 27 6 33
Expected Count 28.6 4.4 33.0
Adjusted Residual -.9 .9
Mini Count 9 8 17
Expected Count 14.7 2.3 17.0
Adjusted Residual -4.3 4.3
Pseudo Count 16 3 19
Expected Count 16.4 2.6 19.0
Adjusted Residual -.3 .3
Unifacial Count 10 5 15
Expected Count 13.0 2.0 15.0
Adjusted Residual -2.4 2.4
Total Count 154 24 178
Expected Count 154.0 24.0 178.0
Chi-Square Tests
Value df
Asymp. Sig. (2-sided)
Pearson Chi-Square
32.598a 4 .000
Likelihood Ratio 30.958 4 .000
N of Valid Cases 178

247
The final raw material analysis encompasses nearly the entire sample of points and
preforms and completely eliminates the problem of small sample sizes. In order for this analysis
to be performed across sites, the raw material types from each site are homogenized into
“Dominant” and “Non-dominant” categories. The occurrences of the most abundant raw
materials for each site are counted until those materials account for at least 50% of the points and
preforms from that site. Those raw materials are then renamed “Dominant.” All the other raw
materials from that site are termed “Non-dominant.” Only two sites are eliminated from this
analysis: Plainview, due to its lack of Folsom artifacts; and Two Moon, because it only contains
two Folsom points made from different materials, making it impossible to determine which is
dominant. On the other hand, the large personal collections of Tom Westfall and Jim Cox are
included in this analysis, despite the fact that they are not from discrete sites, because dominant
raw materials are readily discernible in both collections. Most point types from this sample are
included in the analysis, but a few are eliminated due to small sample sizes. The removed types
are Cody and Milnesand, while the Goshen points from Hell Gap are lumped in with Plainview.
If this analysis supports Hofman’s approach, then Folsom points should be preferentially made
from dominant materials, while Midland, unifacially fluted, pseudo-fluted, and miniature points
would more likely be made from the non-dominant materials, since those materials should
represent the supplies that were running low.
The results of the Chi-square test comparing point types with dominant and non-
dominant raw materials are highly significant (Table 62). However, the direction of the
significance is almost the opposite of the expectations based on Hofman’s model. Folsom points
are made on non-dominant materials more often than expected, while Midland points are made
on dominant materials more often than expected. The final point type with a significant adjusted
248
residual score is indeterminate unfluted, which is made from non-dominant materials more often
than expected. Unifacially fluted, pseudo-fluted, and miniature points do not deviate
significantly from their expected proportions of material types. These results do not support
Hofman’s approach as stipulated in the analysis procedure, but the presence of other significant
results may indicate that the underlying assumption of direct raw material procurement is
incorrect.

249
Table 62: Chi-square test comparing point types to dominant and non-dominant material types
for all applicable assemblages.
Style * Material Crosstabulation
Material
Total Dominant Non-
dominant
Style Folsom Count 374 186 560
Expected Count 392.8 167.2 560.0
Adjusted Residual -2.70 2.70
Indet Count 9 13 22
Expected Count 15.4 6.6 22.0
Adjusted Residual -3.03 3.03
Midland Count 182 38 220
Expected Count 154.3 65.7 220.0
Adjusted Residual 4.65 -4.65
Miniature Count 24 8 32
Expected Count 22.4 9.6 32.0
Adjusted Residual 0.61 -0.61
Plainview Count 21 12 33
Expected Count 23.1 9.9 33.0
Adjusted Residual -0.83 0.83
Pseudo-fluted
Count 29 14 43
Expected Count 30.2 12.8 43.0
Adjusted Residual -0.40 0.40
Unifacially Fluted
Count 33 15 48
Expected Count 33.7 14.3 48.0
Adjusted Residual -0.22 0.22
Total Count 672 286 958
Expected Count 672.0 286.0 958.0

250
Table 62 continued.
Chi-Square Tests
Value df
Asymp. Sig. (2-sided)
Pearson Chi-Square
29.851a 6 .000
Likelihood Ratio 30.675 6 .000
N of Valid Cases 958

251
Ultrathin Bifaces
These finely made bifaces are not present in large numbers in most Folsom sites, but their
raw materials can be analyzed as an aggregate using the same “dominant” and “non-dominant”
categories as the preceding analysis. For the sake of consistency, the raw materials of the
ultrathin bifaces are determined to be dominant or non-dominant based on the projectile point
and preform data. Because of this decision, some sites and collections have more ultrathin
bifaces made from non-dominant materials than from dominant materials. Those assemblages
are Lindenmeier, Krmpotich, Mud Springs, and the Cox collection. However, the three sites in
this list have a very small sample of ultrathin bifaces. Krmpotich and Mud Springs only have
one biface each in this sample, and Lindenmeier only has five due to the fact that none of the
bifaces in the Smithsonian collection were examined. Finally, the Cox collection of ultrathins
does not come from a specific archaeological site and may be unrelated to the projectile point
collection. As such, it appears likely that ultrathin bifaces are generally made from the most
abundant materials present at any particular site, or at least they are made from the same
materials as the majority of the projectile points at a site.
However, not all of the bifaces assigned to the ultrathin biface category are
technologically the same. In the technological analysis chapter, some of these artifacts are
termed “thick bifaces” or “flake bifaces.” These bifaces appear to have served the same purpose
as ultrathins, but it is possible that they are morphologically different due to being made from
different raw materials. Table 63 gives the results of the Chi-square test comparing different
bifacial knife forms to material type (dominant vs. non-dominant). The results show that
finished ultrathin bifaces and flake bifaces match the expected proportions of dominant and non-
dominant materials, while ultrathin preforms and thick bifaces deviate from their expected

252
proportions. Ultrathin preforms fall just shy of having a significant adjusted residual score, but
their results are worth discussing. The preforms are more commonly made from dominant
materials than expected, suggesting that ultrathin bifaces are indeed likely made from the most
prevalent materials available, at least in terms of projectile point raw materials. On the other
hand, thick bifaces are made from less commonly used materials, and these materials often
appear to be coarser varieties such as quartzite. Flake bifaces are the least common form, but it
appears that raw material type does not play a significant role in determining their morphology.
Instead, they may simply be a more expedient form of ultrathin biface.

253
Table 63: Chi-square test comparing ultrathin biface forms to dominant and non-dominant
material types for all applicable assemblages.
Style * Material Crosstabulation
Material
Total Dominant Non-
dominant
Style Flake Biface
Count 2 1 3
Expected Count 2.1 .9 3.0
Adjusted Residual -0.11 0.11
Thick Biface
Count 1 6 7
Expected Count 4.9 2.1 7.0
Adjusted Residual -3.30 3.30
Ultrathin Count 44 18 62
Expected Count 43.0 19.0 62.0
Adjusted Residual 0.51 -0.51
Ultrathin Preform
Count 12 1 13
Expected Count 9.0 4.0 13.0
Adjusted Residual 1.95 -1.95
Total Count 59 26 85
Expected Count 59.0 26.0 85.0
Chi-Square Tests
Value df
Asymp. Sig. (2-sided)
Pearson Chi-Square
13.310a 3 .004
Likelihood Ratio 13.366 3 .004
N of Valid Cases 85

254
Discussion
The preceding raw material analysis for the sampled Folsom point assemblages does
bring up some intriguing questions. Since there is little support for Hofman’s approach when
looking at the sample as a whole, the first question must be whether his approach accurately
describes Folsom behavior in certain regions. There are five sites that may provide tentative
support for Hofman’s model and ten sites that do not (provided one accepts the results of the
site-by-site Chi-square tests). The five sites that support the model are included based on having
significant adjusted residual scores for non-dominant raw materials for Midland, unifacially
fluted, pseudo-fluted, and/or miniature points. These sites are Shifting Sands, Scharbauer, Cedar
Creek, Sulphur River, and Mud Springs. Lindenmeier may also be considered based on these
criteria, but it was excluded because numerous non-dominant raw materials are also represented
solely by Folsom points. Perhaps the most important observation to note on these sites is that
four of them come from the southern Plains, and three of those sites are located in Texas.
However, none of the five sites listed above provide particularly strong support for Hofman’s
model. Shifting Sands has some significant scores, but it also has a greater than expected count
of Midland points made on Edwards chert, the site’s dominant material. Scharbauer’s and
Sulphur River’s significances are based on one point each. Mud Springs has a significant
Midland and a unifacially fluted point, but it has a wide variety of raw materials, most of which
are only represented by one artifact each. Finally, Cedar Creek actually yields some promising
results in favor of Hofman’s hypothesis, but the overall Chi-square test for the site is not
significant. Perhaps the fact that significant residuals appear primarily in southern Plains sites is
simply the result of more unfluted Folsom-age points being present at these sites than elsewhere.

255
The implications of this regional difference were touched upon in the Gault chapter and will be
further explored in the next chapter.
The second question raised is whether a factor other than stone tool technology is
contributing to the results observed in the analysis of dominant vs. non-dominant material types.
One possibility worth considering is that some of the non-dominant raw materials may have been
obtained indirectly via trade or small task groups. Hofman’s (1992:197) approach assumes that
Folsom groups obtained their lithic materials directly as part of their regular movements.
However, other researchers have considered other options. Speth et al. (2013) explore the
possibility of trade and small group procurement of raw materials from an ethnographic
perspective. For example, select groups of male Australian Aborigines have been recorded
traveling on a 300 mile trip to obtain red ochre, and each individual would carry about 70 pounds
of it back to the base camp (Speth et al. 2013:115). If recent Aborigines were willing to make
such an arduous trip for a material that is unrelated to subsistence, then it is not difficult to
imagine Folsom-age Paleoindians making similar trips for exotic lithic supplies. In this case, the
red ochre is valuable for its use in ceremonies and for its potential to be traded for a variety of
goods. However, red ochre is not the only material that Aborigines sent special task groups to
procure. According to Speth et al. (2013:116), special groups were sent to obtain any material
that was considered to hold significant spiritual or symbolic properties, including:
…obsidian, turquoise, mica, copper, silver, galena, freshwater pearls, quartz crystals,
greenstone for making stone axes, salt, marine shells, feathers, shark’s teeth and other
fossils, furs, hair (both human and animal), red ocher, herbal medicines, catlinite, special
construction timbers and wood for making bows and arrows, and many other materials
and substances…
As mentioned previously, Bamforth (2009) has also explored the possibility of toolstone
procurement by trade or task groups, specifically within the context of Paleoindian projectile

256
points, which often appear to be made from more distantly obtained materials than any other
tools found at a site. When addressing the issue of trade, Meltzer (2003:553) states that lithic
raw materials are unlikely to be traded in an unmodified form; instead, finished points and
perhaps bifacial cores would be exchanged between groups. This inference leads to a possible
explanation for the raw material variability observed among Folsom points in this study. If
Folsom points are more commonly made from non-dominant raw materials than the other point
types, it may be because Folsom points were exchanged more often than the other types. In that
case, assuming that Meltzer is correct in that finished points are more likely to be exchanged
than unfinished tools, then more finished Folsom points should be made of non-dominant
materials than preforms. Table 64 gives the results of a Chi-square test indicating that this
inference is likely correct for this research sample. Finished Folsom points are made from non-
dominant materials more often than expected, fluted preforms (late stage) match the expected
counts, and unfluted preforms (early stage) are made from dominant materials more often than
expected. Although these results indicate the possibility of trade occurring during the Folsom
period, this explanation is not the only way to interpret the data. It may be possible that finished
Folsom points are more curated than the other point types, and so discarded Folsom points made
from non-dominant materials represent points that were retained for a long time. However, an
examination of maximum lengths for complete Folsom and Midland points in the Technological
Analysis chapter reveals no significant difference between the two point types, suggesting that
they underwent similar use-lives prior to discard. Instead, the existence of a trend from
dominant materials in early stage preforms to non-dominant materials in finished points most
likely suggests that Folsom preforms were kept in an unfinished state for a while before being
finished and employed as weapons. This scenario indicates that staged approaches to Folsom

257
point production as suggested by Frison and Bradley (1980) may be more than just modern
analytical categories and could be accurate representations of past human behavior.
Another explanation is that the aggregate data used in Table 64 are biased by the
presence of Folsom points from specific sites or collections, where points made from various
materials are often present to the exclusion of most other artifacts. A site-by-site examination of
dominant and non-dominant raw materials for Folsom points and preforms (see “Dominant
Materials.xls” in the attached files) shows that there are 15 sites or collections with both Folsom
points and preforms that are made from dominant and non-dominant materials (although two of
those sites, Scharbauer and Sulphur River, only have a single preform each). Of these, only Rio
Rancho, the Westfall site, and Big Black have significant Chi-square tests with greater than
expected counts of non-dominant Folsom points. Lindenmeier also deserves mention because it
does not have a significant Chi-square, but the adjusted residuals for non-dominant Folsom
points are high. Therefore, only a small number of individual sites have Folsom points that are
made on non-dominant materials more often than expected when compared to preforms. That
being the case, it appears that a small number of sites may be inflating the total count of Folsom
points made from non-dominant materials and making the population-level results appear
significant.

258
Table 64: Chi-square test comparing Folsom points and preforms to dominant and non-dominant
material types for all applicable assemblages.
MorphType * Material Crosstabulation
Material
Total Dominant Non-
dominant
MorphType Fluted Point
Count 193 122 315
Expected Count 210.4 104.6 315.0
Adjusted Residual -3.14 3.14
Fluted Preform
Count 136 58 194
Expected Count 129.6 64.4 194.0
Adjusted Residual 1.21 -1.21
Unfluted Preform
Count 45 6 51
Expected Count 34.1 16.9 51.0
Adjusted Residual 3.41 -3.41
Total Count 374 186 560
Expected Count 374.0 186.0 560.0
Chi-Square Tests
Value df
Asymp. Sig. (2-sided)
Pearson Chi-Square
15.861a 2 .000
Likelihood Ratio 17.806 2 .000
N of Valid Cases 560

259
One final test remains to determine whether the trade of finished artifacts contributes to
the prevalence of Folsom points made from non-dominant materials. The chapter on skill
analysis mentions the presence of very finely made projectile points in many assemblages,
informally termed “extra fine” points in this research. If Meltzer’s hypothesis is correct that
finished points were more likely to be traded than lithic materials in a rougher form, then “extra
fine” projectile points would likely have been highly prized. It would make sense then that these
high quality points would be traded more often than the more ordinary forms. However, a Chi-
square test examining dominant and non-dominant materials among “extra fine” and normal
points shows no significant differences (Table 65). Extra fine points are no more or less likely to
be made from other materials than regular points, suggesting that the high quality points were
obtained in the same manner as the rest of the points.

260
Table 65: Chi-square test comparing “extra fine” and normal quality points to dominant and non-
dominant material types for all applicable assemblages.
Quality * Material Crosstabulation
Material
Total Dominant Non-
dominant
Quality "Extra Fine"
Count 37 19 56
Expected Count 38.0 18.0 56.0
Adjusted Residual -0.29 0.29
Normal Count 420 198 618
Expected Count 419.0 199.0 618.0
Adjusted Residual 0.29 -0.29
Total Count 457 217 674
Expected Count 457.0 217.0 674.0
Chi-Square Tests
Value df
Asymp. Sig. (2-sided)
Exact Sig. (2-sided)
Exact Sig. (1-sided)
Pearson Chi-Square
.084a 1 .772
Continuity Correction
b .020 1 .888
Likelihood Ratio .083 1 .773
Fisher's Exact Test .767 .438
N of Valid Cases 674

261
Directionality and Distance of Dominant Raw Materials
As mentioned before, many of the raw materials differentiated in this study are not
properly identified by regional names, and their source locations are unknown. However, the
materials labeled as “dominant” are the most abundant and most easily recognizable in their
respective assemblages, and many of these materials can be traced to a particular source.
Therefore, these dominant materials may be used to determine the most recent travel directions
and distances that Folsom groups underwent prior to occupation of their respective sites. In sites
where lithic procurement took place, this analysis does not reveal any information on movement
because the dominant materials are immediately available at or near the site itself. This
consideration includes Barger Gulch in Wyoming and the Knife River Flint Quarry sites of
Bobtail Wolf and Big Black, along with Edwards Plateau sites such as Gault, Pavo Real,
Kincaid, Wilson-Leonard, and Bonfire. Edwards chert outcrops across the widest geographic
range of any lithic material source in North America (Hofman et al. 1991:297), is notoriously
variable in appearance, and differentiation among local sources has only recently become
possible using high resolution elemental analyses (Speer 2011). As such, an analysis directed
towards understanding the mobility patterns of Folsom-age groups utilizing Edwards chert
within the Edwards Plateau was not conducted, although its occurrence beyond this area was
examined. An examination of sites was conducted to see if the sourcing of the dominant
materials reveals useful insights on Folsom-age mobility. The distances included in this study
assume that Folsom-age people obtained their dominant raw materials from the primary source
of the stone, rather than from secondary sources such as stream cobbles.
Shifting Sands, Scharbauer, Wyche Ranch, and Lubbock Lake are all west Texas
Folsom-Midland sites largely dominated by Edwards chert. The TARL collection of points from

262
the Folsom assemblage from Blackwater Draw, New Mexico is also largely made up of Edwards
chert and can be considered as part of this grouping as well. In the case of Shifting Sands, the
closest identified source of Edwards chert is 150 km to the east, near Sterling City, Texas
(Hofman 1992:211). Scharbauer is located 80 km to the east of Shifting Sands, making it about
70 km distant from the same Edwards chert source (Hofman et al. 1990:221). Similarly, Wyche
Ranch is roughly 20 km east of Shifting Sands, placing it about 130 km east of the Sterling City
chert source (Holliday 1997:4). For Lubbock Lake, the distance to the same Edwards chert
source is just over 200 km to the south-southeast. Finally, the distance from Blackwater Draw to
the Edwards chert source at Sterling City is about 330 km to the southeast. For the sampled sites
in which Edwards chert dominates that are located away from the Edwards Plateau, the direction
of movement is primarily to the west and north, although no Folsom-age sites have been sampled
to the south and east of the plateau, making this sample biased. The fact that Edwards chert
dominates sites over 300 km away is a testament to its value to hunter-gatherers during the
Folsom period, and the extensive presence of Edwards chert in the Folsom artifacts from the
Martin site in New Mexico (Reitze et al. 2012) indicates that the material was even transported
in bulk as far as 550 km northwest from the Sterling City outcrop.
Rio Rancho is located only about 50 km west of the Martin site, but it completely lacks
Edwards chert. Instead, the most prevalent raw material at the site is termed “yellow and brown”
chert, but its source location is currently unknown (Huckell and Kilby 2002:22). The other most
common raw materials for the points and preforms sampled are obsidian and silicified wood.
The obsidian is known to occur in the Jemez Mountains 50 to 70 km to the north, but the
silicified wood source is also unknown (Huckell and Kilby 2002:21). Based on the obsidian and
less prevalent materials such as Pedernal, Chuska, Zuni Spotted, and San Andres cherts, the

263
surrounding Jemez, Chuska, and Zuni mountain ranges are the likely procurement locations for
many of the raw materials at Rio Rancho. These mountain ranges are located to the north (50-70
km), west (220 km), and southwest (115 km), respectively, suggesting that the Folsom-age
groups living in this area travelled in a curvilinear pattern between these ranges. However, the
uneven distribution of raw materials at the different Folsom loci in Rio Rancho complicates any
interpretation and brings up the possibility that either multiple groups or multiple occupations
converged at the site (Huckell and Kilby 2002:27-28).
The Folsom points and preforms from Lindenmeier are made from a wide variety of
materials, but only three of them stand out as dominant. The first, Flattop chalcedony, is derived
from a source due east, near Sterling, Colorado (Hofman 1990:20). The nearest town to
Lindenmeier is Wellington, Colorado, and the distance between Wellington and Sterling is about
150 km. However, this distance should be considered a maximum distance, as Wilmsen and
Roberts (1978:114) note that the chalcedony from Lindenmeier closely resembles lithic materials
from four outcrops about 7.8 km to the west. In this respect, Flattop chalcedony could possibly
be considered a local material. One of the other dominant materials is an unnamed chalcedony,
termed “Chalcedony A” in this analysis. In natural light, Chalcedony A appears white or gray in
color, in contrast to the pink color of Flattop chalcedony, but it is possible that both materials are
actually Flattop chalcedony, considering that they fluoresce similarly under UV light. The final
dominant raw material from Lindenmeier is Hartville Uplift chert. The Hartville Uplift lies in
eastern Wyoming, about due north of Lindenmeier. Using Wellington, Colorado again as a
proxy for Lindenmeier and Hartville, Wyoming as a proxy for the Hartville Uplift, the distance
between the two locations is about 170 km.

264
For the sample that was analyzed from the Folsom site, the dominant material is Alibates.
Alibates is present in proportionately smaller amounts in other assemblages in this research, such
as Blackwater Draw, Plainview, the Baker collection, Lindenmeier, and Cedar Creek, but it is
rarely the dominant material. The Alibates source is located in a fairly small outcrop north of
Amarillo, Texas, along the Canadian River. The Folsom site is located 265 m to the northwest of
the Alibates quarry (Meltzer 2006:261).
The Westfall collection consists of artifacts collected primarily from secondary stream
contexts in northeastern Colorado and southwestern Nebraska. Like Lindenmeier, the dominant
materials are Flattop chalcedony and Hartville Uplift chert. Because the source of Flattop
chalcedony is located near the town of Sterling in northeastern Colorado, it can be considered a
local material for many of the artifacts included in this assemblage. However, some of the more
distant counties in the Westfall collection may be up to 100 km northeast of the Flattop source.
The Hartville Uplift is located in east-southeast Wyoming. Using the towns of Hartville,
Wyoming and Sterling, Colorado as proxies, the source of Hartville Uplift chert is located
approximately 230 km northwest of the Westfall collection. However, it is necessary to point
out that the North Platte River runs along the south end of the Hartville Uplift and may have
transported chert cobbles into southwestern Nebraska, where some of the Westfall collection
originates.
The Westfall site, on the other hand, is dominated by Black Forest silicified wood. Since
the site is located near the headwaters of Bijou Creek in Elbert County, Colorado, the nearby
town of Elbert is used as a proxy in this analysis. According to Jodry (1999:88), Black Forest
silicified wood outcrops between Colorado Springs and Denver, with one variety of the material

265
appearing near Elbert itself. As such, the Westfall site appears to be composed mainly of local
raw materials.
The Krmpotich site lies in southwestern Wyoming, about 45 km north of the city of Rock
Springs (Peterson 2001:14). The two dominant materials in the research sample are called Green
River chert and oolitic chert in this analysis, and they refer to Green River Formation Upper
Laney Member chert (type 1-4) and ostracod chert (type 6), respectively, according to Peterson’s
MA thesis on the site (2001:46-49). Both of these materials could be considered local, as the
Green River chert can be found 20 km to the northeast, and oolitic chert outcrops are only 5 km
to the southeast of the site. Peterson (2001:46) states that all but two of the raw materials
identified at Krmpotich are found within 75 km of the site, indicating that the Folsom-age
inhabitants of the site did not need to travel far to acquire toolstone.
The Hanson site, in Big Horn County of northern Wyoming, is generally considered a
lithic procurement site (Frison and Bradley 1980). However, because its dominant raw materials
include two different cherts, some elaboration may be necessary. Morrison chert outcrops within
the Hanson site and is the apparent local material. Phosphoria, the other dominant material,
occurs on the western slopes of the Big Horn Mountains and is also close to the Hanson site,
although the distance has not been calculated.
For Agate Basin, the most dominant identifiable material of the Folsom component was
initially identified as Green River chert, but subsequent experience indicates that the material is
actually Knife River flint (Frison 1982c:176). This material occurs a substantial distance away
from Agate Basin, especially when considering its abundance among the Folsom points and
preforms. Using Edgemont, South Dakota as the town nearest to Agate Basin and Dunn Center
as the town nearest to the Knife River flint quarries, the distance from the Knife River quarries to
266
the Agate Basin site is over 470 km to the south-southwest. It should be noted, however, that a
material that appears similar to Knife River flint may occur within the Hartville Uplift and as
such may not represent long distance movement, according to Sellet’s (1999:24) communication
with Jim Miller regarding Knife River flint in the assemblage from Hell Gap.
The dominant raw materials for the Folsom, Goshen, and Midland components at Hell
Gap are somewhat difficult to properly identify due to variations in UV light reactions. One of
the dominant materials has been assigned the name “Hartville B” because it has the visual
appearance of Hartville Uplift chert but reacts differently under UV light. Generally, Hartville
Uplift chert has no noticeable UV reaction, but Hartville B turns orange in longwave and green
in shortwave light. The other dominant material is given the name “Phosphoria A” for similar
reasons. Phosphoria and red jasper have proven difficult to distinguish in the eyes of a
researcher who is inexperienced in High Plains raw material types, resulting in tentative
identifications that may be subject to change. In the present research, the dominant material
types for Hell Gap are considered to be derived from the sources for Hartville Uplift and
Phosphoria cherts. Due to the location of Hell Gap within the source area for Hartville Uplift
chert, Hartville B is likely a local material. Using the town of Ten Sleep just west of the Big
Horn mountains as a source location for Phosphoria A and Hartville as the proxy for Hell Gap, it
appears that Phosphoria A was transported about 260 km to the southeast to arrive at the Hell
Gap site.
Cedar Creek is located in a chert-poor area of Oklahoma, so all of the material at the site
was obtained from sources that are significant distances away. The dominant material is
Edwards chert, and good quality outcrops of this material occur at least 300 km to the south. The

267
most prevalent non-dominant material is Alibates, which appears over 250 km to the northwest,
according to Hofman (1990:20).
Figure 20 traces the movements of dominant raw materials for most of the sites and
collections in the research sample. Because only the dominant raw materials are accounted for in
this map, it most likely represents the most recent retooling events for each of these sites. Still, it
is worth noting Hofman’s (1992:208) caveat that there may not necessarily be a straight line
from a retooling event to the site of discard, although specifically examining the last retooling
events eliminates as many detours as possible. Figure 20 documents an overall trend for Folsom
period material movements, in which raw materials from the northernmost and southernmost
Folsom localities tend to move the farthest, and those movements tend to travel into the center of
Folsom’s geographic range. Meanwhile, the sites closer to the center of the Folsom geographic
range (particularly in Colorado) tend to have artifacts made primarily from local materials or
from materials that are sourced fairly close by. These raw materials do not travel in any large
amounts away from the center, however. These combined trends give an impression of Folsom
toolstone movements as contracting inward towards the center of the geographic range. Of
course, it is important to remember that this analysis only traces the dominant raw materials
involved in projectile point production and may not represent the raw materials used for other
tools (see Bamforth 2009).

268
Figure 20: Map portraying the approximate locations of 21 Folsom sites sampled in this research.
Arrows indicate the movement of dominant raw material types.

269
Conclusions
The analyses performed in this chapter generally do not support Hofman’s model of
Folsom-era projectile point raw material movement, but these results are likely due to a problem
with the underlying assumptions of the model. Hofman’s (1992:199-208) model assumes that
raw material is transported in the form of large bifacial cores or flake blanks, but it appears that
individual Folsom preforms were often transported long distances before being finished into
points. On the other hand, the other point forms were more likely made in one sitting. This
interpretation may be significant to the study of Folsom point technology because it indicates
that a “staged” approach to the analysis of Folsom points and preforms may have some
prehistoric validity. Further study will be necessary to determine whether modern staged
reduction systems approximate possible prehistoric systems. Because the other point types are
not as commonly made from non-dominant raw materials, it is reasonable to infer that they were
typically manufactured in one sitting. As a cautionary note, however, the aggregate data used to
reveal this trend may be biased by a small portion of the sampled sites, so additional data from
more Folsom-age residential campsites may be necessary to verify the phenomenon.

270
CHAPTER 7: REGIONAL ANALYSES
The previous three chapters address issues largely related to Folsom-age stone tool
technology as a whole entity, without addressing trends that may vary between regions. This
chapter explores possible regional trends in order to address some lingering questions. First, the
discussion section in the Gault chapter mentions that there may be a link between chronology,
latitude, and the relative abundance of Midland points at Folsom sites. The first portion of this
chapter tests this idea quantitatively, first by comparing proportions of point types to the
longitude and latitude of site locations, then by comparing point type proportions to the available
radiocarbon dates of relevant sites, and finally by checking the results of Collard et al. (2010) by
comparing longitude and latitude of Folsom sites to the available radiocarbon dates. The next
portion of this chapter explores a question first presented in the technological analysis chapter: if
Midland points were hafted differently from Folsom as suggested by some of their
measurements, is it likely that they were used for hunting game other than bison? This section
relies on analyzing sites in which faunal remains are preserved to compare proportions of Folsom
and non-Folsom points to proportions of bison and non-bison game. Finally, the last portion of
this analysis explores occurrences of certain sub-types of artifacts to determine whether any
regional trends are apparent. Of particular interest in this section are regional distributions of
“extra fine” points and pristine but discarded Folsom preforms.
Latitude/Longitude Analysis of Folsom-age Point Types
Archaeologists have often casually observed that Midland points are more common in the
southern Plains than in any other region in which Folsom points occur (Amick 1995), but the

271
extent of this geographic trend has not been quantified. Moreover, researchers have not explored
whether a similar trend holds true for unifacially fluted, pseudo-fluted, or miniature points. For
this analysis, points are given latitude and longitude coordinates based on the county in which
they were found. Because the extent of the Folsom range covers the entire central portion of the
continental U.S., using county-level data should provide sufficient resolution while allowing for
the inclusion of as many points as possible. Points from every archaeological site and almost
every personal collection retain a record of their county of origin, with the exception of the
Baker collection and a few miscellaneous points, allowing for a significant sample size. The
analysis uses independent samples t-tests to determine whether significant differences in mean
latitude and longitude are present for the different point types.
Comparing the latitudes and longitudes of Folsom and Midland points gives both
expected and unexpected results (Table 66). Levene’s test gives p-values lower than 0.05,
indicating that the variances between Folsom and Midland points are unequal. This result is
expected based on the inference that Folsom points occur commonly across a wider area than
Midland points. The significant difference in latitude is also expected, as the dearth of Midland
points in the northern Plains has been noted before. In this study, the difference in latitude is
highly significant, with Folsom points having a mean latitude that is between 3.3 and 4.8 degrees
higher than Midland points at 95% confidence. The more unexpected result is that the difference
in longitude between Folsom and Midland points also gives a highly significant p-value, with
Folsom points having an average longitude that is between 1.2 and 2.2 degrees greater than
Midland points. Therefore, these results indicate that Midland points are relatively rare in
Folsom sites that are in the northern or western portions of Folsom’s geographic extent. Amick
(1995:30) has noted that Midland points are not nearly as prevalent in the Basin and Range

272
region of New Mexico when compared to their strong presence in west Texas, and this
distinction may contribute to the significant longitude difference. However, this difference may
also be a result of sampling bias, as the sites and collections sampled tend to fall on a slight
northwest/southeast geographic axis. Either way, it should be noted that even though the
difference in longitude is statistically significant, the mean longitude difference is not nearly as
strong as the difference in latitude.
Unifacially fluted points appear somewhat evenly spread across regions, but even still
Table 67 indicates a statistically significant difference in average latitude between Folsom and
unifacially fluted points. Levene’s test for variances reveals no significant difference between
the two point types, indicating that they indeed likely extend across similarly sized ranges. The
difference in mean latitude between the points has a significant p-value of 0.033, but the 95%
confidence interval for this difference is between 0.13 and 3.08 degrees. Therefore, the
difference in latitude between Folsom and unifacially fluted points may not be very great despite
the statistical significance. There is no significant difference in longitude between the two point
types.
The differences in mean latitude and longitude for Folsom and pseudo-fluted points is
much the same as those between Folsom and unifacially fluted points (Table 68). A statistically
significant difference in latitude is present (p=0.018), but the 95% confidence interval ranges
from 0.33 to 3.44 degrees, making the magnitude of that difference fairly small. No significant
difference in mean longitude exists between Folsom and pseudo-fluted points.
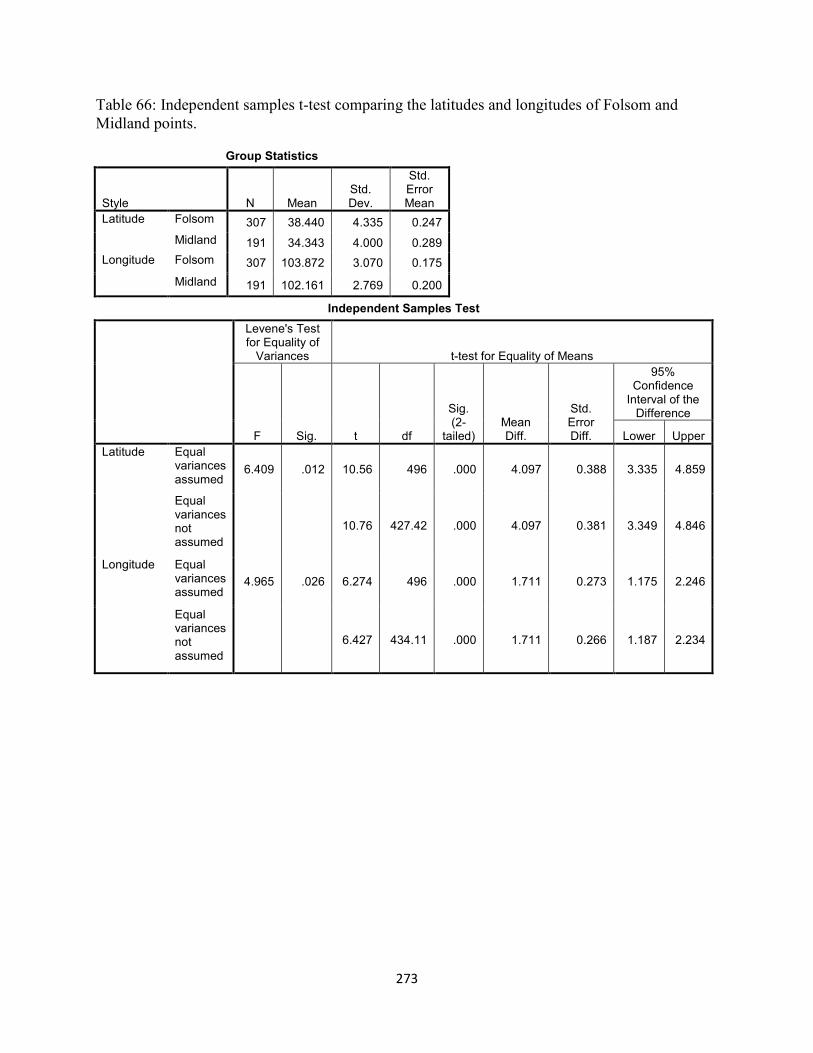
273
Table 66: Independent samples t-test comparing the latitudes and longitudes of Folsom and
Midland points.
Group Statistics
Style N Mean Std. Dev.
Std. Error Mean
Latitude Folsom 307 38.440 4.335 0.247
Midland 191 34.343 4.000 0.289
Longitude Folsom 307 103.872 3.070 0.175
Midland 191 102.161 2.769 0.200
Independent Samples Test
Levene's Test for Equality of Variances t-test for Equality of Means
F Sig. t df
Sig. (2-
tailed) Mean Diff.
Std. Error Diff.
95% Confidence Interval of the Difference
Lower Upper
Latitude Equal variances assumed
6.409 .012 10.56 496 .000 4.097 0.388 3.335 4.859
Equal variances not assumed
10.76 427.42 .000 4.097 0.381 3.349 4.846
Longitude Equal variances assumed
4.965 .026 6.274 496 .000 1.711 0.273 1.175 2.246
Equal variances not assumed
6.427 434.11 .000 1.711 0.266 1.187 2.234

274
Table 67: Independent samples t-test comparing the latitudes and longitudes of Folsom and
unifacially fluted points.
Group Statistics
Style N Mean Std. Dev.
Std. Error Mean
Latitude Folsom 307 38.440 4.335 0.247
Unifacia 37 36.833 4.063 0.668
Longitude Folsom 307 103.872 3.070 0.175
Unifacia 37 103.322 3.087 0.507
Independent Samples Test
Levene's Test for Equality of Variances t-test for Equality of Means
F Sig. t df
Sig. (2-
tailed) Mean Diff.
Std. Error Diff.
95% Confidence Interval of the Difference
Lower Upper
Latitude Equal variances assumed
.017 .896 2.14 342 .033 1.607 0.749 0.133 3.081
Equal variances not assumed
2.26 46.45 .029 1.607 0.712 0.174 3.040
Longitude Equal variances assumed
.656 .419 1.03 342 .305 0.549 0.535 -0.502 1.601
Equal variances not assumed
1.02 45.02 .312 0.549 0.537 -0.532 1.630

275
Table 68: Independent samples t-test comparing the latitudes and longitudes of Folsom and
pseudo-fluted points.
Group Statistics
Style N Mean Std. Dev.
Std. Error Mean
Latitude Folsom 307 38.440 4.335 0.247
Pseudo-f 33 36.552 4.152 0.723
Longitude Folsom 307 103.872 3.070 0.175
Pseudo-f 33 103.122 2.637 0.459
Independent Samples Test
Levene's Test for Equality of Variances t-test for Equality of Means
F Sig. t df
Sig. (2-
tailed) Mean Diff.
Std. Error Diff.
95% Confidence Interval of the Difference
Lower Upper
Latitude Equal variances assumed
.168 .682 2.39 338 .018 1.888 0.791 0.332 3.444
Equal variances not assumed
2.47 39.88 .018 1.888 0.764 0.344 3.432
Longitude Equal variances assumed
2.997 .084 1.35 338 .178 0.750 0.555 -0.343 1.842
Equal variances not assumed
1.53 41.91 .135 0.750 0.491 -0.242 1.741

276
For the analysis comparing the latitudes and longitudes of Folsom and miniature points,
all the sub-types of miniature points are combined to increase their sample size. The results
indicate that a statistically significant difference exists for both mean latitude and longitude for
the two point types (Table 69). For latitude, the difference is highly significant with a p-value of
0.000 and a 95% confidence interval between 2.91 and 6.08 degrees. For longitude, the
difference is still significant, but not as strongly as it is for latitude. The p-value for longitude is
0.021, and the interval is between 0.18 and 2.04 degrees, indicating that the difference in
longitude between the point types is not very great. Based on these results, the difference in
mean coordinates between Folsom and miniature points is similar to the difference between
Folsom and Midland points, with miniature points being prevalent in the southern or eastern
portions of Folsom’s geographic range.
Comparing the mean longitude and latitude of Midland points to the remainder of the
Folsom variants also reveals significant differences. First, both the latitudes and longitudes of
Midland and unifacially fluted points are statistically different (Table 70). For latitude, the
difference has a p-value of 0.001 and a 95% confidence interval of 1.07 to 3.91 degrees, with
Midland point occurrences centered farther south than unifacially fluted points. In terms of
longitude, the difference has a p-value of 0.023 and a confidence interval between 0.16 and 2.16
degrees, indicating that Midland points tend to occur slightly farther to the east than unifacially
fluted points, although the difference may be negligible.

277
Table 69: Independent samples t-test comparing the latitudes and longitudes of Folsom and
miniature points.
Group Statistics
Style N Mean
Std. Deviatio
n
Std. Error Mean
Latitude Folsom 307 38.440 4.335 0.247
Miniatur 32 33.943 4.351 0.769
Longitude Folsom 307 103.872 3.070 0.175
Miniatur 32 102.763 2.414 0.427
Independent Samples Test
Levene's Test for Equality of Variances t-test for Equality of Means
F Sig. t df
Sig. (2-
tailed) Mean Diff.
Std. Error Diff.
95% Confidence Interval of the Difference
Lower Upper
Latitude Equal variances assumed
.023 .881 5.58 337 .000 4.497 0.805 2.912 6.081
Equal variances not assumed
5.57 37.70 .000 4.497 0.808 2.861 6.133
Longitude Equal variances assumed
3.900 .049 1.98 337 .049 1.109 0.560 0.007 2.211
Equal variances not assumed
2.40 42.22 .021 1.109 0.461 0.178 2.039

278
Table 70: Independent samples t-test comparing the latitudes and longitudes of Midland and
unifacially fluted points.
Group Statistics
Style N Mean Std. Dev.
Std. Error Mean
Latitude Midland 191 34.343 4.000 0.289
Unifacia 37 36.833 4.063 0.668
Longitude Midland 191 102.161 2.769 0.200
Unifacia 37 103.322 3.087 0.507
Independent Samples Test
Levene's Test for Equality of Variances t-test for Equality of Means
F Sig. t df
Sig. (2-
tailed) Mean Diff.
Std. Error Diff.
95% Confidence Interval of the Difference
Lower Upper
Latitude Equal variances assumed
1.376 .242 -3.46 226 .001 -2.490 0.720 -3.909 -1.071
Equal variances not assumed
-3.42 50.45 .001 -2.490 0.728 -3.952 -1.028
Longitude Equal variances assumed
.112 .739 -2.29 226 .023 -1.161 0.507 -2.160 -0.163
Equal variances not assumed
-2.13 47.88 .038 -1.161 0.546 -2.259 -0.064

279
Comparing the latitude means for Midland and pseudo-fluted points yields similar results,
but the difference in longitude is not significant at the 95% level (Table 71). For latitude, the
difference between Midland and pseudo-fluted points has a p-value of 0.004 and a confidence
interval between 0.72 and 3.7 degrees, with the mean Midland point latitude occurring south of
the mean for pseudo-fluted points. The difference in mean longitude has a p-value of 0.065,
slightly above the 0.05 cutoff for a 95% confidence interval.
Finally, a comparison of mean latitude and longitude between Midland and miniature
points yields no significant differences (Table 72). The p-value for latitude between the two is
0.606, and it is 0.248 for longitude, indicating that there is no significant difference in the means
of these two point types. Not coincidentally, Midland and miniature points both have the most
significant differences in mean coordinates from Folsom points, suggesting that the occurrences
of Midland and miniature points are correlated on a regional scale.

280
Table 71: Independent samples t-test comparing the latitudes and longitudes of Midland and
pseudo-fluted points.
Group Statistics
Style N Mean Std. Dev.
Std. Error Mean
Latitude Midland 191 34.343 4.000 0.289
Pseudo-f 33 36.552 4.152 0.723
Longitude Midland 191 102.161 2.769 0.200
Pseudo-f 33 103.122 2.637 0.459
Independent Samples Test
Levene's Test for Equality of Variances t-test for Equality of Means
F Sig. t df
Sig. (2-
tailed) Mean Diff.
Std. Error Diff.
95% Confidence Interval of the Difference
Lower Upper
Latitude Equal variances assumed
2.611 .108 -2.91 222 .004 -2.209 0.758 -3.704 -0.715
Equal variances not assumed
-2.84 42.90 .007 -2.209 0.778 -3.780 -0.639
Longitude Equal variances assumed
.359 .550 -1.85 222 .065 -0.961 0.519 -1.983 0.061
Equal variances not assumed
-1.92 45.08 .061 -0.961 0.501 -1.970 0.048

281
Table 72: Independent samples t-test comparing the latitudes and longitudes of Midland and
miniature points.
Group Statistics
Style N Mean Std. Dev.
Std. Error Mean
Latitude Midland 191 34.343 4.000 0.289
Miniatur 32 33.943 4.351 0.769
Longitude Midland 191 102.161 2.769 0.200
Miniatur 32 102.763 2.414 0.427
Independent Samples Test
Levene's Test for Equality of Variances t-test for Equality of Means
F Sig. t df
Sig. (2-
tailed) Mean Diff.
Std. Error Diff.
95% Confidence Interval of the Difference
Lower Upper
Latitude Equal variances assumed
1.746 .188 .516 221 .606 0.399 0.774 -1.125 1.924
Equal variances not assumed
.486 40.27 .630 0.399 0.822 -1.261 2.060
Longitude Equal variances assumed
.716 .398 -1.16 221 .248 -0.602 0.520 -1.627 0.423
Equal variances not assumed
-1.28 45.82 .208 -0.602 0.471 -1.551 0.347

282
To summarize, an analysis of Folsom-age point variants based on the average latitudes
and longitudes in which they were found reveals that significant differences in spatial
distributions do exist. These differences are primarily related to latitude. The mean coordinates
for Folsom points occur farther to the north than the other types, while Midland and miniature
points appear farthest to the south. Unifacially fluted and pseudo-fluted points occur roughly
halfway in between the Folsom and Midland/miniature coordinates. In terms of longitude,
statistically significant differences exist between some point types, but the values of those
differences are fairly small. For the most part, the differences in longitude are only significant
among the point types with the most geographically disparate coordinates, particularly between
Folsom/Midland and Folsom/miniature points. However, Midland and unifacially fluted points
also have significant differences in longitude, and the results for Midland and pseudo-fluted
point longitudes are almost significant, but not quite. Overall, the geographic trend in mean
coordinates for the point variants (starting from Folsom and ending at Midland and miniature
points) is primarily from north to south, and to a lesser extent from west to east (Figure 21).
These results do come with a caveat: not all assemblages or collections have been
sampled to 100% of their known artifact counts, and not all known Folsom sites and collections
have been accounted for in this research. In particular, only a fraction of the extensive
Lindenmeier assemblage has been analyzed here, and a more complete analysis of that site
would pull all of the plots in Figure 21 farther north. Therefore, these results are subject to
change as more data are accumulated and more Folsom sites are discovered. However, it is also
expected that the geographic distinction between the point types will remain significant as the
pool of data increases.

283
Figure 21: Maps with dots representing the mean coordinates for each Folsom point variant.
Ellipses represent variation about the mean within one standard deviation.

284
Radiocarbon Analysis
Chapter 3 summarized the results of Collard et al. (2010), who compiled radiocarbon
dates from Folsom and Clovis sites to determine whether the two technological complexes
overlap in age. Their findings suggest that Folsom and Clovis ages overlap in the north, but
there is a hiatus between them in the south, with the gap appearing south of 36°N latitude. These
results appear to coincide with the increasing prevalence of Midland and other Folsom-age point
types in the southern portion of Folsom’s geographic range. Based on these results, it is
tempting to state that fluting becomes de-emphasized towards the latter end of the Folsom
period, starting with the increased appearance of unifacially and pseudo-fluted points and
followed by Midland and miniature points in the southernmost (and hence, latest) sites. Before
that assertion can be made with confidence, however, it is necessary to test the reproducibility of
Collard et al.’s results using a methodology that encompasses the full range of Folsom-age
radiocarbon variation.
Collard et al. (2010:2514-2515) employ a methodology that utilizes pooled mean dates
from a sample of 16 Folsom sites and 14 Clovis sites. Each site is represented by a single date,
which in most cases is the mean of multiple dates that have been averaged in order to “prevent
site-phases with multiple dates from biasing the results” (Collard et al. 2010:2514). Any dates
with standard errors over 200 years are rejected. For sites with multiple Folsom occupations,
they only sample dates from the oldest component. Their analysis also utilizes calibrated dates
rather than the original radiocarbon dates, though they are careful to note that the “calibration
cliff” that occurs between 12,900 and 12,700 calendar years BP does not significantly affect their
post-calibration error ranges (Collard et al. 2010:2516). Collard et al. measure the distances
between sites in two ways (2010:2514). They first use a method that sets each site sequentially

285
as center point and measures the distances between it and all the other sites in turn and calculates
correlation coefficients between the sites and their respective pooled calibrated radiocarbon ages.
Second, the correlation coefficients are then compared to the sites’ latitudes to determine the
direction of the correlation. In this way, Collard et al. determine that Hell Gap is the site closest
to the point of origin for Folsom, and the technology spreads primarily in a southerly direction
from there, with the emergence of Folsom technology south of 36°N latitude being the result of
migration rather than cultural diffusion (2010:2516-2517).
The analysis conducted here is more straightforward and inclusive than Collard et al.’s,
which gives it the advantage of a larger sample size, but it can also obscure and reduce the power
of the results. The dated sites used for this analysis consist of those sampled by Collard et al.
(2010:2514, Table 1) and Holliday (2000:241-243, Table IIIb). The sites include Agate Basin,
Blackwater Draw, Bonfire Shelter, Carter-Kerr/McGee, Folsom, Hanson, Hell Gap,
Lindenmeier, Lipscomb, Lubbock Lake, and Waugh (Holliday 2000), as well as Barger Gulch
(Mayer et al. 2005), Black Mountain (Jodry et al. 1996), Bobtail Wolf (Root et al. 1996), Cooper
(Johnson and Bement 2009), Indian Creek (Davis and Baumler 2000), MacHaffie (Davis et al.
2002), and Mountaineer (Stiger 2006). The analysis includes all accepted Folsom dates,
regardless of standard error and including previously calculated averages. The dates are not
calibrated because absolute ages are not relevant in this study; the relationship between the
relative ages of the sites is what matters. Each date is given five entries: one for the mean, two
for the mean plus and minus one standard error, and two for the mean plus and minus two
standard errors, to account for 95% of the variation about the mean for each date. As with the
previous analysis, the latitude and longitude of the sites are determined based on the counties in
which the sites are located. The relationships between latitude, longitude, and the ages of the

286
Folsom sites are then investigated using scatterplots, correlation analysis, and regression
analysis.
The scatterplots (Figure 22) do not reveal an immediately apparent pattern. Naturally,
individual sites and dates have widely varying standard errors, making any possible trend
difficult to discern. However, by looking at the medians of each column of dates, a possible
trend may be evident. The relationship between age and latitude still appears random, while the
relationship between age and longitude appears to peak slightly in one area, suggesting that the
oldest Folsom sites occur just east of 104°W longitude. Still, this interpretation of the
scatterplots is by no means conclusive, so more quantitative analyses are necessary to parse more
definitive relationships.
A correlation analysis reveals that some significant relationships between latitude,
longitude, and age do exist (Table 73), although the results appear different from those expected
based on the scatterplots. First, there is a highly significant correlation (p=0.002) between
latitude and age, supporting Collard et al.’s (2010) results. Also, latitude and longitude are
highly correlated with each other (p=0.000), but that is simply an indication of the northwest-
southeast geographic trend of the dated Folsom sites. The correlation analysis does not find a
significant relationship between longitude and age, but this result is likely because the analysis
searches for linear relationships, while the scatterplot in Figure 22b indicates a curvilinear one.

287
Figure 22: Scatterplots showing the relationship between Folsom-age radiocarbon dates and
latitude (a) and longitude (b).

288
Table 73: Analysis of the correlations between latitude, longitude and age for dated Folsom sites.
Correlations
Age Longitude Latitude
Age Pearson Correlation 1 .005 0.159
Sig. (2-tailed) .919 .002
N 385 385 385
Longitude Pearson Correlation .005 1 0.665
Sig. (2-tailed) .919 .000
N 385 385 385
Latitude Pearson Correlation 0.159 0.665 1
Sig. (2-tailed) .002 .000
N 385 385 385
289
Regression analysis can provide additional insights into the relationships between age
and latitude and longitude. Using linear regression, a significant relationship is again apparent
between latitude and age, with age as the dependent variable (p=0.002, R2=0.025). The direction
of this relationship indicates that the older sites are in the north, and the younger sites are in the
south, but the extremely low R2 value reveals that the regression equation accounts for very little
of the variation in the data. This variation is due to the inclusion of two levels of standard errors
for each radiocarbon date, making it difficult if not impossible for any regression equation to
fully encompass all the data. However, even if all the standard errors are removed and only the
mean radiocarbon date values are used, the R2 value only increases to 0.064. While remaining
significant, the p-value also increases to 0.026.
It is worth noting that an outlier exists within the latitude and radiocarbon data. As seen
in Figure 23a, one site is located considerably farther south than the others and also has
radiocarbon dates that are noticeably younger on average than most of the others. This outlier is
Bonfire Shelter, and the relationship between its radiocarbon dates and its Folsom component
has been the subject of some debate. In the original analysis of the site, the Paleoindian
component of Bone Bed 2 is interpreted as representing three kill events, with the lowest kill
being Folsom in age and the others being associated with Plainview points (Dibble 1965:30-33).
The radiocarbon samples were taken from the uppermost kill and thought to be related only to
the Plainview component. However, a recent interpretation of the site proposes that Bone Bed 2
represents a single kill event and that the Folsom and Plainview points are contemporaneous
(Byerly et al. 2005; Cooper and Byerly 2005), although not all researchers accept this
interpretation (Bement 2007). Moreover, Collins (personal communication) states that the
radiocarbon sample was taken from an intrusive pit and is not related to Bone Bed 2 whatsoever.

290
Therefore, regression analysis must also be run while excluding the Bonfire dates from the
sample. Without the presence of the Bonfire Shelter dates, the linear regression analysis loses all
significance (p=0.498, R2=0.001), and the north-south trend disappears.
Because the scatterplot of longitude and age (Figure 22b) appears to have a slight
curvilinear trend, quadratic regression is also used to determine whether a significant relationship
exists between age and latitude or longitude. The results indicate that significant correlations
exist for both latitude (p=0.000, R2=0.098) and longitude (p=0.007, R
2=0.025), with latitude and
age actually expressing the more significant relationship of the two regressions (Figure 23).
However, as noted with the linear regression, the very low R2 values indicate that neither latitude
nor longitude are very powerful variables for encompassing the variation that is present in the
radiocarbon dates. When the standard errors of the radiocarbon dates are ignored and only the
mean date values are used, the quadratic regression for latitude and age remains significant at
p=0.00, while the R2 value increases to 0.248. However, using the same dates for the quadratic
regression of longitude and age eliminates the significance between these variables at the 95%
confidence level, inflating the p-value to 0.085, with an R2 value of 0.065. Unlike the linear
regression analysis, removing the Bonfire Shelter data from the sample does not eliminate the
significance of these quadratic regression analyses, although the significance and power of the
analyses are reduced slightly without the Bonfire data.

291
Figure 23: Scatterplots with overlaid quadratic regression lines. a. Latitude/age scatterplot with the quadratic
regression expressed as y(x) = -4.746x2 + 381.233x + 2958.046, where x = latitude and y = age. b. Longitude/age
scatterplot with the quadratic regression expressed as y(x) = -5.983x2 + 1260.142x – 55828.785, where x =
longitude and y = age.

292
The fact that curvilinear lines best depict the geographic distribution of Folsom period
radiocarbon dates indicates that the oldest sites occur somewhere towards the middle of their
geographic range, with the spread of Folsom technology moving more or less in all directions
from there. Assuming that the quadratic equations mentioned in the caption of Figure 23 are
accurate representations of a geographic trend among dated Folsom sites (despite the low R2
values), then a hypothetical latitude and longitude of the oldest Folsom occupation in North
America can be calculated from these equations. Based on the quadratic equations provided by
the regression analyses, the location of origin for Folsom technology appears to be at about
40.16°N latitude and 105.31°W longitude, which lies just west of Longmont, Colorado. This
result is roughly 250 km to the south of Collard et al.’s (2010:2514) estimate of a Folsom origin
near the Hell Gap site in Wyoming.
In summary, there appears to be a slight correlation between the age of Folsom sites and
their geographic location based on the methods used in this analysis. These results are slightly
different from those expressed in Collard et al. (2010), however. While Collard et al. suggest
that Folsom technology emerged in the northern portion of its range, near the Hell Gap site, the
analysis conducted here indicates that Folsom technology may have emerged closer towards the
center of its range, in north-central Colorado. At this point it is unclear which study may be the
more accurate. Collard et al.’s inclusion of possible non-Folsom radiocarbon dates from the
Bonfire Shelter may have skewed their results and inflated their significance. On the other hand,
the quadratic regressions used here are not strongly affected by the Bonfire data, but the low R2
values mean that the regression equations do a poor job of accounting for the wide variation of
standard errors in the radiocarbon dates. If these results are accepted, then there does not appear

293
to be a one-to-one correlation between Folsom site age and the relative abundance of unifacially
fluted, pseudo-fluted, Midland, and miniature points. Instead, the projectile point distribution
trend appears strictly geographic. Sites to the north of Colorado tend to have fewer of the non-
Folsom point varieties, while sites to the south typically have more. This trend may be due to the
preferences of different regional Folsom hunter-gatherer bands, but the possibility of a link
between point types and prey choice also deserves investigation.
Comparison of Point Types and Faunal Remains
The results of the technological analysis indicate that a statistically significant
morphological difference exists between Folsom and Midland points, suggesting that the two
types may have been hafted differently. The preceding sections indicate that although there are
geographic differences in the occurrences of Folsom and the other point types, there does not
appear to be a direct relationship between the occurrences of the point types and the ages of the
sites. These two results suggest that Folsom, Midland, and the other point types are roughly
contemporaneous but may have been used for slightly different purposes. The interpretation that
these tools are the tips of weapons intended to be thrown or otherwise propelled towards prey
from a distance is not challenged here, but it may be worth investigating whether there is a
correlation between Folsom-age point variants and proportions of bison and non-bison game. In
other words, this section considers the possibility that fluted Folsom points were largely reserved
for hunting bison, while Midland, unifacially fluted, pseudo-fluted, and/or miniature points were
used to hunt other game animals.
Table 74 displays the sites used in this analysis, along with the counts of point types and
faunal remains. The sites included in this analysis are those whose artifacts I have personally

294
analyzed and which also have yielded faunal remains that have been quantified in prior research.
Although numerous other Folsom sites with preserved faunal remains exist, the typology of the
artifacts associated with those remains may not have been determined using the same criteria as
this analysis, and so these extraneous sites are not included. Some sites, such as Blackwater
Draw, have Folsom components that have been analyzed here and also have well preserved
faunal remains, but those remains have not been sufficiently quantified for this comparison. The
point counts used in this section consist solely of finished projectile points and not preforms
because only finished points would presumably be used to hunt game. The “Folsom point”
designation includes only the formal, bifacially fluted Folsom points of the classic definition,
while the “other points” category is reserved for unifacially fluted, Midland, pseudo-fluted, and
miniature points. Plainview, Goshen, Cody, Milnesand, and indeterminate unfluted points are
excluded from the analysis. For the faunal remains, the data used are the minimum number of
individuals (MNI) counts for their respective Folsom components. The “bison” section refers to
the MNI of Bison antiquus from these components, while “other game” refers to any other prey
type of a size that would likely require a propelled dart to hunt successfully. In most cases, the
“other game” category pertains to deer and/or pronghorn, but other occurrences include elk,
peccary, horse, camel, and even wolf and dog. The horse and camel remains (from Bonfire
Shelter and Lindenmeier and Agate Basin, respectively) may be intrusive and not actually related
to the Folsom occupations, but they are included in this analysis for the sake of completeness.
Wolf and dog are included in this analysis because remains from the Agate Basin site exhibit
cutmarks suggesting human utilization of these animals (Walker 1982).

295
Table 74: Folsom sites containing faunal remains from the research sample. Includes counts of
sampled Folsom and variant point types as well as counts of bison and non-bison game.
Site Folsom
Points
Other
Points Bison
Other
Game References
Kincaid 3 2 1 0 Collins 1990:30
Lubbock Lake 4 3 3 1 Johnson 1987:62, 84
Bonfire 1 0 27 1 Dibble and Lorrain
1968:30
Wilson-
Leonard 0 2 2 0 Baker 1998:1506
Lindenmeier 70 40 13 6 Wilmsen and Roberts
1978:46
Folsom 5 1 32 1 Meltzer 2006:236, 243-
245
Agate Basin 3 2 9 9 Zeimens 1982:227-229,
Walker 1982:281
Hell Gap 2 9 4 2 Rapson and Niven 2009
Bobtail Wolf 10 3 5 1 Emerson 2000a:341
Big Black 12 0 1 1 Emerson 2000b:131, 136

296
Based on the data in Table 74, there does not appear to be any direct correlation between
the counts of projectile points and the MNI counts of game animals from the sampled sites. This
result is to be expected, however, as many of these sites represent different activities and
durations of residence, which can increase the counts of projectile points relative to faunal
remains or vice versa. Ratio variables can be created to reduce the effect of disparate count data
between points and faunal remains, but ratios such as “other points/Folsom points” and “non-
bison/bison MNIs,” are also imperfect. For example, the lack of Folsom points from Wilson-
Leonard means that such a point ratio is impossible for that site and must be excluded.
Performing regression analyses using the aforementioned ratio variables yields extremely
insignificant results (p-value=0.784 and R2=0.011 for linear, and p-value=0.966 and R
2=0.012
for quadratic regression). Based on this simple study, a correlation between Folsom-age point
types and Folsom prey choice cannot be supported.
This analysis represents a simple exploration of the possibility that different Folsom point
types were used in the pursuit of different game, so it does not account for the numerous factors
that affect the presence, absence, and preservation of these materials that can obscure the results.
The most obvious factor, though, is sample size. The sample of sites and collections used in this
research is not oriented towards the study of faunal remains, so the sample size for fauna is
smaller and likely less representative than the point sample. Also, site function is a previously
mentioned factor that can affect the amounts of faunal remains and artifacts present. The sites in
this sample range from extensive, long-term campsites like Lindenmeier, to large communal kill
sites like Folsom, and even to ephemeral sites such as Kincaid, whose Folsom component is
interpreted as the death site of a wounded bison that escaped an unsuccessful hunting attempt
(Collins 1990:30). A more thorough analysis of this topic would control for site types, analyzing

297
kill sites, residential camps, logistical camps, and lithic procurement sites on their own terms.
Finally, the different effects that weathering and taphonomic processes can have on large bison
bone opposed to the smaller bone of deer and other game has not been accounted for. The size
and density of larger bone such as bison makes it less likely to deteriorate or be transported by
scavengers or natural processes than the bones of smaller game (Lyman 1984). In their
ethnographic study of the Hadza in Tanzania, O’Connell et al. (1992:339) observe that the
remains of large game kill sites are far more visible than the remains from other forms of
subsistence, indicating that the importance of large game is often overemphasized in the
archaeological record.
The choice of weapon that is used to dispatch different types of game may also depend on
factors other than the game itself. For example, Frison (1991:241) states that projectile points
may not be used at all in the hunting of pronghorn when using corral traps. Historic accounts of
Assiniboine pronghorn corralling indicate that the animals were led into a corral, where they
would run around the perimeter to the point of exhaustion, allowing the Assiniboine to enter and
kill the animals with clubs. In the case of Folsom, Bamforth (1991:311-314) demonstrates that
fluted Folsom points are preferentially employed in communal bison hunts, but that preference
may not necessarily carry over to less formal bison kills. In the course of encounter-based kills,
a hunter is more likely to use whatever dart point types he (or she) has on hand. In that case,
Midland or other point types may be used to bring down a bison, or Folsom points may be used
on pronghorn, deer, or other game. If this scenario is correct, then Folsom points are more often
to be found with bison due to their importance in communal kills, but the correlation may be
obscured by the use of a variety of points (including Folsom) in other hunting situations. Some
blood residue analyses have indicated that Folsom points were likely used on a variety of game,

298
including pronghorn, bear, and rabbit, as well as bison (Amick 1994b:253-255; Hyland and
Anderson 1990:109).
A related topic concerns the implications of prey choice and weapon systems in
conjunction with miniature points specifically. Amick (1994a:23-25) proposes the possibility
that miniature points represent a Folsom-age manifestation of bow and arrow technology. He
goes on to mention that even full-sized Folsom points have similar size dimensions as later arrow
points. This hypothesis is based entirely on conjecture, however, and relies on morphological
similarities between Folsom and Late Prehistoric points and the contemporary occurrence of bow
and arrow technology in Paleolithic Europe. A recent study by Tomka (2013) presents a series
of experiments involving bows and arrows built to specifications derived from historic examples.
The results indicate that historic bow proportions would be able to bring down medium-sized
game (deer, pronghorn) at up to 45 m distance, and they could possibly kill larger game (caribou)
at up to 20 m distance, but the bows would be ineffective against very large game (bison) even at
relatively close distances of 10 m (Tomka 2013:562). As such, the greater penetrative power of
atlatls and darts may have been preferred for larger game, while the greater projectile velocity
offered by bows and arrows may have been more effective for hunting agile medium-sized game.
Tomka (2013:564) notes that bows were occasionally used to hunt large game like bison
prehistorically, but the use of bows against such large animals may have been limited to
situations in which the animals were trapped or confined, allowing the hunters to shoot multiple
times from very close range. It is unclear whether this interpretation is supported in the Late
Prehistoric archaeological record, however. Also, the extent to which this study may apply to the
Folsom period remains in the realm of speculation, but it may be worth considering in

299
conjunction with the appearance of miniature points in Folsom and other Paleoindian
assemblages (Bonnichsen and Keyser 1982; Storck 1991:156-158).
In sum, no correlation is apparent between the abundances of Folsom-era point types and
that of different game-sized prey species, although numerous factors affect the occurrences of
point types and faunal remains and likely obscure any such correlation. A more exhaustive study
would be necessary to examine individual site proveniences for direct associations between
different point types and faunal remains. Such detailed site analyses have not been compiled in
this research, with the exception of the Gault site, which has no significant faunal remains that
can be reliably attributed to the Folsom period.
Regional Occurrences of “Extra Fine” Projectile Points and Pristine Preforms
The skill analysis chapter mentions the occurrence of “extra fine” projectile points and
notes that these well made specimens appear among the Folsom, Midland, and unifacially fluted
types. The fact that these points are so well made suggests that a subset of flintknapping
specialists existed during the Folsom period, and the consistency of the quality in these points
also suggests that the specialists may have been in communication with each other. This section
investigates whether extra fine points occur more often in one portion of the Folsom range than
in any other. Additionally, the appearance of “pristine” but discarded complete Folsom preforms
seems to coincide with the emphasis on Folsom point production in the northern portion of the
range, but this hypothesis also requires testing.
The analysis of the extra fine points consists of a Chi-square test comparing the observed
and expected counts for extra fine and ordinary points for the sites and collections in the sample
(Table 75). Overall, the Chi-square test gives significant results, with a p-value of 0.001 and a

300
Chi-square value of 58.9, although many of the cells have counts below five. The results
indicate that higher than expected counts of extra fine points occur at Blackwater Draw, Big
Black, Folsom, and the Westfall site, based on adjusted residual scores that are greater than 1.96.
The sites represent a variety of purposes, with Blackwater Draw being a campsite and small kill
locality (Bamforth 1991:313), Big Black being a lithic procurement site (Williams 2000:233-
267), Folsom being a large kill site (Meltzer 2006), and the Westfall site being a campsite
(Hofman et al. 2002). Additionally, these sites with high proportions of extra fine points are
widely distributed geographically. Blackwater Draw and Folsom are located in New Mexico, the
Westfall site is in Colorado, and Big Black is in North Dakota. Therefore, there does not appear
to be a single location in which these skillfully made points likely originate. Although extra fine
points are probably made by the most talented flintknappers in a group, these flintknappers do
not seem to have come from a single origin but instead follow a similar tradition across space.

301
Table 75: Chi-square test comparing occurrences of “extra fine” and ordinary point forms for
each site/collection.
Site * Quality Crosstabulation
Quality
Total "Extra Fine" Normal
Site Agate Basin Count 0 5 5
Expected Count 0.4 4.6 5
Adjusted Residual -0.7 0.7
Baker Collection Count 1 24 25
Expected Count 2.1 22.9 25
Adjusted Residual -0.8 0.8
Barger Gulch Count 1 14 15
Expected Count 1.3 13.7 15
Adjusted Residual -0.3 0.3
Big Black Count 5 7 12
Expected Count 1 11 12
Adjusted Residual 4.1 -4.1
Blackwater Draw Count 5 16 21
Expected Count 1.8 19.2 21
Adjusted Residual 2.5 -2.5
Bobtail Wolf Count 0 13 13
Expected Count 1.1 11.9 13
Adjusted Residual -1.1 1.1
Bonfire Shelter Count 0 5 5
Expected Count 0.4 4.6 5
Adjusted Residual -0.7 0.7
Cedar Creek Count 2 36 38
Expected Count 3.3 34.7 38
Adjusted Residual -0.8 0.8

302
Table 75 continued.
Quality
Total "Extra Fine" Normal
Site Cox Collection Count 4 65 69
Expected Count 5.9 63.1 69
Adjusted Residual -0.9 0.9
Deann's Site Count 0 1 1
Expected Count 0.1 0.9 1
Adjusted Residual -0.3 0.3
Folsom Count 2 3 5
Expected Count 0.4 4.6 5
Adjusted Residual 2.5 -2.5
Gault Count 0 16 16
Expected Count 1.4 14.6 16
Adjusted Residual -1.2 1.2
Hanson Count 2 8 10
Expected Count 0.9 9.1 10
Adjusted Residual 1.3 -1.3
Hell Gap Count 0 16 16
Expected Count 1.4 14.6 16
Adjusted Residual -1.2 1.2
Kincaid Count 0 2 2
Expected Count 0.2 1.8 2
Adjusted Residual -0.4 0.4
Krmpotich Count 0 8 8
Expected Count 0.7 7.3 8
Adjusted Residual -0.9 0.9
Lindenmeier Count 7 109 116
Expected Count 9.9 106.1 116
Adjusted Residual -1.1 1.1
Lubbock Lake Count 0 7 7
Expected Count 0.6 6.4 7
Adjusted Residual -0.8 0.8

303
Table 75 continued.
Quality
Total "Extra Fine" Normal
Site Misc. Colorado Count 2 4 6
Expected Count 0.5 5.5 6
Adjusted Residual 2.2 -2.2
Misc. New Mexico Count 1 3 4
Expected Count 0.3 3.7 4
Adjusted Residual 1.2 -1.2
Misc. Texas Count 0 7 7
Expected Count 0.6 6.4 7
Adjusted Residual -0.8 0.8
Mud Springs Count 1 16 17
Expected Count 1.5 15.5 17
Adjusted Residual -0.4 0.4
Rio Rancho Count 0 23 23
Expected Count 2 21 23
Adjusted Residual -1.5 1.5
Scharbauer Count 1 21 22
Expected Count 1.9 20.1 22
Adjusted Residual -0.7 0.7
Shifting Sands Count 12 97 109
Expected Count 9.3 99.7 109
Adjusted Residual 1 -1
Sulphur River Count 0 5 5
Expected Count 0.4 4.6 5
Adjusted Residual -0.7 0.7
Westfall Collection Count 5 41 46
Expected Count 3.9 42.1 46
Adjusted Residual 0.6 -0.6
Westfall Site Count 1 1 2
Expected Count 0.2 1.8 2
Adjusted Residual 2.1 -2.1

304
Table 75 continued.
Quality
Total "Extra Fine" Normal
Site Wilson-Leonard Count 0 2 2
Expected Count 0.2 1.8 2
Adjusted Residual -0.4 0.4
Wyche Ranch Count 3 12 15
Expected Count 1.3 13.7 15
Adjusted Residual 1.6 -1.6
Total Count 55 587 642
Expected Count 55 587 642
Chi-Square Tests
Value df Asymp. Sig. (2-sided)
Pearson Chi-Square 58.901
a 29 0.001
Likelihood Ratio 51.6 29 0.006
N of Valid Cases 642

305
Pristine Folsom preforms are ones that are complete and in good enough condition that
they likely could have been made into points, but they were discarded for unknown reasons. An
examination of the sample for the sites in which these preforms are found reveals that most of
them do come from the north. One pristine preform each is found in Gault, the Cox collection,
Barger Gulch, and Hanson, with two preforms each from Big Black and Lindenmeier. The small
sample of pristine preforms eliminates the usefulness of statistics, but it is worth noting that the
average latitude of these preforms is 41.06°N, which lies just north of the Wyoming-Colorado
border. Therefore, pristine Folsom preforms do seem to occur more commonly in the north than
the south, and it may be related to the prevalence of Folsom points as opposed to the other point
variants in the northern part of the range. The existence of these preforms has sometimes been
attributed to perfectionism in a ritual context (Bradley 1993:255-256), but considering the results
of the raw material analysis in Chapter 6, it is possible that Folsom-age hunter-gatherers were
carrying these preforms with the full intention of finishing them later, but somehow lost them
along the way.
Conclusions
Of the regional trends investigated, only the first produces statistically significant results.
The first analysis reveals that geographic distributions of the five Folsom-era point types are
significantly different, with Folsom points appearing more abundantly to the north and west,
Midland and miniature points appearing primarily in the south and east, and unifacially fluted
and pseudo-fluted points appearing roughly in the middle. The second analysis attempts to
determine whether this geographic distribution correlates with Folsom-era radiocarbon dates, as
suggested by Collard et al.’s (2010) research. The results of this analysis indicate that the oldest

306
Folsom sites likely occur in central to north-central Colorado, which falls roughly in the center of
the distribution of known Folsom sites in North America. Therefore, the significant north-south
distribution of point types does not appear to match the chronological trend, suggesting that the
occurrences of the different point types is more due to regional preferences than to change over
time. The faunal analysis is a cursory exploration of a potential link between Folsom-age point
types and the remains of game species found at Folsom sites. The results show no significant
link between the two occurrences, but more thorough faunal and site-specific research may be
necessary to research this topic further. Finally, an examination of the occurrences of extra fine
points and pristine preforms yields mixed results. The extra fine points do not appear to follow
any regional trend, while the pristine Folsom preforms do seem to occur more commonly in the
northern part of the Folsom range than in the south.

307
CHAPTER 8: CONCLUSIONS
If I were to sum up the results of this whole enterprise in three words, it would be these:
“Bamforth was right.” The most significant factor that contributes to the variation in Folsom-age
projectile point types appears to be skill. But naturally, the details are more complicated than
that. The examination of the Gault assemblage (Chapter 3) sets the stage for the larger research
questions that follow, and while some of the results of those larger analyses corroborate the
initial observations from Gault, not all of them hold up under the weight of a larger sample. The
technological analysis (Chapter 4) expands on the similarities and differences in morphology and
production techniques between Folsom, Midland, unifacially fluted, pseudo fluted, and miniature
points and preforms, as well as ultrathin bifaces. The skill analysis (Chapter 5) uses ratio
variables to approximate the level of skill that went into the production of each point relative to
each other and supports the assertion that the fluted Folsom type is the most skillfully made in
general, followed by unifacially fluted, Midland, and pseudo-fluted, respectively. The raw
material analysis (Chapter 6) tests the idea that the unfluted point types were made as raw
material supplies diminished and finds that the idea cannot be supported with the present data,
primarily due to differential curation of Folsom preforms compared to the other types. The
regional analysis (Chapter 7) tests several lingering questions regarding the geographic
distribution, age, and function of the various Folsom-era point types and finds that only their
geographic distribution contains a significant trend.

308
Revisiting Gault
Many of the conclusions drawn from the technological and typological examination of
the Folsom and Midland points from the Gault site require additional discussion in light of the
conclusions obtained from the larger research sample. For the most part, the larger sample
agrees with and builds on the ideas put forth in the Gault chapter, but a few, such as Hofman’s
raw material hypothesis and the potential correlation between site ages and the types of points
present, are not supported by the subsequent research. This section details each of the Gault-
derived conclusions individually.
The Gault analysis indicates that some Folsom preforms lack the pressure flaking that is
usually found prior to fluting on most preforms from other sites. Chapter 4 reports that this
anomaly in the reduction sequence also appears to a lesser extent in Big Black, Lindenmeier,
Boca Negra Wash, and the Westfall collection. This lack of pressure flaking may represent a
novice’s lack of understanding of proper Folsom point production, or may be the result of
younger individuals attempting to make Folsom preforms, but they have not yet acquired the
upper body strength to properly pressure flake.
Other Folsom preform anomalies are found in assemblages outside Gault and are
mentioned in Chapter 4. While most preforms are prepared and fluted on one face at a time,
about four percent of the Folsom preforms in the sample have a well prepared second face
despite a fluting failure on the first. Another anomaly consists of points and preforms that have
been fluted from the distal end. In most cases, distal fluting of points is a result of inverting a
used point and resharpening it on the opposite ends; while distal fluting on preforms occurs
among unusually shaped specimens and appears to be related to the learning process. There is
one notable exception from the Big Black site, however, in which a well made preform was

309
fluted from both proximal and distal ends. Overall, these Folsom production anomalies appear to
be the exceptions that prove the rule, in that they are so rare that it seems to indicate that
bifacially fluted point production was fairly uniform in general.
Additionally, Gault reveals that some Midland points were likely thinned by percussion
flaking and others by pressure, and the technique used likely depends on the size of the original
flake blank. An analysis of the skill involved in producing both of these Midland forms (Chapter
5) indicates that their skill levels are similar overall, with a significant difference only in terms of
flake scar counts. Contrary to expectations, percussion thinned Midland points consistently have
higher flake scar counts than their pressure thinned counterparts. This result is probably due to
the need for more edge retouch on the percussion thinned points compared to the pressure
thinned ones.
The Gault site appears to have Midland preforms in its assemblage, but these possible
preforms are less skillfully made and often smaller than the finished points, suggesting that they
may have been discarded practice pieces made by novices. A scatterplot comparing the widths
and thicknesses of all the Midland points and preforms from the entire research sample (Figure
13b, Chapter 4) indicates that Midland preforms in general have widely varying sizes and are not
consistently larger than most finished Midland points, as would be expected of preforms in
general. On the other hand, Folsom and pseudo-fluted preforms are consistently both wider and
thicker than their finished counterparts. Additionally, Chapter 5 compares the mistake ratios of
Folsom and Midland preforms from the entire research sample and reveals that Folsom preforms
consistently exhibit less mistakes than Midland preforms, suggesting that Folsom points are
indeed produced with more skill in general than Midland points.

310
A comparison of the counts of Folsom and Midland points and preforms from Gault
provides some initial support for Hofman’s (1992) model, revealing that Midland points appear
to have been preferentially discarded at the site, while Folsom preforms were preferentially
made, suggesting that Midland points were being exchanged for Folsom at lithic procurement
localities. However, Chapter 6 explores the model further and reaches different conclusions.
Relying on the assumption that Hofman’s hypothesis expects Midland and other non-Folsom
point types to be made from the more depleted stone resources at any given site, while Folsom
points should be made from the resources that are most abundant. The results end up being the
opposite of this expectation, with Folsom points being made most often from exotic raw
materials compared to the other point types, failing to support Hofman’s model overall.
Analysis of the Folsom and Midland points from the Gault site indicate that the two types
are not always distinct entities and that occasional “hybridization” occurs, in which technological
aspects of both Folsom and Midland points may be present on a single specimen. The most
obvious hybrids are unifacially fluted points in which one face is fluted and the other is thinned
by Midland-style collateral flaking. These points make up 19 of the 42 unifacially fluted points
in the research sample, roughly 45%. The next hybrid form consists of Folsom points in which
one or more of the flutes do not reach the distal end, leaving the remainder of the point to be
thinned by collateral flaking. Evidence for this thinning pattern appears on 14 points in the
research sample, but this count is likely a low estimate due to the large number of fragmentary
and resharpened points in the sample. A final hybrid form is made up of Midland points that
retain a non-functional basal “nipple” platform that is usually reserved for Folsom fluting. Only
10 Midland points in the sample exhibit this platform, but they are widely dispersed across
multiple sites. While the nipple platform appears to be a mere stylistic decision when it appears

311
on Midland points, it may be possible that these points had been considered candidates for
fluting at some point in their reduction sequence. Evidence for this possibility is present in a
handful of channel flakes (primarily from the Shifting Sands assemblage) that exhibit Midland-
style collateral flaking on their dorsal surfaces. A more systematic examination of channel flake
morphology may reveal whether this occurrence is more widespread.
The Gault chapter concludes with a discussion of the possibility that the proportions of
Folsom points to unifacially fluted, Midland, pseudo-fluted, and miniature points may be
correlated with the ages of the Folsom sites in which they were found. This idea is based on the
conclusions of Collard et al. (2010), who state that Folsom sites are oldest in the north and
youngest in the south. The regional analysis (Chapter 7) finds that the proportions of point types
do indeed follow a geographic trend, with the non-Folsom varieties becoming increasingly
prevalent to the south, but the analysis of the radiocarbon ages do not quite replicate the results
of Collard et al. Instead, the regional analysis indicates that central Colorado appears to be the
origin of Folsom technology, placing Folsom’s origin roughly in the center of its distribution.
Revisiting the Technological Analysis
The quantitative portion of the technological analysis in Chapter 4 indicates that Folsom
points are consistently wider than Midland, unifacially fluted, pseudo-fluted, and miniature
points. Additionally, Midland points have consistently narrower bases than Folsom points, and
complete Midland points typically exhibit considerably longer edge grinding than Folsom points.
The other variants have basal widths that fall in between Folsom and Midland, but their edge
grinding could not be accurately assessed due to a shortage of complete specimens. These three
significant differences between Folsom and Midland points suggest that the two types may have

312
been hafted differently. The possibility of Folsom and Midland points being hafted differently
brings up the possibility that the two point types served slightly different purposes, such as being
used to hunt different species of game. However, Chapter 7 explores this possibility and
tentatively finds no correlation between the presence of Midland points (and other Folsom-age
variants) and non-bison game remains. While this topic deserves further exploration, at this
point it appears that Folsom and Midland points were hafted differently due to the requirements
of their slightly different morphologies (Midland points may have needed extra binding), rather
than due to differences in their use.
The technological analysis separately explores the variations among miniature points and
ultrathin bifaces. Miniature Folsom and Midland points do not exhibit the same morphological
differences as their full sized counterparts and instead compare more favorably to each other.
Miniature pseudo-fluted points, however, often seem to be narrower and thinner than the
miniature Folsom and Midland points. This distinction is likely due to the fact that miniature
Folsom and Midland points are usually reworked from full size points, while the miniature
pseudo-fluted points are more likely made from small flakes with the intention of being
miniature. An examination of ultrathin bifaces reveals that there are a couple of additional
bifacial forms that appear similar in technology to ultrathins but have slightly different
morphologies. These other forms are called “thick bifaces” and “flake bifaces.” Chapter 6
examines the raw materials of ultrathin bifaces and these alternate forms and finds that the
ultrathin and flake bifaces appear to match the expected proportions of raw material types used
in projectile points, while the thick bifaces are far more often made from other raw materials,
particularly quartzite. Additional research will be necessary to determine whether thick bifaces

313
served a different purpose from the other types, or if they performed the same function and their
thickness is simply due to raw material constraints.
Revisiting the Skill Analysis
Chapter 5 focuses on the skill involved in the production of the various Folsom-era point
types, and the results produced here are the most consistently significant out of all the analyses.
For that reason, Bamforth’s (1991) approach to the Folsom-Midland problem appears to be the
most accurate out of the ideas considered in this research. By examining the width/thickness
ratios, mistakes per 10 mm, mistake ratios, and the coefficients of variation, Folsom points
consistently emerge as the most well made points in the sample. Additionally, occurrences of
“extra fine” point-making style are much higher among Folsom points than they are among the
other types, suggesting that most highly skilled flintknappers at the time more often put great
effort into the making of Folsom points than they did into the making of Midland, unifacially
fluted, or pseudo-fluted points. Raw material analysis in Chapter 6 reveals that these extra fine
points are made from the same proportions of dominant and non-dominant raw materials as the
rest of the points, indicating that these points were not more extensively traded than any other
forms despite their apparent high quality. Additionally, Chapter 7 explores the sites in which the
extra fine points are prevalent and finds that there appears to be no geographic trend in their
distribution. These points appear to represent a small but consistent presence of highly skilled
flintknapping across the geographic range of Folsom. Other skill analyses include the
aforementioned comparison of percussion thinned and pressure thinned Midland points, as well
as a comparison of formal and informal pseudo-fluted points, in which a point is considered
“formal” if the dorsal face is carefully flaked and “informal” if it appears expediently flaked.

314
While formal pseudo-fluted points appear more skillfully made than the informal points in a
subjective sense, there are no statistically significant differences between them in terms of
quantitative variables.
Revisiting the Raw Material Analysis
As noted in the preceding section on Gault, the raw material analysis in Chapter 6 does
not support Hofman’s model overall. This lack of support does not necessarily mean the model
is wrong; instead, it appears that Folsom points often undergo more extended reduction
sequences compared to the other types, and this sequence throws off the assumption of direct raw
material procurement for all types. When the raw materials for all sites and collections are
divided into “dominant” and “non-dominant” varieties based on their relative proportions within
each assemblage, Folsom points tend to be made from non-dominant materials more often than
the other point variants. On the other hand, Midland points tend to be made from dominant
materials more often than expected, and the unifacially fluted, pseudo-fluted, and miniature
points match the expected proportions of raw materials. When examining Folsom points and
preforms, another trend becomes apparent. Early stage preforms are disproportionately made
from dominant materials, late stage preforms match the expected proportion, and completed
points are disproportionately made from non-dominant materials. This pattern most likely
indicates that Folsom preforms were often left in an unfinished state and carried around for a
time before being finished into points and employed as weapons. On the other hand, the other
point variants were most likely finished in one sitting and utilized shortly after their creation.
While Hofman’s hypothesis assumes a direct procurement of raw materials for all the point

315
types, it does not account for the delay in Folsom point production compared to the other point
types.
A map tracing the direction and distance of movement for the dominant raw materials for
most of the sites in the sample (Figure 20) indicates that the southernmost raw materials tend to
move north across long distances, the northernmost raw materials tend to move south across long
distances, and raw materials located near the center of Folsom’s geographic distribution do not
move very far in any particular direction. These results seem counterintuitive compared to the
results of the radiocarbon analysis conducted in Chapter 7, in which Folsom technology is
determined to have originated in north-central Colorado and spread from there. According to the
movement of dominant raw materials, people during the Folsom period instead appear to have
been converging on Colorado rather than dispersing from there. In all likelihood, these two
disparate analyses may reflect back-and-forth pulses of migration between the mountainous
central sites and the plains sites to the north and south. It is also possible that this area represents
a gathering location for Folsom groups from separate regions. A closer examination and better
identification of non-dominant raw materials in each of the sampled sites may reveal evidence of
such movements.
Tying It All Together
So what do these results mean in terms of human behavior during the Folsom period?
Perhaps the simplest and most obvious lesson to be learned is that Folsom projectile point
technology is versatile enough to encompass a wide range of skill levels. Although the classic,
bifacially fluted Folsom projectile point is considered to be extremely difficult to make, it is not
the only point form that is present in Folsom assemblages. Midland and unifacially fluted points

316
are also very skillfully made, but they do not require as complex a reduction process as Folsom
points. They can be made by people of more intermediate skill or under less-than-ideal
conditions. Pseudo-fluted points are often made from minimally modified flakes and can be
expediently produced by even novice flintknappers when no better option is available.
Still, the production of bifacially fluted Folsom points was the norm during this period,
and the process of making these points was carefully thought out and often took place over an
extended period of time. Accepting Bamforth’s (1991:314) assertion that these points were often
completed as part of the gearing-up process for special communal hunting events, I propose a
scenario of staged Folsom point production. In this scenario, competent Folsom flintknappers at
lithic procurement sites such as Gault would make a surplus supply of Folsom preforms, and
only a portion of those would be finished into complete points on-site. The unfinished preforms
would be retained until the time of the next communal hunt. Having formal Folsom points
available during these communal hunts appears to have been important enough to warrant the
stockpiling of preforms in anticipation of the event. It is possible, as Bradley (1993:255-256)
suggests, that the fluting of these preforms played an important role in the ritual preparation for
these hunts. In the meantime, if hunters were exhausting their current supply of Folsom points,
they may have resorted to making unifacially fluted, Midland, or pseudo-fluted points out of
whatever raw materials were on hand, in order to save their Folsom preforms for the more formal
hunts to come. Although Midland preforms are present at the Gault site, these preforms appear
to be the work of novices, and it is possible that inexperienced knappers tried their hands at
making the “easier” points at such localities.
Does this mean that there was a subset of flintknapping specialists during the Folsom
period, who supplied everyone with their fluted points? Yes and no. The “extra fine” points

317
found in many Folsom assemblages suggest that there was indeed a group of people who were
exceedingly skilled at making projectile points. These individuals may have been the old or
infirm, who could not participate in most hunting and gathering activities and instead devoted
much of their time to flintknapping. On the other hand, most Folsom points do not match up to
the skill that is evident in these select few. It is likely that most people were at least aware of the
process involved in producing fluted points, and many could accomplish the feat to an acceptable
degree. However, there were also other projectile point options in place for those who could
never master Folsom production, so no one had to starve for lack of knapping ability.
Ultrathin bifaces also represent a very high level of flintknapping skill, and these artifacts
were likely made by a specialized subset of individuals. These bifaces were designed to be
consistently thin across their entire surfaces, meaning that they could be resharpened many times
while still retaining an optimal cutting edge. This aspect suggests that these bifaces would have
been highly curated and would likely have been discarded only when they broke or were
resharpened beyond their usefulness. As such, it is likely that these bifaces had a fairly low
attrition rate, and the most skilled flintknappers in a group could supply them as needed without
too much hassle. However, the occasional presence of thick bifaces and flake bifaces that
exhibit ultrathin-like flaking patterns suggests that non-experts sometimes resorted to making
tools that resemble ultrathin bifaces.
Miniature points represent something of a mystery in the Folsom complex, as well as in
the other archaeological assemblages in which they appear. In the case of Folsom, miniature
points occur primarily in the southern portion of Folsom’s geographic extent, with the exception
of Lindenmeier. The fact that some of them have impact damage strongly suggests they were
used as projectiles, but their size makes them unlikely to have been hafted onto regular dart

318
shafts. Amick (1994) suggests the possibility of bow and arrow use during the Folsom period,
but according to Tomka (2013), the use of bows and arrows generally suggests the hunting of
game smaller than bison. In this research, there is no evidence to suggest that miniatures or any
other Folsom-age projectile points were strictly used to hunt non-bison game, but more extensive
faunal research may be necessary.
Tying these conclusions into inferences about Folsom period social systems is
speculative at best, but some hypothetical scenarios may be suggested. It appears likely that the
smallest social unit during this period consisted of small family-based bands, and these bands
gathered regularly into larger groups to prepare for communal hunts, to exchange information,
and to find mates. It is unlikely that every small group retained an “expert” flintknapper, so
these groups would not regularly have access to “extra fine” points. Instead, their hunting
toolkits would consist of whatever projectile points their skills enabled them to make, resulting
in the variety of point types that are present in the Folsom archaeological record. Jodry (1998)
suggests that ultrathin bifaces may have been used for jerky production, which was the work of
women according to historic accounts of Plains tribes. Accordingly, it may be possible that
expert female flintknappers made and supplied ultrathin bifaces to their brethren for such a
purpose. This research cannot determine whether women participated in game hunting in
addition to gathering, trapping, and campsite activities. However, it is likely that their
participation in all but the most communal bison hunting would have been limited due to the
inherent dangers and travel distances involved. Finally, children were likely involved in hunter
and gathering efforts at as young an age as possible. It may be possible that miniature points
represent part of a child’s hunting arsenal, and children may have engaged in the pursuit of small
game at a fairly early age.

319
As always, more research breeds more questions. In the case of this research, the broad
scope enables informed generalizations to be made about Folsom technology, but the data would
benefit from finer resolution studies dealing with specific questions regarding particular
assemblages. As stated above, a better understanding of the relationship between point types and
faunal remains would aid in the interpretations of the use of these points. Another useful inquiry
would be more rigorous analyses of the lithic material types utilized during the Folsom period
and the tracking of those materials across sites both near and far. A better understanding of
Folsom-era material culture helps us move beyond our imagination of the people as point-fluting,
bison-hunting automatons and gives us a broader picture of their true diversity.

320
REFERENCES

321
Ahler, Stanley A. and Phil R. Geib
2000 Why Flute? Folsom Point Design and Adaptation. Journal of Archaeological Science
27:799-820.
Amick, Daniel S.
1994a Technological Organization and Structure of Inference in Lithic Analysis: An
Examination of Folsom Hunting Behavior in the American Southwest. In The
Organization of North American Prehistoric Chipped Stone Tool Technologies, edited by
Philip J. Carr, pp. 9-34. International Monographs in Prehistory, Archaeological Series 7,
Ann Arbor, Michigan.
1994b Folsom Diet Breadth and Land Use in the American Southwest. Unpublished PhD
Dissertation, University of New Mexico, Albuquerque.
1995 Patterns of Technological Variation Among Folsom and Midland Projectile Points in
the American Southwest. Plains Anthropologist 40(151):23-38.
1999 Folsom Lithic Technology: Explorations in Structure and Variation. Archaeological
Series 12, International Monographs in Prehistory, Ann Arbor, Michigan.
2002 Manufacturing Variations in Folsom Points and Fluted Preforms. In Folsom
Technology and Lifeways, edited by John E. Clark and Michael B. Collins, pp.159-187.
Special Publication 4, Department of Anthropology, University of Tulsa, Tulsa,
Oklahoma.
Andrefsky, William, Jr.
2005 Lithics: Macroscopic Approaches to Analysis. 2nd
edition. Cambridge University
Press, New York.
Baker, Barry W.
1998 Vertebrate Faunal Remains from 1/4-inch and 1/8-inch Screens. In Wilson-Leonard:
An 11,000-year Archeological Record of Hunter-Gatherers in Central Texas, Volume V:
Special Studies. Edited by Michael B. Collins, pp.1463-1509. Studies in Archeology 31,
Texas Archeological Research Laboratory, The University of Texas at Austin.
Archeology Studies Program Report 10, Texas Department of Transportation,
Environmental Affairs Division.
Bamforth, Douglas B.
1991 Flintknapping Skill, Communal Hunting, and Paleoindian Projectile Point Typology.
Plains Anthropologist 36(137):309-322.
2009 Projectile Points, People, and Plains Paleoindian Perambulations. Journal of
Anthropological Archaeology 28:142-157.
Bamforth, Douglas B. and Peter Bleed
1997 Technology, Flaked Stone Technology, and Risk. Archeological Papers of the
American Anthropological Association 7(1):109-139.
Bamforth, Douglas B. and Nyree Finlay
2008 Introduction: Archaeological Approaches to Lithic Production Skill and Craft
Learning. Journal of Archaeological Method and Theory 15:1-27.

322
Bamforth, Douglas B. and Keri Hicks
2008 Production Skill and Paleoindian Workgroup Organization in the Medicine Creek
Drainage, Southwestern Nebraska. Journal of Archaeological Method and Theory
15:132–153.
Bement, Leland C.
1986 Mammalian Faunal and Cultural Remains in the Late Pleistocene Deposits of Bonfire
Shelter, 41VV218, Southwest Texas. The University of Texas at Austin.
1999 Bison Hunting at the Cooper Site: Where Lightning Bolts Drew Thundering Herds.
University of Oklahoma Press, Norman.
2007 Bonfire Shelter: A Jumping off Point for Comments for Byerly et al. American
Antiquity 72(2):366-372.
Bement, Leland C. and Brian J. Carter
2010 Jake Bluff: Clovis Bison Hunting on the Southern Plains of North America.
American Antiquity 75(4):907-933.
Blaine, J. C.
1968 A Preliminary Report of an Early Man Site in West Texas. Transactions of the Third
Regional Archeological Symposium for Southeastern New Mexico and Western Texas.
Lubbock, TX.
Bonnichsen, B. Robson and James D. Keyser
1982 Three Small Points: A Cody Complex Problem. Plains Anthropologist 27(96):137-
144.
Bousman, Britt, Michael B. Collins, Jan Guy, Paul R. Takac, and Gail L. Bailey
1998 History of Investigations. In Wilson-Leonard: An 11,000-year Archeological Record
of Hunter-Gatherers in Central Texas, Volume I: Introduction, Background, and
Synthesis. Edited by Michael B. Collins, pp.33-53. Studies in Archeology 31, Texas
Archeological Research Laboratory, The University of Texas at Austin. Archeology
Studies Program Report 10, Texas Department of Transportation, Environmental Affairs
Division.
Bradley, Bruce A.
1993 Paleo-Indian Flaked Stone Technology in the North American High Plains. In From
Kostenki to Clovis: Upper Paleolithic – Paleo-Indian Adaptations, edited by Olga Soffer
and N. D. Praslov, pp. 251-262.
2009 The Hell Gap Bifaces and Projectile Points. In Hell Gap: A Stratified Paleoindian
Campsite at the Edge of the Rockies, edited by M. Larson, M. Kornfeld, and G. Frison,
pp. 259-273. University of Utah Press, Salt Lake City.
Bradley, Bruce A., Michael B. Collins, and Andrew Hemmings
2010 Clovis Technology. International Monographs in Prehistory, Archaeological Series
17, Ann Arbor, Michigan.

323
Bradley, Bruce A. and Dennis Stanford
2006 The Solutrean-Clovis Connection: Reply to Straus, Meltzer and Goebel. World
Archaeology 38(4):704-714.
Byerly, Ryan M., Judith R. Cooper, David J. Meltzer, Matthew E. Hill and Jason M.
LaBelle
2005 On Bonfire Shelter (Texas) as a Paleoindian Bison Jump: An Assessment Using GIS
and Zooarchaeology. American Antiquity 70(4):595-629.
Callahan, E.
1979 The Basics of Biface Knapping in the Eastern Fluted Point Tradition. Archaeology of
Eastern North America 7:1-180.
Clark, John E. and Michael B. Collins (eds.)
2002 Folsom Technology and Lifeways. Special Publication 4, Department of
Anthropology, University of Tulsa, Tulsa, Oklahoma.
Collard, Mark, Briggs Buchanan, Marcus J. Hamilton, Michael J. O’Brien
2010 Spatiotemporal Dynamics of the Clovis-Folsom Transition. Journal of
Archaeological Science 37:2513-2519.
Collins, Michael B.
1990 The Archaeological Sequence at Kincaid Rockshelter, Uvalde County, Texas. In
Transactions of the 25th Regional Archeological Symposium for Southwestern New
Mexico and Western Texas. Midland Archeological Society, Midland, Texas.
1998a Background to the Archaeological Investigations. In Wilson-Leonard: An 11,000-
year Archeological Record of Hunter-Gatherers in Central Texas, Volume I:
Introduction, Background, and Synthesis. Edited by Michael B. Collins, pp.55-67.
Studies in Archeology 31, Texas Archeological Research Laboratory, The University of
Texas at Austin. Archeology Studies Program Report 10, Texas Department of
Transportation, Environmental Affairs Division.
1998b Early Paleoindian Components. In Wilson-Leonard: An 11,000-year Archeological
Record of Hunter-Gatherers in Central Texas, Volume I: Introduction, Background, and
Synthesis. Edited by Michael B. Collins, pp.123-159. Studies in Archeology 31, Texas
Archeological Research Laboratory, The University of Texas at Austin. Archeology
Studies Program Report 10, Texas Department of Transportation, Environmental Affairs
Division.
1999 Clovis and Folsom Lithic Technology on and near the Southern Plains: Similar Ends,
Different Means. In Folsom Lithic Technology: Explorations in Structure and Variation,
edited by Daniel S. Amick, pp.12-38. Archaeological Series 12, International
Monographs in Prehistory, Ann Arbor, Michigan.

324
2003 Paleoindian Pavo Real. In Pavo Real (41BX52): A Paleoindian and Archaic Camp
and Workshop on the Balcones Escarpment, South-Central Texas, edited by Michael B.
Collins, Dale B. Hudler, and Stephen L. Black, pp. 83-190. Studies in Archeology 41,
Texas Archeological Research Laboratory, The University of Texas at Austin and
Archeological Studies Program, Report 50 Environmental Affairs Division, Texas
Department of Transportation.
2007 Discerning Clovis Subsistence from Stone Artifacts and Site Distributions on the
Southern Plains Periphery. In Foragers of the Terminal Pleistocene in North America,
edited by Renee B. Walker and Boyce N. Driskell, pp. 59-87. University of Nebraska
Press, Lincoln.
Collins, Michael B., Dale B. Hudler, and Stephen L. Black
2003 Research Design for Pavo Real (41BX52). In Pavo Real (41BX52): A Paleoindian
and Archaic Camp and Workshop on the Balcones Escarpment, South-Central Texas,
edited by Michael B. Collins, Dale B. Hudler, and Stephen L. Black, pp. 7-21. Studies in
Archeology 41, Texas Archeological Research Laboratory, The University of Texas at
Austin and Archeological Studies Program, Report 50 Environmental Affairs Division,
Texas Department of Transportation.
Collins, Michael B. and C. E. Mear
1998 The Site and Its Setting. In Wilson-Leonard: An 11,000-year Archeological Record
of Hunter-Gatherers in Central Texas, Volume I: Introduction, Background, and
Synthesis. Edited by Michael B. Collins, pp.5-32. Studies in Archeology 31, Texas
Archeological Research Laboratory, The University of Texas at Austin. Archeology
Studies Program Report 10, Texas Department of Transportation, Environmental Affairs
Division.
Cooper, Judith R. and Ryan M. Byerly
2005 The Significance of a Second Folsom Projectile Point from Bonfire Shelter, Texas.
Current Research in the Pleistocene 22:41-43.
Crabtree, Don
1966 A Stoneworker’s Approach to Analyzing and Replicating the Lindenmeier Folsom.
Tebiwa 9:3-39.
Davis, Leslie B. and Mark F. Baumler
2000 Clovis and Folsom Occupations at Indian Creek. Current Research in the Pleistocene
17:17-19.
Davis, Leslie B., Christopher L. Hill, and John W. Fisher, Jr.
2002 Radiocarbon Dates for Paleoindian Components (Folsom, Scottsbluff) at the
MacHaffie Site, West-Central Montana Rockies. Current Research in the Pleistocene
19:18-20.

325
Dial, Susan W., Anne C. Kerr, and Michael B. Collins
1998 Projectile Points. In Wilson-Leonard: An 11,000-year Archeological Record of
Hunter-Gatherers in Central Texas, Volume II: Chipped Stone Artifacts. Edited by
Michael B. Collins, pp.313-445. Studies in Archeology 31, Texas Archeological
Research Laboratory, The University of Texas at Austin. Archeology Studies Program
Report 10, Texas Department of Transportation, Environmental Affairs Division.
Dibble, Dale S.
1965 Bonfire Shelter: A Stratified Bison Kill in the Amistad Reservior Area, Val Verde
County, Texas. Miscellaneous Papers No. 5, Texas Archeological Salvage Project,
Austin.
Dibble, Dale S. and Dessamae H. Lorrain
1968 Bonfire Shelter: A Stratified Bison Kill Site, Val Verde County, Texas. Miscellaneous
Papers No. 1. Texas Memorial Museum Publications, University of Texas, Austin.
Driese, Steven G., Lee C. Nordt, Michael R. Waters, and Joshua L. Keene
2013 Analysis of Site Formation History and Potential Disturbance of Stratigraphic
Context in Vertisols at the Debra L. Friedkin Archaeological Site in Central Texas, USA.
Geoarchaeology, in press, 1-28.
Emerson, Alice M.
2000a Analysis of Vertebrate Faunal Remains. In The Archaeology of the Bobtail Wolf Site:
Folsom Occupation of the Knife River Flint Quarry Area, North Dakota, edited by
Matthew J. Root, pp. 309-345. Washington State University Press, Pullman,
Washington.
2000b Vertebrate Remains from the Big Black Site. In The Big Black Site: A Folsom
Complex Workshop in the Knife River Flint Quarry Area, North Dakota, edited by Jerry
D. William, pp. 117-137. Washington State University Press, Pullman, Washington.
Ferguson, Jeffrey R.
2008 The When, Where, and How of Novices in Craft Production. Journal of
Archaeological Method and Theory 15:51-67.
Finley, Judson B., Marcel Kornfeld, Brian N. Andrews, George C. Frison, Chris Finley, and
Michael T. Bies
2005 Rockshelter Archaeology and Geoarchaeology in the Bighorn Mountains, Wyoming.
Plains Anthropologist 50(195):227-248.
Fischel, Hans E.
1939 Folsom and Yuma Culture Finds. American Antiquity 4(3):232-264.
Frison, George C.
1978 Prehistoric Hunters of the High Plains. Academic Press, San Diego.

326
1982a Introduction. In The Agate Basin Site: A Record of the Paleoindian Occupation of
the Northwestern High Plains, edited by George C. Frison and Dennis Stanford, pp. 1-26.
Academic Press, New York.
1982b Archaeology. In The Agate Basin Site: A Record of the Paleoindian Occupation of
the Northwestern High Plains, edited by George C. Frison and Dennis Stanford, pp. 27-
180. Academic Press, New York.
1982c Raw Stone Flaking Material Sources. In The Agate Basin Site: A Record of the
Paleoindian Occupation of the Northwestern High Plains, edited by George C. Frison
and Dennis Stanford, pp. 173-178. Academic Press, New York.
1991 Prehistoric Hunters of the High Plains, Second Edition. Academic Press, San Diego.
Frison, George C. and Bruce A. Bradley
1980 Folsom Tools and Technology at the Hanson Site, Wyoming. University of New
Mexico Press, Albuquerque.
Frison, George C. and Dennis Stanford
1982 Summary and Conclusions. In The Agate Basin Site: A Record of the Paleoindian
Occupation of the Northwestern High Plains, edited by George C. Frison and Dennis
Stanford, pp. 361-370. Academic Press, New York.
Gryba, Eugene
1988 A Stone Age Pressure Method of Folsom Fluting. Plains Anthropologist 33:53-66.
2002 The Case for the Use of Heat Treated Lithics in the Production of Fluted Points by
Folsom Knappers. In Folsom Technology and Lifeways, edited by John E. Clark and
Michael B. Collins, pp. 309-314. Special Publication 4, Department of Anthropology,
University of Tulsa, Tulsa, Oklahoma.
Gunnerson, J.
1987 Archaeology of the High Plains. Bureau of Land Management, Denver.
Hayden, B. and A. Cannon
1984 Interaction Inferences in Archaeology and Learning Frameworks of the Maya.
Journal of Anthropological Archaeology 3:325–367.
Haynes, C. Vance, Jr.
2009 Geochronology. In Hell Gap: A Stratified Paleoindian Campsite at the Edge of the
Rockies, edited by M. Larson, M. Kornfeld, and G. Frison, pp. 39-52. University of Utah
Press, Salt Lake City.
Haynes, C. Vance, Jr., Roelf P. Beukens, A. J. T. Jull, and Owen K. Davis
1992 New Radiocarbon Dates for Some Old Folsom Sites: Accelerator Technology. In Ice
Age Hunters of the Rockies, edited by Dennis J. Stanford and Jane S. Day, pp. 83-100.
University Press of Colorado, Niwot.

327
Haynes, C. Vance, Jr. and James W. Warnica
2012 Geology, Archaeology and Climate Change in Blackwater Draw, New Mexico: F.
Earl Green and the Geoarchaeology of the Clovis Type Site, edited by J. David Kilby.
Eastern New Mexico University.
Hester, James J.
1972 Blackwater Locality No. 1: A Stratified Early Man Site in Eastern New Mexico. With
sections by Ernest L. Lundelius, Jr. and Roald Fryxell. Fort Burgwin Research Center,
Inc, Southern Methodist University, Rancho de Taos, New Mexico.
Hester, Thomas R.
2003 Introduction. In Pavo Real (41BX52): A Paleoindian and Archaic Camp and
Workshop on the Balcones Escarpment, South-Central Texas, edited by Michael B.
Collins, Dale B. Hudler, and Stephen L. Black, pp. 1-6. Studies in Archeology 41, Texas
Archeological Research Laboratory, The University of Texas at Austin and
Archeological Studies Program, Report 50 Environmental Affairs Division, Texas
Department of Transportation.
Hofman, Jack L.
1990 Cedar Creek: A Folsom Locality in Southwestern Oklahoma. Current Research in
the Pleistocene 7:19-22.
1992 Recognition and Interpretation of Folsom Technological Variability on the Southern
Plains. In Ice Age Hunters of the Rockies, edited by Dennis J. Stanford and Jane S. Day,
pp. 193-224. University Press of Colorado, Niwot.
Hofman, Jack L, Daniel S. Amick, and Richard O. Rose
1990 Shifting Sands: A Folsom-Midland Assemblage from a Campsite in Western Texas.
Plains Anthropologist 35(129):221-253.
Hofman, Jack L., Lawrence C. Todd, and Michael B. Collins
1991 Identification of Central Texas Edwards Chert at the Folsom and Lindenmeier Sites.
Plains Anthropologist 36(137):297-308.
Hofman, Jack L., Grayson Westfall, and Tom Westfall
2002 A Folsom Camp in the Black Forest Area of Colorado. Current Research in the
Pleistocene 19:34-37.
Holliday, Vance T.
1997 Paleoindian Geoarchaeology of the Southern High Plains. University of Texas Press,
Austin.
2000 The Evolution of Paleoindian Geochronology and Typology on the Great Plains.
Geoarchaeology 15(3):227–290.
Holliday, Vance T. and David J. Meltzer
1996 Geoarchaeology of the Midland (Paleoindian) Site, Texas. American Antiquity 61(4):
755-771.

328
Holliday, Vance T., Bruce B. Huckell, James H. Mayer, Steven L. Forman, and Leslie D.
McFadden
2006 Geoarchaeology of the Boca Negra Wash Area, Albuquerque Basin, New Mexico,
USA. Geoarchaeology 21(8):765-802.
Huckell, Bruce B. and J. David Kilby
2002 Folsom Point Production at the Rio Rancho Site, New Mexico. In Folsom
Technology and Lifeways, edited by John E. Clark and Michael B. Collins, pp. 11-29.
Special Publication 4, Department of Anthropology, University of Tulsa, Tulsa,
Oklahoma.
Hyland, David C. and Thomas R. Anderson
1990 Blood Residue Analysis of the Lithic Assemblage from the Mitchell Locality,
Blackwater Draw, New Mexico. Plains Anthropologist 35(130):105-110. Memior 24:
Lithic Technology at the Mitchell Locality of Blackwater Draw: A Stratified Folsom Site
in Eastern New Mexico (September 1990).
Ingbar, Eric E.
1992 The Hanson Site and Folsom on the Northwestern Plains. In Ice Age Hunters of the
Rockies, edited by Dennis J. Stanford and Jane S. Day, pp. 169-192. University Press of
Colorado, Niwot.
Irwin-Williams, Cynthia, Henry T. Irwin, George A. Agogino, and C. Vance Haynes, Jr.
1973 Hell Gap: A Paleo-Indian Occupation on the High Plains. Plains Anthropologist
18(59):40-53.
Jennings, Thomas A.
2012 Clovis, Folsom, and Midland Components at the Debra L. Friedkin Site, Texas:
Context, Chronology, and Assemblages. Journal of Archaeological Science 39:3239-
3247.
Jodry, Margaret A.
1998 The Possible Design of Folsom Ultrathin Bifaces as Fillet Knives for Jerky
Production. Current Research in the Pleistocene 15:75-77.
1999 Folsom Technological and Socioeconomic Strategies: Views from Stewart’s Cattle
Guard and the Upper Rio Grande Basin, Colorado. Unpublished PhD Dissertation,
Department of Anthropology, American University, Washington, D.C.
Jodry, Margaret A., Mort D. Turner, Vince Spero, Joanne C. Turner, and Dennis Stanford
1996 Folsom in the Colorado High Country: The Black Mountain Site. Current Research
in the Pleistocene 13:25-27.

329
Johnson, Eileen
1987 Vertebrate Remains. In Lubbock Lake: Late Quaternary Studies on the Southern
High Plains, edited by Eileen Johnson, pp. 49-89. Texas A&M University Press, College
Station.
Johnson, Eileen and Leland C. Bement
2009 Bison Butchery at Cooper, a Folsom Site on the Southern Plains. Journal of
Archaeological Science 36:1430-1446.
Johnson, Eileen and Vance Holliday
1987a Introduction. In Lubbock Lake: Late Quaternary Studies on the Southern High
Plains, edited by Eileen Johnson, pp. 3-13. Texas A&M University Press, College
Station.
1987b Lubbock Lake Artifact Assemblages. In Lubbock Lake: Late Quaternary Studies on
the Southern High Plains, edited by Eileen Johnson, pp. 100-119. Texas A&M
University Press, College Station.
Judge, James M.
1970 Systems Analysis and the Folsom-Midland Question. Southwestern Journal of
Anthropology 26:40-51.
Katz, Lienke
1997 The History of Blackwater Draw. Eastern New Mexico University, Portales.
Kilby, David
2008 An Investigation of Clovis Caches: Content, Function, and Technological
Organization. Unpublished PhD Dissertation, Department of Anthropology, University
of New Mexico, Albuquerque, NM.
Kornfeld, Marcel
2002 Folsom Technological Organization in the Middle Park of Colorado: A Case for
Broad Spectrum Foraging. In Folsom Technology and Lifeways, edited by John E. Clark
and Michael B. Collins, pp. 47-67. Special Publication 4, Department of Anthropology,
University of Tulsa, Tulsa, Oklahoma.
Kornfeld, Marcel and Mary Lou Larson
2009 Reinvestigation in Context: Paleoindian Prehistory at the Edge of the Rockies. In
Hell Gap: A Stratified Paleoindian Campsite at the Edge of the Rockies, edited by M.
Larson, M. Kornfeld, and G. Frison, pp. 3-13. University of Utah Press, Salt Lake City.
Krieger, Alex D.
1944 The Typological Concept. American Antiquity 9(3):271-288.

330
LeTourneau, Philippe David
1998 The “Folsom Problem.” In Unit Issues in Archaeology: Measuring Time, Space, and
Material, edited by A. Ramenofsky and A. Steffen, pp. 52-73. University of Utah Press,
Salt Lake City.
2000 Folsom Toolstone Procurement in the Southwest and Southern Plains. Unpublished
PhD Dissertation, Department of Anthropology, University of New Mexico,
Albuquerque, NM.
Lohse, John
2010 Evidence for Learning and Skill Transmission in Clovis Blade Production and Core
Maintenance. In Clovis Technology, edited by Bruce A. Bradely, Michael B. Collins, and
Andrew Hemmings, pp. 157-176. International Monographs in Prehistory,
Archaeological Series 17, Ann Arbor, Michigan.
2011 Step by Step: The Influence of Reduction Sequence Models on Understanding
Learning and Skill Transmission. Lithic Technology 36(2):97-108.
Lyman, R. L.
1984 Bone Density and Differential Survivorship of Fossil Classes. Journal of
Anthropological Archaeology 3(4):259-299.
Madrigal, Lorena
2012 Statistics for Anthropology, 2nd
edition. Cambridge University Press, New York.
Mayer, James H., Todd A. Surovell, Nicole M. Waguespack, Marcel Kornfeld, Richard G.
Reider, and George C. Frison
2005 Paleoindian Environmental Change and Landscape Response in Barger Gulch,
Middle Park, Colorado. Geoarchaeology 20(6):599-625.
McKinney, C. R.
1992 Midland Woman: The Oldest American. G.S.A. Abstracts with Programs 24:A26.
Geological Society of America, Boulder, Colorado.
Meltzer, David J.
1989 Was Stone Exchanged Among Eastern North American Paleoindians? In Eastern
Paleoindian Lithic Resource Use, edited by C. J. Ellis and J. C. Lothropp, pp. 11-39.
Westview Press, Boulder.
2003 Peopling of North America. Developments in Quaternary Sciences 1:539-563.
2006 Folsom: New Archaeological Investigations of a Classic Paleoindian Bison Kill.
University of California Press, Berkeley.
Meltzer, David J., John D. Seebach, and Ryan M. Byerly
2006 The Hot Tubb Folsom-Midland Site (41 CR 10), Texas. Plains Anthropologist
51(198):157-184.

331
Morrow, Juliet E., Stuart J. Fiedel, Donald L. Johnson, Marcel Kornfeld, Moye Rutledge, and W.
Raymond Wood
2012 Pre-Clovis in Texas? A Critical Assessment of the “Buttermilk Creek Complex.”
Journal of Archaeological Science doi: 10.1016/j.jas.2012.05.018.
Nami, Hugo G.
1999 The Folsom Biface Reduction Sequence: Evidence from the Lindenmeier Collection.
In Folsom Lithic Technology: Explorations in Structure and Variation, edited by Daniel
S. Amick, pp. 82-97. Archaeological Series 12, International Monographs in Prehistory,
Ann Arbor, Michigan.
Nelson, N. C.
1937 Review of F. H. H. Roberts, Jr.: Additional Information on the Folsom Complex.
American Antiquity 2(4):317-320.
O'Connell, J. F., Hawkes, K., and Blurton-Jones, N. G.
1992 Patterns in the Distribution, Site Structure and Assemblage Composition of Hadza
Kill-Butchering Sites. Journal of Archaeological Science 19(3):319-345.
Olausson, Deborah J.
2008 Does Practice Make Perfect? Craft Expertise as a Factor in Aggrandizer Strategies.
Journal of Archaeological Method and Theory 15:28-50.
Patten, Bob
2002 Solving the Folsom Fluting Problem. In Folsom Technology and Lifeways, edited by
John E. Clark and Michael B. Collins, pp. 299-308. Special Publication 4, Department of
Anthropology, University of Tulsa, Tulsa, Oklahoma.
Peterson, Michael R.
2001 Folsom Mobility and Technological Organization at the Krmpotich Site: An Analysis
of the Lithic Artifact Assemblage. MA Thesis, University of Wyoming, Laramie.
Pevny, Charlotte D.
2012 Distinguishing Taphonomic Processes from Stone Tool Use at the Gault Site, Texas.
In Contemporary Lithic Analysis in the Southeast: Problems, Solutions, and
Interpretations, edited by Philip J. Carr, Andrew P. Bradbury, and Sarah E. Price, pp. 55-
78. The University of Alabama Press, Tuscaloosa.
Rapson, David J. and Laura B. Niven
2009 Faunal Assemblage, 1966-1968. In Hell Gap: A Stratified Paleoindian Campsite at
the Edge of the Rockies, edited by M. Larson, M. Kornfeld, and G. Frison, pp. 111-134.
University of Utah Press, Salt Lake City.
Reitze, William T., Christina Sinkovec, and Bruce B. Huckell
2012 Folsom Technology and Toolstone Use at the Martin Site, North Central New
Mexico. Plains Anthropologist 57(223):237-258.

332
Renaud, E. B.
1937 Folsom and Yuma Points as Known Today. Bulletin of the Texas Archeological and
Paleontological Society 9.
Root, Matthew J.
2000 Site Summary and Conclusions. In The Archaeology of the Bobtail Wolf Site: Folsom
Occupation of the Knife River Flint Quarry Area, North Dakota, edited by Matthew J.
Root, pp. 363-368. Washington State University Press, Pullman, Washington.
2002 Heat Treatment and Knife River Flint Folsom Point Manufacture. In Folsom
Technology and Lifeways, edited by John E. Clark and Michael B. Collins, pp. 315-331.
Special Publication 4, Department of Anthropology, University of Tulsa, Tulsa,
Oklahoma.
Root, Matthew J., Doulgas MacDonald, and Alice M. Emerson
1996 The Bobtail Wolf Site: An Update on Recent Excavations. Current Research in the
Pleistocene 13:38-40.
Root, Matthew J. and Alan J. Osborn
2000 Introduction: The Long and Winding Road. In The Archaeology of the Bobtail Wolf
Site: Folsom Occupation of the Knife River Flint Quarry Area, North Dakota, edited by
Matthew J. Root, pp. 1-23. Washington State University Press, Pullman, Washington.
Root, Matthew J., Jerry D. William, and Alice M. Emerson
2000 Stone Tools and Flake Debris. In The Archaeology of the Bobtail Wolf Site: Folsom
Occupation of the Knife River Flint Quarry Area, North Dakota, edited by Matthew J.
Root, pp. 223-308. Washington State University Press, Pullman, Washington.
Root, Matthew J., Jerry D. William, Marvin Kay, and Lisa Shifrin
1999 Folsom Ultrathin Biface and Radial Break Tools in the Knife River Flint Quarry
Area. In Folsom Lithic Technology: Explorations in Structure and Variation, edited by
Daniel S. Amick, pp.144-168. Archaeological Series 12, International Monographs in
Prehistory, Ann Arbor, Michigan.
Rose, Richard O.
2011 The Shifting Sands Site: A Southern Plains Folsom-Midland Assemblage. Bulletin of
the Texas Archeological Society 82:299-324.
Seebach, John D.
2004 Past and Present at the Chispa Creek Folsom Site, Culberson County, Texas. Journal
of Big Bend Studies 16:1-30.
Sellards, E. H.
1952 Early Man in America. University of Texas Press, Austin.

333
Sellards, E. H., Glen L. Evans, Grayson Meade, and Alex Krieger
1947 Fossil Bison and Associated Artifacts from Plainview, Texas. Bulletin of the
Geological Society of America 58:927-954.
Sellet, Frédéric
1999 A Dynamic View of Paleoindian Assemblages at the Hell Gap Site, Wyoming:
Reconstructing Lithic Technological Systems. Unpublished Ph.D. dissertation,
Department of Anthropology, Southern Methodist University.
Smallwood, Ashley Michelle
2006 Use-Wear Analysis of the Clovis Biface Collection from the Gault Site in Central
Texas. Master’s Thesis, Texas A&M University.
Sollberger, J. B.
1971 A Technological Study of Beveled Knives. Plains Anthropologist 16(53):209-218.
Sollberger, J. B. and Leland W. Patterson
1980 Attributes of Experimental Folsom Points and Channel Flakes. Bulletin of the Texas
Archeological Society 51:289-299.
Speer, Charles A.
2011 Using LA-ICP-MS to Characterize Clovis Artifacts at the Gault Site. Poster
presented at the 76th
annual meeting of the Society for American Archaeology,
Sacramento, California.
Speth, John D., Khori Newlander, Andrew A. White, Ashley K. Lemke, and Lars E. Anderson
2013 Early Paleoindian Big-Game Hunting in North America: Provisioning or Politics?
Quaternary International 285:111-133.
Stiger, Mark
2006 A Folsom Structure in the Colorado Mountains. American Antiquity 71(2):321-351.
Storck, Peter L.
1991 Imperialists without a State: The Cultural Dynamics of Early Paleoindian
Colonization as Seen from the Great Lakes Region. In Clovis Origins and Adaptations,
edited by Robson Bonnichsen and Karen L. Turnmire, pp. 153-162. Center for the Study
of the First Americans, College Station, Texas.
Surovell, Todd A.
2009 Toward a Behavioral Ecology of Lithic Technology: Cases from Paleoindian
Archaeology. University of Arizona Press, Tucson.
Surovell, Todd A., Nicole M. Waguespack, and Marcel Kornfeld
2003 A Note on the Functions of Folsom Ultrathin Bifaces. Current Research in the
Pleistocene 20:75-77.

334
Takakura, Jun
2012 Emergence and Development of the Pressure Microblade Production: A View from
the Upper Paleolithic of Northern Japan. In The Emergence of Pressure Blade Making:
From Origin to Modern Experimentation, edited by Pierre M. Desrosiers, pp. 285-306.
Springer, New York.
Titmus, Gene L. and James C. Woods
1991 A Closer Look at Margin “Grinding” on Folsom and Clovis Points. Journal of
California and Great Basin Anthropology 13(2):194-203.
Tomka, Steve A.
2013 The Adoption of the Bow and Arrow: A Model Based on Experimental Performance
Characteristics. American Antiquity 78(3):553-569.
Tunnell, Curtis
1977 Fluted Projectile Point Production as Revealed by Lithic Specimens from the Adair-
Steadman Site in Northwest Texas. Museum Journal 17:140-168.
Turner, Ellen Sue, Thomas R. Hester, and Richard L. McReynolds
2011 Stone Artifacts of the Texas Indians, 3rd
edition. Taylor Trade Publishing, New York.
Walker, Danny N.
1982 Early Holocene Vertebrate Fauna. In The Agate Basin Site: A Record of the
Paleoindian Occupation of the Northwestern High Plains, edited by George C. Frison
and Dennis Stanford, pp. 274-308. Academic Press, New York.
Waters, Michael R., Charlotte D. Pevny, and David L. Carlson
2011 Clovis Lithic Technology: Investigation of a Stratified Workshop at the Gault Site,
Texas. Texas A&M University Press, College Station, Texas.
Wendorf, Fred, Alex D. Krieger, and Claude C. Albritton
1955 The Midland Discovery: A Report on the Pleistocene Human Remains from Midland,
Texas. University of Texas Press, Austin.
Wendorf, Fred and Alex D. Krieger
1959 New Light on the Midland Discovery. American Antiquity 25(1):66-78.
Wernecke, D. Clark and Michael B. Collins
2012 Patterns and Process: Some Thoughts on the Incised Stones from the Gault Site,
Central Texas, United States. In L'Art Pléistocène Dans Le Monde, edited by Jean
Clottes. N° spécial de Préhistoire, Art et Sociétés, Bulletin de la Société Préhistorique
Ariège-Pyrénées LXV-LXVI:Book: p. 120-121, CD: p. 669-681
2013 The Gault Site (41BL323), Bell County, Texas. Gault School of Archaeological
Research, Texas State University, San Marcos.
335
Wheat, Joe Ben
1972 The Olsen Chubbuck Site: A Paleo-Indian Bison Kill. Society for American
Archaeology Memior 26, Washington, D.C.
Wilke, Philip J.
2002 Bifacial Flake-Core Reduction Strategies and Related Aspects of Early Paleoindian
Lithic Technology. In Folsom Technology and Lifeways, edited by John E. Clark and
Michael B. Collins, pp. 345-370. Special Publication 4, Department of Anthropology,
University of Tulsa, Tulsa, Oklahoma.
William, Jerry D.
2000 Folsom Stone Tools. In The Big Black Site: A Folsom Complex Workshop in the
Knife River Flint Quarry Area, North Dakota, edited by Jerry D. William, pp. 169-230.
Washington State University Press, Pullman, Washington.
Wilmsen, Edwin N. and Frank H. H. Roberts, Jr.
1978 Lindenmeier, 1934-1974: Concluding Report on Investigations. Smithsonian
Institution Press, Washington, D.C.
Young, David E. and Robson Bonnichsen
1984 Theoretical Foundations of the Cognitive Approach. In Understanding Stone Tools:
A Cognitive Approach, edited by David E. Young and Robson Bonnichsen. Peopling of
Americas Process Series: Vol. 1. Center for the Study of Early Man, University of Maine
at Orono.
Young, David E., Robson Bonnichsen, Diane Douglas, Jill McMahon, and Lise Swartz.
1994 Low-Range Theory and Lithic Technology: Exploring the Cognitive Approach. In
Method and Theory for Investigating the Peopling of the Americas, edited by Robson
Bonnichsen and D. Gentry Steele, pp. 209-237. Center for the Study of the First
Americans, Oregon State University, Corvallis.
Zeimens, George M.
1982 Analysis of Postcranial Bison Remains. In The Agate Basin Site: A Record of the
Paleoindian Occupation of the Northwestern High Plains, edited by George C. Frison
and Dennis Stanford, pp. 213-240. Academic Press, New York.

336
VITA
Robert Detlef Lassen was born on February 28, 1979 in Louisville, Kentucky to his
parents, Peter and Carol Lassen. He was born the seventh son of a seventh son. He has the
power to heal. He has the gift of the second sight. He is the chosen one. So it shall be written,
so it shall be done. As a child he attended the Xavier School for Gifted Youngsters. During this
time, Robert engaged in volunteer archaeological excavations with the Brotherhood of the
Cruciform Sword. After graduating high school in the spring of 1997, Robert enrolled at Balamb
Garden, where he received SeeD training in guardian forces with a minor in gunblades. After
graduating in 2001, Robert spent a year frozen in carbonite with little hope for advancement or
happiness. However, that dark time inspired him to return to school and to renew his interest in
archaeology. Robert received a Master of Dark Arts in anthropology from the Durmstrang
Institute in the fall of 2005. After graduating, Robert spent nearly two years in the warm belly of
a dead tauntaun. In the fall of 2007, Robert enrolled in the Ph.D. program in anthropology at the
University of Tennessee. While there, Robert worked for four years trying to break into the cave
beneath the McClung Museum of Natural History and Culture, and he spent one year showing
highlights from the Maury Show to the students of Anth 110: Human Origins. Robert is
currently a staff specialist at the Rachael Ray Show. Finally, almost nothing in the preceding
account is true.