DISSERTAÇÃO Pedro Henrique Sousa de Moraes ... - RI UFPE
114
UNIVERSIDADE FEDERAL DE PERNAMBUCO CENTRO DE INFORMÁTICA PÓS-GRADUAÇÃO EM CIÊNCIA DA COMPUTAÇÃO PEDRO HENRIQUE SOUSA DE MORAES Willow: A Tool for Interactive Data Structures and Algorithms Visualization Recife 2020
-
Upload
khangminh22 -
Category
Documents
-
view
0 -
download
0
Transcript of DISSERTAÇÃO Pedro Henrique Sousa de Moraes ... - RI UFPE

UNIVERSIDADE FEDERAL DE PERNAMBUCOCENTRO DE INFORMÁTICA
PÓS-GRADUAÇÃO EM CIÊNCIA DA COMPUTAÇÃO
PEDRO HENRIQUE SOUSA DE MORAES
Willow: A Tool for Interactive Data Structures and Algorithms Visualization
Recife2020

PEDRO HENRIQUE SOUSA DE MORAES
Willow: A Tool for Interactive Data Structures and Algorithms Visualization
Dissertation presented to the Postgraduate Pro-gram in Computer Science at the Federal Univer-sity of Pernambuco, as a partial requirement toobtain the degree of Master at Computer Science.
Concentration Area: Software Engineeringand Programming Languages
Advisor: Leopoldo Motta Teixeira
Recife2020

Catalogação na fonte
Bibliotecária Monick Raquel Silvestre da S. Portes, CRB4-1217
M827w Moraes, Pedro Henrique Sousa de
Willow: a tool for interactive data structures and algorithms visualization / Pedro Henrique Sousa de Moraes. – 2020.
113 f.: il., fig., tab. Orientador: Leopoldo Motta Teixeira. Dissertação (Mestrado) – Universidade Federal de Pernambuco. CIn,
Ciência da Computação, Recife, 2020. Inclui referências e apêndices.
1. Engenharia de software. 2. Linguagem de programação. I. Teixeira, Leopoldo Motta (orientador). II. Título. 005.1 CDD (23. ed.) UFPE - CCEN 2020 - 207

Pedro Henrique Sousa de Moraes
“Willow: A Tool for Interactive Data Structures and Algorithms Visualization”
Dissertação de Mestrado apresentada ao Programa de Pós-Graduação em Ciência da Computação da Universidade Federal de Pernambuco, como requisito parcial para a obtenção do título de Mestre em Ciência da Computação.
Aprovado em: 29/10/2020.
BANCA EXAMINADORA
_______________________________________________________ Prof. Dr. Leopoldo Motta Teixeira
Centro de Informática/ UFPE (Orientador)
_______________________________________________________ Prof. Dr. , Roberto Almeida Bittencourt
Departamento de Ciências Exatas / UEFS
______________________________________________________ Prof. Dr. Christina von Flach Garcia Chavez
Departamento de Ciência da Computação / UFBA

ACKNOWLEDGEMENTS
This work was accomplished with the help of several people. I would like to expressmy deeply appreciation to my advisor Leopoldo Motta Teixeira, who instructed me alongmy trajectory and provided me with encouragement and patience throughout the dura-tion of this project. I would also like to extend my gratitude to the professor Marcelod’Amorim, whose help in several stages of the research with practical suggestions cannotbe overestimated. I gratefully acknowledge the assistance of professor Waldemar Neto,who provided a good amount of assistance during the development of the research.
All the gratitude to my parents (Genilda Teófilo and Pedro Saraiva), for all the supportand always ensuring that I had everything to complete this stage of life.
We acknowledge support from FACEPE (IBPG-0751-1.03/18 and APQ-0570-1.03/14),and CNPq (409335/2016-9). This research was partially funded by INES 2.0,FACEPE grants PRONEX APQ-0388-1.03/14 and APQ-0399-1.03/17, and CNPq grant465614/2014-0.

ABSTRACT
Teaching Introductory Programming and Data Structures and Algorithms is an im-portant part of Information Technology courses. Both disciplines include essential con-cepts for software development. Preparing lessons for these courses can be time demand-ing and tedious as instructors often need to create and modify examples using slides andsketches on a board. Students may also have difficulties due to the high level of abstractionof the content taught in both courses. Educational visualization tools, such as PythonTutor exist, but they provide rigid choices of visualization schemes used to represent thedata. Most educational tools are discontinued or have limited support to the visualizationof data structures and algorithms. Other tools create visualizations of several algorithms,but lack the ability to edit the source code or inputs. This work proposes Willow, aweb-based interactive tool to visualize program state. Willow enables the user to cus-tomize visualizations and to walk through the code in both directions to facilitate codeunderstanding. The sensible features of Willow are its ability to change data represen-tations, jump to any point of a program with visual support during debug sessions, anddetection and animation of common data structures such as lists and trees. To evaluateWillow, we conducted two studies, a survey with instructors of several universities, anda follow up experiment with programmers of a freelancing platform. We obtained positivefeedback from 91% of the survey participants, suggesting that Willow can be used asan teaching aid tool by instructors. In the follow up experiment with programmers, wecould not find significant difference between participants that used Willow and partic-ipants that did not, the results of the experiment were not conclusive. Nevertheless, weobtained positive results after considering a subset of the experiment tasks, participantsalso reacted positively to the tool and many would like to use it again.
Keywords: Program Visualization. Algorithm Visualization. Educational Tool.
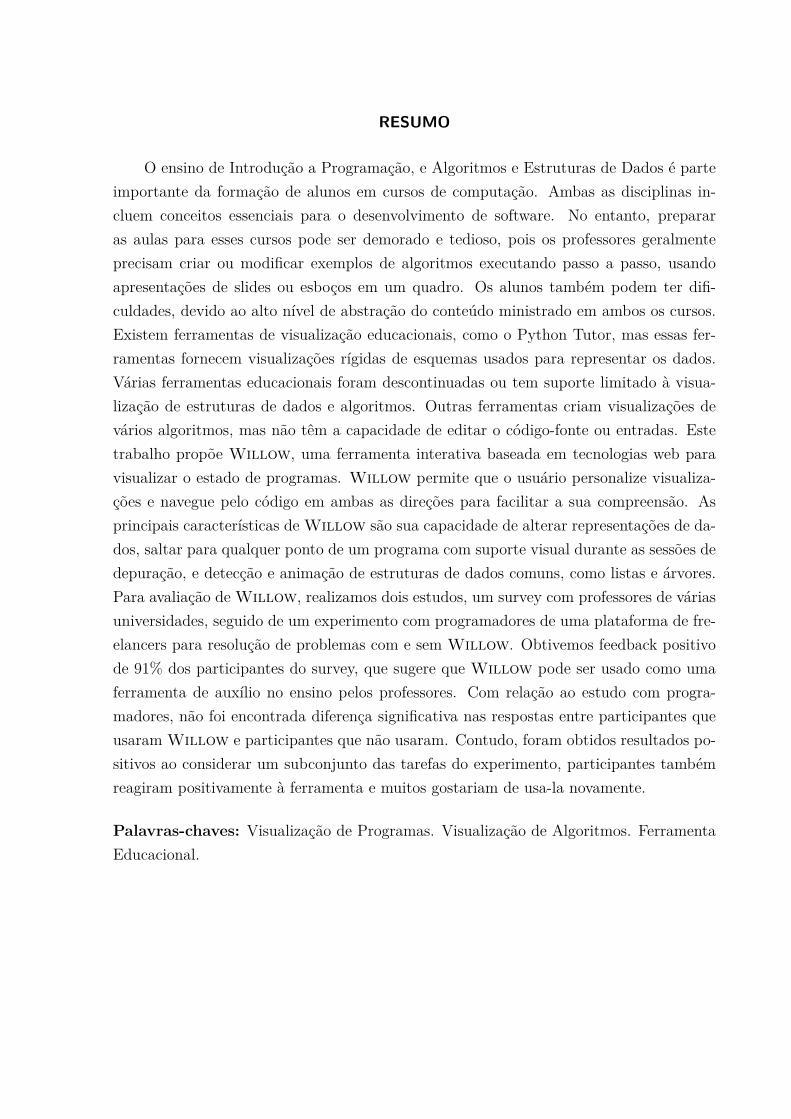
RESUMO
O ensino de Introdução a Programação, e Algoritmos e Estruturas de Dados é parteimportante da formação de alunos em cursos de computação. Ambas as disciplinas in-cluem conceitos essenciais para o desenvolvimento de software. No entanto, prepararas aulas para esses cursos pode ser demorado e tedioso, pois os professores geralmenteprecisam criar ou modificar exemplos de algoritmos executando passo a passo, usandoapresentações de slides ou esboços em um quadro. Os alunos também podem ter difi-culdades, devido ao alto nível de abstração do conteúdo ministrado em ambos os cursos.Existem ferramentas de visualização educacionais, como o Python Tutor, mas essas fer-ramentas fornecem visualizações rígidas de esquemas usados para representar os dados.Várias ferramentas educacionais foram descontinuadas ou tem suporte limitado à visua-lização de estruturas de dados e algoritmos. Outras ferramentas criam visualizações devários algoritmos, mas não têm a capacidade de editar o código-fonte ou entradas. Estetrabalho propõe Willow, uma ferramenta interativa baseada em tecnologias web paravisualizar o estado de programas. Willow permite que o usuário personalize visualiza-ções e navegue pelo código em ambas as direções para facilitar a sua compreensão. Asprincipais características de Willow são sua capacidade de alterar representações de da-dos, saltar para qualquer ponto de um programa com suporte visual durante as sessões dedepuração, e detecção e animação de estruturas de dados comuns, como listas e árvores.Para avaliação de Willow, realizamos dois estudos, um survey com professores de váriasuniversidades, seguido de um experimento com programadores de uma plataforma de fre-elancers para resolução de problemas com e sem Willow. Obtivemos feedback positivode 91% dos participantes do survey, que sugere que Willow pode ser usado como umaferramenta de auxílio no ensino pelos professores. Com relação ao estudo com progra-madores, não foi encontrada diferença significativa nas respostas entre participantes queusaram Willow e participantes que não usaram. Contudo, foram obtidos resultados po-sitivos ao considerar um subconjunto das tarefas do experimento, participantes tambémreagiram positivamente à ferramenta e muitos gostariam de usa-la novamente.
Palavras-chaves: Visualização de Programas. Visualização de Algoritmos. FerramentaEducacional.

LIST OF FIGURES
Figure 1 – Software Visualization Categories. . . . . . . . . . . . . . . . . . . . . . 20Figure 2 – Simulation of a sorting algorithm in VisuAlgo. . . . . . . . . . . . . . . 26Figure 3 – Scratch editor. . . . . . . . . . . . . . . . . . . . . . . . . . . . . . . . 27Figure 4 – Python Tutor interface. . . . . . . . . . . . . . . . . . . . . . . . . . . 28Figure 5 – Omnicode IDE. . . . . . . . . . . . . . . . . . . . . . . . . . . . . . . . 29Figure 6 – OPT+GRAPH data structure visualization pane. . . . . . . . . . . . . 30Figure 7 – UUhisle, a visualization tool for Introductory Programming Education. 32Figure 8 – FluidEdit interface. . . . . . . . . . . . . . . . . . . . . . . . . . . . . . 33Figure 9 – Kanon interface. . . . . . . . . . . . . . . . . . . . . . . . . . . . . . . 34Figure 10 – Willow interface. . . . . . . . . . . . . . . . . . . . . . . . . . . . . . 37Figure 11 – Willow’s editors. . . . . . . . . . . . . . . . . . . . . . . . . . . . . . 38Figure 12 – Willow’s stack and call tree of a Fibonacci sequence algorithm. . . . 39Figure 13 – Willow’s node representations. . . . . . . . . . . . . . . . . . . . . . 41Figure 14 – Willow’s architecture. . . . . . . . . . . . . . . . . . . . . . . . . . . 44Figure 15 – Python Tutor visualization of a tree structure. . . . . . . . . . . . . . . 47Figure 16 – Kanon’s representation of arrays. . . . . . . . . . . . . . . . . . . . . . 48Figure 17 – Participants’ teaching institutions. . . . . . . . . . . . . . . . . . . . . 54Figure 18 – Participants years of experience with IP and DSA. . . . . . . . . . . . 55Figure 19 – Common teaching practices adopted by instructors. . . . . . . . . . . . 56Figure 20 – Participants perception about Willow’s visualizations. . . . . . . . . 57Figure 21 – Participants confidence in their solutions. . . . . . . . . . . . . . . . . . 66Figure 22 – Time participants take to solve problems. . . . . . . . . . . . . . . . . 67Figure 23 – Participants’ scores average and medians for each question and treatment. 68

LIST OF TABLES
Table 1 – Differences between categories of Software Visualization tools. . . . . . . 23Table 2 – Latin-square design, a complete 2x2 layout. . . . . . . . . . . . . . . . . 64Table 3 – Threats to validity and control actions. . . . . . . . . . . . . . . . . . . 68

CONTENTS
1 INTRODUCTION . . . . . . . . . . . . . . . . . . . . . . . . . . . . 111.1 MOTIVATION . . . . . . . . . . . . . . . . . . . . . . . . . . . . . . . . 121.2 RESEARCH . . . . . . . . . . . . . . . . . . . . . . . . . . . . . . . . . . 122 BACKGROUND . . . . . . . . . . . . . . . . . . . . . . . . . . . . . 132.1 THE LEARNING CHALLENGE . . . . . . . . . . . . . . . . . . . . . . . 132.1.1 Misconceptions . . . . . . . . . . . . . . . . . . . . . . . . . . . . . . . 132.2 FACTORS CONTRIBUTING TO MISCONCEPTIONS . . . . . . . . . . . 172.3 MENTAL MODELS . . . . . . . . . . . . . . . . . . . . . . . . . . . . . 182.3.1 Notional Machines . . . . . . . . . . . . . . . . . . . . . . . . . . . . . 192.3.2 Visualizing Notional Machines . . . . . . . . . . . . . . . . . . . . . . 192.4 EDUCATIONAL PROGRAM VISUALIZATION . . . . . . . . . . . . . . . 202.4.1 Algorithm Visualization . . . . . . . . . . . . . . . . . . . . . . . . . . 212.4.2 Program Visualization . . . . . . . . . . . . . . . . . . . . . . . . . . . 213 RELATED WORK . . . . . . . . . . . . . . . . . . . . . . . . . . . . 253.1 VISUALGO . . . . . . . . . . . . . . . . . . . . . . . . . . . . . . . . . . 253.2 SCRATCH . . . . . . . . . . . . . . . . . . . . . . . . . . . . . . . . . . 263.3 PYTHON TUTOR . . . . . . . . . . . . . . . . . . . . . . . . . . . . . . 273.4 OMNICODE . . . . . . . . . . . . . . . . . . . . . . . . . . . . . . . . . 293.5 OPT+GRAPH . . . . . . . . . . . . . . . . . . . . . . . . . . . . . . . . 303.6 UUHISLE . . . . . . . . . . . . . . . . . . . . . . . . . . . . . . . . . . . 313.7 FLUIDEDIT . . . . . . . . . . . . . . . . . . . . . . . . . . . . . . . . . . 323.8 KANON . . . . . . . . . . . . . . . . . . . . . . . . . . . . . . . . . . . . 333.9 SURVEYS . . . . . . . . . . . . . . . . . . . . . . . . . . . . . . . . . . . 344 WILLOW . . . . . . . . . . . . . . . . . . . . . . . . . . . . . . . . . 364.1 DESIGN . . . . . . . . . . . . . . . . . . . . . . . . . . . . . . . . . . . . 364.1.1 Editors . . . . . . . . . . . . . . . . . . . . . . . . . . . . . . . . . . . . 374.1.2 Stack and Call Tree . . . . . . . . . . . . . . . . . . . . . . . . . . . . 384.1.3 Heap . . . . . . . . . . . . . . . . . . . . . . . . . . . . . . . . . . . . . 404.1.3.1 Node Types . . . . . . . . . . . . . . . . . . . . . . . . . . . . . . . . . . 404.1.3.2 Positioning and Animation . . . . . . . . . . . . . . . . . . . . . . . . . . 414.1.3.3 Program Navigation . . . . . . . . . . . . . . . . . . . . . . . . . . . . . 424.1.4 Language Support . . . . . . . . . . . . . . . . . . . . . . . . . . . . . 424.1.5 Limitations . . . . . . . . . . . . . . . . . . . . . . . . . . . . . . . . . 424.2 ARCHITECTURE . . . . . . . . . . . . . . . . . . . . . . . . . . . . . . . 434.2.1 Client . . . . . . . . . . . . . . . . . . . . . . . . . . . . . . . . . . . . . 434.2.2 Database . . . . . . . . . . . . . . . . . . . . . . . . . . . . . . . . . . . 454.2.3 Tracers . . . . . . . . . . . . . . . . . . . . . . . . . . . . . . . . . . . . 45

4.3 COMPARISON WITH OTHER TOOLS . . . . . . . . . . . . . . . . . . . 465 EVALUATION . . . . . . . . . . . . . . . . . . . . . . . . . . . . . . 495.1 SURVEY . . . . . . . . . . . . . . . . . . . . . . . . . . . . . . . . . . . 495.1.1 Objective . . . . . . . . . . . . . . . . . . . . . . . . . . . . . . . . . . 495.1.2 Research Questions . . . . . . . . . . . . . . . . . . . . . . . . . . . . 505.1.3 Research Method . . . . . . . . . . . . . . . . . . . . . . . . . . . . . . 505.1.4 Population . . . . . . . . . . . . . . . . . . . . . . . . . . . . . . . . . . 505.1.5 Questionnaire . . . . . . . . . . . . . . . . . . . . . . . . . . . . . . . . 505.1.6 Results . . . . . . . . . . . . . . . . . . . . . . . . . . . . . . . . . . . . 535.1.6.1 Participants Teaching Practices . . . . . . . . . . . . . . . . . . . . . . . 535.1.6.2 Participants Perceptions Towards Willow . . . . . . . . . . . . . . . . . 565.1.7 Threats to Validity . . . . . . . . . . . . . . . . . . . . . . . . . . . . . 595.2 EXPERIMENT . . . . . . . . . . . . . . . . . . . . . . . . . . . . . . . . 595.2.1 Objective . . . . . . . . . . . . . . . . . . . . . . . . . . . . . . . . . . 605.2.2 Research Question and Hypothesis . . . . . . . . . . . . . . . . . . . 605.2.3 Variables . . . . . . . . . . . . . . . . . . . . . . . . . . . . . . . . . . . 615.2.3.1 Independent Variables . . . . . . . . . . . . . . . . . . . . . . . . . . . . 615.2.3.2 Dependent Variables . . . . . . . . . . . . . . . . . . . . . . . . . . . . . 615.2.4 The Choice of Dependent Variables . . . . . . . . . . . . . . . . . . . 625.2.5 Experimental Subjects . . . . . . . . . . . . . . . . . . . . . . . . . . . 625.2.5.1 Ethical Concerns . . . . . . . . . . . . . . . . . . . . . . . . . . . . . . . 625.2.6 Objects and Tasks . . . . . . . . . . . . . . . . . . . . . . . . . . . . . 635.2.7 Experimental Design . . . . . . . . . . . . . . . . . . . . . . . . . . . . 635.2.8 Protocol . . . . . . . . . . . . . . . . . . . . . . . . . . . . . . . . . . . 645.2.9 Results . . . . . . . . . . . . . . . . . . . . . . . . . . . . . . . . . . . . 655.2.10 Threats to Validity and Control Actions . . . . . . . . . . . . . . . . 686 FINAL CONSIDERATIONS . . . . . . . . . . . . . . . . . . . . . . . 716.1 CONCLUSION . . . . . . . . . . . . . . . . . . . . . . . . . . . . . . . . 716.2 FUTURE WORK . . . . . . . . . . . . . . . . . . . . . . . . . . . . . . . 71
REFERENCES . . . . . . . . . . . . . . . . . . . . . . . . . . . . . . 72APPENDIX A - SURVEY QUESTIONNAIRE . . . . . . . . . . . . 82APPENDIX B - EXPERIMENT FORM . . . . . . . . . . . . . . . . 94APPENDIX C - EXPERIMENT TEST INPUTS . . . . . . . . . . . 113

11
1 INTRODUCTION
Introductory Programming (IP) and Data Structures and Algorithms (DSA) are impor-tant courses in the Computer Science curriculum. Teaching and Learning these coursescan be challenging for instructors and students. Abstract concepts and programminglanguages can be overwhelming and lead students to misconceptions and difficulties tounderstand the concepts. To help students, instructors typically prepare examples onlecture slides or create sketches on the board to illustrate algorithm behavior (GUO,2013).
This task can be daunting for instructors and ineffective for students. Lecture slidesrequire a great deal of planning and preparation from the instructors and whiteboardsketches take time to draw during class, and the diagrams can get confusing (ORSEGA;VANDER ZANDEN; SKINNER, 2012). Moreover, both approaches require the instructorto create new examples every time new inputs and modifications are proposed.
Another option to illustrate how DSAs work is through the use of graphical tools. Someof these tools, (e.g., Python Tutor) were already adopted in introductory CS courses inUniversities in the US and Canada such as Berkeley and Toronto with good acceptanceof instructors, who indicated the tool helped clarify basic programming concepts (GUO,2013). Unfortunately, the currently available graphical tools generate “rigid” graphicalrepresentations—they adopt the same visual elements to represent different types of datastructures and do not preserve the positioning of objects. Hence, many of the algorithmsusually seen through a DSA course can not be consistently represented (SORVA et al.,2012; FOUH; AKBAR; SHAFFER, 2012). Python Tutor, for example, can not creategood visualizations for data structures more complex than linked lists, due to its restric-tions in the positioning of objects.
To overcome these limitations we propose Willow, a tool for generating interactiveexamples of algorithms, data structures and other basic programming concepts. Willowallows users to create visualizations for programs written in Python or Java, with fewrestrictions. In order to create better representations of algorithms, Willow also allowsusers to change how objects are represented, by doing so, users can achieve better qualityexamples which favor understanding.
Willow’s main focus is to provide a tool that can help instructors and studentsthrough the visualization of more complex DSAs, since the best current available toolssuch as Python Tutor (and derivatives) (GUO, 2013) and Kanon (OKA; MASUHARA;AOTANI, 2018) are not capable of effectively showing a good variety of algorithms.
To be able to create such visualizations, Willow allows users to manipulate a basevisualization, changing how objects are represented, creating animations for data struc-tures, and navigating to any point of a program.

12
1.1 MOTIVATION
In the past decades, several tools had been developed with the purpose of visual-izing generic programs, focusing mainly in didactic visualizations to teach students ofintroductory courses. However, very few educational tools targeted more complex algo-rithms commonly taught in DSA (SORVA; KARAVIRTA; MALMI, 2013; VELÁZQUEZ-ITURBIDE, 2019). Another factor that motivated the creation of Willow is that almostall educational tools are discontinued for several reasons, such as the use of old technolo-gies, closed source development and abandonment.
Willow was created to be flexible and extensible, being able to support multiplelanguages (an extremely rare feature among the older tools) and create visualizations forany source code the user provides. Willow’s implementation also uses the most recentweb technologies and is open-source, its repository is available at: https://github.com/
pedro00dk/willow.
1.2 RESEARCH
To evaluate Willow, we carried two studies, a survey with IP and DSA instructorsof several universities and an experiment with amateur programmers from the freelanc-ing platform Upwork (UPWORK, 2020). Our studies aimed at answering the followingresearch questions:
• RQ1: What are the most common practices used by instructors when teachingcoding-related courses?
• RQ2: What are the perceptions of these instructors towards Willow?
• RQ3: What are the benefits Willow can offer to programmers when solving datastructures and algorithms problems, with regard to time to solve, confidence andcorrectness?
In the following chapters we discuss the background of our research (Chapter 2) andsome of the most recent related work (Chapter 3). We then describe our proposed tool(Chapter 4). We detail all the evaluation process and results of both studies applied in theevaluation of Willow(Chapter 5). Finally, we conclude this dissertation (Chapter 6).

13
2 BACKGROUND
This chapter introduces an overview of the difficulties that Information Technology stu-dents suffer in initial courses, such as Introductory Programming, and Data Structures andAlgorithms. These difficulties are categorized, detailed and associated with the conceptof notional machines. Notional machines are abstractions of how students comprehendcode execution dynamics. Educational visualization tools provide support for students byshowing correct models of notional machines, making abstractions more clear and, hence,helping them to better understand the programming concepts.
2.1 THE LEARNING CHALLENGE
The challenges that Information Technology students have to overcome are presentedsince the beginning, when they have to attend to their potentially first IntroductoryProgramming courses. Introductory Programming courses can be very challenging tonovices. The primary goal is to make students learn how to create their own programs, andsolve simple problems using some programming language. This is a demanding task forstudents, and is often not achieved. As a result of that, courses fail to teach programmingworldwide, exhibiting high failure rates (SORVA et al., 2012).
One of the main causes of failures are misconceptions and other difficulties exhibitedby novices throughout the courses, drastically reducing students ability to learn and makeprogress (QIAN; LEHMAN, J., 2017). Still, misconceptions are only one of many possiblecauses that may lead to students difficulties in learning. There are several other reasonsthat may impact the students learning process, such as social, personal or institutionalproblems (SILVA RIBEIRO; BRANDÃO; BRANDÃO, 2012),
2.1.1 Misconceptions
The early studies in the area of misconceptions in Computer Science and programmingarose in 1980s (BAYMAN; MAYER, 1983; DU BOULAY, 1986). Many studies emergedfrom researchers in the Computer Science education area, analysing students impreciseor incomplete understandings of programming concepts. Since there is no commonlyused definition to students difficulties, studies use misconception or similar terms, suchas "difficulties", "errors", "mistakes" and so on (QIAN; LEHMAN, J., 2017).
Misconceptions are deficient or inadequate understandings for many practical con-texts. In programming, misconceptions includes syntax errors, confusions with controlflow primitives, wrong interpretation of concepts, difficulties in using learned constructs,planning and debugging problems and others (QIAN; LEHMAN, J., 2017; SORVA; KAR-

14
AVIRTA; MALMI, 2013; JACKSON; COBB; CARVER, 2005).
Misconceptions with Syntax
Novices in Introductory Programming courses often exhibit syntactic errors in theirprogramming activities. A study on large volumes of student source code in the Javalanguage (ALTADMRI; BROWN, 2015), showed that the most frequent errors presentedby students are mismatches of parenthesis, brackets and quotation marks. Other commonJava syntactic errors committed by novices are missing semicolons, unresolved symbolsand illegal expressions (JACKSON; COBB; CARVER, 2005). Semicolon is a characterused to terminate statements in Java and other programming languages, and it is oftenforgotten by novices. The unresolved symbol error is frequently the result of accessingthe value of a undeclared variable. And illegal expression errors are often caused bymalformed boolean expressions due to unfamiliarity with operators. For example, oftennovices mistakenly use the assignment operator (=) as a comparison operator (==), caus-ing syntactic errors and in some cases semantic errors, which are harder to be fixed bynovices (ALTADMRI; BROWN, 2015; SORVA et al., 2012).
Syntactic errors are among of the most frequent mistakes students make (JACKSON;COBB; CARVER, 2005; ALTADMRI; BROWN, 2015). However, they can be easilyfixed, because most modern integrated development environments (IDE) and languagecompilers can easily spot syntax problems and present the user with error messages aboutthe problems and sometimes hints for correction (QIAN; LEHMAN, J., 2017).
Misconceptions with Semantics
Most of the errors students make are related to syntax of programming languages (JACK-SON; COBB; CARVER, 2005; GARNER; HADEN; ROBINS, 2005), they are the mostfrequent type, but also superficial, and easy to fix. However, students misconceptionswith program semantics have a much greater impact on their mental models of a programruntime. These misconceptions prevent the student to correctly express their solutions forproblems, because they cannot understand the behavior of the programs they make (BAY-MAN; MAYER, 1983; SORVA et al., 2012).
There are many sources of misconceptions in the semantic context of programminglanguages, such as variables, for instance, variables are one of the fundamental buildingblocks for any program, used to store inputs and outputs of program operations. Manydifferent types of misconceptions involving variables were reported by studies. Studentsmay not understand that variables only store a single value, causing then to try assign-ing and retrieving multiple values at the same time for a single variable (DOUKAKIS;

15
GRIGORIADOU; TSAGANOU, 2007). Novices can also misunderstand how both thestatement order and the expression order (e.g. A=B; B=A;) influence in the result of theassignment (DU BOULAY, 1986). Another source of confusion around variables is themeaning of their names, which can cause novices to misinterpret the value of a variable.Variable names, even being arbitrary, may cause students to think the value containedin a variable is always the meaning of the variable name (KACZMARCZYK et al., 2010;QIAN; LEHMAN, J., 2017).
Other difficult concepts for novices that cause many misconceptions, are control flowprimitives (e.g. if-else, while, for). For instance, students may believe that bothif and else conditional blocks are executed, or that if the condition for a conditionalstatement evaluates to false, the program execution stops. Loop constructs are also achallenge to novices, since they still did not develop a concise understanding of variablescopes, the use of loop structures becomes too confusing. Novices may not know whichlines of the loop scope are executed, how many times the loop executes, initialization,stop and increment statements, and so forth (QIAN; LEHMAN, J., 2017). Anothermisconception involving loop statements is about how the loop code executes. Somestudents fail to understand that loop code executes sequentially and that informationcan be propagated to the next loop executions (DU BOULAY, 1986). In programminglanguages with multiple loop constructs such as Java, many novices avoid using some ofthese constructs, as they believe that one construct is better than the others. This is aresult of the lack of understanding of the benefits of each loop construct and how to usethem to help solving different problems (QIAN; LEHMAN, J., 2017).
Since the increase in popularity of the object-oriented paradigm (OOP) in the 1990s,studies conducted with novices reported that students often struggle with many OOPprinciples (GUZDIAL, 1995; RAGONIS; BEN-ARI, 2005; SORVA et al., 2012). Con-cepts such as classes and objects are among the most confusing in OOP, novices oftenmisunderstand what these elements are for, and how they relate to one another (KACZ-MARCZYK et al., 2010). Methods and functions are other sources of misconceptions.These concepts introduce new ways to interpret already seen concepts, such as variablescopes, making it even more confusing when mixed with classes and instances attributes.Some students may exhibit difficulties in understanding where the function parameterscome from, as well as side effects that may or may not happen on parameters values,how the return statement works and where the return value goes (RAGONIS; BEN-ARI,2005). Novices may not even understand the role of the main method, or the relationshipbetween methods, objects and classes (SAJANIEMI; KUITTINEN; TIKANSALO, 2008).When objects are introduced, novices have to deal with references, a new type of variablevalue. Although in most languages the assignment semantics of a reference value is iden-tical to the semantics of primitive values, novices may not distinguish between referencesand objects, causing them to misunderstand the result of copying references (KACZMAR-

16
CZYK et al., 2010). This misinterpretation may cause students to build different mentalmodels about reference assignments (QIAN; LEHMAN, J., 2017).
Besides misconceptions with general object-oriented programming concepts, novicesmay also exhibit difficulties in developing decentralized solutions, required for OOP pro-gramming (GUZDIAL, 1995), and correct construction of a object oriented mental modeland notional machines (SORVA et al., 2012).
Misconceptions with Strategies
Strategies refer to knowledge in programming activities such as planning, writing,testing and debugging programs. Different terms were adopted to describe programmer’sstrategic knowledge, such as plans, patterns, schemas and others (EBRAHIMI, 1994;LOPEZ et al., 2008; QIAN; LEHMAN, J., 2017).
The first barrier novices have to overcome to develop good strategy knowledge is acorrect understanding of programming language syntax and semantics. Studies reportthat students misconceptions in strategic knowledge are highly correlated with difficultiesin syntactic and semantic knowledge (EBRAHIMI, 1994; LOPEZ et al., 2008). Sincenovices only have small programming knowledge, their lack in strategies and patternsto solve programming problems. This lack of strategies is associated to their capacityto interpret the problem objectives and decompose the problem, which influences in theplanning, testing and debugging (MULLER, 2005).
Most novices in Introductory Programming are capable of creating programs that"work". However their program often will not check program invariants, conditions andother edge cases which can cause the program to fail at runtime (SAJANIEMI; KUITTI-NEN, 2005). In some cases, students may not know how to check the correctness of theirprograms, and believe that they can obtain a partially correct result from the program ifpart of the code they wrote is correct.
Another problem is the use of debugging tools. Novices are unfamiliar with the in-formation provided by debuggers. By combining the unfamiliarity with debuggers andsemantic elements of the program, the result is a poor and local analysis of the programruntime behaviour (QIAN; LEHMAN, J., 2017). After all, most of the problems novicesconfront in debugging tasks are not fixing the program errors, but rather understandingthe program behaviour and finding the error (MCCAULEY et al., 2008). After identify-ing and locating the errors in the program, novices can fix most of them (FITZGERALDet al., 2008).

17
Misconceptions on Data Structures and Algorithms
Not only students of Introductory programming suffer from misconceptions of pro-gramming topics. Some studies reported misconceptions with topics of Data Struc-tures and Algorithms courses (DANIELSIEK; PAUL; VAHRENHOLD, 2012; PAUL;VAHRENHOLD, 2013; KARPIERZ; WOLFMAN, 2014; ZEHRA et al., 2018; ZINGAROet al., 2018; VELÁZQUEZ-ITURBIDE, 2019). These studies showed that students ofData Structure and Algorithms (DSA) courses commonly exhibit misunderstandings ofthe subjects studied, some students also show misunderstandings on Introductory Pro-gramming topics.
One study reported that students exhibited confusion in understanding the differencesbetween heaps and binary search trees (BST). This confusion was caused because studentsdeveloped restricted mental models of heaps, where the data structure representation mustbe similar to a tree. Another misconception that contributed to the confusion was theunawareness of the left-completeness property of heaps (PAUL; VAHRENHOLD, 2013).Another study reported source of confusion involving binary search trees was that studentsstruggled with the possibility of inserting duplicate keys (keys already present in the datastructure) (KARPIERZ; WOLFMAN, 2014). Students also exhibited misconceptions ingreedy algorithms, they did not understand the design decisions that lead to efficientimplementations, which led to bad greedy algorithm implementations (VELÁZQUEZ-ITURBIDE, 2019).
2.2 FACTORS CONTRIBUTING TO MISCONCEPTIONS
Many factors can contribute to novices misconceptions and other difficulties. Previ-ous research reported previous math knowledge, understanding of the English language,task complexity, instructor knowledge and teaching methods, and more, as factors thatmay contribute to novices misconceptions (ROBINS; ROUNTREE; ROUNTREE, 2003;URQUIZA-FUENTES; VELÁZQUEZ-ITURBIDE, 2009).
Prior math knowledge is a great source of misconceptions among novices. It is speciallytrue for students that had a deficient basic formation in the area of exact sciences (SORVA;LÖNNBERG; MALMI, 2013). Due to the lack of math knowledge, students may ex-hibit difficulties when abstracting information or to interpret syntax and semantics ofprogramming languages. Difficulties related to algebraic expressions are common, andstudents often forget to declare variables before using it, because it is not necessary inhigh school (JACKSON; COBB; CARVER, 2005). Other misconceptions caused by mathknowledge is about integer and floating point variables and numeric precision. Studentsmay believe that variables are capable of holding numbers of any precision, which maycause confusion when applying operators with different data types or due to unexpected

18
floating point operation results due to limited precision (DOUKAKIS; GRIGORIADOU;TSAGANOU, 2007).
Many programming language constructs are based on natural languages, specially inthe English language. A study with Chinese high school students reported that the abilitywith English was the best predictor of students success rates (QIAN; LEHMAN, J. D.,2016).
Task complexity is a factor that affects novices’ cognitive load, causing confusionmainly among early beginners that are still unfamiliar with programming language key-words and syntax. Beginners may forget the most basic programming constructs such asparenthesis, operators or semicolons when solving problems. A study reported that stu-dents submissions for the first Introductory Programming activities were mostly flawless,but when activities become increasingly challenging, students started to present more syn-tactic errors (ANDERSON; JEFFRIES, 1985). Students may also suffer when debuggingcode, tracing skills require high demand on concentration, and due to limited knowl-edge novices often use wrong variable values and miss errors when debugging (VAINIO;SAJANIEMI, 2007).
Occasionally, teaching methods adopted by instructors may contribute to students’misunderstandings. Instructors may use inadequate analogies or metaphors. A commonexample in Introductory Programming is to describe a variable as a box, students maybelieve that a variable may hold more than one value because boxes can hold manyobjects (CLANCY, 2004). The use of analogies can contribute to students’ understanding,especially for complex concepts, but their inadequate use may create barriers for novices,preventing then from building correct knowledge and progress in learning.
2.3 MENTAL MODELS
Mental models are interpretations of the thinking processes about the behavior ofanything in the real world (RAMALINGAM; LABELLE; WIEDENBECK, 2004). Theseinterpretations shape how a person understands the relationships, opportunities and con-sequences of his or her actions. A mental model can be seen as descriptions of the processesof how something works, since it is impossible to remember all details. These models al-low us to simplify complexity and evaluate which things are more relevant, defining howwe reason. Mental models play a major role in the learning process, particularly in manyactivities related to problem solving, such as cognition, reasoning, decision-making andevent anticipation (GÖTSCHI; SANDERS; GALPIN, 2003).

19
2.3.1 Notional Machines
In the Computer Science context, a notional machine is a mental model for how aperson understands the the behaviour of programming constructs. Programmers thinkof the notional machine as a conceptual computer, whose operations and properties areimplied by their knowledge of the programming language being used (SORVA et al., 2012).
Students in Introductory Programming start developing their own notional machinessince the beginning of the course. However, novices have fragile knowledge in program-ming languages syntax and semantics, which tends to affect their notional machines,hence, developing misconceptions (LOPEZ et al., 2008).
2.3.2 Visualizing Notional Machines
To help students comprehend programming concepts, instructors often use visualiza-tions of some sort in their classes (NAPS; RÖSSLING, et al., 2002). With the help ofvisualizations, instructors can show details of program concepts, bringing to the surfacethe program runtime, which was hidden from the students focusing on the program onlyat the code level. Visualization can be of any sort, and depending on the instructorobjectives, different levels of abstractions may be used to represent a program runtime.Usually, these representations are visualizations of instructors’ own notional machines, andserve as conceptual models to help students build their programming knowledge (SORVA;KARAVIRTA; MALMI, 2013).
A common strategy adopted by instructors to show visualizations is the chalk-and-talkapproach (BECKER; WATTS, 2001), where instructors draw sketches of visualizationson the blackboard. Another alternative to only drawing sketches, is involving novicesin this activity. Some studies experimented with novices participation by making themdraw their own perceptions of program runtimes (HERTZ; JUMP, 2013; HOLLIDAY;LUGINBUHL, 2004). However, drawing sketches may take a long time, which limits theamount of examples a instructor can show in a lecture (SORVA; KARAVIRTA; MALMI,2013). The drawing can also get messy and possibly confuse novices (GUO, 2013). Itis also common for instructors to use lecture slides containing pictures and diagrams toillustrate programming concepts, data structures or algorithms. Still, the creation ofpresentation material of good quality for lectures requires a long time of planning andpreparation (ORSEGA; VANDER ZANDEN; SKINNER, 2012).

20
2.4 EDUCATIONAL PROGRAM VISUALIZATION
To assist novices and instructors in providing examples of programming concepts, sev-eral tools that aim to make visualization more practical were developed since the 1980s.The idea behind most of these tools is to show a program or algorithm runtime steps.The level of abstraction may vary with the tool, as well as if the steps are displayed auto-matically or require some interaction (SORVA; KARAVIRTA; MALMI, 2013). With thehelp of these tools, instructors can demonstrate programming concepts and algorithms,and students can analyse behavior.
There are some studies that define different taxonomies to classify software visualiza-tion (SV) tools (NAPS; COOPER, et al., 2003; HUNDHAUSEN; DOUGLAS; STASKO,2002; MALETIC; MARCUS; COLLARD, 2002; KELLEHER; PAUSCH, 2005). Fig-ure 1 shows a diagram of how Software Visualization tools for education are organized,the diagram shows a common taxonomy used by review studies to categorise softwarevisualization tools by form, and contain two main categories, which are Algorithm Vi-sualization (AV) and Program Visualization (PV) (PRICE; BAECKER; SMALL, 1993).Algorithm Visualization tools show highly specialized visualizations for a limited set ofalgorithm it supports, the algorithms cannot be modified. Program Visualization toolsrequire users to implement their own code, the purpose of visualization in these tools vary,some tools abstract the code representation, other create visualizations of the programruntime dynamics.
Figure 1 – Software Visualization Categories.
The Software Visualization term (SV) refers only to educational tools. Diagram adaptedfrom (SORVA; KARAVIRTA; MALMI, 2013). The area of the categories do not matter.

21
2.4.1 Algorithm Visualization
Algorithm Visualization tools are by far the most common kind of tool studied in thefield of educational program visualization (SORVA; LÖNNBERG; MALMI, 2013). TheAlgorithm Visualization category includes tools that automatically execute predefinedprograms. The provided programs cannot be changed, and for many tools, users cannoteven change program inputs. The tools in this category provide very low control oftheir visual elements. Users usually only have access to the program execution controls.Another property of AV tools is their high level of abstraction. This makes AV tools lessinteresting for novices, because it makes learning fundamentals of program runtime moredifficult (SORVA; KARAVIRTA; MALMI, 2013).
Since AV tools only provide a single or a small set of programs, they generate visual-izations with detailed elements, which can be useful for instructors to use in demonstra-tions. Algorithm Visualizations can still be used by more advanced students alone, butit requires sufficient attention to the visualizations. However, simply viewing generatedvisualizations may not be enough to help the student understand the content (SORVA;LÖNNBERG; MALMI, 2013).
AV tools are an interesting approach to demonstrate data structures and algorithmsfrom a visual and abstract point of view. However, some studies propose that having stu-dents interacting with visualizations rather than only viewing is more beneficial from alearning point of view (HUNDHAUSEN; DOUGLAS; STASKO, 2002; NAPS; COOPER,et al., 2003). This shifted the trend of educational program visualization from Algo-rithm Visualization to Program Visualization (SORVA; LÖNNBERG; MALMI, 2013).Examples of AV tools are provided in the Chapter 3.
2.4.2 Program Visualization
The Program Visualization (PV) category includes tools that allow the user to ma-nipulate program source code. PV tools are further divided into two main groups showedin Figure 1.
Some tools use visual abstractions of program source code structures, which allowusers to create programs using simplified visual components that represent code elementssuch as variables, operators, flow control flow primitives and so forth.
Other tools focus on providing visualizations for program runtime dynamics. Thesetools work like debugger applications, the code provided is analysed while in execution,the collected information is used to generate visualizations which are displayed to theuser (SORVA; KARAVIRTA; MALMI, 2013). However, this flexibility comes with a cost.Generated visualizations are good for explaining simple programming concepts, but due totool limitations, they lack detail to explain more complex data structures and algorithms.

22
Examples of PV tools are provided in the Chapter 3.
Visual Programming
Within the program visualization category, Visual Programming tools attempt toprovide new ways to create programs by dropping common text based formats in favorof using graphic components. One of the Visual Programming most adopted strategies isthe use of programming blocks (ROQUE, 2007; WEINTROP; WILENSKY, 2015; BAUet al., 2017). Another strategy adopted by tools is the use of programming nodes for dataprocessing pipelines, which is common among rendering and game development software. 1
Due to their simplicity, Visual Programming tools were being used for a long timein other environments besides education, such as multimedia creation, data analysis andother fields (BRESSON; AGON; ASSAYAG, 2011; LAURSON; KUUSKANKARE; NO-RILO, 2009; YOUNG; ARGIRO; KUBICA, 1995; TAKATSUKA; GAHEGAN, 2002).
Visual Program Simulation
In Visual Program Simulation (VPS), the learner takes the role of the computer, heor she is responsible for the program execution. This is possible in VPS tools because thevisualization components are interactive. These components are controlled by the learnerto declare variables, to evaluate expressions, to make modifications in the program state,and to control the program flow. By using these graphical controls, VPS tool users canguide the program runtime execution step by step (SORVA et al., 2012). Therefore, VPStools only provide visual support as the user reads and advances through the source code.
The strategy adopted by VPS tools is beneficial for novices. Solving problems usingVPS tools challenges novices by making them think like a computer. Such activitieshelp them to understand the dynamics of program runtimes, one of the main difficultiesstudents have in Introductory Programming courses (SORVA; LÖNNBERG; MALMI,2013).
However, VPS tools are not well suited for more advanced students. From the momentthe student has a better consolidated knowledge about program runtime dynamics, havingto control program execution step by step becomes bothersome and tedious, reducingstudents cognitive engagement.1 https://www.blender.org https://unity.com https://www.unrealengine.com

23
Program Animation
Similar to Algorithm Visualization, tools in the Programming Animation (PA) cate-gory display visualizations of program runtime elements.
Programming Animation tools can create visualizations from any source code providedby users. However, the generated visualizations usually have lower levels of abstractions,these visualization often contain all declared variables and their values, allocated ob-jects and information of their attributes, and so on. Navigation through the programruntime is often manually controlled by the user and with step (a source code line) reso-lution (SORVA; KARAVIRTA; MALMI, 2013).
The low level of abstraction makes visualizations harder to understand by early novices.On the other hand, PA tools have debugging capabilities similar to typical tree-view de-buggers, and a study reported that PA tools can be used even by professional developersfor some activities such as data structure development (OKA; MASUHARA; AOTANI,2018).
Table 1 – Differences between categories of Software Vi-sualization tools.
Tool type Source code Program in-puts
State visualiza-tion
Code execution
AlgorithmVisualiza-tion
Provided by thetool. May con-tain support foronly one or multi-ple algorithms.
May be pro-vided by thetool or theuser.
High level visu-alization, withspecific detailfor individualalgorithms.
Controlled by thetool, but sometools allow theuser to control ex-ecution.
VisualProgram-ming
Provided by theuser, but assistedby the tool. Theuser programswith visual struc-tures rather thanplain text.
Provided bythe user.
No direct statevisualization.
The executionis uninterruptedas a normalprogram.

24
VisualprogramSimula-tion
Provided by theuser.
Provided bythe user.
Low level visu-alization, show-ing all the dataallocated in thestack and mem-ory.
The user acts asthe computer,executing everystep of the pro-gram. The userhas to interactwith the statevisualization in-terface to informwhat computa-tion is happeningin the program.
ProgramAnimation
Provided by theuser.
Provided bythe user.
Low level visu-alization, show-ing all the dataallocated in thestack and mem-ory.
Controlled by theuser.

25
3 RELATED WORK
This chapter presents a review of visualization tools intended to use in IntroductoryProgramming or Data Structures and Algorithms courses, and small descriptions on howthese tools were evaluated. All tools described in this section were prominent tools createdwithin the last decade, nevertheless, some of them are already discontinued.
3.1 VISUALGO
VisuAlgo is a web based tool that provides visualizations for dozens of algorithmscommonly studied in Data Structures and Algorithms courses (DIXIT; YALAGI, 2017). 1
Since VisuAlgo is an Algorithm Visualization tool, it provides predefined visualiza-tions, not allowing users to create their own programs. Although users cannot createtheir own programs, it is possible to change algorithm inputs in some of the visualiza-tions, allowing users to analyse the behaviour of the algorithms in different cases. The toolprovides a large collection of visualizations, for sorting algorithms, lists, trees, graphs, andso on. Figure 2 shows the execution of a sorting algorithm and some of the visualizationdetails.
The authors conducted an experiment with 78 students of Design and Analysis ofAlgorithms. The participants were divided into 4 groups and had to answer exercisesabout the quicksort algorithm, two of the four groups were allowed to access Visualgothrough its website (VISUALGO,. . . , n.d.). The study found that the best students hadgood results no matter in which of the groups they were. For the other participants, theones from the group that was allowed to access Visual exhibited better scores.
Besides VisuAlgo, there are many others Algorithm Visualization tools such as OpenDSA 2,AlgoVIZ (ROMANOWSKA et al., 2018), IScketchMate (ORSEGA; VANDER ZANDEN;SKINNER, 2012), DAVE (VRACHNOS; JIMOYIANNIS, 2014), and more. All of thesetools provide very similar visualizations for the available algorithms and data structures.On the other hand, Program Visualization tools offer more diverse visualizations and waysof interaction.
1 https://visualgo.net2 https://opendsa-server.cs.vt.edu

26
Figure 2 – Simulation of a sorting algorithm in VisuAlgo.
The image shows an array (1) being ordered, the operations that the user can run are listed inthe orange box (2). On the right size (3), a pseudo-code that accompany the program
execution is provided, also describing the operations being executed.
3.2 SCRATCH
Scratch3 is a web based programming environment for novices (MALONEY et al.,2010). Scratch works by providing a visual interface for program construction. Users cancreate programs by using blocks of several types, simple blocks that can be used to declarevariables, control the program flow, use operators, and more complex blocks that readuser input, play sounds, interact with sprites and so forth (BAU et al., 2017). Therefore,Scratch can be categorized as a Visual Programming tool.
Figure 3 shows Scratch interface and the blocks used to build a program. Users createprograms by combining several types of logic blocks, which can be used to read inputs,play sounds and control sprites in a canvas.
Visual Programming tools fulfill the role of creating abstractions of programminglanguages syntax, reducing novices cognitive load. A study with 90 students reported thatparticipants found it was easier to create programs using block-based environments ratherthan text-based (WEINTROP; WILENSKY, 2015). On the other hand, the number ofsyntax constructions mapped by the provided blocks are limited, not allowing the use of3 https://scratch.mit.edu

27
Figure 3 – Scratch editor.
Example of a program built using scratch, programs are built using a (1) list of blocks for flowcontrol, variable declarations, operators, read user input and interacting with sprites. Userscan drag blocks to the program pane (2) and create any logic they want. Scratch offer many
video tutorials (3) in how to create several programs. After build the program, users canexecute the program, and sprites (5) will act in the output pane (4) according to the program
logic.
more complex programming constructions such as objects, pointers, arrays, classes andmore. These concepts are fundamental for Introductory Programming students, as theyare needed to express more complex programs.
3.3 PYTHON TUTOR
Python Tutor4 is currently one of the most well-known visualization tools in the Pro-gram Animation category. (GUO, 2013). Since its release, Python Tutor has been adoptedby some universities in their Introductory Programming courses, such as UC Berkeley5,MIT, University of Washington and University of Waterloo (GUO, 2013). Some of themajor elements that contributed to the high popularity of this tool were the fact that itwas developed for the web environment, being easily accessible by students and professors,4 http://pythontutor.com5 https://cs61a.org/

28
and the growth in popularity of the Python language among Introductory Programmingcourses. Before Python Tutor, most Program Visualization tools only supported lan-guages such as Java and C/C++.
Python Tutor was first released in January 2010, motivated by the experience of itscreator with the Python language to novices, by drawing messy diagrams on the board.Currently, the tool still receives updates (PYTHON. . . , n.d.). The main goal was to createa tool that professors and students prefer to use in addition to traditional strategies suchas sketches and lecture slides (GUO, 2013).
Figure 4 – Python Tutor interface.
The screenshot shows the visualization of a linked list. The components showed in thevisualization are (1) the source code provided to the tool with highlights on the lines being
executed, (2) slider and buttons for code step navigation, (3) view of the program stackframes, scopes and variables and (5) view of the program heap, showing allocated objects and
references.
Most types of objects can be represented in Python Tutor, with dedicated representa-tions for some built-in data structures such as sets and dictionaries, Figure 4 shows therepresentation of a linked list made of Python’s native tuples. However, Python Tutorcan only understand simple linear data structures, such as linked lists, stacks and queues.More complex data structures, such as trees, are still displayed, but the objects position-ing does not represent the data structure, and modifications in the structure completelychange the object layout. The behavior of Python Tutor visualizations in these situa-tions makes harder to understand data structures, which discourages its use in a DataStructures and Algorithms course.
Due to Python Tutor success and the fact that it is open source, many new tools

29
where created using its source code as base. Some of these tools are Omnicode (KANG;GUO, 2017) and OPT+GRAPH (DIEN; ASNAR, 2018), that provide new elements to thevisualization and others tools such as Codeopticon (GUO, 2015) and Codechella (GUO;WHITE; ZANELATTO, 2015), which allow multiple online users to interact in real timethrough the tool.
3.4 OMNICODE
The objective of Omnicode is to provide a live programming environment (KRAMERet al., 2014; TANIMOTO, 2013; BURNETT; ATWOOD; WELCH, 1998) that shows theentire history of the entire program execution at once. Like Python Tutor, Omnicode canshow the abstract representations of program stack and heap, and in addition, representthe entire history of a program. Omnicode uses scatter plots to show variable valuesthroughout the program execution. These plots are used to represent numeric variablesand also some properties derived from other data types (KANG; GUO, 2017), Figure 5shows an example of a program visualization and scatter plots used to represent the entireprogram state.
Figure 5 – Omnicode IDE.
Omnicode is a tool based on Python Tutor where users can (1) load programming problemsfrom a library and (2) test cases, (3) see visualizations of the history os variables values
throughout the program execution in a matrix of scatter plots, (4) visualize values derivedfrom native data structures and evaluate their own expressions, (5) filter generated
visualizations by selecting variables in code and (6) view the stack frames and allocatedobjects. This image was taken and modified from the original article (KANG; GUO, 2017).
The authors ran a small exploratory study with 10 novice programmers. The study

30
objective was to evaluate if Omnicode could contribute to novices ability to write andunderstand code, form proper mental models and their ability in explain the programbehavior to others. They found that Omnicode can contribute to novice students in bothprogram debugging and as a tool to facilitate communication.
3.5 OPT+GRAPH
Just like Omnicode, OPT+GRAPH is another tool derived from Python Tutor, whichis in its name, OPT means Online Python Tutor). OPT+GRAPH is one of few program-ming visualization tools that offer support to graph data structures (DIEN; ASNAR,2018).
Graphs are detected based on matching of the three most common ways to representthese data structures, which are adjacency matrices, adjacency lists and edge lists. Afterdetecting a graph data structure, the OPT+GRAPH will render the graph in a dedicatedpane as shown in Figure 6.
Figure 6 – OPT+GRAPH data structure visualization pane.
Small graph visualization obtained from the OPT+GRAPH tool, other components which arenot shown in the picture are similar to Python Tutor’s. This image was taken and modified
from the original article (DIEN; ASNAR, 2018).
To evaluate OPT+GRAPH, the authors performed an online experiment. The ob-jective was to evaluate the effectiveness of the visualizations provided by the tool basedon the correctness and time participants take to answer questions. The presented resultsshowed that visualization tools influenced positively in the time students took to answerquestions and the correctness.

31
3.6 UUHISLE
UUhisle is another program visualization tool for Introductory Programming and othersimilar courses, meant for simple and small programs (SORVA et al., 2012; SORVA;LÖNNBERG; MALMI, 2013; UUHISLE,. . . , n.d.). Although only working with simpleprograms, UUhisle is a flexible tool that can be used for many activities.
Users can use UUhisle to view their program execution, UUhisle acts as a debugger,providing detailed information of the variable values and animations. Professors can useUUhisle to create examples and animations to their students, UUhisle allows professorsadjust how the created examples are displayed. Students can also use UUhisle as an VisualProgram Simulation tool, where they take the role of the computer and are responsiblefor carrying the execution of a program. This is possible by allowing users to interactthe created visualizations, being able to create variables, call functions and execute manykinds of operations (SORVA et al., 2012). Figure 7 shows the user interacting with thetool interface in the Visual Program Simulation mode.
The authors evaluated UUhisle through a qualitative research with 11 students of In-troductory Programming. The authors conducted semi-structured interviews with partic-ipants, they had to answer to a Visual Programming Simulation exercise while thinkingaloud (SORVA; LÖNNBERG; MALMI, 2013). Supplementary data was also collectedfrom previous studies with UUhisle (SORVA et al., 2012).
The study results were a mix of good and bad results. They found that it is possiblefor novices to use Visual Program Simulation tool effectively and learn from then in arich way. However, novices can exhibit different ways of understanding the visualizations,for some participants, learning through VPS is nothing more than learning to performgraphical manipulations. These difficulties must be first addressed to make the tool moreuseful.

32
Figure 7 – UUhisle, a visualization tool for Introductory Programming Education.
Interface of UUhisle in Visual Program Simulation mode, the user is manually executing aprogram containing a recursive factorial function. The interface shows the (1) code and linebeing executed, a (2) basic visualization of objects allocated in the heap, (3) information of
variables and values of the program stack, (4) buttons for code execution to step forward andbackward.
3.7 FLUIDEDIT
Different from previous tools that focused in novices from Introductory Programmingcourses, FluidEdit tries to help students from Data Structures and Algorithms by pro-viding a method for automatic heap representation that can be used to focus on essentialparts of data structures (OU; VECHEV; HILLIGES, 2015).
FluidEdit is a tool to help development, analysis and debugging of data structures.The tool tries to generate visualizations that automatically capture only the essentialelements at any given point of the program being analyzed while abstracting the rest.This feature allows users to focus only in the local elements of their program.
FluidEdit also allows users to stop and continue the execution of a program at anypoint, and interact with the elements of data structure being analyzed by showing, hidingand modifying program objects.
The authors evaluated FluidEdit with 27 participants, ranging from undergraduatesto post-doctoral researchers. The experiment main objective was to verify if visualizingthe heap of a program could improve the code understanding and help participants to

33
Figure 8 – FluidEdit interface.
FluidEdit showing a linked list data structure being reversed. This image was taken andmodified from the original article (KANG; GUO, 2017).
find errors in the source code if compared to a traditional debugger. The study reportedthat FluidEdit helps users to detect errors in data structures algorithms faster than usingdebuggers provided by IDEs.
3.8 KANON
Kanon6 is a development environment focused in the visualization of data struc-tures (OKA; MASUHARA; AOTANI, 2018; OKA; MASUHARA; IMAI, et al., 2017).The objective of this tool however, is not to help novices or Data Structures and Algo-rithms students, but for any programmer in general that is developing data structures.Although not geared towards students, Kanon provides similar visualizations of programheaps similar to many other educational tools, showing objects, their properties and ref-erences.
One of the Kanon main features is the ability to automatically compute data structurelayouts, preserve and update them as the user navigates through the code. In Figure 9, thelayout was automatically computed by Kanon. This feature is called mental map preser-vation, and help users preserve the representation of the data structure in their minds bynot abruptly changing the layout of objects in the tool. Although this tool is interestingfor data structures based on nodes, such as linked lists and trees, the same representationis used for all objects, which makes impossible to visualize data structures based on ar-rays. Another interesting feature is the support for live programming (KRAMER et al.,2014; TANIMOTO, 2013; BURNETT; ATWOOD; WELCH, 1998), which updates thevisualization immediately and renders the program visualization to the point the user isediting.
The authors of Kanon ran an small study with 13 participants, all of then were pro-6 https://prg-titech.github.io/Kanon/

34
Figure 9 – Kanon interface.
Kanon showing the visualization of a binary search tree. On the left (1) the user can provideany code to be executed, by simply changing the code, the visualization is immediately
recomputed and presented in the heap. The heap view (2) shows all allocated objects, theirproperties and references, green arrows represent variables from the stack. Kanon also provide
a basic overview of the program stack trace (3), showing functions called and their order.
fessional developers. The study was a small qualitative evaluation of the participants’impressions about the tool. They asked participants to try solving programming prob-lems using Kanon and common textual environments (IDEs). No difference was foundbetween Kanon and textual environments, although participants were positive about us-ing Kanon, the authors reported that participants took longer to resolve errors and usedinappropriate strategies to solve problems when using Kanon.
3.9 SURVEYS
All tools presented in this Chapter were developed in the last decade. Still, thereare hundreds of older Algorithm Visualization and Software Visualization tools and stud-ies made before that. Surveys of older systems can be found in the following refer-ences (SORVA; KARAVIRTA; MALMI, 2013; FOUH; AKBAR; SHAFFER, 2012; SHAF-

35
FER et al., 2010; URQUIZA-FUENTES; VELÁZQUEZ-ITURBIDE, 2009).Section 4.3 compares the visualizations of some of the tools reviewed in this Chapter
with our proposed tool.

36
4 WILLOW
This chapter presents Willow, an educational tool for generating program visualizations.In the following sections we give a basic introduction of the tool, then we present designdetails and a brief overview of the tool architecture.
Willow is a Program Animation tool (Section 2.4.2), therefore, it can create visual-ization directly from the source code of a program. Willow focuses in providing featuresthat allow users to manipulate the generated visual elements, allowing the creation ofmore expressive visualizations, which can be useful for representing data structures andalgorithms.
Because Willow requires extra interactions to create visualizations, the tool is mainlytargeted at instructors, they can use the tool to create lecture material by creating vi-sualizations for the programs they want to teach, and testing the program with differentinput data. Although instructors are the main target, students can also use the toolwithout any hassle for a variety of activities such as developing programs with visualsupport, analysis and debugging of data structures and algorithms, understanding basicprogramming concepts ans so forth.
Willow’s source code, website and other resources are available through the followingURL: https://github.com/pedro00dk/willow.
Videos with examples of Willow’s visualizations are available online on YouTubeand can be accessed through the following playlist:
https://www.youtube.com/playlist?list=PLpNZKTBEk73m5-DcKbpc45PZIe8WbEsj2
4.1 DESIGN
Figure 10 shows a screenshot of Willow. The tool is divided into two main groups ofcomponents. On the left side we have the source code and input editors, and the outputpane. On the right side there are the visualization components, that display the programstack and heap representation.
Willow visualizations are based on Stack and Heap memory abstractions, whichare common in several programming languages. Many elements of Willow’s visualiza-tions are inspired by Python Tutor (Figure 4), but with extra features to support therepresentation of more complex algorithms and data structures.
By interacting with Willow’s visualizations, users can modify them to representmore complex concepts. Data structures and algorithms that rely on uni-dimensionalor bi-dimensional arrays such as sorting algorithms, binary search, heaps, dynamic pro-gramming and more, can be represented using special data representations that help thevisualization of interactions on these structures. Node based data structures such as linked
37
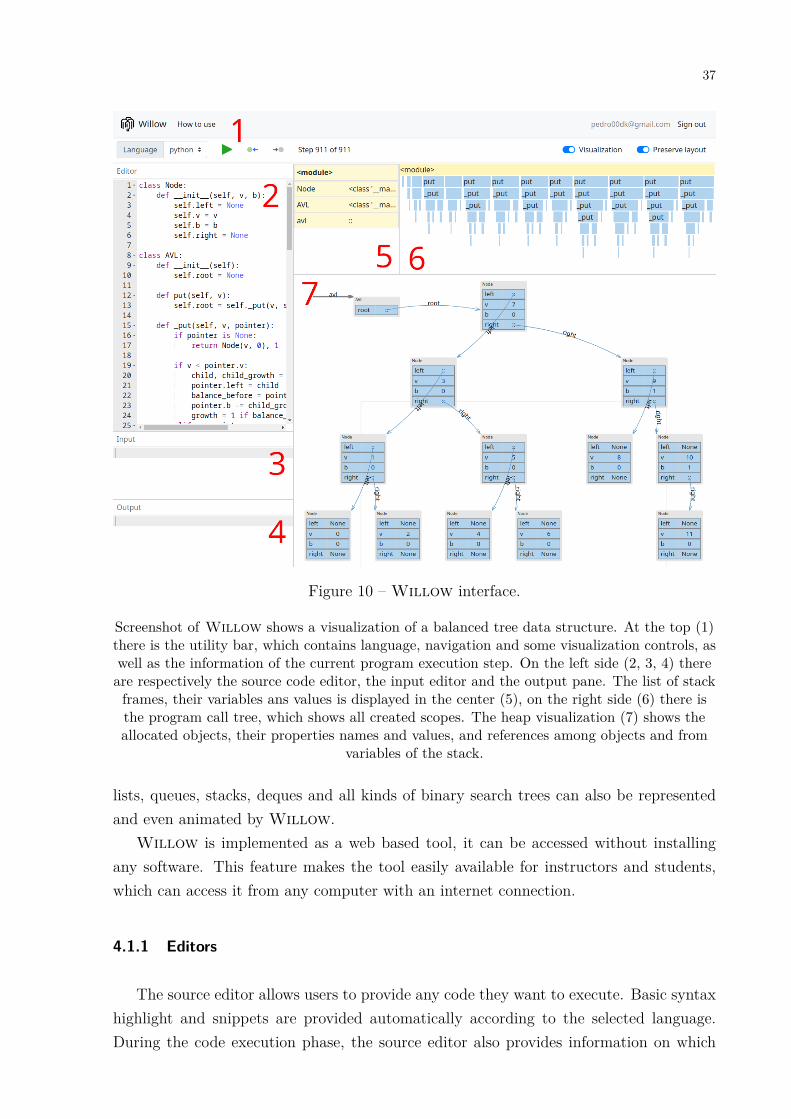
Figure 10 – Willow interface.
Screenshot of Willow shows a visualization of a balanced tree data structure. At the top (1)there is the utility bar, which contains language, navigation and some visualization controls, aswell as the information of the current program execution step. On the left side (2, 3, 4) thereare respectively the source code editor, the input editor and the output pane. The list of stack
frames, their variables ans values is displayed in the center (5), on the right side (6) there isthe program call tree, which shows all created scopes. The heap visualization (7) shows theallocated objects, their properties names and values, and references among objects and from
variables of the stack.
lists, queues, stacks, deques and all kinds of binary search trees can also be representedand even animated by Willow.
Willow is implemented as a web based tool, it can be accessed without installingany software. This feature makes the tool easily available for instructors and students,which can access it from any computer with an internet connection.
4.1.1 Editors
The source editor allows users to provide any code they want to execute. Basic syntaxhighlight and snippets are provided automatically according to the selected language.During the code execution phase, the source editor also provides information on which

38
line is going to be executed and the type of operation the code executed. These operationsare distinguished by the the line highlight color, they are: function calls (green), functionreturns (yellow) and raised exceptions (red).
The input editor allows users to provide input to the program to be executed. Thiseditor acts as the program standard input stream, meaning that users can use simple waysto read input data as if the code would have been executing locally. Because of that, it iseasier to parameterize the code and test different cases just by changing the input.
Besides the created program visualizations, Willow also outputs any text informa-tion the program generates. Any data written to the standard output and standarderror streams is displayed in the output pane. This includes printed messages, uncaughtexceptions and compilation errors.
Figure 11 – Willow’s editors.
Willow’s editors, they are shown in a different layout from Figure 10 because thevisualization is disabled.
4.1.2 Stack and Call Tree
The stack component shows all program scopes (function calls) and their declaredvariables at the current program execution point. When the user navigates through theprogram, the stack also highlights variables that changed value, allowing easy identifica-

39
tion of what has been modified. Stack scopes also show function return values and raisedexceptions, even though they are not captured by any variable.
The call tree component displays all function calls performed during program exe-cution. It shows their names, the caller and which other functions they call. It alsohighlights the scope of the current execution point. The call tree is specially useful tonavigate through the program by clicking on the function scopes, which makes the currentexecution point jump to the beginning selected scope, or by double clicking to go to theend of the scope instead.
Figure 12 shows the stack and call tree of two Fibonacci sequence algorithms, the firstimplementation (fib) uses the naive recursive strategy, while the second implementation(fib_memo) uses memoization. Similarly to the source code editor, both stack and calltree show color codes to indicate function calls, return and exceptions.
Figure 12 – Willow’s stack and call tree of a Fibonacci sequence algorithm.
Screenshot of the execution of two Fibonacci sequence algorithms. The Call Tree componenton the top right shows the recursive behaviour of both implementations. The first algorithm(left to right) is the naive implementation, while the second algorithm is a memoized version.
The Stack on the top left shows the last scope of the Fibonacci algorithm, the yellow color andthe “#return#” variable indicates the scope is returning. On the bottom, the Heap component
shows the dictionary used by the memoized algorithm.

40
4.1.3 Heap
The heap shows objects created by the program at some execution point. This com-ponent is where users can interact with the visualizations, the interactions allow users tomodify the visual representation of objects, change their layout and create animations.
The heap component does not display all objects of a program, many objects areomitted, such as builtin objects and strings, since these objects are allocated in the heap,visualizations would get too polluted. Each program object is associated to a node type,which is how Willow visually represents the objects in the view. However, objects arenot tightly coupled to their node types. This means that they can be changed if needed,changing the way the object is displayed.
4.1.3.1 Node Types
Figure 13 shows Willow’s nodes. Four types of nodes are currently supported, theyare:
• Array: The array node shows all fields of the underlying object as a list of its values.Array is the default node for integer indexable types, such as implementations ofarrays and lists in different languages.
• Columns: This is an alternative to visualize numeric arrays as a column chart,which can help noticing when changes happen in the underlying object. This nodecan be used to highlight swap operations in sorting algorithms. The arrangementhelps the user to understand how elements are sorted. The visualization is based incommon patterns found in examples of sorting algorithms.
• Map: This node displays object fields as a pair of columns of keys and values.Map is usually used for dictionary-like objects, Figures 10 and 12 use this node torepresent objects.
• Field: Field is used to show a single property of an array or object. It is use-ful for representing user-created data structures, where objects may contain manyproperties, making it cleaner and easier for understanding.
Each node type also comes with a set of extra parameters, which can be modified bythe user through context menus, affecting the way the node is rendered.

41
Figure 13 – Willow’s node representations.
All four node types currently supported by Willow.
4.1.3.2 Positioning and Animation
All nodes rendered by Willow can be moved by the user. Their positions are re-membered by Willow and, when the user goes through the same section of code again,Willow replays all previous object positions. This feature can be used to create anima-tions for many kinds of algorithms, e.g. linked list insertions or balanced tree rotations.
Another feature is the detection and automatic layout of groups of objects that belongto common data structures such as lists or trees. The automatic layout feature is triggeredby the user by double-clicking any object that belongs to a data structure, which appliesthe layout to the inner elements that compose the data structure. Nevertheless, there aresome restrictions in the data structure detection, which are as follows:
• The inner data structure elements must be made of objects of the same type.
• Objects of a data structure can contain references to other objects which storevalues, but these values must have a different type from the data structure objects,otherwise they will be detected as part of the structure.
By combining detection of data structures, automatic layout and re-positioning, userscan quickly create animations of entire data structures without having to move objects

42
one by one.
4.1.3.3 Program Navigation
Willow provides three ways to navigate though the program being visualized. Theuser can use the keyboard left and right arrows, or click on the step forward and stepbackward buttons in the utility bar (Figure 10). Willow allows navigation in bothdirections of the program, the user can go forward or backward, even when an exceptionis reached during the program execution, this feature is called time travel navigation.
It is also possible to click on the scope of a function displayed in the call tree (Fig-ure 12), allowing users to jump to any point in the program they desire, skipping partsof the program that would not be useful to the visualization. By jumping from an scopeto another, all the accumulated differences in the objects and variables of a program arehighlighted, providing an overview of all changes.
4.1.4 Language Support
Willow mainly supports the Python programming language, which is a popularlanguage among introductory courses. In the recent years, Python has been adoptedas the Introductory Programming language across many Universities. MIT1 and UCBerkeley, some of the largest departments of Computer Science use Python. Severalonline courses also use Python in their introductory courses (ATEEQ et al., 2014; GUO,2013).
Despite Python’s growing popularity, many Introductory Programming courses stilluse Java or even C/C++ as their programming language. Based on that, Willow alsoprovides support for Java. The current language can be switched easily through the utilitybar as shown in Figure 10.
4.1.5 Limitations
Although being a Program Animation tool that can execute user provided source code,there are some limitations on what can be executed and for how long. Some of theselimitations come from Willow design itself, where others are dependent on the selectedlanguage back-end.
The main limitations are:
• Willow expects that all code of the program is provided in a single file. Sinceour main goal is to support Introductory Programming and Data Structures and
1 https://ocw.mit.edu/courses/intro-programming

43
Algorithms classes, we believe that requiring everything to be in a single file isreasonable. Still, this limitation can confuse novices in some situations, such asdeclaring many classes in a single file.
• Programs have restricted time to execute. Time restriction comes in two forms: theduration of the program execution in seconds and the number of source code stepsexecuted. Source code steps are approximately linked to the source code lines. Asource code line usually represents a single program step, but in some cases moresteps are executed per line.
Programming language limitations are related to the access of languages libraries andfeatures. These limitations include blocked access to the file system, network and multi-threading libraries. These limitations were intentionally added to prevent abuse againstthe tool.
There are also limitations related to the visualization. Most simple data structuresand algorithms have abstract representations similar to machine representations, e.g. eachlinked list node is an object or struct. These data structures are easy to represent usingWillow. More complex data structure are harder to, or can not be represent using Wil-low. Graphs are an example of structures of which Willow can not create good abstractrepresentations. This limitation is due to different ways of representing graphs, such asadjacency matrix, adjacency list and edges list. These machine representations of graphsare not similar to its abstract representation. In this case, the generated visualizationswould run over the machine representation of the graph, not an abstract representation.Willow can however be used to highlight the differences of the machine representations,showing their advantages and disadvantages
4.2 ARCHITECTURE
Figure 14 shows Willow’s architecture, which is composed of three elements: the userclient, a database to log user actions, and tracers, which are responsible for executing andcollecting program runtime information.
4.2.1 Client
Willow’s client is a web application implemented using React2, a popular libraryfor creating user interfaces. The client is composed of several modules, mainly split intouser, tracer and visualization tasks.2 https://reactjs.org
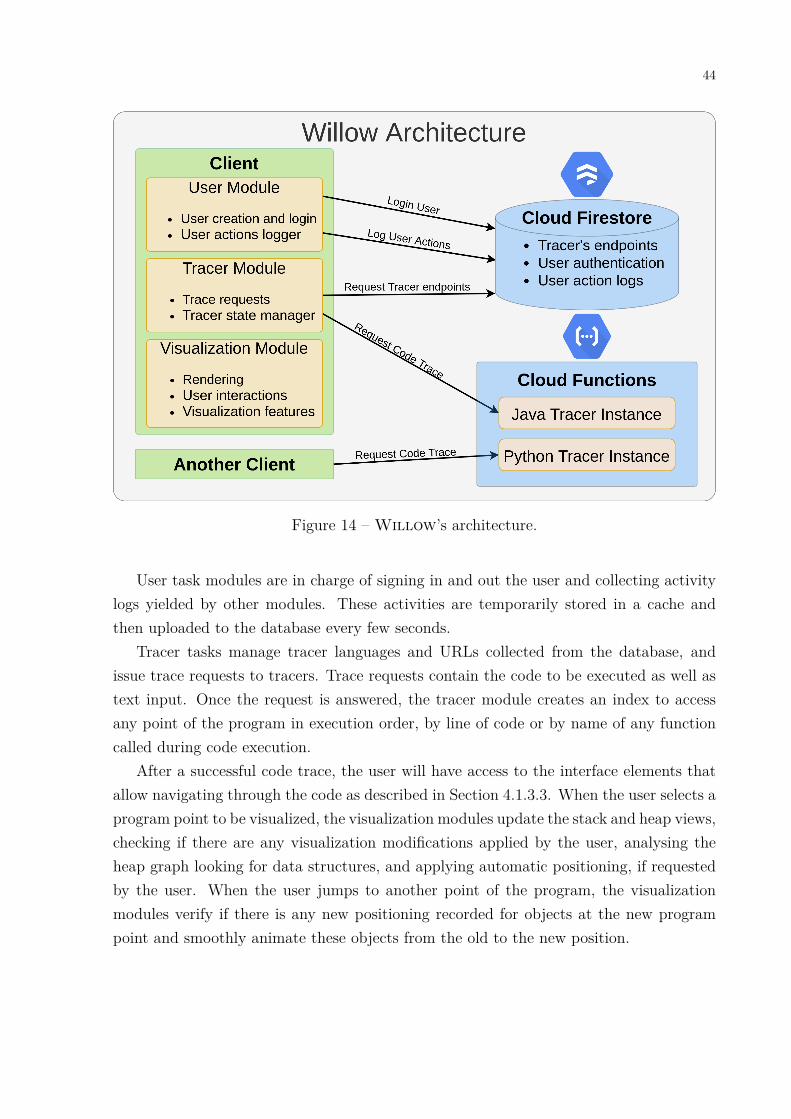
44
Figure 14 – Willow’s architecture.
User task modules are in charge of signing in and out the user and collecting activitylogs yielded by other modules. These activities are temporarily stored in a cache andthen uploaded to the database every few seconds.
Tracer tasks manage tracer languages and URLs collected from the database, andissue trace requests to tracers. Trace requests contain the code to be executed as well astext input. Once the request is answered, the tracer module creates an index to accessany point of the program in execution order, by line of code or by name of any functioncalled during code execution.
After a successful code trace, the user will have access to the interface elements thatallow navigating through the code as described in Section 4.1.3.3. When the user selects aprogram point to be visualized, the visualization modules update the stack and heap views,checking if there are any visualization modifications applied by the user, analysing theheap graph looking for data structures, and applying automatic positioning, if requestedby the user. When the user jumps to another point of the program, the visualizationmodules verify if there is any new positioning recorded for objects at the new programpoint and smoothly animate these objects from the old to the new position.

45
4.2.2 Database
Willow’s database is implemented with Google’s Firestore database services, whichalready provides user authentication services. Since this is mainly used for logging pur-poses, there is no need for a back-end to manage authentication or other complex tasks.The database stores actions users execute in the client, including the source code; inputand language used in tracing requests; a basic summary of the request result, indicatingif the code executed successfully or if there was any compilation or runtime error; anduser interactions with the visualization, such as steps using the keyboard, arrows or calltree scopes, changes in object representation and the use of automatic layout detectionand positioning features. The database also stores currently available tracers in a tablewith tracer languages and URLs.
4.2.3 Tracers
Tracers are the components which conduct all necessary code compilation, executionand analysis. Tracers work similarly to traditional debuggers. When a tracer receives acode trace request from a client, it executes the code and creates records of the programstate at each step. The record contains information about the line of code that wasexecuted. For instance, if the current line is a function call, a function return or if anexception is being raised, the variables declared in each scope of the program and theirvalues at that specific execution point, as well as objects allocated in the heap and theirproperties. At the end of the program analysis, the record is serialized into JSON andsent back to the client.
Because Willow only interacts with tracers through HTTP requests, they are com-pletely independent from other Willow’s modules and can be implemented using anytechnology. Previous versions of Willow had their tracers implemented using IAAStechnologies (Infrastructure as a service) and Docker, which allowed high control of theresources that tracers had access, and fast initial response times. However, since the toolwas not frequently used, the cost of maintaining the virtual machine provided by theIAAS was unnecessarily high. The current Willow version implements tracers usingFAAS technologies (Function as a service, also known as serverless) provided by GoogleCloud Functions3. Since tracers are stateless, the migration from IAAS was fairly simpleand yielded a large reduction in costs, while increasing system scalability.
Tracers can be implemented in any language. Both Java and Python tracers areimplemented in their respective languages to benefit from features that each programminglanguage provides to support the implementation of debuggers.3 https://cloud.google.com/functions

46
The Java Tracer uses the Java Platform Debugger Architecture (JPDA), which is usedto spawn a new JVM process in debug mode (also called debuggee JVM) to execute therequested code, and then connect the current JVM using the Java Debug Interface (JDI).Interruptions are sent to the debuggee JVM and its current state is recorded through theJDI.
The Python Tracer is simpler than the Java Tracer, since Python code does not requirecompilation, and also, for performance reasons, the code to be traced is executed usingPython’s builtin exec function. The exec function also allows the specification of aninitial global scope, which is used to create a new empty scope and prevent variablecontamination between the code to be traced and the tracer itself. The specification of aglobal scope is also used to restrict access to some builtin function and modules. Pythonoffers its debugging capabilities through the settrace function of the sys module. Aftersetting a trace function, it is called after each executed line of code. The trace functionhas access to the program scope, making easy to directly collect all record data.
4.3 COMPARISON WITH OTHER TOOLS
Program Animation tools generally provide support for only simple algorithms andstructures common to introductory coding courses. Even most recent tools have limita-tions when handling some data types or data structures. Willow’s extends on thesetools by providing features that support the visualization of a larger set of algorithms anddata structures.
Python Tutor, for instance, cannot represent data structures more complex than linkedlists, even doubly linked lists diagrams are drawn in messy layouts, which makes harderto visualize the data structure. This is due to the static visualizations, making impossiblechange how objects are represented or change their positions. Figure 15 shows the PythonTutor execution of same balanced tree algorithm presented in Figure 10. The final diagramlayout is messy and hard to understand.
Another advantage of Willow over Python Tutor is the program navigation. PythonTutor visualizations only provide a slider where users can drag to choose a point of of theprogram to be rendered. Willow on the other hand, allows users to precisely navigateto any function call of the program through the Call Tree.
Kanon (OKA; MASUHARA; AOTANI, 2018) is another recent Program Animationtool with similar features to Willow. Similarly to Willow, Kanon supports the de-tection of some data structures, such as lists and trees, and it has some other interestingfeatures such as live programming and code navigation based on line of code being edited.
However, there are some disadvantages in using Kanon with educational purposes.Kanon only supports the JavaScript programming language, which is not commonlyadopted as an introductory language. Another disadvantage of Kanon is the represen-

47
Figure 15 – Python Tutor visualization of a tree structure.
The illustration is cut in three parts because is too long and elements are badly positioned,making it harder to navigate.
tation adopted for arrays, which are extremely poor and cannot be used to illustratealgorithms.
Figure 16 shows how Kanon represents arrays, as opposed to Willow in Figures 13,which has more than one way to represent data of different types. Kanon uses a rep-resentation that does not preserve the order of elements, which makes the visualizationimpractical to represent several array based algorithms and data structures.

48
Figure 16 – Kanon’s representation of arrays.
This representation of an array has no ordering structure; therefore, it cannot be properly usedin array based algorithms.

49
5 EVALUATION
This chapter discusses in detail the studies we carried to evaluate Willow and theobtained results. We ran two studies to evaluate Willow. The first is a survey with in-structors of Introductory Programming (IP), and Data Structures and Algorithms (DSA)courses, and the second is an experiment with programmers.
The main goal of the survey was to evaluate the potential impact of Willow as ateaching aid. The specific goals of the survey are 1) to understand the practices that arecommonly adopted by instructors when teaching (e.g., how often they use the board asopposed to slide presentations and other strategies) and 2) to understand their opinionson the usefulness of Willow, relative to the quality of the produced examples, resistanceand difficulties on the adoption of the tool in class, and opinions on the impact of thetool on their students.
Based on encouraging results obtained in the survey, we conducted a second studywhere we recruited participants from the freelancing platform upwork1. In the experimentwe switched the focus from the instructor (analysed in the survey) to the student. Duringthe experiment, participants had to solve programming problems with and without thesupport of Willow. The goal of the experiment was to evaluate how can Willow assistparticipants in solving programming problems and to what extent. More precisely, weassessed if participants that use Willow can produce more correct solutions, if the toolhelped them to solve problems faster, and also if there were any difference in the theirconfidence when solving the problems with or without Willow.
5.1 SURVEY
This section elaborates on the study design of the survey we conducted to assess thepotential impact of Willow as an aid to instructors of IP and DSA courses.
5.1.1 Objective
The survey objective is to analyse the perceptions and opinions of participants aboutWillow, with the purpose of comparing the tool with traditional teaching strategiesadopted by the participants, with respect to the benefits Willow may provide in thecreation of programming concepts and algorithms examples, from the point of view ofinstructors of IT courses, in the context of Introductory Programming, and Algorithmsand Data Structures courses.1 https://www.upwork.com/

50
5.1.2 Research Questions
We translated our objective in two research questions:
• RQ1: What are the most common practices used by instructors when teachingcoding-related courses?
• RQ2: What are the perceptions of these instructors towards Willow?
The first question helps us to understand the behavior of instructors when teachingcode-related courses. For example, a “hands-on” instructor that engages with students inwriting code during lectures is more likely to react positively to Willow and other SVtools. This question therefore attempts to characterize the teacher. The second questionevaluates the reactions of teachers based on observations of the key features of Willow.
5.1.3 Research Method
To answer our research questions, we adopted a mixed methods research method (LAM-BERT; LAMBERT, 2012). Since we collect participants perceptions and opinions aboutWillow, this survey can be classified as a descriptive study (LAMBERT; LAMBERT,2012), where outcomes are unlikely to change by carrying the study multiple times. Thisallowed us to carry out the study in a cross-sectional manner (WOHLIN et al., 2012;LEVIN, 2006) (run the study only once), because there are no factors in the study thatrequire a longitudinal application.
5.1.4 Population
The population of this study is composed of instructors that teach or have taught in IT-related courses, such as Computer Science, Computer Engineering, Software Engineeringand so forth. Since the study is carried out only once (Subsection 5.1.3) and we use anonline questionnaire to collect participants’ data (Subsection 5.1.5), we did not present aparticipation agreement form to the participants. Because of that, the consent term andethical concerns where included in the questionnaire.
5.1.5 Questionnaire
We used online questionnaires, which is an indirect strategy for data collection (wherethere is no physical interaction between researchers and participants).
The questionnaire was designed with two main goals:

51
1. Identify the practices that are most commonly adopted by instructors in their class-rooms (to answer RQ1).
2. Identify their perceptions about Willow (to answer RQ2).
The questionnaire presents the study objectives, researchers’ names and contact in-formation, a description of Willow, the expected duration to answer the questions,concerns about privacy and a consent term. The questionnaire contains mainly closedquestions, containing single choice, multiple choices and Likert scale questions. All Lik-ert scale questions in the questionnaire are followed by optional open questions, whereparticipants could provide rationale for their answers if they wanted.
In the first part, we asked whether or not instructors of IP and DSA courses adoptcertain practices in the classroom, for example, sketch diagrams on the board, use pro-gramming tools during class, etc. In the second part, we prepared various short videos ofapproximately 2 minutes to demonstrate the tool features using small examples of datastructures and algorithms which are related to the courses we focused. We also provideda link to Willow so that participants could give a go on the tool, if they wanted.
In total, 6 videos were presented in the questionnaire, 3 videos contained basic conceptscommonly taught in Introductory Programming courses, the remaining 3 videos containedexamples commonly taught in Data Structures and Algorithms course. All videos usedthe Python language. In what follows we detail each video.
• Introductory Programming:
– Tuples, Lists and Mutation: This example shows the creation of these datastructures, followed by some operations that can be executed with them, suchas indexing elements, slicing, update, insertion and removal in lists, and sorting.The goal of this video is to demonstrate which operations are possible witheach data structure, what happens when one attempts to change the contentsof an immutable data structure, and consequently demonstrate the differencebetween mutable and immutable data structures.
– Recursion: This video presents the visualization of a factorial function. Themain goal of the visualization is to shows the behavior of recursive functionswith respect to the program stack. In the video, it is possible to see how thefunction scopes are stacked one after the other in the stack, and the value oftheir variables preserved during the execution until the function reaches thebase case, when they start to be popped.
– Objects and Special Functions: This video show how Willow displays objects,the parameter binding in method calls and how Python can overload operationsthrough the use of functions with special names.

52
• Data Structures and Algorithms:
– Quicksort: This video shows an example of the classic Quicksort algorithm.To better represent the operations the quicksort algorithm executes in thelist, a column based representation is used. The column representation incombination with the default color hints of modifications in the data structureis used to highlight the swap operations executed by the sorting algorithm.
– N-Queens: The second video about Data Structures and Algorithms shows twoexamples of the N-Queens backtracking algorithm for N=4 and N=5. Similarto the Quicksort example, a different visualization of the list data structureis adopted. This time a matrix is used, and combined again with color hintsof modifications, the visualization displays the check areas of the board everytime a new queen is placed or removed.
– Self-Balancing Tree: The last example example show the visualization of con-secutive insertions in an AVL-Tree. this visualization uses more advancedfeatures, such as data structure detection and automatic positioning (Sec-tion 4.1.3.2), and time traveling (Section 4.1.3.3). These features are combinedto show animations of the insertion of new nodes in the tree.
Different features of Willow are presented in the videos, such as multiple objectrepresentations, delta highlighting, time-traveling, automatic data structure detectionand positioning, and animations. The videos are available online on YouTube and can beaccessed through the following playlist:
https://www.youtube.com/playlist?list=PLpNZKTBEk73m5-DcKbpc45PZIe8WbEsj2
The questionnaire was revised several times in pilot trials. Two instructors not directlyinvolved with Willow offered their assistance to informally assess whether the surveybalanced completeness (as to answer the questions we posed) and time-consumption (asto reduce the effort of participants). Their answers were discarded and not used in theanalysis. Finally, the questionnaire included background questions (e.g., name, experi-ence, etc.) and questions about practices, questions about the perception of participantson Willow in the context of IP and DSA disciplines, and questions to collect feedbackand criticism.
Considering background information, we asked each participant’s name, institution,courses taught, years of experience, and demographics. Regarding the teaching practicesadopted by instructors, the survey covered different practices that we observed as com-monly used and had an open text field for participants to indicate practices that we didnot cover. Finally, considering the part related to the perception of participants aboutWillow, we prepared questions related to the videos in the playlist above, asking partic-ipants whether such a tool could help the teaching activities. For example, after showing

53
a video containing examples of tree rotations in Willow, we asked “Do you agree thatthe animations shown in the video helps to illustrate tree rotation?”. We collected answersabout such perceptions on a 5-point Likert scale. The scale indicates how strongly theparticipant felt about a question associated with a given video. Participants had theoption to provide a rationale for their scores.
Since participants may have experience in only one of the courses of interest, we splitvideos and questions into two sections contained in the same form, one for each course.We also made all questions optional, and informed that participants may skip a questionif that question does not apply. At the end, we collected suggestions, comments, andcritics. The form content is available in the Appendix 1.2
5.1.6 Results
This section discusses the data we collected from the survey. We sent invitationsthrough email to 1771 instructors that teach or taught IP or DSA and collected a total of111 responses from them. Not all of the 111 responses where considered in the analysis,6 participants did not have experience with the courses of interest, and 1 participantanswered the form twice, 104 remained. From the 104 participants that answered thesurvey, 97 of them taught IP, 81 taught DSA, and 74 participants taught both courses.
To send such number of invitations, we established a criteria to gather candidates.Participants should be instructors in one of Brazil’s Federal Universities. This criteriawas established because it provided us a limit of candidates to send emails. If we chose tocollect candidates of any Brazilian institution, it could not be possible to gather candidatesfrom all institutions. Federal Universities are also recognized in Brazil by their aboveaverage quality, and are spread across the country, providing us with high diversity data.Figure 17 shows the number of participants per institution.
Figure 18 shows two histograms—one for each course of interest—to summarize char-acteristics. Each histogram shows the distribution of years of teaching experience ofparticipants on a given course. Although the number of experienced instructors in IPwas higher compared to DSA, overall, there was a balanced number of experienced andinexperienced instructors participating in the survey. We considered that the answer ofboth kinds of participants are important.
5.1.6.1 Participants Teaching Practices
To understand teaching practices adopted by the participants, we presented questionsthat relate to common strategies used in classes. Figure 19 shows the prevalence of each2 The questionnaire and videos were translated to English. The original language is Portuguese.

54
Figure 17 – Participants’ teaching institutions.
practice. The size of each bar shows the number of participants who adopted a givenpractice, as indicated in the survey.
The most commonly-adopted practices in the classroom appears at the top of thefigure. The three most common were writing sketches of code and data on the board,writing program code during class, and using slides to illustrate diagrams. Overall, wefound that the adoption of interactive visual aids (e.g., visualizations of state transitions,or that allow changes in source code or input) in teaching IP and DSA was relatively low,as indicated in the size of the second to last listed practice on Figure 19.
We also asked questions about instructors’ experiences with SV tools, we asked “Haveyou ever used any tool that automatically create program visualizations?”, and collectedthe names of tools that participants have used. Since participants may not be familiarwith the definition of Software Visualization (SV), we used a somewhat generic question,and filtered results based on the list of tools that participants provided. For instance,some participants mentioned that they use PowerPoint, which does not qualify as a SVtool. After filtering only those with answers that interest us, we identified that someparticipants have not necessarily used SV tools to prepare lectures or during the lectures,but they know that such tools exist and what can they can do. In total, 29 participants

55
Figure 18 – Participants years of experience with IP and DSA.
have tried SV tools.Although the use of simple illustrations is common among participants (79.8%), only
29 participants (27.9%) have tried SV tools to create visualizations. Among these, themost commonly used tools were Python Tutor (GUO, 2013) and VisuAlgo (DIXIT;YALAGI, 2017), which had been tried by 16 and 13 instructors respectively, older toolssuch as Jeliot (3) and BlueJ (3) where also reported, a few remaining tools were reportedby one participant each.
Participants also gave their opinions on results obtained from SV tools they have used.Most of them had good experiences, only one participant reported results as unsatisfying.Although we could not verify if instructors indeed used SV tools during class or to createlecture materials, when correlating the use of SV tools with adopted practices, we foundthat 59% of instructors that use tools to create or that contain interactive visualizationshave used SV tools, whereas for all other practices, 25% have used SV tools. This suggeststhat some instructors adopted SV in their classes.

56
Figure 19 – Common teaching practices adopted by instructors.
Answering RQ1: According to the collected data, board sketchesis the most common practice used by instructors, closely
followed by writing code during class and using lecture slides toshow diagrams and algorithm illustrations. Only 27.9% ofinstructors reported experimenting with SV tools, and the
adoption of such tools in classes is even smaller.
5.1.6.2 Participants Perceptions Towards Willow
In the following sections of the form, the goal was to collect perceptions of the partic-ipants towards Willow, in the context of IP and DSA disciplines.
Figure 20 shows participants’ perceptions toward videos containing examples of basicprogramming concepts, data structures and algorithms, created using Willow. Thesevideos are described in Section 5.1.5. Figure 20 displays a diverging stacked bar chartquantifying and summarizing participants’ perceptions over different Willow featuresillustrated by the videos. The size of each bar represents the number of participants whohave chosen a particular value in a 5-point Likert scale, ranging from “totally disagree” to“totally agree” or “Very unsatisfactory” to “Very satisfactory” for a given question (e.g.,“Regarding recursion, do you think your students can benefit from the features illustratedin the video?”). The three first rows in the chart refer to the perception of basic pro-

57
gramming concepts common to IP 3. The fourth and fifth rows refer to data structuresand algorithms common to DSA, and the last row refers to participants opinions regard-ing if Willow could contribute to lecture material participants proposed previously forexplaining tree rotations. The scatter traces are the average and median of participants’answers.
Figure 20 – Participants perception about Willow’s visualizations.
Diverging stacked bar chart showing the perception of participants about Willow in a scalefrom 1 (negative perception) to 5 (positive perception). The average and median are
represented by the scatter traces on the right side.
Figure 20 shows that participants had an overall good acceptance on all of Willow’svisualizations, and agreed with the possible applicability of Willow in the teachingprocess.
In general participants mostly agreed with the following benefits of using Willow:
• Good representation of programming concepts: Participants liked Willow’s visu-alizations and agreed that the visualization elements can provide good visual ab-stractions to explain programming concepts and inner workings of algorithms tostudents.
• Fast way to create examples: Many participants reported that Willow may helpby making the creation of examples faster. They would not have to create examplesin lecture slides or draw sketches, which would save class time. Some participantsalso said it would be very useful for algorithms that require drawing of too manysteps, such as sorting algorithms. Other participants also cited the possibility of
3 The number of answers in the “objects” entry is smaller due to a problem in the execution phase, partof the responses had to be discarded.

58
making small modifications in the algorithms without having to redraw illustrationsagain.
• Benefits to students: Another common received feedback was the benefits for stu-dents, such as being able to explore the content in an interactive manner, and thatWillow could be used as an “extra class” resource, where students could use it tostudy alone by following visualizations of algorithm executions, and go beyond theexplanations given by their instructions.
A few participants did not appreciate some of Willow’s visualizations. The mostcommon complaints were related to:
• Complicated visualizations: Participants reported that some visualizations were notintuitive due to several causes. For example, they complained that sometimes toomuch information could be displayed at once, and that having multiple focus pointsmay confuse beginners. Moreover, they also mention pointer “pollution”, whenmultiple variables point to the same object. Willow already applies filtering ofreferences, this feature can be made customizable to filter more references and reducethis problem.
• Indistinguishable objects: Some objects rendered in the heap are very similar, suchas tuples and lists, which are distinguishable only by the type name over the objectrepresentation. Different representations of objects already exist in Willow, theserepresentations could be used to differentiate objects, new representations can alsobe implemented if necessary.
• Adherence of visualizations to a single programming language: Instructors com-plained that visualizations may be tied to a single programming language, whichcould compromise students understanding of programming concepts. Some partici-pants also reported that they would not use Willow because it does not supportC/C++. Because the visualizations used the Python language, some participantsthought it was the only supported language. It is true that Willow currently doesnot support C/C++, but visualizations are not restrained to a single language. BothPython and Java can be used, and since Willow has an extensible language sup-port, C/C++ and other languages might be added. Although further investigationon how to map language elements in visualization elements is necessary.
Answering RQ2: Results indicate that the majority ofparticipants (91.3%) had positive impressions about Willow.
In particular, 5 participants manifested strong interest inapplying Willow in their next classes, even though Willow is
still not mature.

59
5.1.7 Threats to Validity
Some of the common validity criteria used in quantitative studies, such as internal va-lidity, reliability, and objectivity are not suitable for qualitative studies. The main threatsto validity in qualitative studies are related to trustworthiness, which can be translated inthe question “Can the findings of the study be trusted?”. Based on that, we adopted thefollowing validity criteria: credibility, transferability, and confirmability (KORSTJENS;MOSER, 2018)
The following describes each criteria and our actions to accomplish them:
• Credibility: The confidence that research findings are correctly inferred from the col-lected data. To ensure credibility, the development of the questionnaire and otherresearch materials was conducted by two researchers, the questionnaire complete-ness was corroborated with pilot trials with two instructors, and although this isa qualitative study, a large part of the data collected from questions was alreadyquantified and categorized through the use Likert scales and predefined categories.
• Transferability: The degree to which the results of our survey can be transferredto other contexts or settings with other respondents. All materials necessary tocarry the study —questionnaire content, videos and Willow itself— are publiclyavailable. We collected responses from a large sample of our population, which areIP and DSA instructors, totalizing 104 participants of several universities.
• Confirmability: The degree to which the findings of the study could be confirmed byother researchers. All the findings we obtained were derived directly from the ques-tionnaire answers, a large part of our conclusions were derived from the quantitativedata we collected, while using participants provided rationale to further understandtheir decisions. Although, we did not had authorization to publish participantsresponses. Finally, we also described in detail our research design, processes andtaken decisions throughout this document.
5.2 EXPERIMENT
This section reports the results of an experiment comparing the performance of devel-opers who used Willow and traditional textual tools to solve simple data structure andalgorithms problems.

60
5.2.1 Objective
According to the Goal/Question/Metric (GQM) template, our research goal (BASILI;ROMBACH, 1988) is as follows:
Analyze developers as experimental subjects, for the purpose of comparing theperformance when using Willow against textual tools (IDEs or text editors of prefer-ence), with respect to time to solve the problem, confidence of the developer in theiranswer, and the correctness of the answer, from the point of view of amateur softwaredevelopers, in the context of an experiment involving developers hired from an onlineoutsourcing platform platform and involving online tools.
5.2.2 Research Question and Hypothesis
We translated our goal in the following research question, and its associated hypoth-esis:
• RQ3: What are the benefits Willow can offer to programmers when solving datastructures and algorithms problems, with regard to time to solve, confidence andcorrectness?
In the definition of the objective (Section 5.2.1), we manifested that we want to com-pare participants in two situations, which are the use of Willow and the use of traditionaltextual tools. The participant performance can be translated in the metrics described inthe objective. Based on that, and since we are looking for any benefits Willow canprovide to users, the hypothesis for the RQ3 is stated as:
H0: There is no benefit in using Willow as an assisting tool with regard to time tosolve, confidence and correctness.
𝐻0 : 𝜇(𝑇𝐼𝑀𝐸)textual ≤ 𝜇(𝑇𝐼𝑀𝐸)willow ∧
𝜇(𝐶𝑂𝑁𝐹𝐼𝐷𝐸𝑁𝐶𝐸)textual ≥ 𝜇(𝐶𝑂𝑁𝐹𝐼𝐷𝐸𝑁𝐶𝐸)willow ∧
𝜇(𝐶𝑂𝑅𝑅𝐸𝐶𝑇𝑁𝐸𝑆𝑆)textual ≥ 𝜇(𝐶𝑂𝑅𝑅𝐸𝐶𝑇𝑁𝐸𝑆𝑆)willow
Ha: There is benefit in using Willow as an assisting tool with regard to time to solve,confidence and correctness.
𝐻a : 𝜇(𝑇𝐼𝑀𝐸)textual > 𝜇(𝑇𝐼𝑀𝐸)willow ∨
𝜇(𝐶𝑂𝑁𝐹𝐼𝐷𝐸𝑁𝐶𝐸)textual < 𝜇(𝐶𝑂𝑁𝐹𝐼𝐷𝐸𝑁𝐶𝐸)willow ∨
𝜇(𝐶𝑂𝑅𝑅𝐸𝐶𝑇𝑁𝐸𝑆𝑆)textual < 𝜇(𝐶𝑂𝑅𝑅𝐸𝐶𝑇𝑁𝐸𝑆𝑆)willow
• 𝜇(𝑇𝐼𝑀𝐸)textual: The time taken to answer the problem using textual tools.

61
• 𝜇(𝑇𝐼𝑀𝐸)willow: The time taken to answer the problem using Willow.
• 𝜇(𝐶𝑂𝑁𝐹𝐼𝐷𝐸𝑁𝐶𝐸)textual: The confidence of the participant in their solution usingtextual tools.
• 𝜇(𝐶𝑂𝑁𝐹𝐼𝐷𝐸𝑁𝐶𝐸)willow: The confidence of the participant in their solution usingWillow.
• 𝜇(𝐶𝑂𝑅𝑅𝐸𝐶𝑇𝑁𝐸𝑆𝑆)textual: The correctness of the participant’s solution using tex-tual tools.
• 𝜇(𝐶𝑂𝑅𝑅𝐸𝐶𝑇𝑁𝐸𝑆𝑆)willow: The correctness of the participant’s solution usingWillow.
5.2.3 Variables
5.2.3.1 Independent Variables
The only independent variable (factor) of this experiment is the tool to be used. Thisindependent variable contains two levels:
1. participant must use a textual environment (text editor, IDE, etc.) to solve prob-lems.
2. participant must use Willow to solve problems.
This variable is manipulated by asking participants to use Willow in the middle ofthe experiment. More about level switching is explained in the Sections 5.2.7 and 5.2.8.Since the tool to be used is the only factor of the experiment, the levels of this variablecan be interpreted directly as the only treatments of the experiment.
5.2.3.2 Dependent Variables
The dependent variables are the time to understand and solve problems (TIME),participants confidence in their solutions (CONFIDENCE) and the correctness of thesolution (CORRECTNESS).
TIME is collected when the participant submits a solution, the elapsed time is au-tomatically by the tool used to conduct the experiment. CONFIDENCE is provided bythe participant after solving each problem, participants choose the confidence on theirsolution through a 5-point Likert scale asking how confident they have in the providedsolution. CORRECTNESS is extracted from participants’ source code, by executing it

62
with test inputs. The correctness of each answer was evaluated against 6 test cases whichare available in Appendix Section 6.2.
5.2.4 The Choice of Dependent Variables
Since the purpose of visualization tools is to provide visual aid through the creation ofillustrations, we expected that users would understand the behavior of programs’ abstractconstructs more easily and clearly with the help of illustrations. For this reason, wedecided to collect the time the participant takes to solve a problem and the correctnessof the solution. The confidence was collected to complement the other variables, thepurpose of this metric was to verify if Willow had any impact in the participants’ ownunderstanding of their solutions.
5.2.5 Experimental Subjects
The population is composed of developers with “basic knowledge” of the Python pro-gramming language and data structures and algorithms, regardless of the their profes-sional experience or formation. Due to the COVID-19 outbreak, universities were closedand this made hard to recruit students to participate in the experiment. This way, weused the Upwork platform (UPWORK, 2020). We published our experiment as a job offerin the platform and received proposals from freelancers all over the world. Each proposalwas filtered according to the population constraints, and we then hired each freelancerand sent all information necessary to run the experiment. We received 34 proposals fromfreelancers, and 18 participants were selected and participated in our experiment.
The participant selection was complex due to our population constraints. In ourconception, “basic knowledge” means that participants should have the intuition on howto solve problems, but they should not have much experience or be experts in the topics.Participants also could not be too amateurs, to the point of not even understanding theproblems, or having no idea how to solve them.
Another limitation on participant selection was the financial, due to the limited bud-get, we could only hire 18 freelancers as participants.
5.2.5.1 Ethical Concerns
Due to the nature of the experiment, we did not notice any possible ethical concernsthat could lead to problems, except for privacy concerns. We decided that all participantinformation would be private, and clearly stated this in the experiment introduction.Although, since all participants were paid to participate in the experiment, we did not

63
allow participants to request withdrawal from the experiment and consequently discardtheir responses.
5.2.6 Objects and Tasks
Four objects (data structures and algorithms problems) are used during the exper-iment. All problems are fairly simple to solve, but also allow different solutions withvarying difficulty degrees. The problems are:
1. Cycle Detection: Participants have to implement a solution to find if a linked listcontains a cycle;
2. Jessie Cookies: Participants have to consecutively combine the smallest elements inan array and create a new one until the smallest element surpasses a threshold;
3. Lowest Common Ancestor : Participants need to find the lowest common ancestorof two nodes in a binary search tree;
4. Reverse List: Participants have to reverse a singly linked list.
Each problem contains a basic description of the objective, a program template, whichreads inputs and prints outputs, and some examples. Participants are supposed to imple-ment only one function, which is described in the objective and with the signature alreadyin the template. Problems (1) and (2) compose the first task and problems (3) and (4)compose the second task.
Appendix Section 6.2 contains the form used to present the questions during theexperiment. This form contains the description of all objects of the experiment.
5.2.7 Experimental Design
Our experiment is based on programming exercises, where participants have to solvealgorithms and data structures problems. We chose this kind of experiment because ourgoal is to objectively evaluate and classify participants’ solutions using test cases. Thishelped us to avoid the subjective part of the participants’ opinions on the tool, which hasalready been evaluated already in the survey. The only inherently subjective element inthis study is the participant’s confidence in the provided answers.
We adopted a single-factor latin-square (WOHLIN et al., 2012) experimental designwith with two treatments. The adopted design is illustrated by Table 2. The latin-squaredesign was chosen to avoid within-subjects design drawbacks in this specific experiment,i.e., to reduce impact on the performance of participants when solving problems theyalready solved using another treatment. In this design, participants are divided into

64
groups, and each group solves a set of tasks using different treatments (Section 5.2.6).Treatments correspond to the tool used by the participant to solve a task (Section 5.2.3).
Table 2 – Latin-square design, a complete 2x2 layout.
Treatment 1 Treatment 2Participant group 1 Task 1 Task 2Participant group 2 Task 2 Task 1
An important property to ensure validity of latin-square designs is randomizing theparticipants’ groups. In controlled experiments where all participants are present at thesame time, this can be done a priori, before the experiment starts. To conduct this exper-iment, however, we used the Upwork freelancing platform (UPWORK, 2020) for selectingparticipants. Therefore, we did not had access to all participants promptly so they couldnot be randomly distributed into groups prior to the experiment. To mitigate and solvethis problem, we created a form engine, dubbed json-form4, designed to apply simplefactorial designs in an online setting. With json-form, when new participants accessthe form, they are randomly assigned to a group, automatically, and the specific order fortasks and treatments of the chosen group is then applied. json-form also solved otherissues that we had experienced when using common form engines (e.g., Google Forms),such as collecting the time that participants take to solve problems. Most importantly,it enables us to present formatted text, which is a prominent need in an experiment suchas ours, where we need to show source code when describing the input and output of thepresented problems. With the help of json-form, participants could join the experimentat any moment, without researcher supervision.
5.2.8 Protocol
The process started with hiring amateur freelancers. After posting a job calling forparticipants, we filtered participants questions about data structures and algorithms, re-moving candidates with too much or too little experience (the former would not benefitfrom the tool due to very solid mental models, the latter would not be capable of answer-ing questions due to lack of knowledge). After being accepted, the participant receivedinstructions and access to the form created with json-form (the form is available in theAppendix Section 6.2). Participants could answer the form at any moment until theirdue date.
When accessing the form, participants are presented with information about the study,such as researchers contact, study objective, privacy concerns, procedures and expectedtime to answer the form (which is approximately 1 hour based on 5 pilots). The formpresents tasks in different orders based on the group which was randomly chosen for the4 https://github.com/pedro00dk/json-form

65
participant. After the introduction section of the form, the following sections present twoproblems to be solved using any textual tool (e.g., IDEs or text editors) the participantfeel most comfortable.
After the first two questions, Willow is presented to the participants and a smalltutorial section must be completed before proceeding to the next problems. The tutorialis composed of four steps, which teach participants how to execute code on Willow andhave basic interactions with the visualization. After the tutorial, two more problems arepresented, which have to be solved using Willow.
Participants were prohibited of accessing search engines and look for solutions, al-though, search for documentation was allowed. Participants also had to record theirscreen during the entire process, the recording was used to verify if participants respectedthe restrictions (Section 5.2.10) and followed the tutorial and other procedures.
5.2.9 Results
This section discusses the data we collected from the experiment. From the 18 par-ticipants, 6 were graduated developers, 3 were developers without a major degree, and 9were undergraduate students. Since our hypothesis is composed of sub-components, wefirst present the data and hypothesis tests, and then discuss about them.
Figure 21 shows participants confidence in the solutions they submitted when usingtextual environments and Willow, each bar represents the number of participants thatmanifested their confidence in a 5-point Likert scale.
As shown in Figure 21, the confidence of participants participants clearly does notfollow the Poisson distribution. We applied the Brunner-Munzel test (BRUNNER; MUN-ZEL, 2000), which is a non-parametric test similar to the Wilcoxon-Mann-Whitney U test(also known as generalized Wilcoxon test), but does not assume similar variance of thesamples being tested. Our tests yielded a p-value of 0.49 in a one-sided test, which doesnot reject the confidence term in from the null hypothesis:
𝜇(𝐶𝑂𝑁𝐹𝐼𝐷𝐸𝑁𝐶𝐸)textual ≥ 𝜇(𝐶𝑂𝑁𝐹𝐼𝐷𝐸𝑁𝐶𝐸)willow
Figure 22 shows the time in minutes participants took to solve the programmingproblems using their preferred textual environment and Willow. Each point representsone of the samples of a participant, and the violin plot on the side displays the distributionof the data.
The distribution of the time participants took to solve problems does not follow thenormal distribution. We applied Brunner-Munzel test to verify if there were differencesbetween the samples. We obtained a p-value of 0.59 in an one-sided test, which does notreject the time term from the null hypothesis:

66
Figure 21 – Participants confidence in their solutions.
𝜇(𝑇𝐼𝑀𝐸)textual ≤ 𝜇(𝑇𝐼𝑀𝐸)willow
Figure 23 shows the statistics of the solutions correctness when using textual toolsand Willow. Each trace represents the average (colored traces) or median (gray traces)for each question. Section 5.2.6 describes each question. The purple trace and dottedtrace with squares show the average and median of solutions written with textual tools.The green trace and dotted trace with circles shows the average and median of solutionswritten with Willow.
The distribution of the solutions correctness does not follow the normal distributionsince the average and median are far apart. We applied Brunner-Munzel test again toverify if there were differences between the samples. We obtained a p-value of 0.38 in anone-sided test, which does not reject the correctness term from the null hypothesis:
𝜇(𝐶𝑂𝑅𝑅𝐸𝐶𝑇𝑁𝐸𝑆𝑆)textual ≤ 𝜇(𝐶𝑂𝑅𝑅𝐸𝐶𝑇𝑁𝐸𝑆𝑆)willow
We also tested our hypothesis with all subsets of questions. For the time and confidencevariables, we did not find any marginally better result. However, some subsets of questionspresented much better results. Especially, q1 and q2 individually yielded a p-value of

67
Figure 22 – Time participants take to solve problems.
0.14 and 0.11 individually. When combining the solutions for q1 and q2, we obtained ap-value of 0.054. Still, the hypothesis could not be rejected at a significance level of 5%.Discarding the answers of q3 and q4 and increasing the significance level might increasetype II error, which would be favorable to our conclusion. Thus we prefer to stick with asignificance level of 5% in this experiment.
Answering RQ3: Since we could not reject the null hypothesis,the evidence collected in this study does not allow us to claimthat Willow brings the benefits we analysed to programmers
with regard to time to solve, confidence and correctness.
Since the survey with instructors presented very positive results, we expected goodresults in this follow-up experiment, even though the context and populations are different.We suspect that our main problems were the participant selection and the Willow’stutorial.
Due to the population constraints related to participant’s knowledge and experience,and the online setting in which the experiment occurred, it was hard to classify and select

68
Figure 23 – Participants’ scores average and medians for each question and treatment.
participants to the experiment. Some participants were much more experienced than thepopulation allows and others were too immature. For instance, 3 of the 18 participantswere not able to solve a single problem.
Willow’s tutorial was too short for the experiment, but because of financial restric-tions we could not make the experiment any longer. Willow’s tutorial can be viewed inAppendix Section 6.2.
5.2.10 Threats to Validity and Control Actions
During the planning phase of this experiment, we focused mainly in how to handlethreats that could occur in an online setting. Since the experiment happened in anasynchronous manner (experimenter did not watch participants resolution), we decidedto focus in preventive and fix-up control actions. Table 3 shows a list with threats tovalidity and their respective control actions.
Table 3 – Threats to validity and control actions.

69
Threats to Validity Threat Description Control Actions
Incomplete data col-lection (internal)
Participants may sub-mit incomplete an-swers.
⋆ Clearly state in the data col-lection tool how to fill the data.⋆ Verify if the failure is caused bythe submission method.
Interaction betweentreatments (con-struct)
When a treatment in-fluences positively ornegatively the resultsof the next treat-ments.
⋆ The latin-square design is used toprevent participants from solving thesame questions with different treat-ments.
Insufficient Training(internal)
When the trainingprocess does notprovide all necessaryinformation to theparticipants, or doesnot give enough timefor practicing.
Familiarity with theexperimental material(internal)
When the participanthas very little or noknowledge of the ex-periment material.
⋆ Use simple problems that allowmultiple different solutions.
Heterogeneous Sam-ple (conclusion)
When there are dif-ferences among theparticipants related toexpertise and experi-ence.
⋆ Use an experimental design thatminimizes the impact of hetero-geneous samples (latin-square).⋆ Assign participants to groupsrandomly.
Fatigue can affect theparticipant’s perfor-mance (internal)
If the experiment istoo long, participantsmay feel tired orbored.
⋆ Use problems that canbe resolved more quickly.⋆ Add breaks between the ob-jects and tasks.

70
Application of inap-propriate statisticaltest (conclusion)
There are factors thatmust be met in orderfor a statistical test tobe used, such as sam-ple size and data nor-mality.
⋆ Verify is the sample data fits allconstraints of the statistical test.⋆ Verify the adoption of the statis-tical test in other experiments.
Precision on data col-lection (internal)
The data may not beprecise if the partici-pants are responsiblefor collecting it.
⋆ Use a tool to do all data collection.
Abandonment (inter-nal)
Participants mayabandon the experi-ment (internal)
⋆ Discard participant’s incompletedata.
Interruption (inter-nal)
Participant may haveto stop executing theexperiment by anyreason.
⋆ Add breaks between the objectsand tasks.
Ignore treatments(construct)
Participant may ig-nore the treatmentswhen solving thetasks.
⋆ Disqualify participant and discardtheir data.
Search for solutions(construct)
Participants maysearch for solutions ofthe problems online.
⋆ Disqualify participant and discardtheir data.

71
6 FINAL CONSIDERATIONS
This chapter presents the conclusions we drawn from the development and evaluation ofWillow. We then describe our expectations of future work involving the tool.
6.1 CONCLUSION
This work presents Willow, a tool to support Data Structure and Algorithms lessonsthrough the creation of interactive program visualizations that can be used by instructorsand students in the teaching-learning process. Notable features are the ability to changethe representation of the program data, create animations and navigate to any point of aprogram, specialized nodes to show array data or select specific fields of an object allow theuser to better control which and how objects are shown in order to make programs easierto understand. This allows the creation of visualizations for Introductory Programmingconcepts, and Data Structures and Algorithms.
The first conducted study with instructors revealed that Willow can be promisingif used as an aid tool for the creation of algorithm visualization in both IntroductoryProgramming and Data Structures and Algorithms courses. Instructors also agreed thatWillow could be beneficial to students if used directly by them. In our follow-up ex-periment, however, we were not able to verify such statement, even though we had suchpositive results in the first study.
6.2 FUTURE WORK
Future work includes execution of another experiment similar to the one executedwith freelancers, this time with students from IT courses. We also plan to continue thedevelopment of Willow, bringing new features, such as better data structure detection,representations for complex data structures like graphs, new ways to visualize objects,general visualization improvements and support for new programming languages. Fi-nally, we want to publish our results to present Willow and our studies to the scientificcommunity.

72
REFERENCES
ALTADMRI, Amjad; BROWN, Neil CC. 37 million compilations: Investigating noviceprogramming mistakes in large-scale student data. In: PROCEEDINGS of the 46thACM Technical Symposium on Computer Science Education. [S.l.: s.n.], 2015.P. 522–527.
ANDERSON, John R; JEFFRIES, Robin. Novice LISP errors: Undetected losses ofinformation from working memory. Human–Computer Interaction, Taylor &Francis, v. 1, n. 2, p. 107–131, 1985.
ATEEQ, Muhammad et al. C++ or Python? Which One to Begin with: A Learner’sPerspective. In: IEEE. 2014 International Conference on Teaching and Learning inComputing and Engineering. [S.l.: s.n.], 2014. P. 64–69.
BARBOSA, Marcelo RG et al. Implementação de compilador e ambiente deprogramação icônica para a linguagem logo em um ambiente de robótica pedagógica debaixo custo. In: 1. BRAZILIAN Symposium on Computers in Education (SimpósioBrasileiro de Informática na Educação-SBIE). [S.l.: s.n.], 2009. v. 1.
BASILI, Victor R; ROMBACH, H Dieter. The TAME project: Towardsimprovement-oriented software environments. IEEE Transactions on softwareengineering, IEEE, v. 14, n. 6, p. 758–773, 1988.
BAU, David et al. Learnable programming: blocks and beyond. Communications ofthe ACM, ACM New York, NY, USA, v. 60, n. 6, p. 72–80, 2017.
BAYMAN, Piraye; MAYER, Richard E. A diagnosis of beginning programmers’misconceptions of BASIC programming statements. Communications of the ACM,ACM New York, NY, USA, v. 26, n. 9, p. 677–679, 1983.
BECKER, William E; WATTS, Michael. Teaching economics at the start of the 21stcentury: Still chalk-and-talk. American Economic Review, v. 91, n. 2, p. 446–451,2001.
BLENDER, the free and open source 3D creation suite. [S.l.: s.n.].https://www.blender.org/. Accessed: 2020-06-06.
BERKELEY University CS 61A: Structure and Interpretation of Computer Programs.[S.l.: s.n.]. https://cs61a.org/. Accessed: 2020-06-10.
BRESSON, Jean; AGON, Carlos; ASSAYAG, Gérard. OpenMusic: visual programmingenvironment for music composition, analysis and research. In: PROCEEDINGS of the19th ACM international conference on Multimedia. [S.l.: s.n.], 2011. P. 743–746.

73
BRUNNER, Edgar; MUNZEL, Ullrich. The nonparametric Behrens-Fisher problem:asymptotic theory and a small-sample approximation. Biometrical Journal: Journalof Mathematical Methods in Biosciences, Wiley Online Library, v. 42, n. 1,p. 17–25, 2000.
BURNETT, Margaret M; ATWOOD, John Wesley; WELCH, Zachary T. Implementinglevel 4 liveness in declarative visual programming languages. In: IEEE.PROCEEDINGS. 1998 IEEE Symposium on Visual Languages (Cat. No. 98TB100254).[S.l.: s.n.], 1998. P. 126–133.
CHRISTIAWAN, Lucky; KARNALIM, Oscar. AP-ASD1: An Indonesian Desktop-basedEducational Tool for Basic Data Structure Course. Jurnal Teknik Informatika danSistem Informasi, v. 2, n. 1, 2016.
CLANCY, Michael. Misconceptions and attitudes that interfere with learning toprogram. Computer science education research, Taylor and Francis Group,London, p. 85–100, 2004.
DANIELSIEK, Holger; PAUL, Wolfgang; VAHRENHOLD, Jan. Detecting andunderstanding students’ misconceptions related to algorithms and data structures. In:PROCEEDINGS of the 43rd ACM technical symposium on Computer ScienceEducation. [S.l.: s.n.], 2012. P. 21–26.
DIEN, Habibie Ed; ASNAR, Yudistira Dwi Wardhana. OPT+ Graph: Detection ofGraph Data Structure on Program Visualization Tool to Support Learning. In: IEEE.2018 5th International Conference on Data and Software Engineering (ICoDSE).[S.l.: s.n.], 2018. P. 1–6.
DIXIT, Rashmi K; YALAGI, Pratibha S. Visualization based intelligent tutor system toimprove study of Computer Algorithms. Computer, v. 1, n. 2, p. 1, 2017.
DOUKAKIS, Dimitrios; GRIGORIADOU, Maria; TSAGANOU, Grammatiki.Understanding the programming variable concept with animated interactive analogies.In: PROCEEDINGS of the The 8th Hellenic European Research on ComputerMathematics & Its Applications Conference (HERCMA’07). [S.l.: s.n.], 2007.
DU BOULAY, Benedict. Some difficulties of learning to program. Journal ofEducational Computing Research, SAGE Publications Sage CA: Los Angeles, CA,v. 2, n. 1, p. 57–73, 1986.
EBRAHIMI, Alireza. Novice programmer errors: Language constructs and plancomposition. International Journal of Human-Computer Studies, Elsevier, v. 41,n. 4, p. 457–480, 1994.
EGAN, Matthew Heinsen; MCDONALD, Chris. Program visualization and explanationfor novice C programmers. In: ACE. [S.l.: s.n.], 2014. P. 51–57.

74
FITZGERALD, Sue et al. Debugging: finding, fixing and flailing, a multi-institutionalstudy of novice debuggers. Computer Science Education, Taylor & Francis, v. 18,n. 2, p. 93–116, 2008.
FOUH, Eric; AKBAR, Monika; SHAFFER, Clifford A. The role of visualization incomputer science education. Computers in the Schools, Taylor & Francis, v. 29,n. 1-2, p. 95–117, 2012.
GARNER, Sandy; HADEN, Patricia; ROBINS, Anthony. My program is correct but itdoesn’t run: a preliminary investigation of novice programmers’ problems. In:PROCEEDINGS of the 7th Australasian conference on Computing education-Volume42. [S.l.: s.n.], 2005. P. 173–180.
GÖTSCHI, Tina; SANDERS, Ian; GALPIN, Vashti. Mental models of recursion. In:PROCEEDINGS of the 34th SIGCSE technical symposium on Computer scienceeducation. [S.l.: s.n.], 2003. P. 346–350.
GUO, Philip J. Codeopticon: Real-time, one-to-many human tutoring for computerprogramming. In: PROCEEDINGS of the 28th Annual ACM Symposium on UserInterface Software & Technology. [S.l.: s.n.], 2015. P. 599–608.
. Online python tutor: embeddable web-based program visualization for cseducation. In: ACM. PROCEEDING of the 44th ACM technical symposium onComputer science education. [S.l.: s.n.], 2013. P. 579–584.
GUO, Philip J; WHITE, Jeffery; ZANELATTO, Renan. Codechella: Multi-user programvisualizations for real-time tutoring and collaborative learning. In: IEEE. 2015 IEEESymposium on Visual Languages and Human-Centric Computing (VL/HCC). [S.l.: s.n.],2015. P. 79–87.
GUZDIAL, Mark. Centralized mindset: A student problem with object-orientedprogramming. ACM SIGCSE Bulletin, ACM New York, NY, USA, v. 27, n. 1,p. 182–185, 1995.
HERTZ, Matthew; JUMP, Maria. Trace-based teaching in early programming courses.In: PROCEEDING of the 44th ACM technical symposium on Computer scienceeducation. [S.l.: s.n.], 2013. P. 561–566.
HOLLIDAY, Mark A; LUGINBUHL, David. CS1 assessment using memory diagrams.In: PROCEEDINGS of the 35th SIGCSE technical symposium on Computer scienceeducation. [S.l.: s.n.], 2004. P. 200–204.
HUNDHAUSEN, Christopher D; DOUGLAS, Sarah A; STASKO, John T. Ameta-study of algorithm visualization effectiveness. Journal of Visual Languages &Computing, Elsevier, v. 13, n. 3, p. 259–290, 2002.

75
JACKSON, James; COBB, Michael; CARVER, Curtis. Identifying top Java errors fornovice programmers. In: IEEE. PROCEEDINGS frontiers in education 35th annualconference. [S.l.: s.n.], 2005. t4c–t4c.
KACZMARCZYK, Lisa C et al. Identifying student misconceptions of programming. In:PROCEEDINGS of the 41st ACM technical symposium on Computer science education.[S.l.: s.n.], 2010. P. 107–111.
KANON, a live programming environment specialized for data structure programming.[S.l.: s.n.]. https://prg-titech.github.io/Kanon/. Accessed: 2020-06-15.
KANG, Hyeonsu; GUO, Philip J. Omnicode: A novice-oriented live programmingenvironment with always-on run-time value visualizations. In: PROCEEDINGS of the30th Annual ACM Symposium on User Interface Software and Technology. [S.l.: s.n.],2017. P. 737–745.
KARPIERZ, Kuba; WOLFMAN, Steven A. Misconceptions and concept inventoryquestions for binary search trees and hash tables. In: PROCEEDINGS of the 45th ACMtechnical symposium on Computer science education. [S.l.: s.n.], 2014. P. 109–114.
KELLEHER, Caitlin; PAUSCH, Randy. Lowering the barriers to programming: Ataxonomy of programming environments and languages for novice programmers. ACMComputing Surveys (CSUR), ACM New York, NY, USA, v. 37, n. 2, p. 83–137,2005.
KORSTJENS, Irene; MOSER, Albine. Series: Practical guidance to qualitative research.Part 4: Trustworthiness and publishing. European Journal of General Practice,Taylor & Francis, v. 24, n. 1, p. 120–124, 2018.
KRAMER, Jan-Peter et al. How live coding affects developers’ coding behavior. In:IEEE. 2014 IEEE Symposium on Visual Languages and Human-Centric Computing(VL/HCC). [S.l.: s.n.], 2014. P. 5–8.
LAMBERT, Vickie A; LAMBERT, Clinton E. Qualitative descriptive research: Anacceptable design. Pacific Rim International Journal of Nursing Research, v. 16,n. 4, p. 255–256, 2012.
LAURSON, Mikael; KUUSKANKARE, Mika; NORILO, Vesa. An overview of PWGL,a visual programming environment for music. Computer Music Journal, MIT Press,v. 33, n. 1, p. 19–31, 2009.
LEVIN, Kate Ann. Study design III: Cross-sectional studies. Evidence-baseddentistry, Nature Publishing Group, v. 7, n. 1, p. 24–25, 2006.
LOPEZ, Mike et al. Relationships between reading, tracing and writing skills inintroductory programming. In: PROCEEDINGS OF THE FOURTHINTERNATIONAL WORKSHOP ON COMPUTING EDUCATION RESEARCH.[S.l.: s.n.], 2008. P. 101–112.

76
MALETIC, Jonathan I; MARCUS, Andrian; COLLARD, Michael L. A task orientedview of software visualization. In: IEEE. PROCEEDINGS First International Workshopon Visualizing Software for Understanding and Analysis. [S.l.: s.n.], 2002. P. 32–40.
MALONEY, John et al. The scratch programming language and environment. ACMTransactions on Computing Education (TOCE), ACM New York, NY, USA,v. 10, n. 4, p. 1–15, 2010.
MCCAULEY, Renee et al. Debugging: a review of the literature from an educationalperspective. Computer Science Education, Taylor & Francis, v. 18, n. 2, p. 67–92,2008.
MIT Open Courseware, introductory programming courses. [S.l.: s.n.].https://ocw.mit.edu/courses/intro-programming/. Accessed: 2020-06-22.
MORENO, Andrés et al. Visualizing programs with Jeliot 3. In: PROCEEDINGS of theworking conference on Advanced visual interfaces. [S.l.: s.n.], 2004. P. 373–376.
MULLER, Orna. Pattern oriented instruction and the enhancement of analogicalreasoning. In: PROCEEDINGS of the first international workshop on Computingeducation research. [S.l.: s.n.], 2005. P. 57–67.
NAPS, Thomas L; RÖSSLING, Guido, et al. Exploring the role of visualization andengagement in computer science education. In: WORKING group reports from ITiCSEon Innovation and technology in computer science education. [S.l.: s.n.], 2002.P. 131–152.
NAPS, Thomas; COOPER, Stephen, et al. Evaluating the educational impact ofvisualization. ACM SIGCSE Bulletin, ACM New York, NY, USA, v. 35, n. 4,p. 124–136, 2003.
OPENDSA, build your knowledge of Data Structures through visualizations andpractice! [S.l.: s.n.]. https://opendsa-server.cs.vt.edu/. Accessed: 2020-06-06.
OKA, Akio; MASUHARA, Hidehiko; AOTANI, Tomoyuki. Live, synchronized, andmental map preserving visualization for data structure programming. In:PROCEEDINGS of the 2018 ACM SIGPLAN International Symposium on New Ideas,New Paradigms, and Reflections on Programming and Software. [S.l.: s.n.], 2018.P. 72–87.
OKA, Akio; MASUHARA, Hidehiko; IMAI, Tomoki, et al. Live Data StructureProgramming. In: COMPANION to the first International Conference on the Art,Science and Engineering of Programming. [S.l.: s.n.], 2017. P. 1–7.
ORSEGA, Michael C; VANDER ZANDEN, Bradley T; SKINNER, Christopher H.Experiments with algorithm visualization tool development. In: PROCEEDINGS of the43rd ACM technical symposium on Computer Science Education. [S.l.: s.n.], 2012.P. 559–564.

77
OU, Jibin; VECHEV, Martin; HILLIGES, Otmar. An interactive system for datastructure development. In: PROCEEDINGS of the 33rd Annual ACM Conference onHuman Factors in Computing Systems. [S.l.: s.n.], 2015. P. 3053–3062.
PAUL, Wolfgang; VAHRENHOLD, Jan. Hunting high and low: instruments to detectmisconceptions related to algorithms and data structures. In: PROCEEDING of the 44thACM technical symposium on Computer science education. [S.l.: s.n.], 2013. P. 29–34.
PRICE, Blaine A; BAECKER, Ronald M; SMALL, Ian S. A principled taxonomy ofsoftware visualization. Journal of Visual Languages & Computing, Elsevier, v. 4,n. 3, p. 211–266, 1993.
PYTHON Tutor development history. [S.l.: s.n.].https://github.com/pgbovine/OnlinePythonTutor/blob/master/history.txt.Accessed: 2020-06-10.
QIAN, Yizhou; HAMBRUSCH, Susanne, et al. Teachers’ Perceptions of StudentMisconceptions in Introductory Programming. Journal of Educational ComputingResearch, SAGE Publications Sage CA: Los Angeles, CA, v. 58, n. 2, p. 364–397, 2020.
QIAN, Yizhou; LEHMAN, James. Students’ misconceptions and other difficulties inintroductory programming: A literature review. ACM Transactions on ComputingEducation (TOCE), ACM New York, NY, USA, v. 18, n. 1, p. 1–24, 2017.
QIAN, Yizhou; LEHMAN, James D. Correlates of Success in IntroductoryProgramming: A Study with Middle School Students. Journal of Education andLearning, ERIC, v. 5, n. 2, p. 73–83, 2016.
RAGONIS, Noa; BEN-ARI, Mordechai. A long-term investigation of the comprehensionof OOP concepts by novices. Computer Science Education, Taylor & Francis, 2005.
RAMALINGAM, Vennila; LABELLE, Deborah; WIEDENBECK, Susan. Self-efficacyand mental models in learning to program. In: PROCEEDINGS of the 9th annualSIGCSE conference on Innovation and technology in computer science education.[S.l.: s.n.], 2004. P. 171–175.
ROBINS, Anthony; ROUNTREE, Janet; ROUNTREE, Nathan. Learning and teachingprogramming: A review and discussion. Computer science education, Taylor &Francis, v. 13, n. 2, p. 137–172, 2003.
ROMANOWSKA, Katarzyna et al. Towards Developing an Effective AlgorithmVisualization Tool for Online Learning. In: IEEE. 2018 IEEE SmartWorld, UbiquitousIntelligence & Computing, Advanced & Trusted Computing, Scalable Computing &Communications, Cloud & Big Data Computing, Internet of People and Smart CityInnovation (SmartWorld/SCALCOM/UIC/ATC/CBDCom/IOP/SCI). [S.l.: s.n.], 2018.P. 2011–2016.

78
ROQUE, Ricarose Vallarta. OpenBlocks: an extendable framework for graphicalblock programming systems. 2007. PhD thesis – Massachusetts Institute ofTechnology.
SAJANIEMI, Jorma; KUITTINEN, Marja. An experiment on using roles of variables inteaching introductory programming. Computer Science Education, Taylor &Francis, v. 15, n. 1, p. 59–82, 2005.
SAJANIEMI, Jorma; KUITTINEN, Marja; TIKANSALO, Taina. A study of thedevelopment of students’ visualizations of program state during an elementaryobject-oriented programming course. Journal on Educational Resources inComputing (JERIC), ACM New York, NY, USA, v. 7, n. 4, p. 1–31, 2008.
SCRATCH, create stories, games and animations, share with others around the world.[S.l.: s.n.]. https://scratch.mit.edu/. Accessed: 2020-06-06.
SHAFFER, Clifford A et al. Algorithm visualization: The state of the field. ACMTransactions on Computing Education (TOCE), ACM New York, NY, USA,v. 10, n. 3, p. 1–22, 2010.
SILVA RIBEIRO, Romenig da; BRANDÃO, Leônidas de O; BRANDÃO, Anarosa AF.Uma visão do cenário Nacional do Ensino de Algoritmos e Programação: uma propostabaseada no Paradigma de Programção Visual. In: 1. BRAZILIAN Symposium onComputers in Education (Simpósio Brasileiro de Informática na Educação-SBIE).[S.l.: s.n.], 2012. v. 23.
SORVA, Juha et al. Visual program simulation in introductory programmingeducation. 2012. PhD thesis.
SORVA, Juha; KARAVIRTA, Ville; MALMI, Lauri. A review of generic programvisualization systems for introductory programming education. ACM Transactionson Computing Education (TOCE), ACM New York, NY, USA, v. 13, n. 4, p. 1–64,2013.
SORVA, Juha; LÖNNBERG, Jan; MALMI, Lauri. Students’ ways of experiencing visualprogram simulation. Computer Science Education, Taylor & Francis, v. 23, n. 3,p. 207–238, 2013.
STOREY, M-AD; FRACCHIA, F David; MÜLLER, Hausi A. Cognitive design elementsto support the construction of a mental model during software exploration. Journal ofSystems and Software, Elsevier, v. 44, n. 3, p. 171–185, 1999.
SYKES, Edward R. Determining the effectiveness of the 3D Alice programmingenvironment at the computer science I level. Journal of Educational ComputingResearch, SAGE Publications Sage CA: Los Angeles, CA, v. 36, n. 2, p. 223–244, 2007.

79
TAKATSUKA, Masahiro; GAHEGAN, Mark. GeoVISTA Studio: A codeless visualprogramming environment for geoscientific data analysis and visualization. Computers& Geosciences, Elsevier, v. 28, n. 10, p. 1131–1144, 2002.
TANIMOTO, Steven L. A perspective on the evolution of live programming. In: IEEE.2013 1st International Workshop on Live Programming (LIVE). [S.l.: s.n.], 2013.P. 31–34.
UNITY Engine, a cross-platform game engine developed by Unity Technologies.[S.l.: s.n.]. https://unity.com/. Accessed: 2020-06-06.
UNREAL Engine, the world’s most open and advanced real-time 3D creation tool.[S.l.: s.n.]. https://www.unrealengine.com/en-US/. Accessed: 2020-06-06.
UPWORK. [S.l.: s.n.], 2020. Available from: <https://www.upwork.com/>. Visited on:1 Aug. 2020.
URQUIZA-FUENTES, Jaime; VELÁZQUEZ-ITURBIDE, J Ángel. A survey ofsuccessful evaluations of program visualization and algorithm animation systems. ACMTransactions on Computing Education (TOCE), ACM New York, NY, USA, v. 9,n. 2, p. 1–21, 2009.
UUHISLE, a Program Visualization Tool for Introductory Programming Education.[S.l.: s.n.]. http://uuhistle.org/index.php. Accessed: 2020-06-06.
VAINIO, Vesa; SAJANIEMI, Jorma. Factors in novice programmers’ poor tracing skills.ACM SIGCSE Bulletin, ACM New York, NY, USA, v. 39, n. 3, p. 236–240, 2007.
VISUALGO, visualising data structures and algorithms through animation. [S.l.: s.n.].https://visualgo.net/. Accessed: 2020-06-06.
VELÁZQUEZ-ITURBIDE, J Ángel. Students’ Misconceptions of OptimizationAlgorithms. In: PROCEEDINGS of the 2019 ACM Conference on Innovation andTechnology in Computer Science Education. [S.l.: s.n.], 2019. P. 464–470.
VRACHNOS, Euripides; JIMOYIANNIS, Athanassios. Design and evaluation of aweb-based dynamic algorithm visualization environment for novices. ProcediaComputer Science, Elsevier, v. 27, p. 229–239, 2014.
WEINTROP, David; WILENSKY, Uri. To block or not to block, that is the question:students’ perceptions of blocks-based programming. In: PROCEEDINGS of the 14thinternational conference on interaction design and children. [S.l.: s.n.], 2015. P. 199–208.
WOHLIN, Claes et al. Experimentation in software engineering. [S.l.]: SpringerScience & Business Media, 2012.
YOUNG, Mark; ARGIRO, Danielle; KUBICA, Steven. Cantata: Visual programmingenvironment for the Khoros system. ACM SIGGRAPH Computer Graphics, ACMNew York, NY, USA, v. 29, n. 2, p. 22–24, 1995.

80
ZEHRA, Shamama et al. Student misconceptions of dynamic programming. In:PROCEEDINGS of the 49th ACM technical symposium on Computer ScienceEducation. [S.l.: s.n.], 2018. P. 556–561.
ZINGARO, Daniel et al. Identifying student difficulties with basic data structures. In:PROCEEDINGS of the 2018 ACM Conference on International Computing EducationResearch. [S.l.: s.n.], 2018. P. 169–177.

1.
Check all that apply.
I agree to participate
Opinions and interest in the Willow tool# ResearchersPedro Moraes -- [email protected] Teixeira -- [email protected] d'Amorim -- [email protected] Neto -- [email protected]
# ParticipantsThe participant must have experience as a professor teaching a CS-related course.
# WillowWillow is a tool for creating program visualizations from source code, focusing on representing basic programming concepts, algorithms, and data structures.It is available at https://willow-beta.web.app/It is not required to use Willow before answering this form, short videos will be presented showing features while the participant responds to the survey.
# ObjectiveAnalyze participants' interests and opinions about the Willow tool, for the purpose of comparing Willow with traditional teaching strategies used by participants, with respect to the ease of creating illustrations of basic programming concepts, algorithms, and data structures created to assist in the teaching, from the point of view of professors of CS-related courses.
# DurationThe estimated duration is 15 minutes.All questions besides the demographic questionnaire below are optional.
# PrivacyThe information obtained from your participation in this study will be kept strictly confidential. Any material will be referenced only by an identifier. For registration of the work, you must provide your name. Any results presented in future scientific publications will be anonymized* Required
By proceeding, I declare that I have had sufficient time to read and understandthe information contained in this form. The objectives have been explained, aswell as what will be required of me as a participant. I am aware that I can give upparticipating in the survey at any time, and in doing so, request that my datashould not be used for analysis and discarded. *
81
APPENDIX A - SURVEY QUESTIONNAIRE

2.
3.
4.
Mark only one oval per row.
5.
Mark only one oval per row.
6.
Mark only one oval.
Yes
No
Your name *
Your teaching institution *
When was the last time you taught any of the courses below? *IP: Introduction to Programming, Programming 101, or equivalent; DSA: Data structures and Algorithms orequivalent.
I am currentlyteaching it
Less than1 year
From 1 to2 years
From 2 to5 years
More than5 years
Never
IP
DSA
IP
DSA
For how long have you taught these courses? *IP: Introduction to Programming, Programming 101, or equivalent; DSA: Data structures and Algorithms orequivalent.
NeverLess than 1
yearBetween 1 and 2
yearsBetween 2 and 5
yearsMore than 5
years
IP
DSA
IP
DSA
Do you prepare examples of programs, algorithms, or data structures beforehandto be used as lesson material? *
82

7.
Mark only one oval.
Totally agree
1 2 3 4 5
Totally disagree
8.
Mark only one oval per row.
9.
Other:
Check all that apply.
I only talk and do not use visual resources
Draw sketches on a blackboard
Use simple diagrams in lecture slides
Build entire algorithm examples using slide presentations
Write program code during class (python notebooks, live coding)
Use programs or websites that build or contain interactive visualizations
Use traditional debuggers to show program execution step by step
Do you think this task takes too long or it is tedious?
Do you use visual resources, such as illustrations or animations to help withstudents' comprehension of algorithms and code snippets? *IP: Introduction to Programming, Programming 101, or equivalent; DSA: Data structures and Algorithms orequivalent.
Sim Não
IP
DSA
Other disciplines
IP
DSA
Other disciplines
What tools or strategies have you used to teach in your classes? *
83

10.
Mark only one oval.
Yes
No
11.
Other:
Check all that apply.
Python Tutor
VisuAlgo
OpenDSA
UUhisle
12.
Mark only one oval.
Very unsatisfactory
1 2 3 4 5
Very satisfactory
IntroductoryProgrammingcourses
This section contains questions about using Willow in the context of an introductory programming discipline or similar.
Note: The visualizations shown are created directly from the program source code.We recommend you to open the videos in a new tab by clicking on the "youtube" button (after starting it).
Have you ever used any tool to automatically create program visualizations? *
Which visualization tools have you used?Only answer this question if you have already used some visualization tool
What did you think of the results?Only answer this question if you have already used some visualization tool
84

13.
This video shows basic interactions with tuples and lists using Willow. The goal is toshow the behavior of the operations over mutating structures.
http://youtube.com/watch?v=ntxWBNUuvFU
14.
Mark only one oval.
Totally disagree
1 2 3 4 5
Totally agree
Which topics in introductory programming courses do you see as mostchallenging for students? Please, provide some rationale, if possible.
Do you think the effect of operations and functions over lists and tuples in thevideo above is clear and that the features of Willow can help students tocomprehend mutability?
85

15.
16.
Mark only one oval.
Yes
No
17.
This video shows the runtime behavior of a simple recursive algorithm using Willow.
http://youtube.com/watch?v=�Oc3QjpDPo
If you want, you can provide the rationale for your answer from the previousquestion.
Are difficulties or misconceptions in understanding the concept of recursioncommon among your students?
What strategies or metaphors do you use to explain recursion?
86

18.
Mark only one oval.
Totally disagree
1 2 3 4 5
Totally agree
19.
This video shows an example of class and objects, also showing how special methodsare called by operators.
http://youtube.com/watch?v=nBcGBUSRBdk
Regarding recursion, do you think your students can benefit from the featuresillustrated in the video?
If you want, you can provide the rationale for your answer from the previousquestion.
87

20.
Mark only one oval.
Totally disagree
1 2 3 4 5
Totally agree
21.
Data Structuresand Algorithms
This section contains questions about using Willow in the context of a data structures and algorithms course.
Note: The visualizations shown are created directly from the program source code.We recommend you to open the videos in a new tab by clicking on the "youtube" button (after starting it).
22.
Mark only one oval.
Totally disagree
1 2 3 4 5
Totally agree
The object-oriented paradigm is a complex subject for novices. Manyprofessors recur to illustrations to demonstrate the relationship betweenclasses and objects. Do you think Willow can help to create visualizations aboutthis subject to be presented to students?
If you want, you can provide the rationale for your answer from the previousquestion.
How much do you agree with this statement: "Visualizing animated versions ofalgorithms and data structures helps students on understanding how theywork".
88

23.
The video shows an array ordered by the quicksort algorithm. A column-basedrepresentation is used to facilitate perceiving operations on the list.
http://youtube.com/watch?v=VuoXhjiR3OI
This video is a visualization of the N queens problem. This time, a matrix representsthe board. When a new queen is placed, we can see the board highlighting thechanges.
http://youtube.com/watch?v=UG22rlOsPoA
If you want, you can provide the rationale for your answer from the previousquestion.
89

24.
Mark only one oval.
Totally disagree
1 2 3 4 5
Totally agree
25.
26.
Other:
Check all that apply.
Draw on the blackboard the trees before and after the rotation
Create lecture slides showing examples of tree rotations
Use visualization tools to create examples of tree rotations
The videos above show the same data structure (list) represented in differentforms. Do you think that flexible visualizations may contribute to students'understanding of an algorithm or data structure behavior if used correctly?
If you want, you can provide the rationale for your answer from the previousquestion.
Suppose you will teach a lesson on balanced trees. How would you explainrotation operations to students?
90

This video contains a series of insertions of sequential values in an AVL tree, showing,in a general way, how rotation operations modify the tree.
http://youtube.com/watch?v=KsApC71GxNQ
27.
Mark only one oval.
Very unsatisfactory
1 2 3 4 5
Very satisfactory
28.
29.
Mark only one oval.
Totally disagree
1 2 3 4 5
Totally agree
What did you think of the animations shown in the video above?
If you want, you can provide the rationale for your answer from the previousquestion.
Do you agree that the animations shown in the video could help to complementthe material you proposed previously?
91

30.
Conclusion
31.
32.
This content is neither created nor endorsed by Google.
If you want, you can provide the rationale for your answer from the previousquestion.
Do you think Willow could contribute in any way to you as a professor and toyour students? Why?
Are there any suggestions, comments, or criticism you want to make?
Forms
92
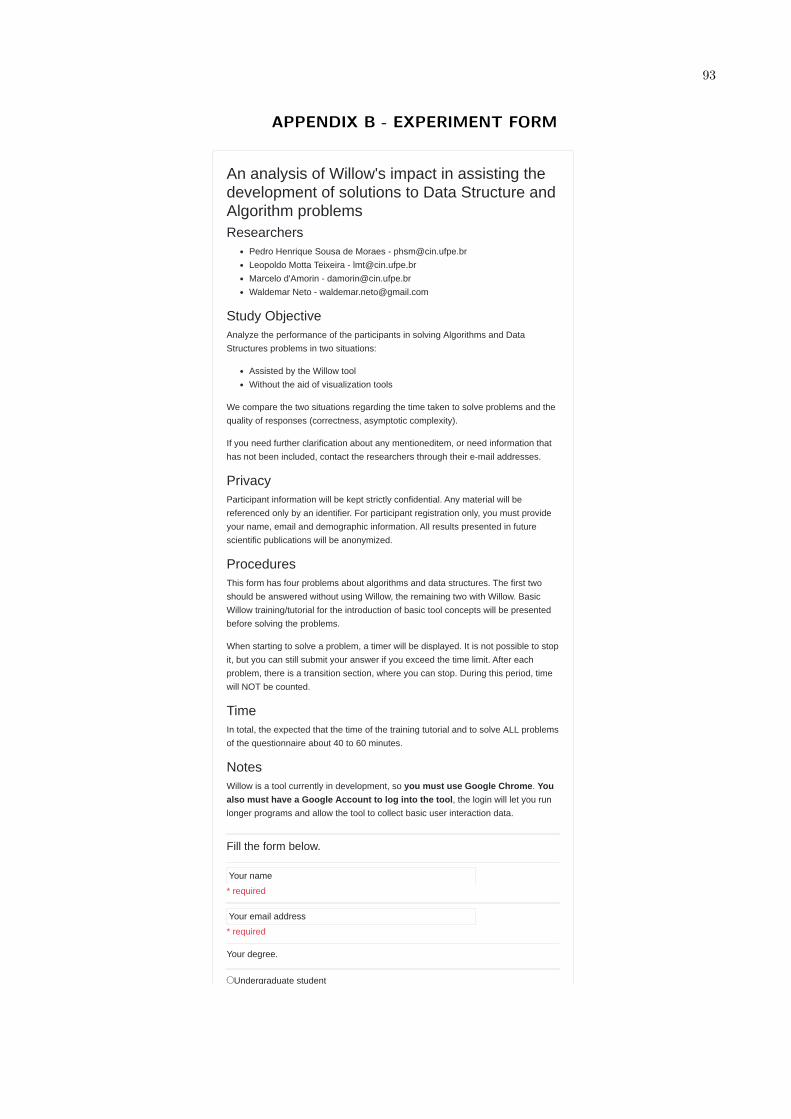
An analysis of Willow's impact in assisting thedevelopment of solutions to Data Structure andAlgorithm problemsResearchers
Pedro Henrique Sousa de Moraes - [email protected] Motta Teixeira - [email protected] d'Amorin - [email protected] Neto - [email protected]
Study ObjectiveAnalyze the performance of the participants in solving Algorithms and DataStructures problems in two situations:
Assisted by the Willow toolWithout the aid of visualization tools
We compare the two situations regarding the time taken to solve problems and thequality of responses (correctness, asymptotic complexity).
If you need further clarification about any mentioneditem, or need information thathas not been included, contact the researchers through their e-mail addresses.
PrivacyParticipant information will be kept strictly confidential. Any material will bereferenced only by an identifier. For participant registration only, you must provideyour name, email and demographic information. All results presented in futurescientific publications will be anonymized.
ProceduresThis form has four problems about algorithms and data structures. The first twoshould be answered without using Willow, the remaining two with Willow. BasicWillow training/tutorial for the introduction of basic tool concepts will be presentedbefore solving the problems.
When starting to solve a problem, a timer will be displayed. It is not possible to stopit, but you can still submit your answer if you exceed the time limit. After eachproblem, there is a transition section, where you can stop. During this period, timewill NOT be counted.
TimeIn total, the expected that the time of the training tutorial and to solve ALL problemsof the questionnaire about 40 to 60 minutes.
NotesWillow is a tool currently in development, so you must use Google Chrome. Youalso must have a Google Account to log into the tool, the login will let you runlonger programs and allow the tool to collect basic user interaction data.
Fill the form below.
Your name
* required
Your email address
* required
Your degree.
Undergraduate student
93
APPENDIX B - EXPERIMENT FORM

g
Post-graduate studentProfessor
Graduated developer
Non-graduated developer
* required
If you are an undergraduate, post-graduate student or professor, fill the fieldsbelow.
Your institution
Your course name
Your current semester (only undergraduates)
Next
94

No toolsIn the following sections, two problems will be presented. You can use theprogramming environment (text editor, IDE, etc) that you find most comfortable.You can also use websites that execute code online, such as https://repl.it/. Youmust prepare your programming environment now.
In each problem, a base code that already reads inputs and prints the program'soutputs will be provided. You should only implement a function presented in theproblem. After solving the problem, you must copy all the code in the answer field.
ImportantYou CAN still submit your response if the time limit is exceeded. There is noproblem if your answers are not be completely correct.
If you need to stop, there is a waiting session between the problems, it is NOTpossible to stop the timer while solving a problem.
Next
95

9:57 remaining
Cycle DetectionA linked list contains a cycle if any of its nodes is visited more than once when yougo through the list.
head | v +---+ next +---+ next +---+ | 1 |----------> | 2 |----------> | 3 |---+ +---+ +---+ +---+ | ^ | | next | +-----------------------+
You have to complete the function has_cycle(head) that receives one argument:
head: the head of a linked list
The function must return True if the list contains a cycle or False otherwise.
InputThe input is composed of only one line, which contains numbers that compose thelinked list, if there is a cycle in the list, the element that starts the cycle is precededby a #. For the diagram above, the input is 1 #2 3. There will be always at leastone element in the list.
Code# implement the function below def has_cycle(head): # return False class ListNode: def __init__(self, v): self.v = v self.next = None if __name__ == '__main__': head, tail, cycle = None, None, None for v in input().split(): if not head: head = tail = ListNode(v) else: tail.next = ListNode(v ) tail = tail.next if v[0] == '#': cycle = tail tail.next = cycle tail = cycle = None print(has_cycle(head))
ExamplesInput:
0 0 # 0 0 0 0 0 1 2 3 # 4 5 # 0 1 2 3 4 5 0 1 2 3 4 5
96

Output:
True True True False
* required
Next
When you're done, paste all the code here
97

How confident are you about the correctness of your previous solution?
Not confident 1 2 3 4 5 Very confident
* required
Next
98

9:57 remaining
Jessie CookiesJessie loves cookies. He wants the sweetness of his cookies to be greater then avalue k. To archieve that, Jessie repeatedly mixes his two less sweet cookies c0and c1, and creates a new combined cookie c.
Let the cookie c0 be less or as sweet as another cookie c1, the new cookie willhave the sweeteness c = c0 + 2 * c1.
He repeats the proceduer until all of his remaining cookies have the sweetnessgreater than or equal k.
You have to complete the function combinations(cookies, k), which takes twoarguments:
cookies: a list containing cookies sweetnessk: the minimum expected sweetness
The function must return how many cookie mixes are necessary for all cookies tohave at least k sweetness. If the sweetness can not be archieved, the functionmust return -1.
InputThe first input line contains a list of numbers when represent the sweetness ofeach cookie. The second line contains k.
Code# implement the function below def combinations(cookies, k): # return -1 if __name__ == '__main__': cookies = [int(i) for i in input().split()] k = int(input()) print(combinations(cookies, k))
ExamplesInput:
7 1 9 8 5 9 50 7 2 5 1 3 2 6 7 70 2 2 5 3 1 1 45
Output:
5 7 -1
When you're done, paste all the code here
99

* required
Next
100

How confident are you about the correctness of your previous solution?
Not confident 1 2 3 4 5 Very confident
* required
Next
101

WillowIn the following sections, two problems will be presented. You must use Willow tohelp visualizing and solving the problems.
TutorialYou must follow this tutorial slowly and paying close attention to the textbefore advancing to the next problems. The estimated time to finish this tutorialranges from 6 to 10 minutes.
Before proceeding to the problems, you must access Willow and follow the stepsbelow. The steps will provide basic training on how to use Willow. Read theinstructions, look at the images and clips, and then, do the same.
First click on the link below to access the Willow website.
https://willow-beta.web.app/
After accessing the site, you must log-in with a google account through the buttonin the right upper corner. The log-in will allow you to run longer programs.
Step 1Select the Python language in the toolbar, and then paste the code below intoEditor. This code is a linked list implementation, and it will be used to showfeatures of Willow.
Paste also the program inputs into Input, which are the values that will be used tocreate the list nodes.
class Node: def __init__(self, v): self.next = None self.v = v self.prev = None
class LinkedList: def __init__(self): self.head = self.tail = None self.size = 0
def append(self, v): new = Node(v) if self.size == 0: self.head = self.tail = new else: self.tail.next = new new.prev = self.tail self.tail = new self.size += 1
ll = LinkedList() ll.append(input()) ll.append(input()) ll.append(input()) ll.append(input()) ll.append(input())
0
102

Step 2To run the code, click the play button on the toolbar. Wait a few seconds for thevisualization is generated.
Step 3Use the right and left arrows to navigate to the end of the program. You can alsoclick on a call tree scope to jump to this point in the program. Double-clickingjumps to the end of a scope instead of the beginning.
1 2 3 4
103

Step 4Now, try to drag the heap objects around.
You can also activate automatic layout, just double-click on any internal object inthe list. It also works with other linked data structures, such as binary trees.
When activating automatic layout, the outline of the nodes will be slightly darkened.If you move any node, the automatic arrangement will be disabled.
With automatic layout enabled, try to navigate through the program using the arrowkeys and clicking on the scopes.
In each problem, a base code that already reads inputs and prints the outputs ofthe program will be provided. You should only implement a function presented inthe problem. After solving the problem, you must copy all the code in the answer
104

field.
ImportantYou CAN still submit your response if the time limit is exceeded. There is noproblem if your answers are not be completely correct.
If you need to stop, there is a waiting session between the problems, it is notpossible to stop the timer while solving a problem.
Next
105

9:58 remaining
Lowest Common AncestorIn a binary search tree, the lowest common ancestor of two nodes va and vb is thecommon ancestor of these nodes which is the farthest from the tree root. If va is aparent or ancestor of vb or vice-versa, then the parent is also the commonancestor.
You have to implemente thr function lca(root, va, vb) with takes threearguments:
root: the binary tree root nodeva e vb: values of two tree nodes, such that va <= vb, of which we want toobtain the common ancestor.
The function must return the value of the lowest common ancestor of va e vb.
InputThe first line is a list of numbers to be inserted one at a time in a BST. The secondsline contains the values va and vb. va and vb are always contained in the BST.
Code# implement the function below def lca(root, va, vb): # return 0 class BSTNode: def __init__(self, v): self.v = v self.left = None self.right = None if __name__ == '__main__': root = None for v in (int(v) for v in input().split()): parent, node = None, root while node is not None and v != node.v: node, parent = (node.left if v < node.v else node.right), node if node is not None: continue if parent is None: root = BSTNode(v) elif v < parent.v: parent.left = BSTNode(v) else: parent.right = BSTNode(v) va, vb = [int(v) for v in input().split()] print(lca(root, va, vb))
ExamplesInput:
7 0 8 5 9 5 9 6 3 1 5 4 9 7 1 4
Output:
7 3
Wh ' d t ll th d h
106

* required
Next
When you're done, paste all the code here
107

How confident are you about the correctness of your previous solution?
Not confident 1 2 3 4 5 Very confident
* required
Next
108

9:58 remaining
Reverse ListA singly linked list is allows the navigation only from the head towards the tail of thelist. Sometimes we need to navigate in the opposite direction frequently, and for theto be possible, the list direction must be reversed. After the list reverse, the previostail becomes the new head, and the previous head the new tail.
You have to complete the function reverse(head) which takes one argument:
head: the head node of a singly linked list
The function must return the new list head after the reverse operation.
InputThe input is composed of only one line, which contains numbers that compose thelinked list. There will be always at least one element in the list.
Multiple inputs can be provided at once, ther must be an empty line between eachinput line.
Code# implement the function below def reverse(head): # return head class ListNode: def __init__(self, v): self.v = v self.next = None if __name__ == '__main__': head, tail = None, None for v in (int(v) for v in input().split()): if not head: head = tail = ListNode(v) else: tail.next = ListNode(v) tail = tail.next head = reverse(head) while head is not None: print(head.v, end=' ' if head.next is not None else '\n') head = head.next
ExamplesInput:
4 10 20 30 0 2 3 4 5 8 9 9 8 5 4 3 2 0
Output:
4 30 20 10 9 8 5 4 3 2 0 0 2 3 4 5 8 9
109

* required
Next
When you're done, paste all the code here
110

How confident are you about the correctness of your previous solution?
Not confident 1 2 3 4 5 Very confident
* required
Next
111

Finally, answer what you think of Willow
Do you think Willow helped you understand thebehavior of your code and solve the problems?
Totally disagree 1 2 3 4 5 Totally agree
* required
What fetures of Willow do you find more interesting?And why?
* required
Would you use Willow again to study or debug analgorithm?
I would not use it again 1 2 3 4 5 I would use it again
* required
Describe all problems you encountered when usingwillow, recommendations and ideas for features thatyou think would be interesting.
* required
Write here
Write what you thought here
112

113
APPENDIX C - EXPERIMENT TEST INPUTS