Accounting as rhetorical devices during the COVID-19 pandemic
Upload
khangminh22Category
view
0download
0
Direct and indirect effectsof the COVID-19 pandemic and response in South AsiaCommissioned by

© United Nations Children’s Fund © United Nations Children’s Fund
Publication Date: March 2021Publication Date: March 2021
Address: UNICEF Regional Office for South Asia (ROSA)Address: UNICEF Regional Office for South Asia (ROSA)P.O. Box 5815, Lekhnath Marg, Kathmandu, NepalP.O. Box 5815, Lekhnath Marg, Kathmandu, NepalTel: +977-1-4417082 Email: [email protected] Tel: +977-1-4417082 Email: [email protected] Website: www.unicef.org/rosa/Website: www.unicef.org/rosa/
This report was commissioned by UNICEF and was This report was commissioned by UNICEF and was implemented by SickKids, Center for Global Child Health, to implemented by SickKids, Center for Global Child Health, to evaluate the direct and indirect effects the COVID-19 pandemic evaluate the direct and indirect effects the COVID-19 pandemic in South Asia.in South Asia.
For SickKids, this work was led by Professor Zulfiqar A. Bhutta For SickKids, this work was led by Professor Zulfiqar A. Bhutta and the Research Team includes Aatekah Owais (SickKids), and the Research Team includes Aatekah Owais (SickKids), Susan Horton (U Waterloo) Arjumand Rizvi, (AKU) Imran Nisar Susan Horton (U Waterloo) Arjumand Rizvi, (AKU) Imran Nisar (AKU), Jai Das (AKU), James Wright (SickKids)(AKU), Jai Das (AKU), James Wright (SickKids)Edward Mills (Cytel), Ofir Harari (Cytel), Jamie Forrest (Cytel)Edward Mills (Cytel), Ofir Harari (Cytel), Jamie Forrest (Cytel)Warren Stevens (Medicus Economics)Warren Stevens (Medicus Economics)
For UNICEF, this work was led by Paul David Rutter (UNICEF For UNICEF, this work was led by Paul David Rutter (UNICEF ROSA) and coordinated by Atnafu Getachew Asfaw (UNICEF ROSA) and coordinated by Atnafu Getachew Asfaw (UNICEF ROSA) and Ralfh Moreno Garcia (UNICEF HQ)ROSA) and Ralfh Moreno Garcia (UNICEF HQ)
We acknowledge colleagues in UNICEF HQ, UNICEF Country We acknowledge colleagues in UNICEF HQ, UNICEF Country Offices in South Asia, IFPRI-New Delhi, WHO regional Office Offices in South Asia, IFPRI-New Delhi, WHO regional Office for South East Asia and UNFPA regional Office for Asia-Pacific for South East Asia and UNFPA regional Office for Asia-Pacific for their contributions in reviewing drafts as well as getting the for their contributions in reviewing drafts as well as getting the data from National Health Information Systems in respective data from National Health Information Systems in respective countries.countries.
Design and layout: Design and layout: Marta Rodríguez, ConsultantMarta Rodríguez, Consultant
Cover Photo:Cover Photo: © UNICEF/India/UN0380513/Das/2020 © UNICEF/India/UN0380513/Das/2020
The statements in this publication do not necessarily reflect The statements in this publication do not necessarily reflect the policies or the views of UNICEF. Permission is required the policies or the views of UNICEF. Permission is required to reproduce any part of this publication: All images and to reproduce any part of this publication: All images and illustrations used in this publication are intended for illustrations used in this publication are intended for informational purposes only and must be used only in informational purposes only and must be used only in reference to this publication and its content. All photos are reference to this publication and its content. All photos are used for illustrative purposes only. UNICEF photographs used for illustrative purposes only. UNICEF photographs are copyrighted and may not be used for an individual’s or are copyrighted and may not be used for an individual’s or organization’s own promotional activities or in any commercial organization’s own promotional activities or in any commercial context. The content cannot be digitally altered to change context. The content cannot be digitally altered to change meaning or context. All reproductions of non-brand content meaning or context. All reproductions of non-brand content MUST be credited, as follows: Photographs: “© UNICEF /MUST be credited, as follows: Photographs: “© UNICEF /photographer’s last name”. Assets not credited are not photographer’s last name”. Assets not credited are not authorized. Thank you for supporting UNICEF.authorized. Thank you for supporting UNICEF.
Direct and indirect effects of the COVID-19 pandemic and response in South Asia

Content
Foreword
Chapter 1: Background
Chapter 2: Methods
Chapter 3: Results
Chapter 4: Implications and Way Forward for South Asia
Conclusions
Glossary
References
Supplementary tables
Appendix A
Appendix B
5
6
10
16
31
36
37
38
41
48
54

5
Foreword
© U
NIC
EF/
Afg
hani
stan
/UN
I368
583/
Faze
l/202
0
Over recent decades, South Asia has made remarkable progress in improving the health of mothers and children. Access to life-saving interventions has been expanded, and so millions of needless deaths have been prevented. The year 2020 brought a great shock to South Asia, as it did to the whole world. The COVID-19 pandemic has had major and multiple impacts – both direct and indirect.
One of the critical indirect impacts has been severe disruptions to the delivery and use of routine services, including essential health and nutrition services. Health systems, which were already stretched in many parts of the region, were not ready to adjust swiftly to the shock. Women and children suddenly faced limitations in accessing facilities. The region saw significant drops in the use of both preventive and curative services. As detailed in this report, Direct and indirect effects of the COVID-19 pandemic in South Asia, the pandemic has undoubtedly resulted in more deaths and more illness – particularly for the most vulnerable women and children. The pandemic is also reversing the development gains made over recent years and risks a negative impact on the overall wellbeing of the population for years to come. It reduces the likelihood of achieving the Sustainable Development Goals.
In South Asia, millions have fallen sick from COVID-19, costing thousands of lives and costing countries billions of dollars. The basic public health tools are key – starting with physical distancing, hand washing, and mask wearing. This report computes the potential to save lives and minimize health care costs by further strengthening the implementation of these across the region.
COVID-19 is likely to remain a significant public health problem for some time. Governments need to achieve a difficult balancing act. They need to continue combatting the pandemic, whilst also minimizing the disruption of the economy and of critical health and other services. This is crucial for the health and well-being of the most vulnerable people. Evidence to help guide this balancing act is urgently required to help guide decisions on how to calibrate COVID-19 mitigation measures.
UNICEF has a mandate to be a voice for every woman and child. In line with this, and to address the critical need for actionable information, we commissioned this study to assess and report on the direct and indirect effects of the COVID-19 pandemic and response. The study focuses on the six most populous countries in South Asia: Afghanistan, Bangladesh, India, Nepal, Pakistan and Sri Lanka. This report will be of value for policy makers, program managers and other stakeholders in prudently fighting the pandemic while increasing the reach to women and children with quality services.
This report is also a call for action. It is a call to governments and to partners. We must urgently come together to address the imperative for focused investment and effort – to strike the difficult balance in the months and years ahead, for the sake of the region’s most vulnerable women and children.
Sun Ah KimDeputy Regional Director UNICEF Regional Office for South Asia

Chapter 1 Background 6
Chapter 1: Background
The SARS-CoV-2 pandemic and the global response to limit its spread and mortality from COVID-19 has been unprecedented, both in terms of a global health crisis, as well as measures that have been undertaken by countries around the world to combat its spread, including those in South Asia. Response has ranged from physical distancing measures and school closures to travel restrictions and nationwide lockdowns, which has resulted in reduced access to essential healthcare services and wide-ranging disruption of economic activities. As of February 2021, South Asia, which includes Afghanistan, Bangladesh, Bhutan, Maldives, Nepal, India, Pakistan and Sri Lanka, has reported more than 12 million cases of COVID-19, with the vast majority being in India, which has reported more than 10.9 million cases (Figure 1) .
Figure 1: Cumulative confirmed COVID-19 cases and test positivity rate using the log scale, in South Asia
In addition to the direct impact of SARS-CoV-2 in terms of morbidity and mortality, there is growing concern in the global public health community about the extent and scope of the indirect effects COVID-19 pandemic and response on the health, nutrition and social well-being of vulnerable populations in resource-limited settings, especially women and children.
Evidence from past crises, such as the 1997 East Asian financial crisis, the 2008 global financial, and food price increase crises, and the 2013 – 16 Ebola outbreak in West Africa, underscore the vulnerability of these populations and the need for definitive and swift action aimed at alleviating the indirect impacts of the COVID-19 pandemic (2-5).
© UNICEF/India/UN0380018/Panjwani/2020

7Chapter 1 Background
Table 1: Country-specific estimate for selected SRMNCH indicators in South Asia
South Asia is home to more than 1.8 billion people, with 1 in 10 living below the international poverty line of US$1.90 and accounting for a third of the global income poor (6). The region also struggles with poor population health and nutrition, educational attainment, and social well-being. South Asia experienced 1.5 million under-5 deaths in 2018, a number that was second only to Sub-Saharan Africa (7). One in three
children under five years of age in the region are stunted, and 15% are wasted (7). Furthermore, less than half of pregnant women 15-49 years receive ≥ 4 antenatal care visits (7). However, these aggregate figures obscure the inequities that exists within the region. Country-specific estimates for selected sexual and reproductive, maternal, neonatal, and child health (SRMNCH) indicators are presented in Table 1.
Similar to other countries in the world, those in South Asia instituted swift and stringent mitigation responses including sweeping lock-down and stay-at-home orders, in March and April 2020. Since then, most countries in South Asia have eased the most severe restrictions, but some, such as school closures, are still in place.
Figure 2 illustrates the composite stringency index for several countries in South Asia from the outset and the current situation. The index, rescaled from 0 – 100, measures the severity of government response across nine indicators, including closure of businesses and schools, and travel restrictions (9).
Selected SRMNCH indicators AFG BGD BTN IND MDV NPL PAK SLK
All figures are percentages AFG: Afghanistan; BGD: Bangladesh; BTN: Bhutan; IND: India, MDV: Maldives; NPL: Nepal; PAK: Pakistan; SLK: Sri Lanka Source: UNICEF Global Databases *Data for illustrative purposes only. ¥11 of 75 districts have CMAM programs running; £Coverage only available for Khyber Pakhtunkhwa
Children received 3 dose of pentavalent vaccine (DPTHepB-Hib)
Women who received ≥ 4 antenatal care visits
Women who delivered in health facilities
Caesarean sections performed in the facilities
Newborns who received postnatal health check
Demand for family planning satisfied with modern methods
CMAM program* (8)
66 98 97 89 99 91 75 99
21 47 85 51 82 69 51 93
48 37 74 79 95 57 66 100
7 33 12 17 40 9 22 32
19 52 30 27 82 58 64 -
42 73 85 67 43 56 49 74
1.5 0 0 0 NA 14.7¥ 2.8£ 0
© U
NIC
EF/
Ban
glad
esh/
UN
I358
194/
Him
u/20
20

Chapter 1 Background 8
Figure 2: Severity of COVID-19 mitigation response in South Asia
Interruption of essential services is an expected consequence of movement restrictions and closure of services, and were recognized at an early stage of the crisis and COVID-19 mitigation measures. It was anticipated that reduced access to family planning services in low- and middle-income countries (LMICs) could lead to millions of unintended pregnancies in the near future (10). A modelling study used the Lives Saved Tool (LiST) to highlight the potential indirect
effects of the pandemic and the response to it on maternal and child mortality (11). According the authors’ estimates, the disruption to health services provision and access and the rising food insecurity could lead to additional 253,500 – 1,157,000 child deaths and 12,200 – 56,700 maternal deaths, globally. As a result of these disruptions in South Asia, child mortality could potentially increase by 18 – 40% and maternal mortality by 14 – 52%, over the next year (11).
© U
NIC
EF/
Indi
a/U
NI3
5581
6/Pa
njw
ani/2
020

9Chapter 1 Background
Figure 3: A conceptual framework for the indirect impact of COVID-19 pandemic and response on maternal, child and adolescent health and well-being
Given the challenges faced by South Asian countries prior to the current pandemic, the potential impact of COVID-19 pandemic response on the health and well-being of 1.8 billion people was a serious cause for concern. Governments in these countries would need to balance the need for controlling the pandemic within their borders, along with the impact cessation and/or disruption of critical primary health and other services could have on the health
and well-being of the most vulnerable of their populations. Notwithstanding the aforementioned health effects, it was recognized that indirect effects of mitigation measures could be much greater than those related to disruption of health services alone. The pathways through which COVID-19 pandemic and response could indirectly impact maternal, child and adolescent health and well-being are presented in Figure 3.
At this unprecedented time, governments need information that will help guide their decisions on when to ease/lift COVID-19 mitigation measures. To address this urgent issue, we conducted a series of modelling exercises to assess the expected mortality, hospitalizations and intensive care unit (ICU) admissions due to COVID-19 itself, as well as the impact of nationwide stay-at-home orders
implemented to curb the spread of COVID-19 on maternal and child mortality, educational attainment of children, and general economy. We also estimated the potential benefits of mitigation strategies to address these anticipated multi-sectoral challenges focused on the six most populous countries in South Asia: Afghanistan, Bangladesh, Nepal, India, Pakistan and Sri Lanka.
© U
NIC
EF/
Ban
glad
esh/
UN
0354
647/
Kiro
n/20
20

Chapter 2 Methods 10
Model Structure
To evaluate the effects of public health interventions on COVID-19 and forecast its spread in South Asia, we conducted a simulation study using a computational stochastic individual contact model (ICM) based on an extension of the Susceptible-Infectious-Recovered (SIR) compartment model (12), which was used to provide initial projections for the burden of COVID-19 in Pakistan (13). This model comprises of seven compartments as illustrated in Figure 4 (see Supplementary Table 1 for further details). Three components are similar to SIR compartment model: The S compartment denotes susceptible individuals; the I compartment denotes symptomatic individuals who are both infected with COVID-19 and infectious to others; and the R compartment denotes individuals who have recovered from COVID-19 and are no longer infectious.
The SIR model was expanded with the addition of four compartments (E, Q, H, and F) to model both anticipated mitigating effects of public health intervention strategies as well as measurable impact on public health, and extended to September 2021. Unlike the E compartment in traditional SEIR models, the E compartment in our model denotes asymptomatic COVID-19-positive individuals who are infectious, in order to enable simulation of transmission during the COVID-19 incubation period, as reported by several investigators (14); the Q compartment represents symptomatic (or test-positive) infectious individuals who are self-isolating or in supervised isolation; the H compartment represents individuals who require hospitalization (if the number of required hospitalizations is below the hospital capacity, then it is assumed in the model that these individuals would be hospitalized, but if hospital capacity is exceeded then the excess portion of those requiring
COVID-19 associated morbidity and mortality and forecasting
Chapter 2: Methodshospitalization remain not hospitalized, with consequently higher mortality for that fraction of cases); and the F compartment denotes case fatalities due to COVID-19.
Model parameters
Model parameters were populated using a combination of model calibration for a small subset consisting of four key parameters and choice of plausible values for the remaining ones (Supplementary Table 2). The four parameters chosen for calibration include the daily average number of exposure events involving symptomatic individuals, the probability of transmission by symptomatic cases, the daily hospitalization rate of symptomatic cases and the daily case fatality rate. Weekly totals of case fatalities, as recorded on the Covid-19 page of the Our World in Data (OWID) website (15) were the basis for the calibration, using the mean squared error
where Fimodel (θ) is the total number of deaths simulated
for the ith week using the quadruple of parameters θ for simulation, i=1,…,K, K=14 is the number of weekly totals between June 1st and August 31st, 2020 (the time period used for calibration) and Fi
obs is the corresponding observed number of deaths recorded. Calibrated values for the four key parameters are then chosen to minimize the MSE,
namely where minimization was carried out using sequential Bayesian optimization based on the Expected Improvement criterion proposed by Jones et al (16).
© U
NIC
EF/
Indi
a/U
NI3
4262
2/Pa
njw
ani/2
020

11Chapter 2 Methods
National projections under the various interventions were then carried out running the simulation for one year out starting from September 1st, 2020, using the calibrated parameter values as well as the estimated number of symptomatic, asymptomatic and quarantined and recovered cases obtained at the end of the calibration period. The set of interventions included:
1. Smart lockdowns,2. Use of face masks, and3. Hand hygiene
All interventions were assumed to have been applied at present at the 25% adherence level, and the simulation study compared a baseline scenario – in which no further intervention was applied – to scenarios where one intervention at a time was raised to the 50% adherence level, as well as a combination off all different intervention applied at once.
The relative reductions in key inputs, as appearing in Supplementary Table 2, are presented in Table 3 below.
Table 3: Effect estimates for selected interventions aimed at reducing the relative risk of exposure and transmission of COVID-19 and other reparatory viruses
Figure 4: Transition diagram of the extended SIR compartment model. This figure illustrates the transitions between compartments denoted in each box: S - susceptible individuals; E - asymptomatic infectious patients; I - symptomatic infectious patients; Q – self-iso-
lated infectious patients; H – patients requiring hospitalization; R – COVID-19 recovered patients; and F – case fatalities due to
COVID-19.
Maternal and child mortality and nutrition
We used the Lives Saved Tool (LiST) and the Family Planning (FamPlan) modules of Spectrum to estimate the increase in maternal and under-5 child mortality, as well as pregnancies, rates of maternal anemia, childhood stunting and wasting, and SGA and LBW, resulting from reduced access and provision of essential SRMNCH services.
We used the most recent Demographic and Health Survey (DHS) and/or MICS from each country to determine baseline (2019) coverage of SRMNCH services. Level of disruption due to COVID-19 pandemic and response was estimated using actual country-specific data available from DHIS/HMIS dashboards. Where health systems data were not available, coverage disruption data were estimated using either a related country-level indicator, or average estimates from the other countries as proxy (Supplementary Table 3). Service disruption was estimated by quarter as follows:
• Compare DHIS/HMIS coverage data between Jan – Mar 2019 and Jan – Mar 2020 (Q1 levels)• Compare DHIS/HMIS coverage data between Apr – Jun 2019 and Apr – Jun 2020 (Q2 levels)• 2020 Q3 estimates: 50% recovery from Q2 levels• 2020 Q4 estimates: 80% recovery from Q2 levels• 2021 Q1 estimates: 10% increase from 2020 Q4 levels• 2021 Q2 estimates: 20% increase from 2020 Q4 levels
The interventions included in the LiST and FamPlan modules, along with the estimated disruption to services by each quarter are summarized in Appendix A.
Intervention Relative risk reduction in Reference
All numbers are relative reduction in risk with 95% CI
Smart lockdowns vs. none
Exposure
0.38 (0.01 - 0.56)
0.34 (0.26 - 0.45)
0.50 (0.38 - 0.66)
0.30 (0.20 - 0.44)
Adapted from Aleta et al (17)
From Chu et al (18)
From Talaat M et al (19)
From Chu et al (18)
Transmission
Use of face masks
Hand hygiene
Physical distancing (≥ 1m vs. < 1m)

Chapter 2 Methods 12
School-age child and adolescent mortality
Mortality estimates for children aged 5-9, 10-14, and 15-19, stratified by sex, were extracted from the IHME GBD Results Tool (20). The causes of death for which data were extracted, and for which the impact of COVID-19 mitigation strategies are estimated, include:
• Road traffic accidents• Maternal causes for females aged 15-19• HIV/AIDS, TB, typhoid, and malaria
We assumed that the number of deaths would be distributed equally throughout the year. Therefore, the total number of deaths in each country, and for each age/sex category by cause of death were divided by 12 to estimate the expected number of deaths expected to occur each month.
A literature search was undertaken to identify either a) estimates of the impact of COVID-19 on these causes of death, or b) studies quantifying the impact on cause-specific mortality of certain interventions, from which we calculated an assumed impact on mortality that could be expected if these interventions were removed/unavailable. From this literature search, we identified six papers quantifying the effect of COVID-19 on vehicular injuries among adolescents (21-26). Of these, one study based in Turkey, gave estimates for the impact on adolescent mortality (26). From this, we assumed a distributional impact of COVID-19 on adolescent mortality whereby the first few months of 2020 saw no decrease as compared to previous years, March saw a 20% decrease as lockdown measures were slowly introduced, April and May saw the largest reduction of 60% as lockdowns were in full effect, with the impact gradually increasing back to expected levels by the end of the year.
To estimate the impact of COVID-19 on maternal mortality amongst 15-19 year-old females, we used the expected increase in maternal deaths from our country-specific LiST and FamPlan models. To quantify the impact of reduced treatment coverage on adolescent mortality due to communicable diseases, we use the effect estimated for same during the
2014 – 2015 Ebola outbreak in West Africa (27). Parpia and colleagues (27) calculated that a 50% reduction in treatment coverage in West Africa during the 2014-15 Ebola crisis would lead to a 48% increase in malaria deaths among adolescents in Guinea, a 53.6% increase in Liberia, and a 50% increase in Sierra Leone. Similarly, TB deaths would increase by 51.1%, 59%, and 61.4% in these three countries, respectively, while HIV/AIDS deaths would increase by 16.2%, 13.0%, and 9.1%, respectively. For deaths due to typhoid, we assumed a 30% mortality rate in the absence of any treatment (28). We scaled these estimated percentage increase in deaths by the reduction in facility-based deliveries calculated as part of our LiST analysis mentioned previously. For example, if a 50% decrease in treatment coverage resulted in a 48% increase in malaria deaths, then a 25% decrease in treatment coverage was assumed to result in a 24% increase in mortality. These estimates were used to calculate the expected number of deaths in adolescents by scaling the observed monthly deaths by each of the effect sizes mentioned above.
Educational attainment
The COVID-19 pandemic has forced school closures across the globe. In South Asia, this mitigation strategy has left 420 million children out of school. We assessed the potential impact of the COVID-19 pandemic on educational attainment of school-aged children in six South Asian countries, and its sequelae on individual earnings and national Gross Domestic Product (GDP). Loss in educational attainment can occur in multiple ways, such as loss of learning time or loss of already acquired learning due to school closures (29). However, we focus on the loss of educational attainment that will occur due to the increase in number of students who permanently drop out of school because of prolonged school closures.
We conceptualized the current cohort of children enrolled in primary and secondary schools using population estimates available from UNESCO (30), and net attendance ratios available from the most recent DHS, for each country (31-36). We used age- and quintile-specific school dropout rates (Table 4), adapted from those observed during the 1997 East Asian financial crisis in Indonesia (37).
© U
NIC
EF/
Indi
a/U
N03
7994
7/Pa
njw
ani/2
020

13Chapter 2 Methods
Table 4: School dropout rates by child age, gender, and wealth quintile
Table 5: Median years of education completed by age and gender in six South Asian countries
We assumed that those who drop out in primary school would complete 2.5 years, and those who drop out in secondary school would complete 8.5 years of education. The corresponding years of education lost were calculated based on the highest median years of education attained, irrespective of age and gender, for each country (Table 5). We estimated income loss
associated with reduced educational attainment by assuming that one less year of primary and secondary education reduces an individual’s income by 4.04% and 2.44%, respectively (38). The 2019 GDP per capita, in current US$, for each country was assumed as baseline. A discount rate of 3% was applied to calculate the present value of loss in lifetime earnings.
Child characteristic Primary school (7 - 12 years) Secondary school (13 - 19 years)
1st
Wealth quintile
6.2 11.3
4.5
2.3
2.2
2.2
5.6
3.9
0
2.4
1
1
2.4
2.6
2nd
3rd
4th
5th
Gender
Male
Female
Adapted from Frankenburg et al (37)
Country Age category Gender Median years ofschooling*
Years of schooling lost
Primary Secondary
Pakistan 20 – 24 years
15 – 19 years
20 – 24 years
20 – 24 years
20 – 24 years
20 – 24 years
Male 7.7 5.2 0
5.8 0
7.5 1.5
6.6 0.6
4.8 0
8.9 2.9
8.3
10
9.1
7.3
11.4
Female
Female
Male
Male
Male
Bangladesh
India
Nepal
Afghanistan
Sri Lanka
Source: Most recent country DHS (31-33, 35, 36, 39) *Assumed for both boys and girls currently enrolled in school

Chapter 2 Methods 14
To address uncertainty around school dropout rates, we also conducted sensitivity analyses using school dropout rates observed during the Ebola crisis in Guinea (40) and Sierra Leone (41). We also conducted sensitivity analysis to address the uncertainty around the economic impact of reduced educational attainment, using an 8% return per year for education, as used by Psacharopoulos et al (42).
Early marriage and adolescent pregnancies
We also estimated the expected number of girls who will drop out of school as a result of the pandemic, using gender-specific school dropout rates observed during the 1997 East Asian financial crisis in Indonesia (37). Dropping out of school is associated with early marriage, especially for girls (43). There is also evidence that number of adolescent pregnancies have increased during the past few months of school closures (44). We used the baseline prevalence of adolescent pregnancies reported in the most recent DHS for each country (31-33, 35, 36, 39), and assumed that adolescent pregnancy rates will increase by 28% as a result of school closures due to COVID-19 pandemic response (44). We assumed that although risk of maternal mortality in adolescent pregnancies will be the same as those observed for women > 19 years (45), risk of neonatal mortality and low birthweight births will increase by 9% and 42%, respectively (46). We also assumed that 20% of children born with low birthweight will be stunted by age 2 years (47), and will lose 10% of their lifetime earnings as a result of their short stature (48).
Economic Impact of COVID-19 control measures
Measures to control the spread of COVID-19 have resulted in wide-ranging disruption of economic activities across the globe. We estimated the economic impact of
these strategies on the following outcomes:
1. Change in GDP2. Job losses3. Change in poverty rate4. Change in proportion of population who is food insecure
Given the dynamic nature of the epidemic and the lag in production of many economic inputs, we assumed that the model will be static in nature (i.e. output, employment and poverty will not be an exponential function of ongoing changes per time period, but a function of change from the period prior to the beginning of the epidemic) and as a result may be less sensitive than a fully dynamic model.
The severity of control measures was classified as follows:
• Stage 0 – Baseline: No changes• Stage 1 – Limited: Warnings/advisories, public gatherings ban, social distancing, schools closures• Stage 2 – Mild: Closure of shopping areas, imports/ exports reduced• Stage 3 – Moderate: Closure of restaurants, public transport reduced, imports/exports reduced to essential
• Stage 4 – Severe: Closure of parks, public transport closed, all trading restricted
To estimate the impact of the different stages of control measures on output (GDP) we deconstructed output into labor and non-labor related outputs (interest on loans, debt repayment, bonds, etc.). Our model estimated changes in labor-related output only, as this is the area most likely to be affected by the COVID-19 control measures, leading to reduced capacity of workplaces, factories etc.
© UNICEF/India/UN0379948/Panjwani/2020

15Chapter 2 Methods
Table 6: Labor force laid off by at each mitigation stage, by industry
Industry LimitedRestrictions
MildRestrictions
ModerateRestrictions
SevereRestrictions
Manufacturing
Agriculture 0% 10% 15% 20%
10% 35% 53% 70%
10% 35% 53% 70%
10% 45% 68% 90%
0% 5% 8% 10%
0% 45% 68% 90%
0% 25% 38% 50%
11% 36% 54% 73%
17% 20% 30% 40%
Electricity & gas
Construction
Wholesale & retail trade
Transport, storage & communications
Finance & insurance
Other private
Government services
Adapted from: Faraz and Khalid, 2020 (50)
The starting point for this part of the model was to estimate the proportion of output (GDP) that is derived from labor-based productivity. Most sets of national accounts highlight this by producing output by sector. Given that we wanted to link output, workforce, capacity, and relative risk of unemployment and proportion of households vulnerable to poverty (relative likelihood of falling into poverty if the primary provider loses income for more than a month), we settled on the following sectors:
1. Agriculture and fisheries, 2. Mining and quarrying, 3. Manufacturing and textiles, 4. Energy generation, 5. Construction, 6. Wholesale and retail trade, 7. Transport and communications, 8. Finance and insurance services, 9. Other private sector and government services
Workforce was estimated by working age population, labor force participation rate, and formal and informal sector worker estimates from the International Labour Organization (ILO). Job losses leading to increase in poverty rates were estimated using the methodology described by Iqbal et al (49). The proportion of labor force laid off at each stage of COVID-19 control measures, is summarized in the table below.
The output model was based on marginal rate of productivity per worker (MPW) as a function of output and workforce data from Jan – Dec 2019.
It was estimated under the following caveats or assumptions:
• No change in stock of capital, or the marginal rate of return on capital (or land) • No technological advancement/change leading to a rise in relative rate of productivity per worker hour • Exclude any effects of economies of scale or specialization on changes in MPW, earnings or GDP• Within the same industry, marginal productivity in worker A will not be affected by the marginal productivity of worker B• Across industries, marginal productivity of any workers in industry A will not be affected by changes in the marginal productivity of a worker in industry B• A perfectly competitive market where marginal productivity = marginal cost • Mitigation strategies will be in place for 12 months, with the impact on outcomes estimated for the same period
Given limited data from other countries and to determine the pandemic’s impact on food insecurity, we assessed the relationship between change in household income and food consumption in the previous week as observed in Nepal in April 2020 (51), using a simple linear regression. We then applied the results of this regression to the estimated change in GDP resulting from each stage of mitigation strategies, and assessed the rise in the proportion of population who could become food insecure due to the COVID-19 mitigation response.

Chapter 3 Results 16
Chapter 3: Results
COVID-19 predicted morbidity and mortality
Based on the results of our extended SIER model, and a potential status quo in infection control and prevention measures, an additional half a million deaths due to COVID-19 are possible in South Asia, between October 2020 and September 2021, (Table 7). This is the number of individuals expected to die of COVID-19, and who likely would not have died in the absence of the pandemic i.e. additional deaths. The highest number of deaths are expected occur in India, with more than 490,000 deaths projected to occur in the country during this period.
Not surprisingly, the expected number of hospital-izations and ICU admission are also expected to be highest in India, with the numbers expected to rise to their highest level in February 2021 (Table 7).
Results for individual mitigations strategies are presented in Appendix B.
Since the observed number of COVID-19 cases and deaths are rising most rapidly in India, compared to other South Asian countries, the impact of modelling the increased coverage and effectiveness of mitigation strategies is also highest in the country (Table 7). Instituting all mitigation strategies could reduce the numbers of deaths due to COVID-19 by 83% (491,117 deaths under the no-additional mitigation scenario vs. 85,821 deaths if all strategies were instituted; Table 7). Similar effects are also noted for hospitalizations and ICU admissions, both of which are expected to decrease by 75% in February 2021, if all mitigation strategies are instituted (Table 7). Results for individual mitigation strategies are presented in Appendix B.
Table 7: Estimated number of COVID-19 deaths, hospitalizations and ICU admissions, by mitigation response and country
Intervention No additional mitigation
CumulativeDeaths
CumulativeDeaths
Hospitalizations* Hospitalizations*ICUs* ICUs*
All strategies
Country
India
65,228 NA NANA NA
103,994 67,613
76,074
82,772
87,896
88,209
84,831
77,316
70,447
61,320
52,311
43,937
36,442
11,932
13,425
14,607
15,511
15,566
14,970
13,644
12,432
10,821
9,231
7,754
6,431
65,228
64,676
71,214
75,781
78,916
81,267
82,653
83,721
84,526
85,050
85,412
85,658
85,821
12,821
9,104
6,354
4,283
3,079
2,141
1,580
1,048
721
538
383
215
2,262
1,607
1,121
756
543
378
279
185
127
95
68
38
139,937
178,008
222,202
267,186
307,089
348,060
383,795
418,121
445,995
470,231
491,117
Month
Apr-21
Dec-20
Aug-21
Oct-20
Jun-21
Feb-21
Sep-20¥
May-21
Jan-21
Sep-21
Nov-20
Jul-21
Mar-21
© UNICEF/Bangladesh/UN0353777/Paul/2020

© UNICEF/Bangladesh/UN0353777/Paul/2020
Bangladesh
Nepal
NA
NA
NA
NA
NA 4,281
NA
NA
NA
4,281
5,086 444 78 4,973 466 82
5,905 427 75 5,839 432 76
6,656 316 56 6,623 370 65
7,266 341 60 7,335 323 57
7,892 298 53 7,940 271 48
8,378 268 47 8,345 250 44
8,840 191 34 8,838 229 40
9,209 193 34 9,253 187 33
9,564 176 31 9,614 165 29
9,863 171 30 9,916 162 29
10,159 139 25 10,217 124 22
10,412 110 19 10,462 96 17
228
424
499
555
596
629
654
675
690
703
711
65
50
38
30
23
19
15
12 8 7
12 9 7 5 4 3 3 2 1 1
57
46
33
28
21
16
13 9 8 6
10 8 6 5 4 3 2 2 1 1
228
422
487
536
573
602
625
644
659
670
678
Apr-21
Apr-21
Dec-20
Dec-20
Aug-21
Oct-20
Oct-20
Jun-21
Jun-21
Feb-21
Feb-21
Sep-20¥
Sep-20¥
May-21
May-21
Jan-21
Jan-21
Sep-21
Nov-20
Nov-20
Jul-21
Jul-21
Mar-21
Mar-21
Pakistan
NA NANA NA6,298
7,374
7,400
7,409
7,423
7,434
7,446
7,464
7,473
7,481
7,487
7,499
7,507
398
351
404
465
503
552
522
487
450
380
332
294
70
62
71
82
89
97
92
86
79
67
59
52
6,298
7,332
7,354
7,361
7,366
7,369
7,372
7,377
7,385
7,388
7,388
7,388
7,390
391
295
227
174
147
149
140
120
114
129
118
140
69
52
40
31
26
26
25
21
20
23
21
25
Apr-21
Dec-20
Aug-21
Oct-20
Jun-21
Feb-21
Sep-20¥
May-21
Jan-21
Sep-21
Nov-20
Jul-21
Mar-21
Intervention No additional mitigation
CumulativeDeaths
CumulativeDeaths
Hospitalizations* Hospitalizations*ICUs* ICUs*
All strategies
Country Month

Chapter 3 Results 18
The direct costs associated with COVID-19 hospital-izations and ICU admissions are commensurate with their observed and expected numbers for each country. We estimated the direct costs as follows:
• Costs of diagnostic tests, assumed to be US$ 20 (52)• Healthcare utilization costs associated with COVID-19 mortality, assuming a 16 days’ stay in the hospital, including ICU admission, and cost of care assumed to be US$ 4,708 (53-55)
To date, the disease is estimated to have cost the region more than US$ 2.4 billion, including cost of testing (US$ 1.9 billion) and healthcare utilization for COVID-19 deaths (US$ 581 million). If the current status quo in terms of testing, and infection control and prevention, is maintained, the region is expected to spend an additional US$ 8.1 billion on COVID-19 diagnostic tests,
and between US$ 520 million and US$ 2.4 billion on healthcare utilization by September 2021, depending on the level of mitigation response instituted. India is expected to bear the largest share of these costs with the country having to spend more than US$ 7.8 billion on testing, and US$ 1.7 billion on healthcare utilizations due to COVID-19 infections leading to death by September 2021. Table 8 summarizes the estimated costs associated with COVID-19 diagnostic tests and healthcare utilization until September 2021.
Although there will be costs associated with implementing COVID-19 mitigation strategies, such as households having to spend money out-of-pocket purchasing masks and hand sanitizers, these cannot be measured with any specificity. However, any costs associated with increased use of masks and hand sanitizers will likely be much lower than what countries will spend on COVID-19 healthcare utilization.
Afghanistan
NA NANA NA1,406
2,306
2,850
3,354
3,885
4,375
4,807
5,230
5,638
6,075
6,453
6,802
7,106
1,406
2,157
2,607
3,015
3,455
3,849
4,204
4,565
4,910
5,259
5,552
5,825
6,094
326
305
288
273
251
248
241
236
218
201
185
177
58
54
51
48
44
44
42
42
38
35
33
31
442
426
406
378
359
349
323
311
291
266
241
237
78
75
72
67
63
62
57
55
51
47
42
42
Apr-21
Dec-20
Aug-21
Oct-20
Jun-21
Feb-21
Sep-20¥
May-21
Jan-21
Sep-21
Nov-20
Jul-21
Mar-21
¥Number of deaths observed as of September 1, 2020. Source: Our World in Data (15) *Numbers are “snapshots” taken on the 1st of every month, indicating healthcare utilization over time
717
723
5 5
1 1
5 4
1 1
686
691
Aug-21
Sep-21
Nepal
Intervention No additional mitigation
CumulativeDeaths
CumulativeDeaths
Hospitalizations* Hospitalizations*ICUs* ICUs*
All strategies
Country Month

19Chapter 3 Results
Table 8: Estimated costs (US$) of COVID-19 testing, and healthcare utilization, by mitigation response and country
CountryNo additional
mitigationHand
HygieneSmart
LockdownsMasks All strategiesTesting*
Total 8,087,763,734 2,433,400,420 775,718,328 1,305,989,784 962,828,372 520,036,264
2,312,178,836
35,342,956
49,019,696
3,403,884
33,455,048
659,011,716
34,396,648
49,010,280
3,323,848
29,975,836
1,188,388,652
33,464,464
48,544,188
3,342,680
32,249,800
845,015,380
34,095,336
48,878,456
3,370,928
31,468,272
404,045,268
34,792,120
49,255,096
3,253,228
28,690,552
India
Pakistan
Bangladesh
Nepal
Afghanistan
7,895,416,016
87,407,669
78,182,660
26,757,389
NA
Maternal and child mortality and nutrition
Even before the World Health Organization (WHO) declared COVID-19 a pandemic on March 11, 2020, coverage of essential SRMNCH services were being affected in several countries of South Asia. The SRMNCH services for which actual DHIS/HMIS data were available for all countries are summarized in Panel 1. Based on actual data available from country-specific health data systems, coverage of family planning services decreased by 3 – 31% in five of the six South Asian countries included in our analysis (Figure 5) in the first quarter of 2020, compared to that observed during the same period in 2019. Afghanistan is the only country which reported an increase in coverage family planning services over this period, which could be questioned as erroneous (^12%, Figure 5).
In the second quarter of 2020, which corresponds with the most stringent COVID-19 control strategies being instituted in the region, coverage of all essential
Panel 1: SRMNCH services included and modelled in the LiST analysis
Family planningAntenatal care (4+ visits)Tetanus Toxoid (2 or more doses)Facility birthsPostnatal visit within 2 days after birthVaccine: DPT3/Penta3Full immunizationZinc for treatment of diarrhea – Zinc SupplementationAntibiotics for pneumoniaSAM - treatment for severe acute malnutrition
SRMNCH services declined substantially, with coverage of most services reducing by >50% across South Asia (Figure 5), compared to levels observed during the same period in 2019.
© U
NIC
EF
Ban
glad
esh/
UN
I340
636/
Suj
an/2
020
All figures are in US$ No testing data available for Afghanistan *Testing is assumed to continue at the current level

Chapter 3 Results 20
Figure 5: Observed (Quarter 1 and 2) and estimated (Quarter 3 and 4 of 2020, and Quarter 1 and 2 of 2021) coverage disruption of selected SRMNCH services in 2020 and 2021, due to the COVID-19 pandemic response in South Asia
The observed and estimated disruption in SRMNCH services is expected to have had a substantial impact on maternal and child mortality. The number of deaths among children < 5 years are estimated to increase by a total of 228,641 across the six South Asian countries in 2020 compared to the previous year, with 134,789 of these deaths expected to occur in the neonatal period. The greatest increases are anticipated in India (154,020, 15% increase) and Pakistan (59,251, 14% increase) respectively.
The number of stillbirths are also predicted to increase in the region. Across South Asia as a whole, an estimated 89,434 additional stillbirths are anticipated as a result of reduced coverage of essential SRMNCH services. At the country-level, the largest increase in the number of stillbirths is expected in India (60,179, 10% increase), followed by Pakistan (39,752, 11% increase) and
Bangladesh (5,502, 3% increase). Similarly, the number of maternal deaths is also expected to increase in 2020 as a result of the COVID-19 pandemic response, compared to those observed in 2019, with the highest number of deaths anticipated in India (7,750, 18% increase) and Pakistan (2,069, 21% increase). Due to the observed and expected reduction in coverage of modern contraceptive methods, more than 3.5 million additional unintended pregnancies are expected in South Asia, with the highest number likely in India (~3 million).
The number of unsafe abortions are also expected to increase in the region, by more than 50%. Overall in South Asia, child and maternal mortality is expected to increase by 14% and 16%, respectively. Table 9 summarizes the estimated increase in maternal and under-5 child mortality, and pregnancies, for each country by each quarter of 2020.

21Chapter 3 Results
Table 9: Estimated increase in deaths, pregnancies and abortions by country and quarter of 2020
2020* Afghanistan Bangladesh India Nepal Pakistan Sri Lanka Overall
Childmortality
Neonatal mortality
Stillbirths
Maternal deaths
Q1
Q2
Q3
Q4
Overall
-0.6%
2.8%
2.0%
1.5%
1.4% -
0.2%
2.3%
1.7%
1.4%
1.3%
0.5%
1.8%
1.5%
1.3%
1.3%
0.0%
3.3%
2.2%
1.5%
1.7%
5.0%
29.3%
13.0%
4.7%
13.0%
4.4%
22.3%
9.6%
3.4%
9.9%
1.2%
8.8%
2.7%
0.7%
3.4%
1.6%
24.7%
8.3%
2.9%
9.4%
0.0%
39.3%
16.8%
5.7%
15.4%
2.2%
36.5%
14.8%
4.5%
14.5%
1.1%
26.7%
10.6%
2.9%
10.3%
-1.6%
47.1%
18.7%
6.0%
17.6%
6.2%
12.8%
7.1%
1.0%
6.8%
2.6%
16.6%
9.8%
1.5%
7.6%
1.1%
14.1%
11.1%
0.4%
6.7%
6.1%
34.4%
23.4%
3.0%
16.7%
3.2%
33.2%
16.6%
5.0%
14.5%
1.2%
39.1%
20.2%
5.4%
16.5%
0.8%
23.6%
16.4%
2.3%
10.8%
2.3%
47.5%
30.1%
5.2%
21.3%
16.9%
5.1%
1.9%
0.5%
6.1%
24.3%
2.5%
0.8%
-0.1%
6.9%
51.7%
3.0%
1.1%
0.0%
14.0%
77.2%
5.4%
2.2%
1.1%
21.5%
16.9%
5.1%
1.9%
0.5%
6.1%
24.3%
2.5%
0.8%
-0.1%
6.9%
51.7%
3.0%
1.1%
0.0%
14.0%
77.2%
5.4%
2.2%
1.1%
21.5%
Q1
Q2
Q3
Q4
Overall
Q1
Q2
Q3
Q4
Overall
Q1
Q2
Q3
Q4
Overall
© U
NIC
EF
Afg
hani
stan
/UN
I367
259/
Faze
l/202
0

Chapter 3 Results 22
Table 10: Increase in rates of maternal anemia in Q2 2020, compared to 2019, by country
Compared to 2019 levels, we did not observe a significant impact on child nutrition as measured by changes in rates of childhood wasting and stunting, and SGA and LBW, in 2020 (Supplementary Table 4). This is likely due to low rates of current coverage of many key interventions
related to community management of moderate and severe malnutrition and food supplementation. However, based on LiST estimates, rates of maternal anemia increased in Q2 of 2020, corresponding to the largest disruption in coverage of essential health services.
We also assessed the impact of essential SRMNCH services coverage recovery in Q1 and Q2 of 2021. Given the current state of the pandemic in India (the major population driver) and continued gradual upsurges in other countries of the region, we have used conservative estimates for recovery in anticipation of the persisting COVID-19 challenge in 2021, potentially until an effective vaccine is deployed and widely available. We assumed 10-20% pragmatic increase in service coverage across the continuum of SRMNCH interventions in the first half of 2021, the end-date of the current modelling exercise.
If service coverage improved by 10% in Q1 2021, and 20% in Q2 2021, compared to their Q4 2020 levels, an additional 537 child deaths (0.1% increase), but 97
fewer maternal deaths (0.3% decrease) are expected in the region. Nepal and Sri Lanka are expected to see a decrease in child deaths in both Q1 and Q2 of 2021, whereas Bangladesh, India and Sri Lanka are expected to have fewer maternal deaths in Q1 and Q2 of 2021, compared to those observed in 2019. However, number of unintended pregnancies are still expected to be higher in 2021, compared to those observed during the same period in 2019. This is plausible given the lag period between restitution of family planning services and reduction in unwanted pregnancies.
Table 11 summarizes the estimated impact on maternal and child mortality, and pregnancies, for each country for first two quarters of 2021.
Additional unintended pregnancies
Additional unsafeabortion
-2,747
2,567
518
-555
-217
-7.8%
14.5%
6.8%
2.3%
3.9%
28,873
96,536
40,409
13,956
179,774
20.6%
58.0%
26.6%
10.2%
28.9%
18,780
2,237,563
622,372
201,488
3,080,202
15.3%
200.1%
74.7%
27.4%
79.4%
2451
11,434
2,901
-254
16,531
26.0%
61.8%
28.5%
10.6%
31.7%
14722
176,453
41,299
2,504
234,978
3.0%
52.8%
19.6%
6.3%
20.4%
2,708
2,806
1,405
630
7,548
14.1%
8.2%
4.1%
1.8%
7.1%
2,708
2,806
1,405
630
7,548
14.1%
8.2%
4.1%
1.8%
7.1%
Q1
Q2
Q3
Q4
Overall
Q1
Q2
Q3
Q4
Overall
2020* Afghanistan Bangladesh India Nepal Pakistan Sri Lanka Overall
Afghanistan Bangladesh India Nepal Pakistan Sri Lanka
Pregnant women with IDA 2.1% 11.2% 2.3% 20.7% 4.8% 2.0%
Pregnant women with anemia 4.4% 22.8% 5.0% 40.8% 11.0% 3.2%
IDA: Iron deficiency anemia
*Compared to 2019

23Chapter 3 Results
School-age child and adolescent mortality
The number of deaths due to maternal causes among 15-19 year-old females is estimated to increase by a total of 1,191 across South Asia in 2020, compared to the previous year, with the greatest increases anticipated in India (643) and Pakistan (476), respectively.
A rise in communicable disease-related adolescent mortality is also likely. Across South Asia as a whole, an estimated 5,943 additional deaths from malaria, TB, HIV/AIDS, and typhoid are anticipated as a result of reduced treatment coverage, with the largest increases expected in typhoid (2,243) and malaria (1,965). At the country-level, India is expected to be hit hardest with an additional 3,412 adolescent deaths followed by Pakistan (1,629) and Bangladesh (836).
However, the increases in both adolescent maternal and communicable disease mortality are more than offset by the expected reduction in adolescent deaths as a result of fewer road accident related deaths. An estimated 8,079 fewer adolescents are expected to die in 2020 as a result of traffic accidents across South Asia as compared to the previous year, with the greatest reduction in India (4,145) followed by Pakistan (2,697). Bangladesh is the only country where an increase in the number of adolescent deaths is expected, mainly due to an increase in deaths due to malaria and typhoid (Table 12).
Overall, adolescent deaths caused by road traffic accidents, maternal causes, or communicable diseases are expected to decrease by 945 in South Asia, with the largest reduction expected in Pakistan (533) and Afghanistan (495) (Table 12).
Table 11: Estimated increase in deaths, pregnancies and abortions by country and quarter of 2021
2021* Afghanistan Bangladesh India Nepal Pakistan Sri Lanka Overall
Childmortality
Neonatal mortality
Stillbirths
Maternal deaths
Additional unintended pregnancies
Additional unsafeabortion
Q1
Q2
Overall
2.7%
2.7%
2.7%
3.6%
3.6%
3.6%
3.6%
3.6%
3.6%
3.6%
3.6%
3.6%
6,536
6,472
13,008
3.6%
3.6%
3.6%
0.1%
-0.4%
-0.2%
-0.4%
-0.8%
-0.6%
-0.2%
-0.3%
-0.2%
-0.2%
-1.4%
-0.8%
6592
4373
10,964
-0.2%
-1.4%
-0.8%
0.1%
-0.4%
-0.2%
-0.4%
-0.8%
-0.6%
-0.2%
-0.5%
-0.3%
-0.5%
-1.0%
-0.7%
41151
21079
62,230
-0.5%
-1.0%
-0.7%
-0.3%
-0.3%
-0.3%
0.1%
0.1%
0.1%
0.3%
0.3%
0.3%
-1.3%
0.1%
-0.6%
2533
2533
5,065
-1.3%
0.1%
-0.6%
0.5%
-0.1%
0.2%
0.4%
-0.2%
0.1%
0.7%
0.5%
0.6%
0.6%
0.1%
0.3%
17399
15007
32,406
0.6%
0.1%
0.3%
-1.2%
-1.3%
-1.2%
-1.0%
-1.0%
-1.0%
-1.0%
-1.1%
-1.0%
-1.1%
-1.1%
-1.1%
61
-20
41
-1.1%
-1.1%
-1.1%
0.3%
-0.2%
0.1%
0.0%
-0.4%
-0.2%
0.2%
-0.1%
0.0%
0.0%
-0.5%
-0.3%
74271
49442
123,713
0.0%
-0.5%
-0.3%
Q1
Q2
Overall
Q1
Q2
Overall
Q1
Q2
Overall
Q1
Q2
Overall
Q1
Q2
Overall
*Compared to 2019

Chapter 3 Results 24
Table 12: Expected change in number of deaths due to road traffic accidents, maternal causes, and communicable diseases among adolescents in 2020 and compared to 2019
India
Pakistan
Nepal
Bangladesh
Sri Lanka
Afghanistan
South Asia
Q1
Q2
Q3
Q4
OveralI
-176
-1,407
-879
-176
-2,637
-276
-2211
-1382
-276
-4,145
-13
-102
-64
-13
-192
-38
-302
-189
-38
-566
-2
-19
-12
-2
-36
-33
-268
-167
-33
-502
-539
-4309
-2693
-539
-8,079
Q1
Q2
Q3
Q4
OveralI
Q1
Q2
Q3
Q4
OveralI
Q1
Q2
Q3
Q4
OveralI
Q1
Q2
Q3
Q4
OveralI
Q1
Q2
Q3
Q4
OveralI
Q1
Q2
Q3
Q4
OveralI
Country 2020HIV/AIDS TB Typhoid Malaria
Overall RTAs* Maternal causes
Communicable diseases
13
263
171
29
476
-14
431
171
55
643
2
8
6
1
16
2
32
11
4
48
1
0
0
0
1
0
3
2
2
7
3
737
361
90
1,191
0
3
1
1
5
0
25
11
6
41
0
1
1
0
2
0
0
0
0
1
0
0
0
0
0
0
0
0
0
0
0
29
13
7
50
0
187
100
50
336
0
736
393
196
1,325
3
13
7
4
27
60
274
146
73
553
1
0
0
0
1
0
0
0
0
0
64
1210
646
323
2,243
0
459
225
112
796
0
491
227
113
831
2
6
3
1
12
5
23
11
6
46
0
0
0
0
0
0
0
0
0
0
7
980
466
233
1,685
0
288
144
60
491
0
710
355
148
1,214
3
12
6
3
24
27
123
61
26
236
0
0
0
0
0
0
0
0
0
0
30
1133
566
236
1,965
-163
-208
-238
76
-533
-291
183
-225
242
-91
-3 -
61
-41
-4
-110
57
150
41
70
318
0
-19
-12
-2
-34
-34
-264
-165
-32
-495
-434
-219
-641
349
-945
*Road traffic accidents resulting in death of either pedestrian or passenger Maternal causes include all pregnancy-related deaths in girls 15 – 19 years

25Chapter 3 Results
Table 13: Number of estimated additional dropouts and present value of per student average income loss in annual, lifetime and national gross GDP terms in six South Asian countries
Educational attainment
South Asia is home to approximately 420 million school-aged children who have been out of school since March 2020. At best, only 2 out of every 3 are being reached by remote learning, with children living in rural areas and poorer households less likely to be able to access remote learning (56). The impact on the youngest children, who are within the most sensitive windows for learning, are also likely to be substantial. As a result of prolonged school closures in response to the COVID-19 pandemic almost 9 million (8,788,476) primary and secondary school-aged children (2,724,686, and 6,063,789, respectively) are expected to permanently dropout of schools, with the highest number expected in India (7,017,721) (Table 13).
The disruption in education is also expected to have considerable economic costs over the long term. Across South Asia, lower educational attainment by this cohort will result in a 15 – 23% decrease in their future lifetime earnings, costing the region US$ 63.5 billion over 45 years. The highest cost will be borne by India (US$ 52.8
billion) and Bangladesh (US$ 7.4 billion), followed by Sri Lanka (US$ 1.9 billion). Table 13 summarizes the estimated number of children expected to permanently dropout of school, and the impact this will have on each country’s GDP over the course of these children’s lifetime.
© U
NIC
EF/
bang
lade
sh/U
N03
9146
0/K
halid
uzza
man
/202
0
Dropouts Present value of income loss
N % Per year
National
Lifetime (45 yrs.) Gross GDP
Primary dropouts
Primary dropouts
Primary dropouts
Primary dropouts
Secondary dropouts
Secondary dropouts
Secondary dropouts
Secondary dropouts
Total
Total
Total
Total
261,305 15.6% $201 $3,816
268,631 6.9% $313 $27,484
2,031,509 20.3% $427 $18,029
48,703 18.5% $198 $4,985
128,893 1.5% $16 $397
177,595 $504 $21,265 $293,982,934
4,986,212 3.6% $77 $3,236
359,972 0% - -
403,695 0% - -
664,999 $ 201 $ 3,816 $997,072,322
628,602 $313 $27,484 $7,383,005,896
7,017,721 $ 504 $21,265 $52,762,813,476
Per student
Pakistan
India
Nepal
Bangladesh
Chapter 3 Results 26
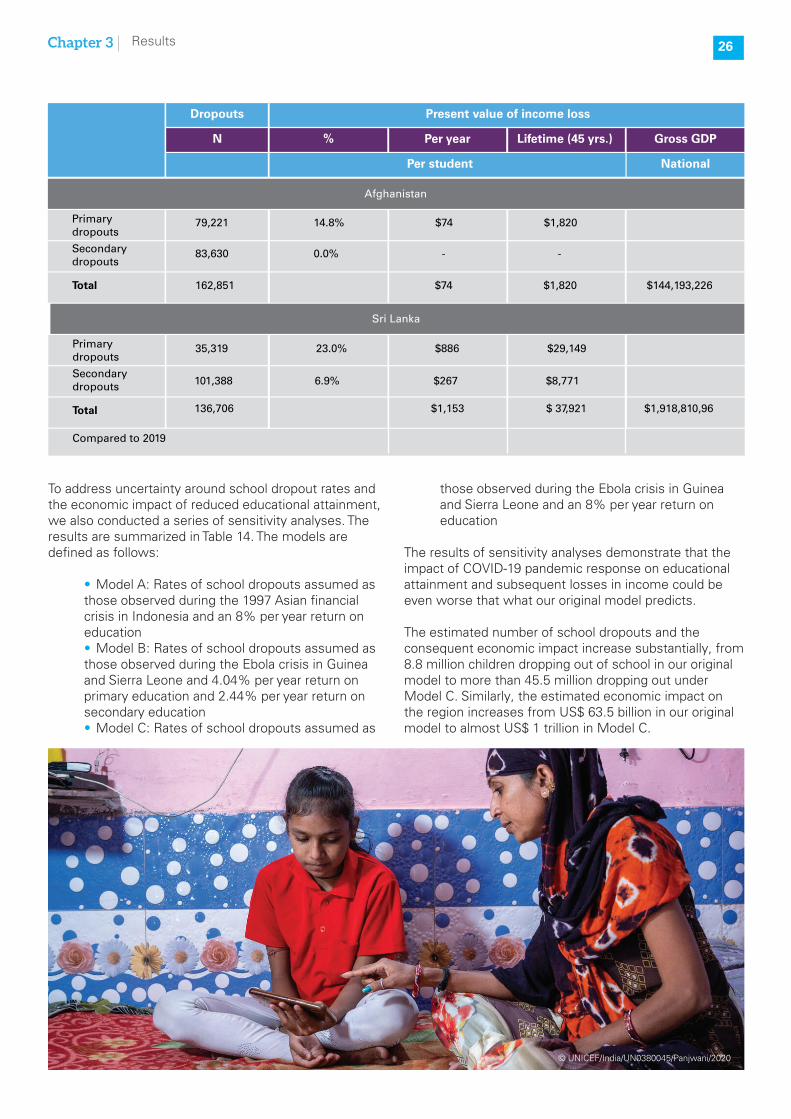
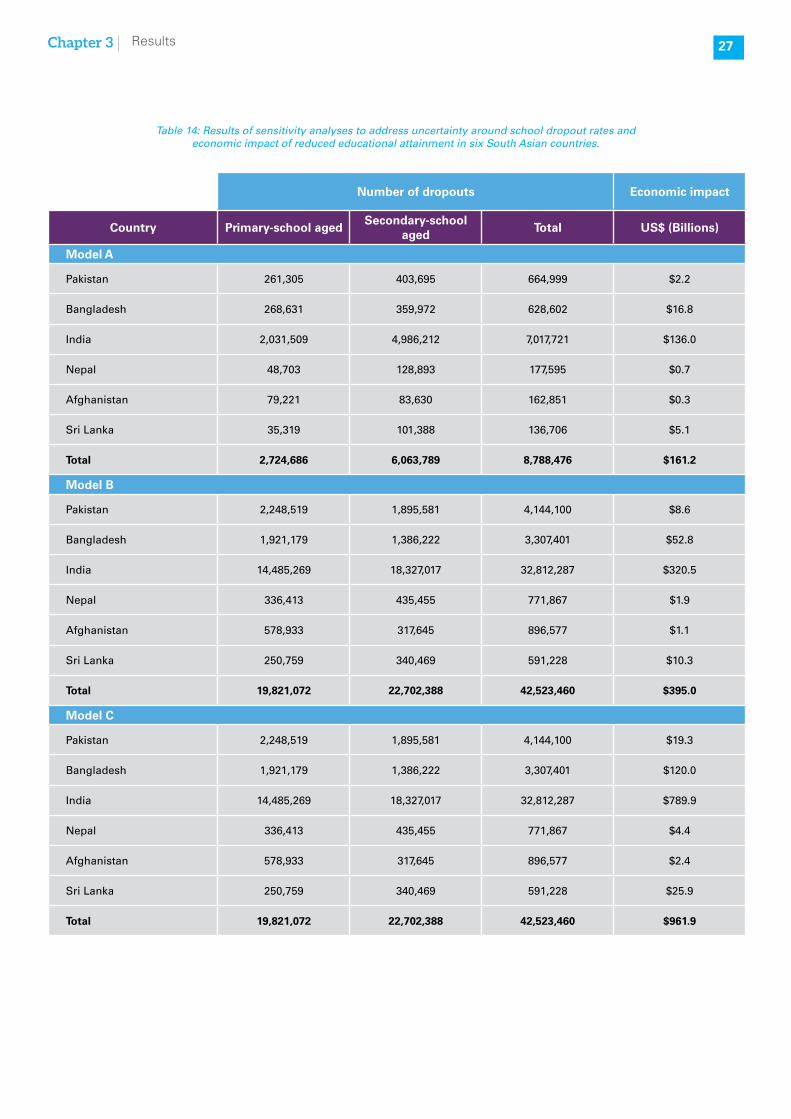
To address uncertainty around school dropout rates and the economic impact of reduced educational attainment, we also conducted a series of sensitivity analyses. The results are summarized in Table 14. The models are defined as follows:
• Model A: Rates of school dropouts assumed as those observed during the 1997 Asian financial crisis in Indonesia and an 8% per year return on education• Model B: Rates of school dropouts assumed as those observed during the Ebola crisis in Guinea and Sierra Leone and 4.04% per year return on primary education and 2.44% per year return on secondary education• Model C: Rates of school dropouts assumed as
those observed during the Ebola crisis in Guinea and Sierra Leone and an 8% per year return on education
The results of sensitivity analyses demonstrate that the impact of COVID-19 pandemic response on educational attainment and subsequent losses in income could be even worse that what our original model predicts.
The estimated number of school dropouts and the consequent economic impact increase substantially, from 8.8 million children dropping out of school in our original model to more than 45.5 million dropping out under Model C. Similarly, the estimated economic impact on the region increases from US$ 63.5 billion in our original model to almost US$ 1 trillion in Model C.
Compared to 2019
Primary dropouts
Primary dropouts
Secondary dropouts
Secondary dropouts
Total
Total
79,221 14.8% $74 $1,820
35,319 23.0% $886 $29,149
101,388 6.9% $267 $8,771
83,630 0.0% - -
136,706 $1,153 $ 37,921 $1,918,810,96
162,851 $74 $1,820 $144,193,226
© UNICEF/India/UN0380045/Panjwani/2020
Dropouts Present value of income loss
N % Per year
National
Lifetime (45 yrs.) Gross GDP
Per student
Afghanistan
Sri Lanka
27Chapter 3 Results
Number of dropouts Economic impact
Country Primary-school agedSecondary-school
agedTotal US$ (Billions)
Model A
Pakistan 261,305 403,695 664,999 $2.2
Bangladesh 268,631 359,972 628,602 $16.8
India 2,031,509 4,986,212 7,017,721 $136.0
Nepal 48,703 128,893 177,595 $0.7
Afghanistan 79,221 83,630 162,851 $0.3
Sri Lanka 35,319 101,388 136,706 $5.1
Total 2,724,686 6,063,789 8,788,476 $161.2
Model B
Pakistan 2,248,519 1,895,581 4,144,100 $8.6
Bangladesh 1,921,179 1,386,222 3,307,401 $52.8
India 14,485,269 18,327,017 32,812,287 $320.5
Nepal 336,413 435,455 771,867 $1.9
Afghanistan 578,933 317,645 896,577 $1.1
Sri Lanka 250,759 340,469 591,228 $10.3
Total 19,821,072 22,702,388 42,523,460 $395.0
Model C
Pakistan 2,248,519 1,895,581 4,144,100 $19.3
Bangladesh 1,921,179 1,386,222 3,307,401 $120.0
India 14,485,269 18,327,017 32,812,287 $789.9
Nepal 336,413 435,455 771,867 $4.4
Afghanistan 578,933 317,645 896,577 $2.4
Sri Lanka 250,759 340,469 591,228 $25.9
Total 19,821,072 22,702,388 42,523,460 $961.9
Table 14: Results of sensitivity analyses to address uncertainty around school dropout rates and economic impact of reduced educational attainment in six South Asian countries.

Chapter 3 Results 28
Table 15: Estimated number of additional adolescent pregnancies, maternal and neonatal deaths, low birthweight births and stunted children resulting from girls dropping out of school due to the COVID-19 pandemic in six South Asian countries
Early marriage and adolescent pregnancies
Rates of adolescent pregnancies are quite high in South Asia, with the proportion of girls 15 – 19 years who have given birth ranging from 5.2% in India (32) to 24.6% in Bangladesh (31). Of the 8.8 million children expected to permanently drop out of school, 4.5 million of them are expected to be girls (Table 15). Given the cultural and social context of South Asia, as well as the economic hardship many families in the region are facing as a result of the COVID-19 pandemic and response, many of these girls are likely to be married off early, resulting in an increase in the number of adolescent pregnancies.
Recent data from Kenya shows that the rate of adolescent pregnancies between April and June 2020
has indeed increased by 28%, compared to the same period in 2019 (44).
As a result of the increase in the number of girls dropping out of school early due to the COVID-19 pandemic, the number of adolescent pregnancies are expected to increase by 405,640 in the region, and could lead to an additional 655 maternal and 9,986 neonatal deaths, 154,985 low birthweight births, and 29,000 children who are likely to be stunted by the age of 2 years.
Table 15 summaries the estimated number of girls expected to permanently dropout of school and the sequelae resulting from their early marriages and consequent adolescent pregnancies.
© UNICEF/Bangladesh/UN0207509/Sokol/2018
CountrySchool
dropoutsAdolescent pregnancies
Maternal deaths
Neonatal deaths
LBW births Stunted
Pakistan 397,453 28,998 41 1,328 11,118 1,958
Bangladesh 352,250 110,916 192 2,055 44,100 8,409
India 3,531,683 235,069 341 5,893 90,125 16,846
Nepal 84,587 18,406 34 401 5,750 1,070
Afghanistan 69,288 7,095 45 286 2,720 487
Sri Lanka 66,024 5,155 2 22 1,171 230
Total 4,501,285 405,640 655 9,986 154,985 29,000
Compared to 2019

29Chapter 3 Results
Economic impact of COVID-19 control measures
In the absence of an effective vaccine or clinical treatment, the main strategy used to control the spread of disease has been non-pharmaceutical interventions, such as physical distancing measures, school closures, travel restrictions and nationwide lockdowns. All of these have resulted in wide-ranging disruption of economic activities.
To assess the economic impact of the COVID-19 pandemic response by different stages of severity of mitigation measures, we estimated the impact on GDP, poverty and food insecurity, resulting from wage loss due
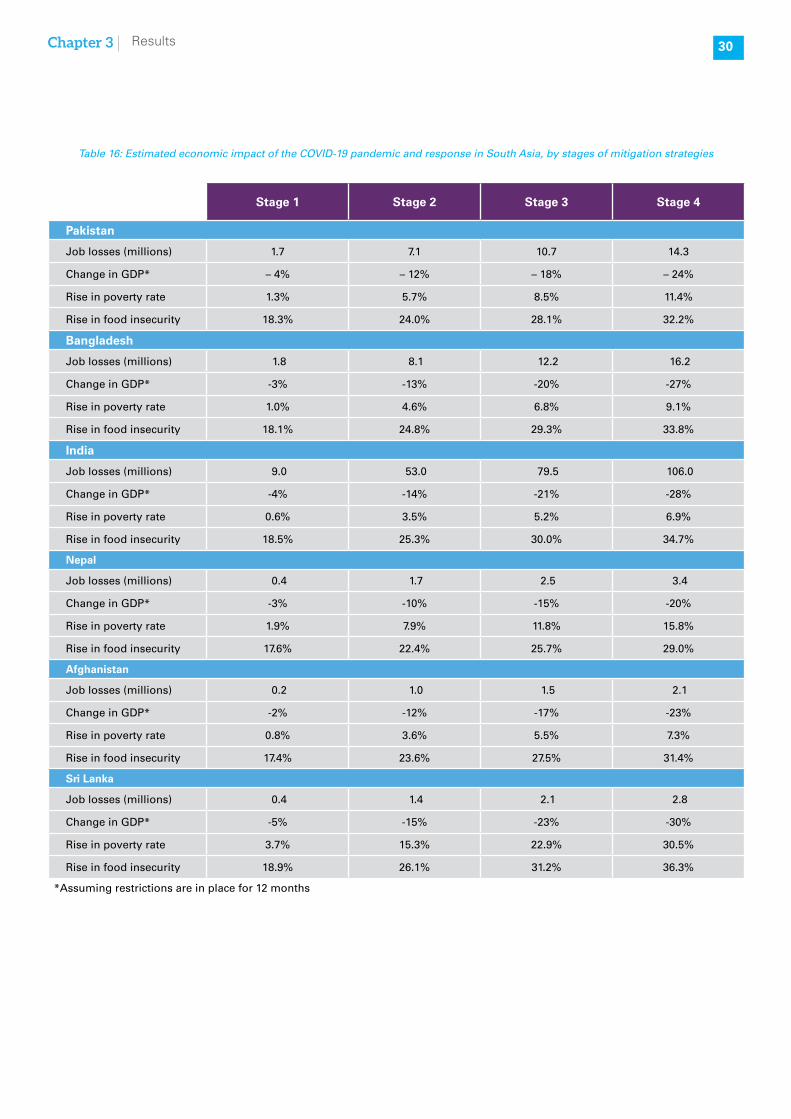
to the proportion of industry-specific labor force laid off at each stage (Table 16).
It is not surprising that the economic impact of COVID-19 mitigation strategies worsens with the severity of these strategies, with the most severe stage (Stage 4) resulting in a 20 – 28% year-on-year decrease in GDP, with consequent implications for rates of national poverty and food insecurity. Even at the least severe stage (Stage 1), the increase in the share of the population who is food insecure could range from 17.4% in Afghanistan to 18.9% in Sri Lanka. The estimated impact of the COVID-19 pandemic and response, across the range of economic indicators, is summarized in Table 16.
© U
NIC
EF/
Indi
a/U
NI3
4267
6/Pa
njw
ani/2
020
Chapter 3 Results 30
Table 16: Estimated economic impact of the COVID-19 pandemic and response in South Asia, by stages of mitigation strategies
Stage 1 Stage 2 Stage 3 Stage 4
Pakistan
Job losses (millions) 1.7 7.1 10.7 14.3
Change in GDP* – 4% – 12% – 18% – 24%
Rise in poverty rate 1.3% 5.7% 8.5% 11.4%
Rise in food insecurity 18.3% 24.0% 28.1% 32.2%
Bangladesh
Job losses (millions) 1.8 8.1 12.2 16.2
Change in GDP* -3% -13% -20% -27%
Rise in poverty rate 1.0% 4.6% 6.8% 9.1%
Rise in food insecurity 18.1% 24.8% 29.3% 33.8%
India
Job losses (millions) 9.0 53.0 79.5 106.0
Change in GDP* -4% -14% -21% -28%
Rise in poverty rate 0.6% 3.5% 5.2% 6.9%
Rise in food insecurity 18.5% 25.3% 30.0% 34.7%
Nepal
Job losses (millions) 0.4 1.7 2.5 3.4
Change in GDP* -3% -10% -15% -20%
Rise in poverty rate 1.9% 7.9% 11.8% 15.8%
Rise in food insecurity 17.6% 22.4% 25.7% 29.0%
Afghanistan
Job losses (millions) 0.2 1.0 1.5 2.1
Change in GDP* -2% -12% -17% -23%
Rise in poverty rate 0.8% 3.6% 5.5% 7.3%
Rise in food insecurity 17.4% 23.6% 27.5% 31.4%
Sri Lanka
Job losses (millions) 0.4 1.4 2.1 2.8
Change in GDP* -5% -15% -23% -30%
Rise in poverty rate 3.7% 15.3% 22.9% 30.5%
Rise in food insecurity 18.9% 26.1% 31.2% 36.3%
*Assuming restrictions are in place for 12 months

31Chapter 4 Implications and Way Forward for South Asia
Chapter 4: Implications and Way Forward for South Asia
We systematically quantified the direct and indirect effects of COVID-19 pandemic and response, and the associated economic costs for South Asia. To our knowledge, this is the first study to do so at a regional level and across a large population (> 1.5 Billion). Our analysis provides a comprehensive view of the adverse impact of COVID-19 pandemic and response across a multitude of population health indicators, and the economic consequences of the disease, as well as the mitigation strategies instituted to control it. The results can be used to inform economic and public health policies in South Asia aimed at mitigating the direct and indirect effects of COVID-19 pandemic and response, over the medium and long term.
The current repertoire of interventions for COVID-19 pandemic response has been defined by lead global health agencies focused on “flattening the curve” and curbing the pandemic, without much regard for the resulting economic and public health fall-out. Almost a year into the pandemic, we now know that a one-size-fits-all mitigation response may not have been the right course of action, and in some cases such as India, perhaps applied too early, given the continuing spike in cases, and for too long in light of the impact on the economy (57). Apart from the enormous impact on lives and livelihoods of millions of people living in poverty or forced below the poverty line, the stringent measures also uprooted millions from urban slums to move to rural areas, often on foot and at huge human costs (58). It remains to be seen if this was also a factor in the widespread transmission of COVID-19 beyond major population centers in South Asia, especially India. There are also additional consequences for interrupting the education of children and girls dropping out of school that
are life long and difficult to quantify in their entirety. There are also intriguing elements of country-specific responses which suggest that the pandemic could have been brought under control reasonably well and with a more limited impact on economies (59, 60). Recent serological survey data from South Asia underline the need for a regional and/or country-specific response. Given the high prevalence of COVID-19 antibodies observed in Afghanistan, India and Pakistan (ZAB’s personal communication and unpublished data), a blanket “stay-at-home” order is not the best way forward for South Asia. Our models help identify evidence-informed mitigation and remedial strategies that will be suitable for low-income countries in general, and for South Asia in particular.
Re-establishing essential maternal and child health services
In addition to dealing with the direct effects of COVID-19, there is a critical need to address the much larger and longer-term fallout from the indirect effects of the pandemic. According to our estimates, additional ~230,000 child, and ~11,000 maternal deaths will occur in South Asia in 2020 alone, as a result of coverage disruption of essential SRMNCH services due to the COVID-19 pandemic and response. This number(> 240,000 maternal and child deaths) is far higher than the COVID-19 deaths observed and expected (< 200,000 by Dec 1, 2020) if no additional mitigation strategies are instituted in the region this year. Furthermore, even if coverage of essential services improves to pre-COVID-19 levels or better, some deficits such as fewer facility births or treatment for diarrhea and pneumonia are opportunities lost for good.
© U
NIC
EF/
Ban
glad
esh/
UN
0353
739/
Paul
/202
0

Chapter 4 Implications and Way Forward for South Asia 32
WHO has recommended strategies to minimize the disruption to essential SRMNCH services, including use of telemedicine to minimize patient-provider contact in the midst of the pandemic, strengthening infection prevention and control capacities, and ensuring essential supplies (61). Encouragingly, many countries have indicated the need for technical assistance and support in implementing these strategies to ensure that the impact of COVID-19 on essential SRMNCH services is minimized (61).
In addition, rates of undernutrition, including anemia, stunting and wasting are also likely to increase as disruptions in food supply systems and economic activity lead to increase in poverty and food insecurity. Prospective data from Bangladesh underscores this concern, where households experiencing food insecurity increased by more than 50% during stay-at-home orders implemented in March – May 2020 (62). Similarly, our economic impact model shows, that even the least severe stage of mitigation strategies, which include warnings/advisories, public gatherings ban, social distancing, and schools closures, could increase the share of the population who is food insecure by almost 20%.
As countries, including those in South Asia, continue to ease COVID-19 restrictions, coverage of maternal and child health and nutrition services need to be prioritized. These services include, but are not limited to: 1) prioritization of services to maximize health impact and protect services for the most vulnerable such as pregnant women and young infants or patients with pre-existing conditions 2) ensuring supply chain of essential medicines and commodities with change in protocols as needed to ensure adequate therapy such as provision of longer term supply 3) protection of supply-chain and delivery mechanisms for continued and increasing
coverage of childhood immunizations, antenatal care and family planning services, with the aim to avoid stock-outs amid a potential surge in demand for emergency contraception and abortion services; 4) Safe re-opening of ambulatory care systems for antenatal, delivery and child health and nutrition with adequate provision of PPE and a secure, safe environment for patients; 5) improving coverage of community-based nutrition services and immunizations for all antigens included under each country’s Expanded Programme on Immunizations, using outreach services such supplementary immunization activities; 6) expanding the capacity of existing fixed and outreach health services such as community health workers , with an increased focus on MNCH, nutrition, and detection and triage of serious illnesses for rapid referral to facilities; and 7) instituting and improving nutrition support services for the most vulnerable, such as community-based management of moderate and acute malnutrition (CMAM) programs, the need for which is likely to increase across the region in the wake of the COVID-19 pandemic.
Strategies for control, prevention and management of COVID-19
Given the current global trajectory of the pandemic, we might be living with COVID-19 for the foreseeable future (for the best part of 2021 and potentially into 2022). In the absence of an effective vaccine or clinical treatments, COVID-19 prevention and management methods will continue to rely on non-pharmaceutical interventions, such as targeted “smart” lockdowns and use of masks, as well as health systems strengthening to successfully resolve severe cases. Even after a vaccine or an effective treatment has been found, it will take time for it be produced and made available globally and at scale (63). Until then, non-pharmaceutical interventions are the world’s best defense against COVID-19.
© UNICEF/India/UN0377935/Panjwani/2020

33Chapter 4 Implications and Way Forward for South Asia
© UNICEF/India/UN0377935/Panjwani/2020
Measures for personal protection
Many countries, including those in South Asia have invested heavily in procuring and securing supply-chains for personal protective equipment (PPE) for health workers and ventilators for treatment of severe cases of COVID-19. In Pakistan, for example, total number of beds allocated for COVID-19 patients has increased from less than 8,000 in March 2020 to 30,000 in July 2020, including more than 50,000 healthcare staff virtually trained in providing critical care (ZAB personal communication).
Many countries, including India and Pakistan have also issued directives mandating face masks in public spaces (64, 65). However, with limited enforcement, it is unclear what proportion of the population is consistently complying with these mandates. These are however, highly effective and we would strongly endorse the continued focus on the established principles for self and community protection against the spread of COVID-19 including
• Universal usage of appropriate face masks in public places and group settings• Physical distancing and restrictions on indoor gatherings as well as large scale gatherings outdoors • Hand sanitization and frequent washing • Special precautions in public transport, train and air travel
Safe schools
As countries come out of the initial lockdowns imposed to curb the spread of COVID-19, safe reopening of schools is a top priority. School closures in Bangladesh and Nepal have been extended, while those in Sri Lanka were forced to close again after reopening in July and experiencing a spike in cases (66). In India, schools are open on a voluntary basis for older students, but five
states and the capital Delhi are continuing with school closures (66). Pakistan has issued a set of Standard Operating Procedures (SOPs) for safe reopening of schools, including a limit of 25 students per class, alternating school days, ban on assemblies and other group events, temperature checks for all entrants into a school, and encouraging use of face masks (67). Reopening of school needs to be done while minimizing risk of COVID-19 exposure and transmission, and policies need to be coordinated between the federal and subsequent administrative levels within a country.
School re-openings also need to be targeted, based on localized rates of disease transmission and public health capabilities around testing and contract tracing. There must also be appropriate support for safe transportation of children to schools with adequate space in buses and vans and utilization of private resources for transportation by families (where and as possible).
Smart lockdowns
As countries emerge from the initial sweeping lockdowns and stay-at-home orders instituted early in the pandemic, smart lockdowns that target potential hot-spots of COVID-19 infection have gained increasing global popularity, and are an extension of the “test, trace and quarantine” policy. Across the globe, these smart lockdowns are being more and more frequently used by governments to stem the spread of the virus, while ensuring continuation and resumption of economic activities (60). The strategy has also been hailed as pivotal for stemming the spread of COVID-19 in Pakistan (59). The impact on India’s economy resulting from the sweeping stay-at-home orders instituted on March 24, 2020 (57), also highlights the need for targeted, “smart” lockdowns. In the absence of the understandable lack of political appetite for another wave of blanket, nationwide stay-at-home orders, these smart lockdowns seem to be an effective tool in the world’s public health arsenal against COVID-19.
© U
NIC
EF/
Indi
a/U
N03
7551
5/K
aur/
2020

Chapter 4 Implications and Way Forward for South Asia 34
Securing and re-establishing food supply chain
The COVID-19 pandemic has highlighted the vulnerability of existing food systems, with the effects of disruptions being disproportionately felt by the most vulnerable (68). Vulnerable food systems can lead to increase in food insecurity and consumption of poor quality diets, which in turn affects the health and nutrition of populations, especially women and children (69). This pandemic highlights the immediate need to create and facilitate sustainable food systems which ensure an affordable and nutritionally adequate diet to all peoples of the world.
Failure to build and foster resilient food systems which yield improved diet quality, will have immeasurable consequences for the health of most of the world’s population. While the state bears a clear responsibility for restituting food security through food supply chain and food systems as well as price-regulation, there is also the need for ensuring adequate financial support and purchasing power for families through cash transfers. There are notable examples of this initiative in South Asia with cash transfer programs such as the Ehsaas program under the auspices of the Benazir Income Support program in Pakistan (70) .
Education
Education has been another indirect casualty of the COVID-19 pandemic, with over 90% of the world’s students forced to stay home during temporary school-closures earlier this year. Even prior to the pandemic, disparities in educational attainment existed, both within and across countries. However, the pandemic is expected exacerbate existing inequities, especially along socioeconomic and gendered lines, with serious consequences for school-aged children and adolescent health, nutrition, educational attainment and economic productivity and earnings during adulthood.
Many countries have implemented remote learning polices in the wake of temporary school closures, but 31% of the world’s students cannot be reached by remote learning programs, with more than 70% of children from rural and/or poor households unable to access these programs (71). There is also limited focus on early childhood education, with almost 70% of children who were attending preschool prior to the pandemic unable to access remote learning programs (71).
The COVID-19 pandemic is an opportunity to design and enact innovative education programs and policies that will reduce and overcome pre-existing inequities in education access, such as introduction of school shift systems and open air classrooms, and incentivizing continued
and increased attendance for girls using conditional cash transfers to families. We need to ensure that all children of the world are able to access quality education, irrespective of their gender or socioeconomic status.Schools in Pakistan are reopening in a phased manner as we speak and early experience indicates that despite much apprehension, it has been possible to get the bulk of secondary school children back to school.
Strict imposition of standard operating procedures and compliance with protocols are needed with sentinel surveillance to ensure that there are no major outbreaks. Given the many primary schools are still closed at the time of writing this report, it is imperative that safe protocols be adopted to get these children back into an education and learning environment soonest before they lose a vital and sensitive year of learning.
Poverty alleviation and safety nets
Designing and implementing these policies will take time, which most of the vulnerable populations, including women, children, people with disabilities and daily wage earners, simply do not have in the wake of the pandemic. This is where poverty alleviation and social support programs can help bridge the gap. Since the start of the pandemic, many countries, including LMICs, have instituted social safety net programs, such as income or food support, to alleviate the hardships brought on by the sweeping lockdowns put in place for several weeks earlier this year.
A recent report from United Nations Development Programme (UNDP) highlights the efficacy of unconditional emergency cash transfers, or temporary basic income (TBI) in ameliorating the worst effects of COVID-19, especially on poor or near-poor households (72). The authors stipulate that at a cost of 0.27 – 0.63% of each country’s GDP, TBI is within reach for all 132 countries included in their analysis (72).
One example of a TBI program implemented to mitigate the worst of the immediate effects of the COVID-19 pandemic is Ehsaas Emergency Cash program in Pakistan, which provided a lump sum of PKR 12000 (~US$75) to poor households, and is reported to have reached more than 14.6 million beneficiaries since its inception earlier this year (73, 74). The program is also focusing on gender equality in Pakistan by ensuring that at least 50% of all beneficiaries are women (75).
The World Bank reports that since March 2020, a total of $589 billion has been spent (reported from 114 countries) on social protection programs with per capita spending ranging from $121 in high-income countries to $1 in low-income settings (76). The impact of these on utilization and access to health and nutrition services is still unknown and needs to be estimated.

35Chapter 4 Implications and Way Forward for South Asia
Data systems and rapid information
The COVID-19 pandemic has highlighted the importance of national health data systems. Not only are these systems necessary for monitoring progress towards public health targets, such as Sustainable Development Goals, they are also critical in detecting infectious disease outbreaks, such as the current COVID-19 pandemic, containing them and minimizing the economic fall-out (77). National health data systems are specially lacking in LMICs, including those in South Asia. Even with support from UNICEF country offices, we had difficulty in obtaining data on COVID-19 cases and deaths, and had to obtain these data from University of Oxford’s Our World in Data (OWID) website (15), for our direct effects model.
Investing in health data systems that are updated in real time and publicly available for research collaborations, needs to be a priority at the regional and global level.
Limitations
Our models have several limitations, most if not all, resulting from constraints around data availability, especially at sub-national level. Although we were able to use country-level DHIS/HMIS data for many indicators included in our LiST analysis, for some we either had to use a related country-level indicator or average estimates
from the other countries, as proxies (Supplementary Table 3). We also faced limitations with data availability for our models assessing the impact on educational attainment, economy and food insecurity. Even though there is considerable historical evidence on how crises can impact children’s schooling and incomes of households, it is limited with reference to the unique effects of the COVID-19 pandemic in both scale and rapidity of spread.
We were constrained to apply the assumptions on rates of school dropouts from Indonesia during the 1997 Asian financial crisis, and households experiencing food insecurity in Nepal in April 2020, across all six countries.
These could well be under-estimates and as one very recent report from Bangladesh indicates that the proportion of households earning less than US$ 1.90 per day increased from <1% to almost 50%, and those experiencing food insecurity increased by more than 50% (62). For our economic impact model, we used labor force attrition by industry estimated for Pakistan across the other five South Asian countries, as country-specific data were not available. Our economic impact model also does not include gender related impacts, since data on capacity and MPW by industry were not disaggregated by gender. This is a limitation since the type of industry, hierarchical position, level of payment, and share within informal sector are all affected by gender.
© U
NIC
EF/
Indi
a/U
N03
7549
2/K
aur/
2020

planning services, antenatal care, skilled birth attendance and postnatal care, and community-based health and nutrition support services
Ensure safe reopening of schools, with increased focus on continued and increased enrollment of vulnerable children, especially girls.
Continue social safety net programs to support vulnerable population, with increased focus on women-led households, people with disabilities, and daily wage earners
All countries, including those in South Asia need to continue, and even increase investment in health systems, poverty alleviation, education and creation of human capital, and gender equity, if the world wants to maintain and improve on the gains in maternal, child and adolescent health and nutrition achieved over the past few decades.
We need to do more than just catch up the loss in health and human capital experienced over the past several months. We need to build back better, overcoming gaps in equity and disadvantages faced by populations, simply because of the geographic region they live in. This pandemic may have been unprecedented, but those in the future will not be, and the world needs to be prepared.
Conclusions
Both modelled and prospective data reveal serious consequences of the COVID-19 pandemic with implications for maternal and child health and nutrition (11, 62). Therefore, it is imperative that we now turn our focus towards mitigating the indirect effects of the COVID-19 pandemic and response.
These should include strengthening food systems to ensure a resilient supply of nutritious and affordable foods, creating economic opportunities and income generating activities using a gendered lens, ameliorating inequities in educational attainment, and a renewed focus on improving coverage of basic health and nutrition interventions during pregnancy, infancy and childhood, and adolescence, especially for girls.
Our modelling study also has implications for specific public policy measures that should be undertaken by the region’s governments. These include, but are not limited to:
Increase the coverage of COVID-19 mitigation measures, such as use of masks and hand hygiene, which can lead to ~400,000 fewer deaths over the next year
Ensure uninterrupted and improved coverage of essential maternal and child health and nutrition services, such as family
© UNICEF/India/UN0378029/Panjwani/2020

Glossary
DHIS
DHS
DPT
GDP
GBD
HMIS
ICU
IHME
ILO
LBW
LiST
LMIC
MICS
MPW
Penta
SAM
District Health Information System
Demographic and Health Survey
Diphtheria, pertussis and tetanus
Gross Domestic Product
Global Burden of Disease
Health Management Information System
Intensive care unit
Institute for Health Metrics and Evaluation
International Labour Organization
Low birthweight
Lives Saved Tool
Low and middle income countries
Multiple Indicator Cluster Survey
Marginal rate of productivity per worker
Pentavalent
Severe acute malnutrition
© UNICEF/Sri Lanka/UNI355638/Kodikara/AFP/2020
SGA
SRMNCH
TBI
UNDP
UNICEF
WHO
Small for gestational age
Sexual, reproductive, maternal, newborn, and child health
Temporary basic income
United Nations Development Programme
United Nations International Children’s Emergency Fund
World Health Organization

38References
References
1. Johns Hopkins University and Medicine: Coronavirus Resource Center; 2020 [Available from: https://coronavirus.jhu.edu/map.html]
2. Parmar D, Stavropoulou C, Ioannidis JP. Health outcomes during the 2008 financial crisis in Europe: systematic literature review. BMJ. 2016;354:i4588.3. Wilhelm JA, Helleringer S. Utilization of non-Ebola health care services during Ebola outbreaks: a systematic review and meta-analysis. J Glob Health. 2019;9(1):010406.
4. Christian P. Impact of the economic crisis and increase in food prices on child mortality: exploring nutritional pathways. J Nutr. 2010;140(1):177S-81S.
5. Green R, Cornelsen L, Dangour AD, Turner R, Shankar B, Mazzocchi M, et al. The effect of rising food prices on food consumption: systematic review with meta-regression. BMJ. 2013;346:f3703.
6. Deyshappriya NRR. LSE. 2018. [May 11, 2020]. Available from: https://blogs.lse.ac.uk/southasia/2018/07/31/examining-poverty-trends-in-south-asian-countries-where-is-sri-lanka-among-its-south-asian-counterparts/.
7. UNICEF. The State of the World’s Children 2019. Children, Food and Nutrition: Growing well in a changing world. New York: UNICEF; 2019.
8. Ahmed T, Hossain M, Mahfuz M, Choudhury N, Hossain MM, Bhandari N, et al. Severe acute malnutrition in Asia. Food Nutr Bull. 2014;35(2 Suppl):S14-26.
9. COVID-19: Government Response Stringency Index: Our World in Data; 2020 [cited 2020 October 8]. Available from: https://ourworldindata.org/grapher/covid-stringency-index?tab=chart&time=2020-01-22..latest.
10. New UNFPA projections predict calamitous impact on women’s health as COVID-19 pandemic continues [press release]. April 28 2020.
11. Roberton T, Carter ED, Chou VB, Stegmuller AR, Jackson BD, Tam Y, et al. Early estimates of the indirect effects of the COVID-19 pandemic on maternal and child mortality in low-income and middle-income countries: a modeling study. Lancet Glob Health. 2020.
12. Jenness SM, Goodreau SM, Morris M. EpiModel: An R Package for Mathematical Modeling of Infectious Disease over Networks. J Stat Softw. 2018;84.13. Bhutta ZA, Harari O, Park JJ, Zannat N, Zoratti
M, Churches T, et al. Evaluation of effects of public health interventions on COVID-19 transmission for Pakistan: A mathematical simulation study. medRxiv. 2020:2020.04.30.20086447.
14. Qian G, Yang N, Ma AHY, Wang L, Li G, Chen X, et al. A COVID-19 Transmission within a family cluster by presymptomatic infectors in China. Clin Infect Dis. 2020.
15. Max Roser, Hannah Ritchie, Esteban Ortiz-Ospina and Joe Hasell (2020) - “Coronavirus Pandemic (COVID-19)”. Published online at OurWorldInData.org. Retrieved from: ‘https://ourworldindata.org/coronavirus’ [Online Resource]
16. Jones DR, Schonlau M, Welch WJ. Efficient Global Optimization of Expensive Black-Box Functions. Journal of Global Optimization. 1998;13(4):455-92.
17. Aleta A, Martin-Corral D, Piontti APY, Ajelli M, Litvinova M, Chinazzi M, et al. Modeling the impact of social distancing, testing, contact tracing and household quarantine on second-wave scenarios of the COVID-19 epidemic. medRxiv. 2020.
18. Chu DK, Akl EA, Duda S, Solo K, Yaacoub S, Schunemann HJ, et al. Physical distancing, face masks, and eye protection to prevent person-to-person transmission of SARS-CoV-2 and COVID-19: a systematic review and meta-analysis. Lancet. 2020;395(10242):1973-87.
19. Talaat M, Afifi S, Dueger E, El-Ashry N, Marfin A, Kandeel A, et al. Effects of hand hygiene campaigns on incidence of laboratory-confirmed influenza and absenteeism in schoolchildren, Cairo, Egypt. Emerg Infect Dis. 2011;17(4):619-25.
20. IHME. IHME GBD Results Tool 2020.
21. Hamill JK, Sawyer MC. Reduction of childhood trauma during the COVID-19 Level 4 lockdown in New Zealand. ANZ J Surg. 2020.
22. Morris D, Rogers M, Kissmer N, Du Preez A, Dufourq N. Impact of lockdown measures implemented during the Covid-19 pandemic on the burden of trauma presentations to a regional emergency department in Kwa-Zulu Natal, South Africa. Afr J Emerg Med. 2020.
23. Sakelliadis EI, Katsos KD, Zouzia EI, Spiliopoulou CA, Tsiodras S. Impact of Covid-19 lockdown on characteristics of autopsy cases in Greece. Comparison between 2019 and 2020. Forensic Sci Int. 2020;313:110365.

39References
24. Barnes SR, Beland L, Huh J, Kim D. The Effect of COVID-19 Lockdown on Mobility and Traffic Accidents: Evidence from Louisiana. 2020.
25. Calderon-Anyosa RJC, Kaufman JS. Impact of COVID-19 Lockdown Policy on Homicide, Suicide, and Motor Vehicle Deaths in Peru. 2020.
26. Oguzoglu U. Covid-19 Lockdowns and Decline in Traffic Related Deaths and Injuries. IZA Discussion Paper No. 13278. 2020.
27. Parpia AS, Ndeffo-Mbah ML, Wenzel NS, Galvani AP. Effects of Response to 2014-2015 Ebola Outbreak on Deaths from Malaria, HIV/AIDS, and Tuberculosis, West Africa. Emerg Infect Dis. 2016;22(3):433-41.
28. WHO. Typhoid and other invasive salmonellosis.
29. Azvedo JP, Hasan A, Goldemburg D, Iqbal SA, Geven K. Simulating the Potential Impacts of COVID-19 School Closures on Schooling and Learning Outcomes: A Set of Global Estimates. World Bank; 2020.
30. UNESCO. Data for the Sustainable Development Goals [Available from: http://uis.unesco.org/.
31. Bangladesh Demographic and Health Survey 2014. Dhaka, Bangladesh, and Rockville, Maryland, USA: National Institute of Population Research and Training (NIPORT), Mitra and Associates, and ICF International; 2016.
32. National Family Health Survey (NFHS-4), 2015-16: India. Mumbai: International Institute for Population Sciences and ICF; 2017.
33. Nepal Demographic and Health Survey 2016. Kathmandu, Nepal: Ministry of Health, Nepal; New ERA; and ICF; 2017.
34. Wirth JP, Woodruff BA, Engle-Stone R, Namaste SM, Temple VJ, Petry N, et al. Predictors of anemia in women of reproductive age: Biomarkers Reflecting Inflammation and Nutritional Determinants of Anemia (BRINDA) project. Am J Clin Nutr. 2017;106(Suppl 1):416S-27S.
35. Sri Lanka Demographic and Health Survey 2016. Sri Lanka: Department of Census and Statistics (DCS) and Ministry of Health, Nutrition and Indigenous Medicine; 2017.
36. Pakistan Demographic and Health Survey 2017-18. Islamabad, Pakistan, and Rockville, Maryland, USA: National Institute of Population Studies (NIPS) [Pakistan] and ICF; 2019.
37. Frankenburg E, Thomas D, Beegle K. The real cost of Indonesia’s economic crises: preliminary findings from the Indonesia Family Life Surveys.1999.38. Psacharopoulos G. Copenhagen Consensus 2012
Perspective Paper: Education. 2012.
39. Afghanistan Demographic and Health Survey 2015. Kabul, Afghanistan: Central Statistics Organization (CSO), Ministry of Public Health (MoPH), and ICF; 2017.
40. Ebola two years on: how deadly virus stopped millions from going to school. Theirworld; 2016 March 16.
41. Rasul I, Smurra A, Bandiera O. Lessons from Sierra Leone’s Ebola pandemic on the impact of school closures on girls. The Conversation. 2020 May 20.
42. Psacharopoulos G, Collis V, Patrinos HA, Vegas E. Lost Wages: The COVID-19 Cost of School Closures The World Bank; 2020. Contract No.: 9246.
43. Bajracharya A, Psaki SR, Sadiq M. Child marriage, adolescent pregnancy and school dropout in South Asia. UNICEF; 2019.
44. Smith E. Dramatic rise in Kenya early pregnancies amid school closures, IRC data suggests. 2020.
45. Nove A, Matthews Z, Neal S, Camacho AV. Maternal mortality in adolescents compared with women of other ages: evidence from 144 countries. Lancet Glob Health. 2014;2(3):e155-64.
46. Gibbs CM, Wendt A, Peters S, Hogue CJ. The impact of early age at first childbirth on maternal and infant health. Paediatr Perinat Epidemiol. 2012;26 Suppl 1:259-84.
47. Black RE, Victora CG, Walker SP, Bhutta ZA, Christian P, de Onis M, et al. Maternal and child undernutrition and overweight in low-income and middle-income countries. Lancet. 2013;382(9890):427-51.
48. Galasso E, Wagstaff A, Naudeau S, Shekar M. Economic Costs of Stunting and How to Reduce Them. World Bank Group; 2017.
49. Iqbal N, ul Haque N, Nayab D. COVID-19 in Pakistan: Caring for the Poor and Vulnerable. 2020.
50. Faraz N, Nasir M. Sectoral Analysis of the Vulnerably Employed: COVID-19 and the Pakistan’s Labour Market. Pakistan Institute of Development Economics; 2020.
51. The Impact of COVID-19 on Households in Nepal: mVAM Household Livelihoods, Food Security and Vulnerability Survey. World Food Programme (WFP) Nepal and the Ministry of Agriculture and Livestock Development (MoALD); 2020.
52. Karnataka caps prices for Covid-19 tests; Rs 2000 for RT-PCR, 700 for rapid test. Indian Express. 2020 July 25.

40References
53. Haque A, Siddiqui NU, Kumar R, Hoda M, Lakahni G, Hooda K. Cost of care in a paediatric intensive care unit of a tertiary-care university hospital of Pakistan. J Pak Med Assoc. 2015;65(6):651-4.
54. Khealani BA, Javed ZF, Syed NA, Shafqat S, Wasay M. Cost of acute stroke care at a tertiary care hospital in Karachi, Pakistan. J Pak Med Assoc. 2003;53(11):552-5.
55. Liu X, Zhou H, Zhou Y, Wu X, Zhao Y, Lu Y, et al. Risk factors associated with disease severity and length of hospital stay in COVID-19 patients. J Infect. 2020;81(1):e95-e7.
56. COVID-19: Are children able to continue learning during school closures? A global analysis of the potential reach of remote learning policies. UNICEF; 2020.
57. India’s economic woes may have only just begun. BBC News. 2020 September 1.
58. Pandey V, Verma A. Coronavirus India: Death and despair as migrant workers flee cities. BBC News. 2020.
59. ‘Smart lockdowns’ lead to effective handling of Covid-19 in Pakistan. Dawn News. 2020 August 11.
60. Guigliano F. COVID-19: Europe is looking at ‘smart lockdowns’. Gulf News. 2020 June 26.
61. Pulse survey on continuity of essential health services during the COVID-19 pandemic. Interim report. WHO; 2020.
62. Hamadani JD, Hasan MI, Baldi AJ, Hossain SJ, Shiraji S, Bhuiyan MSA, et al. Immediate impact of stay-at-home orders to control COVID-19 transmission on socioeconomic conditions, food insecurity, mental health, and intimate partner violence in Bangladeshi women and their families: an interrupted time series. Lancet Glob Health. 2020.
63. Hillman J. Drugs and Vaccines Are Coming—But to Whom? How to Make Sure Patents Don’t Stand in the Way of Global Health. Foreign Affairs. 2020 May 19.
64. Alberga H, Kao J, Robbins CP, Waldie P, York G. Masks to combat COVID-19: Which countries are embracing, requiring or rejecting them? A global guide. The Globe and Mail Canada. 2020 August 7.
65. Saifi S. Pakistan makes face masks mandatory in public. CNN. 2020 May 31.
66. Menon S. Coronavirus: How the lockdown has changed schooling in South Asia. BBC News. 2020.
67. Covid-19 SOPs for schools issued in Pakistan. The Express Tribune. 2020.
68. Impact of COVID-19 on Food Security and Nutrition (FSN) High-Level Panel of Experts on Food Security and nutrition (HLPE); 2020.
69. Akseer N, Kandru G, Keats EC, Bhutta ZA. COVID-19 pandemic and mitigation strategies: implications for maternal and child health and nutrition. Am J Clin Nutr. 2020;112(2):251-6.
70. Nishtar S. Ehsaas Emergency Cash: A digital solution to protect the vulnerable in Pakistan during the COVID-19 crisis. Government of Pakistan; 2020.
71. Covid-19: Are Children Able to Continue Learning During School Closures? A global analysis of the potential reach of remote learning policies using data from 100 countries. UNICEF; 2020.
72. Molina GG, Ortiz-Juarez E. Temporary Basic Income: Protecting Poor and Vulnerable People in Developing Countries. UNDP; 2020.73. Ehsaas Emergency Cash 2020 [Available from: https://pass.gov.pk/ecs/uct_all.html.
74. Ehsaas Emergency Cash. Government of Pakistan; 2020.
75. Ehsaas: 50%+ benefits for Women. 2020.
76. Gentilini U, Almenfi MBA, Dale P, Lopez AV, V. MCI, Rodrigo EQ, et al. Social Protection and Jobs Responses to COVID-19 : A Real-Time Review of Country Measures The World Bank; 2020.
77. Appel D, Badiee S. A Vaccine Is Not the Only Answer to COVID-19: Why Strengthening Statistical and Data Systems Must Be Part of the Solution. NextBillion. 2020.

41Supplementary Tables
Supplementary tables
Table 1:Compartments and functional definitions of the model
Compartment Functional definition
S Susceptible individuals
E Exposed and infected, not yet symptomatic but potentially infectious
I Infected, symptomatic, and infectious
Q Infectious, but (self-)isolated
H Requiring hospitalization (would normally be hospitalised if capacity available)
R Recovered, immune from further infection
F Case fatality (death due to COVID-19, not other causes)
Table 2:Model parameters for base case scenarios
Variable name DescriptionNo
interventionHand
hygieneFace
masksSmart
lockdownsComments
s.num
Initial number of susceptible (not yet infected) individuals in the simulated population.
Population size divided by the cumulative number of known active cases at the beginning of the calibration period
These values were chosen to scale the simulation size to q.num = 1.
e.num
Initial number of exposed (infected, asymptomatic, and potentially infectious) individuals in the simulated population.
1 at start of calibration. Simulation starts with the value obtained at the end of the calibration period.
Assumptions made for the model; discussed in the manuscript
i.num
Initial number of infected (symptomatic and infectious) individuals in the simulated population.
1 at start of calibration. Simulation starts with the value obtained at the end of the calibration period.
Assumptions made for the model; discussed in the manuscript
q.num Initial number of infectious but quarantined.
1 at start of calibration. Simulation starts with the value obtained at the end of the calibration period.
The simulation size was scaled according to this choice.
h.numInitial number of individuals requiring hospitalization.
0 at start of calibration. Simulation starts with the value obtained at the end of the calibration period.
Assumed zero at the beginning of calibration.
r.num Initial number of recovered (and immune) individuals.
0 at start of calibration. Simulation starts with the value obtained at the end of the calibration period.
Assumed zero at the beginning of calibration.

42Supplementary Tables
Variable name DescriptionNo
interventionHand
hygieneFace
masksSmart
lockdownsComments
s.num
Initial number of susceptible (not yet
infected) individuals in the simulated population.
Population size divided by the cumulative number of known active cases at the beginning of the calibration
period
These values were chosen to scale the simulation size to
q.num = 1.
e.num
Initial number of exposed (infected, asymptomatic,
and potentially infectious) individuals in the
simulated population.
1 at start of calibration. Simulation starts with the value obtained at the end of the calibration period.
Assumptions made for the model; discussed in the
manuscript
i.num
Initial number of infected (symptomatic and
infectious) individuals in the simulated population.
1 at start of calibration. Simulation starts with the value obtained at the end of the calibration period.
Assumptions made for the model; discussed in the
manuscript
q.num Initial number of infectious but quarantined.
1 at start of calibration. Simulation starts with the value obtained at the end of the calibration period.
The simulation size was scaled according to this choice.
h.numInitial number of
individuals requiring hospitalization.
0 at start of calibration. Simulation starts with the value obtained at the end of the calibration period.
Assumed zero at the beginning of calibration.
r.num Initial number of recovered (and immune) individuals.
0 at start of calibration. Simulation starts with the value obtained at the end of the calibration period.
Assumed zero at the beginning of calibration.
Table 2:Model parameters for base case scenarios
f.num Initial number of fatalities. 0 at start of calibration. Simulation starts with the value obtained at the end of the calibration period.
Assumed zero at the beginning of calibration. Recorded fatalities before start of simulation run are added to the eventual total after rescaling.
act.rate.i
The daily number of exposure events (encounters) between susceptible and infectious (symptomatic).
Calibrated to match fatalities data – discussed in manuscript.
No change from the calibrated value.
No change from the calibrated value.
4% reduction off the calibrated value.
inf.prob.i
Probability of passing on infection at each exposure event between infectious (symptomatic) people and susceptible.
Calibrated to match fatalities data – discussed in manuscript.
10% reduction off the calibrated value.
7% reduction off the calibrated value.
No change from the calibrated value.
act.rate.e
The number of exposure events (encounters) between susceptible and exposed (asymptomatic) per day.
Same as act.rate.i.
inf.prob.e
Probability of passing on infection at each exposure event between exposed (asymptomatic) people and susceptible.
2/3 of inf.prob.i.
act.rate.q
The daily number of exposure events (encounters) between susceptible and quarantined (symptomatic)
25% of act.rate.e.
inf.prob.q
Probability of passing on infection at each exposure event between quarantined (symptomatic) people and susceptible.
Same as inf.prob.i.
quar.rate
Rate per day at which symptomatic (or tested positive), infected people enter self-isolation
0.033333
Value chosen to reflect a 50% probability of self-isolation within 21 days since onset of symptoms.
hosp.rate
Rate per day at which symptomatic (or tested positive), infected people require hospital care
Calibrated to match fatalities data – discussed in manuscript.
disch.rateRate per day at which people requiring hospital care recover
0.066667 Daily recovery rate of 2%
prog.rate
Rate per day at which infected and asymptomatic people become symptomatic.
0.04830550% of exposed individuals develop symptoms within 2 weeks
rec.rateRate per day at which infected and symptomatic people recover.
0.05
Expected recovery duration of 20 days from onset of symptoms (Default value used by Tim Churches)
fat.rate.baseBaseline daily mortality rate for people needing hospitalisation.
Calibrated to match fatalities data – discussed in manuscript.

43Supplementary Tables
Table 3:Summary of indicators used as proxy in LiST analysis, by country
Country LiST indicator Proxy indicator from DHIS/HMIS
Afghanistan Family planning services Couple year of protection from Afghanistan HMIS data
Afghanistan Tetanus Toxoid (2 or more doses) Antenatal care seeking from Afghanistan HMIS data
Afghanistan Postnatal visit within 2 days after birth Facility births from Afghanistan HMIS data
Bangladesh Family planning services Family planning services from Pakistan DHIS data
Bangladesh Tetanus Toxoid (2 or more doses) Antenatal care seeking from Bangladesh HMIS data
Bangladesh Measles vaccine DPT3/PENTA3 from Bangladesh HMIS data
Nepal FP clients, injectable, condom, male and female sterilization
Average of available family planning services from Nepal HMIS data
Nepal Tetanus Toxoid (2 or more doses) Antenatal care seeking from Nepal HMIS data
Nepal Measles vaccine DPT3/PENTA3 from Nepal HMIS data
Sri Lanka Tetanus Toxoid (2 or more doses) Antenatal care seeking from Sri Lanka data
Sri Lanka
Vaccination (DPT3/PENTA3/measles)
Averages of rest of the countriesCare seeking for diarrhea/pneumonia
Malnutrition
India FP clients Average of short term family planning services from India HMIS data
Variable name DescriptionNo
interventionHand
hygieneFace
masksSmart
lockdownsComments
hosp.capNumber of available hospital beds for the modelled population
Extracted from the table downloaded from https://github.com/owid/covid-19-data/tree/master/public/data. Scaled by the same factor as s.num.
fat.rate.overcap
Daily mortality rate for people needing hospitalisation but cannot get into hospital due to the hospitals being full
fat.rate.base times 2.
fat.tcoeff
Time coefficient for increasing mortality rate for people requiring hospitalization who cannot get a hospital bad
0.5 0.5 0.5 0.5
This assumes that the fatality rate doubles once the number of hospitalizations required exceeds the hospitalization capacity

44Supplementary Tables
Table 4:Estimated impact on maternal anemia, childhood stunting and wasting, and small for gestational age (SGA) and low birthweight (LBW), using LiST, by country and quarter of 2020 and 2021
Country Indicators 20192020 2021
Q1 Q2 Q3 Q4 Q1 Q2
Afghanistan
Pregnant women with anemia 38.2 38.1 39.0 38.6 38.4 38.4 38.4
Pregnant women with iron-deficiency anemia 18.6 18.4 19.4 19.0 18.7 18.7 18.7
Women of reproductive age with anemia 41.9 41.9 42.0 41.9 41.9 41.9 41.9
Women of reproductive age with iron-deficiency anemia 19.1 19.0 19.2 19.1 19.1 19.1 19.1
Moderate wasting 7.8 8.0 7.9 7.9 7.9 8.0 8.0
Severe wasting 3.1 2.9 2.9 2.9 2.9 2.9 2.9
Moderate stunting 22.0 22.0 22.0 22.0 22.0 21.9 21.9
Severe stunting 16.0 16.0 16.0 16.0 16.0 16.0 16.0
Pre-term: Small for gestational age (SGA) 2.6 2.6 2.6 2.6 2.6 2.6 2.6
Pre-term: Appropriate for gestational age (AGA) 9.0 9.0 9.0 9.0 9.0 9.0 9.0
Term: Small for gestational age (SGA) 37.4 37.4 37.4 37.4 37.4 37.4 37.4
Term: Appropriate for gestational age (AGA) 51.1 51.1 51.1 51.1 51.1 51.1 51.1
Percent low birth weight (LBW) 23.7 23.6 23.6 23.6 23.6 23.6 23.6
Bangladesh
Pregnant women with anemia 45.7 45.2 50.8 48.3 46.7 46.7 44.9
Pregnant women with iron-deficiency anemia 22.4 21.9 27.5 24.9 23.4 23.4 21.6
Women of reproductive age with anemia 40.0 40.0 40.3 40.1 40.0 40.0 39.9
Women of reproductive age with iron-deficiency anemia 20.5 20.5 20.8 20.7 20.6 20.6 20.5
Moderate wasting 11.3 11.3 11.3 11.3 11.3 11.3 11.3
Severe wasting 3.1 3.1 3.1 3.1 3.1 3.1 3.1
Moderate stunting 24.3 24.3 24.2 24.3 24.3 24.3 24.3

45Supplementary Tables
Country Indicators 20192020 2021
Q1 Q2 Q3 Q4 Q1 Q2
Bangladesh
Severe stunting 11.5 11.5 11.5 11.5 11.5 11.5 11.5
Pre-term: Small for gestational age (SGA) 3.1 3.1 3.1 3.1 3.1 3.1 3.1
Pre-term: Appropriate for gestational age (AGA) 10.9 10.9 10.9 10.9 10.9 10.9 10.9
Term: Small for gestational age (SGA) 36.5 36.5 36.5 36.5 36.5 36.5 36.5
Term: Appropriate for gestational age (AGA) 49.5 49.5 49.5 49.5 49.5 49.5 49.5
Percent low birth weight (LBW) 24.4 24.4 24.4 24.4 24.4 24.4 24.4
India
Pregnant women with anemia 50.1 50.1 51.2 51.2 50.3 50.3 50.3
Pregnant women with iron-deficiency anemia 22.7 22.8 23.9 23.9 23.0 22.9 22.9
Women of reproductive age with anemia 51.4 51.4 51.5 51.5 51.4 51.4 51.4
Women of reproductive age with iron-deficiency anemia 21.9 21.9 21.9 21.9 21.9 21.9 21.9
Moderate wasting 13.7 13.7 13.8 13.7 13.7 13.7 13.7
Severe wasting 7.7 7.7 7.8 7.7 7.7 7.7 7.7
Moderate stunting 21.8 21.8 21.6 21.8 21.8 21.8 21.8
Severe stunting 16.1 16.1 16.0 16.1 16.1 16.1 16.1
Pre-term: Small for gestational age (SGA) 2.9 2.9 2.9 2.9 2.9 2.9 2.9
Pre-term: Appropriate for gestational age (AGA) 10.1 10.1 10.1 10.1 10.1 10.1 10.1
Term: Small for gestational age (SGA) 44.0 44.0 44.0 44.0 44.0 44.0 44.0
Term: Appropriate for gestational age (AGA) 43.0 43.0 43.0 43.0 43.0 43.0 43.0
Percent low birth weight (LBW) 27.5 27.5 27.5 27.5 27.5 27.5 27.5
Nepal
Pregnant women with anemia 40.0 44.3 48.3 44.1 41.7 38.6 41.7
Pregnant women with iron-deficiency anemia 20.3 24.6 28.6 24.4 22.0 18.9 22.0
Women of reproductive age with anemia 35.2 35.5 35.8 35.5 35.3 35.1 35.3
Women of reproductive age with iron-deficiency anemia 18.0 18.3 18.6 18.3 18.2 18.0 18.2

46Supplementary Tables
Country Indicators 20192020 2021
Q1 Q2 Q3 Q4 Q1 Q2
Nepal
Moderate wasting 7.9 7.9 7.9 7.9 7.9 7.9 7.9
Severe wasting 1.9 1.9 1.9 1.9 1.9 1.9 1.9
Moderate stunting 23.6 23.8 23.6 23.6 23.7 23.6 23.6
Severe stunting 11.5 11.6 11.5 11.5 11.6 11.6 11.6
Pre-term: Small for gestational age (SGA) 3.1 3.1 3.1 3.1 3.1 3.1 3.1
Pre-term: Appropriate for gestational age (AGA) 10.9 10.9 10.9 10.9 10.9 10.9 10.9
Term: Small for gestational age (SGA) 36.2 36.2 36.2 36.2 36.2 36.2 36.2
Term: Appropriate for gestational age (AGA) 49.8 49.8 49.8 49.8 49.8 49.8 49.8
Percent low birth weight (LBW) 24.3 24.3 24.3 24.3 24.3 24.3 24.3
Pakistan
Pregnant women with anemia 51.3 51.9 53.8 52.5 51.8 51.8 51.8
Pregnant women with iron-deficiency anemia 22.4 23.0 24.9 23.6 22.9 22.9 22.9
Women of reproductive age with anemia 52.1 52.2 52.4 52.2 52.2 52.2 52.2
Women of reproductive age with iron-deficiency anemia 20.2 20.3 20.5 20.3 20.3 20.3 20.3
Moderate wasting 7.8 7.9 7.9 7.9 7.9 7.9 7.9
Severe wasting 3.4 3.3 3.4 3.3 3.3 3.3 3.3
Moderate stunting 20.9 20.9 20.9 20.9 20.9 20.9 20.9
Severe stunting 23.4 23.4 23.3 23.4 23.4 23.4 23.4
Pre-term: Small for gestational age (SGA) 3.5 3.5 3.5 3.5 3.5 3.5 3.5
Pre-term: Appropriate for gestational age (AGA) 12.3 12.3 12.3 12.3 12.3 12.3 12.3
Term: Small for gestational age (SGA) 43.5 43.5 43.5 43.5 43.5 43.5 43.5
Term: Appropriate for gestational age (AGA) 40.7 40.8 40.7 40.8 40.8 40.8 40.8
Percent low birth weight (LBW) 28.6 28.6 28.6 28.6 28.6 28.6 28.6
Sri Lanka Pregnant women with anemia 35.4 37.5 36.1 35.8 35.6 35.6 35.6

47Supplementary Tables
Country Indicators 20192020 2021
Q1 Q2 Q3 Q4 Q1 Q2
Sri Lanka
Pregnant women with iron-deficiency anemia 22.3 24.3 23.0 22.7 22.4 22.4 22.4
Women of reproductive age with anemia 32.7 32.8 32.7 32.7 32.7 32.7 32.7
Women of reproductive age with iron-deficiency anemia 17.7 17.8 17.7 17.7 17.7 17.7 17.7
Moderate wasting 7.7 7.8 7.8 7.8 7.8 7.8 7.8
Severe wasting 3.0 3.0 3.0 3.0 3.0 3.0 3.0
Moderate stunting 22.2 22.2 22.2 22.2 22.2 22.2 22.2
Severe stunting 16.2 16.2 16.2 16.2 16.2 16.2 16.2
Pre-term: Small for gestational age (SGA) 2.4 2.4 2.4 2.4 2.4 2.4 2.4
Pre-term: Appropriate for gestational age (AGA) 8.3 8.3 8.3 8.3 8.3 8.3 8.3
Term: Small for gestational age (SGA) 21.9 21.9 21.9 21.9 21.9 21.9 21.9
Term: Appropriate for gestational age (AGA) 67.4 67.4 67.4 67.4 67.4 67.4 67.4
Percent low birth weight (LBW) 16.0 16.0 16.0 16.0 16.0 16.0 16.0
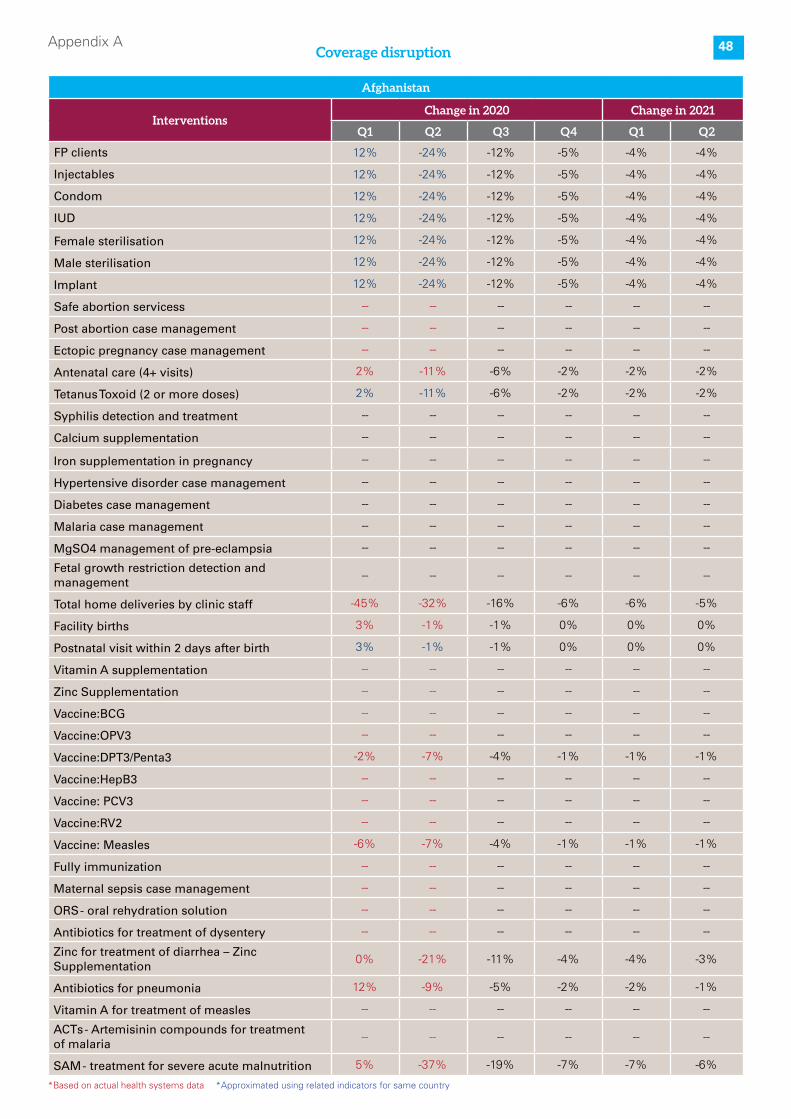
48Appendix ACoverage disruption
Pakistan
InterventionsChange in 2020 Change in 2021
Q1 Q2 Q3 Q4 Q1 Q2
FP clients -31% -78% -39% -16% -14% -12%
Injectables -24% -68% -34% -14% -12% -11%
Condom -15% -87% -44% -17% -16% -14%
IUD -13% -81% -41% -16% -15% -13%
Female sterilisation -27% -88% -44% -18% -16% -14%
Male sterilisation -29% -96% -48% -19% -17% -15%
Implant -65% -79% -40% -16% -14% -13%
safe abortion servicess -- -- -- -- -- --
Post abortion case management -3% -55% -27% -11% -10% -9%
Ectopic pregnancy case management -- -- -- -- -- --
Antenatal care (4+ visits) -16% -66% -33% -13% -12% -11%
Tetanus Toxoid (2 or more doses) -12% -52% -26% -10% -9% -8%
Syphilis detection and treatment -- -- -- -- -- --
Calcium supplementation -- -- -- -- -- --
Iron supplementation in pregnancy -- -- -- -- -- --
Hypertensive disorder case management -- -- -- -- -- --
Diabetes case management -- -- -- -- -- --
Malaria case management -- -- -- -- -- --
MgSO4 management of pre-eclampsia -- -- -- -- -- --
Fetal growth restriction detection and management
-- -- -- -- -- --
Total home deliveries by clinic staff -- -- -- -- -- --
Facility births -3% -53% -26% -11% -10% -8%
Postnatal visit within 2 days after birth 8% -52% -26% -10% -9% -8%
Vitamin A supplementation -- -- -- -- -- --
Zinc Supplementation -- -- -- -- -- --
Vaccine:BCG -- -- -- -- -- --
Vaccine:OPV3 -- -- -- -- -- --
Vaccine:DPT3/Penta3 -24% -67% -33% -13% -12% -11%
Vaccine:HepB3 -- -- -- -- -- --
Vaccine: PCV3 -- -- -- -- -- --
Vaccine:RV2 -- -- -- -- -- --
Vaccine: Measles -15% -53% -26% -11% -9% -8%
Fully immunization 0% -51% -26% -10% -9% -8%
Maternal sepsis case management -- -- -- -- -- --
ORS - oral rehydration solution -- -- -- -- -- --
Antibiotics for treatment of dysentery -- -- -- -- -- --
Zinc for treatment of diarrhea – Zinc Supplementation
-12% -69% -34% -14% -12% -11%
Antibiotics for pneumonia -16% -74% -37% -15% -13% -12%
Vitamin A for treatment of measles -- -- -- -- -- --
ACTs - Artemisinin compounds for treatment of malaria
-- -- -- -- -- --
SAM - treatment for severe acute malnutrition 36% -67% -34% -13% -12% -11%
Afghanistan
InterventionsChange in 2020 Change in 2021
Q1 Q2 Q3 Q4 Q1 Q2
FP clients 12% -24% -12% -5% -4% -4%
Injectables 12% -24% -12% -5% -4% -4%
Condom 12% -24% -12% -5% -4% -4%
IUD 12% -24% -12% -5% -4% -4%
Female sterilisation 12% -24% -12% -5% -4% -4%
Male sterilisation 12% -24% -12% -5% -4% -4%
Implant 12% -24% -12% -5% -4% -4%
Safe abortion servicess -- -- -- -- -- --
Post abortion case management -- -- -- -- -- --
Ectopic pregnancy case management -- -- -- -- -- --
Antenatal care (4+ visits) 2% -11% -6% -2% -2% -2%
Tetanus Toxoid (2 or more doses) 2% -11% -6% -2% -2% -2%
Syphilis detection and treatment -- -- -- -- -- --
Calcium supplementation -- -- -- -- -- --
Iron supplementation in pregnancy -- -- -- -- -- --
Hypertensive disorder case management -- -- -- -- -- --
Diabetes case management -- -- -- -- -- --
Malaria case management -- -- -- -- -- --
MgSO4 management of pre-eclampsia -- -- -- -- -- --
Fetal growth restriction detection and management
-- -- -- -- -- --
Total home deliveries by clinic staff -45% -32% -16% -6% -6% -5%
Facility births 3% -1% -1% 0% 0% 0%
Postnatal visit within 2 days after birth 3% -1% -1% 0% 0% 0%
Vitamin A supplementation -- -- -- -- -- --
Zinc Supplementation -- -- -- -- -- --
Vaccine:BCG -- -- -- -- -- --
Vaccine:OPV3 -- -- -- -- -- --
Vaccine:DPT3/Penta3 -2% -7% -4% -1% -1% -1%
Vaccine:HepB3 -- -- -- -- -- --
Vaccine: PCV3 -- -- -- -- -- --
Vaccine:RV2 -- -- -- -- -- --
Vaccine: Measles -6% -7% -4% -1% -1% -1%
Fully immunization -- -- -- -- -- --
Maternal sepsis case management -- -- -- -- -- --
ORS - oral rehydration solution -- -- -- -- -- --
Antibiotics for treatment of dysentery -- -- -- -- -- --
Zinc for treatment of diarrhea – Zinc Supplementation
0% -21% -11% -4% -4% -3%
Antibiotics for pneumonia 12% -9% -5% -2% -2% -1%
Vitamin A for treatment of measles -- -- -- -- -- --
ACTs - Artemisinin compounds for treatment of malaria
-- -- -- -- -- --
SAM - treatment for severe acute malnutrition 5% -37% -19% -7% -7% -6%
*Based on actual health systems data *Approximated using related indicators for same country

49Appendix A
Bangladesh
InterventionsChange in 2020 Change in 2021
Q1 Q2 Q3 Q4 Q1 Q2
FP clients -31% -78% -39% -16% -14% -12%
Injectables -24% -68% -34% -14% -12% -11%
Condom -15% -87% -44% -17% -16% -14%
IUD -13% -81% -41% -16% -15% -13%
Female sterilisation -27% -88% -44% -18% -16% -14%
Male sterilisation -29% -96% -48% -19% -17% -15%
Implant -65% -79% -40% -16% -14% -13%
Safe abortion servicess -- -- -- -- -- --
Post abortion case management -- -- -- -- -- --
Ectopic pregnancy case management -- -- -- -- -- --
Antenatal care (4+ visits) 5% -50% -25% -10% -9% -8%
Tetanus Toxoid (2 or more doses) 5% -50% -25% -10% -9% -8%
Syphilis detection and treatment -- -- -- -- -- --
Calcium supplementation -- -- -- -- -- --
Iron supplementation in pregnancy -- -- -- -- -- --
Hypertensive disorder case management -- -- -- -- -- --
Diabetes case management -- -- -- -- -- --
Malaria case management -- -- -- -- -- --
MgSO4 management of pre-eclampsia -- -- -- -- -- --
Fetal growth restriction detection and management
-- -- -- -- -- --
Total home deliveries by clinic staff -- -- -- -- -- --
Facility births -11% -52% -26% -10% -9% -8%
Postnatal visit within 2 days after birth -21% -51% -25% -10% -9% -8%
Vitamin A supplementation -- -- -- -- -- --
Zinc Supplementation -- -- -- -- -- --
Vaccine:BCG -- -- -- -- -- --
Vaccine:OPV3 -- -- -- -- -- --
Vaccine:DPT3/Penta3 -6% -37% -18% -7% -7% -6%
Vaccine:HepB3 -- -- -- -- -- --
Vaccine: PCV3 -- -- -- -- -- --
Vaccine:RV2 -- -- -- -- -- --
Vaccine: Measles -6% -37% -18% -7% -7% -6%
Fully immunization -- -- -- -- -- --
Maternal sepsis case management -- -- -- -- -- --
ORS - oral rehydration solution -- -- -- -- -- --
Antibiotics for treatment of dysentery -- -- -- -- -- --
Zinc for treatment of diarrhea – Zinc Supplementation
-5% -66% -33% -13% -12% -11%
Antibiotics for pneumonia -14% -74% -37% -15% -13% -12%
Vitamin A for treatment of measles -- -- -- -- -- --
ACTs - Artemisinin compounds for treatment of malaria
-- -- -- -- -- --
SAM - treatment for severe acute malnutrition -22% -82% -41% -16% -15% -13%
*Based on actual health systems data *Approximated using related indicators for same country
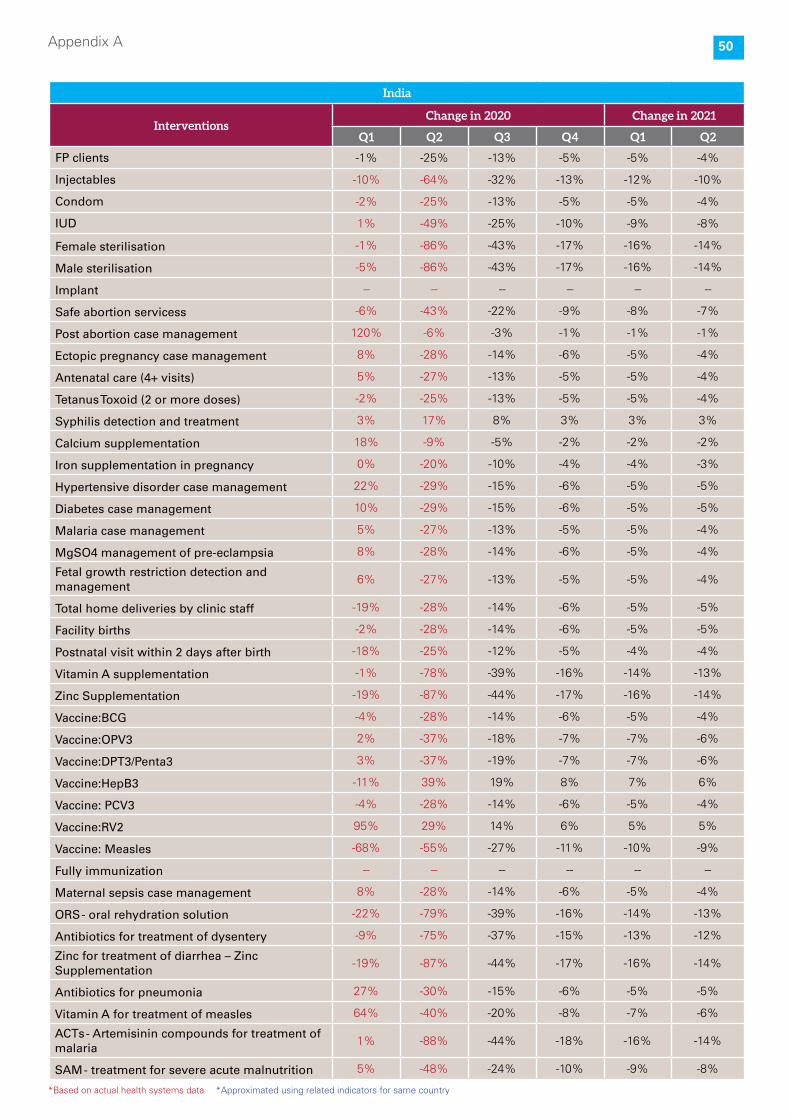
50Appendix A
India
InterventionsChange in 2020 Change in 2021
Q1 Q2 Q3 Q4 Q1 Q2
FP clients -1% -25% -13% -5% -5% -4%
Injectables -10% -64% -32% -13% -12% -10%
Condom -2% -25% -13% -5% -5% -4%
IUD 1% -49% -25% -10% -9% -8%
Female sterilisation -1% -86% -43% -17% -16% -14%
Male sterilisation -5% -86% -43% -17% -16% -14%
Implant -- -- -- -- -- --
Safe abortion servicess -6% -43% -22% -9% -8% -7%
Post abortion case management 120% -6% -3% -1% -1% -1%
Ectopic pregnancy case management 8% -28% -14% -6% -5% -4%
Antenatal care (4+ visits) 5% -27% -13% -5% -5% -4%
Tetanus Toxoid (2 or more doses) -2% -25% -13% -5% -5% -4%
Syphilis detection and treatment 3% 17% 8% 3% 3% 3%
Calcium supplementation 18% -9% -5% -2% -2% -2%
Iron supplementation in pregnancy 0% -20% -10% -4% -4% -3%
Hypertensive disorder case management 22% -29% -15% -6% -5% -5%
Diabetes case management 10% -29% -15% -6% -5% -5%
Malaria case management 5% -27% -13% -5% -5% -4%
MgSO4 management of pre-eclampsia 8% -28% -14% -6% -5% -4%
Fetal growth restriction detection and management
6% -27% -13% -5% -5% -4%
Total home deliveries by clinic staff -19% -28% -14% -6% -5% -5%
Facility births -2% -28% -14% -6% -5% -5%
Postnatal visit within 2 days after birth -18% -25% -12% -5% -4% -4%
Vitamin A supplementation -1% -78% -39% -16% -14% -13%
Zinc Supplementation -19% -87% -44% -17% -16% -14%
Vaccine:BCG -4% -28% -14% -6% -5% -4%
Vaccine:OPV3 2% -37% -18% -7% -7% -6%
Vaccine:DPT3/Penta3 3% -37% -19% -7% -7% -6%
Vaccine:HepB3 -11% 39% 19% 8% 7% 6%
Vaccine: PCV3 -4% -28% -14% -6% -5% -4%
Vaccine:RV2 95% 29% 14% 6% 5% 5%
Vaccine: Measles -68% -55% -27% -11% -10% -9%
Fully immunization -- -- -- -- -- --
Maternal sepsis case management 8% -28% -14% -6% -5% -4%
ORS - oral rehydration solution -22% -79% -39% -16% -14% -13%
Antibiotics for treatment of dysentery -9% -75% -37% -15% -13% -12%
Zinc for treatment of diarrhea – Zinc Supplementation
-19% -87% -44% -17% -16% -14%
Antibiotics for pneumonia 27% -30% -15% -6% -5% -5%
Vitamin A for treatment of measles 64% -40% -20% -8% -7% -6%
ACTs - Artemisinin compounds for treatment of malaria
1% -88% -44% -18% -16% -14%
SAM - treatment for severe acute malnutrition 5% -48% -24% -10% -9% -8%
*Based on actual health systems data *Approximated using related indicators for same country

51Appendix A
Nepal
InterventionsChange in 2020 Change in 2021
Q1 Q2 Q3 Q4 Q1 Q2
FP clients -24% -52% -26% -10% -9% -8%
Injectables -24% -52% -26% -10% -9% -8%
Condom -24% -52% -26% -10% -9% -8%
IUD -35% -61% -30% -12% -11% -10%
Female sterilisation -24% -52% -26% -10% -9% -8%
Male sterilisation -24% -52% -26% -10% -9% -8%
Implant -13% -43% -22% -9% -8% -7%
Safe abortion servicess -- -- -- -- -- --
Post abortion case management -- -- -- -- -- --
Ectopic pregnancy case management -- -- -- -- -- --
Antenatal care (4+ visits) -9% -29% -15% -6% -5% -5%
Tetanus Toxoid (2 or more doses) -9% -29% -15% -6% -5% -5%
Syphilis detection and treatment -- -- -- -- -- --
Calcium supplementation -- -- -- -- -- --
Iron supplementation in pregnancy -14% -26% -13% -5% -5% -4%
Hypertensive disorder case management -- -- -- -- -- --
Diabetes case management -- -- -- -- -- --
Malaria case management -- -- -- -- -- --
MgSO4 management of pre-eclampsia -- -- -- -- -- --
Fetal growth restriction detection and management
-- -- -- -- -- --
Total home deliveries by clinic staff -- -- -- -- -- --
Facility births -7% -27% -13% -5% -5% -4%
Postnatal visit within 2 days after birth -7% -15% -8% -3% -3% -2%
Vitamin A supplementation -91% -3% -1% -1% 0% 0%
Zinc Supplementation -- -- -- -- -- --
Vaccine:BCG -- -- -- -- -- --
Vaccine:OPV3 -- -- -- -- -- --
Vaccine:DPT3/Penta3 -23% 3% 3% 3% 3% 2%
Vaccine:HepB3 -- -- -- -- -- --
Vaccine: PCV3 -- -- -- -- -- --
Vaccine:RV2 -- -- -- -- -- --
Vaccine: Measles -23% 3% 3% 3% 3% 2%
Fully immunization -- -- -- -- -- --
Maternal sepsis case management -- -- -- -- -- --
ORS - oral rehydration solution -- -- -- -- -- --
Antibiotics for treatment of dysentery -- -- -- -- -- --
Zinc for treatment of diarrhea – Zinc Supplementation
-12% -35% -18% -7% -6% -6%
Antibiotics for pneumonia -12% -49% -24% -10% -9% -8%
Vitamin A for treatment of measles -- -- -- -- -- --
ACTs - Artemisinin compounds for treatment of malaria
-- -- -- -- -- --
SAM - treatment for severe acute malnutrition -53% -83% -42% -17% -15% -13%
*Based on actual health systems data *Approximated using related indicators for same country

52Appendix A
Pakistan
InterventionsChange in 2020 Change in 2021
Q1 Q2 Q3 Q4 Q1 Q2
FP clients -31% -78% -39% -16% -14% -12%
Injectables -24% -68% -34% -14% -12% -11%
Condom -15% -87% -44% -17% -16% -14%
IUD -13% -81% -41% -16% -15% -13%
Female sterilisation -27% -88% -44% -18% -16% -14%
Male sterilisation -29% -96% -48% -19% -17% -15%
Implant -65% -79% -40% -16% -14% -13%
Safe abortion servicess -- -- -- -- -- --
Post abortion case management -3% -55% -27% -11% -10% -9%
Ectopic pregnancy case management -- -- -- -- -- --
Antenatal care (4+ visits) -16% -66% -33% -13% -12% -11%
Tetanus Toxoid (2 or more doses) -12% -52% -26% -10% -9% -8%
Syphilis detection and treatment -- -- -- -- -- --
Calcium supplementation -- -- -- -- -- --
Iron supplementation in pregnancy -- -- -- -- -- --
Hypertensive disorder case management -- -- -- -- -- --
Diabetes case management -- -- -- -- -- --
Malaria case management -- -- -- -- -- --
MgSO4 management of pre-eclampsia -- -- -- -- -- --
Fetal growth restriction detection and management
-- -- -- -- -- --
Total home deliveries by clinic staff -- -- -- -- -- --
Facility births -3% -53% -26% -11% -10% -8%
Postnatal visit within 2 days after birth 8% -52% -26% -10% -9% -8%
Vitamin A supplementation -- -- -- -- -- --
Zinc Supplementation -- -- -- -- -- --
Vaccine:BCG -- -- -- -- -- --
Vaccine:OPV3 -- -- -- -- -- --
Vaccine:DPT3/Penta3 -24% -67% -33% -13% -12% -11%
Vaccine:HepB3 -- -- -- -- -- --
Vaccine: PCV3 -- -- -- -- -- --
Vaccine:RV2 -- -- -- -- -- --
Vaccine: Measles -15% -53% -26% -11% -9% -8%
Fully immunization 0% -51% -26% -10% -9% -8%
Maternal sepsis case management -- -- -- -- -- --
ORS - oral rehydration solution -- -- -- -- -- --
Antibiotics for treatment of dysentery -- -- -- -- -- --
Zinc for treatment of diarrhea – Zinc Supplementation
-12% -69% -34% -14% -12% -11%
Antibiotics for pneumonia -16% -74% -37% -15% -13% -12%
Vitamin A for treatment of measles -- -- -- -- -- --
ACTs - Artemisinin compounds for treatment of malaria
-- -- -- -- -- --
SAM - treatment for severe acute malnutrition 36% -67% -34% -13% -12% -11%
*Based on actual health systems data *Approximated using related indicators for same country

53Appendix A
Sri Lanka
InterventionsChange in 2020 Change in 2021
Q1 Q2 Q3 Q4 Q1 Q2
FP clients -17% -7% -3% -1% -1% -1%
Injectables -22% -12% -6% -2% -2% -2%
Condom -11% 3% 2% 1% 1% 1%
IUD -30% -34% -17% -7% -6% -5%
Female sterilisation -1% -8% -4% -2% -1% -1%
Male sterilisation -21% -55% -27% -11% -10% -9%
Implant -19% -9% -4% -2% -2% -1%
Safe abortion servicess -- -- -- -- -- --
Post abortion case management -- -- -- -- -- --
Ectopic pregnancy case management -- -- -- -- -- --
Antenatal care (4+ visits) -6% -2% -1% 0% 0% 0%
Tetanus Toxoid (2 or more doses) -6% -2% -1% 0% 0% 0%
Syphilis detection and treatment -- -- -- -- -- --
Calcium supplementation -- -- -- -- -- --
Iron supplementation in pregnancy -- -- -- -- -- --
Hypertensive disorder case management -- -- -- -- -- --
Diabetes case management -- -- -- -- -- --
Malaria case management -- -- -- -- -- --
MgSO4 management of pre-eclampsia -- -- -- -- -- --
Fetal growth restriction detection and management
-- -- -- -- -- --
Total home deliveries by clinic staff -- -- -- -- -- --
Facility births -6% -2% -1% 0% 0% 0%
Postnatal visit within 2 days after birth -6% -2% -1% 0% 0% 0%
Vitamin A supplementation -19% 3% 1% 1% 1% 0%
Zinc Supplementation -- -- -- -- -- --
Vaccine:BCG -- -- -- -- -- --
Vaccine:OPV3 -- -- -- -- -- --
Vaccine:DPT3/Penta3 -14% -27% -13% -5% -5% -4%
Vaccine:HepB3 -- -- -- -- -- --
Vaccine: PCV3 -- -- -- -- -- --
Vaccine:RV2 -- -- -- -- -- --
Vaccine: Measles -12% -23% -12% -5% -4% -4%
Fully immunization -- -- -- -- -- --
Maternal sepsis case management -- -- -- -- -- --
ORS - oral rehydration solution -- -- -- -- -- --
Antibiotics for treatment of dysentery -- -- -- -- -- --
Zinc for treatment of diarrhea – Zinc Supplementation
-7% -48% -24% -10% -9% -8%
Antibiotics for pneumonia -7% -51% -26% -10% -9% -8%
Vitamin A for treatment of measles -- -- -- -- -- --
ACTs - Artemisinin compounds for treatment of malaria
-- -- -- -- -- --
SAM - treatment for severe acute malnutrition -8% -67% -34% -13% -12% -11%
*Based on actual health systems data *Approximated using related indicators for same country

54Appendix B
Intervention No additional mitigation Hand Hygiene
Country MonthCumulative
DeathsHospitalizations ICUs
Cumulative
DeathsHospitalizations ICUs
India
1/Sep/20 65,228 NA NA 65,228 NA NA
1/Oct/20 103,994 67,613 11,932 77,784 25,700 4,535
1/Nov/20 139,937 76,074 13,425 90,662 21,920 3,868
1/Dec/20 178,008 82,772 14,607 100,901 18,487 3,262
1/Jan/21 222,202 87,896 15,511 109,545 14,824 2,616
1/Feb/21 267,186 88,209 15,566 116,676 12,170 2,148
1/Mar/21 307,089 84,831 14,970 122,100 10,026 1,769
1/Apr/21 348,060 77,316 13,644 126,942 7,797 1,376
1/May/21 383,795 70,447 12,432 130,592 6,555 1,157
1/Jun/21 418,121 61,320 10,821 133,519 5,214 920
1/Jul/21 445,995 52,311 9,231 135,935 4,275 754
1/Aug/21 470,231 43,937 7,754 138,185 3,649 644
1/Sep/21 491,117 36,442 6,431 139,977 3,014 532
Intervention No additional mitigation Hand Hygiene
Country MonthCumulative
DeathsHospitalizations ICUs
Cumulative
DeathsHospitalizations ICUs
Pakistan
1/Sep/20 6,298 NA NA 6,298 NA NA
1/Oct/20 7,374 398 70 7,220 388 68
1/Nov/20 7,400 351 62 7,245 304 54
1/Dec/20 7,409 404 71 7,256 292 51
1/Jan/21 7,423 465 82 7,267 261 46
1/Feb/21 7,434 503 89 7,273 242 43
1/Mar/21 7,446 552 97 7,280 220 39
1/Apr/21 7,464 522 92 7,285 219 39
1/May/21 7,473 487 86 7,288 205 36
1/Jun/21 7,481 450 79 7,292 202 36
1/Jul/21 7,487 380 67 7,296 184 33
1/Aug/21 7,499 332 59 7,301 170 30
1/Sep/21 7,507 294 52 7,306 157 28
Smart Lockdowns Masks All strategies
Cumulative
DeathsHospitalizations ICUs
Cumulative
DeathsHospitalizations ICUs
Cumulative
DeathsHospitalizations ICUs
65,228 NA NA 65,228 NA NA 65,228 NA NA
91,294 44,743 7,896 83,783 33,395 5,893 64,676 12,821 2,262
114,432 43,770 7,724 100,998 30,865 5,447 71,214 9,104 1,607
135,828 42,001 7,412 115,771 26,972 4,760 75,781 6,354 1,121
156,109 39,629 6,993 128,184 23,101 4,077 78,916 4,283 756
174,339 36,225 6,393 139,125 20,131 3,552 81,267 3,079 543
189,569 32,850 5,797 147,704 16,959 2,993 82,653 2,141 378
204,667 28,577 5,043 155,553 14,509 2,560 83,721 1,580 279
217,388 24,415 4,309 162,042 12,363 2,182 84,526 1,048 185
228,789 20,701 3,653 168,005 10,357 1,828 85,050 721 127
238,071 17,314 3,055 172,840 8,383 1,479 85,412 538 95
245,890 13,955 2,463 176,663 6,727 1,187 85,658 383 68
252,419 11,724 2,069 179,485 5,200 918 85,821 215 38
Smart Lockdowns Masks All strategies
Cumulative
DeathsHospitalizations ICUs
Cumulative
DeathsHospitalizations ICUs
Cumulative
DeathsHospitalizations ICUs
6,298 NA NA 6,298 NA NA 6,298 NA NA
7,004 340 60 7,154 387 68 7,332 391 69
7,015 315 56 7,175 350 62 7,354 295 52
7,030 340 60 7,183 306 54 7,361 227 40
7,042 374 66 7,193 306 54 7,366 174 31
7,049 373 66 7,205 307 54 7,369 147 26
7,055 388 68 7,215 278 49 7,372 149 26
7,074 369 65 7,222 260 46 7,377 140 25
7,090 346 61 7,228 253 45 7,385 120 21
7,094 333 59 7,230 255 45 7,388 114 20
7,099 289 51 7,236 219 39 7,388 129 23
7,103 258 46 7,240 201 36 7,388 118 21
7,108 238 42 7,242 185 33 7,390 140 25
Deaths and hospitalizations

55Appendix B
Intervention No additional mitigation Hand Hygiene
Country MonthCumulative
DeathsHospitalizations ICUs
Cumulative
DeathsHospitalizations ICUs
Bangladesh
1/Sep/20 4,281 NA NA 4,281 NA NA
1/Oct/20 5,086 444 78 5,032 468 83
1/Nov/20 5,905 427 75 5,921 431 76
1/Dec/20 6,656 316 56 6,631 362 64
1/Jan/21 7,266 341 60 7,253 304 54
1/Feb/21 7,892 298 53 7,853 263 46
1/Mar/21 8,378 268 47 8,312 242 43
1/Apr/21 8,840 191 34 8,797 234 41
1/May/21 9,209 193 34 9,186 191 34
1/Jun/21 9,564 176 31 9,506 153 27
1/Jul/21 9,863 171 30 9,811 166 29
1/Aug/21 10,159 139 25 10,136 143 25
1/Sep/21 10,412 110 19 10,410 123 22
Intervention No additional mitigation Hand Hygiene
Country MonthCumulative
DeathsHospitalizations ICUs
Cumulative
DeathsHospitalizations ICUs
Nepal
1/Sep/20 228 NA NA 228 NA NA
1/Oct/20 424 65 12 417 60 11
1/Nov/20 499 50 9 486 47 8
1/Dec/20 555 38 7 538 39 7
1/Jan/21 596 30 5 580 28 5
1/Feb/21 629 23 4 611 22 4
1/Mar/21 654 19 3 635 19 3
1/Apr/21 675 15 3 658 16 3
1/May/21 690 12 2 675 10 2
1/Jun/21 703 8 1 685 8 1
1/Jul/21 711 7 1 694 7 1
1/Aug/21 717 5 1 700 6 1
1/Sep/21 723 5 1 706 5 1
Smart Lockdowns Masks All strategies
Cumulative
DeathsHospitalizations ICUs
Cumulative
DeathsHospitalizations ICUs
Cumulative
DeathsHospitalizations ICUs
4,281 NA NA 4,281 NA NA 4,281 NA NA
4,972 448 79 5,164 462 81 4,973 466 82
5,812 395 70 5,999 412 73 5,839 432 76
6,525 366 65 6,675 364 64 6,623 370 65
7,230 352 62 7,345 305 54 7,335 323 57
7,830 280 49 7,895 267 47 7,940 271 48
8,295 243 43 8,320 239 42 8,345 250 44
8,753 233 41 8,767 221 39 8,838 229 40
9,166 201 36 9,154 204 36 9,253 187 33
9,486 168 30 9,559 177 31 9,614 165 29
9,770 136 24 9,868 127 22 9,916 162 29
10,043 141 25 10,135 146 26 10,217 124 22
10,311 122 22 10,382 105 18 10,462 96 17
Smart Lockdowns Masks All strategies
Cumulative
DeathsHospitalizations ICUs
Cumulative
DeathsHospitalizations ICUs
Cumulative
DeathsHospitalizations ICUs
228 NA NA 228 NA NA 228 NA NA
427 61 11 427 61 11 422 57 10
496 47 8 494 48 8 487 46 8
548 36 6 546 36 6 536 33 6
587 28 5 587 29 5 573 28 5
618 22 4 622 23 4 602 21 4
641 18 3 643 18 3 625 16 3
662 14 2 664 15 3 644 13 2
676 11 2 681 11 2 659 9 2
688 9 2 692 11 2 670 8 1
696 6 1 703 7 1 678 6 1
704 5 1 711 5 1 686 5 1
710 4 1 716 4 1 691 4 1
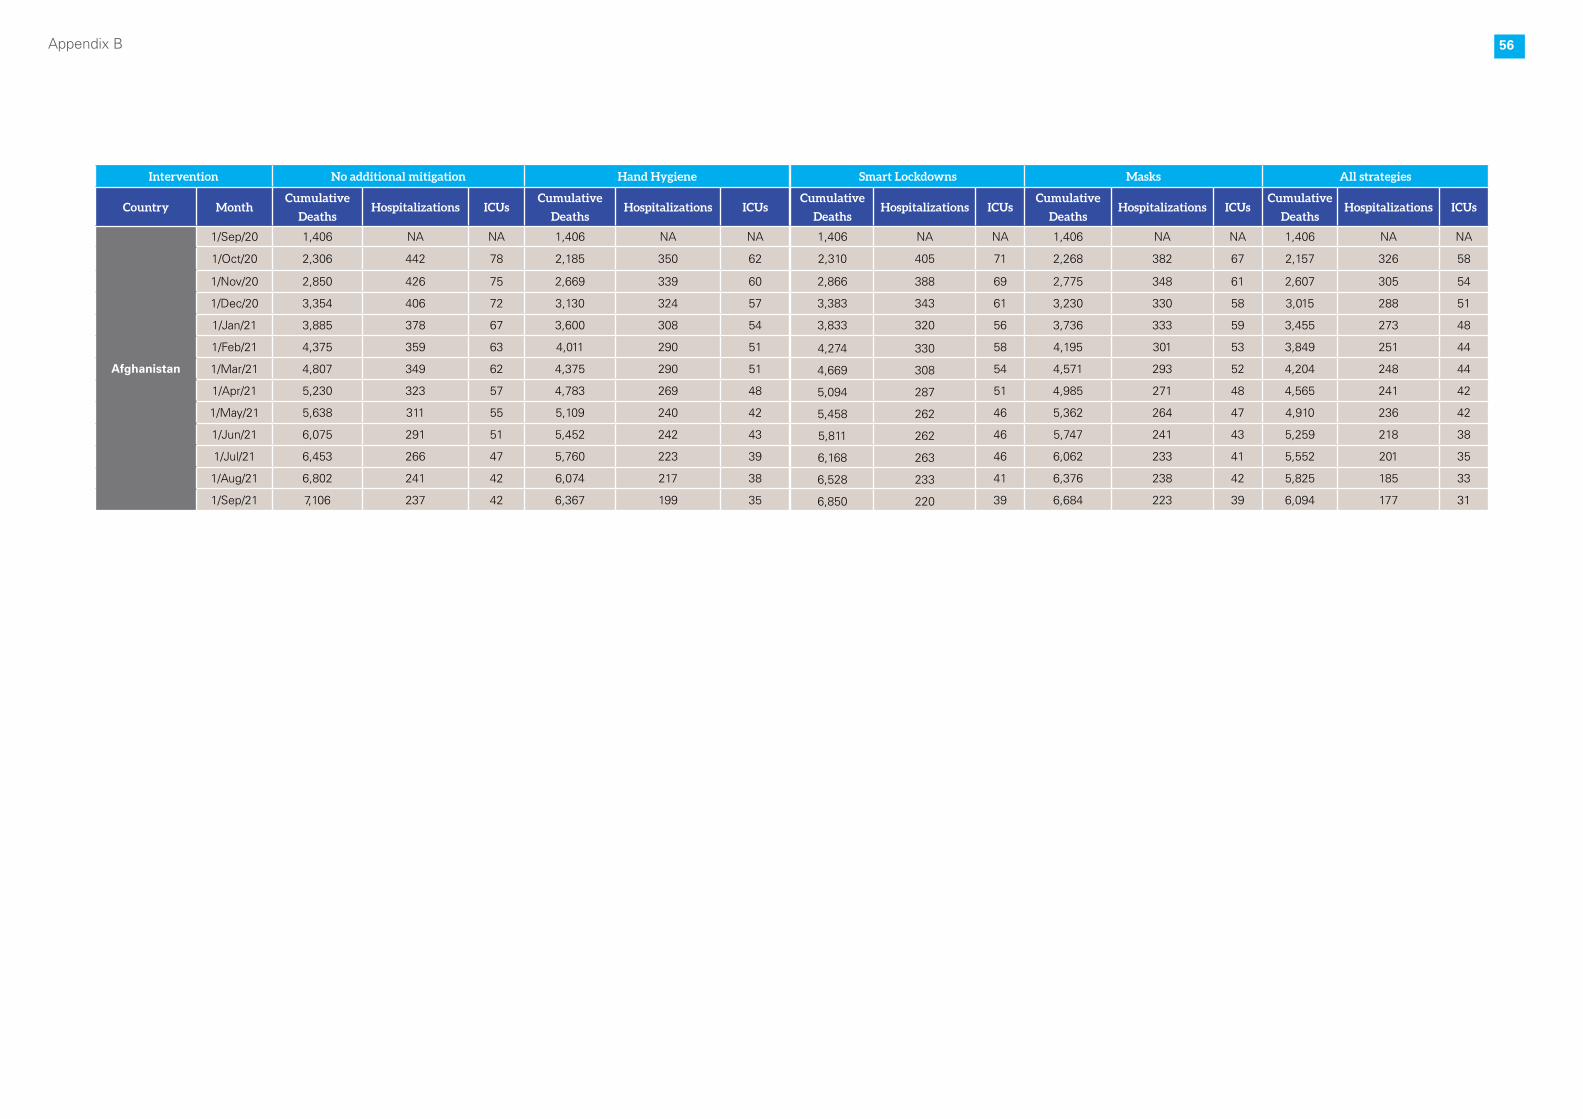
56Appendix B
Intervention No additional mitigation Hand Hygiene
Country MonthCumulative
DeathsHospitalizations ICUs
Cumulative
DeathsHospitalizations ICUs
Afghanistan
1/Sep/20 1,406 NA NA 1,406 NA NA
1/Oct/20 2,306 442 78 2,185 350 62
1/Nov/20 2,850 426 75 2,669 339 60
1/Dec/20 3,354 406 72 3,130 324 57
1/Jan/21 3,885 378 67 3,600 308 54
1/Feb/21 4,375 359 63 4,011 290 51
1/Mar/21 4,807 349 62 4,375 290 51
1/Apr/21 5,230 323 57 4,783 269 48
1/May/21 5,638 311 55 5,109 240 42
1/Jun/21 6,075 291 51 5,452 242 43
1/Jul/21 6,453 266 47 5,760 223 39
1/Aug/21 6,802 241 42 6,074 217 38
1/Sep/21 7,106 237 42 6,367 199 35
Smart Lockdowns Masks All strategies
Cumulative
DeathsHospitalizations ICUs
Cumulative
DeathsHospitalizations ICUs
Cumulative
DeathsHospitalizations ICUs
1,406 NA NA 1,406 NA NA 1,406 NA NA
2,310 405 71 2,268 382 67 2,157 326 58
2,866 388 69 2,775 348 61 2,607 305 54
3,383 343 61 3,230 330 58 3,015 288 51
3,833 320 56 3,736 333 59 3,455 273 48
4,274 330 58 4,195 301 53 3,849 251 44
4,669 308 54 4,571 293 52 4,204 248 44
5,094 287 51 4,985 271 48 4,565 241 42
5,458 262 46 5,362 264 47 4,910 236 42
5,811 262 46 5,747 241 43 5,259 218 38
6,168 263 46 6,062 233 41 5,552 201 35
6,528 233 41 6,376 238 42 5,825 185 33
6,850 220 39 6,684 223 39 6,094 177 31

57Appendix B
Direct and indirect effects of the COVID-19 pandemic in South Asia
For Further Information:UNICEF Regional Office for South Asia (ROSA)P.O. Box 5815, Lekhnath Marg, Kathmandu, NepalTel: +977-1-4417082 Email: [email protected] Website: www.unicef.org/rosa/
Copyright © 2022 FDOKUMEN