a study of information literacy skills of farmers of koppal and ...
Upload
khangminh22Category
view
4download
0
education sciences
Article
Direct and Indirect Effects of Literacy Skills andWriting Fluency on Writing Quality AcrossThree Genres
Gary A. Troia 1,* , Julie S. Brehmer 1, Kaitlin Glause 2, Heather L. Reichmuth 1 andFrank Lawrence 1
1 College of Education, Michigan State University, East Lansing, MI 48824, USA;[email protected] (J.S.B.); [email protected] (H.L.R.); [email protected] (F.L.)
2 English Department, Millikin University, Decatur, IL 62522, USA; [email protected]* Correspondence: [email protected]
Received: 2 October 2020; Accepted: 19 October 2020; Published: 22 October 2020�����������������
Abstract: Data were collected for this study early in the school year to analyze the direct and indirecteffects of word-level literacy skills (word recognition, spelling, and written vocabulary use) andhandwriting fluency on writing quality across three genres of typewritten papers. We further exploredwhether typing fluency and text generation fluency mediated the effects. Finally, we examined whetherthere was any difference in the effects across three writing genres. Fourth and fifth graders (N = 175)from 21 typical classrooms in 12 different Midwestern U.S. schools participated. Regression pathanalyses were employed and revealed that word-level literacy skills had both significant direct andserial indirect effects on quality, via typing fluency and then text generation fluency (text length)when controlling for handwriting fluency. Further, handwriting fluency had no direct effect whencontrolling for word-level literacy skills but did have a significant serial indirect effect on writingquality via typing fluency then text generation fluency. Results indicate that handwriting fluencymatters, even when composing on the computer. Stronger transcription fluency, particularly byhand, leads to higher quality writing, likely because less cognitive effort is devoted to transcription.This study adds to limited research on the cross-modal effects of transcription on writing quality.
Keywords: handwriting fluency; typing fluency; writing quality; serial mediation; path analysis
1. Introduction
The simple view of writing [1–3] postulates that writing is represented by an integrated array ofknowledge and skills executed during writing tasks within one’s limited capacity working memory.This array of knowledge and skills includes transcription (spelling, handwriting, and keyboarding),text generation (ideation and language formulation at the word, sentence, and discourse levels),and executive functions, initially supported by others, that coordinate transcription and text generation(e.g., conscious control of attention, concentration, and effort as well as flexible self-regulation ofwriting-related behaviors, thoughts, and emotions). Transcription skills and knowledge, in particular,are foundational to writing development and performance [4], as they exert a strong influence over thesuccess of text generation processes in writing tasks (at least those that do not rely on dictation) due tolimited cognitive capacity. Thus, unless and until transcription is automatized, written expression islikely to be more limited in length and quality [5–8].
1.1. Relationships between Transcription and Writing Performance
The importance of transcription is demonstrated by studies in which handwriting fluency andboth isolated and contextual spelling proficiency have been found to explain a significant, non-trivial
Educ. Sci. 2020, 10, 297; doi:10.3390/educsci10110297 www.mdpi.com/journal/education

Educ. Sci. 2020, 10, 297 2 of 21
portion of variance in handwritten composition quality and quantity across different genres throughoutgrade school [9–15]. Moreover, teaching transcription by hand yields moderate to large effects forwriting productivity and quality [16–18]. Likewise, keyboarding (i.e., typing) fluency has a significantassociation with word-processed compositional quality and productivity and keyboarding instructionproduces at least modest effects on computer-generated writing performance [19–21]. Most relevant tothe purposes of our study, handwriting fluency is positively correlated (r = 0.38) with word-processedcomposition quality and typing fluency is positively correlated (r = 0.44) with handwritten compositionquality [20], meaning that, regardless of transcription mode, more fluent transcription by hand and/orby keyboard is associated with higher quality writing. However, research suggests that handwritingfluency may be only indirectly related to writing quality in older students cf. [13,22–24]. What remainsunclear from the extant research, which we address here, is to what extent all these aspects oftranscription (and other literacy skills) make direct and indirect contributions to writing quality, and dothese contributions differ depending on the genre of writing produced. In particular, we are interestedin examining how precisely handwriting and typing fluency (i.e., graphomotor fluency) influencecomputer-generated composition quality.
1.2. Relationships between Aspects of Transcription
There is evidence to indicate the varied aspects of transcription—spelling, handwriting,and keyboarding—are related because they rely to varying degrees on three integrated knowledgesources [19,25]: phonological (letter names and their associated sounds), orthographic (rules associatedwith combining individual letters and letter clusters to form words), and graphomotor (motor plansand movements required to produce written symbols). A meta-analysis performed by Feng, Lindner, Ji,and Joshi [10] observed a significant average weighted effect size of 0.561 for the relationship betweenhandwriting and keyboarding fluency (accuracy plus speed) and 0.431 for the relationship betweenhandwriting and keyboarding speed, but the effect size for the relationship between handwriting andkeyboarding accuracy was not significantly different from zero. The four to five studies used to calculatethese effect sizes included students in grades four and beyond, including adults. Overall, these fewresearch studies indicate that students who possess weaker handwriting fluency also generally possessweaker keyboarding fluency, at least in the absence of adequate keyboarding instruction or a history ofregular keyboard use cf. [26].
The meta-analysis conducted by Feng and colleagues [10] reported that neither the mean effect sizefor the association between spelling accuracy and handwriting fluency (0.290) nor the mean effect sizefor the relationship between spelling errors and handwriting fluency (−0.147) was significantly differentfrom zero based on seven studies located, the majority of which included students in the primary grades.Spelling accuracy and errors were derived from writing samples rather than independent measuresof spelling performance. Nevertheless, a study by Limpo, Alves, and Connelly [24], which was notincluded in the Feng et al. meta-analysis, found a significant correlation of 0.41 between handwritingfluency and composition spelling accuracy in a group of seventh and eighth-graders. The best-fittingmodel for the data suggested these were independent but correlated constructs, differentially associatedwith planning and translating, and their effects on opinion writing quality were fully mediated by thehigher-level writing processes of planning and translating (at the sentence level). Studies describingrelationships between keyboarding and spelling are relatively rare, but Cohen and Wicklund [27]reported a significant correlation of 0.37 between typing speed and spelling error recognition taskperformance among high school students. More recently, Jiménez and Hernández-Cabrera [28] reportedsignificant correlations of about 0.30 between typing fluency tasks and dictated spelling accuracy tasksin first and second graders.
Of course, relationships between the three aspects of transcription, putatively due to relianceon shared knowledge resources in long-term memory, do not mean they are executed in the samemanner or use these resources to the same degree. Handwriting, typing, and written spelling allrequire memorization and rapid recall of letter forms and planned sequential movements (graphomotor

Educ. Sci. 2020, 10, 297 3 of 21
knowledge). In fact, evidence suggests letter forms are represented in long-term memory coupledwith their associated motor movements derived through writing by hand but not typing [29–31].Spelling, however, recruits additional phonological and orthographic information, though transcribingdictated material by hand or keyboard also recruits these knowledge resources because spelling is stillinvolved. Thus, the nature of the transcription task is an important consideration—copying text andusing retrieval of rote content such as the alphabet foreground graphomotor fluency and deemphasize(but do not eliminate) phonological and orthographic processing.
Handwriting employs a stylus to transcribe language, whereas keyboarding employs key presses(and recall of the locations of specific letter keys on the keyboard). Handwriting is believed to involvemore temporally and spatially unified visual and haptic experiences than typing [32–34]. For instance,visual attention while typing (at least among those who have not developed touch typing skills) mustbe directed both at the screen and the keyboard, separating motor input from the visual output. This isa presumed reason for the observed positive effects on orthographic recall and encoding conveyedby handwriting but not typing noted by Longcamp and colleagues [29–32]. More generally, typing isexecuted with less precise motor control and coordination than handwriting, demonstrated by thesheer volume of typographic errors committed by most individuals. Consequently, while typingand handwriting speed and fluency do appear to be related, there is reason to believe they involvesomewhat distinct graphomotor operations.
1.3. Relationships between Other Literacy Abilities and Writing Performance
It is important to acknowledge the contribution of other word-level literacy abilities to writingperformance. The most obvious contributor is reading proficiency, because reading relies onphonological and orthographic knowledge sources, though not graphomotor. A recent meta-analysisreported by Kent and Wanzek [13] found correlations between reading performance and text lengthranged from −0.08 to 0.69 across 16 samples with a total of 1306 individuals. The relationship wasmoderated by grade—a modest positive association was found for students in the primary grades(kindergarten through third grade) but an insignificant association was observed for students ingrades four through six. Reading ability also predicts writing quality, and increasingly so as childrengrow older [35,36]. Of course, the relations between reading ability and writing performance arenot unidirectional—development and/or instruction in one affects performance in the other [37–40].A particular finding to note, because we capitalize on it in our study, is that word reading and spellingare highly correlated (rs often greater than 0.65 in primary and intermediate grades), much more sothan reading and writing component skills at higher levels of language [35–37], leading Mehta andcolleagues [41] to consider decoding and spelling a singular word-level literacy factor.
1.4. Study Rationale
Though there seem to be solid conceptual grounds for an association between graphomotorfluency and spelling, especially regarding the reinforcing effect handwriting appears to have onlearning of spelling patterns, the empirical evidence is inconsistent. Spelling and word reading,on the other hand, have a well-documented and strong association. Thus, in this study, we combinedictated spelling accuracy, isolated word reading accuracy, and correct written vocabulary use toform a written language composite to represent word-level literacy abilities. We include vocabularyas a literacy component skill because it has been shown to make unique contributions to writingquality across grades [42–44]. Though handwriting and typing differ in motor execution and degreeof visual-proprioceptive integration, correlations between these two modes of transcription havebeen observed. Yet, it is unclear how they operate in tandem to affect composition productivity andquality. Moreover, it is reasonable to assume that there are significant effects of handwriting fluency onkeyboarded papers, but these effects may be mediated by more proximal transcription factors whenwriting on a computer, namely typing fluency. Consequently, our study aims to address the followingthree key research questions. First, to what degree do word-level literacy skills and handwriting
Educ. Sci. 2020, 10, 297 4 of 21
fluency directly and indirectly influence the quality of typewritten papers? Second, are the effects ofword-level literacy skills and handwriting fluency on typed papers mediated by typing fluency andtext generation fluency? Third, are direct and/or indirect relationships between word-level literacyskills/graphomotor fluency and text quality replicated across different genres of writing? Although wehave no particular reason to believe genre would influence the existence of any observed relationships,cognitive models of writing [45,46] suggest that schemas for varied genres operate as a controllinginfluence on other writing processes during composing, and thus may influence the strength of therelationships. For example, a poorly elaborated writing schema associated with a less familiar genrewould be expected to place more cognitive demands on the writer, resulting in weaker relationshipsbetween lower-level skills and writing performance because more variance would be attributable tothe higher-level controlling influences [47].
2. Materials and Methods
2.1. Participants
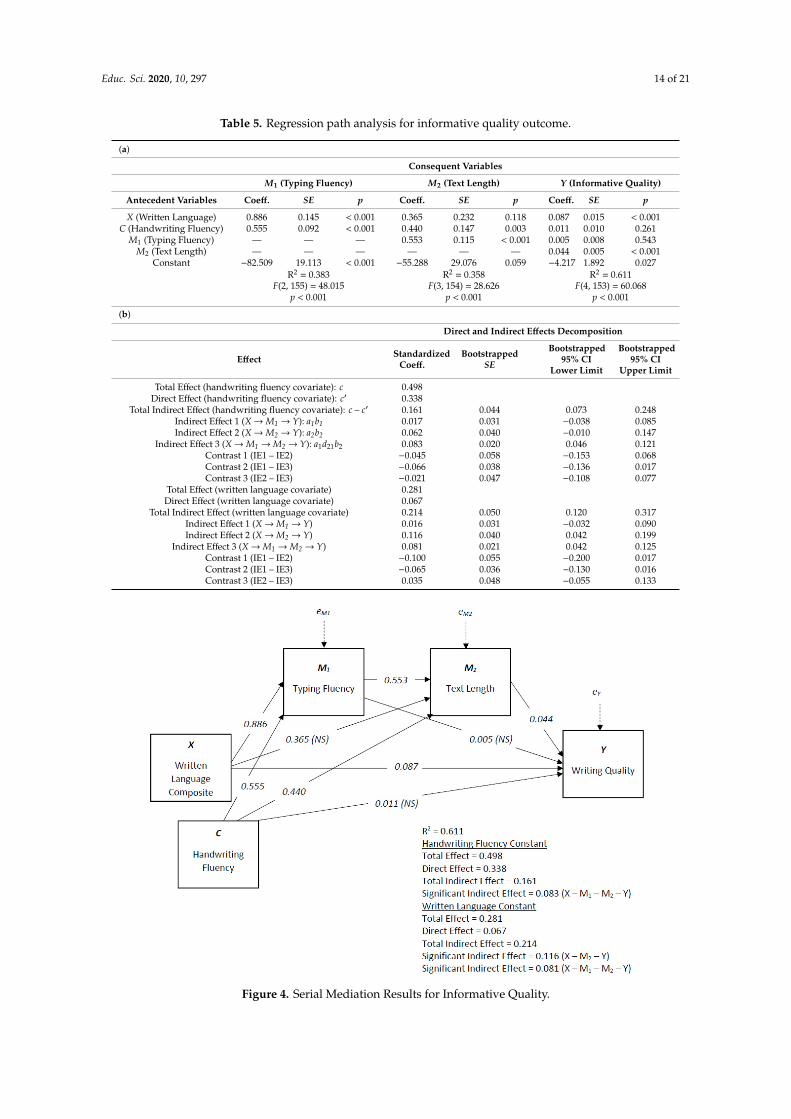
A total of 175 students from grades 4 (n = 60) and 5 (n = 115), ages 9−0 to 11−2, participated.These students came from 21 general education classrooms distributed throughout 12 differentMidwestern schools. The teachers were surveyed regarding aspects of their writing instruction. Out ofthe 21 teachers, only six reported devoting any instructional time to keyboarding or typing, between10 and 60 min per week (M = 30.00, SD = 18.97). Only one teacher reported devoting time (10 minper week) to handwriting instruction. Thirteen teachers reported spending any instructional timeon spelling, between 5 and 80 min per week (M = 28.46, SD = 24.27). The students in this studywere recruited at the classroom level as part of a larger study of the relationships between teachers’writing instructional practices and annual growth in their students’ writing performance, knowledge,and motivation. Of the participants, 52% (n = 91) were female and 67.4% were White (n = 118).Additionally, about 10% (n = 17) of the students were considered non-native English learners orstudents with disabilities (learning disability, ADHD, or autism) (n = 18). Participant data werecollected in the first three months of the school year using procedures approved by the authors’institutional review board.
2.2. Measures
2.2.1. Word Reading
The Reading subtest of the Wide Range Achievement Test-3 [48] was administered to measurestudents’ word recognition ability. Students were asked to read as many of the 42 words as possibleon the test plate, which were presented in rows with increasing difficulty. Responses had to be givenwithin 10 s and had to be correct whole-word pronunciations to be marked correct. Internal consistencyreliabilities for the age group of students in this study range between 0.88 and 0.90.
2.2.2. Spelling
The Spelling subtest of the Test of Written Language-4 [49] was given to students to evaluatetheir spelling ability. Students were presented with a series of dictated sentences they had to write.Each sentence was scored correct if all the written words were correctly spelled (though minor wordsubstitutions were permitted, substituted words also had to be spelled correctly to receive credit).Obligatory capitalization also was considered part of spelling accuracy. A sentence fragment or majordeviation from the dictated sentence was scored incorrect. The internal consistency reliabilities for theage group of students in this study range between 0.90 and 0.93.

Educ. Sci. 2020, 10, 297 5 of 21
2.2.3. Written Vocabulary
The Vocabulary subtest of the Test of Written Language-4 [49] was given to students to evaluate theirvocabulary knowledge. Students were presented with a written word that they read independentlyand then created a sentence that incorporated the word, as written, to demonstrate their understandingof its meaning. Sentences were scored correct if a single sentence clearly displayed appropriatesemantic use of the target word without altering its form; errors in other aspects of sentence writing(e.g., grammar, spelling) were not considered. The internal consistency reliabilities for the age groupof students in this study range between 0.85 and 0.92.
2.2.4. Handwriting Fluency
A paragraph copy task like the one developed by Monroe and Sherman [50] was used to measurehandwriting fluency. A paragraph of 147 words and 602 characters (pilot testing indicated the originalparagraph used by Monroe and Sherman required lengthening to avoid ceiling effects) was presentedon a sheet of paper with widely spaced lines below it for copying the text. They were given 90 s to copyas much of the paragraph as possible and reminded that it was not necessary to read the text beforecopying it. The number of characters correctly written (i.e., characters accurately copied in sequenceexcluding additions or substitutions) in the time allotted was calculated (see [11]). All students electedto copy the paragraph using manuscript print.
2.2.5. Typing Fluency
This task was a typed analog to the handwriting fluency task described above using a computerkeyboard to type text into a text box below the paragraph presented on a desktop or laptop screen.Again, the number of characters correctly written in 90 s was calculated. This task was administered atleast several days after the handwriting fluency task.
2.2.6. Text Length
The total number of words written for each typewritten text in response to a narrative, opinion,or informative prompt was automatically calculated by computer. Because the amount of time studentshad to compose was limited to 15 min, text length in our study best represents text generation fluency.
2.2.7. Writing Quality
Participants’ typewritten texts (see below for details regarding how texts were elicited) werehand-scored using a rubric based on the Smarter Balanced Assessment Consortium performance taskwriting rubrics. The rubric contains seven dimensions: (1) reader orientation to purpose, (2) logicalcoherence, (3) concluding section, (4) cohesion through linking words or phrases, (5) development ofideas using details such as facts, examples, quotes, and experiences, (6) precise and varied language;and (7) correct grammar/usage/mechanics (i.e., writing conventions). Each dimension was scored ona scale of 0 (no evidence of dimensional quality, severely flawed/incomprehensible) to 5 (excellentevidence of dimensional quality, virtually no flaws/fully comprehensible) for a total score between0 and 35. Each paper was initially read without scoring to obtain an overall impression of writingquality and to initially segregate the papers into high-, medium-, and low-quality subsets to expeditescoring using the rubric, a common practice in large-scale writing assessments [51]. Then, all paperswere scored on each dimension in succession, beginning with writing conventions and ending withreader orientation to purpose, until scores for all seven dimensions were assigned. For this study,we excluded the dimension scores for writing conventions to enable a stricter test of our hypotheses.The remaining six dimension scores loaded on a single factor that accounted for 55.6%, 61.8%, and 61.4%of the total variance for narrative, opinion, and informative papers, respectively. Internal consistencyreliabilities using the six dimensions were 0.81, 0.85, and 0.87 for narrative, opinion, and informativepapers, respectively. All of the papers were double scored by trained undergraduates and the interrater

Educ. Sci. 2020, 10, 297 6 of 21
reliability estimates, calculated with a two-way random effects intraclass correlation (ICC), were 0.85for each of the three genres using absolute agreement.
2.3. Writing Tasks
All tasks in this study were administered by one or two of the first four study authors to groupsof 6 to 15 students. After completing the norm-referenced tests of word reading, spelling, and writtenvocabulary, and the timed handwriting fluency copying task, students were asked to respond to onewriting prompt each for narrative, opinion, and informative genres (in that order) on a computer orlaptop and to complete the typing fluency copying task on the same equipment using a web-basedapplication called Writing Architect 1.0 [52]. Except for word reading, all tasks in this study weregroup administered. Students were encouraged to complete the handwriting fluency task after eachtime they wrote a paper to improve their performance, but this was not mandatory; thus, for moststudents, the data reported for this task are the average of two or three attempts. The writing promptswere administered over a period of several days so that students did not complete all three in onesitting. For each writing prompt to which students responded, they were given a printed copy ofmaterials they viewed on the computer screen as well as a blank space below the printed promptinstructions for planning their papers (they were instructed to plan in whatever fashion they hadbeen taught for the genre). Students were permitted up to three minutes to plan each paper and15 min to write. When writing using Writing Architect 1.0, all accessibility and auto-correction wordprocessing features are disabled. For planning, a countdown clock appeared in the lower-left corner ofthe screen; the prompt instruction page automatically advanced to the next screen page (informing thestudents they were going to be given 15 min to write a paper in response to the prompt they had beenassigned in a blank text box on the next screen page; students had to manually advance to the text boxscreen page to begin writing) after the maximum time elapsed, but students could advance to the nextscreen page if they did not wish to plan or finished early. For writing, an audible beep paired witha visual warning flashed across the top of the screen was given when one minute remained. Just asfor planning, students could advance to the next screen page if they completed their writing beforethe 15 min elapsed. All instructions (and passages for informational papers, see below) were not onlypresented in print and on the computer screen, but also were audibly presented by the computer tohelp alleviate problems encountered by weaker readers. Students were provided with headphones tolisten simultaneously while reading the hard copy and/or electronic versions of materials.
Each genre had four prompt options and one option from each genre was randomly assigned toeach student. The prompts (and task instructions noted below) were reviewed by an expert panel ofwriting researchers and teachers. Narrative prompts were in the form of a story title: (1) One Day ofInvisibility; (2) The Attack; (3) Fantastic Voyage; (4) Don’t Go into The Attic. Opinion prompts were inthe form of a question: (1) Should sugary foods be allowed at school?; (2) Should a person always behonest?; (3) Should cellphones be allowed in classrooms?; (4) Should families be able to pick who theirchildren’s friends are? Informative prompts were linked to modified expository passages from onlinesources. The passage titles were: (1) 13-Year-Old World War II Veteran; (2) Swat Up: Six Reasons toLove Flies; (3) Can an Elevated Bus Solve China’s Traffic Woes?; (4) Plastic Bottle Village. Permissionwas obtained from the copyright holders to use and modify the passages for research. The passageswere modified to be within a range of readability appropriate for grades 3 through 8 based on wordcount, Lexile®, Flesch–Kincaid, and Coh–Metrix degree of narrativity (below 50% for each passage).A pilot study to evaluate the equivalence of these prompts with a sample of approximately 175 childrenin grades 3 through 8 found no significant differences in text length and quality (including conventions)associated with prompt in any genre.
When responding to a narrative prompt, students were told to “write a creative, fictional story—a make believe story—to match the title; write a story others will find interesting and enjoyable toread and remember, a good story (1) establishes the setting, (2) develops the characters, (3) describesan exciting plot sequence that has a clear beginning event, character actions related to that event,

Educ. Sci. 2020, 10, 297 7 of 21
and an outcome or conclusion, and (4) follows the rules of writing.” When responding to an opinionprompt, students were told to “write a persuasive essay that convinces readers to agree with youranswer to the question and remember, a good persuasive essay (1) clearly states your opinion, (2) givesdetailed facts and personal experiences to support your opinion, (3) has a conclusion that helps yourreaders understand why they should agree with your opinion, and (4) follows the rules of writing.”When responding to an informative prompt, students were told to “write an informative paper thatwill help others learn about the topic of the passage you read; be sure to use information from thearticle you just read to give reasons why it is important and remember, a well written informativepaper (1) has a clear main idea and stays on topic, (2) includes a good introduction and conclusion,(3) uses information from the article stated in your own words plus your own ideas, and (4) followsthe rules of writing.”
2.4. Data Analysis
We first screened all measures for univariate normality and homogeneity of variance across grade,gender, and ability (students with a disability versus those without) groups. Except for handwritingfluency, which exhibited group variance heterogeneity (in this case, an appropriate alternative wasused for inferential statistical tests), the data from the measures were normally distributed withoutextreme outliers and exhibited equivalent variances across groups. We also examined the scatterplots ofresiduals as a function of predicted values for all variables and the assumptions of homoscedasticity andlinear relationships were valid in all cases. Means and standard deviations for all measures by grade,gender, and ability group are presented in Table 1. We then used one-way ANOVAs (with α = 0.005to adjust for multiple hypothesis testing) to determine if there were group differences for any of themeasures (see Table 1 for summary) and dependent samples t-tests to determine if students’ writingfluency differed significantly by mode of production or if there were significant differences betweengenres with regard to text length or quality. Subsequently, we computed bivariate correlations for allthe measures using the entire dataset; these are reported in Table 2. Statistical significance was set to α
= 0.001 after applying the Bonferroni correction for the experiment-wise error. Finally, we employedregression path analysis using the PROCESS v3.3 macro [53] for SPSS, which permits the evaluation oftotal direct, total indirect, and discrete indirect effects between antecedent (i.e., predictor) and consequent(i.e., outcome) observed variables. Path analyses were conducted separately for each genre to examine howwritten language skills, indexed by a composite of word reading, spelling, and vocabulary (see below),and handwriting fluency are related to writing quality, mediated by typing fluency and then text length.Figure 1 illustrates the proposed serial mediation model tested for each genre. It should be noted thatbecause PROCESS allows examination of effects on a terminal consequent variable by only a single focusantecedent (the X in Figure 1), any other focus antecedent variable must be treated as a covariate (the C inFigure 1) and, subsequently, the two are switched (i.e., the covariate becomes the focal antecedent, and theoriginal focal antecedent is treated as a covariate) to estimate the effects of both variables. Mathematically,this yields the same regression coefficients and direct and indirect effects as if the variables were enteredsimultaneously using structural equation modeling [53] (p. 144).

Educ. Sci. 2020, 10, 297 8 of 21
Table 1. Means (and standard deviations) for study variables by group and mean comparisons.
VariableGrade Gender Disability
4(n = 60)
5(n = 115)
Male(n = 84)
Female(n = 91)
Yes(n = 18)
No(n = 157)
Word Reading 109.68 (12.73) 105.15 (13.10) 107.85 (13.09) 105.66 (13.12) 96.50 (13.29) 107.89 (12.61) *
Spelling 10.13 (2.81) 9.90 (3.11) 9.83 (3.18) 10.12 (2.85) 6.61 (2.91) 10.37 (2.77) *Written Vocabulary 10.92 (2.51) 10.92 (3.25) 11.10 (3.24) 10.76 (2.78) 8.11 (2.61) 11.24 (2.89) *
HandwritingFluency 98.77 (23.38) 110.98 (28.84) * 103.88 (28.45) 109.47 (26.72) 84.17 (27.82) 109.38 (26.48) *Typing Fluency 84.32 (42.16) 95.10 (37.50) 94.81 (41.06) 88.46 (37.75) 62.45 (37.60) 94.50 (38.39) *
Narrative Length 128.87 (75.40) 145.31 (69.75) 131.34 (68.27) 147.18 (74.60) 70.38 (52.24) 147.03 (69.90) *Narrative Quality 11.86 (3.86) 12.63 (3.38) 11.81 (3.43) 12.87 (3.62) 8.56 (2.71) 12.77 (3.40) *Opinion Length 76.85 (49.10) 113.69 (61.32) * 87.99 (54.44) 113.08 (62.40) 64.14 (54.04) 104.89 (59.41)Opinion Quality 11.55 (4.47) 13.18 (3.84) 11.69 (3.90) 13.47 (4.16) * 8.50 (4.64) 13.04 (3.85) *
Informative Length 83.17 (56.51) 93.81 (55.26) 85.55 (57.22) 94.37 (54.39) 58.71 (38.97) 93.30 (56.27)Informative Quality 11.42 (4.03) 13.05 (4.75) 12.24 (4.76) 12.72 (4.42) 8.71 (4.20) 12.87 (4.45) *
Notes: All variables were normally distributed within groups with no extreme outliers; * indicates significantdifference between groups at p < 0.005 (Bonferroni adjusted value; the Brown–Forsythe robust test of equality ofmeans was used when the assumption of homogeneity of variances was not met for handwriting fluency).
Table 2. Bivariate correlations between study variables.
Variable 1 2 3 4 5 6 7 8 9 10 11
1. Word Reading –2. Spelling 0.69 * –3. Written Vocabulary 0.63 * 0.64 * –4. Hand. Fluency 0.17 0.37 * 0.31 * –5. Typing Fluency 0.41 * 0.55 * 0.40 * 0.46 * –6. Narrative Length 0.21 0.40 * 0.27 * 0.45 * 0.68 * –7. Narrative Quality 0.50 * 0.60 * 0.49 * 0.30 * 0.53 * 0.49 * –8. Opinion Length 0.13 0.30 * 0.26 0.39 * 0.47 * 0.64 * 0.36 * –9. Opinion Quality 0.46 * 0.60 * 0.39 * 0.38 * 0.50 * 0.49 * 0.68 * 0.51 * –10. Inform. Length 0.29 * 0.38 * 0.44 * 0.44 * 0.56 * 0.59 * 0.45 * 0.55 * 0.45 * –11. Inform. Quality 0.48 * 0.61 * 0.57 * 0.40 * 0.53 * 0.46 * 0.64 * 0.50 * 0.63 * 0.69 * –
* p < 0.001 (Bonferroni adjusted value).
Educ. Sci. 2020, 10, x FOR PEER REVIEW 8 of 22
Narrative Quality 11.86 (3.86)
12.63 (3.38)
11.81 (3.43)
12.87 (3.62)
8.56 (2.71)
12.77 (3.40) *
Opinion Length 76.85
(49.10) 113.69
(61.32) * 87.99
(54.44) 113.08 (62.40)
64.14 (54.04)
104.89 (59.41)
Opinion Quality 11.55 (4.47)
13.18 (3.84)
11.69 (3.90)
13.47 (4.16) *
8.50 (4.64)
13.04 (3.85) *
Informative Length 83.17 (56.51)
93.81 (55.26)
85.55 (57.22)
94.37 (54.39)
58.71 (38.97)
93.30 (56.27)
Informative Quality 11.42 (4.03)
13.05 (4.75)
12.24 (4.76)
12.72 (4.42)
8.71 (4.20)
12.87 (4.45) *
Notes: All variables were normally distributed within groups with no extreme outliers; * indicates significant difference between groups at p < 0.005 (Bonferroni adjusted value; the Brown–Forsythe robust test of equality of means was used when the assumption of homogeneity of variances was not met for handwriting fluency).
Table 2. Bivariate correlations between study variables.
Variable 1 2 3 4 5 6 7 8 9 10 11 1. Word Reading -- 2. Spelling 0.69 * -- 3. Written Vocabulary 0.63 * 0.64 * -- 4. Hand. Fluency 0.17 0.37 * 0.31 * -- 5. Typing Fluency 0.41 * 0.55 * 0.40 * 0.46 * -- 6. Narrative Length 0.21 0.40 * 0.27 * 0.45 * 0.68 * -- 7. Narrative Quality 0.50 * 0.60 * 0.49 * 0.30 * 0.53 * 0.49 * -- 8. Opinion Length 0.13 0.30 * 0.26 0.39 * 0.47 * 0.64 * 0.36 * -- 9. Opinion Quality 0.46 * 0.60 * 0.39 * 0.38 * 0.50 * 0.49 * 0.68 * 0.51 * -- 10. Inform. Length 0.29 * 0.38 * 0.44 * 0.44 * 0.56 * 0.59 * 0.45 * 0.55 * 0.45 * -- 11. Inform. Quality 0.48 * 0.61 * 0.57 * 0.40 * 0.53 * 0.46 * 0.64 * 0.50 * 0.63 * 0.69 * --
* p < 0.001 (Bonferroni adjusted value).
Figure 1. Proposed serial mediation model.
Figure 1. Proposed serial mediation model.
3. Results
3.1. Group Comparisons
As noted in Table 1, students with disabilities consistently performed significantly poorer on allmeasures compared to their peers without disabilities: word reading, F(1, 173) = 13.14, MSE = 159.90,

Educ. Sci. 2020, 10, 297 9 of 21
p < 0.001, g = −0.90, spelling, F(1, 173) = 29.56, MSE = 7.72, p < 0.001, g = −1.35, written vocabulary,F(1, 173) = 19.60, MSE = 8.17, p < 0.001, g = −1.09, handwriting fluency, F(1, 172) = 14.48, MSE = 708.33,p < 0.001, g = −0.95, typing fluency, F(1, 171) = 13.05, MSE = 1443.86, p < 0.001, g = −0.90, narrativepaper length and quality, F(1, 167) = 17.66 and 22.04, MSE = 4732.42 and 11.39, p < 0.001, g = −1.10and −1.24, respectively, opinion paper quality, F(1, 169) = 21.46, MSE = 15.42, p < 0.001, g = −1.22,and informative paper quality, F(1, 157) = 9.96, MSE = 19.56, p = 0.002, g = −0.85. Girls performedbetter than boys with respect to opinion paper quality, F(1, 169) = 7.97, MSE = 16.60, p = 0.012, g = 0.43,but did not significantly differ from boys otherwise. Fifth graders wrote longer, F(1, 169) = 8.71,MSE = 3916.20, p = 0.004, g = 0.48, but not qualitatively better opinion papers than fourth graders.Fifth graders also exhibited greater handwriting fluency, F(1, 172) = 7.99, MSE = 733.87, p = 0.005,g = 0.45, though not typing fluency.
3.2. Transcription Mode and Writing Genre Comparisons
We did find that handwriting fluency was significantly greater than typing fluency in our sampleof students, t(171) = 5.82, p < 0.001, d = 0.47. Additionally, students produced narrative papers thatwere significantly longer than opinion papers, t(165) = 8.19, p < 0.001, d = 0.54, and informative papers,t(156) = 10.36, p < 0.001, d = 0.76, and opinion papers that were significantly longer than informativepapers, t(156) = 2.53, p = 0.013, d = 0.19. However, paper quality was not significantly differentacross genres.
3.3. Associations between Variables
Table 2 illustrates that word reading, spelling, and written vocabulary scores from norm-referencedtests were all strongly positively correlated, sharing at least 40% variance; thus, we created a word-levelWritten Language Composite (WLC) for subsequent analyses by summing the scores from thesethree measures. Handwriting and typing fluency are significantly positively related to each otherand to writing length and quality in each genre, though typing fluency is more strongly related totext length and quality when writing on a computer than handwriting fluency, as might be expected.Additionally notable is that the relationship between text length and quality is significantly weakerfor narrative papers (r = 0.49) compared to informative papers (r = 0.69), z = −2.79, p = 0.005, and foropinion papers (r = 0.51) compared to informative papers, z = −2.56, p = 0.01. Additionally, text qualityacross genres is generally slightly more strongly related than text length across genres.
3.4. Predicting Narrative Writing Quality
The results of regression path analysis to determine how written language skills transmit theireffect to narrative writing quality through typing fluency and text length, while controlling forhandwriting fluency, are presented in Table 3 (also see Figure 2 for a visual summary of results).As can be seen in this table and the associated figure, students with higher scores on WLC displayedstronger typing fluency (a1 = 0.851) but did not produce longer narratives (a2 = −0.274, NS) whencontrolling for handwriting fluency. Conversely, typing fluency was not associated with story quality(b1 = 0.142, NS) but those students who wrote longer narratives did write better stories (b2 = 0.013)when controlling for handwriting fluency. Bootstrap 95% confidence intervals based on 5,000 samplesfor the indirect effects of written language skills on narrative quality via typing fluency (a1b1) and viatext length (a2b2) both included zero and thus represented no significant indirect effects. However,the bootstrap confidence interval for the mediation of the effects of written language skills on narrativequality via typing fluency and then text length (a1d21b2) was entirely above zero (0.026, 0.110) andthus represented a significant serial indirect effect. For every one standard deviation change in WLCcontrolling for handwriting fluency, there was a difference of about one-tenth of a standard deviationin story quality as a result of the total indirect effects. There also was evidence that students’ WLCscore was positively associated with narrative quality, independent of written language skills’ effectson typing fluency or text length, but still controlling for handwriting fluency (c′ = 0.085); for every one

Educ. Sci. 2020, 10, 297 10 of 21
standard deviation change in WLC, there was approximately four-tenths of a standard deviation changein narrative quality independent of the mediators. Overall, when controlling for handwriting fluency,typing fluency and text length together significantly mediated the relationship between WLC andnarrative quality, and WLC had a significant direct effect on narrative quality as well. These antecedentvariables explained approximately 45% of variance in narrative quality.
Also in Table 3 and Figure 2 are the results regarding how handwriting fluency transmits its effecton narrative writing quality through typing fluency and text length, while controlling for writtenlanguage skills. Students with more fluent handwriting displayed stronger typing fluency (a1 = 0.527)and wrote longer narratives (a2 = 0.434) when controlling for WLC. The bootstrap confidence intervalfor the indirect effect of handwriting fluency on narrative quality via typing fluency (a1b1) includedzero and thus was not significant, but for the indirect effect via text length (a2b2), the bootstrap intervaldid not include zero (0.007, 0.097) and thus did represent a significant indirect effect. The bootstrapconfidence interval for the mediation of the effects of handwriting fluency on narrative quality viatyping fluency and then text length (a1d21b2) was entirely above zero (0.025, 0.111) and thus representeda significant serial indirect effect. For every one standard deviation change in handwriting fluencycontrolling for WLC, there was a difference of about 0.17 standard deviation in story quality as a resultof the total indirect effects. There was no evidence that students’ handwriting fluency was positivelyassociated with narrative quality independent of the mediators when controlling for WLC (c′ = 0.001,NS). Overall, when controlling for WLC, typing fluency and text length significantly mediated therelationship between handwriting fluency and narrative quality, but there was no significant directeffect of handwriting fluency on story quality.
Table 3. Regression path analysis for narrative quality outcome.
(a)
Consequent Variables
M1 (Typing Fluency) M2 (Text Length) Y (Narrative Quality)
Antecedent Variables Coeff. SE p Coeff. SE p Coeff. SE p
X (Written Language) 0.851 0.148 <0.001 −0.274 0.265 0.303 0.085 0.014 <0.001C (Handwriting Fluency) 0.527 0.092 <0.001 0.434 0.164 0.009 0.001 0.009 0.914
M1 (Typing Fluency) — — — 1.147 0.127 <0.001 0.142 0.008 0.078M2 (Text Length) — — — — — — 0.013 0.004 0.001
Constant −73.870 19.396 <0.001 23.414 32.905 0.478 −1.811 1.694 0.287R2 = 0.344 R2 = 0.482 R2 = 0.447
F(2, 164) = 42.933 F(3, 163) = 50.499 F(4, 162) = 32.774
p < 0.001 p < 0.001 p < 0.001
(b)
Direct and Indirect Effects Decomposition
Effect StandardizedCoeff.
BootstrappedSE
Bootstrapped95% CI
Lower Limit
Bootstrapped95% CI
Upper Limit
Total Effect (handwriting fluency covariate): c 0.517Direct Effect (handwriting fluency covariate): c′ 0.413
Total Indirect Effect (handwriting fluency covariate): c – c′ 0.104 0.037 0.033 0.177Indirect Effect 1 (X→M1 → Y): a1b1 0.058 0.033 −0.004 0.124Indirect Effect 2 (X→M2 → Y): a2b2 −0.018 0.021 −0.064 0.019
Indirect Effect 3 (X→M1 →M2 → Y): a1d21b2 0.063 0.021 0.026 0.110Contrast 1 (IE1 – IE2) 0.076 0.036 0.004 0.146Contrast 2 (IE1 – IE3) −0.005 0.044 −0.095 0.082Contrast 3 (IE2 – IE3) −0.081 0.035 −0.161 −0.022
Total Effect (written language covariate) 0.174Direct Effect (written language covariate) 0.007
Total Indirect Effect (written language covariate) 0.167 0.043 0.090 0.259Indirect Effect 1 (X→M1 → Y) 0.058 0.035 −0.005 0.135Indirect Effect 2 (X→M2 → Y) 0.045 0.023 0.007 0.097
Indirect Effect 3 (X→M1 →M2 → Y) 0.063 0.022 0.025 0.111Contrast 1 (IE1 – IE2) 0.013 0.045 −0.072 0.105Contrast 2 (IE1 – IE3) −0.005 0.044 −0.093 0.083Contrast 3 (IE2 – IE3) −0.018 0.028 −0.081 0.032

Educ. Sci. 2020, 10, 297 11 of 21
Educ. Sci. 2020, 10, x FOR PEER REVIEW 11 of 22
Indirect Effect 1 (X → M1 → Y): a1b1 0.058 0.033 −0.004 0.124 Indirect Effect 2 (X → M2 → Y): a2b2 −0.018 0.021 −0.064 0.019
Indirect Effect 3 (X → M1 → M2 → Y): a1d21b2 0.063 0.021 0.026 0.110 Contrast 1 (IE1 – IE2) 0.076 0.036 0.004 0.146 Contrast 2 (IE1 – IE3) −0.005 0.044 −0.095 0.082 Contrast 3 (IE2 – IE3) −0.081 0.035 −0.161 −0.022
Total Effect (written language covariate) 0.174 Direct Effect (written language covariate) 0.007
Total Indirect Effect (written language covariate)
0.167 0.043 0.090 0.259
Indirect Effect 1 (X → M1 → Y) 0.058 0.035 −0.005 0.135 Indirect Effect 2 (X → M2 → Y) 0.045 0.023 0.007 0.097
Indirect Effect 3 (X → M1 → M2 → Y) 0.063 0.022 0.025 0.111 Contrast 1 (IE1 – IE2) 0.013 0.045 −0.072 0.105 Contrast 2 (IE1 – IE3) −0.005 0.044 −0.093 0.083 Contrast 3 (IE2 – IE3) −0.018 0.028 −0.081 0.032
Figure 2. Serial Mediation Results for Narrative Quality.
3.5. Predicting Opinion Writing Quality
Table 4 (also see Figure 3) displays the results of the regression path analysis using opinion writing quality as the terminal consequent variable. As can be seen in this table and the associated figure, students with higher scores on WLC displayed stronger typing fluency (a1 = 0.860) but did not produce longer opinion papers (a2 = −0.162, NS) when controlling for handwriting fluency. Conversely, typing fluency was not associated with opinion paper quality (b1 = 0.014, NS) but those students who wrote longer texts did write better opinion papers (b2 = 0.022) when controlling for handwriting fluency. The bootstrap confidence interval for the indirect effect of written language skills on opinion quality via typing fluency (a1b1) did not contain zero (0.001, 0.102) and thus was significant, though the confidence interval for the indirect effect via text length (a2b2) did include zero and consequently was not significant. The bootstrap confidence interval for the mediation of the effects of written language skills on opinion quality via typing fluency and then text length (a1d21b2) was entirely above zero (0.024, 0.091) and thus represented a significant serial indirect effect.
Figure 2. Serial Mediation Results for Narrative Quality.
3.5. Predicting Opinion Writing Quality
Table 4 (also see Figure 3) displays the results of the regression path analysis using opinionwriting quality as the terminal consequent variable. As can be seen in this table and the associatedfigure, students with higher scores on WLC displayed stronger typing fluency (a1 = 0.860) but didnot produce longer opinion papers (a2 = −0.162, NS) when controlling for handwriting fluency.Conversely, typing fluency was not associated with opinion paper quality (b1 = 0.014, NS) but thosestudents who wrote longer texts did write better opinion papers (b2 = 0.022) when controlling forhandwriting fluency. The bootstrap confidence interval for the indirect effect of written languageskills on opinion quality via typing fluency (a1b1) did not contain zero (0.001, 0.102) and thus wassignificant, though the confidence interval for the indirect effect via text length (a2b2) did include zeroand consequently was not significant. The bootstrap confidence interval for the mediation of the effectsof written language skills on opinion quality via typing fluency and then text length (a1d21b2) wasentirely above zero (0.024, 0.091) and thus represented a significant serial indirect effect.

Educ. Sci. 2020, 10, 297 12 of 21
Table 4. Regression path analysis for opinion quality outcome.
(a)
Consequent Variables
M1 (Typing Fluency) M2 (Text Length) Y (Opinion Quality)
Antecedent Variables Coeff. SE p Coeff. SE p Coeff. SE p
X (Written Language) 0.860 0.145 < 0.001 −0.162 0.278 0.561 0.085 0.015 < 0.001C (Handwriting Fluency) 0.498 0.092 < 0.001 0.532 0.174 0.003 0.014 0.010 0.147
M1 (Typing Fluency) — — — 0.638 0.135 < 0.001 0.014 0.008 0.082M2 (Text Length) — — — — — — 0.022 0.004 < 0.001
Constant −71.897 18.986 < 0.001 8.250 34.418 0.811 −3.489 1.896 0.068R2 = 0.337 R2 = 0.262 R2 = 0.463
F(2, 166) = 42.091 F(3, 165) = 19.538 F(4, 164) = 35.341p < 0.001 p < 0.001 p < 0.001
(b)
Direct and Indirect Effects Decomposition
Effect StandardizedCoeff.
BootstrappedSE
Bootstrapped95% CI
Lower Limit
Bootstrapped95% CI
Upper Limit
Total Effect (handwriting fluency covariate): c 0.446Direct Effect (handwriting fluency covariate): c′ 0.359
Total Indirect Effect (handwriting fluency covariate): c – c′ 0.087 0.040 0.017 0.175Indirect Effect 1 (X→M1 → Y): a1b1 0.051 0.026 0.001 0.102Indirect Effect 2 (X→M2 → Y): a2b2 −0.015 0.029 −0.065 0.050
Indirect Effect 3 (X→M1 →M2 → Y): a1d21b2 0.052 0.017 0.024 0.091Contrast 1 (IE1 – IE2) 0.066 0.037 −0.014 0.134Contrast 2 (IE1 – IE3) −0.001 0.032 −0.068 0.056Contrast 3 (IE2 – IE3) −0.067 0.038 −0.140 0.010
Total Effect (written language covariate) 0.268Direct Effect (written language covariate) 0.096
Total Indirect Effect (written language covariate) 0.172 0.054 0.081 0.290Indirect Effect 1 (X→M1 → Y) 0.046 0.025 0.001 0.099Indirect Effect 2 (X→M2 → Y) 0.079 0.044 0.011 0.079
Indirect Effect 3 (X→M1 →M2 → Y) 0.047 0.016 0.021 0.081Contrast 1 (IE1 – IE2) −0.033 0.048 −0.140 0.050Contrast 2 (IE1 – IE3) −0.001 0.029 −0.060 0.056Contrast 3 (IE2 – IE3) 0.032 0.047 −0.045 0.141
Educ. Sci. 2020, 10, x FOR PEER REVIEW 13 of 22
Figure 3. Serial Mediation Results for Opinion Quality.
Table 4 and Figure 3 also give results regarding how handwriting fluency transmits its effect on opinion writing quality through typing fluency and text length, while controlling for written language skills. Students with more fluent handwriting displayed stronger typing fluency (a1 = 0.498) and wrote longer opinion papers (a2 = 0.532) when controlling for WLC. The 95% bootstrap confidence intervals based on 5,000 samples for the indirect effects of handwriting fluency on opinion quality via typing fluency (a1b1) and via text length (a2b2) were both significant as they did not contain the value of zero (0.001, 0.099 and 0.011, 0.079, respectively). Moreover, the bootstrap confidence interval for the mediation of the effects of handwriting fluency on opinion quality via typing fluency and then text length (a1d21b2) was entirely above zero (0.021, 0.081) and thus represented a significant serial indirect effect. For every one standard deviation change in handwriting fluency controlling for WLC, there was a difference of about 0.17 standard deviation in opinion paper quality as a result of the total indirect effects. There was no evidence that students’ handwriting fluency was positively associated with opinion quality independent of the mediators when controlling for WLC (c′ = 0.014, NS). Overall, when controlling for WLC, typing fluency and text length significantly mediated the relationship between handwriting fluency and opinion quality, but there was no significant direct effect of handwriting fluency on opinion quality.
3.6. Predicting Informative Writing Quality
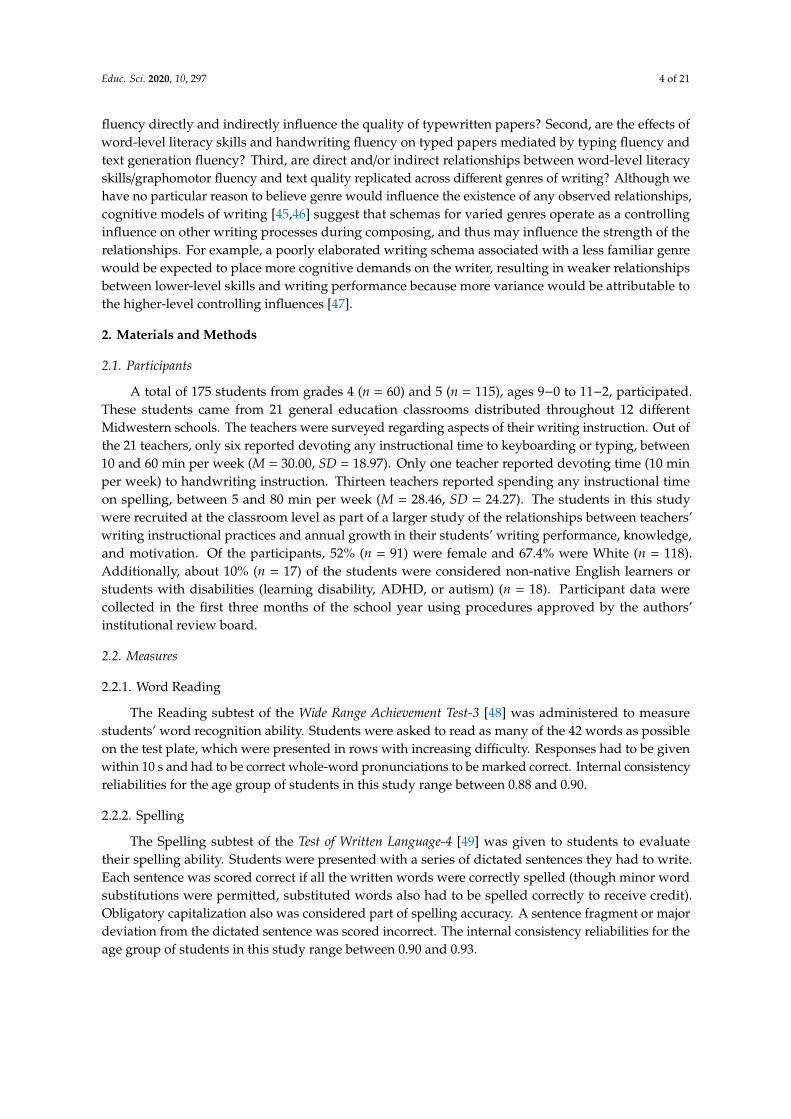
Finally, the results associated with the regression path analysis using informative writing quality as the terminal consequent variable are presented in Table 5 and Figure 4. Students with higher scores on WLC displayed stronger typing fluency (a1 = 0.886) but did not produce longer informative papers (a2 = 0.365, NS) when controlling for handwriting fluency. Conversely, typing fluency was not related to informative quality (b1 = 0.005, NS) but those students who wrote longer texts did write better informative papers (b2 = 0.044) when controlling for handwriting fluency. The bootstrap confidence interval for the indirect effects of written language skills on informative quality via typing fluency (a1b1) and via text length (a2b2) included zero and consequently were not significant. The bootstrap
Figure 3. Serial Mediation Results for Opinion Quality.

Educ. Sci. 2020, 10, 297 13 of 21
For every one standard deviation change in WLC controlling for handwriting fluency, there was adifference of about 0.08 standard deviation in opinion paper quality as a result of the total indirecteffects. There also was evidence that students’ WLC score was positively associated with opinionquality, independent of written language skills’ effects on typing fluency or text length, but stillcontrolling for handwriting fluency (c′ = 0.085); for every one standard deviation change in WLC,there was approximately a third of a standard deviation change in opinion quality independent ofthe mediators. Overall, when controlling for handwriting fluency, typing fluency and text lengthsignificantly mediated the relationship between WLC and opinion quality, and WLC had a significantdirect effect on opinion quality as well. These antecedent variables explained approximately 46% ofvariance in opinion paper quality.
Table 4 and Figure 3 also give results regarding how handwriting fluency transmits its effect onopinion writing quality through typing fluency and text length, while controlling for written languageskills. Students with more fluent handwriting displayed stronger typing fluency (a1 = 0.498) andwrote longer opinion papers (a2 = 0.532) when controlling for WLC. The 95% bootstrap confidenceintervals based on 5,000 samples for the indirect effects of handwriting fluency on opinion qualityvia typing fluency (a1b1) and via text length (a2b2) were both significant as they did not contain thevalue of zero (0.001, 0.099 and 0.011, 0.079, respectively). Moreover, the bootstrap confidence intervalfor the mediation of the effects of handwriting fluency on opinion quality via typing fluency andthen text length (a1d21b2) was entirely above zero (0.021, 0.081) and thus represented a significantserial indirect effect. For every one standard deviation change in handwriting fluency controlling forWLC, there was a difference of about 0.17 standard deviation in opinion paper quality as a result ofthe total indirect effects. There was no evidence that students’ handwriting fluency was positivelyassociated with opinion quality independent of the mediators when controlling for WLC (c′ = 0.014,NS). Overall, when controlling for WLC, typing fluency and text length significantly mediated therelationship between handwriting fluency and opinion quality, but there was no significant directeffect of handwriting fluency on opinion quality.
3.6. Predicting Informative Writing Quality
Finally, the results associated with the regression path analysis using informative writing qualityas the terminal consequent variable are presented in Table 5 and Figure 4. Students with higher scoreson WLC displayed stronger typing fluency (a1 = 0.886) but did not produce longer informative papers(a2 = 0.365, NS) when controlling for handwriting fluency. Conversely, typing fluency was not relatedto informative quality (b1 = 0.005, NS) but those students who wrote longer texts did write betterinformative papers (b2 = 0.044) when controlling for handwriting fluency. The bootstrap confidenceinterval for the indirect effects of written language skills on informative quality via typing fluency (a1b1)and via text length (a2b2) included zero and consequently were not significant. The bootstrap confidenceinterval for the mediation of the effects of written language skills on informative paper quality viatyping fluency and then text length (a1d21b2) was entirely above zero (0.046, 0.121) and thus representeda significant serial indirect effect. For every one standard deviation change in WLC controlling forhandwriting fluency, there was a difference of about 0.16 standard deviation in informative paperquality as a result of the total indirect effects. There also was evidence that students’ WLC scorewas positively associated with informative quality, independent of written language skills’ effects ontyping fluency or text length, but still controlling for handwriting fluency (c′ = 0.087); for every onestandard deviation change in WLC, there was approximately a third of a standard deviation change ininformative quality independent of the mediators. Overall, when controlling for handwriting fluency,typing fluency and text length significantly mediated the relationship between WLC and informativepaper quality, and WLC had a significant direct effect on informative quality as well. These antecedentvariables explained approximately 61% of variance in informative paper quality.
Educ. Sci. 2020, 10, 297 14 of 21
Table 5. Regression path analysis for informative quality outcome.
(a)
Consequent Variables
M1 (Typing Fluency) M2 (Text Length) Y (Informative Quality)
Antecedent Variables Coeff. SE p Coeff. SE p Coeff. SE p
X (Written Language) 0.886 0.145 < 0.001 0.365 0.232 0.118 0.087 0.015 < 0.001C (Handwriting Fluency) 0.555 0.092 < 0.001 0.440 0.147 0.003 0.011 0.010 0.261
M1 (Typing Fluency) — — — 0.553 0.115 < 0.001 0.005 0.008 0.543M2 (Text Length) — — — — — — 0.044 0.005 < 0.001
Constant −82.509 19.113 < 0.001 −55.288 29.076 0.059 −4.217 1.892 0.027R2 = 0.383 R2 = 0.358 R2 = 0.611
F(2, 155) = 48.015 F(3, 154) = 28.626 F(4, 153) = 60.068p < 0.001 p < 0.001 p < 0.001
(b)
Direct and Indirect Effects Decomposition
Effect StandardizedCoeff.
BootstrappedSE
Bootstrapped95% CI
Lower Limit
Bootstrapped95% CI
Upper Limit
Total Effect (handwriting fluency covariate): c 0.498Direct Effect (handwriting fluency covariate): c′ 0.338
Total Indirect Effect (handwriting fluency covariate): c – c′ 0.161 0.044 0.073 0.248Indirect Effect 1 (X→M1 → Y): a1b1 0.017 0.031 −0.038 0.085Indirect Effect 2 (X→M2 → Y): a2b2 0.062 0.040 −0.010 0.147
Indirect Effect 3 (X→M1 →M2 → Y): a1d21b2 0.083 0.020 0.046 0.121Contrast 1 (IE1 – IE2) −0.045 0.058 −0.153 0.068Contrast 2 (IE1 – IE3) −0.066 0.038 −0.136 0.017Contrast 3 (IE2 – IE3) −0.021 0.047 −0.108 0.077
Total Effect (written language covariate) 0.281Direct Effect (written language covariate) 0.067
Total Indirect Effect (written language covariate) 0.214 0.050 0.120 0.317Indirect Effect 1 (X→M1 → Y) 0.016 0.031 −0.032 0.090Indirect Effect 2 (X→M2 → Y) 0.116 0.040 0.042 0.199
Indirect Effect 3 (X→M1 →M2 → Y) 0.081 0.021 0.042 0.125Contrast 1 (IE1 – IE2) −0.100 0.055 −0.200 0.017Contrast 2 (IE1 – IE3) −0.065 0.036 −0.130 0.016Contrast 3 (IE2 – IE3) 0.035 0.048 −0.055 0.133
Educ. Sci. 2020, 10, x FOR PEER REVIEW 15 of 22
Lower Limit Upper Limit Total Effect (handwriting fluency
covariate): c 0.498
Direct Effect (handwriting fluency covariate): c′
0.338
Total Indirect Effect (handwriting fluency covariate): c – c′
0.161 0.044 0.073 0.248
Indirect Effect 1 (X → M1 → Y): a1b1 0.017 0.031 −0.038 0.085 Indirect Effect 2 (X → M2 → Y): a2b2 0.062 0.040 −0.010 0.147 Indirect Effect 3 (X → M1 → M2 →
Y): a1d21b2 0.083 0.020 0.046 0.121
Contrast 1 (IE1 – IE2) −0.045 0.058 −0.153 0.068 Contrast 2 (IE1 – IE3) −0.066 0.038 −0.136 0.017 Contrast 3 (IE2 – IE3) −0.021 0.047 −0.108 0.077
Total Effect (written language covariate)
0.281
Direct Effect (written language covariate)
0.067
Total Indirect Effect (written language covariate)
0.214 0.050 0.120 0.317
Indirect Effect 1 (X → M1 → Y) 0.016 0.031 −0.032 0.090 Indirect Effect 2 (X → M2 → Y) 0.116 0.040 0.042 0.199
Indirect Effect 3 (X → M1 → M2 → Y) 0.081 0.021 0.042 0.125 Contrast 1 (IE1 – IE2) −0.100 0.055 −0.200 0.017 Contrast 2 (IE1 – IE3) −0.065 0.036 −0.130 0.016 Contrast 3 (IE2 – IE3) 0.035 0.048 −0.055 0.133
Figure 4. Serial Mediation Results for Informative Quality.
Figure 4. Serial Mediation Results for Informative Quality.

Educ. Sci. 2020, 10, 297 15 of 21
Table 5 and Figure 4 also give results regarding how handwriting fluency transmits its effecton informative writing quality through typing fluency and text length, while controlling for writtenlanguage skills. Students with more fluent handwriting displayed stronger typing fluency (a1 = 0.555)and wrote longer informative papers (a2 = 0.440) when controlling for WLC. The 95% bootstrapconfidence interval for the indirect effect of handwriting fluency on informative quality via typingfluency (a1b1) was not significant (−0.032, 0.090) but was for the indirect effect via text length(a2b2) (0.042, 0.199). Moreover, the bootstrap confidence interval for the mediation of the effects ofhandwriting fluency on informative paper quality via typing fluency and then text length (a1d21b2)did not include the value of zero (0.042, 0.125) and thus represented a significant serial indirect effect.For every one standard deviation change in handwriting fluency controlling for WLC, there was adifference of about two-tenths of a standard deviation in informative paper quality as a result ofthe total indirect effects. There was no evidence that students’ handwriting fluency was positivelyassociated with informative quality independent of the mediators when controlling for WLC (c′ = 0.011,NS). Overall, when controlling for WLC, typing fluency and text length significantly mediated therelationship between handwriting fluency and informative quality, but there was no significant directeffect of handwriting fluency on informative quality.
4. Discussion
In our sample of fourth and fifth graders from typical classrooms in the Midwestern UnitedStates, we found that, regardless of genre, a composite score representing word−level writtenlanguage skills—word recognition, spelling, and written vocabulary use—has both a significantdirect and a serial indirect (through typing fluency and then text length) effect on writing quality,when controlling for handwriting fluency. Overall, a one standard deviation change in the WLCcorresponded to about a one-half standard deviation change in writing quality across genres, and about20−32% of that change was due to indirect effects, depending on the genre. This finding implies twothings. One, stronger component literacy skills enhance typewritten text quality; spelling, vocabulary,and reading performance each have been found to predict writing quality [13,36,43,44]. That is,students who possess greater breadth and depth in their vocabulary knowledge and who are morecapable of decoding and encoding phonological and orthographic information can leverage theseabilities to write better papers. Our quality scale included a dimension devoted to precise and variedlanguage, which subsumes vocabulary use, and thus would be sensitive to individual variationin semantic skills such as vocabulary use. However, we excluded writing conventions (includingspelling) as part of measured writing quality, so the direct influence of word-level literacy skills onquality probably indicates that more proficient phonological and orthographic processing frees upcognitive resources for other aspects of composing, which is in line with extant research (e.g., [46]).Two, stronger component literacy skills are associated with increased typing fluency, which in turnis related to higher text generation fluency, and finally these together positively impact typewrittenpaper quality. Again, we believe this demonstrates how stronger foundation literacy skills reducethe total cognitive load associated with writing, permitting students to divert adequate resources fortranscription and text generation fluency while composing on the computer.
Most importantly, we found that, regardless of genre, handwriting fluency had a significantserial indirect effect on writing quality via typing fluency then text generation fluency (and via textgeneration fluency alone), though no significant direct effect, when controlling for word-level literacyskills. Overall, a one standard deviation change in handwriting fluency corresponded to about aone-fifth to a one-third standard deviation change in writing quality, and about 64−96% of that changewas due to indirect effects, depending on the genre. Though the effects of handwriting fluency oncomputer-generated paper quality are indirect, mediated by more proximal writing fluency factors,namely typing fluency and text generation fluency, the fact that handwriting fluency matters evenwhen composing on the computer elevates the importance of this aspect of transcription regardless ofmode and adds to limited findings regarding cross-modal effects of transcription on writing quality [20].
Educ. Sci. 2020, 10, 297 16 of 21
The indirect manner in which handwriting fluency transmits its effects to writing quality is anticipatedfor students in late elementary grades; we may have very well observed direct effects if we had sampledyounger students for whom transcription is far less automatized cf. [13,22–24]. The indirect pathbetween handwriting fluency, text generation fluency, and writing quality deserves special mention.Scholars have posited that greater transcription fluency, especially handwriting fluency (in olderstudents in particular), permits higher-level writing processes to occur more efficiently and effectivelyduring the parallel processing required for most writing tasks [54], whether measured by duration ofwritten language production bursts [55–57] or simply writing productivity or quality [11]. Our findingthat handwriting fluency transmits its effects on quality not only through typing fluency then textgeneration fluency (as typing fluently permits one to produce more text in a given period of time)but also just through text generation fluency complements this account of the special influence ofhandwriting on composition. Overall, we see not only greater graphomotor fluency across modes oftranscription leads to higher quality typed papers, but also more fluent transcription by hand, with itsputative deep connections to other lower- and higher-level linguistic processes [15], benefits textgeneration fluency, which itself results in better quality typed papers. Students who develop strongproficiency with handwriting in elementary school, where most writing tasks still employ inscriptionusing a stylus (e.g., [58]), have probably accumulated greater flexibility with diverting cognitive effortto idea generation and language formulation (text generation) for many writing tasks, including thoseusing a keyboard.
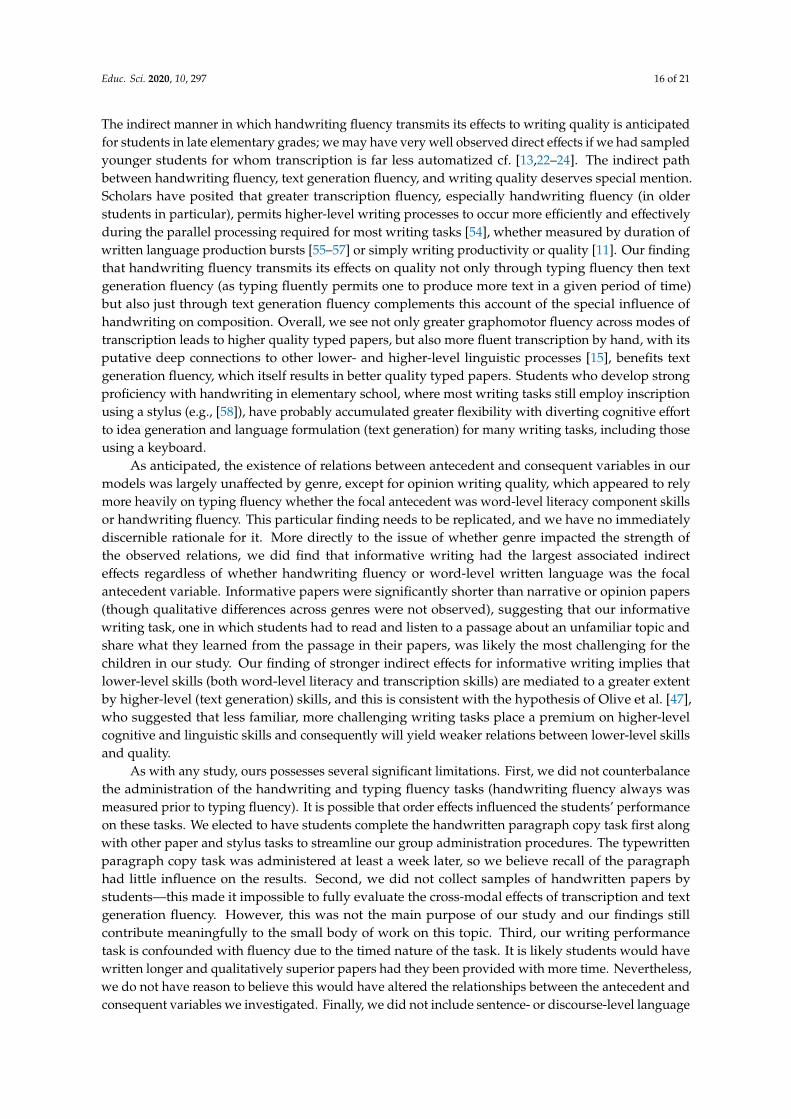
As anticipated, the existence of relations between antecedent and consequent variables in ourmodels was largely unaffected by genre, except for opinion writing quality, which appeared to relymore heavily on typing fluency whether the focal antecedent was word-level literacy component skillsor handwriting fluency. This particular finding needs to be replicated, and we have no immediatelydiscernible rationale for it. More directly to the issue of whether genre impacted the strength ofthe observed relations, we did find that informative writing had the largest associated indirecteffects regardless of whether handwriting fluency or word-level written language was the focalantecedent variable. Informative papers were significantly shorter than narrative or opinion papers(though qualitative differences across genres were not observed), suggesting that our informativewriting task, one in which students had to read and listen to a passage about an unfamiliar topic andshare what they learned from the passage in their papers, was likely the most challenging for thechildren in our study. Our finding of stronger indirect effects for informative writing implies thatlower-level skills (both word-level literacy and transcription skills) are mediated to a greater extentby higher-level (text generation) skills, and this is consistent with the hypothesis of Olive et al. [47],who suggested that less familiar, more challenging writing tasks place a premium on higher-levelcognitive and linguistic skills and consequently will yield weaker relations between lower-level skillsand quality.
As with any study, ours possesses several significant limitations. First, we did not counterbalancethe administration of the handwriting and typing fluency tasks (handwriting fluency always wasmeasured prior to typing fluency). It is possible that order effects influenced the students’ performanceon these tasks. We elected to have students complete the handwritten paragraph copy task first alongwith other paper and stylus tasks to streamline our group administration procedures. The typewrittenparagraph copy task was administered at least a week later, so we believe recall of the paragraphhad little influence on the results. Second, we did not collect samples of handwritten papers bystudents—this made it impossible to fully evaluate the cross-modal effects of transcription and textgeneration fluency. However, this was not the main purpose of our study and our findings stillcontribute meaningfully to the small body of work on this topic. Third, our writing performancetask is confounded with fluency due to the timed nature of the task. It is likely students would havewritten longer and qualitatively superior papers had they been provided with more time. Nevertheless,we do not have reason to believe this would have altered the relationships between the antecedent andconsequent variables we investigated. Finally, we did not include sentence- or discourse-level language

Educ. Sci. 2020, 10, 297 17 of 21
and literacy components in our models. Thus, we cannot determine if our results would replicate witha more robust accounting of known influences on writing outcomes. In the context of our study, it ispossible that the effects of word-level literacy skills and graphomotor fluency on writing quality wouldbe muted if higher-level skills had been included. Our models accounted for anywhere between 45%and 61% of variance in writing quality, leaving ample variance unexplained. Even so, our results arelargely consistent with theory and prior research findings [22]. Additionally, because we separatethe effects of transcription (spelling and graphomotor fluency) from text generation in this study,we believe, in fact, we do account to some extent for lower-level and higher-level component writingskills, albeit without the precision afforded by a comprehensive array of component skills measures.
5. Conclusions
Our results highlight the importance of graphomotor fluency, which tends to be ignored ortreated as a nuisance with minimal attention by educators, for writing performance in two ways.First, greater handwriting fluency permits more cognitive resources to be devoted to text generationfluency (i.e., efficiently generating ideas and translating them into appropriate and effective language),which is essential for good writing. This appears to be the case even when a student composes usinga word processor, which involves somewhat different visual-proprioceptive integration and motorplanning and execution processes for transcription by keyboard. It is likely the unique connectionsbetween handwriting and other cognitive resources and processes relied upon when writing are atplay. Second, greater handwriting fluency is related to greater writing fluency more broadly, as morefluent handwriting is associated with better typing fluency (they both are fundamentally graphomotortasks) and thus typed text generation fluency, which is related because a student is constrained whencomposing on the computer within time limits by how fast they can type.
We observed that students in our sample who were identified with disabilities (approximately10%) exhibited not only significantly poorer word-level literacy skills, but also less fluent transcriptionacross modes and poorer writing quality across genres. However, their texts were not significantlyshorter for the opinion and informative writing tasks. This may indicate these students did not have asmuch difficulty with text generation fluency as they did with transcription fluency, which highlightsthe importance of transcription for students with writing difficulties [59,60]. Handwriting mustbe explicitly taught to students, particularly those with writing problems, despite such instructionhaving low status [61] and teachers feeling ill-prepared to teach handwriting [58]. The benefits of suchinstruction on student writing outcomes even beyond handwriting fluency and legibility are welldocumented [1,16,62,63].
Looking across all participants in our study, students were significantly more fluent whentranscribing by hand than by keyboard, and both of these facets of graphomotor fluency were predictiveof writing output and quality, reinforcing the idea that not only handwriting, but keyboarding also mustbe explicitly taught so that students become proficient with composing on the computer. We should notethat, on average, the students in our sample could copy text at a rate of approximately 70 characters/minby hand and 60 characters/min by keyboard, which is roughly equivalent to 17.5 words/min and15 words/min, respectively, based on an average of four characters per word in the paragraph we used.Thus, the students in our sample, on average, were relatively fluent with transcription in either modecompared with extant data. For instance, Graham and Miller [64] found that students in grades 4through 6 can copy text by hand at a rate of 7 to 10 words/min and Graves [65] found a range of 8 to19 words/min for 9- and 10-year-olds when composing by hand. Without keyboarding instruction,students in these grades can generally type 3 to 5 words/min [66], but with instruction, students canincrease their typing speed to around 10−12 words/min or greater [67,68].
To reiterate, our study findings suggest the following three educational implications.First, educators should employ with consistency and fidelity evidence-based instructional practices toaddress component literacy skills such as vocabulary knowledge and word-level decoding and encodingskills, as a strong foundation in such component skills appears to free up cognitive resources needed for

Educ. Sci. 2020, 10, 297 18 of 21
transcription and text generation during writing activities, especially activities that involve less familiardiscourse structures. Second, explicit and systematic handwriting instruction in the primary grades(K-3) is vital to a strong performance in writing tasks, regardless of whether the text is composed on thecomputer or on paper, in part because attaining fluent handwriting reinforces the development of otherlanguage and literacy skills. Likewise, for students to compose successfully using a computer or otherdigital device, they must possess adequately fluent keyboarding skills. Fluent handwriting and typingskills appear to be especially important for children with disabilities, as these children appear to strugglemore with transcription than text generation, at least in our study sample. Third, because the writingquality depends on students’ graphomotor fluency (i.e., fluent handwriting and typing) and their textgeneration fluency (i.e., fluent translation of thoughts into acceptable language), instruction that aimsto integrate these two aspects of writing may prove to be beneficial.
Author Contributions: Conceptualization, G.A.T.; methodology, G.A.T.; formal analysis, G.A.T. and F.L.;investigation, G.A.T., K.G., and H.L.R.; data curation, G.A.T., J.S.B., K.G., and H.R.; writing—original draftpreparation, G.A.T. and J.S.B.; writing—review and editing, G.A.T., J.S.B., K.G., and H.L.R.; project administration,G.A.T.; funding acquisition, G.A.T. and F.L. All authors have read and agreed to the published version ofthe manuscript.
Funding: This research was supported in part by grant #R305A160049 from the U.S. Department of Education,Institute of Education Sciences, to Michigan State University. Statements do not necessarily reflect the positions orpolicies of this agency, and no official endorsement by it should be inferred.
Acknowledgments: We wish to thank the teachers and students who participated in this research project as wellas the following undergraduate research assistants who spent many hours scoring the standardized tests andwriting samples: Taylor Arnold, Mikayla Kalik, Amanda Ling, and Nicole Steele.
Conflicts of Interest: The authors declare no conflict of interest. The funder had no role in the design of the study;in the collection, analyses, or interpretation of data; in the writing of the manuscript, or in the decision to publishthe results.
References
1. Berninger, V.W.; Amtmann, D. Preventing written expression disabilities through early and continuingassessment and intervention for handwriting and/or spelling problems. Research into practice. In Handbookof Learning Disabilities; Swanson, H.L., Harris, K.R., Graham, S., Eds.; Guilford Press: New York, NY, USA,2003; pp. 345–363.
2. Berninger, V.W.; Chanquoy, L. What writing is and how it changes across early and middle childhooddevelopment: A multidisciplinary perspective. In Writing: A Mosaic of New Perspectives; Grigorenko, E.,Mambrino, E., Preiss, D., Eds.; Psychology Press: New York, NY, USA, 2012; pp. 65–84.
3. Berninger, V.W.; Vaughan, K.; Abbott, R.D.; Begay, K.; Coleman, K.B.; Curtin, G.; Hawkins, J.M.; Graham, S.Teaching spelling and composition alone and together: Implications for the simple view of writing.J. Ed. Psychol. 2002, 94, 291–304. [CrossRef]
4. Berninger, V.W.; Swanson, H.L. Modifying Hayes and Flower’s model of skilled writing to explain beginningand developing writing. In Advances in Cognition and Educational Practice: Children’s Writing: Toward a ProcessTheory of the Development of Skilled Writing; Butterfield, E.C., Ed.; JAI Press: Greenwich, CT, USA, 1994;Volume 2, pp. 57–82.
5. Alamargot, D.; Fayol, M. Modelling the development of written composition. In Handbook of WritingDevelopment; Beard, R., Myhill, D., Nystrand, M., Riley, J., Eds.; Sage: London, UK, 2009; pp. 23–47.
6. Kim, Y.G.; Park, S. Unpacking pathways using the direct and indirect effects model of writing (DIEW) andthe contributions of higher order cognitive skills to writing. Read. Writ. 2019, 32, 1319–1343. [CrossRef]
7. Olive, T.; Kellogg, R.T.; Piolat, A. Verbal, visual, and spatial working memory demands during textcomposition. Appl. Psycholinguist 2008, 29, 669–687. [CrossRef]
8. VanDrempt, N.; McCluskey, A.; Lannin, N.A. A review of factors that influence adult handwritingperformance. Aust. Occup. Ther. J. 2011, 58, 321–328. [CrossRef] [PubMed]
9. Bourdin, B.; Fayol, M. Even in adults, written production is still more costly than oral production.Int. J. Psychol. 2002, 37, 219–227. [CrossRef]

Educ. Sci. 2020, 10, 297 19 of 21
10. Feng, L.; Lindner, A.; Ji, S.R.; Joshi, R.M. The roles of handwriting and keyboarding in writing: A meta-analyticreview. Read. Writ. 2019, 32, 33–63. [CrossRef]
11. Graham, S.; Berninger, V.W.; Abbott, R.; Abbott, S.; Whitaker, D. Role of mechanics in composting ofelementary school students: A new methodological approach. J. Ed. Psychol. 1997, 89, 170–182. [CrossRef]
12. Jones, D.; Christensen, C.A. The relationship between automaticity in handwriting and students’ ability togenerate written text. J. Ed. Psychol. 1999, 91, 44–49. [CrossRef]
13. Kent, S.C.; Wanzek, J. The relationship between component skills and writing quality and production acrossdevelopmental levels: A meta-analysis of the last 25 years. Rev. Ed. Res. 2016, 86, 570–601. [CrossRef]
14. Puranik, C.S.; Al Otaiba, S. Examining the contribution of handwriting and spelling to written expression inkindergarten children. Read. Writ. 2012, 25, 1523–1546. [CrossRef]
15. Wagner, R.K.; Puranik, C.S.; Foorman, B.; Foster, E.; Wilson, L.G.; Tschinkel, E.; Kantor, P.T. Modeling thedevelopment of written language. Read. Writ. 2011, 24, 203–220. [CrossRef] [PubMed]
16. Graham, S.; McKeown, D.; Kiuhara, S.; Harris, K.R. A meta-analysis of writing instruction for students in theelementary grades. J. Ed. Psychol. 2012, 104, 879–896. [CrossRef]
17. Graham, S.; Santangelo, T. Does spelling instruction make students better spellers, readers, and writers?A meta-analytic review. Read. Writ. 2014, 27, 1703–1743. [CrossRef]
18. Santangelo, T.; Graham, S. A comprehensive meta-analysis of handwriting instruction. Ed. Psychol. Rev.2016, 28, 225–265. [CrossRef]
19. Christensen, C.A. The role of orthographic-motor integration in the production of creative and well-structuredwritten text for students in secondary school. Ed. Psychol. 2005, 25, 441–453. [CrossRef]
20. Connelly, V.; Gee, D.; Walsh, E. A comparison of keyboarded and handwritten compositions and therelationship with transcription speed. Br. J. Ed. Psychol. 2007, 77, 479–492. [CrossRef]
21. Shorter, L.L. Keyboarding Versus Handwriting: Effects on the Composition Fluency and Composition Quality ofThird Grade Students; University of South Alabama: Mobile, AL, USA, 2001.
22. Kim, Y.G.; Schatschneider, C. Expanding the developmental models of writing: A direct and indirect effectsmodel of developmental writing (DIEW). J. Ed. Psychol. 2017, 109, 35–50. [CrossRef]
23. Limpo, T.; Alves, R.A. Modeling writing development: Contribution of transcription and self-regulation toPortuguese students’ text generation quality. J. Ed. Psychol. 2013, 105, 401–413. [CrossRef]
24. Limpo, T.; Alves, R.A.; Connelly, V. Examining the transcription-writing link: Effects of handwritingfluency and spelling accuracy on writing performance via planning and translating in middle grades.Learn. Ind. Differ. 2017, 53, 26–36. [CrossRef]
25. Berninger, V.W.; Abbott, R.D.; Jones, J.; Wolf, B.J.; Gould, L.; Anderson-Youngstrom, M.; Shimada, S.;Apel, K. Early development of language by hand: Composing, reading, listening, and speaking connections;three letter-writing modes; and fast mapping in spelling. Dev. Neuropsychol. 2006, 29, 61–92. [CrossRef]
26. Rogers, J.; Case-Smith, J. Relationships between handwriting and keyboarding performance of sixth-gradestudents. Am. J. Occup. Ther. 2002, 56, 34–39. [CrossRef] [PubMed]
27. Cohen, M.R.; Wicklund, D.A. Component abilities of spelling, memory, and motor skill in novices’transcription typing. Percept. Mot. Ski. 1990, 70, 19–31. [CrossRef]
28. Jiménez, J.E.; Hernández-Cabrera, J.A. Transcription skills and written composition in Spanish beginningwriters: Pen and keyboard modes. Read. Writ. 2019, 32, 1847–1879. [CrossRef]
29. Longcamp, M.; Boucard, C.; Gilhodes, J.-C.; Velay, J.-L. Remembering the orientation of newly learnedcharacters depends on the associated writing knowledge: A comparison between handwriting and typing.Hum. Mov. Sci. 2006, 25, 646–656. [CrossRef] [PubMed]
30. Longcamp, M.; Boucard, C.; Gilhodes, J.-C.; Anton, J.L.; Roth, M.; Nazarian, B.; Velay, J.-L. Learning throughhand- or typewriting influences visual recognition of new graphic shapes: Behavioral and functional imagingevidence. J. Cogn. Neurosci. 2008, 20, 802–815. [CrossRef]
31. Longcamp, M.; Zerbato-Poudou, M.-T.; Velay, J.-L. The influence of writing practice on letter recognition inpreschool children: A comparison between handwriting and typing. Acta Psychol. 2005, 119, 67–79. [CrossRef]
32. Longcamp, M.; Tanskanen, T.; Hari, R. The imprint of action: Motor cortex involvement in visual perceptionof handwritten letters. NeuroImage 2006, 33, 681–688. [CrossRef]
33. Mangen, A. The disappearing trace and the abstraction of inscription in digital writing. In ExploringTechnology for Writing and Writing Instruction; Pytash, K., Ferdig, R., Eds.; IGI Global: Hershey, PA, USA, 2014;pp. 100–113.

Educ. Sci. 2020, 10, 297 20 of 21
34. Mangen, A.; Velay, J.-L. Digitizing literacy: Reflections on the haptics of writing. In Advances in Haptics;Zadeh, M.H., Ed.; InTech: Rijeka, Croatia, 2010; pp. 385–402.
35. Abbott, R.D.; Berninger, V.W. Structural equation modeling of relationships among developmental skills andwriting skills in primary- and intermediate-grade writers. J. Ed. Psychol. 1993, 85, 478–508. [CrossRef]
36. Berninger, V.; Abbott, R.; Abbott, S.; Graham, S.; Richards, T. Writing and reading: Connections betweenlanguage by hand and language by eye. J. Learn. Dis. 2002, 35, 39–56. [CrossRef]
37. Ahmed, Y.; Wagner, R.K.; Lopez, D. Developmental relations between reading and writing at the word,sentence and text levels: A latent change score analysis. J. Ed. Psychol. 2014, 106, 419–434. [CrossRef]
38. Abbott, R.D.; Berninger, V.W.; Fayol, M. Longitudinal relationships of levels of language in writing andbetween writing and reading in grades 1 to 7. J. Ed. Psychol. 2010, 102, 281–298. [CrossRef]
39. Graham, S.; Hebert, M. Writing to read: A meta-analysis of the impact of writing and writing instruction onreading. Harv. Ed. Rev. 2011, 81, 710–744. [CrossRef]
40. Shanahan, T. Relations among oral language, reading, and writing development. In Handbook of Writing Research;MacArthur, C.A., Graham, S., Fitzgerald, J., Eds.; Guilford Press: New York, NY, USA, 2006; pp. 171–183.
41. Mehta, P.; Foorman, B.; Branum-Martin, L.; Taylor, W. Literacy as a unidimensional multilevel construct:Validation, sources of influence, and implications in a longitudinal study in grades 1 to 4. Sci. Stud. Read.2005, 9, 85–116. [CrossRef]
42. Grobe, G. Syntactic maturity, mechanics, and vocabulary as predictors of quality ratings. Res. Teach. Engl.1981, 15, 75–85.
43. Olinghouse, N.G.; Leaird, J.T. The relationship between measures of vocabulary and narrative writing qualityin second- and fourth-grade students. Read. Writ. 2009, 22, 545–565. [CrossRef]
44. Olinghouse, N.G.; Wilson, J. The relationship between vocabulary and writing quality in three genres.Read. Writ. 2013, 26, 45–65. [CrossRef]
45. Hayes, J.R. A new framework for understanding cognition and affect in writing. In The Science of Writing:Theories, Methods, Individual Differences, and Applications; Levy, C.M., Randall, S., Eds.; Erlbaum: Mahwah, NJ,USA, 1996; pp. 1–27.
46. McCutchen, D. Knowledge, processing, and working memory: Implications for a theory of writing. Ed.Psychol. 2000, 35, 13–23. [CrossRef]
47. Olive, T.; Favart, M.; Beauvais, C.; Beauvais, L. Children’s cognitive effort and fluency in writing: Effects ofgenre and of handwriting automatisation. Learn. Instr. 2009, 19, 299–308. [CrossRef]
48. Wilkinson, G.S. WRAT-3: The Wide Range Achievement Test, 3rd ed.; Wide Range, Inc.: Wilmington, DE, USA,1993.
49. Hammill, D.D.; Larsen, S.C. Test of Written Language, 4th ed.; PRO-ED: Austin, TX, USA, 2009.50. Monroe, M.; Sherman, E. Group Diagnostic Reading Aptitude and Achievement Tests; C. H. Nevins Printing Co.:
Bradenton, FL, USA, 1966.51. Troia, G.A.; Harbaugh, A.G.; Shankland, R.K.; Wolbers, K.A.; Lawrence, A.M. Relationships between writing
motivation, writing activity, and writing performance: Effects of grade, sex, and ability. Read. Writ. 2013, 26,17–44. [CrossRef]
52. Truckenmiller, A.J.; McKindles, J.V.; Petscher, Y.; Eckert, T.L.; Tock, J. Expanding curriculum-basedmeasurement in written expression for middle school. J. Spec. Ed. 2020, 54, 133–145. [CrossRef]
53. Hayes, A.F. Introduction to Mediation, Moderation, and Conditional Process Analysis: A Regression-Based Approach,2nd ed.; Guilford Press: New York, NY, USA, 2018.
54. Olive, T.; Kellogg, R.T. Concurrent activation of high- and low-level production processes in writtencomposition. Mem. Cogn. 2002, 30, 594–600. [CrossRef] [PubMed]
55. Alves, R.A.; Branco, M.; Castro, S.L.; Olive, T. Effects of handwriting skill, handwriting and dictationmodes, and gender of fourth graders on pauses, written language bursts, fluency, and quality. In Past,Present, and Future Contributions of Cognitive Writing Research to Cognitive Psychology; Berninger, V.W., Ed.;Psychology Press: New York, NY, USA, 2012; pp. 389–402.
56. Alves, R.A.; Limpo, T. Progress in written language bursts, pauses, transcription, and written compositionacross schooling. Sci. Stud. Read. 2015, 19, 374–391. [CrossRef]
57. Alves, R.A.; Limpo, T.; Fidalgo, R.; Carvalhais, L.; Pereira, L.A.; Castro, S.L. The impact of promotingtranscription on early text production: Effects on bursts and pauses, levels of written language, and writingperformance. J. Ed. Psychol. 2016, 108, 665–679. [CrossRef]

Educ. Sci. 2020, 10, 297 21 of 21
58. Gilbert, J.; Graham, S. Teaching writing to elementary students in grades 4–6: A national survey. Elem. Sch. J.2010, 110, 494–518. [CrossRef]
59. Berninger, V.W.; Winn, W.D. Implications of advancements in brain research and technology forwriting development, writing instruction, and educational evolution. In Handbook of Writing Research;MacArthur, C.A., Graham, S., Fitzgerald, J., Eds.; Guilford Press: New York, NY, USA, 2006; pp. 96–114.
60. Graham, S.; Harris, K.R. The role of self-regulation and transcription skills in writing and writing development.Ed. Psychol. 2000, 35, 3–12. [CrossRef]
61. Medwell, J.; Wray, D. Handwriting—A forgotten language skill? Lang. Ed. 2008, 22, 34–47. [CrossRef]62. Feder, K.P.; Majnemer, A. Handwriting development, competency, and intervention. Dev. Med. Child. Neurol.
2007, 49, 312–317. [CrossRef] [PubMed]63. Yancosek, K.E.; Howell, D. Systematic review of interventions to improve or augment handwriting ability in
adult clients. OTJR 2011, 31, 55–63. [CrossRef]64. Graham, S.; Miller, L. Handwriting research and practice: A unified approach. Focus Except. Child. 1980, 13, 1–16.
[CrossRef]65. Graves, D.H. Writing: Teachers and Children at Work; Heinemann: Exeter, NH, USA, 1983.66. Wetzel, K. Keyboarding skills: Elementary, my dear. Comput. Teach. 1985, 12, 15–19.67. Nichols, L. A comparison of two methods for teaching keyboarding in the elementary school. Comput. Sch.
1995, 11, 15–25. [CrossRef]68. Sormunen, C. Elementary school keyboarding: A case for skill development. Bus. Ed. Forum 1991, 45, 28–30.
Publisher’s Note: MDPI stays neutral with regard to jurisdictional claims in published maps and institutionalaffiliations.
© 2020 by the authors. Licensee MDPI, Basel, Switzerland. This article is an open accessarticle distributed under the terms and conditions of the Creative Commons Attribution(CC BY) license (http://creativecommons.org/licenses/by/4.0/).
Copyright © 2022 FDOKUMEN