Dinâmica da comunidade microbiana entre múltiplas escalas ...
183
Universidade Federal do Rio Grande do Sul Instituto de Pesquisas Hidráulicas Programa de Pós-graduação em Recursos Hídricos e Saneamento Ambiental Dinâmica da comunidade microbiana entre múltiplas escalas espaciais e temporais em lagos rasos costeiros do extremo sul do Brasil Marla Sonaira Lima Defesa de Tese de doutorado submetida ao Programa de Pós-Graduação em Recursos Hídricos e Saneamento Ambiental da Universidade Federal do Rio Grande do Sul, como requisito à obtenção do título de DOUTORA. Orientador: David da Motta Marques Porto Alegre, 19 de dezembro de 2016
-
Upload
khangminh22 -
Category
Documents
-
view
0 -
download
0
Transcript of Dinâmica da comunidade microbiana entre múltiplas escalas ...

Universidade Federal do Rio Grande do Sul Instituto de Pesquisas Hidráulicas
Programa de Pós-graduação em Recursos Hídricos e Saneamento Ambiental
Dinâmica da comunidade microbiana entre múltiplas escalas espaciais e
temporais em lagos rasos costeiros do extremo sul do Brasil
Marla Sonaira Lima
Defesa de Tese de doutorado submetida ao
Programa de Pós-Graduação em Recursos
Hídricos e Saneamento Ambiental da
Universidade Federal do Rio Grande do Sul,
como requisito à obtenção do título de
DOUTORA.
Orientador: David da Motta Marques
Porto Alegre, 19 de dezembro de 2016
II
Dinâmica da comunidade microbiana entre múltiplas escalas espaciais e
temporais em lagos rasos costeiros do extremo sul do Brasil
Marla Sonaira Lima
Defesa de Tese de doutorado submetida ao Programa de Pós-Graduação em Recursos
Hídricos e Saneamento Ambiental da Universidade Federal do Rio Grande do Sul
Orientador: David da Motta Marques
Banca Examinadora:
Dra. Dionéia Evangelista Cesar Departamento de Biologia Universidade Federal de Juiz de Fora (UFJF) Dr. Vinicius Fortes Farjalla Departamento de Ecologia Universidade Federal do Rio de Janeiro (UFRJ) Dra. Lúcia Helena Ribeiro Rodrigues Laboratório de Ecotecnologia e Limnologia Aplicada, Instituto de Pesquisas Hidráulicas (IPH) /Universidade Federal do Rio Grande do Sul (UFRGS).
Porto Alegre, 19 de dezembro de 2016

III
Descobrir consiste em ver o que todos viram e pensar o
que ninguém pensou.”
Albert Szent Gyorgy

IV
AGRADECIMENTOS Agradeço infinitamente à minha família, que sempre esteve presente me
apoiando incondicionalmente. Meus amados pais, Roque Antônio Lima e Nívia Salete
Lima, que dedicando suas vidas às filhas; nunca hesitaram em me ouvir, me aconselhar
e a me ensinar a persistir sempre. Minhas três irmãs, Mircéia, Maira e Mariene, que com
suas peculiares formas de pensar a vida, me ajudaram a refletir sobre a minha. E a Vó
Cema, que sempre esteve pertinho acalmando minhas angústias e me ensinando a
enfrentá-las. Amos muito vocês!
Meu especial agradecimento ao amor da minha vida, Rogério Rammê, que é
meu eterno parceiro e companheiro. Que dividiu comigo longos 4 anos de muito estudo,
debates e sempre presente, me dando a força e os incentivos necessários. Amo você!
Aos meus sogros Iara Rammê e Roberto Rammê, que sempre me acolheram
com muito carinho e respeito.
Ao meu Orientador, David da Motta Marques, pela grande oportunidade de me
fazer viver a ciência de modo strictu sensu. Hoje entendo a importância da sua
cobrança, sua insistência.
À querida Katherine McMahon (Trina), que sempre me recebeu de portas
abertas em seu laboratório no departamento de engenharia civil, ambiental e de
bacteriologia na University of Wisconsin – Madison. Trina teve fundamental
contribuição nas análises de ARISA e revisão dos artigos em que é co-autora. Além de
servir de exemplo de força e inteligência.
V
À professora Luciane Passaglia, por ter cedido seu laboratório de
Microbiologia Agrícola no Departamento de Genética da UFRGS para que eu pudesse
realizar as extrações de DNA de todas as amostras coletadas durante essa tese.
Às minhas colegas de luta na pesquisa, Andressa Wieliczko, Juliana
Bohnenberger, Luana Morais e Mônica Hessel, aos meninos, Mauricio Munar e Rafael
Cavalcante. Obrigada pela convivência, pelas risadas, pelos conselhos, pelas discussões
dos mais variados temas e pelos mapas meninos. Vocês são demais!
Ao querido colega e amigo Ng Haig They que a pesquisa me trouxe. Que
apesar da longa distância, está sempre tão perto, presente e disposto a me ajudar e dar
grandes conselhos sempre. Às professoras Eliete Canterle, Fabiana Schneck, Luciana
Cardoso, Luciane Crossetti, Lucia Rodrigues e Vanessa Becker, sempre bem
humoradas, agradeço a amizade, os bons conselhos em todas as horas, os ensinamentos.
Aos queridos colegas que, ao longo dessa jornada, acabaram me trazendo grandes
ensinamentos. Aos técnicos do laboratório de saneamento do IPH, Mara Domingues
(Maravilha), Louidi, e Tiago.
Obrigada pela grande parceria!
Eterna gratidão a todos!

Dinâmica da comunidade microbiana entre múltiplas escalas espaciais e temporais em lagos rasos costeiros do extremo sul do Brasil – Sumário
Sumário
Resumo ........................................................................................................................... 16
Abstract ........................................................................................................................... 18
Capítulo 1. Introdução .................................................................................................... 20
Justificativa ................................................................................................................. 20
Hipóteses ..................................................................................................................... 27
Objetivo Geral ............................................................................................................. 28
Objetivos Específicos .............................................................................................. 28
Material e Métodos ..................................................................................................... 29
Área de Estudo ........................................................................................................ 29
Delineamento Amostral ........................................................................................... 29
Estrutura da Tese ........................................................................................................ 30
Referências .................................................................................................................. 31
Capítulo 2. Contrasting factors drive within-lake bacterial community composition and
functional traits in a large shallow subtropical lake ....................................................... 38
Apresentação ............................................................................................................... 38
Abstract ....................................................................................................................... 39
Introduction ................................................................................................................. 41
Materials and Methods ................................................................................................ 43
Results ......................................................................................................................... 48

Dinâmica da comunidade microbiana entre múltiplas escalas espaciais e temporais em lagos rasos costeiros do extremo sul do Brasil – Sumário
Discussion ................................................................................................................... 52
References ................................................................................................................... 59
Supplementary Material .............................................................................................. 80
Capítulo 3. Bacterial beta diversity among lakes, but not within lakes, is regulated by
local factors..................................................................................................................... 88
Apresentação ............................................................................................................... 88
Introduction ................................................................................................................. 90
Materials and Methods ................................................................................................ 92
Results ......................................................................................................................... 99
Discussion ................................................................................................................. 101
Acknowledgments .................................................................................................... 104
Conflict of Interest .................................................................................................... 105
References ................................................................................................................. 105
Capítulo 4. Resistance and resilience of aquatic bacterial community over a cold front
event ............................................................................................................................. 125
Apresentação ............................................................................................................. 125
Abstract ..................................................................................................................... 126
Introduction ............................................................................................................... 127
Material and Methods ............................................................................................... 129
Results ....................................................................................................................... 134

Dinâmica da comunidade microbiana entre múltiplas escalas espaciais e temporais em lagos rasos costeiros do extremo sul do Brasil – Sumário
Discussion ................................................................................................................. 143
Acknowledgments .................................................................................................... 146
References ................................................................................................................. 146
Capítulo 5. Discussão Geral ......................................................................................... 150
Conclusões ................................................................................................................ 158
Contribuições e Perspectivas .................................................................................... 159
Referências ................................................................................................................ 162
ANEXO ........................................................................................................................ 167

Dinâmica da comunidade microbiana entre múltiplas escalas espaciais e temporais em lagos rasos costeiros do
extremo sul do Brasil – Lista de Figuras
Lista de Figuras
Capítulo 2
Fig. 1 Sampling points in Lake Mangueira, southern Brazil. South (points 1 to
6), Center (points 7-12) and North (points 13-18).
p.73
Fig. 2 Biplot of the pRDA of the BCC constrained by the environmental
variables matrix, after removing the effect of all other explanatory matrices.
p.74
Fig. 3 Biplot of the pRDA of the BCC constrained by the phytoplankton major
classes’ biomass matrix, after removing the effect of all other explanatory
matrices.
p.74
Supplementary Fig. S1 Contour plots showing temporal variation of OTUs and
carbon substrates that contributed most to BCC and FT dissimilarities,
according to SIMPER. Black dots represent the sampling points along Lake
Mangueira.
p.84
Supplementary Fig. S2 Contour plot showing spatial variation of OTUs and
carbon substrates that contributed most to BCC and FT dissimilarities,
according to SIMPER. Black dots represent the sampling points along the
South, Center and North areas of Lake Mangueira.
p.87
Capítulo 3
Figure 1 Twenty-five shallow coastal lakes sampled in the Tramandaí River
System, southern Brazil. Red dots: sampling sites.
p.123
Figure 2 Bacterial beta diversity components within-lakes based on mean
distance to group centroid of three sites per lake in 25 subtropical shallow lakes.
p.124
Capítulo 4
Figure 1 Study area, in particular the sampling station in the pelagic zone of
Lake Mangueira.
p.131
Figure 2 Variation of environmental conditions measured during seven days of
six daily sampling along the short-term cold front event, totalizing 42 samples.
p.136

Dinâmica da comunidade microbiana entre múltiplas escalas espaciais e temporais em lagos rasos costeiros do
extremo sul do Brasil – Lista de Figuras
Except for total solid suspended, total phosphorus and dissolved organic carbon,
in which for the first day of sampling we have only two samples, and for the
second day sampling, four samples, totalizing 36 samples during seven days.
Figure 3. Bacterial biomass concentration values, indicating variation along the
cold front (seven days, with six daily samplings), including pre, disturb and
post-disturb periods. Numbers in the box are average and standard deviation.
p.137
Figure 4 Temporal relative biomass variation of bacterial morphotypes along
seven days of short-term cold front event (pre, during and post distrub) in Lake
Mangueira.
p.138
Figure 5 Redundancy analyses (RDA biplot) between bacterial biomass,
morphotypes and environmental variables. Temp: air temperature; WD: wind
direction; WS: Wind velocity; ChlF: chlorophyll fluorescence; cDOM:
chromophoric dissolved organic matter.
p.142
Figure 6 RDA biplot between bacterial composition and environmental
variables. Temp: air temperature; WD: wind direction; WS: Wind velocity;
ChlF: chlorophyll fluorescence; cDOM: Organic matter dissolved
chromophoric.
p.143

Dinâmica da comunidade microbiana entre múltiplas escalas espaciais e temporais em lagos rasos costeiros do
extremo sul do Brasil – Lista de Tabelas
Lista de Tabelas
Capítulo 2
Table 1 Mean (standard deviation) of environmental variables and chlorophyll
a across seasons and locations for Lake Mangueira.
p.75
Table 2 Mean (standard deviation) of biomass (mg L-1) of major classes of
phytoplankton across seasons and locations for Lake Mangueira.
p.76
Table 3 Differences among seasons and locations, assessed by PERMANOVA
for BCC and FT in Lake Mangueira.
p.76
Table 4 RDA and variation partitioning (pRDA) of the bacterial community
composition (BCC) among four explanatory matrices in Lake Mangueira.
p.77
Table 5 RDA and variation partitioning (pRDA) of the bacterial functional
traits (FT) among four explanatory matrices in Lake Mangueira
p.78
Table 6 Comparison of studies that have addressed within-lake heterogeneity
in BCC through molecular approaches
p.79
Supplementary Table S1 Geographical distance matrix (meters) between
sampling points in Lake Mangueira. From south to center the longest distance
was 65,378.1 m, between S1 and C12, and the shortest distance was 11,008.1
m, between S5 and C8. From south to north the longest distance was 89,726.4
m, between S1 and N18; and the shortest was 49,119.0 m, between S4 and N13.
From center to north the longest distance was 55,978.6 m, between C9 and
N18; and the shortest was 11,230.7 m, between C12 and N13.
p.80
Supplementary Table S2 OTUs and substrates with the highest contribution to
dissimilarity in BCC and FT among seasons, according to SIMPER. For the
BCC, OTUs 399 and 546 contributed most to the dissimilarity between summer
× spring and summer × autumn, respectively. OTU 634 contributed to
dissimilarity between winter × summer and winter × autumn, whereas OTU
403 contributed most to the winter × spring dissimilarity. Differences between
p.81

Dinâmica da comunidade microbiana entre múltiplas escalas espaciais e temporais em lagos rasos costeiros do
extremo sul do Brasil – Lista de Tabelas
autumn × spring were mostly due to OTU 654. Overall, OTUs 399 and 547
increased in summer, 438, 650 and 654 increased in autumn, 511, 634 and 699
in winter and 404, 520 and 546 in spring. For the FT, the carbon source
phenylethylamine (G4) and 2-hydroxy benzoic (C3) were the main substrates
responsible for dissimilarities, as they showed high mean potential oxidation in
winter and spring. Phenylethylamine contributed most to dissimilarities
between summer × autumn, summer × winter, autumn × winter and summer ×
spring, whereas 2-hydroxybenzoic acid contributed most to dissimilarities
between winter × spring and autumn × spring.
Supplementary Table S3 OTUs and substrates with the highest contributions
to dissimilarity in BCC and FT among locations, estimated by SIMPER. OTU
403 was the major one responsible for the dissimilarity between north × south.
OTUs 399, 511, 547, 634, 654 showed higher relative abundance in the south,
while 403 and 404 were higher in the north, and 546 in the center. For FT, the
phenylethylamine (G4) and 2-hydroxybenzoic acid (C3) were the substrates
that showed higher potential oxidation in the south compared to north and
center, whereas i-erythritol (C2) and γ-hydroxybutyric acid (E3) predominated
in the center. In the north, glucose-1-phosphate had the highest potential
oxidation.
p.85
Capítulo 3
Tabela 1 Mean distance to group centroid for bacterioplankton, environmental
heterogeneity and phytoplankton composition heterogeneity for each lake. F-
and p-values were obtained from tests for homogeneity of multivariate
dispersions of the sites to their group centroid.
p.116
Tabela 2 Summary of best models selected through second-order Akaike’s
information criterion (AICc) to explain within-lake variation in beta diversity.
Env, environmental heterogeneity; Phyto, heterogeneity in phytoplankton
composition; Chl, chlorophyll a; df, degrees of freedom; Delta, AIC difference
to the best model; Weight, Akaike weight; Adj R², ordinary adjusted coefficient
of determination.
p.118

Dinâmica da comunidade microbiana entre múltiplas escalas espaciais e temporais em lagos rasos costeiros do
extremo sul do Brasil – Lista de Tabelas
Supplementary Table S1 Mean, maximum, minimum and standard deviation
of environmental variables among all 25 lakes.
p.119
Supplementary Table S2 Mean, maximum, minimum and standard deviation
of chlorophyll a, and phytoplankton biomass of taxonomic classes among all 25
lakes.
p.121
Capítulo 4
Table 1 SIMPER analysis of morphotypes comparing the contribution of each
and the mean abundance between pre-disturb x disturb, pre-disturb x post-
disturb and disturb x post-disturb.
p.139
Table 2. Spearman correlation values between biomass and environmental
variables along a cold front.
p.141
Dinâmica da comunidade microbiana entre múltiplas escalas espaciais e temporais em lagos rasos costeiros do
extremo sul do Brasil – Abreviaturas e Símbolos
Abreviaturas e Símbolos
AF – Atributos funcionais
AH – Ácidos húmicos
ARISA – Automated ribosomal intergenic spacer analysis
BCC – Bacterial community composition
BDEHR – Beta diversity-environmental heterogeneity relationship
BNES – Componente da diversidade beta - aninhamento
BSIM- Componente da diversidade beta – turnover
BSOR – Índice de diversidade beta
CCB – Composição da comunidade bacteriana
CDOM – Chromophoric dissolved organic matter
Chla – Clorofila a
ChlF – Chlorophyll fluorescence
CI – Curve integration index
COD – Carbono orgânico dissolvido
COT – Carbono orgânico total
DNA – Deoxyribonucleic acid/ácido desoxirribonucleico
DO – Dissolved oxygen
DOC – Dissolved organic carbon
FT – Functional traits
HS – Humic substances
MODC - Matéria orgânica dissolvida cromofórica
NH4- - Amônia/ammonium
NO3- - Nitrato/nitrate
NT – Nitrogênio total
OD – Optical density
ORP – Oxidation-redution potential
OTUs - Operational taxonomic units
PCNM – Principal Coordinates of Neighbour Matrices
PERANOVA – Permutation ANOVA

Dinâmica da comunidade microbiana entre múltiplas escalas espaciais e temporais em lagos rasos costeiros do
extremo sul do Brasil – Abreviaturas e Símbolos
PERMANOVA – Permutation MANOVA
PT – Fósforo total
RDA – Redundance analysis
RNA – Ribonucleic acid/ácido ribonucleio
SHT – Sistema Hidrológico do Taim
SIMPER – Similarity percentage analysis
SRP – Soluble reactive phosphorus
TN – Total nitrogen
TOC – Total organic carbon
TP – Total phosphorous
TSS – Total solid suspensed
TURB – Turbidity
VIF – Variation inflation factor
WT – Water transparency
WV – Wind velocity

Dinâmica da comunidade microbiana entre múltiplas escalas espaciais e temporais em lagos rasos costeiros do
extremo sul do Brasil – Resumo
Resumo
A comunidade bacteriana aquática foi estudada quanto à composição, biomassa e à
atividade de consumo de carbono (perfil de consumo potencial de substratos orgânicos
através de Ecoplates Biolog™) ao longo de diferentes escalas espaciais e temporais em
26 lagoas costeiras do sul do Brasil. Com o objetivo de investigar a influência de
distintos padrões temporais e espaciais na dinâmica da comunidade, investigou-se i) a
variação da composição da comunidade bacteriana (CCB) e de seus atributos funcionais
(AF) em função de efeitos exclusivos do ambiente, do espaço, do tempo, ou de todos os
fatores na Lagoa Mangueira; ii) os padrões espaciais de distribuição da diversidade beta
bacteriana aquática e os fatores influenciando tais variações ao longo de 25 lagoas com
diferentes graus de conectividade, no Sistema do rio Tramandaí; e iii) a dinâmica
temporal da composição e biomassa bacteriana ao longo de um distúrbio provocado por
frentes frias na Lagoa Mangueira. Dessa forma, três perguntas principais foram
compostas: i) há variação da composição da comunidade bacteriana (CCB) e de seus
atributos funcionais (AF) em função de efeitos exclusivos do ambiente, do espaço, do
tempo, ou de todos os fatores? ii) a diversidade beta bacteriana aquática apresenta
padrão de distribuição aninhado ou turnover e quais processos influenciam tais padrões?
iii) a composição e biomassa da comunidade bacteriana muda em resposta a distúrbios
de curta duração ocorridos pela entrada de frente fria polar? Como resultados
consistentes observaram-se que: i) a CCB e seus AF variam temporal e espacialmente,
sendo sua distribuição explicada principalmente pelos filtros ambientais (species-
sorting) e pela distância espacial, respectivamente; ii) a diversidade beta bacteriana
entre e dentro das lagoas é principalmente o resultado da substituição de espécies
(turnover), sendo que a relação entre a diversidade beta bacteriana e a heterogeneidade
16

Dinâmica da comunidade microbiana entre múltiplas escalas espaciais e temporais em lagos rasos costeiros do
extremo sul do Brasil – Resumo
ambiental entre as lagoas parece ser resultado de species-sorting, enquanto que dentro
das lagoas pode ser o resultado do efeito de massa, devido à alta conectividade e
dispersão dentro das lagoas; iii) a comunidade bacteriana em termos de biomassa
apresenta-se resiliente ao distúrbio, enquanto que a composição da comunidade
apresenta-se resistente ao distúrbio provocado por frente fria. Assim, esta tese contribui
no incremento de discussões acerca dos padrões ecológicos da comunidade bacteriana
entre múltiplas escalas espaciais e temporais, mostrando que a menor escala de
heterogeneidade bacteriana detectada pode estar positivamente relacionada ao tamanho
do lago. Além disso a comunidade apresenta distintas respostas de estabilidade em
termos composicionais e biomassa em eventos que causam distúrbios ao sistema.
Finalmente, esse estudo conseguiu verificar variação espacial e temporal da comunidade
bacteriana entre multiplas escalas no sistema aquático, em resposta às variações nas
características ambientais nas diferentes escalas estudadas. Portanto, esse estudo
identifica a resposta bacteriana aos distintos padrões espaciais e temporais, e quais
mecanismos influenciam a comunidade bacteriana, evidenciando a importância em se
considerar múltiplas escalas para a compreensão da biogeografia microbiana e a sua
habilidade de responder a perturbações.
Palavras-chave: ARISA, biogeografia microbiana, composição da comunidade
bacteriana, diversidade beta, ecoplate, lagoas costeiras, metacomunidade, resistência,
resiliência.
17

Dinâmica da comunidade microbiana entre múltiplas escalas espaciais e temporais em lagos rasos costeiros do
extremo sul do Brasil – Abstract
Abstract
The aquatic bacterial community was studied in terms of composition, biomass and
carbon consumption activity (physiological profile - Ecoplate) over different spatial and
temporal scales in 26 coastal lagoons in southern Brazil. In order to investigate the
influence of different spatial and temporal patterns in community dynamics, we
investigated i) the variation of the bacterial community composition (CBB) and its
functional traits (FT) as a function of exclusive effects of the environment, of the space,
of the time, or of all the factors in Lake Mangueira; ii) the patterns of distribution of the
aquatic bacterial beta diversity and the factors influencing such variations along 25
lakes with different degrees of connectivity in the Tramandaí River System; and iii)
temporal dynamics of bacterial composition and biomass along a disturbance provoked
by cold fronts in Lake Mangueira. In this way, three mainly questions were made: i) is
there variation in the BCC and its FT as a function of the sole purpose of environment,
of space, time, or all of the factors? ii) Does aquatic bacterial beta diversity presents a
nested pattern of distribution or turnover and which processes influence these patterns?
iii) Do the composition and biomass of the bacterial community change in response to
short-term disturbs due to the polar cold front event? As a consistent result, it was
observed that: i) the BCC and its FT varied temporally and spatially, and its distribution
is explained mainly by environmental filters (species-sorting) and spatial distance,
respectively; ii) the bacterial beta diversity between and within lake is primarily the
result of species turnover, and the bacterial beta diversity-environmental heterogeneity
relationship (BDEHR) among lakes appears to result from species-sorting, while within-
lake the beta diversity should be a result of the mass effect, due to the high connectivity
and dispersion within-lake; iii) the bacterial community, in terms of biomass is resilient
18

Dinâmica da comunidade microbiana entre múltiplas escalas espaciais e temporais em lagos rasos costeiros do
extremo sul do Brasil – Abstract
to the disturbance, whereas the bacterial composition is resistant to the disturbance.
Thus, this thesis contributes in increasing discussions about the ecological patterns of
the bacterial community between multiple scales showing that the smaller scale of
bacterial heterogeneity detected can be positively related to the lake size. In addition,
the community presents distinct stability responses in terms of composition and biomass
over events that cause disturbances to the system. This study was able to verify spatial
and temporal variation of the bacterial community among multiple scales in the aquatic
system, in response to different environmental factors among the multiple scales
studied. Therefore, this study identified the bacterial response to the different spatial and
temporal patterns, and the mechanisms that influence the bacterial community,
evidencing the importance in considering multiple scales for the understanding of
microbial biogeography and its ability to respond to disturbs.
Key-words: ARISA, bacterial community composition, beta diversity, coastal lakes,
ecoplate, metacommunity, microbial biogeography, resistance, resilience.
19

Capítulo 1. Introdução Geral – Bacterioplâncton: padrões temporais e espaciais em ecossistemas lacustres.
Capítulo 1. Introdução
Justificativa
A compreensão de padrões e processos da biodiversidade é uma questão
fundamental em estudos ecológicos. A biodiversidade governa e regula processos
ecossistêmicos, influenciando a forma como os ecossistemas funcionam (Hillebrand e
Matthiessen, 2009). Por isso, entender os mecanismos que a determinam é essencial
para prever alterações nos ecossistemas.
Nesse contexto, as bactérias representam grande fração da diversidade do planeta
(Pace, 1997). Essa diversidade inclui tanto a composição genética dos microrganismos,
como seu papel ecológico ou funcional dentro do ecossistema (Hunter-Cevera, 1998),
assumindo papel essencial no seu funcionamento. Esses microorganismos atuam nos
processos de remineralização de nutrientes orgânicos, participando de toda a respiração
anaeróbica e de grande parte da aeróbica, da decomposição e regeneração de nutrientes
e também como importantes componentes das teias tróficas (Cole, 1999; Pomeroy,
1974; Azam et al., 1983). Tais serviços bacterianos prestados aos ecossistemas
dependem fortemente da riqueza de espécies e da composição taxonômica (Bell et al.,
2005), sendo assim decisivo identificar quais fatores afetam a estrutura das
comunidades bacterianas.
Dada a importância dessas comunidades para os processos metabólicos nos
ecossistemas, e sabendo-se que as bactérias podem representar mais de 90% dos
microorganismos no ambiente aquático (Hahn, 2006) torna-se relevante identificar a
influência dos padrões espaciais e temporais na sua distribuição e organização e
entender como variam entre diferentes escalas de tempo e de espaço para reconhecer os
processos que governam a assembléia bacteriana e a sua habilidade de responder a
20

Capítulo 1. Introdução Geral – Bacterioplâncton: padrões temporais e espaciais em ecossistemas lacustres.
perturbações. Estudos com este enfoque nos permitem, além de descrever padrões de
distribuição e de diversidade de espécies em função de gradientes ambientais e
geográficos, reconhecer os mecanismos que promovem variações na estruturação das
comunidades (Logue et al., 2011).
Em 1934, Bass-Becking, referindo-se à distribuição dos microorganismos,
postulou: “Everything is everywhere, but the environment selects”, indicando que os
microorganismos distribuem-se ubiquamente no planeta em função da seleção de fatores
locais, ou seja, que as condições ambientais e interação entre espécies são mais
relevantes que fatores regionais, como a distância entre ecossistemas. O reconhecimento
da importância da seleção ambiental para os taxa bacterianos, por Bass-Becking,
destaca a relevância de trade-offs em traços ecológicos entre as espécies bacterianas,
incorporando o conceito de nicho em um ambiente heterogêneo, o qual constitui um dos
quatro paradigmas de metacomunidade (species-sorting) delineados por Leibold et al.
(2004). Desde então se evoca o pensamento de padrões biogeográficos para populações
microbianas, o qual vem tornando-se cada vez mais significativo devido ao advento de
técnicas moleculares para o estudo da diversidade microbiana. Com o aperfeiçoamento
de técnicas para acessar a diversidade microbiana, constatou-se que essa diversidade é
muito superior à obtida através de técnicas cultiváveis, uma vez que cerca de 99% da
diversidade microbiana não pode ser cultivada (Muyzer, 1999). Assim, vem crescendo o
debate acerca dos fatores responsáveis pelos padrões biogeográficos microbianos, que
têm sido considerados importantes estruturadores dessas comunidades (Azevedo e
Farjalla, 2010).
Apesar da visão clássica de ampla distribuição desses microorganismos no
planeta, alguns estudos apontam para a estruturação espacial das comunidades
bacterianas, indicando padrões biogeográficos na distribuição desses organismos (e.g.
21
Capítulo 1. Introdução Geral – Bacterioplâncton: padrões temporais e espaciais em ecossistemas lacustres.
Fenchel e Finlay, 2004; Martiny et al., 2006; Verleyen et al., 2009; Heino et al., 2010).
Porém, outros autores contrariam a equivalência entre padrões biogeográficos em
microbiologia e macroecologia, devido às taxas de dispersão e evolução extremamente
distintas em bactérias (Milici et al., 2016).
Atualmente os estudos de diversidade perpassam diferentes escalas, desde a escala
local, os quais incluem a descrição da riqueza de espécies (diversidade alfa), as
diferenças na diversidade entre escalas temporais e espaciais (diversidade beta) e a
diversidade regional (diversidade gama) (Jones et al., 2012). Nesse sentido, a variação
na composição de espécies e na estrutura de comunidades biológicas entre sítios (i.e.
diversidade beta) é consequência de fatores locais e regionais, que afetam sua dispersão
(Leibold et al., 2004; Logue et al., 2011). Ou seja, comunidades microbianas aquáticas
variam composicional e funcionalmente entre escalas espaciais e temporais, como
resposta à interação de múltiplos fatores ambientais embutidos nessas diferentes escalas,
tais como condições físico-químicas (van der Gucht et al., 2007; Souffreau et al., 2015),
interações bióticas, principalmente entre fitoplâncton e zooplâncton (Kent et al., 2004;
Kent et al., 2006; Kent et al., 2007), estado trófico (Yannarell et al., 2003), paisagem e
morfometria da lagoa (Lear et al., 2014). Mas ainda é pouco compreendido o quanto
cada fator contribui para a resposta bacteriana. Tradicionalmente esses fatores vêm
sendo estudados em conjunto, sem a preocupação de se avaliar a contribuição isolada de
cada um, através da partição da variância desses fatores, por exemplo. No entanto a
análise da influência pura de cada fator na variação composicional e funcional do
bacterioplâncton vem revelando respostas contrastantes na estruturação das
comunidades. Alguns estudos apontam para efeitos significativos exclusivos do
ambiente (van der Gucht et al., 2007; Logue e Lindström, 2010), exclusivos do espaço
22
Capítulo 1. Introdução Geral – Bacterioplâncton: padrões temporais e espaciais em ecossistemas lacustres.
(Lear et al., 2014) ou de ambos do ambiente e do espaço (Langenheder e Ragnarsson,
2007; Schiaffino et al., 2011; Liu et al., 2015).
Nesse contexto, é importante reconhecer como diferentes gradientes ambientais
afetam a diversidade beta bacteriana, por exemplo, uma menor heterogeneidade
ambiental - seja por causas naturais (e.g. menor variação das características
limnológicas, menor área, menor conectividade, etc) ou antrópicas, tendem a resultar
em menos espécies do pool regional, reduzindo a diversidade beta em comparação a
ambientes com maior heterogeneidade ambiental, que tendem a promover maior
diversidade de espécies (Ricklefs e Schluter 1993). Nessas condições ambientalmente
homogêneas, as diferenças na composição de espécies entre duas comunidades podem
refletir a perda de espécies (aninhamento). Isso ocorre quando a composição de espécies
em comunidades pobres é um subconjunto da composição de espécies de comunidades
ricas (Wright et al., 1998), provavelmente devido à exclusão de espécies suscetíveis à
perda de determinadas características ambientais e de habitats. Entretanto, em lagoas
que diferem nas suas características ambientais, mas apresentam riqueza de espécies
similar, as diferenças na composição de espécies entre duas comunidades podem ser
atribuídas à substituição de espécies (turnover) imposta por diferentes filtros ecológicos
(Wright et al., 1998; Baselga, 2010).
Mundialmente, é crescente o número de estudos investigando os fatores que
afetam a dinâmica e estruturação das comunidades bacterianas aquáticas. No Brasil,
esse número é igualmente crescente, entretanto concentra-se principalmente em estudos
de metabolismo microbiano, produção e crescimento microbiano (e.g Farjalla et al.,
2006; Amado et al., 2006; Farjalla et al., 2009; Vidal et al., 2011; They et al., 2012;
Amado et al., 2013), sendo ainda muito incipientes estudos focando os padrões
biogeográficos, principalmente avaliando-se diferenças da diversidade e composição
23

Capítulo 1. Introdução Geral – Bacterioplâncton: padrões temporais e espaciais em ecossistemas lacustres.
bacteriana entre múltiplas escalas. De maneira geral, alguns autores sugerem ampla
distribuição taxonômica ao redor do globo, demonstrando similaridade dos níveis
taxonômicos de bacterioplâncton entre sistemas aquáticos do Brasil e do mundo
(Tessler et al., 2016), outros indicam a noção de espécies e de processos bacterianos
ecologicamente definidos, suportando as relações entre diversidade bacteriana e
parâmetros ambientais na região tropical (Silveira et al., 2011) e verificam relação
positiva entre a heterogeneidade do bacterioplanctôn (composição, morfotipos,
biomassa, biovolume, produção) e a área do lago (Haig-They et al., 2010).
Como se percebe, há ainda para a microbiologia aquática uma lacuna para o
entendimento da ideal escala de variação característica das comunidades microbianas
aquáticas (Lindstrom e Langenheder, 2012). Reconhecer como as comunidades
microbianas variam em função do tempo e do espaço é uma peça chave para o
entendimento básico da diversidade bacteriana aquática, o que dificulta o
desenvolvimento de teorias acerca da sua estabilidade (Jones et al., 2012),
principalmente frente à distúrbios, por exemplo.
A discussão acerca de distúrbios ambientais vem recebendo bastante destaque em
estudos ecológicos, porém menor ênfase tem sido dada aos padrões de resposta da
comunidade microbiana a esses distúrbios (Shade et al. 2012). Com as mudanças
climáticas globais, estima-se o aumento em frequência de eventos climáticos intensos
(IPCC, 2007), promovendo maior pressão sobre rios, lagos e, pequenos corpos d’águas,
pela variação abrupta de temperatura, carga de nutrientes, alteração da hidrologia, etc
(Graham e Vinebrooke, 2009; Carey et al. 2012). Tais variações no sistema acabam por
afetar significativamente a comunidade planctônica (White e Picket, 1985). Nesse
contexto, a estabilidade da comunidade planctônica frente a distúrbios, como de frentes
frias, por exemplo, reflete sua sensibilidade ou insensibilidade ao agente estressor
24

Capítulo 1. Introdução Geral – Bacterioplâncton: padrões temporais e espaciais em ecossistemas lacustres.
(Ryckiel, 1985). Mudanças na composição microbiana frequentemente associam-se a
mudanças nas taxas de processos ecossistêmicos e vice-versa (e.g Schimel e Gulledge,
1998; Gulledge et al. 1997).
Nesta tese procurou-se investigar a variação espacial e temporal da comunidade
microbiana entre múltiplas escalas e quais fatores influenciam tais variações. Os estudos
foram conduzidos em dois sistemas aquáticos distintos: i ) sistema hidrológico do Taim,
estudando-se a comunidade microbiana da lagoa Mangueira e ii)sistema hidrológico do
Rio Tramandaí, analisando-se as comunidades microbianas ocorrentes em 25 lagoas
pertencentes a esse sistema. Ambos os sistemas são compostos de lagoas rasas e
costeiras, de clima subtropical.
A Lagoa Mangueira caracteriza-se por seu extenso comprimento (90km) e grande
área total (820 km2). Esse extenso espelho d’água é cercado por dunas fixas no lado
costeiro, ao norte é dominada por macrófitas emergentes e ao sul por um denso leito de
macrófitas submersas, ao sul. Na porção ocidental da lagoa, há principalmente o cultivo
de arroz em antigas zonas húmidas. Esse sistema sofre grande influência de alta
freqüência de frentes frias originárias da Antártida, causando mudanças significativas
nas condições hidrometeorológicas e sendo a força dominante nesse ecossistema
aquático (Fragoso et al., 2008). Essas frentes apresentam maior freqüência e intensidade
durante o inverno e a primavera (Brito et al., 1996) e têm como principal efeito a
mistura e homogeneização da coluna de água dessas lagoas (Tundisi 1983, Tundisi et
al.2010). Por essas características, a Lagoa Mangueira foi palco para o desenvolvimento
dos estudos apresentados nos capítulos 2 e 4 desta tese.
Com relação às lagoas pertencentes ao sistema do Rio Tramandaí, elas foram
escolhidas para o desenvolvimento do capítulo 3 da tese por abrangerem uma ampla
gama de condições ambientais ao longo da zona costeira do litoral norte do Rio Grande
25
Capítulo 1. Introdução Geral – Bacterioplâncton: padrões temporais e espaciais em ecossistemas lacustres.
do Sul, com variados graus de conectividade, idade, influência marinha e paisagem
(áreas de pastagem / agricultura, florestas, arrozais e influência urbana), contribuindo
para a abordagem de avaliação de variação da diversidade beta bacteriana entre e dentro
das 25 lagoas.
Por essas considerações, surgem importantes questões a respeito da estrutura e
função das comunidades bacterianas entre diferentes escalas espaciais e temporais que
nortearam esse estudo, tais como:
i) a comunidade bacteriana varia em sua composição e função dentro do
lago, como resposta aos efeitos exclusivos do ambiente, do espaço, do
tempo, ou de todos os fatores? Qual a escala apropriada para amostragem
bacteriana?
ii) quais os padrões de distribuição da diversidade beta bacteriana aquática e
quais os mecanismos influenciam tais variações?
iii) qual a dinâmica da comunidade bacteriana em resposta a distúrbios de
curta duração ocorridos pela entrada de frentes frias polares ? Essa
comunidade pode se apresentar sensível e consequentemente resiliente ao
distúrbio ou insensível e, portanto, resistente?
Dessa forma, este estudo visa contribuir com informações relevantes acerca da
dinâmica da comunidade microbiana aquática em lagoas costeiras rasas que sofrem
freqüente influência dos fatores locais, do regime de ventos, da paisagem, da morfologia
entre outros, para compreender, suas variações espaciais e temporais e suas respostas
frente a distúrbios que influenciam a ecologia desses sistemas.
26

Capítulo 1. Introdução Geral – Bacterioplâncton: padrões temporais e espaciais em ecossistemas lacustres.
Hipóteses
Pelas questões referenciadas acima foram formuladas hipóteses para a realização
deste trabalho. A seguir são apresentadas as hipóteses desenvolvidas para cada capítulo
da tese.
Capítulo 2
Uma lagoa de grande extensão, com grande influência do vento, frequentemente
misturada e com grande conectividade, como a Lagoa Mangueira, não apresentará
barreiras de dispersão para taxa bacterianos e seus atributos funcionais, até mesmo em
grandes meso escalas. Assim, as variações espaciais e temporais na composição e
função bacteriana devem ser reflexo dos filtros ambientais impostos.
Capítulo 3
Dentro e entre as lagoas o padrão de distribuição das comunidades terá
prevalencia do tunover (substituição de espécies), devido à heterogeneidade ambiental
apesar da alta conectividade das lagoas. Também previmos que a beta diversidade
dentro e entre as lagoas será positivamente relacionada à heterogeneidade de habitats
(ambiental, fitoplâncton, a paisagem e a distância espacial), nas escalas intra-lagoa e
entre lagoas.
Capítulo 4
A comunidade bacteriana da Lagoa Mangueira, sob efeito de distúrbios durante o
inverno, apresentará uma mudança composicional e de biomassa, seguida de uma
recuperação (resiliencia) à medida que os distúrbios diminuem.
27

Capítulo 1. Introdução Geral – Bacterioplâncton: padrões temporais e espaciais em ecossistemas lacustres.
Objetivo Geral
O objetivo geral desta tese de doutorado foi investigar os padrões espaciais e
temporais da composição filogenética, biomassa e dos atributos funcionais da
comunidade bacteriana em lagoas costeiras rasas do Sul do Brasil. Dessa forma,
contribuir para o entendimento dos padrões biogeográficos e da resposta frente a
distúrbio das comunidades bacterianas entre múltiplas escalas e avaliar os fatores
responsáveis por esses padrões.
Nesse contexto, esta tese desenvolveu objetivos específicos que foram
desenvolvidos em diferentes capítulos.
Objetivos Específicos
Capítulo 2
Investigar a heterogeneidade espacial e temporal da composição da comunidade
bacteriana (CCB) e de seus atributos funcionais (AF) e avaliar o efeito isolado das
condições ambientais, da biomassa fitoplanctônica, do espaço e do tempo, através da
partição da variância da CCB e AF na lagoa Mangueira.
Capítulo 3
Identificar os padrões de distribuição da diversidade beta bacteriana aquática e
seus componentes. Também avaliar quais fatores, entre ambientais, biológicos,
espaciais ou de paisagem, promovem tais padrões na comunidade bacteriana.
Capítulo 4
Analisar a dinâmica bacteriana em termos da composição da comunidade e
biomassa ao longo de distúrbios decorrentes de entradas de frentes frias polares. E
28

Capítulo 1. Introdução Geral – Bacterioplâncton: padrões temporais e espaciais em ecossistemas lacustres.
avaliar a sensibilidade bacteriana aos distúrbios, considerando se sua biomassa e
composição são resiliente ou resistente a ele.
Material e Métodos
Área de Estudo
O presente estudo foi conduzido em dois sistemas lacunares costeiros rasos, do
Sul do Brasil. Um é a Lagoa Mangueira, pertencente ao sistema hidrológico do Taim.
Essa lagoa é rasa, costeira, possui uma grande área de cerca de 820 km2, grande
extensão, 90 km e sofre intensa ação de ventos, provocando frenquentes distúrbios na
coluna d’água. Por tais características, ela foi escolhida para investigar as questões
referentes ao capítulo 2 e capítulo 4, uma vez que sua morfometria e hidrologia, com
intensa influência de ação de ventos pode influenciar o padrão de distribuição espacial e
temporal e a dinâmica das comunidades. O segundo sistema estudado, no capítulo 3, é o
Sistema Hidrológico do Rio Tramandaí composto por 41 lagoas costeiras rasas no
litoral norte do Rio Grande do Sul, que historicamente se formaram durante o período
Quaternário como resultado de transgressões e regressões marinhas (Holz, 1999). Das
41 lagoas pertencentes a este sistema foram analisadas 25. As características
consideradas na escolha das lagoas foram a proximidade ao mar, diferentes graus de
conectividade, área, perímetro e facilidade de acesso, através de visualização em cartas
cartográficas de escala 1:50.000. Tais características foram definidas para compreender
o padrão espacial da distribuição da diversidade beta e seus componentes ao longo do
sistema de lagoas.
Delineamento Amostral
O delineamento amostral variou em função das questões formuladas
especificamente para cada capítulo, focando principalmente nas diferentes escalas
29

Capítulo 1. Introdução Geral – Bacterioplâncton: padrões temporais e espaciais em ecossistemas lacustres.
espaciais e temporais para a coleta de dados. Nesse contexto, foram coletados dados
ambientais e biológicos, cujo detalhamento de análise é apresentado nos capítulos que
seguem.
Estrutura da Tese
A presente tese de doutorado representa um conjunto de estudos, que foram
realizados em dois ambientes aquáticos distintos, realizados no âmbito de diferentes
projetos com objetivos afins. Assim, nesta tese, são apresentados três capítulos que se
referem aos artigos desenvolvidos como resultado da pesquisa de doutorado:
Capítulo 2. Contrasting factors drive within-lake bacterial community composition and
functional traits in a large shallow subtropical lake
Neste capítulo é apresentado o artigo publicado na revista Hydrobiologia. Ele investiga
os padrões temporal e espacial da comunidade bacteriana aquática e apresenta a
contribuição relativa dos fatores ambientais, biológico, espacial e temporal sobre a
composição da comunidade.
Capítulo 3. Bacterial beta diversity among lakes, but not within lakes, is positively
related to different aspects of habitat heterogeneity
Este capítulo é um manuscrito de artigo submetido para a revista The ISME Journal.
Neste estudo, a comunidade bacteriana aquática foi analisada com o objetivo de
compreender a distribuição da diversidade beta e seus componentes ao longo e dentro
30

Capítulo 1. Introdução Geral – Bacterioplâncton: padrões temporais e espaciais em ecossistemas lacustres.
de 25 lagoas rasas, e verificar quais fatores da heterogeneidade de habitat influenciam
essa variação.
Capítulo 4. Resistance and resilience of aquatic bacterial community over a cold front
event
Este capítulo é um manuscrito de artigo ainda não submetido para publicação. Neste
estudo, a comunidade bacteriana aquática foi analisada, em termos de composição e
biomassa, com o objetivo de compreender a sua sensibilidade frente a distúrbio
provocado por frente fria polar, e verificar os fatores influenciando seus padrões.
Referências
Amado AM, Farjalla VF, Esteves FDA, Bozelli RL, Roland F, Enrich-Prast A. (2006).
Complementary pathways of dissolved organic carbon removal pathways in clear-water
Amazonian ecosystems: photochemical degradation and bacterial uptake. FEMS
Microbiology Ecology, 56: 8-17.
Amado AM, Meirelles-Pereira F, Vidal LDOV, Sarmento HS, Suhett A, Farjalla VF,
Roland F. (2013). Tropical freshwater ecosystems have lower bacterial growth
efficiency than temperate ones. Frontiers in microbiology, 4: 167.
Azam F, Fenchel T, Field JG, Gray JS, Meyer-Reil LA, Thigstad F. (1983). The
ecological role of water-column microbes in the sea. Marine Ecology Progress Series.
10:257-263.
Azevedo FDA, Farjalla VF. (2010). Biogeografia de Microrganismos: padrões,
dificuldades e perspectivas Oecologia Australis 14: 839-852.
31

Capítulo 1. Introdução Geral – Bacterioplâncton: padrões temporais e espaciais em ecossistemas lacustres.
Baas Becking LGM. (1934). Beobiologie of Inleiding Tot de Milleukunde (in Dutch).
The Hague, the Netherlands: W.P. Van Stockum & Zoon.
Baselga A. (2010). Partitioning the turnover and nestedness components of beta
diversity. Global Ecology and Biogeography, 19:134–143. doi:10.1111/j.1466-
8238.2009.00490.x
Bell T, Newman JA, Silverman BW, Turner SL, Lilley AK. (2005). The contribution of
species richness and composition to bacterial services. Nature 436:1157-1160.
Carey, CC, Ibelings BW, Hoffmann EP, Hamilton DP, Brookes JD. (2012). Eco-
physiological adaptations that favour freshwater cyanobacteria in a changing climate.
Waterres.46:1394–1407, doi:10.1016/j.watres.2011.12.01
Cole JJ. (1999). Aquatic microbiology for ecosystem scientists: new and recycled
paradigms in ecological microbiology. Ecosystems 2:215-225.
Farjalla VF, Azevedo DA, Esteves FA, Bozelli RL, Roland F, Enrich-Prast A. (2006).
Influence of hydrological pulse on bacterial growth and DOC uptake in a clear-water
Amazonian lake. Microbial Ecology, 52: 334-344.
Farjalla VF, Marinho CC, Faria BM, Amado AM, Esteves FA, Bozelli RL, Giroldo D.
(2009). Synergy of fresh and accumulated organic matter to bacterial growth. Microbial
ecology, 57: 657-666.
Fenchel T, Finlay BJ. (2004). The ubiquity of small species: patterns of local and global
diversity. Bioscience 54: 777–784.
Graham, MD and RD Vinebrooke, (2009). Extreme weather events alter planktonic
communities in boreal lakes. Limnol. Oceanogr., 54: 2481-2492.
32
Capítulo 1. Introdução Geral – Bacterioplâncton: padrões temporais e espaciais em ecossistemas lacustres.
Gulledge J, Doyle AP, Schimel JP. (1997). Low-concentration kinetics of atmoshperic
CH4 oxidation in soil and mechanism of NH4_ inhibition. Appl Environ Microbiol
64:4291–4298.
Hahn MW. (2006). The Microbial Diversity of Inland Waters. Current Opinion in
Biotechnology, 17:256-261.
Haig-They Ng, Motta Marques D, Jeppesen E, Sondergaard M. (2010).
Bacterioplankton in the littoral and pelagic zones of subtropical shallow lakes.
Hydrobiologia DOI 10.1007/s10750-010-0177-z
Heino J, Bini LM, Karjalainen SM, Mykrä H, Soininen J, Vieira LCG, Diniz-Filho JAF.
(2010). Geographical patterns of micro-organismal community structure: are diatoms
ubiquitously distributed across boreal streams? Oikos, 119:129–137.
Hillebrand H, Matthiessen B. (2009). Biodiversity in a complex world: consolidation
and progress in functional biodiversity research. Ecology Letters, 12:1405-1419.
Holz M. (1999). Do mar ao deserto. A Evolução do Rio Grande do Sul no Tempo
Geológico, 2nd ed. UFRGS, Porto Alegre: 131–144.
Hunter-Cevera JC. (1998). The value of microbial diversity. Current Opinion in
Microbiology. 1:278-285.
Intergovernmental Panel on Climate Change, (2007). Climate Change 2007 Synthesis
Report, eds R. K. Pachauri and A. Reisinger (Geneva).
Jones SE, Cadkin TA, Newton RJ, McMahon KD. (2012). Spatial and temporal scales
of aquatic bacterial beta diversity. Frontiers in Microbiology 3:318.
Kent AD, Jones SE, Lauster GH, Graham JM, Newton RJ, McMahon KD. (2006).
Experimental manipulations of microbial food web interactions in a humic lake: shifting
33

Capítulo 1. Introdução Geral – Bacterioplâncton: padrões temporais e espaciais em ecossistemas lacustres.
biological drivers of bacterial community structure. Environmental Microbiology
8:1448–1459.
Kent AD, Jones SE, Yannarell AC, Graham JM, Lauster GH, Kratz TK, Triplett EW.
(2004). Annual Patterns in Bacterioplankton Community Variability in a Humic Lake.
Microbial Ecology 48:550-560.
Kent AD, Yannarell AC, Rusak JA, Triplett EW, McMahon KD, (2007). Synchrony in
aquatic microbial community dynamics. The ISME Journal 1:38–47.
Langenheder S, Ragnarsson H. (2007). The role of environmental and spatial factors for
the composition of aquatic bacterial communities. Ecology 88:2154-2161.
Lear G, Bellamy J, Case BS, Lee JE, Buckley HL. (2014). Fine-scale patterns in
bacterial community composition and function within freshwater ponds. The ISME
Journal 8:1715-1726.
Leibold MA, Holyoak M, Mouquet N, Amarasekare P, Chase JM, Hoopes MF, Holt
RD, Shurin JB, Law R, Tilman D, Loreau M, Gonzalez A. (2004). The metacommunity
concept: a framework for multi-scale community ecology. Ecology Letters 7:601–613.
Lindström ES, Langenheder S. (2012). Local and regional factors influencing bacterial
community assembly. Environmental Microbiology Reports 4:1-9.
Liu L, Yang J, Yu Z, Wilkinson DM. (2015). The biogeography of abundant and rare
bacterioplankton in the lakes and reservoirs of China. The ISME Journal 9:2068-2077.
Logue JB, Lindström ES. (2010). Species sorting affects bacterioplankton community
composition as determined by 16S rDNA and 16S rRNA fingerprints. The ISME
Journal 4:729-738.
34
Capítulo 1. Introdução Geral – Bacterioplâncton: padrões temporais e espaciais em ecossistemas lacustres.
Logue, JB, Mouquet N, Peter H, Hillebrand H. (2011). Empirical approaches to
metacommunities: a review and comparison with theory. Trends in Ecology &
Evolution, 26(9), pp.482–491.
Martiny JBH, Bohannan BJM, Brown JH, Colwell RK, Fuhrman JA, Green JL, Horner-
Devine MC, Kane M, Krumins JA, Kuske CR, Morin PJ, Naeem S, Øvreas L,
Reysenbach A-L, Smith VH, Staley JT. (2006). Microbial biogeography: putting
microorganisms on the map. Nature Reviews Microbiology 4:102-112.
Milici M, Tomasch J, Wos-Oxley ML, Decelle J, Jáuregui R, Wang H, Deng Z-L,
Plumeier I, Giebel H-A, Badewien TH, Wurst M, Pieper DH, Simon M, Wagner-Döbler
I. (2016). Bacterioplankton Biogeography of the Atlantic Ocean: A Case Study of the
Distance-Decay Relationship. Frontiers in Microbiology, 7:590.
Muyzer G. (1999). DGGE/TGGE as method for indetifying genes from natural
ecosystems. Curr. Opin. Microbiol. 2:317-322.
Pace NRA. (1997). Molecular view of microbial diversity and the biosphere. Science
276:734-740.
Pomeroy LR. (1974). The ocean’s food web, a changing paradigm. Bioscience
24(9):499-504.
Ricklefs RE, Schluter D. (eds.). (1993). Species Diversity in Ecological Communities:
Historical and Geographical Perspectives. University of Chicago Press 414 pp. ISBN: 0-
226-71823-9.
Rykiel EJ. (1985). Towards a definition of ecological disturbance. Aust. J. Ecol. 10,
361–365.
35

Capítulo 1. Introdução Geral – Bacterioplâncton: padrões temporais e espaciais em ecossistemas lacustres.
Schiaffino MR, Unrein F, Gasol JM, Massana R, Balagué V, Izaguirre I. (2011).
Bacterial community structure in a latitudinal gradient of lakes: the role of spatial versus
environmental factors. Freshwater Biology 56:1973-1991.
Schimel JP, Gulledge J. (1998). Microbial community structure and global trace
gases.Glob Change Biol 4:745–758.
Shade A, Peter H, Allison SD, Baho DL, Berga M, Bürgmann H, Huber DH,
Langenheder S, Lennon JT, Martiny JBH, Matulich KL, Schmidt TM, Handelsman J.
(2012). Fundamentals of microbial community resistance and resilience. Frontiers in
microbiology, 3(December), 417. doi:10.3389/fmicb.2012.00417.
Silveira CB, Vieira RP, Cardoso AM, Paranhos R, Albano RM, Martins OB. (2011).
Influence of Salinity on Bacterioplankton Communities from the Brazilian Rain Forest
to the Coastal Atlantic Ocean. PLoS ONE 6(3): e17789. doi:
10.1371/journal.pone.0017789.
Souffreau C, van der Gucht K, van Gremberghe I, Kosten S, Lacerot G, Lobão LM, de
Moraes Huszar VL, Roland F, Jeppesen E, Vyverman W, De Meester L. (2015).
Environmental rather than spatial factors structure bacterioplankton communities in
shallow lakes along a > 6000 km latitudinal gradient in South America. Environmental
Microbiology 17:2336-2351.
Tessler M, Brugler MR, DeSalle R, Hersch R, Velho LFM, Segovia BT, Lansac-Toha
FA, Lemke MJ. (2016). A Global eDNA Comparison of Freshwater Bacterioplankton
Assemblages Focusing on Large-River Floodplain Lakes of Brazil Microb Ecol.
doi:10.1007/s00248-016-0834-5.
They NgH, Motta-Marques D, Souza RS. (2012). Lower respiration in littoral zone of
subtropical shallow lake. Front. Microbio. 3:434. doi:10.3389/fmicb.2012.00434.
36
Capítulo 1. Introdução Geral – Bacterioplâncton: padrões temporais e espaciais em ecossistemas lacustres.
van der Gucht K, Cottenie K, Muylaert K, Vloemans N, Cousin S, Declerck S, Jeppesen
E, Conde-Porcuna J-M, Schwenk K, Zwart G, Degans H, Vyverman W, De Meester L.
(2007). The power of species sorting: Local factors drive bacterial community
composition over a wide range of spatial scales. Proceedings of the National Academy
of Sciences of the USA 104:20404-20409.
Verleyen E, Vyverman W, Sterken M, Hodgson DA, De Wever A, Juggins S, Van de
Vijver B, Jones VJ, Vanormelingen P, Roberts D, Flower R, Kilroy C, Souffreau C,
Sabbe K. (2009), The importance of dispersal related and local factors in shaping the
taxonomic structure of diatom metacommunities. Oikos, 118: 1239–1249.
doi:10.1111/j.1600-0706.2009.17575.x
Vidal LO, Granéli W, Daniel CB, Heiberg L, Roland F. (2011). Carbon and phosphorus
regulating bacterial metabolism in oligotrophic boreal lakes. Journal of plankton
research, fbr059.
White PS, Pickett STA. (1985). The ecology of natural disturbance and patch dynamics.
Academic Press.
Wright DH, Patterson BD, Mikkelson GM, Cutler A, Atmar W. (1998). A comparative
analysis of nested subset patterns of species composition. Oecologia, 113: 1–20.
Yannarell AC, Kent AD, Lauster GH, Kratz TK, Triplett EW. (2003). Temporal
patterns in bacterial communities in three temperate lakes of different trophic status.
Microbial Ecology 46: 391–405.
37

Capítulo 2. Contrasting factors drive within-lake bacterial community and functional traits in a large shallow
subtropical lake
Capítulo 2. Contrasting factors drive within-lake bacterial community
composition and functional traits in a large shallow subtropical lake
Apresentação
Este artigo foi submetido no dia 01 de abril de 2015, revisado dia 20 de novembro
e aceito para publicação em 05 de dezembro de 2015 pela revista Hydrobiologia -
Springer International Publishing Switzerland para a edição especial “Shallow lakes in a
fast changing world”.
O capítulo apresentado a seguir é a inserção do artigo publicado na versão on line
DOI: 10.1007/s10750-015-2610-9.
Forma de citar o artigo:
Lima MS, Marques DM, They NgH, McMahon KD, Rodrigues LR, Cardoso LS,
Crossetti LO. (2016). Contrasting factors drive within-lake bacterial community
composition and functional traits in a large shallow subtropical lake. Hydrobiologia.
doi: 10.1007/s10750-015-2610-9
38

Capítulo 2. Contrasting factors drive within-lake bacterial community and functional traits in a large shallow
subtropical lake
Contrasting factors drive within-lake bacterial community 1
composition and functional traits in a large shallow subtropical lake 2
3
Marla Sonaira Lima1*; David da Motta Marques1; Ng Haig They 2; Katherine D. 4
McMahon3; Lúcia Ribeiro Rodrigues1; Luciana de Souza Cardoso4; Luciane de 5
Oliveira Crossetti5 6
7
1Laboratório de Ecotecnologia e Limnologia Aplicada, Instituto de Pesquisas Hidráulicas - IPH, 8
Universidade Federal Rio Grande do Sul,/UFRGS, Av. Bento Gonçalves, 9500, Porto Alegre, RS 91501-9
970, Brazil. 10
*Corresponding actor: [email protected], telephone number: +55 51 33086326 11
2 Laboratorio de Limnologia, Departmento de Oceanografia e Limnologia, Universidade Federal do Rio 12
Grande do Norte, UFRN, Av. Senador Dinarte de Medeiros Mariz s/n Praia de Mãe Luiza, Natal RN 13
59014-002, Brazil. 14
3 Departments of Civil and Environmental Engineering and Bacteriology, University of Wisconsin-15
Madison, 3204 Engineering Drive, Madison, WI 53706-1691, USA. 16
4 Departmento de Botânica, Instituto de Biociências, Universidade Federal do Rio Grande do Sul, Av. 17
Bento Gonçalves, 9500, Porto Alegre, RS 91501-970, Brazil. 18
5 Departmento de Ecologia, Instituto de Biosciências, Universidade Federal do Rio Grande do Sul, Av. 19
Bento Gonçalves, 9500, Porto Alegre, RS 91501-970, Brazil. 20
21
Abstract 22
23
Lakes are considered as “islands” for assessing microbial biogeography, but bacterial 24
community composition (BCC) and function may vary significantly within lakes, with 25
39

Capítulo 2. Contrasting factors drive within-lake bacterial community and functional traits in a large shallow
subtropical lake
the roles of scale and connectivity still unclear. This study investigated the spatial and 26
temporal heterogeneity of the BCC (Automated Ribosomal Intergenic Spacer Analysis) 27
and Functional Traits (FT, carbon-source utilization), and the contribution of: (i) 28
environmental variables, (ii) phytoplankton, (iii) season and (iv) space, through variance 29
partitioning in the large and well-mixed Lake Mangueira. The BCC and FT differed in 30
time and space, with BCC being explained by environmental variables and 31
phytoplankton, whereas FT explained only by space. The smallest scale of variability 32
detected for the BCC and FT (~49 km) was the largest in comparison with findings in 33
other studies, suggesting an effect of lake size (fetch and connectivity). Our results 34
indicate that barriers to bacterial dispersal due to long distances are overcome by high 35
connectivity, reinforcing the role of species sorting for BCC. FT were probably driven 36
by gene dispersal and/or the effects of local conditions on migrant bacterial taxa and 37
resuspended bacteria. Our results highlight the role of within-lake heterogeneity for 38
ecosystem functioning and the implications for the appropriate scale for sampling 39
bacterial communities. 40
41
42
Keywords: Automated Ribosomal Intergenic Spacer Analysis, Ecoplate, within-lake 43
biogeography, variance partitioning, species sorting, dispersal, Lake Mangueira 44
45
46
47
48
49
40
Capítulo 2. Contrasting factors drive within-lake bacterial community and functional traits in a large shallow
subtropical lake
Introduction 50
51
Microbes represent a large fraction of the biosphere’s diversity (Pace, 1997) and 52
are key players in aquatic ecosystem functioning (Cole, 1999). Consequently, 53
understanding the mechanisms controlling their diversity and function in aquatic 54
ecosystems is of paramount importance. 55
Lakes are often assumed to have a homogeneous microbial community and are 56
therefore considered as “islands” in most biogeographical analyses that test factors 57
shaping microbial diversity and distribution. Consequently, the factors driving variation 58
among lakes is relatively well known and lake microbial communities change rapidly in 59
space and time in response to habitat size (Horner-Devine et al., 2004; Yannarell & 60
Triplett, 2004; Bell et al., 2005; Reche et al., 2005; Green & Bohannan, 2006; Crump et 61
al., 2007). Yet, increasing evidence for within-lake variability in factors such as 62
physical and chemical conditions (van de Gucht et al., 2007; Souffreau et al., 2015) 63
biotic interactions (Kent et al., 2006), and trophic status (Yannarell et al., 2003; Wu et 64
al., 2007), suggests microbial communities within lakes are also heterogeneous. As 65
environmental variables tend to be structured across the landscape within space and 66
time, the disentanglement of the drivers of microbial diversity and function is therefore 67
a key topic for research (Lear et al., 2014). Studies using approaches based on variance 68
partitioning have obtained contrasting results, indicating significant pure effects of the 69
environment (van de Gucht et al., 2007; Logue & Lindström, 2010), space (Lear et al., 70
2014), or a combination of both environment and space (Langenheder & Ragnarsson, 71
2007; Schiaffino et al., 2011; Liu et al., 2015; see the thorough discussion by Lindström 72
& Langenheder, 2012). 73
41
Capítulo 2. Contrasting factors drive within-lake bacterial community and functional traits in a large shallow
subtropical lake
Several studies have described the temporal and spatial dynamics of bacterial 74
functional traits using patterns of substrate utilization as a proxy for bacterial activity in 75
freshwater (e.g. Grover & Chrzanowski, 2000; Christian & Lind, 2006; Tiquia, 2010), 76
sediment-water interfaces (Christian & Lind, 2007) and the marine environment (Sala et 77
al., 2006). All these studies found that substrate utilization was strongly associated with 78
environmental conditions. In contrast, studies on smaller scales in freshwater ponds 79
(Lear et al., 2014) and small to meso-scales in soil (Bissett et al., 2010), have found 80
either a higher contribution of geographical distance (Lear et al., 2014) or an absence of 81
relationships between function and environmental variables (Bissett et al., 2010). These 82
differences suggest that other factors such as the degree of connectivity, rates of 83
dispersal and life history of microorganisms can drive bacterial functional traits in space 84
and time (Bissett et al., 2010; Severin et al., 2013; Lear et al., 2014). 85
Few studies address biogeographical questions within individual lakes since rates 86
of dispersal and connectivity are typically assumed to be high within lakes. 87
Surprisingly, these studies have found not only an important additional role of within-88
lake heterogeneity of environmental conditions (Wu et al., 2007; Shade et al., 2008; 89
Tian et al., 2009), but also evidence for barriers to dispersal on scales as small as 20 m 90
in a lake (Lear et al., 2014). Given such small-scale heterogeneity within lakes, a key 91
question in the study of microbial diversity and function is the most appropriate scale 92
for sampling. 93
Similarly to large-bodied organisms, microbes exhibit a distance-decay 94
relationship between species composition and geographic distance (see review in Green 95
and Bohannan, 2006), which suggests an increasing role of environmental heterogeneity 96
and barriers for dispersal in larger lakes. However, the relative role of local factors (i.e., 97
environmental variables) versus space (i.e., barriers to dispersal) in shaping the bacterial 98
42

Capítulo 2. Contrasting factors drive within-lake bacterial community and functional traits in a large shallow
subtropical lake
community composition and functional traits within a lake remains unknown. We 99
hypothesized that a wind-driven and well-mixed large lake with high connectivity will 100
not present barriers to the dispersal of bacterial taxa and their functional traits, even 101
across larger meso-scales. 102
In this study we investigated the spatial and temporal heterogeneity of the 103
bacterial community composition (BCC) and functional traits (FT), as well as the pure 104
effects of lake environmental conditions, phytoplankton biomass, space and time, 105
through variance partitioning of BCC and FT in Mangueira, a large, shallow, sub-106
tropical lake. The sampling design covered the 90-km length of the lake during one 107
year, i.e., a biogeographical mesoscale (10-3000 km; Martiny et al., 2006). We tested 108
whether there were consistent differences among lake regions (center, south and north) 109
and seasons (winter, spring, summer and autumn) in BCC and FT, and also which 110
explanatory variables significantly explained individual fractions of the variances of 111
BCC and FT. 112
113
Materials and Methods 114
115
Study Area and Sampling 116
117
Lake Mangueira (Fig. 1) is located in the state of Rio Grande do Sul, southern 118
Brazil (~30°31’22”S 53°07'48”W). It is a large shallow subtropical coastal lake, 119
covering a total area of 820 km2, 90 km long and 3-10 km wide, with a mean depth of 120
2.6 m and a maximum depth of 7.0 m. The trophic state ranges from oligotrophic to 121
mesotrophic (Crossetti et al., 2013). Lake Mangueira is surrounded by fixed dunes on 122
43
Capítulo 2. Contrasting factors drive within-lake bacterial community and functional traits in a large shallow
subtropical lake
the Atlantic Ocean side, by emergent macrophytes in the northern wetland, and a dense 123
bed of submersed macrophytes on the southern side. The western side is used for 124
agriculture, primarily rice production in former wetlands. 125
Water samples for environmental and biological variables including chlorophyll a, 126
phytoplankton, and bacterial compositional and functional characterization were 127
collected in summer (February 2010), autumn (May 2010), winter (August 2010) and 128
spring (November 2010). In each season, the lake was sampled in an identical fashion 129
for all variables, at 18 sampling points: 6 in the southern, 6 in the center and 6 in the 130
northern part of the lake (Fig. 1 and Supplementary Table S1). 131
Location of Figure 1 132
133
Environmental variables and Chlorophyll a 134
135
Turbidity (Turb), pH, dissolved oxygen (DO), depth, water temperature and 136
oxidation-reduction potential (ORP) were measured with a multiparameter probe (YSI 137
6600). Water transparency (WT) was estimated with a Secchi disk, and the amount of 138
total suspended solids (TSS) was assessed gravimetrically by water evaporation in 139
porcelain dishes (APHA, 1999). Nutrients, including total nitrogen (TN), nitrate (NO3-), 140
and soluble reactive phosphorus (SRP) were measured through colorimetric methods 141
following APHA (1999). Analyses of ammonium (NH4-) and total phosphorus (TP) 142
followed Mackereth et al. (1989). A Carbon Analyzer (Shimadzu VCPH) was used to 143
determine the dissolved organic carbon (DOC) of the fraction that passed through a 144
450ºC pre-combusted glass fiber filter (0.45 μm mean mesh size). Chlorophyll a (Chla) 145
was extracted from GF/F filters with 90% ethanol and measured by spectrophotometry 146
44

Capítulo 2. Contrasting factors drive within-lake bacterial community and functional traits in a large shallow
subtropical lake
(Jespersen & Christoffersen, 1987). Humic substances (HS) were estimated as the ratio 147
of the absorption coefficients at 250 and 365 nm (Strome & Miller, 1978), using a 148
Varian Cary 1-E spectrophotometer with a quartz cuvette. 149
The meteorological data (wind velocity and direction; precipitation; nebulosity, 150
i.e. the percentage in tenths of the sky covered by clouds; insolation and evaporation) 151
were obtained from the Santa Vitória do Palmar Meteorological Station (INMET, Rio 152
Grande do Sul), located approximately 23 km from the lake, with data collected three 153
times per day (00:00, 12:00 and 18:00 h). Data were interpolated according to the time 154
when each sampling point was visited. 155
156
Phytoplankton biomass 157
158
Phytoplankton was counted according to Utermöhl (1958) after sedimentation 159
(Lund et al., 1958). At least 100 specimens of the most frequent species were 160
enumerated (counting error < 5%, Lund et al., 1958). Biomass (mm³ L-1) was estimated 161
through biovolume, according to Hillebrand et al. (1999). For data analysis, the biomass 162
of all phytoplankton taxonomical classes was used. 163
164
Bacterial composition and functional traits 165
166
The bacterial community composition (BCC) was assessed through Amplified 167
Ribosomal Intergenic Spacer Analysis (ARISA). Bacterial cells were concentrated 168
through filtration of 250 ml of water from each sample onto cellulose acetate membrane 169
filters (0.22 µm pore size; 47 mm diameter; Sartorius). Total DNA was extracted from 170
45

Capítulo 2. Contrasting factors drive within-lake bacterial community and functional traits in a large shallow
subtropical lake
the membrane filter using the PowerSoil DNA isolation kit (MO BIO). We used the 171
filter in place of the 0.25 g soil recommended for this method. The region between the 172
23S and 16S ribosomal RNA genes from the total DNA extracted was amplified using 173
the 6-FAM-labelled universal primer 1406F (5′- TGYACACACCGCCCGT-3′) and the 174
bacteria-specific primer 23Sr (5′-GGGTTBCCCCATTCRG-3′) (Fisher and Triplett, 175
1999; Yannarell et al., 2003). ARISA profiles were analyzed according to Jones & 176
McMahon (2009). Since this method under-represents rare member of the community, 177
BCC hereafter refers to the most abundant taxa. 178
The functional traits of the heterotrophic microbial community were measured as 179
carbon utilization patterns through Biolog Ecoplates® (Hayward, CA, USA). In the 180
field, water samples were pre-filtered in a 20 µm-mesh sieve and placed in 50-ml amber 181
glass bottles to prevent interference from phytoplankton. In the laboratory, samples 182
were inoculated in the plates and incubated at approximately 22°C (Christian & Lind, 183
2007). The utilization of the substrates was assessed through optical density (OD) 184
measured at 590 nm, with an automated plate reader (SpectraMax 5.0, Molecular 185
Devices), immediately after the wells were filled (t=0 h) and every 24 h for 12 days, to 186
ensure that saturation of carbon utilization was reached in all samples (Salomo et al., 187
2009). 188
189
Statistical Analyses 190
191
For BCC analyses we used relative abundance data, including OTUs with >5% 192
frequency of occurrence (Shade et al., 2008). For functional traits, we corrected the raw 193
absorbance data by subtracting each response well against its own first reading (t=0), to 194
46

Capítulo 2. Contrasting factors drive within-lake bacterial community and functional traits in a large shallow
subtropical lake
compensate for the intrinsic absorbance of the carbon sources (Insam & Goberna, 195
2004). Then, we subtracted the control from the response well, and any negative values 196
were considered zero (no oxidation). The areas under the curve of the three Ecoplate 197
replicates were integrated for each of the 31 carbon sources in order to estimate the 198
curve integration index (CI) (Guckert et al., 1996). The CI is a trapezoidal 199
approximation, and this approach incorporates additional information from the 200
absorbance versus incubation time (lag phases, rates of color development, and 201
maximum absorbance) into a single number. The single value obtained for each 202
substrate was expressed as the percentage area of the total area of the plate (sum of all 203
areas of substrates). 204
Since the data were non-parametric, we performed PERMANOVAs 205
(PERmutation MANOVAs) for BCC and for FT, and PERANOVAs (PERmutation 206
ANOVAs) for environmental variables (Euclidean distance) and phytoplankton (Bray-207
Curtis distance) to test for differences over time (winter, spring, summer, autumn) and 208
space (south, center and north). P-values were adjusted by Bonferroni correction for 209
multiple testing. The OTUs (Bray-Curtis of transformed abundances) and substrates 210
(Euclidean distance) that contributed most to the dissimilarity among groups of factors 211
(time and space) were examined through Similarity Percentage Analysis (SIMPER), 212
with a threshold of > 1.5% for OTUs and >5.5% for substrates. 213
The degree of association between the BCC and FT data was assessed through a 214
Mantel test (Mantel, 1967). This is used to compare two independent dissimilarity (or 215
similarity) matrices describing the same set of entities, and to test whether the 216
correlation is higher than expected by chance (Sokal & Rolf, 1995). 217
For the variance partitioning of BCC and FT, we first performed Redundant 218
Analyses (RDA) on each of the four explanatory matrices: environmental variables 219
47

Capítulo 2. Contrasting factors drive within-lake bacterial community and functional traits in a large shallow
subtropical lake
(physical, chemical, and meteorological variables + chlorophyll a); time (using dummy 220
variables to encode for summer, spring, winter and autumn); phytoplankton (biomass of 221
phytoplankton taxonomical classes); and space (PCNM vectors obtained from latitude 222
and longitude coordinates; Borcard & Legendre, 2002; Dray et al., 2006). The 223
explanatory variables for the models were selected through variation inflation factors 224
(VIFs), which identify collinear constraints. Variables with VIF > 10 were removed 225
from the RDAs (Gross, 2003). The significance of the global RDAs was tested by 226
permutation (P-value ≤ 0.05, 1,000 iterations) and the significant RDAs were then 227
submitted to variation partitioning through Partial Redundancy Analysis (pRDA) 228
(Borcard et al., 1992; Legendre & Legendre, 1998) to evaluate the significance of the 229
contribution of each matrix after the effect of the others was removed. The BCC data 230
were treated using Hellinger transformation prior to the analyses (Ramette, 2007). The 231
PER(M)ANOVA analyses were performed in PAST software, the SIMPER analysis 232
was carried out in PRIMER v.6.1.9 (Primer-E Ltd, Plymouth, UK) and the Mantel test, 233
RDAs, pRDAs and graphical presentations were performed in the software Rstudio (R 234
Core Team, 2013) using the vegan package (Oksanen et al., 2013). 235
236
Results 237
238
Temporal and spatial differences 239
240
Environmental variables, chlorophyll a and phytoplankton 241
242
48

Capítulo 2. Contrasting factors drive within-lake bacterial community and functional traits in a large shallow
subtropical lake
The PERANOVA revealed differences among seasons for several variables. Most 243
of them were higher in summer (chla, TP and pH) or in summer and in another season: 244
temperature, ORP and insolation (summer and spring); TSS, TN and HS (summer and 245
autumn). Other variables were higher in other seasons: SRP (autumn and spring); DO 246
and water transparency (winter); nitrate (winter and spring); precipitation, wind velocity 247
(WV) and nebulosity (autumn). DOC was lowest in spring. Biomass of most 248
phytoplankton groups were higher in spring (Cyanobacteria and Zygnemaphyceae) or in 249
spring and autumn (Bacillariophyceae, Chlorophyceae). There was no seasonal 250
variation for Dinophyceae, Chrysophyceae and Euglenophyceae. Among all groups, 251
Cyanobacteria was dominant overall and was mainly represented by Aphanocapsa spp., 252
Chroococcus spp. and Planktolyngbya spp. (Tables 1 and 2). 253
Spatial differences were also detected by PERANOVA. The north stations were 254
generally shallower, with lower water transparency and higher turbidity, TP, NH4+ and 255
nebulosity; while the south stations were generally deeper, with higher water 256
transparency and lower turbidity and chlorophyll a concentrations. The center stations 257
were more similar to the north stations in some variables, and to the south stations in 258
others. For phytoplankton, no spatial differences were observed (Tables 1 and 2). 259
260
Location of Tables 1 and 2 261
262
263
Bacterial Community Composition (BCC) and Functional Traits (FT) 264
265
49

Capítulo 2. Contrasting factors drive within-lake bacterial community and functional traits in a large shallow
subtropical lake
A total of 121 Operational Taxonomic Units (OTUs) were detected by ARISA; 266
116 of them had >5% of frequency of occurrence. Most of them were shared over time 267
(78%) or locations (95%), but when taking into account the abundance of the OTUs, the 268
PERMANOVA indicated that the temporal variation was more important than the 269
spatial variation (R2 = 0.22 and R2 = 0.06, respectively). In this context, all seasons were 270
different from each other, whereas only south × north displayed consistent differences 271
in BCC (Table 3). 272
A similar response was found for FT, with all the 31 carbon sources being 273
consumed in all samples; however, the degree of utilization varied over time and along 274
the spatial scale. There were consistent differences among all seasons (R2 = 0.13), while 275
for the spatial variation (R2 = 0.06) only south x center did not differ significantly 276
(Table 3). 277
278
Location of Table 3 279
280
Based on the SIMPER analysis and the arbitrary cutoffs chosen, the OTUs 399, 403, 281
404, 438, 511, 520, 546, 547, 634, 650, 654 and 669, and the substrates 282
phenylethylamine (G4), 2-hydroxy benzoic acid (C3), γ-hydroxybutyric acid (E3), 283
glucose-1-phosphate (G2), α-D-lactose (H1), α-ketobutyric acid (E3), i-erythritol (C2), 284
glycogen (F1) and L-phenylalanine (C4) made stronger contributions to the 285
dissimilarity among seasons (see Supplementary Table S2 and Supplementary Figure 286
S1 for details). Regarding spatial differences, the OTUs 399, 403, 404, 511, 546, 547, 287
634 and 654 and the carbon sources phenylethylamine (G4), i-erythritol (C2), glucose-288
1-phosphate (G2), γ-hydroxybutyric acid (E3) and 2-hydroxybenzoic acid (C3), most 289
50

Capítulo 2. Contrasting factors drive within-lake bacterial community and functional traits in a large shallow
subtropical lake
notably G4 and C3, contributed most to the dissimilarity among sites (see 290
Supplementary Table S3 and Supplementary Figure S2 for details). 291
Although BCC and FT showed similar temporal and spatial patterns, they were 292
not significantly correlated (Mantel test, r = -0.05258, P=0.71), suggesting that even 293
though they shared the same pattern, they responded to different drivers. 294
295
Variance Partitioning of BCC and FT 296
297
All explanatory matrices were significant for BCC when separate RDAs were run, 298
and hence were included in the variance partitioning. However, when tested for their 299
isolated effects through pRDA, only the matrices for the environmental variables and 300
the phytoplankton biomass were significant. These matrices explained 7.3 and 4.7%, 301
respectively, of the total inertia, and the residual variance was very high (63.6%) (Table 302
4). The contributions of the environmental variables to the BCC pattern after the 303
removal of the other explanatory matrices were, in decreasing order of importance: I) 304
First RDA axis: TP, SRP, turbidity, TN, chla and depth (negatively); II) Second RDA 305
axis: WT, NH4+, WD, pH, nitrate, TSS, and evaporation (negatively) and HS, 306
nebulosity, ORP, WV and DOC (positively) (Fig. 2). The contribution of phytoplankton 307
classes to the BCC patterns after the removal of the other explanatory matrices were, in 308
decreasing order of importance: I) First RDA axis: Zygnemaphyceae and 309
Bacillariophyceae (negatively) and Euglenophyceae (positively); II) Second RDA axis: 310
Dinophyceae, Cyanobacteria, Chlorophyceae and Chrysophyceae (negatively) (Fig. 3). 311
For bacterial FT, all explanatory matrices run separately were significant except 312
the phytoplankton matrix, which therefore was not included in the variance partitioning. 313
51
Capítulo 2. Contrasting factors drive within-lake bacterial community and functional traits in a large shallow
subtropical lake
The pRDA revealed that only the spatial matrix (PCNMs) was significant after the 314
effect of the other explanatory matrices was removed. Around 81.5% of the total inertia 315
remained unexplained by the explanatory matrices tested (Table 5). 316
317
Location of Tables 4 and 5 318
Location of Figures 2 and 3 319
320
Discussion 321
Our results revealed a strong spatial and temporal heterogeneity in Lake 322
Mangueira for environmental variables, chlorophyll a and phytoplankton taxonomical 323
classes. Similarly, the BCC and FT showed strong temporal heterogeneity, while the 324
spatial analysis showed differences between the north-south axis. When considering 325
differences in BCC and FT as assessed by PERMANOVA, the effects of environmental 326
variables and distance are confounded, and it is therefore necessary to compare their 327
individual effects on the dynamics of BCC and FT. The pRDAs revealed that local 328
factors (environment and phytoplankton) were the significant factors explaining the 329
BCC dynamics; whereas, unexpectedly, the FT seemed to be driven by dispersal 330
constraints. 331
Although 95% of OTUs were found in all three parts of the lake and 78% in all 332
seasons of the year, the BCC differed significantly from the northern to the southern 333
areas of the lake and across all seasons, suggesting that the majority of freshwater 334
bacterial taxa are not confined to a subset of regions on the geographical or temporal 335
scales. Our results suggests that ubiquitous taxa are prevalent in bacterial communities, 336
and support previous observations of high percentage OTUs occurring across sampling 337
52

Capítulo 2. Contrasting factors drive within-lake bacterial community and functional traits in a large shallow
subtropical lake
sites (85%, 76% and 77.6% of all OTUs) found by van der Gucht et al. (2007), 338
Souffreau et al. (2015) and Lear et al. (2014), respectively. Even though the ARISA 339
method is highly reproducible (Jones et al., 2012), it is biased toward the detection of 340
the most abundant OTUs, a limitation of all fingerprinting methods (Jones et al., 2012). 341
It is possible that the inability to detect a pure spatial effect for the BCC stemmed from 342
the failure to detect rare members of the bacterial community, since rare OTUs may 343
display strong biogeographical signals and significantly impact the results of the 344
analysis if they are included (Yannarel & Triplett, 2004; Galand et al., 2009). 345
Assessing within-lake heterogeneity is a critical issue when considering the 346
appropriate scale for sampling microbial communities. Such small scale variability was 347
recognized early, and Palmer et al. (1967) reported patchiness in the distribution of 348
bacterial plate counts at scales of approximately 20 m. More recently, a significant 349
variability of within-lake BCC has been reported via molecular and culture-independent 350
methods (e.g. Wu et al., 2007) and scales as short as 10 m (Jones et al., 2012) to < 20 m 351
(Lear et al., 2014) have been pointed to be significant for dispersal of bacterial OTUs. 352
Although the scale of heterogeneity seems to be positively related to lake size, within-353
lake variation in BCC occurs across all types of morphometry (Table 6). Another 354
important factor controlling variability in BCC is the degree of connectivity, which 355
depends on the mixing regime, wind (velocity, direction and fetch), the presence of 356
physical barriers such as islands, embayments or constrictions (Yannarell & Triplett, 357
2004; Lear et al., 2014) and lake heterogeneity (e.g., presence of macrophytes) (Wu et 358
al., 2007; Lear et al., 2014). 359
Given the high connectivity of Lake Mangueira due to its wind-driven and well-360
mixed nature, barriers to dispersal are expected to be weak or nonexistent, and this is 361
reflected in the smallest scale of heterogeneity in BCC detected (~49 km), which is the 362
53

Capítulo 2. Contrasting factors drive within-lake bacterial community and functional traits in a large shallow
subtropical lake
largest yet found in comparison to other studies (Table 6). Assuming that the fetch 363
increases with lake size, we hypothesize that the relatively large scale of variability in 364
BCC in Lake Mangueira is derived from its long fetch. The significant differences 365
between the northern and southern parts of the lake can be explained by i) the long fetch 366
of the lake due to prevailing northeast or southeast winds parallel to the main axis of the 367
lake, which controls sediment resuspension between these two areas (Fragoso Jr. et al., 368
2008) and, ii) differences in the composition of dominant macrophytes (mostly 369
emergent in the northern wetlands and mostly submersed in the southern part), which 370
are known to affect BCC in many lakes (Wu et al., 2007; Lear et al., 2014) including 371
Lake Mangueira (They et al., 2010). 372
The temporal patterns of BCC and FT were stronger than the spatial patterns. 373
Even though patterns in time are not as often explored as patterns in space for BCC and 374
FT, the few studies available are in agreement with our results. Stronger temporal 375
variation of BCC was reported for a large estuarine area, where temperature changes 376
had a stronger seasonal influence than the spatial dynamics (Kan et al., 2007). 377
Alternative explanations may include a dependence on the phenological cycle of other 378
components of the microbial loop such as phytoplankton and zooplankton (Kent et al., 379
2004). Considering that Lake Mangueira is a large lake, this pattern is in agreement 380
with the positive relationship between the time similarity-decay and ecosystem size 381
found for several aquatic species, including planktonic ones (Korhonen et al., 2010). 382
Similarly, FT (assessed as substrate utilization) have been reported to vary on a seasonal 383
basis in lakes, associated with patterns of stratification (Christian & Lind, 2007) 384
temperature, and the availability of nutrients and organic substrates (Dickerson & 385
Williams, 2014). 386
54
Capítulo 2. Contrasting factors drive within-lake bacterial community and functional traits in a large shallow
subtropical lake
The higher explanatory power of local factors over dispersal has often been 387
emphasized in studies that addressed BCC variation over geographic scales (Beisner et 388
al., 2006; van der Gucht et al., 2007, Sommaruga & Casamayor, 2008; Souffreau et al., 389
2015). Other studies have found that both environmental and spatial factors explain 390
bacterioplankton community dynamics (Schiaffino et al., 2011), or even that the 391
interaction of environmental conditions, region, time and landscape influence BCC 392
(Yanarell & Tripplet, 2005). Our study supports the view that the bacterioplankton 393
community structure is primarily the result of species-sorting selection (Chase and 394
Leibold, 2003; Leibold et al., 2004), which is in accordance with the high rates of 395
dispersal expected for Lake Mangueira. 396
In Lake Mangueira, the significant environmental variables that contributed most 397
to the RDAs explaining the BCC (total phosphorus, PO4-3, NH4
+, water transparency, 398
turbidity and water temperature) varied seasonally and spatially as a result of water 399
withdrawal for agricultural irrigation and nutrient inputs (i.e., low watershed nutrient 400
loads in winter and high loads in summer) (Fragoso Jr. et al., 2008; Rodrigues et al., 401
2015). These inorganic nutrients are essential and often limiting for bacterial growth 402
(Carlsson and Caron, 2001; Caron, 1994), whereas water transparency and turbidity are 403
inversely linked, and along with temperature (Lindström et al., 2005) can be an 404
important source of variation of the BCC in lakes (e.g. Yannarell & Triplett, 2005). 405
In addition, the significance of the share of BCC variance explained by the 406
biomass of phytoplankton taxonomical classes is in accordance with the influence of 407
phytoplankton on bacterioplankton diversity and metabolism (Kamjunke et al., 1997; 408
del Giorgio & Cole, 1998; Höfle et al., 1999; Cotner & Biddanda, 2002; Eiler and 409
Bertilsson, 2004; Honer-Devine et al., 2003; Kent et al., 2007). Phytoplankton also 410
competes with bacteria for nutrients (Cotner & Biddanda, 2002) and positively 411
55

Capítulo 2. Contrasting factors drive within-lake bacterial community and functional traits in a large shallow
subtropical lake
influences bacteria through exudation of dissolved organic matter, which can fuel as 412
much as half of the carbon required for bacterial production (Baines & Pace, 1991), 413
determining patterns of BCC (Jones et al., 2009). Since phytoplankton production tends 414
to be more important in larger lakes (Vadeboncoeur et al., 2008), especially in the 415
pelagic zone, algae are expected to significantly influence BCC in Lake Mangueira. The 416
biomass of large groups such as Cryptophytes and Chrysophytes has been found to be 417
correlated with BCC in lakes (Lindström, 2000); however, since a wide metabolic 418
repertoire in terms of exudates of organic carbon is expected for these broad classes of 419
phytoplankton, it is impossible to link each specific algal class to the results found. 420
Bacterivory by phytoplankton is another possibility, since mixotrophy is higher in more 421
oligotrophic lakes (Saad et al., 2013) and prevalent in members of Dinophyceae and 422
Chrysophyceae, among others (see review by Stoecker, 1998). Notably, in some 423
systems mixotrophy may represent as much as 50% of the total bacterivory by 424
flagellates (Unrein et al., 2007). 425
A similar pattern of spatial and temporal variation was found for FT, even though 426
all substrates were oxidized in all seasons and locations, and the BCC and FT were not 427
significantly correlated. This lack of correlation between BCC and FT has also been 428
found by Lear et al. (2014) for individual ponds, and by Comte & del Giorgio (2010), 429
who reported that even though BCC and FT were not directly correlated, their rates of 430
change along environmental gradients did correlate. Several explanations such as those 431
summarized by Lear et al. (2014) can be considered: i) inability of migrant bacteria to 432
grow, thereby contributing to BCC but not to FT; ii) contribution of Archaea or 433
picoeukaryotes to the substrate utilization pattern; iii) the potentially higher functional 434
redundancy due to the generic metabolic pathways assessed by this study. 435
56
Capítulo 2. Contrasting factors drive within-lake bacterial community and functional traits in a large shallow
subtropical lake
To our knowledge, this is the first evidence for dispersal of functional traits in 436
bacterial communities, as shown by the smallest scale of variation found for FT (~49 437
km). This unexpected dispersal driven FT may be explained by: i) indirect effect of 438
local factors, ii) exclusion of significant explanatory variables and iii) horizontal gene 439
transfer. Local factors act by modulating the FT due to the interaction of local 440
conditions and migrating bacteria. For example, Severin et al. (2013), found that the 441
ecosystem functioning (using bacterial secondary production as a proxy) was strongly 442
explained by the functional traits of bacterial communities along a dispersal-rate 443
gradient, with the receiving local environment being critical for the final effects on the 444
functional traits of the migrant cells. Hence, the adaptive success and subsequent 445
likelihood of immigrant bacteria contributing their original functional traits to the 446
receiving community is inversely proportional to the difference in the local conditions 447
(i.e., distance). In terms of potentially significant explanatory variables excluded, the 448
contribution of attached (sediment) bacteria stands out. Since we had significant 449
differences in wind velocity across seasons and the wind in shallow lakes often 450
resuspends the sediment, we believe that sediment bacteria may have had a role in the 451
FT patterns found. This was confirmed by the fact that wind velocity correlated 452
significantly with 4 of 9 substrates indicated by SIMPER as the most important for 453
differences among seasons (not shown). Additionally, attached bacteria may be richer in 454
oxidized Ecoplate® substrates compared to free-living bacteria (Lyons and Dobbs, 455
2012). A further indication that other important variables may not have been included in 456
the models tested is the large proportion of unexplained variation, since it is inherently 457
impossible to control field conditions and/or to measure all relevant environmental 458
variables. At last, horizontal gene transfer may be another factor that is unaccounted for 459
in this study, as gene flow can occur even under high phylogenetic dispersal limitation 460
57

Capítulo 2. Contrasting factors drive within-lake bacterial community and functional traits in a large shallow
subtropical lake
(Parnell et al., 2010). In this case we may have detected a signal of gene dispersal, 461
which unfortunately cannot be confirmed through patterns of substrate utilization. 462
In summary, this study showed significant differences in bacterioplankton 463
community composition and function over spatial and temporal gradients in a shallow 464
lake, with temporal differences being stronger than spatial ones. Compared to previous 465
studies, the smallest scale of variability detected in BCC and FT was large (~49 km). 466
Thus, our results suggest that the smallest scale of heterogeneity detected may be 467
positively related to lake size. However, at least part of the results was likely due to the 468
long fetch of Lake Mangueira, which may be responsible for higher connectivity 469
through mixing. Variance partitioning revealed, however, that the bacterial community 470
composition and functional traits were driven by environmental conditions and spatial 471
factors respectively, and our results reinforce the role of local factors in structuring BCC 472
in highly connected systems. Regardless of whether the spatial differences found were 473
driven by environmental factors or dispersal, the results have important implications for 474
sampling design and for understanding the dynamics of freshwater microbial 475
communities. Specifically, spatial and temporal differences in microbial communities 476
within a given lake may be comparable to differences among lakes. The current results 477
are in line with a growing number of other studies (summarized in Table 6), which 478
together highlight within-lake variability as an important component of the total 479
variability of the landscape. Thus, biogeographical studies should be extended to 480
include scales of variability within lakes for explaining biodiversity and ecosystem 481
function. 482
483
58

Capítulo 2. Contrasting factors drive within-lake bacterial community and functional traits in a large shallow
subtropical lake
Location of Table 6 484
485 486
Acknowledgments 487
This study was supported by the Conselho Nacional de Desenvolvimento Científico e 488 Tecnológico (CNPq), Brazil. We acknowledge the assistance provided by the Instituto 489 Chico Mendes de Conservação da Biodiversidade (ICMBio) and Estação Ecológica do 490 TAIM (ESEC-Taim), Ministério do Meio Ambiente, Brazil. We are also grateful to the 491 Global Lake Ecological Observatory Network (GLEON) for providing venue and 492 resources for lake science discussions. M. S. Lima also received support through a 493 doctoral scholarship from Programa de Pós Graduação em Recursos Hídricos e 494 Saneamento Ambiental, Instituto de Pesquisas Hidráulicas (CNPq 141228/2012-1), and 495 N. H. They has a post-doctoral scholarship from Coordination of Higher-Level Staff 496 Improvement (Capes 88887.065146/2014-00). Special thanks go to Dr. Lacina Maria 497 Freitas-Teixeira for helping with the raw phytoplankton data, to MSc. J. Rafael 498 Cavalcanti and MSc. Mauricio Munar for helping with maps drawings. We are grateful 499 to Dr. Janet Reid (Trumansburg, NY, U.S.A.) for revising the English text. The authors 500 are grateful to two anonymous reviewers for their invaluable comments. 501 502
References 503
APHA, 1999. Eaton, A. D., L. S. Clesceri & A. E. Greenberg (eds.). Standard 504
Methods for the examination of water and wastewater. 20th ed. Washington: 505
American Public Health Association, Inc. 506
Baines, S. B. & M. L. Pace, 1991. The production of dissolved organic matter by 507
phytoplankton and its importance to bacteria: patterns across marine and freshwater 508
systems. Limnology and Oceanography 36:1078-1090. 509
Beisner, B. E., P. R. Peres-Neto, E. S. Lindström, A. Barnett & M. L. Longhi, 2006. 510
The role of environmental and spatial processes in structuring lake communities 511
from bacteria to fish. Ecology 87:2985-2991. 512
59
Capítulo 2. Contrasting factors drive within-lake bacterial community and functional traits in a large shallow
subtropical lake
Bell, T., D. Ager, J-I. Song, J. A. Newmann, I. P. Thompson, A. K. Lilley & C. J. 513
van der Gast, 2005. Larger islands house more bacterial taxa. Science 308:188. 514
Bissett, A., A. E. Richardson, G. Baker, S. Wakelin & P. H. Thrall, 2010. Life 515
history determines biogeographical patterns of soil bacterial communities over 516
multiple spatial scales. Molecular Ecology 19:4315-4327. 517
Borcard, D. & P. Legendre, 2002. All-scale spatial analysis of ecological data by 518
means of principal coordinates of neighbor matrices. Ecological Modelling 153:51-519
68. 520
Borcard, D., P. Legendre & P. Drapeau, 1992. Partialling out the spatial component 521
of ecological variation. Ecology 73:1045–1055. 522
Carlsson, P., & D. A. Caron, 2001. Seasonal variation of phosphorus limitation of 523
bacterial growth in a small lake. Limnology and Oceanography 46:108–120. 524
Caron, D. A., 1994. Inorganic nutrients, bacteria, and the microbial loop. Microbial 525
Ecology 28:295–298. 526
Chase, J. M. & M. A. Leibold, 2003. Ecological niches: linking classical and 527
contemporary approaches. Chicago: University of Chicago Press. 528
Christian, B. W. & T. L. Lind, 2006. Key issues concerning biolog use for aerobic 529
and anaerobic freshwater bacterial community-level physiological profiling. 530
International Review of Hydrobiology 91:257-268. 531
Christian, B. W. & T. L. Lind, 2007. Multiple carbon substrate utilization by 532
bacteria at the sediment-water interface: seasonal patterns in stratified eutrophic 533
reservoir. Hydrobiologia 586:43-56. 534
60

Capítulo 2. Contrasting factors drive within-lake bacterial community and functional traits in a large shallow
subtropical lake
Cole, J. J., 1999. Aquatic microbiology for ecosystem scientists: new and recycled 535
paradigms in ecological microbiology. Ecosystems 2:215-225. 536
Comte, J. & P. A. del Giorgio, 2010. Linking the patterns of change in composition 537
and function in bacterioplankton successions along environmental gradients. 538
Ecology 91:1466-1476. 539
Cotner, J. B. & B. A. Biddanda, 2002. Small players, large role: microbial influence 540
on biogeochemical processes in pelagic aquatic ecosystems. Ecosystems 5:105-101. 541
Crossetti, L. O., V. Becker, L. S. Cardoso, L. R. Rodrigues, L. S. Costa & D. Motta-542
Marques, 2013. Is phytoplankton functional classification a suitable tool to 543
investigate spatial heterogeneity in a subtropical shallow lake? Limnologica 43:157-544
163. 545
Crump, B. C., H. E. Adams, J. E. Hobbie & G. W. Kling, 2007. Biogeography of 546
bacterioplankton in lakes and streams of an arctic tundra catchment. Ecology 547
88:1365-1378. 548
del Giorgio, P. A. & J. Cole, 1998. Bacterial growth efficiency in natural aquatic 549
systems. Annual Review of Ecology, Evolution and Systematics 29:503-541. 550
Dickerson, T. L. & H. N. Williams, 2014. Functional diversity of bacterioplankton 551
in threen North Florida Freshwater Lakes over Annual Cycle. Microbial Ecology 552
67:34-44. 553
Dray, S., P. Legendre & P. R. Peres-Neto, 2006. Spatial modelling: a 554
comprehensive framework for principal component analysis of neighbor matrices 555
(PCNM). Ecological Modelling 196:483-493. 556
61

Capítulo 2. Contrasting factors drive within-lake bacterial community and functional traits in a large shallow
subtropical lake
Eiler, A. & S. Bertilsson, 2004. Composition of freshwater bacterial communities 557
associated with cyanobacterial blooms in four Swedish lakes. Environmental 558
Microbiology 6:1228–1243. 559
Fisher, M. M. & E. W. Triplett, 1999. Automated approach for ribosomal intergenic 560
spacer analysis of microbial diversity and its application to freshwater bacterial 561
communities. Applied and Environmental Microbiology 65:4630–4636. 562
Fragoso Jr., C. R., D. M. L. Motta Marques, W. Collischonn, C. E. M. Tucci & E. 563
H. van Nes, 2008. Modelling spatial heterogeneity of phytoplankton in Lake 564
Mangueira, a large shallow subtropical lake in South Brazil. Ecological Modelling 565
219:125-137. 566
Galand, P. E., E. O. Casamayor, D. L. Kirchman & C. Lovejoy, 2009. Ecology of 567
the rare microbial biosphere of the Arctic Ocean. Proceedings of the National 568
Academy of Sciences of the USA 106:22427-22432. 569
Green, J. & B. J. M. Bohannan, 2006. Spatial scaling of microbial diversity. Trends 570
in Ecology & Evolution 21:501-507. 571
Gross, J., 2003. Variance inflation factors. R News 1:13-15. 572
Grover, J. P. & T. H. Chrzanowski, 2000. Seasonal patterns of substrate utilization 573
by bacterioplankton: case studies in four temperate lakes of different latitudes. 574
Aquatic Microbial Ecology 23:41-54. 575
Guckert, J. B., G. J. Carr, T. D. Johnson, B. G. Hamm, D. H. Davidson & Y. 576
Kumagai, 1996. Community analysis by biolog: curve integration for statistical 577
62

Capítulo 2. Contrasting factors drive within-lake bacterial community and functional traits in a large shallow
subtropical lake
analysis of active sludge microbial habitats. Journal of Microbiological Methods 578
27:183-197. 579
Hillebrand, H., D. Dürseken, D. Kirschiel, U. Pollingher & T. Zohary, 1999. 580
Biovolume calculation for pelagic and benthic microalgae. Journal of Phycology 581
35:403-424. 582
Höfle, M. G., H. Haas & K. Dominik, 1999. Seasonal dynamics of bacterioplankton 583
community structure in a eutrophic lake as determined by 5S rRNA analysis. 584
Applied and Environmental Microbiology 65:3164–3174. 585
Horner-Devine, M. C., M. Lage, J. B. Hughes & B. J. M. Bohannan, 2004. A taxa-586
area relationship for bacteria. Nature 432:750-753. 587
Horner-Devine, M. C., S. V. H. Leibold & B. J. M. Bohannan, 2003. Bacterial 588
diversity patterns along a gradient of primary productivity. Ecology Letters 6:613-589
622. 590
Insam, H. & M. Goberna, 2004. Use of Biolog for the Community Level 591
Physiological Profiling (CLPP) of environmental samples. Molecular Microbial 592
Ecology Manual 4.01:853–860. 593
Jespersen, A. M. & K. Christoffersen, 1987. Measurements of chlorophyll-a from 594
phytoplankton using ethanol as extraction solvent. Archiv für Hydrobiologie 595
109:445-454. 596
Jones, S. E. & K. D. McMahon, 2009. Species-sorting may explain an apparent 597
minimal effect of immigration on freshwater bacterial community dynamics. 598
Environmental Microbiology 11:905-913. 599
63
Capítulo 2. Contrasting factors drive within-lake bacterial community and functional traits in a large shallow
subtropical lake
Jones, S. E., R. J. Newton & K. D. McMahon, 2009. Evidence for structuring of 600
bacterial community composition by organic matter carbon source in temperate 601
lakes. Environmental Microbiology 11:2463-2472. 602
Jones, S. E., T. A. Cadkin, R. J. Newton & K. D. McMahon, 2012. Spatial and 603
temporal scales of aquatic bacterial beta diversity. Frontiers in Microbiology 3:318. 604
Kamjunke, N., W. Böing & H. Voigt, 1997. Bacterial and primary production under 605
hypertrophic conditions. Aquatic Microbial Ecology 13:29-35. 606
Kan, J., M. T. Suzuki, K. Wang, S. E. Evans and F. Chen, 2007. High temporal but 607
low spatial heterogeneity of bacterioplankton in the Chesapeake Bay. Applied and 608
Environmental Microbiology 73:6776–6789. 609
Kent, A. D., S. E. Jones, A. C. Yannarell, J. M. Graham, G. H. Lauster, T. K. Kratz 610
and E. W. Triplett, 2004. Annual Patterns in Bacterioplankton Community 611
Variability in a Humic Lake. Microbial Ecology 48:550-560. 612
Kent, A. D., S. E. Jones, G. H. Lauster, J. M. Graham, R. J. Newton & K. D. 613
McMahon, 2006. Experimental manipulations of microbial food web interactions in 614
a humic lake: shifting biological drivers of bacterial community structure. 615
Environmental Microbiology 8:1448–1459. 616
Kent, A. D., A. C. Yannarell, J. A. Rusak, E. W. Triplett & K. D. McMahon, 2007. 617
Synchrony in aquatic microbial community dynamics. The ISME Journal 1:38–47. 618
Korhonen J. J., J. Soininen & H. Hillebrand, 2010. A quantitative analysis of 619
temporal turnover in aquatic species assemblages across ecosystems. Ecology 620
91:508–517. 621
64

Capítulo 2. Contrasting factors drive within-lake bacterial community and functional traits in a large shallow
subtropical lake
Langenheder, S. & H. Ragnarsson, 2007. The role of environmental and spatial 622
factors for the composition of aquatic bacterial communities. Ecology 88:2154-623
2161. 624
Lear, G., J. Bellamy, B. S. Case, J. E. Lee & H. L. Buckley, 2014. Fine-scale 625
patterns in bacterial community composition and function within freshwater ponds. 626
The ISME Journal 8:1715-1726. 627
Legendre, P. & L. Legendre, 1998. Numerical Ecology, 2nd edn. Elsevier Science 628
BV: Amsterdam. 629
Leibold, M. A., M. Holyoak, N. Mouquet, P. Amarasekare, J. M. Chase, M. F. 630
Hoopes, R. D. Holt, J. B. Shurin, R. Law, D. Tilman, M. Loreau & A. Gonzalez, 631
2004. The metacommunity concept: a framework for multi-scale community 632
ecology. Ecology Letters 7:601–613. 633
Lindström, E. S. & S. Langenheder, 2012. Local and regional factors influencing 634
bacterial community assembly. Environmental Microbiology Reports 4:1-9. 635
Lindström, E. S., 2000. Bacterioplankton community composition in five lakes 636
differing in trophic status and humic content. Microbial Ecology 40:104-113. 637
Lindström, E. S., M. K-V. Agterveld & G. Zwart, 2005. Distribution of typical 638
freshwater bacterial groups is associated with pH, temperature, and lake water 639
retention time. Applied and Environmental Microbiology 71:8201-8206. 640
Liu, L., J. Yang, Z. Yu & D. M. Wilkinson, 2015. The biogeography of abundant 641
and rare bacterioplankton in the lakes and reservoirs of China. The ISME Journal 642
9:2068-2077. 643
65
Capítulo 2. Contrasting factors drive within-lake bacterial community and functional traits in a large shallow
subtropical lake
Logue, J. B. & E. S. Lindström, 2010. Species sorting affects bacterioplankton 644
community composition as determined by 16S rDNA and 16S rRNA fingerprints. 645
The ISME Journal 4:729-738. 646
Lund, J. W. G., C. Kipling & E. D. LeCren, 1958. The invert microscope method of 647
estimating algal numbers and the statistical basis of estimations by counting. 648
Hydrobiologia 11:143-170. 649
Lyons, M. M. & F. C. Dobbs, 2012. Differential utilization of carbon substrates by 650
aggregate-associated and water-associated heterotrophic bacterial communities. 651
Hydrobiologia 686:181-193. 652
Mackereth, F. J. H., J. Heron & J. F. Talling, 1989. Water analysis: some revised 653
methods for limnologists. 2nd ed. Ambleside: Freshwater Biological Association. 654
Mantel, N. A., 1967. The detection of disease clustering and a generalized 655
regression approach. Cancer Research 27:209-220. 656
Martiny, J. B. H., B. J. M. Bohannan, J. H. Brown, R. K. Colwell, J. A. Fuhrman, J. 657
L. Green, M. C. Horner-Devine, M. Kane, J. A. Krumins, C. R. Kuske, P. J. Morin, 658
S. Naeem, L. Øvreas, A-L. Reysenbach, V. H. Smith & J. T. Staley, 2006. Microbial 659
biogeography: putting microorganisms on the map. Nature Reviews Microbiology 660
4:102-112. 661
Oksanen, J., G. B. Blanchet, R. Kindt, P. Legendre, P. R. Minchin, R. B. O´Hara, G. 662
L. Simpson, P. Solymos, M. H. H. Stevens & H. Wegner, 2013. vegan: community 663
Ecology package. R package version 2.0-9. http://CRAN.R-664
project.org/package=vegan 665
66
Capítulo 2. Contrasting factors drive within-lake bacterial community and functional traits in a large shallow
subtropical lake
Pace, N. R. A., 1997. Molecular view of microbial diversity and the biosphere. 666
Science 276:734-740. 667
Palmer, F. E., R. D. Methot Jr. & J. T. Staley, 1967. Patchiness in the distribution of 668
planktonic heterotrophic bacteria in lakes. Applied and Environmental Microbiology 669
31:1003-1005. 670
Parnell, J. J., G. Rompato, L. C. Latta IV, M. E. Pfrender, J. D. van Nostrand, J. 671
Zou, G. Andersen, P. Champine, B. Ganesan & B. C. Weimer, 2010. Functional 672
biogeography as evidence of gene transfer in hypersaline microbial communities. 673
PLoS One 5(9):e12919. DOI: 10.1371/journal.pone.0012919. 674
R Core Team, 2013. R: A language and environment for statistical computing. R 675
Foundation for Statistical Computing, Vienna, Austria. URL http://www.R-676
project.org/. 677
Ramette, A., 2007. Multivariate analyses in microbial ecology. FEMS Microbiology 678
Ecology 62:142-160. 679
Reche, I., E. Pulido-Villena, R. Morales-Baquero & E. O. Casamayor, 2005. Does 680
ecosystem size determine aquatic bacterial richness? Ecology 86:1715–1722. 681
Rodrigues, L. R., D. Motta Marques & N. F. Fontoura, 2015. Fish community in a 682
large coastal subtropical lake: how an environmental gradient may affect the 683
structure of trophic guilds. Limnetica 34:495-506. 684
Saad, J. F., M. R. Schiaffino, A. Vinocur, I. O’Farrell, G. Tell & I. Izaguirre, 2013. 685
Microbial planktonic communities of freshwater environments from Tierra del 686
67

Capítulo 2. Contrasting factors drive within-lake bacterial community and functional traits in a large shallow
subtropical lake
Fuego: dominant trophic strategies in lakes with contrasting features. Journal of 687
Plankton Research 35:1220-1233. 688
Sala, M. M., J. Pinhassi & J. M. Gasol, 2006. Estimation of bacterial use of 689
dissolved organic nitrogen compounds in aquatic ecosystems using Biolog plates. 690
Aquatic Microbial Ecology 42:1-5. 691
Salomo, S., C. Münch & I. Röske, 2009. Evaluation of the metabolic diversity of 692
microbial communities in four different filter layers of a constructed wetland with 693
vertical flow by Biolog analysis. Water Research, 43:4569–4578. 694
Schiaffino, M. R., F. Unrein, J. M. Gasol, R. Massana, V. Balagué & I. Izaguirre, 695
2011. Bacterial community structure in a latitudinal gradient of lakes: the role of 696
spatial versus environmental factors. Freshwater Biology 56:1973-1991. 697
Severin, I., Ö. Östman & E. S. Lindström, 2013. Variable effects of dispersal on 698
productivity of bacterial communities due to changes in functional trait composition. 699
Plos One 8(12):e80825. DOI:10.1371/journal.pone.0080825 700
Shade, A., S. E. Jones & K. D. McMahon, 2008. The influence of habitat 701
heterogeneity on freshwater bacterial community composition and dynamics. 702
Environmental Microbiology 10:1057–1067. 703
Sokal, R. R. & F. J. Rolf, 1995. Biometry. 3rd edn, W. H. Freeman and Company, 704
New York, NY. 705
Sommaruga, R. & E. O. Casamayor, 2008. Bacterial ‘cosmopolitanism’ and 706
importance of local environmental factors for community composition in remote 707
high-altitude lakes. Freshwater Biology 54:994-1005. 708
68

Capítulo 2. Contrasting factors drive within-lake bacterial community and functional traits in a large shallow
subtropical lake
Souffreau, C., K. van der Gucht, I. van Gremberghe, S. Kosten, G. Lacerot, L. M. 709
Lobão, V. L. de Moraes Huszar, F. Roland, E. Jeppesen, W. Vyverman & L. De 710
Meester, 2015. Environmental rather than spatial factors structure bacterioplankton 711
communities in shallow lakes along a > 6000 km latitudinal gradient in South 712
America. Environmental Microbiology 17:2336-2351. 713
Stoecker, D. K., 1998. Conceptual models of mixotrophy in planktonic protists and 714
some ecological and evolutionary implications. European Journal of Protistology 715
34:281-290. 716
Strome, D. J. & M. C. Miller, 1978. Photolytic changes in dissolved humic 717
substances. Verhandlungen der Internationalen Vereinigung für Theoretische und 718
Angewandte Limnologie 20:1248-1254. 719
They, N-H., D. M. Marques, E. Jeppesen & M. Søndergaard, 2010. 720
Bacterioplankton in the littoral and pelagic zones of subtropical shallow lakes. 721
Hydrobiologia 646:311-326. 722
Tian, C., J. Tan, X. Wu, W. Ye, X. Liu, D. Li & H. Yang, 2009. Spatiotemporal 723
transition of bacterioplankton diversity in a large shallow hypertrophic freshwater 724
lake, as determined by denaturing gradient gel electrophoresis. Journal of Plankton 725
Research 31:885–897. 726
Tiquia, S. M., 2010. Metabolic diversity of the heterotrophic microorganisms and 727
potential link to pollution of the Rouge River. Environmental Pollution 158:1435–728
1443. 729
69
Capítulo 2. Contrasting factors drive within-lake bacterial community and functional traits in a large shallow
subtropical lake
Unrein, F., R. Massana, L. Alonso-Saéz & J. M. Gasol, 2007. Significant year-round 730
effect of small mixotrophic flagellates on bacterioplankton in an oligotrophic coastal 731
system. Limnology and Oceanography 52:456-469. 732
Utermöhl, H., 1958. Zur Vervolkomnung der quantitative Phytoplankton: Methodik. 733
Mitteilung der Internationalen Vereinigung für Theoretische und Angewandte 734
Limnologie 9:1-38. 735
Vadeboncoeur, Y., G. Peterson, M. Jake, V. Zanden & J. Kalfe, 2008. Benthic algal 736
production across lake size gradients: interactions among morphometry, nutrients, 737
and light. Ecology 89:2542-2552. 738
Van der Gucht, K., K. Cottenie, K. Muylaert, N. Vloemans, S. Cousin, S. Declerck, 739
E. Jeppesen, J-M. Conde-Porcuna, K. Schwenk, G. Zwart, H. Degans, W. 740
Vyverman & L. De Meester, 2007. The power of species sorting: Local factors drive 741
bacterial community composition over a wide range of spatial scales. Proceedings 742
of the National Academy of Sciences of the USA 104:20404-20409. 743
Wu, Q. L., G. Zwart, J. Wu, M. P. K-v. Agterveld, S. Liu & M. W. Hahn, 2007. 744
Submersed macrophytes play a key role in structuring bacterioplankton community 745
composition in the large, shallow, subtropical Taihu Lake, China. Environmental 746
Microbiology 9:2765-2774. 747
Yannarell, A. C. & E. W Triplett, 2004. Within- and between-Lake Variability in 748
the Composition of Bacterioplankton Communities : Investigations Using Multiple 749
Spatial Scales. Applied and Environmental Microbiology 70:214–223. 750
70

Capítulo 2. Contrasting factors drive within-lake bacterial community and functional traits in a large shallow
subtropical lake
Yannarell, A. C. & E. W. Triplett, 2005. Geographic and environmental sources of 751
variation in lake bacterial community composition. Applied and Environmental 752
Microbiology 71:227-239. 753
Yannarell, A.C., A. D. Kent, G. H. Lauster, T. K. Kratz & E. W. Triplett, 2003. 754
Temporal patterns in bacterial com- munities in three temperate lakes of different 755
trophic status. Microbial Ecology 46:391–405. 756
757
71

Capítulo 2. Contrasting factors drive within-lake bacterial community and functional traits in a large shallow
subtropical lake
Figure captions 758
Fig. 1 Sampling points in Lake Mangueira, southern Brazil. South (points 1 to 6), center 759 (points 7-12) and north (points 13-18). 760 761 Fig. 2 Biplot of the pRDA of the BCC constrained by the environmental variables 762 matrix, after removing the effect of all other explanatory matrices. 763 764
Fig. 3 Biplot of the pRDA of the BCC constrained by the phytoplankton major classes’ 765 biomass matrix, after removing the effect of all other explanatory matrices. 766
767
Supplementary Fig. S1 Contour plots showing temporal variation of OTUs and carbon 768 substrates that contributed most to BCC and FT dissimilarities, according to SIMPER. 769 Black dots represent the sampling points along Lake Mangueira. 770 771
Supplementary Fig. S2 Contour plot showing spatial variation of OTUs and carbon 772 substrates that contributed most to BCC and FT dissimilarities, according to SIMPER. 773 Black dots represent the sampling points along the southern, center and northern parts 774 of Lake Mangueira. 775 776
777
72

Capítulo 2. Contrasting factors drive within-lake bacterial community and functional traits in a large shallow
subtropical lake
Fig. 1
73

Capítulo 2. Contrasting factors drive within-lake bacterial community and functional traits in a large shallow
subtropical lake
Fig.2
Fig.3
74

Capítulo 2. Contrasting factors drive within-lake bacterial community and functional traits in a large shallow subtropical lake
Table 1 Mean (standard deviation) of environmental variables and chlorophyll a across seasons and locations for Lake Mangueira
Season Location Summer Autumn Winter Spring South Center North Temp (ºC) 22.75 (1.05)a 17.79 (0.34)b 11.66 (0.44)c 22.16 (0.66)a 18.18 (4.39)a 18.63 (4.61)a 19.27(4.54)a DO (mg L-1) 9.09 (0.43)a 9.33 (0.19)a 11.45 (0.31)b 8.61 (0.16)c 9.53(1.21)a 9.65 (1.18)a 9.61 (0.99)a ORP (mV) 170.37 (13.83)a 137.74 (17.61)b 96.01 (15.38)c 166.19 (9.29)a 145.62 (38.29)a 142.64 (33.66)a 141.37 (26.08)a Depth (m) 2.92 (1.53)a 2.74 (1.52)a 3.12 (1.68)a 3.30 (1.64)a 3.8 (1.47)a 3.30 (2.04)ab 2.36 (0.76)b WT (m) 1.16 (0.26)a 0.94 (0.31)a 1.63 (0.62)b 1.08 (0.25)a 1.41 (0.47)a 1.12 (0.47)ab 1.05 (0.34)b TSS (mg L-1) 14.50 (4.17)a 14.31 (6.57)a 9.71 (3.22)b 10.06 (5.48)b 10.71 (4.42)a 13.06 (5.24)a 12.78 (6.43)a Turb (NTU) 4.90 (2.11)a 6.33 (2.81)a 5.18 (2.14)a 4.08 (3.07)a 3.70 (1.78)a 5.58 (2.15)b 6.12 (3.26)b TP (mg L-1) 0.04 (0.01)a 0.02 (0.01)b 0.03 (0.02)b 0.03 (0.01)b 0.02 (0.01)a 0.03 (0.01)ab 0.03 (0.01)b SRP (µg L-1) 10.10 (2.02)a 12.76 (5.06)ab 11.54 (2.25)a 15.46 (3.67)b 11.30 (3.58)a 12.96 (2.85)a 13.21 (5.04)a TN (mg L-1) 0.48 (0.12)a 0.43 (0.07)a 0.25 (0.03)b 0.22 (0.13)b 0.35 (0.12)a 0.32 (0.14)a 0.37 (0.18)a NH4
+ (mg L-1) 0.05 (0.11)a 0.03 (0.02)a 0.03 (0.02)a 0.13 (0.09)a 0.03 (0.03)ab 0.03 (0.02)a 0.06 (0.09)b Nitrate (mg L-1) 0.07 (0.05)a 0.06 (0.01)a 0.11 (0.02)b 0.13 (0.09)b 0.10 (0.06)a 0.08 (0.05)a 0.10 (0.07)a DOC (mg L-1) 2.07 (1.19)ab 2.72 (0.86)a 2.68 (0.81)a 1.96 (0.55)b 2.46 (1.01)a 2.02 (0.92)a 2.59 (0.78)a HS (nm) 8.06 (1.88)a 8.18 (1.31)a 4.33 (0.68)b 5.12 (0.91)c 7.14 (2.76)a 6.34 (1.82)a 5.84 (1.47)a chla (µg L-1) 6.20 (2.01)a 3.79 (1.58)bc 4.36 (1.35)b 2.95 (1.09)c 3.52 (1.45)a 4.81 (1.97)b 4.66 (2.15)ab pH 8.54 (0.12)a 8.13 (0.05)b 8.04 (0.09)c 8.01 (0.10)c 8.19 (0.17)a 8.17 (0.21)a 8.28 (0.31)a WD ( ⁰) S (S)a SSE (NE-WSW)ab SE (S-E)b SE (SE)ab SE (S-ENE)a S (SO-ESE)a SSE (SSW-ESE)a WV (m s-1) 1.75 (0.39)a 7.78 (1.17)b 1.94 (1.03)a 3.17 (0.77)c 3.44 (3.31)a 3.46 (2.15)a 4.17 (2.24)a Nebulosity (tenths) 1.58 (1.20)a 9.50 (0.79)b 3.00 (3.68)ac 6.33 (3.28)c 3.13 (4.31)a 5.48 (4.10)ab 6.87 (2.38)b Precip (mm) 0.00 (0.00)a 9.19 (5.82)b 0.00 (0.00)a 0.00 (0.00)a 0.53 (0.93)a 2.94 (5.65)a 3.57 (6.15)a Insol (h) 10.80 (0.00)a 0.55 (0.45)b 5.44 (1.30)c 5.60 (0.00)ac 5.85 (3.96)a 5.51 (3.67)a 5.43 (3.72)a
Different letters indicate significance at P < 0.05. Temp, water temperature; DO, dissolved oxygen; ORP, oxidation-reduction potential; depth, local depth; WT, water transparency; TSS, total suspended solids, Turb, turbidity; TP, total phosphorus; SRP, soluble reactive phosphorus; TN, total nitrogen; NH4+, ammonium; DOC, dissolved organic carbon; HS, humic substances ratio (Abs 250:365 nm); chla, chlorophyll a; WD, wind direction; WV, wind velocity; Precip, precipitation; Insol, insolation
75

Capítulo 2. Contrasting factors drive within-lake bacterial community and functional traits in a large shallow
subtropical lake
Table 2 Mean (standard deviation) of biomass (mg L-1) of major classes of phytoplankton across seasons and locations for Lake Mangueira
Season Location
Summer Autumn Winter Spring South Center North
Bacillariophyceae 0.10 (0.33)a 0.11 (0.09)b 0.02 (0.02)c 0.15 (0.15)b 0.09 (0.10)a 0.10 (0.28)a 0.09 (0.14)a
Chlorophyceae 0.21 (0.24)a 0.43 (0.31)bc 0.29 (0.08)b 0.96 (0.83)c 0.33 (0.31)a 0.53 (0.61)a 0.57 (0.64)a
Chrysophyceae 0.00 (0.00)a 0.01 (0.01)a 0.00 (0.01)a 0.00 (0.01)a 0.00 (0.01)a 0.00 (0.01)a 0.00 (0.00)a
Cyanobacteria 4.31 (2.56)a 4.86 (1.34)a 6.00 (2.13)a 9.67 (4.66)b 4.95 (2.23)a 6.26 (3.93)a 7.48 (4.00)a
Dinophyceae 0.02 (0.04)a 0.00 (0.00)a 0.00 (0.00)a 0.01 (0.04)a 0.00 (0.00)a 0.01 (0.04)a 0.01 (0.03)a
Euglenophyceae 0.00 (0.00)a 0.00 (0.00)a 0.00 (0.00)a 0.00 (0.01)a 0.00 (0.00)a 0.00 (0.00)a 0.00 (0.00)a
Zygnemaphyceae 0.01 (0.01)abc 0.00 (0.00)a 0.00 (0.00)b 0.02 (0.03)c 0.00 (0.01)a 0.01 (0.02)a 0.01 (0.02)a
Different letters indicate significance at P < 0.05
Table 3 Differences among seasons and locations, assessed by PERMANOVA for BCC and FT in Lake Mangueira
BCC Functional Traits
F R2 P F R2 P
Temporal 6.271 0.22 0.0001* 3.432 0.13 0.0001*
Summer vs Autumn 4.216 - 0.0414* 2.052 - 0.048*
Summer vs Winter 8.708 - 0.0006* 3.315 - 0.0006*
Summer vs Spring 5.205 - 0.003* 3.254 - 0.0006*
Autumn vs Winter 6.719 - 0.0006* 5.087 - 0.0006*
Autumn vs Spring 6.892 - 0.0006* 4.473 - 0.0012*
Winter vs Spring 6.135 - 0.0006* 3.091 - 0.0066*
Spatial 2.314 0.06 0.01* 2.126 0.06 0.001*
South vs Center 1.178 - 0.8394 1.193 - 0.7305
South vs North 3.267 - 0.0129* 3.183 - 0.0012*
Center vs North 2.272 - 0.1155 2.045 - 0.0279*
(*) significant at P < 0.05; (-), not available
76
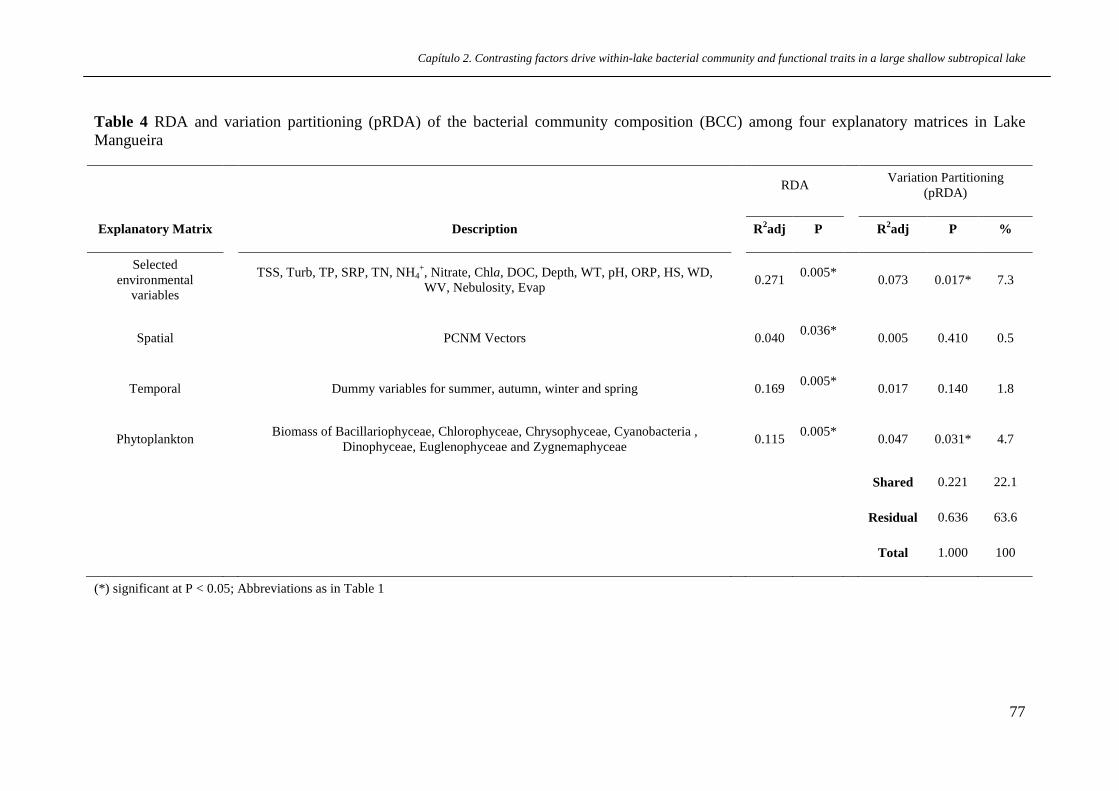
Capítulo 2. Contrasting factors drive within-lake bacterial community and functional traits in a large shallow subtropical lake
Table 4 RDA and variation partitioning (pRDA) of the bacterial community composition (BCC) among four explanatory matrices in Lake Mangueira
RDA Variation Partitioning (pRDA)
Explanatory Matrix Description R2adj P R2adj P %
Selected environmental
variables TSS, Turb, TP, SRP, TN, NH4
+, Nitrate, Chla, DOC, Depth, WT, pH, ORP, HS, WD, WV, Nebulosity, Evap 0.271 0.005* 0.073 0.017* 7.3
Spatial PCNM Vectors 0.040 0.036* 0.005 0.410 0.5
Temporal Dummy variables for summer, autumn, winter and spring 0.169 0.005* 0.017 0.140 1.8
Phytoplankton Biomass of Bacillariophyceae, Chlorophyceae, Chrysophyceae, Cyanobacteria , Dinophyceae, Euglenophyceae and Zygnemaphyceae 0.115 0.005* 0.047 0.031* 4.7
Shared 0.221 22.1
Residual 0.636 63.6
Total 1.000 100
(*) significant at P < 0.05; Abbreviations as in Table 1
77

Capítulo 2. Contrasting factors drive within-lake bacterial community and functional traits in a large shallow subtropical lake
Table 5 RDA and variation partitioning (pRDA) of the bacterial functional traits (FT) among four explanatory matrices in Lake Mangueira
RDA Variation Partitioning (pRDA)
Explanatory Matrix Description R2adj P R2adj P %
Selected environmental
variables TSS,Turb, TP, SRP, TN, NH4
+, Nitrate, Chla, DOC, Depth, WT, pH, ORP, HS, WD, WV, Nebulosity, Evap 0.118 0.005* 0.032 0.160 3.2
Spatial PCNM Vectors 0.042 0.015* 0.062 0.005* 6.2
Temporal Dummy variables for summer, autumn, winter and spring 0.093 0.005* 0.0004 0.500 0.0
Phytoplankton Biomass of Bacillariophyceae, Chlorophyceae, Chrysophyceae, Cyanobacteria, Dinophyceae, Euglenophyceae and Zygnemaphyceae 0.021 0.130 - - -
Shared 0.090 9.1
Residual 0.815 81.5
Total 1.000 100.00
(*) significant at P < 0.05; Abbreviations as in Table 1
78

Capítulo 2. Contrasting factors drive within-lake bacterial community and functional traits in a large shallow subtropical lake
Table 6 Comparison of studies that have addressed within-lake heterogeneity in BCC through molecular approaches
Number of systems studied
Size (km2)
Ecosystem Mean Depth
(m)
Max Depth
(m) Sampling layout
Nº sampling
points
Smallest scale identified Reference
1 820 Large, shallow subtropical lake 2.6 7.0 18 sampling sites, from ~1.9 to
~90 km apart 18 49 km* This study
2 0.005 39.38
Small and shallow lake x Large and deep lake
1.7 12.8
2.5 25.3
32 sites 32 32
10 m Jones et al. (2012)
3 0.00245 0.0028 0.0039
Shallow, small ponds 0.5 (all) 0.5 (all) 7×7 m grids 33 35 53
20 m Lear et al. (2007)
1 2338 Large, shallow subtropical lake 1.9** < 3.0
3 sampling sites 100 and 1000 m apart, located inside 6
sampling areas 3 >1 km Wu et al. (2007)
13 0.005-39.38 Small to large, shallow to deep temperate lakes NA 2.5-35.7
3 stations in each basin - equilateral triangle centered on
the deepest point. The variability within lakes was
determined at two scales: 10 m (station level) and 100 m
(basin level)
90 100 m Yannarell and Triplett (2004)
* - Considering the smallest difference between pairs of northern and southern sampling stations.
** - Qin, B., 2008. Lake Taihu, China: Dynamics and Environmental Change. Springer. 356 pp.
NA – not available
79
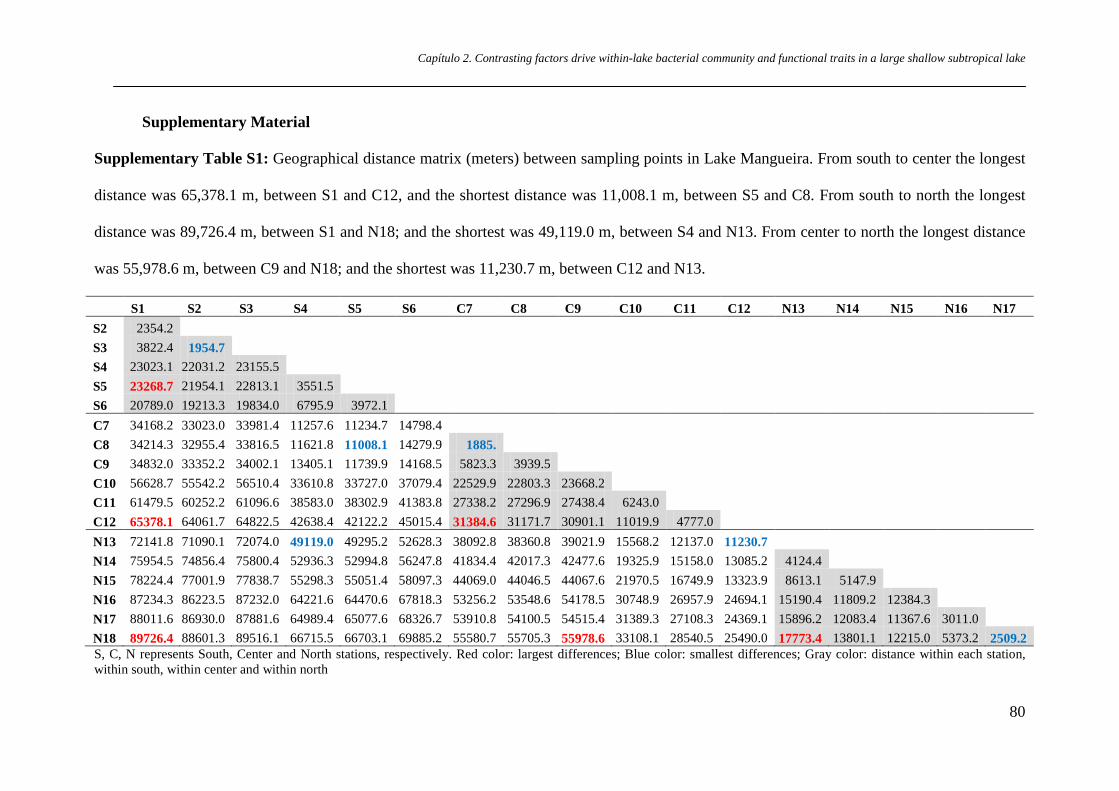
Capítulo 2. Contrasting factors drive within-lake bacterial community and functional traits in a large shallow subtropical lake
Supplementary Material
Supplementary Table S1: Geographical distance matrix (meters) between sampling points in Lake Mangueira. From south to center the longest
distance was 65,378.1 m, between S1 and C12, and the shortest distance was 11,008.1 m, between S5 and C8. From south to north the longest
distance was 89,726.4 m, between S1 and N18; and the shortest was 49,119.0 m, between S4 and N13. From center to north the longest distance
was 55,978.6 m, between C9 and N18; and the shortest was 11,230.7 m, between C12 and N13.
S1 S2 S3 S4 S5 S6 C7 C8 C9 C10 C11 C12 N13 N14 N15 N16 N17 S2 2354.2 S3 3822.4 1954.7 S4 23023.1 22031.2 23155.5 S5 23268.7 21954.1 22813.1 3551.5 S6 20789.0 19213.3 19834.0 6795.9 3972.1 C7 34168.2 33023.0 33981.4 11257.6 11234.7 14798.4 C8 34214.3 32955.4 33816.5 11621.8 11008.1 14279.9 1885. C9 34832.0 33352.2 34002.1 13405.1 11739.9 14168.5 5823.3 3939.5 C10 56628.7 55542.2 56510.4 33610.8 33727.0 37079.4 22529.9 22803.3 23668.2 C11 61479.5 60252.2 61096.6 38583.0 38302.9 41383.8 27338.2 27296.9 27438.4 6243.0 C12 65378.1 64061.7 64822.5 42638.4 42122.2 45015.4 31384.6 31171.7 30901.1 11019.9 4777.0 N13 72141.8 71090.1 72074.0 49119.0 49295.2 52628.3 38092.8 38360.8 39021.9 15568.2 12137.0 11230.7 N14 75954.5 74856.4 75800.4 52936.3 52994.8 56247.8 41834.4 42017.3 42477.6 19325.9 15158.0 13085.2 4124.4 N15 78224.4 77001.9 77838.7 55298.3 55051.4 58097.3 44069.0 44046.5 44067.6 21970.5 16749.9 13323.9 8613.1 5147.9 N16 87234.3 86223.5 87232.0 64221.6 64470.6 67818.3 53256.2 53548.6 54178.5 30748.9 26957.9 24694.1 15190.4 11809.2 12384.3 N17 88011.6 86930.0 87881.6 64989.4 65077.6 68326.7 53910.8 54100.5 54515.4 31389.3 27108.3 24369.1 15896.2 12083.4 11367.6 3011.0 N18 89726.4 88601.3 89516.1 66715.5 66703.1 69885.2 55580.7 55705.3 55978.6 33108.1 28540.5 25490.0 17773.4 13801.1 12215.0 5373.2 2509.2 S, C, N represents South, Center and North stations, respectively. Red color: largest differences; Blue color: smallest differences; Gray color: distance within each station, within south, within center and within north
80

Capítulo 2. Contrasting factors drive within-lake bacterial community and functional traits in a large shallow subtropical lake
Supplementary Table S2 OTUs and substrates with the highest contribution to dissimilarity in BCC and FT among seasons, according to SIMPER. For the
BCC, OTUs 399 and 546 contributed most to the dissimilarity between summer × spring and summer × autumn, respectively. OTU 634 contributed to
dissimilarity between winter × summer and winter × autumn, whereas OTU 403 contributed most to the winter × spring dissimilarity. Differences between
autumn × spring were mostly due to OTU 654. Overall, OTUs 399 and 547 increased in summer, 438, 650 and 654 increased in autumn, 511, 634 and 699 in
winter and 404, 520 and 546 in spring. For the FT, the carbon source phenylethylamine (G4) and 2-hydroxy benzoic (C3) were the main substrates responsible
for dissimilarities, as they showed high mean potential oxidation in winter and spring. Phenylethylamine contributed most to dissimilarities between summer ×
autumn, summer × winter, autumn × winter and summer × spring, whereas 2-hydroxybenzoic acid contributed most to dissimilarities between winter × spring
and autumn × spring.
OTU Average Average Cont.% Cum.% Carbon-Source Average Average Cont.% Cum.% Summer Autumn Summer Autumn
546 0.170 0.160 2.460 2.460 G4 0.116 0.120 9.270 9.270 399 0.200 0.120 2.070 4.530 C3 0.068 0.053 8.420 17.690 438 0.010 0.100 1.930 6.460 E3 0.131 0.120 6.330 24.020 654 0.140 0.150 1.820 8.280 G2 0.113 0.096 6.270 30.280
H1 0.187 0.143 6.180 36.460 Summer Winter Summer Winter
634 0.000 0.180 2.990 2.990 G4 0.116 0.181 11.990 11.990 669 0.010 0.140 2.150 5.140 C3 0.068 0.091 10.040 22.030 399 0.200 0.150 1.810 6.950 E3 0.131 0.052 9.140 31.170
C2 0.084 0.151 8.850 40.020 G2 0.113 0.143 5.770 45.790 Autumn Winter Autumn Winter
81

Capítulo 2. Contrasting factors drive within-lake bacterial community and functional traits in a large shallow subtropical lake
OTU Average Average Cont.% Cum.% Carbon-Source Average Average Cont.% Cum.% 634 0.040 0.180 2.700 2.700 G4 0.120 0.181 11.700 11.700 669 0.020 0.140 2.170 4.870 C3 0.053 0.091 10.520 22.220 546 0.160 0.180 2.170 7.030 E3 0.120 0.052 8.710 30.930 654 0.150 0.060 2.010 9.040 C2 0.092 0.151 6.850 37.780 438 0.100 0.000 1.900 10.940 G2 0.096 0.143 6.780 44.560 650 0.150 0.050 1.810 12.750 F1 0.221 0.174 5.670 50.230
Summer Spring Summer Spring 399 0.200 0.100 2.620 2.620 G4 0.116 0.177 12.130 12.130 403 0.190 0.210 2.550 5.170 C3 0.068 0.089 12.080 24.200 654 0.140 0.010 2.220 7.390 E3 0.131 0.046 10.500 34.700 546 0.170 0.210 2.000 9.380 C2 0.084 0.122 6.460 41.170 547 0.300 0.280 1.880 11.270 G2 0.113 0.143 5.780 46.940 404 0.110 0.170 1.850 13.110
Autumn Spring Autumn Spring 654 0.150 0.010 2.360 2.360 C3 0.053 0.089 12.920 12.920 403 0.170 0.210 2.280 4.640 G4 0.120 0.177 12.090 25.010 404 0.070 0.170 2.160 6.810 E3 0.120 0.046 10.230 35.240 546 0.160 0.210 2.140 8.950 G2 0.096 0.143 6.920 42.160
Winter Spring Winter Spring 403 0.210 0.210 2.610 2.610 C3 0.091 0.089 19.760 19.760 634 0.180 0.090 2.120 4.730 G4 0.181 0.177 10.580 30.350 669 0.140 0.010 2.120 6.850 G3 0.103 0.145 8.660 39.010 399 0.150 0.100 2.060 8.910 F1 0.174 0.201 8.190 47.190 547 0.250 0.280 1.960 10.880 C2 0.151 0.122 6.770 53.960 511 0.170 0.070 1.820 12.700 C4 0.103 0.140 5.520 59.480 520 0.030 0.140 1.800 14.490
82

Capítulo 2. Contrasting factors drive within-lake bacterial community and functional traits in a large shallow subtropical lake
Carbon sources: phenylethylamine (G4), L-phenylalanine (C4), i-erythritol (C2), glucose-1-phosphate (G2), α-D-lactose (H1), γ-
hydroxybutyric acid (E3), α-ketobutyric acid (G3), 2-hydroxy benzoic acid (C3), glycogen (F1). Average, abundance average in season
or location; Cont. %, percentual contribution of the OTU or substrate for the difference; Cum. %, cumulative percentual contribution.
83
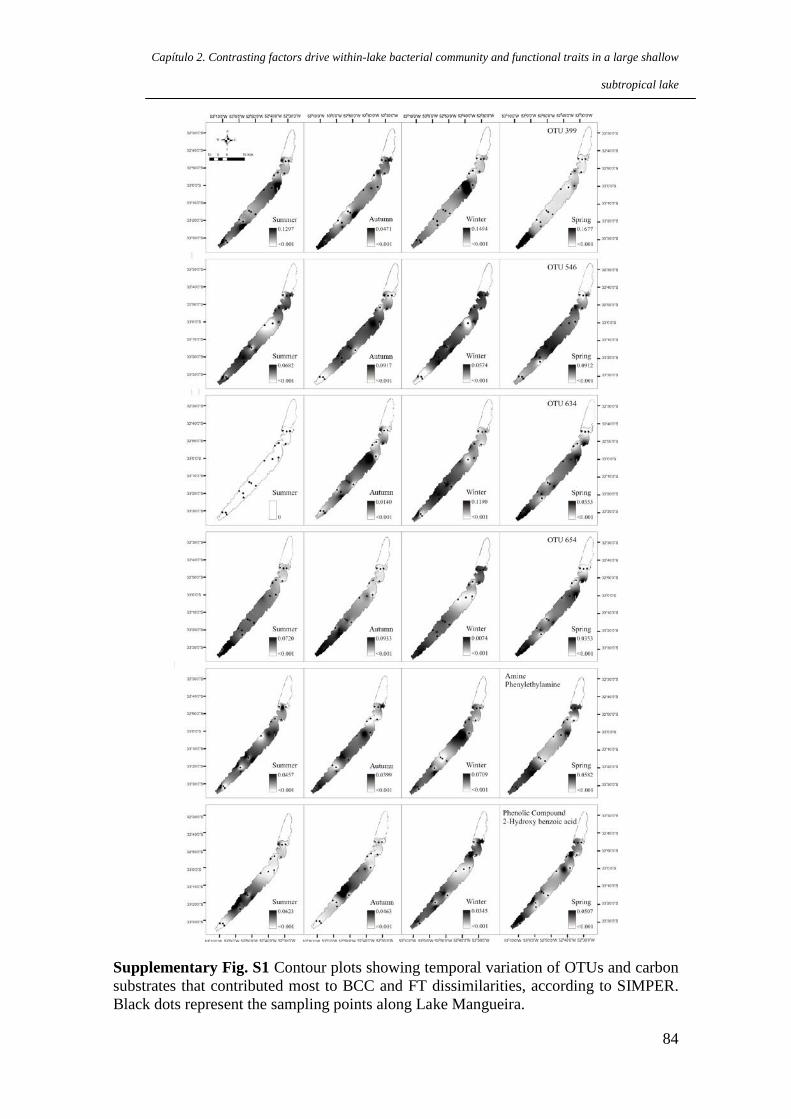
Capítulo 2. Contrasting factors drive within-lake bacterial community and functional traits in a large shallow
subtropical lake
Supplementary Fig. S1 Contour plots showing temporal variation of OTUs and carbon substrates that contributed most to BCC and FT dissimilarities, according to SIMPER. Black dots represent the sampling points along Lake Mangueira.
84

Capítulo 2. Contrasting factors drive within-lake bacterial community and functional traits in a large shallow subtropical lake
Supplementary Table S3 OTUs and substrates with the highest contributions to dissimilarity in BCC and FT among locations, estimated by
SIMPER. OTU 403 was the major one responsible for the dissimilarity between north × south. OTUs 399, 511, 547, 634, 654 showed higher
relative abundance in the south, while 403 and 404 were higher in the north, and 546 in the center. For FT, the phenylethylamine (G4) and 2-
hydroxybenzoic acid (C3) were the substrates that showed higher potential oxidation in the south compared to north and center, whereas i-
erythritol (C2) and γ-hydroxybutyric acid (E3) predominated in the center. In the north, glucose-1-phosphate had the highest potential oxidation.
OTU Average Average Cont.% Cum.% Carbon-Source Average Average Cont.% Cum.% South Center South Center
546 0.170 0.190 2.240 2.240 C3 0.080 0.073 13.060 13.060 654 0.130 0.080 2.070 4.310 G4 0.162 0.159 8.610 21.670 399 0.180 0.150 2.070 6.370 E3 0.086 0.102 8.310 29.980 634 0.090 0.090 2.040 8.410 G2 0.115 0.127 7.060 37.040 403 0.190 0.170 1.980 10.390 C2 0.105 0.116 6.300 43.340
South North South North 403 0.190 0.230 2.120 2.120 G4 0.162 0.122 13.860 13.860 399 0.180 0.090 2.100 4.220 C3 0.080 0.072 11.230 25.090 546 0.170 0.170 1.970 6.190 E3 0.086 0.074 6.810 31.900 404 0.090 0.170 1.940 8.120 C2 0.105 0.113 6.290 38.180 547 0.300 0.260 1.790 9.910 G2 0.115 0.129 6.120 44.300 654 0.130 0.060 1.780 11.690 511 0.170 0.090 1.710 13.410 634 0.090 0.050 1.620 15.030
Center North Center North 403 0.170 0.230 2.150 2.150 G4 0.159 0.122 11.450 11.450
85
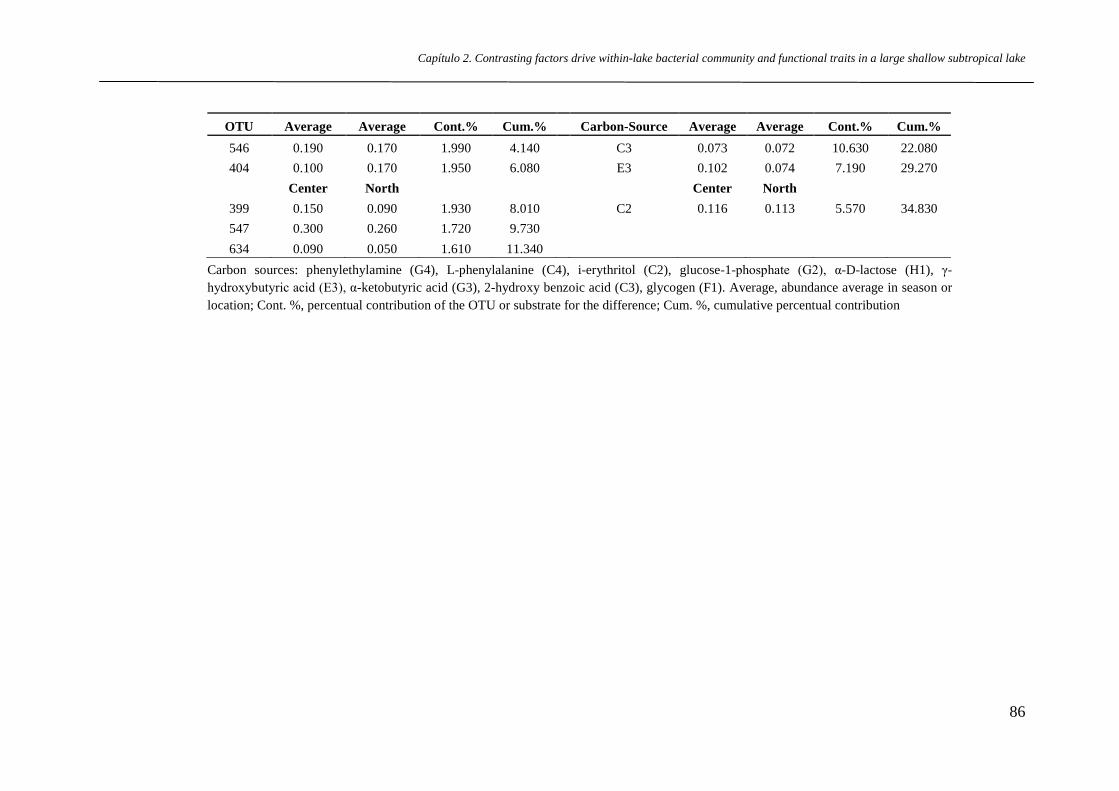
Capítulo 2. Contrasting factors drive within-lake bacterial community and functional traits in a large shallow subtropical lake
OTU Average Average Cont.% Cum.% Carbon-Source Average Average Cont.% Cum.% 546 0.190 0.170 1.990 4.140 C3 0.073 0.072 10.630 22.080 404 0.100 0.170 1.950 6.080 E3 0.102 0.074 7.190 29.270
Center North Center North 399 0.150 0.090 1.930 8.010 C2 0.116 0.113 5.570 34.830 547 0.300 0.260 1.720 9.730 634 0.090 0.050 1.610 11.340
Carbon sources: phenylethylamine (G4), L-phenylalanine (C4), i-erythritol (C2), glucose-1-phosphate (G2), α-D-lactose (H1), γ-hydroxybutyric acid (E3), α-ketobutyric acid (G3), 2-hydroxy benzoic acid (C3), glycogen (F1). Average, abundance average in season or location; Cont. %, percentual contribution of the OTU or substrate for the difference; Cum. %, cumulative percentual contribution
86
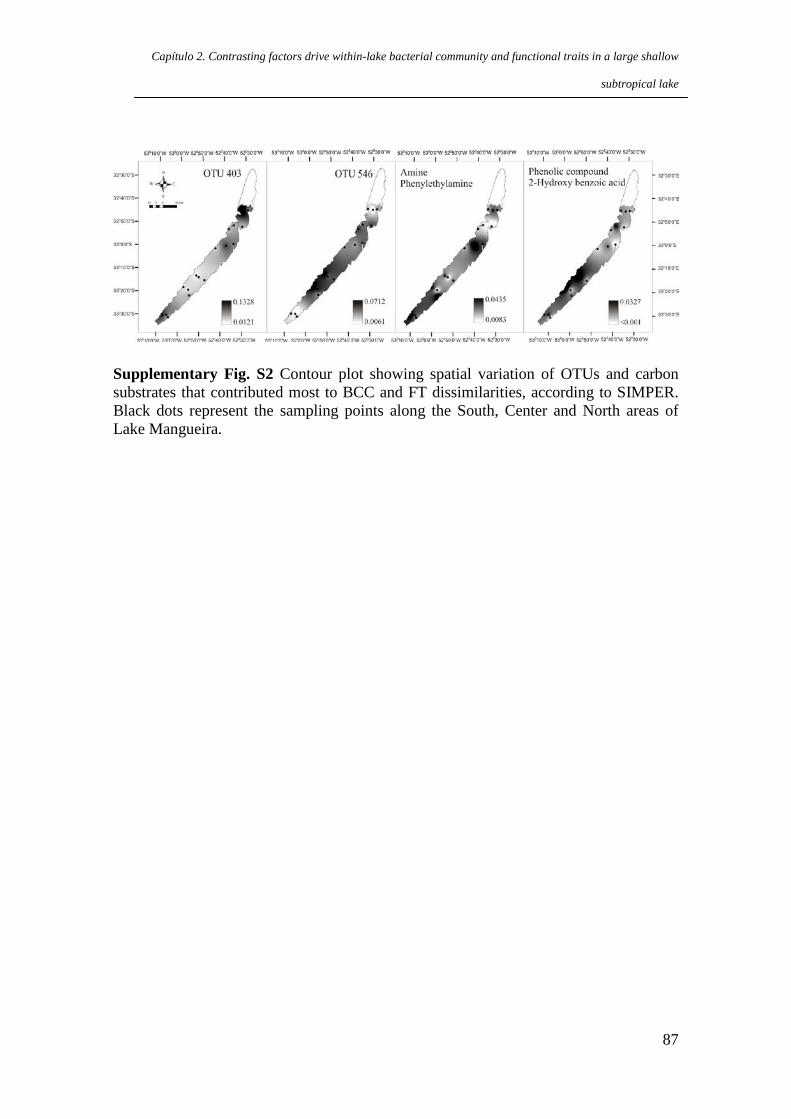
Capítulo 2. Contrasting factors drive within-lake bacterial community and functional traits in a large shallow
subtropical lake
Supplementary Fig. S2 Contour plot showing spatial variation of OTUs and carbon substrates that contributed most to BCC and FT dissimilarities, according to SIMPER. Black dots represent the sampling points along the South, Center and North areas of Lake Mangueira.
87
Capítulo 3. Bacterial beta diversity among lakes, but not within lakes, is regulated by local factors
Capítulo 3. Bacterial beta diversity among lakes, but not within lakes, is regulated
by local factors
Apresentação
O capítulo apresentado a seguir é o manuscrito do artigo no formato requerido
pela revista The ISME Journal ao qual será submetido.
88

Capítulo 3. Bacterial beta diversity among lakes, but not within lakes, is regulated by local factors
Bacterial beta diversity among lakes, but not within lakes, is regulated 1
by local factors 2
Running title: Bacterial environmental heterogeneity relationship 3
Marla Sonaira Lima1, Fabiana Schneck2, Ng Haig They3, Luciane Oliveira Crossetti4, 4
Juliana E. Bohnenberger1, Katherine D. McMahon5 David da Motta Marques1 5
1Laboratório de Ecotecnologia e Limnologia Aplicada, Instituto de Pesquisas Hidráulicas - IPH, 6
Universidade Federal Rio Grande do Sul,/UFRGS, Av. Bento Gonçalves, 9500, Porto Alegre, RS 91501-7
970, Brazil. 8
*Corresponding author: [email protected], telephone number: +55 51 33086326 9
2 Instituto de Ciências Biológicas, Universidade Federal do Rio Grande – FURG, CP 474, Rio Grande, 10
RS, 96203-900, Brazil 11
3 Laboratório de Limnologia, Departamento de Oceanografia e Limnologia, Universidade Federal do Rio 12
Grande do Norte, UFRN, Av. Senador Dinarte de Medeiros Mariz s/n Praia de Mãe Luiza, Natal RN 13
59014-002, Brazil. 14
4 Laboratório de Limnologia, Departamento de Ecologia, Instituto de Biociências, Universidade Federal 15
do Rio Grande do Sul, Av. Bento Gonçalves, 9500, Porto Alegre, RS 91501-970, Brazil. 16
5 Departments of Civil and Environmental Engineering and Bacteriology, University of Wisconsin-17
Madison, 3204 Engineering Drive, Madison, WI 53706-1691, USA. 18
Subject Category: Microbial population and community ecology 19
Abstract 20
Beta diversity and its components are important in explaining ecological patterns of 21
species composition among and within sites. Considering the importance of bacterial 22
community composition (BCC) to aquatic ecosystem functions, it is essential to 23
understand the ecological patterns and spatial variation of BCC. Here, we explored the 24
aquatic bacterial beta diversity and their components (turnover and nestedness) among 25
and within 25 coastal shallow lakes and evaluated which factors of habitat heterogeneity 26
89

Capítulo 3. Bacterial beta diversity among lakes, but not within lakes, is regulated by local factors
(environmental, phytoplankton composition, landscape and spatial distance) explained 27
the variation in community composition. We found that spatial turnover component 28
contributed more strongly to beta diversity than nestedness over all lakes ( among and 29
within). Among lakes, the Sørensen dissimilarity was positively related to 30
phytoplankton dissimilarity, whereas Bray-Curtis dissimilarity and turnover component 31
was positively related to environmental and phytoplankton dissimilarity. The turnover 32
was also negatively related to geographic distance among lakes, whereas the nestedness 33
component was only explained by geographic distance. Contrary to our expectation 34
within-lake bacterial beta diversity was not related to any explanatory variable 35
measured. We conclude that the bacterial beta diversity-environmental heterogeneity 36
relationship among lakes is a result of species sorting, whereas within-lake should be 37
the result of mass effects, due to high connectivity within-lakes. 38
39
Key words: aquatic bacteria, distance-decay, phytoplankton influence, mass effect, 40
metacommunity; microbial biogeography, species-sorting 41
42
Introduction 43
Biological diversity can be partitioned into additive and hierarchical components α, β 44
and γ, which measure within communities, among communities and the total or regional 45
diversity, respectively (Whittaker, 1960; Whittaker, 1972; Lande, 1996). While most 46
past efforts have focused on understanding patterns and drivers of α-diversity, in recent 47
years efforts have concentrated on identifying the amount of variation in species 48
composition among sites, the beta diversity (Legendre et al., 2005; Anderson et al., 49
2011), and determining which factors promote and maintain such variation. 50
90
Capítulo 3. Bacterial beta diversity among lakes, but not within lakes, is regulated by local factors
Beta diversity may be decomposed into turnover and nestedness. The former 51
refers to the true change in species composition from one community to another, while 52
the later refers to the loss of species in some communities in such a way that the less 53
diverse communities represent a species subset of the more diverse ones (Baselga, 54
2010). Different drivers may be responsible for the prevalence of turnover and/or 55
nestedness patterns. For instance, nestedness may be related to dispersal limitation and 56
recolonization-after-extinction such as glaciations events (Dobrovolski et al., 2012), 57
while turnover may be driven by selection through environmental filters (Baselga, 58
2010). 59
Bacteria are among the most abundant and diverse organisms in the planet and 60
their diversity drives many ecological functions and services (Pace, 1997; Cole, 1999; 61
Bell et al., 2005). Hence, understanding the ecological patterns and spatial variation in 62
bacterial community composition (BCC) in aquatic systems is crucial for understanding 63
ecosystem functioning and for envisioning conservation and environmental monitoring 64
(Jones et al., 2012). Most of the studies on bacterial beta diversity point to stronger 65
contribution of environmental filters (Lindström et al., 2005; Yannarel and Tripplet, 66
2005, Logue and Lindström, 2010) and phytoplankton community composition (del 67
Giorgio and Cole, 1998; Cotner and Biddanda, 2002; Eiler and Bertilsson, 2004; Kent et 68
al., 2007; Jones et al., 2009; Lima et al., 2016; Tada and Suzuki, 2016), while 69
dispersion limitation usually seems to be a less important factor (Beisner et al., 2006; 70
van der Gucht et al., 2007; Jones and McMahon, 2009; Nelson et al., 2009; Souffreau et 71
al., 2015). 72
In this context, we expect that in landscapes with high environmental 73
heterogeneity the major contribution of the turnover component of bacterial beta 74
diversity will be due to species sorting (Chase and Leibold 2003; Leibold et al., 2004). 75
91
Capítulo 3. Bacterial beta diversity among lakes, but not within lakes, is regulated by local factors
On the other hand, in lakes with high connectivity, even strong environmental filters can 76
be overcome by mass effects (e.g. Beisner et al., 2006; Jones and McMahon, 2009; 77
Souffreau et al., 2015; Lima et al., 2016). 78
However, to disentangle the beta diversity-environmental heterogeneity 79
relationship it is essential to consider different spatial scales, since most patterns in 80
ecology are scale dependent (Levin, 1992), and thus important for the understanding of 81
microbial biogeography (Martiny et al., 2011). Further, evaluating the importance of 82
landscape and environmental filters on the beta diversity patterns across a region is 83
essential to better understand the organization of aquatic bacterial communities. This 84
approach demands analysis in several scales of variation of beta diversity (Martiny et 85
al., 2006), including the within-lake variability, in which dispersal limitation is low, but 86
also the landscape total variability (Yannarel and Triplett, 2004; Wu et al., 2007; Jones 87
et al., 2012; Lear et al., 2014; Lima et al., 2016). 88
In this study we investigated beta diversity patterns of free-living bacteria within 89
and among 25 coastal shallow lakes, encompassing a wide range of environmental 90
conditions. Our hypotheses are that both within and among lakes the turnover 91
component contributes most to total beta diversity, in spite of the high connectivity of 92
the lakes. We also predicted that beta diversity would be positively related to habitat 93
heterogeneity (environmental, phytoplankton, landscape and spatial distance) at the 94
among-lake and within-lake scales. 95
96
Materials and Methods 97
Study Area 98
The 25 lakes comprising this study belong to the Tramandaí River System, located in 99
the Coastal Plain of Rio Grande do Sul, southern Brazil (29º37’ to 30º30’ S, 49º’74’ to 100
92

Capítulo 3. Bacterial beta diversity among lakes, but not within lakes, is regulated by local factors
50º24’ W). (Figure 1). The process of evolution of this coastal plain occurred by marine 101
transgressions and regressions, which formed a complex system of coastal lagoons 102
during the Holocene (Schwarzbold and Schäfer, 1984; Holz, 1999). The Tramandaí 103
system presents 41 lakes with variable degrees of connectivity, age, marine influence 104
and landscape (grassland areas/agriculture, forests, rice paddies, and urban influence) 105
(Guimarães et al., 2014). 106
We collected sub-surface water samples for environmental and biological 107
variables, including bacterial community composition (BCC), phytoplankton biomass 108
and chlorophyll a. The sampling was carried out in three sites within each lake in a 109
longitudinal transect including littoral and pelagic areas (Figure 1). 110
111
Location of Figure 1 112
113
Bacterial community composition (BCC) 114
A volume of 400 ml of sub-superficial lake water was pre-filtered onto cellulose acetate 115
membrane filters (0.65 µm pore size; 47 mm diameter; Sartorius) to remove 116
phytoplankton and bacterivorous protozoa (Tada and Suzuki, 2006). The free-living 117
bacterial cells were then concentrated by filtration onto polyethersulfone membrane 118
filter (0.22 µm pore size; 47 mm diameter; Millipore) and the samples were frozen at -119
80 oC for further analyses. Total DNA was extracted following Lima et al. (2016) and 120
the BCC was assessed through DNA fingerprinting by Amplified Ribosomal Intergenic 121
Spacer Analysis (ARISA) according to Fisher and Triplett (1999). In summary, the 122
intergenic spacer region between the 23S and 16S ribosomal rRNA genes was amplified 123
using the 6-FAM-labeled universal primer 1406F (5’-TGYACACACCGCCCGT-3’) 124
and the bacterial-specific primer 23Sr (5’-GGGTTBCCCCATTCRG-3’) (Fisher and 125
93
Capítulo 3. Bacterial beta diversity among lakes, but not within lakes, is regulated by local factors
Triplett, 1999; Yannarell et al., 2003). The ARISA profiles were examined following 126
Jones and McMahon (2009). The BCC data were obtained as operational taxonomic 127
units (OTUs). Since this method is biased towards the detection of the most abundant 128
members of the community, the rare members are underrepresented in the BCC (Jones 129
et al., 2012). 130
131
Phytoplankton biomass and chlorophyll a 132
For phytoplankton biomass, 250 ml of sub-superficial lake water were fixed with 1% 133
acetic lugol solution for the quantitative analysis following Utermöhl (1958) and the 134
settling time and quantification accuracy of Lund et al. (1958). Biomass (mm3 L-1) was 135
estimated by multiplying density by the biovolume of each species (Hillebrand et al., 136
1999). For data analysis, we used the biomass of each phytoplankton taxonomic class 137
separately (Bacillariophyceae, Chlorophyceae, Chrysophyceae, Cryptophyceae, 138
Cyanophyceae, Dinophyceae, Euglenophyceae, Klebsormidiophyceae, 139
Raphidophyceae, Xanthophyceae, Zygnematophyceae) (Guiry and Guiry, 2016) and 140
also the total phytoplanktonic biomass. We determined chlorophyll a (Chla) by 141
extracting pigments with 90% ethanol after filtration through a Whatman GF/F filter 142
and measuring it spectrophotometrically (Jespersen and Christoffersen, 1987). 143
144
Environmental variables 145
Conductivity (Cond), pH and dissolved oxygen (DO) were measured is situ using a 146
multiparameter probe. Water transparency (WT) was estimated with a Secchi disk. 147
Suspended solids were estimated through filtration on glass fiber filters (GF/C 1.2 µm, 148
Whatman), which were dried (total suspended solids, TSS) and ignited (fixed suspended 149
solids, FSS) at 350 ºC > 3 h. Volatile suspended solids (VSS) were calculated as the 150
94

Capítulo 3. Bacterial beta diversity among lakes, but not within lakes, is regulated by local factors
difference between TSS and FSS (APHA, 2012). Turbidity was measured by the 151
nephelometric method in nephelometric turbidity units (NTU), color (absorbance at 430 152
nm) and nutrients, including nitrate (NO3-), nitrite (NO2
-), soluble reactive phosphorus 153
(SRP) and silicate (SIL), were measured through colorimetric methods following APHA 154
(2012). Analyses of total ammoniacal nitrogen or ammonium (NH3+NH4+) and total 155
phosphorus (TP) followed Mackereth et al. (1989). Organic carbon, total nitrogen (NT) 156
and total dissolved nitrogen (TDN) were analyzed in a TOC analyzer (Shimadzu 157
VCPH). Dissolved organic carbon (DOC) and dissolved inorganic carbon (DIC) were 158
the fractions that passed through a 450 oC pre-combusted glass-fiber filter (0.45-µm 159
mean mesh size). DOC and total organic carbon (TOC) were measured through the 160
NPOC method (non-purgeable organic carbon) (burning after acid addition), while DIC 161
was estimated as the difference between acidified and non-acidified NPOC 162
measurements. Particulate organic carbon (POC) was obtained as the difference 163
between TOC and DOC. 164
165
Landscape variables 166
Landscape variables included lake area (ha), distance from the sea (m), and 167
connectivity. Connectivity was calculated taking into account the type, length and 168
number of connections between each lake and its neighboring lakes and the area of all 169
neighboring lakes (Guimarães et al., 2014). We also obtained the geographical 170
coordinates for each site. 171
172
Data analysis 173
Overall bacterial beta diversity 174
95

Capítulo 3. Bacterial beta diversity among lakes, but not within lakes, is regulated by local factors
We estimated the overall bacterial beta diversity among-lakes using multiple-site 175
Sørensen dissimilarity (βSØR, or total beta diversity), which was partitioned into its two 176
components: beta diversity due to species turnover (βSIM, Simpson dissimilarity index) 177
and beta diversity due to nestedness (βSNE), where βSNE = βSØR – βSIM (Baselga, 2010). 178
We then evaluated the relative contribution of turnover and nestedness to overall beta 179
diversity by calculating the proportion of nestedness-resultant component to overall 180
multiple-site dissimilarity: βratio = βSNE/ βSØR. Values of βratio lower than 0.5 indicate that 181
species turnover is responsible for most of beta diversity, whereas values greater than 182
0.5 indicate that the nestedness-resultant component is dominant (Dobrovolski et al., 183
2012). 184
185
Evaluation of beta diversity among lakes 186
Beta diversity of the aquatic bacterial community was assessed using four dissimilarity 187
pairwise coefficients: i) Bray-Curtis dissimilarity index applied to BCC relative 188
abundance data after logarithmic (x+1) transformation (Faith et al., 1987; Legendre and 189
Legendre 1998); ii) Sørensen dissimilarity index applied to presence-absence data (βsør) 190
iii) Simpson dissimilarity index (βsim) and iv) β-diversity due to nestedness (βsne) 191
(Baselga, 2010). 192
To evaluate beta diversity among the 25 lakes, we first generated matrices 193
containing average values of the three sites sampled per lake for bacteria OTUs 194
abundance, environmental variables and phytoplankton biomass. To calculate the spatial 195
distance between lakes we used the central geographical coordinate of each lake. We 196
then generated BCC dissimilarity matrices using the four coefficients described above 197
and eight explanatory dissimilarity matrices using all environmental variables, 198
geographic distance, phytoplankton composition (taxonomic classes), total 199
96

Capítulo 3. Bacterial beta diversity among lakes, but not within lakes, is regulated by local factors
phytoplanktonic biomass (the sum of biomass among all taxonomic classes), 200
chlorophyll a, lake area, connectivity, and distance from the sea. For phytoplankton 201
composition we used the Bray-Curtis index on log (x+1) data, while for all other 202
explanatory matrices we used Euclidian distance (Legendre and Legendre, 1998). 203
Dissimilarity in chlorophyll a among lakes was excluded from analyses because it was 204
highly correlated with environmental dissimilarity (r=0.89). Correlations between all 205
other explanatory matrices were low (r < 0.35). Finally, we used multiple regressions on 206
distance matrices (MRM, Legendre et al., 1994; Lichstein, 2007) to evaluate the 207
relationship between dissimilarity in BCC and seven explanatory dissimilarity matrices. 208
The significances of the standardized partial regression coefficients were evaluated with 209
9999 permutations. Following Martiny et al. (2011), we first performed the MRM test 210
with all seven explanatory variables and then reran the test after excluding the 211
nonsignificant variables to reduce the effect of spurious relationships. We show the 212
results from this second test. Before MRM, all dissimilarity matrices were standardized 213
(mean = 0; variance = 1). 214
215
Evaluation of beta diversity within lakes 216
Bacterial beta diversity within lakes was calculated as the average biological distance of 217
the three sites within a lake to the group centroid (PERMDISP, Anderson et al., 2006) 218
for each of the four dissimilarity indices already mentioned. PERMDISP evaluates the 219
multivariate dispersion of the sites to their group centroid (here, each lake) in the full 220
dimensional space calculated in a Principal Coordinates Analysis (PCoA), so the greater 221
the average distance to the centroid, the greater the beta diversity of the lake. We also 222
calculated environmental heterogeneity (Euclidean distance) and variation in 223
phytoplankton composition (Bray-Curtis index) within lakes using the PERMDISP 224
97

Capítulo 3. Bacterial beta diversity among lakes, but not within lakes, is regulated by local factors
approach. Differences in the within-lake bacterial beta diversity, environmental 225
heterogeneity and phytoplankton heterogeneity among lakes were evaluated using 226
permutation tests (9999 permutations). In all cases we tested the null hypothesis that 227
within-lake bacterial, environmental and phytoplankton dispersion does not differ 228
among lakes. Differences in within-lake turnover and nestedness components of the 229
bacterial community were tested using a paired t-test. 230
Finally, we used multiple regressions followed by model selection to test the 231
relationship between beta diversity (Bray-Curtis, Sørensen, Simpson and Nestedness-232
resultant distances to the group centroid) and environmental heterogeneity (Euclidian 233
distance to a group centroid), heterogeneity in phytoplankton composition (Bray-Curtis 234
distance to a group centroid), coefficient of variation of chlorophyll a (coefficient of 235
variation within each lake), lake area, distance from the sea, and lake connectivity. 236
Spatial extent (the average distance of sites to the lake centroid) and total 237
phytoplanktonic biomass (coefficient of variation within each lake) were also 238
calculated, but were excluded from the regressions because of their strong correlation 239
with lake area (r=0.96) and heterogeneity in phytoplankton composition (r=0.72), 240
respectively. Regression residuals were normally distributed, according to Shapiro-241
Wilk's tests. Further, spatial autocorrelation in the response variables and in the 242
regression residuals were evaluated using Moran’s I coefficient based on 10 distance 243
classes and no significant spatial autocorrelation was detected using Bonferroni’s 244
correction (P = 0.05/10 distance classes). 245
The best models were selected using second-order Akaike’s information criterion 246
(AICc). We used AICc differences between each model and the best model to select all 247
models with AICc differences <2, which were considered as having equivalent levels of 248
support (Burnham and Anderson, 2002). 249
98

Capítulo 3. Bacterial beta diversity among lakes, but not within lakes, is regulated by local factors
All analyses were performed in the R environment (R Core Team, 2016). The 250
partition of beta diversity was calculated using the betapart package (Baselga and 251
Orme, 2012). MRM was run using the ecodist package (Goslee and Urban, 2007), 252
PERMDISP using the vegan package (Oksanen et al., 2016), spatial autocorrelation was 253
tested with pgirmess package (Giraudoux, 2016), and AICc using MuMIn (Barton, 254
2016). 255
Results 256
Overall aquatic bacterial beta diversity 257
A total of 215 OTUs were identified by ARISA, 36 of which occurred in more than 258
50% of the samples. Only one OTU occurred in more than 90% of the samples and no 259
OTU was common to all of them. Multiple-site Sørensen dissimilarity among all lakes 260
was high (βSØR=0.84) and was mainly determined by turnover (βSIM=0.79), as the 261
proportion of the nestedness component in overall beta diversity was lower than 0.5 262
(βratio=0.05). 263
Beta diversity among lakes 264
According to the MRM results, dissimilarity in BCC based on the Sørensen coefficient 265
was positively related only to dissimilarity in phytoplankton composition (p=0.0002). 266
On the other hand, dissimilarity in the BCC turnover component showed a positive 267
relationship with both environmental (p=0.014) and phytoplankton composition 268
(p=0.013) dissimilarities and a negative relationship with geographic distance 269
(p=0.0001). The nestedness-resultant component was positively related only to 270
geographic distance (p=0.005). Finally, using the Bray-Curtis coefficient, the 271
dissimilarity in BCC showed a positive relationship with environmental (p=0.002) and 272
phytoplankton composition (p=0.0003) dissimilarities. Environmental, chlorophyll a 273
and phytoplankton data for all lakes are shown in Supplementary Table S1 and Table 274
99

Capítulo 3. Bacterial beta diversity among lakes, but not within lakes, is regulated by local factors
S2. Landscape variables as lake area, distance from the sea and connectivity did not 275
show any significant relationship with bacterial beta diversity 276
277
Beta diversity within lakes 278
Within-lake bacterial total beta diversity (Sørensen coefficient) measured as the mean 279
distance to group centroid ranged from 0.128 to 0.338 (mean = 0.239 ± 0.058) (Table 280
1). Distance from centroid based on turnover varied from 0.061 to 0.292 (mean = 0.194 281
± 0.067), while nestedness varied from 0.009 to 0.166 (mean = 0.059 ± 0.037), and the 282
turnover components was significantly higher than the nestedness component (paired t-283
test, t = 7.495, P<0.0001, Figure 2). The structural variation of BCC (Bray-Curtis 284
distance to group centroid) varied from 0.103 to 0.410 (mean = 0.271 ± 0.093). 285
Environmental heterogeneity varied from 0.846 to 4.674 (mean = 1.912 ± 0.960) and 286
phytoplankton composition heterogeneity ranged from 0.064 to 0.332 (mean = 0.153 ± 287
0.073). In all cases the mean distance to group centroid did not differ among lakes 288
(Table 1). 289
290
Location of Figure 2 291
292
In this context, according to AICc, among the best models selected for each of the 293
beta diversity measures (models with delta<2) none of the models outperformed the null 294
model (without any explanatory variable and only the intercept) (Table 2). 295
296
Location of Table 1 and Table 2 297
298
100

Capítulo 3. Bacterial beta diversity among lakes, but not within lakes, is regulated by local factors
Discussion 299
As expected, beta diversity at both scales (among and within lakes) resulted from spatial 300
turnover, indicating that changes in species composition among lakes is mainly due to 301
species replacement and less due to differences in species richness. Among lakes, the 302
total beta diversity due to Sorensen dissimilarity was positively related to 303
phytoplankton, whereas the Bray-Curtis dissimilarity and the turnover component were 304
positively explained by environmental variables and phytoplankton. The turnover was 305
also negatively explained by the geographic distance; the nestedness component was 306
positively explained only by geographic distance. Within lakes, no model comprised of 307
measured variables explained the variation of beta diversity better than a null model 308
without variables. Thus, this result did not support the hypothesized relationship of 309
within-lake bacterial beta diversity and any explanatory variable measured here, 310
including environmental heterogeneity and heterogeneity in phytoplankton composition. 311
A higher contribution of turnover to total beta diversity is expected if 312
environmental filtering is the major driver of BCC distribution, emphasizing spatial 313
environmental niche separation (Chase and Leibold, 2003; Leibold et al., 2004). The 314
positive relationship between environmental heterogeneity and beta diversity is 315
expected because a greater variety of environmental conditions among sites allows the 316
occurrence of species adapted to those different conditions. These local factors that 317
include physical and chemical characteristics of the environment have been extensively 318
reported to affect BCC (e.g Sommaruga and Casamayor, 2008; Jones and McMahon, 319
2009; Souffreau et al., 2015; Lima et al., 2016). Also, dissimilarities in community 320
composition might be mediated by competitive interactions, reducing nestedness 321
(Matthews et al., 2015; Xingfeng et al., 2015). Local factors could include 322
phytoplankton community composition, since others have suggested it affects BCC 323
101

Capítulo 3. Bacterial beta diversity among lakes, but not within lakes, is regulated by local factors
patterns (Horner-Devine et al., 2003; Kent et al., 2007; Lima et al., 2016), possibly 324
through the exudation of different classes of dissolved organic matter (DOM) (Baines 325
and Pace, 1991; Cole, 1999). Actively growing phytoplankton release a wide range of 326
labile low molecular weight (LMW) DOM compounds like amino acids, carbohydrates 327
and carboxylic acids (Fogg, 1983; Bjørrisen, 1988; Tada and Suzuki, 2016) that are able 328
to stimulate bacterial growth (Bertilsson and Tranvik, 1998) and mediate shifts in free-329
living heterotrophic BCC (Tada and Suzuki, 2016). 330
Given that connectivity occurs to different degrees among lakes, although the 331
lakes have areas ranging from 23.03 ha to 5065.22 ha, barriers to dispersion controlled 332
by the landscape were not strong, which was evidenced by the lack of observed 333
relationship between landscape variables and BCC heterogeneity. Nevertheless, we 334
found unexpected negative relationships between Simpson dissimilarity (spatial 335
turnover component) and geographic distance, suggesting a distance-increase similarity 336
rather than distance-decay, where neighboring lakes have distinct BCC, and more 337
distant lakes have similar community composition. Similar patterns have been found for 338
polychaete communities, which have been attributed to directional dispersion by winds, 339
for example (Moritz et al. 2013). Thus, the expected increase in dispersal limitation 340
with increasing distances among sites leading to species replacement, once different 341
regional species pools are assessed (Heino et al., 2013; Heino et al., 2015a), was not 342
observed here. Instead, we observed that the distance-decay relationship (Nekola and 343
White 1999) resulted from nestedness. Some alternative explanations can be raised for 344
explaining this pattern: i) the failure to detect rare members of the BCC, which were 345
underrepresented in fingerprinting methods such as ARISA (Jones et al., 2012), which 346
might hide strong biogeographical signals from rare members (Galand et al., 2009); ii) a 347
consequence of the interaction of species-specific environmental responses that are 348
102

Capítulo 3. Bacterial beta diversity among lakes, but not within lakes, is regulated by local factors
spatially structured and were not accounted for in this study. For example, neighboring 349
lakes, in which one lake receives sewage discharge and the other not, will harbor a 350
distinct species composition that, may have similar species composition as a distant lake 351
that also receive sewage discharge; iii) randomness in species distribution due to wind-352
driven disturbances (Shade et al., 2012), which is a strong influence in these coastal and 353
shallow lakes (Fragoso et al., 2008; Cardoso and Motta-Marques, 2009), promoting 354
intense effects or even temporary extinctions of some species from a lake. In this sense, 355
the link between species loss and local extinctions with the nested pattern has been 356
suggested in previous studies (Dobrovolski et al., 2012; Xingfeng et al., 2015). 357
Regarding the within-lake scale, we did not observe within-lake bacterial beta 358
diversity variation among lakes, which was quite unexpected given the range in lake 359
size and environmental characteristics. Also, no one of the wide array of explanatory 360
variables measured here explained the variation in beta diversity, independent of the 361
component evaluated (βsør, βsim, βsne or Bray-Curtis). This suggests that within-lake mass 362
effects may be masking any potential structuring role of species sorting, since an 363
organism with high dispersion rates can occur even in places that do not correspond to 364
their tolerances and environmental requirements (Leibold et al., 2004; Heino and 365
Grönroos, 2013; Heino et al., 2013). However, it should be noted that in the context of 366
our study, the role of species sorting may be underestimated considering that the 367
ARISA technique does not discriminate dead and living cells. Similar lack of beta 368
diversity-environmental heterogeneity relationship (BDEHR) was also observed for 369
unpredictable species distributions of macroinvertebrates in streams, with no species-370
specific responses to environmental variables (Heino, 2013). Even though patterns of 371
beta diversity may relate or not with habitat heterogeneity (Heino et al., 2015b), beta 372
103

Capítulo 3. Bacterial beta diversity among lakes, but not within lakes, is regulated by local factors
diversity can be comparable and as large at smaller scales (local) than at larger 373
(regional) scales (Comte et al., 2015). 374
In summary, our hypothesis that dissimilarity in community composition among 375
lakes would be positively related to dissimilarities in local factors (e.g physical and 376
chemical variables and phytoplankton composition) and that the larger share of beta 377
diversity is due to species turnover was confirmed. Also we found an interesting inverse 378
spatial relationship with turnover and positive relationship with nestedness. For within-379
lakes, the expected variation in within-lake bacterial beta diversity among lakes and the 380
contribution of environmental factors and phytoplankton was not confirmed. We found 381
that bacterial BDEHR among lakes appears to result from species sorting, whereas 382
within-lake bacterial beta diversity was not related to within-lake habitat heterogeneity, 383
probably being a result of mass effects masking species sorting. Nevertheless our 384
analyses of variation in bacterial community composition and structure among-lakes 385
(based on dissimilarity matrix) and within-lake beta diversity (based on mean distance 386
to group centroid) represent different types of beta diversity, resulting in different 387
conclusions about the bacterial BDEHR. In this sense, it is important to consider 388
multiple spatial scales for understanding microbial biogeography, since the majority of 389
ecological patterns and process are scale dependent (Levin, 1992; Logue et al., 2011; 390
Moritz et al.,2013; Stein, 2014). 391
392
Acknowledgments 393
The authors thank the Conselho Nacional de Desenvolvimento Científico e Tecnológico 394
(CNPq) for funding part of this project (process CNPq 474279/2013-8). We are also 395
grateful to the Global Lake Ecological Observatory Network (GLEON) for providing 396
the opportunity and resources to start the collaboration that made this study possible. 397
104
Capítulo 3. Bacterial beta diversity among lakes, but not within lakes, is regulated by local factors
The authors are also grateful for the assistance provided by the Centro de Estudos 398
Costeros, Limnológicos e Marinhos (CECLIMAR). Marla Sonaira Lima received 399
support through a doctoral scholarship at Programa de Pós Graduação em Recursos 400
Hídricos e Saneamento Ambiental, Instituto de Pesquisas Hidráulicas (CNPq 401
141228/2012-1) and Ng Hay They received a post-doctoral scholarship from 402
Coordenação de Aperfeiçoamento de Pessoal de Nível Superior (Capes 403
88887.065146/2014-00). Special thanks to MSc. Taís de Fátima Ramos Guimarães, Dr. 404
Fernando Gertum Becker and Dra. Sandra Maria Hartz for providing the landscape data, 405
to MSc. Mauricio Munar for helping with the map, and to Dr. Janet W. Reid for English 406
revision. 407
Conflict of Interest 408
The authors declare no conflict of interest. 409
410
References 411
American Public Health Association APHA. (2012). Eaton AD, Clesceri LS, Greenberg 412
AE (orgs.). Standard Methods for Examination of Water and Waste Water. Byrd 413
Prepress Springfield: Washington DC. 414
Anderson MJ, Crist TO, Chase JM, Vellend M, Inouye BD, Freestone AL, et al. (2011). 415
Navigating the multiple meanings of b diversity : a roadmap for the practicing ecologist. 416
Ecol Lett 14:19–28. 417
Anderson MJ. (2006). Distance-based tests for homogeneity of multivariate dispersions. 418
Biometrics 62, 245–53. 419
105

Capítulo 3. Bacterial beta diversity among lakes, but not within lakes, is regulated by local factors
Baines SB, Pace ML. (1991). The production of dissolved organic matter by 420
phytoplankton and its importance to bacteria: patterns across marine and freshwater 421
systems. Limnol Oceanogr 36: 1078–1090. 422
Barton K. (2016). MuMIn: multi-model inference. R package version 1.15.6. 423
http://CRAN.R-project.org/package=MuMIn 424
Baselga A, Orme CDL. (2012). Betapart: an R package for the study of β-diversity. 425
Method Ecol Evol 3: 808-12. 426
Baselga A. (2010). Partitioning the turnover and nestedness components of beta 427
diversity. Global Ecol Biogeogr 19: 134–143. 428
Beisner BE, Peres-Neto PR, Lindström ES, Barnett A, Longhi ML. (2006). The role of 429
environmental and spatial processes in structuring lake communities from bacteria to 430
fish. Ecology 87: 2985–2991. 431
Bell T, Ager D, Song JI, Newmann JA, Thompson IP, Lilley AK, et al. (2005). Larger 432
islands house more bacterial taxa. Science 308: 1884. 433
Bertilsson S, Tranvik LJ. (1998). Photochemically produced carboxylic acids as 434
substrates for freshwater bacterioplankton. Limnol Oceanogr 43: 885–895. 435
Bjørrisen PK. (1988). Phytoplankton exudation of organic matter: Why do healthy cells 436
do it? Limnol Oceanogr 33:151-154. 437
Burnham KP, Anderson DR. (2002). Model selection and multimodel inference: a 438
practical information-theoretic approach. Springer: New York, NY, USA. 439
Cardoso LS, Motta-Marques DM. (2009). Hydrodynamics-driven plankton community 440
in a shallow lake. Aquat Ecol 43: 73-84. 441
106
Capítulo 3. Bacterial beta diversity among lakes, but not within lakes, is regulated by local factors
Chase JM, Leibold MA. (2003). Ecological Niches: Linking Classical and 442
Contemporary Approaches. University of Chicago Press: Chicago,IL, USA 443
Cole JJ. (1999). Aquatic microbiology for ecosystem scientists: new and recycled 444
paradigms in ecological microbiology. Ecosystems 2: 215–225. 445
Comte J, Monier A, Crevecoeur S, Lovejoy C, Vicent WF. (2015). Microbial 446
biogeography of permafrost thaw ponds across the changing northern landscape. 447
Ecography 38:001-010. 448
Cotner JB, Biddanda BA. (2002). Small players, large role: microbial influence on 449
biogeochemical processes in pelagic aquatic ecosystems. Ecosystems 5: 101–105. 450
del Giorgio PA, Cole J. (1998). Bacterial growth efficiency in natural aquatic systems. 451
Annu Rev Ecol Syst 29: 503–541. 452
Dobrovolski R, Melo AS, Cassemiro FAS, Diniz-Filho JAF. (2012). Climatic history 453
and dispersal ability explain the relative importance of turnover and nestedness 454
components of β-diversity. Global Ecol. Biogeogr. 21:191-7. 455
Eiler A, Bertilsson S. (2004). Composition of freshwater bacterial communities 456
associated with cyanobacterial blooms in four Swedish lakes. Environ Microbiol 6: 457
1228–1243. 458
Faith DP, Minchin PR, Belbin L. (1987). Compositional dissimilarity as a robust 459
measure of ecological distance. Vegetatio 69: 57–68. 460
Fisher MM, Triplett EW. (1999). Automated approach for ribosomal intergenic spacer 461
analysis of microbial diversity and its application to freshwater bacterial communities. 462
Appl Environ Microbiol 65: 4630–4636. 463
107

Capítulo 3. Bacterial beta diversity among lakes, but not within lakes, is regulated by local factors
Fogg GE. (1983). The ecological significance of extracellular products of 464
phytoplankton photosynthesis. Bot. Mar. 26:3-14. 465
Fragoso CR, Motta-Marques DML, Collischonn W, Tucci CEM, van Nes EH. (2008). 466
Modelling spatial heterogeneity of phytoplankton in Lake Mangueira, a large shallow 467
subtropical lake in South Brazil. Ecological Modelling 219: 125–137. 468
Fuhrman JA, Ammerman JW, Azam F. (1980). Bacterioplankton in the coastal euphtic 469
zone: Distribution, activity and possible relationship with phytoplankton. Mar. Biol. 470
60:201-207. 471
Galand PE, Casamayor EO, Kirchman DL, Lovejoy C. (2009). Ecology of the rare 472
microbial biosphere of the Arctic Ocean. Proc Natl Acad Sci USA 106: 22427–22432. 473
Giraudoux P. (2016). Package ‘pgirmess’: Data Analysis in Ecology. R package version 474
1.6.5. https://CRAN.R-project.org/package=pgirmess. 475
Goslee SC, Urban DL. (2007). The ecodist package for dissimilarity-based analysis of 476
ecological data. Journal of Statistical Software 22:1-19. 477
Guimarães TFR, Hartz SM, Becker FG. (2014). Lake connectivity and fish species 478
richness in southern Brazilian coastal lakes. Hydrobiologia 740:207-217. 479
Guiry MD, Guiry GM. (2016). AlgaeBase. World-wide electronic publication, National 480
University of Ireland, Galway. http://www.algaebase.org; searched on 27 October 2016. 481
Heino J, Grönroos M, Ilmonen J, Karhu T, Niva M, Paasivirta L. (2013). Environmental 482
heterogeneity and β diversity of stream macroinvertebrate communities at intermediate 483
spatial scales. Freshwater Science 32:142–154. 484
108

Capítulo 3. Bacterial beta diversity among lakes, but not within lakes, is regulated by local factors
Heino J, Grönroos M. (2013). Does environmental heterogeneity affect species co-485
occurrence in ecological guilds across stream macroinvertebrate metacommunities? 486
Ecography 36: 926–936. 487
Heino J, Melo AS, Bini LM, Altermatt F, Al-Shami AS, Angeler DG, et al. (2015a). A 488
comparative analysis reveals weak relationships between ecological factors and beta 489
diversity of stream insect metacommunities at two spatial levels. Ecology and Evolution 490
doi: 10.1002/ece3.1439. 491
Heino J, Melo AS, Bini LM. (2015b). Reconceptualising the beta diversity-492
environmental heterogeneity relationship in running water systems. Freshwater Biology 493
60, 223–235. 494
Heino J. (2013). Does dispersal ability affect the relative importance of environmental 495
control and spatial structuring of littoral macroinvertebrate communities? Oecologia 496
171: 971–980. 497
Hillebrand H, Dürseken D, Kirschiel D, Pollingher U, Zohary T. (1999). Biovolume 498
calculation for pelagic and benthic microalgae. J Phycol 35: 403–424. 499
Holz M. (1999). Do mar ao deserto. A Evolução do Rio Grande do Sul no Tempo 500
Geológico. UFRGS: Porto Alegre 131–144 (Portuguese). 501
Horner-Devine MC, Leibold SVH, Bohannan BJM. (2003). Bacterial diversity patterns 502
along a gradient of primary productivity. Ecol Lett 6: 613–622. 503
Jespersen AM, Christoffersen K. (1987). Measurements of chlorophyll-a from 504
phytoplankton using ethanol as extraction solvent. Archiv für Hydrobiologie 109: 445–505
454. 506
Jones SE, Cadkin TA, Newton RJ, McMahon KD. (2012). Spatial and temporal scales 507
of aquatic bacterial beta diversity. Front Microbiol 3: 318. 508
109

Capítulo 3. Bacterial beta diversity among lakes, but not within lakes, is regulated by local factors
Jones SE, McMahon KD. (2009). Species-sorting may explain an apparent minimal 509
effect of immigration on freshwater bacterial community dynamics. Environ Microbiol 510
11: 905–913. 511
Jones SE, Newton RJ, McMahon KD. (2009). Evidence for structuring of bacterial 512
community composition by organic matter carbon source in temperate lakes. Environ 513
Microbiol 11: 2463–2472. 514
Kent AD, Yannarell AC, Rusak JA, Triplett EW, McMahon KD. (2007). Synchrony in 515
aquatic microbial community dynamics. ISME J 1: 38–47. 516
Lande R. (1996). Statistics and partitioning of species diversity, and similarity among 517
multiple communities. Oikos 76: 5–13. 518
Lear G, Bellamy J, Case BS, Lee JE, Buckley HL. (2014). Fine-scale patterns in 519
bacterial community composition and function within freshwater ponds. ISME J 8: 520
1715–1726. 521
Legendre P, Borcard D, Peres-Neto PR. (2005). Analyzing beta diversity: partitioning 522
the spatial variation of community composition data. Ecol Monogr 75:435–450. 523
Legendre P, Lapointe FJ, Casgrain P. (1994). Modeling brain evolution from behavior: 524
A permutational regression approach. Evolution 48:1487–1499. 525
Legendre P, Legendre L. (1998). Numerical Ecology. Elsevier: New York, NY, USA. 526
Leibold MA, Holyoak M, Mouquet N, Amarasekare P, Chase JM, Hoopes MF, et al. 527
(2004). The metacommunity concept: a framework for multi-scale community ecology. 528
Ecol Lett 7: 601–613. 529
Levin SA. (1992). The problem of pattern and scale in ecology. Ecology 73: 1943–530
1967. 531
110

Capítulo 3. Bacterial beta diversity among lakes, but not within lakes, is regulated by local factors
Lichstein J (2007). Multiple regression on distance matrices: A multivariate spatial 532
analysis tool. Plant Ecol 188:117-131. 533
Lima MS, Marques DM, They NgH, McMahon KD, Rodrigues LR, Cardoso LS, et al. 534
(2016). Contrasting factors drive within-lake bacterial community composition and 535
functional traits in a large shallow subtropical lake. Hydrobiologia. doi: 536
10.1007/s10750-015-2610-9 537
Lindström ES, Agterveld MK-V, Zwart G. (2005). Distribution of typical freshwater 538
bacterial groups is associated with pH, temperature, and lake water retention time. Appl 539
Environ Microbiol 71: 8201–8206. 540
Logue JB, Lindström ES. (2010). Species sorting affects bacterioplankton community 541
composition as determined by 16S rDNA and 16S rRNA fingerprints. ISME J 4:729-542
738. 543
Logue JB, Mouquet N, Peter H, Hillebrand H. (2011). Empirical approaches to 544
metacommunities: a review and comparison with theory. Trends in Ecol and Evol 26: 545
482-491. 546
Lund JWG, Kipling C, LeCren ED. (1958). The invert microscope method of estimating 547
algal numbers and the statistical basis of estimations by counting. Hydrobiologia. 548
11:143-170. 549
Mackeret, F. J. H., Heron, J., and Talling, J. F. (1989). Water Analysis: some revised 550
methods for limnologists. Freshwater Biological Association Scientific Publication N. 551
36, Far Sawrey, Ambleside. 552
Martiny JBH, Bohannan BJM, Brown JH, Colwell RK, Fuhrman JA, Green JL, et al. 553
(2006). Microbial biogeography: putting microorganisms on the map. Nat Rev 554
Microbiol 4: 102–112. 555
111

Capítulo 3. Bacterial beta diversity among lakes, but not within lakes, is regulated by local factors
Martiny JBH, Eisen JA, Penn K, Allison SD, Horner-Devine MC. (2011). Drivers of 556
bacterial β-diversity depend on spatial scale. Proc Natl Acad Sci USA 108:7850-7854. 557
Matthews TJ, Cotte-Jones HEW, Whittaker RJ. (2015). Quantifying and 558
interpretingnestedness in habitat islands: a synthetic analysis of multiple datasets. 559
Drives Distrib 21:392-404. 560
Moritz C, Meynard CN, Devictor V, Guizien K, Labrune C, Guarini J-M, et al. (2013). 561
Disentangling the role of connectivity, environmental filtering, and spatial structure on 562
metacommunity dynamics. Oikos, 000:001-010 doi: 10.1111/j.1600-0706.2013.00377.x 563
Nekola JC, White PS. (1999). The distance decay of community similarity in 564
biogeography and ecology. J. Biogeogr. 26:867–878. 565
Nelson CE, Sadro S, Melack JM. (2009). Contrasting the influence of stream inputs and 566
landscape position on bacterioplankton community structure and dissolved organic 567
matter composition in high-elevation lake chains. Limnol. Oceanogr. 54: 1292-1305. 568
Oksanen J, Blanchet GB, Friendly M, Kindt R, Legendre P, McGlinn D, et al. (2016). 569
vegan: Community Ecology Package. R package version 2.4-1. http://CRAN. R-570
project.org/package=vegan. 571
Pace NRA. (1997). Molecular view of microbial diversity and the biosphere. Science 572
276:734-740. 573
R Core Team (2016). R: A language and environment for statistical computing. R 574
Foundation for Statistical Computing, Vienna, Austria. URL http://www.R-project.org/. 575
Schwarzbold A, Schäfer A. (1984). Gênese e morfologia das lagoas costeiras do Rio 576
Grande do Sul – Brasil. Amazoniana 9: 87–104. (Portuguese). 577
112
Capítulo 3. Bacterial beta diversity among lakes, but not within lakes, is regulated by local factors
Shade A, Peter H, Allison SD, Baho DL, Berga M, Bürgmann H, et al. 2012. 578
Fundamentals of microbial community resistance and resilience. Front Microbiol 3:417. 579
Sommaruga R, Casamayor EO. (2008). Bacterial ‘cosmopolitanism’ and importance of 580
local environmental factors for community composition in remote high-altitude lakes. 581
Freshw Biol 54: 994–1005. 582
Souffreau C, van der Gucht K, van Gremberghe I, Kosten S, Lacerot G, Lobão LM, et 583
al. (2015). Environmental rather than spatial factors structure bacterioplankton 584
communities in shallow lakes along a > 6000 km latitudinal gradient in South America. 585
Environ Microbiol 17: 2336–2351. 586
Stein A, Gerstner K, Kreft H. (2014). Environmental heterogeneity as a universal driver 587
of species richness across taxa, biomes and spatial scales. Ecol Lett 588
doi:10.1111/ele.12277. 589
Tada Y, Suzuki K. (2016). Changes in the community structure of free-living 590
heterotrophic bacteria in the open tropical Pacific Ocean in response to microalgal 591
lysate-derived dissolved organic matter. FEMS Microbiol Ecol 592
doi:10.1093/femsec/fiw099 593
Utermöhl H. (1958). Zur Vervollkommnung der quantitativen Phytoplankton. Method 594
Mitt Int Ver Limnol. 9:1–38 (German). 595
Van der Gucht K, Cottenie K, Muylaert K, Vloemans N, Cousin S, Declerck S, et al. 596
(2007). The power of species sorting: local factors drive bacterial community 597
composition over a wide range of spatial scales. Proc Natl Acad Sci USA 104: 20404–598
20409. 599
Whittaker RH. (1960). Vegetation of the Siskiyou Mountains, Oregon and California. 600
Ecol Monogr 30: 279-338. 601
113
Capítulo 3. Bacterial beta diversity among lakes, but not within lakes, is regulated by local factors
Whittaker RH. (1972). Evolution and measurement of species diversity. Taxon 21: 231-602
251. 603
Wu QL, Zwart G, Wu J, Kamst-van Agterveld MP, Liu S, Hahn MW. (2007). 604
Submersed macrophytes play a key role in structuring bacterioplankton community 605
composition in the large, shallow, subtropical Taihu Lake, China. Environ Microbiol 9: 606
2765–2774. 607
Xingfeng S, Baselga A, Ding P. (2015). Revealing Beta-Diversity Patterns of Breeding 608
Bird and Lizard Communities on Inundated Land-Bridge Islands by Separating the 609
Turnover and Nestedness Components. Plos One doi:10.1371/journal.pone.0127692. 610
Yannarell AC, Kent AD, Lauster GH, Kratz TK, Triplett EW. (2003). Temporal 611
patterns in bacterial communities in three temperate lakes of different trophic status. 612
Microb Ecol 46: 391–405. 613
Yannarell AC, Triplett EW. (2004). Within- and between lake variability in the 614
composition of bacterioplankton communities: investigations using multiple spatial 615
scales. Appl Environ Microbiol 70: 214–223. 616
Yannarell AC, Triplett EW. (2005). Geographic and environmental sources of variation 617
in lake bacterial community composition. Appl Environ Microbiol 71: 227–239. 618
114
Capítulo 3. Bacterial beta diversity among lakes, but not within lakes, is regulated by local factors
Figure legends
Figure 1 Twenty-five shallow coastal lakes sampled in the Tramandaí River System,
southern Brazil. Red dots: sampling sites.
Figure 2 Bacterial beta diversity components within-lakes based on mean distance to
group centroid of three sites per lake in 25 subtropical shallow lakes.
115

Capítulo 3. Bacterial beta diversity among lakes, but not within lakes, is regulated by local factors
Table 1 Mean distance to group centroid for bacterioplankton, environmental
heterogeneity and phytoplankton composition heterogeneity for each lake. F- and p-
values were obtained from tests for homogeneity of multivariate dispersions of the sites
to their group centroid.
Lakes Bray-
Curtis
Sørensen
(βsør)
Simpson
(βsim)
Nestedness-
(βsne)
Environment Phytoplankton
Ramalhete 0.325 0.236 0.138 0.089 1.628 0.154
Negra 0.124 0.148 0.114 0.033 1.410 0.102
Malvas 0.200 0.269 0.261 0.072 4.674 0.127
Passo 0.204 0.225 0.204 0.026 1.543 0.133
Caieira 0.103 0.128 0.126 0.029 1.662 0.310
Lessa 0.364 0.300 0.241 0.065 2.013 0.149
Traira 0.325 0.310 0.272 0.032 2.433 0.221
Caconde 0.379 0.338 0.292 0.042 2.208 0.106
Peixoto 0.143 0.176 0.069 0.166 1.891 0.096
Marcelino 0.347 0.226 0.201 0.052 3.519 0.175
Rincão da
Cadeia
0.233 0.244 0.228 0.099 3.486 0.332
Pombas 0.135 0.157 0.104 0.075 1.452 0.111
Horacio 0.189 0.195 0.184 0.009 1.169 0.212
Tramandai 0.280 0.247 0.151 0.100 2.882 0.274
Dom Daniel 0.358 0.290 0.232 0.080 3.103 0.153
116

Capítulo 3. Bacterial beta diversity among lakes, but not within lakes, is regulated by local factors
Lakes Bray-
Curtis
Sørensen
(βsør)
Simpson
(βsim)
Nestedness-
(βsne)
Environment Phytoplankton
Emboaba 0.352 0.310 0.259 0.063 0.907 0.092
Emboabinha 0.167 0.176 0.061 0.109 0.846 0.081
Custodias 0.410 0.327 0.269 0.054 1.881 0.064
Gentil 0.271 0.204 0.167 0.028 1.251 0.134
Tapera 0.371 0.311 0.259 0.066 1.010 0.130
Manuel Nunes 0.192 0.190 0.121 0.084 1.784 0.241
Fortaleza 0.327 0.231 0.207 0.028 1.108 0.066
Suzana 0.334 0.230 0.199 0.051 1.011 0.136
Cidreira 0.302 0.242 0.235 0.010 1.718 0.124
Cerquinha 0.342 0.260 0.248 0.010 1.207 0.098
F24,50 0.588 0.536 1.101 1.454 1.394 0.775
P 0.923 0.950 0.376 0.121 0.152 0.759
117

Capítulo 3. Bacterial beta diversity among lakes, but not within lakes, is regulated by local factors
Table 2 Summary of best models selected through second-order Akaike’s information
criterion (AICc) to explain within-lake variation in beta diversity. Env, environmental
heterogeneity; Phyto, heterogeneity in phytoplankton composition; Chl, chlorophyll a;
df, degrees of freedom; Delta, AIC difference to the best model; Weight, Akaike
weight; Adj R², ordinary adjusted coefficient of determination.
AICc df Delta Weight Adj. R2 Bray-Curtis No variables -44.2 2 0.00 0.374 0.000 Phyto -43.4 3 0.78 0.254 0.030 Chl -42.9 3 1.31 0.195 0.009 Phyto+Chl -42.7 4 1.49 0.178 0.069 Sørensen (βsør) No variables -67.5 2 0.00 0.317 0.000 Chl -66.4 3 1.09 0.184 0.018 Env -66.3 3 1.16 0.178 0.015 Env+ Phyto -66.3 4 1.19 0.175 0.080 Phyto -65.9 3 1.55 0.146 -0.001 Simpson (βsim) Chl -62.0 3 0.00 0.427 0.109 No variables -60.7 2 1.36 0.216 0.000 Chl + Env -60.5 4 1.57 0.195 0.116 Env -60.1 3 1.95 0.161 0.037 Nestedness-resultant from richness difference (βsne) No variables -90.3 2 0.00 0.489 0.000 Env -89.4 3 0.92 0.308 0.241 Chl -88.5 3 1.77 0.202 -0.009
118

Capítulo 3. Bacterial beta diversity among lakes, but not within lakes, is regulated by local factors
Supplementary Table S1 Mean, maximum, minimum and standard deviation of environmental variables among all 25 lakes.
Cond pH
DO (mg l-
1) WT (m)
Color(mg l-1 Pt-Co)
Turb (NTU)
TSS (mg l-
1)
FSS (mg l-
1)
TP (mg l-
1)
SRP (µg l-
1) SIL(mg
l-1)
TN (mg l-
1)
TDN (mg l-
1) NH3+NH4
+
(mg l-1)
NO3-
(mg l-
1)
NO2-
(mg l-
1)
TOC (mg l-
1)
DOC (mg l-
1)
DIC (mg l-
1)
POC (mg l-
1) Ramalhete 63.90 6.59 9.71 0.55 40.47 11.33 21.67 14.33 43.72 4.35 3.58 0.34 0.20 0.03 0.01 0.00 5.09 4.23 2.43 0.86 Negra 69.83 6.70 7.89 0.83 51.53 5.67 18.67 11.67 18.62 1.60 3.73 0.34 0.29 0.12 0.01 0.00 7.65 6.20 2.31 1.45 Malvas 122.10 7.24 8.25 0.87 16.07 2.81 154.00 13.33 20.69 2.05 1.95 0.22 0.17 0.00 0.01 0.00 3.56 0.91 5.96 2.65 Passo 78.13 6.94 9.54 0.53 29.27 5.16 34.00 26.67 20.92 2.28 4.06 0.17 0.16 0.00 0.01 0.00 4.81 2.99 4.01 1.82 Caieira 69.43 6.73 9.85 0.40 42.80 14.33 20.00 12.33 39.80 1.82 1.71 0.44 0.36 0.02 0.01 0.00 5.50 4.65 3.69 0.85 Lessa 67.23 7.14 8.69 0.70 42.90 21.00 23.33 16.00 34.28 4.35 0.40 0.52 0.46 0.11 0.00 0.01 5.01 3.47 2.84 1.54 Traira 60.50 7.13 8.95 0.97 30.57 7.67 9.00 4.33 66.98 77.13 0.49 0.46 0.38 0.09 0.00 0.00 7.11 4.68 4.29 2.43 Caconde 60.83 7.09 9.70 0.93 25.60 7.33 12.33 6.67 11.25 1.60 0.58 0.45 0.37 0.02 0.01 0.01 7.48 5.09 5.14 2.39 Peixoto 153.27 8.68 7.93 0.73 33.70 3.01 61.67 7.33 91.39 25.07 0.37 0.48 0.43 0.00 0.01 0.00 6.17 4.97 2.76 1.19 Marcelino 359.67 10.45 14.07 0.12 80.37 10.73 63.00 17.67 599.66 186.74 5.75 4.18 1.74 1.05 0.01 0.01 10.42 5.13 2.34 5.29 Rincão da Cadeia 210.80 6.57 9.33 0.53 53.47 1.85 16.67 10.00 32.90 4.12 4.89 0.35 0.30 0.04 0.00 0.00 6.33 4.06 7.47 2.27
Pombas 59.80 6.85 9.16 0.70 31.37 7.33 11.67 7.67 8.95 1.60 3.02 0.28 0.25 0.05 0.01 0.00 4.73 2.66 3.06 2.07 Horacio 67.80 6.59 7.83 0.77 52.57 5.00 11.67 5.67 21.15 1.60 3.61 0.26 0.25 0.10 0.01 0.00 8.30 4.85 1.90 3.45 Tramandai 10382.67 8.16 7.34 0.73 20.47 4.33 14.33 8.67 33.36 1.60 3.57 0.20 0.15 0.21 0.01 0.01 6.93 5.24 2.12 1.68 Dom Daniel 5332.67 7.37 8.53 0.77 25.07 5.00 13.67 8.67 13.55 3.66 2.38 0.63 0.40 0.04 0.01 0.00 5.22 4.35 2.47 0.87 Emboaba 71.17 6.58 8.55 0.80 42.07 3.67 8.67 4.67 21.61 1.60 1.35 0.28 0.24 0.02 0.00 0.00 6.27 4.42 3.57 1.85 Emboabinha 62.07 6.59 8.42 0.80 46.83 4.00 7.33 4.00 11.71 1.60 1.59 0.30 0.27 0.02 0.00 0.00 6.21 5.29 2.67 0.92 Custodias 3920.33 8.96 6.66 0.87 21.70 2.28 37.00 21.00 8.48 1.60 1.47 0.81 0.64 0.11 0.01 0.00 6.06 3.23 2.21 2.83 Gentil 317.67 7.08 7.29 1.10 28.53 0.57 13.67 4.00 10.79 1.60 1.55 0.40 0.31 0.00 0.00 0.00 6.35 5.51 1.94 0.84 Tapera 78.93 6.28 8.45 1.10 26.17 4.33 9.67 8.00 10.33 1.60 1.29 2.48 0.20 0.00 0.00 0.00 4.23 3.76 2.20 0.47 Manuel Nunes 253.43 7.08 7.07 0.67 18.00 1.21 71.33 6.67 30.13 1.60 2.80 0.38 0.42 0.02 0.01 0.01 7.56 5.78 2.11 1.78
119

Capítulo 3. Bacterial beta diversity among lakes, but not within lakes, is regulated by local factors
Cond pH
DO (mg l-
1) WT (m)
Color(mg l-1 Pt-Co)
Turb (NTU)
TSS (mg l-
1)
FSS (mg l-
1)
TP (mg l-
1)
SRP (µg l-
1) SIL(mg
l-1)
TN (mg l-
1)
TDN (mg l-
1) NH3+NH4
+
(mg l-1)
NO3-
(mg l-
1)
NO2-
(mg l-
1)
TOC (mg l-
1)
DOC (mg l-
1)
DIC (mg l-
1)
POC (mg l-
1) Fortaleza 196.67 7.21 8.86 0.78 22.10 3.33 26.67 16.67 18.62 1.60 0.89 2.52 0.17 0.07 0.01 0.00 2.45 0.57 1.21 1.89 Suzana 155.13 7.06 8.35 0.73 17.00 2.67 9.33 4.67 23.22 1.60 1.37 0.28 0.22 0.06 0.00 0.00 3.98 3.15 1.93 0.83 Cidreira 204.67 7.19 8.35 0.77 18.53 3.67 11.33 6.67 16.31 1.60 0.93 1.17 0.21 0.10 0.00 0.00 5.04 4.39 4.20 0.65 Cerquinha 213.67 6.99 7.79 0.67 16.87 3.33 19.33 11.33 27.37 1.60 1.07 0.30 0.23 0.09 0.00 0.00 5.23 4.95 3.79 0.29 Maximum 10382.67 8.96 9.33 1.10 53.47 7.33 71.33 21.00 33.36 4.12 4.89 2.52 0.64 0.21 0.01 0.01 8.30 5.78 7.47 3.45 Minimum 59.80 6.28 6.66 0.53 16.87 0.57 7.33 4.00 8.48 1.60 0.89 0.20 0.15 0.00 0.00 0.00 2.45 0.57 1.21 0.29 Standard Deviation 2941.01 0.68 0.78 0.15 13.00 1.68 16.46 4.77 8.73 0.81 1.20 0.77 0.12 0.06 0.00 0.00 1.48 1.35 1.51 0.92
Cond, conductivity; DO, dissolved oxygen; WT, water transparency; TSS, total suspended solid; FSS, fixed suspended solids; TP, total
phosphorus; SRP, soluble reactive phosphorus; SIL, silicate; TN, total nitrogen; TDN, total dissolved nitrogen; NH3+NH4+, ammonium; NO3
-,
nitrate; NO2-, nitrite; TOC, total organic carbon, DOC, dissolved organic carbon; DIC, dissolved inorganic carbon; POC, particulate organic
carbon.
120

Capítulo 3. Bacterial beta diversity among lakes, but not within lakes, is regulated by local factors
Supplementary Table S2 Mean, maximum, minimum and standard deviation of chlorophyll a, and phytoplankton biomass of taxonomic classes among all 25 lakes.
Chl (µg l-1) BAC CHL CHR CRY CYA DIN EUG KLEB RAP XAN ZYG
Ramalhete 5.56 0.21 162.80 0.01 0.13 0.64 0.00 0.00 0.00 0.00 0.00 1.79 Negra 5.56 1.66 126.97 0.00 0.08 0.74 5.11 0.05 0.00 0.00 0.00 0.01 Malvas 2.69 0.66 12.56 0.02 0.43 2.81 0.03 0.00 0.00 0.00 0.00 1.63 Passo 6.23 4.38 22.88 0.01 0.00 7.70 0.09 0.02 0.00 0.00 0.00 0.59 Caieira 15.16 4.45 245.52 0.00 0.22 0.58 0.00 0.01 0.00 0.00 0.00 0.33 Lessa 27.45 6.20 163.21 0.00 0.16 5.05 0.00 0.08 0.00 0.00 0.00 2.10 Traira 2.36 1.63 12.37 0.01 0.22 2.36 0.35 0.20 0.00 0.00 0.00 15.52 Caconde 5.73 2.00 3.89 0.00 0.07 5.24 0.57 0.23 0.00 0.00 0.00 51.33 Peixoto 24.08 9.98 118.91 0.03 1.12 8.14 0.25 0.12 0.00 0.00 0.00 2.20 Marcelino 418.81 4.03 100.46 0.00 3.92 53.90 2.46 0.00 0.00 0.95 0.00 0.13 Rincão da Cadeia 9.67 1.32 26.62 0.55 0.01 2.87 0.11 0.22 0.00 0.00 0.00 0.48 Pombas 5.73 6.00 335.93 0.00 0.05 1.06 0.02 3.20 0.01 0.00 0.00 0.05 Horacio 5.39 1.87 29.81 0.00 0.23 3.21 2.79 0.00 0.00 0.00 0.00 0.12 Tramandai 40.08 17.57 0.17 0.00 0.05 3.55 0.01 0.28 0.00 0.00 0.92 0.55 Dom Daniel 10.61 9.21 42.64 0.02 0.03 8.42 0.12 0.00 0.00 0.42 0.02 0.77 Emboaba 2.36 0.75 149.91 0.00 0.13 0.64 0.03 0.00 0.00 0.29 0.00 0.02 Emboabinha 8.42 4.09 165.47 0.00 0.08 0.75 0.03 0.10 0.00 0.00 0.00 0.03 Custodias 7.58 28.81 0.89 0.00 0.01 9.52 0.04 0.00 0.00 0.00 0.00 0.72 Gentil 4.72 4.86 11.72 0.00 0.13 28.65 0.06 0.02 0.00 0.00 0.00 0.57 Tapera 4.04 0.71 84.17 0.00 0.06 0.84 0.02 0.29 0.00 0.19 0.02 1.07
121

Capítulo 3. Bacterial beta diversity among lakes, but not within lakes, is regulated by local factors
Chl (µg l-1) BAC CHL CHR CRY CYA DIN EUG KLEB RAP XAN ZYG
Manuel Nunes 5.39 1.07 1.98 0.02 0.00 32.53 0.07 0.41 0.00 0.00 0.02 0.41 Fortaleza 3.03 1.47 138.93 0.01 0.03 1.17 0.01 0.00 0.00 0.00 0.00 1.02 Suzana 2.53 0.21 61.16 0.00 0.01 0.86 0.01 0.01 0.00 0.00 0.00 0.15 Cidreira 3.03 1.21 97.61 0.01 0.04 1.02 0.00 0.00 0.00 0.00 0.00 0.59 Cerquinha 2.36 1.13 144.20 0.01 0.10 2.23 0.01 0.65 0.00 0.00 0.00 0.50 Maximum 40.08 28.81 335.93 0.55 0.23 32.53 2.79 3.20 0.01 0.42 0.92 1.07 Minimum 2.36 0.21 0.17 0.00 0.00 0.64 0.00 0.00 0.00 0.00 0.00 0.02 Standard Deviation 9.36 7.94 90.85 0.14 0.06 10.18 0.71 0.81 0.00 0.13 0.24 0.34
Chl, Chlorophyll a; BAC, Bacillariophyceae; CHL, Chlorophyceae; CHR, Chrysophyceae; CRY, Cryptophyceae; CYA, Cyanophyceae; DIN, Dinophyceae; EUG, Euglenophyceae; KLEB, Klebsormidiophyceae; RAP, Raphidophyceae; XAN, Xanthophyceae; ZYG, Zygnematophyceae.
122

Capítulo 3. Bacterial beta diversity among lakes, but not within lakes, is regulated by local factors
Figure 1
123

Capítulo 3. Bacterial beta diversity among lakes, but not within lakes, is regulated by local factors
Figure 2
124

Capítulo 4. Resistance and resilience of aquatic bacterial community over a cold front event
Capítulo 4. Resistance and resilience of aquatic bacterial community over a cold
front event
Apresentação
O capítulo apresentado a seguir é o manuscrito do artigo em preparação ainda não
submetido para publicação.
125

Capítulo 4. Resistance and resilience of aquatic bacterial community over a cold front event
Resistance and resilience of aquatic bacterial community over a short-term cold
front event
Autores: Marla Sonaira Lima1, David da Motta Marques1, Katherine D. McMahon2
Juliana E. D. Bohnenberger1, Lúcia Ribeiro Rodrigues1
1Laboratório de Ecotecnologia e Limnologia Aplicada, Instituto de Pesquisas Hidráulicas - IPH,
Universidade Federal Rio Grande do Sul,/UFRGS, Av. Bento Gonçalves, 9500, Porto Alegre, RS 91501-
970, Brazil. 2 Departments of Civil and Environmental Engineering and Bacteriology, University of Wisconsin-
Madison, 3204 Engineering Drive, Madison, WI 53706-1691, USA.
*Corresponding author: [email protected], telephone number: +55 51 33086326
Abstract
The abrupt variation on climate affect microbial communities, but little is known about
the influence of intense events on its structure and function. Given the microbial
importance in the metabolic processes of aquatic ecosystems, a current issue in
environmental studies is to understand the responses of these communities to intense
weather events, such as the passage of cold fronts. However, it is still difficult to
understand and predict how microorganisms behave in the face of such disorders. In this
study, we investigate the dynamics of aquatic bacterial (composition and biomass),
during a short-term cold front event. This work was conducted in Mangueira, a shallow,
subtropical and coastal lake in the southern of Rio Grande do Sul, Brazil. This
ecosystem is strongly influenced by cold fronts, mainly during winter. During the
course of seven days, six daily water samples for analysis of bacterial community and
environmental variables, totaling 42 samples were collected directly in the lake. To
assess differences or similarities before, during and after the disturbance, one-way
PERANOVA were performed for bacterial biomass, and one-way PERMANOVA for
bacterial composition and environmental data. Spearman correlation and RDA were
then performed to verify the relationship between environmental conditions and
bacterial community. The results showed a significant variation of bacterial biomass
and environment conditions, but not for bacterial community composition data over the
126

Capítulo 4. Resistance and resilience of aquatic bacterial community over a cold front event
cold front event. At the beginning of the disturbance, there was a significant increase of
biomass, comparing to the period before the event. After the front end, the biomass
returned to the initial condition. In general, the biomass bacterial community of Lake
Mangueira showed to be resilient after the occurrence of the disturbance and the BCC
showed resistant.
Key-words: bacterial biomass, disturbance, stability, sensitivity, insensitivity shallow
lake
Introduction
Disturbances are causal events that can immediately alter the environment, and
reverberate indirect responses in the community, or may directly alter the community,
causing relative changes in their abundance (Rykiel 1985; Lake 2000). The definition of
disturbance depends on its context and scale (Shade et al. 2012a), its intensity and
frequency, being characterized by temporal patterns, mainly as pulse or pressure
disorders (Lake 2000; Shade et al. 2012a). Pulse disorders are short-term and often
intense, sharply delineated, which rapidly decrease their severity for a short time,
reflecting a condition in which the stressor returns to the pre-disturbance condition.
Pressure disorders, on the other hand, are continuous and can start very well, but they
reach a constant level that is maintained for a long period of time, that is, the stressor
agent does not return to the pre-disturber condition (Lake 2000). Aquatic ecosystems
oscillate in response to changing environmental conditions. This natural response of the
system can occur smoothly and continuously or intensively and abruptly, promoting
changes from one persistent regime to another (Scheffer et al. 2001). With global
climate change, pulse disturbances such as extreme weather events (storms and cold
fronts) will tend to increase in frequency, while pressure disturbances (eg increase in
atmospheric carbon dioxide, acidification of the oceans, etc.) will be continuous (IPCC
127
Capítulo 4. Resistance and resilience of aquatic bacterial community over a cold front event
2007). As a consequence of the increase in these extreme climatic events, it is expected
that the frequency of climate effects on rivers, lakes and reservoirs will increase due to
abrupt temperature variation, allochthonous nutrient loading, hydrology and longer
periods of thermal stratification (Graham and Vinebrooke 2009; Carey et al. 2012).
Such variations promote disorder in the system and significant effects on the planktonic
community (White and Picket 1985).
Despite the great prominence of environmental disturbances studies in the
ecological literature, few studies have evaluated the microbial community's response
patterns to these disturbances (Shade et al. 2012b), and most in temperate regions
(Yannarell et al. 2003; Allison 2004; Nelson 2009; Shade et al. 2010). Hence, the
evaluation of resistance and resilience of microbial communities against perturbation
remain rare (e.g. Wertz et al. 2007; McKew et al. 2011). Disturbance events may induce
bacterial community changes, followed by post-disturbance return to the original
composition and function.
The response of the aquatic microbial community in the face of disturbances
associated with global climatic changes is extremely important, since in general,
microorganisms are fundamental elements for the ecological processes that occur in
aquatic ecosystems (Azam 1983, Cole 1999), and changes in microbial composition are
often associated with changes in the rates of ecosystem processes (eg Schimel and
Gulledge 1998; Gulledge et al. 1997). Therefore, it is important to understand and
recognize the stability (resilience and resistance) of aquatic microbial communities and
the factors underlying it, in order to predict how the structure and function of these
communities respond to the disturbances (Shade et al., 2012a).
In this context, the present work was conducted in Lake Mangueira, a large,
coastal and shallow lake system, which is highly influenced by intense cold front
128
Capítulo 4. Resistance and resilience of aquatic bacterial community over a cold front event
events, and aimed to answer: i) does short-term disturb due to polar cold front event
promotes changes in the aquatic bacterial community? ii) are the bacterial community
resilient or resistant to these disorders? We expect that the bacterial community under
the influence of disturbances during the winter will change in structure and biomass
after a disturb followed by post-disturbance return to its original pre-disturb patterns as
a response to hydrological changes over the disturbance event.
Material and Methods
Study area
Lake Mangueira is located in the Taim Hydrological System (SHT), a complex of
lakes and wetlands, which are part of the perimeter of the Taim Ecological Station, an
integral protection conservation unit. The lake is located at the southern of Rio Grande
do Sul (~ 30o31'22 "S 53o 07'48" W), comprising stretches of the Municipalities of
Santa Vitória do Palmar and Rio Grande between latitudes 32° 20'S and 33° 00' S, and
Mirim Lake and the South Atlantic Ocean (52° 20'W and 52° 45'W) (Figure 1). It is
located near Arroio Chuí, on the border with Uruguay. Lake Mangueira is a large
aquatic system of the region, covering a total area of 820 km2, 90 km long and 3 to 10
km wide, with an average depth of 2.6 m and a maximum depth of 6.0 m. Its trophic
state varies from oligotrophic to mesotrophic (Crossetti et al., 2013). The climate of the
region, according to the Köppen-Geiger System, is of type Cfa, presenting precipitation
distributed in every month throughout the year. The temperatures of the warmer months
are on average higher than 22 ºC, while those of the colder months range between 18
and -3 ºC (Ferreira, 2005). This region presents annual precipitation of 1,300 mm and
undergoes strong action of the winds, whose predominant direction is Northeast -
Southwest (Cardoso et al., 2012).
129

Capítulo 4. Resistance and resilience of aquatic bacterial community over a cold front event
This system has a large influence of cold fronts originating in Antarctica, and
affecting all coastal lakes in southern Brazil. These fronts occur with high frequency in
the southern region of Brazil, causing significant changes in the hydrometeorological
conditions and being the dominant force in subtropical coastal aquatic ecosystems of
southern Brazil (Fragoso et al. 2008). These fronts present higher frequency and
intensity during winter and spring (Brito et al., 1996) and have as main effect the
mixing and homogenization of the water column of these ponds (Tundisi 1983, Tundisi
et al.2010).
Sampling
Water samples were collected for environmental data and bacterioplankton
composition and biomass. The collection occurred during the winter, during 7 days,
from July 31 to August 6, 2013 at the central point of Lake Mangueira (Figure 1).
Sampling occurred every four hours (2h, 6h, 10h, 14h, 18h, 22h), totaling 6 samples per
day, using two ISCO 6712 automatic samplers with the insulating canister, containing
twelve 1 liter samples containers, which were installed in the central tower of Lake
Mangueira.
130

Capítulo 4. Resistance and resilience of aquatic bacterial community over a cold front event
Figure 1 Study area, in particular the sampling station in the pelagic zone of
Lake Mangueira.
Bacterial community
We first performed a pre-filtration of the crude sample directly from the automatic
sampler, using a 10 μm mesh sieve. Samples destined for biomass analysis were then
fixed in 40% formalin (9: 1 vol: vol) in plastic polyethylene bottles. Biomass,
131

Capítulo 4. Resistance and resilience of aquatic bacterial community over a cold front event
biovolume and bacterial morphotypes were accessed by filtration of 5 ml of sample in a
Vacuum Mainfold Filtration Tower (Millipore). The cells were concentrated onto black
polycarbonate membrane sample of 0.22 μm pore size and 25 mm diameter (GE) and
1ml of 10% of acridine orange stain was added to the filters for 5 min, and then washed
with pre-filtered Mili-Q (0.2µm) water and air dried. Filters were arranged in slides with
mineral oil and images (MOTIC image 3.2) were captured through an inverted
epifluorescence microscope, according to Massana et al (1997). These images were
processed through the CMEIAS software of Image Tool 1.27 (Liu et al, 2001) for
classification of morphotypes, density, biomass and biovolume values. By statistical
classification the program allows to classify 11 bacterial morphotypes (Coccus, Spiral,
Curved Rod, U-Shaped Rod, Regular Rod, Unbranched Rod, Ellipsoid, Club,
Prosthecate, Rudimentary Branched Rod and Branched Filament). From the specific
equations (Massana et al, 1997), the biovolume (μm3) is calculated and converted to
carbon, generating the biomass in pgC (Norland, 1993).
For the bacterial community composition (BCC), 500 ml of prefiltered water
sample were field-filtered on polyethersulfone membrane with 0.22 μm pore size and 47
μm in diameter (Milipore). After filtration, the filter was cooled to -20 oC until it
returned to the laboratory where it was conditioned at -80 oC until analysis. The
composition of the bacterial community was accessed through DNA extraction as Lima
et al. (2016). Ribosomal intergenic space amplification analysis (ARISA) was
performed according to Fisher and Triplett (1999), Yannarell et al. (2003) and Jones
and McMahon, (2009). The BCC data were obtained as operational taxonomic units
(OTUs).
132

Capítulo 4. Resistance and resilience of aquatic bacterial community over a cold front event
Environmental variables
Air temperature, wind velocity (WV) and direction (WD), chlorophyll
fluorescence (ChlF), and chromophoric dissolved organic matter (cDOM) were
collected directly from instruments installed in the center of the lake tower. Total
suspended solids (TSS) was assessed gravimetrically by water evaporation in porcelain
dishes (APHA, 1999). Nutrients, including total nitrogen (TN) was measured through
colorimetric methods following APHA (1999), and total phosphorus (TP) followed
Mackereth et al. (1989). A Carbon Analyzer (Shimadzu VCPH) was used to determine
the dissolved organic carbon (DOC) of the fraction that passed through a 450ºC pre-
combusted glass fiber filter (0.45 μm mean mesh size).
Data analysis
The microbial community composition and morphotypes were tested for its
resilience and resistance after disturbances comparing the composition of the pre-
disturbance bacterial assembly with each subsequent day (disturb and post-disturbance)
by one-way non-parametric MANOVA (PERMANOVA), using the similarity of Bray-
Curtis. Bacterial biomass, however, being a single variable, was tested by grouping pre,
disturb and post-disturb values through one-way non-parametric ANOVA (NP
MANOVA in univariate mode) (Anderson, 2001). The changes in environmental
conditions were also evaluated in pre, disturb and post-disturb through PERMANOVA,
comparing to the Euclidean distance data previously transformed into log (x + 1). The
null hypothesis (P> 0.05) is that the community and the environment are resistant if
there are no differences, and the alternative hypothesis (P<0.05) the community and
environment are not resistant. A similarity percentage analysis (SIMPER) was perfomed
133

Capítulo 4. Resistance and resilience of aquatic bacterial community over a cold front event
for morphotype data to evaluate the contribution of each morphotypes along the cold
front event.
To evaluate the relationship between environmental conditions with the bacterial
community, we performed a Spearman correlation between bacterial biomass and
environmental conditions, and two redundancy analyzes (RDA): one between
environmental variables and biomass and morphotypes and another between
environmental conditions and BCC.
Results
The cold front period showed in figure 2. Through the local environmental conditions
graphics, we verified that during the 7 days of short-term cold front event, the beginning
of the cold front is marked mainly by temperature drop. Also the period is marked by an
increase of wind speed, chlorophyll fluorescence, chromophoric dissolved organic
matter, total solid suspended, total phosphorus, and dissolved organic matter from the
second day of sampling, until, approximately the penultimate day (Figure 2).
Accordingly, the environmental variation over seven days of event (including pre,
during and post-disturbance) showed significant differences (PERMANOVA; F = 6.46;
P = 0.0019).
Related to the aquatic bacterial community, a total of 158 OTUs were detected by
ARISA, of which 96 OTUs occurred before the disturbance, 151 OTUs during the
disturbance, and 102 OTUs post-disturb. The bacterial biomass and morphotypes varied
significantly along the seven days of short-term cold front event (PERANOVA; F =
68.82, P <0.0001; F=11.56, P<0.0001, respectively). However the BCC did not varied
significantly (PERMANOVA, F= 1.164; P=0.2622).
134

Capítulo 4. Resistance and resilience of aquatic bacterial community over a cold front event
The environmental conditions changed during the disturbance (P=0.0216)
followed by return to its original conditions (P=0.19) (Figure 2). The bacterial biomass
average increased significantly (P<0.0001) during the disturb (96.35±23.36) comparing
to the pre-disturbance period (6.87±2.69) and post-disturbance (14.97±9.91). After the
cold front ended, the biomass returned to the initial condition, that is, did not differ
significantly from the pre-disturb period (P = 0.07) (Figure 3). In contrast, the bacterial
morphotypes changed during the disturbance (P<0.0001) but did not return to its
original (pre-disturb) condition (P=0.0117).
Overall, the coccus form was predominant in the community over all period,
including pre, disturb and post-disturb. Nevertheless there was an increase in other
morphotypes, along with a reduction of coccus, during disturb. Although at post-disturb,
the coccus form increased their contribution, in relation to the reduction of the other
morphotypes (Figure 4; Table 1), this variation did not represent a significant recovery
to the preconditions.
135

Capítulo 4. Resistance and resilience of aquatic bacterial community over a cold front event
Figure 2 Variation of environmental conditions measured during seven days of six
daily sampling along the short-term cold front event, totalizing 42 samples. Except for
total solid suspended, total phosphorus and dissolved organic carbon, in which for the
first day of sampling we have only two samples, and for the second day sampling, four
samples, totalizing 36 samples during seven days.
136

Capítulo 4. Resistance and resilience of aquatic bacterial community over a cold front event
Figure 3. Bacterial biomass concentration values, indicating variation along the cold
front (seven days, with six daily samplings), including pre, disturb and post-disturb
periods. Numbers in the box are average and standard deviation.
137
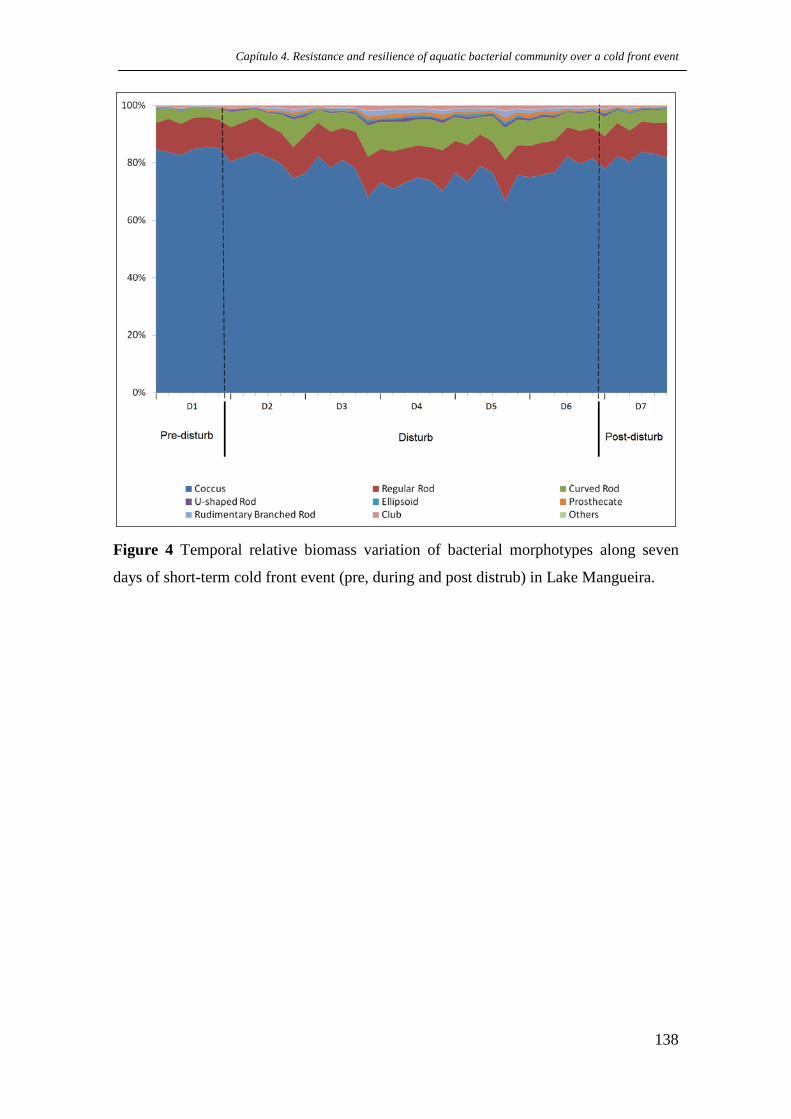
Capítulo 4. Resistance and resilience of aquatic bacterial community over a cold front event
Figure 4 Temporal relative biomass variation of bacterial morphotypes along seven
days of short-term cold front event (pre, during and post distrub) in Lake Mangueira.
138

Capítulo 4. Resistance and resilience of aquatic bacterial community over a cold front event
Table 1 SIMPER analysis of morphotypes comparing the contribution of each and the mean abundance between pre-disturb x disturb, pre-
disturb x post-disturb and disturb x post-disturb.
Contribution Cumulative % Mean abundance Mean abundance Pre-disturb Disturb Coccus 3.8750 48.98 0.8450 0.7670 Curved Rod 1.9040 73.05 0.0383 0.0757 Regular Rod 0.7416 82.42 0.1050 0.1180 Rudimentary Branched Rod 0.3868 87.31 0.0022 0.0099 Club 0.3315 91.5 0.0039 0.0102 Prosthecate 0.3079 95.4 0.0026 0.0086 U-shaped Rod 0.2537 98.6 0.0014 0.0065 Ellipsoid 0.1017 99.89 0.0024 0.0038 Others 0.0088 100 0.0000 0.0002 Pre-disturb Post-disturb Coccus 1.4870 46.16 0.8450 0.8160 Curved Rod 0.6548 66.47 0.0383 0.0509 Regular Rod 0.4724 81.13 0.1050 0.1120 Club 0.1528 85.87 0.0039 0.0057 Rudimentary Branched Rod 0.1321 89.97 0.0022 0.0034 U-shaped Rod 0.1306 94.03 0.0014 0.0040 Prosthecate 0.1218 97.81 0.0026 0.0047 Ellipsoid 0.0707 100 0.0024 0.0035 Others 0.0000 100 0.0000 0.0000
139

Capítulo 4. Resistance and resilience of aquatic bacterial community over a cold front event
Contribution Cumulative % Mean abundance Mean abundance Disturb Post-disturb Coccus 2.7230 46.79 0.7670 0.8160 Curved Rod 1.4340 71.43 0.0757 0.0509 Regular Rod 0.5214 80.39 0.1180 0.1120 Rudimentary Branched Rod 0.3590 86.56 0.0099 0.0034 Club 0.2663 91.13 0.0102 0.0057 Prosthecate 0.2427 95.3 0.0086 0.0047 U-shaped Rod 0.1737 98.29 0.0065 0.0040 Ellipsoid 0.0908 99.85 0.0038 0.0035 Others 0.0088 100 0.0002 0.0000
140
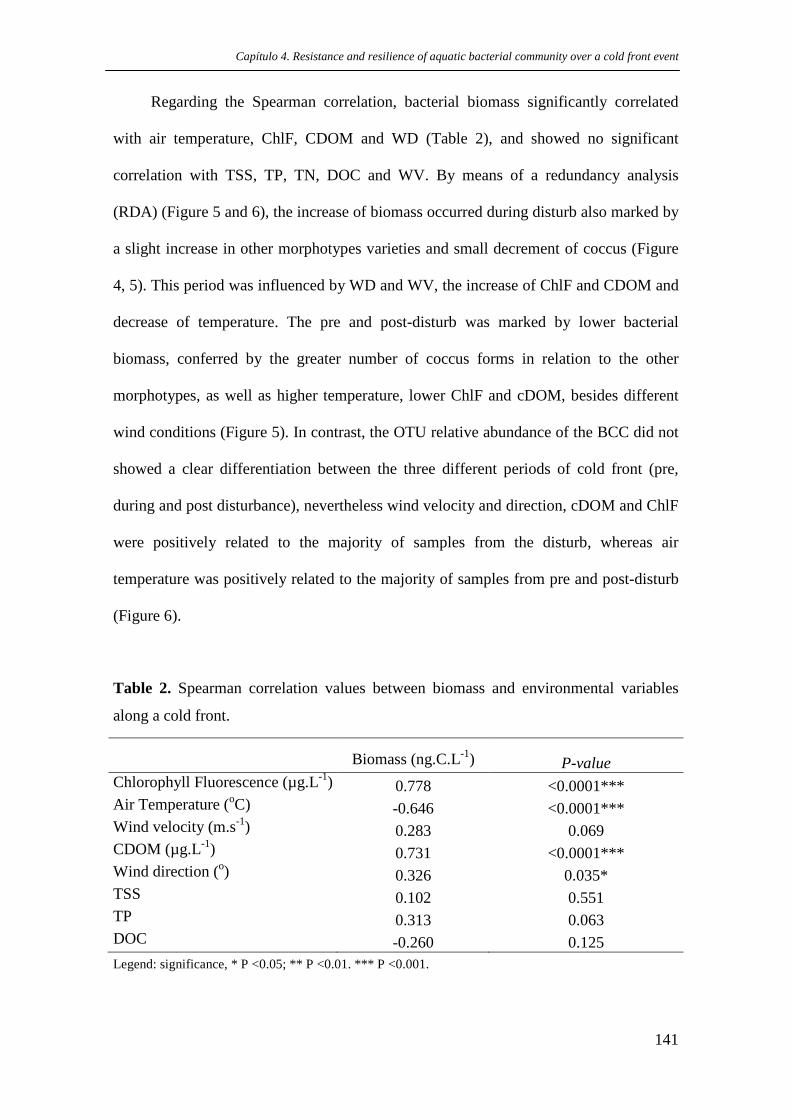
Capítulo 4. Resistance and resilience of aquatic bacterial community over a cold front event
Regarding the Spearman correlation, bacterial biomass significantly correlated
with air temperature, ChlF, CDOM and WD (Table 2), and showed no significant
correlation with TSS, TP, TN, DOC and WV. By means of a redundancy analysis
(RDA) (Figure 5 and 6), the increase of biomass occurred during disturb also marked by
a slight increase in other morphotypes varieties and small decrement of coccus (Figure
4, 5). This period was influenced by WD and WV, the increase of ChlF and CDOM and
decrease of temperature. The pre and post-disturb was marked by lower bacterial
biomass, conferred by the greater number of coccus forms in relation to the other
morphotypes, as well as higher temperature, lower ChlF and cDOM, besides different
wind conditions (Figure 5). In contrast, the OTU relative abundance of the BCC did not
showed a clear differentiation between the three different periods of cold front (pre,
during and post disturbance), nevertheless wind velocity and direction, cDOM and ChlF
were positively related to the majority of samples from the disturb, whereas air
temperature was positively related to the majority of samples from pre and post-disturb
(Figure 6).
Table 2. Spearman correlation values between biomass and environmental variables
along a cold front.
Biomass (ng.C.L-1) P-value Chlorophyll Fluorescence (µg.L-1) 0.778 <0.0001*** Air Temperature (oC) -0.646 <0.0001*** Wind velocity (m.s-1) 0.283 0.069 CDOM (µg.L-1) 0.731 <0.0001*** Wind direction (o) 0.326 0.035* TSS 0.102 0.551 TP 0.313 0.063 DOC -0.260 0.125 Legend: significance, * P <0.05; ** P <0.01. *** P <0.001.
141

Capítulo 4. Resistance and resilience of aquatic bacterial community over a cold front event
Figure 5 Redundancy analyses (RDA biplot) between bacterial biomass, bacterial
morphotypes and environmental variables. Temp: air temperature; WD: wind direction;
WS: Wind velocity; ChlF: chlorophyll fluorescence; cDOM: chromophoric dissolved
organic matter.
142

Capítulo 4. Resistance and resilience of aquatic bacterial community over a cold front event
Figure 6 RDA biplot between bacterial composition and environmental variables.
Temp: air temperature; WD: wind direction; WS: Wind velocity; ChlF: chlorophyll
fluorescence; cDOM: Organic matter dissolved chromophoric.
Discussion
Overall, we found that the bacterial community in terms of biomass and morphotypes
varied over the cold front event in response to the change in environmental conditions.
However, the BCC did not follow this tendency. In this way, bacterial biomass of Lake
Mangueira changed during the disturbance, recovering after the occurrence of the event,
suggesting a resilience-type response, as a result of environmental variability along de
cold front. The morphtypes also changed during disturbance, but were not immediately
143

Capítulo 4. Resistance and resilience of aquatic bacterial community over a cold front event
resilient to it. The BCC, in contrast, did not change over all the short-term cold front
event, in which variation in OTU relative abundance were randomly.
The response of the bacterial biomass and morphotypes along to the cold front
event may be a result of short-term hydrodynamics conditions variation. When the cold
fronts reach coastal lakes the colder air passes over lakes and the long fetch, due to
prevailing northeast or southeast winds parallel to the main axis of the lake, displaces
water, mixing the water column more than usually occurs within shallow lakes (Fragoso
et al. 2008; Tundisi et al. 2010). Hence, the wind-driven environment promotes great
resuspension of the sediment in water column, and changes in environmental
conditions, as physical, chemical, and in biological descriptors (Cardoso and Motta-
Marques 2009), although no significant relationship were observed between TSS, and
suspended nutrients. Such changes in the water column may potentially have a major
impact on the aquatic microbial community (Shade et al. 2012b), because when the
water column mixes, there is thermal and chemical homogenization and such gradients
are known to influence the microbial distribution (Weithoff et al., 2000). In Lake
Mangueira, the increasing in cDOM and ChlF, for example, and also the recruitment of
benthic bacteria in the water column, previously only available in the sediment, were
directly or indirectly affected by hydrodynamics, thus contributing for the increasing in
biomass and morphotypes variety to the community, but not affecting BCC structure,
which remained resistant to the perturbation.
Baho et al. (2012) suggest that the bacterial response to disorder might be likely
due to temporal and spatial refuges that facilitate community to resist or recover acting
analogous to a regional species pool in a metacommunity. In which higher species
diversity may dampen disorders dynamics within a community (Allison, 2004). In this
144

Capítulo 4. Resistance and resilience of aquatic bacterial community over a cold front event
context, is reasonable to assume that repeated perturbations shape communities to be
more resistant or resilient.
The community stability is a response to disturbances, reflecting the sensitivity or
insensitivity to a stressor agent. It is recognized, mainly as the resilience or resistance of
the community in response to the disturbance (Pimm, 1984). Thus, the community can
present mechanisms of resilience and, therefore, the capacity to recover after a
disturbance (Allison and Martiny, 2008). The microbial community may also be
resistant and thus withstand the disturbances (Pimm, 1984; Allison and Martiny, 2008).
Also the microbial composition can be sensitive to disturbances, but not immediately
resilient to it, regardless of the taxonomic range of the group or the type of disorder
(Allison and Martiny 2008). However, depending on the type of disorder, it is possible
to verify distinct behaviors in the community. Jones et al. (2009), for example, observed
that the bacterial community exhibited many characteristics of secondary succession,
initiated after large infrequent disturbances, but which induced some interesting
differences. Allison and Martiny (2008) suggest that as the frequency of disturbances
increases, if the composition of the bacterial community is very resilient, it may be less
likely to detect compositional change (confounding the stability conferred by high
resilience as resistance). However, Shade et al. (2012a) complain that the community's
report of the disorder's sensitivity in many studies may be a reflection of the lack of
publication of studies in which no changes in composition and/or function were found
after disturbance, reflecting a potential trend of the results.
In this study, the bacterial community changed after the disturbance, exhibiting
biomass sensitivity immediately to the beginning of the perturbation event, followed by
quick post-disturbance recovery, thus being resiliente of the event. Bacterial
145

Capítulo 4. Resistance and resilience of aquatic bacterial community over a cold front event
morphotypes also immediately changed during the event, but were not promptly
resilient. In contrast bacterial composition showed resistant to the perturbation.
In conclusion, these findings have implications for the understanding of bacterial
community responses on the effects of environmental disturbances on short-term
temporal scales. As far as we know, it was the first time that microbial community
(composition, structure, biomass and morphotypes) was investigated for their response
to a disturbance event in subtropical coastal shallow lake.
Acknowledgments
This study was supported by the Conselho Nacional de Desenvolvimento Científico e
Tecnológico (CNPq), Brazil. We acknowledge the assistance provided by the Instituto
Chico Mendes de Conservação da Biodiversidade (ICMBio) and Estacão Ecológica do
TAIM (ESEC-Taim), Ministério do Meio Ambiente, Brazil. We are also grateful to the
Global Lake Ecological Observatory Network (GLEON) for providing venue and
resources for lake science discussions. M. S. Lima also received support through a
doctoral scholarship from Programa de Pós Graduação em Recursos Hídricos e
Saneamento Ambiental, Instituto de Pesquisas Hidráulicas (CNPq 141228/2012-1).
References
Allison G. (2004). The influence of species diversity and stress intensity on community resistance and resilience. Ecol Monogr 74:117-134.
Allison SD, Martiny JBH. (2008). Resistance, resilience, and redundancy in microbial communities. Proc. Natl. Acad. Sci.U.S.A. 105, 11512–11519.
Anderson MJ. (2001). A new method for non-parametric multivariate analysis of variance. Austral Ecol. 26, 32–46.
146
Capítulo 4. Resistance and resilience of aquatic bacterial community over a cold front event
Azam F, Fenchel T, Field JG, Gray JS, Meyer-Reil LA, Thigstad F. (1983). The ecological role of water-column microbes in the sea. Marine Ecology Progress Series. 10:257-263.
Baho DL, Peter H, Tranvik LJ. (2012). Resistance and resilience of microbial communities – temporal and spatial insurance against perturbations. Environ Microbiol 14: 2283-2292
Britto FP, Krusche N, (1996). Freqüência e intensidade das frentes frias em Rio Grande. IX Congresso Brasileiro de Meteorologia. Campos do Jordão, São Paulo. p: 185-188.
Cardoso LS, Motta-Marques DM. (2009). Hydrodynamics-driven plankton community in a shallow lake. Aquat Ecol 43: 73-84.
Cardoso LS, Fragoso CR, Souza RS, Marques DM. (2012). Hydrodynamic Control of Plankton Spatial and Temporal Heterogeneity in Subtropical Shallow Lakes, Hydrodynamics - Natural Water Bodies, Prof. Harry Schulz (Ed.), ISBN: 978-953-307-893-9, InTech, Available from: http://www.intechopen.com/books/hydrodynamics-natural-water-bodies/hydrodynamic-control-of-plankton-spatial-and-temporal-heterogeneity-in-subtropical-shallow-lakes
Carey CC, Ibelings BW, Hoffmann EP, Hamilton DP, Brookes JD. (2012). Eco-physiological adaptations that favour freshwater cyanobacteria in a changing climate. Waterres.46:1394–1407, doi:10.1016/j.watres.2011.12.01
Cole JJ. (1999). Aquatic microbiology for ecosystem scientists: new and recycled paradigms in ecological microbiology. Ecosystems 2:215-225.
Crossetti LO, Becker V, Cardoso LS, Rodrigues LR, Costa LS, Motta-Marques D. (2013) Is phytoplankton functional classification a suitable tool to investigate spatial heterogeneity in a subtropical shallow lake? Limnologica 43:157-163.
Ferreira TF. (2005). Ecologia e aplicabilidade de métodos para avaliação da produção primária de Zizaniopsis bonariensis: uma macrófita aquática emergente, no Sistema Hidrológico do Taim, RS. Dissertação de Mestrado, Universidade Federal do Rio Grande do Sul, Porto Alegre, 141p.
Fisher MM, Triplett EW. (1999). Automated approach for ribosomal intergenic spacer analysis of microbial diversity and its application to freshwater bacterial communities. Applied and Environmental Microbiology 65:4630–4636.
Fragoso Jr. CR, Motta Marques D, Collischonn W, Tucci C, Van Nes E. (2008). Modelling spatial heterogeneity of phytoplankton in Lake Mangueira, a large shallow subtropical lake in South Brazil. Ecolog. Model., 219, 125-137.
Graham MD, Vinebrooke RD (2009). Extreme weather events alter planktonic communities in boreal lakes. Limnol. Oceanogr., 54: 2481-2492.
Gulledge J, Doyle AP, Schimel JP. (1997). Low-concentration kinetics of atmoshperic CH4 oxidation in soil and mechanism of NH4_ inhibition. Appl Environ Microbiol 64:4291–4298.
147

Capítulo 4. Resistance and resilience of aquatic bacterial community over a cold front event
Intergovernmental Panel on Climate Change. (2007). Climate Change 2007 Synthesis Report, eds R. K. Pachauri and A. Reisinger (Geneva).
Jones SE, Kratz TK, Chiu CY, McMahon KD. (2009). Influence of typhoons on annual CO2 flux from a subtropical, humic lake. Global Change Biology, 15:243-254.
Jones SE, McMahon KD. (2009). Species-sorting may explain an apparent minimal effect of immigration on freshwater bacterial community dynamics. Environmental Microbiology 11:905-913.
Lake P. (2000). Disturbance, patchiness and species diversity in streams. J. North Am. Benthol. Soc. 19, 573–592.
Lima MS, Motta Marques D, They NgH, McMahon KD, Rodrigues LR, Cardoso LS, Crossetti LO. (2016). Contrasting factors drive within-lake bacterial community composition and functional traits in a large shallow subtropical lake. DOI – 10.1007/s10750-015-2610-9.
Liu J, Dazzo FB, Glagoleva O, Yu B, Jain AK. (2001). CMEIAS: a computer-aided system for the image analysis of bacterial morphotypes in microbial communities. Microbial Ecology 41: 173–194.
Massana R, Gasol JM, Bjørnsen PK, Black-Burn N, Hagström A, Hietanen S, Hygum BH, Kuparinen J, Pedrós-Alió C. (1997). Measurement of bacterial size via image analysis of epifluorescence preparations: description of an inexpensive system and solutions to some of the most common problems. Scientia Marina 61: 397–407.
McKew BA, Taylor JD, McGenity TJ, Underwood GJC. (2011). Resistance and resilience of bentic biofilm communities from a temperate saltmarsh to desiccation and rewetting. ISME J 5:30-41
Nelson CE. (2009) Phenology of high-elevation pelagic bacteria: the roles of meteorologic variability, catchment inputs and thermal stratification in structuring communities. ISME J 3: 13-30.
Norland S. (1993). The relationship between biomass and volume of bacteria. In Kemp, PF, Sherr BF, Sherr EB, Cole JJ (eds), Handbook of Methods in Aquatic Microbial Ecology. Lewis Publishers, USA: 339–345, 777 pp.
Pimm SL. (1984). The complexity and stability of ecosystems. Nature 307, 321–326.
Scheffer M, Carpenter SR, Foley JA, Folke C, Walker B. (2001). Catastrophic shifts in ecosystems. Nature, 413, 591-596.
Schimel JP, Gulledge J. (1998). Microbial community structure and global trace gases.Glob Change Biol 4:745–758.
Seluchi ME, Marengo JA. (2000). Tropical mid latitude exchange of air masses during summer and winter in South America: Climatic aspects and examples of intense events. International Journal of Climatology 20:1167-1190.
148
Capítulo 4. Resistance and resilience of aquatic bacterial community over a cold front event
Shade A, Chiu CY, McMahon KD. (2010). Differential bacterial dynamics promote emergent community robustness to lake mixing: an epilimnion to hypolimnion transplant experiment. Environm Microbiol 12:455-466.
Shade A, Read JS, Youngblut ND, Fierer N, Knight R, Kratz TK, Lottig NR, Roden EE, Stanley EH, Stombaugh J, Whitaker RJ, Wu CH, McMahon KD. (2012b). Lake microbial communities are resilient after a whole-ecosystem disturbance. The ISME Journal Multidisciplinary Journal of Microbial Ecology.
Shade A, Peter H, Allison SD, Baho DL, Berga M, Bürgmann H, Huber DH, Langenheder S, Lennon JT, Martiny JBH, Matulich KL, Schmidt TM, Handelsman J. (2012a). Fundamentals of microbial community resistance and resilience. Frontiers in microbiology, 3(December), 417. doi:10.3389/fmicb.2012.00417.
Tundisi JG, Matsumura-Tundisi T, Pereira KC, Luzia AP, Passerini MD, Chiba WAC, Morais MA, Sebastien NY. (2010). Cold fronts and reservoir limnology: an integrated approach towards the ecological dynamics of freshwater ecosystems. Brazilian Journal of Biology 70:815-824.
Tundisi JG. (1983). A review of basic ecological processes interacting with production and standing-stock of phytoplankton in lakes and reservoirs in Brazil. Hydrobiologia100:223-243.
Weithoff G, Lorke A, Walz N. (2000). Effects of water column mixing on bacteria, phytoplankton, and rotifers under different levels of herbivory in a shallow eutrophic lake. Oecologia 125: 91–100.
Wertz S, Degrange V, Prosser JI, Poly F, Commeaux C, Guillaumaud N, Le Roux X. (2007). Decline of soil microbial diversity does not influence the resistance and resilience of key soil microbial functional groups following a model disturbance. Environ Microbiol 9:2211-2219.
White PS, Pickett STA. (1985). The ecology of natural disturbance and patch dynamics. Academic Press.
Yannarell AC, Kent AD, Lauster GH, Kratz TK, Triplett EW. (2003). Temporal patterns in bacterial communities in three temperate lakes of different trophic status. Microbial Ecology 46:391–405.
149

Capítulo 5.Discussão geral
Capítulo 5. Discussão Geral
Os trabalhos desenvolvidos nesta tese avaliaram a dinâmica da comunidade
bacteriana em termos de composição, consumo de fontes de carbono e biomassa em
múltiplas escalas espaciais e temporais. Esses estudos utilizaram diferentes amostragens e
estratégias para avaliar amplamente o efeito das escalas espaciais e temporais, das variáveis
ambientais e biológicas (biomassa fitoplanctônica), de paisagem e meteorológicas sobre a
comunidade bacteriana. Os estudos foram conduzidos em dois sistemas lacunares distintos:
i) Sistema Hidrológico do Taim, lagoa Mangueira e ii) Sistema Hidrológico do Rio
Tramandaí, em 25 lagoas. Ambos os sistemas caracterizam-se por serem rasos, costeiros e
de clima subtropical, sobre grande influência da hidrodinâmica devido à velocidade e
direção dos ventos (Cardoso e Motta Marques, 2007; Fragoso Jr. et al., 2010), que tem
grande efeito sobre a homogeneização da coluna d’água (Tundisi, 1983; Tundisi et al.,
2010) o qual tende a promover alta conectividade intra-lagoa.
No primeiro trabalho desenvolvido (Capítulo 2) a CCB e os AF apresentaram
dinâmica temporal e espacial, sendo que a dinâmica temporal foi mais significativa que a
dinâmica espacial. O padrão temporal verificado pode estar ligado a vários aspectos: i)
uma dependência do ciclo fenológico de outros componentes do elo microbiano, tais
como fitoplâncton e zooplâncton (Kent et al., 2004; Kent et al., 2007), provavelmente
como consequência da influência da produção fitoplanctônica sobre o bacterioplâncton,
através dos exsudatos de matéria orgânica dissolvida (MOD) (Baines e Pace, 1991; del
Giorgio e Cole, 1998; Cotner e Biddanda, 2002; Eiler e Bertilsson, 2004; Tada e
Suzuki, 2016; Lima et al., 2016); ii) reflexo do decaimento da similaridade ao longo do
tempo e do tamanho do ecossistema, conforme relatado para várias espécies plantônicas
(Korhonen et al., 2010); além de iii) variações de temperatura e de disponibilidade de
nutrientes e substratos orgânicos (Dickerson e Williams, 2014).
150

Capítulo 5.Discussão geral
O padrão espacial, embora mais fraco que o temporal, não foi menos importante,
trazendo grandes implicações à importância do papel da heterogeneidade intra-lagoa para
o funcionamento do ecossistema e as implicações para a escala apropriada para usar em
amostragem de comunidades bacterianas. De maneira geral, foram observados efeitos
contrastantes governando a composição e os AF da comunidade intra-lagoa. Em termos
composicionais a dinâmica da comunidade bacteriana foi fortemente influenciada pelos
filtros ambientais (variáveis ambientais e fitoplanctônicas), reforçando o papel da species
sorting na composição da comunidade, demonstrando que barreiras de dispersão bacteriana,
devido à grande distância entre os extremos norte e sul da lagoa foram sobrepostas pela alta
conectividade da lagoa, conferida pela hidrodinâmica (velocidade do vento e mistura da
coluna d’água). Já a influência exclusiva do espaço para os AF é um dos primeiros registros
de dispersão dos AF, mostrada pela menor escala de variação (~49km) dentro da lagoa.
Esse padrão inesperado pode estar sendo impulsionado pela dispersão genética, pelos
efeitos indiretos das condições locais sobre taxa bacteriana migrante e/ou as bactérias
aderidas ao sedimento.
O segundo trabalho desenvolvido nesta tese, apresentado no capítulo 3, indicou
que o padrão de distribuição da diversidade beta bacteriana aquática, independente da
escala dentro e entre as 25 lagoas foi principalmente caracterizado pelo turnover,
indicando que as variações da CCB ocorrem principalmente pela substituição de
espécies, invés da perda de espécies. Em geral microorganismos são abundantes, com
curto tempo de geração e altas taxas de mutação, características que produzem variação
genética, que juntamente com a diversidade fisiológica viabilizam a diversificação,
sendo importante para a especiação microbiana (Horner-Devine et al., 2004; Foissner,
2008) e permitindo ampla dispersão e baixa taxa de extinção em escalas locais (Fenchel
e Finlay, 2004) Por outro lado, a alta densidade que apresentam tende a favorecer a
homogeneização ao longo dos habitats, porém, conforme observado neste estudo,
151

Capítulo 5.Discussão geral
dissimilaridades na estrutura e composição bacteriana foram influenciadas por filtros
ambientais, tais como a heterogeneidade ambiental e heterogeneidade na composição do
fitoplâncton. E essa contribuição significativa dos filtros ambientais sobre a diversidade
beta bacteriana (βSor, βSim and Bray-Curtis dissimilarity), enfatiza a regulação da
distribuição da metacomunidade bacteriana por species sorting (Chase e Leibold, 2003;
Leibold et al., 2004). No entanto, o fator espacial também foi observado, influenciando
a distribuição da CCB. Neste caso, porém, esse fator, surpreendentemente, revelou que
a diversidade beta dada pela dissimilaridade de Simpson (turnover) não apresentou a
esperada relação positiva com a distância (i.e distance-decay; Nekola e White 1999;
Heino et al., 2013; Heino et al., 2015), pelo contrário, descresceu; enquanto que o
padrão aninhado de distribuição apresentou essa relação positiva com a distância
espacial. Esse resultado aponta para várias explicações alternativas, dentre elas, ser
consequência de interações de respostas ambientais espécie-específica que podem estar
espacialmente estruturadas e não foram avaliadas neste estudo. Com relação à variação
da diversidade beta intra-lagos entre as lagoas, não foi confirmada variação
significativa, além disso, nenhuma variável explicou a variação da diversidade beta
melhor do que um modelo nulo sem variáveis.
Já o terceiro estudo, apresentado no capítulo 4 revelou as respostas da
comunidade bacteriana (em termos composicionais, estruturais, de biomassa e
morfotipos), frente a distúrbio climático de curta duração provocado por frentes frias.
Nesse contexto, a estrutura e composição da comunidade bacteriana mostrou-se
resistente ao longo de todo o distrúbio. Contrastando essa resposta, a biomassa
bacteriana e os morfotipos apresentarammudanças significativas em resposta à entrada
da frente, ocorrendo um aumento da biomassa durante o distúrbio, juntamente com um
pequeno recrutamento de outras formas de morfotipos, em relação à pequena redução da
152

Capítulo 5.Discussão geral
contribuição de coccus para a comunidades. Cessada a frente fria a biomassa retornou à
sua condição original juntamente com o aumento de formas coccus e redução das
demais formas. Entretanto, a resposta dos morfotipos após a passagem da frente fria não
refletiu um retorno à condição original anterior ao distúrbio. A variação desses
descritores ao longo da passagem da fente fria pode ser reflexo das alterações das
condiçoes ambientais, no que se refere ao revolvimento do fundo, trazendo à coluna
d’água bacterias do sedimento que antes não estavam disponíveis.
Esses resultados demonstram a habilidade da comunidade a responder ao
distúrbio, seja sofrendo alterações e se recuperando caracterizando-se por ser resiliente
ou não sofrendo alterações significativas e se caracterizando por ser resistente ao
distúrbio. Esse resultado traz grandes implicações ao estudo da estabilidade de
comunidades bacterianas, agregando mais informação a respeito de suas dinâmicas
frente a distúrbios.
Finalmente, nossos resultados sugerem como é importante considerar múltiplas
escalas espaciais para a compreensão da biogeografia microbiana e escalas temporais
para a compreensão da resposta bacteriana frente a distúrbios, uma vez que a maioria
dos padrões ecológicos e processo são escala dependentes (Levin, 1992; Logue et al.,
2011; Moritz et al., 2013; Stein, 2014). Nesse contexto temos que a menor escala de
heterogeneidade bacteriana detectada pode estar positivamente relacionada ao tamanho
do lago, conforme apontado no capítulo 2, , fortalecendo o papel dos fatores locais na
estruturação da CCB em sistemas altamente conectados e surpreendentemente dos
fatores espacias na estruturação das características funcionais. Ou como apontado no
capítulo 3, que a relação entre a beta diversidade bacteriana e a heterogeneidade
ambiental responde a diferentes escalas, nas quais a diversidade beta bacteriana é
resultado de species-sorting entre lagoas, enquanto que intra-lagos a ausência de
153

Capítulo 5.Discussão geral
explicação das variáveis ambientais sobre diversidade beta, pode ser o reflexo do efeito
de massa (Leibold et al., 2004). E finalmente, no útlimo capítulo 4, de que comunidade
bacteriana responde às mudanças do sistema apresentando diferentes respostas de
estabilidade: mudança sem recuperação, resiliência e resistência.
Neste contexto, as interações de múltiplos fatores ambientais embutidos nessas
múltiplas escalas também se mostraram relevantes para compreender a variabilidade da
comunidade bacteriana aquática. A hidrodinâmica das lagoas, por exemplo, é um fator
potencial responsável pela maior conectividade dentro e entre lagoas, devido ao longo
fetch e a intensidade dos ventos, influenciando as condiçoes ambientais das lagoas e
provocando a mistura interna. E nesse estudo a hidrodinâmica, sendo com efeito direto
ou indireto sobre as condições ambientais influenciou a composiçao, a estrutura, a
função, a diversidade beta bacteriana e a biomassa nas múltiplas escalas estudadas.
Outro fator relevante é a paisagem, que tende a provocar efeitos sobre a composição das
comunidades. Medidas de conectividade, área do lago, distância do mar, distância entre
lagoas são fatores que ajudam a investigar limitações de dispersão. A conectividade, por
exemplo, é um fator central para o estudo da ecologia de metacomunidades (Leibold et
al., 2004;. Heino, 2013). Considerando que a conectividade em sistemas aquáticos é
comumente sinônimo de isolamento, lagos geralmente são ligados entre si por
diferentes tipos e graus de conectividade (Guimarães et al., 2014; Heino et al., 2015).
Desta forma, a conectividade em lagos pode representar eficiência diferente como filtros
de limitação de dispersão, dependendo do organismo estudado. De maneira geral,
organismos aquáticos com limitação de motilidade (por exemplo, crustáceo,
zooplâncton e peixe) podem ser muito mais afetados por fatores espaciais do que por
fatores ambientais. Nesse caso, em sistema de lagoas interligadas, seria de esperar maior
riqueza e similaridade na composição de espécies entre lagoas próximas, enquanto que
154
Capítulo 5.Discussão geral
em sistemas isolados ou com baixa conectividade, seria de esperar baixas taxas de
dispersão e colonização, onde a riqueza é o resultado da área da lagoa e as condições
ambientais locais (e.g. Heino e Muotka, 2006;. Shurin et al., 2009). No entanto, para os
microorganismos, esses tendem a ser mais afetados por fatores ambientais que pelo
espaço (Beisner et al., 2006; Jones e McMahon, 2009; Souffreau et al., 2015; Lima et
al., 2016).
Neste contexto, as condições físicas e químicas do sistema atuam como um
conjunto de filtros para a distribuição da CCB, enfatizando a separação espacial de
nicho ecológico. Sugerindo que a autocorrelação espacial da estrutura ambiental
controla fortemente a metacomunidade. Assim taxa imigrantes são selecionados por
filtros ambientais ao atingirem a lagoa de destino, sendo que lagoas próximas tendem a
ser semelhante ambientalmente, abrigando espécies similares, em relação às lagoas mais
distantes (Lichstein et al., 2002;. Moritz et al., 2013).
Outro fator igualmente importante é a influência da composição da comunidade
fitoplanctônica, definindo padrões na CCB (Fuhrman et al., 1980; del Giorgio e Cole,
1998; Cotner e Biddanda, 2002; Eiler e Bertilsson, 2004; Jones et al., 2009). Tal relação
pode ser resultado da influência da produção fitoplanctônica sobre o bacterioplâncton
através dos exsudatos fitoplanctônicos (MOD), como também das interações específicas
entre fitoplâncton e bacterioplâncton (Baines e Pace, 1991; Kent et al., 2006; Kent et
al., 2007). Em vista disso, poderia se esperar que uma composição fitoplanctônica mais
variável resultaria em mais tipos de exsudados e, consequentemente, uma maior
diversidade bacteriana (Baines e Pace, 1991; Tada e Suzuki, 2016), de modo que a CCB
passa a ser afetada pela composição fitoplanctônica tanto quanto pelas condições físico-
químicas da lagoa.
155

Capítulo 5.Discussão geral
Outro fator de relevância para os estudos de comunidade bacteriana, igualmente
discutido nos capítulos anteriores, é a limitação dos métodos utilizados para acessar a CCB,
através do ARISA (Automated Ribossomal Intergenic Spacer Analysis) e os AF através do
consumo de fontes de carbono pelo Biolog EcoplateTM.
Com relação ao ARISA, é importante destacar que esse método, como tantos outros
métodos fingerprinting são tendenciosos para a detecção das OTUs mais abundantes,
pois a técnica utiliza a amplificação do DNA através de PCR, em que apenas espécies
com alta frequência de ocorrência (>1-2%; Murray et al., 1996; Nocker et al., 2007) serão
principalmente detectadas e até mesmo células mortas e inativas, devido à estabilidade
do DNA no ambiente. Embora apresente tais limitações, esse métodos é altamente
reprodutível, permitindo detectar diferenças composicionais de aproximadamente 0.05
ou mais através do índice de Sørensen, por exemplo (Jones et al., 2012). De maneira
geral, o ARISA pode detectar OTUs com uma única diferença de comprimento de onda
quando os fragmentos estão entre 300-1000bp de comprimento. Essa resolução decai
para 3-5pb, a medida que os comprimentos aumentam de 1000 para 1500bp
(comprimento máximo), isso devido à mancha ou alongamento de bandas que migram
através do capilar do sequenciador (Fisher e Triplett, 1999).
Como resultado, nossas análises negligenciam a provável contribuição de
numerosos membros raros da comunidade bacteriana aquática, sendo portanto, difícil
prever como a inclusão de membros mais raros de comunidades de bactérias aquáticas
impactariam os padrões aqui observados, uma vez que espécies raras possuem forte
sinal biogeográfico (Galand, 2009).
Com relação ao Biolog EcoplateTM, este ensaio foi utilizado para avaliar os
atributos funcionais da comunidade bacteriana através da variação na utilização das
fontes de carbono pela comunidade. Essa abordagem foi utilizada somente no capítulo 2
156

Capítulo 5.Discussão geral
deste trabalho. Esse ensaio oferece uma resposta interessante para o potencial
metabólico da comunidade microbiana, permitindo avaliar, simultaneamente, as
respostas ao consumo de 31 fontes de carbono distintas. Entretanto, ele não reflete a
função da comunidade microbiana global in situ, pois os substratos disponíveis nas
placas, não são necessariamente encontrados no ambiente de estudo, ou os substratos do
sistema aquático podem ser mais complexos do que aqueles no Ecoplate (Smalla et al.,
1998, Preston-Mafham et al., 2002). Ainda, esse ensaio poder ser seletivo, uma vez que a
avaliação de consumo do substrato se dá pela mudança de coloração, para leitura da
absorbância, a qual depende do crescimento de bactérias em altas densidades (> 108 células
mL-1) (Konopka et al., 1998), não representando todos os membros da comunidade,
embora a presença de membros raros possa ser detectada (Haack et al., 1995). Apesar
das limitações consideradas, esta técnica permite de forma rápida acessar a variabilidade
funcional da comunidade, sendo uma ferramenta valiosa que produz um rico conjunto
de dados, ideal para detectar e comparar diferenças específicas na diversidade funcional
microbiana ao longo de escalas espaciais e temporais (Zak et al., 1994, Garland, 1997).
157
Capítulo 5.Discussão geral
Conclusões
De maneira geral, conseguimos responder às perguntas propostas que nortearam
esse estudo.
Observamos que a composição da comunidade e seus atributos funcionais
variaram temporal e espacialmente. A variabilidade da composição foi explicada
principalmente pela atuação de filtros ambientais, tais como as condições físico-
químicas e a composição fitoplanctônica, indicando que as barreiras de dispersão pela
longa distância de norte a sul da lagoa Mangueira são superadas pela conectividade da
lagoa, e que a distribuição da CCB é explicada pelos fatores locais (species sorting). Já
a atividade bacteriana (AF), foi influenciada exclusivamente pelo espaço, devido
provavelmente à dispersão gênica, às bacterias migrantes e em suspensão e/ou aos
efeitos indiretos dos fatores locais.
Neste estudo também observou-se que a variabilidade intra-lagoa pode ser um
importante componente para a variabilidade geral e o funcionamento do sistema.
Portanto, estudos de biogeografia deveriam ser ampliados para incluir tais escalas de
variabilidade para explicar padrões ecológicos. Isso sugere a importância em se
considerar a escala de amostragem apropriada conforme o ambiente estudado.
Também verificamos que o turnover predominou para o padrão da diversidade
beta bacteriana tanto intra-lagoas como entre as 25 lagoas. Além disso, a diversidade
beta total, dada pela dissimilaridade de Sørensen foi positivamente relacionada à
dissimilaridade do fitoplâncton, enquanto que a dissimilaridade de Bray-Curtis e o
componente de turnover foram positivamente relacionados com a dissimilaridade
ambiental e fitoplanctônica. O turnover foi negativamente relacionado à distância
espacial entre os lagos, enquanto que o componente de aninhamento foi explicado
apenas pela distância espacial. Contrariamente à nossa expectativa, nenhuma variável
158
Capítulo 5.Discussão geral
explicativa medida foi relacionada à diversidade beta bacteriana ou à algum de seus
componentes (βsør, βsim, βsne or Bray-Curtis) dentro das lagoas. No geral, a relação da
diversidade beta bacteriana à heterogeneidade ambiental entre as lagoas se dá pelo
efeito dos fatores locais, enquanto que intra-lagoa pode estar relacionado ao efeito de
massa, devido à alta conectividade dentro das lagoas, mascarando os fatores locais.
E finalmente, vimos que a comunidade bacteriana em termos de biomassa
apresenta-se sensível ao distúrbio e se passada a perturbação do sistema ela prontamente
se recupera, Enquanto que os morfotipos permanecem sensíveis mesmo após cessado o
distúrbio. Diferentemente, a composição da comunidade bacteriana mostrou-se
insensível ao evento de frente fria, sugerindo que embora sua biomassa e morfotipos
alterem, sua estrutura manteve-se resistente ao distúrbio.
Contribuições e Perspectivas
Esta tese de doutorado permitiu verificar os padrões ecológicos da comunidade
bacteriana entre múltiplas escalas espaciais e temporais. Os resultados aqui obtidos nos
permitiram incrementar o debate sobre quais os fatores responsáveis pelos padrões
biogeográficos microbianos, que têm sido considerados importantes estruturadores
dessas comunidades. Nesse contexto, sugerimos nesse trabalho que estudos de padrões
biogeográficos microbianos devem ser ampliados para incluir múltiplas escalas de
análise, desde variações intra-lagoa até entre lagoas, abrangendo distintas variações de
distância espacial, atentando para os diferentes fatores que influenciam tais padrões
biogeográficos para explicar a biodiversidade e o funcionamento do ecossistema. Além
disso, nessa tese conseguimos discutir a dinâmica da comunidade em sistemas
perturbados por evento climático e sugerimos que mais estudos envolvendo a resposta
bacteriana a perturbações devam ser explorados, incluindo por exemplos sua relação
159
Capítulo 5.Discussão geral
com outras variáveis biológicas, como o fitoplâncton e ampliando o período de
amostragem para incluir mais eventos.
A tese de doutorado aumenta o conhecimento acerca dos fatores que ditam os
padrões de distribuição espacial e temporal da comunidade bacteriana aquática. Ressalta
a forte influência dos fatores locais (species sorting) sobre a composição e estrutura da
comunidade. Tanto em ambientes, cujas barreiras de dispersão, em lagoas de grande
extensão, são superadas devido à conectividade e à hidrodinâmica, como também entre
lagoas com diferentes graus de conectividade. Dentre os fatores locais, destaca-se a
influência das condições ambientais e da composição fitoplanctônica na distribuição
bacteriana. Também acrescenta a habilidade da comunidade a responder de diferentes
formas a perturbações.
Finalmente, este estudo colabora com o desenvolvimento do entendimento de
padrões e processos ecológicos relacionados à estrutura e função de comunidades
bacterianas aquáticas em lagos rasos costeiros subtropicais. Apesar desses avanços, há
ainda para a microbiologia aquática questões que são sugeridas após esse estudo, para
incrementarem o entendimento da escala de variação característica das comunidades
microbianas aquáticas:
i) Quais os efeitos da composição fitoplanctônica, a heterogeneidade ambiental, a
conectividade, a hidrodinâmica, e a distância espacial sobre a biomassa bacteriana nas
múltiplas escalas? Terão o mesmo efeito que na composição bacteriana?
ii) Qual a relação espécie-específica ou gênero-específica entre a comunidade bacteriana
e fitoplanctônica ao longo de gradientes espaciais e temporais?
iii) Qual a relação da estrutura e função bacteriana ao longo de evento de distúrbio de
curta duração?
160

Capítulo 5.Discussão geral
iv) Como perturbações contínuas (de longa duração) no sistema afetam a comunidade
bacteriana, em relação a sua estrutura e função?
161
ANEXO
Referências
Baines SB, Pace ML. (1991). The production of dissolved organic matter by
phytoplankton and its importance to bacteria: patterns across marine and freshwater
systems. Limnol Oceanogr 36: 1078–1090.
Beisner BE, Peres-Neto PR, Lindström ES, Barnett A, Longhi ML. (2006). The role of
environmental and spatial processes in structuring lake communities from bacteria to
fish. Ecology 87: 2985–2991.
Cardoso LS, Motta-Marques DM. (2009). Hydrodynamics-driven plankton community
in a shallow lake. Aquat Ecol 43: 73-84.
Chase JM, Leibold MA. (2003). Ecological Niches: Linking Classical and
Contemporary Approaches. University of Chicago Press: Chicago,IL, USA
Cotner JB, Biddanda BA. (2002). Small players, large role: microbial influence on
biogeochemical processes in pelagic aquatic ecosystems. Ecosystems 5: 101–105.
del Giorgio PA, Cole J. (1998). Bacterial growth efficiency in natural aquatic systems.
Annu Rev Ecol Syst 29: 503–541.
Dickerson TL, Williams HN. (2014). Functional diversity of bacterioplankton in three
North Florida freshwater lakes over an annual cycle. Microbial Ecology 67: 34–44.
Eiler A, Bertilsson S. (2004). Composition of freshwater bacterial communities associated with cyanobacterial blooms in four Swedish lakes. Environ Microbiol 6: 1228–1243. Fenchel T, Finlay BJ. (2004). The ubiquity of small species: patterns of local and global
diversity. Bioscience 54: 777–784.
Fisher MM, Triplett EW. (1999). Automated approach for ribosomal intergenic spacer
analysis of microbial diversity and its application to freshwater bacterial communities.
Appl Environ Microbiol 65: 4630–4636.
Foissner W. 2008. Protist diversity and distribution: some basic considerations.
Biodiversity and conservation, 17: 235-242.
Fragoso CR, Motta-Marques DML, Collischonn W, Tucci CEM, van Nes EH. (2008).
Modelling spatial heterogeneity of phytoplankton in Lake Mangueira, a large shallow
subtropical lake in South Brazil. Ecological Modelling 219: 125–137.
162

ANEXO
Fuhrman JA, Ammerman JW, Azam F. (1980). Bacterioplankton in the coastal euphtic
zone: Distribution, activity and possible relationship with phytoplankton. Mar. Biol.
60:201-207.
Galand PE, Casamayor EO, Kirchman DL, Lovejoy C. (2009). Ecology of the rare
microbial biosphere of the Arctic Ocean. Proc Natl Acad Sci USA 106: 22427–22432.
Garland JL. (1997). Analysis and interpretation of community-level-physiological
profile in microbial ecology. FEMS Microb. Ecol. 24:289-300.
Guimarães TFR, Hartz SM, Becker FG. (2014). Lake connectivity and fish species
richness in southern Brazilian coastal lakes. Hydrobiologia 740:207-217.
Haack SK, Garchow H, Klug MJ, Forney LJ. (1995). Analysis of factors affecting the
accuracy, reproducibility and interpretation of microbial community carbon source
utilization patterns. Appl. Environ. Microb. 61:1458-1468.
Heino J, Muotka T. (2005). Highly nested snail and clam assemblages in boreal lake
littorals : Roles of isolation , area , and habitat suitability 1. Ecoscience 12:141–146.
Heino J, Melo AS, Bini LM. (2015b). Reconceptualising the beta diversity-
environmental heterogeneity relationship in running water systems. Freshwater Biology
60: 223–235.
Heino J, Melo AS, Bini LM, Altermatt F, Al-Shami AS, Angeler DG, et al. (2015a). A
comparative analysis reveals weak relationships between ecological factors and beta
diversity of stream insect metacommunities at two spatial levels. Ecology and Evolution
doi: 10.1002/ece3.1439.
Heino J. (2013). Does dispersal ability affect the relative importance of environmental
control and spatial structuring of littoral macroinvertebrate communities? Oecologia
171: 971–980.
Heino J, Grönroos M, Ilmonen J, Karhu T, Niva M, Paasivirta L. (2013). Environmental
heterogeneity and β diversity of stream macroinvertebrate communities at intermediate
spatial scales. Freshwater Science 32:142–154.
163

ANEXO
Horner-Devine MC, Leibold SVH,. Bohannan BJM. (2003). Bacterial diversity patterns
along a gradient of primary productivity. Ecology Letters 6: 613–622.
Jones SE, McMahon KD. (2009). Species-sorting may explain an apparent minimal
effect of immigration on freshwater bacterial community dynamics. Environ Microbiol
11: 905–913.
Jones SE, Newton RJ, McMahon KD. (2009). Evidence for structuring of bacterial
community composition by organic matter carbon source in temperate lakes. Environ
Microbiol 11: 2463–2472.
Jones SE, Cadkin TA, Newton RJ, McMahon KD. (2012). Spatial and temporal scales
of aquatic bacterial beta diversity. Frontiers in Microbiology 3:318.
Kent AD, Jones SE, Lauster GH, Graham JM, Newton RJ, McMahon KD. (2006).
Experimental manipulations of microbial food web interactions in a humic lake: shifting
biological drivers of bacterial community structure. Environmental Microbiology
8:1448–1459
Kent AD, Yannarell AC, Rusak JA, Triplett EW, McMahon KD, (2007). Synchrony in
aquatic microbial community dynamics. The ISME Journal 1:38–47.
Konopka A, Oliver L, Turco RF Jr (1998) The use of carbon substrate utilization
patterns in environmental and ecological microbiology. Microb Ecol 35:103-115.
Korhonen, JJ, Soininen J, Hillebrand H. (2010). A quantitative analysis of temporal
turnover in aquatic species assemblages across ecosystems. Ecology 91: 508–517.
Leibold MA, Holyoak M, Mouquet N, Amarasekare P, Chase JM, Hoopes MF, et al.
(2004). The metacommunity concept: a framework for multi-scale community ecology.
Ecol Lett 7: 601–613.
Levin SA. (1992). The problem of pattern and scale in ecology. Ecology 73: 1943–
1967.
Lichstein J (2007). Multiple regression on distance matrices: A multivariate spatial
analysis tool. Plant Ecol 188:117-131.
Lima MS, Marques DM, They NgH, McMahon KD, Rodrigues LR, Cardoso LS,
Crossetti, LO. (2016). Contrasting factors drive within-lake bacterial community
164

ANEXO
composition and functional traits in a large shallow subtropical lake. Hydrobiologia.
doi: 10.1007/s10750-015-2610-9.
Logue JB, Mouquet N, Peter H, Hillebrand H. (2011). Empirical approaches to
metacommunities: a review and comparison with theory. Trends in Ecol and Evol 26:
482-491.
Moritz C, Meynard CN, Devictor V, Guizien K, Labrune C, Guarini J-M, Mouquet N.
(2013). Disentangling the role of connectivity, environmental filtering, and spatial
structure on metacommunity dynamics. Oikos, 000:001-010 doi: 10.1111/j.1600-
0706.2013.00377.x.
Murray AE, Hollibaugh JT, Orrego C. (1996). Phylogenetic compositions of
bacterioplankton from two california estuaries compared by Denaturing Gradient Gel
Electrophoresis of 16S rDNA fragments. Appl. Environ. Microbiol. 62(7):2676-2680.
Nekola JC, White PS. (1999). The distance decay of community similarity in
biogeography and ecology. J. Biogeogr. 26:867–878.
Nocker A, Burr M, Camper AK. (2007). Genotypic microbial community profiling: a
critical technical review. Microb. Ecol. 54:276-289.
Preston-Mafham J, Body L, Randerson PF. (2002). Analysis of microbial community
functional diversity using sole-carbon-source utilization profiles - a critique. FEMS
Microbiol. Ecol. 42:1-14.
Shurin JB, Cottenie K, Hillebrand H. (2009). Spatial autocorrelation and dispersal limitation
in freshwater organisms. Oecologia 159: 151–159.
Smalla K, Wachtendorf U, Heuer H, Liu W-T, Forney L. (1998). Analysis of BIOLOG GN
substrate utilization patterns by microbial communities. Appl. Environ. Microbiol.
64(4):1220-1225.
Souffreau C, van der Gucht K, van Gremberghe I, Kosten S, Lacerot G, Lobão LM, et
al. (2015). Environmental rather than spatial factors structure bacterioplankton
communities in shallow lakes along a > 6000 km latitudinal gradient in South America.
Environ Microbiol 17: 2336–2351.
Stein A, Gerstner K, Kreft H. (2014). Environmental heterogeneity as a universal driver
of species richness across taxa, biomes and spatial scales. Ecol Lett
doi:10.1111/ele.12277.
165
ANEXO
Tada Y, Suzuki K. (2016). Changes in the community structure of free-living
heterotrophic bacteria in the open tropical Pacific Ocean in response to microalgal
lysate-derived dissolved organic matter. FEMS Microbiol Ecol
doi:10.1093/femsec/fiw099.
Tundisi JG, Matsumura-Tundisi T, Pereira KC, Luzia AP, Passerini MD, Chiba WAC,
Morais MA, Sebastien NY. (2010). Cold fronts and reservoir limnology: an integrated
approach towards the ecological dynamics of freshwater ecosystems. Brazilian Journal
of Biology 70:815-824.
Tundisi JG. (1983). A review of basic ecological processes interacting with production
and standing-stock of phytoplankton in lakes and reservoirs in Brazil. Hydrobiologia
100:223-243.
166

ANEXO
ANEXO
167
SHALLOW LAKES
Contrasting factors drive within-lake bacterial communitycomposition and functional traits in a large shallowsubtropical lake
Marla Sonaira Lima . David da Motta Marques . Ng Haig They .
Katherine D. McMahon . Lucia Ribeiro Rodrigues .
Luciana de Souza Cardoso . Luciane Oliveira Crossetti
Received: 2 April 2015 / Revised: 20 November 2015 / Accepted: 5 December 2015
� Springer International Publishing Switzerland 2016
Abstract Lakes are considered as ‘‘islands’’ for
assessing microbial biogeography, but bacterial com-
munity composition (BCC) and function may vary
significantly within lakes, with the roles of scale and
connectivity still unclear. This study investigated the
spatial and temporal heterogeneity of the BCC (auto-
mated ribosomal intergenic spacer analysis) and
functional traits (FT, carbon-source utilization), and
the contribution of: (i) environmental variables, (ii)
phytoplankton, (iii) season, and (iv) space, through
variance partitioning in the large and well-mixed Lake
Mangueira. The BCC and FT differed in time and
space, with BCC being explained by environmental
variables and phytoplankton, whereas FT was
explained only by space. The smallest scale of
variability detected by the BCC and FT (*49 km)
was larger than scales found in the other studies,
suggesting an effect of lake size (fetch and connec-
tivity). Our results indicate that barriers to bacterial
dispersal due to long distances are overcome by high
connectivity, reinforcing the role of species sorting for
BCC. FT were probably driven by gene dispersal and/
or the effects of local conditions on migrant bacterial
taxa and resuspended bacteria. Our results highlight
the role of within-lake heterogeneity for ecosystem
functioning and the implications for the appropriate
scale to use in sampling bacterial communities.
Keywords Automated ribosomal intergenic spacer
analysis � Ecoplate � Within-lake biogeography �Variance partitioning � Species sorting � Dispersal �Lake Mangueira
Guest editors: M. Beklioglu, M. Meerhoff, T. A. Davidson,
K. A. Ger, K. E. Havens & B. Moss / Shallow Lakes in a
Fast Changing World
Electronic supplementary material The online version ofthis article (doi:10.1007/s10750-015-2610-9) contains supple-mentary material, which is available to authorized users.
M. S. Lima (&) � D. da Motta Marques � L. R. Rodrigues
Laboratorio de Ecotecnologia e Limnologia Aplicada,
Instituto de Pesquisas Hidraulicas - IPH, Universidade
Federal do Rio Grande do Sul/UFRGS, Av. Bento
Goncalves, 9500, Porto Alegre, RS 91501-970, Brazil
e-mail: [email protected]
N. H. They
Laboratorio de Limnologia, Departamento de
Oceanografia e Limnologia, Universidade Federal do Rio
Grande do Norte/UFRN, Av. Senador Dinarte de
Medeiros Mariz s/n Praia de Mae Luiza, Natal,
RN 59014-002, Brazil
K. D. McMahon
Departments of Civil and Environmental Engineering and
Bacteriology, University of Wisconsin-Madison, 3204
Engineering Drive, Madison, WI 53706-1691, USA
L. S. Cardoso
Departamento de Botanica, Instituto de Biociencias,
Universidade Federal do Rio Grande do Sul/UFRGS, Av.
Bento Goncalves, 9500, Porto Alegre, RS 91501-970,
Brazil
123
Hydrobiologia
DOI 10.1007/s10750-015-2610-9

Introduction
Microbes represent a large fraction of the biosphere’s
diversity (Pace, 1997) and are key players in aquatic
ecosystem functioning (Cole, 1999). Consequently,
understanding the mechanisms controlling their diver-
sity and function in aquatic ecosystems is of paramount
importance.
Lakes are often assumed to have a homogeneous
microbial community and are therefore considered as
‘‘islands’’ in most biogeographical analyses that test
factors shaping microbial diversity and distribution.
Consequently, the factors driving variation among lakes
are relatively well-known, and lake microbial commu-
nities change rapidly in space and time in response to
habitat size (Horner-Devine et al., 2004; Yannarell &
Triplett, 2004; Bell et al., 2005; Reche et al., 2005;
Green & Bohannan, 2006; Crump et al., 2007).
However, increasing evidence for within-lake variabil-
ity in factors such as physical and chemical conditions
(Van der Gucht et al., 2007; Souffreau et al., 2015),
biotic interactions (Kent et al., 2006), and trophic status
(Yannarell et al., 2003; Wu et al., 2007) suggests that
microbial communities within lakes are also heteroge-
neous. As environmental variables tend to be structured
across the landscape in space and time, elucidating the
drivers of microbial diversity and function is a key topic
for research (Lear et al., 2014). Studies using
approaches based on variance partitioning have
obtained contrasting results, indicating significant pure
effects of the environment (van der Gucht et al., 2007;
Logue & Lindstrom, 2010), space (Lear et al., 2014), or
a combination of both environment and space (Lan-
genheder & Ragnarsson, 2007; Schiaffino et al., 2011;
Liu et al., 2015; see the thorough discussion by
Lindstrom & Langenheder, 2012).
Several studies have described the temporal and
spatial dynamics of bacterial functional traits using
patterns of substrate utilization as a proxy for bacterial
activity in freshwater (e.g., Grover & Chrzanowski,
2000; Christian & Lind, 2006; Tiquia, 2010), sediment–
water interfaces (Christian & Lind, 2007), and the
marine environment (Sala et al., 2006). All these studies
found that substrate utilization was strongly associated
with environmental conditions. In contrast, studies on
smaller scales in freshwater ponds (Lear et al., 2014)
and small to meso-scales in soil (Bissett et al., 2010)
have found either a higher contribution of geographical
distance (Lear et al., 2014) or an absence of relation-
ships between function and environmental variables
(Bissett et al., 2010). These differences suggest that
other factors such as the degree of connectivity, rates of
dispersal, and life history of microorganisms can drive
bacterial functional traits in space and time (Bissett
et al., 2010; Severin et al., 2013; Lear et al., 2014).
Few studies have addressed biogeographical ques-
tions within individual lakes, since rates of dispersal
and connectivity are typically assumed to be high
within lakes. Surprisingly, these studies have found
not only an important additional role of within-lake
heterogeneity of environmental conditions (Wu et al.,
2007; Shade et al., 2008; Tian et al., 2009), but also
evidence for barriers to dispersal on scales as small as
20 m in a lake (Lear et al., 2014). In view of such
small-scale heterogeneity within lakes, a key question
in the study of microbial diversity and function is how
to select the most appropriate scale for sampling.
Similarly to large-bodied organisms, microbes exhibit
a distance-decay relationship between species composi-
tion and geographical distance (see review by Green &
Bohannan, 2006), which suggests an increasing role of
environmental heterogeneity and barriers to dispersal in
larger lakes. However, the relative roles of local factors
(i.e., environmental variables) versus space (i.e., barriers
to dispersal) in shaping the bacterial community compo-
sition and functional traits within a lake remain unknown.
We hypothesized that a wind-driven and well-mixed
large lake with high connectivity will not present barriers
to the dispersal of bacterial taxa and their functional traits,
even across larger meso-scales.
In this study, we investigated the spatial and
temporal heterogeneity of the bacterial community
composition (BCC) and functional traits (FT), as well
as the pure effects of lake environmental conditions,
phytoplankton biomass, space and time, through
variance partitioning of BCC and FT in Mangueira,
a large shallow subtropical lake. The sampling design
covered the 90-km length of the lake during 1 year,
i.e., a biogeographical mesoscale (10–3,000 km;
Martiny et al., 2006). We tested whether there were
consistent differences among lake areas (Center,
South, and North) and seasons (winter, spring, sum-
mer, and autumn) in BCC and FT, and also which
L. O. Crossetti
Departamento de Ecologia, Instituto de Biosciencias,
Universidade Federal do Rio Grande do Sul/UFRGS, Av.
Bento Goncalves, 9500, Porto Alegre, RS 91501-970,
Brazil
Hydrobiologia
123

explanatory variables significantly explained individ-
ual fractions of the variances of BCC and FT.
Materials and methods
Study area and sampling
Lake Mangueira (Fig. 1) is located in the state of Rio
Grande do Sul, southern Brazil (*30�3102200S53�0704800W). It is a large shallow subtropical coastal
lake, covering a total area of 820 km2, 90 km long and
3–10 km wide, with a mean depth of 2.6 m and a
maximum depth of 7.0 m. The trophic state ranges
from oligotrophic to mesotrophic (Crossetti et al.,
2013). Lake Mangueira is bordered by fixed dunes on
the Atlantic Ocean side, emergent macrophytes in the
northern wetland, and a dense bed of submersed
macrophytes on the southern side. The western side is
used for agriculture, primarily rice production in
former wetlands.
Water samples for environmental and biological
variables including chlorophyll a, phytoplankton, and
bacterial compositional and functional characteriza-
tion were collected in summer (February 2010),
autumn (May 2010), winter (August 2010), and spring
(November 2010). In each season, the lake was
sampled in an identical fashion for all variables, at
18 sampling points: 6 in the southern, 6 in the center,
and 6 in the northern part of the lake (Fig. 1 and
Supplementary Table S1).
Environmental variables and chlorophyll a
Turbidity (Turb), pH, dissolved oxygen (DO), depth,
water temperature, and oxidation–reduction potential
(ORP) were measured with a multiparameter probe
(YSI 6600). Water transparency (WT) was estimated
with a Secchi disk, and the amount of total suspended
solids (TSS) was assessed gravimetrically by water
evaporation in porcelain dishes (APHA, 1999). Nutri-
ents, including total nitrogen (TN), nitrate (NO3-),
and soluble reactive phosphorus (SRP) were measured
through colorimetric methods, following APHA
(1999). Analyses of ammonium (NH4-) and total
phosphorus (TP) followed Mackereth et al. (1989). A
carbon analyzer (Shimadzu VCPH) was used to
determine the dissolved organic carbon (DOC) of the
fraction that passed through a 450�C pre-combusted
glass-fiber filter (0.45-lm mean mesh size). Chloro-
phyll a (Chla) was extracted from GF/F filters with
90% ethanol and measured by spectrophotometry
(Jespersen & Christoffersen, 1987). Humic substances
(HS) were estimated as the ratio of the absorption
coefficients at 250 and 365 nm (Strome & Miller,
1978), using a Varian Cary 1-E spectrophotometer
with a quartz cuvette.
The meteorological data (wind velocity and direc-
tion; precipitation; nebulosity, i.e., the percentage in
tenths of the sky covered by clouds; insolation and
evaporation) were obtained from the Santa Vitoria do
Palmar Meteorological Station (INMET, Rio Grande
do Sul), located approximately 23 km from the lake,
with data collected three times per day (00:00, 12:00,
and 18:00 h). Data were interpolated according to the
time when each sampling point was visited.
Phytoplankton biomass
Phytoplankton was counted according to Utermohl
(1958) after sedimentation (Lund et al., 1958). At least
100 specimens of the most frequent species were
enumerated (counting error\5%, Lund et al., 1958).
Biomass (mm3 l-1) was estimated through biovolume,
according to Hillebrand et al. (1999). For data
analysis, the biomass of all phytoplankton taxonomic
classes was used.
Bacterial composition and functional traits
The bacterial community composition (BCC) was
assessed through amplified ribosomal intergenic spacer
analysis (ARISA). Bacterial cells were concentrated by
filtration of 250 ml of water from each sample onto
cellulose acetate membrane filters (0.22-lm pore size;
47 mm diameter; Sartorius). Total DNA was extracted
from the membrane filter using the PowerSoil DNA
isolation kit (MO BIO). We used the filter in place of the
0.25 g soil recommended for this method. The region
between the 23S and 16S ribosomal RNA genes from
the total DNA extracted was amplified using the
6-FAM-labeled universal primer 1406F (50-TGYACA
CACCGCCCGT-30) and the bacteria-specific primer
23Sr (50-GGGTTBCCCCATTCRG-30) (Fisher & Tri-
plett, 1999; Yannarell et al., 2003). ARISA profiles were
analyzed according to Jones & McMahon (2009). Since
this method under-represents rare members of the
Hydrobiologia
123

community, BCC hereafter refers to the most abundant
taxa.
The functional traits of the heterotrophic microbial
community were measured as carbon utilization
patterns through Biolog Ecoplates� (Hayward, CA,
USA). In the field, water samples were pre-filtered
through a 20-lm-mesh sieve and placed in 50-ml
amber glass bottles to prevent interference from
phytoplankton. In the laboratory, samples were inoc-
ulated in the plates and incubated at approximately
22�C (Christian & Lind, 2007). The utilization of the
substrates was assessed through optical density (OD)
measured at 590 nm, with an automated plate reader
(SpectraMax 5.0, Molecular Devices), immediately
after the wells were filled (t = 0 h) and every 24 h for
12 days, to ensure that saturation of carbon utilization
was reached in all samples (Salomo et al., 2009).
Statistical analyses
For BCC analyses, we used relative abundance data,
including OTUs with[ 5% frequency of occurrence
(Shade et al., 2008). For functional traits, we corrected
the raw absorbance data by subtracting each response
well against its own first reading (t = 0), to compen-
sate for the intrinsic absorbance of the carbon sources
Fig. 1 Sampling points in
Lake Mangueira, southern
Brazil. South (points 1–6),
Center (points 7–12), and
North (points 13–18)
Hydrobiologia
123
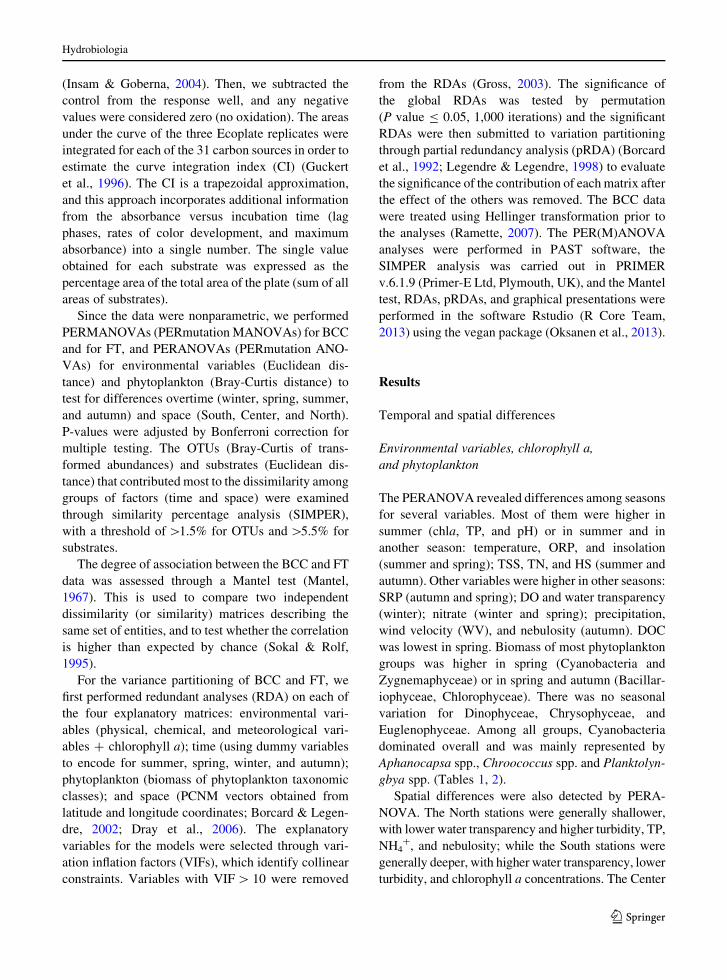
(Insam & Goberna, 2004). Then, we subtracted the
control from the response well, and any negative
values were considered zero (no oxidation). The areas
under the curve of the three Ecoplate replicates were
integrated for each of the 31 carbon sources in order to
estimate the curve integration index (CI) (Guckert
et al., 1996). The CI is a trapezoidal approximation,
and this approach incorporates additional information
from the absorbance versus incubation time (lag
phases, rates of color development, and maximum
absorbance) into a single number. The single value
obtained for each substrate was expressed as the
percentage area of the total area of the plate (sum of all
areas of substrates).
Since the data were nonparametric, we performed
PERMANOVAs (PERmutation MANOVAs) for BCC
and for FT, and PERANOVAs (PERmutation ANO-
VAs) for environmental variables (Euclidean dis-
tance) and phytoplankton (Bray-Curtis distance) to
test for differences overtime (winter, spring, summer,
and autumn) and space (South, Center, and North).
P-values were adjusted by Bonferroni correction for
multiple testing. The OTUs (Bray-Curtis of trans-
formed abundances) and substrates (Euclidean dis-
tance) that contributed most to the dissimilarity among
groups of factors (time and space) were examined
through similarity percentage analysis (SIMPER),
with a threshold of[1.5% for OTUs and[5.5% for
substrates.
The degree of association between the BCC and FT
data was assessed through a Mantel test (Mantel,
1967). This is used to compare two independent
dissimilarity (or similarity) matrices describing the
same set of entities, and to test whether the correlation
is higher than expected by chance (Sokal & Rolf,
1995).
For the variance partitioning of BCC and FT, we
first performed redundant analyses (RDA) on each of
the four explanatory matrices: environmental vari-
ables (physical, chemical, and meteorological vari-
ables ? chlorophyll a); time (using dummy variables
to encode for summer, spring, winter, and autumn);
phytoplankton (biomass of phytoplankton taxonomic
classes); and space (PCNM vectors obtained from
latitude and longitude coordinates; Borcard & Legen-
dre, 2002; Dray et al., 2006). The explanatory
variables for the models were selected through vari-
ation inflation factors (VIFs), which identify collinear
constraints. Variables with VIF[ 10 were removed
from the RDAs (Gross, 2003). The significance of
the global RDAs was tested by permutation
(P value B 0.05, 1,000 iterations) and the significant
RDAs were then submitted to variation partitioning
through partial redundancy analysis (pRDA) (Borcard
et al., 1992; Legendre & Legendre, 1998) to evaluate
the significance of the contribution of each matrix after
the effect of the others was removed. The BCC data
were treated using Hellinger transformation prior to
the analyses (Ramette, 2007). The PER(M)ANOVA
analyses were performed in PAST software, the
SIMPER analysis was carried out in PRIMER
v.6.1.9 (Primer-E Ltd, Plymouth, UK), and the Mantel
test, RDAs, pRDAs, and graphical presentations were
performed in the software Rstudio (R Core Team,
2013) using the vegan package (Oksanen et al., 2013).
Results
Temporal and spatial differences
Environmental variables, chlorophyll a,
and phytoplankton
The PERANOVA revealed differences among seasons
for several variables. Most of them were higher in
summer (chla, TP, and pH) or in summer and in
another season: temperature, ORP, and insolation
(summer and spring); TSS, TN, and HS (summer and
autumn). Other variables were higher in other seasons:
SRP (autumn and spring); DO and water transparency
(winter); nitrate (winter and spring); precipitation,
wind velocity (WV), and nebulosity (autumn). DOC
was lowest in spring. Biomass of most phytoplankton
groups was higher in spring (Cyanobacteria and
Zygnemaphyceae) or in spring and autumn (Bacillar-
iophyceae, Chlorophyceae). There was no seasonal
variation for Dinophyceae, Chrysophyceae, and
Euglenophyceae. Among all groups, Cyanobacteria
dominated overall and was mainly represented by
Aphanocapsa spp., Chroococcus spp. and Planktolyn-
gbya spp. (Tables 1, 2).
Spatial differences were also detected by PERA-
NOVA. The North stations were generally shallower,
with lower water transparency and higher turbidity, TP,
NH4?, and nebulosity; while the South stations were
generally deeper, with higher water transparency, lower
turbidity, and chlorophyll a concentrations. The Center
Hydrobiologia
123

Table
1M
ean
(sta
nd
ard
dev
iati
on
)o
fen
vir
on
men
tal
var
iab
les
and
chlo
rop
hy
lla
acro
ssse
aso
ns
and
loca
tio
ns
for
Lak
eM
ang
uei
ra
Sea
son
Lo
cati
on
Su
mm
erA
utu
mn
Win
ter
Sp
rin
gS
ou
thC
ente
rN
ort
h
Tem
p(�
C)
22
.75
(1.0
5)a
17
.79
(0.3
4)b
11
.66
(0.4
4)c
22
.16
(0.6
6)a
18
.18
(4.3
9)a
18
.63
(4.6
1)a
19
.27
(4.5
4)a
DO
(mg
l-1)
9.0
9(0
.43
)a9
.33
(0.1
9)a
11
.45
(0.3
1)b
8.6
1(0
.16
)c9
.53
(1.2
1)a
9.6
5(1
.18
)a9
.61
(0.9
9)a
OR
P(m
V)
17
0.3
7(1
3.8
3)a
13
7.7
4(1
7.6
1)b
96
.01
(15
.38
)c1
66
.19
(9.2
9)a
14
5.6
2(3
8.2
9)a
14
2.6
4(3
3.6
6)a
14
1.3
7(2
6.0
8)a
Dep
th(m
)2
.92
(1.5
3)a
2.7
4(1
.52
)a3
.12
(1.6
8)a
3.3
0(1
.64
)a3
.8(1
.47
)a3
.30
(2.0
4)a
b2
.36
(0.7
6)b
WT
(m)
1.1
6(0
.26
)a0
.94
(0.3
1)a
1.6
3(0
.62
)b1
.08
(0.2
5)a
1.4
1(0
.47
)a1
.12
(0.4
7)a
b1
.05
(0.3
4)b
TS
S(m
gl-
1)
14
.50
(4.1
7)a
14
.31
(6.5
7)a
9.7
1(3
.22
)b1
0.0
6(5
.48
)b1
0.7
1(4
.42
)a1
3.0
6(5
.24
)a1
2.7
8(6
.43
)a
Tu
rb(N
TU
)4
.90
(2.1
1)a
6.3
3(2
.81
)a5
.18
(2.1
4)a
4.0
8(3
.07
)a3
.70
(1.7
8)a
5.5
8(2
.15
)b6
.12
(3.2
6)b
TP
(mg
l-1)
0.0
4(0
.01
)a0
.02
(0.0
1)b
0.0
3(0
.02
)b0
.03
(0.0
1)b
0.0
2(0
.01
)a0
.03
(0.0
1)a
b0
.03
(0.0
1)b
SR
P(l
gl-
1)
10
.10
(2.0
2)a
12
.76
(5.0
6)a
b1
1.5
4(2
.25
)a1
5.4
6(3
.67
)b1
1.3
0(3
.58
)a1
2.9
6(2
.85
)a1
3.2
1(5
.04
)a
TN
(mg
l-1)
0.4
8(0
.12
)a0
.43
(0.0
7)a
0.2
5(0
.03
)b0
.22
(0.1
3)b
0.3
5(0
.12
)a0
.32
(0.1
4)a
0.3
7(0
.18
)a
NH
4?
(mg
l-1)
0.0
5(0
.11
)a0
.03
(0.0
2)a
0.0
3(0
.02
)a0
.13
(0.0
9)a
0.0
3(0
.03
)ab
0.0
3(0
.02
)a0
.06
(0.0
9)b
Nit
rate
(mg
l-1)
0.0
7(0
.05
)a0
.06
(0.0
1)a
0.1
1(0
.02
)b0
.13
(0.0
9)b
0.1
0(0
.06
)a0
.08
(0.0
5)a
0.1
0(0
.07
)a
DO
C(m
gl-
1)
2.0
7(1
.19
)ab
2.7
2(0
.86
)a2
.68
(0.8
1)a
1.9
6(0
.55
)b2
.46
(1.0
1)a
2.0
2(0
.92
)a2
.59
(0.7
8)a
HS
(nm
)8
.06
(1.8
8)a
8.1
8(1
.31
)a4
.33
(0.6
8)b
5.1
2(0
.91
)c7
.14
(2.7
6)a
6.3
4(1
.82
)a5
.84
(1.4
7)a
chla
(lg
l-1)
6.2
0(2
.01
)a3
.79
(1.5
8)b
c4
.36
(1.3
5)b
2.9
5(1
.09
)c3
.52
(1.4
5)a
4.8
1(1
.97
)b4
.66
(2.1
5)a
b
pH
8.5
4(0
.12
)a8
.13
(0.0
5)b
8.0
4(0
.09
)c8
.01
(0.1
0)c
8.1
9(0
.17
)a8
.17
(0.2
1)a
8.2
8(0
.31
)a
WD
(�)
S(S
)aS
SE
(NE
-WS
W)a
bS
E(S
-E)b
SE
(SE
)ab
SE
(S-E
NE
)aS
(SO
-ES
E)a
SS
E(S
SW
-ES
E)a
WV
(ms-
1)
1.7
5(0
.39
)a7
.78
(1.1
7)b
1.9
4(1
.03
)a3
.17
(0.7
7)c
3.4
4(3
.31
)a3
.46
(2.1
5)a
4.1
7(2
.24
)a
Neb
ulo
sity
(ten
ths)
1.5
8(1
.20
)a9
.50
(0.7
9)b
3.0
0(3
.68
)ac
6.3
3(3
.28
)c3
.13
(4.3
1)a
5.4
8(4
.10
)ab
6.8
7(2
.38
)b
Pre
cip
(mm
)0
.00
(0.0
0)a
9.1
9(5
.82
)b0
.00
(0.0
0)a
0.0
0(0
.00
)a0
.53
(0.9
3)a
2.9
4(5
.65
)a3
.57
(6.1
5)a
Inso
l(h
)1
0.8
0(0
.00
)a0
.55
(0.4
5)b
5.4
4(1
.30
)c5
.60
(0.0
0)a
c5
.85
(3.9
6)a
5.5
1(3
.67
)a5
.43
(3.7
2)a
Dif
fere
nt
lett
ers
ind
icat
esi
gn
ifica
nce
atP\
0.0
5
Tem
pw
ater
tem
per
atu
re,DO
dis
solv
edo
xy
gen
,ORP
ox
idat
ion
–re
du
ctio
np
ote
nti
al,depth
loca
ld
epth
,WT
wat
ertr
ansp
aren
cy,TSS
tota
lsu
spen
ded
soli
ds,Turb
turb
idit
y,TP
tota
l
ph
osp
ho
rus,
SRP
solu
ble
reac
tiv
ep
ho
sph
oru
s,TN
tota
ln
itro
gen
,NH4?
amm
on
ium
,DOC
dis
solv
edo
rgan
icca
rbo
n,HS
hu
mic
sub
stan
ces
rati
o(A
bs
25
0:3
65
nm
),chla
chlo
rop
hy
lla,WD
win
dd
irec
tio
n,WV
win
dv
elo
city
,Precip
pre
cip
itat
ion
,Insol
inso
lati
on
Hydrobiologia
123

stations were more similar to the North stations in some
variables, and to the South stations in others. For
phytoplankton, no spatial differences were observed
(Tables 1, 2).
Bacterial community composition (BCC)
and functional traits (FT)
A total of 121 operational taxonomic units (OTUs)
were detected by ARISA; 116 of them had [5% of
frequency of occurrence. Most of them were shared
over time (78%) or locations (95%), but when taking
into account the abundance of the OTUs, the
PERMANOVA indicated that the temporal variation
was more important than the spatial variation
(R2 = 0.22 and R2 = 0.06, respectively). All seasons
were different from each other, whereas only
South 9 North displayed consistent differences in
BCC (Table 3).
A similar response was found for FT, with all 31
carbon sources being consumed in all samples;
however, the degree of utilization varied over time
and along the spatial scale. There were consistent
differences among all seasons (R2 = 0.13), while for
the spatial variation (R2 = 0.06) only South x Center
did not differ significantly (Table 3).
Based on the SIMPER analysis and the arbitrary
cutoffs chosen, the OTUs 399, 403, 404, 438, 511,
520, 546, 547, 634, 650, 654, and 669, and the
Table 2 Mean (standard deviation) of biomass (mg l-1) of major classes of phytoplankton across seasons and locations for Lake
Mangueira
Season Location
Summer Autumn Winter Spring South Center North
Bacillariophyceae 0.10 (0.33)a 0.11 (0.09)b 0.02 (0.02)c 0.15 (0.15)b 0.09 (0.10)a 0.10 (0.28)a 0.09 (0.14)a
Chlorophyceae 0.21 (0.24)a 0.43 (0.31)bc 0.29 (0.08)b 0.96 (0.83)c 0.33 (0.31)a 0.53 (0.61)a 0.57 (0.64)a
Chrysophyceae 0.00 (0.00)a 0.01 (0.01)a 0.00 (0.01)a 0.00 (0.01)a 0.00 (0.01)a 0.00 (0.01)a 0.00 (0.00)a
Cyanobacteria 4.31 (2.56)a 4.86 (1.34)a 6.00 (2.13)a 9.67 (4.66)b 4.95 (2.23)a 6.26 (3.93)a 7.48 (4.00)a
Dinophyceae 0.02 (0.04)a 0.00 (0.00)a 0.00 (0.00)a 0.01 (0.04)a 0.00 (0.00)a 0.01 (0.04)a 0.01 (0.03)a
Euglenophyceae 0.00 (0.00)a 0.00 (0.00)a 0.00 (0.00)a 0.00 (0.01)a 0.00 (0.00)a 0.00 (0.00)a 0.00 (0.00)a
Zygnemaphyceae 0.01 (0.01)abc 0.00 (0.00)a 0.00 (0.00)b 0.02 (0.03)c 0.00 (0.01)a 0.01 (0.02)a 0.01 (0.02)a
Different letters indicate significance at P\ 0.05
Table 3 Differences among seasons and locations, assessed by PERMANOVA for BCC and FT in Lake Mangueira
BCC Functional traits
F R2 P F R2 P
Temporal 6.271 0.22 0.0001* 3.432 0.13 0.0001*
Summer versus Autumn 4.216 – 0.0414* 2.052 – 0.048*
Summer versus Winter 8.708 – 0.0006* 3.315 – 0.0006*
Summer versus Spring 5.205 – 0.003* 3.254 – 0.0006*
Autumn versus Winter 6.719 – 0.0006* 5.087 – 0.0006*
Autumn versus Spring 6.892 – 0.0006* 4.473 – 0.0012*
Winter versus Spring 6.135 – 0.0006* 3.091 – 0.0066*
Spatial 2.314 0.06 0.01* 2.126 0.06 0.001*
South versus Center 1.178 – 0.8394 1.193 – 0.7305
South versus North 3.267 – 0.0129* 3.183 – 0.0012*
Center versus North 2.272 – 0.1155 2.045 – 0.0279*
* Significant at P\ 0.05
– not available
Hydrobiologia
123
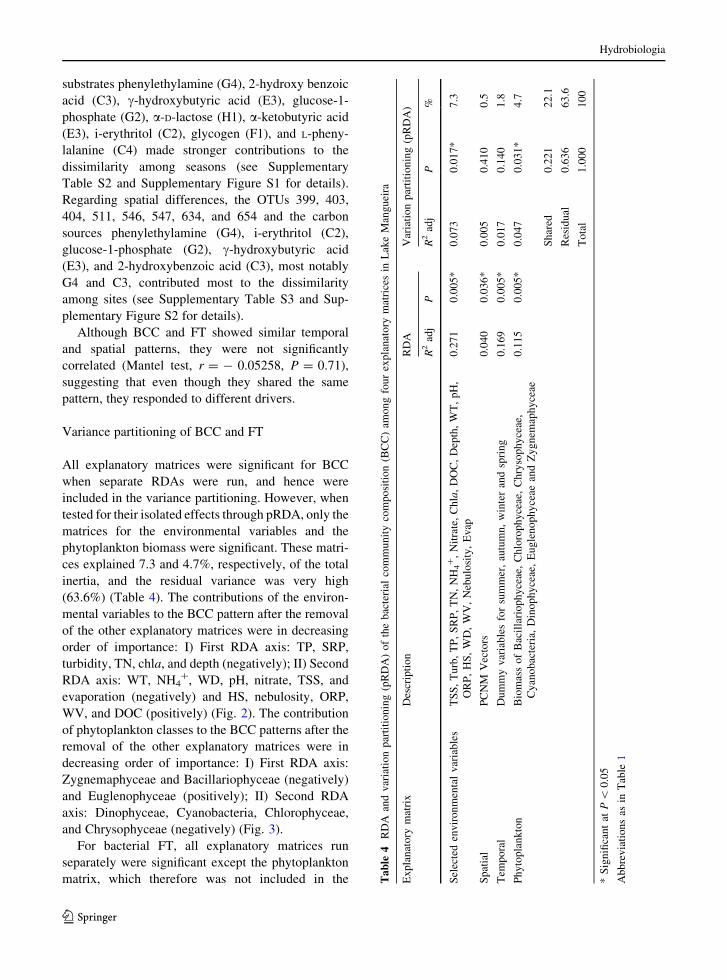
substrates phenylethylamine (G4), 2-hydroxy benzoic
acid (C3), c-hydroxybutyric acid (E3), glucose-1-
phosphate (G2), a-D-lactose (H1), a-ketobutyric acid
(E3), i-erythritol (C2), glycogen (F1), and L-pheny-
lalanine (C4) made stronger contributions to the
dissimilarity among seasons (see Supplementary
Table S2 and Supplementary Figure S1 for details).
Regarding spatial differences, the OTUs 399, 403,
404, 511, 546, 547, 634, and 654 and the carbon
sources phenylethylamine (G4), i-erythritol (C2),
glucose-1-phosphate (G2), c-hydroxybutyric acid
(E3), and 2-hydroxybenzoic acid (C3), most notably
G4 and C3, contributed most to the dissimilarity
among sites (see Supplementary Table S3 and Sup-
plementary Figure S2 for details).
Although BCC and FT showed similar temporal
and spatial patterns, they were not significantly
correlated (Mantel test, r = - 0.05258, P = 0.71),
suggesting that even though they shared the same
pattern, they responded to different drivers.
Variance partitioning of BCC and FT
All explanatory matrices were significant for BCC
when separate RDAs were run, and hence were
included in the variance partitioning. However, when
tested for their isolated effects through pRDA, only the
matrices for the environmental variables and the
phytoplankton biomass were significant. These matri-
ces explained 7.3 and 4.7%, respectively, of the total
inertia, and the residual variance was very high
(63.6%) (Table 4). The contributions of the environ-
mental variables to the BCC pattern after the removal
of the other explanatory matrices were in decreasing
order of importance: I) First RDA axis: TP, SRP,
turbidity, TN, chla, and depth (negatively); II) Second
RDA axis: WT, NH4?, WD, pH, nitrate, TSS, and
evaporation (negatively) and HS, nebulosity, ORP,
WV, and DOC (positively) (Fig. 2). The contribution
of phytoplankton classes to the BCC patterns after the
removal of the other explanatory matrices were in
decreasing order of importance: I) First RDA axis:
Zygnemaphyceae and Bacillariophyceae (negatively)
and Euglenophyceae (positively); II) Second RDA
axis: Dinophyceae, Cyanobacteria, Chlorophyceae,
and Chrysophyceae (negatively) (Fig. 3).
For bacterial FT, all explanatory matrices run
separately were significant except the phytoplankton
matrix, which therefore was not included in the Table
4R
DA
and
var
iati
on
par
titi
on
ing
(pR
DA
)o
fth
eb
acte
rial
com
mu
nit
yco
mp
osi
tio
n(B
CC
)am
on
gfo
ur
exp
lan
ato
rym
atri
ces
inL
ake
Man
gu
eira
Ex
pla
nat
ory
mat
rix
Des
crip
tio
nR
DA
Var
iati
on
par
titi
on
ing
(pR
DA
)
R2
adj
PR
2ad
jP
%
Sel
ecte
den
vir
on
men
tal
var
iab
les
TS
S,
Tu
rb,
TP
,S
RP
,T
N,
NH
4?
,N
itra
te,
Ch
la,
DO
C,
Dep
th,
WT
,p
H,
OR
P,
HS
,W
D,
WV
,N
ebu
losi
ty,
Ev
ap
0.2
71
0.0
05
*0
.07
30
.01
7*
7.3
Sp
atia
lP
CN
MV
ecto
rs0
.04
00
.03
6*
0.0
05
0.4
10
0.5
Tem
po
ral
Du
mm
yv
aria
ble
sfo
rsu
mm
er,
autu
mn
,w
inte
ran
dsp
rin
g0
.16
90
.00
5*
0.0
17
0.1
40
1.8
Ph
yto
pla
nk
ton
Bio
mas
so
fB
acil
lari
op
hy
ceae
,C
hlo
rop
hy
ceae
,C
hry
sop
hy
ceae
,
Cy
ano
bac
teri
a,D
ino
ph
yce
ae,
Eu
gle
no
ph
yce
aean
dZ
yg
nem
aph
yce
ae
0.1
15
0.0
05
*0
.04
70
.03
1*
4.7
Sh
ared
0.2
21
22
.1
Res
idu
al0
.63
66
3.6
To
tal
1.0
00
10
0
*S
ign
ifica
nt
atP\
0.0
5
Ab
bre
via
tio
ns
asin
Tab
le1
Hydrobiologia
123

variance partitioning. The pRDA revealed that only
the spatial matrix (PCNMs) was significant after the
effect of the other explanatory matrices was removed.
Around 81.5% of the total inertia remained unex-
plained by the explanatory matrices tested (Table 5).
Discussion
Our results revealed a strong spatial and temporal
heterogeneity in Lake Mangueira for environmental
variables, chlorophyll a, and phytoplankton taxo-
nomic classes. Similarly, the BCC and FT showed
strong temporal heterogeneity, while the spatial anal-
ysis showed differences along the north–south axis.
When considering differences in BCC and FT as
assessed by PERMANOVA, the effects of environ-
mental variables and distance are confounded, and it is
therefore necessary to compare their individual effects
on the dynamics of BCC and FT. The pRDAs revealed
that local factors (environment and phytoplankton)
were the significant factors explaining the BCC
dynamics, whereas unexpectedly, the FT seemed to
be driven by dispersal constraints.
Although 95% of OTUs were found in all three
parts of the lake and 78% in all seasons of the year, the
Fig. 2 Biplot of the pRDA of the BCC constrained by the
environmental variables matrix, after removing the effect of all
other explanatory matrices
Fig. 3 Biplot of the pRDA of the BCC constrained by the
phytoplankton major classes’ biomass matrix, after removing
the effect of all other explanatory matrices
Table 5 RDA and variation partitioning (pRDA) of the bacterial functional traits (FT) among four explanatory matrices in Lake
Mangueira
Explanatory
matrix
Description RDA Variation partitioning
(pRDA)
R2
adj
P R2 adj P %
Selected
environmental
variables
TSS,Turb, TP, SRP, TN, NH4?, Nitrate, Chla, DOC,
Depth, WT, pH, ORP, HS, WD, WV, Nebulosity, Evap
0.118 0.005* 0.032 0.160 3.2
Spatial PCNM Vectors 0.042 0.015* 0.062 0.005* 6.2
Temporal Dummy variables for summer, autumn, winter and
spring
0.093 0.005* 0.0004 0.500 0.0
Phytoplankton Biomass of Bacillariophyceae, Chlorophyceae,
Chrysophyceae, Cyanobacteria, Dinophyceae,
Euglenophyceae and Zygnemaphyceae
0.021 0.130 – – –
Shared 0.090 9.1
Residual 0.815 81.5
Total 1.000 100.00
Significant at P\ 0.05; Abbreviations as in Table 1
Hydrobiologia
123

BCC differed significantly from the northern to the
southern areas of the lake and across all seasons,
suggesting that the majority of freshwater bacterial
taxa are not confined to a subset of regions on the
geographical or temporal scales. Our results suggest
that ubiquitous taxa are prevalent in bacterial com-
munities, and support previous observations of high
percentages of OTUs occurring across sampling sites
(85, 76, and 77.6% of all OTUs) found by Van der
Gucht et al. (2007), Souffreau et al. (2015), and Lear
et al. (2014), respectively. Even though the ARISA
method is highly reproducible (Jones et al., 2012), it is
biased toward the detection of the most abundant
OTUs, a limitation of all fingerprinting methods
(Jones et al., 2012). It is possible that the inability to
detect a pure spatial effect for the BCC stemmed from
the failure to detect rare members of the bacterial
community, since rare OTUs may display strong
biogeographical signals and significantly impact the
results of the analysis if they are included (Yannarell
& Triplett, 2004; Galand et al., 2009).
Assessing within-lake heterogeneity is a critical
issue when considering the appropriate scale for
sampling microbial communities. Such small-scale
variability was recognized early, and Palmer et al.
(1967) reported patchiness in the distribution of
bacterial plate counts at scales of approximately
20 m. More recently, a significant variability of
within-lake BCC has been reported via molecular
and culture-independent methods (e.g., Wu et al.,
2007), and scales as short as 10 m (Jones et al., 2012)
to \20 m (Lear et al., 2014) have proved to be
significant for dispersal of bacterial OTUs. Although
the scale of heterogeneity seems to be positively
related to lake size, within-lake variation in BCC
occurs across all types of morphometry (Table 6).
Another important factor controlling variability in
BCC is the degree of connectivity, which depends on
the mixing regime, wind (velocity, direction, and
fetch), the presence of physical barriers such as
islands, embayments, or constrictions (Yannarell &
Triplett, 2004; Lear et al., 2014) and lake heterogene-
ity (e.g., presence of macrophytes) (Wu et al., 2007;
Lear et al., 2014).
Given the high connectivity of Lake Mangueira due
to its wind-driven and well-mixed nature, barriers to
dispersal are expected to be weak or nonexistent, and
this is reflected in the smallest scale of heterogeneity
in BCC detected (*49 km), which is the largest yet
found in comparison to other studies (Table 6).
Assuming that the fetch increases with lake size, we
hypothesize that the relatively large scale of variability
in BCC in Lake Mangueira is derived from its long
fetch. The significant differences between the northern
and southern parts of the lake can be explained by
(i) the long fetch due to prevailing northeast or
southeast winds parallel to the main axis of the lake,
which controls sediment resuspension between these
two areas (Fragoso et al., 2008), and (ii) differences in
the composition of dominant macrophytes (mostly
emergent in the northern wetlands and mostly sub-
mersed in the southern part), which are known to
affect BCC in many lakes (Wu et al., 2007; Lear et al.,
2014) including Lake Mangueira (They et al., 2010).
The temporal patterns of BCC and FT were stronger
than the spatial patterns. Even though patterns in time
are not as often explored as patterns in space for BCC
and FT, the few studies available are in agreement
with our results. Stronger temporal variation of BCC
was reported for a large estuarine area, where
temperature changes had a stronger seasonal influence
than the spatial dynamics (Kan et al., 2007). Alterna-
tive explanations may include a dependence on the
phenological cycle of other components of the micro-
bial loop such as phytoplankton and zooplankton
(Kent et al., 2004). Considering that Lake Mangueira
is large, this pattern is in agreement with the positive
relationship between the decay in similarity over time
and ecosystem size found for several aquatic species,
including planktonic ones (Korhonen et al., 2010).
Similarly, FT (assessed as substrate utilization) have
been reported to vary on a seasonal basis in lakes,
associated with patterns of stratification (Christian &
Lind, 2007), temperature, and the availability of
nutrients and organic substrates (Dickerson & Wil-
liams, 2014).
The higher explanatory power of local factors,
versus dispersal, has often been emphasized in studies
that addressed BCC variation over geographical scales
(Beisner et al., 2006; van der Gucht et al., 2007,
Sommaruga & Casamayor, 2008; Souffreau et al.,
2015). Other studies have found that both environ-
mental and spatial factors explain bacterioplankton
community dynamics (Schiaffino et al., 2011), or even
that the interaction of environmental conditions,
region, time, and landscape influence BCC (Yannarell
& Triplett, 2005). Our study supports the view that the
bacterioplankton community structure is primarily the
Hydrobiologia
123

Table
6C
om
par
iso
no
fst
ud
ies
that
hav
ead
dre
ssed
wit
hin
-lak
eh
eter
og
enei
tyin
BC
Cth
rou
gh
mo
lecu
lar
app
roac
hes
Nu
mb
ero
f
syst
ems
stu
die
d
Siz
e(k
m2)
Eco
syst
emM
ean
dep
th
(m)
Max
dep
th
(m)
Sam
pli
ng
lay
ou
tN
o.
sam
pli
ng
po
ints
Sm
alle
st
scal
e
iden
tifi
ed
Ref
eren
ce
18
20
Lar
ge,
shal
low
sub
tro
pic
alla
ke
2.6
7.0
18
sam
pli
ng
site
s,fr
om
*1
.9to
*9
0k
map
art
18
49
km
*T
his
stu
dy
20
.00
24
5
0.0
02
8
0.0
03
9
Sh
allo
w,
smal
l
po
nd
s
0.5 (a
ll)
0.5
(all
)79
7m
gri
ds
33
35
53
20
mL
ear
etal
.
(20
14)
30
.00
5
39
.38
Sm
all
and
shal
low
lak
e9
Lar
ge
and
dee
pla
ke
1.7
12
.8
2.5
25
.3
32
site
s3
2
32
10
mJo
nes
etal
.
(20
12)
12
33
8L
arg
e,sh
allo
w
sub
tro
pic
alla
ke
1.9
**
\3
.03
sam
pli
ng
site
s1
00
and
10
00
map
art,
loca
ted
insi
de
6sa
mp
lin
g
area
s
3[
1k
mW
uet
al.
(20
07)
13
0.0
05
–3
9.3
8S
mal
lto
larg
e,
shal
low
tod
eep
tem
per
ate
lak
es
NA
2.5
–3
5.7
3st
atio
ns
inea
chb
asin
-eq
uil
ater
altr
ian
gle
cen
tere
do
nth
ed
eep
est
po
int.
Th
ev
aria
bil
ity
wit
hin
lak
esw
asd
eter
min
edat
two
scal
es:
10
m(s
tati
on
lev
el)
and
10
0m
(bas
inle
vel
)
90
10
0m
Yan
nar
ell
& Tri
ple
tt
(20
04)
*C
on
sid
erin
gth
esm
alle
std
iffe
ren
ceb
etw
een
pai
rso
fn
ort
her
nan
dso
uth
ern
sam
pli
ng
stat
ion
s
**
Qin
,B
.,2
00
8.
Lak
eT
aih
u,
Ch
ina:
Dy
nam
ics
and
En
vir
on
men
tal
Ch
ang
e.S
pri
ng
er.
35
6p
p
NA
no
tav
aila
ble
Hydrobiologia
123

result of species-sorting selection (Chase & Leibold,
2003; Leibold et al., 2004), which is in accordance
with the high rates of dispersal expected for Lake
Mangueira.
In Lake Mangueira, the significant environmental
variables that contributed most to the RDAs explaining
the BCC (total phosphorus, PO4-3, NH4
?, water trans-
parency, turbidity, and water temperature) varied sea-
sonally and spatially as a result of water withdrawal for
agricultural irrigation and nutrient inputs (i.e., low-
watershed nutrient loads in winter and high loads in
summer) (Fragoso et al., 2008; Rodrigues et al., 2015).
These inorganic nutrients are essential and often limiting
for bacterial growth (Carlsson & Caron, 2001; Caron,
1994), whereas water transparency and turbidity are
inversely linked, and along with temperature (Lindstrom
et al., 2005) can be an important source of variation of the
BCC in lakes (e.g., Yannarell & Triplett, 2005).
In addition, the significance of the share of BCC
variance explained by the biomass of phytoplankton
taxonomic classes is in accordance with the influence
of phytoplankton on bacterioplankton diversity and
metabolism (Kamjunke et al., 1997; del Giorgio &
Cole, 1998; Hofle et al., 1999; Cotner & Biddanda,
2002; Eiler & Bertilsson, 2004; Horner-Devine et al.,
2003; Kent et al., 2007). Phytoplankton also competes
with bacteria for nutrients (Cotner & Biddanda, 2002)
and positively influences bacteria through exudation
of dissolved organic matter, which can fuel as much as
half of the carbon required for bacterial production
(Baines & Pace, 1991), determining patterns of BCC
(Jones et al., 2009). Since phytoplankton production
tends to be more important in larger lakes (Vadebon-
coeur et al., 2008), especially in the pelagic zone,
algae are expected to significantly influence BCC in
Lake Mangueira. The biomass of large groups such as
Cryptophytes and Chrysophytes has been found to be
correlated with BCC in lakes (Lindstrom, 2000);
however, since a wide metabolic repertoire in terms of
exudates of organic carbon is expected for these broad
classes of phytoplankton, it is impossible to link each
specific algal class to the results found. Bacterivory by
phytoplankton is another possibility, since mixotrophy
is higher in more oligotrophic lakes (Saad et al., 2013)
and prevalent in members of Dinophyceae and
Chrysophyceae, among others (see review by
Stoecker, 1998). Notably, in some systems mixotro-
phy may represent as much as 50% of the total
bacterivory by flagellates (Unrein et al., 2007).
A similar pattern of spatial and temporal variation
was found for FT, even though all substrates were
oxidized in all seasons and locations, and the BCC and
FT were not significantly correlated. This lack of
correlation between BCC and FT has also been found
by Lear et al. (2014) for individual ponds, and by
Comte & del Giorgio (2010), who reported that even
though BCC and FT were not directly correlated, their
rates of change along environmental gradients did
correlate. Several explanations such as those summa-
rized by Lear et al. (2014) can be considered: (i) the
inability of migrant bacteria to grow, thereby con-
tributing to BCC but not to FT; (ii) the contribution of
Archaea or picoeukaryotes to the substrate utilization
pattern; and (iii) the potentially higher functional
redundancy due to the generic metabolic pathways
assessed by this study.
To our knowledge, this is the first evidence for
dispersal of functional traits in bacterial communities,
as shown by the smallest scale of variation found for
FT (* 49 km). This unexpected dispersal-driven FT
may be explained by: i) indirect effect of local factors,
ii) exclusion of significant explanatory variables, and
iii) horizontal gene transfer. Local factors act by
modulating the FT due to the interaction of local
conditions and migrating bacteria. For example,
Severin et al. (2013) found that the ecosystem
functioning (using bacterial secondary production as
a proxy) was well explained by the functional traits of
bacterial communities along a dispersal-rate gradient,
with the receiving local environment being critical for
the final effects on the functional traits of the migrant
cells. Hence, the adaptive success and subsequent
likelihood that immigrant bacteria will contribute their
original functional traits to the receiving community
are inversely proportional to the difference in the local
conditions (i.e., distance). In terms of potentially
significant explanatory variables excluded, the contri-
bution of attached (sediment) bacteria stands out.
Since the wind velocity differed significantly across
seasons and the wind often resuspends the sediment in
shallow lakes, we believe that sediment bacteria may
have had a role in the FT patterns found. This was
confirmed by the significant correlation of wind
velocity with 4 of 9 substrates that were indicated by
SIMPER as the most important for differences among
seasons (not shown). Additionally, attached bacteria
may be richer in oxidized Ecoplate� substrates
compared to free-living bacteria (Lyons & Dobbs,
Hydrobiologia
123

2012). A further indication that other important
variables may not have been included in the models
tested is the large proportion of unexplained variation,
since it is inherently impossible to control field
conditions and/or to measure all relevant environmen-
tal variables. Last, horizontal gene transfer may be
another factor that is unaccounted for in this study, as
gene flow can occur even when phylogenetic dispersal
is highly limited (Parnell et al., 2010). In this case, we
may have detected a signal of gene dispersal, which
unfortunately cannot be confirmed through patterns of
substrate utilization.
In summary, this study showed significant differ-
ences in bacterioplankton community composition
and function over spatial and temporal gradients in a
shallow lake, with temporal differences being stronger
than spatial ones. Compared to previous studies, the
smallest scale of variability detected in BCC and FT
was large (*49 km). Thus, our results suggest that the
smallest scale of heterogeneity detected may be
positively related to lake size. However, at least part
of the results was likely due to the long fetch of Lake
Mangueira, which may be responsible for higher
connectivity through mixing. Variance partitioning
revealed, however, that the bacterial community
composition and functional traits were driven by
environmental conditions and spatial factors, respec-
tively, and our results reinforce the role of local factors
in structuring the BCC in highly connected systems.
Regardless of whether the spatial differences found
were driven by environmental factors or dispersal, the
results have important implications for sampling
design and for understanding the dynamics of fresh-
water microbial communities. Specifically, spatial and
temporal differences in microbial communities within
a lake may be comparable to differences among lakes.
The current results are in line with a growing number
of other studies (summarized in Table 6), which
together highlight within-lake variability as an impor-
tant component of the total variability of the land-
scape. Thus, biogeographical studies should be
extended to include scales of variability within lakes
for explaining biodiversity and ecosystem function.
Acknowledgments This study was supported by the Conselho
Nacional de Desenvolvimento Cientıfico e Tecnologico
(CNPq), Brazil. We acknowledge the assistance provided by
the Instituto Chico Mendes de Conservacao da Biodiversidade
(ICMBio) and Estacao Ecologica do TAIM (ESEC-Taim),
Ministerio do Meio Ambiente, Brazil. We are also grateful to the
Global Lake Ecological Observatory Network (GLEON) for
providing venue and resources for lake science discussions.
M. S. Lima also received support through a doctoral scholarship
from Programa de Pos Graduacao em Recursos Hıdricos e
Saneamento Ambiental, Instituto de Pesquisas Hidraulicas
(CNPq 141228/2012-1), and N. H. They has a post-doctoral
scholarship from Coordination of Higher-Level Staff
Improvement (Capes 88887.065146/2014-00). Special thanks
go to Dr. Lacina Maria Freitas-Teixeira for helping with the raw
phytoplankton data, to MSc. J. Rafael Cavalcanti and MSc.
Mauricio Munar for helping with maps drawings. We are
grateful to Dr. Janet Reid (Trumansburg, NY, U.S.A.) for
revising the English text. The authors are grateful to two
anonymous reviewers for their invaluable comments.
References
APHA, 1999. Eaton, A. D., L. S. Clesceri & A. E. Greenberg
(eds). Standard Methods for the examination of water and
wastewater. 20th ed. American Public Health Association
Inc., Washington.
Baines, S. B. & M. L. Pace, 1991. The production of dissolved
organic matter by phytoplankton and its importance to
bacteria: patterns across marine and freshwater systems.
Limnology and Oceanography 36: 1078–1090.
Beisner, B. E., P. R. Peres-Neto, E. S. Lindstrom, A. Barnett &
M. L. Longhi, 2006. The role of environmental and spatial
processes in structuring lake communities from bacteria to
fish. Ecology 87: 2985–2991.
Bell, T., D. Ager, J.-I. Song, J. A. Newmann, I. P. Thompson, A.
K. Lilley & C. J. van der Gast, 2005. Larger islands house
more bacterial taxa. Science 308: 188.
Bissett, A., A. E. Richardson, G. Baker, S. Wakelin & P.
H. Thrall, 2010. Life history determines biogeographical
patterns of soil bacterial communities over multiple spatial
scales. Molecular Ecology 19: 4315–4327.
Borcard, D. & P. Legendre, 2002. All-scale spatial analysis of
ecological data by means of principal coordinates of
neighbor matrices. Ecological Modelling 153: 51–68.
Borcard, D., P. Legendre & P. Drapeau, 1992. Partialling out the
spatial component of ecological variation. Ecology 73:
1045–1055.
Carlsson, P. & D. A. Caron, 2001. Seasonal variation of phos-
phorus limitation of bacterial growth in a small lake.
Limnology and Oceanography 46: 108–120.
Caron, D. A., 1994. Inorganic nutrients, bacteria, and the
microbial loop. Microbial Ecology 28: 295–298.
Chase, J. M. & M. A. Leibold, 2003. Ecological Niches: Linking
Classical and Contemporary Approaches. University of
Chicago Press, Chicago.
Christian, B. W. & T. L. Lind, 2006. Key issues concerning
Biolog use for aerobic and anaerobic freshwater bacterial
community-level physiological profiling. International
Review of Hydrobiology 91: 257–268.
Christian, B. W. & T. L. Lind, 2007. Multiple carbon substrate
utilization by bacteria at the sediment-water interface:
seasonal patterns in stratified eutrophic reservoir. Hydro-
biologia 586: 43–56.
Hydrobiologia
123

Cole, J. J., 1999. Aquatic microbiology for ecosystem scientists:
new and recycled paradigms in ecological microbiology.
Ecosystems 2: 215–225.
Comte, J. & P. A. del Giorgio, 2010. Linking the patterns of
change in composition and function in bacterioplankton
successions along environmental gradients. Ecology 91:
1466–1476.
Cotner, J. B. & B. A. Biddanda, 2002. Small players, large role:
microbial influence on biogeochemical processes in pela-
gic aquatic ecosystems. Ecosystems 5: 101–105.
Crossetti, L. O., V. Becker, L. S. Cardoso, L. R. Rodrigues, L.
S. Costa & D. Motta-Marques, 2013. Is phytoplankton
functional classification a suitable tool to investigate spa-
tial heterogeneity in a subtropical shallow lake? Limno-
logica 43: 157–163.
Crump, B. C., H. E. Adams, J. E. Hobbie & G. W. Kling, 2007.
Biogeography of bacterioplankton in lakes and streams of
an arctic tundra catchment. Ecology 88: 1365–1378.
del Giorgio, P. A. & J. Cole, 1998. Bacterial growth efficiency in
natural aquatic systems. Annual Review of Ecology,
Evolution and Systematics 29: 503–541.
Dickerson, T. L. & H. N. Williams, 2014. Functional diversity of
bacterioplankton in three North Florida freshwater lakes
over an annual cycle. Microbial Ecology 67: 34–44.
Dray, S., P. Legendre & P. R. Peres-Neto, 2006. Spatial mod-
elling: a comprehensive framework for principal compo-
nent analysis of neighbor matrices (PCNM). Ecological
Modelling 196: 483–493.
Eiler, A. & S. Bertilsson, 2004. Composition of freshwater
bacterial communities associated with cyanobacterial
blooms in four Swedish lakes. Environmental Microbiol-
ogy 6: 1228–1243.
Fisher, M. M. & E. W. Triplett, 1999. Automated approach for
ribosomal intergenic spacer analysis of microbial diversity
and its application to freshwater bacterial communities.
Applied and Environmental Microbiology 65: 4630–4636.
Fragoso Jr, C. R., D. M. L. Motta Marques, W. Collischonn, C.
E. M. Tucci & E. H. van Nes, 2008. Modelling spatial
heterogeneity of phytoplankton in Lake Mangueira, a large
shallow subtropical lake in South Brazil. Ecological
Modelling 219: 125–137.
Galand, P. E., E. O. Casamayor, D. L. Kirchman & C. Lovejoy,
2009. Ecology of the rare microbial biosphere of the Arctic
Ocean. Proceedings of the National Academy of Sciences
of the USA 106: 22427–22432.
Green, J. & B. J. M. Bohannan, 2006. Spatial scaling of
microbial diversity. Trends in Ecology & Evolution 21:
501–507.
Gross, J., 2003. Variance inflation factors. R News 1: 13–15.
Grover, J. P. & T. H. Chrzanowski, 2000. Seasonal patterns of
substrate utilization by bacterioplankton: case studies in
four temperate lakes of different latitudes. Aquatic
Microbial Ecology 23: 41–54.
Guckert, J. B., G. J. Carr, T. D. Johnson, B. G. Hamm, D.
H. Davidson & Y. Kumagai, 1996. Community analysis by
Biolog: curve integration for statistical analysis of active
sludge microbial habitats. Journal of Microbiological
Methods 27: 183–197.
Hillebrand, H., D. Durseken, D. Kirschiel, U. Pollingher & T.
Zohary, 1999. Biovolume calculation for pelagic and
benthic microalgae. Journal of Phycology 35: 403–424.
Hofle, M. G., H. Haas & K. Dominik, 1999. Seasonal dynamics
of bacterioplankton community structure in a eutrophic
lake as determined by 5S rRNA analysis. Applied and
Environmental Microbiology 65: 3164–3174.
Horner-Devine, M. C., S. V. H. Leibold & B. J. M. Bohannan,
2003. Bacterial diversity patterns along a gradient of pri-
mary productivity. Ecology Letters 6: 613–622.
Horner-Devine, M. C., M. Lage, J. B. Hughes & B. J. M.
Bohannan, 2004. A taxa-area relationship for bacteria.
Nature 432: 750–753.
Insam, H. & M. Goberna, 2004. Use of Biolog for the Com-
munity Level Physiological Profiling (CLPP) of environ-
mental samples. Molecular Microbial Ecology Manual
4(01): 853–860.
Jespersen, A. M. & K. Christoffersen, 1987. Measurements of
chlorophyll-a from phytoplankton using ethanol as
extraction solvent. Archiv fur Hydrobiologie 109:
445–454.
Jones, S. E. & K. D. McMahon, 2009. Species-sorting may
explain an apparent minimal effect of immigration on
freshwater bacterial community dynamics. Environmental
Microbiology 11: 905–913.
Jones, S. E., R. J. Newton & K. D. McMahon, 2009. Evidence
for structuring of bacterial community composition by
organic matter carbon source in temperate lakes. Envi-
ronmental Microbiology 11: 2463–2472.
Jones, S. E., T. A. Cadkin, R. J. Newton & K. D. McMahon,
2012. Spatial and temporal scales of aquatic bacterial beta
diversity. Frontiers in Microbiology 3: 318.
Kamjunke, N., W. Boing & H. Voigt, 1997. Bacterial and pri-
mary production under hypertrophic conditions. Aquatic
Microbial Ecology 13: 29–35.
Kan, J., M. T. Suzuki, K. Wang, S. E. Evans & F. Chen, 2007.
High temporal but low spatial heterogeneity of bacterio-
plankton in the Chesapeake Bay. Applied and Environ-
mental Microbiology 73: 6776–6789.
Kent, A. D., S. E. Jones, A. C. Yannarell, J. M. Graham, G.
H. Lauster, T. K. Kratz & E. W. Triplett, 2004. Annual
Patterns in Bacterioplankton Community Variability in a
Humic Lake. Microbial Ecology 48: 550–560.
Kent, A. D., S. E. Jones, G. H. Lauster, J. M. Graham, R.
J. Newton & K. D. McMahon, 2006. Experimental
manipulations of microbial food web interactions in a
humic lake: shifting biological drivers of bacterial com-
munity structure. Environmental Microbiology 8:
1448–1459.
Kent, A. D., A. C. Yannarell, J. A. Rusak, E. W. Triplett & K.
D. McMahon, 2007. Synchrony in aquatic microbial
community dynamics. The ISME Journal 1: 38–47.
Korhonen, J. J., J. Soininen & H. Hillebrand, 2010. A quanti-
tative analysis of temporal turnover in aquatic species
assemblages across ecosystems. Ecology 91: 508–517.
Langenheder, S. & H. Ragnarsson, 2007. The role of environ-
mental and spatial factors for the composition of aquatic
bacterial communities. Ecology 88: 2154–2161.
Lear, G., J. Bellamy, B. S. Case, J. E. Lee & H. L. Buckley,
2014. Fine-scale patterns in bacterial community compo-
sition and function within freshwater ponds. The ISME
Journal 8: 1715–1726.
Legendre, P. & L. Legendre, 1998. Numerical Ecology, 2nd ed.
Amsterdam, Elsevier Science BV.
Hydrobiologia
123

Leibold, M. A., M. Holyoak, N. Mouquet, P. Amarasekare, J.
M. Chase, M. F. Hoopes, R. D. Holt, J. B. Shurin, R. Law,
D. Tilman, M. Loreau & A. Gonzalez, 2004. The meta-
community concept: a framework for multi-scale com-
munity ecology. Ecology Letters 7: 601–613.
Lindstrom, E. S., 2000. Bacterioplankton community compo-
sition in five lakes differing in trophic status and humic
content. Microbial Ecology 40: 104–113.
Lindstrom, E. S. & S. Langenheder, 2012. Local and regional
factors influencing bacterial community assembly. Envi-
ronmental Microbiology Reports 4: 1–9.
Lindstrom, E. S., M. K.-V. Agterveld & G. Zwart, 2005.
Distribution of typical freshwater bacterial groups is
associated with pH, temperature, and lake water retention
time. Applied and Environmental Microbiology 71:
8201–8206.
Liu, L., J. Yang, Z. Yu & D. M. Wilkinson, 2015. The bio-
geography of abundant and rare bacterioplankton in the
lakes and reservoirs of China. The ISME Journal 9:
2068–2077.
Logue, J. B. & E. S. Lindstrom, 2010. Species sorting affects
bacterioplankton community composition as determined
by 16S rDNA and 16S rRNA fingerprints. The ISME
Journal 4: 729–738.
Lund, J. W. G., C. Kipling & E. D. LeCren, 1958. The invert
microscope method of estimating algal numbers and the
statistical basis of estimations by counting. Hydrobiologia
11: 143–170.
Lyons, M. M. & F. C. Dobbs, 2012. Differential utilization of
carbon substrates by aggregate-associated and water-as-
sociated heterotrophic bacterial communities. Hydrobi-
ologia 686: 181–193.
Mackereth, F. J. H., J. Heron & J. F. Talling, 1989. Water
Analysis: Some Revised Methods for Limnologists, 2nd
ed. Freshwater Biological Association, Ambleside.
Mantel, N. A., 1967. The detection of disease clustering and a
generalized regression approach. Cancer Research 27:
209–220.
Martiny, J. B. H., B. J. M. Bohannan, J. H. Brown, R. K. Col-
well, J. A. Fuhrman, J. L. Green, M. C. Horner-Devine, M.
Kane, J. A. Krumins, C. R. Kuske, P. J. Morin, S. Naeem,
L. Øvreas, A.-L. Reysenbach, V. H. Smith & J. T. Staley,
2006. Microbial biogeography: putting microorganisms on
the map. Nature Reviews Microbiology 4: 102–112.
Oksanen, J., G. B. Blanchet, R. Kindt, P. Legendre, P.
R. Minchin, R. B. OHara, G. L. Simpson, P. Solymos, M.
H. H. Stevens & H. Wagner, 2013. vegan: Community
Ecology Package. R package version 2.0-9. http://CRAN.
R-project.org/package=vegan.
Pace, N. R. A., 1997. Molecular view of microbial diversity and
the biosphere. Science 276: 734–740.
Palmer, F. E., R. D. Methot Jr & J. T. Staley, 1967. Patchiness in
the distribution of planktonic heterotrophic bacteria in
lakes. Applied and Environmental Microbiology 31:
1003–1005.
Parnell, J. J., G. Rompato, L. C. Latta IV, M. E. Pfrender, J. D.
van Nostrand, J. Zou, G. Andersen, P. Champine, B.
Ganesan & B. C. Weimer, 2010. Functional biogeography
as evidence of gene transfer in hypersaline microbial
communities. PLoS One 5(9): e12919. doi:10.1371/
journal.pone.0012919.
R Core Team, 2013. R: A language and environment for sta-
tistical computing. R Foundation for Statistical Comput-
ing, Vienna, Austria. URL http://www.R-project.org/.
Ramette, A., 2007. Multivariate analyses in microbial ecology.
FEMS Microbiology Ecology 62: 142–160.
Reche, I., E. Pulido-Villena, R. Morales-Baquero & E.
O. Casamayor, 2005. Does ecosystem size determine
aquatic bacterial richness? Ecology 86: 1715–1722.
Rodrigues, L. R., D. Motta Marques & N. F. Fontoura, 2015.
Fish community in a large coastal subtropical lake: how an
environmental gradient may affect the structure of trophic
guilds. Limnetica 34: 495–506.
Saad, J. F., M. R. Schiaffino, A. Vinocur, I. O’Farrell, G. Tell &
I. Izaguirre, 2013. Microbial planktonic communities of
freshwater environments from Tierra del Fuego: dominant
trophic strategies in lakes with contrasting features. Journal
of Plankton Research 35: 1220–1233.
Sala, M. M., J. Pinhassi & J. M. Gasol, 2006. Estimation of
bacterial use of dissolved organic nitrogen compounds in
aquatic ecosystems using Biolog plates. Aquatic Microbial
Ecology 42: 1–5.
Salomo, S., C. Munch & I. Roske, 2009. Evaluation of the
metabolic diversity of microbial communities in four dif-
ferent filter layers of a constructed wetland with vertical
flow by Biolog analysis. Water Research 43: 4569–4578.
Schiaffino, M. R., F. Unrein, J. M. Gasol, R. Massana, V.
Balague & I. Izaguirre, 2011. Bacterial community struc-
ture in a latitudinal gradient of lakes: the role of spatial
versus environmental factors. Freshwater Biology 56:
1973–1991.
Severin, I., O. Ostman & E. S. Lindstrom, 2013. Variable effects
of dispersal on productivity of bacterial communities due
to changes in functional trait composition. PLoS One
8(12): e80825. doi:10.1371/journal.pone.0080825.
Shade, A., S. E. Jones & K. D. McMahon, 2008. The influence of
habitat heterogeneity on freshwater bacterial community
composition and dynamics. Environmental Microbiology
10: 1057–1067.
Sokal, R. R. & F. J. Rolf, 1995. Biometry, 3rd ed. W. H. Free-
man and Company, New York.
Sommaruga, R. & E. O. Casamayor, 2008. Bacterial ‘cos-
mopolitanism’ and importance of local environmental
factors for community composition in remote high-altitude
lakes. Freshwater Biology 54: 994–1005.
Souffreau, C., K. van der Gucht, I. van Gremberghe, S. Kosten,
G. Lacerot, L. M. Lobao, V. L. de Moraes Huszar, F.
Roland, E. Jeppesen, W. Vyverman & L. De Meester,
2015. Environmental rather than spatial factors structure
bacterioplankton communities in shallow lakes along
a[ 6000 km latitudinal gradient in South America.
Environmental Microbiology 17: 2336–2351.
Stoecker, D. K., 1998. Conceptual models of mixotrophy in
planktonic protists and some ecological and evolutionary
implications. European Journal of Protistology 34: 281–290.
Strome, D. J. & M. C. Miller, 1978. Photolytic changes in dis-
solved humic substances. Verhandlungen der Interna-
tionalen Vereinigung fur Theoretische und Angewandte
Limnologie 20: 1248–1254.
They, N.-H., D. M. Marques, E. Jeppesen & M. Søndergaard,
2010. Bacterioplankton in the littoral and pelagic zones of
subtropical shallow lakes. Hydrobiologia 646: 311–326.
Hydrobiologia
123

Tian, C., J. Tan, X. Wu, W. Ye, X. Liu, D. Li & H. Yang, 2009.
Spatiotemporal transition of bacterioplankton diversity in a
large shallow hypertrophic freshwater lake, as determined
by denaturing gradient gel electrophoresis. Journal of
Plankton Research 31: 885–897.
Tiquia, S. M., 2010. Metabolic diversity of the heterotrophic
microorganisms and potential link to pollution of the
Rouge River. Environmental Pollution 158: 1435–1443.
Unrein, F., R. Massana, L. Alonso-Saez & J. M. Gasol, 2007.
Significant year-round effect of small mixotrophic flagel-
lates on bacterioplankton in an oligotrophic coastal system.
Limnology and Oceanography 52: 456–469.
Utermohl, H., 1958. Zur Vervollkommnung der quantitativen
Phytoplankton-Methodik. Mitteilung der Internationalen
Vereinigung fur Theoretische und Angewandte Limnolo-
gie 9: 1–38.
Vadeboncoeur, Y., G. Peterson, M. Jake, V. Zanden & J. Kalfe,
2008. Benthic algal production across lake size gradients:
interactions among morphometry, nutrients, and light.
Ecology 89: 2542–2552.
Van der Gucht, K., K. Cottenie, K. Muylaert, N. Vloemans, S.
Cousin, S. Declerck, E. Jeppesen, J.-M. Conde-Porcuna, K.
Schwenk, G. Zwart, H. Degans, W. Vyverman & L. De
Meester, 2007. The power of species sorting: local factors
drive bacterial community composition over a wide range
of spatial scales. Proceedings of the National Academy of
Sciences of the USA 104: 20404–20409.
Wu, Q. L., G. Zwart, J. Wu, M. P. K-v, S. Liu Agterveld & M.
W. Hahn, 2007. Submersed macrophytes play a key role in
structuring bacterioplankton community composition in
the large, shallow, subtropical Taihu Lake, China. Envi-
ronmental Microbiology 9: 2765–2774.
Yannarell, A. C. & E. W. Triplett, 2004. Within- and between-
lake variability in the composition of bacterioplankton
communities: investigations using multiple spatial scales.
Applied and Environmental Microbiology 70: 214–223.
Yannarell, A. C. & E. W. Triplett, 2005. Geographic and
environmental sources of variation in lake bacterial com-
munity composition. Applied and Environmental Micro-
biology 71: 227–239.
Yannarell, A. C., A. D. Kent, G. H. Lauster, T. K. Kratz & E.
W. Triplett, 2003. Temporal patterns in bacterial commu-
nities in three temperate lakes of different trophic status.
Microbial Ecology 46: 391–405.
Hydrobiologia
123