

DIGITAL HUMANITIES Cases of Malaysian Youth & Media
153
DIGITAL HUMANITIES Cases of Malaysian Youth & Media Multimedia Innovation and Digital Humanities Research Unit
-
Upload
khangminh22 -
Category
Documents
-
view
0 -
download
0
Transcript of DIGITAL HUMANITIES Cases of Malaysian Youth & Media
i
DIGITAL HUMANITIES
Cases of Malaysian
Youth & Media
Multimedia Innovation and Digital Humanities Research Unit
YMS2021, Universiti Utara Malaysia
Digital Humanities: Cases of Malaysian Youth & Media
(Eds.) Norshuhada Shiratuddin Azizah Che Omar Siti Mahfuzah Sarif Goh Chiew Keoh Nureen Syafiqah Jaafar
YMS2021, Universiti Utara Malaysia
Multimedia Innovation and Digital Humanities (MIDH) Research Unit School of Multimedia Technology and Communication Universiti Utara Malaysia 06010 UUM Sintok Kedah, Malaysia © 2021 UUM MIDH Research Unit Perpustakaan Negara Malaysia Cataloguing-in-Publication Data DIGITAL HUMANITIES: Cases of Malaysian Youth & Media/(Eds.): Norshuhada
Shiratuddin, Azizah Che Omar, Siti Mahfuzah Sarif, Goh Chiew Keoh, Nureen Syafiqah Jaafar. Mode of access: Internet eISBN 978-967-19730-0-4 1. Digital humanities. 2. Social media. 3. Technology and youth. 4. Technological innovations. 5. Government publications--Malaysia. 6. Electronic books. I. Norshuhada Shiratuddin, 1969-. II. Azizah Che Omar, 1986-. III. Siti Mahfuzah Sarif, 1979-. IV. Goh, Chiew Keoh, 1997-. V. Nureen Syafiqah Jaafar, 1999-. 302.231
Published by School of Multimedia Technology and Communication, Universiti Utara Malaysia
All Rights reserved. No part of this publication may be reproduced in any form or by any means without prior permission from the
copyright holder.
Printed in Malaysia.
This collection of research articles is published in electronic format at smmtc.uum.edu.my/yms2021/eproceedings.pdf
YMS2021, Universiti Utara Malaysia
YOUTH & MEDIA SEMINAR 2021
Working committee
ADVISOR Prof. Dr. Norshuhada Shiratuddin A.M.N
Dr. Azizah Binti Che Omar
CONFERENCE CHAIR
Muhammad Tajuddin Nor Azman
DEPUTY CHAIR
Nurul Farzana Anis Ahmad
TREASURER SECRETARY
Loh Wei Hau Lim Wei Wen
Nur Azimah Azmi SECRETARIAT & REGISTRATION SECRETARIAT & MC
Aina Farzana Mohd Azmi Low Kah Yan
Taranni Manoharan Kenneth Chooi Wai Seng
Nurainaazuwa Zulkipli Ahmad Ikmah Sujali
Chen Jia Rong
Nanthini Oulaganathan PROTOCOL
Nurul Asyiqin Abdul Aziz
PUBLICITY Choong Hui Zhi
Nurul Syahirah Khalid Nurul Aini Abdul Rahman
Nur Izzati Ghazali Siti Nurzulaifah Sheikh Allaudin Nebila Masidin Aishah Mohd Noor
Nur Farzana Ahmad
WEBSITE
PROMOTION & ADVERTISING CHANNEL Siti Nurhanani Tajul Ariffin
Nureen Syafiqah Jaafar Nor Izzati Husna Mohamad
Nazifa Zafirah Abdul Halim Nur Hafizah Sapuan
Shazalina Fildzah Suhailee Koh Jia Hui
Nur Ayuni Sabihah Sukri Lee Jiahui
Nur Zinnirah Ahmad Ibrahim Lim Shu Li
Nur Hana Ahmad Shahruzi
YMS2021, Universiti Utara Malaysia
SOUVENIRS SPONSORSHIP
Liew Jia Qi Cuckthima Wat
Leow Thing Ni Nurul Syahidah Robia
Jagvinderjit Singh Rajinder Singh Siti Nor Hamidah Hidayah Abd Jalil
Nur Farisah Mohd Wira Muhammad Amirul Husaini Norli
Nur Hidayah Mohd Suhaimi Leong Chun Hung
Stark Aisyah Nurjannah Sia San Hou
COMPETITION
BEST POSTER BEST PAPER
Teh Xiao Lin Asma Balqis Zainuddin
Nur Izzati Mohd Saruji Afandi Nurul Syuhaidah Ibrahim
Sarvinthraan a/l Nathan Nur Afifah Abdul Manan LOGISTICS PUBLICATION
Chan Chun Sheng Goh Chiew Keoh
Phan Jia Le Fauziah Miswari
Leong Jia Wei Amy Cheong Shuet Yeng
Siti Marsitah Abdul Razak
TECHNICAL Wong Ka Hei
Wong Xin Yi Ewe Jia Yen
Roazfazleen Azlan Siti Intan Rasyiqah Mohd Riduan
Ainan Midrara Hamat Fauzi Lee Cinyi
Yi Si Qi
YMS2021, Universiti Utara Malaysia
PUBLICATION COMMITTEE
Goh Chiew Keoh Fauziah Miswari
Amy Cheong Shuet Yeng Siti Marsitah Abdul Razak
Wong Ka Hei Ewe Jia Yen
Siti Intan Rasyiqah Mohd Riduan Lee Cinyi Yi SiQi
BOARD OF REVIEWERS Prof. Dr. Norshuhada Shiratuddin, A.M.N
Dr. Azizah Che Omar Dr. Siti Mahfuzah Sarif Nur Farzana Ahmad
Stark Aisyah Nurjannah Nurul Asyiqin Abdul Aziz Nurul Aini Abdul Rahman
Siti Nurzulaifah Sheikh Allaudin Fauziah Miswari
Ainan Midrara Hamat Fauzi Roazfazleen Azlan
SEMINAR KEYNOTE SPEAKER Prof. Dr. ZaidatunTasir
Dean, Faculty of Social Science & Humanities, Universiti
Teknologi Malaysia (UTM), Malaysia.
FORUM DISCUSSANTS
Dr. Siti Mahfuzah Sarif
Aisyah Shakirah Suhaidi
Kenneth Chooi Wai Seng
YMS2021, Universiti Utara Malaysia
Foreword I am pleased, on behalf of the committee, to highlight the studies and findings of UUM young and inexperienced researchers; comprising of young lecturers, postgraduate and undergraduate students. This book of seminar papers is dedicated to the field of Digital Humanities (DH), which is a fairly new academic field that I am advocating in this institution. DH is an intersection between computing, multimedia and the disciplines of the humanities. It is methodological by nature and interdisciplinary in scope. All the papers highlighted in this book are the collection of the Youth and Media Seminar (YMS) which was organized in June 2021. I thank all authors and presenters who participated in this seminar, which was jointly organized by the students of the School of Multimedia Technology & Communication, and Multimedia, Innovation & Digital Humanities (MIDH) Research Unit.
After a meticulous peer-review processes, this book publishes 21 papers that are specifically relevant to the current theoretical and analytical issues between youth, media and technology use. This book covers the following themes where the young authors are putting their research and writing skills in practiced:
▪ Youth, Media and Tools ▪ Media and Youth Social issues ▪ Media and Game Violence Impacts ▪ Media and Youth Participation ▪ Media, Youth and Consumerism ▪ Media and Youth Empowerment ▪ Media and Youth Emerging Culture
First, the book deliberates on the Trend of Using Social Media to Spread Information among Youth. Being able to use digital technologies should be akin to understanding their function as digital citizens of Malaysia. Therefore, the next article is dedicated to reporting a study that examined the youths’ current knowledge on digital citizenship and literacy. Youth awareness of the fundamental of digital media, technology and citizenship are made the focused of study. Next, the influence of mass media on adolescent morality is elaborated where findings of a survey among youth are presented. The following paper identifies the uses of the Tiktok apps, and the factors that escalate the use of Tiktok apps among the youth. In particular, the article argues the positive impact of Tiktok on society and lifestyle among youth. Social media causes insecurities among youth in Malaysia are discussed next. The study found that individuals’ self-esteem is influenced by social media, where social networking sites are used by youths for communication, information, and sustaining relationships with others. This is followed by the impact of social media on mental health issues where it was determined that cyberbullying in social media does impact on youth. Media and game violence among youth in Malaysia and the connection between violent video game and youth aggression are also exhibited. Then, since youth love to shop online, youth online shopping behavior is deliberated. Before the book concludes, the negative impacts of social media on youth, youth experience in digital museum and how storytelling could increase youth knowledge, skills and value achievement are detailed. Finally, the importance of logo design in branding among youth ends the content elaboration of this young researchers’ book series. Prof. Dr. Norshuhada Shiratuddin Senior fellow of MIDH-RU
YMS2021, Universiti Utara Malaysia
Table of Contents ARTICLE Title & Author Page
1 Trend of Using Social Media to Spread Information among Youth in Malaysia Taranni Manoharan, Nur Hana Ahmad Shahruzi, Nur Zinnirah Ahmad Ibrahim, Nur Hidayah Mohd Suhaimi & Nur Hafizah Sapuan
1
2 Youth Awareness of the Fundamental of Digital Media, Technology and Citizenship Ummul Asnah Navabsa & Norshuhada Shiratuddin
7
3 Social Media Causes Insecurities among Youth in Malaysia Siti Nurzulaifah Sheikh Allaudin, Fauziah Miswari, Ainan Midrara Hamat Fauzi & Roazfazleen Azlan
15
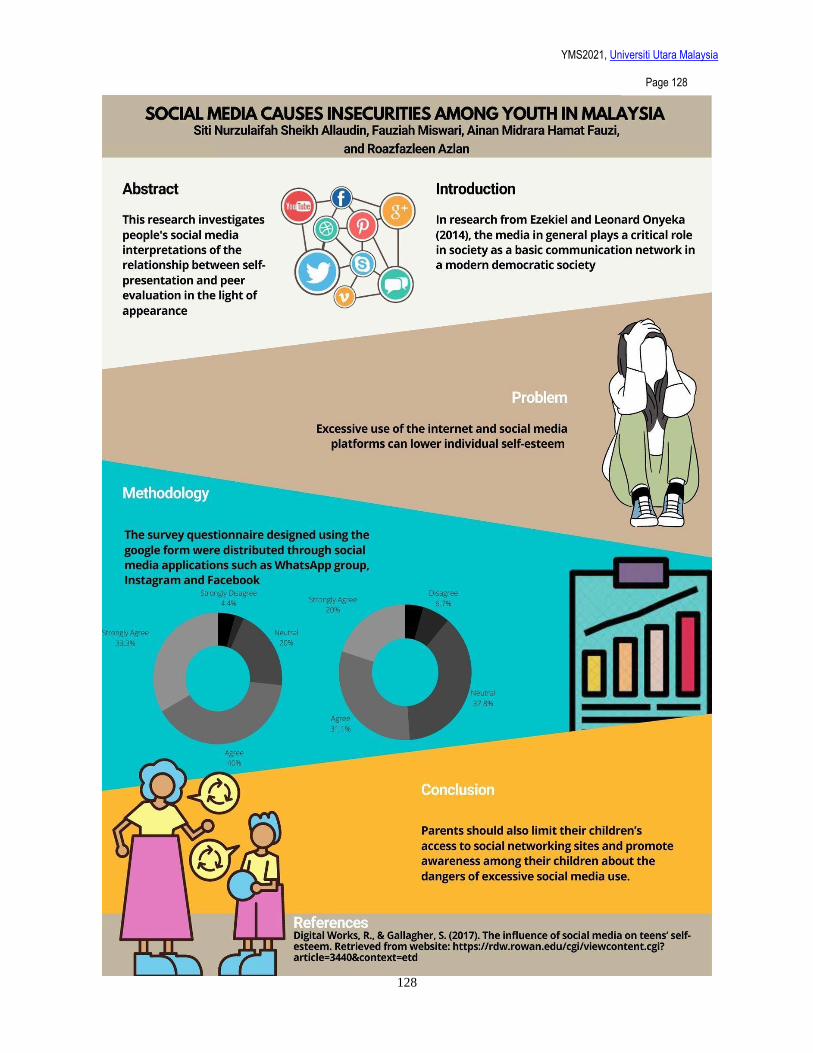
4 The Influence of Mass Media on Adolescent Morality Nurul Syahidah Robia, Nur Farisah Mohd Wira, Lee Cinyi & Cuckthima Wat
21
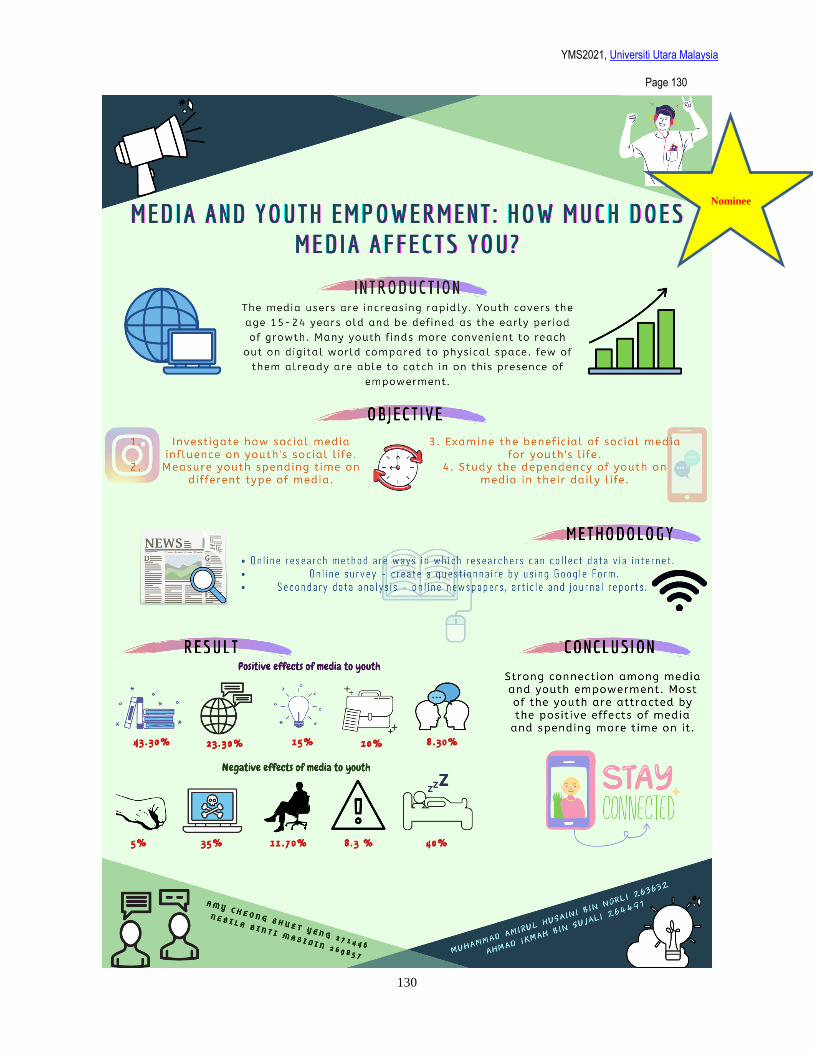
5 Media and Youth Empowerment: How Much Does Media Affect You? Amy Cheong Shuet Yeng, Nebila Masidin, Muhammad Amirul Husaini Norli, & Ahmad Ikmah Sujali
26
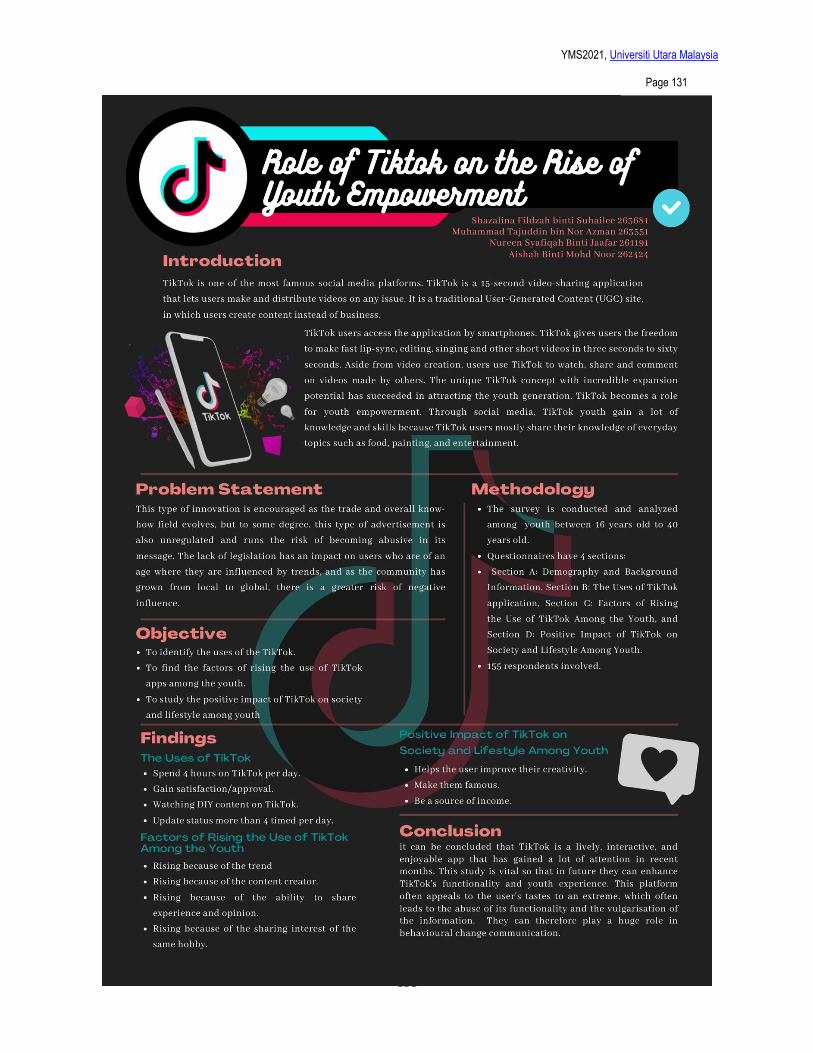
6 Role of TikTok on the Rise of Youth Empowerment Shazalina Fildzah Suhailee, Muhammad Tajuddin Nor Azman, Nureen Syafiqah Jaafar & Aishah Mohd Noor
30
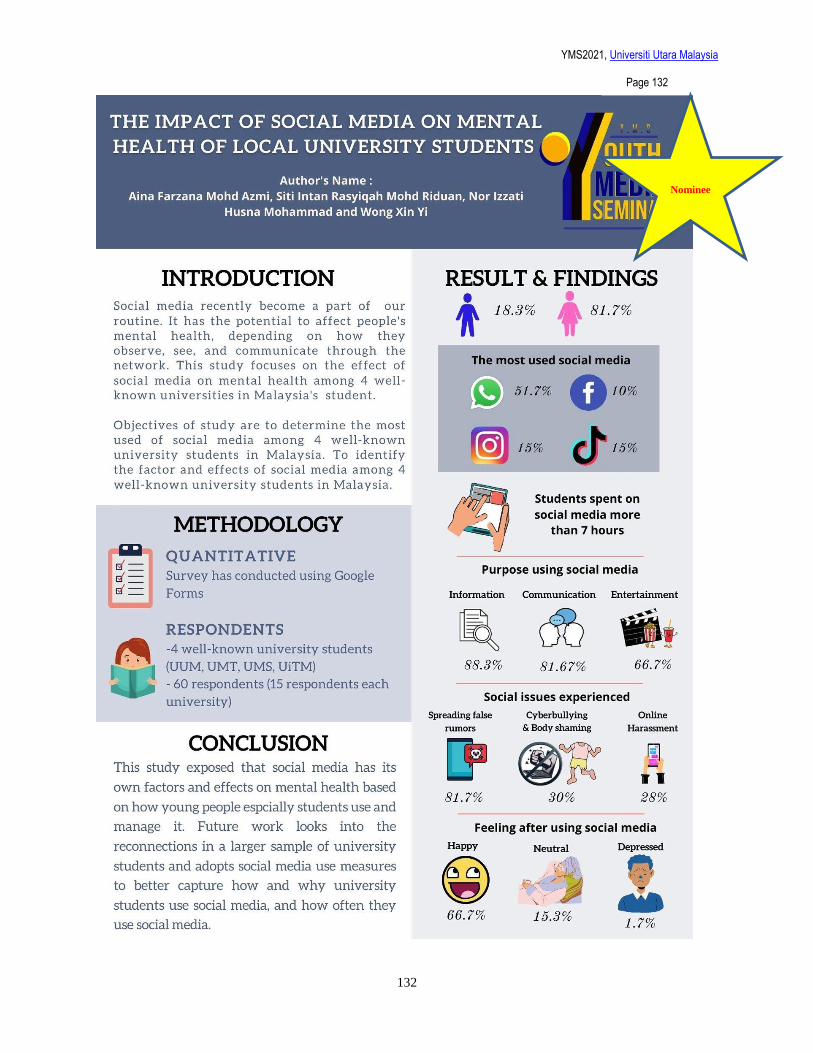
7 The Impact of Social Media on Mental Health of Local University Students Aina Farzana Mohd Azmi, Nor Izzati Husna Mohamad, Wong Xin Yi & Siti Intan Rasyiqah Mohd Riduan
37
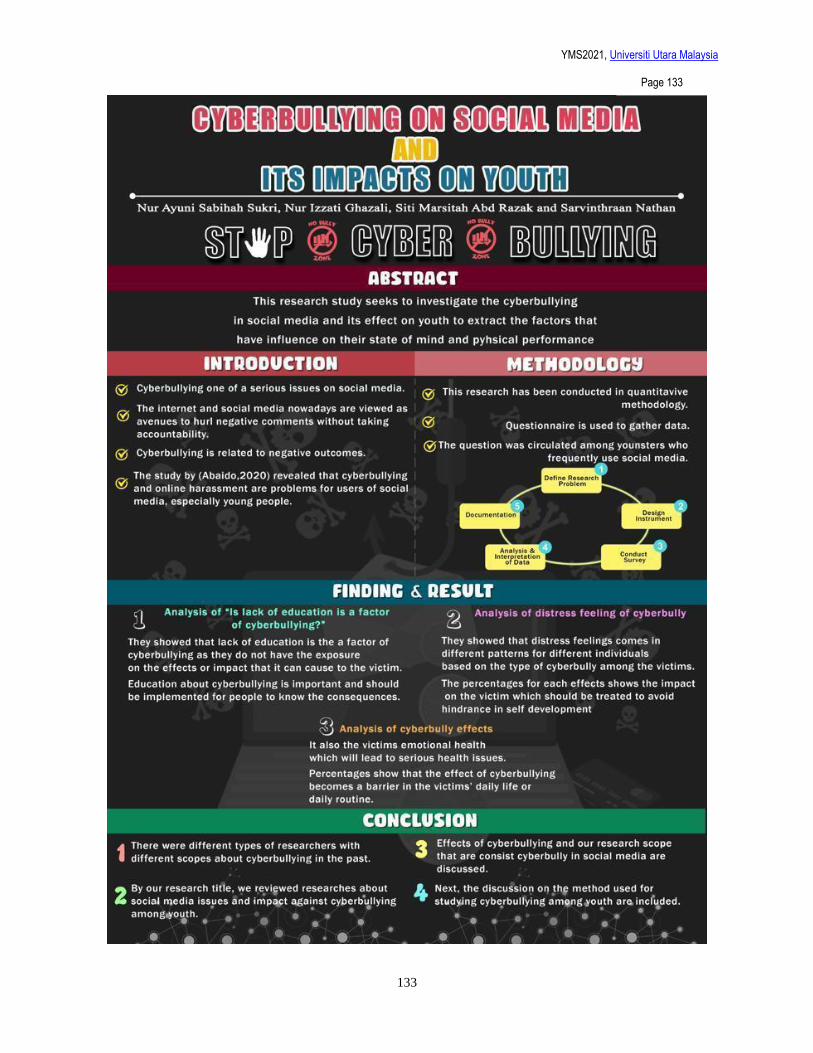
8 Cyberbullying on Social Media and Its Impacts on Youth Nur Ayuni Sabihah Sukri, Nur Izzati Ghazali, Siti Marsitah Abd Razak & Sarvinthraan Nathan
43
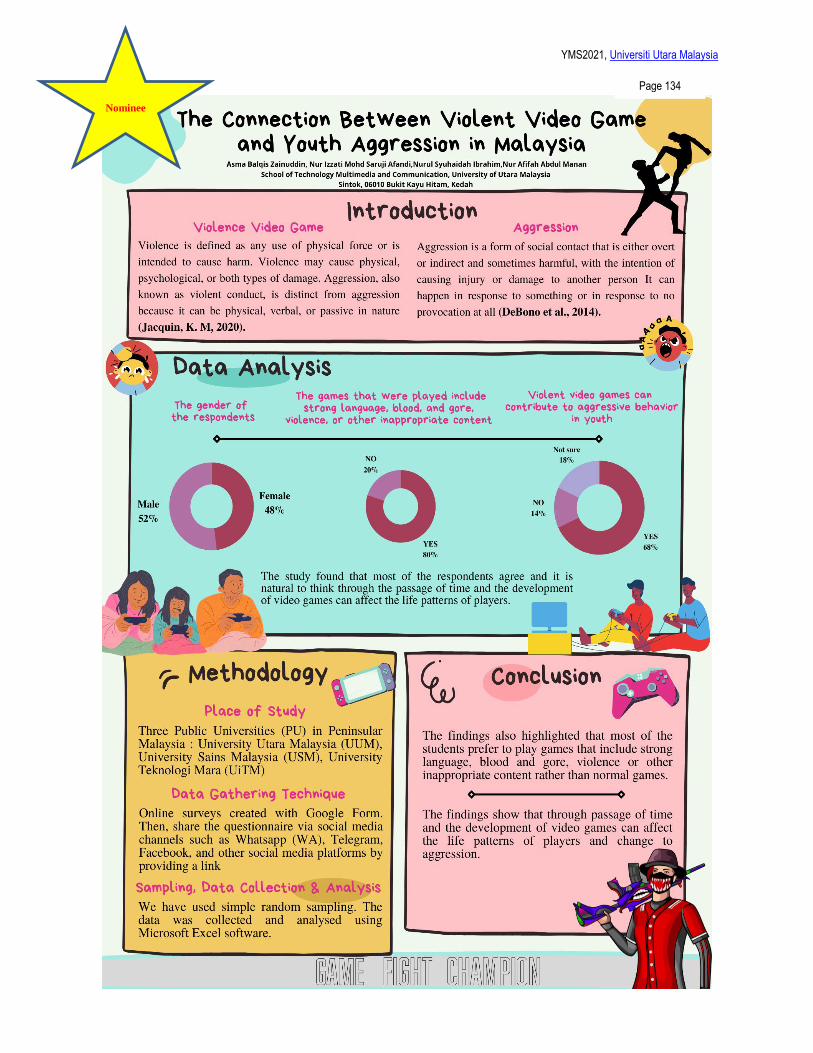
9 The Connection Between Violent Video Game and Youth Aggression in Malaysia Asma Balqis Zainuddin, Nurul Syuhaidah Ibrahim, Nur Afifah Abdul Manan, & Nur Izzati Mohd Saruji Afandi
48
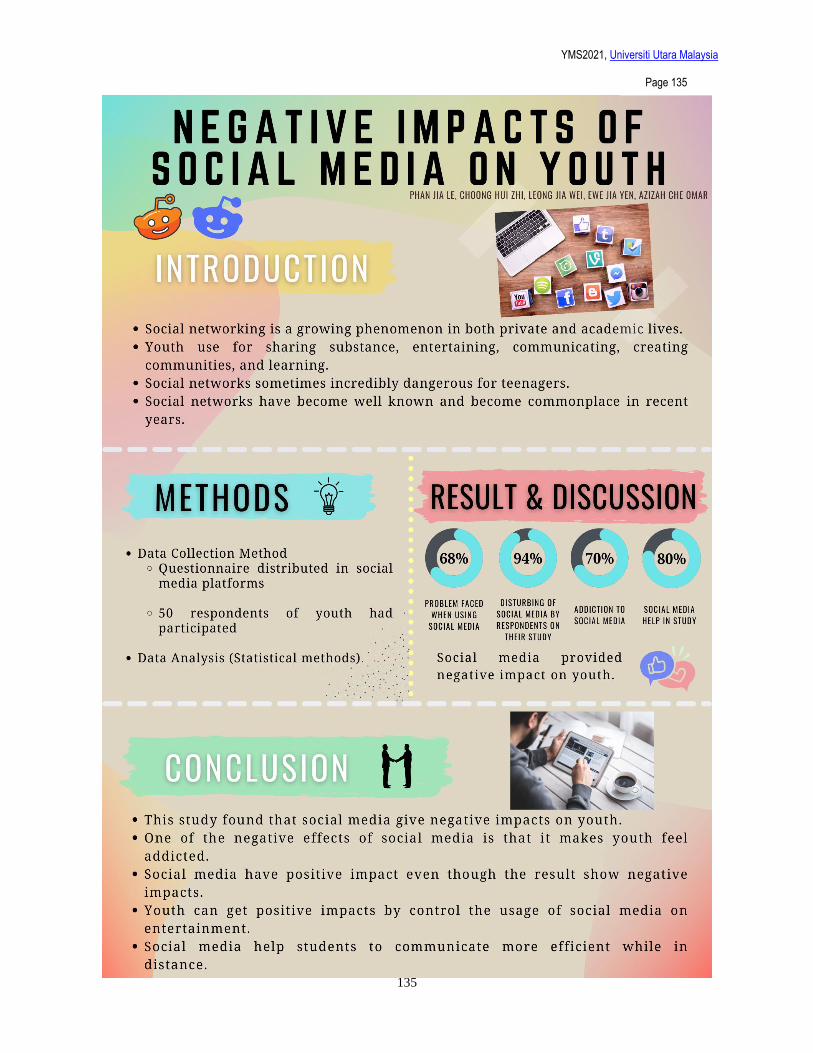
10 Negative Impacts of Social Media on Youth Phan Jia Le, Choong Hui Zhi, Leong Jia Wei, Ewe Jia Yen & Azizah Che Omar
55
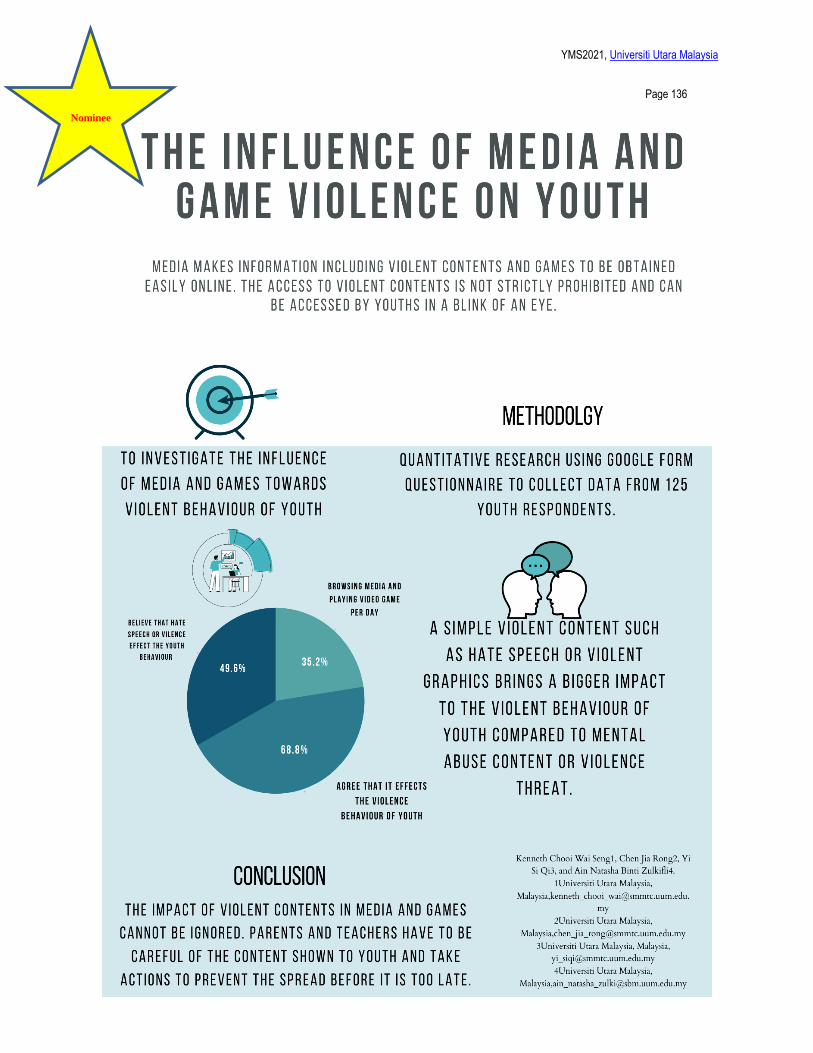
11 The Influence of Media and Game Violence on Youth Kenneth Chooi Wai Seng, Chen Jia Rong, Yi Siqi & Ain Natasha Zulkifli
60
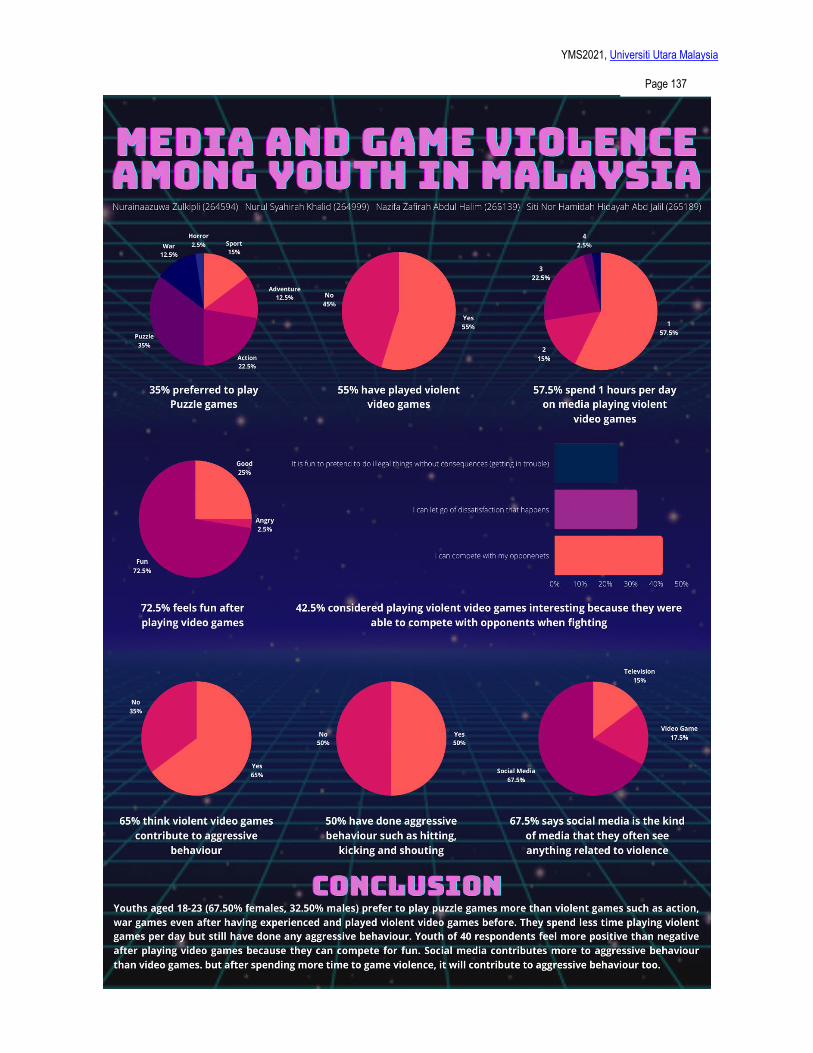
12 Media and Game Violence among Youth in Malaysia Nurainaaazuwa Zulkipli, Nurul Syahirah Khalid, Nazifa Zafirah Abdul Halim & Siti Nor Hamidah Hidayah Abd Jalil
63
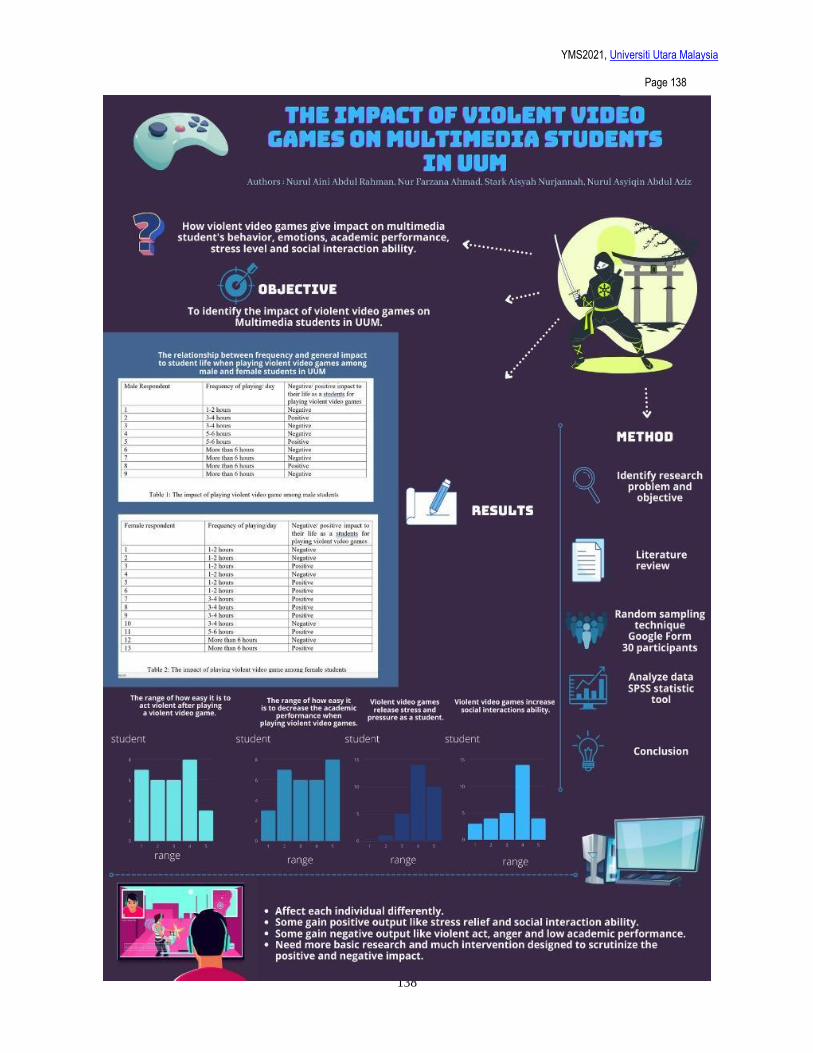
13 The Impact of Violent Video Games on Multimedia Students in UUM Nurul Aini Abdul Rahman, Nur Farzana Ahmad, Stark Aisyah Nurjannah & Nurul Asyiqin Abdul Aziz
72
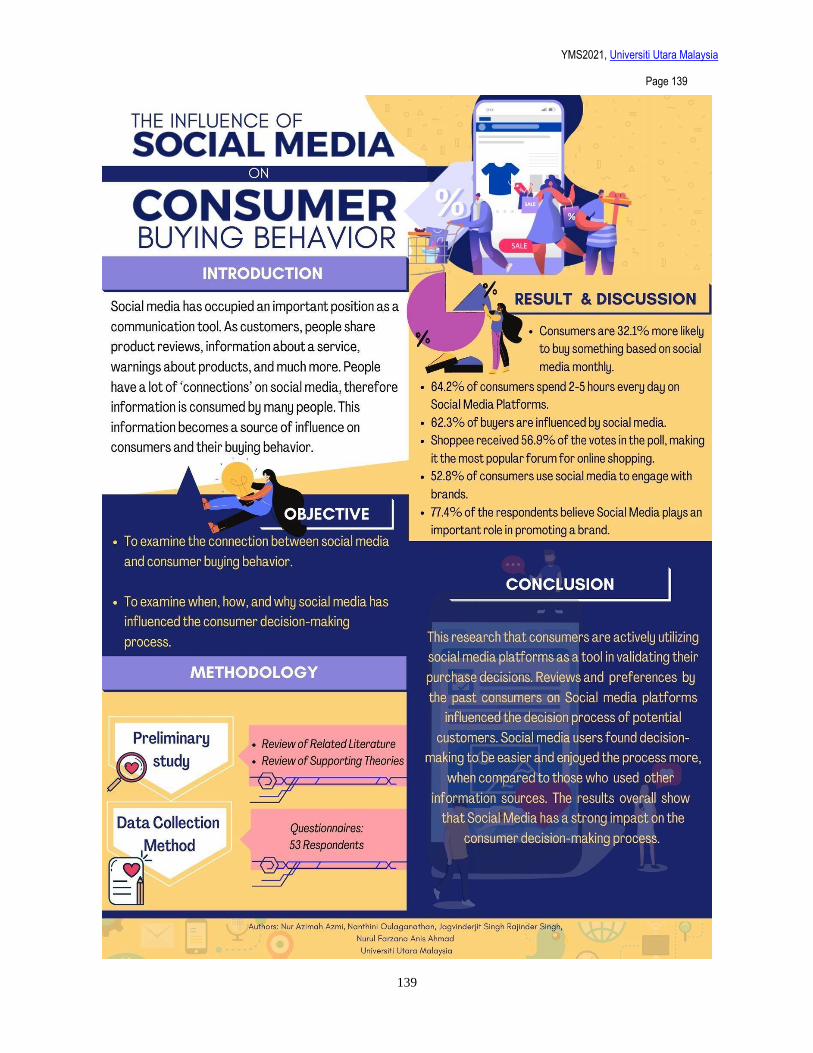
14 The Influence of Social Media on Consumer Buying Behavior Nur Azimah Azmi, Nanthini Oulaganathan, Jagvinderjit Singh Rajinder Singh & Nurul Farzana Anis Ahmad
77
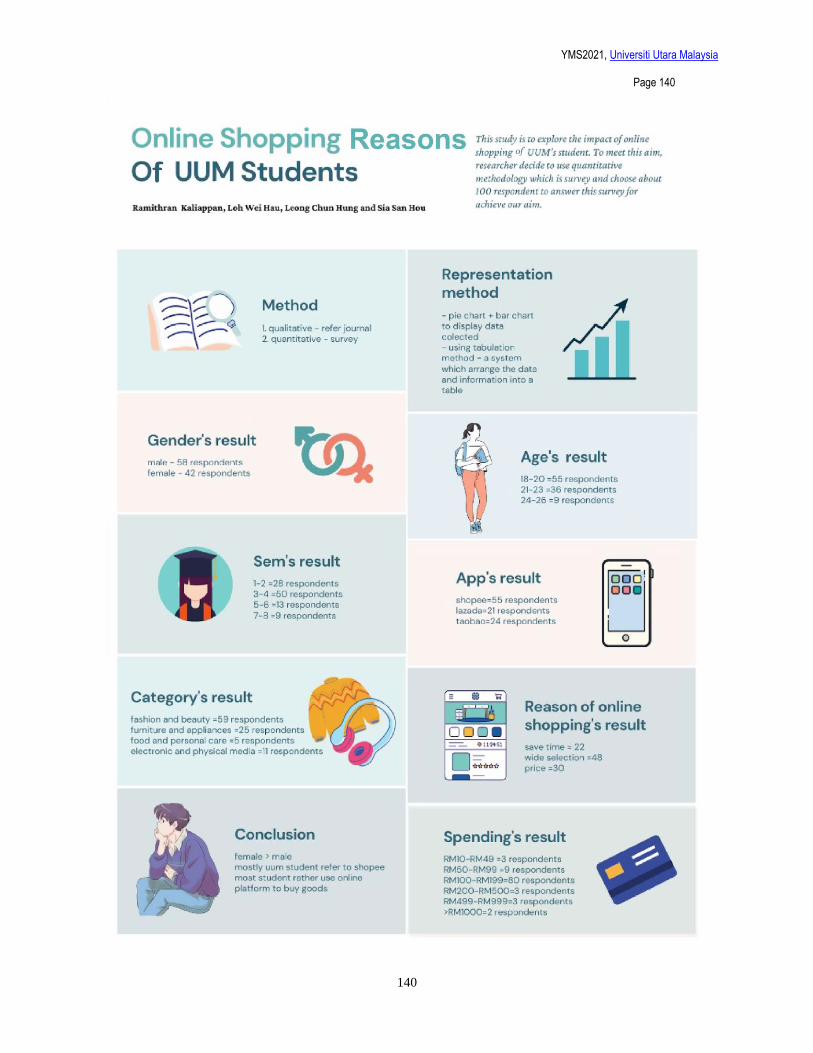
15 Online Shopping Reasons of UUM Students Ramithran Kaliappan, Loh Wei Hau, Leong Chun Hung & Sia San Hou
83
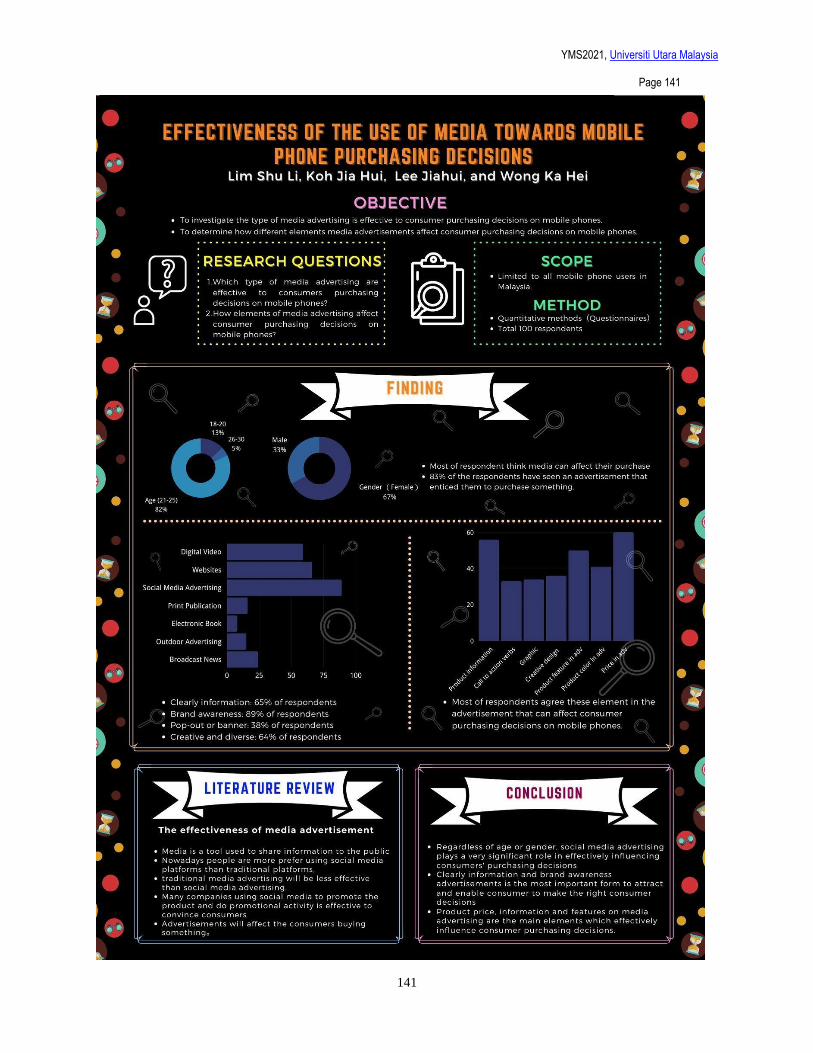
16 Effectiveness of the Use of Media Towards Mobile Phone Purchasing Decisions Lim Shu Li, Koh Jia Hui, Lee Jiahui, & Wong Ka Hei
87
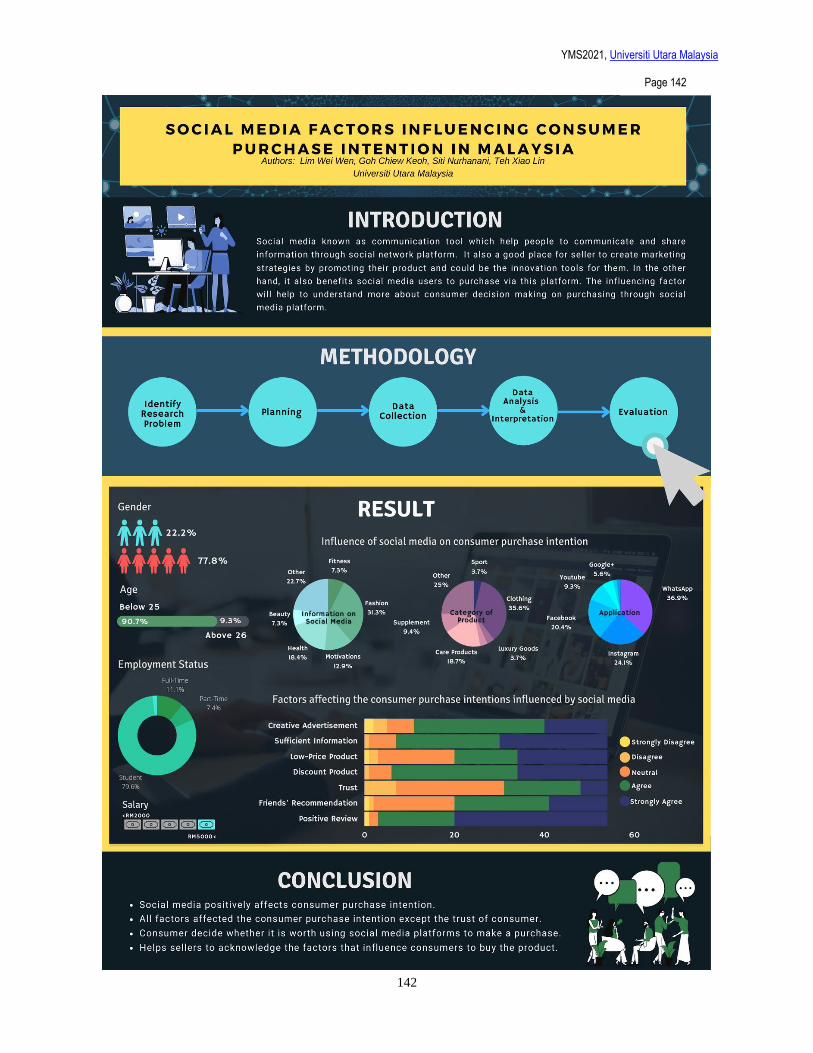
17 Social Media Factors Influencing Consumer Purchase Intention in Malaysia Lim Wei Wen, Siti Nurhanani Tajul Ariffin, Goh Chiew Keoh & Teh Xiao Lin
94
YMS2021, Universiti Utara Malaysia
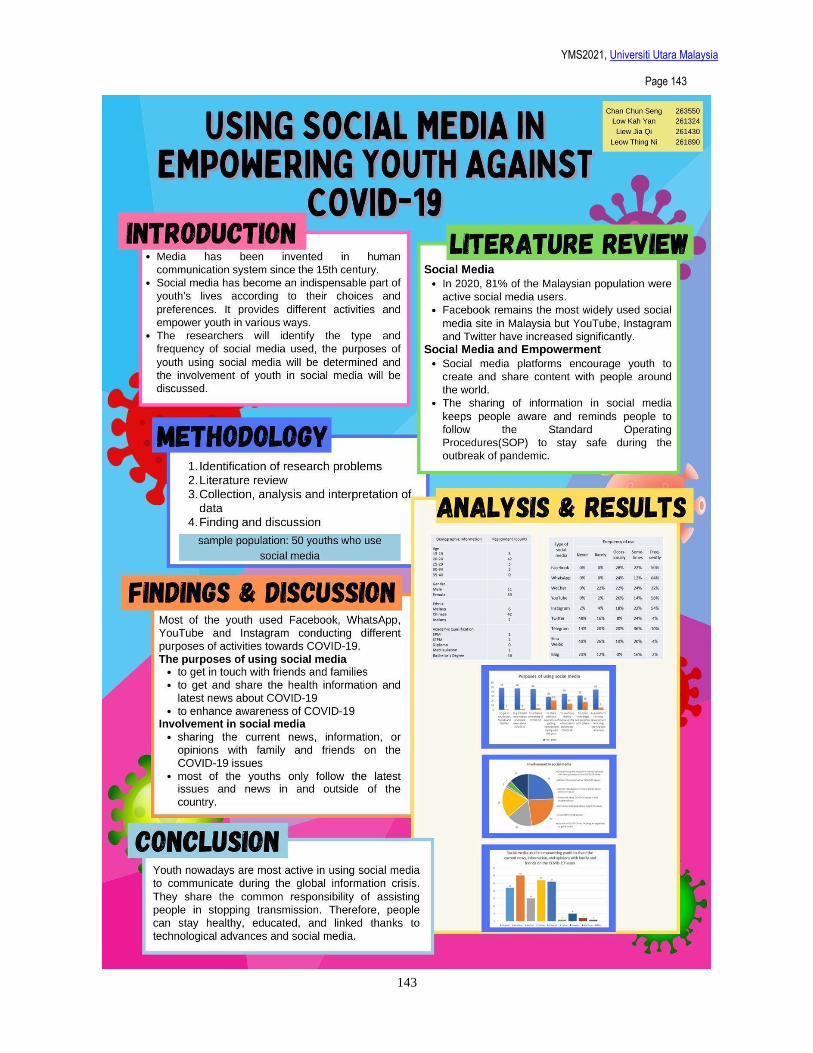
18 Using Social Media in Empowering Youth Against Covid-19 Chan Chun Sheng, Low Kah Yan, Liew Jia Qi & Leow Thing Ni
100
19 Digital Tourism: Youth Experience in Museum Halizayanie Kimlin
105
20 Application of MA Play with Storytelling: Increasing Youth Knowledge, Skills and Value Achievement Christina Lim, Hashiroh Hussain & Haslina Japri
113
21 The Application of the Golden Ratio to Measure the Accuracy of Object Proportion in Company Logo Design Azmir Mamat Nawi & Mohd Nizam Saad
119
POSTER
Posters section
-end-
127
143
YMS2021, Universiti Utara Malaysia
1
Page 1
Trend of Using Social Media to Spread Information
among Youth in Malaysia
Taranni Manoharan1, Nur Hana Ahmad Shahruzi2, Nur Zinnirah Ahmad Ibrahim3, Nur Hidayah Mohd
Suhaimi4 & Nur Hafizah Sapuan5 1Universiti Utara Malaysia, Malaysia, [email protected]
2Universiti Utara Malaysia, Malaysia, [email protected] 3Universiti Utara Malaysia, Malaysia, [email protected]
4Universiti Utara Malaysia, Malaysia, [email protected] 5Universiti Utara Malaysia, Malaysia,
ABSTRACT
This paper focuses on the trend in using social media
to spread information among youth in Malaysia. The
information shared on social media cannot be verified
of its source or authenticity; is one of the common
problems on social media. The objective of this
research is therefore to find the trend, whether
information being shared are verified or not before
sharing is executed. A survey was conducted. It was
hypothesized that when more hours are spent on social
media, more information is spread. In conclusion, we
can conclude that a lot of youth use social media
platforms to share various information with their
friends, family, and relatives.
Keywords: Social Media, information, youth, trend
I INTRODUCTION
Based on surveys, many social media users use
social networks such as Facebook, WhatsApp, and
others. As a result, they understand that social media
allows them to help and encourage people even though
they are far away, such as fighting poverty in Africa,
protecting the rainforest, or providing educational
tools for underprivileged children. Technology has
shown rapid advancement nowadays that allows users
to share information as well as other things. Social
media often introduces children to a critical global
problem that has always been an issue nowadays.
Sharing fake news on social media sites is
becoming a global issue, with analysis in this article
offering little insight into the motivations behind the
sharing. By manipulating political, ethnic, and
religious currents, fake news is deliberately designed
to create mistrust and exacerbate social in an existing
country or nation. Social media is a tool to gather
information today and has become a source of
information and news for many people because it is
easy, and attracts their attention.
Once they start a social network, they can follow
almost anyone who has a social media account. From
authors and athletes to celebrities and popular
magazines, they connect with various types of
information quickly. In addition, they can share
information easily. This can affect the privacy of other
users on social media. Fake news can be made to look
like true news to trick users into thinking it is real
(Shalini, et al, 2020).
Online rumors can start about the safety of certain
foods, products, ingredients, or treatments that do not
have the right foundation can have a detrimental effect
on manufacturers or the government. But social media
users continue to spread this misinformation and can
cause readers to avoid buying, or even considering,
products or services. For example, the spread of fake
news about Covid-19 is getting hotly debated these
days. Consumers often share information before
reading or understanding the news. A total of 274
investigation papers were opened by the Royal
Malaysian Police (PDRM) and the Malaysian
Communications and Multimedia Commission
(MCMC) regarding the fake news during COVID-19
(Mohd Nasaruddin & Fahmy, 2020).
As technology has become so prevalent, people
are seen glued to their smartphones. This study
investigates the relationship and disconnection
between the use of social media and the activities
found in it. This should result in a clearer development
of theories of social media use effect and provide
additional insights on the offense of sharing incorrect
information to the use of social media.
II PROBLEM STATEMENT
The first problem statement formed in this study
is information shared on social media cannot be
verified of its source where authenticity is one of the
YMS2021, Universiti Utara Malaysia
2
common problems on social media. Often social
media users always share unauthenticated information
to other users on social media. The second problem
statement is, users like to talk about hot issues such as
the case of lawsuits among celebrities in Malaysia.
This is because this issue is more often read and
shared. The third is to investigate whether or not it is
dangerous to spread negative information on social
media, which is also a problem that needs to be
resolved. For most users they often share negative
information that can trigger problems where they often
share personal information on social media regardless
of security concerns.
III LITERATURE REVIEW
Social media has become the main reason for
youth emerging culture. Chan et al. (2016) stated in
their study that youth use online platforms such as
Facebook and YouTube frequently. It has become part
of daily life for most young people all over the world.
allowing everyone to create and exchange user-
generated content. Uzuegbunam (2017) stated in his
study that youth will express their youthfulness in the
current youth culture through new technologies and
the media.
Youth who speaks through online platforms the
non-verbal way give them the ability to talk on behalf
of others in an acceptable and beneficial way.
Faulkner (2009). Other than that, The World Youth
Assembly (2015) also raised a voice on youth
participation through the online platforms will lead to
better results and planning outcomes. In a study by
Lovejoy and Saxton (2012), they stated that youth
ability can be increased through the media and
communication tools, particularly social media.
With more and more people using the internet, this
encourages people to voice out their views and
opinions from the comfort of their own home (Dagona
et. al, 2013). This helps the youth to voice out their
opinions without being afraid of attacks by others. But
as the usage of social media rises, this also brings the
issue of data privacy being breached by other people
on the internet. According to Chan et al. (2017),
although online outreach gives out greater visibility, it
also brings the problem of losing personal privacy on
the internet. According to Eckert et al (2020), doxing
has become quite a normalization among people on the
internet and could possibly be harmful to the persons.
With this, it is important to make sure the privacy of
people on the internet are kept safe.
IV METHODOLOGY
This study aims to investigate the trend of using
social media to spread information among youth in
Malaysia. This study has taken the quantitative
approach. This type of research method requires
quantifiable data involving numerical and statistical
explanations. Other than that, variables that were used
in these methods are discrete variables where possible
values can be listed. The data collection that was used
in this study is a survey. Youth ages between 18 and
24 were chosen to answer the survey. The google form
was applied to collect data from the respondents
because this technique is easier to access, and can
record respondents’ opinion easily. Respondents were
given a link to an online google through WhatsApp.
The google form consists of three sections. Section A
is the demographic section. Section B consists of 14
multiple choice questions regarding research topics
and the last section consists of a scale section. (1 =
[Strongly disagree], 2 = Disagree, 3 = Neutral, 4 =
Agree, 5 = [Strongly agree]. The questionnaire is
developed based on discussion of authors.
V RESULTS
The aim of this study is to examine the trend of
using social media to spread information among youth
in Malaysia. An analysis of the result reveals that most
of the respondents of this survey are from age 21-23
which is 60%. 32% are aged from 24 and above and
only 8% are aged from 18-20. 79% of females and
21% of male respondents responded to this survey.
Most of the respondents are undergraduate students
and the highest level of education is Bachelor Degree.
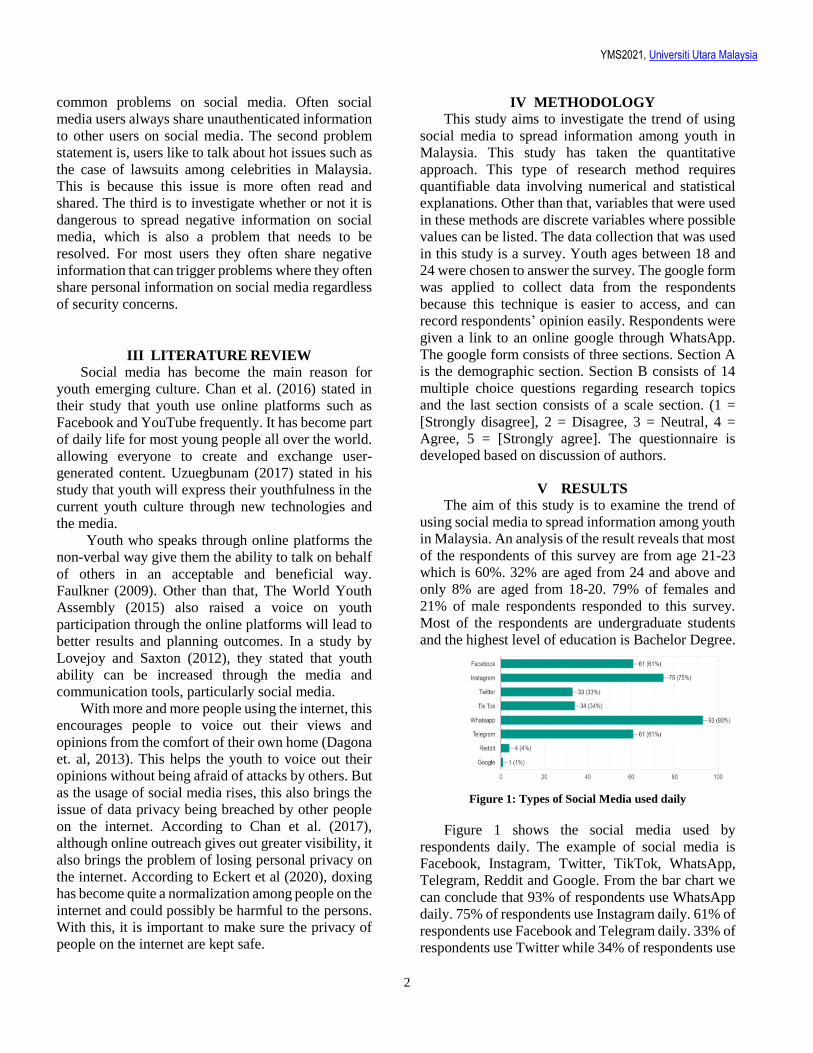
Figure 1: Types of Social Media used daily
Figure 1 shows the social media used by
respondents daily. The example of social media is
Facebook, Instagram, Twitter, TikTok, WhatsApp,
Telegram, Reddit and Google. From the bar chart we
can conclude that 93% of respondents use WhatsApp
daily. 75% of respondents use Instagram daily. 61% of
respondents use Facebook and Telegram daily. 33% of
respondents use Twitter while 34% of respondents use
YMS2021, Universiti Utara Malaysia
3
Tik Tok. Only 4% of respondents use Reddit and 1%
of respondents use Google. So, we can conclude that
the majority of respondents use WhatsApp daily to
spread information in Malaysia.
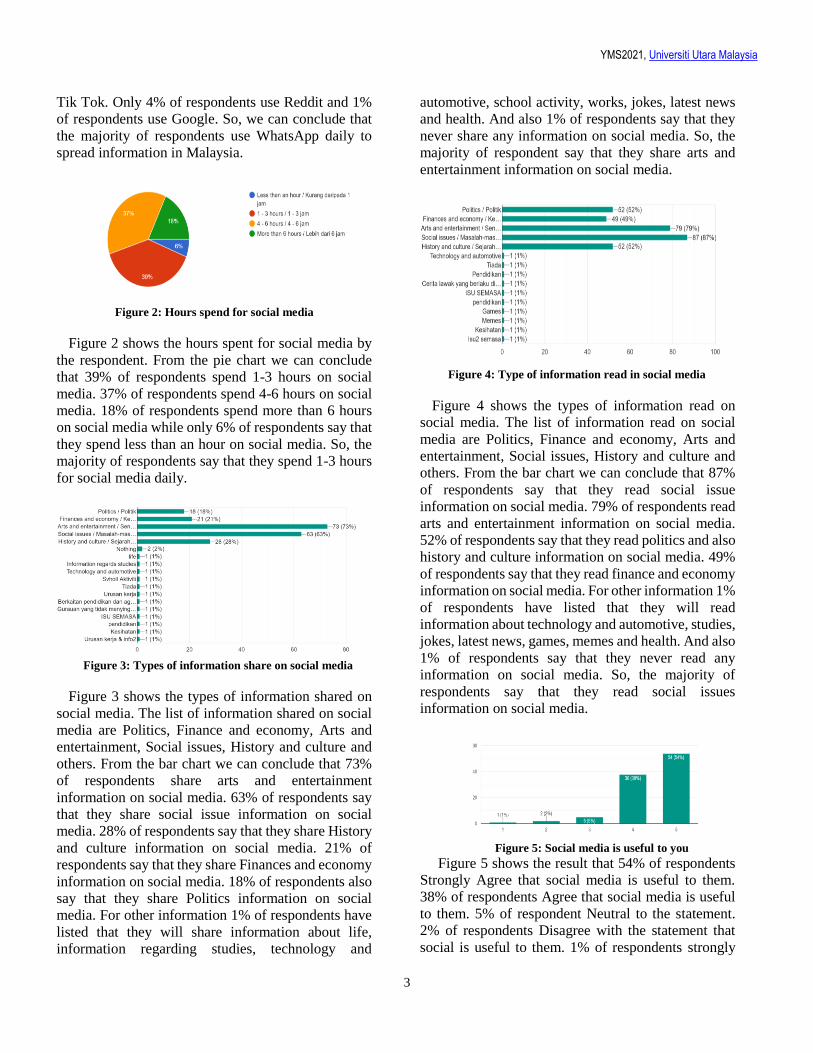
Figure 2: Hours spend for social media
Figure 2 shows the hours spent for social media by
the respondent. From the pie chart we can conclude
that 39% of respondents spend 1-3 hours on social
media. 37% of respondents spend 4-6 hours on social
media. 18% of respondents spend more than 6 hours
on social media while only 6% of respondents say that
they spend less than an hour on social media. So, the
majority of respondents say that they spend 1-3 hours
for social media daily.
Figure 3: Types of information share on social media
Figure 3 shows the types of information shared on
social media. The list of information shared on social
media are Politics, Finance and economy, Arts and
entertainment, Social issues, History and culture and
others. From the bar chart we can conclude that 73%
of respondents share arts and entertainment
information on social media. 63% of respondents say
that they share social issue information on social
media. 28% of respondents say that they share History
and culture information on social media. 21% of
respondents say that they share Finances and economy
information on social media. 18% of respondents also
say that they share Politics information on social
media. For other information 1% of respondents have
listed that they will share information about life,
information regarding studies, technology and
automotive, school activity, works, jokes, latest news
and health. And also 1% of respondents say that they
never share any information on social media. So, the
majority of respondent say that they share arts and
entertainment information on social media.
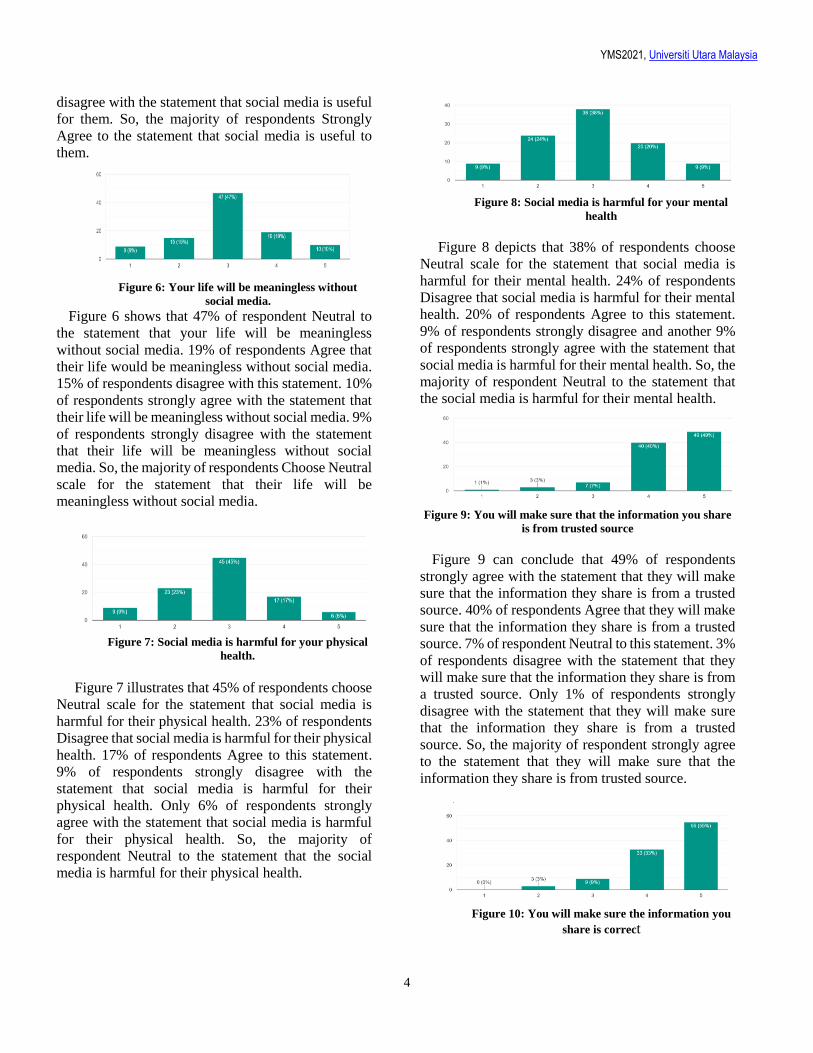
Figure 4: Type of information read in social media
Figure 4 shows the types of information read on
social media. The list of information read on social
media are Politics, Finance and economy, Arts and
entertainment, Social issues, History and culture and
others. From the bar chart we can conclude that 87%
of respondents say that they read social issue
information on social media. 79% of respondents read
arts and entertainment information on social media.
52% of respondents say that they read politics and also
history and culture information on social media. 49%
of respondents say that they read finance and economy
information on social media. For other information 1%
of respondents have listed that they will read
information about technology and automotive, studies,
jokes, latest news, games, memes and health. And also
1% of respondents say that they never read any
information on social media. So, the majority of
respondents say that they read social issues
information on social media.
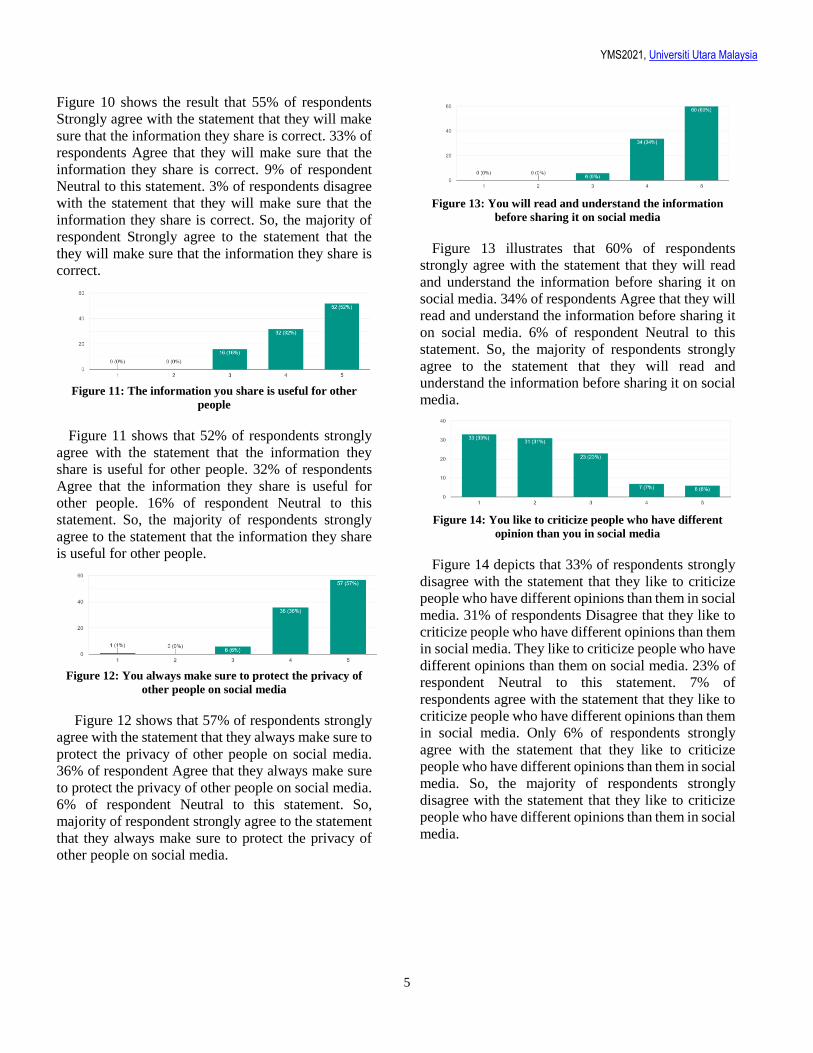
Figure 5: Social media is useful to you
Figure 5 shows the result that 54% of respondents
Strongly Agree that social media is useful to them.
38% of respondents Agree that social media is useful
to them. 5% of respondent Neutral to the statement.
2% of respondents Disagree with the statement that
social is useful to them. 1% of respondents strongly
YMS2021, Universiti Utara Malaysia
4
disagree with the statement that social media is useful
for them. So, the majority of respondents Strongly
Agree to the statement that social media is useful to
them.
Figure 6: Your life will be meaningless without
social media.
Figure 6 shows that 47% of respondent Neutral to
the statement that your life will be meaningless
without social media. 19% of respondents Agree that
their life would be meaningless without social media.
15% of respondents disagree with this statement. 10%
of respondents strongly agree with the statement that
their life will be meaningless without social media. 9%
of respondents strongly disagree with the statement
that their life will be meaningless without social
media. So, the majority of respondents Choose Neutral
scale for the statement that their life will be
meaningless without social media.
Figure 7: Social media is harmful for your physical
health.
Figure 7 illustrates that 45% of respondents choose
Neutral scale for the statement that social media is
harmful for their physical health. 23% of respondents
Disagree that social media is harmful for their physical
health. 17% of respondents Agree to this statement.
9% of respondents strongly disagree with the
statement that social media is harmful for their
physical health. Only 6% of respondents strongly
agree with the statement that social media is harmful
for their physical health. So, the majority of
respondent Neutral to the statement that the social
media is harmful for their physical health.
Figure 8: Social media is harmful for your mental
health
Figure 8 depicts that 38% of respondents choose
Neutral scale for the statement that social media is
harmful for their mental health. 24% of respondents
Disagree that social media is harmful for their mental
health. 20% of respondents Agree to this statement.
9% of respondents strongly disagree and another 9%
of respondents strongly agree with the statement that
social media is harmful for their mental health. So, the
majority of respondent Neutral to the statement that
the social media is harmful for their mental health.
Figure 9: You will make sure that the information you share
is from trusted source
Figure 9 can conclude that 49% of respondents
strongly agree with the statement that they will make
sure that the information they share is from a trusted
source. 40% of respondents Agree that they will make
sure that the information they share is from a trusted
source. 7% of respondent Neutral to this statement. 3%
of respondents disagree with the statement that they
will make sure that the information they share is from
a trusted source. Only 1% of respondents strongly
disagree with the statement that they will make sure
that the information they share is from a trusted
source. So, the majority of respondent strongly agree
to the statement that they will make sure that the
information they share is from trusted source.
Figure 10: You will make sure the information you
share is correct
YMS2021, Universiti Utara Malaysia
5
Figure 10 shows the result that 55% of respondents
Strongly agree with the statement that they will make
sure that the information they share is correct. 33% of
respondents Agree that they will make sure that the
information they share is correct. 9% of respondent
Neutral to this statement. 3% of respondents disagree
with the statement that they will make sure that the
information they share is correct. So, the majority of
respondent Strongly agree to the statement that the
they will make sure that the information they share is
correct.
Figure 11: The information you share is useful for other
people
Figure 11 shows that 52% of respondents strongly
agree with the statement that the information they
share is useful for other people. 32% of respondents
Agree that the information they share is useful for
other people. 16% of respondent Neutral to this
statement. So, the majority of respondents strongly
agree to the statement that the information they share
is useful for other people.
Figure 12: You always make sure to protect the privacy of
other people on social media
Figure 12 shows that 57% of respondents strongly
agree with the statement that they always make sure to
protect the privacy of other people on social media.
36% of respondent Agree that they always make sure
to protect the privacy of other people on social media.
6% of respondent Neutral to this statement. So,
majority of respondent strongly agree to the statement
that they always make sure to protect the privacy of
other people on social media.
Figure 13: You will read and understand the information
before sharing it on social media
Figure 13 illustrates that 60% of respondents
strongly agree with the statement that they will read
and understand the information before sharing it on
social media. 34% of respondents Agree that they will
read and understand the information before sharing it
on social media. 6% of respondent Neutral to this
statement. So, the majority of respondents strongly
agree to the statement that they will read and
understand the information before sharing it on social
media.
Figure 14: You like to criticize people who have different
opinion than you in social media
Figure 14 depicts that 33% of respondents strongly
disagree with the statement that they like to criticize
people who have different opinions than them in social
media. 31% of respondents Disagree that they like to
criticize people who have different opinions than them
in social media. They like to criticize people who have
different opinions than them on social media. 23% of
respondent Neutral to this statement. 7% of
respondents agree with the statement that they like to
criticize people who have different opinions than them
in social media. Only 6% of respondents strongly
agree with the statement that they like to criticize
people who have different opinions than them in social
media. So, the majority of respondents strongly
disagree with the statement that they like to criticize
people who have different opinions than them in social
media.
YMS2021, Universiti Utara Malaysia
6
VI DISCUSSION
The main purpose of this research is to find
the trend of using social media to disseminate
information among youth in Malaysia which is often
talked about today. A study was conducted among the
Malaysian population also shows the importance of
social media users when using social media.
From the results, we can conclude that social
media has become the most important venue for users
to get updated in this modern world. Through this
social media users can get informed about any news or
can upgrade their knowledge within a second. So
social media plays an important role in youth life.
In addition, this article concludes that many
users often use WhatsApp to share information
because this application is easier to share. Many users
are found to read information before sharing. This
shows users are aware of not sharing wrong,
unverified information. Social media platforms also
facilitate the affairs of users to interact with anyone
they want easily without any hindrance from anything
else. Subsequently, communication between the two
parties is easily conveyed, well and clearly received.
VII CONCLUSION
In conclusion, many youth use social media platforms
to share various information with their friends, family
and relatives. When the use of social media increases
among the youth, this builds new culture. For
example, if social media shows an actor wearing a
stylish dress that attracts youth interest. Therefore,
persuading them to wear stylish dresses like the actor.
Media have the potential to set agendas for youth in
environment which they are living in. Media may not
decide youth decisions, but they have become
successful in telling and suggesting to youth what to
think about.
REFERENCES Chan, C., & Holosko, M. J. (2017). The utilization of social media for
youth outreach engagement: A case study. Qualitative Social Work, 16(5), 680-697. Retrieved from
https://scholar.google.com/scholar?hl=en&as_sdt=0%2C5&q=The+u
tilization+of+social+media+for+youth+outreach+engagement%3A+A+case+study&btnG=
Dagona, Z. K., Karick, H., & Abubakar, F. M. (2013). Youth participation
in social media and political attitudes in Nigeria. Journal of sociology, psychology and anthropology in practice, 5(1), 1-7.
Eckert, S., & Metzger-Riftkin, J. (2020). Doxxing, Privacy and Gendered
Harassment. The Shock and Normalization of Veillance Cultures. Medien & Kommunikation swissenschaft, 68(3), 27
Faizah Yunus.Youth Employment and Employability In
Malaysia.Universiti Malaya.Malaysian Youth Report (2007.) Faulkner (2009). Youth participation in ongoing public decision-making
projects. Retrieved from
https://journals.sagepub.com/doi/10.1177/0907568208101692 Lovejoy and Saxton (2012). Information, Community, and Action: How
Nonprofit Organizations Use Social Media. Retrieved from
https://www.researchgate.net/publication/224039759_Information_Community_and_Action_How_Nonprofit_Organizations_UseSocial_
Media. Mohd Nasaruddin Parzi and Fahmy A Rosli - November 10, 2020
https://www.bharian.com.my/berita/nasional/2020/11/752654/274-
kes-berita-palsu-berkaitan-covid-19-disiasat. Shalini Talwar A , Amandeep Dhir B.C, Dilraj Singh D , Gurnam Singh
Virk E, and Jari Salo F (2020). Sharing of fake news on social media:
Application of the honeycomb framework and the third-person effect hypothesis. Elsevier Ltd.
Uzuegbunam, C. E. (2017). Between media celebrities and the youth:
exploring the impact of emerging celebrity culture on the lifestyle of young Nigerians. Mgbakoigba: Journal of African Studies, 6(2), 130-
141.
World Youth Assembly (2015). Social Media as a Channel to Promote Youth Participation in Governance. Retrieved from
https://ndpublisher.in/admin/issues/SAJSSHv1n1d.pdf
YMS2021, Universiti Utara Malaysia
7
Page 7
Fundamental of Digital Media, Technology and Citizenship:
A Survey on Youth Awareness in Malaysia
Ummul Asnah Navabsa1 & Norshuhada Shiratuddin2
1Ministry of Defense, Malaysia 2Universiti Utara Malaysia,Malaysia
ABSTRACT
This article describes a preliminary study of the
fundamental knowledge of Malaysian youth on digital
media and citizenship. The aims of this study are to
examine the respondents’ current knowledge about
digital citizenship and literacy, and then explore the
respondents’ expectation of digital citizenship. The
method used was a survey by distributing a set of
questionnaires to youth and their closest stakeholders.
Findings show the youth in Malaysian are mostly
aware of the digital citizenship term, but they lack
understanding of what the fundamentals are and how
the notion is relatable in the near future. Furthermore,
most of the respondents agreed there is a need to
develop a model, guideline or policy of digital
citizenship for the youth in Malaysia to mold them to
become good digital citizens with moral digital
citizenship values.
Keywords: Digital Citizenship, digital literacy,
Malaysian youth, digital citizen
I. INTRODUCTION
Internet has become a necessity for many. Most
daily activities are influenced by the current internet
structures (Manzuoli et al., 2019). The availability of
this technology makes every task quickly and easily
accessible (Noorsuriani Maon et al., 2018). has also
led humans to sophisticated and multifunctional
equipments (Marino et al., 2019) such as smartphones,
smart television and computers; which have too been
improved in line with the technological developments
by having fast, higher-powered, and portable features. Furthermore, these technological developments have
brought many changes to the various sectors of the
world, including the manufacturing and business
sectors. The education system is also one of the sectors
that has undergone significant changes where the use
of the internet technology in teaching and learning is
commonly applied (Kamarudin and Ab Jalil, 2019).
Such use of digital devices with internet connection
has become popular among the youth (Kamarudin and
Ab Jalil, 2019). Many studies show, young people are
the ones most associated with this internet technology
(Wook et al., 2019). The majority of the Internet users (61.8%) that
share contents online are mostly younger users.
Educational and entertainment contents being the
highest usually shared content, most of which were
shared online through social media (73.8%) and group
messaging (70.6%) (MCMC, 2018). This data
indicates the group that uses this digital technology the
most is youth. The youth population represents a
significant asset for the country's future. The youth
need to participate in becoming proactive and
continually contribute to the national development
effort to achieve the 2020 country’s vision (Lee,
2018). However, this social transformation has
brought enormous implications to the youth way of
thinking and lifestyle (Lee, 2018). Besides, most of the
youth nowadays enjoy using these technology features
without acknowledging the threats behind these
facilities (Wook et al., 2019). Nevertheless, no doubt
this technology has had a positive impact on the youth
(Lee, 2018).
The use of digital and media technologies like
computers and mobile phones make it easier and
frequent for the user to access social media. Therefore,
more personal information of the user is available
online than ever before such as sharing the location
and contact information on social media (Czodli,
2016). The youth are not aware that every searching,
activity, interest, interaction, and the things that are
shared on cyberspace leave traces in the internet
browsing history (Wook et al., 2019). The third parties
who could be anyone could use the information
irresponsibly for profit and self-satisfaction as leakage
of other people's personal information is illegally.
Some studies have shown teens in Malaysia are
YMS2021, Universiti Utara Malaysia
8
exposed to the usage of the internet from a young age
but the teens still need to be observed due to their low-
level awareness of the cyber threat (Susanty et al.,
2019). The youth are likely to get mixed up in the
misuse of technology. Most of the crimes being
targeted at the insecure youth with lack of knowledge
on how to use the internet technology more carefully
(Kim and Choi, 2018). Also, the potential threats
resulting from excessive technology exposure and its
inappropriate content will have a prolonged damaging
impact on the youth (Susanty et al., 2019) which could
be the cause of future collapse of the world youth
generation.
II. MOTIVATION OF STUDY In the physical world, some countries have
governments to take care of all the country's affairs,
but how about the internet in a cyber-world? The
internet does not have any specific government to
govern its citizens. Moreover, all the potential threats
posed by this digital technology have caused concern
among all the stakeholders who are responsible for
giving the youth education of digital citizenship
(Susanty et al., 2019). While it may be desirable to
build some mechanism on the internet use, teaching
digital citizenship would provide skills and resources
to the youth in a global society (Soon et al., 2019).
Digital citizenship is defined as appropriate
guidelines and attitudes of responsibility towards
using technology, it is a concept on how the users need
to know to use technology ethically (Ribble and
Bailey, 2011). In other words, digital citizenship is the
ability to manage and monitor behavior in the use of
technology considering safety principles, ethics,
norms and culture (Jones and Mitchell, 2016).
Being a digital citizen is significant nowadays
(Isman and Canan Gungoren, 2015). However, in
Malaysia, studies state that knowledge of the digital
citizenship is still at a basic level (Susanty et al., 2019)
and less are known about variables of digital
citizenship issues of safety, ethics and profiling,
Moreover, it is equally useful and necessary to mold
good digital citizens (Nordin, 2015). Every youth must
be prepared with the necessary knowledge and skills
to explore the cyber world appropriately and be full of
responsibilities by concerning all the surroundings
without hurting others.
There are also possibilities that learning about
digital citizenship will help the youth to practice
respectful online disagreement, debate, and engage in
online civic activities that might aid in lessen online
bullying and abuse behaviors (Jones and Mitchell,
2016). This digital citizenship approach is more than
shielding young people from potential threats and is
about educating the youth on how to make wise
decisions in all facets of the online activities (Kim and
Choi, 2018). Furthermore, the path of digital
citizenship education should be set to allow youth to
grow to be citizens who are actively engaged in the
relationship with other citizens from a different
interest in the online community to tackle different
communities and global problems (Kim and Choi,
2018).
World now faces the challenges of Covid-19
pandemic. As a result of the pervasive spread of the
disease, most countries in the world have taken the
approach of closing national borders and undergoing
lockdowns. Most of the country's main activities such
as the public and private sectors have been carried out
online, including in learning institutions. This issue
has driven this preliminary study to know whether
Malaysian youth are aware of digital citizenship and
its fundamentals. Youth need to be proficient in using
the internet wisely and need to have good digital
citizenship values to control themselves and others
online. In addition, when youth have good digital
citizenship in themselves, they are ready to live in the
growing IR4 era. Malaysia is now going towards IR4
technology.
III. LITERATURE REVIEW
A. Digital And Media Technology
According to the Department of Education and
Training Victoria (2019), digital technology relate to
electronics items, devices, and systems that store,
create, and process information. Digital technology is
now deeply embedded in the culture of the university
learning and teaching process, from the university
management system until the use of Email and Google
(Selwyn, 2017). One of the closest examples of digital
technology is social media. As studied by (Rice et al.,
2016) social media relates to the social interaction
when users exchange knowledge and share views in
the online communities, it also allows the user to
collaborate and communicate with each other. In
higher education students tend to use digital
technology the most and it has already become like a
part of the routine in the academic environment
(Selwyn, 2017).
Moreover, as studied by Gallardo Echenique et al.
(2015) students see digital technology as a tool to fulfil
communication needs. The study discovered social
YMS2021, Universiti Utara Malaysia
9
media and WhatsApp are the most significant
applications for the students because they allow the
students to interact over long distances and keep in
contact with people of common interest, regardless of
the physical location (Gallardo Echenique et al.,
2015). These findings provide an initial insight into
the extent of students’ use of digital technology for
educational and social purposes, and how these uses
are linked. This can be very helpful in determining
specific initiatives for education and as a reflection on
the skills students have included in their lives
(Gallardo Echenique et al., 2015).
B. Youth Engagement with Digital and
Media Technology
In this 21st era, digital and media technology, and
youth are inseparable. This happens because all the
stuffs surrounding the youth are involved with how
rapidly technology grows (Lyons, 2012). According to
(Villanti et al., 2017) youth are often identified as the
period from the late teenagers through the 20s. This
age is a critical stage for self-identity construction.
This statement is aligned with the research by
Boulianne and Theocharis (2020) who mentioned
youth are defined as the technology addicts that have
managed to lose the potential to communicate face to
face. At the critical age, the youth do not have enough
maturity to decide which is good or bad action
throughout life. This will lead to the usage of
technology all the time just for fun without
considering certain effects that might be happening.
Furthermore, it will lead the youth to communicate
more in the digital world compared to the real world
and affect how the youth interact with each other. As
contended by (Jones and Mitchell, 2016) middle
school conversation commonly about the
responsibilities of internet use and the issues of
privacy, cyberbullying, and protection, this is related
to the (Boulianne and Theocharis, 2020) indicated
youth are perceived as susceptible to online sexual
abuse. Sexual harassment is one of the behaviors
associated with cyberbullying. Cyberbullying is an
online crime that occurs in the digital world to bully
others without knowing who the real identity of the
criminal is. From this analysis, youth do engaged well
with digital technology but at the same time youth are
vulnerable to the cyber threat coupled with less
parental intervention.
C. Digital Citizenship
As defined by Nordin et al. (2016) digital
citizenship is the ability of the individual to utilize the
technology in a behavioral way. However, some of the
interpretations of digital citizenship contradict due to
the complexity of the topic. These interpretations are
found in the literature (Manzuoli et al., 2019). Jones
and Mitchell (2016) stated digital citizenship relates to
digital literacy but focused more on the respect
behavior and online civic engagement while Alazemi
et al.(2019) describe digital citizenship as closely
related to how the individual use the technology
competently and understands the content. Manzuoli et
al. (2019) argue that digital citizenship plays an
important role in democratic principles. However, the
most acceptable description of digital citizenship has
been described as “the norms of behavior with regard
to the technology use” (Ribble et al., 2004:7). This
definition was chosen because it is arguably the most
prominent norm.
Regardless of the many definitions, most of the
studies indicate that the digital citizenship knowledge
is important and need to be taught to the youth
generation (Xu et al., 2019). Next, as defined by
Ribble (2015), digital citizenship facilitates human
behavior guidelines so everybody can profit from
digital society. To formalize the argument, Ribble and
Bailey (2007) develop a nine series of digital
citizenship framework. These nine digital citizenship
elements in the framework were recommended to
address the different part of the digital environment,
including the education and personal environments.
After the nine elements were constructed, Ribble and
Miller (2013) then clustered all the nine elements into
three-dimension, which are respect, educate, and
protect.
Respect Digital Access, Digital Etiquette, and Digital Law Educate Digital Literacy, Digital Communication, and Digital Commerce
Protect Digital Rights and Responsibilities, Digital Security and Digital
Health and Wellness
The digital citizenship framework was revised, and
named S3 Framework (Ribble and Park, 2019) and
added sub-elements that relate to the digital
citizenship main concept. Furthermore, the original
three-dimension name were changed to (refer to
Figure 1): -
(i)Respect � Social
(ii) Educate � Savvy
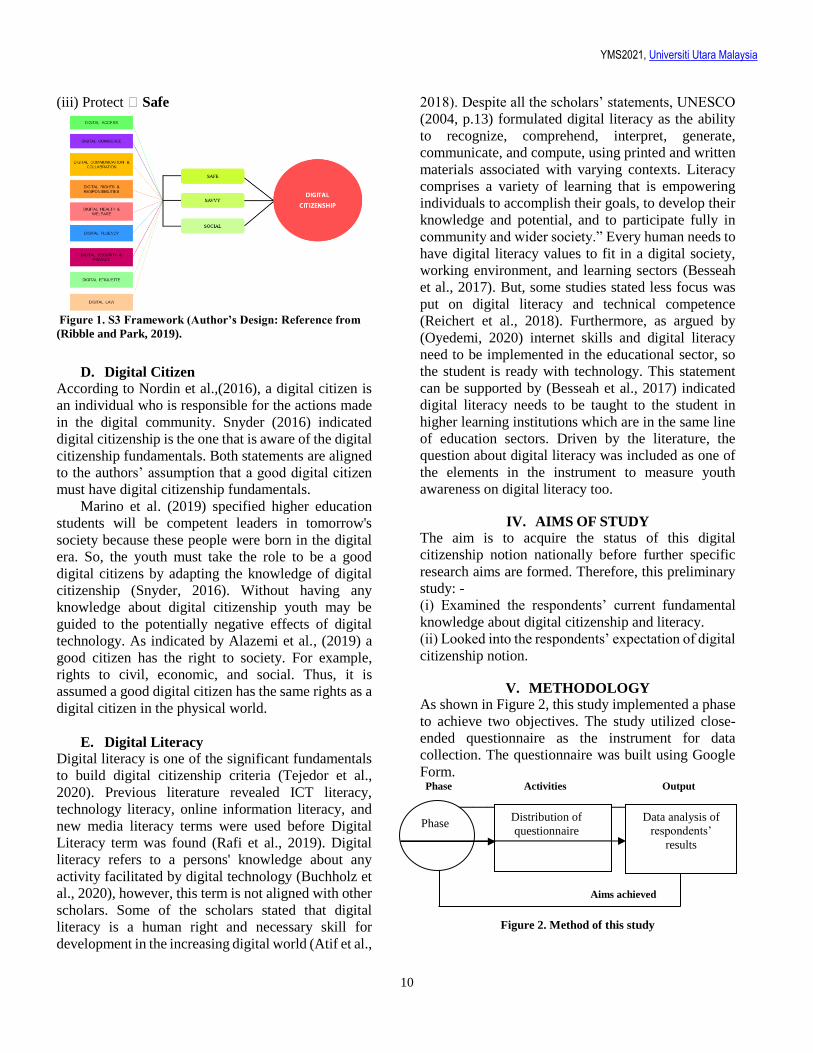
YMS2021, Universiti Utara Malaysia
10
(iii) Protect � Safe
Figure 1. S3 Framework (Author’s Design: Reference from
(Ribble and Park, 2019).
D. Digital Citizen
According to Nordin et al.,(2016), a digital citizen is
an individual who is responsible for the actions made
in the digital community. Snyder (2016) indicated
digital citizenship is the one that is aware of the digital
citizenship fundamentals. Both statements are aligned
to the authors’ assumption that a good digital citizen
must have digital citizenship fundamentals.
Marino et al. (2019) specified higher education
students will be competent leaders in tomorrow's
society because these people were born in the digital
era. So, the youth must take the role to be a good
digital citizens by adapting the knowledge of digital
citizenship (Snyder, 2016). Without having any
knowledge about digital citizenship youth may be
guided to the potentially negative effects of digital
technology. As indicated by Alazemi et al., (2019) a
good citizen has the right to society. For example,
rights to civil, economic, and social. Thus, it is
assumed a good digital citizen has the same rights as a
digital citizen in the physical world.
E. Digital Literacy
Digital literacy is one of the significant fundamentals
to build digital citizenship criteria (Tejedor et al.,
2020). Previous literature revealed ICT literacy,
technology literacy, online information literacy, and
new media literacy terms were used before Digital
Literacy term was found (Rafi et al., 2019). Digital
literacy refers to a persons' knowledge about any
activity facilitated by digital technology (Buchholz et
al., 2020), however, this term is not aligned with other
scholars. Some of the scholars stated that digital
literacy is a human right and necessary skill for
development in the increasing digital world (Atif et al.,
2018). Despite all the scholars’ statements, UNESCO
(2004, p.13) formulated digital literacy as the ability
to recognize, comprehend, interpret, generate,
communicate, and compute, using printed and written
materials associated with varying contexts. Literacy
comprises a variety of learning that is empowering
individuals to accomplish their goals, to develop their
knowledge and potential, and to participate fully in
community and wider society.” Every human needs to
have digital literacy values to fit in a digital society,
working environment, and learning sectors (Besseah
et al., 2017). But, some studies stated less focus was
put on digital literacy and technical competence
(Reichert et al., 2018). Furthermore, as argued by
(Oyedemi, 2020) internet skills and digital literacy
need to be implemented in the educational sector, so
the student is ready with technology. This statement
can be supported by (Besseah et al., 2017) indicated
digital literacy needs to be taught to the student in
higher learning institutions which are in the same line
of education sectors. Driven by the literature, the
question about digital literacy was included as one of
the elements in the instrument to measure youth
awareness on digital literacy too.
IV. AIMS OF STUDY The aim is to acquire the status of this digital
citizenship notion nationally before further specific
research aims are formed. Therefore, this preliminary
study: -
(i) Examined the respondents’ current fundamental
knowledge about digital citizenship and literacy.
(ii) Looked into the respondents’ expectation of digital
citizenship notion.
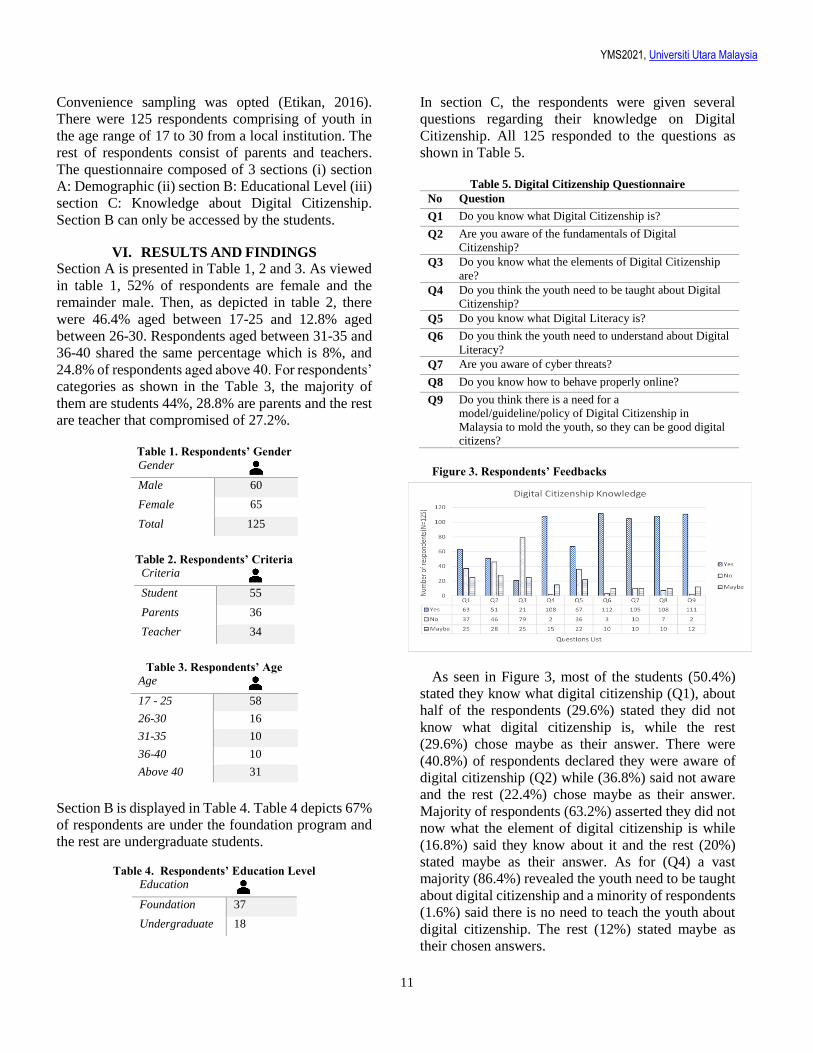
V. METHODOLOGY As shown in Figure 2, this study implemented a phase
to achieve two objectives. The study utilized close-
ended questionnaire as the instrument for data
collection. The questionnaire was built using Google
Form. Phase Activities Output
__________________________________________
_
Figure 2. Method of this study
Aims achieved
Phase
Distribution of
questionnaire
Data analysis of
respondents’
results
YMS2021, Universiti Utara Malaysia
11
Convenience sampling was opted (Etikan, 2016).
There were 125 respondents comprising of youth in
the age range of 17 to 30 from a local institution. The
rest of respondents consist of parents and teachers.
The questionnaire composed of 3 sections (i) section
A: Demographic (ii) section B: Educational Level (iii)
section C: Knowledge about Digital Citizenship.
Section B can only be accessed by the students.
VI. RESULTS AND FINDINGS Section A is presented in Table 1, 2 and 3. As viewed
in table 1, 52% of respondents are female and the
remainder male. Then, as depicted in table 2, there
were 46.4% aged between 17-25 and 12.8% aged
between 26-30. Respondents aged between 31-35 and
36-40 shared the same percentage which is 8%, and
24.8% of respondents aged above 40. For respondents’
categories as shown in the Table 3, the majority of
them are students 44%, 28.8% are parents and the rest
are teacher that compromised of 27.2%.
Table 1. Respondents’ Gender
Gender
Male 60
Female 65
Total 125
Table 2. Respondents’ Criteria
Criteria
Student 55
Parents 36
Teacher 34
Table 3. Respondents’ Age
Age
17 - 25 58
26-30 16
31-35 10
36-40 10
Above 40 31
Section B is displayed in Table 4. Table 4 depicts 67%
of respondents are under the foundation program and
the rest are undergraduate students.
Table 4. Respondents’ Education Level
Education
Foundation 37
Undergraduate 18
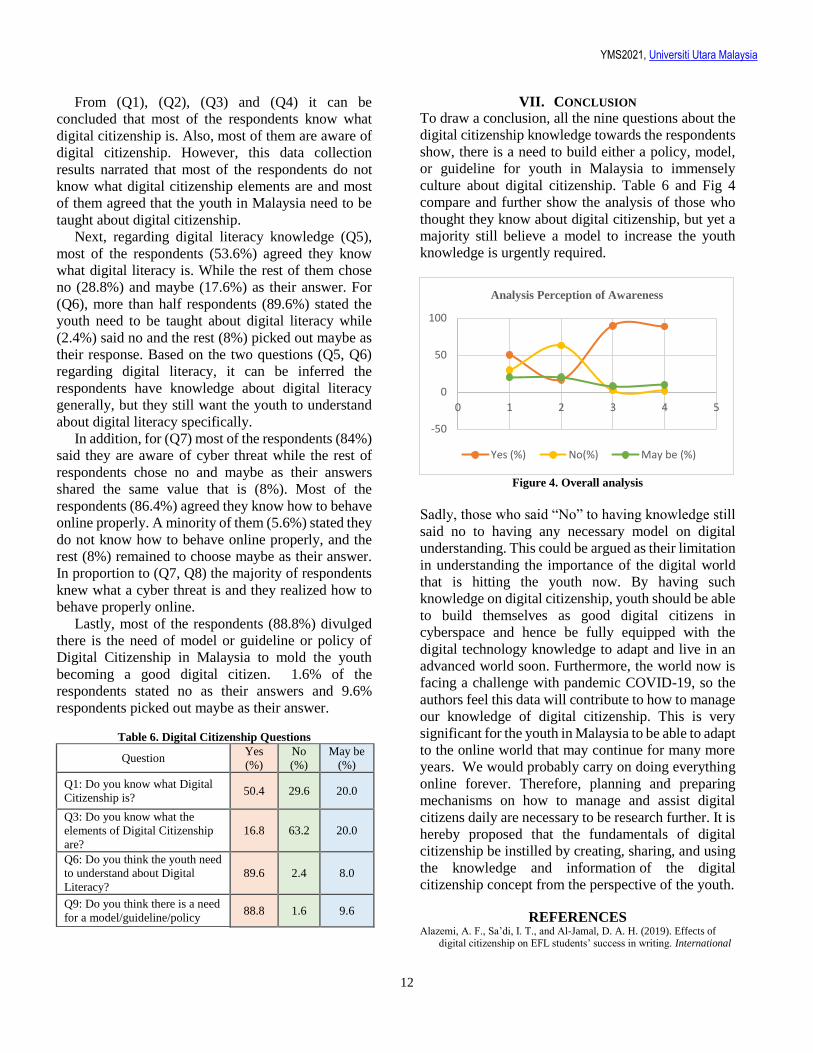
In section C, the respondents were given several
questions regarding their knowledge on Digital
Citizenship. All 125 responded to the questions as
shown in Table 5.
Table 5. Digital Citizenship Questionnaire
No Question
Q1 Do you know what Digital Citizenship is?
Q2 Are you aware of the fundamentals of Digital
Citizenship?
Q3 Do you know what the elements of Digital Citizenship
are?
Q4 Do you think the youth need to be taught about Digital
Citizenship?
Q5 Do you know what Digital Literacy is?
Q6 Do you think the youth need to understand about Digital
Literacy?
Q7 Are you aware of cyber threats?
Q8 Do you know how to behave properly online?
Q9 Do you think there is a need for a
model/guideline/policy of Digital Citizenship in
Malaysia to mold the youth, so they can be good digital
citizens?
Figure 3. Respondents’ Feedbacks
As seen in Figure 3, most of the students (50.4%)
stated they know what digital citizenship (Q1), about
half of the respondents (29.6%) stated they did not
know what digital citizenship is, while the rest
(29.6%) chose maybe as their answer. There were
(40.8%) of respondents declared they were aware of
digital citizenship (Q2) while (36.8%) said not aware
and the rest (22.4%) chose maybe as their answer.
Majority of respondents (63.2%) asserted they did not
now what the element of digital citizenship is while
(16.8%) said they know about it and the rest (20%)
stated maybe as their answer. As for (Q4) a vast
majority (86.4%) revealed the youth need to be taught
about digital citizenship and a minority of respondents
(1.6%) said there is no need to teach the youth about
digital citizenship. The rest (12%) stated maybe as
their chosen answers.
YMS2021, Universiti Utara Malaysia
12
From (Q1), (Q2), (Q3) and (Q4) it can be
concluded that most of the respondents know what
digital citizenship is. Also, most of them are aware of
digital citizenship. However, this data collection
results narrated that most of the respondents do not
know what digital citizenship elements are and most
of them agreed that the youth in Malaysia need to be
taught about digital citizenship.
Next, regarding digital literacy knowledge (Q5),
most of the respondents (53.6%) agreed they know
what digital literacy is. While the rest of them chose
no (28.8%) and maybe (17.6%) as their answer. For
(Q6), more than half respondents (89.6%) stated the
youth need to be taught about digital literacy while
(2.4%) said no and the rest (8%) picked out maybe as
their response. Based on the two questions (Q5, Q6)
regarding digital literacy, it can be inferred the
respondents have knowledge about digital literacy
generally, but they still want the youth to understand
about digital literacy specifically.
In addition, for (Q7) most of the respondents (84%)
said they are aware of cyber threat while the rest of
respondents chose no and maybe as their answers
shared the same value that is (8%). Most of the
respondents (86.4%) agreed they know how to behave
online properly. A minority of them (5.6%) stated they
do not know how to behave online properly, and the
rest (8%) remained to choose maybe as their answer.
In proportion to (Q7, Q8) the majority of respondents
knew what a cyber threat is and they realized how to
behave properly online.
Lastly, most of the respondents (88.8%) divulged
there is the need of model or guideline or policy of
Digital Citizenship in Malaysia to mold the youth
becoming a good digital citizen. 1.6% of the
respondents stated no as their answers and 9.6%
respondents picked out maybe as their answer.
Table 6. Digital Citizenship Questions
Question Yes
(%)
No
(%)
May be
(%)
Q1: Do you know what Digital
Citizenship is? 50.4 29.6 20.0
Q3: Do you know what the
elements of Digital Citizenship
are?
16.8 63.2 20.0
Q6: Do you think the youth need
to understand about Digital
Literacy?
89.6 2.4 8.0
Q9: Do you think there is a need
for a model/guideline/policy 88.8 1.6 9.6
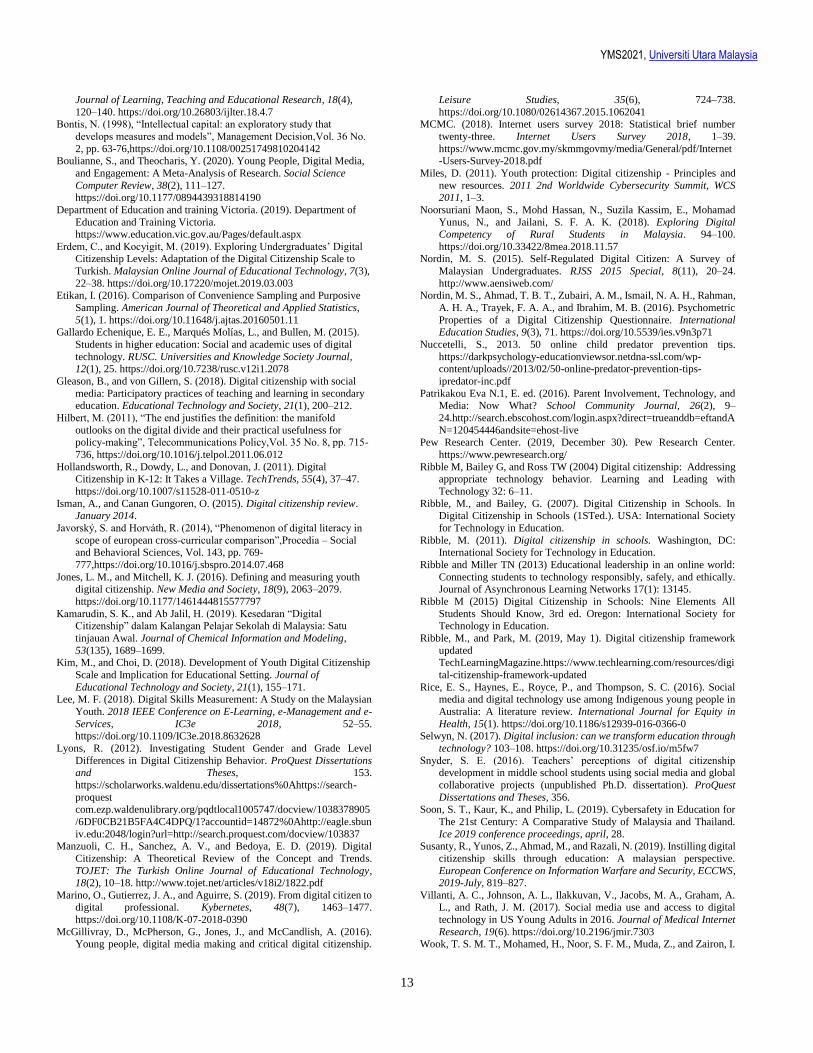
VII. CONCLUSION To draw a conclusion, all the nine questions about the
digital citizenship knowledge towards the respondents
show, there is a need to build either a policy, model,
or guideline for youth in Malaysia to immensely
culture about digital citizenship. Table 6 and Fig 4
compare and further show the analysis of those who
thought they know about digital citizenship, but yet a
majority still believe a model to increase the youth
knowledge is urgently required.
Figure 4. Overall analysis
Sadly, those who said “No” to having knowledge still
said no to having any necessary model on digital
understanding. This could be argued as their limitation
in understanding the importance of the digital world
that is hitting the youth now. By having such
knowledge on digital citizenship, youth should be able
to build themselves as good digital citizens in
cyberspace and hence be fully equipped with the
digital technology knowledge to adapt and live in an
advanced world soon. Furthermore, the world now is
facing a challenge with pandemic COVID-19, so the
authors feel this data will contribute to how to manage
our knowledge of digital citizenship. This is very
significant for the youth in Malaysia to be able to adapt
to the online world that may continue for many more
years. We would probably carry on doing everything
online forever. Therefore, planning and preparing
mechanisms on how to manage and assist digital
citizens daily are necessary to be research further. It is
hereby proposed that the fundamentals of digital
citizenship be instilled by creating, sharing, and using
the knowledge and information of the digital
citizenship concept from the perspective of the youth.
REFERENCES Alazemi, A. F., Sa’di, I. T., and Al-Jamal, D. A. H. (2019). Effects of
digital citizenship on EFL students’ success in writing. International
-50
0
50
100
0 1 2 3 4 5
Analysis Perception of Awareness
Yes (%) No(%) May be (%)
YMS2021, Universiti Utara Malaysia
13
Journal of Learning, Teaching and Educational Research, 18(4),
120–140. https://doi.org/10.26803/ijlter.18.4.7 Bontis, N. (1998), “Intellectual capital: an exploratory study that
develops measures and models”, Management Decision,Vol. 36 No.
2, pp. 63-76,https://doi.org/10.1108/00251749810204142 Boulianne, S., and Theocharis, Y. (2020). Young People, Digital Media,
and Engagement: A Meta-Analysis of Research. Social Science
Computer Review, 38(2), 111–127. https://doi.org/10.1177/0894439318814190
Department of Education and training Victoria. (2019). Department of
Education and Training Victoria. https://www.education.vic.gov.au/Pages/default.aspx
Erdem, C., and Kocyigit, M. (2019). Exploring Undergraduates’ Digital Citizenship Levels: Adaptation of the Digital Citizenship Scale to
Turkish. Malaysian Online Journal of Educational Technology, 7(3),
22–38. https://doi.org/10.17220/mojet.2019.03.003 Etikan, I. (2016). Comparison of Convenience Sampling and Purposive
Sampling. American Journal of Theoretical and Applied Statistics,
5(1), 1. https://doi.org/10.11648/j.ajtas.20160501.11 Gallardo Echenique, E. E., Marqués Molías, L., and Bullen, M. (2015).
Students in higher education: Social and academic uses of digital
technology. RUSC. Universities and Knowledge Society Journal, 12(1), 25. https://doi.org/10.7238/rusc.v12i1.2078
Gleason, B., and von Gillern, S. (2018). Digital citizenship with social
media: Participatory practices of teaching and learning in secondary education. Educational Technology and Society, 21(1), 200–212.
Hilbert, M. (2011), “The end justifies the definition: the manifold
outlooks on the digital divide and their practical usefulness for policy-making”, Telecommunications Policy,Vol. 35 No. 8, pp. 715-
736, https://doi.org/10.1016/j.telpol.2011.06.012
Hollandsworth, R., Dowdy, L., and Donovan, J. (2011). Digital Citizenship in K-12: It Takes a Village. TechTrends, 55(4), 37–47.
https://doi.org/10.1007/s11528-011-0510-z
Isman, A., and Canan Gungoren, O. (2015). Digital citizenship review. January 2014.
Javorský, S. and Horváth, R. (2014), “Phenomenon of digital literacy in
scope of european cross-curricular comparison”,Procedia – Social and Behavioral Sciences, Vol. 143, pp. 769-
777,https://doi.org/10.1016/j.sbspro.2014.07.468
Jones, L. M., and Mitchell, K. J. (2016). Defining and measuring youth digital citizenship. New Media and Society, 18(9), 2063–2079.
https://doi.org/10.1177/1461444815577797
Kamarudin, S. K., and Ab Jalil, H. (2019). Kesedaran “Digital Citizenship” dalam Kalangan Pelajar Sekolah di Malaysia: Satu
tinjauan Awal. Journal of Chemical Information and Modeling,
53(135), 1689–1699. Kim, M., and Choi, D. (2018). Development of Youth Digital Citizenship
Scale and Implication for Educational Setting. Journal of
Educational Technology and Society, 21(1), 155–171. Lee, M. F. (2018). Digital Skills Measurement: A Study on the Malaysian
Youth. 2018 IEEE Conference on E-Learning, e-Management and e-
Services, IC3e 2018, 52–55. https://doi.org/10.1109/IC3e.2018.8632628
Lyons, R. (2012). Investigating Student Gender and Grade Level
Differences in Digital Citizenship Behavior. ProQuest Dissertations and Theses, 153.
https://scholarworks.waldenu.edu/dissertations%0Ahttps://search-
proquest com.ezp.waldenulibrary.org/pqdtlocal1005747/docview/1038378905
/6DF0CB21B5FA4C4DPQ/1?accountid=14872%0Ahttp://eagle.sbun
iv.edu:2048/login?url=http://search.proquest.com/docview/103837 Manzuoli, C. H., Sanchez, A. V., and Bedoya, E. D. (2019). Digital
Citizenship: A Theoretical Review of the Concept and Trends.
TOJET: The Turkish Online Journal of Educational Technology, 18(2), 10–18. http://www.tojet.net/articles/v18i2/1822.pdf
Marino, O., Gutierrez, J. A., and Aguirre, S. (2019). From digital citizen to digital professional. Kybernetes, 48(7), 1463–1477.
https://doi.org/10.1108/K-07-2018-0390
McGillivray, D., McPherson, G., Jones, J., and McCandlish, A. (2016). Young people, digital media making and critical digital citizenship.
Leisure Studies, 35(6), 724–738.
https://doi.org/10.1080/02614367.2015.1062041 MCMC. (2018). Internet users survey 2018: Statistical brief number
twenty-three. Internet Users Survey 2018, 1–39.
https://www.mcmc.gov.my/skmmgovmy/media/General/pdf/Internet-Users-Survey-2018.pdf
Miles, D. (2011). Youth protection: Digital citizenship - Principles and
new resources. 2011 2nd Worldwide Cybersecurity Summit, WCS 2011, 1–3.
Noorsuriani Maon, S., Mohd Hassan, N., Suzila Kassim, E., Mohamad
Yunus, N., and Jailani, S. F. A. K. (2018). Exploring Digital Competency of Rural Students in Malaysia. 94–100.
https://doi.org/10.33422/8mea.2018.11.57 Nordin, M. S. (2015). Self-Regulated Digital Citizen: A Survey of
Malaysian Undergraduates. RJSS 2015 Special, 8(11), 20–24.
http://www.aensiweb.com/ Nordin, M. S., Ahmad, T. B. T., Zubairi, A. M., Ismail, N. A. H., Rahman,
A. H. A., Trayek, F. A. A., and Ibrahim, M. B. (2016). Psychometric
Properties of a Digital Citizenship Questionnaire. International Education Studies, 9(3), 71. https://doi.org/10.5539/ies.v9n3p71
Nuccetelli, S., 2013. 50 online child predator prevention tips.
https://darkpsychology-educationviewsor.netdna-ssl.com/wp-content/uploads//2013/02/50-online-predator-prevention-tips-
ipredator-inc.pdf
Patrikakou Eva N.1, E. ed. (2016). Parent Involvement, Technology, and Media: Now What? School Community Journal, 26(2), 9–
24.http://search.ebscohost.com/login.aspx?direct=trueanddb=eftandA
N=120454446andsite=ehost-live Pew Research Center. (2019, December 30). Pew Research Center.
https://www.pewresearch.org/
Ribble M, Bailey G, and Ross TW (2004) Digital citizenship: Addressing appropriate technology behavior. Learning and Leading with
Technology 32: 6–11.
Ribble, M., and Bailey, G. (2007). Digital Citizenship in Schools. In Digital Citizenship in Schools (1STed.). USA: International Society
for Technology in Education.
Ribble, M. (2011). Digital citizenship in schools. Washington, DC: International Society for Technology in Education.
Ribble and Miller TN (2013) Educational leadership in an online world:
Connecting students to technology responsibly, safely, and ethically. Journal of Asynchronous Learning Networks 17(1): 13145.
Ribble M (2015) Digital Citizenship in Schools: Nine Elements All
Students Should Know, 3rd ed. Oregon: International Society for Technology in Education.
Ribble, M., and Park, M. (2019, May 1). Digital citizenship framework
updated TechLearningMagazine.https://www.techlearning.com/resources/digi
tal-citizenship-framework-updated
Rice, E. S., Haynes, E., Royce, P., and Thompson, S. C. (2016). Social media and digital technology use among Indigenous young people in
Australia: A literature review. International Journal for Equity in
Health, 15(1). https://doi.org/10.1186/s12939-016-0366-0 Selwyn, N. (2017). Digital inclusion: can we transform education through
technology? 103–108. https://doi.org/10.31235/osf.io/m5fw7
Snyder, S. E. (2016). Teachers’ perceptions of digital citizenship development in middle school students using social media and global
collaborative projects (unpublished Ph.D. dissertation). ProQuest
Dissertations and Theses, 356. Soon, S. T., Kaur, K., and Philip, L. (2019). Cybersafety in Education for
The 21st Century: A Comparative Study of Malaysia and Thailand.
Ice 2019 conference proceedings, april, 28. Susanty, R., Yunos, Z., Ahmad, M., and Razali, N. (2019). Instilling digital
citizenship skills through education: A malaysian perspective.
European Conference on Information Warfare and Security, ECCWS, 2019-July, 819–827.
Villanti, A. C., Johnson, A. L., Ilakkuvan, V., Jacobs, M. A., Graham, A. L., and Rath, J. M. (2017). Social media use and access to digital
technology in US Young Adults in 2016. Journal of Medical Internet
Research, 19(6). https://doi.org/10.2196/jmir.7303 Wook, T. S. M. T., Mohamed, H., Noor, S. F. M., Muda, Z., and Zairon, I.
YMS2021, Universiti Utara Malaysia
14
Y. (2019). Awareness of digital footprint management in the new
media amongst youth. Jurnal Komunikasi: Malaysian Journal of Communication, 35(3), 407–421. https://doi.org/10.17576/JKMJC-
2019-3503-24
Xu, S., Yang, H. H., MacLeod, J., and Zhu, S. (2019). Social media competence and digital citizenship among college students.
Convergence, 25(4), 735–752.
https://doi.org/10.1177/1354856517751390 Yue, A., Nekmat, E., and Beta, A. R. (2019). Digital literacy through
digital citizenship: Online civic participation and public opinion
evaluation of youth minorities in Southeast Asia. Media and Communication, 7(2 Critical Perspectives), 100–114.
https://doi.org/10.17645/mac.v7i2.1899 UNESCO (2013), Media and Information Literacy Policy and Strategy
Guidelines, UNESCO, Paris.
15
Page 15
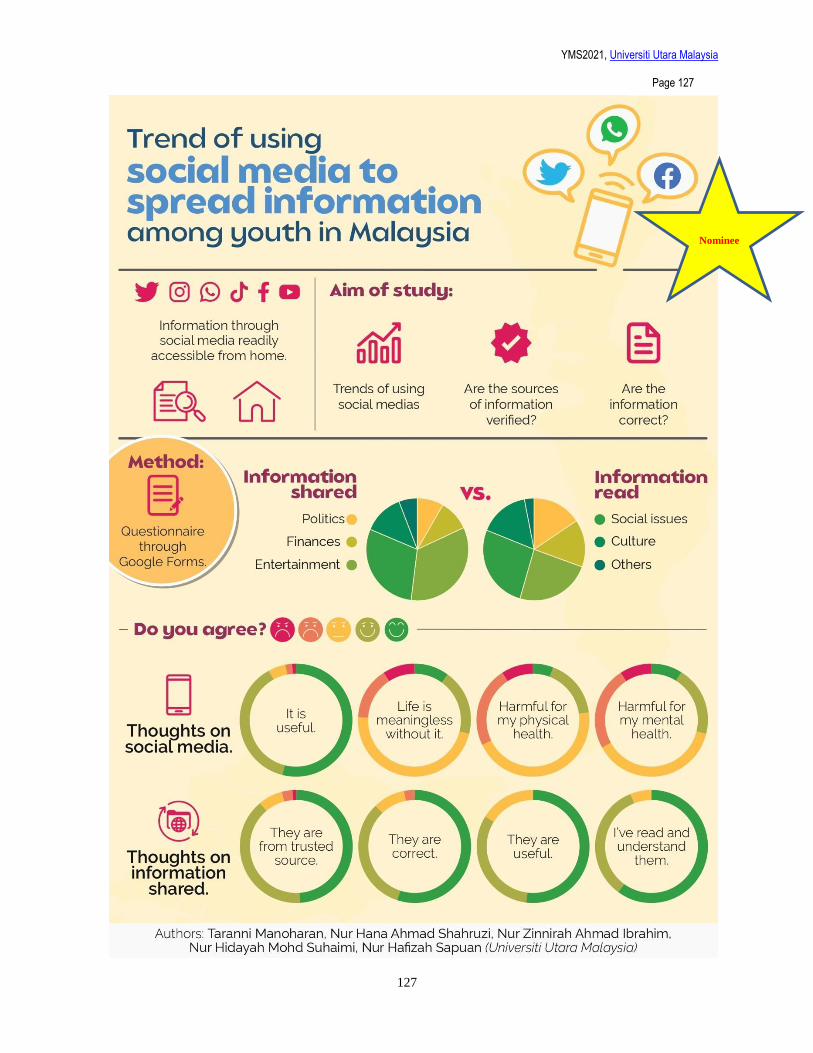
Social Media Causes Insecurities among Youth in Malaysia
Siti Nurzulaifah Sheikh Allaudin1, Fauziah Miswari2, Ainan Midrara Hamat Fauzi3 & Roazfazleen Azlan4
1Universiti Utara Malaysia, Malaysia, [email protected] 2Universiti Utara Malaysia, Malaysia, [email protected]
3Universiti Utara Malaysia, Malaysia, [email protected] 4Universiti Utara Malaysia, Malaysia, [email protected]
ABSTRACT
Social media platforms offer alternative channels for
people to express social and peer pressures on their
perceptions of appearance toward an idyllic concept.
This research investigates people's social media
interpretations of the relationship between self-
presentation and peer evaluation in the light of
appearance. Peers played various roles in influencing
people's expectations and appearance of perfection,
including fictional viewers, judges, acquiring the
skills, platforms, and reference goals. The
questionnaire was designed to explore people's
experiences and understanding of social media causes
of insecurities among youth. The target population of
this study was females and males youths. The findings
from this study reveal the struggles faced by today's
youth and provide insights for future investigations
and interventions related to the presentation and
personality of youth on social media.
Keywords: peer pressures; self-presentation; social
media; youth.
I. INTRODUCTION
In research from Ezekiel and Leonard Onyeka (2014),
the media in general plays a critical role in society as
a basic communication network in a modern
democratic society. This means that people rely on the
media to keep up with what's going on in their
surroundings. Social media allows individuals to
interact with various people, interact in cyberspace
and view various types of posts, pictures of one’s
success, most of them are from influencers who often
show their successful life and their beauty appearance.
Excessive use of the internet and social media
platforms can lower individual self-esteem. As a
result, individuals may feel insecure and depressed.
Social media has created a modern digital forum
where personality and peer control engage to create
standards of beauty (Meier & Gray, 2018). More youth
are also influenced by online personalities, such as
uploading self-portraits or "selfies" of themselves and
exchanging "hipster" photographs in order to evaluate
and start comparing themselves with others. As an
outcome, the aim of this research is to access critical
gaps in the current literature. This research
investigated the following two research questions in
order to determine the fundamental strength of the
issue between personality and peer comparison in
social media (RQ1) How do youth describe their role
in self-presentation by posting their life on social
media? (RQ2) How do youth describe peer
comparisons on social media? As a result, the aim of
this research is to investigate the causes of insecurity
among Malaysian’s youth. The following are the
objectives of this research (RO1) to investigate how
youth describe their role in self-presentation by
posting their life on social media. (RO2) To identify
how youth describe peer comparisons on social media.
II. LITERATURE REVIEW
A. Media vs. Social Media
Media or also known as mass media is a type of
technology that aims to reach a large number of people
(What Is Mass Media? - Definition, Types, Influence
& Examples Video, 2021). Mass media usually used
television, radio or newspaper as their platform to
deliver what they want people to know about. The
public often depend on the media for information on
political, social, and entertainment topics, as well as
other global events. Nowadays, technology has
advanced dramatically and is now widely used all
around the country. According to Digital Works and
Gallagher (2017) whether using cellphones, PCs,
tablets, or laptops, a huge part of the population has
Internet access at their fingertips. Youth are more
interested in using social media as social media is an
immediate and real-time platform, unlike traditional
media, which can be delayed due to press time. With
social media, the general public seems to have more
access and exposure to what is going on in the world
and keeping up with current events. Apart from that,
youth prefer to use social media because it is a two-
way communication that can make them stay
YMS2021, Universiti Utara Malaysia
16
connected with their members despite the separating
distance (“Social vs. Traditional Media: Has the Battle
Already Ended?” 2016).
B. Social Media and Youth Most individuals use social media to
communicate with new and old buddies, whether
they are in person or online. Referring to
TVETipedia Glossary (2016), "Youth" is best
defined as a period of transformation from childhood
dependence to adulthood's independence and
realization of our community's interdependence.
Individuals that aged between 15 to 24 years
considered as youth. These are the people who utilize
social media to share their daily lives and stay in
touch with their distant and virtual buddies as social
media makes interconnecting the world effortless.
One can use Twitter to find out what their favorite
celebrity is up to, Facebook to find out when a
friend's birthday is, or Instagram to promote a new
business (Digital Works & Gallagher, 2017). Despite
all the uses of social media, could there be no
disadvantage from it?
C. Pros and Cons of Social Media Usage Apart from connecting people, social media is
also used to share and expose other countries'
traditions, food, or lifestyle. The youth can explore a
lot of things by using social media and can open their
eyes and perceptions to something unfamiliar
without requiring them to travel to that exact
location. As an example, the social media user is
coming from different countries and definitely with
a different lifestyle. Malaysian users can learn about
other countries' political status, what are the current
issues being discussed, or as simple as trying to get
inspired by other countries' fashion sense. However,
we must keep in mind that social media cannot take
the place of real life. 95% of youth aged 12 to 17
have access to the Internet and 74% have mobile
Internet devices (Madden et al., 2013). Youth at this
stage are considered fragile and easily influenced.
Social media can bring harm to these people such as
they can easily compare themselves with others and
begin to be dissatisfied with what they had. This can
lead to insecurities and depression among youth.
Youth also got addicted and became too dependent
on their gadgets and social media. Addiction to
social media sites can result in poor social
interactions. People who use online social
networking often are at risk of social isolation, which
can lead to depression and a loss of social skills
(Positive and Negative Effects of Social Media,
2017).
III. METHODOLOGY
This study was designed primarily to create awareness
about social media that causes insecurities among
youth in Malaysia. The questionnaire was designed to
explore people's experiences and understanding of
social media causes of insecurities among youth. The
target population of this study was females and males
youths. This section explains the research procedures
of this study including participants, data collection
procedures, and data analysis.
A. Literature review
The literature reviews were conducted by examining
the existing research related to social media causes of
insecurities among youth including the references
from journals, books, and webpages.
B. Survey
The survey questionnaires designed using the Google
Form were distributed through social media
applications such as WhatsApp group, Instagram and
Facebook. Questionnaire explained about the factors,
effects and steps taken about Social media that causes
insecurities among youth in Malaysia. The
questionnaire was divided into several section that
covered the respondents 1) Demographics data
included (age, gender, and current status), 2) How
many hours do you spend on social media per day, 3)
What social media applications do you often use 4) If
yes, what did they comment about, 5) How did you
feel when received the comment, 6) Do you think that
excessive use of social media will affect your
insecurity, 7) Do social media increased your self-
esteem , 8) Does the existence of various types of
filters on social media platforms help boost your self-
confidence, 9) Social media is a fake life, 10) Does the
appearance of other social media user give you
motivation, 11) Does the appearance of other social
media make you feel worthless, 12) Does the
appearance of other social media user help you to love
yourself, 13) Do you being yourself on social media,
14) Do you try to compare yourself with other social
media user, 15) Do you feel comfortable to use social
media.
IV. RESULTS
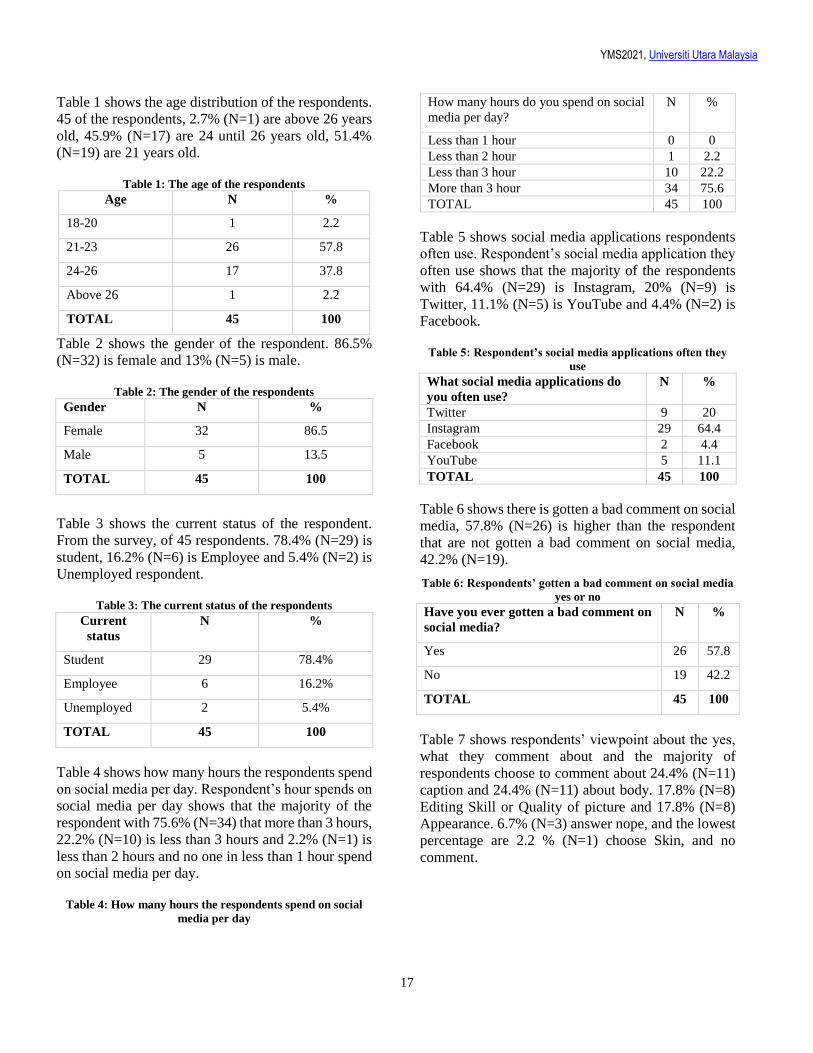
YMS2021, Universiti Utara Malaysia
17
Table 1 shows the age distribution of the respondents.
45 of the respondents, 2.7% (N=1) are above 26 years
old, 45.9% (N=17) are 24 until 26 years old, 51.4%
(N=19) are 21 years old.
Table 1: The age of the respondents Age N %
18-20 1 2.2
21-23 26 57.8
24-26 17 37.8
Above 26 1 2.2
TOTAL 45 100
Table 2 shows the gender of the respondent. 86.5%
(N=32) is female and 13% (N=5) is male.
Table 2: The gender of the respondents
Gender N %
Female 32 86.5
Male 5 13.5
TOTAL 45 100
Table 3 shows the current status of the respondent.
From the survey, of 45 respondents. 78.4% (N=29) is
student, 16.2% (N=6) is Employee and 5.4% (N=2) is
Unemployed respondent.
Table 3: The current status of the respondents
Current
status
N %
Student 29 78.4%
Employee 6 16.2%
Unemployed 2 5.4%
TOTAL 45 100
Table 4 shows how many hours the respondents spend
on social media per day. Respondent’s hour spends on
social media per day shows that the majority of the
respondent with 75.6% (N=34) that more than 3 hours,
22.2% (N=10) is less than 3 hours and 2.2% (N=1) is
less than 2 hours and no one in less than 1 hour spend
on social media per day.
Table 4: How many hours the respondents spend on social
media per day
How many hours do you spend on social
media per day?
N %
Less than 1 hour 0 0
Less than 2 hour 1 2.2
Less than 3 hour 10 22.2
More than 3 hour 34 75.6
TOTAL 45 100
Table 5 shows social media applications respondents
often use. Respondent’s social media application they
often use shows that the majority of the respondents
with 64.4% (N=29) is Instagram, 20% (N=9) is
Twitter, 11.1% (N=5) is YouTube and 4.4% (N=2) is
Facebook.
Table 5: Respondent’s social media applications often they
use
What social media applications do
you often use?
N %
Twitter 9 20
Instagram 29 64.4
Facebook 2 4.4
YouTube 5 11.1
TOTAL 45 100
Table 6 shows there is gotten a bad comment on social
media, 57.8% (N=26) is higher than the respondent
that are not gotten a bad comment on social media,
42.2% (N=19).
Table 6: Respondents’ gotten a bad comment on social media
yes or no
Have you ever gotten a bad comment on
social media?
N %
Yes 26 57.8
No 19 42.2
TOTAL 45 100
Table 7 shows respondents’ viewpoint about the yes,
what they comment about and the majority of
respondents choose to comment about 24.4% (N=11)
caption and 24.4% (N=11) about body. 17.8% (N=8)
Editing Skill or Quality of picture and 17.8% (N=8)
Appearance. 6.7% (N=3) answer nope, and the lowest
percentage are 2.2 % (N=1) choose Skin, and no
comment.
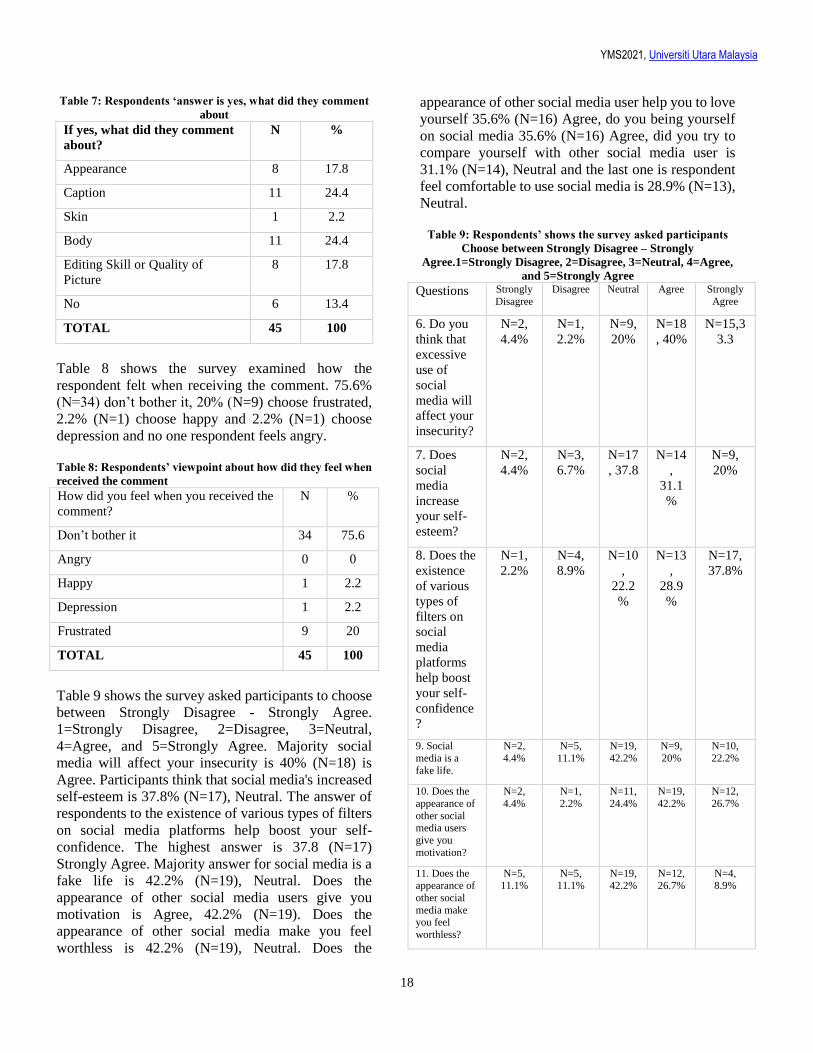
YMS2021, Universiti Utara Malaysia
18
Table 7: Respondents ‘answer is yes, what did they comment
about
If yes, what did they comment
about?
N %
Appearance 8 17.8
Caption 11 24.4
Skin 1 2.2
Body 11 24.4
Editing Skill or Quality of
Picture
8 17.8
No 6 13.4
TOTAL 45 100
Table 8 shows the survey examined how the
respondent felt when receiving the comment. 75.6%
(N=34) don’t bother it, 20% (N=9) choose frustrated,
2.2% (N=1) choose happy and 2.2% (N=1) choose
depression and no one respondent feels angry.
Table 8: Respondents’ viewpoint about how did they feel when
received the comment How did you feel when you received the
comment?
N %
Don’t bother it 34 75.6
Angry 0 0
Happy 1 2.2
Depression 1 2.2
Frustrated 9 20
TOTAL 45 100
Table 9 shows the survey asked participants to choose
between Strongly Disagree - Strongly Agree.
1=Strongly Disagree, 2=Disagree, 3=Neutral,
4=Agree, and 5=Strongly Agree. Majority social
media will affect your insecurity is 40% (N=18) is
Agree. Participants think that social media's increased
self-esteem is 37.8% (N=17), Neutral. The answer of
respondents to the existence of various types of filters
on social media platforms help boost your self-
confidence. The highest answer is 37.8 (N=17)
Strongly Agree. Majority answer for social media is a
fake life is 42.2% (N=19), Neutral. Does the
appearance of other social media users give you
motivation is Agree, 42.2% (N=19). Does the
appearance of other social media make you feel
worthless is 42.2% (N=19), Neutral. Does the
appearance of other social media user help you to love
yourself 35.6% (N=16) Agree, do you being yourself
on social media 35.6% (N=16) Agree, did you try to
compare yourself with other social media user is
31.1% (N=14), Neutral and the last one is respondent
feel comfortable to use social media is 28.9% (N=13),
Neutral.
Table 9: Respondents’ shows the survey asked participants
Choose between Strongly Disagree – Strongly
Agree.1=Strongly Disagree, 2=Disagree, 3=Neutral, 4=Agree,
and 5=Strongly Agree Questions Strongly
Disagree
Disagree Neutral Agree Strongly
Agree
6. Do you
think that
excessive
use of
social
media will
affect your
insecurity?
N=2,
4.4%
N=1,
2.2%
N=9,
20%
N=18
, 40%
N=15,3
3.3
7. Does
social
media
increase
your self-
esteem?
N=2,
4.4%
N=3,
6.7%
N=17
, 37.8
N=14
,
31.1
%
N=9,
20%
8. Does the
existence
of various
types of
filters on
social
media
platforms
help boost
your self-
confidence
?
N=1,
2.2%
N=4,
8.9%
N=10
,
22.2
%
N=13
,
28.9
%
N=17,
37.8%
9. Social
media is a
fake life.
N=2,
4.4%
N=5,
11.1%
N=19,
42.2%
N=9,
20%
N=10,
22.2%
10. Does the
appearance of
other social media users
give you
motivation?
N=2,
4.4%
N=1,
2.2%
N=11,
24.4%
N=19,
42.2%
N=12,
26.7%
11. Does the appearance of
other social
media make you feel
worthless?
N=5, 11.1%
N=5, 11.1%
N=19, 42.2%
N=12, 26.7%
N=4, 8.9%
YMS2021, Universiti Utara Malaysia
19
12. Does the
appearance of other social
media users
help you to love yourself?
N=1,
2.2%
N=5,
11.1%
N=15,
33.3%
N=16,
35.6%
N=8,
17.8%
13. Do you
being yourself
on social media?
N=2,
4.4%
N=6,
13.3%
N=11,
24.4%
N=16,
35.6%
N=10,
22.2%
14. Do you try
to compare yourself with
other social
media users?
N=4,
8.9%
N=4,
8.9%
N=14,
31.1%
N=11,
24.4%
N=12,
26.7%
15. Do you
feel
comfortable
using social
media?
N=1,
2.2%
N=7,
15.6%
N=13,
28.9%
N=12,
26.7%
N=12,
26.7%
V. DISCUSSION
In this study, we discovered that the majority of
respondents were between 21 till 23 years old with
the percentage 51.4% and female respondents
outnumbered male respondents with 86.5%.
However, the high percentage of that age and gender
does not yet influence the awareness of the insecurity
using social media because we cannot recognize
those who are aware of and unaware about the issue.
According to the findings, the highest percentage of
youths, 78.4% choose to focus on their studies over
working and being unemployed. It shows that more
people prefer to study rather than working and do
nothing during their youth. According to the results,
75.6% of youths spend more than three hours every
day on social media. Jan, Soomro, and Ahmad
(2017) discovered that as their use of social media
rose, their self-esteem decreased.
When asked if they had ever received a negative
comment on social media, 57.8% of the respondents
chose “Yes”. They have gotten a few nasty remarks
regarding their body, the caption, their appearance,
and editing skills, as well as the picture’s quality.
Because of the growing number of social media
users, material posted on the Internet is sometimes
difficult to verify. The privilege of a person’s private
life has decreased massively (Asemah & Edegoh,
2013). As people spend more time on social media,
they will be more likely to look at other people’s
accounts and feel envious of those who they think
are superior or better-off than them. Next, according
to the findings, the highest percentage of respondents
who feel nothing when they receive a negative
comment on social media is 75.6%. It varies from a
research by Chua and Chang (2016), which shows
that peer comparison might affect people’s self-
esteem and insecurity, resulting in a self-sustaining
cycle.
There were 40% of respondents who chose
“Agree” that excessive use of social media will
affect their insecurity, yet 31.1% of youths chose
“Neutral” when asked if they try to compare
themselves with other social media users.
Kircaburun (2016) found that depression was
influenced by daily Internet use, students who spent
more time on the Internet had higher scores on
depression inventory. Acts of self-presentation and
peer comparison among teenage girls are motivated
by a desire to get approval, attention, and
appreciation, which can lead to developing
insecurity and low self-esteem (Chua & Chang,
2016).
Following that, 37.8% of youths chose “Neutral”
when asked if social media improved their self-
esteem. “Agree” was selected by 37.8% of the youths.
According to Chua and Chang (2016), teenage girls
are vulnerable to peer norms of beauty that emphasize
physical characteristics such as beautiful skin,
thinness, and sparkling eyes. However, 42.2% chose
“Neutral” about social media as a fake life. Between
the ideal of beauty and the real selves, social media
allows one to create another self-image that is as close
as possible to the ideal while maintaining a level of
validity that is acceptable (Chua & Chang, 2016).
However, 42.2% of youths chose “Neutral” when
asked if the appearance of other social media users
makes them feel worthless. It is related with a study
by Chua and Chang (2016) that teenage girls evaluate
their appearance and build judgments of themselves
with others by comparing the popularity of their self-
presentation on social media that make their insecurity
increased.
Furthermore, “Agree” was selected by 35.6% and
42.2% of respondents that the appearance of other
social media users helps them to love themselves, and
appearance of other social media users motivates them
respectively according to the findings. It is related to
the existence of many sorts of filters on social
networking sites that helps to increase their self-
confidence. According to the findings, 35.6% of the
respondents “Agree” that they are being themselves on
social media. In contrast to Chua and Chang (2016),
who found that the editable and self-production
characteristics in social media give the teenage girls
YMS2021, Universiti Utara Malaysia
20
the freedom to refine their self-images that are closer
to their ideal of beauty. They can accentuate their
greatest traits and hide their flaws in front of others
with careful planning, editing, and design. Lastly,
28.9% of youths “Agree” that they are comfortable
using social media. Youths described that they use
social media to look for information or content such as
news, and humorous posts so they do not miss news
about artists and for distraction (Radovic, Gmelin,
Stein & Miller, 2017).
VI. CONCLUSION
This study discusses how social media can lead
to insecurity. We found that individuals’ self-esteem
is not really influenced by social media, even social
networking sites are most used by youths based on
the findings. Social media can be used for many
things such as for communication, information, and
sustaining relationships with others. Next, one of the
recommendations for raising awareness of
insecurities produced on social media among the
youths is to hold campaigns to educate people,
particularly youths regarding the negative
consequences of social networking sites and the
long-term impacts it can have on the victims. Parents,
guardians and teachers can help their children
develop self-recognition, self-esteem, and self-
confidence by guiding them. Lastly, for the
recommendations for the future works they can
expand the participants to get more feedback about
how social media causes insecurities among youth in
Malaysia.
REFERENCES Asemah, E., S., & Edegoh, l., O. (2013). An Appraisal Of The Social Media
And Insecurity In Nigeria. Lagos: African Council for CommUnication
education, 240, 2013. Retrieved from http://accenigeria.org/a/wp-content/uploads/2014/04/101.pdf
Chua, T. H. H., & Chang, L. (2016). Follow me and like my beautiful
selfies: Singapore teenage girls’ engagement in self-presentation and peer comparison on social media. Computers in Human Behavior, 55,
190-197.
Digital Works, R., & Gallagher, S. (2017). The influence of social media on teens’ self-esteem. Retrieved from website:
https://rdw.rowan.edu/cgi/viewcontent.cgi?article=3440&context=etd
Ezekiel, S. A. S. E. M. A. H., & Leonard Onyeka, E. D. E. G. O. H. (2014). AN APPRAISAL OF THE SOCIAL MEDIA AND INSECURITY IN
NIGERIA. Communication and the New Media in Nigeria. Published.
http://accenigeria.org/a/wp-content/uploads/2014/04/101.pdf Gallagher, S., M. (2017). The influence of social media on teens' self-
esteem. Theses and Dissertations. 2438. Retrieved from
http://rdw.rowan.edu/cgi/viewcontent.cgi?article=3440&context=etd Gibson, K., & Trnka, S. (2019). Young people's priorities for support on
social media: “It takes trust to talk about these issues”. Computers in
Human Behavior, 102 (2020), 238–247. https://doi.org/10.1016/j.chb.2019.08.030
Jan, M., Soomro, S. A., & Ahmad, N. (2017). Impact of Social Media on
Self-Esteem. European Scientific Journal,13 (23), 329-341, 2017. doi: 10.19044/esj.2017.v13n23p329
Kaplan, A. M., & Haenlein, M. (2019). Users of the world, unite! The
challenges and opportunities of social media. Business Horizons, 53(1), 59-68.
Kircaburun, K. (2016). Self-Esteem, Daily Internet Use and Social Media
Addiction as Predictors of Depression among Turkish Adolescents. Journal of Education and Practice 7 (24), 64-72, 2016. Retrieved from
https://eric.ed.gov/?id=EJ1112856
Madden, M., Lenhart, A., Maeve Duggan, Cortesi, S., & Urs Gasser. (2013, March 13). Teens and Technology 2013. Retrieved May 20, 2021, from
Pew Research Center: Internet, Science & Tech website: https://www.pewresearch.org/internet/2013/03/13/teens-and-technology-
2013/
Meier, E. P., & Gray, J. (2018). Facebook photo activity associated with body image disturbance in adolescent girls. Cyberpsychology, Behavior,
and Social Networking, 17(4), 199-206
Radovic, A., Gmelin, T., Stein, B. D., & Miller, E. (2017). Depressed adolescents’ positive and negative use of social media. J Adolesc.
(2017) 55: 5–15. doi:10.1016/j.adolescence.2016.12.002
Social vs. Traditional Media: Has the Battle Already Ended? (2016, April). Retrieved from PRSA website:
https://apps.prsa.org/Intelligence/Tactics/Articles/view/11445/1124/Soci
al_vs_Traditional_Media_Has_the_Battle_Already#.YKXJeqgzY2z What Is Mass Media? - Definition, Types, Influence & Examples Video.
(2021). What Is Mass Media? - Definition, Types, Influence &
Examples - Business Class [2021 Video] | Study.com. Retrieved from Study.com website: https://study.com/academy/lesson/what-is-mass-
media-definition-types-influence-
examples.html#:~:text=Mass%20media%20means%20technology%20that,%2C%20television%2C%20and%20the%20Internet.
Woods, H., C., & Scott, H. (2016). ) #Sleepyteens: social media use in
adolescence is associated with poor sleep quality, anxiety, depression and low self-esteem. Journal of Adolescence, 51, pp. 41-49.
doi:10.1016/j.adolescence.2016.05.00
YMS2021, Universiti Utara Malaysia
21
Page 21
The Influence of Mass Media on Adolescent Morality
Nurul Syahidah Robia1, Nur Farisah Mohd Wira2, Lee Cinyi3 & Cuckthima Wat 4
1Universiti Utara Malaysia, Malaysia, [email protected] 2Universiti Utara Malaysia, Malaysia, [email protected]
3 Universiti Utara Malaysia, Malaysia, [email protected] 4Universiti Utara Malaysia, Malaysia, [email protected]
ABSTRACT
To date, the growing electronic and print media has
had a significant impact on juvenile behaviour and
personality. This is due to the fact that youngsters are
easily affected and experiment with new things by
forging their own identities. The study's goal was to
determine which applications are often utilized by
youth, as well as the extent to which mass media
relationships lead to moral death and the impact of
mass media on moral issues among youth. A total of
45 youth took part in the study. The study employs a
quantitative approach of field research by distributing
a google form to the young over the Whatsapp
network. Using SPSS version 17.0, the study was
descriptively analyzed to determine the frequency,
percentage, and mean. The findings revealed that the
most frequent users of apps and media are youths aged
20 to 25, accounting for 55.6 % of all users, and that
the use of apps to encourage immoral behaviour in
youths has a moderate effect of 11.1 %. Furthermore,
research demonstrates that youngsters use the media
to obtain information relevant to their current
requirements. The inference is that through
disseminating informed da'wah through society's
influential mass media, youth might develop noble
virtues.
Keywords: Mass media, morality, youth
I. INTRODUCTION
The term media, which is the plural of media, refers
to the communication channels through which we
disseminate news, music, films, education,
promotional messages and other data. These include
physical and online newspapers and magazines,
television, radio, billboards, telephones, Internet, fax
and billboards (Fourth Edition Hall Dictionary). Next,
the meaning of youth empowerment is the process by
which children and young people are motivated to take
over their lives. They do this by addressing their
situation and then taking action to increase their access
to resources and change their awareness through their
beliefs, values, and attitudes. Media and Youth
Empowerment is such a big topic that our group chose
to break down your scope into smaller ones and focus
on descriptions of the influence of mass media on
youth morality.
Television, newspapers, magazines, and other forms
of mass media may be thought of as tools or resources
that provide information to the public at a rapid pace
and in a limited amount of time. The mass media also
plays an important role in disseminating knowledge to
society because it has the ability to shape and colour
people's perceptions of humanity. All of this material
from the media is presented in the form of basic news
so that the general public can understand it. Electronic
and print media are used to disseminate information in
the form of news. Electronic media delivers a vast
volume of news to the public much quicker than print
media. Since it serves as a persuasive tool used for the
good of society in their different operations, electronic
media is able to cross continents and countries in ways
that other media might not be able to.
According to Mohd. Ismail Mustari (2005),
electronic media transmit information to audiences
faster than print media. Television, radio, and the
internet are examples of electronic media. Electronic
media can spread through continents and countries in
ways that other media cannot. Electronic media is a
persuasion method that is used for the good of society
in a variety of activities. Electronic media has a
significant impact and serves as a means of
communicating with society. The media also serves as
a continuous conduit for cultural, social, intelligence,
values, and norms from one generation to the next.
Electronic media is a persuasion method that is used
for the good of society in a variety of activities.
Electronic media has a significant impact and serves
as a means of communicating with society. The media
also serves as a continuous conduit for cultural, social,
intelligence, values, and norms from one generation to
the next.
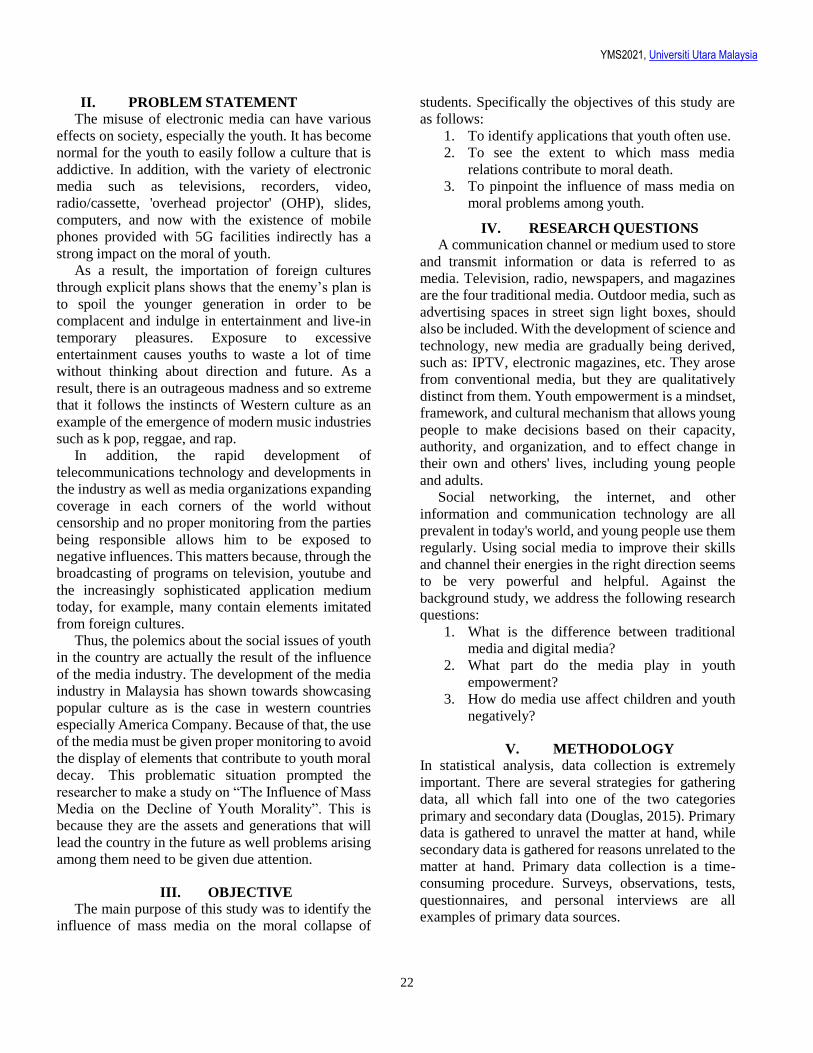
YMS2021, Universiti Utara Malaysia
22
II. PROBLEM STATEMENT
The misuse of electronic media can have various
effects on society, especially the youth. It has become
normal for the youth to easily follow a culture that is
addictive. In addition, with the variety of electronic
media such as televisions, recorders, video,
radio/cassette, 'overhead projector' (OHP), slides,
computers, and now with the existence of mobile
phones provided with 5G facilities indirectly has a
strong impact on the moral of youth.
As a result, the importation of foreign cultures
through explicit plans shows that the enemy’s plan is
to spoil the younger generation in order to be
complacent and indulge in entertainment and live-in
temporary pleasures. Exposure to excessive
entertainment causes youths to waste a lot of time
without thinking about direction and future. As a
result, there is an outrageous madness and so extreme
that it follows the instincts of Western culture as an
example of the emergence of modern music industries
such as k pop, reggae, and rap.
In addition, the rapid development of
telecommunications technology and developments in
the industry as well as media organizations expanding
coverage in each corners of the world without
censorship and no proper monitoring from the parties
being responsible allows him to be exposed to
negative influences. This matters because, through the
broadcasting of programs on television, youtube and
the increasingly sophisticated application medium
today, for example, many contain elements imitated
from foreign cultures.
Thus, the polemics about the social issues of youth
in the country are actually the result of the influence
of the media industry. The development of the media
industry in Malaysia has shown towards showcasing
popular culture as is the case in western countries
especially America Company. Because of that, the use
of the media must be given proper monitoring to avoid
the display of elements that contribute to youth moral
decay. This problematic situation prompted the
researcher to make a study on “The Influence of Mass
Media on the Decline of Youth Morality”. This is
because they are the assets and generations that will
lead the country in the future as well problems arising
among them need to be given due attention.
III. OBJECTIVE
The main purpose of this study was to identify the
influence of mass media on the moral collapse of
students. Specifically the objectives of this study are
as follows:
1. To identify applications that youth often use.
2. To see the extent to which mass media
relations contribute to moral death.
3. To pinpoint the influence of mass media on
moral problems among youth.
IV. RESEARCH QUESTIONS
A communication channel or medium used to store
and transmit information or data is referred to as
media. Television, radio, newspapers, and magazines
are the four traditional media. Outdoor media, such as
advertising spaces in street sign light boxes, should
also be included. With the development of science and
technology, new media are gradually being derived,
such as: IPTV, electronic magazines, etc. They arose
from conventional media, but they are qualitatively
distinct from them. Youth empowerment is a mindset,
framework, and cultural mechanism that allows young
people to make decisions based on their capacity,
authority, and organization, and to effect change in
their own and others' lives, including young people
and adults.
Social networking, the internet, and other
information and communication technology are all
prevalent in today's world, and young people use them
regularly. Using social media to improve their skills
and channel their energies in the right direction seems
to be very powerful and helpful. Against the
background study, we address the following research
questions:
1. What is the difference between traditional
media and digital media?
2. What part do the media play in youth
empowerment?
3. How do media use affect children and youth
negatively?
V. METHODOLOGY
In statistical analysis, data collection is extremely
important. There are several strategies for gathering
data, all which fall into one of the two categories
primary and secondary data (Douglas, 2015). Primary
data is gathered to unravel the matter at hand, while
secondary data is gathered for reasons unrelated to the
matter at hand. Primary data collection is a time-
consuming procedure. Surveys, observations, tests,
questionnaires, and personal interviews are all
examples of primary data sources.
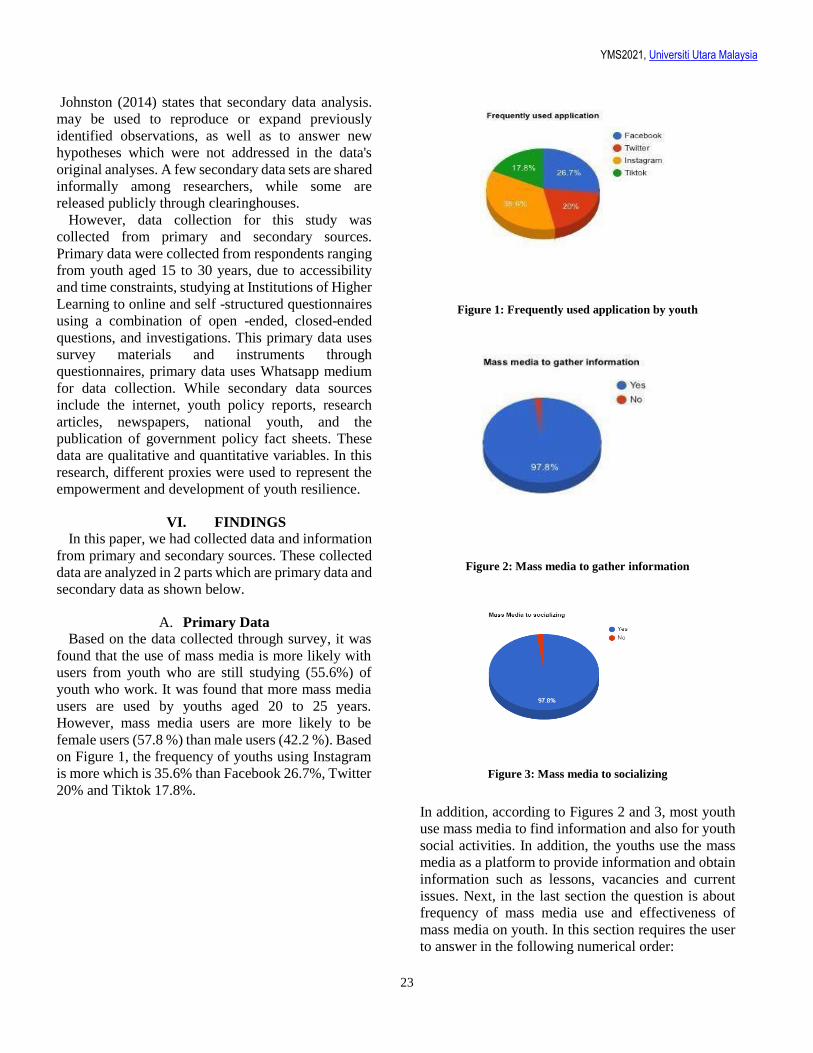
YMS2021, Universiti Utara Malaysia
23
Johnston (2014) states that secondary data analysis.
may be used to reproduce or expand previously
identified observations, as well as to answer new
hypotheses which were not addressed in the data's
original analyses. A few secondary data sets are shared
informally among researchers, while some are
released publicly through clearinghouses.
However, data collection for this study was
collected from primary and secondary sources.
Primary data were collected from respondents ranging
from youth aged 15 to 30 years, due to accessibility
and time constraints, studying at Institutions of Higher
Learning to online and self -structured questionnaires
using a combination of open -ended, closed-ended
questions, and investigations. This primary data uses
survey materials and instruments through
questionnaires, primary data uses Whatsapp medium
for data collection. While secondary data sources
include the internet, youth policy reports, research
articles, newspapers, national youth, and the
publication of government policy fact sheets. These
data are qualitative and quantitative variables. In this
research, different proxies were used to represent the
empowerment and development of youth resilience.
VI. FINDINGS
In this paper, we had collected data and information
from primary and secondary sources. These collected
data are analyzed in 2 parts which are primary data and
secondary data as shown below.
A. Primary Data
Based on the data collected through survey, it was
found that the use of mass media is more likely with
users from youth who are still studying (55.6%) of
youth who work. It was found that more mass media
users are used by youths aged 20 to 25 years.
However, mass media users are more likely to be
female users (57.8 %) than male users (42.2 %). Based
on Figure 1, the frequency of youths using Instagram
is more which is 35.6% than Facebook 26.7%, Twitter
20% and Tiktok 17.8%.
Figure 1: Frequently used application by youth
Figure 2: Mass media to gather information
Figure 3: Mass media to socializing
In addition, according to Figures 2 and 3, most youth
use mass media to find information and also for youth
social activities. In addition, the youths use the mass
media as a platform to provide information and obtain
information such as lessons, vacancies and current
issues. Next, in the last section the question is about
frequency of mass media use and effectiveness of
mass media on youth. In this section requires the user
to answer in the following numerical order:
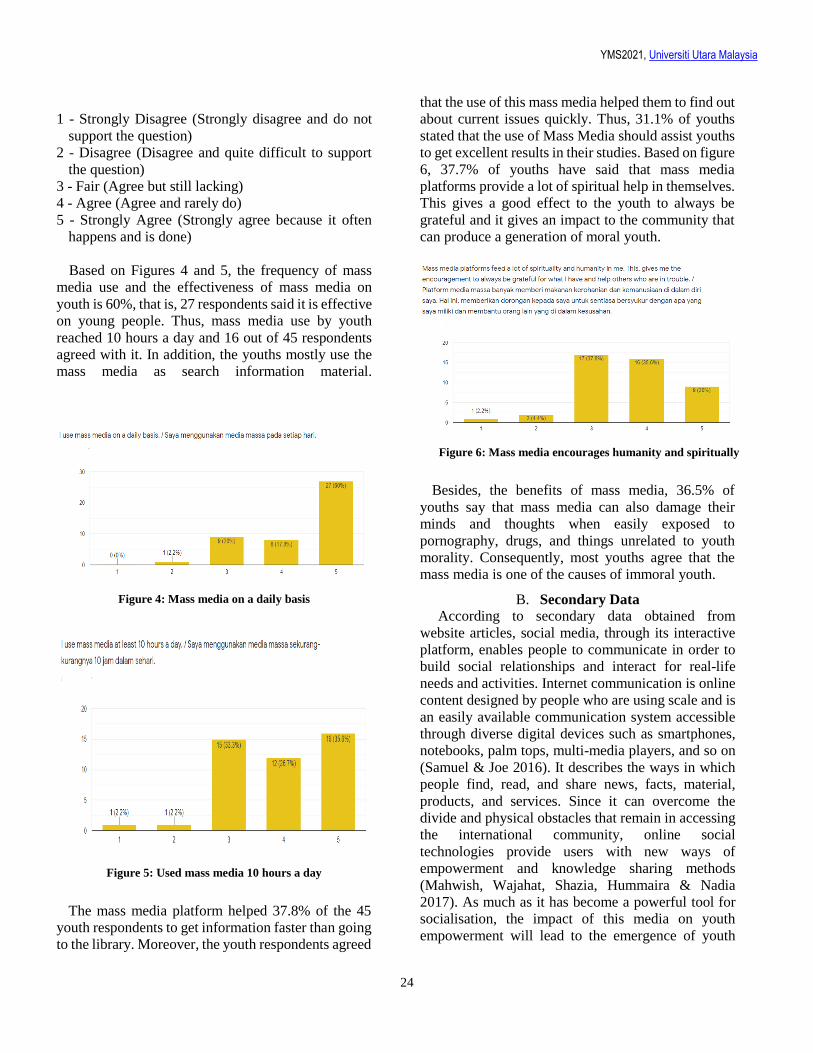
YMS2021, Universiti Utara Malaysia
24
1 - Strongly Disagree (Strongly disagree and do not
support the question)
2 - Disagree (Disagree and quite difficult to support
the question)
3 - Fair (Agree but still lacking)
4 - Agree (Agree and rarely do)
5 - Strongly Agree (Strongly agree because it often
happens and is done)
Based on Figures 4 and 5, the frequency of mass
media use and the effectiveness of mass media on
youth is 60%, that is, 27 respondents said it is effective
on young people. Thus, mass media use by youth
reached 10 hours a day and 16 out of 45 respondents
agreed with it. In addition, the youths mostly use the
mass media as search information material.
Figure 4: Mass media on a daily basis
Figure 5: Used mass media 10 hours a day
The mass media platform helped 37.8% of the 45
youth respondents to get information faster than going
to the library. Moreover, the youth respondents agreed
that the use of this mass media helped them to find out
about current issues quickly. Thus, 31.1% of youths
stated that the use of Mass Media should assist youths
to get excellent results in their studies. Based on figure
6, 37.7% of youths have said that mass media
platforms provide a lot of spiritual help in themselves.
This gives a good effect to the youth to always be
grateful and it gives an impact to the community that
can produce a generation of moral youth.
Figure 6: Mass media encourages humanity and spiritually
Besides, the benefits of mass media, 36.5% of
youths say that mass media can also damage their
minds and thoughts when easily exposed to
pornography, drugs, and things unrelated to youth
morality. Consequently, most youths agree that the
mass media is one of the causes of immoral youth.
B. Secondary Data
According to secondary data obtained from
website articles, social media, through its interactive
platform, enables people to communicate in order to
build social relationships and interact for real-life
needs and activities. Internet communication is online
content designed by people who are using scale and is
an easily available communication system accessible
through diverse digital devices such as smartphones,
notebooks, palm tops, multi-media players, and so on
(Samuel & Joe 2016). It describes the ways in which
people find, read, and share news, facts, material,
products, and services. Since it can overcome the
divide and physical obstacles that remain in accessing
the international community, online social
technologies provide users with new ways of
empowerment and knowledge sharing methods
(Mahwish, Wajahat, Shazia, Hummaira & Nadia
2017). As much as it has become a powerful tool for
socialisation, the impact of this media on youth
empowerment will lead to the emergence of youth
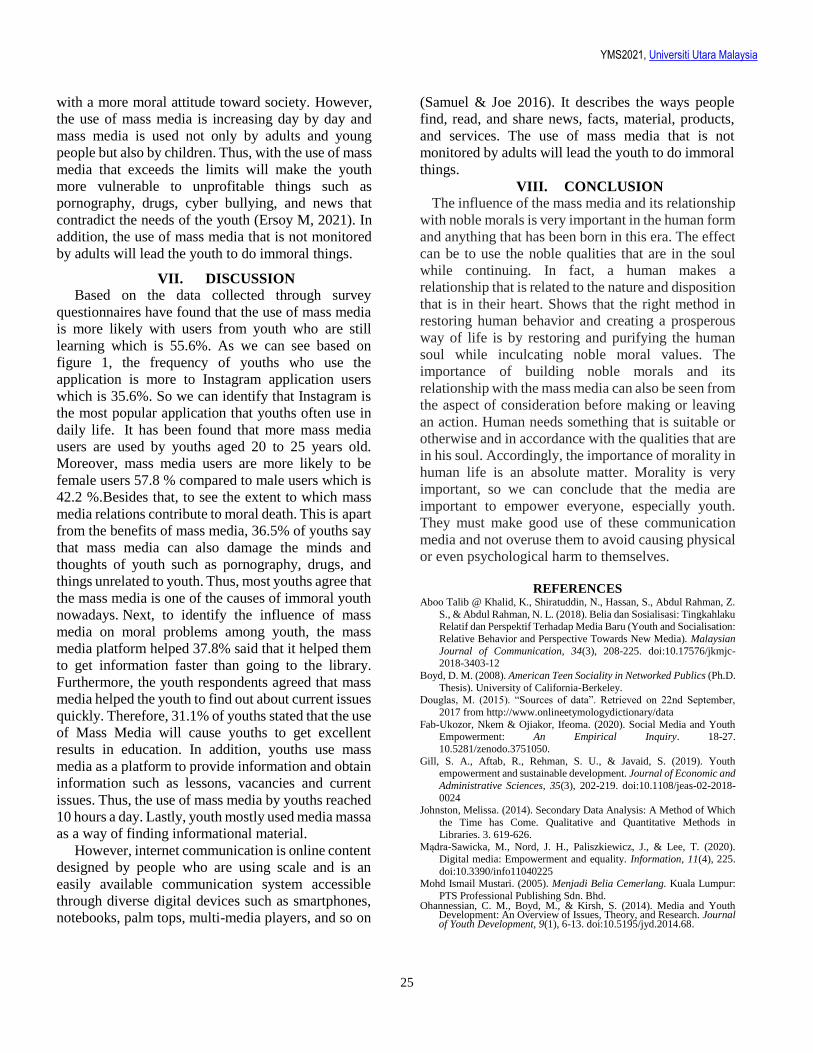
YMS2021, Universiti Utara Malaysia
25
with a more moral attitude toward society. However,
the use of mass media is increasing day by day and
mass media is used not only by adults and young
people but also by children. Thus, with the use of mass
media that exceeds the limits will make the youth
more vulnerable to unprofitable things such as
pornography, drugs, cyber bullying, and news that
contradict the needs of the youth (Ersoy M, 2021). In
addition, the use of mass media that is not monitored
by adults will lead the youth to do immoral things.
VII. DISCUSSION
Based on the data collected through survey
questionnaires have found that the use of mass media
is more likely with users from youth who are still
learning which is 55.6%. As we can see based on
figure 1, the frequency of youths who use the
application is more to Instagram application users
which is 35.6%. So we can identify that Instagram is
the most popular application that youths often use in
daily life. It has been found that more mass media
users are used by youths aged 20 to 25 years old.
Moreover, mass media users are more likely to be
female users 57.8 % compared to male users which is
42.2 %.Besides that, to see the extent to which mass
media relations contribute to moral death. This is apart
from the benefits of mass media, 36.5% of youths say
that mass media can also damage the minds and
thoughts of youth such as pornography, drugs, and
things unrelated to youth. Thus, most youths agree that
the mass media is one of the causes of immoral youth
nowadays. Next, to identify the influence of mass
media on moral problems among youth, the mass
media platform helped 37.8% said that it helped them
to get information faster than going to the library.
Furthermore, the youth respondents agreed that mass
media helped the youth to find out about current issues
quickly. Therefore, 31.1% of youths stated that the use
of Mass Media will cause youths to get excellent
results in education. In addition, youths use mass
media as a platform to provide information and obtain
information such as lessons, vacancies and current
issues. Thus, the use of mass media by youths reached
10 hours a day. Lastly, youth mostly used media massa
as a way of finding informational material.
However, internet communication is online content
designed by people who are using scale and is an
easily available communication system accessible
through diverse digital devices such as smartphones,
notebooks, palm tops, multi-media players, and so on
(Samuel & Joe 2016). It describes the ways people
find, read, and share news, facts, material, products,
and services. The use of mass media that is not
monitored by adults will lead the youth to do immoral
things.
VIII. CONCLUSION
The influence of the mass media and its relationship
with noble morals is very important in the human form
and anything that has been born in this era. The effect
can be to use the noble qualities that are in the soul
while continuing. In fact, a human makes a
relationship that is related to the nature and disposition
that is in their heart. Shows that the right method in
restoring human behavior and creating a prosperous
way of life is by restoring and purifying the human
soul while inculcating noble moral values. The
importance of building noble morals and its
relationship with the mass media can also be seen from
the aspect of consideration before making or leaving
an action. Human needs something that is suitable or
otherwise and in accordance with the qualities that are
in his soul. Accordingly, the importance of morality in
human life is an absolute matter. Morality is very
important, so we can conclude that the media are
important to empower everyone, especially youth.
They must make good use of these communication
media and not overuse them to avoid causing physical
or even psychological harm to themselves.
REFERENCES Aboo Talib @ Khalid, K., Shiratuddin, N., Hassan, S., Abdul Rahman, Z.
S., & Abdul Rahman, N. L. (2018). Belia dan Sosialisasi: Tingkahlaku Relatif dan Perspektif Terhadap Media Baru (Youth and Socialisation:
Relative Behavior and Perspective Towards New Media). Malaysian
Journal of Communication, 34(3), 208-225. doi:10.17576/jkmjc-2018-3403-12
Boyd, D. M. (2008). American Teen Sociality in Networked Publics (Ph.D.
Thesis). University of California-Berkeley. Douglas, M. (2015). “Sources of data”. Retrieved on 22nd September,
2017 from http://www.onlineetymologydictionary/data
Fab-Ukozor, Nkem & Ojiakor, Ifeoma. (2020). Social Media and Youth Empowerment: An Empirical Inquiry. 18-27.
10.5281/zenodo.3751050.
Gill, S. A., Aftab, R., Rehman, S. U., & Javaid, S. (2019). Youth empowerment and sustainable development. Journal of Economic and
Administrative Sciences, 35(3), 202-219. doi:10.1108/jeas-02-2018-
0024 Johnston, Melissa. (2014). Secondary Data Analysis: A Method of Which
the Time has Come. Qualitative and Quantitative Methods in
Libraries. 3. 619-626. Mądra-Sawicka, M., Nord, J. H., Paliszkiewicz, J., & Lee, T. (2020).
Digital media: Empowerment and equality. Information, 11(4), 225.
doi:10.3390/info11040225 Mohd Ismail Mustari. (2005). Menjadi Belia Cemerlang. Kuala Lumpur:
PTS Professional Publishing Sdn. Bhd. Ohannessian, C. M., Boyd, M., & Kirsh, S. (2014). Media and Youth
Development: An Overview of Issues, Theory, and Research. Journal of Youth Development, 9(1), 6-13. doi:10.5195/jyd.2014.68.
YMS2021, Universiti Utara Malaysia
26
Page 26
Media and Youth Empowerment: How Much Does Media Affect You?
Amy Cheong Shuet Yeng1, Nebila Binti Masidin2, Muhammad Amirul Husaini Norli3 & Ahmad Ikmah Sujali4
1Universiti Utara Malaysia, Malaysia, [email protected] 2Universiti Utara Malaysia, Malaysia, [email protected]
3 Universiti Utara Malaysia, Malaysia, [email protected] 4Universiti Utara Malaysia, Malaysia, [email protected]
ABSTRACT
The number of media users increases due to the
improvement of Information Communication
Technology notably the internet and friends influence.
Meanwhile, cybercrime is also on the rise nowadays.
Despite this terrible trend, we have to be optimistic
that the internet can function effectively once all of the
responsible individuals can use the network in proper
ways. In 2020, research shows that 3.8 billion people
have used social media, which is more than half of the
global population. However, there are just less than
2.5 billion people who have their mobile devices that
are used in social media worldwide. Even though there
are many issues about negative impacts of media,
there are a lot of positive effects of using different
types of media. The sample population was 50 media
users in Malaysia whose age was around 6-26 above.
The participants were sampled from online surveys
that were created by using Google Form. The result
revealed that there are strong connections among
media and youth empowerment, while representing
that the majority (75%) of the youths are addicted to
the use of media by being attracted to the positive
effects compared to 3.4% of youths who rarely use it
for time spending. In addition, there were major gaps
in media users' appeal between male and female
influence on different aspects. It is recommended that
youths should be aware of proper ways of media use
and parents need to monitor and manage their
children’s time spent on media.
Keywords: Media, internet, negative impacts, positive
effects, youth empowerment
I. INTRODUCTION Media are used for data storage and delivery. The
term refers to the elements of mass communication,
such as news media, web media and social media.
News media are types of media that deliver news to
the general public like broadcast news and online
newspapers. Web media is a form of media that uses
audio, text and graphics to create the content
personally. For instance, podcasts, blogs and videos
that are created individually. Moreover, the most
common media type is social media, which is usually
used by everyone. It is a digital tool that allows users
to communicate with others quickly. Facebook,
Instagram, Whatsapp, YouTube and TikTok are
examples of social media. (Amelia, 2021).
Year after year, the media users are increasing
rapidly and the time spent on social media use is also
rising up. In 2017, the amount of people that are using
social media is less than 2.5 billion while a research
showed that 3.8 billion people will have their own
account on social media in 2020. (Simon, 2020).
According to a study from qz.com, 60% of youth that
age 13-17 years old have spent too much time in the
media and consider it is the most important thing they
need to face at that age. (Jenny, 2018).
From an article by Bryant. (2017), there is research
that is related to the aggression of youth and improper
ways in media use. The results show that most of the
youth players are easily affected by the violent video
games and will bring the risky actions into life.
However, other authors have argued that the media are
able to provide great opportunities to study the
environment on daily mood alteration and self-esteem
(Eveline and Elly, 2018).
In this age of advanced networking, many things can
be achieved easily and effectively. There are lots of
things that can be discovered through the internet and
we believe that youth are understanding the presence
of empowerment. For instance, they know how to
market their own products and manage courier
services for the products delivery by using the
functions of media. (Ukozor and Ojiakor, 2020)
Based on the boundless opportunities provided by
the media, there might be more empowerment among
youths to create their own future and be a better
person. Therefore, this study aims to investigate how
social media influences youth social life, measure
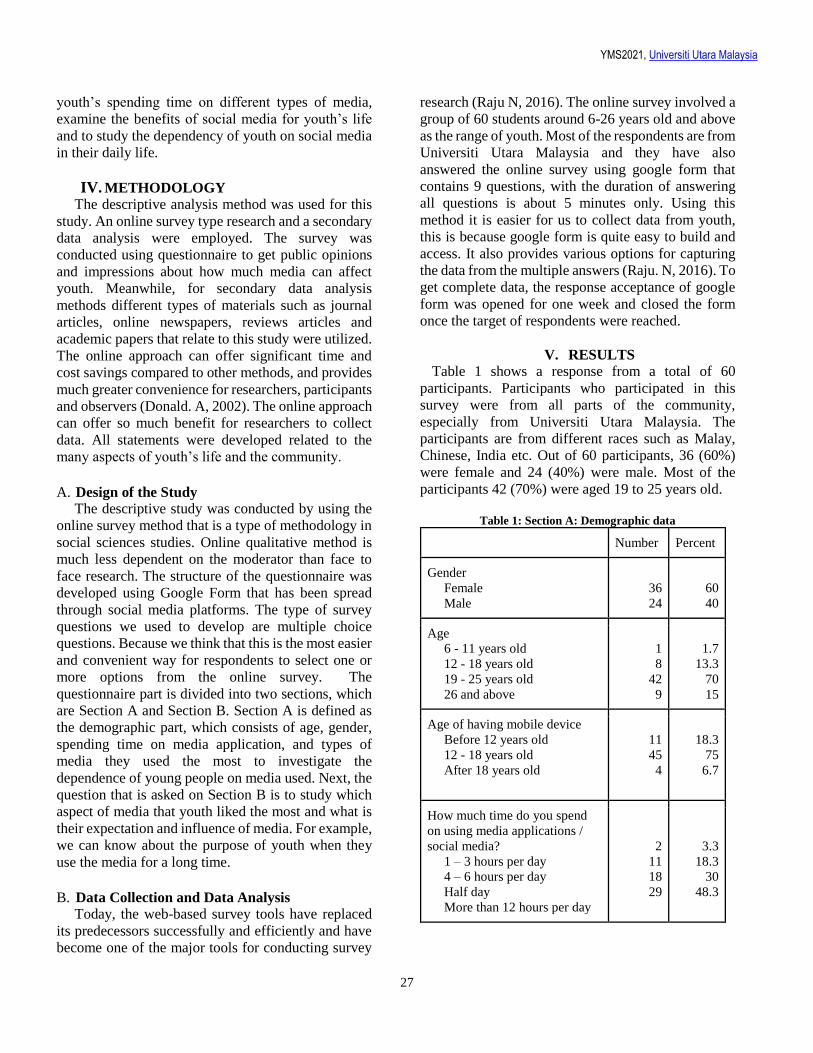
YMS2021, Universiti Utara Malaysia
27
youth’s spending time on different types of media,
examine the benefits of social media for youth’s life
and to study the dependency of youth on social media
in their daily life.
IV. METHODOLOGY The descriptive analysis method was used for this
study. An online survey type research and a secondary
data analysis were employed. The survey was
conducted using questionnaire to get public opinions
and impressions about how much media can affect
youth. Meanwhile, for secondary data analysis
methods different types of materials such as journal
articles, online newspapers, reviews articles and
academic papers that relate to this study were utilized.
The online approach can offer significant time and
cost savings compared to other methods, and provides
much greater convenience for researchers, participants
and observers (Donald. A, 2002). The online approach
can offer so much benefit for researchers to collect
data. All statements were developed related to the
many aspects of youth’s life and the community.
A. Design of the Study
The descriptive study was conducted by using the
online survey method that is a type of methodology in
social sciences studies. Online qualitative method is
much less dependent on the moderator than face to
face research. The structure of the questionnaire was
developed using Google Form that has been spread
through social media platforms. The type of survey
questions we used to develop are multiple choice
questions. Because we think that this is the most easier
and convenient way for respondents to select one or
more options from the online survey. The
questionnaire part is divided into two sections, which
are Section A and Section B. Section A is defined as
the demographic part, which consists of age, gender,
spending time on media application, and types of
media they used the most to investigate the
dependence of young people on media used. Next, the
question that is asked on Section B is to study which
aspect of media that youth liked the most and what is
their expectation and influence of media. For example,
we can know about the purpose of youth when they
use the media for a long time.
B. Data Collection and Data Analysis
Today, the web-based survey tools have replaced
its predecessors successfully and efficiently and have
become one of the major tools for conducting survey
research (Raju N, 2016). The online survey involved a
group of 60 students around 6-26 years old and above
as the range of youth. Most of the respondents are from
Universiti Utara Malaysia and they have also
answered the online survey using google form that
contains 9 questions, with the duration of answering
all questions is about 5 minutes only. Using this
method it is easier for us to collect data from youth,
this is because google form is quite easy to build and
access. It also provides various options for capturing
the data from the multiple answers (Raju. N, 2016). To
get complete data, the response acceptance of google
form was opened for one week and closed the form
once the target of respondents were reached.
V. RESULTS
Table 1 shows a response from a total of 60
participants. Participants who participated in this
survey were from all parts of the community,
especially from Universiti Utara Malaysia. The
participants are from different races such as Malay,
Chinese, India etc. Out of 60 participants, 36 (60%)
were female and 24 (40%) were male. Most of the
participants 42 (70%) were aged 19 to 25 years old.
Table 1: Section A: Demographic data
Number Percent
Gender
Female
Male
36
24
60
40
Age
6 - 11 years old
12 - 18 years old
19 - 25 years old
26 and above
1
8
42
9
1.7
13.3
70
15
Age of having mobile device
Before 12 years old
12 - 18 years old
After 18 years old
11
45
4
18.3
75
6.7
How much time do you spend
on using media applications /
social media?
1 – 3 hours per day
4 – 6 hours per day
Half day
More than 12 hours per day
2
11
18
29
3.3
18.3
30
48.3
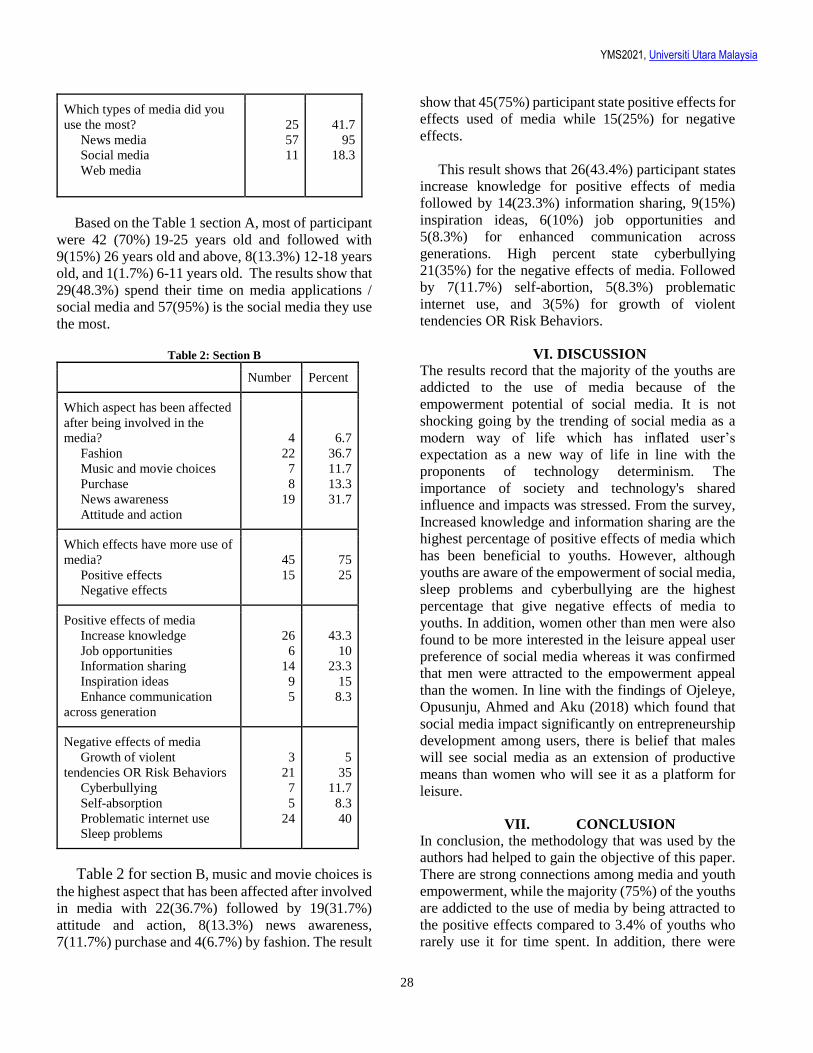
YMS2021, Universiti Utara Malaysia
28
Which types of media did you
use the most?
News media
Social media
Web media
25
57
11
41.7
95
18.3
Based on the Table 1 section A, most of participant
were 42 (70%) 19-25 years old and followed with
9(15%) 26 years old and above, 8(13.3%) 12-18 years
old, and 1(1.7%) 6-11 years old. The results show that
29(48.3%) spend their time on media applications /
social media and 57(95%) is the social media they use
the most.
Table 2: Section B
Number Percent
Which aspect has been affected
after being involved in the
media?
Fashion
Music and movie choices
Purchase
News awareness
Attitude and action
4
22
7
8
19
6.7
36.7
11.7
13.3
31.7
Which effects have more use of
media?
Positive effects
Negative effects
45
15
75
25
Positive effects of media
Increase knowledge
Job opportunities
Information sharing
Inspiration ideas
Enhance communication
across generation
26
6
14
9
5
43.3
10
23.3
15
8.3
Negative effects of media
Growth of violent
tendencies OR Risk Behaviors
Cyberbullying
Self-absorption
Problematic internet use
Sleep problems
3
21
7
5
24
5
35
11.7
8.3
40
Table 2 for section B, music and movie choices is
the highest aspect that has been affected after involved
in media with 22(36.7%) followed by 19(31.7%)
attitude and action, 8(13.3%) news awareness,
7(11.7%) purchase and 4(6.7%) by fashion. The result
show that 45(75%) participant state positive effects for
effects used of media while 15(25%) for negative
effects.
This result shows that 26(43.4%) participant states
increase knowledge for positive effects of media
followed by 14(23.3%) information sharing, 9(15%)
inspiration ideas, 6(10%) job opportunities and
5(8.3%) for enhanced communication across
generations. High percent state cyberbullying
21(35%) for the negative effects of media. Followed
by 7(11.7%) self-abortion, 5(8.3%) problematic
internet use, and 3(5%) for growth of violent
tendencies OR Risk Behaviors.
VI. DISCUSSION
The results record that the majority of the youths are
addicted to the use of media because of the
empowerment potential of social media. It is not
shocking going by the trending of social media as a
modern way of life which has inflated user’s
expectation as a new way of life in line with the
proponents of technology determinism. The
importance of society and technology's shared
influence and impacts was stressed. From the survey,
Increased knowledge and information sharing are the
highest percentage of positive effects of media which
has been beneficial to youths. However, although
youths are aware of the empowerment of social media,
sleep problems and cyberbullying are the highest
percentage that give negative effects of media to
youths. In addition, women other than men were also
found to be more interested in the leisure appeal user
preference of social media whereas it was confirmed
that men were attracted to the empowerment appeal
than the women. In line with the findings of Ojeleye,
Opusunju, Ahmed and Aku (2018) which found that
social media impact significantly on entrepreneurship
development among users, there is belief that males
will see social media as an extension of productive
means than women who will see it as a platform for
leisure.
VII. CONCLUSION
In conclusion, the methodology that was used by the
authors had helped to gain the objective of this paper.
There are strong connections among media and youth
empowerment, while the majority (75%) of the youths
are addicted to the use of media by being attracted to
the positive effects compared to 3.4% of youths who
rarely use it for time spent. In addition, there were
YMS2021, Universiti Utara Malaysia
29
major gaps in media users' appeal between male and
female influence on different aspects. It is
recommended that youths should be aware of proper
ways of media use and parents need to monitor and
manage their children’s time spent on media.
Acknowledgement
The authors would like to express our gratitude to our
friends and respondents for the support and
willingness to spend some time to fill in the
questionnaires.
REFERENCES Amelia Ellicott. (2021). What are the different types of media? Retrieved
from https://www.axiapr.com/blog/what-are-the-different-types-of-
media
Ameller, D., Burguess, X., Collell, O., Costal, D., Franch, X., & Papazoglou, M. P. (2015). Development of service-oriented
architectures using model-driven development: A mapping
study. Information and Software Technology, 62(1), 42–66. http://doi.org/10.1016/j.infsof.2015.02.006
Bryant Furlow. (2017). Media violence and youth aggression. Retrieve
from https://www.google.com/url?sa=D&q=https://www.thelancet.com/jo
urnals/lanchi/article/PIIS23 52-4642%2817%2930033-
0/fulltext&ust=16215 31560000000&usg=AOvVaw3yvw8ZU2h8OptBg6IuD5C8&hl=zh-
CN&source=gmail
Eveline. A. C & Elly. A. K. (2018). Media Use and Brain Development during Adolescence. Retrieved from
https://www.nature.com/articles/s41467-018-03126-x#Sec8
Jenny Anderson. (2018). Even teens are worried they spend too much time on their phones. Retrieve from https://qz.com/1367506/pew-research-
teens-worried-they-spend-too-much-time-on-phones/
Kordkheili, G. F., Verina. W & Daniel. S. (2013). The Impact of Social Media on Medical Professionalism: A Systematic Qualitative Review
of Challenges and Opportunities. J Med Internet Res, 15(8), e184. https://dx.doi.org/10.2196%2Fjmir.2708
Lenhart, A. (2009). Teens and Social Media an Over view. New York:
Department of Health & Mental Hygiene, USA. Retrieved from https://www.pewresearch.org/internet/2009/04/10/teens-and-social-
media-an-overview/
Nkem Fab-Ukozor & Ifeoma. C. Ojiakor. (2020). Social Media and Youth Empowerment: An Empirical Inquiry. Research Gate, 18-27.
http://doi.org/10.5281/zenodo.3751050
Simon Kemp. (2020). Digital 2020: 3.8 Billion People Use Social Media. Retrieved from https://wearesocial.com/blog/2020/01/digital-20 20-3-
8-billion-people-use-socialmedia#:~:text=
Worldwide%2C%20there%20are%203.80%20billion,since%20this%20time%20last%20year
Vasantha Raju N. & Harinarayana. N. S. (2016). Online survey tools: A
case study of Google Forms. ResearchGate, (n.d.).
Zaltzman, J., & Leichliter, B. (2013). Social Media-Related Qualitative
Research, China. Retrieved on May 19, 2021 from
http://www.newqualitative.org/qualitative-research/social-media-qualitative
YMS2021, Universiti Utara Malaysia
30
Best Paper Nominee
Role of TikTok on the Rise of Youth Empowerment
Shazalina Fildzah Suhailee1, Muhammad Tajuddin Nor Azman2,
Nureen Syafiqah Jaafar3 & Aishah Mohd Noor4
1Universiti Utara Malaysia, Malaysia, [email protected] 2Universiti Utara Malaysia, Malaysia, [email protected]
3Universiti Utara Malaysia, Malaysia, [email protected] 4Universiti Utara Malaysia, Malaysia, [email protected]
ABSTRACT
Social media is not just a communication and
collaboration tool, but it has now become an
obsession among youth. The objective of the article
is to discuss the uses of Tiktok, the factors that lead
to the rising of TikTok’s use among the youth and
the positive impacts on them. Literature on social
media regarding Tiktok and youth empowerment
found in the Google Scholar database were analyzed
and collected. A survey was also conducted.
Findings suggest that TikTok could be associated
with youth empowerment. It also has the potential to
raise awareness about the current issue.
Keywords: Social media, youth empowerment,
TikTok
I. INTRODUCTION
TikTok is one of the most famous social media
platforms. It is a 15-second video-sharing application
that lets users make and distribute videos on any issue
(Influencermarketinghub, 2021). It is a traditional
User-Generated Content (UGC) site, in which users
create content instead of business. TikTok users access
the application by smartphones. It gives users the
freedom to make fast lip-sync, edit, sing and other
short videos in three to sixty seconds. Aside from
video creation, users use TikTok to watch, share and
comment on videos made by others. Memes, the remix
and reinterpretation of slogan, plots, and songs, as well
as other formulaic elements, were usually used by
users to represent their thinking and community, alike
to the meme practiced by Miller Ryan on other social
media sites. Many users constantly acquire more
followers or acceptance from the group as a result of
their consistent production of video content (Yang,
2020). The unique TikTok concept with incredible
expansion potential has succeeded in attracting the
youth generation.
TikTok could become a role for youth empowerment.
Through social media youth gain a lot of knowledge
and skills by mostly sharing their knowledge of
everyday topics such as food, painting, and
entertainment. Many of the shared contents are new to
youth and can be used in everyday life. Furthermore,
many users on TikTok prefer to spread good messages
and raise awareness about relevant or current issues,
such as Covid-19 (WESS Side Stories, 2021).
Therefore, TikTok has a huge impact on the younger
generation.
A. Problem Statement
The majority of social media have created new sources
of revenue where influencers have become
synonymous with the potential of non-talented
celebrities as more people turn to the platforms to
make a living. Like other social media outlets, TikTok
has its share of influencers, and the 15-second video
format attracts what is known as meme machines.
Influencers who make money off of views, likes,
tweets, and shares are known as meme machines.
There are already over 35 TikTok stars with tens of
millions of fans (Sehl, 2020). Spreading awareness via
TikTok is now a popular phenomenon among today's
youth. Every youth is in some way linked to the media.
TikTok has found the ability to influence the youth
where they get the ability to change others' opinions
and perspectives. In essence, this type of innovation is
encouraged as the trade and overall know-how field
evolves, but to some degree, this type of advertisement
is also unregulated and runs the risk of becoming
abusive in its message. The lack of legislation has an
impact on users who are of an age where they are
influenced by trends, and as the community has grown
from local to global, there is a greater risk of negative
influence. This study intends to understand these
occurrences among fellow youth.
B
B
YMS2021, Universiti Utara Malaysia
31
B. Research Objectives (RO)
RO1: To identify the uses of the Tiktok.
RO2: To find the factors that upsurge the use of
TikTok apps among the youth.
RO3: To determine the positive impacts of TikTok on
society and lifestyle among youth.
C. Scope
This study aims to identify the respondents among
the youth who like to use Tiktok apps. A survey
questionnaire was created to collect and analyze the
data. Besides, a qualitative approach can also be used
based on specific observation. The collected data were
from primary and secondary data. The target audience
of this study are those between 16 to 40 year old. Items
asked included the factors being perceived as rising
the use of TikTok among the youth and the positive
impact of TikTok on society and lifestyle among
youth.
D. Significance
Tiktok has become a massive component in today’s
youth lives. The social media platform can be used to
spread awareness among youth and TikTok is a
popular phenomenon. From the study, we will get
practical information regarding the role of TikTok rise
for youth empowerment. The information helps to
better understand how TikTok impacts the youth by
allowing them to alter the thoughts and perspectives of
others. As a social media platform, TikTok popularity
is significantly growing, the youth need to ensure they
are fully aware of the factors of rising the use of
TikTok and how TikTok have a positive impact on
their social and lifestyle.
II. LITERATURE REVIEW
A. Social Media
Social media consists of two keywords: “social”
and “media” the combination of which represents the
intrinsic human need to interact with others through
different media/channels in one way or another. It is
argued that social media differs from more
conventional types of media in that it enables students
or users to communicate more directly with their peers
and teachers and to participate and comment on topics
both outside and inside the classroom setting. It also
helps advance educational ideas and engages students
in fresh and meaningful ways and offers a better
experience than conventional media can provide.
Social media is a community of internet-based apps
that build on the ideological and technical foundation
of Web 2.0 and allow user-generated content to be
produced and shared. “Websites and applications used
for social networking are also defined as social
media.” In the late 1990s, social media started with the
first known social media network in 1997 called
“SixDegrees” and this technology allowed people to
upload a profile and make friends. This division of
social media into groups has been helpful for scholars
and individuals to easily define and research a specific
form of social media, but today a problem may arise
due to the high prevalence of social media and one
may wonder which category falls into a newly formed
type of social media. In the 21st century, social media
is the fastest growing web application, and technical
innovation is behind this rapid growth. Today, social
media has taken a new dimension and facilitated
greater engagement by launching mobile phones that
support applications for social networks.
B. Youth Empowerment
Malaysia's National Youth Development Policy
describes youth as people aged 15 to 40. The growth
of self-efficacy and positive attitudes, skills, and
behaviours is facilitated by youth empowerment,
which manifests itself in the increased involvement of
youth in the decision-making process. Furthermore,
engaging with nearby services aids adolescents in
developing the cognitive and behavioural skills
needed to objectively understand their social
environment. Develop your ability to solve problems
and make decisions on your own. Empowerment
enables young people to build the skills and trust they
need to grow into healthier adults and escape health-
harming habits.
C. Tiktok
TikTok is one of the most popular social media
platforms. In Asia, the United States, and other
countries, this app seems to be the greatest attraction
for making custom mobile videos. TikTok, also
defined as Douyin in China, began in September 2016
and is managed by Byte Dance, the creators of the app
Musical.ly (Lauren Hallanan, 2018). Since the
creation of TikTok, there has been a significant rise in
the use of such applications by youths in an attempt to
acquire popularity and help ease boredom. TikTok has
created a modern trend among youths by allowing
users to create and share short 15 to 60-second videos
with music, effects, or soundbites. This media app is
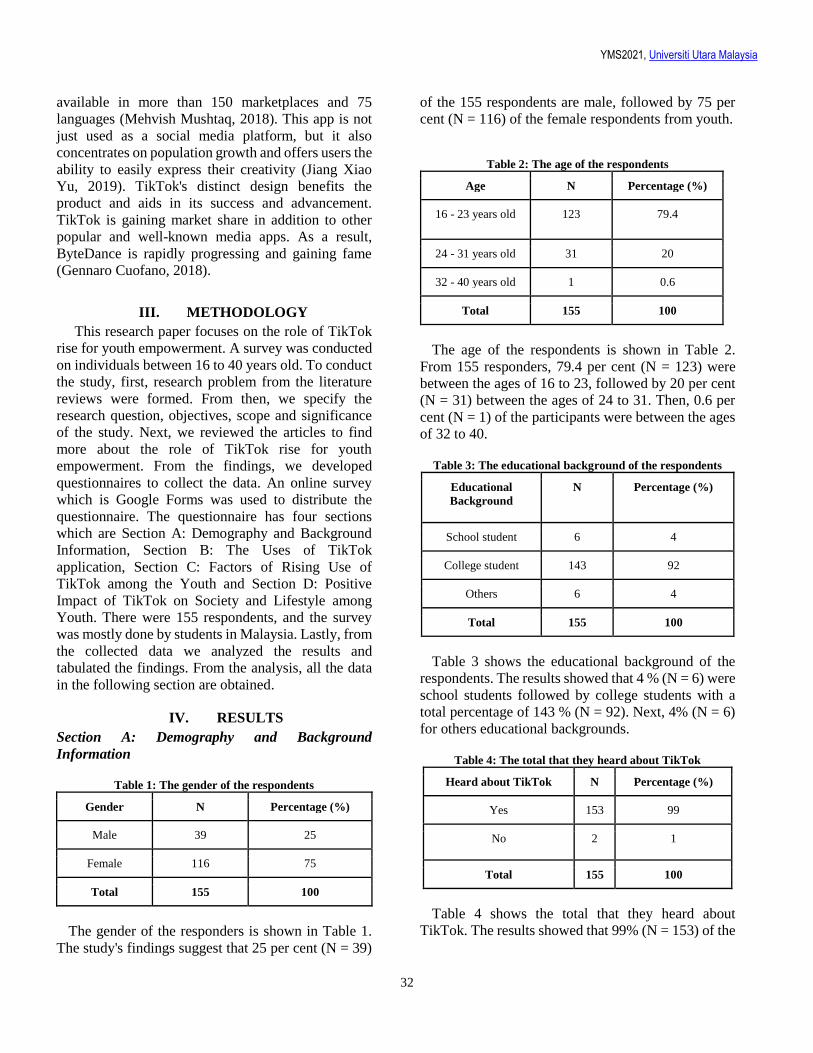
YMS2021, Universiti Utara Malaysia
32
available in more than 150 marketplaces and 75
languages (Mehvish Mushtaq, 2018). This app is not
just used as a social media platform, but it also
concentrates on population growth and offers users the
ability to easily express their creativity (Jiang Xiao
Yu, 2019). TikTok's distinct design benefits the
product and aids in its success and advancement.
TikTok is gaining market share in addition to other
popular and well-known media apps. As a result,
ByteDance is rapidly progressing and gaining fame
(Gennaro Cuofano, 2018).
III. METHODOLOGY
This research paper focuses on the role of TikTok
rise for youth empowerment. A survey was conducted
on individuals between 16 to 40 years old. To conduct
the study, first, research problem from the literature
reviews were formed. From then, we specify the
research question, objectives, scope and significance
of the study. Next, we reviewed the articles to find
more about the role of TikTok rise for youth
empowerment. From the findings, we developed
questionnaires to collect the data. An online survey
which is Google Forms was used to distribute the
questionnaire. The questionnaire has four sections
which are Section A: Demography and Background
Information, Section B: The Uses of TikTok
application, Section C: Factors of Rising Use of
TikTok among the Youth and Section D: Positive
Impact of TikTok on Society and Lifestyle among
Youth. There were 155 respondents, and the survey
was mostly done by students in Malaysia. Lastly, from
the collected data we analyzed the results and
tabulated the findings. From the analysis, all the data
in the following section are obtained.
IV. RESULTS
Section A: Demography and Background
Information
Table 1: The gender of the respondents
Gender N Percentage (%)
Male 39 25
Female 116 75
Total 155 100
The gender of the responders is shown in Table 1.
The study's findings suggest that 25 per cent (N = 39)
of the 155 respondents are male, followed by 75 per
cent (N = 116) of the female respondents from youth.
Table 2: The age of the respondents
Age N Percentage (%)
16 - 23 years old 123 79.4
24 - 31 years old 31 20
32 - 40 years old 1 0.6
Total 155 100
The age of the respondents is shown in Table 2.
From 155 responders, 79.4 per cent (N = 123) were
between the ages of 16 to 23, followed by 20 per cent
(N = 31) between the ages of 24 to 31. Then, 0.6 per
cent (N = 1) of the participants were between the ages
of 32 to 40.
Table 3: The educational background of the respondents
Educational
Background
N Percentage (%)
School student 6 4
College student 143 92
Others 6 4
Total 155 100
Table 3 shows the educational background of the
respondents. The results showed that 4 % (N = 6) were
school students followed by college students with a
total percentage of 143 % (N = 92). Next, 4% (N = 6)
for others educational backgrounds.
Table 4: The total that they heard about TikTok
Heard about TikTok N Percentage (%)
Yes 153 99
No 2 1
Total 155 100
Table 4 shows the total that they heard about
TikTok. The results showed that 99% (N = 153) of the
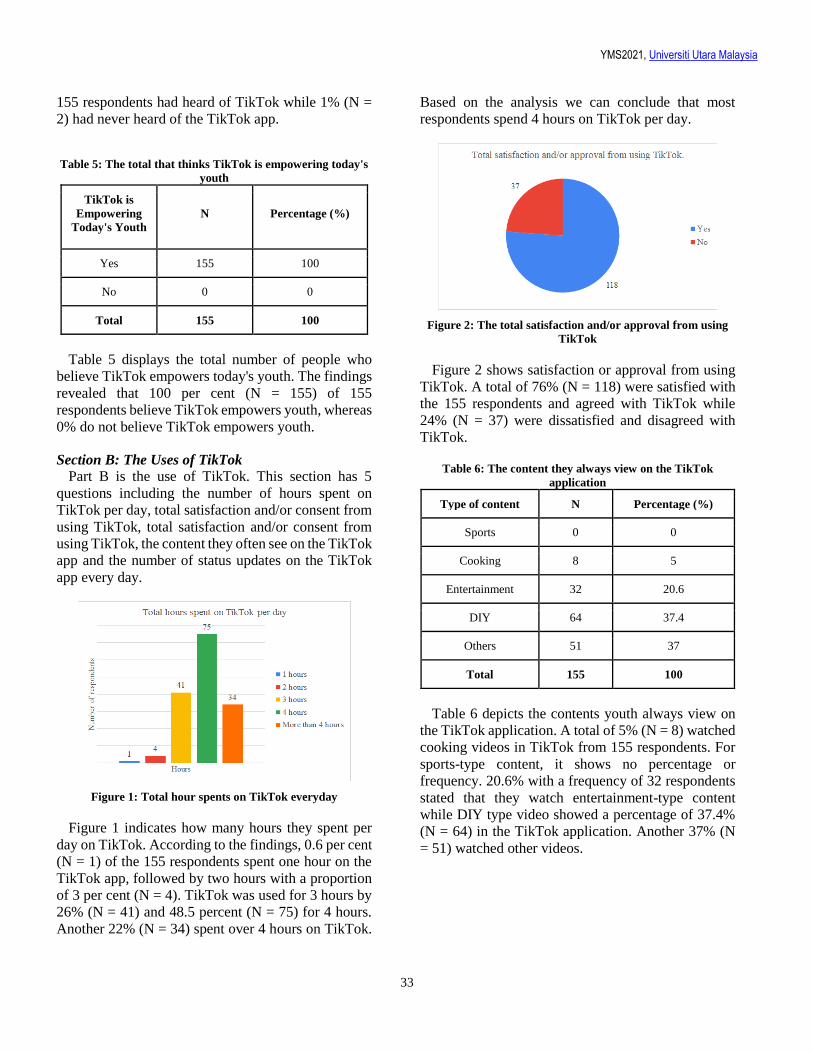
YMS2021, Universiti Utara Malaysia
33
155 respondents had heard of TikTok while 1% (N =
2) had never heard of the TikTok app.
Table 5: The total that thinks TikTok is empowering today's
youth
TikTok is
Empowering
Today's Youth
N Percentage (%)
Yes 155 100
No 0 0
Total 155 100
Table 5 displays the total number of people who
believe TikTok empowers today's youth. The findings
revealed that 100 per cent (N = 155) of 155
respondents believe TikTok empowers youth, whereas
0% do not believe TikTok empowers youth.
Section B: The Uses of TikTok
Part B is the use of TikTok. This section has 5
questions including the number of hours spent on
TikTok per day, total satisfaction and/or consent from
using TikTok, total satisfaction and/or consent from
using TikTok, the content they often see on the TikTok
app and the number of status updates on the TikTok
app every day.
Figure 1: Total hour spents on TikTok everyday
Figure 1 indicates how many hours they spent per
day on TikTok. According to the findings, 0.6 per cent
(N = 1) of the 155 respondents spent one hour on the
TikTok app, followed by two hours with a proportion
of 3 per cent (N = 4). TikTok was used for 3 hours by
26% (N = 41) and 48.5 percent (N = 75) for 4 hours.
Another 22% (N = 34) spent over 4 hours on TikTok.
Based on the analysis we can conclude that most
respondents spend 4 hours on TikTok per day.
Figure 2: The total satisfaction and/or approval from using
TikTok
Figure 2 shows satisfaction or approval from using
TikTok. A total of 76% (N = 118) were satisfied with
the 155 respondents and agreed with TikTok while
24% (N = 37) were dissatisfied and disagreed with
TikTok.
Table 6: The content they always view on the TikTok
application
Type of content N Percentage (%)
Sports 0 0
Cooking 8 5
Entertainment 32 20.6
DIY 64 37.4
Others 51 37
Total 155 100
Table 6 depicts the contents youth always view on
the TikTok application. A total of 5% (N = 8) watched
cooking videos in TikTok from 155 respondents. For
sports-type content, it shows no percentage or
frequency. 20.6% with a frequency of 32 respondents
stated that they watch entertainment-type content
while DIY type video showed a percentage of 37.4%
(N = 64) in the TikTok application. Another 37% (N
= 51) watched other videos.
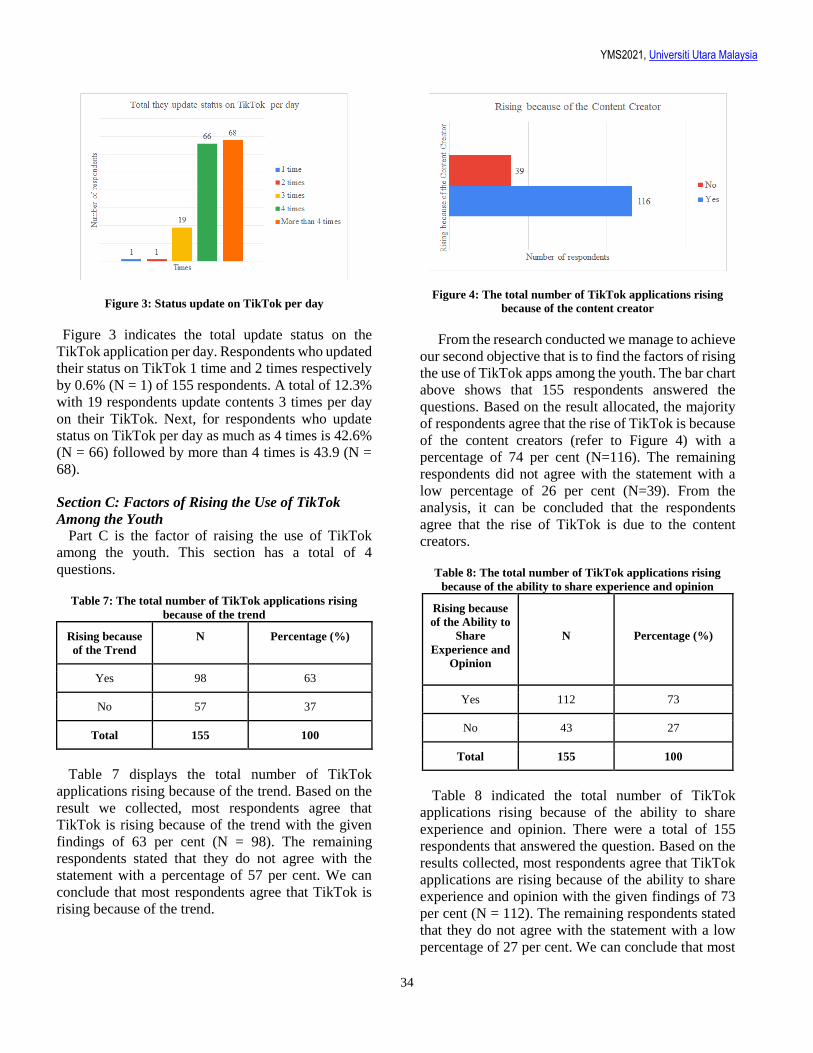
YMS2021, Universiti Utara Malaysia
34
Figure 3: Status update on TikTok per day
Figure 3 indicates the total update status on the
TikTok application per day. Respondents who updated
their status on TikTok 1 time and 2 times respectively
by 0.6% (N = 1) of 155 respondents. A total of 12.3%
with 19 respondents update contents 3 times per day
on their TikTok. Next, for respondents who update
status on TikTok per day as much as 4 times is 42.6%
(N = 66) followed by more than 4 times is 43.9 (N =
68).
Section C: Factors of Rising the Use of TikTok
Among the Youth
Part C is the factor of raising the use of TikTok
among the youth. This section has a total of 4
questions.
Table 7: The total number of TikTok applications rising
because of the trend
Rising because
of the Trend
N Percentage (%)
Yes 98 63
No 57 37
Total 155 100
Table 7 displays the total number of TikTok
applications rising because of the trend. Based on the
result we collected, most respondents agree that
TikTok is rising because of the trend with the given
findings of 63 per cent (N = 98). The remaining
respondents stated that they do not agree with the
statement with a percentage of 57 per cent. We can
conclude that most respondents agree that TikTok is
rising because of the trend.
Figure 4: The total number of TikTok applications rising
because of the content creator
From the research conducted we manage to achieve
our second objective that is to find the factors of rising
the use of TikTok apps among the youth. The bar chart
above shows that 155 respondents answered the
questions. Based on the result allocated, the majority
of respondents agree that the rise of TikTok is because
of the content creators (refer to Figure 4) with a
percentage of 74 per cent (N=116). The remaining
respondents did not agree with the statement with a
low percentage of 26 per cent (N=39). From the
analysis, it can be concluded that the respondents
agree that the rise of TikTok is due to the content
creators.
Table 8: The total number of TikTok applications rising
because of the ability to share experience and opinion
Rising because
of the Ability to
Share
Experience and
Opinion
N Percentage (%)
Yes 112 73
No 43 27
Total 155 100
Table 8 indicated the total number of TikTok
applications rising because of the ability to share
experience and opinion. There were a total of 155
respondents that answered the question. Based on the
results collected, most respondents agree that TikTok
applications are rising because of the ability to share
experience and opinion with the given findings of 73
per cent (N = 112). The remaining respondents stated
that they do not agree with the statement with a low
percentage of 27 per cent. We can conclude that most
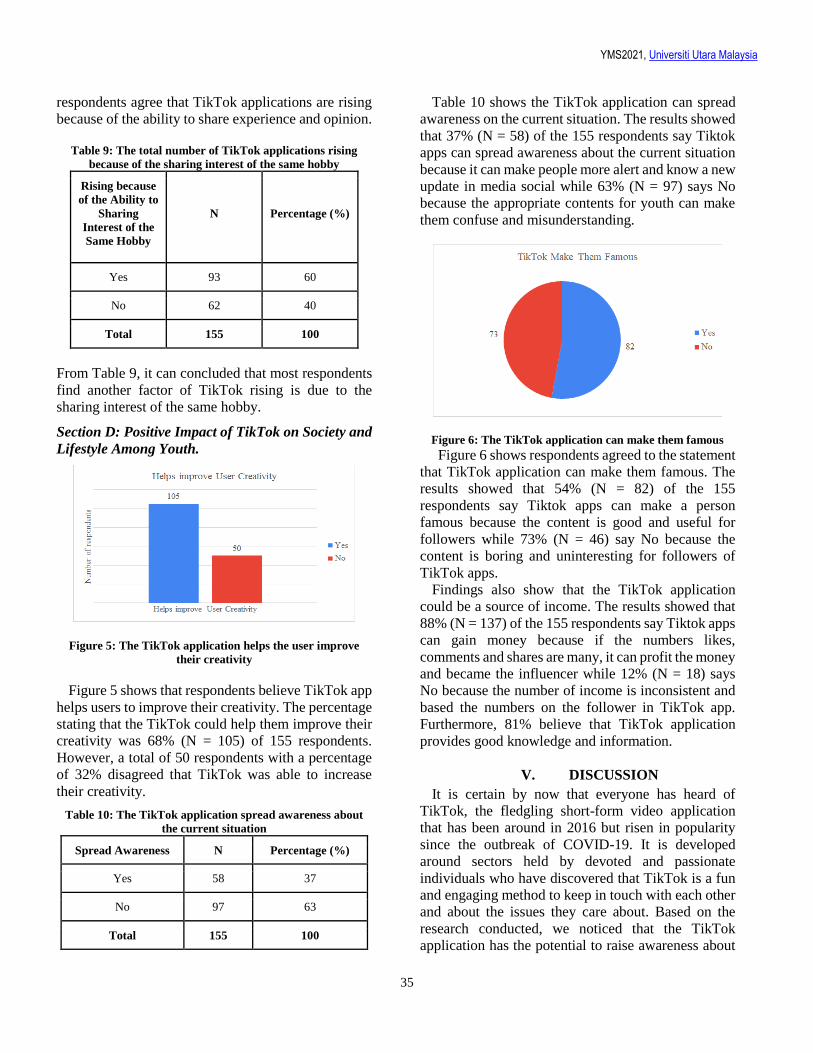
YMS2021, Universiti Utara Malaysia
35
respondents agree that TikTok applications are rising
because of the ability to share experience and opinion.
Table 9: The total number of TikTok applications rising
because of the sharing interest of the same hobby
Rising because
of the Ability to
Sharing
Interest of the
Same Hobby
N Percentage (%)
Yes 93 60
No 62 40
Total 155 100
From Table 9, it can concluded that most respondents
find another factor of TikTok rising is due to the
sharing interest of the same hobby.
Section D: Positive Impact of TikTok on Society and
Lifestyle Among Youth.
Figure 5: The TikTok application helps the user improve
their creativity
Figure 5 shows that respondents believe TikTok app
helps users to improve their creativity. The percentage
stating that the TikTok could help them improve their
creativity was 68% (N = 105) of 155 respondents.
However, a total of 50 respondents with a percentage
of 32% disagreed that TikTok was able to increase
their creativity.
Table 10: The TikTok application spread awareness about
the current situation
Spread Awareness N Percentage (%)
Yes 58 37
No 97 63
Total 155 100
Table 10 shows the TikTok application can spread
awareness on the current situation. The results showed
that 37% (N = 58) of the 155 respondents say Tiktok
apps can spread awareness about the current situation
because it can make people more alert and know a new
update in media social while 63% (N = 97) says No
because the appropriate contents for youth can make
them confuse and misunderstanding.
Figure 6: The TikTok application can make them famous
Figure 6 shows respondents agreed to the statement
that TikTok application can make them famous. The
results showed that 54% (N = 82) of the 155
respondents say Tiktok apps can make a person
famous because the content is good and useful for
followers while 73% (N = 46) say No because the
content is boring and uninteresting for followers of
TikTok apps.
Findings also show that the TikTok application
could be a source of income. The results showed that
88% (N = 137) of the 155 respondents say Tiktok apps
can gain money because if the numbers likes,
comments and shares are many, it can profit the money
and became the influencer while 12% (N = 18) says
No because the number of income is inconsistent and
based the numbers on the follower in TikTok app.
Furthermore, 81% believe that TikTok application
provides good knowledge and information.
V. DISCUSSION
It is certain by now that everyone has heard of
TikTok, the fledgling short-form video application
that has been around in 2016 but risen in popularity
since the outbreak of COVID-19. It is developed
around sectors held by devoted and passionate
individuals who have discovered that TikTok is a fun
and engaging method to keep in touch with each other
and about the issues they care about. Based on the
research conducted, we noticed that the TikTok
application has the potential to raise awareness about
YMS2021, Universiti Utara Malaysia
36
the current issue. For instance, TikTok can be used to
avoid cyberbullying. Youth speak out against
cyberbullying and attempt to change society's
opinions of what is acceptable and what is not
acceptable. TikTok youth users are using the potential
power of weak relationships inside the social network
to reach a larger audience, which has the potential to
enhance youth empowerment. TikTok's socio-
technical elements enable youth to network and
cooperate by establishing the third space for them to
negotiate and communicate their social ideals while
deviating from dominant narratives about these
values. Many youths are feeling increasingly
empowered as a result of the platform that TikTok
gives for them to express what they are passionate
about. TikTok is a global community, where the users
define the tone and thus create an environment in
which others can feel free to write and express what is
important to them. Overall, we agree TikTok would
benefit by identifying, elevating, and otherwise
promoting TikTok that help to establish a positive,
tolerant, and respectable community so that users of
all categories such as youth will feel supported.
VI. CONCLUSION
From the study, it can be concluded that TikTok is a
lively, interactive, and enjoyable app that has gained a
lot of attention in recent months especially among
users of the age 16 to 23 years old. Mostly, college
students are the ones who prefer to use TikTok. They
use TikTok for a few different reasons including
spending 4 hours on the application, gaining
satisfaction or approval, watching mostly DIY content
and updating status more than 4 times per day. The
majority of the users are young, between the ages of
16 to 23 years old. The usage of TikTok brings a
positive impact to the youth such as it helps them
improve their creativity, make them famous as well as
become a source of income. This study is vital so that
in future they can enhance TikTok's functionality and
youth experience. This platform often appeals to the
user's tastes to an extreme, which often leads to the
abuse of its functionality and the vulgarisation of the
information. They can therefore play a huge role in
behavioural change communication.
REFERENCES Does TikTok have a more positive or negative impact? (2021, January 16).
WESS Side Stories. https://wess-sidestories.com/1859/op-ed/does-tiktok-have-a-more-positive-or-negative-impact/#:~:text=One%20of%20the%20positive%20effects,advice%20from%20your%20age%20group
Importance of TikTok Type Videos for Learning. COL. (2020, January 23). https://www.col.org/news/col-blog/importance-tiktok-type-videos-learning.
Jaffar, B. A., Riaz, S., & Mushtaq, A. (2019). Living in a Moment: Impact of TicTok on Influencing Younger Generation into Micro-Fame. https://www.amity.edu/gwalior/jccc/pdf/jccc-12-19-19.pdf
Park, E. (2017). 1. Youth Empowerment: Teens Create Smoking Prevention Videos. Nursing Outlook, 65(1), 134–135. https://doi.org/10.1016/j.outlook.2016.11.017
Cheng, J. C. P., Law, K. H., Bjornsson, H., Jones, A., & Sriram, R. (2010). A service-oriented framework for construction supply chain integration. Automation in Construction, 19(2), 245–260. http://doi.org/10.1016/j.autcon.2009.10.003
Sehl, K. (2020, July 18). Everything Brands Need to Know About TikTok in 2020. Social Media Marketing & Management Dashboard. https://blog.hootsuite.com/what-is-tiktok/.
What is TikTok? (2020, May 10). Influencermarketinghub. https://influencermarketinghub.com/what-is-tiktok/
Yang Yuxin (2020, June 2020). Understanding Young Adults' TikTok Usage. Retrieved from https://communication.ucsd.edu/_files/undergrad/yang-yuxin-understanding-young-adults-tiktok-usage.pdf/
YMS2021, Universiti Utara Malaysia
37
Best Paper Nominee
The Impact of Social Media on Mental Health of Local University Students
Aina Farzana Mohd Azmi1, Nor Izzati Husna Mohammad2, Wong Xin Yi3 & Siti Intan Rasyiqah Mohd Riduan4
1Universiti Utara Malaysia, Malaysia, [email protected] 2Universiti Utara Malaysia, Malaysia, [email protected]
3Universiti Utara Malaysia, Malaysia, [email protected] 4Universiti Utara Malaysia, Malaysia, [email protected]
ABSTRACT
This study is carried out to analyze the impact of social
media on mental health issues among students in four
universities. The study also focused on the usage of
social media and the effects of the factor of social
media on mental health among students. Sixty
university students participated in a survey that was
carried out through online platforms. Most
respondents choose WhatsApp as their most used
social media and they use it for bountiful hours. The
result showed that they feel anxious if they are unable
to access social media and most of them agreed that
they feel unease while using social media. In short,
social media do impact on the mental health of youth
and this is supported based by their experience in
using social media and interacting with the contents
available on them. Keywords: Social media, mental health, youth
I INTRODUCTION
Enabling people to create, share and exchange
knowledge, ideas, work experience, and other modes
of expression through virtual communities and
networks is known as social media. People are
spending hours per day on social media, which has
only recently become a part of their everyday routine
(Karim et al., 2020). People nowadays are rather
socialized through social media instead of socializing
in the real world. Facebook, WhatsApp, Instagram,
Snapchat, YouTube, Twitter, and more are examples
of social media that people always use in their daily
life. These modern-day platforms are rapidly
expanding and serving as accessible hubs for
entertainment and communication among younger
generations (Solomons, 2020). Social media also
helps people to get information much easier and much
faster rather than buying newspapers. People will have
nothing to do with their life without accessing the
internet and social media because nowadays social
media is one of their parts of daily life where they
could spend hours on it. However, the usage of social
media impacts social issues if they use social media in
the wrong ways. The social issues that recently
happened on human health especially among young
people are mental health.
Our emotional, psychological and social well-being
are all part of our mental well-being. It has an effect
on the way we think, action and feel. It also influenced
how we handle the tension, interact with others, and
make decisions. Mental health has a lot of categories
such as depression, anxiety, feeling lonely, being sad
and not happy, and more. The usage of social media
has its benefit and negative impact if they use social
media on mental health in the wrong way. According
to Karim et al. (2020), the usage of social media
affects mental health by affecting how people
perceive, manage and communicate through networks.
Mental health also gives an impact on someone who is
too addicted to social media and not being socialized
with other people in the real world, such as they
always want to be alone and don’t want to interact with
people.
This study focuses on the effect of social media on
mental health among 4 universities in Malaysia. The
objective of this study is to determine the most used
social media among 4 university students in Malaysia.
Furthermore, this study is conducted to identify the
factors and effects of social media on mental health
among 4 university students in Malaysia. This paper is
coordinated as follows Section A conferred the
respondent’s demographic while Section B presented
the usage of social media and for the last section which
is Section C is the factors and effects of social media
on mental health.
II LITERATURE REVIEW
A. Youths and Mental Health The previous articles indicated that youths are more
vulnerable to major mental health issues (Solomons,
B
B
YMS2021, Universiti Utara Malaysia
38
2020; O’Reilly, 2020). Reporting on mental disease in children and women is more objective and fair than reporting on mental illness in adults and men (Ma, 2017). Some of the youths believed social media was helpful for their mental health and their use of social media should be unrestricted (O’Reilly, 2020).
B. Social media For providing updates on health-related topics,
social media is a significant and advanced source
(Sadagheyani & Tatari, 2020). The youths often turn
to social media and the internet for mental health
information (O’Reilly et al., 2019). While according
to Swarnam (2021), the majority of people use social
media for entertainment. An article by Palyan (2019)
indicated that the youths usually spend 1 to 5 hours a
day on social media. They are the most active on
Instagram. They share images on social media once a
week and claim that views and comments on images
are significant to them (Magner, 2018).
C. Impacts on Mental Health Palyan (2019) found that more hours spent on social
media was linked to a rise in depressive symptoms.
People who spend most of their time online and doing
image management on social networking sites were
found to have signs of severe depression (Karim et al.,
2020). Social media addiction and long-term use can
minimize real-world social experiences as well as
mental health functioning and well-being
(Sadagheyani & Tatari, 2020). Swarnam (2021)
identified that people who spend too much time on
social media and sleep too late at night, which is
detrimental to their mental health. Keles et al. (2020)
reported that the time spent on social media,
behaviours such as frequent searching for updates,
personal investment, and addictive or problematic use
were all identified as major risk factors for depression,
anxiety, and psychological distress. A study by
Solomons (2020) showed that internet stalking,
texting, tension, exhaustion, isolation, loss of
academic skills, cyberbullying, emotion suppression,
and lack of focus affect the mental health of youths.
While on the other hand, Swarnam (2021) pointed out
that some people find that communicating with friends
and family on social media helps them resolve
sadness, irritation, or some other negative emotion.
III METHODOLOGY
This part describes the research strategy of this study
consisting of data analysis, data collection method,
and respondents.
A. Respondents To further understand the relationship between social
media and mental health, the views of direct
respondents are helpful. To ensure population
diversity, we recruited respondents through 4 well-
known university students in Malaysia are Universiti
Utara Malaysia, Universiti Malaysia Sabah, Universiti
Malaysia Terengganu, and Universiti Teknologi
MARA. 4 well-known universities in Malaysia are
chosen as our respondents and our target respondents
are 60 students. 15 students each from 4 universities
are counted as our respondents for this research study.
B. Survey
The respondents from 4 well-known universities were
given a structured questionnaire to fill out. The
structured questionnaire that was generated using
Google Form has been distributed through social
media platforms such as WhatsApp and Facebook.
The questions were divided into two groups that
reflected the focus of the relationship between social
media and mental health issues including the social
media they use the most, and the factors and effects of
social media on mental health. The questionnaire is
divided into the following parts: 1) Demographics data
(age, gender, education, and university), 2) The usage
of social media, and 3) The factors and the effects of
social media on mental health.
C. Data Analysis The results of the data that are collected in Google
Form were shown in pie charts as well as bar charts.
To analyze the data we gathered, we calculated it using
percentages and the number of respondents.
IV RESULTS & FINDINGS
A. Respondents Demography
The resulting study shows that 11.7% (N=7) are 18-21
years old from 60 respondents followed by 88.3%
(N=53) are 22-25 years old meanwhile the rest of 26-
28 and 29 above is no data recorded. Figure 1 shows
the gender of the respondents. The result captured that
from 60 respondents, 81.7% (N=49) are female
respondents who are rolling the highest number of
male respondents with only 18.3% (N=11).
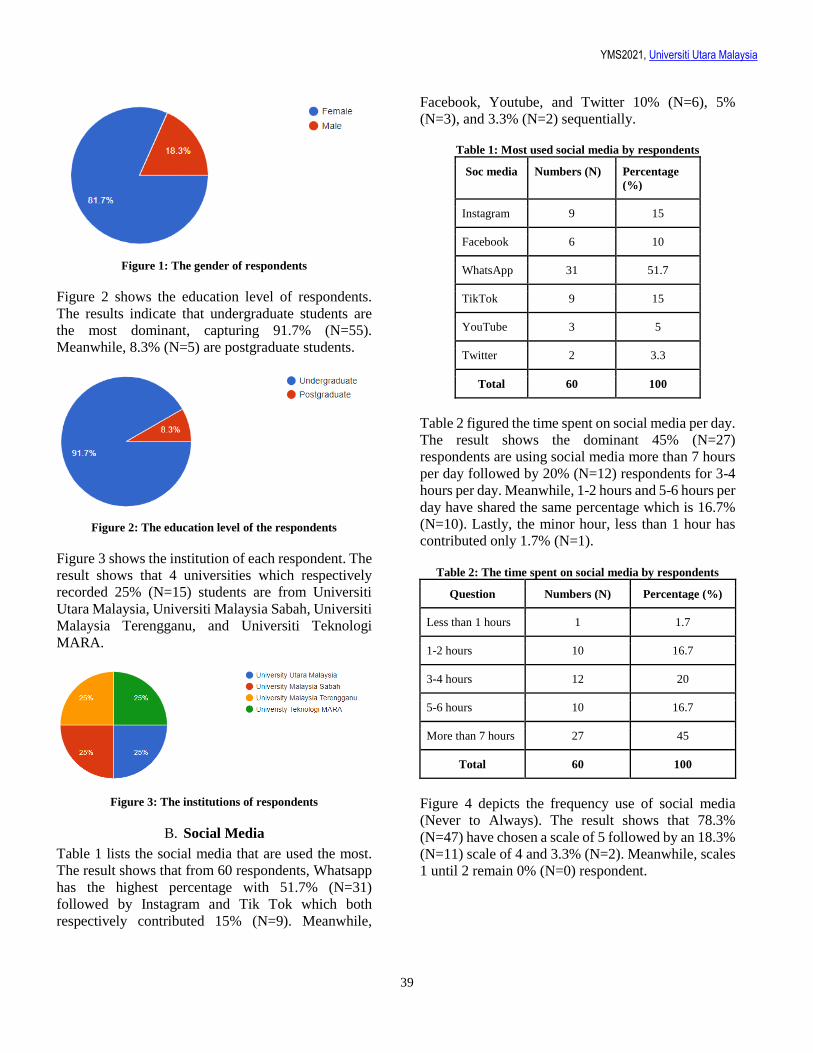
YMS2021, Universiti Utara Malaysia
39
Figure 1: The gender of respondents
Figure 2 shows the education level of respondents.
The results indicate that undergraduate students are
the most dominant, capturing 91.7% (N=55).
Meanwhile, 8.3% (N=5) are postgraduate students.
Figure 2: The education level of the respondents
Figure 3 shows the institution of each respondent. The
result shows that 4 universities which respectively
recorded 25% (N=15) students are from Universiti
Utara Malaysia, Universiti Malaysia Sabah, Universiti
Malaysia Terengganu, and Universiti Teknologi
MARA.
Figure 3: The institutions of respondents
B. Social Media
Table 1 lists the social media that are used the most.
The result shows that from 60 respondents, Whatsapp
has the highest percentage with 51.7% (N=31)
followed by Instagram and Tik Tok which both
respectively contributed 15% (N=9). Meanwhile,
Facebook, Youtube, and Twitter 10% (N=6), 5%
(N=3), and 3.3% (N=2) sequentially.
Table 1: Most used social media by respondents
Soc media Numbers (N) Percentage
(%)
Instagram 9 15
Facebook 6 10
WhatsApp 31 51.7
TikTok 9 15
YouTube 3 5
Twitter 2 3.3
Total 60 100
Table 2 figured the time spent on social media per day.
The result shows the dominant 45% (N=27)
respondents are using social media more than 7 hours
per day followed by 20% (N=12) respondents for 3-4
hours per day. Meanwhile, 1-2 hours and 5-6 hours per
day have shared the same percentage which is 16.7%
(N=10). Lastly, the minor hour, less than 1 hour has
contributed only 1.7% (N=1).
Table 2: The time spent on social media by respondents
Question Numbers (N) Percentage (%)
Less than 1 hours 1 1.7
1-2 hours 10 16.7
3-4 hours 12 20
5-6 hours 10 16.7
More than 7 hours 27 45
Total 60 100
Figure 4 depicts the frequency use of social media
(Never to Always). The result shows that 78.3%
(N=47) have chosen a scale of 5 followed by an 18.3%
(N=11) scale of 4 and 3.3% (N=2). Meanwhile, scales
1 until 2 remain 0% (N=0) respondent.
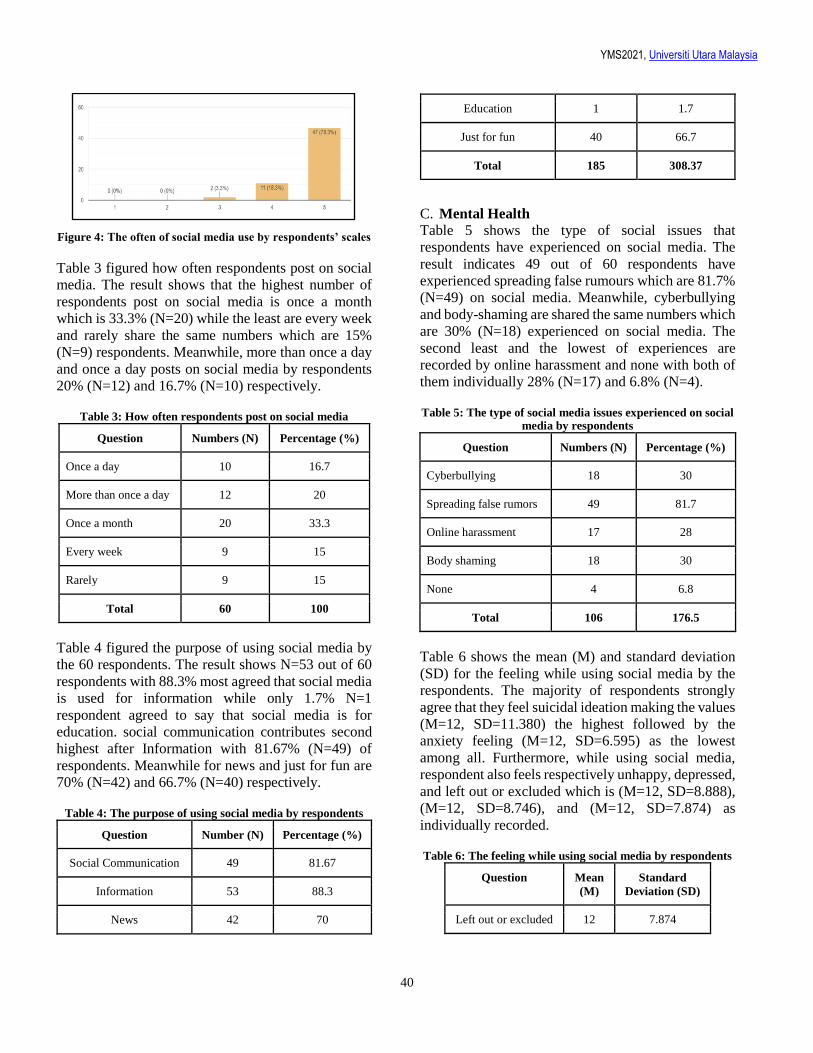
YMS2021, Universiti Utara Malaysia
40
Figure 4: The often of social media use by respondents’ scales
Table 3 figured how often respondents post on social
media. The result shows that the highest number of
respondents post on social media is once a month
which is 33.3% (N=20) while the least are every week
and rarely share the same numbers which are 15%
(N=9) respondents. Meanwhile, more than once a day
and once a day posts on social media by respondents
20% (N=12) and 16.7% (N=10) respectively.
Table 3: How often respondents post on social media
Question Numbers (N) Percentage (%)
Once a day 10 16.7
More than once a day 12 20
Once a month 20 33.3
Every week 9 15
Rarely 9 15
Total 60 100
Table 4 figured the purpose of using social media by
the 60 respondents. The result shows N=53 out of 60
respondents with 88.3% most agreed that social media
is used for information while only 1.7% N=1
respondent agreed to say that social media is for
education. social communication contributes second
highest after Information with 81.67% (N=49) of
respondents. Meanwhile for news and just for fun are
70% (N=42) and 66.7% (N=40) respectively.
Table 4: The purpose of using social media by respondents
Question Number (N) Percentage (%)
Social Communication 49 81.67
Information 53 88.3
News 42 70
Education 1 1.7
Just for fun 40 66.7
Total 185 308.37
C. Mental Health
Table 5 shows the type of social issues that
respondents have experienced on social media. The
result indicates 49 out of 60 respondents have
experienced spreading false rumours which are 81.7%
(N=49) on social media. Meanwhile, cyberbullying
and body-shaming are shared the same numbers which
are 30% (N=18) experienced on social media. The
second least and the lowest of experiences are
recorded by online harassment and none with both of
them individually 28% (N=17) and 6.8% (N=4).
Table 5: The type of social media issues experienced on social media by respondents
Question Numbers (N) Percentage (%)
Cyberbullying 18 30
Spreading false rumors 49 81.7
Online harassment 17 28
Body shaming 18 30
None 4 6.8
Total 106 176.5
Table 6 shows the mean (M) and standard deviation
(SD) for the feeling while using social media by the
respondents. The majority of respondents strongly
agree that they feel suicidal ideation making the values
(M=12, SD=11.380) the highest followed by the
anxiety feeling (M=12, SD=6.595) as the lowest
among all. Furthermore, while using social media,
respondent also feels respectively unhappy, depressed,
and left out or excluded which is (M=12, SD=8.888),
(M=12, SD=8.746), and (M=12, SD=7.874) as
individually recorded.
Table 6: The feeling while using social media by respondents
Question Mean
(M)
Standard
Deviation (SD)
Left out or excluded 12 7.874
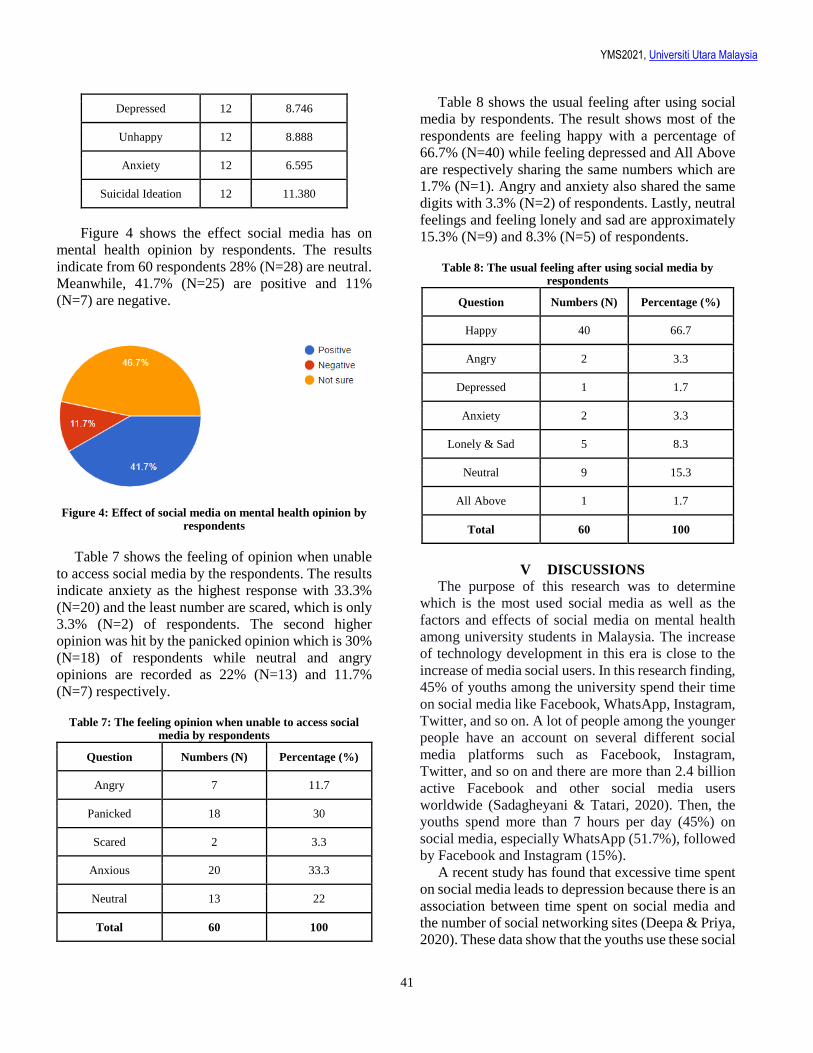
YMS2021, Universiti Utara Malaysia
41
Depressed 12 8.746
Unhappy 12 8.888
Anxiety 12 6.595
Suicidal Ideation 12 11.380
Figure 4 shows the effect social media has on
mental health opinion by respondents. The results
indicate from 60 respondents 28% (N=28) are neutral.
Meanwhile, 41.7% (N=25) are positive and 11%
(N=7) are negative.
Figure 4: Effect of social media on mental health opinion by respondents
Table 7 shows the feeling of opinion when unable
to access social media by the respondents. The results
indicate anxiety as the highest response with 33.3%
(N=20) and the least number are scared, which is only
3.3% (N=2) of respondents. The second higher
opinion was hit by the panicked opinion which is 30%
(N=18) of respondents while neutral and angry
opinions are recorded as 22% (N=13) and 11.7%
(N=7) respectively.
Table 7: The feeling opinion when unable to access social media by respondents
Question Numbers (N) Percentage (%)
Angry 7 11.7
Panicked 18 30
Scared 2 3.3
Anxious 20 33.3
Neutral 13 22
Total 60 100
Table 8 shows the usual feeling after using social
media by respondents. The result shows most of the
respondents are feeling happy with a percentage of
66.7% (N=40) while feeling depressed and All Above
are respectively sharing the same numbers which are
1.7% (N=1). Angry and anxiety also shared the same
digits with 3.3% (N=2) of respondents. Lastly, neutral
feelings and feeling lonely and sad are approximately
15.3% (N=9) and 8.3% (N=5) of respondents.
Table 8: The usual feeling after using social media by respondents
Question Numbers (N) Percentage (%)
Happy 40 66.7
Angry 2 3.3
Depressed 1 1.7
Anxiety 2 3.3
Lonely & Sad 5 8.3
Neutral 9 15.3
All Above 1 1.7
Total 60 100
V DISCUSSIONS
The purpose of this research was to determine
which is the most used social media as well as the
factors and effects of social media on mental health
among university students in Malaysia. The increase
of technology development in this era is close to the
increase of media social users. In this research finding,
45% of youths among the university spend their time
on social media like Facebook, WhatsApp, Instagram,
Twitter, and so on. A lot of people among the younger
people have an account on several different social
media platforms such as Facebook, Instagram,
Twitter, and so on and there are more than 2.4 billion
active Facebook and other social media users
worldwide (Sadagheyani & Tatari, 2020). Then, the
youths spend more than 7 hours per day (45%) on
social media, especially WhatsApp (51.7%), followed
by Facebook and Instagram (15%).
A recent study has found that excessive time spent
on social media leads to depression because there is an
association between time spent on social media and
the number of social networking sites (Deepa & Priya,
2020). These data show that the youths use these social
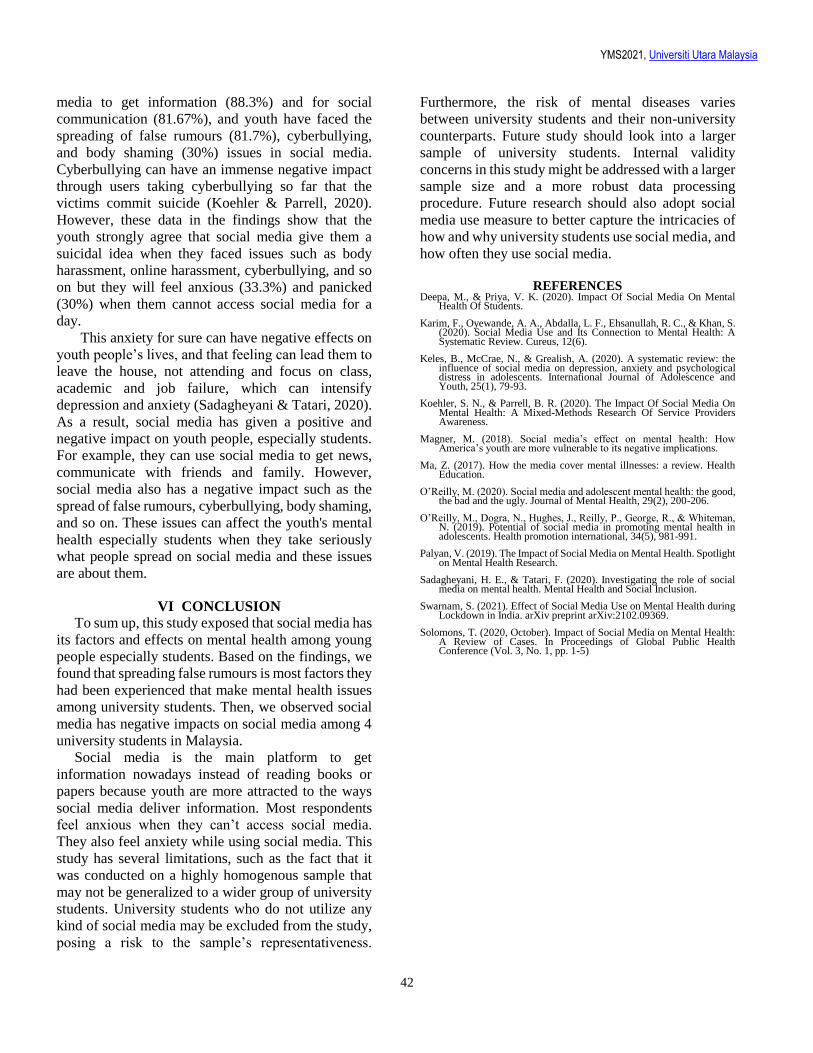
YMS2021, Universiti Utara Malaysia
42
media to get information (88.3%) and for social
communication (81.67%), and youth have faced the
spreading of false rumours (81.7%), cyberbullying,
and body shaming (30%) issues in social media.
Cyberbullying can have an immense negative impact
through users taking cyberbullying so far that the
victims commit suicide (Koehler & Parrell, 2020).
However, these data in the findings show that the
youth strongly agree that social media give them a
suicidal idea when they faced issues such as body
harassment, online harassment, cyberbullying, and so
on but they will feel anxious (33.3%) and panicked
(30%) when them cannot access social media for a
day.
This anxiety for sure can have negative effects on
youth people’s lives, and that feeling can lead them to
leave the house, not attending and focus on class,
academic and job failure, which can intensify
depression and anxiety (Sadagheyani & Tatari, 2020).
As a result, social media has given a positive and
negative impact on youth people, especially students.
For example, they can use social media to get news,
communicate with friends and family. However,
social media also has a negative impact such as the
spread of false rumours, cyberbullying, body shaming,
and so on. These issues can affect the youth's mental
health especially students when they take seriously
what people spread on social media and these issues
are about them.
VI CONCLUSION
To sum up, this study exposed that social media has
its factors and effects on mental health among young
people especially students. Based on the findings, we
found that spreading false rumours is most factors they
had been experienced that make mental health issues
among university students. Then, we observed social
media has negative impacts on social media among 4
university students in Malaysia.
Social media is the main platform to get
information nowadays instead of reading books or
papers because youth are more attracted to the ways
social media deliver information. Most respondents
feel anxious when they can’t access social media.
They also feel anxiety while using social media. This
study has several limitations, such as the fact that it
was conducted on a highly homogenous sample that
may not be generalized to a wider group of university
students. University students who do not utilize any
kind of social media may be excluded from the study,
posing a risk to the sample’s representativeness.
Furthermore, the risk of mental diseases varies
between university students and their non-university
counterparts. Future study should look into a larger
sample of university students. Internal validity
concerns in this study might be addressed with a larger
sample size and a more robust data processing
procedure. Future research should also adopt social
media use measure to better capture the intricacies of
how and why university students use social media, and
how often they use social media.
REFERENCES Deepa, M., & Priya, V. K. (2020). Impact Of Social Media On Mental
Health Of Students.
Karim, F., Oyewande, A. A., Abdalla, L. F., Ehsanullah, R. C., & Khan, S. (2020). Social Media Use and Its Connection to Mental Health: A Systematic Review. Cureus, 12(6).
Keles, B., McCrae, N., & Grealish, A. (2020). A systematic review: the influence of social media on depression, anxiety and psychological distress in adolescents. International Journal of Adolescence and Youth, 25(1), 79-93.
Koehler, S. N., & Parrell, B. R. (2020). The Impact Of Social Media On Mental Health: A Mixed-Methods Research Of Service Providers Awareness.
Magner, M. (2018). Social media’s effect on mental health: How America’s youth are more vulnerable to its negative implications.
Ma, Z. (2017). How the media cover mental illnesses: a review. Health Education.
O’Reilly, M. (2020). Social media and adolescent mental health: the good, the bad and the ugly. Journal of Mental Health, 29(2), 200-206.
O’Reilly, M., Dogra, N., Hughes, J., Reilly, P., George, R., & Whiteman, N. (2019). Potential of social media in promoting mental health in adolescents. Health promotion international, 34(5), 981-991.
Palyan, V. (2019). The Impact of Social Media on Mental Health. Spotlight on Mental Health Research.
Sadagheyani, H. E., & Tatari, F. (2020). Investigating the role of social media on mental health. Mental Health and Social Inclusion.
Swarnam, S. (2021). Effect of Social Media Use on Mental Health during Lockdown in India. arXiv preprint arXiv:2102.09369.
Solomons, T. (2020, October). Impact of Social Media on Mental Health: A Review of Cases. In Proceedings of Global Public Health Conference (Vol. 3, No. 1, pp. 1-5)
YMS2021, Universiti Utara Malaysia
43
Best paper Nominee
Cyberbullying on Social Media and Its Impacts on Youth
Nur Ayuni Sabihah Sukri1, Nur Izzati Ghazali2, Siti Marsitah Abd Razak3 & Sarvinthraan Nathan4
1Universiti Utara Malaysia, Malaysia, [email protected] 2Universiti Utara Malaysia, Malaysia, [email protected] 3Universiti Utara Malaysia, Malaysia, [email protected] 4Universiti Utara Malaysia, Malaysia, [email protected]
ABSTRACT
This study aims to analyze cyberbullying on social
media and its impacts on youth to identify the
elements that impact their mental and physical
performance. 43 respondents among youth
participated in this study through the online survey and
it has yielded some interesting results. The majority of
the respondents know what cyberbullying is and are
not involved in it. Overall, the study concludes that
cyberbullying harms the psychology of youth,
resulting in poor emotional disturbance, academic
achievement, and relational gaps.
Keywords: Social media, cyberbullying, youth
I. INTRODUCTION The growth of information and communication
technology, such as the increased availability of internet access, has benefited both youth and adults. They can obtain information with a single click from their cell phones, tablets, or laptops. There are many advantages as well as disadvantages to the use of the Internet. Information on current issues is obtained within minutes and updated frequently compared to obtained information the next day from printed newspapers. Besides that, users can follow issues that are trending in real-time; however, they must exercise discretion on the types of information to be accepted and rejected, respectively. Rumours travel quicker with the emergence of the internet, and readers are ready to make nasty remarks online without carefully reading the article or relying just on hearsay. As a result, both the users and the victim may suffer from physical and emotional health issues.
Cyberbullying is one of the serious issues on media social that must be addressed among youngsters. Cyberbullying can be defined as repeated acts of aggressive behaviour by a group or individual over time through the use of electronic devices (Rashid et al., 2017). The internet and social media nowadays are viewed as avenues to hurl negative comments without taking accountability.
Cyberbullying is related to negative outcomes. The study by (Abaido, 2020) revealed that cyberbullying and online harassment are problems for social media users, especially young people. Cyberbullying is the act of harassing people on social media or any other online medium by sending or posting untoward messages, usually anonymously or intentionally by a person or in a group using digital devices such as smartphones, tablets and computers (Abaido, 2020).
Cyberbullying can also occur through text messages, although most users are more active online on social media using their profiles or false profiles made on Facebook, Instagram, Snapchat, and Twitter to harass or disgrace others. This is due to the ease with which social media platforms such as Facebook, Instagram, Twitter, and others are accessible to everyone, particularly young people. From a previous study (Cohen-Almagor, 2018), more youths experienced cyberbullying on social media like Instagram than at other platforms at 42% with Facebook at 37 per cent. The majority of teens have experienced some form of cyberbullying.
Youth are an important population to focus on the issue of cyberbullying because this period is a unique time for identity formation choices that can be stressful for them. Therefore, the purpose of this research is to study the impact of cyberbullying on social media among youth. Specifically, the objectives of the research are
a) To identify the social media issues related to
cyberbullying
b) To investigate the effects of cyberbullying, and
c) To evaluate the reasons youth are involved in
cyberbullying.
II. LITERATURE REVIEW
Cyberbullying is described as “an aggressive,
intentional act carried out by a group or individual,
using electronic forms of contact, repeatedly and
overtime against a victim who cannot easily defend
him or herself” (Smith et al., 2008, p. 376). Similar
essence was also given by Tokunaga who described
B
B
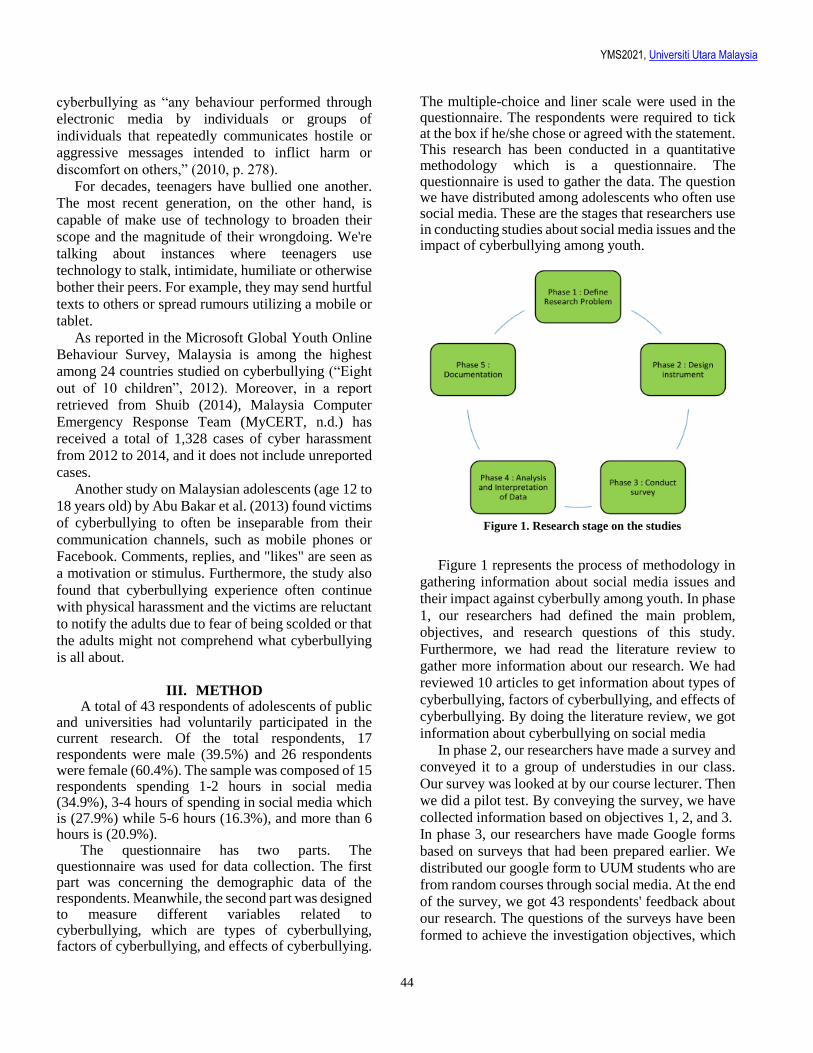
YMS2021, Universiti Utara Malaysia
44
cyberbullying as “any behaviour performed through
electronic media by individuals or groups of
individuals that repeatedly communicates hostile or
aggressive messages intended to inflict harm or
discomfort on others,” (2010, p. 278).
For decades, teenagers have bullied one another.
The most recent generation, on the other hand, is
capable of make use of technology to broaden their
scope and the magnitude of their wrongdoing. We're
talking about instances where teenagers use
technology to stalk, intimidate, humiliate or otherwise
bother their peers. For example, they may send hurtful
texts to others or spread rumours utilizing a mobile or
tablet.
As reported in the Microsoft Global Youth Online
Behaviour Survey, Malaysia is among the highest
among 24 countries studied on cyberbullying (“Eight
out of 10 children”, 2012). Moreover, in a report
retrieved from Shuib (2014), Malaysia Computer
Emergency Response Team (MyCERT, n.d.) has
received a total of 1,328 cases of cyber harassment
from 2012 to 2014, and it does not include unreported
cases.
Another study on Malaysian adolescents (age 12 to
18 years old) by Abu Bakar et al. (2013) found victims
of cyberbullying to often be inseparable from their
communication channels, such as mobile phones or
Facebook. Comments, replies, and "likes" are seen as
a motivation or stimulus. Furthermore, the study also
found that cyberbullying experience often continue
with physical harassment and the victims are reluctant
to notify the adults due to fear of being scolded or that
the adults might not comprehend what cyberbullying
is all about.
III. METHOD A total of 43 respondents of adolescents of public
and universities had voluntarily participated in the current research. Of the total respondents, 17 respondents were male (39.5%) and 26 respondents were female (60.4%). The sample was composed of 15 respondents spending 1-2 hours in social media (34.9%), 3-4 hours of spending in social media which is (27.9%) while 5-6 hours (16.3%), and more than 6 hours is (20.9%).
The questionnaire has two parts. The questionnaire was used for data collection. The first part was concerning the demographic data of the respondents. Meanwhile, the second part was designed to measure different variables related to cyberbullying, which are types of cyberbullying, factors of cyberbullying, and effects of cyberbullying.
The multiple-choice and liner scale were used in the questionnaire. The respondents were required to tick at the box if he/she chose or agreed with the statement. This research has been conducted in a quantitative methodology which is a questionnaire. The questionnaire is used to gather the data. The question we have distributed among adolescents who often use social media. These are the stages that researchers use in conducting studies about social media issues and the impact of cyberbullying among youth.
Figure 1. Research stage on the studies
Figure 1 represents the process of methodology in
gathering information about social media issues and
their impact against cyberbully among youth. In phase
1, our researchers had defined the main problem,
objectives, and research questions of this study.
Furthermore, we had read the literature review to
gather more information about our research. We had
reviewed 10 articles to get information about types of
cyberbullying, factors of cyberbullying, and effects of
cyberbullying. By doing the literature review, we got
information about cyberbullying on social media
In phase 2, our researchers have made a survey and
conveyed it to a group of understudies in our class.
Our survey was looked at by our course lecturer. Then
we did a pilot test. By conveying the survey, we have
collected information based on objectives 1, 2, and 3. In phase 3, our researchers have made Google forms
based on surveys that had been prepared earlier. We
distributed our google form to UUM students who are
from random courses through social media. At the end
of the survey, we got 43 respondents' feedback about
our research. The questions of the surveys have been
formed to achieve the investigation objectives, which
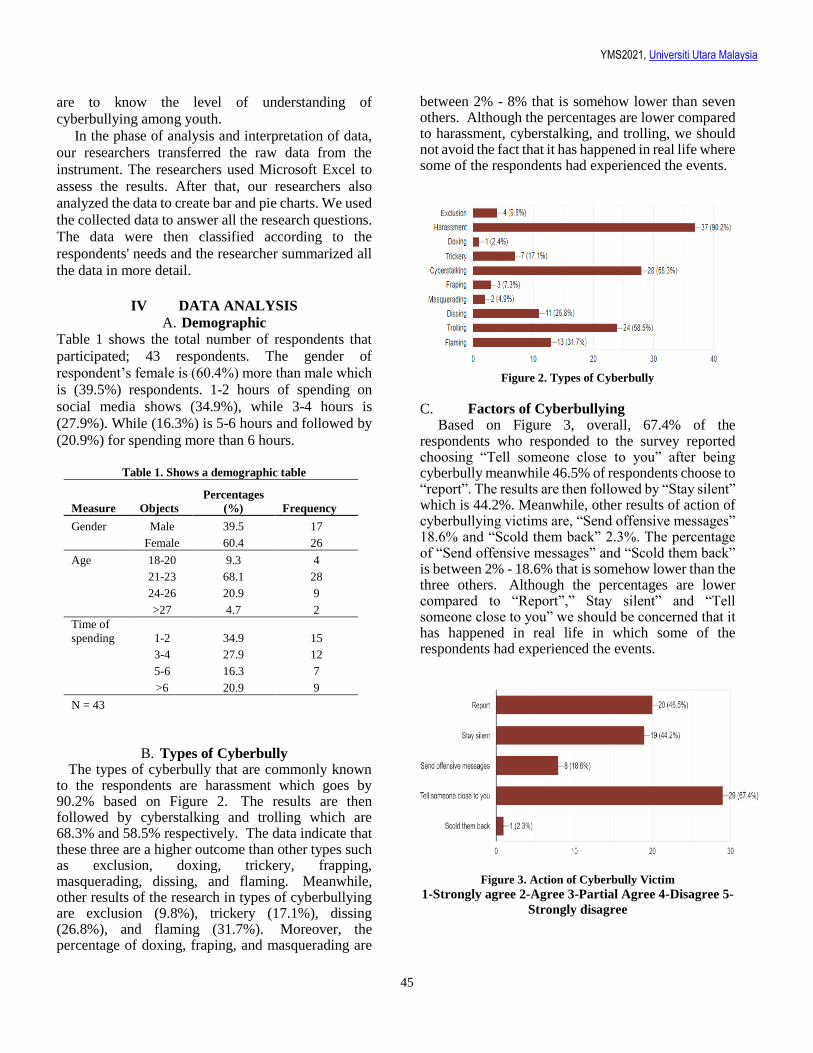
YMS2021, Universiti Utara Malaysia
45
are to know the level of understanding of
cyberbullying among youth. In the phase of analysis and interpretation of data,
our researchers transferred the raw data from the
instrument. The researchers used Microsoft Excel to
assess the results. After that, our researchers also
analyzed the data to create bar and pie charts. We used
the collected data to answer all the research questions.
The data were then classified according to the
respondents' needs and the researcher summarized all
the data in more detail.
IV DATA ANALYSIS
A. Demographic
Table 1 shows the total number of respondents that
participated; 43 respondents. The gender of
respondent’s female is (60.4%) more than male which
is (39.5%) respondents. 1-2 hours of spending on
social media shows (34.9%), while 3-4 hours is
(27.9%). While (16.3%) is 5-6 hours and followed by
(20.9%) for spending more than 6 hours.
Table 1. Shows a demographic table
Measure Objects
Percentages
(%) Frequency
Gender Male 39.5 17
Female 60.4 26
Age 18-20 9.3 4
21-23 68.1 28
24-26 20.9 9
>27 4.7 2
Time of
spending 1-2 34.9 15
3-4 27.9 12
5-6 16.3 7
>6 20.9 9
N = 43
B. Types of Cyberbully The types of cyberbully that are commonly known
to the respondents are harassment which goes by 90.2% based on Figure 2. The results are then followed by cyberstalking and trolling which are 68.3% and 58.5% respectively. The data indicate that these three are a higher outcome than other types such as exclusion, doxing, trickery, frapping, masquerading, dissing, and flaming. Meanwhile, other results of the research in types of cyberbullying are exclusion (9.8%), trickery (17.1%), dissing (26.8%), and flaming (31.7%). Moreover, the percentage of doxing, fraping, and masquerading are
between 2% - 8% that is somehow lower than seven others. Although the percentages are lower compared to harassment, cyberstalking, and trolling, we should not avoid the fact that it has happened in real life where some of the respondents had experienced the events.
Figure 2. Types of Cyberbully
C. Factors of Cyberbullying Based on Figure 3, overall, 67.4% of the
respondents who responded to the survey reported choosing “Tell someone close to you” after being cyberbully meanwhile 46.5% of respondents choose to “report”. The results are then followed by “Stay silent” which is 44.2%. Meanwhile, other results of action of cyberbullying victims are, “Send offensive messages” 18.6% and “Scold them back” 2.3%. The percentage of “Send offensive messages” and “Scold them back” is between 2% - 18.6% that is somehow lower than the three others. Although the percentages are lower compared to “Report”,” Stay silent” and “Tell someone close to you” we should be concerned that it has happened in real life in which some of the respondents had experienced the events.
Figure 3. Action of Cyberbully Victim
1-Strongly agree 2-Agree 3-Partial Agree 4-Disagree 5-
Strongly disagree
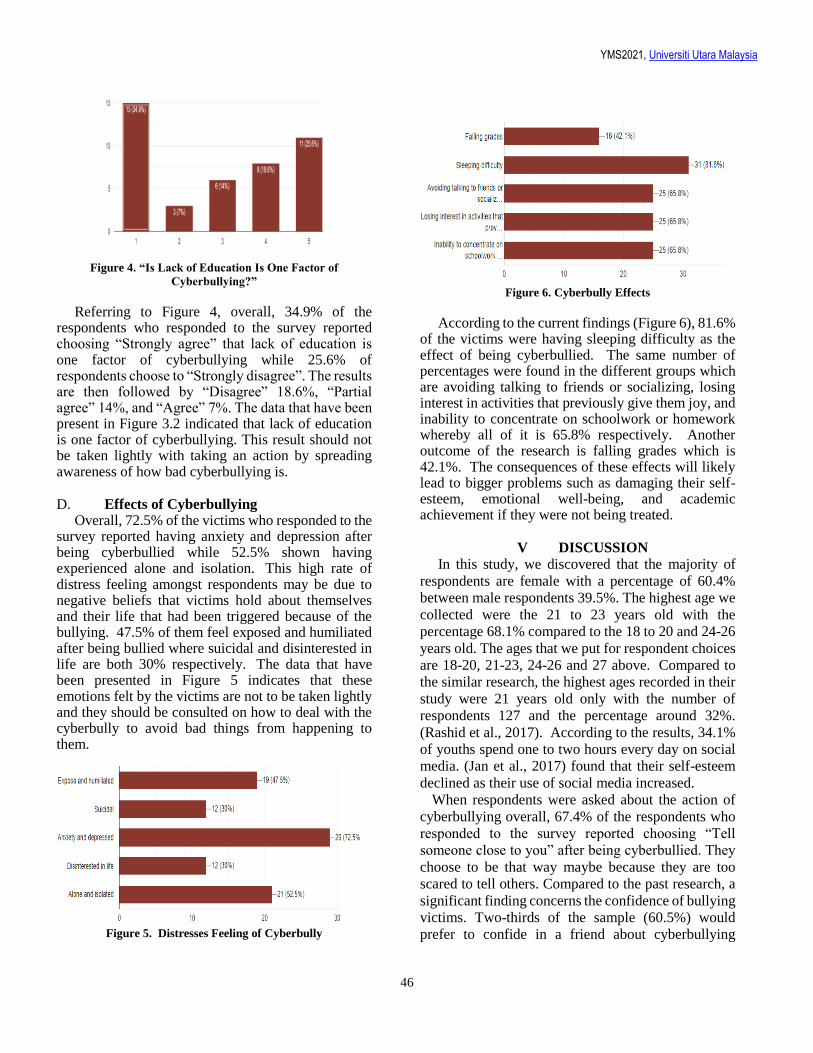
YMS2021, Universiti Utara Malaysia
46
Figure 4. “Is Lack of Education Is One Factor of
Cyberbullying?”
Referring to Figure 4, overall, 34.9% of the respondents who responded to the survey reported choosing “Strongly agree” that lack of education is one factor of cyberbullying while 25.6% of respondents choose to “Strongly disagree”. The results are then followed by “Disagree” 18.6%, “Partial agree” 14%, and “Agree” 7%. The data that have been present in Figure 3.2 indicated that lack of education is one factor of cyberbullying. This result should not be taken lightly with taking an action by spreading awareness of how bad cyberbullying is.
D. Effects of Cyberbullying Overall, 72.5% of the victims who responded to the
survey reported having anxiety and depression after being cyberbullied while 52.5% shown having experienced alone and isolation. This high rate of distress feeling amongst respondents may be due to negative beliefs that victims hold about themselves and their life that had been triggered because of the bullying. 47.5% of them feel exposed and humiliated after being bullied where suicidal and disinterested in life are both 30% respectively. The data that have been presented in Figure 5 indicates that these emotions felt by the victims are not to be taken lightly and they should be consulted on how to deal with the cyberbully to avoid bad things from happening to them.
Figure 5. Distresses Feeling of Cyberbully
Figure 6. Cyberbully Effects
According to the current findings (Figure 6), 81.6% of the victims were having sleeping difficulty as the effect of being cyberbullied. The same number of percentages were found in the different groups which are avoiding talking to friends or socializing, losing interest in activities that previously give them joy, and inability to concentrate on schoolwork or homework whereby all of it is 65.8% respectively. Another outcome of the research is falling grades which is 42.1%. The consequences of these effects will likely lead to bigger problems such as damaging their self-esteem, emotional well-being, and academic achievement if they were not being treated.
V DISCUSSION
In this study, we discovered that the majority of
respondents are female with a percentage of 60.4%
between male respondents 39.5%. The highest age we
collected were the 21 to 23 years old with the
percentage 68.1% compared to the 18 to 20 and 24-26
years old. The ages that we put for respondent choices
are 18-20, 21-23, 24-26 and 27 above. Compared to
the similar research, the highest ages recorded in their
study were 21 years old only with the number of
respondents 127 and the percentage around 32%.
(Rashid et al., 2017). According to the results, 34.1%
of youths spend one to two hours every day on social
media. (Jan et al., 2017) found that their self-esteem
declined as their use of social media increased.
When respondents were asked about the action of
cyberbullying overall, 67.4% of the respondents who
responded to the survey reported choosing “Tell
someone close to you” after being cyberbullied. They
choose to be that way maybe because they are too
scared to tell others. Compared to the past research, a
significant finding concerns the confidence of bullying
victims. Two-thirds of the sample (60.5%) would
prefer to confide in a friend about cyberbullying
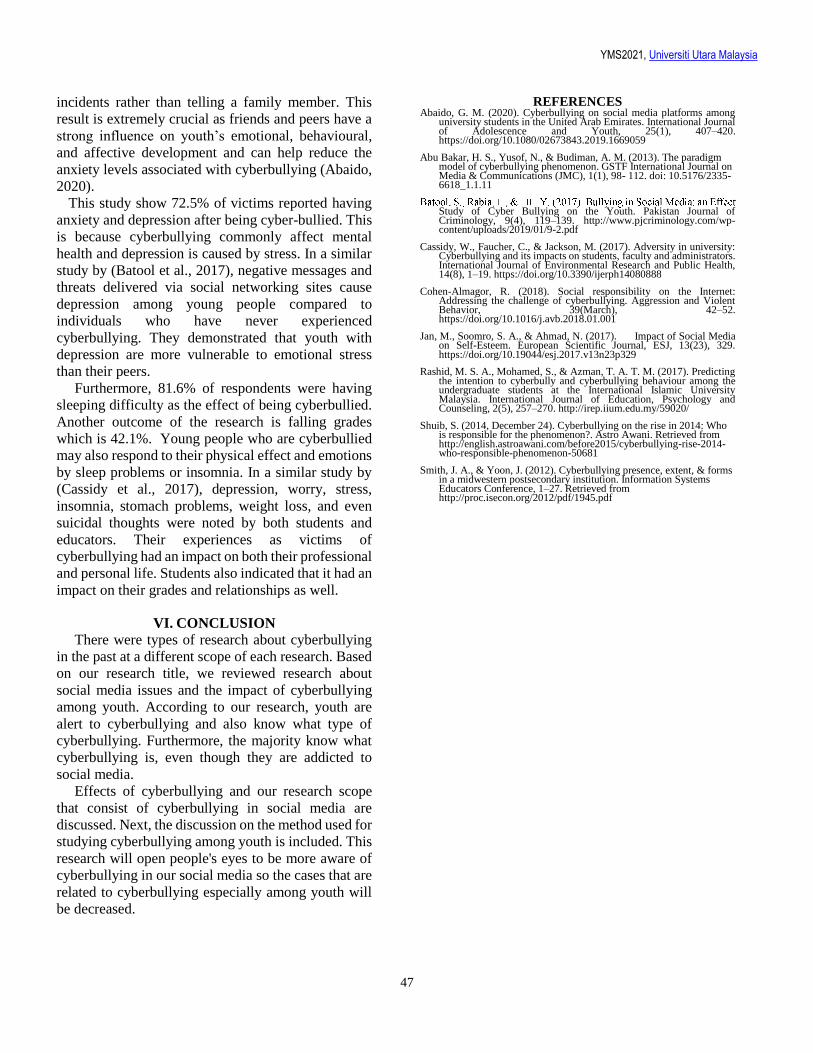
YMS2021, Universiti Utara Malaysia
47
incidents rather than telling a family member. This
result is extremely crucial as friends and peers have a
strong influence on youth’s emotional, behavioural,
and affective development and can help reduce the
anxiety levels associated with cyberbullying (Abaido,
2020).
This study show 72.5% of victims reported having
anxiety and depression after being cyber-bullied. This
is because cyberbullying commonly affect mental
health and depression is caused by stress. In a similar
study by (Batool et al., 2017), negative messages and
threats delivered via social networking sites cause
depression among young people compared to
individuals who have never experienced
cyberbullying. They demonstrated that youth with
depression are more vulnerable to emotional stress
than their peers.
Furthermore, 81.6% of respondents were having
sleeping difficulty as the effect of being cyberbullied.
Another outcome of the research is falling grades
which is 42.1%. Young people who are cyberbullied
may also respond to their physical effect and emotions
by sleep problems or insomnia. In a similar study by
(Cassidy et al., 2017), depression, worry, stress,
insomnia, stomach problems, weight loss, and even
suicidal thoughts were noted by both students and
educators. Their experiences as victims of
cyberbullying had an impact on both their professional
and personal life. Students also indicated that it had an
impact on their grades and relationships as well.
VI. CONCLUSION
There were types of research about cyberbullying
in the past at a different scope of each research. Based
on our research title, we reviewed research about
social media issues and the impact of cyberbullying
among youth. According to our research, youth are
alert to cyberbullying and also know what type of
cyberbullying. Furthermore, the majority know what
cyberbullying is, even though they are addicted to
social media.
Effects of cyberbullying and our research scope
that consist of cyberbullying in social media are
discussed. Next, the discussion on the method used for
studying cyberbullying among youth is included. This
research will open people's eyes to be more aware of
cyberbullying in our social media so the cases that are
related to cyberbullying especially among youth will
be decreased.
REFERENCES Abaido, G. M. (2020). Cyberbullying on social media platforms among
university students in the United Arab Emirates. International Journal of Adolescence and Youth, 25(1), 407–420. https://doi.org/10.1080/02673843.2019.1669059
Abu Bakar, H. S., Yusof, N., & Budiman, A. M. (2013). The paradigm model of cyberbullying phenomenon. GSTF International Journal on Media & Communications (JMC), 1(1), 98- 112. doi: 10.5176/2335-6618_1.1.11
Study of Cyber Bullying on the Youth. Pakistan Journal of Criminology, 9(4), 119–139. http://www.pjcriminology.com/wp-content/uploads/2019/01/9-2.pdf
Cassidy, W., Faucher, C., & Jackson, M. (2017). Adversity in university: Cyberbullying and its impacts on students, faculty and administrators. International Journal of Environmental Research and Public Health, 14(8), 1–19. https://doi.org/10.3390/ijerph14080888
Cohen-Almagor, R. (2018). Social responsibility on the Internet: Addressing the challenge of cyberbullying. Aggression and Violent Behavior, 39(March), 42–52. https://doi.org/10.1016/j.avb.2018.01.001
Jan, M., Soomro, S. A., & Ahmad, N. (2017). Impact of Social Media on Self-Esteem. European Scientific Journal, ESJ, 13(23), 329. https://doi.org/10.19044/esj.2017.v13n23p329
Rashid, M. S. A., Mohamed, S., & Azman, T. A. T. M. (2017). Predicting the intention to cyberbully and cyberbullying behaviour among the undergraduate students at the International Islamic University Malaysia. International Journal of Education, Psychology and Counseling, 2(5), 257–270. http://irep.iium.edu.my/59020/
Shuib, S. (2014, December 24). Cyberbullying on the rise in 2014: Who is responsible for the phenomenon?. Astro Awani. Retrieved from http://english.astroawani.com/before2015/cyberbullying-rise-2014-who-responsible-phenomenon-50681
Smith, J. A., & Yoon, J. (2012). Cyberbullying presence, extent, & forms in a midwestern postsecondary institution. Information Systems Educators Conference, 1–27. Retrieved from http://proc.isecon.org/2012/pdf/1945.pdf
YMS2021, Universiti Utara Malaysia
48
Best Paper Nominee
The Connection between Violent Video Games and
Youth Aggression in Malaysia Asma Balqis Zainuddin1, Nurul Syuhaidah Ibrahim2,
Nur Afifah Abdul Manan3 & Nur Izzati Mohd Saruji Afandi4
1University Utara Malaysia, Malaysia, [email protected] 2University Utara Malaysia, Malaysia, [email protected] 3University Utara Malaysia, Malaysia, [email protected] 4University Utara Malaysia, Malaysia, [email protected]
ABSTRACT
This study is conducted to investigate the connection
between violent video games causing aggression
among youth at public universities in Malaysia. The
data collection methods used in this study are online
surveys using Google form and the distribution of this
survey via social media platforms such as WhatsApp
and Facebook. The respondents consisted of 50
students from three public universities. This survey
consisted of 15 questions including demographic
questions. Result: Most of the respondents (n= 40)
play games that include strong language, blood, and
gore, violence, or other inappropriate content while 10
of the respondents did not play it. Conclusion: Media
and games violence are intended to be one of the
causes of aggression among youth and the survey
concludes that youth like students love to play violent
video games.
Keywords: play games, violent, video game,
aggression, youth.
I. INTRODUCTION
A. Research Background
Violent Video Game
Violence is defined as any use of physical force or
is intended to cause harm. Violence may cause
physical, psychological, or both types of damage.
Aggression, also known as violent conduct, is distinct
from aggression because it can be physical, verbal, or
passive (Jacquin, 2020). Video games are examples of
electronic games that involve direct interaction with a
user interface through a joystick, keyboard, and others
that are related and visual that were displayed through
desktop screen or TV. It is a sort of entertainment
source for youth, even adults too to fulfil their leisure
time. Towards the video game industry booming, such
e-sport keeps attracting the interest of youth in the
society. However, the improper influence of video
games that involve violence is known as a video game
that is associated with killing, dismembering, or
imagery of human beings sexually assaulting
(Anderson, n.d.). Most video game players prefer
violent video games because they are claimed to have
more excitement than non-violent video games
(Zendle, 2018). This research would therefore
investigate the effect of media and game violence
among youth thus predicting youth aggression.
Aggression
Aggression is known as a behaviour that can cause
harm to physical and psychological. It may happen
either directly or indirectly. Aggression is a form of
social contact that is either overt or indirect and
sometimes harmful, intending to cause injury or
damage to another person. It can happen in response
to something or response to no provocation at all.
Human aggression can be affected by a lot of factors,
ranging from anger over requirement expectations to
feeling disrespect (DeBono et al., 2014). Aggression
can be caused by numerous triggers. For example,
frustration from the goal they cannot achieve.
Aggression may be an automatic response driven by
hard-wired self-protection mechanisms like fight or
flight or involve a script for aggressive behaviour that
is so commonly enacted that the response is no longer
thought-through (Anderson & Waburton, 2013).
B. Problem statement
The term ‘violence’ interchangeably with the term
‘aggression.’ Treating these as synonymous creates
miscommunications and confusion among
researchers, public policy-makers, and the general
public. Among most social psychologists, violence is
a subtype of aggression. More precisely, ‘violence’ is
aggression that is intended to cause harm extreme
enough to require medical attention or to cause death.
(Anderson & Waburton, 2013). The American
Psychological Association (APA) considers violent
B
B
YMS2021, Universiti Utara Malaysia
49
video games a risk factor for aggression. In 2017, the
APA Task Force on Violent Media concluded that
violent video game exposure was linked to increased
aggressive behaviours, thoughts, and emotions, as
well as decreased empathy. However, it is not clear
whether violent video game exposure was linked to
criminality or delinquency. World Health
Organization (WHO) defined in the 11th Revision of
the International Classification of Diseases (ICD-11)
as a pattern of gaming behaviour (“digital-gaming” or
“video-gaming”) characterized by impaired control
over gaming, increasing priority given to gaming over
other activities to the extent that gaming takes
precedence over other interests and daily activities,
and continuation or escalation of gaming despite the
occurrence of negative consequences (Addictive
Behaviors: Gaming Disorder, 2018). The awareness
about violent video games and aggression needs to be
continuous to alert society on how they should handle
it very well. The more these concerns are discussed
with the public, especially youth, our society will be
more educated and understand these matters.
The negative effects of playing video games have
become a topic of debate among various mental health
organizations and schools of thought. According to
(Robert, 2007), playing these games can harm a
person's behaviour. Then there's the possibility that
there's a connection between playing violent video
games and aggressive behaviour. Violent video games
can also desensitize people to seeing aggressive
behaviour and decrease prosocial behaviours such as
helping another person and feeling empathy (the
ability to understand others). The longer that
individuals are exposed to violent video games, the
more likely they are to have aggressive behaviours,
thoughts, and feelings.
C. Research Scope
This study scope targets 50 respondents, consisting
of male and female students from several public
universities which will be filled in the questionnaire
that will be distributed using social media randomly
within a week. After receiving the data from
respondents, the data analysis phase will be
conducted. The survey consists of a descriptive
statistical method to achieve the objective of the
analysis of obtaining violent video games that cause
aggression among public university students. The
discovery of playing video games is interesting to play
for youth. This study is also able to verify the use of
video games leads to aggressive behaviour.
II. METHODOLOGY
A. Study Design
The information is needed to collect meaningful
data for the study, as well as selecting an appropriate
location based on the study's goals. As a result, the
research was carried out at three Public Universities
(PU) in Peninsular Malaysia: PU 1, PU 2, and PU 3.
PU 1 was founded on February 16, 1984, and is
headquartered in Sintok, Kedah. In the QS World
University Rankings 2020 (UUM, 2020), PU 1 is
classed as a management university and is ranked in
the 591-600 range. The main campus is in Sintok and
PU 1 on Jalan Raja Muda Abdul Aziz are the second
campuses of PU 1. PU 2 was established as a
Malaysian public research university on June 1, 1969.
The main campus is on Penang Island, Kelantan
Health Campus, and Nibong Tebal Engineering
Campus are the third campus (USM, n.d). PU 3 is a
public university in Shah Alam, Malaysia that only
accepts Bumiputera students. PU 3 began as RIDA's
Training Center under the Rural & Industrial
Development Authority. The institution is made up of
one main campus and 34 state campuses (UiTM, n.d).
When completed at these universities, this study
focuses on violent video games that cause aggression
among youth certainly be appropriate if conducted at
these universities. This is because the university is
home to many young people that are full of new ideas,
brave, and energetic.
B. Data Gathering Technique
The research instruments utilized in this study were
online surveys created with Google Form. By reducing
geographic ranges, polls allow the analyst to reach out
to a large number of participants in a short amount of
time. This platform's recommendation is to share the
questionnaire via social media channels such as
Whatsapp (WA), Telegram, Facebook, and other
social media platforms by providing a link. The
respondents are students in various stages of their
academic careers, including foundation,
undergraduate, and postgraduate courses. Based on the
social media blitz, a random list of respondents will be
chosen. The survey will be distributed to selected
students to explain the "how" and "what" connection
between violent video games that cause aggression
among youth at public universities in Malaysia.
C. Sampling, Data Collection & Analysis
In determining the selection of respondents to
represent the population of the study, we have used
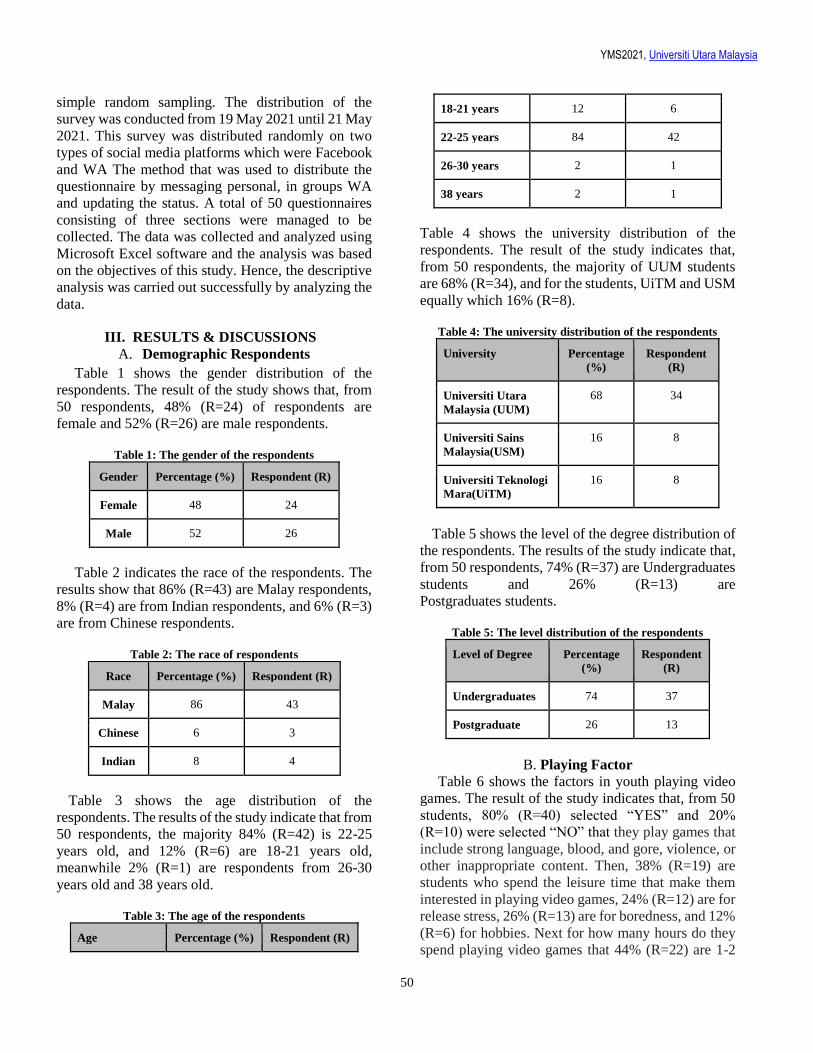
YMS2021, Universiti Utara Malaysia
50
simple random sampling. The distribution of the
survey was conducted from 19 May 2021 until 21 May
2021. This survey was distributed randomly on two
types of social media platforms which were Facebook
and WA The method that was used to distribute the
questionnaire by messaging personal, in groups WA
and updating the status. A total of 50 questionnaires
consisting of three sections were managed to be
collected. The data was collected and analyzed using
Microsoft Excel software and the analysis was based
on the objectives of this study. Hence, the descriptive
analysis was carried out successfully by analyzing the
data.
III. RESULTS & DISCUSSIONS
A. Demographic Respondents
Table 1 shows the gender distribution of the
respondents. The result of the study shows that, from
50 respondents, 48% (R=24) of respondents are
female and 52% (R=26) are male respondents.
Table 1: The gender of the respondents
Gender Percentage (%) Respondent (R)
Female 48 24
Male 52 26
Table 2 indicates the race of the respondents. The
results show that 86% (R=43) are Malay respondents,
8% (R=4) are from Indian respondents, and 6% (R=3)
are from Chinese respondents.
Table 2: The race of respondents
Race Percentage (%) Respondent (R)
Malay 86 43
Chinese 6 3
Indian 8 4
Table 3 shows the age distribution of the
respondents. The results of the study indicate that from
50 respondents, the majority 84% (R=42) is 22-25
years old, and 12% (R=6) are 18-21 years old,
meanwhile 2% (R=1) are respondents from 26-30
years old and 38 years old.
Table 3: The age of the respondents
Age Percentage (%) Respondent (R)
18-21 years 12 6
22-25 years 84 42
26-30 years 2 1
38 years 2 1
Table 4 shows the university distribution of the
respondents. The result of the study indicates that,
from 50 respondents, the majority of UUM students
are 68% (R=34), and for the students, UiTM and USM
equally which 16% (R=8).
Table 4: The university distribution of the respondents
University Percentage
(%)
Respondent
(R)
Universiti Utara
Malaysia (UUM)
68 34
Universiti Sains
Malaysia(USM)
16 8
Universiti Teknologi
Mara(UiTM)
16 8
Table 5 shows the level of the degree distribution of
the respondents. The results of the study indicate that,
from 50 respondents, 74% (R=37) are Undergraduates
students and 26% (R=13) are
Postgraduates students.
Table 5: The level distribution of the respondents
Level of Degree Percentage
(%)
Respondent
(R)
Undergraduates 74 37
Postgraduate 26 13
B. Playing Factor
Table 6 shows the factors in youth playing video
games. The result of the study indicates that, from 50
students, 80% (R=40) selected “YES” and 20%
(R=10) were selected “NO” that they play games that
include strong language, blood, and gore, violence, or
other inappropriate content. Then, 38% (R=19) are
students who spend the leisure time that make them
interested in playing video games, 24% (R=12) are for
release stress, 26% (R=13) are for boredness, and 12%
(R=6) for hobbies. Next for how many hours do they
spend playing video games that 44% (R=22) are 1-2
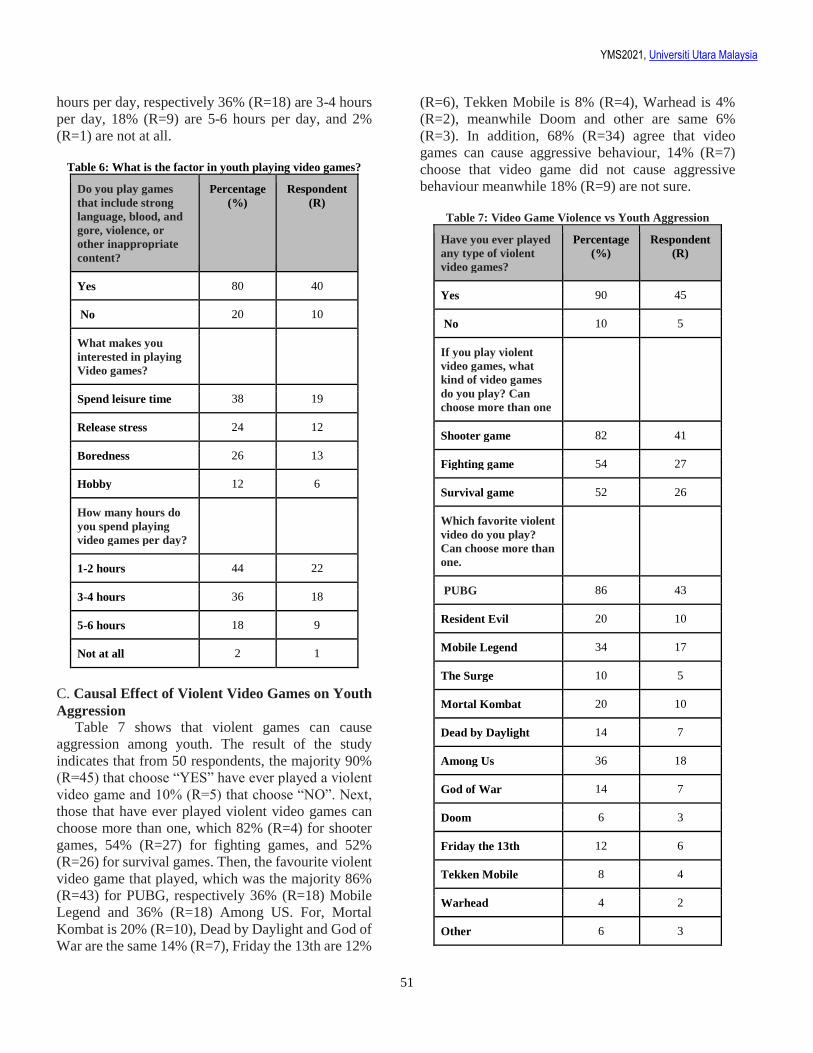
YMS2021, Universiti Utara Malaysia
51
hours per day, respectively 36% (R=18) are 3-4 hours
per day, 18% (R=9) are 5-6 hours per day, and 2%
(R=1) are not at all.
Table 6: What is the factor in youth playing video games?
Do you play games
that include strong
language, blood, and
gore, violence, or
other inappropriate
content?
Percentage
(%)
Respondent
(R)
Yes 80 40
No 20 10
What makes you
interested in playing
Video games?
Spend leisure time 38 19
Release stress 24 12
Boredness 26 13
Hobby 12 6
How many hours do
you spend playing
video games per day?
1-2 hours 44 22
3-4 hours 36 18
5-6 hours 18 9
Not at all 2 1
C. Causal Effect of Violent Video Games on Youth
Aggression
Table 7 shows that violent games can cause
aggression among youth. The result of the study
indicates that from 50 respondents, the majority 90%
(R=45) that choose “YES” have ever played a violent
video game and 10% (R=5) that choose “NO”. Next,
those that have ever played violent video games can
choose more than one, which 82% (R=4) for shooter
games, 54% (R=27) for fighting games, and 52%
(R=26) for survival games. Then, the favourite violent
video game that played, which was the majority 86%
(R=43) for PUBG, respectively 36% (R=18) Mobile
Legend and 36% (R=18) Among US. For, Mortal
Kombat is 20% (R=10), Dead by Daylight and God of
War are the same 14% (R=7), Friday the 13th are 12%
(R=6), Tekken Mobile is 8% (R=4), Warhead is 4%
(R=2), meanwhile Doom and other are same 6%
(R=3). In addition, 68% (R=34) agree that video
games can cause aggressive behaviour, 14% (R=7)
choose that video game did not cause aggressive
behaviour meanwhile 18% (R=9) are not sure.
Table 7: Video Game Violence vs Youth Aggression
Have you ever played
any type of violent
video games?
Percentage
(%)
Respondent
(R)
Yes 90 45
No 10 5
If you play violent
video games, what
kind of video games
do you play? Can
choose more than one
Shooter game 82 41
Fighting game 54 27
Survival game 52 26
Which favorite violent
video do you play?
Can choose more than
one.
PUBG 86 43
Resident Evil 20 10
Mobile Legend 34 17
The Surge 10 5
Mortal Kombat 20 10
Dead by Daylight 14 7
Among Us 36 18
God of War 14 7
Doom 6 3
Friday the 13th 12 6
Tekken Mobile 8 4
Warhead 4 2
Other 6 3
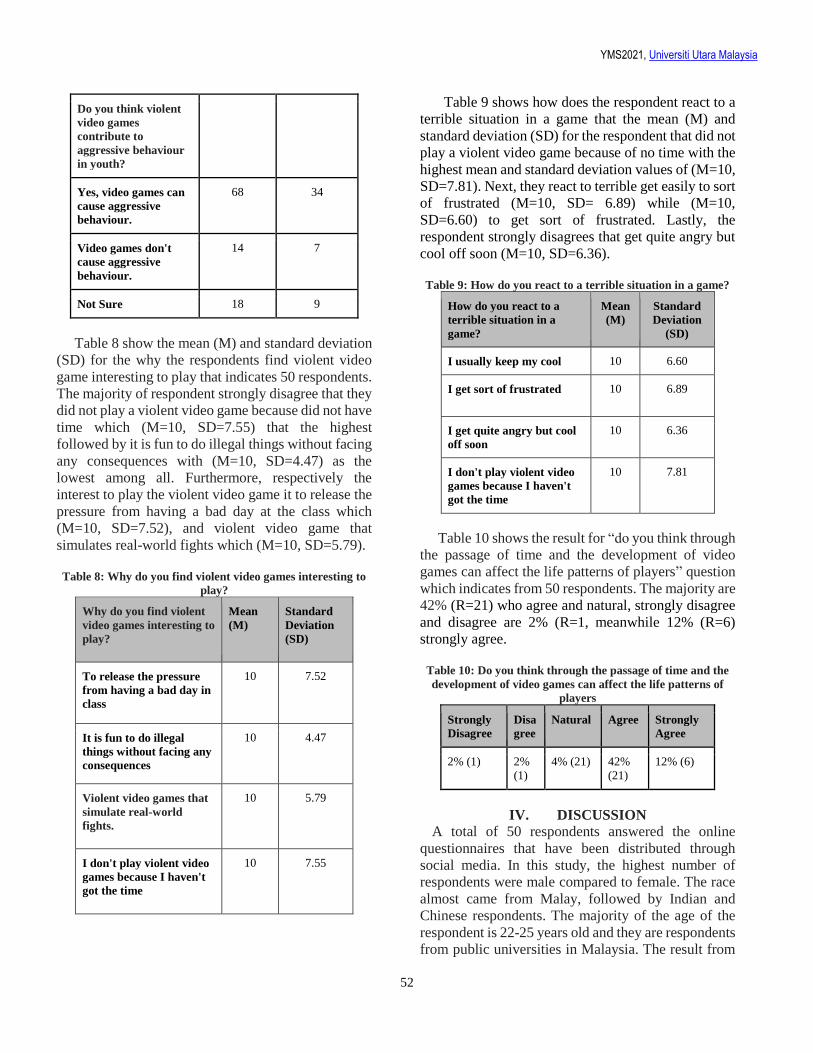
YMS2021, Universiti Utara Malaysia
52
Do you think violent
video games
contribute to
aggressive behaviour
in youth?
Yes, video games can
cause aggressive
behaviour.
68 34
Video games don't
cause aggressive
behaviour.
14 7
Not Sure 18 9
Table 8 show the mean (M) and standard deviation
(SD) for the why the respondents find violent video
game interesting to play that indicates 50 respondents.
The majority of respondent strongly disagree that they
did not play a violent video game because did not have
time which (M=10, SD=7.55) that the highest
followed by it is fun to do illegal things without facing
any consequences with (M=10, SD=4.47) as the
lowest among all. Furthermore, respectively the
interest to play the violent video game it to release the
pressure from having a bad day at the class which
(M=10, SD=7.52), and violent video game that
simulates real-world fights which (M=10, SD=5.79).
Table 8: Why do you find violent video games interesting to
play?
Why do you find violent
video games interesting to
play?
Mean
(M)
Standard
Deviation
(SD)
To release the pressure
from having a bad day in
class
10 7.52
It is fun to do illegal
things without facing any
consequences
10 4.47
Violent video games that
simulate real-world
fights.
10 5.79
I don't play violent video
games because I haven't
got the time
10 7.55
Table 9 shows how does the respondent react to a
terrible situation in a game that the mean (M) and
standard deviation (SD) for the respondent that did not
play a violent video game because of no time with the
highest mean and standard deviation values of (M=10,
SD=7.81). Next, they react to terrible get easily to sort
of frustrated (M=10, SD= 6.89) while (M=10,
SD=6.60) to get sort of frustrated. Lastly, the
respondent strongly disagrees that get quite angry but
cool off soon (M=10, SD=6.36).
Table 9: How do you react to a terrible situation in a game?
How do you react to a
terrible situation in a
game?
Mean
(M)
Standard
Deviation
(SD)
I usually keep my cool 10 6.60
I get sort of frustrated 10 6.89
I get quite angry but cool
off soon
10 6.36
I don't play violent video
games because I haven't
got the time
10 7.81
Table 10 shows the result for “do you think through
the passage of time and the development of video
games can affect the life patterns of players” question
which indicates from 50 respondents. The majority are
42% (R=21) who agree and natural, strongly disagree
and disagree are 2% (R=1, meanwhile 12% (R=6)
strongly agree.
Table 10: Do you think through the passage of time and the
development of video games can affect the life patterns of
players
Strongly
Disagree
Disa
gree
Natural Agree Strongly
Agree
2% (1) 2%
(1)
4% (21) 42%
(21)
12% (6)
IV. DISCUSSION
A total of 50 respondents answered the online
questionnaires that have been distributed through
social media. In this study, the highest number of
respondents were male compared to female. The race
almost came from Malay, followed by Indian and
Chinese respondents. The majority of the age of the
respondent is 22-25 years old and they are respondents
from public universities in Malaysia. The result from
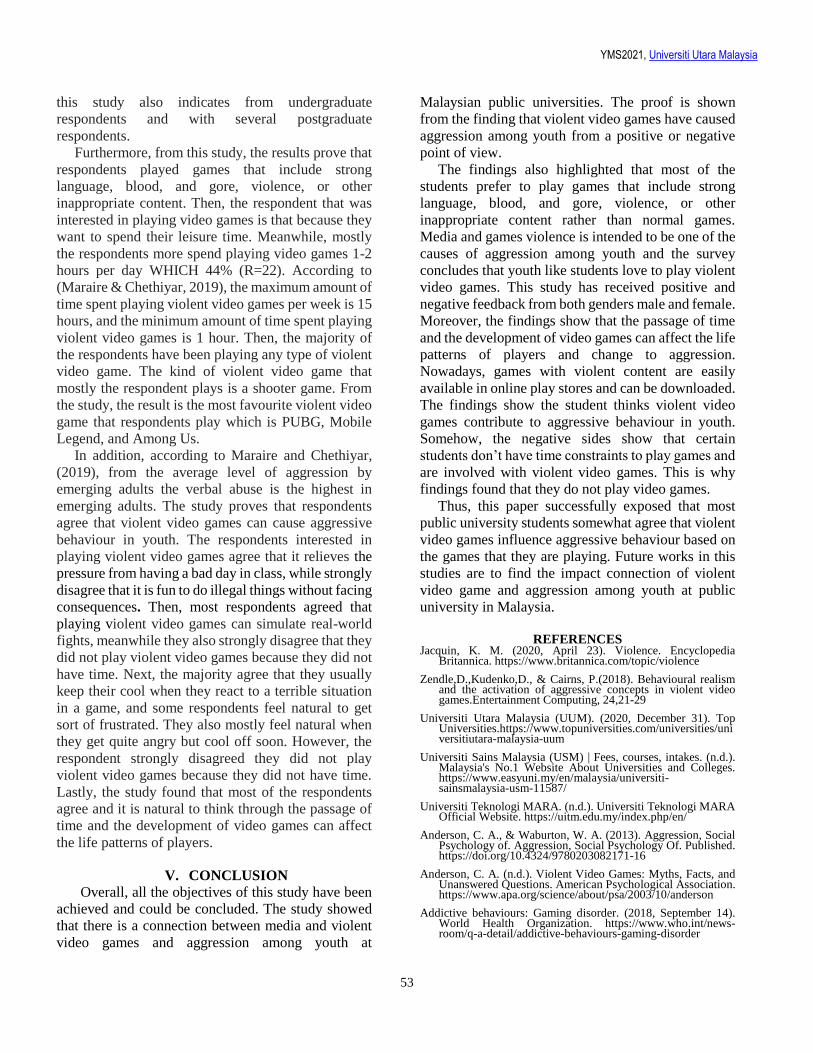
YMS2021, Universiti Utara Malaysia
53
this study also indicates from undergraduate
respondents and with several postgraduate
respondents.
Furthermore, from this study, the results prove that
respondents played games that include strong
language, blood, and gore, violence, or other
inappropriate content. Then, the respondent that was
interested in playing video games is that because they
want to spend their leisure time. Meanwhile, mostly
the respondents more spend playing video games 1-2
hours per day WHICH 44% (R=22). According to
(Maraire & Chethiyar, 2019), the maximum amount of
time spent playing violent video games per week is 15
hours, and the minimum amount of time spent playing
violent video games is 1 hour. Then, the majority of
the respondents have been playing any type of violent
video game. The kind of violent video game that
mostly the respondent plays is a shooter game. From
the study, the result is the most favourite violent video
game that respondents play which is PUBG, Mobile
Legend, and Among Us.
In addition, according to Maraire and Chethiyar,
(2019), from the average level of aggression by
emerging adults the verbal abuse is the highest in
emerging adults. The study proves that respondents
agree that violent video games can cause aggressive
behaviour in youth. The respondents interested in
playing violent video games agree that it relieves the
pressure from having a bad day in class, while strongly
disagree that it is fun to do illegal things without facing
consequences. Then, most respondents agreed that
playing violent video games can simulate real-world
fights, meanwhile they also strongly disagree that they
did not play violent video games because they did not
have time. Next, the majority agree that they usually
keep their cool when they react to a terrible situation
in a game, and some respondents feel natural to get
sort of frustrated. They also mostly feel natural when
they get quite angry but cool off soon. However, the
respondent strongly disagreed they did not play
violent video games because they did not have time.
Lastly, the study found that most of the respondents
agree and it is natural to think through the passage of
time and the development of video games can affect
the life patterns of players.
V. CONCLUSION
Overall, all the objectives of this study have been
achieved and could be concluded. The study showed
that there is a connection between media and violent
video games and aggression among youth at
Malaysian public universities. The proof is shown
from the finding that violent video games have caused
aggression among youth from a positive or negative
point of view.
The findings also highlighted that most of the
students prefer to play games that include strong
language, blood, and gore, violence, or other
inappropriate content rather than normal games.
Media and games violence is intended to be one of the
causes of aggression among youth and the survey
concludes that youth like students love to play violent
video games. This study has received positive and
negative feedback from both genders male and female.
Moreover, the findings show that the passage of time
and the development of video games can affect the life
patterns of players and change to aggression.
Nowadays, games with violent content are easily
available in online play stores and can be downloaded.
The findings show the student thinks violent video
games contribute to aggressive behaviour in youth.
Somehow, the negative sides show that certain
students don’t have time constraints to play games and
are involved with violent video games. This is why
findings found that they do not play video games.
Thus, this paper successfully exposed that most
public university students somewhat agree that violent
video games influence aggressive behaviour based on
the games that they are playing. Future works in this
studies are to find the impact connection of violent
video game and aggression among youth at public
university in Malaysia.
REFERENCES Jacquin, K. M. (2020, April 23). Violence. Encyclopedia
Britannica. https://www.britannica.com/topic/violence
Zendle,D.,Kudenko,D., & Cairns, P.(2018). Behavioural realism and the activation of aggressive concepts in violent video games.Entertainment Computing, 24,21-29
Universiti Utara Malaysia (UUM). (2020, December 31). Top Universities.https://www.topuniversities.com/universities/universitiutara-malaysia-uum
Universiti Sains Malaysia (USM) | Fees, courses, intakes. (n.d.). Malaysia's No.1 Website About Universities and Colleges. https://www.easyuni.my/en/malaysia/universiti-sainsmalaysia-usm-11587/
Universiti Teknologi MARA. (n.d.). Universiti Teknologi MARA Official Website. https://uitm.edu.my/index.php/en/
Anderson, C. A., & Waburton, W. A. (2013). Aggression, Social Psychology of. Aggression, Social Psychology Of. Published. https://doi.org/10.4324/9780203082171-16
Anderson, C. A. (n.d.). Violent Video Games: Myths, Facts, and Unanswered Questions. American Psychological Association. https://www.apa.org/science/about/psa/2003/10/anderson
Addictive behaviours: Gaming disorder. (2018, September 14). World Health Organization. https://www.who.int/news-room/q-a-detail/addictive-behaviours-gaming-disorder
YMS2021, Universiti Utara Malaysia
54
DeBono, Amber; Muraven, Mark (1 November 2014). "Rejection perceptions: feeling disrespected leads to greater aggression than feeling disliked". Journal of Experimental Social Psychology. 55: 43–52. doi:10.1016/j.jesp.2014.05.014. ISSN 0022-1031
The American Psychological Association Task Force on Violent Media. (2017). The American Psychological Association Task Force Assessment of Violent Video Games: Science in the Service of Public Interest. American Psychologist.http://dx.doi.org/10.1037/a0040413
Maraire, T., & Chethiyar, S. D. M. (2019). The nexus between violent video game playing and aggression among emerging adults at Universiti Utara Malaysia. 4, 298–308. https://doi.org/10.35631/IJEPC.4330023
YMS2021, Universiti Utara Malaysia
55
Page 55
Negative Impacts of Social Media on Youth
Phan Jia Le1, Choong Hui Zhi2, Leong Jia Wei3, Ewe Jia Yen4 & Azizah Che Omar5
1University Utara Malaysia, Malaysia, [email protected] 2University Utara Malaysia, Malaysia, [email protected]
3University Utara Malaysia, Malaysia, [email protected] 4University Utara Malaysia, Malaysia, [email protected]
5University Utara Malaysia, Malaysia, [email protected]
ABSTRACT Many studies have acknowledged the potential
negative impacts of social media on youth. This paper
discusses the negative impacts of social media on
youth from a survey that was distributed among fifty
youth through online platforms. The finding shows
that the majority of respondents choose Facebook and
WhatsApp as their most used social media in their
daily life. Besides that, the result also indicates that
most of the respondents feel addicted to social media
until it affected their study performance.
Keywords: Social Media, Negative Impacts, Social
Networking, Study, Youth.
I. INTRODUCTION In the modern era, social media and social
networks affect the youth community, and this
technology has become a part of everyone's life in
contemporary society (Abbas, Aman, Nurunnabi &
Bano, 2019). The use of social networking is a
growing phenomenon in both private and academic
lives. Young people nowadays have used this type of
society in sharing substance, entertaining,
communicating, creating communities, and learning.
They must be taught about the use of social media to
promote their professional development and self-
improvement. On the positive side, social networks
can be valuable tools for professionals. They
accomplish this goal by helping youth develop their
skills and looking for business opportunities, however
on the negative side, and the Internet is full of
numerous risks related to online communities.
The Internet is an incredibly significant thing in
daily life. In addition to education, many people
nowadays prefer to use some social media platforms
for online shopping. There is a sizable population of
people who use the Internet for pure school education
but still have a sizable community of people,
including some youth and teenagers, who use the
Internet solely for social networking. Today, online
shopping or education, social networking has mainly
become essential tools in every individual's life. Due
to the advancement of social media, human lifestyles
are changing. The word "social media" is often used
to describe emerging types of media that encourage
interactive participation (Harvey, 2014). Nowadays,
people can easily communicate through social media
using tools such as social networking sites and blogs.
The Internet is a huge technological advancement, but
when it comes to social networks, they are sometimes
incredibly dangerous for teenagers, and social
networks have become well known and become
commonplace in recent years.
II LITERATURE REVIEW
Social media now is not simply a medium of
communication but a location where can be socialized
(Miller et al., 2016). Social media should not
primarily be considered the platforms on which
individuals publish, but as the material they post.
Before social media, private discussion media or
public broadcasting media were generally available.
In a very general sense, youth is a stage of existence
between childhood and adulthood (Shafer, 2015). It is
described as a period of experimenting with roles and
identities, still free of societal standards and
obligations and steadily preparing young people as
complete members of the social collective for their
lives.
Media cultures have played a big part in
establishing meaning for youth in the world (Poyntz
& Pedri, 2018). This particularly applies to the way
knowledge is shared and learned. As a result, the
media contribute to the ongoing moulding and
transformation of learning resources. Young people
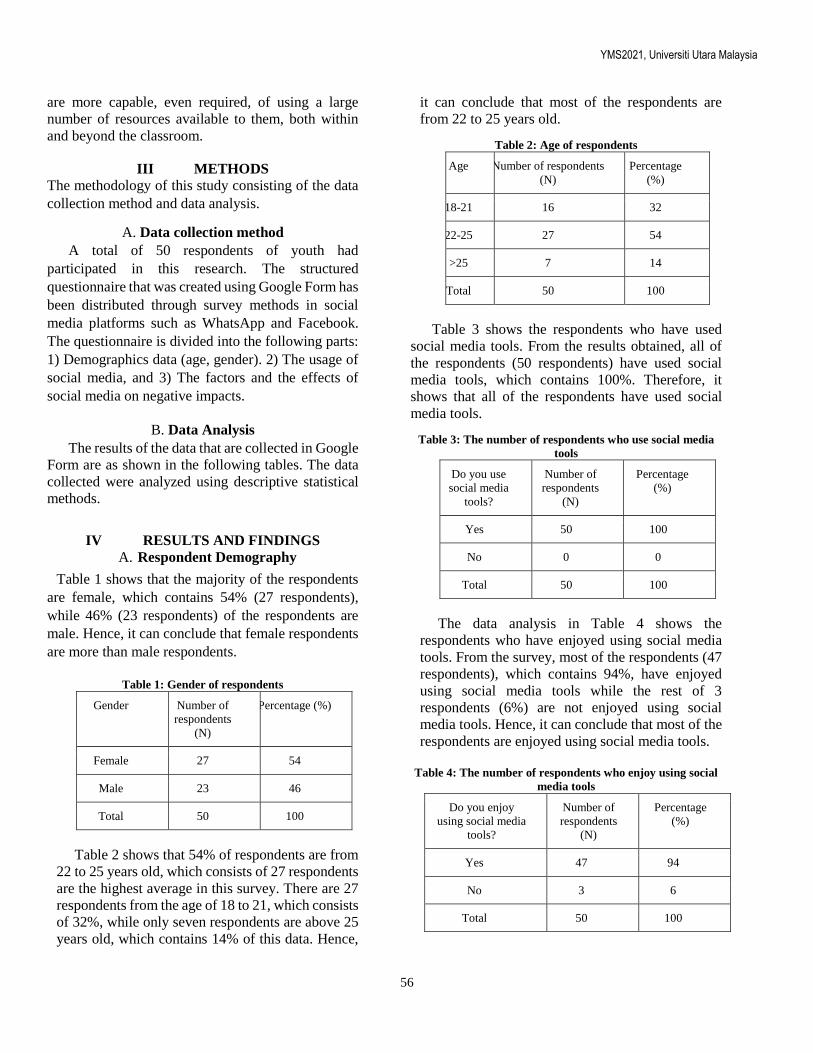
YMS2021, Universiti Utara Malaysia
56
are more capable, even required, of using a large
number of resources available to them, both within
and beyond the classroom.
III METHODS
The methodology of this study consisting of the data
collection method and data analysis.
A. Data collection method
A total of 50 respondents of youth had
participated in this research. The structured
questionnaire that was created using Google Form has
been distributed through survey methods in social
media platforms such as WhatsApp and Facebook.
The questionnaire is divided into the following parts:
1) Demographics data (age, gender). 2) The usage of
social media, and 3) The factors and the effects of
social media on negative impacts.
B. Data Analysis
The results of the data that are collected in Google
Form are as shown in the following tables. The data
collected were analyzed using descriptive statistical
methods.
IV RESULTS AND FINDINGS
A. Respondent Demography
Table 1 shows that the majority of the respondents
are female, which contains 54% (27 respondents),
while 46% (23 respondents) of the respondents are
male. Hence, it can conclude that female respondents
are more than male respondents.
Table 1: Gender of respondents
Gender Number of
respondents
(N)
Percentage (%)
Female 27 54
Male 23 46
Total 50 100
Table 2 shows that 54% of respondents are from
22 to 25 years old, which consists of 27 respondents
are the highest average in this survey. There are 27
respondents from the age of 18 to 21, which consists
of 32%, while only seven respondents are above 25
years old, which contains 14% of this data. Hence,
it can conclude that most of the respondents are
from 22 to 25 years old.
Table 2: Age of respondents
Age Number of respondents
(N)
Percentage
(%)
18-21 16 32
22-25 27 54
>25 7 14
Total 50 100
Table 3 shows the respondents who have used
social media tools. From the results obtained, all of
the respondents (50 respondents) have used social
media tools, which contains 100%. Therefore, it
shows that all of the respondents have used social
media tools.
Table 3: The number of respondents who use social media
tools
Do you use
social media
tools?
Number of
respondents
(N)
Percentage
(%)
Yes 50 100
No 0 0
Total 50 100
The data analysis in Table 4 shows the
respondents who have enjoyed using social media
tools. From the survey, most of the respondents (47
respondents), which contains 94%, have enjoyed
using social media tools while the rest of 3
respondents (6%) are not enjoyed using social
media tools. Hence, it can conclude that most of the
respondents are enjoyed using social media tools.
Table 4: The number of respondents who enjoy using social
media tools
Do you enjoy
using social media
tools?
Number of
respondents
(N)
Percentage
(%)
Yes 47 94
No 3 6
Total 50 100
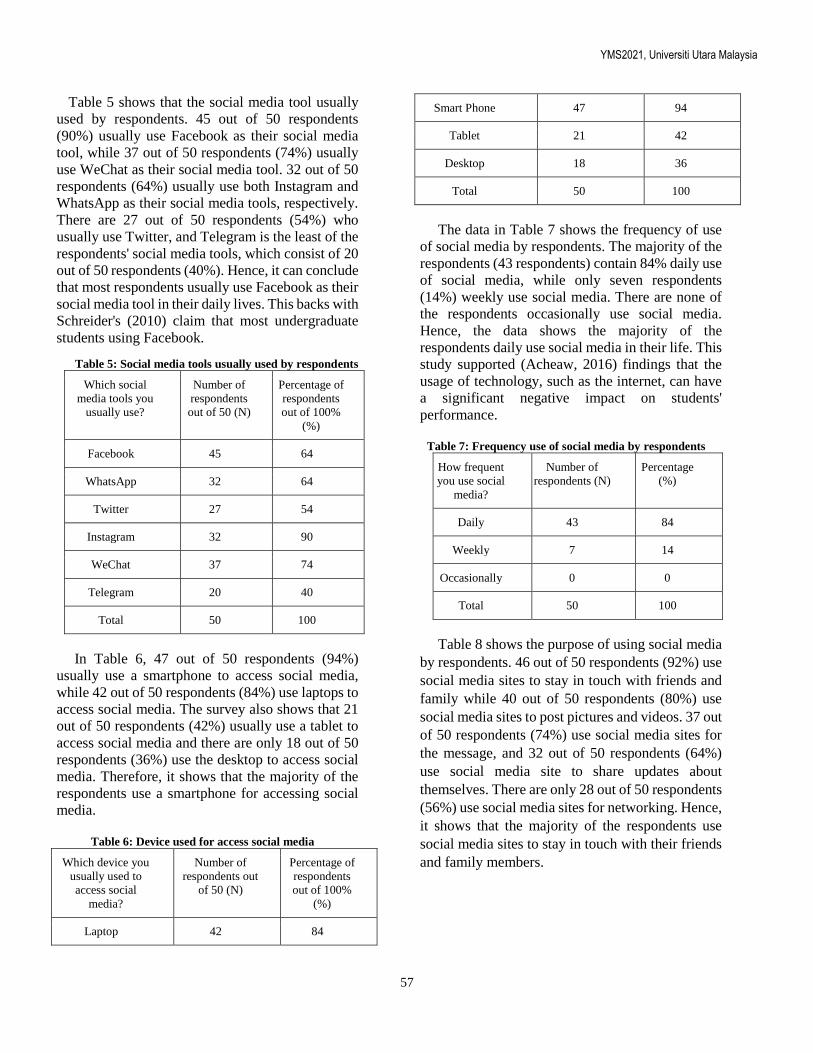
YMS2021, Universiti Utara Malaysia
57
Table 5 shows that the social media tool usually
used by respondents. 45 out of 50 respondents
(90%) usually use Facebook as their social media
tool, while 37 out of 50 respondents (74%) usually
use WeChat as their social media tool. 32 out of 50
respondents (64%) usually use both Instagram and
WhatsApp as their social media tools, respectively.
There are 27 out of 50 respondents (54%) who
usually use Twitter, and Telegram is the least of the
respondents' social media tools, which consist of 20
out of 50 respondents (40%). Hence, it can conclude
that most respondents usually use Facebook as their
social media tool in their daily lives. This backs with
Schreider's (2010) claim that most undergraduate
students using Facebook.
Table 5: Social media tools usually used by respondents
Which social
media tools you
usually use?
Number of
respondents
out of 50 (N)
Percentage of
respondents
out of 100%
(%)
Facebook 45 64
WhatsApp 32 64
Twitter 27 54
Instagram 32 90
WeChat 37 74
Telegram 20 40
Total 50 100
In Table 6, 47 out of 50 respondents (94%)
usually use a smartphone to access social media,
while 42 out of 50 respondents (84%) use laptops to
access social media. The survey also shows that 21
out of 50 respondents (42%) usually use a tablet to
access social media and there are only 18 out of 50
respondents (36%) use the desktop to access social
media. Therefore, it shows that the majority of the
respondents use a smartphone for accessing social
media.
Table 6: Device used for access social media
Which device you
usually used to
access social
media?
Number of
respondents out
of 50 (N)
Percentage of
respondents
out of 100%
(%)
Laptop 42 84
Smart Phone 47 94
Tablet 21 42
Desktop 18 36
Total 50 100
The data in Table 7 shows the frequency of use
of social media by respondents. The majority of the
respondents (43 respondents) contain 84% daily use
of social media, while only seven respondents
(14%) weekly use social media. There are none of
the respondents occasionally use social media.
Hence, the data shows the majority of the
respondents daily use social media in their life. This
study supported (Acheaw, 2016) findings that the
usage of technology, such as the internet, can have
a significant negative impact on students'
performance.
Table 7: Frequency use of social media by respondents
How frequent
you use social
media?
Number of
respondents (N)
Percentage
(%)
Daily 43 84
Weekly 7 14
Occasionally 0 0
Total 50 100
Table 8 shows the purpose of using social media
by respondents. 46 out of 50 respondents (92%) use
social media sites to stay in touch with friends and
family while 40 out of 50 respondents (80%) use
social media sites to post pictures and videos. 37 out
of 50 respondents (74%) use social media sites for
the message, and 32 out of 50 respondents (64%)
use social media site to share updates about
themselves. There are only 28 out of 50 respondents
(56%) use social media sites for networking. Hence,
it shows that the majority of the respondents use
social media sites to stay in touch with their friends
and family members.
YMS2021, Universiti Utara Malaysia
58
Table 8: Purpose of using social media
What do you use
social media sites for?
Number of
respondents
out of 50 (N)
Percentage
of
respondents
out of 100%
(%)
Sharing updates
about myself
32 64
Posting pictures
and videos
40 80
Staying in touch
with friends and
family
46 92
Messaging 37 74
Networking 28 56
Total 50 100
In Table 9, 34 out of 50 respondents (68%)
faced the problem of their social media accounts
being hacked when they used social media. Besides,
29 out of 50 respondents (58%) faced cyberbullying
when using social media, while 21 out of 50
respondents (42%) faced the problem of being
scammed when they used social media. Therefore,
the majority of the respondents faced the problems
of social media account being hacked.
Table 9: Problem faced when using social media
Problem faced
while using
social media
Number of
respondents
out of 50 (N)
Percentage of
respondents out of
100% (%)
Cyberbullying 29 58
Social media
account being
hacked
34 68
Being scammed 21 42
Total 50 100
The data analysis in Table 10 shows the disturbing
of social media by respondents in their study. The
majority of the respondents (47 respondents), which
contains 94%, think that social media will disturb
their study, but only three respondents (6%) think
that social media will not disturb their study.
Therefore, this survey shows that the majority of the
respondents think that social media will disturb
them in their study.
Table 10: Disturbing of social media by respondents on their
study
Do you think
social media
will disturb
your study?
Number of
respondents
(N)
Percentage
(%)
Yes 47 94
No 3 6
Total 50 100
Table 11 shows the data analysis of the addiction
to social media. 35 respondents (70%) think that
social media will make them addicted, while 15
respondents (30%) think that social media will not
make them addicted. Hence, this data analysis
shows that majority of the respondents think that
social media will make them addicted.
Table 11: Addiction to social media
Do you think
social media
will make you
addicted?
Number of
respondents
(N)
Percentage
(%)
Yes 35 70
No 15 30
Total 50 100
Table 12 shows the data analysis of social media
help in the study. 40 respondents (80%) think that it
does not help in their study, while 10 respondents
(30%) think that social media will help them in their
study. Hence, this data analysis shows that majority
of the respondents think that social media not
helping in their study. Most of the respondents were
aware that their usage of social media has an impact
on their academic performance, according to the
hypothesis. This was because the majority of
respondents in the study stated that they use social
networking sites for non-academic objectives. The
consequence is that respondents' academic
performance is unlikely to improve as a result of
using social media.
YMS2021, Universiti Utara Malaysia
59
Table 12: Social media help in the study
Do you think
social media
will help in
your study?
Number of
respondents
(N)
Percentage
(%)
Yes 10 10
No 40 80
Total 50 100
V. CONCLUSION
To sum up, this study found that social media give
negative impacts on youth. One of the negative
effects of social media is that it makes youth feel
addicted. When they feel addicted, they will spend a
lot of time on social media by sharing updates about
themselves, posting pictures and videos, staying in
touch with friends and family, and many more. In
addition, social media also brought bad impacts on
youth, especially in their study performance. They
can not focus and concentrate on their study when
constantly distracted by checking Facebook, Twitter,
LinkedIn, Youtube other social media updates. Most
of the negative impacts on social media can be
overcome by reducing the amount of time spent on
social network sites.
However, social media could benefit youth with
many positive impacts. Youth can get positive
impacts by control the usage of social media for
entertainment. They can use social media to study.
Social media have huge databases with study
materials for users too. Youth can catch these
opportunities to study. Besides, social media can help
students to communicate more efficient while in
distance. Social media can help youth doing their
assignment more efficient.
Furthermore, we nominate for future work more
studies and add some ways or actions to control or
reduce the usage of social media among youth. This
can help youth to know how to control the usage of
social media for entertainment and learning through
social media.
REFERENCES Acheaw, M. (2016). Social media usage and its impact on reading habits: a
study of Koforidua Polytechnic students. International Journal of Social Media And Interactive Learning Environments, 4(3), 211. doi: 10.1504/ijsmile.2016.079493
Akram, W. (2018). A Study on Positive and Negative Effects of Social Media on Society. International Journal of Computer Sciences and Engineering. Retrieved from https://www.researchgate.net/publication/323903323_A_Study_on_Positive_and_Neg ative_Effects_of_Social_Media_on_Society
Amedie, J. (2015). The Impact of Social Media on Society. Advanced Writing: Pop Culture Intersections. Retrieved from https://scholarcommons.scu.edu/cgi/viewcontent.cgi?article=1002&context=engl_176
Elisabeta Ioanăs, Ivona Stoica. (2014). Social Media and its Impact on Consumers Behavior. International Journal of Economic Practices and Theories, Vol. 4, No. 2, 2014, Special issue on Marketing and Business Development, e-ISSN 2247–7225. Retrieved from http://www.ijept.eu/index.php/ijept%20/article/view/Social_Media_and_its_Impact_on _Consumers_Behavior
Harvey, K. (2014). Encyclopedia of social media and politics. Los Angeles, Calif: SAGE.
Jaffar Abbas, Jaffar Aman, Mohammad Nurunnabi & Shaber Bano. (2019). The Impact of Social Media on Learning Behavior for Sustainable Education: Evidence of Students from Selected Universities in Pakistan. Retrieved from https://www.readcube.com/articles/10.3390/su11061683
Kennedy, K.. (2019) Positive and negative effects of social media on adolescent well being. Cornerstone: A Collection of Scholarly and Creative Works for Minnesota State University, Mankato. https://cornerstone.lib.mnsu.edu/etds/925/
Kitchenham, B. A. (2004). Systematic Reviews. 10th International Symposium on Software Metrics. Proceedings. doi:10.1109/metric.2004.1357885
Miller, D., Sinanan, J., Wang, X., McDonald, T., Haynes, N., Costa, E., ... & Nicolescu, R. (2016). How the world changed social media (p. 286). UCL Press.
Poyntz, S. R., & Pedri, J. (2018). Youth and media culture. In Oxford Research Encyclopedia of Education.
Reginald H. Gonzales. (2014). Social Media as a Channel and its Implications on Cyber Bullying. Presented at the DLSU Research Congress 2014 De La Salle University, Manila Philippines, March 6-8, 2014. Retrieved from https://www.dlsu.edu.ph/wpcontent/uploads/dlsu-research-congress-proceedings/2014/LCCS-I-009-FT.pdf
Siddiqui, S., & Singh, T. (2016). Social Media its Impact with Positive and Negative Aspects. International Journal Of Computer Applications Technology And Research, 5(2), 71-75. doi: 10.7753/ijcatr0502.1006
Shafer, I. (2015). Youth, Revolt, Recognition. The Young Generation During and After the 'Arab Spring'. Berlin: Mediterranean Institute Berlin (MIB)/HU Berlin.
Schneider N. (2010) Facebook, Other Social Network Sites Could Lead to Lower Grades for Students. http://www.associatedcontent.com/article.1650000/facebook_other_social_network_sites.html?cat=4. Retrieved 20/08/13
Selasi, K.O., Wolali, A., Charles F.O. (2016). The Impact Of Social Media On The Youth: The Ghanaian Perspective. International Journal Of Engineering Technology And Sciences (IJETS), 6(1), 90-100. http://dx.doi.org/10.15282/ijets.6.2016.1.12.1062 90 Owusu, M.A., Agatha, G.F. (2015). Use of Social Media and its Impact on Academic Performance of Tertiary Institution Students: A Study of Students of Koforidua Polytechnic, Ghana. Journal of Education and Practice, 6(6), 94-101.
YMS2021, Universiti Utara Malaysia
60
Page 60
The Influence of Media and Game Violence on Youth
Kenneth Chooi Wai Seng1, Chen Jia Rong2, Yi Si Qi3 & Ain Natasha Zulkifli4
1Universiti Utara Malaysia, Malaysia, [email protected] 2Universiti Utara Malaysia, Malaysia, [email protected]
3Universiti Utara Malaysia, Malaysia, [email protected] 4Universiti Utara Malaysia, Malaysia, [email protected]
ABSTRACT
Violent media and games have skyrocketed their
promotion in the gaming community which consists
mostly of teenagers. This is the concern of most
parents as the limits and effects of violent media and
video games on the younger generation remain
unknown. This study aims to investigate the
relationship between media and video games with
violent behaviour. The investigation includes the time
usage on media and games and the effects of the
content portrayed by media and games. This study
searched through the survey that is distributed online
to gain opinions from respondents on the influence of
media and game violence on youth. The formal
standardized questionnaire, the dichotomous
questions and the multiple-choice question were used
to collect data. Then, the data collected will be
analyzed in descriptive statistics using Microsoft
Excel. The end of the research shows that the majority
of the respondents believes that violent media and
games content will promote violent behaviour in
youth.
Keywords: Media, video games, violent behaviour,
youth
I INTRODUCTION
Recent surveys have shown widespread violence in
modern media. In addition, many children and young
people spend a lot of time consuming violent media.
Although it is clear that reducing exposure to media
violence will reduce aggression and violence, it is
unclear which interventions will reduce media
exposure. The sparse research literature shows that
anti-attitude and parental mediation interventions may
have beneficial effects, but media literacy
interventions themselves are not successful.
Although the scientific debate on whether media
violence will exacerbate aggressiveness and violence
is basically over, there are still some key tasks. In
order to better understand the underlying
psychological process, other laboratory and field
studies are needed, which will eventually lead to more
effective interventions. Large-scale longitudinal
research will help determine the extent to which media
violence affects the most serious types of violence.
Facing the greater social challenge, providing children
and adolescents with a healthier media diet may
become more difficult and costly, especially in
science, journalism, public policy, and entertainment
communities that fail to reach the public about the true
nature of media. Risk situations-exposure to violence
against children and adolescents.
For various reasons, it is time to reassess the
scientific knowledge of how media violence affects
young people and what measures can be taken to
mitigate these adverse effects (Anderson, 1997)
Research institutions on television violence continue
to grow in depth and breadth. In addition, important
changes are taking place in the field of entertainment
media use, some of which have inspired new areas of
research. The rise of new media, especially the rise of
interactive media (such as video games and the
Internet), has provided new ways for children and
young people to be exposed to violence. The role of
these new media in creating youth violence should be
considered based on existing theories and new
research.
II METHODOLOGY
This research was conducted using a quantitative
research design. Quantitative research design is
chosen because it helps to collect and analyze
numerical data. It used to find patterns and test causal
relationships and generalize results to populations
(Bhandari, 2021). A formal standardized
questionnaire (Ross, 1978) was used to collect data. A
total of 125 respondents participated in this study.
Three closed questions were asked in the
YMS2021, Universiti Utara Malaysia
61
questionnaire. Due to the covid-19 pandemic, the
questionnaire was conducted via the online form to
collect the data. The multiple-choice question (Ross,
1978) consists of 5 items that measured the total time
respondents spent on media per day was used to
answer the first question. Second, the dichotomous
question (Ross, 1978) was used to measure whether
respondents agree that media and game will affect the
violent behaviour of youth or not. The last multiple-
choice question, respondents were required to answer
the question: if media and games affect the violent
behaviour of youth, which of these content (hate
speech or graphic violence/ mental abuse/ violence
threat) in media and games will affect youth the most
for violent behaviour? After that, all the collected data
will be analyzed in descriptive statistics by using
Microsoft Excel.
III RESULTS
A. Research Question 1 How much time do you spend browsing media and playing games per day?
Table 1: Time spent by respondents on browsing media and playing games per day
Frequency (f)
Cumulative Frequency
Percentage (%)
1-3 hours per day
32 32 25.6
4-6 hours per day
17 49 13.6
7-9 hours per day
44 93 35.2
10-12 hours per day
20 113 16
More than 12 hours per day
12 125 9
Total 125 100
Table 1 shows the time spent by respondents on browsing media and playing games per day. Majority of the respondents (35.2%) spent 7 to 9 hours browsing media and playing games per day, followed by the respondents (25.6%) who browse media and play games for 1 to 3 hours per day. 13.6% of the respondents browse media and play games for 4 to 6 hours per day and 16% of the respondents only browse media and play games for 10 to 12 hours per day. A minority of respondents (9%) browse media and play games for more than 12 hours per day.
B. Research Question 2 Do you think that media and games will affect the violent behaviour of youth?
Table 2: Relationship between media and games with the violent behaviour of youth
Frequency (f)
Cumulative Frequency
Percentage (%)
Yes 86 86 68.8
No 39 125 31.2
Total 125 100
Table 2 shows the relationship between media and games with the violent behaviour of youth. A leading majority of respondents (68.8%) agreed that media and games are related to the violent behaviour of youth while the minority of respondents (31.2%) disagreed with this statement.
C. Research Question 3
If media and games affect the violent behaviour of
youth, which of these content in media and games
will affect youth the most for violent behaviour?
Table 3: Type of violent content of media and games affects
youth the most
Frequency (f)
Cumulative Frequency
Percentage (%)
Hate speech or graphic violence
62 62 49.6
Mental abuse 22 84 17.6
Violence threat
41 125 32.8
Total 125 100
Table 3 shows which violent content of media and
games affects youth the most. Majority of the
respondents (49.6%) proposed that hate speech or
graphic violence affects the violent behaviour of youth
the most, followed by the respondents (32.8%)
believes that action of violence threat in media and
games affects the violent behaviour of youth the most.
A minority of the respondents (17.6%) agreed that the
action of mental abuse will affect the violent
behaviour of youth.
IV DISCUSSION
In general, the results show that the contents portrayed
in media and games does affect the violence behaviour
of youth. The results convey that youth spends a large
YMS2021, Universiti Utara Malaysia
62
amount of time (more than half a day) browsing on
media channels and playing games. With the
advancement and the drastic improvements of media
technologies, a variety of content can be obtained
easily and quickly through media. Furthermore, the
improvements on the qualities of game’s graphics and
content had caught the attention of people to involve
themselves in the world of games. With the curiosity
on different contents of media and games, youth tend
to spend more time surfing the media and playing a
variety of games that they discovered throughout their
exploration. This is aligned with the findings from
Jean M. Twenge (2019) and Monica Anderson (2018).
The results also indicate that the majority of
respondents agreed that violence behaviour of youth is
affected by browsing media and playing games. Media
and games may contain some content which exhibits
violent behaviour that is unfiltered or unwarned by the
producer to the users of media and games. Thus, youth
are exposed to these violent contents which is easily
explored online and in the games that they usually
play. The result on this topic is consistent with the
findings from Tan Yun Hoong (2020) and Front.
Psychol(2019).
This study shows that hate speech or graphic
violence contributes the most to the violence
behaviour of youth if they are affected by media and
games compared to mental abuse and violence threat.
This proves that the act of mental abuse and violence
threatening are rarely made and found in media and
games. Moreover, the simple act of a hate speech in
the content or graphics that exhibits violence
properties are exposed more often to youth nowadays.
Thus, youth are easily affected and swayed along to
hate speeches or graphic violence that are present in
media and games. According to Jill Richmond and J.
Clare Wilson (2008), the association between violent
media and aggression is consistent and a frequent
exposure to it can contribute to the creation of an
aggressive personality. This result is also consistent
with the findings from Anderson (2003).
V CONCLUSION The majority of studies conclude that there is a relationship between the media and video games to the player's behavior. In these studies, the researchers conclude that the media and video games have an impact on the youth in their personality, emotions, reflexes, behaviors, motivations, needs, thinking way and approach to internal and external situations. On the other hand, there is another research community
that claims that the video games have no impact on the players. The researchers in this community support their assumption by conducting a set of experiments. They support their claim in two aspects. The first one is based on the game and media type and the second one is based on the time that the youth spent. Finally, from our point of view from all the existing research on this field, the impact of video games on the behavior and emotions of the youth cannot be ignored. In addition, most of the research that denied the existence of the impact of media and video games relies on a small number of participants or weak evidence.
REFERENCES Anderson, C.A. (1997). Effects of violent movies and trait irritability on
hostile feelings and aggressive thoughts. Aggressive Behavior, 23, 161–178.
Anderson, Craig & Berkowitz, Leonard & Donnerstein, Edward & Huesmann, L. & Johnson, James & Linz, Daniel & Malamuth, Neil & Wartella, Ellen. (2003). The Influence of Media Violence on Youth. Psychological Science in the Public Interest. 4. 10.1111/j.1529-1006.2003.pspi_1433.x.
Bhandari, P. (2021, February 15). What Is Quantitative Research?: Definition, Uses and Methods. Scribbr. http://www.scribbr.com/methodology/quantitative-research/.
Jean M. Twenge, Gabrielle N. Martin and Brian H. Spitzberg (2019). Trends in U.S. Adolescents’ Media Use, 1976 –2016: The Rise of Digital Media, the Decline of TV, and the (Near) Demise of Print.
Jill Richmond and J. Clare Wilson (2008). Are Graphic Media Violence, Aggression and Moral Disengagement Related?
Monica A and JingJing J(2018). Teens, Social Media and Technology
Ross, K. N. (1978). Sample design for educational survey research. Pergamon.
Shao R and Wang Y (2019). The Relation of Violent Video Games to Adolescent Aggression: An Examination of Moderated Mediation Effect.
Tan Yun Hoong, Paul GnanaSelvam Pakirnathan, Irene Law Hong Ling (2020). The effect of media violence on the verbal aggressive behaviours of Malaysian Chinese Independent Secondary School students
YMS2021, Universiti Utara Malaysia
63
Best Paper Nominee
Media and Game Violence among Youth in Malaysia
Nurainaazuwa Zulkipli1, Nurul Syahirah Khalid2,
Nazifa Zafirah Abdul Halim3 and Siti Nor Hamidah Hidayah Abd Jalil4
1,2,3,4School of Multimedia Technology and Communication, Universiti Utara Malaysia (UUM), Sintok Kedah, Malaysia [email protected] [email protected] [email protected] [email protected]
ABSTRACT
It is a widespread concern that violence is now very
common in the media but this study focuses on the
context of video games. Forty participants from
university students in Malaysia took part in the data
collection of survey questionnaires to examine this
issue. The study concluded that there is a strong
relation between youth, media, and gaming violence
which affect behavioral aggressiveness among
Malaysian. These findings have their own limitations
and future research in this area was discussed.
Keywords: Youth, Media, Game, Violence
I INTRODUCTION
Concerns that violent media and video games
contribute to violence against youth have been part of
community dialogue for some time now. For statistical
purposes, the United Nations describes ‘youth’ as
those between the ages of 15 and 24 years. The
growing youth of today face various challenges of new
things in their lives. From this life they learn
something and apply it in life. However, in today's
reality the media and even games are things that have
become a trend or things that young people do to spend
time and these people are more exposed to the things
that are fun and satisfying.
Media is a constant evolving field, and the game
industry has also undergone revolutionary changes.
People in the twentieth century experienced
significant psychological and social changes as a
result of the advent of mass media. Radio, television,
film, music, video games, and computer networks are
all important parts of our everyday lives. Our views,
attitudes, and ideals have also been influenced by the
media. Almost all family traditions now include
watching television. Television viewing is not
necessarily a family activity. For example, most
families have a television set, and a few young people
like to watch television in their private bedroom.
Sometimes when watching television, young people
will be isolated from other activities or watch alone.
Therefore, they are likely to be exposed to all kinds of
content that may be violent and aggressive in nature
(Abid Zafar, Umar Ghazanfar Chaudhary, 2018). In addition, the violence shown on television has a
very serious and harmful impact on the lives of young
people. It enables them to take and accept aggressive
behaviors against others. After watching a lot of
violence in the media, they began to think in a similar
way. They may think that violence is common in the
real world. This makes them feel terrified. After
watching crime and violence movies, young people
imitate the performances they watch. Aggression can
be defined as conduct designed to hurt another
individual who does not want to be harmed. Physical
violence includes punching, biting, pinching, slashing,
and shooting.
Furthermore, almost all young people in the
developed world are now playing video games, and
this popularity has raised concerns about the possible
negative effects of this entertainment activity
(Przybylski, 2019). Based on a study by René Weber
et.al., 2020, it said that the relationship between
violent video game play and offensive thoughts and
behaviors has been intensely debated in the public
domain and academia. However, due to the emphasis
on violent behavior in video games, it has led to the
development of video games. Other aspects were
forgotten in the connection with aggressiveness,
which were not visible in film or television (Andre
Dowset, 2019). Video games are a common form of
entertainment for young people, especially boys.
Video games are mainly violent games, and every
young person likes video games. Most of them spend
at least two hours a week playing video games (Abid
Zafar, 2018).
B
B
YMS2021, Universiti Utara Malaysia
64
Moreover, video games consist of various types of
these same violent or non-violent games. In this study,
it relied on youth to accurately report their video
games usage. We can know whether today’s youth are
vulnerable to video games. Among them, some may
choose games that have elements of violence such as
action or war video games that are quite popular today
such as PUBG and Mobile Legends. Games like this
can bring good or bad impact depending on how the
youth themselves control their situation after playing
video games. However, there are also games that teach
the youth, which are able to stimulate the brain to think
faster, be smart in strategy and so on.
Focusing on the background of video games, it
clearly shows the impact of such games on
individuals, especially young people who play games.
The media and video games will bring either a positive
or negative influence to today’s youth. However, in
this study, we can see the relationship between the
media and this game of violence to youth. Therefore,
the purpose of this study was designed primarily to
review on topic media and game violence among
youth in Malaysia. This study will help youth to
understand the pros and cons gained from media and
games. Also, this study helps them to be aware of the
violence that appears in the media and also video
games.
II LITERATURE REVIEW
Now technology is evolving rapidly and the
dominant people who use it are millennials, generation
Y and Z. Currently, they are in their youth age and
phase which means they love to play, especially
games.
Video games nowadays have become increasingly
advanced as it starts to mimic natural behaviors
including containing violence such as the model
characters’ expression, movements, realistics
environments, sounds and weapon controllers to make
the user feel more engaged in the game storyline
(Farrar et. al., 2017).
A study by DeCamp et al. (2017) uses survey
research designed of questionnaires that measures
violent video game exposure and other factors on
youth violence in eighth grade (n=5133) and eleventh
grade (n=3886) from Delaware School Survey (DSS).
In that research, results yield overall mixed-to-null
results by using time spent playing violent video
games as measure which suggest that video games
play either very little or no role in youth violence.
The limitation from the study is that it only
studies whether violent video games contribute to
youth violence among scholars (young youth). Game
violence is a topic that has been much researched
outside of Malaysia and other factors such as the
media aspect are also important to fill the gaps. So,
further study needs to be done among university
students (adult youth) in Malaysia.
Media Television
In addition, digital media have become an inextricable
part of daily life. It is really worth considering if
people's constant exposure to television has an impact
on them, particularly if negative effects are a
possibility. In fact, through television programs, it is
much more violent even in cartoon shows. So, the
diversity of television channels has an element of
violence and has influenced children in terms of their
behavior, attitudes, action and so on. It can be
concluded that media violence is one of the risk factors
for attacks (Patrick KBenderet et al., 2018).
According to Abid Zafar and Umar Ghazanfar
Chaudhary (2018), a study of 110 mothers with
children aged 4 to 12 years discovered through a
survey that these children are vulnerable to violence,
especially in the form of media. By introducing
teenagers into violent video games, aggressive
perceptions and behaviors can be improved, which can
also be supported, which can be measured by playing
various violent and non-violent games (Qian Zhanget
et al., 2021). While the researchers from (Andre
Dowsett et al., 2019) focus on those aged between 18
and 53 years from Australian metropolitan university,
they evaluated using real experimental designs and the
same play environment. The researchers focused on
competition and the influence of violence is in
aggression.
The research of this study states that media
violence like television is the largest platform that
causes violence among children and the widespread
use of computers can also cause violence. This is
because when children watch television on their own,
they will be exposed to a variety of content that may
contain violence or be detrimental to children in other
ways (Abid Zafar et al., 2018). The author also said
over 90.2% said that excessive exposure to television
and the dimension of violence causes more negative
behaviors to occur towards children.
Finally, television for example, is a form of media
that influences children's behaviour. This is because
we all know how easily children can be affected or
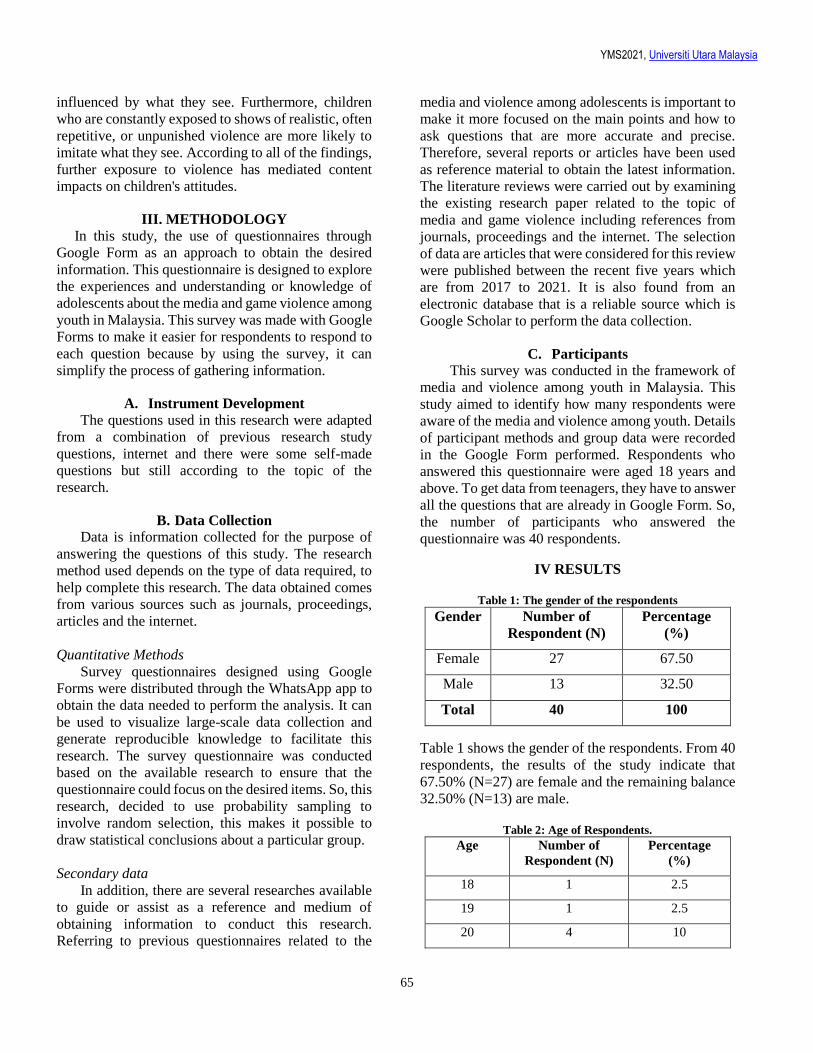
YMS2021, Universiti Utara Malaysia
65
influenced by what they see. Furthermore, children
who are constantly exposed to shows of realistic, often
repetitive, or unpunished violence are more likely to
imitate what they see. According to all of the findings,
further exposure to violence has mediated content
impacts on children's attitudes.
III. METHODOLOGY In this study, the use of questionnaires through
Google Form as an approach to obtain the desired
information. This questionnaire is designed to explore
the experiences and understanding or knowledge of
adolescents about the media and game violence among
youth in Malaysia. This survey was made with Google
Forms to make it easier for respondents to respond to
each question because by using the survey, it can
simplify the process of gathering information.
A. Instrument Development
The questions used in this research were adapted
from a combination of previous research study
questions, internet and there were some self-made
questions but still according to the topic of the
research.
B. Data Collection
Data is information collected for the purpose of
answering the questions of this study. The research
method used depends on the type of data required, to
help complete this research. The data obtained comes
from various sources such as journals, proceedings,
articles and the internet.
Quantitative Methods
Survey questionnaires designed using Google
Forms were distributed through the WhatsApp app to
obtain the data needed to perform the analysis. It can
be used to visualize large-scale data collection and
generate reproducible knowledge to facilitate this
research. The survey questionnaire was conducted
based on the available research to ensure that the
questionnaire could focus on the desired items. So, this
research, decided to use probability sampling to
involve random selection, this makes it possible to
draw statistical conclusions about a particular group.
Secondary data
In addition, there are several researches available
to guide or assist as a reference and medium of
obtaining information to conduct this research.
Referring to previous questionnaires related to the
media and violence among adolescents is important to
make it more focused on the main points and how to
ask questions that are more accurate and precise.
Therefore, several reports or articles have been used
as reference material to obtain the latest information.
The literature reviews were carried out by examining
the existing research paper related to the topic of
media and game violence including references from
journals, proceedings and the internet. The selection
of data are articles that were considered for this review
were published between the recent five years which
are from 2017 to 2021. It is also found from an
electronic database that is a reliable source which is
Google Scholar to perform the data collection.
C. Participants
This survey was conducted in the framework of
media and violence among youth in Malaysia. This
study aimed to identify how many respondents were
aware of the media and violence among youth. Details
of participant methods and group data were recorded
in the Google Form performed. Respondents who
answered this questionnaire were aged 18 years and
above. To get data from teenagers, they have to answer
all the questions that are already in Google Form. So,
the number of participants who answered the
questionnaire was 40 respondents.
IV RESULTS
Table 1: The gender of the respondents
Gender Number of
Respondent (N)
Percentage
(%)
Female 27 67.50
Male 13 32.50
Total 40 100
Table 1 shows the gender of the respondents. From 40
respondents, the results of the study indicate that
67.50% (N=27) are female and the remaining balance
32.50% (N=13) are male.
Table 2: Age of Respondents.
Age Number of
Respondent (N)
Percentage
(%)
18 1 2.5
19 1 2.5
20 4 10
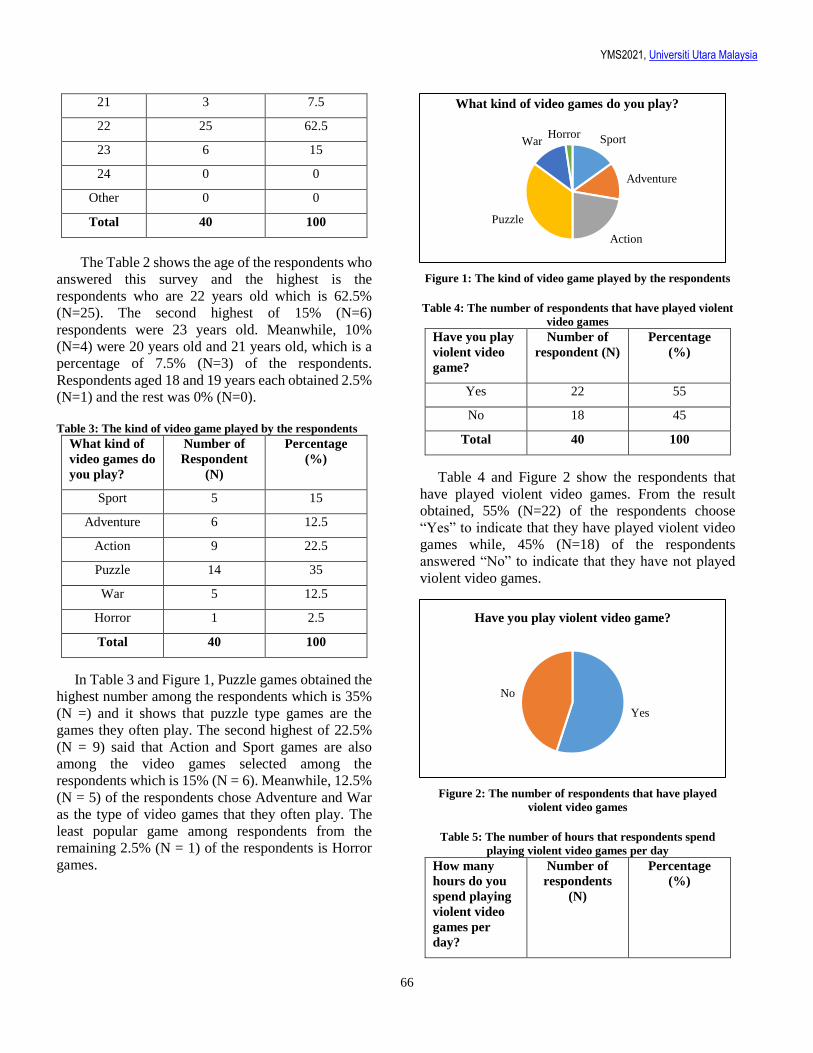
YMS2021, Universiti Utara Malaysia
66
21 3 7.5
22 25 62.5
23 6 15
24 0 0
Other 0 0
Total 40 100
The Table 2 shows the age of the respondents who
answered this survey and the highest is the
respondents who are 22 years old which is 62.5%
(N=25). The second highest of 15% (N=6)
respondents were 23 years old. Meanwhile, 10%
(N=4) were 20 years old and 21 years old, which is a
percentage of 7.5% (N=3) of the respondents.
Respondents aged 18 and 19 years each obtained 2.5%
(N=1) and the rest was 0% (N=0).
Table 3: The kind of video game played by the respondents
What kind of
video games do
you play?
Number of
Respondent
(N)
Percentage
(%)
Sport 5 15
Adventure 6 12.5
Action 9 22.5
Puzzle 14 35
War 5 12.5
Horror 1 2.5
Total 40 100
In Table 3 and Figure 1, Puzzle games obtained the
highest number among the respondents which is 35%
(N =) and it shows that puzzle type games are the
games they often play. The second highest of 22.5%
(N = 9) said that Action and Sport games are also
among the video games selected among the
respondents which is 15% (N = 6). Meanwhile, 12.5%
(N = 5) of the respondents chose Adventure and War
as the type of video games that they often play. The
least popular game among respondents from the
remaining 2.5% (N = 1) of the respondents is Horror
games.
Figure 1: The kind of video game played by the respondents
Table 4: The number of respondents that have played violent
video games
Have you play
violent video
game?
Number of
respondent (N)
Percentage
(%)
Yes 22 55
No 18 45
Total 40 100
Table 4 and Figure 2 show the respondents that
have played violent video games. From the result
obtained, 55% (N=22) of the respondents choose
“Yes” to indicate that they have played violent video
games while, 45% (N=18) of the respondents
answered “No” to indicate that they have not played
violent video games.
Figure 2: The number of respondents that have played
violent video games
Table 5: The number of hours that respondents spend
playing violent video games per day
How many
hours do you
spend playing
violent video
games per
day?
Number of
respondents
(N)
Percentage
(%)
Sport
Adventure
Action
Puzzle
WarHorror
What kind of video games do you play?
Yes
No
Have you play violent video game?
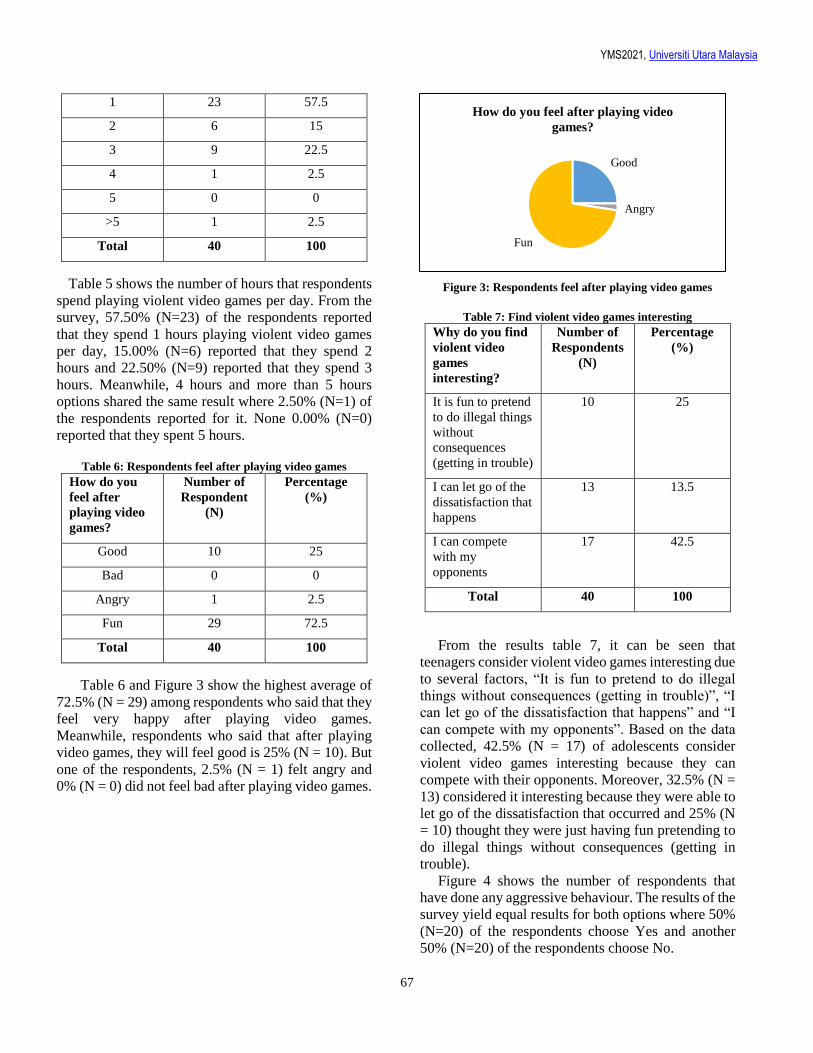
YMS2021, Universiti Utara Malaysia
67
1 23 57.5
2 6 15
3 9 22.5
4 1 2.5
5 0 0
>5 1 2.5
Total 40 100
Table 5 shows the number of hours that respondents
spend playing violent video games per day. From the
survey, 57.50% (N=23) of the respondents reported
that they spend 1 hours playing violent video games
per day, 15.00% (N=6) reported that they spend 2
hours and 22.50% (N=9) reported that they spend 3
hours. Meanwhile, 4 hours and more than 5 hours
options shared the same result where 2.50% (N=1) of
the respondents reported for it. None 0.00% (N=0)
reported that they spent 5 hours.
Table 6: Respondents feel after playing video games
How do you
feel after
playing video
games?
Number of
Respondent
(N)
Percentage
(%)
Good 10 25
Bad 0 0
Angry 1 2.5
Fun 29 72.5
Total 40 100
Table 6 and Figure 3 show the highest average of
72.5% (N = 29) among respondents who said that they
feel very happy after playing video games.
Meanwhile, respondents who said that after playing
video games, they will feel good is 25% (N = 10). But
one of the respondents, 2.5% (N = 1) felt angry and
0% (N = 0) did not feel bad after playing video games.
Figure 3: Respondents feel after playing video games
Table 7: Find violent video games interesting
Why do you find
violent video
games
interesting?
Number of
Respondents
(N)
Percentage
(%)
It is fun to pretend
to do illegal things
without
consequences
(getting in trouble)
10 25
I can let go of the
dissatisfaction that
happens
13 13.5
I can compete
with my
opponents
17 42.5
Total 40 100
From the results table 7, it can be seen that
teenagers consider violent video games interesting due
to several factors, “It is fun to pretend to do illegal
things without consequences (getting in trouble)”, “I
can let go of the dissatisfaction that happens” and “I
can compete with my opponents”. Based on the data
collected, 42.5% (N = 17) of adolescents consider
violent video games interesting because they can
compete with their opponents. Moreover, 32.5% (N =
13) considered it interesting because they were able to
let go of the dissatisfaction that occurred and 25% (N
= 10) thought they were just having fun pretending to
do illegal things without consequences (getting in
trouble).
Figure 4 shows the number of respondents that
have done any aggressive behaviour. The results of the
survey yield equal results for both options where 50%
(N=20) of the respondents choose Yes and another
50% (N=20) of the respondents choose No.
Good
Angry
Fun
How do you feel after playing video
games?
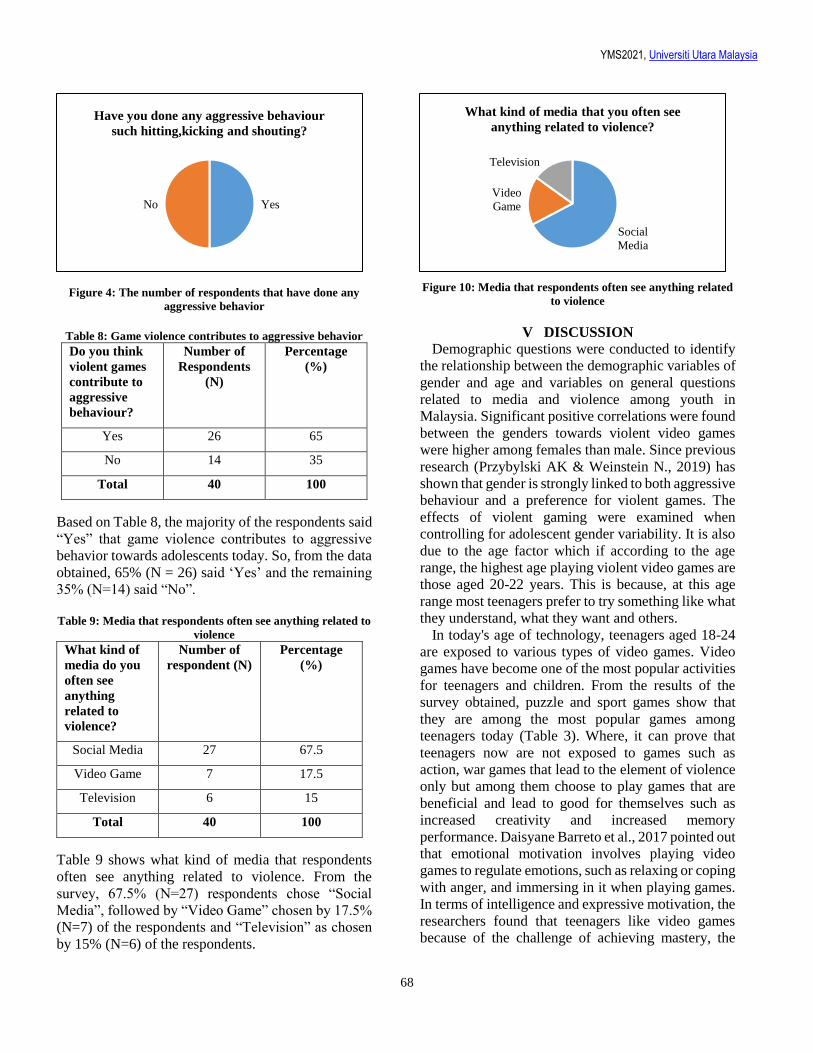
YMS2021, Universiti Utara Malaysia
68
Figure 4: The number of respondents that have done any
aggressive behavior
Table 8: Game violence contributes to aggressive behavior
Do you think
violent games
contribute to
aggressive
behaviour?
Number of
Respondents
(N)
Percentage
(%)
Yes 26 65
No 14 35
Total 40 100
Based on Table 8, the majority of the respondents said
“Yes” that game violence contributes to aggressive
behavior towards adolescents today. So, from the data
obtained, 65% (N = 26) said ‘Yes’ and the remaining
35% (N=14) said “No”.
Table 9: Media that respondents often see anything related to
violence
What kind of
media do you
often see
anything
related to
violence?
Number of
respondent (N)
Percentage
(%)
Social Media 27 67.5
Video Game 7 17.5
Television 6 15
Total 40 100
Table 9 shows what kind of media that respondents
often see anything related to violence. From the
survey, 67.5% (N=27) respondents chose “Social
Media”, followed by “Video Game” chosen by 17.5%
(N=7) of the respondents and “Television” as chosen
by 15% (N=6) of the respondents.
Figure 10: Media that respondents often see anything related
to violence
V DISCUSSION
Demographic questions were conducted to identify
the relationship between the demographic variables of
gender and age and variables on general questions
related to media and violence among youth in
Malaysia. Significant positive correlations were found
between the genders towards violent video games
were higher among females than male. Since previous
research (Przybylski AK & Weinstein N., 2019) has
shown that gender is strongly linked to both aggressive
behaviour and a preference for violent games. The
effects of violent gaming were examined when
controlling for adolescent gender variability. It is also
due to the age factor which if according to the age
range, the highest age playing violent video games are
those aged 20-22 years. This is because, at this age
range most teenagers prefer to try something like what
they understand, what they want and others.
In today's age of technology, teenagers aged 18-24
are exposed to various types of video games. Video
games have become one of the most popular activities
for teenagers and children. From the results of the
survey obtained, puzzle and sport games show that
they are among the most popular games among
teenagers today (Table 3). Where, it can prove that
teenagers now are not exposed to games such as
action, war games that lead to the element of violence
only but among them choose to play games that are
beneficial and lead to good for themselves such as
increased creativity and increased memory
performance. Daisyane Barreto et al., 2017 pointed out
that emotional motivation involves playing video
games to regulate emotions, such as relaxing or coping
with anger, and immersing in it when playing games.
In terms of intelligence and expressive motivation, the
researchers found that teenagers like video games
because of the challenge of achieving mastery, the
YesNo
Have you done any aggressive behaviour
such hitting,kicking and shouting?
Social
Media
Video
Game
Television
What kind of media that you often see
anything related to violence?
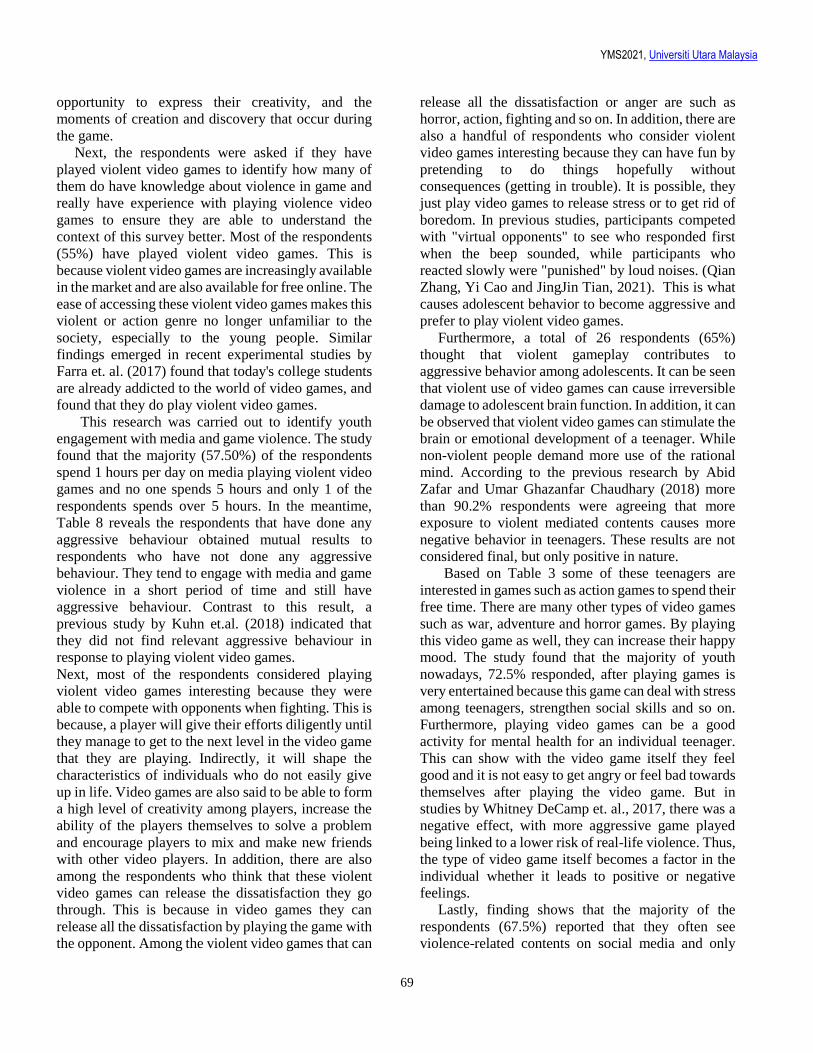
YMS2021, Universiti Utara Malaysia
69
opportunity to express their creativity, and the
moments of creation and discovery that occur during
the game.
Next, the respondents were asked if they have
played violent video games to identify how many of
them do have knowledge about violence in game and
really have experience with playing violence video
games to ensure they are able to understand the
context of this survey better. Most of the respondents
(55%) have played violent video games. This is
because violent video games are increasingly available
in the market and are also available for free online. The
ease of accessing these violent video games makes this
violent or action genre no longer unfamiliar to the
society, especially to the young people. Similar
findings emerged in recent experimental studies by
Farra et. al. (2017) found that today's college students
are already addicted to the world of video games, and
found that they do play violent video games.
This research was carried out to identify youth
engagement with media and game violence. The study
found that the majority (57.50%) of the respondents
spend 1 hours per day on media playing violent video
games and no one spends 5 hours and only 1 of the
respondents spends over 5 hours. In the meantime,
Table 8 reveals the respondents that have done any
aggressive behaviour obtained mutual results to
respondents who have not done any aggressive
behaviour. They tend to engage with media and game
violence in a short period of time and still have
aggressive behaviour. Contrast to this result, a
previous study by Kuhn et.al. (2018) indicated that
they did not find relevant aggressive behaviour in
response to playing violent video games.
Next, most of the respondents considered playing
violent video games interesting because they were
able to compete with opponents when fighting. This is
because, a player will give their efforts diligently until
they manage to get to the next level in the video game
that they are playing. Indirectly, it will shape the
characteristics of individuals who do not easily give
up in life. Video games are also said to be able to form
a high level of creativity among players, increase the
ability of the players themselves to solve a problem
and encourage players to mix and make new friends
with other video players. In addition, there are also
among the respondents who think that these violent
video games can release the dissatisfaction they go
through. This is because in video games they can
release all the dissatisfaction by playing the game with
the opponent. Among the violent video games that can
release all the dissatisfaction or anger are such as
horror, action, fighting and so on. In addition, there are
also a handful of respondents who consider violent
video games interesting because they can have fun by
pretending to do things hopefully without
consequences (getting in trouble). It is possible, they
just play video games to release stress or to get rid of
boredom. In previous studies, participants competed
with "virtual opponents" to see who responded first
when the beep sounded, while participants who
reacted slowly were "punished" by loud noises. (Qian
Zhang, Yi Cao and JingJin Tian, 2021). This is what
causes adolescent behavior to become aggressive and
prefer to play violent video games.
Furthermore, a total of 26 respondents (65%)
thought that violent gameplay contributes to
aggressive behavior among adolescents. It can be seen
that violent use of video games can cause irreversible
damage to adolescent brain function. In addition, it can
be observed that violent video games can stimulate the
brain or emotional development of a teenager. While
non-violent people demand more use of the rational
mind. According to the previous research by Abid
Zafar and Umar Ghazanfar Chaudhary (2018) more
than 90.2% respondents were agreeing that more
exposure to violent mediated contents causes more
negative behavior in teenagers. These results are not
considered final, but only positive in nature.
Based on Table 3 some of these teenagers are
interested in games such as action games to spend their
free time. There are many other types of video games
such as war, adventure and horror games. By playing
this video game as well, they can increase their happy
mood. The study found that the majority of youth
nowadays, 72.5% responded, after playing games is
very entertained because this game can deal with stress
among teenagers, strengthen social skills and so on.
Furthermore, playing video games can be a good
activity for mental health for an individual teenager.
This can show with the video game itself they feel
good and it is not easy to get angry or feel bad towards
themselves after playing the video game. But in
studies by Whitney DeCamp et. al., 2017, there was a
negative effect, with more aggressive game played
being linked to a lower risk of real-life violence. Thus,
the type of video game itself becomes a factor in the
individual whether it leads to positive or negative
feelings.
Lastly, finding shows that the majority of the
respondents (67.5%) reported that they often see
violence-related contents on social media and only
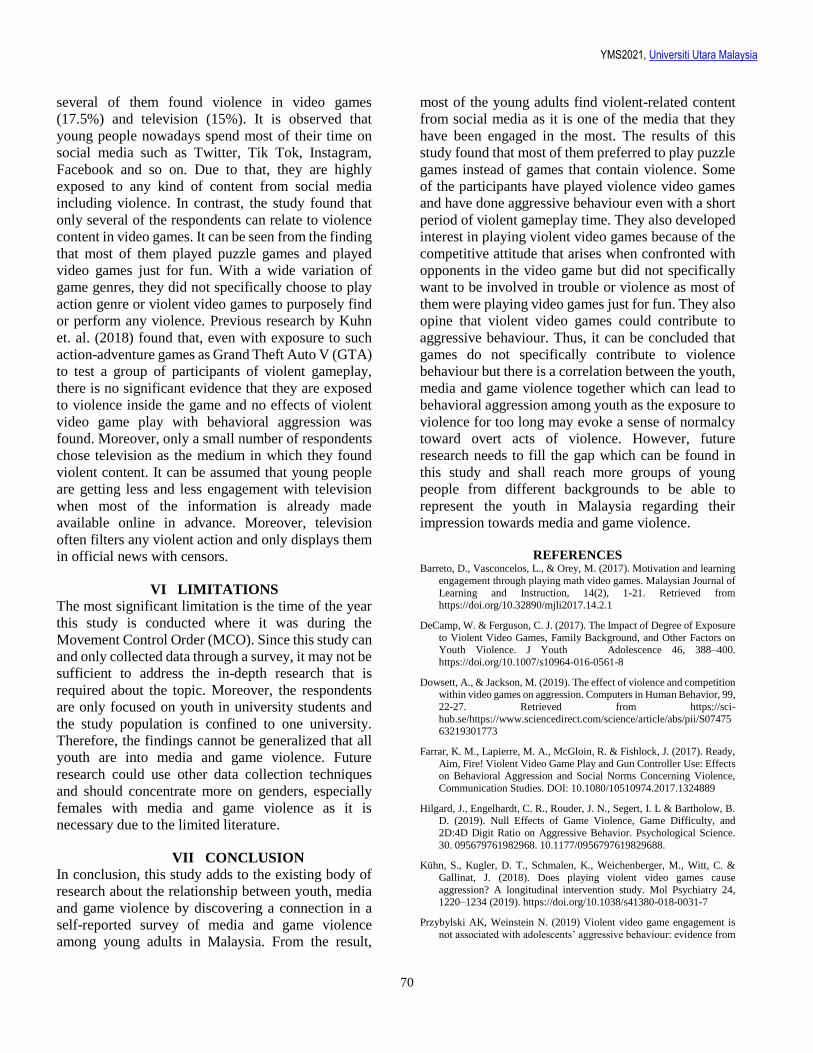
YMS2021, Universiti Utara Malaysia
70
several of them found violence in video games
(17.5%) and television (15%). It is observed that
young people nowadays spend most of their time on
social media such as Twitter, Tik Tok, Instagram,
Facebook and so on. Due to that, they are highly
exposed to any kind of content from social media
including violence. In contrast, the study found that
only several of the respondents can relate to violence
content in video games. It can be seen from the finding
that most of them played puzzle games and played
video games just for fun. With a wide variation of
game genres, they did not specifically choose to play
action genre or violent video games to purposely find
or perform any violence. Previous research by Kuhn
et. al. (2018) found that, even with exposure to such
action-adventure games as Grand Theft Auto V (GTA)
to test a group of participants of violent gameplay,
there is no significant evidence that they are exposed
to violence inside the game and no effects of violent
video game play with behavioral aggression was
found. Moreover, only a small number of respondents
chose television as the medium in which they found
violent content. It can be assumed that young people
are getting less and less engagement with television
when most of the information is already made
available online in advance. Moreover, television
often filters any violent action and only displays them
in official news with censors.
VI LIMITATIONS The most significant limitation is the time of the year
this study is conducted where it was during the
Movement Control Order (MCO). Since this study can
and only collected data through a survey, it may not be
sufficient to address the in-depth research that is
required about the topic. Moreover, the respondents
are only focused on youth in university students and
the study population is confined to one university.
Therefore, the findings cannot be generalized that all
youth are into media and game violence. Future
research could use other data collection techniques
and should concentrate more on genders, especially
females with media and game violence as it is
necessary due to the limited literature.
VII CONCLUSION In conclusion, this study adds to the existing body of
research about the relationship between youth, media
and game violence by discovering a connection in a
self-reported survey of media and game violence
among young adults in Malaysia. From the result,
most of the young adults find violent-related content
from social media as it is one of the media that they
have been engaged in the most. The results of this
study found that most of them preferred to play puzzle
games instead of games that contain violence. Some
of the participants have played violence video games
and have done aggressive behaviour even with a short
period of violent gameplay time. They also developed
interest in playing violent video games because of the
competitive attitude that arises when confronted with
opponents in the video game but did not specifically
want to be involved in trouble or violence as most of
them were playing video games just for fun. They also
opine that violent video games could contribute to
aggressive behaviour. Thus, it can be concluded that
games do not specifically contribute to violence
behaviour but there is a correlation between the youth,
media and game violence together which can lead to
behavioral aggression among youth as the exposure to
violence for too long may evoke a sense of normalcy
toward overt acts of violence. However, future
research needs to fill the gap which can be found in
this study and shall reach more groups of young
people from different backgrounds to be able to
represent the youth in Malaysia regarding their
impression towards media and game violence.
REFERENCES Barreto, D., Vasconcelos, L., & Orey, M. (2017). Motivation and learning
engagement through playing math video games. Malaysian Journal of
Learning and Instruction, 14(2), 1-21. Retrieved from https://doi.org/10.32890/mjli2017.14.2.1
DeCamp, W. & Ferguson, C. J. (2017). The Impact of Degree of Exposure
to Violent Video Games, Family Background, and Other Factors on Youth Violence. J Youth Adolescence 46, 388–400.
https://doi.org/10.1007/s10964-016-0561-8
Dowsett, A., & Jackson, M. (2019). The effect of violence and competition within video games on aggression. Computers in Human Behavior, 99,
22-27. Retrieved from https://sci-
hub.se/https://www.sciencedirect.com/science/article/abs/pii/S0747563219301773
Farrar, K. M., Lapierre, M. A., McGloin, R. & Fishlock, J. (2017). Ready,
Aim, Fire! Violent Video Game Play and Gun Controller Use: Effects on Behavioral Aggression and Social Norms Concerning Violence,
Communication Studies. DOI: 10.1080/10510974.2017.1324889
Hilgard, J., Engelhardt, C. R., Rouder, J. N., Segert, I. L & Bartholow, B. D. (2019). Null Effects of Game Violence, Game Difficulty, and
2D:4D Digit Ratio on Aggressive Behavior. Psychological Science.
30. 095679761982968. 10.1177/0956797619829688.
Kühn, S., Kugler, D. T., Schmalen, K., Weichenberger, M., Witt, C. &
Gallinat, J. (2018). Does playing violent video games cause
aggression? A longitudinal intervention study. Mol Psychiatry 24, 1220–1234 (2019). https://doi.org/10.1038/s41380-018-0031-7
Przybylski AK, Weinstein N. (2019) Violent video game engagement is
not associated with adolescents’ aggressive behaviour: evidence from
YMS2021, Universiti Utara Malaysia
71
a registered report. R. Soc. open sci. 6: 171474.
http://dx.doi.org/10.1098/rsos.171474
Weber, R., Behr, K. M., Fisher, J. T., Lonergan, C. & Quebral C. (2020)
Video GameViolence and Interactivity: Effect or Equivalence?.
Journal of Communication, Volume 70, Issue 2, April 2020, Pages 219–244. https://doi.org/10.1093/joc/jqz048
Zafar, A., & Chaudhary, U. G. (2018). Effects of violence shown in media
on children: A study of parent’s perspective. Journal of Early Childhood Care and Education, 2. http://jecce.aiou.edu.pk/wp-
content/uploads/2019/01/05-Effect-of-voilence.pdf
Zhang, Q., Cao, Y., & Tian, J. (2021). Effects of Violent Video Games on Aggressive Cognition and Aggressive Behavior. Cyberpsychology,
Behavior, and Social Networking, 24(1), 5-10. Retrieved from https://sci-hub.mksa.top/10.1002/ab.218

YMS2021, Universiti Utara Malaysia
72
Best Paper Nominee
The Impact of Violent Video Games on Multimedia Students in UUM
Nurul Aini Abdul Rahman1, Nur Farzana Ahmad2,
Stark Aisyah Nurjannah3 & Nurul Asyiqin Abdul Aziz 4 1Universiti Utara Malaysia, Malaysia, [email protected]
2Universiti Utara Malaysia, Malaysia, [email protected] 3Universiti Utara Malaysia, Malaysia, [email protected]
4Universiti Utara Malaysia, Malaysia, [email protected]
ABSTRACT
As technology advances, video games have become
popular among the younger generation. Due to the
increasing interest among the younger generation,
several types of video games cause worries to society,
for example violence type of game. A study was
conducted with a problem statement how violent video
games give impact on students. This research aims to
identify the impact of violence video games on
multimedia students in UUM. The quantitative
research approach was applied, data collected in the
form of a questionnaire. A total of 30 multimedia
students in UUM participated, 21 female students and
9 male students. Three dimensions were measured and
evaluated including the demographic, violent video
game exposure and violent video game implications.
The results show that the negative impact of student
academic performance, violent video behavior after
playing violent video games and anger after losing
violent video games as well as positive impacts such
as stress relief and social interaction ability remain
inconsistent as there is no significant relationship
between subject matters and violent video games.
Therefore, violence video games affect each
individual differently in terms of student’s behavior,
emotions, academic performance, stress level and
social interaction ability.
Keywords: Violent video games, game violence
exposure, youth
I INTRODUCTION
The video game industry has flourished to become
the world’s largest entertainment medium. It has had a
profound effect on the life of the younger generations
especially students (Arockiyasamy et al., 2016). Video
games have gotten more complex, interactive and
challenging as technology has advanced, allowing for
a broader range of activities, goals and social
behaviour. Furthermore, most people play games for a
variety of reasons, including relaxation, social
interaction, stress relief, mental escape from the real
world and enjoyment. (Almalki & Aldajani, 2020). A
study by Dewa Putu Eskasasnanda (2017), “one kind
of video game that can bring a serious danger for
students is violence games, in violence games such as
war games.” In recent years, video games have been
chastised and denounced for the negative effects they
have, especially violent games. (Nasution, 2015).
A study carried out by Karzan et al. (2017)
indicated that “the students playing between 1-3 hours
per day, their GPA did not decrease or was very
minimal which was -0.22%/h. At the same time,
students that played more than 3 hours per day their
GPA decreased more which is -2.41%/h.” Sleep
disturbances, low grades, skipping school and
endorsed feelings are among the most common
conditions associated with excessive video games use,
according to reports. (Almalki & Aldajani, 2020). The
findings by Nasution et al. (2015) found that there
were important correlations between video game play
and academic success. However, Karzan et al. (2017)
concluded that the impact of computer technology and
computer games on students’ creativity differs
significantly. In recognition of skills and problem
solving, children who played computer games scored
significantly higher than those who did not. The
researchers also noted that computer and video games
can help children improve their cognitive skills and
problem solving abilities.
On the other hand, in a study which was conducted
by International Islamic University Malaysia with the
aim of investigating the relationship between video
games and academic performance among their
students, came with a quite different conclusion in
which their findings proof that there is no significant
relationship between gaming frequency and academic
performance among IIUM students due to the gaming
frequency portraying an inconsistent effect towards
academic performance of each of the individual
B
B
YMS2021, Universiti Utara Malaysia
73
students (Nasution, 2015). Based on a study conducted
by University of Karunya, the researchers also came
to the conclusion that there is only a very low
correlation between gaming habits and their
performance in academic studies. (Arockiyasamy et
al., 2016). Addition to that, an article by
Arockiyasamy et al. (2019), the research found that
playing 3D video games like ’Super Mario’ will help
gamers improve their memory. Another study found
that computer games’ have a major impact on
students’ authenticity and expansion dimensions.
A study by Karzan et al. (2017) found that the
estimated GPA of high usage video game players and
low usage video game players differed significantly.
This is a very important finding as it relates to the
college-age demographic that the research focused on.
Based on a study by Dewa Putu Eskasasnanda (2017)
stating one advantage is that it can be used as a
medium for brain refreshment. Due to school activities
and homework, students are often stressed and tired.
Therefore, in conclusion video games affect each
individual differently, some would get badly affected
and distracted while others might only have minimal
effect or no effects at all to their academic
performance and in some cases students might even
gain positive output from playing video games.
II METHODOLOGY
A cross-sectional questionnaire-based study was
carried out among multimedia students in Universiti
Utara Malaysia (UUM) to assess the impact of
violence videogames on students. Also, to assess the
degree of video game violence exposure and the
positive and negative impact of violence game as a
student perspective. The study starts by defining a
research problem. The study formulated the problems
from the literature findings in this phase of identifying
the study problem, which are relevant to the impact of
violence videogames on students. Based on the
research title, the study also determined the objectives,
scope, research questions and importance of the study.
Second, devised a strategy. During this phase of
planning, the study started by making some review to
conduct a literature study in order to learn more about
the elements that influence students according to
involvement in playing violence video games on
students. A questionnaire was adopted from secondary
resources. The questions were designed as five-point
Likert scales. Respondents were asked to scale their
level of agreement with the statements on a scale of
1:strongly disagree, 2:disagree, 3:neutral, 4:agree,
5:strongly agree. A random sampling technique was
used to select the participants of the study. In addition,
considering the quantity and the principle of proximity
in order to collect enough information in a short time,
it has been thought that 30 samples to be collected in
random sampling technique to do the questionnaires.
Therefore, it has been decided to use the number of 30
respondents to improve the accuracy. The study
included all multimedia students. The questionnaires
are divided into three dimensions which are
demographic, violent video game exposure and
implication of violent video games. Demographic
dimension is focusing on gender of multimedia
students response in UUM, violent video game
exposure dimension is focusing on major causes of
violence exposure in video games as well as time
spending to play violent video games per day and
implication dimension is focusing on the negative and
positive impact on violent video games in term of
student performance, aggressive behaviour, anger
emotion, stress relief and social interaction ability.
III RESULTS
The aim of this research was to study the impact
of violent video games among multimedia students in
University Utara Malaysia (UUM). Therefore, the
researchers tried to identify the frequency the students
played violent video games, this has been grouped into
‘Never’,’ 1-2 hours a day’, ‘3-4 hours a day’, ‘5-6
hours a day’ and ‘more than 6 hours a day’.
The researchers start by gathering the students'
personal opinions on violent games before getting
information on whether students think it could lead to
violent acts or not. The research question begins with
the demographic of the respondents which are from 21
female students (70%) and 9 male students (30%). All
9 of the male respondents play violence video games
while only 13 female respondents play violence video
games. The students are from age groups ranging from
ages 18 to 26. This study includes Malaysian students
from various races including Malay, Chinese and
Indian (95%) and International students from
Indonesia (5%).
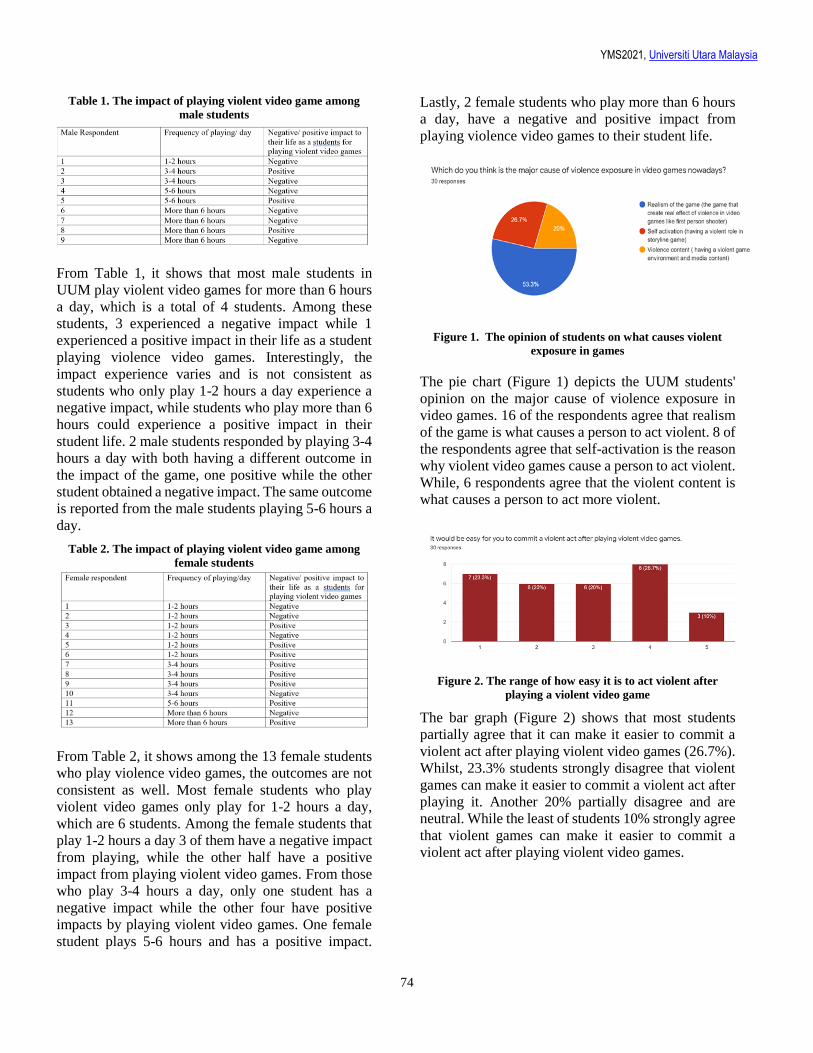
YMS2021, Universiti Utara Malaysia
74
Table 1. The impact of playing violent video game among
male students
From Table 1, it shows that most male students in
UUM play violent video games for more than 6 hours
a day, which is a total of 4 students. Among these
students, 3 experienced a negative impact while 1
experienced a positive impact in their life as a student
playing violence video games. Interestingly, the
impact experience varies and is not consistent as
students who only play 1-2 hours a day experience a
negative impact, while students who play more than 6
hours could experience a positive impact in their
student life. 2 male students responded by playing 3-4
hours a day with both having a different outcome in
the impact of the game, one positive while the other
student obtained a negative impact. The same outcome
is reported from the male students playing 5-6 hours a
day.
Table 2. The impact of playing violent video game among
female students
From Table 2, it shows among the 13 female students
who play violence video games, the outcomes are not
consistent as well. Most female students who play
violent video games only play for 1-2 hours a day,
which are 6 students. Among the female students that
play 1-2 hours a day 3 of them have a negative impact
from playing, while the other half have a positive
impact from playing violent video games. From those
who play 3-4 hours a day, only one student has a
negative impact while the other four have positive
impacts by playing violent video games. One female
student plays 5-6 hours and has a positive impact.
Lastly, 2 female students who play more than 6 hours
a day, have a negative and positive impact from
playing violence video games to their student life.
Figure 1. The opinion of students on what causes violent
exposure in games
The pie chart (Figure 1) depicts the UUM students'
opinion on the major cause of violence exposure in
video games. 16 of the respondents agree that realism
of the game is what causes a person to act violent. 8 of
the respondents agree that self-activation is the reason
why violent video games cause a person to act violent.
While, 6 respondents agree that the violent content is
what causes a person to act more violent.
Figure 2. The range of how easy it is to act violent after
playing a violent video game
The bar graph (Figure 2) shows that most students
partially agree that it can make it easier to commit a
violent act after playing violent video games (26.7%).
Whilst, 23.3% students strongly disagree that violent
games can make it easier to commit a violent act after
playing it. Another 20% partially disagree and are
neutral. While the least of students 10% strongly agree
that violent games can make it easier to commit a
violent act after playing violent video games.
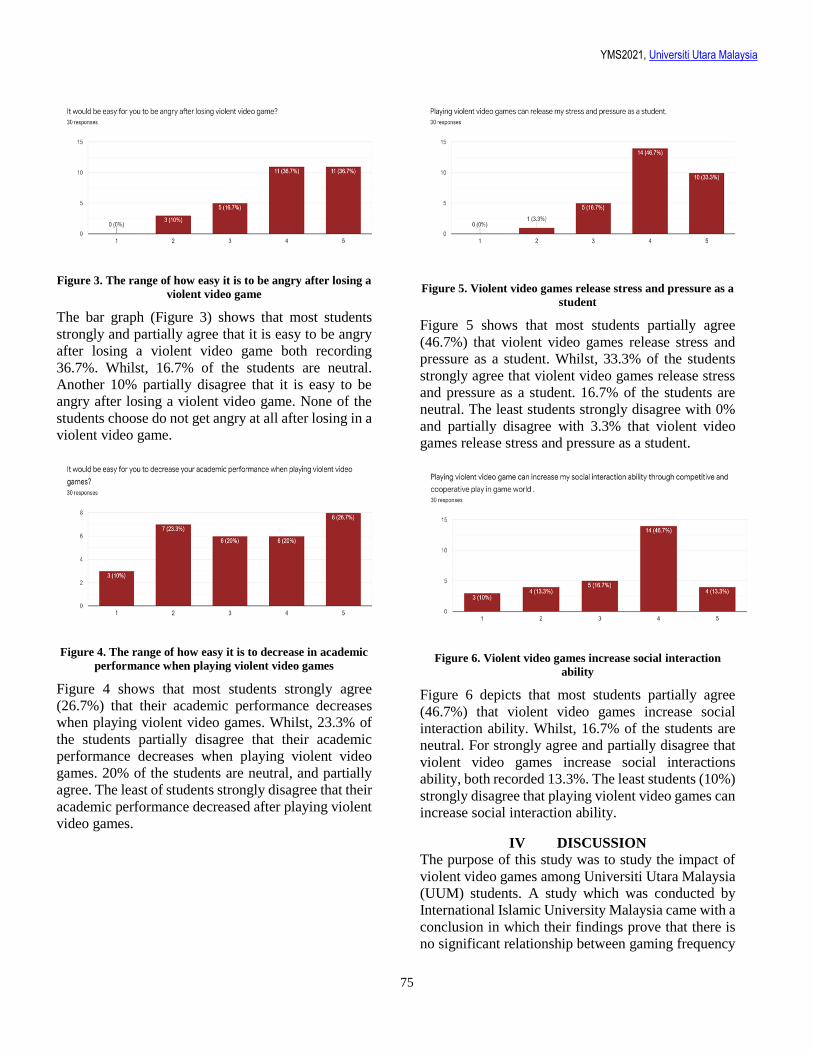
YMS2021, Universiti Utara Malaysia
75
Figure 3. The range of how easy it is to be angry after losing a
violent video game
The bar graph (Figure 3) shows that most students
strongly and partially agree that it is easy to be angry
after losing a violent video game both recording
36.7%. Whilst, 16.7% of the students are neutral.
Another 10% partially disagree that it is easy to be
angry after losing a violent video game. None of the
students choose do not get angry at all after losing in a
violent video game.
Figure 4. The range of how easy it is to decrease in academic
performance when playing violent video games
Figure 4 shows that most students strongly agree
(26.7%) that their academic performance decreases
when playing violent video games. Whilst, 23.3% of
the students partially disagree that their academic
performance decreases when playing violent video
games. 20% of the students are neutral, and partially
agree. The least of students strongly disagree that their
academic performance decreased after playing violent
video games.
Figure 5. Violent video games release stress and pressure as a
student
Figure 5 shows that most students partially agree
(46.7%) that violent video games release stress and
pressure as a student. Whilst, 33.3% of the students
strongly agree that violent video games release stress
and pressure as a student. 16.7% of the students are
neutral. The least students strongly disagree with 0%
and partially disagree with 3.3% that violent video
games release stress and pressure as a student.
Figure 6. Violent video games increase social interaction
ability
Figure 6 depicts that most students partially agree
(46.7%) that violent video games increase social
interaction ability. Whilst, 16.7% of the students are
neutral. For strongly agree and partially disagree that
violent video games increase social interactions
ability, both recorded 13.3%. The least students (10%)
strongly disagree that playing violent video games can
increase social interaction ability.
IV DISCUSSION
The purpose of this study was to study the impact of
violent video games among Universiti Utara Malaysia
(UUM) students. A study which was conducted by
International Islamic University Malaysia came with a
conclusion in which their findings prove that there is
no significant relationship between gaming frequency
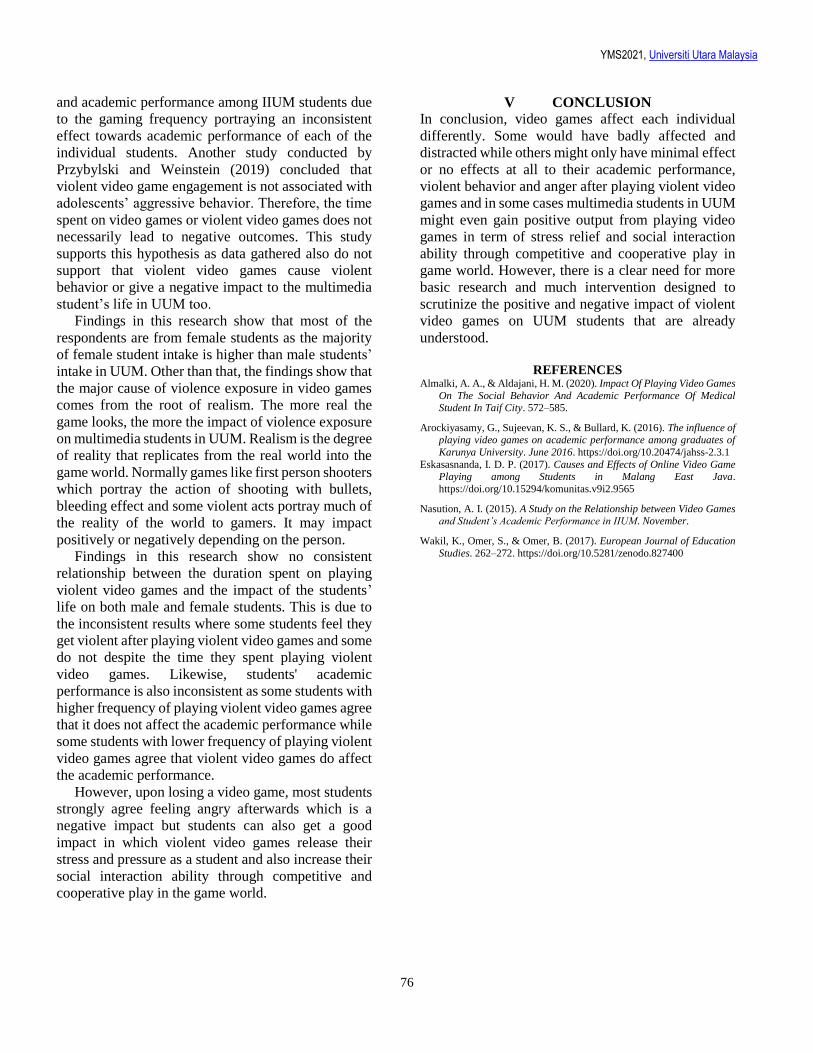
YMS2021, Universiti Utara Malaysia
76
and academic performance among IIUM students due
to the gaming frequency portraying an inconsistent
effect towards academic performance of each of the
individual students. Another study conducted by
Przybylski and Weinstein (2019) concluded that
violent video game engagement is not associated with
adolescents’ aggressive behavior. Therefore, the time
spent on video games or violent video games does not
necessarily lead to negative outcomes. This study
supports this hypothesis as data gathered also do not
support that violent video games cause violent
behavior or give a negative impact to the multimedia
student’s life in UUM too.
Findings in this research show that most of the
respondents are from female students as the majority
of female student intake is higher than male students’
intake in UUM. Other than that, the findings show that
the major cause of violence exposure in video games
comes from the root of realism. The more real the
game looks, the more the impact of violence exposure
on multimedia students in UUM. Realism is the degree
of reality that replicates from the real world into the
game world. Normally games like first person shooters
which portray the action of shooting with bullets,
bleeding effect and some violent acts portray much of
the reality of the world to gamers. It may impact
positively or negatively depending on the person.
Findings in this research show no consistent
relationship between the duration spent on playing
violent video games and the impact of the students’
life on both male and female students. This is due to
the inconsistent results where some students feel they
get violent after playing violent video games and some
do not despite the time they spent playing violent
video games. Likewise, students' academic
performance is also inconsistent as some students with
higher frequency of playing violent video games agree
that it does not affect the academic performance while
some students with lower frequency of playing violent
video games agree that violent video games do affect
the academic performance.
However, upon losing a video game, most students
strongly agree feeling angry afterwards which is a
negative impact but students can also get a good
impact in which violent video games release their
stress and pressure as a student and also increase their
social interaction ability through competitive and
cooperative play in the game world.
V CONCLUSION
In conclusion, video games affect each individual
differently. Some would have badly affected and
distracted while others might only have minimal effect
or no effects at all to their academic performance,
violent behavior and anger after playing violent video
games and in some cases multimedia students in UUM
might even gain positive output from playing video
games in term of stress relief and social interaction
ability through competitive and cooperative play in
game world. However, there is a clear need for more
basic research and much intervention designed to
scrutinize the positive and negative impact of violent
video games on UUM students that are already
understood.
REFERENCES Almalki, A. A., & Aldajani, H. M. (2020). Impact Of Playing Video Games
On The Social Behavior And Academic Performance Of Medical Student In Taif City. 572–585.
Arockiyasamy, G., Sujeevan, K. S., & Bullard, K. (2016). The influence of playing video games on academic performance among graduates of
Karunya University. June 2016. https://doi.org/10.20474/jahss-2.3.1
Eskasasnanda, I. D. P. (2017). Causes and Effects of Online Video Game Playing among Students in Malang East Java.
https://doi.org/10.15294/komunitas.v9i2.9565
Nasution, A. I. (2015). A Study on the Relationship between Video Games and Student’s Academic Performance in IIUM. November.
Wakil, K., Omer, S., & Omer, B. (2017). European Journal of Education
Studies. 262–272. https://doi.org/10.5281/zenodo.827400
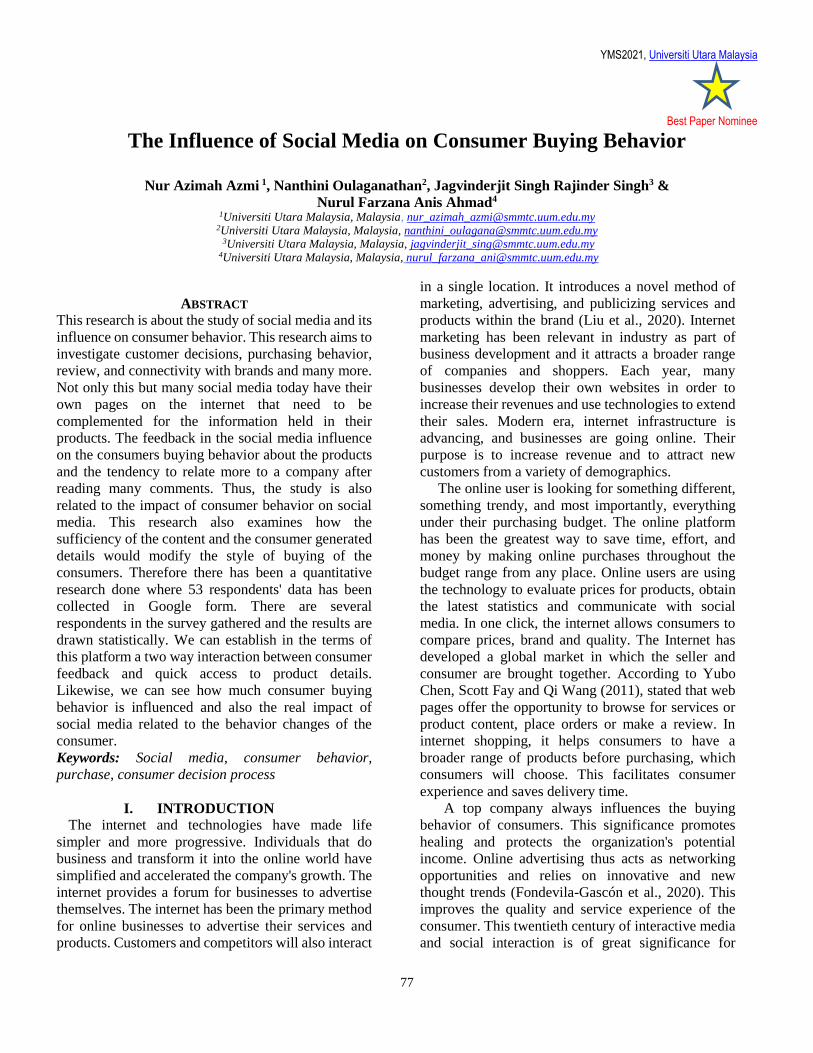
YMS2021, Universiti Utara Malaysia
77
Best Paper Nominee
The Influence of Social Media on Consumer Buying Behavior
Nur Azimah Azmi 1, Nanthini Oulaganathan2, Jagvinderjit Singh Rajinder Singh3 &
Nurul Farzana Anis Ahmad4 1Universiti Utara Malaysia, Malaysia, [email protected]
2Universiti Utara Malaysia, Malaysia, [email protected]
3Universiti Utara Malaysia, Malaysia, [email protected] 4Universiti Utara Malaysia, Malaysia, [email protected]
ABSTRACT
This research is about the study of social media and its
influence on consumer behavior. This research aims to
investigate customer decisions, purchasing behavior,
review, and connectivity with brands and many more.
Not only this but many social media today have their
own pages on the internet that need to be
complemented for the information held in their
products. The feedback in the social media influence
on the consumers buying behavior about the products
and the tendency to relate more to a company after
reading many comments. Thus, the study is also
related to the impact of consumer behavior on social
media. This research also examines how the
sufficiency of the content and the consumer generated
details would modify the style of buying of the
consumers. Therefore there has been a quantitative
research done where 53 respondents' data has been
collected in Google form. There are several
respondents in the survey gathered and the results are
drawn statistically. We can establish in the terms of
this platform a two way interaction between consumer
feedback and quick access to product details.
Likewise, we can see how much consumer buying
behavior is influenced and also the real impact of
social media related to the behavior changes of the
consumer.
Keywords: Social media, consumer behavior,
purchase, consumer decision process
I. INTRODUCTION The internet and technologies have made life
simpler and more progressive. Individuals that do
business and transform it into the online world have
simplified and accelerated the company's growth. The
internet provides a forum for businesses to advertise
themselves. The internet has been the primary method
for online businesses to advertise their services and
products. Customers and competitors will also interact
in a single location. It introduces a novel method of
marketing, advertising, and publicizing services and
products within the brand (Liu et al., 2020). Internet
marketing has been relevant in industry as part of
business development and it attracts a broader range
of companies and shoppers. Each year, many
businesses develop their own websites in order to
increase their revenues and use technologies to extend
their sales. Modern era, internet infrastructure is
advancing, and businesses are going online. Their
purpose is to increase revenue and to attract new
customers from a variety of demographics.
The online user is looking for something different,
something trendy, and most importantly, everything
under their purchasing budget. The online platform
has been the greatest way to save time, effort, and
money by making online purchases throughout the
budget range from any place. Online users are using
the technology to evaluate prices for products, obtain
the latest statistics and communicate with social
media. In one click, the internet allows consumers to
compare prices, brand and quality. The Internet has
developed a global market in which the seller and
consumer are brought together. According to Yubo
Chen, Scott Fay and Qi Wang (2011), stated that web
pages offer the opportunity to browse for services or
product content, place orders or make a review. In
internet shopping, it helps consumers to have a
broader range of products before purchasing, which
consumers will choose. This facilitates consumer
experience and saves delivery time.
A top company always influences the buying
behavior of consumers. This significance promotes
healing and protects the organization's potential
income. Online advertising thus acts as networking
opportunities and relies on innovative and new
thought trends (Fondevila-Gascón et al., 2020). This
improves the quality and service experience of the
consumer. This twentieth century of interactive media
and social interaction is of great significance for
B
B
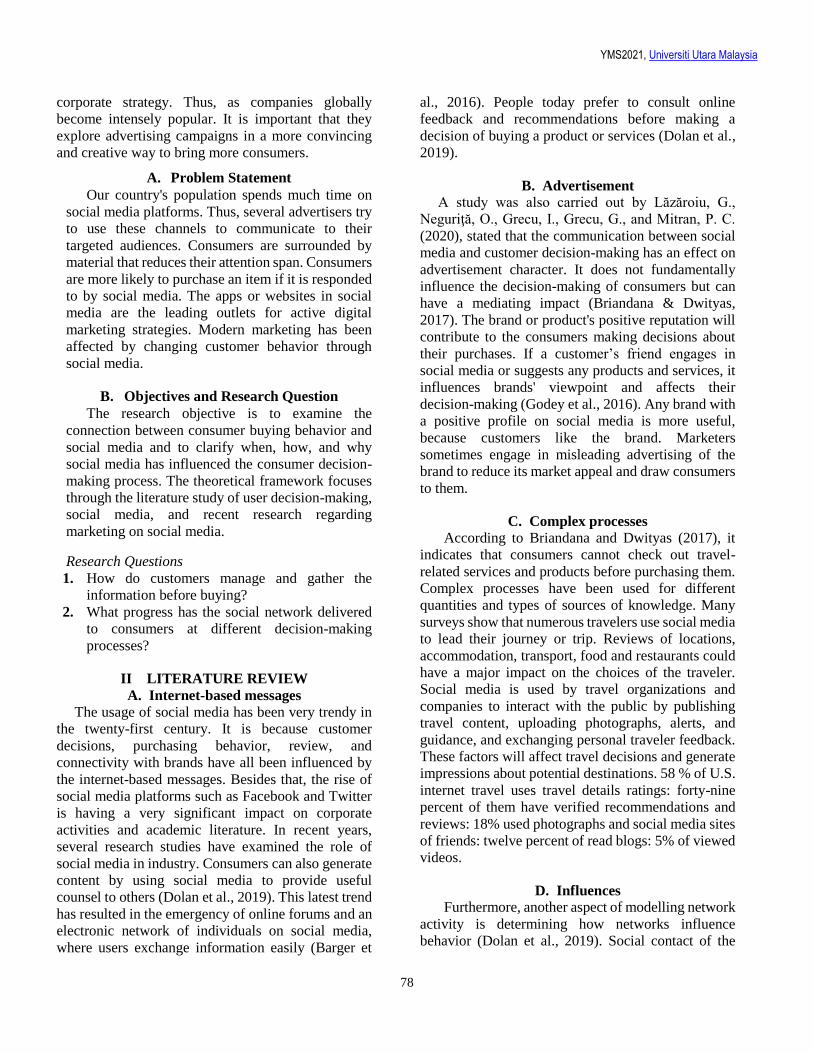
YMS2021, Universiti Utara Malaysia
78
corporate strategy. Thus, as companies globally
become intensely popular. It is important that they
explore advertising campaigns in a more convincing
and creative way to bring more consumers.
A. Problem Statement
Our country's population spends much time on
social media platforms. Thus, several advertisers try
to use these channels to communicate to their
targeted audiences. Consumers are surrounded by
material that reduces their attention span. Consumers
are more likely to purchase an item if it is responded
to by social media. The apps or websites in social
media are the leading outlets for active digital
marketing strategies. Modern marketing has been
affected by changing customer behavior through
social media.
B. Objectives and Research Question
The research objective is to examine the
connection between consumer buying behavior and
social media and to clarify when, how, and why
social media has influenced the consumer decision-
making process. The theoretical framework focuses
through the literature study of user decision-making,
social media, and recent research regarding
marketing on social media.
Research Questions
1. How do customers manage and gather the
information before buying?
2. What progress has the social network delivered
to consumers at different decision-making
processes?
II LITERATURE REVIEW
A. Internet-based messages
The usage of social media has been very trendy in
the twenty-first century. It is because customer
decisions, purchasing behavior, review, and
connectivity with brands have all been influenced by
the internet-based messages. Besides that, the rise of
social media platforms such as Facebook and Twitter
is having a very significant impact on corporate
activities and academic literature. In recent years,
several research studies have examined the role of
social media in industry. Consumers can also generate
content by using social media to provide useful
counsel to others (Dolan et al., 2019). This latest trend
has resulted in the emergency of online forums and an
electronic network of individuals on social media,
where users exchange information easily (Barger et
al., 2016). People today prefer to consult online
feedback and recommendations before making a
decision of buying a product or services (Dolan et al.,
2019).
B. Advertisement
A study was also carried out by Lăzăroiu, G.,
Neguriţă, O., Grecu, I., Grecu, G., and Mitran, P. C.
(2020), stated that the communication between social
media and customer decision-making has an effect on
advertisement character. It does not fundamentally
influence the decision-making of consumers but can
have a mediating impact (Briandana & Dwityas,
2017). The brand or product's positive reputation will
contribute to the consumers making decisions about
their purchases. If a customer’s friend engages in
social media or suggests any products and services, it
influences brands' viewpoint and affects their
decision-making (Godey et al., 2016). Any brand with
a positive profile on social media is more useful,
because customers like the brand. Marketers
sometimes engage in misleading advertising of the
brand to reduce its market appeal and draw consumers
to them.
C. Complex processes
According to Briandana and Dwityas (2017), it
indicates that consumers cannot check out travel-
related services and products before purchasing them.
Complex processes have been used for different
quantities and types of sources of knowledge. Many
surveys show that numerous travelers use social media
to lead their journey or trip. Reviews of locations,
accommodation, transport, food and restaurants could
have a major impact on the choices of the traveler.
Social media is used by travel organizations and
companies to interact with the public by publishing
travel content, uploading photographs, alerts, and
guidance, and exchanging personal traveler feedback.
These factors will affect travel decisions and generate
impressions about potential destinations. 58 % of U.S.
internet travel uses travel details ratings: forty-nine
percent of them have verified recommendations and
reviews: 18% used photographs and social media sites
of friends: twelve percent of read blogs: 5% of viewed
videos.
D. Influences
Furthermore, another aspect of modelling network
activity is determining how networks influence
behavior (Dolan et al., 2019). Social contact of the
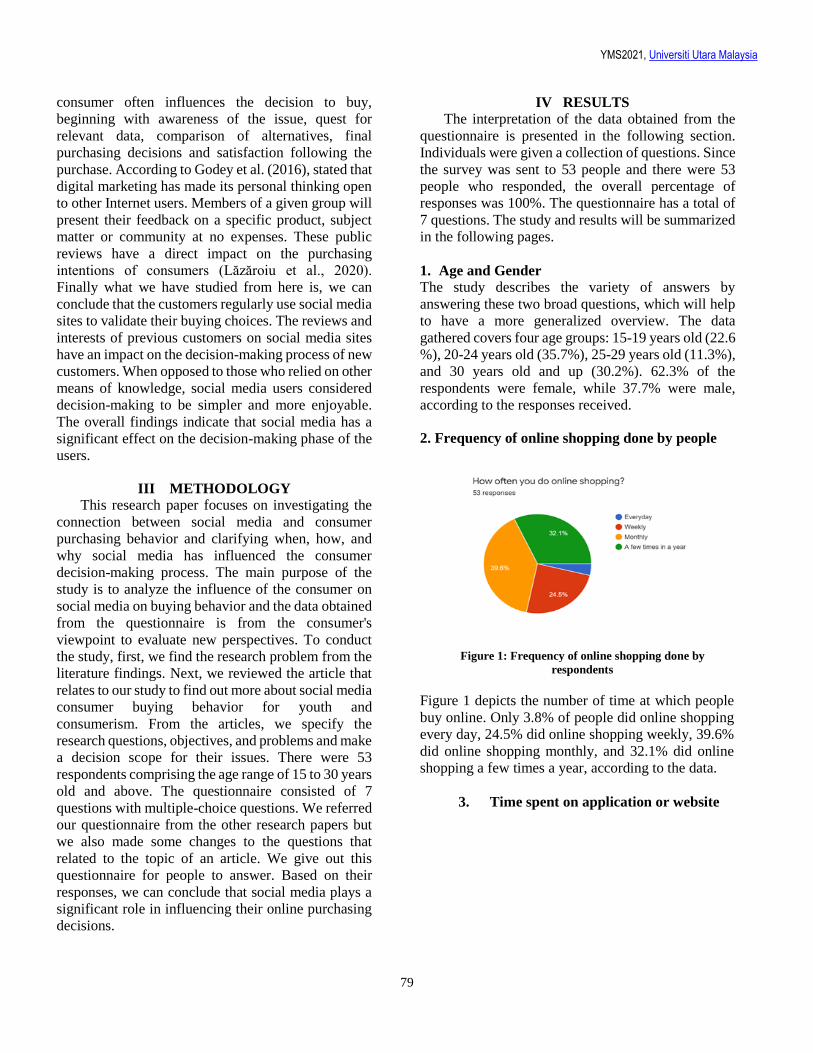
YMS2021, Universiti Utara Malaysia
79
consumer often influences the decision to buy,
beginning with awareness of the issue, quest for
relevant data, comparison of alternatives, final
purchasing decisions and satisfaction following the
purchase. According to Godey et al. (2016), stated that
digital marketing has made its personal thinking open
to other Internet users. Members of a given group will
present their feedback on a specific product, subject
matter or community at no expenses. These public
reviews have a direct impact on the purchasing
intentions of consumers (Lăzăroiu et al., 2020).
Finally what we have studied from here is, we can
conclude that the customers regularly use social media
sites to validate their buying choices. The reviews and
interests of previous customers on social media sites
have an impact on the decision-making process of new
customers. When opposed to those who relied on other
means of knowledge, social media users considered
decision-making to be simpler and more enjoyable.
The overall findings indicate that social media has a
significant effect on the decision-making phase of the
users.
III METHODOLOGY
This research paper focuses on investigating the
connection between social media and consumer
purchasing behavior and clarifying when, how, and
why social media has influenced the consumer
decision-making process. The main purpose of the
study is to analyze the influence of the consumer on
social media on buying behavior and the data obtained
from the questionnaire is from the consumer's
viewpoint to evaluate new perspectives. To conduct
the study, first, we find the research problem from the
literature findings. Next, we reviewed the article that
relates to our study to find out more about social media
consumer buying behavior for youth and
consumerism. From the articles, we specify the
research questions, objectives, and problems and make
a decision scope for their issues. There were 53
respondents comprising the age range of 15 to 30 years
old and above. The questionnaire consisted of 7
questions with multiple-choice questions. We referred
our questionnaire from the other research papers but
we also made some changes to the questions that
related to the topic of an article. We give out this
questionnaire for people to answer. Based on their
responses, we can conclude that social media plays a
significant role in influencing their online purchasing
decisions.
IV RESULTS
The interpretation of the data obtained from the
questionnaire is presented in the following section.
Individuals were given a collection of questions. Since
the survey was sent to 53 people and there were 53
people who responded, the overall percentage of
responses was 100%. The questionnaire has a total of
7 questions. The study and results will be summarized
in the following pages.
1. Age and Gender
The study describes the variety of answers by
answering these two broad questions, which will help
to have a more generalized overview. The data
gathered covers four age groups: 15-19 years old (22.6
%), 20-24 years old (35.7%), 25-29 years old (11.3%),
and 30 years old and up (30.2%). 62.3% of the
respondents were female, while 37.7% were male,
according to the responses received.
2. Frequency of online shopping done by people
Figure 1: Frequency of online shopping done by
respondents
Figure 1 depicts the number of time at which people
buy online. Only 3.8% of people did online shopping
every day, 24.5% did online shopping weekly, 39.6%
did online shopping monthly, and 32.1% did online
shopping a few times a year, according to the data.
3. Time spent on application or website
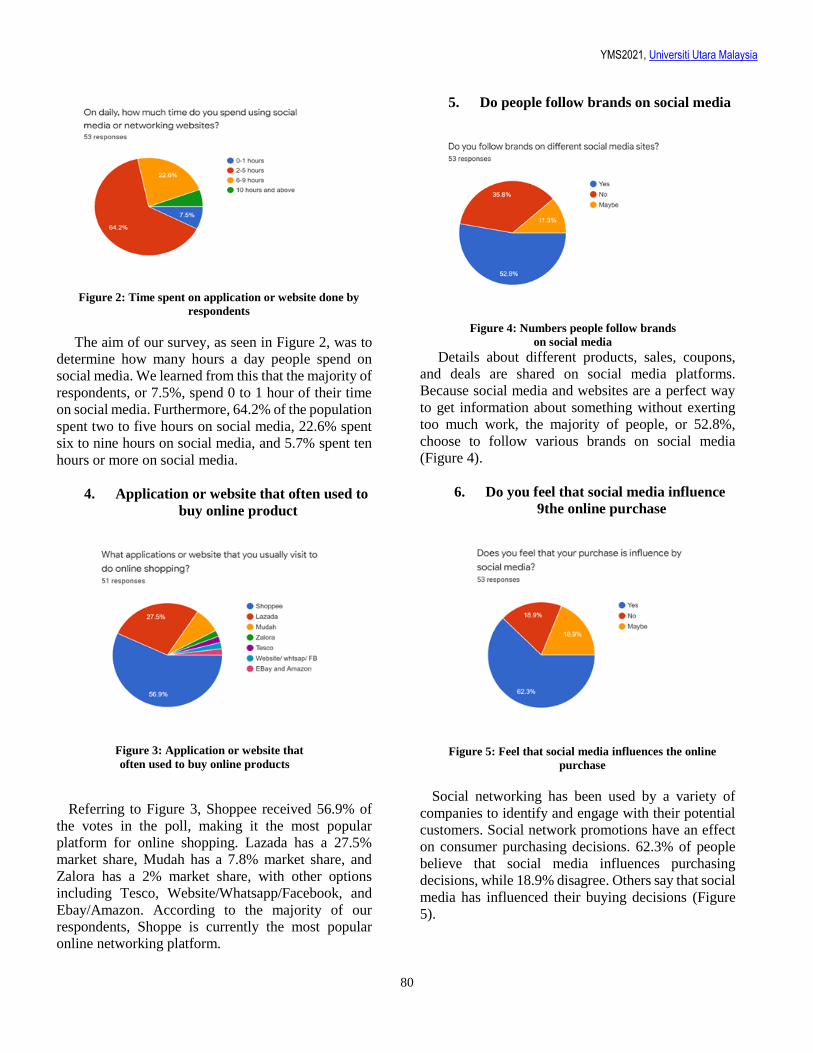
YMS2021, Universiti Utara Malaysia
80
Figure 2: Time spent on application or website done by
respondents
The aim of our survey, as seen in Figure 2, was to
determine how many hours a day people spend on
social media. We learned from this that the majority of
respondents, or 7.5%, spend 0 to 1 hour of their time
on social media. Furthermore, 64.2% of the population
spent two to five hours on social media, 22.6% spent
six to nine hours on social media, and 5.7% spent ten
hours or more on social media.
4. Application or website that often used to
buy online product
Figure 3: Application or website that
often used to buy online products
Referring to Figure 3, Shoppee received 56.9% of
the votes in the poll, making it the most popular
platform for online shopping. Lazada has a 27.5%
market share, Mudah has a 7.8% market share, and
Zalora has a 2% market share, with other options
including Tesco, Website/Whatsapp/Facebook, and
Ebay/Amazon. According to the majority of our
respondents, Shoppe is currently the most popular
online networking platform.
5. Do people follow brands on social media
Figure 4: Numbers people follow brands
on social media
Details about different products, sales, coupons,
and deals are shared on social media platforms.
Because social media and websites are a perfect way
to get information about something without exerting
too much work, the majority of people, or 52.8%,
choose to follow various brands on social media
(Figure 4).
6. Do you feel that social media influence
9the online purchase
Figure 5: Feel that social media influences the online
purchase
Social networking has been used by a variety of
companies to identify and engage with their potential
customers. Social network promotions have an effect
on consumer purchasing decisions. 62.3% of people
believe that social media influences purchasing
decisions, while 18.9% disagree. Others say that social
media has influenced their buying decisions (Figure
5).
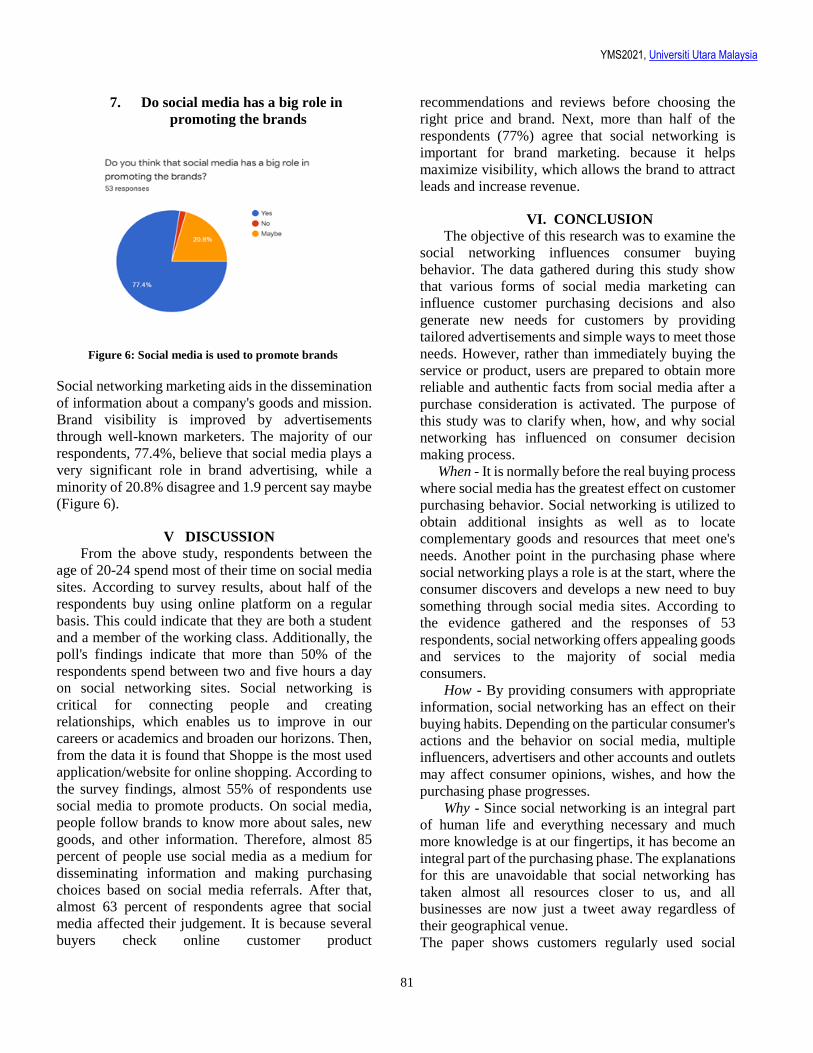
YMS2021, Universiti Utara Malaysia
81
7. Do social media has a big role in
promoting the brands
Figure 6: Social media is used to promote brands
Social networking marketing aids in the dissemination
of information about a company's goods and mission.
Brand visibility is improved by advertisements
through well-known marketers. The majority of our
respondents, 77.4%, believe that social media plays a
very significant role in brand advertising, while a
minority of 20.8% disagree and 1.9 percent say maybe
(Figure 6).
V DISCUSSION
From the above study, respondents between the
age of 20-24 spend most of their time on social media
sites. According to survey results, about half of the
respondents buy using online platform on a regular
basis. This could indicate that they are both a student
and a member of the working class. Additionally, the
poll's findings indicate that more than 50% of the
respondents spend between two and five hours a day
on social networking sites. Social networking is
critical for connecting people and creating
relationships, which enables us to improve in our
careers or academics and broaden our horizons. Then,
from the data it is found that Shoppe is the most used
application/website for online shopping. According to
the survey findings, almost 55% of respondents use
social media to promote products. On social media,
people follow brands to know more about sales, new
goods, and other information. Therefore, almost 85
percent of people use social media as a medium for
disseminating information and making purchasing
choices based on social media referrals. After that,
almost 63 percent of respondents agree that social
media affected their judgement. It is because several
buyers check online customer product
recommendations and reviews before choosing the
right price and brand. Next, more than half of the
respondents (77%) agree that social networking is
important for brand marketing. because it helps
maximize visibility, which allows the brand to attract
leads and increase revenue.
VI. CONCLUSION The objective of this research was to examine the
social networking influences consumer buying
behavior. The data gathered during this study show
that various forms of social media marketing can
influence customer purchasing decisions and also
generate new needs for customers by providing
tailored advertisements and simple ways to meet those
needs. However, rather than immediately buying the
service or product, users are prepared to obtain more
reliable and authentic facts from social media after a
purchase consideration is activated. The purpose of
this study was to clarify when, how, and why social
networking has influenced on consumer decision
making process.
When - It is normally before the real buying process
where social media has the greatest effect on customer
purchasing behavior. Social networking is utilized to
obtain additional insights as well as to locate
complementary goods and resources that meet one's
needs. Another point in the purchasing phase where
social networking plays a role is at the start, where the
consumer discovers and develops a new need to buy
something through social media sites. According to
the evidence gathered and the responses of 53
respondents, social networking offers appealing goods
and services to the majority of social media
consumers.
How - By providing consumers with appropriate
information, social networking has an effect on their
buying habits. Depending on the particular consumer's
actions and the behavior on social media, multiple
influencers, advertisers and other accounts and outlets
may affect consumer opinions, wishes, and how the
purchasing phase progresses.
Why - Since social networking is an integral part
of human life and everything necessary and much
more knowledge is at our fingertips, it has become an
integral part of the purchasing phase. The explanations
for this are unavoidable that social networking has
taken almost all resources closer to us, and all
businesses are now just a tweet away regardless of
their geographical venue.
The paper shows customers regularly used social
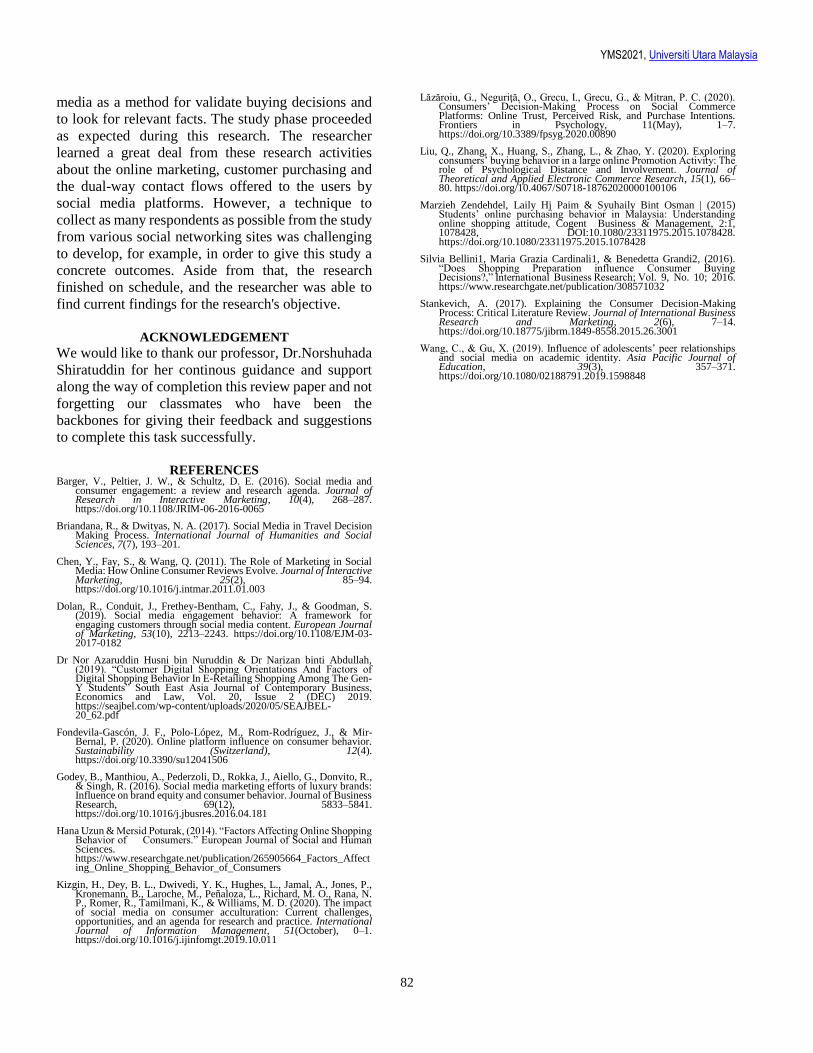
YMS2021, Universiti Utara Malaysia
82
media as a method for validate buying decisions and
to look for relevant facts. The study phase proceeded
as expected during this research. The researcher
learned a great deal from these research activities
about the online marketing, customer purchasing and
the dual-way contact flows offered to the users by
social media platforms. However, a technique to
collect as many respondents as possible from the study
from various social networking sites was challenging
to develop, for example, in order to give this study a
concrete outcomes. Aside from that, the research
finished on schedule, and the researcher was able to
find current findings for the research's objective.
ACKNOWLEDGEMENT
We would like to thank our professor, Dr.Norshuhada
Shiratuddin for her continous guidance and support
along the way of completion this review paper and not
forgetting our classmates who have been the
backbones for giving their feedback and suggestions
to complete this task successfully.
REFERENCES
Barger, V., Peltier, J. W., & Schultz, D. E. (2016). Social media and consumer engagement: a review and research agenda. Journal of Research in Interactive Marketing, 10(4), 268–287. https://doi.org/10.1108/JRIM-06-2016-0065
Briandana, R., & Dwityas, N. A. (2017). Social Media in Travel Decision Making Process. International Journal of Humanities and Social Sciences, 7(7), 193–201.
Chen, Y., Fay, S., & Wang, Q. (2011). The Role of Marketing in Social Media: How Online Consumer Reviews Evolve. Journal of Interactive Marketing, 25(2), 85–94. https://doi.org/10.1016/j.intmar.2011.01.003
Dolan, R., Conduit, J., Frethey-Bentham, C., Fahy, J., & Goodman, S. (2019). Social media engagement behavior: A framework for engaging customers through social media content. European Journal of Marketing, 53(10), 2213–2243. https://doi.org/10.1108/EJM-03-2017-0182
Dr Nor Azaruddin Husni bin Nuruddin & Dr Narizan binti Abdullah, (2019). “Customer Digital Shopping Orientations And Factors of Digital Shopping Behavior In E-Retailing Shopping Among The Gen-Y Students” South East Asia Journal of Contemporary Business, Economics and Law, Vol. 20, Issue 2 (DEC) 2019. https://seajbel.com/wp-content/uploads/2020/05/SEAJBEL-20_62.pdf
Fondevila-Gascón, J. F., Polo-López, M., Rom-Rodríguez, J., & Mir-Bernal, P. (2020). Online platform influence on consumer behavior. Sustainability (Switzerland), 12(4). https://doi.org/10.3390/su12041506
Godey, B., Manthiou, A., Pederzoli, D., Rokka, J., Aiello, G., Donvito, R., & Singh, R. (2016). Social media marketing efforts of luxury brands: Influence on brand equity and consumer behavior. Journal of Business Research, 69(12), 5833–5841. https://doi.org/10.1016/j.jbusres.2016.04.181
Hana Uzun & Mersid Poturak, (2014). “Factors Affecting Online Shopping Behavior of Consumers.” European Journal of Social and Human Sciences. https://www.researchgate.net/publication/265905664_Factors_Affecting_Online_Shopping_Behavior_of_Consumers
Kizgin, H., Dey, B. L., Dwivedi, Y. K., Hughes, L., Jamal, A., Jones, P., Kronemann, B., Laroche, M., Peñaloza, L., Richard, M. O., Rana, N. P., Romer, R., Tamilmani, K., & Williams, M. D. (2020). The impact of social media on consumer acculturation: Current challenges, opportunities, and an agenda for research and practice. International Journal of Information Management, 51(October), 0–1. https://doi.org/10.1016/j.ijinfomgt.2019.10.011
Lăzăroiu, G., Neguriţă, O., Grecu, I., Grecu, G., & Mitran, P. C. (2020). Consumers’ Decision-Making Process on Social Commerce Platforms: Online Trust, Perceived Risk, and Purchase Intentions. Frontiers in Psychology, 11(May), 1–7. https://doi.org/10.3389/fpsyg.2020.00890
Liu, Q., Zhang, X., Huang, S., Zhang, L., & Zhao, Y. (2020). Exploring consumers’ buying behavior in a large online Promotion Activity: The role of Psychological Distance and Involvement. Journal of Theoretical and Applied Electronic Commerce Research, 15(1), 66–80. https://doi.org/10.4067/S0718-18762020000100106
Marzieh Zendehdel, Laily Hj Paim & Syuhaily Bint Osman | (2015) Students’ online purchasing behavior in Malaysia: Understanding online shopping attitude, Cogent Business & Management, 2:1, 1078428, DOI:10.1080/23311975.2015.1078428. https://doi.org/10.1080/23311975.2015.1078428
Silvia Bellini1, Maria Grazia Cardinali1, & Benedetta Grandi2, (2016). “Does Shopping Preparation influence Consumer Buying Decisions?,” International Business Research; Vol. 9, No. 10; 2016. https://www.researchgate.net/publication/308571032
Stankevich, A. (2017). Explaining the Consumer Decision-Making Process: Critical Literature Review. Journal of International Business Research and Marketing, 2(6), 7–14. https://doi.org/10.18775/jibrm.1849-8558.2015.26.3001
Wang, C., & Gu, X. (2019). Influence of adolescents’ peer relationships and social media on academic identity. Asia Pacific Journal of Education, 39(3), 357–371. https://doi.org/10.1080/02188791.2019.1598848
YMS2021, Universiti Utara Malaysia
83
Page 83
Online Shopping Reasons of UUM Students
Ramithran Kaliappan1, Loh Wei Hau2, Leong Chun Hung3 & Sia San Hou4
1Universiti Utara Malaysia, Malaysia, [email protected] 2Universiti Utara Malaysia, Malaysia, [email protected]
3Universiti Utara Malaysia, Malaysia, [email protected] 4Universiti Utara Malaysia, Malaysia, [email protected]
ABSTRACT
Social media has changed the consumer online
decision making purchasing process. This study
identifies the reasons for using online shopping among
UUM students and the types of products they buy
online. To meet these aims, a survey was conducted
where 100 respondents participated. Most respondents
use the Shopee apps to buy products online for reasons
of time saving, wider product selections and better
prices.
Keywords: social media, online shopping, youth,
survey
I. INTRODUCTION
E-commerce (electronic commerce) is the buying
and selling of goods and services, or the transmitting
of funds or data, over an electronic network, primarily
the internet. These business transactions occur either
as business-to-business (B2B), business-to-consumer
(B2C), consumer-to-consumer or consumer-to-
business. E-commerce is powered by the internet,
where customers can access an online store to browse
through, and place orders for products or services via
their own devices.
Buying things online has become a common
practice among millions of people around the world in
this era. Recently the number of people buying goods
and services online has increased more than ever
before. The reason for choosing online shopping could
vary from convenience to competitive prices. In
addition to that, online businesses are trying their best
to make sure that the experience of online shopping
matches in-person shopping experiences. This
includes providing customers with detailed product
descriptions and images.
Customers shopping at a physical store may have a
hard time determining which aisle a particular product
is in. In e-commerce, visitors can browse product
category pages and use the site search feature to find
the product immediately. This situation provides easy
accessibility to the customer. Aside from scheduled
maintenance, e-commerce sites are available 24 hours
and 7 days in a week, allowing visitors to browse and
shop any time. Brick-and-mortar businesses tend to
open for a fixed number of hours and may even close
entirely on certain days. The availability of online
features makes the customers spend less time on
shopping.
The growth of online shopping is simply
impressive. It does not seem like it is going to slow
down. It is a good opportunity for those who want to
build up their own business with online shopping. And
the opportunity attracts more people to enter e-
commerce and start their business at a lower cost. Pure
e-commerce businesses avoid the cost associated with
physical stores, such as rent, inventory and cashiers,
although they may incur shipping and warehouse
costs. They can choose to build up their own online
shopping business in its own webpage or in a platform
such as Taobao, Shopee, Lazada and others.
Youth are the people who lead the online trend.
They are the people who always get the newest
information and easier to change their mind to follow
the trend. E-commerce is the one which university and
college students follow the trend and now basically
use it constantly. As a result, the study described in
this article involved Universiti Utara Malaysia (UUM)
students to find out the online shopping reasons and
the kinds of products the youth go for.
II. METHODOLOGY
The questions in the survey are divided into two
categories of responses, which are quantitative and
qualitative. Qualitative data is the data that
approximates and characteristics. Qualitative data are
also known as categorical data. The qualitative
questions are non-numerically values in its answer.
Qualitative data may be more difficult to precisely
measure and analyze compared to quantitative data.
However, qualitative data can provide us with more
detailed information to explain particular issues. For
YMS2021, Universiti Utara Malaysia
84
example, the question that uses qualitative data in this
project is “Gender of the students”.
Quantitative data is the type of data in which the
value can be measured in numbers or counts, with a
unique numerical value associated with each data
set. A quantitative question probably would be
numerically valued in its answer. Qualitative data can
either be compared or counted on a numeric scale.
Quantitative questions will result in data that is easy to
convert into objective, numbers-based analysis.
Quantitative data is easier to measure using statistical
analysis because we can assign numeric values and
directly compare different answers to the same questions
(Coral, 2021; Maryam, 2020).
A. Data Collection Method
In this survey, a set of questionnaires was prepared
in order to collect the data from the random-sampling
respondents who are UUM students. This
questionnaire is organized in Google form because it
is one of the easiest ways for everyone to access it.
Google Forms is a web-based app used to create forms
for data collection purposes. Students and teachers
can use Google Form to take surveys, quizzes, or
event registration sheets. The form can be shared with
respondents by sending a link or emailing a message.
Apart from that, Google forms nowadays become a
priority choice because it is a free option.
After the Google form was created, the Google
form link was sent and shared through various types
of social media such as Whatsapp, Facebook or
Instagram. The purpose of sharing the link is to collect
data from different respondents. Google Form is
mobile friendly and hence the respondents’ data can
be collected in a faster way. The importance of Google
Form usage is its cross-platform compatibility. This
means that respondents can easily access the link no
matter which device they use. (Edelmayer, 2020)
B. Data Representation Methods
In this survey, various types of data representation
methods were used to analyze and represent our data
(Coral, 2021; Maryam, 2020).
In this study, pie or bar charts are mostly
utilized to display the data. A graphical tool
effectively conveys the data to make the figures
clearer and easily understood. Tabulation method is
also one of the data representation methods.
Tabulation method is a system which arranges the data
and information into a table after processing it.
Complex data can be simplified by using the
tabulation method. Data will be easier to compare
when they are arranged in the rows and columns.
However, tabulation is not presented here due to
writing space limitations.
III RESULTS
It was found that most of the respondents are
female (Figure 1) which is 58 respondents (58%) out
of 100 respondents and the rest of the respondents are
male which is 42 respondents (42%). This is because
the female ratio is more than male in this institution.
Figure 1: Gender
Figure 2: Age Group
Besides that, as shown in Figure 2, most
respondents are from the age 21 to 23 years old, which
is 55%. Next, there are 9 respondents (9%) from the
age 24 to 26 years old. Also, there are 36 respondents
(36%) from the age 18 to 20 years old.
42%58%
Gender
Male Female
36%
55%
9%
Age
18-20 21-23 24-26
YMS2021, Universiti Utara Malaysia
85
Figure 3: Semester
Then, most of the respondents are from the Sem
3-4, which made up 50% (refer to Figure 3). Another
28 respondents (28%) are from the Sem 1-2. 13% are
from the Sem 5-6 and 9% from Sem 7-8.
Figure 4: Which app do you use for online shopping?
From the data collected (Figure 4), it was found
that most of the respondents (55%) prefer Shopee as
the app they use for online shopping while 21% of
respondents prefer Taobao and 24% respondents
choose Lazada. Most respondents choose Shopee
because Shopee is the most visited and popular e-
commerce platform in Malaysia.
Figure 5: Reason for buying online
According to the data collected from google form,
the main reason for buying online is saving time (refer
to Figure 5), where 48% of respondents picked it. In
this Covid-19 pandemic time, the respondents can buy
what they want through online shopping easily
without going out to the traditional shops. The second
reason is the wider selection of products (30%). There
are varieties of products from different manufacturers
in online shopping. So, the respondents are able to do
comparisons of the same products, when they compare
several sellers, decision making becomes easy to
choose the best. Next, the third reason is better prices
which 22% of respondents agreed on. As can be seen,
the prices of online shops are normally cheaper than
the traditional shops. That is why respondents choose
to go online for shopping.
Figure 6: Which shopping categories do you prefer in
an online shop?
Figure 6 depicts 59% of the respondents go online
shopping for fashion and beauty products, 25% for
food and personal care and only 5% go shopping for
furniture and appliances. This may be due to most of the
respondents are female, so they prefer to go online for
fashion and beauty.
Figure 7: How much money is spent on online
shopping per month?
28%
50%
13%
9% Semester
Sem 1-2 Sem 3-4 Sem 5-6 Sem 7-8
55%
21%
24%
Which app do you use for online shopping?
Shopee Lazada Taobao
YMS2021, Universiti Utara Malaysia
86
While most of the respondents (i.e 80%) spend
RM100 - RM199 monthly on online shopping only 2%
spend more than RM1,000 per month (refer to Figure
7). Of course, the purchasing power of youth in higher
institutions reflects these findings. However, nearly
RM200/monthly is considered much also.
IV CONCLUSION The results of this survey supported the usage
impact of online shopping in UUM. It was found that
most of the respondents are female which made up
58% of the respondents. They are all of youth age.
Shopee is the most preferred online shopping
environment. next to Taobao and Lazada. The main
reason online shopping is a hit now is due to the
Covid-19 pandemic. Youth also use online platforms
to view and buy fashion and beauty products. They
considered the online environment as saving their
time, providing wider selections and allowing them to
easily compare prices.
REFERENCES
Coral, O. (6 January 2021). Online Shopping Statistics You Need to Know in 2021. Retrieved from: https://optinmonster.com/online-shopping-statistics/
Maryam, M. (23 March 2020). 10 Online Shopping Statistic You Need To Know In 2021. Retrieved from: https://my.oberlo.com/blog/online-shopping-statistics
Edelmayer, S. (2020, Mac 27). Make Use Of. Retrieved from: https://www.makeuseof.com/tag/5-awesome-reasons-to-use-google-forms/
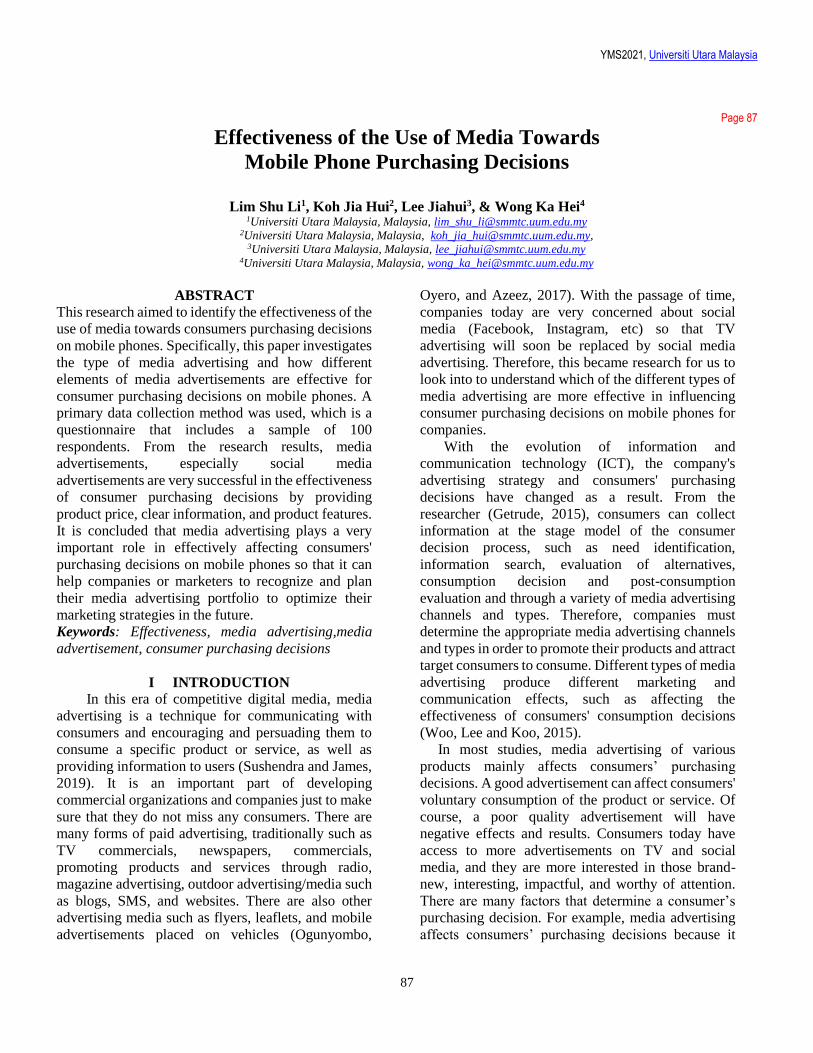
YMS2021, Universiti Utara Malaysia
87
Page 87
Effectiveness of the Use of Media Towards
Mobile Phone Purchasing Decisions
Lim Shu Li1, Koh Jia Hui2, Lee Jiahui3, & Wong Ka Hei4
1Universiti Utara Malaysia, Malaysia, [email protected] 2Universiti Utara Malaysia, Malaysia, [email protected],
3Universiti Utara Malaysia, Malaysia, [email protected] 4Universiti Utara Malaysia, Malaysia, [email protected]
ABSTRACT
This research aimed to identify the effectiveness of the
use of media towards consumers purchasing decisions
on mobile phones. Specifically, this paper investigates
the type of media advertising and how different
elements of media advertisements are effective for
consumer purchasing decisions on mobile phones. A
primary data collection method was used, which is a
questionnaire that includes a sample of 100
respondents. From the research results, media
advertisements, especially social media
advertisements are very successful in the effectiveness
of consumer purchasing decisions by providing
product price, clear information, and product features.
It is concluded that media advertising plays a very
important role in effectively affecting consumers'
purchasing decisions on mobile phones so that it can
help companies or marketers to recognize and plan
their media advertising portfolio to optimize their
marketing strategies in the future.
Keywords: Effectiveness, media advertising,media
advertisement, consumer purchasing decisions
I INTRODUCTION
In this era of competitive digital media, media
advertising is a technique for communicating with
consumers and encouraging and persuading them to
consume a specific product or service, as well as
providing information to users (Sushendra and James,
2019). It is an important part of developing
commercial organizations and companies just to make
sure that they do not miss any consumers. There are
many forms of paid advertising, traditionally such as
TV commercials, newspapers, commercials,
promoting products and services through radio,
magazine advertising, outdoor advertising/media such
as blogs, SMS, and websites. There are also other
advertising media such as flyers, leaflets, and mobile
advertisements placed on vehicles (Ogunyombo,
Oyero, and Azeez, 2017). With the passage of time,
companies today are very concerned about social
media (Facebook, Instagram, etc) so that TV
advertising will soon be replaced by social media
advertising. Therefore, this became research for us to
look into to understand which of the different types of
media advertising are more effective in influencing
consumer purchasing decisions on mobile phones for
companies.
With the evolution of information and
communication technology (ICT), the company's
advertising strategy and consumers' purchasing
decisions have changed as a result. From the
researcher (Getrude, 2015), consumers can collect
information at the stage model of the consumer
decision process, such as need identification,
information search, evaluation of alternatives,
consumption decision and post-consumption
evaluation and through a variety of media advertising
channels and types. Therefore, companies must
determine the appropriate media advertising channels
and types in order to promote their products and attract
target consumers to consume. Different types of media
advertising produce different marketing and
communication effects, such as affecting the
effectiveness of consumers' consumption decisions
(Woo, Lee and Koo, 2015).
In most studies, media advertising of various
products mainly affects consumers’ purchasing
decisions. A good advertisement can affect consumers'
voluntary consumption of the product or service. Of
course, a poor quality advertisement will have
negative effects and results. Consumers today have
access to more advertisements on TV and social
media, and they are more interested in those brand-
new, interesting, impactful, and worthy of attention.
There are many factors that determine a consumer’s
purchasing decision. For example, media advertising
affects consumers’ purchasing decisions because it
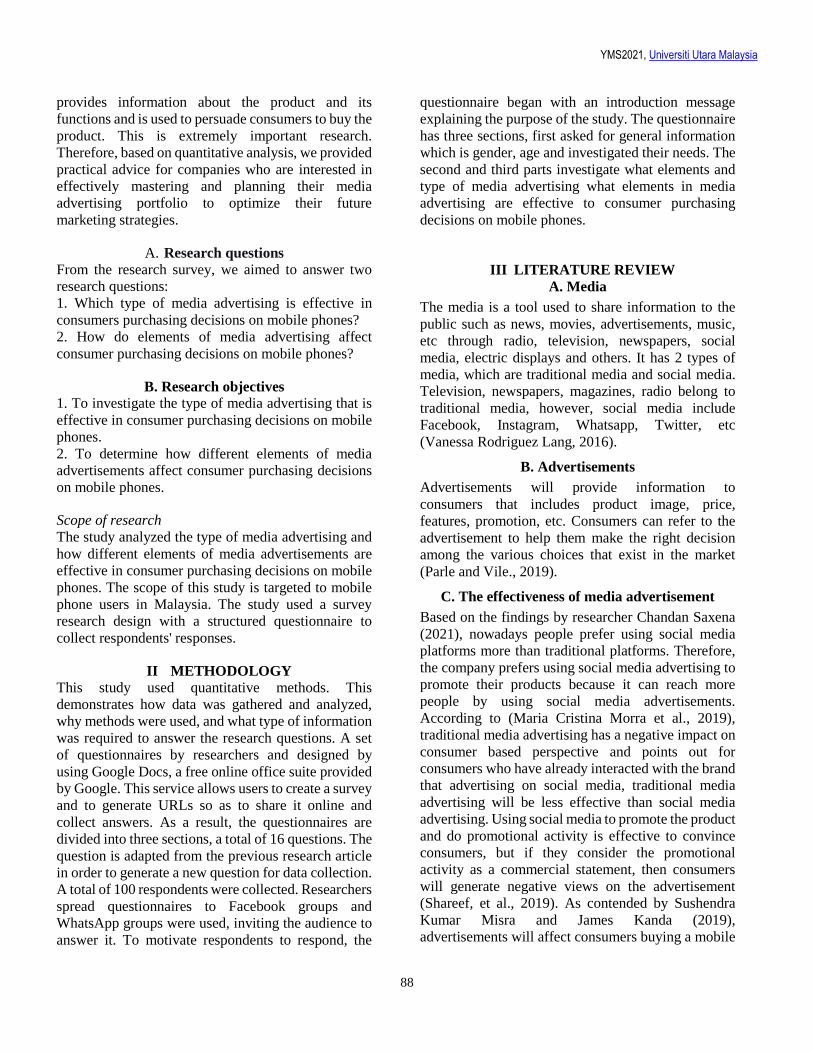
YMS2021, Universiti Utara Malaysia
88
provides information about the product and its
functions and is used to persuade consumers to buy the
product. This is extremely important research.
Therefore, based on quantitative analysis, we provided
practical advice for companies who are interested in
effectively mastering and planning their media
advertising portfolio to optimize their future
marketing strategies.
A. Research questions
From the research survey, we aimed to answer two
research questions:
1. Which type of media advertising is effective in
consumers purchasing decisions on mobile phones?
2. How do elements of media advertising affect
consumer purchasing decisions on mobile phones?
B. Research objectives
1. To investigate the type of media advertising that is
effective in consumer purchasing decisions on mobile
phones.
2. To determine how different elements of media
advertisements affect consumer purchasing decisions
on mobile phones.
Scope of research
The study analyzed the type of media advertising and
how different elements of media advertisements are
effective in consumer purchasing decisions on mobile
phones. The scope of this study is targeted to mobile
phone users in Malaysia. The study used a survey
research design with a structured questionnaire to
collect respondents' responses.
II METHODOLOGY
This study used quantitative methods. This
demonstrates how data was gathered and analyzed,
why methods were used, and what type of information
was required to answer the research questions. A set
of questionnaires by researchers and designed by
using Google Docs, a free online office suite provided
by Google. This service allows users to create a survey
and to generate URLs so as to share it online and
collect answers. As a result, the questionnaires are
divided into three sections, a total of 16 questions. The
question is adapted from the previous research article
in order to generate a new question for data collection.
A total of 100 respondents were collected. Researchers
spread questionnaires to Facebook groups and
WhatsApp groups were used, inviting the audience to
answer it. To motivate respondents to respond, the
questionnaire began with an introduction message
explaining the purpose of the study. The questionnaire
has three sections, first asked for general information
which is gender, age and investigated their needs. The
second and third parts investigate what elements and
type of media advertising what elements in media
advertising are effective to consumer purchasing
decisions on mobile phones.
III LITERATURE REVIEW
A. Media
The media is a tool used to share information to the
public such as news, movies, advertisements, music,
etc through radio, television, newspapers, social
media, electric displays and others. It has 2 types of
media, which are traditional media and social media.
Television, newspapers, magazines, radio belong to
traditional media, however, social media include
Facebook, Instagram, Whatsapp, Twitter, etc
(Vanessa Rodriguez Lang, 2016).
B. Advertisements
Advertisements will provide information to
consumers that includes product image, price,
features, promotion, etc. Consumers can refer to the
advertisement to help them make the right decision
among the various choices that exist in the market
(Parle and Vile., 2019).
C. The effectiveness of media advertisement
Based on the findings by researcher Chandan Saxena
(2021), nowadays people prefer using social media
platforms more than traditional platforms. Therefore,
the company prefers using social media advertising to
promote their products because it can reach more
people by using social media advertisements.
According to (Maria Cristina Morra et al., 2019),
traditional media advertising has a negative impact on
consumer based perspective and points out for
consumers who have already interacted with the brand
that advertising on social media, traditional media
advertising will be less effective than social media
advertising. Using social media to promote the product
and do promotional activity is effective to convince
consumers, but if they consider the promotional
activity as a commercial statement, then consumers
will generate negative views on the advertisement
(Shareef, et al., 2019). As contended by Sushendra
Kumar Misra and James Kanda (2019),
advertisements will affect consumers buying a mobile
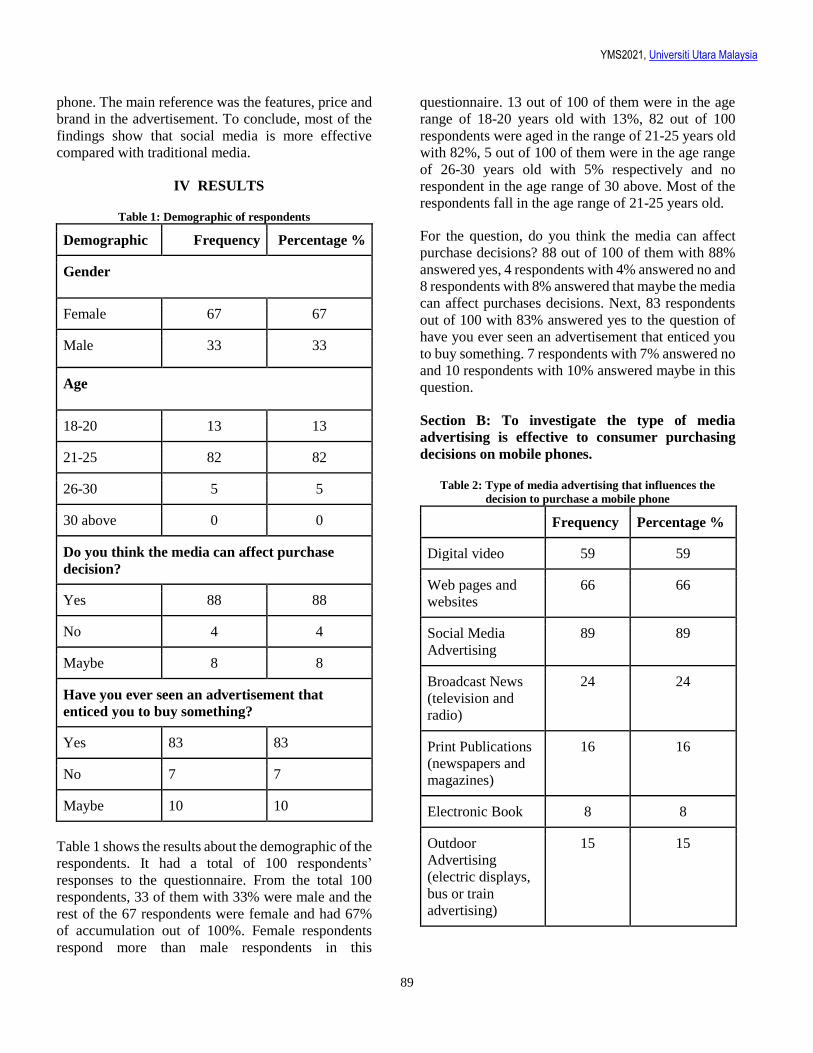
YMS2021, Universiti Utara Malaysia
89
phone. The main reference was the features, price and
brand in the advertisement. To conclude, most of the
findings show that social media is more effective
compared with traditional media.
IV RESULTS
Table 1: Demographic of respondents
Demographic Frequency Percentage %
Gender
Female 67 67
Male 33 33
Age
18-20 13 13
21-25 82 82
26-30 5 5
30 above 0 0
Do you think the media can affect purchase
decision?
Yes 88 88
No 4 4
Maybe 8 8
Have you ever seen an advertisement that
enticed you to buy something?
Yes 83 83
No 7 7
Maybe 10 10
Table 1 shows the results about the demographic of the
respondents. It had a total of 100 respondents’
responses to the questionnaire. From the total 100
respondents, 33 of them with 33% were male and the
rest of the 67 respondents were female and had 67%
of accumulation out of 100%. Female respondents
respond more than male respondents in this
questionnaire. 13 out of 100 of them were in the age
range of 18-20 years old with 13%, 82 out of 100
respondents were aged in the range of 21-25 years old
with 82%, 5 out of 100 of them were in the age range
of 26-30 years old with 5% respectively and no
respondent in the age range of 30 above. Most of the
respondents fall in the age range of 21-25 years old.
For the question, do you think the media can affect
purchase decisions? 88 out of 100 of them with 88%
answered yes, 4 respondents with 4% answered no and
8 respondents with 8% answered that maybe the media
can affect purchases decisions. Next, 83 respondents
out of 100 with 83% answered yes to the question of
have you ever seen an advertisement that enticed you
to buy something. 7 respondents with 7% answered no
and 10 respondents with 10% answered maybe in this
question.
Section B: To investigate the type of media
advertising is effective to consumer purchasing
decisions on mobile phones.
Table 2: Type of media advertising that influences the
decision to purchase a mobile phone
Frequency Percentage %
Digital video 59 59
Web pages and
websites
66 66
Social Media
Advertising
89 89
Broadcast News
(television and
radio)
24 24
Print Publications
(newspapers and
magazines)
16 16
Electronic Book 8 8
Outdoor
Advertising
(electric displays,
bus or train
advertising)
15 15
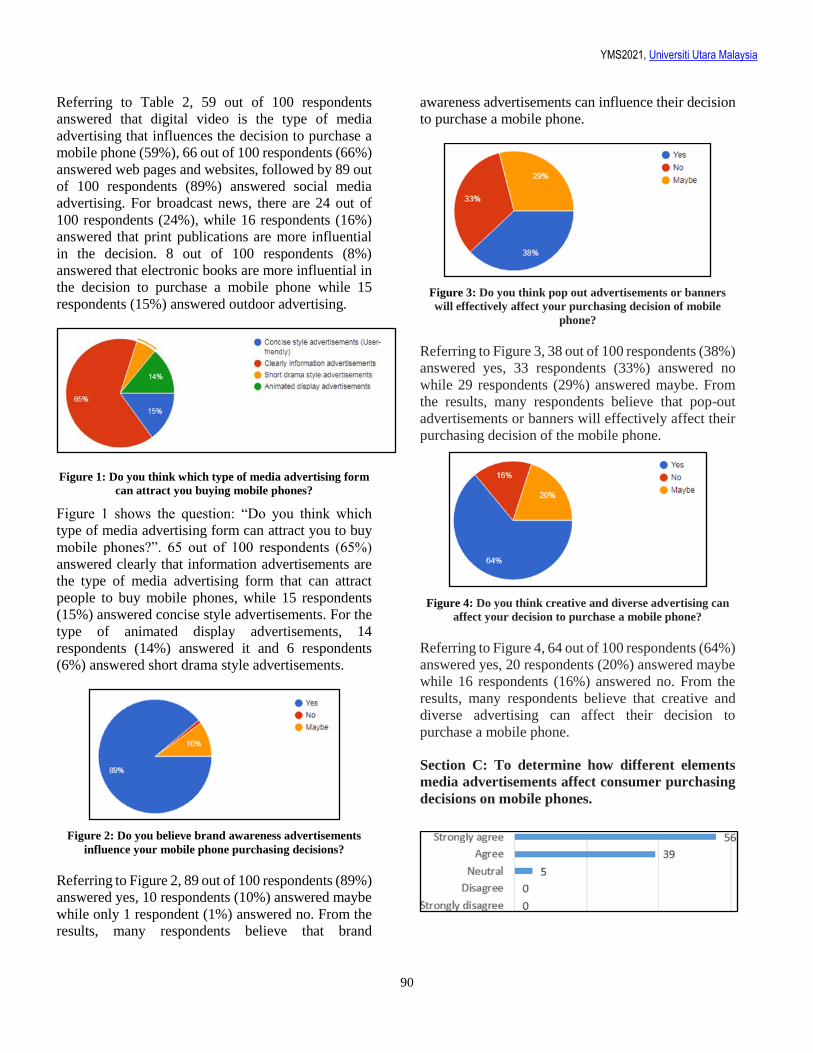
YMS2021, Universiti Utara Malaysia
90
Referring to Table 2, 59 out of 100 respondents
answered that digital video is the type of media
advertising that influences the decision to purchase a
mobile phone (59%), 66 out of 100 respondents (66%)
answered web pages and websites, followed by 89 out
of 100 respondents (89%) answered social media
advertising. For broadcast news, there are 24 out of
100 respondents (24%), while 16 respondents (16%)
answered that print publications are more influential
in the decision. 8 out of 100 respondents (8%)
answered that electronic books are more influential in
the decision to purchase a mobile phone while 15
respondents (15%) answered outdoor advertising.
Figure 1: Do you think which type of media advertising form
can attract you buying mobile phones?
Figure 1 shows the question: “Do you think which
type of media advertising form can attract you to buy
mobile phones?”. 65 out of 100 respondents (65%)
answered clearly that information advertisements are
the type of media advertising form that can attract
people to buy mobile phones, while 15 respondents
(15%) answered concise style advertisements. For the
type of animated display advertisements, 14
respondents (14%) answered it and 6 respondents
(6%) answered short drama style advertisements.
Figure 2: Do you believe brand awareness advertisements
influence your mobile phone purchasing decisions?
Referring to Figure 2, 89 out of 100 respondents (89%)
answered yes, 10 respondents (10%) answered maybe
while only 1 respondent (1%) answered no. From the
results, many respondents believe that brand
awareness advertisements can influence their decision
to purchase a mobile phone.
Figure 3: Do you think pop out advertisements or banners
will effectively affect your purchasing decision of mobile
phone?
Referring to Figure 3, 38 out of 100 respondents (38%)
answered yes, 33 respondents (33%) answered no
while 29 respondents (29%) answered maybe. From
the results, many respondents believe that pop-out
advertisements or banners will effectively affect their
purchasing decision of the mobile phone.
Figure 4: Do you think creative and diverse advertising can
affect your decision to purchase a mobile phone?
Referring to Figure 4, 64 out of 100 respondents (64%)
answered yes, 20 respondents (20%) answered maybe
while 16 respondents (16%) answered no. From the
results, many respondents believe that creative and
diverse advertising can affect their decision to
purchase a mobile phone.
Section C: To determine how different elements
media advertisements affect consumer purchasing
decisions on mobile phones.
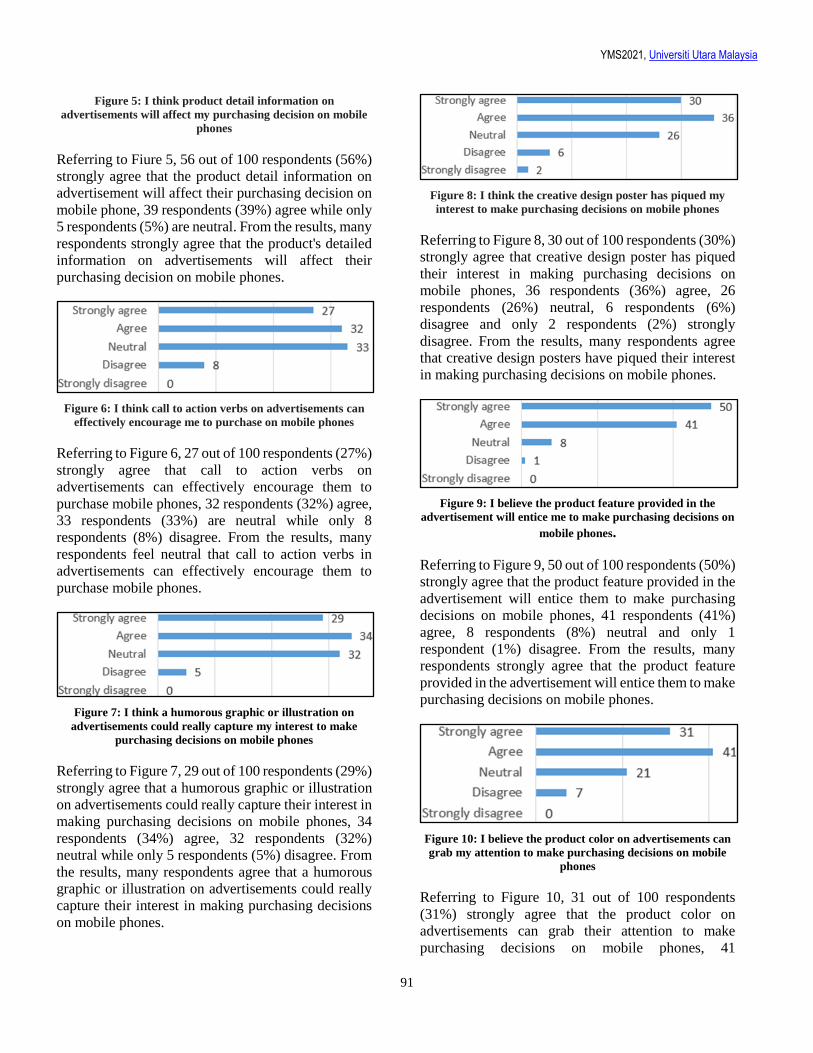
YMS2021, Universiti Utara Malaysia
91
Figure 5: I think product detail information on
advertisements will affect my purchasing decision on mobile
phones
Referring to Fiure 5, 56 out of 100 respondents (56%)
strongly agree that the product detail information on
advertisement will affect their purchasing decision on
mobile phone, 39 respondents (39%) agree while only
5 respondents (5%) are neutral. From the results, many
respondents strongly agree that the product's detailed
information on advertisements will affect their
purchasing decision on mobile phones.
Figure 6: I think call to action verbs on advertisements can
effectively encourage me to purchase on mobile phones
Referring to Figure 6, 27 out of 100 respondents (27%)
strongly agree that call to action verbs on
advertisements can effectively encourage them to
purchase mobile phones, 32 respondents (32%) agree,
33 respondents (33%) are neutral while only 8
respondents (8%) disagree. From the results, many
respondents feel neutral that call to action verbs in
advertisements can effectively encourage them to
purchase mobile phones.
Figure 7: I think a humorous graphic or illustration on
advertisements could really capture my interest to make
purchasing decisions on mobile phones
Referring to Figure 7, 29 out of 100 respondents (29%)
strongly agree that a humorous graphic or illustration
on advertisements could really capture their interest in
making purchasing decisions on mobile phones, 34
respondents (34%) agree, 32 respondents (32%)
neutral while only 5 respondents (5%) disagree. From
the results, many respondents agree that a humorous
graphic or illustration on advertisements could really
capture their interest in making purchasing decisions
on mobile phones.
Figure 8: I think the creative design poster has piqued my
interest to make purchasing decisions on mobile phones
Referring to Figure 8, 30 out of 100 respondents (30%)
strongly agree that creative design poster has piqued
their interest in making purchasing decisions on
mobile phones, 36 respondents (36%) agree, 26
respondents (26%) neutral, 6 respondents (6%)
disagree and only 2 respondents (2%) strongly
disagree. From the results, many respondents agree
that creative design posters have piqued their interest
in making purchasing decisions on mobile phones.
Figure 9: I believe the product feature provided in the
advertisement will entice me to make purchasing decisions on
mobile phones.
Referring to Figure 9, 50 out of 100 respondents (50%)
strongly agree that the product feature provided in the
advertisement will entice them to make purchasing
decisions on mobile phones, 41 respondents (41%)
agree, 8 respondents (8%) neutral and only 1
respondent (1%) disagree. From the results, many
respondents strongly agree that the product feature
provided in the advertisement will entice them to make
purchasing decisions on mobile phones.
Figure 10: I believe the product color on advertisements can
grab my attention to make purchasing decisions on mobile
phones
Referring to Figure 10, 31 out of 100 respondents
(31%) strongly agree that the product color on
advertisements can grab their attention to make
purchasing decisions on mobile phones, 41
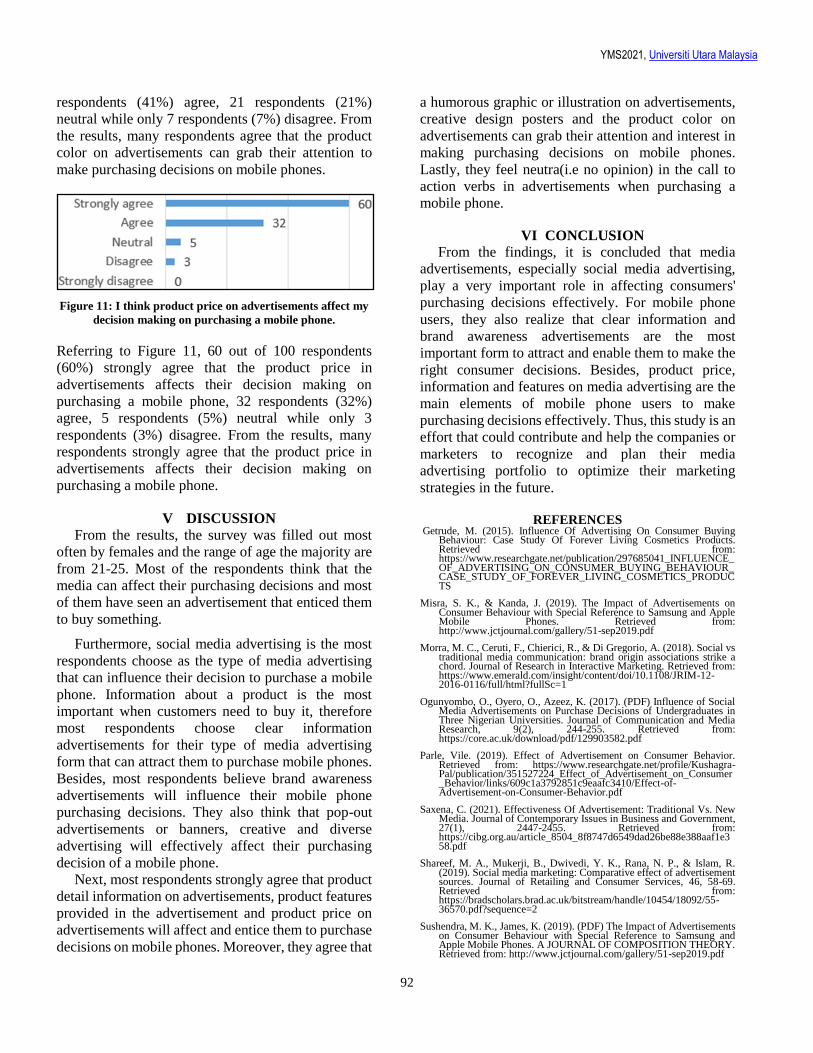
YMS2021, Universiti Utara Malaysia
92
respondents (41%) agree, 21 respondents (21%)
neutral while only 7 respondents (7%) disagree. From
the results, many respondents agree that the product
color on advertisements can grab their attention to
make purchasing decisions on mobile phones.
Figure 11: I think product price on advertisements affect my
decision making on purchasing a mobile phone.
Referring to Figure 11, 60 out of 100 respondents
(60%) strongly agree that the product price in
advertisements affects their decision making on
purchasing a mobile phone, 32 respondents (32%)
agree, 5 respondents (5%) neutral while only 3
respondents (3%) disagree. From the results, many
respondents strongly agree that the product price in
advertisements affects their decision making on
purchasing a mobile phone.
V DISCUSSION
From the results, the survey was filled out most
often by females and the range of age the majority are
from 21-25. Most of the respondents think that the
media can affect their purchasing decisions and most
of them have seen an advertisement that enticed them
to buy something.
Furthermore, social media advertising is the most
respondents choose as the type of media advertising
that can influence their decision to purchase a mobile
phone. Information about a product is the most
important when customers need to buy it, therefore
most respondents choose clear information
advertisements for their type of media advertising
form that can attract them to purchase mobile phones.
Besides, most respondents believe brand awareness
advertisements will influence their mobile phone
purchasing decisions. They also think that pop-out
advertisements or banners, creative and diverse
advertising will effectively affect their purchasing
decision of a mobile phone.
Next, most respondents strongly agree that product
detail information on advertisements, product features
provided in the advertisement and product price on
advertisements will affect and entice them to purchase
decisions on mobile phones. Moreover, they agree that
a humorous graphic or illustration on advertisements,
creative design posters and the product color on
advertisements can grab their attention and interest in
making purchasing decisions on mobile phones.
Lastly, they feel neutra(i.e no opinion) in the call to
action verbs in advertisements when purchasing a
mobile phone.
VI CONCLUSION
From the findings, it is concluded that media
advertisements, especially social media advertising,
play a very important role in affecting consumers'
purchasing decisions effectively. For mobile phone
users, they also realize that clear information and
brand awareness advertisements are the most
important form to attract and enable them to make the
right consumer decisions. Besides, product price,
information and features on media advertising are the
main elements of mobile phone users to make
purchasing decisions effectively. Thus, this study is an
effort that could contribute and help the companies or
marketers to recognize and plan their media
advertising portfolio to optimize their marketing
strategies in the future.
REFERENCES Getrude, M. (2015). Influence Of Advertising On Consumer Buying
Behaviour: Case Study Of Forever Living Cosmetics Products. Retrieved from: https://www.researchgate.net/publication/297685041_INFLUENCE_OF_ADVERTISING_ON_CONSUMER_BUYING_BEHAVIOUR_CASE_STUDY_OF_FOREVER_LIVING_COSMETICS_PRODUCTS
Misra, S. K., & Kanda, J. (2019). The Impact of Advertisements on Consumer Behaviour with Special Reference to Samsung and Apple Mobile Phones. Retrieved from: http://www.jctjournal.com/gallery/51-sep2019.pdf
Morra, M. C., Ceruti, F., Chierici, R., & Di Gregorio, A. (2018). Social vs traditional media communication: brand origin associations strike a chord. Journal of Research in Interactive Marketing. Retrieved from: https://www.emerald.com/insight/content/doi/10.1108/JRIM-12-2016-0116/full/html?fullSc=1
Ogunyombo, O., Oyero, O., Azeez, K. (2017). (PDF) Influence of Social Media Advertisements on Purchase Decisions of Undergraduates in Three Nigerian Universities. Journal of Communication and Media Research, 9(2), 244-255. Retrieved from: https://core.ac.uk/download/pdf/129903582.pdf
Parle, Vile. (2019). Effect of Advertisement on Consumer Behavior. Retrieved from: https://www.researchgate.net/profile/Kushagra-Pal/publication/351527224_Effect_of_Advertisement_on_Consumer_Behavior/links/609c1a3792851c9eaafc3410/Effect-of-Advertisement-on-Consumer-Behavior.pdf
Saxena, C. (2021). Effectiveness Of Advertisement: Traditional Vs. New Media. Journal of Contemporary Issues in Business and Government, 27(1), 2447-2455. Retrieved from: https://cibg.org.au/article_8504_8f8747d6549dad26be88e388aaf1e358.pdf
Shareef, M. A., Mukerji, B., Dwivedi, Y. K., Rana, N. P., & Islam, R. (2019). Social media marketing: Comparative effect of advertisement sources. Journal of Retailing and Consumer Services, 46, 58-69. Retrieved from: https://bradscholars.brad.ac.uk/bitstream/handle/10454/18092/55-36570.pdf?sequence=2
Sushendra, M. K., James, K. (2019). (PDF) The Impact of Advertisements on Consumer Behaviour with Special Reference to Samsung and Apple Mobile Phones. A JOURNAL OF COMPOSITION THEORY. Retrieved from: http://www.jctjournal.com/gallery/51-sep2019.pdf

YMS2021, Universiti Utara Malaysia
93
Todri, V., Ghose, A., Singh, P. V. (2020). Trade-offs in online advertising: Advertising effectiveness and annoyance dynamics across the purchase funnel. Information Systems Research, 31(1), 102-125. doi:10.1287/isre.2019.0877
Vanessa Rodriguez Lang. (2016). Social Media vs. Traditional Media – Make the Transition to Digital Marketing. Retrieved from: https://uhurunetwork.com/social-media-vs-traditional-media/
Woo, J., Ahn, J., Lee, J., & Koo, Y. (2015). Media channels and consumer purchasing decisions. Industrial Management Data Systems, 115(8), 1510-1528. doi:10.1108/imds-02-2015-0036
YMS2021, Universiti Utara Malaysia
94
Page 94
Social Media Factors Influencing
Consumer Purchase Intention in Malaysia
Lim Wei Wen1, Siti Nurhanani Tajul Ariffin2, Goh Chiew Keoh3 & Teh Xiao Lin4
1Universiti Utara Malaysia, Malaysia, [email protected] 2Universiti Utara Malaysia, Malaysia, [email protected] 3Universiti Utara Malaysia, Malaysia, [email protected]
4Universiti Utara Malaysia, Malaysia, [email protected]
ABSTRACT
With the growth of technology and the situation of the
pandemic, Internet services are becoming more
important to people. According to statistics, up to 3.96
billion people are using social media, and the devices
that have been used the most are mobile phones.
Nowadays, social media is not only for entertainment
purposes but also includes online shopping, which is
of great help to people facing the pademic. This shows
that social media has a fundamental impact on
consumers' buying behavior. The purpose of this
research is to investigate the influence of social media
on the consumer buying decision-making process and
examine the factors affecting the consumer purchase
intention influenced by social media. An online
questionnaire survey was conducted. The results show
that these factors have positive influences on
consumers' purchase intentions. These results show
that online trading is popular, which not only
facilitates unlimited shopping but also creates new job
opportunities for people.
Keywords: social media, purchase intention,
consumerism, media
I INTRODUCTION
Social media in the practical sense is presented as
application and website for users to communicate with
each other to send and receive information through
some of the online social network such as social
networking sites (Facebook), video and photo sharing
sites (Youtube) and micro blogging applications
(Twitter) (Nadaraja et al., 2013). According to
Vinerean (2017), social media is also a marketing
strategy which allows co-created value, connects
brands and consumers in an interactive way, monitors
brand-related discussions and emotions, and helps
consumers in decision making, to facilitate way for
interaction between customers and customers, and
transforms consumers into brand advocates.
Moreover, organizations using social media as a
modern tool in order to send the information to their
target markets, to encourage consumers, provide good
quality products and service and meet their
requirements can also protect the company reputation
(Nadaraja et al., 2013). Furthermore, it is an
innovation tool in marketing which engages customers
to their organization, cost effective and minimizes the
communication to consumers and establishes a high
level of brand loyalty. Social media brings the impact
for their business functions such as sales, marketing,
corporate communication and public relations,
customer service, product development and employee
communication and collaboration (Bansal, et al.,
2014). Singh and Sinha (2017) mentions that social
media has a positive effect for business growth and
performance. Companies establish their brand image
and interact with their customers while marketing their
product. Social media are able to increase customer
satisfaction in the initial stage of information search
and alternative assessment but not in decision making
stage and many of the customer are satisfied only
while they purchase in physical store (Voramontri &
Klieb, 2019) whereas from the article (Chopra et al.,
2020) found that the use of social media for the user in
decision-making process are easier, enjoyed and more
satisfied overall. Social media taken as the electronic
word of mouth (eWOM), reviews and past consumers
preferences will affect the decision making process for
potential customers. According to Sharma et al.
(2021), trust can make consumers willing to purchase
the product because it will give more satisfaction and
commitment to the specific brands. This article looks
into such factors that would influence purchasing
intentions.
II LITERATURE REVIEW
A. Advertisement
Advertising is a kind of persuasive public
communication to introduce products or services. The
YMS2021, Universiti Utara Malaysia
95
advertisement must be financially supported by the
sponsor, promoted from major media, and a message
designed for a special audience. Therefore, advertising
not only attracts long-distance customers, improves
the visibility of products and companies, but also
stimulates sales share, which is an important element
in competition with other companies (Frolova, 2014).
Advertising is divided into traditional and online.
Traditional advertising is mostly in television, radio,
newspapers, etc., has more channels than online
advertising e.g. social media but it may be able to
spread the information in certain geographically.
Online advertising solves the regional restrictions of
traditional advertising, it could market products and
services more effectively through the Internet. The
information on online advertising is more
comprehensive than traditional ads (Umarani &
Rajalakshmi, 2017). This is because online ads can be
updated at any time and provide the latest information
to customers. Customers can access the websites that
are shared on social media, interact with sellers with
chat functions, comments or lives broadcasting. The
integrity of information can increase the value of
advertising and the credibility of products, thereby
affecting consumers 'attitudes and behavior.
Compared to traditional advertising, animation and
video can assist online advertising and make product
information more entertaining. Entertainment effects
have a positive impact on online advertising (Brahim,
2016), which can temporarily relieve the fatigue of the
audience and bring joy, and it can also deepen the
audience's impression of the product. This has always
focused on the creativity of online advertising. It has
been observed that effective emotional attraction can
actively attract high levels of attention (Liu-
Tompkins, 2018). Therefore, advertisements can
attract audiences through rich life story content. A
vivid story can satisfy the audience's emotional needs
and deepen the impression. There are many ways to
innovate advertising. It can provide complete product
or service information in a fun, sad, happy, and
beautiful atmosphere to affect the psychological needs
and trust of customers, thereby persuading the
audience's willingness to purchase.
B. Price
Price is one of the important considerations for
every customer before shopping. The pandemic
reduces the economy and tightens people's spending,
so people will choose relatively cheap and practical
products or services. Promotional activities are one of
the strategies to encourage the increase of product
sales, usually to promote products at preferential
prices. The preferential price will be much lower than
usual, which will affect the number of purchases of
consumers and reduce the decision-making time
(Bhatti, 2018). Discounted prices in promotional
activities, such as a 20% discount, can increase the
value of the product and affect consumers’ purchase
intentions and purchase quantity. Therefore, the price
will affect consumers' willingness to buy.
C. Trust
Trust is one of the main things that should have
when it comes to online purchasing. It shows that the
trust could help customers in decision making to make
a purchase. Online purchase should be beneficial to
customers in order to gain trust from them such as
providing information about the product that can meet
their expectations (Dachyar & Banjarnahor, 2017).
Moreover, the trust can be measured based on their
interaction toward the product especially when it
occurs at the risk of their purchasing. In this context,
customers are more preferably going to a physical
store when they have a trust issue with it (Bansal et al.,
2020). On this aspect, the engagement of the customer
toward online purchase might decrease due to
occurring trusted issues (Dachyar & Banjarnahor,
2017).
D. Friend’s recommendation (Traditional Word
of Mouth)
Traditional Word of Mouth had been used for a
long time which has been described as conveying
other consumers based on communication from one
person to another person to persuade them whether the
product is good or not (Huete-Alcocer, 2017). This
way has been used widely because of its reliability and
it can influence the consumers when the consumers
trust other consumers rather than the seller itself
(Huete-Alcocer, 2017). The credibility of the
information that has been received by communication
between both consumers which are family or friends
can help them to make a decision to either buy the
product. Beside, all the communication between the
consumers are private and all the information cannot
be deliver faster since it is between the consumers and
for other consumers that need more information about
the product need to ask the other consumers that have
acknowledge about the product that might affect their
interest on purchasing even might have different
YMS2021, Universiti Utara Malaysia
96
perspective either positive or negative (Huete-
Alcocer, 2017; Kumar et al., 2020).
E. Positive review (Electronic Word of Mouth)
Electronic Word of Mouth or also known as
digital platform for customers to give a review which
connects the digital consumers from all around the
globe to give feedback using online platforms (Kumar
et al., 2020). The reviews that have been written are
not private and can be read by the public to make
decisions on purchasing, especially using online
platforms (Huete-Alcocer, 2017). It will depend on the
user base on their experience using the product
whether the feedback could be positive or negative
(Kumar et al., 2020). EWOM can easily go viral due
to the digital platform that can transmit the
information and feedback of the product faster through
the internet (Huete-Alcocer, 2017; Kumar et al.,
2020). This platform is also easy to access due to the
online platform having become the main platform to
influence users on decision making and for user to
know the feedback about the product from different
perspectives which can reach their expectation
(Kumar et al., 2020).
III METHODOLOGY
Figure 1: The phase of methodology
This study implemented five phases which are to
identify research problems, planning, data collection,
analysis and interpretation of data and evaluation.
(refer to Figure 1).
This study started by identifying research problems
that are related to the research title which is media and
consumerism. Searching for several articles or
journals that relate to the title and to survey the current
problems. The problem has been found which is that
social media had a radical impact on consumer
purchase behaviour. The second phase is planning. In
this phase a discussion among group members to
choose the best title and related problems were
conducted. To gain more information, a review of
some related articles to build objectives was too
conducted.
The third phase is data collection with samples of
customers in Malaysia. Random sampling then a
survey was administered. The questionnaire was
created by using Google form and blasted through
WhatsApp. The participants had to answer all the
sections in the questionnaire. The fourth phase is
analysis and interpretation of data. All the data that
were collected and analyzed followed by the findings
discussion. The last phase concluded the relationship
between the factors of social media and customer
purchase intention in Malaysia based on the analysis
of data.
IV RESULTS
Based on the questionnaire that is separated into
A, B and C sections, Section A is demography, Section
B is the influence of social media on consumer
purchase intention and Section C is factors affecting
the consumer purchase intentions influenced by social
media. Based on Table 1, there are 54 respondents, 42
were female (77.8%) and 10 were male (22.2%). The
majority of the respondents (87%) are between 21
until 25 years old. Others between 26-30 years old
(5.6%), 20 years old and below (3.7%), 31 until 35
years old and 41 years old and above (1.9%). The
majority of respondents are students (79.6%), 6
respondents are with full-time employment (11.1%),
part-time employment has 4 respondents (7.4%) and 1
respondent has retired (1.9%). 48 respondents, which
is the majority, have income less than RM 2,000
(88.9%).
Table 1: Demographic of respondents
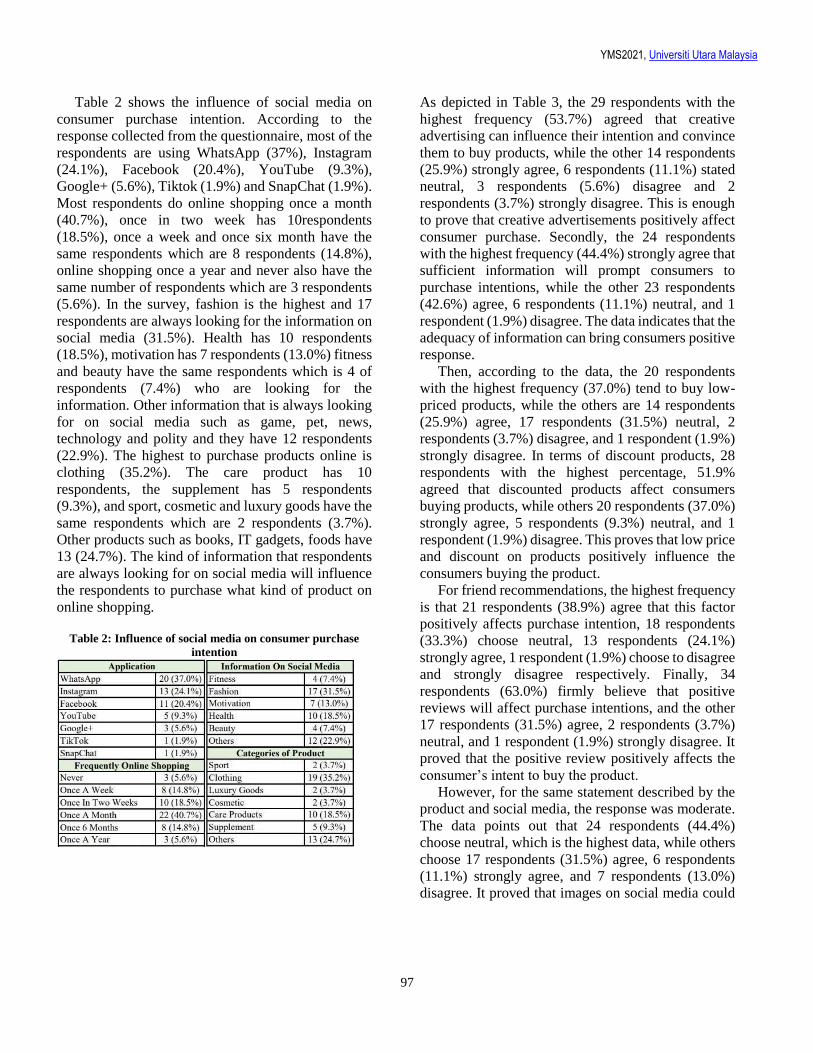
YMS2021, Universiti Utara Malaysia
97
Table 2 shows the influence of social media on
consumer purchase intention. According to the
response collected from the questionnaire, most of the
respondents are using WhatsApp (37%), Instagram
(24.1%), Facebook (20.4%), YouTube (9.3%),
Google+ (5.6%), Tiktok (1.9%) and SnapChat (1.9%).
Most respondents do online shopping once a month
(40.7%), once in two week has 10respondents
(18.5%), once a week and once six month have the
same respondents which are 8 respondents (14.8%),
online shopping once a year and never also have the
same number of respondents which are 3 respondents
(5.6%). In the survey, fashion is the highest and 17
respondents are always looking for the information on
social media (31.5%). Health has 10 respondents
(18.5%), motivation has 7 respondents (13.0%) fitness
and beauty have the same respondents which is 4 of
respondents (7.4%) who are looking for the
information. Other information that is always looking
for on social media such as game, pet, news,
technology and polity and they have 12 respondents
(22.9%). The highest to purchase products online is
clothing (35.2%). The care product has 10
respondents, the supplement has 5 respondents
(9.3%), and sport, cosmetic and luxury goods have the
same respondents which are 2 respondents (3.7%).
Other products such as books, IT gadgets, foods have
13 (24.7%). The kind of information that respondents
are always looking for on social media will influence
the respondents to purchase what kind of product on
online shopping.
Table 2: Influence of social media on consumer purchase
intention
As depicted in Table 3, the 29 respondents with the
highest frequency (53.7%) agreed that creative
advertising can influence their intention and convince
them to buy products, while the other 14 respondents
(25.9%) strongly agree, 6 respondents (11.1%) stated
neutral, 3 respondents (5.6%) disagree and 2
respondents (3.7%) strongly disagree. This is enough
to prove that creative advertisements positively affect
consumer purchase. Secondly, the 24 respondents
with the highest frequency (44.4%) strongly agree that
sufficient information will prompt consumers to
purchase intentions, while the other 23 respondents
(42.6%) agree, 6 respondents (11.1%) neutral, and 1
respondent (1.9%) disagree. The data indicates that the
adequacy of information can bring consumers positive
response.
Then, according to the data, the 20 respondents
with the highest frequency (37.0%) tend to buy low-
priced products, while the others are 14 respondents
(25.9%) agree, 17 respondents (31.5%) neutral, 2
respondents (3.7%) disagree, and 1 respondent (1.9%)
strongly disagree. In terms of discount products, 28
respondents with the highest percentage, 51.9%
agreed that discounted products affect consumers
buying products, while others 20 respondents (37.0%)
strongly agree, 5 respondents (9.3%) neutral, and 1
respondent (1.9%) disagree. This proves that low price
and discount on products positively influence the
consumers buying the product.
For friend recommendations, the highest frequency
is that 21 respondents (38.9%) agree that this factor
positively affects purchase intention, 18 respondents
(33.3%) choose neutral, 13 respondents (24.1%)
strongly agree, 1 respondent (1.9%) choose to disagree
and strongly disagree respectively. Finally, 34
respondents (63.0%) firmly believe that positive
reviews will affect purchase intentions, and the other
17 respondents (31.5%) agree, 2 respondents (3.7%)
neutral, and 1 respondent (1.9%) strongly disagree. It
proved that the positive review positively affects the
consumer’s intent to buy the product.
However, for the same statement described by the
product and social media, the response was moderate.
The data points out that 24 respondents (44.4%)
choose neutral, which is the highest data, while others
choose 17 respondents (31.5%) agree, 6 respondents
(11.1%) strongly agree, and 7 respondents (13.0%)
disagree. It proved that images on social media could
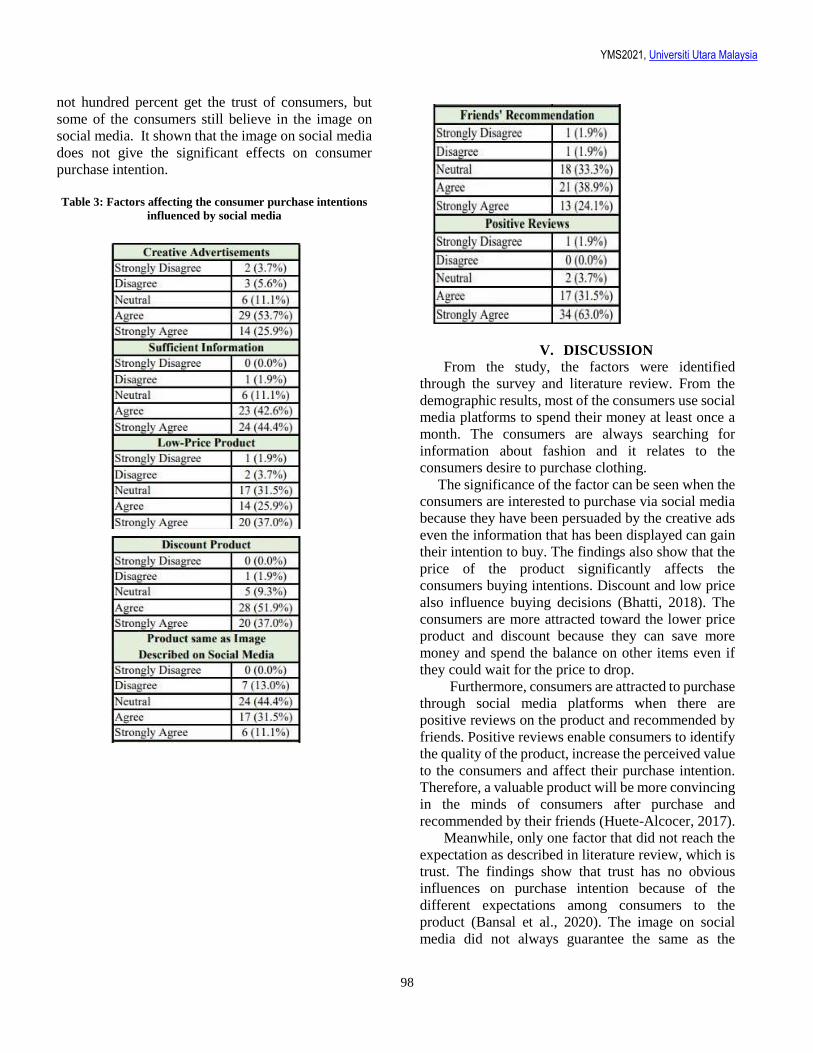
YMS2021, Universiti Utara Malaysia
98
not hundred percent get the trust of consumers, but
some of the consumers still believe in the image on
social media. It shown that the image on social media
does not give the significant effects on consumer
purchase intention.
Table 3: Factors affecting the consumer purchase intentions
influenced by social media
V. DISCUSSION
From the study, the factors were identified
through the survey and literature review. From the
demographic results, most of the consumers use social
media platforms to spend their money at least once a
month. The consumers are always searching for
information about fashion and it relates to the
consumers desire to purchase clothing.
The significance of the factor can be seen when the
consumers are interested to purchase via social media
because they have been persuaded by the creative ads
even the information that has been displayed can gain
their intention to buy. The findings also show that the
price of the product significantly affects the
consumers buying intentions. Discount and low price
also influence buying decisions (Bhatti, 2018). The
consumers are more attracted toward the lower price
product and discount because they can save more
money and spend the balance on other items even if
they could wait for the price to drop.
Furthermore, consumers are attracted to purchase
through social media platforms when there are
positive reviews on the product and recommended by
friends. Positive reviews enable consumers to identify
the quality of the product, increase the perceived value
to the consumers and affect their purchase intention.
Therefore, a valuable product will be more convincing
in the minds of consumers after purchase and
recommended by their friends (Huete-Alcocer, 2017).
Meanwhile, only one factor that did not reach the
expectation as described in literature review, which is
trust. The findings show that trust has no obvious
influences on purchase intention because of the
different expectations among consumers to the
product (Bansal et al., 2020). The image on social
media did not always guarantee the same as the
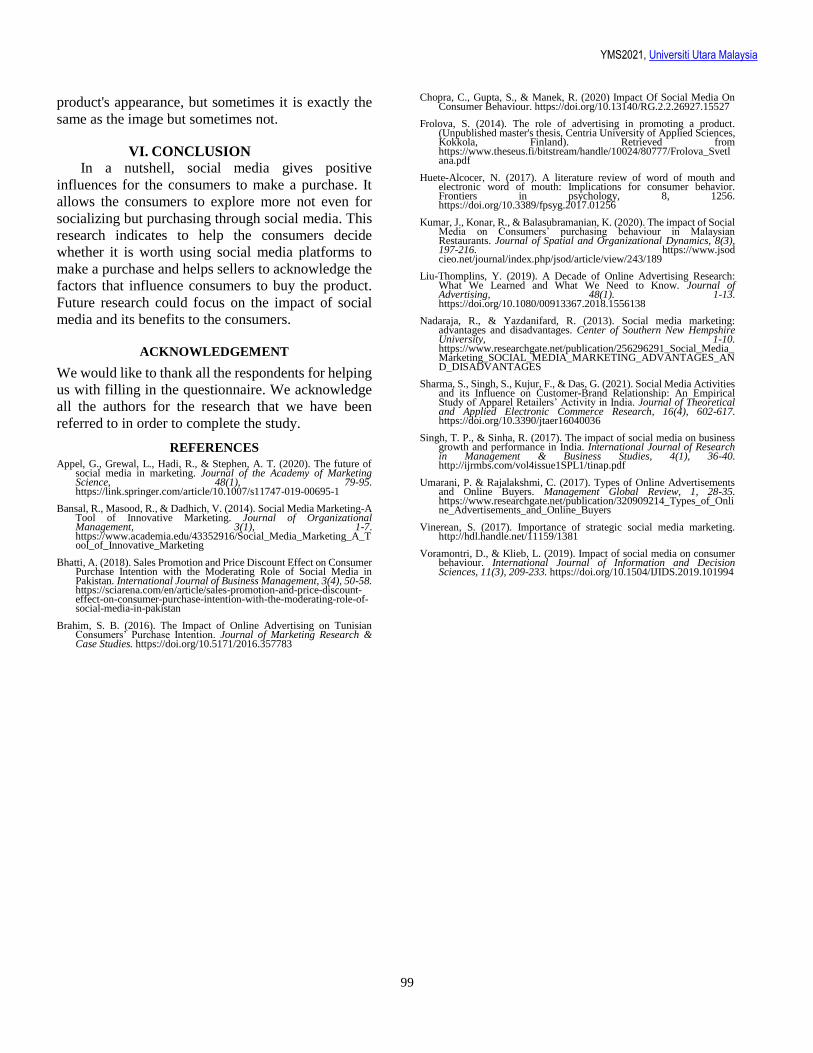
YMS2021, Universiti Utara Malaysia
99
product's appearance, but sometimes it is exactly the
same as the image but sometimes not.
VI. CONCLUSION
In a nutshell, social media gives positive
influences for the consumers to make a purchase. It
allows the consumers to explore more not even for
socializing but purchasing through social media. This
research indicates to help the consumers decide
whether it is worth using social media platforms to
make a purchase and helps sellers to acknowledge the
factors that influence consumers to buy the product.
Future research could focus on the impact of social
media and its benefits to the consumers.
ACKNOWLEDGEMENT
We would like to thank all the respondents for helping
us with filling in the questionnaire. We acknowledge
all the authors for the research that we have been
referred to in order to complete the study.
REFERENCES
Appel, G., Grewal, L., Hadi, R., & Stephen, A. T. (2020). The future of social media in marketing. Journal of the Academy of Marketing Science, 48(1), 79-95. https://link.springer.com/article/10.1007/s11747-019-00695-1
Bansal, R., Masood, R., & Dadhich, V. (2014). Social Media Marketing-A Tool of Innovative Marketing. Journal of Organizational Management, 3(1), 1-7. https://www.academia.edu/43352916/Social_Media_Marketing_A_Tool_of_Innovative_Marketing
Bhatti, A. (2018). Sales Promotion and Price Discount Effect on Consumer Purchase Intention with the Moderating Role of Social Media in Pakistan. International Journal of Business Management, 3(4), 50-58. https://sciarena.com/en/article/sales-promotion-and-price-discount-effect-on-consumer-purchase-intention-with-the-moderating-role-of-social-media-in-pakistan
Brahim, S. B. (2016). The Impact of Online Advertising on Tunisian Consumers’ Purchase Intention. Journal of Marketing Research & Case Studies. https://doi.org/10.5171/2016.357783
Chopra, C., Gupta, S., & Manek, R. (2020) Impact Of Social Media On Consumer Behaviour. https://doi.org/10.13140/RG.2.2.26927.15527
Frolova, S. (2014). The role of advertising in promoting a product. (Unpublished master's thesis, Centria University of Applied Sciences, Kokkola, Finland). Retrieved from https://www.theseus.fi/bitstream/handle/10024/80777/Frolova_Svetlana.pdf
Huete-Alcocer, N. (2017). A literature review of word of mouth and electronic word of mouth: Implications for consumer behavior. Frontiers in psychology, 8, 1256. https://doi.org/10.3389/fpsyg.2017.01256
Kumar, J., Konar, R., & Balasubramanian, K. (2020). The impact of Social Media on Consumers’ purchasing behaviour in Malaysian Restaurants. Journal of Spatial and Organizational Dynamics, 8(3), 197-216. https://www.jsod cieo.net/journal/index.php/jsod/article/view/243/189
Liu-Thomplins, Y. (2019). A Decade of Online Advertising Research: What We Learned and What We Need to Know. Journal of Advertising, 48(1). 1-13. https://doi.org/10.1080/00913367.2018.1556138
Nadaraja, R., & Yazdanifard, R. (2013). Social media marketing: advantages and disadvantages. Center of Southern New Hempshire University, 1-10. https://www.researchgate.net/publication/256296291_Social_Media_Marketing_SOCIAL_MEDIA_MARKETING_ADVANTAGES_AND_DISADVANTAGES
Sharma, S., Singh, S., Kujur, F., & Das, G. (2021). Social Media Activities and its Influence on Customer-Brand Relationship: An Empirical Study of Apparel Retailers’ Activity in India. Journal of Theoretical and Applied Electronic Commerce Research, 16(4), 602-617. https://doi.org/10.3390/jtaer16040036
Singh, T. P., & Sinha, R. (2017). The impact of social media on business growth and performance in India. International Journal of Research in Management & Business Studies, 4(1), 36-40. http://ijrmbs.com/vol4issue1SPL1/tinap.pdf
Umarani, P. & Rajalakshmi, C. (2017). Types of Online Advertisements and Online Buyers. Management Global Review, 1, 28-35. https://www.researchgate.net/publication/320909214_Types_of_Online_Advertisements_and_Online_Buyers
Vinerean, S. (2017). Importance of strategic social media marketing. http://hdl.handle.net/11159/1381
Voramontri, D., & Klieb, L. (2019). Impact of social media on consumer behaviour. International Journal of Information and Decision Sciences, 11(3), 209-233. https://doi.org/10.1504/IJIDS.2019.101994
YMS2021, Universiti Utara Malaysia
100
Best Paper Nominee
Using Social Media in Empowering Youth against Covid-19
Chan Chun Sheng1, Low Kah Yan2, Liew Jia Qi3 & Leow Thing Ni4
1Universiti Utara Malaysia, Malaysia, [email protected] 2Universiti Utara Malaysia, Malaysia, [email protected]
3Universiti Utara Malaysia, Malaysia, [email protected] 4Universiti Utara Malaysia, Malaysia, [email protected]
ABSTRACT
The usage of social media by youth is increasing
especially when physical interactions are being
reduced due to the increase of positive COVID-19
cases in Malaysia. As youth relied on social media to
obtain information and news about the virus, it would
be beneficial in empowering youth against COVID-19
if effectively applied. This study is conducted to
investigate how social media empowers youth against
COVID-19. The study was carried out using
quantitative survey methodology with a sample of 50
youths. The results revealed that WhatsApp is the
most used platform by youth in carrying out various
activities against COVID-19, whereas Twitter and
Blog are the least used. Youth also used social media
to get in touch with family and friends during the
pandemic. Furthermore, social media empower youth
to share the health information and latest news about
COVID-19 with family and friends. The awareness of
COVID-19 could indeed be enhanced among the
youth through the use of social media.
Keywords: social media, youth empowerment,
COVID-19
I INTRODUCTION
Media was invented in the 15th century. As time goes
by, the traditional media has transformed and evolved
into digital media. Nowadays, people can interact with
one another easily by using social media. It connects
people around the world and changes the trend of the
world's communication method. Now, it plays a
pivotal role in everyone’s life, especially in youth.
Social media has become an indispensable part of
youth’s lives according to their choices and
preferences. It provides different activities and
empower youth in various ways (Rana & Jadhav,
2019).
Since the outbreak of COVID-19, the rapid increase of
positive cases in Malaysia has caused the government
of Malaysia to impose the Movement Control Order
(MCO). This includes restrictions of movement, social
distancing and mass gatherings. A “new normal” life
where physical interaction becomes limited and
emotional adjustments need to be made by all persons
(Noor Azah, Othman, Lugova & Suleiman, 2020).
Reduction of physical interactions caused youth to
rely on social media to obtain latest information and
news about the virus and stay connected with families
and friends.
In this paper, a study on the correlation of social
media with youth empowerment against COVID-19 is
discussed. First, the types and frequency of social
media used are identified. Second, the purposes of
youth using social media are determined. Finally, the
involvement of youth in social media is elaborated.
II LITERATURE REVIEW
A. Social Media
As of 2020, about 81 percent of the Malaysian
population were active social media users. Although
Facebook remains the most widely used social media
platform in Malaysia, the percentage of Facebook
users has declined from 97.3% in 2018 to 91.7% in
2020. Meanwhile, the users of other social media
platforms such as YouTube, Instagram and Twitter
have increased significantly. YouTube particularly
has the most significant increase from 48.3% to 80.6%
from 2018 to 2020. Instagram users grow from 57% in
2018 to 63.1% in 2020, whereas Twitter users have
risen from 23.8% to 37.1% in the same period
(MCMC, 2020).
B. Social Media and Empowerment
Social media platforms encourage youth to create and
share content with people around the world, which has
louden their voices and expands the potential for
change. Social media helps youth become more
knowledgeable and engage in an issue. It is becoming
more and more popular among youth to explore social
connections, build social awareness, and share their
views on several issues across the globe (Rana &
Jadhav, 2019). Francisca Luhong James, a 25 year old
B
B
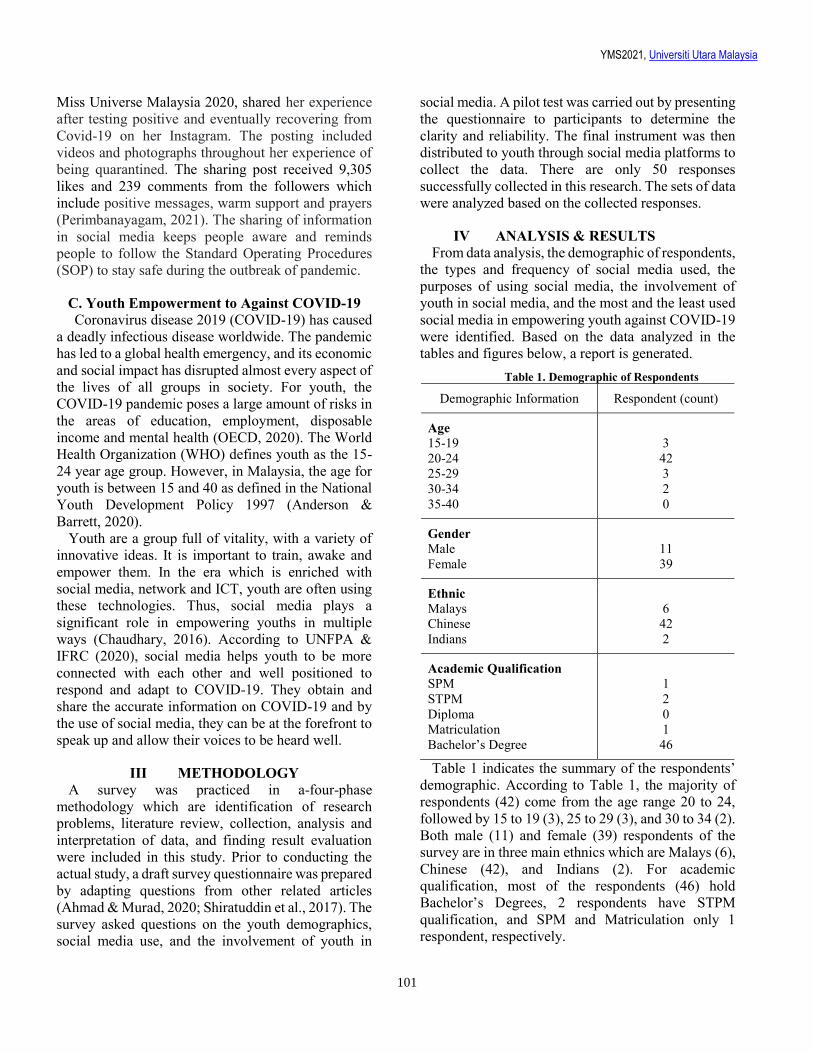
YMS2021, Universiti Utara Malaysia
101
Miss Universe Malaysia 2020, shared her experience
after testing positive and eventually recovering from
Covid-19 on her Instagram. The posting included
videos and photographs throughout her experience of
being quarantined. The sharing post received 9,305
likes and 239 comments from the followers which
include positive messages, warm support and prayers
(Perimbanayagam, 2021). The sharing of information
in social media keeps people aware and reminds
people to follow the Standard Operating Procedures
(SOP) to stay safe during the outbreak of pandemic.
C. Youth Empowerment to Against COVID-19 Coronavirus disease 2019 (COVID-19) has caused
a deadly infectious disease worldwide. The pandemic
has led to a global health emergency, and its economic
and social impact has disrupted almost every aspect of
the lives of all groups in society. For youth, the
COVID-19 pandemic poses a large amount of risks in
the areas of education, employment, disposable
income and mental health (OECD, 2020). The World
Health Organization (WHO) defines youth as the 15-
24 year age group. However, in Malaysia, the age for
youth is between 15 and 40 as defined in the National
Youth Development Policy 1997 (Anderson &
Barrett, 2020).
Youth are a group full of vitality, with a variety of
innovative ideas. It is important to train, awake and
empower them. In the era which is enriched with
social media, network and ICT, youth are often using
these technologies. Thus, social media plays a
significant role in empowering youths in multiple
ways (Chaudhary, 2016). According to UNFPA &
IFRC (2020), social media helps youth to be more
connected with each other and well positioned to
respond and adapt to COVID-19. They obtain and
share the accurate information on COVID-19 and by
the use of social media, they can be at the forefront to
speak up and allow their voices to be heard well.
III METHODOLOGY
A survey was practiced in a-four-phase
methodology which are identification of research
problems, literature review, collection, analysis and
interpretation of data, and finding result evaluation
were included in this study. Prior to conducting the
actual study, a draft survey questionnaire was prepared
by adapting questions from other related articles
(Ahmad & Murad, 2020; Shiratuddin et al., 2017). The
survey asked questions on the youth demographics,
social media use, and the involvement of youth in
social media. A pilot test was carried out by presenting
the questionnaire to participants to determine the
clarity and reliability. The final instrument was then
distributed to youth through social media platforms to
collect the data. There are only 50 responses
successfully collected in this research. The sets of data
were analyzed based on the collected responses.
IV ANALYSIS & RESULTS
From data analysis, the demographic of respondents,
the types and frequency of social media used, the
purposes of using social media, the involvement of
youth in social media, and the most and the least used
social media in empowering youth against COVID-19
were identified. Based on the data analyzed in the
tables and figures below, a report is generated.
Table 1. Demographic of Respondents
Demographic Information Respondent (count)
Age 15-19
20-24
25-29
30-34
35-40
3
42
3
2
0
Gender Male
Female
11
39
Ethnic Malays
Chinese
Indians
6
42
2
Academic Qualification SPM
STPM
Diploma
Matriculation
Bachelor’s Degree
1
2
0
1
46
Table 1 indicates the summary of the respondents’
demographic. According to Table 1, the majority of
respondents (42) come from the age range 20 to 24,
followed by 15 to 19 (3), 25 to 29 (3), and 30 to 34 (2).
Both male (11) and female (39) respondents of the
survey are in three main ethnics which are Malays (6),
Chinese (42), and Indians (2). For academic
qualification, most of the respondents (46) hold
Bachelor’s Degrees, 2 respondents have STPM
qualification, and SPM and Matriculation only 1
respondent, respectively.
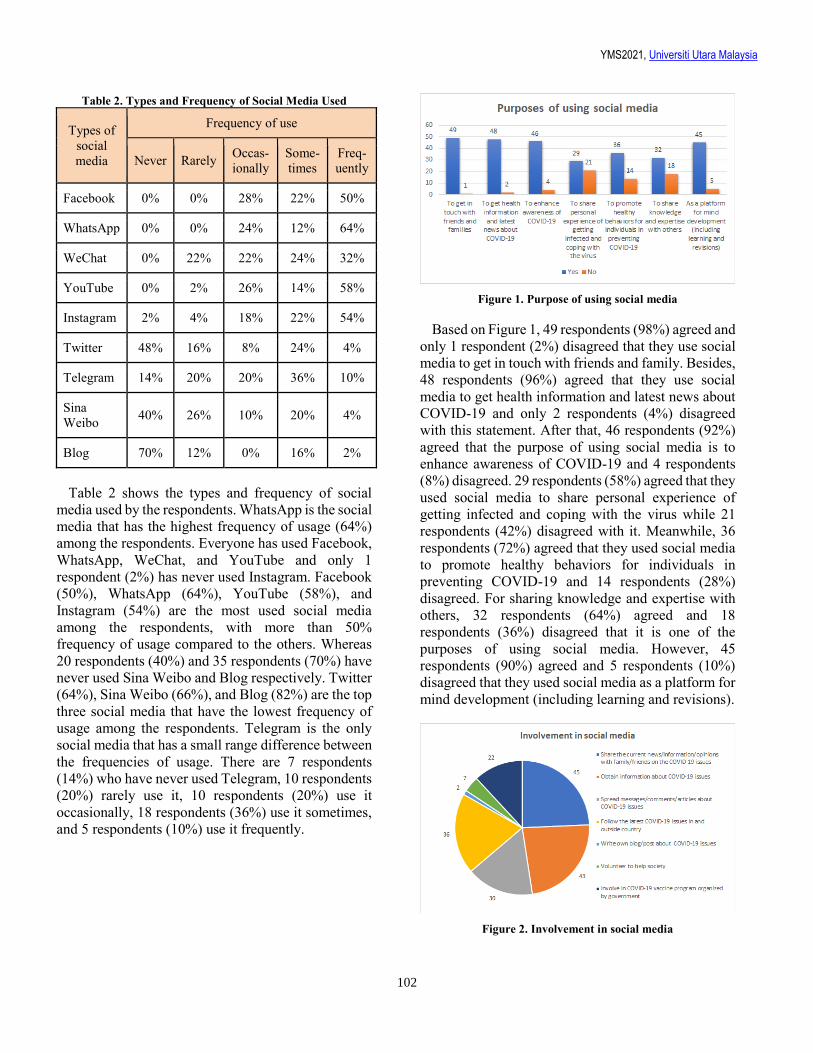
YMS2021, Universiti Utara Malaysia
102
Table 2. Types and Frequency of Social Media Used
Types of
social
media
Frequency of use
Never Rarely Occas-
ionally
Some-
times
Freq-
uently
Facebook 0% 0% 28% 22% 50%
WhatsApp 0% 0% 24% 12% 64%
WeChat 0% 22% 22% 24% 32%
YouTube 0% 2% 26% 14% 58%
Instagram 2% 4% 18% 22% 54%
Twitter 48% 16% 8% 24% 4%
Telegram 14% 20% 20% 36% 10%
Sina
Weibo 40% 26% 10% 20% 4%
Blog 70% 12% 0% 16% 2%
Table 2 shows the types and frequency of social
media used by the respondents. WhatsApp is the social
media that has the highest frequency of usage (64%)
among the respondents. Everyone has used Facebook,
WhatsApp, WeChat, and YouTube and only 1
respondent (2%) has never used Instagram. Facebook
(50%), WhatsApp (64%), YouTube (58%), and
Instagram (54%) are the most used social media
among the respondents, with more than 50%
frequency of usage compared to the others. Whereas
20 respondents (40%) and 35 respondents (70%) have
never used Sina Weibo and Blog respectively. Twitter
(64%), Sina Weibo (66%), and Blog (82%) are the top
three social media that have the lowest frequency of
usage among the respondents. Telegram is the only
social media that has a small range difference between
the frequencies of usage. There are 7 respondents
(14%) who have never used Telegram, 10 respondents
(20%) rarely use it, 10 respondents (20%) use it
occasionally, 18 respondents (36%) use it sometimes,
and 5 respondents (10%) use it frequently.
Figure 1. Purpose of using social media
Based on Figure 1, 49 respondents (98%) agreed and
only 1 respondent (2%) disagreed that they use social
media to get in touch with friends and family. Besides,
48 respondents (96%) agreed that they use social
media to get health information and latest news about
COVID-19 and only 2 respondents (4%) disagreed
with this statement. After that, 46 respondents (92%)
agreed that the purpose of using social media is to
enhance awareness of COVID-19 and 4 respondents
(8%) disagreed. 29 respondents (58%) agreed that they
used social media to share personal experience of
getting infected and coping with the virus while 21
respondents (42%) disagreed with it. Meanwhile, 36
respondents (72%) agreed that they used social media
to promote healthy behaviors for individuals in
preventing COVID-19 and 14 respondents (28%)
disagreed. For sharing knowledge and expertise with
others, 32 respondents (64%) agreed and 18
respondents (36%) disagreed that it is one of the
purposes of using social media. However, 45
respondents (90%) agreed and 5 respondents (10%)
disagreed that they used social media as a platform for
mind development (including learning and revisions).
Figure 2. Involvement in social media
YMS2021, Universiti Utara Malaysia
103
Based on Figure 2, the results show that the
participants were not actively involved in all activities
in social media. The highest involvement of youth in
social media is sharing the current news, information,
or opinions with family and friends on the COVID-19
issues (90%), followed by to obtain information about
COVID-19 issues (86%). There are 36 respondents
(72%) following the latest COVID-19 issues in and
outside the country and 30 respondents (60%) will
spread the messages, comments or articles about
COVID-19 issues in their social media. 22
respondents (44%) participate in COVID-19 vaccine
program organized by the government through social
media while 7 respondents (14%) volunteer to help
society against COVID-19. There are only 2
respondents (4%) who will write their own blog or
post about COVID-19 issues in social media.
Figure 3. Social media used in empowering youth to share the
current news, information, and opinions with family and
friends on the COVID-19 issues
This section is meant to determine the social media
that was used the most and the least in empowering
youth against COVID-19. The activity that has the
highest involvement in Figure 2 was used for the
determination. Based on Figure 3, WhatsApp (60%) is
the social media that is used the most in empowering
youth against COVID-19, followed by YouTube
(54%) and Instagram (52%). On the other hand, both
Twitter and Blog are the social media that used the
least (2%) among youth. Facebook (44%), WeChat
(30%), Telegram (10%), and Sina Weibo (4%) are also
having a low frequency of usage in empowering
youth.
V FINDINGS & DISCUSSION
Based on the data analysis, social media becomes an
important tool in youths’ daily life against COVID-19.
The results show that social media such as Facebook,
WhatsApp, YouTube, and Instagram have high usage
in conducting different purposes of activities towards
COVID-19. Youths used social media to get in touch
with friends and families frequently in order to know
the latest condition of them during the pandemic.
Social media empower youth to get and share the
health information and latest news about COVID-19.
The awareness of COVID-19 could be enhanced
among the youths as they can easily know the
symptoms and consequences of being infected with
COVID-19 in social media.
Besides, social media empower youths to share their
personal experiences of getting infected and how to
cope with the virus, in order to alert the community to
have healthy behaviors and help other infected persons
to fight against the virus. The experiences can be
valuable information to help others in getting a cure
and help in spreading awareness of COVID-19.
However, only very few of them write their own blog
and post in spreading the awareness of COVID-19.
Most of the youths only follow the latest issues and
news in and outside of the country. By knowing the
latest news and information of COVID-19 through
social media, the awareness of youth is increased and
they have involved themselves in the COVID-19
vaccine program organized by the government.
VI CONCLUSION
In conclusion, youth nowadays are most active in
using social media to communicate during the global
crisis. The youth is also an important community in
the light of this pandemic, and they share the common
responsibility of assisting people in stopping
transmission of virus. Furthermore, the number of
respondents in this study was relatively small, but the
empowerment of the youth against COVID-19 is huge
as shown from the results. Therefore, people can stay
healthy, educated, and linked thanks to technological
advances and social media.
REFERENCES
Anderson, K. & Barrett, J. (2020). Situation Analysis of Adolescents in Malaysia. Retrieved from https://www.unicef.org/malaysia/media/1521/file/Situation%20Analysis%20of%20Adolescents%20in%20Malaysia.pdf
Ahmad, A. R. & Murad, H. R. (2020). The Impact of Social Media on
Panic During the COVID-19 Pandemic in Iraqi Kurdistan: Online Questionnaire Study. Journal of Medical Internet Research, 22(5). http://doi.org/10.2196/19556
Chaudhary, A. (2016). Role of Social Media to Empower Youth-
Challenges and Opportunities. New Media and Mass Communication Vol.56, pp 17-19. Retrieved from https://iiste.org/Journals/index.php/NMMC/article/view/34772/35753
Malaysian Communications and Multimedia Commission (MCMC),
(2020). Internet Users Survey 2020. Communications & Multimedia:
YMS2021, Universiti Utara Malaysia
104
Pocket Book of Statistics, a half yearly statistical bulletin of the Communications & Multimedia industry. Retrieved from https://www.mcmc.gov.my/skmmgovmy/media/General/pdf/IUS-2020-Report.pdf
Noor Azah Aziz, Othman, J., Lugova, H., & Suleiman, A. (2020).
Malaysia's approach in handling COVID-19 onslaught: Report on the Movement Control Order (MCO) and targeted screening to reduce community infection rate and impact on public health and economy. Journal of Infection and Public Health , 13(12), 1823-1829. Retrieved from https://www.journals.elsevier.com/journal-of-infection-and-public-health
Organisation for Economic Co-operation and Development (OECD).
(2020). Youth and COVID-19: Response, recovery and resilience. Retrieved from https://www.oecd.org/coronavirus/policy-responses/youth-and-covid-19-response-recovery-and-resilience-c40e61c6/
Perimbanayagam, K. (2021). Miss Universe Malaysia Francisca Luhong
shares Covid-19 experience. New Straits Times. https://www.nst.com.my/news/nation/2021/01/659203/miss-universe-malaysia-francisca-luhong-shares-covid-19-experience
Rana, S. & Jadhav, J. (2019). The Impact of Media on Dalit Youth: A Case
Study. Integrated Journal of Social Sciences, 6(1), 1-5. Retrieved from https://www.researchgate.net/profile/Suman-Rana/publication/333133946_INTEGRATED_JOURNAL_OF_SOCIAL_SCIENCES_The_Impact_of_Media_on_Dalit_Youth_A_Case_Study/links/5d0cc88da6fdcc2462982dab/INTEGRATED-JOURNAL-OF-SOCIAL-SCIENCES-The-Impact-of-Media-on-Dalit-Youth-A-Case-Study.pdf
Shiratuddin, N., Hassan, S., Mohd Sani, M. A., Ahmad, M. K., Khalid, K.
A., Abdull Rahman, N. L., Abd Rahman, Z. S. & Ahmad, N. S. Y. (2017). Media and Youth Participation in Social and Political Activities: Development of a Survey Instrument and Its Critical Findings. Pertanika Journals Social Sciences & Humanities, 25(S), pp 1-20. Retrieved from http://repo.uum.edu.my/23269/1/JSSH%28S%29%2025%20%28S%29%20%201-%2020%20%202017.pdf
United Nations Population Fund (UNFPA) & International Federation of
the Red Cross and Red Crescent Societies (IFRC). (2020). COVID-19: Working with and for young people. Compact for Young People in Humanitarian Action. Retrieved from https://www.unfpa.org/sites/default/files/resource-pdf/COMPACTCOVID19-05.pdf
World Health Organization(WHO). (n.d.). Adolescent health in the South-
East Asia Region. Retrieved from https://www.who.int/southeastasia/health-topics/adolescent-heal
YMS2021, Universiti Utara Malaysia
105
Best Paper Nominee
Digital Tourism: Youth Experience at a Museum
Halizayanie Kimlin
Politeknik Tuanku Syed Sirajudin [email protected]
ABSTRACT
The digital tourism sector including indoor tourism
such as museums also benefits from latest advances in
technology. This study generally investigates youth
experience at Museum through the mobile augmented
reality application namely called OmetTs Apps. The
process of developing OmetTs apps and the
implementation of usability testing is described in
detail. A group of youth were given the opportunity to
explore Kota Kayang heritage archaeology galleries.
The research findings were elaborated for future
improvement.
Keywords: Digital tourism, youth, museum
I INTRODUCTION
The industrial revolution 4.0 began in mid-2020
and has a major impact on various areas. Industry 4.0
is a term which refers to the development process in
the production and automation industry to a more
intelligent level than existing with more appropriate
and flexible technology; the machine will operate
independently, or cooperate with humans in terms of
operating autonomously, which becomes an
independent entity that will collect and analyze data.
The pervasive developments of smart device
technology provide infinite space for the diversity of
innovative ideas in the form of mobile or ubiquitous
smart apps. Augmented reality (AR) takes place by
providing design and technological functions that
enable the widespread availability of consumer
devices in different fields. It transforms how people
work, learn, play and connect with the world around
us. In contrast, adaptive AR is the latest augmented
reality functionality that allows users to personalize
their interest through a multilevel filter in the adaptive
augmented reality (AAR) application. For tourism
perspectives, there are many adaptive augmented
reality applications that have successfully achieved the
goals of digitizing the field of tourism. However, it
still requires much study to integrate innovative
models best suited in tourism fields.
Omet The Storyteller (OmetTS) is an AAR
application that gives personalized experiences for
indoor museum tours. The adaptive element is built
through a specific user model. This study aims to build
deep understanding and practical knowledge on
adaptive augmented reality application.
II AIMS OF STUDY
The aims of this study are to develop a mobile AAR
app for a museum gallery and investigate youth
experience in digital tourism through usability testing
held in such an indoor museum gallery.
III LITERATURE REVIEW
This section elaborates the potential and practice of
adaptive augmented reality in the area of heritage
archaeology, adaptive augmented reality
characteristic, design and system architecture, as well
as user interfaces, simulations and storytelling models.
The study includes a comparative study to come up
with adaptive AR models best suited for personalized
adaptive experiences in local heritage archaeology
tourism.
A. Industrial Revolution 4.0
The founder and executive chairman of the World
Economic Forum (WEF), Klaus Schwab, through The
Fourth Industrial Revolution (2017) explains that
industrial revolution 4.0 is changing the way people
communicate, work and live. These changes are
driven by three key technology domains namely
physical, digital and biological across the nine pillars
of Industry 4.0, including simulation and virtual
reality, vertical and horizontal system integration,
Internet of Things (IoT) industry, cybersecurity, cloud
computing, add-ons, supply chain, data analysis and
robot automation. The constant industrial revolution
4.0 around the world requires all parties to act quickly
in line with the swift development in high-tech
products or services and intelligent automation
systems. It is more the just a fashionable buzzword.
New challenges infiltrate into all service and
industrial sectors forcing the drive of various
B
B
YMS2021, Universiti Utara Malaysia
106
initiatives to improve knowledge and skills as well as
organizing multiple forums, discussions and strategic
plan to welcome the positive and negative
implications into potentially massive opportunities.
Malaysia had come out with a national policy driven
by multiple factors. MITI (2018) in Industry 4WRD:
National Policy on Industry 4.0 noted the overarching
philosophy behind this policy is A-C-T - attract, create
and transform. The main key is to attract stakeholders
to Industry 4.0 technologies and processes; create the
right ecosystem for Industry 4.0 technologies to be
adopted and to nurture innovations; and transform
capabilities of the manufacturing industry to be
Industry 4.0-ready. The policies emphasize on
“making better things while making things better”
with four drive factors includes shifts in the global
economic order, rate of technology advancement and
its convergence, knowledge and skills for the future
and global supply chain dynamics by creating
sustainable future with four domain smart materials,
smart technological industry, smart applicators and
smart community embedded innovative products and
services that will meet customer needs.
Despite the issues and challenges to Industry 4.0,
MBOT (2017), which determines the level and
motivation for this study, outlined technology in
tourism into six characteristics namely digitalization
interaction, mobile, real time insights, wearables,
robots and real time customization. The
recommendation highlighted in the field of tourism
includes strengthening the governance role by
enforcement of law, enhancing tourist experience
through mobile technologies, adopting international
best practice to promote and develop sustainable
tourism, and increasing standards and productivity at
all levels. Therefore, this report focuses on a
combination of mobile technology, digital experience
through adaptive augmented reality and local
environment.
B. Augmented Reality
Augmented reality is a core branch with the
potential to attract people to learn about almost
everything. The fact that humans love to learn and
explore new things, so they feel equality with others.
User readiness to experience AR, or whether the user
device technology is still relevant for AR experience
debated in the AR application development industry.
A major difference between native mobile application
and augmented reality, according to interaction design
foundation, is its physical environment where digital
elements appear over real and allow interaction
between user and the artefacts. AR used to direct
people’s attention through AR features and
interactivity. Fundamentally, AR is a computer
technology that uses cameras to capture and display
real-world environments, objects, or images, and
juxtaposes digital information onto reality in real-
time. Augmented reality-based applications require a
specific device to support the functionality of the
application. The minimum is that the system should be
able to use marker-based tracking. In other words, the
devices should be able to open AR cameras to scan
images. It was also the most uncomplicated technical
requirement to develop one AR application. There is a
web-based software for the purpose. A location-based
application capable of being a facilitator in various
ways. From traffic conditions to military AR assisted
apps, bring users a fun and enjoyable experience.
Simulation and 3D models are proven to be effective
in teaching and learning to attract students to interact
with the 3D model and increase their interest to learn.
C. Digital Tourism Experience
Tourism refers to the activity of visitors (IRTS,
2008) or the movement of the people from their
residence to another place for leisure, business or other
purposes. The tourism industry is necessary for
adopting new technologies because of its contribution
to impacting the economy. The latest technology trend
that emerged was the augmented reality assisted
tourism application. Consumer behavior is shifting,
and technologies are undeniably revolutionizing and
enhancing the tourist experience at visited places
where valuable and additional knowledge is obtained
easily through AR apps. AR apps alter and enhance
people’s perceptions of their physical surroundings
when seen through a particular device.
According to O’Keeffe (2014), heritage adhering to
the concept of inheritance which has considerable
antiquity, the word heritage is of western and medieval
origin, and applied originally to property and land. The
definition of heritage according to the Oxford
dictionary is the study of human history and prehistory
through the excavation of sites and the analysis of
artefacts and other physical remains. Cigola (2015)
defines heritage archaeology as a movable or
immovable sign of the ancient past, brought to light
through technical excavation or not yet unearthed, but
whose presence has been established at a given place.
Therefore, this adaptive augmented reality application
is devoted to the existence of the Hoabinhian cultural
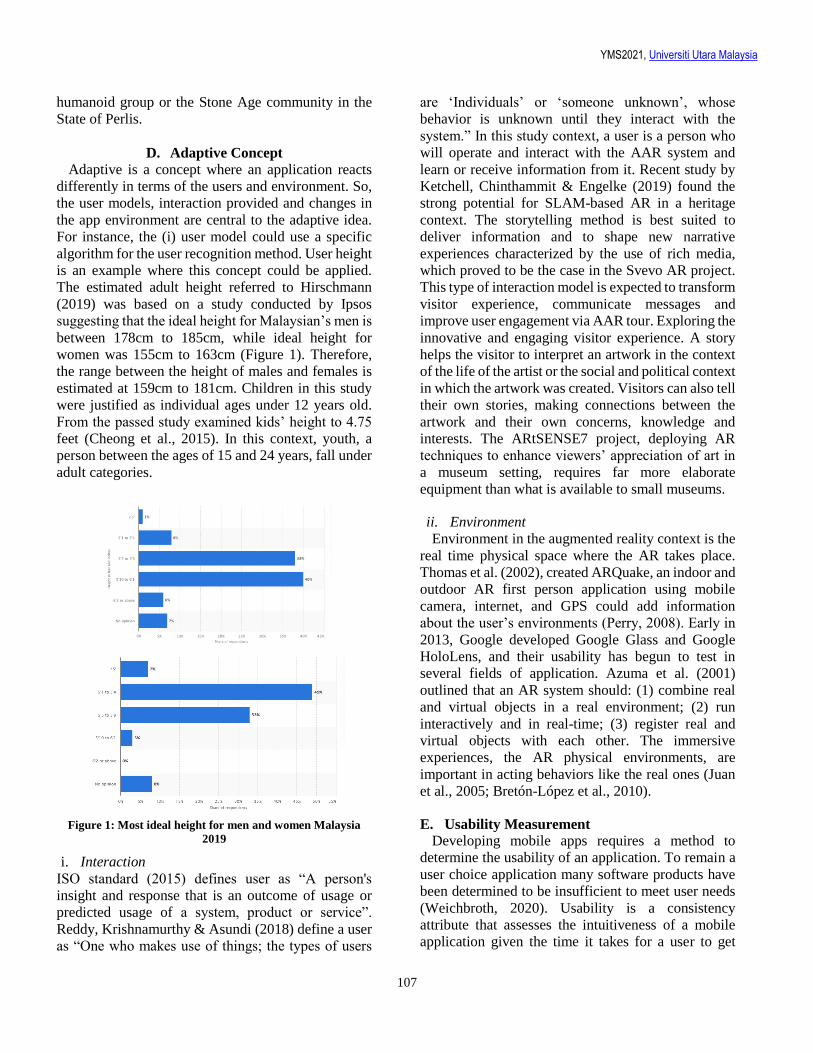
YMS2021, Universiti Utara Malaysia
107
humanoid group or the Stone Age community in the
State of Perlis.
D. Adaptive Concept
Adaptive is a concept where an application reacts
differently in terms of the users and environment. So,
the user models, interaction provided and changes in
the app environment are central to the adaptive idea.
For instance, the (i) user model could use a specific
algorithm for the user recognition method. User height
is an example where this concept could be applied.
The estimated adult height referred to Hirschmann
(2019) was based on a study conducted by Ipsos
suggesting that the ideal height for Malaysian’s men is
between 178cm to 185cm, while ideal height for
women was 155cm to 163cm (Figure 1). Therefore,
the range between the height of males and females is
estimated at 159cm to 181cm. Children in this study
were justified as individual ages under 12 years old.
From the passed study examined kids’ height to 4.75
feet (Cheong et al., 2015). In this context, youth, a
person between the ages of 15 and 24 years, fall under
adult categories.
Figure 1: Most ideal height for men and women Malaysia
2019
i. Interaction
ISO standard (2015) defines user as “A person's
insight and response that is an outcome of usage or
predicted usage of a system, product or service”.
Reddy, Krishnamurthy & Asundi (2018) define a user
as “One who makes use of things; the types of users
are ‘Individuals’ or ‘someone unknown’, whose
behavior is unknown until they interact with the
system.” In this study context, a user is a person who
will operate and interact with the AAR system and
learn or receive information from it. Recent study by
Ketchell, Chinthammit & Engelke (2019) found the
strong potential for SLAM-based AR in a heritage
context. The storytelling method is best suited to
deliver information and to shape new narrative
experiences characterized by the use of rich media,
which proved to be the case in the Svevo AR project.
This type of interaction model is expected to transform
visitor experience, communicate messages and
improve user engagement via AAR tour. Exploring the
innovative and engaging visitor experience. A story
helps the visitor to interpret an artwork in the context
of the life of the artist or the social and political context
in which the artwork was created. Visitors can also tell
their own stories, making connections between the
artwork and their own concerns, knowledge and
interests. The ARtSENSE7 project, deploying AR
techniques to enhance viewers’ appreciation of art in
a museum setting, requires far more elaborate
equipment than what is available to small museums.
ii. Environment
Environment in the augmented reality context is the
real time physical space where the AR takes place.
Thomas et al. (2002), created ARQuake, an indoor and
outdoor AR first person application using mobile
camera, internet, and GPS could add information
about the user’s environments (Perry, 2008). Early in
2013, Google developed Google Glass and Google
HoloLens, and their usability has begun to test in
several fields of application. Azuma et al. (2001)
outlined that an AR system should: (1) combine real
and virtual objects in a real environment; (2) run
interactively and in real-time; (3) register real and
virtual objects with each other. The immersive
experiences, the AR physical environments, are
important in acting behaviors like the real ones (Juan
et al., 2005; Bretón-López et al., 2010).
E. Usability Measurement
Developing mobile apps requires a method to
determine the usability of an application. To remain a
user choice application many software products have
been determined to be insufficient to meet user needs
(Weichbroth, 2020). Usability is a consistency
attribute that assesses the intuitiveness of a mobile
application given the time it takes for a user to get
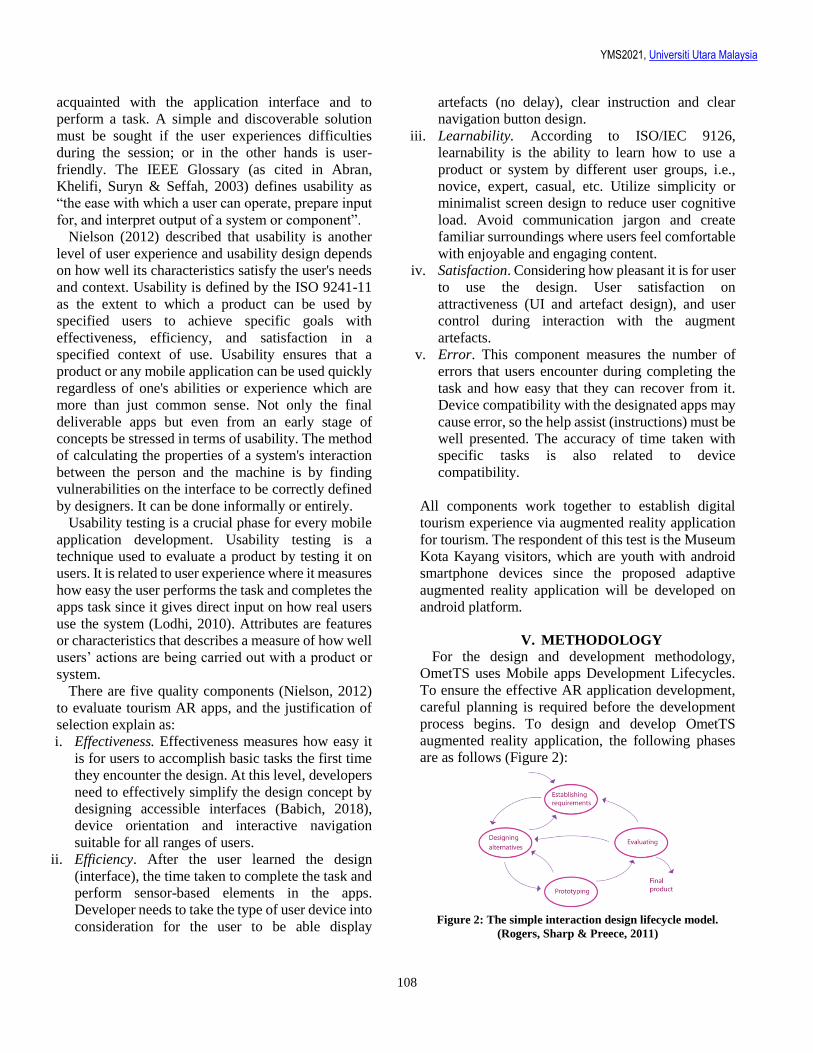
YMS2021, Universiti Utara Malaysia
108
acquainted with the application interface and to
perform a task. A simple and discoverable solution
must be sought if the user experiences difficulties
during the session; or in the other hands is user-
friendly. The IEEE Glossary (as cited in Abran,
Khelifi, Suryn & Seffah, 2003) defines usability as
“the ease with which a user can operate, prepare input
for, and interpret output of a system or component”.
Nielson (2012) described that usability is another
level of user experience and usability design depends
on how well its characteristics satisfy the user's needs
and context. Usability is defined by the ISO 9241-11
as the extent to which a product can be used by
specified users to achieve specific goals with
effectiveness, efficiency, and satisfaction in a
specified context of use. Usability ensures that a
product or any mobile application can be used quickly
regardless of one's abilities or experience which are
more than just common sense. Not only the final
deliverable apps but even from an early stage of
concepts be stressed in terms of usability. The method
of calculating the properties of a system's interaction
between the person and the machine is by finding
vulnerabilities on the interface to be correctly defined
by designers. It can be done informally or entirely.
Usability testing is a crucial phase for every mobile
application development. Usability testing is a
technique used to evaluate a product by testing it on
users. It is related to user experience where it measures
how easy the user performs the task and completes the
apps task since it gives direct input on how real users
use the system (Lodhi, 2010). Attributes are features
or characteristics that describes a measure of how well
users’ actions are being carried out with a product or
system.
There are five quality components (Nielson, 2012)
to evaluate tourism AR apps, and the justification of
selection explain as:
i. Effectiveness. Effectiveness measures how easy it
is for users to accomplish basic tasks the first time
they encounter the design. At this level, developers
need to effectively simplify the design concept by
designing accessible interfaces (Babich, 2018),
device orientation and interactive navigation
suitable for all ranges of users.
ii. Efficiency. After the user learned the design
(interface), the time taken to complete the task and
perform sensor-based elements in the apps.
Developer needs to take the type of user device into
consideration for the user to be able display
artefacts (no delay), clear instruction and clear
navigation button design.
iii. Learnability. According to ISO/IEC 9126,
learnability is the ability to learn how to use a
product or system by different user groups, i.e.,
novice, expert, casual, etc. Utilize simplicity or
minimalist screen design to reduce user cognitive
load. Avoid communication jargon and create
familiar surroundings where users feel comfortable
with enjoyable and engaging content.
iv. Satisfaction. Considering how pleasant it is for user
to use the design. User satisfaction on
attractiveness (UI and artefact design), and user
control during interaction with the augment
artefacts.
v. Error. This component measures the number of
errors that users encounter during completing the
task and how easy that they can recover from it.
Device compatibility with the designated apps may
cause error, so the help assist (instructions) must be
well presented. The accuracy of time taken with
specific tasks is also related to device
compatibility.
All components work together to establish digital
tourism experience via augmented reality application
for tourism. The respondent of this test is the Museum
Kota Kayang visitors, which are youth with android
smartphone devices since the proposed adaptive
augmented reality application will be developed on
android platform.
V. METHODOLOGY
For the design and development methodology,
OmetTS uses Mobile apps Development Lifecycles.
To ensure the effective AR application development,
careful planning is required before the development
process begins. To design and develop OmetTS
augmented reality application, the following phases
are as follows (Figure 2):
Figure 2: The simple interaction design lifecycle model.
(Rogers, Sharp & Preece, 2011)
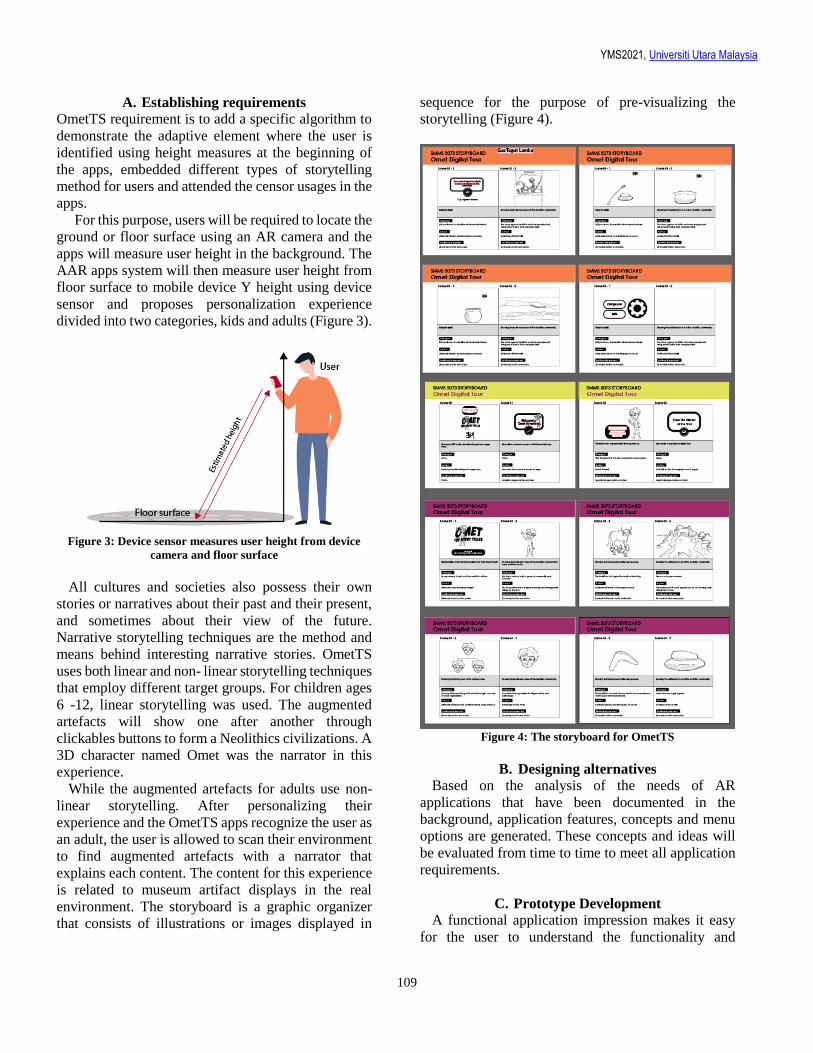
YMS2021, Universiti Utara Malaysia
109
A. Establishing requirements
OmetTS requirement is to add a specific algorithm to
demonstrate the adaptive element where the user is
identified using height measures at the beginning of
the apps, embedded different types of storytelling
method for users and attended the censor usages in the
apps.
For this purpose, users will be required to locate the
ground or floor surface using an AR camera and the
apps will measure user height in the background. The
AAR apps system will then measure user height from
floor surface to mobile device Y height using device
sensor and proposes personalization experience
divided into two categories, kids and adults (Figure 3).
Figure 3: Device sensor measures user height from device
camera and floor surface
All cultures and societies also possess their own
stories or narratives about their past and their present,
and sometimes about their view of the future.
Narrative storytelling techniques are the method and
means behind interesting narrative stories. OmetTS
uses both linear and non- linear storytelling techniques
that employ different target groups. For children ages
6 -12, linear storytelling was used. The augmented
artefacts will show one after another through
clickables buttons to form a Neolithics civilizations. A
3D character named Omet was the narrator in this
experience.
While the augmented artefacts for adults use non-
linear storytelling. After personalizing their
experience and the OmetTS apps recognize the user as
an adult, the user is allowed to scan their environment
to find augmented artefacts with a narrator that
explains each content. The content for this experience
is related to museum artifact displays in the real
environment. The storyboard is a graphic organizer
that consists of illustrations or images displayed in
sequence for the purpose of pre-visualizing the
storytelling (Figure 4).
Figure 4: The storyboard for OmetTS
B. Designing alternatives
Based on the analysis of the needs of AR
applications that have been documented in the
background, application features, concepts and menu
options are generated. These concepts and ideas will
be evaluated from time to time to meet all application
requirements.
C. Prototype Development
A functional application impression makes it easy
for the user to understand the functionality and
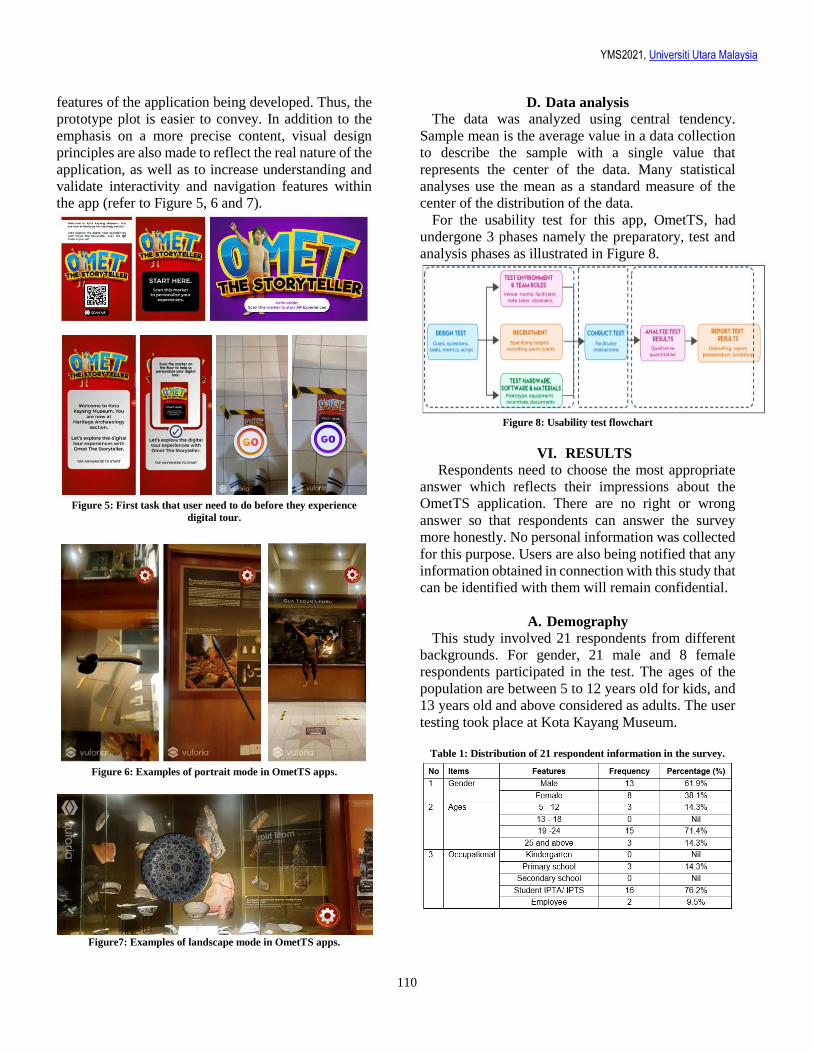
YMS2021, Universiti Utara Malaysia
110
features of the application being developed. Thus, the
prototype plot is easier to convey. In addition to the
emphasis on a more precise content, visual design
principles are also made to reflect the real nature of the
application, as well as to increase understanding and
validate interactivity and navigation features within
the app (refer to Figure 5, 6 and 7).
Figure 5: First task that user need to do before they experience
digital tour.
Figure 6: Examples of portrait mode in OmetTS apps.
Figure7: Examples of landscape mode in OmetTS apps.
D. Data analysis
The data was analyzed using central tendency.
Sample mean is the average value in a data collection
to describe the sample with a single value that
represents the center of the data. Many statistical
analyses use the mean as a standard measure of the
center of the distribution of the data.
For the usability test for this app, OmetTS, had
undergone 3 phases namely the preparatory, test and
analysis phases as illustrated in Figure 8.
Figure 8: Usability test flowchart
VI. RESULTS
Respondents need to choose the most appropriate
answer which reflects their impressions about the
OmetTS application. There are no right or wrong
answer so that respondents can answer the survey
more honestly. No personal information was collected
for this purpose. Users are also being notified that any
information obtained in connection with this study that
can be identified with them will remain confidential.
A. Demography
This study involved 21 respondents from different
backgrounds. For gender, 21 male and 8 female
respondents participated in the test. The ages of the
population are between 5 to 12 years old for kids, and
13 years old and above considered as adults. The user
testing took place at Kota Kayang Museum.
Table 1: Distribution of 21 respondent information in the survey.
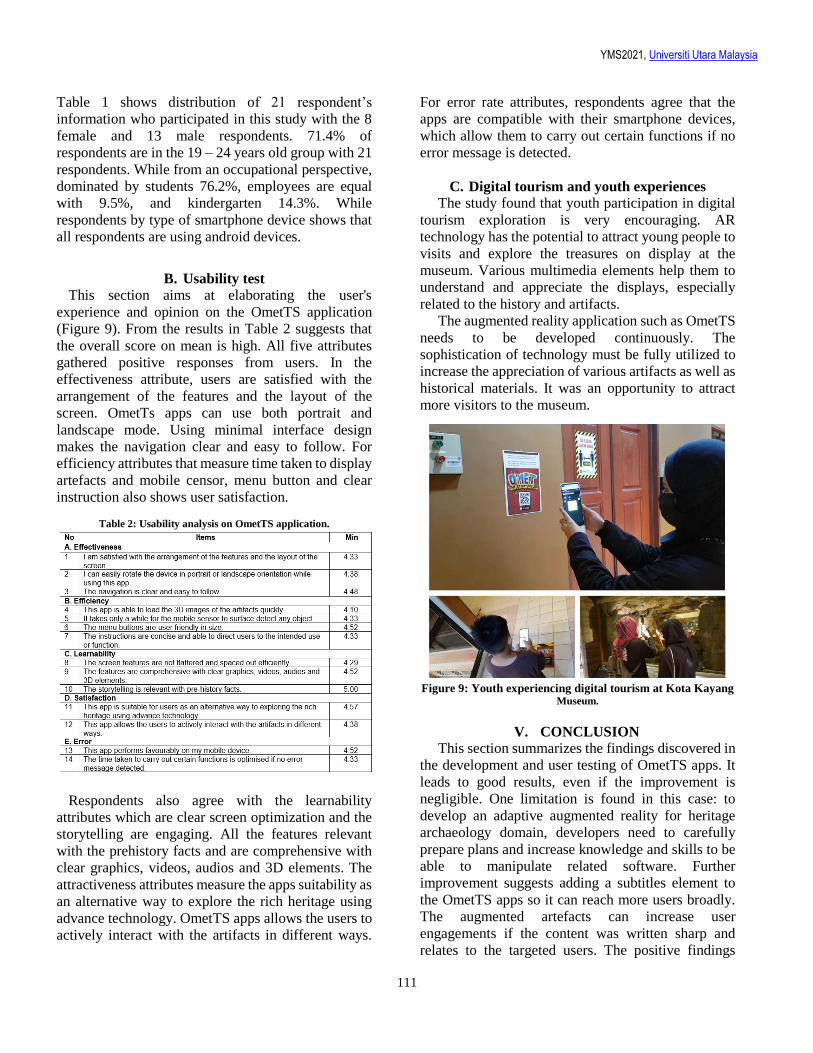
YMS2021, Universiti Utara Malaysia
111
Table 1 shows distribution of 21 respondent’s
information who participated in this study with the 8
female and 13 male respondents. 71.4% of
respondents are in the 19 – 24 years old group with 21
respondents. While from an occupational perspective,
dominated by students 76.2%, employees are equal
with 9.5%, and kindergarten 14.3%. While
respondents by type of smartphone device shows that
all respondents are using android devices.
B. Usability test
This section aims at elaborating the user's
experience and opinion on the OmetTS application
(Figure 9). From the results in Table 2 suggests that
the overall score on mean is high. All five attributes
gathered positive responses from users. In the
effectiveness attribute, users are satisfied with the
arrangement of the features and the layout of the
screen. OmetTs apps can use both portrait and
landscape mode. Using minimal interface design
makes the navigation clear and easy to follow. For
efficiency attributes that measure time taken to display
artefacts and mobile censor, menu button and clear
instruction also shows user satisfaction.
Table 2: Usability analysis on OmetTS application.
Respondents also agree with the learnability
attributes which are clear screen optimization and the
storytelling are engaging. All the features relevant
with the prehistory facts and are comprehensive with
clear graphics, videos, audios and 3D elements. The
attractiveness attributes measure the apps suitability as
an alternative way to explore the rich heritage using
advance technology. OmetTS apps allows the users to
actively interact with the artifacts in different ways.
For error rate attributes, respondents agree that the
apps are compatible with their smartphone devices,
which allow them to carry out certain functions if no
error message is detected.
C. Digital tourism and youth experiences
The study found that youth participation in digital
tourism exploration is very encouraging. AR
technology has the potential to attract young people to
visits and explore the treasures on display at the
museum. Various multimedia elements help them to
understand and appreciate the displays, especially
related to the history and artifacts.
The augmented reality application such as OmetTS
needs to be developed continuously. The
sophistication of technology must be fully utilized to
increase the appreciation of various artifacts as well as
historical materials. It was an opportunity to attract
more visitors to the museum.
Figure 9: Youth experiencing digital tourism at Kota Kayang
Museum.
V. CONCLUSION
This section summarizes the findings discovered in
the development and user testing of OmetTS apps. It
leads to good results, even if the improvement is
negligible. One limitation is found in this case: to
develop an adaptive augmented reality for heritage
archaeology domain, developers need to carefully
prepare plans and increase knowledge and skills to be
able to manipulate related software. Further
improvement suggests adding a subtitles element to
the OmetTS apps so it can reach more users broadly.
The augmented artefacts can increase user
engagements if the content was written sharp and
relates to the targeted users. The positive findings
YMS2021, Universiti Utara Malaysia
112
conclude the appropriateness of the use of augmented
reality as a medium to deliver content and knowledge
to tourists at indoor museums.
REFERENCES
Abidin, R. Z., Arshad, H., & Shukri, S. A. (2017). Adaptive multimodal interaction in mobile augmented reality: A conceptual framework. https://doi.org/10.1063/1.5005483
Abran, A., & Khelifi, A., Suryn, W. & Seffah, A. (2003). Usability Meanings and Interpretations in ISO Standards. Software Quality Journal. 11. 325-338. 10.1023/A:1025869312943.
Azuma R., Baillot Y., Behringer R., Feiner S., Julier S., MacIntyre B. (2001). Recent advances in augmented reality. IEEE Comp. Graph. Appl. 21 34–47. 10.1109/38.963459
Babich, N. (2018). A comprehensive guide to mobile app design — Smashing magazine. Smashing Magazine.
Bretón-López, J., Quero, S., Botella, C., García-Palacios, A., Baños, R. M., & Alcañiz, M. (2010). An augmented reality system validation for the treatment of cockroach phobia. Cyberpsychology, Behavior, and Social Networking, 13(6), 705-710. https://doi.org/10.1089/cyber.2009.0170
Cheong, K. C., Ghazali, M. M., Nuur, H., & Selamat, R. (2015). Development of growth chart for Malaysian children. Welcome to IIUM Repository (IRep) - IIUM Repository (IRep). https://irep.iium.edu.my/49395/
Cigola, M. (2015). Digital Tools for Urban and Architectural Heritage. In Brusaporci, S. (Eds.), Handbook of Research on Emerging Digital Tools for Architectural Surveying, Modeling, and Representation (pp. 403-424). IGI Global. http://doi:10.4018/978-1-4666-8379-2.ch014
Damala, A., Stojanovic, N., Schuchert, T., Moragues, J., Cabrera, A., & Gilleade, K. (2012). Adaptive augmented reality for cultural heritage: ARtSENSE project. Progress in Cultural Heritage Preservation, 746-755. doi:10.1007/978-3-642-34234-9_79
Hirschmann, R. (2019). Malaysia: Most ideal height for women 2019. Statista. https://www.statista.com/statistics/1046739/malaysia-most-ideal-height-women
International Recommendations for Tourism Statistics. (2008). https://unstats.un.org. https://unstats.un.org/unsd/statcom/doc08/BG-TourismStats.pdf
ISO DIS 9241-11: Ergonomics of human-system interaction - Part 11: Usability: Definitions and concepts (2015)
Juan, M., Botella, C., Alcaniz, M., Banos, R., Carrion, C., Melero, M., & Lozano, J. (n.d.). An augmented reality system for treating psychological disorders: Application to phobia to cockroaches. Third IEEE and ACM International Symposium on Mixed and Augmented Reality. https://doi.org/10.1109/ismar.2004.14
Kong, J., Zhang, W., Yu, N., & Xia, X. (2011). Design of human-centric adaptive multimodal interfaces. International Journal of Human-Computer Studies, 69(12), 854-869. https://doi.org/10.1016/j.ijhcs.2011.07.006
Ketchell, S., Chinthammit, W., & Engelke, U. (2019). Situated storytelling with SLAM enabled augmented reality. The 17th International Conference on Virtual-Reality Continuum and its Applications in Industry. https://doi.org/10.1145/3359997.3365681
Lee, M., Billinghurst, M., Baek, W., Green, R., & Woo, W. (2013). A usability study of multimodal input in an augmented reality environment. Virtual Reality,17(4),293-305.https://doi.org/10.1007/s10055-013-0230-0
Lodhi, A. (2010). Usability Heuristics as an assessment parameter: For performing Usability Testing. 10.1109/ICSTE.2010.5608809.
MBOT. (2018, August 1). Industrial Revolution 4.0. Techies, 5. Retrieved from https://www.mbot.org.my/MBOT/files/b6/b61c9f4a-b897-4e8e-a91a-cc9b9ee8df41.pdf
MITI (2018). Industry 4WRD: National Policy on Industry 4.0. Perpustakaan Negara Malaysia.
Neilson, J. (2012). Usability 101: Introduction to Usability. Nielsen Norman Group. https://www.nngroup.com/articles/usability-101-introduction-to-usability/
O’Keeffe T. (2014) Heritage and Archaeology. In: Smith C. (eds) Encyclopedia of Global Archaeology. Springer, New York, NY. https://doi.org/10.1007/978-1-4419-0465-2_1053
Perry, S. (2008). Wikitude: Android App with Augmented Reality: Mind Blow-Ing. Digital Lifestyles.
Reddy, B. S., Krishnamurthy, M., & Asundi, A. Y. (2018). Information use, user, user needs and seeking behaviour: A review. DESIDOC Journal of Library & Information Technology, 38(2), 82. https://doi.org/10.14429/djlit.38.2.12098
Schwab, K. (2017). The fourth Industrial Revolution. Penguin UK.
Rogers, Y., Sharp, H., & Preece, J. (2011). Interaction DESIGN: Beyond human-computer interaction (3rd ed.).
Thomas, B., Close, B., Donoghue, J., Squires, J., Bondi, P. D., & Piekarski, W. (2002). First person indoor/Outdoor augmented reality application: ARQuake. Personal and Ubiquitous Computing, 6(1), 75-86. https://doi.org/10.1007/s007790200007
Weichbroth, P. (2020). Usability of Mobile Applications: A Systematic Literature Study. IEEE Access, 8, 55563-55577
YMS2021, Universiti Utara Malaysia
113
Best Paper Nominee
Application of MA Play with storytelling: Increasing youth knowledge,
skills and value achievement
Christina Lim1, Hashiroh Hussain2 & Haslina Japri3
1Institut Pendidikan Guru Kampus Darulaman, Malaysia, [email protected] 2Institut Pendidikan Guru Kampus Darulaman, Malaysia, [email protected] 3Institut Pendidikan Guru Kampus Darulaman, Malaysia, [email protected]
ABSTRACT
Only a few students choose science as their final year
subject in school. Most of them reject Science subjects
especially dealing with Science concepts. Thus, in
order to attract and attain the attention of students in
this subject, a media application called Mixture
Apparatus or “MA PLAY” with storytelling was
developed using Scratch. The aim of this study is to
increase knowledge, skills and value achievement for
Science subject. Data collection was employed from
five respondents at a school in Kubang Pasu, Kedah.
Data was analyzed using pre- and post- test, and
anecdote. The result shows that the apps have
increased achievement in terms of knowledge, skills
and values. For further research, the apps can be
improved by integrating other subjects and other
topics. Besides, in order to increase the student’s
participation, higher order thinking skills questions
and virtual experiments can be embedded in the apps.
This finding can contribute to ease students in
comprehending Science subject using a media
application with storytelling.
Keywords: Media application, youth, scratch,
storytelling
I INTRODUCTION
The rapid development of Information and
Communications Technology (ICT) has caused
significant changes to the methods of learning and
teaching among teachers. The seventh thrust of the
Malaysian Education Blueprint (MEB) 2013-2025
which was developed by the Ministry of Education
Malaysia (MOE) states the need of ICT in teaching
and learning to scale up quality learning across
Malaysia (MOE, 2013). In the 21st century, the use
of ICT has become more important in education as it
can provide a proactive teaching and learning
environment (Gabare, et al., 2014). The use of ICT
also makes instructional delivery of teaching easier
and enhances the quality of teaching and learning.
However, the application of ICT in teaching and
learning is still a challenge for primary school Science
teachers because it is found that the use of Science
digital applications is at a moderate level (Zurina
Yasak, Shamsudin Yamhari & Ahmad Esa, 2010). The
application of ICT is a process which a technology is
adapted with the situations of teaching and learning,
whether inside or outside of the classroom (Norazrena
& Khairul, 2007; Qistina & Hazman, 2006). An
interactive multimedia is a system that merges several
elements of multimedia such as text, audio, picture,
animation and video. It also involves the participation
of users in terms of giving instructions, controlling and
manipulating specific information (Ilham Eka et al.,
2013).
The paper discusses the background of media
application, storytelling and the development of MA
PLAY. The section presents the methodology using
quantitative and qualitative approaches. Finally, the
discussion on results of study to increase knowledge,
skills and value achievement is discussed.
II BACKGROUND STUDY
A. Media Application
Teaching media is one of the important components
in the system of instructional design of teaching
(Holden & Gamor, 2010). It is also a platform for
delivering messages, stimulating thinking, increasing
motivation and students’ attention, which brings
effective learning (Rafiza & Maryam, 2013; Rian &
Kamisah, 2013). Teaching media is divided into two
categories, which are classic teaching media and
modern teaching media. Classical teaching media
includes books, journals, graphs, models, pictures,
cartoons, newspapers, diorama, blackboard and
others. Modern teaching media includes multimedia
materials, films, radio, television, computer and
Internet (Isman, 2011). The integration of computers
in modern teaching media has caused positive impacts
in increasing the quality of learning and achievement
B
B
YMS2021, Universiti Utara Malaysia
114
of students (Yahya & Dayang Raini, 2011). Besides,
it promotes self-learning based on students’ level of
learning (Mazyrah, Wan Fatimah, Shahrina, & Suziah,
2008; Muhammad Adri, 2007). In fact, it was aligned
with the concept of computer-assisted learning which
involves elements such as interactive, student
oriented, repeatable and user-friendly (Jamaluddin &
Zaidatun, 2005). Nevertheless, modern teaching
media still lack support from teachers as it is not
suitable in presenting content (Ariffin, 2009). The
presentation of media should be more interactive to
prompt creative delivery of learning content, through
the combination of multimedia technology and
traditional storytelling (Lowenthal, 2008). Therefore,
the proses of development of teaching media should
be integrated with the element of digital storytelling to
increase students’ interest. The next section discusses
the process of media development that involves digital
storytelling in detail.
Scratch is a digital storytelling tool used to create
interactive stories, games and animations. The product
can be shared with other users among online
community. It is a project developed by Lifelong
Kindergarten Group from Management Information
Technology Media Lab since 2003, with the support
from National Science Foundation, Intel Foundation,
Microsoft, Macarthur Foundation, LEGO, Code to
Learn Foundation, Google Dell, Fastly, Inversoft, and
has started to interact with portable devices in 2014.
Although this application involves coding and
programming language, it is designed with user-
friendly “drag and drop” coding blocks which makes
it easier for novice creators in programming. As a
result, it can help users to think creatively,
systematically and collaborate using 21st century
skills. Nowadays, it is used as a tool to develop
multimedia materials in Information and
Communication Technology subject for students in
Malaysia. The design of Scratch consists of several
features which are script, costume, and sound. The
script of programming is categorized as several blocks
such as motion, looks, sound, pen, data events, control,
sensing operator and blocks. This application uses a
concept based on storytelling of certain characters and
it is very suitable for users that wish to improve
English language skills.
B. Storytelling
The introduction of the concept of narrative in
delivering content of learning has attracted the interest
of study. This concept has begun since humans carved
images on stones and the walls of caves 30,000 years
ago to communicate and convey certain information
(Sova & Sova, 2011). Today, this concept is suitable
to be used in education which involves all subjects to
improve communication and memory (Robiatul
A’dawiah & Halimah, 2011). Based on the traditional
idea of narrative concept, the combination of text,
graphics (sketches), and audio (musical instruments)
enable stories to be delivered easily in a more effective
way to attract the audience’s attention (Emory’s
Center for Interactive Teaching, 2014; Robin, 2006).
Storytelling is defined as the activity and the method
of delivering stories, and the expression of a specific
character to the audience (Dewan Bahasa dan Pustaka,
2005).
The transition of traditional storytelling to digital
storytelling (DST) is introduced by Dana Atchley with
the collaboration with Joe Lambert to create a more
effective storytelling method (Lambert, 2006; Signes,
2008). There are various opinions regarding the
definition of DST. Robin (2006) defined DST as a
combination of the art of storytelling with multimedia
elements such as digital graphics, text, audio, and
music to deliver information about a particular topic.
Miller (2008) stated DST as a narrative entertainment
which connects the audience through technology and
media in his book “Digital Storytelling: A Creator’s
Guide to Interactive Entertainment. In other words,
Lambert (2010) concluded that DST is a short story in
a narrative video which is created using the
combination of recorded voices, images, music or
sound and animations.
Most of the storytelling tools developed are more
technical and require higher skills, which are difficult
for teachers to learn (Malkawi & Davies, 2012;
Truong et al., 2006). Thus, this research focuses on
storytelling tools which have elements and
characteristics of DST and can be used in touch screen
tablets. Some examples of DST tools are Storykit,
Scratch, Storyboardthat, Wevideo and Animoto Kita.
Scratch is used to develop MA PLAY, which is
discussed in the next section.
C. Development of MA PLAY
The Mixture Apparatus PLAY is created using
Scratch with the concept of storytelling. The
application is to solve student’s problems who are
confused about the type of apparatus and the use of
apparatus to separate mixtures. There are three phases
of development of MA PLAY, which are Story
(Narrative advance organizer), Learn (Presentation of
YMS2021, Universiti Utara Malaysia
115
learning task and material) and Play (Strengthening
cognitive organization) as in Figure 1 (Ausubel, 2000;
Agra et al., 2019).
Figure 1. Development Phases of MA PLAY
Phase 1. Phase 1 is the Story Phase. Narrative advance
organizer in the form of digital storytelling is
introduced to students. Students will have to think and
state ways to help the character in MA PLAY to solve
a problem about separating a mixture based on the
situation given in the story as shown in Figure 2.
Figure 2. Storytelling in MA PLAY
Phase 2. Phase 2 is the Learn Phase. Learning tasks
and materials are given in this phase. Students will
learn about methods to separate different mixtures,
which is guided by a character in the story of MA
PLAY. They will also solve learning task by playing
the Memory Card Game as shown in Figure 3.
Figure 3. Memory Card Game
Phase 3. Phase 3 is the Play Phase. Students’ cognitive
organization is strengthened by playing games about
the methods of separating mixtures such as the Find
The Objects Game as shown in Figure 4. Students will
obtain scores upon completion of the games. As a
result, they are able to relate existing knowledge with
new information and gain interest towards the concept
of mixture through these games.
Figure 4. Find the Objects Game
III METHODOLOGY
The implementation of data collection consists of
two phases: preliminary study and evaluation as
shown in Figure 5. During preliminary study, there
were various activities carried out, such as diagnostic
tests and observation. While evaluation was to
implement pre- and post-tests, document analysis, and
anecdote. Data collection was conducted among five
respondents who were students from a primary school
in Kubang Pasu, Kedah.
Figure 5. Methodology of study
Diagnostic Test. Diagnostic test was conducted among
respondents to determine the problem statement. The
diagnostic test consists of ten objective questions
about the concept of mixture. The questions in the
diagnostic test were created based on the remembering
and understanding level in the Bloom Taxonomy
(MOE, 2014).
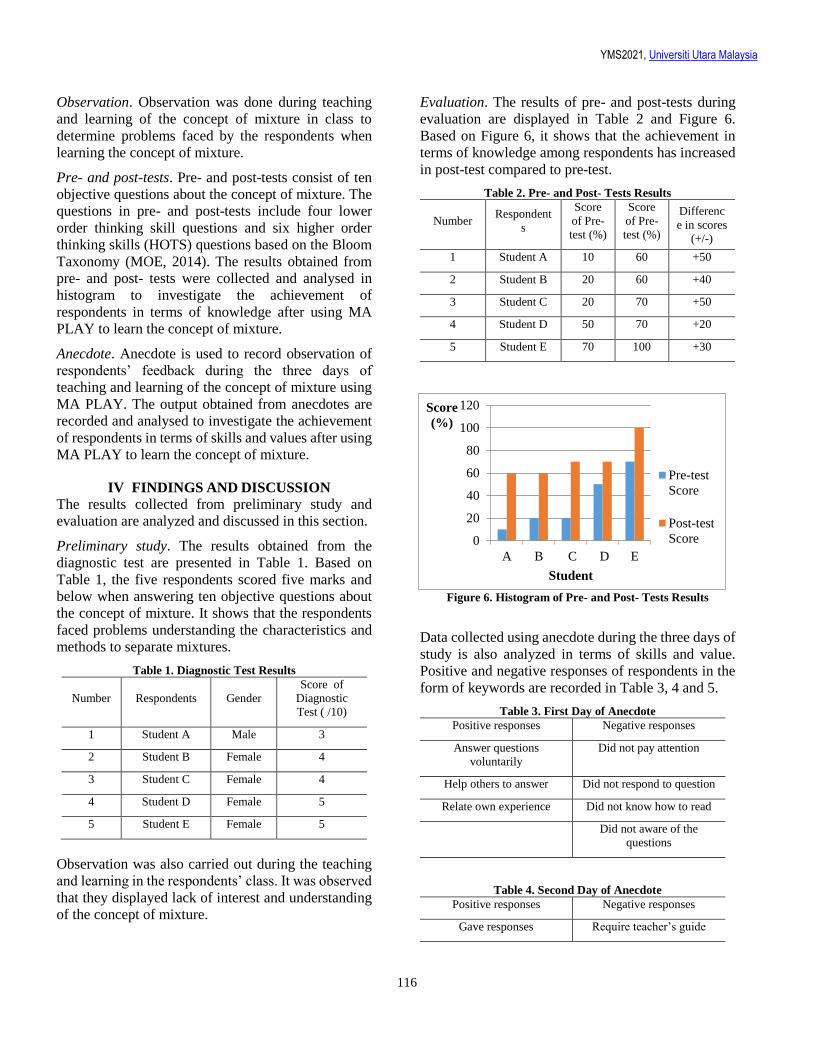
YMS2021, Universiti Utara Malaysia
116
Observation. Observation was done during teaching
and learning of the concept of mixture in class to
determine problems faced by the respondents when
learning the concept of mixture.
Pre- and post-tests. Pre- and post-tests consist of ten
objective questions about the concept of mixture. The
questions in pre- and post-tests include four lower
order thinking skill questions and six higher order
thinking skills (HOTS) questions based on the Bloom
Taxonomy (MOE, 2014). The results obtained from
pre- and post- tests were collected and analysed in
histogram to investigate the achievement of
respondents in terms of knowledge after using MA
PLAY to learn the concept of mixture.
Anecdote. Anecdote is used to record observation of
respondents’ feedback during the three days of
teaching and learning of the concept of mixture using
MA PLAY. The output obtained from anecdotes are
recorded and analysed to investigate the achievement
of respondents in terms of skills and values after using
MA PLAY to learn the concept of mixture.
IV FINDINGS AND DISCUSSION
The results collected from preliminary study and
evaluation are analyzed and discussed in this section.
Preliminary study. The results obtained from the
diagnostic test are presented in Table 1. Based on
Table 1, the five respondents scored five marks and
below when answering ten objective questions about
the concept of mixture. It shows that the respondents
faced problems understanding the characteristics and
methods to separate mixtures.
Table 1. Diagnostic Test Results
Number Respondents Gender
Score of
Diagnostic
Test ( /10)
1 Student A Male 3
2 Student B Female 4
3 Student C Female 4
4 Student D Female 5
5 Student E Female 5
Observation was also carried out during the teaching
and learning in the respondents’ class. It was observed
that they displayed lack of interest and understanding
of the concept of mixture.
Evaluation. The results of pre- and post-tests during
evaluation are displayed in Table 2 and Figure 6.
Based on Figure 6, it shows that the achievement in
terms of knowledge among respondents has increased
in post-test compared to pre-test.
Table 2. Pre- and Post- Tests Results
Number Respondent
s
Score
of Pre-
test (%)
Score
of Pre-
test (%)
Differenc
e in scores
(+/-)
1 Student A 10 60 +50
2 Student B 20 60 +40
3 Student C 20 70 +50
4 Student D 50 70 +20
5 Student E 70 100 +30
Figure 6. Histogram of Pre- and Post- Tests Results
Data collected using anecdote during the three days of
study is also analyzed in terms of skills and value.
Positive and negative responses of respondents in the
form of keywords are recorded in Table 3, 4 and 5.
Table 3. First Day of Anecdote
Positive responses Negative responses
Answer questions
voluntarily
Did not pay attention
Help others to answer Did not respond to question
Relate own experience Did not know how to read
Did not aware of the
questions
Table 4. Second Day of Anecdote
Positive responses Negative responses
Gave responses Require teacher’s guide
0
20
40
60
80
100
120
A B C D E
Score
(%)
Student
Pre-test
Score
Post-test
Score
YMS2021, Universiti Utara Malaysia
117
Complete task correctly Did not give responses
Several attempts after
making mistake
State own ideas
Try to explain
Ask questions
Table 5. Third Day of Anecdote
Positive responses Negative responses
Gave responses Did not respond to question
Several attempts after
making mistake
Relate existing knowledge
Raise hand to answer
Complete game
Express joy of achievement
Guide other friend
State observation
Based on Table 3, 4 and 5, it is shown that the
respondents display more positive responses on the
third day of teaching and learning using MA PLAY
compared to the first and second day. It is observed
that the respondents’ skills such as predicting,
inferring, communicating, observing, classifying,
evaluating, relating existing knowledge, creative and
critical thinking skills have increased. Therefore,
respondents’ achievement in terms of skills is
increased through MA PLAY.
Besides, it is also observed that the respondents
practice more scientific attitude and positive values on
the third day of study compared to the first and second
day of study. The respondents show values such as be
brave to try, confident, open-minded, helpful, curious,
and show interest towards learning. Hence,
respondents’ achievement in terms of values is
increased through MA PLAY.
V CONCLUSION
In conclusion, the findings show that MA PLAY can
help to increase achievement in terms of knowledge,
skills and values among students in the concept of
Science. Besides, this proves that a digital storytelling
tool or Scratch is a useful tool in helping to increase
students’ achievement and interest in learning. For
future research, MA PLAY can be customized so that
it can be used and integrated in various topics and
subjects. Higher order thinking skills (HOTS)
questions can also be added into MA PLAY to
stimulate students to think creatively and critically
while discussing the questions in groups. Besides,
virtual experiments can be added in MA PLAY so that
students can conduct simulation experiments in school
or at home.
REFERENCES Ariffin, A. M. (2009). Conceptual design of reality learning media (RLM) model based entertaining and fun constructs. UUM. Agra, G., Formiga, N. S., Oliveira, P. S., Costa, M. M. L., Fernandes, M. G. M. & Nóbrega, M. M. L. (2019). Analysis of the concept of
meaningful learning in light of the Ausubel’s theory. Rev Bras Enferm, 72(1), 248-255.
Ausubel, D. P. (1960). The use of advance organizers in the learning and retention of meaningful verbal material. Journal of Educational
Psychology, 51(5), 267-272. Dewan Bahasa dan Pustaka. (2005). Kamus Dewan (Edisi keempat.). Kuala Lumpur: Dewan Bahasa dan Pustaka. Emory’s Center for Interactive Teaching, E. U. (2014). Teaching Tools:
Digital Storytelling. Atlanta, Georgia: Emory’s Center for Interactive Teaching (ECIT). Retrieved from http://ecit.emory.edu/teaching_tools/digitalstorytelling.html
Gabare, C., Gabarre, S., Rosseni Din, Parilah Mohd Shah, & Aidah Abdul Karim. (2014). iPads in the foreign language classroom: A
learner’s perspective. The Southeast Asian Journal of English Language Studies, 20(1), 115 -128.
Hashiroh Hussain., & Norshuhada Shiratuddin. (2016). The digital storytelling process: A comparative analysis from various experts. AIP
Conference Proceedings 1761, 1-7. Hashiroh, H., & Norshuhada S. (2017). Persepsi pereka bentuk (guru) terhadap kualiti garis panduan pembangunan media pengajaran
berkonsepkan penceritaan digital untuk tablet skrin sentuh. Malaysian Journal of Learning and Instruction (MJLI), 14 (2), 271-292.
Holden, J. T., & Gamor, K. I. (2010). An instructional media selection guide for distance learning (Second Edition). United States of America:
United States Distance Learning Association. Ilham Eka Putra., S. Kom., dan M. Hum. (2013). Teknologi media
pembelajaran sejarah melalui pemanfaatan multimedia animasi interaktif. Jurnal TEKNOIF, 1(2), 20-25.
Isman, A. (2011). Instructional design in education: New model. Turkish Online Journal of Educational Technology - TOJET, 10(1), 136–
142. Retrieved from http://eric.ed.gov/?q=(+Lesson+plan+OR+lesson+planning+) Jamaluddin Harun., & Zaidatun Tasir. (2005). Multimedia, konsep dan praktis. Kuala Lumpur: Venton Publishing. Lambert, J.(2006). Digital storytelling: Capturing lives, creating
community (2nd ed.). Berkelay CA: Digital Diner Press. Lambert, J. (2010). Digital storytelling cookbook. Seven Steps of Digital
Storytelling, 9–24. Berkeley, CA: Digital Diner Press. Retrieved from http://static.squarespace.com/505a3ab2e4b0f1416c7df69a/t/51c3458be4b096e91f04d680/1371751819981/ cookbook_sample.pdf
Lowenthal, P. (2006). Digital storytelling: An emerging institutional technology? Story circle: Digital storytelling around the world, 297–305.
United States: Wiley-Blackwell. Malkawi, R. & Davies, P. (2012). Integration of multi-media technologies to facilitate reflection and learning, particularly in the area of
digital storytelling. International Conference on Education and e-Learning Innovations, 1-5.
Mazyrah Masri., Wan Fatimah Wan Ahmad., Shahrina Mohd Nordin., & Suziah Sulaiman. (2008). A conceptual framework for English
Language courseware using storytelling approach: Case study in University Teknologi Petronas. 2008 International Symposium on Information Technology, 1-6.
Miller, C. H. (2008). Digital Storytelling: A Creator’s Guide to Interactive Entertainment: Second Edition. Burlington, USA: Focal
express. Ministry of Education Malaysia. (2013). Malaysian Education Blueprint
YMS2021, Universiti Utara Malaysia
118
2013-2025. Putrajaya: Bahagian Pendidikan Guru. Ministry of Education Malaysia. (2014). Kemahiran berfikir aras tinggi aplikasi di sekolah. Putrajaya: Bahagian Pembangunan Kurikulum,
Ministry of Education Malaysia. Muhammad Adri. (2007). Strategi Pengembangan Multimedia Instructional Design (Suatu Kajian Teoritis). Jurnal Invotek, VIII (1). Norazrena Abu Samah., & Khairul Anuar Abdul Rahman. (2007). Pengaplikasian perisian matematik bagi tajuk pecahan terhadap pelajar
pendidikan khas. Bahan Pengajaran dan Pembelajaran Berasaskan Komputer, 201-218.
Nur Qistina., & Hazman Ali. (2006). Penggunaan teknologi maklumat dan
komunikasi (ICT) dalam kalangan guru-guru sekolah kebangsaan. Johor: Universiti Teknologi Malaysia.
Rafiza, A. R., & Maryam, A. R. (2013). Pembinaan media pengajaran
berasaskan multimedia di kalangan guru ICTL. Jurnal Kurikulum & Pengajaran Asia Pasifik, 1(2), 20–31.
Rian, V., & Kamisah, O. (2013). Keberkesanan penggunaan pelbagai
media pengajaran dalam meningkatkan kemahiran proses sains dalam kalangan pelajar. Jurnal Pendidikan Malaysia, 37(1), 1–11.
Robiatul A’dawiah, J., & Halimah, Z. B. (2011). Pembangunan perisian
Cerita animasi interaktif Untuk Pendidikan sains. Jurnal Teknologi Pendidikan Malaysia, 1, 5-18. Retrieved from
http://www.jtpm-meta.com/resources/141 - JTPM V1N4 - 2011 - Rabiatul - 1.pdf
Robin, B. R. (2006). The educational uses of digital storytelling. Proceedings of Society for Information Technology and Teacher
Education International Conference, 709-716. Sova, R., & Sova, D. H. (2011). Storyboards: A dynamic storytelling tool. Usability Professionals’ Association Forum, UPA 2006. Usability
Professionals Association. Retrieved from http://teced.com/wpcontent/uploads/2011/06/upa2006_storyboards_a_dynamic_story telling_tool.pdf
Signes, C. G. (2010). Practical uses of digital storytelling. Spain: University of Valencia. Truong, K. N., Hayes, G., & Abowd, G. (2006). Storyboarding: an empirical determination of best practices and effective guidelines.
Proceedings of the Conference on Designing Interactive Systems, 12-21.
Yahya, O., & Dayang Raini, P. (2011). Kesan Aplikasi Perisian Cerita Interaktif Semasa Mengajarkan Kemahiran Bacaan dan Kefahaman dalam
Kalangan Murid Tahun 4 di Brunei Darussalam. Jurnal Pendidikan Bahasa Melayu, 1(1), 27-49.
Zurina Yasak., Shamsudin Yamhari., & Ahmad Esa. (2010). Penggunaan teknologi dalam mengajar sains di sekolah rendah. Seminar
Majlis Dekan Pendidikan IPTA 2010, 1-7
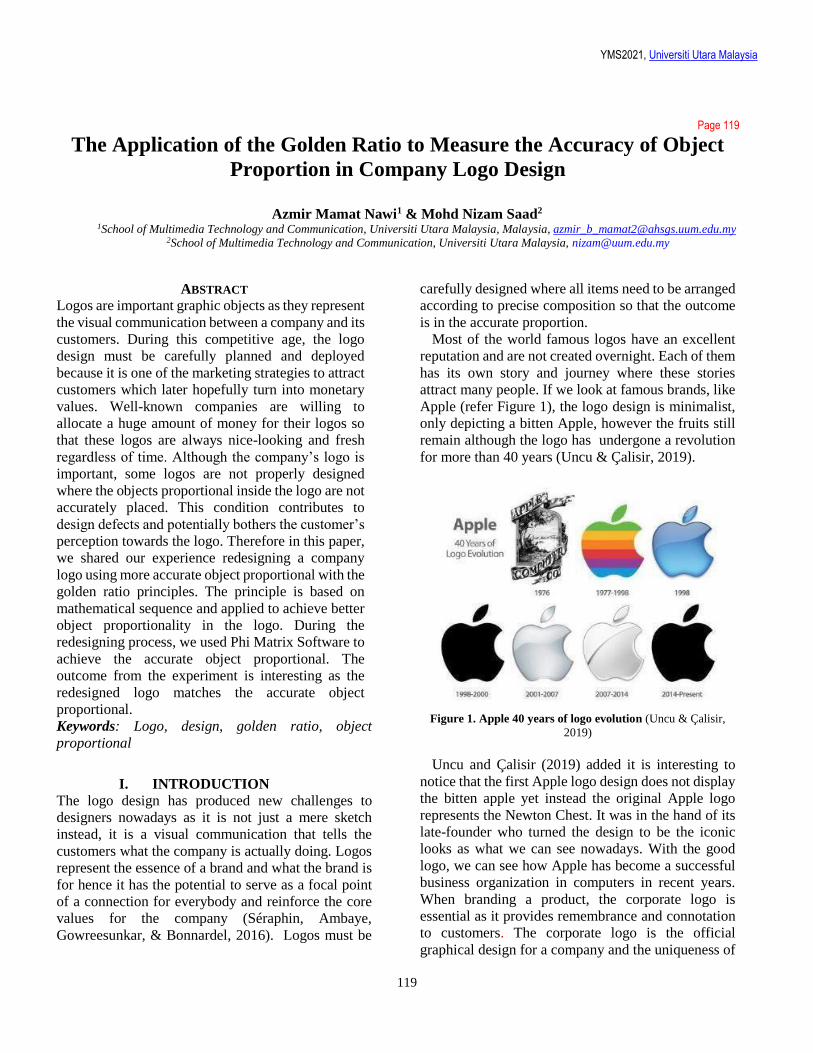
YMS2021, Universiti Utara Malaysia
119
Page 119
The Application of the Golden Ratio to Measure the Accuracy of Object
Proportion in Company Logo Design
Azmir Mamat Nawi1 & Mohd Nizam Saad2
1School of Multimedia Technology and Communication, Universiti Utara Malaysia, Malaysia, [email protected]
2School of Multimedia Technology and Communication, Universiti Utara Malaysia, [email protected]
ABSTRACT
Logos are important graphic objects as they represent
the visual communication between a company and its
customers. During this competitive age, the logo
design must be carefully planned and deployed
because it is one of the marketing strategies to attract
customers which later hopefully turn into monetary
values. Well-known companies are willing to
allocate a huge amount of money for their logos so
that these logos are always nice-looking and fresh
regardless of time. Although the company’s logo is
important, some logos are not properly designed
where the objects proportional inside the logo are not
accurately placed. This condition contributes to
design defects and potentially bothers the customer’s
perception towards the logo. Therefore in this paper,
we shared our experience redesigning a company
logo using more accurate object proportional with the
golden ratio principles. The principle is based on
mathematical sequence and applied to achieve better
object proportionality in the logo. During the
redesigning process, we used Phi Matrix Software to
achieve the accurate object proportional. The
outcome from the experiment is interesting as the
redesigned logo matches the accurate object
proportional.
Keywords: Logo, design, golden ratio, object
proportional
I. INTRODUCTION
The logo design has produced new challenges to
designers nowadays as it is not just a mere sketch
instead, it is a visual communication that tells the
customers what the company is actually doing. Logos
represent the essence of a brand and what the brand is
for hence it has the potential to serve as a focal point
of a connection for everybody and reinforce the core
values for the company (Séraphin, Ambaye,
Gowreesunkar, & Bonnardel, 2016). Logos must be
carefully designed where all items need to be arranged
according to precise composition so that the outcome
is in the accurate proportion.
Most of the world famous logos have an excellent
reputation and are not created overnight. Each of them
has its own story and journey where these stories
attract many people. If we look at famous brands, like
Apple (refer Figure 1), the logo design is minimalist,
only depicting a bitten Apple, however the fruits still
remain although the logo has undergone a revolution
for more than 40 years (Uncu & Çalisir, 2019).
Figure 1. Apple 40 years of logo evolution (Uncu & Çalisir,
2019)
Uncu and Çalisir (2019) added it is interesting to
notice that the first Apple logo design does not display
the bitten apple yet instead the original Apple logo
represents the Newton Chest. It was in the hand of its
late-founder who turned the design to be the iconic
looks as what we can see nowadays. With the good
logo, we can see how Apple has become a successful
business organization in computers in recent years.
When branding a product, the corporate logo is
essential as it provides remembrance and connotation
to customers. The corporate logo is the official
graphical design for a company and the uniqueness of
YMS2021, Universiti Utara Malaysia
120
the design requires significant creativity and is aligned
with a company’s strategy and identity (Foroudi,
Melewar, & Gupta, 2017). Businesses spend a lot of
time and money developing their logos. For instance,
designing the 2012 Olympics logo in London has cost
$625.000, redesigning Pepsi in 2008 has cost $1
million for the company, and the BP logo redesign in
the same year has cost $211 million (van Grinsven &
Das, 2016). Huge amount of money allocated to the
logo design has signified how important this graphic
design is to the company. Therefore, logo design is
considered as a crucial task for any company, and
having a good logo to represent them is a must.
Although logos are important to companies,
unfortunately, some of the logo designs are not
properly made, especially in deciding the accurate
objects proportional inside the logo. As a result, it
causes small design defects in the logo and could
potentially irritate the customer perception towards the
logo. To make things worse, some designers decide to
layout the object proportional only based on their
experience and opinion without referring to any design
theories like the golden principle. Hence, the attitude
has affected the logo design and might contribute to
design error. Therefore, in this paper, we are sharing
experience redesigning a logo based on the golden
principle in order to reposition the object proportional.
By using the principle, we have made adjustments to
the object from the original logo so that the outcome
will be better. This paper has been segmented into five
sections for the discussion. Section II will discuss the
design of logo, Section III will elaborate the golden
ratio principle in correcting the object proportional in
logos. In Section IV, we share our experience to
redesign one logo from a known food company.
Finally, Section V concludes our work in redesigning
the logo using the golden principle.
II. LOGO DESIGN In short, logos are visual and textual marks used to
identify brands and their products (Luffarelli, Mukesh,
& Mahmood, 2019). Logo's act as the visual
communication where it ensures that the messages that
are being communicated are memorable and easily
received by the public that lead to an association with
the brand name (Adîr, Adîr, & Dobrescu, 2015;
Séraphin et al., 2016).
The impact of logo design to customers is very
significant. For instance, logo plays major influence
for youth in order to determine types of product that
they preferred. A study done by Zhu, Cao, & Li (2017)
among 120 individuals in China indicates that there
are four main factors that influence these respondents
when choosing the best logo of youth education
brands. These factors are sense of contemporaneity,
sense of aesthetics, feeling of interest and sense of
style. In brief, their findings conclude that youth prefer
logos that include English text with the Chinese
characters because it is very trendy and fashionable.
For the second factor, the youth would like simple and
unified logos where they perceived these logo designs
as more aesthetic and easy to recall. The youth also
feel more interest in logos with vivid and striking
designs and finally this generation choose logos with
rounded shapes as the shape is associated with
approachableness, friendliness, and harmony.
Uncu & Çalisir (2019) have listed at least seven
attributes of logo which include legible, coherent,
adaptable, reproducible, memorable, timeless and
simple. All attributes reflect the visual and emotional
communication that requires the message to be
understood by the society. Hence designing a logo is
not an easy task to complete since logos are the visual
marketing stimuli tools. Design attributes like colour,
pattern and forms must be carefully selected and
arranged in the logo. Hammond, Dockrell, Arnott,
Lee, & McNeill (2009) found that design for cigarette
pack that have slogans like ‘light’, ‘smooth’, ‘gold’
and ‘silver’ was most likely to be perceived as less
harmful by smokers among the youth. Additionally,
these smokers also believed that cigarette packs with
lighter colors design were rated as less harmful and
easier to quit. In both cases, we can see that the logo
design has a big influence for this generation until they
underestimate the health risks and addictive potential.
Logos dynamism, incompleteness and circularity
enable these visual communication items to appear
more modern, innovative and customer sensitive
respectively thus improving brand image, facilitating
brand identification and leading to more favourable
brand attitudes (Luffarelli, Stamatogiannakis, &
Yang, 2019). There are two important processes to
produce a good logo; research process and design
process (Uncu & Çalisir, 2019). The research process
includes tasks such as finding suitable company
theme, SWOT analysis, logos review as well as
required support knowledge especially in the visual
design elements. Meanwhile the design processes
involved lots of brainstorming sessions, sketches,
fonts search, object combinations, briefing and
creative presentation. After all of these tasks are
completed then a good logo can be born to mesmerize
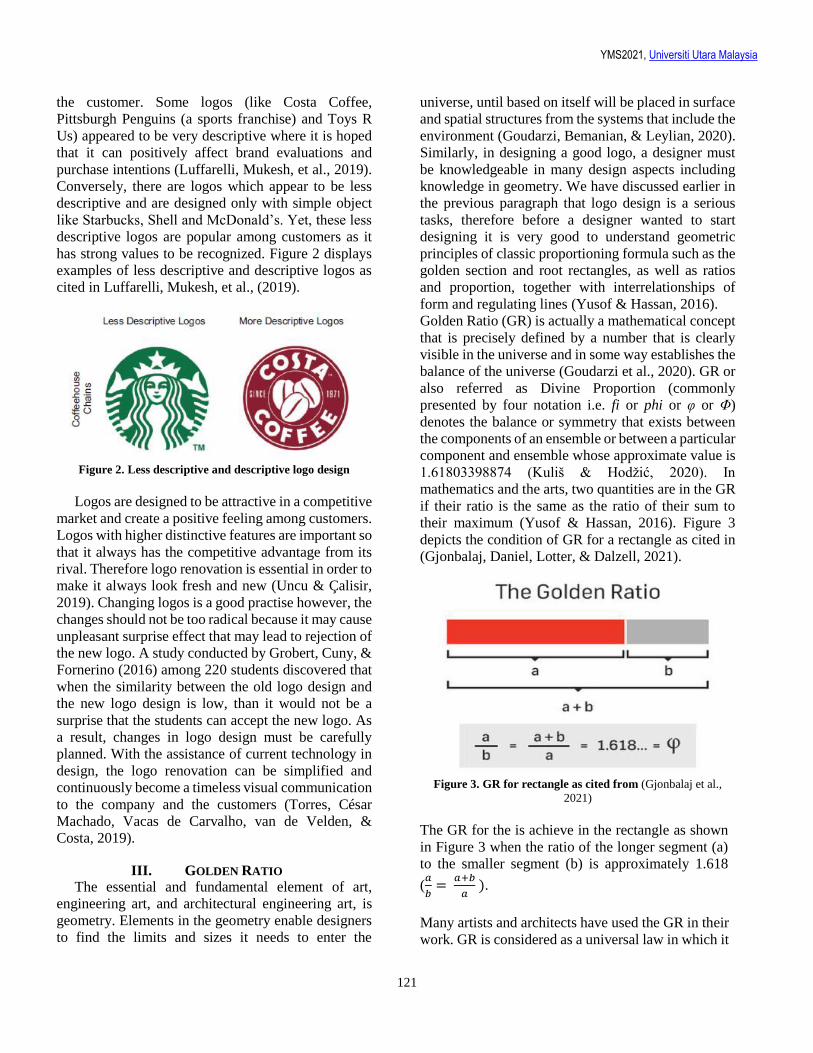
YMS2021, Universiti Utara Malaysia
121
the customer. Some logos (like Costa Coffee,
Pittsburgh Penguins (a sports franchise) and Toys R
Us) appeared to be very descriptive where it is hoped
that it can positively affect brand evaluations and
purchase intentions (Luffarelli, Mukesh, et al., 2019).
Conversely, there are logos which appear to be less
descriptive and are designed only with simple object
like Starbucks, Shell and McDonald’s. Yet, these less
descriptive logos are popular among customers as it
has strong values to be recognized. Figure 2 displays
examples of less descriptive and descriptive logos as
cited in Luffarelli, Mukesh, et al., (2019).
Figure 2. Less descriptive and descriptive logo design
Logos are designed to be attractive in a competitive
market and create a positive feeling among customers.
Logos with higher distinctive features are important so
that it always has the competitive advantage from its
rival. Therefore logo renovation is essential in order to
make it always look fresh and new (Uncu & Çalisir,
2019). Changing logos is a good practise however, the
changes should not be too radical because it may cause
unpleasant surprise effect that may lead to rejection of
the new logo. A study conducted by Grobert, Cuny, &
Fornerino (2016) among 220 students discovered that
when the similarity between the old logo design and
the new logo design is low, than it would not be a
surprise that the students can accept the new logo. As
a result, changes in logo design must be carefully
planned. With the assistance of current technology in
design, the logo renovation can be simplified and
continuously become a timeless visual communication
to the company and the customers (Torres, César
Machado, Vacas de Carvalho, van de Velden, &
Costa, 2019).
III. GOLDEN RATIO The essential and fundamental element of art,
engineering art, and architectural engineering art, is
geometry. Elements in the geometry enable designers
to find the limits and sizes it needs to enter the
universe, until based on itself will be placed in surface
and spatial structures from the systems that include the
environment (Goudarzi, Bemanian, & Leylian, 2020).
Similarly, in designing a good logo, a designer must
be knowledgeable in many design aspects including
knowledge in geometry. We have discussed earlier in
the previous paragraph that logo design is a serious
tasks, therefore before a designer wanted to start
designing it is very good to understand geometric
principles of classic proportioning formula such as the
golden section and root rectangles, as well as ratios
and proportion, together with interrelationships of
form and regulating lines (Yusof & Hassan, 2016).
Golden Ratio (GR) is actually a mathematical concept
that is precisely defined by a number that is clearly
visible in the universe and in some way establishes the
balance of the universe (Goudarzi et al., 2020). GR or
also referred as Divine Proportion (commonly
presented by four notation i.e. fi or phi or φ or Φ)
denotes the balance or symmetry that exists between
the components of an ensemble or between a particular
component and ensemble whose approximate value is
1.61803398874 (Kuliš & Hodžić, 2020). In
mathematics and the arts, two quantities are in the GR
if their ratio is the same as the ratio of their sum to
their maximum (Yusof & Hassan, 2016). Figure 3
depicts the condition of GR for a rectangle as cited in
(Gjonbalaj, Daniel, Lotter, & Dalzell, 2021).
Figure 3. GR for rectangle as cited from (Gjonbalaj et al.,
2021)
The GR for the is achieve in the rectangle as shown
in Figure 3 when the ratio of the longer segment (a)
to the smaller segment (b) is approximately 1.618
(𝑎
𝑏=
𝑎+𝑏
𝑎 ).
Many artists and architects have used the GR in their
work. GR is considered as a universal law in which it
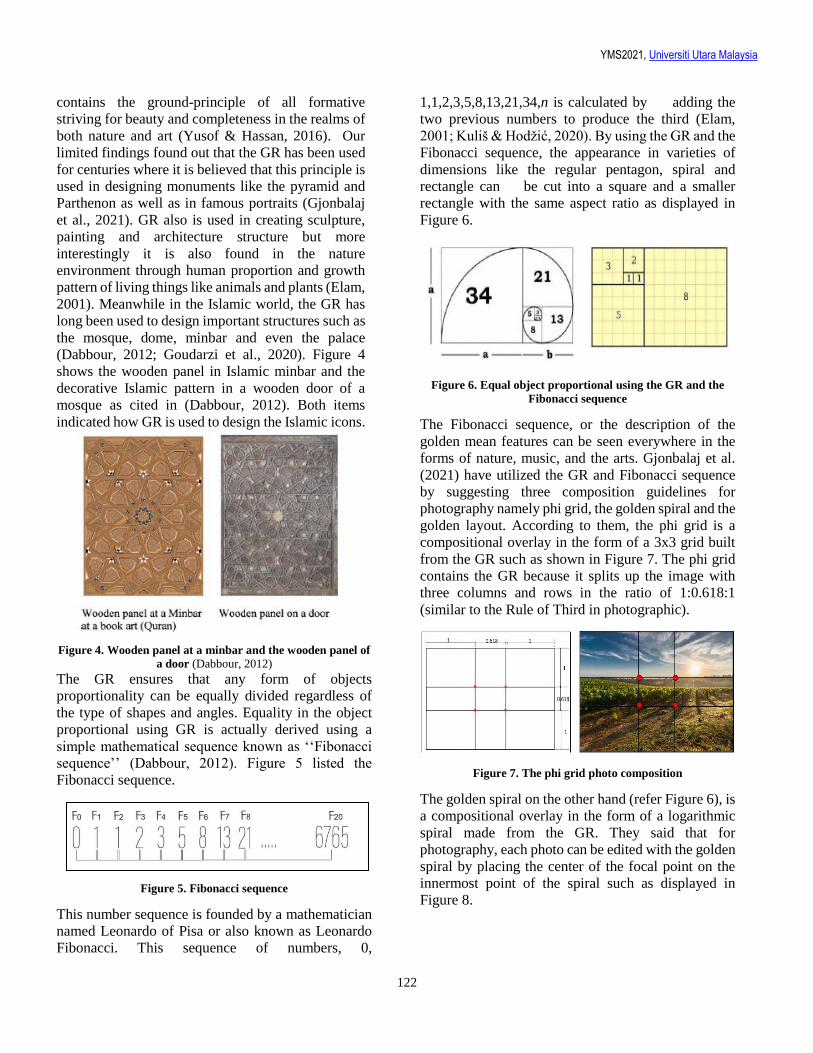
YMS2021, Universiti Utara Malaysia
122
contains the ground-principle of all formative
striving for beauty and completeness in the realms of
both nature and art (Yusof & Hassan, 2016). Our
limited findings found out that the GR has been used
for centuries where it is believed that this principle is
used in designing monuments like the pyramid and
Parthenon as well as in famous portraits (Gjonbalaj
et al., 2021). GR also is used in creating sculpture,
painting and architecture structure but more
interestingly it is also found in the nature
environment through human proportion and growth
pattern of living things like animals and plants (Elam,
2001). Meanwhile in the Islamic world, the GR has
long been used to design important structures such as
the mosque, dome, minbar and even the palace
(Dabbour, 2012; Goudarzi et al., 2020). Figure 4
shows the wooden panel in Islamic minbar and the
decorative Islamic pattern in a wooden door of a
mosque as cited in (Dabbour, 2012). Both items
indicated how GR is used to design the Islamic icons.
Figure 4. Wooden panel at a minbar and the wooden panel of
a door (Dabbour, 2012)
The GR ensures that any form of objects
proportionality can be equally divided regardless of
the type of shapes and angles. Equality in the object
proportional using GR is actually derived using a
simple mathematical sequence known as ‘‘Fibonacci
sequence’’ (Dabbour, 2012). Figure 5 listed the
Fibonacci sequence.
Figure 5. Fibonacci sequence
This number sequence is founded by a mathematician
named Leonardo of Pisa or also known as Leonardo
Fibonacci. This sequence of numbers, 0,
1,1,2,3,5,8,13,21,34,n is calculated by adding the
two previous numbers to produce the third (Elam,
2001; Kuliš & Hodžić, 2020). By using the GR and the
Fibonacci sequence, the appearance in varieties of
dimensions like the regular pentagon, spiral and
rectangle can be cut into a square and a smaller
rectangle with the same aspect ratio as displayed in
Figure 6.
Figure 6. Equal object proportional using the GR and the
Fibonacci sequence
The Fibonacci sequence, or the description of the
golden mean features can be seen everywhere in the
forms of nature, music, and the arts. Gjonbalaj et al.
(2021) have utilized the GR and Fibonacci sequence
by suggesting three composition guidelines for
photography namely phi grid, the golden spiral and the
golden layout. According to them, the phi grid is a
compositional overlay in the form of a 3x3 grid built
from the GR such as shown in Figure 7. The phi grid
contains the GR because it splits up the image with
three columns and rows in the ratio of 1:0.618:1
(similar to the Rule of Third in photographic).
Figure 7. The phi grid photo composition
The golden spiral on the other hand (refer Figure 6), is
a compositional overlay in the form of a logarithmic
spiral made from the GR. They said that for
photography, each photo can be edited with the golden
spiral by placing the center of the focal point on the
innermost point of the spiral such as displayed in
Figure 8.
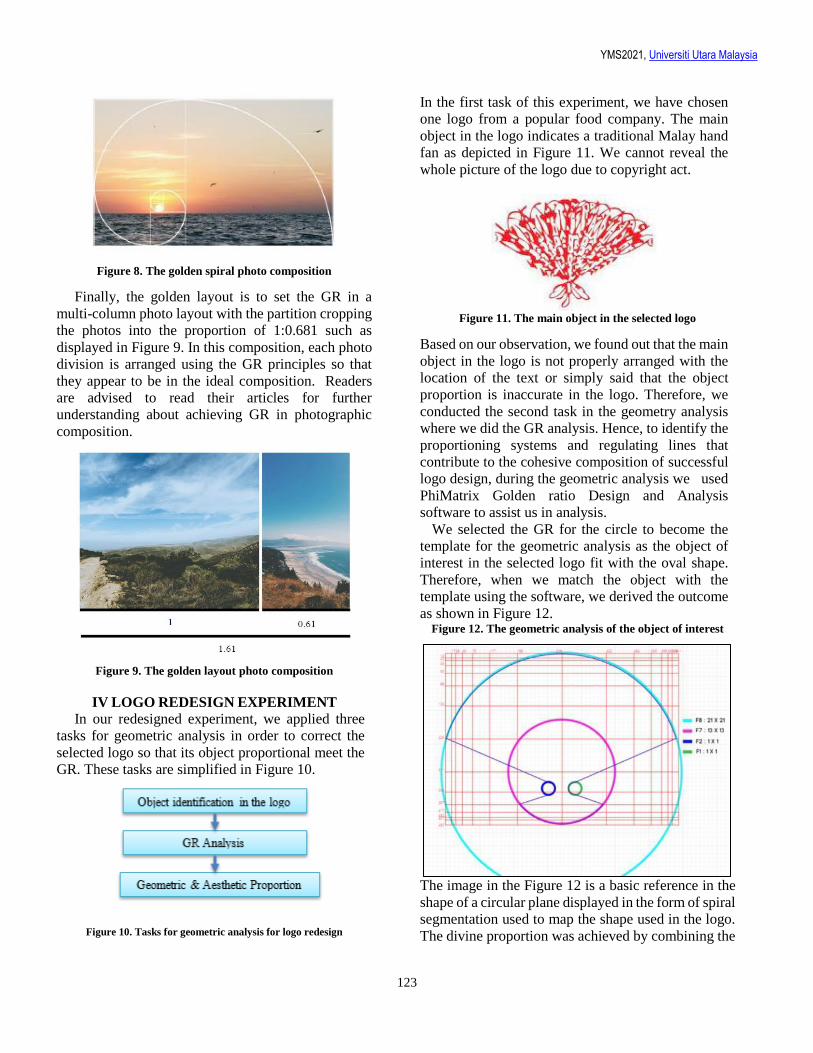
YMS2021, Universiti Utara Malaysia
123
Figure 8. The golden spiral photo composition
Finally, the golden layout is to set the GR in a
multi-column photo layout with the partition cropping
the photos into the proportion of 1:0.681 such as
displayed in Figure 9. In this composition, each photo
division is arranged using the GR principles so that
they appear to be in the ideal composition. Readers
are advised to read their articles for further
understanding about achieving GR in photographic
composition.
Figure 9. The golden layout photo composition
IV LOGO REDESIGN EXPERIMENT
In our redesigned experiment, we applied three
tasks for geometric analysis in order to correct the
selected logo so that its object proportional meet the
GR. These tasks are simplified in Figure 10.
Figure 10. Tasks for geometric analysis for logo redesign
In the first task of this experiment, we have chosen
one logo from a popular food company. The main
object in the logo indicates a traditional Malay hand
fan as depicted in Figure 11. We cannot reveal the
whole picture of the logo due to copyright act.
Figure 11. The main object in the selected logo
Based on our observation, we found out that the main
object in the logo is not properly arranged with the
location of the text or simply said that the object
proportion is inaccurate in the logo. Therefore, we
conducted the second task in the geometry analysis
where we did the GR analysis. Hence, to identify the
proportioning systems and regulating lines that
contribute to the cohesive composition of successful
logo design, during the geometric analysis we used
PhiMatrix Golden ratio Design and Analysis
software to assist us in analysis.
We selected the GR for the circle to become the
template for the geometric analysis as the object of
interest in the selected logo fit with the oval shape.
Therefore, when we match the object with the
template using the software, we derived the outcome
as shown in Figure 12. Figure 12. The geometric analysis of the object of interest
The image in the Figure 12 is a basic reference in the
shape of a circular plane displayed in the form of spiral
segmentation used to map the shape used in the logo.
The divine proportion was achieved by combining the
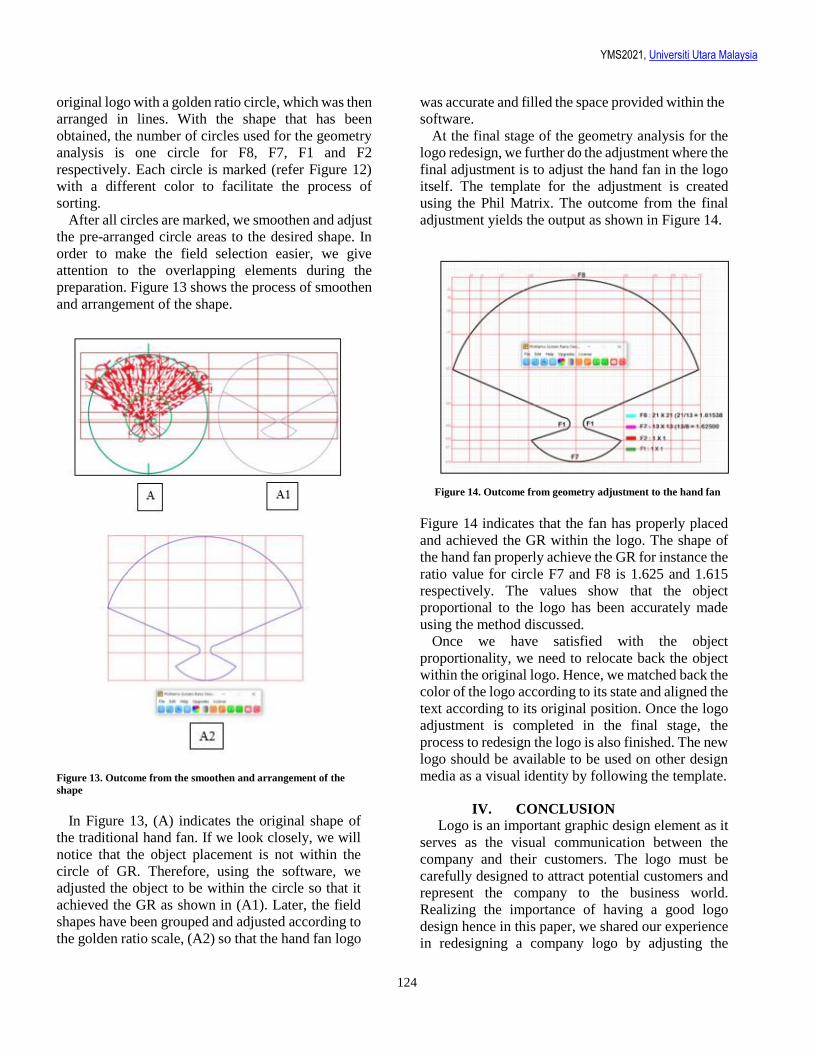
YMS2021, Universiti Utara Malaysia
124
original logo with a golden ratio circle, which was then
arranged in lines. With the shape that has been
obtained, the number of circles used for the geometry
analysis is one circle for F8, F7, F1 and F2
respectively. Each circle is marked (refer Figure 12)
with a different color to facilitate the process of
sorting.
After all circles are marked, we smoothen and adjust
the pre-arranged circle areas to the desired shape. In
order to make the field selection easier, we give
attention to the overlapping elements during the
preparation. Figure 13 shows the process of smoothen
and arrangement of the shape.
Figure 13. Outcome from the smoothen and arrangement of the
shape
In Figure 13, (A) indicates the original shape of
the traditional hand fan. If we look closely, we will
notice that the object placement is not within the
circle of GR. Therefore, using the software, we
adjusted the object to be within the circle so that it
achieved the GR as shown in (A1). Later, the field
shapes have been grouped and adjusted according to
the golden ratio scale, (A2) so that the hand fan logo
was accurate and filled the space provided within the
software.
At the final stage of the geometry analysis for the
logo redesign, we further do the adjustment where the
final adjustment is to adjust the hand fan in the logo
itself. The template for the adjustment is created
using the Phil Matrix. The outcome from the final
adjustment yields the output as shown in Figure 14.
Figure 14. Outcome from geometry adjustment to the hand fan
Figure 14 indicates that the fan has properly placed
and achieved the GR within the logo. The shape of
the hand fan properly achieve the GR for instance the
ratio value for circle F7 and F8 is 1.625 and 1.615
respectively. The values show that the object
proportional to the logo has been accurately made
using the method discussed.
Once we have satisfied with the object
proportionality, we need to relocate back the object
within the original logo. Hence, we matched back the
color of the logo according to its state and aligned the
text according to its original position. Once the logo
adjustment is completed in the final stage, the
process to redesign the logo is also finished. The new
logo should be available to be used on other design
media as a visual identity by following the template.
IV. CONCLUSION
Logo is an important graphic design element as it
serves as the visual communication between the
company and their customers. The logo must be
carefully designed to attract potential customers and
represent the company to the business world.
Realizing the importance of having a good logo
design hence in this paper, we shared our experience
in redesigning a company logo by adjusting the
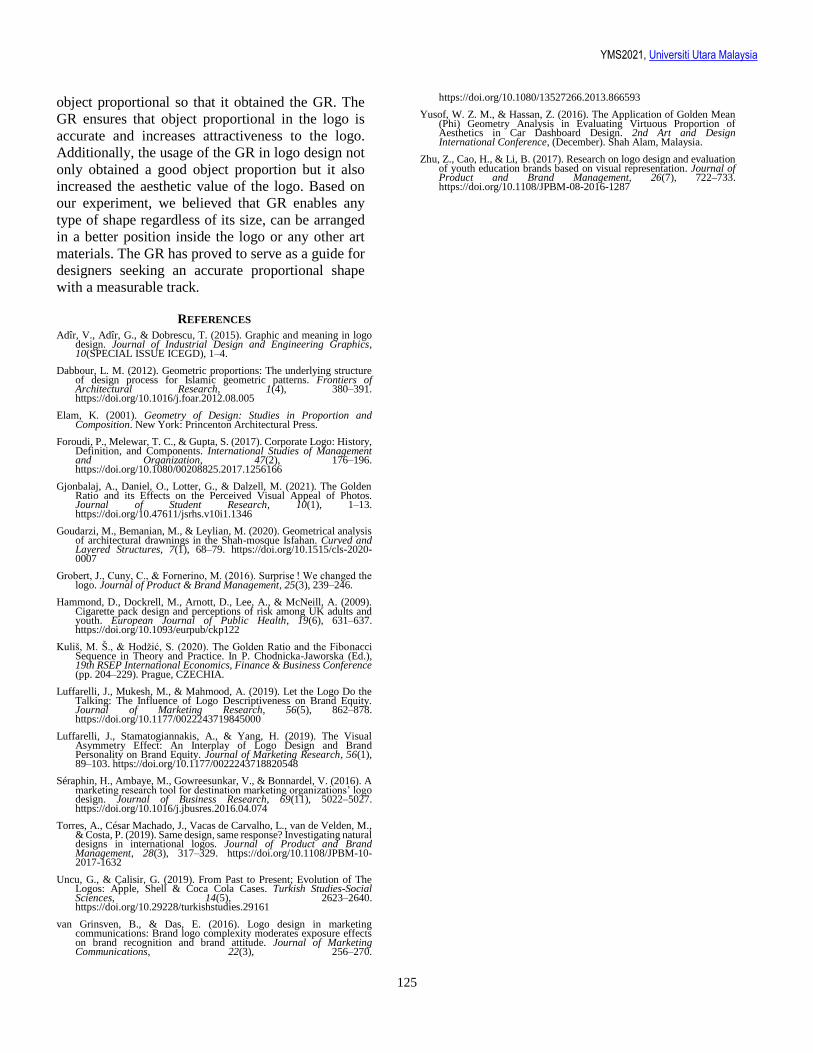
YMS2021, Universiti Utara Malaysia
125
object proportional so that it obtained the GR. The
GR ensures that object proportional in the logo is
accurate and increases attractiveness to the logo.
Additionally, the usage of the GR in logo design not
only obtained a good object proportion but it also
increased the aesthetic value of the logo. Based on
our experiment, we believed that GR enables any
type of shape regardless of its size, can be arranged
in a better position inside the logo or any other art
materials. The GR has proved to serve as a guide for
designers seeking an accurate proportional shape
with a measurable track.
REFERENCES
Adîr, V., Adîr, G., & Dobrescu, T. (2015). Graphic and meaning in logo design. Journal of Industrial Design and Engineering Graphics, 10(SPECIAL ISSUE ICEGD), 1–4.
Dabbour, L. M. (2012). Geometric proportions: The underlying structure of design process for Islamic geometric patterns. Frontiers of Architectural Research, 1(4), 380–391. https://doi.org/10.1016/j.foar.2012.08.005
Elam, K. (2001). Geometry of Design: Studies in Proportion and Composition. New York: Princenton Architectural Press.
Foroudi, P., Melewar, T. C., & Gupta, S. (2017). Corporate Logo: History, Definition, and Components. International Studies of Management and Organization, 47(2), 176–196. https://doi.org/10.1080/00208825.2017.1256166
Gjonbalaj, A., Daniel, O., Lotter, G., & Dalzell, M. (2021). The Golden Ratio and its Effects on the Perceived Visual Appeal of Photos. Journal of Student Research, 10(1), 1–13. https://doi.org/10.47611/jsrhs.v10i1.1346
Goudarzi, M., Bemanian, M., & Leylian, M. (2020). Geometrical analysis of architectural drawnings in the Shah-mosque Isfahan. Curved and Layered Structures, 7(1), 68–79. https://doi.org/10.1515/cls-2020-0007
Grobert, J., Cuny, C., & Fornerino, M. (2016). Surprise ! We changed the logo. Journal of Product & Brand Management, 25(3), 239–246.
Hammond, D., Dockrell, M., Arnott, D., Lee, A., & McNeill, A. (2009). Cigarette pack design and perceptions of risk among UK adults and youth. European Journal of Public Health, 19(6), 631–637. https://doi.org/10.1093/eurpub/ckp122
Kuliš, M. Š., & Hodžić, S. (2020). The Golden Ratio and the Fibonacci Sequence in Theory and Practice. In P. Chodnicka-Jaworska (Ed.), 19th RSEP International Economics, Finance & Business Conference (pp. 204–229). Prague, CZECHIA.
Luffarelli, J., Mukesh, M., & Mahmood, A. (2019). Let the Logo Do the Talking: The Influence of Logo Descriptiveness on Brand Equity. Journal of Marketing Research, 56(5), 862–878. https://doi.org/10.1177/0022243719845000
Luffarelli, J., Stamatogiannakis, A., & Yang, H. (2019). The Visual Asymmetry Effect: An Interplay of Logo Design and Brand Personality on Brand Equity. Journal of Marketing Research, 56(1), 89–103. https://doi.org/10.1177/0022243718820548
Séraphin, H., Ambaye, M., Gowreesunkar, V., & Bonnardel, V. (2016). A marketing research tool for destination marketing organizations’ logo design. Journal of Business Research, 69(11), 5022–5027. https://doi.org/10.1016/j.jbusres.2016.04.074
Torres, A., César Machado, J., Vacas de Carvalho, L., van de Velden, M., & Costa, P. (2019). Same design, same response? Investigating natural designs in international logos. Journal of Product and Brand Management, 28(3), 317–329. https://doi.org/10.1108/JPBM-10-2017-1632
Uncu, G., & Çalisir, G. (2019). From Past to Present; Evolution of The Logos: Apple, Shell & Coca Cola Cases. Turkish Studies-Social Sciences, 14(5), 2623–2640. https://doi.org/10.29228/turkishstudies.29161
van Grinsven, B., & Das, E. (2016). Logo design in marketing communications: Brand logo complexity moderates exposure effects on brand recognition and brand attitude. Journal of Marketing Communications, 22(3), 256–270.
https://doi.org/10.1080/13527266.2013.866593
Yusof, W. Z. M., & Hassan, Z. (2016). The Application of Golden Mean (Phi) Geometry Analysis in Evaluating Virtuous Proportion of Aesthetics in Car Dashboard Design. 2nd Art and Design International Conference, (December). Shah Alam, Malaysia.
Zhu, Z., Cao, H., & Li, B. (2017). Research on logo design and evaluation of youth education brands based on visual representation. Journal of Product and Brand Management, 26(7), 722–733. https://doi.org/10.1108/JPBM-08-2016-1287