
Diffusion tensor imaging in preclinical and presymptomatic carriers of familial Alzheimer's disease...
10
Diffusion tensor imaging in preclinical and presymptomatic carriers of familial Alzheimer’s disease mutations John M. Ringman, 1 Joseph O’Neill, 2 Daniel Geschwind, 1 Luis Medina, 1 Liana G. Apostolova, 1 Yaneth Rodriguez, 3 Barbara Schaffer, 1 Arousiak Varpetian, 4 Benjamin Tseng, 5 Freddy Ortiz, 1,6,7 Jaime Fitten, 1,6,7 Jeffrey L. Cummings 1,2 and George Bartzokis 1,8 1 Alzheimer’s Disease Research Center, UCLA Department of Neurology, Los Angeles, CA, 2 Psychiatry and Biobehavioral Science, UCLA, Los Angeles, CA, USA, 3 Laboratory of Experimental Psychology, National Institute of Neurology and Neurosurgery, Mexico City, Mexico, 4 Department of Neurology, Keck School of Medicine, USC, Rancho Los Amigos National Rehabilitation Center, Downey, CA, 5 Ahmanson-Lovelace Brain Mapping Center, UCLA, Los Angeles, CA, 6 Neuropsychiatry Research Memory Clinic, Olive View-UCLA Medical Center, Sylmar, CA, USA, 7 Greater Los Angeles Veterans Affairs Healthcare System, Sepulveda Campus and 8 Department of Psychiatry, VA Greater Los Angeles Healthcare System, West Los Angeles, California, USA Correspondence to: John M. Ringman, MD, Assistant Professor, UCLA Department of Neurology, Alzheimer’s Disease Research Center, 10911 Weyburn Ave, Suite 200, Los Angeles, CA 90095 -7226, USA E-mail: [email protected] Measures are needed that identify persons that will develop Alzheimer’s disease in order to target them for preventative interventions. There is evidence from animal, pathological and imaging studies that disruption of white matter occurs in the course of Alzheimer’s disease and may be an early event. Prior studies have suggested that late-myelinating regions or white matter connecting limbic structures are particularly susceptible to degra- dation. Persons destined to develop the disease by virtue of fully penetrant genetic alterations (familial Alzheimer’s disease or FAD) provide a model in which early and even presymptomatic changes of the disease may be identified. In this study we performed diffusion tensor imaging (DTI) on 2 demented and 21 subjects at-risk for inheriting an FAD mutation.We compared global and localized fractional anisotropy (FA) measures in white matter between FAD mutation carriers and non-carriers in the preclinical (clinical dementia rating 5 1, n ¼ 20) and presymptomatic (clinical dementia rating ¼ 0, n ¼15) stages of the disease. There were no significant differences between mutation carriers and non-carriers with regard to absolute age, age relative to the typical age of disease diagnosis in their family, gender or Mini-Mental Status Examination Score. Among preclinical FAD mutation carriers ( n ¼12), mean whole brain white-matter FA (P ¼ 0.045), FA of the columns of the fornix (P ¼ 0.012), area of the perforant pathways bilaterally (right side: P ¼ 0.028, left side: P ¼ 0.027) and left orbitofrontal lobe (P ¼ 0.024) were decreased relative to that of non-carriers ( n ¼ 8).We also found that FA in the columns of the fornix (P ¼ 0.008) and left orbitofrontal lobe white matter (P ¼ 0.045) were decreased in the eight presymptomatic mutation carriers compared to seven non-carriers. Logistic regression demonstrated that FA of the columns of the fornix was a better predictor of mutation status than was cross-sectional area of the fornix, global mean white- matter FA and left frontal lobe white-matter FA. In a linear regression analysis, white-matter volume (P ¼ 0.002), hippocampal volume (P ¼ 0.023) and mutation status (P ¼ 0.032) significantly predicted fornix FA.We conclude that FA is decreased in the white matter in preclinical and even presymptomatic FAD mutation carriers, particularly in the late-myelinating tracts connecting limbic structures. Decreased FA in of the columns of the fornix is particularly robust in early FAD and may provide a biomarker for early disease in sporadic Alzheimer’s disease. Keywords: familial Alzheimer’s disease; presymptomatic; diffusion tensor imaging; fractional anisotropy; Presenilin-1; amyloid precursor protein; white matter; fornix; biomarker doi:10.1093/brain/awm102 Brain (2007), 130, 1767^1776 ß The Author (2007). Published by Oxford University Press on behalf of the Guarantors of Brain. All rights reserved. For Permissions, please email: [email protected] by guest on September 3, 2016 http://brain.oxfordjournals.org/ Downloaded from
-
Upload
independent -
Category
Documents
-
view
2 -
download
0
Transcript of Diffusion tensor imaging in preclinical and presymptomatic carriers of familial Alzheimer's disease...

Diffusion tensor imaging in preclinical andpresymptomatic carriers of familial Alzheimer’sdisease mutationsJohn M. Ringman,1 Joseph O’Neill,2 Daniel Geschwind,1 Luis Medina,1 Liana G. Apostolova,1
Yaneth Rodriguez,3 Barbara Schaffer,1 Arousiak Varpetian,4 BenjaminTseng,5 Freddy Ortiz,1,6,7
Jaime Fitten,1,6,7 Jeffrey L. Cummings1,2 and George Bartzokis1,8
1Alzheimer’s Disease Research Center, UCLA Department of Neurology, Los Angeles, CA, 2Psychiatry and BiobehavioralScience, UCLA, Los Angeles, CA, USA, 3Laboratory of Experimental Psychology, National Institute of Neurology andNeurosurgery, Mexico City, Mexico, 4Department of Neurology, Keck School of Medicine,USC, Rancho Los Amigos NationalRehabilitation Center, Downey, CA, 5Ahmanson-Lovelace Brain Mapping Center, UCLA, Los Angeles, CA, 6NeuropsychiatryResearch Memory Clinic, Olive View-UCLA Medical Center, Sylmar, CA, USA, 7Greater Los Angeles Veterans AffairsHealthcare System, Sepulveda Campus and 8Department of Psychiatry,VA Greater Los Angeles Healthcare System,West Los Angeles, California, USA
Correspondence to: John M. Ringman, MD, Assistant Professor, UCLA Department of Neurology, Alzheimer’s DiseaseResearch Center, 10911Weyburn Ave, Suite 200, Los Angeles, CA 90095-7226, USAE-mail: [email protected]
Measures are needed that identify persons that will develop Alzheimer’s disease in order to target them forpreventative interventions. There is evidence from animal, pathological and imaging studies that disruption ofwhitematter occurs in the course of Alzheimer’s disease andmay be an early event. Prior studies have suggestedthat late-myelinating regions or whitematter connecting limbic structures are particularly susceptible to degra-dation. Persons destined to develop the disease by virtue of fully penetrant genetic alterations (familialAlzheimer’s disease or FAD) provide a model in which early and even presymptomatic changes of the diseasemay be identified. In this study we performed diffusion tensor imaging (DTI) on 2 demented and 21 subjectsat-risk for inheriting an FADmutation.We compared global and localized fractional anisotropy (FA) measures inwhite matter between FAD mutation carriers and non-carriers in the preclinical (clinical dementia rating51,n¼ 20) and presymptomatic (clinical dementia rating¼ 0, n¼15) stages of the disease.There were no significantdifferences between mutation carriers and non-carriers with regard to absolute age, age relative to the typicalage of disease diagnosis in their family, gender or Mini-Mental Status Examination Score. Among preclinicalFAD mutation carriers (n¼12), mean whole brain white-matter FA (P¼ 0.045), FA of the columns of the fornix(P¼ 0.012), area of theperforantpathwaysbilaterally (right side:P¼ 0.028, left side:P¼ 0.027) andleftorbitofrontallobe (P¼ 0.024) were decreasedrelative to that of non-carriers (n¼ 8).We also found that FA in the columns of thefornix (P¼ 0.008) andleft orbitofrontal lobewhitematter (P¼ 0.045) were decreasedin the eightpresymptomaticmutation carriers compared to seven non-carriers. Logistic regression demonstrated that FA of the columns ofthe fornixwasabetterpredictorofmutation statusthanwascross-sectionalareaofthe fornix, globalmeanwhite-matter FA and left frontal lobewhite-matter FA. In a linear regression analysis, white-matter volume (P¼ 0.002),hippocampalvolume (P¼ 0.023) andmutation status (P¼ 0.032) significantlypredicted fornix FA.We conclude thatFA is decreased in the white matter in preclinical and even presymptomatic FADmutation carriers, particularlyin the late-myelinating tracts connecting limbic structures. Decreased FA in of the columns of the fornix isparticularly robust in early FAD andmay provide a biomarker for early disease in sporadic Alzheimer’s disease.
Keywords: familial Alzheimer’s disease; presymptomatic; diffusion tensor imaging; fractional anisotropy; Presenilin-1;amyloid precursor protein; white matter; fornix; biomarker
doi:10.1093/brain/awm102 Brain (2007), 130, 1767^1776
� The Author (2007). Published by Oxford University Press on behalf of the Guarantors of Brain. All rights reserved. For Permissions, please email: [email protected]
by guest on September 3, 2016
http://brain.oxfordjournals.org/D
ownloaded from

Abbreviations: APP¼ amyloid precursor protein; CDR¼ clinical dementia rating; DTI¼diffusion tensor imaging;DWI¼diffusion-weighted imaging; FAD¼ familial Alzheimer’s disease; MCI¼mild cognitive impairment
Received December 15, 2006. Revised March 26, 2007. Accepted April 5, 2007. Advance Access publication May 23, 2007
IntroductionDisruption of white matter in Alzheimer’s disease has beendemonstrated in studies of post-mortem human brain(Chia et al., 1984; Englund et al., 1988), in animal models(Pak et al., 2003; Wirths et al., 2006) and in vivo in humans(Bartzokis et al., 2003, 2004). The electron microscopicappearance of white matter in Alzheimer’s disease wasdescribed in 1964 (Terry et al., 1964). In this report, thenormal lamellar structure of myelin was noted to be lost inplaces despite relatively normal-appearing axoplasm. It hasbeen argued that such disruption of white matter reflectsthe susceptibility of late-myelinating regions to the effectsof aging and Alzheimer’s disease, and that these changes areprimary in causing the clinical manifestations of the disease(Bartzokis, 2004). Whether a primary or secondary event inthe aetiology of Alzheimer’s disease, a comprehensiveexplanation of the disease must include an understandingof these changes.Diffusion-weighted imaging (DWI) takes advantage of the
ability of MRI to measure the direction and magnitude ofproton diffusion. Various measures of water proton diffusioncan be obtained using DWI including the overall magnitudeof diffusion (diffusivity) as well as the tendency with whichdiffusion tends to be directionally dependent. This latterproperty is measured by calculating a diffusion tensorfor each voxel using diffusion tensor imaging or DTI(Basser et al., 1994). As diffusion in white matter tendsto be parallel to the direction of fibre tracts and disruption ofthese tracks can reduce this tendency, DTI provides a measureof white-matter integrity. Fractional anisotropy (FA) isone index of the tendency for water diffusion to occur in asingle direction within a voxel. FA is measured on a scalefrom 0 (random diffusion) to 1 (highly linear diffusion).Previous studies of changes in white-matter integrity in
Alzheimer’s disease employing DTI have variably shownrelatively increased mean diffusivity and decreased FA inanterior (Bozzali et al., 2002) or posterior (Medina et al.,2006) regions of white matter. Other DTI studies haveattempted to elucidate the earliest point at which suchchanges can be detected by focusing on persons in theearliest clinical stages of the disease (mild cognitiveimpairment or MCI) or persons at genetic risk forAlzheimer’s disease by virtue of carrying an ApoE e4allele. A recent study (Rose et al., 2006) found increaseddiffusivity in the entorhinal and parieto-occipital cortices aswell as other regions and decreased FA in the limbicparahippocampal sub-gyral white matter in persons withMCI compared to controls. Another study found that meandiffusivity in the hippocampus in persons with the amnesticsub-type of MCI predicted future progression to dementia(Kantarci et al., 2005). The ApoE e4 allele, which accounts
for about 13% of ApoE alleles in the non-demented elderlycaucasian population (Tang et al., 1998), is the mostimportant known genetic risk factor for the development oflate-onset Alzheimer’s disease. A DTI study demonstratedthat non-demented carriers of the ApoE e4 allele had lowerFA in the corpus callosum (particularly in its posteriorportion) and in the left posterior hippocampus relative topersons not carrying this allele (Persson et al., 2006).
Though studying persons with MCI and those carryingthe ApoE e4 allele increase our ability to study the earlieststages of Alzheimer’s disease, these factors are imperfectpredictors of the future development of the disease.Identification of the earliest changes occurring inAlzheimer’s disease therefore remains a challenge. Threegenes have been identified, alteration of which causesa nearly 100% penetrant, autosomal dominantly inheritedform of Alzheimer’s disease. Though rare, the study ofpersons at-risk for inheriting this form of FAD due tomutations in the Presenilin-1 (PS1) or amyloid precursorprotein (APP) genes provides a model in which we can useDTI to study white matter in persons in whom the futuredevelopment of Alzheimer’s disease can be reliably predicted.In the current study, we used DTI to quantify white-matterintegrity in persons destined to develop Alzheimer’s diseaseby virtue of inheriting mutations causing FAD. Wehypothesized that FAD mutation carriers would havedecreased FA in white-matter tracts connecting limbicstructures (the cingula and columns of the fornix) and inlate-myelinating regions (frontal lobe white matter and genuof the corpus callosum) as opposed to early-myelinatingregions (inferior splenium of the corpus callosumand corticospinal tracts). We compared mean overall white-matter FA between preclinical (some cognitive impair-ment present but not demented) and presymptomatic(without identifiable cognitive deficits) FAD mutationcarriers and non-carriers as well as FA in these specific areas.
Material and MethodsPopulationTwenty-three persons established to have (n¼ 2) or be at-risk for(n¼ 21) known pathogenic PS1 (n¼ 19) or APP (n¼ 4)mutations received in-depth clinical, cognitive and imagingassessments. The Clinical Dementia Rating Scale (CDR) wasperformed by the PI and the Mini-Mental Status Examination(MMSE) by a research assistant. Both investigators performedthese assessments blind to subjects’ genetic status in 20 subjects.Mutation status had been clinically established in the twodemented patients and one presymptomatic at-risk patient.At-risk persons who tested negative for the FAD mutation presentin their family served as controls in this study. All subjects,or their proxies, signed written, informed consent. All studyprocedures were approved by the Institutional Review Boards at
1768 Brain (2007), 130, 1767^1776 J. M. Ringman et al.
by guest on September 3, 2016
http://brain.oxfordjournals.org/D
ownloaded from
UCLA and the National Institute of Neurology and Neurosurgeryin Mexico City.
Magnetic resonance imagingAll images were obtained on the same 1.5 T Siemens SonataMRI scanner. Four immediately sequential, six-direction diffu-sion-weighted whole-brain volumes were acquired on all subjectsin the plane of the AC–PC line using Echo-Planar Imaging (EPI)with a TR of 6 s, TE of 78ms. B-values were 0 and 1000 s/mm2.Voxel size was 3 � 3 � 3mm3. FA maps were then generatedusing the FMRIB’s Diffusion Toolbox (FDT) in FSL software(version 3.2) (Behrens et al., 2003; Smith et al., 2004). The fourvolumes for each subject were co-registered using FMRIB’s LinearImage Registration Tool (FLIRT) to correct for any shift in headposition between acquisitions (Jenkinson and Smith, 2001). Thesefour volumes were then averaged together. The averagedB¼ 1000 s/mm2 volume generated six subvolumes, each represent-ing one of the six diffusion directions. These subvolumes togetherwith the B¼ 0 (non-diffusion weighted) volume were concate-nated into seven volumes in a single file. Eddy current correctionwas then applied, also using FDT. A diffusion tensor model was fitat each voxel using FDTs DTIFIT, generating fractional anisotropy(FA) maps. Two types of analyses were performed on these FAmaps; global and region-of-interest (ROI) analyses of selectedareas in white matter.All subjects also underwent structural MRI in the same session
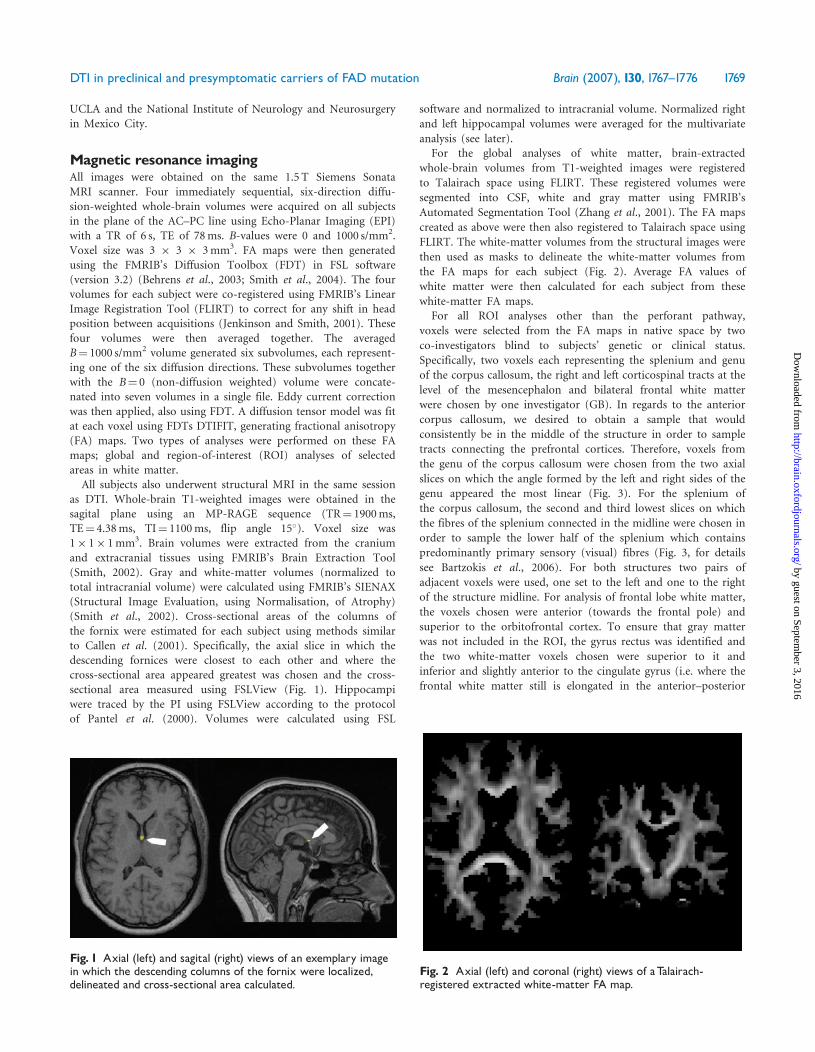
as DTI. Whole-brain T1-weighted images were obtained in thesagital plane using an MP-RAGE sequence (TR¼ 1900ms,TE¼ 4.38ms, TI¼ 1100ms, flip angle 15�). Voxel size was1� 1� 1mm3. Brain volumes were extracted from the craniumand extracranial tissues using FMRIB’s Brain Extraction Tool(Smith, 2002). Gray and white-matter volumes (normalized tototal intracranial volume) were calculated using FMRIB’s SIENAX(Structural Image Evaluation, using Normalisation, of Atrophy)(Smith et al., 2002). Cross-sectional areas of the columns ofthe fornix were estimated for each subject using methods similarto Callen et al. (2001). Specifically, the axial slice in which thedescending fornices were closest to each other and where thecross-sectional area appeared greatest was chosen and the cross-sectional area measured using FSLView (Fig. 1). Hippocampiwere traced by the PI using FSLView according to the protocolof Pantel et al. (2000). Volumes were calculated using FSL
software and normalized to intracranial volume. Normalized right
and left hippocampal volumes were averaged for the multivariate
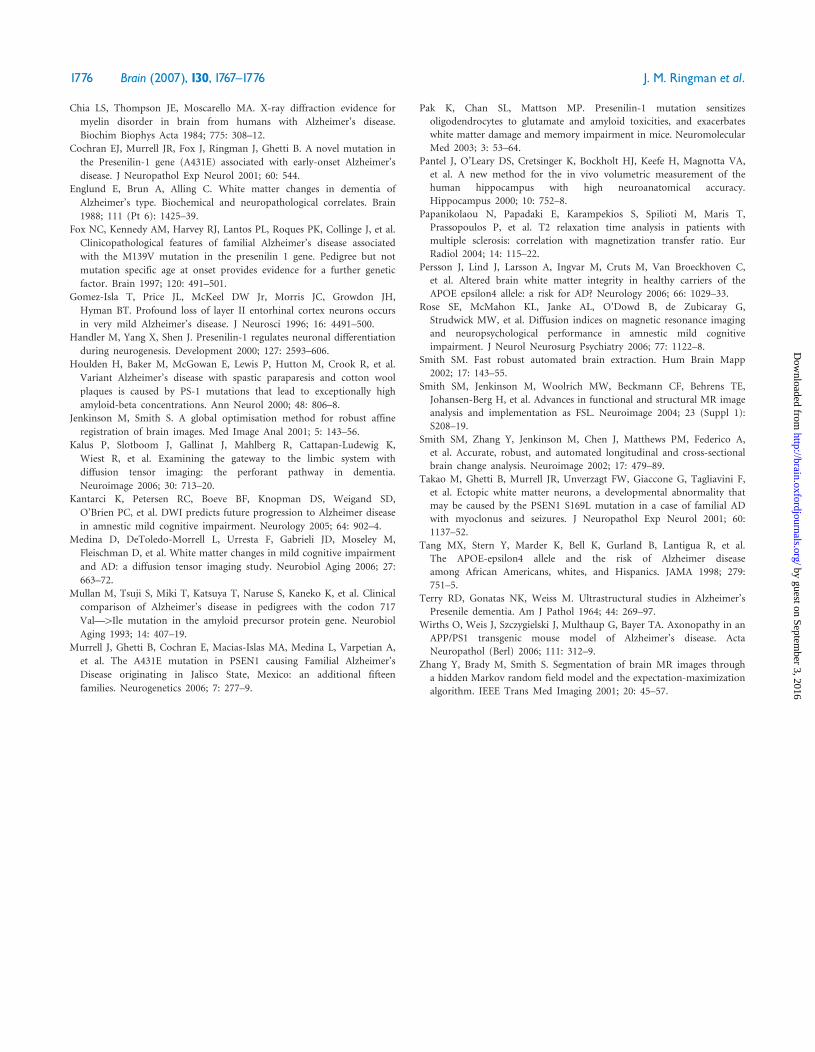
analysis (see later).For the global analyses of white matter, brain-extracted
whole-brain volumes from T1-weighted images were registered
to Talairach space using FLIRT. These registered volumes were
segmented into CSF, white and gray matter using FMRIB’s
Automated Segmentation Tool (Zhang et al., 2001). The FA maps
created as above were then also registered to Talairach space using
FLIRT. The white-matter volumes from the structural images were
then used as masks to delineate the white-matter volumes from
the FA maps for each subject (Fig. 2). Average FA values of
white matter were then calculated for each subject from these
white-matter FA maps.For all ROI analyses other than the perforant pathway,
voxels were selected from the FA maps in native space by two
co-investigators blind to subjects’ genetic or clinical status.
Specifically, two voxels each representing the splenium and genu
of the corpus callosum, the right and left corticospinal tracts at the
level of the mesencephalon and bilateral frontal white matter
were chosen by one investigator (GB). In regards to the anterior
corpus callosum, we desired to obtain a sample that would
consistently be in the middle of the structure in order to sample
tracts connecting the prefrontal cortices. Therefore, voxels from
the genu of the corpus callosum were chosen from the two axial
slices on which the angle formed by the left and right sides of the
genu appeared the most linear (Fig. 3). For the splenium of
the corpus callosum, the second and third lowest slices on which
the fibres of the splenium connected in the midline were chosen in
order to sample the lower half of the splenium which contains
predominantly primary sensory (visual) fibres (Fig. 3, for details
see Bartzokis et al., 2006). For both structures two pairs of
adjacent voxels were used, one set to the left and one to the right
of the structure midline. For analysis of frontal lobe white matter,
the voxels chosen were anterior (towards the frontal pole) and
superior to the orbitofrontal cortex. To ensure that gray matter
was not included in the ROI, the gyrus rectus was identified and
the two white-matter voxels chosen were superior to it and
inferior and slightly anterior to the cingulate gyrus (i.e. where the
frontal white matter still is elongated in the anterior–posterior
Fig. 1 Axial (left) and sagital (right) views of an exemplary imagein which the descending columns of the fornix were localized,delineated and cross-sectional area calculated.
Fig. 2 Axial (left) and coronal (right) views of aTalairach-registered extracted white-matter FA map.
DTI in preclinical and presymptomatic carriers of FAD mutation Brain (2007), 130, 1767^1776 1769
by guest on September 3, 2016
http://brain.oxfordjournals.org/D
ownloaded from

direction, Fig. 4). For each hemisphere, the averages of
the FA values of the two voxels in the splenium, genu and
inferior frontal lobes were taken as representative for the
respective region.
The brightest voxel corresponding to the body of the fornices,the right and left cingulum bundle and the area of the perforantpathway were chosen by another investigator (LA). Orthogonalviews of the FA maps in native space were employed to pick thebrightest voxel corresponding to the descending columns of thefornix (Fig. 5). Again in native space, FA colour maps in whichthe directionality of diffusion is colour-coded were generated andused to facilitate the selection of posterior cingulum voxels.Representative right and left posterior cingulum voxels werechosen as voxels having blue colour (i.e. preponderence ofsuperior–inferior diffusion) located behind the corpus callosum(identified as a strip of red colour, i.e. preponderance of right–leftdiffusion). To define FA in the area of the perforant pathways,FA maps and T1-weighted images were co-registered in Talairachspace. These images were superimposed and for each subject thesagital slice where the hippocampus was seen in its full length wasused to select voxels in the underlying region of the perforantpathway. Two voxels were chosen on each side: the brightest FAvoxel underlying the head of the hippocampus (e.g. it’s anteriorthird) and the brightest voxel underlying the anterior part of thebody of the hippocampus (or it’s middle third, Fig. 6). These werethen averaged to provide the value for that side.
Genetic testingSubjects underwent genetic testing for the FAD mutation forwhich they were known to be at-risk. They were informed theywould be tested but in the context of the research protocol wouldnot be told the result. The option of revealing genetic testingthrough a genetic counselor outside of the study was offered.Blood samples were coded according to a unique identifier andforwarded to the genetics laboratory. DNA was extracted andApoE genotyping were performed using standard techniques.The presence of the A431E (number at risk¼ 11) and L235V(n¼ 7) substitutions in PSEN1 were assessed using RFLP analyses.The presence of the G206A substitution in PSEN1 (n¼ 1) and
Fig. 4 Two contiguous voxels were chosen in the inferior frontalwhite matter where it is elongated in the anterior^posteriordirection in a slice superior to the orbitofrontal cortex and inferiorand slightly anterior to the cingulate gyrus.
Fig. 5 Axial view of an exemplary FA map demonstrating how thebrightest voxel corresponding to the descending columns of thefornix was chosen.
Fig. 3 Two contiguous corpus callosum voxels were chosen onboth sides of the midline in the horizontal planes depicted byarrows. The plane of the genu (right) was defined by its widestpart, where axons connecting the prefrontal cortices cross.The plane of the splenium was below its widest part, where axonsconnecting primary visual cortex cross.
1770 Brain (2007), 130, 1767^1776 J. M. Ringman et al.
by guest on September 3, 2016
http://brain.oxfordjournals.org/D
ownloaded from

the V717I substitution in APP (n¼ 4) was assessed directly with
bi-directional sequencing.
Statistical analysesSubjects were categorized as either demented (CDR total
scores �1), ‘preclinical’ (CDR scores 51) or ‘presymptomatic’
(CDR scores¼ 0). Within families harbouring PS1 and APP
mutations, the age of disease onset tends to be fairly consistent
(Fox et al., 1997). Therefore, in order to estimate the subjects’ age
relative to the typical age of onset in their families, an ‘adjusted
age’ or number of years prior to the typical age of dementia
diagnosis in their families was calculated.Two-tailed independent sample t-tests were performed com-
paring FA measures, brain volume defined as percent of total
intracranial volume, normalized grey and white-matter volumes,cross-sectional area of the columns of the fornix, mean normalized
volumes of the right and left hippocampi, MMSE score and
adjusted age between pre-clinical FAD mutation carriers (MCs)
and non-carriers (NCs). All t-tests were performed twice; once for
preclinical subjects and once for presymptomatic subjects.In order to determine which variables best predicted FAD
mutation status in presymptomatic subjects, a logistic regression
analysis was performed with mutation status as the dependent
variable. Those variables that differed between mutation carriers
and non-carriers with total CDR scores of 0 by t-test at the 0.05
significance level were entered as independent variables.To establish what the strongest determinants of fornix FA were,
linear regression analyses were performed with fornix FA as the
dependent variable and fornix area, normalized white and
gray-matter volumes, normalized mean hippocampal volume andFAD mutation status as predictor variables. Data from all
23 subjects were included in the logistic and linear regression
analyses. Because of the relatively low numbers of subjects
available for this type of study, P-values of 0.05 were used
throughout without adjustments for multiple comparisons.
All analyses were performed using the Statistical Package for the
Social Sciences, Version 11.0.2.
ResultsFourteen subjects were FAD MCs and nine were NCs(Fig. 7). Of the 14 FAD MCs, two were demented (CDRscores of 2 and 3). All 23 subjects were female except forone NC and two MCs (1 CDR¼ 0, 1 CDR¼ 0.5). One NCwas approximately 18 years older than the typical age ofdiagnosis in her family and therefore was excluded from the
Fig. 7 Chart indicating the break-down of subjects by clinical andFAD mutation status. CDR¼Clinical Dementia Rating scale.
Fig. 6 Sagital view of superimposed Talairach-registeredT1-weighted image and FA map depicting how voxels in the areof the perforant pathway were selected (see text for details).
Table 1 Demographic data for the 12 preclinical(CDR total score50.5) FAD MCs (mutation carriers) and8 non-carriers (NCs)
FAD MCs(n¼12)
FAD NCs(n¼ 8)
P-values
Mean age in years (SD) 35 (6.4) 36 (6.2) 0.64Mean adjusted age (SD) �11 (6.8) �12 (7.2) 0.73Mean MMSE score (range) 27.1 (21^30) 28.1 (24^29) 0.40Gender (# female) 10 7 n.s.
Note: MMSE¼Mini-Mental Status Examination
Table 2 Demographic data for the eight presymptomatic(CDR total score¼ 0) FAD MCs (mutation carriers) andseven non-carriers (NCs)
FAD MCs(n¼ 8)
FAD NCs(n¼ 7)
P-values
Mean age in years (SD) 32 (6.4) 36 (6.6) 0.34Mean adjusted age (SD) �13 (6.0) �12 (7.7) 0.76Mean MMSE score (range) 28.8 (28^30) 28 (24^29) 0.29Gender (# female) 7 6 n.s.
Note: MMSE¼Mini-Mental Status Examination.
DTI in preclinical and presymptomatic carriers of FAD mutation Brain (2007), 130, 1767^1776 1771
by guest on September 3, 2016
http://brain.oxfordjournals.org/D
ownloaded from

t-tests comparing preclinical and presymptomatic subjectsas she was no longer ‘at-risk’. Of the remaining 20 pre-clinical at-risk subjects, 12 were MCs (CDR¼ 0.5 in 4, 0 in8) and 8 were NCs (CDR¼ 0.5 in 1, 0 in 7). Therefore,15 subjects (8 MCs and 7 NCs) were presymptomatic
(CDR¼ 0). There were no significant differences in age,adjusted age or MMSE score between the 12 preclinicalMCs and 9 NCs (Table 1) nor between the 8 presymptom-atic MCs and 7 NCs (Table 2).
There was no significant difference between MCs andNCs in regards to overall brain size, white and gray-mattervolumes or mean hippocampal volumes in either pre-clinical or presymptomatic subjects. Cross-sectional area ofthe fornix was smaller in MCs in both the preclinical(16.4 versus 20.5mm2, P¼ 0.043, Table 3) and presymptom-atic subjects (16.6 versus 21.3mm2, P¼ 0.045, Table 4,Fig. 8). In preclinical and presymptomatic subjects, meanFA values of MCs were numerically lower in all ROIs exceptfor the inferior splenium of the corpus callosum and theright and left corticospinal tracts (Tables 3 and 4).Mean overall FA was statistically lower in the preclinical(0.30 versus 0.32, P¼ 0.045) but not the presymptomaticsubjects (P¼ 0.070). FA in the columns of the fornix wasalso lower in preclinical (0.53 versus 0.66, P¼ 0.012)and presymptomatic (0.50 versus 0.66, P¼ 0.008, Fig. 4)subjects. In the area of the perforant path, FA was lowerbilaterally in preclinical MCs (0.28 versus 0.36, P¼ 0.028 onthe right side, 0.29 versus 0.36, P¼ 0.027 on the left side).FA was non-significantly decreased in the perforant path-way in presymptomatic MCs (P-values of 0.067 on rightand 0.076 on the left). FA in MCs was also lower in thewhite matter of the left frontal lobe (0.50 versus 0.56,P¼ 0.024 for preclinical subjects, 0.49 versus 0.56, P¼ 0.045for presymptomatic subjects).
In the logistic regression analysis, FA of the fornix wasthe best predictor of mutation status (P¼ 0.005), followedby left frontal white FA (P¼ 0.007), and cross-sectionalarea of the fornix (P¼ 0.031). In the linear regression model,white-matter volume was the greatest predictor of fornix FA
Table 3 MRI variables in the 12 preclinical MCs versus8 NCs
FAD MCs(n¼12)
FAD NCs(n¼ 8)
P-values
Brain size as percent ofintracranial volume
86% 88% 0.125
Gray-matter vol (mm3) 835 646 844 891 0.752White-matter vol (mm3) 776296 803328 0.285Mean R and L hippocampalvolume (mm3)
3283 3135 0.408
Fornix area, mm2 (SD) 16.4 (4.2) 20.5 (4.0) 0.043Mean whole brainWMFA (SD)
0.30 (0.02) 0.32 (0.02) 0.045
FA fornix (SD) 0.53 (0.09) 0.66 (0.11) 0.012FA R cingulum (SD) 0.49 (0.08) 0.56 (0.07) 0.065FA L cingulum (SD) 0.49 (0.07) 0.52 (0.08) 0.262FA R perforant patharea (SD)
0.28 (0.03) 0.36 (0.08) 0.028
FA L perforant patharea (SD)
0.29 (0.06) 0.36 (0.06) 0.027
FA genu of c.c. (SD) 0.77 (0.06) 0.82 (0.05) 0.089FA splenium of c.c. (SD) 0.83 (0.09) 0.81 (0.10) 0.551FA R frontal white matter (SD) 0.51 (0.06) 0.54 (0.07) 0.389FA L frontal whitematter (SD)
0.50 (0.05) 0.56 (0.06) 0.024
FA R CS tract (SD) 0.70 (0.07) 0.69 (0.11) 0.861FA L CS tract (SD) 0.72 (0.07) 0.70 (0.08) 0.622
Note: FA¼ fractional anisotropy, R¼ right, L¼ left, c.c.¼ corpuscallosum,WM¼white matter, CS¼ corticospinal. P-valuesrepresent results of two-tailed independent sample t-tests.Valuesthat are different at the P50.05 level are shown in bold italics.
Table 4 MRI variables in the 8 presymptomatic MCs versus 7 NCs
FAD MCs (n¼ 8) FAD NCs (n¼ 7) P-values
Brain size as percent of intracranial volume 87% 88% 0.257Gray-matter vol, mm3 855311 839705 0.631White-matter vol, mm3 767920 811023 0.182Mean R and L hippocampal volume, mm3 3307 3103 0.360Fornix area, mm2 (SD) 16.6 (4.4) 21.3 (3.5) 0.045MeanWhole brainWM FA (SD) 0.30 (0.02) 0.32 (0.02) 0.070FA fornix (SD) 0.50 (0.06) 0.66 (0.12) 0.008FA R cingulum (SD) 0.50 (0.09) 0.56 (0.08) 0.195FA L cingulum (SD) 0.49 (0.07) 0.54 (0.07) 0.195FA R perforant pathway area (SD) 0.29 (0.03) 0.36 (0.09) 0.067FA L perforant pathway area (SD) 0.29 (0.07) 0.36 (0.07) 0.076FA genu of c.c. (SD) 0.77 (0.07) 0.82 (0.05) 0.116FA splenium of c.c. (SD) 0.84 (0.08) 0.81 (0.10) 0.554FA R frontal white matter (SD) 0.52 (0.04) 0.53 (0.07) 0.763FA L frontal white matter (SD) 0.49 (0.05) 0.56 (0.06) 0.045FA R CS tract (SD) 0.72 (0.05) 0.71 (0.11) 0.780FA L CS tract (SD) 0.75 (0.06) 0.69 (0.09) 0.201
Note: FA¼ fractional anisotropy, R¼ right, L¼ left, c.c.¼ corpus callosum,WM¼white matter, CS¼ corticospinal. P-values representresults of two-tailed independent sample t-tests.Values that are different at the P50.05 level are shown in bold italics.
1772 Brain (2007), 130, 1767^1776 J. M. Ringman et al.
by guest on September 3, 2016
http://brain.oxfordjournals.org/D
ownloaded from

(P¼ 0.002), followed by hippocampal volume (P¼ 0.023),and FAD mutation status (P¼ 0.032). Cross-sectional areaof the fornix (P¼ 0.127) and gray-matter volume(P¼ 0.339) were not significant predictors of fornix FA.
DiscussionIn the current study, we found that FA is reduced in specificareas of white matter in persons carrying FAD mutationsprior to the development of symptoms of dementia.The global analysis suggests that average whole-brain white-matter FA is reduced in pre-clinical FAD mutation carriers,and the ROI analyses demonstrated that this effect wasevident in the fornix and white matter underlying theorbitofrontal region during the presymptomatic stage of theillness. This effect was not present in the early-myelinatingregions of splenium of the corpus callosum or thecorticospinal tracts at the level of the midbrain. This isconsistent with prior studies demonstrating that limbicprojections and pathways connecting the frontal lobes arepreferentially affected in the course of Alzheimer’s disease(Braak and Braak, 1996; Bartzokis et al., 2004). The greatestreduction we found using our methods was in the columnsof the fornix and decreased FA in the fornix was a moresensitive measure for predicting FAD mutation status inpresymptomatic persons than were cross-sectional area ofthe fornix, overall brain size, white and grey-mattervolumes or hippocampal volumes. Though these measureswere not different between preclinical or presymptomaticFAD MCs and NCs, the observation in the linear regressionanalysis that overall white-matter volume was highly relatedto fornix FA suggests that low FA in this structuremay represent an earlier manifestation of white-matterdeterioration than can be detected by comparison ofvolumes.Neuronal death occurring secondary to excessive produc-
tion or decreased degradation of toxic forms of beta-amyloidis the most widely accepted aetiological mechanism forAlzheimer’s disease. Nonetheless, multiple studies in both
animal models and humans have demonstrated that theintegrity of white matter is affected during the courseof Alzheimer’s disease and indeed can be an early event.Whether myelin pathology is primary or if axonal disruptiondue to neuronal loss is causative is uncertain but it is clearthat changes in white matter occur in Alzheimer’s diseaseand they can be measured using various techniques.
In previous investigations of living subjects, this has beenstudied by measuring white-matter volumes (Bartzokis et al.,2001), transverse relaxation rates (Bartzokis et al., 2003)and by employing DTI (Medina et al., 2006). The watercontent of white matter increases as its myelin componentdecreases in various pathological states. The transverserelaxation rate (R2) provides an index of the water contentof a tissue with lower values reflecting higher waterconcentrations. Decreased R2 values are seen in areas ofpathology in demyelinating diseases (Papanikolaou et al.,2004) as well as in normal aging (Bartzokis et al., 2001,2004), individuals at-risk for Alzheimer’s disease(Bartzokis et al., 2006) and Alzheimer’s disease (Bartzokiset al., 2003). Prior studies using this technique havedemonstrated that R2 is below normal in the frontallobe white matter of persons with Alzheimer’s disease(Bartzokis et al., 2003) and suggest that R2 of the frontallobes and genu of the corpus callosum decreases withage at a faster rate in carriers of the ApoE e4 allele(Bartzokis et al., 2006). It has been hypothesized that thisgreater involvement of late-myelinating areas is due to aselective vulnerability of oligodendrocytes in these regions(Bartzokis et al., 2004). Regardless of the underlying cause,our finding of significantly decreased FA in the whitematter of the frontal lobe of FAD MCs and trends towardsthis in the genu of the corpus callosum (despite our smallnumber of subjects) but not in the splenium or corticospi-nal tract provides convergent evidence for selectiveinvolvement of these late-myelinating areas in earlyAlzheimer’s disease.
Neuronal loss is earliest and most severe in the medialtemporal lobe in Alzheimer’s disease. It might therefore be
Fig. 8 Scatterplots of the FA (left) and cross-sectional area of the columns of the fornix (right) in 8 FAD MCs and 7 NCs.
DTI in preclinical and presymptomatic carriers of FAD mutation Brain (2007), 130, 1767^1776 1773
by guest on September 3, 2016
http://brain.oxfordjournals.org/D
ownloaded from

expected that the most significant alterations in whitematter would be found in the tracts connecting this regionand other limbic (Callen et al., 2001) and non-limbic brainregions. A previous pathological study demonstrated a 60%loss of neurons in layer II of the entorhinal cortex inpersons dying with a CDR score of 0.5 (Gomez-Isla et al.,1996). As the neurons in this layer give rise to the perforantpathway that projects to the hippocampus, one mightexpect that the FA in this area might decline as result.Indeed, a prior DTI study demonstrated that the intervoxelcoherence in the area of the perforant pathway wasdecreased in persons with MCI compared to controls(Kalus et al., 2006). Using our methods, we were able todetect significant decreases in FA in the area of theperforant pathway bilaterally in preclinical but notpresymptomatic FAD MCs. The fornix is the predominantoutflow tract of the hippocampus and connects it with theseptal nuclei as well as the mamillary bodies in thehypothalamus. FA of the cingulum bundle, another outflowtract of the medial temporal lobe that connects it with thecingulate gyrus, was also reduced, albeit non-significantlyso, in presymptomatic MCs. Our finding of decreased FA inthe columns of the fornix of persons inheriting but not yetaffected by FAD confirms its early involvement in thedisease and suggest that FA of the fornix might be a usefulindex of early disease in sporadic Alzheimer’s disease.We know of one prior abstract in which FA of the columnsof the fornix was reported to be decreased in persons withAlzheimer’s disease (Bozoki et al., 2004).A prior report found that non-demented persons with an
ApoE e4 allele had decreased FA in the posterior corpuscallosum and the left posterior hippocampus compared tocontrols without this allele (Persson et al., 2006). It isunclear if this represents a consequence of the early changes
of Alzheimer’s disease of a trait associated with the ApoE e4genotype. In our multiple linear regression analysis, we didnot find an robust effect of ApoE genotype on fornix FA(data not shown) but our study was likely underpowered toidentify such an effect if present (4 of 23 subjects carried anApoE e4 allele.
A possible confounder in this study is that atrophy of thefornix in its intraventricular course would also contributeto decreased FA. That is, the smaller the fornix, the moreCSF would be included in a given voxel size (3mm inour study). Since CSF has an FA near 0, the partial volumeeffect of increased CSF in the voxel would cause the meanFA within that voxel to be decreased. As the voxels chosento represent the fornix in our study did not have FAsdramatically lower than those from the parenchymal whitematter, we do not feel this effect was pronounced in ourstudy. Also, the regression analyses in our study suggestthat cross-sectional area of the fornix influences FA butdoes not completely explain the decreases seen in FADMCs. We speculate that the significant drop we see is thecomposite result of decreased FA within the fornix witha possible smaller contribution from diminished fornixsize in these subjects. Replication of our study using higher-resolution DTI would help resolve this question.
An advantage to studying relatively young personswith or at-risk for FAD is the paucity of co-morbid illness(e.g. hypertension) that might contribute to confoundingcerebral pathology (e.g. ischaemic changes). None of thesubjects in our study had notable non-Alzheimer’s cerebralpathology and they thus provide a relatively ‘pure’ model ofthe disease. However, there may be limitations to the degreeto which the findings of our study of FAD are generalizableto sporadic Alzheimer’s disease. Other than age of onset,there are additional clinical (Assini et al., 2003) and
Fig. 9 Scatterplots of mean white-matter FA in FAD NCs and MCs in relation to absolute age (left and middle) and age relative to thefamily-specific median age of disease diagnosis (adjusted age or ‘relative age’) in MCs (right).
1774 Brain (2007), 130, 1767^1776 J. M. Ringman et al.
by guest on September 3, 2016
http://brain.oxfordjournals.org/D
ownloaded from

pathological (Houlden et al., 2000; Takao et al., 2001)differences between FAD and sporadic Alzheimer’s disease.Abnormal white matter may represent a quality of FAD notdirectly related to the incipient pathology of Alzheimer’sdisease. Persons carrying FAD mutations may have life-longwhite-matter abnormalities (a trait) rather than acquiredchanges (a state) of developing Alzheimer’s diseasecharacterized by decreased fractional anisotropy. Thoughthere is a suggestion of accelerated decrease of FA withadvancing age in MCs (Fig. 9), the data presented in Fig. 9are also compatible with even earlier decreases in FA in thispopulation.Evidence for developmental abnormalities in PS1-related
FAD comes from both animal and human studies. Embryosof transgenic mice in which both copies of the PS1 genehave been knocked out have abnormalities of neuronalmigration and differentiation characterized by disorganiza-tion of the cerebral cortex (Handler et al., 2000). Also,a patient with a PS1 mutation who developed young-onsetAlzheimer’s disease and came to autopsy was noted to haveectopic neurons in the white matter (Takao et al., 2001).Though we do not know of any such structural abnorm-alities having been reported in the white matter of personsdying with the FAD mutations included in this study(Mullan et al., 1993; Cochran et al., 2001), such apossibility exists. If present, one might expect that thiscould account for the differences seen.If PS1 mutations cause aberrant neuronal migration or
other white-matter abnormalities, it would be of interest toknow the effect of APP mutations on white-matter integrityas to our knowledge white-matter abnormalities have notbeen described in pathological specimens of persons dyingwith APP mutations. Notably, four subjects in the currentstudy were at-risk for the V717I substitution in the APPgene and among them the tendency for MCs to have lowermean white-matter FA was maintained. Unfortunately, dueto these small numbers and the necessity to maintainsubject anonymity with regard to mutation status littlemore can be said or concluded about this.Among persons with the A431E substitution in the
PSEN1 gene, many develop significant spastic tetraparesisas the dementia progresses (Murrell et al., 2006).In pathological studies, tetraparesis occurring in FAD hasbeen related to disproportionate involvement of the motorcortex with amyloid pathology with presumptive conse-quent degeneration of the corticospinal tracts. None of the11 subjects in our study at-risk for this mutation hadsignificant para- or tetraparesis but it is notable that onesuch MC who had a CDR score of 0.5 was hyperreflexicand had relatively low FA of the corticospinal tract in thecerebral peduncle (data not shown). This suggests that DTImay have utility in detecting and possibly in predicting thiscomplication.Our data indicate that loss of white-matter integrity,
as indexed by FA acquired through DTI, is an early featurein FAD. Furthermore, this loss is somewhat selective,
disproportionately affecting tracts that connect limbicstructures and the frontal lobes. Though there arelimitations to our study regarding the resolution of theDTI technique employed and the ability to generalize fromFAD to the more common form of late-onset Alzheimer’sdisease, we feel that further investigations of early changesin white matter, particularly of the FA of the columns ofthe fornix, are merited as potential indicators or evenpredictors of Alzheimer’s disease status.
AcknowledgementsThis study was supported by PHS K08 AG-22228,California DHS #04-35522, M01-RR00865, GeneralClinical Research Centers Program and the Shirley andJack Goldberg Trust. Further support for this study camefrom Alzheimer’s Disease Research Center Grant AG-16570from the National Institute on Aging, an Alzheimer’sDisease Research Center of California grant, and the SidellKagan Foundation.
ReferencesAssini A, Terreni L, Borghi R, Giliberto L, Piccini A, Loqui D, et al.
Pure spastic paraparesis associated with a novel presenilin 1 R278K
mutation. Neurology 2003; 60: 150.
Bartzokis G. Age-related myelin breakdown: a developmental model of
cognitive decline and Alzheimer’s disease. Neurobiol Aging 2004; 25:
5–18 author reply 49–62.
Bartzokis G, Beckson M, Lu PH, Nuechterlein KH, Edwards N, Mintz J.
Age-related changes in frontal and temporal lobe volumes in men:
a magnetic resonance imaging study. Arch Gen Psychiatry 2001; 58:
461–5.
Bartzokis G, Cummings JL, Sultzer D, Henderson VW, Nuechterlein KH,
Mintz J. White matter structural integrity in healthy aging adults and
patients with Alzheimer disease: a magnetic resonance imaging study.
Arch Neurol 2003; 60: 393–8.
Bartzokis G, Lu PH, Geschwind DH, Edwards N, Mintz J, Cummings JL.
Apolipoprotein E genotype and age-related myelin breakdown in healthy
individuals: implications for cognitive decline and dementia. Arch Gen
Psychiatry 2006; 63: 63–72.
Bartzokis G, Sultzer D, Lu PH, Nuechterlein KH, Mintz J, Cummings JL.
Heterogeneous age-related breakdown of white matter structural
integrity: implications for cortical "disconnection" in aging and
Alzheimer’s disease. Neurobiol Aging 2004; 25: 843–51.
Basser PJ, Mattiello J, LeBihan D. MR diffusion tensor spectroscopy and
imaging. Biophys J 1994; 66: 259–67.
Behrens TE, Woolrich MW, Jenkinson M, Johansen-Berg H, Nunes RG,
Clare S, et al. Characterization and propagation of uncertainty in
diffusion-weighted MR imaging. Magn Reson Med 2003; 50: 1077–88.
Bozoki A, Delano M, Huang J, Potchen M. Diffusion tensor imaging of
the fornix in Alzheimer’s disease. Neurology 2004; 62: A126.
Bozzali M, Falini A, Franceschi M, Cercignani M, Zuffi M, Scotti G, et al.
White matter damage in Alzheimer’s disease assessed in vivo using
diffusion tensor magnetic resonance imaging. J Neurol Neurosurg
Psychiatry 2002; 72: 742–6.
Braak H, Braak E. Development of Alzheimer-related neurofibrillary
changes in the neocortex inversely recapitulates cortical myelogenesis.
Acta Neuropathol (Berl) 1996; 92: 197–201.
Callen DJ, Black SE, Gao F, Caldwell CB, Szalai JP. Beyond the
hippocampus: MRI volumetry confirms widespread limbic atrophy in
AD. Neurology 2001; 57: 1669–74.
DTI in preclinical and presymptomatic carriers of FAD mutation Brain (2007), 130, 1767^1776 1775
by guest on September 3, 2016
http://brain.oxfordjournals.org/D
ownloaded from
Chia LS, Thompson JE, Moscarello MA. X-ray diffraction evidence for
myelin disorder in brain from humans with Alzheimer’s disease.
Biochim Biophys Acta 1984; 775: 308–12.
Cochran EJ, Murrell JR, Fox J, Ringman J, Ghetti B. A novel mutation in
the Presenilin-1 gene (A431E) associated with early-onset Alzheimer’s
disease. J Neuropathol Exp Neurol 2001; 60: 544.
Englund E, Brun A, Alling C. White matter changes in dementia of
Alzheimer’s type. Biochemical and neuropathological correlates. Brain
1988; 111 (Pt 6): 1425–39.
Fox NC, Kennedy AM, Harvey RJ, Lantos PL, Roques PK, Collinge J, et al.
Clinicopathological features of familial Alzheimer’s disease associated
with the M139V mutation in the presenilin 1 gene. Pedigree but not
mutation specific age at onset provides evidence for a further genetic
factor. Brain 1997; 120: 491–501.
Gomez-Isla T, Price JL, McKeel DW Jr, Morris JC, Growdon JH,
Hyman BT. Profound loss of layer II entorhinal cortex neurons occurs
in very mild Alzheimer’s disease. J Neurosci 1996; 16: 4491–500.
Handler M, Yang X, Shen J. Presenilin-1 regulates neuronal differentiation
during neurogenesis. Development 2000; 127: 2593–606.
Houlden H, Baker M, McGowan E, Lewis P, Hutton M, Crook R, et al.
Variant Alzheimer’s disease with spastic paraparesis and cotton wool
plaques is caused by PS-1 mutations that lead to exceptionally high
amyloid-beta concentrations. Ann Neurol 2000; 48: 806–8.
Jenkinson M, Smith S. A global optimisation method for robust affine
registration of brain images. Med Image Anal 2001; 5: 143–56.
Kalus P, Slotboom J, Gallinat J, Mahlberg R, Cattapan-Ludewig K,
Wiest R, et al. Examining the gateway to the limbic system with
diffusion tensor imaging: the perforant pathway in dementia.
Neuroimage 2006; 30: 713–20.
Kantarci K, Petersen RC, Boeve BF, Knopman DS, Weigand SD,
O’Brien PC, et al. DWI predicts future progression to Alzheimer disease
in amnestic mild cognitive impairment. Neurology 2005; 64: 902–4.
Medina D, DeToledo-Morrell L, Urresta F, Gabrieli JD, Moseley M,
Fleischman D, et al. White matter changes in mild cognitive impairment
and AD: a diffusion tensor imaging study. Neurobiol Aging 2006; 27:
663–72.
Mullan M, Tsuji S, Miki T, Katsuya T, Naruse S, Kaneko K, et al. Clinical
comparison of Alzheimer’s disease in pedigrees with the codon 717
Val—4Ile mutation in the amyloid precursor protein gene. Neurobiol
Aging 1993; 14: 407–19.
Murrell J, Ghetti B, Cochran E, Macias-Islas MA, Medina L, Varpetian A,
et al. The A431E mutation in PSEN1 causing Familial Alzheimer’s
Disease originating in Jalisco State, Mexico: an additional fifteen
families. Neurogenetics 2006; 7: 277–9.
Pak K, Chan SL, Mattson MP. Presenilin-1 mutation sensitizes
oligodendrocytes to glutamate and amyloid toxicities, and exacerbates
white matter damage and memory impairment in mice. Neuromolecular
Med 2003; 3: 53–64.
Pantel J, O’Leary DS, Cretsinger K, Bockholt HJ, Keefe H, Magnotta VA,
et al. A new method for the in vivo volumetric measurement of the
human hippocampus with high neuroanatomical accuracy.
Hippocampus 2000; 10: 752–8.
Papanikolaou N, Papadaki E, Karampekios S, Spilioti M, Maris T,
Prassopoulos P, et al. T2 relaxation time analysis in patients with
multiple sclerosis: correlation with magnetization transfer ratio. Eur
Radiol 2004; 14: 115–22.
Persson J, Lind J, Larsson A, Ingvar M, Cruts M, Van Broeckhoven C,
et al. Altered brain white matter integrity in healthy carriers of the
APOE epsilon4 allele: a risk for AD? Neurology 2006; 66: 1029–33.
Rose SE, McMahon KL, Janke AL, O’Dowd B, de Zubicaray G,
Strudwick MW, et al. Diffusion indices on magnetic resonance imaging
and neuropsychological performance in amnestic mild cognitive
impairment. J Neurol Neurosurg Psychiatry 2006; 77: 1122–8.
Smith SM. Fast robust automated brain extraction. Hum Brain Mapp
2002; 17: 143–55.
Smith SM, Jenkinson M, Woolrich MW, Beckmann CF, Behrens TE,
Johansen-Berg H, et al. Advances in functional and structural MR image
analysis and implementation as FSL. Neuroimage 2004; 23 (Suppl 1):
S208–19.
Smith SM, Zhang Y, Jenkinson M, Chen J, Matthews PM, Federico A,
et al. Accurate, robust, and automated longitudinal and cross-sectional
brain change analysis. Neuroimage 2002; 17: 479–89.
Takao M, Ghetti B, Murrell JR, Unverzagt FW, Giaccone G, Tagliavini F,
et al. Ectopic white matter neurons, a developmental abnormality that
may be caused by the PSEN1 S169L mutation in a case of familial AD
with myoclonus and seizures. J Neuropathol Exp Neurol 2001; 60:
1137–52.
Tang MX, Stern Y, Marder K, Bell K, Gurland B, Lantigua R, et al.
The APOE-epsilon4 allele and the risk of Alzheimer disease
among African Americans, whites, and Hispanics. JAMA 1998; 279:
751–5.
Terry RD, Gonatas NK, Weiss M. Ultrastructural studies in Alzheimer’s
Presenile dementia. Am J Pathol 1964; 44: 269–97.
Wirths O, Weis J, Szczygielski J, Multhaup G, Bayer TA. Axonopathy in an
APP/PS1 transgenic mouse model of Alzheimer’s disease. Acta
Neuropathol (Berl) 2006; 111: 312–9.
Zhang Y, Brady M, Smith S. Segmentation of brain MR images through
a hidden Markov random field model and the expectation-maximization
algorithm. IEEE Trans Med Imaging 2001; 20: 45–57.
1776 Brain (2007), 130, 1767^1776 J. M. Ringman et al.
by guest on September 3, 2016
http://brain.oxfordjournals.org/D
ownloaded from