Molecular basis for nonspecificity of nonsteroidal anti-inflammatory drugs (NSAIDs
Upload
cas-historydeptt-amuCategory
view
0download
0
Accepted Manuscript
Differential Effects of Anti-cancer and Anti-hepatitis drugs on liver cystatin
Aaliya Shah, Medha Priyadarshini, Mohd Shahnawaz Khan, Mohd Aatif,Fakhra Amin, Shams Tabrez, Galila F Zaher, Bilqees Bano
PII: S1319-562X(14)00073-4DOI: http://dx.doi.org/10.1016/j.sjbs.2014.06.006Reference: SJBS 317
To appear in: Saudi Journal of Biological Sciences
Received Date: 27 April 2014Revised Date: 27 June 2014Accepted Date: 28 June 2014
Please cite this article as: A. Shah, M. Priyadarshini, M.S. Khan, M. Aatif, F. Amin, S. Tabrez, G.F. Zaher, B. Bano,Differential Effects of Anti-cancer and Anti-hepatitis drugs on liver cystatin, Saudi Journal of BiologicalSciences (2014), doi: http://dx.doi.org/10.1016/j.sjbs.2014.06.006
This is a PDF file of an unedited manuscript that has been accepted for publication. As a service to our customerswe are providing this early version of the manuscript. The manuscript will undergo copyediting, typesetting, andreview of the resulting proof before it is published in its final form. Please note that during the production processerrors may be discovered which could affect the content, and all legal disclaimers that apply to the journal pertain.
Differential Effects of Anti-cancer and Anti-hepatitis drugs on liver
cystatin
Aaliya Shah1, Medha Priyadarshini2, Mohd Shahnawaz Khan3, Mohd Aatif1, Fakhra
Amin1, Shams Tabrez4, Galila F Zaher5, and Bilqees Bano*1
1Department of Biochemistry, F/O Life Sciences, AMU, Aligarh, INDIA.
2Department of Medicine, Division of Endocrinology, Metabolism and Molecular
Medicine, Northwestern University Feinberg School of Medicine, Chicago, IL 60611,
USA
3Department of Biochemistry, College of Science, King Saud University, KSA
4King Fahd Medical Research Center, King Abdulaziz University, Jeddah 21589, Saudi
Arabia
5Department of Haematology, College of Medicine, King Abdulaziz University, Jeddah
21589, Saudi Arabia
Corresponding Author:
Professor Bilqees Bano
Department of Biochemistry, F/O Life Sciences,
Aligarh Muslim University, INDIA
Email: [email protected]
ABSTRACT
The drug-protein interaction has been the subject of increasing interest over the decades.
In the present communication, the interaction of liver cystatin with anti-cancer
(adriamycin) and anti-hepatitis (adevofir dipivoxal) drug was studied by thiol-protease
inhibitory assay, UV absorption, fluorescence spectroscopy and Circular dichroism (CD).
A static type of quenching was observed between the protein and the drug molecules.
Binding constant (Ka) of adriamycin to liver cystatin (LC) was found to be 1.08x10⁶M-1.
Moreover, binding sites number was found to be 2. Importantly, cystatin loses its activity
in the presence of adriamycin. However, intrinsic fluorescence studies in the presence of
adevofir dipivoxal showed enhancement in the fluorescence intensity suggesting that
binding of adevofir to LC caused unfolding of the protein. The unfolding of the test
protein was also accompanied by significant loss of inhibitory activity. CD spectroscopy
result showed, both adriamycin and adevofir dipivoxal caused perturbation in the
secondary structure of liver cystatin. The possible implications of these results will help
in combating drug induced off target effects.
Keywords: Liver cystatin, Adriamycin, Adevofir dipivoxial, Fluorescence, UV-
spectroscopy

1. INTRODUCTION
Drug-protein associations are vital, since most of the administered drugs are reversibly
bound to proteins. The bound drugs are transported mainly as a complex with these
proteins. The binding factors are useful in studying the pharmacological response and
drugs dosage design (Borga and Borga, 1997). The present report summarizes the
interaction of goat liver cystatin (thiol-proteinase inhibitor) with an anti-sarcoma drug,
Adriamycin and an anti-hepatitis drug, Adevofir dipivoxil. Adriamycin (doxorubicin
hydrochloride) is an excellent anti-tumor antibiotic and is very effective against a large
number of human malignancies. The anti-cancer activity of adriamycin is associated with
the formation of intercalative complexes with DNA (Bryn and Dolch, 1978).
Adevofir dipivoxil is a diester prodrug of adevofir. It is an acyclic nucleotide analogue
having activity against human hepatitis B virus (HBV). Moreover, it inhibits HBV-DNA
polymerase (reverse transcriptase) action via natural substrate deoxyadenosine
triphosphate binding and DNA chain termination. The chemical structure of Adriamycin
(Doxorubicin Hydrochloride) and Adevofir dipivoxil is shown in figure 1 and 2
respectively.
Cystatins are the family of proteins that regulate and inhibit the detrimental effect
associated with cysteine proteinases (Ekiel et al., 1997). Cystatins could protect the cells
from unnecessary proteolysis which might leads to several pathological conditions (Shah
and Bano, 2009).
The goat liver cystatin used in the present study was purified in our laboratory (Shah and
Bano, 2011). Further, conformational changes in the purified thiol protease inhibitor
after association with anti-cancer and anti hepatitis drug were monitored by UV-visible,
fluorescence and circular dichroism spectroscopic techniques. Moreover, the current
paper also addresses the kind of interaction involved in the binding of these drugs with
thiol protease inhibitor.
2. MATERIALS AND METHODS
MATERIALS:
Casein, papain, EDTA, acetone, sephacryl-S100HR, CBB R-250 and cysteine were
procured from Sigma Aldrich. Adriamycin (Doxorubucin hydrochloride) was purchased
from VHB Life Sciences Limited India. Adevofir dipivoxil was purchased from Sun
Pharmaceutical Industries, India. All other chemicals used were of analytical grade.
METHODS:
2.1.Protein Estimation
The concentration of purified protein was quantitated by Lowry et al. (1951) method.
2.2.Preparation of Drug Solutions
As adriamycin (ADR) is sensitive to light and oxygen, a stock solution of ADR within
the theraupetic range in normal saline was prepared just before use. 2µM of goat LC was
incubated with varying concentrations of ADR in the range of 0.5-3µM for 30 minutes.
Moreover, a stock solution of adevofir dipivoxil in 0.05M sodium phosphate buffer (pH
7.2) was prepared fresh just before use. Goat liver cystatin at a concentration of 2 µM
was incubated with varying concentration of adevofir dipivoxil (0.1 µM-1 µM) for 30
minutes.
2.3. Thiol proteinase inhibitory activity assay
Aliquots from the incubated samples were tested for their thiol protease inhibition
potential by the method of Kunitz (1947).
2.4.UV-Visible spectroscopy
Absorption spectra of cystatin and cystatins incubated with ADR and adevofir dipivoxil
were measured on UV-visible spectrophotometer at 220-400 nm wavelength range by the
use of 1cm path length cell holder.
2.5.Fluorescence spectroscopy
The measurements of fluorescence were performed on a spectrofluorometre (Shimadzu)
at 25˚C by the use of a quartz cell of 1cm path length. The fluorescence of cystatin bound
drugs were recorded at the wavelength range of 250-400 nm after exciting the complex at
280 nm.
2.6.Circular dichroism measurement
Far-UV CD measurements were performed by use of a circular dichroismchiroptical
spectrometer (Applied Photophysics, Chira-scan-Plus, UK). Samples were maintained at
250C with the help of circulating water bath in a 1 mm quartz cuvette. Spectra of LC in
the absence and presence of various concentrations of adriamycin and adevofir dipioxal
were measured in the range 190-250 nm with a step size of 1.0 nm.
RESULTS AND DISCUSSION
2.7.Interaction of liver cystatin with adriamycin
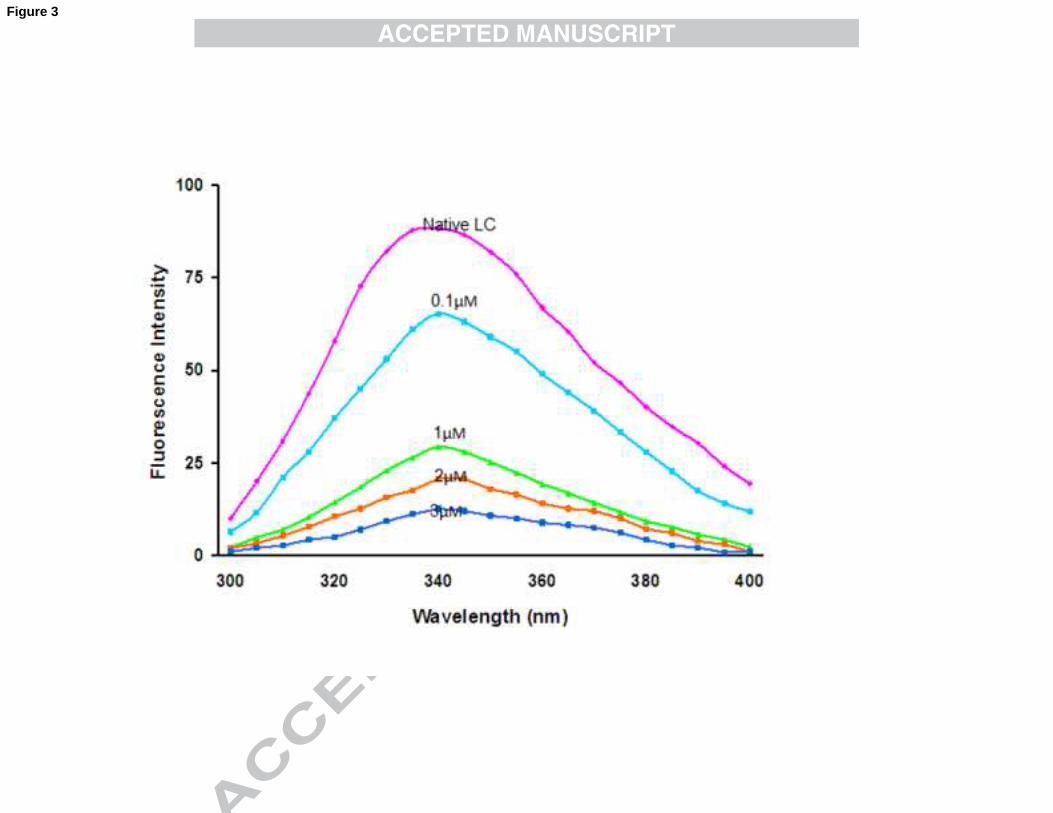
Fluorescence measurements reveal information about the binding of small molecules with
proteins, such as binding constant, binding sites and binding mechanism. Binding of
ADR with goat liver cystatin caused quenching in the fluorescence intensity. The
concentration increase of ADR resulted in the rise in quenching of the cystatin-ADR
complex. The fluorescence emission spectra of the said complex in the presence of
increasing concentration of ADR have been illustrated in Figure (3). The maximum
quenching was observed at 3µM adriamycin concentration. To determine the mechanism
of binding between ADR and goat liver cystatin the fluorescence intensity data were
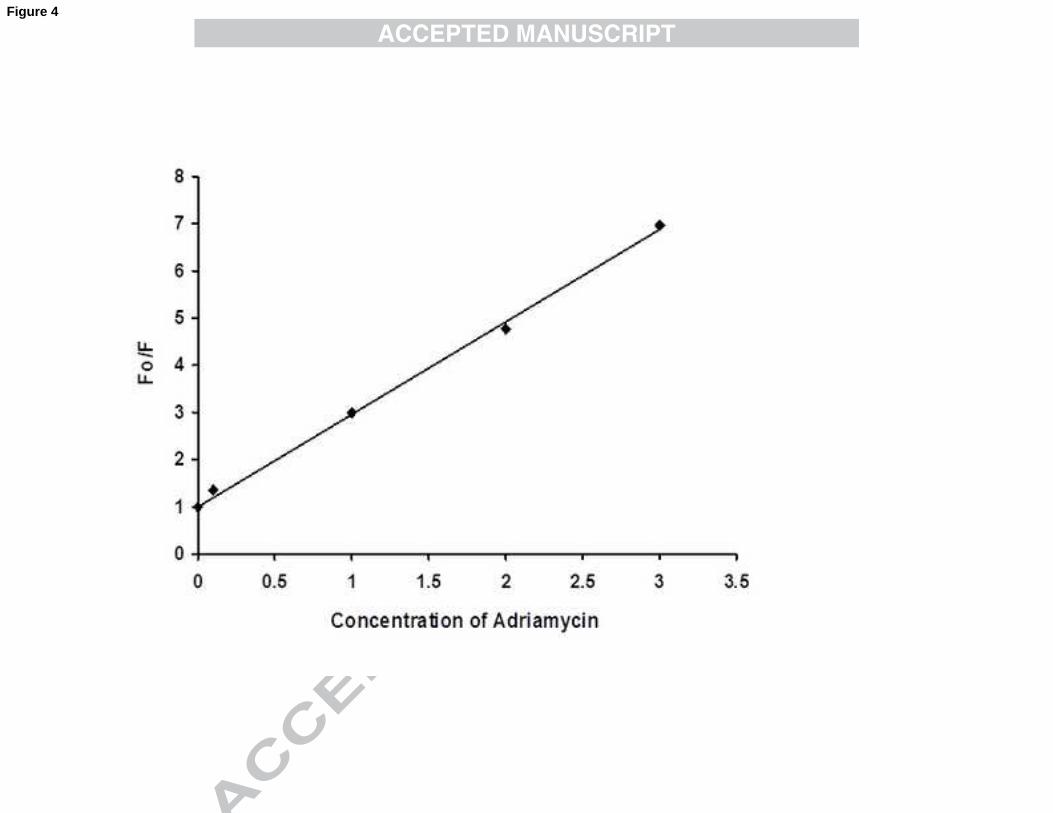
analyzed by Stern-Volmer equation (Shang et al., 2006).
Literature analysis illustrates two type of quenching namely static and dynamic. Static
quenching involves the formation of a stable complex between the fluor and quencher.
On the other hand, in dynamic quenching the ligandhits with excited fluor, leads to loss
of some energy.
The plot of F₀ /F vs [Q] exhibited a good linear relationship indicating, the interaction
was purely static in nature (Figure 4).
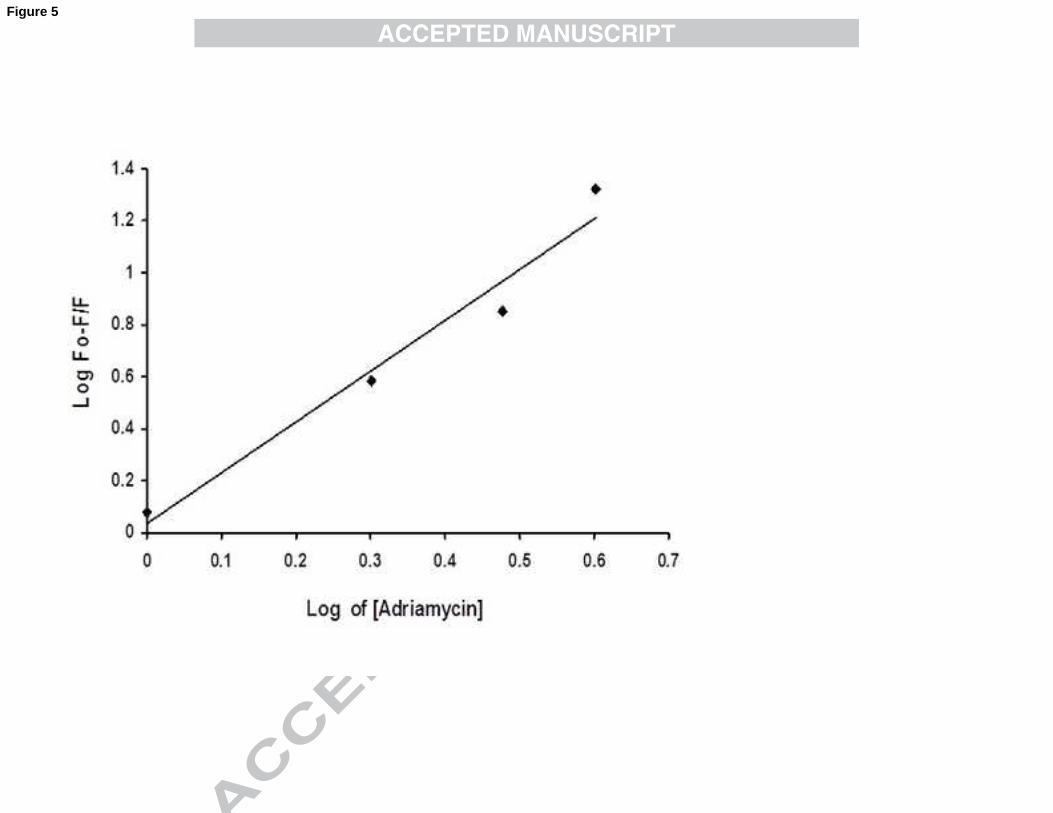
The binding constant and the number of binding sites can be determined by the equation
given by Gao et al. (2004).
Log [(F₀-F)/F] =Log K n Log [Q].
Where K and n are the binding constant and binding site numbers. Binding constant was
found to be 1.08×10⁶M-1 and the binding sites number was found to be 2 as shown in
figure 5.
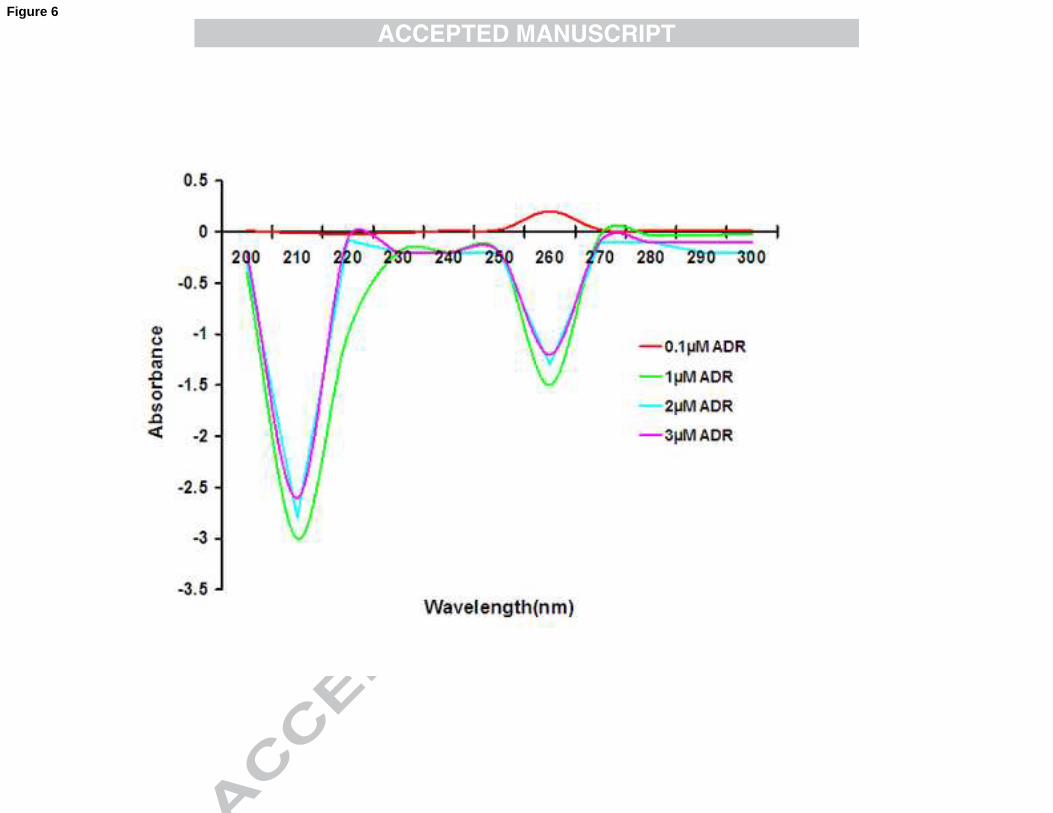
2.8.UV- visible spectra of adriamycin cystatin complex
Absorption spectral measurements on liver cystatin in the presence of drugs provided
information related to their interaction. Difference spectra of drug protein complex were
measured against protein alone (Figure 6). For the difference spectra obtained at 0.1µM
ADR, positive peaks at 260 nm might have the contribution of phenylalanine. The
negative peak at 210 nm observed for liver cystatin-ADR (LC-ADR) complexes at 1, 2
and 3µM ADR concentrations respectively may have contributions from histidine
residues (Donovan, 1969). The intense negative peak at 260 nm for LC-ADR complexes
is indicative of involvement of phenylalanine and tyrosine in complexation process. The
broad shoulders at 290 nm are also due to tryptophan and may contain contribution from
phenyalanine (Gao et al., 2004).
2.9. Inhibitory activity of adriamycin cystatin complex by papain
Changes in the inhibitory activity of LC after incubating for 30 minutes with increasing
concentration of LC are shown in the Table 1. The results show that liver cystatin lost
complete inhibitory activity at 3µM concentration of adriamycin. This suggests that
increasing concentration of adriamycin resulted in the functional inactivation of cystatin.
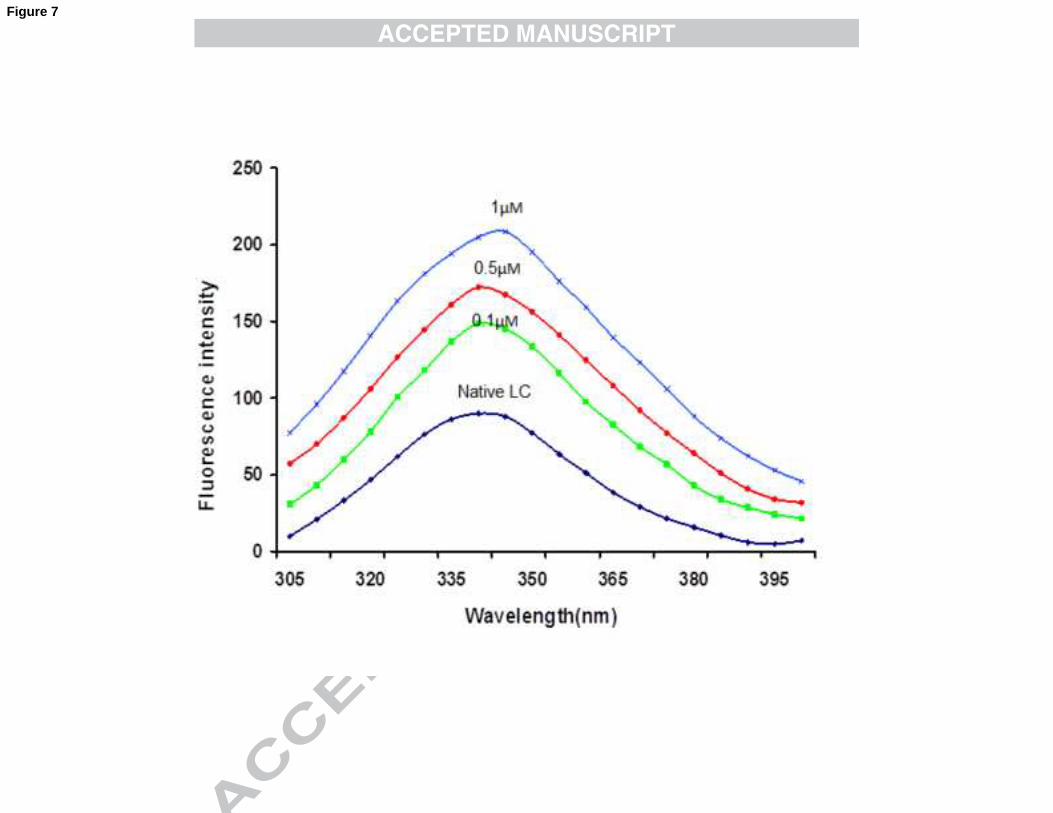
2.10. Fluorescence spectra of adevofir dipivoxal cystatin complex
Binding of adevofir dipivoxal with goat liver cystatin led to an increase in the
fluorescence intensity of the goat liver cystatin indicating that the binding caused
unfolding of the protein as shown in figure 7. Maximum unfolding was observed at 1µM
concentration of the drug. Increase in fluorescence intensity was also accompanied by a
red shift of 5nm which indicates perturbation in the environment of aromatic residues and
unfolding of goat liver cystatin in the presence of adefovir dipivoxal.
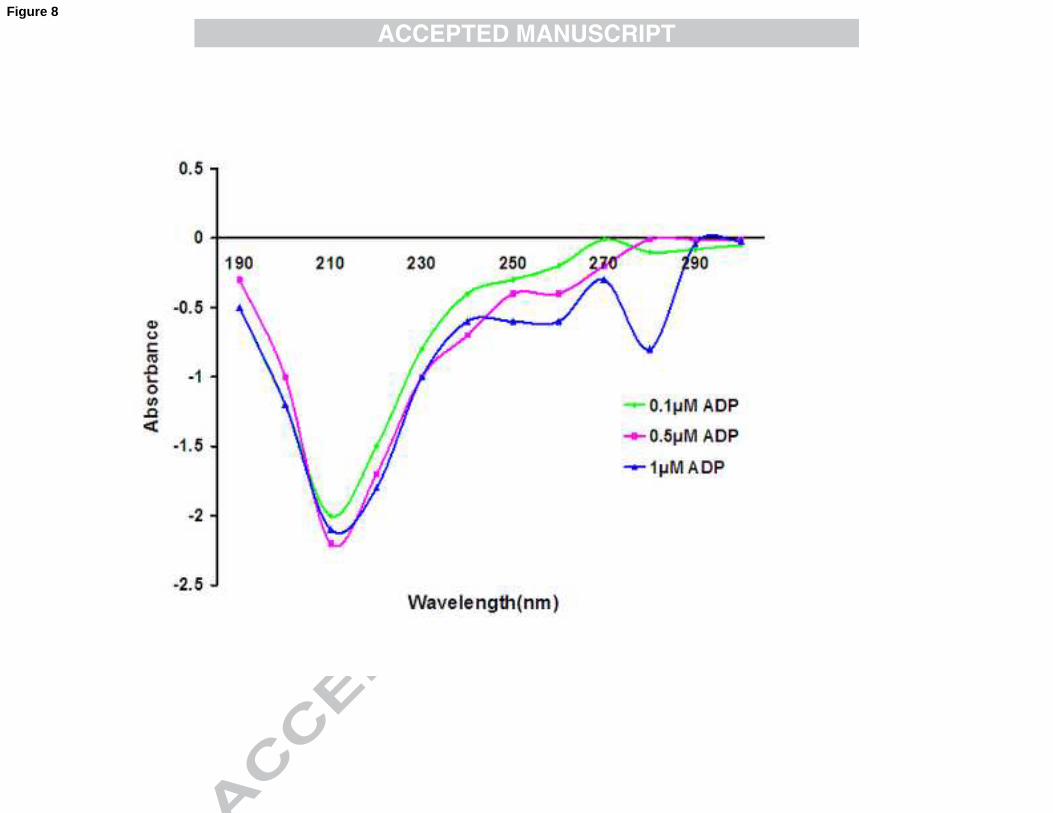
2.11. UV-visible absorption spectra of adevofir dipivoxal cystatin complex
UV-visible absorption difference spectra were computed at varying drug concentrations
from 0.1µM to 1µM. However, profound changes were noted only for those obtained at
0.1µM, 0.5 µM and 1µM concentrations of drug. A sharp negative peak noticeable at 210
nm in difference spectra obtained at 0.1µM adevofir dipivoxal, suggest changes around
the histidine residues. A negative peak noticeable at 280 nm suggests changes around
tyrosine residues (Donovan, 1969). Difference spectra of drug protein complex at 1µM
drug concentration showed broad shoulder at 260 nm, indicative of involvement of
phenylalanine (Figure 8).
2.12. Inhibitory activity of goat liver cystatin in the presence adevofir dipivoxal
Changes in the inhibitory activity of goat liver cystatin with increasing concentration of
adevofir dipovixal are shown in Table 2. The results show that goat liver cystatin lost
significant amount of inhibitory activity at 1µM concentration of adevofir dipivoxal. Loss
of inhibitory activity could be attributed to the modulation in the conformation of goat
liver cystatin.
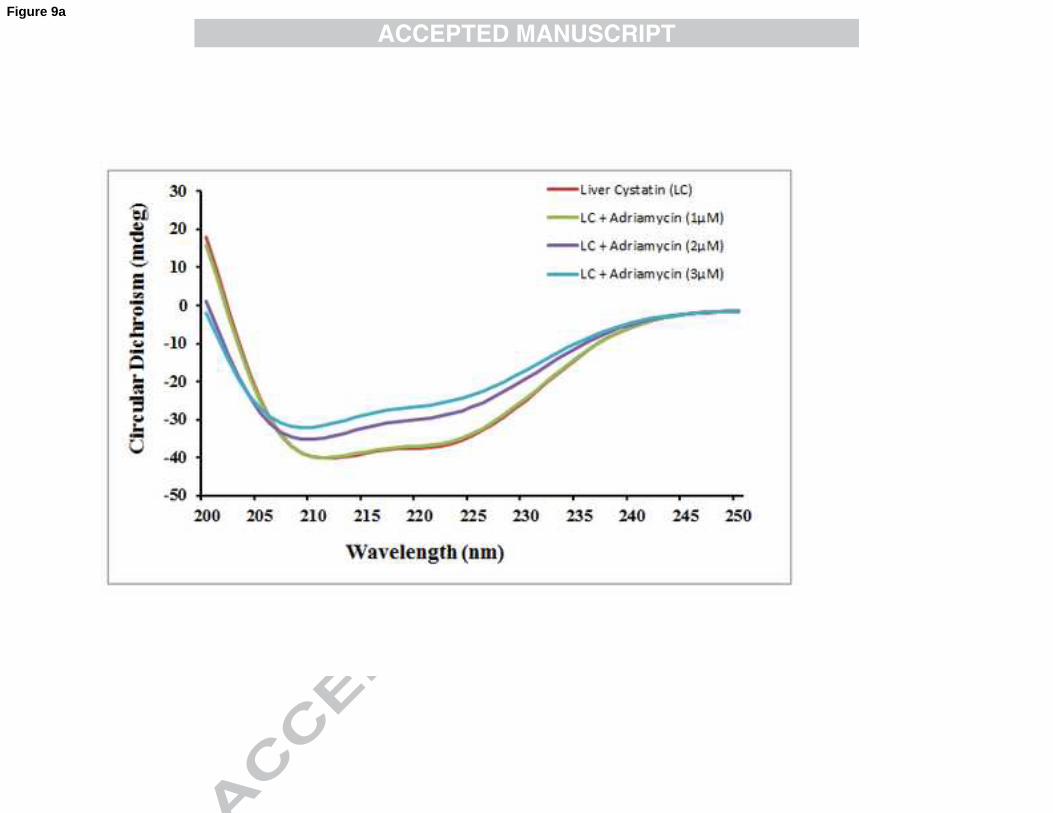
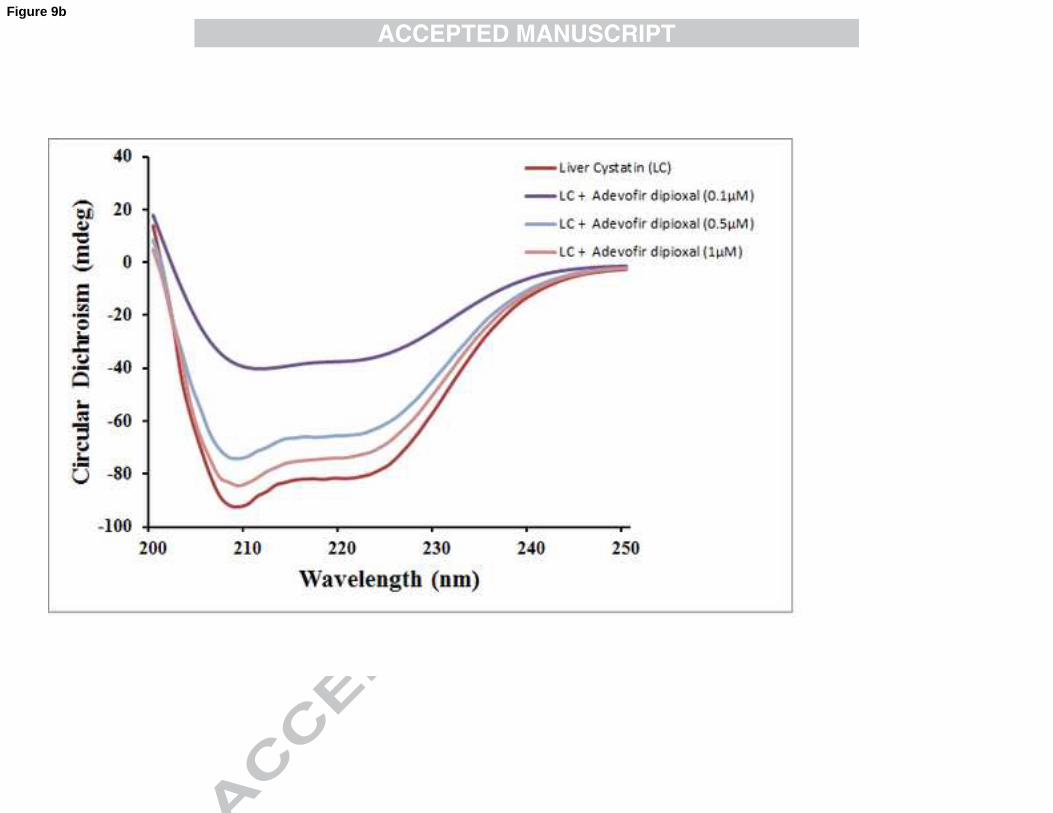
2.13. Drug-Protein interaction analysis: Circular dichroism measurement
Circular Dichroism (CD) is a spectroscopic technique widely used for the evaluation of
the conformation and stability of proteins in several environmental conditions and in the
presence of various ligands. The obtained data showed negative peak around 222 and 208
nm, indicating α-helical characteristic of liver cystatin. While interaction with adriamycin
and adevofir dipivoxal, ellipticity decreases with increasing concentration of drugs
(Figure 9a and 9b). Secondary structural change in the liver cystatin was found to be
more pronounced in the presence of anti-hepatitis drug (Adevofir dipioxal) compared
with anti-cancer drug (Adriamycin).
3. Conclusion
The conformational changes induced in goat liver cystatin upon binding of adriamycin
and adevofir dipivoxal helps in addressing the kind of interactions involved in the
binding. Understanding the molecular basis of these interactions will help in combating
drug induced off target effects which in the present case might be activation or
dsyregulation of cysteine proteases.
Acknowledgment: The authors extend their appreciation to the Deanship of Scientific
Research at KSU for funding this work through research group project number RGP-
VPP-215.
Abbreviations:
LC: Liver cystatin
ADR: Adriamycin
CD: Circular dichroism
Ka: Binding constant
HBV: Human hepatitis B virus
REFERENCES
Borga, O., Borga, B., 1997. Serum protein binding of nonsteroidal antiinflammatory
drugs: a comparative study. J. Pharmacok. Biopharm. 25, 63-67.
Bryn, S.R., Dolch G.D., 1978. Analysis of binding of daunorubicin and doxorubicin to
DNA using computerized curve-fitting procedures. J. Pharm Sci., 67, 688-690.
Donovan, J.W., 1969. Changes in ultraviolet absorption produced by alteration of protein
conformation. J. Biol Chem. 244, 1961-1967.
Ekiel I., Abrahamson M., Fulton D.B., Lindahl, P.1997. NMR structural studies of human
cystatin C dimers and monomers. J Mol Biol.271, 266-271.
Gao, H., Lei, L., Liu, J., Qin, K., Chen, X., Hu, Z. J., 2004. Photochem Photobiol Part
A.167: 213-221.
Kunitz, M., 1947. Crystalline soybean trypsin inhibitor: II. General Properties. J. Physiol.
30, 291-310.
Lowry, H., Rosebrough N.J, Farr A.L., Randall, R., 1951. Protein measurement with the
Folin phenol reagent. J. Biol Chem.193: 265-275.
Shah, A., and Bano, B., 2011. Spectroscopic studies on the interaction of bilirubin with
liver cystatin. European Biophysics Journal. 40, 175-180.
Shah, A., Bano B., 2009. Cystatins in health and diseases. Int. J. Pept. Res.Ther. 15, 43-
48.
Shang, L., Jiang., X.U., Dong, S.J., 2006. In vitro study on the binding of neutral red to
bovine serum albumin by molecular spectroscopy. J Photochem Photobiol A Chem. 184,
93-97.
Thipperudrappa, J., Biradar, D.S., Lagare, M.T., 2006. Fluorescence quenching of BPBD
by aniline in benzene–acetonitrile mixtures.J Photochem Photobiol AChem. 177, 89-93.
Legends to Figures:
1) Chemical structure of Adriamycin (Doxorubicin Hydrochloride)
2) Chemical structure of Adevofir Dipivoxal.
3) Fluorescence emission spectra of adriamycin–cystatin complex in the presence of
differentconcentrations of adriamycin obtained in sodium phosphate buffer, pH,
7.5. Protein concentration was 2µM.Concentration of Adriamycin was (from
bottom to top) 3 µM, 2µM, 1 µM, 0.1µM respectively.
4) Determination of types of quenching by Stern-Volmer constant.
5) Determination of Binding Site by Stern-Volmer.
6) Light absorption spectra of adriamycin–cystatin complex in the presence of
different concentrations of adriamycin obtained in sodium phosphate buffer, pH
7.5. Protein concentration was 1µM.Concentration of 3µM, 2µM, 1 µM, 0.1µM
respectively.
7) Fluorescence emission spectra of adevofir dipivoxal–cystatin complex in the
presence of different concentrations of adevofir dipivoxal obtained in
sodium phosphate buffer, pH7.5. Protein concentration was 1µM.Concentration
of adevofir dipivoxal was (from bottom to top) 0.1µM, 0.5 µM, and 1µM.
8) Light absorption spectra of adevofir dipivoxal-cystatin complex in the presence of
different concentrations of adevofir dipivoxal obtained in sodium phosphate
buffer, pH 7.5. Protein concentration was 1µM. Concentration of adevofir
dipivoxal was (from bottom to top) 0.1µM, 0.5 µM,1µM.
9) Circular dichroism spectra of liver cystatin in the absence and presence of various
concentration of adriamycin (a) and adevofir dipioxal (b). The concentration of
native liver cystatin was (0.2mg/ml).
Tables Legends:
Table 1: Antiproteolytic activity of liver cystatin in the presence of varying concentration
of adriamycin (ADR) after incubation for 30 minutes.
Table 2: Effect of Adefovir dipivoxal on inhibitory activity of liver cystatin after
incubation for 30 minutes
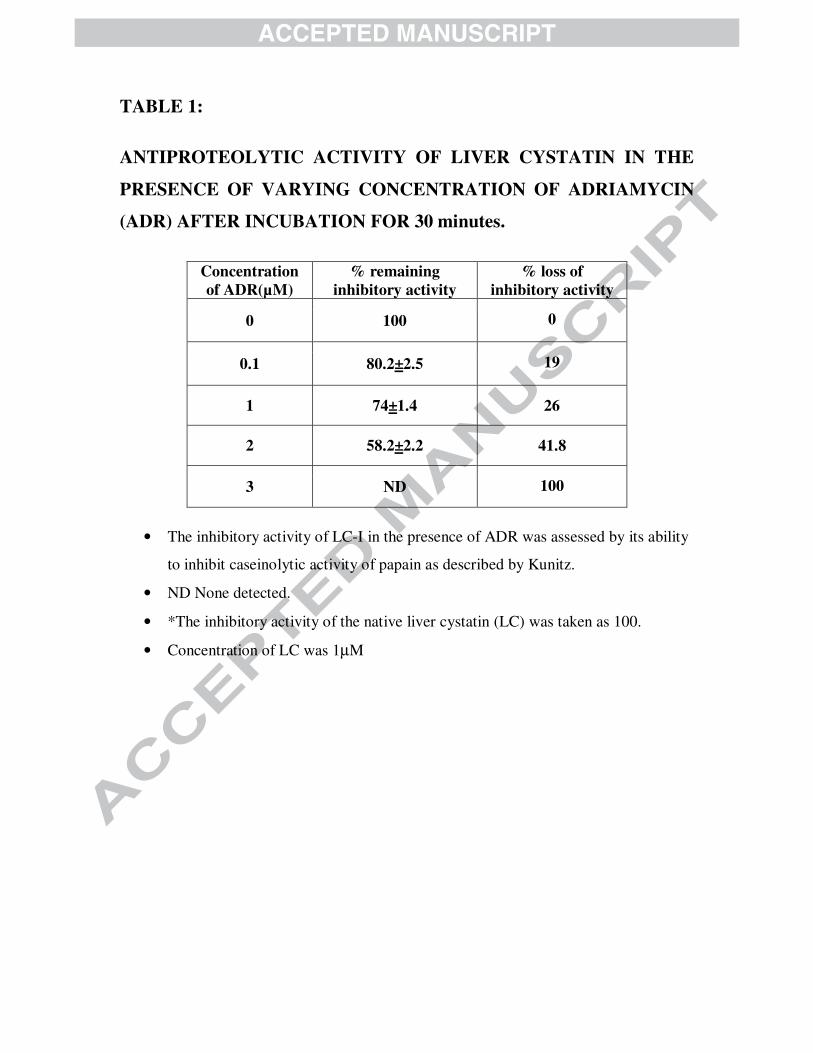
TABLE 1:
ANTIPROTEOLYTIC ACTIVITY OF LIVER CYSTATIN IN THE
PRESENCE OF VARYING CONCENTRATION OF ADRIAMYCIN
(ADR) AFTER INCUBATION FOR 30 minutes.
Concentration
of ADR(µM)
% remaining
inhibitory activity
% loss of
inhibitory activity
0 100 0
0.1 80.2±2.5 19
1 74±1.4 26
2 58.2±2.2 41.8
3 ND 100
• The inhibitory activity of LC-I in the presence of ADR was assessed by its ability
to inhibit caseinolytic activity of papain as described by Kunitz.
• ND None detected.
• *The inhibitory activity of the native liver cystatin (LC) was taken as 100.
• Concentration of LC was 1µM

TABLE 2:
EFFECT OF ADEFOVIR DIPIVOXAL ON INHIBITORY ACTIVITY
OF LIVER CYSTATIN (LC) AFTER INCUBATION FOR 30
MINUTES.
Concentration of
Adevofir
Dipivoxal (µµµµM)
% remaining
inhibitory
activity
% Loss in
Inhibitory
activity of LC*
0 100 0
0.1 67±1 33
0. 5 42±2 58
1 82±1 18
• *The inhibitory activity of the native liver cystatin (LC) was taken as 100.
• The inhibitory activity of LC-I in the presence of ADP was assessed by its ability
to inhibit caseinolytic activity of papain as described by Kunitz.
• Concentration of LC was 1µM.
Copyright © 2022 FDOKUMEN