Different Heat Processing Methods on Flour Yield, Nutritional ...

www.elsevier.com/locate/foodchem
Food Chemistry 95 (2006) 290–300
FoodChemistry
Differences in content and composition of free lipids andcarotenoids in flour of spring and winter wheat cultivated in Poland
Iwona Konopka *, Sylwester Czaplicki, Daniela Rotkiewicz
Chair of Food Plant Chemistry and Processing, University of Warmia and Mazury in Olsztyn, Pl. Cieszynski 1, 10-957, Olsztyn, Poland
Received 26 July 2004; received in revised form 4 January 2005; accepted 4 January 2005
Abstract
The work presents the content and composition of free lipids and carotenoids in spring and winter classes of wheat flour. It dis-
cusses genetical and physiological aspects of their synthesis and accumulation in wheat kernels and also indicates how methodolog-
ical differences explain differences in results presented in the literature. It has been reported that spring wheat flours are richer in free
lipids, especially in the non-polar fraction. The content of glycolipids ranged from 134 to 215 mg/100 g flour and was more stable
within the winter wheat class. The percentages of the two main fractions, namely DGDG and MGDG, were similar in both wheat
classes and reached ca. 77%. Phospholipids constituted the smallest fraction of the flour free lipids in both wheat classes; however,
spring wheat flours were richer in these compounds, which is likely associated with a greater content of spherosomes in the endo-
sperm of this wheat class. The free lipids of spring wheat flour contained more oleic and slightly less linoleic and linolenic acids.
Spring wheat flour was also richer in carotenoids, although there were varieties in both classes that deviated from this. The main
carotenoid was lutein, whose total percentage in the form of different isomers ranged from 71.3% to 83.3% and was slightly lower
for spring wheat flour. Lutein, in the form of a trans-isomer, constituted about 62% and 70% of all carotenoids in spring and winter
wheat flours, respectively.
� 2005 Elsevier Ltd. All rights reserved.
Keywords: Carotenoids; Free lipids; Glycolipids; Wheat flour
1. Introduction
It is well known that the baking value of wheat flour
depends mainly on the content and composition of pro-
teins, but can be significantly modified by flour lipids
(reviewed by Chung & Ohm, 1997). According to Mar-ion and Clark (1995), the functionality of wheat lipids
results from: (1) participation in redox processes, involv-
ing lipooxygenase-catalysed oxidation of polyunsatu-
rated fatty acids, which has an effect on the
rearrangement of disulphide bonds of gluten proteins,
(2) involvement of lipids and lipid-protein complexes
in the formation and stabilisation of air/water (foam)
0308-8146/$ - see front matter � 2005 Elsevier Ltd. All rights reserved.
doi:10.1016/j.foodchem.2005.01.011
* Corresponding author. Fax: +4889 523 34 66.
E-mail address: [email protected] (I. Konopka).
and oil/water (emulsion) interfaces, during dough mix-
ing, proofing and baking. Among flour lipids, the so-
called �free fraction� that can be extracted by non-polar
solvents is of great interest. The content of this fraction
is also considerably more changeable than that of bound
lipids, as was reported by Ruibal-Mendieta, Delacroix,and Meurens (2002) and Bekes, Zawistowska, Zillman,
and Bushuk (1986), for winter and spring wheat,
respectively.
Most studies into free lipids have concerned wheat
cultivated in the US (Chung, Pomeranz, & Finney,
1982; Ohm & Chung, 1999, 2000, 2002), Canada (Bekes
et al., 1986), Australia (Panozzo, Hannah, O�Brien, &Bekes, 1993), UK (Bell, Daniels, & Fearn, 1987), Hun-gary (Karpati, Bekes, Lasztity, & Oersi, 1990) and
Greece (Matsoukas & Morrison, 1991). It was shown

I. Konopka et al. / Food Chemistry 95 (2006) 290–300 291
that wheat lipids are quite a complex family of com-
pounds with varied and often opposite effects on flour
baking value. These papers, and particularly, the long-
term studies carried out by Chung et al. (1982) and
co-authors, provided evidence that free glycolipids,
especially digalactosyldiglicerides (DGDG) play a keyrole in the improvement of flour baking value.
Although the biosynthetic mechanisms of plant lipids
are quite well understood, their regulation is not (Mor-
eau et al., 1998). Morrison, Law, Wylie, Coventry, and
Seekings (1989) discovered that the free polar lipid level
is controlled partly, by a gene allelic to hardness Ha
locus on the short arm of chromosome 5D or closely
linked to it. They also reported that variation in free lip-ids cannot be due to this gene alone and is probably
modified by gene/genes on the long arm of this chromo-
some, proximal to Vrn3 (the gene for spring and winter
wheat habit).
The crude lipid fraction of flour also includes accom-
panying compounds of similar polarity in which carote-
noids are of special nutritional importance. The main
carotenoids of wheat are xanthophylls, predominantlylutein (Heinonen, Olliainen, Linkola, Varo, & Koivisto-
inen, 1989; Kaneko, Nagamine, & Yamada, 1995;
Lepage & Sims, 1968). The second wheat grain caroten-
oid is zeaxanthin (Humphries & Khachik, 2003). The ra-
tio of lutein to zeaxanthin is established at ca. 9.3 and
2.5 in mature and green-harvestaed wheat kernels,
respectively (Humphries & Khachik, 2003). The same
authors also stated that green-harvested wheat is muchricher in carotenoids (about 1100 ng/g of grain in com-
parison to 35–250 ng/g of mature grain) and that both
carotenoids appear predominantly in the form of
trans-isomers.
Table 1
Basic characteristics of used flours
Variety Flour yield (%) Protein (%, d.b.)
Spring varieties Zebra 71.97 13.4
Jasna 68.47 13.7
Olimpia 72.18 12.8
Koksa 70.60 13.6
Opatka 69.60 12.7
�x 70.56a 13.2a
s 1.57 0.44
c.v. 2.22 3.31
Winter varieties Zyta 72.47 14.0
Korweta 73.57 13.6
Finezja 75.43 12.3
Tonacja 76.24 11.5
Mewa 76.14 11.7
Slawa 73.89 12.1
�x 74.62a 12.5a
s 1.54 1.02
c.v. 2.06 8.19
�x, mean value; s, standard deviation; c.v., coefficient of variability (%); FWA
same letter are not significantly different at p < 0.05.
The main classification of wheat is based on its
growing habit and divides wheat varieties into winter
and spring market classes. This diversity is caused by
the vernalization genes Vrn1 and Vrn3 on wheat chro-
mosomes 5AL and 5DL, respectively (Nelson et al.,
1995). The objective of this study was to elucidatewhether wheat growing habit (spring/winter) is con-
nected with the specific accumulation of free lipids
and carotenoids in grain. The latter is of especial sig-
nificance for human health because lutein and zeaxan-
thin are known to prevent age-related macular
degradation (see review by Snodderly, 1995). Their
concentration in human macula can be manipulated
by dietary intake (Bone, Landrum, Dixon, Chen, &Llerena, 2000), thus indicating that wheat class or
varieties richer in these compounds are worth
considering.
2. Materials and methods
2.1. Material
Eleven Polish wheat varieties (five spring and six win-
ter wheats) cultivated in the same Crop Cultivation Sta-
tion in north-eastern Poland, in 2003, were the subject of
the study. Before analyses, the grain was sieve-separated
and, for further investigations, only dominant fractions
with widths larger than 2.8 mm were taken. Dry grain
(approximately 12% of moisture) was stored in linenbags at 9 �C and a relative humidity of 70% and succes-
sively milled into extraction flour.
The extraction flours were obtained by milling
the grain, tempered to 14% moisture content, in a
Zeleny test (cm3) FWA (%) Amylograph viscosity (BU)
52 59.74 880
50 61.11 950
47 59.87 800
52 61.37 940
50 59.07 760
50a 60.23a 866a
2.05 0.97 84.14
4.10 1.62 9.72
51 61.69 1200
49 61.62 1250
47 59.58 950
49 61.15 1020
45 57.55 720
41 57.18 610
47a 59.79a 958a
3.58 2.03 255
7.61 3.40 26.6
, water absorption. Mean values for each class of wheat flour with the

292 I. Konopka et al. / Food Chemistry 95 (2006) 290–300
Brabender Quadrumat Junior (Brabender OHG, Duis-
burg, Germany). The flour yields and their basic charac-
teristics are presented in Table 1. The flours obtained
immediately after milling were analysed for free lipids
and carotenoids.
2.2. Free lipids extraction and fractionation
The content of free lipids was analysed by the
Soxhlet method with petroleum ether according to Pol-
ish Standard PN-73/R-66164. Crude lipid extract was
dissolved in 25 cm3 of chloroform and was then frac-
tionated using SPE prepacked columns (Bond Elut
Glass-SI, 1000MG 6ML, Varian). Column condition-ing and lipid separation were done according to
Ohm and Chung (1999) using a vacuum manifold (Ba-
ker). The non-polar lipid, glycolipid and phospholipid
fractions were separated by elution with 10 cm3 of a
chloroform–acetone mixture (4:1, v/v), followed by
15 cm3 of an acetone–methanol mixture (9:1, v/v)
and 10 cm3 of methanol, respectively. The solvent flow
rate was stabilized at 0.7 ml/min. Each fraction wasevaporated under pressure and nitrogen to dryness at
40 �C and weighed. The recovery of fractionated lipids
was in the range 96–100% of extracted free lipids. The
efficiency of the SPE procedure for separating main
classes of wheat lipids was 100% (purity of each frac-
tion was analysed by thin-layer chromatography in
preliminary studies).
2.3. Free glycolipids analysis
Glycolipids were re-dissolved in 10 cm3 of chloro-
form and separated by thin layer chromatography
using pre-coated TLC plates Silgur-25 UV254 (Mach-
ery-Nagel, Germany) of dimensions 20 · 20 cm, 0.25
cm layer thickness, with isolated concentration zone.
Before analyses, the plates were developed in a mixtureof chloroform: methanol (2:1) and activated at 130 �C/1 h. On such prepared plates, 25 ll of sample were
placed and developed according to Prieto, Ebri, and
Collar (1992) in two solvent systems: I: chloro-
form:acetone:acetic acid:water (10:90:2:3) and II: ethyl
ether:acetic acid (99:1). The developed plates were
sprayed with a 25% solution of sulphuric acid supple-
mented with 0.6% potassium (II) chromate and heatedat 130 �C for 1 h. Next, the plates were scanned (Plus-
tek Optic Pro UT 24 scaner at 600 dpi) and measured
densitometrically using LUCIA G v. 4.8 software. Gly-
colipids were quantified by multiplying the mean gray
level and area of each spot. The qualitative and quan-
titative identification of the obtained spots was carried
out with the use of the MGDG and DGDG standards
(Sigma) and by comparing the results with the separa-tion model presented in the paper by Prieto et al.
(1992).
2.4. Fatty acid analysis
The fatty acid composition of free lipids was
analysed according to Polish Standard PN-EN-ISO-
5508:1996. The conditions of separation were as fol-
lows: CHROM 5 GC with FID detector, a glasscolumn filled with GP3% SP-2310/2% SP-2300 on
100/120 Chromosorb W AW, injection, oven and
detector temperatures were: 230, 210 and 250 �C,respectively. Fatty acid methyl esters (FAME) were
prepared according to Zadernowski and Sosulski
(1978) using a mixture of chloroform:methanol:sulphu-
ric acid (100:100:1, v/v/v). Fatty acids were identified
and quantified using a reference mix of rapeseed oilfatty acids (Supelco).
2.5. Carotenoids extraction and analysis
The isolation of carotenoids was performed as de-
scribed by Chen, Peng, and Chen (1995). The pigments
were extracted from 30 g of flour using 30 cm3 mixture
of hexane, acetone, 99.8% ethanol and toluene in theproportions of 10:7:6:7 v/v/v/v and 6 cm3 of 40%
KOH in methanol. In order to prevent carotenoid oxi-
dation, 4 cm3 of 0.1% BHT were used. The solution
was saponified at room temperature in the dark for 16
h. Next, the sample was supplemented with 30 cm3 of
hexane and made up to 200 cm3 with 10% Na2SO4.
The upper phase was collected and the lower phase
was thrice rinsed with 10 cm3 of hexane. All superna-tants were evaporated at 40 �C under a nitrogen stream
and dissolved in 2 cm3 of methanol:dichloromethane
(45:55 v/v) and filtered through Rezist 30/0.2. The puri-
fied extracts were separated and quantified at 25 �C by
HPLC (Hewlett–Packard 1050) equipped with YMC-
C30 10 · 4.6 mm, 3 lm precolumn and YMC-C30
250 · 4.6 mm, 5 lm column (YMC-Europe GMBH).
The pigments were eluted by methanol:MTBE (89:11)at a flow rate of 1 ml/min. The absorbance was mea-
sured at the wavelength of 450 nm. Carotenoids were
identified, based on retention times of the lutein and
a- and b-carotene true standards (Sigma) and by com-
paring the UV–Visible absorption spectra with previ-
ously published results. The hypsochromic shift,
occurrence of significant absorption in ultraviolet re-
gion, the Q ratio (ratio of maximum absorption of transto cis-peak) (Tai & Chen, 2000) and the % III/II ratio
(height of longest wavelength absorption peak), desig-
nated III, to that of middle absorption peak, designated
II, taking the minimum between the two peaks as base-
line, multiplied by 100 (Rodriguez-Amaya, 2001) were
analysed.
Total carotenoid content was measured according to
Rodriguez-Amaya (2001). The absorption coefficient(A1%
1 cm) of lutein in ethanol at 445 nm (2 550) was
taken.
I. Konopka et al. / Food Chemistry 95 (2006) 290–300 293
2.6. Flour quality analysis
The flours were also tested for moisture and protein
contents (Polish Standard PN-91/A-74010 and PN-75/
A-04018, respectively), Zeleny test (ISO 5529), amylo-
graph viscosity (according to ISO 7973 in AmylographModel. No. 800145, Brabender OHG, Duisburg, Ger-
many) and water absorption (AACC method 54-21 in
a Brabender farinograph OHG, Duisburg, Germany).
These measurements were performed to check the wheat
sample quality and confirm that the kernels were not
damaged by hydrolytic enzymes.
2.7. Statistical analysis
Quality control of lipid fractionation on silica SPE
columns and carotenoid extraction and detection was
intra-laboratory tested in preliminary studies using
known standards. Significant differences between spring
and winter wheat flours were calculated using Statistica
6.0 PL software (StatSoft Tulsa, USA) at a significance
level of p < 0.05. Analysis of variance with Duncan testswas conducted for each variety sampled, in triplicate, for
lipid and carotenoids measurements.
3. Results and discussion
3.1. Free lipids
Free lipid composition is mainly variety- and envi-
ronment-dependent (Chung & Ohm, 1997; Simmonds,
1989) but it can be modified by the milling technology
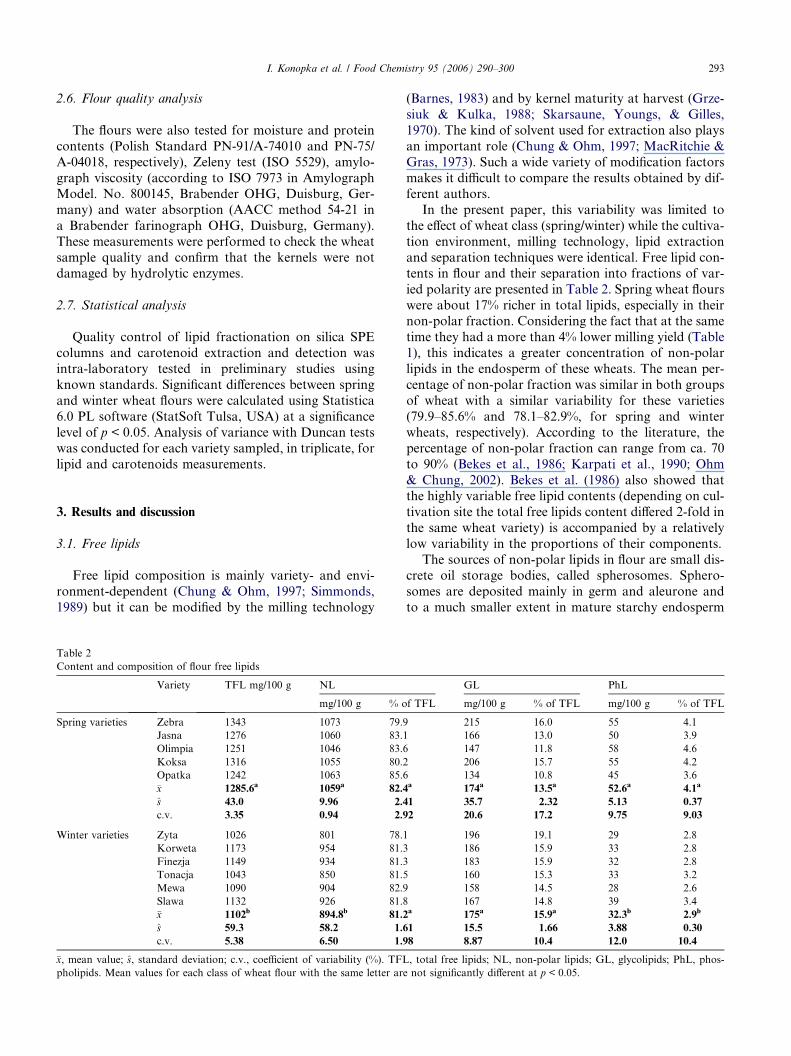
Table 2
Content and composition of flour free lipids
Variety TFL mg/100 g NL
mg/100 g % o
Spring varieties Zebra 1343 1073 79.9
Jasna 1276 1060 83.1
Olimpia 1251 1046 83.6
Koksa 1316 1055 80.2
Opatka 1242 1063 85.6
�x 1285.6a 1059a 82.4
s 43.0 9.96 2.4
c.v. 3.35 0.94 2.9
Winter varieties Zyta 1026 801 78.1
Korweta 1173 954 81.3
Finezja 1149 934 81.3
Tonacja 1043 850 81.5
Mewa 1090 904 82.9
Slawa 1132 926 81.8
�x 1102b 894.8b 81.2
s 59.3 58.2 1.6
c.v. 5.38 6.50 1.9
�x, mean value; s, standard deviation; c.v., coefficient of variability (%). TFL
pholipids. Mean values for each class of wheat flour with the same letter are
(Barnes, 1983) and by kernel maturity at harvest (Grze-
siuk & Kulka, 1988; Skarsaune, Youngs, & Gilles,
1970). The kind of solvent used for extraction also plays
an important role (Chung & Ohm, 1997; MacRitchie &
Gras, 1973). Such a wide variety of modification factors
makes it difficult to compare the results obtained by dif-ferent authors.
In the present paper, this variability was limited to
the effect of wheat class (spring/winter) while the cultiva-
tion environment, milling technology, lipid extraction
and separation techniques were identical. Free lipid con-
tents in flour and their separation into fractions of var-
ied polarity are presented in Table 2. Spring wheat flours
were about 17% richer in total lipids, especially in theirnon-polar fraction. Considering the fact that at the same
time they had a more than 4% lower milling yield (Table
1), this indicates a greater concentration of non-polar
lipids in the endosperm of these wheats. The mean per-
centage of non-polar fraction was similar in both groups
of wheat with a similar variability for these varieties
(79.9–85.6% and 78.1–82.9%, for spring and winter
wheats, respectively). According to the literature, thepercentage of non-polar fraction can range from ca. 70
to 90% (Bekes et al., 1986; Karpati et al., 1990; Ohm
& Chung, 2002). Bekes et al. (1986) also showed that
the highly variable free lipid contents (depending on cul-
tivation site the total free lipids content differed 2-fold in
the same wheat variety) is accompanied by a relatively
low variability in the proportions of their components.
The sources of non-polar lipids in flour are small dis-crete oil storage bodies, called spherosomes. Sphero-
somes are deposited mainly in germ and aleurone and
to a much smaller extent in mature starchy endosperm
GL PhL
f TFL mg/100 g % of TFL mg/100 g % of TFL
215 16.0 55 4.1
166 13.0 50 3.9
147 11.8 58 4.6
206 15.7 55 4.2
134 10.8 45 3.6a 174a 13.5a 52.6a 4.1a
1 35.7 2.32 5.13 0.37
2 20.6 17.2 9.75 9.03
196 19.1 29 2.8
186 15.9 33 2.8
183 15.9 32 2.8
160 15.3 33 3.2
158 14.5 28 2.6
167 14.8 39 3.4a 175a 15.9a 32.3b 2.9b
1 15.5 1.66 3.88 0.30
8 8.87 10.4 12.0 10.4
, total free lipids; NL, non-polar lipids; GL, glycolipids; PhL, phos-
not significantly different at p < 0.05.

294 I. Konopka et al. / Food Chemistry 95 (2006) 290–300
(Hargin, Morrison, & Fulcher, 1980). Their chemical
compositions vary to a small extent between different
plant species (Tzen & Huang, 1992). In the case of maize
kernel, lipid bodies are composed of 97% triglycerides,
constituting their hydrophobic core and about 1% phos-
pholipids. building a ‘‘half-unit’’ membrane of theseorganelles (Tzen & Huang, 1992). The lipids of this
monolayer consist of three main fractions (PC, PI and
Fig. 1. Thin-layer chromatogram of free glycolipids from winter wheat flour
and water (10:90:2:3) to 13 cm and ethyl ether and acetic acid (99:1) to 16
monogalactosyldiglycerol), 1–6-lines of analysed flours.
Table 3
Content and composition of flour glycolipids
Variety DGMG DGDG
% of GL mg/100 g % of GL
Spring varieties Zebra 8.46 18 51.8
Jasna 7.70 13 60.0
Olimpia 8.83 13 62.4
Koksa 8.02 17 61.5
Opatka 9.60 13 53.3
�x 8.52a 15a 57.8a
s 0.74 2.49 4.91
c.v. 8.68 16.60 8.49
Winter varieties Zyta 12.33 24 63.5
Korweta 13.23 25 57.3
Finezja 13.79 25 65.9
Tonacja 13.83 22 63.5
Mewa 14.37 23 63.9
Slawa 10.20 17 61.2
�x 12.96b 23b 62.5
s 1.52 3.01 2.98
c.v. 11.71 13.09 4.76
�x, mean value; s, standard deviation; c.v., coefficient of variability (%). DGM
monogalactosylmonoglycerol; MGDG, monogalactosyldiglycerol. Mean valu
different at p < 0.05.
PE); however, the percentage of the first two fractions
is considerably greater (about 37% each) (Moreau et al.,
1998).
The content of the total glycolipids was more con-
nected with wheat variety than with its class (Table 2).
The slightly higher mean percentages of free lipids offlour from winter wheat was accompanied by smaller
variability within varieties. Spring varieties also varied
s (separation in two-solvent systems: chloroform, acetone, acetic acid,
cm). S-line of standards (DGDG-digalactosyldiglycerol and MGDG-
MGMG MGDG
mg/100 g % of GL mg/100 g % of GL mg/100 g
111 18.4 40 21.4 46
100 12.9 21 19.4 32
92 8.10 12 20 30
127 9.66 20 20.8 43
71 19.8 26 17.8 24
100a 13.8a 24a 20.0 35a
21.0 5.18 10.4 1.44 9.22
21.0 37.63 43.1 7.18 26.3
125 10.33 20 13.2 26
107 15.35 29 14.1 26
121 8.57 16 11.7 21
102 7.62 12 15.1 24
101 7.86 12 13.9 22
102 10.5 18 18.12 30
109a 10.0a 18a 14.4b 25a
10.6 2.87 6.34 2.16 3.25
9.74 28.6 35.2 15.0 13.0
G, digalactosylmonoglycerol; DGDG, digalactosyldiglycerol; MGMG,
es for each class of wheat flour with the same letter are not significantly

I. Konopka et al. / Food Chemistry 95 (2006) 290–300 295
to a greater extent in content of glycolipids (134–215
mg/100 g of flour) than did winter wheats (158–196
mg/100 g of flour).
Literature on which wheat class is richer in free glyco-
lipids is ambiguous. Their greater content in the winter
wheat flours can be speculated by comparing the resultsof Ohm and Chung (2002) and Bekes et al. (1986). The
first authors find that free glycolipids constitute from
12.8% to 16.6% of HWW wheat flour and, the second,
7.7–10.2% of HWS wheat flour. According to Matso-
ukas and Morrison (1991), winter bread wheats grown
in Greece contain about 15.5% glycolipids in the free li-
pid fraction. It seems, however, that different analytical
procedures for lipid extraction and separation, appliedin the cited studies, cannot be the basis for concluding
that free lipids of winter wheat flour contains more gly-
colipids. As long as 30 years ago, MacRitchie and Gras
(1973) suggested that the terms ‘‘free’’ lipids may be mis-
leading because, in flour, there appears to be a portion
of total lipid associated with different compounds, which
may be extracted to a greater or lesser degree by differ-
ent cold solvents. More distinct comparison of thesewheat classes was presented by Bell et al. (1987) who re-
ported that spring wheats were richer in free glycolipids.
This shows that the question of glycolipid connection
with wheat specific class is not fully explained. Further
research should be performed on wheat samples of sim-
ilar quality, especially in protein content and composi-
tion. More synonymous results would probably be
obtained by extraction of all glycolipids. Glycolipidsare deposited in the membrane of amyloplasts, so num-
ber and magnitude of starch granules can strongly influ-
ence their content.
Table 4
Fatty acids compositions of flour free lipids
Variety Fatty acid (%)
C16:0 C16:1
Spring varieties Zebra 19.1 0.02
Jasna 18.9 0.02
Olimpia 19.8 0.04
Koksa 20.0 0.02
Opatka 19.6 0.01
�x 19.5 0.02a
s 0.49 0.01
c.v. 2.52 54.8
Winter varieties Zyta 19.4 0.04
Korweta 19.6 0.05
Finezja 19.8 0.01
Tonacja 19.3 0.02
Mewa 19.4 0.01
Slawa 20.7 0.01
�x 19.7a 0.02a
s 0.51 0.02
c.v. 2.58 87.6
�x, mean value; s, standard deviation; c.v., coefficient of variability (%). Me
significantly different at p < 0.05.
Phospholipids constituted the smallest percentage of
flour free lipids and ranged from 2.6% to 4.6% (Table
2). A greater content of FPhL in spring wheat can be
associated with a greater content of non-polar lipids
(likely greater percentage of spherosomes). However,
looking at the spherosome membrane, only about 1%of the FNL mass, which was about 10 mg phospholip-
ids, originated from this. Thus, other cellular biomem-
branes were the source of the remaining FPhL. They
can also originate from mechanically damaged starch,
in which they occur as integral components (Morrison,
1995).
Polar lipids in kernels are not a storage material, but
build varied cellular membranes. The degree of theirextraction with cold non-polar solvents can be related
to membrane destruction level. Such destruction occurs
naturally in a kernel at endosperm programmed cell
death (PCD) during kernel maturation and as result of
different kinds of stresses (Young & Gallie, 2000). As
a result of these processes, lamellar biomembranes of
starchy endosperm, composed partly of polar lipids, be-
come non-lamellar, mainly hexagonal and/or cubic(Marion & Clark, 1995; Welti et al., 2002). In addition,
the stress of mechanical endosperm destruction during
kernel grinding (measured as, e.g., the amount of dam-
aged starch or mean flour particle diameter) may modify
lipid susceptibility to extraction.
3.2. Free glycolipids composition
Among the free glycolipids, four main fractions
were detected and identified as DGMG, DGDG,
MGMG and MGDG (Table 2, Fig. 1) by comparing
C18:0 C18:1 C18:2 C18:3 Others
0.68 13.5 63.0 3.38 0.34
0.57 14.1 62.2 3.72 0.48
0.64 13.7 62.8 2.81 0.27
0.68 14.2 62.0 2.72 0.46
0.67 15.1 62.8 1.80 0.04
0.65a 14.1a 62.6a 2.89a 0.32a
0.05 0.60 0.43 0.73 0.18
7.17 4.22 0.69 25.4 55.6
0.69 11.5 63.4 4.74 0.21
0.54 11.2 63.3 4.97 0.38
0.48 11.2 63.4 4.59 0.54
0.50 11.7 64.2 4.05 0.24
0.49 11.8 63.5 4.28 0.50
0.47 11.3 63.2 3.80 0.63
0.53b 11.5b 63.5b 4.41b 0.42a
0.08 0.26 0.37 0.44 0.17
15.6 2.29 0.58 10.0 40.3
an values for each class of wheat flour with the same letter are not

296 I. Konopka et al. / Food Chemistry 95 (2006) 290–300
with standards (DGDG and MGDG) and literature
(Prieto et al., 1992). The DGDG predominated and
constituted, on average, approx. 58% and 63% of
FGL from spring and winter wheat, respectively.
Spring wheats were richer in MGDG, both in mass
and percentage. The percentage sums of both thesediacylglycerols were similar in both wheat classes and
approx. 77%. According to Ohm and Chung (2002),
DGDG constitute on average 42.5% and MGDG
17.5% of the composition of FGL from HWW wheat
cultivated in the US. Studies by Karpati et al. (1990)
into wheat cultivated in Hungary found a greater sim-
ilarity of its glycolipid composition to that presented
0 10 20 3
mAU
0
2
4
6
8
10
12
14
1
2
3
4
5
6
325 350 375 400 4
Norm .
0
20
40
60
80
100
Fig. 2. An example of HPLC chromatogram of carotenoids in wheat flour of
1 ml/min at 25 �C on YMC-C30 250 · 4.6 mm, 5 lm column, detection at 450
4. lutein, 5. zeaxanthin, 6.9-cis-lutein, 7. a-carotene, 8. b-carotene; (b) Abso
in the present paper. These authors showed that, in
some cases, the total content of the two main fractions
(DGDG and MGDG) reached 90%. The source of
both glycolipid fractions is exclusively associated with
plastid membranes (Moreau et al., 1998). The presence
of galactosylomonoglycerol fractions in flour indicatesthe activity of lipolytic acyl hydrolases in mature or
maturing wheat endosperm (Barnes, 1983).
3.3. Free lipid fatty acid composition
An analysis of fatty acid composition of free lipids
did not reveal any significant diversification in either
min0 40 50
78
nm25 450 475 500 525
1
2
(a)
(b)
variety Olimpia (elution with methanol:MTBE (89:11) at a flow rate of
nm). (a) Peaks identification: 1/2. 13/13 0-cis-lutein, 3. 13-cis-zeaxanthin,
rbance spectra of main components: 1. lutein, 2. zeaxanthin.

Table 5
Composition of carotenoids in spring and winter wheat flour
Variety Content
(lg/100 g of d.b.)
Composition (%)
13/13 0-cis-lutein
13-
cis-zeaxanthin
Lutein Zeaxanthin 9-cis-lutein a-carotene b-carotene Unidentified Total
lutein
Total
zeaxanthin
L/Z
ratio
Spring varieties Zebra 334 11.3% 6.26 59.9 13.00 3.31 2.30 2.73 1.27 74.4 19.3 3.87
Jasna 248 11.1 5.81 64.2 14.0 3.63 0.00 0.00 1.31 78.9 19.8 3.98
Olimpia 397 8.23 4.40 59.4 16.1 3.72 2.81 4.45 0.89 71.3 20.51 3.48
Koksa 301 12.0 6.55 60.5 15.0 4.78 0.00 0.00 1.10 77.4 21.6 3.59
Opatka 481 10.1 5.61 65.6 12.4 2.65 0.00 2.70 0.93 78.3 18.0 4.34
�x 352a 10.54a 5.73a 61.9a 14.1a 3.62a 1.02 1.98a 1.10a 76.1 19.8a 3.85a
s 90 1.46 0.83 2.80 1.49 0.77 1.41 1.94 0.19 3.15 1.32 0.34
c.v. 25.57 13.9 14.5 4.51 10.6 21.4 138 98.1 17.4 4.14 6.65 8.87
Winter varieties Zyta 191 10.30 5.72 67.7 12.4 2.80 0.00 0.00 1.00 80.9 18 4.48
Korweta 266 7.54 3.69 70.7 11.9 2.13 0.00 3.18 0.86 80.3 15.6 5.14
Finezja 265 8.59 4.36 72.9 11.4 1.87 0.00 0.00 0.88 83.3 15.8 5.27
Tonacja 211 7.58 3.47 72.2 13.6 2.12 0.00 0.00 1.04 81.9 17.04 4.81
Mewa 164 8.79 2.72 67.2 21.3 0.00 0.00 0.00 0.00 76.0 24.01 3.16
Slawa 359 7.95 3.83 72.0 11.21 2.50 0.00 1.65 0.88 82.4 15.0 5.48
�x 242b 8.46b 3.97b 70.5b 13.6a 1.90b 0.00 0.81a 0.78a 80.8b 17.60a 4.72a
s 70 1.04 1.01 2.40 3.84 0.99 0.00 1.34 0.39 2.59 3.33 0.84
c.v. 28.9 12.3 25.5 3.41 28.2 51.9 – 166 49.9 3.21 18.9 17.84
�x, mean value; s, standard deviation; c.v., coefficient of variability (%). Mean values for each class of wheat flour with the same letter are not significantly different at p < 0.05.
I.Konopkaet
al./FoodChem
istry95(2006)290–300
297

298 I. Konopka et al. / Food Chemistry 95 (2006) 290–300
class of wheat (Table 3). The fatty acids of spring
wheat contained more oleic and slightly less linoleic
and linolenic acids. Armanino, De Acutis, and Festa
(2002) found lower levels of linoleic acid (ca. 57.4%)
in 54 samples of Triticum aestivum grown in Germany,
Italy and the UK. Davis et al. (1980) also obtainedsimilar results for wheats cultivated in the US. Apart
from genetic factors, the fatty acid composition is also
determined by climatic conditions. Welch (1975) re-
ported that a colder growing temperature can result
in increased lipid content and an increased amount
of unsaturation in wheat cultivated in the US. This
is either not in agreement with our results (year 2003
in Poland was extremely warm and dry) or varietiescultivated in Poland are characterized by higher con-
tents of unsaturated fatty acids.
3.4. Flour carotenoids
The carotenoid content and composition of ana-
lysed flours are presented in Table 4 and Fig. 2. It
was shown that the mean content of their sums isgreater in spring wheat flour (on average 352 against
242 lg/100 g of flour, dry basis); however, there were
varieties that overlapped both classes. The results are
similar to those presented by other authors (Abdel-
Aal et al., 2002; Heinonen et al., 1989; Kaneko
et al., 1995; Zandomeneghi, Festa, & Carbonaro,
2000). A much smaller content of these pigments in
wheat was reported by Humphries and Khachik(2003) but they analysed only two samples of mature
wheat kernels. Previous studies (Konopka, Kozirok,
& Rotkiewicz, 2004) showed that the content of
carotenoids in Polish winter wheat flour was from
156 to 228 lg/100 g. The present results showed a
higher content of carotenoids in the flour of this class
of wheat. This can be explained, along with changes in
fatty acids composition, by specific plant growth andkernel maturing conditions. Both growing plants and
moulded kernels were subjected to heat and light stres-
ses that could induce defence mechanisms in which
carotenoids are known to be efficacious compounds
against photooxidation (Bartley & Scolnik, 1995). Re-
cently, Rabbani, Beyer, v.Lintig, Hugueney, and Klei-
nig (1998) reported that the carotenogenic pathway is
not maximally active under normal conditions (re-search on alga Dunaliella Bardawil). Overproduction
b-carotene occurs under stress conditions (e.g., high
light intensity) and is accompanied by higher accumu-
lation of oil droplets. So, this could explain the larger
contents both free lipids and carotenoids in flour of
spring wheat, but further research on this subject is
necessary.
The main compound of this group of pigments waslutein, whose total percentage in the form of different
isomers ranged from 71.3% to 83.3% and was slightly
lower for spring wheat flour. Previous investigations
(Konopka et al., 2004) found that the lutein in Polish
winter wheat flour accounted for ca. 95% of all carote-
noids. The differences can be due to modification of
HPLC analyses conditions. In the present study, a C30
instead of C18 phase column was used, which is moreselective for efficient separation of carotenoids (Dach-
tler, Kohler, & Albert, 1998; Rodriguez-Amaya, 2001).
Lutein, in the form of a trans-isomer, constituted about
2/3 of all carotenoids. The remaining important com-
pounds were zeaxanthin and 13-cis and 13 0-cis-isomers
of both main fractions (lutein and zeaxanthin). The
presence of a- and b-carotene was noted in only a few
samples and their content reached maximally 4.45% ofthe total carotenoids. The presence of b-carotene in
flour can indicate its contamination with the bran layer.
This is in agreement with results of Heinonen et al.
(1989) who reported that the content of b-carotene de-
creased from 5.3 to below 1 lg/100 g of flour with ash
content in flour decreasing from 1.3% to 0.7%. (See
Table 5).
The carotenoid biosynthetic pathway, presented inthe work of Park, Kreunen, Cuttriss, DellaPenna,
and Pogson (2002), shows that lutein and zeaxanthin
have different precursors, a- and b-carotene, respec-
tively. The pathway of carotenoid synthesis is quite
well understood (Park et al., 2002) but their regula-
tion is controlled by a yet-unidentified developmental
signal and also their function in non-photosynthetic
tissue, such as wheat endosperm, is not clear (Bartley& Scolnik, 1995). Zeaxanthin is known to be a pre-
cursor of abscisis acid (ABA), a phytohormone that
modulates developmental and stress processes (Bartley
& Scolnik, 1995) and it is responsible for grain
maturation.
4. Conclusions
Wheat native lipids are minor components of flour
but they play significant roles in baking. Wheat flour,
consumed in the form of bread, cakes, pasta, and
other snacks, is also an important source of unsatu-
rated fatty acids and carotenoids. The results suggest
that free lipid and carotenoid contents have to be
partly regulated by wheat vernalization genes. Floursmilled from spring wheat kernels of plants cultivated
in the same place and subjected to the same weather
conditions differed in free lipids (especially in non-po-
lar fraction and phospholipids), fatty acids and carot-
enoid composition. However, both groups of
compounds can be significantly changed by stresses
during plant growth and kernel maturation (so-called
environmental variability). Prediction of wheat kernelcomposition can help improve its utilization and also
human health.

I. Konopka et al. / Food Chemistry 95 (2006) 290–300 299
References
Abdel-Aal, E. S., Young, J. C., Wood, P. J., Rabalski, I., Hud, P.,
Falk, D., et al. (2002). Einkorn: a potential candidate for
developing high lutein wheat. Cereal Chemistry, 79, 455–457.
Armanino, C., De Acutis, R., & Festa, M. R. (2002). Wheat lipids to
discriminate species, varieties, geographical origins and crop years.
Analytica Chimica Acta, 454, 315–326.
Barnes, P. J. (1983). Lipids in cereal technology. London: Academic
Press.
Bartley, G. E., & Scolnik, P. A. (1995). Plant carotenoids: pigments for
photoprotection, visual attraction, and human health. The Plant
Cell, 7, 1027–1038.
Bekes, F., Zawistowska, U., Zillman, R. R., & Bushuk, W. (1986).
Relationship between lipid content and composition and loaf
volume of 26 common spring wheats. Cereal Chemistry, 63,
327–331.
Bell, B. M., Daniels, D. G. H., & Fearn, T. (1987). Lipid compositions,
baking qualities and other characteristics of wheat varieties grown
in the UK. Journal of Cereal Science, 5, 277–286.
Bone, R. A., Landrum, J. T., Dixon, Z., Chen, Y., & Llerena, C. M.
(2000). Lutein and zeaxanthin in the eyes, serum and diet of human
subjects. Experimental Eye Research, 71, 239–245.
Chen, B. H., Peng, H. Y., & Chen, H. E. (1995). Changes of
carotenoids, color and vitamin A contents during processing of
carrot juice. Journal of Agricultural and Food Chemistry, 43,
1912–1918.
Chung, O. K., & Ohm, J. B. (1997). Wheat lipids as a quality
determinant. In Proceedings of the international wheat quality
conference, Manhattan, Kansas, USA, 18–22 May 1997 (pp. 83–
100).
Chung, O. K., Pomeranz, Y., & Finney, K. F. (1982). Relation of polar
lipid content to mixing requirement and loaf volume potential of
hard red winter wheat flour. Cereal Chemistry, 59, 14–20.
Dachtler, M., Kohler, K., & Albert, K. (1998). Reversed-phase high-
performance liquid chromatographic identification of lutein and
zeaxanthin stereoisomers in bovine retina using a C30 bonded
phase. Journal of Chromatography B, 720, 211–216.
Davis, K. R., Litteneker, N., Le Tourneau, D., Cain, R. F., Peters,
L. J., & McGinnis, J. (1980). Evaluation of the nutrient
composition of wheat. I. Lipid constituents. Cereal Chemistry,
57, 178–184.
Grzesiuk, S., & Kulka, K. (1988). Biologia ziarniakow zbo_z. Warszawa,
Poland: PWN.
Hargin, K. D., Morrison, W. R., & Fulcher, R. G. (1980). Triacylg-
licerol deposits in the starchy endosperm of wheat. Cereal
Chemistry, 57, 320–325.
Heinonen, M., Olliainen, V., Linkola, E., Varo, P., & Koivistoinen, P.
(1989). Carotenoids and retinoids in finnish foods: cereal and
bakery products. Cereal Chemistry, 66, 270–273.
Humphries, J. M., & Khachik, F. (2003). Distribution of lutein,
zeaxanthin, and related geometrical isomers in fruit, vegetables,
wheat, and pasta products. Journal of Agricultural and Food
Chemistry, 51, 1322–1327.
Kaneko, S., Nagamine, T., & Yamada, T. (1995). Esterification of
endosperm lutein with fatty acids during the storage of wheat seeds.
Bioscience Biotechnology Biochemistry, 59, 1–4.
Karpati, E. M., Bekes, F., Lasztity, R., & Oersi, F. (1990). Investi-
gation of the relationship between wheat lipids and baking
propertes. Acta Alimentaria, 19, 237–260.
Konopka, I., Kozirok, W., & Rotkiewicz, D. (2004). Lipids and
carotenoids of wheat grain and flour and attempt of correlating
them with digital image analysis of kernel surface and cross-
sections. Food Research International, 37, 429–438.
Lepage, M., & Sims, R. P. A. (1968). Carotenoids of wheat flour: their
identification and composition. Cereal Chemistry, 45, 600–604.
MacRitchie, F., & Gras, P. W. (1973). The role of lipids in baking.
Cereal Chemistry, 50, 292–302.
Marion, D., & Clark, D. C., (1995). Wheat lipids and lipid-binding
proteins: structure and function. In J. D. Schofield (Ed.), The
proceedings of a conference organised by the Royal Society of
Chemistry, UK (pp. 245–260).
Matsoukas, N., & Morrison, W. R. (1991). Breadmaking quality of ten
Greek breadwheats. II. Relationships of protein, lipid and starch
components to baking quality. Journal of the Science of Food and
Agriculture, 55, 87–101.
Moreau, P., Bessoule, J. J., Mongrand, S., Testet, E., Vincent, P., &
Cassagne, C. (1998). Lipid trafficking in plant cells. Progress in
Lipid Research, 37, 371–391.
Morrison, W. R., Law, C. N., Wylie, L. J., Coventry, A. M., &
Seekings, J. (1989). The effect of group 5 chromosomes on the free
polar lipids and breadmaking quality of wheat. Journal of Cereal
Science, 9, 41–51.
Morrison, W. R., (1995). Starch lipids, starch granule structure and
properties. In J. D. Schofield (Ed.), The proceedings of a conference
organised by the Royal Society of Chemistry, UK (pp. 261–270).
Nelson, J. C., Sorrels, M. E., Van-Deynze, A. E., Lu, Y. H., Atkinson,
M., Bernard, M., et al. (1995). Molecular mapping of wheat: a
major genes and rearrangements in homoeologous groups 4, 5 and
7. Genetics, 141, 721–731.
Ohm, J. B., & Chung, O. K. (1999). Estimation of free glycolipids in
wheat flour by HPLC. Cereal Chemistry, 76, 873–876.
Ohm, J. B., &Chung,O.K. (2000).NIR transmittance estimation of free
lipid content and its glycolipid and digalactosylgliceride contents
using wheat flour lipid extracts. Cereal Chemistry, 77, 556–559.
Ohm, J. B., & Chung, O. K. (2002). Relationships of free lipids with
quality factors in hard winter wheat flours. Cereal Chemistry, 79,
274–278.
Panozzo, J. F., Hannah, M. C., O�Brien, L., & Bekes, F. (1993). The
relationship of free lipids and flour protein to breadmaking quality.
Journal of Cereal Science, 17, 47–62.
Park, H., Kreunen, S. S., Cuttriss, A. J., DellaPenna, D., & Pogson, B.
J. (2002). Identification of the carotenoid isomerase provides
insight into carotenoid biosynthesis, prolamellar body formation,
and photomorphogenesis. The Plant Cell, 14, 321–332.
Prieto, J. A., Ebri, A., & Collar, C. (1992). Optimized separation of
nonpolar and polar lipid classes from wheat flour by solid-phase
extraction. Journal of American Oil Chemists Society, 69, 387–391.
Rabbani, S., Beyer, P., v.Lintig, J., Hugueney, P., & Kleinig, H. (1998).
Induced b-carotene synthesis driven by triacylglycerol deposition in
the unicellular alga Dunaliella Bardawil. Plant Physiology, 116,
1239–1248.
Rodriguez-Amaya, D. B. (2001). A guide to carotenoid analysis in
foods. Washinghton, USA: ILSI (International Life Sciences
Institute) Press.
Ruibal-Mendieta, N. L., Delacroix, D. L., & Meurens, M. (2002). A
comparative analysis of free, bound and total lipid content on spelt
and winter wheat wholemeal. Journal of Cereal Science, 35,
337–342.
Simmonds, D. H. (1989). Wheat and wheat quality in Australia.
Chapter11. Fundamental aspects of wheat quality: the lipid fraction.
Australia: CSIRO.
Skarsaune, S. K., Youngs, V. L., & Gilles, K. A. (1970). Changes in
wheat lipids during seed maturation. I. Physical and chemical
changes in the kernel. Cereal Chemistry, 47, 522–531.
Snodderly, D. M. (1995). Evidence for protection against age-related
macular degeneration by carotenoids and antioxidant vitamins.
American Journal of Clinical Nutrition, 62(Suppl.), 1448S–1461S.
Tai, C.-Y., & Chen, B. H. (2000). Analysis and stability of carotenoids
in the flowers of daylily (Hemerocallis) disticha as affected by
various treatments. Journal of Agriculture and Food Chemistry, 48,
5962–5968.

300 I. Konopka et al. / Food Chemistry 95 (2006) 290–300
Tzen, J. T. C., & Huang, A. H. C. (1992). Surface structure and
properties of plant seed oil bodies. The Journal of Cell Biology, 117,
327–335.
Welch, R. W. (1975). Fatty acid composition of grain from winter and
spring sown oats, barley and wheat. Journal of the Science of Food
and Agriculture, 26, 429–437.
Welti, R., Li, W., Li, M., Sang, Y., Biesiada, H., Zhou, H.-E., et al.
(2002). Profiling membrane lipids in plant stress responses. The
Journal of Biological Chemistry, 277, 31994–32002.
Young, T. E., & Gallie, D. R. (2000). Programmed cell death
during endosperm development. Plant Molecular Biology, 44,
283–301.
Zadernowski, R., & Sosulski, F. (1978). Composition of total lipids in
rapeseed. Journal of the American Oil Chemists� Society, 55,
870–872.
Zandomeneghi, M., Festa, C., & Carbonaro, L. (2000). Front-surface
absorbance spectra of wheat flour: determination of carotenoids.
Journal of Agricultural and Food Chemistry, 48, 2216–2221.
Copyright © 2022 FDOKUMEN