Diet and lifestyle are associated with serum C-reactive protein concentrations in a population-based...
13
Quantex CRP ultrasensitive was selected by “Hospital Universitari de Sant Joan de Reus” in Spain in order to perform two extensive clinical and population studies. As a result of these studies, two articles have been published in wellknown scientific journals. We attach the articles herewith: 1) Diet and lifestyle are associated with serum C- reactive protein concentrations in a population- based study. J. Lab Clin Med. January 2005 2) Evaluation of a high-sensitivity turbidimetric immunoassay for serum C-reactive protein: application to the study of longitudinal changes throughout normal pregnancy. Clin Chem Lab Med 2005;43(3):308-313 14/06/05 196/MKT/Q/69 Publications of studies using quantex CRP ultrasensitive
Transcript of Diet and lifestyle are associated with serum C-reactive protein concentrations in a population-based...
Quantex CRP ultrasensitive was selected by “Hospital Universitari de Sant Joan de Reus” in Spain in order to perform two extensive clinical and population studies. As a result of these studies, two articles have been published in wellknown scientific journals. We attach the articles herewith:
1) Diet and lifestyle are associated with serum C-reactive protein concentrations in a population-based study.J. Lab Clin Med. January 2005
2) Evaluation of a high-sensitivity turbidimetric immunoassay for serum C-reactive protein: application to the study of longitudinal changes throughout normal pregnancy. Clin Chem Lab Med 2005;43(3):308-313
14/06/05
196/MKT/Q/69
Publications of studies using quantex CRP ultrasensitive
Diet and lifestyle are associated with serumC-reactive protein concentrations in apopulation-based study
NURIA BERTRAN, JORDI CAMPS, JOAN FERNANDEZ-BALLART, VICTORIA ARIJA,NATALIA FERRE, MONICA TOUS, DOLORS SIMO, MICHELLE M. MURPHY, ELISABET VILELLA,and JORGE JOVEN
REUS, CATALONIA, SPAIN
C-reactive protein (CRP) has been proposed as an independent risk factor forcardiovascular disease. In this study we sought to investigate the association be-tween several nutritional and lifestyle factors and serum CRP concentration in apopulation-based study. We studied 359 individuals (172 women, 187 men; agerange 18–75 years) randomly selected from the town hall’s registers and assessedtheir daily dietary intake using a 3-day estimated-food record. The median serumCRP concentration was 1.40 mg/L (range <0.10–47.48 mg/L; geometric mean 1.20mg/L). We noted significant and independent direct associations between CRP andage, body-mass index, female sex, and serum triglyceride concentration. Bivariateanalysis showed a significant inverse association between CRP and many nutrients(e.g., carbohydrates, proteins, lipids, thiamine, pyridoxine, tocopherol, and folate),but multiple-regression analysis indicated that only the effect of dietary folateintake was not dependent on other factors. Differences in folate intake did notproduce changes in plasma homocysteine concentration, and we detected nonegative correlation between dietary folate intake and log homocysteine (r � .02,P � .711). Strong positive correlations between the intake of folate and numerousother nutrients were found. This population-based study shows that a higher folateintake, in addition to other known constitutive and lifestyle factors, is significantlyassociated with a lower serum CRP concentration. (J Lab Clin Med 2005;145:41–6)
Abbreviations: ANOVA � analysis of variance; BMI � body-mass index; CRP � C-reactiveprotein; EDTA � ethylenediaminetetraacetate; HDL � high-density lipoprotein; hs-CRP �C-reactive protein measured with the use of high-sensitivity methods; LDL � low-densitylipoprotein; MUFA � monounsaturated fatty acid; PUFA � polyunsaturated fatty acid
I t is generally accepted that vascular inflammationplays a role in the development of atherosclerosis1,2
and that inflammation seems to be a predictive fac-tor for the further development of acute coronary syn-dromes such as myocardial infarction and unstable an-gina.3 A feature of most forms of inflammation is the
increase in the circulating concentration of severalplasma proteins known as acute-phase proteins,4
among them CRP. Substantial evidence supports astrong relationship between serum concentrations ofhs-CRP and cardiovascular diseases and their compli-cations.5–12 The Physicians Health Study showed that
From the Centre de Recerca Biomèdica, Hospital Universitari de SantJoan and the Unitat de Medicina Preventiva i Salut Pública, Facultatde Medicina, Universitat Rovira i Virgili, Institut de Recerca enCiències de la Salut.
Supported by grants 00/0252 and 00/0954 from the Fondo de Inves-tigación Sanitaria (FIS) of the Instituto de Salud Carlos III, Red deCentros de Metabolismo y Nutrición (C03/08), Madrid, Spain. DrsFerre and Tous were recipients of grants 99-FI-790 and 02-FI-806,respectively, from the Generalitat de Catalunya.
Submitted for publication May 10, 2004; accepted for publicationNovember 5, 2004.
Reprint requests: Jordi Camps, PhD, Centre de Recerca Biomèdica,Hospital Universitari de Sant Joan, C/. Sant Joan s/n, 43201-Reus,Catalonia, Spain; e-mail: [email protected].
0022-2143/$ – see front matter
© 2005 Elsevier Inc. All rights reserved.
doi:10.1016/j.lab.2004.11.002
41
participants in the highest quartile of hs-CRP distribu-tion had a 2 times greater risk of stroke, a 3 timesgreater risk of myocardial infarction or sudden cardiacdeath, and a 4 times greater higher risk of peripheral-artery disease.5,6 Many other studies support the hy-pothesis that baseline CRP concentration is an indepen-dent risk factor of future cardiovascular events amongapparently healthy individuals.13 A recent study dem-onstrated that hs-CRP is a stronger predictor of cardio-vascular events than LDL cholesterol concentration,and that adds prognostic information to the data pro-vided by the conventional risk factors.12 We have stud-ied the effect of several nutritional and lifestyle factorson serum CRP concentration in a population-basedstudy.
METHODS
Study population. A representative sample of 359 sub-jects from 2 Catalonian villages (172 women, 187 men) wasrandomly selected from the town halls’ population registers(mean age 42 years old, range 19–75 years). All the partici-pants were of white-Mediterranean ethnic origin. The sex andage distributions of the subjects selected were in accordancewith those of the population registers. We sent 784 subjects,selected randomly, a letter informing them about the study,then contacted them by means of telephone and askedwhether wanted to participate. In 15.8% of cases, the letterwas sent in errors (eg, subject deceased, wrong address), and5.1% of addressees were excluded because of dementia, useof folate-antagonist medication, the use of folate or vitaminB6/B12 supplements, or pregnancy. Once these subjects wereexcluded, 79.1% were eligible for inclusion. Of these, 31.5%refused to participate and 2.6% could not make the appoint-ment. Therefore 65.9% (n � 409) of the subjects deemedeligible participated. All of the selected subjects were invitedto attend a clinical examination, to provide a fasting bloodsample, and to complete a 3-day dietary record. After theexamination and standard clinical laboratory tests, we ex-cluded 50 participants in whom we suspected renal alter-ations, hepatic damage, or neoplasia. Use of medication wasan exclusion criterion in the case interference by vitamins ordrugs with homocysteine metabolism (eg, methrotrexate, tu-berculostatics, theophylline, vitamin B6 antagonists). Thestudy population did not consume vitamin supplements, andlocal foods are not fortified with vitamins in Spain. The studywas approved by the Ethics Comittees of the Hospital Uni-versitari de Sant Joan and the Jordi Gol Foundation. Allsubjects gave their full informed consent in accordance withthe Declaration of Helsinki.
Methods of dietary assessment. We assessed dietary in-take using a 3-day estimated-food record.14 Subjects wereinstructed to record all food and beverage consumption (in-cluding snacks) over 2 nonconsecutive weekdays and 1 week-end day. Quantities were expressed in household measures.The food record was checked by the study’s dietitian, whoverified and classified the quantities and types of food re-corded. Portion sizes were confirmed with photographic mod-
els depicting a variety of standard household measures. Eachof the records was codified by the dietitian. This was a recordof real food-and-beverage intake, not a food-frequency ques-tionnaire, and the subjects registered what they ate rather thanestimate their usual eating habits. The French Food Compo-sition Table,15 complemented by the Spanish Food Compo-sition Table,16 was used to calculate daily nutrient intake.
Biochemical measurements. We obtained blood sampleswhile subjects fasted, collecting specimens into potassiumEDTA–containing tubes for homocysteine determinations orinto tubes with no anticoagulants added for the other bio-chemical tests. One week elapsed between recording of foodintake and blood sampling. The serum concentration of hs-CRP was measured with the use of a particle-enhanced tur-bidimetric immunoassay (Quantex hs-CRP kit; Biokit, Bar-celona, Spain) with a limit of detection of 0.10 mg/L.Coefficients of variation were less than 2% (intraassay) andless than 4% (interassay). HDL-cholesterol concentration wasanalyzed by a homogeneous method (ITC Diagnostics, Bar-celona, Spain). Serum cholesterol and triglycerides were as-sessed with the use of standard techniques (ITC Diagnostics).LDL cholesterol was estimated with the use of Friedewald’sequation.17 We measured plasma homocysteine concentrationusing a fluorescence polarization immunoassay (Abbott Di-agnostics, Abbott Park, Ill).
Statistical analysis. We used the Kolmogorov-Smirnovand Shapiro-Wilks methods to determine whether the vari-ables were normally distributed. To check differences be-tween CRP quartiles on the variables studied, we usedANOVA or the Kruskal-Wallis method followed by theMann-Whitney U test, corrected for multiple comparisonswhen appropriate. To verify the association between CRP andthe other variables, we fitted a multiple–linear regressionmodel. This analysis was performed in 2 phases. In the first,we forced the inclusion into the model of factors previouslyreported to be related to CRP that were also significant in ourdata (Table I) such as age, smoking, BMI, and triglycerideconcentrations. We also included pyridoxine because a sig-nificant inverse association has been reported between circu-lating vitamin B6 and CRP.18 Although sex was not signifi-cant, it was also included. In the second phase, we determinedwhich nutrients had an independent relationship with CRP, ofall the nutrients previously shown to be related (Table I), withthe use of stepwise methods of selecting variables. We alsoforced the introduction of energy intake into the model (astandard procedure to separate the effect of the total amounteaten from the amount of each specific nutrient). CRP con-centrations were log-transformed (natural logarithms) beforethe application of the model. To estimate the degree of changeproduced in serum CRP concentration by modifications of theindependent variable value, we calculated the antilogarithmof the B regression coefficient: Average percent change �(antilogeB � 1) � 100. For calculation purposes, we assignedCRP concentrations below the assay’s limit of detection thevalue of 0.10 mg/L. Statistical analyses were performed withthe Statistical Package for Social Sciences (SPSS) version11.5 (SPSS Inc., Chicago, Ill).
J Lab Clin Med42 Bertran et al January 2005
RESULTS
Population description. Of the participants, 140(39.0%) reported that they were current consumers ofalcoholic beverages. Twenty-six other participants(7.2%) reported that they had stopped drinking alcoholbetween 1 and 38 years ago (4 had not consumedalcohol for 1 year, 12 had not consumed alcohol for2–10 years, and 10 had abstained for �10 years), andthey were therefore considered nondrinkers. Among theprevious consumers of alcohol, 4 reported having drunkmore than 80 g/day. One-hundred eight participants(30.1%) reported current cigarette smoking. Seventy-eight others (21.7%) reported that they had stoppedsmoking between 1 and 40 years ago (1 individual had
stopped a year ago, 34 had stopped 2–10 years ago, and43 had stopped �10 years ago), and were considered asnonsmokers. Among the ex-smokers, 21 reported hav-ing smoked more than 20 cigarettes a day. The preva-lence of current cigarette smoking was higher amongthe younger subjects (44% of those aged 18–29 years,44.8% of those aged 30–44 years, 21.3% of those aged45–54 years, 16.7% of those aged 55–64 years, and8.9% of those aged 65–75 years; P � .001). Fifty-fourwomen were menopausal, but just 7 took hormone-replacement therapy.
Serum CRP measurements. Serum CRP was detect-able in 341 of the 359 participants (95.0 %). A fre-quency histogram of CRP concentrations in our popu-
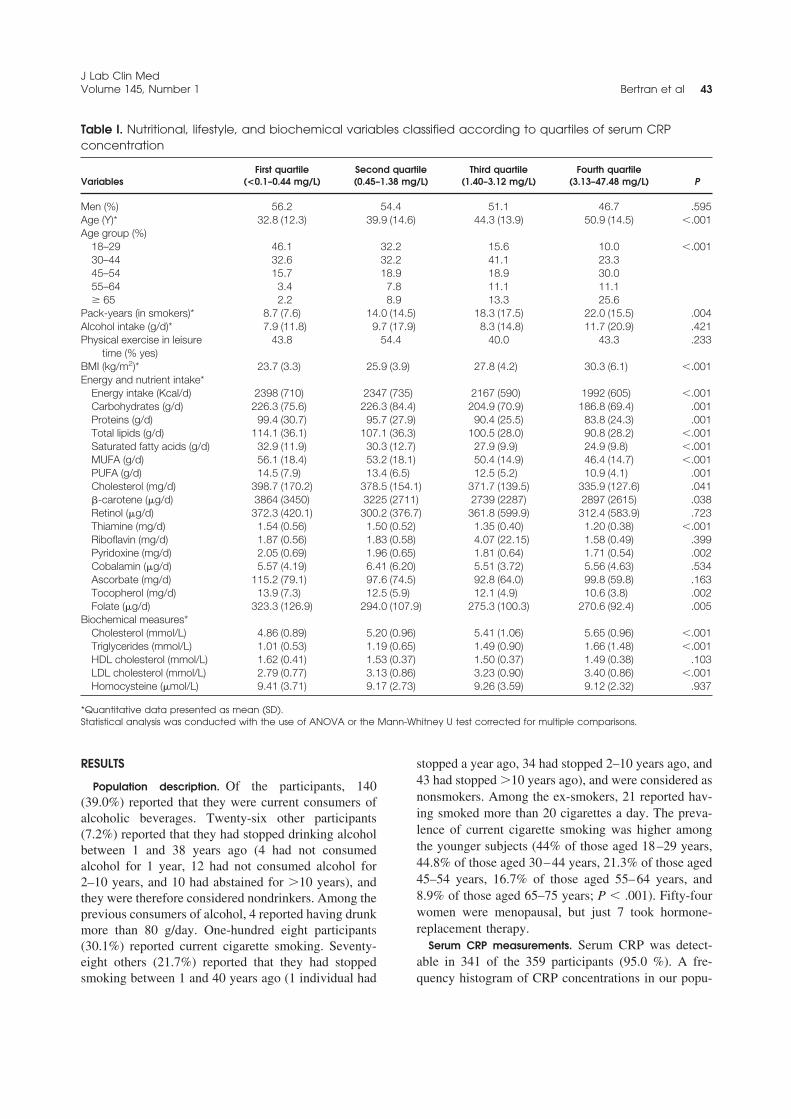
Table I. Nutritional, lifestyle, and biochemical variables classified according to quartiles of serum CRPconcentration
VariablesFirst quartile
(<0.1–0.44 mg/L)Second quartile(0.45–1.38 mg/L)
Third quartile(1.40–3.12 mg/L)
Fourth quartile(3.13–47.48 mg/L) P
Men (%) 56.2 54.4 51.1 46.7 .595Age (Y)* 32.8 (12.3) 39.9 (14.6) 44.3 (13.9) 50.9 (14.5) �.001Age group (%)
18–29 46.1 32.2 15.6 10.0 �.00130–44 32.6 32.2 41.1 23.345–54 15.7 18.9 18.9 30.055–64 3.4 7.8 11.1 11.1� 65 2.2 8.9 13.3 25.6
Pack-years (in smokers)* 8.7 (7.6) 14.0 (14.5) 18.3 (17.5) 22.0 (15.5) .004Alcohol intake (g/d)* 7.9 (11.8) 9.7 (17.9) 8.3 (14.8) 11.7 (20.9) .421Physical exercise in leisure
time (% yes)43.8 54.4 40.0 43.3 .233
BMI (kg/m2)* 23.7 (3.3) 25.9 (3.9) 27.8 (4.2) 30.3 (6.1) �.001Energy and nutrient intake*
Energy intake (Kcal/d) 2398 (710) 2347 (735) 2167 (590) 1992 (605) �.001Carbohydrates (g/d) 226.3 (75.6) 226.3 (84.4) 204.9 (70.9) 186.8 (69.4) .001Proteins (g/d) 99.4 (30.7) 95.7 (27.9) 90.4 (25.5) 83.8 (24.3) .001Total lipids (g/d) 114.1 (36.1) 107.1 (36.3) 100.5 (28.0) 90.8 (28.2) �.001Saturated fatty acids (g/d) 32.9 (11.9) 30.3 (12.7) 27.9 (9.9) 24.9 (9.8) �.001MUFA (g/d) 56.1 (18.4) 53.2 (18.1) 50.4 (14.9) 46.4 (14.7) �.001PUFA (g/d) 14.5 (7.9) 13.4 (6.5) 12.5 (5.2) 10.9 (4.1) .001Cholesterol (mg/d) 398.7 (170.2) 378.5 (154.1) 371.7 (139.5) 335.9 (127.6) .041�-carotene (�g/d) 3864 (3450) 3225 (2711) 2739 (2287) 2897 (2615) .038Retinol (�g/d) 372.3 (420.1) 300.2 (376.7) 361.8 (599.9) 312.4 (583.9) .723Thiamine (mg/d) 1.54 (0.56) 1.50 (0.52) 1.35 (0.40) 1.20 (0.38) �.001Riboflavin (mg/d) 1.87 (0.56) 1.83 (0.58) 4.07 (22.15) 1.58 (0.49) .399Pyridoxine (mg/d) 2.05 (0.69) 1.96 (0.65) 1.81 (0.64) 1.71 (0.54) .002Cobalamin (�g/d) 5.57 (4.19) 6.41 (6.20) 5.51 (3.72) 5.56 (4.63) .534Ascorbate (mg/d) 115.2 (79.1) 97.6 (74.5) 92.8 (64.0) 99.8 (59.8) .163Tocopherol (mg/d) 13.9 (7.3) 12.5 (5.9) 12.1 (4.9) 10.6 (3.8) .002Folate (�g/d) 323.3 (126.9) 294.0 (107.9) 275.3 (100.3) 270.6 (92.4) .005
Biochemical measures*Cholesterol (mmol/L) 4.86 (0.89) 5.20 (0.96) 5.41 (1.06) 5.65 (0.96) �.001Triglycerides (mmol/L) 1.01 (0.53) 1.19 (0.65) 1.49 (0.90) 1.66 (1.48) �.001HDL cholesterol (mmol/L) 1.62 (0.41) 1.53 (0.37) 1.50 (0.37) 1.49 (0.38) .103LDL cholesterol (mmol/L) 2.79 (0.77) 3.13 (0.86) 3.23 (0.90) 3.40 (0.86) �.001Homocysteine (�mol/L) 9.41 (3.71) 9.17 (2.73) 9.26 (3.59) 9.12 (2.32) .937
*Quantitative data presented as mean (SD).Statistical analysis was conducted with the use of ANOVA or the Mann-Whitney U test corrected for multiple comparisons.
J Lab Clin MedVolume 145, Number 1 Bertran et al 43
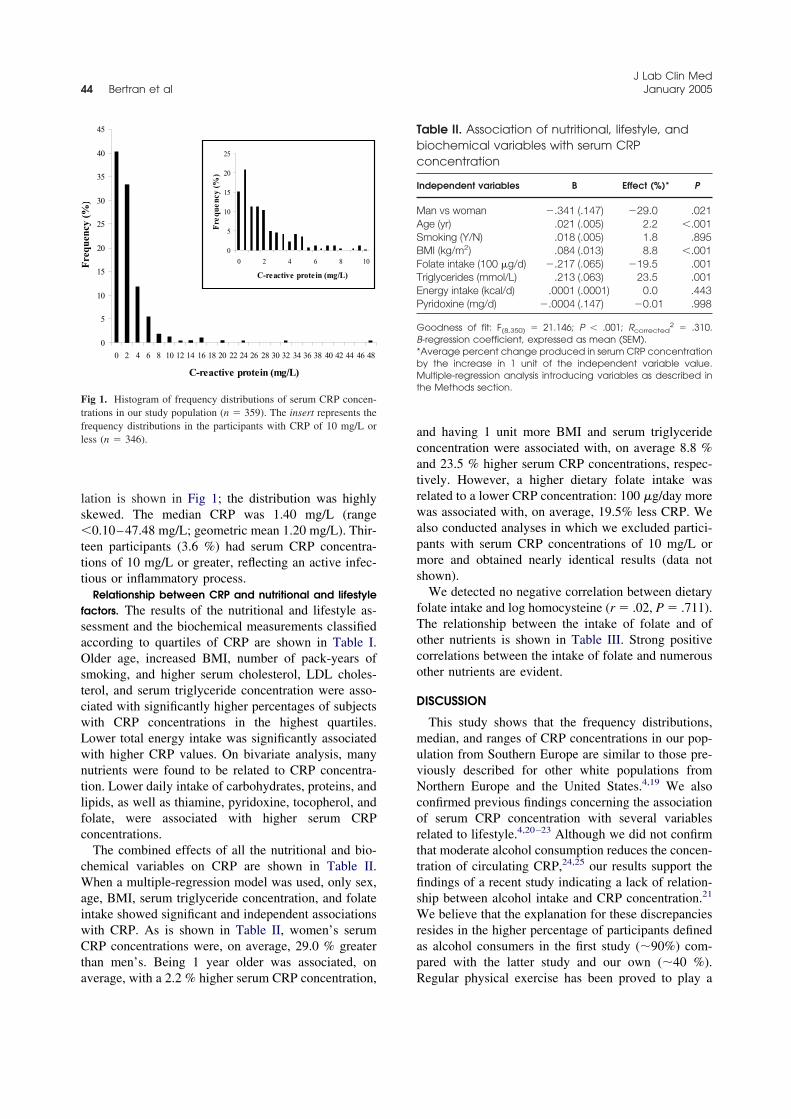
lation is shown in Fig 1; the distribution was highlyskewed. The median CRP was 1.40 mg/L (range�0.10–47.48 mg/L; geometric mean 1.20 mg/L). Thir-teen participants (3.6 %) had serum CRP concentra-tions of 10 mg/L or greater, reflecting an active infec-tious or inflammatory process.
Relationship between CRP and nutritional and lifestylefactors. The results of the nutritional and lifestyle as-sessment and the biochemical measurements classifiedaccording to quartiles of CRP are shown in Table I.Older age, increased BMI, number of pack-years ofsmoking, and higher serum cholesterol, LDL choles-terol, and serum triglyceride concentration were asso-ciated with significantly higher percentages of subjectswith CRP concentrations in the highest quartiles.Lower total energy intake was significantly associatedwith higher CRP values. On bivariate analysis, manynutrients were found to be related to CRP concentra-tion. Lower daily intake of carbohydrates, proteins, andlipids, as well as thiamine, pyridoxine, tocopherol, andfolate, were associated with higher serum CRPconcentrations.
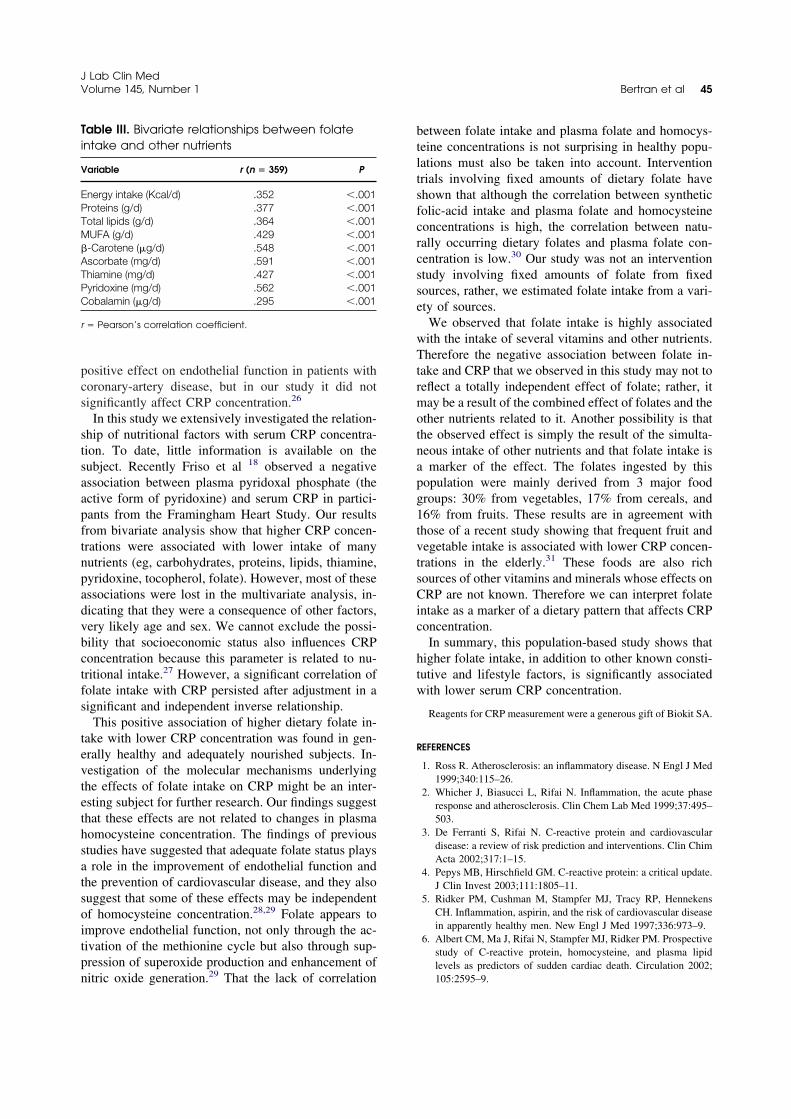
The combined effects of all the nutritional and bio-chemical variables on CRP are shown in Table II.When a multiple-regression model was used, only sex,age, BMI, serum triglyceride concentration, and folateintake showed significant and independent associationswith CRP. As is shown in Table II, women’s serumCRP concentrations were, on average, 29.0 % greaterthan men’s. Being 1 year older was associated, onaverage, with a 2.2 % higher serum CRP concentration,
and having 1 unit more BMI and serum triglycerideconcentration were associated with, on average 8.8 %and 23.5 % higher serum CRP concentrations, respec-tively. However, a higher dietary folate intake wasrelated to a lower CRP concentration: 100 �g/day morewas associated with, on average, 19.5% less CRP. Wealso conducted analyses in which we excluded partici-pants with serum CRP concentrations of 10 mg/L ormore and obtained nearly identical results (data notshown).
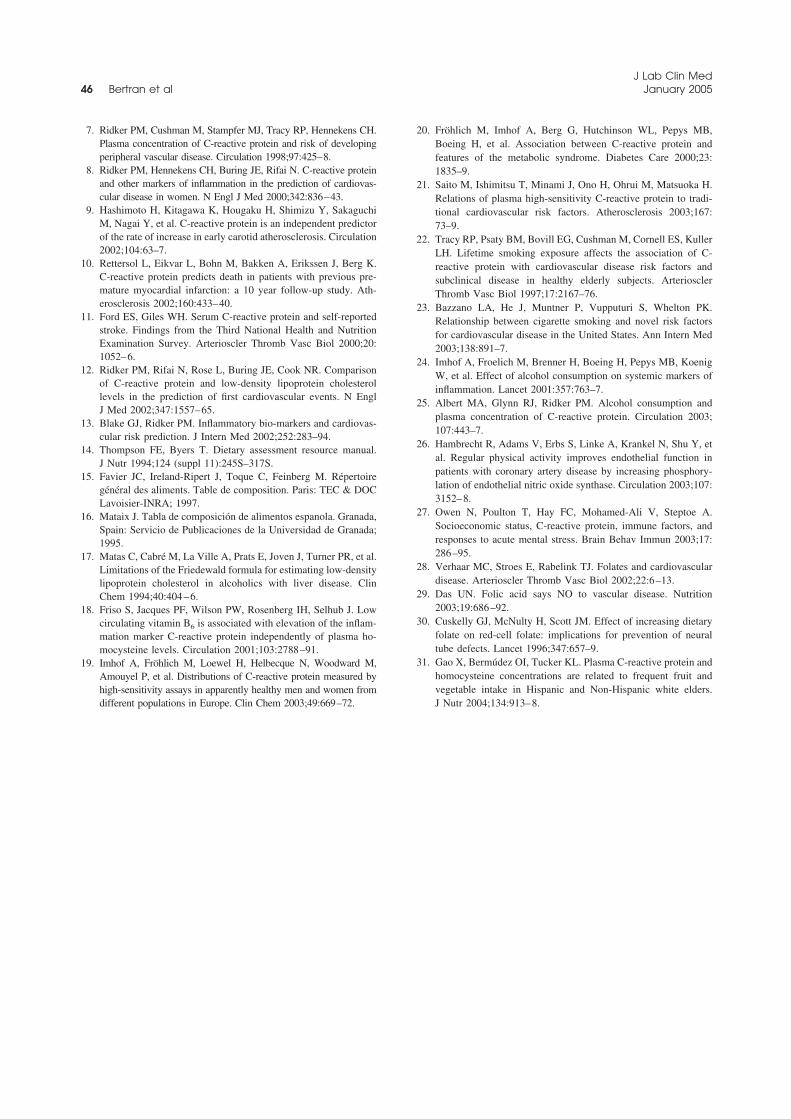
We detected no negative correlation between dietaryfolate intake and log homocysteine (r � .02, P � .711).The relationship between the intake of folate and ofother nutrients is shown in Table III. Strong positivecorrelations between the intake of folate and numerousother nutrients are evident.
DISCUSSION
This study shows that the frequency distributions,median, and ranges of CRP concentrations in our pop-ulation from Southern Europe are similar to those pre-viously described for other white populations fromNorthern Europe and the United States.4,19 We alsoconfirmed previous findings concerning the associationof serum CRP concentration with several variablesrelated to lifestyle.4,20–23 Although we did not confirmthat moderate alcohol consumption reduces the concen-tration of circulating CRP,24,25 our results support thefindings of a recent study indicating a lack of relation-ship between alcohol intake and CRP concentration.21
We believe that the explanation for these discrepanciesresides in the higher percentage of participants definedas alcohol consumers in the first study (�90%) com-pared with the latter study and our own (�40 %).Regular physical exercise has been proved to play a
0
5
10
15
20
25
30
35
40
45
0 2 4 6 8 10 12 14 16 18 20 22 24 26 28 30 32 34 36 38 40 42 44 46 48
C-reactive protein (mg/L)
Fre
quen
cy (
%)
0
5
10
15
20
25
0 2 4 6 8 10
C-reactive protein (mg/L)
Freq
uenc
y (%
)
0
5
10
15
20
25
0 2 4 6 8 10
C-reactive protein (mg/L)
Fre
quen
cy (
%)
Fig 1. Histogram of frequency distributions of serum CRP concen-trations in our study population (n � 359). The insert represents thefrequency distributions in the participants with CRP of 10 mg/L orless (n � 346).
Table II. Association of nutritional, lifestyle, andbiochemical variables with serum CRPconcentration
Independent variables B Effect (%)* P
Man vs woman �.341 (.147) �29.0 .021Age (yr) .021 (.005) 2.2 �.001Smoking (Y/N) .018 (.005) 1.8 .895BMI (kg/m2) .084 (.013) 8.8 �.001Folate intake (100 �g/d) �.217 (.065) �19.5 .001Triglycerides (mmol/L) .213 (.063) 23.5 .001Energy intake (kcal/d) .0001 (.0001) 0.0 .443Pyridoxine (mg/d) �.0004 (.147) �0.01 .998
Goodness of fit: F(8,350) � 21.146; P � .001; Rcorrected2 � .310.
B-regression coefficient, expressed as mean (SEM).*Average percent change produced in serum CRP concentrationby the increase in 1 unit of the independent variable value.Multiple-regression analysis introducing variables as described inthe Methods section.
J Lab Clin Med44 Bertran et al January 2005
positive effect on endothelial function in patients withcoronary-artery disease, but in our study it did notsignificantly affect CRP concentration.26
In this study we extensively investigated the relation-ship of nutritional factors with serum CRP concentra-tion. To date, little information is available on thesubject. Recently Friso et al 18 observed a negativeassociation between plasma pyridoxal phosphate (theactive form of pyridoxine) and serum CRP in partici-pants from the Framingham Heart Study. Our resultsfrom bivariate analysis show that higher CRP concen-trations were associated with lower intake of manynutrients (eg, carbohydrates, proteins, lipids, thiamine,pyridoxine, tocopherol, folate). However, most of theseassociations were lost in the multivariate analysis, in-dicating that they were a consequence of other factors,very likely age and sex. We cannot exclude the possi-bility that socioeconomic status also influences CRPconcentration because this parameter is related to nu-tritional intake.27 However, a significant correlation offolate intake with CRP persisted after adjustment in asignificant and independent inverse relationship.
This positive association of higher dietary folate in-take with lower CRP concentration was found in gen-erally healthy and adequately nourished subjects. In-vestigation of the molecular mechanisms underlyingthe effects of folate intake on CRP might be an inter-esting subject for further research. Our findings suggestthat these effects are not related to changes in plasmahomocysteine concentration. The findings of previousstudies have suggested that adequate folate status playsa role in the improvement of endothelial function andthe prevention of cardiovascular disease, and they alsosuggest that some of these effects may be independentof homocysteine concentration.28,29 Folate appears toimprove endothelial function, not only through the ac-tivation of the methionine cycle but also through sup-pression of superoxide production and enhancement ofnitric oxide generation.29 That the lack of correlation
between folate intake and plasma folate and homocys-teine concentrations is not surprising in healthy popu-lations must also be taken into account. Interventiontrials involving fixed amounts of dietary folate haveshown that although the correlation between syntheticfolic-acid intake and plasma folate and homocysteineconcentrations is high, the correlation between natu-rally occurring dietary folates and plasma folate con-centration is low.30 Our study was not an interventionstudy involving fixed amounts of folate from fixedsources, rather, we estimated folate intake from a vari-ety of sources.
We observed that folate intake is highly associatedwith the intake of several vitamins and other nutrients.Therefore the negative association between folate in-take and CRP that we observed in this study may not toreflect a totally independent effect of folate; rather, itmay be a result of the combined effect of folates and theother nutrients related to it. Another possibility is thatthe observed effect is simply the result of the simulta-neous intake of other nutrients and that folate intake isa marker of the effect. The folates ingested by thispopulation were mainly derived from 3 major foodgroups: 30% from vegetables, 17% from cereals, and16% from fruits. These results are in agreement withthose of a recent study showing that frequent fruit andvegetable intake is associated with lower CRP concen-trations in the elderly.31 These foods are also richsources of other vitamins and minerals whose effects onCRP are not known. Therefore we can interpret folateintake as a marker of a dietary pattern that affects CRPconcentration.
In summary, this population-based study shows thathigher folate intake, in addition to other known consti-tutive and lifestyle factors, is significantly associatedwith lower serum CRP concentration.
Reagents for CRP measurement were a generous gift of Biokit SA.
REFERENCES
1. Ross R. Atherosclerosis: an inflammatory disease. N Engl J Med1999;340:115–26.
2. Whicher J, Biasucci L, Rifai N. Inflammation, the acute phaseresponse and atherosclerosis. Clin Chem Lab Med 1999;37:495–503.
3. De Ferranti S, Rifai N. C-reactive protein and cardiovasculardisease: a review of risk prediction and interventions. Clin ChimActa 2002;317:1–15.
4. Pepys MB, Hirschfield GM. C-reactive protein: a critical update.J Clin Invest 2003;111:1805–11.
5. Ridker PM, Cushman M, Stampfer MJ, Tracy RP, HennekensCH. Inflammation, aspirin, and the risk of cardiovascular diseasein apparently healthy men. New Engl J Med 1997;336:973–9.
6. Albert CM, Ma J, Rifai N, Stampfer MJ, Ridker PM. Prospectivestudy of C-reactive protein, homocysteine, and plasma lipidlevels as predictors of sudden cardiac death. Circulation 2002;105:2595–9.
Table III. Bivariate relationships between folateintake and other nutrients
Variable r (n � 359) P
Energy intake (Kcal/d) .352 �.001Proteins (g/d) .377 �.001Total lipids (g/d) .364 �.001MUFA (g/d) .429 �.001�-Carotene (�g/d) .548 �.001Ascorbate (mg/d) .591 �.001Thiamine (mg/d) .427 �.001Pyridoxine (mg/d) .562 �.001Cobalamin (�g/d) .295 �.001
r � Pearson’s correlation coefficient.
J Lab Clin MedVolume 145, Number 1 Bertran et al 45
7. Ridker PM, Cushman M, Stampfer MJ, Tracy RP, Hennekens CH.Plasma concentration of C-reactive protein and risk of developingperipheral vascular disease. Circulation 1998;97:425–8.
8. Ridker PM, Hennekens CH, Buring JE, Rifai N. C-reactive proteinand other markers of inflammation in the prediction of cardiovas-cular disease in women. N Engl J Med 2000;342:836–43.
9. Hashimoto H, Kitagawa K, Hougaku H, Shimizu Y, SakaguchiM, Nagai Y, et al. C-reactive protein is an independent predictorof the rate of increase in early carotid atherosclerosis. Circulation2002;104:63–7.
10. Rettersol L, Eikvar L, Bohn M, Bakken A, Erikssen J, Berg K.C-reactive protein predicts death in patients with previous pre-mature myocardial infarction: a 10 year follow-up study. Ath-erosclerosis 2002;160:433–40.
11. Ford ES, Giles WH. Serum C-reactive protein and self-reportedstroke. Findings from the Third National Health and NutritionExamination Survey. Arterioscler Thromb Vasc Biol 2000;20:1052–6.
12. Ridker PM, Rifai N, Rose L, Buring JE, Cook NR. Comparisonof C-reactive protein and low-density lipoprotein cholesterollevels in the prediction of first cardiovascular events. N EnglJ Med 2002;347:1557–65.
13. Blake GJ, Ridker PM. Inflammatory bio-markers and cardiovas-cular risk prediction. J Intern Med 2002;252:283–94.
14. Thompson FE, Byers T. Dietary assessment resource manual.J Nutr 1994;124 (suppl 11):245S–317S.
15. Favier JC, Ireland-Ripert J, Toque C, Feinberg M. Répertoiregénéral des aliments. Table de composition. Paris: TEC & DOCLavoisier-INRA; 1997.
16. Mataix J. Tabla de composición de alimentos espanola. Granada,Spain: Servicio de Publicaciones de la Universidad de Granada;1995.
17. Matas C, Cabré M, La Ville A, Prats E, Joven J, Turner PR, et al.Limitations of the Friedewald formula for estimating low-densitylipoprotein cholesterol in alcoholics with liver disease. ClinChem 1994;40:404–6.
18. Friso S, Jacques PF, Wilson PW, Rosenberg IH, Selhub J. Lowcirculating vitamin B6 is associated with elevation of the inflam-mation marker C-reactive protein independently of plasma ho-mocysteine levels. Circulation 2001;103:2788–91.
19. Imhof A, Fröhlich M, Loewel H, Helbecque N, Woodward M,Amouyel P, et al. Distributions of C-reactive protein measured byhigh-sensitivity assays in apparently healthy men and women fromdifferent populations in Europe. Clin Chem 2003;49:669–72.
20. Fröhlich M, Imhof A, Berg G, Hutchinson WL, Pepys MB,Boeing H, et al. Association between C-reactive protein andfeatures of the metabolic syndrome. Diabetes Care 2000;23:1835–9.
21. Saito M, Ishimitsu T, Minami J, Ono H, Ohrui M, Matsuoka H.Relations of plasma high-sensitivity C-reactive protein to tradi-tional cardiovascular risk factors. Atherosclerosis 2003;167:73–9.
22. Tracy RP, Psaty BM, Bovill EG, Cushman M, Cornell ES, KullerLH. Lifetime smoking exposure affects the association of C-reactive protein with cardiovascular disease risk factors andsubclinical disease in healthy elderly subjects. ArteriosclerThromb Vasc Biol 1997;17:2167–76.
23. Bazzano LA, He J, Muntner P, Vupputuri S, Whelton PK.Relationship between cigarette smoking and novel risk factorsfor cardiovascular disease in the United States. Ann Intern Med2003;138:891–7.
24. Imhof A, Froelich M, Brenner H, Boeing H, Pepys MB, KoenigW, et al. Effect of alcohol consumption on systemic markers ofinflammation. Lancet 2001:357:763–7.
25. Albert MA, Glynn RJ, Ridker PM. Alcohol consumption andplasma concentration of C-reactive protein. Circulation 2003;107:443–7.
26. Hambrecht R, Adams V, Erbs S, Linke A, Krankel N, Shu Y, etal. Regular physical activity improves endothelial function inpatients with coronary artery disease by increasing phosphory-lation of endothelial nitric oxide synthase. Circulation 2003;107:3152–8.
27. Owen N, Poulton T, Hay FC, Mohamed-Ali V, Steptoe A.Socioeconomic status, C-reactive protein, immune factors, andresponses to acute mental stress. Brain Behav Immun 2003;17:286–95.
28. Verhaar MC, Stroes E, Rabelink TJ. Folates and cardiovasculardisease. Arterioscler Thromb Vasc Biol 2002;22:6–13.
29. Das UN. Folic acid says NO to vascular disease. Nutrition2003;19:686–92.
30. Cuskelly GJ, McNulty H, Scott JM. Effect of increasing dietaryfolate on red-cell folate: implications for prevention of neuraltube defects. Lancet 1996;347:657–9.
31. Gao X, Bermúdez OI, Tucker KL. Plasma C-reactive protein andhomocysteine concentrations are related to frequent fruit andvegetable intake in Hispanic and Non-Hispanic white elders.J Nutr 2004;134:913–8.
J Lab Clin Med46 Bertran et al January 2005
Clin Chem Lab Med 2005;43(3):308–313 � 2005 by Walter de Gruyter • Berlin • New York. DOI 10.1515/CCLM.2005.053 2005/165Article in press - uncorrected proof
Evaluation of a high-sensitivity turbidimetric immunoassay
for serum C-reactive protein: application to the study of
longitudinal changes throughout normal pregnancy
Nuria Bertran1, Jordi Camps1,*, Joan
Fernandez-Ballart2, Michelle M. Murphy2,
Victoria Arija2, Natalia Ferre1, Monica Tous1
and Jorge Joven1
1 Centre de Recerca Biomedica, Hospital Universitaride Sant Joan,2 Unitat de Medicina Preventiva i Salut Publica,Facultat de Medicina i Ciencies de la Salut,Universitat Rovira i Virgili, Institut de Recerca enCiencies de la Salut, Reus, Catalunya, Spain
Abstract
C-Reactive protein has been associated with severalcomplications of pregnancy. The aims of the presentstudy were: (1) to evaluate a turbidimetric immuno-assay for the measurement of C-reactive protein; and(2) to investigate the chronological changes of the lev-els of this protein from preconception throughoutnormal pregnancy and its relationship with variablesassociated with preconception and pregnancy out-come. Inter-assay imprecision was -5% for C-reac-tive protein )1 mg/L and 18% at a mean value of0.33 mg/L. The limit of detection was 0.10 mg/L. Themethod was linear between 0.10 and 30 mg/L. Therewere no observed interferences from jaundice,hemolysis, lipemia or paraproteinemia at the levelsstudied. There was good agreement with the nephe-lometric method. A total of 39 women were studiedat preconception, at 8, 20 and 32 weeks of pregnancy,and in labor. Preconception C-reactive protein con-centration was 1.17"0.18 mg/L and increased(p-0.001) throughout pregnancy up to 5.69"0.82mg/L. Body mass index at preconception and weightgain during pregnancy were the main factors associ-ated with this increase in C-reactive protein.
Keywords: C-reactive protein; inflammation; methodevaluation; pregnancy.
Introduction
C-Reactive protein (CRP) has been associated withseveral diseases, involving endothelial dysfunctionand systemic inflammation, such as type 2 diabetesmellitus, metabolic syndrome, and cardiovascular dis-
*Corresponding author: Dr. Jordi Camps, Centre deRecerca Biomedica, Hospital Universitari de Sant Joan,C/. Sant Joan s/n, 43201-Reus, Catalunya, SpainPhone: q34-977-310300, Fax: q34-977-312569,E-mail: [email protected]
ease (1–10). Endothelial dysfunction and inflamma-tion are involved in the pathogenesis of preeclampsiaand other important complications of pregnancy,including gestational diabetes and fetal overgrowth(11–13). Hence, its measurement has recently arousedconsiderable interest. Several studies have analyzedserum CRP concentrations at different stages of preg-nancy in order to investigate its association withvarious pregnancy complications (12–16). However,appropriate interpretation of these studies shouldbe based on knowledge of the temporal changes inserum CRP concentrations during normal pregnancy,which have not yet been reported.
The development of high-sensitivity CRP assayshas played a pivotal role in the exploration of itsinvolvement in endothelial dysfunction and subclin-ical inflammation (17). These methods allow the reli-able measurement of low concentrations of serumCRP and are often easily automated, which per-mits the investigation of serum CRP in healthypopulations.
The aim of this study was: 1) to evaluate a particle-enhanced turbidimetric immunoassay (PETIA) for themeasurement of CRP concentrations; and 2) to inves-tigate the chronological changes in the levels of thisprotein from preconception throughout normal preg-nancy, and its relationship with pre-pregnancy anddelivery maternal body mass index (BMI), age, parity,weight gain during pregnancy, and fetal and placentalweight at birth.
Materials and methods
Assay method
The CRP PETIA was performed with an ILab 1800, an auto-mated, random-access, discrete clinical chemistry analyzer(Instrumentation Laboratories, Milan, Italy). This instrumentallows spectrophotometric and turbidimetric reactions to becarried out at 378C, using one or two reagents, in bar-codedprimary tubes. We used commercial reagents obtained fromBiokit (Quantex hs-CRP kit, Biokit, S.A., Barcelona, Spain).The assay requires two reagents. In the first step, 6 mL ofserum was diluted with 130 mL of 0.17 mol/L glycine buffer(pH 9.0) with sodium azide (0.8 g/L) and incubated for 192 s.In the second step, the diluted sample was mixed with asuspension of 130 mL of uniformly sized polystyrene latexparticles (approx. 180 nm in diameter) coated with anti-human CRP monoclonal antibody, and incubated for 324 s.The resulting agglutination was read at 570 nm. Both re-agents are liquid, require no preparation before the analysisand are stable at 48C for up to 1 year. The linearity claimedby the manufacturer ranged between 0.25 and 20 mg/L.
Bertran et al.: Serum C-reactive protein in pregnancy 309
Article in press - uncorrected proof
Values higher than 20 mg/L were automatically diluted one-third and re-run, so linearity could be expanded to 60 mg/L.
Calibrators and controls
The PETIA assay calibrators were supplied by Biokit (Quan-tex ultrasensitive CRP standard multipoint) and consisted offive vials of liquid standards from human sources rangingfrom 0.50 to 20.00 mg/L. These calibrators have been stan-dardized according to Certified Reference Material 470 fromthe European Community Bureau of Reference (Institute forReference Materials and Methods, Geel, Belgium). The ana-lyzer automatically performs calculation of results by point-to-point interpolation. The control (CRP range 1.24–1.87mg/L) was also from Biokit. Four pools of sera designatedA–D and with increasing CRP concentrations were used forperformance studies. The sera were obtained from routineclinical samples, mixed and then frozen. When necessary,the samples were thawed and mixed gently for 20 min on arotating mixer.
Imprecision study
Intra-assay imprecision was determined with 20 replicateanalyses of the control and the four pools. To assess inter-assay imprecision, aliquots of these controls stored at y208Cwere analyzed over 20 consecutive days.
Recovery
We added 20 mL of three different calibrators (20.00, 10.00and 5.00 mg/L) to 180 mL of a sample containing undetec-table levels of CRP.
Linearity and detection limit
Linearity was assessed by measuring serial dilutions of threehigh samples (valued at 22.3, 24.8, and 31.5 mg/L) in physi-ological saline solution, from undiluted up to a dilution of1/128. The assessment of linearity assumed that the analyzerautomatically diluted one-third of the high samples. Thedetection limit was determined by measuring the absor-bance of the reagent blank 20 times. The mean and SD werecalculated and the detection limit was defined as the CRPconcentration for an absorbance equal to the mean of thereagent blank value q2 SD.
Interference
Interference from triglycerides, hemoglobin, and bilirubinwas assessed as previously described (18). Pools B, C and Dwere supplemented with chylomicrons, hemoglobin, or bil-irubin at various concentrations, and the percentage reco-very was then calculated. Experiments were carried out intriplicate.
Effect of paraproteinemia and rheumatoid factor
The effect that non-specific aggregation and/or cross-reacti-vity from paraproteinemia or rheumatoid factor had on theCRP determination was assessed as described elsewhere(18). Serial dilutions (300 mL) in physiological saline of serafrom patients with immunoglobulin (Ig)G, IgM, and IgA mye-loma or rheumatoid arthritis were added to identical vol-umes of pool C, gently mixed on a Coulter mixer (CoulterElectronics Ltd, Hialeah, FL, USA) for 20 min and analyzed.The percentage recovery was then calculated. Assessmentswere carried out in triplicate.
Method comparison
The PETIA CRP method was compared with an immunone-phelometric measurement on a Behring nephelometer II(Dade-Behring, Liederbach, Germany). The latter techniquewas taken as the reference method. The manufacturer’sclaimed analytical range for the Behring method was0.17–210 mg/L. The limit of detection was 0.01 mg/L. Intra-and inter-assay CV were 4.1% and 7.5%, respectively. Meth-od comparison was performed on 100 serum samples (55men, 45 women, aged from 21 to 65 years) obtained fromroutine analysis requests, and covering a wide range of CRPconcentrations. The use of leftover materials for evaluationof diagnostic methods is in agreement with the EuropeanLaw for Medical and Diagnostic Products. These sampleswere analyzed double blind in parallel on both instruments.
Participants
A total of 39 healthy women aged between 18 and 35 yearswith the intention of immediately becoming pregnant partic-ipated in the study. They were a subgroup of a more exten-sive longitudinal study on the evolution of women’snutritional status before conception and throughout preg-nancy, which was carried out in the Unit of Preventive Med-icine and Public Health of our university. The design andbackground to this study have been explained in detail pre-viously (19). The approval of the Ethics Committee of ourhospital was obtained and all participants gave their signedinformed consent in accordance with the declaration ofHelsinki.
On the week of each blood sample collection, subjectswere weighed (kg) using scales with an accuracy of 0.1 kg.At preconception their height (m) was also measured to anaccuracy of 0.1 cm. Their BMI at preconception was thencalculated as weight/height2. Skinfold measurements at thetriceps, biceps, suprailiac and subscapular regions were per-formed at preconception and the last pregnancy visit andused to calculate the percentage fat mass as previouslydescribed (20). Blood samples were drawn from the ante-cubital vein at preconception (2–10 weeks before concep-tion), at 8, 20 and 32 weeks of pregnancy, and on admissionto hospital with confirmed labor. All blood samples werefasting with the exception of those taken during labor.Serum for CRP measurement was stored at y808C.
Statistical analysis
We used standard methods (Kolmogorov-Smirnov and Sha-piro-Wilks) to check whether variables were normally distri-buted when required for the application of a statistical test.For method evaluation, values of CRP by the two assayswere compared using the Wilcoxon rank-sum test. The asso-ciation between variables was measured using Demingregression analysis (21). The degree of agreement betweenthe turbidimetric and nephelometric methods was estimatedusing the Bland-Altman graphical procedure (22). A one-wayanalysis of variance (ANOVA) for repeated measures wasused to explore the changes in CRP concentrations overpregnancy time (intra-subject factor). A repeated contrast(comparing the mean at each time point with the mean atthe subsequent time point, maintaining the type I error at5%) was used to test the significance of differences in CRPmeans, between the different time points of pregnancy,labor and preconception. A multiple linear regression modelwas fitted to test the effect of maternal age, parity, precon-ception BMI, gestation length, weight and fat mass gain dur-ing pregnancy, newborn sex, and birth and placenta weighton CRP. Diagnosis of residuals was used to test whether the
310 Bertran et al.: Serum C-reactive protein in pregnancy
Article in press - uncorrected proof
Table 1 Analytical imprecision of the CRP PETIA.
Control Mean CRP, Intra-assay Inter-assaymaterial mg/L
SD, mg/L CV, % SD, mg/L CV, %
Commercial 1.40 0.04 2.86 0.06 4.29
Pool A 0.33 0.05 15.15 0.06 18.18Pool B 2.18 0.05 2.29 0.10 4.58Pool C 10.80 0.10 0.92 0.19 1.76Pool D 17.34 0.13 0.75 0.26 1.50
Table 2 Effects of paraproteinemia and rheumatoid factor on the PETIA for CRP.
Constituent Recovery, %
1:2 dilution 1:4 dilution 1:8 dilution 1:16 dilution
IgG (54 g/L) 101 (5) 100 (3) 100 (2) 99 (2)IgA (40 g/L) 103 (3) 100 (2) 101 (6) 104 (2)IgM (36 g/L) 100 (4) 101 (5) 103 (5) 107 (4)RF (800 kIU/L) 100 (3) 99 (2) 98 (5) 100 (5)
Mean (SD) percentages of recovery (ns3) after addition of serial dilutions of sera from three patients with myeloma and onepatient with rheumatoid arthritis to aliquots of pool C. RF, rheumatoid factor.
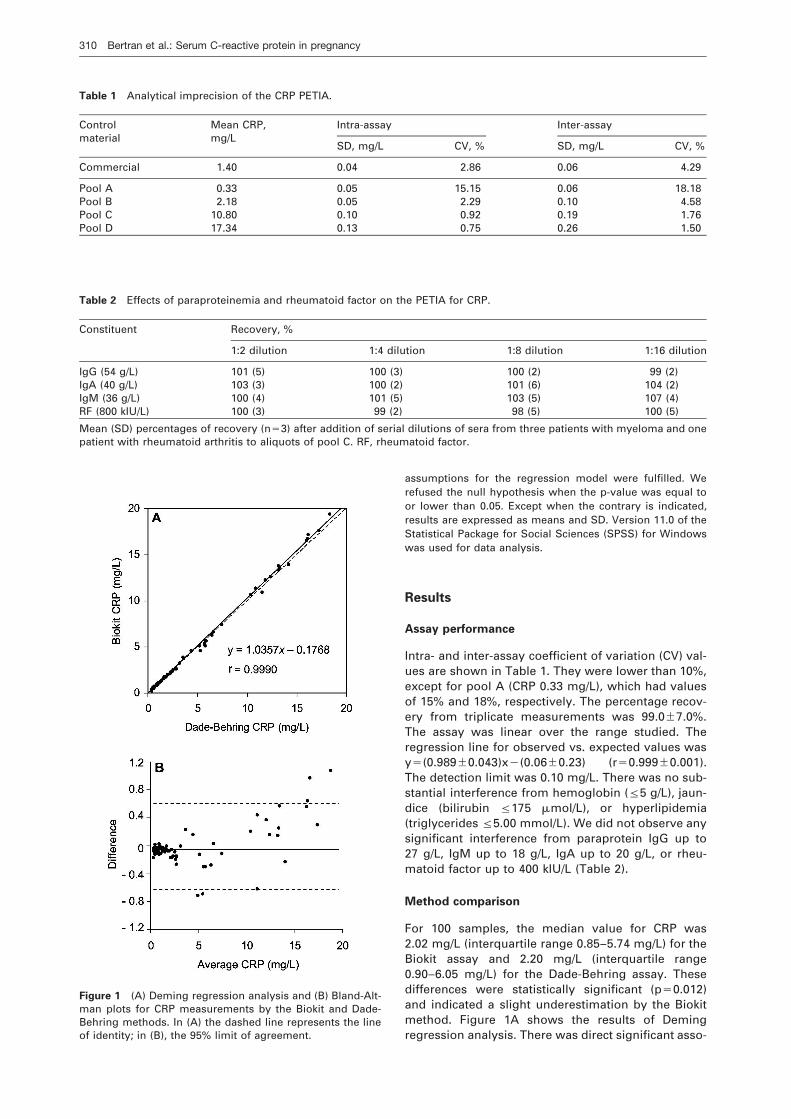
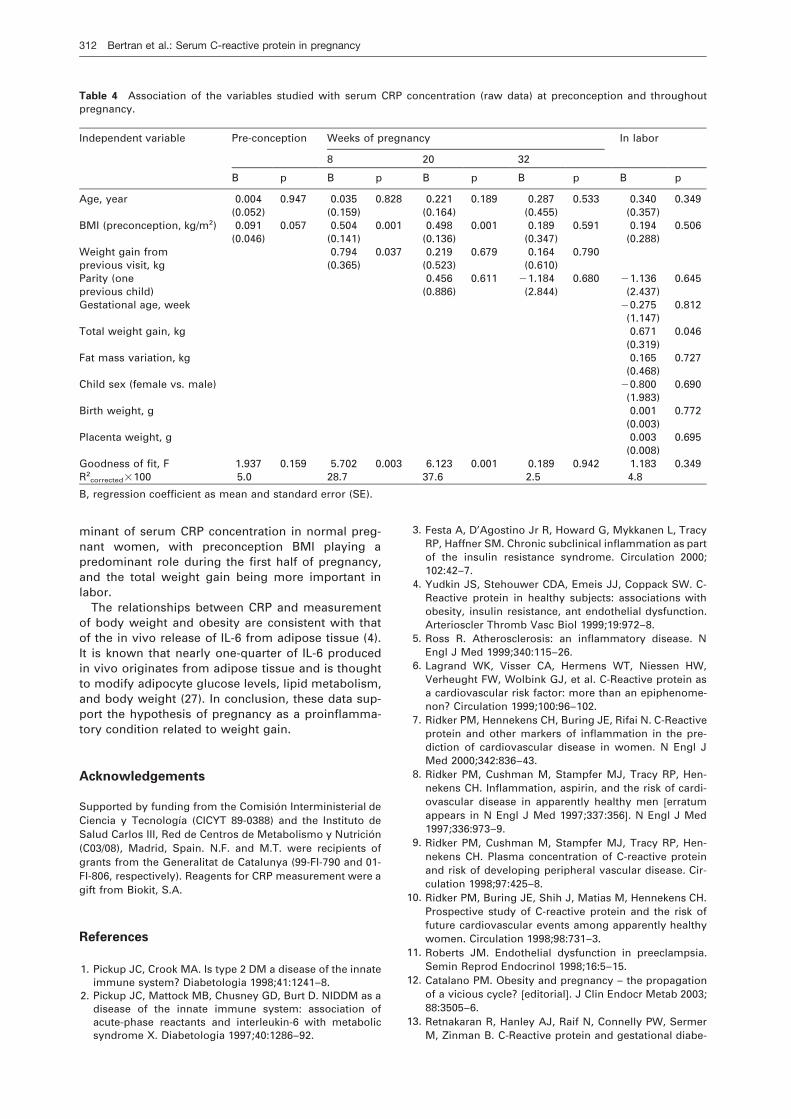
Figure 1 (A) Deming regression analysis and (B) Bland-Alt-man plots for CRP measurements by the Biokit and Dade-Behring methods. In (A) the dashed line represents the lineof identity; in (B), the 95% limit of agreement.
assumptions for the regression model were fulfilled. Werefused the null hypothesis when the p-value was equal toor lower than 0.05. Except when the contrary is indicated,results are expressed as means and SD. Version 11.0 of theStatistical Package for Social Sciences (SPSS) for Windowswas used for data analysis.
Results
Assay performance
Intra- and inter-assay coefficient of variation (CV) val-ues are shown in Table 1. They were lower than 10%,except for pool A (CRP 0.33 mg/L), which had valuesof 15% and 18%, respectively. The percentage recov-ery from triplicate measurements was 99.0"7.0%.The assay was linear over the range studied. Theregression line for observed vs. expected values wasys(0.989"0.043)xy(0.06"0.23) (rs0.999"0.001).The detection limit was 0.10 mg/L. There was no sub-stantial interference from hemoglobin (F5 g/L), jaun-dice (bilirubin F175 mmol/L), or hyperlipidemia(triglycerides F5.00 mmol/L). We did not observe anysignificant interference from paraprotein IgG up to27 g/L, IgM up to 18 g/L, IgA up to 20 g/L, or rheu-matoid factor up to 400 kIU/L (Table 2).
Method comparison
For 100 samples, the median value for CRP was2.02 mg/L (interquartile range 0.85–5.74 mg/L) for theBiokit assay and 2.20 mg/L (interquartile range0.90–6.05 mg/L) for the Dade-Behring assay. Thesedifferences were statistically significant (ps0.012)and indicated a slight underestimation by the Biokitmethod. Figure 1A shows the results of Demingregression analysis. There was direct significant asso-
Bertran et al.: Serum C-reactive protein in pregnancy 311
Article in press - uncorrected proof
Table 3 Baseline and delivery characteristics of women(ns39) and their neonates.
Mean (SD) Frequency, %
Age, years 29.2 (2.7)Parity
0 661 34
BMI (preconception) 23.3 (3.1)Gestational age, weeks 40.0 (0.93)Weight gain, kg 11.2 (3.1)Fat mass variation, kg 0.82 (2.13)Child sex
Male 39Female 61
Birth weight, g 3387.6 (505.9)Placenta weight, g 673.5 (140.9)
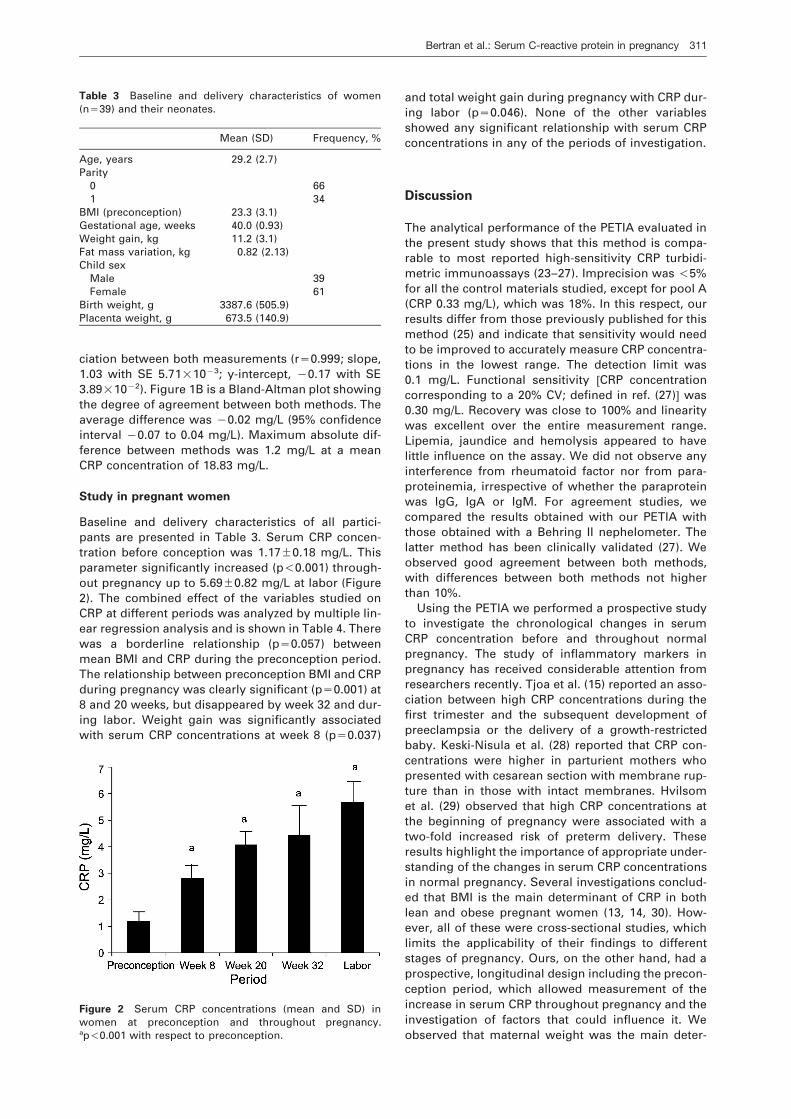
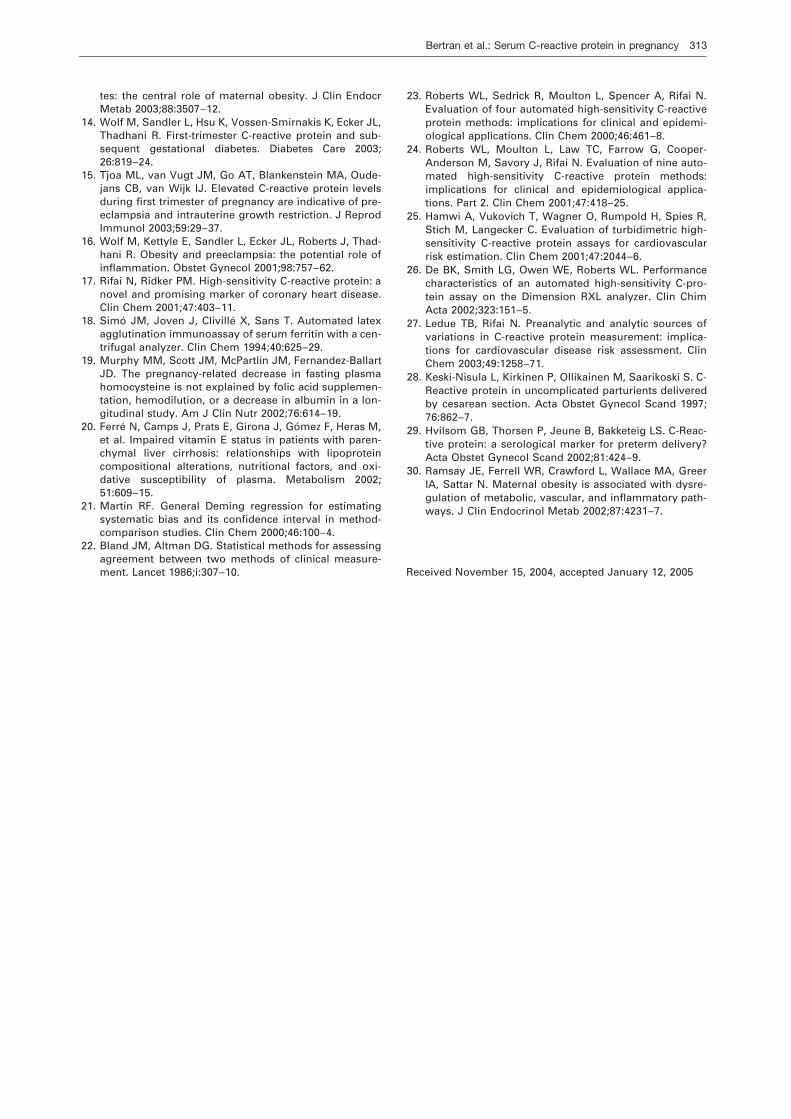
Figure 2 Serum CRP concentrations (mean and SD) inwomen at preconception and throughout pregnancy.ap-0.001 with respect to preconception.
ciation between both measurements (rs0.999; slope,1.03 with SE 5.71=10y3; y-intercept, y0.17 with SE3.89=10y2). Figure 1B is a Bland-Altman plot showingthe degree of agreement between both methods. Theaverage difference was y0.02 mg/L (95% confidenceinterval y0.07 to 0.04 mg/L). Maximum absolute dif-ference between methods was 1.2 mg/L at a meanCRP concentration of 18.83 mg/L.
Study in pregnant women
Baseline and delivery characteristics of all partici-pants are presented in Table 3. Serum CRP concen-tration before conception was 1.17"0.18 mg/L. Thisparameter significantly increased (p-0.001) through-out pregnancy up to 5.69"0.82 mg/L at labor (Figure2). The combined effect of the variables studied onCRP at different periods was analyzed by multiple lin-ear regression analysis and is shown in Table 4. Therewas a borderline relationship (ps0.057) betweenmean BMI and CRP during the preconception period.The relationship between preconception BMI and CRPduring pregnancy was clearly significant (ps0.001) at8 and 20 weeks, but disappeared by week 32 and dur-ing labor. Weight gain was significantly associatedwith serum CRP concentrations at week 8 (ps0.037)
and total weight gain during pregnancy with CRP dur-ing labor (ps0.046). None of the other variablesshowed any significant relationship with serum CRPconcentrations in any of the periods of investigation.
Discussion
The analytical performance of the PETIA evaluated inthe present study shows that this method is compa-rable to most reported high-sensitivity CRP turbidi-metric immunoassays (23–27). Imprecision was -5%for all the control materials studied, except for pool A(CRP 0.33 mg/L), which was 18%. In this respect, ourresults differ from those previously published for thismethod (25) and indicate that sensitivity would needto be improved to accurately measure CRP concentra-tions in the lowest range. The detection limit was0.1 mg/L. Functional sensitivity wCRP concentrationcorresponding to a 20% CV; defined in ref. (27)x was0.30 mg/L. Recovery was close to 100% and linearitywas excellent over the entire measurement range.Lipemia, jaundice and hemolysis appeared to havelittle influence on the assay. We did not observe anyinterference from rheumatoid factor nor from para-proteinemia, irrespective of whether the paraproteinwas IgG, IgA or IgM. For agreement studies, wecompared the results obtained with our PETIA withthose obtained with a Behring II nephelometer. Thelatter method has been clinically validated (27). Weobserved good agreement between both methods,with differences between both methods not higherthan 10%.
Using the PETIA we performed a prospective studyto investigate the chronological changes in serumCRP concentration before and throughout normalpregnancy. The study of inflammatory markers inpregnancy has received considerable attention fromresearchers recently. Tjoa et al. (15) reported an asso-ciation between high CRP concentrations during thefirst trimester and the subsequent development ofpreeclampsia or the delivery of a growth-restrictedbaby. Keski-Nisula et al. (28) reported that CRP con-centrations were higher in parturient mothers whopresented with cesarean section with membrane rup-ture than in those with intact membranes. Hvilsomet al. (29) observed that high CRP concentrations atthe beginning of pregnancy were associated with atwo-fold increased risk of preterm delivery. Theseresults highlight the importance of appropriate under-standing of the changes in serum CRP concentrationsin normal pregnancy. Several investigations conclud-ed that BMI is the main determinant of CRP in bothlean and obese pregnant women (13, 14, 30). How-ever, all of these were cross-sectional studies, whichlimits the applicability of their findings to differentstages of pregnancy. Ours, on the other hand, had aprospective, longitudinal design including the precon-ception period, which allowed measurement of theincrease in serum CRP throughout pregnancy and theinvestigation of factors that could influence it. Weobserved that maternal weight was the main deter-
312 Bertran et al.: Serum C-reactive protein in pregnancy
Article in press - uncorrected proof
Table 4 Association of the variables studied with serum CRP concentration (raw data) at preconception and throughoutpregnancy.
Independent variable Pre-conception Weeks of pregnancy In labor
8 20 32
B p B p B p B p B p
Age, year 0.004 0.947 0.035 0.828 0.221 0.189 0.287 0.533 0.340 0.349(0.052) (0.159) (0.164) (0.455) (0.357)
BMI (preconception, kg/m2) 0.091 0.057 0.504 0.001 0.498 0.001 0.189 0.591 0.194 0.506(0.046) (0.141) (0.136) (0.347) (0.288)
Weight gain from 0.794 0.037 0.219 0.679 0.164 0.790previous visit, kg (0.365) (0.523) (0.610)Parity (one 0.456 0.611 y1.184 0.680 y1.136 0.645previous child) (0.886) (2.844) (2.437)Gestational age, week y0.275 0.812
(1.147)Total weight gain, kg 0.671 0.046
(0.319)Fat mass variation, kg 0.165 0.727
(0.468)Child sex (female vs. male) y0.800 0.690
(1.983)Birth weight, g 0.001 0.772
(0.003)Placenta weight, g 0.003 0.695
(0.008)Goodness of fit, F 1.937 0.159 5.702 0.003 6.123 0.001 0.189 0.942 1.183 0.349R2
corrected=100 5.0 28.7 37.6 2.5 4.8
B, regression coefficient as mean and standard error (SE).
minant of serum CRP concentration in normal preg-nant women, with preconception BMI playing apredominant role during the first half of pregnancy,and the total weight gain being more important inlabor.
The relationships between CRP and measurementof body weight and obesity are consistent with thatof the in vivo release of IL-6 from adipose tissue (4).It is known that nearly one-quarter of IL-6 producedin vivo originates from adipose tissue and is thoughtto modify adipocyte glucose levels, lipid metabolism,and body weight (27). In conclusion, these data sup-port the hypothesis of pregnancy as a proinflamma-tory condition related to weight gain.
Acknowledgements
Supported by funding from the Comision Interministerial deCiencia y Tecnologıa (CICYT 89-0388) and the Instituto deSalud Carlos III, Red de Centros de Metabolismo y Nutricion(C03/08), Madrid, Spain. N.F. and M.T. were recipients ofgrants from the Generalitat de Catalunya (99-FI-790 and 01-FI-806, respectively). Reagents for CRP measurement were agift from Biokit, S.A.
References
1. Pickup JC, Crook MA. Is type 2 DM a disease of the innateimmune system? Diabetologia 1998;41:1241–8.
2. Pickup JC, Mattock MB, Chusney GD, Burt D. NIDDM as adisease of the innate immune system: association ofacute-phase reactants and interleukin-6 with metabolicsyndrome X. Diabetologia 1997;40:1286–92.
3. Festa A, D’Agostino Jr R, Howard G, Mykkanen L, TracyRP, Haffner SM. Chronic subclinical inflammation as partof the insulin resistance syndrome. Circulation 2000;102:42–7.
4. Yudkin JS, Stehouwer CDA, Emeis JJ, Coppack SW. C-Reactive protein in healthy subjects: associations withobesity, insulin resistance, ant endothelial dysfunction.Arterioscler Thromb Vasc Biol 1999;19:972–8.
5. Ross R. Atherosclerosis: an inflammatory disease. NEngl J Med 1999;340:115–26.
6. Lagrand WK, Visser CA, Hermens WT, Niessen HW,Verheught FW, Wolbink GJ, et al. C-Reactive protein asa cardiovascular risk factor: more than an epiphenome-non? Circulation 1999;100:96–102.
7. Ridker PM, Hennekens CH, Buring JE, Rifai N. C-Reactiveprotein and other markers of inflammation in the pre-diction of cardiovascular disease in women. N Engl JMed 2000;342:836–43.
8. Ridker PM, Cushman M, Stampfer MJ, Tracy RP, Hen-nekens CH. Inflammation, aspirin, and the risk of cardi-ovascular disease in apparently healthy men werratumappears in N Engl J Med 1997;337:356x. N Engl J Med1997;336:973–9.
9. Ridker PM, Cushman M, Stampfer MJ, Tracy RP, Hen-nekens CH. Plasma concentration of C-reactive proteinand risk of developing peripheral vascular disease. Cir-culation 1998;97:425–8.
10. Ridker PM, Buring JE, Shih J, Matias M, Hennekens CH.Prospective study of C-reactive protein and the risk offuture cardiovascular events among apparently healthywomen. Circulation 1998;98:731–3.
11. Roberts JM. Endothelial dysfunction in preeclampsia.Semin Reprod Endocrinol 1998;16:5–15.
12. Catalano PM. Obesity and pregnancy – the propagationof a vicious cycle? weditorialx. J Clin Endocr Metab 2003;88:3505–6.
13. Retnakaran R, Hanley AJ, Raif N, Connelly PW, SermerM, Zinman B. C-Reactive protein and gestational diabe-
Bertran et al.: Serum C-reactive protein in pregnancy 313
Article in press - uncorrected proof
tes: the central role of maternal obesity. J Clin EndocrMetab 2003;88:3507–12.
14. Wolf M, Sandler L, Hsu K, Vossen-Smirnakis K, Ecker JL,Thadhani R. First-trimester C-reactive protein and sub-sequent gestational diabetes. Diabetes Care 2003;26:819–24.
15. Tjoa ML, van Vugt JM, Go AT, Blankenstein MA, Oude-jans CB, van Wijk IJ. Elevated C-reactive protein levelsduring first trimester of pregnancy are indicative of pre-eclampsia and intrauterine growth restriction. J ReprodImmunol 2003;59:29–37.
16. Wolf M, Kettyle E, Sandler L, Ecker JL, Roberts J, Thad-hani R. Obesity and preeclampsia: the potential role ofinflammation. Obstet Gynecol 2001;98:757–62.
17. Rifai N, Ridker PM. High-sensitivity C-reactive protein: anovel and promising marker of coronary heart disease.Clin Chem 2001;47:403–11.
18. Simo JM, Joven J, Cliville X, Sans T. Automated latexagglutination immunoassay of serum ferritin with a cen-trifugal analyzer. Clin Chem 1994;40:625–29.
19. Murphy MM, Scott JM, McPartlin JM, Fernandez-BallartJD. The pregnancy-related decrease in fasting plasmahomocysteine is not explained by folic acid supplemen-tation, hemodilution, or a decrease in albumin in a lon-gitudinal study. Am J Clin Nutr 2002;76:614–19.
20. Ferre N, Camps J, Prats E, Girona J, Gomez F, Heras M,et al. Impaired vitamin E status in patients with paren-chymal liver cirrhosis: relationships with lipoproteincompositional alterations, nutritional factors, and oxi-dative susceptibility of plasma. Metabolism 2002;51:609–15.
21. Martin RF. General Deming regression for estimatingsystematic bias and its confidence interval in method-comparison studies. Clin Chem 2000;46:100–4.
22. Bland JM, Altman DG. Statistical methods for assessingagreement between two methods of clinical measure-ment. Lancet 1986;i:307–10.
23. Roberts WL, Sedrick R, Moulton L, Spencer A, Rifai N.Evaluation of four automated high-sensitivity C-reactiveprotein methods: implications for clinical and epidemi-ological applications. Clin Chem 2000;46:461–8.
24. Roberts WL, Moulton L, Law TC, Farrow G, Cooper-Anderson M, Savory J, Rifai N. Evaluation of nine auto-mated high-sensitivity C-reactive protein methods:implications for clinical and epidemiological applica-tions. Part 2. Clin Chem 2001;47:418–25.
25. Hamwi A, Vukovich T, Wagner O, Rumpold H, Spies R,Stich M, Langecker C. Evaluation of turbidimetric high-sensitivity C-reactive protein assays for cardiovascularrisk estimation. Clin Chem 2001;47:2044–6.
26. De BK, Smith LG, Owen WE, Roberts WL. Performancecharacteristics of an automated high-sensitivity C-pro-tein assay on the Dimension RXL analyzer. Clin ChimActa 2002;323:151–5.
27. Ledue TB, Rifai N. Preanalytic and analytic sources ofvariations in C-reactive protein measurement: implica-tions for cardiovascular disease risk assessment. ClinChem 2003;49:1258–71.
28. Keski-Nisula L, Kirkinen P, Ollikainen M, Saarikoski S. C-Reactive protein in uncomplicated parturients deliveredby cesarean section. Acta Obstet Gynecol Scand 1997;76:862–7.
29. Hvilsom GB, Thorsen P, Jeune B, Bakketeig LS. C-Reac-tive protein: a serological marker for preterm delivery?Acta Obstet Gynecol Scand 2002;81:424–9.
30. Ramsay JE, Ferrell WR, Crawford L, Wallace MA, GreerIA, Sattar N. Maternal obesity is associated with dysre-gulation of metabolic, vascular, and inflammatory path-ways. J Clin Endocrinol Metab 2002;87:4231–7.
Received November 15, 2004, accepted January 12, 2005