Did New Public Management Matter? An Empirical Analysis of ...
39
Munich Personal RePEc Archive Did New Public Management Matter? An Empirical Analysis of The Outsourcing and Decentralization Effects on Public Sector Size Alonso, Jose M. and Clifton, Judith and Díaz-Fuentes, Daniel December 2011 Online at https://mpra.ub.uni-muenchen.de/43255/ MPRA Paper No. 43255, posted 13 Dec 2012 12:08 UTC
-
Upload
khangminh22 -
Category
Documents
-
view
1 -
download
0
Transcript of Did New Public Management Matter? An Empirical Analysis of ...

Munich Personal RePEc Archive
Did New Public Management Matter?
An Empirical Analysis of The
Outsourcing and Decentralization Effects
on Public Sector Size
Alonso, Jose M. and Clifton, Judith and Díaz-Fuentes, Daniel
December 2011
Online at https://mpra.ub.uni-muenchen.de/43255/
MPRA Paper No. 43255, posted 13 Dec 2012 12:08 UTC
Did New Public Management matter? An empirical
analysis of the outsourcing and decentralization effects
on public sector size
Jose M. Alonso Judith Clifton Daniel Diaz-Fuentes
December 2011
Abstract
This paper evaluates whether reforms associated with the New Public Management
(NPM) doctrine led to a reduction in public sector expenditure and employees. Savings and
downsizing the public sector were a major justification when the international movement
of public sector reforms began in the 1980s. Since then, NPM has been the subject of ex-
tensive academic debate as to its successes and failures. However, empirical assessments of
whether NPM reached its stated objectives are relatively scarce, mainly due to the difficulty
of quantifying the impact of such reforms. This paper is an attempt to do this, especially
looking at outsourcing and decentralization. We test a number of hypotheses related to
the outsourcing and decentralization effects on public sector expenditure and employees
through an econometric analysis using a panel data model for eighteen European Countries
over the period 1980 to 2010. The results suggest a positive correlation between the degree
of outsourcing in the provision of public services and government spending in the short
term. On the other hand we find that decentralization tends to decrease the size of general
government, particularly in the long-run.
Keywords: New Public Management, outsourcing, decentralization, public sector size.
JEL Classification: H10, H63, H77, L33
Ackowledgements: The authors wish to thank Rhys Andrews, Klaus Brosamle, Sorin Dan,
Oliver James, Sebastian Jilke, Per Laegreid, Edoardo Ongaro, Christopher Pollitt and Steven
Van de Walle for their helpful comments.
1
1 Introduction
As a result of the ongoing global financial and economic crisis, most European countries are
again considering what measures to take to cut public spending in order to reduce the deficit
and public debt. Cutting public expenditure is back on the agenda. Across most of the twentieth
century, particularly after World War II, a broad consensus was forged on how economic activity
should be governed across the most of the Western world. In Europe, Keynesianism prevailed,
and the role of the state was consolidated as a provider of public services and the Welfare State
(Berkowitz and McQuaid, 1988; Comin and Diaz-Fuentes, 2004). But, from the seventies,
a radically different consensus on the appropriate role of the State in the economy and the
optimum way to manage economic activity took hold. First starting in the UK (Vickers and
Yarrow, 1988), and then spreading to the rest of Europe over the next two decades, a deep
reform of the public sector was set in place (Clifton, Comin, and Diaz-Fuentes, 2003, 2006).
This included sweeping privatization, liberalization and deregulation programmes.
Where privatization was not feasible technically or politically, new ideas were developed
about how those activities which would remain in the public sector could best be managed.
These ideas were driven by the quest to introduce criteria from private sector management
into traditional methods of public administration. Such ideas came to be labelled NPM. NPM
emerged in response to a growing perception that the public sector was too inefficient, and
its growth was getting out of control. In general terms, NPM aimed to correct some of the
perceived pathologies associated with the public sector. As the NPM doctrine emerged during
the 1980s, its proponents put great emphasis on strategies to minimize and downsize, with
the aim of rendering government smaller (Pollitt and Bouckaert 2003, p.21; Van de Walle and
Hammerschid, 2011, p.24).
It is of interest, therefore, to enquire whether, after two, and sometimes three, decades of
reform, NPM can be found to be associated with reduced government spending and fewer pub-
lic employees, as predicted by its proponents (Kettl, 2000, Osborne and Gaebler, 1992). This
is the central question which this paper seeks to answer. Interestingly and, rather ironically,
although one of the major drivers of NPM was to promote the improvement of the measurement
and hence evaluation of public sector performance, scholars and government agencies have pro-
duced relatively little in the way of evaluating NPM itself (Clifton, Comin, and Diaz-Fuentes,
2005; Costas, 2007; Clifton and Diaz-Fuentes, 2010). In particular, only a small number of
studies have attempted to evaluate the effects of NPM-style reforms on public sector size (Fer-
lie et al. 1996; Kettl, 2000; Pollitt and Bouckaert, 2004). However, these studies are limited
in two main ways. Firstly, they examined changes in public sector size at the macro level but
failed to establish a causal link between NPM reforms and public sector size1. Secondly, they
1One exception is O’Toole and Meier (2004) who find outsourcing did not led to more “efficient” spending in
2
cover a limited number of countries and time periods, largely due to the scarcity of key data (see
Van de Walle and Hammerschmid, 2011, COCOPS Working Paper 1). Fortunately, this has im-
proved recently, after considerable efforts were made here2 by organizations such the European
Commission (EC) and the Organization for Economic Cooperation and Development (OECD)
to improve the quality of public sector statistics and facilitate cross-national comparability.
To evaluate the effect of NPM on public sector size, we selected two major policies associ-
ated with NPM for study, outsourcing and decentralization. The advantages of this selection are
two-fold. Firstly, the effects of both policies can be measured quantitatively and, secondly, sub-
stantial theoretical literature exists which affirm that these policies may well affect public sector
size, both expenditure and employees. In this way, we attempt to contribute to the NPM-related
literature by using a methodology that, to the best of our knowledge, has not been previously
used in the study of NPM reforms. Firstly, we use a static panel data model3 to assess whether
there is any relationship between government spending and the NPM reforms under analysis.
Next, we estimate both the long-term relationship between NPM reforms and public sector size,
and an error correction model to distinguish between the short-term and long-term effects of the
reforms.
After deriving five hypotheses about the relationship between outsourcing, decentralization
and public sector size on the basis of the theoretical literature, we test the hypotheses with
an econometric analysis using a panel data model for eighteen European Union members4,
including Eastern European countries, over the period 1980 to 2010 5.
Some of the limitations of this research should be stated at the outset. Firstly, this paper does
not claim to evaluate the effects of a whole range of reforms associated with NPM on public
sector size. As observed by many scholars, NPM is a wide-ranging and, sometimes, fuzzy con-
cept, and it has been associated with multiple, distinct and even contradictory policies around
the world. Some of the policies promoted by NPM are exceedingly difficult, if not impossible,
to quantify. Our research is much more modest, seeking only to evaluate the effects of out-
sourcing and decentralization on public sector size. Secondly, this paper only seeks to answer
whether outsourcing and decentralization led to a reduction in the size of the public sector. No
core activities and was connected to larger bureaucracies.2Specifically Eurostat started using the new System of National Accounts from 1995, which helped greatly to
standardize and make comparable statistical data in a reliable manner across countries.3The advantages and disadvantages of using panel data over time series are discussed in a later section.4The selected countries are Austria, Belgium, Denmark, Estonia, Italy, Finland, France, Germany, Greece,
Hungary, Ireland, Luxembourg, Netherlands, Spain, Sweden, Portugal, Norway and the United Kingdom.5The choice of these countries is justified on the basis that they have all introduced significant public sector
reform over the last two or three decades and we assume a certain homogeneity among them since all are EU
Member States, which is important for our estimates. Likewise, the availability of reliable data in an acceptable
time period was a crucial point in making this selection. Finally, the selection was also influenced by the fact that
this paper forms a contribution to the ongoing project Coordinating for the Cohesion of the Public Sector of the
Future(COCOPS) within the 7th Framework Project, and covers all of its participants.
3
conclusions are drawn as to whether a reduction or otherwise of government expenditure and
employees led to greater public sector efficiency and effectiveness, whether the services pro-
vided were improved or worsened, or the effects on social welfare. Despite our limited aims,
it is still worthwhile testing for the effects of outsourcing and decentralization on public sector
size, since these remain a popular tool for governments around the world.
The rest of the paper is organized as follows. The second section briefly synthesizes the
main policies associated with NPM reform, justifies the selection of outsourcing and decentral-
ization, and develops hypotheses for testing. Section 3 describes the statistical model that is
used for inference, the data, and then briefly discusses the main trends of public sector size in
the countries under analysis. Section 4 reports the estimation results and interprets them. Sec-
tion 5 concludes, summarizing our results, their limitations and possible directions for further
research.
2 New Public Management: a framework for analysis
New Public Management, as a label, has become like an umbrella term covering a set of public
sector reforms carried out from the eighties across most OECD countries (Hood, 1991; Pollitt,
1993; Pollitt and Dan, 2011). Most scholars coincide that NPM began as a phenomenon in
Anglo-Saxon countries, and was then picked up and promoted by the OECD on a world-wide
scale (Kettl, 2000). Today, NPM-style reforms have been implemented across most of the
Western world and beyond. However, pinning down what NPM actually means, when translated
into discrete policies, is very difficult (Dunleavy and Hood, 1994; Flynn, 2002; Barzelay, 2002),
and it has an “hybrid” character (Christensen and Laegreid, 2002) . Even Christopher Hood,
widely acclaimed as one of the inventors of the label NPM has admitted the term has been
over-used to the point of concept-overstretch (Hood, 2000). The consequence of this is that the
assessment of the impact of NPM in general, and on public sector expenditure and employees in
particular, is far from simple. To complicate matters further, it should be noted that, even if NPM
has been presented as a global reform movement by some scholars (Ketll, 2000; Christensen
and Laegreid, 2007), implementation of NPM-style reforms has differed substantially across
countries (Ferlie et al, 1996; Hammersmichd et al., 2007; Pollitt and Bouckaert, 2011). Torres
and Pina (2004) argued that both the definition and implementation of NPM-style reforms are
influenced by domestic culture, institutional settings and administrative law traditions. Despite
these difficulties, in this section, we briefly synthesize some of the key literature which defines
NPM, before justifying our focus on outsourcing and decentralization before proceeding to
develop the hypotheses.
In general terms, there is broad consensus that NPM involves the “the attempt to implement
management ideas from business and private sector into the public services” (Haynes, 2003).
4
Pollitt (2007, p.110) usefully argued that the NPM is a two-level phenomenon, including, on
the top layer, a general motivation to improve the public sector, and, on the second-tier layer, a
set of specific concepts, policies and practices which aim to reform the public sector. Remain-
ing at this second-tier layer, a reading of key NPM literature would suggest ten major policy
areas. These broadly coincide with interpretations of NPM by the OECD (2010) as well as
a number of influential publications on the topic, including Hood (1991,1995), Dunleavy and
Hood (1994), Pollitt (1993), Ferlie et al (1996), Borins (1994), Pollitt and Summa (1997), Ketl
(2000), Barzelay (2001), Christensen and Laegreid (2001), and Flynn (2002).
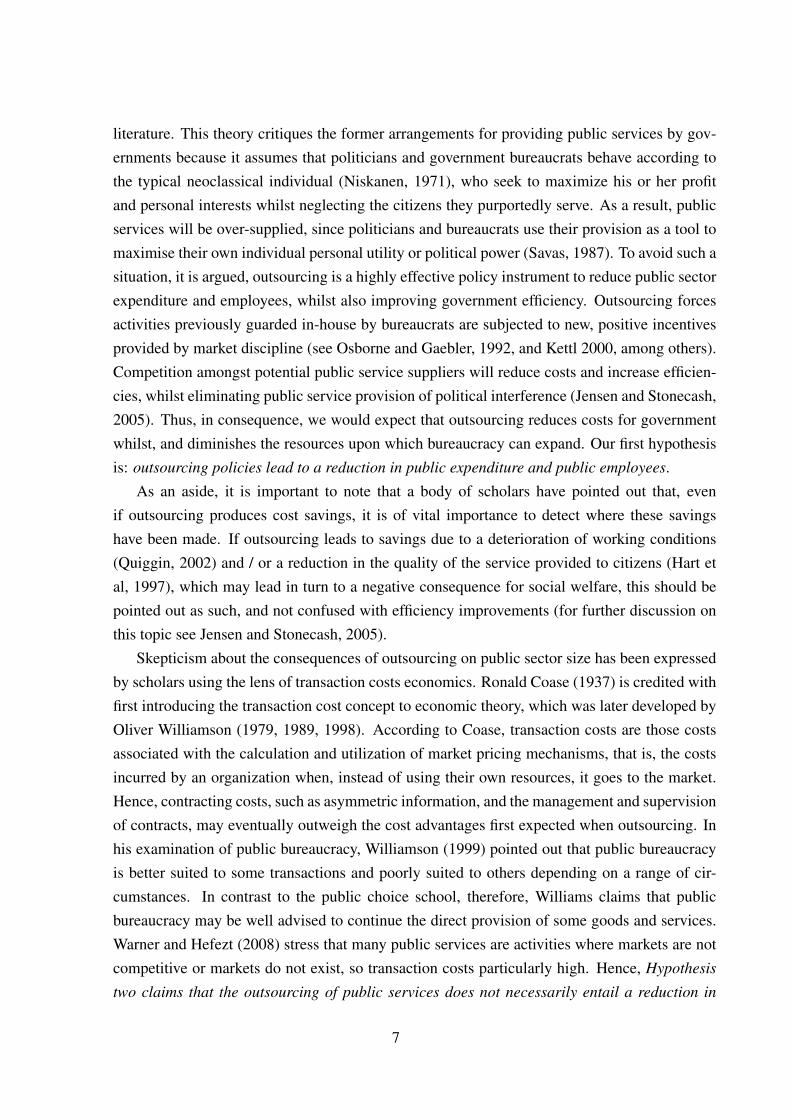
Synthetically, the ten practices most commonly associated with NPM are: (i) introduc-
ing greater competition into the public sector (Hood, 1991; Dunleavy and Hodd, 1994, (ii)
downsizing (Ferlie et al, 1996; Pollitt and Bouckaert, 2003), (iii) introducing private-sector
styles of management practises (Hood, 1991; Osborne and Gaebler, 1992), (iv) replacing
input control by output control (Hood, 1991; Dunleavy and Hodd, 1994; Osborne and Gae-
bler, 1992), (v) decentralization (Pollitt, 1993,1994; Ferlie et al, 1996; Osborne and Gae-
bler, 1992; Kettl, 2000) , (vi) disaggregating centralized bureaucracies into agencies (Pollitt,
1993,2007a), (vii) outsourcing (Kettl, 2000; Pollitt, 2007a; OECD, 2010), (viii) separating
purchaser/provider (Pollitt, 1993, 2007a), (ix) customer orientation (Osborne and Gaebler,
1992; Pollitt, 1993; Borins, 1994; Kettl, 2000) and (x) separating political decision-making
from the direct management of public services (Osborne and McLaughlin, 2002). To organ-
ise these practices, they can be grouped into three overall categories: market-type mechanisms,
which refers to the increasing use of markets and competition in the provision of public services;
managerialism or managerial improvement and organizational restructuring; and customer ori-
entation. Table 1 visualizes the ten practices and three policy areas supported by selected au-
thors.
Quantifying NPM / outsourcing and decentralization
Our aim is to determine whether NPM-style reforms rendered the public sector smaller. Clearly,
a full-scale, comprehensive response would require, at least, quantification of all the ten major
practices associated with NPM. The problem here, as noted by the OECD (2010, p.22) is two-
fold. Firstly, some of the NPM-related policies are difficult, if not impossible, to quantify. Take,
for instance, the question of public sector league tables. Assembling a league table of the public
sector would be controversial enough in one country, but would cause an outcry if implemented
at a regional or international level, as each government would state the purpose of its public
sector differed to that of its peers, making comparison futile. For many of the other policies,
the main problem is the lack of data. For instance, it would be interesting to quantify the effect
of the use of “performance related pay”, “performance budgeting”, or “agentification”. The
5
Table 1: Main NPM components and key authors
Topic NPM component Authors
Market-type Shift to greater competition Hood, 1991
mechanisms in the public sector Dunleavy and Hood, 1994
Outsourcing Osborne and Gaebler, 1992
Performance related pay Borins, 1994
Competitive tendering Pollitt, 2007a
Public sector league tables
Managerialism Decentralizing Hood, 1991
Hands on professional Dunleavy and Hood, 1994
management Osborne and Gaebler, 1992
Purchaser/provider split Pollitt, 1993, 2007a
Output control Ferlie et al, 1996
Disaggregation of Kettl, 2000
organizational forms
Customer orientation Improve service quality Pollitt, 1993, 1995, 2007
Use of service Charters Borins, 1994
Ferlie et all, 1996
Kettl, 2000
Source: Authors
problem is that, currently, there is only limited available data for short periods of time, such
a couple of years (see OECD, 2009, 2011). Unfortunately, therefore, this prohibits the use of
assessing temporal patterns or using panel data or time series methods to analyze the effect of
the reforms. For these reasons, we have selected to use just two major practices, associated
with NPM: outsourcing and decentralization. This is justified by the fact that, firstly, reliable,
high-quality data is available on both and, secondly, because, according to a body of theoretical
literature, both these practices may affect public sector size.
Government outsourcing can be defined as the delivery of public services by agents other
than government employees (Minicucci and Donahue, 2004). Governments can outsource the
provision of public services in two main ways: they can either purchase goods and services
from the private sector or non-governmental organizations in order to include them in their own
production chain (termed in the System of National Accounts (SNA) “intermediate consump-
tion”), or they can hire a company to directly provide public goods and services to the final
consumer or citizen, termed in the SNA “social transfers in kind via market producers” (OECD,
2011).
Outsourcing public service delivery has become commonplace across most EU countries.
Despite its prevalence, there is still a lack of consensus in the theoretical literature as to whether
or when this will result in government savings (for a comprehensive overview, see Jensen and
Stonecash, 2005). Many of those promoting outsourcing were influenced by the public choice
6
literature. This theory critiques the former arrangements for providing public services by gov-
ernments because it assumes that politicians and government bureaucrats behave according to
the typical neoclassical individual (Niskanen, 1971), who seek to maximize his or her profit
and personal interests whilst neglecting the citizens they purportedly serve. As a result, public
services will be over-supplied, since politicians and bureaucrats use their provision as a tool to
maximise their own individual personal utility or political power (Savas, 1987). To avoid such a
situation, it is argued, outsourcing is a highly effective policy instrument to reduce public sector
expenditure and employees, whilst also improving government efficiency. Outsourcing forces
activities previously guarded in-house by bureaucrats are subjected to new, positive incentives
provided by market discipline (see Osborne and Gaebler, 1992, and Kettl 2000, among others).
Competition amongst potential public service suppliers will reduce costs and increase efficien-
cies, whilst eliminating public service provision of political interference (Jensen and Stonecash,
2005). Thus, in consequence, we would expect that outsourcing reduces costs for government
whilst, and diminishes the resources upon which bureaucracy can expand. Our first hypothesis
is: outsourcing policies lead to a reduction in public expenditure and public employees.
As an aside, it is important to note that a body of scholars have pointed out that, even
if outsourcing produces cost savings, it is of vital importance to detect where these savings
have been made. If outsourcing leads to savings due to a deterioration of working conditions
(Quiggin, 2002) and / or a reduction in the quality of the service provided to citizens (Hart et
al, 1997), which may lead in turn to a negative consequence for social welfare, this should be
pointed out as such, and not confused with efficiency improvements (for further discussion on
this topic see Jensen and Stonecash, 2005).
Skepticism about the consequences of outsourcing on public sector size has been expressed
by scholars using the lens of transaction costs economics. Ronald Coase (1937) is credited with
first introducing the transaction cost concept to economic theory, which was later developed by
Oliver Williamson (1979, 1989, 1998). According to Coase, transaction costs are those costs
associated with the calculation and utilization of market pricing mechanisms, that is, the costs
incurred by an organization when, instead of using their own resources, it goes to the market.
Hence, contracting costs, such as asymmetric information, and the management and supervision
of contracts, may eventually outweigh the cost advantages first expected when outsourcing. In
his examination of public bureaucracy, Williamson (1999) pointed out that public bureaucracy
is better suited to some transactions and poorly suited to others depending on a range of cir-
cumstances. In contrast to the public choice school, therefore, Williams claims that public
bureaucracy may be well advised to continue the direct provision of some goods and services.
Warner and Hefezt (2008) stress that many public services are activities where markets are not
competitive or markets do not exist, so transaction costs particularly high. Hence, Hypothesis
two claims that the outsourcing of public services does not necessarily entail a reduction in
7
public spending due to high transaction costs associated with market imperfections.
Following from this, some authors have suggested that, even if outsourcing is associated
with a reduction in public sector expenditure in the first instance, over the long-term, these pos-
itive effects may be reversed due to the dynamic nature of contractual relationships between
governments and those private companies which provide the outsourced services. The poten-
tial cost savings from outsourcing may diminish or disappear over time by rising prices of the
private sector companies (Williamson, 1979; Schmalensee, 1979). Due to the complexity of an-
ticipating every possible contingency when drafting a contract between the government and the
private sector, and the high associated costs, if an unforeseen event occurs, governments may be
in the position of having to renegotiate the initial contract. The private sector companies - with
their incentives to maximize profits - may thus increase the price they charge to the government
for the provision to citizens of certain services during the course of this renegotiation. This
phenomenon is referred to in the literature as “hold-up” (Jensen and Stonecash, 2005). Thus, it
is possible that even if outsourcing reduces expenditures in the short term, in the long-run this
effect is negligible or even opposite, increasing government spending (third hypothesis).
The fourth and fifth hypotheses refer to decentralization. Decentralization is a very broad
concept that has been defined by different scholars in a variety of ways. In this paper, we
follow Falleti (2005, p. 328), who defines decentralization as a process or reform consisting of
a number of public policies that transfer responsibility, resources or authority from a higher to
a lower level of government. Depending the type of authority devolved, there are three types of
decentralization: administrative, fiscal and political (Falletti, 2005; Schneider, 2003; Treisman,
2007).
Administrative decentralization involves the transferring autonomy for the provision of cer-
tain public services to lower levels of government. The lower level assumes autonomy for
public policy management, personnel control and control over public finances (Rondinelli et al,
1984). Fiscal decentralization refers to transferring down fiscal autonomy to sub-national levels
of government (Schneider, 2003; Falleti, 2005), while political decentralization means transfer-
ring political authority or electoral power to sub-national actors (Falleti, 2005; Pollitt, 2007b).
In this paper, we focus on the effects of two types of decentralization mentioned: administrative
and fiscal 6.
Scholars have intensely debated the advantages and disadvantages of decentralization. The
NPM doctrine, with its focus on government savings, efficiency, effectiveness and customer
orientation, saw decentralization as an essential practice in its tool kit in its quest to render
government more efficient and effective (Osborne and Gaebler, 1992). NPM advocates, again
influenced by public choice, argued that administrative decentralization would facilitate the pro-
6Although the effect of political decentralization would also be interesting to quantify, the available indicators
for its measurement are time invariant so cannot therefore be included in our model.
8

vision of public goods and services from different levels of government, making it more likely
that citizens’ needs would be known and satisfied, whilst rendering these bureaucrats more di-
rectly accountable to citizens (Treisman, 2007). Red tape could be diminished, coordination
and control could be enhanced (Tullock, 1965; Downs, 1967; Niskanen, 1971) and, as a conse-
quence, costs would be lowered (Brennan and Buchanan, 1980).
Similarly, scholars argued that fiscal decentralization led to greater efficiency and a smaller
public sector (Tiebout, 1956; Oates, 1972). One of the most extreme exponents of this is per-
haps the Brennan and Buchanan Leviathan model (1980). According to Tiebout (1956), the
closer the provision of public goods to each citizen’s preferences, the higher the public or social
welfare. This is because fiscal autonomy leads to greater territorial competition that limits pub-
lic sector growth whilst increasing efficiency. According to Brennan and Buchanan (1980), the
decentralization of expenses (revenues) can create a “market-like solution”, limiting the taxing
power of the different government levels. Moreover, in line with the Tiebout model, individuals
seeking to maximize their tax benefits can generate competitive behaviour between jurisdic-
tions, which will encourage more efficient production of public goods and services, restrictig
the growth of sub-national governments and therefore the aggregate public sector. Based on
these theories, the fourth hypothesis argues that the greater the degree of decentralization, the
lower the cost incurred by governments.
Finally, in contrast, scholars such as Prud’homme (1995), argued that, although the effect of
economies of scale in the provision of local public services may appear minimal, economies of
scope may exist. Central bureaucratic providers may be more efficient than local ones, primar-
ily due to their greater investment capacity in technology, research, development, promotion
and innovation. Moreover, Prud’homme observed that because national government bureau-
cracies are more likely to offer good careers and better promotion opportunities, they tend ton
attract more qualified staff, to the detriment of sub-national governments. This may also dilute
the potential benefits of decentralization. Likewise, decentralization can lead to a loss of co-
ordination between different levels of government, not only in relation to policies but also to
programs (Peters and Savoie, 1996), with the associated costs that a lack of coordination can
produce. Furthermore, from a fiscal standpoint, if decentralization is based on intergovernmen-
tal transfers and not in a meaningful transfer of fiscal autonomy, such a decentralization can
significantly increase the costs of sub-national government (Oates, 1985), which may result in
the so-called “problem of the commons”, arising when there is disconnection between public
service beneficiaries and who pays for them, that is, revenues remain centralized while expen-
ditures are decentralized (Jin and Zou, 2002). Hypothesis five claims that the greater the degree
of decentralization, the greater the expenses incurred by governments.
9

3 Empirical analysis
The five hypotheses are tested using panel data techniques. The use of panel data techniques
instead of a country-by-country analysis is justified by the advantages of using these techniques
over the pure time series method. As a brief summary, Hsiao (2003) lists several benefits of
this method including: the control for individual heterogeneity, obtaining higher quality data,
greater freedom and more efficiency. A particularly important advantage is that panel data
techniques facilitate the identification and measurement of effects that are not always detectable
using pure time series data. Our empirical analysis aims to evaluate the short and long-run
relationships between the variables measuring the NPM-style reforms and two independent
variables measuring public sector size at the general government level (expenditure and public
employment). We attempt to examined the combined short and long-run dynamics of those
relationships.
3.1 Econometric specification
The first single-equation model is formulated from a variable relative to the size of the public
sector which depends on a linear combination of a number of explanatory variables, the basic
model to estimate being the following two-way error component regression model:
yit = α + β1NPMit + β2Zit + νit (1)
νit = µi + δt + ǫit
where yit is a measure of the public sector size in country i at time t, α is an scalar, NPMit is
the itth observation on K New Public Management indicators7, Zit the itth observation on P
control variables, β1, β2, are the K x 1 and P x 1 coefficients vectors respectively, µi denotes
the unobservable country specific effect, δt represents the unobservable specific time effect
(common to all countries) and ǫit the remainder stochastic disturbance term.
We can derive different models according to different assumptions about the unobserved
country and time effects. Assuming that all µi and δt are equal, we have the Pooled Ordinary
Least Squares (POLS) model. Allowing µi and δt to differ, but assuming they are fixed numbers,
we have the Fixed Effects (FE), as called the Least Square Dummy Variable (LSDV) model.
It is important to note that by introducing country and time specific variables into the model
specification it is possible to reduce or avoid the omitted-variable bias (Hsiao, 2003). Finally,
assuming that both unobserved effects are random variables we have the Random Effects (RE)
model.
7Outsourcing and decentralization.
10

Our analysis covers the period from 1980 to 2010, so having a moderately large T implies
that we should be concerned with non-stationary time series that define the panel data, because
using non-stationary variables implies it is possible to engage in spurious relationships. Kao
(1999) examined the spurious regression in panel data, showing that the Least Squares Dummy
Variable (LSDV) estimator is consistent for its true value but not the t-statistic, so inference
about the regression coefficients could be incorrect. Following Wooldridge (2003,p.447), when
T is large and N small (less than 20) and we suspect non-stationarity problems in our data, the
use of first differences is a good way to avoid the problems signalled by Kao(1999). Taking first
differences on equation (1) we get:
△yit = β1△NPMit + β2△Zit +△δt +△ǫit (2)
This transformation should convert our suspected non-stationary variables in stationary ones
(if they are I(1)) and eliminates the country fixed effect µi. Model (2) can be estimated with
a LSDV estimator including fixed time effects to control for common or cyclical trends in
government expenditures. Homoskedasticity and no serial correlation are critical assumptions
to obtain unbiased standard errors estimates of the true parameters of our model so, if we detect
heteroskedasticity or autocorrelation, we will use a Feasible Generalized Least Squares (FGLS)
estimator or a LSDV estimator with panel corrected standard errors (PCSE).
Once we have analyzed the short-term effects of our variables under analysis we will turn to
long-term effects. To estimate the long-run relationship, the literature proposes different estima-
tors including POLS, Fully Modified Ordinary Least Squares (FMOLS) or Dynamic Ordinary
Least Squares (DOLS). Although for a single equation, POLS is a consistent estimator of the
cointegrating vector, it has a non-negligible bias in finite samples (Kao and Chiang, 2000). To
overcome this problem, Phillips and Moon (1999) and Pedroni (2000) proposed the FMOLS
estimator, while Kao and Chiang(2000) proposed an alternative approach based on a DOLS
estimator (Baltagi, 2008). Kao and Chiang also examined the properties of FMOLS in relation
to DOLS, proving that the DOLS estimator is preferable over FMOLS. Moreover, Mark and
Sul (2003) proved that time and country specific effects could be include in the panel DOLS
regression without affecting the asymptotic variance of the estimator. Due to the advantages pre-
viously mentioned of the DOLS estimator and its simpler computation we will use the DOLS
technique. Let us consider our long-run regression as follows:
yit = µi + δt + γXit + ǫit (3)
Xit = Xit−1 + υit
11

where Xit is the itth observation of L cointegrated regressors and ǫit and υit are stationary error
terms. The DOLS estimator is based on the following error decomposition:
ǫit =q∑
j=−q
ωij△Xit−j + ϕit (4)
where q represents the number of leads and lags and ϕit is a stationary error term. Combining
equations (3) and (4) we get:
yit = µi + δt + γXit +q∑
j=−q
ωij△Xit−j + ϕit (5)
where the panel DOLS estimator of γ are our long-run coefficients of interest which, according
to Mark and Sul (2003), are consistent and normally distributed in the limit, so hypothesis
testing can be conducted as usual.
In addition, to assess properly the effects of different types of NPM reforms, we perform
a combined short and long-run analysis. Thus, we convert model (1) into an autoregressive
distributive lag (ARDL) dynamic panel specification of the form:
yit = λyi,t−1 + β1NPMit + β2NPMi,t−1 + β3Zit + β3Zi,t−1 + µi + δt + ǫit (6)
To analyze short and long-run effects we can specify and error correction model (ECM). The
error correction reparameterization of (6) is:
△yit = △θ1NPMit +△θ2Zit + ecmt−1 + δt + ǫit (7)
ecmt−1 = φ(yi,t−1 − γXi,t−1) (8)
where ecmt−1 is the error correction term, Xi,t−1 is the it-1th observation of L cointegrated
regressors, φ is the error correction speed of adjustment and γ is the L x 1 vector of long run
parameters, which are of primary interest. Our approach to estimate this model is similar to the
one followed by Ashworth et al (2007), through an Engle-Granger two-step procedure. Firstly,
we can assess the long-run effects by estimating the cointegrating vector, next we include the
lagged residuals as the error correction term in (7) to assess how the short-run relationship varies
from the long-run one.
12
3.2 The data
We use in this paper an unbalanced panel data of 18 European countries8 from 1980 to 2010, and
classified the main variables into three categories: public sector size indicators, NPM indicators
and control variables. The following is a description of the variables used in the analysis and
table 13. Appendix A sets out the data sources and descriptive statistics.
Public sector size
The aim of this paper is to analyze the NPM effects on government expenditure and public sec-
tor employment. Our first dependent variable is an aggregate indicator of general government
expenses (EXP), which consists of the ratio of total general government expenses as a share of
Gross Domestic Product (GDP), while our second dependent variable, public sector employ-
ment, is measured using the ratio public administration and defence employees (Group L of
the ISIC classification) as a share of total population (PADMIN). This proxy is used instead
of the amount of public employees for two reasons: first, because the analysis of government
efficiency regarding administrative employment is a point of major interest (OECD, 2010) and
second, due to the lack of cross-country comparable data on public sector employment9.
NPM indicators
Our analysis is focused on two NPM-related elements, outsourcing and decentralization (both
fiscal and administrative). A measure for government outsourcing (OUTS) is the sum of in-
termediate consumption plus social transfers in kind via market producers 10 (OECD, 2011)
as a share of final government consumption. Fiscal decentralization is measured in this paper
as the share of sub-national public expenditure in consolidated national public expenditures 11,
named here expenditure decentralization (EXPDEC). The use of this indicator is very common
in the literature, but it is not exempt from criticism. Stegarescu (2005) pointed out that the
measure of expenditure decentralization often tends to overestimate the degree of decentraliza-
tion in most countries, since this does not take into account the degree of fiscal autonomy of
sub-national levels of government, which could bias our results. To partly overcome this prob-
lem, we omit from our indicator all transfers between levels of government and Social Security
8When analyzing the effects of NPM reforms on administrative public employment we have excluded Austria
and the United Kingdom due to lack of comparable data.9Currently, the International Labour Organization (ILO) and the OECD are working to construct a joint
database on public employment and finance, but this will not be available until the end of 2011, as discussed
during the Public Finance and Employment Database experts’ committee held in July 2011 at the OECD, Paris.10Social transfers in kind via market producers consist of individual goods and services provided as transfers in
kind to individual households by government units, purchased on the market.11Excluding transfers between levels of government and Social Security funds.
13

funds. To measure administrative decentralization, we include in our regressions two indica-
tors; public employment decentralization (EMPDEC) and a measure of sub-national autonomy
(AUT). Public employment decentralization is measured as the share of sub-national compen-
sation of public employees in compensation of general government employees. The use of the
compensation of public employees as a proxy instead of the real number of public employees
is justified by the fact that there is not sufficient available cross-country comparable data on the
number of civil servants at different levels of government, as pointed in the previous subsec-
tion. Sub-national autonomy is measured as the percentage of total sub-national revenues not
accounted for by transfers (see Schneider, 2003), ie the share of central government transfers to
state and local governments in the total sub-national government revenues. It should be noted
that the simple correlation coefficient between the expenditure decentralization and the decen-
tralization of public employment indicators is high and statistically significant12, so we do not
include them simultaneously in the regressions to avoid multi-collinearity problems.
Control variables
Following the fiscal federalism literature (Levine and Renelt,1992; Rodden, 2003; Fiva,2006;
Cassette and Paty, 2010), which traditionally has been concerned about the effect of certain poli-
cies on the size of public sector, we also include in our model a set of control variables which
could affect government expenditure: two macrovariables; GDP per capita (GDPCAP) and the
unemployment rate (UNEMP); and two demographic variables, population density (DENS) and
the old-age dependency ratio (POP65), which is the population over 65 years old as a share of
the population between 15 and 64 years old. The first two control variables, GDP per capita
and unemployment rate, can be used to identify the economic cycle, while the other two should
be positively associated with government expenditure, unless there are economies of scale, in
which case the coefficient associated with the population density ratio should be negative. Dif-
ferent authors propose the inclusion of additional control variables, such as degree of trade
openness (Rodrick, 1998), rural population versus urban population (Fiva, 2006), political vari-
ables (Rodden, 2003; Fiva, 2006) and self-employed population (Cassette and Paty, 2010). Due
to the contradictory results found in previous studies about the statistical significance and rele-
vance of some of these variables, we decided not to include in our models more control variables
than those mentioned to avoid loosing degrees of freedom and time periods.
As a corollary to this subsection, we must not overlook two important limitations of the data.
The first is the use of GDP as the denominator in the public expenditure indicator, because the
evolution of this ratio may be strongly influenced by changes in GDP. The second is the limited
time series dimension in the case of some countries, which may introduce some bias into our
12See table 14 on Appendix A.
14
results in the long-term analysis.
3.3 Government outlays, outsourcing and decentralization trends
Government outlays and administrative public employment
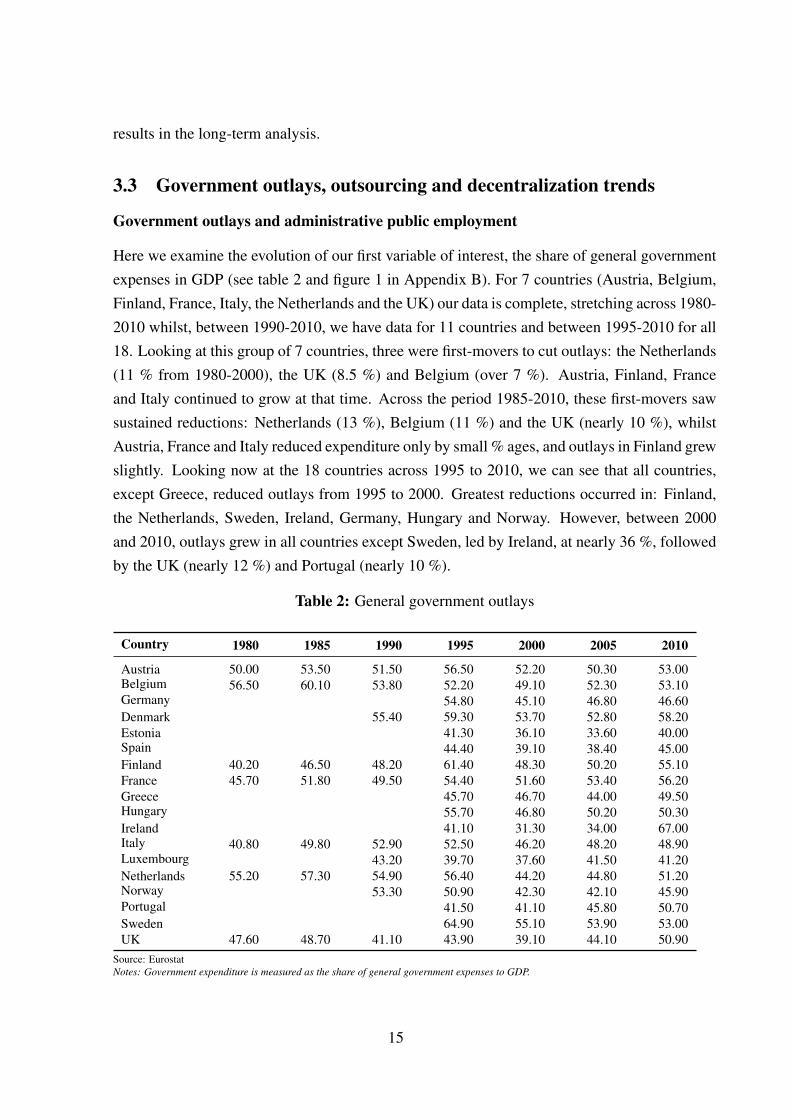
Here we examine the evolution of our first variable of interest, the share of general government
expenses in GDP (see table 2 and figure 1 in Appendix B). For 7 countries (Austria, Belgium,
Finland, France, Italy, the Netherlands and the UK) our data is complete, stretching across 1980-
2010 whilst, between 1990-2010, we have data for 11 countries and between 1995-2010 for all
18. Looking at this group of 7 countries, three were first-movers to cut outlays: the Netherlands
(11 % from 1980-2000), the UK (8.5 %) and Belgium (over 7 %). Austria, Finland, France
and Italy continued to grow at that time. Across the period 1985-2010, these first-movers saw
sustained reductions: Netherlands (13 %), Belgium (11 %) and the UK (nearly 10 %), whilst
Austria, France and Italy reduced expenditure only by small % ages, and outlays in Finland grew
slightly. Looking now at the 18 countries across 1995 to 2010, we can see that all countries,
except Greece, reduced outlays from 1995 to 2000. Greatest reductions occurred in: Finland,
the Netherlands, Sweden, Ireland, Germany, Hungary and Norway. However, between 2000
and 2010, outlays grew in all countries except Sweden, led by Ireland, at nearly 36 %, followed
by the UK (nearly 12 %) and Portugal (nearly 10 %).
Table 2: General government outlays
Country 1980 1985 1990 1995 2000 2005 2010
Austria 50.00 53.50 51.50 56.50 52.20 50.30 53.00Belgium 56.50 60.10 53.80 52.20 49.10 52.30 53.10Germany 54.80 45.10 46.80 46.60
Denmark 55.40 59.30 53.70 52.80 58.20
Estonia 41.30 36.10 33.60 40.00Spain 44.40 39.10 38.40 45.00
Finland 40.20 46.50 48.20 61.40 48.30 50.20 55.10
France 45.70 51.80 49.50 54.40 51.60 53.40 56.20
Greece 45.70 46.70 44.00 49.50Hungary 55.70 46.80 50.20 50.30
Ireland 41.10 31.30 34.00 67.00Italy 40.80 49.80 52.90 52.50 46.20 48.20 48.90Luxembourg 43.20 39.70 37.60 41.50 41.20
Netherlands 55.20 57.30 54.90 56.40 44.20 44.80 51.20Norway 53.30 50.90 42.30 42.10 45.90Portugal 41.50 41.10 45.80 50.70
Sweden 64.90 55.10 53.90 53.00
UK 47.60 48.70 41.10 43.90 39.10 44.10 50.90
Source: Eurostat
Notes: Government expenditure is measured as the share of general government expenses to GDP.
15
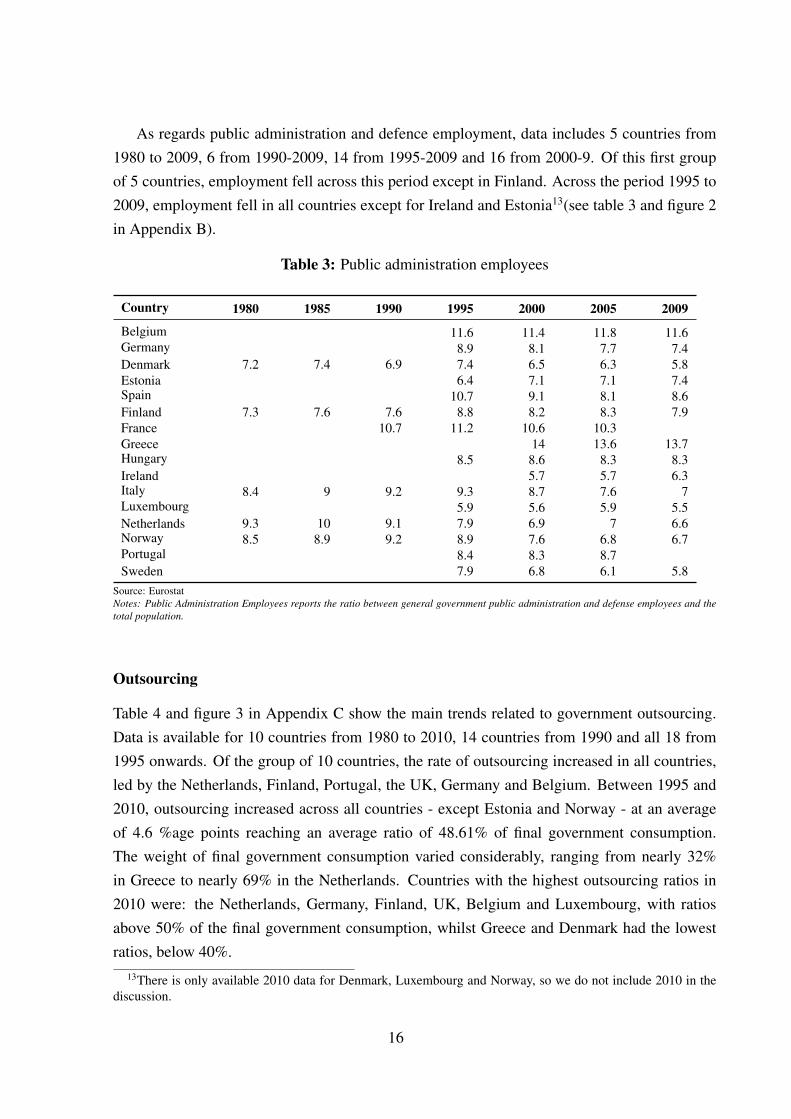
As regards public administration and defence employment, data includes 5 countries from
1980 to 2009, 6 from 1990-2009, 14 from 1995-2009 and 16 from 2000-9. Of this first group
of 5 countries, employment fell across this period except in Finland. Across the period 1995 to
2009, employment fell in all countries except for Ireland and Estonia13(see table 3 and figure 2
in Appendix B).
Table 3: Public administration employees
Country 1980 1985 1990 1995 2000 2005 2009
Belgium 11.6 11.4 11.8 11.6Germany 8.9 8.1 7.7 7.4
Denmark 7.2 7.4 6.9 7.4 6.5 6.3 5.8
Estonia 6.4 7.1 7.1 7.4Spain 10.7 9.1 8.1 8.6
Finland 7.3 7.6 7.6 8.8 8.2 8.3 7.9
France 10.7 11.2 10.6 10.3
Greece 14 13.6 13.7Hungary 8.5 8.6 8.3 8.3
Ireland 5.7 5.7 6.3Italy 8.4 9 9.2 9.3 8.7 7.6 7Luxembourg 5.9 5.6 5.9 5.5
Netherlands 9.3 10 9.1 7.9 6.9 7 6.6Norway 8.5 8.9 9.2 8.9 7.6 6.8 6.7Portugal 8.4 8.3 8.7
Sweden 7.9 6.8 6.1 5.8
Source: Eurostat
Notes: Public Administration Employees reports the ratio between general government public administration and defense employees and the
total population.
Outsourcing
Table 4 and figure 3 in Appendix C show the main trends related to government outsourcing.
Data is available for 10 countries from 1980 to 2010, 14 countries from 1990 and all 18 from
1995 onwards. Of the group of 10 countries, the rate of outsourcing increased in all countries,
led by the Netherlands, Finland, Portugal, the UK, Germany and Belgium. Between 1995 and
2010, outsourcing increased across all countries - except Estonia and Norway - at an average
of 4.6 %age points reaching an average ratio of 48.61% of final government consumption.
The weight of final government consumption varied considerably, ranging from nearly 32%
in Greece to nearly 69% in the Netherlands. Countries with the highest outsourcing ratios in
2010 were: the Netherlands, Germany, Finland, UK, Belgium and Luxembourg, with ratios
above 50% of the final government consumption, whilst Greece and Denmark had the lowest
ratios, below 40%.
13There is only available 2010 data for Denmark, Luxembourg and Norway, so we do not include 2010 in the
discussion.
16
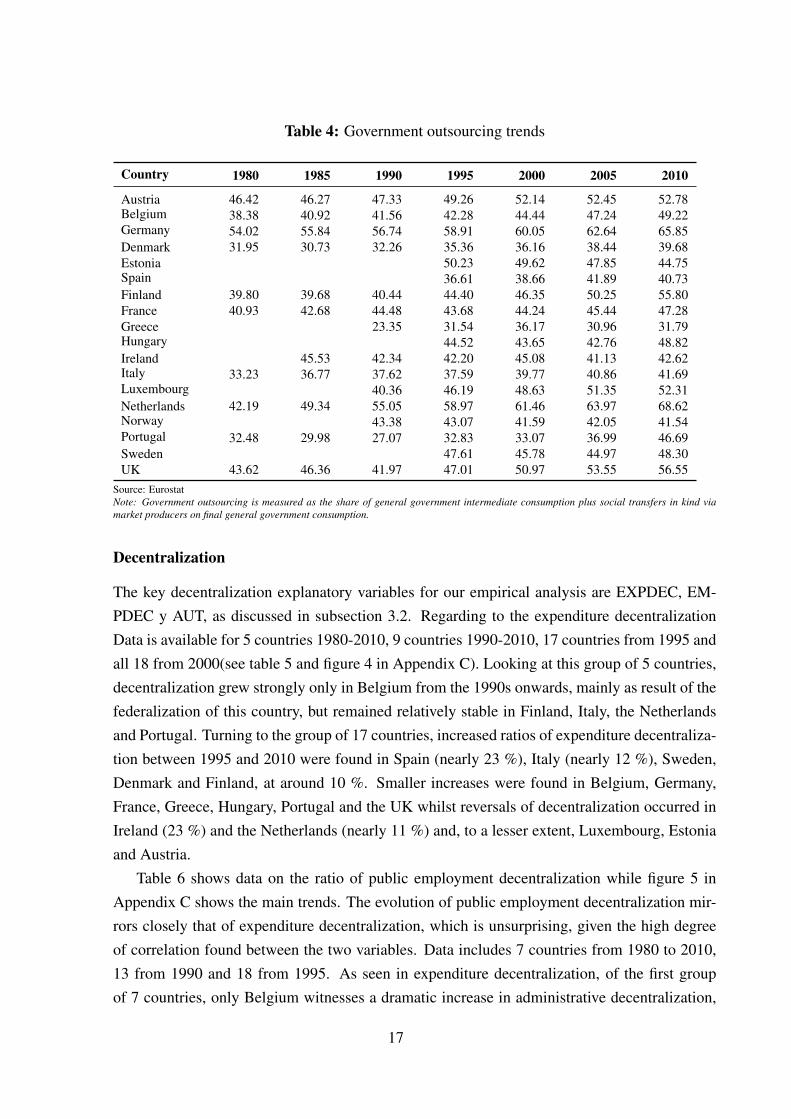
Table 4: Government outsourcing trends
Country 1980 1985 1990 1995 2000 2005 2010
Austria 46.42 46.27 47.33 49.26 52.14 52.45 52.78Belgium 38.38 40.92 41.56 42.28 44.44 47.24 49.22Germany 54.02 55.84 56.74 58.91 60.05 62.64 65.85
Denmark 31.95 30.73 32.26 35.36 36.16 38.44 39.68
Estonia 50.23 49.62 47.85 44.75Spain 36.61 38.66 41.89 40.73
Finland 39.80 39.68 40.44 44.40 46.35 50.25 55.80
France 40.93 42.68 44.48 43.68 44.24 45.44 47.28
Greece 23.35 31.54 36.17 30.96 31.79Hungary 44.52 43.65 42.76 48.82
Ireland 45.53 42.34 42.20 45.08 41.13 42.62Italy 33.23 36.77 37.62 37.59 39.77 40.86 41.69Luxembourg 40.36 46.19 48.63 51.35 52.31
Netherlands 42.19 49.34 55.05 58.97 61.46 63.97 68.62Norway 43.38 43.07 41.59 42.05 41.54Portugal 32.48 29.98 27.07 32.83 33.07 36.99 46.69
Sweden 47.61 45.78 44.97 48.30
UK 43.62 46.36 41.97 47.01 50.97 53.55 56.55
Source: Eurostat
Note: Government outsourcing is measured as the share of general government intermediate consumption plus social transfers in kind via
market producers on final general government consumption.
Decentralization
The key decentralization explanatory variables for our empirical analysis are EXPDEC, EM-
PDEC y AUT, as discussed in subsection 3.2. Regarding to the expenditure decentralization
Data is available for 5 countries 1980-2010, 9 countries 1990-2010, 17 countries from 1995 and
all 18 from 2000(see table 5 and figure 4 in Appendix C). Looking at this group of 5 countries,
decentralization grew strongly only in Belgium from the 1990s onwards, mainly as result of the
federalization of this country, but remained relatively stable in Finland, Italy, the Netherlands
and Portugal. Turning to the group of 17 countries, increased ratios of expenditure decentraliza-
tion between 1995 and 2010 were found in Spain (nearly 23 %), Italy (nearly 12 %), Sweden,
Denmark and Finland, at around 10 %. Smaller increases were found in Belgium, Germany,
France, Greece, Hungary, Portugal and the UK whilst reversals of decentralization occurred in
Ireland (23 %) and the Netherlands (nearly 11 %) and, to a lesser extent, Luxembourg, Estonia
and Austria.
Table 6 shows data on the ratio of public employment decentralization while figure 5 in
Appendix C shows the main trends. The evolution of public employment decentralization mir-
rors closely that of expenditure decentralization, which is unsurprising, given the high degree
of correlation found between the two variables. Data includes 7 countries from 1980 to 2010,
13 from 1990 and 18 from 1995. As seen in expenditure decentralization, of the first group
of 7 countries, only Belgium witnesses a dramatic increase in administrative decentralization,
17
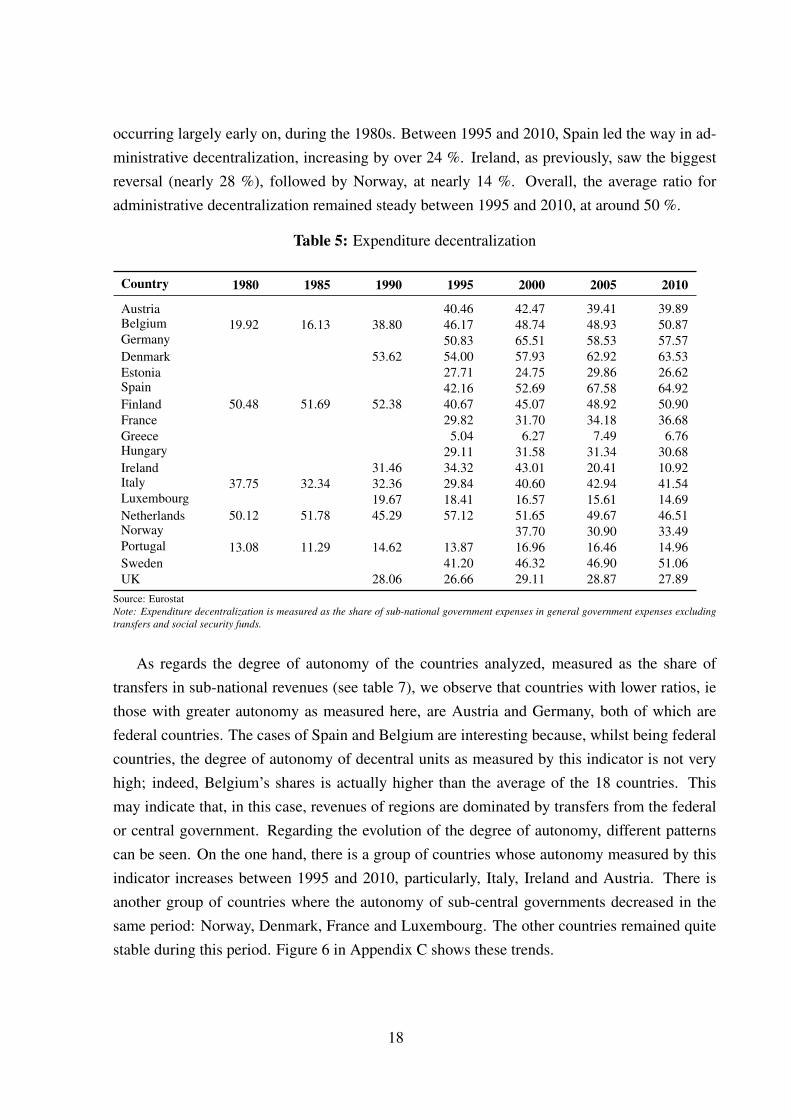
occurring largely early on, during the 1980s. Between 1995 and 2010, Spain led the way in ad-
ministrative decentralization, increasing by over 24 %. Ireland, as previously, saw the biggest
reversal (nearly 28 %), followed by Norway, at nearly 14 %. Overall, the average ratio for
administrative decentralization remained steady between 1995 and 2010, at around 50 %.
Table 5: Expenditure decentralization
Country 1980 1985 1990 1995 2000 2005 2010
Austria 40.46 42.47 39.41 39.89Belgium 19.92 16.13 38.80 46.17 48.74 48.93 50.87Germany 50.83 65.51 58.53 57.57
Denmark 53.62 54.00 57.93 62.92 63.53
Estonia 27.71 24.75 29.86 26.62Spain 42.16 52.69 67.58 64.92
Finland 50.48 51.69 52.38 40.67 45.07 48.92 50.90
France 29.82 31.70 34.18 36.68
Greece 5.04 6.27 7.49 6.76Hungary 29.11 31.58 31.34 30.68
Ireland 31.46 34.32 43.01 20.41 10.92Italy 37.75 32.34 32.36 29.84 40.60 42.94 41.54Luxembourg 19.67 18.41 16.57 15.61 14.69
Netherlands 50.12 51.78 45.29 57.12 51.65 49.67 46.51Norway 37.70 30.90 33.49Portugal 13.08 11.29 14.62 13.87 16.96 16.46 14.96
Sweden 41.20 46.32 46.90 51.06
UK 28.06 26.66 29.11 28.87 27.89
Source: Eurostat
Note: Expenditure decentralization is measured as the share of sub-national government expenses in general government expenses excluding
transfers and social security funds.
As regards the degree of autonomy of the countries analyzed, measured as the share of
transfers in sub-national revenues (see table 7), we observe that countries with lower ratios, ie
those with greater autonomy as measured here, are Austria and Germany, both of which are
federal countries. The cases of Spain and Belgium are interesting because, whilst being federal
countries, the degree of autonomy of decentral units as measured by this indicator is not very
high; indeed, Belgium’s shares is actually higher than the average of the 18 countries. This
may indicate that, in this case, revenues of regions are dominated by transfers from the federal
or central government. Regarding the evolution of the degree of autonomy, different patterns
can be seen. On the one hand, there is a group of countries whose autonomy measured by this
indicator increases between 1995 and 2010, particularly, Italy, Ireland and Austria. There is
another group of countries where the autonomy of sub-central governments decreased in the
same period: Norway, Denmark, France and Luxembourg. The other countries remained quite
stable during this period. Figure 6 in Appendix C shows these trends.
18
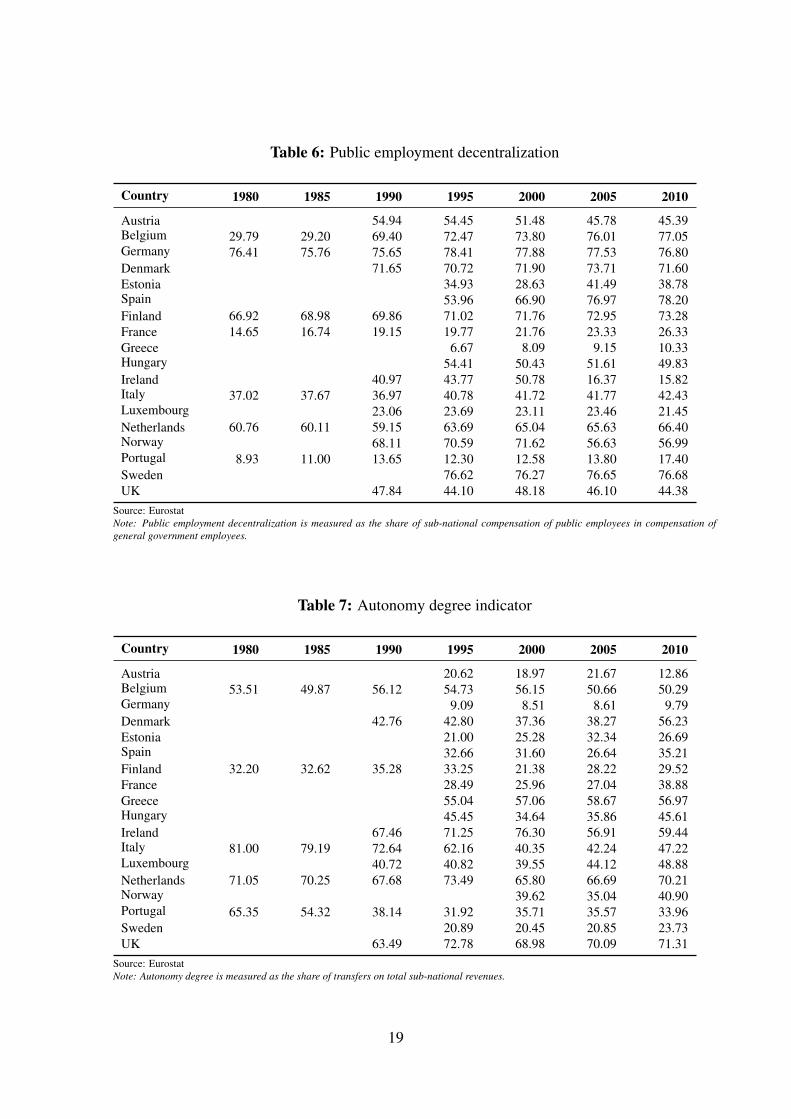
Table 6: Public employment decentralization
Country 1980 1985 1990 1995 2000 2005 2010
Austria 54.94 54.45 51.48 45.78 45.39Belgium 29.79 29.20 69.40 72.47 73.80 76.01 77.05Germany 76.41 75.76 75.65 78.41 77.88 77.53 76.80
Denmark 71.65 70.72 71.90 73.71 71.60
Estonia 34.93 28.63 41.49 38.78Spain 53.96 66.90 76.97 78.20
Finland 66.92 68.98 69.86 71.02 71.76 72.95 73.28
France 14.65 16.74 19.15 19.77 21.76 23.33 26.33
Greece 6.67 8.09 9.15 10.33Hungary 54.41 50.43 51.61 49.83
Ireland 40.97 43.77 50.78 16.37 15.82Italy 37.02 37.67 36.97 40.78 41.72 41.77 42.43Luxembourg 23.06 23.69 23.11 23.46 21.45
Netherlands 60.76 60.11 59.15 63.69 65.04 65.63 66.40Norway 68.11 70.59 71.62 56.63 56.99Portugal 8.93 11.00 13.65 12.30 12.58 13.80 17.40
Sweden 76.62 76.27 76.65 76.68
UK 47.84 44.10 48.18 46.10 44.38
Source: Eurostat
Note: Public employment decentralization is measured as the share of sub-national compensation of public employees in compensation of
general government employees.
Table 7: Autonomy degree indicator
Country 1980 1985 1990 1995 2000 2005 2010
Austria 20.62 18.97 21.67 12.86Belgium 53.51 49.87 56.12 54.73 56.15 50.66 50.29Germany 9.09 8.51 8.61 9.79
Denmark 42.76 42.80 37.36 38.27 56.23
Estonia 21.00 25.28 32.34 26.69Spain 32.66 31.60 26.64 35.21
Finland 32.20 32.62 35.28 33.25 21.38 28.22 29.52
France 28.49 25.96 27.04 38.88
Greece 55.04 57.06 58.67 56.97Hungary 45.45 34.64 35.86 45.61
Ireland 67.46 71.25 76.30 56.91 59.44Italy 81.00 79.19 72.64 62.16 40.35 42.24 47.22Luxembourg 40.72 40.82 39.55 44.12 48.88
Netherlands 71.05 70.25 67.68 73.49 65.80 66.69 70.21Norway 39.62 35.04 40.90Portugal 65.35 54.32 38.14 31.92 35.71 35.57 33.96
Sweden 20.89 20.45 20.85 23.73
UK 63.49 72.78 68.98 70.09 71.31
Source: Eurostat
Note: Autonomy degree is measured as the share of transfers on total sub-national revenues.
19
4 Results
4.1 Short-term analysis
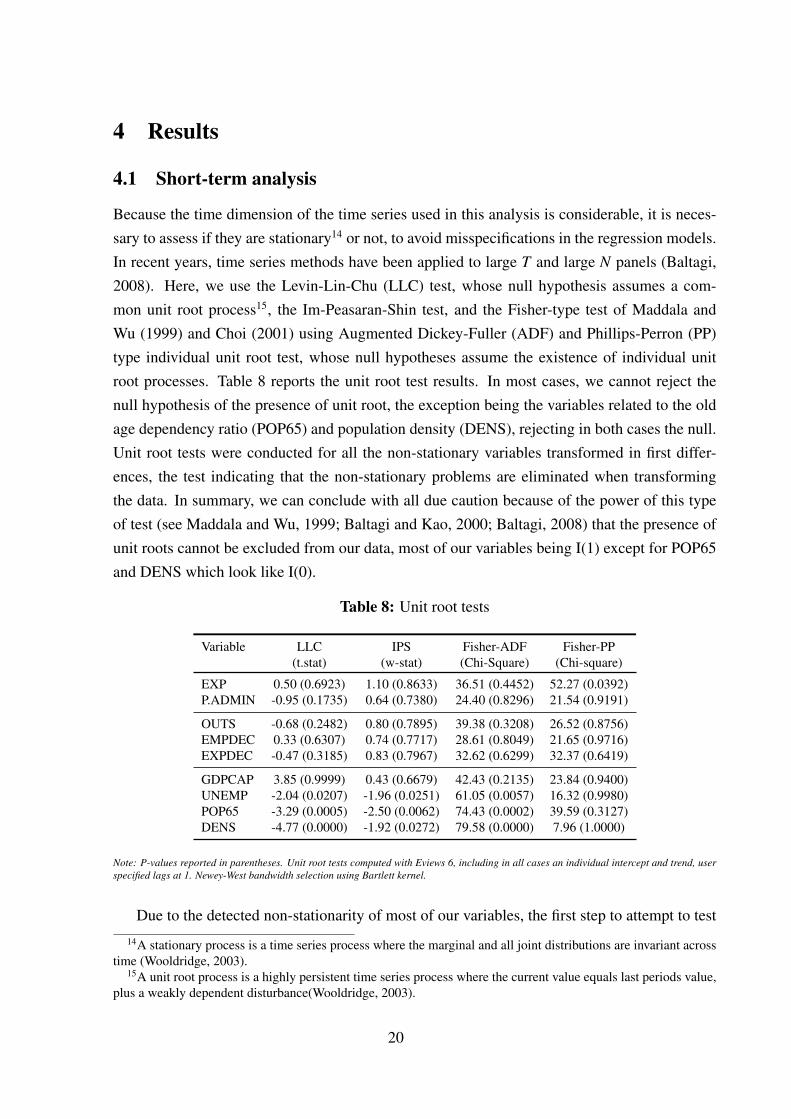
Because the time dimension of the time series used in this analysis is considerable, it is neces-
sary to assess if they are stationary14 or not, to avoid misspecifications in the regression models.
In recent years, time series methods have been applied to large T and large N panels (Baltagi,
2008). Here, we use the Levin-Lin-Chu (LLC) test, whose null hypothesis assumes a com-
mon unit root process15, the Im-Peasaran-Shin test, and the Fisher-type test of Maddala and
Wu (1999) and Choi (2001) using Augmented Dickey-Fuller (ADF) and Phillips-Perron (PP)
type individual unit root test, whose null hypotheses assume the existence of individual unit
root processes. Table 8 reports the unit root test results. In most cases, we cannot reject the
null hypothesis of the presence of unit root, the exception being the variables related to the old
age dependency ratio (POP65) and population density (DENS), rejecting in both cases the null.
Unit root tests were conducted for all the non-stationary variables transformed in first differ-
ences, the test indicating that the non-stationary problems are eliminated when transforming
the data. In summary, we can conclude with all due caution because of the power of this type
of test (see Maddala and Wu, 1999; Baltagi and Kao, 2000; Baltagi, 2008) that the presence of
unit roots cannot be excluded from our data, most of our variables being I(1) except for POP65
and DENS which look like I(0).
Table 8: Unit root tests
Variable LLC IPS Fisher-ADF Fisher-PP
(t.stat) (w-stat) (Chi-Square) (Chi-square)
EXP 0.50 (0.6923) 1.10 (0.8633) 36.51 (0.4452) 52.27 (0.0392)
P.ADMIN -0.95 (0.1735) 0.64 (0.7380) 24.40 (0.8296) 21.54 (0.9191)
OUTS -0.68 (0.2482) 0.80 (0.7895) 39.38 (0.3208) 26.52 (0.8756)
EMPDEC 0.33 (0.6307) 0.74 (0.7717) 28.61 (0.8049) 21.65 (0.9716)
EXPDEC -0.47 (0.3185) 0.83 (0.7967) 32.62 (0.6299) 32.37 (0.6419)
GDPCAP 3.85 (0.9999) 0.43 (0.6679) 42.43 (0.2135) 23.84 (0.9400)
UNEMP -2.04 (0.0207) -1.96 (0.0251) 61.05 (0.0057) 16.32 (0.9980)
POP65 -3.29 (0.0005) -2.50 (0.0062) 74.43 (0.0002) 39.59 (0.3127)
DENS -4.77 (0.0000) -1.92 (0.0272) 79.58 (0.0000) 7.96 (1.0000)
Note: P-values reported in parentheses. Unit root tests computed with Eviews 6, including in all cases an individual intercept and trend, user
specified lags at 1. Newey-West bandwidth selection using Bartlett kernel.
Due to the detected non-stationarity of most of our variables, the first step to attempt to test
14A stationary process is a time series process where the marginal and all joint distributions are invariant across
time (Wooldridge, 2003).15A unit root process is a highly persistent time series process where the current value equals last periods value,
plus a weakly dependent disturbance(Wooldridge, 2003).
20
the proposed hypotheses is to analyze the static model by estimating equation (2). To analyze
the static effect of NPM-style reforms on government outlays we estimate two different specifi-
cations of equation (2): (i) uses general government expenditures as the dependent variable and
(ii) uses the public employment indicator as a dependent variable.
We now examine which of the estimators is most appropriate. We run a F test to determine
the joint significance of the temporal dummies in our model. In both cases we reject the null hy-
pothesis that all the unobserved time effects are equal, suggesting that POLS estimates are not
accurate. Using the Hausman test, we reject in all cases the null hypothesis that the regressors
and effects are uncorrelated. As this result suggests that the random effects estimator is incon-
sistent, we use the fixed effects estimator (LSDV) to estimate equation (2). We cannot reject
the null hypothesis of no autocorrelation at a significance level of 1 % using the Woolddridge
test (2002) in both specifications, ie (i) and (ii). We also reject in both cases the hypothesis of
homoscedasticity using the modified Wald test for group-wise heteroskedasticity in fixed effect
regression model. Based on these tests we use both, a LSDV estimator with panel-corrected
standard errors (PCSE), and the FGLS estimator, to check our results’ robustness16. Estimation
results are reported in table 9.
What is the impact of the variables of interest? Our empirical results are ambiguous regard-
ing the effect on government outlays of the NPM-style reforms analyzed. With respect to the
impact of outsourcing, the positive (and statistically significant) correlation between the out-
sourcing and the public expenditure ratio could indicate that the outsourcing of public service
delivery to private or non-profit sectors did not end up translating into a most cost-effective
provision of public services. This would seem to confirm the second hypothesis, that outsourc-
ing does not necessarily lead to reductions in public expenditure because of the existence of
transaction costs. Theoretically, according to Hypothesis 1, an increase in outsourcing should
led to fewer public employees; however, we found that there was a negative and not statistically
significant relationship between public employment and the outsourcing ratio, again, providing
evidence for hypothesis 2.17.
Turning now to decentralization, we find no significant evidence of a short-term relationship
between expenditure decentralization and public employment, both effects being negative but
statistically not different from zero. We do not find, therefore, empirical evidence to support
16There has been some discussion about which estimator is preferred (see Beck and Katz, (1995) and Chen, Lin
and Reed (2010)). Both are acceptable estimators given the panel-heteroskedasticity assumption. If the assumption
holds, FGLS estimates are more efficient and should be preferred over PCSE. If the assumption is not true, FGLS
will be inefficient and standard errors will be incorrect. PCSE estimates are, in both cases, consistent but never
fully efficient. However, because the PCSE estimator is considered the most “conservative” approach in finite
samples, we will restrict our discussions to those results obtained using it. Moreover, the results of both estimates
are very similar in all cases which may indicate the robustness of our results.17It should be noted here that this result may be highly influenced by the proxy used to measure public sector
employment, group L of the ISIC classification, which includes employment in the public administration and
defense, but not in public enterprises.
21
either hypothesis 4 or 5.
Taking the public employment decentralization ratio as an indicator for administrative de-
centralization, we find a negative and statistically significant effect on government expenditure.
Although the value of the coefficient associated with our variable of interest is not very high,
there is evidence confirming the fourth hypothesis which predicts that decentralization will re-
duce costs. Once more, as occurred in the case of the ratio of expenditure decentralization,
no significant evidence of a short-run relationship between public employment decentraliza-
tion and public employment is found, the effect is statistically not different from zero. Finally,
consistent with previous results, the variable measuring the degree of autonomy of sub-central
governments has a statistically significant positive effect on government spending, so that the
lower the autonomy of sub-central governments, the higher is aggregate government expen-
diture. This would seem to confirm again the fourth hypothesis in relation to administrative
decentralization. The effect of the degree of autonomy of sub-central governments in the num-
ber of employees appears to be statistically insignificant.
What is the effect of our control variables? Inline with previous studies, the unemployment
rate has a positive and statistically significant correlation with the increase of public expendi-
ture and public employees. An increase in the rate of unemployment tends to lead to increased
spending on passive and active employment policies which may generate more public expen-
diture and public employment respectively. These results suggest a counter-cyclical public
expending policy pattern may exist. GDP per capita is negatively correlated with public expen-
ditures but is not statistically significant. However, this result may be a statistical artifact due
to the presence of GDP in the denominator of the dependent variable in the numerator of the
GDP per capita ratio. While the influence of GDP per capita is not particularly relevant in this
research, it could bias other results. For this reason, we conducted some robustness tests, to
exclude this variable from our estimates 18. The results of these tests confirm that our variables
of interest are not affected by the presence of GDP per capita ratio. Regarding the demographic
variables, the results indicate that the population density ratio is not significant, while the old
age dependency ratio has a significant positive effect on public sector size and the amount of
public employees.
18Not reported. Available on request from authors.
22

Table 9: New Public Management and Government Outlays. First differences model estimates.
(i) (ii)
Government expenditure Public employment
△EXP △PADMIN
Explanatory variables
PCSE FGLS PCSE FGLS PCSE FGLS PCSE FGLS
△OUTS .2307** .1867** .2505*** .2010** -.0245 -.0127 -.0275 -.0173
(.0924) (.0785) (.0935) (.0805) (.0183) (.0133) (.0188) (.0134)
△EXPDEC -.2366*** -.2291*** .0016 .0012
(.0336) (.0381) (.0045) (.0042)
△ EMPDEC -.0571* -.0643* .0061 .0078*
(.0323) (.0331) (.0042) (.0039)
△AUT .0941*** .0597** .0386 .0578** -.0042 -.0033 -.0058 -.0058
(.0290) (.0282) (.0304) (.0289) (.0044) (.0040) (.0045) (.0040)
△GDPCAP -.0000 -.0000 -.0000 -.0000 .0000 .0000 .0000 .0000
(.0000) (.0000) (.0000) (.0000) (.0000) (.0000) (.0001) (.0000)
△UNEMP .2762** .1737** .3449*** .2423*** .0686*** .0738*** .0687*** .0742***
(.1165) (.0890) (.1190) (.0845) (.0121) (.0115) (.0120) (.0114)
△POP65 .5078* .4235 .4678* .4594 .0866** .0183 .0810** .0157
(.3062) (.3064) (.2807) (.3261) (.0398) (.0399) (.0382) (.0394)
△DENS .0352 .1407 .0345 .0901 -.0080 -.0118 -.0080 -.0110
(.0657) (.1073) (.0711) (.1058) (.0156) (.0118) (.0153) (.0117)
R-squared 0.46 0.41 0.40 0.40
Wald-chi2 1493.46 427.33 1338.66 395.01 430.73 211.39 540.78 217.75
AR(1) test 0.209 0.209 0.007 0.007 1.193 1.193 1.058 1.058
Heteroskedasticity test 8716.95 8716.95 4708.97 4708.97 480.67 480.67 509.25 509.25
Number of countries 18 18 18 18 16 16 16 16
Number of observations 317 317 317 317 251 251 251 251
Notes: Period fixed effects are included in all the models (not reported). The asterisks ***,**, and * denote significance at the 1%, 5%, and 10% levels, respectively. AR(1) test computed
after first differences estimation and heteroskedasticity tests computed after first differences-GLS estimations.Corrected standard errors reported in parentheses. Standard errors corrected for
heteroskedasticity and contemporaneous correlation.
23
4.2 Long-run analysis
We now turn our attention to the short and long-run dynamics analysis of the relationship be-
tween the selected NPM-style reforms and government outlays and employees. In addition to
the unit root test reported in table 8, cointegration19 of our I(1) variables should be verified. In
the empirical literature which uses panel data, different methodologies have been applied to test
for cointegration issues, the most popular cointegration tests following Pedroni (2000,2004),
constructed under the null hypothesis of no cointegration 20. Here we use three of Pedroni’s
tests applying the ADF principle21 and the Maddala and Wu(1999) Fisher-type test (Johansen-
Fisher test). Table 10 report the cointegration tests. From the results, we conclude that it seems
that the public expenditure indicator and the non-stationary variables that measure NPM re-
forms are cointegrated 22, rejecting in almost all cases the null hypothesis of no cointegration
at a 5% significance level. In relation to the variable measuring public employment and our
variables of interest, we find no clear evidence of cointegration 23, so the results regarding the
long-term effect of outsourcing and decentralization on the amount of public employees will be
discussed with caution.
We estimate the cointegrating vector, ie the long-run relationship established in equation
(5), with DOLS. The basic idea behind the single equation DOLS estimator is to remove the
endogeneity bias by adding lead and lags of the different explanatory variables. The choice
of the appropriate number of leads and lags is not trivial, since an arbitrary choice can bias
our estimates. In this paper, the choice of the number of leads and lags is based on a data
dependent determination 24, selecting the highest order of leads and lags significant at a 10%
level. According to this rule, we use three leads and three lags in specification (i), and one lead
and one lag in (ii). Due to the detected heteroskedasticity and autocorrelation we use panel
corrected standard errors (PCSE) to estimate equation (5).
Table 11 reports the results of the long-run relationship between the public sector size mea-
surements and the NPM variables. We find that, in the long-run, outsourcing is positively
correlated with public expenditure but this effect is not statistically significant. This tends to
lend support to hypothesis three, that, in the long-run, the effects of outsourcing on public ex-
penditures may be negligible or even positive. As regards the long-term effect of outsourcing
19Cointegration means that there is a long-term relationship between the variables. More technically, cointegra-
tion means that a linear combination of two series, each of which is integrated of order one, is integrated of order
zero.20For further discussion about these types of tests see Baltagi, 2008.21Wagner and Hlouskova(2007) proved that ADF Pedroni’s test perform better than non-ADF Pedroni’s tests.22We do not report the tests with the autonomy index (AUT) because we do not find any evidence of cointegration
when including the autonomy indicator, thus we do not include AUT in our long-run estimations.23The null of no cointegration is not rejected in five out of six Pedroni ADF test for OUTS, EXPDEC and four
out of six Pedroni tests for OUTS, EMPDEC.24See Westerlund (2003) for further discussion.
24
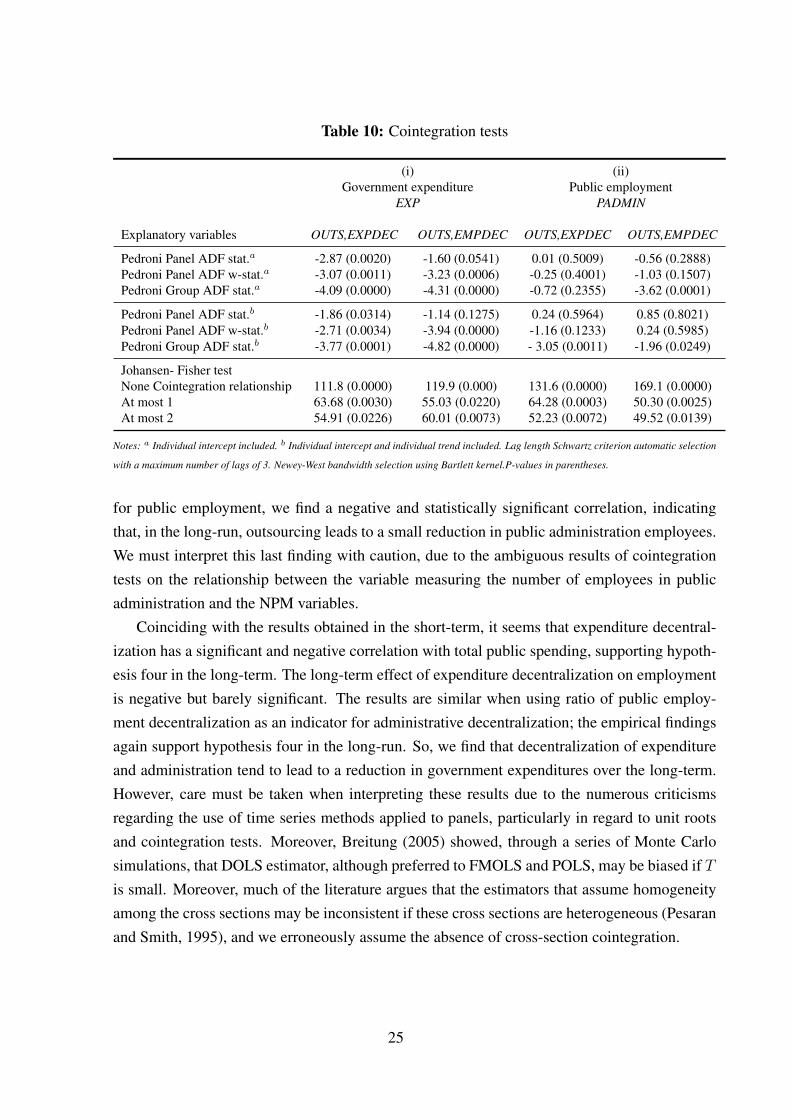
Table 10: Cointegration tests
(i) (ii)
Government expenditure Public employment
EXP PADMIN
Explanatory variables OUTS,EXPDEC OUTS,EMPDEC OUTS,EXPDEC OUTS,EMPDEC
Pedroni Panel ADF stat.a -2.87 (0.0020) -1.60 (0.0541) 0.01 (0.5009) -0.56 (0.2888)
Pedroni Panel ADF w-stat.a -3.07 (0.0011) -3.23 (0.0006) -0.25 (0.4001) -1.03 (0.1507)
Pedroni Group ADF stat.a -4.09 (0.0000) -4.31 (0.0000) -0.72 (0.2355) -3.62 (0.0001)
Pedroni Panel ADF stat.b -1.86 (0.0314) -1.14 (0.1275) 0.24 (0.5964) 0.85 (0.8021)
Pedroni Panel ADF w-stat.b -2.71 (0.0034) -3.94 (0.0000) -1.16 (0.1233) 0.24 (0.5985)
Pedroni Group ADF stat.b -3.77 (0.0001) -4.82 (0.0000) - 3.05 (0.0011) -1.96 (0.0249)
Johansen- Fisher test
None Cointegration relationship 111.8 (0.0000) 119.9 (0.000) 131.6 (0.0000) 169.1 (0.0000)
At most 1 63.68 (0.0030) 55.03 (0.0220) 64.28 (0.0003) 50.30 (0.0025)
At most 2 54.91 (0.0226) 60.01 (0.0073) 52.23 (0.0072) 49.52 (0.0139)
Notes: a Individual intercept included. b Individual intercept and individual trend included. Lag length Schwartz criterion automatic selection
with a maximum number of lags of 3. Newey-West bandwidth selection using Bartlett kernel.P-values in parentheses.
for public employment, we find a negative and statistically significant correlation, indicating
that, in the long-run, outsourcing leads to a small reduction in public administration employees.
We must interpret this last finding with caution, due to the ambiguous results of cointegration
tests on the relationship between the variable measuring the number of employees in public
administration and the NPM variables.
Coinciding with the results obtained in the short-term, it seems that expenditure decentral-
ization has a significant and negative correlation with total public spending, supporting hypoth-
esis four in the long-term. The long-term effect of expenditure decentralization on employment
is negative but barely significant. The results are similar when using ratio of public employ-
ment decentralization as an indicator for administrative decentralization; the empirical findings
again support hypothesis four in the long-run. So, we find that decentralization of expenditure
and administration tend to lead to a reduction in government expenditures over the long-term.
However, care must be taken when interpreting these results due to the numerous criticisms
regarding the use of time series methods applied to panels, particularly in regard to unit roots
and cointegration tests. Moreover, Breitung (2005) showed, through a series of Monte Carlo
simulations, that DOLS estimator, although preferred to FMOLS and POLS, may be biased if T
is small. Moreover, much of the literature argues that the estimators that assume homogeneity
among the cross sections may be inconsistent if these cross sections are heterogeneous (Pesaran
and Smith, 1995), and we erroneously assume the absence of cross-section cointegration.
25
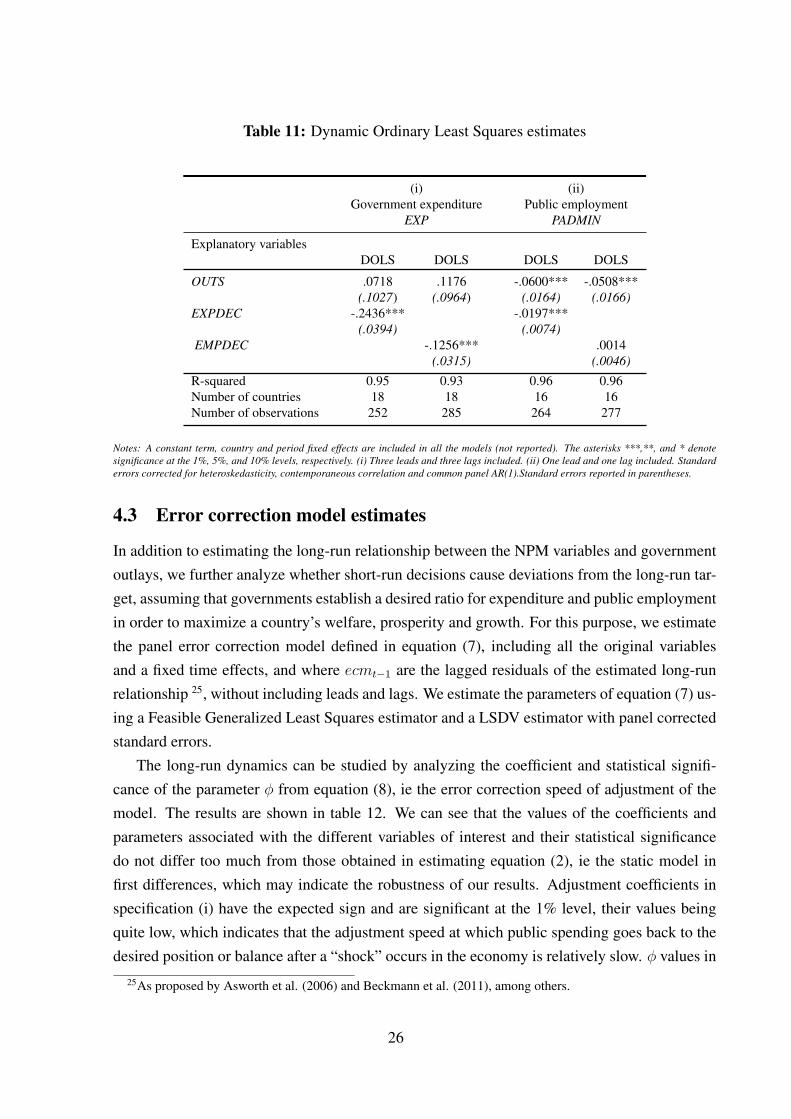
Table 11: Dynamic Ordinary Least Squares estimates
(i) (ii)
Government expenditure Public employment
EXP PADMIN
Explanatory variables
DOLS DOLS DOLS DOLS
OUTS .0718 .1176 -.0600*** -.0508***
(.1027) (.0964) (.0164) (.0166)
EXPDEC -.2436*** -.0197***
(.0394) (.0074)
EMPDEC -.1256*** .0014
(.0315) (.0046)
R-squared 0.95 0.93 0.96 0.96
Number of countries 18 18 16 16
Number of observations 252 285 264 277
Notes: A constant term, country and period fixed effects are included in all the models (not reported). The asterisks ***,**, and * denote
significance at the 1%, 5%, and 10% levels, respectively. (i) Three leads and three lags included. (ii) One lead and one lag included. Standard
errors corrected for heteroskedasticity, contemporaneous correlation and common panel AR(1).Standard errors reported in parentheses.
4.3 Error correction model estimates
In addition to estimating the long-run relationship between the NPM variables and government
outlays, we further analyze whether short-run decisions cause deviations from the long-run tar-
get, assuming that governments establish a desired ratio for expenditure and public employment
in order to maximize a country’s welfare, prosperity and growth. For this purpose, we estimate
the panel error correction model defined in equation (7), including all the original variables
and a fixed time effects, and where ecmt−1 are the lagged residuals of the estimated long-run
relationship 25, without including leads and lags. We estimate the parameters of equation (7) us-
ing a Feasible Generalized Least Squares estimator and a LSDV estimator with panel corrected
standard errors.
The long-run dynamics can be studied by analyzing the coefficient and statistical signifi-
cance of the parameter φ from equation (8), ie the error correction speed of adjustment of the
model. The results are shown in table 12. We can see that the values of the coefficients and
parameters associated with the different variables of interest and their statistical significance
do not differ too much from those obtained in estimating equation (2), ie the static model in
first differences, which may indicate the robustness of our results. Adjustment coefficients in
specification (i) have the expected sign and are significant at the 1% level, their values being
quite low, which indicates that the adjustment speed at which public spending goes back to the
desired position or balance after a “shock” occurs in the economy is relatively slow. φ values in
25As proposed by Asworth et al. (2006) and Beckmann et al. (2011), among others.
26
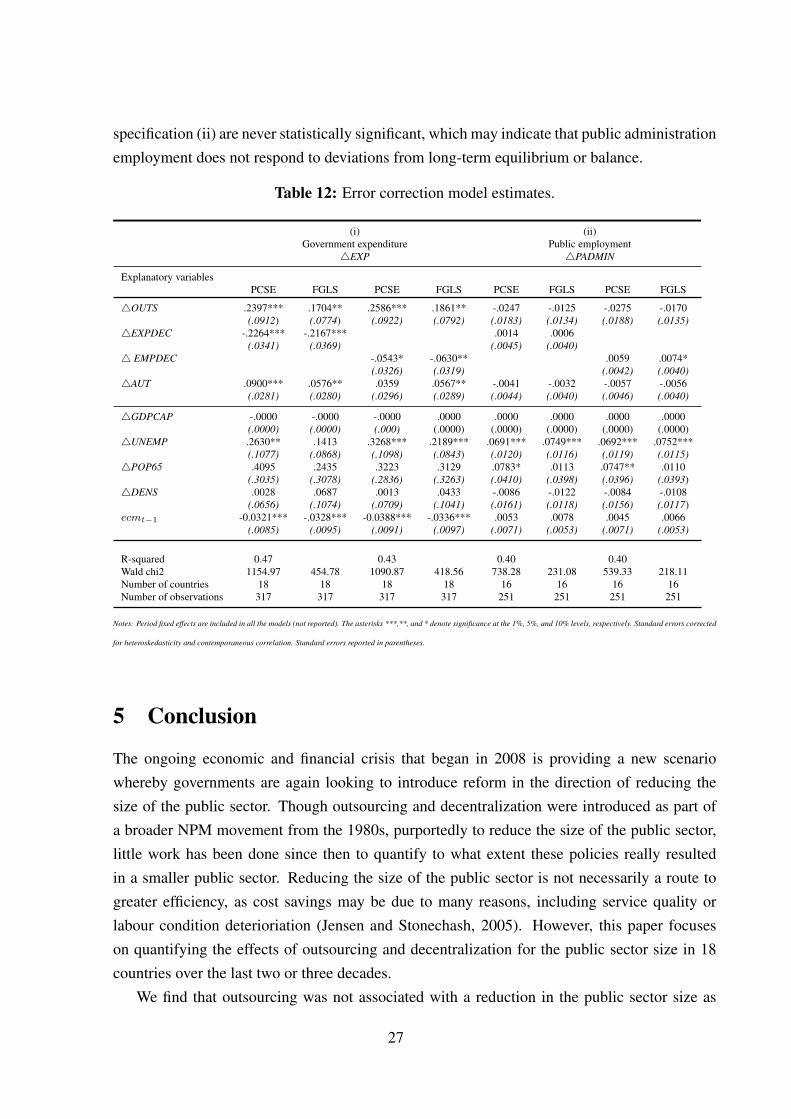
specification (ii) are never statistically significant, which may indicate that public administration
employment does not respond to deviations from long-term equilibrium or balance.
Table 12: Error correction model estimates.
(i) (ii)
Government expenditure Public employment
△EXP △PADMIN
Explanatory variables
PCSE FGLS PCSE FGLS PCSE FGLS PCSE FGLS
△OUTS .2397*** .1704** .2586*** .1861** -.0247 -.0125 -.0275 -.0170
(.0912) (.0774) (.0922) (.0792) (.0183) (.0134) (.0188) (.0135)
△EXPDEC -.2264*** -.2167*** .0014 .0006
(.0341) (.0369) (.0045) (.0040)
△ EMPDEC -.0543* -.0630** .0059 .0074*
(.0326) (.0319) (.0042) (.0040)
△AUT .0900*** .0576** .0359 .0567** -.0041 -.0032 -.0057 -.0056
(.0281) (.0280) (.0296) (.0289) (.0044) (.0040) (.0046) (.0040)
△GDPCAP -.0000 -.0000 -.0000 .0000 .0000 .0000 .0000 .0000
(.0000) (.0000) (.000) (.0000) (.0000) (.0000) (.0000) (.0000)
△UNEMP .2630** .1413 .3268*** .2189*** .0691*** .0749*** .0692*** .0752***
(.1077) (.0868) (.1098) (.0843) (.0120) (.0116) (.0119) (.0115)
△POP65 .4095 .2435 .3223 .3129 .0783* .0113 .0747** .0110
(.3035) (.3078) (.2836) (.3263) (.0410) (.0398) (.0396) (.0393)
△DENS .0028 .0687 .0013 .0433 -.0086 -.0122 -.0084 -.0108
(.0656) (.1074) (.0709) (.1041) (.0161) (.0118) (.0156) (.0117)
ecmt−1 -0.0321*** -.0328*** -0.0388*** -.0336*** .0053 .0078 .0045 .0066
(.0085) (.0095) (.0091) (.0097) (.0071) (.0053) (.0071) (.0053)
R-squared 0.47 0.43 0.40 0.40
Wald chi2 1154.97 454.78 1090.87 418.56 738.28 231.08 539.33 218.11
Number of countries 18 18 18 18 16 16 16 16
Number of observations 317 317 317 317 251 251 251 251
Notes: Period fixed effects are included in all the models (not reported). The asterisks ***,**, and * denote significance at the 1%, 5%, and 10% levels, respectively. Standard errors corrected
for heteroskedasticity and contemporaneous correlation. Standard errors reported in parentheses.
5 Conclusion
The ongoing economic and financial crisis that began in 2008 is providing a new scenario
whereby governments are again looking to introduce reform in the direction of reducing the
size of the public sector. Though outsourcing and decentralization were introduced as part of
a broader NPM movement from the 1980s, purportedly to reduce the size of the public sector,
little work has been done since then to quantify to what extent these policies really resulted
in a smaller public sector. Reducing the size of the public sector is not necessarily a route to
greater efficiency, as cost savings may be due to many reasons, including service quality or
labour condition deterioriation (Jensen and Stonechash, 2005). However, this paper focuses
on quantifying the effects of outsourcing and decentralization for the public sector size in 18
countries over the last two or three decades.
We find that outsourcing was not associated with a reduction in the public sector size as
27
regards expenditure and employment either in the short or long-term. In contrast, fiscal and
administrative decentralization, measured as the ratio of expenditure and public employment
decentralization, as well as the autonomy of the sub-central government, do seem to lead to a
smaller public sector as regards expenditure, both in the short and long-term. We do not find,
however, that decentralization led to a reduction in public sector employment. These results
may indicate that the observed decline in public spending in the late 1980s and 1990s may not
necessarily be truly associated with NPM-style reforms but, rather, simple cost-cutting reform.
As a caveat, this paper modestly sought to assess the consequences of NPM-style reforms
on public sector size. This is not to forget that NPM pursued not only a slimmer public sector,
but also, a more efficient and effective public sector, aimed at increasing consumer satisfac-
tion and choice. Clearly, though outsourcing did not lead to a smaller public sector, if public
sector working conditions, service quality improved, and/or social welfare was strengthened,
this could be interpreted as a benefit of such a policy. If, however, the increase in govern-
ment spending was not accompanied by such improvement, this could suggest the existence of
high transaction and coordination costs and the appropriation of social income by the private
sector (the so-called “hold up” effect), or, that the private provision of public goods does not
necessarily entail efficiency gains.
Finally, though we have presented sets of correlations between NPM reform and public
sector size, these conclusions must be interpreted with caution. Even if the results are robust
to different specifications, as is this case, the empirical specification does not allow for the
establishment of a strong causal relationships, mainly due to a possible problem of endogeneity
of the regressors. Though this can be corrected by using panel cointegration techniques, as
we have performed, this methodology has been subject to criticism. Likewise, as discussed by
Pollitt and Bouchaert (2003), the ratios using GDP as the denominator may be very influenced
by the use of this indicator. For example, during 1990-2000, a period of strong economic
growth, the steady growth of GDP could mask increases in public spending and debt and the
opposite in times of recession
A major task for future research is, on the one hand, to include in the model further indi-
cators for NPM-style reforms, such as the use of “performance related pay” or “performance
budgeting” and, on the other hand, the use of reliable data on the total employment in both
central and sub-central public sector levels. Another challenge is to investigate the net effect of
the policies under analysis as regards social welfare effects.
References
Ashworth, J.and Galli, E. & Padovano, F. (2006), Decentralization as a constraint to Leviathan: a panel
cointegration analysis, Working paper, Italian Society of Public Economics Conference 2006.
28
Baltagi, B. (2008), Econometric Analysis of Panel Data, Wiley, John and Sons, Inc.
Baltagi, B. & Kao, C. (2000), ‘Nonstationary panels, cointegration in panels and dynamic panels: a
survey’, Advances in Econometrics 15, 7–51.
Barzelay, M. (2002), New public management: Current trends and future prospects, London, Routledge,
chapter Origins of the New Public Management: An international view from public administra-
tion/political science, pp. 15–33.
Beck, N. & Katz, J. (1995), ‘What to do (and not to do) with time-series cross-section data’, American
Politial Science Review 89(3), 634–647.
Beckmann, J., Belke, A. & Dobnik, F. (2011), Cross-section Dependence and the Monetary Exchange
Rate Model: A Panel Analysis, Discussion Paper 1119, Deutsches Institut fr Wirtschaftsforschung.
Bel, G., Fageda, X. & Warner, M. (2010), ‘Is private production of public services cheaper than pub-
lic production? a meta-regression analysis of solid waste and water services’, Journal of Policy
Analysis and Management 29(3), 553–577.
Berkowitz, E. & McQuaid, K. (1988), Creating the Welfare State: The Political Economy of Twentieth
Century Reform, second edn, New York: Praeger Press. Revised and Expanded.
Borins, S. (1994), Government in Transition: A New Paradigm in Public Administration, Technical
report, Commonwealth Association for Public Administration and Management (28 August, Char-
lottetown, Prince Edward Islands).
Breitung, J. (2005), ‘A parametric approach to the estimation of cointegration vectors in panel data’,
Econometric Reviews 24, 151–173.
Brennan, G. & Buchanan, J. (1980), The Power to Tax. Analytical Foundations of a Fiscal Constitution,
Cambridge: Cambridge University Press.
Cassette, A. & Paty, S. (2010), ‘Fiscal decentralization and the size of government: a European country
empirical analysis ’, Public Choice 143(1-2), 173–189.
Chen, X., Lin, S. & Reed, R. (2010), ‘A Monte Carlo evaluation of the efficiency of the PCSE estimator
’, Applied Economic Letters 17(1), 7–10.
Choi, I. (2001), ‘Unit root tests for panel data’, Journal of International Money and Finance 20(2), 249–
272.
Christensen, T. & Laegreid, P. (2002), ‘New public management: Puzzles of democracy and the influence
of citizens’, Journal of Political Philosophy 10(3), 267–295.
Christensen, T. & Laegreid, P. (2007), ‘The Whole-of-Government Approach to Public Sector Reform’,
Public Administration Review 67, 1059–1066.
29
Christensen, T. & Laegreid, P., eds (2001), New Public management: the transformation of ideas and
practice, Aldershot, Ashgate.
Clifton, J., Comin, F. & Diaz-Fuentes, D. (2003), Privatization in the European Union: Public Enterprise
and Integration, Dordrecht: Kluwer Academic Publishers.
Clifton, J., Comin, F. & Diaz-Fuentes, D. (2005), ‘Empowering Europe’s Citizens? On the prospects for
a Charter for Services of General Interest’, Public Management Review .
Clifton, J., Comin, F. & Diaz-Fuentes, D. (2006), ‘Privatization in the European Union: Pragmatic,
Ideological, Inevitable?’, Journal of European Public Policy .
Clifton, J., Comin, F. & Diaz-Fuentes, D., eds (2007), Tranforming Public Enterprise in Europe and the
Americas: Transnationalisation and Integration, Palgrave.
Clifton, J. & Diaz-Fuentes, D. (2010), ‘Evaluating EU policies on public services: A citizens’ perspec-
tive’, Annals of Public and Cooperative Economics .
Coase, R. (1937), ‘The nature of the firm’, Economica 4(16), 386–405.
Comin, F. & Diaz-Fuentes, D. (2004), La empresa publica en Europa, Sintesis.
Costas, A. (2007), ‘De consumidor a ciudadano: el papel de la satisfaccion del ciudadano en la sosteni-
bilidad de los mercados de servicios publicos’, Informacion Comercial Espanola 836, 33–50.
Dunleavy, P. & Hood, C. (1994), ‘From old public administration to new management’, Public Money
and Management 14(3), 9–16.
Falleti, T. (2005), ‘A Sequential Theory of Decentralization: Latin American Cases in Comparative
Perspective’, The American Political Science Review 99(3), 327–346.
Ferlie, E., Pettigrew, A., Ashburner, L. & Fitzgerald, L. (1996), The New Public Management in Action,
Oxford University Press, Oxford.
Fiva, J. (2006), ‘New Evidence on the Effect of Fiscal Decentralization on the Size and Composition of
Government Spending’, FinanzArchiv: Public Finance Analysis 62(2), 250–280.
Flynn, N. (2002), New public management: Current trends and future prospects, London, Routledge,
chapter Explaining the New Public Management: the importance of context, pp. 57–76.
Hammerschmid, G., Meyer, R. E. & et al (2007), Cultural Aspects of Public Management Reform, JAI
press, chapter Public administration modernization: Common reform trends or different paths and
national understandings in the EU countries, pp. 145–169.
Hart, O., Shleifer, A. & Vishny, R. (1997), ‘The proper scope of government: theory and an application
to prisons’, Quarterly Journal of Economics 112, 1127–1161.
30
Haynes, P. (2003), Managing complexity in the public services, Open University Press.
Hood, C. (1991), ‘A public management for all seasons’, Public Administration 69(1), 3–19.
Hood, C. (1995), ‘The ”New Public Management” in the 1980s: Variations on a Theme’, Accounting,
Organizations and Society 20, 93–109.
Hood, C. (2000), The Art of the State. Culture, Rhetoric, and Public Management, Oxford: Oxford
University Press.
Hsiao, C. (2003), Analysis of Panel Data, second edn, Cambridge Universtity Press.
Jensen, P. & Stonecash, T. (2005), ‘Incentives and the efficiency of public sector-outsourcing contracts’,
Journal of Economic Surveys 19(5), 767–787.
Jin, J. & Zou, H. (2002), ‘How does fiscal decentralization affect aggregate, national and subnational
government size?,’, Journal of Urban Economics 52, 270–293.
Kao, C. (1999), ‘Spurious regression and residual-based tests for cointegration in panel data’, Journal of
Econometrics 90, 1–44.
Kao, C. & Chiang, M. (2000), ‘On the estimation and inference of a cointegrated regression in panel
data’, Advances in Econometrics 15, 179–222.
Kettl, D. (2000), The global public management revolution: a report on the transformation of gover-
nance, Washington, D.C., Brookings Institution Press.
Levine, R. & Renelt, D. (1992), ‘A Sensitivity Analysis of Cross-Country Growth Regressions’, The
American Economic Review 82(4), 942–963.
Maddala, G. S. & Wu, S. (1999), ‘A Comparative Study of Unit Root Tests with Panel Data and a New
Simple Test’, Oxford Bulletin of Economics and Statistics 61, 631–652.
Mark, N. C. & Sul, D. (2003), ‘Cointegration vector estimation by panel dols and long-run money de-
mand’, Oxford Bulletin of Economics and Statistics 65(5), 655–680.
Minicucci, S. & Donahue, J. D. (2004), ‘A simple estimation method for aggregate government outsourc-
ing’, Journal of Policy Analysis and Management 23(3), 489–507.
Niskanen, W. (1971), Bureaucracy and Representative Government, Chicago: Aldine Atherton.
Oates, W. (1972), Fiscal Federalism, Harcourt Brace Jovanovich, New York.
Oates, W. (1985), ‘Searching for Leviathan: An Empirical Analysis’, American Economic Review
75, 748–757.
OECD (2009), Government at a Glance 2009, Technical report, OECD.
31
OECD (2010), Public administation after new public management, Technical report, OECD.
OECD (2011), Government at a Glance 2011, Technical report, OECD.
Osborne, D. & Gaebler, T. (1992), Reinventing Government: How the Entrepreneurial Spirit is Trans-
forming the Public Sector, Addison-Wesley, Reading.
Osborne, S. P. & McLaughlin, K. (2002), New public management: Current trends and future prospects,
London, Routledge, chapter The New Public Management in context, pp. 7–14.
O’Toole, L. & Meier, K. (2004), ‘Parkinson’s Law and the New Public Management? Contracting De-
terminants and Service-Quality Consequences in Public Education’, Public Administration Review
64(3), 342–352.
Pedroni, P. (2000), ‘Fully modified OLS for heterogeneus cointegrated panels’, Advances in Economet-
rics 15, 93–130.
Pedroni, P. (2004), ‘Panel cointegration: asymptotic and finite sample properties of pooled time series
tests with an application to the ppp hypothesis’, Econometric theory 20, 597–625.
Pesaran, M. & Smith, R. (1995), ‘Estimating long-run relationships from dynamic heterogeneous pan-
els’, Journal of Econometrics 68, 79–113.
Peters, G. & Savoie, D. (1996), ‘Managing Incoherence: The Coordination and Empowerment Conun-
drum’, Pubilc Administration Review 56(3), 281–289.
Polidano, C. (1998), ‘Public sector reform in developing countries: the state of practice. introduction:
new public management, old hat?’, Journal of International Development 10, 373–375.
Pollitt, C. (1993), Managerialism and the Public Services: The Anglo-American Experience, second edn,
Blackwell, Oxford.
Pollitt, C. (2007a), ‘The new public management: An overview of its current status’, Administratie SI
Management Public 8, 110–115.
Pollitt, C. (2007b), The Oxford Handbook Of Public Management, Oxford University Press, chapter
Decentralization.
Pollitt, C. & Bouckaert, G. (2003), Evaluation in Public Sector Reform: Concepts and Practise in an
international perspective, Edard Elgar, chapter Evaluating Public Management Reforms: An inter-
national perspective.
Pollitt, C. & Bouckaert, G. (2004), Public Management Reform: An international comparison, Oxford
University Press.
Pollitt, C. & Bouckaert, G. (2011), Public management reform: a comparative analysis: New Public
management, Governance and the Neo-Weberian State, Oxford: Oxford University Press.
32
Pollitt, C. & Dan, S. (2011), The impacts of the new public management in europe: A metaanalysis,
Working paper WP 3, COCOPS.
Pollitt, C. & Summa, H. (1997), ‘Trajectories of reform: public management change in four countries’,
Public Money and Management 17(1), 1–13.
Prud’homme, R. (1995), ‘The dangers of decentralization’, The World Bank Research Observer
10(2), 201–220.
Quiggin, J. (2002), ‘Contracting out: promise and performance’, Economic and Labour Relations Review
13(1), 88–104.
Rodden, J. (2003), ‘Revising Leviathan: Fiscal Federalism and the Growth of Government’, Interna-
tional Organization 57, 695–729.
Rodrick, D. (1998), ‘Why do more open economies have bigger governments?’, Journal of Political
Economy 106, 997–1032.
Rondinelli, D., Nellis, J. & Shabbir, G. (1984), Decentralization in Developing Countries: A Review of
Recent Experience., Washington, D.C.: World Bank.
Savas, E. (1987), Privatization. The key to better government, Chatham, NJ: Chatham House.
Schmalensee, R. (1979), The Control of Natural Monopolies, Massachusetts: Lexington Books.
Schneider, A. (2003), ‘Decentralization: Conceptualization and Measurement’, Studies in Comparative
International Development 38(3), 32–56.
Stegarescu, D. (2005), ‘Public sector decentralization: measurement concepts and recent international
trends,’, Fiscal Studies 26(301-333).
Tiebout, C. (1956), ‘A Pure Theory of Local Public Expenditures’, Journal of Political Economy 64, 416–
424.
Torres, L. & Pina, V. (2004), ‘Reshaping public administration: the Spanish experience compared to the
UK’, Public Administration 82(2), 445–464.
Treisman, D. (2007), The architecture of government: rethinking political decentralization, New York:
Cambridge University.
Tullock, G. (1965), The politics of Bureaucracy, Washington DC: Public Affairs Press.
Van de Walle, S. & Hammerschmid, G. (2011), Coordinating for cohesion in the public sector of the
future: Cocops project background paper, Working paper WP 1, COCOPS.
Vickers, J. & Yarrow, G. (1988), Privatization: An Economic Analysis, MIT press, Cambridge, Mass.
33
Wagner, M. & Hlouskova, J. (2007), The performance of panel cointegration methods: results from large
scale simulation study, working paper, Institute of Advanced Studies.
Warner, M. & Hefezt, A. (2008), ‘Managing Markets for Public Service: The Role of Mixed Pub-
lic/Private Delivery of City Services’, Public Administration Review 68(1), 150–161.
Wegrich, K. (2009), International Handbook of Public Management Reform, Edward Elgar, chapter
Public Management Reform in the United Kingdom: Great leaps, small steps, and policies as their
own cause, pp. 137–154.
Westerlund, J. (2003), Feasible estimation in cointegrated panels, Discussion paper, Department of Eco-
nomics, University of Lund.
Williamson, O. (1979), ‘Transaction cost economics: the governance of contractual relationships’, Jour-
nal of Law and Economics 22, 233–261.
Williamson, O. (1989a), Handbook of Industrial Organization, New York: North Holland, chapter Trans-
action Costs Economics, pp. 136–184.
Williamson, O. (1989b), ‘Transaction Costs Economics: How It Works; Where It Is Headed’, De
Economist 146, 23–58.
Williamson, O. (1999), ‘Public and Private Bureaucracies: A Transaction Cost Economics Perspective’,
Journal of Law and Economics 15(1), 306–402.
Wooldridge, J. (2002), Econometric Analysis of Cross Section and Panel Data, Cambridge, Mas-
sachusetts ; London : The MIT Press.
Wooldridge, J. (2003), Introductory Econometrics: A Modern Approach, second edn, Cincinnati, OH:
South-Western College Publishing.
34
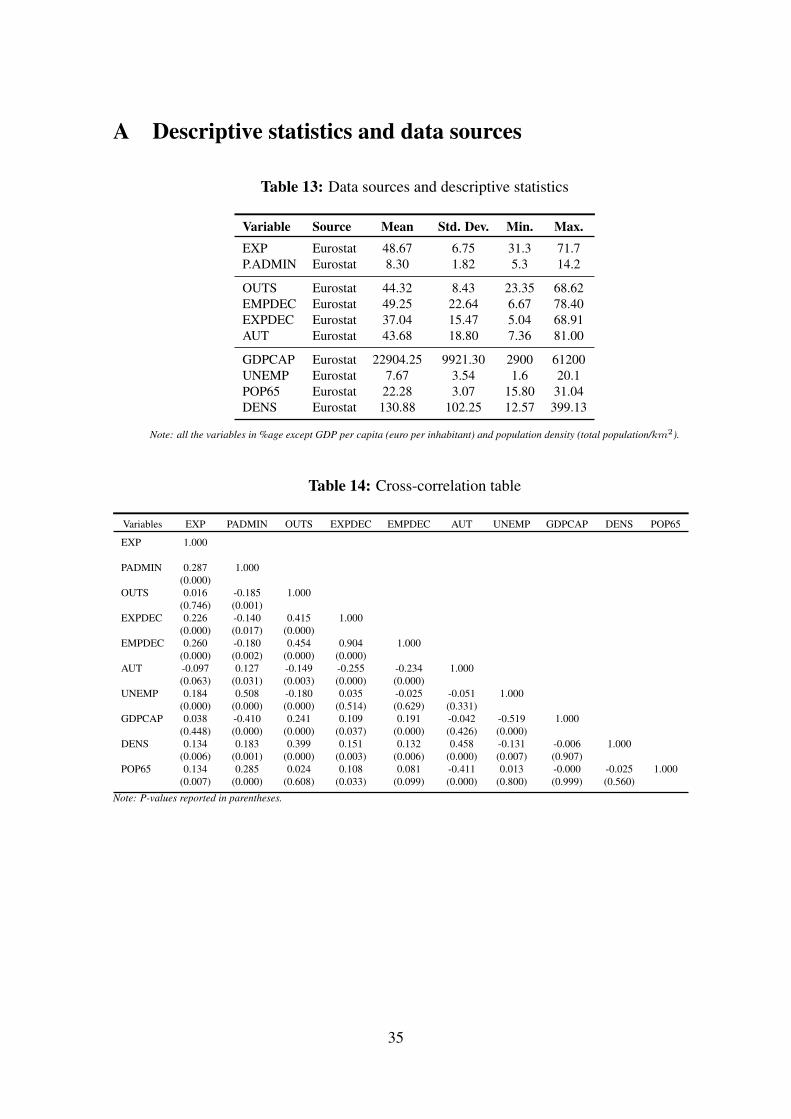
A Descriptive statistics and data sources
Table 13: Data sources and descriptive statistics
Variable Source Mean Std. Dev. Min. Max.
EXP Eurostat 48.67 6.75 31.3 71.7
P.ADMIN Eurostat 8.30 1.82 5.3 14.2
OUTS Eurostat 44.32 8.43 23.35 68.62
EMPDEC Eurostat 49.25 22.64 6.67 78.40
EXPDEC Eurostat 37.04 15.47 5.04 68.91
AUT Eurostat 43.68 18.80 7.36 81.00
GDPCAP Eurostat 22904.25 9921.30 2900 61200
UNEMP Eurostat 7.67 3.54 1.6 20.1
POP65 Eurostat 22.28 3.07 15.80 31.04
DENS Eurostat 130.88 102.25 12.57 399.13
Note: all the variables in %age except GDP per capita (euro per inhabitant) and population density (total population/km2).
Table 14: Cross-correlation table
Variables EXP PADMIN OUTS EXPDEC EMPDEC AUT UNEMP GDPCAP DENS POP65
EXP 1.000
PADMIN 0.287 1.000
(0.000)
OUTS 0.016 -0.185 1.000
(0.746) (0.001)
EXPDEC 0.226 -0.140 0.415 1.000
(0.000) (0.017) (0.000)
EMPDEC 0.260 -0.180 0.454 0.904 1.000
(0.000) (0.002) (0.000) (0.000)
AUT -0.097 0.127 -0.149 -0.255 -0.234 1.000
(0.063) (0.031) (0.003) (0.000) (0.000)
UNEMP 0.184 0.508 -0.180 0.035 -0.025 -0.051 1.000
(0.000) (0.000) (0.000) (0.514) (0.629) (0.331)
GDPCAP 0.038 -0.410 0.241 0.109 0.191 -0.042 -0.519 1.000
(0.448) (0.000) (0.000) (0.037) (0.000) (0.426) (0.000)
DENS 0.134 0.183 0.399 0.151 0.132 0.458 -0.131 -0.006 1.000
(0.006) (0.001) (0.000) (0.003) (0.006) (0.000) (0.007) (0.907)
POP65 0.134 0.285 0.024 0.108 0.081 -0.411 0.013 -0.000 -0.025 1.000
(0.007) (0.000) (0.608) (0.033) (0.099) (0.000) (0.800) (0.999) (0.560)
Note: P-values reported in parentheses.
35

B Evolution of general government outlays
Figure 1: General Government Expenditures as a share of GDP trends
30
40
50
60
70
30
40
50
60
70
30
40
50
60
70
30
40
50
60
70
1980 1990 2000 2010 1980 1990 2000 2010
1980 1990 2000 2010 1980 1990 2000 2010 1980 1990 2000 2010
Belgium Germany Estonia Spain France
Hungary Italy Netherlands Norway United Kingdom
Austria Denmark Finland Greece Ireland
Luxembourg Portugal Sweden
Exp
en
se
s g
en
era
l g
ove
rnm
en
t ra
tio
yearSource: Eurostat
Figure 2: General Government Public Administration Employees as a share of total population
51
01
55
10
15
51
01
55
10
15
1980 1990 2000 2010 1980 1990 2000 2010
1980 1990 2000 2010 1980 1990 2000 2010 1980 1990 2000 2010
Belgium Germany Estonia Spain France
Hungary Italy Netherlands Norway United Kingdom
Austria Denmark Finland Greece Ireland
Luxembourg Portugal Sweden
Pu
blic
ad
min
istr
atio
n r
atio
yearSource: Eurostat
36
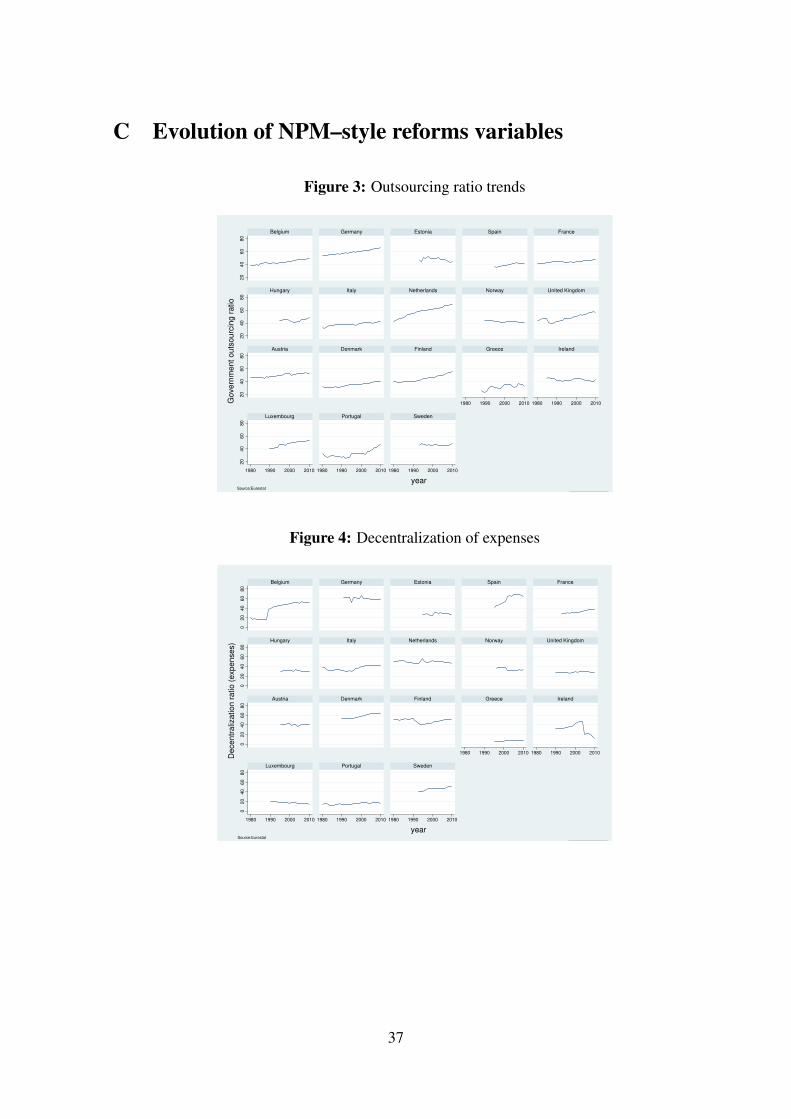
C Evolution of NPM–style reforms variables
Figure 3: Outsourcing ratio trends
20
40
60
80
20
40
60
80
20
40
60
80
20
40
60
80
1980 1990 2000 2010 1980 1990 2000 2010
1980 1990 2000 2010 1980 1990 2000 2010 1980 1990 2000 2010
Belgium Germany Estonia Spain France
Hungary Italy Netherlands Norway United Kingdom
Austria Denmark Finland Greece Ireland
Luxembourg Portugal Sweden
Go
ve
rnm
en
t o
uts
ou
rcin
g r
atio
yearSource:Eurostat
Figure 4: Decentralization of expenses
02
04
06
08
00
20
40
60
80
02
04
06
08
00
20
40
60
80
1980 1990 2000 2010 1980 1990 2000 2010
1980 1990 2000 2010 1980 1990 2000 2010 1980 1990 2000 2010
Belgium Germany Estonia Spain France
Hungary Italy Netherlands Norway United Kingdom
Austria Denmark Finland Greece Ireland
Luxembourg Portugal Sweden
De
ce
ntr
aliz
atio
n r
atio
(e
xp
en
se
s)
yearSource:Eurostat
37

Figure 5: Decentralization of employment
02
04
06
08
00
20
40
60
80
02
04
06
08
00
20
40
60
80
1980 1990 2000 2010 1980 1990 2000 2010
1980 1990 2000 2010 1980 1990 2000 2010 1980 1990 2000 2010
Belgium Germany Estonia Spain France
Hungary Italy Netherlands Norway United Kingdom
Austria Denmark Finland Greece Ireland
Luxembourg Portugal Sweden
de
ce
ntr
aliz
atio
n o
f e
mp
loym
en
t ra
tio
yearSource: Eurostat
Figure 6: Sub-national governments autonomy
02
04
06
08
00
20
40
60
80
02
04
06
08
00
20
40
60
80
1980 1990 2000 2010 1980 1990 2000 2010
1980 1990 2000 2010 1980 1990 2000 2010 1980 1990 2000 2010
Belgium Germany Estonia Spain France
Hungary Italy Netherlands Norway United Kingdom
Austria Denmark Finland Greece Ireland
Luxembourg Portugal Sweden
Au
ton
om
y in
dic
ato
r
yearSource: Eurostat
38