Diabetes prevalence and income: Results of the Canadian Community Health Survey
8
Health Policy 99 (2011) 116–123 Contents lists available at ScienceDirect Health Policy journal homepage: www.elsevier.com/locate/healthpol Diabetes prevalence and income: Results of the Canadian Community Health Survey Serban Dinca-Panaitescu a,∗ , Mihaela Dinca-Panaitescu b , Toba Bryant c , Isolde Daiski d , Beryl Pilkington d , Dennis Raphael a a School of Health Policy and Management, York University, Faculty of Health, 4700 Keele St., Toronto, ON, M3J 1P3 Canada b York Institute for Health Research, York University, Canada c Health Studies, University of Toronto, Scarborough, Canada d School of Nursing, York University, Canada article info Keywords: Diabetes Determinants of health Health policy Public health abstract This paper contributes to a growing body of literature indicating the importance of income as a key socioeconomic status marker in accounting for the increased prevalence of type 2 diabetes (T2DM). Methods: We analyzed data from the Canadian Community Health Survey cycle 3.1 con- ducted by Statistics Canada. Descriptive statistics on the prevalence of self-reported diabetes were computed. Multiple logistic regression was used to examine the association between income and prevalence of T2DM. Results: In 2005 an estimated 1.3 million Canadians (4.9%) reported having diabetes. The prevalence of T2DM in the lowest income group is 4.14 times higher than in the highest income group. Prevalence of diabetes decreases steadily as income goes up. The likeli- hood of diabetes was significantly higher for low-income groups even after adjusting for socio-demographic status, housing, BMI and physical activity. There is a graded association between income and diabetes with odds ratios almost double for men (OR 1.94, 95% CI 1.57–2.39) and almost triple for women (OR 2.75 95% CI 2.24–3.37) in the lowest income compared to those in highest income. Conclusion: These findings suggest that strategies for diabetes prevention should combine person-centered approaches generally recommended in the diabetes literature research with public policy approaches that acknowledge the role of socioeconomic position in shaping T2DM prevalence/incidence. Crown Copyright © 2010 Published by Elsevier Ireland Ltd. All rights reserved. 1. Introduction Diabetes mellitus (diabetes) is the seventh leading cause of death in Canada that affects over two million Canadi- ans [1]. From the three types of diabetes, type 2 diabetes (T2DM) affects approximately 90% of Canadians diagnosed with diabetes [2] and is the primary focus of this paper. ∗ Corresponding author. Tel.: +1 416 736 2100x33186; fax: +1 416 736 5227. E-mail address: [email protected] (S. Dinca-Panaitescu). With the aging of the Canadian population, the number of cases of T2DM is projected to increase. While the mainstream medical literature acknowledges the “multifactorial” nature of diabetes [3,4], a substantive body of literature subscribes to an individualistic discourse which emphasizes the characteristics of patients (their biology, behaviours, psychological states, or culture) and focuses on changing patients’ attitudes and risk behaviours rather than changing the economic circumstances that may have led to disease-promoting attitudes and behaviours [5]. However, there is an increasing literature that highlights the importance of the social determinants of health in the 0168-8510/$ – see front matter. Crown Copyright © 2010 Published by Elsevier Ireland Ltd. All rights reserved. doi:10.1016/j.healthpol.2010.07.018
-
Upload
independent -
Category
Documents
-
view
0 -
download
0
Transcript of Diabetes prevalence and income: Results of the Canadian Community Health Survey

DC
SIa
b
c
d
a
KDDHP
1
oa(w
f
0d
Health Policy 99 (2011) 116–123
Contents lists available at ScienceDirect
Health Policy
journa l homepage: www.e lsev ier .com/ locate /hea l thpol
iabetes prevalence and income: Results of the Canadianommunity Health Survey
erban Dinca-Panaitescua,∗, Mihaela Dinca-Panaitescub, Toba Bryantc,solde Daiskid, Beryl Pilkingtond, Dennis Raphaela
School of Health Policy and Management, York University, Faculty of Health, 4700 Keele St., Toronto, ON, M3J 1P3 CanadaYork Institute for Health Research, York University, CanadaHealth Studies, University of Toronto, Scarborough, CanadaSchool of Nursing, York University, Canada
r t i c l e i n f o
eywords:iabeteseterminants of healthealth policyublic health
a b s t r a c t
This paper contributes to a growing body of literature indicating the importance of incomeas a key socioeconomic status marker in accounting for the increased prevalence of type 2diabetes (T2DM).Methods: We analyzed data from the Canadian Community Health Survey cycle 3.1 con-ducted by Statistics Canada. Descriptive statistics on the prevalence of self-reporteddiabetes were computed. Multiple logistic regression was used to examine the associationbetween income and prevalence of T2DM.Results: In 2005 an estimated 1.3 million Canadians (4.9%) reported having diabetes. Theprevalence of T2DM in the lowest income group is 4.14 times higher than in the highestincome group. Prevalence of diabetes decreases steadily as income goes up. The likeli-hood of diabetes was significantly higher for low-income groups even after adjusting forsocio-demographic status, housing, BMI and physical activity. There is a graded associationbetween income and diabetes with odds ratios almost double for men (OR 1.94, 95% CI
1.57–2.39) and almost triple for women (OR 2.75 95% CI 2.24–3.37) in the lowest incomecompared to those in highest income.Conclusion: These findings suggest that strategies for diabetes prevention should combineperson-centered approaches generally recommended in the diabetes literature researchwith public policy approaches that acknowledge the role of socioeconomic position invalence Copyri
shaping T2DM preCrown
. Introduction
Diabetes mellitus (diabetes) is the seventh leading cause
f death in Canada that affects over two million Canadi-ns [1]. From the three types of diabetes, type 2 diabetesT2DM) affects approximately 90% of Canadians diagnosedith diabetes [2] and is the primary focus of this paper.∗ Corresponding author. Tel.: +1 416 736 2100x33186;ax: +1 416 736 5227.
E-mail address: [email protected] (S. Dinca-Panaitescu).
168-8510/$ – see front matter. Crown Copyright © 2010 Published by Elsevier Iroi:10.1016/j.healthpol.2010.07.018
/incidence.ght © 2010 Published by Elsevier Ireland Ltd. All rights reserved.
With the aging of the Canadian population, the number ofcases of T2DM is projected to increase.
While the mainstream medical literature acknowledgesthe “multifactorial” nature of diabetes [3,4], a substantivebody of literature subscribes to an individualistic discoursewhich emphasizes the characteristics of patients (theirbiology, behaviours, psychological states, or culture) and
focuses on changing patients’ attitudes and risk behavioursrather than changing the economic circumstances that mayhave led to disease-promoting attitudes and behaviours [5].However, there is an increasing literature that highlightsthe importance of the social determinants of health in theeland Ltd. All rights reserved.
Health
S. Dinca-Panaitescu et al. /incidence and management of diabetes [6–8]. T2DM seemsto be common in all populations in industrialized countriesaffecting disproportionately socially and materially disad-vantaged adults [9–14]. The risk of diabetes is also greaterfor people who are obese [15], physically inactive [16], orhave hypertension [17], all these conditions being morecommon among people with low socioeconomic position.Evidence of increasing income inequality among Canadi-ans and increasing numbers of low-income families duringthe past decade [18] directs special attention to the poten-tial effects of low income upon the health and wellbeing ofthose living with diabetes [19].
This paper examines the relationship between incomeand T2DM using a large Canadian data set that allowsfor greater ability to detect differences across income lev-els among men and women. In addition, it assesses therole of a number of behavioural antecedents, importantsocio-demographics, and additional markers of economicsecurity in mediating the association between income anddiabetes, factors which are common conceptualizationsrelated to population health [20–24].
This study contributes to the literature that emphasizesthe special role of income within the web of social deter-minants of health as it influences the quality of early life,levels of stress, availability and quality of food and socialexclusion [25,26].
2. Methods
2.1. Data sources and sample
We analyzed data from the Canadian Community HealthSurvey (CCHS) cycle 3.1. This is a cross-sectional surveyconducted by Statistics Canada that collects informationrelated to health status, health care utilization and healthdeterminants for the Canadian population living in pri-vate occupied dwellings in 122 health regions coveringall provinces and territories. Data for Cycle 3.1 were col-lected between January and December 2005 and coversapproximately 98% of the Canadian population aged 12and over. Excluded from the sampling frame are indi-viduals living on Indian Reserves and on crown lands,institutional residents, full-time members of the Canadianarmed forces, and residents of certain remote regions. TheCCHS questionnaire was administered using computer-assisted interviewing with data collected directly fromsurvey respondents.
132,947 respondents were surveyed and the overallresponse rate was 78.9%. We performed analyses of the98,298 cases (73.9%) with complete data. 8,200 respon-dents reported a diagnosis of diabetes. CCHS cycle 3.1does not include a self-report of the participants’ types ofdiabetes; therefore we used Ng–Dasgupta–Johnson algo-rithm [27] in order to distinguish T2DM from T1DMand gestational diabetes. Based on this algorithm, T2DMincorporates insulin treatment no earlier than 6 months
following diagnosis, diabetes diagnosis not during preg-nancy and age at diagnosis greater than 30 years. Using thisalgorithm, 343 (4.2%) of the respondents were categorizedas having T1DM diabetes, 51 (0.006%) respondents withgestational diabetes and 7806 (95.8%) as having T2DM.Policy 99 (2011) 116–123 117
T1DM and gestational diabetes were excluded from theanalysis.
2.2. Definition of variables
We assessed the association of income and T2DM preva-lence considering a range of covariates: socio-demographiccharacteristics (age, sex, race/ethnicity, immigration sta-tus, marital status, education, geographical location),housing, body mass index (BMI) and physical activity.
T2DM prevalence. The number of people with diabeteswas calculated for different subgroups of the sample foreach variable based on the self-reported data in the CCHS3.1.
Income. A series of six dummy variables was used tocharacterize income: no income or less than $15,000;$15,000–29,999; $30,000–49,999; $50,000–59,999;$60,000–79,999; and at least $80,000 as reference cat-egory. These cut-points balanced the requirement of aminimum sample size in each dummy variable cate-gory and also allowed for comparisons among varioustransitional groups from lowest to highest income.
Covariates. Socio-demographic status considered bothascribed and achieved dimensions. Ascribed status wasrepresented by age, sex, race/ethnicity, and immigra-tion status. Measures of ethnicity and immigration werecombined into a composite measure with the follow-ing categories: white–immigrant; visible minority–non-immigrant; visible minority–immigrant; and white–non-immigrant as reference category. Achieved status, consid-ered to be gained through individual volition and accessto opportunity in social and geographical environments,was represented by factors such as marital status, edu-cation, and geographical location. Education was basedon the highest number of years of schooling successfullycompleted. Four categories of education were considered:less than secondary school; secondary school; other post-secondary school and university with the last categoryas reference. Four categories were considered for maritalstatus: married/common law as reference; widowed; sepa-rated/divorced; and single (never married). We consideredgeographic location as urban versus rural.
Housing tenure was considered as a marker of economicsecurity and was measured in terms of ownership by amember of the household.
BMI was calculated from self-reported height andweight and measured using two dummy variables: over-weight (25 ≤ BMI ≤ 29.99 kg/m2) versus not overweight orobese, and obese (BMI ≥ 30 kg/m2) versus not overweightor overweight. The underweight category was includedunder not overweight category due to a small sample (lessthan 1%).
Physical activity was based on total energy expendi-ture (EE) during leisure time where EE was calculatedusing the frequency and duration of respondents’ reported
leisure-time activities in the previous 3 months and themetabolic energy demand of each activity. Three categoriesof physical activity were considered: inactive (EE < 1.5);moderately active (1.5 ≤ E < 3) and active (EE ≥ 3) as refer-ence category.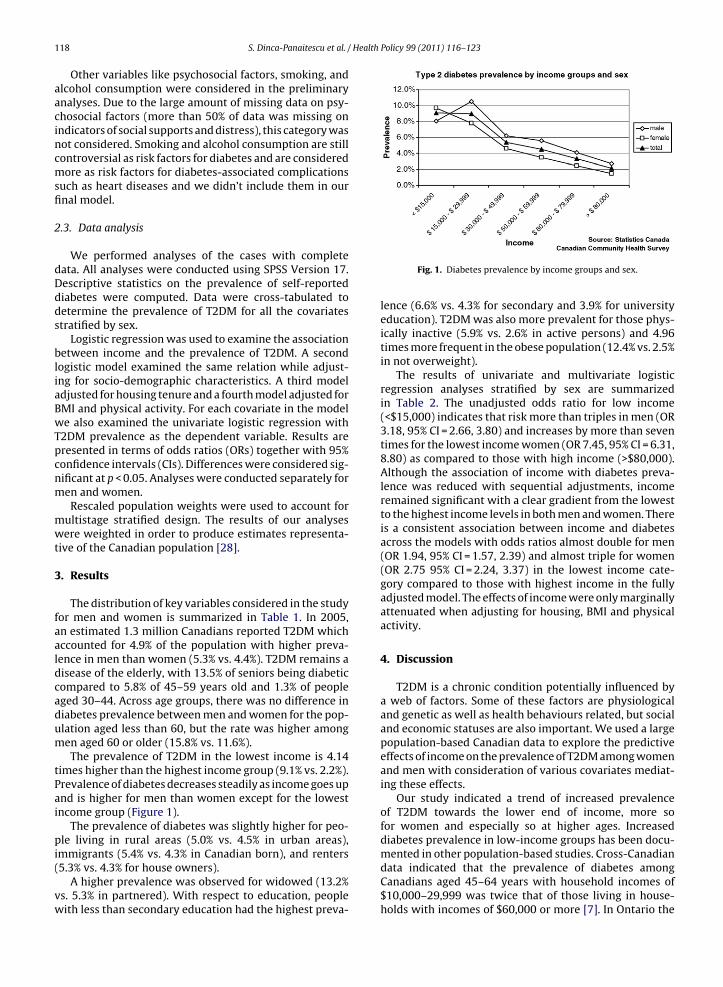
1 Health Policy 99 (2011) 116–123
aacincmsfi
2
dDdds
bliaBwTpcnm
mwt
3
faaldcadum
tPai
pi(
vw
18 S. Dinca-Panaitescu et al. /
Other variables like psychosocial factors, smoking, andlcohol consumption were considered in the preliminarynalyses. Due to the large amount of missing data on psy-hosocial factors (more than 50% of data was missing onndicators of social supports and distress), this category wasot considered. Smoking and alcohol consumption are stillontroversial as risk factors for diabetes and are consideredore as risk factors for diabetes-associated complications
uch as heart diseases and we didn’t include them in ournal model.
.3. Data analysis
We performed analyses of the cases with completeata. All analyses were conducted using SPSS Version 17.escriptive statistics on the prevalence of self-reportediabetes were computed. Data were cross-tabulated toetermine the prevalence of T2DM for all the covariatestratified by sex.
Logistic regression was used to examine the associationetween income and the prevalence of T2DM. A second
ogistic model examined the same relation while adjust-ng for socio-demographic characteristics. A third modeldjusted for housing tenure and a fourth model adjusted forMI and physical activity. For each covariate in the modele also examined the univariate logistic regression with
2DM prevalence as the dependent variable. Results areresented in terms of odds ratios (ORs) together with 95%onfidence intervals (CIs). Differences were considered sig-ificant at p < 0.05. Analyses were conducted separately foren and women.Rescaled population weights were used to account for
ultistage stratified design. The results of our analysesere weighted in order to produce estimates representa-
ive of the Canadian population [28].
. Results
The distribution of key variables considered in the studyor men and women is summarized in Table 1. In 2005,n estimated 1.3 million Canadians reported T2DM whichccounted for 4.9% of the population with higher preva-ence in men than women (5.3% vs. 4.4%). T2DM remains aisease of the elderly, with 13.5% of seniors being diabeticompared to 5.8% of 45–59 years old and 1.3% of peopleged 30–44. Across age groups, there was no difference iniabetes prevalence between men and women for the pop-lation aged less than 60, but the rate was higher amongen aged 60 or older (15.8% vs. 11.6%).The prevalence of T2DM in the lowest income is 4.14
imes higher than the highest income group (9.1% vs. 2.2%).revalence of diabetes decreases steadily as income goes upnd is higher for men than women except for the lowestncome group (Figure 1).
The prevalence of diabetes was slightly higher for peo-le living in rural areas (5.0% vs. 4.5% in urban areas),
mmigrants (5.4% vs. 4.3% in Canadian born), and renters5.3% vs. 4.3% for house owners).
A higher prevalence was observed for widowed (13.2%s. 5.3% in partnered). With respect to education, peopleith less than secondary education had the highest preva-
Fig. 1. Diabetes prevalence by income groups and sex.
lence (6.6% vs. 4.3% for secondary and 3.9% for universityeducation). T2DM was also more prevalent for those phys-ically inactive (5.9% vs. 2.6% in active persons) and 4.96times more frequent in the obese population (12.4% vs. 2.5%in not overweight).
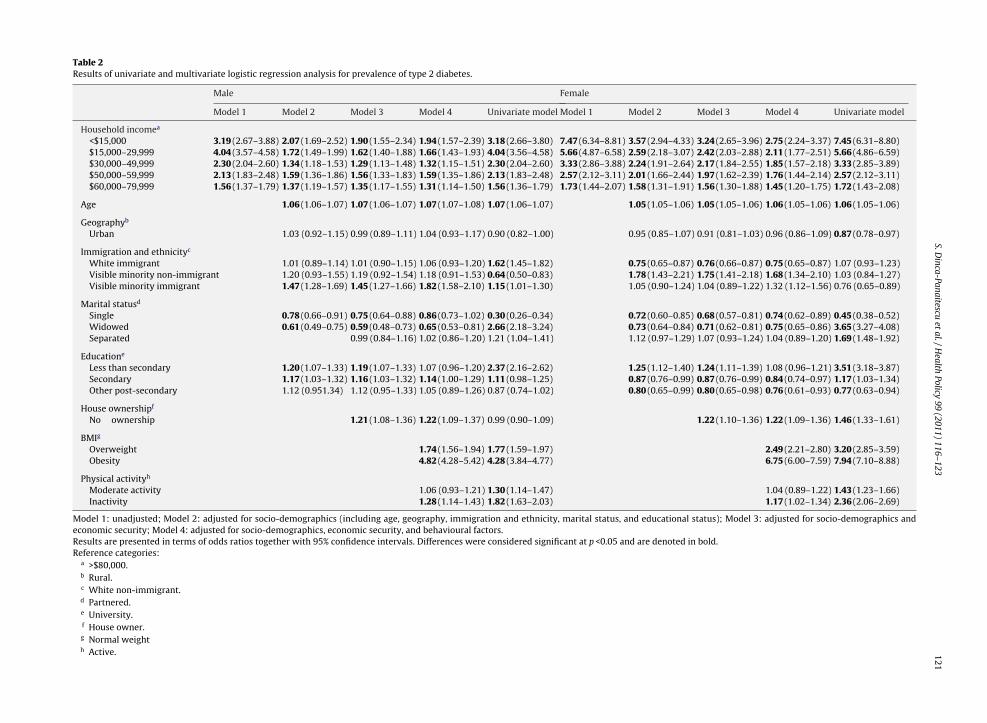
The results of univariate and multivariate logisticregression analyses stratified by sex are summarizedin Table 2. The unadjusted odds ratio for low income(<$15,000) indicates that risk more than triples in men (OR3.18, 95% CI = 2.66, 3.80) and increases by more than seventimes for the lowest income women (OR 7.45, 95% CI = 6.31,8.80) as compared to those with high income (>$80,000).Although the association of income with diabetes preva-lence was reduced with sequential adjustments, incomeremained significant with a clear gradient from the lowestto the highest income levels in both men and women. Thereis a consistent association between income and diabetesacross the models with odds ratios almost double for men(OR 1.94, 95% CI = 1.57, 2.39) and almost triple for women(OR 2.75 95% CI = 2.24, 3.37) in the lowest income cate-gory compared to those with highest income in the fullyadjusted model. The effects of income were only marginallyattenuated when adjusting for housing, BMI and physicalactivity.
4. Discussion
T2DM is a chronic condition potentially influenced bya web of factors. Some of these factors are physiologicaland genetic as well as health behaviours related, but socialand economic statuses are also important. We used a largepopulation-based Canadian data to explore the predictiveeffects of income on the prevalence of T2DM among womenand men with consideration of various covariates mediat-ing these effects.
Our study indicated a trend of increased prevalenceof T2DM towards the lower end of income, more sofor women and especially so at higher ages. Increaseddiabetes prevalence in low-income groups has been docu-mented in other population-based studies. Cross-Canadian
data indicated that the prevalence of diabetes amongCanadians aged 45–64 years with household incomes of$10,000–29,999 was twice that of those living in house-holds with incomes of $60,000 or more [7]. In Ontario the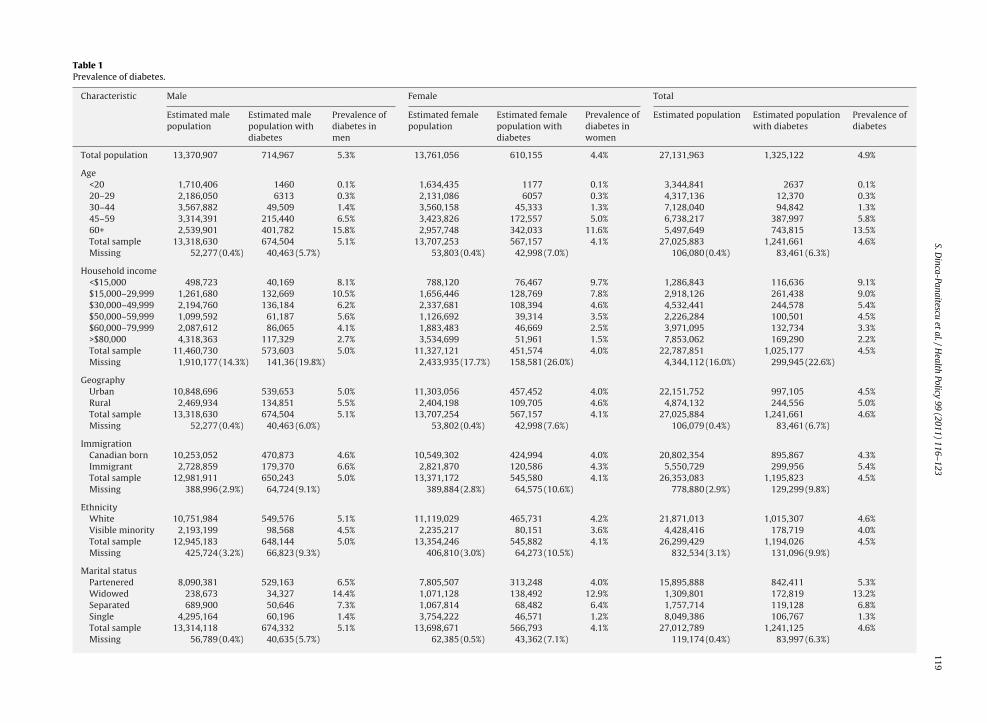
S.Dinca-Panaitescu
etal./H
ealthPolicy
99 (2011) 116–123119
Table 1Prevalence of diabetes.
Characteristic Male Female Total
Estimated malepopulation
Estimated malepopulation withdiabetes
Prevalence ofdiabetes inmen
Estimated femalepopulation
Estimated femalepopulation withdiabetes
Prevalence ofdiabetes inwomen
Estimated population Estimated populationwith diabetes
Prevalence ofdiabetes
Total population 13,370,907 714,967 5.3% 13,761,056 610,155 4.4% 27,131,963 1,325,122 4.9%
Age<20 1,710,406 1460 0.1% 1,634,435 1177 0.1% 3,344,841 2637 0.1%20–29 2,186,050 6313 0.3% 2,131,086 6057 0.3% 4,317,136 12,370 0.3%30–44 3,567,882 49,509 1.4% 3,560,158 45,333 1.3% 7,128,040 94,842 1.3%45–59 3,314,391 215,440 6.5% 3,423,826 172,557 5.0% 6,738,217 387,997 5.8%60+ 2,539,901 401,782 15.8% 2,957,748 342,033 11.6% 5,497,649 743,815 13.5%Total sample 13,318,630 674,504 5.1% 13,707,253 567,157 4.1% 27,025,883 1,241,661 4.6%Missing 52,277 (0.4%) 40,463 (5.7%) 53,803 (0.4%) 42,998 (7.0%) 106,080 (0.4%) 83,461 (6.3%)
Household income<$15,000 498,723 40,169 8.1% 788,120 76,467 9.7% 1,286,843 116,636 9.1%$15,000–29,999 1,261,680 132,669 10.5% 1,656,446 128,769 7.8% 2,918,126 261,438 9.0%$30,000–49,999 2,194,760 136,184 6.2% 2,337,681 108,394 4.6% 4,532,441 244,578 5.4%$50,000–59,999 1,099,592 61,187 5.6% 1,126,692 39,314 3.5% 2,226,284 100,501 4.5%$60,000–79,999 2,087,612 86,065 4.1% 1,883,483 46,669 2.5% 3,971,095 132,734 3.3%>$80,000 4,318,363 117,329 2.7% 3,534,699 51,961 1.5% 7,853,062 169,290 2.2%Total sample 11,460,730 573,603 5.0% 11,327,121 451,574 4.0% 22,787,851 1,025,177 4.5%Missing 1,910,177 (14.3%) 141,36 (19.8%) 2,433,935 (17.7%) 158,581 (26.0%) 4,344,112 (16.0%) 299,945 (22.6%)
GeographyUrban 10,848,696 539,653 5.0% 11,303,056 457,452 4.0% 22,151,752 997,105 4.5%Rural 2,469,934 134,851 5.5% 2,404,198 109,705 4.6% 4,874,132 244,556 5.0%Total sample 13,318,630 674,504 5.1% 13,707,254 567,157 4.1% 27,025,884 1,241,661 4.6%Missing 52,277 (0.4%) 40,463 (6.0%) 53,802 (0.4%) 42,998 (7.6%) 106,079 (0.4%) 83,461 (6.7%)
ImmigrationCanadian born 10,253,052 470,873 4.6% 10,549,302 424,994 4.0% 20,802,354 895,867 4.3%Immigrant 2,728,859 179,370 6.6% 2,821,870 120,586 4.3% 5,550,729 299,956 5.4%Total sample 12,981,911 650,243 5.0% 13,371,172 545,580 4.1% 26,353,083 1,195,823 4.5%Missing 388,996 (2.9%) 64,724 (9.1%) 389,884 (2.8%) 64,575 (10.6%) 778,880 (2.9%) 129,299 (9.8%)
EthnicityWhite 10,751,984 549,576 5.1% 11,119,029 465,731 4.2% 21,871,013 1,015,307 4.6%Visible minority 2,193,199 98,568 4.5% 2,235,217 80,151 3.6% 4,428,416 178,719 4.0%Total sample 12,945,183 648,144 5.0% 13,354,246 545,882 4.1% 26,299,429 1,194,026 4.5%Missing 425,724 (3.2%) 66,823 (9.3%) 406,810 (3.0%) 64,273 (10.5%) 832,534 (3.1%) 131,096 (9.9%)
Marital statusPartenered 8,090,381 529,163 6.5% 7,805,507 313,248 4.0% 15,895,888 842,411 5.3%Widowed 238,673 34,327 14.4% 1,071,128 138,492 12.9% 1,309,801 172,819 13.2%Separated 689,900 50,646 7.3% 1,067,814 68,482 6.4% 1,757,714 119,128 6.8%Single 4,295,164 60,196 1.4% 3,754,222 46,571 1.2% 8,049,386 106,767 1.3%Total sample 13,314,118 674,332 5.1% 13,698,671 566,793 4.1% 27,012,789 1,241,125 4.6%Missing 56,789 (0.4%) 40,635 (5.7%) 62,385 (0.5%) 43,362 (7.1%) 119,174 (0.4%) 83,997 (6.3%)

120 S. Dinca-Panaitescu et al. / Health
Edu
cati
onLe
ssth
ense
con
dar
y3,
125,
413
195,
615
6.3%
3,13
8,85
721
6,32
96.
9%6,
264,
270
411,
944
6.6%
Seco
nd
ary
1,87
6,89
190
,237
4.8%
2,10
2,69
479
,937
3.8%
3,97
9,58
517
0,17
44.
3%O
ther
pos
t-se
con
dar
y1,
143,
624
42,0
573.
7%1,
161,
605
25,8
182.
2%2,
305,
229
67,8
752.
9%U
niv
ersi
ty6,
772,
191
314,
027
4.6%
6,91
0,62
021
9,83
43.
2%13
,682
,811
533,
861
3.9%
Tota
lsam
ple
12,9
18,1
1964
1,93
65.
0%13
,313
,776
541,
918
4.1%
26,2
31,8
951,
183,
854
4.5%
Mis
sin
g45
2,78
8(3
.4%
)73
,031
(10.
2%)
447,
280
(3.3
%)
68,2
37(1
1.2%
)90
0,06
8(3
.3%
)14
1,26
8(1
0.7%
)
Hou
seow
ner
ship
Hou
seow
ner
ship
10,0
47,1
9150
1,18
35.
0%10
,057
,903
368,
562
3.7%
20,1
05,0
9486
9,74
54.
3%N
oow
ner
ship
2,84
0,87
814
4,03
25.
1%3,
226,
044
174,
508
5.4%
6,06
6,92
231
8,54
05.
3%To
tals
amp
le12
,888
,069
645,
215
5.0%
13,2
83,9
4754
3,07
04.
1%26
,172
,016
1,18
8,28
54.
5%M
issi
ng
482,
838
(3.6
%)
69,7
52(9
.8%
)47
7,10
9(3
.5%
)67
,085
(11.
0%)
959,
947
(3.5
%)
136,
837
(10.
3%)
BM
I Nor
mal
wei
ght
4,99
6,62
016
3,85
63.
3%6,
870,
554
136,
936
2.0%
11,8
67,1
7430
0,79
22.
5%O
verw
eigh
t4,
907,
064
262,
836
5.4%
3,19
2,01
218
1,85
45.
7%8,
099,
076
444,
690
5.5%
Obe
se2,
014,
310
241,
634
12.0
%1,
734,
321
221,
959
12.8
%3,
748,
631
463,
593
12.4
%To
tals
amp
le11
,917
,994
668,
326
5.6%
11,7
96,8
8754
0,74
94.
6%23
,714
,881
1,20
9,07
55.
1%M
issi
ng
1,45
2,91
3(1
0.9%
)46
,641
(6.5
%)
1,96
4,16
9(1
4.3%
)69
,406
(11.
4%)
3,41
7,08
2(1
2.6%
)11
6,04
7(8
.8%
)
Phys
ical
acti
vity
Act
ive
3,91
7,81
311
9,08
33.
0%3,
234,
683
66,3
112.
0%7,
152,
496
185,
394
2.6%
Mod
erat
eac
tivi
ty3,
185,
240
148,
115
4.7%
3,43
4,50
410
3,44
73.
0%6,
619,
744
251,
562
3.8%
Inac
tive
5,86
6,96
237
2,71
36.
4%6,
756,
215
367,
440
5.4%
12,6
23,1
7774
0,15
35.
9%To
tals
amp
le12
,970
,015
639,
911
4.9%
13,4
25,4
0253
7,19
84.
0%26
,395
,417
1,17
7,10
94.
5%M
issi
ng
400,
892
(3.0
%)
75,0
56(1
0.5%
)33
5,65
4(2
.4%
)72
,957
(12.
0%)
736,
546
(2.7
%)
148,
013(
11.2
%)
Policy 99 (2011) 116–123
prevalence rate for diabetes is four times greater amongwomen in low-income communities than those in high-income communities [8].
This study identified a graded association betweenincome and diabetes prevalence in both men and womenwith higher likelihood of diabetes in low-income groupcompared to those in highest income. This associationremained significant after adjusting for various traditionalpredictors of the disease. There is evidence in the litera-ture that diabetes is associated with low socioeconomicposition in industrialized countries [29–31]. Some stud-ies reported similar findings in developing countries withdifferences between rural and urban areas [32,33]. Thishas direct implications for the types of interventions thatshould be developed to reduce health inequalities amongpeople with diabetes.
Further adjustment for socio-demographic factors,including education, did not meaningfully alter effect sizesfor either men or women. Moreover, having less than sec-ondary education, even significantly related to diabetesprevalence in the model adjusted for socio-demographiccovariates, its effect vanished once adjusting for physi-cal activity and BMI in both groups. Education representsone of the markers of socioeconomic position intensivelyexplored especially in economics literature that docu-mented worse health outcomes, particularly diabetes inindividuals with lower socioeconomic status [34,35]. How-ever, there is still a debating question on what dimensionsof socioeconomic position matter the most. Epidemio-logic literature that considered both income and educationas markers of socioeconomic position showed a range ofresults: similar effects of education and income on diabetes[36,37]; effect of education disappearing after adjusting forage, sex and income [38]; or varying effects across racialgroups [11,39]. Further longitudinal studies are requiredin order to shed light on the separate effects of educationand income on diabetes.
The effect of income remained quite stable with furtheradjustments for economic security and other variables usu-ally regarded as modifiable personal characteristics. Evenwhen obesity – which captured most of the attention asa consistent and most strongly associated risk factor ofdiabetes – was accounted for, income was independentlyassociated with higher risk of developing the disease.We did document a significantly increased likelihood ofdiabetes for obese persons, with a much stronger effectin women. However, additional adjustment for BMI didnot substantially alter our estimates of differences in theprevalence of diabetes across income levels. The fact thatindividual risk behaviours do not explain a substantial partof the income association with health is a common findingin cardiovascular diseases [40–42] and also documentedby some diabetes studies [43]. Health and psychosocialcharacteristics are shaped over time by the socioeconomicconditions imposed on individual at different stages of thelife course. In line with this, our study suggests that the
diabetes burden associated with poor health behavioursshould be looked at through the lens of socioeconomic con-ditions that generate them.Within the multicultural context of Canada, culturalfactors might also play a significant role for a better
S.Dinca-Panaitescu
etal./H
ealthPolicy
99 (2011) 116–123121
Table 2Results of univariate and multivariate logistic regression analysis for prevalence of type 2 diabetes.
Male Female
Model 1 Model 2 Model 3 Model 4 Univariate model Model 1 Model 2 Model 3 Model 4 Univariate model
Household incomea
<$15,000 3.19 (2.67–3.88) 2.07 (1.69–2.52) 1.90 (1.55–2.34) 1.94 (1.57–2.39) 3.18 (2.66–3.80) 7.47 (6.34–8.81) 3.57 (2.94–4.33) 3.24 (2.65–3.96) 2.75 (2.24–3.37) 7.45 (6.31–8.80)$15,000–29,999 4.04 (3.57–4.58) 1.72 (1.49–1.99) 1.62 (1.40–1.88) 1.66 (1.43–1.93) 4.04 (3.56–4.58) 5.66 (4.87–6.58) 2.59 (2.18–3.07) 2.42 (2.03–2.88) 2.11 (1.77–2.51) 5.66 (4.86–6.59)$30,000–49,999 2.30 (2.04–2.60) 1.34 (1.18–1.53) 1.29 (1.13–1.48) 1.32 (1.15–1.51) 2.30 (2.04–2.60) 3.33 (2.86–3.88) 2.24 (1.91–2.64) 2.17 (1.84–2.55) 1.85 (1.57–2.18) 3.33 (2.85–3.89)$50,000–59,999 2.13 (1.83–2.48) 1.59 (1.36–1.86) 1.56 (1.33–1.83) 1.59 (1.35–1.86) 2.13 (1.83–2.48) 2.57 (2.12–3.11) 2.01 (1.66–2.44) 1.97 (1.62–2.39) 1.76 (1.44–2.14) 2.57 (2.12–3.11)$60,000–79,999 1.56 (1.37–1.79) 1.37 (1.19–1.57) 1.35 (1.17–1.55) 1.31 (1.14–1.50) 1.56 (1.36–1.79) 1.73 (1.44–2.07) 1.58 (1.31–1.91) 1.56 (1.30–1.88) 1.45 (1.20–1.75) 1.72 (1.43–2.08)
Age 1.06 (1.06–1.07) 1.07 (1.06–1.07) 1.07 (1.07–1.08) 1.07 (1.06–1.07) 1.05 (1.05–1.06) 1.05 (1.05–1.06) 1.06 (1.05–1.06) 1.06 (1.05–1.06)
Geographyb
Urban 1.03 (0.92–1.15) 0.99 (0.89–1.11) 1.04 (0.93–1.17) 0.90 (0.82–1.00) 0.95 (0.85–1.07) 0.91 (0.81–1.03) 0.96 (0.86–1.09) 0.87 (0.78–0.97)
Immigration and ethnicityc
White immigrant 1.01 (0.89–1.14) 1.01 (0.90–1.15) 1.06 (0.93–1.20) 1.62 (1.45–1.82) 0.75 (0.65–0.87) 0.76 (0.66–0.87) 0.75 (0.65–0.87) 1.07 (0.93–1.23)Visible minority non-immigrant 1.20 (0.93–1.55) 1.19 (0.92–1.54) 1.18 (0.91–1.53) 0.64 (0.50–0.83) 1.78 (1.43–2.21) 1.75 (1.41–2.18) 1.68 (1.34–2.10) 1.03 (0.84–1.27)Visible minority immigrant 1.47 (1.28–1.69) 1.45 (1.27–1.66) 1.82 (1.58–2.10) 1.15 (1.01–1.30) 1.05 (0.90–1.24) 1.04 (0.89–1.22) 1.32 (1.12–1.56) 0.76 (0.65–0.89)
Marital statusd
Single 0.78 (0.66–0.91) 0.75 (0.64–0.88) 0.86 (0.73–1.02) 0.30 (0.26–0.34) 0.72 (0.60–0.85) 0.68 (0.57–0.81) 0.74 (0.62–0.89) 0.45 (0.38–0.52)Widowed 0.61 (0.49–0.75) 0.59 (0.48–0.73) 0.65 (0.53–0.81) 2.66 (2.18–3.24) 0.73 (0.64–0.84) 0.71 (0.62–0.81) 0.75 (0.65–0.86) 3.65 (3.27–4.08)Separated 0.99 (0.84–1.16) 1.02 (0.86–1.20) 1.21 (1.04–1.41) 1.12 (0.97–1.29) 1.07 (0.93–1.24) 1.04 (0.89–1.20) 1.69 (1.48–1.92)
Educatione
Less than secondary 1.20 (1.07–1.33) 1.19 (1.07–1.33) 1.07 (0.96–1.20) 2.37 (2.16–2.62) 1.25 (1.12–1.40) 1.24 (1.11–1.39) 1.08 (0.96–1.21) 3.51 (3.18–3.87)Secondary 1.17 (1.03–1.32) 1.16 (1.03–1.32) 1.14 (1.00–1.29) 1.11 (0.98–1.25) 0.87 (0.76–0.99) 0.87 (0.76–0.99) 0.84 (0.74–0.97) 1.17 (1.03–1.34)Other post-secondary 1.12 (0.951.34) 1.12 (0.95–1.33) 1.05 (0.89–1.26) 0.87 (0.74–1.02) 0.80 (0.65–0.99) 0.80 (0.65–0.98) 0.76 (0.61–0.93) 0.77 (0.63–0.94)
House ownershipf
No ownership 1.21 (1.08–1.36) 1.22 (1.09–1.37) 0.99 (0.90–1.09) 1.22 (1.10–1.36) 1.22 (1.09–1.36) 1.46 (1.33–1.61)
BMIg
Overweight 1.74 (1.56–1.94) 1.77 (1.59–1.97) 2.49 (2.21–2.80) 3.20 (2.85–3.59)Obesity 4.82 (4.28–5.42) 4.28 (3.84–4.77) 6.75 (6.00–7.59) 7.94 (7.10–8.88)
Physical activityh
Moderate activity 1.06 (0.93–1.21) 1.30 (1.14–1.47) 1.04 (0.89–1.22) 1.43 (1.23–1.66)Inactivity 1.28 (1.14–1.43) 1.82 (1.63–2.03) 1.17 (1.02–1.34) 2.36 (2.06–2.69)
Model 1: unadjusted; Model 2: adjusted for socio-demographics (including age, geography, immigration and ethnicity, marital status, and educational status); Model 3: adjusted for socio-demographics andeconomic security; Model 4: adjusted for socio-demographics, economic security, and behavioural factors.Results are presented in terms of odds ratios together with 95% confidence intervals. Differences were considered significant at p <0.05 and are denoted in bold.Reference categories:
a >$80,000.b Rural.c White non-immigrant.d Partnered.e University.f House owner.g Normal weighth Active.
1 Health
updhistasifoaInscea
4
dTatNutapadsttbuanecwtstladsdbapttwcWa
22 S. Dinca-Panaitescu et al. /
nderstanding of the relationship between socioeconomicosition and diabetes prevalence. Although there is evi-ence that cultural factors have a profound impact onealth in the general population, little work has been done
n this area among persons with diabetes. These studiesuggest that the association between culture and accul-uration and diabetes vary by place of origin and gender,nd for certain ethnic groups seem to be closely linked toocioeconomic position [44–48]. In this study, we used vis-ble minority and immigration status as proxies to accountor cultural differences among individuals. In women, thedds ratios were consistently higher for visible minoritynd non-immigrants and remained stable across models.n men, visible minority and immigrant status were sig-ificantly related to diabetes prevalence. However, furthertudies are required that take into account other socio-ultural factors that may play a more important role thanthnicity per se in quality of life and use of health servicesmong persons with diabetes.
.1. Limitations
A major limitation of this study is that the surveyata used do not distinguish among types of diabetes.he validity of the relationship between the determinantsnd diabetes prevalence could be affected if this distinc-ion is not made. To overcome this limitation we used theg–Dasgupta–Johnson algorithm. However, the algorithmsed to differentiate between types of diabetes, even a fur-her refined version, has not been validated as a whole,lthough a number of criteria used in the algorithm werereviously validated. Given that categorization of T1DMnd T2DM produced by the algorithm corresponds to theistribution of the two diseases in Canada, we are rea-onably confident that the algorithm classified accuratelyhe respondents. Another potential limitation is that therue prevalence of diabetes could be underestimated, CCHSeing a questionnaire-based survey and there is about onendiagnosed case for each known diabetic person [49]. Theccuracy of self-reported data on a number of determi-ants of health, including BMI and level of physical activity,ntails other problems. We also acknowledge the diffi-ulty of separating the effects of education and incomehen studying the association between socioeconomic sta-
us and health status. Being limited to a cross-sectionalurvey, we controlled for education to partially overcomehis drawback. However, this is still an open debate in theiterature with further longitudinal studies required. Welso were precluded from considering in our model theomain of psychosocial factors due to inadequate sampleizes. These factors are commonly recognized as healtheterminants. However, the literature on the associationetween diabetes and psychological factors is controversialnd mainly focused on depression with much less attentionaid to other factors such as stress and life events. Some ofhe studies have reported that elevated depressive symp-
oms are associated with incident type diabetes [50,51]hile others reported a non-significant association, espe-ially following adjustments for life style factors [52–54].e considered in our analysis another model which further
djusted for distress and various indicators of psychologi-
Policy 99 (2011) 116–123
cal factors (distress, emotional and affection supports) ona smaller sample (about half the initial sample) with com-plete data on these variables. None of these factors werefound to be significant and the effect of income remainedsignificant in both men and women even with this fur-ther adjustment. The cross-sectional design of our studyalso limits assumptions concerning causality regarding theassociation of diabetes with income level. However, thepersisting effect of income after adjusting for various fac-tors emphasizes the need for further studies consideringincome among other factors to better understand diabetesdisparities.
5. Conclusion
Findings from this study underscore the importance ofincome among a web of factors in determining the riskof T2DM, regardless of other factors that may confoundor mediate these associations. Canada is experiencing aperiod of both growing income inequality and a parallelincrease in diabetes mortality, especially in low-incomeneighbourhoods. Therefore, strategies for diabetes pre-vention should address the socioeconomic inequalities inaddition to person-centred approaches. Our findings sug-gest that attention should be paid to considering the socialdeterminants of illness such as income in further investi-gations of the etiology of T2DM among Canadians.
Acknowledgements
We thank the Research Data Centre at University ofToronto for facilitating the access to the data.
Funding: This study was supported by the Social Sci-ences and Humanities Research Council (SSHRC) grantentitled: The Societal Determinants of the Incidence and Man-agement of Diabetes.
References
[1] Public Health Agency of Canada. Report from the National DiabetesSurveillance System: diabetes in Canada. Ottawa, Canada: PublicHealth Agency of Canada; 2008. Report No.: HP32-2/2006.
[2] Canadian Diabetes Association, Diabetes 2000. available at:www.diabetes.ca.
[3] McCarthy M, Hattersley A. Molecular diagnostics in monogenic andmultifactorial forms of type 2 diabetes. Expert Review of MolecularDiagnosis 2001;1(4):403–12.
[4] Hansen T. Type 2 diabetes mellitus—a multifactorial disease. Annalsof University of Mariae Curie Sklodowska 2002;57(1):544–9.
[5] Lynch J, Kaplan G, Salonen J. Why do poor people behave poorly?Variation in adult health behaviours and psychosocial characteris-tics by stages of the socioeconomic lifecourse. Social Science andMedicine 1997;44(6):809–19.
[6] Raphael D, Anstice S, Raine K, McGannon K, Rizi S, Yu V. Thesocial determinants of the incidence and management of type 2diabetes mellitus: are we prepared to rethink our questions andredirect our research activities? International Journal of HealthCare Quality Assurance incorporating Leadership in Health Services2003;16(3):10–20.
[7] James R, Young TK, Mustard C, Blanchard J. The health of Canadianswith diabetes. Health Reports 1997;9(3):47–52.
[8] Hux J, Booth G, Laupacis A. The ICES practice atlas: diabetes inOntario. Institute for Clinical Evaluative Sciences (ICES), and theCanadian Diabetes Association; 2002.
[9] Barker DJ, Gardner MJ, Power C. Incidence of diabetes amongst peo-ple aged 18–50 years in nine British towns: a collaborative study.Diabetologia 1982;22(6):421–5.
Health
[
[
[
[
[
[
[
[
[
[
[
[
[
[
[
[
[
[
[
[
[
[
[
[
[
[
[
[
[
[
[
[
[
[
[
[
[
[
[
[
[
[
[
S. Dinca-Panaitescu et al. /
10] Scragg R, Baker J, Metcalf P, Dryson E. Prevalence of diabetes mel-litus and impaired glucose tolerance in a New Zealand multiracialworkforce. New Zealand Medical Journal 1991;104:395–7.
11] Robbins JM, Vaccarino V, Zhang H, Kasl SV. Socioeconomic statusand type 2 diabetes in African American and non-Hispanic whitewomen and men: evidence from the Third National Health andNutrition Examination Survey. American Journal of Public Health2001;91:76–83.
12] Brown AF, Ettner SL, Piette J, Weinberger M, Gregg E, Shapiro MF,et al. Socioeconomic position and health among persons with dia-betes mellitus: a conceptual framework and review of the literature.Epidemiologic Reviews 2004;26:63–77.
13] Larranaga I, Arteagoitia JM, Rodriquez JL, Gonzalez F, Esnaola S,Pinies JA. Socioeconomic inequalities in the prevalence of Type 2diabetes, cardiovascular risk factors and chronic diabetic compli-cations in the Basque Country, Spain. Diabetes Medicine 2005;22:1047–53.
14] Ismail AA, Beeching NJ, Gill GV, Bellis MA. Capture–recaptureadjusted prevalence rates of type 2 diabetes are related to socialdeprivation. Quarterly Journal of Medicine 1999;92:707–10.
15] Narayan KM, Boyle JP, Thompson TJ, Gregg EW, Williamson DF.Effect of BMI on lifetime risk for diabetes in the US. Diabetes Care2007;30:1562–6.
16] Sigal RJ, Kenny GP, Wasserman DH, Castaneda-Sceppa C, WhiteRD. Physical activity/exercise and type 2 diabetes: a consensusstatement from the American Diabetes Association. Diabetes Care2006;29(6):1433–8.
17] D’Agostino Jr RB, Hamman RF, Karter AJ, Mykkanen L, WagenknechtLE, Haffner SM. Cardiovascular disease risk factors predict the devel-opment of type 2 diabetes: the insulin resistance atherosclerosisstudy. Diabetes Care 2004;27(9):2234–40.
18] Organization for Economic Cooperation Development. Growingunequal: income distribution and poverty in OECD Nations. Paris:Organization for Economic Co-operation and Development; 2008.
19] Canadian Institute for Health Information. Charting the course: apan-Canadian consultation on population and public health pri-orities. Ottawa, Canada: Canadian Institute for Health Information(CIHI); 2002.
20] Health Canada. The population health template: key elements andactions that define a population health approach. Strategic PolicyDirectorate, Population and Public Health Branch, Health Canada;2001.
21] Marmot M, Wilkinson R. Social determinants of health. Oxford:Oxford University Press; 2000.
22] Raphael D. Poverty, income inequality and health in Canada, Centrefor Social Justice Foundation for Research and Education (CSJ) 2002;available at: www.socialjustice.org/pubs/justiceHearts.pdf.
23] McKinlay J, Marceau L. US Public Health and the 21st century: dia-betes mellitus. The Lancet 2000;356:757–61.
24] Riste L, Khan F, Cruickshank K. High prevalence of type 2 diabetes inall ethnic groups, including Europeans, in a British inner city. Relativepoverty, history, inactivity, or 21st century Europe? Diabetes Care2001;24:1377–83.
25] Raphael D. Social justice is good for our hearts: why societal factors– not lifestyles – are major causes of heart disease in Canada andelsewhere. Toronto, Canada: Centre for Social Justice Foundation forResearch and Education (CSJ); 2002.
26] Auger N, Alix C. Income and health in Canada. In: Raphael D, edi-tor. Social determinants of health: Canadian perspectives. 2nd ed.Toronto: Canadian Scholars Press; 2008. p. 61–74.
27] Ng E, Dasgupta K, Johnson J. An algorithm to differentiate dia-betic respondents in the Canadian Community Health Survey. HealthReports 2008, 19(1). Statistics Canada Catalogue 82-003.
28] Statistics Canada. CCHS Cycle 3.1, Public Use Microdata FileDocumentation. 2006. Available at: http://www.statcan.gc.ca/imdb-bmdi/document/3226 D7 T9 V3-eng.pdf.
29] Dalstra JA, Kunst AE, Borrell C, Breeze E, Cambois E, Costa G, et al.Socioeconomic differences in the prevalence of common chronic dis-eases: an overview of eight European countries. International Journalof Epidemiology 2005;34(2):316–26.
30] Tang M, Chen Y, Krewski D. Gender-related differences in the asso-
ciation between socioeconomic status and self-reported diabetes.International Journal of Epidemiology 2003;32:381–5.31] Espelt A, Borrell C, Roskam AJ, Rodriguez-Sanz M, Stirbu I, Dalmau-Bueno A, et al. Socioeconomic inequalities in diabetes mellitusacross Europe at the beginning of the 21st century. Diabetologia2008;51:1971–9.
[
[
Policy 99 (2011) 116–123 123
32] Abu Saveed M, Ali L, Hussain MZ, Rumi MA, Banu A, Azad Khan AK.Effect of socioeconomic risk factors on the difference in prevalenceof diabetes between rural and urban populations in Bangladesh. Dia-betes Care 1997;20:551–5.
33] Connolly V, Unwin N, Sherriff P, Bilous R, Kelly W. Diabetes preva-lence and socioeconomic status: a population based study showingincreased prevalence of type 2 diabetes mellitus in deprived areas.Journal of Epidemiology Community Health 2000;54:173–7.
34] Smith J. The impact of socioeconomic status on health over the life-course. The Journal of Human Resources 2007;XLII(4):739–64.
35] Smith J. Diabetes and the rise of the SES health gradient. Workingpaper 12905. National Bureau of Economic Research; 2007. Availableat: http://www.nber.org/papers/w12905.
36] Dasgupta K, Khan S, Ross NA. Type 2 diabetes in Canada: con-centration of risk among most disadvantaged men but inversesocial gradient across groups in women. Diabetic Medicine2010;27(5):522–31.
37] Wray LA, Alwin DF, McCammon RJ, Manning T, Best LE. Social status,risky health behaviors and diabetes in middle-aged and older adults.Journals of Gerontology Series B-Psychological Sciences and SocialSciences 2006;61:S290–8.
38] Choi BCK, Shi F. Risk factors for diabetes mellitus by age andsex: results of the National Population Health Survey. Diabetologia2001;44:1221–31.
39] Maty SC, James SA, Kaplan GA. Life-course socioeconomic posi-tion and incidence of diabetes mellitus among blacks and whites:the Alameda County Study, 1965–1999. American Journal of PublicHealth 2010;100(1):137–45.
40] Kaplan GA, Keil JE. Socioeconomic factors and cardiovascular disease:a review of the literature. Circulation 1993;88:1973–98.
41] Lantz PM, House JS, Lepkowski JM, Williams DR, Mero RP, Chen JJ.Socioeconomic factors, health behaviors, and mortality. Journal ofthe American Medical Association 1998;279(21):1703–8.
42] Roux A, Merkin S, Arnett D. Neighbourhood of residence and inci-dence of coronary heart disease. New England Journal of Medicine2000;345:99–106.
43] Brunner E, Marmot MG. Social organization, stress, and health. In:Marmot MG, Wilkinson RG, editors. Social determinants of health.Oxford: Oxford University Press; 1999. p. 17–43.
44] Walsh ME, Katz MA, Sechrest L. Unpacking cultural factors in adap-tation to type 2 diabetes mellitus. Medical Care 2002;40:129–39.
45] Huang B, Rodriguez BL, Burchfiel CM, Chyou PH, Curb JD, Yano K.Acculturation and prevalence of diabetes among Japanese-Americanmen in Hawaii. American Journal of Epidemiology 1996;144:674–81.
46] Stern MP, Knapp JA, Hazuda HP, Haffner SM, Patterson JK, MitchellBD. Genetic and environmental determinants of type II diabetes inMexican Americans. Is there a “descending limb” to the moderniza-tion/diabetes relationship? Diabetes Care 1991;14(7):649–54.
47] Hazuda HP, Haffner SM, Stern MP, Eifler CW. Effects of acculturationand socioeconomic status on obesity and diabetes in Mexican Ameri-cans: the San Antonio Heart Study. American Journal of Epidemiology1988;128:1289–301.
48] Brown SA, Garcia AA, Kouzekanani K, Hanis CL. Culturallycompetent diabetes self-management education for Mexican Amer-icans: the Starr County Border Health Initiative. Diabetes Care2002;25(2):259–68.
49] Health Canada. Diabetes in Canada: national statistics and oppor-tunities for improved surveillance, prevention and control. Ottawa:Minister of Public Works and Government Services; 1999. ReportNo.: H49-121/1999.
50] Carnethon MR, Kinder LS, Fair JOm, Stafford RS, Fortmann SP. Symp-toms of depression as a risk factor for incident diabetes: findingsfrom the National Health and Nutritious Examination Epidemio-logic follow-up study, 1971–1992. American Journal of Epidemiology2003;158(5):416–23.
51] Engum A. The role of depression and anxiety in onset of diabetes ina large population-based study. Journal of Psychosomatic Research2007;62(1):31–8.
52] Golden SH, Lazo M, Carnethon M, Bertoni AG, Schreiner P, Roux AD, etal., Examining a bidirectional association between depressive symp-toms and diabetes.
53] Kumari M, Head J, Marmot M. Prospective study of social and otherrisk factors for incidence of type 2 diabetes in the Whitehall II study.Archives of Internal Medicine 2004;164:1874–80.
54] Saydah SH, Brancati FL, Golden SH, Fradkin J, Harris MI. Depressivesymptoms and the risk of type 2 diabetes mellitus in a US sample.Diabetes-Metabolism Research and Reviews 2003;19(3):202–8.