Diabetes and the Off-Reserve Aboriginal population in Canada
134
Diabetes and the Off-Reserve Aboriginal population in Canada by Stephanie A. Crocker BDSc, University of British Columbia, 2010 A Thesis Submitted in Partial Fulfillment of the Requirements for the Degree of MASTERS OF SCIENCE in the Social Dimensions of Health Program Stephanie Crocker, 2013 University of Victoria All rights reserved. This thesis may not be reproduced in whole or in part, by photocopy or other means, without the permission of the author.
-
Upload
khangminh22 -
Category
Documents
-
view
2 -
download
0
Transcript of Diabetes and the Off-Reserve Aboriginal population in Canada
Diabetes and the Off-Reserve Aboriginal population in Canada
by
Stephanie A. Crocker BDSc, University of British Columbia, 2010
A Thesis Submitted in Partial Fulfillment of the Requirements for the Degree of
MASTERS OF SCIENCE
in the Social Dimensions of Health Program
Stephanie Crocker, 2013 University of Victoria
All rights reserved. This thesis may not be reproduced in whole or in part, by photocopy
or other means, without the permission of the author.
ii
Supervisory Committee
Diabetes and the Off-Reserve Aboriginal population in Canada
by
Stephanie Crocker BDSc, University of British Columbia, 2010
Supervisory Committee Dr. Jeffrey Reading, Co-supervisor (Indigenous Governance program, Director of the Centre for Aboriginal Health Research) Dr. Michael Hayes, Co-supervisor (Social Dimensions of Health program, Director of Health Research and Education)
iii
Abstract
Supervisory Committee Dr. Jeffrey Reading, Co-supervisor (Indigenous Governance program, Director of the Centre for Aboriginal Health Research) Dr. Michael Hayes, Co-supervisor (Social Dimensions of Health program, Director of Health Research and Education)
The purpose of this study is to describe findings of the 2006 Aboriginal peopless
Survey (APS) that was conducted by Statistics Canada. They collected data on the living
conditions and lifestyles of Aboriginal peoples living off-reserve in Canada. The thesis
describes diabetes, co-morbidities, and social determinants of health that affect this
population through the lens of intersectionality and Dr. Nancy Krieger’s eco-social
theory.
iv
Table of Contents
Supervisory Committee ...................................................................................................... ii Abstract .............................................................................................................................. iii Table of Contents............................................................................................................... iv List of Tables ..................................................................................................................... vi List of Figures ................................................................................................................... vii Acknowledgments............................................................................................................ viii Dedication .......................................................................................................................... ix Chapter One: Introduction .................................................................................................. 1
1.1 Introduction............................................................................................................... 1 1.2 Statement of the Problem.......................................................................................... 3 1.3 Structure of the Thesis .............................................................................................. 3 1.4 Background of the Problem ...................................................................................... 6 1.5 Theoretical and Conceptual Foundation ................................................................. 10
1.5.1 Intersectionality................................................................................................ 10 1.5.2 Concepts of determinants of health and Eco-Social Theory............................ 11 1.5.3 Eco-Social theory............................................................................................. 12
1.6 Research Questions................................................................................................. 15 1.7 Significance of the Study ........................................................................................ 15
Chapter Two: Review of the Literature ............................................................................ 16 2.1 Introduction............................................................................................................. 16
2.1.1 Off-reserve Aboriginal peopless ...................................................................... 16 2.2 Health Conditions/Co-morbidity ............................................................................ 17
2.2.1 Diabetes............................................................................................................ 18 2.2.1.1 Oral Health……………………………………………………………….19 2.2.1.2 Prevalence of diabetes……………………………………………………25 2.2.1.3 Metabolic Syndrome……………………………………………………..26
2.2.2 Obesity ............................................................................................................. 26 2.2.3 Cardiovascular disease..................................................................................... 27 2.2.4 Stress ................................................................................................................ 28 2.2.5 Determinants of Health .................................................................................... 28
2.3 Reported barriers to diabetes diagnosis and care.................................................... 32 2.3.1 Income.............................................................................................................. 32 2.3.2 Cultural acceptance.......................................................................................... 33
2.4 Summary of Literature Reviewed and Rationale for the Study.............................. 34 Chapter Three: Research Design and Methods................................................................. 37
3.1 Introduction............................................................................................................. 37 3.2 Research Design...................................................................................................... 38 3.3 Population of the Study........................................................................................... 39 3.4 Sampling design...................................................................................................... 40
3.4.1 Domains of estimation ..................................................................................... 40 3.4.2 Sampling Plan .................................................................................................. 41
3.5 The Sample ............................................................................................................. 42
v 3.6 Data Collection ....................................................................................................... 42
3.6.1 Mode of collection ........................................................................................... 42 3.6.2 Aboriginal languages ....................................................................................... 43
3.7 Ethical Considerations ............................................................................................ 43 3.8 Data Processing....................................................................................................... 43
3.8.1 Data capture ..................................................................................................... 43 3.8.2 Editing.............................................................................................................. 43 3.8.3 Weighting......................................................................................................... 44
3.9 Data Quality ............................................................................................................ 45 3.9.1 Sampling Errors ............................................................................................... 45 3.9.2 Non-sampling Errors........................................................................................ 45
3.10 Dissemination ....................................................................................................... 45 Chapter Four: Results ....................................................................................................... 46
4.1 Introduction............................................................................................................. 46 4.2 General Description of the Data ............................................................................. 46 4.3 Hypothesis-by-Hypothesis Presentation and Interpretation of Results .................. 48
4.3.1 Null Hypothesis 1 ............................................................................................ 48 4.3.2 Hypothesis 2..................................................................................................... 51 4.3.3 Hypothesis 3..................................................................................................... 52
4.4 Summary of Findings.............................................................................................. 54 Chapter Five: Discussion .................................................................................................. 56
5.1 Introduction............................................................................................................. 56 5.2 Discussions ............................................................................................................. 57
5.2.1 General Health Status ...................................................................................... 57 5.2.2 Health Conditions ............................................................................................ 58
5.2.2.1 Diabetes…………………………………………………………………..59 5.2.2.2 Obesity…………………………………………………………………...60
5.2.3. Access to Health Services............................................................................... 60 5.2.4. Income............................................................................................................. 60 5.2.5 Chronic Stress .................................................................................................. 62
5.3 Implications............................................................................................................. 63 Chapter Six: Conclusion ................................................................................................... 64
6.1 Conclusion .............................................................................................................. 64 6.2 Limitations .............................................................................................................. 65 6.3 Recommendations................................................................................................... 66 6.4 Suggestions for Further Studies .............................................................................. 67
Works Cited ...................................................................................................................... 69 Appendix A Ethics Waiver Form ..................................................................................... 78 Appendix B Statistics Canada Methods Guide................................................................. 79
vi
List of Tables
Table 1 Social Determinants of Health............................................................................. 29 Table 2 Adult Health (Census, APS, 2006) ...................................................................... 47 Table 3 Child Health (Census, APS, 2006) ...................................................................... 48
vii
List of Figures Figure 1: Comparison of Aboriginal Males General Health............................................. 49 Figure 2: Comparison of Aboriginal Females General Health ......................................... 50 Figure 3: Comparison of Aboriginal Children’s General Health...................................... 50 Figure 4: Comparison of Aboriginal Adults with and without diabetes, by weight ......... 51 Figure 5: Total Aboriginal Family Income with and without diabetes, off-reserve ......... 52 Figure 6: Aboriginal Family Income off-reserve by gender, with diabetes, under 30 years old ..................................................................................................................................... 53 Figure 7: Total Family Income, off-reserve Aboriginal Children 6-14, with and without diabetes ............................................................................................................................. 54
viii
Acknowledgments
It has been a pleasure to be part of the Interdisciplinary Program called the Social Dimensions of Health. My time at the University of Victoria was enriched through the connections I made with my classmates and faculty.
I would sincerely like to thank the National Association of Friendship Centres for
permission to use the Statistics Canada data, specifically Heather King Andrews and Tricia McGuire-Adams. Thank you both for your agreement and support for me working with Jeff on your contract/project, without that, this Masters Thesis would not be. My hope is that through partnerships like this, positive changes can and will take place for Aboriginal peoples health.
To my supervisors: Jeff- This study would not have been possible without your willingness to include me
in the opportunity you had with Statistics Canada and the National Association of Aboriginal Friendship Centres. Thank you for making me feel welcome at the Centre for Aboriginal Health Research, for your mentorship, discuss my research proposal and all of the data tables. Also, your help and clarification with the data at the eleventh hour was greatly appreciated!
Michael- I would like to first thank you for being involved with the Social Dimensions
of Health program, and for sharing your knowledge and wisdom with myself and the rest of the class. Most importantly, I would like to give you my greatest gratitude for standing with me and seeing me through the thesis writing process. I truly would not have completed this, if it weren’t for your leadership and support. Thank you!
Next I would like to acknowledge my writing coach, Lindsay, who opened my eyes to
dangling modifiers and the passive voice….. thank you for taking the time to work with me on this paper, and for helping me to become a better writer.
And lastly, to my colleagues at Vancouver Island University who offered words of
encouragement, gentle nudges and reminders that I needed to keep moving forward, and believed I would get this done.
ix
Dedication
To my partner, Peter…..I love you! You believed in me when I did not believe in myself. Your encouragement has never waned and you constantly reminded me to keep putting one foot forward. You have read many assignments, and helped with editing many papers. You have endured my growing pains throughout this process and thus endured many tears and lots of doubt. You have seen me through two degrees in the past four years. Thank You! Through all of this you never lost faith in my ability to see this journey through. We did it! To my mum……thank you for your unfailing love and support, and for always believing in me. I have achieved a feat I never imagined I would. Thank you for all the support you gave during this process…. I love you!
Chapter One: Introduction
1.1 Introduction
“According to the United Nations Human Development Index, which measures health through longevity, educational achievement and adult literacy, First Nations people in Canada rank 63rd in the world, yet Canada ranks 6th in the world” (NAHO, March 2012).
Life expectancy for people with type 2 diabetes may be shortened by five to
ten years, and type 2 diabetes has reached epidemic proportions in Canadian
Aboriginal1 peoples with prevalence rates 3-5 fold higher than the non-Aboriginal
Canadian (Canadian Diabetes Assoc.(www.diabetes.ca); Young, Reading, Elias &
O’Neil, 2000). Type 2 diabetes trajectories are developing earlier in the life course,
and at much higher rates in Canadian Aboriginal populations. The health impact on
Aboriginal peoples now and in future generations is an area that is in great need of
more effective disease interventions, health promotion strategies, and culturally
relevant programs. In Canada, First Nations2 children as young as eight years of age
are being diagnosed with type 2 diabetes, and one-third of Aboriginal peoples over
15 years of age have been told by a health practitioner they have a chronic
condition such as type 2 diabetes, cardiovascular disease, and high blood pressure
1 Aboriginal peoples- Defined as the descendents of the original inhabitants of North America. The Canadian
constitution recognizes three groups of Aboriginal peoples: First Nations, Métis, and Inuit. These are three separate peoples with unique heritages, languages, cultural practices, and spiritual beliefs. Aboriginal is respectively used in this thesis to describe these groups and their descendants.
2 First Nations- is a term that became common usage in the 1970’s to replace the word “Indian” which people had found offensive. The term First Nations is widely used, however, no legal definition exists. The term “First Nations peoples” refers to the North American Indian people of Canada, both Status and Non-Status. (Métis- are people of mixed North American Indian and European ancestry who identify themselves as Métis people. The Métis have a unique culture that draws on their diverse ancestral origins, such as French, Scottish, Ojibway and Cree. Inuit- means “people” in Inuktitut, the language of the Inuit people. Most Inuit people live in the NorthWest Territories, Nunavut, Northern Quebec and Labrador).
2 (First Nations and Inuit Regional Health Survey National Steering Committee/
FNIRHSC, 1999, 2003). As reported in the 2002/03 Regional Health Survey, over
19.7% of First Nations adults have been diagnosed with type 2 diabetes compared
to just 4.5% in the general Canadian population (McKee, Clarke, Kimetic &
Reading, 2009).
Obesity is an accepted risk factor for type 2 diabetes, and the percentage of
overweight to obese First Nations children is 62.3%, which indicates a potential for
even higher diabetes rates in the future (First Nations Information Governance
Committee/ FNIGC, 2011). With rising prevalence of type 2 diabetes and obesity in
Aboriginal youth, there is an impending increase in the diabetes health crisis. The
Aboriginal population is the fastest growing population in Canada, and more than
half of the urban off-reserve population is 25 years of age or younger. This is a
crucial point to consider in the coming decades. As these young adults and youth
become older, there is potential for immense stress on the health care system, not to
mention the heavy burden of disease that will be experienced. Effective
interventions that begin early in the life course will have the greatest impact on type
2 diabetes trajectories, and interventions at any point in the life course would aid in
a positive change in trajectory.
3
1.2 Statement of the Problem
To date there is limited research explicitly devoted to off-reserve Aboriginal
populations in Canada. The health of Aboriginal peoples is generally not a priority in
Canadian society, or for the current Federal government. Consequences of this low
priority are illustrated by the magnitude of the Aboriginal diabetes health crisis, and the
burden of illness in the lives of the Aboriginal population. Disease trajectories continue to
increase in prevalence, thus it is crucial to examine the health status of Aboriginal
peoples with diabetes living off-reserve in Canada, along with those living on-reserve.
1.3 Structure of the Thesis
I describe and analyze findings from the 2006 Aboriginal peoples Survey
(APS) conducted by Statistics Canada, which collected data on the living
conditions and lifestyles of Canadian Aboriginal peoples living off-reserve.
Quantitative analysis was done through an exploratory study of secondary data in
the form of anonymized, coded data tables compiled by a Statistics Canada analyst
using the data collected in the 2006 APS. These data tables were assessed and
categorized in relation to diabetes3, and diabetes care in the life course from
childhood to adulthood. Charts and graphs were then created using excel
spreadsheets, to illustrate the findings from the coded data tables, which are
discussed in more detail in Chapter 4. The Statistics Canada data was made
available for my thesis in partnership with the National Association of Friendship
3 For the purpose of this thesis, I will be using the term “diabetes” when discussing methods, results, and
findings, as the data tables I received from Statistics Canada do not differentiate type 1 or type 2 diabetes. I do acknowledge and recognize that type 2 is more prevalent.
4 Centres (NAFC) through my supervisor, Dr. Jeffrey Reading, Director of the
Centre for Aboriginal Health Research, University of Victoria.
The NAFC was established in 1972, and acts as a central unifying body for a
network of 119 Aboriginal Friendship Centres from coast to coast to coast. Friendship
Centres are primary providers of culturally-enhanced programs and services to urban
Aboriginal residents, and facilitate the transition of Aboriginal peoples from rural,
remote, and reserve life to the urban environment. Aboriginal Friendship Centres play a
critical role in community and economic development through training and employment
opportunities, building resources, and facilitating social development.
Core activities of the NAFC include:
- enhancing governance practices
- promoting and advocating for the Friendship Centre movement
- coordinating and facilitating the delivery of national programs and services
- developing policy
- acting as a mediation body during difficulties
- working with service agencies, volunteer organizations, private industry and all
levels of government to improve the lives of urban Aboriginal peoples.
Study findings and suggested interventions will empower the NAFC in advocating policy
changes that will improve Aboriginal health outcomes.
When I first entered the Social Dimensions of Health program, my hope and
intent was to conduct a study looking at the link between diabetes and oral health in
Aboriginal peoples, specifically with Cowichan Tribes, in Duncan, BC. For study
design, I had wanted to do a forensic chart audit of dental charts, studying dental hygiene
5 care, periodontal treatment, and glucose monitoring for those clients who had indicated
they had type 2 diabetes in their health history, as Cowichan Tribes has a dental office
accessible to their band members. My supervisor had a contact through the Centre for
Aboriginal Health at UVIC that I was to use, and unfortunately she could not arrange
introductions, and therefore I was unable to follow that path. In discussing this closed
door with my supervisor, I was fortunate to be given the opportunity to work on this
present study, which is to analyze data tables sent from Statistics Canada, regarding
specific questions from the 2006 Aboriginal peoples Survey (APS) directly related to
diabetes and off-reserve Aboriginal4 populations in Canada.
I describe the characteristics of health and social determinants of Aboriginal
peoples off-reserve with and without diabetes, with areas of focus being self perceived
overall health, obesity, health conditions/co-morbidities of diabetes, access to healthcare,
and income. Further, I discuss the burden of illness, allostatic load, access to culturally
relevant healthcare, and determinants of health that play a role in and potentially affect
disease prevalence across the life course of Aboriginal populations living off-reserve.
This thesis is organized as follows: a review of literature researched for this study
will be discussed in Chapter 2, followed by a description of methods and study design in
Chapter 3. The results are reported in Chapter 4, followed by a discussion in Chapter 5.
The thesis will close with conclusions and recommendations in Chapter 6.
4 As stated in footnote 1, Aboriginal is respectively used in this thesis to describe three distinct groups of
people: First Nations, Inuit and Métis. The data received from Statistics Canada did not differentiate into FN, Inuit and Métis groupings for this study, perhaps due to the small sample size of 61,000, but also due to the study being interested in the social dimensions of health for mostly urban, and some rural Aboriginal Canadians off-reserve. I am aware that the prevalence rates presented in my thesis are not equal across these very unique populations, and a question I am unable to take on is whether FN=Inuit=Métis in regard to the burden of illness of diabetes and social dimensions of health.
6 1.4 Background of the Problem Aboriginal peoples in Canada have historically and persistently experienced poor
health outcomes because they are socially marginalized. Factors linked to poor health
outcomes include access to employment, adequate housing, potable water, as well as non-
material resources such as social and cultural exclusion, connectedness, and
communication. Upstream factors affecting health are poverty, addictions, food security,
lifestyle, and poor housing. Inequalities are directly tied to social class, as shown by The
Black Report5 which found that at a population level, poverty matters. Occupational class
is a marker for power, as is access to material and non-material resources. Inequalities in
health were found to be caused by economic inequality.
Historically, the marginalization and oppression of the Aboriginal population in
Canada is a direct result of the colonial policies that aimed to erase Aboriginal culture
and assimilate Aboriginal peoples into the dominant colonial population (Wilson,
Rosenberg & Abonyi, 2011). The Federal government has been in control of Aboriginal
affairs since 1867, and the Indian Act (1876) was a paternalistic, intrusive piece of
Federal legislation that has governed most aspects of First Nations life, from Indian
status, resources and land, to education and health (Mikkonen & Raphael, 2010). The
Indian Act is a policy which determines who is an Indian by way of assigning Status, and
is used by the Federal government to determine who is considered an Indian, and
therefore a Federal fiduciary obligation. The Indian Act also established federal
jurisdictional boundaries called “reserves” and Federal responsibility for health care is
5 The Black Report- This document was published by the Department of Health and Social Security in the
United Kingdom. It was a report generated by an expert committee into health inequality and was chaired by Sir Douglas Black.
7 restricted to Aboriginal persons living on-reserve. In the past, as wards of The Crown, the
First Nations peoples’ were forbidden to speak their languages or practice traditions, had
their ceremonial belongings taken and burned, and were placed on reserves. They could
not leave the reserve unless they had a pass issued by the Indian Agent; any First Nations
person who earned a university degree would automatically lose his or her Indian status,
and status women who married non-status men would lose their Indian status (Mikkonen
& Raphael, 2010). The Crown Indian Agents controlled the reserves which were arbitrary
pieces of land decided upon by the Government.
The most aggressive step taken by the government towards assimilation was the
creation of government and church run residential schools, the first of which opened in
the late 1800s. By the 1930s, there were 80 such schools across the country. Aboriginal
children were forcibly taken from their homes to become ‘civilized’ in the residential
schools. These are all now closed, with the last residential school closing in 1996
(Assembly of First Nations, 2009; Wilson et al, 2011). Within the last 30 years,
survivors of the residential school system began disclosing the physical, mental and
sexual abuse they suffered as children. This government policy broke up families, and is
responsible for abuse and suffering of children that has had, and will continue to have,
impact across generations. Connectedness to their culture and families was fractured;
mental illness and addiction stem directly from the experiences of residential school
survivors. Experience in the residential schools has seriously inhibited the ability of
individuals to look after their physical needs.
Iwasaki et al, (2005) argue that while it is obviously necessary to give attention to
broader cultural, socioeconomic, historical, and political factors surrounding diabetes in
8 Aboriginal peoples, changes caused by colonization6 are a major factor for the rise in
diabetes incidence among Aboriginal peoples globally (Iwasaki, Bartlett & O’Neil,
2005).
Delivery of health care services to Aboriginal peoples has been greatly influenced
by the Indian Act of 1876. Aboriginal peoples suffer higher rates of morbidity and
mortality which can be attributed to a fragmented delivery of health care service (Kelly,
2011). Also, the health care system contains public policies that create jurisdictional gaps
regarding responsibility for delivery of health care to Canadian Aboriginal peoples
(British Columbia Provincial Health Officer, 2009; Jacklin & Warry, 2004; Lavoie,
Forget & Browne, 2010). The Federal government accepts responsibility for delivering
primary health care on-reserve, and provides funding to the provinces for cost-sharing
programs, contracted services, and premiums for Status Indians (Lavoie & Forget, 2008).
Provincial governments are responsible for primary health care services, and hospital and
physician services for off-reserve Aboriginal peoples.
The Federal government has never acknowledged its legal obligation to provide
health care services to Aboriginal peoples. The government views its provision for health
care services on-reserve as a matter of goodwill rather than responsibility, and takes the
stance they have a special relationship with Canada’s First Nations, which they are
committed to maintaining (British Columbia Health Officer, 2009, First Nations Inuit
Health Branch, 2007). The Indian Act (1876) did include a health related provision, but
the language used in this provision failed to provide clear legislative authority for Indian
6 Colonization- defined as dispossession of ancestral lands, the imposition of colonial institutions and the
disruption of traditional lifestyles.
9 health to the Federal government ( “The Aboriginal Health Legislation and Policy
Framework in Canada”, 2011). The Federal government’s role is primarily limited to
public health and prevention services offered by the First Nations and Inuit Health
Branch, with services being offered to status Indians living on-reserve and to Inuit living
in their traditional territories ( “The Aboriginal Health Legislation and Policy Framework
in Canada”, 2011). The Branch provides non-insured health benefits such as prescription
drugs, dental and vision coverage to all status/registered Indians and Inuit regardless of
where they live, yet this benefit is not offered to the Métis7 ( “The Aboriginal Health
Legislation and Policy Framework in Canada”). Hospital and physician care is provided
by the Provincial and Territorial governments ( “The Aboriginal Health Legislation and
Policy Framework in Canada”, 2011). For First Nations people living on-reserve, health
care is predominately the responsibility of the Federal government; other Aboriginal
groups fall under the Provincial or Territorial governments ( “The Aboriginal Health
Legislation and Policy Framework in Canada”, 2011). The Aboriginal legislation and
health policy framework is complex, and the framework fails to address the health care
needs of Aboriginal peoples who are either not registered or living off-reserve ( “The
Aboriginal Health Legislation and Policy Framework in Canada”, 2011). As Romanow,
(2002) states “the jurisdictional gaps and debates add to this complexity in legislation and
negatively impacts access to appropriate and responsive health care for Canadian
Aboriginal peoples”.
7 As of the week of January 8, 2013, the Federal Court of Canada ruled that Ottawa (the Federal Government)
must recognize Métis and non-status Indians under the Constitution Act, 1867. The ruling found that these peoples should be entitled to the same rights and benefits accorded to status Indians living on-reserve. This includes access to health, education and other benefits. This could deliver equality under the Canadian Constitution to over 600,000 Aboriginal peoples in Canada. However, this decision could yet be appealed. (www.cbc.ca/news)
10 In 2005, Prime Minister Paul Martin, the provincial premiers, and Aboriginal
leaders met in Kelowna, British Columbia for the First Ministers Conference on
Aboriginal Affairs. This meeting resulted in The Kelowna Accord, a five-year, five-
billion dollar plan to improve the lives of First Nations, Inuit and Métis peoples in urban
areas. The plan set targets to improve health and water services, education, housing, and
economic development, with hope of eradicating poverty. Martin’s government fell
seventy-two hours later, and the Conservative government dismantled the Kelowna
agreement by reducing and eliminating funding. Also, the federal government has now
withdrawn funding for the National Aboriginal Health Organization (NAHO), which
resulted in its closing June 30, 2012. The NAHO was a not-for-profit organization whose
mandate was to advance the health of First Nations, Métis and Inuit people in Canada.
1.5 Theoretical and Conceptual Foundation
1.5.1 Intersectionality Intersectionality is considered a critical analysis of privilege, power, identity and
oppression that claims no one element of identity or oppression stands alone. Proponents
of intersectionality suggest that we cannot claim any identity has a pure essence, or that
any aspect of identity is inherently oppressive. It also acknowledges that identities are not
fixed, but are fluid and shift over time and with context. Recognizing this complex
diversity, an intersectional analysis does not ignore unjust social structures such as
conscious or unconscious racism or patriarchy, or, how they play out in policies,
practices, laws or unquestioned norms. Intersectionality focuses on simultaneous
intersections between aspects of social difference and identity (gender, race, class, age)
and forms of systemic oppression (racism, marginalization, classism) at micro and macro
levels that are interdependent and complex (Hankivsky & Cormier, 2009).
11 As mentioned, the disproportionate burden of poor health experienced by
Aboriginal peoples can be attributed in part to a fragmented system that is rooted in
jurisdictional gaps and long-standing debates between Aboriginal, Federal and Provincial
governments (Kelly, 2011). It can also be attributed to multifactoral complexities of
health disparities. This complex phenomenon cannot be understood with the insufficient
current approaches to health inequalities. Traditional frameworks have placed health
vulnerabilities into categories such as gender, race, socioeconomic, geography or disease
status. The influence and context of social power inequalities usually fail to be considered
or analyzed. An intersectional perspective will be used in my thesis to investigate the
interaction of numerous characteristics of the off-reserve Aboriginal population, at
individual and social levels, to analyze the multiple contexts that shape their individual
lives and health status.
1.5.2 Concepts of determinants of health and Eco-Social Theory Although precise causal pathways in which the social determinants of health
operate are not fully understood, it is clear that unequal distribution of employment,
education, income, and housing, produce inequalities in health (Graham, 2000).
Additionally, it is also the quality of these experiences, not just the distribution. Poor
health outcomes are associated with marginalization and social disadvantage (Braveman,
2003). Four groups of theories have been proposed to explain these inequalities in health
across socioeconomic position. Firstly, the Materialist/structuralist theory, proposes that
ill health is produced through inadequate individual income levels which lead to a lack of
resources to cope with the stressors of life (Frolich, Corin & Potvin, 2001). Secondly, the
Psycho-social theory proposes that stress which comes from discrimination based on
12 one’s place in the social hierarchy, causes a neuroendocrine response that produces
disease (Evans & Stoddart, 2003; Siegrist & Marmot, 2004). Thirdly, the Social
production of health theory proposes that capitalist priorities for accumulating wealth,
power, prestige and material assets are achieved at the cost of the disadvantaged in
society (Krieger, 2001). Finally, the Eco-Social theory brings together the psyco-social
and social production of health models, and examines how social and physical
environments interact with biology, and how individuals “embody” aspects of the life and
work contexts (Krieger, 2001). This builds on the premise that lifestyle choices are
influenced by life chances which are defined by the environment in which people live
(Frolich et al, 2001).
1.5.3 Eco-Social theory Dr. Nancy Krieger introduced the term “ecosocial’ theory in 1994. Her visual
fractal metaphor of an evolving tree of life intertwined at every level, micro and macro,
with scaffolding of society that differing core social groups daily reinforce or wish to
alter, is a metaphor that fits well when discussing health outcomes of off-reserve
Aboriginal peoples (Krieger, 2001). This fractal metaphor elicits thought on current and
changing population patterns of health, well-being and disease in relation to each level of
ecological, biological and social organization, such as cell, organ, individual, family,
community, population, and ecosystem (Krieger, 2001). Krieger’s four core constructs of
eco-social theory are embodiment, pathways of embodiment, cumulative interplay
between exposure, susceptibility and resistance, and accountability and agency (Krieger,
2001). Embodiment, is defined by Krieger as referring to how people literally biologically
incorporate the material and social world in which they live, from conception to death,
13 and that no aspect of a persons biology can be understood absent of knowledge of history
and the individual and societal ways of living (Krieger, 2001). Pathways of embodiment,
is structured simultaneously by: a) constraints and possibilities of a persons biology,
shaped by evolution, ecological context, and individual histories; and b) societal
arrangements of power and property, and contingent patterns of production, reproduction,
and consumption (Krieger, 2001). Cumulative interplay between exposure, susceptibility
and resistance, Krieger explains, is expressed in pathways of embodiment, and each
factor and its distribution is conceptualized at multiple levels, such as individual,
regional, national, and political. It also is experienced in multiple domains, like home,
work, and school, in relation to ecological niches, and then manifested in processes at
multiple scales of space and time (Krieger, 2001). Accountability and agency is expressed
in pathways of knowledge regarding embodiment, in relation to institutions (business,
government), individuals and households. Also, accountability and agency pertains to
scientists for theories used or ignored to explain social inequalities in health (Krieger,
2001).
These constructs of eco-social theory begin to make clear the population patterns
of health, well-being and disease as biological expressions of social relationships, and
begin to view how these social relationships influence the basic understanding of biology,
and the social constructs of disease (Krieger, 2001).
The construct and process that is central to eco-social theory is embodiment.
Krieger discusses how the notion of embodiment brings about three critical claims:
1. bodies tell stories about the conditions of a person’s existence, and study of this cannot be divorced from this fact.
2. bodies tell stories that often match a person’s stated accounts
14 3. bodies tell stories that people cannot or will not tell, because they are
unable, forbidden, or choose not to. Social and economic deprivation and discrimination, physical and sexual abuse,
inadequate health care; food insecurity and fast food; lack of potable water and
inadequate sanitation, and toxic exposures all leave marks on a person’s body (Krieger,
2005). Krieger argues embodiment is literal- the eco-social premise states that clues to
current and changing population patterns of health, which include social disparities in
health, are found in the dynamic material, social, and ecological contexts into which a
person is born, develops, interacts, and endeavours to live a meaningful life (Krieger,
2005). An embodied approach, then, would promote testing hypotheses to ascertain if the
observed disparities are a biological expression of racial discrimination, considering the
past and present (Krieger, 2005). Racial inequalities, as seen with health outcomes for
Aboriginal populations, become biologically embodied over the lifecourse and across
generations, which therefore create and perpetuate racial ethnic disparity (Krieger, 2001;
Krieger, 2005).
Suffice it to say, determinants of health are multi-faceted and complex, and while
causal pathways are not fully understood, there is increasing evidence to show how social
determinants of health (such as income, housing and food insecurity) interact with
biology to shape health outcomes (Yu & Raphael, 2004). It appears that type 2 diabetes is
a disease that is particularly susceptible to the effects of these factors (Yu & Raphael,
2004).
15 1.6 Research Questions 1. Do off-reserve Aboriginal peoples with a diagnosis of diabetes report a difference in excellent-very good health status compared to Aboriginal peoples without this diagnosis? 2. Do off-reserve Aboriginal people’s obesity rates exhibit higher rates when they have diabetes, than when they don’t? 3. Do off-reserve Aboriginal peoples with diabetes show a difference in total family income compared to those without diabetes?
1.7 Significance of the Study Off-reserve Aboriginal populations are likely to suffer a disproportionate burden
of ill health, although little to no research has been conducted about this population. This
study will fill a gap in the literature, as it uniquely examines the characteristics of health
and social determinants of Aboriginal populations with diabetes living off-reserve within
the framework of intersectionality and the theoretical concepts of determinants of health,
specifically the eco-social theory.
16
Chapter Two: Review of the Literature
2.1 Introduction
There is limited research on or with, and data about, Aboriginal off-reserve
populations, as the majority of research done to date on Aboriginal populations has been
done in rural settings, on-reserve. To address this gap, research is needed for off-reserve
populations. In this chapter, I will synthesize literature I reviewed on characteristics of
urban Aboriginal populations, Aboriginal health status and health conditions.
2.1.1 Off-reserve Aboriginal peoples In 1951, the Canadian census revealed 6.7% of the Aboriginal population lived
in cities, by 2001 that percentage increased to 49% and in 2006 reached 54% (APS,
2006; Policy Research Initiative, 2003). Of this population, approximately 34% live in
five major cities: Winnipeg, Edmonton, Vancouver, Calgary, and Toronto (www.aandc-
aadnc.gc.ca). The urban Aboriginal population is young. In 2006, 28% were under 15
years of age compared to 17% of non-Aboriginals. Today, in 2012, more than half of
Aboriginal populations are under 25 years of age (www.aandc-aadnc.gc.ca).
Cultural adaptation was the challenge of early urbanization, but by the 1980s, the
emphasis shifted away from adaptation to poverty, and urban Aboriginal peoples faced
challenges such as unemployment, inadequate housing, and low levels of education and
income (Policy Research Initiative, 2003).
The report of the Royal Commission on Aboriginal peoples (RCAP) accurately
represents the contemporary discourse on the urban Aboriginal experience; the tension
between loss and opportunity (Policy Research Initiative, 2003). On the one hand, the
17 city represented loss of culture and community for Aboriginal migrants, yet there was
also an emerging urban Aboriginal culture (Policy Research Initiative, 2003). On the
other hand, the city represented opportunity for better education and employment. The
downside to this migration was it drew many of the best and brightest away from reserve
and rural communities (Policy Research Initiative, 2003). The RCAP emphasized the
importance of Aboriginal culture to the well- being of urban Aboriginal peoples.
Urban Aboriginal peoples are similar to other urban Canadians, for they have
interests, aspirations, goals, and needs that they wish to pursue within an urban landscape
(Policy Research Initiative, 2003). While some Aboriginal peoples experience
marginalization, others experience success; some maintain connection to their culture,
many do not; some experience low socioeconomic status, others experience success and
wealth. Contemporary urban Aboriginal peoples are more positive about their identity
now than they have been historically (Policy Research Initiative, 2003).
2.2 Health Conditions/Co-morbidity
Research has proven that hypertension, metabolic syndrome, and diabetic
complications such as cardiovascular disease (CVD), stroke, and neuropathy are all major
contributors to poor health (Oster et al, 2009; Bruce & Young, 2008; Bruce et al, 2011).
CVD is one of the leading causes of death in Canada, and Aboriginal populations have
twice the CVD death rate of non-Aboriginal populations. The CVD rate was 8% among
people of European ancestry, but 18% among Canadian Aboriginal peoples, based on a
random sample (Bruce et al, 2011).
18 2.2.1 Diabetes Diabetes is a chronic condition and can be caused by resistance to insulin, too
little insulin, or both (www.diabetes.ca). The body gets energy by making glucose from
food. To use glucose, the body needs insulin. Insulin is a hormone that helps the body
control the level of glucose in the blood, and is secreted by beta cells in the pancreas. If
diabetes is left uncontrolled, the results are consistently high blood sugar levels, which is
known as hyperglycemia. Over time, this condition of hyperglycemia can damage nerves,
blood vessels, and organs such as the heart, eyes and kidneys (“Diabetes Facts and
Figures”, 2011). There are different types of diabetes. The causes and risk factors are
different for each, as listed below:
Type 1 diabetes: is most often diagnosed in children, teens, or young adults, but
can occur at any age. The body makes little or no insulin, and the exact cause is not
known. Daily injections of insulin are needed (www.diabetes.ca).
Type 2 diabetes: most often occurs in adulthood, however, due to high obesity
rates, younger people are being diagnosed. Type 2 diabetes makes up most diabetes
cases. This type of diabetes is avoidable, and once contracted, can be treated or controlled
through a healthy diet and exercise (www.diabetes.ca).
Gestational diabetes: is defined as high blood sugar that develops any time during
pregnancy in women who do not have diabetes (www.diabetes.ca).
As explained by the World Health Organization (WHO), diabetes can, over time, damage
the eyes, kidneys, nerves, heart and blood vessels
(www.who.int/mediacentre/factsheets/fs312/en).
19
The list below describes common consequences of diabetes taken from the WHO
website www.who.int/mediacentre/factsheets/fs312/en
• Diabetes increases the risk of heart disease and stroke. 50% of people with diabetes die of cardiovascular disease (primarily heart disease and stroke).
• Combined with reduced blood flow, neuropathy in the feet increases the chance of
foot ulcers, infection and in extreme cases consequential limb amputation.
• Diabetic retinopathy is an important cause of blindness, and occurs as a result of long-term accumulated damage to the small blood vessels in the retina. After 15 years of diabetes, approximately 2% of people become blind, and about 10% develop severe visual impairment.
• Diabetes is among the leading causes of kidney failure. 10-20% of people with
diabetes die of kidney failure.
• Diabetic neuropathy is damage to the nerves as a result of diabetes, and affects up to 50% of people with diabetes. Although many different problems can occur as a result of diabetic neuropathy, common symptoms are tingling, pain, numbness, or weakness in the feet and hands.
• The overall risk of dying among people with diabetes is at least double the risk of
their peers without diabetes.
2.2.1.1 Oral Health The American Diabetes Association states another consequence or complication of
diabetes is oral health, as research demonstrates there is an increased prevalence of gum
disease among those with diabetes (www.diabetes.org). Oral health is an overlooked
complication of diabetes in Canada. Diabetes and periodontal disease8 are common
chronic illnesses. Research has found that associations between diabetes and periodontal
disease are biologically linked, and related conditions of inflammation, obesity, and
8 Periodontal disease- occurs when inflammation of the gingival (gum tissue) is untreated or delayed, and
spreads to the ligaments and bone that support the teeth. Loss of this support causes the teeth to become loose, which can eventually be lost.
20 insulin resistance are considered to have an important role in this association (Ide et al,
2011). Several epidemiological studies have suggested diabetes increases the risk of
periodontal disease (Mealey & Oates, 2006; Mealey & Ocampo, 2007; Taylor &
Borgnakke, 2008). Ide et al, (2011) state that clinical and epidemiologic findings further
suggest that periodontal infection contributes to lessened glycemic control in people with
diabetes. Relatively little is known about the effects periodontal disease have on the
occurrence of diabetes in the general population, or the off-reserve Aboriginal
population.
Effects of hyperglycemia enhance the formation of glycosylated proteins and
lipids which are biologically active, and these promote inflammation and intensify the
effects of the periodontal infection (Lalla, et al, 2000).
Dunning, (2009) lists several explanations for the association between periodontal
disease and diabetes that have been proposed in the literature, including:
• Microvascular disease, also known as small vessel disease, is a condition in which
small arteries in the heart become narrowed (www.mayoclinic.com/health/small-
vessel-disease)
• Formation of irreversible advanced glycated end products associated with
oxidative stress, which affects the function and structure of the basement
membranes, particularly in the small blood vessels, therefore contributing to
microvascular disease
• Changes in the composition of gingival cervicular fluid
• Altered collagen metabolism
21 • Changes in the flora of the oral cavity and overgrowth of anerobes, such as
Actinobacillus actinomycetemcomitans and Porphyomonas gingivalis
• Altered immune response and changed white blood cell function during
hyperglycemia that contributes to delayed infection control and wound healing
• Over expression of inflammatory cytokines, such as interleukin-1B, tumor
necrosis factor, and prostaglandin E2
There is an abundance of general literature available regarding periodontal disease
and therapy. Literature suggests several risk factors that affect and promote periodontal
disease. These risk factors included plaque and oral hygiene, tobacco use, systemic
conditions such as diabetes, specific sub-gingival bacteria, age, gender and other factors
such as genetics, and environment (“Epidemiology of Perio”, 1996; Lux, 2006;
“Originating group”, 2001). It has been hypothesized that high prevalence of diabetes and
tobacco use coupled with reduced access and use of preventive dental/dental hygiene
services could put Aboriginals at higher risk for periodontal disease (Ellerby, et al, 2000;
“Epidemiology of Perio”, 1996; Lamster, Lalla, Borgnakke & Taylor, 2008; MacEntee et
al., 2001; Wardman, Clement & Quantz, 2005; Ziebarth, 2003). Unfortunately, little
information was found that directly stated the incidence of periodontal disease and no
studies were found related to periodontal disease in Aboriginal populations.
Curiously, oral health is not addressed in the 2006 APS. Only one question was
included which asked respondents if they had seen a dentist or orthodontist in the past 12
months. There were no questions about gum health or missing teeth, both of which can
affect quality of life. Diabetes, periodontal disease and dental caries (decay) are of high
22 concern to the Aboriginal population in all stages of the lifespan. This absence of oral
health in the survey could be explained through the study parameters, or survey
constraints, or could reflect a gap in research design when looking at health.
National and local surveys provide evidence of substantial child oral health
inequalities in Canadian Aboriginal children who experience a higher prevalence and
severity of dental caries (decay) than non-Aboriginal Canadian children (FNRLHS,
2002,2003; Environmental Scan, 2012; Lawrence et al, 2008). The 2012 Environmental
Scan Oral Health Services in British Columbia for First Nations and Aboriginal Children
aged 0-7 years found 28.5% of Aboriginal kindergarten-aged children had evidence of
visible decay, compared to 16.2% of non-Aboriginal children. 8.8% of these Aboriginal
children had evidence of decay in three or four quadrants, compared to 3.7% of non-
Aboriginal children (p.5). Further, the dental health of kindergarten-aged First Nations
children in First Nations schools is poorer than the dental health of Aboriginal children in
public or independent schools (Lawrence et al, 2008). 41.5% of Aboriginal children
attending public or independent schools were caries immune (no evidence of visible
decay and no existing restorations), while only 18.1% of First Nations children attending
First Nations schools surveyed were caries immune (Lawrence et al, 2008).
Aboriginal families living off-reserve often face unique problems such as
navigating the health care system, finding a dentist and claiming benefits (Lawrence et al,
2008). These realities further deepen the oral health divide between non-Aboriginal and
Aboriginal Canadians. Research supports the fact that oral health status is linked to
socio-economic status, and that people living in more isolated areas with fewer dental
23 caregivers generally have poorer oral health (Lawrence et al, 2008). Research has also
shown that until the 2002/2003 RHS, the only national indicator of First Nations oral
health in Canada was the data obtained from the NIHB program, which is limited to
actual users of dental services and neglects those who don’t access care through this
program (Lawrence et al, 2008). Findings from the RHS 2002/2003 questionnaires
revealed 41% of First Nations adults did not receive any dental care in the previous 12
months; moreover, 19% of First Nations children had experienced some dental pain in the
previous 12 months (Lawrence et al, 2008).
Research has also identified periodontal disease as an additional oral health
concern for Aboriginal peoples (First Nations and Inuit Health Branch, 2003).
Unfortunately, little information was found that directly stated the incidence of
periodontal disease and no studies related to periodontal disease in Aboriginal peoples
were found.
Lamster et al, (2008), report on two longitudinal studies of the Gila River Indian
Community in Arizona which support the relationship between the risk of clinical
complications of diabetes and poor periodontal health (Lamster et al, 2008).
They report the following:
“Saremi and colleagues studied 628 adults 35 years or older who had diabetes for a median of 11 years. Using a fully adjusted model, the researchers found that the risk of death from cardiac or renal disease for people with severe periodontitis was 3.2 times higher than that of people with no, mild, or moderate periodontitis. Shultis and colleagues examined periodontitis as a risk factor for renal complications of diabetes, including nephropathy and end stage renal disease. They used the same definitions of periodontal disease, as did Saremi and colleagues and observed similar findings. Using a fully adjusted model, they found that the incidence of nephropathy was 2.0 to 2.6 times greater in people who had moderate to severe periodontitis or
24 who were edentulous than it was for those who had no or mild periodontitis” (pp. 234-235).
Additional research suggests that diabetic patients with periodontal disease
may have an increased risk of diabetic complications. Deshpande et al, (2010) cite a
study which analyzed over 600 subjects. Their findings indicate that periodontal
disease is a significant risk factor for myocardial infarction and stroke, as well as
diabetes. The study also found that patients with severe periodontitis have a 2.3
times higher death rate from ischemic heart disease compared to those with no or
mild periodontitis (Deshpande et al, 2010). Also, in patients with severe
periodontitis, the death rate from diabetic nephropathy was 8.5 times higher, and
the overall mortality rate from cardio renal disease was 3.5 fold higher (Deshpande
et al, 2010). Further research involving Aboriginal communities is required to
increase our understanding of the oral health status and related issues within this
population.
2.2.1.2 Prevalence of diabetes Causes of type 2 diabetes are complex; age, obesity, inactivity, genetics and
ethnicity are important risk factors. Economic, social, environmental and lifestyle factors
have significant effects on the distribution of type 2 diabetes in the Canadian population.
In 2008/09, almost 2.4 million Canadians were living with diabetes. From 1999- 2009,
the prevalence of diabetes among Canadians increased by 70%, with the greatest increase
seen in the 35-39 and 40-44 year old age groups, in which the proportion doubled
(“Diabetes facts and figures”, 2011). However, at every age group, individuals with
diabetes experienced mortality rates at least two times higher than those without
(“Diabetes fact and figures”, 2011).
25 The 2002/2003 First Nations Regional Health Survey reported over 19.7% of First
Nations adults having been diagnosed with type 2 diabetes, whereas in the general
Canadian population the rate is 4.5% (McKee et al, 2009). Diabetes was rare in the North
American Aboriginal population prior to 1940, with rates increasing rapidly after 1950
and currently reaching epidemic levels (“Diabetes facts and figures”, 2011). In the First
Nations, Inuit and Métis populations, rates of diabetes and its complications have
increased in the last fifty years, with significant contributors being socio-cultural,
environmental, biological and lifestyle changes (“Diabetes facts and figures”, 2011).
Current theories found in the literature suggest the transition to a western diet of high
carbohydrate and fat-rich type food, lifestyle changes, and complex psycho/social factors
have resulted in increased obesity rates, obesity being the accepted risk factor for diabetes
(Sharp, 2009). However, there are other possible risk factors not yet fully explored by
health researchers which may contribute to the observed high prevalence rates in the
Aboriginal population.
2.2.1.3 Metabolic Syndrome According to the Canadian Diabetes Association, metabolic syndrome is a term used
to describe a group of conditions that places a person at higher risk for developing type 2
diabetes, heart disease, and heart related problems (www.diabetes.ca). A person is
considered to have metabolic syndrome if 3 or more of the following are present:
- Abdominal obesity or too much fat around the waist ( a waist circumference
greater than 102cm in men and greater than 88cm in women).
- Low levels of HDL, the “good” cholesterol ( lower than 1.0 mmol/L in men or 1.3
mmol/L in women)
26 - High fasting blood glucose levels ( 5.6 mmol/L or higher)
- High blood pressure ( 130/85 mmhg or higher)
- High level triglycerides, a type of fat in the blood ( 1.7mmol/L or higher)
There is continued debate regarding the exact cause of metabolic syndrome; some
researchers believe the cause to be insulin resistance, others feel it is caused by genetics,
old age or lifestyle (www.diabetes.ca). Abraham et al, (2007), add to this debate by
stating “accumulating epidemiological, biological, and mechanistic evidence indicates
that psychosocial, neuroendocrine, immunogenic, and oxidative stress play critical roles
in the development of metabolic syndrome, cardiovascular disease, and type 2 diabetes
(Abraham, Brunner, Eriksson & Robertson, 2007)”.
2.2.2 Obesity The prevalence of being overweight and obese is much higher among Aboriginal
peoples than among the rest of the population in several countries, including Canada, the
United States, Australia, New Zealand, and the Pacific Islands (Garriguet, 2008). Being
overweight or obese has been associated with several chronic systemic conditions, such
as diabetes, cardiovascular disease and high blood pressure. According to the 2000/2001
Canadian Community Health Survey, 33.5% of off- reserve Aboriginal peoples were
overweight and an additional 24.7% were obese (Tjepkema, M, 2002). However, in the
2006 APS, 80% of Aboriginals living off-reserve reported being overweight to obese.
One study found the prevalence of obesity and associated co-morbidities was higher
among women than men (Bruce et al, 2011). Factors associated significantly with obesity
among women were employment status, diastolic blood pressure, and insulin resistance
27 (Bruce et al, 2011). In a sample drawn from Manitoba First Nations adults, co- morbidity
was high among young people in the 18-29 year age group (Bruce et al, 2011). This is a
finding of concern, especially for young women in this age group who are of
reproductive age. The relationships between maternal obesity and type 2 diabetes,
gestational diabetes, poor birth outcomes, and development of obesity and type 2 diabetes
among the offspring are well documented (Bruce et al, 2011). Bruce et al, (2011) observe
that despite the evidence of excess obesity, diabetes, and related metabolic conditions
among Canada’s First Nation populations, few researchers have investigated their
coexistence (Bruce et al, 2011 p. 2). According to Katzmarzyk and Janssen, (2004) the
direct and indirect medical costs associated with overweight to obesity in Canada in 2001
were estimated at $1.6 billion (CAD) and $2.7 billion (CAD), respectively. This
represents 2.2% of the total healthcare costs (Pouliou & Elliott, 2010).
2.2.3 Cardiovascular disease Bruce et al, (2011) found that among participants with abdominal obesity, 48%
had hypertension and 35% had diabetes, yet alarmingly, about one-third of the
hypertension and one-quarter of diabetes cases among this group were undiagnosed (p.
4). Prevalence of cardiovascular disease among Aboriginal peoples in Canada has been
increasing and is now higher than the prevalence in the non-Aboriginal population
(Riediger, Bruce & Young, 2011). In a random sample of Canadian Aboriginal peoples,
prevalence of cardiovascular disease was 18%, compared to just 8% in Canadians of
European decent (Riediger et al, 2011).
Despite the high rate of type 2 diabetes and cardiovascular disease among
Canadian Aboriginals, little research has gone beyond examining traditional risk factors
28 (Riediger et al, 2011 p. 1). In addition, research has been based on chart review, and the
few population-based studies conducted have been limited to localized First Nation
communities (p. 1-2). A shortcoming of this data is that due to its cross-sectional nature,
no health outcome data is available.
2.2.4 Stress Literature also suggests a critical link between stress and diabetes. Stress has been
recognized as a key etiology of type 2 diabetes and directly affects the management of
diabetes among people already diagnosed with this disease through behavioural and
physiological mechanisms (International Diabetes Foundation, 2003). Stress can arise
when Aboriginal peoples cope with conditions such as low income, poor quality housing,
unstable employment, food insecurity, and discrimination based on Aboriginal status,
gender, or disability (Mikkonen & Raphael, 2010). Also, stress is increased through
social isolation, lack of supportive relationships, and mistrust of others (Mikkonen &
Raphael, 2010). Chronic stress, at a physiological level, can lead to prolonged biological
reactions which strain on the body, for evidence has shown this continuous stress
weakens the resistance to disease and disrupts metabolic and hormonal function
( McEwan, 2008; Mikkonen & Raphael, 2010). These physiological stresses make people
more vulnerable to serious illnesses such as type 2 diabetes, cardiovascular disease, and
immune system conditions (Mikkonen & Raphael, 2010).
2.2.5 Determinants of Health According to the World Health Organization (WHO) the social determinants of
health are defined as the conditions in which people are born, grow, live, work and age,
29 including the health care system. These conditions are further influenced by the
distribution of wealth, power and resources. (www.who.int/social_determinants/en).
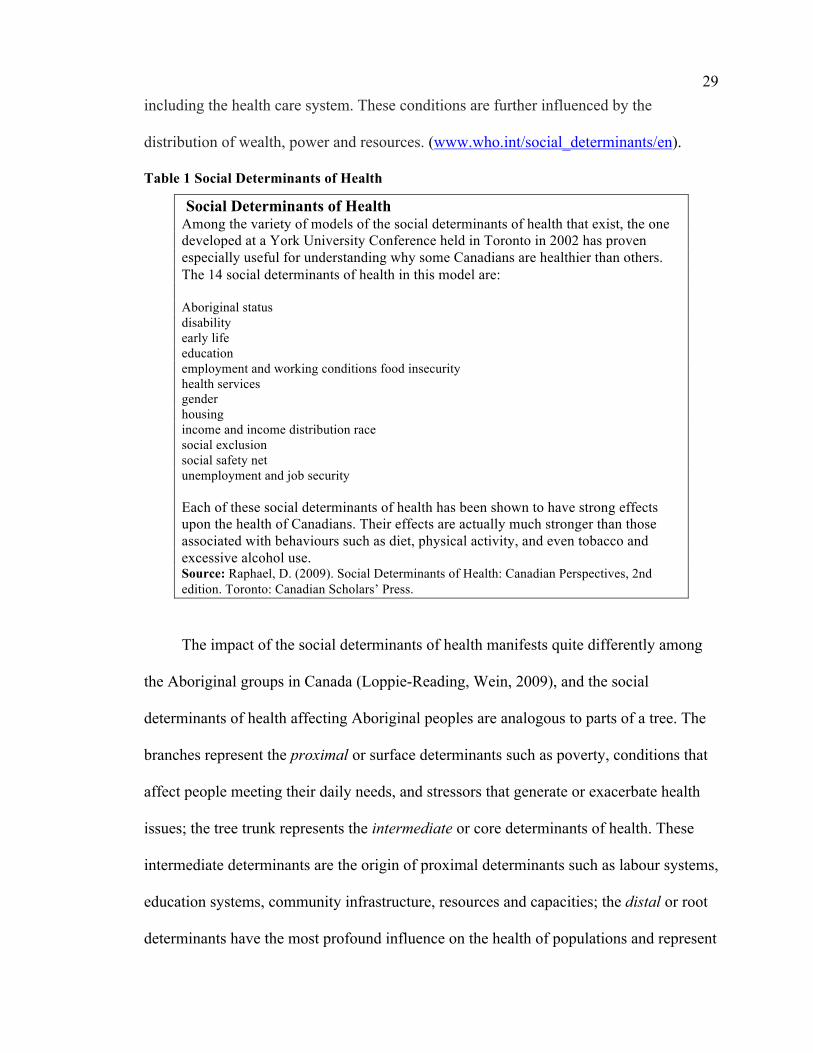
Table 1 Social Determinants of Health
Social Determinants of Health Among the variety of models of the social determinants of health that exist, the one developed at a York University Conference held in Toronto in 2002 has proven especially useful for understanding why some Canadians are healthier than others. The 14 social determinants of health in this model are: Aboriginal status disability early life education employment and working conditions food insecurity health services gender housing income and income distribution race social exclusion social safety net unemployment and job security Each of these social determinants of health has been shown to have strong effects upon the health of Canadians. Their effects are actually much stronger than those associated with behaviours such as diet, physical activity, and even tobacco and excessive alcohol use. Source: Raphael, D. (2009). Social Determinants of Health: Canadian Perspectives, 2nd edition. Toronto: Canadian Scholars’ Press.
The impact of the social determinants of health manifests quite differently among
the Aboriginal groups in Canada (Loppie-Reading, Wein, 2009), and the social
determinants of health affecting Aboriginal peoples are analogous to parts of a tree. The
branches represent the proximal or surface determinants such as poverty, conditions that
affect people meeting their daily needs, and stressors that generate or exacerbate health
issues; the tree trunk represents the intermediate or core determinants of health. These
intermediate determinants are the origin of proximal determinants such as labour systems,
education systems, community infrastructure, resources and capacities; the distal or root
determinants have the most profound influence on the health of populations and represent
30 political, economic and social systems or structures. An example of distal determinants
are colonization, racism, marginalization and oppression. All of these determinants of
health illustrate intersectionality: the complex simultaneous intersections of identity,
systemic oppression and social difference, both at micro and macro levels, which seem
to impact the Canadian Aboriginal population.
Proximal determinants (or surface determinants) of health are conditions that have
a direct impact on mental, spiritual, emotional and physical health. These conditions act
as stressors which can increase behavioural, emotional and social problems for youth and
adults (Loppie-Reading, Wein, 2009). It is difficult to find literature that describes the
mechanism with which the proximal determinants influence health. Proximal
determinants of health are key factors in a person’s ability to gain access to the basic
material resources (Loppie-Reading, Wein, 2009).
Well recognized proximal determinants are health behaviours. Among Aboriginal
peoples, the documented health behaviours include the overuse of alcohol, and cigarettes
(Loppie-Reading, Wein, 2009). Lack of exercise and poor diet are also behavioural
factors that contribute to the increase of type 2 diabetes rates in both Aboriginal adults
and youth. While the 2006 APS did not find a significant difference in the percentage of
self-reported smokers with and without diabetes (31% vs. 34%), Loppie-Reading & Wein
(2009), reported that Aboriginal adults are more than twice as likely to smoke cigarettes
as non-Aboriginal adults (p.7).
Intermediate or core determinants of health are defined as the origin of proximal
determinants discussed above. Poverty and harmful living environments stem from a lack
of community infrastructure, resources, and restricted environmental stewardship
31 (Loppie-Reading, Wein, 2009). The inequitable health care and educational systems
create barriers to developing or accessing health promoting behaviours, opportunities,
and resources (Loppie-Reading &Wein, 2009). Current health care services remain
focused on communicable diseases, while mortality and morbidity among Aboriginal
peoples increasingly result from chronic illness, while social access to health care is
limited or denied to Aboriginal peoples through health systems that fail to account for
culture, language, or social and economic determinants of Aboriginal peoples’s health
(Loppie-Reading & Wein, 2009). Current research suggests that adequate education
continues to be denied to Aboriginal peoples, which impacts their potential income,
employment and living conditions (Tjepkema, 2002). Most Canadian educational
curriculum continues to lack Indigenous content or learning styles, through culturally
competent curriculum even though this has demonstrated benefits and facilitates retaining
Aboriginal high school students (Loppie-Reading, Wein, 2009). An important step in
improving these intermediate determinants is to include culturally competent curriculum
in all levels of education.
Environmental stewardship is another recognized intermediate determinant of
health. Prior to European colonization of the Americas, traditional ties to the natural
environment provided a major resource to maintaining the superior health of Indigenous
peoples, but the contamination of fish, vegetation, wildlife, and water has forced
Aboriginal peoples to rely less on their natural environment.
Distal or root determinants are believed to have the most profound influence on
the health of populations, for they represent economic, political and social contexts that
construct both intermediate and proximal determinants (Loppie-Reading & Wein, 2009).
32 For Aboriginal peoples, social exclusion, colonialism, racism, and repressed self-
determination act as the distal determinants from which all other determinants are
constructed (Loppie-Reading & Wein, 2009). Again, this is an illustration of
intersectionality, which was discussed in Chapter 1.
While neo-colonialism detrimentally influences the health of contemporary
Aboriginal peoples, historic, successively traumatic events continue to affect generations
through what can be referred to as ‘historic or cultural’ trauma (Klem, 1998). The
collective burden of a repressive colonial system on Aboriginal peopless has created
conditions of economic, political, psychological, and physical disadvantage.
Aboriginal peoples cannot attain the same level of health as other Canadian
people unless there is equitable distribution of the determinants of health (Loppie-
Reading & Wein, 2009). Often marginalized by colonization and access to material
resources, Aboriginal peoples continue to be exposed to health damaging intermediate
and proximal determinants, which increase their vulnerability to illness and reduce their
capacity to address ill health (Loppie-Reading & Wein, 2009). This is evident in the
results and findings reported in the 2006 APS and the results chapter of this thesis.
2.3 Reported barriers to diabetes diagnosis and care
2.3.1 Income The legacy of colonization has left Aboriginal peoples disproportionately ranked
among the poorest of Canadians. In 2006, the median income for Aboriginal peoples was
$18,962 (Wilson & Macdonald, 2010). This is 30% lower than the median income of
$27,097 for the rest of Canada; the income gap in urban settings is $7,083 and $4,492 in
rural settings (Wilson & Macdonald, 2010). While income disparity between Aboriginal
peoples and other Canadians narrowed slightly between 1996 and 2006, it will take 63
33 years for the gap to be erased when using this current rate of change (Wilson &
Macdonald, 2010). According to Frohlich et al, (2006) Canadians with the highest
household incomes are two and a half times more likely to report excellent to very good
health than those with the lowest income (p. 137).
Income could be the most important social determinant of health, as level of
income affects psychological functioning, shapes overall living conditions, and
influences health related behaviours such as excessive alcohol use, tobacco use, quality of
diet, extent of physical activity, food security, and housing (Mikkonen & Raphael, 2010).
Low income predisposes people to social and material deprivation; the greater the
deprivation the less likely people are able to afford the basic pre-requisites of health, such
as clothing, housing and food (Mikkonen & Raphael, 2010). Many studies show that type
2 diabetes and heart attacks are more common among low income Canadians (Mikkonen
& Raphael, 2010). In theory, low income as a barrier to care can be manifested indirectly
through expressions of poverty including lack of knowledge regarding availability of
care, due to lack of television, computer, newspapers or literature; transportation costs to
access care, either automobile or public transit and apathy or hopelessness about their
health and other factors unique to individual circumstances.
2.3.2 Cultural acceptance Although cultural acceptance is a barrier to care, Aboriginal healthcare providers
may help to overcome this barrier. The traditional view of health among most Aboriginal
peoples is a holistic view of the manifestations of illness, (Wien et al., 1999; McKee et
al., 2009) such as treating minor illnesses, colds or headaches, with herbal medication,
while relying on healers to treat serious illnesses (Wien et al., 1999; McKee et al., 2009).
34 Even though Aboriginal peoples in Canada can now benefit from the Non-Insured Health
Benefits Program (NIHB) of the First Nations and Inuit Health Branch of Health Canada,
there have been difficulties balancing cultural differences and awareness of how health
care is understood between Aboriginal communities and non-Aboriginal communities
(“First Nations Action”, 2005; Gerlach, 2007; Schroth et al., 2008; Wien et al., 1999).
As a result, The First Nation and Inuit Regional Health Survey (FNIRHS) found
complaints such as poor communication between patients and doctors, as well as
separation of knowledge and power between Aboriginal peoples and non-Aboriginal
providers (Wien et al., 1999). A report of the Health Status of Canada’s First Nations,
Métis and Inuit peoples outlined the lack of culturally sensitive workers and programs as
one of the determinants of health (Schroth et al., 2008). Therefore, in order to approach
Aboriginal peoples with cultural sensitivity, several qualities have been suggested:
respecting the individual, practicing conscious communication (listening well and taking
notes), using interpreters, involving the family in decision making, recognizing
alternative approaches to truth-telling (avoiding direct communication), practicing non-
interference (decisions made by personal identity and cultural knowledge), and allowing
for aboriginal medicine (involving of aboriginal elders and healers) (Ellerby et al., 2000).
2.4 Summary of Literature Reviewed and Rationale for the Study
Research is scarce for longitudinal trends of type 2 diabetes in Aboriginal
populations (Oster, R.T, et al, 2011). Significant gaps found in the literature search
support the need for research for Aboriginal populations with type 2 diabetes living off -
reserve in urban centres. Cumulatively, the articles suggest need for more research into
cultural sensitivity, and health implications of type 2 diabetes on Aboriginal children,
35 adults and families. There is a great need for culturally safe non-Aboriginal healthcare
professionals, and for Aboriginal peoples to be trained in health professions. Cultural
safety should be taught to students in healthcare professions as part of their curriculum to
raise awareness of the social conditions regarding the gross inequalities that exist for
Aboriginal children, youth and families, but perhaps more important, the health care
providers’ privileged role and challenging them to critically examine their underlying
assumptions about Aboriginal peoples’ health and the unequal power relationship
experienced by many Aboriginal peoples, in hopes that inequality gaps will rapidly
decrease through awareness and advocacy.
Non-Aboriginal Canadians need to recognize the horrific inequity experienced by
many Aboriginal peoples in the form of marginalization, poverty, lack of healthcare and
poor living conditions, yet improvements can only be made through changes in policies,
education, eradication of extreme poverty and greater cultural understanding.
It is important for healthcare programs or health research to be done in partnership with
Aboriginal peoples as a way of combating the historical impacts of colonization and
oppression, as well as utilizing traditional Aboriginal culture and teachings to realized a
better future regarding Aboriginal health.
Off-reserve Aboriginal communities, the Victoria Friendship Centre, the Diabetes
Association, and the Centre for Aboriginal Health Research Centre at the University of
Victoria are all key stakeholders that can interact to aid with informing the topic of type 2
diabetes, reducing barriers to diagnosis and treatment, and promoting best practices when
36 conducting health research with Aboriginal populations off-reserve because of the
strength in diversity of vast information, resources and life experiences they can offer.
37
Chapter Three: Research Design and Methods
3.1 Introduction
Quantitative data evaluation was completed through an exploratory analytic cross-
sectional study of secondary data from the APS received from Statistics Canada. The data
came in the form of coded, anonymized data tables derived from two (2) National
surveys , the Adult Core 9(15yrs +) and Child & Youth 10(6-14 yrs) that were conducted
by Statistics Canada in 2006, as part of the Aboriginal peoples Survey (APS). The APS is
a national survey of Aboriginal peoples (First Nations, Inuit and Métis) living off-reserve
in urban, rural and northern locations throughout Canada. These tables reflected answers
to survey questions related to obesity, diabetes, and diabetes care, from childhood to
adulthood. Access to the original raw data information was not granted by Statistics
Canada for this study.
Analytic cross-sectional studies observe a sample of a population at a single point
or brief period of time. These are sometimes referred to as prevalence studies, since
prevalence rates are the usual measure employed in the analysis. There are major
strengths and weakness to this type of study. They are generally onetime surveys with
little to no follow up, so are quick, easy to undertake, and economical. Yet, it can be a
challenge to differentiate cause and effect from simple association, and cross-sectional
studies do not provide an explanation for the findings.
9 Adult Core Survey- was administered to Aboriginal adults (all Aboriginal adults, which includes First
Nations, Inuit and Métis), 15 years and older living off-reserve, in all provinces and territories. 10 Child and Youth Survey- was directed at Aboriginal children and youth, 6-14 years old living off-reserve in
all provinces and territories. The parent or guardian answered the questionnaire on behalf of the child or youth.
38 Due to the constraints of this study, with coded data provided by Statistics Canada, the
methods used for data analysis were theirs. Again, I stress that I did not have access to the
data directly, and did not request the data directly, as this was done by my primary
supervisor.
Therefore, the following chapter is a condensed summary of the full methods guide for this
survey which may be accessed at http://www.statcan.gc.ca/pub/89-637-x/89-637-
x2008003-eng.htm.
3.2 Research Design
The Aboriginal peoples Survey (APS) is conducted on citizens aged 6 years and
older, and provides data on the economic and social conditions of First Nations people
living off-reserve, as well as Métis and Inuit people (Appendix B 11, p. 6). The 2006
Aboriginal peoples Survey was conducted by Statistics Canada and its design and
implementation were done in partnership with national Aboriginal organizations
(Appendix B, p. 6). With Statistics Canada releasing the 2006 survey, the Aboriginal
peoples Survey (APS) provides a current picture of the situation for off-reserve
Aboriginal peoples, as changes can be tracked by comparing it to the two previous
Aboriginal peoples Surveys conducted first in 1991 and again in 2001 (Appendix B, p.
6). Survey objectives were primarily to provide data on the economic and social
conditions of off-reserve Aboriginal peoples in Canada, specifically focusing on issues of
income, employment, language, housing, schooling, mobility and health (Appendix B, p.
6). The APS 2006 was designed to address some of the gaps that exist in the data that had
11 Statistics Canada Methods Guide for the 2006 APS can be found at http://www.statcan.gc.ca/pub/89-637-
x/89-637-x2008003-eng.htm.
39 previously existed for Aboriginal peoples (Appendix B, p. 6). This information cannot be
found anywhere else, and can be used to answer a wide range of questions related to
community planning, program development and healthcare priorities (Appendix B, p. 6).
Over 60,000 people were invited to take part in the 2006 APS (Appendix B, p.6).
The response rate was noted to be 80.1%. The Statistics Canada Methods guide includes
a summary table of sample sizes and response rates by geographic domain under tab 5.4,
p. 17, but does not provide more detailed statistics, such as age, gender, or educational
attainment.
3.3 Population of the Study
The target population for the 2006 APS includes all Aboriginal peoples 6 years of
age and older as of October 31, 2006 living in Canada who have North American Indian,
Métis, or Inuit identity or ancestry; excluding those populations living in Indian
settlements or on-reserve, but including all of the Aboriginal peoples living in the
territories (Appendix B, p. 12). The Aboriginal peoples Survey is a postcensal survey,
for the APS sample was selected from reported responses to the Census questionnaire
(Appendix B, p. 12). The APS sample was selected from reported answers to four
screening questions on the Census long form (Appendix B, p. 12). The four questions
used to screen and identify the Aboriginal population are the ethnic origin question
(question 17), the Aboriginal self-reporting question (question 18), the Indian band/ First
Nation membership question (question 20) and the Treaty or Registered Indian question
(question 21) (Appendix B, p. 12).
The Identity Aboriginal groups were defined as follows in the APS 2006 methods guide:
• North American Indian (NAI) only- individuals reporting only NAI to question 18
40 • Métis only- individuals reporting only Métis to question 18 • Inuit only- individuals reporting only Inuit to question 18 • Multiple identity- individuals reporting more than one group to question 18 • Registered Indian or band member only- individuals with a positive answer to
question 20 or question 21 but NO to question 18
Geographic regions were separated between Inuit regions and outside Inuit regions
(Appendix B, p. 15).
3.4 Sampling design
3.4.1 Domains of estimation a) Domains
Domains of estimation are groups of units for which estimates are targeted
(Appendix B, p. 14). The domains of estimation for the 2006 APS were very similar to
the ones used in 2001, except that Indian reserves were not covered in 2006, with the
exception of the Territories (Appendix B, p. 14). No estimate is targeted for the ancestry-
only population, but the domains of estimation were based on the identity population
mentioned in section 3.3 above (Appendix B, p. 14).
i) Inuit regions
Estimates are targeted for both children and adults in Inuit communities
(Appendix B, p. 15). The target for individual Inuit community profiles in the adult
population was to estimate a characteristic present in no less than 10% of the population,
and a coefficient of variation (CV) of 25% (Appendix B, p.15).
ii) Outside Inuit regions
Large provinces were divided into the main Census Metropolitan Areas (CMAs),
the rest of the urban portion of the province, and the remaining rural portion of the
province (Appendix B, p. 15). Certain small provinces were divided into rural and urban
41 only, and Newfoundland was divided between Labrador and non Labrador (Appendix B,
p. 15). Additionally, estimates were targeted for 5 Census Subdivisions (CSDs) with
large Aboriginal concentrations for all Aboriginal groups combined, and children and
adults counted separately (Appendix B, p.16).
The 5 CSDs are as follows:
• Thompson (Manitoba) • Prince Albert (Saskatchewan) • Prince Rupert (British Columbia) • Whitehorse (Yukon) • Yellowknife (Northwest Territories)
The target was to estimate a minimum proportion of 7.5% for adults and 10% for
children, with a CV of 20%; for the CSDs; a minimum proportion of 10% for adults and
15% for children was used, with a CV of 25% (Appendix B, p.15).
b) Targets in each domain
Several factors could influence the ability of achieving the targeted CVs such as
population size, the expected response rate, the number of long forms available, the
expected number of false positives (for example, an Aboriginal person according to the
Census but a non Aboriginal person according to the APS), the expected sample loss due
to the constraint of selecting no more than three individuals per household, the expected
loss due to the reduction of overlap with other postcensal surveys, and the expected loss
due to overlap with the National Longitudinal Survey of Children and Youth (NLSCY)
(Appendix B, p. 16).
3.4.2 Sampling Plan The APS selects its samples from the Census long form sample, either from the
2B or 2D version of the long form (Appendix B, p. 16). Once the frame is constructed, it
is stratified according to the domains of estimation, and then further stratified by the
42 2B/2D regions (Appendix B, p. 16). The next step is to select a simple random sample
within each domain of estimation that is crossed by the 2B/2D regions (Appendix B, p.
16). A two-phase sample design is used since the Aboriginal peopless Survey (APS) is a
long form sample, whereas a sample of households are selected in the first phase and a
sample of individuals is selected in the second phase (Appendix B, p. 16).
3.5 The Sample
For the APS the initial sample size was 62,579. After the overlap reduction with
other surveys, the number was reduced to 61,041 individuals (Appendix B, p. 17).
3.6 Data Collection The Aboriginal peoples survey was conducted from October 2006 to March 2007
(Appendix B, p. 18).
3.6.1 Mode of collection The APS was collected using paper questionnaires; the Adult questionnaire was
administered to adults (15 years and older), and the Children and Youth questionnaire
was administered to Aboriginal children and youth age 6 to 14 years old (Appendix B, p.
18). No interview could proceed without prior approval of an individual’s parent or
guardian for Aboriginals between the ages of 15 to 17 years of age (Appendix B, p. 18).
For children and youth, the parent or guardian answered the questionnaire on their behalf,
yet children from 12 to 14 years could respond with parent/guardian permission
(Appendix B, p. 18). Children who lived on their own, however, could complete the
questionnaire without parental or guardian consent (Appendix B, p. 18).
43 Telephone interviews were conducted in most areas; however, in Inuit regions,
Labrador and the Northwest Territories personal interviews were conducted (Appendix
B, p. 18).
3.6.2 Aboriginal languages The Aboriginal peoples Survey was translated into 20 Aboriginal languages and
both interpreters and translators were hired when necessary (Appendix B, p. 18).
3.7 Ethical Considerations
Ethical considerations were addressed through an application for ethical review
waiver form, which was submitted to the University of Victoria ethics committee.
Approval of this waiver was granted, as all data received from Statistics Canada was
coded in the form of secondary data. Please see Appendix A.
3.8 Data Processing
3.8.1 Data capture The data capture was performed at the head office of Statistics Canada in Ottawa.
Two methods were used to capture the questionnaires: optical character recognition
(scanning), and key entry (Appendix B, p. 19). When data quality fell below acceptable
standards, questionnaires were recaptured and some abnormalities created by the optical
reading system were identified and corrected during editing (Appendix B, p. 19).
3.8.2 Editing The first stage of error detection was done during data collection. Interviewers
were asked to check their questionnaires page by page to ensure everything had been
filled out clearly and correctly, as well as making sure skips had been followed properly
(Appendix B, p. 19). When questions had been incorrectly missed, interviewers were
44 instructed to contact respondents again to obtain the missing information (Appendix B, p.
19).
Stage two of the survey processing involved editing all survey records according
to pre-specified edit rules (Appendix B, p. 19). This was done to check for gaps, errors
and inconsistencies in the survey data (Appendix B, p. 19). Validity checks on each
variable were made, and inconsistencies between related questions were corrected
(Appendix B, p, 19). When errors were found, the information was replaced with “not
stated” code, or corrected based on the answers to other questions (Appendix B, p. 19).
Corrections were usually done in an automated way, but analysts reviewed some
problematic situations on a case-by-case basis (Appendix B, p. 19).
Lastly, a macro-level verification was done through analyzing frequency distributions to
identify anomalies (Appendix B, p. 19).
3.8.3 Weighting In a sample survey, each selected person represents not only herself/himself, but
also persons not sampled (Appendix B, p. 19). Consequently, a weight is associated with
each selected person to indicate the number of persons that she/he represents (Appendix
B, p. 19). This weight must be used for all estimations; for example, in a simple random
sample of 2% of the population, each person represents 50 people in the population
(Appendix B, p. 19). The initial weight is then adjusted. There were seven steps used in
the weighting process (Appendix B, p. 19).
These seven steps include: 1) Initial weights, 2) Adjustment for overlap with other
surveys, 3) Adjustment for units selected in the Aboriginal Children’s Survey, 4)
Adjustment for adult-child child-adult conversion, 5) Adjustment for out of scope units,
45 6) Adjustment for non-response, and 7) Post-stratification adjustments (Appendix B, pp.
20-22).
3.9 Data Quality
3.9.1 Sampling Errors The APS used the coefficient of variation (CV) of the estimate as the measure of
sampling error, which is the standard error of the estimate divided by the estimate itself
(Appendix B, p. 23).
3.9.2 Non-sampling Errors To aid in the reduction of non-sampling error, the 2001 APS experience was used
to evaluate the entire 2006 APS survey process, from the questionnaire to the data
processing (Appendix B, p. 24). The bias was assumed to be small due to the high
response rate obtained in the Census, and the adjustments made on the initial Census
weights (Appendix B, p. 24). The APS guide further discusses interviewer training and
quality control measures which were used to minimize the occurrence of non-sampling
errors.
3.10 Dissemination
The 2006 APS master file is available in Statistics Canada’s Research Data
Centres (RDCs) which has accompanying information that includes the record layout,
SAS and SPSS syntax to load the file, as well as metadata in codebook form that
describes each variable and provides weighted and unweighted frequency counts
(Appendix B, p. 25). Upon request, custom tabulations will be produced on a cost-
recovery basis (Appendix B, p. 25). All information regarding the Aboriginal people’s
Survey is available on Statistics Canada’s website.
46
Chapter Four: Results
4.1 Introduction
In this chapter, I will discuss results of the Statistics Canada data tables to support
the hypothesis that Canadian Aboriginal adults and children continue to suffer poor
overall health, and struggle with low socioeconomic status as well as associated co-
morbidities. I will present the data, the interpretation of the hypotheses, and the
summarized findings.
4.2 General Description of the Data
Distributions of selected health measures with and without diabetes are
summarized in Table 1 for adults, and Table 2 for children and youth. The overwhelming
theme is the profound effect diabetes has on the health and well being of Aboriginal
adults, children and youth. Oral health is not included, as it was not significantly reflected
in the APS, 2006. Therefore, significant data could not be analyzed and reported.
According to the 2006 APS, 7.2% of the adult Aboriginal population self-reported being
diagnosed with diabetes. Of those adults, 14.1% stated it was type 1 diabetes, 66.5%
stated it was type 2 diabetes, and 19.4% of responses fell into the “unknown” category.
Due to the nature of type 1 diabetes, it could be assumed that a person would know if
they had type 1, therefore, the majority of the 19.4% would be type 2 diabetes.
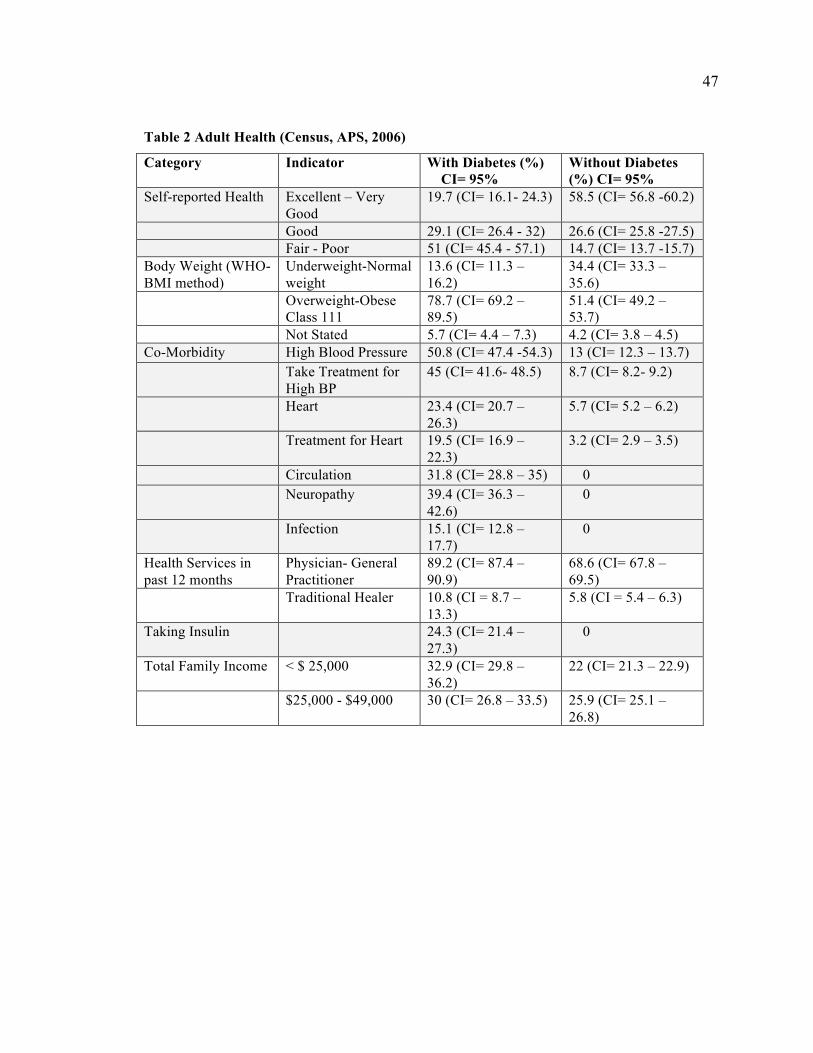
47
Table 2 Adult Health (Census, APS, 2006)
Category Indicator With Diabetes (%) CI= 95%
Without Diabetes (%) CI= 95%
Self-reported Health Excellent – Very Good
19.7 (CI= 16.1- 24.3) 58.5 (CI= 56.8 -60.2)
Good 29.1 (CI= 26.4 - 32) 26.6 (CI= 25.8 -27.5) Fair - Poor 51 (CI= 45.4 - 57.1) 14.7 (CI= 13.7 -15.7)
Body Weight (WHO- BMI method)
Underweight-Normal weight
13.6 (CI= 11.3 – 16.2)
34.4 (CI= 33.3 – 35.6)
Overweight-Obese Class 111
78.7 (CI= 69.2 – 89.5)
51.4 (CI= 49.2 – 53.7)
Not Stated 5.7 (CI= 4.4 – 7.3) 4.2 (CI= 3.8 – 4.5) Co-Morbidity High Blood Pressure 50.8 (CI= 47.4 -54.3) 13 (CI= 12.3 – 13.7)
Take Treatment for High BP
45 (CI= 41.6- 48.5) 8.7 (CI= 8.2- 9.2)
Heart 23.4 (CI= 20.7 – 26.3)
5.7 (CI= 5.2 – 6.2)
Treatment for Heart 19.5 (CI= 16.9 – 22.3)
3.2 (CI= 2.9 – 3.5)
Circulation 31.8 (CI= 28.8 – 35) 0 Neuropathy 39.4 (CI= 36.3 –
42.6) 0
Infection 15.1 (CI= 12.8 – 17.7)
0
Health Services in past 12 months
Physician- General Practitioner
89.2 (CI= 87.4 – 90.9)
68.6 (CI= 67.8 – 69.5)
Traditional Healer 10.8 (CI = 8.7 – 13.3)
5.8 (CI = 5.4 – 6.3)
Taking Insulin 24.3 (CI= 21.4 – 27.3)
0
Total Family Income < $ 25,000 32.9 (CI= 29.8 – 36.2)
22 (CI= 21.3 – 22.9)
$25,000 - $49,000 30 (CI= 26.8 – 33.5) 25.9 (CI= 25.1 – 26.8)
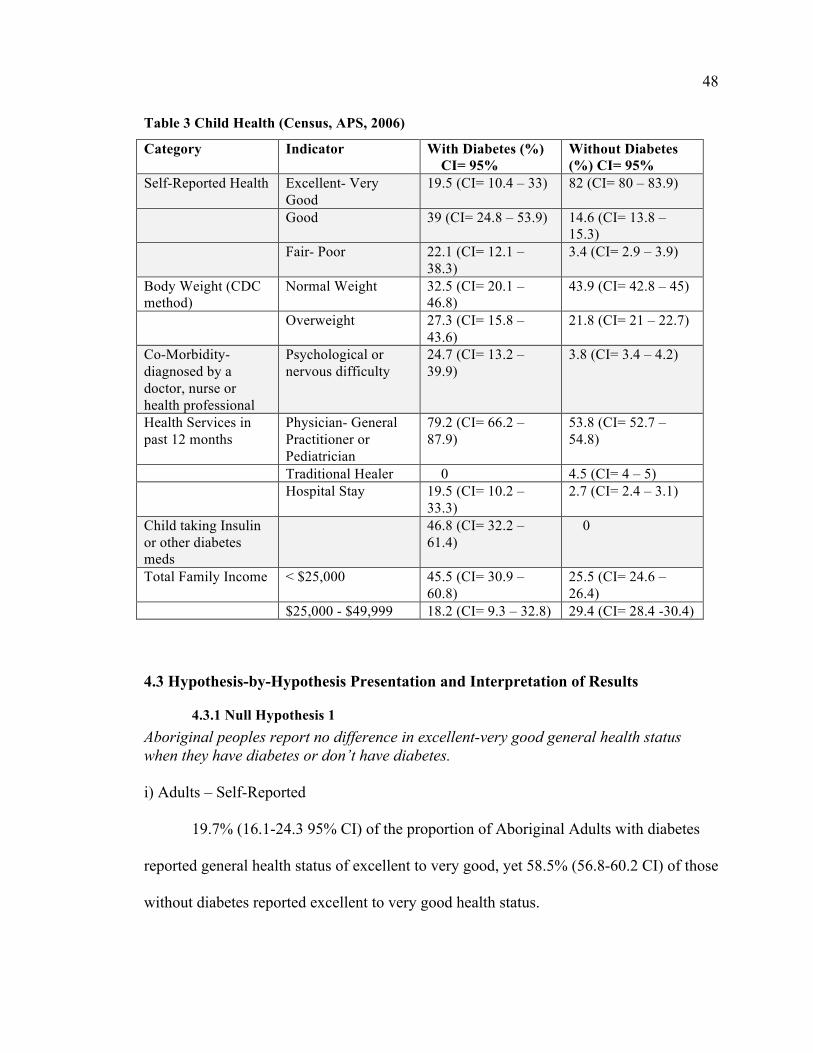
48 Table 3 Child Health (Census, APS, 2006)
Category Indicator With Diabetes (%) CI= 95%
Without Diabetes (%) CI= 95%
Self-Reported Health Excellent- Very Good
19.5 (CI= 10.4 – 33) 82 (CI= 80 – 83.9)
Good 39 (CI= 24.8 – 53.9) 14.6 (CI= 13.8 – 15.3)
Fair- Poor 22.1 (CI= 12.1 – 38.3)
3.4 (CI= 2.9 – 3.9)
Body Weight (CDC method)
Normal Weight 32.5 (CI= 20.1 – 46.8)
43.9 (CI= 42.8 – 45)
Overweight 27.3 (CI= 15.8 – 43.6)
21.8 (CI= 21 – 22.7)
Co-Morbidity- diagnosed by a doctor, nurse or health professional
Psychological or nervous difficulty
24.7 (CI= 13.2 – 39.9)
3.8 (CI= 3.4 – 4.2)
Health Services in past 12 months
Physician- General Practitioner or Pediatrician
79.2 (CI= 66.2 – 87.9)
53.8 (CI= 52.7 – 54.8)
Traditional Healer 0 4.5 (CI= 4 – 5) Hospital Stay 19.5 (CI= 10.2 –
33.3) 2.7 (CI= 2.4 – 3.1)
Child taking Insulin or other diabetes meds
46.8 (CI= 32.2 – 61.4)
0
Total Family Income < $25,000 45.5 (CI= 30.9 – 60.8)
25.5 (CI= 24.6 – 26.4)
$25,000 - $49,999 18.2 (CI= 9.3 – 32.8) 29.4 (CI= 28.4 -30.4)
4.3 Hypothesis-by-Hypothesis Presentation and Interpretation of Results
4.3.1 Null Hypothesis 1 Aboriginal peoples report no difference in excellent-very good general health status when they have diabetes or don’t have diabetes. i) Adults – Self-Reported
19.7% (16.1-24.3 95% CI) of the proportion of Aboriginal Adults with diabetes
reported general health status of excellent to very good, yet 58.5% (56.8-60.2 CI) of those
without diabetes reported excellent to very good health status.
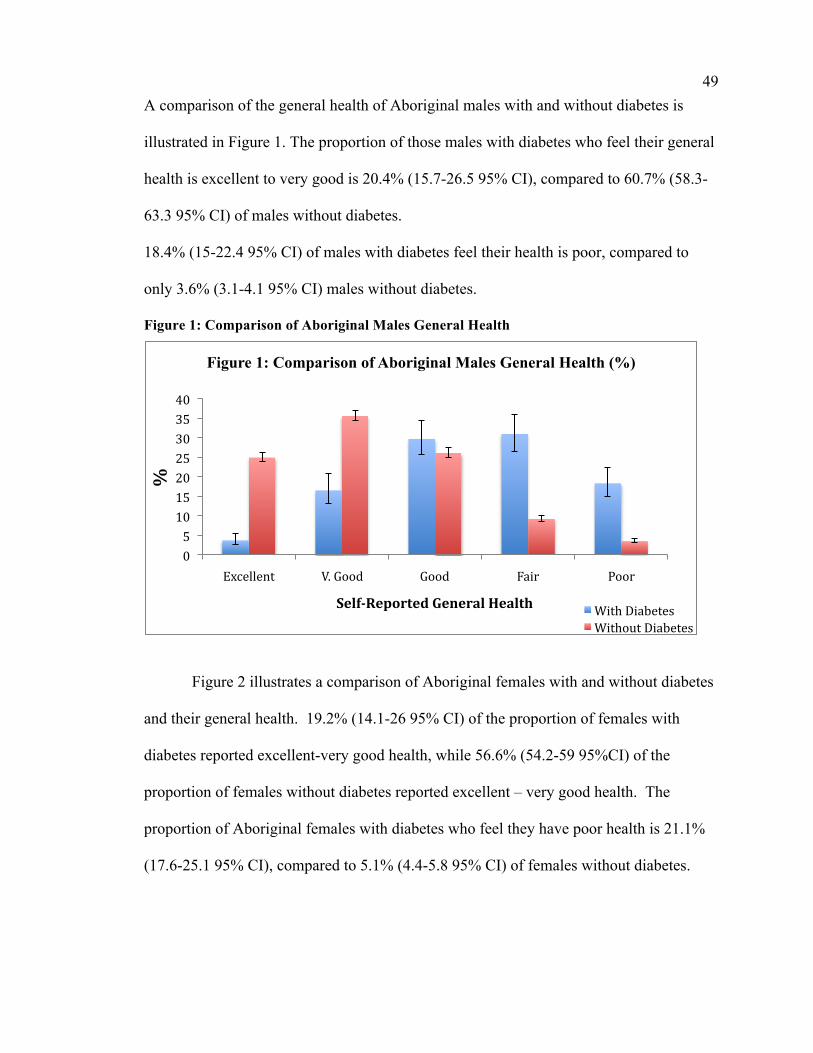
49 A comparison of the general health of Aboriginal males with and without diabetes is
illustrated in Figure 1. The proportion of those males with diabetes who feel their general
health is excellent to very good is 20.4% (15.7-26.5 95% CI), compared to 60.7% (58.3-
63.3 95% CI) of males without diabetes.
18.4% (15-22.4 95% CI) of males with diabetes feel their health is poor, compared to
only 3.6% (3.1-4.1 95% CI) males without diabetes.
Figure 1: Comparison of Aboriginal Males General Health
Figure 2 illustrates a comparison of Aboriginal females with and without diabetes
and their general health. 19.2% (14.1-26 95% CI) of the proportion of females with
diabetes reported excellent-very good health, while 56.6% (54.2-59 95%CI) of the
proportion of females without diabetes reported excellent – very good health. The
proportion of Aboriginal females with diabetes who feel they have poor health is 21.1%
(17.6-25.1 95% CI), compared to 5.1% (4.4-5.8 95% CI) of females without diabetes.
0 5 10 15 20 25 30 35 40
Excellent V. Good Good Fair Poor
%
Self-Reported General Health
Figure 1: Comparison of Aboriginal Males General Health (%)
With Diabetes Without Diabetes
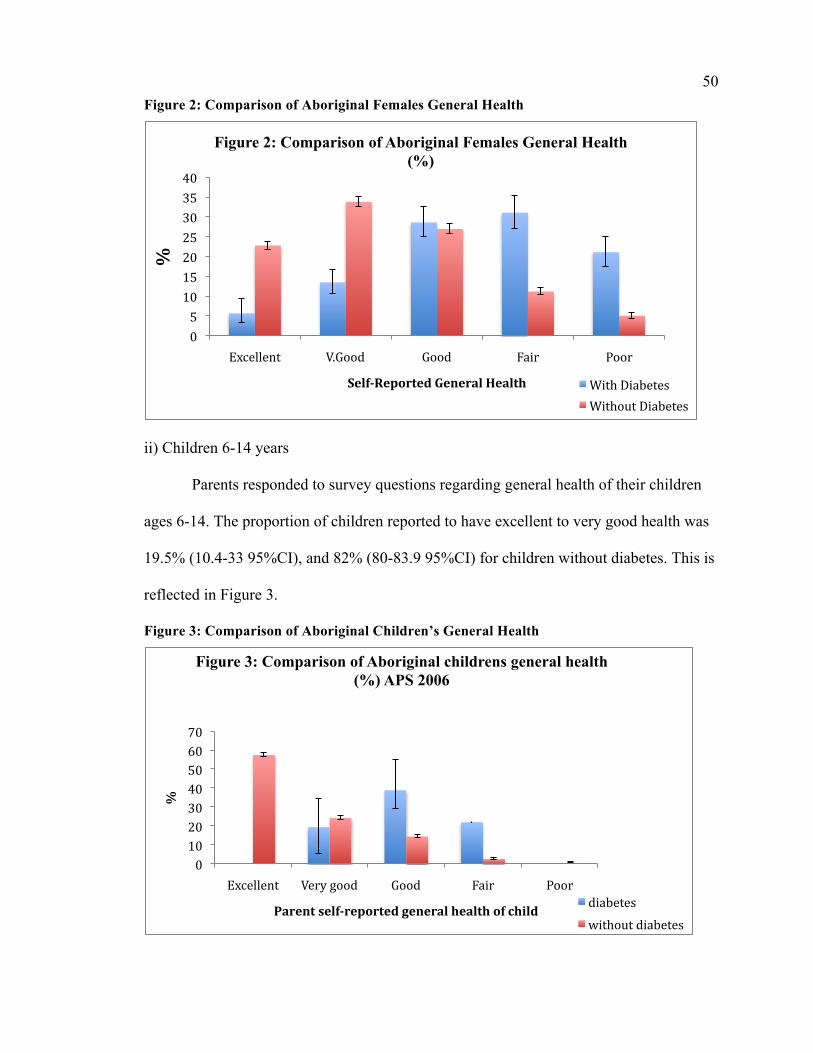
50 Figure 2: Comparison of Aboriginal Females General Health
ii) Children 6-14 years
Parents responded to survey questions regarding general health of their children
ages 6-14. The proportion of children reported to have excellent to very good health was
19.5% (10.4-33 95%CI), and 82% (80-83.9 95%CI) for children without diabetes. This is
reflected in Figure 3.
Figure 3: Comparison of Aboriginal Children’s General Health
0 5 10 15 20 25 30 35 40
Excellent V.Good Good Fair Poor
%
Self-Reported General Health
Figure 2: Comparison of Aboriginal Females General Health (%)
With Diabetes Without Diabetes
0 10 20 30 40 50 60 70
Excellent Very good Good Fair Poor
%
Parent self-reported general health of child
Figure 3: Comparison of Aboriginal childrens general health (%) APS 2006
diabetes without diabetes
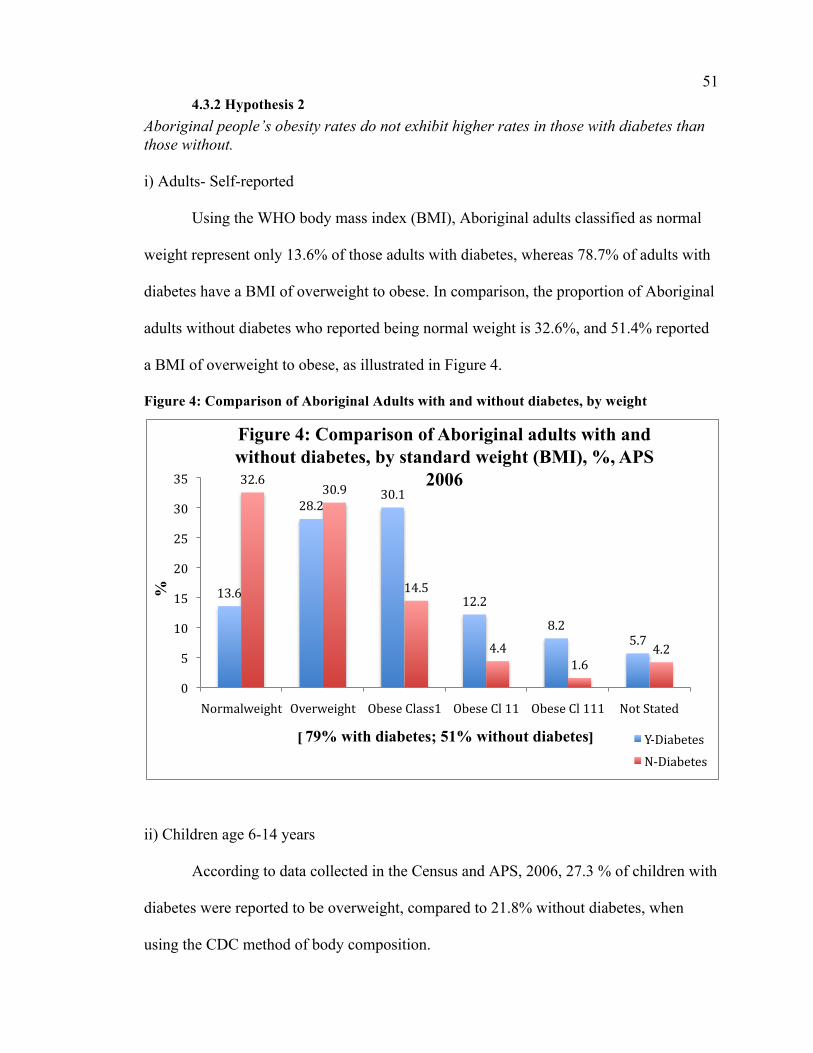
51 4.3.2 Hypothesis 2
Aboriginal people’s obesity rates do not exhibit higher rates in those with diabetes than those without. i) Adults- Self-reported
Using the WHO body mass index (BMI), Aboriginal adults classified as normal
weight represent only 13.6% of those adults with diabetes, whereas 78.7% of adults with
diabetes have a BMI of overweight to obese. In comparison, the proportion of Aboriginal
adults without diabetes who reported being normal weight is 32.6%, and 51.4% reported
a BMI of overweight to obese, as illustrated in Figure 4.
Figure 4: Comparison of Aboriginal Adults with and without diabetes, by weight
ii) Children age 6-14 years
According to data collected in the Census and APS, 2006, 27.3 % of children with
diabetes were reported to be overweight, compared to 21.8% without diabetes, when
using the CDC method of body composition.
13.6
28.2 30.1
12.2
8.2 5.7
32.6 30.9
14.5
4.4 1.6
4.2
0
5
10
15
20
25
30
35
Normalweight Overweight Obese Class1 Obese Cl 11 Obese Cl 111 Not Stated
%
[ 79% with diabetes; 51% without diabetes]
Figure 4: Comparison of Aboriginal adults with and without diabetes, by standard weight (BMI), %, APS
2006
Y-‐Diabetes N-‐Diabetes
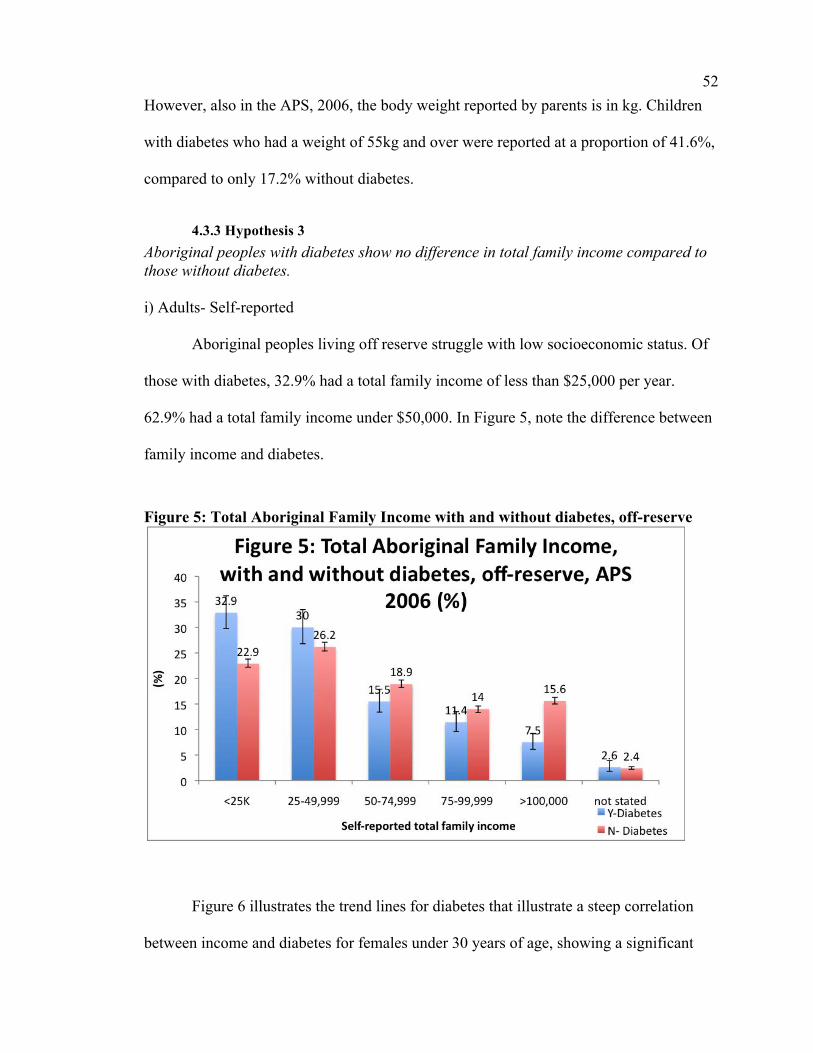
52 However, also in the APS, 2006, the body weight reported by parents is in kg. Children
with diabetes who had a weight of 55kg and over were reported at a proportion of 41.6%,
compared to only 17.2% without diabetes.
4.3.3 Hypothesis 3 Aboriginal peoples with diabetes show no difference in total family income compared to those without diabetes. i) Adults- Self-reported
Aboriginal peoples living off reserve struggle with low socioeconomic status. Of
those with diabetes, 32.9% had a total family income of less than $25,000 per year.
62.9% had a total family income under $50,000. In Figure 5, note the difference between
family income and diabetes.
Figure 5: Total Aboriginal Family Income with and without diabetes, off-reserve
Figure 6 illustrates the trend lines for diabetes that illustrate a steep correlation
between income and diabetes for females under 30 years of age, showing a significant
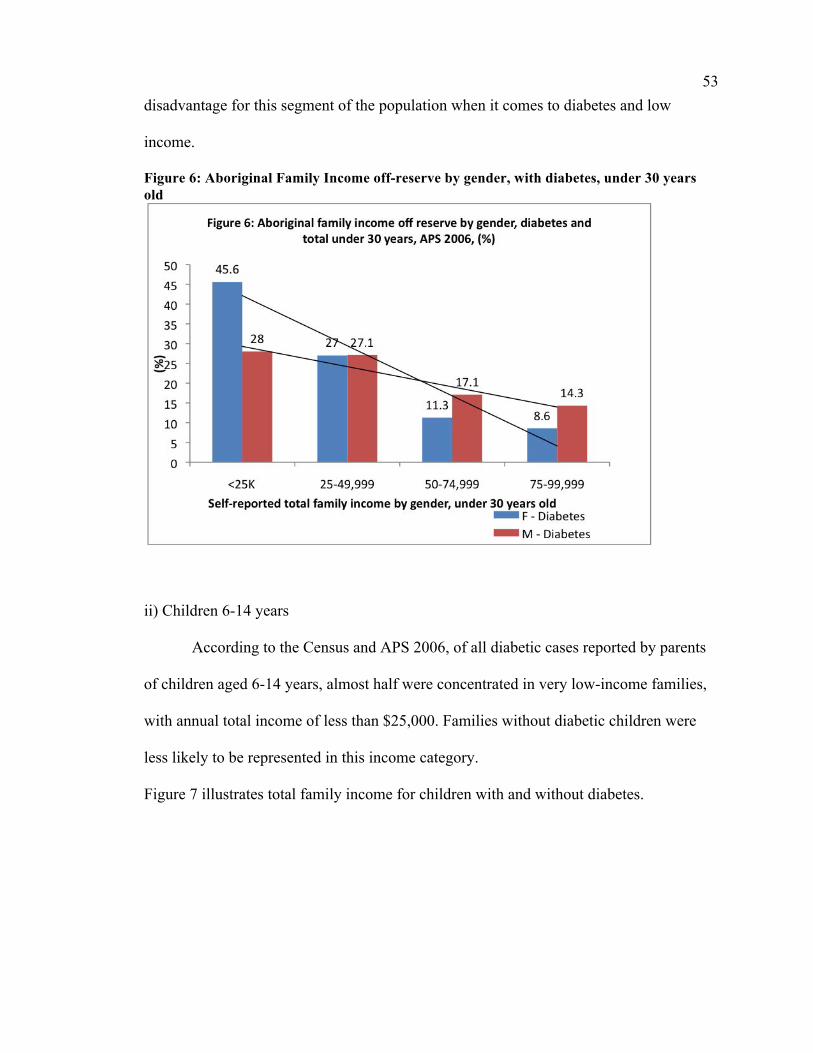
53 disadvantage for this segment of the population when it comes to diabetes and low
income.
Figure 6: Aboriginal Family Income off-reserve by gender, with diabetes, under 30 years old
ii) Children 6-14 years
According to the Census and APS 2006, of all diabetic cases reported by parents
of children aged 6-14 years, almost half were concentrated in very low-income families,
with annual total income of less than $25,000. Families without diabetic children were
less likely to be represented in this income category.
Figure 7 illustrates total family income for children with and without diabetes.
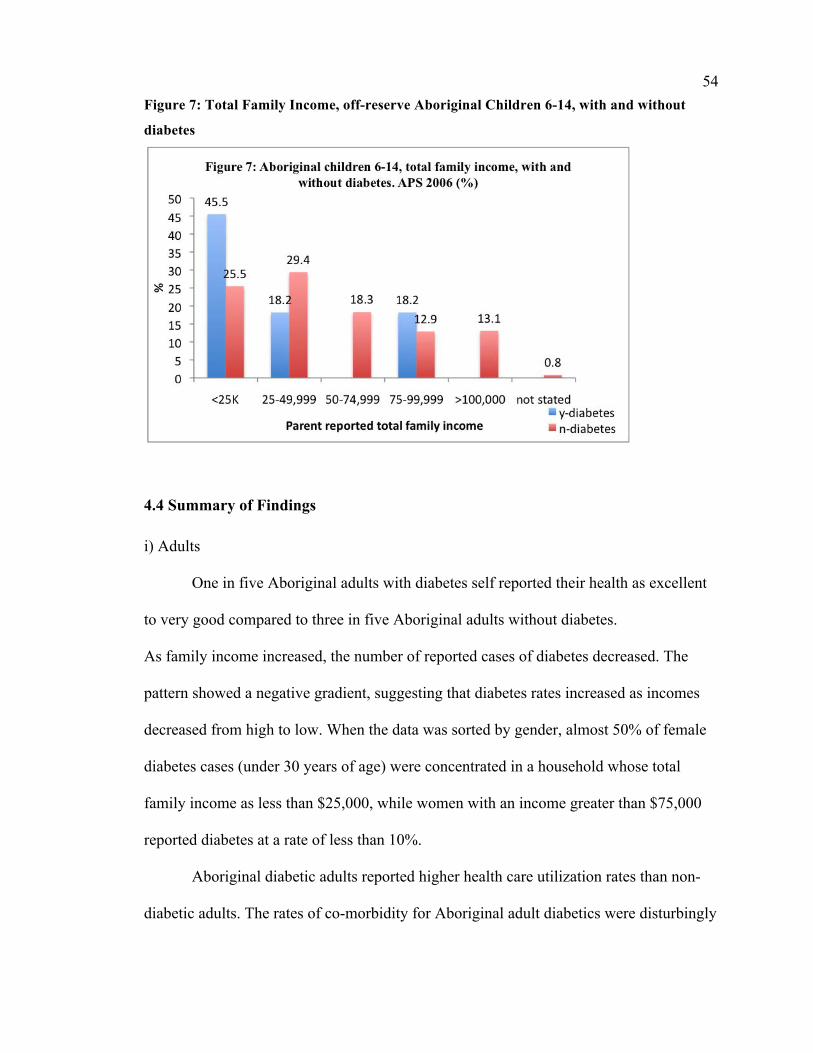
54 Figure 7: Total Family Income, off-reserve Aboriginal Children 6-14, with and without
diabetes
4.4 Summary of Findings i) Adults
One in five Aboriginal adults with diabetes self reported their health as excellent
to very good compared to three in five Aboriginal adults without diabetes.
As family income increased, the number of reported cases of diabetes decreased. The
pattern showed a negative gradient, suggesting that diabetes rates increased as incomes
decreased from high to low. When the data was sorted by gender, almost 50% of female
diabetes cases (under 30 years of age) were concentrated in a household whose total
family income as less than $25,000, while women with an income greater than $75,000
reported diabetes at a rate of less than 10%.
Aboriginal diabetic adults reported higher health care utilization rates than non-
diabetic adults. The rates of co-morbidity for Aboriginal adult diabetics were disturbingly
55 high for conditions including high blood pressure (50.8%), treatment for high blood
pressure (45%), heart conditions (23.4%), treatment for heart conditions (19.5%),
circulation (31.8%), neuropathy (39.4%), and infection (15.1%).
ii) Children 6-14 years
Parents or caregivers were asked to report for Aboriginal children 6-14 years of
age. Approximately one in five Aboriginal children with diabetes was reported to have
excellent to very good health, compared to four out of five children without diabetes. Of
all cases of reported childhood diabetes, almost half were found to be concentrated in
very low-income families with a total family annual income of less than $25,000.
Children without diabetes were less likely to be represented in this income category.
Parents reported a 6.5 fold higher diagnosis for “psychological or nervous
difficulty” by a doctor, nurse or health professional for children with diabetes compared
to children without (24.7% vs. 3.8%). Visits to general practitioners and pediatricians
were higher for children with diabetes (79.2% vs. 53.8%). Children with diabetes were
seven times more likely to have spent the night in the hospital in the 12 months preceding
the survey. Alarmingly, in a similar pattern to the adult insulin utilization reports, less
than half (48.6%) of diabetic children were reported to be taking medication or insulin
for diabetes.
56
Chapter Five: Discussion
5.1 Introduction Michael Gracey and Malcolm King (2009) summarize the Indigenous health crisis:
“The world’s almost 400 million Indigenous people have low standards of health. This poor health is associated with poverty, malnutrition, overcrowding, poor hygiene, environmental contamination, and prevalent infections. Inadequate clinical care and health promotion, and poor disease prevention services aggravate this situation. Some Indigenous groups, as they move from traditional to transitional and modern lifestyles, are rapidly acquiring lifestyle diseases, such as obesity, cardiovascular disease and type 2 diabetes, and physical, social and mental disorders linked to misuse of alcohol and other drugs. Correction of these inequalities needs increased awareness, political commitment, and recognition rather than governmental denial and neglect of these serious and complex problems. Indigenous people should be encouraged, trained and enabled to become increasingly involved in overcoming these challenges” (p. 65)
Indigenous people are proportionately increasing in urban communities
through migration from rural areas, socioeconomic opportunities, and high fertility
rates; this migration could also be spurred by a loss of housing, resources, and
traditional lands (Cardinal, 2006). The Canadian Aboriginal population has
significantly higher growth rates than non-Aboriginal populations, and
approximately 50% already live in urban areas (Cardinal, 2006). Yet even with
these statistics available, almost no jurisdictions or organizations report on the
condition of Aboriginal populations living in urban areas, despite the fact that this
population often faces oppression, discrimination, and poverty in these urban
57 centres, and significant barriers to equal opportunity to education, employment, and
housing (Cardinal, 2006). Further exacerbating the poor quality of life for the
majority of this population is the lack of research and related information regarding
urban Aboriginal peoples, and a lack of public awareness (Cardinal, 2006).
5.2 Discussions I assumed that living off-reserve would reflect more positive health outcomes due
to increased access to health professionals for diagnosis, treatment and care, as well as
employment opportunities. This, however, was not the case. The results reveal that
diabetes, obesity and several determinants of health are affecting the Canadian Aboriginal
population living off-reserve with as much, if not or more frequency then studies reveal
for on-reserve populations. This is consistent with the overall picture for Indigenous
health outcomes as discussed in Chapter 2.
5.2.1 General Health Status Population health surveys commonly use self-reported health as a measure of
health status, and self-reported health measures have been reliable across different
cultures (Tjepkema, 2002). Off-reserve Aboriginal populations in each geographic region
(urban, rural, and territories) have reported higher levels of fair or poor health than non-
Aboriginal peoples in the same region (Tjepkema, 2002). The proportion of Aboriginal
peoples reporting poor or fair health decreased as the household income increased
(Tjepkema, 2002). As observed in the results chapter, only 1 in 5 Aboriginal adults with
diabetes rated their general health as very good or excellent, compared to 3 out of 5
Aboriginal adults without diabetes. A strikingly similar result was found for Aboriginal
children and youth age 6-14 years, when parents or caregivers were asked to report on
58 their children’s general health. Only 1 in 5 children/youth had parents rate their general
health as very good to excellent, whereas 4 out of 5 children/youth without diabetes
reportedly had very good to excellent health according to their parents or caregivers.
Research substantiates the fact that Canadian Aboriginal peoples have a
significantly lower life expectancy than non-Aboriginal Canadians, regardless of their
living in urban centres or rural communities (King, 2010).
Tjepkema et al, (2010), studied mortality of urban Aboriginal adults over an 11-year
period, from 1991-2001, linking mortality registry data with census and tax filers data,
and found life expectancy 4.7 years lower for men and 6.5 years lower for women. The
result parameter in Chapter 4 are consistent with these analyses of premature mortality.
5.2.2 Health Conditions
5.2.2.1 Diabetes Historically, diabetes has gone undetected in Canada’s Aboriginal populations,
yet recent evidence reveals epidemic proportions of type 2 diabetes in First Nations
communities (AFN, 2005). The 1991 Aboriginal peoples Survey reflects a crude
prevalence for diabetes in First Nations people as 6.4% and 8.5% for those living on- and
off-reserve respectively (Bobet, 1998). In contrast, the 2002/2003 Regional Health
Survey (RHS) reported an age standardized prevalence of 19.7% for First Nations
peoples, which indicates a substantial increase since 1991 (First Nations Governance
Committee/FNIGC, 2005). This is significantly higher than the national average of
diabetes in 1991, which was reported as 3.1% (Bobet, 1998), reported in 2002/2003 as
being 4.5% (FNIGC, 2005). The RHS 2008/2010 shows this prevalence had reached
20.7% (FNIGC, 2011). The disease trajectory is overwhelming increasing in the
Canadian Aboriginal population.
59 It could be hypothesized that Aboriginal adults with type 2 diabetes have a feeling of
hopelessness about their diagnosis, or that they lack sufficient access to care and
education. Type 2 diabetes is both avoidable and treatable, so why does research show
its prevalence in these population?
The results of the APS 2006 reflect 7.2% of off-reserve Aboriginal adults self-reported a
diagnosis of diabetes. Of these adults with diabetes, 71% reported living in urban areas,
compared to 25% living in rural areas. The 2006 APS also reveals 83% of children/youth
age 6-14 years with diabetes living in urban areas, compared to 17% living in rural areas,
as reported by parents or caregivers.
The RHS 2008/2010 showed that First Nations women have higher rates of
diabetes than men across all age categories, with close to 50% of women over 65 years
with diabetes (FNIGC, 2011). In the general Canadian population, the opposite pattern is
reflected, with diabetes being more prevalent in men in the same age group.
5.2.2.2 Obesity Obesity affects Aboriginal peoples of all ages, and is increasing in prevalence.
This could be attributed to changes in food choice due to poverty or food availability,
lack of traditional diet, sedentary lifestyles, and family history. Obesity is a risk factor for
several diseases, one of which is type 2 diabetes. Obesity and diabetes are rising in
prevalence among Aboriginal children and youth, and results of this thesis study
demonstrate that this is true of the off-reserve Aboriginal populations. 79% (APS, 2006)
of Aboriginal adults self-reported being overweight to obese, while parents reported
27.3% (APS, 2006) of children age 6-14 years being overweight.
60 The prevalence of obesity in Canada has risen steadily over the past 29 years
(Garriguet, 2008). Research has previously shown obesity to be a recognized risk factor
for type 2 diabetes and cardiovascular diseases. The 2004 Canadian Community Health
Survey (CCMS), found that Ontario and the Western provinces had a much higher
prevalence of overweight-obese and obesity among 19-50 year olds and was much higher
among off- reserve Aboriginal peoples than among non-Aboriginal peoples. The study
also found that those living in a low-income household had associated higher rates of
obesity for Aboriginal peoples, yet household income was not associated with obesity
among non-Aboriginal peoples (Garriguet, 2008).
5.2.3. Access to Health Services Off-reserve Aboriginal populations may encounter a lack of cultural sensitivity or
cultural acceptance when seeking health care. Although there is more healthcare available
in major centers off-reserve, Aboriginal peoples fear of being misunderstood may prevent
their accessing it. Aboriginal peoples living off-reserve may also feel isolated living away
from family networks, elders and traditional healers, which affect their sense of
connectedness and belongingness.
5.2.4. Income Historically, socioeconomic status (SES) has been linked to health; individuals
who are higher in the social hierarchy typically enjoy better health than those below
(Adler et al, 1994). Almost every disease and condition finds SES differences in
mortality and morbidity rates (Adler et al, 1994). A recent cross-sectional analysis of
The Canadian Community Health Survey (CCHS) made clear the magnitude the role of
income plays when determining the health of Canadians (Frolich et al, 2006). The CCHS
61 demonstrates that those with the highest incomes in Canada are two and a half times
more likely to report very good or excellent health than those with the lowest incomes.
The 2006 APS reports similar findings as noted in the results chapter. Researchers
commonly believe that inequalities in income translate into disparities of health, through
inequities in material conditions, such as nutrition, and lack of housing (Frolich et al,
2006). It is postulated that the poorer one is, the less likely one will be engaged in with
healthy behaviours. Behavioural factors account for about half of premature mortality,
and almost all vary by socioeconomic status (SES) (Frolich et al, 2006). This evidence is
supported by the findings in the British Whitehall Study in which almost half of the
lowest socioeconomic group experienced increased risk of heart disease. Mortality in the
lowest socioeconomic group was attributed to risk factors and health behaviours such as
smoking, obesity, blood pressure and cholesterol. Coping styles, optimism, social
support, and personal control are all traits and factors related to health outcomes and
appear to vary across socioeconomic groups (Taylor & Seeman, 1999).
The average family income is generally lower in off-reserve Aboriginal families
than that of the general Canadian population with 45.6% of females under 30 years of age
earn less than $25.000/yr as reported in the 2006 APS. Inequalities in income are linked
to health disparities since people earning lower incomes live and work in environments
that are more stressful, perpetuating the cycle (Frolich et al, 2006). This is another
example of how intersectionality impacts the lives of Canadian Aboriginal peoples.
Wilson and Macdonald, (2010) found the median incomes for Aboriginal peoples in 2006
had still not reached the $21,431 median income level that non-Aboriginal Canadians
achieved in 1996 (p. 8). Colonialism has left Aboriginal peoples ranked among the
62 poorest of Canadians and current national studies show that income inequality exists
today.
5.2.5 Chronic Stress Living with constant stress, oppression and poverty likely have generational
impacts on the health of Aboriginal peoples. The historical impacts of colonization
including the Indian Act, lack of educational opportunity, and racism also likely
contribute to health disparities experienced among Aboriginal peoples. Both chronic and
acute exposure to stress may have long-term health consequences. Research suggests that
stress, which is associated with neuroendocrine responses, can have cascading effects on
other body systems by increasing blood pressure and immune responses (McEwan, 1998,
Mair et al, 2011). Allostatic load (AL) refers to the body’s ability to adjust
physiologically to stressors and is measured through a diverse set of clinical
measurements. These biomarkers are collected from blood and saliva, and reflect
cardiovascular, metabolic, inflammatory, neuodocrine, and immune-related risk
(McEwan, 1998; Mair, Cutchin, Peek, 2011). This could be a piece of the puzzle,
explaining the increase in obesity and type 2 diabetes in children and youth. Diabetes in
this population group is as high or higher than previous studies have stated for on-reserve
populations.
As has been highlighted by McEwen (2006), recurrent stress responses triggered in early
life by adverse social environments can initiate enduring physiological changes, such as
alterations in lipid metabolism and the accumulation of body fat, the development of
hypertension, and the development of insulin resistance leading to Type 2 diabetes
mellitus and CVD. In a Norwegian study, the highest risk of mortality among men and

63 women was observed in the group that was poor both in childhood and in adulthood,
suggesting a cumulative influence of social circumstances across the life course on
mortality risk (Claussen et al., 2003). In the same study, cardiovascular mortality was
more strongly associated with childhood than with adulthood social circumstances. The
patterning of behaviour and lifestyle habits, which occurs in childhood, highlights the
need to focus on childhood circumstances.
5.3 Implications The 2006 Aboriginal peoples Survey conducted by Statistics Canada has revealed
diabetes as an important health issue for off-reserve Aboriginal adults and children. Type
2 diabetes is reaching epidemic proportions in Aboriginal adults and is increasing in
prevalence in Aboriginal children and youth. Diabetes is associated with growing obesity
challenges; and is also associated with upstream determinants of health including poor
self-perception of overall health and well- being, challenges in access to preventive
services, medical treatment and care, and household income.
Diabetes is recognized nationally as a major health concern for Aboriginal populations
living on-reserve. More research is needed to investigate the burden of diabetes affecting
Aboriginal peoples in these communities, but this research should include off-reserve
populations.
64
Chapter Six: Conclusion
6.1 Conclusion
The 2006 Aboriginal peoples survey conducted by Statistics Canada indicates
that diabetes is a very important health concern for off-reserve Aboriginal peoples in
Canada. Type 2 diabetes trajectories are increasing at alarming rates in the Canadian
Aboriginal population. Children and adults with diabetes rarely rated their general health
as very good or excellent. Research has substantiated that Canadian Aboriginal peoples
have a significantly lower life expectancy than non-Aboriginal Canadians.
Obesity is rising in prevalence among Aboriginal children and youth, and
occurring at younger ages. Those Aboriginal peoples living in a low-income household
had associated higher rates of obesity. Dental caries and periodontal disease are of
concern for Aboriginal peoples of all ages, and periodontal disease has been scientifically
linked to diabetes (Ellerby, et al, 2000; “Epidemiology of Perio”, 1996; Lamster, Lalla,
Borgnakke & Taylor, 2008; MacEntee et al., 2001; Wardman, Clement & Quantz, 2005;
Ziebarth, 2003). Past research has identified periodontal disease as an oral health
concern for Aboriginal peoples, yet this research was focused on the rural on-reserve
population. Further study is needed to identify if oral health is also of concern for off-
reserve populations.
Type 2 diabetes is clearly connected to a number of chronic conditions, such as
hypertension, renal disease, visual impairment and blindness, stroke, neuropathy and
cardiovascular disease (CVD). All of these co-morbidities contribute to poor health and
significant disability and disease. Aboriginal peoples have twice the CVD death rate of
65 non-Aboriginal Canadians. 40-80% of those Aboriginal peoples with diabetes reported
having neuropathy, high blood pressure and/or were receiving treatment for heart
conditions in the APS 2006 . Type 2 diabetes is shown to be associated to upstream
health determinants including household poverty, poor self perception of general health
and well being, food insecurity and changing diet. Aboriginal peoples continue to face
challenges in access to preventive services and medical care/treatment.
Aboriginal health does not seem to be an important or urgent issue for the general
society of Canada, a point exacerbated by racism and reinforced by political apathy
witnessed through broken policies, removal of funding or blatant lack of action. This will
present challenges for researchers of Aboriginal health; perseverance is encouraged in
tackling these challenges through dialogue, determination, education, and advocacy.
As discussed in Chapter 1, an intersectional approach to Aboriginal health
outcomes is complex and focuses on simultaneous intersections between social difference
and identity, and forms of systemic oppression at micro and macro levels (Hankivsky &
Cormier, 2009). Results in Chapter 4 show that this is true of the off-reserve Aboriginal
population of Canada. Also discussed in Chapter 1, regarding intersectionality, is that
identities are not fixed, but are fluid and change over time. This could also be said
regarding the off-reserve Aboriginal population; their movements could be fluid and shift
with context, living on and off-reserve at different times of life is a likely a reality.
6.2 Limitations
I did not have access to individual data, as data requests went through Statistics
Canada who then prepared and presented the grouped data in table form. Survey
66 questions were used to gather the APS data, and all responses were self-reported with no
confirmation from health professionals.
I would like to mention that I am acutely aware of the problem of stating the prevalence
numbers for the “Aboriginal” population as if the prevalence rates were equal in all of the
First Nations, Inuit and Métis populations. Due to the nature of the study, I could only
conduct a “status blind” study that put all of these unique groups of people into one
grouping. What I estimate in my thesis is either an overestimate or an underestimate of
the true prevalence, yet due to the small sample size, and therefore the assumed unequal
representation of FN, Inuit and Métis people in the population sample, the change would
be minor in either over or under estimations.
6.3 Recommendations
It is time to address the Aboriginal issues of social and economic disparity and
initiate health reforms grounded in cultural sensitivity. Poverty, reflected as low
household income, appears to be connected to diabetes. Thus, it seems likely that diabetes
rates will be reduced if income can be improved to mitigate the corrosive effects of
poverty on Aboriginal peoples growth and development. Gender specific interventions
need to be structured to ensure equal opportunity and access to programs and services for
everyone.
The National Association of Friendship Centres is well positioned to play a role in
improving health and wellness of Aboriginal adults, youth, and children by creating
programs that are designed with, by and for Aboriginal peoples to promote self-
determination. This could be accomplished through community-based Aboriginal health
67 centres, as well as diabetes screening and education. Friendship Centres do offer
community ‘healthy meals’ classes, where cooking is done together and portions taken
home by all participants. A variety of exercise classes are also available. Coordinated oral
screenings and oral health education seminars could be implemented in partnership with
an interdisciplinary health team. All of these suggestions would need to support
connectedness to Aboriginal culture and tradition.
Dialogue and communication are critical in building relationships with Aboriginal
peoples, with their needs and opinions regarding health interventions being a high
priority in determining health polices. Working with the National Association of
Friendship Centres, healthcare professionals can begin a partnership for the journey of
change that is so desperately needed. To improve treatment and care, healthcare
professionals should be trained in cultural sensitivity and competency. Education is
critical for Aboriginal peoples regarding health, nutrition, and oral health; prevention
strategies constitute a step in breaking the cycle of poor metabolic health outcomes.
Access to education for Aboriginal populations should be made a priority for the current
and future governments. Encouraging and supporting Aboriginal students to become
involved in the healthcare field could aid in bringing cultural safety to Aboriginal
populations, which in turn could promote greater access to care.
6.4 Suggestions for Further Studies
The lack of information about the health of Aboriginal peoples living off-reserve
is due in part to past emphasis being placed on researching only Aboriginal populations
living on-reserve. There is ample opportunity for researchers to investigate off-reserve
68 Aboriginal health with the intention of implementing policy change that can positively
impact Aboriginal peoples health. For example, addressing the barriers to culturally
relevant and culturally safe care, investigating roles of how traditional healers could
compliment western medical practitioners, studying traditional Aboriginal diet and
western diet as they relate to health, and comparing data from research conducted on-
reserve to off-reserve, to suggest a few.
It is evident that further research is needed in specific areas of Aboriginal health
in Canada. Yet, the evidence clearly indicates continued poorer health for Aboriginal
peoples when compared to non-Aboriginal Canadians. Advocacy of this injustice is key
in educating Canadians regarding this health crisis, with the end goal being governmental
policy change that supports improved health outcomes for Canadian Aboriginal peoples.
69
Works Cited
Aboriginal peopless Survey (2006). Statistics Canada. Abraham, N.G., Brunner, E.J., Eriksson, J.W., Robertson, R.P. (2007). Metabolic
Syndrome: psychosocial, neuroendocrine, and classical risk factors in type 2 diabetes. Annals New York Academy Science, October 2007 1113: pp 256-275.
Adler, N.E., Boyce, T., Chesney, M.A., Cohen, S., Folkman, S., Khan, R.L., Syme,
S.L. (1994) Socioeconomic status and health: The challenge of the gradient. American Psychologist 0003-066x 49(1).
AFN (2005) First Nations health research and information action plan. AFN, Editor Bobet, E. (1998) Diabetes among First Nations people: information from the Statistics
Canada 1991 Aboriginal peoples Survey. Health Canada and Statistics Canada. Ottawa, Health Canada.
Braveman, P.A. (2003) Monitoring equity in health and healthcare: A conceptual framework. Journal of Health Population Nutrition. 12(3): pp. 181-192.
British Columbia Provincial Health Officer (2009). Pathways to health and healing-
2nd report on the health and well-being of Aboriginal peoples in British Columbia. Provincial Health Officer’s annual report 2007. Victoria, BC: Ministry of Healthy Living and Sport.
Brothwell, D., Ghiabi, E. (2009) Periodontal Health Status of the Sandy Bay First Nation in Manitoba, Canada. Circumpolar Health. 68(1): pp. 23-33.
Bruce, S.G., Riediger, N.D., Zacharias, J.M., Young, T.K. (2011) Obesity and Obesity- Related Comorbidities in a Canadian First Nation Population, Prev. Chronic Dis 8(1). Bruce, S.G., Young, T.K. (2008) Prevalence and risk factors for neurophathy in a
Canadian First Nation community. Diabetes Care, 31(9): pp. 1837-1841. Cairns, A.C. (2000) Citizens plus: Aboriginal peoples and Canadian state. Vancouver,
BC: University of British Columbia Press. Cardinal, N. (2006) The exclusive city: Identifying, measuring, and drawing attention
to Aboriginal and Indigenous experiences in an urban context. Cities, Vol 23, No. 3 pp. 217-228.
70 Claussen, B., Davey Smith, G., & Thelle, D. (2003). Impact of childhood and adulthood
socioeconomic position on cause specific mortality: The Oslo Mortality Study. Journal of Epidemiology and Community Health, 57(1): 40-45.
Collard J. (2007) Constructing Theory for Leadership in Intercultural Contexts. Journal
of Educational Admin. Vol. 45 No. 6 p 740-755 Emerald Group Publishing Ltd. University of Canberra.
Department of Justice (2010). Canada Health act. Retrieved from
http://laws.justice.gc.ca/eng/C-6/FullText.html. Deshpande, K., Jain, A., Sharma, R., Prashar, S., Jain, R. (2010) Diabetes and
periodontitis. J Indian Soc Periodontol. Oct-Dec, 14(4): pp. 207-212. “Diabetes Facts and Figures” (2011). Public Health Agency of Canada, Diabetes in
Canada: Facts and Figures from a public health perspective. Ottawa, 2011. Diabetes. (2005) In: First Nations Regional Longitudinal Health Survey (RHS) 2002/03:
results for adults, youth and children living in First Nations communities. Ottawa: First Nations Centre; Retrieved from: URL: http://www.rhs-ers.ca/english/pdf/rhs2002-03reports/rhs2002-03-technicalreport-afn.pdf
Dunning, T. (2009). Periodontal Disease- The Overlooked Diabetes Complication.
Nephrology Nursing Journal Sept-Oct. 2009 36(5) pp. 489-495 Ellerby J.H., McKenzie J, McKay S, Gilbert J. Gariépy, Kaufert J.M. (2000) Bioethics
for Clinicians: Aboriginal Cultures. CMAJ 163(7) pp. 845-850. Epidemiology of Periodontal Diseases (1996) J Periodontol 67 pp.935-945 Environmental Scan- Oral Health Services of British Columbia for First Nations and
Aboriginal Children aged 0-7 years (2012). Ministry of Health. Healthy Women, Children and Youth Secretariat. First Nations and Inuit Health Branch, Health Canada.
Evans, R.G., Stoddart, G.L. (2003) Consuming research, producing policy? American Journal of Public Health. 93(3): pp. 371-379.
First Nations Action Plan For Non-Insured Health Benefits. (2005) Assembly of First
Nations, April 25, 2005. Retrieved from: URL: http://www.afn.ca/cmslib/general/NIHB%20Action%20Plan_Fe.pdf
71 First Nations Health Blueprint for British Columbia. (2005) BC First Nations Leadership
council. Retrieved from URL:http://www.fns.bc.ca/pdf/HBprintBC150705.pdf First Nations and Inuit Health Branch (2003). A statistical profile on the health of First
Nations in Canada. Ottawa: Health Canada.
First Nations and Inuit Health Branch (2007). Indian Health Policy 1979. Retrieved from: http://www.hc-sc.gc.ca/ahc-asc/branch-dirgen/fnihb-dgspni/poli_1979-eng.php.
First Nations and Inuit Regional Health Survey National Steering Committee (1999).
First Nations and Inuit regional health survey. Ottawa: First Nations and Inuit Regional Health Survey National Steering Committee.
First Nations and Inuit Regional Health Survey National Steering Committee (2003).
First Nations Regional Longitudinal Health Survey, in RHS 2002/2003. Ottawa: First Nations and Inuit RHS National Steering Committee.
First Nations Information Governance Committee (2005), First Nations Regional Health
Survey (2002/03). Ottawa: FNIGC
First Nations Information Governance Committee (2011). First Nations Regional Health Survey, Phase 2 (2008/10) Preliminary Results. Ottawa: FNIGC.
Frolich, K.L., Corin, H., Potvin, L. (2001) A theoretical proposal for the relationship
between context and disease. Sociology of Health & Illness. 23(6): pp. 776-797.
Frohlich K, Ross N, Richmond C. (2006) Health disparities in Canada today: some evidence and a theoretical framework. Health Policy 79 pp. 132-143.
Garriguet, D. (2008) Obesity and the eating habits of the Aboriginal population. Health
Reports 19 (1): pp. 1-11.
Gerlach A. (2007) Steps in the Right Direction- Connecting & Collaborating in Early Intervention Therapy with Aboriginal Families & Communities in BC. BC Aboriginal Child Care Society. pp. 1-48.
Gracey, M., King, M. (2009) Indigenous health part 1: determinants and disease
patterns. Lancet 374: pp. 65-75. Graham, H. (ed) (2000) Understanding Health Inequalities. Buckingham: Open
University Press.
72 Green, C., Hoppa, R.D., Young, T. K., Blanchard, J.F. (2003) Geographic analysis of
diabetes prevalence in an urban area. Social Science and Medicine 57 (3) August 2003 pp.551- 560 (10).
Hankivsky, O., Cormier, R. (2009). Intersectionality: Moving Women’s Health Research and Policy Forward. Vancouver: Women’s Health Research Network.
Harrison R.L., MacNab A.J., Duffy D.J., Benton D.H.J. (2006) Brighter Smiles Service Learning, Inter-professional Collaboration and Health Promotion in a First Nations Community. Cad J of Pub Health. May-June; 97(3) pp. 237-40. Health Canada (2005) Ten years of health transfer First Nation and Inuit Control.
Retrieved from http://www.hc-sc.gc.ca/fniah-spnia/pubs/finance/_agree- accord/10_years_ans_trans/2_intro-eng.php.
Ide, R., Hoshuyama, T., Wilson, D., Takahashi, K., Higashi, T. (2011). Periodontal
Disease and Incident Diabetes: a Seven-year Study. Journal of Dental Research 90(1) pp. 41-46.
Indian Affairs and Northern Canada (2010) Fact Sheet: Treaties with Aboriginal
people in Canada. Retrieved from http://www.ainc-inac.gc.ca/ai/mr/is/tra-eng.asp.
International Diabetes Foundation (2003). Diabetes atlas. (2nd ed.). Brussels, Belgium: International Diabetes Foundation.
Inuit Health and social conditions. (2006) Statistics Canada, Aboriginal Survey 2006
[Online] Retrieved from: URL: http://www.statcan.gc.ca/pub/89-637-x/89-637-x2008001-eng.htm
Inuit Health and social conditions. (2006) Statistics Canada, Aboriginal Survey 2006 [Online] Retrieved from: URL: http://www.statcan.gc.ca/pub/89-637-x/89-637- x2008001-eng.htm. Iwasaki, Y., Bartlett, J., O’Neil, J. (2005). Coping with stress among Aboriginal
women and men with diabetes in Winnipeg, Canada. Social Science & Medicine 60: pp. 977-988.
Jacklin, K.M., Warry, W. (2004) The Indian health transfer policy in Canada: Toward
self-determination or cost containment? In A. Castro, & M. Singer (Eds), Unhealthy health policy: A critical anthropological examination (pp. 215-234). Walnut Creek, CA: AltaMira Press.
Katzmarzyk, P.T., Janssen, I. (2004). The economic costs associated with physical
inactivity and obesity in Canada: an update. Canadian Journal of Applied Physiology, 29(1) pp. 90-115.
73 Kelly, M.D. (2011) Toward a New Era of Policy: Health Care Service Delivery to First Nations. The International Indigenous Policy Journal, 2 (1) pp. 1-12. King, M. (2010) Chronic diseases and mortality in Canadian Aboriginal peoples:
learning from the knowledge. Chronic Diseases in Canada. 31 (1): pp. 2-3. Klem, M. E. (1998). Colonizing bodies: Aboriginal health and healing in British
Columbia, 1900-50. Vancouver: UBC Press.
Krieger, N. (2001) Theories for social epidemiology in the 21st century: an ecosocial perspective. International Journal of Epidemiology. 30(4): pp. 668-677.
Krieger, N. (2005). Embodiment: a conceptual glossary for epidemiology. Journal of
Epidemiology and Community Health 59: pp. 350-355. Laboratory Centre for Disease Control. Diabetes, D. (2000). Diabetes in Canada,
National statistics and opportunities for improved surveillance, prevention and control. Ottawa, Health Canada, Health Protection Branch, Laboratory Centre for Disease Control, Bureau of Cardio-Respiratory Diseases & Diabetes, Diabetes Division: 70, xiii,76.
Lalla, E., Lamster, I.B., Drury, S., Fu, C., Schmidt, A.M. (2000). Hyperglycemia, glycoxidation and receptor for advanced glycation endproducts: potential mechanisms underlying diabetic complications, including diabetes-associated periodontitis. Periodontology June 2000, 23: pp. 50-62.
Lamster I.B., Lalla E, Borgnakke W.S., Taylor G.W. (2008). The relationship between
oral health and diabetes mellitus. JADA 139(10supp) pp. 195-245
Lavoie, J.G., Forget, E.L. (2008) The cost of doing nothing: Implications for the Manitoba health care system. Pimatisiwin: A Journal of Aboriginal and Indigenous Community Health, 6 (1): pp. 107-121.
Lavoie, J.G., Forget, E.L., Browne, A.J. (2010) Caught at the crossroad: First Nations, health care, and the legacy of the Indian Act. Pimatisiwin: A Journal of Aboriginal and Indigenous Community Health, 8 (1): pp. 83-100.
Lawrence, H.P. (2010) Oral health interventions among Indigenous populations in
Canada. International Dental Journ 60: pp. 1-6.
74
Lawrence, H.P., Binguis, D., Douglas, J., McKeown, L., Switzer, B., Figueiredo, R.,
Reade, M. (2009) Oral health inequalities between Aboriginal and non-Aboriginal children living in Ontario, Canada. Community Dent Oral Epidemiol 37: pp. 495-508.
Loppie-Reading, C., Wein, F. (2009) Health Inequalities and Social Determinants of
Aboriginal peoples’ Health. National Collaborating Centre for Aboriginal Health. Retrieved at http://www.nccah-ccnsa.ca/docs/.../NCCAH-loppie-Wien_report.pdf.
Lux J. (2006) Review of the Oral Disease-Systemic Disease Link. Part 1: Heart Disease,
Diabetes. Canadian J of Dent Hyg. Nov-Dec 40 (6) pp. 288-342
McKee G, Clarke F, Kmetic A, Reading J. (2009) Health Practitioners’ Perspectives on the Barriers To Diagnosis and Treatment of Diabetes in Aboriginal peoples on Vancouver Island. Pimatisiwin: A Journal of Aboriginal and Indigenous Community Health. 7(1) pp. 49-64.
McEwan, B.S. (1998) Protective and damaging effects of stress mediators. New England Journ of Medicine 338: pp. 171-179.
McEwen, B. (2006). Protective and damaging effects of stress mediators: Central role of
the brain. Dialogues in Clinical Neuroscience, 8(4): 367-81
McNab, A.J., Rozmus, J., Benton, D., Gagnon, F.A. (2008) 3-year results of a collaborative school based oral health program in a remote First Nations Community. Rural and Remote Health. [Online] Retrieved from: URL: http://www.rrh.org.au/articles/subviewnew.asp?ArticleID=882
MacEntee M, Harrison R, Wyatt. (2001) Strategies to Enhance the Oral Health of British
Columbians, specifically Aboriginal peopless, Tobacco-Users, and those of Low Socioeconomic Background. Tobacco Reduction and Control Branch Preventive and Health Promotion Division of the Ministry of Health of the Government of British Columbia. May: 1-59.
Mair, C.A., Cutchin, M.P., Peek, M.K. (2011) Allostatic load in an environmental
riskscape: The role of stressors and gender. Health & Place 17: pp. 978-987.
Mealey, B.L., Oates, T.W. (2006). Diabetes mellitus and periodontal diseases. Journal of Periodontology 77(8) pp. 1289-1303.
75 Mealey, B.L., Ocampo, G.L. (2007). Diabetes mellitus and periodontal disease.
Periodontology 2000. 44(1): pp. 127-153. Mikkonen, J., Raphael, D. (2010). Social Determinants of Health: The Canadian Facts.
Toronto. York University School of Health Policy and Management.
National Aboriginal Health Organization (NAHO). March, 2012. Retrieved on July 18, 2012. URL://www.naho.ca/health-health-issues-of-aboriginal-canadians-scrutinized/
Navara, A.S., Sequist, T.D. (2010) Reducing Health Disparities in American Indians with Chronic Kidney Disease. Seminars in Nephrology 30 (1): pp. 19-25.
Newbold, K. B. (1998) Economics of Health Care Systems, Aboriginal Physician Use in
Canada: Location, Orientation and Identity. Health Economics. Dec; 6(2) pp.197-207.
Ng, C., Young, T.K., Corey, P.N. (2010) Associations of television viewing, physical
activity and dietary behaviours with obesity in Aboriginal and non-Aboriginal Canadian Youth. Public Health Nutrition 13 (9): pp. 1430-1437.
Obesity in Canada: A Joint Report from the Public Health Agency of Canada and the
Canadian Institute for Health Information. (2011) Public Health Agency of Canada. Ottawa, 2011.
Originating group: American academy of Periodontology-Research, Science and Therapy
Committee. (2001) Treatment of Plaque-induced Gingivitis, Chronic Periodontitis and Other Clinical Conditions. J Periodontal, 72(12) pp.1790-1800
Oster, R.T., Toth, E.L. (2009) Differences in the prevalence of diabetes risk-factors
among First Nations, Métis and non-Aboriginal adults attending screening clinics in rural Alberta, Canada. Rural and Remote Health 9 (2).
Oster, R.T., Johnson, J.A., Hemmelgarn, B.R., King, M., Balko, S.U., Svenson, L.W., Crowshoe, L., Toth, E.L. (2011) Recent epidemiologic trends of diabetes mellitus among status Aboriginal adults, Canadian Medical Assoc Journal 183(12): pE803- E809 Panagiotopoulos, C., Rozmus, J., Gagnon, R.E., MacNab, A.J. (2007) Diabetes screening of children in a remote First Nations community on the west coast of Canada: challenges and solutions, Rural and Remote Health 7(771).
76 Pouliou, T., Elliot, S.J. (2010) Individual and socio-environmental determinants of
overweight and obesity in urban Canada. Health and Place, 16: pp. 389-398. Raphael, D. (2009). Social Determinants of Health: Canadian Perspectives, 2nd edition.
Toronto: Canadian Scholars’ Press.
Riediger, N.D., Bruce, S.G., Young, T.K. (2011) Cardiovascular Risk According to Plasma Apolipoprotein and Lipid Profiles in a Canadian First Nation. Prev Chronic Dis. 8 (1): A05 pp. 1-8.
Romanow, R. (2002). Building on Values: The Future of Health Care in Canada. Retrieved on Nov. 20, 2012 from www.publications.gc.ca/collections/Collection/CP32-85-2002E.pdf
Schroth R, Harris R, Lawrence HP, Peressini S. (2008) Oral health and the Aboriginal child: A forum for community members, researcher and policy makers. JCDA. June; 74(5) pp. 429-432. Sharp, D. (2009). Environmental Toxins, A Potential Risk Factor For Diabetes
Among Canadian Aboriginals. International Journal of Circumpolar Health 68 (4): pp. 316-326.
Siegrist, J., Marmot, M. (2004) Health inequalities and the psychosocial environment- two scientific challenges. Social Science & Medicine. 58: pp. 1463-1473.
Statistical Profile on the Health of First Nations in Canada. (2005) [Online] Health
Canada Retrieved from: URL: http://www.hc-sc.gc.ca/fniah-spnia/pubs/aborig-autoch/stats_profil-eng.php
Taylor, GW, Borgnakke, WS. (2008) Periodontal disease: association with diabetes, glycemic control and complications. Oral Diseases. 14 pp.191-203. Taylor, S. E., & Seeman, T. E. (1999). Psychosocial resources and the SES-health
relationship. Annals of the New York Academy of Sciences, 896, 210-25. The Aboriginal Health Legislation and Policy Framework in Canada (2011).
Retrieved from: www.nccah-ccnsa.ca/docs/Health%20Legislation%20and%20Policy_Eng
Tjepkema, M. (2002) The Health of the Off-Reserve Aboriginal Population.
Supplement to Health Reports, 13: pp. 1-16.
77 Wardman, D., Clement, K., Quantz, D. (2005) Access and utilization of health services
by British Columbia’s rural Aboriginal population. Leadership in Health Services. 18 (2) pp. xxvi-xxxi.
Wien F, McIntyre L. (1999) Health and Dental Services for Aboriginal peoples. Nations and Inuit regional health survey national report. The First Nations and Inuit Regional Health Survey National Steering Committee. pp. 219-245.
Wilson, D., Macdonald, D. (2010) The Income Gap Between Aboriginal peopless and the Rest of Canada. Canadian Centre for Policy Alternatives. pp. 1-34 [online] Retrieved at http://www.growinggap.ca.
Wilson, K., Rosenberg, M.W., Abonyi, S. (2011) Aboriginal peopless, health and healing approaches: The effects of age and place on health. Social Science & Med 72: pp. 355-364.
www.aadndc-aadnc.gc.ca Aboriginal Affairs and Northern Development Canada www.diabetes.ca Canadian Diabetes Association www.diabetes.org American Diabetes Association www.who.int/mediacentre/Factsheets/fs312 World Health Organization www.who.int/social_determinants/en World Health Organization Yeates, K., Tonelli, M. (2010) Chronic Kidney Disease amoung Aboriginal peoples
living in Canada. Clinical Nephrology 74: pp. S57-S60.
Young T.K., Reading J, Elias B, O’Neil J.D. (2000) Type 2 Diabetes Mellitus in Canada’s First Nations: Status of an Epidemic in progress. Canadian Medical Assoc or its Licensors. Sept 163(5) pp. 561-566.
Yu, V., Raphael, D. (2004). Identifying and addressing the social determinants of the incidence and successful management of type 2 diabetes mellitus in Canada. Canadian Journal of Public Health, 95(5) pp. 366-368
Ziebarth, S. (2003) First Nations and Inuit Oral Health: An oral presentation to the House of Commons Standing Committee on Health, Canadian Dental Hygienists Association. Retrieved from URL: http://www.cdha.ca/content/newsroom/pdf/aboriginal_peoples.pdf
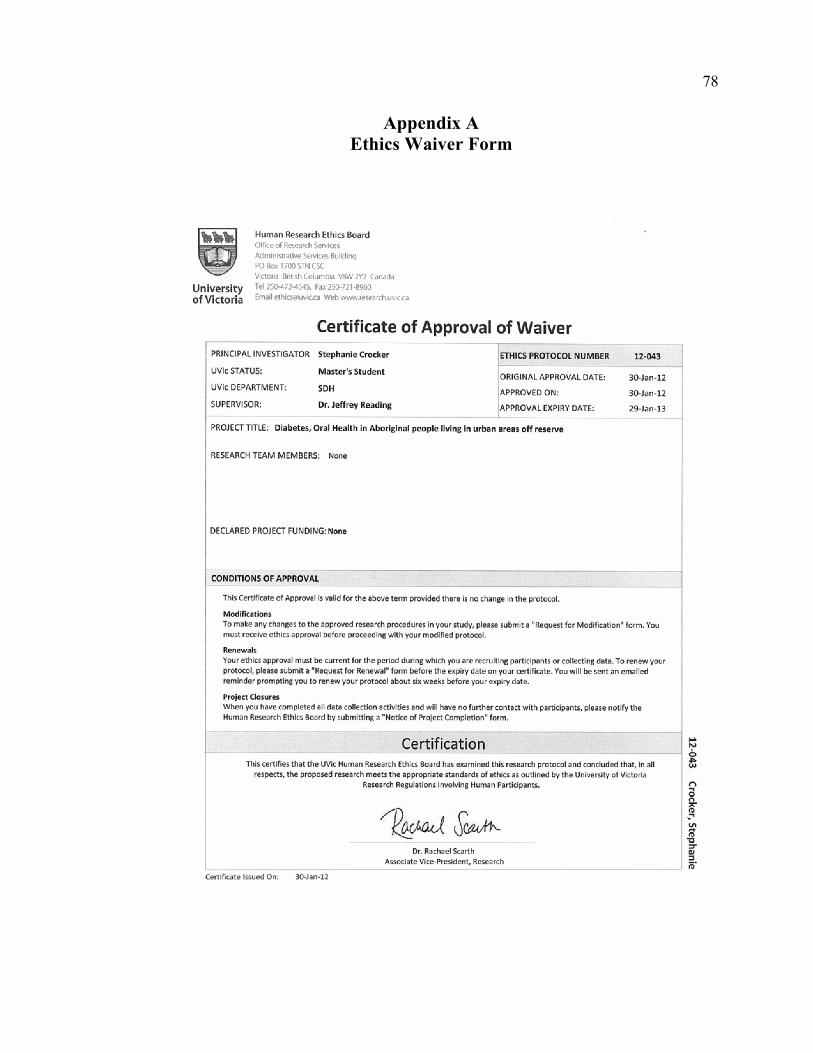
78
Appendix A Ethics Waiver Form
79
Appendix B Statistics Canada Methods Guide
80
81
82
83
84

85
86
87
88
89
90
91
92
93
94
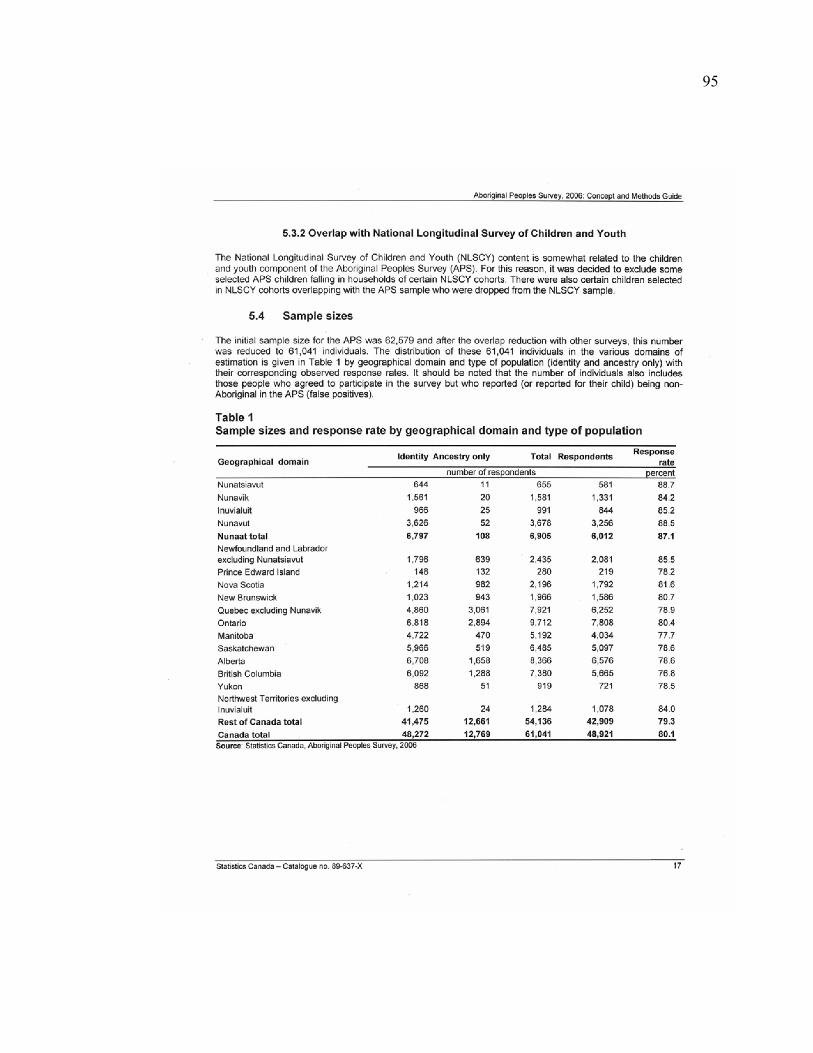
95
96
97
98
99
100
101
102
103
104
105
106
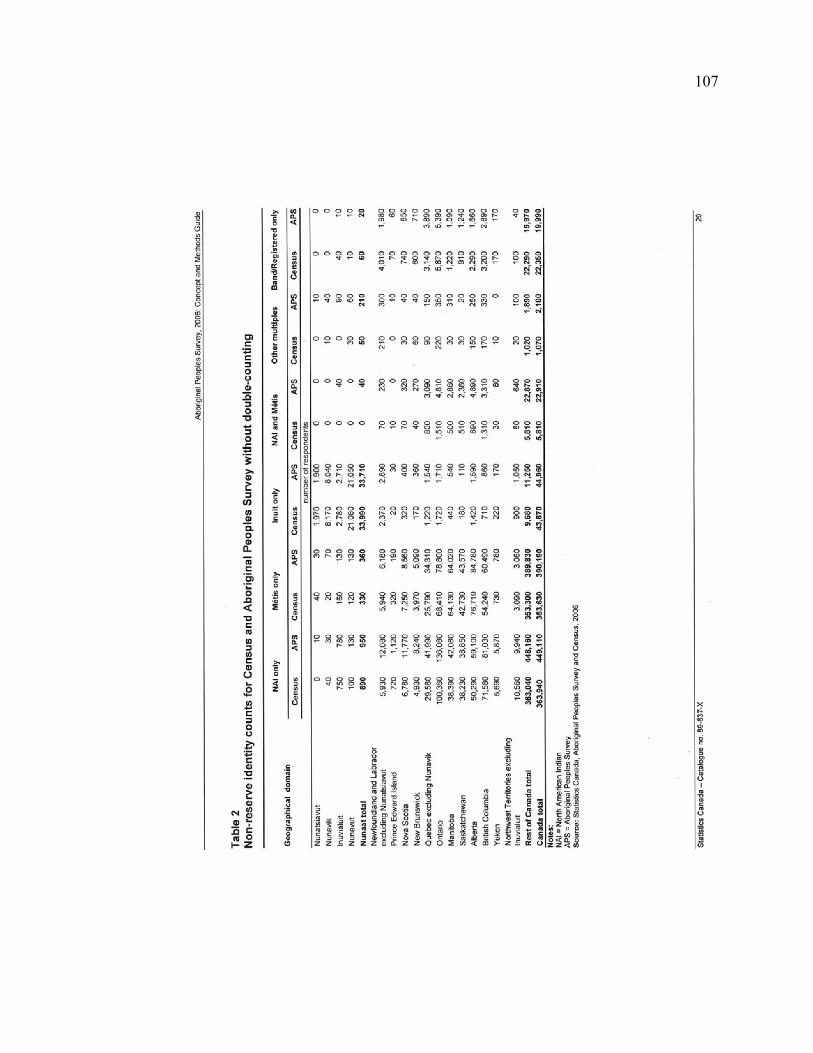
107
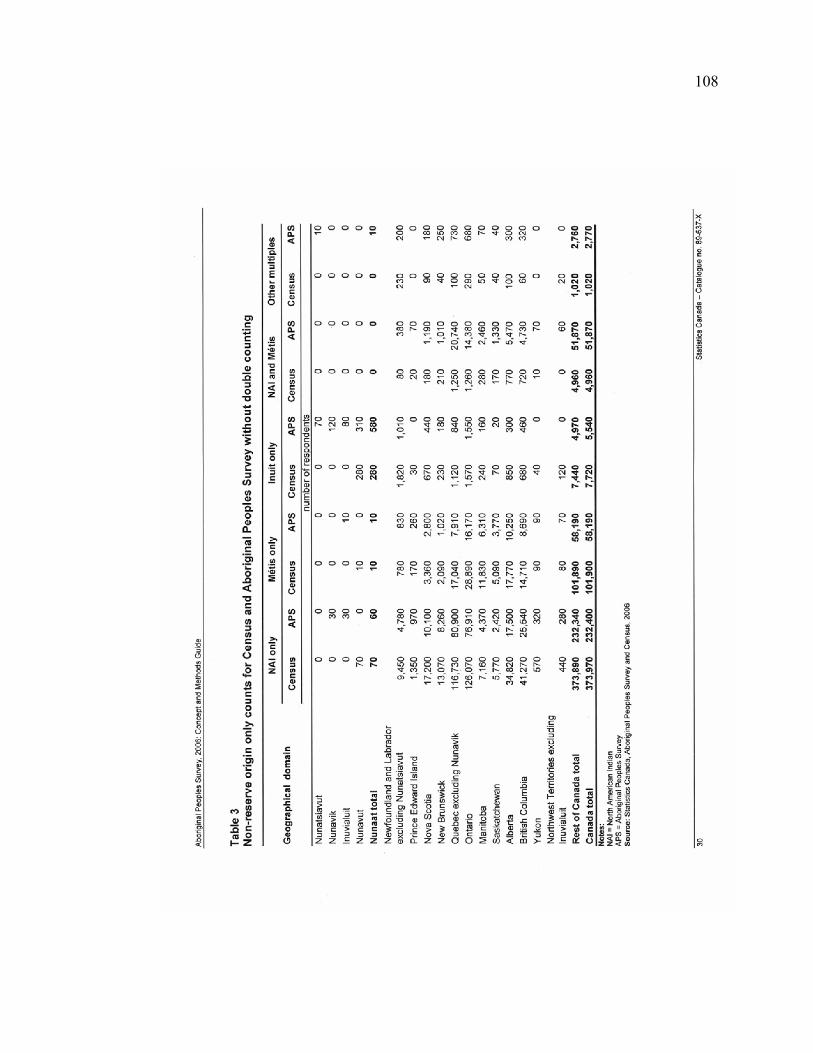
108
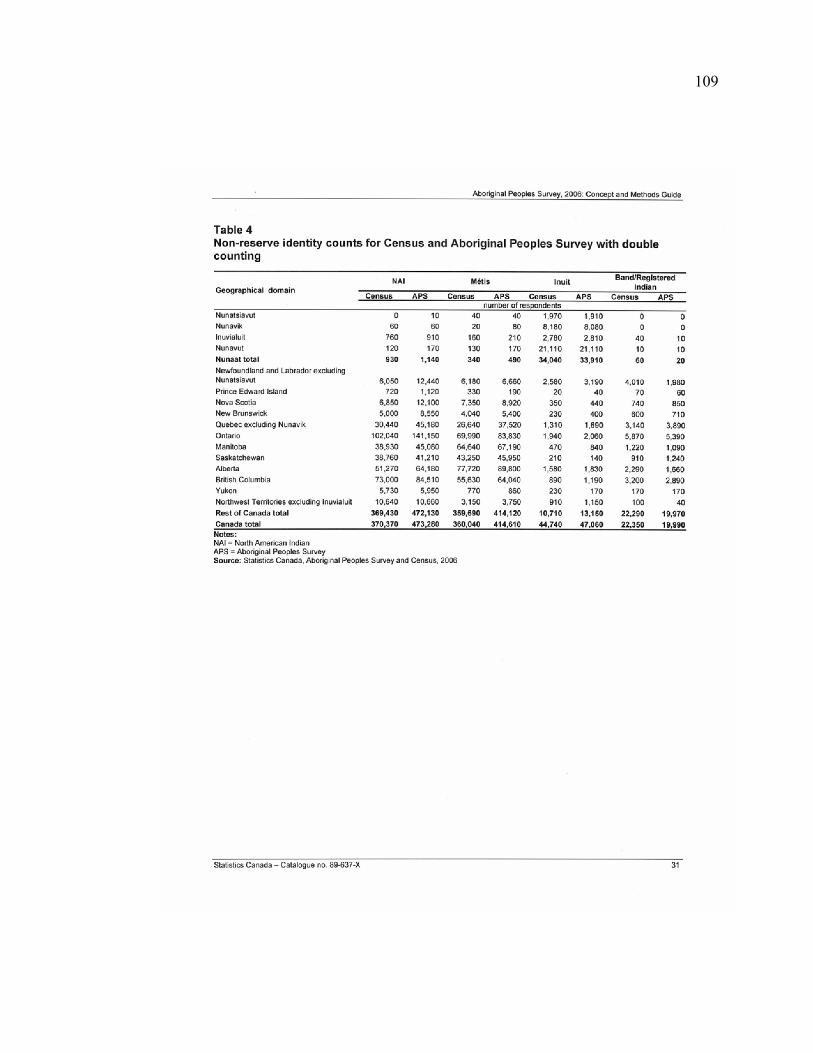
109
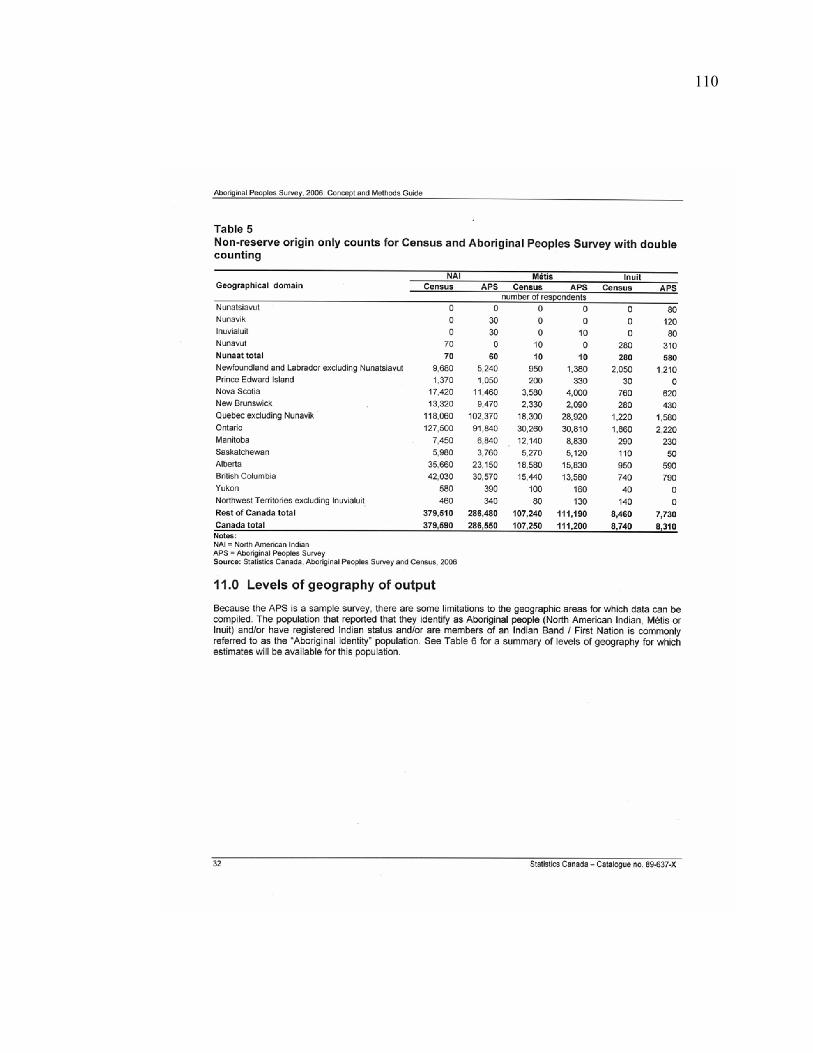
110
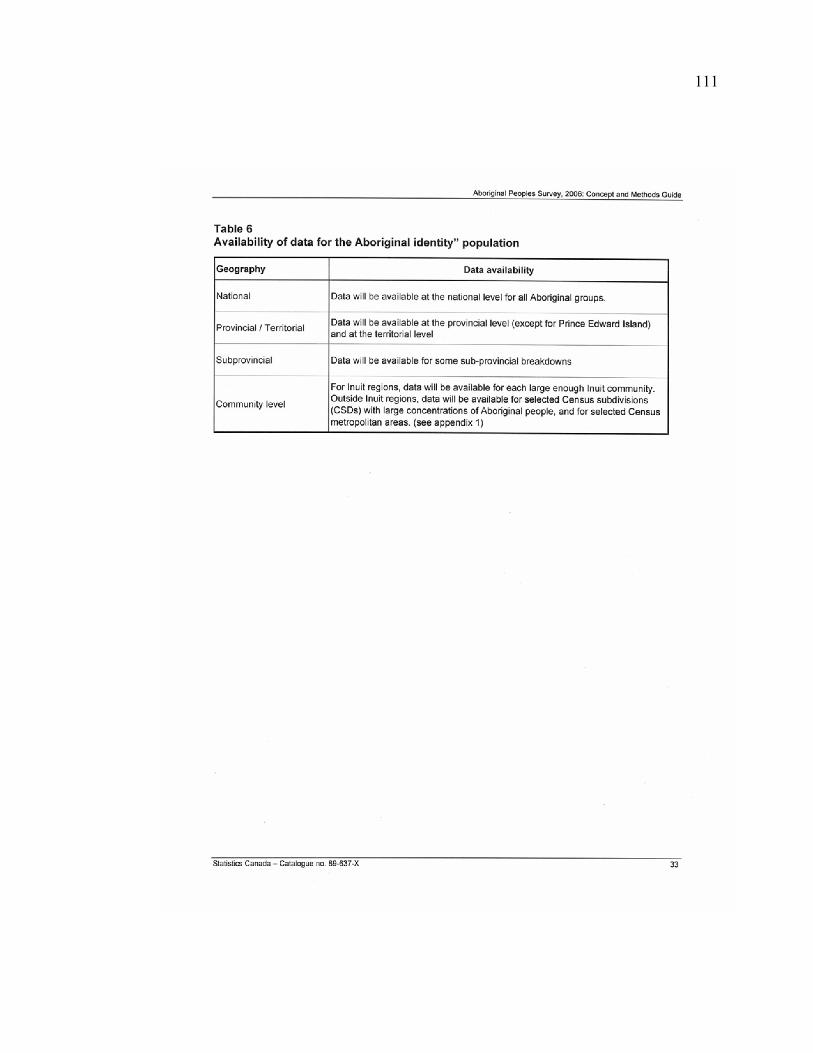
111

112
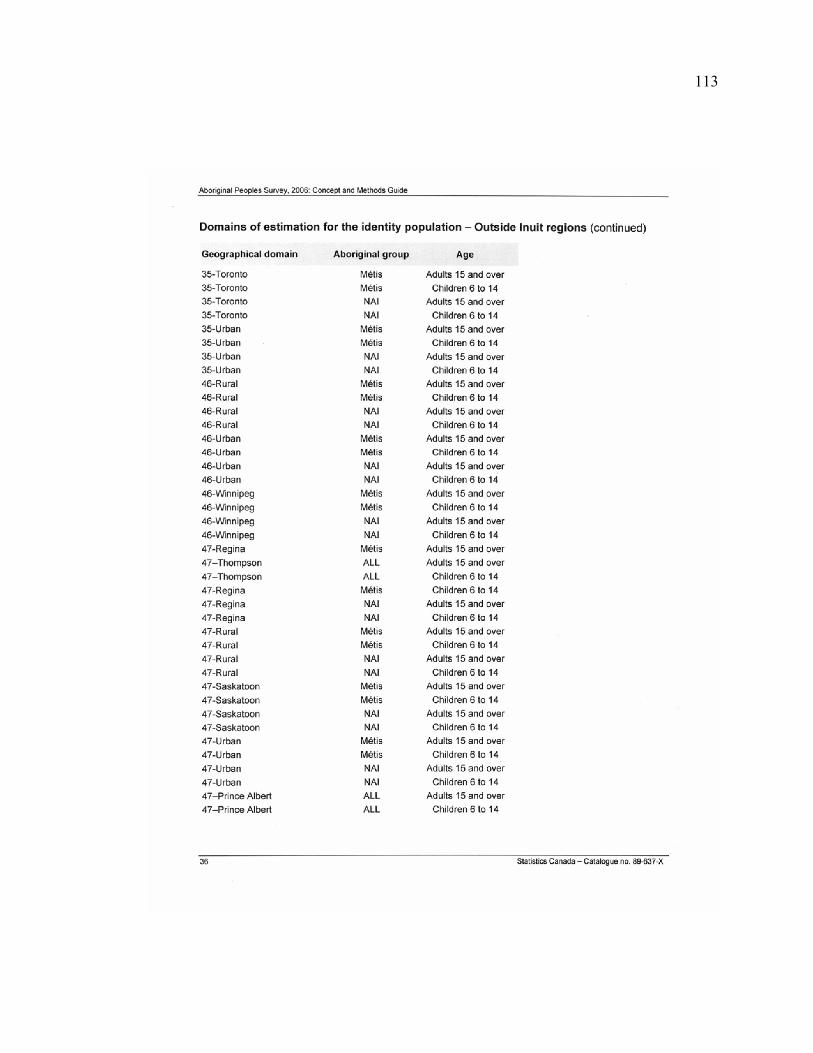
113
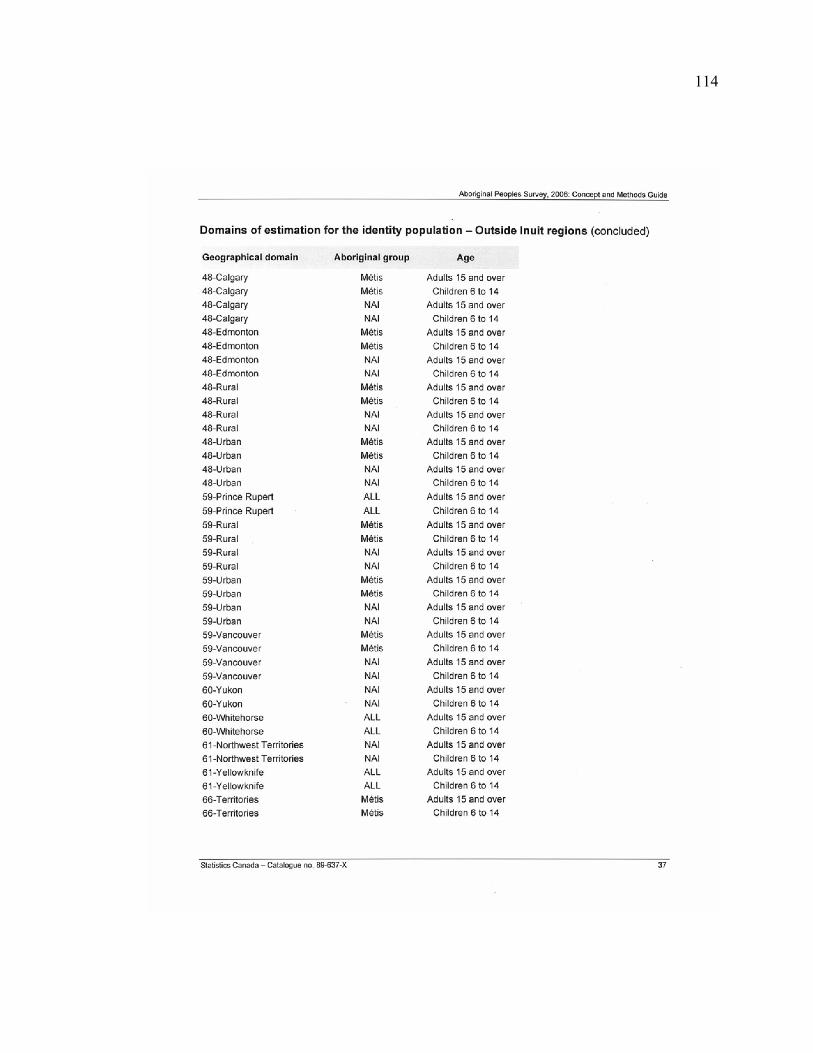
114
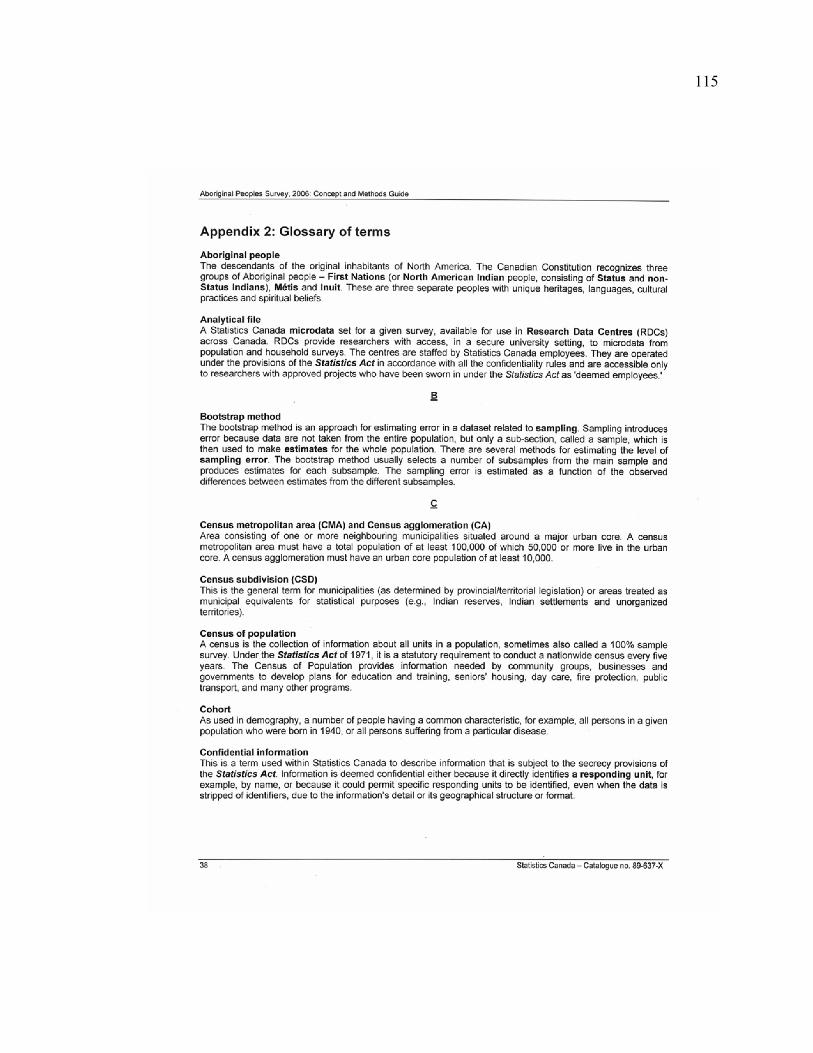
115
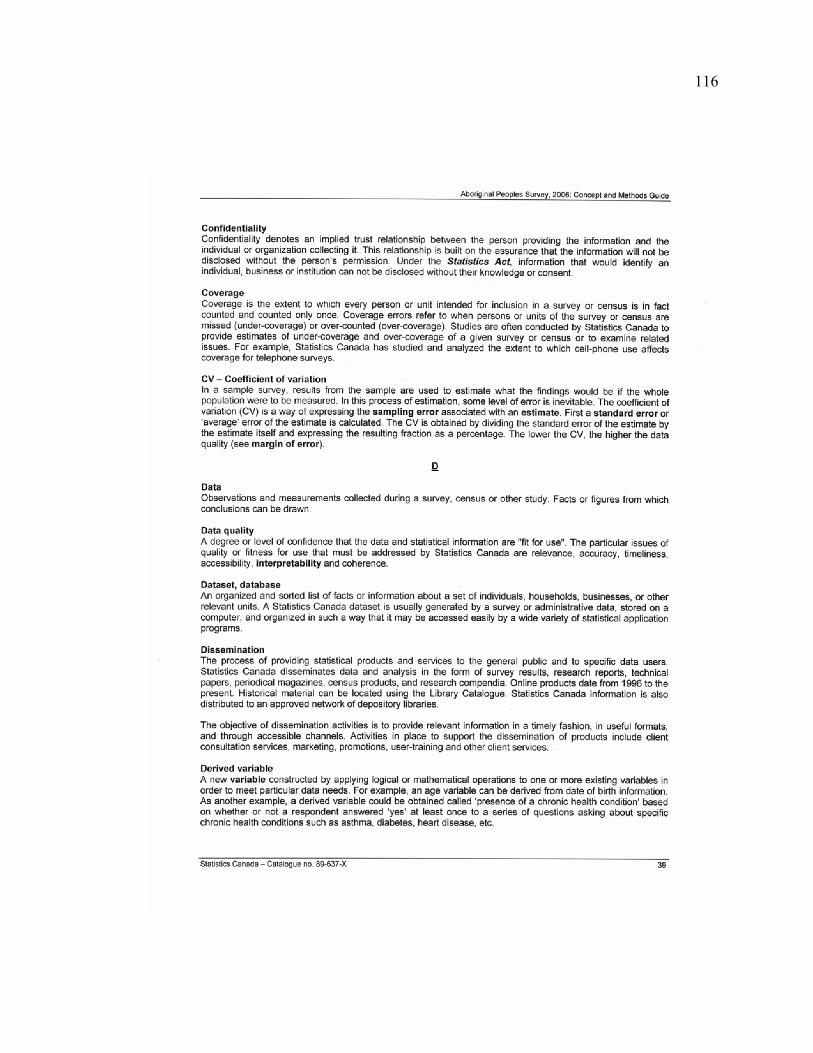
116
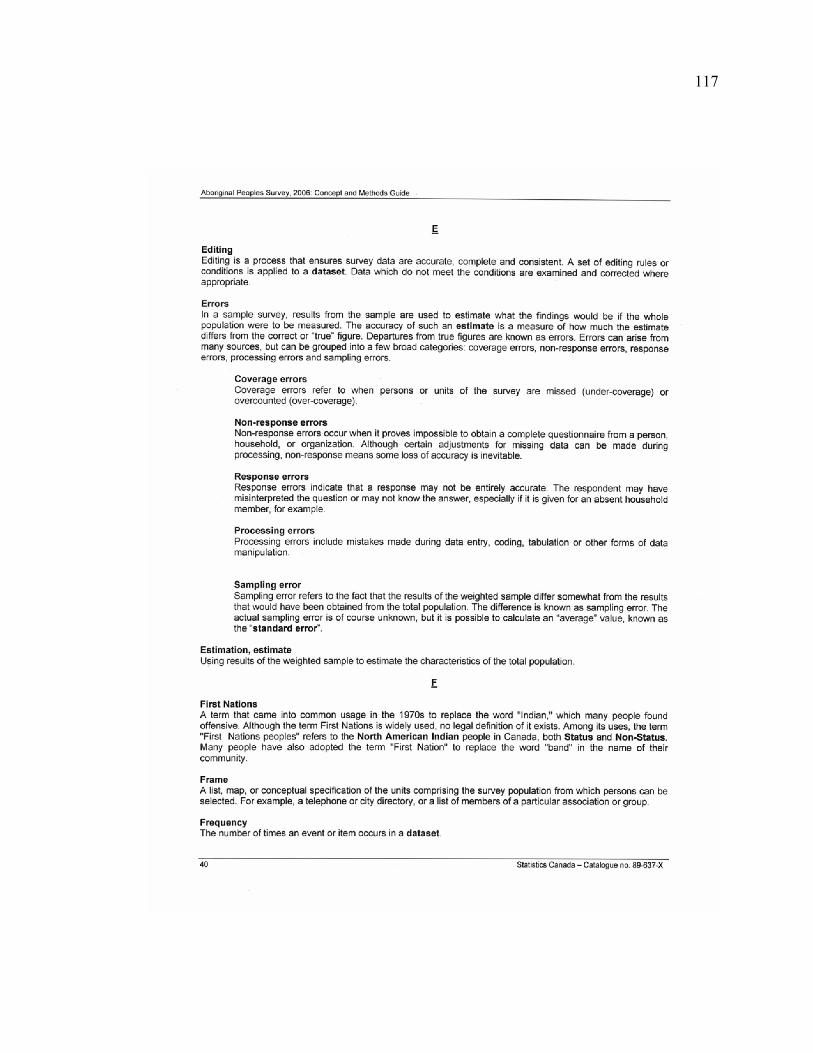
117
118
119
120
121
122
123
124

125