Developmental Stability Covaries with Genome-Wide and Single-Locus Heterozygosity in House Sparrows
10
Developmental Stability Covaries with Genome-Wide and Single-Locus Heterozygosity in House Sparrows Carl Vangestel 1 *, Joachim Mergeay 2 , Deborah A. Dawson 3 , Viki Vandomme 1 , Luc Lens 1 1 Terrestrial Ecology Unit, Department of Biology, Ghent University, Ghent, Belgium, 2 Research Group of Genetic Diversity, Research Institute for Nature and Forest, Geraardsbergen, Belgium, 3 Department of Animal and Plant Sciences, University of Sheffield, Sheffield, South Yorkshire, United Kingdom Abstract Fluctuating asymmetry (FA), a measure of developmental instability, has been hypothesized to increase with genetic stress. Despite numerous studies providing empirical evidence for associations between FA and genome-wide properties such as multi-locus heterozygosity, support for single-locus effects remains scant. Here we test if, and to what extent, FA co-varies with single- and multilocus markers of genetic diversity in house sparrow (Passer domesticus) populations along an urban gradient. In line with theoretical expectations, FA was inversely correlated with genetic diversity estimated at genome level. However, this relationship was largely driven by variation at a single key locus. Contrary to our expectations, relationships between FA and genetic diversity were not stronger in individuals from urban populations that experience higher nutritional stress. We conclude that loss of genetic diversity adversely affects developmental stability in P. domesticus, and more generally, that the molecular basis of developmental stability may involve complex interactions between local and genome-wide effects. Further study on the relative effects of single-locus and genome-wide effects on the developmental stability of populations with different genetic properties is therefore needed. Citation: Vangestel C, Mergeay J, Dawson DA, Vandomme V, Lens L (2011) Developmental Stability Covaries with Genome-Wide and Single-Locus Heterozygosity in House Sparrows. PLoS ONE 6(7): e21569. doi:10.1371/journal.pone.0021569 Editor: William J. Etges, University of Arkanas, United States of America Received December 8, 2010; Accepted June 3, 2011; Published July 1, 2011 Copyright: ß 2011 Vangestel et al. This is an open-access article distributed under the terms of the Creative Commons Attribution License, which permits unrestricted use, distribution, and reproduction in any medium, provided the original author and source are credited. Funding: Genotyping was performed at the NERC Biomolecular Analysis Facility funded by the Natural Environment Research Council, UK. Fieldwork and genetic analyses were funded by research grants G.0149.09 of the Fund for Scientific Research - Flanders (to LL) and research grant 01J01808 of Ghent University (to LL). The funders had no role in study design, data collection and analysis, decision to publish, or preparation of the manuscript. Competing Interests: The authors have declared that no competing interests exist. * E-mail: [email protected] Introduction Developmental stability refers to the ability of an organism to achieve a phenotypic endpoint, predetermined by its genotype and the environment, along a developmental pathway in the face of random perturbations [1]. Because developmental stability has been shown to decrease with environmental and genetic stress and to correlate with fitness traits such as fecundity, attractiveness, competitive ability, parasite resistance and survival (see reviews in for example [1,2,3]), it has received much attention in ecology and conservation biology. Furthermore, as developmental instability may increase morphological variation and reveal cryptic genetic variation (e.g. [4]), it can affect evolutionary processes, and possibly speciation, too [5]. Population and individual levels of developmental stability are most commonly estimated by corresponding levels of fluctuating asymmetry (FA), i.e. small, random deviations from perfect left- right symmetry in bilateral traits [6]. Developmental stability and FA are inversely related to one another as high levels of FA reflect poor developmental stability. Developmental theory assumes that left and right trait sides reflect two independent replicates of the same developmental event and should therefore develop symmet- rically in the absence of random perturbations [3]. While empirical studies revealed positive relationships between FA and genetic stress (reviewed by [7,8]), numerous inconclusive examples nourish the debate over the generality of these relationships [9,10]. Relationships between FA, stress and fitness have not always been consistent in the past but seem to be highly variable and species, stress and trait specific [2,3]. Heterogeneity in the strength or direction of relationships with FA may result from complex genotype-environment interactions [11]. For example, the fact that relationships between FA and heterozygosity were only significant under suboptimal rearing conditions in the freshwater fish Gambusia holbrooki [12], suboptimal foraging conditions in the forest bird Turdus helleri [13], and suboptimal growing conditions in the flowering plant Lychnis viscaria [14], suggests that developmen- tal stability may be traded-off against other vital life-history traits when individuals become energetically challenged [12,13,15]. Based on developmental and genetic theory, at least two hypothetical mechanisms underlying the genetic basis of develop- mental stability have been put forward [7,9,]: (i) the heterozygosity hypothesis states that individuals with high levels of protein heterozygosity are developmentally stable as a result of dominance or overdominance effects [8,16,17,18]. Genetic dominance refers to increased expression of deleterious recessive alleles in homozygote individuals [19], whereas genetic overdominance refers to superior biochemical efficiency of individuals that are heterozygous for genes at marker loci (‘true overdominance’) or at non-neutral genes tightly linked to the latter (‘associative overdominance’) [7,20,21,22]. Both genetic dominance and ‘associative’ overdominance implies genetic disequilibria, however, the ecological conditions under which these disequilibria occur, can differ. Genetic dominance is most strongly associated with non-random association of diploid genotypes in zygotes (identity disequilibria) which is common under partial inbreeding [17]. Associative overdominance, in turn, is more strongly associated PLoS ONE | www.plosone.org 1 July 2011 | Volume 6 | Issue 7 | e21569
-
Upload
independent -
Category
Documents
-
view
3 -
download
0
Transcript of Developmental Stability Covaries with Genome-Wide and Single-Locus Heterozygosity in House Sparrows

Developmental Stability Covaries with Genome-Wideand Single-Locus Heterozygosity in House SparrowsCarl Vangestel1*, Joachim Mergeay2, Deborah A. Dawson3, Viki Vandomme1, Luc Lens1
1 Terrestrial Ecology Unit, Department of Biology, Ghent University, Ghent, Belgium, 2 Research Group of Genetic Diversity, Research Institute for Nature and Forest,
Geraardsbergen, Belgium, 3 Department of Animal and Plant Sciences, University of Sheffield, Sheffield, South Yorkshire, United Kingdom
Abstract
Fluctuating asymmetry (FA), a measure of developmental instability, has been hypothesized to increase with genetic stress.Despite numerous studies providing empirical evidence for associations between FA and genome-wide properties such asmulti-locus heterozygosity, support for single-locus effects remains scant. Here we test if, and to what extent, FA co-varieswith single- and multilocus markers of genetic diversity in house sparrow (Passer domesticus) populations along an urbangradient. In line with theoretical expectations, FA was inversely correlated with genetic diversity estimated at genome level.However, this relationship was largely driven by variation at a single key locus. Contrary to our expectations, relationshipsbetween FA and genetic diversity were not stronger in individuals from urban populations that experience highernutritional stress. We conclude that loss of genetic diversity adversely affects developmental stability in P. domesticus, andmore generally, that the molecular basis of developmental stability may involve complex interactions between local andgenome-wide effects. Further study on the relative effects of single-locus and genome-wide effects on the developmentalstability of populations with different genetic properties is therefore needed.
Citation: Vangestel C, Mergeay J, Dawson DA, Vandomme V, Lens L (2011) Developmental Stability Covaries with Genome-Wide and Single-Locus Heterozygosityin House Sparrows. PLoS ONE 6(7): e21569. doi:10.1371/journal.pone.0021569
Editor: William J. Etges, University of Arkanas, United States of America
Received December 8, 2010; Accepted June 3, 2011; Published July 1, 2011
Copyright: � 2011 Vangestel et al. This is an open-access article distributed under the terms of the Creative Commons Attribution License, which permitsunrestricted use, distribution, and reproduction in any medium, provided the original author and source are credited.
Funding: Genotyping was performed at the NERC Biomolecular Analysis Facility funded by the Natural Environment Research Council, UK. Fieldwork and geneticanalyses were funded by research grants G.0149.09 of the Fund for Scientific Research - Flanders (to LL) and research grant 01J01808 of Ghent University (to LL).The funders had no role in study design, data collection and analysis, decision to publish, or preparation of the manuscript.
Competing Interests: The authors have declared that no competing interests exist.
* E-mail: [email protected]
Introduction
Developmental stability refers to the ability of an organism to
achieve a phenotypic endpoint, predetermined by its genotype and
the environment, along a developmental pathway in the face of
random perturbations [1]. Because developmental stability has
been shown to decrease with environmental and genetic stress and
to correlate with fitness traits such as fecundity, attractiveness,
competitive ability, parasite resistance and survival (see reviews in
for example [1,2,3]), it has received much attention in ecology and
conservation biology. Furthermore, as developmental instability
may increase morphological variation and reveal cryptic genetic
variation (e.g. [4]), it can affect evolutionary processes, and
possibly speciation, too [5].
Population and individual levels of developmental stability are
most commonly estimated by corresponding levels of fluctuating
asymmetry (FA), i.e. small, random deviations from perfect left-
right symmetry in bilateral traits [6]. Developmental stability and
FA are inversely related to one another as high levels of FA reflect
poor developmental stability. Developmental theory assumes that
left and right trait sides reflect two independent replicates of the
same developmental event and should therefore develop symmet-
rically in the absence of random perturbations [3]. While
empirical studies revealed positive relationships between FA and
genetic stress (reviewed by [7,8]), numerous inconclusive examples
nourish the debate over the generality of these relationships [9,10].
Relationships between FA, stress and fitness have not always been
consistent in the past but seem to be highly variable and species,
stress and trait specific [2,3]. Heterogeneity in the strength or
direction of relationships with FA may result from complex
genotype-environment interactions [11]. For example, the fact
that relationships between FA and heterozygosity were only
significant under suboptimal rearing conditions in the freshwater
fish Gambusia holbrooki [12], suboptimal foraging conditions in the
forest bird Turdus helleri [13], and suboptimal growing conditions in
the flowering plant Lychnis viscaria [14], suggests that developmen-
tal stability may be traded-off against other vital life-history traits
when individuals become energetically challenged [12,13,15].
Based on developmental and genetic theory, at least two
hypothetical mechanisms underlying the genetic basis of develop-
mental stability have been put forward [7,9,]: (i) the heterozygosity
hypothesis states that individuals with high levels of protein
heterozygosity are developmentally stable as a result of dominance
or overdominance effects [8,16,17,18]. Genetic dominance refers
to increased expression of deleterious recessive alleles in
homozygote individuals [19], whereas genetic overdominance
refers to superior biochemical efficiency of individuals that are
heterozygous for genes at marker loci (‘true overdominance’) or at
non-neutral genes tightly linked to the latter (‘associative
overdominance’) [7,20,21,22]. Both genetic dominance and
‘associative’ overdominance implies genetic disequilibria, however,
the ecological conditions under which these disequilibria occur,
can differ. Genetic dominance is most strongly associated with
non-random association of diploid genotypes in zygotes (identity
disequilibria) which is common under partial inbreeding [17].
Associative overdominance, in turn, is more strongly associated
PLoS ONE | www.plosone.org 1 July 2011 | Volume 6 | Issue 7 | e21569

with non-random associations of alleles at different loci in gametes
(linkage disequilibria), which typically occurs under recent
population bottlenecks followed by rapid population expansion
or intermixing of genetically differentiated populations; (ii) the
genomic co-adaptation hypothesis states that balanced co-adapted gene
complexes result in higher developmental stability because natural
selection favours alleles at many different loci that ‘harmoniously’
interact during the developmental process to produce stable
phenotypes [7,9,16]. Strong selection or outbreeding has been
shown to break up such co-adapted gene complexes [7,9].
While numerous studies have provided empirical evidence for
associations between developmental stability and genome-wide
processes such as multi-locus heterozygosity, evidence for single
locus effects (local effect hypothesis sensu [16,17,23]) is still scant. A
study of inactive/null alleles at lactate dehydrogenase (LDH) loci
in rainbow trout (Oncorhynchus mykiss) showed reduced levels of
developmental stability in heterozygotes, probably due to a
reduction in enzyme activity despite potential beneficial effects
of chromosomal heterozygosity [24]. A study on blowflies (Lucilia
cuprina) showed that developmental stability in bristle numbers (but
not wing characters) initially decreased upon exposure to a new
pesticide but restored after modification of the genetic background
through natural selection [25]. While loss of developmental
stability was first explained by a disruption of co-adapted gene
complexes, further study revealed direct effects of single resistance
and modifier genes [26]. Recently, transcriptional knockdown
techniques demonstrated the involvement of heath shock protein
genes in the molecular control of developmental stability in
Drosophila melanogaster and Arabidopsis thaliana [27,28].
Here we study how developmental stability in a metric trait co-
varies with indices of genome-wide and single-locus genetic
diversity in microsatellite markers, within and among 26 house
sparrow (Passer domesticus) populations along an urban gradient.
Despite the wealth of analytic tools developed for non-coding
neutral markers and their presumed suitability to test relationships
with genetic diversity, few studies have applied such markers to
model single- and multi-locus relationships with developmental
stability [29,30,31]. Based on the following ecological and genetic
evidence, relationships between developmental stability and
genetic diversity are predicted to be stronger in more urbanized
areas. First, urban house sparrows are more strongly, energetically
challenged than suburban and rural individuals [32,33]. A
previous study confirmed that a similar stress gradient was
apparent within our study area [34]. Second, urban populations
are on average smaller than suburban and rural ones (C.
Vangestel, unpublished data). Under reduced population sizes,
variation in inbreeding, estimates of genome-wide diversity based
on restricted numbers of markers [21], and statistical power to
detect relationships with developmental stability, are expected to
increase. Individual-level FA and genetic estimates of multi-locus
diversity show high sampling variability. The former represents
variances based on two data points (e.g. left and right) while the
latter attempts to estimate genome-wide characteristics using only
a limited number of markers. As such, both estimates may become
very noisy and are therefore regarded as weak estimates of
complex biological processes such as respectively developmental
stability [35,36] and genome-wide diversity [37]. Consequently,
associations between both estimates can be expected to be low (see
[38] for a general discussion) while joint analysis of average values
between groups can still be done with reasonable accuracy as long
as the number of sampled individuals is high. As the strength of
relationships between developmental stability and genetic diversity
may hence vary with the hierarchical level of statistical analysis
[31,39,40], hypotheses are tested at the level of populations and
individuals.
Materials and Methods
Ethics StatementAll procedures involving animals were reviewed and approved
by the Animal Ethics Committee of Ghent University (Permit
Number ECP 08/05).
Study siteHouse sparrows were sampled along an urban gradient ranging
from the city centre of Ghent (northern Belgium) and its suburban
periphery to the rural village of Zomergem, located ca. 12 km NW
of Ghent. Urbanization was measured as the ratio of built-up to
total grid cell area (each cell measuring 90,000 m2 on the ground)
and ranged between 0–0.10 (‘rural’), 0.11–0.30 (‘suburban’) and
larger than 0.30 (‘urban’) (Arcgis version 9.2.). We selected 26 plots
along this gradient (Figure 1) in which we captured a total of 690
adult house sparrows by standard mist netting between 2003 and
2009 (equal sex ratios in majority of plots). Upon capture, each
individual was sexed and aged and body mass (to the nearest 0.1 g),
wing length (to the nearest 0.5 mm) and length of the left and right
tarsus (to the nearest 0.01 mm; three repeated measurements
sequenced left-right-left-right-left-right or vice versa and with digital
slide calliper reset to zero between two consecutive measurements)
were measured. Before release, we collected a small sample of body
feathers for DNA analysis and the left and right fifth rectrix
(counting outward) for feather growth analysis [34].
Fluctuating asymmetry analysisTo estimate FA in tarsus length at an individual and population
level, we carried out mixed regression analysis with restricted
maximum likelihood parameter estimation (REML) to obtain
unbiased individual FA estimates [41]. ‘‘Side’’ was modelled as a
fixed effect, while ‘‘individual’’ and ‘‘individual*side’’ were
modelled as random effects. Individual FA estimates were
obtained from the individual random effects (‘‘individual*side’’).
First, we modelled separate variances in measurement errors (ME)
for each bird bander as the level of accuracy between banders
might differ. Second we tested for the presence of directional
asymmetry (fixed ‘‘side’’ effect; DA) by F-statistics, adjusting the
denominator degrees of freedom by Satterthwaite’s formula [42].
The distribution of signed FA in tarsus length showed a significant
directional component in all bird banders as measurements of
right tarsi were consistently larger than those of left ones. These
differences were attributed to the specific handling of a bird when
measuring both tarsi and therefore do not compromise the FA
values as the mixed regression model corrects for this systemic bias
by estimating subject-specific deviations from the fixed regression
slope. Third, we tested the significance of FA by comparing the
likelihood of models with and without random ‘‘individual*side’’
effect. Variation in length between repeated measurements within
each side (ME) was significantly separated from variation between
both trait sides (signed FA) (x2 = 8454.7, d.f. = 1, p,0.001) and
resulted in strong signal-to-noise ratios (all sFA2/sME
2 .9.4).
Fourth, we calculated unbiased signed FA values (subject specific
slope deviations from the fixed regression represented the amount
of asymmetry after correcting for DA and ME). Finally, we
calculated absolute values of the signed FA values (unsigned FA
estimates, further referred to as ‘‘FA’’) for hypothesis testing. These
individual estimates were used for individual-based analyses while
population mean values were used for analyses conducted at the
population level.Fifth, we compared the kurtosis levels of the
Heterozygosity and Developmental Stability
PLoS ONE | www.plosone.org 2 July 2011 | Volume 6 | Issue 7 | e21569

signed FA values to detect antisymmetry [43]. Visual inspection of
signed FA values did not indicate the presence of antisymmetry as
platycurtotic distributions were absent.
DNA extraction, PCR and genotypingGenomic DNA was extracted from ten plucked body feathers
using a Chelex resin-based method (InstaGene Matrix, Bio-Rad)
[44]. Polymerase chain reactions were organized in four multiplex-
sets and included both traditional ‘anonymous’ microsatellites as
well as those developed based on expressed sequence tags. For all
loci full sequence length, chromosome location on the zebra finch
genome and the nearest known zebra finch gene are given in an
appendix (Table S1) (genome locations were assigned using WU-
BLAST 2.0 software). The first multiplex reaction contained
Pdom1 [45], Pdo32, Pdo47 [46] and TG04-012 [47]; the second
one contained Pdom3 [45], Pdom5 [48], TG13-017 and TG07-022
[47]; the third multiplex reaction contained Pdo10 [48], Pdo16,
Pdo19, Pdo22 [46] and TG01-040 [47]; the last set consisted of
Figure 1. Geographical location of urban (filled circles), suburban (open circles) and rural (filled triangles) study plots within andnear the city of Ghent (Belgium). Inner contour encompasses Ghent city centre, outer contour encompasses surrounding municipalities and greyshading represents built-up area.doi:10.1371/journal.pone.0021569.g001
Heterozygosity and Developmental Stability
PLoS ONE | www.plosone.org 3 July 2011 | Volume 6 | Issue 7 | e21569

Pdo9 [48], TG01-148 and TG22-001 [47]. PCR reactions were
performed on a 2720 Thermal Cycler (Applied Biosystems) in
9 mL volumes and contained approximately 3 mL genomic DNA,
3 mL QIAGEN Multiplex PCR Mastermix (QIAGEN) and 3 mL
primermix (concentrations were 0.1 mM (Pdom1), 0.12 mM (TG01-
148), 0.16 mM (Pdo10, Pdo19, Pdo22, Pdo32, TG04-012) and
0.2 mM (Pdom3, Pdom5, Pdo9, Pdo16, Pdo47, TG01-040, TG07-
022, TG13-017, TG22-001)). The applied PCR profile used
included an initial denaturation step of 15 min at 95uC, followed
by 35 cycli of 30 s at 94uC, 90 s at 57uC and 60 s at 72uC;
followed by an additional elongation step of 30 min at 60uC and
an indefinite hold at 4uC. Prior to genotyping samples were
quantified using a ND1000 spectrometer (Nanodrop technologies)
and adjusted to a final concentration of 10 ng/mL. Negative and
positive controls were employed during extraction and PCR to
rule out contamination of reagents and ensure adequate primer
aliquot working, respectively. PCR products were visualized on an
ABI3730 Genetic Analyzer (Applied Biosystems), an internal LIZ-
600 size standard was applied to determine allele size, known
standard samples were added to align different runs and fragments
were scored using the software package GENEMAPPER 4.0.
Only individuals for which at least 10 markers successfully
amplified were selected for subsequent analyses.
Genetic data analysisBecause the genotyping of noninvasive DNA samples is
potentially prone to artefacts [49,50] we tested for scoring errors
due to stuttering or differential amplification of size-variant alleles
that may cause drop-out of large alleles using MICRO-
CHECKER [51]. The same program was also used to assess the
observed and expected frequency of null alleles by comparing
frequencies of observed and Monte Carlo simulated homozygotes
[52]. All microsatellite loci (n = 16) were checked for Hardy-
Weinberg and linkage equilibrium with GENEPOP 4.0 [53,54].
Mean unbiased expected heterozygosity across all populations (He
[55]) was computed for each locus using FSTAT 2.9.3.2. [56].
Individual genetic diversity was estimated by (i) standardized
multilocus heterozygosity (hereafter called MLH [57]), (ii) Ritland
inbreeding coefficients (f_
, [58]) and (iii) squared differences in
allele size (d2, [59,60]).
(i) MLH was calculated as the ratio of the proportion of typed
loci for which a given individual was heterozygote over the
mean heterozygosity of those loci [57], thereby eliminating
possible confounding effects of unbalanced datasets. Indi-
vidual MLH estimates were calculated using Rhh [61], an
extension package of R (http://www.r-project.org), which
also provides two additional heterozygosity-based indices,
i.e. homozygosity by loci (HL [62]) and internal relatedness
(IR [63]). HL weighs the contribution of each locus and is
calculated as HL =
PEhP
EhzP
Ej
, where Eh and Ej represent
the expected heterozygosities of the homozygous and
heterozygous loci, respectively. IR on the other hand
incorporates allele frequencies to estimate levels of homo-
zygosity. IR = 2H{P
fið Þ= 2N{P
fið Þ, where H
represents the number of homozygous loci, N the total
number of loci and fi the frequency of the ith allele in the
genotype. Positive values reflect high levels of homozygosity
while negative values are indicative for high heterozygosity.
As all three indices were strongly correlated (all |r|.0.97;
p,0.001) (Figure 2a) and results remained unaffected when
based on MLH, IR or HL (despite differences in the relative
weight given to alleles or loci when estimating heterozygosity
[63]), only results of analyses with MLH are reported.
(ii) Ritland estimates were obtained from the software program
MARK (available at http://genetics.forestry.ubc.ca/
ritland/programs.html) and calculated as f_
~P
i,l (Sil{p2
il
pil)/
Pl (nl{1), where i and l represent alleles and loci,
respectively; Sil equals 1 if both alleles are allele i or 0
otherwise, Pil is the frequency of allele i at locus l and nl
denotes the number of alleles at locus l [58]. This unbiased
Figure 2. Correlation matrix between multi-locus (a) heterozygosity-based indices (MLH, HL and IR; see text for details) and (b)genetic diversity indices (MLH, d2 and f
__
).doi:10.1371/journal.pone.0021569.g002
Heterozygosity and Developmental Stability
PLoS ONE | www.plosone.org 4 July 2011 | Volume 6 | Issue 7 | e21569

method-of-moment estimator is thought to be particularly
useful for highly variable markers since precision of the
estimate is proportional to the number of alleles per locus
[64].
(iii) Mean squared distances between two alleles within an
individual were calculated as mean d2~Pn
i~1
i1{i2ð Þ2
n, where
i1 and i2 are the length in repeat units of allele 1 and allele 2
at locus i and n is the number of loci analyzed. By dividing
all d2 values by the maximum observed value at that locus,
effects of highly variable loci were accounted for [63,65].
This estimator is thought to allow inference about the time
since coalescence of two alleles, given that alleles of more
similar length are more likely related by common ancestry
[60,65] and has proven to be a valuable measure in the
event of recent admixture of highly differentiated popula-
tions and superior fitness of hybrid descendant due to
heterosis. Under such conditions, d2 is hypothesized to be
the most optimal fitness predictor asit integrates the
migration signature into its estimate [65], unlike the other
heterozygosity-based indices.
To test whether the number of genetic markers used in our
study was sufficient to make valid inferences on genome-wide
heterozygosity, we divided our marker set in two random subsets
and calculated individual multilocus heterozygosity indices for
each subset with the program Rhh [61]. In order to make the
claim of genome-wide heterozygosity tenable, both subsets should
yield comparable estimates of individual multilocus heterozygosity.
Hence, individual multilocus heterozygosity estimates should be
positively correlated and this procedure was repeated 1000 times
to obtain confidence intervals for mean heterozygosity-heterozy-
gosity correlations.
Statistical analysisWe used Pearson correlation coefficients to quantify the
strength of associations between d2, MLH and f_
, and general
linear models with Gaussian error structure to study between-plot
variation in genetic diversity and relationships with tarsus FA.
Observer was added as a covariate to account for possible
confounding effects of between-observer heterogeneity and
analyses were tested at two hierarchical levels: among individuals
and among populations (using mean values). Individual-based
analyses were conducted in two ways. First, associations between
FA and genetic diversity were estimated for each population using
an ANCOVA model (population, genetic diversity and their
interaction were modelled as fixed factors). An average within-
population effect was estimated using a contrast statement.
Second, individuals were pooled across all populations. While in
the former model differences between populations are ignored,
results from the latter model should resemble those of the
population-level analysis if strong population effects are present.
Initially, models were run for all markers combined (genome-wide
effects). Next, the procedure was repeated per locus (unstandard-
ized heterozygosity and d2 estimates) and the relationship between
genetic variability and strength, measured as total variance
explained, of these (single-locus) genotype-FA associations was
assessed. Positive Spearman rank correlation coefficients imply
that more heterozygous markers are more informative [23].
Finally, we applied a general linear mixed model to test whether
associations between FA and genetic diversity varied with
urbanization. Genetic diversity, urbanization, their interaction
and bird bander were included as fixed factors Study plot and the
interaction with each index of genetic variation were modelled as
random effects. Degrees of freedom were estimated by Sat-
terthwaite formulas to account for statistical dependence [66]. Per
multi-locus genetic diversity index a sequential Bonferroni
correction [67] was applied to account for multiple comparisons.
All statistical analyses were performed with program SAS (version
9.2., SAS Institute 2008, Cary, NC, USA).
Results
Genetic diversityAll loci were highly polymorphic and most locus by population
combinations were in Hardy-Weinberg equilibrium, yet some
deviations reached significance after Bonferroni correction (three
populations for Pdo47, two populations for Pdom5 and one for
respectively Pdo9, Pdo32 and TG13-017). There was no evidence
that scoring errors due to large allele drop-out or stutter
contributed to this nonequilibrium. To ascertain these deviations
did not influence our results we ran all analyses with and without
these five markers. Removing these loci did not alter any of the
overall conclusions, hence only results based on the total dataset
are reported. There was no evidence for linkage disequilibrium
between any pair of loci. Standard statistics for each marker are
presented in Table 1. Estimates of genetic diversity were
significantly correlated at the individual level, most strongly
between f_
and MLH ( f_
-MLH: r = 20.77, p,0.001; d2-MLH:
r = 0.52, p,0.001; d2-f_
: r = 20.40, p,0.001) (Figure 2b). MLH
was a weak predictor of genome-wide heterozygosity as indepen-
dent random sets of loci resulted in a low (but significant) positive
heterozygosity-heterozygosity correlations (mean r = 0.16, 95%
CI = [0.10–0.22]). MLH and f_
significantly varied among
populations (resp. F25,502 = 2.35, p = 0.0003 and F25,502 = 2.00,
p = 0.0031) while d2 showed a near-significant trend
(F25,502 = 1.52, p = 0.053).
Table 1. Locus specific descriptive statistics for 16microsatellite markers.
Locus N NA Ho He fnull
TG01-040 537 6 0.40 0.44 0.028 (0.01)
TG01-148 486 3 0.42 0.38 20.023 (0.02)
TG04-012 549 5 0.53 0.59 0.039 (0.016)
TG07-022 493 5 0.37 0.41 0.026 (0.012)
TG13-017 547 8 0.52 0.64 0.074 (0.015)
TG22-001 478 11 0.34 0.41 0.054 (0.013)
Pdom1 550 20 0.80 0.85 0.024 (0.009)
Pdom3 515 19 0.83 0.85 0.015 (0.007)
Pdom5 523 22 0.76 0.82 0.033 (0.011)
Pdo9 442 31 0.65 0.75 0.052 (0.013)
Pdo10 596 18 0.78 0.82 0.021 (0.011)
Pdo16 549 17 0.81 0.84 0.016 (0.01)
Pdo19 573 9 0.60 0.62 0.008 (0.011)
Pdo22 578 16 0.73 0.72 20.005 (0.011)
Pdo32 491 20 0.59 0.75 0.093 (0.015)
Pdo47 562 17 0.68 0.83 0.078 (0.013)
Number of individuals genotyped (N), number of distinct alleles per locus (NA),observed (Ho) and expected (He) heterozygosity and null allele frequency (fnull).doi:10.1371/journal.pone.0021569.t001
Heterozygosity and Developmental Stability
PLoS ONE | www.plosone.org 5 July 2011 | Volume 6 | Issue 7 | e21569

Multi-locus association between FA and genetic diversityGenetic diversity estimated by MLH and f
_
was significantly
associated with tarsus FA modeled across all individuals. Highly
homozygous individuals showed higher levels of FA compared to
more heterozygous ones. However, MLH and f_
explained only
little variation in FA (MLH: F1,517 = 6.59, p = 0.01, R2 = 0.049; f_
:
F1,517 = 4.70, p = 0.03, R2 = 0.046) (Table 2). When tested in each
population separately, a similar (non-significant) trend occurred
(MLH: F1,467 = 1.73, p = 0.19; f_
: F1, 467 = 0.70, p = 0.40). As
opposed to the weak associations measured at the individual level,
mean values of MLH and f_
were strongly associated with mean
levels of FA across all populations (MLH: F1,24 = 12.31, p = 0.001,
R2 = 0.34; f_
: F1,24 = 7.88, p = 0.009, R2 = 0.25) (Figure 3; Table 2).
In contrast, d2 was not correlated with FA at the individual nor
population level (all p.0.15).
Single-locus association between FA and geneticdiversity
Single-locus effects at the individual level were in concordance
with those based on multiple loci, i.e. individual genotypes failed to
explain variation in FA at each locus (all R2#0.06). When
analyzing each microsatellite locus separately, the association
between heterozygosity and FA at population level was strongest at
loci Pdom1, Pdo16 and TG04-012, whereas mean differences in
allelic size were strongest at locus Pdo16. After sequential
Bonferroni correction for multiple testing, the association at locus
Pdom1 remained significant (Table 3). As all loci were in linkage
equilibrium and heterozygosity-heterozygosity correlations were
low, FA was modeled as a multiple regression with mean
heterozygosity at each locus as independent variable. A model
with all loci explained 85% of the variance in FA, whereas 43% of
the variance was explained by a model with locus Pdom1 only, and
53% by a model with loci Pdom1 and Pdo16 only. After removing
one or both loci, FA-MLH relationships remained significant
(Pdom1 removed: F1,24 = 9.97, p = 0.0043, R2MLH = 0.29 ;
Pdom1+Pdo16 removed: F1,24 = 6.94, p = 0.015, R2MLH = 0.22).
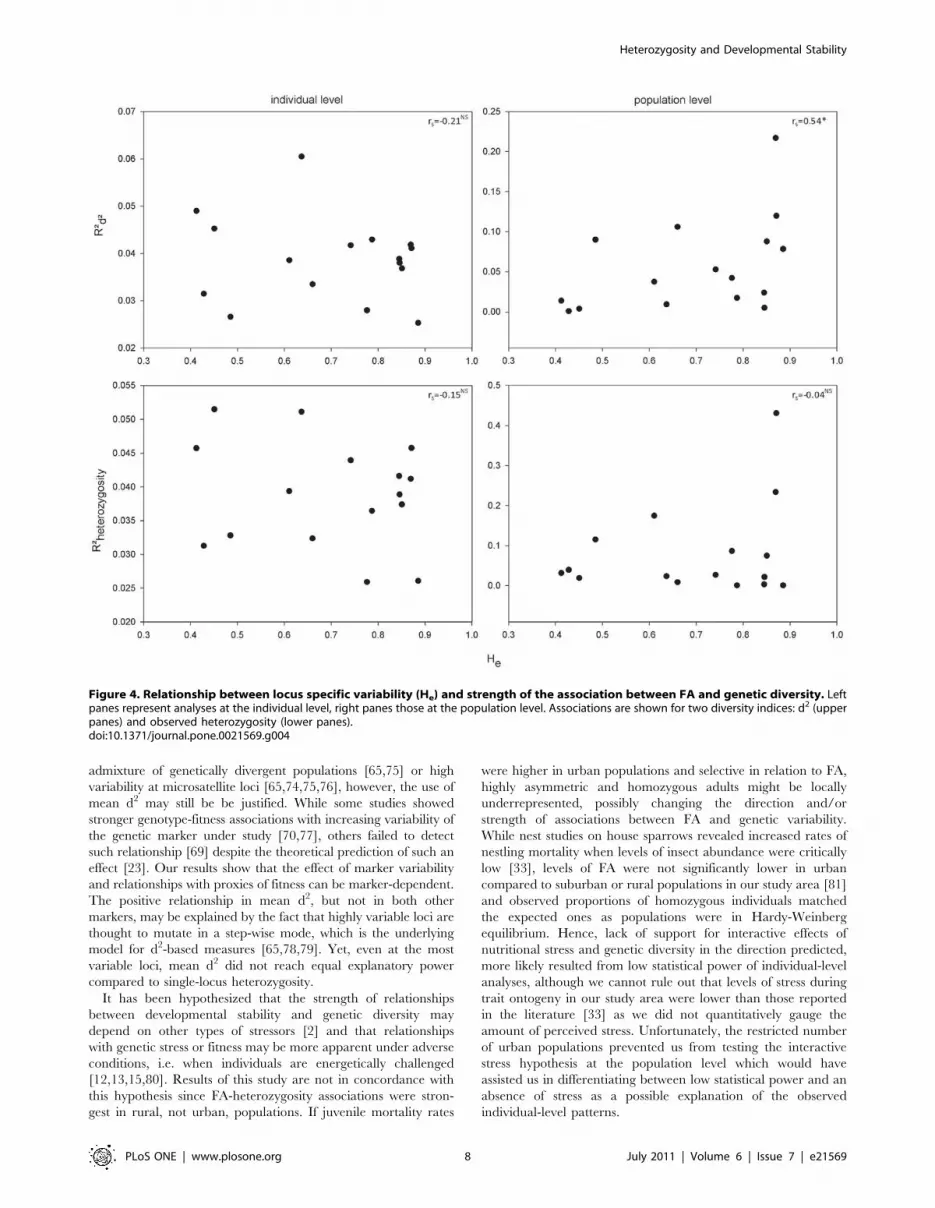
The strength of single-locus FA-d2 relationships (16 loci) were
positively correlated with expected heterozygosity at population
level (rs = 0.54, p = 0.03) but not at individual level (rs = 20.21,
p = 0.43). In contrast, FA-MLH relationships did not significantly
vary with genetic diversity (all p.0.58) (Figure 4).
Effects of urbanization on FA- genotype relationshipsThe strength of FA-MLH relationships tested at the individual
level significantly varied with urbanization (F2,513 = 4.25, p = 0.01):
both variables were inversely related in rural populations
(t513 = 23.73, p = 0.002), but unrelated in urban (t513 = 20.45,
p = 0.65) and suburban (t513 = 0.95, p = 0.34) ones. In contrast, the
strength and direction of FA- f_
(F2,41.6 = 0.79, p = 0.46) and FA-d2
(F2,507 = 2.05, p = 0.13) relationships did not vary with urbaniza-
tion.
Discussion
Estimates of genetic diversity and developmental stability,
averaged across individuals, significantly co-varied in the direction
expected by developmental theory, whereas individual estimates
were only weakly associated. Both genome-wide and locus-specific
estimates of genetic diversity strongly correlated with develop-
mental stability at the population level, and this correlation was
mainly driven by genetic variation at two key loci only.
Whether relationships between developmental stability and genetic
variability are driven by genome-wide heterozygosity or local effect of
key loci, remains a topic of much debate [7,9]. Relationships between
proxies of developmental stability and genetic variability have
typically been based on limited numbers of loci only, which were
implicitly assumed to represent genome-wide properties. Such
assumption, however, is only justified when repeated random subsets
of markers give rise to strong heterozygosity-heterozygosity correla-
tions [61], and this premise is often violated in randomly mating
populations [61,68,69]. As levels of heterozygosity among markers
within individuals were only moderately correlated in this study, our
Figure 3. Inverse relationship between standardized multilocus heterozygosity and fluctuating asymmetry across 26 housesparrow populations.doi:10.1371/journal.pone.0021569.g003
Heterozygosity and Developmental Stability
PLoS ONE | www.plosone.org 6 July 2011 | Volume 6 | Issue 7 | e21569

results do not fully support the role of genome-wide heterozygosity
underlying relationships with developmental stability. Rather, single-
locus effects at a few key loci, such as Pdom1, are more likely to drive
these relationships.
Recent studies challenged the view that high levels of linkage
disequilibrium are uncommon in natural populations, especially in
small, bottlenecked or recently-mixed populations [70,71,72]. In
addition, the selection of markers in genetic studies may be biased
if based on the criterion of maximum variability [37], resulting in a
slight overrepresentation of genes under balancing selection that
retain enhanced levels of gene diversity due to heterosis. In our
study, both markers that showed the strongest single-locus effects
on developmental stability also displayed very high levels of
heterozygosity. Likewise, fitness traits responded most strongly to
the genetic constitution of the four most variable loci in a study on
Acrocephalus arundinaceus [70]. Despite the fact that results from our
study provide strong evidence for single-locus effects, genome-wide
effects cannot entirely be ruled out as associations between FA and
MLH persisted after removal of the two presumed key loci.
Unlike MLH and Ritland estimates, mean d2 only weakly
predicted patterns in developmental stability at the population
level. Results from this study hence support the conclusion that
heterozygosity-based measures usually outperform those based on
allelic distances like d2 to estimate inbreeding [73] and the
negative appraisal of the use of squared distances between alleles
to model relationships with fitness or its proxies [74]. Under recent
Table 2. Relationship between fluctuating asymmetry and three multi-locus genetic diversity estimates at three hierarchical levelsof statistical analysis.
d2 MLH Ritland estimates
slope(SE) F
num,den p R2
slope(SE) F
num,den p R2
slope(SE) F
num,den p R2
Individual level acrossall individuals
21.20(0.83)
2.11 1, 517 0.15 0.041 20.49(0.19)
6.59 1, 517 0.01 0.049 0.63(0.29)
4.70 1, 517 0.03 0.046
Individual levelwithin population
21.02(0.94)
1.18 1, 467 0.28 2 20.30(0.23)
1.73 1, 467 0.19 2 0.33(0.39)
0.70 1, 467 0.40 2
Population level 23.93(3.12)
1.59 1, 24 0.22 0.062 21.88(0.54)
12.31 1, 24 0.001 0.339 2.18(0.78)
7.88 1, 24 0.009 0.247
Significant tests are indicated in bold.F = F-test, num,den = numerator and denumerator degrees of freedom, R2 = amount of variation in FA explained by heterozygosity.doi:10.1371/journal.pone.0021569.t002
Table 3. Relationship between fluctuating asymmetry and single-locus genetic diversity at the individual (across all individuals)and population level.
Individual level analysis Population level analysis
d2 heterozygosity d2 heterozygosity
Locus He Fnum,den p R2 F
num,den p R2 F
num,den p R2 F
num,den p R2
TG01-040 0.45 3.53 1, 495 0.06 0.045 6.8 1, 495 0.01 0.051 0.09 1, 24 0.76 0.004 0.47 1, 24 0.50 0.019
TG01-148 0.41 3.05 1, 374 0.08 0.049 1.77 1, 374 0.18 0.046 0.34 1, 24 0.57 0.014 0.78 1, 24 0.38 0.032
TG04-012 0.61 0.09 1, 474 0.77 0.039 0.48 1, 474 0.49 0.039 0.93 1, 24 0.34 0.037 5.09 1, 24 0.03 0.175
TG07-022 0.43 0.29 1, 433 0.59 0.031 0.21 1, 433 0.65 0.031 0.02 1, 24 0.90 0.001 0.99 1, 24 0.33 0.040
TG13-017 0.66 0.91 1, 469 0.34 0.033 0.38 1, 469 0.54 0.032 2.85 1, 24 0.10 0.106 0.21 1, 24 0.65 0.009
TG22-001 0.49 0.04 1, 369 0.84 0.027 2.4 1, 369 0.12 0.033 2.38 1, 24 0.14 0.090 3.13 1, 24 0.09 0.115
Pdom1 0.87 0.46 1, 495 0.50 0.041 2.86 1, 495 0.09 0.046 3.26 1, 24 0.08 0.120 18.17 1, 24 0.001 0.431
Pdom3 0.89 0.22 1, 400 0.64 0.025 0.55 1, 400 0.46 0.026 2.04 1, 24 0.17 0.078 0.02 1, 24 0.88 0.001
Pdom5 0.85 0.71 1, 442 0.40 0.038 1.1 1, 442 0.29 0.039 0.12 1, 24 0.73 0.005 0.53 1, 24 0.47 0.022
Pdo9 0.79 3.15 1, 378 0.08 0.043 0.62 1, 378 0.43 0.036 0.42 1, 24 0.52 0.017 0.01 1, 24 0.96 0.001
Pdo10 0.84 0.14 1, 477 0.71 0.039 1.51 1, 477 0.22 0.042 0.59 1, 24 0.45 0.024 0.08 1, 24 0.78 0.003
Pdo16 0.87 0.35 1, 482 0.56 0.042 0.02 1, 482 0.88 0.041 6.65 1, 24 0.02 0.217 7.33 1, 24 0.01 0.234
Pdo19 0.64 10.81 1, 481 0.001 0.060 6.01 1, 481 0.01 0.051 0.23 1, 24 0.64 0.009 0.58 1, 24 0.45 0.024
Pdo22 0.74 0.04 1, 500 0.84 0.042 1.19 1, 500 0.27 0.044 1.34 1, 24 0.26 0.053 0.67 1, 24 0.42 0.027
Pdo32 0.78 1.01 1, 446 0.31 0.028 0.08 1, 446 0.78 0.026 1.06 1, 24 0.31 0.042 2.28 1, 24 0.14 0.087
Pdo47 0.85 0.5 1, 476 0.48 0.037 0.78 1, 476 0.38 0.037 2.31 1, 24 0.14 0.088 1.95 1, 24 0.18 0.075
Statistical significance levels before (bold) and after (underlined) Bonferroni correction for multiple tests refer to a critical alpha-value of 0.05.F = F-test, num,den = numerator and denumerator degrees of freedom, R2 = amount of variation in FA explained by heterozygosity.doi:10.1371/journal.pone.0021569.t003
Heterozygosity and Developmental Stability
PLoS ONE | www.plosone.org 7 July 2011 | Volume 6 | Issue 7 | e21569
admixture of genetically divergent populations [65,75] or high
variability at microsatellite loci [65,74,75,76], however, the use of
mean d2 may still be be justified. While some studies showed
stronger genotype-fitness associations with increasing variability of
the genetic marker under study [70,77], others failed to detect
such relationship [69] despite the theoretical prediction of such an
effect [23]. Our results show that the effect of marker variability
and relationships with proxies of fitness can be marker-dependent.
The positive relationship in mean d2, but not in both other
markers, may be explained by the fact that highly variable loci are
thought to mutate in a step-wise mode, which is the underlying
model for d2-based measures [65,78,79]. Yet, even at the most
variable loci, mean d2 did not reach equal explanatory power
compared to single-locus heterozygosity.
It has been hypothesized that the strength of relationships
between developmental stability and genetic diversity may
depend on other types of stressors [2] and that relationships
with genetic stress or fitness may be more apparent under adverse
conditions, i.e. when individuals are energetically challenged
[12,13,15,80]. Results of this study are not in concordance with
this hypothesis since FA-heterozygosity associations were stron-
gest in rural, not urban, populations. If juvenile mortality rates
were higher in urban populations and selective in relation to FA,
highly asymmetric and homozygous adults might be locally
underrepresented, possibly changing the direction and/or
strength of associations between FA and genetic variability.
While nest studies on house sparrows revealed increased rates of
nestling mortality when levels of insect abundance were critically
low [33], levels of FA were not significantly lower in urban
compared to suburban or rural populations in our study area [81]
and observed proportions of homozygous individuals matched
the expected ones as populations were in Hardy-Weinberg
equilibrium. Hence, lack of support for interactive effects of
nutritional stress and genetic diversity in the direction predicted,
more likely resulted from low statistical power of individual-level
analyses, although we cannot rule out that levels of stress during
trait ontogeny in our study area were lower than those reported
in the literature [33] as we did not quantitatively gauge the
amount of perceived stress. Unfortunately, the restricted number
of urban populations prevented us from testing the interactive
stress hypothesis at the population level which would have
assisted us in differentiating between low statistical power and an
absence of stress as a possible explanation of the observed
individual-level patterns.
Figure 4. Relationship between locus specific variability (He) and strength of the association between FA and genetic diversity. Leftpanes represent analyses at the individual level, right panes those at the population level. Associations are shown for two diversity indices: d2 (upperpanes) and observed heterozygosity (lower panes).doi:10.1371/journal.pone.0021569.g004
Heterozygosity and Developmental Stability
PLoS ONE | www.plosone.org 8 July 2011 | Volume 6 | Issue 7 | e21569

In conclusion, results of this study provide strong evidence that
relationships between developmental stability and heterozygosity
can be driven by local effects at a few key loci, possibly in synergy
with genome-wide effects, the relative contribution of which may
depend on relative frequencies and fitness effects of deleterious
genes [23]. Despite the fact that local linkage disequilibrium with
key loci is regarded as the most promising mechanism to explain
associations between developmental stability and heterozygosity,
empirical support for the local effect hypothesis remains scant.
Further research is therefore needed to unravel the relative effects
of single-locus and genome-wide processes on developmental
stability of populations with different genetic properties. While
developmental stability earlier proved to be weakly associated with
nutritional stress [81], relationships with heterozygosity appear
stronger at the population level, irrespective of the underlying
genetic basis. This study emphasizes again that the accuracy of
developmental stability as a proxy for heterozygosity at the
individual level remains low and the application of individual FA
estimates in general should be abandoned.
Supporting Information
Table S1 Details of the 16 microsatellites used in thisstudy, their location on the zebra finch (Taeniopygiaguttata) genome and the position of the nearest knownzebra finch gene.(PDF)
Acknowledgments
We are indebted to H. Matheve, T. Cammaer and C. Nuyens for field
assistance and A. Krupa and G. Horsburgh for laboratory assistance. We
thank Terry Burke for supporting this work and helpful discussions. We are
greatful to two anonymous reviewers for providing helpful comments that
greatly improved the manuscript.
Author Contributions
Conceived and designed the experiments: CV JM DAD LL. Performed the
experiments: CV DAD VV. Analyzed the data: CV JM LL. Contributed
reagents/materials/analysis tools: CV VV. Wrote the paper: CV JM DAD
VV LL. Prepared figures and tables: CV VV. Editorial review: CV LL.
References
1. Polak M (2003) Developmental instability: Causes and consequences. Oxford:
Oxford University Press.
2. Lens L, Van Dongen S, Kark S, Matthysen E (2002) Fluctuating asymmetry asan indicator of fitness: can we bridge the gap between studies? Biol Rev 77:
27–38.
3. Graham JH, Raz S, Hel-Or H, Nevo E (2010) Fluctuating asymmetry: methods,theory and applications. Symmetry 2: 466–540.
4. Breuker C, Debat V, K CP (2006) Functional evo-devo. Tends Ecol Evol 21:
488–492.
5. Badyaev AV, Foresman KR (2000) Extreme environmental change andevolution: stress-induced morphological variation is strongly concordant with
patterns of evolutionary divergence in shrew mandibles. Proc R Soc Lond B BiolSci 267: 371–377.
6. Ludwig W (1932) Das rechts-links-problem im tierreich und beim menschen.
Berlin, Heidelberg, New York: Springer.
7. Markow TA (1995) Evolutionary ecology and developmental instability. AnnuRev Entomol 40: 105–120.
8. Mitton JB (1993) Enzyme heterozygosity, metabolism and developmental
stability. Genetica 89: 47–65.
9. Clarke GM (1993) The genetic-basis of developmental stability. I. relationshipsbetween stability, heterozygosity and genomic coadaptation. Genetica 89:
15–23.
10. Vollestad LA, Hindar K, Moller AP (1999) A meta-analysis of fluctuatingasymmetry in relation to heterozygosity. Heredity 83: 206–218.
11. Palmer AR, Strobeck C (1986) Fluctuating asymmetry - measurement, analysis,
patterns. Annu Rev Ecol Syst 17: 391–421.
12. Mulvey M, Keller GP, Meffe GK (1994) Single-locus and multiple-locusgenotypes and life-history responses of Gambusia-holbrooki reared at 2 tempera-
tures. Evolution 48: 1810–1819.
13. Lens L, Van Dongen S, Galbusera P, Schenck T, Matthysen E (2000)Developmental instability and inbreeding in natural bird populations exposed to
different levels of habitat disturbance. J Evol Biol 13: 889–896.
14. Siikamaki P, Lammi A (1998) Fluctuating asymmetry in central and marginalpopulations of Lychnis viscaria in relation to genetic and environmental factors.
Evolution 52: 1285–1292.
15. Talloen W, Lens L, Van Dongen S, Adriaensen F, Matthysen E (2010) Mildstress during development affects the phenotype of great tit Parus major
nestlings: a challenge experiment. Biol J Linn Soc 100: 103–110.
16. David P (1998) Heterozygosity-fitness correlations: new perspectives on oldproblems. Heredity 80: 531–537.
17. Hansson B, Westerberg L (2002) On the correlation between heterozygosity and
fitness in natural populations. Mol Ecol 11: 2467–2474.
18. Pertoldi C, Kristensen TN, Andersen DH, Loeschcke V (2006) Developmentalinstability as an estimator of genetic stress. Heredity 96: 122–127.
19. Parsons PA (1990) Fluctuating asymmetry - an epigenetic measure of stress. Biol
Rev Camb Philos Soc 65: 131–145.
20. Lerner IM (1954) Genetic Homeostasis. Olivier and Boyd, Edinburgh.
21. Mitton JB (1997) Selection in Natural Populations. Oxford: Oxford University
Press.
22. Chapman JR, Nakagawa S, Coltman DW, Slate J, Sheldon BC (2009) Aquantitative review of heterozygosity-fitness correlations in animal populations.
Mol Ecol 18: 2746–2765.
23. Zouros E (1993) Associative overdominance - evaluating the effects of inbreedingand linkage disequilibrium. Genetica 89: 35–46.
24. Leary RF, Allendorf FW, Knudsen KL (1993) Null alleles at 2 lactate-dehydrogenase loci in rainbow-trout are associated with decreased developmen-
tal stability. Genetica 89: 3–13.
25. Clarke GM (1997) The genetic and molecular basis of developmental stability:the Lucilia story. Trends Ecol Evol 12: 89–91.
26. Clarke GM, Yen JL, McKenzie JA (2000) Wings and bristles: character
specificity of the asymmetry phenotype in insecticide-resistant strains of Lucilia
cuprina. Proc R Soc Lond B Biol Sci 267: 1815–1818.
27. Takahashi KH, Rako L, Takano-Shimizu T, Hoffman AA, Lee SF (2010)
Effects of small Hsp genes on developmental stability and microenvironmentalcanalization. BMC Evol Biol 10: 284. Doi: 10.1186/1471-2148-10-284.
28. Sangster TA, Bahrami A, Wilczek A, Watanabe E, Schellenberg K, et al. (2007)
Phenotypic diversity and altered environmental plasticity in Arabidopsis thaliana
with reduced Hsp90 Levels. Plos One 2: 15.
29. Kruuk LEB, Sheldon BC, Merila J (2002) Severe inbreeding depression in
collared flycatchers (Ficedula Albicollis). Proc R Soc Lond B Biol Sci 269:
1581–1589.
30. Borrell YJ, Pineda H, McCarthy I, Vazquez E, Sanchez JA, et al. (2004)
Correlations between fitness and heterozygosity at allozyme and microsatellite
loci in the Atlantic salmon, Salmo salar L. Heredity 92: 585–593.
31. Zachos FE, Hartl GB, Suchentrunk F (2007) Fluctuating asymmetry and genetic
variability in the roe deer (Capreolus capreolus): a test of the developmental stability
hypothesis in mammals using neutral molecular markers. Heredity 98: 392–400.
32. Liker A, Papp Z, Bokony V, Lendvai AZ (2008) Lean birds in the city: body size
and condition of house sparrows along the urbanization gradient. J Anim Ecol
77: 789–795.
33. Peach WJ, Vincent KE, Fowler JA, Grice PV (2008) Reproductive success of
house sparrows along an urban gradient. Anim Conserv 11: 493–503.
34. Vangestel C, Braeckman BP, Matheve H, Lens L (2010) Constraints on homerange behaviour affect nutritional condition in urban house sparrows (Passer
domesticus). Biol J Linn Soc 101: 41–50.
35. Van Dongen S (1998) The distribution of individual fluctuating asymmetry: Whyare the coefficients of variation of the unsigned FA so high? Ann Zool Fenn 35:
79–85.
36. Whitlock M (1998) The repeatability of fluctuating asymmetry: a revision andextension. Proc R Soc Lond B Biol Sci 265: 1429–1431.
37. Balloux F, Amos W, Coulson T (2004) Does heterozygosity estimate inbreeding
in real populations? Mol Ecol 13: 3021–3031.
38. Moller AP, Jennions MD (2002) How much variance can be explained by
ecologists and evolutionary biologists? Oecologia 132: 492–500.
39. Hartl GB, Suchentrunk F, Willing R, Petznek R (1995) Allozyme heterozygosityand fluctuating asymmetry in the brown hare (Lepus europaeus): A test of the
developmental homeostasis hypothesis. Philos Trans R Soc Lond B Biol Sci 350:
313–323.
40. Karvonen E, Merila J, Rintamaki PT, van Dongen S (2003) Geography of
fluctuating asymmetry in the greenfinch, Carduelis chloris. Oikos 100: 507–516.
41. Van Dongen S, Molenberghs G, Matthysen E (1999) The statistical analysis offluctuating asymmetry: REML estimation of a mixed regression model. J Evol
Biol 12: 94–102.
42. Verbeke G, Molenberghs G (2000) Linear mixed models for longitudinal data.New York: Springer-Verlag.
43. Knierim U, Van Dongen S, Forkman B, Tuyttens FAM, Spinka M, et al. (2007)
Fluctuating asymmetry as an animal welfare indicator - A review of methodologyand validity. Physiol Behav 92: 398–421.
Heterozygosity and Developmental Stability
PLoS ONE | www.plosone.org 9 July 2011 | Volume 6 | Issue 7 | e21569
44. Walsh PS, Metzger DA, Higuchi R (1991) Chelex-100 as a medium for simple
extraction of dna for pcr-based typing from forensic material. BioTechniques 10:506–513.
45. Neumann K, Wetton JH (1996) Highly polymorphic microsatellites in the house
sparrow Passer domesticus. Mol Ecol 5: 307–309.46. Dawson DA, Horsburgh GJ, Krupa A, Stewart IRK, Skjelseth S, et al. A
predicted microsatellite map of the house sparrow Passer domesticus genome. (Re-submitted to Mol Ecol Resour) (In preparation).
47. Dawson DA, Horsburgh GJ, Kupper C, Stewart IRK, Ball AD, et al. (2010)
New methods to identify conserved microsatellite loci and develop primer sets ofhigh cross-species utility - as demonstrated for birds. Mol Ecol Resour 10:
475–494.48. Griffith SC, Dawson DA, Jensen H, Ockendon N, Greig C, et al. (2007)
Fourteen polymorphic microsatellite loci characterized in the house sparrowPasser domesticus (Passeridae, Aves). Mol Ecol Notes 7: 333–336.
49. Dakin EE, Avise JC (2004) Microsatellite null alleles in parentage analysis.
Heredity 93: 504–509.50. Gebhardt KJ, Waits LP (2008) High error rates for avian molecular sex
identification primer sets applied to molted feathers. J Field Ornithol 79:286–292.
51. Van Oosterhout C, Hutchinson WF, Wills DPM, Shipley P (2004) Micro-
checker: software for identifying and correcting genotyping errors in microsat-ellite data. Mol Ecol Notes 4: 535–538.
52. Brookfield JFY (1996) A simple new method for estimating null allele frequencyfrom heterozygote deficiency. Mol Ecol 5: 453–455.
53. Rousset F (2008) Genepop ’ 007: a complete re-implementation of the Genepopsoftware for Windows and Linux. Mol Ecol Resour 8: 103–106.
54. Raymond M, Rousset F (1995) GENEPOP (Version -1.2) - population-genetics
software for exact tests and ecumenicism. J Hered 86: 248–249.55. Nei M (1978) Estimation of average heterozygosity and genetic distance from a
small number of individuals. Genetics 89: 583–590.56. Goudet J (1995) FSTAT (Version 1.2): A computer program to calculate F-
statistics. J Hered 86: 485–486.
57. Coltman DW, Pilkington JG, Smith JA, Pemberton JM (1999) Parasite-mediatedselection against inbred Soay sheep in a free-living, island population. Evolution
53: 1259–1267.58. Ritland K (1996) Estimators for pairwise relatedness and individual inbreeding
coefficients. Genet Res 67: 175–185.59. Coulson T, Albon S, Slate J, Pemberton J (1999) Microsatellite loci reveal sex-
dependent responses to inbreeding and outbreeding in red deer calves. Evolution
53: 1951–1960.60. Pemberton JM, Coltman DW, Coulson TN, Slate J (1999) Using microsatellites
to measure fitness consequences of inbreeding and outbreeding. In: Microsatellites
Evolution and Applications, Goldstein DB, Schlotterer C, eds., Oxford: Oxford
University Press. pp 151–164.
61. Alho JS, Valimaki K, Merila J (2010) Rhh: an R extension for estimatingmultilocus heterozygosity and heterozygosity-heterozygosity correlation. Mol
Ecol Resour.
62. Aparicio JM, Ortego J, Cordero PJ (2006) What should we weigh to estimate
heterozygosity, alleles or loci? Mol Ecol 15: 4659–4665.63. Amos W, Wilmer JW, Fullard K, Burg TM, Croxall JP, et al. (2001) The
influence of parental relatedness on reproductive success. Proc R Soc Lond B Biol
Sci 268: 2021–2027.64. Sweigart A, Karoly K, Jones A, Willis JH (1999) The distribution of individual
inbreeding coefficients and pairwise relatedness in a population of Mimulus
guttatus. Heredity 83: 625–632.
65. Hansson B (2010) The use (or misuse) of microsatellite allelic distances in the
context of inbreeding and conservation genetics. Mol Ecol 19: 1082–1090.66. Littell RC, Milliken WW, Stroup WW, Wolfinger RD (1996) SAS system for
mixed models. Cary, NC, USA: SAS Institute Inc.67. Rice WR (1989) Analyzing tables of statistical tests. Evolution 43: 223–225.
68. Chakraborty R (1981) The distribution of the number of heterozygous loci in anindividual in natural-populations. Genetics 98: 461–466.
69. Slate J, Pemberton JM (2002) Comparing molecular measures for detecting
inbreeding depression. J Evol Biol 15: 20–31.70. Hansson B, Westerdahl H, Hasselquist D, Akesson M, Bensch S (2004) Does
linkage disequilibrium generate heterozygosity-fitness correlations in great reedwarblers? Evolution 58: 870–879.
71. Reich DE, Cargill M, Bolk S, Ireland J, Sabeti PC, et al. (2001) Linkage
disequilibrium in the human genome. Nature 411: 199–204.72. McRae AF, McEwan JC, Dodds KG, Wilson T, Crawford AM, et al. (2002)
Linkage disequilibrium in domestic sheep. Genetics 160: 1113–1122.73. Coltman DW, Slate J (2003) Microsatellite measures of inbreeding: A meta-
analysis. Evolution 57: 971–983.74. Tsitrone A, Rousset F, David P (2001) Heterosis, marker mutational processes
and population inbreeding history. Genetics 159: 1845–1859.
75. Coulson TN, Pemberton JM, Albon SD, Beaumont M, Marshall TC, et al.(1998) Microsatellites reveal heterosis in red deer. Proc R Soc Lond B Biol Sci
265: 489–495.76. Kretzmann M, Mentzer L, DiGiovanni R, Leslie MS, Amato G (2006)
Microsatellite diversity and fitness in stranded juvenile harp seals (Phoca
groenlandica). J Hered 97: 555–560.77. Heath DD, Bryden CA, Shrimpton JM, Iwama GK, Kelly J, et al. (2002)
Relationships between heterozygosity, allelic distance (d2), and reproductivetraits in chinook salmon, Oncorhynchus tshawytscha. Can J Fish Aquat Sci 59:
77–84.78. Schlotterer C (2000) Evolutionary dynamics of microsatellite DNA. Chromo-
soma 109: 365–371.
79. Lai YL, Sun FZ (2003) The relationship between microsatellite slippagemutation rate and the number of repeat units. Mol Biol Evol 20: 2123–2131.
80. Kark S, Safriel UN, Tabarroni C, Randi E (2001) Relationship betweenheterozygosity and asymmetry: a test across the distribution range. Heredity 86:
119–127.
81. Vangestel C, Lens L (2011) Does fluctuating asymmetry constitute a sensitivebiomarker of nutritional stress in house sparrows (Passer domesticus)? Ecol Ind 11:
389–394.
Heterozygosity and Developmental Stability
PLoS ONE | www.plosone.org 10 July 2011 | Volume 6 | Issue 7 | e21569