primitive Angiosperm flower – a discussion - Natuurtijdschriften
Upload
khangminh22Category
view
0download
0
First Australian New Crops Conference 1996 – Volume 2
107
Development of Rice Flower (Ozothamnus diosmifolius ) as a Cut Flower Crop
Peter Beal1, Cynthia Carson1, Lois Turnbull1, Leif Forsberg1, and Jim Lewis2 1 QDPI, Redlands Research Station, PO Box 327, Cleveland Qld 4163 2 QDPI, 19 Hercules Street, Hamilton Qld 4007 Abstract Rice flower (Ozothamnus diosmifolius), an Australian native plant, was harvested for cut flowers from natural stands up to the late 1980s. Comprehensive research into marketing and cultivation of rice flower was conducted from 1992 to 1995. Marketing research established that the industry was based on 25,000 plants in the ground in 1992. Maturity standards for export rice flower were determined. The need to integrate efficient production with market strategies involving quality control, promotion and test marketing was acknowledged. Production research identified promising varieties (including two commercially available PBR varieties, ‘Cook’s Tall Pink’ and ‘Cook’s Snow White’, and QDPI variety ‘Redlands Sandra’) with an aggregate 3-6 weeks production season. A major opportunity for extending the production season to 10-12 weeks from existing germplasm was also identified. Agronomic requirements have been suggested, disease problems identified and tentative control measures suggested and aspects of harvesting and postharvest handling indicated. The results of these investigations have enhanced the opportunities for commercial development of this emerging industry. Introduction Ozothamnus diosmifolius syn. Helichrysum diosmifolium (rice flower), family Asteraceae, is a spring flowering perennial woody shrub occurring naturally in the eastern mainland states of Australia with colour forms ranging from white to dark pink. Rice flower has considerable potential for development as a cutflower crop as it is in demand on both the Australian and international markets. Until the late 1980s this flower was cut exclusively from natural stands. Early research to develop rice flower as a cut flower crop was conducted by Lacey (1989) and by pioneering growers (Graham and Esther Cook, pers. comm.). Information on handling of rice flower for export and marketing opportunities for growers, wholesalers and exporters was required. In addition, there was a need for information on the selection and use of superior cutflower forms, the most appropriate cultural requirements, disease problems and their control and postharvest treatment. These two areas of investigation, funded by Rural Industries Research and Development Corporation, were incorporated in the marketing project ‘Development of rice flower as a cut flower export industry’ and the production project ‘Development of rice flower as a cut flower crop’. This paper reports on the research undertaken in these projects from 1992 to 1995 to improve understanding of these marketing and production issues.

First Australian New Crops Conference 1996 – Volume 2
108
Marketing Research The potential of, and constraints to, both the domestic and export markets for rice flower were assessed through a survey (conducted by the Department of Primary Industries, Queensland) of growers, wholesalers and exporters conducted in September and October 1992. This was followed up by desktop research of overseas markets for flowers in December 1992 and January 1993. Also, quality standards for export stems of rice flower were developed in conjunction with growers and exporters. Supplementary market research, specific to rice flower, is in progress in countries identified by desktop research. The project aimed to develop an integrated management package for growers with a market-driven approach to production, emphasising export. The roles of each of the links of the export marketing chain from grower to overseas buyer have been examined for the main market. This has developed an understanding of the processes of and impediments to successful rice flower export. Industry Survey The 1992 RIRDC survey found that 94% of rice flower was grown for the export of fresh product. The remainder was sold on the domestic market as either fresh or dried product. Ninety percent of exported product was sent to Japan, with small quantities being tested in other markets. In 1995 Japan was still the primary market, however the quantities sold into the USA have increased. Exhibits of rice flower and other Australian native flowers, by the Flower Export Council of Australia (FECA) and Austrade in Asian flower shows, has lead to an increased interest and demand from new Asian buyers, in particular Taiwan and provincial Japan. Correctly harvested and treated dried or preserved rice flower exceeds the standard set by most other dried filler flowers marketed in Australia, and possibly the world. The development of treated product lines has been hindered by value-adding companies not matching fresh rice flower market prices. In 1992 25,000 rice flower plants were in the ground, with major expansion predicted. A RIRDC commissioned survey “The Australian Wildflower Industry - A Review”, in late 1993 estimated 45,000 rice flower plants in cultivation, with a further 33,000 intended for planting in 1994 (Karingal Consultants, 1994). This Australia-wide survey of all wildflower growers revealed 38 rice flower growers (total wildflower grower population 445), with 14 hectares of rice flower, representing 0.5% of Australian wildflower plantings (2,515 hectares including South African Proteaceae). Cultivated rice flower can be found in all states of Australia. Many growers have small experimental plots of only a few hundred plants. The harvests from these are often sold on the domestic market. In 1992 total rice flower production was estimated at 200,000 stems. In 1995 an estimated 500,000 stems were produced. This is well short of theoretical production figures due to a combination of poor varieties and grower practices leading to high levels of product wastage, high plant mortality and drought. The move into rice flower has been driven by the enthusiasm of various individuals and regional development/diversification groups scattered around the country. However, it is timely to now (1996) repeat the original survey to determine current industry status.

First Australian New Crops Conference 1996 – Volume 2
109
Product Characteristics and Standards Rice flower is suitable for use in both wildflower and conventional floral arrangements. Long distance transport is facilitated by an excellent product vase-life. Rice flower is positioned as a high value focal filler on the Japanese export market, which has had significant exposure to rice flower. The “rice” flower name, rice grain shape, and colour (white and green in combination and pink) are product attributes that are culturally valued by Japanese designers. Product is sold in 10 cm increments from 50 to 110 cm. Premium prices are paid for high quality material, long stems and pink flower heads. Long stemmed rice flower is suited to large public and foyer displays, shorter stems are used in a variety of modern arrangements and in traditional Ikebana. Very short offcuts are used at the base of floral arrangements. The Japanese market values clean distinct flower colours (clear whites and non-fading pinks), even maturity within the flower head with no “bypassing” (vegetative shoots) and strong straight stems. Clean green high density foliage is used as an indicator of product freshness. On the Australian market, the production season of rice flower (September-October) clashes with a glut of other filler flowers. The oversupply of substitute fillers and the exposure of east coast Australian markets to poor quality bush-harvested product has lowered the perceived value of the product in Australia. Similarly, rice flower is regarded as a general purpose filler in the USA market. The USA is a price sensitive market and substitution with cheaper filler occurs if the price is considered too high. Maturity and objective quality standards have been developed, primarily for export. These have been accepted by both FECA and Standards Australia. The standards incorporate flower, foliage and stem quality, harvest maturity (see Figure 1), uniformity of grading, accuracy in labelling and postharvest cooling. They are designed to provide a basis for Australian rice flower growers to meet customer requirements for quality and consistency.
Figure 1: Corymbs and capitula at three stages: 1(a) immature (wilted); 1(b) mature and 1(c) over-mature.
1(a) Immature (wilted)
1(b) Mature 1(c) Over-mature

First Australian New Crops Conference 1996 – Volume 2
110
Meeting the Market Customers seek quality, service and value for money from their suppliers. In the case of rice flower, quality encompasses the use of superior clonal forms, good vase life (supported by an efficient cool chain) and the implementation of the Australian Standard for grading and treating rice flower. The service dimension is a crucial and frequently neglected area, which is partially within the control of growers. It covers on time delivery, supplying to specification, accurate and complete documentation, the extended availability of product and the free flow of information. A grower has multiple “customers” in the marketing chain, each with their own perspective. Table 1 contains a hypothetical example from the Japanese marketing chain to illustrate this point. The challenge for producers is to broaden their outlook to consider the wider needs of their market and to be responsive to feedback. Each marketing chain has its own unique links and characteristics and will differ from the example. In a ideal system there would be a free flow of information on product quality, performance, quantity and price in both directions through the length of the chain. This would enable continual modifications to the supply, quality, timing, presentation and type of product to meet the changing requirements of the market. Table 1. Some sample viewpoints within an export marketing chain
Export Chain Example Viewpoint
Grower production, profit
Exporter quality, quantity and timing of production, profit
Overseas - Importer quality landed, customs clearance, dealing with documentation, profit
Overseas - Local Wholesaler predicting likely demand, product use, profit
Overseas - Retailer ease of handling (packaging and storage), profit
Overseas - Customer attractiveness, purpose of purchase, probable vase life, value for money
The Role of Exporters Unfortunately the reality is that most marketing chains are flawed and hampered by poor communication. Often the price received is the sole feedback to the grower. For this reason it is crucial that growers establish a rapport with a reputable exporter. Exporters are in a position to obtain overseas market intelligence, and provide information to growers on both production and postharvest practices. They aim to provide their customers with volume, continuity of supply, and product diversity by sourcing from a range of growers and localities. By working together exporters and growers can achieve the goal of supplying quality, consistent, well presented rice flower on time. This will engender buyer confidence, bringing the repeat sales that ultimately will build an industry. Strategic Issues

First Australian New Crops Conference 1996 – Volume 2
111
Strategic issues to be considered by rice flower growers as a group include: • the use of a range of superior clones, geographical locations and possibly preserved or dried
product to extend the (currently short) flowering season. • the development of a marketing strategy embracing;
⇒ test marketing into new Asian markets, identified from desk top research, particularly Taiwan, South Korea, Hong Kong / China, Singapore and provincial Japan
⇒ value-added rice flower (including dried, dyed, preserved and bleached product, souvenirs and crafts)
⇒ promotion to move rice flower from being a niche product based on its’ curiosity value, to a main stream world flower, with intrinsically useful floral characteristics.
Production Research Germplasm Evaluation Rice flower germplasm was collected from the wild, propagated clonally where possible, and evaluated in comparative trials with grower selections or standard genotypes on farms or research stations. Desirable genotypes were identified using criteria including high plant survival, high stem production per plant, high flowering stem quality including long vase life, extension of flowering season, flower colour etc. The collections of rice flower and related Asteraceae germplasm, made and/or evaluated in this project, represent a major resource for the rice flower industry. This germplasm is diverse in attributes relevant to commercial production, i.e., plant vigour and ability to survive in cultivation, productivity, flowering time (September to December), flower colour (white and a range of pinks) and of flower quality. The three clones, ‘Cook’s Tall Pink’, ‘Redlands Sandra’ and ‘Cook’s Snow White’, together can provide a 3 to 6 weeks harvest season. The commercial and experimental clones of rice flower currently held by growers and researchers allied to this emerging industry, have the potential to provide a 10 week harvest season in South East Queensland. Substantial extension of the harvest season, by the influence of location, particularly colder sites in different parts of Australia, is anticipated but is still to be properly defined. In the longer term, a 12-16 week harvest season seems possible if the potential for further genetic improvement is realised. Propagation Rice flower is generally routinely propagated by conventional cutting propagation techniques, stem cuttings producing roots within 5-8 weeks. Methods of clonal propagation including different media, fog and mist systems and different levels of rooting hormone were evaluated. Better strike rates were achieved when motherstock was healthy and vigorous, hormone treatment (2,000 ppm IBA in ethanol) was used, a high minimum relative humidity was constantly maintained and well drained propagation media was used. Tissue culture protocols may have to be developed for difficult to propagate genotypes. Growing Conditions

First Australian New Crops Conference 1996 – Volume 2
112
Comparison of different cultural practices included the use of supportive mesh, post planting and postharvest pruning and a range of intrarow spacings (i.e. 0.5, 0.75 and 1.0m). Trials with ‘Redlands Sandra’ at Redlands Research Station, Cleveland, Queensland, in well drained (mounded), fertile krasnozem soil, with adequate irrigation and planted at optimum intra-row spacings of 0.5-0.75m, resulted in yields of 30-43 marketable stems per plant in the first year of growth and 85-109 stems in year 2. At planting densities of 3,333-5,000 plants per ha, this cultivar has the potential to produce yields in the vicinity of 150,000 stems in year 1 and 400,000 in year 2. However, annual productivity of the rice flower crop is strongly determined by plant survival. This may be influenced by genotype, growing conditions, disease incidence and crop management. Diseases and Pests Plant losses in rice flower plantings, associated with a range of diseases and disorders, commonly range from 10-20% per year. Severe continuing losses (greater than 20%) can reduce economic life of a crop to three years or less. Measures to control these problems and reduce losses are therefore of great importance. Diseases and disorders affecting rice flower were identified as: phytophthora root and collar rot, a major problem at some but not all locations; white rot, a common problem at most locations; root-knot nematodes, causing major damage at many locations; and stem or wood damage caused by wind to which fast growing rice flower is particularly prone. Various fungal wood rot diseases usually follow any plant damage; longicorn borer damage and root congestion aggravate the above problems, all of which contribute to the early decline of plantings. Predisposing factors in the development of these diseases and disorders have been described and tentative measures for control recommended. Rice flower lines tolerant of Phytophthora (three species), have been identified. As yet no useful resistance to root rot nematode infection has been found in rice flower. Harvest and Post-harvest Techniques Preliminary investigations were conducted into earliest inflorescence maturity for harvest, the influence of vase solutions (including sucrose levels) on vase life and the value of cool storage on stem quality. Harvesting and postharvest handling practices to extend the harvest season and maintain stem quality have been identified. The present harvest maturity recommended to industry is when capitula are mature yet unbroken, the corymb is fully expanded and does not readily wilt after harvest. Flowering stems in some clones can be harvested at an earlier maturity (20-40% of capitula of full size) than presently specified. This has the potential to extend the commercial harvest of such clones by up to 10 days, much longer than the present 2-5 day harvest periods of some clones. Rice flower had at least 10 days vase life when held in 0% or 2% sucrose solution with 50ppm chlorine. Sucrose levels of 5% in vase solution were found detrimental to rice flower vase life. The benefits of removing field heat from rice flower stems immediately after harvesting and holding the commodity at around 2oC to avoid foliage blackening was shown in laboratory trials.
First Australian New Crops Conference 1996 – Volume 2
113
Conclusion Members of the emerging rice flower industry have been provided with over 20 relevant technical publications on the results from the production and marketing research projects (e.g. Beal et al. 1994, Carson et al. 1994). A comprehensive rice flower growing and marketing booklet for growers and members of the grower service sector is now being produced. A wider range of rice flower references are easily accessible from the Ornamental Crops database at ‘GrowSearch’, Redlands Research Station, Cleveland Q. Telephone: 07 3286 1488; Facsimile: 07 3821 3784. Further production and postharvest research on rice flower and related species is being undertaken in a new project by the authors together with Tony Slater and Rod Jones of Agriculture Victoria, Institute for Horticultural Development, Knoxfield, Victoria 3180. This project entitled ‘Development of new Asteraceae from the Australian flora to complement the current rice flower industry’ is funded by the Rural Industries Research and Development Corporation. Acknowledgments Funding from the Rural Industries Research and Development Corporation to undertake this marketing and production research, together with additional support from other members of industry including growers and exporters, is gratefully acknowledged. References Beal, P.R., Turnbull, L. and Forsberg, L. 1995. Development of rice flower (Ozothamnus diosmifolius
(Vent.) DC.) as a cut flower crop. Project DAQ127A Rural Industries Research and Development Corporation. Final Report, 120 pp.
Carson, C.J. and Lewis, J.R. 1994. Developing rice flower : Linking Production with Marketing.
Proceedings of Third National Workshop for Australian Native Flowers. University of Queensland, Gatton College, 8-10 February 1994.
Karingal Consultants for RIRDC, 1994. ‘The Australian Wildflower Industry - A Review’, Research
Paper No. 94/9, Australian Government Publishing Service, Canberra. Lacey, S. 1989. ‘Selection of Helichrysum diosmifolium for cut flower production’. Proceedings of
the WA Department of Agriculture Conference ‘The Production and Marketing of Australian Flowers’. Perth 13-14 July 1989.

First Australian New Crops Conference 1996 – Volume 2
114
Towards Improving Nerine Cut-Flower Yields Martin R. Blake1, P.H. Brown2 and R.K. Crowden1 1 Department of Plant Science, University of Tasmania, GPO Box 252C, Hobart, 7001 2 Department of Agricultural Scienc, University of Tasmania, GPO Box 252C, Hobart, 7001 Abstract There is significant potential for Nerine to be grown as a cut-flower crop in Tasmania and south-eastern Australia. However, unpredictable flowering in the genus limits its economic viability as a cut-flower crop. The commercial potential of the genus is summarised and aspects of Nerine physiology currently being investigated are discussed. Flower bud abortion is likely to be sink/source related and is being investigated by following dry-weight distributions, patterns of carbohydrate deposition and hydrolysis and growth regulator analysis. Preliminary findings are discussed which suggest complex patterns of carbohydrate movement within previous seasons leaf scales and current season foliage. Introduction The Nerine Genus Nerine spp. are bulbous monocots belonging to the Amaryllidaceae family. They are mostly Autumn flowering perennials indigenous to southern Africa (Huxley et al. 1992). There are four species predominant in modern cut-flower production. These are N. sarniensis (L.), N. bowdenii W. Watson, N. undulata and N. flexuosa Jacq. (van Brenk and Benschop 1993). Cultivars of N. bowdenii dominate production worldwide (Landon-Lane 1988, van Brenk and Benschop 1993) as they are typically the most amenable to the harsh winters of Europe due to their winter dormancy (Landon-Lane 1988). Nerine Production Nerine spp. first appeared in European gardens during the seventeenth century (Custers and Bergervoet 1992), although the genus was not utilised commercially until 1903 when N. bowdenii was introduced (van Brenk and Benschop 1993). In recent years production of Nerine cut-flowers has expanded in The Netherlands from 156,000 stems in 1960 to over 28 million in 1990 (van Brenk and Benschop 1993). The potential of Nerine as a cut-flower is attributable to several factors: 1. There exists a large variety of colours in the genus, particularily in N. sarniensis. Colours range
from peach and orange to purple and all shades of red (Zuidgeest 1975, Sherriff 1994). Excellent whites and pinks are also produced and bicolours are becoming increasingly common (Huxley et al. 1992).
2. There may be up to 22 florets in an umbel (Smithers 1990), producing a large and attractively
shaped flower-head.

First Australian New Crops Conference 1996 – Volume 2
115
3. Flower stems grow up to 90 cm in length and are leafless and lightweight (Smithers 1990). They are also picked at the bud stage and are therefore economical to freight and transport (Smithers 1990, Cooper 1993).
4. The vase life is long, with flowers typically lasting seven to twelve days (Genders 1973, Cooper
1993). 5. Nerine spp. flower in autumn/winter , a period when other cut-flower are in short supply
(Cooper 1993) and thus can fill a market gap. Although there are currently few growers in Australia, the potential for Nerine as a commercial crop in south-eastern Australia is large for the following reasons: a. Nerine spp. can be produced for the expanding European market at a time when these flowers are
scarce in the northern hemisphere (Landon-Lane 1988). b. Cool temperate climates with mild winters are ideal for Nerine cultivation (Systema 1982, Landon-
Lane 1988). The genus prefers low fertility soils (Smithers 1993), which are common in Australia. The potential for developing N. sarniensis as a cut-flower crop is particularly enticing (Smithers 1990). This species is undoubtedly among the most attractive species, yet due to its frost sensitivity and resultant unsuitability to cultivation in western Europe, cultivars of this species only command a minor market share (van Brenk and Benschop 1993). In Australia this species can be grown outdoors where it may be left to establish and increase (Landon-Lane 1988).
c. Nerine spp. have been identified as having a definite export-market potential by growers and the
Tasmanian Development Authority (Landon-Lane 1988). Nerine Physiology and Culture Problems Use of Nerine as a major cut-flower crop has been limited to some extent by horticultural problems, particularly unpredictable flowering. The nerine appears to be a physiologically complex bulb. Flower buds of N. bowdenii are initiated three growth cycles before anthesis (van Brenk and Benschop 1993). Thus, after senescence of the current year’s flower, buds for the next two years are already initiated. These buds are termed ‘n’ for the current cycles bud, n+1 and n+2 for the next two years respectively (Theron and Jacobs 1992, van Brenk and Benschop 1993). Similarly growth units of outer leaf bases during the development of n may be termed n-1 and n-2 scales. Horticultural practices are still largely trial and error as very little is known of Nerine physiology. Practices differ markedly in The Netherlands and South Africa and both produce conditions different to the bulbs natural habitat (Theron and Jacobs 1994). Some storage temperature treatment trials have been conducted at the University of Tasmania (Dewi 1993); further research in this area is currently underway. The basic aims of storage trials and horticultural practices are to improve stem length, overcome flower bud abortion and to prolong the flowering season. Flower bud abortion and unpredictable flowering reduces the economic yield of all species (e.g. Fortranier et al. 1979, Theron and Jacobs 1992), and is the major problem to be overcome by commercial growers.

First Australian New Crops Conference 1996 – Volume 2
116
The aim of this study is therefore to gain a better understanding of the basic physiology of Nerine spp. using N. bowdenii as a model. Current Research Assimilate Partitioning Statistical evidence has been presented to support the theory that bud abortion in Nerine is related to either competition with other carbohydrate sinks or source limitations (Theron and Jacobs 1992). The exact source of assimilate for any given process within the bulb is currently unknown. Currently dry weight data for all bulb parts are being collated and analysed for one complete growth cycle in the hope that some clues may be gained on the directions of assimilate movement. Bulbs are collected from a commercial grower every two to three weeks, dissected into separate units, snap-frozen and lyophilised. Thus collected material can also be used for extraction of carbohydrates and growth regulators. Dry weight data from a preliminary study are shown in Figure 1.
Figure 1. Percentage dry weight changes between previous two seasons growth units (n-2 and n-1 scales) and current seasons leaf bases (n scales) and current flower and peduncle (n flower). Standard errors are shown as vertical bars Carbohydrate for expanding leaves appears to originate from the n-2 growth unit, while rapid growth of the flower bud coincides with a decline in the dry weight of the n-1 group of scales. However the overall picture is complicated by an apparent transfer of assimilate from n-1 to n-2 scales between days 119 and 178 (figure 1), and a reversal of this process before elongation of the scape (day 178 to 209). These preliminary data would appear to suggest that the carbohydrates stored in leaf bases of both previous seasons are involved in providing assimilate for the current season cycle, and that there may be some interaction between the two. It must be remembered, however, that these data are tentative and will need to be verified by carbohydrate (and possibly enzyme) analysis as well as fluorescent tracer movement. Carbohydrate Analysis
First Australian New Crops Conference 1996 – Volume 2
117
Using GCMS (Cranswick and Zabkiewicz 1979) the primary mono- and disaccharides in Nerine have been determined as glucose, fructose and sucrose. There also appears to be one other, as yet unidentified, disaccharide in small quantities. Sucrose has been identified as the predominant transport form. We have found the major storage polysaccharides to be starch and ethanol insoluble fructans (inulin). Enzymatic assays are currently being used to assess levels of glucose, fructose, sucrose and starch (Chaplin 1986, McCleary et al. 1994). Fructan quantities are determined using a colorimetric alcoholic resorcinol/HCl proceedure (McRary and Slattery 1945, Lambrechts et al. 1994). From this information patterns of polysaccharide distribution and hydrolysis can be determined and used to verify apparent assimilate movement indicated by the dry weight data. It is also necessary to establish whether annual growth units are discrete in terms of assimilate translocation, or whether leaf base storages are utilised independently according to their juxtaposition. Growth Regulators It is recognised that growth regulators play a major role in directing the movement of organic metabolites and in establishing assimilate sinks (Rees 1972). Therefore the identification and quantification of growth regulators acting during bulb ontogeny will also be of paramount importance. Following up on previous work by Dewi (1993), HPLC and GC-SIM techniques (Reid et al. 1990, Reid et al. 1991) have been used to show that gibberellins in Nerine are synthesised via the early 13-hydroxylated pathway (unpublished) and that the biologically active gibberellin is probably GA1. It is envisaged that once major growth regulators have been identified, quantification will be by radio-immunoassay where possible. Conclusions The aim of this this study of N. bowdenii is to elucidate some of the major aspects of Nerine physiology. This information should be of assistance to horticulturalists seeking to establish more successful and economically reliable cultural practices. Other work is being conducted at the University of Tasmania on the breeding systems of Nerine with the aim of establishing new hybrids possessing desirable attributes for cut-flower producers. Acknowledgments This work has been supported by Channel Bulbs Inc. References Chaplin, M.F. 1986. Monosaccharides. In: Carbohydrate Analysis - A Practical Approach. (Eds. M.F.
Chaplin, and J.F. Kennedy) (IRL Press: Oxford). Cooper, K. 1993. Elegant Nerines fill market gap. Australian Horticulture April: 44-45.

First Australian New Crops Conference 1996 – Volume 2
118
Cranswick, A.M. and Zabkiewicz, J.A. 1979. Quantitative analysis of monosaccharides, cyclitols, sucrose, quinic and shikimic acids in Pinus radiata extracts on a glass support-coated open tubular capillary column by automated gas chromatography. Journal of Chromatography 171: 233-242.
Custers, J.B.M. and Bergvoet, J.H.W. 1992. Differences between Nerine hybrids in micropropagation
potential. Scientia Horticulturae 52: 247-256. Dewi, K. 1993. Development and Some Biochemical Aspects of Nerine. (M.Sc. Thesis: University of
Tasmania). Fortranier, E.J., van Brenk, G. and Wellensiek, S.J. 1979. Growth and flowering of Nerine flexuosa
alba. Scientia Horticulturae 11: 281-290. Genders, R. 1973. Bulbs: A Complete Handbook of Bulbs, Corms and Tubers. (Robert Hale and Co.:
London). Huxley, A., Griffiths, M. and Levy, M. 1992. Nerine. In: The New Royal Horticultural Society
Dictionary of Gardening. (McMillan Press: London). Lambrechts, H., Rook, F. and Kollofel, C. 1994. Carbohydrate status of tulip bulbs during cold-
induced flower stalk elongation and flowering. Plant Physiology 104: 515-520. Landon-Lane, C.I. 1988. Cut-Flower Nerine Production. (Department of Primary Industries: Hobart). McCleary, B.V, Solah, V. and Gibson, T.S. 1994. Quantitative measurement of total starch in cereal
flours and products. Journal of Cereal Science 20: 51-58. McRary, W.L. and Slattery, M.C. 1945. The colorimetric determination of fructosan in plant material.
Journal of Biological Chemistry 157: 161-167. Rees, A.R. 1972. The Growth of Bulbs: Applied Aspects of the Physiology of Ornamental Bulbous
Crop Plants. (Academic Press: London). Reid, J.B. Hasan, O. and Ross, J.J. 1990. Internode length in Pisum. Gibberellins and the response to
far-red-rich light. Journal of Plant Physiology 137: 46-52. Reid, J.B., Ross, J.J. and Hasan, O. 1991. Internode length in Pisum. Gene lkc. Plant Growth
Regulators 10: 11-16. Sherriff, L.J. 1994. Nerine Breeding Systems. (B.Sc. Hon. Thesis: University of Tasmania). Smithers, P. 1990. Breeding of N. sarniensis hybrids. Plantsman 12: 10-22. Smithers, P. 1993. Nerine sarniensis. The Garden 118: 190-193. Systema, W. 1982. Flower initiation in Nerine. The Garden 118: 370-371. Theron, K.I. and Jacobs, G. 1992. Inflourescence abortion in Nerine bowdenii W. Watts. Acta
Horticulturae 325: 97-103.

First Australian New Crops Conference 1996 – Volume 2
119
Theron, K.I. and Jacobs, G. 1994. Comparitive growth and development of N. bowdenii W. Watson:
Bulbs in situ versus replanted. HortScience 29: 1493-1496. van Brenk, G. and Benschop, M. 1993. Nerine. In: The Physiology of Flower Bulbs - A
Comprehensive Treatise. (Eds. A.A. De Hertogh, and M. Le Nard) (Elsevier Science Publishers: Amsterdam).
Zuidgeest, G.A.M. 1975. Preliminary report on colour classes of hybrid Nerine clones. Plant Life 31:
85-87.

First Australian New Crops Conference 1996 – Volume 2
120
Kesom Oil – a New Essential Oil for the International Flavour and Fragrance Industry Murray Hunter Brennan Flavours & Fragrances, 22 Michellan Court, Bayswater, Victoria, 3153 Abstract The trend towards natural flavour compounds is creating opportunities for the development of new essential oils. Essential oils that are sources of natural aroma chemicals will be of particular interest to the flavour and fragrance industry. Kesom oil is a potential source of natural aliphatic aldehydes and can be produced economically in North East Victoria. The oil has potential applications in flavours and fragrance compounds. Introduction Traditionally, the flavour and fragrance industry has taken a conservative attitude towards the acceptance of new essential oils. This is changing due to the growing demand for natural flavour compounds in Europe and the United States. There are opportunities for the introduction of new essential oils, especially those which are potential sources of natural aroma chemicals. Kesom oil is one such essential oil which should attract interest, as the oil is a potential source of natural aliphatic aldehydes. Natural aliphatic aldehydes do exist in a number of essential oils, however only in trace or minor amounts. Extraction and isolation of these compounds is therefore very expensive. The high cost and the limited availability of natural aliphatic aldehydes hinders wide use of these materials in flavour applications, where synthetic aroma chemicals, labelled as ‘nature identical’ are preferred. Synthetic aliphatic aldehydes are widely used in the production of flavour and fragrance compounds. n-Decanal, known in the flavour industry as aldehyde C10, is extensively used in perfume and flavour compositions. Likewise dodecanal, known as aldehyde C12 lauric is also widely used and is considered a very versatile raw material. Both materials are in abundant supply and reasonably cheap to synthesise. Aliphatic aldehydes can also be produced from natural sources like coconut and palm kernel oils, which are rich in octyl, decyl and dodecyl acids. However the processes used to convert these acids to their corresponding fatty alcohols and fatty aldehydes do not meet the definition of a natural material, as defined by the International Fragrance Association (IFRA). The Origins and Botany of Kesom Oil
Kesom oil is obtained by steam distillation of the herb Polygonum odoratum (Lour.), a member of the family Polygonaceae. The herb has been recently renamed Persicaria odorata (Lour.) Sojak, thus establishing a more refined group of Polygonum species. Polygonum odoratum L. has green stems with tinges of red at leaf xxxx. The lance shaped leaves are deep green with a red-green crescent marked on the upper side. The herb blossoms with tiny pink flowers when the stems become woody and terminal. In southern Australia, the herb grows up to 1.5 metres in height and becomes dormant for two to three months in the winter (June-August).
First Australian New Crops Conference 1996 – Volume 2
121
Polygonum odoratum is a domesticated plant and has a long history of culinary use in south-east Asia (Burkill 1966). The herb has also been cultivated by ethnic communities in Australia for many years. Literature searches reveal very little about the origin of Polygonum odoratum in Australia, as it was most probably introduced by immigrants sometime early this century. The existence of Polygonum odoratum is also reported in Vietnam. A comparison of the chemical analysis of the essential oil from the Australian and Vietnamese plants suggests the Vietnamese herb has a different chemo-taxonomy and therefore may be another chemotype of the same variety (Dung et al. 1995). The taxonomy of Australian Polygonum odoratum is probably closer to Polygonum minus (Huds.) found on the Malay Peninsula (Yacoob 1987). Both varieties are very similar in appearance, except that P. Odoratum has a slightly broader leaf. The chemo-taxonomy of both varieties is very similar (Yacoob 1990). Chemical Composition and Characteristics of Kesom Oil
Kesom oil was distilled on a pilot commercial scale at the Victorian Department of Agriculture, Ovens Research Station in the North-East Region of Victoria, Australia. GC and GC-MS analyses reveal that the oil contains approximately 10% 1-alcohols (decanol-1 and dodecanol) and over 80% aliphatic aldehydes, primarily n-decanal and dodecanal. The major constituents of kesom oil are decanol-1 3.47%, dodecanol 7.15%, nonanal 0.205%, undecanal 1.40%, n-decanal 25.10%, and dodecanal 55.87%. The sesquiterpene caryophyllene, is also a constituent at 2.50%. A group of terpenes including b-cis-ocimene, b-trans-ocimene and humulene are present at under 1%. Minor traces of carboxylic acids are also present in the oil. Kesom oil is a clear to pale yellow liquid which has a smooth but diffusive predominating aldehydic note with cool earthy and vegetable-like subsidiary notes.The odour is pungent and still very noticeable on a smelling strip after 24 hours. A 0.1% solution of kesom oil in ethanol has a sharp but rounded aldehydic note with floral, earthy and waxy suggestions in the backnotes. The oil has a specific gravity of 0.843 at 20oC. and is miscible in absolute ethanol (soluble in <1 volume of 100% ethanol, insoluble in 10% and 50% ethanol). The oil is relatively stable and is slower to polymerise than pure aliphatic aldehydes under the same conditions. This is probably because the levels of 1-alcohols and fatty aldehydes in the oil outweigh the presence of carboxylic acid traces which aid in the formation of hemiacetals in the oil (Bedoukian 1952). The oil can be safely stored at room temperature in amber glass bottles for many months and should some polymerisation occur, gentle heating of the oil will de-polymerise it. The Production of Kesom Oil
The Ovens Valley in north-east Victoria was selected as the location to develop the crop. The research staff at the Ovens Research Station are committed to essential oil research with a good track record. Farmers in the region are eager to experiment with new crops as alternatives to tobacco production, which has been declining over the last two decades due to declining consumption. The region already has an emerging peppermint industry; approximately 15 tonnes were produced this year. For a new essential oil to be a commercially viable proposition, high yields are necessary to enable attractive pricing to potential end users. The two major factors which most heavily influence the yield and composition of kesom oil are climatic conditions and the applied nitrogen regime during cultivation.
First Australian New Crops Conference 1996 – Volume 2
122
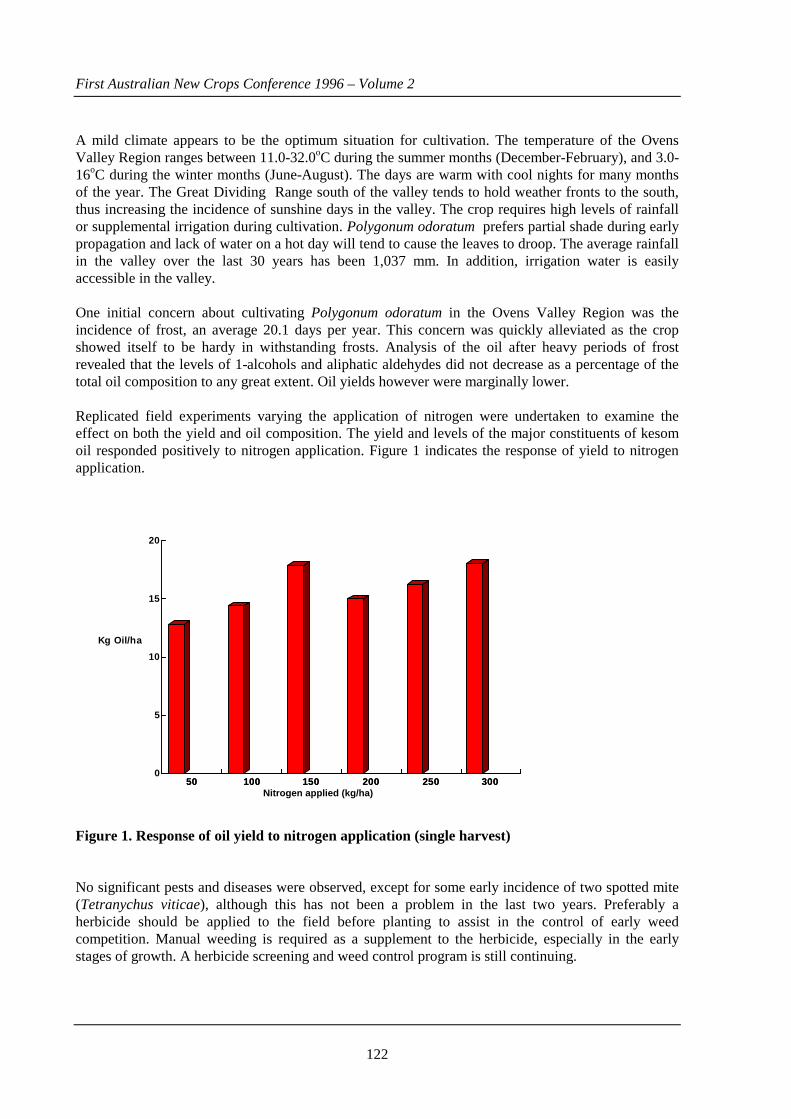
A mild climate appears to be the optimum situation for cultivation. The temperature of the Ovens Valley Region ranges between 11.0-32.0oC during the summer months (December-February), and 3.0-16oC during the winter months (June-August). The days are warm with cool nights for many months of the year. The Great Dividing Range south of the valley tends to hold weather fronts to the south, thus increasing the incidence of sunshine days in the valley. The crop requires high levels of rainfall or supplemental irrigation during cultivation. Polygonum odoratum prefers partial shade during early propagation and lack of water on a hot day will tend to cause the leaves to droop. The average rainfall in the valley over the last 30 years has been 1,037 mm. In addition, irrigation water is easily accessible in the valley. One initial concern about cultivating Polygonum odoratum in the Ovens Valley Region was the incidence of frost, an average 20.1 days per year. This concern was quickly alleviated as the crop showed itself to be hardy in withstanding frosts. Analysis of the oil after heavy periods of frost revealed that the levels of 1-alcohols and aliphatic aldehydes did not decrease as a percentage of the total oil composition to any great extent. Oil yields however were marginally lower. Replicated field experiments varying the application of nitrogen were undertaken to examine the effect on both the yield and oil composition. The yield and levels of the major constituents of kesom oil responded positively to nitrogen application. Figure 1 indicates the response of yield to nitrogen application.
50 100 150 200 250 3000
5
10
15
20
Kg Oil/ha
50 100 150 200 250 300Nitrogen applied (kg/ha)
Figure 1. Response of oil yield to nitrogen application (single harvest) No significant pests and diseases were observed, except for some early incidence of two spotted mite (Tetranychus viticae), although this has not been a problem in the last two years. Preferably a herbicide should be applied to the field before planting to assist in the control of early weed competition. Manual weeding is required as a supplement to the herbicide, especially in the early stages of growth. A herbicide screening and weed control program is still continuing.

First Australian New Crops Conference 1996 – Volume 2
123
The crop can be harvested two to three times a year depending on yearly weather patterns. An estimated annual yield of 36 to 56 kg/ha of kesom oil can be obtained, depending on the number of harvests. Harvest timing is not as critical as with some other essential oil crops like peppermint, as the major chemical constituents in the oil maintain consistent levels throughout the growth of the crop. Therefore, the most critical issue in determining optimum harvest time is maximising biomass to achieve high oil yields. As more is learnt about the responses of the crop to different variables and distillation practices, higher yields can be expected in the future. Not enough historical data is yet available to determine the commercial life of the crop. Potential Industry Applications of Kesom Oil
The major advantage of kesom oil is that it is a complex of 1-alcohols and fatty aldehydes created in nature. The presence of 1-alcohols and other constituents enhance the oil’s olfactory profile. This deep and rich quality can be considered superior to any of the odour profiles of the corresponding synthetic aldehydes, currently used in the flavour and fragrance industry. In flavour and fragrance creation, kesom oil is easier to use because the material is already naturally ‘rounded off’. Thus the use of kesom oil can eliminate, or at least lessen the need for the employment of other terpenes for the purpose of balancing and adding ‘naturalness’ to flavour and fragrance compounds. Pure aliphatic aldehydes are usually used in dilution for flavour and fragrance creation. As kesom oil is relatively stable, there are some advantages in using this material in the crude undiluted form, particularly where there is little room for solvents in flavour compositions because a high concentration is desired in a finished compound. Kesom oil is also highly effective in improving the sharpness of citrus flavours in small concentrations (ppt). Suitable applications would include citrus and fruit complexes, caramel, honey and oriental flavours. The initial drawback to industry acceptance of kesom oil as a flavour material is that it is not currently on the GRAS list (Generally Regarded as Safe). Therefore the immediate commercial future of kesom oil will rely upon the development of its individual constituents and groups of these constituents as natural isolates. These materials are already on the GRAS list. Individual aliphatic aldehydes and 1-alcohols must be physically isolated from the crude oil to meet the IFRA definition of a natural aromatic material. Physical isolation can be achieved through low temperature fractionation to remove the low temperature boiling mono-terpenes and through further repeated fractionation to separate the individual isolates to a purity of 80% or higher. These materials will slightly differ in odour profile to their synthetic equivalents, as they will carry over traces of the parent oil. The potential in perfumery for kesom oil is more limited. The trend to natural flavours has not corresponded in any increase in demand for natural fragrances by consumers. Even though kesom oil in small concentrations will lift and improve the citrus and floral character of fragrances very well, the material could not directly compete against existing synthetic materials already widely used in functional perfumery applications due to cost considerations. Use of Kesom oil in perfumery will be more suitable for fine fragrance applications. Kesom oil will be a good alternative to any of the single aldehydes, where creative perfumers may prefer a complex aldehydic profile for use in citrus, floral and chypre complexes. Conclusion

First Australian New Crops Conference 1996 – Volume 2
124
The kesom project is now entering pilot stage commercial production, just three years after its formal beginning. We will find out only in the next year or so whether our assumptions about the market prove to be correct. Gaining industry acceptance of kesom oil will require proof that the product can be produced and supplied on a consistent basis, otherwise companies within the flavour and fragrance industry will be hesitant to include this material in their palette of aroma materials. There will be a time lag between industry acceptance and use of kesom oil as perfumers and flavourists will require time, effort and imagination to realise its potential. This creates a certain degree of risk on the part of the primary producer where early production must be undertaken with some degree of speculation. Efficient and cost effective production will be a key factor in development of this new essential oil so potential application by users can be as wide as possible. The development of kesom oil as a new essential oil for use in the flavour and fragrance industry will assist in opening up possibilities for the development of other new essential oils in the future. Acknowledgments I wish to acknowledge the Rural Industries Research and Development Corporation for funding the research project and the Victorian Department of Agriculture for providing land and facilities. I would like to thank Mr Michael Morgan, Director of the Ovens Research Station for his support and encouragement and Mr Fred Bienvenu for his tireless research efforts. References Bedoukian, P.Z. 1952. American Perfumer and Essential Oil Record 60:263. Burkill, I. H. 1966. A Dictionary of the Economic Products of the Malay Peninsula,Vol. II.. (Ministry
of Agriculture and Co-operatives: Kuala Lumpur), pp. 1821-1824. Dung, N.X., Hac, L.V. and Leclercq, P.A. 1995. Journal of Essential Oil Research 7(3):339-340. Yacoob, K. 1987. Perfumer & Flavorist 12(5):27-30. Yacoob, K. 1990. Journal of Essential Oil Research 2(4):167-172.

First Australian New Crops Conference 1996 – Volume 2
125
The Growing of Echinacea and Other Medicinal Herbs in Australia Clifton D. Ellyett1 and Warren Morey2 1 Ellyett's Farm, POB 84 Ourimbah, NSW 2258 2
Warren Morey, Development Manager, Hobler-Mann Pty Ltd, POB 4095, Mulgrave, Vic 3170
Abstract Echinacea, starting from nothing 10 years ago, is now both widely grown and widely used in Australia. A typical example is given of how this development arose and how it has achieved top place as a leader of the medicinal herb industry. As more consumer interest turns to health and fitness, the market for herbal preparations of all types will continue to expand. Echinacea with its unique medicinal properties and proven track record will continue to lead the way for the continued development of other medicinal crops. Like all agricultural/horticultural endeavours the elements and market will be difficult to predict but it is clear that a substantial market already exists. Hobler-Mann will be working to become an integral part of this broad industry. The Initial Commercial Development of Echinacea in Australia Echinacea, a genus of the aster family, is a medicinal herb native to the North American continent and used for many complaints by the various tribes of North American Indians before the arrival of the white man. It was soon adopted as a non-specific immune stimulant, holding in check certain bacterial, viral and fungal invasions. It is commonly used for colds and influenza, but has many other applications, and is now used world wide. It was the top-selling medicinal plant in America in the period 1900-1930, but thereafter its usage declined as synthetic antibiotics took the lead in medical prescribing. The position has been steadily changing again from the 1970s to the present as people realise that Echinacea, like medicinal herbs in general, tends to be gentle and free from side effects. In Europe especially, over the past two decades, both the plant and its effects on humans have been studied in great detail, with over 400 scientific papers being published. There are nine species of Echinacea growing naturally in America, but only three have attracted medicinal attention. These are Echinacea purpurea, E. angustifolia and E. pallida. In 1984, 25 seedlings of E. purpurea were obtained and grown on Ellyett's Farm in Ourimbah, on the Central Coast of New South Wales. At that time virtually all medicinal herbs used in Australia were imported in the dry state. A local but well-known herbalist, Mr. Denis Stewart, encouraged us to see if

First Australian New Crops Conference 1996 – Volume 2
126
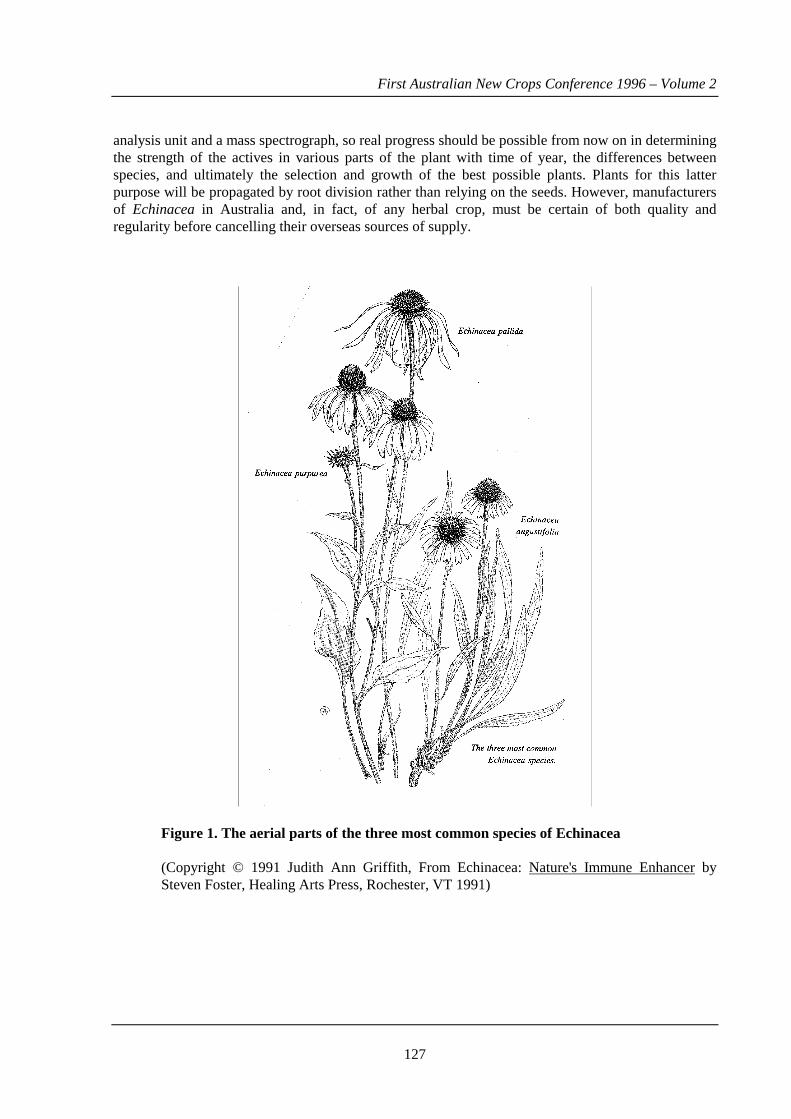
importation could be avoided. The plants prospered, and further ones were grown from self produced seed. In 1988 a packet of seed was obtained in America and vigorous growth was obtained at Ourimbah. Since then no other seed has been used, and the original plants and seed were destroyed. One of the early discoveries was that the E. purpurea - which is a perennial - only requires one season to reach useable maturity, whereas in the USA it appears to require two years before harvesting. There is now insufficient natural wild growth to sustain the increasing demand. Some E. angustifolia was also grown successfully at Ourimbah, but its production was terminated owing to the difficulty of separating the growing areas far enough to make certain that there was no cross-pollination by bees. As a result of publicity, principally in herbal circles, brought about by lectures and journal articles, the E. purpurea is now being grown on several farms, particularly on the Eastern seaboard from Queensland to Tasmania. Ellyett's Farm has purposely kept its crop small, to about 20,000 plants or 0.4 ha per year, so that various experiments could be carried out, giving answers to such questions as when to plant and harvest, how to plant, how to handle weeds, how much to water and so on. Almost all medicinal herbs now being trialed in Australia are being grown organically, as this is required by most local manufacturers. A lesser number of farmers and hobby-farmers are starting to grown E. angustifolia. This should earn at least four times the price of E. purpurea, but only the root is used, which is approximately half the weight of the plant, and the growing time is double. There would thus be little advantage in growing it, except that in the last few months there has been a dramatic increase in the price of E. angustifolia. The third species, E. pallida, has in the past been frequently confused with E. angustifolia. There is at present virtually no market for it in Australia, and there seems little reason medicinally for its introduction, but at least one grower has planted a crop. There is now widespread interest in growing many medicinals in Australia, but even so, probably 95% of total requirement is still imported. Analysis of all products must be made on entry to detect adulteration and other faults. Locally grown material is also analysed for quality. An illustration is given of the three species (Fig. 1). In good soil E. purpurea grows to a height of 75-90 cm and has many flowers. E. angustifolia is only about half this height with a very deep tap root. E. pallida is even taller than E. purpurea. E. purpurea is the easiest to grow with a root system seldom more than 25cm deep. Harvesting is simple. The whole plant at peak growth is taken up, washed by a high pressure jet, and then usually dried and mulched. Drying, for other than small quantities, is best done with a heat pump dryer running at no more than 40°C. Normally two or three green plants weigh 1kg, and when dried go to one third or one quarter of this weight. Drying gives long shelf life and smaller freight costs. Echinacea now cannot strictly be said to be a new crop, as it has been grown on various plots for at least five years and sold within Australia. The annual demand is in the region of 80-100 tonnes green and increasing. Echinacea is probably the furthest ahead of new Australian grown medicinals and has revealed many problems which have usually been overcome by simple means. Ellyett's Farm has the advantage of being alongside the Central Coast Campus of Newcastle University. One of their lines of endeavour is food and herb processing. They have a student just commencing a Ph.D on Echinacea, supported by a high pressure liquid chromatography chemical
First Australian New Crops Conference 1996 – Volume 2
127
analysis unit and a mass spectrograph, so real progress should be possible from now on in determining the strength of the actives in various parts of the plant with time of year, the differences between species, and ultimately the selection and growth of the best possible plants. Plants for this latter purpose will be propagated by root division rather than relying on the seeds. However, manufacturers of Echinacea in Australia and, in fact, of any herbal crop, must be certain of both quality and regularity before cancelling their overseas sources of supply.
Figure 1. The aerial parts of the three most common species of Echinacea (Copyright © 1991 Judith Ann Griffith, From Echinacea: Nature's Immune Enhancer by Steven Foster, Healing Arts Press, Rochester, VT 1991)

First Australian New Crops Conference 1996 – Volume 2
128
Future Possible Developments In the near future it is hoped to examine possible overseas markets, and ultimately the medicinal herb market could become a new export market for Australia. Ellyett's Farm, in conjunction with Mr Denis Stewart, has already sent two quantities of Echinacea fluid extract, of strength 1:1, to Sweden, with great success. Australia has the advantage of six months' phase difference with the northern Hemisphere. Also, the crop is usually grown organically, is not worried by radioactive fallout like the Chernobyl incident, and is largely free from acid rain. Ultimately, with selected plants, Australia should be in a prime position to enter the vast European, and possibly Asian, markets for many medicinal herbs.
Medicinal Herb Markets in Australia and Overseas with an Emphasis on Echinacea Australians consider medicinal herbs and herbal remedies as ‘Alternative’ and ‘New Age’. This is far from the truth, as western herbal medicine has a long history. In Australia, we quickly adopted the new synthetic pharmaceuticals available after World War 2 and ignored the benefits of herbal medicine. Fortunately herbal medicine maintained a strong presence in Europe and to some extent North America. The size of this market would astound many Australians. The US magazine Herbalgram published figures last year quantifying the size of the herbal medicine market in selected regions according to $US Retail sales price (Table 1). Table 1. Herbal Medical Sales in Selected Regions1
Country Retail Sales Price
US$ (millions) Eeastern Europe 6,000 Rest Of Europe 500 Asia 2,300 Japan 2,100 N. America 1,500 Total 124,000
1Source: IMS 1994 and The Herbal Medicine Database 1993 It is obvious that the Eastern Europe with US$6 billion leads the world in phytomedicine usage. Annual world growth rates are impressive at 12% pa., and the European market is currently growing at 8%. There are two reasons why Europeans use so many phytomedicines. Firstly, they have a long history of phytomedicine use and secondly, many European phytomedicines are included in drug reimbursement schemes, similar to our pharmaceutical benefits. Some 40% of European phytomedicines are reimbursed. Echinacea is Germany’s seventh most prescribed herbal in monopreparation although it is included in many more mixed formulae.

First Australian New Crops Conference 1996 – Volume 2
129
U.S. Market Recently (1996) the US Magazine Herbalgram quantified the US herbal market at US$1.6 billion. The top selling herb in Health Food stores was Echinacea at nearly 10% of sales. Only E. purpurea and E. angustifolia were mentioned. Other top selling medicinal herbs are mentioned later in the paper. The Australian Market Unfortunately the statistics for the Australian medicinal herb market are almost non-existent. The retail market for herbal preparations would amount to $100 million. The market for E. purpurea in Australia has previously been estimated at 80 - 100 tonnes green material equivalent. This can be further broken down into market segments. There are four product types: fresh whole plant including roots, dried whole plant including roots, dried aerial parts only, and dried roots. In addition there would be a market in Australia for 10 tonnes of E. angustifolia root. Estimated prices and demand for the Australian market are shown in Table 2. Table 2. Estimated prices and demand for the Australian medicinal herb market Product Price Demand (A$/kg) (kg) Fresh whole plant E. purpurea 5-6 30,000 Dried whole plant E. purpurea 15-20 5,000 Dried aerial parts E. purpurea 8-10 2,000 Dried roots E. purpurea 35-40 10,000 Dried roots E. angustifolia 80-100 10,000
The first three categories are supplied by Australian growers, but currently the dried roots of both E. purpurea and E. angustifolia are imported. This is an area of opportunity for Australian growers. Like other countries, the market is continuing to grow rapidly as Echinacea gains recognition for its unique medicinal properties. The noticeable absentee is E. pallida which has no significant market in Australia. In Europe E. pallida fills a large part of the market and in future, after we develop export markets with E. purpurea and E. angustifolia, it would be possible to grow E. pallida for export to Europe. Role of Brokers
A broker has the ability to consolidate smaller crops to supply large orders. Hobler-Mann Pty Ltd operate as brokers of medicinal herbs, marketing crops to all Australian manufacturers and charging a commission on the sale. The cost of developing export markets is often beyond an individual grower, but Hobler-Mann is currently developing markets in both the United States and Europe. With Hobler-Mann acting for many growers, the costs are shared. Each manufacturer tends to have special requirements and Hobler-Mann often customizes the crop to a manufacturer's requirement. Other Medicinal Plants Echinacea has gained much publicity in Australia as it was the first new medicinal plant commercialised to any extent (except poppies in Tasmania). Echinacea is in fact only one of many medicinal plants gaining wide spread acceptance in the community.

First Australian New Crops Conference 1996 – Volume 2
130
The top seven European herbal products are: ginkgo (Ginkgo biloba), horse chestnut (Aesculus hippoeastanum), hawthorn berries (Crataegus oxycantha), nettles (Urtica dioica), St. John’s wort (Hypericum perforatum), echinacea (Echinacea spp.) and valerian (Valeriana officinale). The top five US products are: echinacea, garlic (Allium sativum), golden seal (Hydrastis canadensis), ginseng (Panax quinquefolium) and ginkgo. Other important products in the US are: chamomile (Matricaria recutita), angelica (Angelica archangelica), ginger (Zingiber officinale), hawthorn (Crataegus oxycantha), licorice (Glycyrrhiza glabra), milk thistle (Silybum marianum), peppermint (Mentha piperita) and skullcap (Scutellaria lateriflora). There is also a large category which covers plants for herbal teas, including Dandelion, Spearmint, Lemon Balm, Red Clover, Sage and others. Quality Quality is paramount in all aspects of production. A healthy, clean crop needs to be dried to below 10% moisture content. It then has to be cut uniformly into pieces 1-2 cm, very fine material is generally undesirable. The finished product then needs to be packed in a poly lined, woven polyethylene bag to prevent any re-absorption of atmospheric moisture. Quality and presentation are the key to marketing success.

First Australian New Crops Conference 1996 – Volume 2
131
�
New Crops, New Products
New Opportunities for Australian Agriculture
Volume 2
Pulses, Oilseeds and Horticultural, Industrial and Bioactive Crops
Proceedings of the First Australian New Crops Conference held at The University of Queensland Gatton College
8 – 11 July 1996
Edited for the Rural Industries Research & Development Corporation by B.C. Imrie with associate editors: R.A. Bray, I.M Wood and R.J. Fletcher

First Australian New Crops Conference 1996 – Volume 2
132
© 1997 Rural Industries Research and Development Corporation. All rights reserved. ISBN 0 642 24646 7 ISSN 1321 2656 “New Crops, New Products (volume 2)“ The information content and the opinions expressed in the papers presented at this conference are those of the authors and do not necessarily reflect the views of the Rural Industries Research and Development Corporation, the University of Queensland, the conference organisers, or the conference sponsors. The conference organisers make no claim as to the accuracy of the information presented at the conference. The views expressed and the conclusions reached in this publication are those of the authors and not necessarily those of persons consulted. RIRDC shall not be responsible in any way whatsoever to any person who relies in whole, or in part, on the contents of this report unless authorised in writing by the Managing Director of RIRDC. This publication is copyright. Apart from any fair dealing for the purposes of research, study, criticism or review as permitted under the Copyright Act 1968, no part may be reproduced in any form, stored in a retrieval system or transmitted without the prior written permission from the Rural Industries Research and Development Corporation. Requests and inquiries concerning reproduction should be directed to the Managing Director. Researcher Contact Details B C Imrie Cunningham Laboratory 306 Carmody Road ST LUCIA QUEENSLAND 4067 Phone: 07 3377 0209 Fax: 07 3371 3946 RIRDC Contact Details Rural Industries Research and Development Corporation Level 1, AMA House 42 Macquarie Street BARTON ACT 2600 PO Box 4776 KINGSTON ACT 2604 Phone: 06 272 4539 Fax: 06 272 5877 email: [email protected] Internet: http://www.dpie.gov.au/rirdc Published in 1997 Typeset by Alice Schwarz Brunold, Telephone (07) 5465 6306 Printed by The University of Queensland Printery, Telephone (07) 3365 2946 Cover illustration by Carol Fletcher

First Australian New Crops Conference 1996 – Volume 2
133
Foreword There is considerable interest in the commercialisation of new crops within Australia’s rural industries. This interest has been reflected in the success of the First Australian New Crops Conference held at Gatton in July 1996. My organisation was pleased to be the major supporter for this event. This set of two volumes includes the written forms of the presentations made in the first two days of the conference and covers the principles of new crop development, case histories and research reports on pulses and oilseeds, horticultural crops and industrial and bioactive crops. The theme for the conference of “New Crops, New Products: New Opportunities for Australian Agriculture” will hopefully bear fruit as this information is put to good use amongst the many new crop practitioners within Australia and overseas. Peter Core Managing Director Rural Industries Research and Development Corporation

First Australian New Crops Conference 1996 – Volume 2
134
Major Supporter Rural Industries Research and Development Corporation
Supporter Grains Research and Development Corporation
Special Sponsors MACRO Agricultural Consultants WESTPAC Bank
Sponsors National Agricultural Commodity Marketing Association Rural Marketing and Supply Association Australian Oilseeds Federation Queensland Produce Seed and Grain Merchants Association Woolworths “The Fresh Food People”
Organising Committee
Advisory Committee Local Logistic Committee
Dr Rob Fletcher, Chairperson Mr Bob Brinsmead Mr John Holland Dr Bruce Imrie Mr Gerry Kregor Mr Jim Murison Mr John Obst Dr Russ Stephenson Dr Brian Stynes Mr John Tyas Mr Ian Wood
Mr Les Baxter Mr Andrew Combe Dr John Downton Mr John Hannay Dr T.K. Lim Dr Chris McRae Mr Michael Perry Mr Greg Seymour Dr Richard Spurway Mr Gary Stokes Mr Graham Walton
Mr Gerry Kregor, Chairperson Mr Glen Beech Mr Simon de Groot Dr Rob Fletcher Mr John Foster Dr Doug George Mr Geoff Groth Mr Timothy Kowitz Mr Brett Jardine Mr Michael Mann Mr Steven Mitchell Mr Tony Sadler Mr Greg O’Sullivan Mr Nicholas Walker Mr Adel Yousif
Conference Secretariat Ms Sally Brown, Ms Kim Doherty and Ms Erica Maddock Continuing Professional Education The University of Queensland
First Australian New Crops Conference 1996 – Volume 2
135
Table of Contents
PULSES AND OILSEEDS
New Crops, New Pests, New Solutions, with Particular Reference to Bean Pod Borer, Maruca testulalis (Geyer), in Adzuki Beans Hugh Brier .........................................................................................................................................................1
Effect of Seed Size on the Performance of Kabuli Chickpea Janine Carter and Trevor Bretag ......................................................................................................................9
Culinary Soybean as a New Crop in Australia Mandy J. Christopher and Andrew T. James...................................................................................................15
Adzuki Beans - R&D for Grain Export and Local Processing Peter Desborough and Robert Redden ............................................................................................................25
Quality Ingredients for Traditional Japanese Sweets: Implications for Australian Azuki Beans Mabo Suzuki, Junko Kiyama, Hilton Deeth, Nola Caffin, Adel Yousif ............................................................29
Alternative Winter Pulses in South Australia W.A. Hawthorne...............................................................................................................................................37
The New Lentil Industry in Australia: Factors Behind Its Success Michael Materne and JanBert Brouwer ..........................................................................................................45
A Scientific Approach to Improvement of Black Gram, a Crop with Export Potential Adrien Mourgues .............................................................................................................................................53
Lima Beans as a New Crop R. Redden, R. Wright and W. Tompkins...........................................................................................................63
Nutritive Value of Grain Legumes for Monogastric Animals K.G. Wiryawan and J.G. Dingle ......................................................................................................................73
Germinability of Meadowfoam Seed C.H. Cheng, I. L. Gordon and P. Coolbear .....................................................................................................89
Some Agronomic Aspects of Sesame Evaluation B.C. Imrie.........................................................................................................................................................99
First Australian New Crops Conference 1996 – Volume 2
136
HORTICULTURAL CROPS
Development of Rice Flower (Ozothamnus diosmifolius) as a Cut Flower Crop Peter Beal, Cynthia Carson, Lois Turnbull, Leif Forsberg, and Jim Lewis.................................................. 107
Towards Improving Nerine Cut-Flower Yields Martin R. Blake............................................................................................................................................. 115
Propagation of Bursaria spinosa by Cuttings Paul Kristiansen............................................................................................................................................ 121
Domestication of Potential New Floricultural Crops Julie Webber, Margaret Johnston, Lynda Ketelhohn and Shaun O’Brien.................................................... 127
Sweet Potatoes in Queensland - Something Old, Something New Ken Jackson .................................................................................................................................................. 135
Troubleshooting Nutritional Problems in a New Industry: Sweet Potato in North Queensland Jane O’Sullivan, Lester Loader, Colin Asher, and Pax Blamey ................................................................... 143
Yield and Root Distribution in a Commercial Licorice Crop R.J.Martin, M.H.Douglas and A.J.Heaney...........................................................................................................149
Preliminary Assessment of South American Tuber Crops R.J.Martin, S. Halloy and B.Deo .........................................................................................................................155
Preliminary Analysis of Culinary Bamboo Shoot Production in Queensland K.B. Walsh, J.R. Milne, J. Leonard, D. Dart and D.J. Midmore .................................................................. 163
Baby Corn R & D in Thailand Chamnan Chutkaew..................................................................................................................................... 177
Pigeon Pea as an Export Vegetable Crop for Fiji M. Prasad, S.Ulitu and S.P. Field................................................................................................................. 183
Developing the Non-Astringent Persimmon Industry in Australia - Retrospect, Prospect and Lessons Learned Ray Collins.................................................................................................................................................... 193
Identification of Superior Cashew Trees for Northern Australian Conditions Felipe S. dela Cruz, Jr. and Robert J. Fletcher ............................................................................................ 203
Use of Cold Technique for Coconut (Cocos nucifera L.) Embryo Collection and Transportation Yohannes M. S. Samosir, Ian D. Godwin and Stephen W. Adkins ........................................................................211

First Australian New Crops Conference 1996 – Volume 2
137
INDUSTRIAL AND BIOACTIVE CROPS
Putting Hemp Back onto the New Crop Agenda Carolyn Ditchfield .........................................................................................................................................221
Low-THC Indian Hemp (Cannabis sativa L.) Trials in Victoria Sam Lolicato, Chris Bluett, and John Blackstock.................................................................................................227
The Potential and Problems of Non-Wood Fibres and Fibre Crops as Feedstocks for the Pulp and Paper Industry Ian M. Wood ..................................................................................................................................................237
Queensland Grown Pelargonium graveolens Leaf Essential Oil: A GC-MS Study Luigino Doimo, Robert James Fletcher, Bruce Robert D’Arcy and Graham Douglas Michael ...................247
Mint Rust and the Peppermint Oil Industry of North-Eastern Victoria J. Edwards, G.M. Halloran, D.G. Parbery, P. Taylor and E.C.K. Pang.......................................................259
The Growing of Echinacea and Other Medicinal Herbs in Australia Clifton D. Ellyett and Warren Morey............................................................................................................263
The Potential for a Neem Medicinals Industry in Australia Joe A. Friend .................................................................................................................................................269
The Development of Commercial Ginseng Production in Australia Charlene Hosemans, Peter Johnson, and Yvonne Werner ............................................................................273
The Implications of Seed Germination and Survival Rates on the Economics of the Production of Ginseng in Australia Tony Sadler....................................................................................................................................................285
Kesom Oil - a New Essential Oil for the International Flavour and Fragrance Industry Murray Hunter...............................................................................................................................................293
Selection of Superior Trees of Melaleuca Species to Increase the Commercial Potential for the Production of Tea Tree Oil Lyall R. Williams and Wang Yan .................................................................................................................299
Quinoa: an Ancient Grain for a Modern Era Duane L. Johnson ..........................................................................................................................................307
Jojoba - a Unique Industrial Crop for Australia Peter L. Milthorpe..........................................................................................................................................313
Effect of Sowing Date, Row Spacing and Cultivar on Seed and Gum Yield in Guar (Cyamopsis tetragonoloba) Helen Murphy, Robert Fletcher and Nola Caffin ..........................................................................................323
Evaluation of Biodegradable, Nonhazardous Engine Oils Duane L. Johnson and James W. Lambert ....................................................................................................333

First Australian New Crops Conference 1996 – Volume 2
138

First Australian New Crops Conference 1996 – Volume 2
139
Preface This is the second of two volumes comprising the Proceedings of the First Australian New Crops Conference, held at the University of Queensland Gatton College from 8th - 11th July 1996. Volume 1 of the Proceedings records the presentations from the Plenary Sessions on the first day of the conference and contributed papers on General Principles and Examples. Volume 2 of the Proceedings comprises the contributed papers presented within the Horticultural, Pulses/Oilseeds and Industrial Streams on the second day. A total of 210 delegates from Fiji, Finland, Israel, South Africa, Thailand, New Zealand, the USA and from throughout Australia attended the conference. Amongst the delegates were primary producers, researchers and educators from a wide range of organisations, marketers, processors, representatives of agribusiness organisations and members of the press. The Australian new crop industry comprises all these components. The organisers acknowledge the positive contribution that delegates made to the outcome of the conference. “New Crops, New Products: New Opportunities for Australian Agriculture” challenged everyone to identify new ways of achieving the successful commercialisation of their favourite new crop. The workshops held on the final day of the conference gave all delegates the opportunity to contribute and workshop reports were rendered to the final Plenary Session. The Session also voted to form the Australian New Crops Association. The conference workshop reports have been reprinted in Issue #7 of the Australian New Crops Newsletter, January 1997, and the Draft Constitution for the Association has been included in a Supplement to Issue #7. We wish to acknowledge the contributions from the sponsors of the First Australian New Crops Conference, the wholehearted support of the Organising Committee throughout the planning of the conference, the efforts of the Local Logistic Committee under Mr Gerry Kregor and the superb contribution from the Conference Organisers at the University of Queensland, Ms Sally Brown and her associates, Ms Kim Doherty and Ms Erica Maddock. Rob Fletcher Chairperson, Organising Committee Bruce Imrie Chairperson, Editorial Sub-committee

First Australian New Crops Conference 1996 – Volume 2
140
Alternative Winter Pulses in South Australia
W.A. Hawthorne Primary Industries SA, Struan, Naracoorte SA 5271 Abstract This paper presents an overview of winter pulse breeding and evaluation programs in South Australia. There is a wide range of current and prospective pulse crops to evaluate and develop through to markets. Many of the previous grain quality and agronomic constraints are being overcome in these crops. Two tables are presented comparing the positive and negative attributes of a range of alternative pulse crop species. Decisions will need to be made on which species to pursue. This paper may help, but more information is needed. Introduction South Australia has 8.9m ha of arable soils potentially suited to pulse cropping. This estimated area has above 300 mm average annual rainfall and excludes 3.8m ha which is subject to waterlogging, or too steep, rocky or shallow (Egan and Hawthorne 1994). This potential area is evenly divided between calcareous (4.41m ha) and non-calcareous (4.47m ha) soil types. Some soils, particularly the mallee soils, have varying amounts of lime present and the extent of the areas or patches of lime depends on the location and soil type. Soil type and structure, free lime content, pH, moisture stress susceptibility, waterlogging susceptibility, erosion risk and general fertility influence the choice of pulse crop grown in SA. Gross value of pulse crop production in SA in 1992-3 was $63m, compared with $710m for all cereals (Australian Bureau of Statistics 1994). Primary Industries South Australia (PISA) estimated the area sown to pulses in SA in 1994 as 265,000 ha which represents 3.0% of the potential area and 10.3% of the estimated 2.570m ha sown to cereals. There appears ample scope for grain legumes to double in line with Pulse Australia expectations for the year 2005 (Grains Council of Australia 1995), but breeding, agronomic improvements and crop development will be essential. Australia has few pulse breeding programs, and so collaborations are required with the National breeding Programs. In SA the South Australian Research & Development Institute (SARDI)/PISA Field Crop Evaluation Unit is the key evaluation mechanism outside of SA based breeder evaluations, especially for developing or alternative pulse crops. Grain quality support is now provided with the Grains Research & Development Corporation (GRDC) national program on quality commenced in 1995. In addition, PISA through its Pulse and New Crop Development Group is instrumental in seeing pulse crop development come to fruition. Chickpea Desi chickpea (Cicer arietinum) is considered by many in SA to be a new or developing alternative legume crop. They are currently grown (11,000 ha) on the red brown earths of the Lower to Upper North and mallee soils of Yorke Penninsula, but have potential to expand into other areas. The big potential in SA is to develop improved, adapted varieties. The National Breeding Program in NSW provides lines and GRDC support for collaborations in SA. Crosses are evaluated as early generation bulks (EGB) for

First Australian New Crops Conference 1996 – Volume 2
141
yield and other attributes, but no selections are made locally as occurs in NSW, WA and Qld. Given the genotype by environment interaction in chickpeas, it would be desirable to do so. Selections from the best performers in our EGB trials are evaluated as inbred lines in SA, if available, but often these lines do not survive NSW evaluations. The programs in NSW, Qld, Vic, and WA also generate numerous and completely different lines which progress to their advanced testing, and the most promising of these are evaluated in SA. Lower rainfall sites are now being included at an earlier stage in SA. Only the better selections progress through to the final stage of testing (9 sites). Some of the more advanced chickpea lines from NSW and Qld are too late maturing for many of our growing areas. In SA there are some areas where these are suitable, but we also have a role for lines which are earlier flowering, drought tolerant and have good pod set under cooler conditions during flowering (“cold tolerant”). Early flowering lines would also have a role in spring sowings in wetter areas with a longer growing season. Thus, early flowering, cold tolerant, and medium flowering lines need to be pursued in SA for specific locations. One of the aims in SA is to develop chickpeas for lower rainfall areas where few chickpeas are currently grown. Specific key issues in SA also need to be addressed, particularly boron toxicity and Pratylenchus (P. neglectus and P. Thornei nematodes). Kabuli chickpeas are not widely grown in SA, and varietal development has not followed the same intensity or path as the desi's. Only a few selections have been evaluated through to final testing, but this will change as the Vic and NSW programs progress. Seed size and colour is important in kabuli chickpeas and all lines grown have bigger seed than cvv. Kaniva and Garnet. Earlier maturing types are required for wider adaptation. Herbicide by commercial variety assessments are conducted at one site. Beans Faba beans (Vicia faba) have declined in area and locations sown in SA (20,000ha) because of disease incidence, the cost and unreliability of control and lack of drought tolerance. Broad beans are a specific alternative, niche market crop grown only in specific long season areas capable of producing seed large enough to meet the limited market requirement. Varietal improvement is critical to the expansion of beans in SA. Disease resistance and higher yields are first priorities, followed by drought tolerance and food quality grain. High yields, waterlogging tolerance, the availability of export food markets, and upright habit for ease of harvest and soil stabilisation are all positive reasons for re-developing the bean industry. The National Bean Breeding Program is based in SA, and funded by GRDC. Wider evaluation of small and large seeded bean lines outside the National Breeding Program in SA is at sites which cover a range of rainfall, disease and nutritional environments. Seed supplies limit the number of sites because of out-crossing and limited resources for pure seed multiplication. Field assessment of disease is undertaken from the National Breeding Disease Support Program. Disease control and variety performance are the main issues with current bean varieties having different resistances and maturities. Hence cvv. Fiord, Ascot and Icarus are being evaluated in variety x fungicide trials conducted across the state at eight sites. Lentils The lentil industry in SA finally began in earnest with the release of adapted lines for sowings in 1994 (400ha). A "lentil check" program ensures that commercially grown lentils are monitored and managed with best known practices to achieve success. The premium priced food market is the target for the lentils. GRDC supports evaluation of lines introduced or bred in the now ceased RIRDC/GRDC
First Australian New Crops Conference 1996 – Volume 2
142
breeding project. Collaboration continues with the National Lentil Program from Victoria which introduces lines from ICARDA, Syria. Pathology support also occurs in SA. Promising lines progress from the primary trials into secondary trials. Varieties released from SA, interstate and from NZ are being evaluated because all are commercially grown. Herbicide by variety assessments on the commercial varieties are conducted at one site. Field Pea Field peas (Pisum sativum) is the most widely grown and traditional pulse crop in SA (155,000ha) and provides the yardstick for other pulse crops. Disease incidence, declining yields, erosion risks and harvest difficulties have led to some dissatisfaction with peas, and inspired interest in the alternative pulse crops. Overcoming these problems in peas is a breeding and agronomic objective in SA. Success could be seen to reduce the necessity to develop alternative legumes, but there will always be a role for these alternatives in rotation with peas and to service specific markets. There are niche food markets for peas (blue boiler, marrowfat, canning) being serviced under market contracts in SA, and the specific varieties and production techniques needed mean that these peas are considered alternative crops by growers. Developing these food quality peas is also one of the breeding objectives of the SA pea breeding program, with pathology support. The breeding program also evaluates lines from Vic, and now WA, at the breeder level in interstate trials. SA and interstate lines close to release are evaluated in secondary pea trials (12 sites). Private entries are also included in SA secondary or interstate trials as appropriate. Apart from the main need to breed peas with disease resistance, in particular the black spot complex, there is a need to select breeding lines from SA and interstate at an early stage in low rainfall areas. Only limited testing currently occurs on Upper Eyre Peninsula. Also, the need for powdery mildew resistance is becoming important in many areas, and screening is done in field trials in the South-East. Pea lines bred locally and interstate need to be evaluated at more enviroments and selected at an earlier stage to make better use of the genetic resource available. Herbicide by variety assessments are conducted on commercial and near release varieties at one site. Lupin The narrow leafed lupin (Lupinus angustifolius) is an established crop on non-calcareous soils in SA (70,000 ha). It is grown predominantly on the sandy soils of the SE, the mallee soils and the red-brown earths of the Lower to Upper North. Narrow leafed lupin does not grow on calcareous soils with free lime. The advantages of lupins are their low cost of production, upright habit and ability to grow on acid soils and infertile sands. Lupinus angustifolius breeding programs in WA and NSW both supply lines each year, as early generation bulks and advanced selections. Testing is coordinated across SA with GRDC support. Lower rainfall sites are now included at an earlier stage of testing. Only the better selections progress to widespread testing (14 sites). There has been only limited production of sweet Mediterranean White (albus) lupin (L. albus) in isolated situations in SA for niche markets. Albus lupins have potential on heavier soil types, but do not tolerate waterlogging as well as narrow leafed lupins. They do not get cucumber mosaic virus (CMV). Grain quality is superior to narrow leafed lupins because of higher protein and energy contents. Breeder’s lines of albus lupin are evaluated at five sites, coordinated in collaboration with the breeders in NSW and WA.

First Australian New Crops Conference 1996 – Volume 2
143
There is a small area (200 ha) of production of a large seeded bitter albus lupin in the lower S-E of SA servicing a niche export market. This will have to be managed carefully so that sweet and bitter albus lupin production do not mix. Contamination and outcrossing could severely jeorpardise the unique sweet (low alkaloid) status that Australian lupins of both species have relative to the rest of the world. The rough seeded lupins (L. pilosus and L. atlanticus) are being heralded as a potential new crop for the calcareous/alkaline soils so predominant in SA, but where other lupin species do not grow. The large, deep tap root, strong stem, erect at harvest and the firmly anchored stubble residues for soil protection against erosion are important factors in their favour. Satisfactory yields have to be obtained. They have some way to go though, in achieving their potential. Breeder's lines of rough seeded lupins from WA are being evaluated on Eyre Peninsula only at this stage, in anticipation of domestication (soft seeded, sweet, non shattering). Wider evaluation will only commence once domesticated lines are available. Testing sites will differ from those in the narrow leafed lupin assessments because of the ability of rough seeded lupins to grow on calcareous soils with free lime. Ascertaining what soil types, rainfall and level of free lime (alkaline earth carbonates) they can tolerate will be important as part of the assessments. Additionally, selections of L. albus made from crosses to a lime tolerant parent ex USA and France should also be evaluated in comparison with the rough seeded lupins. The sand plain lupin (L. cosentinii) is also a rough seeded lupin, and has now been domesticated, but is not being pursued like the other species. Evaluations of three varieties of yellow lupin (L. luteus) from Poland (via WA) commenced in SA at three sites in 1994. These varieties will need to be evaluated where they have most potential, i.e. under conditions of severe Pleiochaeta root rot (or Rhizoctonia), waterlogging, on infertile sands or severe CMV. There is intense interest in WA to release a yellow lupin variety within three years into areas where these problems occur with narrow leaf lupin. Other breeding lines from Poland are being developed for expanded evaluations in Australia. Other Legume Crops The vetch industry in SA almost collapsed after the demise of human consumption markets for Blanchefleur, but vetch is still a widely adapted grain legume crop (10,000ha) with drought tolerance. The vetch (Vicia sativus and other species) screening, breeding and pathology program conducted in SA is overcoming the agronomic and quality limitations of vetch as part of a National GRDC program. It is progressing well, having identified rust resistant, soft seeded lines, and others with low BCA (beta-cyano-alanine) levels in the seed. Vetch has potential as a grain (feed and food), grazing, dual purpose, hay and green manure crop; all end-use alternatives which require evaluation. Advanced breeding lines have been in wider state evaluations since 1995. The drought tolerance, high grain and forage yields of Lathyrus (Lathyrus sativus, L. ochrus), together with apparent freedom from pests and diseases to date, make Lathyrus (grass pea) a crop with potential for development. Like vetch, it would serve as a grain, forage, green manure or dual purpose grazing/grain crop. Lathyrus species and lines have been evaluated in a small way in SA as part of the National program (based in WA). L. sativus is a major target of the National program, with lines now available with nil to low levels of ODAP (beta-N-oxalyl-L-alpha, beta-diamino-propionic acid), the undesirable toxin responsible for lathyrism in humans. L. cicera is also being evaluated as a well adapted, often higher yielding feed grain type with potential to be developed for food uses, having low ODAP. It has not been traditionally consumed as a food overseas though. GRDC funds a program in SA to evaluate lines and on farm uses of Lathyrus. The year 1999 is the target for commercial release of agronomically suitable varieties with improved grain quality. One line of L. cicera privately multiplied

First Australian New Crops Conference 1996 – Volume 2
144
and used on farm on Yorke Peninsula for some years is to be commercialised in 1997 as an alternative to vetch for grazing, hay or green manuring. L. ochrus is now considered a pasture/forage species. Narbon bean (Vicia narbonensis) evaluation, as part of the National program based in Vic continues in a small way in SA. Testing is limited, but this will need to be increased to meet the 1998/89 target of the interstate coordinators for commercial release of agronomically suitable varieties with improved grain quality (low gama-glutamyl derivative of S-ethenyl cysteine). The interest is in narbon's drought tolerance and erect habit and high sulphur content of the grain. Poor palatability of narbon grain is its limitation in pig and poultry rations. Fenugreek (Trigonella foenum-graecum) is produced by a few commercial growers under contract in SA. There are private trials, but we have little information on this crop. It yields well, but the niche markets are limited, with some possibility of expanding. Conclusion There is a wide range of current and prospective pulse crops to evaluate and develop through to markets. Many of the previous grain quality and agronomic constraints are being overcome in these crops. Breeding and evaluation programs are important for their development, making collaboration with National breeding programs imperative. As the new crops are nearing commercial production, additional efforts and resources will be required in the collaborating states. The wide range of new and existing, improved pulse crops and environments in which they will be grown require that some rationalisation and targetting will have to occur. Some crops can be evaluated at common locations, but others will need sites chosen in areas for which these crops are being specifically developed. Markets will need to be developed concurrently, but resources are limited. Some priorities and choices will have to be made as to which crops, or species within a crop, to pursue. It appears to be too soon to make those choices. Market and agronomic considerations could clash in determining priorities (Tables 1, 2). Establish new markets for some agronomically adapted feed legume crops (eg narbon, rough seeded lupin, vetch, Lathyrus cicera) may be more difficult than for others (e.g. lentils, albus lupins, Lathyrus sativus) which have the potential to be more readily accepted in the market place because they are already known. These more marketable types (Table 2) can be less agronomically suitable though (Tables 1, 2). The gross margin (yield by price less costs) achievable will ultimately determine the legume crops that farmers grow and market. However, the full potential of each crop must be developed before this can be assessed.

First Australian New Crops Conference 1996 – Volume 2
145
Table 1. Estimated positive and negative soil related factors to consider for alternative pulse crops#
Calcareous soil Low pH soils
Drought tolerance
Water-logging tolerance
Low fertility soils
Heavy soils Sandy soils Erosion risk as stubble
Erosion risk as seedling
Peas +++ - +++ - - ++ - - - - ++
Beans +++ - - - - - +++ - - +++ - + +++
Chickpeas +++ - - - - - - ++ - + - -
Lentils +++ - - - - - - - - - ++ - - - - -
Narrow leaf lupins
- - - +++ ++ + ++ + +++ ++ -
albus lupins - - - +++ - - - - - - ++ + ++ +
Yellow lupins - - - +++ + ++ +++ + +++ ++ -
Rough seeded lupins
++ ++ ++ ? + ++ ++ ++ +
Lathyrus +++ - ++ +++ ? +++ - - - -
Vetch +++ + ++ + + +++ - - - -
Narbon +++ - - ++ ? ? +++ + + ++
# Range = +++ = highly positive attribute, i.e. highly suited, tolerant, safe to - - - = highly negative attribute, i.e. highly unsuited, intolerant, risky

First Australian New Crops Conference 1996 – Volume 2
146
Table 2. Estimated positive and negative plant factors to consider for alternative pulse crops#
Grain yield potential
Food markets
Feed markets
Low anti nutritional factors
Ease of harvest
Freedom from shattering
Frost tolerance or escape
N fix, rotation benefits
Disease tolerance
Pest tolerance
Competition against weeds
Peas ++ ++ +++ +++ - - ++ - - - +++ - - ++ ++
Beans +++ +++ +++ ++ +++ +++ ++ +++ - - - (+)* + +++
Chickpeas + +++ - +++ ++ + + - - - +++ - -
Lentils - +++ - +++ - - - - - - - - - + - -
Narrow leaf lupins
+ - - +++ ++ +++ +++ +++ +++ + + +
albus lupins + + + + +++ +++ +++ +++ + + ++
Yellow lupins - - - - - ++ +++ + +++ +++ + + +
Rough seeded lupins
-- - - - -- ++ ++ - - -
(++)* +++ ++ + + +
Lathyrus ++ - - - - - (++)*
- - - - - - +++ +++? +++ ++
Vetch ++ - - - + - - (++)* - - - - - +++ - (+)* ++ +
Narbon ++ - - - - - (+)* +++ ++ + +++ + + +++
* ( ) = being overcome in new releases to come from breeding programs # Range = +++ = highly positive attribute, i.e. highly suited to
� - - = highly negative attribute, i.e. highly unsuited

First Australian New Crops Conference 1996 – Volume 2
107
Acknowledgments Pulse personnel in SA whose programs are discussed in this paper are acknowledged: R. Knight (bean breeder), J. Paull (bean breeder), M. Ali ( pea breeder), R. Matic (vetch breeder), M. Ramsey (pathology), G. Palmer (quality), P. Burridge (quality), R. Wheeler (Field Crop Evaluation), J. Egan (Field Crop Evaluation), J. Hannay (Industry Development), M. Tate (vetch quality), C. Maroney (lentils), E. Alberts (virology), Field Crop Evaluation Unit staff. The National pulse breeding programs, their funding , and their support programs are also acknowledged. References Australian Bureau of Statistics 1994. Value of agricultural commodities produced in South Australia.
Australian Bureau of Statistics Catalogue 7503.4 Egan J.P and Hawthorne W.A. 1994. Opportunities for rough-seeded lupins in South Australian
agriculture. Proceedings First Australian Lupin Technical Symposium Perth, 17-21 October 1994. pp. 178-181
Grains Council of Australia 1995. Inventing the future: Australian Grain Legumes Industry Strategic
Plan. (Grains Council of Australia: Canberra).

First Australian New Crops Conference 1996 – Volume 2
108
The Development of Commercial Ginseng Production in Australia Charlene Hosemans, Peter Johnson and Yvonne Werner Australian Ginseng Growers Association Inc, PO Box 250, Gembrook 3783 Abstract Australian imports of dried ginseng root and product exceed 10 tonnes annually with an estimated value of $5 million. There is considerable interest in the establishment of a domestic ginseng industry to supply this market. American ginseng has been successfully farmed by the Hosemans in Victoria since early 1985, with Asian ginseng added to their crop in 1994. More than 700 further ‘trial sites’ have been established in various areas of Victoria, Tasmania, New South Wales, South Australia, Western Australia and SW Queensland since 1992, due to promotions by the Hosemans and also by the Department of Primary Industry and Fisheries in Tasmania. The Australian Ginseng Growers Association Inc. commenced in September 1994. Membership exceeds 150 growers from Australia and New Zealand. The Association's Statement of Purpose covers the promotion of growing and marketing of ginseng as an agricultural crop in Australia, for Import Replacement and Export potential, and the ethical standards of the Australian Ginseng growing and marketing industry. This paper outlines the current status of commercial production and research trials of ginseng in Australia, examines the potential for future development based on current world market trends and identifies aspects which may require research and development assistance from Government programs so that the Australian Ginseng Industry can achieve its full potential. Introduction The term “Alternative Farming” is in constant use these days in Australia (and other ‘westernised’ countries). “Alternative Farmers” are being counted in ever growing numbers, in fact, creating the fastest growing sector of primary production. Perhaps the most exciting alternative crop being trialed in Australia for the last eleven years is Ginseng. Australian imports of dried ginseng root and product exceed 14 tonnes annually with an estimated value of $8 million. It is further estimated that as much as 5 times this amount enters the country undeclared. The rise in consumption of ginseng products in Australia is due to the increase in immigration from South East Asian countries and an increasing demand for health products across the nation. With stocks of wild ginseng from Asian and North America diminishing, coupled with the growing demand for better quality and chemical free ginseng products, Australia's potential for import

First Australian New Crops Conference 1996 – Volume 2
109
replacement and export trade is a clear indicator of the rising number of Australian growers interested in the domestic production of ginseng. This paper outlines the current status of commercial production and research trials of ginseng in Australia, examines the potential for future development based on current world market trends and identifies aspects which may require research and development assistance from Government programs so that the Australian Ginseng Industry can achieve its full potential. Species and Specifications Ginseng (Panax spp.) belongs to the Araliaceae family, and is a slow maturing, woodland plant native to Asia and North America. The plant is prized for its root which is the single most valuable herb in Oriental medicine. Clinical experiences and claims for its uses have been recorded continuously for more than 4,000 years and its medical efficacy has also been partly supported by recent scientific evidence. From 11 known Ginsengs, the two species with greater medicinal and commercial value are Panax ginseng C.A.Meyer (native to Asia and sold as Chinese, Asian or Korean ginseng), and Panax quinquefolius L (native to North America and sold as American or Canadian ginseng). From a philosophical perspective, many Oriental people believe in the Yin and Yang theory, where an equilibrium of these two forces maintains health within the body. Yin is the mild cool force, Yang is the strong, hot one. When Yin and Yang become imbalanced, disease can occur. In Oriental medicine, ginseng is used to balance the Yin and Yang tendencies of the body. Asian ginseng is believed to represent the Yang, and is regarded as a good tonic for the blood. North American ginseng is thought to be the Yin, and is used for respiratory and digestive problems. Western science aims to be more exact and therefore ginseng is under constant scrutiny in the laboratories of numerous scientists from around the world. North American ginseng is now known to have more active ingredients (called ginsenosides) than the Asian variety. In Oriental medicine, both varieties have equal popularity. The whole root is often used when cooking. The use of ‘fresh’ ginseng is proving to have definite health advantages. Wild woodland ginseng has been harvested nearly to extinction in both the Orient and North America and this stimulated the demand for farm grown ginseng. Intensive cultivation of ginseng, under artificial shade structures, has been undertaken in Asian countries for more than 500 years and in North America for more than 100 years. The demand for greater supplies has influenced farming methods to the point where quality is secondary to quantity and sadly, the "bigger and faster" methods are providing fewer health benefits to consumers. Given all this, ginseng continues to be the world's most lucrative legal crop. Growing Conditions and Cultivation in the Northern Hemisphere In temperate climates of the northern hemisphere, ginseng is grown under shade, either artificial or natural tree cover, with a heavy mulch of leaves or straw to simulate the conditions found on the forest floor of deciduous hardwood forests in its native habitat. The mulch, coupled with the plant's hardiness, virtually eliminates any risk of ‘freeze-out’ during the colder seasons. There are three cultivation methods recognised as Artificial Shade, Woods-Grown and Wild Simulated. Each growing method produces different results and consequently different market prices. Approximately 95% of
First Australian New Crops Conference 1996 – Volume 2
110
the world's ginseng production occurs under artificial shade. Wild Simulated is the cheapest growing method and produces the highest returns per dried weight yield. In late summer and early autumn, the seeds are planted in raised beds, which provide the necessary drainage and solar warming of the soil during the spring. After planting, the mulch is applied to conserve moisture and to protect the plants from hard frosts. If shade structures are being used, they don't need to be erected until after the seed has germinated, allowing the sun to help warm the soil and promote germination of the seed. Shade covers need to be in place as the sun gets hotter or the seedlings will burn and die. In areas where it snows, shade covers are often removed during winter but this is not totally necessary. The plants are fully deciduous perennials and therefore die back in autumn with a new growth each spring as the natural cycle. Plants reach maturity during the fourth or fifth year under artificial shade and after 6 or more years when grown under trees. Harvesting of the roots takes place during the dormant period and the roots are then washed and dried ready for sale by dried weight. Harvesting can be done either by hand or by mechanical methods. Ideally, ginseng grows in an acid, nitrogen poor soil which can range in structure from sandy to heavy clay-loam. A climate with four distinct seasons is required to encourage the plants to progress through their cycle in order to reach maturity. A cool winter is required for stimulation of the root to encourage the following years growth. Tropical or sub-tropical climates would not be suitable. Ginseng requires a well drained soil which needs to be keep moist and cool. In times of adversity, ginseng is known to withstand droughts better than floods. Generally speaking, ginseng grown on the forest floor is more potent, medicinally, than that from intensive field cultivation. In cultivated gardens in the northern hemisphere, the roots are harvested after three or more years of growth, washed and dried, and sold by dried weight. A modest gross return per acre is set at $100,000 but in reality, many acres of ginseng bring in $200,000 or more depending on the growing method and the quality of the crop. History and Status of The Australian Industry Cultivation of Ginseng (Panax species) in Australia Since 1985 Acceptable conditions for growing ginseng occur in Australia south of tropical regions. American ginseng (Panax quinquefolius) has been successfully farmed by the Hosemans in Victoria since early 1985, with Asian ginseng (Panax ginseng) added to their crop in 1994. The Hosemans farm has more than 5 acres of plants ranging in age from 1 to 10 years old. Small harvests of 7 year old roots have been undertaken over the last two years, with sales to Asia at prices that equal wild simulated root prices from North America. Full production harvesting of roots, not less than 7 years old, will not be undertaken until seed production yields have reached Australian requirements. Since 1992 More than 1000 further ‘trial sites’ have been established in various areas of Victoria, Tasmania, New South Wales, South Australia, Western Australia and SW Queensland since 1992, due to promotions

First Australian New Crops Conference 1996 – Volume 2
111
by the Hosemans and also by the Department of Primary Industry and Fisheries in Tasmania. (See Figure 1). Figure 1. Map of Australian states with latitudes and trial areas defined Status in 1996 Table 1 shows that more than 900 growers are in their first and second years with trial plots, often containing less than 1000 seeds or 100 root stocks. A further 200 trials are in their third year with some sites being less than a 1/4 acre of planted space. Only a hundred or so sites are considered to be in ‘serious’ trial mode with planting exceeding a 1/4 acre each and most of these sites are in their third or fourth year of cultivation. Cumulatively, the known total planted area of Australian trials is approximately 100 acres to January 1996. It is estimated that another 100 acres will be planted in Spring 1996. The ratio of planted American v Asian ginseng is estimated to be about 80% American and 20% Asian.
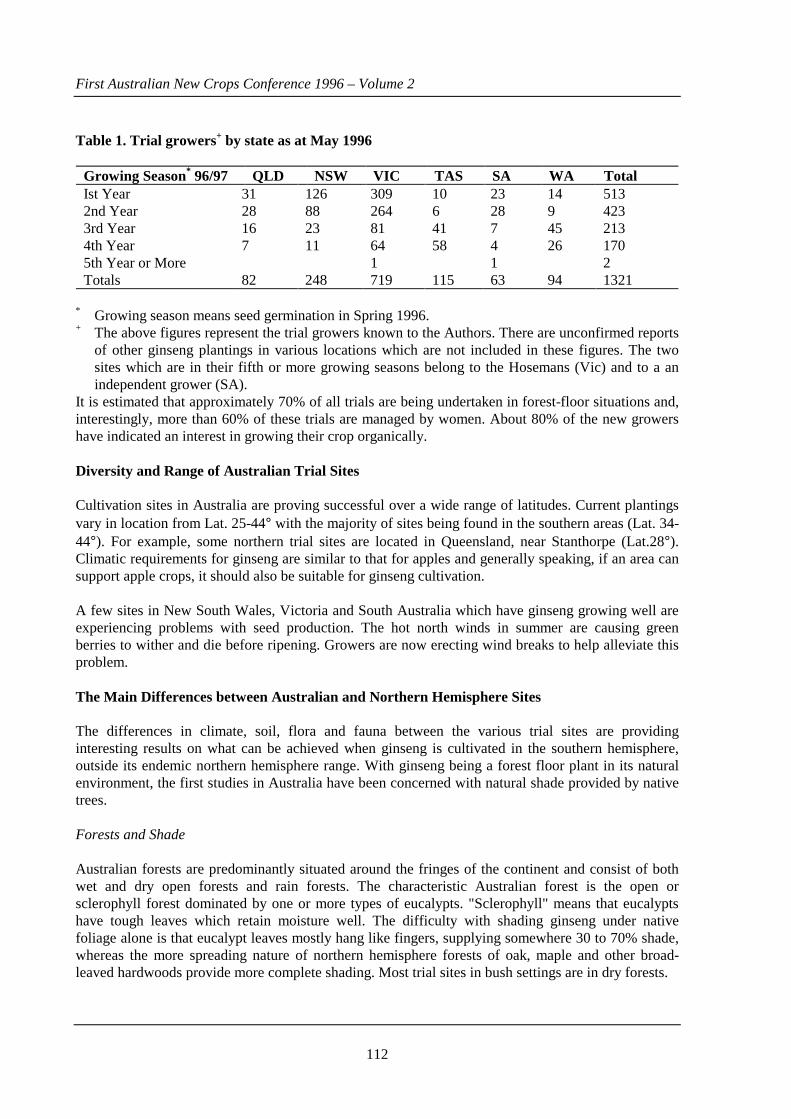
First Australian New Crops Conference 1996 – Volume 2
112
Table 1. Trial growers+ by state as at May 1996 Growing Season* 96/97 QLD NSW VIC TAS SA WA Total Ist Year 31 126 309 10 23 14 513 2nd Year 28 88 264 6 28 9 423 3rd Year 16 23 81 41 7 45 213 4th Year 7 11 64 58 4 26 170 5th Year or More 1 1 2 Totals 82 248 719 115 63 94 1321
* Growing season means seed germination in Spring 1996. + The above figures represent the trial growers known to the Authors. There are unconfirmed reports
of other ginseng plantings in various locations which are not included in these figures. The two sites which are in their fifth or more growing seasons belong to the Hosemans (Vic) and to a an independent grower (SA).
It is estimated that approximately 70% of all trials are being undertaken in forest-floor situations and, interestingly, more than 60% of these trials are managed by women. About 80% of the new growers have indicated an interest in growing their crop organically. Diversity and Range of Australian Trial Sites Cultivation sites in Australia are proving successful over a wide range of latitudes. Current plantings vary in location from Lat. 25-44° with the majority of sites being found in the southern areas (Lat. 34-44°). For example, some northern trial sites are located in Queensland, near Stanthorpe (Lat.28°). Climatic requirements for ginseng are similar to that for apples and generally speaking, if an area can support apple crops, it should also be suitable for ginseng cultivation. A few sites in New South Wales, Victoria and South Australia which have ginseng growing well are experiencing problems with seed production. The hot north winds in summer are causing green berries to wither and die before ripening. Growers are now erecting wind breaks to help alleviate this problem. The Main Differences between Australian and Northern Hemisphere Sites The differences in climate, soil, flora and fauna between the various trial sites are providing interesting results on what can be achieved when ginseng is cultivated in the southern hemisphere, outside its endemic northern hemisphere range. With ginseng being a forest floor plant in its natural environment, the first studies in Australia have been concerned with natural shade provided by native trees. Forests and Shade Australian forests are predominantly situated around the fringes of the continent and consist of both wet and dry open forests and rain forests. The characteristic Australian forest is the open or sclerophyll forest dominated by one or more types of eucalypts. "Sclerophyll" means that eucalypts have tough leaves which retain moisture well. The difficulty with shading ginseng under native foliage alone is that eucalypt leaves mostly hang like fingers, supplying somewhere 30 to 70% shade, whereas the more spreading nature of northern hemisphere forests of oak, maple and other broad-leaved hardwoods provide more complete shading. Most trial sites in bush settings are in dry forests.

First Australian New Crops Conference 1996 – Volume 2
113
Therefore, most trials in Australian ‘bush’ settings require the addition of artificial shade and while this adds to overheads and partially defeats one of the reasons for a grower choosing this method, the quality of ginseng being grown in the Australia bush is worth the trouble. Added shade from polypropylene material is being erected using a light to medium density cloth. Some trials are doing well in cool-temperate rain-forests where, generally speaking, both shade and moisture are being supplied by the natural conditions. Rain forests in Australia have a much heavier middle level tree canopy than the ‘sclerophyll’ forest. Some trials have been established in a ‘wet’ forest situation, at altitudes of 500 metres and more above sea level. Many of these sites have an understory of blackwoods and wattles (Acacias) among taller eucalypts, where no additional shade appears to be required. The organic content of the soil is greater than other bush soils because wattle leaves are softer than gum leaves and therefore, compost more quickly. Where crops are being shaded by polypropylene only, heavy density, black cloth is best. Hot summer temperatures, which often exceed 35°C at many of the trial site areas, make it necessary to provide shade for ginseng at 80-85% density, with 90% required if planting on northern and western slopes. Irrigation Rainfall and run-off vary greatly in Australia, especially in the broad band of the continent lying between Lat. 25-35° where rainfall is not seasonal. However, in the south, most of the rain falls in late winter and early spring and is more dependable for replenishing surface and ground water stocks. As ginseng does not have a high water use, only those trial sites that lie to the north and on western slopes appear to need irrigation during summer months. Excessive moisture in spring and early summer can, in fact, be detrimental to the establishment of a good crop. For example, damping off of 1 year old plants can be a problem when spring rains combine with lower temperatures during the first few weeks after seeds have germinated. Damping-off is generally absent with resprouting of older plants. In sites where summer rains combine with high humidity, the chance of fungal problems is greatly increased. Research shows that the most crucial stage for irrigation, especially for newly planted and nursery beds, is during January and February for sites without summer rain. In many trials, older plants are proving capable of withstanding drier, hotter summers with little or no irrigation so long as the shade and mulch cover are adequate. Disease A wide range of potential pathogens including Rhizoctonia spp., Fusarium spp. and Pythium spp. which are often present in previously cropped soils, also have the potential to destroy young ginseng plants. Although the option to use soil fumigation or chemical treatments may be considered, the majority of Australian growers are tending towards non-chemical practices. A typical bush soil has an acid pH, is low in nitrogen, as are most of the forest soils in the world, and abounds with a multitude of fungi. In comparison to the North American industry where fungal disease is a serious problem, there is little evidence, at this stage, of fungal disease being a major hurdle in Australia. Although small outbreakds of foliar diseases have been detected, Bordeaux sprays are being used with good results. On the other hand, organic growers who are not applying any foliar treatments report that plants that had shown a problem for one or more years have improved to the point where no major fungal problems were detected during the last growing season.

First Australian New Crops Conference 1996 – Volume 2
114
Pests and Predators Trials in previously cultivated or grazed soils, compared to bush sites, have not been as trouble free. Infestations of reticulate slugs (Deroceras reticulatum), cockchafers (Adoryphorus couloni and Aphodius spp.) chevron cutworm (Diarsia intermixta) and corbies (Oncopera spp.) have been the main problems. Various treatments and baits are being used with mixed success. The moist conditions provided by straw mulch are particularly suitable for the build up of large numbers of reticulate slugs which prove difficult to control under these conditions. Applications of abrasive substances like rice hulls, mixed with coarse sawdust, are proving to be more suitable mulches in sites where these pests occur. The main predators in Australia have come from wildlife such as rabbits, kangaroos, wallabies and wombats which are easily deterred by mesh fencing. Netting also needs to be installed to protect seed production by preventing native parrots from grazing on seed berries once they become ripe. In some bush locations, lyre birds need to be controlled by placing netting over mulched beds. Some areas also have wild deer and other wild life which can be destructive to the fragile plants and fencing may be needed. The Australian Ginseng Growers Association Inc. The Australian Ginseng Growers Association Inc. (AGGA) was formed by a foundation group of twelve members at a meeting held at Gembrook on Sunday 4th September 1994 At that meeting, Charlene Hosemans was appointed as Secretary/Public Officer and instructed to register the Association with The Corporate Affairs Commission and apply for incorporation. This was duly done on 13th September 1994 and the Association received its Certificate of Incorporation on 30th September 1994. The first Public Meeting was held on 11th February 1995 to formally adopt the Constitution and Rules, elect the first Council and appoint the Association's Auditor. Statement of Purpose 1. To promote the growing and marketing of ginseng as an agricultural crop in Australia. 2. To promote the marketing of Australian grown ginseng and its ancillary products as Import
Replacement and Export commodities. 3. To promote the attainment of high ethical standards in the Australian Ginseng growing and
marketing industry. Membership During the first year of operation, membership grew to more than 150 new growers. In its second year, AGGA's membership continues to increase as growers from all Australian states, and also from New Zealand, gain experience through initial trials and become more confident to proceed.

First Australian New Crops Conference 1996 – Volume 2
115
Membership Classes Full membership with voting rights and limited to persons directly involved with the cultivation
of ginseng in Australia - fee $80.00 per annum ($100 for 1st Year *) Associate Membership with no voting rights and for persons interested in the Australian Ginseng
industry - fee $40.00 per annum ($60 for 1st Year *) *In the First Year of membership, an additional entry fee of $20.00 applies to both classes of membership. This fee covers the cost of the Association's Constitution and other administration expenses. Grower Support Groups Regional support groups are being formed throughout Australia so that exchanges of vital cultivation techniques and information can be shared and assessed for relevance to the area and/or the whole of the Australian industry. As ginseng is a high security risk crop in the northern hemisphere, confidentiality of growers details is paramount. Validation of Crops The Council is currently involved with establishing a workable system for crop identification, aimed at enhancing growers market potential. While an "Organic" classification is the ultimate aim for most Australian growers, AGGA's intention is to validate all members crops by growing method, including descriptions of chemicals applied during cultivation. AGGA's Validation Process is based on the National Standard for Organic and Bio-Dynamic Produce as developed by AQIS/OPAC. World Market Trends Market trends are best assessed by studying the North American situation. Information from North America is readily accessible and most probably accurate. Similar information from China and Korea, when available, is difficult to correlate. In 1982, the government of British Columbia in Canada, successfully trialled ginseng as an artificial shade crop in the arid reaches of the Fraser River Valley. In the last ten years, the production in that area of Canada has begun to rival the large production from Ontario and Wisconsin in the USA. In 1995 the combined USA and Canadian production exceeded 2.5 million kilograms. The arrival of corporate ginseng growers in Canada and Wisconsin was inevitable. The Oriental countries produce ginseng in tonnage that dwarfs the North American production. Ninety-five percent of this world-wide harvest is consumed in the Asian marketplace. With the opening of the Chinese market for American ginseng, and with dwindling supplies of wild ginseng, the major North American growing regions have registered a massive 400 percent increase in production over the last 10 years and it is estimated that by the year 2000, the current total production will at least double. Further, China is now producing large quantities of lower grade American ginseng, known as ‘China White’. It tastes different to the traditional Chinese ginseng and its reputation is very poor. However,

First Australian New Crops Conference 1996 – Volume 2
116
because the cost of production in China is so low, due mainly to labour costs, it is profitable to produce and sell Chinese grown Panax quinquefolius for approximately one-third the price of the North American grown crop. This is serious competition at the bottom of the market. In addition, ‘China White’ looks nearly identical to the North American grown roots and it is known that these lessor quality roots from China are being mixed with and labelled as grown in North America. The combination of mixing and increased production has caused a drop in market prices of field cultivated ginseng, but prices are expected to level over the next four years. This is making it very difficult for new growers to compete with established growers in the United States and Canada. Even now it is virtually impossible for smaller growers to compete with the large public-traded corporate growers. More importantly, in the short term, the rapid increase in production levels appears to be in danger of exceeding the current demands for low-grade ginseng. On the other hand, the dwindling supply of wild American ginseng and the slower increase in the production of woods grown and wild-simulated ginseng, has seen an incredible rise in market prices for these types of root with wild and good quality wild-simulated ginseng realising more than $1500 per dried kilo in the last sales. It is easy to understand why ginseng is known as the world's most lucrative legal crop. New artificial shade growers, investing in shade and mechanised equipment will face a huge financial risk due to the competition from the large scale and corporate operations. This risk is increased when the new grower is outside the established North American growing areas and most likely has little technical support from grower and research organisations to help solve disease problems, improve production methods and thus increase profitability. To become viable, especially in gardens of less than 5 acres, the new grower may benefit if investment costs can be reduced by sharing equipment and labour with other growers in the same area. In North America, the current opinion is that the traditional small-scale family farmer or part-time grower, outside the large production areas of Wisconsin, Ontario and British Columbia, will be unable to compete in the market place with artificial shade grown roots. The future, for the small scale ginseng grower, is considered to be in the ‘woods’ and/or, at the very least, organically grown. Implications for Marketing of Australian Grown Ginseng Currently, approximately 70% of new Australian growers have established their ginseng trials in bush sites. Growers using this cultivation method will be wise to avoid heavy fertilisation and other tactics that increase the rate of growth and cause roots to resemble those grown under artificial shade. Serious consideration also needs to be given to the age of roots harvested. Roots that are older and small for their age, darker in colour, more gnarled in appearance with many horizontal rings around their trunks, resembling wild roots will have the best market potential. This proved correct in the 1995 North American market and it is considered this trend will continue. Artificial shade growers in Australia are also considered to have good potential for marketing, depending on the quality of roots produced. Cultivation methods need to be modified greatly from those used in the large North American production areas. Ginseng, in a mono-culture garden, is generally far more susceptible to fungal disease. So long as growers consider organic or Bio-Dynamic cultivation techniques, or at best the absolute minimal use of chemical additives or preventatives, coupled with less dense plantings and diligent farm management, better quality roots for harvest will ensure a good market.

First Australian New Crops Conference 1996 – Volume 2
117
Fresh Root Market Australia ginseng growers have one market avenue all to themselves. That is the fresh root market which is impossible to fill with imported ginseng through recognised channels. Some overseas ginseng is currently processed as whole fresh roots in vacuum sealed packaging with a room temperature shelf life of 18 months. However, our sources advise that this type of import would still come under regulations for live plant matter and be quarantined for several months before being available for sale or use. This is generally not a financially feasible operation for retailers. Also, Asian people do not consider this type of packaging favourably and are keen to have a good supply of freshly dug ginseng root. Current North American market prices for artificial shade grown fresh root sales range between $50 - $200 per kilogram, depending on the quality and also the time of year. Most North American growers have a shortened harvest time due to frozen ground. Most Australian trial sites are outside areas where the ground freezes, making harvest possible throughout the dormant period of approximately 6 months. Extra advantages for this type of harvest is that a garden yields at least three times the weight in fresh root to dry root and without the added drying time, roots are ready for market more easily. Ginseng R & D in Australia So Far Gembrook Organic Ginseng Pty Ltd & HRDC - Conference Attendance at the International Ginseng Conference (IGC'94) in Vancouver, and 4 week Study Tour in Canada, USA, Holland and Hong Kong in 1994 Department of Primary Industry & Fisheries, Tasmania and RIRDC - Three years project on the Commercialisation of Ginseng Production in Southern Australia from 1992 - 1995. Primary Options Pty Ltd & RIRDC - Australian Ginseng Research Program: Crop Establishment Project from July 1996 - current. Further R&D Potential The following potential projects are identified with the aim of alerting industry based organisations and relevant Government instrumentalities to the need for further and ongoing assistance which will be sought so that the Australian ginseng industry can achieve its full potential as quickly and easily as possible. Growers Manual for Australian Conditions; Validation of Crops Process; Compilation of Technical Data from current trial sites; Ginseng Cultivation and Agroforestry; Ginseng Productivity in Undisturbed v Cleared Bush; Soil Types, pH and Other Variables and Their Effects on Root Development; General Effects and Growth Rates of Planting Densities and Mulch Types; Mortality and Disease in Fertilised v Unfertilised Crops; VAM and Australian Conditions; Non-Chemical Controls of Pest and Disease in Ginseng; Approved Chemical Use for Ginseng as a Foodstuff;

First Australian New Crops Conference 1996 – Volume 2
118
Quality Controls on Imported Ginseng: HPLC Testing Using a Recognised International Standard Method; Seed Storage; Root Drying, Storage and Handling; Buyer/Grading Assessment Training Program; Market Networking: Understanding the Therapeutic Goods Act and Its Implications on the Australian Ginseng Industry; Conclusions It has been proven that good quality ginseng can be grown on an Australian bush block. Further, many current trial sites in various southern and highland areas of Australia have undertaken one or more successful growing seasons. World trends are proving that, for small-scale ginseng farming in particular, older, organically grown artificial shade roots and forest floor roots have an increasing market potential, compared to younger artificial shade roots which have been subjected to chemical treatments and/or heavy fertilisation. Wild simulated crops, which are also being established in Australia, have an even greater potential and increased market returns. The growing Asian component of the Australian population provides enhanced market potential for import replacement due to the increased market demands for good quality fresh and dried ginseng roots. Also, the Australian population in general is demonstrating a real desire for natural health practices, and per head of population, appears to be in front of other westernised societies in this quest. Continuing industry support from the Australian Ginseng Growers Association combined with R&D projects conducted jointly by the industry and Government agencies will provide Australian ginseng growers with every opportunity to enable their new crop to reach its full market potential. The Australian Ginseng Industry has the potential to be a multi-million dollar industry in this country, by early in the 21st Century.

First Australian New Crops Conference 1996 – Volume 2
119
Some Agronomic Aspects of Sesame Evaluation
B.C. Imrie
CSIRO Division of Tropical Crops and Pastures 306 Carmody Road, St Lucia 4067, Australia
Abstract There is a high risk of loss of seed through capsule dehiscence in sesame before and during harvest. A study comparing cultivars Magwe Brown, Beech’s Choice and Aussie Gold, at crop densities of 20, 40 and 60 plants/m2, and row spacings of 20cm, 40cm, and twin rows 20cm apart on 80cm centres, in factorial combination, was conducted at Lawes, Queensland, to measure the effect of these variables on seed yield, seed harvest loss and plant attributes that might be associated with seed yield and loss. Cultivars varied in several plant attributes, with an indication that Magwe Brown had the best seed retention. Aussie Gold and Beech’s Choice had the highest harvested yield. Increasing crop density affected several plant attributes but did not affect any yield variables. Row spacing only affected harvest height. It was concluded that further research on seed retention is required to provide a sound basis for breeding of varieties with reduced seed loss and high yield. Introduction Sesame is a crop traditionally grown by smallholders in developing countries. The world’s major producers are China, India, Myanmar and Sudan (Russell et al. 1992). Increasing demand in the world market has stimulated attempts to develop sesame as a crop in Australia, where its success will depend on its adaptation to mechanised broad area production. To date, research has identified varieties with climatic adaptation to environments from the Northern Territory to southern NSW and cultural methods such as sowing time, row spacing, seeding rate, fertiliser requirements, and weed control that ensure successful crop growth (Beech 1991, Bennett and Wood 1995). But farmer adoption remains low despite potentially competitive economic returns relative to other crops. A primary reason why farmers are reluctant to grow sesame is its relatively poor adaptation to mechanised harvesting and an associated high risk of crop loss (Wood et al. 1995). High risk of crop loss is a function of the characteristics of the sesame plant. Sesame has an indeterminate growth habit with seed contained in capsules borne in leaf axils. As the plant matures, the capsules progressively ripen from the base of the plant upwards. Maturing capsules split open allowing seeds to be dispersed. Traditional growers harvest by hand by pulling or cutting plants when ripening commences and capsules are closed. Plants are stooked in the field and allowed to ripen in the stooks from where they are hand threshed with minimal loss. For mechanised harvesting, the whole crop must be sufficiently dry for threshing when the crop is harvested. Seed can be dispersed from dry, open capsules on plants awaiting harvest, particularly by plant movement during windy weather, and also when the cutterbar hits the stems during the harvest process. Synchrony of maturity
First Australian New Crops Conference 1996 – Volume 2
120
and retention of seed within capsules are required to minimise loss before harvest while machine design and operating procedures can reduce losses during harvest (Boyle and Oemcke 1995). Both genetic and crop management approaches may be taken to reduce pre-harvest and harvest losses. In the USA, breeders used an indehiscent capsule mutant to prevent seed loss but it was found that pleiotropic effects reduced crop yield and the level of threshing energy required to break the capsules also damaged the seed (Weiss 1971). Consequently, capsules that open and are easy to thresh, but which retain seed are required to minimise seed loss (Imrie 1995). This may be achieved by reducing the opening width and by increasing adhesion of the seeds to the capsule septum (van Rheenan 1981). Genetic variation for both characters is known and the effect of that variation on seed loss is examined in this paper for cultivars adapted to south-east Queensland and northern NSW. Seed dispersion at harvest may possibly be reduced by reducing the impact of the cutterbar on stems, as was found by Walsh (1991) in mungbean. The energy required to cut stems was examined in the context of crop management approaches that might reduce crop yield loss. The aim of the studies reported in this paper was to quantify variation in some factors that could affect seed loss, and to identify management practices to reduce seed loss in order to reduce risk associated with growing sesame. It is recognised that other factors such as synchrony of maturity, whether induced by genetic or chemical means, resistance to disease, and the design and operation of harvesting machinery, can also have a large impact on adaptation of sesame to mechanised production in Australia. Materials and Methods An experiment was grown at Lawes, Queensland, during the summer of 1994-95 to examine the effects of crop density, row spacing and cultivar on variables associated with seed retention and yield. Treatments were a factorial combination of three cultivars (Magwe Brown, Aussie Gold, Beech’s Choice), three crop densities (20, 40, and 60 plants/m2), and three row spacings (20cm, 40cm, and twin rows 20 cm apart on 80cm centres). There were three replicates (blocks) of each treatment sown in a split plot design with row spacings as main plots and density/genotype combinations as sub plots. Plot length was 6m, while width varied with row spacing (13 x 20cm rows, 7 x 40cm rows, and 4 pairs of twin rows). The trial was sown on 21 December, 1994 on a loamy alluvial soil, pre-fertilised with 100 kg/ha of both superphosphate and urea and treated post-planting, pre-emergence with 2 l/ha metolachlor herbicide. Plants were thinned after establishment to achieve desired densities. Actual mean densities were 29, 51 and 67 plants/m2 for the 20, 40 and 60/m2 treatments. The trial was irrigated when necessary to maintain growth and weeds were controlled by chipping. Two harvests were taken: Harvest 1: When the first capsule had ripened on 50% of plants in a plot, ten randomly selected plants were harvested by cutting plants at ground level. Measurements were made on: • Number of branches per plant • Stem diameter (mm) at harvest height (mean of two measurements made 5cm below the lowest
capsule) • Plant height (cm) • Number of capsules per plant

First Australian New Crops Conference 1996 – Volume 2
121
Each ten plant sample was placed in a calico bag with capsule openings pointed downwards. Bags were hung in a shed and left undisturbed for two weeks then plants were threshed by beating the bags repeatedly with a paddle, following which seed was removed and weighed. At this time, all capsules were dry and all seed was retrieved by the threshing process. Variates recorded were: • Total seed weight (g). Seed yield per hectare was estimated from yield/plant and plants/unit area. • This estimated total potential yield of the crop. • Weight (g) of 1000 seeds calculated from two samples of 100 dried seeds. • Seeds per capsule calculated as (total seed weight/number of capsules/single seed weight). Harvest 2: At maturity, which effectively occurred when flowering and capsule development ceased at 104-120 days after sowing, a further sample of ten plants was similarly harvested, dried and threshed. Measurements made on these plants were: • Width (mm) of capsule opening measured on ten capsules on each plant • Number of capsules per plant • Weight (g) of 1000 seeds calculated from two samples of 100 seeds • Total seed weight (g). Seed yield per hectare was estimated from yield/plant and plants/unit area. • This estimated recoverable yield at maturity. Energy required to cut stems was measured with a swinging pendulum type instrument provided by agricultural engineer, Dr. J. Tullberg. The pendulum, fitted with a cutting blade, was lifted to a pre-determined angle from the perpendicular, and allowed to swing so that the blade contacted a stem supported in a fixed position at the base of the perpendicular. The resistance of the stem to the cutting action of the blade was calculated from the angle that the pendulum swung to after cutting. This instrument provided a measure of relative resistance of stems to cutting but the measurements were not converted to standard energy units. Three cuts were made around harvest height on the main stem of each plant. Also at maturity, a 2m2 quadrat was harvested from each plot to obtain better estimates of seed yield and losses. Before harvest, the soil surface was covered with large paper bags to catch seeds dislodged when plants were cut. Following cutting, plants were placed on a large metal tray where further seed was unavoidably dislodged. Plants were then transferred to calico bags for full drying before threshing. Seed lots collected on the paper bags, in the tray and that finally threshed were weighed separately. The weight finally threshed is referred to as seed retained and provided an estimate of the extent to which seeds were held within capsules due to a combination of restricted capsule opening and attachment to the capsule septum. Conversely, the seed collected on the paper bags and in the trays represented the proportion that could potentially be dispersed and lost during the harvest process. The weights of the three samples from each plot were added to provide an estimate of harvestable seed yield. The difference between potential yield estimated at first ripe capsule and harvestable seed yield provided an estimate of seed loss from ripening plants. Analyses of variance and regression analyses were performed on a split plot design using GENSTAT 5.

First Australian New Crops Conference 1996 – Volume 2
122
Experimental Results Plant variables measured were examined in terms of the treatments applied. Row Spacing Row spacing only affected harvest height. The lowest capsule was significantly higher (29cm) on plants grown in twin rows than on plants grown in 40cm (24.0cm) and 20cm (22.4cm) row spacings. Total plant height was greatest in twin rows but differences were not statistically significant. Crop Density As might be expected, increasing crop density reduced the number of branches per plant and the number of capsules per plant. Increasing density also reduced the diameter of stems and the energy required to cut stems. Plant height increased with increasing density, although, as with row spacing, only the effect on the height of the lowest capsule was statistically significant. Crop density did not affect any yield variables. Results are presented in Table 1. Table 1. Effect of three crop densities on several plant traits of sesame
Variate 20 plants/m2 40 plants/m2
60 plants/m2
LSD (5%)
Measured at first ripe capsule Number of branches per plant 3.2 2.7 2.1 0.12 Main stem diameter (mm) 7.53 6.78 6.53 0.30 Number of capsules per plant 44.3 31.1 25.9 2.60 Weight of 1000 seeds (g) 2.84 2.84 2.83 NS Number of seeds per capsule 51.7 48.5 47.6 NS Seed yield per plant (g) 6.30 4.31 3.53 1.14 Estimated seed yield (kg/ha) 1848 2184 2365 Measured at maturity Plant harvest height (cm) 20.2 25.6 29.6 3.57 Width of capsule opening (mm) 7.42 7.73 7.44 NS Energy required to cut stems (relative units)
5.23 3.70 3.46 1.00
Estimated (from 10 plants) seed yield (kg/ha)
1235 1561 1548
Total seed yield (2m2 quadrat) (kg/ha) 1435 1406 1370 NS Percent seed retained in capsules 51.3 50.8 51.2 NS
Cultivar Effects There were significant differences between cultivars for several plant attributes. Minor statistical interactions between row spacing and cultivar for stem diameter, capsules per plant and total seed yield did not change the cultivar ranking or the nterpretation of cultivar effects. The brown seeded Magwe Brown had shorter stature, more branches and more capsules per plant than the other cultivars. Its stems were finer and required less cutting energy. In Magwe Brown, seed retention in the capsules during the harvesting process was greater than in the other cultivars. But the total seed yield of Magwe Brown recovered at maturity was less than the other cultivars, even though the estimated potential yield of all three cultivars measured at the time of first ripe capsule was similar. Highest

First Australian New Crops Conference 1996 – Volume 2
123
yields were obtained from the white seeded cultivars Aussie Gold and Beech’s Choice. Results are presented in Table 2. Table 2. Effect of cultivar on several plant traits of sesame
Variate Magwe Brown
Aussie Gold
Beech’s Choice
LSD (5%)
Measured at first ripe capsule Number of branches per plant 3.52 1.93 2.52 0.34 Main stem diameter (mm) 5.95 7.63 7.25 0.41 Number of capsules per plant 38.9 29.9 32.5 4.30 Weight of 1000 seeds (g) 2.63 3.01 2.87 0.08 Number of seeds per capsule 44.9 52.4 50.4 2.78 Estimated seed yield (kg/ha) 2310 2349 2268 Measured at maturity Plant height 74.4 76.4 88.8 8.61 Width of capsule opening (mm) 6.02 8.49 8.09 1.08 Energy required to cut stems 3.26 4.49 4.63 0.54 Estimated seed yield (from 10 plants) (kg/ha)
1183 1419 1398
Total seed yield (2m2 quadrat) (kg/ha) 1257 1498 1456 176 Percent seed retained in capsules 62.4 36.8 54.2 4.76
Discussion It is generally accepted that introduction of a crop to a new area or farming system is not an easy process when that crop needs to achieve the high economic returns that enable it to compete with current crops and alternative new crops. Experience with sesame has proven to be no exception. The impetus for introduction of sesame to Australian agriculture is a favourable market situation due to increasing world demand and high product prices (Russell et al. 1992). World demand for sesame seed increased at a rate of 5.6% (20,854 tonnes) per annum during the period 1980-94 and now approximates 500,000 tonnes per annum. Farm gate prices in Australia for cleaned and graded seed are presently around $1000 per tonne. But for sesame to become established, it must offer gross economic margins that are comparable with those obtained for current crops such cotton, grain sorghum and sunflower that it would displace and/or other advantages to the grower. Estimated gross margins for dryland sesame at $1000 per tonne and grain sorghum at $200 per tonne on the Darling Downs are presented in Table 3. To ensure a favourable economic return for sesame, yields need to be maximised and high seed quality obtained.

First Australian New Crops Conference 1996 – Volume 2
124
Table 3. Estimated gross economic margins for dryland sesame and grain sorghum on the Darling Downs. Calculations based on cleaned and graded sesame at $1000/t and sorghum at $200/t and production costs used in Queensland Department of Primary Industries Summer Crop Management Notes
Sesame Sorghum Yield (t/ha) Gross Margin ($/ha) Yield (t/ha) Gross Margin ($/ha)
0.25 84 1.0 6 0.50 334 2.0 206 0.75 584 3.0 406 1.00 834 4.0 606 1.25 1084 5.0 806
Paramount to crop success is the selection of well adapted varieties. With sesame, adaptation to climate, soils, and to mechanised production are required. Attempts to commercialise sesame in south-east Queensland in the early eighties failed because the variety chosen on the basis of its high seed quality, Palmetto, was too late-maturing for the region. During this period, D.F. Beech (personal communication) introduced varieties from several countries including Burmese genotypes with good climatic adaptation but deficiencies in other characters. Magwe White was too low yielding, of indifferent seed quality, and poor seed retention. Magwe Brown similarly was too low yielding and although it has brown seed, the flavour of that seed makes it excellent for oil and tahini production. Also, its seed retention was observed to be better than that of many other genotypes. A breeding program by D.F. Beech and B.C. Imrie (Imrie 1995) produced two cultivars, Aussie Gold and Beech’s Choice, with acceptable yield and good seed quality but poor seed retention. The problem of climatic adaptation has been overcome but the problem of adaptation to mechanised harvest remains. Current research is directed to improvement of seed retention to reduce seed loss and thus increase economic yield. The experiment reported in this paper was designed to quantify differences between cultivars in seed retention and yield and to investigate whether varying row spacing and crop density would have any effect on yield, seed loss and plant traits that might affect the ease of harvest. The need for improved seed retention is clearly indicated by the data presented in Table 2. The mean difference between estimated yield at first ripe capsule and at harvest was 980 kg/ha. This represents the potential seed loss that could occur during the ripening process. This loss has been minimised on farm by crop management whereby a dessicant is applied at the first ripe capsule stage in order to force synchrony of maturity and the crop is harvested as soon as the capsules are dry. The percent seed retained in capsules (Table 2) averaged 51% and provides an estimate of potential loss during the harvest process. Seed loss during harvest can be reduced by the adoption of recommended harvesting machinery and practices (Boyle and Oemcke 1995). Most of the variation observed in the experiment was due to differences between cultivars. Differences were observed for all attributes measured except height of the lowest capsule, which affects height of the cutter bar at harvest. Although capsule height was similar, total plant height varied, with Beech’s Choice being taller than the other two cultivars. Magwe Brown had narrower stems which were less resistant to cutting, a narrower opening of the capsules and better seed retention than the other cultivars. The potential for seed loss before and during harvest was consequently considered to be lower. Despite this lower potential for seed loss, estimates of pre-harvest loss based on yield of the ten plant samples taken at first ripe capsule stage and at harvest were unexplainably higher for Magwe Brown than for the other cultivars. Thus no firm conclusions on varietal differences in seed loss can be drawn from this experiment.

First Australian New Crops Conference 1996 – Volume 2
125
The results indicated that varying row spacing or crop density did not have any effect on seed yield or seed loss either at or before harvest. However, the number of branches per plant was progressively reduced by increasing crop density, and stem diameter was greatest at twenty plants/m2. Thicker stems provided greater resistance to cutting and increased the probability of seed loss at harvest. Crop density also affected the height of the lowest capsule with cutter bar height for harvest being estimated to increase from twenty to thirty cm as density increased from twenty to sixty plants/m2. Future research will be directed to screening the germplasm collection to seek genotypes with improved seed retention and to investigations of the morpho/physiologic basis of any variation in seed retention in order to provide a sound basis for breeding and selection of varieties with reduced seed loss combined with high yield. Acknowledgments I am indebted to Mr David Blogg for the technical management of the experiment reported and his dedication in the collection and collation of the data; to Mr Andrew Watkinson who did the statistical analyses and to Dr Jeff Tullberg of University of Queensland, Gatton, for loan of the instrument to measure cutting energy. References
Beech, D.F. 1991. Sesame Crop Guide. (CSIRO Division of Tropical Crops and Pastures: St Lucia). 8pp.
Bennett, M.R. and Wood, I.M. (Eds) 1995. Proceedings of First Australian Sesame Workshop. (Betta Concepts: Northbridge).
Boyle, G.J. and Oemcke, D.J. 1995. Reduction of harvest losses in sesame. In: Proceedings of First Australian Sesame Workshop. (Eds M.R. Bennett and I.M. Wood). (Betta Concepts: Northbridge).
Imrie, B.C. 1995. The potential contribution of breeding to development of a sesame industry in Australia. In: Proceedings of First Australian Sesame Workshop. (Eds M.R. Bennett and I.M. Wood). (Betta Concepts: Northbridge).
Russell, J.S., Pollock, F.G. and Prestwidge, D.B. 1992. A Global Market Analysis of FAO Data as a Guide to Selection of Potential New Crops for Australia. Tropical Agronomy Technical Memorandum No. 75. (CSIRO Division of Tropical Crops and Pastures: St Lucia).
van Rheenan, H.A. 1981. Breeding objectives and assessment of principal commercial strains of sesame. In: Sesame - Status and Improvement. (Ed. A. Ashri). (FAO: Rome). pp. 113-115.
Walsh, P.A. 1991. Harvesting of mungbean. In: Mungbean: The Australian Experience. (Eds B.C. Imrie and R.J. Lawn). (CSIRO Division of Tropical Crops and Pastures: St Lucia). pp. 87-93.
Weiss, E.A. 1971. Castor, Sesame and Safflower. (Leonard Hill: London). pp. 311-528.
Wood, I.M. and Associates and Agtrans Research 1995. A Strategic Plan for the Australian Sesame Industry 1995-2005. (Grains Research and Development Corporation: Canberra).

First Australian New Crops Conference 1996 – Volume 2
126
Sweet Potatoes in Queensland – Something Old, Something New
Ken Jackson Queensland Department of Primary Industries, Gatton Research Station, PO Box 241, Gatton Qld 4343 Abstract Though sweet potatoes are considered as one of the earliest domesticated plants, as historical evidence shows that they were cultivated as a crop in southern Peru and Mexico about 2,000 to 2,500 BC, their history of cultivation in Queensland is naturally much more recent. However, in the context of Queensland agriculture, the cultivation of sweet potatoes has had a relatively long history. Initially the crop was cultivated for stock feed where it played an integral part as a source of sustenance, particularly on dairy farms which were instrumental in the early development of Queensland agriculture. A sweet potato patch commonly in the size range of 2 - 5 hectares provided supplementary grazing for both the dairy cattle and pigs, the latter being an important component of these early enterprises. Both the shoots and the roots were utilised and no doubt the roots were also used as a part of the settlers' diet during these pioneering times. From these early beginnings, the sweet potato industry has changed substantially, particularly from the early 1970s. The crop is now grown primarily for human consumption. This paper briefly traces the history of the crop in Queensland and outlines the research inputs by the Queensland Department of Primary Industries (QDPI) to service this industry with new varieties, a source of virus tested germplasm, improved agronomic practices, and more recently, joint research by QDPI and the University of Queensland, Gatton College to provide an understanding of the importance of feathery mottle virus on yield and quality of sweet potatoes. The size and distribution of the Queensland industry, and production trends, are also discussed. Introduction Historical research indicates that the sweet potato is possibly one of the earliest domesticated plants (Yen 1976). Carbon dating suggests sweet potatoes found in Peru were produced between 8,000 and 10,000 BC. Linguistic and historical evidence exists to believe that cultivation of the crop was widespread in southern Peru and Mexico about 2,000 to 2,500 BC (Bohac et al. 1995). While Austin (1988) proposes that the origin of the sweet potato occurred between the Yucatan and the mouth of the Orinoco river in South America, Yen (1982) describes related species in the tropical north of Australia including Arnhem Land and Cape York as well as the desert region of Central Australia that were used as a food source by aboriginal hunters and gatherers. In the very first issue of the Queensland Agricultural Journal which chronicles the progress of agricultural development in Queensland, Tardent (1897), champions the cause of the sweet potato as a cultivated crop in the pioneering of Queensland Agriculture Records indicate that the crop was at least grown in Queensland as early as 1888 on St Helena Island at the mouth of the Brisbane River (Anon. 1897). Through the ensuing volumes of the Queensland Agricultural Journal some indication of the importance of this crop in the development of agriculture, particularly in coastal districts, can be appreciated. The crop was often an integral part of the pioneering dairying industry where it was
First Australian New Crops Conference 1996 – Volume 2
127
used as a fodder reserve for both cattle and pigs. Brooks (1923) observed that, though the crop was not grown on a large scale for sale, practically every farmer had his own sweet potato patch. At this time, Brooks classified 50 existing varieties into those suitable for stock feeding, culinary use and starch production. Kerr (1943) concluded the varieties available at that time were not particularly suitable to culinary use because of the contorted shapes of storage roots and their high fibre content. In reality, demand for sweet potatoes in the market place at this time depended on a shortfall in the supply of English potatoes. As recently as 1955, Hassell described techniques for the grazing of sweet potatoes by pigs and cattle indicating this was still the major use of sweet potatoes in Queensland at this time (Hassell 1955). A significant change occurred within the Queensland industry in the 1960s partly due to the decline of the dairying industry and also the introduction of new orange fleshed varieties, particularly Centennial, from the United States by Mr Ian Wood of QDPI. During this transition period the area sown to sweet potatoes declined from 250 ha in 1952-53 to 160 ha in 1972-73 (Wood 1976). This paper outlines the growth and location of this new industry and the research input that has serviced its development. Production Australia’s production in 1992/93 was 7,654 t of which Queensland produced 5,726 t from 437 ha (Australian Bureau of Statistics 1995). Production trends (Figure 1) indicate a steady increase with production doubling over the 10 year period 1982/83 - 1992/93. Current estimates of the size and value of the Queensland industry is 8,000 t worth $8 million (L. Loader, pers. comm. 1996). To put this into perspective, China with an annual harvest of approximately 100 million tonnes is responsible for 80% of all production. Only about 2% is grown in industrialised countries, mainly in the United States and Japan (Horton et al. 1989). Location of Industry Sweet potato production is predominantly in Shires located along the eastern coastal and sub coastal regions (Table 1). The major soil types utilised in these areas are coastal sandy loams with low inherent fertility, red volcanic soils on the Atherton Tablelands, Redland Bay and the Bundaberg District and red and brown loams in Central Queensland. Annual rainfall in the main growing areas exceeds 1000 mm, the majority of which falls in the growing period. However, supplementary irrigation is necessary to maintain sufficient soil moisture and is practised by successful growers (Wood 1976).

First Australian New Crops Conference 1996 – Volume 2
128
0
1000
2000
3000
4000
5000
6000
7000
8000
82/83 83/84 84/85 85/86 86/87 87/88 88/89 89/90 90/91 91/92 92/93
Year
Pro
duct
ion
- (t
)
AustraliaQueensland
Figure 1. Production trends in Australia and Queensland over the period 1982/83 to 1992/93. Source: Australian Bureau of Statistics Table 1. Area description, number of producers, growing areas (hectare), production (tonne), average yield (t/ha), and percentage (%) of total production for the major sweet potato growing areas in Queensland (1992-93)*
Area description
(Shires)
No. of producers
Area (ha)
Production (t)
Yield (t/ha)
% of total production
Albert Bowen Caboolture Gooburrum Isis Laidley Landsborough Livingstone Mareeba Redcliffe city Redland Woocoo Woongarra Others
13 1 7
13 3 7 7 3 6 2
10 2 7
20
29 6
33 47 29 39 47 34 47 12 18 11 47 38
452 126 509 736 258 282 253 304 895 164 588 132 724 303
15.8 21.0 15.4 15.8 8.9 7.2 5.4 5.31
19.04 13.67 32.47 12.57 15.33 7.97
7.89 2.2 8.89
12.85 4.51 4.92 4.42 8.8
15.63 2.86
10.27 2.31
12.64 5.29
Total 101 437 5726 13.10 100 * Source: Australian Bureau of Statistics (Hampton, N. personal communication). Variety Introduction

First Australian New Crops Conference 1996 – Volume 2
129
By the 1970s the only two varieties that had survived to any extent the transition of sweet potatoes from the production for stockfeed to an almost exclusive human food were White Maltese and Porto Rico. Much of the recent success of the Queensland sweet potato industry has resulted from the introduction of orange fleshed varieties from breeding programs in North Carolina and Louisiana in the United States. The orange fleshed varieties belong to the dessert type and are characterised by their sweet orange flesh in contrast to the staple type which generally has a white to cream coloured flesh and a higher dry matter content. Current market demand in Queensland is mainly for the dessert type, however substantial amounts of the staple type are grown to meet demand mainly from interstate markets in Sydney and Melbourne. Mr Ian Wood and Mr Terry Harper of QDPI were particularly responsible for the introduction and development of varieties from the United States. The most successful of these introductions were Centennial, Beerwah Gold, Jewel, LO-323 and NC-3 (Harper 1982). All these varieties other than Jewel are still grown today. In the 1980s a group of Taiwanese breeding lines developed by the Asian Vegetable Research and Development Center (AVRDC) as well as two endemic staple varieties (One Moon and Coleambally) plus the US variety, Resisto, were evaluated. None of the AVRDC lines was released mainly due to their poor shape and uneven flesh colour (Loader 1987). The three named varieties were released. Further introductions were made from AVRDC and the US in the early 1990s. A white fleshed, AVRDC line (CN1489-89) and the US variety, Rojo Blanco, are undergoing small commercial trials. In 1994, Mr Lester Loader (QDPI) and a grower, Mr Phil Buchanan, having visited the United States, made further introductions which included the orange fleshed varieties, Hernandez, Beauregard, Garnet, Ureka and Travis. Additionally, they introduced seed of a number of crossbreds from North Carolina. This material, as well as approximately 100 lines from Oceania countries procured from the National Germplasm Collection (held at the Institute for Horticultural Development, Knoxfield, Victoria) by North Queensland grower, Mr George Bolland, are being screened for potential commercial use by Mr Lester Loader at the QDPI Southedge Research Station in North Queensland. Germplasm Maintenance An essential component of the success of the sweet potato industry in recent years has been the development of a germplasm maintenance system for introduced varieties. Since 1981, virus tested planting material of successful new introductions has been made available to producers. Procedures involved in managing this system are reported by Harper et al. (1990). Growers frequently purchase virus-tested material from QDPI research stations at Redlands in Southern Queensland and Walkamin in North Queensland to establish their own nurseries. Part of the germplasm maintenance program involves the regular testing for the presence of sweet potato feathery mottle virus by graft indexing onto the host species Ipomoea setosa. Any variety giving a positive reaction is withdrawn from the commercial nurseries and the virus is eliminated using tissue culture techniques. The regenerated plantlets are again tested to ensure the virus has been eliminated before the variety is re-introduced into the program.

First Australian New Crops Conference 1996 – Volume 2
130
Importance of Sweet Potato Feathery Mottle Virus (SPFMV) SPFMV is found throughout the world sweet potato production areas. The effect of this virus on yield and quality of sweet potatoes however is poorly understood. In a joint research project between QDPI and the University of Queensland, Gatton College, the importance of this virus in the Queensland sweet potato industry was undertaken as a Master’s study by Mr George Pan. An isolate of the virus from SE Queensland reduced yields of Beerwah Gold, LO-323 and Coleambally by 12.3%, 18.2% and 15.5% respectively compared with healthy material. In the variety NC-3 where an additional treatment of older infected material was also included, yield reduction of the older infected material was 17.7% less than the uninfected control compared to 9.2% in the recently infected material (Pan et al. 1995). Infection by the virus did not have a significant effect on dry matter content, sugar content, flesh or skin colour or shape of storage roots in any of the varieties evaluated. Further studies by Pan et al. (1996) examined the effect of three isolates of SPFMV, one each from North Queensland (NQ), S.E. Queensland (SEQ) and Northern New South Wales (NSW) on LO-323 and Beerwah Gold. LO-323 was more susceptible to the three viruses. Yield reductions in LO-323 were 86% (NSW strain), 26.8% (SEQ strain) and 25.2% (NQ strain). The corresponding reductions in yield in Beerwah Gold were 71.3%, 18.2% and 11.0%. Later investigations determined that the NSW strain co-existed with the phytoplasma Sweet Potato Little Leaf. All three isolates caused significant reductions in the number of marketable roots. None of the isolates had any significant effect on the dry matter content though the NSW strain significantly increased the sugar content of both varieties. These studies have established the importance of using virus tested material for commercial plantings. Agronomy With the introduction of the new US varieties commencing in the early 1970s, there was a need to develop a detailed agronomic package to provide producers with guidelines to supply markets with acceptable grades of the new varieties. Population and Growth Cycle Studies Studies by Harper (1984) determined that a 26.6 cm intra-row spacing was optimal for Jewel, Beerwah Gold, NC-3 and Centennial while a 20 cm spacing, or harvesting before 20 weeks, would minimise the production of very large storage roots in LO-323 and White Maltese. Since LO-323 showed greatest potential as a commercial variety, Harper and Walker (1984) studied this variety over a range of planting and harvesting dates to ascertain the year-round production of this variety for the fresh market as well as for starch production. Highest storage root dry matter yield was recorded in the May planting (15.16 t/ha). Plantings in November and January produced 13.9 and 10.5 t/ha respectively. Maximum yields were achieved generally at the last or second last harvest of each planting. Nutrition Nutritional studies were also undertaken by Harper and Walker (1985) to establish the effect of nitrogen (N) and potassium (K) application on the yield and shape of storage roots when applied to the infertile coastal sands and volcanic soils in SE Queensland. They found that the addition of 30 kg N/ha gave significant yield responses in both the sandy and volcanic soils while significant yield responses to the addition of 60 kg K/ha on the sandy soil types were obtained. No response to additional K was measured on the volcanic soil.
First Australian New Crops Conference 1996 – Volume 2
131
Irrigation and Weed Control Studies Irrigation studies by Harper (1985) compared production when irrigation replenishment to field capacity to a depth of 30 cm was scheduled at 75%, 50% and 25% of available soil moisture (ASM). It was concluded that replenishment at 25% ASM was sufficient to maximise yields. Harper and Walker (1987) completed extensive herbicide screening to find a replacement for the discontinued herbicide Lasso. This work resulted in the recommendation of Dual as a replacement, but unfortunately this chemical has not as yet been registered for use in sweet potatoes. Plastic Mulch and Storage Studies Harper and Walker (1987) determined that black plastic mulch had potential for sweet potato plantings between March and May, but was not recommended for August plantings because of the risk of soil rots developing in the hot, wet summer growing conditions encountered following this planting time. Shed versus in-ground storage studies were conducted by Harper and Walker (1980). They concluded that neither White Maltese nor Centennial were suitable for over-winter storage in either the field or a shed. The varieties Jewel and NC-3 were stored successfully in the field and produced higher saleable yields than shed stored material from the same varieties. Under the conditions of the trial, storage for future fresh market sales could not be recommended. These studies were undertaken primarily to supply markets in late winter and spring from SE Queensland production areas to take advantage of the higher prices at this time. Conclusion The sweet potato has served Queensland agriculture both as an old crop to provide a source of reserve fodder on the pioneering dairy farms and more recently as a new crop to supply an estimated 8000 t for human consumption. While this industry is steadily growing, it is still a minor horticultural crop in Queensland. Per capita consumption of sweet potato in Australia is approximately 0.5 kg compared to 35 kg for the English potato. There is a need to promote the nutritional value and the versatility of this crop both as a fresh and a processed vegetable. For example Mason (1976) determined the suitability of Queensland sweet potatoes for canning, but this product has never been commercialised. References Anon. 1897. The sweet potato. Queensland Agricultural Journal 1: 290-291. Austin, D.F. 1988. The Taxonomy, evolution, and genetic diversity of sweet potatoes and related wild
species. In: Exploration and Maintenance and Utilisation of Sweet Potato Genetic Resources, First Planning Conference, Lima, Peru. (International Potato Center ). pp. 27-59.
Bohac, J.R., Dukes, P.D. and Austin, D.F. 1995. Sweet potato Ipomoea batatas (Convolvulaceae). In:
Evaluation of Crop Plants, 2nd edition. (Eds J. Martt and N.W. Simmonds) (Longman). Brooks, G.B. 1923. The sweet potato. Bulletin produced by the Queensland Department of
Agriculture and Stock, Brisbane. pp. 1-21.

First Australian New Crops Conference 1996 – Volume 2
132
Harper, T.W. 1982. Sweet potato varietal studies in coastal southern Queensland. Queensland Agricultural Journal 108: 242-244.
Harper, T.W. 1984. Effect of plant spacing on the yield of sweet potato cultivars at three times of
planting. Queensland Journal of Agricultural and Animal Sciences 41 (1): 27-33. Harper, T.W. 1985. Water requirements of sweet potatoes. QDPI Internal Report (GRS-C025.01).
pp. 1-10 Harper, T.W., Jackson, K.J. and Kerr, J.C. 1990. Sweet potato agronomy in Queensland - A review of
experiments conducted between 1974 and 1989. Queensland Department of Primary Industries Project Report No. Q090019. pp. 1-31.
Harper, T.W. and Walker, I.R. 1980. Assessment of in-ground and shed storage potential of sweet
potato cultivars. Agriculture Branch, QDPI. Internal Report (GRS-C009.01). pp.1-6 Harper, T.W. and Walker, I.R. 1984. Evaluation of sweet potatoes at several times of planting.
Queensland Journal of Agricultural and Animal Sciences 41 (2): 103-113. Harper, T.W. and Walker, I.R. 1985. Responses of a sweet potato variety to levels of nitrogen and
potassium applied at planting. Queensland Journal of Agricultural and Animal Sciences 42 (1): 23-27.
Harper, T.W. and Walker, I.R. 1987. Evaluation of varieties, planting date and polyethylene mulch for
spring and summer sweet potato production in South East Queensland. Queensland Journal of Agricultural and Animal Sciences 44 (1): 9-13.
Harper, T.W. and Walker, I.R. 1987. Sweet potato herbicide screening. QDPI Internal Report
(includes summary of entire project) (GRS-C024.01). pp.1-6 Hassell, O.L. 1955. Sweet potato growing in Queensland. Queensland Agricultural Journal 80: 3-16. Horton, D., Prain, G. and Gregory, P. 1989. High-level investment returns for global sweet potato
research and development. CIP Circular 17: 1-11. Kerr, J.A. 1943. The sweet potato. Queensland Agricultural Journal 57: 72-77. Loader, L. 1987. Sweet potato cultivar testing in Far North Queensland. QDPI Internal Report (GRS-
C006.06) pp. 1-9 Mason, R.L. 1977. Canned sweet potatoes - A new product for Australia. Eleventh Annual Convention
of the Australian Institute of Food Science and Technology, Surfers Paradise, Queensland. pp. 1-9
Pan, G., Jackson, K. and Duff, A. 1995. Assessment of sweet potato varieties grown in Queensland.
Queensland Fruit and Vegetable News, October. pp. 13-15. Pan, G., Jackson, K., Wearing, A. and Persley, D. 1995. Importance of sweet potato feathery mottle
virus. Queensland Fruit and Vegetable News, November. pp. 12-13.
First Australian New Crops Conference 1996 – Volume 2
133
Pan, G., Wearing, A., Jackson, K. and Persley, D. 1996. Sweet potato feathery mottle virus. Queensland Fruit and Vegetable News, January. pp. 12-14.
Tardent, H.A. 1897. A paying crop for the west. Queensland Agricultural Journal 1:12-16. Wood, I.J.L. 1976. Sweet potato growing in Queensland. Queensland Agricultural Journal 102: 523-
566. Yen, D.E. 1976. Sweet potato Ipomoea batatas (Convolvulaceae). In: Evaluation of Crop Plants. (Ed.
N.S. Simmonds)(London). pp. 42-45. Yen, D.E. 1982. Sweet potato in historical perspective. In: Sweet Potato - Proceedings of the first
international symposium. (Eds R.L. Villareal and T.D. Griggs) (Asian Vegetable Research and Development Center, Shanhua, Taiwan).

First Australian New Crops Conference 1996 – Volume 2
134
Quinoa: An Ancient Grain for a Modern Era Duane L. Johnson Department of Soil and Crop Sciences, Colorado State University, Ft. Collins, Colorado 80523-1170 USA Abstract Quinoa, Chenopodium quinoa Willd., is a pseudocereal native to the highlands and coastal regions of western South America. The crop was domesticated by indigenous native populations and became the “Mother Grain” of the Incas. Quinoa lanquished with the Spanish conquest and has only recently become popular with more affluent ethnic populations. Quinoa was first commercialised outside of South America in 1986 in Colorado (USA). Initial testing began in 1983 in both Colorado and in England. Adaptation of quinoa was found to be best in temperate climates using the “sea level” ecotype. Today, the Chilean quinoas are the predominant type grown outside of South America. They differ in size and color from the Bolivian and Peruvian “real”(pronounced Ree-al) quinoas typical of the highlands. Quinoa has potential in numerous markets from a gourmet whole grain to a starch source for fat free cream replacement and pharmaceuticals. Market size and development are discussed as well as cultural practices. Introduction Chenopodium species are widespread throughout the world. They have frequently been used as a food source from ancient North and South America to India and the Himalayas. While most of these chenopods were and still are used as a high protein seed, some are used as vegetables. Huazontle (C. berlandieri ssp. nutalliae) is harvested as the panicles are developing, dipped in a tempura and fried. The best known of the seed Chenopods is quinoa, C. quinoa Willd. The origin of this pseudocereal is estimated to be 5000 B.C. With the invasion of Europeans into the Andean region, quinoa remained a staple food of remote indigenous populations (Cusack 1984). Europeans and subsequent generations preferred the cereals to which they had become accustomed. Quinoa became synonymous with a poverty food. The bias remains today in the coastal Andean region from Columbia to Chile. Quinoa as a food is frequently mentioned in early literature of the twentieth century. Germplasm collection from Western Europe to North America reported failure in production. Poor adaptation to humid temperate and humid subtemperate climatic zones reduced interest in quinoa until the 1980s. Colorado Development of Quinoa Initial experiments conducted by Colorado State University involved evaluation of 103 South American accessions from 6 South American countries. All entries were planted in nonreplicated plots at 10 locations within the eastern half of the state of Colorado. Elevations ranged from 1348 m to 2604 m and latitudes ranged from 35oN to 32oN. All entries in all locations below 2092 m failed to flower or failed to produce seed. Reasons for crop failure were daylength sensitivity in accessions obtained from 4oN to 26oS latitude. Accessions derived from 26oS to 32oS flowered but failed to produce seed presumably because of heat sterilisation of pollen. Plots located at elevations above 2092 m produced seed on plants derived from sources between 26oS and 32oS. Selection for early maturity, insect tolerance and yield narrowed the number of accessions to one cultivar from Isluga, Bolivia and two cultivars from Linares, Chile. These cultivars were designated, using the South American classification system, as “sea level” types typically grown from 500 m to 2400 m in
First Australian New Crops Conference 1996 – Volume 2
135
elevation along the western coast of South America. The Isluga cultivar (CO 128) has minor daylength sensitivity and both Linares cultivars (CO 407 and CO 401) appear to be day neutral (Johnson and Ward 1993). Cultural Evaluation Total water requirements are minimal, being between 25 and 28 cm (precipitation and irrigation combined on sandy-loam to loamy-sand soils). Quinoa responds well to nitrogen. Applications of 13, 55, and 111 kg/ha of nitrogen produced yields of 808, 876, and 1282 kg/ha respectively in first year trials of the variety "Linares". Other varieties have responded similarly. Plants have a wide range of maturity from 90 to 125 days under Colorado conditions. The early maturity types are recommended because of the short season at these high elevations. Once the grain has reached the soft dough stage, plants are not affected by temperatures down to -7o C. A killing frost (-5o C) at Gunnison, CO in early August found the Colorado State University research plots in mid-bloom. We estimated a 70-80% loss in 1985 at this site. Generally a light frost (-1o to 0o C) will not harm quinoa. Planting Quinoa prefers cool soil conditions (7o -10o C) at 2.5 cm below the surface for germination. Planting should be at a depth of 1-2 cm depending on soil type and available soil moisture. Row width can be variable with a minimum of 30 cm between rows. Germination occurs within 24 hours and emergence occurs in 3 to 5 days. A stand of 312,000 plants per hectare appears optimal although plantings at 600,000 to 1,000,000 are not uncommon in Europe. A stand of 312,000 would require between 700 to 1,000 grams of seed per hectare. It is a common practice to double seeding rates when conditions are less than optimum. Weed Control Quinoa is slow growing for the first two weeks in the spring. Weed control in quinoa is difficult since there are no registered herbicides in the United States. Fields for planting quinoa should be as weed free as possible. Cultivation and hand hoeing are recommended for weed control. Weed problems may be compounded with broadcast or drill seeding. Several unregistered post-emergent herbicides have been found to be effective in broadleaf and grass control without significantly effecting quinoa yield or quality. Water Requirements Late spring plantings may not need irrigation until mid-summer, provided the soil profile was near field capacity at planting. Over-irrigation after establishment tends to produce tall lanky plants and yields have not been improved. Over-irrigation in the seedling stages has caused damping off and severe stunting. Water (rainfall plus irrigation) requirements have ranged from 30.1 to 40.6 cm when ambient air temperatures have not exceeded 33o C during the growing season. Water requirements vary depending on fertility and air temperature. Water requirements have generally been 75 to 80% of spring wheat (Flynn 1990).

First Australian New Crops Conference 1996 – Volume 2
136
Harvest At maturity, plants have a sorghum-like head. Drydown is very satisfactory and plants are easily combined. A sorghum header attachment is suggested for quinoa although platform headers and pick-up reels are generally used without serious crop loss. Generally, adjustments to combines include reduction of air and cylinder speed. Grain should thresh easily by hand. The stover (straw) has little fiber to it and basically provides no crop residue. Seed size is similar to millet in diameter (0.16 cm) with two flat surfaces giving it the appearance of a miniature aspirin tablet. Seed color is variable from black, red, crimson, orange, yellow to white. The seed coat coloring is associated with saponin. This bitter-tasting compound has several industrial uses from pharmaceuticals to detergents, but it may be toxic to fish in its native form. For human consumption, the grain is processed to remove the saponin coating. Barley pearling or rice dehulling equipment is currently used in this process. Saponin is water soluble and washing quinoa is common in South America and is being experimentally attempted in Canada. With the coating removed, the marketable grain is generally white or translucent. Rain during harvest periods is undesirable because dried quinoa seed (<10% moisture) will germinate within 24 hours of exposure to moisture. This has been particularly noticeable when heads come in contact with the soil surface. This occurs frequently after drydown if panicles get wet and break. Seed will germinate at 4o C if exposed to constant moisture. Insects Insect pests of quinoa include flea beetles and a wide range of caterpillars and stem flies. Recently, an outbreak of sugarbeet root aphid has significantly reduced yields in isolated fields. It appears that since the crop requires less water, stress may add to the loss of yield. All of these insects find Quinoa to be very tasty. Pesticides have not been cleared for use on Quinoa. Most quinoa is marketed where inorganic pesticide use is not acceptable. Several organic insecticides are available and have been effective with proper usage. Yields Experiments with quinoa in the San Luis Valley of Colorado have given consistent nursery average yields of 1020 kg/ha for the past three years. Currently, only one numbered variety "CO407," is available for experimental production. CO407 has also been called "Dave" by the growers. It typically has early maturity, a short growth habit, predominantly yellow compact heads, and medium-small yellow kernels. The pericarp is resistant and is best removed with abrasion rather than by washing. Yields of materials released or proposed for release within the next three years are given in Table 1. New Colorado lines have incorporated a “sweet” or low saponin trait and a white, opaque endosperm. This is more acceptable to the whole grain market than prior Chilean accessions. Yields of these new quinoas also appear to be superior to lines and accessions commercially grown in Colorado at the present. Nutrition Quinoa is one of the world's most perfect foods. The United Nations Food and Agriculture Organization (FAO) states its quality is "equal to... the protein of whole dried milk." Table 2 illustrates the nutritional value of quinoa and Table 3 shows the composition of proteins in quinoa.

First Australian New Crops Conference 1996 – Volume 2
137
Marketing Quinoa is primarily marketed in the United States as a whole grain replacement for rice. Quinoa marketers have traditionally focused on the healthfood industry but have recently begun development of gourmet grain markets, frequently competing with American and Canadian wild rice. Marketing focuses on quinoa’s relationship with the Incan Empire using product line names such as “Ancient Grains” and “Lost Crops of the Americas”. Secondarily, marketers have focused on the protein composition of the grain which basically meets FAO protein standards in human diets. Table 1. Field observations of quinoas in Colorado
Landrace/ line
Yield (kg/ha)
Panicle colour1
Height (m)
Cahuil 1740 mix 1.3 CO407-78 1692 Y 1.3 CO407-06 1691 Y 1.8 CO407-260 1690 Y 1.4 Milahue 1635 R & W 2.1 Isluga 1499 mix 1.7 Faro 1422 mix 2.0 CO407 1206 mix 1.3 lsd 50 CV 9.0%
1 mix = multiple colours,; Y = yellow or cream; R = red or ??? Table 2. Nutritional analyses of various cereals and pseudocereals Crop Water
% Crude Prot %
Fat %
CHO %
Fibre %
Ash %
Barley1 9.0 14.7 1.1 67.8 2.0 5.5 Buckwheat1 10.7 18.5 4.9 43.5 18.2 4.2 Corn1 13.5 8.7 3.9 70.9 1.7 1.2 Pearl Millet1 11.0 11.9 4.0 68.6 2.0 2.0 Oats1 13.5 11.1 4.6 57.6 10.3 2.9 Quinoa2 12.6 13.8 5.0 59.7 4.1 3.4 Rice1 11.0 7.3 0.4 80.4 0.4 0.5 Rye1 13.5 11.5 1.2 69.6 2.6 1.5 Wheat (HRW)1 10.9 13.0 1.6 70.0 2.7 1.8
1 Crampton and Harris (1969). 2 Cardoza and Tapia (1979).
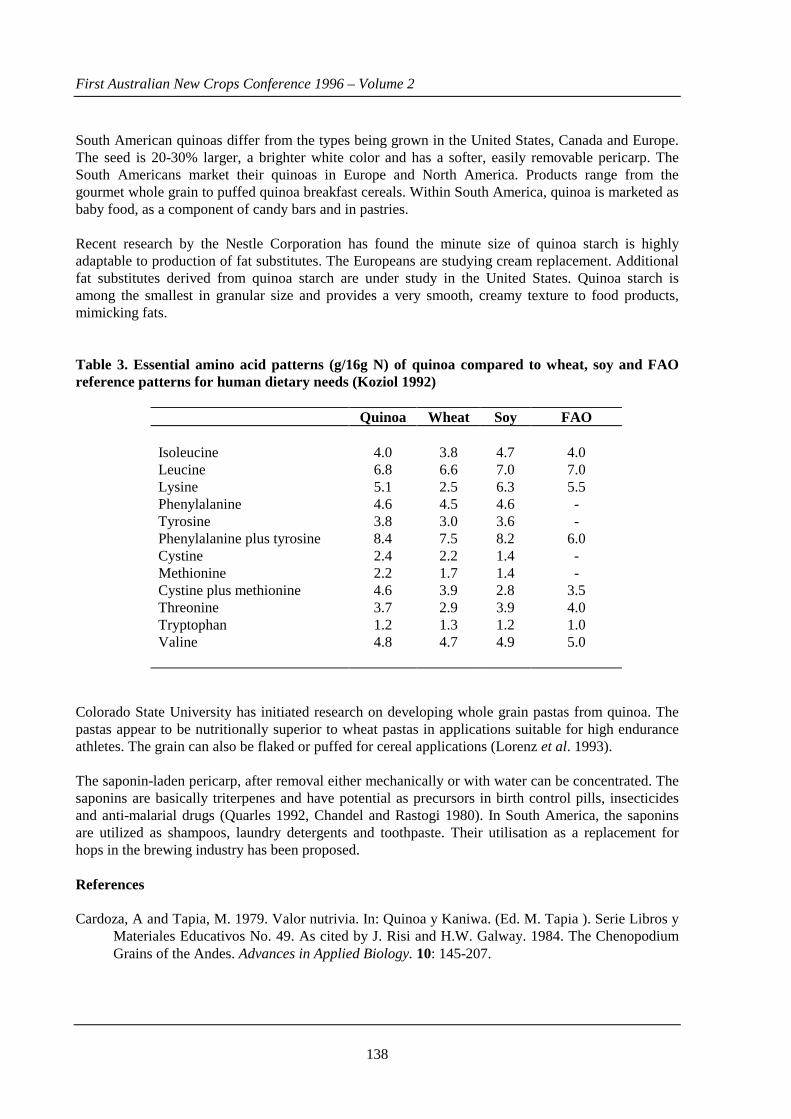
First Australian New Crops Conference 1996 – Volume 2
138
South American quinoas differ from the types being grown in the United States, Canada and Europe. The seed is 20-30% larger, a brighter white color and has a softer, easily removable pericarp. The South Americans market their quinoas in Europe and North America. Products range from the gourmet whole grain to puffed quinoa breakfast cereals. Within South America, quinoa is marketed as baby food, as a component of candy bars and in pastries. Recent research by the Nestle Corporation has found the minute size of quinoa starch is highly adaptable to production of fat substitutes. The Europeans are studying cream replacement. Additional fat substitutes derived from quinoa starch are under study in the United States. Quinoa starch is among the smallest in granular size and provides a very smooth, creamy texture to food products, mimicking fats. Table 3. Essential amino acid patterns (g/16g N) of quinoa compared to wheat, soy and FAO reference patterns for human dietary needs (Koziol 1992)
Quinoa Wheat Soy FAO Isoleucine 4.0 3.8 4.7 4.0 Leucine 6.8 6.6 7.0 7.0 Lysine 5.1 2.5 6.3 5.5 Phenylalanine 4.6 4.5 4.6 - Tyrosine 3.8 3.0 3.6 - Phenylalanine plus tyrosine 8.4 7.5 8.2 6.0 Cystine 2.4 2.2 1.4 - Methionine 2.2 1.7 1.4 - Cystine plus methionine 4.6 3.9 2.8 3.5 Threonine 3.7 2.9 3.9 4.0 Tryptophan 1.2 1.3 1.2 1.0 Valine 4.8 4.7 4.9 5.0
Colorado State University has initiated research on developing whole grain pastas from quinoa. The pastas appear to be nutritionally superior to wheat pastas in applications suitable for high endurance athletes. The grain can also be flaked or puffed for cereal applications (Lorenz et al. 1993). The saponin-laden pericarp, after removal either mechanically or with water can be concentrated. The saponins are basically triterpenes and have potential as precursors in birth control pills, insecticides and anti-malarial drugs (Quarles 1992, Chandel and Rastogi 1980). In South America, the saponins are utilized as shampoos, laundry detergents and toothpaste. Their utilisation as a replacement for hops in the brewing industry has been proposed. References Cardoza, A and Tapia, M. 1979. Valor nutrivia. In: Quinoa y Kaniwa. (Ed. M. Tapia ). Serie Libros y
Materiales Educativos No. 49. As cited by J. Risi and H.W. Galway. 1984. The Chenopodium Grains of the Andes. Advances in Applied Biology. 10: 145-207.

First Australian New Crops Conference 1996 – Volume 2
139
Chandel, R.S. and Rastogi, R.P. 1980. Triterpenoid saponins and saponogens:1973-1978. Phytochemistry 19: 1889-1908.
Crampton, E.W. and Harris, L.E. 1969. Applied Animal Nutrition, Second Edition. (W. H. Freeman
and Company: San Francisco). 753 pp. Cusack, D. 1984. Quinoa:grain of the Incas. Ecologist 14 (1): 21-31. FAO/WHO/UNU.1985. Energy and protein requirements. World Health Organization. 1985 Flynn, R.O. 1990. Growth characteristics of quinoa and yield response to increased soil water deficit.
M.S. thesis, Colorado State University. Fort Collins. Johnson, Duane L. and Ward, Sarah M. 1993. Quinoa. In: Advances in New Crops. (Eds. Jules Janick
and J.E. Simon) (Timber Press, Inc.: Portland, OR). pp. 122-125. Koziol, M.J. 1992. Chemical composition and nutritional evaluation of quinoa (Chenopodium quinoa
Willd.). J. Food Comp. Anal. 5: 35-68. Lorenz, K. Gifford, H and Johnson, D.L. 1993. Quinoa in pasta products. In: Food Flavors,
Ingredients and Composition. Developments in Food Science 32.(Ed. G. Charalambous) (Elsevier: Amsterdam). pp 781-790.
Quarles, W. 1992. Botanical pesticides from Chenopodium? The IPM Practitioner. 14: 1-10. Risi, J. and Galway, N.W. 1989. The Chenopodium grains of the Andes: a crop for temperate
latitudes. In: New Crops for Food and Industry (Eds G.E. Wickens, N.Haq and P.Day ) (Chapman and Hall: London). pp 222-234.

First Australian New Crops Conference 1996 – Volume 2
140
Evaluation of Biodegradable, Nonhazardous Engine Oils Duane L. Johnson1 and James W. Lambert2 1 Agro Management Group, Inc., Research and Quality Control, 2307 Berkshire Dr., Ft.
Collins, Colorado 80526 USA 2 Agro Management Group, Inc., Marketing and Development, 1127 W. Colorado Ave.
Colorado Springs, Colorado 80904 USA Abstract Agro Management Group, Inc. has formulated and is developing a biodegradable, nontoxic engine oil which is solely composed of vegetable (canola) oil and biodegradable additives. Preliminary tests in small and large air-cooled engines have demonstrated the feasibility of using the oil as a replacement for petroleum engine lubricants in four cycle internal combustion engines. The need for such an oil in sensitive environments, in home use and by large generators of hazardous waste from engine oils makes the project feasible. The cost of producing this nontoxic, biodegradable oil is less than that expected of comparable teflon-based "synthetic" oils and vegetable-based synthetic oils but is greater than current commercial petroleum oil lubricants sold in the United States. Introduction In the United States, disposal of used, petroleum-based engine lubricants has become a significant factor for both large waste generators (such as heavy industry and government) and small generators (such as farms and homeowners). The United States Environmental Protection Agency (EPA) estimates over 624,525 litres of used petroleum engine oils are neither recycled nor disposed of in authorised hazardous waste sites in the United States annually. The United States currently uses 9.45 billion litres of petroleum for lubricants annually. Of this total, 4.35 billion litres are used as crankcase oils for automotive and industrial engine applications. To replace petroleum crankcase oil applications completely would require the production of 8.1 million hectares of an oilseed crop yielding 1,335 kg/ha at 36% recovered oil. (Johnson, unpublished). Attempted use of rapeseed, crambe, or sunflower as the basis for a biodegradable engine oil has failed to be successful except when fatty acids are altered via transesterification. The lack of transesterification in combination with engine heat has resulted in a cross linking of fatty acids leading to further polymerisation of the oil into a plastic. This has resulted in the destruction of engines within 5 hours of initial operation. Transesterification processes results in a fully functional oil but at a cost which is not competitive with petroleum. Generally, rape methyl ester (RME) is being considered for a diesel substitute rather than a lubricating oil (Cook et al. 1993, Nemec 1994, Noren et al. 1993). Current estimates are that a transesterified canola or soybean engine oil, for example, would have a retail value of A$19.80/liter (US$14.19/1iter). This compares to the cost of a conventional petroleum engine oil at A$1.74/1iter (US$1.32/1iter). The U.S. market also has synthetic engine oils available which carry vegetable oil additives or micronized teflon at A$6.97/1iter (US$5.28/1iter). These prices do not include a local or
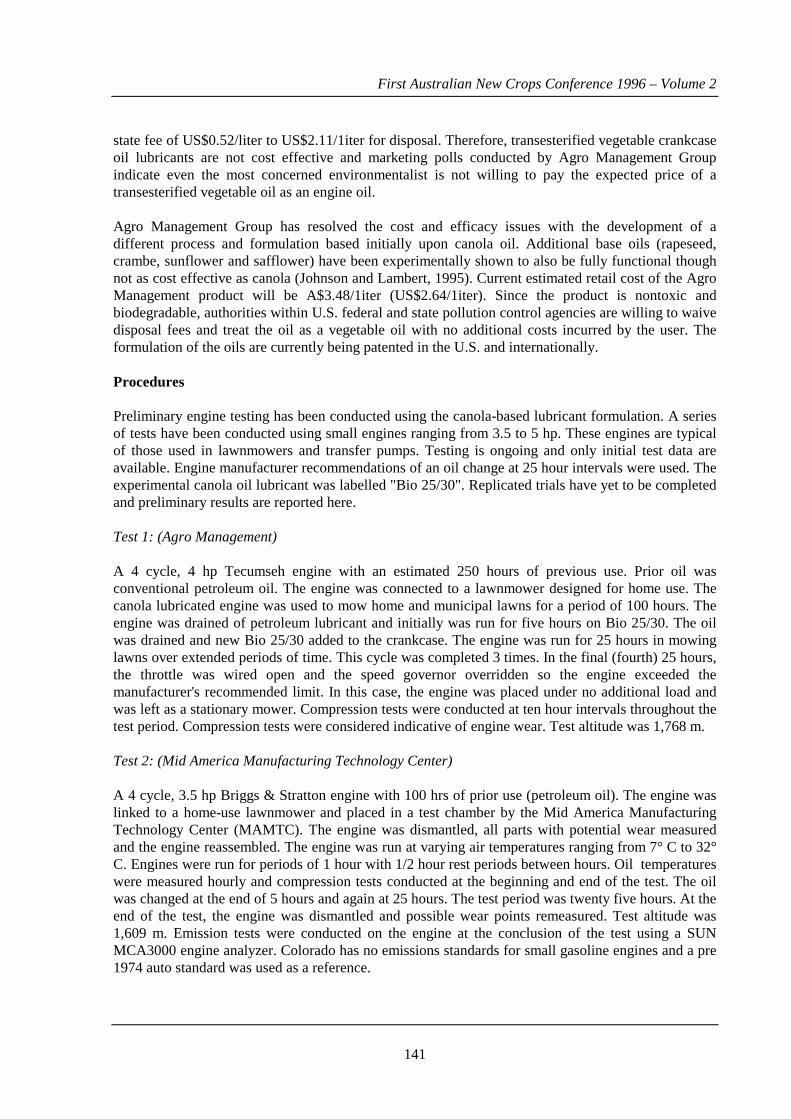
First Australian New Crops Conference 1996 – Volume 2
141
state fee of US$0.52/liter to US$2.11/1iter for disposal. Therefore, transesterified vegetable crankcase oil lubricants are not cost effective and marketing polls conducted by Agro Management Group indicate even the most concerned environmentalist is not willing to pay the expected price of a transesterified vegetable oil as an engine oil. Agro Management Group has resolved the cost and efficacy issues with the development of a different process and formulation based initially upon canola oil. Additional base oils (rapeseed, crambe, sunflower and safflower) have been experimentally shown to also be fully functional though not as cost effective as canola (Johnson and Lambert, 1995). Current estimated retail cost of the Agro Management product will be A$3.48/1iter (US$2.64/1iter). Since the product is nontoxic and biodegradable, authorities within U.S. federal and state pollution control agencies are willing to waive disposal fees and treat the oil as a vegetable oil with no additional costs incurred by the user. The formulation of the oils are currently being patented in the U.S. and internationally. Procedures Preliminary engine testing has been conducted using the canola-based lubricant formulation. A series of tests have been conducted using small engines ranging from 3.5 to 5 hp. These engines are typical of those used in lawnmowers and transfer pumps. Testing is ongoing and only initial test data are available. Engine manufacturer recommendations of an oil change at 25 hour intervals were used. The experimental canola oil lubricant was labelled "Bio 25/30". Replicated trials have yet to be completed and preliminary results are reported here. Test 1: (Agro Management) A 4 cycle, 4 hp Tecumseh engine with an estimated 250 hours of previous use. Prior oil was conventional petroleum oil. The engine was connected to a lawnmower designed for home use. The canola lubricated engine was used to mow home and municipal lawns for a period of 100 hours. The engine was drained of petroleum lubricant and initially was run for five hours on Bio 25/30. The oil was drained and new Bio 25/30 added to the crankcase. The engine was run for 25 hours in mowing lawns over extended periods of time. This cycle was completed 3 times. In the final (fourth) 25 hours, the throttle was wired open and the speed governor overridden so the engine exceeded the manufacturer's recommended limit. In this case, the engine was placed under no additional load and was left as a stationary mower. Compression tests were conducted at ten hour intervals throughout the test period. Compression tests were considered indicative of engine wear. Test altitude was 1,768 m. Test 2: (Mid America Manufacturing Technology Center) A 4 cycle, 3.5 hp Briggs & Stratton engine with 100 hrs of prior use (petroleum oil). The engine was linked to a home-use lawnmower and placed in a test chamber by the Mid America Manufacturing Technology Center (MAMTC). The engine was dismantled, all parts with potential wear measured and the engine reassembled. The engine was run at varying air temperatures ranging from 7° C to 32° C. Engines were run for periods of 1 hour with 1/2 hour rest periods between hours. Oil temperatures were measured hourly and compression tests conducted at the beginning and end of the test. The oil was changed at the end of 5 hours and again at 25 hours. The test period was twenty five hours. At the end of the test, the engine was dismantled and possible wear points remeasured. Test altitude was 1,609 m. Emission tests were conducted on the engine at the conclusion of the test using a SUN MCA3000 engine analyzer. Colorado has no emissions standards for small gasoline engines and a pre 1974 auto standard was used as a reference.

First Australian New Crops Conference 1996 – Volume 2
142
Test 3: (Monte Vista Cooperative Pump Test) Two new 5 hp Briggs & Stratton were linked to hydraulic transfer pumps. One pump was operated using Bio 25/30 and a paired pump operated on a petroleum 10/30 oil. The Bio 25/30 pump was run for 5 hours at full water pressure of 40 p.s.i. and the oil changed. Both engines were then run for 25 hour intervals between oil changes. Oil temperature, oil consumption and compression were monitored regularly at 5 hour intervals. The tests were terminated at 100 operating hours. Both engines had been dismantled, measured and reassembled prior to the test. Both engines were again dismantled and reassembled after the test. Both engines are currently in commercial service to the cooperative as hydraulic pumps. Test altitude was 2,377 m. Test 4: (Colorado State University) A rebuilt industrial 40 hp (1385 cc) air-cooled Volkswagen engine, mounted on a small research combine at the research center of Colorado State University in Ft. Collins was employed. After an initial break-in of five hours, the oil was changed and the combine put into service harvesting chickpeas, dry beans, mungbeans, soybeans and barley. Oil temperature, oil pressure and operating hours are monitored via gauges mounted on the combine body. Ambient air temperatures at engine startup have varied from -29° C (-20° F) to 29° C (85° F). The test altitude is 1,525 m. Biodegradation tests Biodegradation tests have been initiated by Agro Management. Biodegradation is currently monitored by dumping 5 cc of used oil on the surface of contained field soil (sandy clay loam). Field soil was potted and a volume of 3,705 ccs used.. Each pot had a surface area of 181 sq cm. Two weeks were allowed at 28o C and a 10 gram random sample was withdrawn from the top 5 cm of the container for GC analysis. The remaining potted soil was planted to barley (Hordeum vulgare) and compared to a planted check (nontreated) pot of barley. No differences in growth or plant vigour have been noted and GC analysis indicates minimal residual free fatty acid. Results Engine Oil Temperature Oil changes were made following manufacturers recommendations. Oil temperature results in test 2 were unexpected (Table 1). Manufacturers expect engine operating temperatures to be 107° C plus ambient air temperature. The engine operating on Bio 25/30 reached an operating temperature of 98° C and maintained this temperature under all ambient air temperatures in the test. Test 3 results show the engine oil temperature of the two engines was virtually the same at all operating temperatures and remained within normal and acceptable ranges. Test 4 results to date show the Volkswagen engine operating at a temperature of 60° C regardless of ambient air temperature. Normal operating temperature for a Volkswagen engine of this type is 118° C. Engine wear Tests 1, 2 and 3 demonstrated no appreciable loss in engine power or engine wear. In Test 2 , 19 engine components were were measured before and after the testing. Seventeen of these showed no wear at all, while the cam bearing and connecting rod big end showed small but insignificant amounts of wear. It should be noted that in tests 1, 2 and 3 virtually no oil loss during operating was noted in engines operating on Bio 25/30. After 25 hours of operating in test 4 (VW engine) the oil remains
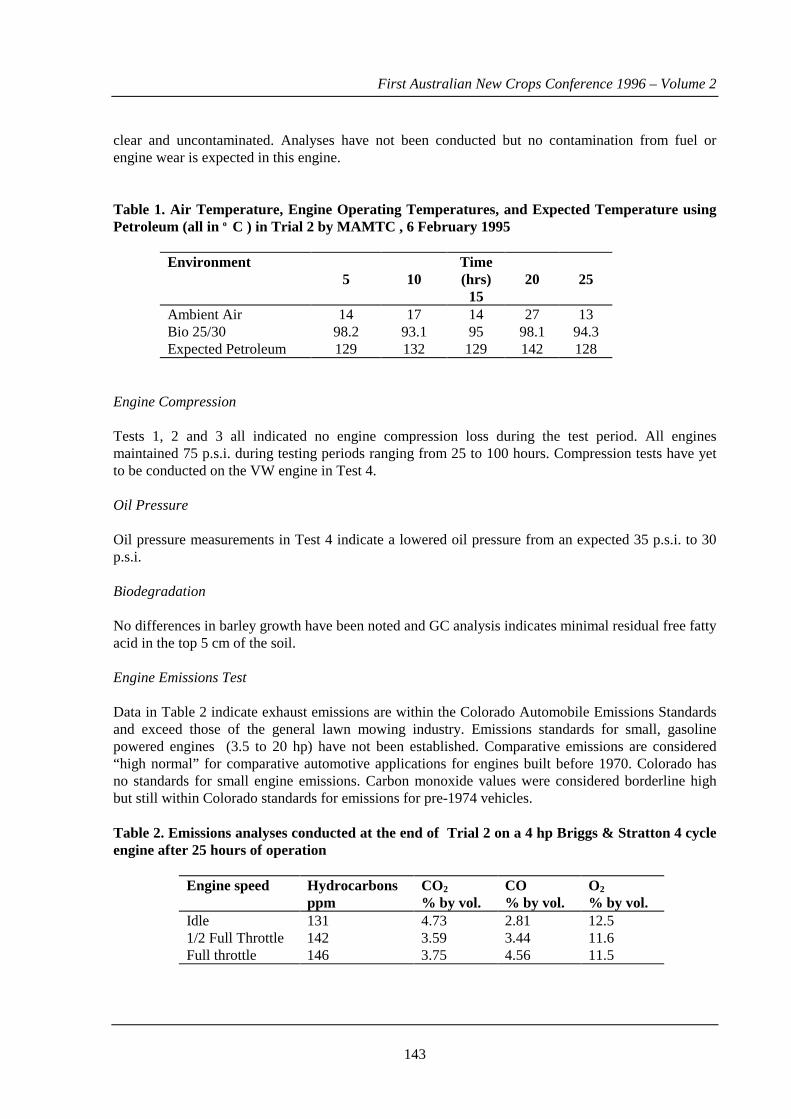
First Australian New Crops Conference 1996 – Volume 2
143
clear and uncontaminated. Analyses have not been conducted but no contamination from fuel or engine wear is expected in this engine. Table 1. Air Temperature, Engine Operating Temperatures, and Expected Temperature using Petroleum (all in o C ) in Trial 2 by MAMTC , 6 February 1995
Environment
5
10
Time (hrs) 15
20
25
Ambient Air 14 17 14 27 13 Bio 25/30 98.2 93.1 95 98.1 94.3 Expected Petroleum 129 132 129 142 128
Engine Compression Tests 1, 2 and 3 all indicated no engine compression loss during the test period. All engines maintained 75 p.s.i. during testing periods ranging from 25 to 100 hours. Compression tests have yet to be conducted on the VW engine in Test 4. Oil Pressure Oil pressure measurements in Test 4 indicate a lowered oil pressure from an expected 35 p.s.i. to 30 p.s.i. Biodegradation No differences in barley growth have been noted and GC analysis indicates minimal residual free fatty acid in the top 5 cm of the soil. Engine Emissions Test Data in Table 2 indicate exhaust emissions are within the Colorado Automobile Emissions Standards and exceed those of the general lawn mowing industry. Emissions standards for small, gasoline powered engines (3.5 to 20 hp) have not been established. Comparative emissions are considered “high normal” for comparative automotive applications for engines built before 1970. Colorado has no standards for small engine emissions. Carbon monoxide values were considered borderline high but still within Colorado standards for emissions for pre-1974 vehicles. Table 2. Emissions analyses conducted at the end of Trial 2 on a 4 hp Briggs & Stratton 4 cycle engine after 25 hours of operation
Engine speed Hydrocarbons ppm
CO2 % by vol.
CO % by vol.
O2
% by vol. Idle 131 4.73 2.81 12.5 1/2 Full Throttle 142 3.59 3.44 11.6 Full throttle 146 3.75 4.56 11.5
First Australian New Crops Conference 1996 – Volume 2
144
Conclusions Preliminary tests of a biodegradable, nontoxic canola engine lubricant have shown the oil can be used successfully in small and air-cooled engine applications. While results are still preliminary and have not been subjected to replicated, comparative tests, results to date have encouraged Agro Management to pursue patenting for the oils and to expand testing to major small engine manufacturers and to the United States Department of Defense. Expansion of the development of the canola engine lubricant to automotive and industrial use is expected to be limited by availability of canola and other acceptable vegetable oil sources. References Cook, P., Walker, K.C., Booth, E.J., and Entwhistle, G. 1993. Farm Management 8 (8): 361. Johnson, D.L. and Lambert, J.W. 1995. Small engine evaluations using a canola-based lubricant.
Assoc. for the Advancement of Industrial Crops (AAIC) Abst. p.12. In J.Janick (Ed.) Third National Symposium : New Crops - New Opportunities, New Technologies, Indianapolis, IN. USA.
Nemec, J. 1994. Prispevak K vyuziti obnovitelnych zdroju energie rostlinneho puvodu (The
exploitation of renewable reources of plant origin). Zemedelka-Ekonomika 40 (6): 457-466. Noren, O., Hadders, G., Johannson, S., and Lindstrom, L. 1993. Smallscale production of rape methyl
ester. Teknik-for-Lantbruket 37: 12pp.

First Australian New Crops Conference 1996 – Volume 2
145
Propagation of Bursaria spinosa by Cuttings Paul Kristiansen Alan Fletcher Research Station, Department of Natural Resources, 27 Magazine Street, Sherwood, Qld 4075 Abstract Blackthorn (Bursaria spinosa) is a widely distributed endemic shrub which has potential as a 'new' pharmaceutical crop, due to its esculin content. Economically viable production from high yielding cultivars would depend upon the development of an efficient clonal propagation technique. Very little work has previously been undertaken on the propagation of blackthorn from cuttings. Stem cuttings were treated with the auxins indole-3-butyric acid (IBA) and α-naphthalene acetic acid (NAA) combined at a range of concentrations from 0 ppm to 10,000 ppm and the strike rate was determined. The results indicate that the applied auxins did not significantly improve rooting. A strike rate of 70% can be achieved without auxins when using juvenile plant material. Further work on the influence of parent plant health and the environmental conditions during propagation may help to improve the strike rate. Introduction Australia is home to a diverse range of plants, many of which are unique to the continent. It also has a modest history concerning the research and development of native plants that contain useful chemicals. During the late 19th and early 20th century, scientists and others were busy finding out what the 'new' continent had to offer. Early books and journals are scattered with discoveries and studies of novel plants and plant products (e.g. Palmer 1883, Maiden 1889, Penfold and Grant 1923, Atkinson 1946). These developments continued for a number of decades, culminating in the first organised investigation of chemicals in the Australian flora (Webb 1949, 1952). Although hundreds of useful species were recorded and despite some early commercial enterprises (Warren 1990), the information faded into irrelevance due to a lack of funding and changing expectations about drug manufacture. Synthetic drugs, analogues of plant-derived organic chemicals, were becoming the desirable option for the future. More recently there has been renewed concern for plant products. In Australia, a surge of interest in the fields of ethnobotany and phytochemistry has lead to the recording and study of traditional medicines, 'bush foods' and native plant products. Many books and articles are now available listing plants which have been reported to have value as foods, medicines, pharmaceuticals, and industrial products (Cribb and Cribb 1990, ACNT 1993, Lassak and McCarthy 1990). One example of an indigenous plant with commercial potential as a drug source is blackthorn, Bursaria spinosa Cav. (Pittosporaceae). The first known report of blackthorn was published over 100 years ago as a result of the screening and analysis of native plants by a pioneer chemist (Rennie 1890). It was noticed that a boiled solution of blackthorn leaves emitted a strong blue fluorescence when exposed to sunlight. He recognised this as the same fluorescence produced by esculin (or
First Australian New Crops Conference 1996 – Volume 2
146
aesculin), a chemical then commonly extracted from bark of the European horse chestnut tree, Aesculus hippocastanum Linn. (Hippocastanaceae). After extraction and isolation of the active substance, it was indeed found to be esculin (Rennie and Turner 1890). Esculin from blackthorn was first used in Australia during the second World War, when supplies of European esculin were cut off. Due to its ability to absorb UV light, the chemical was used sunscreen formulations for air-crews flying at high altitudes. Cheaper synthetic chemicals eventually pushed esculin aside as a sun-screen additive and as a commercial crop in Australia (Smith 1992). It is currently used in the following biological and medical applications: 1. Identifying bacteria, including Golden Staph (Staphylococcus aureus) (Atkinson 1949) and
differentiating species of the genera Streptococcus (Edberg et al. 1985) and Listeria (Fraser and Sperber 1988, Al-Zorecky and Sandine 1990, Siragusa et al. 1990).
2. Testing dairy products for harmful bacteria (Hogan et al. 1986, Dealler and Rotowa 1991). 3. Treating venous disorders, such as haemorrhoids, varicose veins, and nose bleeds (Smith and
Moodie 1988, Cheatle et al. 1991). The present estimated annual demand for dried Bursaria leaf for esculin extraction is approximately 50 to 70 tonnes (Smith pers. comm.). The relatively minor demand for esculin by the drug industry has meant that major research into production in Australia has not been economically worthwhile. However, with the relatively high esculin concentrations of blackthorn growing in the New England area (up to 5%), commercial production may be possible if suitable cultivars were identified, plantations developed and harvesting was mechanised. The tea-tree oil industry provides a possible model for development. In order to assess the suitability of blackthorn for clonal propagation (an important factor in reproducing high yielding cultivars) a series of experiments were performed to test vegetative propagation by cuttings. Preliminary tissue culture trials, not reported here, were also undertaken. Previous propagation work on Bursaria (Smith pers. comm., Youman pers. comm.) involved the use of commercial rooting powders, achieved very low strike rates and no control treatments were used for comparison. Trials on many native species at the Australian National Botanic Gardens have indicated that indole-3-butyric acid (IBA) is the most effective auxin for a wide range of native species, although combinations IBA and α-naphthalene acetic acid (NAA) have also been effective for many taxa. Concentrations at which the auxins are most effective may vary from 500 ppm up to 10,000 ppm or more (Carmen 1993). Juvenile plant material, such as that derived from coppice shoots, is reported to strike more easily for a number of species (Burger 1987, Makinson 1992). From earlier trials, this appeared to be true for blackthorn also. The experimental work, performed in April 1993 and reported here, was designed to evaluate the effect of certain auxins at different concentrations on the clonal propagation of blackthorn by cuttings. Experimental Methods Plant Material Cutting material was obtained from coppice shoots of potted Bursaria plants grown in a polyhouse. The parent plants were transplanted from the wild into 300 mm black plastic pots in July, 1992, cut
First Australian New Crops Conference 1996 – Volume 2
147
back to 50 mm above ground level, maintained in a polyhouse and allowed to reshoot. They initially received 20 g of slow release fertiliser and were watered daily. Prunings were submerged in water to reduce stress prior to propagation. Auxin Treatments The auxins used in this experiment were IBA and NAA. They were dissolved in equal parts of ethanol and distilled water. The control treatment contained solvent only. The treatments were applied at the concentrations of: 0, 500, 1000, 2000, 5000 and 10000 ppm, with both auxins present at the given concentration. There were ten replicates per treatment, with each replicate consisting of one pot with five cuttings. Propagation Method and Conditions A potting medium of coarse sand, peat moss and perlite (1:1:2) was placed into 80 mm square plastic pots and thoroughly dampened prior to the collection of the plant material. Semi-hardwood cuttings 80 mm long were taken and the leaves and spines on the lower 60 mm were removed. Ten cuttings at a time were bundled, the lower 3 mm cut off, immediately dipped in the treatment solution to a depth of 10 mm for 10 seconds, and planted into moist potting medium at a depth of 55 mm. The auxin treatments were applied in a randomised order. The potted cuttings were then put into a white-washed glasshouse. The pots were arranged randomly on a sand propagating bed, with bottom heat (25°C) and automatic misting. After seven weeks the pots were emptied and the cuttings inspected for the presence of roots. A one-way analysis of variance (ANOVA) was used to test for statistical differences and the Least Significant Difference (LSD) calculated to separate the means. A regression analysis was also performed to assess the functional relationship, if any, between auxin concentration and rooting. Results Increasing the concentration of IBA+NAA pre-treatment of blackthorn cuttings had the effect of reducing the strike rate. Cuttings treated with zero or low auxins (≤ 1000 ppm) showed the highest strike rates, ranging from 66 to 74%. Treatments of higher concentration (≥ 2000 ppm) produced progressively lower strike rates, reducing from 46% down to 0%. The decrease in rooting response displayed a negative linear relationship to auxin concentration (r2 = 0.948, P < 0.001). A one-way ANOVA showed that the differences amongst all treatments were highly significant at the 0.1% level. The 1% LSD indicated that the slightly greater rooting response of the 500 ppm treatment in comparison to the control treatment was not significantly different. The data are shown in Table 1. Very little callus was observed on the control and low auxin cuttings which tended to form roots successfully. On the other hand, some of the cuttings treated with higher auxin concentrations produced callus but no roots. The mortality rate was greater for the higher auxin concentrations.

First Australian New Crops Conference 1996 – Volume 2
148
Table 1. Influence of IBA+NAA concentration on the rooting of Bursaria spinosa cuttings
IBA+NAA (ppm)
Mean No. of Rooted Cuttings
(n=5)
Mean % of Rooted Cuttings
Significant Differences1
0 3.5 70 a 500 3.7 74 a
1,000 3.3 66 a 2,000 2.3 46 ab 5,000 1.3 26 bc
10,000 0 0 c 1 Values followed by the same letter are not significantly different
at 1% LSD.
Discussion The results indicate that quite high root initiation can be obtained with no additional auxin. The lower concentrations of IBA+NAA (i.e. 500-1000 ppm) had no significant effect on promoting roots, but concentrations above 2,000 ppm reduced rooting percentage. This suggests that the use of IBA+NAA, and possibly auxins in general, is not necessary for propagating blackthorn by cuttings. High concentration treatments tended to produce callus, which can be more of a problem for root formation (Elliot and Jones 1980). Juvenile cuttings of blackthorn may have an inherent ability to form adventitious roots with reasonable success (e.g. 70%). This ability may be related to genetic factors, biochemical factors or, most likely, a combination of both. However, the substances and processes controlling root initiation and growth are complicated and the primary stimuli are still not known (Davies and Hartmann 1988). Further, the interaction of internal growth hormones and other growth factors (e.g. sugars, nutrients) with external chemicals (such as applied auxins) can be variable. Where the internal auxin levels of clones have been measured in propagation experiments, they seldom correlate with the relative rooting ability of those clones (Loach 1988). Future research on the vegetative propagation of blackthorn by cuttings should be performed with coppice shoots from plants grown under controlled conditions. Clones with superior rooting ability should by identified and utilised. Factors which warrant more attention include:
• the effect of parent plant health, nutrition, etc. on rooting • variation of rooting within the species • the effect of potting medium composition on rooting • environmental conditions during propagation.
Acknowledgments This research was undertaken in the Department of Agronomy and Soil Science, University of New England. Sincere thanks to Reg Smith of Phytex Australia for guidance, support and information. Assistance from Prof. Richard Williams (now at the University of Queensland - Gatton) and the staff at UNE is gratefully acknowledged.

First Australian New Crops Conference 1996 – Volume 2
149
References ACNT (Aboriginal Communities of the Northern Territory). 1993. Traditional Aboriginal Medicine
in the Northern Territory of Australia. (Conservation Commission of the Northern Territory of Australia: Darwin).
Al-Zoreky, N. and Sandine, W.E. 1990. Highly selective medium for isolation of Listeria
monocytogenes from food. Applied Environmental Microbiology 56(10): 3154-3157 Atkinson, N. 1946. Antibacterial activity in members of the native Australian flora. Nature
158(4024): 876-877 Atkinson, N. 1949. Antibiotics in Australian plants and fungi. Medical Journal of Australia 1(19):
605-610 Burger, D.W. 1987. In vitro micropropagation of Eucalyptus sideroxylon. HortScience 22(3): 496-497 Carmen, P. 1993. The propagation of Australian native plants from cuttings at the Australian National
Botanic Gardens. Paper presented at 21st Annual Conference, International Plant Propagators Society (Australian Region), 13-6 May, 1993, Albury, NSW
Cheatle, T.R., Scurr, J.H. and Smith, P.D. 1991. Drug treatment of chronic venous insufficiency and
venous ulceration: a review. Journal of the Royal Society of Medicine 84(6): 354-358 Cribb, A.B. and Cribb, J.W. 1990. Wild Medicine in Australia. (Collins/Angus and Robertson: North
Ryde). Davies, F.T. and Hartmann, H.T. 1988. The physiological basis of adventitious root formation. Acta
Horticulturae 227: 113-120 Dealler, S.F. and Rotowa, N.A. 1991. Rapid screening of colonies from Listeria selective agar.
Journal of Hospital Infection 17(2): 147-150 Edberg, S.C., Trepeta, R.W., Kontnick, C.M. and Torres, A.R. 1985. Measurement of active
constitutive beta-D-glucosidase (esculinase) in the presence of sodium desoxycholate. Journal of Clinical Microbiology 21(3): 363-365
Elliot, W.R. and Jones, D.L. 1980 Encyclopaedia of Australian Plants Suitable for
Cultivation: Volume I. (Lothian: Melbourne). Fraser, J.A. and Sperber, W.H. 1988. Rapid detection of Listeria spp. in food and environmental
samples by esculin hydrolysis. Journal of Food Protection 51(10): 762-765 Hogan, J.S., Pankey, J.W., Murdough, P. and Howard, D.B. 1986. Survey of bulk tank milk using
blood-esculin agar counts. Journal of Food Protection 49(12): 990-993 Lassak, E.V. and McCarthy, T. 1990. Australian Medicinal Plants. (Mandarin: Port Melbourne). Loach, K. 1988. Hormone applications and adventitious root formation in cuttings - a critical
review. Acta Horticulturae 227: 129-133

First Australian New Crops Conference 1996 – Volume 2
150
Maiden, J.H. 1889. The Useful Native Plants of Australia. (Turner and Henderson: Sydney). Makinson, B. 1992 Old Trees. (Australian National Botanic Gardens: Canberra). Palmer, E. 1883. On plants used by the natives of north Queensland, Flinders and Mitchell Rivers, for
food, medicine, etc. Journal and Proceedings of the Royal Society of New South Wales 17:93-113
Penfold, A.R. and Grant, R. 1923. The germicidal values of Australian essential oils (exclusive of
eucalypts) and their pure constituents, together with those for some essential oil isolates and synthetics, Part I. Journal of the Royal Society of New South Wales 57: 211-215
Rennie, E.H. 1890. Fluorescence of bursaria spinosa. Transactions and Proceedings of the Royal
Society of South Australia 13: 237 Rennie, E.H. and Turner, E.F. 1890. On the occurrence of æsculin in bursaria spinosa. Report to the
Australasian Association for the Advancement of Science 2: 399 Siragusa, G.R., Elphingstone, L.A., Wiese, P.L., Haefner, S.M. and Johnson, M.G. 1990. Petite
colony formation by Listeria monocytogenes and Listeria species grown in esculin-containing agar. Canadian Journal of Microbiology 36(10): 697-703
Smith, R. 1992. Bursaria Spinosa and Aesculin Production. (Greening Australia: Armidale). Smith, R.B. and Moodie, J. 1988. Comparative efficacy and tolerability of two ointment and
suppository preparations ('Uniroid' and 'Proctosedyl') in the treatment of second degree haemorrhoids in general practice. Current Medical Research Opinion 11(1): 34-40
Warren, R. 1990. Australian plants are our neglected resource. Australian Horticulture February: 28-
32 Webb, L.J. 1949. An Australian phytochemical survey: 1. Alkaloids and cyanogenetic compounds in
Queensland plants. CSIRO Bulletin. No. 241 Webb, L.J. 1952. An Australian phytochemical survey: 2. Alkaloids in Queensland flowering plants.
CSIRO Bulletin. No. 268

First Australian New Crops Conference 1996 – Volume 2
151
Low-THC Indian Hemp ( Cannabis sativa L.) Trials in Victoria
Sam Lolicato1, Chris Bluett2 and John Blackstock3 1 Agriculture Victoria, Institute of Sustainable Irrigated Agriculture, Tatura, 3616, Australia 2 Agriculture Victoria, Cnr. Mair and Doveton Sts, Ballarat, 3350, Australia 3 Agriculture Victoria, PO Box 500, E. Melbourne, 3002, Australia Abstract
The legislative and administrative processes undertaken to allow the cultivation of low-THC indian hemp in Victoria are outlined. The implementation process used for the 1995-96 crop growing season is described and the seven authorised sites are briefly described. Results of the administrative procedures and preliminary agronomic results are presented.
Government Policy
In July 1995, the Victorian Government authorised a three-year field research program on low-THC hemp (Cannabis sativa L.) to be conducted in collaboration with research organisations and potential end users of hemp fibre. The Government's decision was based on the need for objective data on both the production and processing of hemp in Australia, so that industry participants and the Government can make informed decisions on whether a commercial hemp industry would be economically viable and of net benefit to the community.
Many recent claims of agronomic, environmental and economic benefits of fibre hemp have been overstated or unsubstantiated. While overseas evidence confirms the potential value of local hemp production in the manufacture of a range of specialty fibre, fabric and other products, there is no conclusive evidence that hemp production will be a profitable alternative for Australian farmers or that fibre processors will invest in the processing technology needed to generate local markets.
The Victorian research program addresses economic, health, drug law enforcement and environmental issues. These include:
• the possibility that field trials could be used as a cover for illegal cultivation of high-THC plants; • the possibility that material harvested from field trials could be diverted and sold for illegal
purposes; • the potential for Cannabis to naturalise in some environments and become a serious weed; and • community expectations that trials will be subject to strict rules and be officially monitored for
compliance.
Key principles and conditions announced by the Government in July 1995 when applications for permits were invited were as follows:
• Both private and public entities were eligible for permits.
• Up to ten permits could be issued to target environments with the greatest potential for hemp production in both southern and northern regions of the State.
• Selection of applicants for permits was to be based on:
1. location of trial sites, to ensure that trials were distributed in areas of greatest production potential;
First Australian New Crops Conference 1996 – Volume 2
152
2. demonstrated ability to implement appropriate security measures and other permit provisions;
3. scientific merit of the proposed research and; 4. effective collaboration with commercial end-users.
• Permits were to be granted only for replicated small-plot field trials of total area less than one hectare unless applicants could demonstrate that larger areas were essential.
• Permit holders were required to employ technically qualified persons or collaborate with a research institution to ensure that trials produce scientifically valid results.
• Because only a small proportion of interested parties could participate directly in field trials, permit holders were required to make agronomic data from field trials available for publication. Data obtained by private entities on commercial end uses were to be provided to government agencies but treated as commercial-in-confidence.
• Security risks were addressed through requirements of applicants to implement security arrangements. This included field site security measures, recording and reporting of research projects to provide an audit trail on all seed and hemp material produced and national police records check of persons having unsupervised access to field trials. Two research coordinators appointed by Agriculture Victoria monitored key stages of all trials and the Victoria Forensic Science Centre were to coordinate official sampling and laboratory testing of plants to ensure that plant material did not exceed 0.35% w/w dry weight of THC.
• A steering committee convened by the Department of Health and Community Services and comprising representatives of the Victoria Police, Department of Premier and Cabinet, Agriculture Victoria, Department of Conservation and Natural Resources, Department of Business and Employment and the Victorian Farmers Federation was responsible for considering applications for permits, making recommendations on the issuing of permits, liaising with permit holders and reviewing permit provisions as required.
The inter-departmental steering committee undertook the selection process for trials which were sown in 1995. Seed was imported by Agriculture Victoria under licences and permits issued under the Commonwealth Customs (Prohibited Imports) Regulations. Successful applicants were authorised under the Victorian Drugs, Poisons and Controlled Substances Regulations 1995 and the Catchment and Land Management Act 1994 to conduct the field trials. The steering committee decided to have all trial sites harvested at the flowering stage to prevent seed production. This arose out of concerns about anticipated difficulties in maintaining control over harvested seed and recognition that adequate amounts of commercial seed was available on the international market.
The Government has made it clear to potential participants in the field trial program that the decision to authorise research does not bind the government to approve commercial production in the future. Future decisions on commercial production will need to take into account the results of local research on the agronomy and processing of the crop, the scale of local markets and the cost of policing the strict licence arrangements which would be needed to address the obvious security issues associated with large scale production.
Trial Implementation
Forty applications to cultivate Low-THC Indian Hemp were received by the closing date, on 25 August 1995, but many applicants failed to provide adequate supporting information. All applications with supporting information were presented to the steering committee one week after the closing date. Nine sites were chosen and seven were subsequently sown. Overall coordination of the trials and implementation of policies as outlined by the steering committee were the responsibility of the two

First Australian New Crops Conference 1996 – Volume 2
153
Agriculture Victoria officers, one covering the north and east and the other covering the south and west.
The designated duties of coordinators were to:
1. assess and report on site security for the Department of Health and Community Services; 2. assess and report on the integrity of scientific design; 3. assist applicants in sourcing seed of low-THC hemp varieties; 4. receive and arrange for the testing of imported seed and hold the seed for safekeeping; 5. monitor the sowing of field trials and hold any residual seed for safekeeping; 6. monitor the harvest of field trials and removal or destruction of crop residues and; 7. collate and publish results of trials.
All direct costs incurred by Government agencies to implement the trials were charged to the site managers on a fee-for-service basis. There was a fixed compulsory charge of $3,500 per site to cover the coordinator's time and operating costs expended in carrying out the above designated duties. In addition each site manager received some limited advice and on-ground work on site selection, site security, soil preparation, varieties, harvest timing and product storage, as well as seed handling and storage and plant sampling for drug content analysis.
All sites were funded by organisations which contracted qualified agronomists from Agriculture Victoria and other organisations to work in association with site landowners to grow the crops. The agronomists were also contracted to collect and present field data. In order to gain authorisation to cultivate fibre Hemp, site managers agreed to make important agronomic data available to the coordinators for publication. The published information includes approximate geographic locations, soil types and nutritional status, rainfall, treatments and yield data.
Seed
The coordinators were solely responsible for legally imported Cannabis seed until it was sown at the authorised trial site. All parts of the Cannabis plant are classed as a Schedule 9 Poison, so Health Department permits are required to allow handling and storage of the seed.
On 1 August 1995 Agriculture Victoria placed an order with the South Australian Seedgrowers Co-operative Ltd (Seedco) for one 50 kg bag of each of five French owned varieties (Table 1). Earlier in the year the Co-operative had imported these same varieties for South Australian Hemp trials. Agriculture Victoria took delivery of the seed on the 29 September. Australian Quarantine Inspection Service officials supervised purity and germination testing and three varieties were subsequently found to contain excessive quantities of soil. The soil was in the form of granules about the same size and colour as the seed and was removed on a vibrating (gravity) table before being cleared for use.
On the 14 August an order was placed with the Australian Hemp Industries Association for other certified low-THC varieties to broaden the genetic base for trials. On 13 November, Agriculture Victoria took delivery of four more varieties (Table 1). Two varieties were from the Polish Institute of Natural Fibres and the other two were from the International Hemp Association in The Netherlands, but originating from Hungary and Romania.
First Australian New Crops Conference 1996 – Volume 2
154
Table 1. Varieties, brief descriptions and seed quantities imported by Agriculture Victoria in 1995
Name Origin Maturity grading
Quantity (kg)
Germination %
Flower type *
Ferimon 12 France Early 50 85 Monoecious
Fedora 19 France Early 50 87 Monoecious
Felina 34 France Mid- 50 79 Monoecious
Fedrina 74 France Late 50 65 Monoecious
Futura 77 France Late 50 77 Monoecious
Beniko Poland ___ 4.5 65 ___
Bialobrzeskie Poland ___ 4.5 64 Monoecious
Kompolti TC Hungary ___ 10 15 Dioecious
Secuini Romania ___ 10 64 Monoecious
* Monoecious: individual plant with both male and female parts Dioecious: individual plant with only male or only female parts.
Cost of seed
Department of Health permits $1160 Seedco - French varieties 4124 AHIA - other varieties 585 Seed testing 720
Sampling for THC Analysis
The Victorian Forensic Science Centre directed the Agriculture Victoria coordinators to sample each crop at the flowering stage. Flowering was defined as the stage when 50% of the plants had at least one flower. The top 5 cm of 20 randomly-selected flowering female (or monoecious) plants was sampled from one replicate of each treatment.
Site Security
Security measures to prevent interference with growing crops relied mainly on the requirement for all crops to be situated away from a public thoroughfare and close to a residence. All persons with unsupervised access to a site, including a designated occupant of the residence, were required to have no prior convictions recorded in an Australia-wide police records check.
Fences immediately surrounding the plots were built to a standard that would make it difficult for persons to climb through or over them. Only commonly-used stock fencing materials were required, with electric fencing constructed to a height of 1.2 m and conventional fencing constructed to a height of 1.8 m.
The sites also required two lockable gates between the crop and public access. Two signs were required at the site stating that access was prohibited and the trials were for Low-THC fibre hemp.
Trial Sites
There was a good representation of suitable environments in Victoria, with sites close to:
Benalla and Myrtleford in the north-east; Kerang in the north; Ballarat and Winchelsea in the south;

First Australian New Crops Conference 1996 – Volume 2
155
Maryborough in the centre and; Horsham in the west.
All sites except one had facilities for irrigation.
Preliminary Results
At the time of writing preliminary results were available for all seven sites:
Benalla
This was the first crop to be sown in the trial program in Victoria. The site was well drained with a brown, very fine sandy clay loam soil 15 - 20 cm deep, overlying clay. The pH of surface soil was approximately 5.5. The trial included the five French varieties, replicated six times in a randomised block design.
The five French varieties were sown on 15 October 1995, with viable seeding rate 65 kg/ha and NPK fertiliser (150 kg/ha Pivot 400). The site was flood irrigated after establishment.
In levelling the site before sowing, top-soil had been removed from a corner of the site occupying about 25% of the total area of plots. Plant growth in this area was very poor and measurement procedures did not include this area.
Measurements included crop establishment and several components of yield (Table 2). Observations on flowering time and weed and pest infestation were also recorded.
The crop was cut on 22 December, 68 days after sowing. The earlier-flowering varieties had immature seed developing and significant numbers of heliothis (Family Noctuidae) caterpillars were observed in many of the seed heads. The crop was harvested using a baler producing large rectangular bales.
Table 2. Air dried yield of above ground plant material, and stem density, diameter and maximum height of five French varieties at harvest in the Benalla site
Variety Flower and leaf yield
(t/ha)
Stem yield (t/ha)
Total yield (t/ha)
Stem density (No./m2)
Stem diameter
(mm)
Maximum Height (cm)
Ferimon 12 3.0 3.9 6.9 159 3.82 120 Fedora 19 3.0 4.0 7.0 153 4.10 144 Felina 34 2.7 4.4 7.1 147 3.73 154 Fedrina 74 2.4 4.2 6.7 118 4.28 164 Futura 77 2.5 5.6 8.1 166 4.64 172 Lsd (p<0.05)
0.45 0.88 1.28 68 0.71 16
Seed of the four non-French varieties were hand-broadcast and raked-in on 21 November. These plots failed to establish after flood irrigation to germinate seed.
Myrtleford
The soil was a dark well-drained grey loam. The five French varieties were first sown on 28 October, 1995 and in a second sowing on 21 November. Both had lime (2 t/ha) and fertiliser (N-100 kg/ha, P-40 kg/ha, K-40 kg/ha) incorporated in the soil before sowing. The viable seeding rate in all treatments was 75 kg/ha.
On the second sowing date, the non-French varieties were sown in plots adjoining the French variety site. Sprinkler irrigations were applied at establishment (15 mm) and during December (60 mm). Rainfall during crop growth was 125 mm.

First Australian New Crops Conference 1996 – Volume 2
156
The early-sown plots were harvested with a brush-cutter and tied into bundles on 31 December, 64 days after sowing. Heliothis caterpillars were observed in some of the immature seed heads. The second sown crop was harvested using a hay baler making small (conventional sized) bales on 31 January, 71 days after sowing.
All varieties within the same sowing time appeared to flower within about a 14 day period. The earlier-flowering varieties tended to be shorter than the later flowering varieties.
Above ground air-dried weights were measured. There were no significant differences between the French varieties (Table 3), but the mean of the late-sown treatments (11 t/ha) was significantly (p<0.05) higher than the mean of the early-sown treatments (8 t/ha). The yields of the non-French varieties were similar to the yields of the late-sown French varieties.
Table 3. Air dried yield of above ground plant material and height of five French varieties at the Myrtleford site
Variety Early sowing Late sowing
Yield (t/ha) Height (cm) Yield (t/ha) Height (cm) Ferimon 12 7.2 157 10.9 94 Fedora 19 8.3 172 11.6 102 Felina 34 9.1 178 11.0 104 Fedrina 74 7.8 178 9.6 108 Futura 77 7.6 186 10.8 114 Lsd (p<0.05) 2.16 -- 2.16 --
Kerang
The soil was a poorly structured red-brown earth, prone to crusting. The five French varieties were sown across soils affected by two levels of salt. The salt treatments were classed as low (<3.8 dS/m) and moderate (3.8 - 6.5 dS/m).
Seed was sown approximately 50 - 100 mm deep into dry raised beds on 22 November 1995 and irrigated on 24 November. The seed bed was coarse, with 50 - 80 mm clods on the surface. Most seed failed to emerge.
Small areas appeared to establish where:
a. the beds were higher (better drainage); b. sowing depth was shallower and; c. there was some compaction by tractor wheels after sowing (better seed-soil contact).
There was a small area at the end of the irrigation bays where plants reached a height of 1.2 m at flowering in mid-January, approximately 60 days after sowing.
Winchelsea
This high rainfall site was the only one in Victoria not irrigated. It was sown on 7 December into a fine seedbed with very little moisture. The soil was a basalt clay loam, situated on the slopes of a volcanic cone. Viable seeding rate was 80 kg/ha and fertiliser rate was 100 kg/ha DAP banded with the seed.
In the main trial there were six replicates of the five French varieties. Alongside this were unreplicated observation plots with the following treatments:
a. half, normal (80 kg/ha) and double seed rates;

First Australian New Crops Conference 1996 – Volume 2
157
b. nil, 100 kg/ha and 200 kg/ha DAP fertiliser, banded with the seed on Felina 34 and; c. single plots of four eastern European lines.
Stems at harvest were shorter, thicker and less densely spaced than in the Ballarat irrigated crop sown at similar seed rates.
Rainfall during the crop growing season was: December, 26 mm; January, 35 mm; February, 33 mm.
Plants appeared to go to seed quicker than those on the irrigated sites.
The plots were cut and weighed on 29 February, 84 days after sowing. Undried, above-ground plant yields and plant heights were as follows (not statistically analysed at the time of writing).
Table 4. Undried yield of above ground plant material and height of five French varieties at harvest in the Winchelsea site
Variety Yield (t/ha)
Height (cm)
Ferimon 12 14.75 94 Fedora 19 15.20 102 Felina 34 15.84 104 Fedrina 74 15.97 108 Futura 77 17.40 114
Preliminary measurements showed air dried weight to be approximately 50% of undried weight and stems to be approximately 65% of above-ground material, so yield of air dried stems ranges from 4.8 t/ha to 5.7 t/ha.
The earlier varieties appeared to have less height and undried weight than the later varieties.
In the observation plots, there appeared to be no significant affect from the superphosphate treatments. The normal (80 kg/ha) seeding rate and the half seeding rate plots appeared to be significantly higher yielding than the double seeding rate treatment.
In this district hemp grown as a summer crop may be useful to precede autumn-sowing of a winter crop.
Ballarat
This site was on a deep red volcanic kraznozem soil (Ballarat potato soil). This soil type is very free draining and well structured, but has low water holding capacity (potato crops in peak growth requiring weekly irrigations in summer).
The trial was sown on 22 December, with the five French varieties replicated six times. Unreplicated observation plots contained N and P fertiliser treatments, seeding rate treatments and the four Eastern European varieties. The crop received several effective rainfall events, which were supplemented with spray irrigation from overhead gun equipment. It is likely that the crop was mildly water stressed on some occasions between rainfall and irrigation events. Crop growth was very dense and vigorous, with clear responses to water availability. The rapid initial growth effectively out-competed a dense population of wild radish ( Raphanus raphanistrum) seedlings.
Viable seeding rate was 80 kg/ha and fertiliser rate was 100 kg/ha DAP banded with the seed.
On 1 April, 100 days after sowing, the site was harvested for yield measurements. Undried, above-ground plant yields and plant heights were as follows (not statistically analysed at the time of writing).

First Australian New Crops Conference 1996 – Volume 2
158
Table 5. Undried yield of above ground plant material, stem density and height of five French varieties at harvest in the Ballarat site
Variety Yield (t/ha)
Stem density (No./m2 )
Height (cm)
Ferimon 12 26.5 305 123 Fedora 19 24.1 276 127 Felina 34 26.6 286 142 Fedrina 74 26.3 253 141 Futura 77 28.6 339 154
Assuming air dried weight to be approximately 50% of undried weight and stems to be approximately 65% of above-ground material, then yield of air dried stems ranges from 7.9 t/ha to 9.3 t/ha.
Maximum height of some plants, especially those of Futura 77 exceeded 185 cm. All stems were counted regardless of size. Some plants failed to compete and remained short and thin.
Crop heights of later varieties were clearly greater than earlier ones. However although crop height of Futura 77 was 25% greater than Ferimon 12, undried weight appeared to be 8% higher.
In the observation plots the highest nitrogen rate had the highest yield, but there appeared to be no affect on height. It appeared that superphosphate rates had no significant affects. With increasing seeding rates, plants/m2 and yields appeared to increase, while crop height appeared to decrease.
Maryborough
This site had been laser-levelled for flood irrigation and was formerly under lucerne. The soil was a red duplex clay, with pH(H20) 5.97 and pH(CaCl) 5.38. Colwell P was 10.00 ppm, Colwell K 158 ppm and the levels of exchangeable cations were satisfactory.
The site was sown on 29 November 1995. Treatments were the five French varieties in a factorial design with four rates of phosphorous and with unreplicated observation plots similar to those at Winchelsea.
Soil moisture at sowing was marginal for germination and anticipated follow-up rainfall did not occur, so the site was flood irrigated before full seedling establishment. Final establishment was very uneven and poor. Several more irrigations were applied, however growth was satisfactory only at the end of the irrigation bays, where water coverage was least. Over most of the site there were patches with few live plants and many dead ones a few centimetres tall. Death of the small plants was most likely due to scalding during flood irrigation. Plants in the most vigorous plots were generally about 180 cm high.
Yield comparisons were not possible.
Horsham
The soil was a grey self-mulching clay in a flood irrigation bay, laser-levelled to a slope of less than 1:750. Seed was sown on 5 December into moderate soil moisture. Treatments were the five French varieties replicated six times. Unreplicated observation plots were also sown with treatments similar to those at Winchelsea. Soon after sowing the emerging crop was flood irrigated. Although the irrigation duration was relatively short, with the water supply outlet remaining open for less than one hour, crop establishment was very poor. This result was similar to the results from other sites using flood irrigation to aid establishment.
The most vigorous part of the crop was situated on a slightly raised 4 m2 area near the high end of the irrigation bay. The air-dried yield of above-ground plant material in this area was 5.9 t/ha.

First Australian New Crops Conference 1996 – Volume 2
159
Yield comparisons were not possible.
Results of THC Analysis
Table 6. Results of THC analyses from all tested sites. Shown as gradings based on percent w/w THC levels. (A: ≤ 0.05, B: > 0.05 to ≤ 0.01, C: > 0.10 to ≤ 0.15, D: > 0.15 to ≤ 0.20, E: > 0.20 to ≤ 0.25, F: > 0.25).
Variety Benalla Myrtleford Winchelsea Ballarat Horsham Ferimon 12 B A, B C B E Fedora 19 B A, C F (0.34) B C Felina 34 A A E, D, D B, B, A D Fedrina 74 B A B A, A, A, A B, F (0.30) Futura 77 B B E C F (0.42) Beniko -- B F (0.36) C D Bialobrzeskie -- B F (0.93) B D Kompolti TC -- F (0.50) F (0.30) E F (0.38) Secuini -- F (0.70) C E F (1.03)
Preliminary Conclusions
Security arrangements appeared to be adequate, with only one reported breaching of a fence surrounding a hemp site. There were no reports of plant material being lost from authorised sites.
In well established crops initial hemp plant growth out-competed both grass and broadleaf weeds so that spraying of herbicides was not necessary. At Myrtleford and Ballarat above ground plant material production appeared to approach levels of production reported in European commercial hemp crops (Werf 1994).
In The Netherlands (48o latitude) differences in time from the earliest flowering to the latest flowering in a similar range of French varieties was observed to be up to 47 days (Meijer 1994), while in the current trials this time was approximately only 14 days. Despite this the breeders maturity classification of the French varieties was observed to be retained under local conditions.
There was a clear tendency for early varieties to flower and cease vegetative growth sooner. This resulted in the early varieties being harvested at lower heights and at slightly lower yields than the later varieties. With well established, vigorous plants it is likely that early flowering was the main limitation to stem yields of all varieties. The shorter period from sowing to flowering and the significantly (p<0.05) lower mean yield of all varieties from the early sowing at Myrtleford compared to the late sowing indicates that the short-days of late October were significantly more strongly flower inducing than the daylengths of late November.
The French varieties are adapted to a latitude of 48o (Meijer 1994), while central Victoria is situated at the lower latitude of 36o. Meijer (1994) found that in moving cultivation of a variety from higher latitudes to lower latitudes the period from sowing to flowering was reduced, with consequent reductions in final stem lengths and yield.
Flood irrigation on flat bays or low beds should not be used to establish hemp, even when soil drainage is good. Crop failures in these trials were most likely due to scalding, soil crusting and waterlogging. Early sowing would allow greater reliability for establishment under rainfall, but daylengths in mid-spring induces early flowering and reduced stem yields. Further work is needed to identify varieties more highly adapted to Victorian latitudes (to utilise more of the potential growing season) and to identify best irrigation practices for establishing crops in early summer.

First Australian New Crops Conference 1996 – Volume 2
160
Heliothis caterpillar may to be a limitation to commercial hemp seed production in at least some seasons.
Acknowledgments
The presented agronomic information was made available by J. Avery and A. Dridan for Action Benalla; J. Davis and H. Dennis for the Clarke Consortium; D. Pye and D. Hamilton for Ellendell Pty Ltd; I. Smith and M. Drum for the Central Goldfields Regional Development Board and C. Dyson and J. Haupt for the Northern Irrigation Salinity Group. Valuable information and support was also provided by P. Clayton and the site landholders.
References
Meijer, E. de 1994. Diversity in Cannabis. Thesis, Wageningen, Holland. (ISBN 90-5485-338-7)
Werf, H. van der 1994. Crop Physiology of Fibre Hemp (Cannabis sativa L.). Wageningen, Holland. (ISBN 90-9007171-7). (Australian Hemp Products, PO Box 236, New Lambton, 2305).

First Australian New Crops Conference 1996 – Volume 2
161
Yield and Root Distribution in a Commercial Licorice Crop R.J.Martin1, M.H.Douglas2 and A.J.Heaney2
1 New Zealand Institute for Crop & Food Research, P.B. 4704, Christchurch, New Zealand 2 New Zealand Institute for Crop & Food Research, Redbank Research Station, PO Box 42,
Clyde, New Zealand Abstract Root yield and distribution were determined in a commercial licorice crop in New Zealand. Licorice (Glycyrrhiza glabra L.) is cultivated for the glycyrrhizin rich extract produced when shredded roots and rhizomes are boiled in water. A six-year-old crop was sampled in two successive winter using a self propelled digger. Yield estimates were 10 t/ha in the first winter and 17 t/ha in the second. Root excavation by hand to a depth of 120 cm produced individual plant root yields ranging from 0.5 kg to 13.8 kg, with a mean of 3.8 kg. Root dry matter averaged around 41%, giving a dry matter yield of 4 t/ha in the first winter and 7 t/ha in the second, indicating a glycyrrhizin yield of around 400-800 kg/ha. In the individual plants excavated by hand, around 60% of the root yield was in the top 30 cm, 80% in the top 60 cm, and 95% in the top 90 cm. It is recommended that the crop be grown in sandy soils for ease of harvest and to minimize soil structural damage. Introduction Licorice (Glycyrrhiza glabra L.) is cultivated for the glycyrrhizin-rich extract produced when shredded roots and rhizomes are boiled in water. The black extract, licorice, is widely used as a flavouring agent or flavouring enhancer in tobacco products and medicines, in confectionery and in beverages (Fenwick et al. 1990). Licorice also has medicinal properties, and is used for respiratory tract infections and stomach complaints (Bissett 1994, Chandler 1985). These properties have been recognised for thousands of years, with the plant used in ancient China, India, Egypt, Greece and Rome (Chandler 1985). Licorice is native from southern Europe to Pakistan and northern India, in areas of warm temperate to subtropical climates (Morton 1977). The crop is mainly grown in Mediterranean and middle eastern countries and in China (Singh et al. 1984). World production of roots is about 30,000 t (Singh et al 1984) There is considerable trade in licorice with, for example, current UK usage estimated to be 16,200 t (Fenwick et al 1990). In New Zealand, licorice is purchased in the confectionery trade as a spray dried powder with a minimum 21% glycyrrhizin. The present price varies between NZ$8 -NZ $11/kg for this product but the price is higher for pharmaceutical grades. The licorice plant, an upright perennial leguminous herb having a height of 70-200 cm, produces long roots and creeping underground stems or rhizomes varying in size which are internally juicy and yellowish (Fenwick et al. 1990; Singh et al. 1984). Licorice is a poor seeder and is usually planted from rhizome cuttings. Although a legume, licorice does not form an association with any rhizobia present in New Zealand soils. It is frost tender, and the tops die down in winter. In Italy, when a crop is harvested after three years, the fresh root yield is typically 15 t/ha for rainfed production and 20 t/ha for irrigation (Marzi et al. 1993b). Singh et al. (1984) reported that yields from other countries were around 10-12.5 t/ha, but that exhaustive harvesting can yield up to 50 t/ha.

First Australian New Crops Conference 1996 – Volume 2
162
The major active substance in licorice is glycyrrhizin, a triterpenoid saponin. The standard concentration of glycyrrhizin is 11 to 12% of root dry weight (Anon. 1983), but this can vary from 5 to 24% (Morton 1977, Duke 1985), depending on cultivar, growing conditions, time of harvest, and root age or size (Singh et al.1984, Fenwick et al. 1990). Glycyrrhizin is located in the bark parenchyma of the roots and rhizomes (Marzi et al. 1993a). The amount of glycyrrhizin is higher in the main roots than in the lateral roots and rhizomes, although the reported concentrations in each varies considerably (Fenwick et al. 1990; Marzi et al. 1993a; and Singh et al. 1984). A major research program focusing on new crops for New Zealand to provide alternative land use and production opportunities (Douglas 1993) is in progress. Licorice was identified as a crop with potential. Apart from some early trials (Palmer 1987), licorice has not been researched or produced commercially in New Zealand. In 1987, a 0.5 ha block was established to test the potential of the crop in New Zealand (O'Sullivan personal communication) and this has allowed the yield assessments to be carried out in the winters of 1994 and 1995 to estimate production and to assess the depth of digging needed to harvest the roots. Methods The Crop Cuttings of licorice were produced by tissue culture at the former DSIR, Lincoln, from crown material imported from Sicily. These cuttings were planted out in 1987 in a Waimakariri sandy soil 7 km east of Ashburton in the South Island of New Zealand. A 0.5 ha block was planted, with row spacing of 1.5 m and distance between plants of 0.6 m. An establishment fertiliser of 300 kg/ha of Cropmaster 15 (15% N, 10% P, 10% K) was applied in the first year and the crop was irrigated occasionally in the first two years. When necessary, weed control using glyphosate was undertaken when the licorice tops had died in winter. The crop was very variable, and ranged from areas where the crop failed to areas with vigorous rhizomes and suckers. Yields Yields were measured on four 90 m rows of the crop in 1994 and six 20 m rows in 1995. In 1994, a self propelled digger was used to dig up the licorice plants along four rows each 90 m long on one side of the trial area. The digger bucket excavated to a depth and width of approximately 1.5 m was excavated. Material from the 4 rows was bulked together and transported to a washing area where all soil was washed off and the harvested material weighed. A subsample was taken for glycyrrhizin determination. In the second season, a similar harvesting technique was used, except that 20 m sections were taken from 6 rows selected at random through better established areas of the crop. The harvested material from each row was weighed in the field, subsampled, and soil and dry matter content determined on the subsample in the laboratory. Root Distribution In order to determine root distribution, the diggers were used to dig two trenches 2 m deep on either side of a crop row selected at random from areas in better areas of the crop. The crop row between the trenches was then excavated by hand to expose the crown, root and rhizomes of two adjacent plants. The dead tops were removed and the root system was removed in layers, 0-15, 15-30, 30-60, 60-90 and 90-

First Australian New Crops Conference 1996 – Volume 2
163
120 cm depth. These were taken to the laboratory, washed and dried. Six plants were sampled in this way in 1994 and eight in 1995. Results and Discussion Yield The yield from bulked four rows from the digger harvest in the first year was 10 t/ha, and in the second year 17 t/ha (Table 1). The results from the first year were from one side of the trial where there was competition from volunteer asparagus crops and a poplar shelter belt. There was up to 10 fold difference in yield between adjacent plants from the hand excavations (Table 1). In some cases rhizomes from one plant had extended several metres past several other plants. Table 1. Maximum, minimum and mean total fresh weight yields, standard deviations and number of samples from single plant harvests in 1994 and 1995 and digger harvest in 1995
Year 1994 1995
single plant harvest
(g/plant)
single plant harvest
(g/plant)
digger harvest
(t/ha)
Minimum yield 1291 499 11.4
Maximum yield 13849 4687 22.0
Mean yield 4434 3215 16.6
Standard deviation 4893 1455 0.4
No. of samples 6 8 6
Dry Matter Content Percentage dry matter averaged 40% in 1994 and 42% in 1995, irrespective of root component or depth (Table 2). If the glycyrrhizin is around 11.5% in the dry root (Anon. 1983), then, from the data in Table 1, the calculated yields for the 1994 harvest would be 4 t/ha of dry root and 460 kg/ha of glycyrrhizin, and for the 1995 harvest, 7 t/ha of dry root and 820 kg/ha of glycyrrhizin. Root Distribution Root distributions from the 1994 and 1995 seasons are given in Table 2. In 1994, 59% of the plant material to a depth of 120 cm was in the in the top 30 cm.; in 1995, it was 66%. The more detailed analysis in 1995 showed that the 0-30 cm layer consisted of around one third crowns in the 0-15 cm layer, one half rhizomes and roots in the 0-15 cm layer, and one sixth roots in the 15-30 cm layer. The proportion of root material in the top 60 cm was 80% in both years, and in the top 90 cm 95% in both years. Singh et al. (1984) reported that glycyrrhizin content is higher in thick roots. In these plants, the roots were thinner with increasing depth, and there were very few thick roots below 60 cm. However, this may be countered as older roots tend to have lower glycyrrhizin contents (Singh et al. 1984).
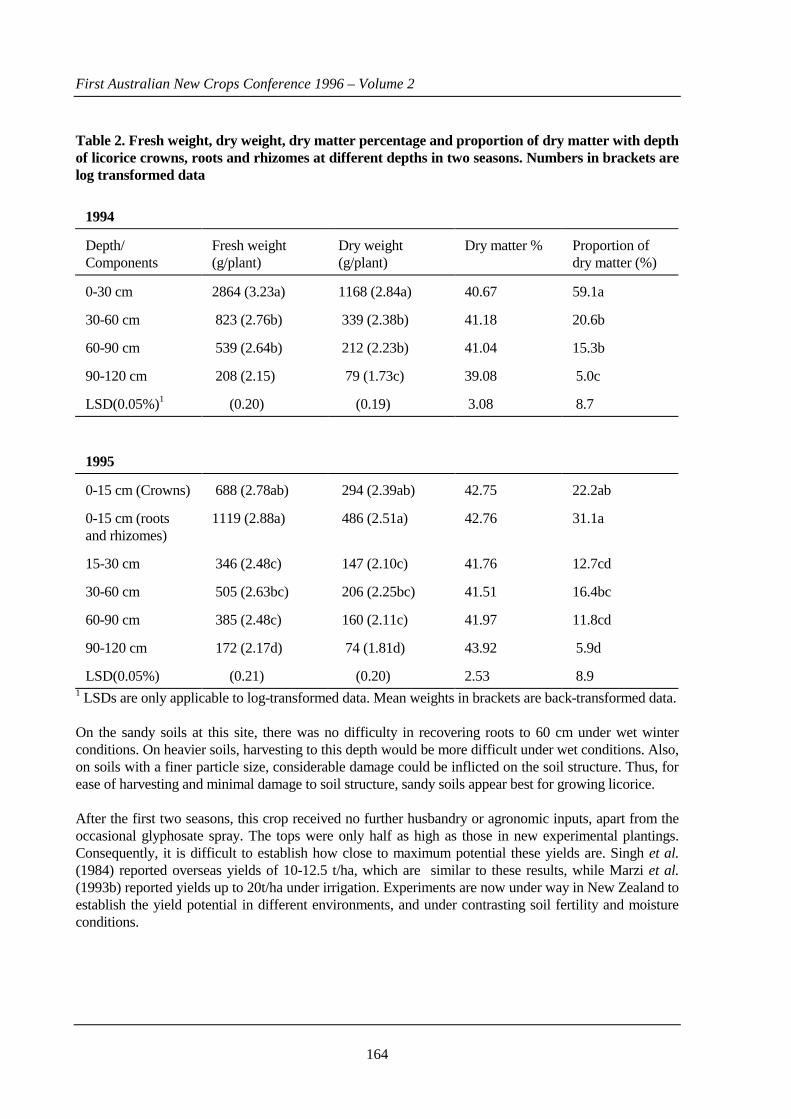
First Australian New Crops Conference 1996 – Volume 2
164
Table 2. Fresh weight, dry weight, dry matter percentage and proportion of dry matter with depth of licorice crowns, roots and rhizomes at different depths in two seasons. Numbers in brackets are log transformed data
1994
Depth/ Components
Fresh weight (g/plant)
Dry weight (g/plant)
Dry matter % Proportion of dry matter (%)
0-30 cm 2864 (3.23a) 1168 (2.84a) 40.67 59.1a
30-60 cm 823 (2.76b) 339 (2.38b) 41.18 20.6b
60-90 cm 539 (2.64b) 212 (2.23b) 41.04 15.3b
90-120 cm 208 (2.15) 79 (1.73c) 39.08 5.0c
LSD(0.05%)1 (0.20) (0.19) 3.08 8.7
1995
0-15 cm (Crowns) 688 (2.78ab) 294 (2.39ab) 42.75 22.2ab
0-15 cm (roots and rhizomes)
1119 (2.88a) 486 (2.51a) 42.76 31.1a
15-30 cm 346 (2.48c) 147 (2.10c) 41.76 12.7cd
30-60 cm 505 (2.63bc) 206 (2.25bc) 41.51 16.4bc
60-90 cm 385 (2.48c) 160 (2.11c) 41.97 11.8cd
90-120 cm 172 (2.17d) 74 (1.81d) 43.92 5.9d
LSD(0.05%) (0.21) (0.20) 2.53 8.9 1 LSDs are only applicable to log-transformed data. Mean weights in brackets are back-transformed data. On the sandy soils at this site, there was no difficulty in recovering roots to 60 cm under wet winter conditions. On heavier soils, harvesting to this depth would be more difficult under wet conditions. Also, on soils with a finer particle size, considerable damage could be inflicted on the soil structure. Thus, for ease of harvesting and minimal damage to soil structure, sandy soils appear best for growing licorice. After the first two seasons, this crop received no further husbandry or agronomic inputs, apart from the occasional glyphosate spray. The tops were only half as high as those in new experimental plantings. Consequently, it is difficult to establish how close to maximum potential these yields are. Singh et al. (1984) reported overseas yields of 10-12.5 t/ha, which are similar to these results, while Marzi et al. (1993b) reported yields up to 20t/ha under irrigation. Experiments are now under way in New Zealand to establish the yield potential in different environments, and under contrasting soil fertility and moisture conditions.

First Australian New Crops Conference 1996 – Volume 2
165
Acknowledgments We wish to thank Emmett O'Sullivan for allowing us to sample his crop and to use his washing facilities. Bas Deo and Barbara Maley assisted in processing the crop. References Anon. 1983. GRAS status of licorice (Glycyrrhiza), ammoniated glycyrrhizin and monoammonium
glycyrrhizinate. Federal Register 48: 54983-54990. Bisset, N.R. 1994. Herbal Drugs and Phytopharmaceuticals. (Medpharm : Stuttgart). Chandler, R.F. 1985. Licorice, more than just a flavour. Canadian Pharmaceutical Journal 118: 420-
424. Douglas, J.A. 1993. New Crop Development in New Zealand. In: New Crops (Eds J. Janik and J.E.
Simon) (Wiley: New York). Duke, J.A. 1985. Handbook of Medicinal Herbs. (CRC Press : Florida). Fenwick, G.R., Lutomski, J. and Nieman, C. 1990. Liquorice, Glycyrrhiza glabra L. - Composition,
Uses and Analysis. Food Chemistry 38: 119-143. Marzi, G., Circella, G. and Vampa, G.M. 1993a. Effect of soil depth on the rooting system growth in
Glycyrrhiza glabra L. Acta Horticulturae 331: 377-379. Marzi, V., Ventrelli, G., and De Mastro, G. 1993b. Influence of intercropping and irrigation on
productivity of Licorice (Glycyrrhiza glabra L). Acta Horticulturae 331: 71-78. Morton, J.F. 1977. Major Medicinal Plants - Botany, Culture and Uses. (Thomas: USA.) Palmer, J. 1987. Licorice - lessons from Lincoln trials. Dittany 8: 46-49. Singh, A.K., Sharma, A., and Kumar, P. Virmani, O.P. 1984. Cultivation and utilization of licorice
(Glycyrrhiza glabra L.): a review. Current Research on Medicinal and Aromatic Plants 6: 98-105.

First Australian New Crops Conference 1996 – Volume 2
166
Preliminary Assessment of South American Tuber Crops R.J.Martin1, S. Halloy2 and B.Deo1 1 New Zealand Institute for Crop & Food Research, P.B. 4704, Christchurch, New Zealand 2 New Zealand Institute for Crop & Food Research, Invermay Agricultural Centre, Private Bag
50034, Mosgiel, New Zealand Abstract Recent accessions of oca or New Zealand Yam (Oxalis tuberosa), mashua (Tropaeolum tuberosum), and yacón (Polymnia sonchifolia) have yielded well in field trials in New Zealand. These South American tuber crops were collected from the high Andes. The oca accessions have different coloured tubers to the currently grown lines, which are usually roasted with meat. Yacón tubers are sweet, can be eaten raw, and contain high levels of inulin. Mashua produces tubers that can be cooked, and the crop seems immune to many insects. In the trials 12 oca accessions yielded well from transplants, but the yield from the small tubers planted out were not as high as the local lines. Mashua produced high yields, but this crop has to be propagated from stem bases or cuttings. One of the two accessions of mashua yielded well, the other poorly. Introduction Many tuber crops are grown in the Andes and lowlands of South America, but only a few of them have been grown widely elsewhere (Brücher 1989, National Research Council 1989, Hernández Bermejo and León 1994). These few include the potato and the sweet potato or kumara (Ipomea batatas). In New Zealand, another South American tuber crop widely grown is the New Zealand yam (Oxalis tuberosa), which is unrelated to the tropical yams, and is known in South America as oca. New Zealand commercial material is based on a narrow genetic base. Commercial growers in New Zealand are keen to access material which may increase the appeal of this crop to consumers. The commercial success of potato, kumara and oca in New Zealand agriculture suggest that other South American tuber crops may also be able to find a market in New Zealand. These include mashua (Tropaeolum tuberosum), yacón (Polymnia sonchifolia) and ulluco (Ulluco tuberosus) (Grau and Halloy 1994). The Biodiversity programme of the New Zealand Ministry of Agriculture and Fisheries, now part of the New Crops Programme of the New Zealand Institute for Crop & Food Research, has brought in new lines of oca (16 accessions), ulluco (15 accessions) and yacón (3 accessions), and accessed two previously imported lines of mashua for evaluation in New Zealand. Many of the introductions were obtained from local markets in Bolivia and Argentina, at elevations of up to 3,500 m above sea level.

First Australian New Crops Conference 1996 – Volume 2
167
Background Mashua, which looks very similar to its close relative, the garden nasturtium, but with smaller flowers, is a spreading plant, which under good conditions quickly covers the ground. The New Zealand accessions produce purplish-green or yellow tubers similar in shape to oca, but in the Andes, there are a large number of cultivars with a wide variety of shape and colour. Flavour and aroma are reported to vary widely from terrible to very nice. The tubers of many cultivars contain isothiocyanates, which produce a very strong flavour, but this often becomes milder when the tubers are cooked well. Mashua is reported tolerant of poor soils, and also seems immune to many insect pests, and is reported to discourage insects in companion crops. Oca is a relative of the common garden oxalis, with similar form but generally larger and more robust. Underground stolons swell into elongate fusiform tubers marked by the transverse scars of dormant buds. The tubers have a tangy flavour and are eaten mainly with roast dinners. The line of oca grown in New Zealand produces pink tubers, whereas in the Andes, there are cultivars with a range of colours, including red, pink, yellow, plain and spotted. Tradition in the Andes states that more coloured varieties tend to be more insect tolerant. Ulluco, or Añu, rivals potato as the major tuber crop in some areas of the Andes, and is commercially produced for supermarkets and for canning. There are a large number of cultivars with a range of highly coloured tubers, including yellow, pink, red and green. The tubers are usually boiled, but then can be eaten hot or cold. The tops are also edible, and can be cooked and eaten like spinach. Like mashua, it seems to be able to tolerate poorer growing conditions than potato. Yacón is a herbaceous plant with large sunflower type leaves and small yellow daisy-like flowers. The dahlia like `tubers' can be eaten raw, with a sweet taste and crisp texture. They can also be cooked. They contain high levels of inulin, and are being grown commercially in Japan as a source of this sugar. New Zealand accessions have a white or creamy taste, but there are other cultivars with pink, yellow, orange and purple coloured flesh. One problem with yacón is that the `tubers' are in fact swollen roots, and so propagation has to be from the buds (`turions') on the stem bases or from stem cuttings. Methods Samples of tubers of oca, ulluco and yacón were collected by Alfredo Grau from local markets in southern Bolivia and northwestern Argentina in 1993. Some accession details of the oca lines are given in Table 1. Both yacón lines came from Argentina, one was collected at an elevation of 1700 m, the other at 1800 m. Fifteen lines of Ulluco were also brought into the country, from similar locations to the oca. The samples were brought back to New Zealand where they were placed in quarantine and tissue cultured until they were free of virus infection. Two different mashua accessions introduced by DSIR to New Zealand several years before were also obtained (IVY 905 and 943). Both yacón lines and 12 of the oca lines were released from quarantine in June 1994. Quarantine glasshouse conditions were 24oC during the day and 18oC at night, and the soil and atmosphere were kept very moist to induce virus development. Upon release, the plants were placed in a glasshouse maintained at slightly cooler temperatures and much drier soil and air conditions. Tubers were induced by placing the plants in a cool room overnight for three to four weeks. Cuttings were taken from the tops and grown in pots in the glasshouse. Two field trials were established for the oca at Lincoln near Christchurch in New Zealand. One of the trials was planted with tubers and the other with plants grown with stem cuttings. With them were
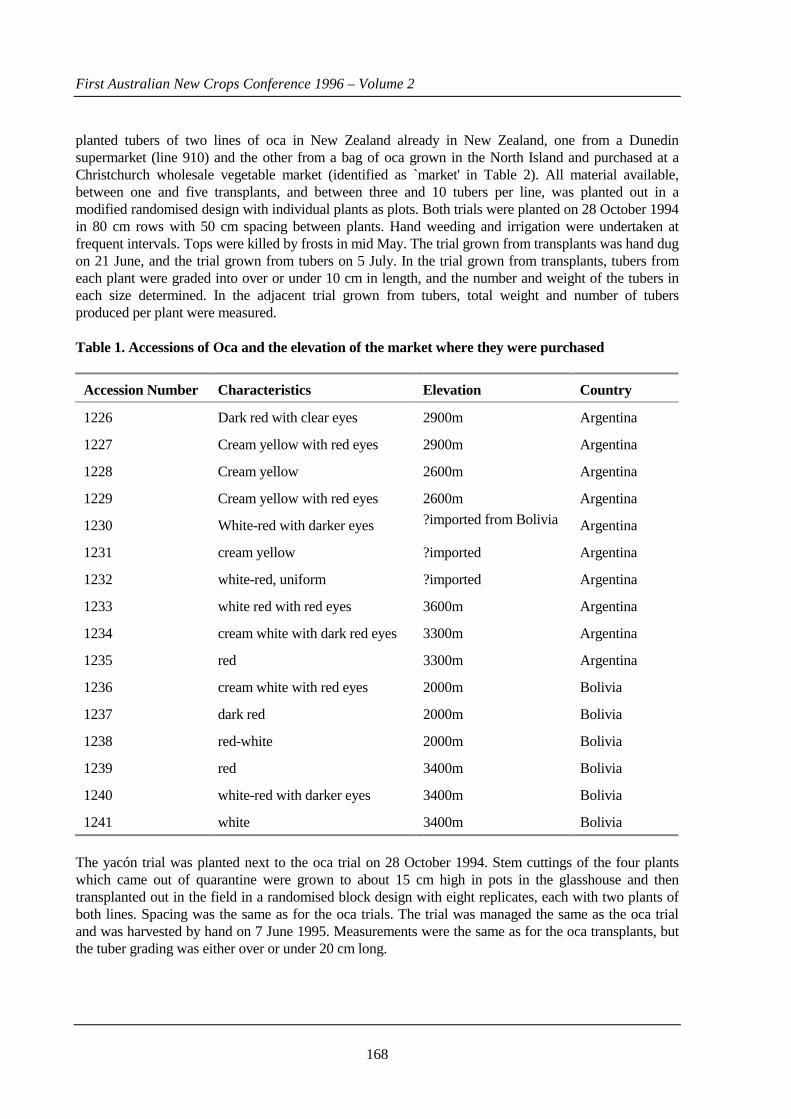
First Australian New Crops Conference 1996 – Volume 2
168
planted tubers of two lines of oca in New Zealand already in New Zealand, one from a Dunedin supermarket (line 910) and the other from a bag of oca grown in the North Island and purchased at a Christchurch wholesale vegetable market (identified as `market' in Table 2). All material available, between one and five transplants, and between three and 10 tubers per line, was planted out in a modified randomised design with individual plants as plots. Both trials were planted on 28 October 1994 in 80 cm rows with 50 cm spacing between plants. Hand weeding and irrigation were undertaken at frequent intervals. Tops were killed by frosts in mid May. The trial grown from transplants was hand dug on 21 June, and the trial grown from tubers on 5 July. In the trial grown from transplants, tubers from each plant were graded into over or under 10 cm in length, and the number and weight of the tubers in each size determined. In the adjacent trial grown from tubers, total weight and number of tubers produced per plant were measured. Table 1. Accessions of Oca and the elevation of the market where they were purchased
Accession Number Characteristics Elevation Country
1226 Dark red with clear eyes 2900m Argentina
1227 Cream yellow with red eyes 2900m Argentina
1228 Cream yellow 2600m Argentina
1229 Cream yellow with red eyes 2600m Argentina
1230 White-red with darker eyes ?imported from Bolivia Argentina
1231 cream yellow ?imported Argentina
1232 white-red, uniform ?imported Argentina
1233 white red with red eyes 3600m Argentina
1234 cream white with dark red eyes 3300m Argentina
1235 red 3300m Argentina
1236 cream white with red eyes 2000m Bolivia
1237 dark red 2000m Bolivia
1238 red-white 2000m Bolivia
1239 red 3400m Bolivia
1240 white-red with darker eyes 3400m Bolivia
1241 white 3400m Bolivia
The yacón trial was planted next to the oca trial on 28 October 1994. Stem cuttings of the four plants which came out of quarantine were grown to about 15 cm high in pots in the glasshouse and then transplanted out in the field in a randomised block design with eight replicates, each with two plants of both lines. Spacing was the same as for the oca trials. The trial was managed the same as the oca trial and was harvested by hand on 7 June 1995. Measurements were the same as for the oca transplants, but the tuber grading was either over or under 20 cm long.

First Australian New Crops Conference 1996 – Volume 2
169
The mashua trial was planted next to the mashua trial site on 27 October 1994. Tubers from two cultivars were planted out in rows 80 cm apart, with 50 cm between tubers within rows. The crop was managed the same as the oca and yacón, and was harvested by hand on 14 June 1995. Measurements were the same as for the oca transplants. Results Yield data from the Lincoln trials are summarised in Tables 2 and 3 for oca, Table 4 for yacón and Table 5 for mashua. None of the ulluco lines have been released from quarantine as they all contained virus and are still being cleaned. Table 2. Tuber numbers and yields/plant from the oca transplant trial at Lincoln
Accession Number
Plant no
Total tuber no
Total tuber wt
Wt/ tuber
Large tuber no
Large tuber wt
Wt/ large tuber
1226 3 105 883 9.1 9 206 21.1
1230 4 93 680 7.1 11 206 19.0
1232 4 109 1018 9.6 14 367 26.3
1233 5 123 1464 11.9 30 732 24.5
1234 4 100 1093 11.2 20 561 28.8
1235 4 90 878 9.8 11 293 26.6
1236 3 115 1015 9.6 15 429 28.1
1237 4 127 1323 10.7 25 591 23.8
1238 1 49 941 19.2 21 656 31.2
1239 4 120 1714 16.0 29 807 27.8
1240 4 140 1229 8.8 16 419 26.8
1241 4 100 1469 15.0 27 873 31.7
9101 13 118 1420 12.1 33 879 26.2
market1 15 80 774 8.7 17 412 21.2
s.e.m.2 n=4 17 194 1.6 4 123 2.1
s.e.m.3 n=15 9 100 0.8 2 64 1.1
1 planted as tubers in both trials 2 standard error of the mean where number of plants in the sample (n) = 4. 3 standard error of the mean where number of plants in the sample (n) = 15. In the oca transplant trial (Table 2), many of the newly released lines produced tuber numbers and yields per plant and weights per tuber similar to those of the market line and the line 910. However, these lines had a head start on the two New Zealand lines, which had to grow from tubers and develop a leaf area.

First Australian New Crops Conference 1996 – Volume 2
170
Where all the lines were planted from tubers (Table 3), many of the recent accessions did not produce as many or as heavy tubers as the local lines, but this may have been because the tubers planted out for many of these lines were much smaller than for the two local lines. The two lines of yacón were very similar in appearance in the field, and produced similar numbers and sizes of tubers (Table 4). At about 3 kg of tubers per plant, yields were twice as high as for oca, but these were from transplants. One of the major problems for the commercial exploitation of this crop will be the isolation, storage and planting of the stem bases or cuttings. Also storage of the tubers needs to be examined, as, when stored in similar conditions to oca, yacón tubers soon got fungal infections. The two lines of mashua had contrasting results (Table 5). The yellow tubered line 905 produced fewer plants and these plants grew more slowly and produced fewer and smaller tubers than the green tubered line 943, which produced about 46 t/ha under conditions of less than optimum fertility and moisture. This trial is being repeated in the 1994-95 season to confirm these results. In this current 1994-95 season, a much larger replicated trial has been undertaken at Lincoln to assess the yields and taste of the oca accessions. Also, many of the lines are being grown on a commercial oca farm in the North Island, where they can be assessed under commercial conditions. Table 3. Tuber numbers and yields/plant from the oca tuber trial at Lincoln Accession No. Plant no Total tuber no Total tuber wt Wt/tuber
1226 18 113 1062 9.7
1230 8 52 596 11.1
1232 - - - -
1233 3 29 469 14.6
1234 17 48 523 10.1
1235 4 25 328 13.0
1236 12 55 495 9.5
1237 2 72 804 10.8
1238 4 43 446 10.4
1239 5 149 1983 13.2
1240 20 50 560 11.0
1241 14 40 406 9.4
9101 10 135 1542 12.2
market1 15 98 1276 12.2
s.e.m.2 20 205 1.3
s.e.m.3 10 106 0.7 1 planted as tubers in both trials 2 standard error of the mean where number of plants in the sample (n) = 4. 3 standard error of the mean where number of plants in the sample (n) =15.
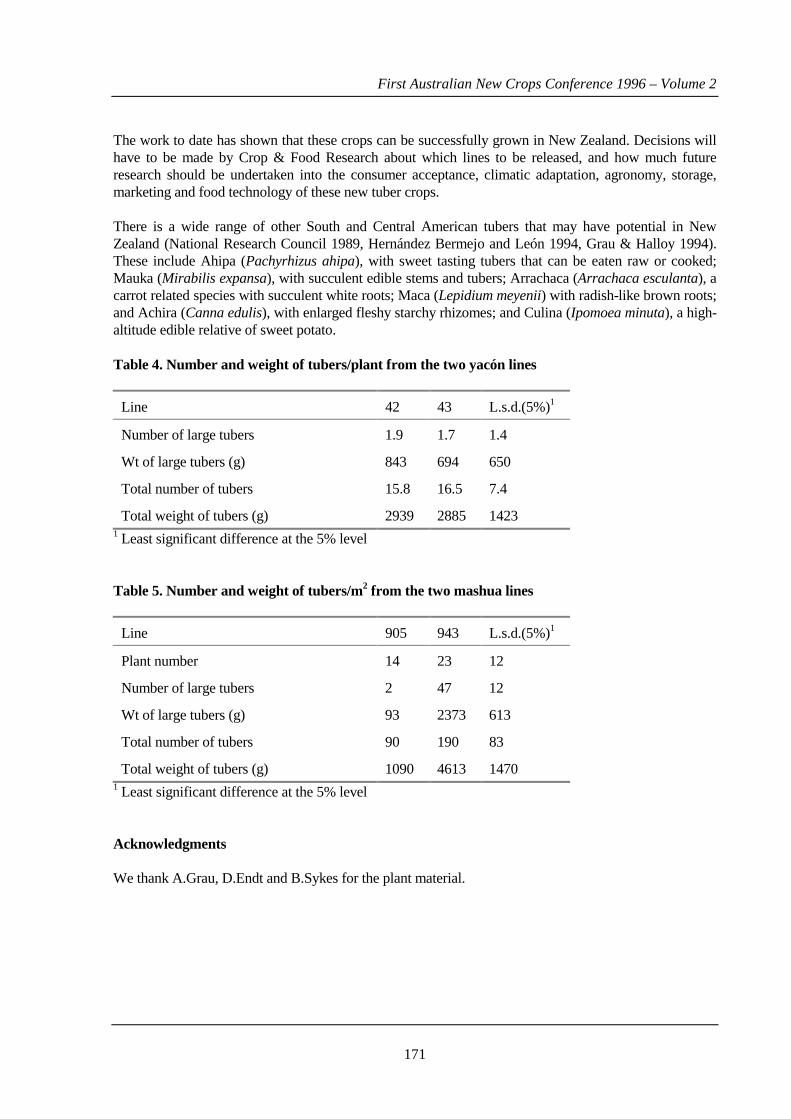
First Australian New Crops Conference 1996 – Volume 2
171
The work to date has shown that these crops can be successfully grown in New Zealand. Decisions will have to be made by Crop & Food Research about which lines to be released, and how much future research should be undertaken into the consumer acceptance, climatic adaptation, agronomy, storage, marketing and food technology of these new tuber crops. There is a wide range of other South and Central American tubers that may have potential in New Zealand (National Research Council 1989, Hernández Bermejo and León 1994, Grau & Halloy 1994). These include Ahipa (Pachyrhizus ahipa), with sweet tasting tubers that can be eaten raw or cooked; Mauka (Mirabilis expansa), with succulent edible stems and tubers; Arrachaca (Arrachaca esculanta), a carrot related species with succulent white roots; Maca (Lepidium meyenii) with radish-like brown roots; and Achira (Canna edulis), with enlarged fleshy starchy rhizomes; and Culina (Ipomoea minuta), a high-altitude edible relative of sweet potato. Table 4. Number and weight of tubers/plant from the two yacón lines
Line 42 43 L.s.d.(5%)1
Number of large tubers 1.9 1.7 1.4
Wt of large tubers (g) 843 694 650
Total number of tubers 15.8 16.5 7.4
Total weight of tubers (g) 2939 2885 1423 1 Least significant difference at the 5% level Table 5. Number and weight of tubers/m2 from the two mashua lines
Line 905 943 L.s.d.(5%)1
Plant number 14 23 12
Number of large tubers 2 47 12
Wt of large tubers (g) 93 2373 613
Total number of tubers 90 190 83
Total weight of tubers (g) 1090 4613 1470 1 Least significant difference at the 5% level Acknowledgments We thank A.Grau, D.Endt and B.Sykes for the plant material.

First Australian New Crops Conference 1996 – Volume 2
172
References Brücher, H. 1989. Useful Plants of Neotropical Origin and their Wild Relatives. (Springer-Verlag :
Berlin). Grau, A., and Halloy, S. 1994. Feast or famine. Growing Today June 1994: 28-33. Hernández Bermejo, J.E.and León, J. 1994. Neglected Crops - 1492 from a different perspective. FAO
Plant Production and Protection Series No.26: 341 pp. National Research Council. 1989. Lost Crops of the Incas. (National Academy Press: Washington).
First Australian New Crops Conference 1996 – Volume 2
173
The New Lentil Industry In Australia: Factors Behind Its Success Michael Materne and JanBert Brouwer Victorian Institute for Dryland Agriculture, Private Bag 260, Horsham 3401 Abstract Lentils (Lens culinaris Medikus) were domesticated in the Near East from the wild progenitor species Lens culinaris spp. orientalis Boiss. over 7,000 years ago. Yet, in Australia lentils are regarded as a new crop. The production of lentil here has expanded from less than 500 hectares prior to 1993 to 20,000 hectares forecasted for 1996. The successful establishment of lentils as a "New Crop" has been achieved through a combination of development and successful commercialisation of better adapted varieties, agronomic research support and skilful and innovative marketing leading to widespread farmer uptake. The current production is already satisfying the domestic market, eliminating the need to import lentils into Australia. In addition, the value of 1995 exports is estimated at four million dollars. Australian lentils are being marketed as a contaminant-free, clean product. Consignments of Australian lentils have already been exported to fifteen countries where the response from traders has been excellent. The emphasis of research has now changed to extending the adaptation range of lentil genotypes, developing new seed types and improving traits which affect marketability such as disease resistance. Agronomy and pathology research will continue so as to ensure that on-farm yields and seed quality are maximised. This will address the need for stability of supply so necessary for market development. It will also provide essential support when the crop is extending into new areas. As the production of lentils increases in Australia, continuing activities in market development and quality assurance are necessary to optimise the export market share for Australian lentils Introduction Cultivated lentil (Lens culinaris Medikus) is one of the oldest known food crops, having being domesticated in the Near East arc early in the Neolithic period over 7, 000 years ago. The wild lentil species Lens culinaris spp. orientalis Boiss, is considered to be the progenitor of cultivated lentils, based on the discoveries of carbonized remains of both species in the same geographic range (Muehlbauer et al. 1995). Cultivated lentils are divided into two main groups based on seed size and cotyledon colour. Macrosperma lentils, also known as green, brown, yellow or Chilean lentils, have a seed diameter of 6 to 9 mm, yellow cotyledons and a green to brown seed coat. Microsperma lentils are also called red or Persian lentils and have red cotyledons, a darker seed coat and a seed diameter of 2 to 6 mm. Lentils are grown over a wide geographic and climatic range. They occur in Europe, the Middle East, North Africa, the Indian subcontinent, South America, the U.S.A., Canada, the Russian Federation, New Zealand and Australia. Lentils are grown exclusively for human consumption (Knights 1987). They are an excellent source of protein, iron and minerals and are low in fat. When mixed with cereal grains, lentils provide a cheap and nutritionally well balanced diet for consumers. Lentils are one of the principal sources of dietary protein in the Indian subcontinent, the Middle East and North Africa. Green lentils are used whole in

First Australian New Crops Conference 1996 – Volume 2
174
many traditional dishes such as 'myaddarah' (lentils with rice) in the Middle East. Red lentils are split or decorticated for use in curries and soups, and lentil flour is added to cereal flour to make pappadams, breads, cakes and baby foods. Lentil crop residues are also highly valued as stockfeed in areas such as the Middle East. The world production of lentils has increased from 1 million tonnes in the 1960s to approximately 2.5 million tonnes in the late 1980s (FAO 1995). India is the largest producer of red lentils but most of its harvest is consumed domestically. Turkey is the second largest producer and the major exporter of red lentils, while Canada is the largest producer and exporter of green lentils (Table 1). Turkey and Canada each exported over 200,000 tonnes of lentils in 1993 (Dowsley et al. 1995). Prior to 1993 the area sown to lentils in Australia did not exceed 500 hectares. The lentil cultivars available were poorly adapted to the cropping environments in Australia and little was known of their agronomic requirements. Until this time Australia imported nearly 2,000 tonnes of lentils annually at a cost of over 1.1 million dollars (Dowsley et al. 1995). That situation has changed considerably and over 15,000 ha are expected to be planted in Australia in 1996. This paper outlines the process by which the lentil industry in Australia was vitalized. Table 1. Lentil production in area and tonnes per hectare for selected countries and the world total (FAO 1993)
Country Area of production (1000 ha) Production (1000 MT) 1979-81 1991 1993 1979-81 1991 1993 Australia 0.3 0.7 0.5 1.3 Bangladesh 290 210 207 171 157 163 Canada 38 238 332 32 343 300 India 934 1188 1172 411 851 779 Nepal 98 119 164 49 73 105 Syria 82 83 105 62 50 95 Turkey 206 787 713 219 640 725 USA 78 49 58 84 76 91 World Total
2218 3303 3353 1327 2665 2698
Provision of Suitable Cultivars The first lentil cultivars introduced into Australia for commercial production were Kye, Laird and Spinner. The red lentil Kye was introduced into South Australia by a private company and is reputedly of Ethiopean origin. It is very early to flower and mature, but it is short, very susceptible to shattering and susceptible to ascochyta blight. Laird is the major lentil cultivar released and grown in Canada. It is recognized as the world standard for green lentils because of its large seed size. Both Laird and Spinner are late flowering and late maturing green lentils. Spinner is of unknown origin. Ted Knights (1987) proposed lentils as a potential crop for Australia after conducting preliminary evaluation work in southern NSW. The cultivar Callisto was released by the NSW Department of Agriculture in 1988 as a result of that work. However, this red lentil is late flowering and susceptible to ascochyta blight. Its limited yield potential failed to attract grower support.

First Australian New Crops Conference 1996 – Volume 2
175
Even in prime croppping areas commercial lentil crops yielded less than 1 t/ha. The Wimmera region of Victoria with its well drained and fertile alkaline clay soils and its comparatively reliable medium rainfall can be regarded as an optimum environment for lentil growing. Yet, the low yields of the cultivars initially available did not provide an economically sustainable crop option. More extensive lentil germplasm evaluation was initiated by Musharaf Ali in South Australia and JanBert Brouwer and Trevor Bretag in Victoria during the mid 1980s. These evaluation programs were based largely on germplasm introduced from the International Center for Agricultural Research in the Dry Areas (ICARDA) located in Syria. ICARDA was established in 1977 and is one of a network of sixteen agricultural research centres of world significance. ICARDA has the world mandate for lentil development and has a large collection of lentil landraces assembled from around the world. A key step in establishing the Australian lentil industry has been the selection of vastly superior cultivars from germplasm provided by ICARDA. Agriculture Victoria released the red lentils Cobber and Digger and the green lentil Matilda for commercial production in 1993. Aldinga and Northfield were released by the South Australian Research and Development Institute (SARDI) in 1993 and 1994 respectively. The most important feature of the new cultivars is their improved adaptation to the medium to high rainfall areas of Australia. The yields of the new red lentils are double that of the older cultivars Kye and Callisto (Table 2). The green lentil Matilda is also significantly higher yielding than its competitors Spinner and Laird. In addition, the new releases have other desirable adaptive traits such as improved resistance to ascochyta blight and shattering and are earlier flowering than Callisto and grow taller than Kye. Digger has so far proved to be the most productive of the new cultivars. Its average yield, measured in regional trials in the Victorian Wimmera from 1989 to 1995, was 2.2 t/ha. Current production costs of lentils in this region are approximately $180 per hectare. At this yield level, and at a 1996 price of $400 per tonne, lentils produce a gross margin of $700 per hectare, which compares very favourably with field peas, chickpeas and faba beans, the other pulse crops in this region. The new lentil releases have therefore established lentils as a viable alternative for farmers in the Wimmera. The crop is also being established in the southern Mallee region of Victoria; the south east, mid north and Yorke Peninsula of South Australia; and in Western Australia. Table 2. Characteristics of lentil cultivars and their grain yield in Victoria (1989-95) as a percentage of Digger Variety Grain type
(Red/Green) Seed size
(100 seed wt.) Maturity Height Yield
(% Digger) Aldinga Red 5.5 medium medium 87 Callisto Red 4.0 late medium 52* Cobber Red 4.4 medium medium 98 Digger Red 4.3 medium medium 100 Kye Red 3.0 early short 48 Laird Green 7.0 late tall 71 Matilda Green 5.5 medium-late medium 84 Northfield Red 3.6 medium medium 89 Spinner Green 6.2 late medium 60*
* Results only from trials conducted in 1995.

First Australian New Crops Conference 1996 – Volume 2
176

First Australian New Crops Conference 1996 – Volume 2
177
Research Support: Agronomy and Pathology Very little was known of the agronomic requirements of lentils in Australia, when cultivar development work began in the 1980s. Knights (1987) first identified the major requirements of lentils in Australia using information from overseas literature and local experience. Since then more recent trial work conducted in Canada, New Zealand and ICARDA and grower experience and agronomic research in Victoria, South Australia, New South Wales and Western Australia have contributed to further clarifying the basic agronomic requirements for growing lentils successfully in Australia. This information has been collated and made available in the form of grower guides (Dowsley et al, 1995). The main limitations to growing lentils are posed by the fungal disease ascochyta blight, by inadequate weed control and by difficulties in harvesting the crop. Ascochyta blight, associated with the fungus Ascochyta lentils, is the major disease of lentils in Australia. Ascochyta blight causes yield losses and reduces seed quality by blemishing the seed coat. These problems can be mimized by not sowing into infected stubble and by using disease free seed, seed dressings and resistant cultivars (Dowsley et al. 1995). Foliar fungicidal sprays at the pod formation stage and harvesting early can reduce seed infection by ascochyta blight (Bretag 1994, Ramsey 1994). Sowing time experiments have identified a negative interaction between sowing time and the percentage of seeds infected by ascochyta blight in southern Australia. Therefore, delayed sowing or the use of late flowering varieties can reduce seed infection by the fungus, although yield penalties are incurred if sowing is too late (Bretag 1992). Lentils grow comparatively slowly during winter and compete poorly with weeds. Weed control is essential to ensure optimum yields, to harvest seed free of contaminants and to limit weed buildup. Research has shown lentils to be comparatively sensitive to herbicides for broadleaf weeds and significant damage can occur. A major problem in establishing a new crop is the lack of chemicals registered for use in that crop. However, there are broadleaf herbicides available which give an adequate control of weeds (Yeatman 1994). Crop damage can be reduced by sowing deeper when using pre-emergence herbicides such as trifluralin and metribuzin. There are clear interactions between the environment and crop damage by herbicides and regional trials continue to be conducted by public research institutions and private industry groups. The first successful genetic transformation of lentils was achieved at The University of Western Australia in 1995. This raises the expectation that continued research in this field may result in certain herbicide resistance genes being transferred into lentils from alien sources, thus improving the options for weed control. Other genes of interest in this research include those conferring resistance to insects. The short plant height of lentils often causes harvesting difficulties. Sowing earlier increases height but not to any great extent. Ingenuity has been shown by growers, who have adapted machinery for harvesting lower to the ground. Using crop lifters and extender fingers can improve crop feed into the machine. Excellent results have been achieved using machines with flexible fronts and the conventional reel replaced with an air system. Essential information such as on suitable sowing rates, has been obtained from trials in Victoria, South Australia and Western Australia, indicating that at least 100-120 plants per m2 are required to produce maximum yields (Bretag 1992, Bretag 1994, Hawthorne 1994, Clements et al. 1995). Recommendations for fertilizer application and for insect control in lentils have been based on practices used in growing peas and chickpeas in Australia. There is ample scope for improvement in on-farm methods and continued research into the agronomic requirements of lentils and their disease problems will enable the full yield potential of the cultivars to be exploited.

First Australian New Crops Conference 1996 – Volume 2
178
The Commercial Partners While public funded research activities in genetic improvement, agronomy and pathology provided the foundation for the new cropping industry, success in realising the commercial potential of the product could not have been achieved without major input from private enterprise. A lesson learned from the development of the lentil industry is that the contribution from the private sector is most effective when it is driven by a combination of crop production expertise and of skills in promoting the cultivars and marketing the final grain product. Agriculture Victoria adopted a deliberate strategy at the time of the release of the new improved cultivars of seeking commercial partners in developing a viable industry. Achieving a good adoption rate for the new lentil cultivars was only part of this startegy. It was recognized that success could only come if the crop was launched in the Wimmera region, where the new lentils had proved to be well adapted and where the growing environment favoured stable productivity. This would provide much needed stability in the initial phase of industry development and would enable close support and guidance by staff from the Victorian Institute for Dryland Agriculture (VIDA). It was envisaged that the crop would extend into other areas after this initial establishment phase. The Lentil Company (TLC) of Horsham in the Victorian Wimmera, successfully tendered for a partnership, giving them exclusive rights to the seed released by Agriculture Victoria of the new lentils Cobber, Digger and Matilda. In addition to well developed skills in commercial production of a range of pulses and seed crops including lentils, the management of TLC had an established track record in marketing pulse grain, both domestically and overseas. TLC has been very successful in expanding lentil production in Victoria through the promotion of lentils and the provision of good agronomic support to farmers. TLC sells high quality seed to farmers and buys back the grain after harvest through a contractual agreement so it can be used either for seed or as a grain product. Seed is graded, contaminants are removed and farmers are paid a pool price for whole clean product and a reduced price for broken or damaged seed (Blair et al, 1995). TLC aims to maintain the quality of lentil seed through rewarding good farm practices. Much of the company’s success can be attributed to its directors, who, being farmers themselves, understand the technicalities of growing lentils and have a good rapport with other farmers. After an initial year of multiplying seed stock TLC did not apply any restriction on seed sales to any interested party and signed production contracts with more than one hundred growers in Victoria, South Australia, Western Australia and New South Wales in 1995. In South Australia, where the marketing rights for the seed of the cultivars Aldinga and Northfield were acquired by the Australian Field Crops Association, lentils have also been adopted by growers but developments have been at a slower pace. Product Marketing The Lentil Company is currently the main exporter of Australian lentils. They maintain strict quality controls by paying farmers a pool price only for whole clean product. This emphasis on quality and reliability of supply will give Australian lentils an advantage over product from other countries. They also undertake their own marketing and exporting to maximise returns to the farmer. The company now employs a full time agronomist and a marketing consultant.
First Australian New Crops Conference 1996 – Volume 2
179
Turkey is the major exporter of red lentils in the world. Although geographically closer to export markets the Turkish product is not always free of contaminants and supply can be unreliable. Canada is the major exporter of green lentils but it has quality problems associated with wet periods during the autumn harvest. However, the small size of current Australian green lentils make them less competitive with the large-sized Canadian product. As an indication of the scale of the activities, more than eleven thousand tonnes of whole and split red lentils and 500 tonnes of whole green lentils from the 1995 harvest have been exported to fifteen countries. This has been achieved within two years of the new cultivars having been released. The importing countries include South Africa, La Reunion, Mauritius, India, Pakistan, Bangladesh, Spain, The United Arabs Emirates, the United Kingdom and the United States. In addition, red lentils have also been sold in Germany for canning purposes. The response from buyers in these countries has been very good. Although red lentils can be split cheaply in countries where labour is not expensive, it is expected that value adding in Australia by splitting or decorticating will become increasingly important as production increases. The return to farmers from lentils varies from approximately $600 to $300 per tonne depending on the market destination. All of the 1995 lentil production has already been sold and further demand indicates that prices in 1996 should be stable. Future Directions Lentil evaluation and breeding in Australia has now become a coordinated effort between collaborators in Victoria, South Australia, New South Wales, Tasmania and Western Australia. The Nationally Coordinated Improvement Program for Lentils in Australia (CIPAL) funded by the Grains Research and Development Corporation and coordinated from VIDA, aims to expand lentil production in Australia through the development and release of cultivars of improved adaptation and marketability. CIPAL maintains close ties with ICARDA which continues to be the main source of lentil germplasm introduced into Australia. Germplasm is also being introduced from the USA, Canada, Bangladesh and Pakistan in addition to hybridization work being conducted at VIDA to address specific needs. A major objective is to improve both seed and foliar resistance to ascochyta blight. Most lentils in Australia are still grown in the medium to high rainfall areas such as the Wimmera of Victoria. Genotypes higher yielding than the recently released cultivars have already been identified for this region (Brouwer et al.1995). A major aim of CIPAL is now to broaden the adaptation range of lentils by developing genotypes adapted to less favourable environments. Prospects for progress in that direction are good as additional introductions were recently found to be significantly higher yielding than the current cultivars in Western Australia (Clements et al. 1995). In Australia, lentils have the potential to be grown in many contrasting environments where seasons can vary greatly in temperature and rainfall. Adaptation trials are being conducted across Australia to categorise regions of Australia based on genotype response so that the requirements of each region can be identified. The study covers the effect of phenology on lentil crop growth and seed yield and its interaction with environment. This GRDC funded project will enable us to more precisely target sources of germplasm for introduction and to improve efficiency in the selection and breeding of lentils in Australia.
First Australian New Crops Conference 1996 – Volume 2
180
A new collaborative project funded by the Australian Centre for International Agricultural Research (ACIAR) facilitates cooperation between lentil scientists in Australia, Nepal, Pakistan and at ICARDA. It will allow us to further consolidate the establishment of the lentil crop by improving stability of yield. The appointment of a pathologist at VIDA as part of that project will strengthen our efforts towards the integrated control of ascochyta blight, while of CLIMA will investigate drought tolerance in lentil with the aim of increasing adaptation to the short season areas of Australia. Marketability remains a major issue. Generally, large seeded green lentils, as represented by the cultivar Laird from Canada, are preferred in the export market. As green lentils are traded and consumed as whole seeds and the visual appearance of the product is most important, a major effort will be made to develop large-seeded green lentil cultivars with resistance to ascochyta blight. Research will also be directed at developing niche market types such as Spanish browns and French greens. Other more complex quality attributes, such as cooking time, are being addressed as part of a national quality improvement program for pulses. Lentils have developed from a new crop into a viable industry in Australia. The industry is entering a phase of expansion in total production and into new agroecological regions. Many factors will affect the rate and level of this expansion. The export price of lentils and their price relative to other grains, wool and livestock will influence farmers’ decisions to grow lentils. There will be a growing need to monitor diseases and pests in lentils once the crop is more widely grown. Conclusions The following conclusions can be drawn from the developments leading to the establishment of the lentil industry in Australia:
• The overall commercial approach should be towards long-term profitability rather than on a quick return on investment.
• Concentrating the initial crop development phase in a proven favourable production environment gives the necessary stability to allow rapid build up of seed stocks and acquisition of expertise in production, seed management, promotion and marketing the product.
• Close interaction between the public researchers and the private commercial partner is necessary to overcome any teething problems.
• Comprehensive grower information should be available at the time of release of new cultivars and should be continuously updated by the public and commercial partners.
• Avoid inflated expectactions of profitability and prices by well documented and explained contractual arrangements and procedures for determination of payments.
• Emphasis on quality and product segregation encourages recognition of reliability, sustains confidence and acceptance in the trade and leads to the identification of additional market opportunities.
• Need for continuing crop research aimed at stabilizing production from existing production areas, at extending production into new areas and at satisfying market requirements for grain quality and additional product types.

First Australian New Crops Conference 1996 – Volume 2
181
References Blair, P., Beddison, W. and Mallon, I. 1995. The lentil company newsletter: January 1995. Horsham. Bretag, T. 1993. Lentil variety comparisons. In: Summary of Field Research in the Wimmera 1992.
(ed. K. Dowsley) (Victorian Institue for Dryland Agriculture: Horsham), pp.122-125. Bretag, T. 1993. Lentil: Effect of seeding rate on yield. In: Summary of Field Research in the
Wimmera 1992 (ed. Dowsley) (Victorian Institute for Dryland Agriculture: Horsham), pp.128-129.
Bretag, T. 1994. Disease control. In: Lentil Workshop Proceedings 1994. (ed. J. Hannay) (Primary
Industries: South Australia), pp. 17-22. Brouwer, J.B., Materne, M.A. and Bolwell, K,A. (1995) CIPAL Report 1995. (Victorian Institute for
Dryland Agriculture: Horsham), pp. 37-40. Clements, J., Siddique, K.M.H. and Francis, C. 1995. Lentil - Germplasm screening. In: Summary of
Experimental Results: Season 1995 (eds S.P. Loss and K.M.H. Siddique) (Agriculture Western Australia: South Perth), pp. 35-36.
Dowsley, K.J., Carter, J.M. and Materne, M.A. 1995. Lentil growers guide: A guide for the
production of lentils in Victoria. Agriculture Victoria. F.A.O. 1993. F.A.O. Production Yearbook 47:105. F.A.O. 1995. Agrostat - PC (Diskette). Hawthorne, W. 1994. Agronomy. In: Lentil Workshop Proceedings 1994. (ed. J. Hannay) (Primary
Industries: South Australia). pp. 32-37. Knights, E.J. 1987. Lentil: A potential winter grain legume crop for temperate Australia. J. Aust. Inst.
Agr. Sci. 53(4):271-280. Muehlbauer, F.J., Kaiser, W.J., Clement, S.L. and Summerfield, R.J. 1995. Production and breeding
of lentil. Advances in Agronomy 54:283-332. Ramsey, M. 1994. Ascochyta blight of lentils. In: Lentil Workshop Proceedings 1994. (ed. J. Hannay)
(Primary Industries, South Australia, pp 30-31. Yeatman, T. 1994. Weed and insect control. In: Lentil Workshop Proceedings 1994. (ed J. Hannay)
(Primary Industries: South Australia). pp. 17-22.

First Australian New Crops Conference 1996 – Volume 2
182
Jojoba – a Unique Industrial Crop for Australia Peter L. Milthorpe NSW Agriculture, P O Box 300, Condobolin NSW 2877 Abstract Jojoba oil, because of its unique properties, has long been sought after by the cosmetics and lubrication industries. The value of growing crops which are deep rooted, perennial and water-use efficient to maintain sustainable production is now recognised by many Australian farmers. They are actively seeking candidate crops. Jojoba possesses not one but all of these attributes. Until recently jojoba was still a wild plant and needed domesticating. Early attempts to grow jojoba failed through a lack of suitable varieties and agronomic knowledge. After fifteen years research,several varieties of jojoba that are extremely well suited to Australian conditions are available and suitable management strategies have been developed to ensure full production. Experience with extensive trial plantings and small-scale commercial plantations has demonstrated that jojoba has the capacity to yield 1.0 tonne of seed per hectare annually at maturity under rainfed conditions. World production is very small compared to the potential demand as only about 1,500 tonnes of the potential 200,000 tonnes is produced. At 1996 prices, gross returns of A$4,500 per hectare for seed, or A$13,500 for the extracted oil can be obtained. The task for our farmers, adequately supported by agronomic and financial backing, is to quickly take advantage of jojoba's potential by adopting it as Australia's own crop. Natural History Jojoba is native to the harsh climate of the Sonoran Desert of south western USA and north western Mexico lying between latitudes 25° and 34° N (Gentry 1958). It occurs at sea level on the coast of California and up to 1,200 m elevation in the mountains of Arizona. In much of its native habitat it rarely exceeds 1 metre in height and usually has blue-grey leaves. The female and male flowers occur on separate plants. The plants are usually dormant during winter, commencing spring growth with flowering and a flush of new shoots. Fruit development and growth continues through spring and into summer when the fruit matures and the seed falls. Vegetative growth continues through summer and autumn whenever there is adequate soil moisture. The seeds are about the size of a pistachio nut (about 0.6 -0.8 g), with a brown coating and a white flesh that looks like a peanut. The seed contains a unique oil (chemically a liquid wax), which is highly sought after. The oil content is usually at least 50% of the seed weight. Historic Development as a Crop Jojoba gained prominence during the late 1970s when it was promoted as a substitute for sperm whale oil following the demise of the whaling industry. At that time agronomists, both here and overseas,
First Australian New Crops Conference 1996 – Volume 2
183
warned that jojoba could not be domesticated without careful selection of high yielding varieties and the development of an effective agronomic system (Begg 1978). Unfortunately rational development of the industry was destabilised by promoters who ignored this agronomic advice and proceeded with large scale plantations of seedlings in the early 1980s. Many plantations were sited in unsuitable areas, established using unselected seed and often poorly managed. Most of them failed to produce economic returns and have now been abandoned. The Australian Research Program In the mid 1970s scientists from CSIRO Division of Plant Industry used jojoba as one of the species in a study of the way plants control water use. The transpiration rate of jojoba leaves experiencing very dry air (high vapour pressure deficits) was less than 10% of that of standard crop plants and its water-use efficiency was almost twice that of wheat. This demonstration of the economy of water use plus information about the value of the oil led the research team to begin evaluating jojoba as a crop. Field trials began in 1976 to establish growth, flowering and seed production patterns as well as to ascertain where jojoba would grow best. Concurrently, high yielding varieties of jojoba were selected and an efficient agronomic package developed for establishing and maintaining plantations (Milthorpe and Dunstone 1989). Water use studies showed that its high efficiency combined with its deep rooted, perennial habit gives it a flexibility of management and drought tolerance well above that of traditional annual crops. The roots of traditional crops and pasture only extract water to a depth of about 1.2 metres. Water that escapes from this zone eventually finds its way into the subsoil, causing water-table problems in adjacent low lying areas. Jojoba roots are not limited by depth and will move into any zone where moisture is present. A field study has shown that jojoba roots extract water below 3.5 metres. Because of this and the high planting density used, jojoba will be more effective than farm trees in controlling water-table induced salinisation under both dryland and irrigation regimes. Environmental Benefits The natural characteristics of jojoba are significantly more adaptable to the Australian farming environment than the traditional annual crops now grown. Because jojoba is a long lived perennial crop the need to have large tracts of bare land, such as occur during the fallow phase of cereal growing, is greatly reduced. After the establishment period of about 2 years the hedges of plants give excellent protection to the soil from wind erosion. Jojoba has a high tolerance of salt and has been grown under irrigation with brackish water and with effluent. Experiments in Israel show no reduction of growth under irrigation with water having an electrical conductivity of 6 dS/m and new work is being carried out by NSW Agriculture at Dareton. Jojoba may have a future role in pioneering salt damaged areas or using effluent water for irrigation. Effluent waters high in phosphorus which are produced in many of our inland towns may be used to irrigate jojoba rather than discharged into the rivers where it poses a threat for blue-green algal contamination. The high water use efficiency of jojoba allows the grower to produce optimum crops with far less water than would be required for an equivalent traditional crop. Furthermore, the timing of rainfall or irrigation is not critical because of its ability to conserve water and extract it from deep in the soil profile.

First Australian New Crops Conference 1996 – Volume 2
184
Competition for river water by competing irrigators and the needs of natural wetlands will reduce the availability and increase the future price of water. The advantages of a crop which is drought resistant and has a low water requirement will become increasingly important as the pressure to maintain river flows mounts. The Need to Change Agricultural Practices Australian farmers have been exceptionally successful in adapting European annual crops to the unreliable climate and poor soils of this continent. However, there is a growing realisation of the need for crops that are intrinsically better adapted to our conditions. Annual crops are more vulnerable to the droughts that are a feature of our climate. In addition the serious environmental problems of soil erosion, soil acidification and salting from rising water tables are clearly linked to the rotation of annual, shallow rooted herbaceous crops. It is now well established that many of these problems can be prevented and the degradation process reversed if deep-rooted woody perennial species can be re-established. To counteract these environmental problems farmers are establishing expensive tree planting schemes to provide long term protection of their land, but their capacity to implement this is governed by profit from other enterprises. Australia requires crops that not only provide the environmental benefits of trees, but produce reliable yields of a readily marketable product. These crops must be adaptable to mechanised farming practices, provide good economic returns to the farmer and produce a commodity suited to further value-adding. Jojoba is now one such crop. Another pleasing feature about jojoba is that the timing of many of the operations is not as critical as for other crops. This does not mean that management can be lax, but rather that some operations can wait until other more pressing farm activities have been completed. For example, major operations such as planting can be spread over a 6 -7 month period and harvesting over 2-3 months. Jojoba is well suited to typical wheat-sheep farm operations as an additional land-use operation. Growing Jojoba It is important that all aspects of crop production are considered before embarking on growing jojoba. Most of the important aspects dealt with including site selection, nutrient requirements, specific machinery needs, ground preparation, planting, post planting management, pest control and harvesting have been described in a recently published Agfact on jojoba. Figure 1 outlines a timetable for the establishment and management of a plantation. Jojoba is a slow crop to establish and has little competitive ability against fast growing annual weeds in the first few years. It is important for any crop that all plants are the highest yielding varieties and behave in a uniform manner, particularly with regard to flowering, seed-set and ripening to ensure ease of management and one-off harvests. Three female varieties of jojoba have been selected as being the most suitable for our conditions and registered under the Plant Breeders Rights (PBR) Act for commercial production. Plants can be established over a long spring-early summer period from late September to November. The best time to plant is in spring as soon as the soil temperature at 10 cm depth rises above 20°C, as this gives the young plants maximum growing time before the onset of winter. A second, shorter autumn planting season extends from late February until early March after the worst of the hot weather is finished. However,

First Australian New Crops Conference 1996 – Volume 2
185
plants can be successfully planted during the heat of summer provided extra care is taken with watering during the initial part of the establishment phase.
Operation Appropriate Timing
Establishment Phase Ground preparation · .. fallowing . . . . . . . . . . . . . . . . . .. . · ..levelling . . . . . . . . . . . . . . . . . . . . . · ..banking . . . . . . . . . . . . . . . . . . . . . · ... ripping . . . . . . . . . . . . . . . . . . . . . · . fertiliser placement . . . . . . . . . . . . · ..irrigation installation . . . . . . . . . . . Planting · ... timing . . . . . . . . . . . . . . . . . . . . . . · bank profiling and hole punching .. . · ...planting . . . . . . . . . . . . . . . . . . . . . · ....watering . . . . . . . . . . . . . . . . . . . . Ongoing Maintenance General management · .....................................weed control - inter-row areas . . . . . . . . . . . . . . -spot spraying . . . . . . . . . . . . . . . . -follow-up protection . . . . . . . . . . · .. bank maintenance . . . . . . . . . . . . . · ...pest control . . . . . . . . . . . . . . . . . . · .. fertilising . . . . . . . . . . . . . . . . . . . . · ..plant shaping . . . . . . . . . . . . . . . . . Irrigation . . . . . . . . . . . . . . . . . . . . . Harvesting . . . . . . . . . . . . . . . . . . . . Oil Crushing . . . . . . . . . . . . . . . . . .
commence at least 12 months prior to planting optional, as convenient early winter or 3-4 months prior to planting to allow settling immediately after banking can be incorporated as part of the ripping operation optional, dripper lines laid after banking in spring (when soil temps reach 20°C) and late summer periodically throughout the day of planting within an hour of hole punching to minimise drying of holes immediately after planting, then not less than 3-day intervals for first fortnight, less frequently for next fortnight as required to prevent seed set of weeds as above (can only be done during calm weather) early autumn (in south) and/or spring (summer rainfall areas) as required (should be rounded and consolidated by year 4) as required after year 2 (incorporated with inter-row weed control) after year 2 (incorporated with weed control along banks) if used, dependent on method of application late February→May not critical (as time permits)
Figure 1. The Main Operations Required for Jojoba Production and Their Timing
General Management The level of management required after the plants have established will vary depending on seasonal conditions and the time of planting. There are five main areas where management is critical: weed control, bank maintenance, pests, fertilising and plant shaping or pruning. Optimum production from jojoba is achieved with about 600 mm of rainfall or irrigation, considerably less when compared with the needs of other conventional irrigated crops like cotton or rice. In areas receiving less than about 400 mm rainfall, or where low saline groundwater is available, timely irrigation

First Australian New Crops Conference 1996 – Volume 2
186
will ensure continuity of production. The water can be applied as drip, furrow or flood irrigation but the planning and installation is best done before planting. Harvesting
As the seeds mature the capsule splits and the ripe seed is released and falls to the ground. Ripening usually commences in late January. As plants age, ripening is delayed until later in February and for well matured, dense plants the ripening period extends over 4-6 weeks. The first fruits to ripen are those nearest the ground on the outer branches of the plant. Ripening then proceeds upward and into the shaded canopy. The fruit is dry by the time it is released from the capsule and does not need to be harvested immediately. It can lie on the ground for several weeks, or even months, without deterioration in either oil content or quality, provided it is not continually wetted by rain or flooding. Birds, rodents, weevils and stock find the seed unappealing. The seed is swept into windrows and collected off well prepared soil surfaces. Vacuum harvesters equipped with rotating brooms have been developed to windrow and collect the seed. Yields The yield pattern from trials at Condobolin and Hillston, grown under dryland conditions, along with an estimate of yield for an irrigated plantation is: Yield (t/ha) Age (years) Dryland Irrigated 4 0.3 0.4 5 0.4 0.7 6 0.5 1.0 7 0.6 1.3 8 0.7 1.6 9 0.8 1.8 10 0.9 2.0 11 1.0 2.0 Once the seed has been collected it should be cleaned of dirt and debris as soon as practical and bulk stored in metal silos or bagged and stored until required for crushing. The seed is crushed in a screw press similar to that used for other common oil seeds�
Oil Properties and Uses
Jojoba oil is a long chain wax ester that is unique in the plant kingdom. The liquid looks like a vegetable oil but it is chemically quite different from other familiar products like canola or peanut oil and is used for different purposes. The first pressing expresses 80-90% of the oil which is suitable for top grade cosmetics and pharmaceuticals. A further pressing followed by solvent extraction will extract all the remaining oil which is suitable for lubrication or chemical applications.
Some properties of jojoba oil are: melting point, 11.5oC; solidifying point 6.8oC; hydrogenated (hard) wax melting point 70.0oC; boiling point 398oC; specific gravity 0.86; and molecular weight 608.

First Australian New Crops Conference 1996 – Volume 2
187
Much of the jojoba oil is sold as the pure filtered oil but it is also a very suitable base for a large range of chemical modifications that change the physical properties of the wax. The wax is currently trans-esterified to produce creams, hydrogenated to form hard waxes, sulphonated to provide lubricants and alk-oxylated to produce surfactants. In the future, jojoba oil will undergo modification by well established methods that involve various levels and types of halogenation to produce a wide range of compounds that behave like thick oils or synthetic rubbers. In addition, the potential for the production of new surfactants and emulsifiers is immense. With a sufficient supply of jojoba oil a whole family of chemical industries will be built up to exploit the long chain molecules of the jojoba liquid wax in the same way as the petro-chemical industries use the shorter chain crude oil base. Jojoba oil has a broad range of industrial applications such as cosmetics, transmission lubricants, pharmaceutical creams, polishes, printers' inks, surfactants, leather dressings and plastics modifiers. Nestle's has been studying the use of jojoba oil in food preparations and have found it can be used as a controlled dose dietary food where it reduces the amount of absorbed fat and lowers the cholesterol levels of obese patients. The seed meal left after oil extraction contains about 30% protein and an appetite suppressant called simmondsin. This meal has potential as a valuable co-product for use as a supplement in livestock feed. At present the meal is not sold in this country because the supply is too low for economic processing. Marketing In an industry overview presented to a conference in 1994, the potential market was estimated to have reached 200,000 tonnes of jojoba oil per year. In 1993 the world production was about 1,100 tonnes, about 0.5% of the amount that will be required to supply a market of this size. Ninety percent of production (the first pressing) is sold in five different forms to the cosmetics and hair care industry. This industry uses the pure oil and the trans-esterified cream as oil fractions, the hydrogenated wax as an exfoliant, the micro-encapsulated form as a high-lighter and the alk-oxylated product as an emulsifier. It is common for a single company to buy a number of these modified forms from a processor and incorporate them directly into a range of cosmetic and hair care formulations. The market for pure filtered oil to be used straight from the bottle as a skin moisturiser is expanding rapidly. Overseas Competition Most of the world's production of jojoba oil comes from the USA, Mexico, Israel and Argentina. Australia produces only about seven tonnes a year at this stage. The USA produces up to 200 tonnes and Mexico 100 tonnes of jojoba oil from a harvest of wild seed. Because the seed is usually picked green the oil may become contaminated by fungus. The remaining production (up to 750 tonnes) comes from the remnants of the large scale plantings of the late 1970s plus a few hectares of selected lines. These irrigated plantations yield about 500 kg per hectare in good years but the crops are regularly decimated by heavy frosts. Israel has an efficient jojoba industry based on well selected varieties grown under drip irrigation on the edge of the Negev Desert. The shortage and high cost of irrigation water as well as the wide range of crop options available to the Israeli farmer will restrict further expansion. Production from the 800 hectares planted to date will increase steadily in yield to about 1,200 tonnes at maturity.

First Australian New Crops Conference 1996 – Volume 2
188
Argentina has about 2,000 hectares of unselected plants and 400 hectares of cuttings. Tax incentives encourage growers to establish plantations in areas that are too arid for other crops and the potential yield is severely limited by the climate and soils. Jojoba does not perform well in the tropics as the plants suffer from fungal diseases and there is no low temperature stimulus to promote flowering. Plantations each exceeding 2,000 hectares of unselected jojoba planted in the tropical zones of Brazil, Paraguay, El Salvador and Costa Rica have already failed and been abandoned. High yielding jojoba varieties are selected for particular climatic zones and cannot be successfully transferred to other countries without several years of field trials. It is unlikely that new countries will be able to become significant jojoba producers without the long period of trials and selection that has already been completed in this country. Competing Products The number of natural products that compete with jojoba oil in the market place are very limited. Sperm whale oil disappeared in 1971 when whaling was banned and the oil obtained from the orange roughy fish is limited and carries a fishy smell that makes it difficult to use in cosmetic and pharmaceutical products.
It is possible to synthesise a wax similar to jojoba oil from erucic acid extracted from specially selected varieties of rapeseed. A company marketed a few tonnes of product in California for several years in the early 1970s . A company was set up in Melbourne to exploit a new process but failed before any oil was produced. As these companies failed at a time when the price of liquid wax was at its peak it does not seem likely that synthetics are a significant threat to jojoba oil. The Oil Market in Australia At the moment Australia produces only about 14 tonnes of jojoba seed (seven tonnes of oil) each year. The seed is either crushed by the grower or marketed to crushers who specialise in the cold pressing of vegetable oils for the health food market. The seed sells for A$4,500 to A$5,000 per tonne and bulk oil for about $45 per litre. The production is retailed as pure oil or is incorporated into cosmetics, soaps and hair products that are usually sold in health stores. The Australian cosmetics and aromatherapy industries are expanding rapidly to fill a market for pure, natural body care products. Expanding companies like Alchemy, Desert Gold, Sanctum, Nutri-Green, Lanni and Sunspirit are all using jojoba oil in their products and some are making a feature of the fact that their oil comes from Australian growers. A number of these companies are either exporting or planning to export their product. Franchised stores such as The Body Shop and Nectar promote pure jojoba oil and jojoba products while chain stores such as David Jones and Woolworths are marketing company lines clearly labelled as containing jojoba oil (almost always imported oil). A number of international cosmetics companies import jojoba oil for their Australian manufacturing operations. Companies such as Lux, Palmolive, Blackmores and L'Oreal advertise jojoba products extensively in this country. Once growers have filled the Australian market the export trade will provide a large market. The largest users, Japan, Germany and France, will continue to depend on imported oil as will new markets in Asia. Manufacturers from Malaysia and China wish to change their formulations to include jojoba oil, one manufacturer alone indicating a requirement in excess of 6,000 tonnes per year.

First Australian New Crops Conference 1996 – Volume 2
189
Reliability of Supply The world production of jojoba has been highly variable from year to year because of the use of unselected plant material and the incidence of severe frosts in the area where most jojoba is presently produced. Manufacturing companies have been very reluctant to spend money on the formulation of new products using large tonnages of jojoba oil when the supply volume and the price have been so erratic. The use of selected varieties under proven agronomic procedures in Australia will allow a very accurate prediction of future yields of the improved plantations. Reliable supply and a stable price structure are the keys to high volume use of jojoba oil by manufacturers. The industrial chemists and marketers will be able to produce modified jojoba oil to suit identified markets of the appropriate scale for each step of the development of yield. The potential users can be approached in time for jojoba oil to be incorporated in their formulations by the time a new market is required for the oil. Value Adding in the Jojoba Industry Jojoba lends itself to comprehensive vertical integration. The grower network that has been established by the Australian Jojoba Industry Association Incorporated is in a position to establish a processing co-operative or support a jojoba processing enterprise that will keep the profits from value adding within the industry. The seed can then be crushed, chemically modified and marketed by specialists, initially to Australian manufacturers and later to world markets. Market Development and Future Prices If Australia expands its plantings using clonal jojoba at the rate of 500 ha per year from 1996 the increase in production of jojoba oil will be steady and approach 1,000 tonnes per year by 2006. Year 2000 2001 2002 2003 2004 2005 2006 Jojoba oil 65 160 270 410 570 750 960 (tonnes) The size of the cosmetics market in the western world was originally estimated to be 20,000 tonnes per year. With the increases in this market due to the increased use of pure oil and the acceptance of cosmetics in Asia it is clear that there will be no pressure to modify the present market balance of 90% cosmetics and 10% lubricants for at least 15 years. However, it is likely that the price will ease from the present high of A$45/l for most first press oil to somewhere in the range of A$15 to A$20 for the large orders that will be required by the international manufacturers. Prices at the lower end of the range will allow entry into a number of new industrial markets and still return strong profits to the grower.

First Australian New Crops Conference 1996 – Volume 2
190
Economics Establishment Costs Land preparation costs vary according to situation. The cost of preparing a new paddock will be greater than for using one which has previously been developed for irrigation and is properly landformed. The cost of ripping, hilling and fertilising will depend on the availability of machinery or the need to hire it. For owner-operated equipment the cost of preparing a cultivation paddock to the stage of planting would be A$100-150/ha. The current price of plants is about A$3,000 per hectare. Planting costs over and above the cost of the plants would be about A$300 per hectare. After planting, the cost of mechanical weed control, fertiliser and herbicide will add a further A$700 per hectare before profits are earned. This compares very favourably with other perennial crops such as table grapes or fruit trees which may cost A$16,000 per hectare to establish. Ongoing maintenance and harvesting costs are about A$300 per hectare per year. Projected Earnings The present price of seed on the Australian market is around A$4,500 per tonne with the extracted oil going into the high priced cosmetics market. However the price of jojoba seed and oil can be expected to ease as the supply increases and the oil moves into the high volume, general cosmetics, lubrication and hard wax markets. A sustainable price for seed is not anticipated for at least 15 to 20 years when it is expected to level at A$1,500-A$2,000 a tonne and the bulk of the production goes into lubricants and general industry. The expected gross margins are given in Table 1. Table 1. Returns from growing jojoba under a range of assumptions
Gross Margin (/ha)
Yield (kg/ha)
Seed sales $/t
Oil sales $/L
$3 500 $1 500 $35 $15
1 000 1 300
$3 240 $4 280
$1 200 $1 640
$15 510 $20 260
$6 220 $8 200
Formation of the Australian Jojoba Industry Association Incorporated An Australian association has recently been formed by interested growers, processors and marketers of jojoba with members in all mainland States. The aims of the association are to promote the production of jojoba, foster research and assist in the development of orderly marketing of the products from this industry.
First Australian New Crops Conference 1996 – Volume 2
191
References Begg, J.E. 1978. Jojoba research in Australia. In: Proceedings of the Third International Conference
on Jojoba. (Ed. D.M. Yermanos) pp. 141-144 (International Conference on jojoba and its uses. Department of Botany and Plant Sciences, University of California, Riverside).
Dunstone, R. L. 1988. The reproductive cycle of jojoba. In: Proceedings of the Seventh International
Conference on jojoba and its Uses. (Ed. A.R. Baldwin) pp. 50-59. (American Oil Chemists' Society: Champaign, Il., U.S.A.)
Gentry, H. S. 1958. The natural history of jojoba (Simmondsia chinensis) and its cultural aspects.
Economic Botany 12: 261-295. Milthorpe, P. L. and Dunstone, R. L. 1989. The potential of jojoba (Simmondsia chinensis) in New
South Wales. 1. Growth and Yield. Australian Journal of Experimental Agriculture 29: 383-387. Milthorpe, P. L. and Dunstone, R. L. 1989. The potential of jojoba (Simmondsia chinensis) in New
South Wales. 2. Some factors affecting yield. Australian Journal of Experimental Agriculture 29: 389-395.

First Australian New Crops Conference 1996 – Volume 2
192
A Scientific Approach to Improvement of Black Gram, a Crop with Export Potential Adrien Mourgues CSIRO Division of Tropical Crops and Pastures, P.M.B., PO Aitkenvale Qld 4814 Australia
Abstract This paper presents black gram (Vigna mungo (L.) Hepper, as a pulse that has the potential to become a profitable new crop for tropical and sub-tropical Australia. Botanical and agronomic aspects, as well as the large scope of uses for this pulse, and production economics are summarised. The major problems facing the development of black gram in Australia are highlighted and opportunities for black gram improvement are explored. Proposed research for crop improvement at CSIRO Davies Laboratory in Townsville, North Queensland, is discussed. The study will focus on genotypic and environmental factors conditioning traits of agronomic and adaptive significance such as plant morphology, flowering, pod development, harvest index for carbon and nitrogen and synchrony of maturity. Results will provide guidelines for breeding black gram adapted to Australian conditions. Introduction Countries of the Asia-Pacific Rim have high population densities and constitute a potential market for agricultural products far more accessible to Australia than the saturated European market. An increasing interest in the new market opportunities emerging in neighbouring countries is a catalyst for research on new crops throughout Australia. V. mungo (L.) Hepper, or black gram, is a tropical pulse widely consumed in India and Japan. V. mungo is a relatively undeveloped crop in Australia where only one cultivar is available for commercial production. The aim of this paper is to examine the priorities and opportunities for black gram improvement in Australia as a prerequisite to development of this pulse. Taxonomy and Botany For close to two hundred years the botanical name of black gram was Phaseolus mungo. In 1956, black gram was transferred to the genus Vigna by Hepper and became Vigna mungo (Lawn and Ahn, 1985).
Smartt (1990), gave the following biosystematic: Family: Leguminosae Sub-family: Papilionoideae Tribe: Phaseoleae Sub-tribe: Phaseolinae Species: Vigna mungo (L.) Hepper. Black gram is often confused with mung bean (Vigna radiata (L.) Wilzcek) but they belong to two separate taxonomic species (Baudoin and Maréchal 1988, Egawa 1991).

First Australian New Crops Conference 1996 – Volume 2
193
Black gram is a pubescent bushy annual about 30-100 cm tall. It can be sub-erect, spreading or of trailing habit. The furrowed stem is diffusely branched from the base. Leaves are trifoliolate, with a petiole 6-20 cm long and large leaflets (4-10 cm x 2-5 cm), ovate or rhombic-ovate. Flowers are yellow and four to six are clustered on initially short but later elongating peduncles (van der Maesen and Somaatmadja 1989). The fruiting habit is characteristically erect or sub-erect, the pods being borne within the canopy. The cylindrical pods (4 to 6 cm long) are usually very hairy and have a short hooked beak. They shelter 4 to 10 oblong seeds with a squarish end and a usually concave white hilum. Seeds are usually grey, black or brown, but some can be olive-green. Both shiny and dull types exist. Seed weight ranges between 40 and 60 g per 1000 seeds. Black gram is a short duration tropical crop. Flowering occurs 30-60 days after sowing and maturity is usually reached within 60-120 days. Duration is strongly influenced by both the photothermal and water regimes in which the crop is grown (Lawn and Ahn 1985, van der Maesen and Somaatmadja 1989). Uses and Economics The mature dried seeds can be eaten whole or split, husked or unhusked, parched or not. They are used in the preparation of ‘dhal’ (decorticated dry split cotyledons (ICRISAT 1991)) which is the final destination of half of the crop production in India (Kay 1979). They can be processed into soups or curries and complement many different dishes (Lawn and Ahn 1985). Black gram dhal is used in two fermented dishes: ‘idli’ and ‘dosa’. Dosa is a type of pancake where dhal is combined with cereals, fermented and fried. Idli is a steamed fermented mixture of ground rice and dhal. Seeds can also be processed into flour which is used to make ‘papads’ (a crunchy fried dough product), spiced balls and biscuits. The seeds can also be germinated to produce sprouts that can be eaten raw or fried and salted (Jain and Mehra 1980). These are particularly appreciated in Japan which is a major importer of black gram (Neale 1991) while in other countries (Europe, USA, Australia) V. radiata is preferred. The green pods can be boiled and used as a vegetable, and the root, considered to be a narcotic, is used in traditional medicine (Kay 1979). It is of interest to note that black gram is thought to contain a hypocholesteremic agent (Geervani 1991). This could be of marketing value in a period of increasing health consciousness. Black gram can be used for animal consumption: boiled seeds that have been used to make broth are given to cattle in Assam. The residues of husking and splitting for the preparation of dhal are also used (Kay 1979). Low quality seeds and the plant parts left after harvesting can be fed to animals, as can the whole plant if grown for forage as in the USA (Cupka and Edwards 1988, Lawn and Imrie 1994). Lastly, black gram is used as a green manure crop, either through the plant residues being chopped and incorporated into the soil, or when the whole crop is ploughed under (Lawn and Imrie 1994). India is the largest producer of black gram and one of the main importers. The quantity of black gram imported by India is variable, depending on the ratio between volume harvested and domestic demand. For example, Indian imports from Thailand were 13,396 t, 41,999 t and 19,310 t in 1984, 1985 and 1986 respectively (Chainuvati et al. 1988; Titapiwakanakun 1988). Japan is the other main

First Australian New Crops Conference 1996 – Volume 2
194
importer of black gram, mainly from Thailand and Burma. Japan requires a high quality product and this is a concern for both of these producing countries facing problems with charcoal rot (Macrophomina phaseolina). Furthermore, world consumption of black gram is increasing. This provides a market opportunity for high quality seeds produced in Australia (Neale 1991). Australian production is about 1500 tonnes/year (ABARE 1994), with prices ranging between AUD 100 and 600, depending on the quality (NSW Agriculture and Fisheries 1992). Japanese imports from Thailand were 33436 t in 1986, which would represent a market of AUD 20 million. There exist many areas in Northern Australia where black gram could potentially be grown (Weston et al. 1981). Furthermore black gram presents many advantages for agriculture: as a legume, nitrogen fixation is a positive side effect (Doughton and Mackenzie 1984); as a short duration crop, it can be easily integrated into a crop rotation and because of its high protein content, it offers many alternative uses for the crop products (export, animal feed, green manure). To summarise, black gram represents a potentially valuable pulse for Northern Australia. Major Constraints to Black Gram Development Many constraints are impairing a broader development of black gram cropping in Australia. Firstly, the fruiting habit of black gram (pods borne within the canopy) and its indeterminate character are not well-suited to mechanised harvest (Lawn et al. 1988). Secondly, seed yields are low in comparison with other pulses like chickpea, soybean and pigeonpeas. Furthermore, limitations imposed by photoperiodism and other environmental factors such as moisture and temperature combine to produce a very narrow window of potential sowing dates in sub-tropical areas (Lawn 1979). The availability of only one commercial cultivar, Regur, released in 1975-76, may also be a limiting factor. Seed quality is important too as it determines the price paid to the farmer and secures a durable market (Lawn and Imrie 1991c). Quality standards are difficult to assess as they involve many different traits (e.g. colour, shape, size, composition) (Thomson et al. 1993). Furthermore, for the sprouting industry targeted in Australia, the occurrence of fungal diseases such as Macrophomina phaseolina may be a major risk. Economic considerations constitute another category of constraints. Black gram production started in 1976-77 when the commercial cultivar Regur was released. The area sown to this crop is limited (<2000 ha). Black gram is produced mainly in Queensland where two areas are involved: the Dawson Callide Basin, centred on Biloela in the Fitzroy Region, and the northern Darling Downs around Dalby (Lawn and Imrie 1991b). In these areas, black gram is grown mainly as a rainfed, summer grown crop, sown in December-January and harvested in March-April. Under marginal rainfed conditions, it offers an alternative to crops such as sorghum and sunflower. However, under more favourable rainfall conditions, black gram would probably not compare favourably with soybeans (Lawn and Russel 1978). In 1992, the gross margin from a crop of black gram was estimated to 116 $/ha, considering an average yield of 0.8 t/ha and a price of 500 $/t. Therefore, the development of black gram cropping is dependent upon the attractiveness of its gross margin relative to other dryland crops such as sorghum or sunflower. It is essential to provide
First Australian New Crops Conference 1996 – Volume 2
195
Australian farmers with a strong and durable market based on the development of an image of Australia as a provider of an excellent quality crop (Lawn and Imrie 1994). Strategy for Black Gram Improvement The aim of crop improvement is to increase productivity and/or product quality (Lawn 1990). Productivity is usually evaluated as yield per unit area (Jain 1977). Productivity can be improved by maximising the genetic potential of the plant through plant breeding. At the same time, any negative impacts of the environment on the realisation of that potential need to be kept to a minimum with appropriate agronomic management. Plant breeding and agronomy are complementary disciplines and, to be most effective, crop improvement involves manipulating both the plant and its environment (Lawn 1990). The key objective of black gram improvement, through the approach above, is to increase yield of the crop whilst retaining acceptable seed quality. It is also important to identify the environments in which black gram can compete successfully with other crops on a gross margin basis. In order to attain this objective, it is necessary to develop a better understanding of both the physiology of yield formation and the basis of adaptation in black gram. These are poorly understood because the crop has been the object of relatively few studies (in comparison with soybean for example). Physiological understanding provides a way to interpret genotype x environment interactions in a biological manner, in contrast with statistical approaches (Lawn and Imrie 1994). Hence it can assist the breeder in assessing the hypothetical performance of a specific genotype in a given environment (Summerfield and Wien 1980, Lawn and Imrie 1994). Another corollary is the development of ideotypes, the concept of which was defined by Donald (1968) as ‘a biological model which is expected to perform or behave in a predictable manner within a defined environment’. A black gram improvement program, involving both genetic and agronomic approaches, has been initiated by the CSIRO Division of Tropical Crops and Pastures with Grains Research and Development Corporation funding support. As part of that program, the aim of my study is to contribute to an understanding of the environmental and physiological basis of adaptation of a range of genotypes. Studies will be undertaken to enhance understanding of two aspects: • the physiology of yield formation in black gram and • environmental and physiological factors contributing to GxE interaction, and influencing
adaptation to environment. This information will in turn be used to help define ideotypes for the three main situations in which black gram is likely to be grown in Australia: as a rainfed summer crop in the subtropics; as an irrigated dry season crop in the tropics; or as a rainfed wet season crop in the tropics. Methodology Selecting Suitable Experimental Germplasm Although only one commercial cultivar of black gram has been released, 85 lines are stored in the CSIRO germplasm collection. Some of these accessions had not been grown in Australia other than in a quarantine glasshouse. An initial sowing was made for seed increase and to obtain data to evaluate the collection of black gram using pattern analysis (Williams 1976, Romesburg 1984). The following
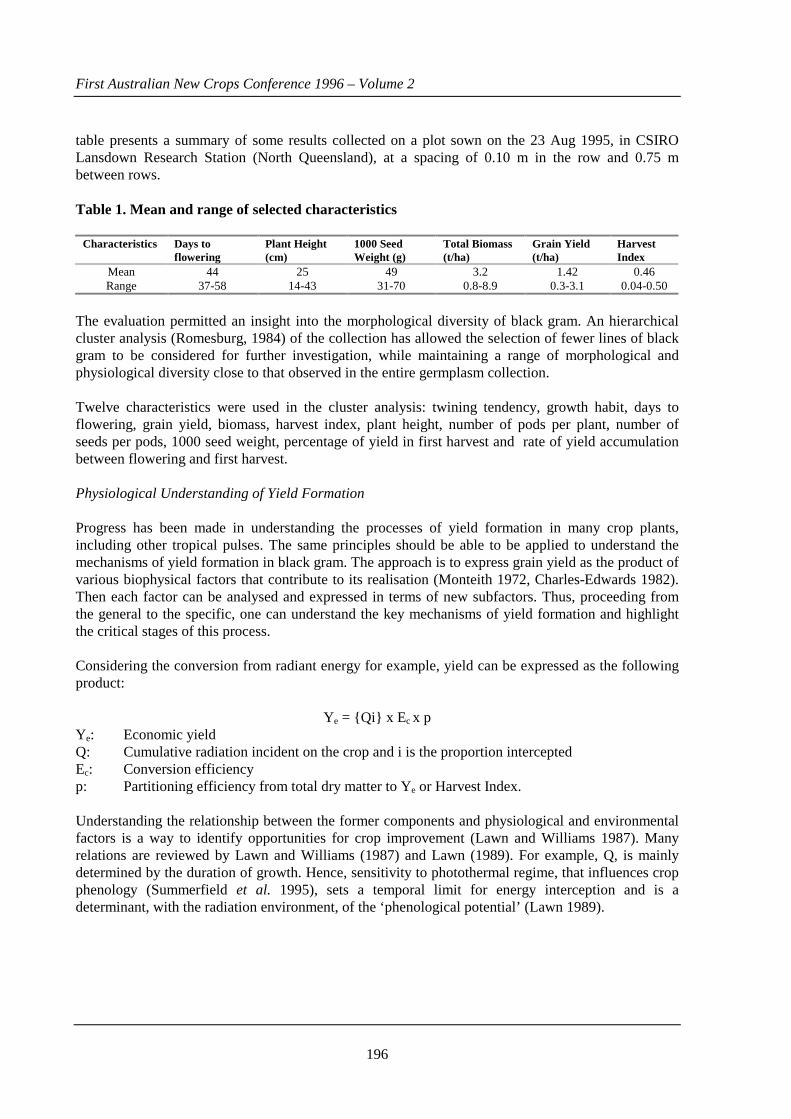
First Australian New Crops Conference 1996 – Volume 2
196
table presents a summary of some results collected on a plot sown on the 23 Aug 1995, in CSIRO Lansdown Research Station (North Queensland), at a spacing of 0.10 m in the row and 0.75 m between rows. Table 1. Mean and range of selected characteristics
Characteristics Days to flowering
Plant Height (cm)
1000 Seed Weight (g)
Total Biomass (t/ha)
Grain Yield (t/ha)
Harvest Index
Mean 44 25 49 3.2 1.42 0.46 Range 37-58 14-43 31-70 0.8-8.9 0.3-3.1 0.04-0.50
The evaluation permitted an insight into the morphological diversity of black gram. An hierarchical cluster analysis (Romesburg, 1984) of the collection has allowed the selection of fewer lines of black gram to be considered for further investigation, while maintaining a range of morphological and physiological diversity close to that observed in the entire germplasm collection. Twelve characteristics were used in the cluster analysis: twining tendency, growth habit, days to flowering, grain yield, biomass, harvest index, plant height, number of pods per plant, number of seeds per pods, 1000 seed weight, percentage of yield in first harvest and rate of yield accumulation between flowering and first harvest. Physiological Understanding of Yield Formation Progress has been made in understanding the processes of yield formation in many crop plants, including other tropical pulses. The same principles should be able to be applied to understand the mechanisms of yield formation in black gram. The approach is to express grain yield as the product of various biophysical factors that contribute to its realisation (Monteith 1972, Charles-Edwards 1982). Then each factor can be analysed and expressed in terms of new subfactors. Thus, proceeding from the general to the specific, one can understand the key mechanisms of yield formation and highlight the critical stages of this process. Considering the conversion from radiant energy for example, yield can be expressed as the following product:
Ye = {Qi} x Ec x p Ye: Economic yield Q: Cumulative radiation incident on the crop and i is the proportion intercepted Ec: Conversion efficiency p: Partitioning efficiency from total dry matter to Ye or Harvest Index. Understanding the relationship between the former components and physiological and environmental factors is a way to identify opportunities for crop improvement (Lawn and Williams 1987). Many relations are reviewed by Lawn and Williams (1987) and Lawn (1989). For example, Q, is mainly determined by the duration of growth. Hence, sensitivity to photothermal regime, that influences crop phenology (Summerfield et al. 1995), sets a temporal limit for energy interception and is a determinant, with the radiation environment, of the ‘phenological potential’ (Lawn 1989).

First Australian New Crops Conference 1996 – Volume 2
197
Genotype x Environment Interactions The variability of morphological traits and ultimately yield, resulting from the effect of genotype and GxE interaction, establish the potential for genetic improvement through breeding. Once the existence of these effects has been demonstrated, it will be important to identify and describe the physiological basis of the genotypic variation for key traits, as such information is necessary for the development of ideotypes and the definition of breeding objectives. Correlation analysis will help highlight interrelationships between yield and yield components in each line. The phenotypic performance (P) of a plant can be modelled as the sum of three components (Comstock and Moll 1963, Allard and Bradshaw 1964):
P = G + E + (GxE) G: The genotypic component, measured as the average performance of a particular genotype in
various environments. E: The environmental component, measured as the average performance of a range of
genotypes in a specific environment. GxE: The interaction component, which measures the variation of performances of genotypes in
various environments, or deviation from mean genotypes and environmental effects. GxE interactions are believed to have slowed down progress in crop improvement (Shorter et al. 1991) because it is necessary to extensively test genotypes to establish expected performances in environments likely to be encountered.
Identification of key environmental factors influencing adaptation to target environments, understanding of the physiological processes or traits influenced by those factors and also the nature and extent of differential genotypic response to those factors are all necessary to establish an a priori prediction of GxE (Lawn and Imrie 1991a). Analysis of GxE is used to identify environments to which specific genotypes are adapted while understanding the traits contributing to adaptation permits the design of ideotypes for high productivity in specific environments. Temperature and photoperiod appear to be the most important environmental factors influencing plant morphology, floral initiation, duration of flowering, pod development and synchrony of maturity (Summerfield et al. 1995). Water availability has a strong influence on physiological processes involved in yield formation such as radiation interception, carbon and nitrogen accumulation and partition (Lawn and Williams 1987). Therefore, investigating the relations between Harvest Index and the ratio of N in seed over the total plant N, or Nitrogen Harvest Index (Bushby and Lawn 1992) of various genotypes in different environments will contribute to understanding of productivity. Given its importance in terms of both yield formation and adaptation, it is logical to investigate the response of black gram genotypes to photothermal regime as part of my studies. After determining the range of environments that black gram is likely to face in the potential cropping areas (an environment being determined here by a specific photothermal regime) a sample of lines will be grown in these various environments. To recreate a large range of combination of temperature and photoperiod, three types of experiments will be considered: serial sowing date, daylength extension and multi-site. The data will assist in identifying the responses of various lines of black gram to different environments and eventually determine response limits. These results, analysed with the computer program

First Australian New Crops Conference 1996 – Volume 2
198
RoDMod (Watkinson et al. 1994), will assist in determining the potential phenological adaptation of lines to specific environments. The effects of photothermal factors and water supply on accumulation and partitioning of N and dry matter will be explored for a smaller subset of genotypes in several managed environments. The outcome of this research will be the elaboration of desirable ‘dynamic’ ideotypes of black gram as discussed by Lawn and Imrie (1991a). It is suspected that different ideotypes might represent the optimal solution in different environments. Different ideotypes will be assembled to suit selected environments in tropical and sub-tropical Australia, where black gram has potential for development (wet season or irrigated dry season in the tropics, summer dryland farming in the sub-tropics). Two complementary strategies will be employed for this exercise: matching the crop to the environment and improving tolerance of the crop to environmental stress. Summary Black gram is a pulse that has the potential to become more widespread as a profitable crop in northern Australia, provided that suitable varieties for growing in different areas are identified. A market appears to exist in Japan for good quality grain. The potential cropping areas are numerous within tropical and sub-tropical Australia. Some improvements are necessary for the full development of this crop and this is the basis for collaboration of the GRDC, CSIRO and James Cook University in a study of the environmental and physiological basis of adaptation in black gram. This study of black gram is expected to define objectives for a black gram breeding program and help in defining screening methods for selection. The results will also assist in defining environmental limits for profitable production. Acknowledgments This research is part of a PhD. program of the author at James Cook University and is a component of the National Vigna Improvement Program conducted by CSIRO Division of Tropical Crops and Pastures with Grains Research and Development Corporation support. The advice of Dr R. J. Lawn and Dr B. C. Imrie in conduct of this research and in preparation of this paper is gratefully acknowledged. References ABARE 1994. Commodity Statistical Bulletin. (Ed. Australian Bureau of Agricultural and Resource
Economics)(Australian Government Publishing Service: Canberra). Baudoin, J. P. and Maréchal, R. 1988. Taxonomy and evolution of the genus Vigna. In: Mungbean:
Proceedings of the Second International Symposium. (Eds S. Shanmugasundaram and B. T. McLean)(Asian Vegetable Research and Development Center: Taiwan).
Bushby, H. V. A. and Lawn, R. J. 1992. Accumulation and partitioning of nitrogen and dry matter by
contrasting genotypes of mungbean (Vigna radiata (L.) Wilczek). Australian Journal of Agricultural Research 43: 1609-28.
Chainuvati, C., Potan, N. and Worasan, T. 1988. Mungbean and black gram production and development
in Thailand. In: Mungbean: Proceedings of the Second International Symposium. (Eds S.
First Australian New Crops Conference 1996 – Volume 2
199
Shanmugasundaram and B. T. McLean)(Asian Vegetable Research and Development Center: Taiwan).
Charles-Edwards, D. A. 1982. Physiological Determinants of Crop Growth. (Academic Press: Sydney). Comstock, R. E. and Moll, R. H. 1963. Genotype-environment interactions. In: Statistical Genetics and
Plant Breeding. (Eds W. D. Hanson and H. F. Robinson)(National Academy of Sciences- National Research Council: Washington. United States of America).
Cupka, T. B. and Edwards, L. H. 1988. Production and Breeding of Mungbean in the U.S.A.. In:
Mungbean: Proceedings of the Second International Symposium. (Eds S. Shanmugasundaram and B. T. McLean)(Asian Vegetable Research and Development Center: Taiwan).
Donald, C. M. 1968. The breeding of crop ideotypes. Euphytica 17: 385-402. Doughton J. A. and Mackenzie, J. 1984. Comparative effects of black and green gram (mungbean) and
grain sorghum on soil mineral nitrogen and subsequent grain sorghum yield on the Eastern Darling Downs. Australian Journal of Experimental Agriculture and Animal Husbandry 24: 244-49.
Egawa, Y. 1991. Phylogenetic relationships in Asian Vigna species. In: Proceedings of the Mungbean
Meeting 90. (Eds C. Thavarasook et al.)(Tropical Agriculture Research Center: Japan). Geervani, P. 1991. Utilization of chickpea in India and scope for novel and alternative uses. In: Uses of
Tropical Grain Legumes: Proceedings of a Consultants Meeting. (Eds S. D. Hall, P. Sudhir, Vithal Rajan and V. Sadhana)(International Crops Research Institute for the Semi-Arid Tropics: Patancheru. India).
ICRISAT, 1991. Uses of Tropical Grain Legumes: Proceedings of a Consultants Meeting. (Eds S.D.
Hall, P. Sudhir, Vithal Rajan and V. Sadhana)(International Crops Research Institute for the Semi-Arid Tropics: Patancheru. India).
Jain, H. K. 1977. Objectives in plant breeding programmes. In: Food Legume Crops: Improvement and
Production. FAO Plant Production and Protection Paper 9. (Food and Agricultural Organisation: Rome. Italy).
Jain, H. K. and Mehra, K. L. 1980. Evolution, adaptation, relationships and uses of the species of Vigna
cultivated in India. In: Advances in Legume Science. (Eds R. J. Summerfield and A. H. Bunting)(Royal Botanical Garden: Kew. United Kingdom).
Kay, D. E. 1979. Food Legumes, TPI Crop and Product Digest No. 3. (Tropical Products Institute:
London. United Kingdom). Lawn, R. J. 1979. Agronomic studies on Vigna spp. in south-eastern Queensland. II Vegetative and
reproductive response of cultivars to sowing date. Australian Journal of Agricultural Research 30: 871-82.
Lawn, R. J. 1989. Agronomic and physiological constraints to the productivity of tropical grain legumes
and prospects for improvement. Experimental Agriculture 25: 509-28.

First Australian New Crops Conference 1996 – Volume 2
200
Lawn, R. J. and Ahn, C. S. 1985. Mungbean (Vigna radiata (L.) Wilczek/ Vigna mungo (L.) Hepper). In: Grain Legume Crops. (Eds R. J. Summerfield and E. H. Roberts)(Collins: London. United Kingdom).
Lawn, R. J., Chay, P. M. and Imrie, B. C. 1988. The mungbean industry in Australia. In: Mungbean:
Proceedings of the Second International Symposium. (Eds S. Shanmugasundaram and B. T. McLean)(Asian Vegetable Research and Development Center: Taiwan).
Lawn, R. J. and Imrie, B. C. 1991a. Crop improvement for tropical and subtropical Australia: Designing
plants for difficult climates. Field Crops Research 26: 113-39. Lawn, R. J. and Imrie, B. C. 1991b. Mungbean, black gram and adzuki bean. In: New Crops Agronomy
and Potential of Alternative Crop Species. (Eds R. . Jessop and R. L. Wright)(Inkata Press: Melbourne).
Lawn, R. J. and Imrie, B. C. 1991c. The Australian mungbean industry in perspective. In: Mungbean:
The Australian Experience. Proceedings of the First Australian Mungbean Workshop. (Eds B. C. Imrie and R. J. Lawn)(CSIRO Division of Tropical Crops and Pastures: Brisbane).
Lawn, R. J. and Imrie, B. C. 1994. Mungbean and related species industry. In: Australian Grains. (Ed. B.
Coombs)(Morescope Publishing Pty Ltd: Camberwell. Victoria). Lawn, R. J. and Russell, J. S. 1978. Mungbean: a grain legume for summer rainfall cropping areas of
Australia. Journal of the Australian Institute of Agricultural Science 44: 28-41. Lawn, R. J. and Williams, J. H. 1987. Limits imposed by climatological factors. In: Food Legume
Improvement for Asian Farming Systems. ACIAR Proceedings No. 18. (Eds E. S. Wallis and D. E. Byth)(Australian Centre for International Agricultural Research: Canberra).
van der Maesen, L. J. G. and Somaatmadja, S. 1989. Plant Resources of South-East Asia No. 1: Pulses.
(Eds L. J. G. van der Maesen and S. Somaatmadja)(PUDOC: Wageningen. The Netherlands). Monteith, J. L. 1972. Solar radiation and productivity in tropical ecosystems. Journal of Applied Ecology
9: 747-66. Neale, D. H. 1991. Marketing Australian mungbean. In: Mungbean: The Australian Experience.
Proceedings of the First Australian Mungbean Workshop. (Eds B. C. Imrie and R. J. Lawn)(CSIRO Division of Tropical Crops and Pastures: Brisbane).
NSW Agriculture and Fisheries, 1992. Mungbean & Blackgram Update. Agnote Reg 5/117. (New South
Wales Agriculture and Fisheries: Wagga). Romesburg, H. C. 1984. Cluster Analysis for Researchers. (Lifetime Learning Publication: Belmont.
United States of America). Shorter, R., Lawn, R. J. and Hammer, G. L. 1991. Improving genotypic adaptation in crops - a role for
breeders, physiologists and modellers. Experimental Agriculture 27: 155-75. Smartt J. 1990. Grain Legumes: Evolution and Genetic Resources. (Ed. J. Smartt)(Cambridge University
Press: Sydney).
First Australian New Crops Conference 1996 – Volume 2
201
Summerfield, R. J., Lawn, R. J., Ellis, R. H., Qi, A., Roberts, E. H., Shanmugasundaram, S., Chay, P. M.,
Brouwer, J. B., Rose, J. L., Yeates, S. J. and Sandover, S. 1995. Towards the Reliable Prediction of Time to Flowering in Six Annual Crops, an International Collaborative Field Research Project. (The University of Reading. Department of Agriculture: Reading. United Kingdom).
Summerfield, R. J. and Wien, H. C. 1980. Effects of photoperiod and air temperature on growth and
yield of economic legumes. In: Advances in Legume Science. (Eds R. J. Summerfield and A. H. Bunting)(Royal Botanical Garden: Kew. United Kingdom).
Thomson, N. J., Henry, R., and Brady, C. 1993. Product quality - tracking or anticipating the moving
target. In: Focused Plant Improvement: Towards Responsible and Sustainable Agriculture. Proceedings of the Tenth Australian Plant Breeding Conference. Volume 1. (Eds B. C. Imrie and J. B. Hacker)(Australian Convention and Travel Service: Canberra).
Titapiwatanakun, B. 1988. The private sector in the development of mungbean and black gram in
Thailand. In: Mungbean: Proceedings of the Second International Symposium. (Eds S. Shanmugasundaram and B. T. McLean)(Asian Vegetable Research and Development Center: Taiwan).
Watkinson, A. R., Lawn, R. J., Ellis, R. H., Qi, A. and Summerfield, R. J. 1994. RoDMod, A computer
program for characterising genotypic variation in flowering responses to photoperiod and temperature. (CSIRO Division of Tropical Crops and Pasture: Brisbane).
Weston, E. J., Harbison, J., Leslie J. K., Rosenthal, K. M. and Mayer, R. J. 1981. Assessment of the
Agricultural and Pastoral Potential of Queensland. Agriculture Branch Technical report 17. (Queensland Department of Primary Industries: Brisbane).
Williams, W. T. 1976. Pattern Analysis in Agricultural Science. (Ed. W. T. Williams)(Elsevier Scientific
Publishing Company: New-York. United States of America).
First Australian New Crops Conference 1996 – Volume 2
202
Effect of Sowing Date, Row Spacing and Cultivar on Seed and Gum Yield in Guar (Cyamopsis tetragonoloba ) Helen Murphy, Robert Fletcher and Nola Caffin The University of Queensland Gatton College, Qld 4345 Abstract Two cultivars and two selections of Cyamopsis tetragonoloba, differing in height and branching habit, viz. CP177, IC9203, CP177 S9 and Brooks S36, were grown under irrigation at University of Queensland Gatton College (UQG) at three row spacings (20, 27 and 40 cm to give plant densities of 50, 37 and 25 plants / sq m respectively) and three sowing dates (5 December, 5 January and 15 February) in summer 1992-1993. Highest seed yields were obtained at the 5 January sowing, with yield being moderately lower at the 5 December sowing and much lower at the 15 February sowing. The reduced yield at the 5 December sowing was due to fewer main stem pods / sq m. The much decreased yield at the 15 February sowing resulted from a reduction in both seed number per pod and seed size. The superior yield of the 5 January sowing was associated with a vertical distribution of leaf area that was less concentrated than that of the other sowings. CP177 S9, a sparsely-branching type, and Brooks S36, a strongly-branching type, were the highest yielders and IC9203, a strongly-branching type, the lowest. Row spacing had no significant effect on seed yield and there no significant interactions. The galactomannan (gum) percentage present in the seed (wt gum/wt seed) varied within individual plants of all cultivars and selections. No consistent trend was evident. The distribution of gum yield, both vertically and between main stem and branches, differed among cultivars and selections due largely to differences in plant habit. In bulk samples of CP177 and Brooks S36, both the galactomannan percentage and the gum yield were significantly higher for Brooks S36, both overall, and at all sowing dates. Galactomannan percentage and gum yield were significantly higher at the 5 January sowing. Row spacing had no significant effect on either the galactomannan percentage or the gum yield. Introduction Cyamopsis tetragonoloba, commonly known as clusterbean or guar, contains an industrially important substance, a galactomannan, in the endosperm of its seed. This galactomannan (gum) is used in the mining, petroleum, paper, pharmaceutical and food industries. The cultivation of C. tetragonoloba for galactomannan, a polysaccharide, requires agronomic practices that will optimise photosynthesis and promote the partitioning of photosynthate to seed development and in particular to the deposition of galactomannan in the endosperm of the seed. The latter activity is dependent on genetic factors and their interaction with the environment. Photosynthesis and the response to environmental change are both dependent on the amount and distribution of leaf in the crop canopy. Sowing date, row spacing and plant habit all influence the development of the crop canopy, and foliage characteristics in particular. They may also affect seed and gum yield. Their influence on seed and gum yield has been researched mainly in India.
First Australian New Crops Conference 1996 – Volume 2
203
Sowing dates between the end of June and mid-July give maximum yields in the northern hemisphere, earlier sowings resulting in a modest reduction in yield and later sowings causing a sharp fall in yield (Singh et al.1979; Jain et al. 1987; Tiwana and Tiwana 1993). Reduced yield from late sowing was associated with fewer pods/plant and lower 100 seed weights (Singh et al. 1979; Tiwana and Tiwana 1993). Gum yield was greatest at the time of maximum seed yield, being associated with the highest seed yield (Jain et al.1987). Effect of row spacing on yield depends on cultivar type. Wide row spacing resulted in increased yield of strongly-branching types and narrow spacing resulted in increased yield of single-stemmed types (Singh et al. 1978; Malik et al. 1981; Taneja et al. 1982). Tiwana and Tiwana (1993) observed no differences in yield when differences in row space width were small. Bhadoria and Chuahan (1994), however, found higher yields at 45 cm than at 30 cm row spacings and that the extent of the difference was dependent on sowing date. Row spacing was found to have no effect on either the gum percentage in the seed (Singh et al. 1978) or on gum yield (Malik et al. 1981). Large differences have been found among cultivars in seed yield (Paroda and Rao 1981; Kacker and Henry 1984). Cultivars that have the highest seed yield across environments have the greatest response to environmental differences (Paroda and Rao 1981; Kacker and Henry 1984). The percentage of gum in the seed has been found to be more responsive to environmenal factors than to genetic factors, with differences between years being greater than differences between locations (Das et al. 1983). Cultivars that have high average gum percentages across environments were the most responsive to environmental change (Das et al.1983). This paper reports the effects of sowing date, row spacing and cultivar on seed and gum yield and the distribution of gum yield. It examines the changes to the components of yield which underlie any observed differences. The association between seed yield and the amount and distribution of leaf is also investigated. The distribution of gum in regard to plant habit is also considered. Materials and Methods Experimental Site The experiment was conducted at Mendel 5A in the Horticultural Field Section of the University of Queensland Gatton College (UQG) at Lawes, Lat. 27°32′ S, Long. 150°20′ E. The soil was a brown clay loam of pH 7.1. Mean maximum daily temperature ranged from 32.5°C in February to 22.1°C in June and mean minimum daily temperature from 19.5°C in February to 7.2°C in June. Mean daily radiation ranged from 23.7 MJ /sq m in December and January to 10.6 MJ /sq m in July.
First Australian New Crops Conference 1996 – Volume 2
204
Treatments sowing date
Sowings selected to give an early, mid-season and late sowing time were on 5 December 1992 (5 Dec), 5 January 1993 (5 Jan) and 15 February 1993 (15 Feb).
row spacing
Row spacings of 40, 27 and 20 cm were used and fell within the normal range recommended for guar under irrigated conditions. Intra-row spacing was 10 cm to give plant densities of 25, 37and 50 plants /sq m for the respective row spacings.
cultivar
The following cultivars and selections were chosen to provide a range of canopy types in guar:
(i) CP177 This is a relatively tall-growing, sparsely-branching, indeterminate, Indian cultivar.
(ii) CP177 Selection 9 (S9) This line was selected by Mr D.F. Beech (of CSIRO Division of Tropical Crops and Pastures, now retired) from a commercial crop of CP177 in the late 1970s. It is a lower-growing type than CP177, sparsely-branched, commonly determinate and shown to have a higher seed yield and higher percentage of gum in its seed than the unselected CP177 (D.F. Beech, pers com).
(iii) IC9203 This is a strongly-branching, indeterminate, Indian cultivar.
(iv) Brooks Selection 36 (Brooks S36). This is a profusely-branching line, also selected by Mr D.F. Beech, from the American-bred cultivar, Brooks. It is indeterminate in habit and of medium height.
Experimental Design A split-split-plot design with the main plots set out in three randomised complete blocks was used. Sowing date treatments were assigned to main plots, with row spacing treatments to sub-plots and cultivars to sub-sub-plots. This produced 108 experimental units comprising 3 sowing date x 3 row spacing x 4 cultivar treatments x 3 replications. Within each block, main plots were separated by 1 metre.Within the main plots, the sub-plots were laid out side by side with an intervening space of 0.5 m. Within the sub-plots, the sub-sub-plots were laid out end-to-end with no intervening space. Each sub-sub-plot was sown with 60 seeds of the appropriate cultivar/selection, the seeds being sown in five rows, with 12 seeds to a row. To utilise unfilled space in the sub-plots with the 27 cm and 20 cm row spacings, extra rows were sown outside the experimental rows, one row on either side in the former case, and two rows on either side in the latter case. Seed Treatment Seed of all cultivars was scarified with sandpaper to overcome any hardseededness. Immediately prior to sowing, seeds were inoculated by immersion in a slurry of CB576 inoculum obtained from Root Nodule Pty. Limited of Woy Woy, NSW Seedbed Preparation and Sowing Procedure The experimental site was cultivated and Trifluralin (400 g/l A.I.) applied at 4 l/ha and incorporated using power harrows. Inoculated seeds were sown by hand to a depth of 2 cm and the site subsequently irrigated. Maintenance

First Australian New Crops Conference 1996 – Volume 2
205
Irrigation was applied after sowing as required. A solid set irrigation system was used until the final irrigation, when a hand shift irrigation system was used. Removal of weeds, mainly nut grass, was done manually. A pod-sucking bug, Riptortus serripes, was a problem in the early part of the experiment and bugs were destroyed manually. The disease, Sclerotium rolfsii affected some plants in one replicate of the 15 Feb sowing, but no suitable control measure was available. Plant Sampling during the Growth Period Plants were sampled at Day 67 after sowing. At this sampling for each sowing date, one plant from each sub-sub-plot was randomly selected and cut off at ground level. Sample plants were labelled, placed in plastic bags and stored in a cold room at 5°C until measurements could be made. Plant tops were marked off into 30 cm vertical zones from the base upwards and the leaves removed from each zone separately. Leaf areas were obtained using a Paton Electronic Planimeter. Final Harvest The 5 Dec sowing was harvested in the last two weeks of June and the first week in July and the 5 Jan and 15 Feb sowings were each harvested over the following three-week periods. Prior to final harvest, the extra rows from the 27 cm and 20 cm row spacing sub-plots were removed. Subsequently, the two outside rows of the five experimental rows were removed, together with the plant at each end of each of the three remaining rows. One plant was randomly selected from these remaining rows and it, and the plants on either side of it were removed, labelled and set aside for subsequent measurement. The remaining plants in these three inner rows were then harvested and the clusters removed. Seed was subsequently threshed from the pods in these clusters with a single head thresher ( F.Walter & H Wintersteiger) and the seed from each sub-sub-plot weighed. The following measurements were made on the three neighbouring plants sampled from each sub-sub-plot: (i) Numbers of clusters, pods, seeds and seed weight for main stem and branches in each 30 cm
vertical zone from 0 to180 cm above ground level; and (ii) Plant height, number of branchs and nodes. Pods on these plants were shelled manually. Galactomannan (gum) Analysis Two samples of seed were randomly selected from the bulk seed from each sub-sub-plot of CP177 and Brooks S36 (i.e. 2 samples x 3 replicates x 3 sowing dates x 3 row spacings x 2 cultivars) and analysed for the percentage of gum in the seed. The analytical method used was a modification of an enzymatic method designed for galactomannan analysis of carob bean but suitable for use with guar (McCleary, pers comm.). Both main stem and branch seed in each 30 cm vertical zone of the canopy of all four cultivars was also analysed by this method. The seed was obtained from the sample plants from the three replicates of the 27 cm row spacing treatment of the 5 Jan sowing.

First Australian New Crops Conference 1996 – Volume 2
206
Statistical Analysis Data were analysed using Genstat and Systat statistical computer programs. Data for gum percentage in seed were square root transformed. Results Seed Yield /sq m Sowing date had a significant effect on seed yield /sq m. At the 5 Jan sowing seed yield /sq m was sgnificantly greater than that recorded at the 5 Dec sowing, which in turn was significantly greater than that at the 15 Feb sowing (p=0.05, Fig.1). Row spacing had no significant effect on seed yield /sq m. There were differences between cultivars for seed yield /sq m. All cultivars yielded more than IC9203, and S9 had greater yield than CP177 (p=0.05, Fig.1). Gum Percentage in Seed and Gum Yield /sq m Sowing date had a significant effect on the percentage of gum present in the seed, with significant differences between all dates (p=0.05). The gum percentage was highest at the 5 Jan sowing, and lowest at the 15 Feb sowing. Similarly, gum yield /sq m was greatest at the 5 Jan sowing and least at the 15 Feb sowing, and differences among sowing dates were significant in all cases (p=0.05, Fig.1). Row spacing had no significant effect on the percentage of gum in the seed nor on gum yield /sq m. There were significant differences between cultivars for percentage of gum present in the seed and for gum yield /sq m. Brooks S36 had significantly greater gum percentage and gum yield /sq m than CP177 (p=0.05, Fig.1 ). This was true at all sowing dates.
Figure 1: Effect of Sowing Date, Row Spacing and Cultivar on Seed and Gum Yield m -2 of Cyamopsis tetragonoloba Grown at UQG in Summer, 1992-1993
(Seed yield m -2 and gum yield m -2 are based on four and two cultivars respectively.)
0
20
40
60
80
100
120
140
160
180
200
5-Dec
5-Jan
15-Feb
40
cm
27
cm
20
cm
CP
17
7
IC9
20
3
S9
Brooks S
36Sowing Date Row Spacing Cultivar
Yie
ld m
(g)
Seed Yield
Gum Yield
lsdp=0.05seed
lsdp=0.05gum
lsdp=0.05gum
lsdp=0.05seed
First Australian New Crops Conference 1996 – Volume 2
207
Effect of Cultivar Type on the Distribution of Gum Yield /sq m in the Canopy Statistical analysis was not undertaken due to large variation among sample plants of each cultivar/selection and the fact that seed in some vertical zones of some plants was insufficient for analysis. The composite results of nine plants for each cultivar/selection are presented in Fig 2. S9 had approximately one-fifth of its total gum yield in its branches, CP177 and Brooks S36 had approximately one-third and IC9203 had approximately two-thirds.
For main stems the zones of highest gum yield were 90-120 cm for CP177, 60-90 cm for IC9203 and Brooks S36 and 30-60 cm for S9. For all cultivars/selections branch gum yield was greatest in the 60-90 cm zone. Leaf Area /sq m at Day 67 Sowing date had a significant effect on total canopy leaf area /sq m and in each 30 cm vertical zone in the canopy except in the 150-180 cm zone (p=0.05, Fig.3). Total leaf area /sq m was significantly greater in the 5 Dec sowing than in the later sowings which did not differ significantly from each other. In the 0-30 cm and 30-60 cm zones leaf area /sq m was significantly greater in the 15 Feb sowing than in the earlier sowings. In the 60-90 cm zone leaf area /sq m in the 15 Feb sowing was significantly less than in the earlier sowings. In the 90-120 cm and 120-150 cm zones leaf area /sq m was significantly greater in the 5 Dec sowing than in the later sowings, with that in the 90-120 cm zone being greater for the 5 Jan sowing than for the 15 Feb sowing. At earlier samplings (days 31 and 46) leaf area /sq m for the 15 Feb sowing was less than at the earlier sowings (unpublished data). Row spacing had no significant effect on total leaf area /sq m or on that in any vertical 30 cm zone. There were differences between cultivars in total leaf area /sq m and in that in the 60-90 cm and 90-120 cm vertical zones. In all of these cases CP177 had significantly greater leaf area /sq m than the other cultivar/selections which did not differ significantly from each other.
Figure 2: Effect of Cultivar on the Distribution of Gum Yield between Main Stem and Branches and between Vertical Zones in the Canopy of Cyamopsis tetragonoloba Grown at UQG in
Summer, 1992-1993
0
5
10
15
20
25
30
35
40
CP
17
7 M
S
CP
17
7 B
r
IC9203 M
S
IC9
20
3 B
r
S9 M
S
S9 B
r
Brooks S
36 MS
Brooks S
36 Br
Cultivar
Gum
Yie
ld m
(g) 120-150 cm
90-120 cm
60-90 cm
30-60 cm
0-30 cm
First Australian New Crops Conference 1996 – Volume 2
208
Vegetative Characteristics at Final Harvest Means for the effect of cultivar/selection on plant height, branches /sq m and nodes /sq m at final harvest are presented in Table 1. CP177 was significantly taller than the other cultivars and S9 was significantly shorter (p=0.05). CP177 and S9 had significantly fewer branches /sq m and nodes /sq m than IC9203 and Brooks S36 (p=0.05). Table 1. Effect of cultivar/selection on the characters, plant height, branches /sq m and nodes /sq m measured at harvest on nine plants, being three randomly chosen consecutive plants from each of three replicate plots, of Cyamopsis tetragonoloba, grown at UQG in summer 1992-1993.
Cultivar/Selection Plant Height (cm) Branches /sq m Nodes /sq m CP177 127.7 133.0 1731 IC9203 107.0 242.8 2285
S9 94.5 118.2 1567 Brooks S36 108.3 270.7 2752
LSD p=0.05 9.1 41.7 410
Figure 3: Effect of Sowing Date, Row Spacing and Cultivar at Day 67 on Total Leaf Area m -2 and the Vertical Distribution of Leaf Area in the Canopy of Cyamopsis tetragonoloba Grown at UQG
in Summer, 1992-1993
0
5000
10000
15000
20000
25000
30000
35000
40000
45000
50000
55000
5-Dec
5-Jan
15-Feb
40
cm
27
cm
20
cm
CP
17
7
IC9
20
3
S9
Brooks S
36Sowing Date Row Spacing Cultivar
Leaf
Are
a cm
/m
150-180 cm
120-150 cm
90-120 cm
60-90 cm
30-60 cm
0-30 cm
lsdp=0.05total leafcultivar
lsdp=0.05total leafsowing date

First Australian New Crops Conference 1996 – Volume 2
209
Discussion Seed Yield Sowing date had a major effect on seed and gum yield /sq m with yield being moderately depressed at early sowing and severely reduced at late sowing. The reduction in the 5 Dec sowing was the result of significantly fewer main stem pods /sq m, 1099, compared with 1508 and 1430 for the 5 Jan and 15 Feb sowings respectively, arising from fewer pods/cluster. Furthermore in the 5 Dec sowing a smaller proportion of nodes were cluster-bearing. These may be photoperiod effects as C. tetragonoloba is considered to be a quantitative short-day plant. The severe reduction in seed yield /sq m in the 15 Feb sowing was due to fewer seeds per pod than at the earlier sowings, 2.30, compared with 4.88 and 5.09 for the 5 Dec and 5 Jan sowings respectively, and to lower 100 seed weight, 1.78, compared with 2.33 and 2.47 for the 5 Dec and 5 Jan sowings respectively. The effect of sowing date on these components of yield can be attributed to smaller amounts of photosynthate being available to the 15 Feb sowing, due to lower mean daylength and lower mean light intensity, compared with the earlier sowings. The seed yield responses to sowing date in this trial were in general agreement with those observed in India although pod /sq m were not significantly reduced at late sowing in the present instance (Singh et al. 1979; Tiwana and Tiwana 1993). The absence of a response to row spacing indicates the ability of branching types of C. tetragonoloba to adjust, within limits, to changes in row spacing. The reduced seed yield /sq m for IC9203 was due to fewer pods /sq m, 1760, compared with 1917, 2027 and 2240 for CP177, S9 and Brooks S36 respectively, and to fewer seeds per pod, 3.80 compared with 4.19, 4.22 and 4.14 for CP177, S9 and Brooks S36 respectively. The reduction in these yield components may indicate a poorer adaption to the prevailing environmental conditions for this cultivar than for the other cultivar/selections. This cultivar performed particularly poorly at late sowing although no significant cultivar x sowing date interaction was observed. Unpublished reports of this cultivar grown under rainfed conditions indicate that its seed yield compares favourably with that of CP177 and Brooks. Gum Percentage and Gum Yield The reduction in the gum percentage in the seed in the 5 Dec sowing compared with the 5 Jan sowing may be due to the presence of a higher proportion of protein. Jain et al. (1987) cite Lal and Gupta (1977) as reporting a negative correlation between gum and protein content in the seed of C.tetragonoloba. Seeds in the 5 Dec sowing were of similar size to those in the 5 Jan sowing and a shortage of photosynthate for grain fill would be unlikely. The smaller number of seed /sq m, due to fewer pods /sq m, compared with the 5 Jan sowing would mean a greater availability of nitrogen to each, as the total supply due to rhizobial activity would be expected to be at least as high as that for the 5 Jan sowing. The greater reduction in the gum percentage in the seed at the 15 Feb sowing was associated with a significant reduction in seed size and is likely to be due to a shortage of photosynthate for galactomannan manufacture. The higher gum percentage in the seed of Brooks S36 compared with that in the seed of CP177 is likely to be due to genetic factors and their interaction with the environment. D.F. Beech (unpublished

First Australian New Crops Conference 1996 – Volume 2
210
data) using a HPLC analytical method found gum percentages for Brooks S36 and CP177 to be 30.8 and 19.9 respectively. The distribution of gum yield in the canopy of the cultivars/selections shows a close association with plant height and the extent of branching, as indicated by branches /sq m and nodes /sq m, at final harvest although a greater proportion of gum yield in the branches would have been expected for Brooks S36. Amount and Distribution of Leaf Area Total leaf area and its distribution in the canopy were the result of the interplay of sowing date, row spacing and cultivar and their interaction with the prevailing environmental conditions. They determined the amount of photosynthetically active radiation (PAR) intercepted and in turn their development was influenced by the photosynthate produced. At Day 67 canopy leaf area was at or near maximum as indicated by the fact that the percentage of PAR intercepted began to decline shortly after. The superior seed and gum yield /sq m at the 5 Jan sowing was associated with a modest amount of leaf area at Day 67 that was distributed through a 180 cm vertical distance without an excessive amount of leaf in any one 30 cm vertical zone. At the 5 Dec sowing the total leaf area was very much greater than in the 5 Jan sowing but was distributed through a similar vertical distance, the additional leaf area being mainly present in the 60-90 cm and 90-120 cm vertical zones. At the 15 Feb sowing leaf area /sq m was not significantly different from that of the 5 Jan sowing but virtually all of it was confined to the 0-30 cm and 30-60 cm vertical zones. The less concentrated vertical distribution of leaf area in the 5 Jan sowing would have exposed a greater proportion of the total leaf surface to the PAR. It is of interest to note that at Day 67 Brooks S36 had much less leaf area than CP177 and that its vertical distribution was much less concentrated. The observations in this trial support the findings overseas of the importance of the choice of sowing date in maximizing seed and gum production. They indicate also the lesser importance of the choice of row spacing if cultivars/selections have some capacity for branching. The habit of cultivars chosen for their gum- yielding potential should have some influence on the choice of row spacing. Choice of cultivar was shown to be important both for seed yield and gum percentage. Planting strategies that avoid excessive vertical concentrations of leaf area would appear to be conducive to optimising seed and gum yield. References . Bhadoria, R.B.S. and Chauhan. 1994. Response of clusterbean (Cyamopsis tetragonoloba) to date of
sowing and spacing. Indian Journal of Agronomy 39(1): 156-157. Jain, V., Yadav, B.D., Sharma, B.D. and Taneja, K. D. 1987. Effect of dates of sowing, row spacing
and varieties on yield and quality of clusterbean (Cyamopsis tetragonoloba (L.) Taub.). Indian Journal of Agronomy 32(4): 378-382.
Kacker, N.L. and Henry A. 1984. Genotype x environment interaction for seed yield in clusterbean.
Indian Journal of Genetics 44(3): 465-486.

First Australian New Crops Conference 1996 – Volume 2
211
Lal, B.M. and Gupta, O.P. (1977). Studies on galactomannan in guar and some correlations for selecting genotypes rich in gum content. Proceedings First ICAR Guar Res. Workshop, Jodhpur. pp. 124-130.
Malik, A.C., Dahiya, D.R., Singh, D.P. and Malik, D.S. 1981. Yield and quality of two guar cultivars
as influenced by inter row spacing and phosphorus application. Haryana Agricultural University Journal of Research 2: 198-201.
Menon, U., Dube M.M. and Bhargava, P.D 1972 Gum content variations in guar Cyamopsis
tetragonoloba (L) Taub. Indian Journal of Heredity 2: 55-58. Mital, S.P., Thomas, T. A., Dabas, B.S. and Lal, B.M. 1971 Gum content as related to seed yield and
other characters in guar. Indian Journal of Genetics & Plant Breeding 31: 228-232 Paroda, R.S. and Rao, G.V.S. 1981. Genotype x environment interactions for seed yield in
clusterbean. Forage Research 7: 169-172 Singh, D.P., Rathore, D.N., Singh, H. and Kumar, V. 1978 A note on crude protein and gum
production of two varieties of Guar (Cyamopsis tetragonoloba (Linn.) Taub.) as influenced by different seed rates and row spacings. Annals of the Arid Zone 17: 329-331.
Singh, K., Kumar S. and Taneja, K.D. 1979 Effect of different sowing dates on the seed yield of
different varieties of guar (Cyamopsis tetragonoloba (L.) Taub). Haryana Agricultural University Journal of Research 9: 312-316.
Taneja, K.D., Gill, P.S. and Sharma, B.D. 1982 Effect of row spacing and intra-row spacings on seed
yield of guar cultivars. Forage Research 8: 111-115. Tiwana, U. S. and Tiwana M.S. 1993 Effect of sowing dates, seed rate and spacing on the seed yield
of guar (Cyamopsis tetragonoloba (L.) Taub.) under irrigated conditions. Forage Research 19: 115-118.

First Australian New Crops Conference 1996 – Volume 2
212
Troubleshooting Nutritional Problems in a New Industry: Sweet Potato in North Queensland Jane O’Sullivan1, Lester Loader2, Colin Asher1 and Pax Blamey1
1 Department of Agriculture, The University of Queensland, Brisbane 4072 2 Queensland Department of Primary Industries, North Region, PO Box 1054,
Mareeba 4880
Abstract Sweet potato (Ipomoea batatas L.) is a new crop in the North Queensland region, with areas planted expanding rapidly over the last 10 years. A number of nutrient deficiencies and toxicities have been observed in sweet potato crops, but farmers are poorly equipped to diagnose and correct problems due to the paucity of information on the crop. Visible symptoms and critical leaf nutrient concentrations for most nutritional disorders in sweet potato have been recently characterised at The University of Queensland, and this information was used to identify deficiencies and toxicities occurring in the region. Disorders observed included deficiencies of N, P, S, B, Zn and Cu, suspected deficiencies of Ca, Mg and Mo, and toxicities of Mn and Cu. Fertilisers applied to crops following diagnosis visibly improved crop growth or the development of marketable roots in a number of cases. Soil amendment trials will be conducted in the coming year, and on-farm amendments documented, in order to improve recommendations available to growers. Introduction In the early decades of this century, sweet potato was widely grown by Queensland farmers as supplementary stock feed (Brooks 1923). However, this practice seems to have died out (Harper et al. 1990). Sweet potato began to appear as a table vegetable after the introduction of the orange-fleshed, or dessert type, in the 1970’s (Harper et al. 1990), and it is only in the last decade that it has begun to reach widespread acceptance in Australian markets. The tobacco (Nicotiana tabacum L.) industry, which has been the long-standing mainstay of the Mareeba-Dimbulah irrigation area, is in decline. Since the early 1980s, the area sown to tobacco has halved, creating a considerable demand for alternative field crops. Sweet potato is one option which has become increasingly important over the last 10 years. Currently, the area planted is approaching 200 ha, producing a crop valued at around $3.5M per annum. While the industry is still small, it has grown at around 10 % p.a. over the last 10 years, and there is scope for greater growth, as the demand for sweet potato continues to grow in Australian markets. However, the high costs of marketing heavy vegetables from this remote region necessitates high yields and efficient production. Currently, yields average around 20 t/ha of marketable roots, although yields of up to 55 t/ha have been attained, suggesting that significant gains may be made through improved management. The Mareeba-Dimbulah region is dominated by light-textured granitic sandy loams, with smaller areas of alluvial soils of mixed sedimentary origin. Most sweet potato production occurs on these light-textured soils, which are inherently infertile, have very low cation exchange capacities and are subject to leaching of nutrients. Consequently, production is highly dependent on appropriate fertiliser application. The more fertile kraznozems found on the higher elevations to the south of the Atherton

First Australian New Crops Conference 1996 – Volume 2
213
Tableland are rarely used due to their heavy texture and the lower temperatures prevalent in these areas. Sweet potato is most commonly grown as a winter crop, to gain price premiums for early produce on the southern markets. However, winter temperatures on the Tableland are often suboptimal for the crop, and may exacerbate other stresses. The current study results from a collaboration between the QDPI North Queensland sweet potato development program, and a project addressing the nutrition of root crops in the South Pacific region, being undertaken by The University of Queensland. The collaboration aims to discover the prevalence and importance of nutritional disorders in sweet potato crops in the region, and to improve information available to growers for the diagnosis and management of nutritional problems. At the same time, the region is providing a testing-ground for the new diagnostic criteria which have been developed at The University of Queensland under controlled experimental conditions. To date, this study has not included controlled fertiliser trials, and it is not possible to quantify yield responses to the amendments made to farm crops. The results are therefore somewhat anecdotal, but reveal the complex nature of nutritional problems found in the area and the importance of correct diagnosis. Procedures A comprehensive range of nutritional disorders in sweet potato has been studied at The University of Queensland over the past four years (O’Sullivan et al. 1995). All deficiencies and toxicities likely to be found in field conditions have been induced in plants grown in solution culture. This work has generated new diagnostic information, including detailed descriptions of visible symptoms of each disorder in a number of cultivars, and the determination of the critical concentration of each nutrient in index leaves, ie. the threshold concentration for deficiency or toxicity (O’Sullivan et al. 1995). This information has permitted a more systematic assessment of nutritional disorders in sweet potato crops in North Queensland, using a three-stage procedure: 1. The crop was visited in response to the farmer’s observation of poor growth or unusual
symptoms. The visible symptoms, together with the fertilisation record of the crop and any soil analysis data available, were used to reach a tentative diagnosis or at least narrow the range of possibilities. Field diagnoses were assisted by the use of a draft field guide including descriptions and colour plates of each disorder. The field guide will be published later this year.
2. Leaf samples were then taken, dried and digested, and multielement analyses conducted using
Inductively-Coupled Plasma Atomic Emission Spectroscopy, or colorimetric analysis in the case of nitrogen (N). Where the resulting nutrient concentrations supported the initial diagnosis, recommendations for amendment were made.
3. A positive response to the application of the suspected deficient nutrient preceded the final
confirmation of the problem. In practice, appropriate fertilisers were frequently applied following the initial assessment, as delays would limit chances of recovery of yield potential. Leaf analyses, which take additional time, were used to confirm the causal nutrient, particularly where more than one amendment had been applied simultaneously. In these cases, while leaf analyses did not contribute to the management of the crop tested, they may lead to more cost-effective management of future crops. The leaf analyses may also

First Australian New Crops Conference 1996 – Volume 2
214
reveal other nutrients which are in inadequate supply and could become limiting to growth after correction of the primary disorder. Leaf painting was also used as a diagnostic tool in some cases of suspected micronutrient deficiency. Solutions of ferrous ammonium sulfate (1 %), zinc sulfate (0.5 %), copper sulfate (0.25 %) and ammonium molybdate (0.25 %) were painted on one half of a leaf blade suspected of iron (Fe), zinc (Zn), copper (Cu) or molybdenum (Mo) deficiency, respectively. Painted leaves were inspected after several days to detect increased greenness or leaf expansion, compared with the unpainted half. Results Ten properties were visited between August 1995 and January 1996. Nutritional problems adversely affecting crop growth were found in 12 of the 16 crops sampled. In all but two cases, crops were visited in response to a suspected problem reported by the grower. In three crops, the problem was localised, significantly affecting only a portion of the crop. In some cases, visible symptoms indicated one disorder, while leaf analyses revealed that two or more nutrients were at concentrations below the adequate range. It is typical for plants to express symptoms only of the disorder most limiting to growth, and these results attest the value of additional diagnostic tools such as tissue analysis for identifying masked deficiencies. Table 1 summarises the incidence of nutritional problems in the crops visited. Table 1. Incidence of nutritional disorders evident in 16 sweet potato crops in North Queensland
Disorder Number of crops with symptoms attributable to the disorder
Number of crops with deficiency or toxicity indicated by leaf
analysis
Deficiency: N 2 2
P 1 1
K 0 1
Mg 1? 1
S 1 2
Ca 1? 3
Fe 21 0
B 4 5
Cu 1 2
Zn 1 1
Mo 1 --2
Toxicity: Mn 1 2
Cu 1 1 1Symptoms of Fe deficiency were induced by Mn toxicity; they do not indicate low soil availability of Fe. 2The multielement analysis technique used was not sufficiently sensitive to quantify Mo in the deficient range.

First Australian New Crops Conference 1996 – Volume 2
215
Boron (B) deficiency seems to be a problem of common occurrence on the granitic sands. Visible symptoms on the storage roots and/or tops were found at four sites, and low leaf concentrations indicated a potential problem on one other crop. Symptoms on the tops may include small, pale or puckered young leaves, twisting of the leaf petioles, and in severe cases, death of the shoot tips. Symptoms on the roots which appear to be attributable to B deficiency include short, thick roots with blunt ends, and in some cases a proliferation of fibrous roots arising from the storage root. Death of tissue at the distal end of the storage root has also been reported. Reports from other areas associate B deficiency with surface cracks and canker, resulting in severely deformed roots (von Stieglitz and Chippendale, 1955). These symptoms have not been observed in the current study, however this may have been because crops were immature at the time of inspection. Growers have commonly reported a high occurrence of roots of unsatisfactory shape, and this may be attributable to B deficiency. Foliar application of Solubor (0.5 %) has typically been recommended and is commonly practiced, but root symptoms appear to respond poorly to this treatment. Crops reported with symptoms on the roots have often had foliar B applied as a routine measure, and leaf analyses reveal adequate levels of B in the above-ground parts. However, soil application of B, or application through irrigation water, appears to be effective in restoring normal root growth. Calcium (Ca) deficiency is a potential problem in the region, and many farmers who apply tobacco fertiliser mixes to sweet potato do not apply Ca. Based on analyses from the three sites from which sequential samplings have been made, Ca status of the crop appears to decline with time. A late onset of Ca deficiency may reduce root yields without visible symptoms in the tops. However, no case of yield limitation resulting from Ca deficiency has been confirmed to date. A positive response was observed in one crop following gypsum application in conjunction with Solubor. Copper deficiency was identified on two sites on granitic sands. On the more severely affected crop, leaf symptoms included interveinal chlorosis on mature leaves and premature senescence of older leaves, symptoms similar to those of magnesium (Mg) deficiency. Roots were slender and undersized, often with dark patches of necrotic tissue just below the surface. This observation is consistent with that of Pillai et al. (1986), who reported brown streaks inside the storage root of sweet potato grown in sand culture. Applications of B, Ca and Mg had been attempted without result, but the subsequent crop responded well to Cu application. Conversely, Cu toxicity was found on one property, apparently resulting from repeated application of copper oxychloride fungicide. A light chlorotic mottling was observed on mature leaves affected by Cu toxicity, consistent with symptoms observed under experimental conditions in solution culture. The effect on root yield, if any, is not known in this case. The alluvial soils in the region contain high levels of manganese (Mn), and a patchy occurrence of Mn toxicity has been observed on other crop species, including onion (Allium cepa L.) and tobacco. On one property, poor growth was observed on sweet potato plants at the lower end of a slope. Plants displayed severe interveinal chlorosis, especially on younger leaves, and dark-coloured necrotic spots which were more abundant on older leaves. Leaf analyses revealed that Mn toxicity was the likely cause. (The chlorosis associated with Mn toxicity is due to Fe deficiency induced by this condition.) The problem appears to be seasonal, and the crop recovered with the onset of warmer weather. Leaf samples taken two months later had greatly reduced concentrations of Mn. North American work has demonstrated a strong interaction between temperature and Mn toxicity in tobacco (Rufty et al., 1979).

First Australian New Crops Conference 1996 – Volume 2
216
Further evidence of micronutrient disorders was found on the DPI Southedge Research Station. The site was initially visited in late August, following a period of low temperatures. There were two plantings of sweet potato of different age, each containing a range of genotypes. The soil was close to its native condition, having been cropped only once before. A macronutrient fertiliser mix had been applied, but application of micronutrients was deliberately deferred. The younger plantings showed very poor establishment and severe symptoms of Zn deficiency: the young leaves were pale and greatly reduced in size. On the older planting, symptoms varied widely among the plants of different genotypes: in some cases the symptoms were consistent with B deficiency, in others a distinct yellow interveinal chlorosis on young leaves characteristic of Fe deficiency was observed, and on some plants there was a general stunting and chlorosis of unknown cause. Leaf painting tests were conducted with Zn, Fe and Mo. Positive responses were observed for Zn on the younger plants, and for Fe on chlorotic young leaves in the older planting. The response to Mo was inconclusive. Leaf analyses reflected the low status of B and Zn, and also high concentrations of Mn. Mn toxicity may have induced the Fe deficiency observed in some plants. Low Cu concentrations in some samples also indicated a potential for Cu deficiency on the site. The analyses conducted were not sufficiently sensitive to assess Mo status. Following the onset of warmer spring weather, the condition of these plants improved considerably. Subsequent leaf analyses indicated alleviation of Zn deficiency and reduced concentrations of Mn, while low B remained the most consistent problem across all genotypes. This site raises a number of issues relevant to nutrient management. Firstly, there was considerable genetic variability in the severity of symptoms and in growth reduction. Secondly, the different responses of the adjacent plantings of differing age indicate the influence of ambient temperatures on the expression of nutritional stress. Conclusions From farm visits it was evident that most farmers were aware of the potential for nutritional problems on these soils, but were not well equipped to diagnose problems which appeared. A major benefit of this study has been to increase the ability of farmers to recognise nutritional disorders, and to make them aware of the resources available to them for diagnosis. Most farmers have been cropping sweet potato for less than 5 years. The growth of the industry is dependent on their successful experiences over this introductory period. Quantitative assessment of the impact of nutritional disorders on yield, and of the effectiveness of corrective measures in increasing yield, has been beyond the scope of this project to date. However, the results obtained indicate that field trials may be of benefit to the industry. Subclinical deficiencies can also be of economic significance, and require well-founded strategies for nutrient management. In the coming year it is hoped to complete a thorough assessment of the nutrient limitations of soil from the DPI Southedge Research Station, and to conduct field trials on selected sites. In addition to the effects on root yield, the impact of nutritional status on root quality warrants further attention. Misshapen roots are heavily discounted in the marketplace, and the influence of B deficiency on root deformation needs to be examined further. Bright flesh colour is also a valued characteristic, and pale colour may be associated with K deficiency. Other possible influences are less well documented, but may be equally important. For example, it was observed by one grower that roots of B deficient crops were bitter, and in another case Cu deficiency may have been responsible

First Australian New Crops Conference 1996 – Volume 2
217
for rapid degeneration of roots after harvesting. The occurrence of such problems poses an obvious threat to a young industry trying to establish a reputation as a reliable supplier of quality product. Acknowledgments The authors wish to thank the participating growers for their co-operation. The financial support of the Australian Centre for International Agricultural Research (ACIAR) for work conducted at The University of Queensland, and of the Queensland Fruit and Vegetable Growers Association for their support of the sweet potato development program of QDPI North Queensland is gratefully acknowledged. References Brooks, G.B. 1923. The Sweet Potato. (Queensland Department of Agriculture and Stock: Brisbane). Harper, T.W., Jackson, K.J. and Kerr, J.C. 1990. Sweet Potato Agronomy in Queensland (Queensland
Department of Primary Industries: Brisbane). O’Sullivan, J.N., Asher, C.J. and Blamey, F.P.C. 1995. ACIAR Working Paper No. 45: Nutritional
Disorders of Sweet Potato. (Australian Centre for International Agricultural Research: Canberra).
Pillai, N.G., Mohankumar, S., Kabeerathumma, S. and Nair, P.G. 1986. Deficiency symptoms of micronutrients in sweet potato (Ipomoea batatas L.). Journal of Root Crops 12(2): 91-95.
Rufty, T.W., Miner, G.S. and Raper, C.D. 1979. Temperature effects on growth and manganese
tolerance in tobacco. Agronomy Journal 71: 638-644. von Stieglitz, C.R. and Chippendale, F. 1955. Nutritional Disorders of Plants. (Queensland
Department of Agriculture and Stock: Brisbane).

First Australian New Crops Conference 1996 – Volume 2
218
Pigeon Pea as an Export Vegetable Crop for Fiji
M. Prasad1, S. Ulitu1 and S.P. Field2 1 Ministry of Agriculture, Fisheries and Forests, Fiji 2 Soil and Crop Evaluation Project, PO Box 77, Nausori, Fiji Abstract New crops offer an opportunity for Fiji to further develop its agriculture, especially in the light of a possible decline in revenue from the country’s sugar industry. In the short term, crops that are traditionally grown in Fiji but can be developed into new products or sold in new markets have the greatest potential. Farmers already have an understanding of how these crops can be cultivated and the market needs. One such crop is pigeon pea. Previous research and development activities have focused on the grain crop for dhal production. However, the green pods are an important vegetable, especially for Fiji-Indian communities in the Pacific Rim countries. The crop has the potential to generate a gross margin of about $5000/ha. Research has identified varieties capable of producing green pods for nine months of the year compared with only three months for traditional varieties. Introduction The Republic of Fiji consists of two large islands and over 300 smaller islands spreading over an area of 1.26 million sq. km. of which the land area is only 18,200 sq. km.. Fiji's total population is approximately 750,000 of which 470,000 are dependent on agriculture. Fifty percent are Melanesian Fijian, 45% are Indian and the remainder are of European, Chinese and Polynesian descent. This ethnic diversity has resulted in the evolution of a diverse range of farming systems ranging from traditional Melanesian systems based on subsistance root crop systems to highly commercial systems based on hydroponics. Agriculture's contribution to total GDP is approximately 16% of total GDP at current prices (MPI 1991) with sugar and subsistence farming the dominant activities of the sector. Each contribute approximately 40% towards agriculture's contribution to GDP. Subsistence agriculture is highly significant to the economy as it reduces the country's dependence on food imports and employs a significant proportion of the country's workforce. Sugar is the country's main agricultural commodity with 23,000 farmers, generating approximately $F250 million/annum1 in foreign exchange earnings and employing 25% of the economically active population. Other commodities only earn about $F14 million in foreign exchange earnings (MAFF 1995). The sugar industry is partially dependent on preferential trade agreements as a part of the Lome Convention. Fiji currently exports 40% of its sugar to Europe at about two to three times the world market price. These exports to Europe are valued at about $F9O million/annum. However, with the successful outcomes of the Uruguay Round, Fiji's access to preferential markets in the future may be restricted and it is expected income from sugar exports will decline (Grynberg 1995). For this reason, the Government of Fiji (GOF) is considering alternative areas where the agricultural sector can continue to maintain its contribution to the country's economy.
1 $F1.00 = $A0.90 April 1996

First Australian New Crops Conference 1996 – Volume 2
219
This paper examines some of the strategies open to the GOF to develop agriculture, with respect to developing new crops, in light of the possible changes in the sugar industry. One new crop currently being developed is the export of green pods of pigeon pea (Cajunus cajan) as a vegetable crop. In this paper we review the potential of this industry to highlight the advantages of developing traditionally grown crops to meet the needs of new markets. Opportunities for Fijian Agriculture - New Crops and New Products Traditionally, the GOF's strategy to develop agriculture has been through the development of bulk commodities such as sugar, cocoa and copra for export and through the development of food crops such as rice and pigeon pea to minimise the imports of basic food needs. Apart from sugar this strategy has had limited success with the area planted to coconuts declining by 70% since 1968 and cocoa production declining from 400 t in 1990 to 160 t in 1994. Fiji is now importing more rice in 1994 than in the 1980s and producing only 43% of the country's needs. The government's present strategy is to develop commodities with export potential with less attention being given to commodities that have import substitution benefits. The main reason for the failure of the bulk commodities like cocoa, copra and rice is that they have to compete in a market that does not receive preferential treatment, as is the case with sugar. Prices fluctuate and returns to the farmers are low. The potential for significant price rises for these bulk crops is limited (Thirlwirl 1991). The gross margins for rice, cocoa and copra are only $500/ha compared to $1,500/ha for sugar cane. When 60% of farms are less than 3ha the potential for farmers to generate income for household needs, based on these commodities, is low. Farmers are therefore interested in producing commodities that are capable of producing at least $1,500/ha or assist in meeting the household's income requirements of at least $175/week. For these reasons, high value crops like taro (Colocasia esculenta var. esculenta), ginger (Zingiber officinale), kava ( Piper methysticum Forst.f ) and fruits offer potential. Traditional crops, which are produced to meet local needs but have potential for export, are currently being examined by the government for potential development. The main markets are the Pacific rim countries with large Fijian, Fiji Indian and Polynesian communities. For example, the Western Samoan Polynesian community in New Zealand has sought alternative suppliers to provide their traditional Tausala ni Samoa variety of taro after the Western Samoan crop was decimated by taro leaf blight in the early 1990s. Fiji currently exports $5.5 million worth of taro to New Zealand, compared with $2.6 million in 1990, and is the country's second major agriculture export earner after sugar. The increased demand in New Zealand, which pushed taro prices to 1.50/kg to give gross margins for the crop above $3,000/ha, was the main stimulus for the increased production in Fiji in recent years (McGregor and Hamilton-Peach 1996). Kava is worth $2 million in export earnings and $50 million in local consumption. Kava is exported to Australia and New Zealand to meet the needs of Pacific Island communities. German pharmaceutical companies are currently purchasing kava to produce anaesthetics from the kava lactones. The industry is expected to grow significantly in importance over time, because of increased demand and high gross margins. The gross margin for kava is approximately $50,000/ha, which is realised about five years after planting the crop or an average gross margin per annum discounted to about $7,000/ha (McGregor and Hamilton-Peach 1996). Two traditional crops used in producing Fijian handicrafts and having potential for export are Pandanus odoratissimus L. (voivoi) and Morus alba L. mulberry (masi). Pandanus is used to produce

First Australian New Crops Conference 1996 – Volume 2
220
mats, while the bark of the mulberry is used for making tapa cloths. These crops currently generate high returns, over $4,000/ha, but the size of the potential market is unknown. A number of vegetable crops have good potential for export. Bele (Abelmoschus manihot) and rourou (leaves of the taro plant) are exported to meet the needs of Fijian communities in Australia and New Zealand. Eggplant (Solanum melongena), okra (Abelmoshcus esculentus) and chillies (Capsicum annuum) are exported to New Zealand, Canada, USA and Australia to meet the needs of the Indian communities that have migrated from Fiji. These crops produced about $0.25 million in export earnings in 1994 (MAFF 1995). One potential crop, currently being evaluated by the Ministry of Agriculture, Fisheries and Forests (MAFF) for export is pigeon pea pods as a vegetable, compared to considering the crop as a grain for use as dhal. Pigeon Pea Pigeon pea was introduced by the indentured Indians who were brought to Fiji in the 1880's to assist with sugar cane production (Dass 1940). The mature seed is split to produce dhal, a vegetable protein soup. The crop is mainly planted in small areas on the boundaries of sugar cane farms to meet household needs. In 1994 there were 1,305 farmers growing pigeon peas on an area of 130 ha. The area planted to pigeon pea has varied considerably from a peak of 1,845ha in 1947 (Parhem 1949). Although area planted to pigeon peas has not increased, the demand for peas to produce dhal has increased (Table 1). To offset the inadequate supply of pigeon peas for dhal, yellow split peas, Prussian peas, Hadlee peas, field peas (Pisium sativum), angsore dahl (Lens esculenta subsp. microspermae Barul.), chickpeas (Cicer arietinum), mungbean (Vigna radiata), urd (Vigna mungo) and cluster beans (Cyamopsis tetragonoloba) are now commonly used. Field peas are mainly imported from Australia and New Zealand and processed in Fiji. However, top quality arhar (or toor) dhal has to be made from pigeon peas. To meet demand for arhar dhal, pigeon peas are imported from Malawi, Nepal, Burma, India and other South Asian countries. In 1994, approximately $4 million worth of split peas and pigeon peas were imported into Fiji. Table 1. Importation of grain legumes for dhal production 1993 - 1995 (tonnes) Year Pigeon Pea Field peas Other peas Total 1993 1994 1995 Main country of origin
217 224 343 India Malawi Vietnam Australia
502 432 468 Malawi Australia New Zealand
1593 1539 1611 Australia New Zealand Vietnam
2312 2195 2422
The traditional varieties of pigeon pea are low yielding, photosensitive varieties that take six to seven months to produce a crop. The crop is planted at the start of the wet season and is harvested in May - June. The plant produces seed in the dry season when the incidence of insect attack is reduced. Based on the GOF's strategy to minimise the import of food crops in the 1970s and 1980s MAFF implemented a research and extension program to identify appropriate pigeon pea production systems for Fiji (Martin 1986). The program mainly focused on identifying appropriate genotypes for different farming systems, pest management strategies and improved agronomic practices in order to meet the country's need for pigeon peas for dhal production. The genotype evaluation program identified high yielding, early maturing, photoperiod insensitive varieties that could be grown all year

First Australian New Crops Conference 1996 – Volume 2
221
round. If the early maturing varieties are sown at the start of the wet season they flower at the end of the wet season and pod boring insects like Maruca testulalis and Helicoverpa armigera are a problem. Strategies based on regular sprayings of lannate and late wet season planting of the crop were developed. Biological control practices were evaluated but have not been successful. The research program identified appropriate plant nutrition strategies for the soils of Fiji, methods to alleviate aluminium toxicity and appropriate genotype, planting density and sowing date recommendations (Martin 1986). The development strategy was initially based on developing a nucleus estate at Nasarawaqa, based on broad acre production systems. This operation based in Vanua Levu lasted only three years before it was abandoned, mainly because the soils were infertile ferruginous latosols. Average yields were 0.5t/ha and only 150 tonnes was produced in 1985 (Martin 1986). The Ministry also developed strategies for small-holder production. As with the Government's strategy with developing Fiji's rice industry, the development of Fiji's pigeon pea industry to meet the country's needs for dhal production was not successful. The main reason for industry failure was insufficient return for farmers growing pigeon pea for dry seed where gross margins were less than $1,500/ha. Pigeon pea also competed with sugar cane for arable land. As a result of the Government's strategy to focus more on crops that had a potential to generate income through export, the need for MAFF to assist in developing Fiji's pigeon pea industry in order to meet the country's needs for dhal has declined. Vegetable Pigeon Pea MAFF’s present strategy is based on working with exporters and farmers. As part of this strategy the Ministry has held discussions with exporters to identify which crops Fiji is currently exporting and which have potential for further development. The Ministry is also examining the major constraints to increased production and reviewing the current production systems from the exporter's perspective. Meetings are also held with farmers to develop an understanding of their production systems and to identify what they perceive as the main constraints to production. It was through this process that an alternative use for pigeon pea was identified. This alternative use was for production of fresh pods for consumption as a vegetable by the Indian community. The pods are harvested when they have reached physiological maturity, i.e. they are filled and easy to peel and the seeds are still green. The pods are peeled and used as an ingredient for curry or roasted and served with tea (ghugri). Green seeds are preferred to ensure the curry remains green. Brown seeds produce a brown curry. Vegetable pigeon pea is nutritionally similar to dhal, except for fibre content and minerals (Table 2).

First Australian New Crops Conference 1996 – Volume 2
222
Table 2. Comparison of constituents of green pigeon pea and dahl Constituent Green seed Dhal Protein (%) 21.0 24.6 Protein digestibility (%) 66.8 60.5 Starch content (%) 48.4 57.6 Soluble sugars (%) 5.1 5.2 Crude fibre (%) 8.2 1.2 Fat (%) 2.3 1.6 Calcium (mg/100g) 94.6 16.3 Magnesium (mg/100g) 113.7 78.9 Copper (mg/100g) 1.4 1.3 Iron (mg/100g) 4.6 2.9 Zinc (mg/100g) 2.5 3.0
Source: Faris et al. (1987) Exporters are exporting green pods and peas to Fiji - Indian communities in Australia, New Zealand and Canada. Green pods are mainly sold to New Zealand and Canada, while frozen peas are sold to Australia because of quarantine regulations. The amount exported has steadily increased over the last four years (Table 3). The drop in exports in 1995 was due to a universal ban on all vegetable exports from Fiji by New Zealand after a consignment of eggplants was found to be contaminated by fruit fly. The $32,000 earned in 1994 represented 12% of the country's fresh vegetable exports. The main problem identified by exporters was that they could only supply the market for three months of the year. This not only limited the total volume that could be exported but hindered consumer acceptance because the vegetable was only available for part of the year. Exporters want to be able to supply the crop all year round. The main varieties presently used for green pod production are the traditional photoperiod-sensitive varieties. These varieties start flowering at the end of the wet season and produces pods between June and September. Local varieties stop flowering in June. The seeds are large and the pods, testa and endosperm are a dark green. Table 3. Current pigeon pea exports as green peas and pods (kg) to New Zealand, Australia and Canada Year New Zealand Australia Canada Export ($) (pods) (Frozen peas) (Pods) 1991 1,250 3,125 1992 6,759 187 98 17,890 1993 8,576 192 465 23,370 1994 11,227 646 638 32,250 1995 4,419 323 28 12,400 1996 (March) 10 15 75 1995 price (farm gate) $2.50/kg $4.00/kg $2.50/kg
Source: Quarantine Service at Nadi airport and Lautoka
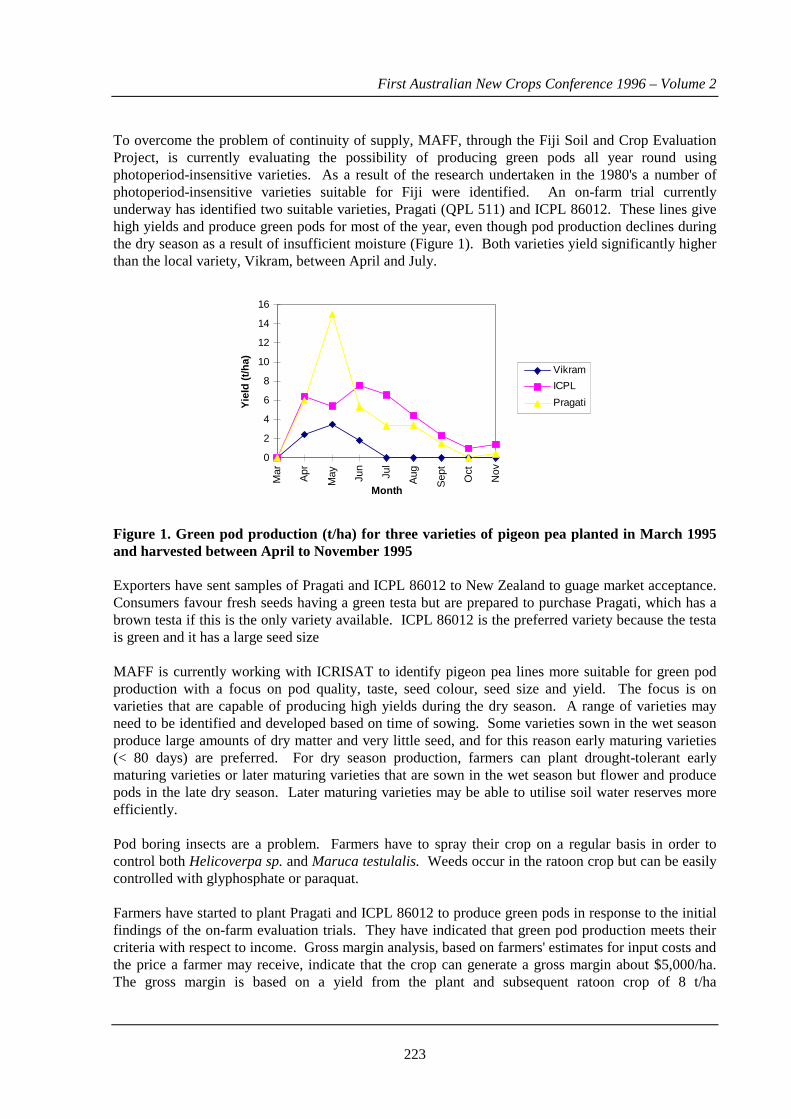
First Australian New Crops Conference 1996 – Volume 2
223
To overcome the problem of continuity of supply, MAFF, through the Fiji Soil and Crop Evaluation Project, is currently evaluating the possibility of producing green pods all year round using photoperiod-insensitive varieties. As a result of the research undertaken in the 1980's a number of photoperiod-insensitive varieties suitable for Fiji were identified. An on-farm trial currently underway has identified two suitable varieties, Pragati (QPL 511) and ICPL 86012. These lines give high yields and produce green pods for most of the year, even though pod production declines during the dry season as a result of insufficient moisture (Figure 1). Both varieties yield significantly higher than the local variety, Vikram, between April and July.
0
2
4
6
8
10
12
14
16
Mar
Apr
May Ju
n
Jul
Aug
Sep
t
Oct
Nov
Month
Yie
ld (
t/ha) Vikram
ICPL
Pragati
Figure 1. Green pod production (t/ha) for three varieties of pigeon pea planted in March 1995 and harvested between April to November 1995 Exporters have sent samples of Pragati and ICPL 86012 to New Zealand to guage market acceptance. Consumers favour fresh seeds having a green testa but are prepared to purchase Pragati, which has a brown testa if this is the only variety available. ICPL 86012 is the preferred variety because the testa is green and it has a large seed size MAFF is currently working with ICRISAT to identify pigeon pea lines more suitable for green pod production with a focus on pod quality, taste, seed colour, seed size and yield. The focus is on varieties that are capable of producing high yields during the dry season. A range of varieties may need to be identified and developed based on time of sowing. Some varieties sown in the wet season produce large amounts of dry matter and very little seed, and for this reason early maturing varieties (< 80 days) are preferred. For dry season production, farmers can plant drought-tolerant early maturing varieties or later maturing varieties that are sown in the wet season but flower and produce pods in the late dry season. Later maturing varieties may be able to utilise soil water reserves more efficiently. Pod boring insects are a problem. Farmers have to spray their crop on a regular basis in order to control both Helicoverpa sp. and Maruca testulalis. Weeds occur in the ratoon crop but can be easily controlled with glyphosphate or paraquat. Farmers have started to plant Pragati and ICPL 86012 to produce green pods in response to the initial findings of the on-farm evaluation trials. They have indicated that green pod production meets their criteria with respect to income. Gross margin analysis, based on farmers' estimates for input costs and the price a farmer may receive, indicate that the crop can generate a gross margin about $5,000/ha. The gross margin is based on a yield from the plant and subsequent ratoon crop of 8 t/ha

First Australian New Crops Conference 1996 – Volume 2
224
(experimental plots have yielded 15 - 20t/ha). The ratoon crop is dependent on available soil moisture. The cost of harvesting the crop is the main cost as the crop is harvested every seven days and is hand picked. Harvesters need to ensure the pods are fully filled but not too mature. Pigeon pea green pod production is currently only a small market production system and a few hectares would easily meet Fiji's current exports. However, expansion of the production season from the present three months to nine months would substantially increase demand and export. As the Australian market requires frozen peas, production should be able to ensure twelve months of supply. Another option is canning the green peas, as occurs in Puerto Rico and Trinidad, where vegetable pigeon pea is an important industry (Purseglove 1968). Caribbean countries mechanised pigeon pea harvesting by adapting green bean pickers and have developed special podders to mechanically shell the peas. Green pea (Pisum sativum) is the main substitute for vegetable pigeon pea because of its availability and short cook.ing time. Pigeon pea is preferred by some consumers because it is not as sweet as green peas. Faris et al. (1987) indicated that vegetable pigeon pea is more nutritious than green pea (Table 4). Future Directions for Fiji Based on the Pigeon Pea Example New crops will play an important role in developing Fiji's agricultural industries. The best prospects are seen to be those crops where Fiji has a competitive advantage. The pigeon pea example demonstrates the importance of considering crops that are part of the local culture. The Fijian and Indian farmers have expertise in cultivating such crops and a knowledge of what the market wants with respect to quality and quantity. These crops may not be new to Fiji but the target markets are new and in some cases the market product is new. Previous research focused on the traditionally accepted product of the crop, such as grain for dhal production and not on the product with the greatest potential. A similar situation may exist with rice and cluster beans. Research has traditionally focused on identifying high yielding rice varieties with limited success; however the greatest opportunity may be in marketing niche varieties for special markets. For example, black seeded rice is sold at a premium. Cluster beans are similar to pigeon peas in that they are also used for curry and can only produce green pods for three months of the year because the local varieties are photoperiod sensitive. MAFF is currently examining photoperiod insensitive lines of cluster beans.

First Australian New Crops Conference 1996 – Volume 2
225
Table 4. Comparison of some nutritional constituents of the edible portion of green pea and vegetable pigeon pea on a fresh weight basis. Constituent Green pea Vegetable pigeon pea Chemical composition (g/100g) Edible portion (shelling %) 53.0 72.0 Moisture 72.1 65.1 Protein 7.2 9.8 Carbohydrates 15.9 16.9 Crude fibre 4.0 6.2 Fat 0.1 1.0 Minerals (mg/100g) Calcium 20.0 57.0 Magnesium 34.0 58.0 Copper 0.1 0.4 Iron 1.5 1.1 Vitamins (mg/100g) Carotene (vit. A /100g) 83.0 439.0 Thiamine (vit B1) 0.1 0.3 Riboflavin (vit. B2) 0.01 0.3 Ascorbic Acid (vit.C) 9.0 25.0 Niacin 0.8 3.0
Source: Gopalan et al. (1984). In seeking to identify and develop new crop industries in Fiji consideration should be given to its special advantages. These include: • relative freedom from serious pests and diseases; • strategic location in the southern hemisphere; • direct transport linkages to major Pacific Rim markets; • duty free access to some markets ( McGregor and Hamilton-Peach 1996). MAFF is often approached to provide assistance to develop new crops with which the Ministry has limited experience or expertise. Tea tree, neem, sunflower, cotton, herbs are a few of the crops currently being considered. The production of organic produce is currently gaining importance around the world. Farmers in Fiji are currently producing organic cocoa, mangoes, papaya and bananas. A large number of crops can be grown in Fiji but only a limited number can be expected to have commercial potential. Procedures need to be developed to assist in identifying which crops are suitable for Fiji and where the Ministry should allocate its limited resources to facilitate the development of these new crops. Kumar et al. (1995) have proposed strategies to identify the most promising new crops and to establish priorities for research and development on new crops in Fiji. Developing networks with organisations undertaking new crop research is equally important, hence the value of participating in conferences such as the First Australian New Crops Conference. However, the key to the successful development of new crop industries will be in developing the skills of agronomists and economists to understand the salient features that need to be considered when identifying a potential new crop.

First Australian New Crops Conference 1996 – Volume 2
226
References Dass, C.M. 1940. The production of dhall. Fiji Agricultural Journal 11: 92-95. Faris, D.G., Saxena, K.B, Mazumdur, S. and Singh, Umaid. 1987. Vegetable pigeonpea: a promising
crop for India (International Crops Research Institute for the Semi Arid Tropics: Patancheru, India).
Gopalan, C., Rama Sastri, B.V. and Balasubramanian, S.C. 1984. Nutritive value of Indian foods.
(Indian Institute of Nutrition: Hyderabad, India) 204 pp. Grynberg, R. 1995. Bananas and sugar - the Lome waiver and the Fiji Sugar Industry. Journal of
South Pacific Agriculture. 2:41-48. Kumar, J., Field, S.P., Dowling, A.J., Wood, I.M., Widdowson, J.P. and Hine, P.T. 1995. Setting
priorities for an agricultural research program in Fiji. Fiji Agricultural Journal 51:43-52 Martin, J.F. 1986. The introduction of agricultural technology: aspects of pigeon pea development in
Fiji. Annual Conference of the Australian Agricultural Economics Society, Canberra, February 1986.
McGregor, A. and Hamilton-Peach, J. 1996. Fiji Agriculture Sector Study. MAFF/ADB, Suva. MAFF. 1995. Ministry of Agriculture, Fisheries and Forests: Annual Report for the year 1994.
Parliament of Fiji Parliamentary Paper No. 52/95 of 1995. Ministry of Primary Industries and Co-operatives. 1991. Fiji National Census. Parham, B.E.V. 1948. Food and cash crops grown by cane farmers 1947/1948. Fiji Agricultural
Journal 19: 32. Purseglove, J.W. 1968. Tropical Crops. Dicotyledons. (Longman: Singapore) Thirlwirl, A.P. 1991, Performance and prospects of the Pacific Island Economies in the World
Economy. Research Report Series No. 14. (Pacific Islands Development Program, East West Centre: Honolulu).
First Australian New Crops Conference 1996 – Volume 2
227
Lima Beans as a New Crop
R. Redden1, R. Wright2 and W. Tompkins3 1 QDPI Hermitage Research Station Warwick, QLD 4370 2 QDPI Horticultural Research Station, Bowen, QLD 4805 3 Bean Growers Australia, River Road, Kingaroy, QLD 4610 Abstract Commercialisation of lima beans appears feasible as a result of studies on sowing time, choice of variety, weed control, and procedures and timing of harvest. Fine tuning of harvest procedures is necessary but difficult due to the indeterminate habit of flowering racemes. Further studies are also required for comprehensive agronomic recommendations. Following pilot plant canning trials, factory scale tests are required to verify the quality of Australian produce in comparison with the currently imported grain. Introduction Lima beans, Phaseolus lunatus, are in the same Phaseolae family as common beans (P. vulgaris) and scarlet runner (P. coccineus). However, very few successful crosses have been made between lima and common beans. The Phaseolae species evolved in the Andes and Meso-America with evolution of lima bean land races at low altitude in both the humid and the dry tropics. Lima beans are a minor legume throughout the Americas and are a major crop in Madagascar, a mainly semi arid region in the sub-tropics. The seed type ranges from round ovoid to very flat ovoid, with a similar diverse range of both solid colours and mixed colour patterns as in common bean, but a wider range in seed size from 5 g/100 seed to over 100 g/100 seed. In Australia, they are mainly consumed as green lima beans (30-40 g/100 seed), canned in brine either as a sole product or in 3 to 4 bean mixes. About 1000 t/year are canned and an unknown quantity sold as packaged dry beans (raw). All are imported from California. Market prices for canning quality beans are about $1500/t, and higher for packaged raw beans. There are potential export markets in Japan and in Europe. Field trials over 8 years in Queensland have demonstrated that lima beans are adapted here, for growing as a wet grain crop (harvested unripe as with green peas) or as a dry grain crop. Most Californian production is as a wet grain crop with dry seed screened off for export. The investigations reported here focus on the potential of lima beans as a dry grain crop.
First Australian New Crops Conference 1996 – Volume 2
228
Materials and Methods These extend over 4 series of trials investigating sowing date, harvesting, weed control and varieties. Sowing Date Four lima bean varieties were sown in 1994/95 at monthly intervals from mid-November to mid-February on a farm 20 km from Kingaroy, fully irrigated with 200 kg/ha of Crop King 200 (32.5%) fertiliser. Plots were 4 rows x 0.9 m apart and 8 m long. Data recorded were establishment population, time to flowering and to maturity, canopy height and width, vineyness at about 60 days after planting, shoot dry matter (1m samples from guard rows), grain yield from the central two rows and seed size. Harvest The leaf nodes of lima beans grow reproductive racemes or stalks which are indeterminate, with flowers still forming at the tip while pods ripen at the base and the plant type tends to have lateral branches at ground level. Both of these factors complicate harvest. In 1994 unreplicated preliminary comparisons were made between (a) chemical dessication with direct harvesting, (b) cutting and drying plants in windrows after cutting roots with a horizontal tractor-mounted disc, and (c) a similar procedure using a rod weeder to cut plant roots at the crown. In 1995 beans were cut with a rod weeder at four stages of pod maturity using 2 replicates of plot size (4 rows x 20 m x 0.9 m apart) and maturity (30, 50, 75 and 90% ripe pods). The cut beans were twice windrowed to achieve drying, then a pick-up-front peanut header harvested plots one week after cutting. In 1996 a similar procedure as for 1995 was used on three varieties with cutting at about 15%, 25%, 40% and 60% maturity. Due to very dry conditions, plots were harvested at 4 to 5 days after cutting, windrowing and turning of windows after 2 days drying. Weed Control Pre-emergence pre-plant applications of the herbicides Eptam (EPTC) at 5.5 l/ha and 7.0 l/ha, Treflan (Trifluralin) at 1.5 l/ha and 3.0 l/ha and Stomp (Pendimethalin) at 1.5 l/ha and 3.0 l/ha were applied on the variety Green Baby Lima 320 on 5/4/94 at Bowen Horticultural Research Station. There were also post emergence herbicides applied: Blazer (acifluorfen) at 1.5 l/ha and 3.0 l/ha and Basagran (Bentazone) at 1.5 l/ha and 2.0 l/ha. These treatments, all with three replicates, were compared with an unweeded control and a hand weeded treatment. The trial was irrigated, with plot size being 4 rows x 10 m x 0.75 m apart. In 1995 the trial was repeated with omission of Eptam; with Q23620, another Green Baby variety. Weed growth and grain yield were recorded in both trials. Variety Trials Varietal yield trials have been successfully conducted over eight seasons from 1987 to 1996, in January/February sowings at Redvale research farm, Kingaroy. These were grown rainfed with plots of 6 to 8 m length, rows 0.9m apart and mainly with 2 rows/plot except in 1996 when there were 4 rows/plot. Entries were mainly of the small green (about 30g/100 seed) seed type ranging in number

First Australian New Crops Conference 1996 – Volume 2
229
from 8 to 18 in different years. In three seasons, a navy bean variety Actolac was included, and in one year the soy bean variety Centaur. Canning quality was assessed by processing 2 kg samples per variety into canned produce, either in the DPI Centre for Food Technology or in pilot plants of commercial processors. Canned beans were sensory evaluated for appearance and texture then given an overall rating. Results
Sowing Date Lima beans sown at Kingaroy produced maximum yield from a December sowing, followed by the November sowing but declining to near zero with the February sowing (Table 1). Shoot dry weight was maximised in both the November and December sowings. Canopy size only declined at the February sowing. The sprawling habit of lima beans was reflected in low pod height scores (on a scale 1 (prostrate) to 9 (all pods above 5 cm) and high lodging scores. Table 1. Agronomic responses of lima beans to date of sowing in 1994/95, Kingaroy. Means over four varieties
Date of Sowing
Attribute November December January February LSD 5%
Grain Yield (kg/ha) 1330 1822 1107 320 366
Total Shoot Weight (kg/ha) 6220 6140 5410 2600 1100
Established Population 181,000 210,600 175,900 169,400 24,800
Harvest Population 190,000 176,900 176,900 184,300 NS
Canopy Height (cm) 48.8 46.6 46.6 42.3 3.4
Canopy Width (cm) 54.6 56.3 52.5 41.9 11.3
Pod Height 4.7 4.5 4.2 4.3 NS
Lodging (%) 58 62 60 56 NS
Harvest Index 0.21 0.30 0.20 0.21 NS
Varietal interaction with sowing date occurred for phenology and seed weight (Table 2). For time to flowering, variety C-Elite was notably later in the December sowing; for maturity, Jackson Wonder was the latest variety in the November sowing but the earliest in the February sowing and for seed weight the varieties Jackson Wonder and Bridgeton were similar over the November to December sowing whereas for C-Elite and Q2360R seed size dramatically declined from the November to the December sowing.

First Australian New Crops Conference 1996 – Volume 2
230
Table 2. Lima bean varietal interactions with date of sowing for days to flowering, days to maturity and 100 seed weight
Date of Sowing Variety Nov Dec Jan Feb LSD 5%
a. Days to Flowering 1.14
Jackson Wonder 42.0 40.7 43.7 42.3
Bridgeton 40.0 40.0 42.7 41.7
C-Elite 41.7 43.7 45.0 43.0
Q23620R 40.7 40.7 43.7 42.3
b. Days to Maturity 2.67
Jackson Wonder 106.3 112.0 104.3 120.0
Bridgeton 104.0 110.0 105.0 122.7
C-Elite 104.0 110.0 106.7 123.3
Q23620R 104.7 110.3 108.0 124.0
c. 100 Seed Weight (g) 3.93
Jackson Wonder 49.3 49.1 43.8 37.1
Bridgeton 43.6 40.9 38.1 37.2
C-Elite 42.2 31.7 31.7 32.1
Q23620R 42.8 36.7 34.4 39.7
For grain yield, the varieties Jackson Wonder and Bridgeton were consistently superior (Table 3). While there were no differences in biomass, varieties differed in partitioning of resources into grain. In other growth features there were only minor or non-significant differences between varieties. Jackson Wonder had the largest seed which was different in colour to other varieties, having a red and buff mottle. Table 3. Agronomic responses of lima bean varieties meaned over sowing dates
Variety
Jackson Wonder
Bridgeton C-Elite Q23620R LSD 5%
Grain Yield (kg/ha) 1285 1215 935 1142 152 Total Shoot Weight (kg/ha) 5316 4946 4893 5302 NS Establishment Population/ha 181,900 159,700 209,700 185,600 25,700 Harvest Population/ha 177,800 142,600 211,100 196,300 31,050 Canopy Height (cm) 47.7 43.1 45.8 48.2 3.49 Canopy Width (cm) 54.4 47.4 52.5 51.1 4.00
The results show that lima beans are adapted to the warm to hot summer growing conditions at Kingaroy, with an apparent optimum sowing date in December. The grain yields were from direct mechanical harvest after desiccation and are an underestimate of total grain yield, since pods at ground level were not harvested. Harvest
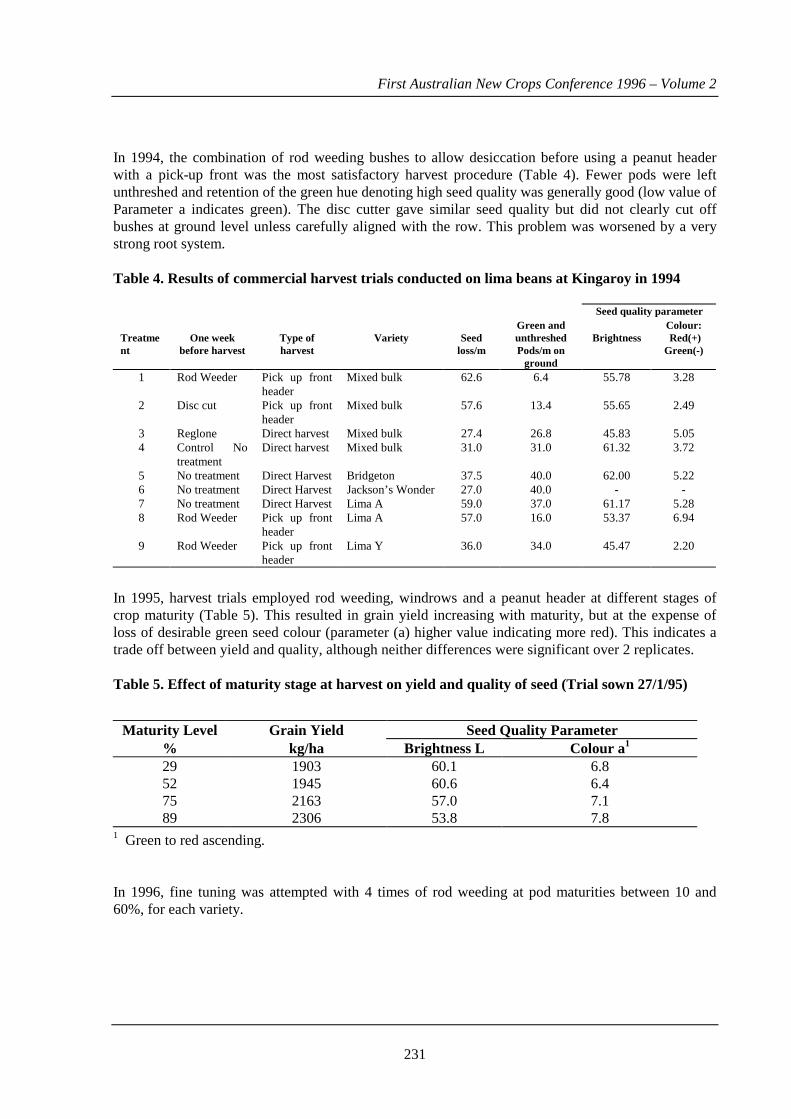
First Australian New Crops Conference 1996 – Volume 2
231
In 1994, the combination of rod weeding bushes to allow desiccation before using a peanut header with a pick-up front was the most satisfactory harvest procedure (Table 4). Fewer pods were left unthreshed and retention of the green hue denoting high seed quality was generally good (low value of Parameter a indicates green). The disc cutter gave similar seed quality but did not clearly cut off bushes at ground level unless carefully aligned with the row. This problem was worsened by a very strong root system. Table 4. Results of commercial harvest trials conducted on lima beans at Kingaroy in 1994
Seed quality parameter
Treatment
One week
before harvest
Type of harvest
Variety
Seed
loss/m
Green and unthreshed Pods/m on
ground
Brightness
Colour: Red(+) Green(-)
1 Rod Weeder Pick up front header
Mixed bulk 62.6 6.4 55.78 3.28
2 Disc cut Pick up front header
Mixed bulk 57.6 13.4 55.65 2.49
3 Reglone Direct harvest Mixed bulk 27.4 26.8 45.83 5.05 4 Control No
treatment Direct harvest Mixed bulk 31.0 31.0 61.32 3.72
5 No treatment Direct Harvest Bridgeton 37.5 40.0 62.00 5.22 6 No treatment Direct Harvest Jackson’s Wonder 27.0 40.0 - - 7 No treatment Direct Harvest Lima A 59.0 37.0 61.17 5.28 8 Rod Weeder Pick up front
header Lima A 57.0 16.0 53.37 6.94
9 Rod Weeder Pick up front header
Lima Y 36.0 34.0 45.47 2.20
In 1995, harvest trials employed rod weeding, windrows and a peanut header at different stages of crop maturity (Table 5). This resulted in grain yield increasing with maturity, but at the expense of loss of desirable green seed colour (parameter (a) higher value indicating more red). This indicates a trade off between yield and quality, although neither differences were significant over 2 replicates. Table 5. Effect of maturity stage at harvest on yield and quality of seed (Trial sown 27/1/95)
Maturity Level Grain Yield Seed Quality Parameter % kg/ha Brightness L Colour a1 29 1903 60.1 6.8 52 1945 60.6 6.4 75 2163 57.0 7.1 89 2306 53.8 7.8
1 Green to red ascending. In 1996, fine tuning was attempted with 4 times of rod weeding at pod maturities between 10 and 60%, for each variety.
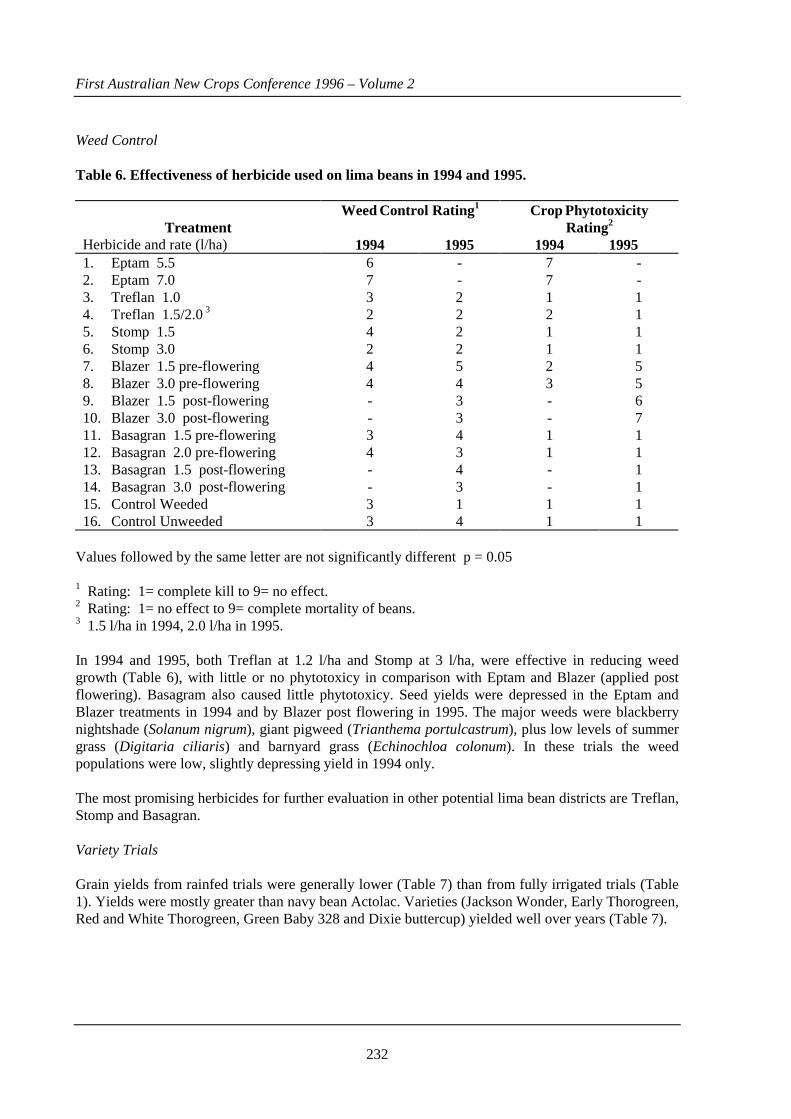
First Australian New Crops Conference 1996 – Volume 2
232
Weed Control Table 6. Effectiveness of herbicide used on lima beans in 1994 and 1995.
Treatment Weed Control Rating1 Crop Phytotoxicity
Rating2 Herbicide and rate (l/ha) 1994 1995 1994 1995 1. Eptam 5.5 6 - 7 - 2. Eptam 7.0 7 - 7 - 3. Treflan 1.0 3 2 1 1 4. Treflan 1.5/2.0 3 2 2 2 1 5. Stomp 1.5 4 2 1 1 6. Stomp 3.0 2 2 1 1 7. Blazer 1.5 pre-flowering 4 5 2 5 8. Blazer 3.0 pre-flowering 4 4 3 5 9. Blazer 1.5 post-flowering 10. Blazer 3.0 post-flowering 11. Basagran 1.5 pre-flowering 12. Basagran 2.0 pre-flowering 13. Basagran 1.5 post-flowering 14. Basagran 3.0 post-flowering
- - 3 4 - -
3 3 4 3 4 3
- - 1 1 - -
6 7 1 1 1 1
15. Control Weeded 3 1 1 1 16. Control Unweeded 3 4 1 1
Values followed by the same letter are not significantly different p = 0.05 1 Rating: 1= complete kill to 9= no effect. 2 Rating: 1= no effect to 9= complete mortality of beans. 3 1.5 l/ha in 1994, 2.0 l/ha in 1995. In 1994 and 1995, both Treflan at 1.2 l/ha and Stomp at 3 l/ha, were effective in reducing weed growth (Table 6), with little or no phytotoxicy in comparison with Eptam and Blazer (applied post flowering). Basagram also caused little phytotoxicy. Seed yields were depressed in the Eptam and Blazer treatments in 1994 and by Blazer post flowering in 1995. The major weeds were blackberry nightshade (Solanum nigrum), giant pigweed (Trianthema portulcastrum), plus low levels of summer grass (Digitaria ciliaris) and barnyard grass (Echinochloa colonum). In these trials the weed populations were low, slightly depressing yield in 1994 only. The most promising herbicides for further evaluation in other potential lima bean districts are Treflan, Stomp and Basagran. Variety Trials Grain yields from rainfed trials were generally lower (Table 7) than from fully irrigated trials (Table 1). Yields were mostly greater than navy bean Actolac. Varieties (Jackson Wonder, Early Thorogreen, Red and White Thorogreen, Green Baby 328 and Dixie buttercup) yielded well over years (Table 7).

First Australian New Crops Conference 1996 – Volume 2
233
Table 7. Relative grain yields (trial mean = 100) of lima bean varieties compared with Actolac navy bean grown rainfed at Kingaroy Variety 87 88 90 92 93 94 95 Mean % (No trials
bracketed) Early Thorogreen 140 91 140 108 108 117 (5) White Thorogreen 127 111 121 92 104 98 109 (6) Red Thorogreen 124 124 (1) Jackson Wonder 114 128 142 119 185 138 113 134 (7) Thorogreen 109 85 119 92 93 98 99 (6) Thaxter 102 102 (1) Concentrated Thaxter 96 98 112 88 109 101 (5) Bridgeton 88 114 93 102 103 80 97 (60 G1 73 73 (1) Henderson 71 71 (1) S33-2A 57 99 71 97 81 111 101 88 (7) Green Baby 328 120 115 86 135 119 115 (5) Green Baby 8-78 112 100 40 774 77 81 (5) Improved Kingston 79 105 86 111 98 96 (5) Mendoza bush 63 94 99 39 74 (4) C-Elite 44 96 116 69 81 (4) Green Baby 5-4 105 105 (1) Q23620R 105 102 104 (2) Dixie Buttercup 116 116 (1) Nemagreen 97 97 (1) Actolac (Navy) 83 62 100 82 (3) Trial Mean (kg/ha) 645 1652 1686 1365 614 1226 1910
Quality was assessed by commercial companies (A&B) as well as at Queensland Department of Primary Industries International Food Institute of Queensland (Table 8). Varieties with consistently good quality were Green Baby 328 and Green Baby 8-78, Improved Kingston and Mendoza bush. The latter unfortunately had low grain yields and Improved Kingston was mediocre.

First Australian New Crops Conference 1996 – Volume 2
234
Table 8. Relative ranking (within years) of varieties for overall canning quality 1987 1990 1992 1994 A B A B IFIQ Green Baby 328 * 4 1 1 10 White Thorogreen 9 2 3 8 Mendoza Bush* 4 4 2 - Improved Kingston* 1 5 10 1 Green Baby 8-78* 1 6 4 1 C-Elite ✓ 7 7 5 1 Bridgeton 1 8 7 10 Thorogreen 5 10 9 8 4 Early Thorogreen 1 9 10 11 4 Concentrated Thaxter 8 11 9 9 S33-2A 1 4 12 6 4 Standard 1 3 7 G1 1
* = consistently good quality ✓ = acceptable The best varieties based on both grain yield and quality, appear to be the Green Baby series. This includes Q23620R as a reselection of Green Baby 328. Thus suitable varieties for a grain crop industry are available, although little germplasm has been studied. Some US imports were very photosensitive, did not set seed before winter and could not be included in yield trials. In a water use efficiency comparison with navy beans, the lima bean Bridgeton was markedly superior (Wright 1996). This suggests that lima beans may be more drought tolerant than navy beans, which is borne out in rainfed yield trial comparisons with the navy bean variety Actolac (Table 7). In general, lima beans have 7 cm lower and 3 cm wider bushes than navy beans, but a generally similar time to flowering (42 day for lima and 40.3 days mean for many beans). If sown in December, maturity is also similar (Table 1). Discussion Timing of harvest to optimise both grain yield and quality requires fine tuning and commercial scale trials for development of recommendations. In particular, at least 1–2 tonnes are required for factory scale tests which must precede any industry launch. Sufficient is known about crop management, choice of weed control, and choice of variety to initiate commercial trials. Further studies should include: plant population and row spacing comparisons, fertiliser rates, insect control, and confirmation of drought tolerance relative to navy beans. Besides Heliothis spp, a potentially important pest is Etiella pod borer which is difficult to control due to protection for most of its life cycle within the thick leathery pods. Districts such as the Burnett have the farm infrastructure necessary for lima beans because of a long history of producing peanuts, ie. rod weeders, windrowers, and harvesters with pick up reels. These districts tend to be rainfed and may be the best target for commercialisation, provided that lima beans are competitive economically with other crops.
First Australian New Crops Conference 1996 – Volume 2
235
References Baudoin, J.P. 1988. Genetic resources, domestication and evolution of lima bean (Phaseolus lunatis)
Section IV In: Genetic Resources of Phaseolus Beans. (Ed. Paul Gepts) (Kluwer Academic Publishers). pp. 393-407.
Harding, J., Tucker, C.L. and Barnes, K. 1981. Genetic variation for flowering response in Phaseolus
lunatus L. Journal of Amercian Society of Horticultural Science 106: 69-72. Wright, G. 1996. Selection for water-use efficiency in food legumes. In: Review Submission ACIAR
PN9216, QDPI). Wright, R.M. 1993. Lima bean (Phaseolus lunatus) research. In: National Workshop for New
Summer Grain Legumes. (Eds R.J. Redden and R.L. Fletcher). pp. 82-86.

First Australian New Crops Conference 1996 – Volume 2
236
The Implications of Seed Germination and Survival Rates on the Economics of the Production of Ginseng in Australia
Tony Sadler Australian Ginseng Research Program, c/- New Crops Program, Department of Plant Production, The University of Queensland Gatton College, QLD 4345 Abstract Ginseng has been grown commercially in Australia for more than a decade and has the potential to significantly replace imports and provide a new domestic and export crop. To date, most production has been from direct seeding but increasingly production from rootlets is being used. The germination rate of Korean ginseng (Panax ginseng) is found to be only 35% in the first year, with germination spread over three months. Losses of new rootlets are 50% in the first ten weeks. Calculations based on the literature and the experiments described in this report show that production of American ginseng (Panax quinquefolius) from rootlets, at a rootlet price of $1.00, provides a return of 66% per annum on investment. Direct seeding returns 50% per annum on investment. This economic comparison shows that production from rootlet stock is favourable when the unit price of rootlets is $1.23 or below. Introduction Background Ginseng is a medicinal plant of great antiquity. It is a slow growing deciduous perennial herb that grows to about a half metre tall. The seed may take a year or two to germinate and the plant three to four years to produce seed. The root takes at least four years before it is ready to harvest. Ginseng roots are viable for hundreds of years - each year getting more valuable. There are a number of ginseng species, two of which make up most of the commercial trade. American ginseng (Panax quinquefolius) is native to the eastern half of North America with distribution from Louisiana into Canada. Korean ginseng (Panax ginseng) is native to Korea and China. The two plants are similar in their growing requirements. Ginseng is one of the most valuable legal agricultural crops in the world. Eastern medicine suggests it has a role in protecting and prolonging life. It is thought to be useful in assisting the body to combat disease and stress. Western medicine has isolated and studied the active ingredients, ginsenosides. Different ginsenosides have effects which include stimulating or sedating the central nervous system, balancing metabolic

First Australian New Crops Conference 1996 – Volume 2
237
processes, controlling blood sugar levels, stimulating the endocrine system and hormone levels and, improving muscle tone. Market Commercial trade in ginseng is at least 5000 years old and so shares a similar past to the silk trade. Recent estimates have put the wholesale value of the world’s ginseng production at A$1.5 billion. Of this, the market in Korea is about $800 million, in China $500 million and in North America $150 million. The retail value of the world market is very difficult to estimate because of political boundaries. Most ginseng is sold through clearing houses in Hong Kong. The principal end-user is China. However, in 1992, ginseng sold as dietary supplements alone, was worth $10.8 million in the UK, $4.3 million in Spain, $11.7 million in Germany and $4.9 million in France. Australia is developing a major internal ginseng market. Total imports have risen from 4.1 tonnes in 1989 to 16.7 tonnes in 1994. Official statistics are not kept of the form in which ginseng is imported. It is believed that much of the Australian importation is in packaged form, such as capsules, with very little in raw form. It is also estimated that five times the official amount comes into the country undeclared (Hosemans, 1995).
Table 1. Ginseng imports to Australia 1989-1994 (Australian Bureau of Statistics)
Year Imports (tonnes) 1989 4.11 1990 6.01 1991 6.52 1992 10.81 1993 10.11 1994 16.72
Agronomy Ginseng is grown from seed. Attempts at propagation from cuttings and tissue culture have not yet been commercially successful. The seed ripens on the plant in autumn. Before germinating, however, the seed must undergo a cold-warm-cold sequence and seedling growth will not normally occur until 18 months, and possibly 30 months, later. Ginseng has been grown commercially in Australia for a little over a decade. The method of growing has been to plant the seeds directly into the beds in which the plant will grow during its six to seven years. This method was copied from North America, the source of most Australian seed and information. The traditional method of growing ginseng in China and Korea is different. Seeds are sown in intensive nursery beds for one or two years. Rootlets are then removed and planted out into the permanent beds for the last four to five years (Hong 1978). This method is only used to a minor extent in North America, possibly because the direct sowing of seeds is more compatible with the large-scale production and mechanisation practised in that region. In Australia the production from rootlets has begun only in the last few years.

First Australian New Crops Conference 1996 – Volume 2
238
The main purpose of this paper is to examine the economics of ginseng production to determine which of the two methods leads to greater profits. While a number of books and papers promoting ginseng production give data on yields per hectare for production from seed, there is a lack of data on production from rootlets and on germination and survival rates. It is possible to calculate some of this information from published data. With American ginseng there are about 17 000 seeds per kg (Oliver et al. 1992; Hosemans and Hosemans 1993; Persons 1994). In British Columbia, an average planting density of 112 kg/ha yields 2240 kg/ha of four year old roots (Oliver et al. 1992). In North Carolina, 6lb (2.724 kg) yields 100lb (45.4 kg) of dried roots in year six (five year old roots) (Persons 1994). In Australia, 20 kg of seed yields 908 kg of dried roots in year six (five year old roots) (Hosemans and Hosemans 1993). The size and weight of ginseng roots vary greatly and can be influenced by a number of factors, most important of which are spacing, mulch type, fertiliser and irrigation. The average weights of American ginseng roots are shown in Table 2 (Proctor and Bailey 1987; Persons 1994).
Table 2. Average weight of American ginseng roots
Age Fresh Dry Number/kg 4 years 27 gm 9 gm 111.1 5 years 38 gm 12.7 gm 78.7 6 years 45 gm 15 gm 66.7
From these figures it can be concluded that of the seeds planted only 13.1% reach maturity in British Columbia, 7.7% in North Carolina and 21% in Australia. In British Columbia germination rates of 70-85 % are claimed (Oliver et al. 1992). In the wild, however, American ginseng has been found to have a success rate of only 0.55% from seed to rootlet production. This high level of seed mortality without germination suggests that the 18 or more months of seed maturation is a highly vulnerable stage in the life cycle of ginseng (Lewis and Zenger 1982). After germinating and surviving for the first few months, the survival rate of gonseng plants approaches 100%. To reasonably compare the economics of seed versus rootlet production, the germination rate and survival rate need to be more accurately determined. Materials and Method From a batch of commercially purchased, stratified Korean ginseng seed (Panax ginseng), 3500 seeds were separated. The seeds were refrigerated at 40C for approximately ten weeks. At that time and at seven day intervals for the following ten weeks, seeds that were beginning to germinate, as evidenced by the noticeable elongation of the radicle, were separated and planted. Ungerminated seeds were soaked in water at room temperature for five minutes before being returned to refrigeration. Planting took place in seed trays using a commercial seedraising mixture (Debco P/L), at a spacing and depth of 2.5 cm. The trays were stored in an external environment of 90-95% shade and watered as required. Average air temperature was 220C; average humidity was 65%. At the end of the second week and at seven day intervals for the following 13 weeks, the number of plants that had living material above the soil surface was counted.

First Australian New Crops Conference 1996 – Volume 2
239
Results Of the 3500 seeds only 1217 (34.8%) germinated. Planting was halted after ten weeks because of the observable reduction in germination rate. In the next five weeks, the seeds were stored at room temperature and only three more germinated. The pattern of germination over the ten week period is shown in Figure 1.
0
50
100
150
200
250
300
1 2 3 4 5 6 7 8 9 10
week
no. germinated
Figure 1. Germination rate of Korean ginseng in an experimental plot
The percentage of rootlets alive and showing plant growth above ground level for weeks 2-10 after planting is shown in Figure 2.
0
20
40
60
80
100
2 3 4 5 6 7 8 9 10
week
% alive
Figure 2. Survival rate of Korean ginseng in an experimental plot

First Australian New Crops Conference 1996 – Volume 2
240
Conclusions The purpose of refrigerating the seeds was to simulate a period of cold in an attempt to enhance germination. Under field conditions growers would plant their seed with an expectation that germination would not occur until the following spring after low winter temperatures provided the final stimulation for germination. In this experiment only 34.8% of the seed germinated. It is likely that more would germinate following the next extended cold chill. However, it seems most unlikely that the 70-85% germination rate claimed in British Columbia would be achieved. The results shown in Figure 1 indicate that ginseng seeds germinate over a period of at least ten weeks. The results also show that the rate of germination follows a unimodal skewed frequency curve. The samples of seeds germinating in weeks two to ten each represent seven days. In week one, however, the sample includes seeds that germinated in the first ten weeks and hence the value shown is higher than expected. The results shown in Figure 2 represent the survival rate of the rootlets over a ten week period. The sample size decreased through weeks 6-10 from 1208 to 512, reflecting the fact that by week 15 those seeds that had germinated later in the experiment had been planted for less than the 6-10 weeks. Although it was not specifically measured, it was noted that not all seeds that were planted produced an above-ground leaf. It is assumed that these died. The actual number dying in this way was small, probably less than 5%, and the reason is unclear. Leading possibilities are a damping-off disease attacking the rootlet resulting in death before emergence or the occurrence of physical damage during planting. During weeks 3-4, extremely high rainfall maintained a high humidity. Losses of rootlets to the presumed damping-off disease were marked. For example, in the batch of germinated seeds from week one, 33.6% of the rootlets died through the disease during week 4. This disease persisted in all rootlet trays throughout the experimental period after week three but at a rate which was less than that of weeks three and four. The graph of percentage survival rate against time asymptotes toward the 48% mark. Economic comparison The price of ginseng varies according to a range of factors such as size, shape, ginsenoside content, method of growing, presence of chemicals, etc. The prices paid for American ginseng at the farm gate in the US (in A$ per kg) for the period 1985-86 to 1992-93 are shown in Table 3 (Persons 1994).

First Australian New Crops Conference 1996 – Volume 2
241
Table 3. American ginseng prices in the US, 1985-86 to 1992-93
Year Wild grown A$
Artificially cultivated A$
1985-86 368-448 60-106 1986-87 346-470 53-88 1987-88 529-661 82-152 1988-89 661-926 88-196 1989-90 581-794 82-132 1990-91 646-794 112-183 1991-92 646-991 117-192 1992-93 617-1,030 82-165
In 1995 the US artificial shade-grown roots with chemical residue at 3-4 year old were selling for $65 per kg, woods-cultivated roots with some chemical residue at 5-6 year old were bringing $300 per kg and wild and wild-simulated roots with no chemical residue at six year old were bringing $950 per kg. In Australia, seven year old woods-cultivated organically-grown roots were bringing about $1000 per kg (Hosemans and Hosemans 1996). To demonstrate the economics of seed versus rootlet production, a calculation has been made in which it is assumed that the crop is woods-cultivated, organically-grown and will sell at $250/kg for five year old and $400/kg for six year old roots. In the calculation, it is assumed that a grower has $20 000 to spend. Seeds are sown at a spacing of 50 mm x 150 mm and rootlets at 100 mm x 150 mm. The seeds have a 35% germination rate 12 months after sowing and 15% 24 months after planting with 50% losses in the first rootlet year. After the first year rootlets from both seed and rootlet origins are assumed to suffer 10% loss. It is also assumed that the germination and survival rates determined for Korean ginseng are also valid for American ginseng. Table 4. Economics of a seed-based ginseng operationnomics over 7 years for American ginseng Expenditure
Seed 4.57kg seed @ $700/kg $3,200 Labour Bed prep. & planting 140hr @ $12/hr 1,680 Care & maintenance 412hr @ $12/hr 4,944 Harvesting 300hr @ $12/hr 3,600 Materials Shade cloth @ $6/m 2,742 Posts/wire 827 Irrigation 570 Mulch 227 Fertiliser & fungicide 410 Site works 1,800 Total 20,000

First Australian New Crops Conference 1996 – Volume 2
242
Income
5 year old 6.75% = 66.7kg @ $250/kg 16,675 6 year old 15.75% = 183.5kg @ $400/kg 73,400 Total after 7 years 90,075 % return per annum 50.1
Table 5. Economics of a rootlet-based ginseng operation over 5 years for American ginseng
Expenditure
Rootlets 16000 seed @ $1 each $16,000 Labour Bed prep. & planting 37hr @ $12/hr 444 Care & maintenance 50hr @ $12/hr 600 Harvesting 52hr @ $12/hr 624 Materials Shade cloth @ $6/m 1,040 Posts/wire 314 Irrigation 156 Mulch 58 Fertiliser & fungicide 80 Site works 684 Total 20,000
Income
6 year old 90% = 216kg @ $400/kg 86,400 Total after 5 years 86,400 % return per annum 66.4
This calculation shows that greater economic returns can be expected from production based on rootlets. Using these assumptions, the return on income from a rootlet operation would equal that of the seed operation at a rootlet cost of $1.23. The 1996 cost of rootlets ranges from $1.00 to $1.50 for American ginseng and $1.50 to $2.00 for Korean ginseng. The higher price for Korean ginseng reflects the lower numbers of rootlets available to the Australian market and can be expected to fall sharply in the coming years. A number of factors have not been taken into account in the calculation. The cost of land, the time value of money, the potential for return from seed harvested during production, and the level of risk have not been included. Recognising these factors would all favour rootlet production. References Hong, S.K. 1978. Ginseng cultivation. In: Korean ginseng. (Ed. H.W. Bae) (Korean Ginseng Research
Institute, Seoul). Hosemans, C. 1995. Cultivating ginseng in Australia. Australian Ginseng Gazette 1: :8-11.

First Australian New Crops Conference 1996 – Volume 2
243
Hosemans, F. and Hosemans, C. 1993. Ginseng growing in Australia. (Gembrook Organic Ginseng: Gembrook, Victoria).
Hosemans, F. and Hosemans, C. 1996. Gembrook Organic Ginseng January Newsletter. (Gembrook
Organic Ginseng: Gembrook, Victoria). Lewis, W.H. and Zenger, V.E. 1982. Population dynamics of the American ginseng Panax
quinquefolium (Araliaceae). American Journal of Botany 69: 1483-1490. Oliver, A., van Dalfsen, B., Lierop, B.V. and Buonassisi, A. 1992. American ginseng culture in the
arid climates of British Columbia. (Ministry of Agriculture, Fisheries and Food: Province of British Columbia).
Persons, W.S. 1994. American ginseng: green gold. (Bright Mountain Books: Asheville, North
Carolina). Proctor, J.T.A. and Bailey, W.G. 1987. Ginseng: Industry, botany and culture. Horticultural Reviews
9: 187-236.

First Australian New Crops Conference 1996 – Volume 2
244
Use of Cold Technique for Coconut (Cocos nucifera L.) Embryo Collection and Transportation Yohannes M. S. Samosir1,2, Ian D. Godwin1 and Stephen W. Adkins1
1 Department of Agriculture, The University of Queensland, St. Lucia, Qld 4072, Australia 2 Indonesian Oil Palm Research Institute, PO Box 1103 Medan 20001, Indonesia Abstract A technique for collecting, transporting and storing coconut embryos (either in plug or excised form) was developed using a low temperature (5+1oC). In plug form, the embryos were in a protective endosperm plug (2.5 cm diam.), removed from the fruits with a cork borer. Removing the plugs from the nuts resulted in some damage of the testa (17%). Some plugs (43%) provided insufficient protection by exposing the haustoriums of the embryos. This trait was cultivar specific while testa damage was due to technical error. Both testa damage and insufficient embryo protection caused higher contamination rates even when stored at low temperature. Low temperature storage was also used to collect the embryos in excised form. The embryos were excised in the field and either placed directly into sterile tubes containing 20 mL of ascorbic acid solution (1 mg/L/ L) or surface sterilised with 2% sodium hypochlorite solution in syringes and filled up with ascorbic acid solution (1 mg/L/ L). The contamination rate of the embryos,once in culture medium, was low (<6%) if a low temperature was applied during transportation and storage period. In contrast, the contamination rate increased up to 32% when they were stored at room temperature (28/25+2oC). Deterioration of endosperm and embryo was suppressed by the low temperature as indicated by the hard texture and white colour of the plug and embryo even after 4 day storage. The subsequent germination of embryos in the culture medium was normal (more than 80% germination rate based on uncontaminated embryos) regardless of temperature, collection and storage techniques indicating that low temperature has no detrimental effect on coconut embryo viability. Introduction Coconut (Cocos nucifera L.) is the most important palm in the tropics. This crop is well adapted to coastal areas between 20oN and 20oS, but can survive at higher latitudes up to 27o. More than 90% of the world's coconuts are grown in the Indo-Pacific region where The Philippines and Indonesia are the major coconut producers (APCC 1990). Coconut is also grown in Australia, particularly in northern Queensland and the Northern Territory. Coconut is well known as 'the tree of life' because virtually every part of the tree can be utilised. More than 100 products have been identified (Persley 1992) ranging from a simple fresh use to the extraction of specific fatty acids for cosmetic and pharmaceutical use. One study has shown the potential of coconut oil as a substitute for diesel (Carandang et al. 1991). Despite this multiple use, many of the products have not been well developed, therefore coconut can still be regarded as a new crop. There are many potential markets in Australia apart from desiccated coconut, but development work is required to incorporate coconut into products such as ice cream, confectionery and beverages (ACIAR 1988). Annual imports of coconut products to Australia, including whole nuts, is A$19 M (based on 1989-1992 average, Australian Bureau of Statistics). Coconut can also be used for gardening and landscaping. Demand for seedlings is very high, particularly for dwarf varieties which commonly have contrasting colour (Foale 1984).

First Australian New Crops Conference 1996 – Volume 2
245
Despite the importance of coconut, the improvement of this crop has been very slow. The productivity has been unchanged for decades (Persley 1992) due to the long lifespan and lack of germplasm collection. Present germplasm collection methods are impeded by the difficulty of transporting this bulky fruit. The methods are expensive and can lead to the introduction of pests and/or diseases into new areas. The method of isolation and culture of mature coconut embryos in vitro (De Guzman 1970, Assy Bah 1986, Samosir 1991) makes coconut collections in embryo form possible. Collection in embryo form is not only safe and convenient but also reduces transportation cost. The weight of a single coconut fruit is equal to 10,000 excised embryos (Harries 1982). Since most of the coconut germplasm is to be found in remote areas which do not have tissue culture facilities, techniques to collect and transport the embryos are essential. Direct field culture techniques have been developed (Assy Bah et al. 1987, Sossou et al. 1987), requiring previously prepared sterile media and equipment for in vitro isolation in the field. To overcome the need to transport equipment, another field technique was developed which involved isolating just the embryo in a plug of its own endosperm tissue and transporting it in a sterile plastic bag to the laboratory (Rillo and Paloma 1992) or soaked in a potassium chloride solution (Assy Bah et al. 1987). These two techniques involve intensive surface sterilisation in the field and re-sterilisation in a tissue culture laboratory at a later date. In addition, the growth of the embryos soaked in potassium chloride solution was reported to be repressed. These techniques will not work well for mutant kopyor or makapuno coconut type where a firm endosperm tissue does not exist. More recently, Ashburner et al. (1993) developed a method which involved the isolation and transportation of naked embryos; however this technique could induce high rates of embryo contamination. The present study investigates reliable and rapid coconut embryo transport technique, either in an endosperm plug or excised form, that can be used in remote areas where aseptic facilities are unavailable. Specifically, low temperature incubation treatment was evaluated to maintain embryo viability, either in plugged or excised form, until a time when standard in vitro embryo culture could be initiated. Materials and Methods Plant Material The coconut fruits were obtained from small-holder plantations located along the west coast of West Lombok, Indonesia approximately 20 km northwest of Mataram. Mature fruits of the cultivar Batu Layar were harvested from randomly selected trees, dehusked, halved and the endosperm plugs removed using a cork borer decontaminated by wiping inside and out with 70% ethanol. Assessment of Endosperm Plug Following Removal from Fruit Two lots of more than 300 plugs each were assessed. The condition of the testa and endosperm-coverage of the plugs were observed prior to placing them in plastic bags. To represent the low temperature treatment one bag was placed in an insulated cooler tank containing ice cubes (5+1oC). A second bag was placed in a similar tank but without ice. Both tanks were transported (ca. 20 km; the collection and transportation took about 6 hours) to the University of Mataram laboratory where the tubes from the tank with ice were removed and placed in a refrigerator (5+1oC), while the tubes from the other tanks were placed on a laboratory shelf. The laboratory had no temperature control and was approximately 28/25 + 2oC. After incubation for 4 days the embryos were isolated from the plugs and surface sterilised using sodium hypochlorite (2%, w/v for 20 min) and double rinsed in sterile deionised water. The embryos were then individually placed in polycarbonate tubes (8.0 x 2.5 cm diam.) containing 10 mL of an sterile liquid culture medium (Y3+ medium) consisting of Y3 nutrients (Eeuwens 1976) supplemented with

First Australian New Crops Conference 1996 – Volume 2
246
Morel and Wetmore vitamins (Morel and Wetmore 1951), sucrose (175 mM) and activated charcoal powder (2.5 g/ L). The pH was adjusted to 5.3 using drop wise additions of 0.1 M HCl or 0.1 M NaOH prior to the addition of activated charcoal. The cultures were then incubated without shaking in the dark at 26+1oC for 3 weeks and then examined for contamination. Field Collection Using Cold Plugged and Excised Embryo Systems Nine lots of 30 undamaged and well endosperm-covered plugs were prepared and placed in plastic bags as described in the previous section. Six bags were placed in an insulated cooler tank containing ice cubes (5+1oC) while the other 3 bags were was placed in a similar tank but without ice. For the excised embryo system, the embryos were removed from the plugs in the field using clean dissecting instruments (decontaminated with 70 % ethanol) and placed into sterile screw cap tubes (18.0 x 2.4 cm diam., 25 embryos each tube) containing 20 mL of ascorbic acid solution (1 mg/L/ L). Any visibly damaged or abnormal embryos were discarded at this stage. Three tubes were placed in an ice tank and another three in a second tank without ice. The collection technique of Ashburner et al. (1993) using excised embryo in sterile syringes was also tested in conjunction with low temperature. Undamaged excised embryos were randomly selected and placed in syringes (20 mL, 25 embryos each). A sodium hypochlorite solution (2% w/v) was sucked in through the needle to surface-sterilise the embryos for 10 minutes followed by a double rinse with sterile deionised water. Finally, the syringes were filled with ascorbic acid solution (1 mg/L/ L) as an incubation medium. The syringes were then placed in the ice tank or in the other tank without ice. Both tanks were transported to the tissue culture laboratory for storage. The plugs from 3 bags in the ice-tank were used as controls and these embryos were immediately isolated (not stored). Twenty five embryos per lot were randomly selected, sterilised and cultured in the liquid Y3+ medium at 26+1oC for 2 weeks. The embryos were subcultured onto the same medium solidified with 7 g/L agar (Sigma Chemical Co., St Louis, USA) and incubated under the same environmental conditions for a further 4 weeks at which germination was assessed. The other three bags, tubes and syringes from the ice-tank were placed in a refrigerator while all lots from the tank without ice were stored on a laboratory shelf at 28/25+2oC. After storage for 4 days, the embryos were removed from the plugs and those that had previously been excised in the field and held in the tubes and syringes were surfaced sterilised and cultured. Culture performance was then assessed for contamination and germination. Germination was considered to have taken placed when either the plumule or radicle visibly emerged (> 3 mm) from the cotyledonary sheath. This experiment was undertaken using a completely randomised design with 3 replicates. The data were statistically analysed for variance and mean comparison according to the Student-Newman-Keuls test using SigmaStat (Jandel Corporation, San Rafael, USA).
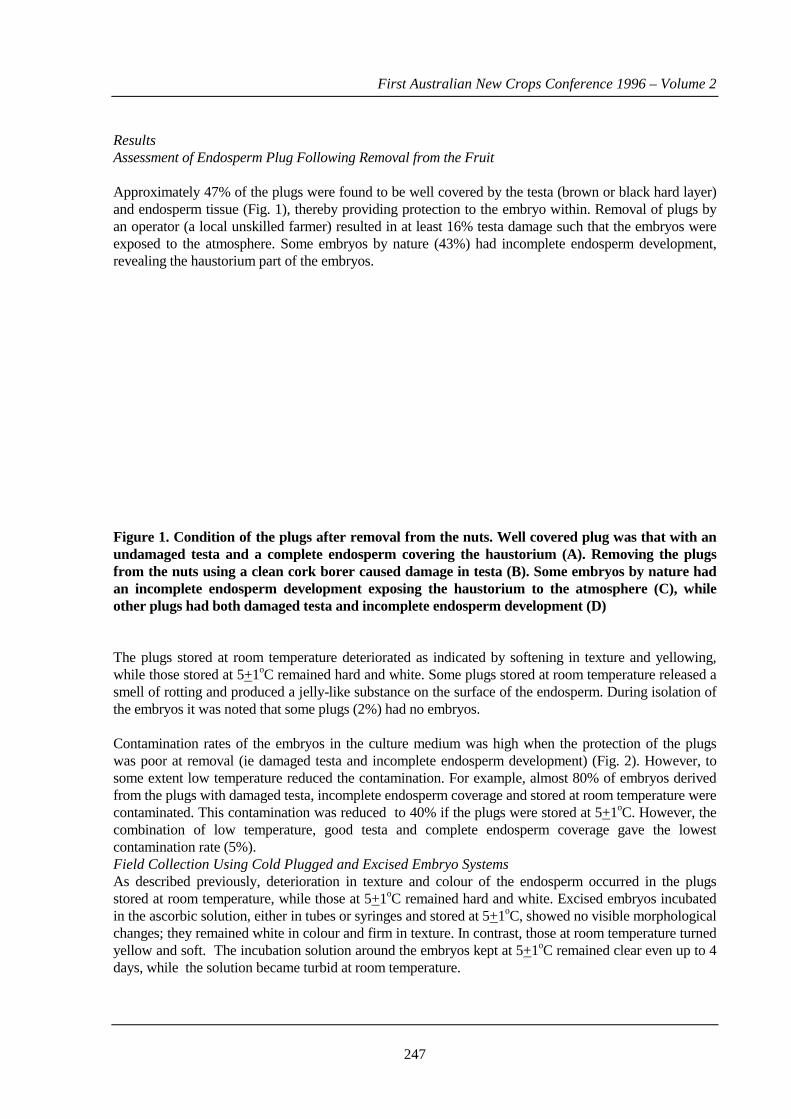
First Australian New Crops Conference 1996 – Volume 2
247
Results Assessment of Endosperm Plug Following Removal from the Fruit Approximately 47% of the plugs were found to be well covered by the testa (brown or black hard layer) and endosperm tissue (Fig. 1), thereby providing protection to the embryo within. Removal of plugs by an operator (a local unskilled farmer) resulted in at least 16% testa damage such that the embryos were exposed to the atmosphere. Some embryos by nature (43%) had incomplete endosperm development, revealing the haustorium part of the embryos. Figure 1. Condition of the plugs after removal from the nuts. Well covered plug was that with an undamaged testa and a complete endosperm covering the haustorium (A). Removing the plugs from the nuts using a clean cork borer caused damage in testa (B). Some embryos by nature had an incomplete endosperm development exposing the haustorium to the atmosphere (C), while other plugs had both damaged testa and incomplete endosperm development (D) The plugs stored at room temperature deteriorated as indicated by softening in texture and yellowing, while those stored at 5+1oC remained hard and white. Some plugs stored at room temperature released a smell of rotting and produced a jelly-like substance on the surface of the endosperm. During isolation of the embryos it was noted that some plugs (2%) had no embryos. Contamination rates of the embryos in the culture medium was high when the protection of the plugs was poor at removal (ie damaged testa and incomplete endosperm development) (Fig. 2). However, to some extent low temperature reduced the contamination. For example, almost 80% of embryos derived from the plugs with damaged testa, incomplete endosperm coverage and stored at room temperature were contaminated. This contamination was reduced to 40% if the plugs were stored at 5+1oC. However, the combination of low temperature, good testa and complete endosperm coverage gave the lowest contamination rate (5%). Field Collection Using Cold Plugged and Excised Embryo Systems As described previously, deterioration in texture and colour of the endosperm occurred in the plugs stored at room temperature, while those at 5+1oC remained hard and white. Excised embryos incubated in the ascorbic solution, either in tubes or syringes and stored at 5+1oC, showed no visible morphological changes; they remained white in colour and firm in texture. In contrast, those at room temperature turned yellow and soft. The incubation solution around the embryos kept at 5+1oC remained clear even up to 4 days, while the solution became turbid at room temperature.

First Australian New Crops Conference 1996 – Volume 2
248
Low temperature reduced contamination significantly in both embryos in the plug and in the excised form (Fig. 3). Contamination was less than 6% when the embryos or plugs were stored at 5+1oC compared with 11 to 32% when stored at room temperature. At room temperature the syringe technique gave the lowest contamination rate (11%) compared with the other techniques. However, when a low temperature was applied the contamination rates of any technique were reduced and not significantly different compared with the control. The germination of the uncontaminated embryos from both temperature treatments was good (Fig. 3) indicating that neither temperature treatment nor the techniques (plug, excised) had adversely damaged the embryos. More than 80% of uncontaminated embryos germinated regardless of temperature or technique and these were no significant differences compared with the control, except with the embryos in the plugs stored at room temperature. Figure 2. Contamination of the embryos in culture medium following storage of the plugs at 5+1oC (❑) or without temperature control (■) for 4 days. Well covered plug was that with an undamaged testa and a complete endosperm covering the haustorium (A). Removing the plugs from the nuts using a clean cork borer caused damage in testa (B). Some embryos by nature had an incomplete endosperm development exposing the haustorium to the atmosphere (C), while other plugs had both damaged testa and incomplete endosperm development (D). The data were derived from two samples of more than 300 plugs each
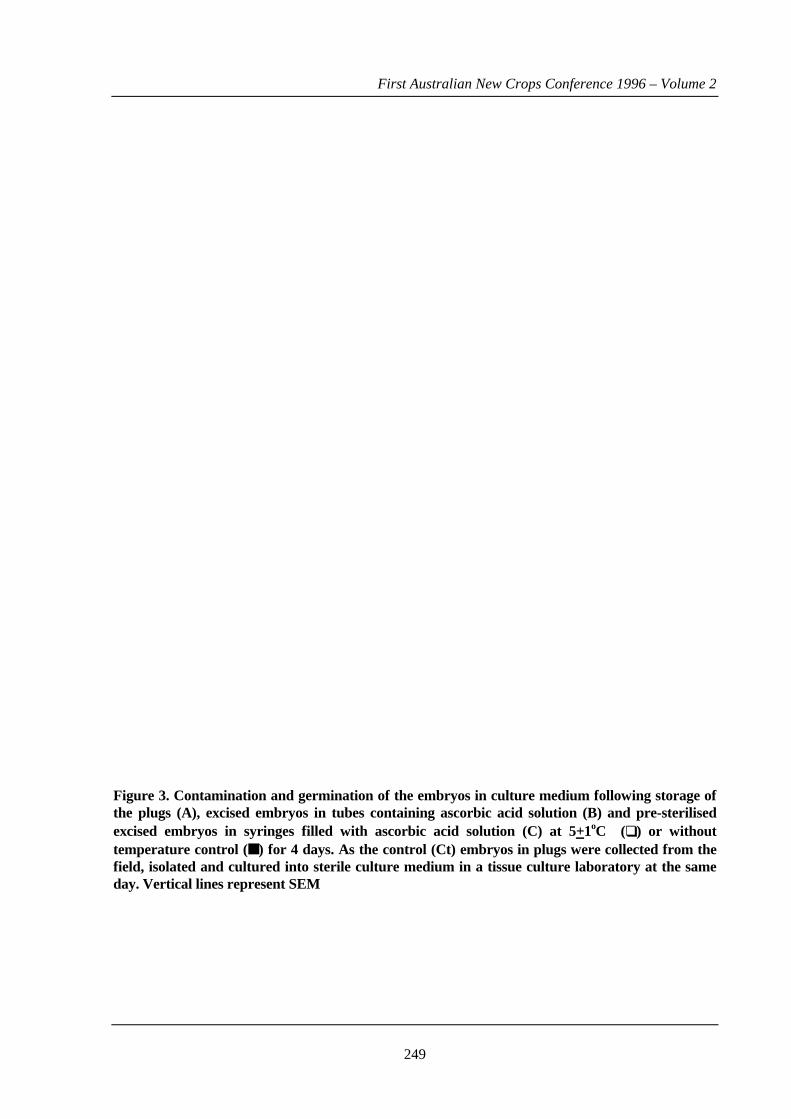
First Australian New Crops Conference 1996 – Volume 2
249
Figure 3. Contamination and germination of the embryos in culture medium following storage of the plugs (A), excised embryos in tubes containing ascorbic acid solution (B) and pre-sterilised excised embryos in syringes filled with ascorbic acid solution (C) at 5+1oC (❑) or without temperature control (■) for 4 days. As the control (Ct) embryos in plugs were collected from the field, isolated and cultured into sterile culture medium in a tissue culture laboratory at the same day. Vertical lines represent SEM

First Australian New Crops Conference 1996 – Volume 2
250
Discussion Low temperature (5+1oC) depressed the contamination rate of the embryos in culture medium without detrimental effect on germination (Fig. 2 and 3). It is believed that the low temperature suppressed microbial activity and the deterioration process in the endosperm during transportation and storage. As a tropical plant with a recalcitrant seed, coconut is thought to be very susceptible to chilling injury (Ng and Ng 1991). For example, storage of coconut embryos on a solid culture medium at 4oC for 3 months resulted in tissue damage (black spot) and a total loss of viability (Karunaratne 1988). However, it is possible that after a shorter period of chilling, coconut may not be damaged as seen in other species (for example see Cal and Obendorf 1972, Bramlage et al. 1978; Bedi and Basra 1993). Testa and endosperm provided protection for the embryo within and damage to these tissues was found to increase contamination (Fig. 2). Testa damage is thought to occur during the removal of the plugs from the fruits as this work was done by an untrained farmer. In addition, the cultivar may also have the trait that the testa is not strongly connected to the endosperm. The incomplete coverage of an embryo by its endosperm at the basal end with the haustorium visible is a cultivar trait. Poor embryo protection makes collection and transportation using the plug system (even with low temperature) impossible as the contamination rate is too high (19%, Fig. 2). In these cases, the embryos can be isolated from their plugs in the field, placed in the ascorbic solution, transported and stored using the cold excised embryo system. Without low temperature, the syringe technique resulted in a lower contamination (11%) compared with the excised embryo incubated in the ascorbic solution (32%). This demonstrates that pre-sterilisation of the excised embryos with sodium hypochlorite in the field can reduce contaminants brought into the incubation solution. However, according to Ashburner et al. (1993) inconsistencies exist when collecting excised embryos using the syringe method (without low temperature treatment). Therefore, the low temperature applied in the present study had the effect of improving the reliability of the system. By maintaining viability for a period of 4 days it should be possible to transport coconut embryos from the field to a laboratory for culturing by normal aseptic procedures. This technique would enable coconut germplasm to be collected from even the most remote field sites. Such sites are common in south east Asia and the Pacific regions where useful coconut germplasm is to be found. In a practical application of the cold incubation collection technique, ice cubes placed into an insulated tank would be used to keep the storage temperature close to 5oC. Alternatively, a portable refrigerator equipped with a rechargeable battery or a car battery could be used to maintain the cold conditions. Collecting the embryos in excised form also has the advantage of reducing the weight of the sample as the weight of one plug is equal to that of 38 excised embryos. Whilst the common coconut cultivars can be collected as a plug or excised embryo form, the mutant kopyor or makapuno coconut type can only be collected by the excised embryo method because no firm or solid endosperm is produced. In conclusion, the findings reported here will alleviate the need to carry bulky equipment and fruits when collecting coconut germplasm in the future. Instead of transporting the entire fruit, it has been demonstrated that cooling the embryo to 5+1oC and either removing the embryo entirely and incubating it an ascorbic acid solution (1 mg/L) or holding it in a small portion of endosperm (plug) reduces contamination. The subsequent germination and health of plantlet were unaffected by the 4-day storage at the low temperature. Acknowledgment The authors wish to thank the Australian Agency for International Development (AusAID) for a scholarship awarded to Y. M. S. Samosir and financial support to conduct this research in Indonesia. We acknowledge the statistical assistance from Mrs J. Priest. Special thanks are also given to Dr Parman and
First Australian New Crops Conference 1996 – Volume 2
251
Dr Mansur Ma'shum, University of Mataram, West Lombok, Indonesia, for their cooperation during the trials. References ACIAR 1988. Potential Australian market for coconut and coconut products. ACIAR Working Paper No.
22. (Australian Centre for International Agricultural Research: Canberra). APCC 1990. Coconut Statistical Yearbook 1989.(Asian and Pacific Coconut Community: Jakarta). Ashburner, G.R., Thompson, W.K., Richards, D. and Halloran, G..M. 1993. Collecting and transporting
coconut germplasm using embryo culture techniques. In: Focused Plant Improvement: Proceedings of Tenth Australian Plant Breeding Conference, Vol 2 (pp 9-10). (Eds. B.C. Imrie and J.B. Hacker) (The Conference Organising Committee: Canberra).
Assy Bah, B. 1986. Culture in vitro d'embryos zygotiques de cocotiers. Oleagineux 41: 321-328 Assy Bah, B., Durand-Gaselin, T. and Pannetier, C. 1987. Use of zygotic embryo culture to collect
germplasm of coconut (Cocos nucifera L.). Plant Genetic Resources Newsletter 71: 4-10 Bedi., S. and Basra, A.S. 1993. Chilling injury in germinating seeds: basic mechanisms and agricultural
implications. Seed Science Research 3: :219-229. Bramlage, W.J., Leopold, A.C. and Parrish, D. J. 1978. Chilling stress to soybeans during imbibition.
Plant Physiology 61: 525-529 Cal, J.P. and Obendorf, R.L. 1972. Imbibition and chilling injury in Zea mays L. altered by initial kernel
of moisture and maternal plant. Crop Science. 12: 369-373. Carandang, E.V, Ferrer, M.L.M. and Red, V.P. 1991. Use of 100 percent coconut methyl ester as
substitute for diesel. Philippine Journal Coconut Studies 16: 22-25. De Guzman, E.V. 1970. The growth and development of makapuno embryo in vitro. I. The induction of
rooting. The Philippine Agriculturist 53: 65-78. Eeuwens, C. J. 1976. Mineral requirements for growth and callus initiation of tissue explants excised
from mature coconut palms (Cocos nucifera) and cultured in vitro. Physiologia Plantarium 36: 23-28
Foale, M. A. 1984. Coconut palm (Cocos nucifera L.). In Tropical tree fruits for Australia. Queensland
p.136-140 (Ed. P.E. Page) (Department of Primary Industries: Brisbane). Harries, H.C. 1982. Coconut genetic resources and the plant breeder: Some new approaches to
collection, use and storage. In: Genetic Resources and the Plant Breeder. p113-118 (Eds. R.B. Singh and N. Chomchalow) (IBPGR: Bangkok).
Karunaratne, S.M. 1988. Short term in vitro preservation coconut seed material: A method to facilitate
field collection and transport of coconut germplasm. CORD 6: 40-47 Morel, G. and Wetmore, R.M. 1951. Fern callus tissue culture. American Journal of Botany 38: 141-143
First Australian New Crops Conference 1996 – Volume 2
252
Ng, S.Y.C. and Ng, N.Q. 1991. Reduced-growth storage of germplasm. In: In vitro Methods for Conservation of Plant Genetic Resources (pp 11-39). (Ed. J.H. Dodds) (Chapman and Hall: London).
Persley, G.J. 1992. Replanting the tree of life: Towards an international agenda for coconut palm
research. (CAB International: Wallingford). Rillo, E.P. and Paloma, M.B.F. 1992. Storage and transport of zygotic embryos of Cocos nucifera L. for
in vitro culture. Plant Genetic Resources Newsletter 86: 1-4 Samosir, Y.M.S. 1991. The growth and development of coconut embryos on three media in vitro culture.
Bulletin Manggar 4: 26-34 Sossou, J., Karunaratne, S. and Kovoor, A. 1987. Collecting palm: In In-vitro explanting in the field.
FAO/IBPGR Plant Genetic Resources Newsletter. 69: 7-18.
First Australian New Crops Conference 1996 – Volume 2
253
Quality Ingredients for Japanese Traditional Sweets: Implications for Australian Azuki Beans
Mabo Suzuki1, Junko Kiyama2, Hilton Deeth3, Nola Caffin3 and Adel Yousif3
1 PO Box 192, Surfers Paradise, QLD 4217, AUSTRALIA
2 Department of Domestic Science, Shoin College, Osaka, JAPAN
3 Department of Food Science and Technology, The University of Queensland Gatton College, Gatton QLD 4343, AUSTRALIA
Abstract Bean paste, a major ingredient of Japanese traditional sweets, uses a large quantity of beans, such as Azuki, in Japan. The sweets are still so popular in Japan that one traditional sweets shop near Kyoto sells over 490 000 sweets items every day. Since the sweets have developed over the centuries in Japan, there exist hundreds of recipes for each sweet. However, these recipes vary, particularly with regard to cooking time, depending on the quality of the ingredients used for cooking. The taste of the food is therefore determined by both the cooking recipe and the ingredients. It is believed that sweetness, viscosity, smoothness and melting rate in the mouth when eaten, are the key factors for a quality taste; these are derived from the quality of the beans and the sugar used, the heating techniques and some other traditional procedures.
From a scientific point of view, describing taste is very difficult as it is subjective and involves personal opinions. However, as most agricultural industries nowadays are focussing attention on the downstream applications of their produce, it is important to discuss the biological and chemical aspects of the quality of this produce in relation to its food applications and processing procedures. In this paper, a general Japanese traditional cooking recipe and taste evaluation procedures are described in order to demonstrate the importance of the quality of the ingredients used for making Japanese sweets.
Introduction Beans are one of the most important agricultural crops after rice in Asia. They are believed to maintain soil fertility when used in a cropping sequence with other vegetable crops. There have been a large number of publications on bean crops in China, Korea and Japan since ancient times, as well as a huge number of recipes and ingredient applications using beans. There is, however, limited knowledge outside of these Far East Asian countries, since the writings are in their own languages and not available in European languages. Furthermore, although these recipes, including selection of quality ingredients, have been developed for a quality taste, there is little information about production-related quality factors. To meet the quality demands of beans in the market, it is important to consider an application-oriented study of the beans.
Azuki beans are one of the most popular beans in the Far East Asian countries. Their annual per capita consumption in Japan is about 1 kg (Japanese Bean Fund Association 1987) while in Korea

First Australian New Crops Conference 1996 – Volume 2
254
they are the second most consumed beans after soybeans. Furthermore, Azuki beans have often been used as a special food in festivals and ceremonies since their red/purple colour is strongly favoured in the culture and traditions of these countries. Most day-to-day food applications of Azuki beans originally developed for use in snack foods such as buns, noodle soup and bean soup. These traditional snacks are also made from haricot or similar red/white beans.
After sugar was introduced to Japan in the 15th century, some snacks began to be sweetened. This was the beginning of Japanese traditional sweets, separating them from the snacks. The sweetened bean paste became the main material for these sweets. This paste is used not only as a food to be eaten but also as a food decoration, with a huge number of variations. The ideal sweetness of the paste is an important quality parameter and a major determinant of the huge demand for the sweets in Japan. Amongst the Far East Asian countries, Japan has some of the most sophisticated recipes for traditional sweets, as the sweets were developed not only for day-to-day living but also for some important cultural occasions such as the tea ceremony and ceremonies of the Japanese religions of Shintoism and Buddhism.
It is obviously true that the taste of a food generally depends on its recipe and the quality of its ingredients. The traditional recipes often contain clues and key factors related to the quality of the ingredients and the quality of the taste of the final product. However, it is difficult to scientifically describe the general taste of bean pastes and there are too many traditional recipes to discuss each bean paste taste for each recipe individually. In this paper, we focus attention on one traditional food application for Azuki bean, bean paste, and discuss a typical traditional recipe for it and aspects of its organoleptic quality. This leads to a discussion of the possible scientific connections between the quality of the ingredients and the final taste quality.
General Traditional Recipe for Sweetened Bean Paste An
Sweetened bean paste is widely known as An, pronounced in English more like “Ahn”. (Lumpkin and McClary 1994). An is usually made from Azuki bean, haricot beans or some other beans and peas. It is used for nearly all Japanese traditional sweets and therefore it is impossible to discuss Japanese traditional sweets without discussing An.
It is known that the bean paste consists of blocks of cotyledon cells, which are separated by boiling the beans. Boiling weakens the cell midle lamellae and, as a result, the cell units separate and form bean granules. The protein in the cell is solidified by the heat, but the bean cell wall does not break. The starch granules in the cell swell during heating, but the granule particle remains intact (Watanabe 1982).
A general recipe for sweetened bean paste includes the following 5 main processes:
A. Preparation (bean selection and soaking)
B. Washing and pre-boiling (removal of astringent components)
C. Main boiling
D. Separation of paste and bean shells
E. Sweetening of paste
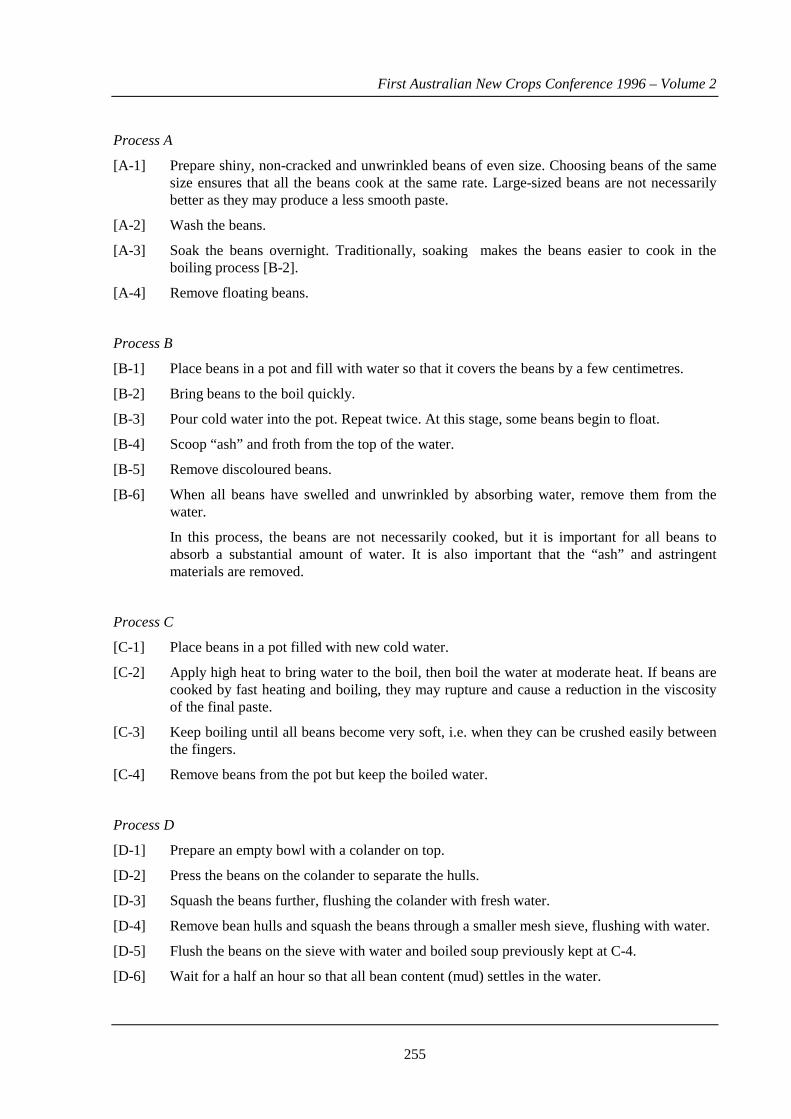
First Australian New Crops Conference 1996 – Volume 2
255
Process A
[A-1] Prepare shiny, non-cracked and unwrinkled beans of even size. Choosing beans of the same size ensures that all the beans cook at the same rate. Large-sized beans are not necessarily better as they may produce a less smooth paste.
[A-2] Wash the beans.
[A-3] Soak the beans overnight. Traditionally, soaking makes the beans easier to cook in the boiling process [B-2].
[A-4] Remove floating beans.
Process B
[B-1] Place beans in a pot and fill with water so that it covers the beans by a few centimetres.
[B-2] Bring beans to the boil quickly.
[B-3] Pour cold water into the pot. Repeat twice. At this stage, some beans begin to float.
[B-4] Scoop “ash” and froth from the top of the water.
[B-5] Remove discoloured beans.
[B-6] When all beans have swelled and unwrinkled by absorbing water, remove them from the water.
In this process, the beans are not necessarily cooked, but it is important for all beans to absorb a substantial amount of water. It is also important that the “ash” and astringent materials are removed.
Process C
[C-1] Place beans in a pot filled with new cold water.
[C-2] Apply high heat to bring water to the boil, then boil the water at moderate heat. If beans are cooked by fast heating and boiling, they may rupture and cause a reduction in the viscosity of the final paste.
[C-3] Keep boiling until all beans become very soft, i.e. when they can be crushed easily between the fingers.
[C-4] Remove beans from the pot but keep the boiled water.
Process D
[D-1] Prepare an empty bowl with a colander on top.
[D-2] Press the beans on the colander to separate the hulls.
[D-3] Squash the beans further, flushing the colander with fresh water.
[D-4] Remove bean hulls and squash the beans through a smaller mesh sieve, flushing with water.
[D-5] Flush the beans on the sieve with water and boiled soup previously kept at C-4.
[D-6] Wait for a half an hour so that all bean content (mud) settles in the water.

First Australian New Crops Conference 1996 – Volume 2
256
[D-7] Discard the water layer.
[D-8] Repeat D-6 and D-7 a few times until the water becomes clear.
[D-9] Wrap the bean mud in a cotton cloth and dehydrate by squeezing the wrapped beans.
Steps D-4 to D-8 are to recover as much of the beans’ contents as possible.
Process E
[E-1] Measure the weight of the plain bean paste from D-9.
[E-2] Weigh out large granulated sugar to 60-75% of the weight of the plain bean paste. (Note: The amount of sugar varies according to the Japanese sweets in which the paste is to be used. A recent dietary trend in Japan is towards reduced amounts of sugar in this cooking).
[E-3] Place the plain bean paste and sugar in a pot.
[E-4] Stir the paste with moderate heating until all the sugar is melted and the paste becomes hard enough, i.e. when a block of the paste placed on a surface retains its shape on standing.
[E-5] Make lumps of the sweetened bean paste by hand and leave overnight with cotton covering. This mellows the sugar taste of the paste [E-7].
The Nissan Sugar Manufacturing Company (1989) in Japan summarised the generalised steps for the industrial production of smooth bean paste as follows: dust separation; stone separation; weighing; washing; soaking; boiling twice in a pressure cooker; rinsing with water to remove anti-nutritive compounds; crushing, removing seed testas; removing excess water in leaching tank; dehydrating; weighing; and combining with sugar and various stabilising ingredients such as agar or bacterial cellulose. It is generally known that manufacturing companies often use stabilisers, starch and other low-cost additives to improve the paste’s performance and keeping quality; however traditional sweets makers do not use additives and prefer to retain the pure, home-made taste.
Organoleptic Quality Attributes of Bean Paste An The views of professional sweets makers from several Japanese sweets shops on the organoleptic quality of bean paste and Japanese sweets are presented below (Ishihara, 1995). These views, which are given under the name of the sweets shop, provide some insight into the quality parameters, considered important in the Japanese trade, which may be influenced by the processing steps or the raw material. • SUETOMI: The taste of Japanese sweets is determined by the quality of the bean paste; the
sweetness is related to the viscosity (associated with the amount of “alpha state starch”), amount of moisture and keeping quality; salt is sometimes added for a taste contrast to the sweetness derived from sugar and in fact increases the sweetness. However, non-salt bean paste is often preferred as a refreshment in tea ceremonies, since the sweet taste remains for a shorter time in the mouth than when salt is present.
• FURYU-DO, which specialises in sweets for the Japanese tea ceremony: The ideal taste is a combination of a very sweet taste, produced by a special boiling technique with less sugar, and the distinctive flavour of the bean. The key is to know how to retain the bean’s flavour, while removing the original bitter taste of the beans by using salt or special processing techniques (Step D-5 in the previous section involving washing the paste with the boiled soup is designed to retain some of the bean flavour). The quality of the sugar is also important since it, together with the structure of the starch in the paste, affects the “melting temperature” of the sweet.

First Australian New Crops Conference 1996 – Volume 2
257
• MISAKI-YA, a non-industrial sweets shop in Tokyo: The taste of bean paste is determined by the melting rate of paste when you put it into your month. The best bean paste, which is used for the Japanese tea ceremony, is one that quickly and smoothly melts in your month, and the sweetness does not remain on your tongue after a certain interval of time (20-40 seconds).
• AKAFUKU, which has a sweets making history of 290 years: It is important to have a taste of semi-dry base sweetness, and it should melt easily in your month, regardless of which kind of beans is used.
• KOOYA: This shop is proud of the fact that its bean paste retains its high quality for one week at room temperature. The key point is to retain the bean cell intact. Careless fast heating results in a poor tasting paste. The sweetness and overall quality of bean paste are not linearly related with a total amount of sugar; the amount of combined sugar with starch is more important.
Traditional Recipes and Taste Factors In this section some important factors in the quality of bean paste and Japanese sweets, based on the above recipes and views of Japanese professional sweets makers, are discussed from a scientific point of view.
Sweetness
In the previous section, the sweetness of bean paste was expressed in different ways. The added sugar obviously makes the bean paste sweet but the perceived sweetness is believed to be related to the level of reducing sugars (Hori 1995, Kugimiya 1992). It also seems to be influenced by the boiling technique and the physical state of the starch, the latter also being related to viscosity. During the long, moderate heating in water the starch in the beans gelatinises and appears to impart a mild sweet taste. The gel state of starch is referred to in Japan as the “alpha state” (Hubo et al. 1987). This sweetness from the starch is unlikely to be the same as the sweet taste derived from sugar. Cooking beans or ingredients that are rich in starch in many Asian countries is believed to make food sweeter without addition of sugar. Salt is also used as a contrast to the sweet taste, while having the effect of increasing the time that the sweet taste remains in the mouth.
Viscosity and Melting Rate
A taste of beans and rice is often discussed in terms of viscosity and melting rate in Asian countries. It relates to the fact that an increased viscosity prolongs the taste stimulation in the mouth, an effect which is favoured when sweet food is consumed, but not for hot or spicy food. The viscosity of food generally has a role of holding a taste of sweetness, salt or spice longer, while the melting phenomenon relates to a short-term sensation of the food in the mouth (Sasaki 1978). The form of the starch or the starch granules may be the key to these two important sensory factors. Both of these factors are also strongly connected with the perception of moistness (Kobayashi et al. 1992).
Sweetness and Starch
One reason for sweetening food with sugar is to improve its keeping quality by increasing its osmotic pressure and inhibiting bacterial growth. According to Hori (1995) the sugar also retards the staling rate of boiled starch by retaining it in the “alpha state” In this way the starch remains in the gel form for a longer time and the products stays moist and soft. This is supported by the comment by the sweets maker at the sweets shop KOOYA (see previous section) about “combined sugar with starch” which suggests that the combination of these components has a favourable effect on retention of flavour of the bean paste, and on its viscosity and moistness. The reason why a specific grain size of sugar is traditionally used in step E-2, is that it is believed to control the “melting temperature” of the sugar at the time of sweetening the bean paste with sugar (step E-4) (Kiyama and Suzuki 1996).

First Australian New Crops Conference 1996 – Volume 2
258
Moisture and Beans
The plant cell wall within the bean, which contains pectin, plays a role in the moistness of the bean paste. It is believed that the pectin holds moisture in the cell (Alberts et al. 1985). Kobayashi et al. (1992) showed that heating melts pectin during the cooking process C, and the bean granules or An granules are formed with a coating layer of this melted pectin. This accords with the point made at step C-2 in section 2 above, about avoiding cooking by fast boiling; under those conditions, pectin is lost and not available to coat the An granules and increase viscosity. Too much pectin causes too much moisture in the bean granule and reduces the viscosity of the bean paste.
Smoothness
Smoothness is normally derived from the large paste particles or An granules. Ideally, An granules after cooking should be evenly sized and not too large. A large bean takes longer to cook than a small one so the starch granules may swell to different sizes during the cooking. Thus bean paste made with random sizes of An granules has a much less smooth taste than paste made of evenly sized granules. This may be the reason why traditional sweet makers commonly emphasise that beans must be cooked by moderate cooking so the bean hull and structure remain intact, and why beans should be chosen to be of the same size, without any cracks or holes, and with unwrinkled skin.
Astringent Taste
Step B of the recipe in section 2 is for the removal of the astringent taste of the beans and to give the paste a milder taste. This is a common process in general Japanese cooking of vegetables, because vegetables generally contains tannins and other components which make food bitter. This bitter (astringent) taste is also removed in step B-4, since the components responsible are apparently removed as floating “ash” and froth during boiling.
Quality of the Ingredients In the recipe steps A-1 and A-3, beans of the same size are selected and soaked overnight. This method was traditionally established to ensure all beans cooked to the same extent in a given time. It is therefore important that beans of even size are made available for paste manufacture. Furthermore, it is known that some beans are hard and do not absorb water during cooking. Generally, these beans are old ones, the cracked ones, the ones with holes and the ones with very thick hulls, i.e. those in which the cell structure and moisture balance are poor.
Bean paste recipes do not vary significantly although different kinds of beans are used. In addition, there is no specific cooking time indicated in the recipe. This is not due to the fact that a general recipe is presented here. It is because cooking time varies according to harvest location, season and even weather conditions during the growing of beans, although there may not be distinct differences in the yield and the chemical composition of these beans (Kobayashi 1992). This suggests that crop quality control could be difficult and that variations in bean quality can be accommodated by varying the processing conditions during paste manufacture. From the discussion above, it can be said that beans are preferred with less “ash” and astringent substance and that evenly sized An granules in the paste are preferred. It may be necessary to further investigate other important quality factors that may not be discussed with the traditional recipe mentioned.
Azuki is an agricultural crop known to be sensitive to excessive moisture and temperature (Sunada et al. 1975). Azuki performs best under warm and dry conditions; it tolerates high temperatures but is sensitive to frost or cold weather conditions (Motomiya and Ito 1972, Japan Bean Fund Association 1987). Tanaka and Konno (1982) reported that 50-60% of all damage to Azuki in Hokkaido is attributable to cold weather damage, 10% to insects and 10% to 20% to disease. However, quality

First Australian New Crops Conference 1996 – Volume 2
259
bean crops can be produced in cold locations. The most valuable and high-quality Azuki for Japanese traditional sweets comes from a table mountain in Nagano Prefecture in Japan, where it is cool throughout the year. These Azuki beans are very limited in quantity and generally difficult to obtain due to keen competition in the market. the next highest quality Azuki beans come from Hokkaido Prefecture (far north island of Japan), where two third of Azuki production occurs. The growing season of Azuki is May to October on Hokkaido island when the mean average temperature is about 13-17°C with the season’s rainfall of 280-300mm. In contrast, the Azuki harvest season in Taiwan and Thailand is winter. Azuki beans from these countries are often used by the sweets manufacture industry rather than by traditional sweets makers, because the beans are irregular in size and cooking characteristics.
Conclusion
The above discussion demonstrates that the traditional Japanese recipes for bean paste, An, have several key points with regard to ingredient selection and procedures which are important for maximising the taste quality of the paste and of the sweets made from it. However, some questions still remain. For example, why does the cooking time have to be varied with different beans even though there are no distinct differences in their yield and chemical composition. More importantly, further information is required on the relationship between bean paste taste quality and the nature of the An granules, the best balance of starch and sugar, and other components such as pectin. Answers to these questions will add to our understanding of the factors relating to bean characteristics and processing variables which determine the quality of sweetened bean pastes and derived sweets.
Acknowledgment
We would like to acknowledge funding support from the Grains Research and Development Corporation and Bean Growers Australia.
References
Endo, T. and Maruta, A. 1992. Sweetness of Japanese cooking (Japanese sweets). (Shibata Books,
Tokyo).
Hori, M. 1995. Traditional Japanese sweets (Skill and keys). ( Shibata Books, Tokyo).
Ishihara, I. 1995. Anko perfect cooking, In: Danchyu, Volume 5. (President Co. Ltd., Tokyo), pp. 55-63.
Japan Bean Fund Association 1987. Report of commercial production conditions of beans produced by prefectures: Second Annual Report 1987.
Kobayashi, R., Michikawa, K., Tsuchibe, M. and Watanabe, T. 1992. Comparison of processing characteristics of Phaseolus as materials of `An’. Nippon Shokuhin Kogyo Gakkaishi 39(8): 657-662.
Kiyama, J. and Suzuki, M. 1996. Azuki bean paste and Japanese sweets Yo-kan, Food Science & Technology Seminar, 11th March, 1996, The University of Queensland Gatton College.
Kubo, K, Nagakura, S, Iguchi, Y and Ezawa, H (Eds) 1987. Iwanami Physical Sciences Handbook, 4th Edition. (Iwanami Publishers Ltd: Tokyo).

First Australian New Crops Conference 1996 – Volume 2
260
Kugimiya, M. 1992. Effects of cooking conditions on rupture and damage of Ann granules. I. Cooked Azuki beans. Nippon Shokuhin Kogyo Gakkaishi 39(2): 167-172.
Lumpkin, T.A. and McClary, D.C. 1994. Azuki Bean, Botany, Production and Uses. (CAB International: Wallingford, U.K).
Motomiya, G. and Ito, R. 1972. Domestic production, importation and utilisation of food legumes and research organisation in Japan, In: Symposium on Food Legumes, 1972: Proceedings of a symposium on Tropical Agriculture Research 12-14 September, 1972, Tropical Agriculture Research Series, No. 6, pp. 23-32.
Sasaki, J. et al. 1978. Nippon Shokuhin Kogyo Handbook. (Nippon Shokuhin Kogyo Society: Tokyo, Japan).
Sunada, S., Kakano, H. and Narukawa, T. 1975. The course of assigned experiments and their results, V. Breeding of soybean, corn and Azuki bean in Hokkaido, Japan. Journal of Agricultural Science (Nogyogijutsu), 30(5): 227-229.
Tanaka, A. and Konno, S. 1982. Country reports on the status of grain legumes projection, Japan, In: Grain Legumes Production in Asia. (Asia Productivity Organisation: Tokyo).
First Australian New Crops Conference 1996 – Volume 2
261
Domestication of Potential New Floricultural Crops
Julie Webber, Margaret Johnston, Lynda Ketelhohn and Shaun O’Brien The University of Queensland, Gatton College QLD 4345 Abstract Australia has a diverse and unusual flora including many wildflowers with the potential for floricultural development. We examine four Queensland species - Caustis blakei, Persoonia virgata, Sticherus flabellatus and Leucopogon melaleucoides - and discuss the implications of bush harvesting. Domestication of these species is essential if they are to reach their full floricultural potential, particularly on the export market. This paper discusses the domestication process in terms of initial biological studies, propagation and selection. Introduction Whilst Australians tend to spend very little per capita on cut flowers and foliage, there is huge demand for flowers in Europe, America and parts of Asia. Much of this demand is met by imports and there is great potential for the export of Australian native flowers (Watkins 1982). Despite this potential only a handful of Queensland native flowers are cut for export; even fewer are cultivated as floricultural crops (Hockings 1982). Problems Associated with Bush Harvesting Many of our native flowers and foliage are presently bush harvested and this has several disadvantages. Our export markets demand a regular and guaranteed supply as well as a high quality product. Japanese markets insist on quality and are prepared to pay higher prices for superior stem length and head and foliage quality (Carson and Lewis 1994). The supply of bush harvested species is limited by its natural occurrence and growing season and can be severely interrupted by drought, bushfires, grazing and land development. The bush picker has little control over quality in terms of pest and disease control, wind damage, water stress or nutrient deficiencies. There are also important environmental aspects to consider which include:- • sustainable harvesting limits are difficult to define and even more difficult to enforce;
• the removal of seed with fruit, flower heads or foliage;
• the removal of nutrients as biomass and subsequent loss of nutrients to what are often very delicately balanced nutrient cycles;
• damage to what are perceived as low value plants which hamper the picker;
• poaching from protected areas;
• the repeated removal of superior stem lengths, flowers and foliage may have the long term effect of changing the makeup of the natural gene pool and may reduce both the diversity and commercial value of the natural stand; and
• the possible spread of plant pathogens, weed seeds and insects through ecosystems.

First Australian New Crops Conference 1996 – Volume 2
262
Many of these problems can be overcome by the domestication of our commercially valuable plants and their subsequent full-scale production. Watkins (1982) sees cultivation as essential to provide the quality and continuity of supply required by the export market. Cultivation can also expand our export markets and add value to the crop by the selection of superior forms; it can add diversity to cut flower and foliage products, offer new opportunities to propagators and growers and protect the genetic diversity of our natural populations. The Domestication Process When approaching the challenge of domestication of wild flowers and foliage, obviously the first thing to establish is whether a plant has floricultural value and, if export sales are intended, whether it possesses qualities that make extended transport and storage possible. This paper is only concerned with the domestication of four species which are already established on the domestic cut foliage market but anyone interested in the criteria for selecting a suitable species is referred to the paper by Mackenzie and Nix (1982). The process of domestication may be a simple matter of collecting seed and growing it on - more often it is a long, arduous process of research and experimentation before any success is achieved. Many of our most attractive and suitable plants of floricultural value grow in oligotrophic environments that are nutrient poor and hence support a very diverse, sclerophyllus flora. These plants can be poor competitors with specific adaptions to their harsh environment - adaptions that can make them difficult to propagate and to grow under artificial conditions. For this reason a thorough understanding of the plant’s biology and ecology is essential for successful domestication. We see the domestication of a native plant species as a 3 step process. 1. A study of the plant in its natural environment and research into any previously published
information. Such a study should cover; • taxonomy; • distribution and abundance; • climate; • soils; • floral associations; • morphology; • growth and development; • seasonality; • response to harvesting.
2. An investigation into propagation methods. This can often be the most frustrating and difficult
part of plant domestication and can require a lot of time and resources. 3. A selection process whereby elite types are chosen. This process may occur at any time during
the domestication and may often be an ongoing process of repeated selections and propagation followed by new selections. Plants are selected for their attractiveness, ease of propagation and suitability for their intended use. This is a slow and labour intensive process requiring a great deal of propagation and growing space.
The four plants we are currently working on are Caustis blakei, Persoonia virgata, Sticherus flabellatus and Leucopogon melaleucoides. Caustis blakei

First Australian New Crops Conference 1996 – Volume 2
263
Caustis blakei is a very attractive bright green foliage plant already well established in the floricultural export market. Exports have fluctuated over the past 9 years, possibly due to the drought in Queensland from 1991 to 1995. Figure 1 illustrates these fluctuations and the overall increase in exports. Figure 2 shows how the market has changed since 1989 from a predominantly European one to a Japanese one. All exported stems are harvested from wild populations.
Figure 1. Total exports of Caustis blakei
0
100
200
300
400
500
600
700
800
900
1000
1989 1990 1991 1992 1993 1994 1995
Num
ber
of S
tem
s (x
1000
)
Year
Figure 2. Exports of Caustis blakei to Japan and Europe
0
100
200
300
400
500
600
700
1989 1990 1991 1992 1993 1994 1995
Year
Num
ber
of s
tem
s (x
1000
)
Japan
Europe

First Australian New Crops Conference 1996 – Volume 2
264
Caustis blakei is a perennial sedge which occurs on sandy soils and weathered sandstones along the Queensland and New South Wales coast, on several coastal islands of South East Queensland and inland near Esk, Helidon and Murphy’s Creek. It is found as far north as Maryborough and Fraser Island and south to Crowdy Bay in New South Wales. Abundance varies between sites. Protected areas such as Fraser Island and Cooloola National Park have very large populations, some forestry areas such as Tuan and Toolara State Forests have smaller, interrupted populations which may be periodically burnt or ploughed. Inland there are small, scattered stands at Murphy’s Creek and Helidon but these grow under much harsher conditions than coastal populations and recover more slowly after fire or damage (Johnston 1994). The inland populations at Helidon and Murphy’s Creek have recently been described as a new sub-species Caustis blakei sub sp. macrantha (Johnston et al 1996). Our work on this plant began in 1989. Johnston (1994) carried out extensive studies on the growth and development, influence of harvesting regimes and soils and floristics of C. blakei. Seeds tend to germinate in the cooler months of May to July and the majority of new culms emerge in the late spring and summer. It is this summer growth that is harvested. Pollination occurs soon after culm emergence but fruit maturity is not attained for several months. The removal of fresh green stems means the removal of fruit. This is more serious than it may sound as C. blakei is a fire-sensitive, obligate seed regenerator with a very low fruit:flower ratio. Caustis grows in very poor soils - sands or loamy sands - with a very low pH (4.1 to 5.3) and low in all major and minor nutrients except iron. Until recently, attempts to propagate C. blakei have been met with failure. Johnston (1994) had some success with propagation with work commenced in 1992 and since then we have made steady progress towards a viable production process. There are still many aspects of domestication that must be addressed, most associated with the problems of growing these plants in an artificial environment. Selection of elite types was started late in 1995 and we expect some results by the end of 1996. All up, the work on the domestication of C. blakei has taken over 6 years and will probably not be completed for another 2 years. Persoonia virgata Persoonia virgata is an erect shrub with small linear leaves and small yellow axillary flowers. It is currently harvested from wild populations and sold on the domestic and export markets as foliage. Figure 3 shows the increase in exports since 1991 most of which were sold to Japan. The figures for 1996 are for the first 6 months only and illustrate the dramatic rise in the number of stems being harvested (9400 in 1995 and 80 000 in 6 months of 1996).

First Australian New Crops Conference 1996 – Volume 2
265
Persoonia virgata occurs along coastal areas from Maryborough in Queensland (Queensland Herbarium 1996) to just north of Kempsey in New South Wales (Weston 1991). It grows in sandy soil in heathlands or open forests (Weston 1991). The fruit is a drupe with a woody endocarp that appears to play a major role in regulating germination (Ketelhohn and Johnston 1995) which usually occurs after disturbance such as fire. (McIntyre 1969, Abbott and Van Heurk 1988). Like many other Proteaceae, persoonia has proven difficult to propagate and this has restricted the development of this plant. Nevertheless, we have had some success and our present studies show that successful cutting propagation is influenced by plant genotype and age. The present work on persoonia commenced in 1992 and now, 3 years later, the project has only reached the point of successful propagation. There are still many issues to resolve in propagation, harvesting effects and general crop management. The time involved in the development of both Caustis blakei and Persoonia virgata are illustrative of how long domestication of a wild plant may take.
Figure 3. Export figures for Persoonia virgata
0
10000
20000
30000
40000
50000
60000
70000
80000
1991 1992 1993 1994 1995 1996
Year
Num
ber
of s
tem
s

First Australian New Crops Conference 1996 – Volume 2
266
Sticherus flabellatas Sticherus flabellatus is a fern with shiny brown erect stipes up to a metre high (Duncan and Isaac 1986) and a dark green frond of branching laminae which give the appearance of a tiered umbrella (Jones and Clemesha 1976). This plant is marketed as Umbrella Fern or Shiny Fan Fern and is sold on both the domestic and export markets. Export of S. flabellatus began in 1993 when 9000 stems were sold to Japan. In 1994 141, 450 stems were sold in Japan and Europe and this increased to 1, 101, 780 in 1995. By April 1996, 431, 420 stems had been exported (see figure 4).
Figure 4. Export figures for Sticherus flabellatus
0
200000
400000
600000
800000
1000000
1200000
1993 1994 1995
Years
Num
ber
of S
tem
s
All harvesting of this plant has been from wild populations, mostly in northern Queensland. It is widespread, growing in Queensland, New South Wales and Victoria as well as New Guinea, New Zealand and New Caledonia. It prefers damp habitats and is most commonly found along creek banks and in soaks and moist gullies (Jones and Clemesha 1976). There are records of plants of S. flabellatus being dug up and repotted but the survival rate is low and it would appear that this plant does not respond well to disturbance. To date, there has been no recorded work done on propagation. Our studies on this plant have only just begun and it is too early to make any claims of success. Fortunately, literature regarding the habitat, climate, distribution and floral associations is already available but nevertheless, field studies are necessary to gain a full understanding of the plant’s requirements and preferences. Leucopogon melaleucoides Leucopogon melaleucoides is a perennial shrub up to 100 cm and, like other Leucopogon species is commonly called bearded heath. It is marketed as Snowflake or Snowbush due to the profusion of terminal spikes of white flowers. L. melaleucoides is currently being harvested from natural stands and sold as a cut flower and foliage on the domestic market. Some has been exported but in very small quantities that suggest it is as yet only being tested for suitability for export. L. melaleucoides is a member of the family Epacridaceae and has been found growing in a variety of habitats from wet, open forests to dry heathlands (Harden 1990). It occurs in soils which tend to be acidic, granite-based sands with a low nutrient status (Morley and Toelken 1983; Harden 1990). It is a

First Australian New Crops Conference 1996 – Volume 2
267
light-demanding plant (Morley and Toelken 1983) but tolerant of frosts and even snow. This plant is found only in South-East Queensland in Moreton, Wide Bay, Darling Downs and the Granite Belt and in New South Wales on the North Coast, Northern Tablelands and North-Western Slopes. There is little literature on the propagation of L. melaleucoides. Bunn et al. (1989) successfully propagated L. obtectus using micropropagation techniques and Bolton (1986) propagated, but did not proliferate, another epacrid, Epacris impressa. We have successfully germinated seeds of L. melaleucoides but it is still too early to make any predictions of further success. Conclusions Domestication of many Australian native species of commercial value is desirable in order to expand our markets, increase the market value of the product and to protect the natural populations. Over the years many genera such as Chamelaucium and Anizoganthus have been successfully domesticated and developed commercially. The process however, is slow, frustrating and very expensive in terms of capital costs and labour. At The University of Queensland, Gatton College, we are currently working on four potentially valuable species of floricultural plants and are optimistic about the final results. Nevertheless, we would consider 8 years a reasonable period of time before these projects reach the point of being commercially viable. Acknowledgments The authors would like to thank the University of Queensland, the Rural Industry Research and Development Corporation, the Australian Flora Foundation and James and Barbara McGeogh of Birkdale Nursery for funding which has enabled the research on C. blakei and P. virgata to continue. Their assistance is not only very much appreciated but was vital for this research to reach the stage it has. References Abbott, I. and Van Heurk, P. 1988. Widespread regeneration failure of Persoonia elliptica
(Proteaceae) in the northern Jarrah forest of Western Australia. Journal of the Royal Society of Western Australia 71:15-22.
Bolton, J. 1986. Propagation of common heath - Epacris impressa. Australian Horticulture 84:60-61. Bunn, E., Dixon, K.W. and Langley, M.A. 1989. In vitro propagation of Leucopogon obtectus Benth.
(Epacridaceae). Plant Cell, Tissue and Organ Culture 19:77-84. Carson, C.J. and Lewis, J.R. 1994. Developing rice flower: linking production with marketing.
Proceedings of the Third National Workshop for Australian Native Flowers, February 1994. Duncan, B.D. and Isaac, G., 1986. Ferns and Allied Plants. (Singapore National Printers : Singapore). Harden, G.J. 1990. Flora of New South Wales. Volume 3. (Kyodo Printery : Singapore). Hockings, F.D. 1982. Overview of wildflowers as cut flowers in Queensland. Proceedings of the
National Technical Workshop on Production and Marketing of Wildflowers for Export, November 1982.

First Australian New Crops Conference 1996 – Volume 2
268
Johnston, M.E. 1994. The biology, harvesting and propagation of Caustis blakei. PhD Thesis, University of Queensland.
Johnston, M.E., Swarbrick, J.T., Wearing, A.H. and Webber, J.H. 1996. A new subspecies of Caustis
blakei Kük. in Queensland. Austrobaileyana (In press). Jones, D.L. and Clemesha, S.C. 1976. Australian Ferns and Fern Allies. (Reed Printery : Sydney). Ketelhohn, L.M. and Johnston, M.E. 1995. The propagation of Persoonia virgata. Proceedings of the
International Plant Propagator’s Society 45:118-121. Mackenzie, D.H and Nix, H.A. 1982. Australian wildflowers for export: which species? where?
Proceedings of the National Technical Workshop on Production and Marketing of Australian Wildflowers for Export, November 1982
. McIntyre, D.K. 1969. The germination of dormant Persoonia pinifolia R.Br. seeds by the use of
giberellic acid. Canberra Botanic Gardens Report 69/6. Morley, B.D. and Toelken, H.R. 1983. Flowering Plants in Australia. (Rigby Publishing Co :
Adelaide). Queensland Herbarium. 1996. Environmental Resources Information Network. Species Occurrence by
Geographic Region. (‘URL : http : // www.erin.gov.au/general/). Watkins, P.A. 1982. Overview of the wildflower industry in Western Australia. Proceedings of the
National Technical Workshop on Production and Marketing of Wildflowers, November 1982. Weston, P.H. 1991. Persoonia. In ‘Flora of New South Wales’. Vol. 2. (Ed. G.J. Harden). (University
of New South Wales Press : Kensington.)

First Australian New Crops Conference 1996 – Volume 2
269
Selection of Superior Trees of Melaleuca Species to Increase the Commercial Potential for the Production of Tea Tree Oil Lyall R. Williams and Wang Yan School of Chemistry, Macquarie University, Sydney, 2109, NSW Abstract A selection program was commenced in 1990 to prepare stock of superior trees of Melaleuca alternifolia and Melaleuca linariifolia for increased production and quality of oil. Initially, more than 250 trees in natural stands were evaluated for productivity, measured as oil quantity in the leaf and superior oil quality which was measured as a high proportion of terpinen-4-ol. Clones of more than 25 initial selections were then prepared for planting out in competitive growth plots. Results of these early trials which were established in the Port Macquarie district of NSW have allowed identification of four selections providing superior quantity and quality of oil. In Far North Queensland clones of one of the selections have been prepared for the establishment of a commercial scale plantation in late 1996.It is anticipated that use of these superior plants will provide oil in excess of 400 kg/ha/annum, a significant improvement on the present industry average of 150 kg, and being highly active with terpinen-4-ol in excess of 40%, commanding a substantial premium over commercial grade tea tree oil. The clones in the trial plots have also produced seed and in order to evaluate their quality 50 seedlings from each clone were planted out in a trial plot in June 1996 and will be ready for evaluation for rate of growth and oil quality in early 1997. Introduction The Australian tea tree oil industry is now at a cross-roads. The development of several new plantations is soon going to provide a much larger tonnage of oil onto the market. The increase in supply may adversely affect prices unless that increase comes from plantations which develop a differentiated product for the market; eg. tea tree oil with high antimicrobial activity or through certified plantation practices, allowing the market to extend its range to include products containing tea tree oil as the active ingredient for therapeutic use. In such cases, price premiums can be anticipated. With increasing Australian production and the possibility of lower prices for the oil, there will also be pressure on each of the existing plantations to minimize their costs of production. For an individual plantation with low levels of productivity it is quite possible that a reduction in prices may result in it becoming uneconomic. If the cost of Australian production in general is not kept under control, foreign plantations will eventually overtake the present Australian monopoly. Australian Tea Tree Management Ltd. has a program of selection and breeding of superior trees of Melaleuca species for the production of tea tree oil, which has been driven by it's desire to increase plantation yields per hectare of tea tree oil. The oil produced should be of high quality and should have a consistent level of antimicrobial activity not presently available commercially but which will command a premium and be sought after for pharmaceutical use.
First Australian New Crops Conference 1996 – Volume 2
270
Selection for High Antimicrobial Activity An index of tea tree oil quality may be inferred from the parameters set by the Australian Standard (AS 2782 - 1985) which, in addition to several physical constraints, requires that cineole be less than 15% and that terpinen-4-ol be more than 30%. We regard the level of terpinen-4-ol as the preferred index of quality, and hence value, because this component is a major determinant of antimicrobial activity (Williams et al. 1993). Oil quality determined by it's antimicrobial activity will become increasingly important as tea tree oil's major use progressively changes from that of a "medicine chest in a bottle" to an ingredient in a variety of cosmetics and toiletries and finally to the active ingredient in formulations prepared to treat a specific condition - i.e. for vaginal thrush, burns, tinea, acne and dandruff. The preliminary step of our selection and breeding program was to identify trees in natural stands which produced oils with high terpinen-4-ol levels as, for all microorganisms we have studied, this component has demonstrated superior activity. For oils from individual trees there is an inverse correlation between cineole and terpinen-4-ol with trees producing oil high in terpinen-4-ol oil usually also having low cineole (Williams et al. 1990). The first stage of our selection program involved the evaluation of trees growing in natural stands in the districts to the south of the major tea tree oil producing regions of NSW where individual trees of both Melaleuca alternifolia and Melaleuca linariifolia, which produce oil with lower cineole (< 2%) and higher terpinen-4-ol (> 40%) than the present oil of commerce, were identified. It should be appreciated that in many of these areas the majority of the trees of Melaleuca linariifolia produced an oil high in cineole but while this is a problem for bush cutters it is of no consequence when individual trees are studied on an experimental basis. Selection for Increased Productivity In addition to the quality of the seed stock, ultimate production of tea tree oil per hectare is dependent upon many other factors including soil, climate, rainfall, and adequate weed control. In general, to be commercially viable, the plantation would strive to produce at least 200 kg of oil/ha/annum which would be possible with a plant density of 28,000 trees/ha with each tree producing 7 g oil/tree. There are several marginal producers with annual production levels of oil lower than 150 kg/ha because of inferior growth due to site, weed growth or dry conditions (Colton and Murtagh 1990). We believe that it is within the parameters of increased oil production that the most significant improvements to the economies of a plantation can be made. Inspection of rows of trees in the commercial plantations which have been established from seed reveals the great diversity of growth rates. At plant densities of 28,000 trees/ha it is quite apparent that a significant proportion of the seedlings do not attain full potential. This variation, combined with moderate heritabilities for growth traits in this species (Butcher et al. 1992), demonstrates that there is an opportunity for selection and breeding programs to increase substantially the production of biomass in the plantations by providing planting stock of consistently vigorous growth. Selection for High Oil Concentration in the Leaf To obtain an accurate measure of the amount of oil in a sample, it was dried to constant weight, and the leaf separated from the stalk prior to steam distillation as has been previously described (Williams and Lusunzi 1994). The percent of oil expressed as g oil/g dry weight of leaf varied between 3 and 9

First Australian New Crops Conference 1996 – Volume 2
271
% and was heritable. These figures are subject to some experimental error but the most likely errors lead to an underestimate of oil level. As the oil level is seasonal and usually drops in the colder winter months (Williams and Home 1988) it was necessary to rank a set of samples taken at the same time. Multiple resampling provided a reliable indication of the amount of oil in the leaf and its quality, as shown for some selections in Table 1. Table 1. Quality and yield of oil / dry weight of leaf for four selections
Tree Date Yield% Cineole% Terpinen-4-ol%
W2 4/93 6.o 1.6 43.8 W2 6/93 6.1 1.4 45.5
W22 5/92 5.0 1.5 41.1 W22 4/93 4.8 1.4 45.3
No.56 3/92 3.2 1.7 46.4 No.56 4/93 3.0 1.5 47.8
No.72 3/92 7.4 2.9 44.0 No.72 2/93 7.6 2.9 39.3
Our initial selection critera, based on quality of oil and percentage of oil in the leaf, was followed by an evaluation of the health and vigour of growth of the parent tree or its regrowth from cutting, and the percentage of oil in the leaf. Other considerations were the ratio of leaf to stalk and the ability of the plant to re-coppice. Selection for Vigour of Growth Once a set of trees with desirable traits had been identified they were replicated by vegetative propagation with the objective of further testing the clones in trial plots to evaluate their growth in a close spaced plantation environment, their ability to coppice after repeated harvesting and their disease and pest resistance. The Commercial Evaluation of Seedlings and Clones Our problem was one of the time required and the commercial cost necessary to produce a superior selection for plantation use. There appeared to be a genetic link for the ease of vegetative propagation and one disappointing aspect of our earlier work was that several of the trees selected for the production of high quality oil (No 56, W2 and W22) were also the most difficult to propagate from cuttings. For this reason, consideration was given to the possibility of producing seedlings for commercial plantations from the seed collected from superior trees located in the natural stands. Evaluation of the Diversity of Oil Quality of Seedlings from Tree No. 56 Preparation of seedlings from seed taken from a selected mother tree was the quickest method to have available selected progeny, but we were concerned about the diversity of the progeny because of cross pollination with neighbouring trees in the natural stands. As tree No 56 was difficult to clone by vegetative means, open pollinated progeny were prepared and grown out to determine the variation in vigour of growth and oil quality. The results shown in Table 2 were quite disappointing with the great

First Australian New Crops Conference 1996 – Volume 2
272
majority of the seedlings producing an oil with higher levels of cineole and lower levels of terpinen-4-ol than the mother tree and the plants producing an even wider variation of growth and oil production (Williams 1996). Table 2. Average quality of oil from seedlings of No 56
Materials Cineole % Terpinen-4-ol % Mother tree No.56 1.7 45.2
20 Seedlings (mean) 5.0 42.6 After consideration of these results we determined that seedlings derived from selected trees in natural stands were not an appropriate source of material for a plantation requiring superior growth and production of high quality oil. A decision was made to continue to prepare clonal material of selected trees from natural stands for establishment in trial plots to accurately determine oil productivity. Measurement of Productivity of Clones in Trial Plots, Port Macquarie 1992-1995 Rather than rely on experimental data of % oil in the leaf to provide a measure of productivity we decided to take the longer path to the selection of superior trees by preparing clones of the preliminary selections for competitive growth trials where the various parameters contributing to overall productivity such as rate of growth, ratio of leaf to stalk and percent of oil in the leaf are combined to provide an accurate measure of the amount of oil produced by the plant. Thus, the clones in the early trial plots were planted in a very close spacing arrangement with 45 cms between the rows and 45 cms between plants. In this crowded environment clones of the more vigorous trees inhibited the growth of the others and so were easily identified. Of interest to us was an observation that there was often an inverse correlation between oil yield in the leaf and rate or vigour of growth. For example, for tree No.72 (Table 1) we were impressed with the quality of the oil, the percentage of oil in the leaf, and its ease of propagation but, unfortunately, this tree had inferior growth. Researchers from the Department of Forestry have recently confirmed that for some plants there is a negative correlation between oil yield in leaf and growth rate (Butcher et al. 1996). Comparative Growth Study of Clones of Selected Trees (Trial Plot 7: June 1993 - August 1994) Due to differences in time of planting and seasonal factors it was not possible to compare the growth and oil production of clones from one trial plot to the next. To obtain an accurate comparison of growth of eleven of the selected trees from trial plots 1-6, trial plot No.7 was established in June 1993. In mid August 1994 one tree of each clone was harvested to obtain a definitive comparison of growth and oil production. The others were left to grow and produce seed. This was a winter harvest and higher oil levels than the range of 10-21 g oil/tree would be expected in the summer months. Trial plot No.7 was established on a ridge where the plants were exposed to wind and the soil was not ideal. No fertiliser was used and there was very limited watering. However, the plot did enable us to make comparisons as, at this site and with identical row spacing, clones of trees which were not selected for vigour of growth produced oil in the range 5-8 g/tree. At this time, although our research to identify and propagate from superior trees was to be ongoing, our immediate aims were to put into commercial production a clone chosen from the 4 selections shown in Table 3. In addition to the desirable parameters relating to productivity and oil quality it was

First Australian New Crops Conference 1996 – Volume 2
273
also necessary to assess, and take into consideration, the ease of vegetative propagation as this varied widely between genotypes. A tree designated as No.88 was chosen to provide clones for our first commercial field trial because of it's higher than average productivity, it's high quality oil and it's ease of vegetative reproduction. Approximately 1000 clones of No.88 have been prepared and are presently being used to establish commercial quantities of clones for planting out in mid 1996. Table 3. Results from Trial Plot 7 - A comparison of the oil quality and production of the best 4 selections for productivity after 14 months growth Selection Oil (g) Cineole % Terpinen-4-ol
% Vegetative propagation
W2 17.7 1.5 43.5 Difficult W22 21.2 1.2 41.2 Difficult No.80 15.6 4.0 40.6 Easy No.88 15.5 1.2 42.4 Easiest
Clones in the Trial Plots as Seed Trees In January 1996 seed was collected from the clones in Trial Plots 1-9 which had flowered in the previous year. Only approximately one quarter of our selections represented by clones did flower . As there are no natural stands in the immediate vicinity of the trial plots it is anticipated that any outcrossing will have occurred between our selections and that the quality of the seedlings will closely resemble the high quality of the parents (Table 4). Table 4. Clones in trial plots 1-9 which flowered and produced seed No. Cineole % Terpinen-4-ol % Growth Vegetative propagation W2 1.5 43.5 +++ + W6 7.0 34.1 ++++ ++ W22 1.2 41.2 ++++ + 48 4.9 38.5 ++ ++ 55 4.7 38.9 ++ +++ 59 1.4 43.2 ++ +++ 77 7.4 41.2 +++++ ++ 80 4.0 40.6 ++ +++ 88 1.2 42.4 +++ +++++
Selection of Seedlings Obtained from the Clones A small sample of seeds obtained from each of the 9 clones shown in Table 4 has been planted out and 20 seedlings of each selected for vigour of growth will be used to establish a further trial plot comparing productivity and oil quality.

First Australian New Crops Conference 1996 – Volume 2
274
Results from Trial Plots in Far North Queensland Our initial 15 trial plots were established at Port Macquarie where the conditions and soil were not ideal but they provided data to allow us to differentiate between clones with different vigour of growth. In these conditions we found that the growth of our selections provided 12-21 g oil/tree after 14 months of growth whereas unselected seedlings produced oil in the range of 4-6 g/tree. We believe that there are superior conditions for growth of Melaleuca species in the Mareeba - Dimboola districts on the Atherton Tableland in Far North Queensland where there is good soil, adequate irrigation, and a climate which provides for the possibility of more growth in the mild winter months than is possible in Northern NSW. A trial plot established by Australian Tea Tree Management Limited in March 1995 was recently harvested after 11.5 months of growth and results of the best 6 of the 12 trees in terms of growth are listed in Table 5. Table 5. Results of trial plot 16. Growth and oil quality - selected seedlings vs clones Plot position Fresh weight (g) Total oil (g) Cineole % Terpinen-4-ol
% 16-4-2 (No.88) 2814 34.5 0.5 39.4 16-2-1 3076 32.7 5.0 35.8 16-1-2 (No.88) 2724 31.5 0.6 48.2 16-3-1 3762 27.5 4.1 40.6 16-1-3 2338 26.2 5.7 37.5 16-4-1 2778 25.0 4.4 34.4
In this trial plot two clones of No 88 (which are Melaleuca alternifolia) were planted with seedlings from selected trees of Melaleuca linariifolia. The results shown in Table 5 confirm the superior growth rate of plants in Far North Queensland and illustrate the productivity of the clones. The clone was not the largest producer of biomass but owes its high productivity of oil to a combination of well above average growth, oil yield in the leaf, and a high ratio of leaf to stalk. Further trial plots have been established and the plants will be harvested as they attain one year of growth. It is anticipated that other superior selections which combine the sought after attributes of high productivity and oil quality will be identified. In the interim we are encouraged by the rate of growth shown by both the clones of No.88 and seedlings in TP 16. Calculations based on approximately one half of the oil produced by the clones of No.88 in the trial plot may be used as a useful guide to estimate the commercial potential for growing tea tree oil with selected clones in Far North Queensland. At 28,000 plants/ha, with each producing 16 g oil/annum, the potential productivity of the plantation is 448 kg/ha. For the calculation of potential cash flow shown in Table 6 a lower figure for productivity (400 kg/ha) has been used.

First Australian New Crops Conference 1996 – Volume 2
275
Summary The first stage of our selection program has identified a superior tree which has now been cloned for commercial production. However, our ongoing research investigating trees from other districts and a continual assessment of the controlled cross-pollinated progeny of our selected clones means that in future we should identify even more productive plants. We are confident that the additional costs of clonal propagation protocols being developed by Australian Tea Tree Management Ltd for the development of superior oil producing plantations are commercially viable. Plantations including selections of superior yielding trees and providing high and consistent quality of oil represent the future for the profitable development of the Australian tea tree oil industry. Table 6. A comparison of revenue from oil produced from selected clones and unselected seedlings in Far North Queensland with the cost of plants amortised in the first year Item Clonal production Seeded production Expense year 1 Plants (28,000/ha) 14000 2240 Field costs/ha 4000 4000 Harvest/distillation 5000 2000 Total expense/ha 23000 8240 Income year 1 Price/kg 50 50 Premium for high quality 10 -- Oil yield/ha 400 175 Gross revenue/ha 24000 8750 Cash flow 1000 510 Year 2 Farm costs/ha 9000 6000 Gross revenue/ha 24000 8750 Cash flow/ha 15000 2750
The margin for cash flow/ha then continues for each year of the project. References Butcher, P.A., Bell, J.C. and Moran, G.F. 1992. Patterns of genetic diversity and nature of the
breeding system in Melaleuca alternifolia . Australian Journal of Botany 40: 365-75. Butcher, P.A., Matheson, A.C. and Slee, M.U. 1996. Potential for genetic improvement of oil
production in Melaleuca alternifolia and M. linariifolia .. New Forests 11: 31-51. Colton, R.T. and Murtagh, G.J. 1990. Tea tree oil plantation production. Agfact P6.4.6. NSW
Department of Agriculture and Fisheries. Williams, L.R., Home, V.N. and Lusunzi, I. 1993. An evaluation of the contribution of cineole and
terpinen-4-ol to the overall antimicrobial activity of tea tree oil. Cosmetics, Aerosols and Toiletries in Australia 7: 25-28, 34.

First Australian New Crops Conference 1996 – Volume 2
276
Williams, L. R., Home V.N. and Asre, S. 1990. Antimicrobial activity of oil of Melaleuca (Tea Tree Oil). Its potential use in cosmetics and toiletries. Cosmetics Aerosols and Toiletries in Australia. 4: 12-13, 16-18, 22.
Williams, L.R. and Home,V.N. 1988. Plantation production of oil of Melaleuca (Tea Tree Oil) - A
revitalised Australian essential oil industry. Search 19: 294-297.
First Australian New Crops Conference 1996 – Volume 2
277
Preliminary Analysis of Culinary Bamboo Shoot Production in Queensland K.B. Walsh1, J.R. Milne1, J. Leonardi1,2, D. Dart3 and D.J. Midmore1 1 Central Queensland University, Rockhampton Qld 4700, Australia 2 CSIRO, PMB 44, Winnellie, NT 0821, Australia 3 Bamboo Australia, Belli Park, Eumundi, Qld 4562, Australia Abstract Bambusa oldhamii and Phyllostachys pubescens are clumping and running types of bamboo that have been suggested for edible shoot production in subtropical Australia. Establishment of a plantation involves planting vegetatively propagated stools (ca. 350 ha-1) and encouraging growth to form a closed canopy (ca. 5-7 years), while thinning old culms to create an open forest. We superimposed irrigation and fertiliser treatments on young (<4 years old) plantations of B. oldhamii and P. pubescens in southeast Queensland to determine nutritional and water stress influences on bamboo growth and shoot production. Bambusa oldhamii shoots were produced from December to February at a rate of 2400 ha-1, while P. pubescens shoots were produced from September to December at a rate of 100,000 ha-1. The crop is shallow rooted and reputedly responds to frequent small irrigations. It is particularly vulnerable to water stress at the time of shoot growth. Bambusa oldhamii, as yet with an incomplete canopy, responded to irrigation via more shoot production while P. pubescens, with a more complete canopy, responded via greater shoot diameter. Response of shoot number and diameter to increasing fertiliser levels was consistent but not significant, although leaf N% and leaf appearance rates were notably greater at greater fertiliser levels. We are attempting to define agronomic practice, in terms of critical nutrient concentrations and water potentials in the plant, with respect to crop phenology. Introduction The uses of bamboo are limited only by the imagination. Ranging from timber that has been minimally processed (eg sky-scraper scaffoldings, 200m long bridges, even airplane wings) to highly processed materials (eg laminated timber, paper, food) the letters of the alphabet need be used many times over to label the multitude of uses to which the bamboo has been put (Farrelly 1984). One of these, culinary shoot production, is now receiving attention in Australia. To date there has been effectively no commercial production of bamboo shoots within Australia, although imported canned bamboo shoots represent a value of approximately $6x10⁶ per year (Dooley 1992). This Australian consumption is expected to increase due to expanding populations of Asian immigrants and increasing numbers of Asian tourists and students. This internal market presents Australian farmers with an opportunity for the development of a new crop, for it is common knowledge that new Australians of Asian descent prefer fresh bamboo shoots over the processed product. An established internal production and marketing ability is an essential stepping stone towards entry into the export market. Dooley (1992) concluded that the primary constraints to the establishment of a bamboo industry relate to selection of appropriate species, to development of suitable vegetative propagation techniques, to availability of planting stock and to cultural manipulation of the crop to achieve quality shoots. One

First Australian New Crops Conference 1996 – Volume 2
278
of ourselves (D. Dart) has built up an adequate level of expertise in propagation and established a bamboo garden with ca. 250 species. Although shoots of almost any bamboo may be eaten, five principal genera are used commercially for shoots: Arundinaria, Bambusa, Dendrocalamus, Gigantochloa and Phyllostachys. These are grown as plantation crops in S.E. Asia and can take from 3-12 years before full shoot production is achieved. The crop is typically maintained as a closed canopy open ‘forest’, with ca. 4000 stems per hectare allowing easy access for harvesting. This habit is radically different from the dense thickets, formed in an unmanaged state. Phyllostachys pubescens Mazel ex Houzeau de Lehaie is a representative of the typically temperate ‘runner’ or monopodial type of bamboo, while Bambusa oldhamii Munro is a tropical, sympodial ‘clumper’. These two species, which are the most commonly consumed in Japan and China, and in Taiwan respectively, were chosen for the current studies. Since no local information on the agronomy of the crop is available, and information from overseas relates to production in areas differing in climate and soil fertility, experiments with these two species were established in southeast Queensland to quantify the influence of irrigation and fertilisation regimes on growth, clump form, canopy structure and shoot production. We aim to provide information on critical nutrient concentrations and soil moisture potentials with respect to phenology of the crop for optimal growth. Materials and Methods Representative meteorological and soil data for the site are presented in Table 1. Experimental plots were superimposed in October 1994 on established P. pubescens and B. oldhamii stands at Belli Park, Eumundi (26° 29´S). The P. pubescens stand was established in November 1990 by planting 18 month old seedlings at six metre intervals along rows seven metres apart. The B. oldhamii stand, established in March 1991, was planted in rows six metres apart with five metres between plants. The B. oldhamii plants were derived from cuttings. Clumps were thinned by removing three-year-old stems, thus maintaining an open habit and encouraging spread of the plant along and out from the planting row. Blood and bone fertiliser was applied at planting and 25:5:14.1 N:P:K fertiliser at 1000 kg ha-1 was applied at approximate six monthly intervals prior to the beginning of the experiment. The P. pubescens stand was irrigated by overhead impact sprinklers along lines placed between rows. Microjet sprinklers, one placed in the middle of each clump, were used to irrigate the B. oldhamii stand. Phyllostachys pubescens Four years after planting of the "runner" bamboo stand, when experimental plots were imposed, rows were still separate from each other. The experimental area was split into two irrigation blocks. Both had regular (i.e. farmer determined) irrigation, but the high irrigation block had an additional irrigation line of rotary sprinklers along each row. Both high irrigation and low irrigation blocks were fed by the same main line. Each irrigation block was split into replicate rows, with three plots along each row in the high irrigation block and four plots for the low irrigation block. Plots comprised four plants within the high irrigation block, the plots along each row were randomly assigned one of three fertiliser treatments: the farmer's rate, 1.5 and 2 times the farmer's rate. In the low irrigation treatment, a further treatment that combined the low fertiliser rate with thinning of the oldest (2 year old) culms in October 1994 was included. Dates and rates of application are detailed in Table 2. Tensiometers at 30 cm and 60 cm depths were installed in two plots (the highest fertiliser rates in both high and low irrigation) and were read periodically from November 1994 to the present.

First Australian New Crops Conference 1996 – Volume 2
279
Table 1. The growing environment (a) Weather data (twenty-five year averages from Nambour, 25k South of Belli Park)
Month Mean monthly rainfall (mm)
Mean monthly pan
evap’n (mm)
Mean max. temp. (°C)
Mean min. temp. (°C)
Mean daily hours of sunshine
Jan 293 176 28.5 19.1 6.5 Feb 276 133 28.1 19.3 6.0 Mar 260 129 27.4 18.1 6.2 Apr 137 115 25.8 15.0 7.0 May 111 87 23.1 11.4 6.4 Jun 84 77 21.4 9.2 6.5 Jul 93 83 20.7 6.9 7.3 Aug 48 101 22.1 7.5 7.6 Sep 48 123 24.1 10.0 7.7 Oct 114 153 26.0 13.4 7.7 Nov 155 164 27.4 16.1 8.0 Dec 178 185 28.6 17.8 7.4
Annual average
1797 1524 25.3 13.7 7.0
(b) Soil chemical characteristics in 1990 (before planting) Attribute Value Attribute Value pH (CaCl2) 4.3 Ca (meq/100g) 1.50 CEC (meq/100g) 4.7 Mg (meq/100g) 1.05 P (Bray-mg/kg) 3.0 Al (meq/100g) 1.30 Table 2. Farmer fertiliser application rates (kg ha-1) and dates during the experiments P. pubescens B. oldhamii Date Ratea Date Rateb 19/10/94 250N:50P:141K 15/1/95 250:N:50P:141K 29/8/95 250N:50P:141K 30/8/95 250N:50P:141K 15/3/96 125N:25P:70.5K aApplied to whole plot bApplied to each 2.25 m2 clump, no fertiliser applied between clumps. Soil and leaf samples (youngest fully expanded) were taken from each plot at the start of the experiment for analysis. Leaf samples were also collected 3 and 18 months after the start of the experiment for nitrogen analysis. Weekly counts of new shoots that emerged during the shooting season (mid summer to early autumn each year at Belli Park) and their diameters (at soil level) were taken in a one metre wide transect within the centre of each plot. Main effects of fertiliser and their interaction with irrigation were analysed with ANOVA techniques.

First Australian New Crops Conference 1996 – Volume 2
280
Bambusa oldhamii The experimental unit of the tropical “clumper”, comprised five clumps per plot (ie 25 m of row). The stand was divided into two blocks. Within each block, groups of three plots along the rows were randomly allocated one of three fertiliser rates. The fertiliser treatments were the same as for the P. pubescens experiment; dates of application are given in Table 2. There were four replicates in each block. Tensiometers at 30 cm and 60 cm depths were placed in two low fertiliser rate plots and at a nontreated clump in November 1994. Tensiometers were installed in a further two plots, both high fertiliser rate plots, in November 1995. Soil and leaf analyses were made as for P. pubescens. Numbers of new shoots that emerged during the shooting season (late winter to early spring each year at Belli Park) were recorded periodically. Shoot stem diameters were measured, after shooting had finished, at the seventh internode above the ground. For two clumps from each of the high and low fertiliser treatments and for two low fertiliser non-irrigated clumps, one leaf on each of five branches of one-and two year old culms were tagged in December 1995, and the appearance of new leaves recorded at approximate monthly intervals. Main effects of fertiliser on shoot counts, shoot diameter and leaf appearance were analysed using ANOVA. Results Leaf and Soil Samples In September 1994, just prior to application of the initial fertiliser treatments, leaf and soil samples from established plantations of both species (Table 3) revealed high levels of manganese most likely associated with the low pH (4.9-5.3) and seasonal water logging. Lime at the rate of 600 kg ha-1 was applied uniformly over the whole experimental area for P. pubescens (August 1995) and beneath the perimeter of the canopy for B. oldhamii (September 1995). By April 1996 treatment averages for pH ranged from 4.82 to 5.35. Leaf samples from green P. pubescens were low in P, K and B (Table 3). Yellow leaves from plants in a water-logged area showed slightly lower levels of these elements. Soil sampled from around those plants showed adequate inorganic N, but low P and B levels. Leaf samples of B. oldhamii collected from yellow and green clumps showed similar nutrient levels (Table 3), with the difference in leaf N% being marked. Soil samples from the same clumps showed levels similar to those with P. pubescens, with the exception of a lower electrical conductivity. Leaf samples collected in January 1995 showed an increase in total nitrogen with higher fertiliser rates for both bamboo species. This increase was more pronounced for P. pubescens (Table 4). Similar results were obtained in April, 1996. Leaves collected from a yellowing P. pubescens showed a much lower leaf N% (1.695%) while leaves of B. oldhamii taken from a vigorous planting in Bundaberg showed a higher leaf N% (3.117%). Over the 126 day period of leaf tagging of B. oldhamii (15 December 1995-19 April 1996) it was evident that leaf production was more rapid in the high fertiliser treatment (Figure 1), both on one and two year old culms, but significant only for the latter. Total new leaf production was greater in younger than in older culms by the end of the sampling period. The comparison with non-irrigated clumps indicated that rainfall (data presented in Figure 9) was sufficient to sustain leaf appearance rates.

First Australian New Crops Conference 1996 – Volume 2
281
A. Old culms (approx. 2 yr old)
0
10
20
30
40
50
60
28 60 91 126
Days since branches were f irst tagged
No
. ne
w le
ave
s /
5 b
ranc
he
IA
I.C
NIA
T reatment
B. Young culms (< 1 yr old)
0
10
20
30
40
50
60
28 60 91 126
Days since branches were f irst tagged
No
. ne
w le
ave
s /
5 b
ranc
he
IA
I.C
NIA
T reatment
F igure 1: Mean number of new leaves appearing on five branches per Bambusa oldhamii clump at approximate monthly intervals during the 1995/1996 growingseason. IA - Irrigated clump with farmer's rate of fertilizer application; I.C - irrigated clump with2X farmer's rate of fertilizer application; NIA - non-irrigated clump with farmer's normal rate offertilizer application. E rror bars repres ent s tandard errors (n=2).
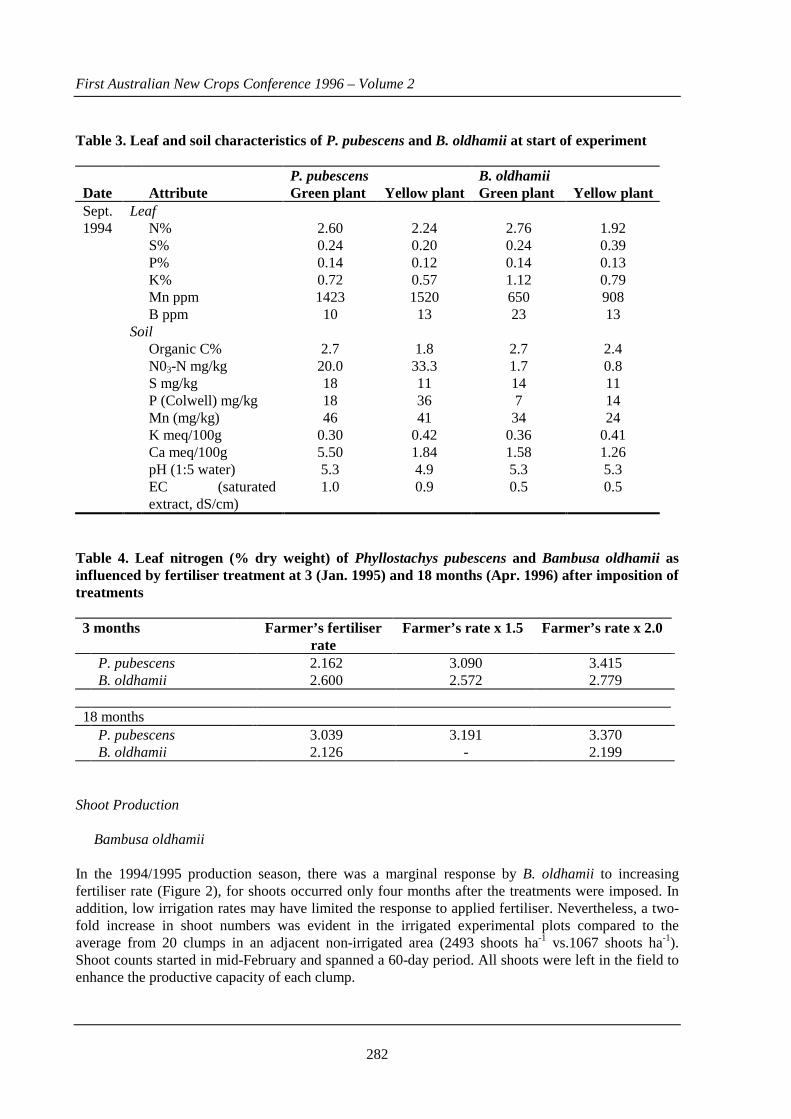
First Australian New Crops Conference 1996 – Volume 2
282
Table 3. Leaf and soil characteristics of P. pubescens and B. oldhamii at start of experiment P. pubescens B. oldhamii Date Attribute Green plant Yellow plant Green plant Yellow plant Sept. Leaf 1994 N% 2.60 2.24 2.76 1.92 S% 0.24 0.20 0.24 0.39 P% 0.14 0.12 0.14 0.13 K% 0.72 0.57 1.12 0.79 Mn ppm 1423 1520 650 908 B ppm 10 13 23 13 Soil Organic C% 2.7 1.8 2.7 2.4 N03-N mg/kg 20.0 33.3 1.7 0.8 S mg/kg 18 11 14 11 P (Colwell) mg/kg 18 36 7 14 Mn (mg/kg) 46 41 34 24 K meq/100g 0.30 0.42 0.36 0.41 Ca meq/100g 5.50 1.84 1.58 1.26 pH (1:5 water) 5.3 4.9 5.3 5.3 EC (saturated
extract, dS/cm) 1.0 0.9 0.5 0.5
Table 4. Leaf nitrogen (% dry weight) of Phyllostachys pubescens and Bambusa oldhamii as influenced by fertiliser treatment at 3 (Jan. 1995) and 18 months (Apr. 1996) after imposition of treatments 3 months Farmer’s fertiliser
rate Farmer’s rate x 1.5 Farmer’s rate x 2.0
P. pubescens 2.162 3.090 3.415 B. oldhamii 2.600 2.572 2.779 18 months P. pubescens 3.039 3.191 3.370 B. oldhamii 2.126 - 2.199
Shoot Production Bambusa oldhamii In the 1994/1995 production season, there was a marginal response by B. oldhamii to increasing fertiliser rate (Figure 2), for shoots occurred only four months after the treatments were imposed. In addition, low irrigation rates may have limited the response to applied fertiliser. Nevertheless, a two-fold increase in shoot numbers was evident in the irrigated experimental plots compared to the average from 20 clumps in an adjacent non-irrigated area (2493 shoots ha-1 vs.1067 shoots ha-1). Shoot counts started in mid-February and spanned a 60-day period. All shoots were left in the field to enhance the productive capacity of each clump.

First Australian New Crops Conference 1996 – Volume 2
283
0
500
1000
1500
2000
2500
3000
12-Feb 22-Feb 4-Mar 14-Mar 24-Mar 3-Apr 13-Apr
Date
No
. sho
ots
ha-1
1X
1.5X
2X
Fertilizer Rates
F igure 2: Cumulative mean number of shoots for three different fertilizer rates thatemerged during the Bambusa oldhamii 1994/1995 shooting season. Fertilizer ratescorres pond to multiples of the farmer's us ual rate. E rror bars repres ent s tandard errors (n=4).
For 1995/96, shoot production began late in December 1995 and most production occurred over a one-month period although overall production spanned a 75 day period (Figure 3). The total number of shoots produced in 1995/6 was similar to the number produced in the previous season (2647 ha-1 vs. 2493 ha-1). Differences between fertiliser treatments were similar to those in the previous season, but were not marked (Figure 3). Shoot size (diameter) was unaffected by fertiliser treatment with diameters on average all very close to 45mm (data not presented).
0
500
1000
1500
2000
2500
3000
19-Dec 8-Jan 28-Jan 17-Feb 8-Mar 28-Mar 17-Apr 7-May
Days since first counts taken
No
. sho
ots
ha-1
1X
1.5X
2X
Fertilizer Rate
F igure 3: Cumulative mean number of Bambusa oldhamii shoots that emerged duringthe 1995/1996 shooting season in experimental plots treated with different fertilizerrates. Fertilizer rates corres pond to multiples of the farmer's us ual rate. E rror bars repres ents tandard errors (n=4). There was no relationship between the density of established culms present prior to shooting and the final number of new shoots per hectare in either season (data not presented).
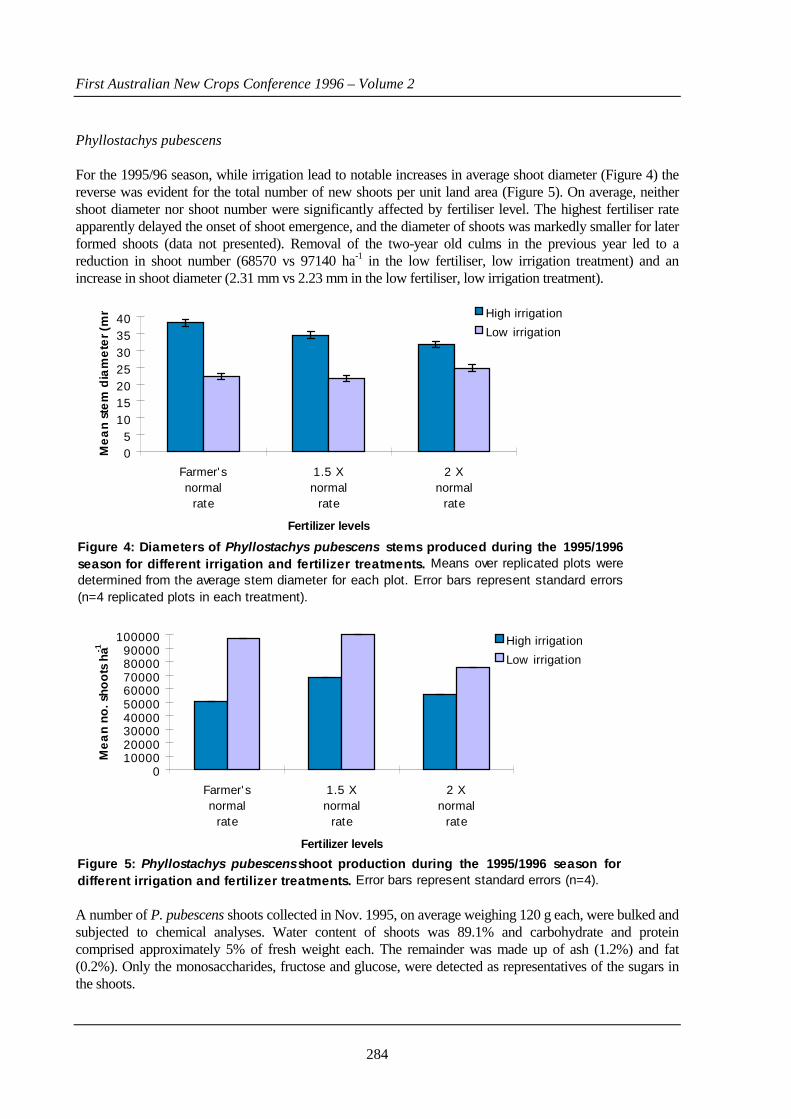
First Australian New Crops Conference 1996 – Volume 2
284
Phyllostachys pubescens For the 1995/96 season, while irrigation lead to notable increases in average shoot diameter (Figure 4) the reverse was evident for the total number of new shoots per unit land area (Figure 5). On average, neither shoot diameter nor shoot number were significantly affected by fertiliser level. The highest fertiliser rate apparently delayed the onset of shoot emergence, and the diameter of shoots was markedly smaller for later formed shoots (data not presented). Removal of the two-year old culms in the previous year led to a reduction in shoot number (68570 vs 97140 ha-1 in the low fertiliser, low irrigation treatment) and an increase in shoot diameter (2.31 mm vs 2.23 mm in the low fertiliser, low irrigation treatment).
05
10152025303540
Farmer' snormal
rate
1.5 Xnormal
rate
2 Xnormal
rate
Fertilizer levels
Me
an
ste
m d
iam
ete
r (m
m High irrigation
Low irrigation
F igure 4: Diameters of Phyllostachys pubescens stems produced during the 1995/1996season for different irrigation and fertilizer treatments. Means over replicated plots weredetermined from the average s tem diameter for each plot. E rror bars repres ent s tandard errors(n=4 replicated plots in each treatment).
0100002000030000400005000060000700008000090000
100000
Farmer' snormal
rate
1.5 Xnormal
rate
2 Xnormal
rate
Fertilizer levels
Me
an
no. s
hoo
ts h
a-1
High irrigation
Low irrigation
F igure 5: Phyllostachys pubescens shoot production during the 1995/1996 season fordifferent irrigation and fertilizer treatments. E rror bars repres ent s tandard errors (n=4).
A number of P. pubescens shoots collected in Nov. 1995, on average weighing 120 g each, were bulked and subjected to chemical analyses. Water content of shoots was 89.1% and carbohydrate and protein comprised approximately 5% of fresh weight each. The remainder was made up of ash (1.2%) and fat (0.2%). Only the monosaccharides, fructose and glucose, were detected as representatives of the sugars in the shoots.

First Australian New Crops Conference 1996 – Volume 2
285
Soil Water While the influence of irrigation on B. oldhamii was evident during the dry winter of 1995 (e.g., mid-June, Figure 6) lack of irrigation into the spring caused an increase in soil moisture tension. The difference in soil water availability between stations and depths was marked, yet not obviously related to the position of each station. Well distributed rain early in 1996 (Figure 7) reduced periods of water deficits at all stations, but increase in water stress was evident from then onwards, and only marginally arrested by light precipitation.
0
20
40
60
80
100
Soil
Mo
istu
re T
ens
ion
(kPa
)
0
20
40
60
80
100
Soil
Mo
istu
re T
ens
ion
(kPa
)
0
20
40
60
80
100
Soil
Mo
istu
re T
ens
ion
(kPa
)
0
10
20
30
40
Date
Wee
kly
Rai
nfal
l (m
m)
0
130 60Tensiometer Depth (cm)
Figure 6: Soil moisture tension within the Bambusa oldhamii experimental area andweekly rainfall records during 1995. Two tensiometers at different soil depths wereinstalled at each station. Station 1 - Low fertilizer plot, highest position on slope; Station 3 -Low fertilizer plot, lowest position; Station 5 - Low fertilizer, amongst guard rows, mid-position.

First Australian New Crops Conference 1996 – Volume 2
286
0
10
20
30
40
50
60
70
80
0
10
20
30
40
50
60
70
0
10
20
30
40
50
60
70
0
10
20
30
40
50
60
70
80
0
10
20
30
40
50
60
70
80
15-Dec 4-Jan 24-Jan 13-F eb 5-Mar
Date
0
20
40
60
80
100
120
140
15-D ec 5-Jan 25- Jan 14- Feb 5-M ar
Date
Rai
nfal
l (m
m)
0
100
130 60Tensiometer Depth (cm)
Figure 7: Soil moisture levels within the Bambusa oldhamii experimental area andweekly rainfall records during 1996. Two tensiometers at different soil depths were installedat each station. Station 1 - Low fertilizer plot, 2nd highest position on slope; Station 2 - Highfertilizer plot, highest position; Station 3 - Low fertilizer plot, lowest position; Station 4 - Highfertilizer plot, 3rd highest position; Station 5 - Low fertilizer, amongst guard rows, 4th highestposition.

First Australian New Crops Conference 1996 – Volume 2
287
For P. pubescens the high irrigation treatment in 1995 (Figure 8) led to enhanced soil moisture status, particularly at 30 cm depth in the autumn and at the 60cm depth as soil dried into the spring. During the summer (Figure 9) soil moisture tension frequently exceeded 20 kPa in all plots because no plots were irrigated due to insufficient water storage. The effect of rainfall on reducing soil moisture tension was apparent throughout the summer.
0
20
40
60
80
100
Soil
Mo
istu
re T
ens
ion
(kPa
) high irrigation block
low irrigation block
0
20
40
60
80
100
Soil
Mo
istu
re T
ens
ion
(kPa
)
high irrigation block
low irrigation block
0
10
20
30
40
31-M
ay
20-J
un
10-J
ul
30-J
ul
19-A
ug
8-Se
p
28-S
ep
Rain
fall
(mm
)
0100
130 60Tensiometer Depth (cm)
Figure 8: Soil moisture tension at 30 cm and 60 cm depths at two stations within thePhyllostachys pubescens experimental area and weekly rainfall records during 1995. Tensiometers were sited within plots with high fertilizer application rates.

First Australian New Crops Conference 1996 – Volume 2
288
0
20
40
60
80
100
Soil
Mo
istu
re T
ens
ion
(kPa
)
high irrigation block
low irrigation block
0
20
40
60
80
100
Soil
Mo
istu
re T
ens
ion
(kPa
)
high irrigation block
low irrigation block
0
40
80
120
160
15-D
ec
25-D
ec
5-Ja
n
15-J
an
25-J
an
4-Fe
b
14-F
eb
24-F
eb
5-M
ar
Date
Rain
fall
(mm
)
Figure 9: Soil moisture tension at 30 cm and 60 cm depths at two stations within thePhyllostachys pubescens experimental area and weekly rainfall records during 1996.Tensiometers were sited within plots with high fertilizer application rates.

First Australian New Crops Conference 1996 – Volume 2
289
Discussion Our data illustrate the feasibility of producing a commercial crop of bamboo shoots in southeast Queensland. Although the plantation was only five years old when initial yield assessment was made, ca. 2500 shoots ha-1 of B. oldhamii were harvestable in each of the 1994/1995 and 1995/1996 seasons. The plantation has yet to form a complete canopy (in April 1996 ground cover was approximately 20%) hence yield is still low. Shoot numbers for P. pubescens at the average weight of 120 g per shoot imply yields of ca. 12.0 t ha-1, more in line with reported yields of 10-20 t ha-1 for Korea and Japan (Farrelly, 1984). The importance of adequate water supply is illustrated by the greater than two-fold difference in shoot number between irrigated and non-irrigated B. oldhamii. Culm number of B. tulda, another sympodial bamboo has been reported to increase with irrigation in India (Aggarwal et al. 1994). For P. pubescens, shoot diameter, and not shoot number was increased by additional irrigation, indicative perhaps that, within the closed canopy of this species, shoot numbers reached a maximum so that response to irrigation was through increase in shoot diameter. The inverse relationship between shoot number and diameter, particularly in response to irrigation treatment (data for Figures 4 and 5), implies that productivity (ie the product of number and size of shoots) was limited by factors other than irrigation. Since all shoots were left in the plantation (ie almost none were removed for harvest) it is possible that through a phenomenon such as apical dominance, potential increases in shoot number, as opposed to shoot diameter were suppressed in response to additional irrigation. This is supported by data from Japan where culm density of ca. 12000 ha-1 in mature stands of P. bambusoides Sieb. et Zucc. (Isagi et al. 1993) restricted recruitment and mortality rates to 1300 and 1100 ha-1, respectively, over a five year period. Over the same period culm biomass and culm diameter increased by factors of 1.57 and 1.19, respectively. Soil moisture tension in P. pubescens at 30 and 60 cm depth, was maintained at 20 kPa or less throughout the shooting period in the high irrigation block (Figure 8), compared to values ranging from 40 to 80 kPa in the low irrigation block. Hence, it is unlikely that the high irrigation plants suffered soil water stress. Further studies to elucidate the influence of irrigation on shoot number and size, and relations to volumes of soil water use and plant water potential are planned. Response of shoot number and diameter to fertiliser was minimal in both species. Leaf appearance rates in 1996 were enhanced by higher fertiliser. The low soil pH (Tables 1 and 3) and poor sub soil drainage most likely induced manganese toxicity. Foliar manganese levels, greater than 500 ppm are considered toxic to other monocotyledenous crops, e.g., wheat and barley (Reuter 1986) and may have limited the response of shoot production to additional fertiliser, although leaf N% did exhibit positive responses (Table 4). Thinning of culms was conducted twice during the experimental period and it is possible that a detectable response to fertiliser was present in the weights of removed culms. These data, unfortunately, were not collected, but it has been shown (Fu et al. n.d.) that P. pubescens stands respond to fertilisation with N, P, K and Si. Given that mature culm (and emerging shoot) diameters increase from year to year, it is expected that shoot yields will continue to increase for P. pubescens, while potential yields of B. oldhamii will likely increase in the future as a result of greater shoot numbers. The influence of irrigation and fertiliser rates on these annual increases will be followed, and related to studies on photosynthesis, canopy dynamics, plant water potential and available soil water. Chemical composition of shoots of P. pubescens harvested in southeast Queensland are somewhat similar to those reported for Zhejiang Province (PRC) and Japan. While water content was within the range reported, protein was approximately double and carbohydrate and fat slightly less. Notable was the absence of sucrose in our samples. The ultimate decider of the economic potential of fresh

First Australian New Crops Conference 1996 – Volume 2
290
bamboo shoot production in Australia will be their palatability and we hope to address this aspect in future research. Acknowledgments We are extremely grateful for the financial support provided for this research by RIRDC and Central Queensland University. References Aggarwal, S.J.M, Khullar, P., Dhawan, V.K. and Joshi, S.R. 1994. Growth and yield of Bambusa
tulda in irrigated and non-irrigated plantations in Haryana. Indian Forester 120: 477-482. Dooley, K. 1992. Report on study of feasibility of establishing a bamboo industry on the Atherton
Tablelands for the Office of Local Government, Dep’t of Immigration, Local Government and Ethnic Affairs.
Farrelly, D. 1984. The Book of Bamboo. (Sierra Club Books: San Francisco). Fu, M.Y., Xie, J.Z., Fang, M.Y., Ren, X.J. and Li, D.Y. 1991. Studies on fertiliser application in
bamboo stands for timber production. In: Selected Papers on Recent Bamboo Research in China. (Chinese Academy of Forestry: Beijing).
Isagi, Y., Kawahara, T. and Kamo, K. 1993. Biomass and net production in a bamboo Phyllostachys
bambusoides stand. Ecological Research 8: 123-133. Reuter, D.J. 1986. Temperate and Sub-tropical Crops. In: Plant Analysis, An Interpretation Manual
(Eds. D.J. Reuter and J.B. Robinson)(Inkata Press: Melbourne).

First Australian New Crops Conference 1996 – Volume 2
291
Nutritive Value of Grain Legumes for Monogastric Animals
K.G. Wiryawan and J.G. Dingle Department of Animal Production, The University of Queensland Gatton College Qld 4343 Abstract World production of grain legumes has steadily increased during the last ten years. In Australia, an eight percent increase in production of grain legumes was reported between 1990 and 1993, mainly for human consumption. Seed rejected for human consumption is available for stockfeed industries. Increasing use of grain legumes in pig and poultry feeds may give economic benefits to these industries and to regional communities. For monogastric animals, grain legumes are regarded primarily as sources of protein. Studies on ten grain legumes (black gram, chickpea, green gram, field pea, faba bean, lentil, lupin, pigeon pea and soybean meal) showed that the crude protein (CP) content was between 18 and 32% of air dry seeds. They are rich in lysine but deficient in sulphur-containing amino acids. On the basis of net protein ratio (NPR) for chickens, chickpea and soy bean meals are of high quality while black gram, faba bean and lupin are of low quality. They are also potential sources of energy with 14 to 16 MJ gross energy (GE)/kg. The range of the true metabolisable energy values for chickens was between 8 and 15.8 MJ/kg DM and the digestible energy value reported for pig was between 13 and 16 MJ/kg. Their use in feed, however, is limited by the possible presence of antinutritional factors (ANFs) such as trypsin inhibitors, lectins and tannins which interfere with normal digestive functions. A wide range of techniques is available to inactivate these ANFs. This paper is focused on the evaluation of grain legumes as sources of energy and amino acids for monogastric animals particularly for poultry. The significant effects of ANFs and methods for improving nutritional value of grain legumes are also discussed. Introduction Grain legumes play an important role among vegetable materials commonly used in human and animal diets. World legume production has steadily increased during recent decades (FAO 1994). Production of soybean, field peas, chickpeas, broad beans and lentils in 1993 was 111,011, 16,032, 6,641, 4,028, and 2,698 metric tonnes respectively, of which over 60% was produced in developing countries. Developed countries are also increasing production of grain legumes to substitute for soybean imports (Gatel 1994). In Asia about 20 grain legumes out of a possible 10,000 or so (Farrington 1974, Ravindran and Blair 1992) are cultivated, mainly for human consumption. Seed rejected for human consumption is available for stockfeed industries. Increasing use of grain legumes in pig and poultry feeds may give economic benefits to these industries and to regional communities. Soybean meal and fish meal currently occupy a central role in the feeding of monogastric animals in many developed countries. Increasing human demand for protein in developing countries, coupled with a relatively high cost of imported ingredients has turned the attention of animal nutritionists to the exploitation of novel legumes indigenous to the tropics (D’Mello 1982).
First Australian New Crops Conference 1996 – Volume 2
292
Grain legumes are potential substitutes for soybean meal because of the similarity in their amino acid and energy profiles (Table 1). Although the use of grain legumes in pig and poultry production is regarded primarily as supplying a source of protein (Wiseman and Cole 1988), they are also potentially good sources of energy (Visitpanich et al. 1985a, Evans 1985, Johnson and Eason 1990, Miller and Holmes 1992) as they contain up to 60% carbohydrates (mainly starch) (Reddy et al. 1984). The potential utilisation of grain legumes as a source of protein and energy for monogastric animals is, however, governed not only by their content of metabolisable energy (ME) and essential amino acids, but also by the possible presence of anti-nutritional factors (ANFs). Therefore the extent to which grain legumes are used in commercial pig and poultry production is still limited because of uncertainty about their effective nutritional quality. Investigation of the factors affecting the nutritional value of grain legumes would yield information useful in deciding the most efficient way to utilise these resources in pig and poultry diets. This paper is focused on the evaluation of grain legumes as sources of protein and energy for monogastric animals, particularly for poultry. The significant effects of ANFs and methods for improving nutritional value are also discussed. Protein Quality of Grain Legumes The nutrient content and amino acid composition of a range of grain legumes are shown in Tables 1 and 2. These unprocessed legumes are potential sources of protein for pigs and poultry. The crude protein content (%N x 6.25) of grain legumes is between 18 and 32% and varies between and within species. The amino acid composition of legume proteins has been widely studied. Although there are differences in amino acid concentrations between legumes, there may be equally as much variation between samples of one legume (Evans 1985). Abdel-Ahmed and Abdel-Noer (1990) reported that the lysine content of Sudanese legume seeds varied from 5.56 to 6.27 g/16g N. The amino acid content of grain legumes varies according to cultivar and environment (Wyckoff et al. 1983, Barampama and Simard 1993). Compared with soybean meal protein (Table 2), legume proteins, with the exception of lupin, are rich in lysine. Grain legumes contain less tryptophan and, in general, less sulphur-containing amino acids than soybean meal. When the amino acid requirements of broiler chickens, layer chickens (NRC 1994) and growing pigs (NRC 1988) are compared with the amino acid content (expressed as mg amino acid per gram protein) of all legumes, grain legumes are generally good sources of lysine but deficient in both methionine and cystine while tryptophan is marginal (Dingle and Wiryawan 1994). Provided that the diet is supplemented with methionine, grain legumes are potential substitutes for soybean meal in the diets of monogastric animals. However untreated grain legumes contain ANFs, which are inherently developed for growth and protection (Gatehouse et al. 1987, Bond and Smith 1989) but reduce production when ingested in sufficient amounts by poultry and pigs. Feeding raw legumes to chickens generally results in lower growth rate and reduced feed efficiency compared with feeding processed legumes. However, each legume produces a different response. Miller and Holmes (1992) reported that increasing the level of chickpea and mung bean from 10 to 40% in the diets of broilers reduced their weight gain by 14%, while feeding the same levels of field peas resulted in weight gains similar to that produced by a commercial diet. Similarly, inclusion of 10
First Australian New Crops Conference 1996 – Volume 2
293
to 50% pigeon pea in broiler diets significantly improved the feed conversion ratio (Tangtaweewipat and Elliot 1989). Net protein ratio (NPR), [calculated as weight gain of the chickens fed the test diet + weight loss of the chickens fed protein-free diet divided by protein intake] of nine raw legumes for broiler chickens was 63 to 100% of that produced by similar amount of protein from soybean meal (Dingle and Wiryawan 1994, Wiryawan and Dingle 1995a). Net weight gain (NWG) of chickens improved significantly, but many grain legumes still varied widely from that produced by methionine supplemented soybean meal, when diets containing grain legumes were supplemented with methionine to 100% of NRC (1994) requirements. The NWG of chickens fed methionine supplemented chickpeas and lentil were not significantly different from methionine supplemented soybean meal, while those of methionine supplemented black gram, faba bean, lupin, green gram, and field pea were 78, 45, 38, 37 and 32% of that of methionine supplemented soybean meal respectively (Wiryawan and Dingle 1995b).

First Australian New Crops Conference 1996 – Volume 2
294
Table 1. Essential amino acid (EAA) composition of some grain legumes (mg AA per g protein)* compared with poultry and pig requirements Legumes Essential
Amino Acid Arg His Ieu Leu Lys Met Met+C
yst Phen Phen+
Tyr Thre Try Val
Black gram (Phaseolus mungo) 71.13 29.15 45.02 84.51 77.17 16.35 24.56 64.01 93.37 35.01 9.76 55.04 Chickpea (Desi) (Cicer arietinum) 94.08 25.34 41.66 73.51 73.46 12.30 27.64 57.84 82.62 36.43 7.09 44.98 Chickpea (Kabuli) (Cicer arietinum) 92.32 24.70 41.52 73.63 72.34 12.47 26.57 58.82 83.76 37.46 6.55 45.73 Faba bean (Vicia faba) 89.66 23.73 38.95 69.95 68.37 6.66 17.65 42.24 70.38 35.27 6.44 43.86 Field pea (Pisum sativum) 96.73 24.19 39.75 70.51 79.22 7.62 20.99 48.10 76.95 37.61 6.94 47.82 Green gram (Vigna radiata) 72.55 29.05 44.26 82.32 80.31 12.07 19.92 63.94 92.23 36.09 9.22 56.49 Red lentil (Lens culinaris), dehulled 86.14 21.39 39.23 68.97 70.16 6.25 15.08 47.31 72.59 35.23 6.36 45.14 Lupin (Lupinus angustifolius) 120.49 26.54 42.79 69.80 53.76 4.91 14.85 42.77 77.41 36.19 8.82 41.98 Pigeon pea (Cajanus cajan) 64.41 37.52 39.33 76.85 77.82 11.32 24.20 104.32 129.89 39.33 5.06 47.28 Soybean mealp (Glycine max) 68.85 24.38 43.59 72.82 63.11 11.29 24.40 50.86 82.67 38.10 21.91 44.88
Broiler, 0 - 3 weeksp 54 15 35 52 48 39 22 58 31 35 9 39 Layersp 47 11 43 55 46 39 20 55 31 31 11 47 Pigq 17 15 31 40 50 27 - 44 - 32 8 32
*Source: Wiryawan, Palmer and Dingle (unpublished). p NRC. (1994) amino acid requirement of broiler chickens and layers.
qNRC. (1988) amino acid requirement for swine based on ration containing 15% protein. - Data was not available.

First Australian New Crops Conference 1996 – Volume 2
295
Table 2. Nutrient content, tannins and trypsin inhibitor activity in grain legumes (g/kg air-dry weight)*
Legumes DM Ether
Extract Crude Protein
Crude Fibre
NDF ADF Ash NFE GE (MJ/kg)
Tanninsqq (mg/g DM)
Trypsin Inhibito r(TUI/mg DM)
Black gram (Vigna mungo) 903.7 11.3 249.9 43.0 148.4 96.3 34.6 564.9 15.27 17.95 5.44 Chickpea (Desi) (Cicer arietinum) 903.4 44.7 193.2 99.0 234.2 159.1 34.6 531.9 15.91 0.69 5.32 Chickpea (Kabuli) (Cicer arietinum) 902.6 57.7 188.9 36.7 108.5 61.9 26.1 593.2 16.49 0.57 4.45 Faba bean (Vicia faba) 908.6 12.3 234.7 87.5 209.6 150.3 31.3 542.8 15.85 2.79 2.52 Field pea (Pisum sativum) 906.1 12.0 223.6 57.8 177.6 98.5 43.7 569.0 15.23 0.67 2.57 Green gram (Vigna radiata)) 899.3 14.1 223.5 43.5 139.9 92.9 47.9 570.3 15.43 2.34 3.68 Red lentil (Lens culinaris), dehulled 893.9 10.5 239.0 14.1 138.2 43.7 19.8 610.5 15.16 <0.1 2.10 Lupin (Lupinus angustifolius) 916.4 50.4 313.5 47.0 239.4 203.7 34.0 371.5 16.61 1.67 <1 Pigeon pea (Cajanus cajan) 885.1 19.0 181.4 74.7 195.7 140.2 37.9 572.1 14.84 2.98 3.33 Soybean mealp (Glycine max) 888.0 15.2 454.5 53.5 164.9 147.8 61.8 303.0 16.13 0.55 2.51
* Source: All from Wiryawan and Dingle (1995) but GE, tannins and trypsin inhibitor activity from Wiryawan and Dingle (Unpublished). pSolvent extracted. q Tannins content expressed as catechin equivalent.


First Australian New Crops Conference 1996 – Volume 2
107
In pigs, feeding a diet containing 26% chickpeas or 30% pigeon peas reduced weight gain by 4 and 12% from that produced by soybean meal respectively (Visitpanich et al. 1985b). The effects appear to be different in pigs from those in poultry. However, it is difficult to compare the severity of the effect of the inclusion of raw legumes in pig diets with those in poultry diets because the same levels of legumes have not been used nor would the base diets be identical. In addition the legumes used might not have been the same cultivars. Metabolisable Energy Values of Grain Legumes The apparent metabolisable energy value measured by others in chickens varied from as low as 8 MJ/kg for pigeon pea to as high as 13.8 MJ/kg for the low-fibre chickpea (Table 3). Studies in our laboratory showed that true metabolisable energy values using a modified Sibbald (1989) diet of ten raw grain legumes for chickens varied from as low as 9.27 MJ/kg for faba bean to as high as 15.8 MJ/kg for chickpea of low fibre content (Wiryawan et al. 1995). The range of digestible energy measured in pigs was 13.5 to 16.2 MJ/kg (Table 3). Table 3. Digestible and metabolisable energy values of some untreated grain legumes. Legume References AME
(Chickens) MJ/kg
DE (Pigs) MJ/kg
Chickpea (low fibre) Chickpea (high fibre)
Johnson and Eason (1990) Visitpanich et al. (1985a) Miller and Holmes (1992) Johnson and Eason (1990) Visitpanich et al. (1985a) Miller and Holmes (1992)
12.5 - 13.8 10.3 - 8.1
- 16.2 - 14.9 -
Cowpea Evans (1985) Fialho et al. (1985)
12.26 -
13.5 14.59
Dolichos Evans (1985) 11.68 13.5 Field pea Evans (1985)
Davies (1984) Johnson and Eason (1990)
12.96 - 10.82
14.2 14 -
Faba bean Johnson and Eason (1990) 11.0 - Lupin Evans (1985) 9.75 14.2 Green gram Evans (1985)
Creswell (1981) Wiryawan (unpublished)
11.70 12.7 -
15.5 - 15.87
Navy bean Evans (1985) 9.75 14.2 Pigeon pea Tangtaweewipat and Elliot
(1989) Fialho et al. (1985) Visitpanich et al. (1985a)
8.0 -
- 14.28 15.1
Soybean meal* Evans (1985) Johnson and Eason (1990)
10.67 9.46
14.2 -
* Solvent extracted

First Australian New Crops Conference 1996 – Volume 2
108
Significant amounts of energy in raw grain legumes are not available to poultry and pigs because there is not a large difference between the gross energy (GE) content of grain legumes (Table 1). Figure 1 shows a comparison of the GE and True Metabolisable Energy (TME) values when untreated legume meals were tested in meat chickens. It is apparent from this trial that most of the energy in chickpeas and green gram was metabolised by chickens, but only 60% of the GE of lupin and faba bean was metabolised by growing chickens. Decreased protein value and TME/GE (%) of grain legumes can be explained by the effects of ANFs.
Figure 1. Comparison of gross energy (GE) and true metabolisable energy (TME)
values of some grain legumes
The Nutritional Significance of ANFs Grain legumes contain a number of naturally occurring substances known as antinutritional factors (ANFs). The main ANFs in grain legumes are protease (trypsin and chymotrypsin) inhibitors, lectins and tannins (Wiseman and Cole 1988). There is a large range of trypsin inhibitor activity in the legumes (from <1 to 5.44 TUI/mg DM). The tannin content of black gram is significantly higher than in other legumes. Other ANFs which may play an important role in decreasing the nutritive value of grain legumes are non-starch polysaccharides. The neutral detergent fibre (NDF) content of lupin and chickpea (Desi type) is higher than others. Because of genetic differences, each legume species or cultivar is likely to have different amounts of ANFs (Grant et al. 1983, Alitor et al. 1994, Gatel 1994). This raises the possibility of improving the nutritional value of grain legumes through genetic manipulation (Bond and Duc 1993).
0
2
4
6
8
10
12
14
16
18
Chi
ckpe
a c
v.K
aniv
a (9
6)
Chi
ckpe
a c
v.D
esi (
89)
G.g
ram
(91
)
Fie
ld p
ea (
85)
Lent
il (8
2)
SB
M (
76)
Pig
eon
pea
(79)
B.g
ram
(70
)
Lupi
n (5
8)
Fab
a be
an(6
0)
TME/GE (%)
Ene
rgy
(MJ/
kg D
M)
GE TME

First Australian New Crops Conference 1996 – Volume 2
109
Protease Inhibitors Protease inhibitors (trypsin and chymotrypsin inhibitors) are proteins of wide distribution in the plant kingdom, and they are common constituents of legume seeds. They are readily denatured by heat, acid and alkali. Active trypsin inhibitors have been shown to have a double detrimental effect on the utilisation of legume proteins because they inhibit trypsin or chymotrypsin activities and they ‘lock in’ a relatively high proportion of cysteine which is already in short supply (Kakade et al. 1969). The physiological responses of animals to the same level of trypsin inhibitor and chymotrypsin inhibitor in different legumes varies. Pigs, for example can tolerate dietary levels of at least 4.7 and 4.5 mg/g of trypsin inhibitor and chymotrypsin inhibitor respectively from chickpea meals (Batterham et al. 1993). However, the growth of pigs fed diets containing a pigeon pea meal which contained a lower level of these two protease inhibitors, was severely depressed. This indicates that other unidentified factors in pigeon pea meal were having an inhibitory effect in pigs in addition to the trypsin and chymotrypsin inhibitors. Kakade et al. (1973) estimated that trypsin inhibitors from raw soybean account for about 40% of the enlargement of the pancreas and 40% of the growth retardation of rats. The extent to which trypsin inhibitors from other legumes inhibit the growth of chickens and pigs has not been fully documented. However it has been found that substances such as lectins, tannins and non-starch polysaccharides in raw soybean and other legumes are responsible for impaired animal performance.
Lectins Lectins, otherwise referred to as phytohaemagglutinins, are glycoproteins capable of agglutinating red blood cells in vitro, and of binding to receptors on the epithelial cells of the intestinal mucosa, thereby interfering with digestion (Baintner, et al. 1993, Gatel 1994). Legume seeds, especially in the cotyledons (Marquardt et al. 1975), are particularly rich in this sugar-binding protein (Grant et al. 1983). Lectins are heat sensitive proteins but they are resistant to gut proteolysis (Nakata and Kimura 1985). A survey conducted by Grant et al. (1983) on the nutritional and haemagglutination properties of legumes in the United Kingdom showed that the lectins in lentils (Lens culinaris), peas (Pisum sativum) chickpeas (Cicer arietinum), black-eyed peas (Vigna sinensis), pigeon peas (Cajanus cajan), green gram (Vigna radiata), faba bean (Vicia faba) and azuki bean (Phaseolus angularis), were non-toxic. The growth depression observed after feeding these legumes therefore appears to be due to other ANFs.
Tannins Tannins are defined as water-soluble phenolic compounds, widely distributed in the plant kingdom and having high protein binding capacity (Marquardt 1989). Most of them reside in the seed coat (Singh 1993). Jadhav et al. (1989) reported that among grain legumes, black gram, faba bean, green gram, horse gram, kidney bean, moth bean, pea and pigeon pea have high tannin content. The white-flowered, or the white seeded cultivars, of both beans and peas have negligible amounts of tannin (Griffiths 1981, Bos and Jetten 1989).

First Australian New Crops Conference 1996 – Volume 2
110
Most nutritional reports on tannins have been based on work with faba bean (Vicia faba) due to the greater negative effect of tannin than other ANFs in this legume (Griffiths 1981). Ingestion of a sufficient amount of dietary tannin reduces daily gain and impairs feed efficiency due to decreased digestibility of protein in rats (Moseley and Griffiths 1980, Alzueta et al. 1992), chickens (Santidrian and Marzo 1989, Longstaff and McNab 1991) and pigs (Jansman et al. 1994). Similar responses were reported from feeding a dark-flowered cultivar of peas. Hlodversson (1987) reported that incorporation of 35% peas (Pisum arvense) in pig diets reduced apparent digestibility of protein and energy by 21.2 and 13.6% respectively compared with the same amount of a white-flowered cultivar (Pisum sativum). These results, however, cannot be fully accounted for by the effect of tannins alone. It is possible that the two cultivars differed in their nutrient composition, or other ANFs may have confounded the results. Non-starch Polysaccharides (NSP) The major components of non-digestible carbohydrates of a feedstuff are non-starch polysaccharides (NSP) made up of water insoluble cellulose and water soluble gums, hemicelluloses, pectic substances and mucilages (Prosky and deVries 1992). Grain legumes have been reported to contain relatively high concentrations of NSP’s (Brillouet et al. 1988, Table 2). These substances are resistant to digestion by enzyme secreted by the alimentary tract (Classen and Bedford, 1991) and the presence of NSP’s decreases the rate of gastric emptying and increases small intestinal transit time (Potkins et al. 1991, Roberfroid 1993). The exact mode of action by which the NSP’s of legume origin affect growth and digestibility in poultry and pigs is not clearly understood. They may act in the same manner as the NSP’s of cereals origin. That is, they may increase the viscosity of the digesta in the lumen of the gut, resulting in a reduction in the rate of hydrolysis of starch (Knudsen et al. 1993) protein and fat (Choct and Annison 1992) and a reduction in the transport and uptake of the products of starch, protein and fat digestion from the gut. Ellis et al. (1995) reported an inverse relationship between glucose absorption and viscosity of jejunal digesta when growing pigs were fed diets with increasing concentration of guar gum. Improving Nutritional Value Promising results have been shown by plant breeders in their efforts to eliminate ANFs (Bond and Duc 1993). Reduction of condensed tannin content through genetic manipulation of faba bean, for example, has resulted in increased digestibility of dry matter and nitrogen in pigs (van der Poel et al. 1992). Plant breeding is, however, a long-term program and the results, at least for the removal of trypsin inhibitors in peas (Pisum sativum), were not consistent. Some cultivars had higher trypsin inhibitor activity than one of their parents, and cultivars derived from the same cross showed different trypsin inhibitor activities, suggesting that the hereditary transmission was not systematic (Luterme et al. 1992). The most widely used methods for the reduction of the negative effects induced by ANFs are chemical and physical treatments. Decortication is an effective method for reducing tannin content of grain legumes since most tannins reside in the testa. Heat treatment is a good method of decreasing the activity of trypsin inhibitors and lectins, generally improving the nutritional value of grain legumes (Hanovar et al. 1962, van der Poel 1990, van der Poel et al. 1990a,b). The effect of heat depends on the temperature and duration of processing. Incorrect heat treatment can result in the
First Australian New Crops Conference 1996 – Volume 2
111
reduction of protein solubility and may destroy certain amino acids (Almas and Bender 1980, Metebe 1989, Dhurandhar and Chang 1990). Dietary enzyme supplements are alternatives to heat treatments. Enzyme supplements that digest NSP are likely to increase the metabolisable energy and protein values of grain legumes in the same way they do in wheat (Choct and Annison 1992, Choct et al. 1995, Hew et al. 1995). Recent studies in our laboratory showed that the true metabolisable energy (TME) value of ten grain legumes (black gram, chickpea (Desi), chickpea (Kabuli), field pea, faba bean, green gram, lentil, lupin, pigeon pea and soybean meal), improved by an average of 5% when supplemented with an enzyme mixture containing hemicellulase and protease (Wiryawan et al. 1995). The lowest TME legumes, lupins and faba bean, had the greatest increase in TME value with the added enzymes. In summary, grain legumes are potential sources of energy and protein for monogastric animals. The ANFs in grain legumes produce their negative effects on animals through their interference with normal digestive functions, resulting in a reduction in the digestibility of dietary energy, protein/amino acids, and other nutrients. Consequently growth or production of the animal is depressed. Heat treatments are the most widely used techniques for inactivating ANFs. However, as well as potentially destroying nutrients, this method increases the operating cost for a feed company. Enzyme supplementation is likely to be an effective way of reducing the negative effects of antinutritional factors in grain legumes. The best enzymes to use and the extent of their effectiveness in improving animal performance need to be elucidated. References
Abdel-Ahmed, H.R. and Abdel-Noer, A.A.M. 1990. Protein quality of common Sudanese
leguminous seeds. Lebensmittel-Wissenschaft und Technologie 23: 301-304. Almas, K. and Bender, A.E. 1980. Effect of heat treatment of legumes on available lysine.
Journal of the Science of Food and Agriculture 31: 448-452. Alitor, V.A., Goodchild, A.V. and Abdel Monein, A.M. 1994. Nutritional and antinutritional
characteristics of selected Vicia genotypes. Animal Feed Science and Technology 47: 125-139.
Alzueta, C., Trevino, J. and Ortiz, L. 1992. Effect of tannins from faba beans on protein
utilisation in rats. Journal of the Science of Food and Agriculture 59: 551-553. Baintner, K., Farningham, D.A.H., Bruce, L.A., Macrae, J.L. and Pusztai, A. 1993. Fate of the
antinutritive proteins of soybean in the ovine gut. Journal of Veterinary Medicine Series A 40: 427 - 431.
Barampama, Z. and Simard, R.E. 1993. Nutrient composition, protein quality and antinutritional
factors of some varieties of dry beans (Phaseolus vulgaris) grown in Burundi. Food Chemistry 47: 159-167.
Batterham, E.S., Saini, H.S., Andersen, L.M. and Baigent, R.D. 1993. Tolerance of growing pigs to
trypsin and chymotrypsin inhibitors in chickpeas (Cicer arietinum) and pigeon peas (Cajanus cajan). Journal of the Science of Food and Agriculture 61: 211-216.
Bond, D.A. and Smith, D.B. 1989. Possibilities for the reduction of antinutritional factors in grain
legumes by breeding. In: Recent Advances of Research in Antinutritional Factors in Legume

First Australian New Crops Conference 1996 – Volume 2
112
Seeds (Eds J. Huisman, A.F.B. van der Poel, and I.E. Liener). (PUDOC: Wageningen, The Netherlands), pp. 285-296.
Bond, D.A. and Duc, G. 1993. Plant breeding as a means of reducing antinutritional factors in grain
legumes. In Recent Advances of Research in Antinutritional Factors in Grain Legume Seeds (Eds A.F.B. van der Poel, J. Huisman, and H. Saini) EAAP Publication No. 70 (Wageningen Press: The Netherlands), pp. 379-396.
Bos, K.D. and Jetten, J. 1989. Determination of tannin in faba beans. In: Recent Advances of
Research in Antinutritional Factors in Legume Seeds (Eds J. Huisman, A.F.B. van der Poel, and I.E. Liener). (PUDOC Wageningen: The Netherlands), pp. 168-169.
Brillouet, J.M., Rovav, X., Hoebler, C., Barry, J.L., Carre, B. and Lorta, E. 1988. A new method for
determination of insoluble cell wall and soluble nonstarchy polysaccharides from plant materials. Journal of Agricultural and Food Chemistry 36: 969-979.
Choct, M. and Annison, G. 1992. The inhibition of nutrient digestion by wheat pentosans. British
Journal of Nutrition 67: 123 - 132. Choct, M., Hughes, R.J., Wang, J., Bedford, M.R., Morgan, A.J. and Annison, G. 1995. Feed enzymes
eliminate anti-nutritive effect of non-starch polysaccharides and modify fermentation in broilers. Proceedings of the Australian Poultry Science Symposium 7: 121-125.
Classen, H.L. and Bedford, M.R. 1991. The use of enzymes to improve the nutritive value of poultry
feeds. In: Recent Advances in Animal Nutrition. (Eds W. Haresign, and D.J.A. Cole). (Butterworth, Heinemann), pp. 95-116.
Creswell, D.C. 1981. Nutritional evaluation of mung beans (Phaseolus aureus) for young broiler
chickens. Poultry Science 60 : 1905-1909. Davies, R.L. 1984. Field peas (Pisum sativum) as a feed for growing and finishing pigs. 1. Nutrient
level in commercial crops. Australian Journal of Experimental Agriculture and Animal Husbandry 24: 350-353.
Dhurandhar, N.H. and Chang, K.C. 1990. Effect of cooking on firmness, trypsin inhibitors, lectins and
cysteine/cystine content of navy bean and red kidney beans. Journal of Food Science 55: 470 - 474.
Dingle, J.G. and Wiryawan, K.G. 1994. Protein value of grain legumes. Queensland Poultry Science
Symposium 3: 73-82. D’Mello, J.P.F. 1982. Toxic factor in some tropical legumes. World Review of Animal Production
XVIII: 41-46.
First Australian New Crops Conference 1996 – Volume 2
113
Ellis, P.R., Robert, F.G., Low, A.G. and MORGAN, L.M. 1995. The effect of high-molecular-weight guar gum on net apparent glucose absorption and net apparent insulin and gastric inhibitory polypeptide production in growing pig: Relationship to rheological changes in jejunal digesta. British Journal of Nutrition 74: 539-556.
Evans, M.E. 1985. Nutrient composition of feedstuffs for pigs and poultry. Queensland Department of
Primary Industries, Pub. No Q15001, Brisbane. FAO. 1994. FAO yearbook: Production. (Food and Agriculture Organisation of the United Nations:
Rome), pp. 97 - 106. Farrington, P. 1974. Grain legume crops: Their role on the world scene and in Australian agriculture.
Journal of the Australian Institute of Agricultural Science 46: 99-108. Fialho, E.T., Albino, L.F.T. and Blume, E. 1985. Chemical composition and energy values of some
feeds for pigs. Pesquisa Agropecuaria Brasileira 20: 1419-1431. Gatehouse, A.M.R., Dobie, P., Hodges, R.J., Meik, J., Pusztai, A. and Boulter, D. 1987. Role of
carbohydrates in insect resistance in Phaseolus vulgaris. Journal of Insect Physiology 33: 843-850.
Gatel, F. 1994. Protein quality of legume seeds for non-ruminant animals: a literature review. Animal
Feed Science and Technology 45: 317-348 Grant, G., Moree, L.J., Mckenzie, N.H., Stewart, J.C. and Pusztai, A. 1983. A survey of the nutritional
and haemagglutination properties of legume seeds generally available in the UK. British Journal of Nutrition 50: 207-214.
Griffiths, D.W. 1981. The polyphenolic content and enzyme inhibitory activity of testa from beans
(Vicia faba) and peas (Pisum spp) varieties. Journal of the Science of Food and Agriculture 28: 983-989.
Hanovar, P. M., Shih, C.P. and Liener, I.E. 1962. Inhibition of growth of rats by purified
hemagglutinin fractions isolated from Phaseolus vulgaris. Journal of Nutrition 77: 109. Hew, L.I., Ravindran, V., Mollah, Y., Gill., R.J. and Bryden, W.L.1995. Enzyme supplementation
improves illeal amino acid digestibility values of wheat for broilers. Proceedings of the Australian Poultry Science Symposium 7: 189.
Hlodversson, R. 1987. The nutritive value of white- and dark-flowered cultivars of pea for growing
pigs. Animal Feed Science and Technology 17: 245 - 255. Jadhav, S.J., Reddy, N.R. and Deshpande, S.S. 1989. Polyphenols. In: Handbook of World Food
Legumes, Volume I. (CRC Press, Inc: Boca Raton, Florida), pp. 145-161. Jansman, A.J.M., Enting, H., Verstegen, M.W.A. and Huisman, J. 1994. Effect of condensed tannins
in hulls of faba beans (Vicia faba L.) on the activities of trypsin and chymotrypsin in digesta collected from the small intestine of pigs. British Journal of Nutrition 71: 627-641.
First Australian New Crops Conference 1996 – Volume 2
114
Johnson, R.J. and Eason, P.J. 1990. Effect of dietary inclusion of field peas, lupins, narbon beans and chickpeas on the growth performance of broiler chickens. . Proceedings of the Australian Poultry Science Symposium 2:96-99.
Kakade, M.L., Arnold, R.L., LIENER, I.E. and Waibel, P.E. 1969. Unavailability of cysteine from
trypsin inhibitors as a factor contributing to poor nutritive value of navy beans. Journal of Nutrition 99: 34 - 42.
Kakade, M.L., Hoffa, D.E. and Liener, I.E. 1973. Contribution of trypsin inhibitors to the deleterious
effect of unheated soybeans fed to rats. Journal of Nutrition 103:1772-1776. Knudsen, K.E.B., Jensen, B.B. and Hansen, I. 1993. Digestion of polysaccharides and other major
components in the small and large intestine of pigs fed on diets consisting of oat fractions rich in beta-D-glucan. British Journal of Nutrition 70: 537-556.
Longstaff, M. and McNab, J.M. 1991. The inhibitory effects of hull polysaccharides and tannin of
faba beans (Vicia faba L.) on the digestion of amino acids, starch and lipid and on digestive enzyme activities in young chicks. British Journal of Nutrition 65: 199-216.
Luterme, P., Monmart, T. and Thewis, A. 1992. Varietal distribution of the trypsin inhibitor activity
in peas (Pisum sativum L.). Animal Feed Science and Technology 37.309-315. Marquardt, R.R. 1989. Dietary effect of tannin, vicine and convicine. In: Recent Advances of
Research in Antinutritional Factors in Legume seeds. pp 141 - 155 (Eds J. Huisman, A.F.B. van der Poel. and I.E. Liener) (PUDOC Wageningen: The Netherlands, pp. 141-155.
Marquardt, R.R., McKirdy, J.A. Ward, A.T. and Campbell, L.D. 1975. Amino acids, haemagglutinin
levels and proximate analysis of faba beans (Vicia faba) and faba bean fraction. Canadian Journal Animal Science 55:421-429.
Metebe, K. 1989. The effect of dry and moist heat on some chemical properties of wing bean seed.
Tropical Grain Legume Bulletin 36: 32-33. Miller, H.M. and Holmes, J.H.G. 1992. Grain legumes for broiler production. Proceedings of the
Australian Poultry Science Symposium 3:38-45. Moseley, G. and Griffiths, D.W. 1980. The effect of diet containing faba beans of high and low
polyphenolic content on the activity of digestive enzyme in the intestines of rats. Journal of the Science of Food and Agriculture 31: 255-259.
Nakata, S. and Kimura, T. 1985. Effect of ingested toxic bean lectins on the gastrointestinal tract in
the rat. Journal of Nutrition 115:1621-1629. NRC. 1988. Nutrient requirements of swine. (National Academy Press: Washington, D.C.). p. 50. NRC. 1994. Nutrient requirements of poultry. (National Academy Press: Washington, D.C.) p. 20,
27. Potkins, Z.V., Lawrence, T.L.J. and Thomlinson, J.R. 1991. Effects of structural and non-structural
polysaccharides in the diet of the growing pig on gastric emptying rate and rate of passage of

First Australian New Crops Conference 1996 – Volume 2
115
digesta to the terminal ileum and through the total gastrointestinal tract. British Journal of Nutrition 65: 391-413.
Prosky, L. and DeVries, J. 1992. Controlling dietary fiber in food products. (Van Nostrand Reinhold:
New York). pp. 6-10. Ravindran, V. and Blair, R. 1992. Feed resources for poultry production in Asia and the Pacific II.
Plant protein sources. World’s Poultry Science Journal 48: 205-231. Reddy, N.R., Pierson, M.D., Sathe, S.K. and Salunkhe, D.K. 1984. Chemical, nutritional and
physiological aspects of dry bean carbohydrates: a review. Food Chemistry 13: 25-68. Roberfroid, M. 1993. Dietary fiber, inulin, and oligofructose: A review comparing their physiological
effects. Critical Review in Food Science and Nutrition 33: 103 - 148. Santidrian, S. and Marzo, F. 1989. Effect of tannic acid and kidney bean (Phaseolus vulgaris) on the
intestinal absorption of d-galactose and l-leucine in chickens. Journal of the Science of Food and Agriculture 47: 435 -442.
Sibbald, I.R. 1989. Metabolisable energy evaluation of poultry diets. In: Recent Development in
Poultry Nutrition (Eds D.J.A. Cole and W. Haresign) pp.12-26 (Butterworth: London). Singh, U. 1993. Protein quality of pigeonpea (Cajanus cajan [L] Millsp) as influenced by seed
polyphenols and cooking process. Plant Foods for Human Nutrition 43: 171-179. Tangtaweewipat, S. and Elliott, R. 1989. Nutritional value of pigeon pea (Cajanus cajan) meal in
poultry diets. Animal Feed Science and Technology 25: 123-135. Van Der Poel, A.F.B. 1990. Effect of processing on antinutritional factors and protein nutritional
value of dry beans (Phaseolus vulgaris). A Review. Animal Feed Science and Technology 29: 179 - 208.
Van Der Poel, T.F.B., Blonk, J., Van Zuilichem, D.J. and Van Oort, M.G. 1990a. Thermal
inactivation of lectins and trypsin inhibitor activity during steam processing of dry beans (Phaseolus vulgaris) and effects on protein quality. Journal of the Science of Food and Agriculture 53: 215-228.
Van Der Poel, A.F.B., Liener, I.E., Mollee, P.W. and Huisman, J. 1990b. Variation among species of
animals in response to the feeding of heat-processed beans (Phaseolus vulgaris). 1. Bean processing and effect on growth, digestibility and organ weight of piglets. Livestock Production Science 25: 121 - 135.
Van Der Poel, A.F.B., Dellaert, L. M.W., Van Norel, A. and Helsper, J.P.F.G. 1992. The digestibility
in piglets of faba bean (Vicia faba L.) as affected by breeding towards the absence of condensed tannins. British Journal of Nutrition 68: 793-800.
Visitpanich, T., Batterham, E.S and Norton, B.W. 1985a. Nutritional value of chickpea (Cicer
arietinum) and pigeonpea (Cajanus cajan) meals for growing pigs and rats. 1. Energy content and protein quality. Australian Journal of Agricultural Research 36: 327 - 335.

First Australian New Crops Conference 1996 – Volume 2
116
Visitpanich, T., Batterham, E.S and Norton, B.W. 1985b. Nutritional value of chickpea (Cicer arietinum) and pigeonpea (Cajanus cajan) meals for growing pigs and rats.2. Effects of autoclaving and alkali treatment. Australian Journal of Agricultural Research 36: 337 - 345.
Wiryawan, K.G., Dingle, J.G., Kumar, A., Gaughan, J.B. and Young, B.A. 1995. True metabolisable
energy content of grain legumes: effects of enzyme supplementation. In: Recent Advances in Animal Nutrition in Australia (Eds J.B. Rowe and J.V. Nolan). (University of New England: Armidale). p. 196.
Wiryawan, K.G. and Dingle, J.G. 1995a. Screening test of the protein quality of grain legumes for
poultry production. British Journal of Nutrition 74: 671-679. Wiryawan, K.G. and Dingle, J.G. 1995b. Protein quality of grain legumes for chickens: Effect of
methionine supplementation. Proceeding of The Nutrition Society of Australia 19. p. 203. Wiseman, J. and Cole, D.J.A. 1988. European legumes in diets for nonruminantia. In: Recent
Advances in Animal Nutrition (Eds W. Haresign and D.J.A. Cole), (Butterworth: London). pp.13-36.
Wyckoff, S., Vohra, P. and Kratzer, F.H. 1983. Nutritional evaluation of coloured and one of white
beans (Phaseolus vulgaris) for Javanese Quail. Poultry Science 62: 1576-1586.

First Australian New Crops Conference 1996 – Volume 2
117
The Potential and Problems of Non-Wood Fibres and Fibre Crops as Feedstocks for the Pulp and Paper Industry Ian M. Wood I.M. Wood and Associates, 258 Bielby Road, Kenmore Hills, QLD 4069, Australia Abstract Non-wood fibre crops, such as jute, kenaf, hemp and sisal, have traditionally been grown as sources of fibre for the manufacture of textiles, ropes, sacking and cordage. With the development of artificial fibres, such as nylon and polypropylene, rapid advances in the quality, productivity and mechanisation of cotton, and the increasing use of bulk handling for the movement of agricultural produce, the demand for the traditional non-wood fibres, other than cotton, has steadily declined. Research has shown that the traditional non-wood fibres can be used to produce high quality writing and specialty papers. In addition, the whole stems of those non-wood fibre crops used as sources of bark fibres can be used to produce pulps and paper with properties comparable to those produced from wood. A number of crop residues, such as cereal straws and sugar cane bagasse, can also be used for pulp and paper production. Currently, only about 8% of the world’s production of pulp is produced from non-wood materials. However, with the increasing interest in forest conservation and an increasing demand for paper there is a growing demand for alternative feedstocks for paper production. This paper reviews the potential and problems of a range of non-wood fibres and fibre crops for pulp and paper production. Bagasse and cereal straws are presently not used for pulp production in Australia but warrant closer study. The most promising non-wood crops appear to be the annual fibre crops, kenaf, roselle and sunn hemp, which have a growing season of 4 to 6 months. These can be readily harvested with conventional forage harvesters and for the production of mechanical pulps they offer the advantage of requiring much less energy than wood. The main disadvantages are the need to store the product for year-round production and uncertainties in production because of seasonal weather conditions. In addition, non-wood pulps drain more slowly than wood pulps. The major factor constraining the use of non-wood fibre crops for pulp production in Australia appears to be that the pulp and paper industry is located in temperate southern Australia while the most promising non-wood fibre crops grow best in the tropics and sub-tropics. Introduction The non-wood fibre crops are those annual and perennial herbaceous plants from which cellulose fibres have traditionally been extracted and used to make textiles, ropes, sacking, twines and cordage. Worldwide, almost 2000 different plant species have been used as sources of fibres but only a few are now grown on a large scale and are important in international trade. These include jute (Corchorus spp.), kenaf (Hibiscus cannabinus), roselle (Hibiscus sabdariffa), industrial hemp (Cannabis sativa), sunn hemp (Crotalaria juncea), flax (Linum usitatissimum), ramie (Boehmeria nivea), abaca (Musa textilis), sisal (Agave sisalana)and henequen (Agave fourcroydes). In all of these, except the last

First Australian New Crops Conference 1996 – Volume 2
118
three, the fibres are contained in the bark of the stem and are termed soft or bast fibres; in the last three the fibres are contained in the leaf and are termed hard fibres. Despite population increases the demand for the traditional non-wood fibres, other than cotton, has steadily declined since the 1950s. This is the combined result of the development of artificial fibres, such as nylon and polypropylene, rapid advances in the quality, productivity and mechanisation of cotton, and the increasing use of bulk handling for the movement of agricultural produce. Currently, only about 8% of the world’s production of pulp is produced from non-wood materials. However, world consumption of paper has been steadily rising. Consumption increased from 40 million tonnes in 1950 to 226 million tonnes in 1988, an increase of 4.7% per annum (Stafford 1990). In 1994 world consumption of paper and paper board was 268 million tonnes representing a 3% annual increase since 1988. The demand for wood for paper production has led to a decline in forest resources in many countries and this trend can be expected to continue. In 1994-95, Australia imported 191,000 tonnes of chemical pulp and 1.3 million tonnes of paper and paper board with a total value of about $1.5 billion. With such a level of imports there is clearly considerable potential to expand local production. While wood will remain the dominant feedstock, non-wood materials could play an important complementary role. This paper reviews the potential and problems of a range of non-wood materials for pulp and paper production in Australia and offers some suggestions on the requirements to establish viable pulping operations using such materials. Non-wood Fibres Used for Pulp Production The non-wood materials that are used for pulp and paper production fall into two main categories. The first comprises the residues left after the primary crop product has been harvested or extracted. These include the cereal straw residues from crops, such as wheat, rice and sorghum, and bagasse, the residue left after the extraction of sugar from sugar cane. It also includes the waste fibres that are recovered from crops grown primarily for the manufacture of textile, sacking or cordage fibres. These waste fibres, referred to as tow, are recovered from scutching and combing that are the initial operations prior to spinning. Tow is recovered from both the soft and hard fibre crops and is often used to produce high strength pulps. The second category comprises those non-wood crops which are grown specifically for pulp production. The traditional non-wood fibres can be used to produce high quality writing and specialty papers or, alternatively, the whole stems of the bark fibre crops can be used to produce pulps with properties comparable to those produced from wood. The bark fibres provide strength to the pulp while the shorter core fibres provide good surface characteristics. The big advantage of pulping whole stems is that it saves the very considerable labour costs and the environmental pollution involved in retting. Current Usage of Non-wood Fibres for Pulp Production The current yearly production of pulp from non-wood fibres is reported to be about 13 million tonnes which is about 8% of the total world production of pulp of 170 million tonnes. The main non-wood feedstocks are bamboo, bagasse, cereal straw, sunn hemp, roselle and kenaf. The following are some examples of the current use of non-wood materials for pulp and paper production.

First Australian New Crops Conference 1996 – Volume 2
119
China produces almost half of the worlds non-wood pulp using such materials as abutilon, kenaf , roselle, bamboo and cereal straw. In India, kenaf, roselle and sunn hemp are used in admixture with a variety of other feedstocks for pulp production. Straw is used at the Packages Ltd mill in Pakistan to produce bleached chemical pulp for folding cardboard. In north east Thailand, roselle is being pulped at a mill commissioned in 1984 by the Phoenix Pulp and Paper Company (now the Phoenix Pulp and Paper Public Company Limited). This mill was designed to produce 70,000 t/year of chemical pulp from roselle but experienced difficulties in securing sufficient supplies of roselle and, in recent years, has had to move to using an increasing proportion of eucalyptus wood as its feedstock. In Cuba and Indonesia, bagasse is being pulped to produce a range of papers. In Europe, industrial hemp pulp is being produced in Spain and used in Germany to produce writing, cigarette and filter papers. In Europe, there are four pulp mills producing paper from straw and recycled fibre. In the Philippines, abaca fibre is being pulped by the Isarog Pulp and Paper Company Inc. at its mill at Legazpi to produce a high value specialty paper that is used for the production of tea bags. In the USA, kenaf is being grown in Mississippi, Louisiana, Texas and New Mexico to produce a range of products, including particle board and speciality paper. Wood vs Non-wood Plants as Feedstocks for Pulp and Paper Production Several papers have reviewed the advantages and disadvantages of trees and non-wood crops as source materials for pulp production. Cameron et al. (1990) compared forestry plantations and the bark fibre crop kenaf and their comparisons would generally hold true for the other bark fibre crops. The conclusions from a workshop conducted to examine the prospects for developing a kenaf industry in Australia also highlighted the problems perceived by the Australian pulp and paper industry in using non-wood materials as feedstock for pulp production (Wood et al. 1990). Again, those conclusions are generally applicable to all the bark fibre crops. Wood (1992) questioned the attitude of the Australian pulp and paper industry to non-wood materials and argued that such materials offered potential as a complementary feedstock for pulp production in Australia. Vanderhoek (1992) responded on behalf of the industry and provided useful guidelines of the requirements of the industry in respect of feedstocks. The Potential of Non-wood Fibres and Non-wood Fibre Crops for Pulp Production SWOT Analysis of Non-Woody Crop Residues as Feedstock for Pulp and Paper Production. The main crop residues in Australia having potential as feedstocks for pulp production are bagasse and cereal straws. The following tables summarise a SWOT analysis for the use of these materials as pulping feedstocks.
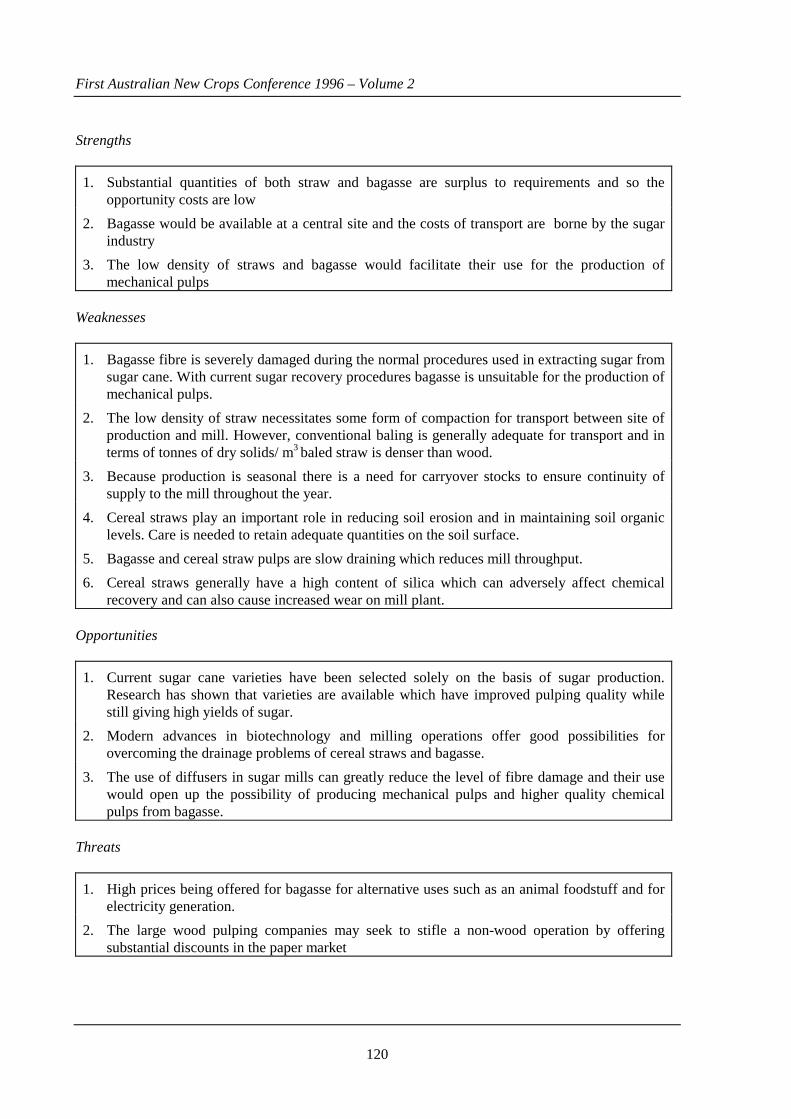
First Australian New Crops Conference 1996 – Volume 2
120
Strengths
1. Substantial quantities of both straw and bagasse are surplus to requirements and so the opportunity costs are low
2. Bagasse would be available at a central site and the costs of transport are borne by the sugar industry
3. The low density of straws and bagasse would facilitate their use for the production of mechanical pulps
Weaknesses
1. Bagasse fibre is severely damaged during the normal procedures used in extracting sugar from sugar cane. With current sugar recovery procedures bagasse is unsuitable for the production of mechanical pulps.
2. The low density of straw necessitates some form of compaction for transport between site of production and mill. However, conventional baling is generally adequate for transport and in terms of tonnes of dry solids/ m3 baled straw is denser than wood.
3. Because production is seasonal there is a need for carryover stocks to ensure continuity of supply to the mill throughout the year.
4. Cereal straws play an important role in reducing soil erosion and in maintaining soil organic levels. Care is needed to retain adequate quantities on the soil surface.
5. Bagasse and cereal straw pulps are slow draining which reduces mill throughput.
6. Cereal straws generally have a high content of silica which can adversely affect chemical recovery and can also cause increased wear on mill plant.
Opportunities
1. Current sugar cane varieties have been selected solely on the basis of sugar production. Research has shown that varieties are available which have improved pulping quality while still giving high yields of sugar.
2. Modern advances in biotechnology and milling operations offer good possibilities for overcoming the drainage problems of cereal straws and bagasse.
3. The use of diffusers in sugar mills can greatly reduce the level of fibre damage and their use would open up the possibility of producing mechanical pulps and higher quality chemical pulps from bagasse.
Threats
1. High prices being offered for bagasse for alternative uses such as an animal foodstuff and for electricity generation.
2. The large wood pulping companies may seek to stifle a non-wood operation by offering substantial discounts in the paper market
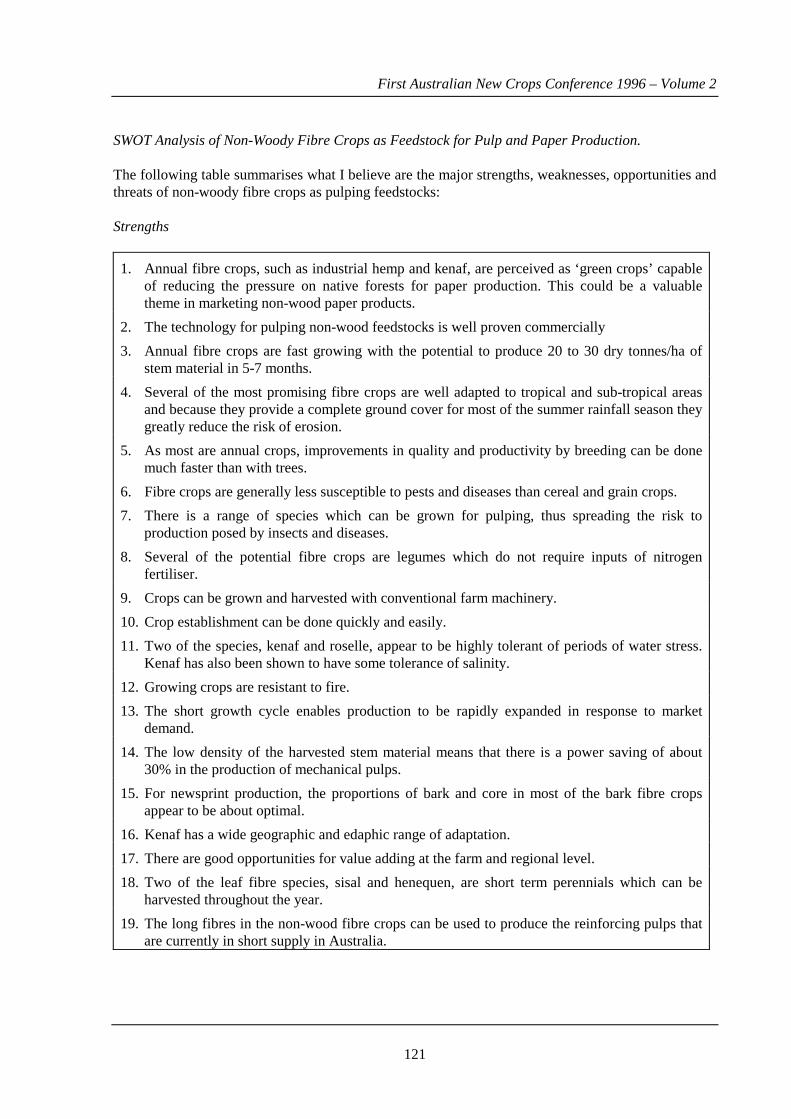
First Australian New Crops Conference 1996 – Volume 2
121
SWOT Analysis of Non-Woody Fibre Crops as Feedstock for Pulp and Paper Production. The following table summarises what I believe are the major strengths, weaknesses, opportunities and threats of non-woody fibre crops as pulping feedstocks: Strengths
1. Annual fibre crops, such as industrial hemp and kenaf, are perceived as ‘green crops’ capable of reducing the pressure on native forests for paper production. This could be a valuable theme in marketing non-wood paper products.
2. The technology for pulping non-wood feedstocks is well proven commercially
3. Annual fibre crops are fast growing with the potential to produce 20 to 30 dry tonnes/ha of stem material in 5-7 months.
4. Several of the most promising fibre crops are well adapted to tropical and sub-tropical areas and because they provide a complete ground cover for most of the summer rainfall season they greatly reduce the risk of erosion.
5. As most are annual crops, improvements in quality and productivity by breeding can be done much faster than with trees.
6. Fibre crops are generally less susceptible to pests and diseases than cereal and grain crops.
7. There is a range of species which can be grown for pulping, thus spreading the risk to production posed by insects and diseases.
8. Several of the potential fibre crops are legumes which do not require inputs of nitrogen fertiliser.
9. Crops can be grown and harvested with conventional farm machinery.
10. Crop establishment can be done quickly and easily.
11. Two of the species, kenaf and roselle, appear to be highly tolerant of periods of water stress. Kenaf has also been shown to have some tolerance of salinity.
12. Growing crops are resistant to fire.
13. The short growth cycle enables production to be rapidly expanded in response to market demand.
14. The low density of the harvested stem material means that there is a power saving of about 30% in the production of mechanical pulps.
15. For newsprint production, the proportions of bark and core in most of the bark fibre crops appear to be about optimal.
16. Kenaf has a wide geographic and edaphic range of adaptation.
17. There are good opportunities for value adding at the farm and regional level.
18. Two of the leaf fibre species, sisal and henequen, are short term perennials which can be harvested throughout the year.
19. The long fibres in the non-wood fibre crops can be used to produce the reinforcing pulps that are currently in short supply in Australia.

First Australian New Crops Conference 1996 – Volume 2
122
Weaknesses
1. Commercial use of non-wood feedstocks requires the establishment of costly dedicated processing plants
2. In Australia, most pulp mills are located in southern Australia while the most promising non-wood crops grow in northern Australia
3. Potential investors see the production and processing system of non-wood materials as unproven in Australia and are reluctant to invest in an enterprise based on such materials. A consequence has been that it has been very difficult to secure R&D funds to develop and prove up a production/processing system.
4. The low density of the harvested material necessitates some form of compaction for transport between the site of production and the mill.
5. Because production is seasonal there is a need for carry-over stocks to ensure continuity of supply to the mill throughout the year.
6. The core pulps are slow draining which reduces mill throughput when pulped in conventional wood mills.
7. The short term perennial species, sisal and henequen, pose difficulties for mechanical harvesting.
8. The high productivity of the crop entails a high removal of plant nutrients from the soil. These will need to be replaced for sustainable production.
9. The need for storage increases costs and there is some risk of fire during storage. Opportunities
1. The short life cycle means that there are good prospects for rapid genetic improvement for such attributes as fibre content, fibre dimensions, disease and insect resistance and growing period.
2. There are good opportunities for developing alternative uses for both the bark and the core material.
3. Non-woody fibre crops offer an alternative to farmers seeking to diversify their production systems. Some of the species are legumes, which can provide a valuable input of nitrogen to the soil.
4. Fibre crops, such as kenaf, can also be used to produce valuable byproducts, such as forage and vegetable oil.
5. Modern advances in biotechnology offer good possibilities for developing technologies to overcome the drainage problems of non-woody materials.
6. Some modern pulping technologies permit recovery of the plant nutrients which can then be returned to the soil.
7. Australia has the potential to develop technologies to produce and use non-wood materials as feedstocks for pulp and paper production and to export the technologies to other countries with limited forest resources

First Australian New Crops Conference 1996 – Volume 2
123
Threats
1. Because non-wood pulps are a new product in many countries, importing paper makers are likely to demand a substantial discount until it becomes established
2. The large wood pulping companies may seek to stifle a kenaf operation by offering substantial discounts in the paper market
Discussion and Conclusion Non-wood fibres are minor sources of fibre for the world’s pulp and paper industry and their use is largely restricted to developing countries where there are limited forest resources. While fibre crops offer some advantages over wood as feedstocks they also are perceived by the Australian pulp and paper industry as having a number of serious disadvantages. These include perceptions of difficulties of ensuring a continuity of supply to a mill, storage costs, slow drainage of the pulp and an apparent surplus of the lower quality core material. There are now new or improved technologies which offer particular promise for non-wood feedstocks and which would overcome the claimed major concerns of the pulp and paper industry. These include procedures to densify the raw material into forms which are easily transported and stored, and easily moved on conveyors and loaded into digesters. They include procedures to recover and utilise as fertiliser the nutrients in the plant material and procedures to improve the drainage characteristics of the pulp. However, funding is required to develop and prove up an integrated production and processing system. The industry would require proof of the system in the form of a pilot operation with a sufficient output to prove the viability of a large-scale commercial operation. The output required for this is likely to be 40 to 50,000 tonnes/year and require an outlay of perhaps $30 to 40 million. Such a pilot operation would require a production area, for say CTMP production, of about 6,000 ha assuming a dryland yield of 8 t/ha of dry stem material and a pulp yield of 85%. In view of the perceived risks involved with a pilot operation of this size it is most unlikely that any commercial company would be prepared to undertake such an operation without major incentives and guarantees. Pulp and paper prices increased substantially during 1995 and this was claimed to be the result of increased prices for the wood feedstock. Within Australia, restrictions on cutting from native forests have accelerated production from plantations and it can be expected that the costs of the feedstock in Australia will rise to cover the higher cots of production in plantations. One effect of such price increases will be to gradually improve the competitiveness of non-wood feedstocks such as bagasse, kenaf and cereal straws. Perhaps the most serious problem associated with the non-wood fibre crops is that all current pulp mills are located in southern Australia in close proximity to forests and have been designed primarily to process wood. However, most of the promising non-wood crops grow best, and can be grown more cheaply, under sub-tropical and tropical conditions. The dilemma for any investor considering establishing a new pulp mill based on annual fibre crops is the Catch 22 syndrome. Growers are not prepared to grow the crop unless they have a guaranteed profitable market while the investors are not be prepared to invest in a mill unless they have assured long-term supplies of feedstock. The solution perhaps lies in a staged development in which the field production system is first established with the raw product being exported to an existing mill. Once the feasibility and viability of the production system has been established consideration can then be given to the establishment of a local pulping facility. A third stage could be the expansion of the enterprise to produce paper.

First Australian New Crops Conference 1996 – Volume 2
124
In developing a pulping facility there will clearly be many options but several warrant special consideration for northern Australia. The first is the development of a facility which permits recovery of the nutrients from the feedstock and enables these to be returned to the soil to maintain soil fertility. The nutrients contained in the above ground biomass of a high yielding fibre crop can be very substantial and unless these nutrients are replaced, regular cropping can be expected to lead to a rapid decline in soil fertility. Wood (1978) reported that a 24 tonne per ha crop of kenaf contained 119 kg of nitrogen, 20 kg of phosphorus, and 270 kg of potassium in the above-ground biomass. The feasibility of recovering the nutrients in the stem material is currently being examined in a pilot operation in Canada established by Canadian Flax Pulp Ltd (Anon. 1993). This company is testing a patented process which uses potassium salts in lieu of sodium salts for pulping. Some of the potassium is recovered from the spent pulping liquor and recycled, with the residue of the liquor being concentrated and sold as a fertiliser. The second promising option is the establishment of a pulping facility which jointly pulps a non-wood fibre crop and bagasse. The advantage here would be that the mill would be able to use bagasse as its core feedstock with the non-wood fibre crop providing a reinforcing pulp to improve the strength characteristics. The development of such a facility would establish sugar cane as a dual purpose crop and stimulate the development of sugar cane cultivars having improved pulping characteristics and changes to the sugar extraction procedures to greatly reduce fibre damage. The non-wood fibre crops appear to offer considerable potential as new crops for northern Australia. The major problems appear not to lie with production, processing or markets but with a lack of commercial and Government interest. An expanded pulp and paper industry in Australia utilising non-wood feedstocks could greatly reduce imports of paper and paper products, provide a new export industry and create job opportunities. References Anon 1993. Canadian Flax Pulp Ltd. Pulp and Paper September 69: 70-71. Cameron, D.M., Rawlins, W. and Rance, S.J. 1990. Kenaf versus forestry plantations as sources of pulp.
In: Development of a Kenaf Industry in Australia. Proceedings of Workshop, Brisbane, 6-7 February 1990. (Ed. M.U.F. Kirschbaum.) pp. 52-60. (Bureau of Rural Resources: Canberra.)
Groon, I. 1995. What’s coming after recycling ? Straw and Grass. Paper Maker December 1995. Stafford, B. 1990. Worldwide fibre supply in the context of the demand for pulp and paper over the
next two decades. In: Development of a Kenaf Industry in Australia. Proceedings of Workshop Brisbane, 6-7 February 1990. (Ed. M.U.F. Kirschbaum.) pp. 3-10. (Bureau of Rural Resources: Canberra.)
Vanderhoek, N. 1992. A commercial evaluation of non-wood fibres. Search 23: 179-80. Wood, I.M., Chudleigh. P.D. and Hamblin, Ann 1990. The 1990 Kenaf Workshop: A summary of the
conclusions and recommendations from the discussion sessions. In: Development of a Kenaf Industry in Australia. Proceedings of Workshop Brisbane, 6-7 February 1990. (Ed. M.U.F. Kirschbaum.) pp. 119-25. (Bureau of Rural Resources: Canberra.)
First Australian New Crops Conference 1996 – Volume 2
125
Wood, I.M. 1978. Preliminary experiments on the growth of kenaf (Hibiscus cannabinus) for paper pulp production in the Ord Irrigation Area, Western Australia. Australian Journal of Experimental Agriculture and Animal Husbandry. 18: 97-106.
Wood, I.M. 1992. Kenaf: a source of paper or a source of controversy? Search 23: 177-8.
Copyright © 2022 FDOKUMEN