Development Challenges of Income Support Schemes and Social Protection in Asia and the Pacific
82
1 Development Challenges of Income Support Schemes and Social Protection in Asia and the Pacific 1 Jorge Carrillo-Rodriguez 1 This is Part I of “Towards Income Security in Asia and the Pacific: A focus on Income Support Schemes” (ST/ESCAP/2700), United Nations Economic and Social Commission for Asia and the Pacific, 2014, Bangkok
-
Upload
independent -
Category
Documents
-
view
0 -
download
0
Transcript of Development Challenges of Income Support Schemes and Social Protection in Asia and the Pacific

1
Development Challenges of Income Support Schemes and Social Protection in Asia and the Pacific1
Jorge Carrillo-Rodriguez
1 This is Part I of “Towards Income Security in Asia and the Pacific: A focus on Income Support Schemes” (ST/ESCAP/2700), United Nations Economic and Social Commission for Asia and the Pacific, 2014, Bangkok
2
Contents
Development context ......................................................................................................................... 4
South-East Asia .................................................................................................................................. 4
North and Central Asia ..................................................................................................................... 6
South and South-West Asia .............................................................................................................. 7
Pacific .................................................................................................................................................. 9
East and North-East Asia ................................................................................................................ 11
Policy challenges – beyond minimum support ............................................................................ 12
Life-cycle risks and vulnerabilities ................................................................................................ 12
Ageing: The impending transformation ............................................................................ 13
Making income support schemes gender-responsive ..................................................... 16
Youth unemployment .......................................................................................................... 18
The case for policy integration ........................................................................................... 20
Informality and mobility ................................................................................................................. 21
Income support as a pathway out of poverty: the graduation model ....................................... 26
The political economy of income support and other social protection schemes ...................... 29
Fiscal contraction and development .............................................................................................. 30
Towards universal support systems .............................................................................................. 33
Resources mobilization and allocation .............................................................................. 34
Institutional capacity ........................................................................................................... 34
Engagement and collaboration ........................................................................................... 35
Annexes ............................................................................................................................................. 37
I. Overview of select income support schemes by categories..................................................... 37
I.A Children and youth ....................................................................................................... 37
I.B. Women ............................................................................................................................ 49
I.C. Older persons ................................................................................................................ 57
I.D. The poor ......................................................................................................................... 67
II. Unemployment rates, 2013 preliminary estimates ( per cent) ............................................... 77
References ......................................................................................................................................... 78

2
List of Tables, Boxes and Charts
Table 1. Key socioeconomic indicators - South East Asia ............................................................. 5
Table 2. Key socioeconomic indicators - North and Central Asia ................................................ 7
Table 3. Key socioeconomic indicators - South and South-West Asia ......................................... 8
Table 4. Key poverty indicators in selected Pacific island countries, 2011 ............................... 10
Table 5. Risks and vulnerabilities across the life-cycle and possible types of interventions .. 13
Table 6. Percentage of population above 60 in Asia and the Pacific .......................................... 14
Table 7. Selected non-contributory support schemes for older persons ................................... 15
Table 8. Employment in the informal economy in select countries of the region .................... 22
Table 9. Austerity adjustment measures, 2010-2013 .................................................................... 31
Box 1. Gendered challenges for income support schemes .......................................................... 17
Box 2. Political economy of gender and income support schemes in Pakistan ........................ 18
Box 3. Social protection for workers in the informal economy in Thailand ............................ 23
Box 4. Categorisation of citizens, their status, rights, obstacles and restrictions in Viet Nam 25
Box 5. Key components of the graduation model ........................................................................ 27
Box 6. Trickle Up Ultra Poor Programme for Women in India .................................................. 28
3
Introduction
In the last two decades, the Asian and Pacific region has witnessed a number of economic
crises and natural disasters that threatened its progress towards reducing poverty. Economic
and financial crises reflect the increase in risks and hazards linked to a more globalized and
thus interdependent economy. Risks transmitted between economies had an effect on all
levels: for instance, the income of poor persons working in garment factories in Cambodia
was susceptible to the state of the housing market in the United States of America as a result
of the global economic crisis in 2008.
In addition to the economic upheavals, the last two decades also saw a number of high-
impact natural calamities which, in addition to the loss of lives, led to increased insecurity of
livelihoods, in particular for poor households located in rural areas. The Indian Ocean
earthquake and tsunami, the cyclone Nargis, and the floods in Pakistan (particularly in 2010)
cost an incalculable number of lives and destroyed assets and sources of livelihoods for
millions more.
These crises notwithstanding, the Asian and Pacific region has made major progress in
terms of poverty reduction but benefits have not always reached all. Recent economic crises
have forced governments to streamline budget, and often allocations for social programmes
have been cut. However, increasingly countries in the region are recognizing that economic
growth needs to be complemented by social interventions and that their rate of development
may be affected if significant parts of the population are left behind,. Social protection, in
particular income support, is being acknowledged as a tool to mitigate the impacts of shocks
and help accelerate the recovery of the people most affected by such impacts. Unfortunately,
much of that interest has focused only on the risks and vulnerabilities that emerged from
specific crises. Consequently, current work has tended to be a reactive response and the
development potential of such programmes has been neglected. Yet, it is known that
poverty and exclusion amplify the effects of crises, and, thus, social support must be linked
to wider efforts to reduce poverty and exclusion. It must also have an impact on the
structural elements that place people in a situation of vulnerability in the first place.
Furthermore, by contributing to basic income security, income support is a key element of a
social protection floor.
This part of the report examines the challenges facing policymakers in their attempts to
provide an acceptable standard of living for the most vulnerable groups while at the same
time ensuring the social and economic development of their nations. In particular, it looks at
the social, economic and policy contexts that shape decisions concerning income support
and social protection.
4
Development context
South-East Asia
“In Southeast Asia, development has seen a reduction in the number of people living in
poverty but an increase in economic inequality; an improvement in the quality of houses
but a spread of squatter settlements and slums; an increase in rural land values but an
increase in landlessness; and the proliferation of protected national parks but an increase
in deforestation.” (McGregor, 2008)
Countries in South-East Asia10 have a range of economic and political systems governing the
allocation and flow of resources, including centrally-planned and market-based economies.
In the last few decades, some economies have experienced rapid and sustained growth, but
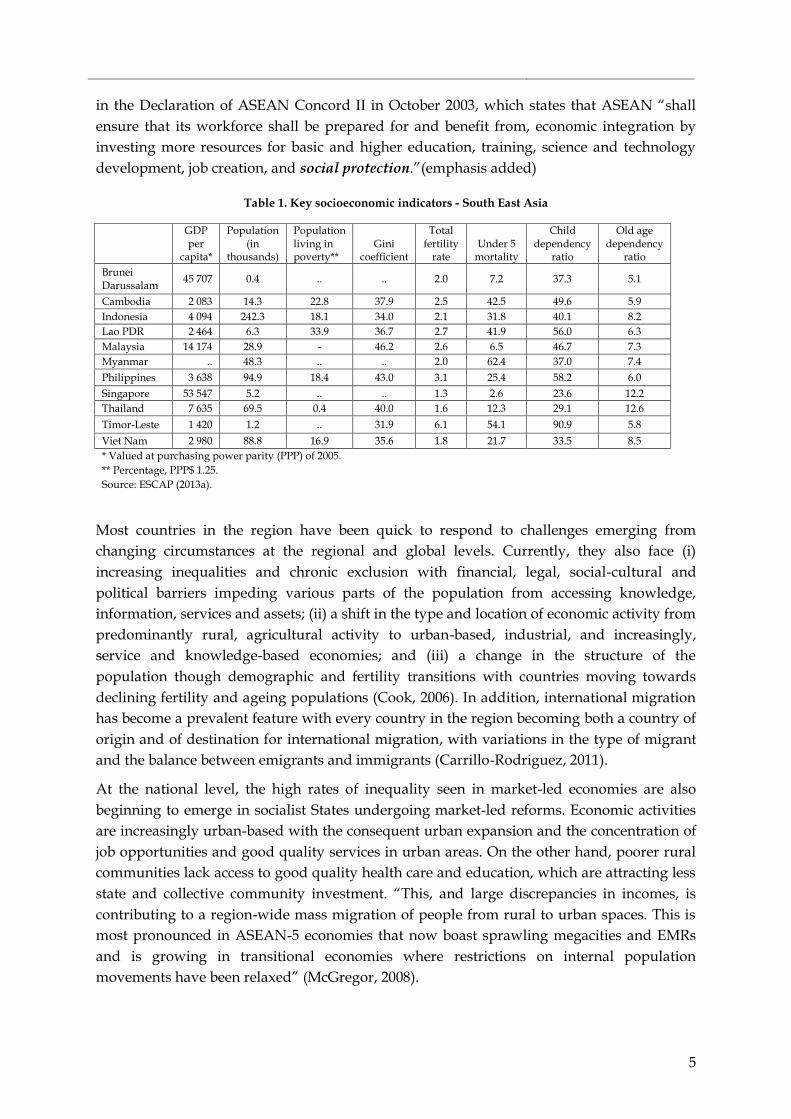
the benefits are often not spread equally (see table 1). More recently, economic growth in
some South-East Asian countries has been slowing down. The Lao People’s Democratic
Republic has maintained fairly high levels of economic growth based on the extraction of
natural resources which presents a unique set of challenges. Viet Nam is still going through
a process of economic reform with the ‘doi moi’ programmes of the mid 1980s but the
country is still basically a centrally planned economy. More than 20 per cent of gross
domestic product (GDP) is agriculture-based, and state-owned enterprises account for more
than 40 per cent of GDP. Controls have been put in place to stem further expansion of the
trade deficit, bringing more State control over the economy rather than liberalization
(Hunter, 2012). Political and economic reforms in Myanmar raise interesting prospects.
There is clearly an intention to maintain a forward momentum and the political discourse is
addressing the key social and political issues. An interesting development that will have an
impact on these countries in the near future is the establishment of the Association of
Southeast Asian Nations (ASEAN) Economic Community in 2015. This single entity has the
objective of streamlining banking, finance, transport infrastructure, customer regulations,
human capital mobility, and economic policy. It is expected to transform ASEAN into a
region with free movement of goods, services, investment, skilled labour, and capital.
Most countries in South-East Asia have done well in achieving the goal of reducing income
poverty. However, disparities in distribution, consumption and assets; deprivation of
capabilities; and inequalities in access and opportunities, combined with processes of social
exclusion, have led to increased risks and vulnerabilities. These disparities and exclusions
are the result of social, economic, physical, cultural and political barriers that impede large
segments of the population from accessing the benefits of economic development.
Income support has been gaining importance in many South-East Asian countries. This has
been prompted in part by economic and demographic structural changes, and, more
importantly, as a response to the natural and man-made crises that have affected the
subregion since the late 1990s. As a result, a strong emphasis was placed on social protection
10 Brunei Darussalam, Cambodia, Indonesia, Leo People’s Democratic Republic, Malaysia, Myanmar, Philippines, Singapore, Thailand, Timor-Leste and Viet Nam.
5
in the Declaration of ASEAN Concord II in October 2003, which states that ASEAN “shall
ensure that its workforce shall be prepared for and benefit from, economic integration by
investing more resources for basic and higher education, training, science and technology
development, job creation, and social protection.”(emphasis added)
Table 1. Key socioeconomic indicators - South East Asia
GDP per
capita*
Population (in
thousands)
Population living in poverty**
Gini coefficient
Total fertility
rate Under 5
mortality
Child dependency
ratio
Old age dependency
ratio
Brunei Darussalam
45 707 0.4 .. .. 2.0 7.2 37.3 5.1
Cambodia 2 083 14.3 22.8 37.9 2.5 42.5 49.6 5.9
Indonesia 4 094 242.3 18.1 34.0 2.1 31.8 40.1 8.2
Lao PDR 2 464 6.3 33.9 36.7 2.7 41.9 56.0 6.3
Malaysia 14 174 28.9 - 46.2 2.6 6.5 46.7 7.3
Myanmar .. 48.3 .. .. 2.0 62.4 37.0 7.4
Philippines 3 638 94.9 18.4 43.0 3.1 25.4 58.2 6.0
Singapore 53 547 5.2 .. .. 1.3 2.6 23.6 12.2
Thailand 7 635 69.5 0.4 40.0 1.6 12.3 29.1 12.6
Timor-Leste 1 420 1.2 .. 31.9 6.1 54.1 90.9 5.8
Viet Nam 2 980 88.8 16.9 35.6 1.8 21.7 33.5 8.5
* Valued at purchasing power parity (PPP) of 2005.
** Percentage, PPP$ 1.25.
Source: ESCAP (2013a).
Most countries in the region have been quick to respond to challenges emerging from
changing circumstances at the regional and global levels. Currently, they also face (i)
increasing inequalities and chronic exclusion with financial, legal, social-cultural and
political barriers impeding various parts of the population from accessing knowledge,
information, services and assets; (ii) a shift in the type and location of economic activity from
predominantly rural, agricultural activity to urban-based, industrial, and increasingly,
service and knowledge-based economies; and (iii) a change in the structure of the
population though demographic and fertility transitions with countries moving towards
declining fertility and ageing populations (Cook, 2006). In addition, international migration
has become a prevalent feature with every country in the region becoming both a country of
origin and of destination for international migration, with variations in the type of migrant
and the balance between emigrants and immigrants (Carrillo-Rodriguez, 2011).
At the national level, the high rates of inequality seen in market-led economies are also
beginning to emerge in socialist States undergoing market-led reforms. Economic activities
are increasingly urban-based with the consequent urban expansion and the concentration of
job opportunities and good quality services in urban areas. On the other hand, poorer rural
communities lack access to good quality health care and education, which are attracting less
state and collective community investment. “This, and large discrepancies in incomes, is
contributing to a region-wide mass migration of people from rural to urban spaces. This is
most pronounced in ASEAN-5 economies that now boast sprawling megacities and EMRs
and is growing in transitional economies where restrictions on internal population
movements have been relaxed” (McGregor, 2008).
6
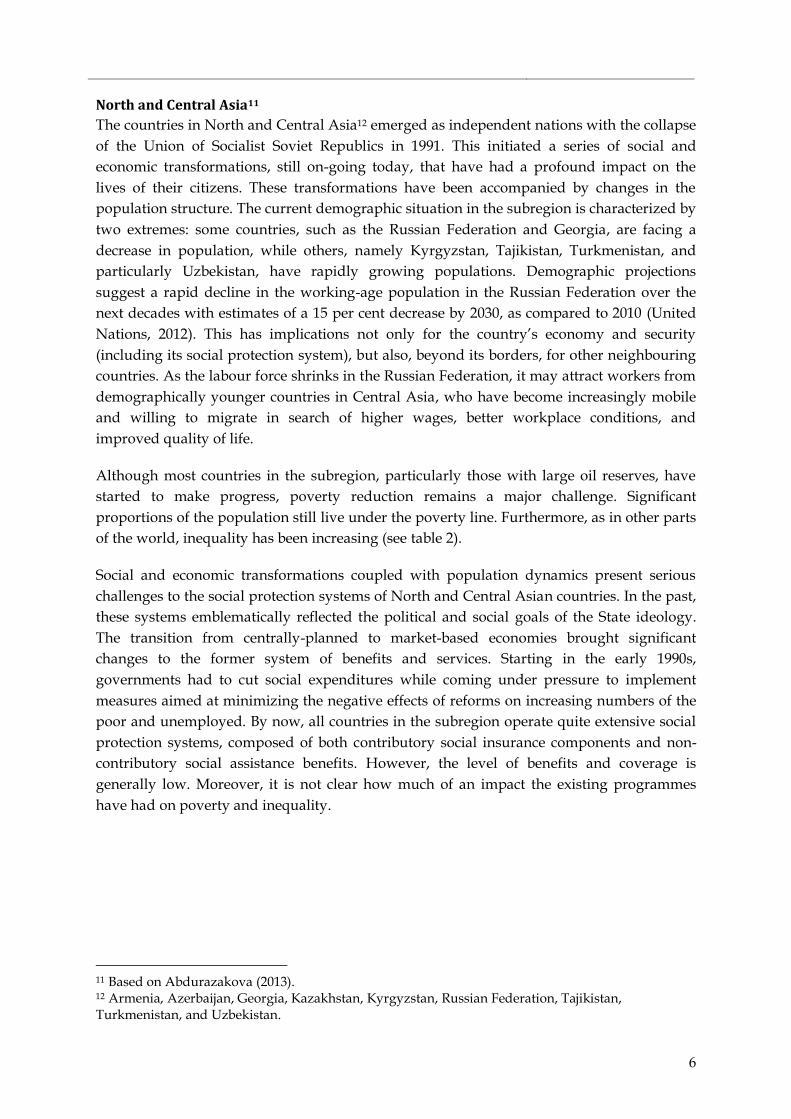
North and Central Asia11
The countries in North and Central Asia12 emerged as independent nations with the collapse
of the Union of Socialist Soviet Republics in 1991. This initiated a series of social and
economic transformations, still on-going today, that have had a profound impact on the
lives of their citizens. These transformations have been accompanied by changes in the
population structure. The current demographic situation in the subregion is characterized by
two extremes: some countries, such as the Russian Federation and Georgia, are facing a
decrease in population, while others, namely Kyrgyzstan, Tajikistan, Turkmenistan, and
particularly Uzbekistan, have rapidly growing populations. Demographic projections
suggest a rapid decline in the working-age population in the Russian Federation over the
next decades with estimates of a 15 per cent decrease by 2030, as compared to 2010 (United
Nations, 2012). This has implications not only for the country’s economy and security
(including its social protection system), but also, beyond its borders, for other neighbouring
countries. As the labour force shrinks in the Russian Federation, it may attract workers from
demographically younger countries in Central Asia, who have become increasingly mobile
and willing to migrate in search of higher wages, better workplace conditions, and
improved quality of life.
Although most countries in the subregion, particularly those with large oil reserves, have
started to make progress, poverty reduction remains a major challenge. Significant
proportions of the population still live under the poverty line. Furthermore, as in other parts
of the world, inequality has been increasing (see table 2).
Social and economic transformations coupled with population dynamics present serious
challenges to the social protection systems of North and Central Asian countries. In the past,
these systems emblematically reflected the political and social goals of the State ideology.
The transition from centrally-planned to market-based economies brought significant
changes to the former system of benefits and services. Starting in the early 1990s,
governments had to cut social expenditures while coming under pressure to implement
measures aimed at minimizing the negative effects of reforms on increasing numbers of the
poor and unemployed. By now, all countries in the subregion operate quite extensive social
protection systems, composed of both contributory social insurance components and non-
contributory social assistance benefits. However, the level of benefits and coverage is
generally low. Moreover, it is not clear how much of an impact the existing programmes
have had on poverty and inequality.
11 Based on Abdurazakova (2013). 12 Armenia, Azerbaijan, Georgia, Kazakhstan, Kyrgyzstan, Russian Federation, Tajikistan, Turkmenistan, and Uzbekistan.
7
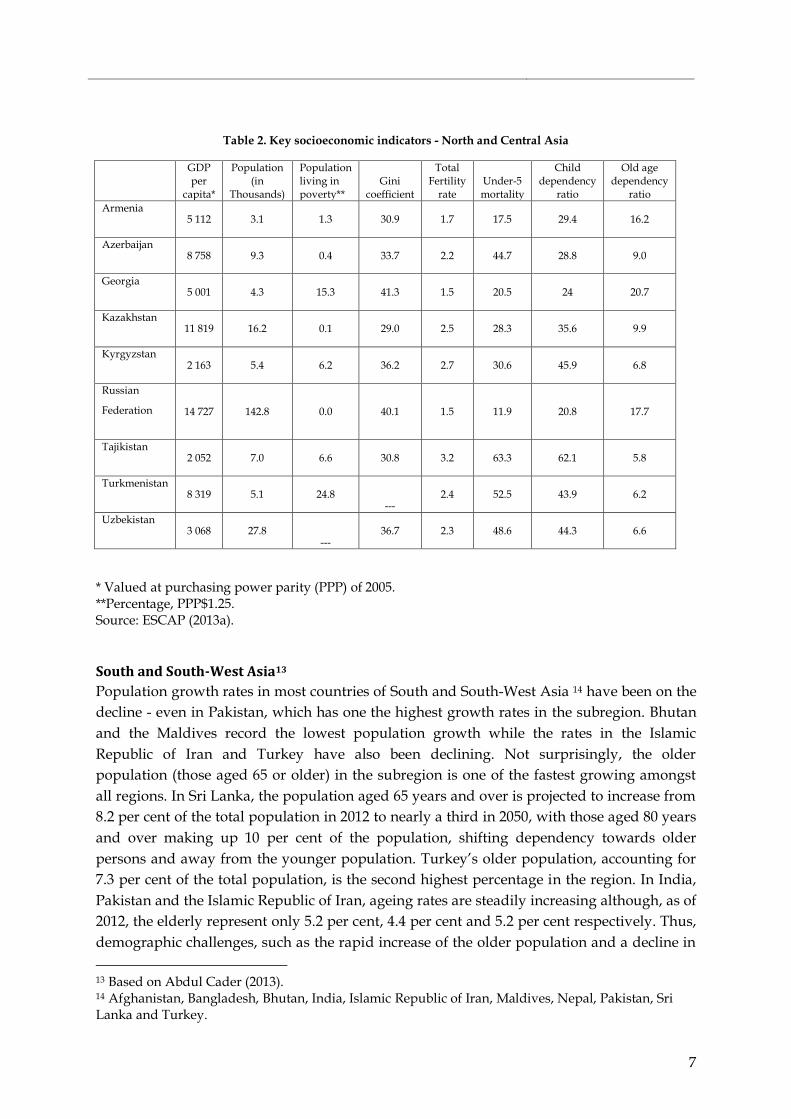
Table 2. Key socioeconomic indicators - North and Central Asia
GDP per
capita*
Population (in
Thousands)
Population living in poverty**
Gini coefficient
Total Fertility
rate Under-5 mortality
Child dependency
ratio
Old age dependency
ratio
Armenia 5 112 3.1 1.3 30.9 1.7 17.5 29.4 16.2
Azerbaijan 8 758 9.3 0.4 33.7 2.2 44.7 28.8 9.0
Georgia 5 001 4.3 15.3 41.3 1.5 20.5 24 20.7
Kazakhstan 11 819 16.2 0.1 29.0 2.5 28.3 35.6 9.9
Kyrgyzstan 2 163 5.4 6.2 36.2 2.7 30.6 45.9 6.8
Russian
Federation 14 727 142.8 0.0 40.1 1.5 11.9 20.8 17.7
Tajikistan 2 052 7.0 6.6 30.8 3.2 63.3 62.1 5.8
Turkmenistan 8 319 5.1 24.8
--- 2.4 52.5 43.9 6.2
Uzbekistan 3 068 27.8
--- 36.7 2.3 48.6 44.3 6.6
* Valued at purchasing power parity (PPP) of 2005. **Percentage, PPP$1.25. Source: ESCAP (2013a).
South and South-West Asia13
Population growth rates in most countries of South and South-West Asia 14 have been on the
decline - even in Pakistan, which has one the highest growth rates in the subregion. Bhutan
and the Maldives record the lowest population growth while the rates in the Islamic
Republic of Iran and Turkey have also been declining. Not surprisingly, the older
population (those aged 65 or older) in the subregion is one of the fastest growing amongst
all regions. In Sri Lanka, the population aged 65 years and over is projected to increase from
8.2 per cent of the total population in 2012 to nearly a third in 2050, with those aged 80 years
and over making up 10 per cent of the population, shifting dependency towards older
persons and away from the younger population. Turkey’s older population, accounting for
7.3 per cent of the total population, is the second highest percentage in the region. In India,
Pakistan and the Islamic Republic of Iran, ageing rates are steadily increasing although, as of
2012, the elderly represent only 5.2 per cent, 4.4 per cent and 5.2 per cent respectively. Thus,
demographic challenges, such as the rapid increase of the older population and a decline in
13 Based on Abdul Cader (2013). 14 Afghanistan, Bangladesh, Bhutan, India, Islamic Republic of Iran, Maldives, Nepal, Pakistan, Sri Lanka and Turkey.
8
birth rates, are placing great pressures on countries in the subregion to deal with the
changing needs of the population.
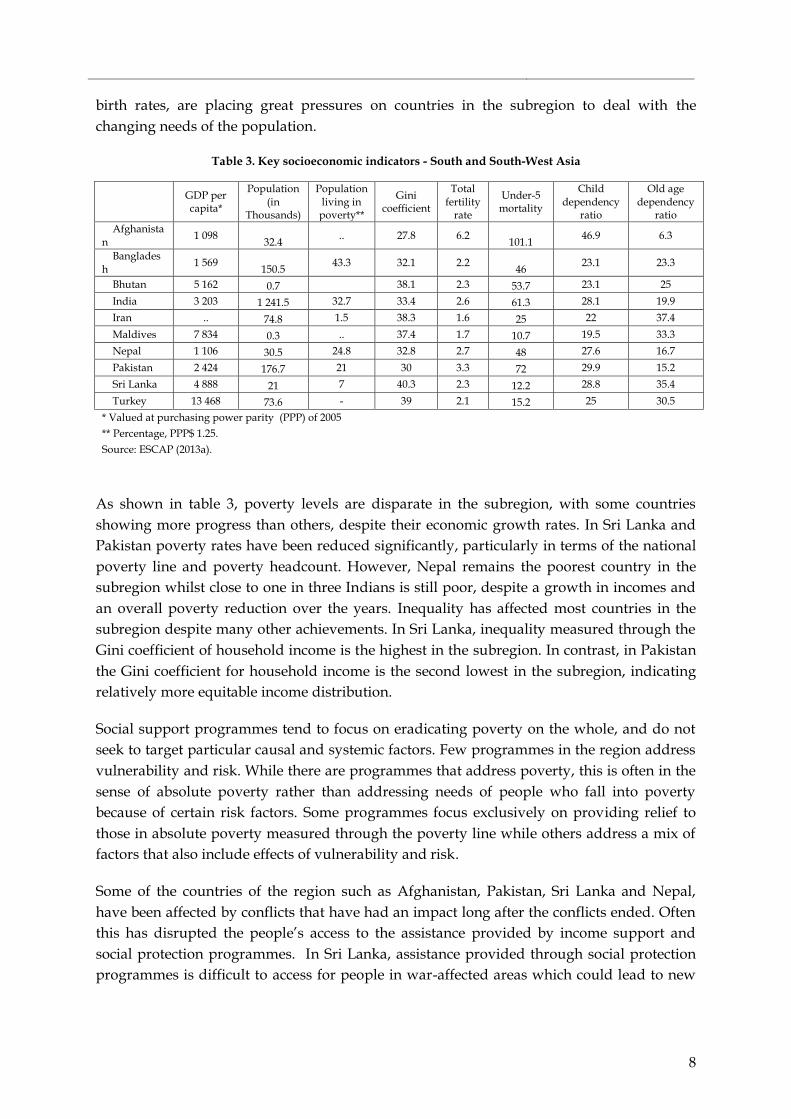
Table 3. Key socioeconomic indicators - South and South-West Asia
GDP per capita*
Population (in
Thousands)
Population living in poverty**
Gini coefficient
Total fertility
rate
Under-5 mortality
Child dependency
ratio
Old age dependency
ratio
Afghanistan
1 098 32.4
.. 27.8 6.2 101.1
46.9 6.3
Bangladesh
1 569 150.5
43.3 32.1 2.2 46
23.1 23.3
Bhutan 5 162 0.7 38.1 2.3 53.7 23.1 25
India 3 203 1 241.5 32.7 33.4 2.6 61.3 28.1 19.9
Iran .. 74.8 1.5 38.3 1.6 25 22 37.4
Maldives 7 834 0.3 .. 37.4 1.7 10.7 19.5 33.3
Nepal 1 106 30.5 24.8 32.8 2.7 48 27.6 16.7
Pakistan 2 424 176.7 21 30 3.3 72 29.9 15.2
Sri Lanka 4 888 21 7 40.3 2.3 12.2 28.8 35.4
Turkey 13 468 73.6 - 39 2.1 15.2 25 30.5
* Valued at purchasing power parity (PPP) of 2005
** Percentage, PPP$ 1.25.
Source: ESCAP (2013a).
As shown in table 3, poverty levels are disparate in the subregion, with some countries
showing more progress than others, despite their economic growth rates. In Sri Lanka and
Pakistan poverty rates have been reduced significantly, particularly in terms of the national
poverty line and poverty headcount. However, Nepal remains the poorest country in the
subregion whilst close to one in three Indians is still poor, despite a growth in incomes and
an overall poverty reduction over the years. Inequality has affected most countries in the
subregion despite many other achievements. In Sri Lanka, inequality measured through the
Gini coefficient of household income is the highest in the subregion. In contrast, in Pakistan
the Gini coefficient for household income is the second lowest in the subregion, indicating
relatively more equitable income distribution.
Social support programmes tend to focus on eradicating poverty on the whole, and do not
seek to target particular causal and systemic factors. Few programmes in the region address
vulnerability and risk. While there are programmes that address poverty, this is often in the
sense of absolute poverty rather than addressing needs of people who fall into poverty
because of certain risk factors. Some programmes focus exclusively on providing relief to
those in absolute poverty measured through the poverty line while others address a mix of
factors that also include effects of vulnerability and risk.
Some of the countries of the region such as Afghanistan, Pakistan, Sri Lanka and Nepal,
have been affected by conflicts that have had an impact long after the conflicts ended. Often
this has disrupted the people’s access to the assistance provided by income support and
social protection programmes. In Sri Lanka, assistance provided through social protection
programmes is difficult to access for people in war-affected areas which could lead to new
9
vulnerabilities. In this sense, the country is facing challenges similar to other post-conflict
societies such as Timor Leste.
Pacific15
The Pacific subregion exhibits wide socioeconomic and cultural diversities. The main
characteristics of the Pacific subregion include its relatively small size, geographic
dispersion, limited human and natural resources, limited domestic markets, lack of
proximity to global markets, as well as vulnerability to natural disasters and extreme climate
change events. The Pacific island countries are at different stages of development and thus
have wide variation in their per capita incomes. Rapid and varied urbanization in Pacific
island countries is posing various socioeconomic challenges and putting pressure on its
environments.
Due to the limited economic opportunities, economic growth has been relatively low in most
Pacific island countries in recent years, with average annual growth not exceeding 3 per cent
in most Pacific island countries over the past ten years. Exceptions are Papua New Guinea
which, on average, grew at 4.9 per cent annually between 2001 and 2011 and Solomon
Islands, which grew at 5.4 per cent annually over the same period (ESCAP, 2012).
Several Pacific island countries were hit badly by the 2008 global economic crisis, with rising
unemployment, loss of revenue from weakening terms of trade, decreasing demand,
delayed investment, high prices and currency fluctuations affecting aid flows (Lowy
Institute for International Policy, 2009 cited in Naidu and Mohanty, 2009). With economic
and environmental changes, including globalization and urbanization, social challenges are
growing and vulnerabilities are expected to rise in Pacific island countries in future.
For many Pacific island countries, migration and resulting remittances are part of their
development strategy. In countries, such as Samoa or Tonga, out-migration keeps
population growth under control in spite of high fertility rates. Through remittances,
migration can be considered as a specific way of harnessing the demographic dividend
(Storey and Steinmayer, 2011).
Poverty in the Pacific island countries is often characterized by poor access to services and
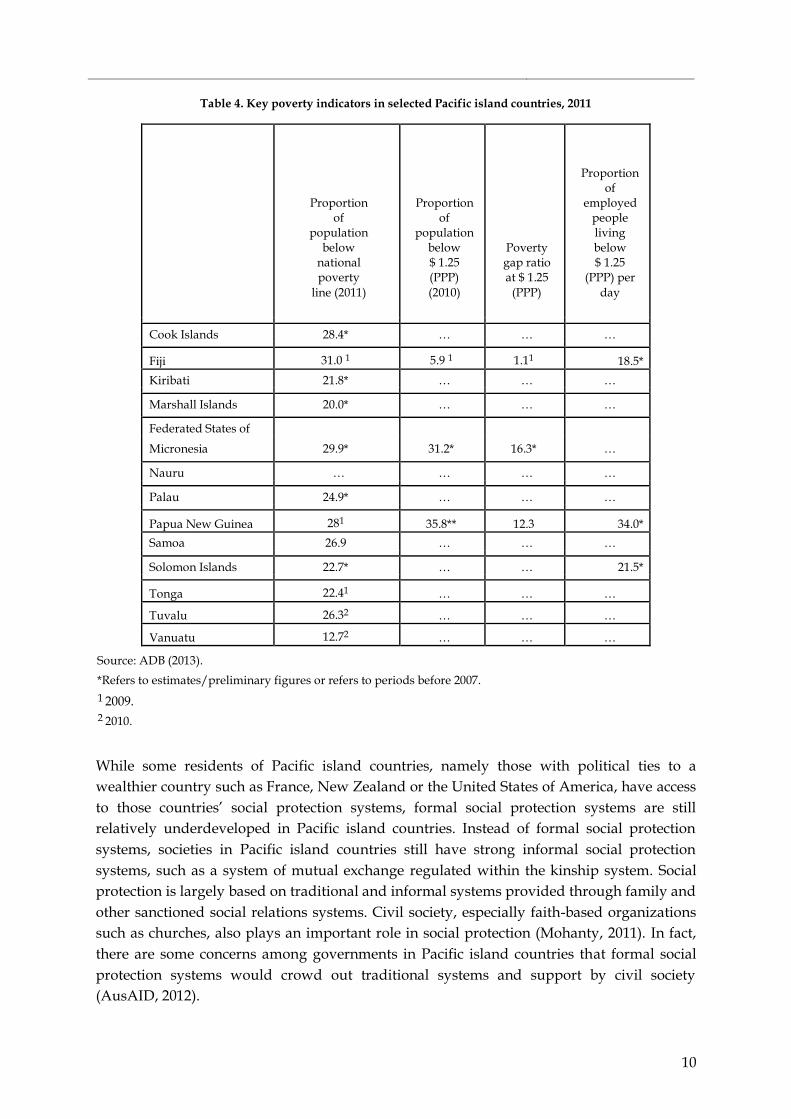
limited opportunities. Significant income and housing poverty also exists (see table 4).
With increasing numbers and percentages of older persons, healthcare costs and social
protection needs for this population group are also expected to increase. Although pension
schemes exist, few people actually have access to pensions. Thus, many older persons still
have to work and are among the groups faced with the most hardships. Furthermore, due to
internal and international migration, many older persons are primary caregivers for young
children (Abbott and Pollard, 2004).
15 This section is taken from ESCAP (2013b). The discussion excludes Australia and New Zealand.
10
Table 4. Key poverty indicators in selected Pacific island countries, 2011
Proportion of
population below
national poverty
line (2011)
Proportion of
population below $ 1.25 (PPP) (2010)
Poverty gap ratio at $ 1.25
(PPP)
Proportion of
employed people living below $ 1.25
(PPP) per day
Cook Islands 28.4* … … …
Fiji 31.0 1 5.9 1 1.11 18.5*
Kiribati 21.8* … … …
Marshall Islands 20.0* … … …
Federated States of
Micronesia 29.9* 31.2* 16.3* …
Nauru … … … …
Palau 24.9* … … …
Papua New Guinea 281 35.8** 12.3 34.0*
Samoa 26.9 … … …
Solomon Islands 22.7* … … 21.5*
Tonga 22.41 … … …
Tuvalu 26.32 … … …
Vanuatu 12.72 … … … Source: ADB (2013).
*Refers to estimates/preliminary figures or refers to periods before 2007. 1 2009. 2 2010.
While some residents of Pacific island countries, namely those with political ties to a
wealthier country such as France, New Zealand or the United States of America, have access
to those countries’ social protection systems, formal social protection systems are still
relatively underdeveloped in Pacific island countries. Instead of formal social protection
systems, societies in Pacific island countries still have strong informal social protection
systems, such as a system of mutual exchange regulated within the kinship system. Social
protection is largely based on traditional and informal systems provided through family and
other sanctioned social relations systems. Civil society, especially faith-based organizations
such as churches, also plays an important role in social protection (Mohanty, 2011). In fact,
there are some concerns among governments in Pacific island countries that formal social
protection systems would crowd out traditional systems and support by civil society
(AusAID, 2012).
11
East and North-East Asia16
Regardless of their achievements in economic development, all the countries in East and
North-East Asia17 are experiencing deepening inequalities although within completely
different contexts. Countries such as Japan and the Republic of Korea, which have achieved
high levels of economic development, are facing increasing inequalities along with the
global economic downturn while China and Mongolia are facing increasing inequalities
while transitioning from centrally-planned to market-based economies.
China has sought to develop an inclusive social protection system in both rural and urban
areas as a means to tackle poverty and polarization of wealth. While economic reforms and
structural changes in the Chinese economy have translated into high rates of economic
growth, certain subgroups have been adversely affected or have been unable to benefit from
the new economic opportunities. The weakening of the old-age safety net provided by
guaranteed employment has also left some households vulnerable. Urban areas have figured
prominently in these concerns about the “new poor.” The Minimum Living Standard
Guarantee Scheme (dibao in Chinese) has been the government’s main response to this new
challenge.
In Japan, the main issue is the ageing population. For example, among the beneficiaries of
the Livelihood Protection Programme in 2010, 43 per cent were households of older persons;
33 per cent were households with at least one person with a disability, and 8 per cent were
households with a single mother. Other households, which include households of
unemployed working-age persons, constituted 16 per cent. The Livelihood Protection
Programme has become difficult to access for ordinary households, due to strict means and
asset tests, rigid application of the “self-help” principle, inaccessibility of welfare offices, and
stigma that deters even needy people from applying.
Poverty is also a serious challenge for Mongolia, with 49 per cent of the total population
living on less than USD 2 a day. Pro-natalist policies have long been the goal of the
Mongolian government, which provide a series of incentives to encourage larger families
and increased numbers of child births. Mongolia has a vast territory and a small population
with a large proportion of youth. The country’s focus is on sustainable population growth
through the development of a well-structured socioeconomic system and the extension of
education for its young population. Many of the challenges facing Mongolia are similar to
those of the Central Asian countries that are also transitioning from a highly centralized and
planned economy to a market-oriented system.
In the Republic of Korea, the 1997 financial crisis and ensuing structural reforms led to a
rapid increase in the number of poor and unemployed persons. Income support schemes
have evolved to respond to changing economic conditions. Programmes such as the
National Basic Livelihood Security System, have expanded to include the poor with working
ability. Moreover, a stronger emphasis has been placed on social responsibility towards
16 Based on KIHASA (2013) 17 China; Democratic People’s Republic of Korea; Hong Kong, China; Japan; Macao, China; Mongolia and Republic of Korea.
12
reducing poverty and strengthening the rights of people in low income to receive public
assistance.
Policy challenges – beyond minimum support
Income support schemes have become common in Asia and the Pacific; however there are
issues of fragmentation, effectiveness, integration and consistency. Frequently, the problem
lies not in the actual design, but rather it is the policy-making process that needs to be
improved. Often analyses of income support schemes or programmes focus exclusively on
technical aspects, that is, the key factors for consideration are the efficiency and effectiveness
of the scheme. This type of technical analysis involves examining administrative capabilities
(including resource mobilization capability), programme selection and design as well as
management and delivery mechanisms, amongst other areas. Nevertheless, these schemes
are not implemented in isolation. It is also critical to look at these programmes within the
political, social and economic processes that shape national development strategies. These
processes generate factors that potentially affect the impact of various schemes and
programmes and, ultimately, whether they contribute or hinder development.
Life-cycle risks and vulnerabilities
The meaning of the term “life-cycle‟ has two dimensions: it reflects a continuum of age-
related stages where the needs of an individual change throughout their life, from
conception to death. However, these changing needs are not solely related to chronological
age. Thus, it also refers to the different stages and life events which an individual or
household passes through, and which often bring with it a different status given to
individuals, such as becoming a widow, widower, a single mother, an adolescent, or an
unemployed person. Table 5 below lists a few examples of risks and vulnerabilities across
the life-cycle and possible interventions.
In a rapidly changing world, an individual does not conform to a linear sequence of life
events relating solely to age (birth, education, marriage, work, nurturing, old-age). Instead,
the individual may follow a cyclical pattern as life events, often due to changing economic,
social and spatial changes - such as death of a relative, accident, loss of job, migration of
household members – that lead to changes in a person’s role, and responsibilities and may
require him/her to revisit certain cycles.

13
Table 5. Risks and vulnerabilities across the life-cycle and possible types of interventions
Group Vulnerability Type of intervention/services
Pregnant mothers High maternal mortality rates (MMR)
Pre-natal health care Maternal nutritional support
Infants and children High malnutrition rates Food subsidies Post-natal health services
Poor quality of education / high dropout rates
Food subsidies/school meals
Youth Poor quality of education / high dropout rates
Conditional cash incentives
Low productivity Vocational support/ paid internship
Working-age population Low productivity Re-training programmes Adult learning
Disability Disability allowance
Older persons Inability to work Social pensions
Entire life cycle Health shocks Universal health care
Natural disasters Emergency allowances
Food insecurity Food stamps/food subsidies
Economic and price crises Unemployment benefits
Source: Adapted from Sann (2009).
A package of income support instruments that come into play at critical stages of the life-
cycle can contribute significantly to breaking the intergenerational transmission of poverty.
Such a package of predictable and secure income supplementary schemes may include child
support grants, disability grants, non-contributory pension, (often referred to as social
pensions), unemployment support, and free access to healthcare services. The crucial
consideration is that the different schemes interact with and support one another in
reducing vulnerability across the life-cycle in such a way that the benefits are cumulative.
Furthermore, a vital characteristic is that these schemes provide a regular and predictable
household income (Cain, 2009).
Ageing: The impending transformation
In 1950, the elderly in Asia accounted roughly for 4 per cent of the total population (Menon,
2009). As shown in table 6, by 2010, this figure had gone up to 10.5 per cent and it is
estimated that by 2050, close to a quarter of the total population of Asia and the Pacific will
be over 60 years old. As older persons are disproportionately affected by poverty, many
governments are increasingly confronted by a substantial and highly vulnerable segment of
the population in urgent need of some form of social protection. The majority of older
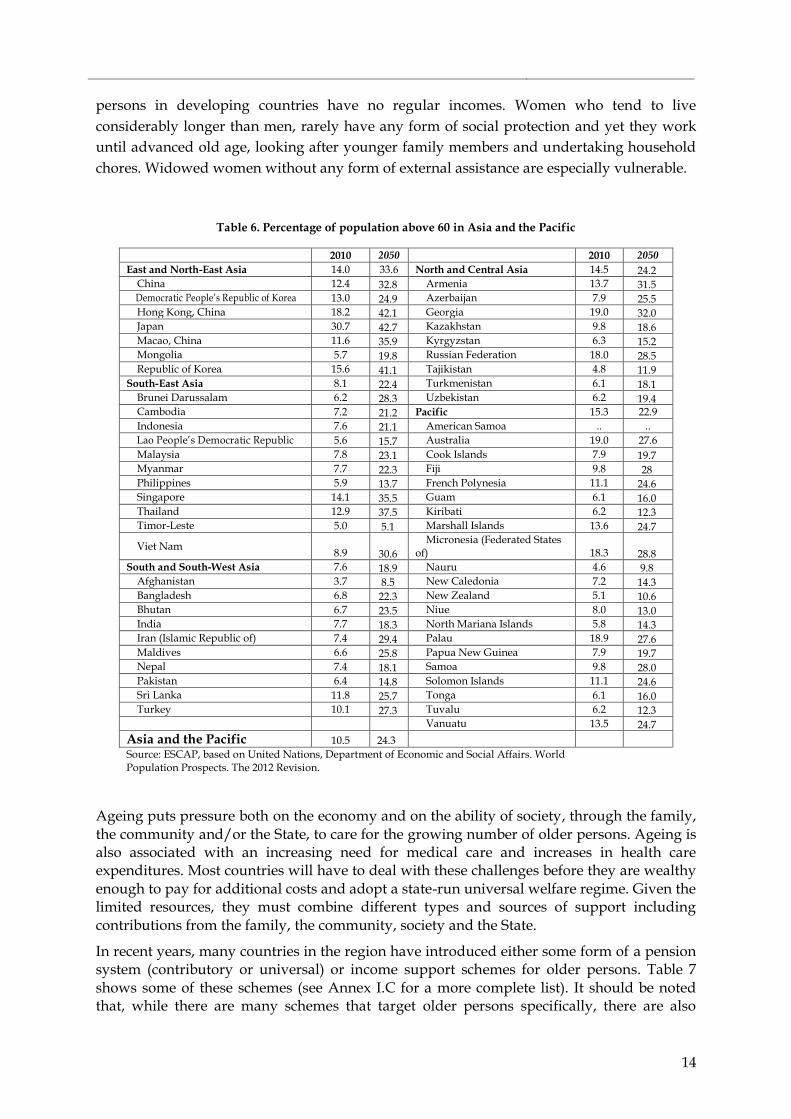
14
persons in developing countries have no regular incomes. Women who tend to live
considerably longer than men, rarely have any form of social protection and yet they work
until advanced old age, looking after younger family members and undertaking household
chores. Widowed women without any form of external assistance are especially vulnerable.
Table 6. Percentage of population above 60 in Asia and the Pacific
2010 2050 2010 2050
East and North-East Asia 14.0 33.6 North and Central Asia 14.5 24.2 China 12.4 32.8 Armenia 13.7 31.5 Democratic People’s Republic of Korea 13.0 24.9 Azerbaijan 7.9 25.5 Hong Kong, China 18.2 42.1 Georgia 19.0 32.0 Japan 30.7 42.7 Kazakhstan 9.8 18.6 Macao, China 11.6 35.9 Kyrgyzstan 6.3 15.2 Mongolia 5.7 19.8 Russian Federation 18.0 28.5 Republic of Korea 15.6 41.1 Tajikistan 4.8 11.9
South-East Asia 8.1 22.4 Turkmenistan 6.1 18.1 Brunei Darussalam 6.2 28.3 Uzbekistan 6.2 19.4 Cambodia 7.2 21.2 Pacific 15.3 22.9
Indonesia 7.6 21.1 American Samoa .. ..
Lao People’s Democratic Republic 5.6 15.7 Australia 19.0 27.6
Malaysia 7.8 23.1 Cook Islands 7.9 19.7 Myanmar 7.7 22.3 Fiji 9.8 28 Philippines 5.9 13.7 French Polynesia 11.1 24.6 Singapore 14.1 35.5 Guam 6.1 16.0 Thailand 12.9 37.5 Kiribati 6.2 12.3 Timor-Leste 5.0 5.1 Marshall Islands 13.6 24.7
Viet Nam 8.9 30.6
Micronesia (Federated States of) 18.3 28.8
South and South-West Asia 7.6 18.9 Nauru 4.6 9.8 Afghanistan 3.7 8.5 New Caledonia 7.2 14.3 Bangladesh 6.8 22.3 New Zealand 5.1 10.6 Bhutan 6.7 23.5 Niue 8.0 13.0 India 7.7 18.3 North Mariana Islands 5.8 14.3 Iran (Islamic Republic of) 7.4 29.4 Palau 18.9 27.6 Maldives 6.6 25.8 Papua New Guinea 7.9 19.7 Nepal 7.4 18.1 Samoa 9.8 28.0 Pakistan 6.4 14.8 Solomon Islands 11.1 24.6 Sri Lanka 11.8 25.7 Tonga 6.1 16.0 Turkey 10.1 27.3 Tuvalu 6.2 12.3 Vanuatu 13.5 24.7
Asia and the Pacific 10.5 24.3 Source: ESCAP, based on United Nations, Department of Economic and Social Affairs. World Population Prospects. The 2012 Revision.
Ageing puts pressure both on the economy and on the ability of society, through the family, the community and/or the State, to care for the growing number of older persons. Ageing is also associated with an increasing need for medical care and increases in health care expenditures. Most countries will have to deal with these challenges before they are wealthy enough to pay for additional costs and adopt a state-run universal welfare regime. Given the limited resources, they must combine different types and sources of support including contributions from the family, the community, society and the State.
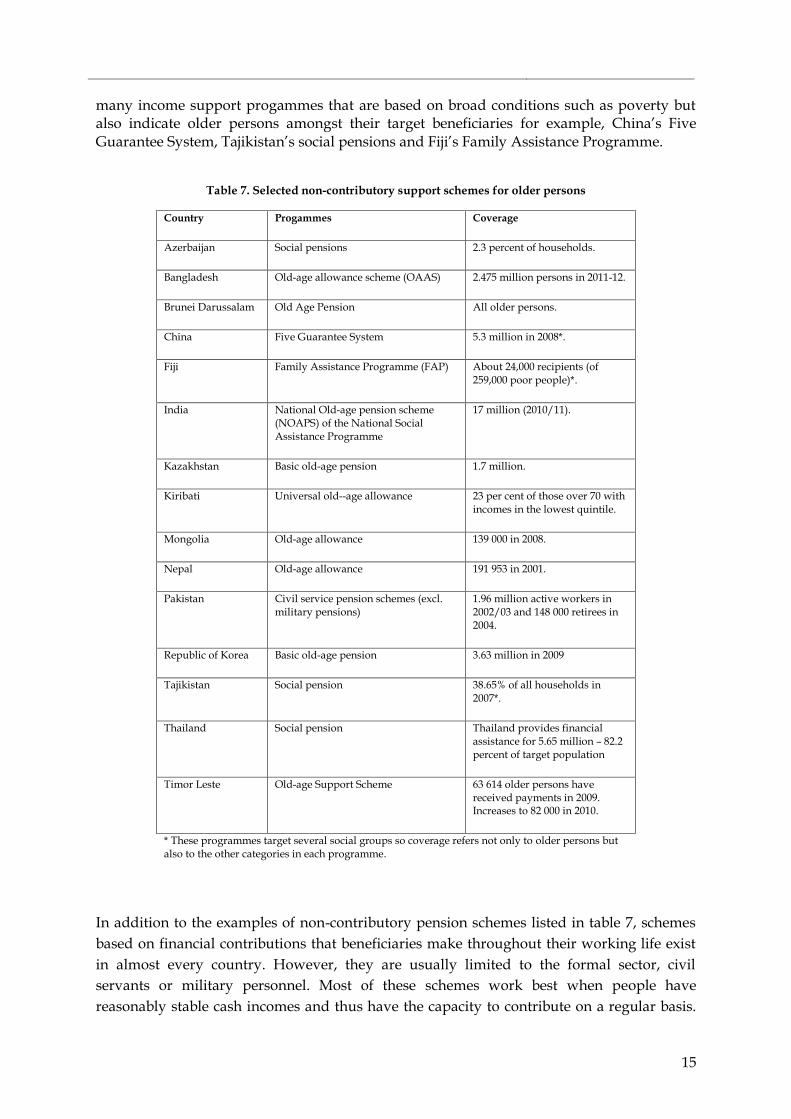
In recent years, many countries in the region have introduced either some form of a pension system (contributory or universal) or income support schemes for older persons. Table 7 shows some of these schemes (see Annex I.C for a more complete list). It should be noted that, while there are many schemes that target older persons specifically, there are also
15
many income support progammes that are based on broad conditions such as poverty but also indicate older persons amongst their target beneficiaries for example, China’s Five Guarantee System, Tajikistan’s social pensions and Fiji’s Family Assistance Programme.
Table 7. Selected non-contributory support schemes for older persons
Country Progammes Coverage
Azerbaijan Social pensions 2.3 percent of households.
Bangladesh Old-age allowance scheme (OAAS) 2.475 million persons in 2011-12.
Brunei Darussalam Old Age Pension All older persons.
China Five Guarantee System 5.3 million in 2008*.
Fiji Family Assistance Programme (FAP) About 24,000 recipients (of 259,000 poor people)*.
India National Old-age pension scheme (NOAPS) of the National Social Assistance Programme
17 million (2010/11).
Kazakhstan Basic old-age pension 1.7 million.
Kiribati Universal old--age allowance 23 per cent of those over 70 with incomes in the lowest quintile.
Mongolia Old-age allowance 139 000 in 2008.
Nepal Old-age allowance 191 953 in 2001.
Pakistan Civil service pension schemes (excl. military pensions)
1.96 million active workers in 2002/03 and 148 000 retirees in 2004.
Republic of Korea Basic old-age pension 3.63 million in 2009
Tajikistan Social pension 38.65% of all households in 2007*.
Thailand Social pension Thailand provides financial assistance for 5.65 million – 82.2 percent of target population
Timor Leste Old-age Support Scheme 63 614 older persons have received payments in 2009. Increases to 82 000 in 2010.
* These programmes target several social groups so coverage refers not only to older persons but also to the other categories in each programme.
In addition to the examples of non-contributory pension schemes listed in table 7, schemes
based on financial contributions that beneficiaries make throughout their working life exist
in almost every country. However, they are usually limited to the formal sector, civil
servants or military personnel. Most of these schemes work best when people have
reasonably stable cash incomes and thus have the capacity to contribute on a regular basis.
16
However, the majority of workers in Asia and the Pacific do not have stable employment
contracts and, hence, do not have the status of “employees”. Most of them are engaged in
informal sector enterprises or in informal employment within formal sector enterprises. This
means that, in most developing countries in the region, contributory old pension schemes
are confined to only about 10 per cent of the work force, including from public, quasi-public
and large private enterprises.
Countries need to undertake pension reforms to introduce or strengthen social pensions as a
policy alternative. According to ADB (2012), the effectiveness of social pensions largely
depends on three sets of factors:
The extent of coverage and the size of pensions determine the degree to which they can reach out to the majority of the poor and vulnerable and provide effective income support.
Eligibility criteria affect the potential for outreach and inclusion. In particular, the selective nature of poverty targeting makes it difficult to identify eligible beneficiaries and leaves significant scope for mismanagement and favouritism. This is especially true in contexts with a high degree of poverty and poor governance.
Strong government capacity is fundamental in determining the quality of the design and implementation of social pension schemes.
Making income support schemes gender-responsive
Many countries in the region have implemented income support schemes which target
women, but there are still major gaps in the way that gender concerns are integrated into
programmes (see box 1). There is a need to address existing gender imbalances in terms of
income and productive assets, as well as access to education, health and food. These
imbalances mean not only that women are exposed to deeper vulnerabilities than men in
similar conditions, but that these imbalances are then transmitted to the rest of the
household, particularly affecting the well-being of children. In addition, the increasing
feminization of the work force, mainly in the informal sector, means that strategies targeting
women can then have a higher impact and multiplier effect than strategies that do not
particularly target women (Kabeer, 2008). The impact of cash transfers on women‘s labour
market activity has been shown to be about twice as effective as that for men (Samson and
Williams, 2007).
Many income support schemes in the region have improved the conditions of women. These
include programmes such the Self-Employed Women’s Association (SEWA) which provides
women with more political voice in India and BRAC’s programme on “Challenging the
Frontiers of Poverty Reduction: Targeting Ultra Poor (CFPR-TUP)” in Bangladesh. Income
support schemes are, generally, considered gender-friendly initiatives, given their targeting
of care-givers and recognition of women’s caring responsibilities. However, it is also
recognized that there have been cases where the potential of some instruments has not been
fully realized due to the lack of a realistic comprehension of the gender dimension. For
example, the role of some of conditional cash transfers in women’s empowerment has been
17
called into question because of the erroneous assumptions about the internal dynamics of
households (Molyneux, 2008).
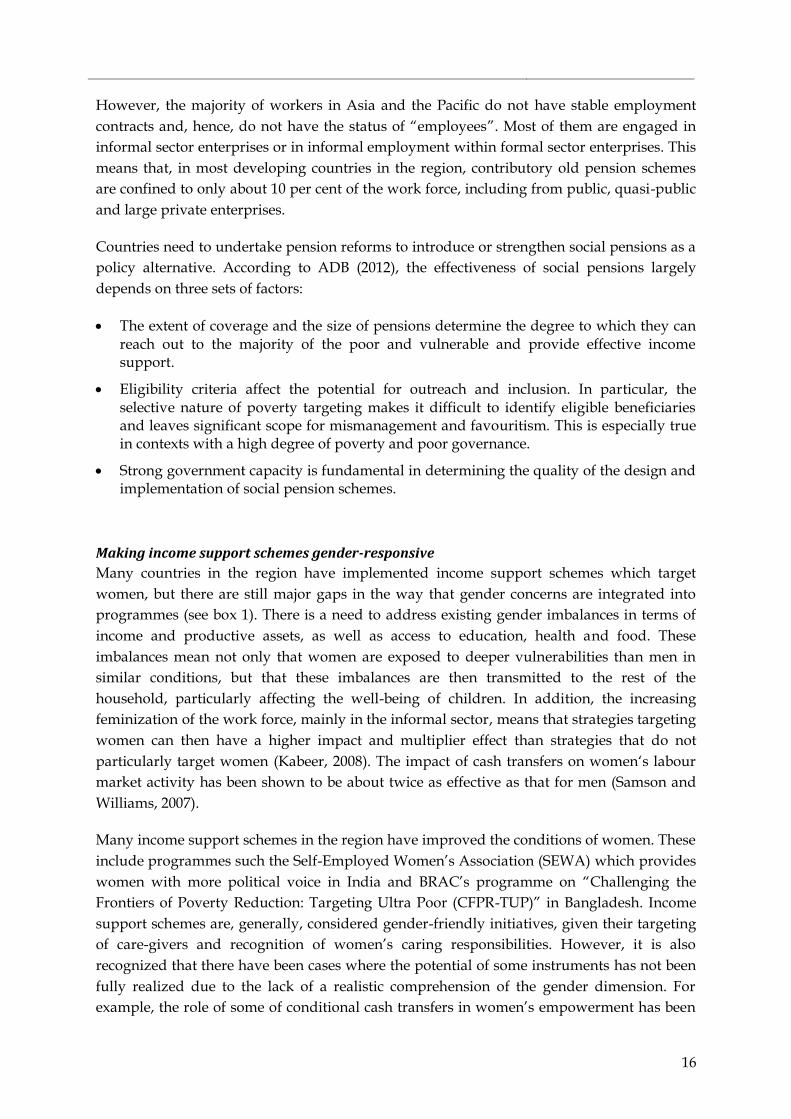
Box 1. Gendered challenges for income support
Maternal and child health services remain limited with high levels of mortality in many parts of the region.
Son preference in some countries has created highly skewed sex ratios, as well as pervasive forms of gender discrimination, e.g. in access to education or other services. Countries with young populations face particular challenges in ensuring equal access to education for girls at the secondary level and higher.
Productive employment for women, as child bearing/rearing tasks are reduced remains limited.
Additional care burdens fall on women particularly for older persons and those who are sick, including persons living with HIV and AIDS.
Status and care of widows may deteriorate as life expectancy increases, and as older persons take increasing responsibility for the care of children (e.g. of migrants, or AIDS orphans).
Source: Cook (2009).
The role of different actors and their political agendas in shaping income support schemes is
an important factor that, on occasions, may lead to “gender blindness” in many
interventions. Certain programmes may be initiated to reach ideological aims, such as
demonstrating a commitment to a strengthened social contract. Gender considerations are
not often part of the design, unless the programme specifically targets women (see box 2).
Similarly, the agenda of the leading agency within the government often determines the
priorities of the programmes. When the lead is with ministries of social welfare, women and
children, these ministries may give more priority to gender inequalities, but they may face
difficulties in “selling” this focus to other ministries. On the other hand, where ministries of
rural development take the lead, gender considerations tend to be a lower priority, as
illustrated by the limited integration of a gender perspective into working practices, weak
linkages to gender focal points and a lack of funding for capacity-building for programme
implementers on these issues (Homes and Jones, 2010).
18
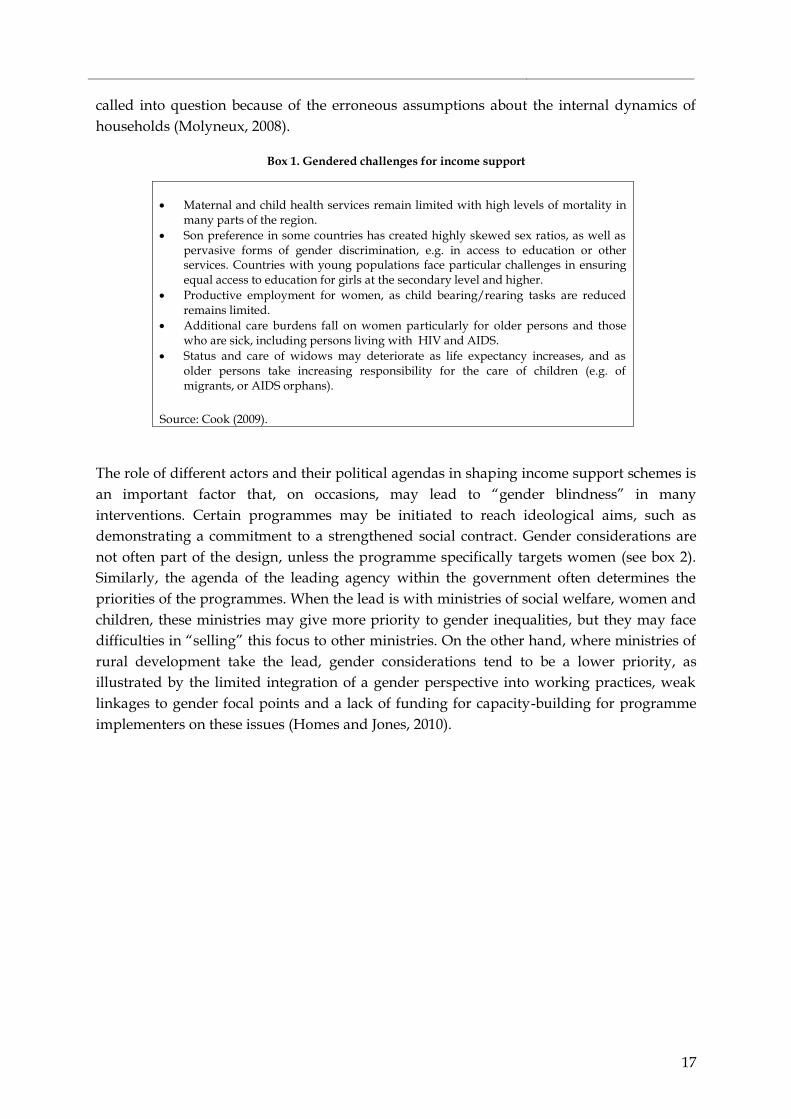
Box 2. Political economy of income support schemes and their gender impact in Pakistan
The Zakat programme, combining a monthly cash transfer with fee exemptions for basic services and marriage assistance, was launched in 1980 by the government in office that time, which adopted a religious governance model. The programme was based on the principle of helping deserving needy Muslims, especially widows, orphans, those with disabilities and the unemployed. Drawing on the Islamic injunction of charity, the government established a Central Zakat Fund, funded by a 2.5 per cent tax on financial assets such as bank deposits, a tax that became voluntary in 1999. While the programme targeted widows, gender equality was not an objective. Almost 30 years later, in 2008, the Benazir Bhutto Income Support Programme (BISP), an unconditional cash transfer programme, was launched as a response to the food, fuel and financial crisis. While some critics argued that its rapid implementation represented a ‘vote bank’, others maintain that it is motivated by a desire to support the consumption patterns of the poor amid mounting food inflation. The programme heralds greater commitment by the government to tackle gendered experiences of poverty and vulnerability, with the family defined as a unit headed by a woman. How this effects gender relations in practice should be monitored in the coming years. Source: Khan and Qutub (2010).
Rapid economic growth has been underpinned by a considerable shift of women into the
paid workforce in many parts of Asia and the Pacific. However, women are more likely to
enter fragile and insecure forms of employment in the formal sector, tend to be
overrepresented within informal sector employment, and are liable to lose their jobs during
periods of economic hardship. In South Asia, for example, about eight out of 10 working
women are considered to be in vulnerable forms of employment (ILO, 2009). A large part of
income support schemes that specifically target women tend to focus on the various
dimensions of childbirth and family care (see Annex I.B).
A number of factors are redefining the position of women in society and income support
systems need to take these changes into consideration. These factors include the decline in
fertility rates, increased access to higher levels of education, increased involvement in
economic activities and careers, shifts from the traditional extended family to smaller, more
diverse family types, rising age of marriage and delayed timing of family formation.
Youth unemployment
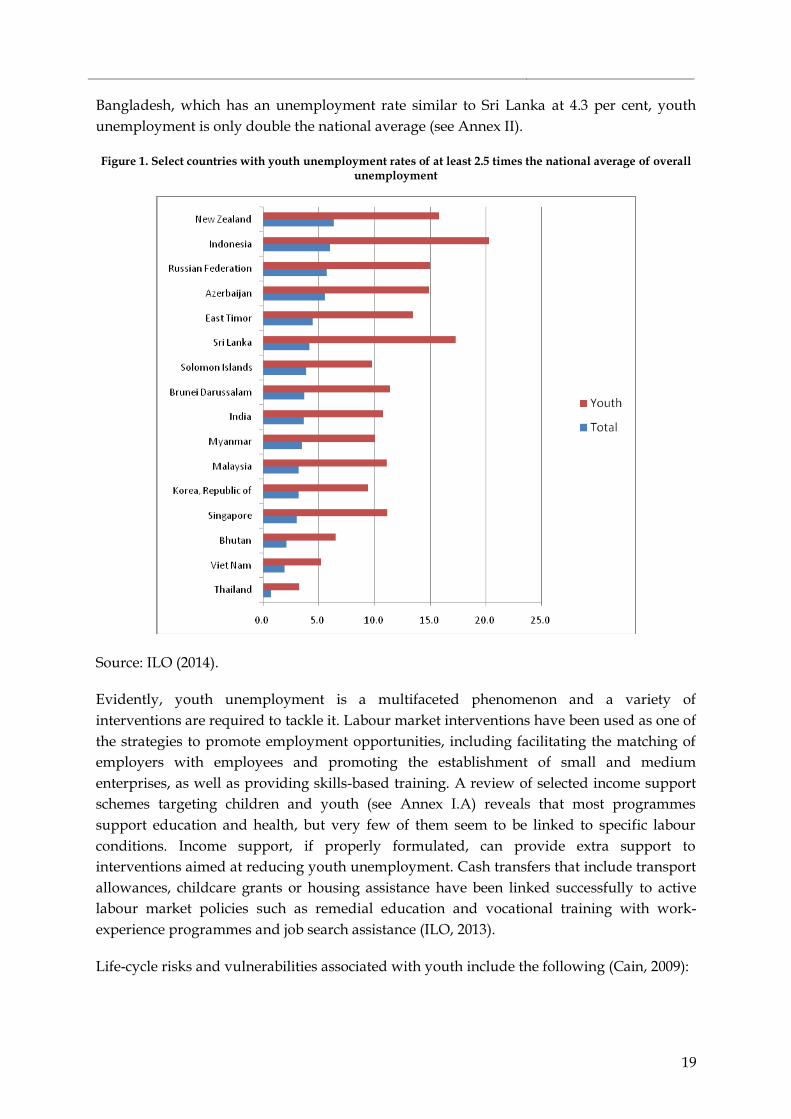
High levels of youth unemployment and underemployment have become prevalent in many
countries of the region, and youth unemployment rates are almost always higher than
unemployment rates of the overall population. As shown in figure 1, the problem is not
restricted to less developed or middle-income countries; New Zealand, Singapore and the
Republic of Korea are also facing serious challenges when it comes to youth unemployment.
An interesting aspect that can be seen in figure 1 is that the level of disparities between the
two rates—overall unemployment and youth unemployment - seem to be independent of
the overall level of unemployment. For example, in both Thailand and Sri Lanka, the youth
unemployment rate is more than four times than the national average. Yet in Thailand, the
overall rate of unemployment is 0.8 per cent, while in Sri Lanka, it is 4.2 per cent. In
19
Bangladesh, which has an unemployment rate similar to Sri Lanka at 4.3 per cent, youth
unemployment is only double the national average (see Annex II).
Figure 1. Select countries with youth unemployment rates of at least 2.5 times the national average of overall unemployment
Source: ILO (2014).
Evidently, youth unemployment is a multifaceted phenomenon and a variety of
interventions are required to tackle it. Labour market interventions have been used as one of
the strategies to promote employment opportunities, including facilitating the matching of
employers with employees and promoting the establishment of small and medium
enterprises, as well as providing skills-based training. A review of selected income support
schemes targeting children and youth (see Annex I.A) reveals that most programmes
support education and health, but very few of them seem to be linked to specific labour
conditions. Income support, if properly formulated, can provide extra support to
interventions aimed at reducing youth unemployment. Cash transfers that include transport
allowances, childcare grants or housing assistance have been linked successfully to active
labour market policies such as remedial education and vocational training with work-
experience programmes and job search assistance (ILO, 2013).
Life-cycle risks and vulnerabilities associated with youth include the following (Cain, 2009):
20
Vulnerability of children(especially girls) to early withdrawal from school due to
lack of parents/family income;
Impact of triple burden of work, unpaid care and schooling on the girl child;
Lack of access to training/formal employment leading to entry into high risk
employment categories;
Increased vulnerability of girls to gender-based violence;
Lack of access to credit asset building opportunities;
Lack of employment or further training/development;
Loss of employment/ reduced income earning potential for women through
pregnancy and childcare.
Youth unemployment is not only a multidimensional issue but the different factors are
interlinked. Consequently, a number of integrated, multisectoral policies are needed to
tackle these issues.
The case for policy integration
Adopting a life-cycle perspective brings into sharp focus the need for policy integration and
coordination. Unfortunately, in many countries of the region, income support schemes are
seen as discreet, almost self-contained exercises with their own objectives, functions,
structures and budgets. In part, this is due to a “crisis” mentality whereby these schemes are
considered as ways to cope with the critical temporary conditions generated by various
shock situations. Many countries have responded to the need for expansion in income
support with more and more schemes targeted at specific groups or contingencies—often
under the pressure of emergencies, including food shortages, civil unrest and economic
shocks. This practice has led to the proliferation of narrowly targeted interventions often
administered by different government agencies, which are increasingly difficult to
coordinate (Cook, 2009). Fragmentation not only leads to a waste of resources, duplication of
efforts and inefficiencies, it also makes it very difficult to tackle problems that require
multipronged approaches such as youth unemployment (see above).
There is a need to build synergies between various income support schemes as well as with
broader social and economic policies and services. Conditional cash transfers to promote
children’s education will not be effective if schools are not properly staffed or the quality of
the teaching is poor. Labour market interventions already feature in the strategies of many
countries to promote employment and income opportunities. However, an integrated
approach needs to also align income support and social protection with economic
development policies. People with stable income have more consumer power and can
participate actively in the market, creating higher demand and larger domestic and regional
markets.
Integrating income support and social protection with agricultural outreach programmes
have also yielded encouraging results in the Greater Mekong countries (Oxfam,
forthcoming). In India, the Mahatma Gandhi National Rural Employment Guarantee Act
(MNREGA) has increased incomes, leading to more demand for essential food items.
However, a strategy like MNREGA should be accompanied by policies that enable

21
expanded production of food and other essential items, including making smallholder
cultivation more viable which may, in turn, require subsidies that encourage more efficient
and sustainable agricultural production.
In less developed countries, the situation is particularly difficult, with most programmes
being operated by a large number of non-governmental organizations on small scales. Many
of their larger programmes are donor-funded, and the influence of donor priorities often
causes further fragmentation amongst programmes. Finally, there is also an issue of
sustainability. Budgetary provisions for the schemes in developing countries are often
dependent on political negotiations, and the terms of many of these schemes may be altered
each time there is a change of government (GCAP, 2010).
To minimize fragmentation, countries first need to take stock of existing programmes and
centralize all the relevant information, through conducting a mapping of scheme types,
eligibility criteria, beneficiaries and implementation arrangements as well as monitoring and
evaluation systems. In many cases, this exercise may be challenging and may require the
development of appropriate information management systems to compile the required
information. To achieve its full potential, it is important that these reforms cut across all
responsible line ministries.
Informality and mobility
Two especial challenges that need to be considered by policy-makers when formulating any
income support strategy are (a) the levels of informal employment, and (b) the increasing
mobility of the population. Dealing with these issues is compounded by the fact that there is
considerable overlap between these two. For example, in China, rural-urban migrants now
comprise a large share of the workers engaged in informal employment in the urban labour
market. The proportion of informally employed internal migrant workers is about 30 to 50
per cent, depending on the cities and industries. The total scale of rural-urban migrant
workers (out of their home districts) is about 150 million; therefore, there are about 30 to 50
million of migrant workers informally employed, accounting for about one third of the total
flexible employment (Wang, 2009).
As shown in table 8, the level of people working in informal employment is very high
throughout the region. Furthermore, there are indications that this is likely to remain at high
levels, particularly considering that, sometimes, it is a voluntary choice over formal
employment (Jütting et al, 2008).

22
Table 8. Employment in the informal economy in select countries of the region
Country Year
Percentage of non-agricultural informal employment*
Persons employed in the informal sector
Persons in informal employment outside the
informal sector
Persons in informal employment
Armenia 2009 10.2 9.6 19.8
China 2010 21.9 12.5 32.6
India 2010 67.5 16.8 83.6
Indonesia 2009 60.2 12.2 72.5
Kyrgyzstan 2009 59.2 n.a. n.a.
Pakistan 2009/10 73.0 8.3. 78.4.
Philippines 2008 72.5 11.5 70.1
Russian Federation 2010 12.1 n.a. n.a.
Sri Lanka 2009 50.5 11.6 62.1
Thailand 2010 n.a. n.a. 42.3
Turkey 2009 n.a. n.a. 30.6
Viet Nam 2009 43.5 25.0 68.2
Source: ILO (2012)
Several countries have introduced schemes that extend protection to the informal sector by
providing contributory schemes on a voluntary basis. For example, the Government of Viet
Nam introduced a law in 2006 that stipulated the step-wise introduction of a compulsory
social insurance scheme, a voluntary scheme, and an unemployment insurance scheme from
2007 to 2009. The voluntary social insurance scheme targets workers in the informal
economy, especially farmers, and consists of an old-age pension and survivors’ insurance. A
ground-breaking feature of the system is that periods of contribution to the voluntary and
compulsory schemes can be added to calculate the amount of benefits granted. This is
beneficial for workers who turn to the informal economy during economic downturns while
seeking employment in the formal economy. Similar efforts have been undertaken by
Indonesia and the Philippines. Indonesia developed a policy that allowed informal workers
to voluntarily join a social security scheme and let them choose which type of insurance to
join, based on the workers’ needs and financial capacity. However, due to high contribution
rates and complex administrative processes, only a few informal sector workers joined the
scheme (Cook, 2009).
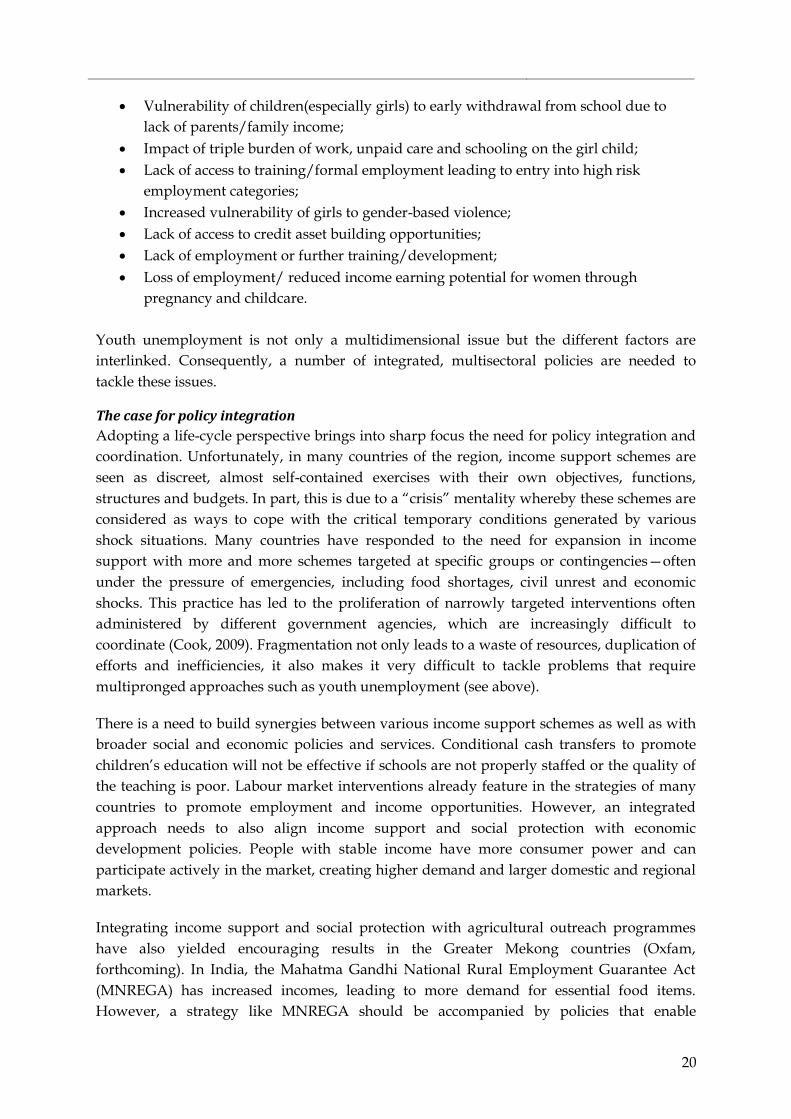
Undoubtedly, informality makes targeting and delivery of support schemes extremely
complicated. Thus, providing protection for informal workers may require a combination of
schemes - some universal, and some targeted - as exemplified by the current efforts in
Thailand (see box 3). This approach has the advantage of offering a way for people to move
from non-contributory systems to contributory schemes if their economic conditions allow
it.
23
Box 3. Social protection for workers in the informal economy in Thailand
As of 2013, social protection schemes for workers in the informal economy comprises of the Universal
Health Coverage Scheme, three universal non-contributory allowances for i) persons with disabilities,
ii) persons living with HIV and AIDS and iii) older persons, as well as the Social Insurance Scheme
under Section 40 of the Social Security Act, B.E. 2533.
Types of security Benefits
Basic security
1. Universal schemes
Universal Health Coverage Scheme (UCS) Medical care
Universal Non-contributory Allowance for Persons living
with HIV/AIDS
HIV and AIDS allowance
Universal Non-contributory Allowance for Persons with
Disabilities
Disability allowance
Universal Non-contributory Allowance for Older People Old-age allowance
2.Voluntary Schemes
Social insurance (Section 40 of Social Security Act, B.E. 2533) Sickness, invalidity, death
and old-age benefits
National Savings Fund (Not yet implemented) Old-age pension or lump
sum
Economic security
1. Government-sponsored schemes
Public welfare benefits
Social services
Public assistance funds
Skills training
2. Informal labour groups or organizations
Organized occupational groups and production groups
such as agricultural groups and taxi cooperatives.
Purchasing on credits,
information dissemination
Cooperatives and credit unions
Group savings, loans and
information dissemination
3. Community welfare
Community welfare is a self-help system among people in
the area. It comes in a variety of forms and methods
covering many aspects of well-being. It is regarded as a
crucial alternative source of social protection for informal
workers.
Savings groups, loans and
community enterprises
Source: Nirathron (forthcoming)
24
Mobility and/or migration are frequent household and individual responses to both
economic difficulties and livelihood opportunities, which, in turn, help to reduce poverty
and to support the development of sending communities. Moreover, migration also
provides a sustained supply of labour force to satisfy the labour needs in various economic
sectors in receiving areas. In other words, directly or indirectly, migrants provide socio-
economic protection for both sending and receiving areas.
A common focus of much of the recent work on portability of social benefits and
entitlements has been international migration but national populations in most countries of
the region are becoming increasingly mobile with rural-urban migration or moves between
secondary cities, emerging as a common feature in the life-cycle of individuals and
households. Unfortunately, social support systems have not kept up with these new trends
and, often, rigid regulations present major obstacles for mobile individuals.
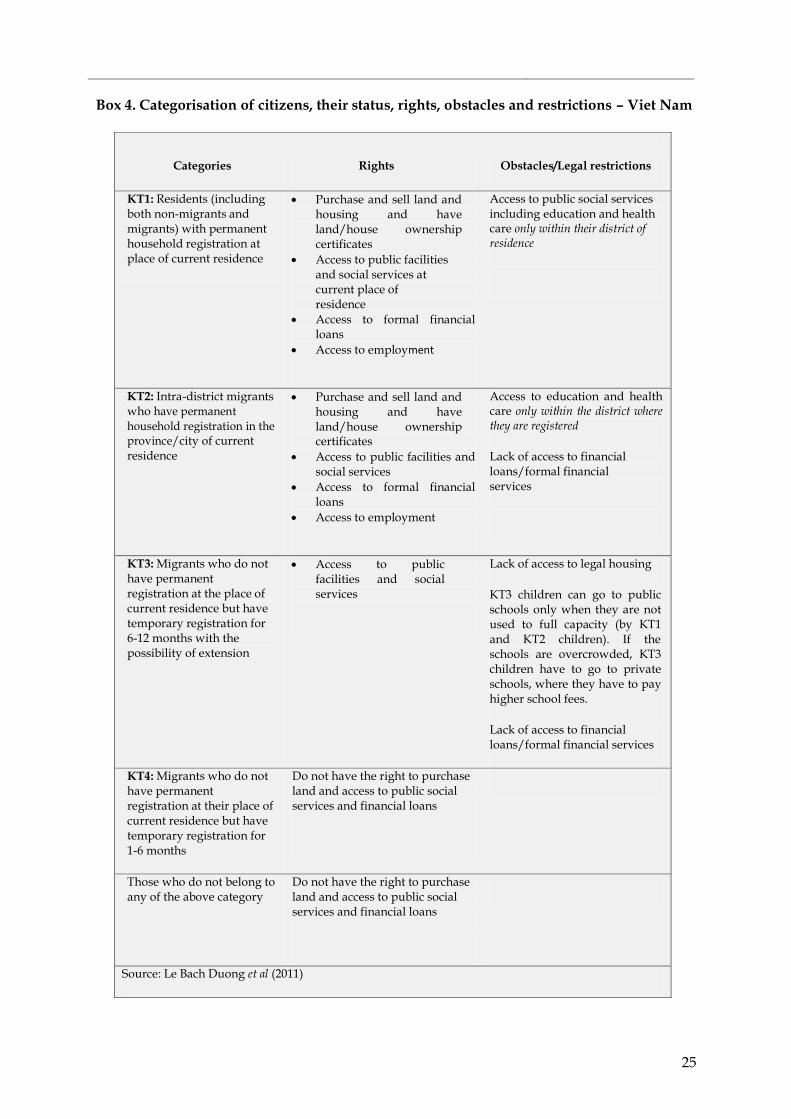
The categorisation of citizens according to their status as either residents or migrants such as
that in Viet Nam (see box 4) is not uncommon in the region. This type of classification is
particularly detrimental to seasonal migrants or to members of multi-local households.
Furthermore, in many countries, where household registration is the main identifier for legal
transactions, mobile populations do present a challenge for the institutions charged with
managing the targeting and delivery of benefits. From the administrative point of view,
mobility implies the involvement of various organizations, such as various local
governments, local offices of line ministries, etc., with the consequential increased pressure
for coordinating procedures. There is also a political dimension since many countries in the
region have a history of trying to control internal migration through the implementation of
strict regulations. Migration is a structural component of contemporary development, and
limiting migration by administrative measures will not reduce migration; rather, it will push
migrants into further vulnerability, marginalisation and poverty (Long, forthcoming).
25
Box 4. Categorisation of citizens, their status, rights, obstacles and restrictions – Viet Nam
Categories Rights Obstacles/Legal restrictions
KT1: Residents (including both non-migrants and migrants) with permanent household registration at place of current residence
Purchase and sell land and housing and have land/house ownership certificates
Access to public facilities and social services at current place of residence
Access to formal financial loans
Access to employment
Access to public social services including education and health care only within their district of residence
KT2: Intra-district migrants who have permanent household registration in the province/city of current residence
Purchase and sell land and housing and have land/house ownership certificates
Access to public facilities and social services
Access to formal financial loans
Access to employment
Access to education and health care only within the district where they are registered
Lack of access to financial loans/formal financial services
KT3: Migrants who do not have permanent registration at the place of current residence but have temporary registration for 6-12 months with the possibility of extension
Access to public facilities and social services
Lack of access to legal housing
KT3 children can go to public schools only when they are not used to full capacity (by KT1 and KT2 children). If the schools are overcrowded, KT3 children have to go to private schools, where they have to pay higher school fees.
Lack of access to financial loans/formal financial services
KT4: Migrants who do not have permanent registration at their place of current residence but have temporary registration for 1-6 months
Do not have the right to purchase land and access to public social services and financial loans
Those who do not belong to any of the above category
Do not have the right to purchase land and access to public social services and financial loans
Source: Le Bach Duong et al (2011)
26
Income support as a pathway out of poverty: the graduation model
In comparison to social protection programmes providing universal benefits, many targeted
income support programmes can actually be more effective to reduce poverty and
vulnerability in the short term since benefit levels tend to be higher than universal benefits.
Unfortunately, these benefits are often much lower than minimum living standards, which
makes it difficult for the poor to “graduate” out of poverty, especially for those who are not
able to work. These programmes may help the recipients sustain their living but do not
support the recipient to escape from the poverty.
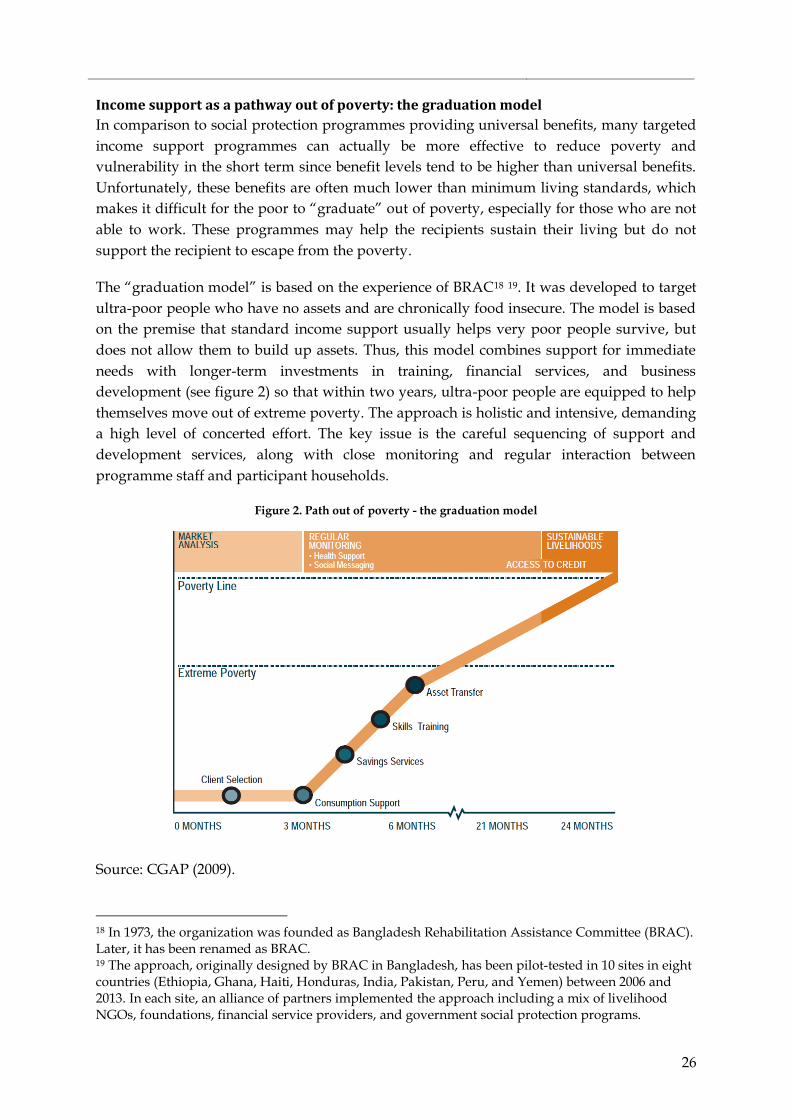
The “graduation model” is based on the experience of BRAC18 19. It was developed to target
ultra-poor people who have no assets and are chronically food insecure. The model is based
on the premise that standard income support usually helps very poor people survive, but
does not allow them to build up assets. Thus, this model combines support for immediate
needs with longer-term investments in training, financial services, and business
development (see figure 2) so that within two years, ultra-poor people are equipped to help
themselves move out of extreme poverty. The approach is holistic and intensive, demanding
a high level of concerted effort. The key issue is the careful sequencing of support and
development services, along with close monitoring and regular interaction between
programme staff and participant households.
Figure 2. Path out of poverty - the graduation model
Source: CGAP (2009).
18 In 1973, the organization was founded as Bangladesh Rehabilitation Assistance Committee (BRAC). Later, it has been renamed as BRAC. 19 The approach, originally designed by BRAC in Bangladesh, has been pilot-tested in 10 sites in eight countries (Ethiopia, Ghana, Haiti, Honduras, India, Pakistan, Peru, and Yemen) between 2006 and 2013. In each site, an alliance of partners implemented the approach including a mix of livelihood NGOs, foundations, financial service providers, and government social protection programs.
27
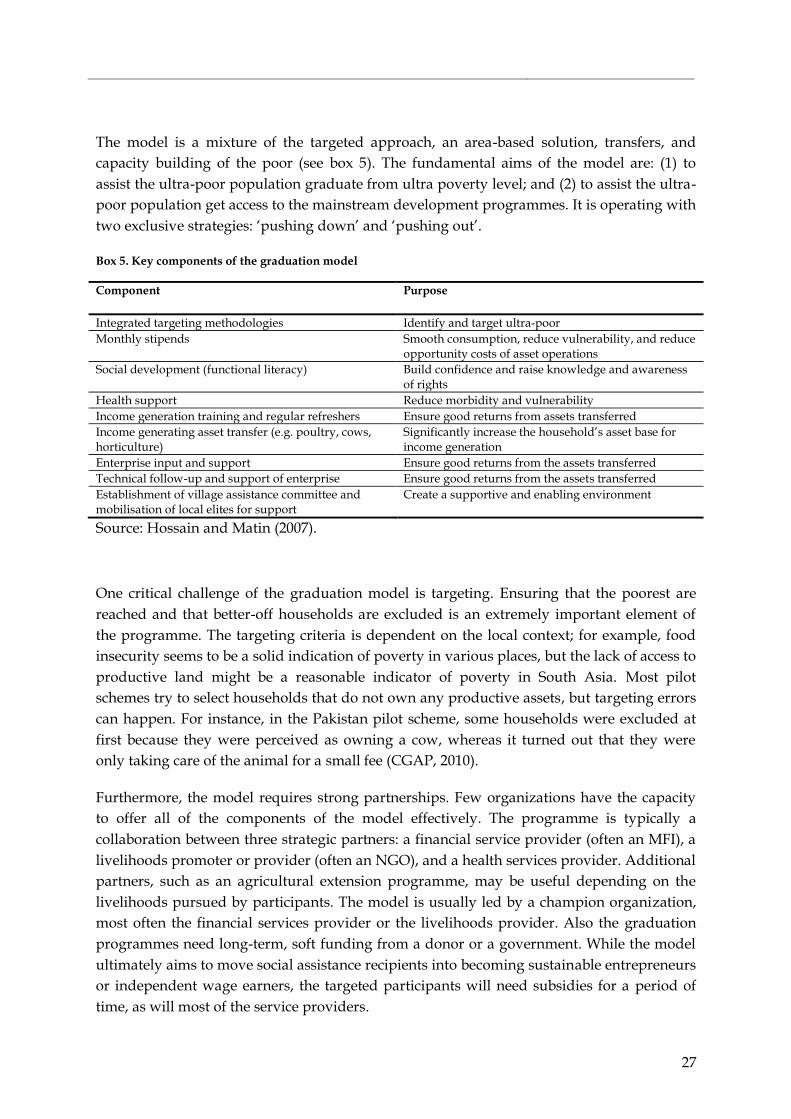
The model is a mixture of the targeted approach, an area-based solution, transfers, and
capacity building of the poor (see box 5). The fundamental aims of the model are: (1) to
assist the ultra-poor population graduate from ultra poverty level; and (2) to assist the ultra-
poor population get access to the mainstream development programmes. It is operating with
two exclusive strategies: ‘pushing down’ and ‘pushing out’.
Box 5. Key components of the graduation model
Component Purpose
Integrated targeting methodologies Identify and target ultra-poor
Monthly stipends Smooth consumption, reduce vulnerability, and reduce opportunity costs of asset operations
Social development (functional literacy) Build confidence and raise knowledge and awareness of rights
Health support Reduce morbidity and vulnerability
Income generation training and regular refreshers Ensure good returns from assets transferred
Income generating asset transfer (e.g. poultry, cows, horticulture)
Significantly increase the household’s asset base for income generation
Enterprise input and support Ensure good returns from the assets transferred
Technical follow-up and support of enterprise Ensure good returns from the assets transferred
Establishment of village assistance committee and mobilisation of local elites for support
Create a supportive and enabling environment
Source: Hossain and Matin (2007).
One critical challenge of the graduation model is targeting. Ensuring that the poorest are
reached and that better-off households are excluded is an extremely important element of
the programme. The targeting criteria is dependent on the local context; for example, food
insecurity seems to be a solid indication of poverty in various places, but the lack of access to
productive land might be a reasonable indicator of poverty in South Asia. Most pilot
schemes try to select households that do not own any productive assets, but targeting errors
can happen. For instance, in the Pakistan pilot scheme, some households were excluded at
first because they were perceived as owning a cow, whereas it turned out that they were
only taking care of the animal for a small fee (CGAP, 2010).
Furthermore, the model requires strong partnerships. Few organizations have the capacity
to offer all of the components of the model effectively. The programme is typically a
collaboration between three strategic partners: a financial service provider (often an MFI), a
livelihoods promoter or provider (often an NGO), and a health services provider. Additional
partners, such as an agricultural extension programme, may be useful depending on the
livelihoods pursued by participants. The model is usually led by a champion organization,
most often the financial services provider or the livelihoods provider. Also the graduation
programmes need long-term, soft funding from a donor or a government. While the model
ultimately aims to move social assistance recipients into becoming sustainable entrepreneurs
or independent wage earners, the targeted participants will need subsidies for a period of
time, as will most of the service providers.
28
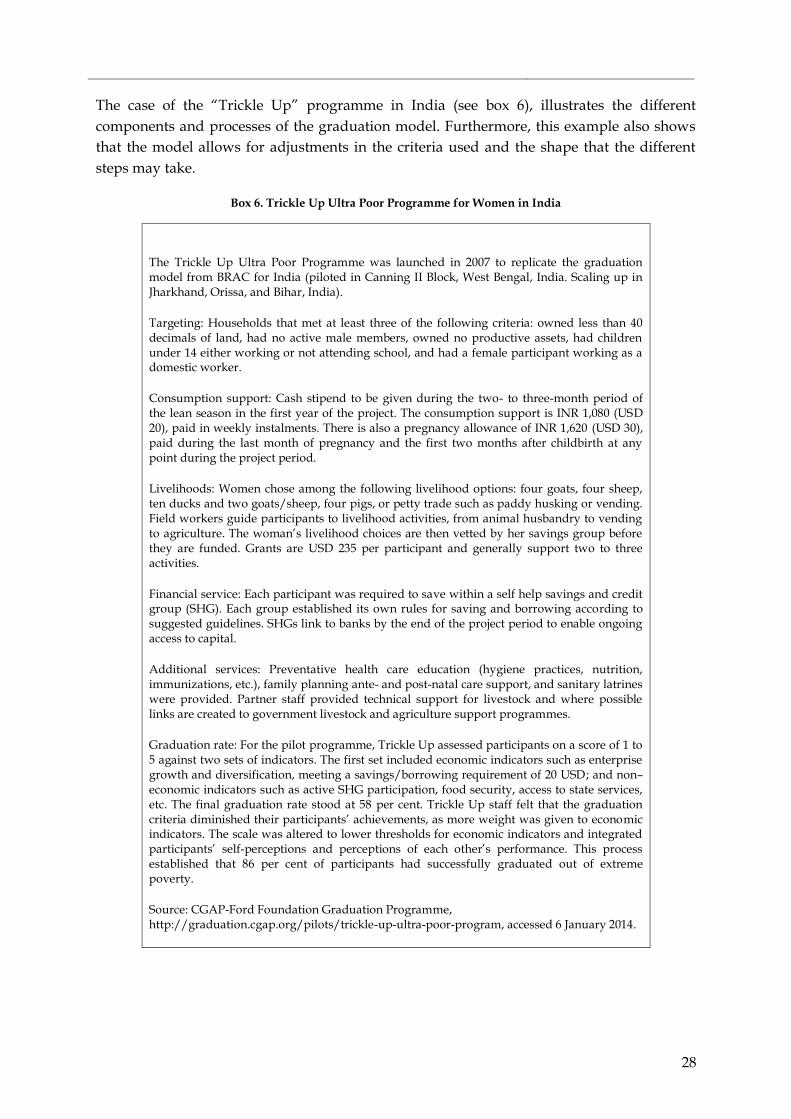
The case of the “Trickle Up” programme in India (see box 6), illustrates the different
components and processes of the graduation model. Furthermore, this example also shows
that the model allows for adjustments in the criteria used and the shape that the different
steps may take.
Box 6. Trickle Up Ultra Poor Programme for Women in India
The Trickle Up Ultra Poor Programme was launched in 2007 to replicate the graduation model from BRAC for India (piloted in Canning II Block, West Bengal, India. Scaling up in Jharkhand, Orissa, and Bihar, India).
Targeting: Households that met at least three of the following criteria: owned less than 40 decimals of land, had no active male members, owned no productive assets, had children under 14 either working or not attending school, and had a female participant working as a domestic worker.
Consumption support: Cash stipend to be given during the two- to three-month period of the lean season in the first year of the project. The consumption support is INR 1,080 (USD 20), paid in weekly instalments. There is also a pregnancy allowance of INR 1,620 (USD 30), paid during the last month of pregnancy and the first two months after childbirth at any point during the project period.
Livelihoods: Women chose among the following livelihood options: four goats, four sheep, ten ducks and two goats/sheep, four pigs, or petty trade such as paddy husking or vending. Field workers guide participants to livelihood activities, from animal husbandry to vending to agriculture. The woman’s livelihood choices are then vetted by her savings group before they are funded. Grants are USD 235 per participant and generally support two to three activities.
Financial service: Each participant was required to save within a self help savings and credit group (SHG). Each group established its own rules for saving and borrowing according to suggested guidelines. SHGs link to banks by the end of the project period to enable ongoing access to capital.
Additional services: Preventative health care education (hygiene practices, nutrition, immunizations, etc.), family planning ante- and post-natal care support, and sanitary latrines were provided. Partner staff provided technical support for livestock and where possible links are created to government livestock and agriculture support programmes.
Graduation rate: For the pilot programme, Trickle Up assessed participants on a score of 1 to 5 against two sets of indicators. The first set included economic indicators such as enterprise growth and diversification, meeting a savings/borrowing requirement of 20 USD; and non–economic indicators such as active SHG participation, food security, access to state services, etc. The final graduation rate stood at 58 per cent. Trickle Up staff felt that the graduation criteria diminished their participants’ achievements, as more weight was given to economic indicators. The scale was altered to lower thresholds for economic indicators and integrated participants’ self-perceptions and perceptions of each other’s performance. This process established that 86 per cent of participants had successfully graduated out of extreme poverty.
Source: CGAP-Ford Foundation Graduation Programme, http://graduation.cgap.org/pilots/trickle-up-ultra-poor-program, accessed 6 January 2014.
29
The political economy of income support and other social protection schemes
Examples from a number of countries in the region reveal that the domestic political
economy often plays a key role in governments’ decisions to adopt a particular programme
(Kabeer and Ainsworth, 2010). Examining these considerations is important for two main
reasons: they can affect the design of the scheme (choice of instrument, consultative
mechanisms, etc.), and, more importantly, they can have a major impact on the
institutionalization and mainstreaming of the scheme or programme, and consequently, its
sustainability.
Governments may adopt the social protection agenda for a variety of reasons. They may
commit to a social protection programme as a response to a natural disaster or crisis. An
example is the Maharashtra Employment Guarantee Scheme (MEGS), which was adopted
by a Federal State government in India in response to major droughts and seasonal
unemployment in agriculture. In Indonesia, the decision to introduce a cash transfer
programme was precipitated by a cut in the fuel subsidy implemented in response to the
sudden rise in fuel prices in 2005, which made the subsidy fiscally unsustainable. The move
to cut the subsidy hit the poor hardest at a time when official data showed a rise in poverty.
Thus, the growing interest in social protection and income support schemes has brought to
the foreground their role, not only in reducing poverty and mitigating shocks, but also as a
key element in building strong social relations and citizenship. This political aspect helps
explain why many debates, studies and experts appear to agree on the usefulness of social
protection, but have very dissimilar views on the content of protection, and on notions of
solidarity and fairness, as well as social and citizen relationships (Destremau, 2006).
The rationale behind the decision of government to undertake any social protection
programme is not only driven by economic justification, but by political motives. At the
same time, social protection programmes can be used by the government as an instrument
to maintain political stability and its legitimacy, as explained in the aforementioned cases.
This argument applies to both the newly democratic regimes and centralized States.
Building popular support for the extension of programmes becomes increasingly important
in cases where governments face democratic elections. In newly democratised countries,
elections have proved to be a key determinant of the expansion of provisions or of
preventing retrenchment. The lack of adequate social protection in situations of crises or the
threat to remove existing programmes can be a powerful driver for the political mobilisation
of groups of citizens. The politics around the removal of fuel subsidies in Indonesia, and
more recently, the opposition to a reduced minimum wage, are examples of popular
pressure on the State. Similarly, in centralized or single party systems, the threat of social
disruption from those excluded from the benefits of economic growth or faced with a loss of
benefits, creates a motivation for government to expand provisions in order to retain broad-
based legitimacy and to maintain social stability.
Political arrangements sometimes also explain why some income support schemes only
survive for a short time, while others can last for longer times. In one South Asian country,
30
the land regularization scheme20 targeting the poor in urban and rural areas was introduced
in the early 1970s at a time when the country had a democratically elected government in
power for the first time since its independence in 1947. The government was replaced by a
military government a few years later, leading to the abandonment of the rural intervention
but the retention and extension of the urban one. This corresponded with the perceived
political basis of the new government. A second rural scheme was introduced in 1987
following several years of political agitation against that government. This intervention was
seen as a concession to the rural population in a particularly restive province in order to
pave the way for a new civilian government to take over from direct military rule. While the
urban scheme survived several regime changes, neither of the two rural schemes retained
the political force of their introduction phase long enough to nurture their development.
The long-term continuity of a social protection programme may depend upon its potential
for institutionalization. Some income support schemes only last as long as the regimes that
put them in place last because they have failed to put down institutional roots and generate
supportive constituencies within government or wider civil society. There is no institutional
mechanism or memory to build further on initiatives in the pipeline (Nishtar, 2009). The
more broad-based the support an income support scheme receives, and the deeper its roots
in the political and societal domain, the more likely it is to become institutionalised.
Fiscal contraction and development
As a reaction to the financial upheaval of recent years, countries all over the world have
adopted various austerity measures aimed at achieving fiscal consolidation. There is no
doubt that this type of crisis has a severe impact not only on the economy but also on health,
education, poverty and gender issues. Van Dijk (2013), examining 187 banking crises in 120
countries, indicates that “in the six years following a crisis, average life expectancy declines
by nine months, primary school enrolment drops by 3.5 per cent, and fertility falls by 5.5 per
cent (but adolescent fertility rises by 4.5 per cent), as well as considerable short-run
worsening of poverty and income equality, and a lasting 50 per cent increase in outbound
refugees and inbound foreign aid.”
However, many of the measures taken to counter the crises, including macroeconomic
policies, have a disproportionate impact on the most vulnerable segments of the population.
It has also been shown that unemployment is one of the main channels through which fiscal
austerity measures are likely to raise inequality (Woo et al;, 2013). Table 9 shows the most
common measures adopted by countries in the region.
20 For the role that land and secure tenure can play in social protection see Gazdar and Mallah (2010), and Mahadevia (2010).
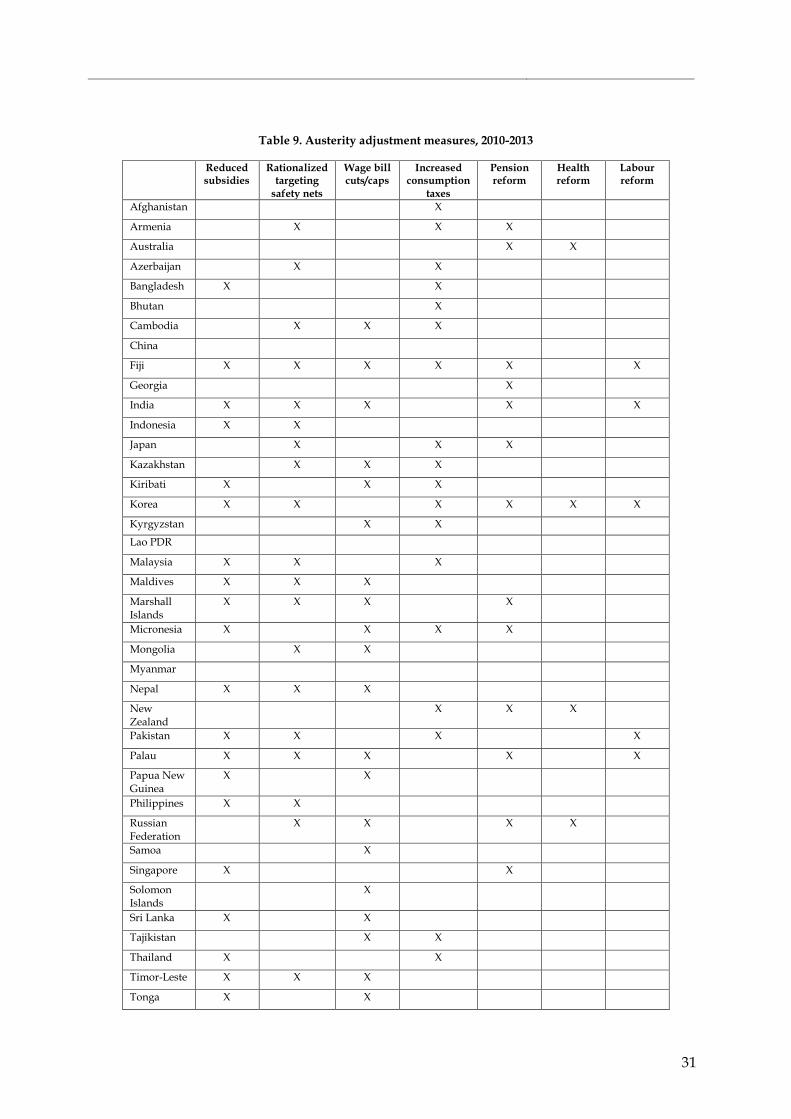
31
Table 9. Austerity adjustment measures, 2010-2013
Reduced subsidies
Rationalized targeting
safety nets
Wage bill cuts/caps
Increased consumption
taxes
Pension reform
Health reform
Labour reform
Afghanistan X
Armenia X X X
Australia X X
Azerbaijan X X
Bangladesh X X
Bhutan X
Cambodia X X X
China
Fiji X X X X X X
Georgia X
India X X X X X
Indonesia X X
Japan X X X
Kazakhstan X X X
Kiribati X X X
Korea X X X X X X
Kyrgyzstan X X
Lao PDR
Malaysia X X X
Maldives X X X
Marshall Islands
X X X X
Micronesia X X X X
Mongolia X X
Myanmar
Nepal X X X
New Zealand
X X X
Pakistan X X X X
Palau X X X X X
Papua New Guinea
X X
Philippines X X
Russian Federation
X X X X
Samoa X
Singapore X X
Solomon Islands
X
Sri Lanka X X
Tajikistan X X
Thailand X X
Timor-Leste X X X
Tonga X X
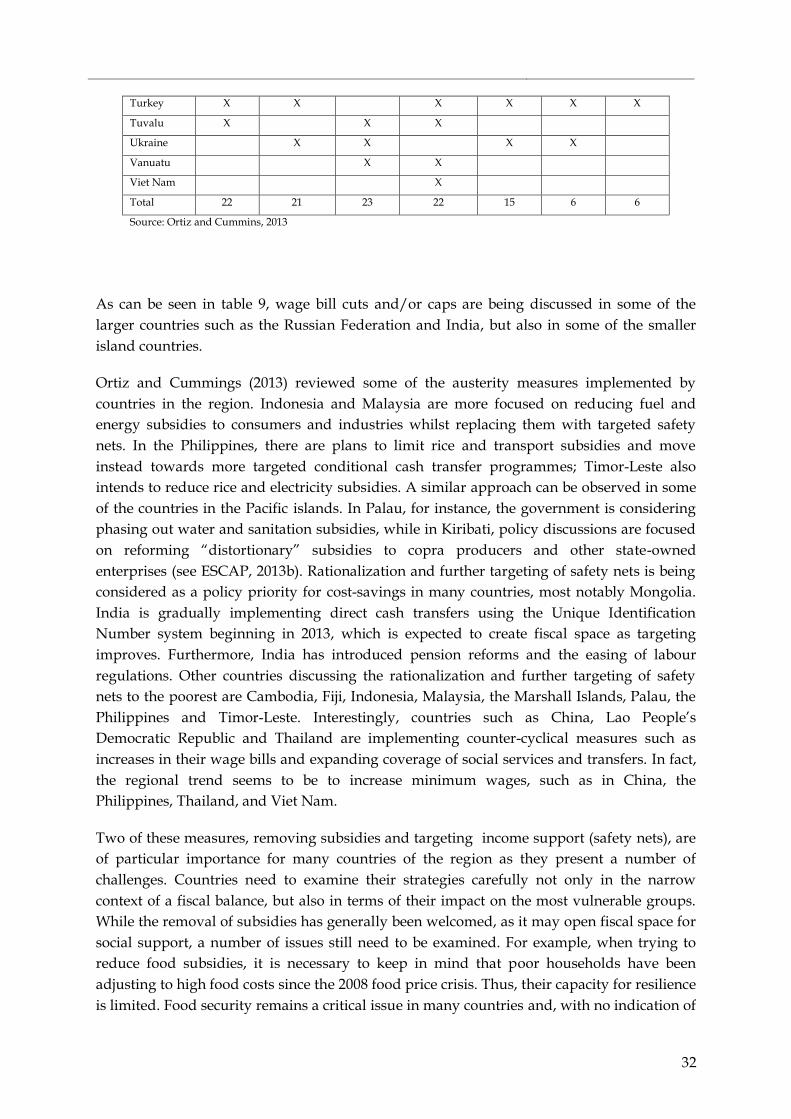
32
Turkey X X X X X X
Tuvalu X X X
Ukraine X X X X
Vanuatu X X
Viet Nam X
Total 22 21 23 22 15 6 6
Source: Ortiz and Cummins, 2013
As can be seen in table 9, wage bill cuts and/or caps are being discussed in some of the
larger countries such as the Russian Federation and India, but also in some of the smaller
island countries.
Ortiz and Cummings (2013) reviewed some of the austerity measures implemented by
countries in the region. Indonesia and Malaysia are more focused on reducing fuel and
energy subsidies to consumers and industries whilst replacing them with targeted safety
nets. In the Philippines, there are plans to limit rice and transport subsidies and move
instead towards more targeted conditional cash transfer programmes; Timor-Leste also
intends to reduce rice and electricity subsidies. A similar approach can be observed in some
of the countries in the Pacific islands. In Palau, for instance, the government is considering
phasing out water and sanitation subsidies, while in Kiribati, policy discussions are focused
on reforming “distortionary” subsidies to copra producers and other state-owned
enterprises (see ESCAP, 2013b). Rationalization and further targeting of safety nets is being
considered as a policy priority for cost-savings in many countries, most notably Mongolia.
India is gradually implementing direct cash transfers using the Unique Identification
Number system beginning in 2013, which is expected to create fiscal space as targeting
improves. Furthermore, India has introduced pension reforms and the easing of labour
regulations. Other countries discussing the rationalization and further targeting of safety
nets to the poorest are Cambodia, Fiji, Indonesia, Malaysia, the Marshall Islands, Palau, the
Philippines and Timor-Leste. Interestingly, countries such as China, Lao People’s
Democratic Republic and Thailand are implementing counter-cyclical measures such as
increases in their wage bills and expanding coverage of social services and transfers. In fact,
the regional trend seems to be to increase minimum wages, such as in China, the
Philippines, Thailand, and Viet Nam.
Two of these measures, removing subsidies and targeting income support (safety nets), are
of particular importance for many countries of the region as they present a number of
challenges. Countries need to examine their strategies carefully not only in the narrow
context of a fiscal balance, but also in terms of their impact on the most vulnerable groups.
While the removal of subsidies has generally been welcomed, as it may open fiscal space for
social support, a number of issues still need to be examined. For example, when trying to
reduce food subsidies, it is necessary to keep in mind that poor households have been
adjusting to high food costs since the 2008 food price crisis. Thus, their capacity for resilience
is limited. Food security remains a critical issue in many countries and, with no indication of
33
a decrease in food prices, at least in the near future, removing subsidies may have
devastating effects.
Rationalization and further targeting of income support also need to be considered carefully.
Targeted systems have been questioned because they often suffer from deficiencies in their
targeting mechanism that can lead to fragmentation; leakages and targeting errors; limited
reach; and lack of coordination across government departments. Targeting also presents a
challenge in terms of the institutional capacity required to implement it effectively. The lack
of the strong institutional setup in many countries of the region often results on a lack of
impact and wastage of resources. Similarly, given the complexities of people’s needs and
conditions, such programmes cannot cover every possible contingency, particularly in
situations where individuals, households, or communities suffer from multiple deprivations.
Under these circumstances, further targeting, which is usually accompanied by a reduction
in coverage, may aggravate these problems and have detrimental effect on the poor and
vulnerable.
Another important consideration is the impact when both measures are implemented at the
same time. As shown in table 9, 12 countries are reducing subsidies while rationalizing the
targeting of income support. Removing subsidies increases levels of vulnerability of the near
poor, even in situations where large part of the subsidies was for the benefit of wealthier
groups. In those circumstances, there is a need for more, not less, broad income support.
In the face of various crises, there is a strong need to continue countercyclical policies and
higher public social spending to avert recession, revitalize the economy, generate productive
employment, support development needs and revise social contract (Ortiz, 2013). Given the
need to support households in times of hardship, as well as to raise people’s incomes to
encourage demand and socio-economic recovery, a strong case can be made to extend
universal income support schemes, to beneficiaries typically included in a social protection
floor (for example, families with children, older persons and persons with disabilities).
Towards universal support systems
The “most vulnerable” can only be sustainably and effectively protected if that
protection is seen as being part and parcel of a social security system aimed at
universal coverage. This implies two things: that protection of the “most vulnerable”
is not dealt with at “the end of the line”, as a residual and specific element, but rather
as an integral part of a global process; and that protection of the “most vulnerable” is
based on the establishment of social rights (of workers and/or citizens), which may be
specific but are not granted for all that as a favour or as charity (Lautier, 2006).
Income support schemes, including a variety of cash transfers (both conditional and
unconditional), have shown to provide solid ground for people to deal with risk and
vulnerabilities throughout their life-cycle. The promotion and establishment of universal
34
programmes implies, in most cases, a radically different way to approach the role of the
State and other actors. This also applies to international development agencies since they
have a limited role in fostering political support.
Resources mobilization and allocation
The capacity of States to mobilize and allocate resources is a key measure of the extent to
which a country can achieve its social protection reform objectives. The capacity to mobilize
resources improves policy space and the ability to set agendas, and moreover, empower
States to implement strategies. However, resource mobilization is highly political. It
generates conflicts over types of resources to be mobilized, who pays, and how much should
be paid. In addition, there is institutional competition within the government for limited
resources. This is particularly important for the reform process aimed at universal coverage.
It is often the case that the resources required are managed by central government agencies
with local governments either playing an implementing role or being left out of the process
altogether, with local functions being taken over by line ministries. Thus, the commitment
by the government to resource mobilization does not always guarantee that the desired
amount of resources will be generated, let alone allocated to preferred income support
schemes, or that the burden of resource extraction will be distributed fairly among different
population groups and institutions. Issues of trust, solidarity, consensus and reciprocity in
state-society relations define the extent to which governments can succeed in extracting
resources from the populace. The policy space for social protection becomes viable only
when both the political and fiscal space coexist. Conflicts can be mitigated when all relevant
stakeholders are provided with accurate information about resource allocation and allowed
to participate in the process of decision-making.
Institutional capacity
In order for universal social protection to be a viable policy option, not only is strong
political will and commitment required, but countries must have high levels of institutional
capacity and integrity in state agencies to advocate for and implement social protection
systems, including income support schemes (de Neubourg, 2002). Effective resource
mobilization and allocation requires that the government has some measure of control or
influence in the financial system. It also requires bureaucracies that are internally coherent
and committed to development goals and also have adequately competent staff, well-
developed information systems that facilitate effective monitoring, and the political
commitment to achieve results. These capacities are enhanced when the government is
knowledgeable about the sectors in which it intervenes. This calls for systematic collection,
storage and analysis of economic and social data of value not only to the government, but
also to businesses and citizens.
The organisational culture within government to advocate for, and implement, universal
programmes, including income support schemes is also a key factor. The importance of
implementing an effective organizational culture concerns issues of ‘fitness for purpose’: for
example, the involvement of public works ministries in employment generation schemes,
when their raison d’être is to build infrastructure rather than work with people, may be

35
problematic. This suggests that agencies that have a mission to work with the most
vulnerable are likely to be better equipped to implement these programmes (Pritchett, 2005).
The inherent universalism of such agencies may clash with a targeted approach that requires
them to take a more disciplinary line. Such departments and ministries tend to be amongst
the weakest in government.
Another related problem is the marginal role of social sector ministries. These ministries
suffer from a lack of appropriate staff equipped to make the case for universal social
protection. Thus, beyond a concern for ensuring a good fit between public agencies and
specific types of social protection, the efforts to enhance not only the institutional but also
the political capacity of social sector ministries will be critical in ensuring strong levels of
political support for universal social protection.
Engagement and collaboration
Political leaders and policy makers have a critical role in shaping social protection policies,
including income support schemes, particularly universal systems. Their commitment to
social protection programmes affects the direction and continuity of the programme. With
limited commitment and support from political leaders, little change and progress of any
social protection programme can be expected.
Political leaders define and make decisions with regards to the size and coverage of the
programmes. In other words, they have an important role in constructing the political and
policy discourse that positively influences the scope and type of social protection
programmes. Political discourse defines the problem and its causes, the most appropriate
means to resolve it, and the groups who deserve support. At the same time, defining those
who should be included as the beneficiaries could raise heated debates and dissatisfaction
from those who are excluded as it may create a “loser versus winner” situation. This is often
a top-down process, but communities and local level organizations many times have a deep
understanding of needs and the means to tackle these issues. Furthermore, local
governments are often better positioned to adapt programmes to the needs and constraints
of their areas. In China, local governments, particularly in coastal regions, have energetically
engaged in a series of policy experiments in search of approaches that best fit with local
circumstances or with national contexts. Although the central government remains key for
social policymaking, it increasingly relies on the local governments as a convenient conduit
to launch preliminary policy experiments in order to collect valuable experiences for
potential diffusion in the future (Shih-Jiunn Shi, 2009).
The reform process needed for effective systems of universal social protection calls for more
effective engagement through consultation, deliberation and negotiation in order to set
priorities, agreement on national frameworks, and consensus on rights and entitlements of
benefits. The market alone does not produce equality or public goods; nor is it concerned
with the situation in the long term.
In many countries, partnerships become a critical factor for the advancement and expansion
of social protection schemes into universal coverage since in most cases there is a need for
36
additional knowledge financial and human resources. However, many governments,
particularly in low income countries, have not only low revenue mobilization capacity but
also suffer from severe shortfalls in terms of manpower and know-how. Therefore,
governments need to seek partnerships with other players to devise, advocate and deliver
the provision of social protection.
Institutional partnerships can involve national and international NGOs, bilateral and
multilateral aid agencies and research institutes, as well as other actors. In many countries,
more thought needs to be given to establishing a framework to enable the effective
engagement of non-state actors – particularly the private sector and non-governmental
organisations – to deliver essential universal social protection.
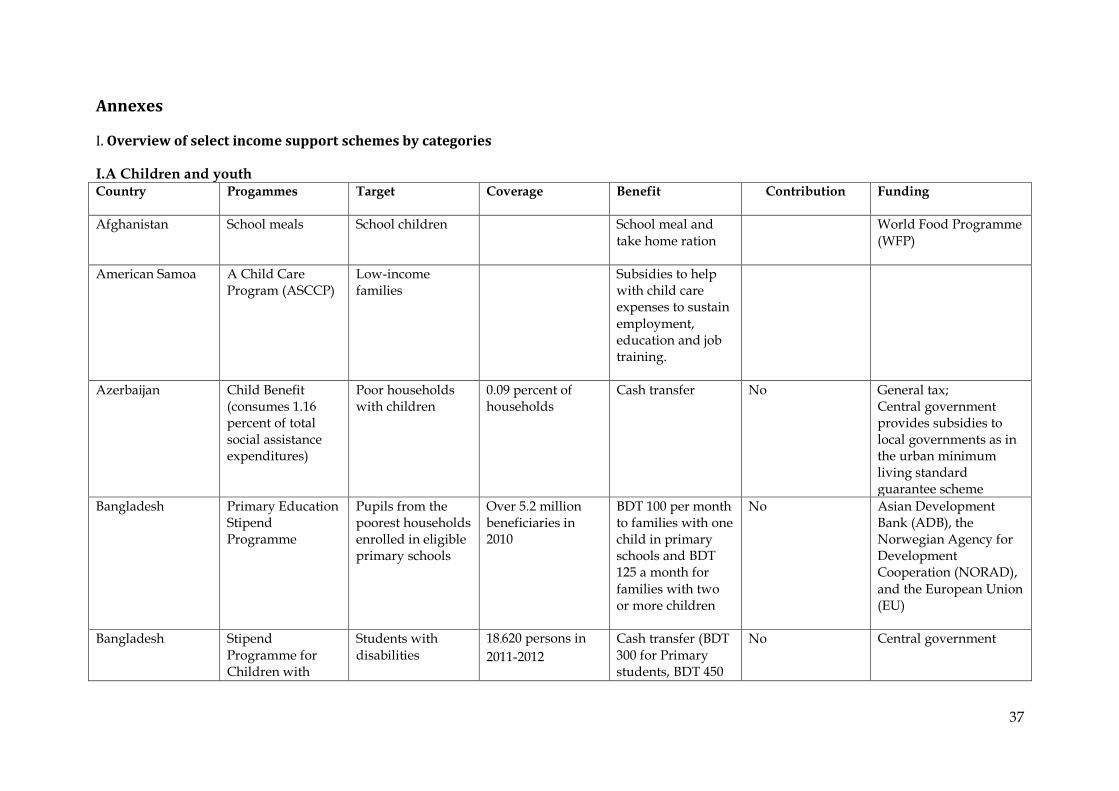
37
Annexes
I. Overview of select income support schemes by categories
I.A Children and youth Country Progammes Target Coverage Benefit Contribution Funding
Afghanistan School meals School children School meal and take home ration
World Food Programme (WFP)
American Samoa A Child Care Program (ASCCP)
Low-income families
Subsidies to help with child care expenses to sustain employment, education and job training.
Azerbaijan Child Benefit (consumes 1.16 percent of total social assistance expenditures)
Poor households with children
0.09 percent of households
Cash transfer
No General tax; Central government provides subsidies to local governments as in the urban minimum living standard guarantee scheme
Bangladesh Primary Education Stipend Programme
Pupils from the poorest households enrolled in eligible primary schools
Over 5.2 million beneficiaries in 2010
BDT 100 per month to families with one child in primary schools and BDT 125 a month for
families with two or more children
No Asian Development Bank (ADB), the Norwegian Agency for Development Cooperation (NORAD),
and the European Union (EU)
Bangladesh Stipend Programme for Children with
Students with disabilities
18,620 persons in
2011-2012
Cash transfer (BDT 300 for Primary students, BDT 450
No Central government
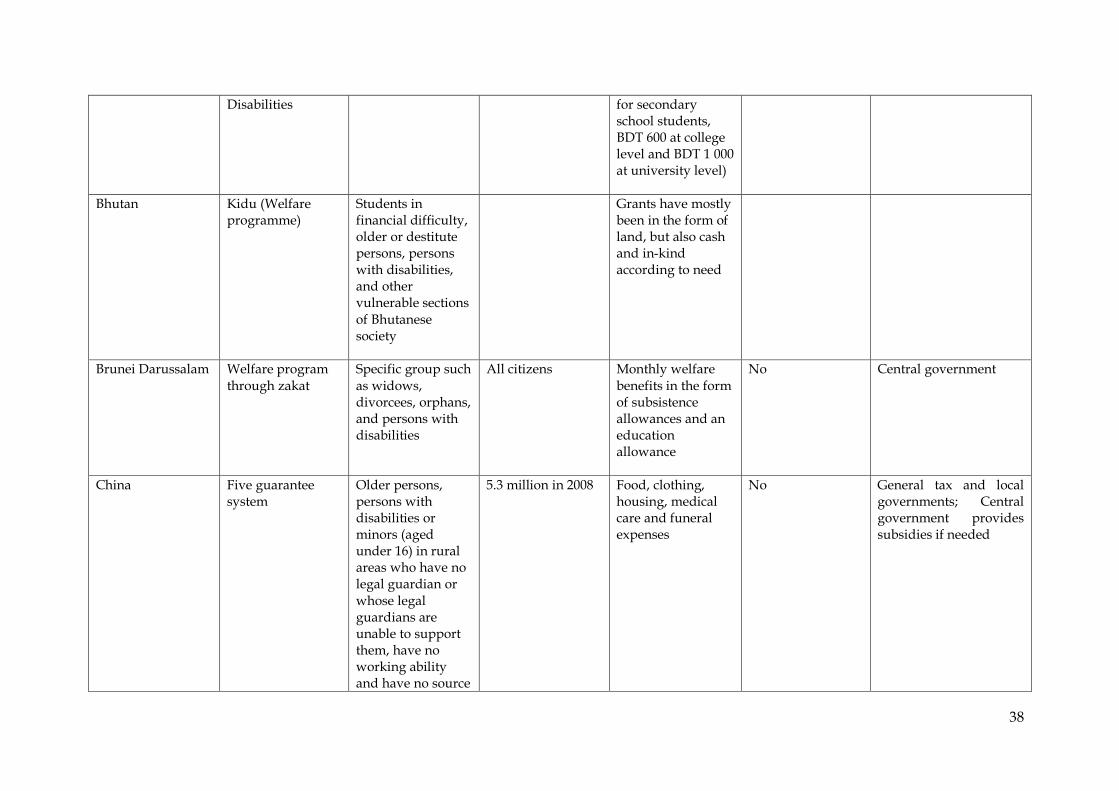
38
Disabilities for secondary school students, BDT 600 at college level and BDT 1 000 at university level)
Bhutan Kidu (Welfare programme)
Students in financial difficulty, older or destitute persons, persons with disabilities, and other vulnerable sections of Bhutanese society
Grants have mostly been in the form of land, but also cash and in-kind according to need
Brunei Darussalam Welfare program through zakat
Specific group such as widows, divorcees, orphans, and persons with disabilities
All citizens Monthly welfare benefits in the form of subsistence allowances and an education allowance
No Central government
China Five guarantee system
Older persons, persons with disabilities or minors (aged under 16) in rural areas who have no legal guardian or whose legal guardians are unable to support them, have no working ability and have no source
5.3 million in 2008 Food, clothing, housing, medical care and funeral expenses
No General tax and local governments; Central government provides subsidies if needed
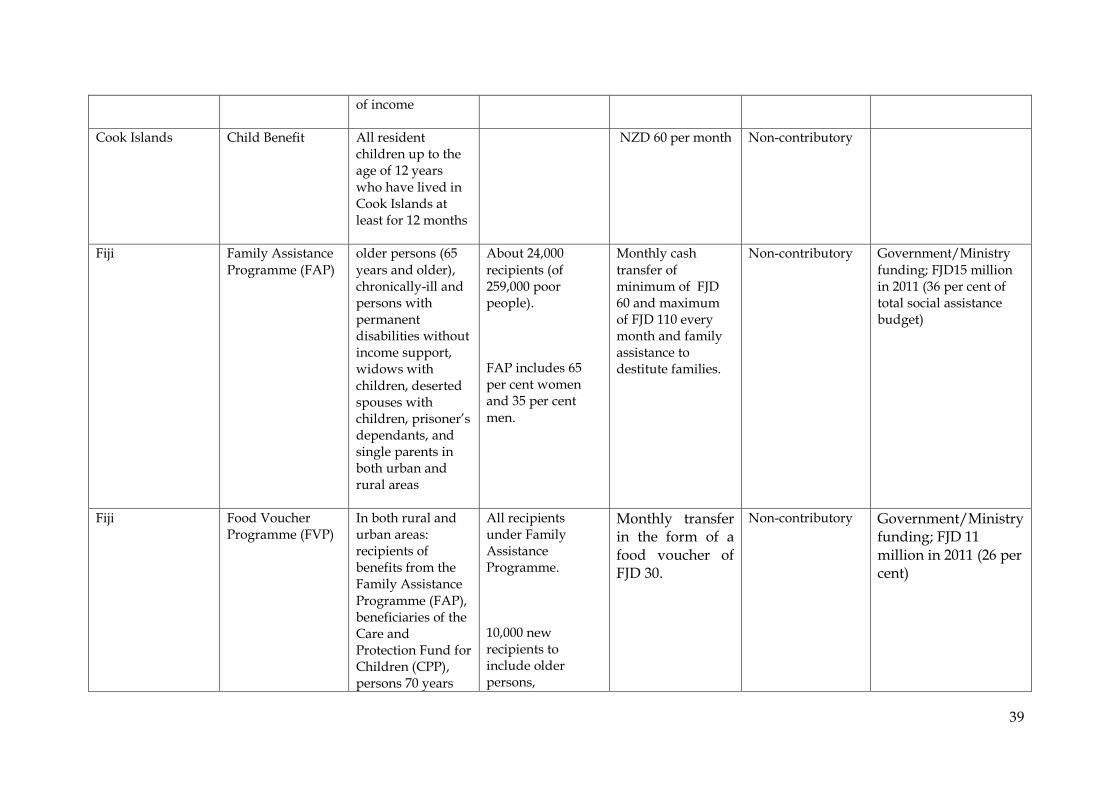
39
of income
Cook Islands Child Benefit All resident children up to the age of 12 years who have lived in Cook Islands at least for 12 months
NZD 60 per month Non-contributory
Fiji Family Assistance
Programme (FAP)
older persons (65
years and older), chronically-ill and persons with permanent disabilities without income support, widows with children, deserted spouses with children, prisoner’s dependants, and single parents in both urban and rural areas
About 24,000
recipients (of 259,000 poor people).
FAP includes 65 per cent women and 35 per cent men.
Monthly cash
transfer of minimum of FJD 60 and maximum of FJD 110 every month and family assistance to destitute families.
Non-contributory Government/Ministry
funding; FJD15 million in 2011 (36 per cent of total social assistance budget)
Fiji Food Voucher Programme (FVP)
In both rural and urban areas: recipients of benefits from the Family Assistance Programme (FAP), beneficiaries of the Care and Protection Fund for Children (CPP), persons 70 years
All recipients under Family Assistance Programme.
10,000 new recipients to include older persons,
Monthly transfer in the form of a food voucher of FJD 30.
Non-contributory Government/Ministry funding; FJD 11 million in 2011 (26 per cent)

40
old and older, disadvantaged families with school children.
In rural areas only: pregnant single mothers.
chronically-ill persons, sick and pregnant mothers living in rural communities
Fiji Extended food Voucher Programme (EFVP)
Older persons not receiving any form of government assistance, pregnant women who fall outside the food assistance eligibility and disadvantaged families with school children.
A target of 14,367 recipients including 3,670 older persons older than 70 years, 6,293 pregnant women and 4,404 disadvantaged families with school age children
Non-contributory Government/Ministry funding: FJD i4 million n 2011 (9.5 per cent)
Fiji Care and Protection Fund for Children (CPP)
Families/ guardians supporting children other than their own, and parents facing difficulties in providing basic care to their children
Families and parents with dependent children receive between FJD 25 and 60 per child per month
Non-contributory Government/Ministry funding: FJD 4 million in 2011 (9.5 per cent)
Fiji Free Bus Fare Concession Programme
Children attending schools and whose parents’ combined
Free bus service for children and persons with
Non-contributory Government/Ministry funding, 12 million in
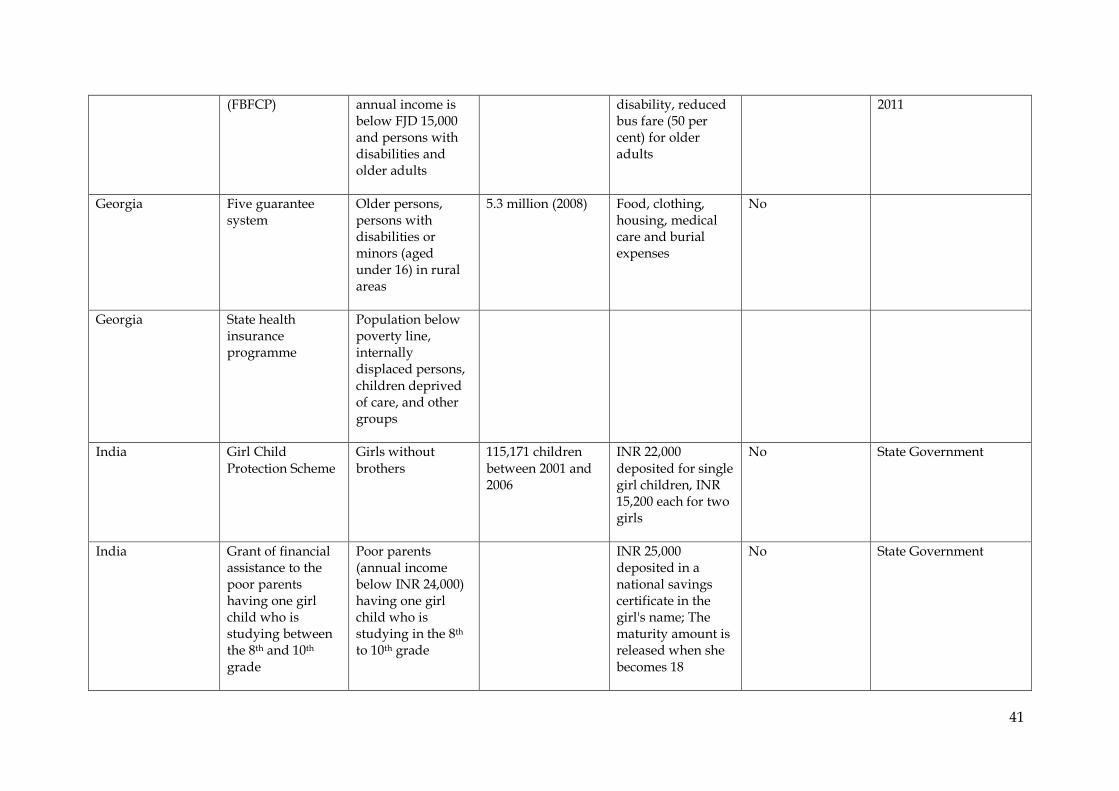
41
(FBFCP) annual income is below FJD 15,000 and persons with disabilities and older adults
disability, reduced bus fare (50 per cent) for older adults
2011
Georgia Five guarantee system
Older persons, persons with disabilities or minors (aged under 16) in rural areas
5.3 million (2008) Food, clothing, housing, medical care and burial expenses
No
Georgia State health insurance programme
Population below poverty line, internally displaced persons, children deprived of care, and other groups
India Girl Child Protection Scheme
Girls without brothers
115,171 children between 2001 and 2006
INR 22,000 deposited for single girl children, INR 15,200 each for two girls
No State Government
India Grant of financial assistance to the poor parents having one girl child who is studying between the 8th and 10th grade
Poor parents (annual income below INR 24,000) having one girl child who is studying in the 8th to 10th grade
INR 25,000 deposited in a national savings certificate in the girl's name; The maturity amount is released when she becomes 18
No State Government
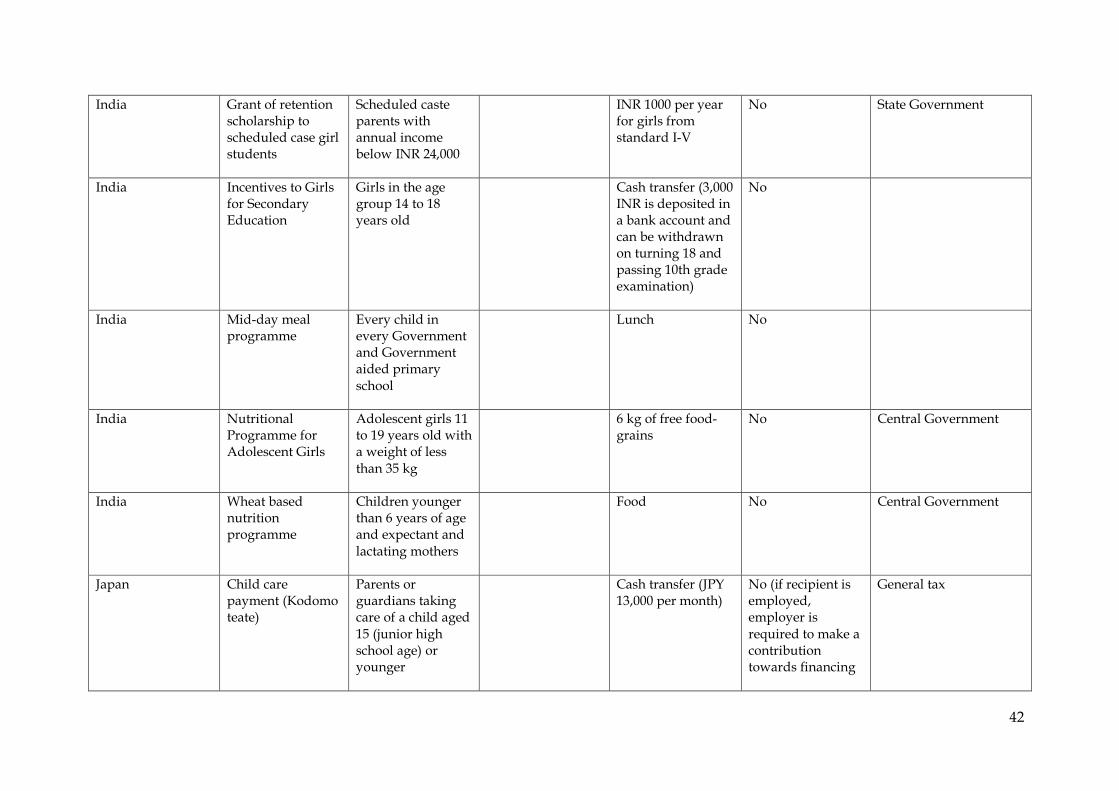
42
India Grant of retention scholarship to scheduled case girl students
Scheduled caste parents with annual income below INR 24,000
INR 1000 per year for girls from standard I-V
No State Government
India Incentives to Girls for Secondary Education
Girls in the age group 14 to 18 years old
Cash transfer (3,000 INR is deposited in a bank account and can be withdrawn on turning 18 and passing 10th grade examination)
No
India Mid-day meal programme
Every child in every Government and Government aided primary school
Lunch No
India Nutritional Programme for Adolescent Girls
Adolescent girls 11 to 19 years old with a weight of less than 35 kg
6 kg of free food-grains
No Central Government
India Wheat based nutrition programme
Children younger than 6 years of age and expectant and lactating mothers
Food No Central Government
Japan Child care payment (Kodomo teate)
Parents or guardians taking care of a child aged 15 (junior high school age) or younger
Cash transfer (JPY 13,000 per month)
No (if recipient is employed, employer is required to make a contribution towards financing
General tax

43
the allowance)
Malaysia Financial Assistance for Children under Jaringan Keselamatan Sosial Malaysia (JKSM), Malaysia Social Safety Net
Children living in low-income families
MYR 100 for each person monthly, to maximum MYR 450 per month to family
No Central government; MYR 850million in 2009
Maldives Education support fund
Students in low income families. Main criteria to be eligible to receive the benefits for any of the indicated programmes are affordability; non- ownership of property such as fishing vessels etc.; income of the family below MVR 4,000
2,086 students obtaining textbooks and uniforms, 95 students obtaining primary and secondary education fees and 293 students obtaining advanced level or ordinary level academic performance fees in 2005
Provision of textbooks and uniforms, school fees and fees for ordinary level and advance level students
No Tha'uleemee Fund
Maldives Vouchers to defray textbook costs, one uniform, shoes, and socks for low income families
Children in low income families based on a points system considering the following criteria: single parent family; children with parents in custody;
1,182 children in 2005
Vouchers for textbooks, uniforms, shoes and socks
No Central Government
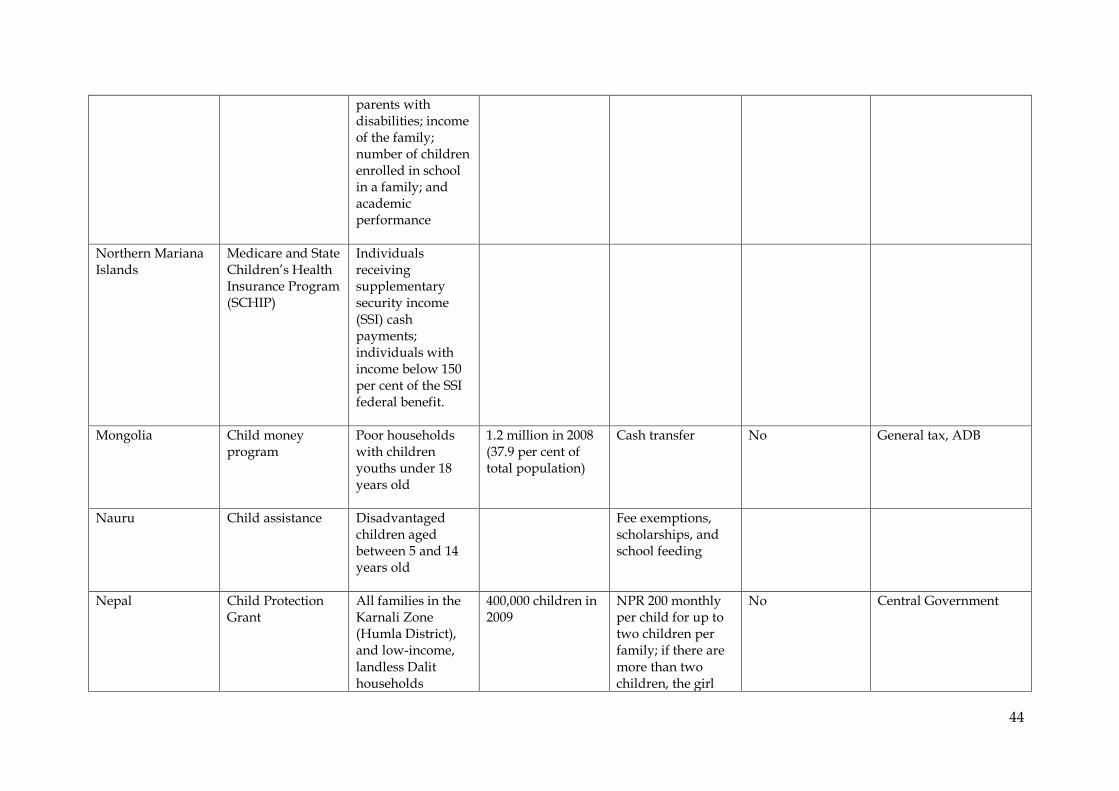
44
parents with disabilities; income of the family; number of children enrolled in school in a family; and academic performance
Northern Mariana Islands
Medicare and State Children’s Health Insurance Program (SCHIP)
Individuals receiving supplementary security income (SSI) cash payments; individuals with income below 150 per cent of the SSI federal benefit.
Mongolia Child money program
Poor households with children youths under 18 years old
1.2 million in 2008 (37.9 per cent of total population)
Cash transfer No General tax, ADB
Nauru Child assistance Disadvantaged children aged between 5 and 14 years old
Fee exemptions, scholarships, and school feeding
Nepal Child Protection Grant
All families in the Karnali Zone (Humla District), and low-income, landless Dalit households
400,000 children in 2009
NPR 200 monthly per child for up to two children per family; if there are more than two children, the girl
No Central Government
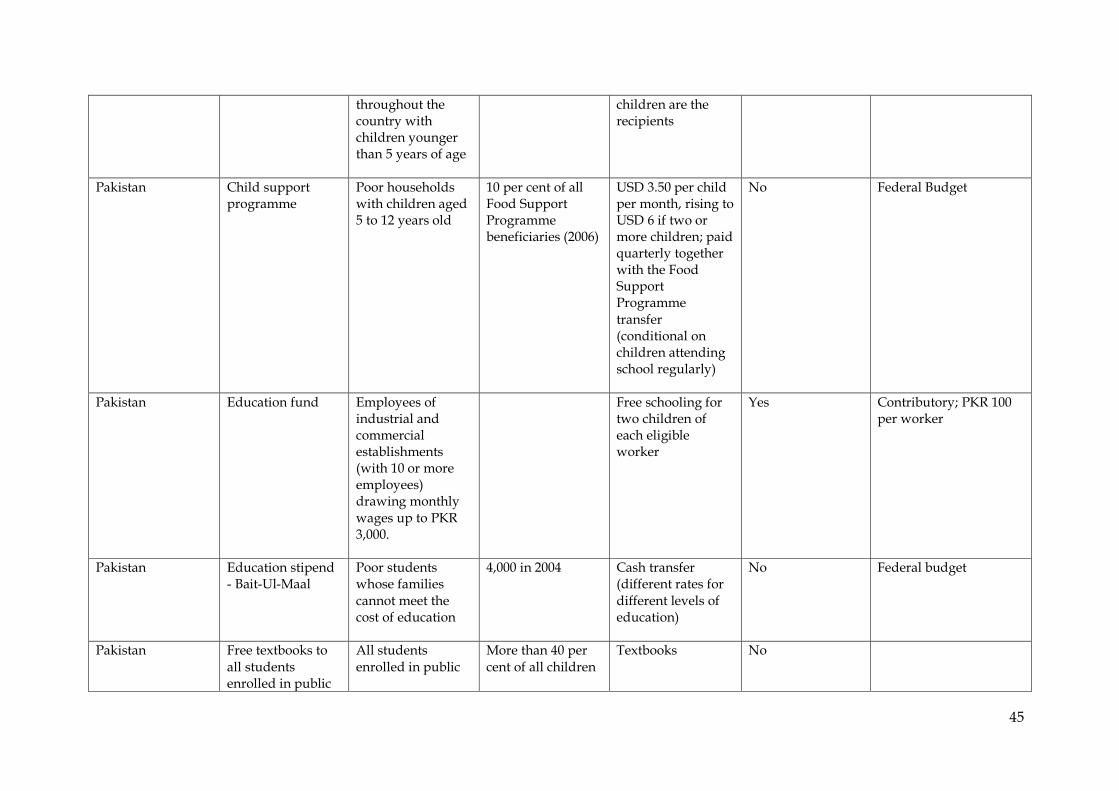
45
throughout the country with children younger than 5 years of age
children are the recipients
Pakistan Child support programme
Poor households with children aged 5 to 12 years old
10 per cent of all Food Support Programme beneficiaries (2006)
USD 3.50 per child per month, rising to USD 6 if two or more children; paid quarterly together with the Food Support Programme transfer (conditional on children attending school regularly)
No Federal Budget
Pakistan Education fund Employees of industrial and commercial establishments (with 10 or more employees) drawing monthly wages up to PKR 3,000.
Free schooling for two children of each eligible worker
Yes Contributory; PKR 100 per worker
Pakistan Education stipend - Bait-Ul-Maal
Poor students whose families cannot meet the cost of education
4,000 in 2004 Cash transfer (different rates for different levels of education)
No Federal budget
Pakistan Free textbooks to all students enrolled in public
All students enrolled in public
More than 40 per cent of all children
Textbooks No

46
schools grades 1 to 7
schools ages 5 to 9
Pakistan Pakistan Bait-ul-Maal Food Support Programme
Persons with disabilities, widows, orphans, and households below the poverty line
1.46 million households (2007)
Food subsidies and cash transfers - PKR 3,000 a year (2005/06)
No Federal Budget
Russian Federation Family allowance
Families with children younger than 16 (or 18, if they continue day time education at state educational institutions), and with an income below the poverty line established by each region (province)
Cash transfer
No Federal and regional state budget (roughly 30 -70 per cent, but highly varies between regions and types of ISS)
Samoa Samoa School Fee Grant Scheme (SSFGS)
Free education in all government, special needs and church schools
Funding by AusAid and New Zealand Aid Programme for three years after which Government of Samoa will meet the costs.
Sri Lanka Free school uniforms
All school-age children in government
schools,
3,890,591 students from 9,662 schools in 2010
Material for school uniforms
No Government
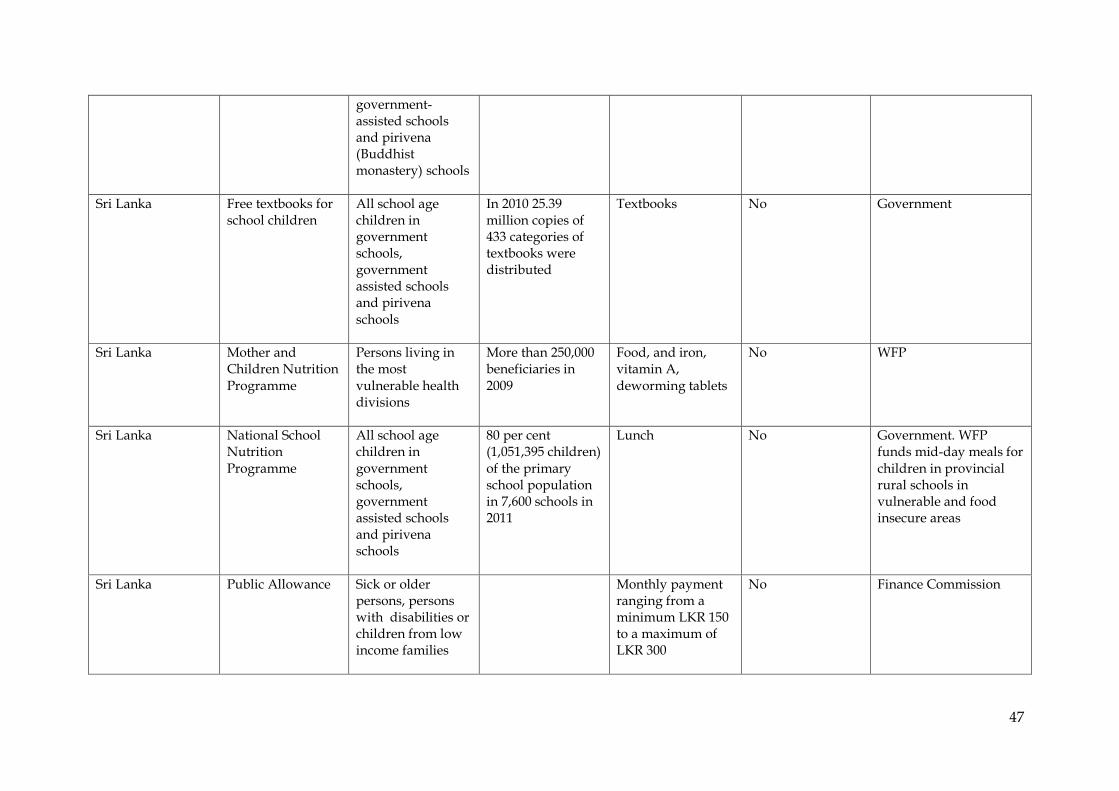
47
government- assisted schools and pirivena (Buddhist monastery) schools
Sri Lanka Free textbooks for school children
All school age children in government schools, government assisted schools and pirivena schools
In 2010 25.39 million copies of 433 categories of textbooks were distributed
Textbooks No Government
Sri Lanka Mother and Children Nutrition Programme
Persons living in the most vulnerable health divisions
More than 250,000 beneficiaries in 2009
Food, and iron, vitamin A, deworming tablets
No WFP
Sri Lanka National School Nutrition Programme
All school age children in government schools, government assisted schools and pirivena schools
80 per cent (1,051,395 children) of the primary school population in 7,600 schools in 2011
Lunch No Government. WFP funds mid-day meals for children in provincial rural schools in vulnerable and food insecure areas
Sri Lanka Public Allowance Sick or older persons, persons with disabilities or children from low income families
Monthly payment ranging from a minimum LKR 150 to a maximum of LKR 300
No Finance Commission
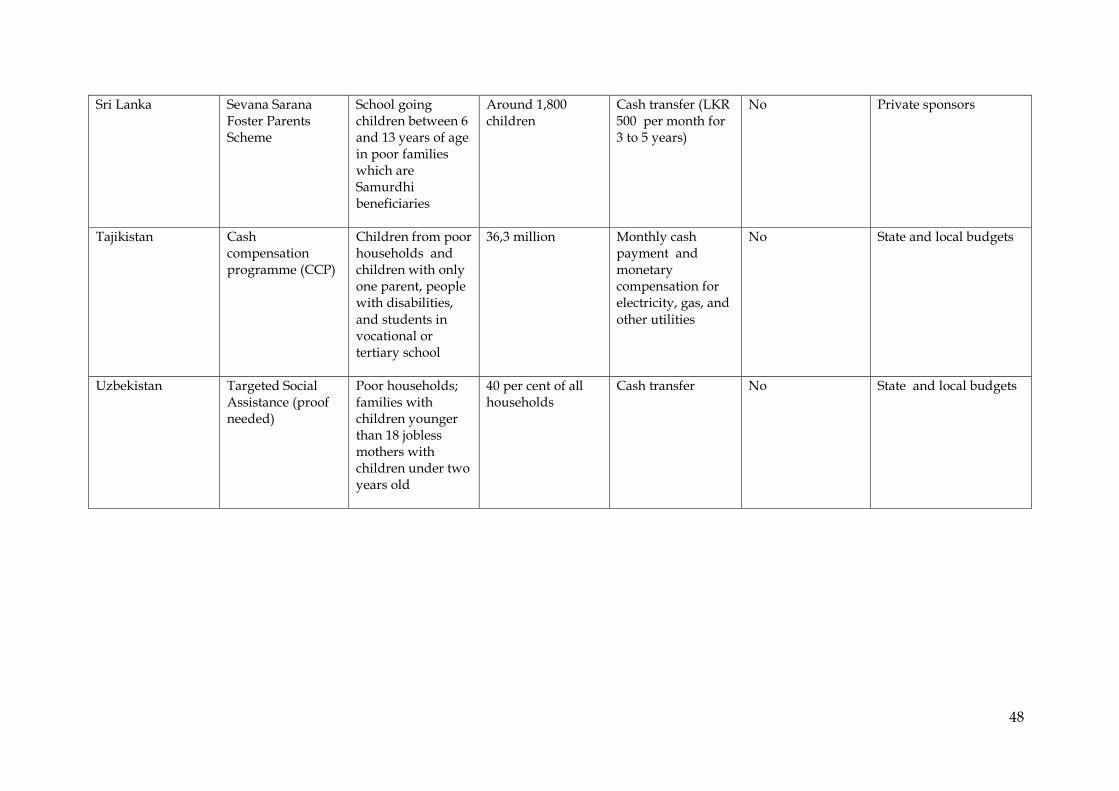
48
Sri Lanka Sevana Sarana Foster Parents Scheme
School going children between 6 and 13 years of age in poor families which are Samurdhi beneficiaries
Around 1,800 children
Cash transfer (LKR 500 per month for 3 to 5 years)
No Private sponsors
Tajikistan Cash compensation programme (CCP)
Children from poor households and children with only one parent, people with disabilities, and students in vocational or tertiary school
36,3 million
Monthly cash payment and monetary compensation for electricity, gas, and other utilities
No State and local budgets
Uzbekistan Targeted Social Assistance (proof needed)
Poor households; families with children younger than 18 jobless mothers with children under two years old
40 per cent of all households
Cash transfer No State and local budgets
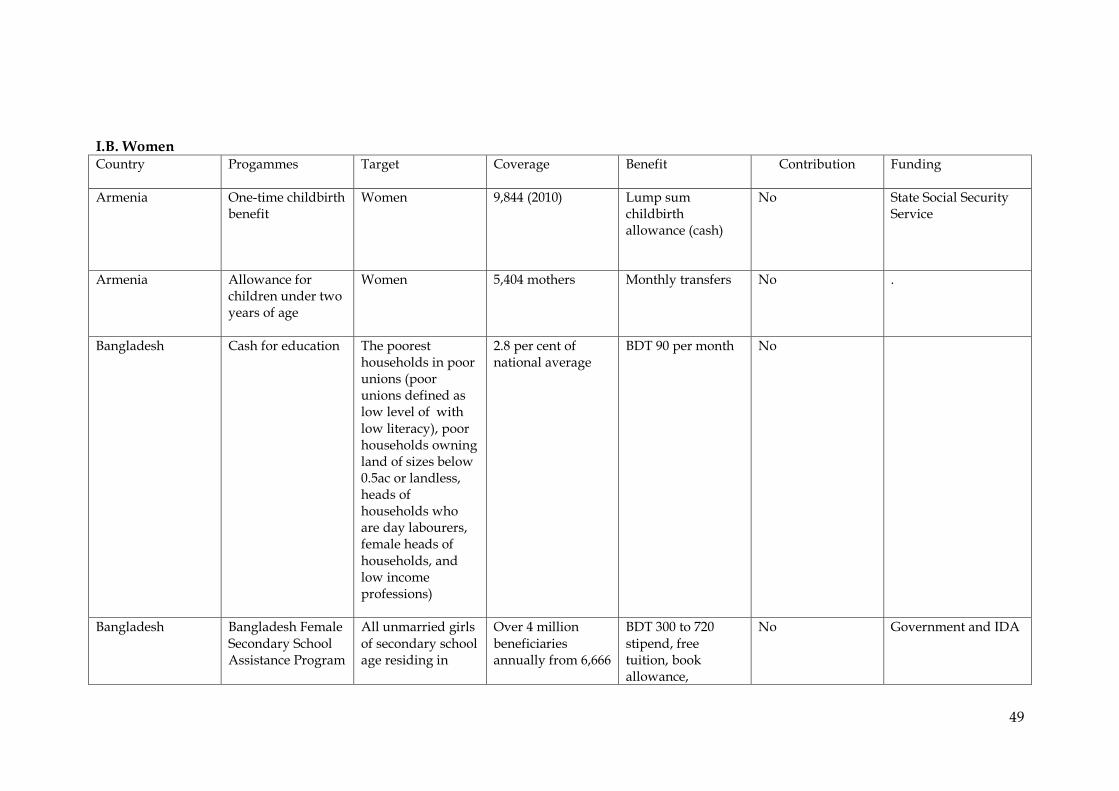
49
I.B. Women Country Progammes Target Coverage Benefit Contribution Funding
Armenia One-time childbirth benefit
Women 9,844 (2010) Lump sum childbirth allowance (cash)
No State Social Security Service
Armenia Allowance for children under two years of age
Women 5,404 mothers
Monthly transfers No .
Bangladesh Cash for education The poorest households in poor unions (poor unions defined as low level of with low literacy), poor households owning land of sizes below 0.5ac or landless, heads of households who are day labourers, female heads of households, and low income professions)
2.8 per cent of national average
BDT 90 per month No
Bangladesh Bangladesh Female Secondary School Assistance Program
All unmarried girls of secondary school age residing in
Over 4 million beneficiaries annually from 6,666
BDT 300 to 720 stipend, free tuition, book allowance,
No Government and IDA
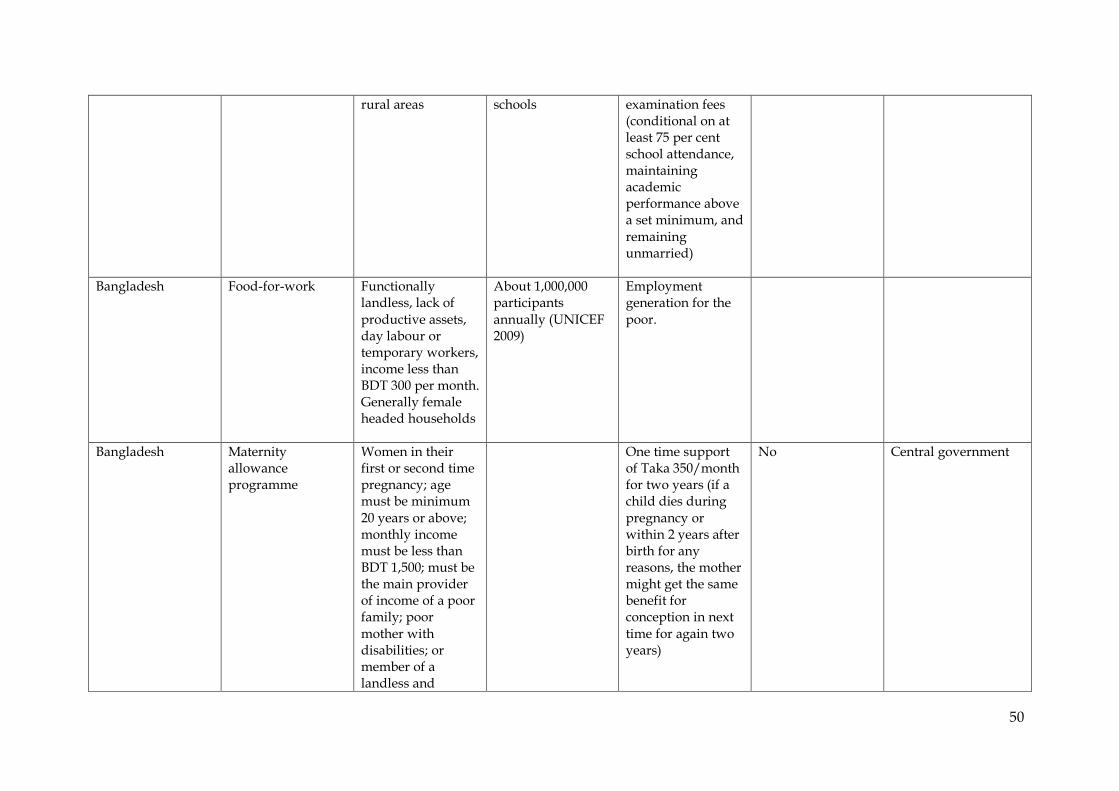
50
rural areas schools examination fees (conditional on at least 75 per cent school attendance, maintaining academic performance above a set minimum, and remaining unmarried)
Bangladesh Food-for-work Functionally landless, lack of productive assets, day labour or temporary workers, income less than BDT 300 per month. Generally female headed households
About 1,000,000 participants annually (UNICEF 2009)
Employment generation for the poor.
Bangladesh Maternity allowance programme
Women in their first or second time pregnancy; age must be minimum 20 years or above; monthly income must be less than BDT 1,500; must be the main provider of income of a poor family; poor mother with disabilities; or member of a landless and
One time support of Taka 350/month for two years (if a child dies during pregnancy or within 2 years after birth for any reasons, the mother might get the same benefit for conception in next time for again two years)
No Central government
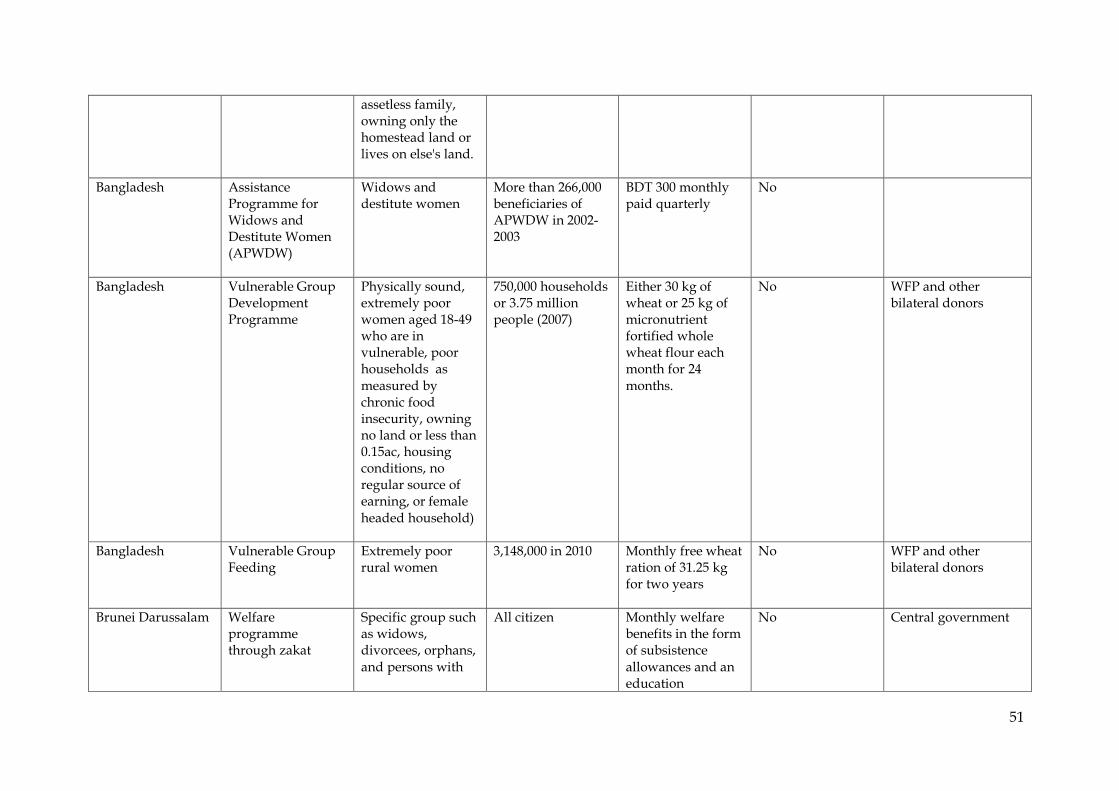
51
assetless family, owning only the homestead land or lives on else's land.
Bangladesh Assistance Programme for Widows and Destitute Women (APWDW)
Widows and destitute women
More than 266,000 beneficiaries of APWDW in 2002-2003
BDT 300 monthly paid quarterly
No
Bangladesh Vulnerable Group Development Programme
Physically sound, extremely poor women aged 18-49 who are in vulnerable, poor households as measured by chronic food insecurity, owning no land or less than 0.15ac, housing conditions, no regular source of earning, or female headed household)
750,000 households or 3.75 million people (2007)
Either 30 kg of wheat or 25 kg of micronutrient fortified whole wheat flour each month for 24 months.
No WFP and other bilateral donors
Bangladesh Vulnerable Group Feeding
Extremely poor rural women
3,148,000 in 2010 Monthly free wheat ration of 31.25 kg for two years
No WFP and other bilateral donors
Brunei Darussalam Welfare programme through zakat
Specific group such as widows, divorcees, orphans, and persons with
All citizen Monthly welfare benefits in the form of subsistence allowances and an education
No Central government
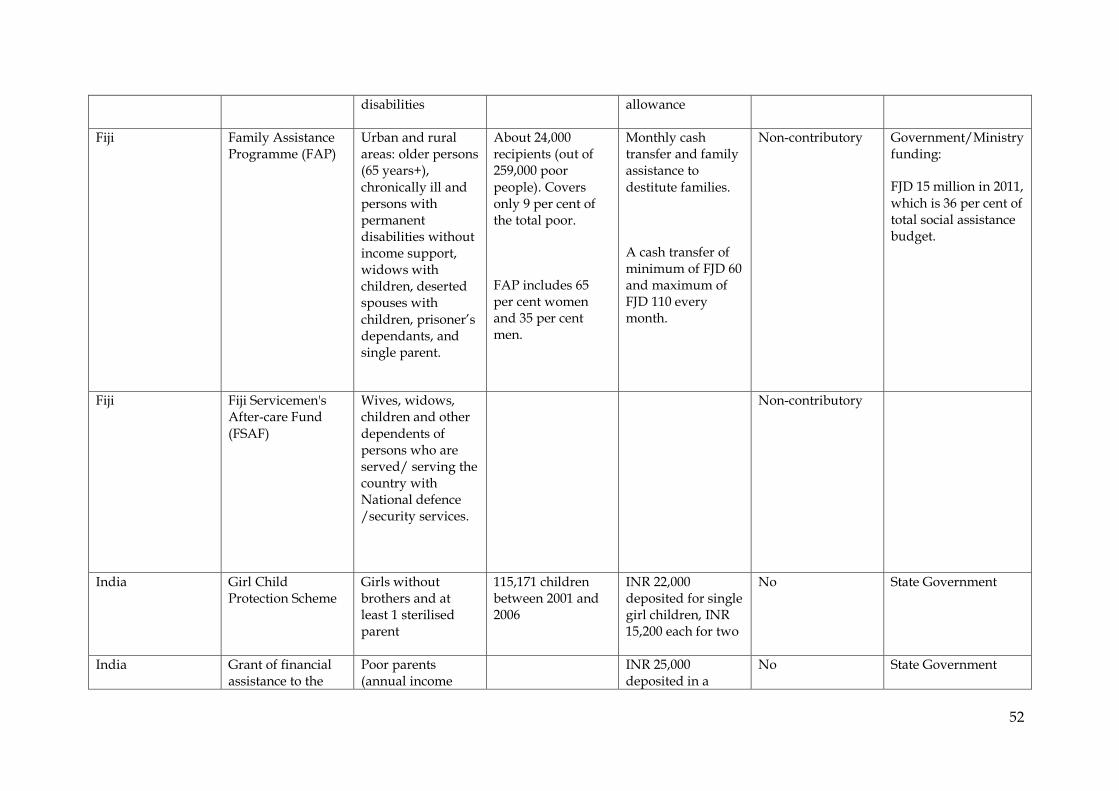
52
disabilities allowance
Fiji Family Assistance Programme (FAP)
Urban and rural areas: older persons (65 years+), chronically ill and persons with permanent disabilities without income support, widows with children, deserted spouses with children, prisoner’s dependants, and single parent.
About 24,000 recipients (out of 259,000 poor people). Covers only 9 per cent of the total poor.
FAP includes 65 per cent women and 35 per cent men.
Monthly cash transfer and family assistance to destitute families.
A cash transfer of minimum of FJD 60 and maximum of FJD 110 every month.
Non-contributory Government/Ministry funding:
FJD 15 million in 2011, which is 36 per cent of total social assistance budget.
Fiji Fiji Servicemen's After-care Fund (FSAF)
Wives, widows, children and other dependents of persons who are served/ serving the country with National defence /security services.
Non-contributory
India Girl Child Protection Scheme
Girls without brothers and at least 1 sterilised parent
115,171 children between 2001 and 2006
INR 22,000 deposited for single girl children, INR 15,200 each for two
No State Government
India Grant of financial assistance to the
Poor parents (annual income
INR 25,000 deposited in a
No State Government

53
poor parents having one girl child who is studying 8th to 10th
below INR 24,000) having one girl child who is studying 8th to 10th grade
national savings certificate in the girl's name. The maturity amount is released when she becomes 18.
India Grant of retention scholarship to S.C. girl students
Scheduled caste parents with annual income below INR 24,000
INR 1000 per year for girls from standard I-V
No State Government
India Incentives to Girls for Secondary Education
Girls in the age group 14-18
Cash transfer (INR 3000 is deposited in a bank account and can be withdrawn when turning 18 years of age and passing the examination after grade 10)
No
India Janani Suraksha Yojana
All Scheduled Caste (SC) and Scheduled Tribe (ST) women. All pregnant women in ”Low Performing States” (LPS) and all pregnant women below poverty line in “high performing” (HP)
8.426 million in 2008/2009
INR 1400 in rural LPS, INR 700 in rural “high performing” States, INR 1000 in urban LPS and INR 600 in urban HP States. Additional benefits in terms of delivery and post-delivery care.
No Central Government
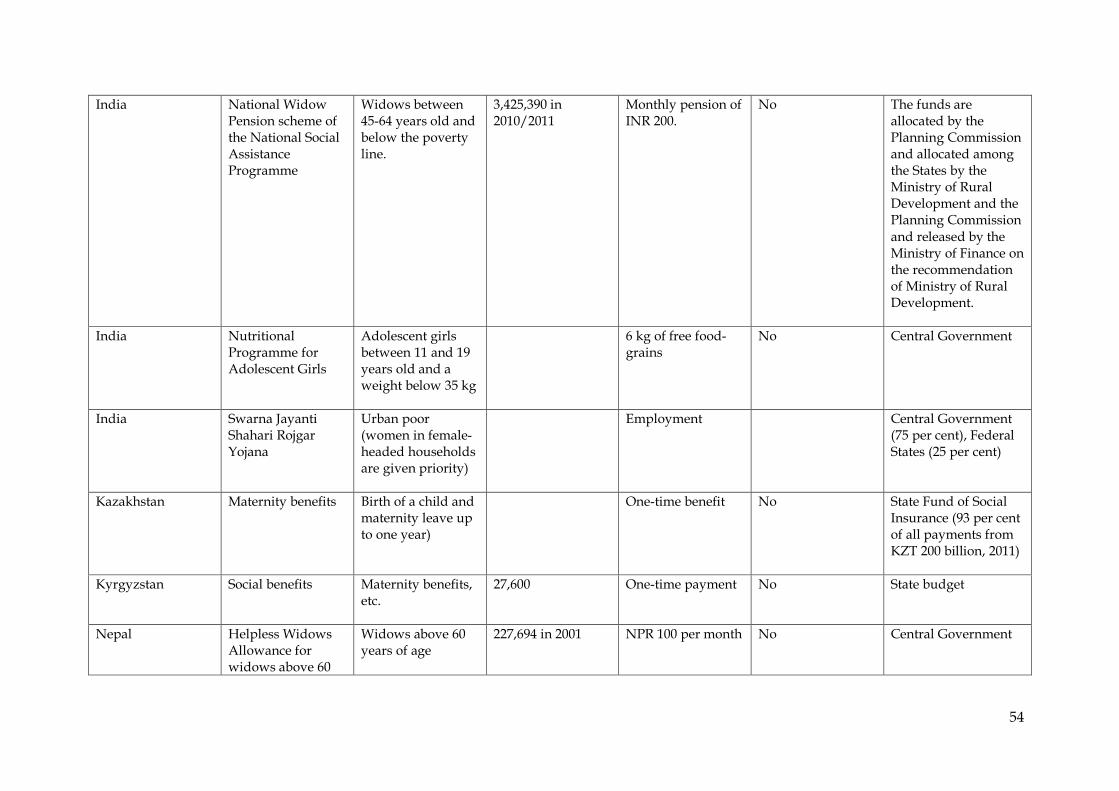
54
India National Widow Pension scheme of the National Social Assistance Programme
Widows between 45-64 years old and below the poverty line.
3,425,390 in 2010/2011
Monthly pension of INR 200.
No The funds are allocated by the Planning Commission and allocated among the States by the Ministry of Rural Development and the Planning Commission and released by the Ministry of Finance on the recommendation of Ministry of Rural Development.
India Nutritional Programme for Adolescent Girls
Adolescent girls between 11 and 19 years old and a weight below 35 kg
6 kg of free food-grains
No Central Government
India Swarna Jayanti Shahari Rojgar Yojana
Urban poor (women in female-headed households are given priority)
Employment Central Government (75 per cent), Federal States (25 per cent)
Kazakhstan Maternity benefits
Birth of a child and maternity leave up to one year)
One-time benefit
No State Fund of Social Insurance (93 per cent of all payments from KZT 200 billion, 2011)
Kyrgyzstan Social benefits Maternity benefits, etc.
27,600 One-time payment No State budget
Nepal Helpless Widows Allowance for widows above 60
Widows above 60 years of age
227,694 in 2001 NPR 100 per month No Central Government

55
years of age
Nepal Marriage allowance Widows from socially excluded groups and inter-caste marriages
Grant for wedding expenses of NPR 50,000 to 100,000
No Central Government
Nepal Support to Safe Motherhood Programme
Poor women Transportation allowance, free delivery services
No DFID
Nepal Survivor allowance Women above 60 years of age
NPR 500 a month No Central Government
Pakistan Pakistan Bait-ul-Maal Food Support Programme
Persons with disabilities, invalids, widows, orphans, and households below the poverty line
1.46 million households (2007)
Food subsidies and cash transfers - PKR 3,000 a year (2005/06)
No Federal Budget
Sri Lanka Empowering Single Parent Families through Self-Employment
Destitute women who are single parents
165 families (end 2010)
Sewing machines, financial assistance to start self-employment
No Government
Sri Lanka Widows, widowers and orphans pension scheme
Dependents of the Public Service Pension Scheme
(widows, children, widowers)
991,627 contributors in 2010
Pension payments Yes 6 to 7 per cent contribution from members’ salaries
Turkmenistan Child birth allowance
All citizens 30,956 (2007) One-time cash payment (approx. USD 270)
No State central budget

56
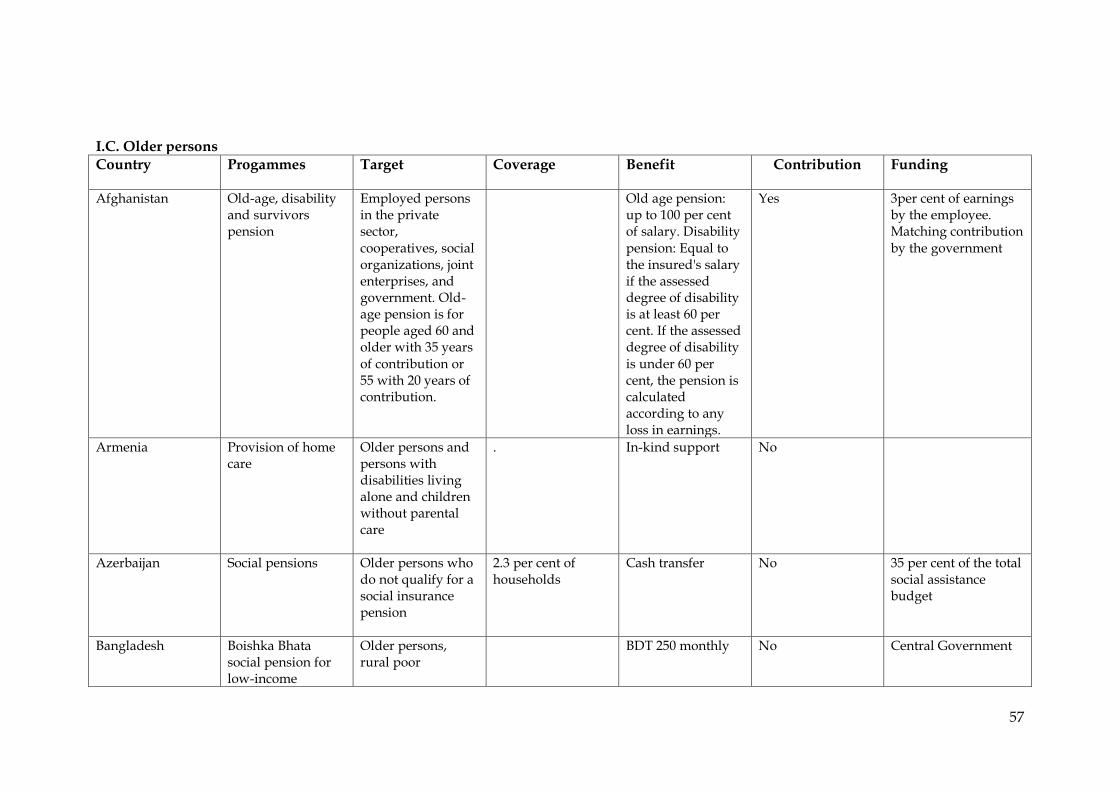
57
I.C. Older persons
Country Progammes Target Coverage Benefit Contribution Funding
Afghanistan Old-age, disability and survivors pension
Employed persons in the private sector, cooperatives, social organizations, joint enterprises, and government. Old-age pension is for people aged 60 and older with 35 years of contribution or 55 with 20 years of contribution.
Old age pension: up to 100 per cent of salary. Disability pension: Equal to the insured's salary if the assessed degree of disability is at least 60 per cent. If the assessed degree of disability is under 60 per cent, the pension is calculated according to any loss in earnings.
Yes 3per cent of earnings by the employee. Matching contribution by the government
Armenia Provision of home care
Older persons and persons with disabilities living alone and children without parental care
. In-kind support No
Azerbaijan Social pensions Older persons who do not qualify for a social insurance pension
2.3 per cent of households
Cash transfer
No 35 per cent of the total social assistance budget
Bangladesh Boishka Bhata social pension for low-income
Older persons, rural poor
BDT 250 monthly No Central Government
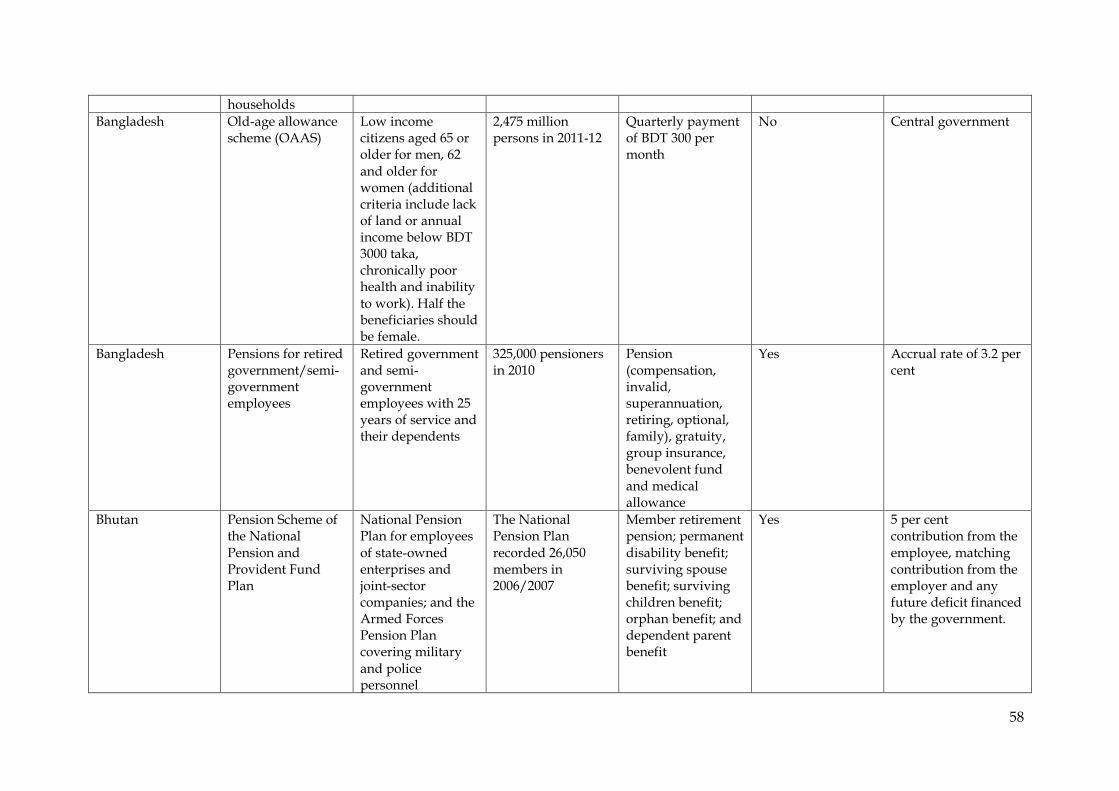
58
households
Bangladesh Old-age allowance scheme (OAAS)
Low income citizens aged 65 or older for men, 62 and older for women (additional criteria include lack of land or annual income below BDT 3000 taka, chronically poor health and inability to work). Half the beneficiaries should be female.
2,475 million persons in 2011-12
Quarterly payment of BDT 300 per month
No Central government
Bangladesh Pensions for retired government/semi-government employees
Retired government and semi-government employees with 25 years of service and their dependents
325,000 pensioners in 2010
Pension (compensation, invalid, superannuation, retiring, optional, family), gratuity, group insurance, benevolent fund
and medical allowance
Yes Accrual rate of 3.2 per cent
Bhutan Pension Scheme of the National Pension and Provident Fund Plan
National Pension Plan for employees of state-owned enterprises and joint-sector companies; and the Armed Forces Pension Plan covering military and police personnel
The National Pension Plan recorded 26,050 members in 2006/2007
Member retirement pension; permanent disability benefit; surviving spouse benefit; surviving children benefit; orphan benefit; and dependent parent benefit
Yes 5 per cent contribution from the employee, matching contribution from the employer and any future deficit financed by the government.
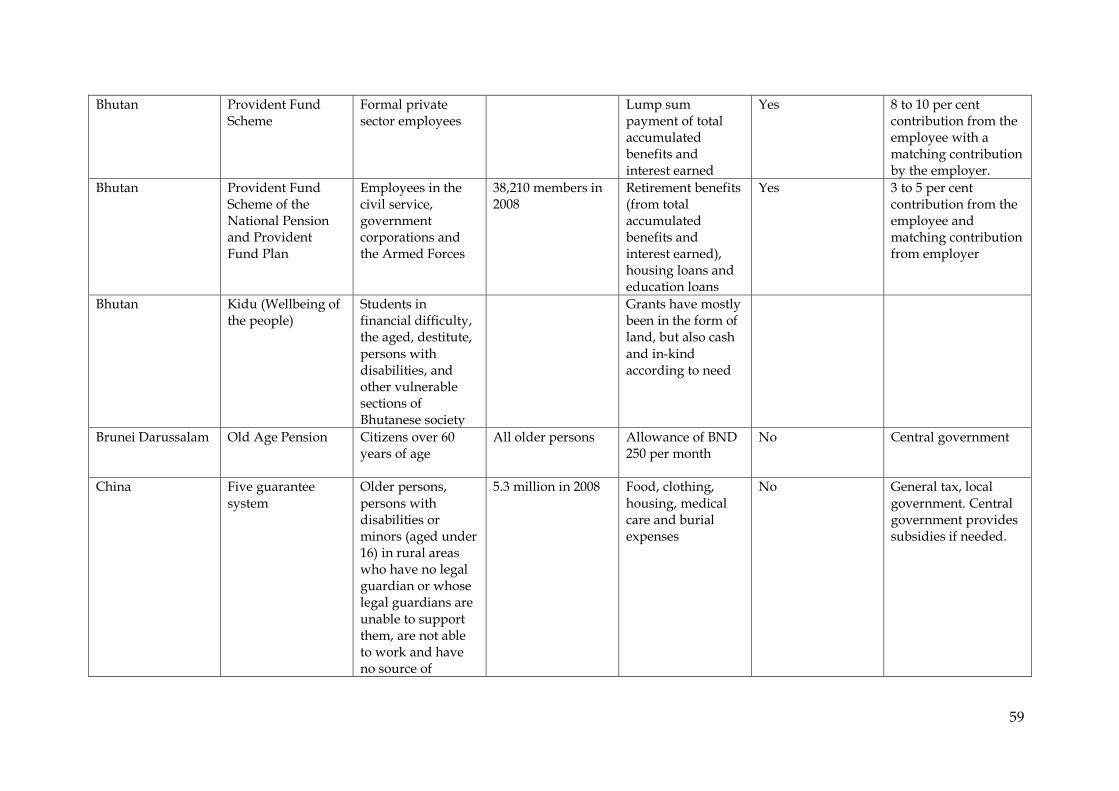
59
Bhutan Provident Fund Scheme
Formal private sector employees
Lump sum payment of total accumulated benefits and interest earned
Yes 8 to 10 per cent contribution from the employee with a matching contribution by the employer.
Bhutan Provident Fund Scheme of the National Pension and Provident Fund Plan
Employees in the civil service, government corporations and the Armed Forces
38,210 members in 2008
Retirement benefits (from total accumulated benefits and interest earned), housing loans and education loans
Yes 3 to 5 per cent contribution from the employee and matching contribution from employer
Bhutan Kidu (Wellbeing of the people)
Students in financial difficulty, the aged, destitute, persons with disabilities, and other vulnerable sections of Bhutanese society
Grants have mostly been in the form of land, but also cash and in-kind according to need
Brunei Darussalam Old Age Pension Citizens over 60 years of age
All older persons Allowance of BND 250 per month
No Central government
China Five guarantee system
Older persons, persons with disabilities or minors (aged under 16) in rural areas who have no legal guardian or whose legal guardians are unable to support them, are not able to work and have no source of
5.3 million in 2008 Food, clothing, housing, medical care and burial expenses
No General tax, local government. Central government provides subsidies if needed.
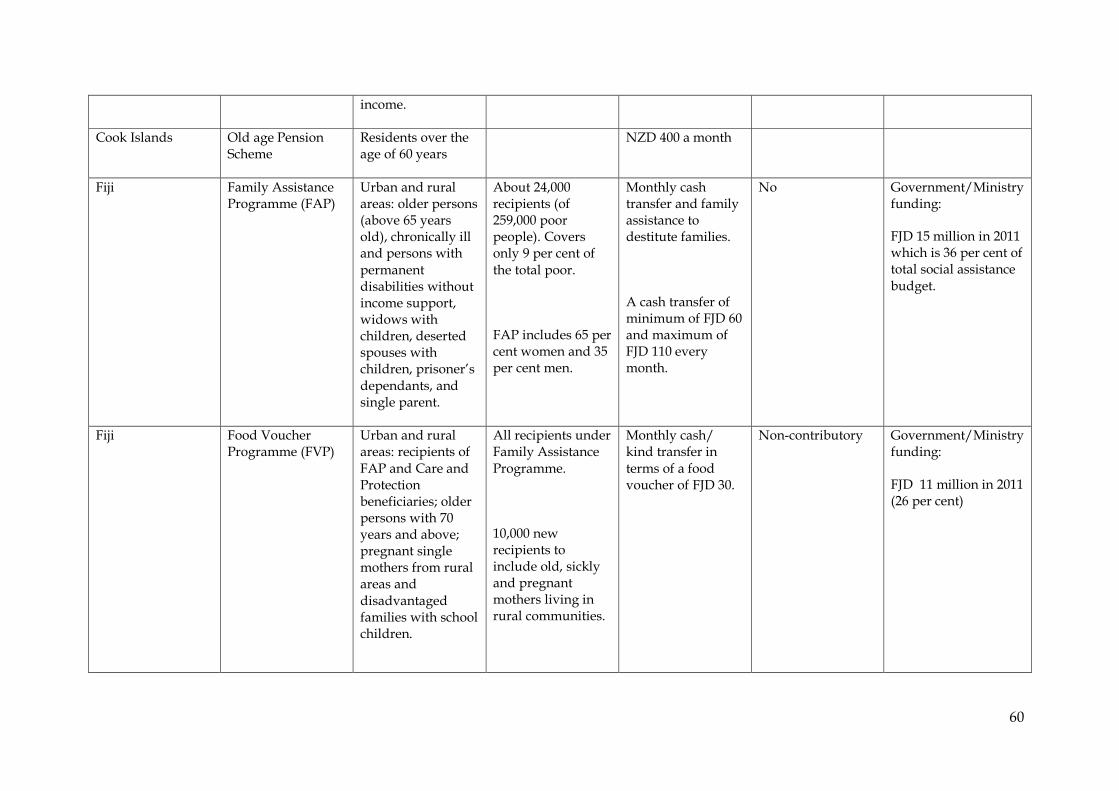
60
income.
Cook Islands Old age Pension Scheme
Residents over the age of 60 years
NZD 400 a month
Fiji Family Assistance Programme (FAP)
Urban and rural areas: older persons (above 65 years old), chronically ill and persons with
permanent disabilities without income support, widows with children, deserted spouses with children, prisoner’s dependants, and single parent.
About 24,000 recipients (of 259,000 poor people). Covers only 9 per cent of
the total poor.
FAP includes 65 per cent women and 35 per cent men.
Monthly cash transfer and family assistance to destitute families.
A cash transfer of minimum of FJD 60 and maximum of FJD 110 every month.
No Government/Ministry funding:
FJD 15 million in 2011 which is 36 per cent of total social assistance budget.
Fiji Food Voucher Programme (FVP)
Urban and rural areas: recipients of FAP and Care and Protection beneficiaries; older persons with 70 years and above; pregnant single mothers from rural areas and disadvantaged families with school children.
All recipients under Family Assistance Programme.
10,000 new recipients to include old, sickly and pregnant mothers living in rural communities.
Monthly cash/ kind transfer in terms of a food voucher of FJD 30.
Non-contributory Government/Ministry funding:
FJD 11 million in 2011 (26 per cent)
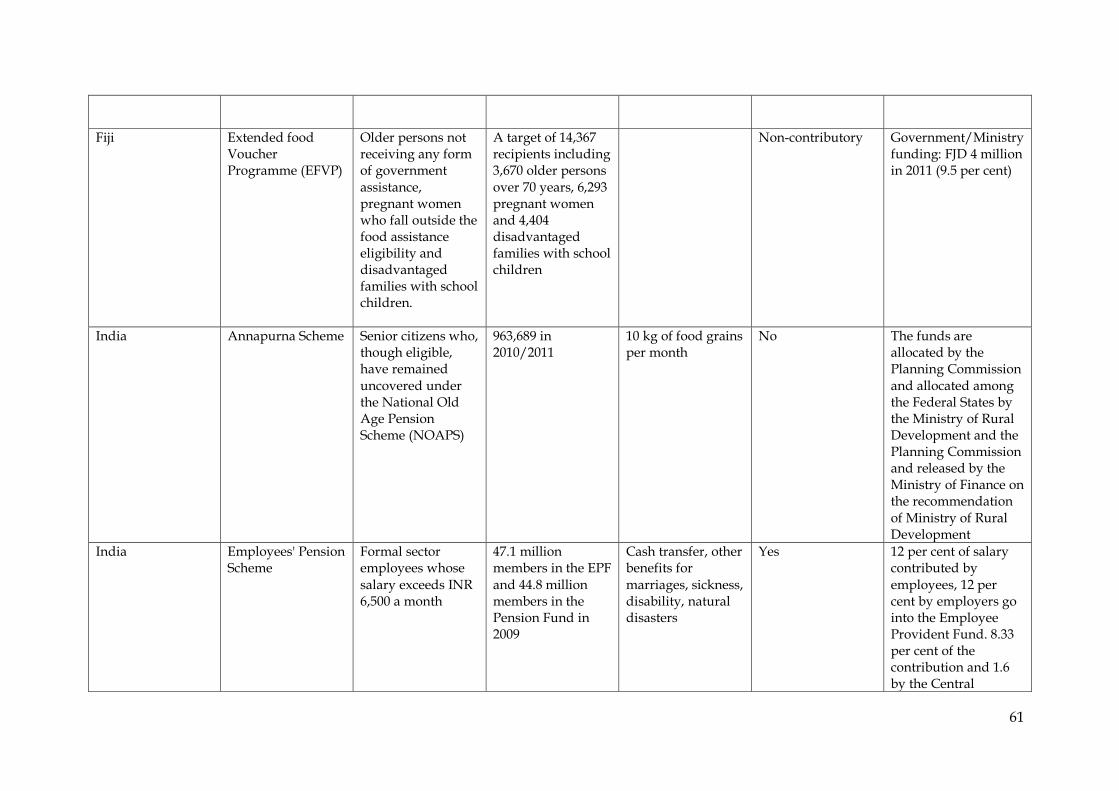
61
Fiji Extended food Voucher Programme (EFVP)
Older persons not receiving any form of government assistance, pregnant women who fall outside the food assistance eligibility and disadvantaged families with school children.
A target of 14,367 recipients including 3,670 older persons over 70 years, 6,293 pregnant women and 4,404 disadvantaged families with school children
Non-contributory Government/Ministry funding: FJD 4 million in 2011 (9.5 per cent)
India Annapurna Scheme Senior citizens who, though eligible, have remained uncovered under the National Old Age Pension Scheme (NOAPS)
963,689 in 2010/2011
10 kg of food grains per month
No The funds are allocated by the Planning Commission and allocated among the Federal States by the Ministry of Rural Development and the Planning Commission and released by the Ministry of Finance on the recommendation of Ministry of Rural Development
India Employees' Pension Scheme
Formal sector employees whose
salary exceeds INR 6,500 a month
47.1 million members in the EPF
and 44.8 million members in the Pension Fund in 2009
Cash transfer, other benefits for
marriages, sickness, disability, natural disasters
Yes 12 per cent of salary contributed by
employees, 12 per cent by employers go into the Employee Provident Fund. 8.33 per cent of the contribution and 1.6 by the Central
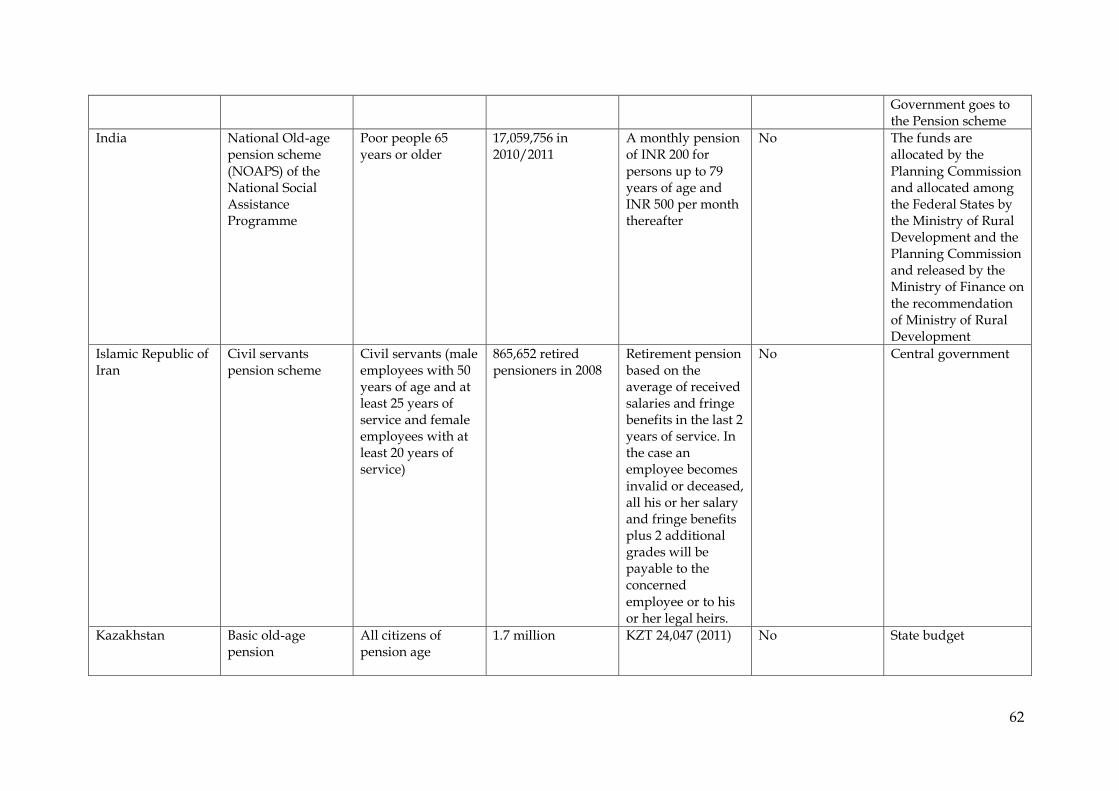
62
Government goes to the Pension scheme
India National Old-age pension scheme (NOAPS) of the National Social Assistance Programme
Poor people 65 years or older
17,059,756 in 2010/2011
A monthly pension of INR 200 for persons up to 79 years of age and INR 500 per month thereafter
No The funds are allocated by the Planning Commission and allocated among the Federal States by the Ministry of Rural Development and the Planning Commission and released by the Ministry of Finance on the recommendation of Ministry of Rural Development
Islamic Republic of Iran
Civil servants pension scheme
Civil servants (male employees with 50 years of age and at least 25 years of service and female employees with at least 20 years of service)
865,652 retired pensioners in 2008
Retirement pension based on the average of received salaries and fringe benefits in the last 2 years of service. In the case an employee becomes
invalid or deceased, all his or her salary and fringe benefits plus 2 additional grades will be payable to the concerned employee or to his or her legal heirs.
No Central government
Kazakhstan Basic old-age pension
All citizens of pension age
1.7 million KZT 24,047 (2011) No State budget
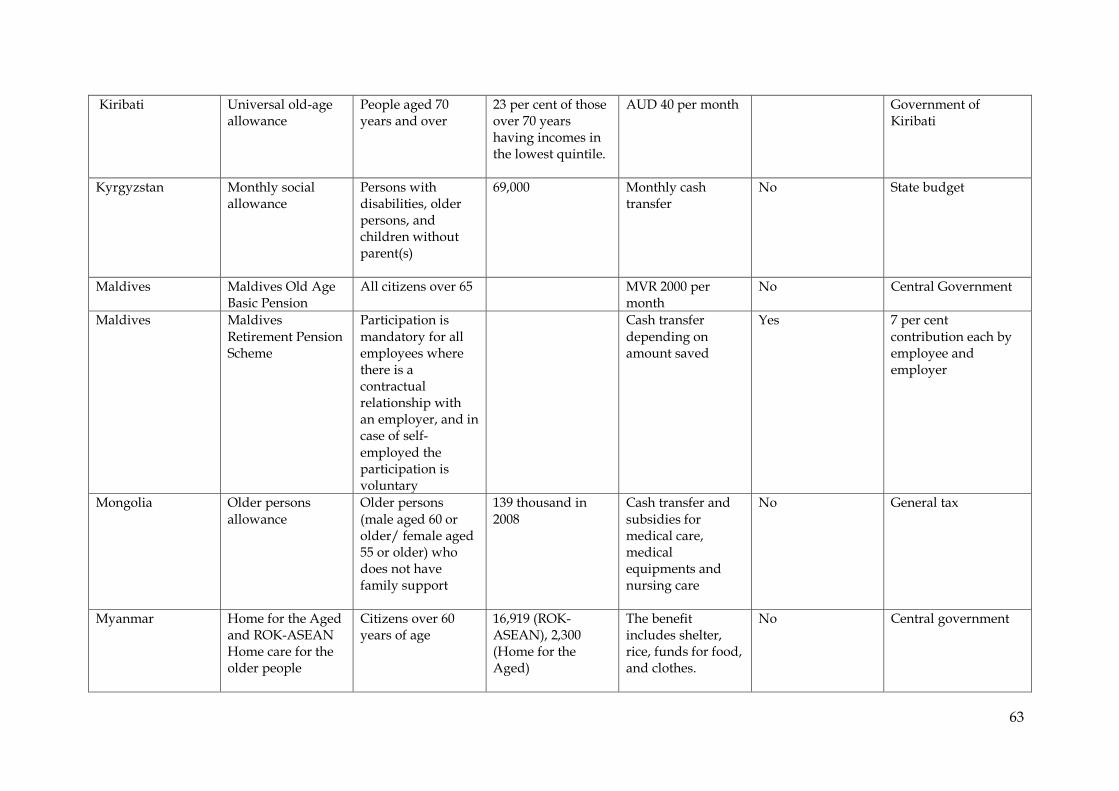
63
Kiribati Universal old-age allowance
People aged 70 years and over
23 per cent of those over 70 years having incomes in the lowest quintile.
AUD 40 per month Government of Kiribati
Kyrgyzstan Monthly social allowance
Persons with disabilities, older persons, and children without parent(s)
69,000 Monthly cash transfer
No State budget
Maldives Maldives Old Age Basic Pension
All citizens over 65 MVR 2000 per month
No Central Government
Maldives Maldives Retirement Pension Scheme
Participation is mandatory for all employees where there is a contractual relationship with an employer, and in case of self-employed the participation is voluntary
Cash transfer depending on amount saved
Yes 7 per cent contribution each by employee and employer
Mongolia Older persons allowance
Older persons (male aged 60 or older/ female aged 55 or older) who does not have family support
139 thousand in 2008
Cash transfer and subsidies for medical care, medical equipments and nursing care
No General tax
Myanmar Home for the Aged and ROK-ASEAN Home care for the older people
Citizens over 60 years of age
16,919 (ROK-ASEAN), 2,300 (Home for the Aged)
The benefit includes shelter, rice, funds for food, and clothes.
No Central government

64
Nepal Old age allowance Older persons above 70 years of age and above 60 years of age for dalits and residents of the Karnali Zone)
191,953 in 2001 NPR 500 per month; NPR 1,000 per month to members of the Raute ethnic group
No Central Government
Pakistan Civil service pension schemes (excluding military pensions)
Public sector employees
1.96 million active workers in 2002/2003 and 148,000 retirees in 2004
Pension (70 per cent of basic pay), disability and survivorship benefits
No Federal Budget
Pakistan Employee old age benefits
Formal sector employees with the maximum wage limit for payment of contribution and payment of benefits being PKR 3,000 per month (excluding government workers, the armed
forces and other nominated excluded industries)
53,356 registered employers, 194 million insured persons in 2003 and 221,268 beneficiaries in 2008
Old age pension (minimum PKR 700, maximum PKR 1,680), invalidity pension (for causes other than work injury or occupational disease), survivors pension, and old age grant (to those
not entitled to pension)
Yes 5 per cent of payroll from employers (with a maximum contribution of PKR 150), PKR 20 from employees and a matching contribution from the government
Republic of Korea Basic old-age pension
Older persons (bottom 70 per cent of older persons aged 65 and above in terms of income and property)
3.63 million in 2009 Cash transfer (5 per cent of average monthly income of National Pension participants)
No General tax
Russian Federation Housing and Pensioners; veterans; persons
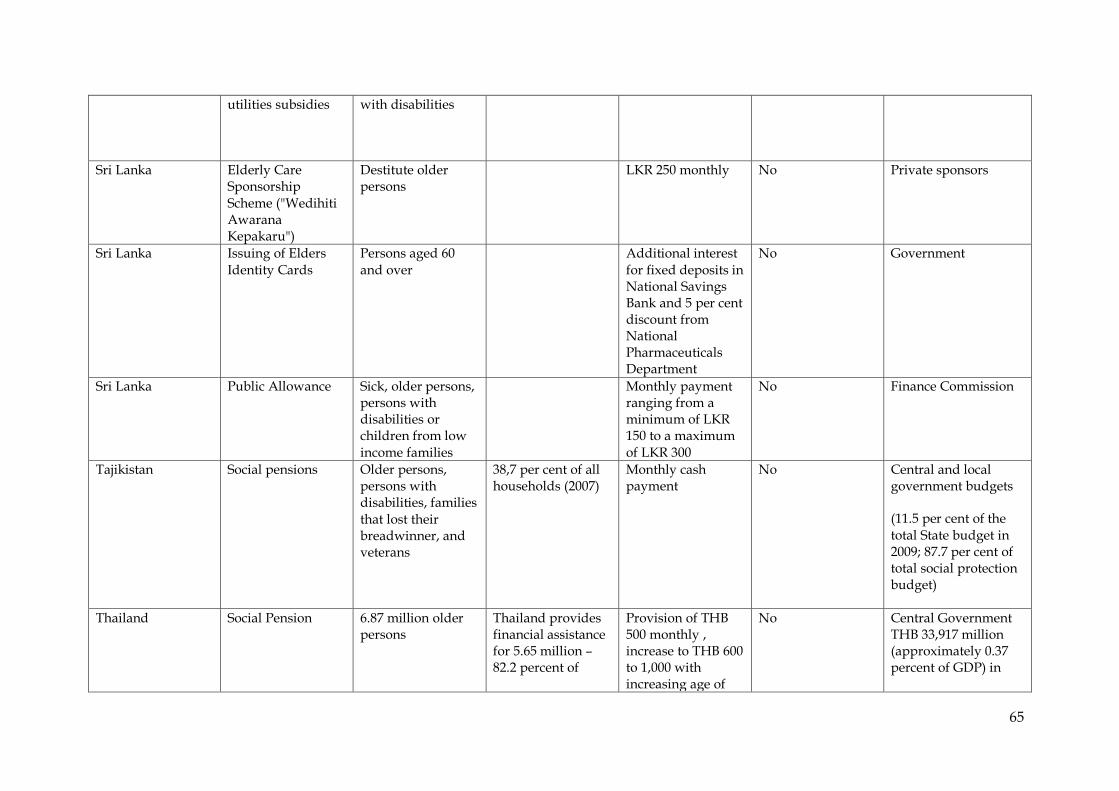
65
utilities subsidies
with disabilities
Sri Lanka Elderly Care Sponsorship Scheme ("Wedihiti Awarana Kepakaru")
Destitute older persons
LKR 250 monthly No Private sponsors
Sri Lanka Issuing of Elders
Identity Cards
Persons aged 60
and over
Additional interest
for fixed deposits in National Savings Bank and 5 per cent discount from National Pharmaceuticals Department
No Government
Sri Lanka Public Allowance Sick, older persons, persons with disabilities or children from low income families
Monthly payment ranging from a minimum of LKR 150 to a maximum of LKR 300
No Finance Commission
Tajikistan Social pensions Older persons, persons with disabilities, families that lost their breadwinner, and veterans
38,7 per cent of all households (2007)
Monthly cash payment
No Central and local government budgets
(11.5 per cent of the total State budget in 2009; 87.7 per cent of total social protection budget)
Thailand Social Pension 6.87 million older persons
Thailand provides financial assistance for 5.65 million – 82.2 percent of
Provision of THB 500 monthly , increase to THB 600 to 1,000 with increasing age of
No Central Government THB 33,917 million (approximately 0.37 percent of GDP) in
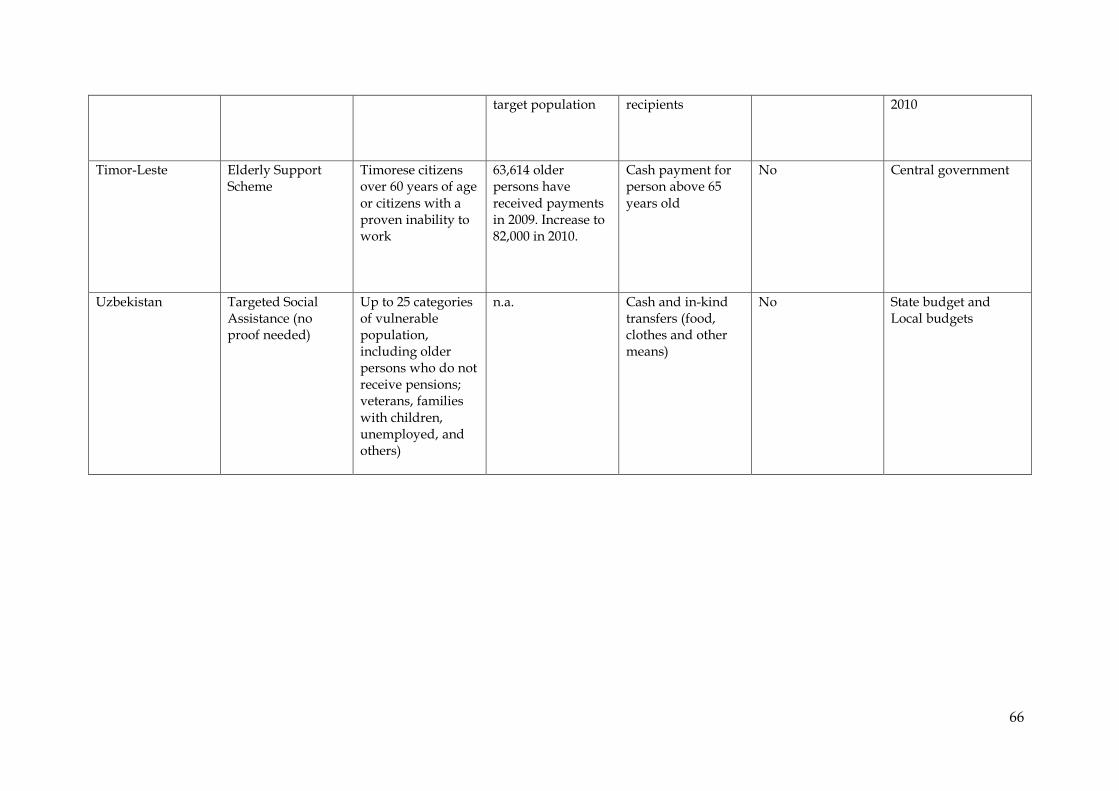
66
target population recipients
2010
Timor-Leste Elderly Support Scheme
Timorese citizens over 60 years of age or citizens with a proven inability to work
63,614 older persons have received payments in 2009. Increase to 82,000 in 2010.
Cash payment for person above 65 years old
No Central government
Uzbekistan Targeted Social Assistance (no proof needed)
Up to 25 categories of vulnerable population, including older persons who do not receive pensions; veterans, families with children, unemployed, and others)
n.a. Cash and in-kind transfers (food, clothes and other means)
No State budget and Local budgets
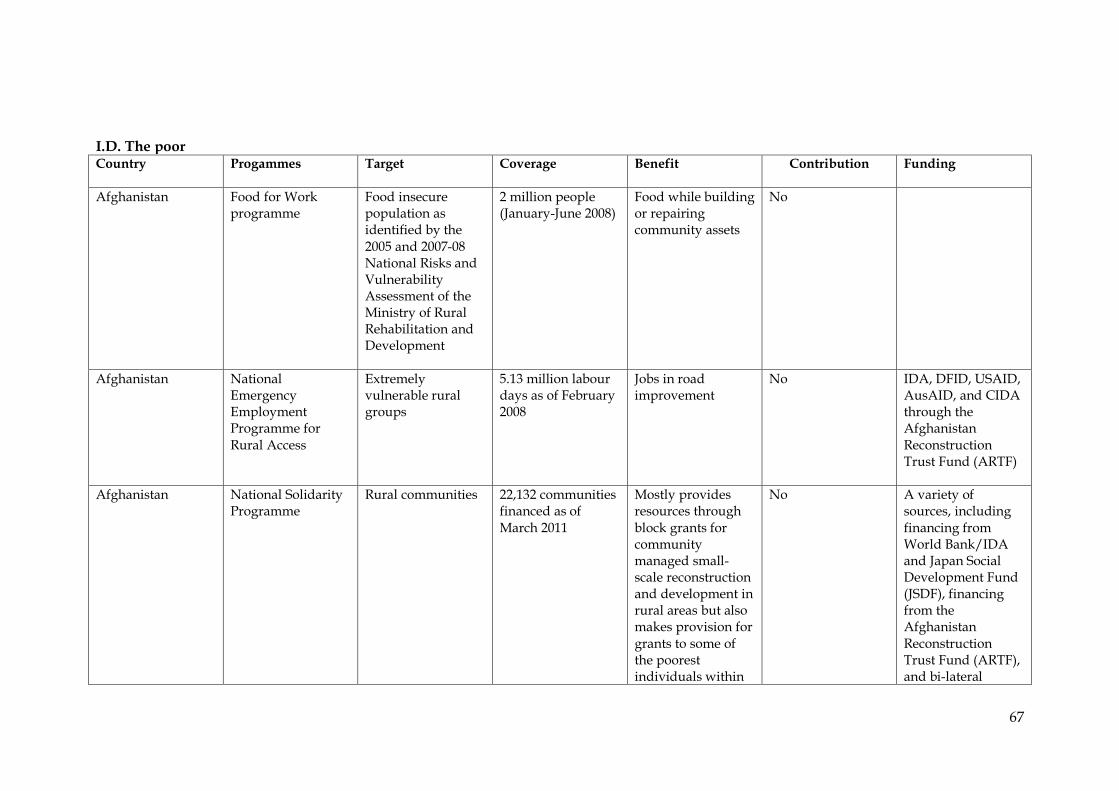
67
I.D. The poor Country Progammes Target Coverage Benefit Contribution Funding
Afghanistan Food for Work programme
Food insecure population as identified by the 2005 and 2007-08 National Risks and Vulnerability Assessment of the Ministry of Rural Rehabilitation and Development
2 million people (January-June 2008)
Food while building or repairing community assets
No
Afghanistan National Emergency Employment Programme for Rural Access
Extremely vulnerable rural groups
5.13 million labour days as of February 2008
Jobs in road improvement
No IDA, DFID, USAID, AusAID, and CIDA through the Afghanistan Reconstruction Trust Fund (ARTF)
Afghanistan National Solidarity Programme
Rural communities 22,132 communities financed as of March 2011
Mostly provides resources through block grants for community managed small-scale reconstruction and development in rural areas but also makes provision for grants to some of the poorest individuals within
No A variety of sources, including financing from World Bank/IDA and Japan Social Development Fund (JSDF), financing from the Afghanistan Reconstruction Trust Fund (ARTF), and bi-lateral
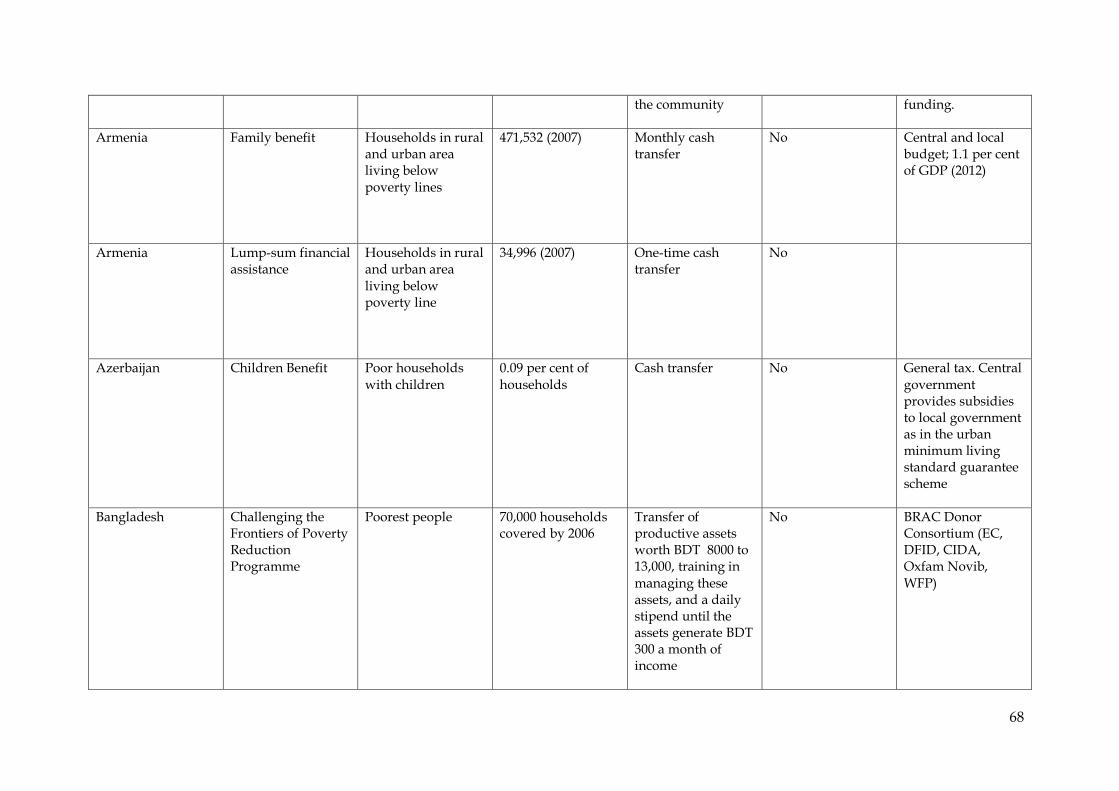
68
the community funding.
Armenia Family benefit Households in rural and urban area living below poverty lines
471,532 (2007)
Monthly cash transfer
No Central and local budget; 1.1 per cent of GDP (2012)
Armenia Lump-sum financial assistance
Households in rural and urban area living below poverty line
34,996 (2007) One-time cash transfer
No
Azerbaijan Children Benefit Poor households with children
0.09 per cent of households
Cash transfer
No General tax. Central government provides subsidies to local government as in the urban minimum living standard guarantee scheme
Bangladesh Challenging the Frontiers of Poverty Reduction Programme
Poorest people 70,000 households covered by 2006
Transfer of productive assets worth BDT 8000 to 13,000, training in
managing these assets, and a daily stipend until the assets generate BDT 300 a month of income
No BRAC Donor Consortium (EC, DFID, CIDA, Oxfam Novib,
WFP)
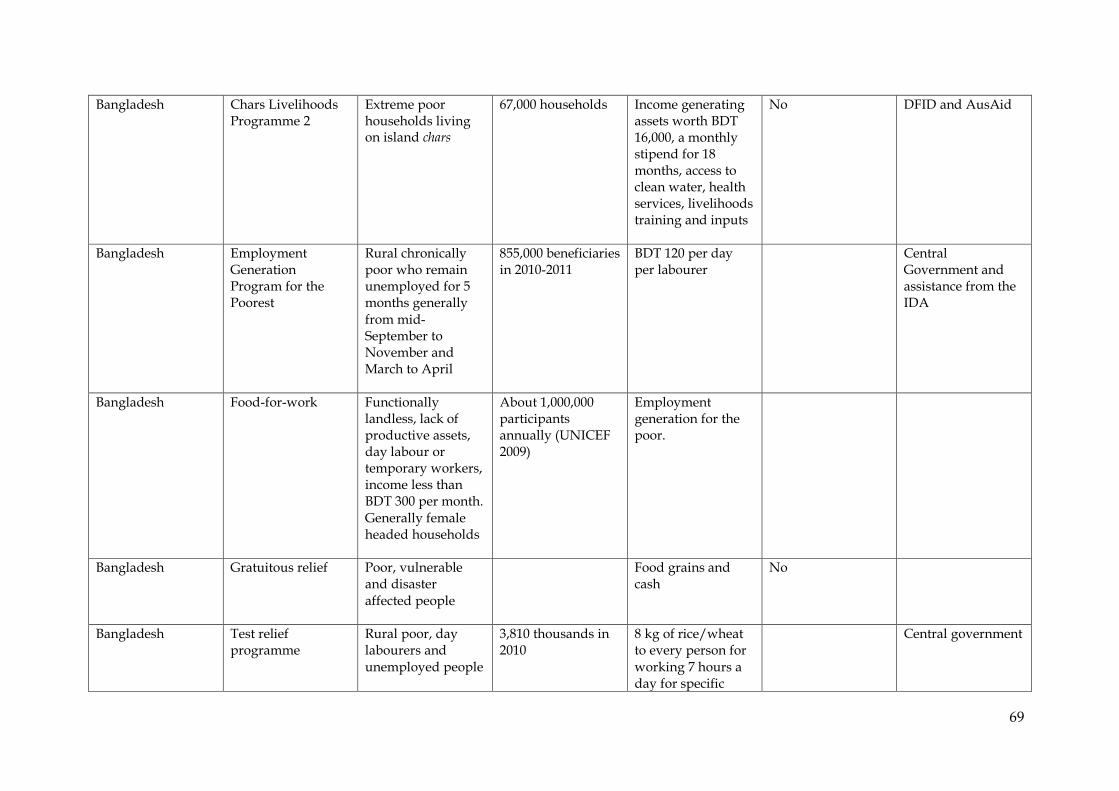
69
Bangladesh Chars Livelihoods Programme 2
Extreme poor households living on island chars
67,000 households Income generating assets worth BDT 16,000, a monthly stipend for 18 months, access to clean water, health services, livelihoods training and inputs
No DFID and AusAid
Bangladesh Employment Generation Program for the Poorest
Rural chronically poor who remain unemployed for 5 months generally from mid-September to November and March to April
855,000 beneficiaries in 2010-2011
BDT 120 per day per labourer
Central Government and assistance from the IDA
Bangladesh Food-for-work Functionally landless, lack of productive assets, day labour or temporary workers, income less than BDT 300 per month. Generally female headed households
About 1,000,000 participants annually (UNICEF 2009)
Employment generation for the poor.
Bangladesh Gratuitous relief Poor, vulnerable and disaster affected people
Food grains and cash
No
Bangladesh Test relief programme
Rural poor, day labourers and unemployed people
3,810 thousands in 2010
8 kg of rice/wheat to every person for working 7 hours a day for specific
Central government
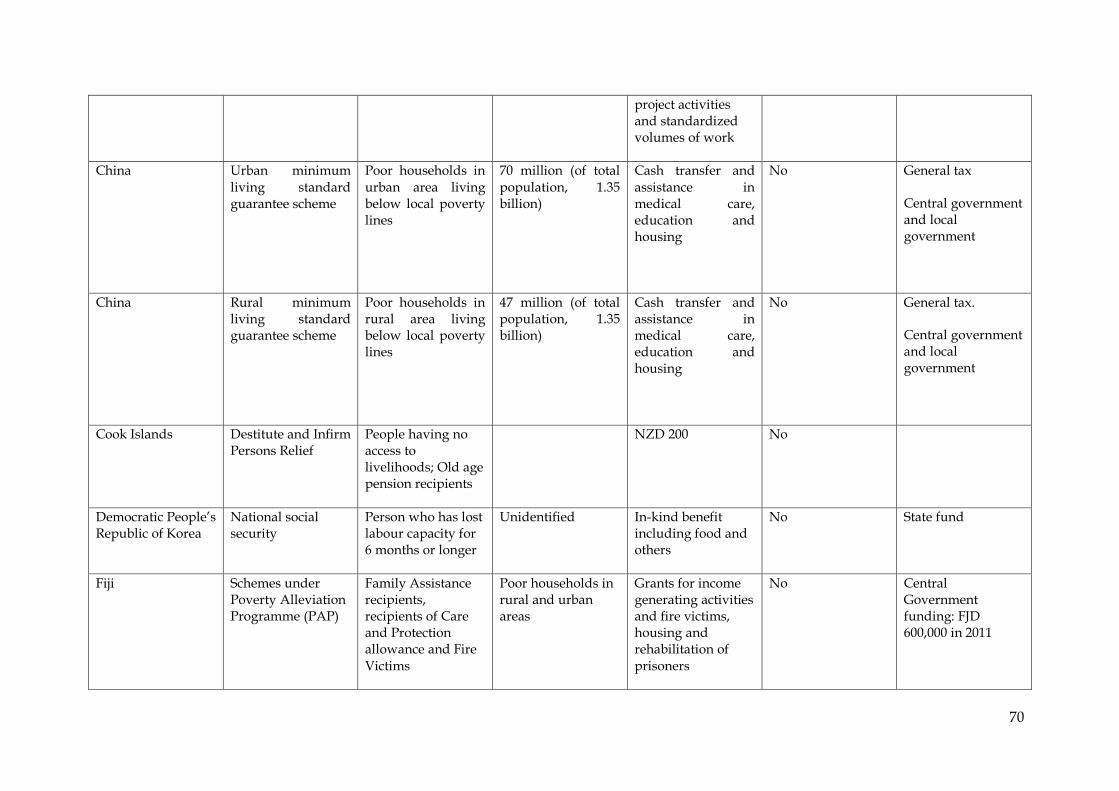
70
project activities and standardized volumes of work
China Urban minimum living standard guarantee scheme
Poor households in urban area living below local poverty lines
70 million (of total population, 1.35 billion)
Cash transfer and assistance in medical care, education and housing
No General tax
Central government and local government
China Rural minimum living standard guarantee scheme
Poor households in rural area living below local poverty lines
47 million (of total population, 1.35 billion)
Cash transfer and assistance in medical care, education and housing
No General tax.
Central government and local government
Cook Islands Destitute and Infirm Persons Relief
People having no access to livelihoods; Old age pension recipients
NZD 200 No
Democratic People’s Republic of Korea
National social security
Person who has lost labour capacity for 6 months or longer
Unidentified In-kind benefit including food and others
No State fund
Fiji Schemes under Poverty Alleviation Programme (PAP)
Family Assistance recipients, recipients of Care and Protection allowance and Fire Victims
Poor households in rural and urban areas
Grants for income generating activities and fire victims, housing and rehabilitation of prisoners
No Central Government funding: FJD 600,000 in 2011
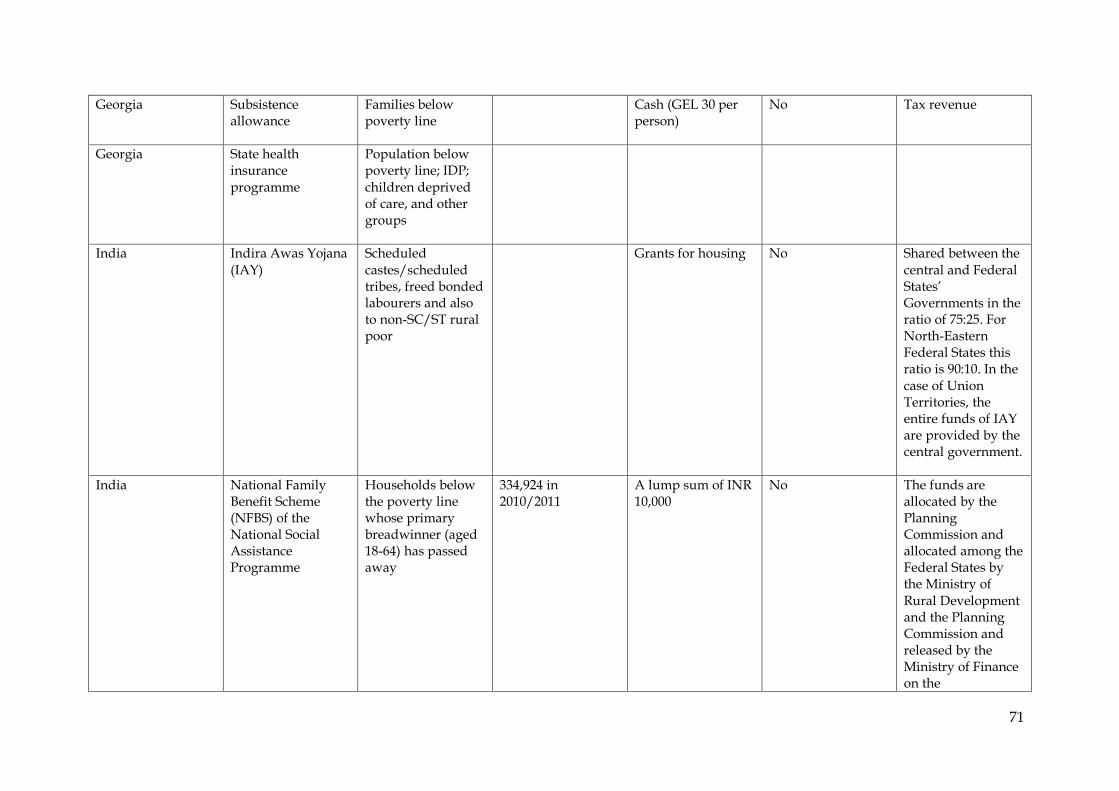
71
Georgia Subsistence allowance
Families below poverty line
Cash (GEL 30 per person)
No Tax revenue
Georgia State health insurance programme
Population below poverty line; IDP; children deprived of care, and other groups
India Indira Awas Yojana
(IAY)
Scheduled
castes/scheduled tribes, freed bonded labourers and also to non-SC/ST rural poor
Grants for housing No Shared between the
central and Federal States’ Governments in the ratio of 75:25. For North-Eastern Federal States this ratio is 90:10. In the case of Union Territories, the entire funds of IAY are provided by the central government.
India National Family Benefit Scheme (NFBS) of the National Social Assistance Programme
Households below the poverty line whose primary breadwinner (aged 18-64) has passed away
334,924 in 2010/2011
A lump sum of INR 10,000
No The funds are allocated by the Planning Commission and allocated among the Federal States by the Ministry of Rural Development and the Planning Commission and released by the Ministry of Finance on the
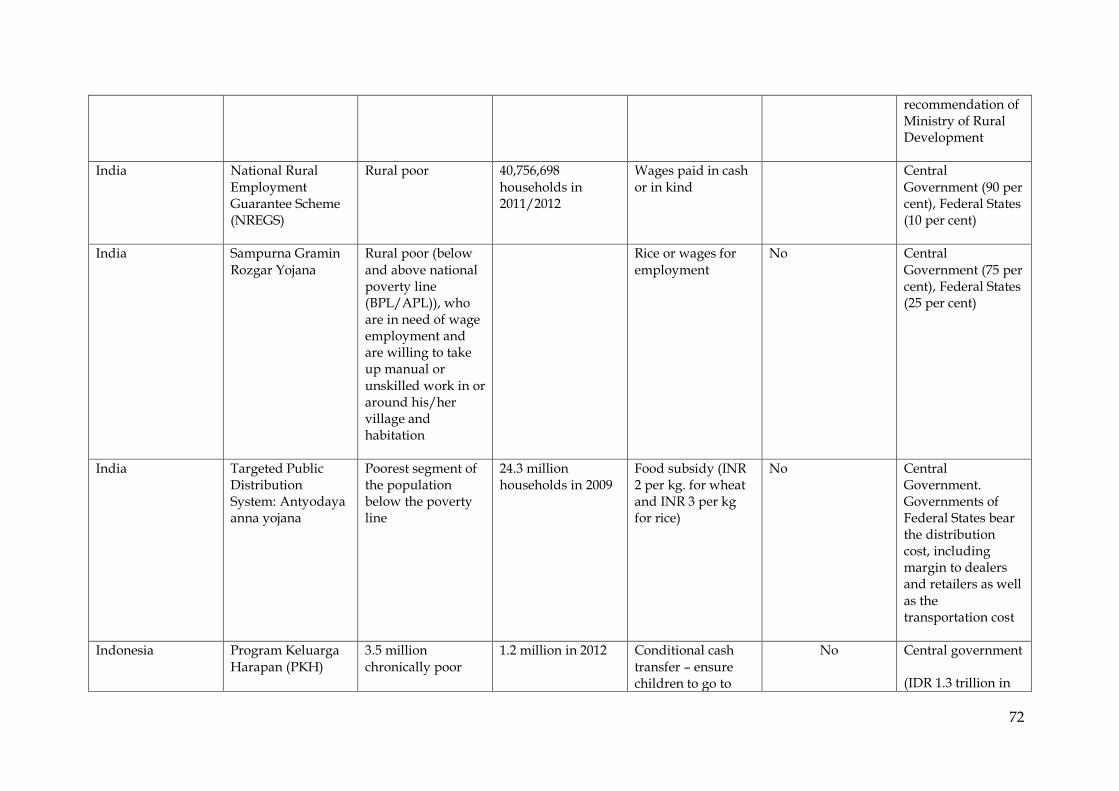
72
recommendation of Ministry of Rural Development
India National Rural Employment Guarantee Scheme (NREGS)
Rural poor 40,756,698 households in 2011/2012
Wages paid in cash or in kind
Central Government (90 per cent), Federal States (10 per cent)
India Sampurna Gramin
Rozgar Yojana
Rural poor (below
and above national poverty line (BPL/APL)), who are in need of wage employment and are willing to take up manual or unskilled work in or around his/her village and habitation
Rice or wages for
employment
No Central
Government (75 per cent), Federal States (25 per cent)
India Targeted Public Distribution System: Antyodaya anna yojana
Poorest segment of the population below the poverty line
24.3 million households in 2009
Food subsidy (INR 2 per kg. for wheat and INR 3 per kg for rice)
No Central Government. Governments of Federal States bear the distribution cost, including margin to dealers and retailers as well as the transportation cost
Indonesia Program Keluarga Harapan (PKH)
3.5 million chronically poor
1.2 million in 2012 Conditional cash transfer – ensure children to go to
No Central government
(IDR 1.3 trillion in

73
households school and pregnant women and children to have regular checkups
2010)
Japan Livelihood protection program
Poor (living below poverty line)
7 million in 2010, 1 per cent of total population
Cash transfer
No General tax
Central and local government (about 75per cent vs 25per cent)
Kazakhstan Targeted social assistance
Citizens with income below poverty line
84,400 (2012) Monthly cash transfer (on average KZT 2036,2)
No Government budget
Kiribati Copra price subsidy programme
Low-income copra farmers in the outer islands
Government of Kiribati
Kyrgyzstan Monthly allowance to poor families with children
Poor households (income per family member below KGS 370 (2011)
123,000 families, with 371,000 children
Monthly cash transfer
No State budget
Lao PDR Health Equity Funds (HEFs)
1,500,000 poor families
1,500 families Free health services under the CBHI programme. The funds from donors are used to purchase Community-Based Health Insurance (CBHI) membership
No Funded by bilateral donors and lending banks and implemented by external partners and NGOs
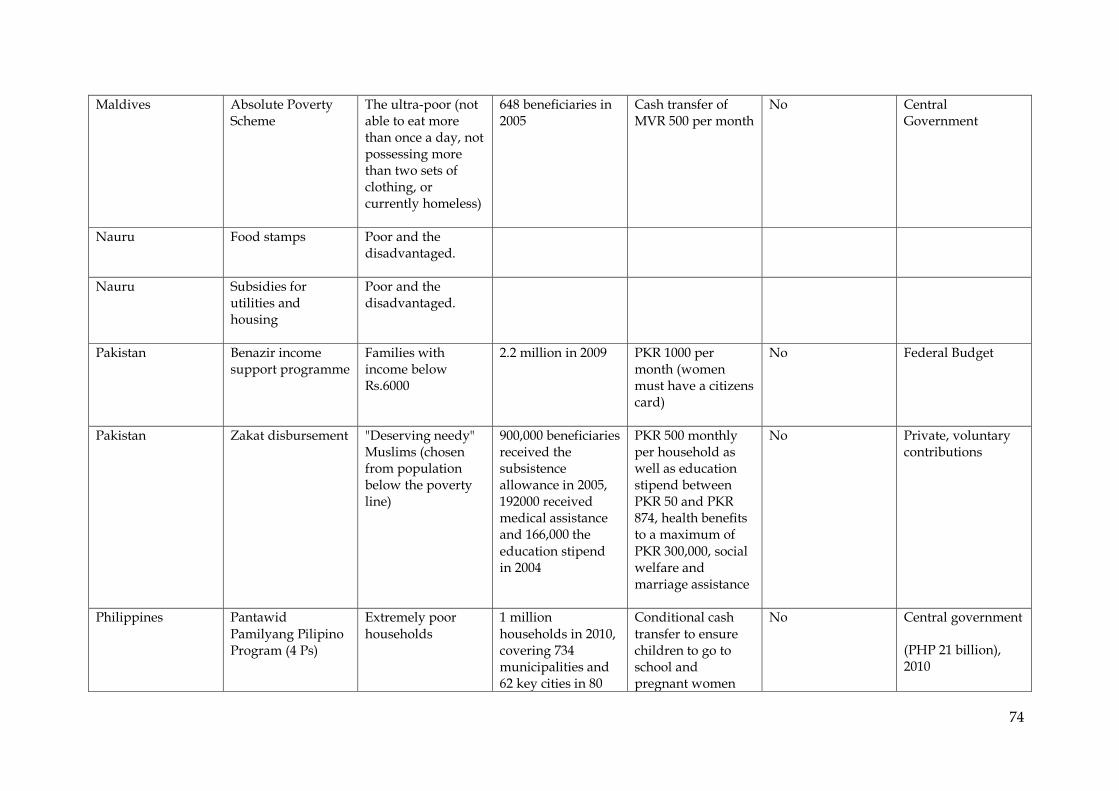
74
Maldives Absolute Poverty Scheme
The ultra-poor (not able to eat more than once a day, not possessing more than two sets of clothing, or currently homeless)
648 beneficiaries in 2005
Cash transfer of MVR 500 per month
No Central Government
Nauru Food stamps Poor and the disadvantaged.
Nauru Subsidies for utilities and housing
Poor and the disadvantaged.
Pakistan Benazir income support programme
Families with income below Rs.6000
2.2 million in 2009 PKR 1000 per month (women must have a citizens card)
No Federal Budget
Pakistan Zakat disbursement "Deserving needy" Muslims (chosen from population below the poverty line)
900,000 beneficiaries received the subsistence allowance in 2005, 192000 received medical assistance and 166,000 the education stipend in 2004
PKR 500 monthly per household as well as education stipend between PKR 50 and PKR 874, health benefits to a maximum of PKR 300,000, social welfare and marriage assistance
No Private, voluntary contributions
Philippines Pantawid Pamilyang Pilipino Program (4 Ps)
Extremely poor households
1 million households in 2010, covering 734 municipalities and 62 key cities in 80
Conditional cash transfer to ensure children to go to school and pregnant women
No Central government
(PHP 21 billion), 2010
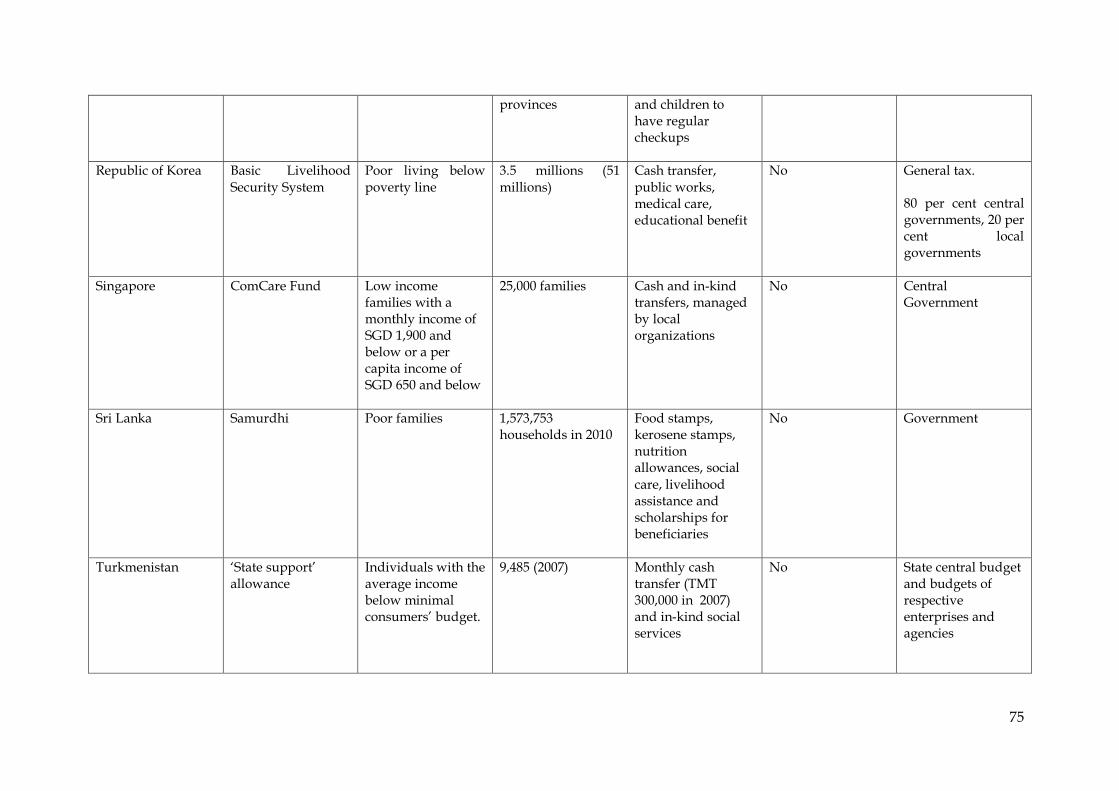
75
provinces and children to have regular checkups
Republic of Korea Basic Livelihood Security System
Poor living below poverty line
3.5 millions (51 millions)
Cash transfer, public works, medical care, educational benefit
No
General tax.
80 per cent central governments, 20 per cent local governments
Singapore ComCare Fund Low income families with a monthly income of SGD 1,900 and below or a per capita income of SGD 650 and below
25,000 families Cash and in-kind transfers, managed by local organizations
No Central Government
Sri Lanka Samurdhi Poor families 1,573,753 households in 2010
Food stamps, kerosene stamps, nutrition allowances, social
care, livelihood assistance and scholarships for beneficiaries
No Government
Turkmenistan ‘State support’ allowance
Individuals with the average income below minimal consumers’ budget.
9,485 (2007) Monthly cash transfer (TMT 300,000 in 2007) and in-kind social services
No State central budget and budgets of respective enterprises and agencies

76
Uzbekistan Targeted Social Assistance (proof needed)
Poor households; families with children under 18 years old; jobless mothers with children under 2 years old
40 per cent of all households
Cash transfer No State budget and local budgets
Vanuatu Health care benefits Poor and disadvantaged
Viet Nam Decree 67 Based on poor list set by MOLISA poor list, other programs are categorical list
One million in 2008, accounting for around 1.2 percent of the population of Viet Nam
Allowance of VND 180,000 and 540,000 per month depending on eligibility criteria
No Central government
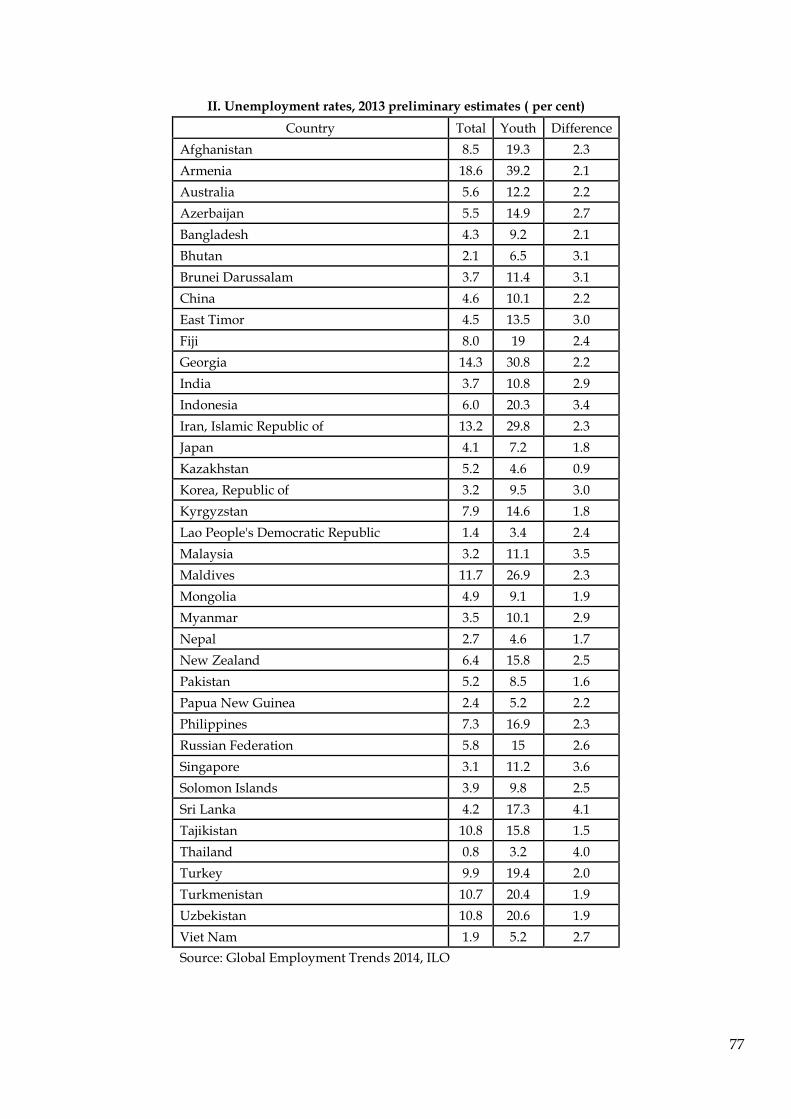
77
II. Unemployment rates, 2013 preliminary estimates ( per cent)
Country Total Youth Difference
Afghanistan 8.5 19.3 2.3
Armenia 18.6 39.2 2.1
Australia 5.6 12.2 2.2
Azerbaijan 5.5 14.9 2.7
Bangladesh 4.3 9.2 2.1
Bhutan 2.1 6.5 3.1
Brunei Darussalam 3.7 11.4 3.1
China 4.6 10.1 2.2
East Timor 4.5 13.5 3.0
Fiji 8.0 19 2.4
Georgia 14.3 30.8 2.2
India 3.7 10.8 2.9
Indonesia 6.0 20.3 3.4
Iran, Islamic Republic of 13.2 29.8 2.3
Japan 4.1 7.2 1.8
Kazakhstan 5.2 4.6 0.9
Korea, Republic of 3.2 9.5 3.0
Kyrgyzstan 7.9 14.6 1.8
Lao People's Democratic Republic 1.4 3.4 2.4
Malaysia 3.2 11.1 3.5
Maldives 11.7 26.9 2.3
Mongolia 4.9 9.1 1.9
Myanmar 3.5 10.1 2.9
Nepal 2.7 4.6 1.7
New Zealand 6.4 15.8 2.5
Pakistan 5.2 8.5 1.6
Papua New Guinea 2.4 5.2 2.2
Philippines 7.3 16.9 2.3
Russian Federation 5.8 15 2.6
Singapore 3.1 11.2 3.6
Solomon Islands 3.9 9.8 2.5
Sri Lanka 4.2 17.3 4.1
Tajikistan 10.8 15.8 1.5
Thailand 0.8 3.2 4.0
Turkey 9.9 19.4 2.0
Turkmenistan 10.7 20.4 1.9
Uzbekistan 10.8 20.6 1.9
Viet Nam 1.9 5.2 2.7
Source: Global Employment Trends 2014, ILO
78
References
Abbott, D. and Pollard, S. (2004). Hardship and Poverty in the Pacific, Asian Development Bank, Manila.
Abdurazakova, D. (2013). The Overview of Income Support Schemes in North & Central Asia, ESCAP Internal Report.
ADB (2012). Social Protection for Older Persons: Social Pensions in Asia, Asian Development Bank: Manila.
ADB (2013). Basic 2013 Statistics, Asian Development Bank: Manila http://www.adb.org/sites/default/files/pub/2013/basic-statistics-2013.pdf.
AusAID (2012). Poverty, vulnerability and social protection in the Pacific. The role of social transfers. AusAID Pacific social protection series: poverty vulnerability and social protection in the Pacific.
Cain, E. (2009). Social Protection and Vulnerability, Risk and Exclusion Across the Life-Cycle, HelpAge International, UK.
Carrillo-Rodriguez, J. (2011). Southeast Asia: Contemporary Multinational Nations. Trendnovation Southeast, 11th Issue, Noviscape, Bangkok.
CGAP (2009). Creating Pathways for the Poorest: Early Lessons on Implementing the Graduation Model, Consultative Group to Assist the Poor Brief, December 2009.
CGAP (2010). Graduation Program Meeting in Bangladesh, Consultative Group to Assist the Poor, January 2010. http://graduation.cgap.org/2010/01/27/graduation-program-meeting-in-bangladesh-2/, accessed 21 January 2014.
Cook, S. (2006). Asian Paths to Poverty Reduction and Inclusive Development, paper prepared for the Asia 2015 Conference, held in London, 6 and 7 March 2006.
Cook, S. (2009). Social protection in East and South East Asia: A regional review, Social Protection in Asia (SPA) working papers, 2009, http://www.socialprotectionasia.org/pdf/Sarah-Cook-SPA-WP02.pdf, downloaded 9 May 2011.
de Neubourg, C. (2002). Incentives and the Role of Institutions in the Provision of Social Safety Nets, World Bank Social Protection Discussion Paper. Washington D.C.: World Bank.
Destremau, B. and Lautier B. (2006). Analysis and comparison of social protection systems in the developing world: Elements of typology and method, IMPACT Network working paper, pre-final version of the translation, http://www.reseau-impact.org/IMG/pdf/4.Social_protection_Eng.pdf, downloaded on 12 June 2013).
ESCAP (2005). Rural-urban linkages for poverty reduction: A review of selected approaches from Asia and the Pacific, United Nations, E/ESCAP/2405.
79
ESCAP (2012). Economic and Social Survey of Asia and the Pacific, United Nations, ST/ESCAP/2570.
ESCAP (2013a). Economic and Social Survey of Asia and the Pacific, United Nations, ST/ESCAP/2654.
ESCAP (2013b). Income support schemes in Pacific Island countries: A brief overview, United Nations, Bangkok.
ESCAP (2013c). Statistical Yearbook for Asia and the Pacific 2013. United Nations, Bangkok.
Gazdar, H. and Mallah, H. (2010). Residential Security as Social Protection. IDS Bulletin, Volume 41, Number 4, July 2010.
Holmes, R. and Jones, N. (2010). Gender, politics and social protection, Briefing paper No. 62, Overseas Development Institute, UK.
Hossain, N. and Matin, I. (2007). Engaging elite support for the poorest? BRAC's Targeted Ultra Poor programme for rural women in Bangladesh. Development in Practice, Vol.17, pp. 380-392.
Hunter, M. (2012). ASEAN’s Missed Opportunities, New Mandala, http://asiapacific.anu.edu.au/newmandala/2012/10/02/aseans-missed-opportunities/, accessed 10th October 2013.
International Labour Organization (ILO) (2009). Global Employment Trends for Women. Geneva.
International Labour Organization (ILO) (2012). “Statistical Update on Employment in the Informal Economy”. ILO Department of Statistics, http://laborsta.ilo.org/applv8/data/INFORMAL_ECONOMY/2012-06-Statistical%20update%20-%20v2.pdf.
International Labour Organization (ILO) (2013). Global Employment Trends for Youth 2013: A generation at risk, Geneva.
International Labour Organization (ILO) (2014). Global Employment Trends 2014. Risk of a Jobless Recovery? Geneva.
Jütting, J., Parlevliet, J. and Xenogiani T. (2008). Informal Employment Re-loaded, Working Paper No. 266, OECD Development Centre, Paris.
Kabeer, N. (2008). Mainstreaming Gender in Social Protection for the Informal Economy, Commonwealth Secretariat.
Kabeer, N. and Ainsworth P. (2010). Findings from DFID-funded social protection research 2003-2010. London: DFID.
Khan, S. and Qutub, S. (2010). The Benazir Income Support Programme and the Zakat Programme: A Political Economy Analysis of Gender in Pakistan. London: ODI.
KIHASA (2013). Analysis of Income Support Schemes in Asia and the Pacific: Sub-regional Report: East and Northeast Asia, ESCAP Internal Report.
80
Lautier, B. (2006). Towards universal social security and protection of the “most vulnerable. In Social protection and inclusion: Experiences and policy issues, International Labour Office, Strategies and Tools against social Exclusion and Poverty programme.
Le Bach Duong, Tran Giang Linh and Nguyen Thi Phuong Thao (2011). Social protection for rural-urban migrants in Vietnam: current situation, challenges and opportunities, CSP Research Report 08, Institute of Development Studies, Sussex.
Long, Giang Thanh (forthcoming). Social Protection of Migrants In Viet Nam: Practice and Policy Issues, United Nations Economic and Social Commission for Asia and the Pacific, Bangkok.
Mahadevia, D. (2010). Tenure security and urban social protection: India. IDS Bulletin, Volume 41, Number 4, July 2010.
Molyneux, M. (2008). Conditional Cash Transfers: A ‘Pathway to Women’s Empowerment’?, Pathway Publication. www.pathwaysofempowerment.org/
McGregor, A. (2008). Southeast Asian Development, Routledge, London.
Menon, J. and Melendez-Nakamura A. (2009). Aging in Asia: Trends, Impacts and Responses; Working Paper Series on Regional Economic Integration No. 25, Asian Development Bank, Manila.
Mohanty, M. (2011). Informal social protection and social development in Pacific Island Countries: Role of NGOs and Civil Society, Asia-Pacific Development Journal, December, 18 (2): 25-56.
Naidu,V. and Mohanty, M. (2009). Situation Analysis of Social Protection Policies, Services and Delivery Mechanisms in the Pacific: Final Report, ESCAP, October, Suva.
Nirathron, N. (forthcoming). Towards Universal Coverage of Social Protection for Workers in the Informal Economy: A Case Study of Thailand, United Nations Economic and Social Commission for Asia and the Pacific, Bangkok.
Nishtar, S. (2009). “Financial crisis, social unrest and reform”, the News International, Monday, January 05, 2009. http://www.thenews.com.pk/TodaysPrintDetail.aspx?ID=155568&Cat=9&dt=1/5/2009, accessed 10 January 2014.
Ortiz, I. and Cummins M. (2011). Global Inequality: Beyond the Bottom Billion – A Rapid Review of Income Distribution in 141 Countries, United Nations Children’s Fund (UNICEF), New York, April 2011.
Ortiz, I. and Cummins M. (2013). The Age of Austerity: A Review of Public Expenditures and Adjustment Measures in 181 Countries, Initiative for Policy Dialogue and the South Centre Working Paper, March 2013.
Oxfam (forthcoming), Social Protection Systems for Small-Scale Agriculture in the Greater Mekong Sub-region, Oxfam GB, Bangkok
81
Pritchett, L. (2005). A lecture on the political economy of targeted safety nets, Washington D.C.: World Bank.
Population Division of the Department of Economic and Social Affairs of the United Nations Secretariat (2012). World Population Prospects: The 2012 Revision, http://esa.un.org/unpd/wpp/index.htm.
Samson, M. and Williams M. (2007). Social Grants and Labour Market Behaviour: Evidence from South Africa‘s Household Surveys, Research Paper No. 43, Economic Policy Research Institute (EPRI), Cape Town.
Sann, V. (2009). Social Protection in Cambodia: Toward Effective and Affordable Social Protection for the Poor and Vulnerable. In Social Protection in East Asia – Current State and Challenges, ERIA Research Project Report 2009, No. 9.
Shih-Jiunn Shi (2009). The Territorial Politics of Social Protection in China: Local Governments as an Emerging Locomotive of Policy Learning and Diffusion, http://www.cccg.umontreal.ca/RC19/PDF/Shi-S_Rc192009.pdf accessed 7 December 2013.
Storey, D. and Steinmayer V. (2011). Mobility as Development Strategy: the case of the Pacific Islands, Asia-Pacific Population Journal, vol. 26, No. 4, December 2011, pp. 57-67.
Van Dijk, M. A. (2013). The Social Costs of Financial Crises (June 12, 2013). Available at SSRN: http://ssrn.com/abstract=2278526 or http://dx.doi.org/10.2139/ssrn.2278526.
United Nations (2012), World Population Prospects: The 2012 Revision, United Nations, Department of Economic and Social Affairs, Population Division, http://esa.un.org/wpp/
Wang, Zhen (2009). Difficulties for migrant workers informally employed participating in old-age security, Working Report, Institute of Economics, Chinese Academy of Social Sciences., Beijing.
Woo, J., Bova, E., Kinda, T. and Zhang, Y. S. (2013). Distributional Consequences of Fiscal Consolidation and the Role of Fiscal Policy: What Do the Data Say? IMF Working Paper No. 13/195.