Developing Probabilistic Reasoning in Preservice Teachers
27
International Journal of Studies in Education and Science (IJSES) is affiliated with the International Society for Technology, Education, and Science (ISTES): www.istes.org www.ijses.net Developing Probabilistic Reasoning in Preservice Teachers: Comparing the Learner-Centered and Teacher-Centered Approaches of Teaching Evans Kofi Hokor St. Teresa’s College of Education, Hohoe, Ghana John Sedofia University of Ghana, Legon, Ghana To cite this article: Hokor, E. K. & Sedofia, J. (2021). Developing probabilistic reasoning in preservice teachers: Comparing the learner-centered and teacher-centered approaches of teaching. International Journal of Studies in Education and Science (IJSES), 2(2), 120-145. The International Journal of Studies in Education and Science (IJSES) is a peer-reviewed scholarly online journal. This article may be used for research, teaching, and private study purposes. Authors alone are responsible for the contents of their articles. The journal owns the copyright of the articles. The publisher shall not be liable for any loss, actions, claims, proceedings, demand, or costs or damages whatsoever or howsoever caused arising directly or indirectly in connection with or arising out of the use of the research material. All authors are requested to disclose any actual or potential conflict of interest including any financial, personal or other relationships with other people or organizations regarding the submitted work. This work is licensed under a Creative Commons Attribution-NonCommercial-ShareAlike 4.0 International License.
-
Upload
khangminh22 -
Category
Documents
-
view
3 -
download
0
Transcript of Developing Probabilistic Reasoning in Preservice Teachers

International Journal of Studies in Education and Science (IJSES) is affiliated with the
International Society for Technology Education and Science (ISTES) wwwistesorg
wwwijsesnet
Developing Probabilistic Reasoning in
Preservice Teachers Comparing the
Learner-Centered and Teacher-Centered
Approaches of Teaching
Evans Kofi Hokor
St Teresarsquos College of Education Hohoe Ghana
John Sedofia
University of Ghana Legon Ghana
To cite this article
Hokor E K amp Sedofia J (2021) Developing probabilistic reasoning in preservice teachers
Comparing the learner-centered and teacher-centered approaches of teaching International
Journal of Studies in Education and Science (IJSES) 2(2) 120-145
The International Journal of Studies in Education and Science (IJSES) is a peer-reviewed scholarly online
journal This article may be used for research teaching and private study purposes Authors alone are
responsible for the contents of their articles The journal owns the copyright of the articles The publisher
shall not be liable for any loss actions claims proceedings demand or costs or damages whatsoever or
howsoever caused arising directly or indirectly in connection with or arising out of the use of the research
material All authors are requested to disclose any actual or potential conflict of interest including any
financial personal or other relationships with other people or organizations regarding the submitted work
This work is licensed under a Creative Commons Attribution-NonCommercial-ShareAlike 40 International License
International Journal of Studies in Education and Science
2021 Vol 2 No 2 120-145 ISSN 2767-9799
120
Developing Probabilistic Reasoning in Preservice Teachers Comparing the
Learner-Centered and Teacher-Centered Approaches of Teaching
Evans Kofi Hokor John Sedofia
Abstract
Many studies have examined the learner-centered and teacher-centered
approaches of teaching but none seems to have compared the two approaches in
developing preservice teachersrsquo probabilistic reasoning by targeting probability
misconceptions This paper calls for assessment of the two teaching methods
based on recent findings and new methodologies This study therefore
examined preservice teachersrsquo probabilistic reasoning by comparing the learner-
centered and teacher-centered approaches of teaching probability targeted at
addressing probabilistic misconceptions In this quasi-experimental research 59
preservice teachers comprising 32 in Group A and 27 in Group B were used The
results showed that learner-centered approach had a statistically significant
positive effect on preservice teachersrsquo probabilistic reasoning [F (1 56) =
114955 p = 000 lt 05] This means that the learner-centered approach was
more effective than the teacher-centered approach in developing preservice
teachersrsquo probabilistic reasoning Thus it was recommended that the learner-
centered approach of teaching directed at addressing misconceptions be used to
develop probabilistic reasoning in preservice teachers to help improve their
problem-solving ability in probability
Keywords Probabilistic reasoning Constructivism Teacher-centered approach
Misconceptions Preservice teachers College of education
Introduction
An essential goal of teacher education is to prepare preservice teachers to become effective classroom teachers
who foster student learning (Santagata amp Sandholtz 2019) In order for teachers to teach Mathematics more
effectively their knowledge of Mathematics and the skills of teaching the subject are very crucial Effective
teachers are an important precondition for student learning (Aina Olanipekun amp Garuba 2015) Effective
teachers require three kinds of teacher knowledge subject matter knowledge pedagogical content knowledge
and curriculum knowledge (Shulman 1986) Subject matter knowledge is the knowledge of the subject without
consideration for the way of teaching the subject Pedagogical Content Knowledge (PCK) refers to how students
learn knowledge about teaching approaches and different theories and assessment procedures Pedagogical
content knowledge is of special interest because it identifies the distinctive bodies of knowledge for teaching
International Journal of Studies in Education and Science (IJSES)
121
Curriculum knowledge on the other hand is the teachersrsquo understanding of the curriculum Kleickmann et al
(2013) found that teachersrsquo content knowledge is a reflection of their pedagogical content knowledge Bolyard
and Packenham 2008 and Sanders and Morris 2000 (cited in Cantoy 2010) observed that even though content
knowledge is vital several research findings suggest effective mathematics teaching depends on adequate
teacher pedagogical content knowledge
Research suggests that studentsrsquo learning of mathematics is greatly influenced by the method of instruction
adopted by the teacher (Sharma 2016) Mathematics can be taught using the learner-centered approach or the
teacher-centered approach A popular learner-centered approach is constructivism Constructivism is a learning
theory which states that the learner is responsible for creating new knowledge for themselves and that new
learning is influenced by past knowledge and experiences (Baerveldt 2013) In a constructivist classroom
instructional strategies like group work and discussions are employed (Denton 2012) According to Clements
and Battista (1990) learner-centered approach for teaching a specific topic in Mathematics has the following
features
i ldquoKnowledge is actively created or invented by the learner not passively received from the environment
ii Students create new mathematical knowledge by reflecting on their physical and mental actions
iii No one true reality exists only individual interpretations of the world
iv Learning is a social process in which students grow into the intellectual life of those around them
v When a teacher demands that students use a set of mathematical methods the sense-making activity of
students is seriously curtailedrdquo (pp 34 and 35)
Thus constructivism states that learning is an active contextualized process of constructing knowledge based
on personal experiences of onersquos environment rather than acquiring knowledge through rote learning In this
study therefore constructivism is conceptualized as helping preservice teachers to construct the ideal meaning
of probability under the guidance of a teacher to help preservice teachers improve and develop a conceptual
understanding of the concept and for improved teaching outcomes If preservice teachers are to construct the
ideal meaning of mathematical concepts in order to apply and teach them well they need to be placed at the
center of the teaching and learning process Although the learner-centered approach of teaching mathematics has
been found to cause studentsrsquo performance in mathematics to improve substantially (National Council of
Teachers of Mathematics 2003) it has been observed that some classrooms in Ghana are still characterized by
the teacher-centered approach of teaching
Lim and Hwa (2007) found that teaching and learning of Mathematics in schools is full of the teacher-centered
approach of teaching and textbook-oriented method where learners memorize mathematical formulae and laws
without understanding the concepts ldquoIt seems that most teachers still prefer the traditional way of delivering
explicit mathematics instruction sometimes combined with challenging questions and mathematical discourse
with the students to promote conceptual understanding and critical analysis of the mathematical contextrdquo
(Voskoglou 2019 p 1) The lecture method is a typical teacher-centered approach to teaching As an approach
lectures are less likely to provide instructors with feedback about student learning and rest on the presumption
that all students learn at the same pace Moreover studentsrsquo attention wanes quickly during lectures and
Hokor amp Sedofia
122
information tends to be forgotten quickly as students are mostly passive learners in this kind of instruction
Finally lectures emphasize learning by listening which is a disadvantage for students who prefer other learning
styles (Schwerdt amp Wuppermann 2011) The lecture method of teaching mathematics may cause students to
lose interest in learning mathematics since it makes learners passive rather than active participants in the
learning process
Many countries have made probability an integral part of the school curriculum (Jun 2000) Although
probability forms a critical part of most mathematics curricula in many countries the training that preservice
teachers need to teach probability is missing in some training programs (Batanero amp Diaz 2012) Meanwhile
Roseth Garfield and Ben-Zvi (2008) argued that probabilistic reasoning is necessary for students to be
informed citizens in the 21st century In the present study probabilistic reasoning refers to the way people reason
about uncertainty situations and making decisions based on likely outcomes Bennett and Anway (2003) defined
probabilistic reasoning as ldquothe way people reason about likelihood (of outcomes) and with uncertaintyrdquo (p138)
Probabilistic reasoning involves
i identifying a desired outcome or a situation that involves uncertainty
ii using theoretical probability to determine the likelihood of that outcome and
iii making a decision with a level of confidence estimate directly from the likelihood (Nguyen 2015)
To develop better probabilistic reasoning in students teachersrsquo correct knowledge about probability is needed
When teachers are equipped with appropriate skills their confidence in teaching probability increases But some
studies have revealed that the current way of training teachers do not provide the essential skills needed to teach
probability effectively (Jones 2005 Khazanov amp Prado 2010) Research has shown that despite the numerous
interventions in helping to improve students learning outcomes individual learning style is very key in our quest
for improved teaching and learning of mathematics (Johnson amp Dasgupta 2005) Learning style serves as the
reference point for curriculum development and instruction
Some preservice teachers come to mathematics classrooms with the erroneous view that mathematics is an exact
or a fact discipline and as such everything about it should be memorized Weldeana and Abraham (2014)
revealed that prospective teachers hold traditional beliefs about mathematics limiting their intellectual
development in the discipline Khazanov amp Gourgey (2009) argued that if we expect improvements in studentsrsquo
conceptions then instructional interventions need to be designed to eliminate studentsrsquo misconceptions of
probability Additional research is also required to clarify the essential components in the preparation of
teachers to teach probability identify adequate methods and establish appropriate levels at which each
component should be taught (Batanero amp Diaz 2012) Despite the importance of probability and statistics there
is limited research about instructional methods and their effects (Shay 2008) and it appears few research
examined the effect of the learner-centered and teacher-centered approaches of teaching statistics on studentsrsquo
understanding in classrooms (Weltman amp Whiteside 2010 Lessani Md Yunus amp Bakar 2017) Lovett and Lee
(2017) examined the preparedness of high school preservice mathematics teachersrsquo ability to teach statistics and
the results revealed that the cohort of preservice teachers entering high school mathematics classrooms are not
prepared to teach statistics
International Journal of Studies in Education and Science (IJSES)
123
Some studies have examined the learner-centered and teacher-centered approaches of teaching mathematics on
studentsrsquo problem-solving abilities but the evidence seems to suggest that none of the studies provides an
empirical comparison of the learner-centered and teacher-centered approaches targeted at addressing
probabilistic misconceptions in relation to developing the probabilistic reasoning of preservice teachers
Additionally it appears there is no study that has compared the effect of the learner-centered and teacher-
centered approaches of teaching on preservice teachersrsquo probabilistic reasoning at the colleges of education level
in Ghana Therefore this study was designed to address the above gaps The important hypothesis that this study
sought to test is There is no significant difference in the probabilistic reasoning (mean scores) between students
who experience the learner-centered approach targeted at addressing probabilistic misconceptions and those
who experience teacher-centered approach targeted at probabilistic misconceptions in the post-test It is hoped
that this study will contribute to the teacher development literature and provide a strong empirical basis for
teaching statistics and probability in colleges of education In the rest of the study we present the review of
relevant literature and the methodology employed for the study It is followed by the presentation and discussion
of results conclusions practical implications and limitations
Literature Review
Theoretical Review
This study is anchored on the socio-cultural constructivist theory of Vygotsky (1978) which contends that
learning occurs at two levels first in the context of shared social activity known as the social or interpersonal
plane and second on the individual plane Learning at these two levels can occur in any context whether
during mathematics lessons in the workplace or in the home Vygotskyrsquos work considered reconstruction of
knowledge in a social context According to him language plays a crucial role in cognitive development
because childrenrsquos knowledge ideas and values develop through interactions with others Vygotsky believed
that a learnerrsquos acquisition of knowledge takes time This suggests that teachers should exercise patience for
learners to explore concepts in order to acquire all the necessary knowledge
One key aspect in the socio-cultural theory is the concept of ldquozone of proximal developmentrdquo (ZPD) which
according to Vygotsky is the difference between a childrsquos current performance (the problems the child can
solve independently without any support) and the level of performance that the child could achieve with
guidance from an adult or by working with a more experienced person such as a teacher a parent a peer or a
sibling Vygotsky thus advocated that for the learner to learn independently there should be an experienced
person to support the learner He contends that the learnersrsquo intellectual life will be greatly developed when
teachers succeeded in leading learners to reorganize their existing ideas with new ones in a meaningful way
This indicates that learners are to be at the center of teaching and learning interacting with their own colleagues
while teachers serve as facilitators It is crucial that teachers are well prepared to facilitate meaningful learning
else learners will be unable to learn effectively The socio-cultural constructivist theory is relevant for this study
because research by Sharma (2016) showed that the theory plays a crucial role in studentsrsquo ability to confront
their own probabilistic misconceptions and resolve them meaningfully
Hokor amp Sedofia
124
Teacher-Centered Approach versus Learner-Centered Approach
In this study the teaching method in which the teacher lectures or stands in front of the class and orally presents
his or her teaching note to the learners is called the teacher-centered approach In the teacher-centered approach
to teaching information flows from the teacher to the learner Learners become a recipient In the constructivist
classroom however the teacher functions as a coach and learners work through problems Where learners
discover concept through activities by themselves they value mathematics and are able to apply it in real-life
The essence of teaching and learning of mathematics is its applicability in solving daily life problems The
learner-centered approach to teaching inspires students to effectively solve problems by relating various
mathematical concepts in real life The differences between the organization of the constructivist and teacher-
centered approach classrooms are presented in Table 1
Table 1 Differences in the Two Approaches of Teaching Mathematics
Learner-centered classroom Teacher-centered classroom
i Students learn from their own
experiences through activities
i Students learn mainly from teachersrsquo
explanations
ii Students are more responsible for their
own learning using the teaching and
learning resources under the guide of a
teacher
ii Students are given more questions to
solve using the rules and formulae by a
teacher
iii Teacher engages all students in
lesson facilitates problem-solving
among students
iii Teacher explains the mathematical
rules and procedures and gives
problems that required the use of such
rules
iv Teacher establishes a purposeful
learning environment interacts
with students and guides them to
construct their own meaning to
concept
iv Teachers focus more on procedural
understanding
v Teachers construct problems
carefully that required studentsrsquo to
apply what they learnt
v Teachers give problems mostly from
textbook that required the use of
formula by learners to solve
Effect of a Learner-centered Approach to Teaching on Studentsrsquo Conceptual Understanding of
Mathematics
Some studies have reported the learner-centered approachs effectiveness in teaching and learning mathematics
on studentsrsquo conceptual understanding Bada (2015) conducted a study on constructivism learning theory for
studentsrsquo understanding of mathematics and contended that if all students are to succeed then teachers have to
use learner-centered approach teaching The study revealed that the learner-centered approach to teaching
International Journal of Studies in Education and Science (IJSES)
125
motivates students to learn and gives teachers the opportunity to assess how the activity is helping the students
to develop an understanding of concepts Furthermore a study was conducted by Major and Mangope (2012) on
constructivist theory in Mathematics in Botswana primary schools The study focused on the extent to which
teachers in Botswana primary schools use the learner-centered approach in teaching and learning of
Mathematics A total of 83 mathematics lessons were videotaped and analyzed The results revealed that most of
the lessons required students to recall rules or formulae However small percentages of the lessons required
students to explore or investigate mathematical ideas
Students are at the center of the learning process in the constructivist class through doing experience action
and peer collaboration National Council of Teachers of Mathematics 2000 (cited in Prideaux 2007) contended
that when teaching is student the learners value mathematics and engage actively in learning the discipline In
solving problems under the constructivist strategy learners are motivated to try various means possible hence
they invent the means of solving the problem themselves In constructivism problems are carefully constructed
to challenge students to reason about the concepts Additionally the interest of the learners increases because
they see the need to study mathematics Mathematics is full of problem-solving So employing a problem-
solving strategytechnique to teach mathematics helps learners to have a better understanding of mathematical
concepts
Materials and Methods
Design
This study used the nonequivalent (pre-test and post-test) control-group design of quasi-experimental research
In this design a dependent variable is measured in one group of subjects before and after a treatment and that
same dependent variable is measured at pre-test and post-test in another nonequivalent control group which does
not receive any treatment The two groups are selected without random assignment and both groups take a
pretest and posttest But only the experimental group receives the treatment (Creswell amp Creswell 2018) This
design makes it possible for researchers to compare scores before and after a treatment in a group that receives
the treatment and also in a nonequivalent control group that does not receive the treatment The nature of the
research problem and the objectives to be achieved warranted quasi-experimental design Importantly in an
environment such as a college of education randomness was impractical (Leedy amp Ormrod 2020) and despite
the argument that quasi-experimental research has low internal validity compared to true experiments quasi-
experimental research has a higher external validity because it helps researchers to do interventions in the real-
world instead of artificial laboratory settings (Thomas 2020)
Population
There are seven public Colleges of Education in the Volta Region of Ghana Six out of the seven colleges are
mixed-sex colleges and one is female-only The single-sex college was purposively chosen to ascertain how
these students develop their probabilistic reasoning from the two different teaching methods discussed above
The population was all second-year preservice teachers of that college since at the time of the study the final
Hokor amp Sedofia
126
years were out for their teaching practice and the first year students had not taken the statistics and probability
course This institution was selected for one main reason they all studied Statistics and Probability and were
thus expected to teach it at the Junior High School level upon completion of their training
Sample and Sampling Procedure
Purposive sampling technique was used to select two intact classes out of six classes identified as Group A and
Group B respectively These groups are similar in terms of their performance in their second-year first-semester
mid-semester quiz scores in mathematics with mean scores of 139 and 137 respectively ldquoQuasi-experimental
designs identify a comparison group that is as similar as possible to the experimental group in terms of pre-
intervention characteristicsrdquo (White amp Sabarwal 2014 p 1) Also it helped to avoid selection bias which is a
concern in quasi-experimental studies
These two intact classes comprised 27 preservice teachers in Group B and 32 in Group A In purposive
sampling certain elements of the population are deliberately selected on the judgment of the researchers and
nothing is left to chance In this study respondents were chosen from a population of regular preservice teachers
who had studied probability previously and were taking statistics and probability as a course in a college of
education The reason for choosing both groups from the same population is that both Group A and Group B
used the same textbooks and course materials Also both groups were chosen from the same population to avoid
bias because all the colleges use different textbooks and the conditions under which students studied are
different from college to college
Achievement Tests (Pre-test and Post-Test)
The test items were administered in two phases in the classrooms These are pre-test and the post-test Items 2i
2ii 3i and 3ii of the pretest were adapted from (Anway amp Bennett 2004 Hirsh amp ODonnell 2001) Two
examiners of statistics and probability were consulted to ensure the questions are at the level of the participants
This is to ensure the validity of the test items The pre-test and the post-test were similar to measure whether
there is a change or not The items were developed to measure the probabilistic reasoning of preservice teachers
The items sought to ascertain preservice teachersrsquo ability in reasoning about uncertainties and the use of
probability daily
The achievement test assessed the following areas correctly applying probability in decision making
equiprobability bias correctly interpreting without replacement situations correctly listing the sample space and
determining the probability representativeness bias and interpreting probability statements correctly and
applying appropriate strategies There were 12 items for the pre-test and 10 items for the post-test We have
more items on the pre-test because the post-test was more open-ended than the pre-test Nevertheless the total
scores in each case was 20 Some of the test items consisted of two parts the principal question (multiple
choice) and a justification of the answer The pre-test and post-test can be seen in appendices A and B
respectively
International Journal of Studies in Education and Science (IJSES)
127
Evaluation of Materials by Experts
The researchers solicited two expertsrsquo views on the test items content coverage content relevance and course
materials It was the view of the experts that the test items of both the pre-test and the post-test were in line with
the mathematics syllabus of colleges of education in Ghana The activities designed for the Group A were also
assessed In the view of the experts the teaching activities had sufficient content coverage and would help pre-
service teachers develop better probabilistic reasoning They acknowledged the idea of having activities that
reflect real life situations to support pre-service teachers since they were aware students have difficulty with
probability related problems The experts further acknowledged that the objectives were measurable and
activities were practical to promote pre-service teachersrsquo involvement in the lessons They said the teaching and
learning materials reflected the learner-centered approach and were in line with the syllabus requirements for
Mathematics in colleges of education in Ghana They believed the activities would promote better probabilistic
reasoning since they reflected real life situations
Data Collection Procedure
Preservice teachers were informed one week ahead of the administration of the pre-test The format of the test
items and the purpose of the study were communicated to the respondents The tests were administered by the
researchers at an Examination Hall to ensure the respondents did independent work
Treatment
The learner-centered approach was applied to group A while the teacher-centered approach of instruction was
applied to group B In each approach the lessons were focused on addressing equiprobability bias
representativeness belief bias positive recency and negative recency effects since some studies suggest that
teaching approaches that target probabilistic misconceptions will help improve studentsrsquo performance
significantly (Khazanov amp Prado 2010 Shay 2008) The implementation of both teaching approaches were
done by the lead researcher
Group A The Learner-centered approach
The teaching and learning took place in traditional classroom settings generally consisting of activities
discussions and questions and answers concurrently once per week for two hours for a month In group A the
activities were designed focusing on probabilistic misconceptions using the learner-centered approach to
teaching to better their probabilistic reasoning Examples of the activities are given below
Card Game This game was played in groups Identical cards were numbered 3 3 4 4 5 5 5 6 6 7 8 and 9
and put in a container and thoroughly mixed Three students will reach in and without looking draw out a card
each at time If the three people pick different numbers then the group wins GH30000 else they lose Is the
chance of winning or losing the same and why The purpose of this activity is to enhance preservice teachersrsquo
Hokor amp Sedofia
128
decision-making ability by addressing equiprobability bias representativeness bias belief and positive and
negative recency effects The aim of predicting before picking was to keep students focused and to confront any
prior misconceptions The game was played 15 times If all the three members of the group pick different colors
then a point of one is recorded else zero After the activity a discussion was organized around their prediction
and the results to challenge their thinking
Pair Game In pairs preservice teachers were asked to toss a coin six times each recording the sequence of tails
and heads The purpose of this activity is to address representativeness bias Before the toss students were asked
to predict the number of tails and heads Their predictions were written in their notebook before the toss Most
preservice teachers predicted equal number of tails and heads Preservice teachers then compare their predicted
sequences to their results after the toss It was noted in many instances that those who predicted equal number of
tails and heads did not obtain results that were consistent with their prediction Discussions were organized
around their predicted sequences and the results obtained after the toss for better probabilistic reasoning
Coin Game Students perform this experiment ten times by tossing a number of fair coins once and record the
outcomes in each case In the first toss a coin was tossed once and the outcome recorded in the second toss
two coins were tossed once and outcomes recorded in third toss three coins were tossed once and outcomes
recorded and so on H stands for heads and T stands for tails The following are a sample of sequence of
outcomes by one student
1st toss H
2nd
toss HT
3rd
toss HTH
4th
toss HTTT
5th
toss THHTT
6th
toss HTHTTT
7th
toss TTHTHHT
8th
toss THTHTHHH
9th
toss HTTTHTHTT
10th
toss THTHTHTHTT
119873119906119898119887119890119903 119900119891 ℎ119890119886119889119904
119873119906119898119887119890119903 119900119891 119905119900119904119904119890119904=
1
1= 1
1
2= 05
2
3= 0667
1
4= 025
2
5= 04
2
6= 0333
3
7= 0429
5
8
= 0625 3
9= 0333
4
10= 04
The average of the probabilities of obtaining a head for each experiment is
=105066702504033304290625033304
10=
4937
10cong 05
International Journal of Studies in Education and Science (IJSES)
129
It must be noted that in experimental or frequentist probability we are concerned about conducting the
experiment many times and considering its approximation or convergence Students were led to conclude that in
general we can say when a fair coin is tossed the probability of getting a head at any time is 1
2 and vice versa
Group B The Teacher-centered approach
Group B was taught using the teacher-centered approach In this case the teacher rather than the learner was at
the center of the teaching and learning process The tutor presented the preservice teachers with facts or
procedures that had been established to solve problems Preservice teachers were given problems that require
the use of these facts or procedures to solve as either assignment exercise test or quiz It is believed that
preservice teachers learned more when they solved similar problems many times When examination questions
that demanded facts were set students could solve the problems without really understanding the concepts
Formulae were presented to students to learn to apply to similar problems Concepts were clearly explained
bearing in mind the probabilistic misconceptions Samples of lessons experienced by Group B are as follow
Lesson one Through questions and answers teacher revises preservice teachersrsquo previous knowledge on playing
of games and probabilistic situations Based on studentsrsquo responses the teacher introduces the lesson
Teacher explains to preservice teachers the concept of probability and three ways we can make probability
statements as classical frequentist and subjective Classical probability is the number of favorable outcomes (E)
divided by the total number of possible outcomes (S) It works on the assumptions that all outcomes are equally
likely Equally likely means that each outcome has the same probability of occurring
Mathematically P(E) =
Students were then led to solve problems using the formula
Experimental probability is a method of calculating probability where the probability is the ratio of the number
of the trials where the desired event occurs to the number of total trials Subjective probability is a statement that
an individual makes based on personal judgment to describe the likelihood of an event Or a personal belief
based on onersquos own experience or expertise The person making the statement should be an expert in the area or
someone who have a sound knowledge on the issue under consideration before it can be considered important
For the statement to be reliable it should be based on a sound premise(s) Nevertheless both experts and non-
experts make use of subjective probability daily For example I have a 90 chance of passing my statistics and
probability exam
Lesson two Teacher explains basic terms of probability such as sample space sample point an event equally
likely to preservice teachers Teacher guides preservice teachers through demonstration to solve probability
problems using classical definition of probability by listing the sample space and finding the probability of an
event Teacher leads preservice teachers to solve probability problems from frequency tables Similarly teacher
explains to preservice teachers independent and dependent events Teacher asks the preservice teachers to solve
problems on independent and dependent events
Hokor amp Sedofia
130
Data Analysis
The data collected were coded and edited before being transferred to computer for analysis using SPSS version
24 A Levenersquos test was used in the study to ensure that the assumptions between each group was not violated
Homogeneity of variances was considered to ensure that each grouprsquos pre-test scores were mostly equal Paired
samples T-test was used to compare two means within each group to determine whether or not the differences in
means were statistically significant Independent sample T-test was used to compare the probabilistic reasoning
mean scores in Group A and the Group B before the experiment at a time to determine whether the two groups
were at the same level or not The independent t-test was used because there were two different groups of
participants It works on the assumption that scores are unique because they come from different participants
Also the equality of variance for running ANCOVA at 5 significance level was checked using Levenersquos test
Table 2 Levenes Test of Equality of Variances
F df1 df2 Sig
1234 1 57 0456
The results from Table 2 indicate that the variances are roughly equal since the significance value of 0456 is
greater than the cut-off value of 005 Therefore we can conclude that homogeneity of variance assumption was
met (Field 2005) This allowed us to examine the relationship between the covariate (pre-test scores) and
dependent variable (post-test scores) Analysis of covariance (ANCOVA) was used to examine the effect of
learner-centered approach to teaching and teacher-centered approach on preservice teachersrsquo probabilistic
reasoning since different participants were in each group The ANCOVA is ideal in removing the bias of these
variables (Field 2005) In order to determine whether or not the occurrence of scores was not by chance a
partial eta squared was used to gauge the magnitude of the difference (effect size) between means of the scores
Pallant (2001) outlined the following criterion for interpreting partial eta squared values as 001 = small effect
006 = moderate effect and 014 = large effect
Results
Before introducing the learner-centered and teacher-centered approaches of teaching preservice teachersrsquo
probabilistic reasoning was compared to ascertain whether or not their results were similar in terms of the mean
scores The result is presented in Table 3
Table 3 Results of the Independent Samples t-test on the Pre-test of the Group B and Group A
Group N Mean Std Dev Mean Difference Df t-value p-value
Group B 27 585 1562 35 56 756 456
Group A 32 550 1967
The results in Table 3 indicate that there was no statistically significant difference between the probabilistic
reasoning mean scores of Group A = 550 = 1967 and Group B = 585 = 1562 in the
International Journal of Studies in Education and Science (IJSES)
131
pretest This is an indication that the two groups are similar and their performance could be compared after the
two teaching approaches
Comparison of Probabilistic Reasoning of the Preservice Teachers before and after Learner-centered
Approach in Group A
The results of analysis of the effect of the learner-centered approach on preservice teachersrsquo probabilistic
reasoning is presented in Table 4
Table 4 Pre-test and Post-test Scores for Group A
Minimum Maximum Mean Std Deviation
Pre-test 1 10 550 1967
Post-test 8 20 1572 3630
Table 4 reveals that in the post-test preservice teachersrsquo probabilistic reasoning mean scores increased from
550 to 1572 in the post-test in Group A
A paired sample t‐test was conducted to compare the post-test and pre-test scores for the preservice teachers
taught with the learner-centered approach to teaching (Group A) in order to determine if the mean difference in
scores was statistically significant This was done to evaluate the effect of the learner-centered approach on
preservice teachersrsquo probabilistic reasoning Table 5 presents the results
Table 5 Paired Sample t-test Results on the Post-test and Pre-test of Group A
Mean
Difference
Std
Deviation
Std Error
Mean
t Df Sig
Post-test ndash Pre-test 10219 2871 507 20137 31 000
The results from Table 5 shows a statistically significant difference in the preservice teachersrsquo probabilistic
reasoning from the pre-test (M = 550 SD = 1967) to the post-test (M = 1572 SD = 3630) with t (31) =
20137 p = 000 The result reveals that preservice teachersrsquo probabilistic reasoning has improved significantly
after the learner-centered approach was used since = 000 05 It can be inferred that the learner-centered
approach to teaching has a positive significant effect on preservice teachersrsquo probabilistic reasoning
Analysis of Probabilistic Reasoning of the Preservice Teachers before and after Teacher-centered
Approach to Teaching
The results of the analysis of the effect of the teacher-centered approach to teaching on preservice teachersrsquo
probabilistic reasoning is presented in Table 6
Hokor amp Sedofia
132
Table 6 Pre-test and Post-test Scores for the Group B
Minimum Maximum Mean Std Deviation
Pre-test 2 8 585 1562
Post-test 5 14 952 2208
The data on Table 6 show that the mean score of preservice teachers in the pre-test was 585 while that of the
post-test was 952 marks This indicates that in the post-test an average of each of the preservice teachersrsquo
probabilistic reasoning increased slightly in Group B To determine if the mean difference is statistically
significant a paired sample t‐test was conducted Table 7 presents the results
Table 7 Results of the Paired Samples t-test on the Post-test and Pre-test of the Group B
Mean
Difference
Std Deviation Std Error
Mean
t Df Sig
Post-test ndash Pre-test 3667 1441 0277 13220 26 000
The result presented on Table 7 shows that the mean score difference between the post-test and pre-test of
Group B was 3667 marks with a corresponding standard deviation of 1441 The paired sample t-test was
conducted to find out if the mean score difference (M = 3667 SD = 1441) was statistically significant This
was done to assess the effect of the teacher-centered approach targeted at addressing misconceptions on
preservice teachersrsquo probabilistic reasoning The results from Table 7 reveal that there was a statistically
significant difference in the preservice teachersrsquo probabilistic reasoning scores from the pre-test (M = 585 SD =
1562) to the post-test (M = 952 SD = 2208) with t (26) = 13220 p = 000 lt 05 This is an indication that the
teacher-centered approach to teaching probability targeted at addressing probabilistic misconceptions aids
students to improve upon their understanding and problem-solving abilities in probability
Next we compared the effectiveness of the learner-centered approach of teaching and the teacher-centered
approach of teaching in terms of probabilistic reasoning of preservice teachers and how they addressed
probabilistic misconceptions
Comparison of Effectiveness of Learner-centered Approach and Teacher-centered Approach in
Developing Probabilistic Reasoning
The preservice teachersrsquo scores on the pre-test of the achievement test were used as covariate in this analysis
The scores from the post-test were then compared using ANCOVA with = 05 to adjust for pre-test
differences that existed between Group A and Group B In the pre-test the mean scores of Group B and Group A
were 585 and 550 respectively ANCOVA was used to adjust the post-test scores statistically to compensate
for the 035 mean point difference between the two groups in the pre-test This adjustment led to a more
accurate post-test comparison Table 8 presents the results
International Journal of Studies in Education and Science (IJSES)
133
Table 8 Summary of ANCOVA of the Performance of Preservice Teachers taught with Learner-centered
Approach and Teacher-centered Approach (N = 59)
Source Sum of
Squares
Df
Mean
Square
F Sig Partial Eta
Squared
Corrected
Model
791144a 2 395562 72150 000 720
Intercept 205135 1 205135 37416 000 401
Pre-test 228184 1 228184 41620 000 426
Group 630253 1 630253 114955 000 672
Error 307026 56 5483
Total 10888000 59
Corrected Total 1098169 58
a R Squared = 720 (Adjusted R Squared = 710)
The data on Table 8 indicate that there is a statistically significant main effect on the preservice teachers who
were taught using the learner-centered approach to learn probability [F (1 56) = 114955 p = 000 lt 05]
Consequently the preservice teachers taught with the learner-centered approach performed better than their
counterparts who experienced the teacher-centered approach to learn probability The partial eta squared value
was found to be 0672 This value indicates a large effect size That is 672 of the variance in the dependent
variable (probabilistic reasoning achievement score) is expounded by the independent variable (teacher-centered
approach) This implies that the magnitude of the difference between the mean score of the preservice teachers
taught with the learner-centered approach and the teacher-centered approach is large With the high scores of
preservice teachers in the Group A it implies that the use of learner-centered approach in the teaching and
learning of probability improved the performance of the preservice teachers
The outcome of the study portrays that there was a statistically significant difference in the probabilistic
reasoning achievement mean scores of Group A than that of Group B [F (1 56) = 114955 p = 000 lt 05] This
finding implies that Group A performed better than Group B in the probabilistic reasoning achievement test
This is an indication that when the learner-centered approach to teaching probability is targeted at addressing
probabilistic misconceptions preservice teachers develop better probabilistic reasoning than teacher-centered
approach
Discussion
This study set out to compare the learner-centered and teacher-centered approaches of teaching in order to
determine the best way of developing preservice teachersrsquo probabilistic reasoning at the College of Education
Hokor amp Sedofia
134
level in Ghana The results as shown on Tables 3 4 5 6 7 and 8 indicate that the learner-centered approach to
teaching probability is more effective than the teacher-centered approach in motivating and inspiring preservice
teachers to learn and apply probability The learner-centered approach provides studentsrsquo opportunities to think
reason reflect and evaluate their ideals and that of colleagues
The findings of the present study are in tandem with several research findings Lessani Md Yunus and Bakar
(2017) investigated mathematics teaching approaches and their consequences on learnersrsquo ability to solve
challenging problems Their findings affirm the learner-centered approach to be more effective in studentsrsquo
creativity and innovation in solving real-life problems than the teacher-centered approach So training
programs for excellent teaching and learning should be flexible and innovative to allow preservice teachers to
explore gaps in learning and teaching (AIAhmad 2021) Similarly Prideaux (2007) found that students who
experienced the learner-centered approach of teaching performed significantly higher than those who were
taught without the learner-centered approach of teaching Roseth Garfield and Ben-Zvi (2008) also examined
the effect of the cooperative framework in classroom teaching and collaboration and found that student-
centered approaches to teaching help students to have better understanding of statistics than teacher-centered
instruction
Furthermore Gurbuz and Birgin (2011) studied the effect of computer-assisted teaching on addressing
probabilistic misconceptions of students The authors used pre-test to collect data on both the computer-assisted
and traditional groups before the experimental teachings After the intervention the post-test was administered
to ascertain the effect of computer-assisted teaching and teacher-centered approach on addressing studentsrsquo
probabilistic misconceptions Their study found computer-assisted teaching to have more significant effect on
studentsrsquo correct probabilistic reasoning than teacher-centered approach of teaching
As noted by Batanero and Diaz (2012) probability forms an integral part of the Mathematics curriculum in
many countries But the concept is one that some learners find difficult to understand partly due to the method
of teaching used by teachers This fact implies that teachers of mathematics should find more creative ways of
teaching the concept so as to make it easier for learners to understand and apply the concept As discovered in
this study the learner-centered approach is effective in developing probabilistic reasoning But the learner-
centered approach works best when certain conditions are present At the outset there is the need for relevant
teaching and learning materials Then teachers need to be trained and retrained in the use of the learner-centered
approach to teaching At the college of education level preservice teachers need to be taught using the learner-
centered approach not only to help them understand probability but also to help them use the learner-centered
approach in their own teaching
The activities used for Group A which is learner-centered approach group in the form of games promote
content knowledge and cognitive skills competencies such as collaboration and problem solving (Belova amp
Zowada 2020) The activities focus on promoting learning experiences rather than stressing on the
entertainment factor While some things students learn in school seem to them predetermined and bound by
laws in other branches of mathematics probability provides students with opportunity to learn that solutions to
International Journal of Studies in Education and Science (IJSES)
135
several problems depend on assumptions and have degrees of doubt So teaching methods that allow students to
predict and test their predictions should be encouraged for students to develop their intellectual repertoire The
processes used in reasoning about sample space will serve students well in life Several calls on the need to pay
attention to the study of probability show that teachers and mathematics teachers must provide their students
with appropriate teaching strategies to enhance their conceptual understanding In the preparation of preservice
teachers to become mathematically competent citizens teacher preparation programs such as teaching methods
must provide opportunities for preservice teachers to confront misconceptions and reason probabilistically
(Courtney amp Caniglia 2021)
The findings of the present study however run counter to those of Weltman and Whiteside (2010) They
conducted a study on the effectiveness of the traditional and active learning method in business statistics The
study found that active learning had not been effective for all category of students It is not precisely clear what
may have accounted for that result This is because active learning methods have generally been known to be
effective in promoting learning Further research is thus required in this regard
Conclusions
This study compared the effects of the learner-centered and teacher-centered approaches of teaching in
addressing probabilistic misconceptions by measuring preservice teachersrsquo probabilistic reasoning scores The
results show that the learner-centered approach aids preservice teachers to develop better probabilistic reasoning
than the teacher-centered approach to teaching Thus the study concludes that the learner-centered approach to
teaching is a solution to preservice teachersrsquo inability to answer questions on probability correctly Even though
each teaching approach targeted at addressing misconceptions was found to have significant effect on pre-
service teachersrsquo probabilistic reasoning the learner-centered approach was found to be more effective than the
teacher-centered approach in addressing misconceptions which limit studentsrsquo ability to solve probability
problems correctly
Implications and Recommendations
This study makes some key contributions to the teacher educationdevelopment literature in general and
particularly to the development of probabilistic reasoning of preservice teachers The study provides empirical
evidence that the learner-centered approach targeted at addressing probabilistic misconceptions is more effective
in developing probabilistic reasoning in preservice teachers What this means is that when teacher educators use
the learner-centered approach to teach the concept of probability and focus on addressing misconceptions
preservice teachers will develop better probabilistic reasoning This will in turn translate into preservice
teachers answering questions on probability correctly in their examinations and ultimately making them teach
the concept more effectively when they complete their training It is thus recommended that teachers should
consider employing the learner-centered approach in teaching the concept of probability
Hokor amp Sedofia
136
Limitations
As with every empirical study employing the quasi-experimental approach the current study has some
limitations which need to be acknowledged and used to guide users of the findings Firstly our sample was
drawn from a population of second year preservice teachers of a female only college of education in a peri-
urban area in Ghana Further experiments are therefore needed in other settings in order to see if the same or
similar results will occur Secondly owing to the narrow characteristics of the participants in the present study
the researchers cannot generalize the results to other individuals who do not have the same characteristics So
additional experiments with groups with different characteristics are necessary Lastly the experiments need to
be repeated at another time to determine if the results are the same (consistent) over time
Acknowledgements
We are grateful to the Principal and preservice teachers for granting access and participating in the study
respectively
References
AIAhmad H (2021) The role of educational communication in promoting student-centered learning style in
multicultural classrooms A reflective essay on learning and teaching in higher education International
Journal of Research in Education and Science (IJRES) 7(3) 838-851 httpsdoiorg1046328ijes2374
Aina J K Olanipekun S S amp Garuba I A (2015) Teachersrsquo effectiveness and its Influence on studentsrsquo
learning Advances in Social Sciences Research Journal 2(4) 88-95
Anway D W amp Bennett E (2004) Common Misconceptions in Probability among Students in an Elementary
Statistics class Unplished Senior Project The ARTIST Roundtable Conference on Assessment in
Statistics held at Lawrence University Supperior WI The University of Wisconsin-Superior
Bada S (2015) Constructivist Learning Theory A Paradigm for Teaching and Learning IOSR Journal of
Research and Method in Education (IOSR-JRME) 5(6) 66-70 httpsDOI1097907388-05616670
Baerveldt C (2013) Constructivism contested Implications of a genetic perspective in psychology Integrative
Psychological and Behavioral Science 47(1) 156-166
Batanero C (2013) Teaching and learning probability In S Lerman (Ed ) Encyclopedia of Mathematics
Education Heidelberg Springer
Batanero C and Diaz C (2012) Training school teachers to teach probability reflections and challenges
Chilean Journal of Statistics 3(1) 3-13
Belova N amp Zowada C (2020) Innovating Higher Education Via Game-Based Learning on Misconceptions
Education Sciences 10 221 doi103390educSCi10090221
Bennett E amp Anway D W (2003) Statistical and Probabilistic Reasoning and Misconceptions among
Selected College Students McNair Scholars Journal Vol 4 httpwwwsocheclchjs
Cantoy O (2010) Mathematics teachersrsquo topic-specific pedagogical content knowledge in the context of
teaching a0 0 and a divide 0 Educational Sciences Theory and Practice 10 (2) 749-769
International Journal of Studies in Education and Science (IJSES)
137
Clements D H amp Battista M (1990) Constructivist Learning and Teaching The
Arithetic Teacher 38(1) ProQuest Central pg 34 DOI105951AT3810034
Creswell J W amp Creswell J D (2018) Research design Qualitative quantitative and
mixed methods approaches (5th
ed) Los Angeles SAGE Publications Inc
Courtney S A amp Caniglia J (2021) Comparing the mathematical practices pre-service teachers and
mathematics teacher educators identified as relevant to problems and tasks International Journal of
Research in Education and Science (IJRES) 7(3) 954-971 httpsdoiorg1046328ijres2335
Denton D W (2012) Enhancing instruction through constructivism cooperative learning and cloud
computing Tech Trends 56(4) 34-41
Gage J (2012) Towards a new Probability Curriculum for Secondary Schools Paper presented at 12th
International Congress on Mathematical Education 8 July-15 July COEX Seoul Korea Cambridge
Cambridge University Uk
Gurbuz R amp Birgin O (2011) The effect of computer-assisted teaching on remedying misconceptions The
case of the subject Probability Journal Homepage 58(2012) DOI 101016jcompedu201111005
Hirsh L amp ODonnell A M (2001) Representativeness in Statistical Reasoning Identifying and Assessing
Misconceptions Journal of Statistics Education 9(2) 96-105 DOI10108010691898200111910655
Johnson H D amp Dasgupta N (2005) Traditional versus Non-traditional Teaching during Perspectives of
Students in Introductory Statistics Classes Journal of Statistics Education 13(2)
httpsdoiorg10108010691898200511910558
Major T amp Mangope B (2012) The Constructivist Theory in Mathematics The case of Botswana Primary
Schools International Review of Social Sciencies and Humanities 3(2) 139-147
Jones G (2005) Reflections In GA Jones (Ed) Exploring probability in school chanlleges for teaching and
probability (367-372) New York Springer
Jun L (2000) Chinese Students Understanding of Probability Published doctoral dissertation Singapore
National Institute of Education Nanyang Technological University
Khazanov L amp Gourgey A (2009) Instructors Perspectives on Students Mistaken Beliefs about Probability
in an Elementary College Statistics Course In K Safford-Ramus (Ed) Proceedings of the Adults
Learning Mathematics a Resaerch Forum (ALM) 15th
Annual International Conference 249-264
Khazanov L amp Prado L (2010) Correcting Students Misconceptions about Probability in an Introductory
College Statistics Course Adults Learning Mathematics-An International Journal 5(1) 23-35
Kleickmann T Richter D Kunter M Elsner J Besser M Krauss S amp Baumert J (2013) Teachersrsquo
Content Knowledge and Pedagogical Content Knowledge The Role of Structural Differences in Teacher
Education Journal of Teacher Education 64(1) 90-106 DOI1011770022487112460398
Leedy P D and Ormrod J E (2020) Practical research Planning and design (12th Global Edition) Harlow
England Pearson
Lessani A Md Yunus AS amp Bakar KBA (2017) Comparison of new mathematics teaching methods with
teacher-centered approach International Journal of Social Sciences 3(2) 1285-1297
httpsdxdoiorg1020319pijss20173212851297
Lim C amp Hwa T (2007) Promoting Mathematical Thinking in the Malaysian Classroom Issues and
challenges httpswwwresearchgatenetpublication252353381
Hokor amp Sedofia
138
Lovett J N amp Lee H S (2017) New Standards Require Teaching More Statistics Are Preservice Secondary
Mathematics Ready Journal of Teachers Education 68(3) 299-311 DOI 1011770022487117697918
Major T amp Mangope B (2012) The Constructivist Theory in Mathematics The case of Botswana Primary
Schools International Review of Social Sciencies and Humanities 3(2) 139-147
National Council of Teachers of Mathematics (2003) Principles and Standards for School Mathematics and
their Implications for Professional Development Reston VA NCTM
Nguyen L (2015) Developing Conceptual Understanding and Probabilistic Thinking through Tree Diagrams
Published MPhil Dissertation Manitoba The Faculty of Graduate Studies of the University of
Manitoba
Prideaux J (2007) The learner-centered approach to Mathematics Teaching and the Active Learning
Strategies used to Enhance Students Understanding Mathematical and Computing Sciences Masters
Paper 29 Fisher Digital Publications httpfisherpubsjfcedumathcsetdmasters29
Roseth C J Garfield J B amp Ben-Zvi D (2008) Collaboration in Learning and Teaching Statistics Journal
of Statistics Education 16 (1) 1069-1898 httpsdoiorg10108010691898200811889557
Santagata R and Sandholtz J H (2019) Preservice teachersrsquo mathematics teaching competence Comparing
performance on two measures Journal of Teacher Education 70 (5) 472 ndash484
Schwerdt G amp Wuppermann A C (2011) Is traditional teaching really all that bad A within-student
between-subject approach Economics of Education Review 30(2) 365-379
Sharma S (2016) Probability from a socio-cultural perspective Statistics Education Research Journal 15(2)
126-144 httpiase-weborgPublicationsphpp=SERJ
Shay K (2008) Tracing middle school students understanding of probability a longitudinal study
Unpublished Doctoral Dissertation New Brunswick New Jersey Rutgers State University of New
Jersey
Shulman L S (1986) Those who understand Knowledge growth in teaching Educational Researcher 15(2)
4-14 doi 1031021001318X015002004
Thomas L (2020) An introduction to quasi-experimental designs
httpswwwscribbrcommethodologyquasi-experimental-design
Voskoglou M (2019) Comparing Teaching Methods of Mathematics at University Level Education Sciences
9(204) doi103390educsci9030204
Vygotsky L S (1978) Mind in society The development of higher psychological processes Cambridge MA
Harvard University Press
Weldeana H N amp Abraham S T (2014) The effect of an historical perspective on prospective teachersrsquo
beliefs in learning mathematics Journal of Mathematics Teacher Education 17 303-330
doi101007s10857-013-9266-z
Weltman D amp Whiteside M (2010) Comparing the Effectiveness of Traditional and active Learning Methods
in Business Statistics Convergence to the Mean 18(1)
httpsdoiorg10108010691898201011889480
White H amp Sabarwal S (2014) Quasi-experimental design and methods methological briefs impact
evaluations Florence UNICEF Office of research
International Journal of Studies in Education and Science (IJSES)
139
Author Information
Evans Kofi Hokor
httpsorcidorg0000-0002-8387-8294
St Teresarsquos College of Education Hohoe
Department of Mathematics and ICT
P O Box 129
Ghana
Contact e-mail evanskhokorgmailcom
John Sedofia
httpsorcidorg0000-0002-5409-516X
University of Ghana Legon
Department of Teacher Education
PO Box LG 1181
Ghana
Hokor amp Sedofia
140
Appendix A Pre-test Probabilistic Reasoning Assessment
This assessment is for research purpose to improve teaching and learning of probability
You are required to answer all questions honestly Do and leave all workings or rough work on the paper
Pre-test Probabilistic Reasoning Assessment Duration 1hr
Index numberhelliphelliphelliphelliphelliphelliphelliphelliphelliphelliphelliphelliphelliphelliphelliphelliphelliphellipLevelhelliphelliphelliphellipAgehelliphelliphellip
Read each statement carefully and circle the letter of the correct (best) option Provide appropriate response in
the space provided under some items as it apply
1 If you rolled an ordinary die and obtained 51246 which of these is most likely to occur on your next
roll
a 1
b 2
c 3
d 4
e 5
f 6
g The options a b c d e and f are all equally
2i A fair coin is tossed and it lands tail The coin is to be tossed a second time What is the probability that the
second toss will also be a tail
a 1
4
b 1
2
c 1
3
d Slightly less than 1
2
e Slightly more than 1
2
f 0
2ii Which of the following best describes the reason for the correct answer to the preceding question (2i)
a The second toss is less likely to be tail because the first toss was tail
b There are four possible outcomes when you toss a coin twice Getting two tails is only one of them
c The chance of getting heads or tails on any one toss is always 1
2
d There are three possible outcomes when you toss a coin twice Getting two tails is only one of the them
e No chance of being a tail in the second toss
3i A box contains 6 balls 2 are red 2 are black and 2 blue Three balls are picked at random one at a time
Each time a ball is picked the colour is recorded and the ball is put back in the box mixed thoroughly If the
first 2 balls are black what color is the third ball most likely to be
a Red
International Journal of Studies in Education and Science (IJSES)
141
b Black
c Blue
d Red and blue are equally likely than black
e Red black and blue are all equally likely
3ii Which of the following best describes the reason for the correct answer in the preceding question (3i)
a The third ball should not be black because too many black ones have already been picked
b The picks are independent so every color has an equally likely chance of being picked
c Black seems to be lucky
d This color is just as likely as any other color
4 A spinner with ten equally divided sectors in which four parts are white and the rests are red is about to
be spin which color is the spinner more likely to land
a White
b Red
c Both white and red are all equally
5 If you toss a fair coin and get heads two times in a row which of these is most likely on next toss
a Tail
b Head
c Both head and tail are all equally
6 A Gh 2 Gh 5 Ghcent10 Gh 20 Gh 50 and Gh 100 notes were put in a box and thoroughly mixed
What is the probability of picking Gh 50 note without looking
a 1
187
b 50
187
c 1
6
d 0
7 In a game you have been offered two options Which of the following give you higher chance of
winning GHcent200
a Tossing one die once and obtaining a 6
b Tossing two dice once and obtaining two 6rsquos
c The options a and b are all equally
8 A fair die is to be toss six times which of these is most likely to occur
a 251634
b 123456
c 666341
d 132244
e The options a b c and d are all equally likely
9 A fair coin is to be toss four times in a row which of these is least likely to occur
a THTH
b TTTH
c HHH
Hokor amp Sedofia
142
d The options a b and c are all equally likely
10 Two fair dice are to be tossed once Which of the following is more likely to occur
a Obtaining a sum of 11
b Obtaining a sum of 10
c A sum of 11 and a sum of 10 are all equally likely
10i Give reason for the correct answer in the preceding question (10)
helliphelliphelliphelliphelliphelliphelliphelliphelliphelliphelliphelliphelliphelliphelliphelliphelliphelliphelliphelliphelliphelliphelliphelliphelliphelliphelliphelliphelliphelliphelliphelliphelliphelliphelliphelliphelliphelliphelliphelliphelliphellip
helliphelliphelliphelliphelliphelliphelliphelliphelliphelliphelliphelliphelliphelliphelliphelliphelliphelliphelliphelliphelliphelliphelliphelliphelliphelliphelliphelliphelliphelliphelliphelliphelliphelliphelliphelliphelliphelliphelliphelliphelliphellip
helliphelliphelliphelliphelliphelliphelliphelliphelliphelliphelliphelliphelliphelliphelliphelliphelliphelliphelliphelliphelliphelliphelliphelliphelliphelliphelliphelliphelliphelliphelliphelliphelliphelliphelliphelliphelliphelliphelliphelliphelliphellip
helliphelliphelliphelliphelliphelliphelliphelliphelliphelliphelliphelliphelliphelliphelliphelliphelliphelliphelliphelliphelliphelliphelliphelliphelliphelliphelliphelliphelliphelliphelliphelliphelliphelliphelliphelliphelliphellip
11 In national lottery one has to choose five numbers from 1 to 90 inclusive You win when at least two of
your numbers are part of the numbers drawn on Saturday at random Eric has chosen 4 6 7 9 and 11
Alex has chosen 15 23 45 66 and 80 Daniel has chosen 71 77 78 83 and 85 Do Eric Alex and
Daniel have the same chance of winning or not and why
helliphelliphelliphelliphelliphelliphelliphelliphelliphelliphelliphelliphelliphelliphelliphelliphelliphelliphelliphelliphelliphelliphelliphelliphelliphelliphelliphelliphelliphelliphelliphelliphelliphelliphelliphelliphelliphelliphelliphelliphellip
helliphelliphelliphelliphelliphelliphelliphelliphelliphelliphelliphelliphelliphelliphelliphelliphelliphelliphelliphelliphelliphelliphelliphelliphelliphelliphelliphelliphelliphelliphelliphelliphelliphelliphelliphelliphelliphelliphelliphelliphellip
helliphelliphelliphelliphelliphelliphelliphelliphelliphelliphelliphelliphelliphelliphelliphelliphelliphelliphelliphelliphelliphelliphelliphelliphelliphelliphelliphelliphelliphelliphelliphelliphelliphelliphelliphelliphelliphelliphelliphelliphellip
helliphelliphelliphelliphelliphelliphelliphelliphelliphelliphelliphelliphelliphelliphelliphelliphelliphelliphelliphelliphelliphelliphelliphelliphelliphelliphelliphelliphelliphelliphelliphelliphelliphelliphelliphellip
12 A box contains 8 yellow balls and 4 green balls Two balls are chosen at random one after the other
without replacement determine the probability that the two balls are of different colours
helliphelliphelliphelliphelliphelliphelliphelliphelliphelliphelliphelliphelliphelliphelliphelliphelliphelliphelliphelliphelliphelliphelliphelliphelliphelliphelliphelliphelliphelliphelliphelliphelliphelliphelliphelliphelliphelliphelliphelliphellip
helliphelliphelliphelliphelliphelliphelliphelliphelliphelliphelliphelliphelliphelliphelliphelliphelliphelliphelliphelliphelliphelliphelliphelliphelliphelliphelliphelliphelliphelliphelliphelliphelliphelliphelliphelliphelliphelliphelliphelliphellip
helliphelliphelliphelliphelliphelliphelliphelliphelliphelliphelliphelliphelliphelliphelliphelliphelliphelliphelliphelliphelliphelliphelliphelliphelliphelliphelliphelliphelliphelliphelliphelliphelliphelliphelliphelliphelliphelliphelliphelliphellip
helliphelliphelliphelliphelliphelliphelliphelliphelliphelliphelliphelliphelliphelliphelliphelliphelliphelliphelliphelliphelliphelliphelliphelliphelliphelliphelliphelliphelliphelliphelliphelliphelliphelliphelliphelliphellip
International Journal of Studies in Education and Science (IJSES)
143
Appendix B Post-test Probabilistic Reasoning Assessment
This assessment is for research purpose to improve teaching and learning of probability
You are required to answer all questions honestly Do and leave all workings or rough work on the paper
Post-test Probabilistic Reasoning Assessment Duration One Hour
Index numberhelliphelliphelliphelliphelliphelliphelliphelliphelliphelliphelliphelliphelliphelliphellipClasshelliphelliphelliphellipAgehelliphelliphelliphellip
Read each statement carefully and circle the letter of the correct (best) option for each item as much as possible
and provide appropriate response in the space provided
1 Suppose a particular outcome from a random event has a probability of 04 Which of the following
statements represents correct interpretations of this probability
a The outcome will not happen
b The outcome will certainly happen about four times out of every 10 trials
c The outcome is expected to happen about four times out of every 10 trials
d The outcome could happen or it couldnrsquot of either result are the same
2 If you toss a fair coin and get heads 3 times in a row what is the chance of getting a head on the next toss
a 1
b Greater than 1
2
c 1
2
d Less than 1
2
e 0
3 A die is numbered 1 2 3 4 4 5 When the die is thrown once Which of these is most likely and why
a 1
b 2
c 3
d 4
e 5
f They are all equally likely
3i Give reason for your chosen answer in (3)
helliphelliphelliphelliphelliphelliphelliphelliphelliphelliphelliphelliphelliphelliphelliphelliphelliphelliphelliphelliphelliphelliphelliphelliphelliphelliphelliphelliphelliphelliphelliphelliphelliphelliphelliphelliphelliphelliphelliphelliphelliphelliphelliphelliphellip
helliphelliphelliphelliphelliphelliphelliphelliphelliphelliphelliphelliphelliphelliphelliphelliphelliphelliphelliphelliphelliphelliphelliphelliphelliphelliphelliphelliphelliphelliphelliphelliphelliphelliphelliphelliphelliphelliphelliphelliphelliphelliphelliphelliphellip
helliphelliphelliphelliphelliphelliphelliphelliphelliphelliphelliphelliphelliphelliphelliphelliphelliphelliphelliphelliphelliphelliphelliphelliphelliphelliphelliphelliphelliphelliphelliphelliphelliphelliphelliphelliphelliphelliphelliphelliphelliphelliphelliphelliphellip
helliphelliphelliphelliphelliphelliphelliphelliphelliphelliphelliphelliphelliphelliphelliphelliphelliphelliphelliphelliphelliphelliphelliphelliphelliphelliphelliphelliphelliphelliphelliphelliphelliphelliphelliphelliphelliphelliphellip
4 German MP tossed two dice once Which of these is mostly likely and why
a Obtaining a sum of 4
b Obtaining a sum of 7
c Obtaining a sum of 11
d All of them have equal chance of occurring that is a b c
Hokor amp Sedofia
144
4i Give reason for your chosen answer in (4)
helliphelliphelliphelliphelliphelliphelliphelliphelliphelliphelliphelliphelliphelliphelliphelliphelliphelliphelliphelliphelliphelliphelliphelliphelliphelliphelliphelliphelliphelliphelliphelliphelliphelliphelliphelliphelliphelliphelliphelliphelliphelliphelliphelliphellip
helliphelliphelliphelliphelliphelliphelliphelliphelliphelliphelliphelliphelliphelliphelliphelliphelliphelliphelliphelliphelliphelliphelliphelliphelliphelliphelliphelliphelliphelliphelliphelliphelliphelliphelliphelliphelliphelliphelliphelliphelliphelliphelliphelliphellip
helliphelliphelliphelliphelliphelliphelliphelliphelliphelliphelliphelliphelliphelliphelliphelliphelliphelliphelliphelliphelliphelliphelliphelliphelliphelliphelliphelliphelliphelliphelliphelliphelliphelliphelliphelliphelliphelliphelliphelliphelliphelliphelliphelliphellip
helliphelliphelliphelliphelliphelliphelliphelliphelliphelliphelliphelliphelliphelliphelliphelliphelliphelliphelliphelliphelliphelliphelliphelliphelliphelliphelliphelliphelliphelliphelliphelliphelliphelliphelliphelliphelliphelliphelliphelliphelliphelliphelliphelliphellip
helliphelliphelliphelliphelliphelliphelliphelliphelliphelliphelliphelliphelliphelliphelliphelliphelliphelliphelliphelliphelliphelliphelliphelliphelliphelliphelliphelliphellip
5i A fair coin is to be toss four times which of these is most likely to occur
a HTHT
b THTT
c TTTT
d HHTH
e The options a b c and d are all equally likely
5ii Give reason for your chosen answer in (5i)
helliphelliphelliphelliphelliphelliphelliphelliphelliphelliphelliphelliphelliphelliphelliphelliphelliphelliphelliphelliphelliphelliphelliphelliphelliphelliphelliphelliphelliphelliphelliphelliphelliphelliphelliphelliphelliphelliphelliphelliphelliphelliphelliphelliphellip
helliphelliphelliphelliphelliphelliphelliphelliphelliphelliphelliphelliphelliphelliphelliphelliphelliphelliphelliphelliphelliphelliphelliphelliphelliphelliphelliphelliphelliphelliphelliphelliphelliphelliphelliphelliphelliphelliphelliphelliphelliphelliphelliphelliphellip
helliphelliphelliphelliphelliphelliphelliphelliphelliphelliphelliphelliphelliphelliphelliphelliphelliphelliphelliphelliphelliphelliphelliphelliphelliphelliphelliphelliphelliphelliphelliphelliphelliphelliphelliphelliphelliphelliphelliphelliphelliphelliphelliphelliphellip
helliphelliphelliphelliphelliphelliphelliphelliphelliphelliphelliphelliphelliphelliphelliphelliphelliphelliphelliphelliphelliphelliphelliphelliphelliphelliphelliphelliphelliphelliphelliphelliphelliphelliphelliphelliphelliphelliphellip
6i A fair coin is to be toss four times which of these is least likely to occur
a HTHT
b THTT
c TTTT
d HHTH
e The options a b c and d are all equally likely
6ii Give reason for your chosen answer in (6i)
helliphelliphelliphelliphelliphelliphelliphelliphelliphelliphelliphelliphelliphelliphelliphelliphelliphelliphelliphelliphelliphelliphelliphelliphelliphelliphelliphelliphelliphelliphelliphelliphelliphelliphelliphelliphelliphelliphelliphelliphelliphelliphelliphelliphellip
helliphelliphelliphelliphelliphelliphelliphelliphelliphelliphelliphelliphelliphelliphelliphelliphelliphelliphelliphelliphelliphelliphelliphelliphelliphelliphelliphelliphelliphelliphelliphelliphelliphelliphelliphelliphelliphelliphelliphelliphelliphelliphelliphelliphellip
helliphelliphelliphelliphelliphelliphelliphelliphelliphelliphelliphelliphelliphelliphelliphelliphelliphelliphelliphelliphelliphelliphelliphelliphelliphelliphelliphelliphelliphelliphelliphelliphelliphelliphelliphelliphelliphelliphelliphelliphelliphelliphelliphelliphellip
helliphelliphelliphellip
7 A college has 300 level 200 students and 236 level 100 students in it Each studentrsquos name is written with
the level on a piece of paper and all the names are put into a box and mixed thoroughly A tutor picks one
name out of the box without looking Which level is the tutor more likely to pick from and why
helliphelliphelliphelliphelliphelliphelliphelliphelliphelliphelliphelliphelliphelliphelliphelliphelliphelliphelliphelliphelliphelliphelliphelliphelliphelliphelliphelliphelliphelliphelliphelliphelliphelliphelliphelliphelliphelliphelliphelliphelliphelliphelliphelliphellip
helliphelliphelliphelliphelliphelliphelliphelliphelliphelliphelliphelliphelliphelliphelliphelliphelliphelliphelliphelliphelliphelliphelliphelliphelliphelliphelliphelliphelliphelliphelliphelliphelliphelliphelliphelliphelliphelliphelliphelliphelliphelliphelliphelliphellip
helliphelliphelliphelliphelliphelliphelliphelliphelliphelliphelliphelliphelliphelliphelliphelliphelliphelliphelliphelliphelliphelliphelliphelliphelliphelliphelliphelliphelliphelliphelliphelliphelliphelliphelliphelliphelliphelliphelliphelliphelliphelliphelliphelliphellip
helliphelliphelliphelliphelliphelliphelliphelliphelliphelliphelliphelliphelliphelliphelliphelliphelliphelliphelliphelliphelliphelliphelliphelliphelliphelliphelliphelliphelliphelliphelliphelliphelliphelliphelliphelliphelliphelliphelliphellip
8 Suppose that you toss a coin three times and all eight outcomes are equally likely If it is known that the first
toss comes up heads what is the probability of an odd number of heads appearing
helliphelliphelliphelliphelliphelliphelliphelliphelliphelliphelliphelliphelliphelliphelliphelliphelliphelliphelliphelliphelliphelliphelliphelliphelliphelliphelliphelliphelliphelliphelliphelliphelliphelliphelliphelliphelliphelliphelliphelliphelliphelliphelliphelliphellip
helliphelliphelliphelliphelliphelliphelliphelliphelliphelliphelliphelliphelliphelliphelliphelliphelliphelliphelliphelliphelliphelliphelliphelliphelliphelliphelliphelliphelliphelliphelliphelliphelliphelliphelliphelliphelliphelliphelliphelliphelliphelliphelliphelliphellip
helliphelliphelliphelliphelliphelliphelliphelliphelliphelliphelliphelliphelliphelliphelliphelliphelliphelliphelliphelliphelliphelliphelliphelliphelliphelliphelliphelliphelliphelliphelliphelliphelliphelliphelliphelliphelliphelliphelliphelliphelliphelliphelliphelliphellip
International Journal of Studies in Education and Science (IJSES)
145
helliphelliphelliphelliphelliphelliphelliphelliphelliphelliphelliphelliphelliphelliphelliphelliphelliphelliphelliphelliphelliphelliphelliphelliphelliphelliphelliphelliphelliphelliphelliphelliphelliphelliphelliphelliphelliphelliphelliphelliphelliphelliphelliphelliphellip
helliphelliphelliphelliphelliphelliphelliphelliphelliphelliphelliphelliphelliphelliphelliphelliphelliphelliphelliphelliphelliphelliphelliphelliphelliphelliphelliphelliphelliphelliphelliphelliphelliphelliphelliphelliphelliphelliphelliphelliphelliphelliphelliphelliphellip
helliphelliphelliphelliphelliphelliphelliphelliphelliphelliphelliphelliphelliphelliphelliphelliphelliphelliphelliphellip
9 A card is selected at random from a pack of 52 cards Find the probability of selecting a card which is a red or
a queen
helliphelliphelliphelliphelliphelliphelliphelliphelliphelliphelliphelliphelliphelliphelliphelliphelliphelliphelliphelliphelliphelliphelliphelliphelliphelliphelliphelliphelliphelliphelliphelliphelliphelliphelliphelliphelliphelliphelliphelliphelliphelliphelliphelliphellip
helliphelliphelliphelliphelliphelliphelliphelliphelliphelliphelliphelliphelliphelliphelliphelliphelliphelliphelliphelliphelliphelliphelliphelliphelliphelliphelliphelliphelliphelliphelliphelliphelliphelliphelliphelliphelliphelliphelliphelliphelliphelliphelliphelliphellip
helliphelliphelliphelliphelliphelliphelliphelliphelliphelliphelliphelliphelliphelliphelliphelliphelliphelliphelliphelliphelliphelliphelliphelliphelliphelliphelliphelliphelliphelliphelliphelliphelliphelliphelliphelliphelliphelliphelliphelliphelliphelliphelliphelliphellip
helliphelliphelliphelliphelliphelliphelliphelliphelliphelliphelliphelliphelliphelliphelliphelliphelliphelliphelliphelliphelliphelliphelliphelliphelliphelliphelliphelliphelliphelliphelliphelliphelliphelliphelliphelliphelliphelliphelliphellip
10 A box contains 6 white balls and 4 green balls Two balls are chosen at random one after the other without
replacement determine the probability that the second ball is white
helliphelliphelliphelliphelliphelliphelliphelliphelliphelliphelliphelliphelliphelliphelliphelliphelliphelliphelliphelliphelliphelliphelliphelliphelliphelliphelliphelliphelliphelliphelliphelliphelliphelliphelliphelliphelliphelliphelliphelliphelliphelliphelliphelliphellip
helliphelliphelliphelliphelliphelliphelliphelliphelliphelliphelliphelliphelliphelliphelliphelliphelliphelliphelliphelliphelliphelliphelliphelliphelliphelliphelliphelliphelliphelliphelliphelliphelliphelliphelliphelliphelliphelliphelliphelliphelliphelliphelliphelliphellip
helliphelliphelliphelliphelliphelliphelliphelliphelliphelliphelliphelliphelliphelliphelliphelliphelliphelliphelliphelliphelliphelliphelliphelliphelliphelliphelliphelliphelliphelliphelliphelliphelliphelliphelliphelliphelliphelliphelliphelliphelliphelliphelliphelliphellip
helliphelliphelliphelliphelliphelliphelliphelliphelliphelliphelliphelliphelliphelliphelliphelliphelliphelliphelliphelliphelliphelliphelliphelliphelliphelliphelliphelliphelliphelliphelliphelliphelliphelliphelliphelliphelliphelliphelliphelliphelliphelliphellip

International Journal of Studies in Education and Science (IJSES)
121
Curriculum knowledge on the other hand is the teachersrsquo understanding of the curriculum Kleickmann et al
(2013) found that teachersrsquo content knowledge is a reflection of their pedagogical content knowledge Bolyard
and Packenham 2008 and Sanders and Morris 2000 (cited in Cantoy 2010) observed that even though content
knowledge is vital several research findings suggest effective mathematics teaching depends on adequate
teacher pedagogical content knowledge
Research suggests that studentsrsquo learning of mathematics is greatly influenced by the method of instruction
adopted by the teacher (Sharma 2016) Mathematics can be taught using the learner-centered approach or the
teacher-centered approach A popular learner-centered approach is constructivism Constructivism is a learning
theory which states that the learner is responsible for creating new knowledge for themselves and that new
learning is influenced by past knowledge and experiences (Baerveldt 2013) In a constructivist classroom
instructional strategies like group work and discussions are employed (Denton 2012) According to Clements
and Battista (1990) learner-centered approach for teaching a specific topic in Mathematics has the following
features
i ldquoKnowledge is actively created or invented by the learner not passively received from the environment
ii Students create new mathematical knowledge by reflecting on their physical and mental actions
iii No one true reality exists only individual interpretations of the world
iv Learning is a social process in which students grow into the intellectual life of those around them
v When a teacher demands that students use a set of mathematical methods the sense-making activity of
students is seriously curtailedrdquo (pp 34 and 35)
Thus constructivism states that learning is an active contextualized process of constructing knowledge based
on personal experiences of onersquos environment rather than acquiring knowledge through rote learning In this
study therefore constructivism is conceptualized as helping preservice teachers to construct the ideal meaning
of probability under the guidance of a teacher to help preservice teachers improve and develop a conceptual
understanding of the concept and for improved teaching outcomes If preservice teachers are to construct the
ideal meaning of mathematical concepts in order to apply and teach them well they need to be placed at the
center of the teaching and learning process Although the learner-centered approach of teaching mathematics has
been found to cause studentsrsquo performance in mathematics to improve substantially (National Council of
Teachers of Mathematics 2003) it has been observed that some classrooms in Ghana are still characterized by
the teacher-centered approach of teaching
Lim and Hwa (2007) found that teaching and learning of Mathematics in schools is full of the teacher-centered
approach of teaching and textbook-oriented method where learners memorize mathematical formulae and laws
without understanding the concepts ldquoIt seems that most teachers still prefer the traditional way of delivering
explicit mathematics instruction sometimes combined with challenging questions and mathematical discourse
with the students to promote conceptual understanding and critical analysis of the mathematical contextrdquo
(Voskoglou 2019 p 1) The lecture method is a typical teacher-centered approach to teaching As an approach
lectures are less likely to provide instructors with feedback about student learning and rest on the presumption
that all students learn at the same pace Moreover studentsrsquo attention wanes quickly during lectures and
Hokor amp Sedofia
122
information tends to be forgotten quickly as students are mostly passive learners in this kind of instruction
Finally lectures emphasize learning by listening which is a disadvantage for students who prefer other learning
styles (Schwerdt amp Wuppermann 2011) The lecture method of teaching mathematics may cause students to
lose interest in learning mathematics since it makes learners passive rather than active participants in the
learning process
Many countries have made probability an integral part of the school curriculum (Jun 2000) Although
probability forms a critical part of most mathematics curricula in many countries the training that preservice
teachers need to teach probability is missing in some training programs (Batanero amp Diaz 2012) Meanwhile
Roseth Garfield and Ben-Zvi (2008) argued that probabilistic reasoning is necessary for students to be
informed citizens in the 21st century In the present study probabilistic reasoning refers to the way people reason
about uncertainty situations and making decisions based on likely outcomes Bennett and Anway (2003) defined
probabilistic reasoning as ldquothe way people reason about likelihood (of outcomes) and with uncertaintyrdquo (p138)
Probabilistic reasoning involves
i identifying a desired outcome or a situation that involves uncertainty
ii using theoretical probability to determine the likelihood of that outcome and
iii making a decision with a level of confidence estimate directly from the likelihood (Nguyen 2015)
To develop better probabilistic reasoning in students teachersrsquo correct knowledge about probability is needed
When teachers are equipped with appropriate skills their confidence in teaching probability increases But some
studies have revealed that the current way of training teachers do not provide the essential skills needed to teach
probability effectively (Jones 2005 Khazanov amp Prado 2010) Research has shown that despite the numerous
interventions in helping to improve students learning outcomes individual learning style is very key in our quest
for improved teaching and learning of mathematics (Johnson amp Dasgupta 2005) Learning style serves as the
reference point for curriculum development and instruction
Some preservice teachers come to mathematics classrooms with the erroneous view that mathematics is an exact
or a fact discipline and as such everything about it should be memorized Weldeana and Abraham (2014)
revealed that prospective teachers hold traditional beliefs about mathematics limiting their intellectual
development in the discipline Khazanov amp Gourgey (2009) argued that if we expect improvements in studentsrsquo
conceptions then instructional interventions need to be designed to eliminate studentsrsquo misconceptions of
probability Additional research is also required to clarify the essential components in the preparation of
teachers to teach probability identify adequate methods and establish appropriate levels at which each
component should be taught (Batanero amp Diaz 2012) Despite the importance of probability and statistics there
is limited research about instructional methods and their effects (Shay 2008) and it appears few research
examined the effect of the learner-centered and teacher-centered approaches of teaching statistics on studentsrsquo
understanding in classrooms (Weltman amp Whiteside 2010 Lessani Md Yunus amp Bakar 2017) Lovett and Lee
(2017) examined the preparedness of high school preservice mathematics teachersrsquo ability to teach statistics and
the results revealed that the cohort of preservice teachers entering high school mathematics classrooms are not
prepared to teach statistics
International Journal of Studies in Education and Science (IJSES)
123
Some studies have examined the learner-centered and teacher-centered approaches of teaching mathematics on
studentsrsquo problem-solving abilities but the evidence seems to suggest that none of the studies provides an
empirical comparison of the learner-centered and teacher-centered approaches targeted at addressing
probabilistic misconceptions in relation to developing the probabilistic reasoning of preservice teachers
Additionally it appears there is no study that has compared the effect of the learner-centered and teacher-
centered approaches of teaching on preservice teachersrsquo probabilistic reasoning at the colleges of education level
in Ghana Therefore this study was designed to address the above gaps The important hypothesis that this study
sought to test is There is no significant difference in the probabilistic reasoning (mean scores) between students
who experience the learner-centered approach targeted at addressing probabilistic misconceptions and those
who experience teacher-centered approach targeted at probabilistic misconceptions in the post-test It is hoped
that this study will contribute to the teacher development literature and provide a strong empirical basis for
teaching statistics and probability in colleges of education In the rest of the study we present the review of
relevant literature and the methodology employed for the study It is followed by the presentation and discussion
of results conclusions practical implications and limitations
Literature Review
Theoretical Review
This study is anchored on the socio-cultural constructivist theory of Vygotsky (1978) which contends that
learning occurs at two levels first in the context of shared social activity known as the social or interpersonal
plane and second on the individual plane Learning at these two levels can occur in any context whether
during mathematics lessons in the workplace or in the home Vygotskyrsquos work considered reconstruction of
knowledge in a social context According to him language plays a crucial role in cognitive development
because childrenrsquos knowledge ideas and values develop through interactions with others Vygotsky believed
that a learnerrsquos acquisition of knowledge takes time This suggests that teachers should exercise patience for
learners to explore concepts in order to acquire all the necessary knowledge
One key aspect in the socio-cultural theory is the concept of ldquozone of proximal developmentrdquo (ZPD) which
according to Vygotsky is the difference between a childrsquos current performance (the problems the child can
solve independently without any support) and the level of performance that the child could achieve with
guidance from an adult or by working with a more experienced person such as a teacher a parent a peer or a
sibling Vygotsky thus advocated that for the learner to learn independently there should be an experienced
person to support the learner He contends that the learnersrsquo intellectual life will be greatly developed when
teachers succeeded in leading learners to reorganize their existing ideas with new ones in a meaningful way
This indicates that learners are to be at the center of teaching and learning interacting with their own colleagues
while teachers serve as facilitators It is crucial that teachers are well prepared to facilitate meaningful learning
else learners will be unable to learn effectively The socio-cultural constructivist theory is relevant for this study
because research by Sharma (2016) showed that the theory plays a crucial role in studentsrsquo ability to confront
their own probabilistic misconceptions and resolve them meaningfully
Hokor amp Sedofia
124
Teacher-Centered Approach versus Learner-Centered Approach
In this study the teaching method in which the teacher lectures or stands in front of the class and orally presents
his or her teaching note to the learners is called the teacher-centered approach In the teacher-centered approach
to teaching information flows from the teacher to the learner Learners become a recipient In the constructivist
classroom however the teacher functions as a coach and learners work through problems Where learners
discover concept through activities by themselves they value mathematics and are able to apply it in real-life
The essence of teaching and learning of mathematics is its applicability in solving daily life problems The
learner-centered approach to teaching inspires students to effectively solve problems by relating various
mathematical concepts in real life The differences between the organization of the constructivist and teacher-
centered approach classrooms are presented in Table 1
Table 1 Differences in the Two Approaches of Teaching Mathematics
Learner-centered classroom Teacher-centered classroom
i Students learn from their own
experiences through activities
i Students learn mainly from teachersrsquo
explanations
ii Students are more responsible for their
own learning using the teaching and
learning resources under the guide of a
teacher
ii Students are given more questions to
solve using the rules and formulae by a
teacher
iii Teacher engages all students in
lesson facilitates problem-solving
among students
iii Teacher explains the mathematical
rules and procedures and gives
problems that required the use of such
rules
iv Teacher establishes a purposeful
learning environment interacts
with students and guides them to
construct their own meaning to
concept
iv Teachers focus more on procedural
understanding
v Teachers construct problems
carefully that required studentsrsquo to
apply what they learnt
v Teachers give problems mostly from
textbook that required the use of
formula by learners to solve
Effect of a Learner-centered Approach to Teaching on Studentsrsquo Conceptual Understanding of
Mathematics
Some studies have reported the learner-centered approachs effectiveness in teaching and learning mathematics
on studentsrsquo conceptual understanding Bada (2015) conducted a study on constructivism learning theory for
studentsrsquo understanding of mathematics and contended that if all students are to succeed then teachers have to
use learner-centered approach teaching The study revealed that the learner-centered approach to teaching
International Journal of Studies in Education and Science (IJSES)
125
motivates students to learn and gives teachers the opportunity to assess how the activity is helping the students
to develop an understanding of concepts Furthermore a study was conducted by Major and Mangope (2012) on
constructivist theory in Mathematics in Botswana primary schools The study focused on the extent to which
teachers in Botswana primary schools use the learner-centered approach in teaching and learning of
Mathematics A total of 83 mathematics lessons were videotaped and analyzed The results revealed that most of
the lessons required students to recall rules or formulae However small percentages of the lessons required
students to explore or investigate mathematical ideas
Students are at the center of the learning process in the constructivist class through doing experience action
and peer collaboration National Council of Teachers of Mathematics 2000 (cited in Prideaux 2007) contended
that when teaching is student the learners value mathematics and engage actively in learning the discipline In
solving problems under the constructivist strategy learners are motivated to try various means possible hence
they invent the means of solving the problem themselves In constructivism problems are carefully constructed
to challenge students to reason about the concepts Additionally the interest of the learners increases because
they see the need to study mathematics Mathematics is full of problem-solving So employing a problem-
solving strategytechnique to teach mathematics helps learners to have a better understanding of mathematical
concepts
Materials and Methods
Design
This study used the nonequivalent (pre-test and post-test) control-group design of quasi-experimental research
In this design a dependent variable is measured in one group of subjects before and after a treatment and that
same dependent variable is measured at pre-test and post-test in another nonequivalent control group which does
not receive any treatment The two groups are selected without random assignment and both groups take a
pretest and posttest But only the experimental group receives the treatment (Creswell amp Creswell 2018) This
design makes it possible for researchers to compare scores before and after a treatment in a group that receives
the treatment and also in a nonequivalent control group that does not receive the treatment The nature of the
research problem and the objectives to be achieved warranted quasi-experimental design Importantly in an
environment such as a college of education randomness was impractical (Leedy amp Ormrod 2020) and despite
the argument that quasi-experimental research has low internal validity compared to true experiments quasi-
experimental research has a higher external validity because it helps researchers to do interventions in the real-
world instead of artificial laboratory settings (Thomas 2020)
Population
There are seven public Colleges of Education in the Volta Region of Ghana Six out of the seven colleges are
mixed-sex colleges and one is female-only The single-sex college was purposively chosen to ascertain how
these students develop their probabilistic reasoning from the two different teaching methods discussed above
The population was all second-year preservice teachers of that college since at the time of the study the final
Hokor amp Sedofia
126
years were out for their teaching practice and the first year students had not taken the statistics and probability
course This institution was selected for one main reason they all studied Statistics and Probability and were
thus expected to teach it at the Junior High School level upon completion of their training
Sample and Sampling Procedure
Purposive sampling technique was used to select two intact classes out of six classes identified as Group A and
Group B respectively These groups are similar in terms of their performance in their second-year first-semester
mid-semester quiz scores in mathematics with mean scores of 139 and 137 respectively ldquoQuasi-experimental
designs identify a comparison group that is as similar as possible to the experimental group in terms of pre-
intervention characteristicsrdquo (White amp Sabarwal 2014 p 1) Also it helped to avoid selection bias which is a
concern in quasi-experimental studies
These two intact classes comprised 27 preservice teachers in Group B and 32 in Group A In purposive
sampling certain elements of the population are deliberately selected on the judgment of the researchers and
nothing is left to chance In this study respondents were chosen from a population of regular preservice teachers
who had studied probability previously and were taking statistics and probability as a course in a college of
education The reason for choosing both groups from the same population is that both Group A and Group B
used the same textbooks and course materials Also both groups were chosen from the same population to avoid
bias because all the colleges use different textbooks and the conditions under which students studied are
different from college to college
Achievement Tests (Pre-test and Post-Test)
The test items were administered in two phases in the classrooms These are pre-test and the post-test Items 2i
2ii 3i and 3ii of the pretest were adapted from (Anway amp Bennett 2004 Hirsh amp ODonnell 2001) Two
examiners of statistics and probability were consulted to ensure the questions are at the level of the participants
This is to ensure the validity of the test items The pre-test and the post-test were similar to measure whether
there is a change or not The items were developed to measure the probabilistic reasoning of preservice teachers
The items sought to ascertain preservice teachersrsquo ability in reasoning about uncertainties and the use of
probability daily
The achievement test assessed the following areas correctly applying probability in decision making
equiprobability bias correctly interpreting without replacement situations correctly listing the sample space and
determining the probability representativeness bias and interpreting probability statements correctly and
applying appropriate strategies There were 12 items for the pre-test and 10 items for the post-test We have
more items on the pre-test because the post-test was more open-ended than the pre-test Nevertheless the total
scores in each case was 20 Some of the test items consisted of two parts the principal question (multiple
choice) and a justification of the answer The pre-test and post-test can be seen in appendices A and B
respectively
International Journal of Studies in Education and Science (IJSES)
127
Evaluation of Materials by Experts
The researchers solicited two expertsrsquo views on the test items content coverage content relevance and course
materials It was the view of the experts that the test items of both the pre-test and the post-test were in line with
the mathematics syllabus of colleges of education in Ghana The activities designed for the Group A were also
assessed In the view of the experts the teaching activities had sufficient content coverage and would help pre-
service teachers develop better probabilistic reasoning They acknowledged the idea of having activities that
reflect real life situations to support pre-service teachers since they were aware students have difficulty with
probability related problems The experts further acknowledged that the objectives were measurable and
activities were practical to promote pre-service teachersrsquo involvement in the lessons They said the teaching and
learning materials reflected the learner-centered approach and were in line with the syllabus requirements for
Mathematics in colleges of education in Ghana They believed the activities would promote better probabilistic
reasoning since they reflected real life situations
Data Collection Procedure
Preservice teachers were informed one week ahead of the administration of the pre-test The format of the test
items and the purpose of the study were communicated to the respondents The tests were administered by the
researchers at an Examination Hall to ensure the respondents did independent work
Treatment
The learner-centered approach was applied to group A while the teacher-centered approach of instruction was
applied to group B In each approach the lessons were focused on addressing equiprobability bias
representativeness belief bias positive recency and negative recency effects since some studies suggest that
teaching approaches that target probabilistic misconceptions will help improve studentsrsquo performance
significantly (Khazanov amp Prado 2010 Shay 2008) The implementation of both teaching approaches were
done by the lead researcher
Group A The Learner-centered approach
The teaching and learning took place in traditional classroom settings generally consisting of activities
discussions and questions and answers concurrently once per week for two hours for a month In group A the
activities were designed focusing on probabilistic misconceptions using the learner-centered approach to
teaching to better their probabilistic reasoning Examples of the activities are given below
Card Game This game was played in groups Identical cards were numbered 3 3 4 4 5 5 5 6 6 7 8 and 9
and put in a container and thoroughly mixed Three students will reach in and without looking draw out a card
each at time If the three people pick different numbers then the group wins GH30000 else they lose Is the
chance of winning or losing the same and why The purpose of this activity is to enhance preservice teachersrsquo
Hokor amp Sedofia
128
decision-making ability by addressing equiprobability bias representativeness bias belief and positive and
negative recency effects The aim of predicting before picking was to keep students focused and to confront any
prior misconceptions The game was played 15 times If all the three members of the group pick different colors
then a point of one is recorded else zero After the activity a discussion was organized around their prediction
and the results to challenge their thinking
Pair Game In pairs preservice teachers were asked to toss a coin six times each recording the sequence of tails
and heads The purpose of this activity is to address representativeness bias Before the toss students were asked
to predict the number of tails and heads Their predictions were written in their notebook before the toss Most
preservice teachers predicted equal number of tails and heads Preservice teachers then compare their predicted
sequences to their results after the toss It was noted in many instances that those who predicted equal number of
tails and heads did not obtain results that were consistent with their prediction Discussions were organized
around their predicted sequences and the results obtained after the toss for better probabilistic reasoning
Coin Game Students perform this experiment ten times by tossing a number of fair coins once and record the
outcomes in each case In the first toss a coin was tossed once and the outcome recorded in the second toss
two coins were tossed once and outcomes recorded in third toss three coins were tossed once and outcomes
recorded and so on H stands for heads and T stands for tails The following are a sample of sequence of
outcomes by one student
1st toss H
2nd
toss HT
3rd
toss HTH
4th
toss HTTT
5th
toss THHTT
6th
toss HTHTTT
7th
toss TTHTHHT
8th
toss THTHTHHH
9th
toss HTTTHTHTT
10th
toss THTHTHTHTT
119873119906119898119887119890119903 119900119891 ℎ119890119886119889119904
119873119906119898119887119890119903 119900119891 119905119900119904119904119890119904=
1
1= 1
1
2= 05
2
3= 0667
1
4= 025
2
5= 04
2
6= 0333
3
7= 0429
5
8
= 0625 3
9= 0333
4
10= 04
The average of the probabilities of obtaining a head for each experiment is
=105066702504033304290625033304
10=
4937
10cong 05
International Journal of Studies in Education and Science (IJSES)
129
It must be noted that in experimental or frequentist probability we are concerned about conducting the
experiment many times and considering its approximation or convergence Students were led to conclude that in
general we can say when a fair coin is tossed the probability of getting a head at any time is 1
2 and vice versa
Group B The Teacher-centered approach
Group B was taught using the teacher-centered approach In this case the teacher rather than the learner was at
the center of the teaching and learning process The tutor presented the preservice teachers with facts or
procedures that had been established to solve problems Preservice teachers were given problems that require
the use of these facts or procedures to solve as either assignment exercise test or quiz It is believed that
preservice teachers learned more when they solved similar problems many times When examination questions
that demanded facts were set students could solve the problems without really understanding the concepts
Formulae were presented to students to learn to apply to similar problems Concepts were clearly explained
bearing in mind the probabilistic misconceptions Samples of lessons experienced by Group B are as follow
Lesson one Through questions and answers teacher revises preservice teachersrsquo previous knowledge on playing
of games and probabilistic situations Based on studentsrsquo responses the teacher introduces the lesson
Teacher explains to preservice teachers the concept of probability and three ways we can make probability
statements as classical frequentist and subjective Classical probability is the number of favorable outcomes (E)
divided by the total number of possible outcomes (S) It works on the assumptions that all outcomes are equally
likely Equally likely means that each outcome has the same probability of occurring
Mathematically P(E) =
Students were then led to solve problems using the formula
Experimental probability is a method of calculating probability where the probability is the ratio of the number
of the trials where the desired event occurs to the number of total trials Subjective probability is a statement that
an individual makes based on personal judgment to describe the likelihood of an event Or a personal belief
based on onersquos own experience or expertise The person making the statement should be an expert in the area or
someone who have a sound knowledge on the issue under consideration before it can be considered important
For the statement to be reliable it should be based on a sound premise(s) Nevertheless both experts and non-
experts make use of subjective probability daily For example I have a 90 chance of passing my statistics and
probability exam
Lesson two Teacher explains basic terms of probability such as sample space sample point an event equally
likely to preservice teachers Teacher guides preservice teachers through demonstration to solve probability
problems using classical definition of probability by listing the sample space and finding the probability of an
event Teacher leads preservice teachers to solve probability problems from frequency tables Similarly teacher
explains to preservice teachers independent and dependent events Teacher asks the preservice teachers to solve
problems on independent and dependent events
Hokor amp Sedofia
130
Data Analysis
The data collected were coded and edited before being transferred to computer for analysis using SPSS version
24 A Levenersquos test was used in the study to ensure that the assumptions between each group was not violated
Homogeneity of variances was considered to ensure that each grouprsquos pre-test scores were mostly equal Paired
samples T-test was used to compare two means within each group to determine whether or not the differences in
means were statistically significant Independent sample T-test was used to compare the probabilistic reasoning
mean scores in Group A and the Group B before the experiment at a time to determine whether the two groups
were at the same level or not The independent t-test was used because there were two different groups of
participants It works on the assumption that scores are unique because they come from different participants
Also the equality of variance for running ANCOVA at 5 significance level was checked using Levenersquos test
Table 2 Levenes Test of Equality of Variances
F df1 df2 Sig
1234 1 57 0456
The results from Table 2 indicate that the variances are roughly equal since the significance value of 0456 is
greater than the cut-off value of 005 Therefore we can conclude that homogeneity of variance assumption was
met (Field 2005) This allowed us to examine the relationship between the covariate (pre-test scores) and
dependent variable (post-test scores) Analysis of covariance (ANCOVA) was used to examine the effect of
learner-centered approach to teaching and teacher-centered approach on preservice teachersrsquo probabilistic
reasoning since different participants were in each group The ANCOVA is ideal in removing the bias of these
variables (Field 2005) In order to determine whether or not the occurrence of scores was not by chance a
partial eta squared was used to gauge the magnitude of the difference (effect size) between means of the scores
Pallant (2001) outlined the following criterion for interpreting partial eta squared values as 001 = small effect
006 = moderate effect and 014 = large effect
Results
Before introducing the learner-centered and teacher-centered approaches of teaching preservice teachersrsquo
probabilistic reasoning was compared to ascertain whether or not their results were similar in terms of the mean
scores The result is presented in Table 3
Table 3 Results of the Independent Samples t-test on the Pre-test of the Group B and Group A
Group N Mean Std Dev Mean Difference Df t-value p-value
Group B 27 585 1562 35 56 756 456
Group A 32 550 1967
The results in Table 3 indicate that there was no statistically significant difference between the probabilistic
reasoning mean scores of Group A = 550 = 1967 and Group B = 585 = 1562 in the
International Journal of Studies in Education and Science (IJSES)
131
pretest This is an indication that the two groups are similar and their performance could be compared after the
two teaching approaches
Comparison of Probabilistic Reasoning of the Preservice Teachers before and after Learner-centered
Approach in Group A
The results of analysis of the effect of the learner-centered approach on preservice teachersrsquo probabilistic
reasoning is presented in Table 4
Table 4 Pre-test and Post-test Scores for Group A
Minimum Maximum Mean Std Deviation
Pre-test 1 10 550 1967
Post-test 8 20 1572 3630
Table 4 reveals that in the post-test preservice teachersrsquo probabilistic reasoning mean scores increased from
550 to 1572 in the post-test in Group A
A paired sample t‐test was conducted to compare the post-test and pre-test scores for the preservice teachers
taught with the learner-centered approach to teaching (Group A) in order to determine if the mean difference in
scores was statistically significant This was done to evaluate the effect of the learner-centered approach on
preservice teachersrsquo probabilistic reasoning Table 5 presents the results
Table 5 Paired Sample t-test Results on the Post-test and Pre-test of Group A
Mean
Difference
Std
Deviation
Std Error
Mean
t Df Sig
Post-test ndash Pre-test 10219 2871 507 20137 31 000
The results from Table 5 shows a statistically significant difference in the preservice teachersrsquo probabilistic
reasoning from the pre-test (M = 550 SD = 1967) to the post-test (M = 1572 SD = 3630) with t (31) =
20137 p = 000 The result reveals that preservice teachersrsquo probabilistic reasoning has improved significantly
after the learner-centered approach was used since = 000 05 It can be inferred that the learner-centered
approach to teaching has a positive significant effect on preservice teachersrsquo probabilistic reasoning
Analysis of Probabilistic Reasoning of the Preservice Teachers before and after Teacher-centered
Approach to Teaching
The results of the analysis of the effect of the teacher-centered approach to teaching on preservice teachersrsquo
probabilistic reasoning is presented in Table 6
Hokor amp Sedofia
132
Table 6 Pre-test and Post-test Scores for the Group B
Minimum Maximum Mean Std Deviation
Pre-test 2 8 585 1562
Post-test 5 14 952 2208
The data on Table 6 show that the mean score of preservice teachers in the pre-test was 585 while that of the
post-test was 952 marks This indicates that in the post-test an average of each of the preservice teachersrsquo
probabilistic reasoning increased slightly in Group B To determine if the mean difference is statistically
significant a paired sample t‐test was conducted Table 7 presents the results
Table 7 Results of the Paired Samples t-test on the Post-test and Pre-test of the Group B
Mean
Difference
Std Deviation Std Error
Mean
t Df Sig
Post-test ndash Pre-test 3667 1441 0277 13220 26 000
The result presented on Table 7 shows that the mean score difference between the post-test and pre-test of
Group B was 3667 marks with a corresponding standard deviation of 1441 The paired sample t-test was
conducted to find out if the mean score difference (M = 3667 SD = 1441) was statistically significant This
was done to assess the effect of the teacher-centered approach targeted at addressing misconceptions on
preservice teachersrsquo probabilistic reasoning The results from Table 7 reveal that there was a statistically
significant difference in the preservice teachersrsquo probabilistic reasoning scores from the pre-test (M = 585 SD =
1562) to the post-test (M = 952 SD = 2208) with t (26) = 13220 p = 000 lt 05 This is an indication that the
teacher-centered approach to teaching probability targeted at addressing probabilistic misconceptions aids
students to improve upon their understanding and problem-solving abilities in probability
Next we compared the effectiveness of the learner-centered approach of teaching and the teacher-centered
approach of teaching in terms of probabilistic reasoning of preservice teachers and how they addressed
probabilistic misconceptions
Comparison of Effectiveness of Learner-centered Approach and Teacher-centered Approach in
Developing Probabilistic Reasoning
The preservice teachersrsquo scores on the pre-test of the achievement test were used as covariate in this analysis
The scores from the post-test were then compared using ANCOVA with = 05 to adjust for pre-test
differences that existed between Group A and Group B In the pre-test the mean scores of Group B and Group A
were 585 and 550 respectively ANCOVA was used to adjust the post-test scores statistically to compensate
for the 035 mean point difference between the two groups in the pre-test This adjustment led to a more
accurate post-test comparison Table 8 presents the results
International Journal of Studies in Education and Science (IJSES)
133
Table 8 Summary of ANCOVA of the Performance of Preservice Teachers taught with Learner-centered
Approach and Teacher-centered Approach (N = 59)
Source Sum of
Squares
Df
Mean
Square
F Sig Partial Eta
Squared
Corrected
Model
791144a 2 395562 72150 000 720
Intercept 205135 1 205135 37416 000 401
Pre-test 228184 1 228184 41620 000 426
Group 630253 1 630253 114955 000 672
Error 307026 56 5483
Total 10888000 59
Corrected Total 1098169 58
a R Squared = 720 (Adjusted R Squared = 710)
The data on Table 8 indicate that there is a statistically significant main effect on the preservice teachers who
were taught using the learner-centered approach to learn probability [F (1 56) = 114955 p = 000 lt 05]
Consequently the preservice teachers taught with the learner-centered approach performed better than their
counterparts who experienced the teacher-centered approach to learn probability The partial eta squared value
was found to be 0672 This value indicates a large effect size That is 672 of the variance in the dependent
variable (probabilistic reasoning achievement score) is expounded by the independent variable (teacher-centered
approach) This implies that the magnitude of the difference between the mean score of the preservice teachers
taught with the learner-centered approach and the teacher-centered approach is large With the high scores of
preservice teachers in the Group A it implies that the use of learner-centered approach in the teaching and
learning of probability improved the performance of the preservice teachers
The outcome of the study portrays that there was a statistically significant difference in the probabilistic
reasoning achievement mean scores of Group A than that of Group B [F (1 56) = 114955 p = 000 lt 05] This
finding implies that Group A performed better than Group B in the probabilistic reasoning achievement test
This is an indication that when the learner-centered approach to teaching probability is targeted at addressing
probabilistic misconceptions preservice teachers develop better probabilistic reasoning than teacher-centered
approach
Discussion
This study set out to compare the learner-centered and teacher-centered approaches of teaching in order to
determine the best way of developing preservice teachersrsquo probabilistic reasoning at the College of Education
Hokor amp Sedofia
134
level in Ghana The results as shown on Tables 3 4 5 6 7 and 8 indicate that the learner-centered approach to
teaching probability is more effective than the teacher-centered approach in motivating and inspiring preservice
teachers to learn and apply probability The learner-centered approach provides studentsrsquo opportunities to think
reason reflect and evaluate their ideals and that of colleagues
The findings of the present study are in tandem with several research findings Lessani Md Yunus and Bakar
(2017) investigated mathematics teaching approaches and their consequences on learnersrsquo ability to solve
challenging problems Their findings affirm the learner-centered approach to be more effective in studentsrsquo
creativity and innovation in solving real-life problems than the teacher-centered approach So training
programs for excellent teaching and learning should be flexible and innovative to allow preservice teachers to
explore gaps in learning and teaching (AIAhmad 2021) Similarly Prideaux (2007) found that students who
experienced the learner-centered approach of teaching performed significantly higher than those who were
taught without the learner-centered approach of teaching Roseth Garfield and Ben-Zvi (2008) also examined
the effect of the cooperative framework in classroom teaching and collaboration and found that student-
centered approaches to teaching help students to have better understanding of statistics than teacher-centered
instruction
Furthermore Gurbuz and Birgin (2011) studied the effect of computer-assisted teaching on addressing
probabilistic misconceptions of students The authors used pre-test to collect data on both the computer-assisted
and traditional groups before the experimental teachings After the intervention the post-test was administered
to ascertain the effect of computer-assisted teaching and teacher-centered approach on addressing studentsrsquo
probabilistic misconceptions Their study found computer-assisted teaching to have more significant effect on
studentsrsquo correct probabilistic reasoning than teacher-centered approach of teaching
As noted by Batanero and Diaz (2012) probability forms an integral part of the Mathematics curriculum in
many countries But the concept is one that some learners find difficult to understand partly due to the method
of teaching used by teachers This fact implies that teachers of mathematics should find more creative ways of
teaching the concept so as to make it easier for learners to understand and apply the concept As discovered in
this study the learner-centered approach is effective in developing probabilistic reasoning But the learner-
centered approach works best when certain conditions are present At the outset there is the need for relevant
teaching and learning materials Then teachers need to be trained and retrained in the use of the learner-centered
approach to teaching At the college of education level preservice teachers need to be taught using the learner-
centered approach not only to help them understand probability but also to help them use the learner-centered
approach in their own teaching
The activities used for Group A which is learner-centered approach group in the form of games promote
content knowledge and cognitive skills competencies such as collaboration and problem solving (Belova amp
Zowada 2020) The activities focus on promoting learning experiences rather than stressing on the
entertainment factor While some things students learn in school seem to them predetermined and bound by
laws in other branches of mathematics probability provides students with opportunity to learn that solutions to
International Journal of Studies in Education and Science (IJSES)
135
several problems depend on assumptions and have degrees of doubt So teaching methods that allow students to
predict and test their predictions should be encouraged for students to develop their intellectual repertoire The
processes used in reasoning about sample space will serve students well in life Several calls on the need to pay
attention to the study of probability show that teachers and mathematics teachers must provide their students
with appropriate teaching strategies to enhance their conceptual understanding In the preparation of preservice
teachers to become mathematically competent citizens teacher preparation programs such as teaching methods
must provide opportunities for preservice teachers to confront misconceptions and reason probabilistically
(Courtney amp Caniglia 2021)
The findings of the present study however run counter to those of Weltman and Whiteside (2010) They
conducted a study on the effectiveness of the traditional and active learning method in business statistics The
study found that active learning had not been effective for all category of students It is not precisely clear what
may have accounted for that result This is because active learning methods have generally been known to be
effective in promoting learning Further research is thus required in this regard
Conclusions
This study compared the effects of the learner-centered and teacher-centered approaches of teaching in
addressing probabilistic misconceptions by measuring preservice teachersrsquo probabilistic reasoning scores The
results show that the learner-centered approach aids preservice teachers to develop better probabilistic reasoning
than the teacher-centered approach to teaching Thus the study concludes that the learner-centered approach to
teaching is a solution to preservice teachersrsquo inability to answer questions on probability correctly Even though
each teaching approach targeted at addressing misconceptions was found to have significant effect on pre-
service teachersrsquo probabilistic reasoning the learner-centered approach was found to be more effective than the
teacher-centered approach in addressing misconceptions which limit studentsrsquo ability to solve probability
problems correctly
Implications and Recommendations
This study makes some key contributions to the teacher educationdevelopment literature in general and
particularly to the development of probabilistic reasoning of preservice teachers The study provides empirical
evidence that the learner-centered approach targeted at addressing probabilistic misconceptions is more effective
in developing probabilistic reasoning in preservice teachers What this means is that when teacher educators use
the learner-centered approach to teach the concept of probability and focus on addressing misconceptions
preservice teachers will develop better probabilistic reasoning This will in turn translate into preservice
teachers answering questions on probability correctly in their examinations and ultimately making them teach
the concept more effectively when they complete their training It is thus recommended that teachers should
consider employing the learner-centered approach in teaching the concept of probability
Hokor amp Sedofia
136
Limitations
As with every empirical study employing the quasi-experimental approach the current study has some
limitations which need to be acknowledged and used to guide users of the findings Firstly our sample was
drawn from a population of second year preservice teachers of a female only college of education in a peri-
urban area in Ghana Further experiments are therefore needed in other settings in order to see if the same or
similar results will occur Secondly owing to the narrow characteristics of the participants in the present study
the researchers cannot generalize the results to other individuals who do not have the same characteristics So
additional experiments with groups with different characteristics are necessary Lastly the experiments need to
be repeated at another time to determine if the results are the same (consistent) over time
Acknowledgements
We are grateful to the Principal and preservice teachers for granting access and participating in the study
respectively
References
AIAhmad H (2021) The role of educational communication in promoting student-centered learning style in
multicultural classrooms A reflective essay on learning and teaching in higher education International
Journal of Research in Education and Science (IJRES) 7(3) 838-851 httpsdoiorg1046328ijes2374
Aina J K Olanipekun S S amp Garuba I A (2015) Teachersrsquo effectiveness and its Influence on studentsrsquo
learning Advances in Social Sciences Research Journal 2(4) 88-95
Anway D W amp Bennett E (2004) Common Misconceptions in Probability among Students in an Elementary
Statistics class Unplished Senior Project The ARTIST Roundtable Conference on Assessment in
Statistics held at Lawrence University Supperior WI The University of Wisconsin-Superior
Bada S (2015) Constructivist Learning Theory A Paradigm for Teaching and Learning IOSR Journal of
Research and Method in Education (IOSR-JRME) 5(6) 66-70 httpsDOI1097907388-05616670
Baerveldt C (2013) Constructivism contested Implications of a genetic perspective in psychology Integrative
Psychological and Behavioral Science 47(1) 156-166
Batanero C (2013) Teaching and learning probability In S Lerman (Ed ) Encyclopedia of Mathematics
Education Heidelberg Springer
Batanero C and Diaz C (2012) Training school teachers to teach probability reflections and challenges
Chilean Journal of Statistics 3(1) 3-13
Belova N amp Zowada C (2020) Innovating Higher Education Via Game-Based Learning on Misconceptions
Education Sciences 10 221 doi103390educSCi10090221
Bennett E amp Anway D W (2003) Statistical and Probabilistic Reasoning and Misconceptions among
Selected College Students McNair Scholars Journal Vol 4 httpwwwsocheclchjs
Cantoy O (2010) Mathematics teachersrsquo topic-specific pedagogical content knowledge in the context of
teaching a0 0 and a divide 0 Educational Sciences Theory and Practice 10 (2) 749-769
International Journal of Studies in Education and Science (IJSES)
137
Clements D H amp Battista M (1990) Constructivist Learning and Teaching The
Arithetic Teacher 38(1) ProQuest Central pg 34 DOI105951AT3810034
Creswell J W amp Creswell J D (2018) Research design Qualitative quantitative and
mixed methods approaches (5th
ed) Los Angeles SAGE Publications Inc
Courtney S A amp Caniglia J (2021) Comparing the mathematical practices pre-service teachers and
mathematics teacher educators identified as relevant to problems and tasks International Journal of
Research in Education and Science (IJRES) 7(3) 954-971 httpsdoiorg1046328ijres2335
Denton D W (2012) Enhancing instruction through constructivism cooperative learning and cloud
computing Tech Trends 56(4) 34-41
Gage J (2012) Towards a new Probability Curriculum for Secondary Schools Paper presented at 12th
International Congress on Mathematical Education 8 July-15 July COEX Seoul Korea Cambridge
Cambridge University Uk
Gurbuz R amp Birgin O (2011) The effect of computer-assisted teaching on remedying misconceptions The
case of the subject Probability Journal Homepage 58(2012) DOI 101016jcompedu201111005
Hirsh L amp ODonnell A M (2001) Representativeness in Statistical Reasoning Identifying and Assessing
Misconceptions Journal of Statistics Education 9(2) 96-105 DOI10108010691898200111910655
Johnson H D amp Dasgupta N (2005) Traditional versus Non-traditional Teaching during Perspectives of
Students in Introductory Statistics Classes Journal of Statistics Education 13(2)
httpsdoiorg10108010691898200511910558
Major T amp Mangope B (2012) The Constructivist Theory in Mathematics The case of Botswana Primary
Schools International Review of Social Sciencies and Humanities 3(2) 139-147
Jones G (2005) Reflections In GA Jones (Ed) Exploring probability in school chanlleges for teaching and
probability (367-372) New York Springer
Jun L (2000) Chinese Students Understanding of Probability Published doctoral dissertation Singapore
National Institute of Education Nanyang Technological University
Khazanov L amp Gourgey A (2009) Instructors Perspectives on Students Mistaken Beliefs about Probability
in an Elementary College Statistics Course In K Safford-Ramus (Ed) Proceedings of the Adults
Learning Mathematics a Resaerch Forum (ALM) 15th
Annual International Conference 249-264
Khazanov L amp Prado L (2010) Correcting Students Misconceptions about Probability in an Introductory
College Statistics Course Adults Learning Mathematics-An International Journal 5(1) 23-35
Kleickmann T Richter D Kunter M Elsner J Besser M Krauss S amp Baumert J (2013) Teachersrsquo
Content Knowledge and Pedagogical Content Knowledge The Role of Structural Differences in Teacher
Education Journal of Teacher Education 64(1) 90-106 DOI1011770022487112460398
Leedy P D and Ormrod J E (2020) Practical research Planning and design (12th Global Edition) Harlow
England Pearson
Lessani A Md Yunus AS amp Bakar KBA (2017) Comparison of new mathematics teaching methods with
teacher-centered approach International Journal of Social Sciences 3(2) 1285-1297
httpsdxdoiorg1020319pijss20173212851297
Lim C amp Hwa T (2007) Promoting Mathematical Thinking in the Malaysian Classroom Issues and
challenges httpswwwresearchgatenetpublication252353381
Hokor amp Sedofia
138
Lovett J N amp Lee H S (2017) New Standards Require Teaching More Statistics Are Preservice Secondary
Mathematics Ready Journal of Teachers Education 68(3) 299-311 DOI 1011770022487117697918
Major T amp Mangope B (2012) The Constructivist Theory in Mathematics The case of Botswana Primary
Schools International Review of Social Sciencies and Humanities 3(2) 139-147
National Council of Teachers of Mathematics (2003) Principles and Standards for School Mathematics and
their Implications for Professional Development Reston VA NCTM
Nguyen L (2015) Developing Conceptual Understanding and Probabilistic Thinking through Tree Diagrams
Published MPhil Dissertation Manitoba The Faculty of Graduate Studies of the University of
Manitoba
Prideaux J (2007) The learner-centered approach to Mathematics Teaching and the Active Learning
Strategies used to Enhance Students Understanding Mathematical and Computing Sciences Masters
Paper 29 Fisher Digital Publications httpfisherpubsjfcedumathcsetdmasters29
Roseth C J Garfield J B amp Ben-Zvi D (2008) Collaboration in Learning and Teaching Statistics Journal
of Statistics Education 16 (1) 1069-1898 httpsdoiorg10108010691898200811889557
Santagata R and Sandholtz J H (2019) Preservice teachersrsquo mathematics teaching competence Comparing
performance on two measures Journal of Teacher Education 70 (5) 472 ndash484
Schwerdt G amp Wuppermann A C (2011) Is traditional teaching really all that bad A within-student
between-subject approach Economics of Education Review 30(2) 365-379
Sharma S (2016) Probability from a socio-cultural perspective Statistics Education Research Journal 15(2)
126-144 httpiase-weborgPublicationsphpp=SERJ
Shay K (2008) Tracing middle school students understanding of probability a longitudinal study
Unpublished Doctoral Dissertation New Brunswick New Jersey Rutgers State University of New
Jersey
Shulman L S (1986) Those who understand Knowledge growth in teaching Educational Researcher 15(2)
4-14 doi 1031021001318X015002004
Thomas L (2020) An introduction to quasi-experimental designs
httpswwwscribbrcommethodologyquasi-experimental-design
Voskoglou M (2019) Comparing Teaching Methods of Mathematics at University Level Education Sciences
9(204) doi103390educsci9030204
Vygotsky L S (1978) Mind in society The development of higher psychological processes Cambridge MA
Harvard University Press
Weldeana H N amp Abraham S T (2014) The effect of an historical perspective on prospective teachersrsquo
beliefs in learning mathematics Journal of Mathematics Teacher Education 17 303-330
doi101007s10857-013-9266-z
Weltman D amp Whiteside M (2010) Comparing the Effectiveness of Traditional and active Learning Methods
in Business Statistics Convergence to the Mean 18(1)
httpsdoiorg10108010691898201011889480
White H amp Sabarwal S (2014) Quasi-experimental design and methods methological briefs impact
evaluations Florence UNICEF Office of research
International Journal of Studies in Education and Science (IJSES)
139
Author Information
Evans Kofi Hokor
httpsorcidorg0000-0002-8387-8294
St Teresarsquos College of Education Hohoe
Department of Mathematics and ICT
P O Box 129
Ghana
Contact e-mail evanskhokorgmailcom
John Sedofia
httpsorcidorg0000-0002-5409-516X
University of Ghana Legon
Department of Teacher Education
PO Box LG 1181
Ghana
Hokor amp Sedofia
140
Appendix A Pre-test Probabilistic Reasoning Assessment
This assessment is for research purpose to improve teaching and learning of probability
You are required to answer all questions honestly Do and leave all workings or rough work on the paper
Pre-test Probabilistic Reasoning Assessment Duration 1hr
Index numberhelliphelliphelliphelliphelliphelliphelliphelliphelliphelliphelliphelliphelliphelliphelliphelliphelliphellipLevelhelliphelliphelliphellipAgehelliphelliphellip
Read each statement carefully and circle the letter of the correct (best) option Provide appropriate response in
the space provided under some items as it apply
1 If you rolled an ordinary die and obtained 51246 which of these is most likely to occur on your next
roll
a 1
b 2
c 3
d 4
e 5
f 6
g The options a b c d e and f are all equally
2i A fair coin is tossed and it lands tail The coin is to be tossed a second time What is the probability that the
second toss will also be a tail
a 1
4
b 1
2
c 1
3
d Slightly less than 1
2
e Slightly more than 1
2
f 0
2ii Which of the following best describes the reason for the correct answer to the preceding question (2i)
a The second toss is less likely to be tail because the first toss was tail
b There are four possible outcomes when you toss a coin twice Getting two tails is only one of them
c The chance of getting heads or tails on any one toss is always 1
2
d There are three possible outcomes when you toss a coin twice Getting two tails is only one of the them
e No chance of being a tail in the second toss
3i A box contains 6 balls 2 are red 2 are black and 2 blue Three balls are picked at random one at a time
Each time a ball is picked the colour is recorded and the ball is put back in the box mixed thoroughly If the
first 2 balls are black what color is the third ball most likely to be
a Red
International Journal of Studies in Education and Science (IJSES)
141
b Black
c Blue
d Red and blue are equally likely than black
e Red black and blue are all equally likely
3ii Which of the following best describes the reason for the correct answer in the preceding question (3i)
a The third ball should not be black because too many black ones have already been picked
b The picks are independent so every color has an equally likely chance of being picked
c Black seems to be lucky
d This color is just as likely as any other color
4 A spinner with ten equally divided sectors in which four parts are white and the rests are red is about to
be spin which color is the spinner more likely to land
a White
b Red
c Both white and red are all equally
5 If you toss a fair coin and get heads two times in a row which of these is most likely on next toss
a Tail
b Head
c Both head and tail are all equally
6 A Gh 2 Gh 5 Ghcent10 Gh 20 Gh 50 and Gh 100 notes were put in a box and thoroughly mixed
What is the probability of picking Gh 50 note without looking
a 1
187
b 50
187
c 1
6
d 0
7 In a game you have been offered two options Which of the following give you higher chance of
winning GHcent200
a Tossing one die once and obtaining a 6
b Tossing two dice once and obtaining two 6rsquos
c The options a and b are all equally
8 A fair die is to be toss six times which of these is most likely to occur
a 251634
b 123456
c 666341
d 132244
e The options a b c and d are all equally likely
9 A fair coin is to be toss four times in a row which of these is least likely to occur
a THTH
b TTTH
c HHH
Hokor amp Sedofia
142
d The options a b and c are all equally likely
10 Two fair dice are to be tossed once Which of the following is more likely to occur
a Obtaining a sum of 11
b Obtaining a sum of 10
c A sum of 11 and a sum of 10 are all equally likely
10i Give reason for the correct answer in the preceding question (10)
helliphelliphelliphelliphelliphelliphelliphelliphelliphelliphelliphelliphelliphelliphelliphelliphelliphelliphelliphelliphelliphelliphelliphelliphelliphelliphelliphelliphelliphelliphelliphelliphelliphelliphelliphelliphelliphelliphelliphelliphelliphellip
helliphelliphelliphelliphelliphelliphelliphelliphelliphelliphelliphelliphelliphelliphelliphelliphelliphelliphelliphelliphelliphelliphelliphelliphelliphelliphelliphelliphelliphelliphelliphelliphelliphelliphelliphelliphelliphelliphelliphelliphelliphellip
helliphelliphelliphelliphelliphelliphelliphelliphelliphelliphelliphelliphelliphelliphelliphelliphelliphelliphelliphelliphelliphelliphelliphelliphelliphelliphelliphelliphelliphelliphelliphelliphelliphelliphelliphelliphelliphelliphelliphelliphelliphellip
helliphelliphelliphelliphelliphelliphelliphelliphelliphelliphelliphelliphelliphelliphelliphelliphelliphelliphelliphelliphelliphelliphelliphelliphelliphelliphelliphelliphelliphelliphelliphelliphelliphelliphelliphelliphelliphellip
11 In national lottery one has to choose five numbers from 1 to 90 inclusive You win when at least two of
your numbers are part of the numbers drawn on Saturday at random Eric has chosen 4 6 7 9 and 11
Alex has chosen 15 23 45 66 and 80 Daniel has chosen 71 77 78 83 and 85 Do Eric Alex and
Daniel have the same chance of winning or not and why
helliphelliphelliphelliphelliphelliphelliphelliphelliphelliphelliphelliphelliphelliphelliphelliphelliphelliphelliphelliphelliphelliphelliphelliphelliphelliphelliphelliphelliphelliphelliphelliphelliphelliphelliphelliphelliphelliphelliphelliphellip
helliphelliphelliphelliphelliphelliphelliphelliphelliphelliphelliphelliphelliphelliphelliphelliphelliphelliphelliphelliphelliphelliphelliphelliphelliphelliphelliphelliphelliphelliphelliphelliphelliphelliphelliphelliphelliphelliphelliphelliphellip
helliphelliphelliphelliphelliphelliphelliphelliphelliphelliphelliphelliphelliphelliphelliphelliphelliphelliphelliphelliphelliphelliphelliphelliphelliphelliphelliphelliphelliphelliphelliphelliphelliphelliphelliphelliphelliphelliphelliphelliphellip
helliphelliphelliphelliphelliphelliphelliphelliphelliphelliphelliphelliphelliphelliphelliphelliphelliphelliphelliphelliphelliphelliphelliphelliphelliphelliphelliphelliphelliphelliphelliphelliphelliphelliphelliphellip
12 A box contains 8 yellow balls and 4 green balls Two balls are chosen at random one after the other
without replacement determine the probability that the two balls are of different colours
helliphelliphelliphelliphelliphelliphelliphelliphelliphelliphelliphelliphelliphelliphelliphelliphelliphelliphelliphelliphelliphelliphelliphelliphelliphelliphelliphelliphelliphelliphelliphelliphelliphelliphelliphelliphelliphelliphelliphelliphellip
helliphelliphelliphelliphelliphelliphelliphelliphelliphelliphelliphelliphelliphelliphelliphelliphelliphelliphelliphelliphelliphelliphelliphelliphelliphelliphelliphelliphelliphelliphelliphelliphelliphelliphelliphelliphelliphelliphelliphelliphellip
helliphelliphelliphelliphelliphelliphelliphelliphelliphelliphelliphelliphelliphelliphelliphelliphelliphelliphelliphelliphelliphelliphelliphelliphelliphelliphelliphelliphelliphelliphelliphelliphelliphelliphelliphelliphelliphelliphelliphelliphellip
helliphelliphelliphelliphelliphelliphelliphelliphelliphelliphelliphelliphelliphelliphelliphelliphelliphelliphelliphelliphelliphelliphelliphelliphelliphelliphelliphelliphelliphelliphelliphelliphelliphelliphelliphelliphellip
International Journal of Studies in Education and Science (IJSES)
143
Appendix B Post-test Probabilistic Reasoning Assessment
This assessment is for research purpose to improve teaching and learning of probability
You are required to answer all questions honestly Do and leave all workings or rough work on the paper
Post-test Probabilistic Reasoning Assessment Duration One Hour
Index numberhelliphelliphelliphelliphelliphelliphelliphelliphelliphelliphelliphelliphelliphelliphellipClasshelliphelliphelliphellipAgehelliphelliphelliphellip
Read each statement carefully and circle the letter of the correct (best) option for each item as much as possible
and provide appropriate response in the space provided
1 Suppose a particular outcome from a random event has a probability of 04 Which of the following
statements represents correct interpretations of this probability
a The outcome will not happen
b The outcome will certainly happen about four times out of every 10 trials
c The outcome is expected to happen about four times out of every 10 trials
d The outcome could happen or it couldnrsquot of either result are the same
2 If you toss a fair coin and get heads 3 times in a row what is the chance of getting a head on the next toss
a 1
b Greater than 1
2
c 1
2
d Less than 1
2
e 0
3 A die is numbered 1 2 3 4 4 5 When the die is thrown once Which of these is most likely and why
a 1
b 2
c 3
d 4
e 5
f They are all equally likely
3i Give reason for your chosen answer in (3)
helliphelliphelliphelliphelliphelliphelliphelliphelliphelliphelliphelliphelliphelliphelliphelliphelliphelliphelliphelliphelliphelliphelliphelliphelliphelliphelliphelliphelliphelliphelliphelliphelliphelliphelliphelliphelliphelliphelliphelliphelliphelliphelliphelliphellip
helliphelliphelliphelliphelliphelliphelliphelliphelliphelliphelliphelliphelliphelliphelliphelliphelliphelliphelliphelliphelliphelliphelliphelliphelliphelliphelliphelliphelliphelliphelliphelliphelliphelliphelliphelliphelliphelliphelliphelliphelliphelliphelliphelliphellip
helliphelliphelliphelliphelliphelliphelliphelliphelliphelliphelliphelliphelliphelliphelliphelliphelliphelliphelliphelliphelliphelliphelliphelliphelliphelliphelliphelliphelliphelliphelliphelliphelliphelliphelliphelliphelliphelliphelliphelliphelliphelliphelliphelliphellip
helliphelliphelliphelliphelliphelliphelliphelliphelliphelliphelliphelliphelliphelliphelliphelliphelliphelliphelliphelliphelliphelliphelliphelliphelliphelliphelliphelliphelliphelliphelliphelliphelliphelliphelliphelliphelliphelliphellip
4 German MP tossed two dice once Which of these is mostly likely and why
a Obtaining a sum of 4
b Obtaining a sum of 7
c Obtaining a sum of 11
d All of them have equal chance of occurring that is a b c
Hokor amp Sedofia
144
4i Give reason for your chosen answer in (4)
helliphelliphelliphelliphelliphelliphelliphelliphelliphelliphelliphelliphelliphelliphelliphelliphelliphelliphelliphelliphelliphelliphelliphelliphelliphelliphelliphelliphelliphelliphelliphelliphelliphelliphelliphelliphelliphelliphelliphelliphelliphelliphelliphelliphellip
helliphelliphelliphelliphelliphelliphelliphelliphelliphelliphelliphelliphelliphelliphelliphelliphelliphelliphelliphelliphelliphelliphelliphelliphelliphelliphelliphelliphelliphelliphelliphelliphelliphelliphelliphelliphelliphelliphelliphelliphelliphelliphelliphelliphellip
helliphelliphelliphelliphelliphelliphelliphelliphelliphelliphelliphelliphelliphelliphelliphelliphelliphelliphelliphelliphelliphelliphelliphelliphelliphelliphelliphelliphelliphelliphelliphelliphelliphelliphelliphelliphelliphelliphelliphelliphelliphelliphelliphelliphellip
helliphelliphelliphelliphelliphelliphelliphelliphelliphelliphelliphelliphelliphelliphelliphelliphelliphelliphelliphelliphelliphelliphelliphelliphelliphelliphelliphelliphelliphelliphelliphelliphelliphelliphelliphelliphelliphelliphelliphelliphelliphelliphelliphelliphellip
helliphelliphelliphelliphelliphelliphelliphelliphelliphelliphelliphelliphelliphelliphelliphelliphelliphelliphelliphelliphelliphelliphelliphelliphelliphelliphelliphelliphellip
5i A fair coin is to be toss four times which of these is most likely to occur
a HTHT
b THTT
c TTTT
d HHTH
e The options a b c and d are all equally likely
5ii Give reason for your chosen answer in (5i)
helliphelliphelliphelliphelliphelliphelliphelliphelliphelliphelliphelliphelliphelliphelliphelliphelliphelliphelliphelliphelliphelliphelliphelliphelliphelliphelliphelliphelliphelliphelliphelliphelliphelliphelliphelliphelliphelliphelliphelliphelliphelliphelliphelliphellip
helliphelliphelliphelliphelliphelliphelliphelliphelliphelliphelliphelliphelliphelliphelliphelliphelliphelliphelliphelliphelliphelliphelliphelliphelliphelliphelliphelliphelliphelliphelliphelliphelliphelliphelliphelliphelliphelliphelliphelliphelliphelliphelliphelliphellip
helliphelliphelliphelliphelliphelliphelliphelliphelliphelliphelliphelliphelliphelliphelliphelliphelliphelliphelliphelliphelliphelliphelliphelliphelliphelliphelliphelliphelliphelliphelliphelliphelliphelliphelliphelliphelliphelliphelliphelliphelliphelliphelliphelliphellip
helliphelliphelliphelliphelliphelliphelliphelliphelliphelliphelliphelliphelliphelliphelliphelliphelliphelliphelliphelliphelliphelliphelliphelliphelliphelliphelliphelliphelliphelliphelliphelliphelliphelliphelliphelliphelliphelliphellip
6i A fair coin is to be toss four times which of these is least likely to occur
a HTHT
b THTT
c TTTT
d HHTH
e The options a b c and d are all equally likely
6ii Give reason for your chosen answer in (6i)
helliphelliphelliphelliphelliphelliphelliphelliphelliphelliphelliphelliphelliphelliphelliphelliphelliphelliphelliphelliphelliphelliphelliphelliphelliphelliphelliphelliphelliphelliphelliphelliphelliphelliphelliphelliphelliphelliphelliphelliphelliphelliphelliphelliphellip
helliphelliphelliphelliphelliphelliphelliphelliphelliphelliphelliphelliphelliphelliphelliphelliphelliphelliphelliphelliphelliphelliphelliphelliphelliphelliphelliphelliphelliphelliphelliphelliphelliphelliphelliphelliphelliphelliphelliphelliphelliphelliphelliphelliphellip
helliphelliphelliphelliphelliphelliphelliphelliphelliphelliphelliphelliphelliphelliphelliphelliphelliphelliphelliphelliphelliphelliphelliphelliphelliphelliphelliphelliphelliphelliphelliphelliphelliphelliphelliphelliphelliphelliphelliphelliphelliphelliphelliphelliphellip
helliphelliphelliphellip
7 A college has 300 level 200 students and 236 level 100 students in it Each studentrsquos name is written with
the level on a piece of paper and all the names are put into a box and mixed thoroughly A tutor picks one
name out of the box without looking Which level is the tutor more likely to pick from and why
helliphelliphelliphelliphelliphelliphelliphelliphelliphelliphelliphelliphelliphelliphelliphelliphelliphelliphelliphelliphelliphelliphelliphelliphelliphelliphelliphelliphelliphelliphelliphelliphelliphelliphelliphelliphelliphelliphelliphelliphelliphelliphelliphelliphellip
helliphelliphelliphelliphelliphelliphelliphelliphelliphelliphelliphelliphelliphelliphelliphelliphelliphelliphelliphelliphelliphelliphelliphelliphelliphelliphelliphelliphelliphelliphelliphelliphelliphelliphelliphelliphelliphelliphelliphelliphelliphelliphelliphelliphellip
helliphelliphelliphelliphelliphelliphelliphelliphelliphelliphelliphelliphelliphelliphelliphelliphelliphelliphelliphelliphelliphelliphelliphelliphelliphelliphelliphelliphelliphelliphelliphelliphelliphelliphelliphelliphelliphelliphelliphelliphelliphelliphelliphelliphellip
helliphelliphelliphelliphelliphelliphelliphelliphelliphelliphelliphelliphelliphelliphelliphelliphelliphelliphelliphelliphelliphelliphelliphelliphelliphelliphelliphelliphelliphelliphelliphelliphelliphelliphelliphelliphelliphelliphelliphellip
8 Suppose that you toss a coin three times and all eight outcomes are equally likely If it is known that the first
toss comes up heads what is the probability of an odd number of heads appearing
helliphelliphelliphelliphelliphelliphelliphelliphelliphelliphelliphelliphelliphelliphelliphelliphelliphelliphelliphelliphelliphelliphelliphelliphelliphelliphelliphelliphelliphelliphelliphelliphelliphelliphelliphelliphelliphelliphelliphelliphelliphelliphelliphelliphellip
helliphelliphelliphelliphelliphelliphelliphelliphelliphelliphelliphelliphelliphelliphelliphelliphelliphelliphelliphelliphelliphelliphelliphelliphelliphelliphelliphelliphelliphelliphelliphelliphelliphelliphelliphelliphelliphelliphelliphelliphelliphelliphelliphelliphellip
helliphelliphelliphelliphelliphelliphelliphelliphelliphelliphelliphelliphelliphelliphelliphelliphelliphelliphelliphelliphelliphelliphelliphelliphelliphelliphelliphelliphelliphelliphelliphelliphelliphelliphelliphelliphelliphelliphelliphelliphelliphelliphelliphelliphellip
International Journal of Studies in Education and Science (IJSES)
145
helliphelliphelliphelliphelliphelliphelliphelliphelliphelliphelliphelliphelliphelliphelliphelliphelliphelliphelliphelliphelliphelliphelliphelliphelliphelliphelliphelliphelliphelliphelliphelliphelliphelliphelliphelliphelliphelliphelliphelliphelliphelliphelliphelliphellip
helliphelliphelliphelliphelliphelliphelliphelliphelliphelliphelliphelliphelliphelliphelliphelliphelliphelliphelliphelliphelliphelliphelliphelliphelliphelliphelliphelliphelliphelliphelliphelliphelliphelliphelliphelliphelliphelliphelliphelliphelliphelliphelliphelliphellip
helliphelliphelliphelliphelliphelliphelliphelliphelliphelliphelliphelliphelliphelliphelliphelliphelliphelliphelliphellip
9 A card is selected at random from a pack of 52 cards Find the probability of selecting a card which is a red or
a queen
helliphelliphelliphelliphelliphelliphelliphelliphelliphelliphelliphelliphelliphelliphelliphelliphelliphelliphelliphelliphelliphelliphelliphelliphelliphelliphelliphelliphelliphelliphelliphelliphelliphelliphelliphelliphelliphelliphelliphelliphelliphelliphelliphelliphellip
helliphelliphelliphelliphelliphelliphelliphelliphelliphelliphelliphelliphelliphelliphelliphelliphelliphelliphelliphelliphelliphelliphelliphelliphelliphelliphelliphelliphelliphelliphelliphelliphelliphelliphelliphelliphelliphelliphelliphelliphelliphelliphelliphelliphellip
helliphelliphelliphelliphelliphelliphelliphelliphelliphelliphelliphelliphelliphelliphelliphelliphelliphelliphelliphelliphelliphelliphelliphelliphelliphelliphelliphelliphelliphelliphelliphelliphelliphelliphelliphelliphelliphelliphelliphelliphelliphelliphelliphelliphellip
helliphelliphelliphelliphelliphelliphelliphelliphelliphelliphelliphelliphelliphelliphelliphelliphelliphelliphelliphelliphelliphelliphelliphelliphelliphelliphelliphelliphelliphelliphelliphelliphelliphelliphelliphelliphelliphelliphelliphellip
10 A box contains 6 white balls and 4 green balls Two balls are chosen at random one after the other without
replacement determine the probability that the second ball is white
helliphelliphelliphelliphelliphelliphelliphelliphelliphelliphelliphelliphelliphelliphelliphelliphelliphelliphelliphelliphelliphelliphelliphelliphelliphelliphelliphelliphelliphelliphelliphelliphelliphelliphelliphelliphelliphelliphelliphelliphelliphelliphelliphelliphellip
helliphelliphelliphelliphelliphelliphelliphelliphelliphelliphelliphelliphelliphelliphelliphelliphelliphelliphelliphelliphelliphelliphelliphelliphelliphelliphelliphelliphelliphelliphelliphelliphelliphelliphelliphelliphelliphelliphelliphelliphelliphelliphelliphelliphellip
helliphelliphelliphelliphelliphelliphelliphelliphelliphelliphelliphelliphelliphelliphelliphelliphelliphelliphelliphelliphelliphelliphelliphelliphelliphelliphelliphelliphelliphelliphelliphelliphelliphelliphelliphelliphelliphelliphelliphelliphelliphelliphelliphelliphellip
helliphelliphelliphelliphelliphelliphelliphelliphelliphelliphelliphelliphelliphelliphelliphelliphelliphelliphelliphelliphelliphelliphelliphelliphelliphelliphelliphelliphelliphelliphelliphelliphelliphelliphelliphelliphelliphelliphelliphelliphelliphelliphellip

Hokor amp Sedofia
122
information tends to be forgotten quickly as students are mostly passive learners in this kind of instruction
Finally lectures emphasize learning by listening which is a disadvantage for students who prefer other learning
styles (Schwerdt amp Wuppermann 2011) The lecture method of teaching mathematics may cause students to
lose interest in learning mathematics since it makes learners passive rather than active participants in the
learning process
Many countries have made probability an integral part of the school curriculum (Jun 2000) Although
probability forms a critical part of most mathematics curricula in many countries the training that preservice
teachers need to teach probability is missing in some training programs (Batanero amp Diaz 2012) Meanwhile
Roseth Garfield and Ben-Zvi (2008) argued that probabilistic reasoning is necessary for students to be
informed citizens in the 21st century In the present study probabilistic reasoning refers to the way people reason
about uncertainty situations and making decisions based on likely outcomes Bennett and Anway (2003) defined
probabilistic reasoning as ldquothe way people reason about likelihood (of outcomes) and with uncertaintyrdquo (p138)
Probabilistic reasoning involves
i identifying a desired outcome or a situation that involves uncertainty
ii using theoretical probability to determine the likelihood of that outcome and
iii making a decision with a level of confidence estimate directly from the likelihood (Nguyen 2015)
To develop better probabilistic reasoning in students teachersrsquo correct knowledge about probability is needed
When teachers are equipped with appropriate skills their confidence in teaching probability increases But some
studies have revealed that the current way of training teachers do not provide the essential skills needed to teach
probability effectively (Jones 2005 Khazanov amp Prado 2010) Research has shown that despite the numerous
interventions in helping to improve students learning outcomes individual learning style is very key in our quest
for improved teaching and learning of mathematics (Johnson amp Dasgupta 2005) Learning style serves as the
reference point for curriculum development and instruction
Some preservice teachers come to mathematics classrooms with the erroneous view that mathematics is an exact
or a fact discipline and as such everything about it should be memorized Weldeana and Abraham (2014)
revealed that prospective teachers hold traditional beliefs about mathematics limiting their intellectual
development in the discipline Khazanov amp Gourgey (2009) argued that if we expect improvements in studentsrsquo
conceptions then instructional interventions need to be designed to eliminate studentsrsquo misconceptions of
probability Additional research is also required to clarify the essential components in the preparation of
teachers to teach probability identify adequate methods and establish appropriate levels at which each
component should be taught (Batanero amp Diaz 2012) Despite the importance of probability and statistics there
is limited research about instructional methods and their effects (Shay 2008) and it appears few research
examined the effect of the learner-centered and teacher-centered approaches of teaching statistics on studentsrsquo
understanding in classrooms (Weltman amp Whiteside 2010 Lessani Md Yunus amp Bakar 2017) Lovett and Lee
(2017) examined the preparedness of high school preservice mathematics teachersrsquo ability to teach statistics and
the results revealed that the cohort of preservice teachers entering high school mathematics classrooms are not
prepared to teach statistics
International Journal of Studies in Education and Science (IJSES)
123
Some studies have examined the learner-centered and teacher-centered approaches of teaching mathematics on
studentsrsquo problem-solving abilities but the evidence seems to suggest that none of the studies provides an
empirical comparison of the learner-centered and teacher-centered approaches targeted at addressing
probabilistic misconceptions in relation to developing the probabilistic reasoning of preservice teachers
Additionally it appears there is no study that has compared the effect of the learner-centered and teacher-
centered approaches of teaching on preservice teachersrsquo probabilistic reasoning at the colleges of education level
in Ghana Therefore this study was designed to address the above gaps The important hypothesis that this study
sought to test is There is no significant difference in the probabilistic reasoning (mean scores) between students
who experience the learner-centered approach targeted at addressing probabilistic misconceptions and those
who experience teacher-centered approach targeted at probabilistic misconceptions in the post-test It is hoped
that this study will contribute to the teacher development literature and provide a strong empirical basis for
teaching statistics and probability in colleges of education In the rest of the study we present the review of
relevant literature and the methodology employed for the study It is followed by the presentation and discussion
of results conclusions practical implications and limitations
Literature Review
Theoretical Review
This study is anchored on the socio-cultural constructivist theory of Vygotsky (1978) which contends that
learning occurs at two levels first in the context of shared social activity known as the social or interpersonal
plane and second on the individual plane Learning at these two levels can occur in any context whether
during mathematics lessons in the workplace or in the home Vygotskyrsquos work considered reconstruction of
knowledge in a social context According to him language plays a crucial role in cognitive development
because childrenrsquos knowledge ideas and values develop through interactions with others Vygotsky believed
that a learnerrsquos acquisition of knowledge takes time This suggests that teachers should exercise patience for
learners to explore concepts in order to acquire all the necessary knowledge
One key aspect in the socio-cultural theory is the concept of ldquozone of proximal developmentrdquo (ZPD) which
according to Vygotsky is the difference between a childrsquos current performance (the problems the child can
solve independently without any support) and the level of performance that the child could achieve with
guidance from an adult or by working with a more experienced person such as a teacher a parent a peer or a
sibling Vygotsky thus advocated that for the learner to learn independently there should be an experienced
person to support the learner He contends that the learnersrsquo intellectual life will be greatly developed when
teachers succeeded in leading learners to reorganize their existing ideas with new ones in a meaningful way
This indicates that learners are to be at the center of teaching and learning interacting with their own colleagues
while teachers serve as facilitators It is crucial that teachers are well prepared to facilitate meaningful learning
else learners will be unable to learn effectively The socio-cultural constructivist theory is relevant for this study
because research by Sharma (2016) showed that the theory plays a crucial role in studentsrsquo ability to confront
their own probabilistic misconceptions and resolve them meaningfully
Hokor amp Sedofia
124
Teacher-Centered Approach versus Learner-Centered Approach
In this study the teaching method in which the teacher lectures or stands in front of the class and orally presents
his or her teaching note to the learners is called the teacher-centered approach In the teacher-centered approach
to teaching information flows from the teacher to the learner Learners become a recipient In the constructivist
classroom however the teacher functions as a coach and learners work through problems Where learners
discover concept through activities by themselves they value mathematics and are able to apply it in real-life
The essence of teaching and learning of mathematics is its applicability in solving daily life problems The
learner-centered approach to teaching inspires students to effectively solve problems by relating various
mathematical concepts in real life The differences between the organization of the constructivist and teacher-
centered approach classrooms are presented in Table 1
Table 1 Differences in the Two Approaches of Teaching Mathematics
Learner-centered classroom Teacher-centered classroom
i Students learn from their own
experiences through activities
i Students learn mainly from teachersrsquo
explanations
ii Students are more responsible for their
own learning using the teaching and
learning resources under the guide of a
teacher
ii Students are given more questions to
solve using the rules and formulae by a
teacher
iii Teacher engages all students in
lesson facilitates problem-solving
among students
iii Teacher explains the mathematical
rules and procedures and gives
problems that required the use of such
rules
iv Teacher establishes a purposeful
learning environment interacts
with students and guides them to
construct their own meaning to
concept
iv Teachers focus more on procedural
understanding
v Teachers construct problems
carefully that required studentsrsquo to
apply what they learnt
v Teachers give problems mostly from
textbook that required the use of
formula by learners to solve
Effect of a Learner-centered Approach to Teaching on Studentsrsquo Conceptual Understanding of
Mathematics
Some studies have reported the learner-centered approachs effectiveness in teaching and learning mathematics
on studentsrsquo conceptual understanding Bada (2015) conducted a study on constructivism learning theory for
studentsrsquo understanding of mathematics and contended that if all students are to succeed then teachers have to
use learner-centered approach teaching The study revealed that the learner-centered approach to teaching
International Journal of Studies in Education and Science (IJSES)
125
motivates students to learn and gives teachers the opportunity to assess how the activity is helping the students
to develop an understanding of concepts Furthermore a study was conducted by Major and Mangope (2012) on
constructivist theory in Mathematics in Botswana primary schools The study focused on the extent to which
teachers in Botswana primary schools use the learner-centered approach in teaching and learning of
Mathematics A total of 83 mathematics lessons were videotaped and analyzed The results revealed that most of
the lessons required students to recall rules or formulae However small percentages of the lessons required
students to explore or investigate mathematical ideas
Students are at the center of the learning process in the constructivist class through doing experience action
and peer collaboration National Council of Teachers of Mathematics 2000 (cited in Prideaux 2007) contended
that when teaching is student the learners value mathematics and engage actively in learning the discipline In
solving problems under the constructivist strategy learners are motivated to try various means possible hence
they invent the means of solving the problem themselves In constructivism problems are carefully constructed
to challenge students to reason about the concepts Additionally the interest of the learners increases because
they see the need to study mathematics Mathematics is full of problem-solving So employing a problem-
solving strategytechnique to teach mathematics helps learners to have a better understanding of mathematical
concepts
Materials and Methods
Design
This study used the nonequivalent (pre-test and post-test) control-group design of quasi-experimental research
In this design a dependent variable is measured in one group of subjects before and after a treatment and that
same dependent variable is measured at pre-test and post-test in another nonequivalent control group which does
not receive any treatment The two groups are selected without random assignment and both groups take a
pretest and posttest But only the experimental group receives the treatment (Creswell amp Creswell 2018) This
design makes it possible for researchers to compare scores before and after a treatment in a group that receives
the treatment and also in a nonequivalent control group that does not receive the treatment The nature of the
research problem and the objectives to be achieved warranted quasi-experimental design Importantly in an
environment such as a college of education randomness was impractical (Leedy amp Ormrod 2020) and despite
the argument that quasi-experimental research has low internal validity compared to true experiments quasi-
experimental research has a higher external validity because it helps researchers to do interventions in the real-
world instead of artificial laboratory settings (Thomas 2020)
Population
There are seven public Colleges of Education in the Volta Region of Ghana Six out of the seven colleges are
mixed-sex colleges and one is female-only The single-sex college was purposively chosen to ascertain how
these students develop their probabilistic reasoning from the two different teaching methods discussed above
The population was all second-year preservice teachers of that college since at the time of the study the final
Hokor amp Sedofia
126
years were out for their teaching practice and the first year students had not taken the statistics and probability
course This institution was selected for one main reason they all studied Statistics and Probability and were
thus expected to teach it at the Junior High School level upon completion of their training
Sample and Sampling Procedure
Purposive sampling technique was used to select two intact classes out of six classes identified as Group A and
Group B respectively These groups are similar in terms of their performance in their second-year first-semester
mid-semester quiz scores in mathematics with mean scores of 139 and 137 respectively ldquoQuasi-experimental
designs identify a comparison group that is as similar as possible to the experimental group in terms of pre-
intervention characteristicsrdquo (White amp Sabarwal 2014 p 1) Also it helped to avoid selection bias which is a
concern in quasi-experimental studies
These two intact classes comprised 27 preservice teachers in Group B and 32 in Group A In purposive
sampling certain elements of the population are deliberately selected on the judgment of the researchers and
nothing is left to chance In this study respondents were chosen from a population of regular preservice teachers
who had studied probability previously and were taking statistics and probability as a course in a college of
education The reason for choosing both groups from the same population is that both Group A and Group B
used the same textbooks and course materials Also both groups were chosen from the same population to avoid
bias because all the colleges use different textbooks and the conditions under which students studied are
different from college to college
Achievement Tests (Pre-test and Post-Test)
The test items were administered in two phases in the classrooms These are pre-test and the post-test Items 2i
2ii 3i and 3ii of the pretest were adapted from (Anway amp Bennett 2004 Hirsh amp ODonnell 2001) Two
examiners of statistics and probability were consulted to ensure the questions are at the level of the participants
This is to ensure the validity of the test items The pre-test and the post-test were similar to measure whether
there is a change or not The items were developed to measure the probabilistic reasoning of preservice teachers
The items sought to ascertain preservice teachersrsquo ability in reasoning about uncertainties and the use of
probability daily
The achievement test assessed the following areas correctly applying probability in decision making
equiprobability bias correctly interpreting without replacement situations correctly listing the sample space and
determining the probability representativeness bias and interpreting probability statements correctly and
applying appropriate strategies There were 12 items for the pre-test and 10 items for the post-test We have
more items on the pre-test because the post-test was more open-ended than the pre-test Nevertheless the total
scores in each case was 20 Some of the test items consisted of two parts the principal question (multiple
choice) and a justification of the answer The pre-test and post-test can be seen in appendices A and B
respectively
International Journal of Studies in Education and Science (IJSES)
127
Evaluation of Materials by Experts
The researchers solicited two expertsrsquo views on the test items content coverage content relevance and course
materials It was the view of the experts that the test items of both the pre-test and the post-test were in line with
the mathematics syllabus of colleges of education in Ghana The activities designed for the Group A were also
assessed In the view of the experts the teaching activities had sufficient content coverage and would help pre-
service teachers develop better probabilistic reasoning They acknowledged the idea of having activities that
reflect real life situations to support pre-service teachers since they were aware students have difficulty with
probability related problems The experts further acknowledged that the objectives were measurable and
activities were practical to promote pre-service teachersrsquo involvement in the lessons They said the teaching and
learning materials reflected the learner-centered approach and were in line with the syllabus requirements for
Mathematics in colleges of education in Ghana They believed the activities would promote better probabilistic
reasoning since they reflected real life situations
Data Collection Procedure
Preservice teachers were informed one week ahead of the administration of the pre-test The format of the test
items and the purpose of the study were communicated to the respondents The tests were administered by the
researchers at an Examination Hall to ensure the respondents did independent work
Treatment
The learner-centered approach was applied to group A while the teacher-centered approach of instruction was
applied to group B In each approach the lessons were focused on addressing equiprobability bias
representativeness belief bias positive recency and negative recency effects since some studies suggest that
teaching approaches that target probabilistic misconceptions will help improve studentsrsquo performance
significantly (Khazanov amp Prado 2010 Shay 2008) The implementation of both teaching approaches were
done by the lead researcher
Group A The Learner-centered approach
The teaching and learning took place in traditional classroom settings generally consisting of activities
discussions and questions and answers concurrently once per week for two hours for a month In group A the
activities were designed focusing on probabilistic misconceptions using the learner-centered approach to
teaching to better their probabilistic reasoning Examples of the activities are given below
Card Game This game was played in groups Identical cards were numbered 3 3 4 4 5 5 5 6 6 7 8 and 9
and put in a container and thoroughly mixed Three students will reach in and without looking draw out a card
each at time If the three people pick different numbers then the group wins GH30000 else they lose Is the
chance of winning or losing the same and why The purpose of this activity is to enhance preservice teachersrsquo
Hokor amp Sedofia
128
decision-making ability by addressing equiprobability bias representativeness bias belief and positive and
negative recency effects The aim of predicting before picking was to keep students focused and to confront any
prior misconceptions The game was played 15 times If all the three members of the group pick different colors
then a point of one is recorded else zero After the activity a discussion was organized around their prediction
and the results to challenge their thinking
Pair Game In pairs preservice teachers were asked to toss a coin six times each recording the sequence of tails
and heads The purpose of this activity is to address representativeness bias Before the toss students were asked
to predict the number of tails and heads Their predictions were written in their notebook before the toss Most
preservice teachers predicted equal number of tails and heads Preservice teachers then compare their predicted
sequences to their results after the toss It was noted in many instances that those who predicted equal number of
tails and heads did not obtain results that were consistent with their prediction Discussions were organized
around their predicted sequences and the results obtained after the toss for better probabilistic reasoning
Coin Game Students perform this experiment ten times by tossing a number of fair coins once and record the
outcomes in each case In the first toss a coin was tossed once and the outcome recorded in the second toss
two coins were tossed once and outcomes recorded in third toss three coins were tossed once and outcomes
recorded and so on H stands for heads and T stands for tails The following are a sample of sequence of
outcomes by one student
1st toss H
2nd
toss HT
3rd
toss HTH
4th
toss HTTT
5th
toss THHTT
6th
toss HTHTTT
7th
toss TTHTHHT
8th
toss THTHTHHH
9th
toss HTTTHTHTT
10th
toss THTHTHTHTT
119873119906119898119887119890119903 119900119891 ℎ119890119886119889119904
119873119906119898119887119890119903 119900119891 119905119900119904119904119890119904=
1
1= 1
1
2= 05
2
3= 0667
1
4= 025
2
5= 04
2
6= 0333
3
7= 0429
5
8
= 0625 3
9= 0333
4
10= 04
The average of the probabilities of obtaining a head for each experiment is
=105066702504033304290625033304
10=
4937
10cong 05
International Journal of Studies in Education and Science (IJSES)
129
It must be noted that in experimental or frequentist probability we are concerned about conducting the
experiment many times and considering its approximation or convergence Students were led to conclude that in
general we can say when a fair coin is tossed the probability of getting a head at any time is 1
2 and vice versa
Group B The Teacher-centered approach
Group B was taught using the teacher-centered approach In this case the teacher rather than the learner was at
the center of the teaching and learning process The tutor presented the preservice teachers with facts or
procedures that had been established to solve problems Preservice teachers were given problems that require
the use of these facts or procedures to solve as either assignment exercise test or quiz It is believed that
preservice teachers learned more when they solved similar problems many times When examination questions
that demanded facts were set students could solve the problems without really understanding the concepts
Formulae were presented to students to learn to apply to similar problems Concepts were clearly explained
bearing in mind the probabilistic misconceptions Samples of lessons experienced by Group B are as follow
Lesson one Through questions and answers teacher revises preservice teachersrsquo previous knowledge on playing
of games and probabilistic situations Based on studentsrsquo responses the teacher introduces the lesson
Teacher explains to preservice teachers the concept of probability and three ways we can make probability
statements as classical frequentist and subjective Classical probability is the number of favorable outcomes (E)
divided by the total number of possible outcomes (S) It works on the assumptions that all outcomes are equally
likely Equally likely means that each outcome has the same probability of occurring
Mathematically P(E) =
Students were then led to solve problems using the formula
Experimental probability is a method of calculating probability where the probability is the ratio of the number
of the trials where the desired event occurs to the number of total trials Subjective probability is a statement that
an individual makes based on personal judgment to describe the likelihood of an event Or a personal belief
based on onersquos own experience or expertise The person making the statement should be an expert in the area or
someone who have a sound knowledge on the issue under consideration before it can be considered important
For the statement to be reliable it should be based on a sound premise(s) Nevertheless both experts and non-
experts make use of subjective probability daily For example I have a 90 chance of passing my statistics and
probability exam
Lesson two Teacher explains basic terms of probability such as sample space sample point an event equally
likely to preservice teachers Teacher guides preservice teachers through demonstration to solve probability
problems using classical definition of probability by listing the sample space and finding the probability of an
event Teacher leads preservice teachers to solve probability problems from frequency tables Similarly teacher
explains to preservice teachers independent and dependent events Teacher asks the preservice teachers to solve
problems on independent and dependent events
Hokor amp Sedofia
130
Data Analysis
The data collected were coded and edited before being transferred to computer for analysis using SPSS version
24 A Levenersquos test was used in the study to ensure that the assumptions between each group was not violated
Homogeneity of variances was considered to ensure that each grouprsquos pre-test scores were mostly equal Paired
samples T-test was used to compare two means within each group to determine whether or not the differences in
means were statistically significant Independent sample T-test was used to compare the probabilistic reasoning
mean scores in Group A and the Group B before the experiment at a time to determine whether the two groups
were at the same level or not The independent t-test was used because there were two different groups of
participants It works on the assumption that scores are unique because they come from different participants
Also the equality of variance for running ANCOVA at 5 significance level was checked using Levenersquos test
Table 2 Levenes Test of Equality of Variances
F df1 df2 Sig
1234 1 57 0456
The results from Table 2 indicate that the variances are roughly equal since the significance value of 0456 is
greater than the cut-off value of 005 Therefore we can conclude that homogeneity of variance assumption was
met (Field 2005) This allowed us to examine the relationship between the covariate (pre-test scores) and
dependent variable (post-test scores) Analysis of covariance (ANCOVA) was used to examine the effect of
learner-centered approach to teaching and teacher-centered approach on preservice teachersrsquo probabilistic
reasoning since different participants were in each group The ANCOVA is ideal in removing the bias of these
variables (Field 2005) In order to determine whether or not the occurrence of scores was not by chance a
partial eta squared was used to gauge the magnitude of the difference (effect size) between means of the scores
Pallant (2001) outlined the following criterion for interpreting partial eta squared values as 001 = small effect
006 = moderate effect and 014 = large effect
Results
Before introducing the learner-centered and teacher-centered approaches of teaching preservice teachersrsquo
probabilistic reasoning was compared to ascertain whether or not their results were similar in terms of the mean
scores The result is presented in Table 3
Table 3 Results of the Independent Samples t-test on the Pre-test of the Group B and Group A
Group N Mean Std Dev Mean Difference Df t-value p-value
Group B 27 585 1562 35 56 756 456
Group A 32 550 1967
The results in Table 3 indicate that there was no statistically significant difference between the probabilistic
reasoning mean scores of Group A = 550 = 1967 and Group B = 585 = 1562 in the
International Journal of Studies in Education and Science (IJSES)
131
pretest This is an indication that the two groups are similar and their performance could be compared after the
two teaching approaches
Comparison of Probabilistic Reasoning of the Preservice Teachers before and after Learner-centered
Approach in Group A
The results of analysis of the effect of the learner-centered approach on preservice teachersrsquo probabilistic
reasoning is presented in Table 4
Table 4 Pre-test and Post-test Scores for Group A
Minimum Maximum Mean Std Deviation
Pre-test 1 10 550 1967
Post-test 8 20 1572 3630
Table 4 reveals that in the post-test preservice teachersrsquo probabilistic reasoning mean scores increased from
550 to 1572 in the post-test in Group A
A paired sample t‐test was conducted to compare the post-test and pre-test scores for the preservice teachers
taught with the learner-centered approach to teaching (Group A) in order to determine if the mean difference in
scores was statistically significant This was done to evaluate the effect of the learner-centered approach on
preservice teachersrsquo probabilistic reasoning Table 5 presents the results
Table 5 Paired Sample t-test Results on the Post-test and Pre-test of Group A
Mean
Difference
Std
Deviation
Std Error
Mean
t Df Sig
Post-test ndash Pre-test 10219 2871 507 20137 31 000
The results from Table 5 shows a statistically significant difference in the preservice teachersrsquo probabilistic
reasoning from the pre-test (M = 550 SD = 1967) to the post-test (M = 1572 SD = 3630) with t (31) =
20137 p = 000 The result reveals that preservice teachersrsquo probabilistic reasoning has improved significantly
after the learner-centered approach was used since = 000 05 It can be inferred that the learner-centered
approach to teaching has a positive significant effect on preservice teachersrsquo probabilistic reasoning
Analysis of Probabilistic Reasoning of the Preservice Teachers before and after Teacher-centered
Approach to Teaching
The results of the analysis of the effect of the teacher-centered approach to teaching on preservice teachersrsquo
probabilistic reasoning is presented in Table 6
Hokor amp Sedofia
132
Table 6 Pre-test and Post-test Scores for the Group B
Minimum Maximum Mean Std Deviation
Pre-test 2 8 585 1562
Post-test 5 14 952 2208
The data on Table 6 show that the mean score of preservice teachers in the pre-test was 585 while that of the
post-test was 952 marks This indicates that in the post-test an average of each of the preservice teachersrsquo
probabilistic reasoning increased slightly in Group B To determine if the mean difference is statistically
significant a paired sample t‐test was conducted Table 7 presents the results
Table 7 Results of the Paired Samples t-test on the Post-test and Pre-test of the Group B
Mean
Difference
Std Deviation Std Error
Mean
t Df Sig
Post-test ndash Pre-test 3667 1441 0277 13220 26 000
The result presented on Table 7 shows that the mean score difference between the post-test and pre-test of
Group B was 3667 marks with a corresponding standard deviation of 1441 The paired sample t-test was
conducted to find out if the mean score difference (M = 3667 SD = 1441) was statistically significant This
was done to assess the effect of the teacher-centered approach targeted at addressing misconceptions on
preservice teachersrsquo probabilistic reasoning The results from Table 7 reveal that there was a statistically
significant difference in the preservice teachersrsquo probabilistic reasoning scores from the pre-test (M = 585 SD =
1562) to the post-test (M = 952 SD = 2208) with t (26) = 13220 p = 000 lt 05 This is an indication that the
teacher-centered approach to teaching probability targeted at addressing probabilistic misconceptions aids
students to improve upon their understanding and problem-solving abilities in probability
Next we compared the effectiveness of the learner-centered approach of teaching and the teacher-centered
approach of teaching in terms of probabilistic reasoning of preservice teachers and how they addressed
probabilistic misconceptions
Comparison of Effectiveness of Learner-centered Approach and Teacher-centered Approach in
Developing Probabilistic Reasoning
The preservice teachersrsquo scores on the pre-test of the achievement test were used as covariate in this analysis
The scores from the post-test were then compared using ANCOVA with = 05 to adjust for pre-test
differences that existed between Group A and Group B In the pre-test the mean scores of Group B and Group A
were 585 and 550 respectively ANCOVA was used to adjust the post-test scores statistically to compensate
for the 035 mean point difference between the two groups in the pre-test This adjustment led to a more
accurate post-test comparison Table 8 presents the results
International Journal of Studies in Education and Science (IJSES)
133
Table 8 Summary of ANCOVA of the Performance of Preservice Teachers taught with Learner-centered
Approach and Teacher-centered Approach (N = 59)
Source Sum of
Squares
Df
Mean
Square
F Sig Partial Eta
Squared
Corrected
Model
791144a 2 395562 72150 000 720
Intercept 205135 1 205135 37416 000 401
Pre-test 228184 1 228184 41620 000 426
Group 630253 1 630253 114955 000 672
Error 307026 56 5483
Total 10888000 59
Corrected Total 1098169 58
a R Squared = 720 (Adjusted R Squared = 710)
The data on Table 8 indicate that there is a statistically significant main effect on the preservice teachers who
were taught using the learner-centered approach to learn probability [F (1 56) = 114955 p = 000 lt 05]
Consequently the preservice teachers taught with the learner-centered approach performed better than their
counterparts who experienced the teacher-centered approach to learn probability The partial eta squared value
was found to be 0672 This value indicates a large effect size That is 672 of the variance in the dependent
variable (probabilistic reasoning achievement score) is expounded by the independent variable (teacher-centered
approach) This implies that the magnitude of the difference between the mean score of the preservice teachers
taught with the learner-centered approach and the teacher-centered approach is large With the high scores of
preservice teachers in the Group A it implies that the use of learner-centered approach in the teaching and
learning of probability improved the performance of the preservice teachers
The outcome of the study portrays that there was a statistically significant difference in the probabilistic
reasoning achievement mean scores of Group A than that of Group B [F (1 56) = 114955 p = 000 lt 05] This
finding implies that Group A performed better than Group B in the probabilistic reasoning achievement test
This is an indication that when the learner-centered approach to teaching probability is targeted at addressing
probabilistic misconceptions preservice teachers develop better probabilistic reasoning than teacher-centered
approach
Discussion
This study set out to compare the learner-centered and teacher-centered approaches of teaching in order to
determine the best way of developing preservice teachersrsquo probabilistic reasoning at the College of Education
Hokor amp Sedofia
134
level in Ghana The results as shown on Tables 3 4 5 6 7 and 8 indicate that the learner-centered approach to
teaching probability is more effective than the teacher-centered approach in motivating and inspiring preservice
teachers to learn and apply probability The learner-centered approach provides studentsrsquo opportunities to think
reason reflect and evaluate their ideals and that of colleagues
The findings of the present study are in tandem with several research findings Lessani Md Yunus and Bakar
(2017) investigated mathematics teaching approaches and their consequences on learnersrsquo ability to solve
challenging problems Their findings affirm the learner-centered approach to be more effective in studentsrsquo
creativity and innovation in solving real-life problems than the teacher-centered approach So training
programs for excellent teaching and learning should be flexible and innovative to allow preservice teachers to
explore gaps in learning and teaching (AIAhmad 2021) Similarly Prideaux (2007) found that students who
experienced the learner-centered approach of teaching performed significantly higher than those who were
taught without the learner-centered approach of teaching Roseth Garfield and Ben-Zvi (2008) also examined
the effect of the cooperative framework in classroom teaching and collaboration and found that student-
centered approaches to teaching help students to have better understanding of statistics than teacher-centered
instruction
Furthermore Gurbuz and Birgin (2011) studied the effect of computer-assisted teaching on addressing
probabilistic misconceptions of students The authors used pre-test to collect data on both the computer-assisted
and traditional groups before the experimental teachings After the intervention the post-test was administered
to ascertain the effect of computer-assisted teaching and teacher-centered approach on addressing studentsrsquo
probabilistic misconceptions Their study found computer-assisted teaching to have more significant effect on
studentsrsquo correct probabilistic reasoning than teacher-centered approach of teaching
As noted by Batanero and Diaz (2012) probability forms an integral part of the Mathematics curriculum in
many countries But the concept is one that some learners find difficult to understand partly due to the method
of teaching used by teachers This fact implies that teachers of mathematics should find more creative ways of
teaching the concept so as to make it easier for learners to understand and apply the concept As discovered in
this study the learner-centered approach is effective in developing probabilistic reasoning But the learner-
centered approach works best when certain conditions are present At the outset there is the need for relevant
teaching and learning materials Then teachers need to be trained and retrained in the use of the learner-centered
approach to teaching At the college of education level preservice teachers need to be taught using the learner-
centered approach not only to help them understand probability but also to help them use the learner-centered
approach in their own teaching
The activities used for Group A which is learner-centered approach group in the form of games promote
content knowledge and cognitive skills competencies such as collaboration and problem solving (Belova amp
Zowada 2020) The activities focus on promoting learning experiences rather than stressing on the
entertainment factor While some things students learn in school seem to them predetermined and bound by
laws in other branches of mathematics probability provides students with opportunity to learn that solutions to
International Journal of Studies in Education and Science (IJSES)
135
several problems depend on assumptions and have degrees of doubt So teaching methods that allow students to
predict and test their predictions should be encouraged for students to develop their intellectual repertoire The
processes used in reasoning about sample space will serve students well in life Several calls on the need to pay
attention to the study of probability show that teachers and mathematics teachers must provide their students
with appropriate teaching strategies to enhance their conceptual understanding In the preparation of preservice
teachers to become mathematically competent citizens teacher preparation programs such as teaching methods
must provide opportunities for preservice teachers to confront misconceptions and reason probabilistically
(Courtney amp Caniglia 2021)
The findings of the present study however run counter to those of Weltman and Whiteside (2010) They
conducted a study on the effectiveness of the traditional and active learning method in business statistics The
study found that active learning had not been effective for all category of students It is not precisely clear what
may have accounted for that result This is because active learning methods have generally been known to be
effective in promoting learning Further research is thus required in this regard
Conclusions
This study compared the effects of the learner-centered and teacher-centered approaches of teaching in
addressing probabilistic misconceptions by measuring preservice teachersrsquo probabilistic reasoning scores The
results show that the learner-centered approach aids preservice teachers to develop better probabilistic reasoning
than the teacher-centered approach to teaching Thus the study concludes that the learner-centered approach to
teaching is a solution to preservice teachersrsquo inability to answer questions on probability correctly Even though
each teaching approach targeted at addressing misconceptions was found to have significant effect on pre-
service teachersrsquo probabilistic reasoning the learner-centered approach was found to be more effective than the
teacher-centered approach in addressing misconceptions which limit studentsrsquo ability to solve probability
problems correctly
Implications and Recommendations
This study makes some key contributions to the teacher educationdevelopment literature in general and
particularly to the development of probabilistic reasoning of preservice teachers The study provides empirical
evidence that the learner-centered approach targeted at addressing probabilistic misconceptions is more effective
in developing probabilistic reasoning in preservice teachers What this means is that when teacher educators use
the learner-centered approach to teach the concept of probability and focus on addressing misconceptions
preservice teachers will develop better probabilistic reasoning This will in turn translate into preservice
teachers answering questions on probability correctly in their examinations and ultimately making them teach
the concept more effectively when they complete their training It is thus recommended that teachers should
consider employing the learner-centered approach in teaching the concept of probability
Hokor amp Sedofia
136
Limitations
As with every empirical study employing the quasi-experimental approach the current study has some
limitations which need to be acknowledged and used to guide users of the findings Firstly our sample was
drawn from a population of second year preservice teachers of a female only college of education in a peri-
urban area in Ghana Further experiments are therefore needed in other settings in order to see if the same or
similar results will occur Secondly owing to the narrow characteristics of the participants in the present study
the researchers cannot generalize the results to other individuals who do not have the same characteristics So
additional experiments with groups with different characteristics are necessary Lastly the experiments need to
be repeated at another time to determine if the results are the same (consistent) over time
Acknowledgements
We are grateful to the Principal and preservice teachers for granting access and participating in the study
respectively
References
AIAhmad H (2021) The role of educational communication in promoting student-centered learning style in
multicultural classrooms A reflective essay on learning and teaching in higher education International
Journal of Research in Education and Science (IJRES) 7(3) 838-851 httpsdoiorg1046328ijes2374
Aina J K Olanipekun S S amp Garuba I A (2015) Teachersrsquo effectiveness and its Influence on studentsrsquo
learning Advances in Social Sciences Research Journal 2(4) 88-95
Anway D W amp Bennett E (2004) Common Misconceptions in Probability among Students in an Elementary
Statistics class Unplished Senior Project The ARTIST Roundtable Conference on Assessment in
Statistics held at Lawrence University Supperior WI The University of Wisconsin-Superior
Bada S (2015) Constructivist Learning Theory A Paradigm for Teaching and Learning IOSR Journal of
Research and Method in Education (IOSR-JRME) 5(6) 66-70 httpsDOI1097907388-05616670
Baerveldt C (2013) Constructivism contested Implications of a genetic perspective in psychology Integrative
Psychological and Behavioral Science 47(1) 156-166
Batanero C (2013) Teaching and learning probability In S Lerman (Ed ) Encyclopedia of Mathematics
Education Heidelberg Springer
Batanero C and Diaz C (2012) Training school teachers to teach probability reflections and challenges
Chilean Journal of Statistics 3(1) 3-13
Belova N amp Zowada C (2020) Innovating Higher Education Via Game-Based Learning on Misconceptions
Education Sciences 10 221 doi103390educSCi10090221
Bennett E amp Anway D W (2003) Statistical and Probabilistic Reasoning and Misconceptions among
Selected College Students McNair Scholars Journal Vol 4 httpwwwsocheclchjs
Cantoy O (2010) Mathematics teachersrsquo topic-specific pedagogical content knowledge in the context of
teaching a0 0 and a divide 0 Educational Sciences Theory and Practice 10 (2) 749-769
International Journal of Studies in Education and Science (IJSES)
137
Clements D H amp Battista M (1990) Constructivist Learning and Teaching The
Arithetic Teacher 38(1) ProQuest Central pg 34 DOI105951AT3810034
Creswell J W amp Creswell J D (2018) Research design Qualitative quantitative and
mixed methods approaches (5th
ed) Los Angeles SAGE Publications Inc
Courtney S A amp Caniglia J (2021) Comparing the mathematical practices pre-service teachers and
mathematics teacher educators identified as relevant to problems and tasks International Journal of
Research in Education and Science (IJRES) 7(3) 954-971 httpsdoiorg1046328ijres2335
Denton D W (2012) Enhancing instruction through constructivism cooperative learning and cloud
computing Tech Trends 56(4) 34-41
Gage J (2012) Towards a new Probability Curriculum for Secondary Schools Paper presented at 12th
International Congress on Mathematical Education 8 July-15 July COEX Seoul Korea Cambridge
Cambridge University Uk
Gurbuz R amp Birgin O (2011) The effect of computer-assisted teaching on remedying misconceptions The
case of the subject Probability Journal Homepage 58(2012) DOI 101016jcompedu201111005
Hirsh L amp ODonnell A M (2001) Representativeness in Statistical Reasoning Identifying and Assessing
Misconceptions Journal of Statistics Education 9(2) 96-105 DOI10108010691898200111910655
Johnson H D amp Dasgupta N (2005) Traditional versus Non-traditional Teaching during Perspectives of
Students in Introductory Statistics Classes Journal of Statistics Education 13(2)
httpsdoiorg10108010691898200511910558
Major T amp Mangope B (2012) The Constructivist Theory in Mathematics The case of Botswana Primary
Schools International Review of Social Sciencies and Humanities 3(2) 139-147
Jones G (2005) Reflections In GA Jones (Ed) Exploring probability in school chanlleges for teaching and
probability (367-372) New York Springer
Jun L (2000) Chinese Students Understanding of Probability Published doctoral dissertation Singapore
National Institute of Education Nanyang Technological University
Khazanov L amp Gourgey A (2009) Instructors Perspectives on Students Mistaken Beliefs about Probability
in an Elementary College Statistics Course In K Safford-Ramus (Ed) Proceedings of the Adults
Learning Mathematics a Resaerch Forum (ALM) 15th
Annual International Conference 249-264
Khazanov L amp Prado L (2010) Correcting Students Misconceptions about Probability in an Introductory
College Statistics Course Adults Learning Mathematics-An International Journal 5(1) 23-35
Kleickmann T Richter D Kunter M Elsner J Besser M Krauss S amp Baumert J (2013) Teachersrsquo
Content Knowledge and Pedagogical Content Knowledge The Role of Structural Differences in Teacher
Education Journal of Teacher Education 64(1) 90-106 DOI1011770022487112460398
Leedy P D and Ormrod J E (2020) Practical research Planning and design (12th Global Edition) Harlow
England Pearson
Lessani A Md Yunus AS amp Bakar KBA (2017) Comparison of new mathematics teaching methods with
teacher-centered approach International Journal of Social Sciences 3(2) 1285-1297
httpsdxdoiorg1020319pijss20173212851297
Lim C amp Hwa T (2007) Promoting Mathematical Thinking in the Malaysian Classroom Issues and
challenges httpswwwresearchgatenetpublication252353381
Hokor amp Sedofia
138
Lovett J N amp Lee H S (2017) New Standards Require Teaching More Statistics Are Preservice Secondary
Mathematics Ready Journal of Teachers Education 68(3) 299-311 DOI 1011770022487117697918
Major T amp Mangope B (2012) The Constructivist Theory in Mathematics The case of Botswana Primary
Schools International Review of Social Sciencies and Humanities 3(2) 139-147
National Council of Teachers of Mathematics (2003) Principles and Standards for School Mathematics and
their Implications for Professional Development Reston VA NCTM
Nguyen L (2015) Developing Conceptual Understanding and Probabilistic Thinking through Tree Diagrams
Published MPhil Dissertation Manitoba The Faculty of Graduate Studies of the University of
Manitoba
Prideaux J (2007) The learner-centered approach to Mathematics Teaching and the Active Learning
Strategies used to Enhance Students Understanding Mathematical and Computing Sciences Masters
Paper 29 Fisher Digital Publications httpfisherpubsjfcedumathcsetdmasters29
Roseth C J Garfield J B amp Ben-Zvi D (2008) Collaboration in Learning and Teaching Statistics Journal
of Statistics Education 16 (1) 1069-1898 httpsdoiorg10108010691898200811889557
Santagata R and Sandholtz J H (2019) Preservice teachersrsquo mathematics teaching competence Comparing
performance on two measures Journal of Teacher Education 70 (5) 472 ndash484
Schwerdt G amp Wuppermann A C (2011) Is traditional teaching really all that bad A within-student
between-subject approach Economics of Education Review 30(2) 365-379
Sharma S (2016) Probability from a socio-cultural perspective Statistics Education Research Journal 15(2)
126-144 httpiase-weborgPublicationsphpp=SERJ
Shay K (2008) Tracing middle school students understanding of probability a longitudinal study
Unpublished Doctoral Dissertation New Brunswick New Jersey Rutgers State University of New
Jersey
Shulman L S (1986) Those who understand Knowledge growth in teaching Educational Researcher 15(2)
4-14 doi 1031021001318X015002004
Thomas L (2020) An introduction to quasi-experimental designs
httpswwwscribbrcommethodologyquasi-experimental-design
Voskoglou M (2019) Comparing Teaching Methods of Mathematics at University Level Education Sciences
9(204) doi103390educsci9030204
Vygotsky L S (1978) Mind in society The development of higher psychological processes Cambridge MA
Harvard University Press
Weldeana H N amp Abraham S T (2014) The effect of an historical perspective on prospective teachersrsquo
beliefs in learning mathematics Journal of Mathematics Teacher Education 17 303-330
doi101007s10857-013-9266-z
Weltman D amp Whiteside M (2010) Comparing the Effectiveness of Traditional and active Learning Methods
in Business Statistics Convergence to the Mean 18(1)
httpsdoiorg10108010691898201011889480
White H amp Sabarwal S (2014) Quasi-experimental design and methods methological briefs impact
evaluations Florence UNICEF Office of research
International Journal of Studies in Education and Science (IJSES)
139
Author Information
Evans Kofi Hokor
httpsorcidorg0000-0002-8387-8294
St Teresarsquos College of Education Hohoe
Department of Mathematics and ICT
P O Box 129
Ghana
Contact e-mail evanskhokorgmailcom
John Sedofia
httpsorcidorg0000-0002-5409-516X
University of Ghana Legon
Department of Teacher Education
PO Box LG 1181
Ghana
Hokor amp Sedofia
140
Appendix A Pre-test Probabilistic Reasoning Assessment
This assessment is for research purpose to improve teaching and learning of probability
You are required to answer all questions honestly Do and leave all workings or rough work on the paper
Pre-test Probabilistic Reasoning Assessment Duration 1hr
Index numberhelliphelliphelliphelliphelliphelliphelliphelliphelliphelliphelliphelliphelliphelliphelliphelliphelliphellipLevelhelliphelliphelliphellipAgehelliphelliphellip
Read each statement carefully and circle the letter of the correct (best) option Provide appropriate response in
the space provided under some items as it apply
1 If you rolled an ordinary die and obtained 51246 which of these is most likely to occur on your next
roll
a 1
b 2
c 3
d 4
e 5
f 6
g The options a b c d e and f are all equally
2i A fair coin is tossed and it lands tail The coin is to be tossed a second time What is the probability that the
second toss will also be a tail
a 1
4
b 1
2
c 1
3
d Slightly less than 1
2
e Slightly more than 1
2
f 0
2ii Which of the following best describes the reason for the correct answer to the preceding question (2i)
a The second toss is less likely to be tail because the first toss was tail
b There are four possible outcomes when you toss a coin twice Getting two tails is only one of them
c The chance of getting heads or tails on any one toss is always 1
2
d There are three possible outcomes when you toss a coin twice Getting two tails is only one of the them
e No chance of being a tail in the second toss
3i A box contains 6 balls 2 are red 2 are black and 2 blue Three balls are picked at random one at a time
Each time a ball is picked the colour is recorded and the ball is put back in the box mixed thoroughly If the
first 2 balls are black what color is the third ball most likely to be
a Red
International Journal of Studies in Education and Science (IJSES)
141
b Black
c Blue
d Red and blue are equally likely than black
e Red black and blue are all equally likely
3ii Which of the following best describes the reason for the correct answer in the preceding question (3i)
a The third ball should not be black because too many black ones have already been picked
b The picks are independent so every color has an equally likely chance of being picked
c Black seems to be lucky
d This color is just as likely as any other color
4 A spinner with ten equally divided sectors in which four parts are white and the rests are red is about to
be spin which color is the spinner more likely to land
a White
b Red
c Both white and red are all equally
5 If you toss a fair coin and get heads two times in a row which of these is most likely on next toss
a Tail
b Head
c Both head and tail are all equally
6 A Gh 2 Gh 5 Ghcent10 Gh 20 Gh 50 and Gh 100 notes were put in a box and thoroughly mixed
What is the probability of picking Gh 50 note without looking
a 1
187
b 50
187
c 1
6
d 0
7 In a game you have been offered two options Which of the following give you higher chance of
winning GHcent200
a Tossing one die once and obtaining a 6
b Tossing two dice once and obtaining two 6rsquos
c The options a and b are all equally
8 A fair die is to be toss six times which of these is most likely to occur
a 251634
b 123456
c 666341
d 132244
e The options a b c and d are all equally likely
9 A fair coin is to be toss four times in a row which of these is least likely to occur
a THTH
b TTTH
c HHH
Hokor amp Sedofia
142
d The options a b and c are all equally likely
10 Two fair dice are to be tossed once Which of the following is more likely to occur
a Obtaining a sum of 11
b Obtaining a sum of 10
c A sum of 11 and a sum of 10 are all equally likely
10i Give reason for the correct answer in the preceding question (10)
helliphelliphelliphelliphelliphelliphelliphelliphelliphelliphelliphelliphelliphelliphelliphelliphelliphelliphelliphelliphelliphelliphelliphelliphelliphelliphelliphelliphelliphelliphelliphelliphelliphelliphelliphelliphelliphelliphelliphelliphelliphellip
helliphelliphelliphelliphelliphelliphelliphelliphelliphelliphelliphelliphelliphelliphelliphelliphelliphelliphelliphelliphelliphelliphelliphelliphelliphelliphelliphelliphelliphelliphelliphelliphelliphelliphelliphelliphelliphelliphelliphelliphelliphellip
helliphelliphelliphelliphelliphelliphelliphelliphelliphelliphelliphelliphelliphelliphelliphelliphelliphelliphelliphelliphelliphelliphelliphelliphelliphelliphelliphelliphelliphelliphelliphelliphelliphelliphelliphelliphelliphelliphelliphelliphelliphellip
helliphelliphelliphelliphelliphelliphelliphelliphelliphelliphelliphelliphelliphelliphelliphelliphelliphelliphelliphelliphelliphelliphelliphelliphelliphelliphelliphelliphelliphelliphelliphelliphelliphelliphelliphelliphelliphellip
11 In national lottery one has to choose five numbers from 1 to 90 inclusive You win when at least two of
your numbers are part of the numbers drawn on Saturday at random Eric has chosen 4 6 7 9 and 11
Alex has chosen 15 23 45 66 and 80 Daniel has chosen 71 77 78 83 and 85 Do Eric Alex and
Daniel have the same chance of winning or not and why
helliphelliphelliphelliphelliphelliphelliphelliphelliphelliphelliphelliphelliphelliphelliphelliphelliphelliphelliphelliphelliphelliphelliphelliphelliphelliphelliphelliphelliphelliphelliphelliphelliphelliphelliphelliphelliphelliphelliphelliphellip
helliphelliphelliphelliphelliphelliphelliphelliphelliphelliphelliphelliphelliphelliphelliphelliphelliphelliphelliphelliphelliphelliphelliphelliphelliphelliphelliphelliphelliphelliphelliphelliphelliphelliphelliphelliphelliphelliphelliphelliphellip
helliphelliphelliphelliphelliphelliphelliphelliphelliphelliphelliphelliphelliphelliphelliphelliphelliphelliphelliphelliphelliphelliphelliphelliphelliphelliphelliphelliphelliphelliphelliphelliphelliphelliphelliphelliphelliphelliphelliphelliphellip
helliphelliphelliphelliphelliphelliphelliphelliphelliphelliphelliphelliphelliphelliphelliphelliphelliphelliphelliphelliphelliphelliphelliphelliphelliphelliphelliphelliphelliphelliphelliphelliphelliphelliphelliphellip
12 A box contains 8 yellow balls and 4 green balls Two balls are chosen at random one after the other
without replacement determine the probability that the two balls are of different colours
helliphelliphelliphelliphelliphelliphelliphelliphelliphelliphelliphelliphelliphelliphelliphelliphelliphelliphelliphelliphelliphelliphelliphelliphelliphelliphelliphelliphelliphelliphelliphelliphelliphelliphelliphelliphelliphelliphelliphelliphellip
helliphelliphelliphelliphelliphelliphelliphelliphelliphelliphelliphelliphelliphelliphelliphelliphelliphelliphelliphelliphelliphelliphelliphelliphelliphelliphelliphelliphelliphelliphelliphelliphelliphelliphelliphelliphelliphelliphelliphelliphellip
helliphelliphelliphelliphelliphelliphelliphelliphelliphelliphelliphelliphelliphelliphelliphelliphelliphelliphelliphelliphelliphelliphelliphelliphelliphelliphelliphelliphelliphelliphelliphelliphelliphelliphelliphelliphelliphelliphelliphelliphellip
helliphelliphelliphelliphelliphelliphelliphelliphelliphelliphelliphelliphelliphelliphelliphelliphelliphelliphelliphelliphelliphelliphelliphelliphelliphelliphelliphelliphelliphelliphelliphelliphelliphelliphelliphelliphellip
International Journal of Studies in Education and Science (IJSES)
143
Appendix B Post-test Probabilistic Reasoning Assessment
This assessment is for research purpose to improve teaching and learning of probability
You are required to answer all questions honestly Do and leave all workings or rough work on the paper
Post-test Probabilistic Reasoning Assessment Duration One Hour
Index numberhelliphelliphelliphelliphelliphelliphelliphelliphelliphelliphelliphelliphelliphelliphellipClasshelliphelliphelliphellipAgehelliphelliphelliphellip
Read each statement carefully and circle the letter of the correct (best) option for each item as much as possible
and provide appropriate response in the space provided
1 Suppose a particular outcome from a random event has a probability of 04 Which of the following
statements represents correct interpretations of this probability
a The outcome will not happen
b The outcome will certainly happen about four times out of every 10 trials
c The outcome is expected to happen about four times out of every 10 trials
d The outcome could happen or it couldnrsquot of either result are the same
2 If you toss a fair coin and get heads 3 times in a row what is the chance of getting a head on the next toss
a 1
b Greater than 1
2
c 1
2
d Less than 1
2
e 0
3 A die is numbered 1 2 3 4 4 5 When the die is thrown once Which of these is most likely and why
a 1
b 2
c 3
d 4
e 5
f They are all equally likely
3i Give reason for your chosen answer in (3)
helliphelliphelliphelliphelliphelliphelliphelliphelliphelliphelliphelliphelliphelliphelliphelliphelliphelliphelliphelliphelliphelliphelliphelliphelliphelliphelliphelliphelliphelliphelliphelliphelliphelliphelliphelliphelliphelliphelliphelliphelliphelliphelliphelliphellip
helliphelliphelliphelliphelliphelliphelliphelliphelliphelliphelliphelliphelliphelliphelliphelliphelliphelliphelliphelliphelliphelliphelliphelliphelliphelliphelliphelliphelliphelliphelliphelliphelliphelliphelliphelliphelliphelliphelliphelliphelliphelliphelliphelliphellip
helliphelliphelliphelliphelliphelliphelliphelliphelliphelliphelliphelliphelliphelliphelliphelliphelliphelliphelliphelliphelliphelliphelliphelliphelliphelliphelliphelliphelliphelliphelliphelliphelliphelliphelliphelliphelliphelliphelliphelliphelliphelliphelliphelliphellip
helliphelliphelliphelliphelliphelliphelliphelliphelliphelliphelliphelliphelliphelliphelliphelliphelliphelliphelliphelliphelliphelliphelliphelliphelliphelliphelliphelliphelliphelliphelliphelliphelliphelliphelliphelliphelliphelliphellip
4 German MP tossed two dice once Which of these is mostly likely and why
a Obtaining a sum of 4
b Obtaining a sum of 7
c Obtaining a sum of 11
d All of them have equal chance of occurring that is a b c
Hokor amp Sedofia
144
4i Give reason for your chosen answer in (4)
helliphelliphelliphelliphelliphelliphelliphelliphelliphelliphelliphelliphelliphelliphelliphelliphelliphelliphelliphelliphelliphelliphelliphelliphelliphelliphelliphelliphelliphelliphelliphelliphelliphelliphelliphelliphelliphelliphelliphelliphelliphelliphelliphelliphellip
helliphelliphelliphelliphelliphelliphelliphelliphelliphelliphelliphelliphelliphelliphelliphelliphelliphelliphelliphelliphelliphelliphelliphelliphelliphelliphelliphelliphelliphelliphelliphelliphelliphelliphelliphelliphelliphelliphelliphelliphelliphelliphelliphelliphellip
helliphelliphelliphelliphelliphelliphelliphelliphelliphelliphelliphelliphelliphelliphelliphelliphelliphelliphelliphelliphelliphelliphelliphelliphelliphelliphelliphelliphelliphelliphelliphelliphelliphelliphelliphelliphelliphelliphelliphelliphelliphelliphelliphelliphellip
helliphelliphelliphelliphelliphelliphelliphelliphelliphelliphelliphelliphelliphelliphelliphelliphelliphelliphelliphelliphelliphelliphelliphelliphelliphelliphelliphelliphelliphelliphelliphelliphelliphelliphelliphelliphelliphelliphelliphelliphelliphelliphelliphelliphellip
helliphelliphelliphelliphelliphelliphelliphelliphelliphelliphelliphelliphelliphelliphelliphelliphelliphelliphelliphelliphelliphelliphelliphelliphelliphelliphelliphelliphellip
5i A fair coin is to be toss four times which of these is most likely to occur
a HTHT
b THTT
c TTTT
d HHTH
e The options a b c and d are all equally likely
5ii Give reason for your chosen answer in (5i)
helliphelliphelliphelliphelliphelliphelliphelliphelliphelliphelliphelliphelliphelliphelliphelliphelliphelliphelliphelliphelliphelliphelliphelliphelliphelliphelliphelliphelliphelliphelliphelliphelliphelliphelliphelliphelliphelliphelliphelliphelliphelliphelliphelliphellip
helliphelliphelliphelliphelliphelliphelliphelliphelliphelliphelliphelliphelliphelliphelliphelliphelliphelliphelliphelliphelliphelliphelliphelliphelliphelliphelliphelliphelliphelliphelliphelliphelliphelliphelliphelliphelliphelliphelliphelliphelliphelliphelliphelliphellip
helliphelliphelliphelliphelliphelliphelliphelliphelliphelliphelliphelliphelliphelliphelliphelliphelliphelliphelliphelliphelliphelliphelliphelliphelliphelliphelliphelliphelliphelliphelliphelliphelliphelliphelliphelliphelliphelliphelliphelliphelliphelliphelliphelliphellip
helliphelliphelliphelliphelliphelliphelliphelliphelliphelliphelliphelliphelliphelliphelliphelliphelliphelliphelliphelliphelliphelliphelliphelliphelliphelliphelliphelliphelliphelliphelliphelliphelliphelliphelliphelliphelliphelliphellip
6i A fair coin is to be toss four times which of these is least likely to occur
a HTHT
b THTT
c TTTT
d HHTH
e The options a b c and d are all equally likely
6ii Give reason for your chosen answer in (6i)
helliphelliphelliphelliphelliphelliphelliphelliphelliphelliphelliphelliphelliphelliphelliphelliphelliphelliphelliphelliphelliphelliphelliphelliphelliphelliphelliphelliphelliphelliphelliphelliphelliphelliphelliphelliphelliphelliphelliphelliphelliphelliphelliphelliphellip
helliphelliphelliphelliphelliphelliphelliphelliphelliphelliphelliphelliphelliphelliphelliphelliphelliphelliphelliphelliphelliphelliphelliphelliphelliphelliphelliphelliphelliphelliphelliphelliphelliphelliphelliphelliphelliphelliphelliphelliphelliphelliphelliphelliphellip
helliphelliphelliphelliphelliphelliphelliphelliphelliphelliphelliphelliphelliphelliphelliphelliphelliphelliphelliphelliphelliphelliphelliphelliphelliphelliphelliphelliphelliphelliphelliphelliphelliphelliphelliphelliphelliphelliphelliphelliphelliphelliphelliphelliphellip
helliphelliphelliphellip
7 A college has 300 level 200 students and 236 level 100 students in it Each studentrsquos name is written with
the level on a piece of paper and all the names are put into a box and mixed thoroughly A tutor picks one
name out of the box without looking Which level is the tutor more likely to pick from and why
helliphelliphelliphelliphelliphelliphelliphelliphelliphelliphelliphelliphelliphelliphelliphelliphelliphelliphelliphelliphelliphelliphelliphelliphelliphelliphelliphelliphelliphelliphelliphelliphelliphelliphelliphelliphelliphelliphelliphelliphelliphelliphelliphelliphellip
helliphelliphelliphelliphelliphelliphelliphelliphelliphelliphelliphelliphelliphelliphelliphelliphelliphelliphelliphelliphelliphelliphelliphelliphelliphelliphelliphelliphelliphelliphelliphelliphelliphelliphelliphelliphelliphelliphelliphelliphelliphelliphelliphelliphellip
helliphelliphelliphelliphelliphelliphelliphelliphelliphelliphelliphelliphelliphelliphelliphelliphelliphelliphelliphelliphelliphelliphelliphelliphelliphelliphelliphelliphelliphelliphelliphelliphelliphelliphelliphelliphelliphelliphelliphelliphelliphelliphelliphelliphellip
helliphelliphelliphelliphelliphelliphelliphelliphelliphelliphelliphelliphelliphelliphelliphelliphelliphelliphelliphelliphelliphelliphelliphelliphelliphelliphelliphelliphelliphelliphelliphelliphelliphelliphelliphelliphelliphelliphelliphellip
8 Suppose that you toss a coin three times and all eight outcomes are equally likely If it is known that the first
toss comes up heads what is the probability of an odd number of heads appearing
helliphelliphelliphelliphelliphelliphelliphelliphelliphelliphelliphelliphelliphelliphelliphelliphelliphelliphelliphelliphelliphelliphelliphelliphelliphelliphelliphelliphelliphelliphelliphelliphelliphelliphelliphelliphelliphelliphelliphelliphelliphelliphelliphelliphellip
helliphelliphelliphelliphelliphelliphelliphelliphelliphelliphelliphelliphelliphelliphelliphelliphelliphelliphelliphelliphelliphelliphelliphelliphelliphelliphelliphelliphelliphelliphelliphelliphelliphelliphelliphelliphelliphelliphelliphelliphelliphelliphelliphelliphellip
helliphelliphelliphelliphelliphelliphelliphelliphelliphelliphelliphelliphelliphelliphelliphelliphelliphelliphelliphelliphelliphelliphelliphelliphelliphelliphelliphelliphelliphelliphelliphelliphelliphelliphelliphelliphelliphelliphelliphelliphelliphelliphelliphelliphellip
International Journal of Studies in Education and Science (IJSES)
145
helliphelliphelliphelliphelliphelliphelliphelliphelliphelliphelliphelliphelliphelliphelliphelliphelliphelliphelliphelliphelliphelliphelliphelliphelliphelliphelliphelliphelliphelliphelliphelliphelliphelliphelliphelliphelliphelliphelliphelliphelliphelliphelliphelliphellip
helliphelliphelliphelliphelliphelliphelliphelliphelliphelliphelliphelliphelliphelliphelliphelliphelliphelliphelliphelliphelliphelliphelliphelliphelliphelliphelliphelliphelliphelliphelliphelliphelliphelliphelliphelliphelliphelliphelliphelliphelliphelliphelliphelliphellip
helliphelliphelliphelliphelliphelliphelliphelliphelliphelliphelliphelliphelliphelliphelliphelliphelliphelliphelliphellip
9 A card is selected at random from a pack of 52 cards Find the probability of selecting a card which is a red or
a queen
helliphelliphelliphelliphelliphelliphelliphelliphelliphelliphelliphelliphelliphelliphelliphelliphelliphelliphelliphelliphelliphelliphelliphelliphelliphelliphelliphelliphelliphelliphelliphelliphelliphelliphelliphelliphelliphelliphelliphelliphelliphelliphelliphelliphellip
helliphelliphelliphelliphelliphelliphelliphelliphelliphelliphelliphelliphelliphelliphelliphelliphelliphelliphelliphelliphelliphelliphelliphelliphelliphelliphelliphelliphelliphelliphelliphelliphelliphelliphelliphelliphelliphelliphelliphelliphelliphelliphelliphelliphellip
helliphelliphelliphelliphelliphelliphelliphelliphelliphelliphelliphelliphelliphelliphelliphelliphelliphelliphelliphelliphelliphelliphelliphelliphelliphelliphelliphelliphelliphelliphelliphelliphelliphelliphelliphelliphelliphelliphelliphelliphelliphelliphelliphelliphellip
helliphelliphelliphelliphelliphelliphelliphelliphelliphelliphelliphelliphelliphelliphelliphelliphelliphelliphelliphelliphelliphelliphelliphelliphelliphelliphelliphelliphelliphelliphelliphelliphelliphelliphelliphelliphelliphelliphelliphellip
10 A box contains 6 white balls and 4 green balls Two balls are chosen at random one after the other without
replacement determine the probability that the second ball is white
helliphelliphelliphelliphelliphelliphelliphelliphelliphelliphelliphelliphelliphelliphelliphelliphelliphelliphelliphelliphelliphelliphelliphelliphelliphelliphelliphelliphelliphelliphelliphelliphelliphelliphelliphelliphelliphelliphelliphelliphelliphelliphelliphelliphellip
helliphelliphelliphelliphelliphelliphelliphelliphelliphelliphelliphelliphelliphelliphelliphelliphelliphelliphelliphelliphelliphelliphelliphelliphelliphelliphelliphelliphelliphelliphelliphelliphelliphelliphelliphelliphelliphelliphelliphelliphelliphelliphelliphelliphellip
helliphelliphelliphelliphelliphelliphelliphelliphelliphelliphelliphelliphelliphelliphelliphelliphelliphelliphelliphelliphelliphelliphelliphelliphelliphelliphelliphelliphelliphelliphelliphelliphelliphelliphelliphelliphelliphelliphelliphelliphelliphelliphelliphelliphellip
helliphelliphelliphelliphelliphelliphelliphelliphelliphelliphelliphelliphelliphelliphelliphelliphelliphelliphelliphelliphelliphelliphelliphelliphelliphelliphelliphelliphelliphelliphelliphelliphelliphelliphelliphelliphelliphelliphelliphelliphelliphelliphellip

International Journal of Studies in Education and Science (IJSES)
123
Some studies have examined the learner-centered and teacher-centered approaches of teaching mathematics on
studentsrsquo problem-solving abilities but the evidence seems to suggest that none of the studies provides an
empirical comparison of the learner-centered and teacher-centered approaches targeted at addressing
probabilistic misconceptions in relation to developing the probabilistic reasoning of preservice teachers
Additionally it appears there is no study that has compared the effect of the learner-centered and teacher-
centered approaches of teaching on preservice teachersrsquo probabilistic reasoning at the colleges of education level
in Ghana Therefore this study was designed to address the above gaps The important hypothesis that this study
sought to test is There is no significant difference in the probabilistic reasoning (mean scores) between students
who experience the learner-centered approach targeted at addressing probabilistic misconceptions and those
who experience teacher-centered approach targeted at probabilistic misconceptions in the post-test It is hoped
that this study will contribute to the teacher development literature and provide a strong empirical basis for
teaching statistics and probability in colleges of education In the rest of the study we present the review of
relevant literature and the methodology employed for the study It is followed by the presentation and discussion
of results conclusions practical implications and limitations
Literature Review
Theoretical Review
This study is anchored on the socio-cultural constructivist theory of Vygotsky (1978) which contends that
learning occurs at two levels first in the context of shared social activity known as the social or interpersonal
plane and second on the individual plane Learning at these two levels can occur in any context whether
during mathematics lessons in the workplace or in the home Vygotskyrsquos work considered reconstruction of
knowledge in a social context According to him language plays a crucial role in cognitive development
because childrenrsquos knowledge ideas and values develop through interactions with others Vygotsky believed
that a learnerrsquos acquisition of knowledge takes time This suggests that teachers should exercise patience for
learners to explore concepts in order to acquire all the necessary knowledge
One key aspect in the socio-cultural theory is the concept of ldquozone of proximal developmentrdquo (ZPD) which
according to Vygotsky is the difference between a childrsquos current performance (the problems the child can
solve independently without any support) and the level of performance that the child could achieve with
guidance from an adult or by working with a more experienced person such as a teacher a parent a peer or a
sibling Vygotsky thus advocated that for the learner to learn independently there should be an experienced
person to support the learner He contends that the learnersrsquo intellectual life will be greatly developed when
teachers succeeded in leading learners to reorganize their existing ideas with new ones in a meaningful way
This indicates that learners are to be at the center of teaching and learning interacting with their own colleagues
while teachers serve as facilitators It is crucial that teachers are well prepared to facilitate meaningful learning
else learners will be unable to learn effectively The socio-cultural constructivist theory is relevant for this study
because research by Sharma (2016) showed that the theory plays a crucial role in studentsrsquo ability to confront
their own probabilistic misconceptions and resolve them meaningfully
Hokor amp Sedofia
124
Teacher-Centered Approach versus Learner-Centered Approach
In this study the teaching method in which the teacher lectures or stands in front of the class and orally presents
his or her teaching note to the learners is called the teacher-centered approach In the teacher-centered approach
to teaching information flows from the teacher to the learner Learners become a recipient In the constructivist
classroom however the teacher functions as a coach and learners work through problems Where learners
discover concept through activities by themselves they value mathematics and are able to apply it in real-life
The essence of teaching and learning of mathematics is its applicability in solving daily life problems The
learner-centered approach to teaching inspires students to effectively solve problems by relating various
mathematical concepts in real life The differences between the organization of the constructivist and teacher-
centered approach classrooms are presented in Table 1
Table 1 Differences in the Two Approaches of Teaching Mathematics
Learner-centered classroom Teacher-centered classroom
i Students learn from their own
experiences through activities
i Students learn mainly from teachersrsquo
explanations
ii Students are more responsible for their
own learning using the teaching and
learning resources under the guide of a
teacher
ii Students are given more questions to
solve using the rules and formulae by a
teacher
iii Teacher engages all students in
lesson facilitates problem-solving
among students
iii Teacher explains the mathematical
rules and procedures and gives
problems that required the use of such
rules
iv Teacher establishes a purposeful
learning environment interacts
with students and guides them to
construct their own meaning to
concept
iv Teachers focus more on procedural
understanding
v Teachers construct problems
carefully that required studentsrsquo to
apply what they learnt
v Teachers give problems mostly from
textbook that required the use of
formula by learners to solve
Effect of a Learner-centered Approach to Teaching on Studentsrsquo Conceptual Understanding of
Mathematics
Some studies have reported the learner-centered approachs effectiveness in teaching and learning mathematics
on studentsrsquo conceptual understanding Bada (2015) conducted a study on constructivism learning theory for
studentsrsquo understanding of mathematics and contended that if all students are to succeed then teachers have to
use learner-centered approach teaching The study revealed that the learner-centered approach to teaching
International Journal of Studies in Education and Science (IJSES)
125
motivates students to learn and gives teachers the opportunity to assess how the activity is helping the students
to develop an understanding of concepts Furthermore a study was conducted by Major and Mangope (2012) on
constructivist theory in Mathematics in Botswana primary schools The study focused on the extent to which
teachers in Botswana primary schools use the learner-centered approach in teaching and learning of
Mathematics A total of 83 mathematics lessons were videotaped and analyzed The results revealed that most of
the lessons required students to recall rules or formulae However small percentages of the lessons required
students to explore or investigate mathematical ideas
Students are at the center of the learning process in the constructivist class through doing experience action
and peer collaboration National Council of Teachers of Mathematics 2000 (cited in Prideaux 2007) contended
that when teaching is student the learners value mathematics and engage actively in learning the discipline In
solving problems under the constructivist strategy learners are motivated to try various means possible hence
they invent the means of solving the problem themselves In constructivism problems are carefully constructed
to challenge students to reason about the concepts Additionally the interest of the learners increases because
they see the need to study mathematics Mathematics is full of problem-solving So employing a problem-
solving strategytechnique to teach mathematics helps learners to have a better understanding of mathematical
concepts
Materials and Methods
Design
This study used the nonequivalent (pre-test and post-test) control-group design of quasi-experimental research
In this design a dependent variable is measured in one group of subjects before and after a treatment and that
same dependent variable is measured at pre-test and post-test in another nonequivalent control group which does
not receive any treatment The two groups are selected without random assignment and both groups take a
pretest and posttest But only the experimental group receives the treatment (Creswell amp Creswell 2018) This
design makes it possible for researchers to compare scores before and after a treatment in a group that receives
the treatment and also in a nonequivalent control group that does not receive the treatment The nature of the
research problem and the objectives to be achieved warranted quasi-experimental design Importantly in an
environment such as a college of education randomness was impractical (Leedy amp Ormrod 2020) and despite
the argument that quasi-experimental research has low internal validity compared to true experiments quasi-
experimental research has a higher external validity because it helps researchers to do interventions in the real-
world instead of artificial laboratory settings (Thomas 2020)
Population
There are seven public Colleges of Education in the Volta Region of Ghana Six out of the seven colleges are
mixed-sex colleges and one is female-only The single-sex college was purposively chosen to ascertain how
these students develop their probabilistic reasoning from the two different teaching methods discussed above
The population was all second-year preservice teachers of that college since at the time of the study the final
Hokor amp Sedofia
126
years were out for their teaching practice and the first year students had not taken the statistics and probability
course This institution was selected for one main reason they all studied Statistics and Probability and were
thus expected to teach it at the Junior High School level upon completion of their training
Sample and Sampling Procedure
Purposive sampling technique was used to select two intact classes out of six classes identified as Group A and
Group B respectively These groups are similar in terms of their performance in their second-year first-semester
mid-semester quiz scores in mathematics with mean scores of 139 and 137 respectively ldquoQuasi-experimental
designs identify a comparison group that is as similar as possible to the experimental group in terms of pre-
intervention characteristicsrdquo (White amp Sabarwal 2014 p 1) Also it helped to avoid selection bias which is a
concern in quasi-experimental studies
These two intact classes comprised 27 preservice teachers in Group B and 32 in Group A In purposive
sampling certain elements of the population are deliberately selected on the judgment of the researchers and
nothing is left to chance In this study respondents were chosen from a population of regular preservice teachers
who had studied probability previously and were taking statistics and probability as a course in a college of
education The reason for choosing both groups from the same population is that both Group A and Group B
used the same textbooks and course materials Also both groups were chosen from the same population to avoid
bias because all the colleges use different textbooks and the conditions under which students studied are
different from college to college
Achievement Tests (Pre-test and Post-Test)
The test items were administered in two phases in the classrooms These are pre-test and the post-test Items 2i
2ii 3i and 3ii of the pretest were adapted from (Anway amp Bennett 2004 Hirsh amp ODonnell 2001) Two
examiners of statistics and probability were consulted to ensure the questions are at the level of the participants
This is to ensure the validity of the test items The pre-test and the post-test were similar to measure whether
there is a change or not The items were developed to measure the probabilistic reasoning of preservice teachers
The items sought to ascertain preservice teachersrsquo ability in reasoning about uncertainties and the use of
probability daily
The achievement test assessed the following areas correctly applying probability in decision making
equiprobability bias correctly interpreting without replacement situations correctly listing the sample space and
determining the probability representativeness bias and interpreting probability statements correctly and
applying appropriate strategies There were 12 items for the pre-test and 10 items for the post-test We have
more items on the pre-test because the post-test was more open-ended than the pre-test Nevertheless the total
scores in each case was 20 Some of the test items consisted of two parts the principal question (multiple
choice) and a justification of the answer The pre-test and post-test can be seen in appendices A and B
respectively
International Journal of Studies in Education and Science (IJSES)
127
Evaluation of Materials by Experts
The researchers solicited two expertsrsquo views on the test items content coverage content relevance and course
materials It was the view of the experts that the test items of both the pre-test and the post-test were in line with
the mathematics syllabus of colleges of education in Ghana The activities designed for the Group A were also
assessed In the view of the experts the teaching activities had sufficient content coverage and would help pre-
service teachers develop better probabilistic reasoning They acknowledged the idea of having activities that
reflect real life situations to support pre-service teachers since they were aware students have difficulty with
probability related problems The experts further acknowledged that the objectives were measurable and
activities were practical to promote pre-service teachersrsquo involvement in the lessons They said the teaching and
learning materials reflected the learner-centered approach and were in line with the syllabus requirements for
Mathematics in colleges of education in Ghana They believed the activities would promote better probabilistic
reasoning since they reflected real life situations
Data Collection Procedure
Preservice teachers were informed one week ahead of the administration of the pre-test The format of the test
items and the purpose of the study were communicated to the respondents The tests were administered by the
researchers at an Examination Hall to ensure the respondents did independent work
Treatment
The learner-centered approach was applied to group A while the teacher-centered approach of instruction was
applied to group B In each approach the lessons were focused on addressing equiprobability bias
representativeness belief bias positive recency and negative recency effects since some studies suggest that
teaching approaches that target probabilistic misconceptions will help improve studentsrsquo performance
significantly (Khazanov amp Prado 2010 Shay 2008) The implementation of both teaching approaches were
done by the lead researcher
Group A The Learner-centered approach
The teaching and learning took place in traditional classroom settings generally consisting of activities
discussions and questions and answers concurrently once per week for two hours for a month In group A the
activities were designed focusing on probabilistic misconceptions using the learner-centered approach to
teaching to better their probabilistic reasoning Examples of the activities are given below
Card Game This game was played in groups Identical cards were numbered 3 3 4 4 5 5 5 6 6 7 8 and 9
and put in a container and thoroughly mixed Three students will reach in and without looking draw out a card
each at time If the three people pick different numbers then the group wins GH30000 else they lose Is the
chance of winning or losing the same and why The purpose of this activity is to enhance preservice teachersrsquo
Hokor amp Sedofia
128
decision-making ability by addressing equiprobability bias representativeness bias belief and positive and
negative recency effects The aim of predicting before picking was to keep students focused and to confront any
prior misconceptions The game was played 15 times If all the three members of the group pick different colors
then a point of one is recorded else zero After the activity a discussion was organized around their prediction
and the results to challenge their thinking
Pair Game In pairs preservice teachers were asked to toss a coin six times each recording the sequence of tails
and heads The purpose of this activity is to address representativeness bias Before the toss students were asked
to predict the number of tails and heads Their predictions were written in their notebook before the toss Most
preservice teachers predicted equal number of tails and heads Preservice teachers then compare their predicted
sequences to their results after the toss It was noted in many instances that those who predicted equal number of
tails and heads did not obtain results that were consistent with their prediction Discussions were organized
around their predicted sequences and the results obtained after the toss for better probabilistic reasoning
Coin Game Students perform this experiment ten times by tossing a number of fair coins once and record the
outcomes in each case In the first toss a coin was tossed once and the outcome recorded in the second toss
two coins were tossed once and outcomes recorded in third toss three coins were tossed once and outcomes
recorded and so on H stands for heads and T stands for tails The following are a sample of sequence of
outcomes by one student
1st toss H
2nd
toss HT
3rd
toss HTH
4th
toss HTTT
5th
toss THHTT
6th
toss HTHTTT
7th
toss TTHTHHT
8th
toss THTHTHHH
9th
toss HTTTHTHTT
10th
toss THTHTHTHTT
119873119906119898119887119890119903 119900119891 ℎ119890119886119889119904
119873119906119898119887119890119903 119900119891 119905119900119904119904119890119904=
1
1= 1
1
2= 05
2
3= 0667
1
4= 025
2
5= 04
2
6= 0333
3
7= 0429
5
8
= 0625 3
9= 0333
4
10= 04
The average of the probabilities of obtaining a head for each experiment is
=105066702504033304290625033304
10=
4937
10cong 05
International Journal of Studies in Education and Science (IJSES)
129
It must be noted that in experimental or frequentist probability we are concerned about conducting the
experiment many times and considering its approximation or convergence Students were led to conclude that in
general we can say when a fair coin is tossed the probability of getting a head at any time is 1
2 and vice versa
Group B The Teacher-centered approach
Group B was taught using the teacher-centered approach In this case the teacher rather than the learner was at
the center of the teaching and learning process The tutor presented the preservice teachers with facts or
procedures that had been established to solve problems Preservice teachers were given problems that require
the use of these facts or procedures to solve as either assignment exercise test or quiz It is believed that
preservice teachers learned more when they solved similar problems many times When examination questions
that demanded facts were set students could solve the problems without really understanding the concepts
Formulae were presented to students to learn to apply to similar problems Concepts were clearly explained
bearing in mind the probabilistic misconceptions Samples of lessons experienced by Group B are as follow
Lesson one Through questions and answers teacher revises preservice teachersrsquo previous knowledge on playing
of games and probabilistic situations Based on studentsrsquo responses the teacher introduces the lesson
Teacher explains to preservice teachers the concept of probability and three ways we can make probability
statements as classical frequentist and subjective Classical probability is the number of favorable outcomes (E)
divided by the total number of possible outcomes (S) It works on the assumptions that all outcomes are equally
likely Equally likely means that each outcome has the same probability of occurring
Mathematically P(E) =
Students were then led to solve problems using the formula
Experimental probability is a method of calculating probability where the probability is the ratio of the number
of the trials where the desired event occurs to the number of total trials Subjective probability is a statement that
an individual makes based on personal judgment to describe the likelihood of an event Or a personal belief
based on onersquos own experience or expertise The person making the statement should be an expert in the area or
someone who have a sound knowledge on the issue under consideration before it can be considered important
For the statement to be reliable it should be based on a sound premise(s) Nevertheless both experts and non-
experts make use of subjective probability daily For example I have a 90 chance of passing my statistics and
probability exam
Lesson two Teacher explains basic terms of probability such as sample space sample point an event equally
likely to preservice teachers Teacher guides preservice teachers through demonstration to solve probability
problems using classical definition of probability by listing the sample space and finding the probability of an
event Teacher leads preservice teachers to solve probability problems from frequency tables Similarly teacher
explains to preservice teachers independent and dependent events Teacher asks the preservice teachers to solve
problems on independent and dependent events
Hokor amp Sedofia
130
Data Analysis
The data collected were coded and edited before being transferred to computer for analysis using SPSS version
24 A Levenersquos test was used in the study to ensure that the assumptions between each group was not violated
Homogeneity of variances was considered to ensure that each grouprsquos pre-test scores were mostly equal Paired
samples T-test was used to compare two means within each group to determine whether or not the differences in
means were statistically significant Independent sample T-test was used to compare the probabilistic reasoning
mean scores in Group A and the Group B before the experiment at a time to determine whether the two groups
were at the same level or not The independent t-test was used because there were two different groups of
participants It works on the assumption that scores are unique because they come from different participants
Also the equality of variance for running ANCOVA at 5 significance level was checked using Levenersquos test
Table 2 Levenes Test of Equality of Variances
F df1 df2 Sig
1234 1 57 0456
The results from Table 2 indicate that the variances are roughly equal since the significance value of 0456 is
greater than the cut-off value of 005 Therefore we can conclude that homogeneity of variance assumption was
met (Field 2005) This allowed us to examine the relationship between the covariate (pre-test scores) and
dependent variable (post-test scores) Analysis of covariance (ANCOVA) was used to examine the effect of
learner-centered approach to teaching and teacher-centered approach on preservice teachersrsquo probabilistic
reasoning since different participants were in each group The ANCOVA is ideal in removing the bias of these
variables (Field 2005) In order to determine whether or not the occurrence of scores was not by chance a
partial eta squared was used to gauge the magnitude of the difference (effect size) between means of the scores
Pallant (2001) outlined the following criterion for interpreting partial eta squared values as 001 = small effect
006 = moderate effect and 014 = large effect
Results
Before introducing the learner-centered and teacher-centered approaches of teaching preservice teachersrsquo
probabilistic reasoning was compared to ascertain whether or not their results were similar in terms of the mean
scores The result is presented in Table 3
Table 3 Results of the Independent Samples t-test on the Pre-test of the Group B and Group A
Group N Mean Std Dev Mean Difference Df t-value p-value
Group B 27 585 1562 35 56 756 456
Group A 32 550 1967
The results in Table 3 indicate that there was no statistically significant difference between the probabilistic
reasoning mean scores of Group A = 550 = 1967 and Group B = 585 = 1562 in the
International Journal of Studies in Education and Science (IJSES)
131
pretest This is an indication that the two groups are similar and their performance could be compared after the
two teaching approaches
Comparison of Probabilistic Reasoning of the Preservice Teachers before and after Learner-centered
Approach in Group A
The results of analysis of the effect of the learner-centered approach on preservice teachersrsquo probabilistic
reasoning is presented in Table 4
Table 4 Pre-test and Post-test Scores for Group A
Minimum Maximum Mean Std Deviation
Pre-test 1 10 550 1967
Post-test 8 20 1572 3630
Table 4 reveals that in the post-test preservice teachersrsquo probabilistic reasoning mean scores increased from
550 to 1572 in the post-test in Group A
A paired sample t‐test was conducted to compare the post-test and pre-test scores for the preservice teachers
taught with the learner-centered approach to teaching (Group A) in order to determine if the mean difference in
scores was statistically significant This was done to evaluate the effect of the learner-centered approach on
preservice teachersrsquo probabilistic reasoning Table 5 presents the results
Table 5 Paired Sample t-test Results on the Post-test and Pre-test of Group A
Mean
Difference
Std
Deviation
Std Error
Mean
t Df Sig
Post-test ndash Pre-test 10219 2871 507 20137 31 000
The results from Table 5 shows a statistically significant difference in the preservice teachersrsquo probabilistic
reasoning from the pre-test (M = 550 SD = 1967) to the post-test (M = 1572 SD = 3630) with t (31) =
20137 p = 000 The result reveals that preservice teachersrsquo probabilistic reasoning has improved significantly
after the learner-centered approach was used since = 000 05 It can be inferred that the learner-centered
approach to teaching has a positive significant effect on preservice teachersrsquo probabilistic reasoning
Analysis of Probabilistic Reasoning of the Preservice Teachers before and after Teacher-centered
Approach to Teaching
The results of the analysis of the effect of the teacher-centered approach to teaching on preservice teachersrsquo
probabilistic reasoning is presented in Table 6
Hokor amp Sedofia
132
Table 6 Pre-test and Post-test Scores for the Group B
Minimum Maximum Mean Std Deviation
Pre-test 2 8 585 1562
Post-test 5 14 952 2208
The data on Table 6 show that the mean score of preservice teachers in the pre-test was 585 while that of the
post-test was 952 marks This indicates that in the post-test an average of each of the preservice teachersrsquo
probabilistic reasoning increased slightly in Group B To determine if the mean difference is statistically
significant a paired sample t‐test was conducted Table 7 presents the results
Table 7 Results of the Paired Samples t-test on the Post-test and Pre-test of the Group B
Mean
Difference
Std Deviation Std Error
Mean
t Df Sig
Post-test ndash Pre-test 3667 1441 0277 13220 26 000
The result presented on Table 7 shows that the mean score difference between the post-test and pre-test of
Group B was 3667 marks with a corresponding standard deviation of 1441 The paired sample t-test was
conducted to find out if the mean score difference (M = 3667 SD = 1441) was statistically significant This
was done to assess the effect of the teacher-centered approach targeted at addressing misconceptions on
preservice teachersrsquo probabilistic reasoning The results from Table 7 reveal that there was a statistically
significant difference in the preservice teachersrsquo probabilistic reasoning scores from the pre-test (M = 585 SD =
1562) to the post-test (M = 952 SD = 2208) with t (26) = 13220 p = 000 lt 05 This is an indication that the
teacher-centered approach to teaching probability targeted at addressing probabilistic misconceptions aids
students to improve upon their understanding and problem-solving abilities in probability
Next we compared the effectiveness of the learner-centered approach of teaching and the teacher-centered
approach of teaching in terms of probabilistic reasoning of preservice teachers and how they addressed
probabilistic misconceptions
Comparison of Effectiveness of Learner-centered Approach and Teacher-centered Approach in
Developing Probabilistic Reasoning
The preservice teachersrsquo scores on the pre-test of the achievement test were used as covariate in this analysis
The scores from the post-test were then compared using ANCOVA with = 05 to adjust for pre-test
differences that existed between Group A and Group B In the pre-test the mean scores of Group B and Group A
were 585 and 550 respectively ANCOVA was used to adjust the post-test scores statistically to compensate
for the 035 mean point difference between the two groups in the pre-test This adjustment led to a more
accurate post-test comparison Table 8 presents the results
International Journal of Studies in Education and Science (IJSES)
133
Table 8 Summary of ANCOVA of the Performance of Preservice Teachers taught with Learner-centered
Approach and Teacher-centered Approach (N = 59)
Source Sum of
Squares
Df
Mean
Square
F Sig Partial Eta
Squared
Corrected
Model
791144a 2 395562 72150 000 720
Intercept 205135 1 205135 37416 000 401
Pre-test 228184 1 228184 41620 000 426
Group 630253 1 630253 114955 000 672
Error 307026 56 5483
Total 10888000 59
Corrected Total 1098169 58
a R Squared = 720 (Adjusted R Squared = 710)
The data on Table 8 indicate that there is a statistically significant main effect on the preservice teachers who
were taught using the learner-centered approach to learn probability [F (1 56) = 114955 p = 000 lt 05]
Consequently the preservice teachers taught with the learner-centered approach performed better than their
counterparts who experienced the teacher-centered approach to learn probability The partial eta squared value
was found to be 0672 This value indicates a large effect size That is 672 of the variance in the dependent
variable (probabilistic reasoning achievement score) is expounded by the independent variable (teacher-centered
approach) This implies that the magnitude of the difference between the mean score of the preservice teachers
taught with the learner-centered approach and the teacher-centered approach is large With the high scores of
preservice teachers in the Group A it implies that the use of learner-centered approach in the teaching and
learning of probability improved the performance of the preservice teachers
The outcome of the study portrays that there was a statistically significant difference in the probabilistic
reasoning achievement mean scores of Group A than that of Group B [F (1 56) = 114955 p = 000 lt 05] This
finding implies that Group A performed better than Group B in the probabilistic reasoning achievement test
This is an indication that when the learner-centered approach to teaching probability is targeted at addressing
probabilistic misconceptions preservice teachers develop better probabilistic reasoning than teacher-centered
approach
Discussion
This study set out to compare the learner-centered and teacher-centered approaches of teaching in order to
determine the best way of developing preservice teachersrsquo probabilistic reasoning at the College of Education
Hokor amp Sedofia
134
level in Ghana The results as shown on Tables 3 4 5 6 7 and 8 indicate that the learner-centered approach to
teaching probability is more effective than the teacher-centered approach in motivating and inspiring preservice
teachers to learn and apply probability The learner-centered approach provides studentsrsquo opportunities to think
reason reflect and evaluate their ideals and that of colleagues
The findings of the present study are in tandem with several research findings Lessani Md Yunus and Bakar
(2017) investigated mathematics teaching approaches and their consequences on learnersrsquo ability to solve
challenging problems Their findings affirm the learner-centered approach to be more effective in studentsrsquo
creativity and innovation in solving real-life problems than the teacher-centered approach So training
programs for excellent teaching and learning should be flexible and innovative to allow preservice teachers to
explore gaps in learning and teaching (AIAhmad 2021) Similarly Prideaux (2007) found that students who
experienced the learner-centered approach of teaching performed significantly higher than those who were
taught without the learner-centered approach of teaching Roseth Garfield and Ben-Zvi (2008) also examined
the effect of the cooperative framework in classroom teaching and collaboration and found that student-
centered approaches to teaching help students to have better understanding of statistics than teacher-centered
instruction
Furthermore Gurbuz and Birgin (2011) studied the effect of computer-assisted teaching on addressing
probabilistic misconceptions of students The authors used pre-test to collect data on both the computer-assisted
and traditional groups before the experimental teachings After the intervention the post-test was administered
to ascertain the effect of computer-assisted teaching and teacher-centered approach on addressing studentsrsquo
probabilistic misconceptions Their study found computer-assisted teaching to have more significant effect on
studentsrsquo correct probabilistic reasoning than teacher-centered approach of teaching
As noted by Batanero and Diaz (2012) probability forms an integral part of the Mathematics curriculum in
many countries But the concept is one that some learners find difficult to understand partly due to the method
of teaching used by teachers This fact implies that teachers of mathematics should find more creative ways of
teaching the concept so as to make it easier for learners to understand and apply the concept As discovered in
this study the learner-centered approach is effective in developing probabilistic reasoning But the learner-
centered approach works best when certain conditions are present At the outset there is the need for relevant
teaching and learning materials Then teachers need to be trained and retrained in the use of the learner-centered
approach to teaching At the college of education level preservice teachers need to be taught using the learner-
centered approach not only to help them understand probability but also to help them use the learner-centered
approach in their own teaching
The activities used for Group A which is learner-centered approach group in the form of games promote
content knowledge and cognitive skills competencies such as collaboration and problem solving (Belova amp
Zowada 2020) The activities focus on promoting learning experiences rather than stressing on the
entertainment factor While some things students learn in school seem to them predetermined and bound by
laws in other branches of mathematics probability provides students with opportunity to learn that solutions to
International Journal of Studies in Education and Science (IJSES)
135
several problems depend on assumptions and have degrees of doubt So teaching methods that allow students to
predict and test their predictions should be encouraged for students to develop their intellectual repertoire The
processes used in reasoning about sample space will serve students well in life Several calls on the need to pay
attention to the study of probability show that teachers and mathematics teachers must provide their students
with appropriate teaching strategies to enhance their conceptual understanding In the preparation of preservice
teachers to become mathematically competent citizens teacher preparation programs such as teaching methods
must provide opportunities for preservice teachers to confront misconceptions and reason probabilistically
(Courtney amp Caniglia 2021)
The findings of the present study however run counter to those of Weltman and Whiteside (2010) They
conducted a study on the effectiveness of the traditional and active learning method in business statistics The
study found that active learning had not been effective for all category of students It is not precisely clear what
may have accounted for that result This is because active learning methods have generally been known to be
effective in promoting learning Further research is thus required in this regard
Conclusions
This study compared the effects of the learner-centered and teacher-centered approaches of teaching in
addressing probabilistic misconceptions by measuring preservice teachersrsquo probabilistic reasoning scores The
results show that the learner-centered approach aids preservice teachers to develop better probabilistic reasoning
than the teacher-centered approach to teaching Thus the study concludes that the learner-centered approach to
teaching is a solution to preservice teachersrsquo inability to answer questions on probability correctly Even though
each teaching approach targeted at addressing misconceptions was found to have significant effect on pre-
service teachersrsquo probabilistic reasoning the learner-centered approach was found to be more effective than the
teacher-centered approach in addressing misconceptions which limit studentsrsquo ability to solve probability
problems correctly
Implications and Recommendations
This study makes some key contributions to the teacher educationdevelopment literature in general and
particularly to the development of probabilistic reasoning of preservice teachers The study provides empirical
evidence that the learner-centered approach targeted at addressing probabilistic misconceptions is more effective
in developing probabilistic reasoning in preservice teachers What this means is that when teacher educators use
the learner-centered approach to teach the concept of probability and focus on addressing misconceptions
preservice teachers will develop better probabilistic reasoning This will in turn translate into preservice
teachers answering questions on probability correctly in their examinations and ultimately making them teach
the concept more effectively when they complete their training It is thus recommended that teachers should
consider employing the learner-centered approach in teaching the concept of probability
Hokor amp Sedofia
136
Limitations
As with every empirical study employing the quasi-experimental approach the current study has some
limitations which need to be acknowledged and used to guide users of the findings Firstly our sample was
drawn from a population of second year preservice teachers of a female only college of education in a peri-
urban area in Ghana Further experiments are therefore needed in other settings in order to see if the same or
similar results will occur Secondly owing to the narrow characteristics of the participants in the present study
the researchers cannot generalize the results to other individuals who do not have the same characteristics So
additional experiments with groups with different characteristics are necessary Lastly the experiments need to
be repeated at another time to determine if the results are the same (consistent) over time
Acknowledgements
We are grateful to the Principal and preservice teachers for granting access and participating in the study
respectively
References
AIAhmad H (2021) The role of educational communication in promoting student-centered learning style in
multicultural classrooms A reflective essay on learning and teaching in higher education International
Journal of Research in Education and Science (IJRES) 7(3) 838-851 httpsdoiorg1046328ijes2374
Aina J K Olanipekun S S amp Garuba I A (2015) Teachersrsquo effectiveness and its Influence on studentsrsquo
learning Advances in Social Sciences Research Journal 2(4) 88-95
Anway D W amp Bennett E (2004) Common Misconceptions in Probability among Students in an Elementary
Statistics class Unplished Senior Project The ARTIST Roundtable Conference on Assessment in
Statistics held at Lawrence University Supperior WI The University of Wisconsin-Superior
Bada S (2015) Constructivist Learning Theory A Paradigm for Teaching and Learning IOSR Journal of
Research and Method in Education (IOSR-JRME) 5(6) 66-70 httpsDOI1097907388-05616670
Baerveldt C (2013) Constructivism contested Implications of a genetic perspective in psychology Integrative
Psychological and Behavioral Science 47(1) 156-166
Batanero C (2013) Teaching and learning probability In S Lerman (Ed ) Encyclopedia of Mathematics
Education Heidelberg Springer
Batanero C and Diaz C (2012) Training school teachers to teach probability reflections and challenges
Chilean Journal of Statistics 3(1) 3-13
Belova N amp Zowada C (2020) Innovating Higher Education Via Game-Based Learning on Misconceptions
Education Sciences 10 221 doi103390educSCi10090221
Bennett E amp Anway D W (2003) Statistical and Probabilistic Reasoning and Misconceptions among
Selected College Students McNair Scholars Journal Vol 4 httpwwwsocheclchjs
Cantoy O (2010) Mathematics teachersrsquo topic-specific pedagogical content knowledge in the context of
teaching a0 0 and a divide 0 Educational Sciences Theory and Practice 10 (2) 749-769
International Journal of Studies in Education and Science (IJSES)
137
Clements D H amp Battista M (1990) Constructivist Learning and Teaching The
Arithetic Teacher 38(1) ProQuest Central pg 34 DOI105951AT3810034
Creswell J W amp Creswell J D (2018) Research design Qualitative quantitative and
mixed methods approaches (5th
ed) Los Angeles SAGE Publications Inc
Courtney S A amp Caniglia J (2021) Comparing the mathematical practices pre-service teachers and
mathematics teacher educators identified as relevant to problems and tasks International Journal of
Research in Education and Science (IJRES) 7(3) 954-971 httpsdoiorg1046328ijres2335
Denton D W (2012) Enhancing instruction through constructivism cooperative learning and cloud
computing Tech Trends 56(4) 34-41
Gage J (2012) Towards a new Probability Curriculum for Secondary Schools Paper presented at 12th
International Congress on Mathematical Education 8 July-15 July COEX Seoul Korea Cambridge
Cambridge University Uk
Gurbuz R amp Birgin O (2011) The effect of computer-assisted teaching on remedying misconceptions The
case of the subject Probability Journal Homepage 58(2012) DOI 101016jcompedu201111005
Hirsh L amp ODonnell A M (2001) Representativeness in Statistical Reasoning Identifying and Assessing
Misconceptions Journal of Statistics Education 9(2) 96-105 DOI10108010691898200111910655
Johnson H D amp Dasgupta N (2005) Traditional versus Non-traditional Teaching during Perspectives of
Students in Introductory Statistics Classes Journal of Statistics Education 13(2)
httpsdoiorg10108010691898200511910558
Major T amp Mangope B (2012) The Constructivist Theory in Mathematics The case of Botswana Primary
Schools International Review of Social Sciencies and Humanities 3(2) 139-147
Jones G (2005) Reflections In GA Jones (Ed) Exploring probability in school chanlleges for teaching and
probability (367-372) New York Springer
Jun L (2000) Chinese Students Understanding of Probability Published doctoral dissertation Singapore
National Institute of Education Nanyang Technological University
Khazanov L amp Gourgey A (2009) Instructors Perspectives on Students Mistaken Beliefs about Probability
in an Elementary College Statistics Course In K Safford-Ramus (Ed) Proceedings of the Adults
Learning Mathematics a Resaerch Forum (ALM) 15th
Annual International Conference 249-264
Khazanov L amp Prado L (2010) Correcting Students Misconceptions about Probability in an Introductory
College Statistics Course Adults Learning Mathematics-An International Journal 5(1) 23-35
Kleickmann T Richter D Kunter M Elsner J Besser M Krauss S amp Baumert J (2013) Teachersrsquo
Content Knowledge and Pedagogical Content Knowledge The Role of Structural Differences in Teacher
Education Journal of Teacher Education 64(1) 90-106 DOI1011770022487112460398
Leedy P D and Ormrod J E (2020) Practical research Planning and design (12th Global Edition) Harlow
England Pearson
Lessani A Md Yunus AS amp Bakar KBA (2017) Comparison of new mathematics teaching methods with
teacher-centered approach International Journal of Social Sciences 3(2) 1285-1297
httpsdxdoiorg1020319pijss20173212851297
Lim C amp Hwa T (2007) Promoting Mathematical Thinking in the Malaysian Classroom Issues and
challenges httpswwwresearchgatenetpublication252353381
Hokor amp Sedofia
138
Lovett J N amp Lee H S (2017) New Standards Require Teaching More Statistics Are Preservice Secondary
Mathematics Ready Journal of Teachers Education 68(3) 299-311 DOI 1011770022487117697918
Major T amp Mangope B (2012) The Constructivist Theory in Mathematics The case of Botswana Primary
Schools International Review of Social Sciencies and Humanities 3(2) 139-147
National Council of Teachers of Mathematics (2003) Principles and Standards for School Mathematics and
their Implications for Professional Development Reston VA NCTM
Nguyen L (2015) Developing Conceptual Understanding and Probabilistic Thinking through Tree Diagrams
Published MPhil Dissertation Manitoba The Faculty of Graduate Studies of the University of
Manitoba
Prideaux J (2007) The learner-centered approach to Mathematics Teaching and the Active Learning
Strategies used to Enhance Students Understanding Mathematical and Computing Sciences Masters
Paper 29 Fisher Digital Publications httpfisherpubsjfcedumathcsetdmasters29
Roseth C J Garfield J B amp Ben-Zvi D (2008) Collaboration in Learning and Teaching Statistics Journal
of Statistics Education 16 (1) 1069-1898 httpsdoiorg10108010691898200811889557
Santagata R and Sandholtz J H (2019) Preservice teachersrsquo mathematics teaching competence Comparing
performance on two measures Journal of Teacher Education 70 (5) 472 ndash484
Schwerdt G amp Wuppermann A C (2011) Is traditional teaching really all that bad A within-student
between-subject approach Economics of Education Review 30(2) 365-379
Sharma S (2016) Probability from a socio-cultural perspective Statistics Education Research Journal 15(2)
126-144 httpiase-weborgPublicationsphpp=SERJ
Shay K (2008) Tracing middle school students understanding of probability a longitudinal study
Unpublished Doctoral Dissertation New Brunswick New Jersey Rutgers State University of New
Jersey
Shulman L S (1986) Those who understand Knowledge growth in teaching Educational Researcher 15(2)
4-14 doi 1031021001318X015002004
Thomas L (2020) An introduction to quasi-experimental designs
httpswwwscribbrcommethodologyquasi-experimental-design
Voskoglou M (2019) Comparing Teaching Methods of Mathematics at University Level Education Sciences
9(204) doi103390educsci9030204
Vygotsky L S (1978) Mind in society The development of higher psychological processes Cambridge MA
Harvard University Press
Weldeana H N amp Abraham S T (2014) The effect of an historical perspective on prospective teachersrsquo
beliefs in learning mathematics Journal of Mathematics Teacher Education 17 303-330
doi101007s10857-013-9266-z
Weltman D amp Whiteside M (2010) Comparing the Effectiveness of Traditional and active Learning Methods
in Business Statistics Convergence to the Mean 18(1)
httpsdoiorg10108010691898201011889480
White H amp Sabarwal S (2014) Quasi-experimental design and methods methological briefs impact
evaluations Florence UNICEF Office of research
International Journal of Studies in Education and Science (IJSES)
139
Author Information
Evans Kofi Hokor
httpsorcidorg0000-0002-8387-8294
St Teresarsquos College of Education Hohoe
Department of Mathematics and ICT
P O Box 129
Ghana
Contact e-mail evanskhokorgmailcom
John Sedofia
httpsorcidorg0000-0002-5409-516X
University of Ghana Legon
Department of Teacher Education
PO Box LG 1181
Ghana
Hokor amp Sedofia
140
Appendix A Pre-test Probabilistic Reasoning Assessment
This assessment is for research purpose to improve teaching and learning of probability
You are required to answer all questions honestly Do and leave all workings or rough work on the paper
Pre-test Probabilistic Reasoning Assessment Duration 1hr
Index numberhelliphelliphelliphelliphelliphelliphelliphelliphelliphelliphelliphelliphelliphelliphelliphelliphelliphellipLevelhelliphelliphelliphellipAgehelliphelliphellip
Read each statement carefully and circle the letter of the correct (best) option Provide appropriate response in
the space provided under some items as it apply
1 If you rolled an ordinary die and obtained 51246 which of these is most likely to occur on your next
roll
a 1
b 2
c 3
d 4
e 5
f 6
g The options a b c d e and f are all equally
2i A fair coin is tossed and it lands tail The coin is to be tossed a second time What is the probability that the
second toss will also be a tail
a 1
4
b 1
2
c 1
3
d Slightly less than 1
2
e Slightly more than 1
2
f 0
2ii Which of the following best describes the reason for the correct answer to the preceding question (2i)
a The second toss is less likely to be tail because the first toss was tail
b There are four possible outcomes when you toss a coin twice Getting two tails is only one of them
c The chance of getting heads or tails on any one toss is always 1
2
d There are three possible outcomes when you toss a coin twice Getting two tails is only one of the them
e No chance of being a tail in the second toss
3i A box contains 6 balls 2 are red 2 are black and 2 blue Three balls are picked at random one at a time
Each time a ball is picked the colour is recorded and the ball is put back in the box mixed thoroughly If the
first 2 balls are black what color is the third ball most likely to be
a Red
International Journal of Studies in Education and Science (IJSES)
141
b Black
c Blue
d Red and blue are equally likely than black
e Red black and blue are all equally likely
3ii Which of the following best describes the reason for the correct answer in the preceding question (3i)
a The third ball should not be black because too many black ones have already been picked
b The picks are independent so every color has an equally likely chance of being picked
c Black seems to be lucky
d This color is just as likely as any other color
4 A spinner with ten equally divided sectors in which four parts are white and the rests are red is about to
be spin which color is the spinner more likely to land
a White
b Red
c Both white and red are all equally
5 If you toss a fair coin and get heads two times in a row which of these is most likely on next toss
a Tail
b Head
c Both head and tail are all equally
6 A Gh 2 Gh 5 Ghcent10 Gh 20 Gh 50 and Gh 100 notes were put in a box and thoroughly mixed
What is the probability of picking Gh 50 note without looking
a 1
187
b 50
187
c 1
6
d 0
7 In a game you have been offered two options Which of the following give you higher chance of
winning GHcent200
a Tossing one die once and obtaining a 6
b Tossing two dice once and obtaining two 6rsquos
c The options a and b are all equally
8 A fair die is to be toss six times which of these is most likely to occur
a 251634
b 123456
c 666341
d 132244
e The options a b c and d are all equally likely
9 A fair coin is to be toss four times in a row which of these is least likely to occur
a THTH
b TTTH
c HHH
Hokor amp Sedofia
142
d The options a b and c are all equally likely
10 Two fair dice are to be tossed once Which of the following is more likely to occur
a Obtaining a sum of 11
b Obtaining a sum of 10
c A sum of 11 and a sum of 10 are all equally likely
10i Give reason for the correct answer in the preceding question (10)
helliphelliphelliphelliphelliphelliphelliphelliphelliphelliphelliphelliphelliphelliphelliphelliphelliphelliphelliphelliphelliphelliphelliphelliphelliphelliphelliphelliphelliphelliphelliphelliphelliphelliphelliphelliphelliphelliphelliphelliphelliphellip
helliphelliphelliphelliphelliphelliphelliphelliphelliphelliphelliphelliphelliphelliphelliphelliphelliphelliphelliphelliphelliphelliphelliphelliphelliphelliphelliphelliphelliphelliphelliphelliphelliphelliphelliphelliphelliphelliphelliphelliphelliphellip
helliphelliphelliphelliphelliphelliphelliphelliphelliphelliphelliphelliphelliphelliphelliphelliphelliphelliphelliphelliphelliphelliphelliphelliphelliphelliphelliphelliphelliphelliphelliphelliphelliphelliphelliphelliphelliphelliphelliphelliphelliphellip
helliphelliphelliphelliphelliphelliphelliphelliphelliphelliphelliphelliphelliphelliphelliphelliphelliphelliphelliphelliphelliphelliphelliphelliphelliphelliphelliphelliphelliphelliphelliphelliphelliphelliphelliphelliphelliphellip
11 In national lottery one has to choose five numbers from 1 to 90 inclusive You win when at least two of
your numbers are part of the numbers drawn on Saturday at random Eric has chosen 4 6 7 9 and 11
Alex has chosen 15 23 45 66 and 80 Daniel has chosen 71 77 78 83 and 85 Do Eric Alex and
Daniel have the same chance of winning or not and why
helliphelliphelliphelliphelliphelliphelliphelliphelliphelliphelliphelliphelliphelliphelliphelliphelliphelliphelliphelliphelliphelliphelliphelliphelliphelliphelliphelliphelliphelliphelliphelliphelliphelliphelliphelliphelliphelliphelliphelliphellip
helliphelliphelliphelliphelliphelliphelliphelliphelliphelliphelliphelliphelliphelliphelliphelliphelliphelliphelliphelliphelliphelliphelliphelliphelliphelliphelliphelliphelliphelliphelliphelliphelliphelliphelliphelliphelliphelliphelliphelliphellip
helliphelliphelliphelliphelliphelliphelliphelliphelliphelliphelliphelliphelliphelliphelliphelliphelliphelliphelliphelliphelliphelliphelliphelliphelliphelliphelliphelliphelliphelliphelliphelliphelliphelliphelliphelliphelliphelliphelliphelliphellip
helliphelliphelliphelliphelliphelliphelliphelliphelliphelliphelliphelliphelliphelliphelliphelliphelliphelliphelliphelliphelliphelliphelliphelliphelliphelliphelliphelliphelliphelliphelliphelliphelliphelliphelliphellip
12 A box contains 8 yellow balls and 4 green balls Two balls are chosen at random one after the other
without replacement determine the probability that the two balls are of different colours
helliphelliphelliphelliphelliphelliphelliphelliphelliphelliphelliphelliphelliphelliphelliphelliphelliphelliphelliphelliphelliphelliphelliphelliphelliphelliphelliphelliphelliphelliphelliphelliphelliphelliphelliphelliphelliphelliphelliphelliphellip
helliphelliphelliphelliphelliphelliphelliphelliphelliphelliphelliphelliphelliphelliphelliphelliphelliphelliphelliphelliphelliphelliphelliphelliphelliphelliphelliphelliphelliphelliphelliphelliphelliphelliphelliphelliphelliphelliphelliphelliphellip
helliphelliphelliphelliphelliphelliphelliphelliphelliphelliphelliphelliphelliphelliphelliphelliphelliphelliphelliphelliphelliphelliphelliphelliphelliphelliphelliphelliphelliphelliphelliphelliphelliphelliphelliphelliphelliphelliphelliphelliphellip
helliphelliphelliphelliphelliphelliphelliphelliphelliphelliphelliphelliphelliphelliphelliphelliphelliphelliphelliphelliphelliphelliphelliphelliphelliphelliphelliphelliphelliphelliphelliphelliphelliphelliphelliphelliphellip
International Journal of Studies in Education and Science (IJSES)
143
Appendix B Post-test Probabilistic Reasoning Assessment
This assessment is for research purpose to improve teaching and learning of probability
You are required to answer all questions honestly Do and leave all workings or rough work on the paper
Post-test Probabilistic Reasoning Assessment Duration One Hour
Index numberhelliphelliphelliphelliphelliphelliphelliphelliphelliphelliphelliphelliphelliphelliphellipClasshelliphelliphelliphellipAgehelliphelliphelliphellip
Read each statement carefully and circle the letter of the correct (best) option for each item as much as possible
and provide appropriate response in the space provided
1 Suppose a particular outcome from a random event has a probability of 04 Which of the following
statements represents correct interpretations of this probability
a The outcome will not happen
b The outcome will certainly happen about four times out of every 10 trials
c The outcome is expected to happen about four times out of every 10 trials
d The outcome could happen or it couldnrsquot of either result are the same
2 If you toss a fair coin and get heads 3 times in a row what is the chance of getting a head on the next toss
a 1
b Greater than 1
2
c 1
2
d Less than 1
2
e 0
3 A die is numbered 1 2 3 4 4 5 When the die is thrown once Which of these is most likely and why
a 1
b 2
c 3
d 4
e 5
f They are all equally likely
3i Give reason for your chosen answer in (3)
helliphelliphelliphelliphelliphelliphelliphelliphelliphelliphelliphelliphelliphelliphelliphelliphelliphelliphelliphelliphelliphelliphelliphelliphelliphelliphelliphelliphelliphelliphelliphelliphelliphelliphelliphelliphelliphelliphelliphelliphelliphelliphelliphelliphellip
helliphelliphelliphelliphelliphelliphelliphelliphelliphelliphelliphelliphelliphelliphelliphelliphelliphelliphelliphelliphelliphelliphelliphelliphelliphelliphelliphelliphelliphelliphelliphelliphelliphelliphelliphelliphelliphelliphelliphelliphelliphelliphelliphelliphellip
helliphelliphelliphelliphelliphelliphelliphelliphelliphelliphelliphelliphelliphelliphelliphelliphelliphelliphelliphelliphelliphelliphelliphelliphelliphelliphelliphelliphelliphelliphelliphelliphelliphelliphelliphelliphelliphelliphelliphelliphelliphelliphelliphelliphellip
helliphelliphelliphelliphelliphelliphelliphelliphelliphelliphelliphelliphelliphelliphelliphelliphelliphelliphelliphelliphelliphelliphelliphelliphelliphelliphelliphelliphelliphelliphelliphelliphelliphelliphelliphelliphelliphelliphellip
4 German MP tossed two dice once Which of these is mostly likely and why
a Obtaining a sum of 4
b Obtaining a sum of 7
c Obtaining a sum of 11
d All of them have equal chance of occurring that is a b c
Hokor amp Sedofia
144
4i Give reason for your chosen answer in (4)
helliphelliphelliphelliphelliphelliphelliphelliphelliphelliphelliphelliphelliphelliphelliphelliphelliphelliphelliphelliphelliphelliphelliphelliphelliphelliphelliphelliphelliphelliphelliphelliphelliphelliphelliphelliphelliphelliphelliphelliphelliphelliphelliphelliphellip
helliphelliphelliphelliphelliphelliphelliphelliphelliphelliphelliphelliphelliphelliphelliphelliphelliphelliphelliphelliphelliphelliphelliphelliphelliphelliphelliphelliphelliphelliphelliphelliphelliphelliphelliphelliphelliphelliphelliphelliphelliphelliphelliphelliphellip
helliphelliphelliphelliphelliphelliphelliphelliphelliphelliphelliphelliphelliphelliphelliphelliphelliphelliphelliphelliphelliphelliphelliphelliphelliphelliphelliphelliphelliphelliphelliphelliphelliphelliphelliphelliphelliphelliphelliphelliphelliphelliphelliphelliphellip
helliphelliphelliphelliphelliphelliphelliphelliphelliphelliphelliphelliphelliphelliphelliphelliphelliphelliphelliphelliphelliphelliphelliphelliphelliphelliphelliphelliphelliphelliphelliphelliphelliphelliphelliphelliphelliphelliphelliphelliphelliphelliphelliphelliphellip
helliphelliphelliphelliphelliphelliphelliphelliphelliphelliphelliphelliphelliphelliphelliphelliphelliphelliphelliphelliphelliphelliphelliphelliphelliphelliphelliphelliphellip
5i A fair coin is to be toss four times which of these is most likely to occur
a HTHT
b THTT
c TTTT
d HHTH
e The options a b c and d are all equally likely
5ii Give reason for your chosen answer in (5i)
helliphelliphelliphelliphelliphelliphelliphelliphelliphelliphelliphelliphelliphelliphelliphelliphelliphelliphelliphelliphelliphelliphelliphelliphelliphelliphelliphelliphelliphelliphelliphelliphelliphelliphelliphelliphelliphelliphelliphelliphelliphelliphelliphelliphellip
helliphelliphelliphelliphelliphelliphelliphelliphelliphelliphelliphelliphelliphelliphelliphelliphelliphelliphelliphelliphelliphelliphelliphelliphelliphelliphelliphelliphelliphelliphelliphelliphelliphelliphelliphelliphelliphelliphelliphelliphelliphelliphelliphelliphellip
helliphelliphelliphelliphelliphelliphelliphelliphelliphelliphelliphelliphelliphelliphelliphelliphelliphelliphelliphelliphelliphelliphelliphelliphelliphelliphelliphelliphelliphelliphelliphelliphelliphelliphelliphelliphelliphelliphelliphelliphelliphelliphelliphelliphellip
helliphelliphelliphelliphelliphelliphelliphelliphelliphelliphelliphelliphelliphelliphelliphelliphelliphelliphelliphelliphelliphelliphelliphelliphelliphelliphelliphelliphelliphelliphelliphelliphelliphelliphelliphelliphelliphelliphellip
6i A fair coin is to be toss four times which of these is least likely to occur
a HTHT
b THTT
c TTTT
d HHTH
e The options a b c and d are all equally likely
6ii Give reason for your chosen answer in (6i)
helliphelliphelliphelliphelliphelliphelliphelliphelliphelliphelliphelliphelliphelliphelliphelliphelliphelliphelliphelliphelliphelliphelliphelliphelliphelliphelliphelliphelliphelliphelliphelliphelliphelliphelliphelliphelliphelliphelliphelliphelliphelliphelliphelliphellip
helliphelliphelliphelliphelliphelliphelliphelliphelliphelliphelliphelliphelliphelliphelliphelliphelliphelliphelliphelliphelliphelliphelliphelliphelliphelliphelliphelliphelliphelliphelliphelliphelliphelliphelliphelliphelliphelliphelliphelliphelliphelliphelliphelliphellip
helliphelliphelliphelliphelliphelliphelliphelliphelliphelliphelliphelliphelliphelliphelliphelliphelliphelliphelliphelliphelliphelliphelliphelliphelliphelliphelliphelliphelliphelliphelliphelliphelliphelliphelliphelliphelliphelliphelliphelliphelliphelliphelliphelliphellip
helliphelliphelliphellip
7 A college has 300 level 200 students and 236 level 100 students in it Each studentrsquos name is written with
the level on a piece of paper and all the names are put into a box and mixed thoroughly A tutor picks one
name out of the box without looking Which level is the tutor more likely to pick from and why
helliphelliphelliphelliphelliphelliphelliphelliphelliphelliphelliphelliphelliphelliphelliphelliphelliphelliphelliphelliphelliphelliphelliphelliphelliphelliphelliphelliphelliphelliphelliphelliphelliphelliphelliphelliphelliphelliphelliphelliphelliphelliphelliphelliphellip
helliphelliphelliphelliphelliphelliphelliphelliphelliphelliphelliphelliphelliphelliphelliphelliphelliphelliphelliphelliphelliphelliphelliphelliphelliphelliphelliphelliphelliphelliphelliphelliphelliphelliphelliphelliphelliphelliphelliphelliphelliphelliphelliphelliphellip
helliphelliphelliphelliphelliphelliphelliphelliphelliphelliphelliphelliphelliphelliphelliphelliphelliphelliphelliphelliphelliphelliphelliphelliphelliphelliphelliphelliphelliphelliphelliphelliphelliphelliphelliphelliphelliphelliphelliphelliphelliphelliphelliphelliphellip
helliphelliphelliphelliphelliphelliphelliphelliphelliphelliphelliphelliphelliphelliphelliphelliphelliphelliphelliphelliphelliphelliphelliphelliphelliphelliphelliphelliphelliphelliphelliphelliphelliphelliphelliphelliphelliphelliphelliphellip
8 Suppose that you toss a coin three times and all eight outcomes are equally likely If it is known that the first
toss comes up heads what is the probability of an odd number of heads appearing
helliphelliphelliphelliphelliphelliphelliphelliphelliphelliphelliphelliphelliphelliphelliphelliphelliphelliphelliphelliphelliphelliphelliphelliphelliphelliphelliphelliphelliphelliphelliphelliphelliphelliphelliphelliphelliphelliphelliphelliphelliphelliphelliphelliphellip
helliphelliphelliphelliphelliphelliphelliphelliphelliphelliphelliphelliphelliphelliphelliphelliphelliphelliphelliphelliphelliphelliphelliphelliphelliphelliphelliphelliphelliphelliphelliphelliphelliphelliphelliphelliphelliphelliphelliphelliphelliphelliphelliphelliphellip
helliphelliphelliphelliphelliphelliphelliphelliphelliphelliphelliphelliphelliphelliphelliphelliphelliphelliphelliphelliphelliphelliphelliphelliphelliphelliphelliphelliphelliphelliphelliphelliphelliphelliphelliphelliphelliphelliphelliphelliphelliphelliphelliphelliphellip
International Journal of Studies in Education and Science (IJSES)
145
helliphelliphelliphelliphelliphelliphelliphelliphelliphelliphelliphelliphelliphelliphelliphelliphelliphelliphelliphelliphelliphelliphelliphelliphelliphelliphelliphelliphelliphelliphelliphelliphelliphelliphelliphelliphelliphelliphelliphelliphelliphelliphelliphelliphellip
helliphelliphelliphelliphelliphelliphelliphelliphelliphelliphelliphelliphelliphelliphelliphelliphelliphelliphelliphelliphelliphelliphelliphelliphelliphelliphelliphelliphelliphelliphelliphelliphelliphelliphelliphelliphelliphelliphelliphelliphelliphelliphelliphelliphellip
helliphelliphelliphelliphelliphelliphelliphelliphelliphelliphelliphelliphelliphelliphelliphelliphelliphelliphelliphellip
9 A card is selected at random from a pack of 52 cards Find the probability of selecting a card which is a red or
a queen
helliphelliphelliphelliphelliphelliphelliphelliphelliphelliphelliphelliphelliphelliphelliphelliphelliphelliphelliphelliphelliphelliphelliphelliphelliphelliphelliphelliphelliphelliphelliphelliphelliphelliphelliphelliphelliphelliphelliphelliphelliphelliphelliphelliphellip
helliphelliphelliphelliphelliphelliphelliphelliphelliphelliphelliphelliphelliphelliphelliphelliphelliphelliphelliphelliphelliphelliphelliphelliphelliphelliphelliphelliphelliphelliphelliphelliphelliphelliphelliphelliphelliphelliphelliphelliphelliphelliphelliphelliphellip
helliphelliphelliphelliphelliphelliphelliphelliphelliphelliphelliphelliphelliphelliphelliphelliphelliphelliphelliphelliphelliphelliphelliphelliphelliphelliphelliphelliphelliphelliphelliphelliphelliphelliphelliphelliphelliphelliphelliphelliphelliphelliphelliphelliphellip
helliphelliphelliphelliphelliphelliphelliphelliphelliphelliphelliphelliphelliphelliphelliphelliphelliphelliphelliphelliphelliphelliphelliphelliphelliphelliphelliphelliphelliphelliphelliphelliphelliphelliphelliphelliphelliphelliphelliphellip
10 A box contains 6 white balls and 4 green balls Two balls are chosen at random one after the other without
replacement determine the probability that the second ball is white
helliphelliphelliphelliphelliphelliphelliphelliphelliphelliphelliphelliphelliphelliphelliphelliphelliphelliphelliphelliphelliphelliphelliphelliphelliphelliphelliphelliphelliphelliphelliphelliphelliphelliphelliphelliphelliphelliphelliphelliphelliphelliphelliphelliphellip
helliphelliphelliphelliphelliphelliphelliphelliphelliphelliphelliphelliphelliphelliphelliphelliphelliphelliphelliphelliphelliphelliphelliphelliphelliphelliphelliphelliphelliphelliphelliphelliphelliphelliphelliphelliphelliphelliphelliphelliphelliphelliphelliphelliphellip
helliphelliphelliphelliphelliphelliphelliphelliphelliphelliphelliphelliphelliphelliphelliphelliphelliphelliphelliphelliphelliphelliphelliphelliphelliphelliphelliphelliphelliphelliphelliphelliphelliphelliphelliphelliphelliphelliphelliphelliphelliphelliphelliphelliphellip
helliphelliphelliphelliphelliphelliphelliphelliphelliphelliphelliphelliphelliphelliphelliphelliphelliphelliphelliphelliphelliphelliphelliphelliphelliphelliphelliphelliphelliphelliphelliphelliphelliphelliphelliphelliphelliphelliphelliphelliphelliphelliphellip
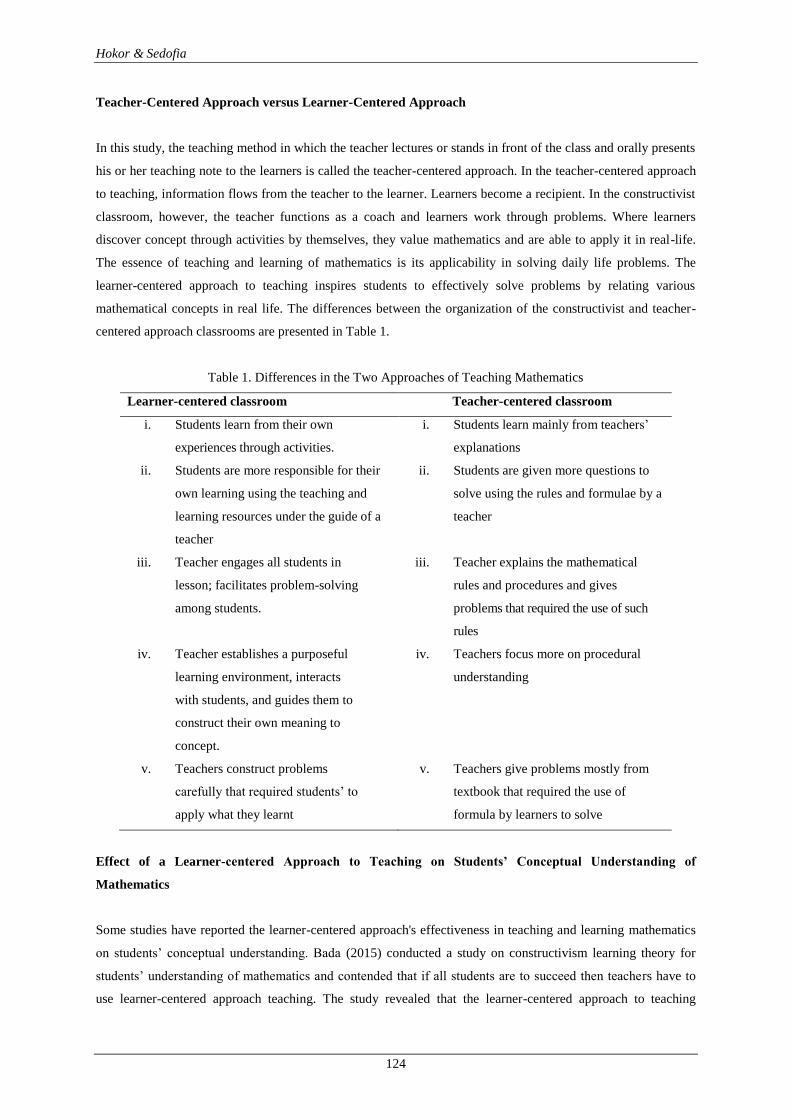
Hokor amp Sedofia
124
Teacher-Centered Approach versus Learner-Centered Approach
In this study the teaching method in which the teacher lectures or stands in front of the class and orally presents
his or her teaching note to the learners is called the teacher-centered approach In the teacher-centered approach
to teaching information flows from the teacher to the learner Learners become a recipient In the constructivist
classroom however the teacher functions as a coach and learners work through problems Where learners
discover concept through activities by themselves they value mathematics and are able to apply it in real-life
The essence of teaching and learning of mathematics is its applicability in solving daily life problems The
learner-centered approach to teaching inspires students to effectively solve problems by relating various
mathematical concepts in real life The differences between the organization of the constructivist and teacher-
centered approach classrooms are presented in Table 1
Table 1 Differences in the Two Approaches of Teaching Mathematics
Learner-centered classroom Teacher-centered classroom
i Students learn from their own
experiences through activities
i Students learn mainly from teachersrsquo
explanations
ii Students are more responsible for their
own learning using the teaching and
learning resources under the guide of a
teacher
ii Students are given more questions to
solve using the rules and formulae by a
teacher
iii Teacher engages all students in
lesson facilitates problem-solving
among students
iii Teacher explains the mathematical
rules and procedures and gives
problems that required the use of such
rules
iv Teacher establishes a purposeful
learning environment interacts
with students and guides them to
construct their own meaning to
concept
iv Teachers focus more on procedural
understanding
v Teachers construct problems
carefully that required studentsrsquo to
apply what they learnt
v Teachers give problems mostly from
textbook that required the use of
formula by learners to solve
Effect of a Learner-centered Approach to Teaching on Studentsrsquo Conceptual Understanding of
Mathematics
Some studies have reported the learner-centered approachs effectiveness in teaching and learning mathematics
on studentsrsquo conceptual understanding Bada (2015) conducted a study on constructivism learning theory for
studentsrsquo understanding of mathematics and contended that if all students are to succeed then teachers have to
use learner-centered approach teaching The study revealed that the learner-centered approach to teaching
International Journal of Studies in Education and Science (IJSES)
125
motivates students to learn and gives teachers the opportunity to assess how the activity is helping the students
to develop an understanding of concepts Furthermore a study was conducted by Major and Mangope (2012) on
constructivist theory in Mathematics in Botswana primary schools The study focused on the extent to which
teachers in Botswana primary schools use the learner-centered approach in teaching and learning of
Mathematics A total of 83 mathematics lessons were videotaped and analyzed The results revealed that most of
the lessons required students to recall rules or formulae However small percentages of the lessons required
students to explore or investigate mathematical ideas
Students are at the center of the learning process in the constructivist class through doing experience action
and peer collaboration National Council of Teachers of Mathematics 2000 (cited in Prideaux 2007) contended
that when teaching is student the learners value mathematics and engage actively in learning the discipline In
solving problems under the constructivist strategy learners are motivated to try various means possible hence
they invent the means of solving the problem themselves In constructivism problems are carefully constructed
to challenge students to reason about the concepts Additionally the interest of the learners increases because
they see the need to study mathematics Mathematics is full of problem-solving So employing a problem-
solving strategytechnique to teach mathematics helps learners to have a better understanding of mathematical
concepts
Materials and Methods
Design
This study used the nonequivalent (pre-test and post-test) control-group design of quasi-experimental research
In this design a dependent variable is measured in one group of subjects before and after a treatment and that
same dependent variable is measured at pre-test and post-test in another nonequivalent control group which does
not receive any treatment The two groups are selected without random assignment and both groups take a
pretest and posttest But only the experimental group receives the treatment (Creswell amp Creswell 2018) This
design makes it possible for researchers to compare scores before and after a treatment in a group that receives
the treatment and also in a nonequivalent control group that does not receive the treatment The nature of the
research problem and the objectives to be achieved warranted quasi-experimental design Importantly in an
environment such as a college of education randomness was impractical (Leedy amp Ormrod 2020) and despite
the argument that quasi-experimental research has low internal validity compared to true experiments quasi-
experimental research has a higher external validity because it helps researchers to do interventions in the real-
world instead of artificial laboratory settings (Thomas 2020)
Population
There are seven public Colleges of Education in the Volta Region of Ghana Six out of the seven colleges are
mixed-sex colleges and one is female-only The single-sex college was purposively chosen to ascertain how
these students develop their probabilistic reasoning from the two different teaching methods discussed above
The population was all second-year preservice teachers of that college since at the time of the study the final
Hokor amp Sedofia
126
years were out for their teaching practice and the first year students had not taken the statistics and probability
course This institution was selected for one main reason they all studied Statistics and Probability and were
thus expected to teach it at the Junior High School level upon completion of their training
Sample and Sampling Procedure
Purposive sampling technique was used to select two intact classes out of six classes identified as Group A and
Group B respectively These groups are similar in terms of their performance in their second-year first-semester
mid-semester quiz scores in mathematics with mean scores of 139 and 137 respectively ldquoQuasi-experimental
designs identify a comparison group that is as similar as possible to the experimental group in terms of pre-
intervention characteristicsrdquo (White amp Sabarwal 2014 p 1) Also it helped to avoid selection bias which is a
concern in quasi-experimental studies
These two intact classes comprised 27 preservice teachers in Group B and 32 in Group A In purposive
sampling certain elements of the population are deliberately selected on the judgment of the researchers and
nothing is left to chance In this study respondents were chosen from a population of regular preservice teachers
who had studied probability previously and were taking statistics and probability as a course in a college of
education The reason for choosing both groups from the same population is that both Group A and Group B
used the same textbooks and course materials Also both groups were chosen from the same population to avoid
bias because all the colleges use different textbooks and the conditions under which students studied are
different from college to college
Achievement Tests (Pre-test and Post-Test)
The test items were administered in two phases in the classrooms These are pre-test and the post-test Items 2i
2ii 3i and 3ii of the pretest were adapted from (Anway amp Bennett 2004 Hirsh amp ODonnell 2001) Two
examiners of statistics and probability were consulted to ensure the questions are at the level of the participants
This is to ensure the validity of the test items The pre-test and the post-test were similar to measure whether
there is a change or not The items were developed to measure the probabilistic reasoning of preservice teachers
The items sought to ascertain preservice teachersrsquo ability in reasoning about uncertainties and the use of
probability daily
The achievement test assessed the following areas correctly applying probability in decision making
equiprobability bias correctly interpreting without replacement situations correctly listing the sample space and
determining the probability representativeness bias and interpreting probability statements correctly and
applying appropriate strategies There were 12 items for the pre-test and 10 items for the post-test We have
more items on the pre-test because the post-test was more open-ended than the pre-test Nevertheless the total
scores in each case was 20 Some of the test items consisted of two parts the principal question (multiple
choice) and a justification of the answer The pre-test and post-test can be seen in appendices A and B
respectively
International Journal of Studies in Education and Science (IJSES)
127
Evaluation of Materials by Experts
The researchers solicited two expertsrsquo views on the test items content coverage content relevance and course
materials It was the view of the experts that the test items of both the pre-test and the post-test were in line with
the mathematics syllabus of colleges of education in Ghana The activities designed for the Group A were also
assessed In the view of the experts the teaching activities had sufficient content coverage and would help pre-
service teachers develop better probabilistic reasoning They acknowledged the idea of having activities that
reflect real life situations to support pre-service teachers since they were aware students have difficulty with
probability related problems The experts further acknowledged that the objectives were measurable and
activities were practical to promote pre-service teachersrsquo involvement in the lessons They said the teaching and
learning materials reflected the learner-centered approach and were in line with the syllabus requirements for
Mathematics in colleges of education in Ghana They believed the activities would promote better probabilistic
reasoning since they reflected real life situations
Data Collection Procedure
Preservice teachers were informed one week ahead of the administration of the pre-test The format of the test
items and the purpose of the study were communicated to the respondents The tests were administered by the
researchers at an Examination Hall to ensure the respondents did independent work
Treatment
The learner-centered approach was applied to group A while the teacher-centered approach of instruction was
applied to group B In each approach the lessons were focused on addressing equiprobability bias
representativeness belief bias positive recency and negative recency effects since some studies suggest that
teaching approaches that target probabilistic misconceptions will help improve studentsrsquo performance
significantly (Khazanov amp Prado 2010 Shay 2008) The implementation of both teaching approaches were
done by the lead researcher
Group A The Learner-centered approach
The teaching and learning took place in traditional classroom settings generally consisting of activities
discussions and questions and answers concurrently once per week for two hours for a month In group A the
activities were designed focusing on probabilistic misconceptions using the learner-centered approach to
teaching to better their probabilistic reasoning Examples of the activities are given below
Card Game This game was played in groups Identical cards were numbered 3 3 4 4 5 5 5 6 6 7 8 and 9
and put in a container and thoroughly mixed Three students will reach in and without looking draw out a card
each at time If the three people pick different numbers then the group wins GH30000 else they lose Is the
chance of winning or losing the same and why The purpose of this activity is to enhance preservice teachersrsquo
Hokor amp Sedofia
128
decision-making ability by addressing equiprobability bias representativeness bias belief and positive and
negative recency effects The aim of predicting before picking was to keep students focused and to confront any
prior misconceptions The game was played 15 times If all the three members of the group pick different colors
then a point of one is recorded else zero After the activity a discussion was organized around their prediction
and the results to challenge their thinking
Pair Game In pairs preservice teachers were asked to toss a coin six times each recording the sequence of tails
and heads The purpose of this activity is to address representativeness bias Before the toss students were asked
to predict the number of tails and heads Their predictions were written in their notebook before the toss Most
preservice teachers predicted equal number of tails and heads Preservice teachers then compare their predicted
sequences to their results after the toss It was noted in many instances that those who predicted equal number of
tails and heads did not obtain results that were consistent with their prediction Discussions were organized
around their predicted sequences and the results obtained after the toss for better probabilistic reasoning
Coin Game Students perform this experiment ten times by tossing a number of fair coins once and record the
outcomes in each case In the first toss a coin was tossed once and the outcome recorded in the second toss
two coins were tossed once and outcomes recorded in third toss three coins were tossed once and outcomes
recorded and so on H stands for heads and T stands for tails The following are a sample of sequence of
outcomes by one student
1st toss H
2nd
toss HT
3rd
toss HTH
4th
toss HTTT
5th
toss THHTT
6th
toss HTHTTT
7th
toss TTHTHHT
8th
toss THTHTHHH
9th
toss HTTTHTHTT
10th
toss THTHTHTHTT
119873119906119898119887119890119903 119900119891 ℎ119890119886119889119904
119873119906119898119887119890119903 119900119891 119905119900119904119904119890119904=
1
1= 1
1
2= 05
2
3= 0667
1
4= 025
2
5= 04
2
6= 0333
3
7= 0429
5
8
= 0625 3
9= 0333
4
10= 04
The average of the probabilities of obtaining a head for each experiment is
=105066702504033304290625033304
10=
4937
10cong 05
International Journal of Studies in Education and Science (IJSES)
129
It must be noted that in experimental or frequentist probability we are concerned about conducting the
experiment many times and considering its approximation or convergence Students were led to conclude that in
general we can say when a fair coin is tossed the probability of getting a head at any time is 1
2 and vice versa
Group B The Teacher-centered approach
Group B was taught using the teacher-centered approach In this case the teacher rather than the learner was at
the center of the teaching and learning process The tutor presented the preservice teachers with facts or
procedures that had been established to solve problems Preservice teachers were given problems that require
the use of these facts or procedures to solve as either assignment exercise test or quiz It is believed that
preservice teachers learned more when they solved similar problems many times When examination questions
that demanded facts were set students could solve the problems without really understanding the concepts
Formulae were presented to students to learn to apply to similar problems Concepts were clearly explained
bearing in mind the probabilistic misconceptions Samples of lessons experienced by Group B are as follow
Lesson one Through questions and answers teacher revises preservice teachersrsquo previous knowledge on playing
of games and probabilistic situations Based on studentsrsquo responses the teacher introduces the lesson
Teacher explains to preservice teachers the concept of probability and three ways we can make probability
statements as classical frequentist and subjective Classical probability is the number of favorable outcomes (E)
divided by the total number of possible outcomes (S) It works on the assumptions that all outcomes are equally
likely Equally likely means that each outcome has the same probability of occurring
Mathematically P(E) =
Students were then led to solve problems using the formula
Experimental probability is a method of calculating probability where the probability is the ratio of the number
of the trials where the desired event occurs to the number of total trials Subjective probability is a statement that
an individual makes based on personal judgment to describe the likelihood of an event Or a personal belief
based on onersquos own experience or expertise The person making the statement should be an expert in the area or
someone who have a sound knowledge on the issue under consideration before it can be considered important
For the statement to be reliable it should be based on a sound premise(s) Nevertheless both experts and non-
experts make use of subjective probability daily For example I have a 90 chance of passing my statistics and
probability exam
Lesson two Teacher explains basic terms of probability such as sample space sample point an event equally
likely to preservice teachers Teacher guides preservice teachers through demonstration to solve probability
problems using classical definition of probability by listing the sample space and finding the probability of an
event Teacher leads preservice teachers to solve probability problems from frequency tables Similarly teacher
explains to preservice teachers independent and dependent events Teacher asks the preservice teachers to solve
problems on independent and dependent events
Hokor amp Sedofia
130
Data Analysis
The data collected were coded and edited before being transferred to computer for analysis using SPSS version
24 A Levenersquos test was used in the study to ensure that the assumptions between each group was not violated
Homogeneity of variances was considered to ensure that each grouprsquos pre-test scores were mostly equal Paired
samples T-test was used to compare two means within each group to determine whether or not the differences in
means were statistically significant Independent sample T-test was used to compare the probabilistic reasoning
mean scores in Group A and the Group B before the experiment at a time to determine whether the two groups
were at the same level or not The independent t-test was used because there were two different groups of
participants It works on the assumption that scores are unique because they come from different participants
Also the equality of variance for running ANCOVA at 5 significance level was checked using Levenersquos test
Table 2 Levenes Test of Equality of Variances
F df1 df2 Sig
1234 1 57 0456
The results from Table 2 indicate that the variances are roughly equal since the significance value of 0456 is
greater than the cut-off value of 005 Therefore we can conclude that homogeneity of variance assumption was
met (Field 2005) This allowed us to examine the relationship between the covariate (pre-test scores) and
dependent variable (post-test scores) Analysis of covariance (ANCOVA) was used to examine the effect of
learner-centered approach to teaching and teacher-centered approach on preservice teachersrsquo probabilistic
reasoning since different participants were in each group The ANCOVA is ideal in removing the bias of these
variables (Field 2005) In order to determine whether or not the occurrence of scores was not by chance a
partial eta squared was used to gauge the magnitude of the difference (effect size) between means of the scores
Pallant (2001) outlined the following criterion for interpreting partial eta squared values as 001 = small effect
006 = moderate effect and 014 = large effect
Results
Before introducing the learner-centered and teacher-centered approaches of teaching preservice teachersrsquo
probabilistic reasoning was compared to ascertain whether or not their results were similar in terms of the mean
scores The result is presented in Table 3
Table 3 Results of the Independent Samples t-test on the Pre-test of the Group B and Group A
Group N Mean Std Dev Mean Difference Df t-value p-value
Group B 27 585 1562 35 56 756 456
Group A 32 550 1967
The results in Table 3 indicate that there was no statistically significant difference between the probabilistic
reasoning mean scores of Group A = 550 = 1967 and Group B = 585 = 1562 in the
International Journal of Studies in Education and Science (IJSES)
131
pretest This is an indication that the two groups are similar and their performance could be compared after the
two teaching approaches
Comparison of Probabilistic Reasoning of the Preservice Teachers before and after Learner-centered
Approach in Group A
The results of analysis of the effect of the learner-centered approach on preservice teachersrsquo probabilistic
reasoning is presented in Table 4
Table 4 Pre-test and Post-test Scores for Group A
Minimum Maximum Mean Std Deviation
Pre-test 1 10 550 1967
Post-test 8 20 1572 3630
Table 4 reveals that in the post-test preservice teachersrsquo probabilistic reasoning mean scores increased from
550 to 1572 in the post-test in Group A
A paired sample t‐test was conducted to compare the post-test and pre-test scores for the preservice teachers
taught with the learner-centered approach to teaching (Group A) in order to determine if the mean difference in
scores was statistically significant This was done to evaluate the effect of the learner-centered approach on
preservice teachersrsquo probabilistic reasoning Table 5 presents the results
Table 5 Paired Sample t-test Results on the Post-test and Pre-test of Group A
Mean
Difference
Std
Deviation
Std Error
Mean
t Df Sig
Post-test ndash Pre-test 10219 2871 507 20137 31 000
The results from Table 5 shows a statistically significant difference in the preservice teachersrsquo probabilistic
reasoning from the pre-test (M = 550 SD = 1967) to the post-test (M = 1572 SD = 3630) with t (31) =
20137 p = 000 The result reveals that preservice teachersrsquo probabilistic reasoning has improved significantly
after the learner-centered approach was used since = 000 05 It can be inferred that the learner-centered
approach to teaching has a positive significant effect on preservice teachersrsquo probabilistic reasoning
Analysis of Probabilistic Reasoning of the Preservice Teachers before and after Teacher-centered
Approach to Teaching
The results of the analysis of the effect of the teacher-centered approach to teaching on preservice teachersrsquo
probabilistic reasoning is presented in Table 6
Hokor amp Sedofia
132
Table 6 Pre-test and Post-test Scores for the Group B
Minimum Maximum Mean Std Deviation
Pre-test 2 8 585 1562
Post-test 5 14 952 2208
The data on Table 6 show that the mean score of preservice teachers in the pre-test was 585 while that of the
post-test was 952 marks This indicates that in the post-test an average of each of the preservice teachersrsquo
probabilistic reasoning increased slightly in Group B To determine if the mean difference is statistically
significant a paired sample t‐test was conducted Table 7 presents the results
Table 7 Results of the Paired Samples t-test on the Post-test and Pre-test of the Group B
Mean
Difference
Std Deviation Std Error
Mean
t Df Sig
Post-test ndash Pre-test 3667 1441 0277 13220 26 000
The result presented on Table 7 shows that the mean score difference between the post-test and pre-test of
Group B was 3667 marks with a corresponding standard deviation of 1441 The paired sample t-test was
conducted to find out if the mean score difference (M = 3667 SD = 1441) was statistically significant This
was done to assess the effect of the teacher-centered approach targeted at addressing misconceptions on
preservice teachersrsquo probabilistic reasoning The results from Table 7 reveal that there was a statistically
significant difference in the preservice teachersrsquo probabilistic reasoning scores from the pre-test (M = 585 SD =
1562) to the post-test (M = 952 SD = 2208) with t (26) = 13220 p = 000 lt 05 This is an indication that the
teacher-centered approach to teaching probability targeted at addressing probabilistic misconceptions aids
students to improve upon their understanding and problem-solving abilities in probability
Next we compared the effectiveness of the learner-centered approach of teaching and the teacher-centered
approach of teaching in terms of probabilistic reasoning of preservice teachers and how they addressed
probabilistic misconceptions
Comparison of Effectiveness of Learner-centered Approach and Teacher-centered Approach in
Developing Probabilistic Reasoning
The preservice teachersrsquo scores on the pre-test of the achievement test were used as covariate in this analysis
The scores from the post-test were then compared using ANCOVA with = 05 to adjust for pre-test
differences that existed between Group A and Group B In the pre-test the mean scores of Group B and Group A
were 585 and 550 respectively ANCOVA was used to adjust the post-test scores statistically to compensate
for the 035 mean point difference between the two groups in the pre-test This adjustment led to a more
accurate post-test comparison Table 8 presents the results
International Journal of Studies in Education and Science (IJSES)
133
Table 8 Summary of ANCOVA of the Performance of Preservice Teachers taught with Learner-centered
Approach and Teacher-centered Approach (N = 59)
Source Sum of
Squares
Df
Mean
Square
F Sig Partial Eta
Squared
Corrected
Model
791144a 2 395562 72150 000 720
Intercept 205135 1 205135 37416 000 401
Pre-test 228184 1 228184 41620 000 426
Group 630253 1 630253 114955 000 672
Error 307026 56 5483
Total 10888000 59
Corrected Total 1098169 58
a R Squared = 720 (Adjusted R Squared = 710)
The data on Table 8 indicate that there is a statistically significant main effect on the preservice teachers who
were taught using the learner-centered approach to learn probability [F (1 56) = 114955 p = 000 lt 05]
Consequently the preservice teachers taught with the learner-centered approach performed better than their
counterparts who experienced the teacher-centered approach to learn probability The partial eta squared value
was found to be 0672 This value indicates a large effect size That is 672 of the variance in the dependent
variable (probabilistic reasoning achievement score) is expounded by the independent variable (teacher-centered
approach) This implies that the magnitude of the difference between the mean score of the preservice teachers
taught with the learner-centered approach and the teacher-centered approach is large With the high scores of
preservice teachers in the Group A it implies that the use of learner-centered approach in the teaching and
learning of probability improved the performance of the preservice teachers
The outcome of the study portrays that there was a statistically significant difference in the probabilistic
reasoning achievement mean scores of Group A than that of Group B [F (1 56) = 114955 p = 000 lt 05] This
finding implies that Group A performed better than Group B in the probabilistic reasoning achievement test
This is an indication that when the learner-centered approach to teaching probability is targeted at addressing
probabilistic misconceptions preservice teachers develop better probabilistic reasoning than teacher-centered
approach
Discussion
This study set out to compare the learner-centered and teacher-centered approaches of teaching in order to
determine the best way of developing preservice teachersrsquo probabilistic reasoning at the College of Education
Hokor amp Sedofia
134
level in Ghana The results as shown on Tables 3 4 5 6 7 and 8 indicate that the learner-centered approach to
teaching probability is more effective than the teacher-centered approach in motivating and inspiring preservice
teachers to learn and apply probability The learner-centered approach provides studentsrsquo opportunities to think
reason reflect and evaluate their ideals and that of colleagues
The findings of the present study are in tandem with several research findings Lessani Md Yunus and Bakar
(2017) investigated mathematics teaching approaches and their consequences on learnersrsquo ability to solve
challenging problems Their findings affirm the learner-centered approach to be more effective in studentsrsquo
creativity and innovation in solving real-life problems than the teacher-centered approach So training
programs for excellent teaching and learning should be flexible and innovative to allow preservice teachers to
explore gaps in learning and teaching (AIAhmad 2021) Similarly Prideaux (2007) found that students who
experienced the learner-centered approach of teaching performed significantly higher than those who were
taught without the learner-centered approach of teaching Roseth Garfield and Ben-Zvi (2008) also examined
the effect of the cooperative framework in classroom teaching and collaboration and found that student-
centered approaches to teaching help students to have better understanding of statistics than teacher-centered
instruction
Furthermore Gurbuz and Birgin (2011) studied the effect of computer-assisted teaching on addressing
probabilistic misconceptions of students The authors used pre-test to collect data on both the computer-assisted
and traditional groups before the experimental teachings After the intervention the post-test was administered
to ascertain the effect of computer-assisted teaching and teacher-centered approach on addressing studentsrsquo
probabilistic misconceptions Their study found computer-assisted teaching to have more significant effect on
studentsrsquo correct probabilistic reasoning than teacher-centered approach of teaching
As noted by Batanero and Diaz (2012) probability forms an integral part of the Mathematics curriculum in
many countries But the concept is one that some learners find difficult to understand partly due to the method
of teaching used by teachers This fact implies that teachers of mathematics should find more creative ways of
teaching the concept so as to make it easier for learners to understand and apply the concept As discovered in
this study the learner-centered approach is effective in developing probabilistic reasoning But the learner-
centered approach works best when certain conditions are present At the outset there is the need for relevant
teaching and learning materials Then teachers need to be trained and retrained in the use of the learner-centered
approach to teaching At the college of education level preservice teachers need to be taught using the learner-
centered approach not only to help them understand probability but also to help them use the learner-centered
approach in their own teaching
The activities used for Group A which is learner-centered approach group in the form of games promote
content knowledge and cognitive skills competencies such as collaboration and problem solving (Belova amp
Zowada 2020) The activities focus on promoting learning experiences rather than stressing on the
entertainment factor While some things students learn in school seem to them predetermined and bound by
laws in other branches of mathematics probability provides students with opportunity to learn that solutions to
International Journal of Studies in Education and Science (IJSES)
135
several problems depend on assumptions and have degrees of doubt So teaching methods that allow students to
predict and test their predictions should be encouraged for students to develop their intellectual repertoire The
processes used in reasoning about sample space will serve students well in life Several calls on the need to pay
attention to the study of probability show that teachers and mathematics teachers must provide their students
with appropriate teaching strategies to enhance their conceptual understanding In the preparation of preservice
teachers to become mathematically competent citizens teacher preparation programs such as teaching methods
must provide opportunities for preservice teachers to confront misconceptions and reason probabilistically
(Courtney amp Caniglia 2021)
The findings of the present study however run counter to those of Weltman and Whiteside (2010) They
conducted a study on the effectiveness of the traditional and active learning method in business statistics The
study found that active learning had not been effective for all category of students It is not precisely clear what
may have accounted for that result This is because active learning methods have generally been known to be
effective in promoting learning Further research is thus required in this regard
Conclusions
This study compared the effects of the learner-centered and teacher-centered approaches of teaching in
addressing probabilistic misconceptions by measuring preservice teachersrsquo probabilistic reasoning scores The
results show that the learner-centered approach aids preservice teachers to develop better probabilistic reasoning
than the teacher-centered approach to teaching Thus the study concludes that the learner-centered approach to
teaching is a solution to preservice teachersrsquo inability to answer questions on probability correctly Even though
each teaching approach targeted at addressing misconceptions was found to have significant effect on pre-
service teachersrsquo probabilistic reasoning the learner-centered approach was found to be more effective than the
teacher-centered approach in addressing misconceptions which limit studentsrsquo ability to solve probability
problems correctly
Implications and Recommendations
This study makes some key contributions to the teacher educationdevelopment literature in general and
particularly to the development of probabilistic reasoning of preservice teachers The study provides empirical
evidence that the learner-centered approach targeted at addressing probabilistic misconceptions is more effective
in developing probabilistic reasoning in preservice teachers What this means is that when teacher educators use
the learner-centered approach to teach the concept of probability and focus on addressing misconceptions
preservice teachers will develop better probabilistic reasoning This will in turn translate into preservice
teachers answering questions on probability correctly in their examinations and ultimately making them teach
the concept more effectively when they complete their training It is thus recommended that teachers should
consider employing the learner-centered approach in teaching the concept of probability
Hokor amp Sedofia
136
Limitations
As with every empirical study employing the quasi-experimental approach the current study has some
limitations which need to be acknowledged and used to guide users of the findings Firstly our sample was
drawn from a population of second year preservice teachers of a female only college of education in a peri-
urban area in Ghana Further experiments are therefore needed in other settings in order to see if the same or
similar results will occur Secondly owing to the narrow characteristics of the participants in the present study
the researchers cannot generalize the results to other individuals who do not have the same characteristics So
additional experiments with groups with different characteristics are necessary Lastly the experiments need to
be repeated at another time to determine if the results are the same (consistent) over time
Acknowledgements
We are grateful to the Principal and preservice teachers for granting access and participating in the study
respectively
References
AIAhmad H (2021) The role of educational communication in promoting student-centered learning style in
multicultural classrooms A reflective essay on learning and teaching in higher education International
Journal of Research in Education and Science (IJRES) 7(3) 838-851 httpsdoiorg1046328ijes2374
Aina J K Olanipekun S S amp Garuba I A (2015) Teachersrsquo effectiveness and its Influence on studentsrsquo
learning Advances in Social Sciences Research Journal 2(4) 88-95
Anway D W amp Bennett E (2004) Common Misconceptions in Probability among Students in an Elementary
Statistics class Unplished Senior Project The ARTIST Roundtable Conference on Assessment in
Statistics held at Lawrence University Supperior WI The University of Wisconsin-Superior
Bada S (2015) Constructivist Learning Theory A Paradigm for Teaching and Learning IOSR Journal of
Research and Method in Education (IOSR-JRME) 5(6) 66-70 httpsDOI1097907388-05616670
Baerveldt C (2013) Constructivism contested Implications of a genetic perspective in psychology Integrative
Psychological and Behavioral Science 47(1) 156-166
Batanero C (2013) Teaching and learning probability In S Lerman (Ed ) Encyclopedia of Mathematics
Education Heidelberg Springer
Batanero C and Diaz C (2012) Training school teachers to teach probability reflections and challenges
Chilean Journal of Statistics 3(1) 3-13
Belova N amp Zowada C (2020) Innovating Higher Education Via Game-Based Learning on Misconceptions
Education Sciences 10 221 doi103390educSCi10090221
Bennett E amp Anway D W (2003) Statistical and Probabilistic Reasoning and Misconceptions among
Selected College Students McNair Scholars Journal Vol 4 httpwwwsocheclchjs
Cantoy O (2010) Mathematics teachersrsquo topic-specific pedagogical content knowledge in the context of
teaching a0 0 and a divide 0 Educational Sciences Theory and Practice 10 (2) 749-769
International Journal of Studies in Education and Science (IJSES)
137
Clements D H amp Battista M (1990) Constructivist Learning and Teaching The
Arithetic Teacher 38(1) ProQuest Central pg 34 DOI105951AT3810034
Creswell J W amp Creswell J D (2018) Research design Qualitative quantitative and
mixed methods approaches (5th
ed) Los Angeles SAGE Publications Inc
Courtney S A amp Caniglia J (2021) Comparing the mathematical practices pre-service teachers and
mathematics teacher educators identified as relevant to problems and tasks International Journal of
Research in Education and Science (IJRES) 7(3) 954-971 httpsdoiorg1046328ijres2335
Denton D W (2012) Enhancing instruction through constructivism cooperative learning and cloud
computing Tech Trends 56(4) 34-41
Gage J (2012) Towards a new Probability Curriculum for Secondary Schools Paper presented at 12th
International Congress on Mathematical Education 8 July-15 July COEX Seoul Korea Cambridge
Cambridge University Uk
Gurbuz R amp Birgin O (2011) The effect of computer-assisted teaching on remedying misconceptions The
case of the subject Probability Journal Homepage 58(2012) DOI 101016jcompedu201111005
Hirsh L amp ODonnell A M (2001) Representativeness in Statistical Reasoning Identifying and Assessing
Misconceptions Journal of Statistics Education 9(2) 96-105 DOI10108010691898200111910655
Johnson H D amp Dasgupta N (2005) Traditional versus Non-traditional Teaching during Perspectives of
Students in Introductory Statistics Classes Journal of Statistics Education 13(2)
httpsdoiorg10108010691898200511910558
Major T amp Mangope B (2012) The Constructivist Theory in Mathematics The case of Botswana Primary
Schools International Review of Social Sciencies and Humanities 3(2) 139-147
Jones G (2005) Reflections In GA Jones (Ed) Exploring probability in school chanlleges for teaching and
probability (367-372) New York Springer
Jun L (2000) Chinese Students Understanding of Probability Published doctoral dissertation Singapore
National Institute of Education Nanyang Technological University
Khazanov L amp Gourgey A (2009) Instructors Perspectives on Students Mistaken Beliefs about Probability
in an Elementary College Statistics Course In K Safford-Ramus (Ed) Proceedings of the Adults
Learning Mathematics a Resaerch Forum (ALM) 15th
Annual International Conference 249-264
Khazanov L amp Prado L (2010) Correcting Students Misconceptions about Probability in an Introductory
College Statistics Course Adults Learning Mathematics-An International Journal 5(1) 23-35
Kleickmann T Richter D Kunter M Elsner J Besser M Krauss S amp Baumert J (2013) Teachersrsquo
Content Knowledge and Pedagogical Content Knowledge The Role of Structural Differences in Teacher
Education Journal of Teacher Education 64(1) 90-106 DOI1011770022487112460398
Leedy P D and Ormrod J E (2020) Practical research Planning and design (12th Global Edition) Harlow
England Pearson
Lessani A Md Yunus AS amp Bakar KBA (2017) Comparison of new mathematics teaching methods with
teacher-centered approach International Journal of Social Sciences 3(2) 1285-1297
httpsdxdoiorg1020319pijss20173212851297
Lim C amp Hwa T (2007) Promoting Mathematical Thinking in the Malaysian Classroom Issues and
challenges httpswwwresearchgatenetpublication252353381
Hokor amp Sedofia
138
Lovett J N amp Lee H S (2017) New Standards Require Teaching More Statistics Are Preservice Secondary
Mathematics Ready Journal of Teachers Education 68(3) 299-311 DOI 1011770022487117697918
Major T amp Mangope B (2012) The Constructivist Theory in Mathematics The case of Botswana Primary
Schools International Review of Social Sciencies and Humanities 3(2) 139-147
National Council of Teachers of Mathematics (2003) Principles and Standards for School Mathematics and
their Implications for Professional Development Reston VA NCTM
Nguyen L (2015) Developing Conceptual Understanding and Probabilistic Thinking through Tree Diagrams
Published MPhil Dissertation Manitoba The Faculty of Graduate Studies of the University of
Manitoba
Prideaux J (2007) The learner-centered approach to Mathematics Teaching and the Active Learning
Strategies used to Enhance Students Understanding Mathematical and Computing Sciences Masters
Paper 29 Fisher Digital Publications httpfisherpubsjfcedumathcsetdmasters29
Roseth C J Garfield J B amp Ben-Zvi D (2008) Collaboration in Learning and Teaching Statistics Journal
of Statistics Education 16 (1) 1069-1898 httpsdoiorg10108010691898200811889557
Santagata R and Sandholtz J H (2019) Preservice teachersrsquo mathematics teaching competence Comparing
performance on two measures Journal of Teacher Education 70 (5) 472 ndash484
Schwerdt G amp Wuppermann A C (2011) Is traditional teaching really all that bad A within-student
between-subject approach Economics of Education Review 30(2) 365-379
Sharma S (2016) Probability from a socio-cultural perspective Statistics Education Research Journal 15(2)
126-144 httpiase-weborgPublicationsphpp=SERJ
Shay K (2008) Tracing middle school students understanding of probability a longitudinal study
Unpublished Doctoral Dissertation New Brunswick New Jersey Rutgers State University of New
Jersey
Shulman L S (1986) Those who understand Knowledge growth in teaching Educational Researcher 15(2)
4-14 doi 1031021001318X015002004
Thomas L (2020) An introduction to quasi-experimental designs
httpswwwscribbrcommethodologyquasi-experimental-design
Voskoglou M (2019) Comparing Teaching Methods of Mathematics at University Level Education Sciences
9(204) doi103390educsci9030204
Vygotsky L S (1978) Mind in society The development of higher psychological processes Cambridge MA
Harvard University Press
Weldeana H N amp Abraham S T (2014) The effect of an historical perspective on prospective teachersrsquo
beliefs in learning mathematics Journal of Mathematics Teacher Education 17 303-330
doi101007s10857-013-9266-z
Weltman D amp Whiteside M (2010) Comparing the Effectiveness of Traditional and active Learning Methods
in Business Statistics Convergence to the Mean 18(1)
httpsdoiorg10108010691898201011889480
White H amp Sabarwal S (2014) Quasi-experimental design and methods methological briefs impact
evaluations Florence UNICEF Office of research
International Journal of Studies in Education and Science (IJSES)
139
Author Information
Evans Kofi Hokor
httpsorcidorg0000-0002-8387-8294
St Teresarsquos College of Education Hohoe
Department of Mathematics and ICT
P O Box 129
Ghana
Contact e-mail evanskhokorgmailcom
John Sedofia
httpsorcidorg0000-0002-5409-516X
University of Ghana Legon
Department of Teacher Education
PO Box LG 1181
Ghana
Hokor amp Sedofia
140
Appendix A Pre-test Probabilistic Reasoning Assessment
This assessment is for research purpose to improve teaching and learning of probability
You are required to answer all questions honestly Do and leave all workings or rough work on the paper
Pre-test Probabilistic Reasoning Assessment Duration 1hr
Index numberhelliphelliphelliphelliphelliphelliphelliphelliphelliphelliphelliphelliphelliphelliphelliphelliphelliphellipLevelhelliphelliphelliphellipAgehelliphelliphellip
Read each statement carefully and circle the letter of the correct (best) option Provide appropriate response in
the space provided under some items as it apply
1 If you rolled an ordinary die and obtained 51246 which of these is most likely to occur on your next
roll
a 1
b 2
c 3
d 4
e 5
f 6
g The options a b c d e and f are all equally
2i A fair coin is tossed and it lands tail The coin is to be tossed a second time What is the probability that the
second toss will also be a tail
a 1
4
b 1
2
c 1
3
d Slightly less than 1
2
e Slightly more than 1
2
f 0
2ii Which of the following best describes the reason for the correct answer to the preceding question (2i)
a The second toss is less likely to be tail because the first toss was tail
b There are four possible outcomes when you toss a coin twice Getting two tails is only one of them
c The chance of getting heads or tails on any one toss is always 1
2
d There are three possible outcomes when you toss a coin twice Getting two tails is only one of the them
e No chance of being a tail in the second toss
3i A box contains 6 balls 2 are red 2 are black and 2 blue Three balls are picked at random one at a time
Each time a ball is picked the colour is recorded and the ball is put back in the box mixed thoroughly If the
first 2 balls are black what color is the third ball most likely to be
a Red
International Journal of Studies in Education and Science (IJSES)
141
b Black
c Blue
d Red and blue are equally likely than black
e Red black and blue are all equally likely
3ii Which of the following best describes the reason for the correct answer in the preceding question (3i)
a The third ball should not be black because too many black ones have already been picked
b The picks are independent so every color has an equally likely chance of being picked
c Black seems to be lucky
d This color is just as likely as any other color
4 A spinner with ten equally divided sectors in which four parts are white and the rests are red is about to
be spin which color is the spinner more likely to land
a White
b Red
c Both white and red are all equally
5 If you toss a fair coin and get heads two times in a row which of these is most likely on next toss
a Tail
b Head
c Both head and tail are all equally
6 A Gh 2 Gh 5 Ghcent10 Gh 20 Gh 50 and Gh 100 notes were put in a box and thoroughly mixed
What is the probability of picking Gh 50 note without looking
a 1
187
b 50
187
c 1
6
d 0
7 In a game you have been offered two options Which of the following give you higher chance of
winning GHcent200
a Tossing one die once and obtaining a 6
b Tossing two dice once and obtaining two 6rsquos
c The options a and b are all equally
8 A fair die is to be toss six times which of these is most likely to occur
a 251634
b 123456
c 666341
d 132244
e The options a b c and d are all equally likely
9 A fair coin is to be toss four times in a row which of these is least likely to occur
a THTH
b TTTH
c HHH
Hokor amp Sedofia
142
d The options a b and c are all equally likely
10 Two fair dice are to be tossed once Which of the following is more likely to occur
a Obtaining a sum of 11
b Obtaining a sum of 10
c A sum of 11 and a sum of 10 are all equally likely
10i Give reason for the correct answer in the preceding question (10)
helliphelliphelliphelliphelliphelliphelliphelliphelliphelliphelliphelliphelliphelliphelliphelliphelliphelliphelliphelliphelliphelliphelliphelliphelliphelliphelliphelliphelliphelliphelliphelliphelliphelliphelliphelliphelliphelliphelliphelliphelliphellip
helliphelliphelliphelliphelliphelliphelliphelliphelliphelliphelliphelliphelliphelliphelliphelliphelliphelliphelliphelliphelliphelliphelliphelliphelliphelliphelliphelliphelliphelliphelliphelliphelliphelliphelliphelliphelliphelliphelliphelliphelliphellip
helliphelliphelliphelliphelliphelliphelliphelliphelliphelliphelliphelliphelliphelliphelliphelliphelliphelliphelliphelliphelliphelliphelliphelliphelliphelliphelliphelliphelliphelliphelliphelliphelliphelliphelliphelliphelliphelliphelliphelliphelliphellip
helliphelliphelliphelliphelliphelliphelliphelliphelliphelliphelliphelliphelliphelliphelliphelliphelliphelliphelliphelliphelliphelliphelliphelliphelliphelliphelliphelliphelliphelliphelliphelliphelliphelliphelliphelliphelliphellip
11 In national lottery one has to choose five numbers from 1 to 90 inclusive You win when at least two of
your numbers are part of the numbers drawn on Saturday at random Eric has chosen 4 6 7 9 and 11
Alex has chosen 15 23 45 66 and 80 Daniel has chosen 71 77 78 83 and 85 Do Eric Alex and
Daniel have the same chance of winning or not and why
helliphelliphelliphelliphelliphelliphelliphelliphelliphelliphelliphelliphelliphelliphelliphelliphelliphelliphelliphelliphelliphelliphelliphelliphelliphelliphelliphelliphelliphelliphelliphelliphelliphelliphelliphelliphelliphelliphelliphelliphellip
helliphelliphelliphelliphelliphelliphelliphelliphelliphelliphelliphelliphelliphelliphelliphelliphelliphelliphelliphelliphelliphelliphelliphelliphelliphelliphelliphelliphelliphelliphelliphelliphelliphelliphelliphelliphelliphelliphelliphelliphellip
helliphelliphelliphelliphelliphelliphelliphelliphelliphelliphelliphelliphelliphelliphelliphelliphelliphelliphelliphelliphelliphelliphelliphelliphelliphelliphelliphelliphelliphelliphelliphelliphelliphelliphelliphelliphelliphelliphelliphelliphellip
helliphelliphelliphelliphelliphelliphelliphelliphelliphelliphelliphelliphelliphelliphelliphelliphelliphelliphelliphelliphelliphelliphelliphelliphelliphelliphelliphelliphelliphelliphelliphelliphelliphelliphelliphellip
12 A box contains 8 yellow balls and 4 green balls Two balls are chosen at random one after the other
without replacement determine the probability that the two balls are of different colours
helliphelliphelliphelliphelliphelliphelliphelliphelliphelliphelliphelliphelliphelliphelliphelliphelliphelliphelliphelliphelliphelliphelliphelliphelliphelliphelliphelliphelliphelliphelliphelliphelliphelliphelliphelliphelliphelliphelliphelliphellip
helliphelliphelliphelliphelliphelliphelliphelliphelliphelliphelliphelliphelliphelliphelliphelliphelliphelliphelliphelliphelliphelliphelliphelliphelliphelliphelliphelliphelliphelliphelliphelliphelliphelliphelliphelliphelliphelliphelliphelliphellip
helliphelliphelliphelliphelliphelliphelliphelliphelliphelliphelliphelliphelliphelliphelliphelliphelliphelliphelliphelliphelliphelliphelliphelliphelliphelliphelliphelliphelliphelliphelliphelliphelliphelliphelliphelliphelliphelliphelliphelliphellip
helliphelliphelliphelliphelliphelliphelliphelliphelliphelliphelliphelliphelliphelliphelliphelliphelliphelliphelliphelliphelliphelliphelliphelliphelliphelliphelliphelliphelliphelliphelliphelliphelliphelliphelliphelliphellip
International Journal of Studies in Education and Science (IJSES)
143
Appendix B Post-test Probabilistic Reasoning Assessment
This assessment is for research purpose to improve teaching and learning of probability
You are required to answer all questions honestly Do and leave all workings or rough work on the paper
Post-test Probabilistic Reasoning Assessment Duration One Hour
Index numberhelliphelliphelliphelliphelliphelliphelliphelliphelliphelliphelliphelliphelliphelliphellipClasshelliphelliphelliphellipAgehelliphelliphelliphellip
Read each statement carefully and circle the letter of the correct (best) option for each item as much as possible
and provide appropriate response in the space provided
1 Suppose a particular outcome from a random event has a probability of 04 Which of the following
statements represents correct interpretations of this probability
a The outcome will not happen
b The outcome will certainly happen about four times out of every 10 trials
c The outcome is expected to happen about four times out of every 10 trials
d The outcome could happen or it couldnrsquot of either result are the same
2 If you toss a fair coin and get heads 3 times in a row what is the chance of getting a head on the next toss
a 1
b Greater than 1
2
c 1
2
d Less than 1
2
e 0
3 A die is numbered 1 2 3 4 4 5 When the die is thrown once Which of these is most likely and why
a 1
b 2
c 3
d 4
e 5
f They are all equally likely
3i Give reason for your chosen answer in (3)
helliphelliphelliphelliphelliphelliphelliphelliphelliphelliphelliphelliphelliphelliphelliphelliphelliphelliphelliphelliphelliphelliphelliphelliphelliphelliphelliphelliphelliphelliphelliphelliphelliphelliphelliphelliphelliphelliphelliphelliphelliphelliphelliphelliphellip
helliphelliphelliphelliphelliphelliphelliphelliphelliphelliphelliphelliphelliphelliphelliphelliphelliphelliphelliphelliphelliphelliphelliphelliphelliphelliphelliphelliphelliphelliphelliphelliphelliphelliphelliphelliphelliphelliphelliphelliphelliphelliphelliphelliphellip
helliphelliphelliphelliphelliphelliphelliphelliphelliphelliphelliphelliphelliphelliphelliphelliphelliphelliphelliphelliphelliphelliphelliphelliphelliphelliphelliphelliphelliphelliphelliphelliphelliphelliphelliphelliphelliphelliphelliphelliphelliphelliphelliphelliphellip
helliphelliphelliphelliphelliphelliphelliphelliphelliphelliphelliphelliphelliphelliphelliphelliphelliphelliphelliphelliphelliphelliphelliphelliphelliphelliphelliphelliphelliphelliphelliphelliphelliphelliphelliphelliphelliphelliphellip
4 German MP tossed two dice once Which of these is mostly likely and why
a Obtaining a sum of 4
b Obtaining a sum of 7
c Obtaining a sum of 11
d All of them have equal chance of occurring that is a b c
Hokor amp Sedofia
144
4i Give reason for your chosen answer in (4)
helliphelliphelliphelliphelliphelliphelliphelliphelliphelliphelliphelliphelliphelliphelliphelliphelliphelliphelliphelliphelliphelliphelliphelliphelliphelliphelliphelliphelliphelliphelliphelliphelliphelliphelliphelliphelliphelliphelliphelliphelliphelliphelliphelliphellip
helliphelliphelliphelliphelliphelliphelliphelliphelliphelliphelliphelliphelliphelliphelliphelliphelliphelliphelliphelliphelliphelliphelliphelliphelliphelliphelliphelliphelliphelliphelliphelliphelliphelliphelliphelliphelliphelliphelliphelliphelliphelliphelliphelliphellip
helliphelliphelliphelliphelliphelliphelliphelliphelliphelliphelliphelliphelliphelliphelliphelliphelliphelliphelliphelliphelliphelliphelliphelliphelliphelliphelliphelliphelliphelliphelliphelliphelliphelliphelliphelliphelliphelliphelliphelliphelliphelliphelliphelliphellip
helliphelliphelliphelliphelliphelliphelliphelliphelliphelliphelliphelliphelliphelliphelliphelliphelliphelliphelliphelliphelliphelliphelliphelliphelliphelliphelliphelliphelliphelliphelliphelliphelliphelliphelliphelliphelliphelliphelliphelliphelliphelliphelliphelliphellip
helliphelliphelliphelliphelliphelliphelliphelliphelliphelliphelliphelliphelliphelliphelliphelliphelliphelliphelliphelliphelliphelliphelliphelliphelliphelliphelliphelliphellip
5i A fair coin is to be toss four times which of these is most likely to occur
a HTHT
b THTT
c TTTT
d HHTH
e The options a b c and d are all equally likely
5ii Give reason for your chosen answer in (5i)
helliphelliphelliphelliphelliphelliphelliphelliphelliphelliphelliphelliphelliphelliphelliphelliphelliphelliphelliphelliphelliphelliphelliphelliphelliphelliphelliphelliphelliphelliphelliphelliphelliphelliphelliphelliphelliphelliphelliphelliphelliphelliphelliphelliphellip
helliphelliphelliphelliphelliphelliphelliphelliphelliphelliphelliphelliphelliphelliphelliphelliphelliphelliphelliphelliphelliphelliphelliphelliphelliphelliphelliphelliphelliphelliphelliphelliphelliphelliphelliphelliphelliphelliphelliphelliphelliphelliphelliphelliphellip
helliphelliphelliphelliphelliphelliphelliphelliphelliphelliphelliphelliphelliphelliphelliphelliphelliphelliphelliphelliphelliphelliphelliphelliphelliphelliphelliphelliphelliphelliphelliphelliphelliphelliphelliphelliphelliphelliphelliphelliphelliphelliphelliphelliphellip
helliphelliphelliphelliphelliphelliphelliphelliphelliphelliphelliphelliphelliphelliphelliphelliphelliphelliphelliphelliphelliphelliphelliphelliphelliphelliphelliphelliphelliphelliphelliphelliphelliphelliphelliphelliphelliphelliphellip
6i A fair coin is to be toss four times which of these is least likely to occur
a HTHT
b THTT
c TTTT
d HHTH
e The options a b c and d are all equally likely
6ii Give reason for your chosen answer in (6i)
helliphelliphelliphelliphelliphelliphelliphelliphelliphelliphelliphelliphelliphelliphelliphelliphelliphelliphelliphelliphelliphelliphelliphelliphelliphelliphelliphelliphelliphelliphelliphelliphelliphelliphelliphelliphelliphelliphelliphelliphelliphelliphelliphelliphellip
helliphelliphelliphelliphelliphelliphelliphelliphelliphelliphelliphelliphelliphelliphelliphelliphelliphelliphelliphelliphelliphelliphelliphelliphelliphelliphelliphelliphelliphelliphelliphelliphelliphelliphelliphelliphelliphelliphelliphelliphelliphelliphelliphelliphellip
helliphelliphelliphelliphelliphelliphelliphelliphelliphelliphelliphelliphelliphelliphelliphelliphelliphelliphelliphelliphelliphelliphelliphelliphelliphelliphelliphelliphelliphelliphelliphelliphelliphelliphelliphelliphelliphelliphelliphelliphelliphelliphelliphelliphellip
helliphelliphelliphellip
7 A college has 300 level 200 students and 236 level 100 students in it Each studentrsquos name is written with
the level on a piece of paper and all the names are put into a box and mixed thoroughly A tutor picks one
name out of the box without looking Which level is the tutor more likely to pick from and why
helliphelliphelliphelliphelliphelliphelliphelliphelliphelliphelliphelliphelliphelliphelliphelliphelliphelliphelliphelliphelliphelliphelliphelliphelliphelliphelliphelliphelliphelliphelliphelliphelliphelliphelliphelliphelliphelliphelliphelliphelliphelliphelliphelliphellip
helliphelliphelliphelliphelliphelliphelliphelliphelliphelliphelliphelliphelliphelliphelliphelliphelliphelliphelliphelliphelliphelliphelliphelliphelliphelliphelliphelliphelliphelliphelliphelliphelliphelliphelliphelliphelliphelliphelliphelliphelliphelliphelliphelliphellip
helliphelliphelliphelliphelliphelliphelliphelliphelliphelliphelliphelliphelliphelliphelliphelliphelliphelliphelliphelliphelliphelliphelliphelliphelliphelliphelliphelliphelliphelliphelliphelliphelliphelliphelliphelliphelliphelliphelliphelliphelliphelliphelliphelliphellip
helliphelliphelliphelliphelliphelliphelliphelliphelliphelliphelliphelliphelliphelliphelliphelliphelliphelliphelliphelliphelliphelliphelliphelliphelliphelliphelliphelliphelliphelliphelliphelliphelliphelliphelliphelliphelliphelliphelliphellip
8 Suppose that you toss a coin three times and all eight outcomes are equally likely If it is known that the first
toss comes up heads what is the probability of an odd number of heads appearing
helliphelliphelliphelliphelliphelliphelliphelliphelliphelliphelliphelliphelliphelliphelliphelliphelliphelliphelliphelliphelliphelliphelliphelliphelliphelliphelliphelliphelliphelliphelliphelliphelliphelliphelliphelliphelliphelliphelliphelliphelliphelliphelliphelliphellip
helliphelliphelliphelliphelliphelliphelliphelliphelliphelliphelliphelliphelliphelliphelliphelliphelliphelliphelliphelliphelliphelliphelliphelliphelliphelliphelliphelliphelliphelliphelliphelliphelliphelliphelliphelliphelliphelliphelliphelliphelliphelliphelliphelliphellip
helliphelliphelliphelliphelliphelliphelliphelliphelliphelliphelliphelliphelliphelliphelliphelliphelliphelliphelliphelliphelliphelliphelliphelliphelliphelliphelliphelliphelliphelliphelliphelliphelliphelliphelliphelliphelliphelliphelliphelliphelliphelliphelliphelliphellip
International Journal of Studies in Education and Science (IJSES)
145
helliphelliphelliphelliphelliphelliphelliphelliphelliphelliphelliphelliphelliphelliphelliphelliphelliphelliphelliphelliphelliphelliphelliphelliphelliphelliphelliphelliphelliphelliphelliphelliphelliphelliphelliphelliphelliphelliphelliphelliphelliphelliphelliphelliphellip
helliphelliphelliphelliphelliphelliphelliphelliphelliphelliphelliphelliphelliphelliphelliphelliphelliphelliphelliphelliphelliphelliphelliphelliphelliphelliphelliphelliphelliphelliphelliphelliphelliphelliphelliphelliphelliphelliphelliphelliphelliphelliphelliphelliphellip
helliphelliphelliphelliphelliphelliphelliphelliphelliphelliphelliphelliphelliphelliphelliphelliphelliphelliphelliphellip
9 A card is selected at random from a pack of 52 cards Find the probability of selecting a card which is a red or
a queen
helliphelliphelliphelliphelliphelliphelliphelliphelliphelliphelliphelliphelliphelliphelliphelliphelliphelliphelliphelliphelliphelliphelliphelliphelliphelliphelliphelliphelliphelliphelliphelliphelliphelliphelliphelliphelliphelliphelliphelliphelliphelliphelliphelliphellip
helliphelliphelliphelliphelliphelliphelliphelliphelliphelliphelliphelliphelliphelliphelliphelliphelliphelliphelliphelliphelliphelliphelliphelliphelliphelliphelliphelliphelliphelliphelliphelliphelliphelliphelliphelliphelliphelliphelliphelliphelliphelliphelliphelliphellip
helliphelliphelliphelliphelliphelliphelliphelliphelliphelliphelliphelliphelliphelliphelliphelliphelliphelliphelliphelliphelliphelliphelliphelliphelliphelliphelliphelliphelliphelliphelliphelliphelliphelliphelliphelliphelliphelliphelliphelliphelliphelliphelliphelliphellip
helliphelliphelliphelliphelliphelliphelliphelliphelliphelliphelliphelliphelliphelliphelliphelliphelliphelliphelliphelliphelliphelliphelliphelliphelliphelliphelliphelliphelliphelliphelliphelliphelliphelliphelliphelliphelliphelliphelliphellip
10 A box contains 6 white balls and 4 green balls Two balls are chosen at random one after the other without
replacement determine the probability that the second ball is white
helliphelliphelliphelliphelliphelliphelliphelliphelliphelliphelliphelliphelliphelliphelliphelliphelliphelliphelliphelliphelliphelliphelliphelliphelliphelliphelliphelliphelliphelliphelliphelliphelliphelliphelliphelliphelliphelliphelliphelliphelliphelliphelliphelliphellip
helliphelliphelliphelliphelliphelliphelliphelliphelliphelliphelliphelliphelliphelliphelliphelliphelliphelliphelliphelliphelliphelliphelliphelliphelliphelliphelliphelliphelliphelliphelliphelliphelliphelliphelliphelliphelliphelliphelliphelliphelliphelliphelliphelliphellip
helliphelliphelliphelliphelliphelliphelliphelliphelliphelliphelliphelliphelliphelliphelliphelliphelliphelliphelliphelliphelliphelliphelliphelliphelliphelliphelliphelliphelliphelliphelliphelliphelliphelliphelliphelliphelliphelliphelliphelliphelliphelliphelliphelliphellip
helliphelliphelliphelliphelliphelliphelliphelliphelliphelliphelliphelliphelliphelliphelliphelliphelliphelliphelliphelliphelliphelliphelliphelliphelliphelliphelliphelliphelliphelliphelliphelliphelliphelliphelliphelliphelliphelliphelliphelliphelliphelliphellip

International Journal of Studies in Education and Science (IJSES)
125
motivates students to learn and gives teachers the opportunity to assess how the activity is helping the students
to develop an understanding of concepts Furthermore a study was conducted by Major and Mangope (2012) on
constructivist theory in Mathematics in Botswana primary schools The study focused on the extent to which
teachers in Botswana primary schools use the learner-centered approach in teaching and learning of
Mathematics A total of 83 mathematics lessons were videotaped and analyzed The results revealed that most of
the lessons required students to recall rules or formulae However small percentages of the lessons required
students to explore or investigate mathematical ideas
Students are at the center of the learning process in the constructivist class through doing experience action
and peer collaboration National Council of Teachers of Mathematics 2000 (cited in Prideaux 2007) contended
that when teaching is student the learners value mathematics and engage actively in learning the discipline In
solving problems under the constructivist strategy learners are motivated to try various means possible hence
they invent the means of solving the problem themselves In constructivism problems are carefully constructed
to challenge students to reason about the concepts Additionally the interest of the learners increases because
they see the need to study mathematics Mathematics is full of problem-solving So employing a problem-
solving strategytechnique to teach mathematics helps learners to have a better understanding of mathematical
concepts
Materials and Methods
Design
This study used the nonequivalent (pre-test and post-test) control-group design of quasi-experimental research
In this design a dependent variable is measured in one group of subjects before and after a treatment and that
same dependent variable is measured at pre-test and post-test in another nonequivalent control group which does
not receive any treatment The two groups are selected without random assignment and both groups take a
pretest and posttest But only the experimental group receives the treatment (Creswell amp Creswell 2018) This
design makes it possible for researchers to compare scores before and after a treatment in a group that receives
the treatment and also in a nonequivalent control group that does not receive the treatment The nature of the
research problem and the objectives to be achieved warranted quasi-experimental design Importantly in an
environment such as a college of education randomness was impractical (Leedy amp Ormrod 2020) and despite
the argument that quasi-experimental research has low internal validity compared to true experiments quasi-
experimental research has a higher external validity because it helps researchers to do interventions in the real-
world instead of artificial laboratory settings (Thomas 2020)
Population
There are seven public Colleges of Education in the Volta Region of Ghana Six out of the seven colleges are
mixed-sex colleges and one is female-only The single-sex college was purposively chosen to ascertain how
these students develop their probabilistic reasoning from the two different teaching methods discussed above
The population was all second-year preservice teachers of that college since at the time of the study the final
Hokor amp Sedofia
126
years were out for their teaching practice and the first year students had not taken the statistics and probability
course This institution was selected for one main reason they all studied Statistics and Probability and were
thus expected to teach it at the Junior High School level upon completion of their training
Sample and Sampling Procedure
Purposive sampling technique was used to select two intact classes out of six classes identified as Group A and
Group B respectively These groups are similar in terms of their performance in their second-year first-semester
mid-semester quiz scores in mathematics with mean scores of 139 and 137 respectively ldquoQuasi-experimental
designs identify a comparison group that is as similar as possible to the experimental group in terms of pre-
intervention characteristicsrdquo (White amp Sabarwal 2014 p 1) Also it helped to avoid selection bias which is a
concern in quasi-experimental studies
These two intact classes comprised 27 preservice teachers in Group B and 32 in Group A In purposive
sampling certain elements of the population are deliberately selected on the judgment of the researchers and
nothing is left to chance In this study respondents were chosen from a population of regular preservice teachers
who had studied probability previously and were taking statistics and probability as a course in a college of
education The reason for choosing both groups from the same population is that both Group A and Group B
used the same textbooks and course materials Also both groups were chosen from the same population to avoid
bias because all the colleges use different textbooks and the conditions under which students studied are
different from college to college
Achievement Tests (Pre-test and Post-Test)
The test items were administered in two phases in the classrooms These are pre-test and the post-test Items 2i
2ii 3i and 3ii of the pretest were adapted from (Anway amp Bennett 2004 Hirsh amp ODonnell 2001) Two
examiners of statistics and probability were consulted to ensure the questions are at the level of the participants
This is to ensure the validity of the test items The pre-test and the post-test were similar to measure whether
there is a change or not The items were developed to measure the probabilistic reasoning of preservice teachers
The items sought to ascertain preservice teachersrsquo ability in reasoning about uncertainties and the use of
probability daily
The achievement test assessed the following areas correctly applying probability in decision making
equiprobability bias correctly interpreting without replacement situations correctly listing the sample space and
determining the probability representativeness bias and interpreting probability statements correctly and
applying appropriate strategies There were 12 items for the pre-test and 10 items for the post-test We have
more items on the pre-test because the post-test was more open-ended than the pre-test Nevertheless the total
scores in each case was 20 Some of the test items consisted of two parts the principal question (multiple
choice) and a justification of the answer The pre-test and post-test can be seen in appendices A and B
respectively
International Journal of Studies in Education and Science (IJSES)
127
Evaluation of Materials by Experts
The researchers solicited two expertsrsquo views on the test items content coverage content relevance and course
materials It was the view of the experts that the test items of both the pre-test and the post-test were in line with
the mathematics syllabus of colleges of education in Ghana The activities designed for the Group A were also
assessed In the view of the experts the teaching activities had sufficient content coverage and would help pre-
service teachers develop better probabilistic reasoning They acknowledged the idea of having activities that
reflect real life situations to support pre-service teachers since they were aware students have difficulty with
probability related problems The experts further acknowledged that the objectives were measurable and
activities were practical to promote pre-service teachersrsquo involvement in the lessons They said the teaching and
learning materials reflected the learner-centered approach and were in line with the syllabus requirements for
Mathematics in colleges of education in Ghana They believed the activities would promote better probabilistic
reasoning since they reflected real life situations
Data Collection Procedure
Preservice teachers were informed one week ahead of the administration of the pre-test The format of the test
items and the purpose of the study were communicated to the respondents The tests were administered by the
researchers at an Examination Hall to ensure the respondents did independent work
Treatment
The learner-centered approach was applied to group A while the teacher-centered approach of instruction was
applied to group B In each approach the lessons were focused on addressing equiprobability bias
representativeness belief bias positive recency and negative recency effects since some studies suggest that
teaching approaches that target probabilistic misconceptions will help improve studentsrsquo performance
significantly (Khazanov amp Prado 2010 Shay 2008) The implementation of both teaching approaches were
done by the lead researcher
Group A The Learner-centered approach
The teaching and learning took place in traditional classroom settings generally consisting of activities
discussions and questions and answers concurrently once per week for two hours for a month In group A the
activities were designed focusing on probabilistic misconceptions using the learner-centered approach to
teaching to better their probabilistic reasoning Examples of the activities are given below
Card Game This game was played in groups Identical cards were numbered 3 3 4 4 5 5 5 6 6 7 8 and 9
and put in a container and thoroughly mixed Three students will reach in and without looking draw out a card
each at time If the three people pick different numbers then the group wins GH30000 else they lose Is the
chance of winning or losing the same and why The purpose of this activity is to enhance preservice teachersrsquo
Hokor amp Sedofia
128
decision-making ability by addressing equiprobability bias representativeness bias belief and positive and
negative recency effects The aim of predicting before picking was to keep students focused and to confront any
prior misconceptions The game was played 15 times If all the three members of the group pick different colors
then a point of one is recorded else zero After the activity a discussion was organized around their prediction
and the results to challenge their thinking
Pair Game In pairs preservice teachers were asked to toss a coin six times each recording the sequence of tails
and heads The purpose of this activity is to address representativeness bias Before the toss students were asked
to predict the number of tails and heads Their predictions were written in their notebook before the toss Most
preservice teachers predicted equal number of tails and heads Preservice teachers then compare their predicted
sequences to their results after the toss It was noted in many instances that those who predicted equal number of
tails and heads did not obtain results that were consistent with their prediction Discussions were organized
around their predicted sequences and the results obtained after the toss for better probabilistic reasoning
Coin Game Students perform this experiment ten times by tossing a number of fair coins once and record the
outcomes in each case In the first toss a coin was tossed once and the outcome recorded in the second toss
two coins were tossed once and outcomes recorded in third toss three coins were tossed once and outcomes
recorded and so on H stands for heads and T stands for tails The following are a sample of sequence of
outcomes by one student
1st toss H
2nd
toss HT
3rd
toss HTH
4th
toss HTTT
5th
toss THHTT
6th
toss HTHTTT
7th
toss TTHTHHT
8th
toss THTHTHHH
9th
toss HTTTHTHTT
10th
toss THTHTHTHTT
119873119906119898119887119890119903 119900119891 ℎ119890119886119889119904
119873119906119898119887119890119903 119900119891 119905119900119904119904119890119904=
1
1= 1
1
2= 05
2
3= 0667
1
4= 025
2
5= 04
2
6= 0333
3
7= 0429
5
8
= 0625 3
9= 0333
4
10= 04
The average of the probabilities of obtaining a head for each experiment is
=105066702504033304290625033304
10=
4937
10cong 05
International Journal of Studies in Education and Science (IJSES)
129
It must be noted that in experimental or frequentist probability we are concerned about conducting the
experiment many times and considering its approximation or convergence Students were led to conclude that in
general we can say when a fair coin is tossed the probability of getting a head at any time is 1
2 and vice versa
Group B The Teacher-centered approach
Group B was taught using the teacher-centered approach In this case the teacher rather than the learner was at
the center of the teaching and learning process The tutor presented the preservice teachers with facts or
procedures that had been established to solve problems Preservice teachers were given problems that require
the use of these facts or procedures to solve as either assignment exercise test or quiz It is believed that
preservice teachers learned more when they solved similar problems many times When examination questions
that demanded facts were set students could solve the problems without really understanding the concepts
Formulae were presented to students to learn to apply to similar problems Concepts were clearly explained
bearing in mind the probabilistic misconceptions Samples of lessons experienced by Group B are as follow
Lesson one Through questions and answers teacher revises preservice teachersrsquo previous knowledge on playing
of games and probabilistic situations Based on studentsrsquo responses the teacher introduces the lesson
Teacher explains to preservice teachers the concept of probability and three ways we can make probability
statements as classical frequentist and subjective Classical probability is the number of favorable outcomes (E)
divided by the total number of possible outcomes (S) It works on the assumptions that all outcomes are equally
likely Equally likely means that each outcome has the same probability of occurring
Mathematically P(E) =
Students were then led to solve problems using the formula
Experimental probability is a method of calculating probability where the probability is the ratio of the number
of the trials where the desired event occurs to the number of total trials Subjective probability is a statement that
an individual makes based on personal judgment to describe the likelihood of an event Or a personal belief
based on onersquos own experience or expertise The person making the statement should be an expert in the area or
someone who have a sound knowledge on the issue under consideration before it can be considered important
For the statement to be reliable it should be based on a sound premise(s) Nevertheless both experts and non-
experts make use of subjective probability daily For example I have a 90 chance of passing my statistics and
probability exam
Lesson two Teacher explains basic terms of probability such as sample space sample point an event equally
likely to preservice teachers Teacher guides preservice teachers through demonstration to solve probability
problems using classical definition of probability by listing the sample space and finding the probability of an
event Teacher leads preservice teachers to solve probability problems from frequency tables Similarly teacher
explains to preservice teachers independent and dependent events Teacher asks the preservice teachers to solve
problems on independent and dependent events
Hokor amp Sedofia
130
Data Analysis
The data collected were coded and edited before being transferred to computer for analysis using SPSS version
24 A Levenersquos test was used in the study to ensure that the assumptions between each group was not violated
Homogeneity of variances was considered to ensure that each grouprsquos pre-test scores were mostly equal Paired
samples T-test was used to compare two means within each group to determine whether or not the differences in
means were statistically significant Independent sample T-test was used to compare the probabilistic reasoning
mean scores in Group A and the Group B before the experiment at a time to determine whether the two groups
were at the same level or not The independent t-test was used because there were two different groups of
participants It works on the assumption that scores are unique because they come from different participants
Also the equality of variance for running ANCOVA at 5 significance level was checked using Levenersquos test
Table 2 Levenes Test of Equality of Variances
F df1 df2 Sig
1234 1 57 0456
The results from Table 2 indicate that the variances are roughly equal since the significance value of 0456 is
greater than the cut-off value of 005 Therefore we can conclude that homogeneity of variance assumption was
met (Field 2005) This allowed us to examine the relationship between the covariate (pre-test scores) and
dependent variable (post-test scores) Analysis of covariance (ANCOVA) was used to examine the effect of
learner-centered approach to teaching and teacher-centered approach on preservice teachersrsquo probabilistic
reasoning since different participants were in each group The ANCOVA is ideal in removing the bias of these
variables (Field 2005) In order to determine whether or not the occurrence of scores was not by chance a
partial eta squared was used to gauge the magnitude of the difference (effect size) between means of the scores
Pallant (2001) outlined the following criterion for interpreting partial eta squared values as 001 = small effect
006 = moderate effect and 014 = large effect
Results
Before introducing the learner-centered and teacher-centered approaches of teaching preservice teachersrsquo
probabilistic reasoning was compared to ascertain whether or not their results were similar in terms of the mean
scores The result is presented in Table 3
Table 3 Results of the Independent Samples t-test on the Pre-test of the Group B and Group A
Group N Mean Std Dev Mean Difference Df t-value p-value
Group B 27 585 1562 35 56 756 456
Group A 32 550 1967
The results in Table 3 indicate that there was no statistically significant difference between the probabilistic
reasoning mean scores of Group A = 550 = 1967 and Group B = 585 = 1562 in the
International Journal of Studies in Education and Science (IJSES)
131
pretest This is an indication that the two groups are similar and their performance could be compared after the
two teaching approaches
Comparison of Probabilistic Reasoning of the Preservice Teachers before and after Learner-centered
Approach in Group A
The results of analysis of the effect of the learner-centered approach on preservice teachersrsquo probabilistic
reasoning is presented in Table 4
Table 4 Pre-test and Post-test Scores for Group A
Minimum Maximum Mean Std Deviation
Pre-test 1 10 550 1967
Post-test 8 20 1572 3630
Table 4 reveals that in the post-test preservice teachersrsquo probabilistic reasoning mean scores increased from
550 to 1572 in the post-test in Group A
A paired sample t‐test was conducted to compare the post-test and pre-test scores for the preservice teachers
taught with the learner-centered approach to teaching (Group A) in order to determine if the mean difference in
scores was statistically significant This was done to evaluate the effect of the learner-centered approach on
preservice teachersrsquo probabilistic reasoning Table 5 presents the results
Table 5 Paired Sample t-test Results on the Post-test and Pre-test of Group A
Mean
Difference
Std
Deviation
Std Error
Mean
t Df Sig
Post-test ndash Pre-test 10219 2871 507 20137 31 000
The results from Table 5 shows a statistically significant difference in the preservice teachersrsquo probabilistic
reasoning from the pre-test (M = 550 SD = 1967) to the post-test (M = 1572 SD = 3630) with t (31) =
20137 p = 000 The result reveals that preservice teachersrsquo probabilistic reasoning has improved significantly
after the learner-centered approach was used since = 000 05 It can be inferred that the learner-centered
approach to teaching has a positive significant effect on preservice teachersrsquo probabilistic reasoning
Analysis of Probabilistic Reasoning of the Preservice Teachers before and after Teacher-centered
Approach to Teaching
The results of the analysis of the effect of the teacher-centered approach to teaching on preservice teachersrsquo
probabilistic reasoning is presented in Table 6
Hokor amp Sedofia
132
Table 6 Pre-test and Post-test Scores for the Group B
Minimum Maximum Mean Std Deviation
Pre-test 2 8 585 1562
Post-test 5 14 952 2208
The data on Table 6 show that the mean score of preservice teachers in the pre-test was 585 while that of the
post-test was 952 marks This indicates that in the post-test an average of each of the preservice teachersrsquo
probabilistic reasoning increased slightly in Group B To determine if the mean difference is statistically
significant a paired sample t‐test was conducted Table 7 presents the results
Table 7 Results of the Paired Samples t-test on the Post-test and Pre-test of the Group B
Mean
Difference
Std Deviation Std Error
Mean
t Df Sig
Post-test ndash Pre-test 3667 1441 0277 13220 26 000
The result presented on Table 7 shows that the mean score difference between the post-test and pre-test of
Group B was 3667 marks with a corresponding standard deviation of 1441 The paired sample t-test was
conducted to find out if the mean score difference (M = 3667 SD = 1441) was statistically significant This
was done to assess the effect of the teacher-centered approach targeted at addressing misconceptions on
preservice teachersrsquo probabilistic reasoning The results from Table 7 reveal that there was a statistically
significant difference in the preservice teachersrsquo probabilistic reasoning scores from the pre-test (M = 585 SD =
1562) to the post-test (M = 952 SD = 2208) with t (26) = 13220 p = 000 lt 05 This is an indication that the
teacher-centered approach to teaching probability targeted at addressing probabilistic misconceptions aids
students to improve upon their understanding and problem-solving abilities in probability
Next we compared the effectiveness of the learner-centered approach of teaching and the teacher-centered
approach of teaching in terms of probabilistic reasoning of preservice teachers and how they addressed
probabilistic misconceptions
Comparison of Effectiveness of Learner-centered Approach and Teacher-centered Approach in
Developing Probabilistic Reasoning
The preservice teachersrsquo scores on the pre-test of the achievement test were used as covariate in this analysis
The scores from the post-test were then compared using ANCOVA with = 05 to adjust for pre-test
differences that existed between Group A and Group B In the pre-test the mean scores of Group B and Group A
were 585 and 550 respectively ANCOVA was used to adjust the post-test scores statistically to compensate
for the 035 mean point difference between the two groups in the pre-test This adjustment led to a more
accurate post-test comparison Table 8 presents the results
International Journal of Studies in Education and Science (IJSES)
133
Table 8 Summary of ANCOVA of the Performance of Preservice Teachers taught with Learner-centered
Approach and Teacher-centered Approach (N = 59)
Source Sum of
Squares
Df
Mean
Square
F Sig Partial Eta
Squared
Corrected
Model
791144a 2 395562 72150 000 720
Intercept 205135 1 205135 37416 000 401
Pre-test 228184 1 228184 41620 000 426
Group 630253 1 630253 114955 000 672
Error 307026 56 5483
Total 10888000 59
Corrected Total 1098169 58
a R Squared = 720 (Adjusted R Squared = 710)
The data on Table 8 indicate that there is a statistically significant main effect on the preservice teachers who
were taught using the learner-centered approach to learn probability [F (1 56) = 114955 p = 000 lt 05]
Consequently the preservice teachers taught with the learner-centered approach performed better than their
counterparts who experienced the teacher-centered approach to learn probability The partial eta squared value
was found to be 0672 This value indicates a large effect size That is 672 of the variance in the dependent
variable (probabilistic reasoning achievement score) is expounded by the independent variable (teacher-centered
approach) This implies that the magnitude of the difference between the mean score of the preservice teachers
taught with the learner-centered approach and the teacher-centered approach is large With the high scores of
preservice teachers in the Group A it implies that the use of learner-centered approach in the teaching and
learning of probability improved the performance of the preservice teachers
The outcome of the study portrays that there was a statistically significant difference in the probabilistic
reasoning achievement mean scores of Group A than that of Group B [F (1 56) = 114955 p = 000 lt 05] This
finding implies that Group A performed better than Group B in the probabilistic reasoning achievement test
This is an indication that when the learner-centered approach to teaching probability is targeted at addressing
probabilistic misconceptions preservice teachers develop better probabilistic reasoning than teacher-centered
approach
Discussion
This study set out to compare the learner-centered and teacher-centered approaches of teaching in order to
determine the best way of developing preservice teachersrsquo probabilistic reasoning at the College of Education
Hokor amp Sedofia
134
level in Ghana The results as shown on Tables 3 4 5 6 7 and 8 indicate that the learner-centered approach to
teaching probability is more effective than the teacher-centered approach in motivating and inspiring preservice
teachers to learn and apply probability The learner-centered approach provides studentsrsquo opportunities to think
reason reflect and evaluate their ideals and that of colleagues
The findings of the present study are in tandem with several research findings Lessani Md Yunus and Bakar
(2017) investigated mathematics teaching approaches and their consequences on learnersrsquo ability to solve
challenging problems Their findings affirm the learner-centered approach to be more effective in studentsrsquo
creativity and innovation in solving real-life problems than the teacher-centered approach So training
programs for excellent teaching and learning should be flexible and innovative to allow preservice teachers to
explore gaps in learning and teaching (AIAhmad 2021) Similarly Prideaux (2007) found that students who
experienced the learner-centered approach of teaching performed significantly higher than those who were
taught without the learner-centered approach of teaching Roseth Garfield and Ben-Zvi (2008) also examined
the effect of the cooperative framework in classroom teaching and collaboration and found that student-
centered approaches to teaching help students to have better understanding of statistics than teacher-centered
instruction
Furthermore Gurbuz and Birgin (2011) studied the effect of computer-assisted teaching on addressing
probabilistic misconceptions of students The authors used pre-test to collect data on both the computer-assisted
and traditional groups before the experimental teachings After the intervention the post-test was administered
to ascertain the effect of computer-assisted teaching and teacher-centered approach on addressing studentsrsquo
probabilistic misconceptions Their study found computer-assisted teaching to have more significant effect on
studentsrsquo correct probabilistic reasoning than teacher-centered approach of teaching
As noted by Batanero and Diaz (2012) probability forms an integral part of the Mathematics curriculum in
many countries But the concept is one that some learners find difficult to understand partly due to the method
of teaching used by teachers This fact implies that teachers of mathematics should find more creative ways of
teaching the concept so as to make it easier for learners to understand and apply the concept As discovered in
this study the learner-centered approach is effective in developing probabilistic reasoning But the learner-
centered approach works best when certain conditions are present At the outset there is the need for relevant
teaching and learning materials Then teachers need to be trained and retrained in the use of the learner-centered
approach to teaching At the college of education level preservice teachers need to be taught using the learner-
centered approach not only to help them understand probability but also to help them use the learner-centered
approach in their own teaching
The activities used for Group A which is learner-centered approach group in the form of games promote
content knowledge and cognitive skills competencies such as collaboration and problem solving (Belova amp
Zowada 2020) The activities focus on promoting learning experiences rather than stressing on the
entertainment factor While some things students learn in school seem to them predetermined and bound by
laws in other branches of mathematics probability provides students with opportunity to learn that solutions to
International Journal of Studies in Education and Science (IJSES)
135
several problems depend on assumptions and have degrees of doubt So teaching methods that allow students to
predict and test their predictions should be encouraged for students to develop their intellectual repertoire The
processes used in reasoning about sample space will serve students well in life Several calls on the need to pay
attention to the study of probability show that teachers and mathematics teachers must provide their students
with appropriate teaching strategies to enhance their conceptual understanding In the preparation of preservice
teachers to become mathematically competent citizens teacher preparation programs such as teaching methods
must provide opportunities for preservice teachers to confront misconceptions and reason probabilistically
(Courtney amp Caniglia 2021)
The findings of the present study however run counter to those of Weltman and Whiteside (2010) They
conducted a study on the effectiveness of the traditional and active learning method in business statistics The
study found that active learning had not been effective for all category of students It is not precisely clear what
may have accounted for that result This is because active learning methods have generally been known to be
effective in promoting learning Further research is thus required in this regard
Conclusions
This study compared the effects of the learner-centered and teacher-centered approaches of teaching in
addressing probabilistic misconceptions by measuring preservice teachersrsquo probabilistic reasoning scores The
results show that the learner-centered approach aids preservice teachers to develop better probabilistic reasoning
than the teacher-centered approach to teaching Thus the study concludes that the learner-centered approach to
teaching is a solution to preservice teachersrsquo inability to answer questions on probability correctly Even though
each teaching approach targeted at addressing misconceptions was found to have significant effect on pre-
service teachersrsquo probabilistic reasoning the learner-centered approach was found to be more effective than the
teacher-centered approach in addressing misconceptions which limit studentsrsquo ability to solve probability
problems correctly
Implications and Recommendations
This study makes some key contributions to the teacher educationdevelopment literature in general and
particularly to the development of probabilistic reasoning of preservice teachers The study provides empirical
evidence that the learner-centered approach targeted at addressing probabilistic misconceptions is more effective
in developing probabilistic reasoning in preservice teachers What this means is that when teacher educators use
the learner-centered approach to teach the concept of probability and focus on addressing misconceptions
preservice teachers will develop better probabilistic reasoning This will in turn translate into preservice
teachers answering questions on probability correctly in their examinations and ultimately making them teach
the concept more effectively when they complete their training It is thus recommended that teachers should
consider employing the learner-centered approach in teaching the concept of probability
Hokor amp Sedofia
136
Limitations
As with every empirical study employing the quasi-experimental approach the current study has some
limitations which need to be acknowledged and used to guide users of the findings Firstly our sample was
drawn from a population of second year preservice teachers of a female only college of education in a peri-
urban area in Ghana Further experiments are therefore needed in other settings in order to see if the same or
similar results will occur Secondly owing to the narrow characteristics of the participants in the present study
the researchers cannot generalize the results to other individuals who do not have the same characteristics So
additional experiments with groups with different characteristics are necessary Lastly the experiments need to
be repeated at another time to determine if the results are the same (consistent) over time
Acknowledgements
We are grateful to the Principal and preservice teachers for granting access and participating in the study
respectively
References
AIAhmad H (2021) The role of educational communication in promoting student-centered learning style in
multicultural classrooms A reflective essay on learning and teaching in higher education International
Journal of Research in Education and Science (IJRES) 7(3) 838-851 httpsdoiorg1046328ijes2374
Aina J K Olanipekun S S amp Garuba I A (2015) Teachersrsquo effectiveness and its Influence on studentsrsquo
learning Advances in Social Sciences Research Journal 2(4) 88-95
Anway D W amp Bennett E (2004) Common Misconceptions in Probability among Students in an Elementary
Statistics class Unplished Senior Project The ARTIST Roundtable Conference on Assessment in
Statistics held at Lawrence University Supperior WI The University of Wisconsin-Superior
Bada S (2015) Constructivist Learning Theory A Paradigm for Teaching and Learning IOSR Journal of
Research and Method in Education (IOSR-JRME) 5(6) 66-70 httpsDOI1097907388-05616670
Baerveldt C (2013) Constructivism contested Implications of a genetic perspective in psychology Integrative
Psychological and Behavioral Science 47(1) 156-166
Batanero C (2013) Teaching and learning probability In S Lerman (Ed ) Encyclopedia of Mathematics
Education Heidelberg Springer
Batanero C and Diaz C (2012) Training school teachers to teach probability reflections and challenges
Chilean Journal of Statistics 3(1) 3-13
Belova N amp Zowada C (2020) Innovating Higher Education Via Game-Based Learning on Misconceptions
Education Sciences 10 221 doi103390educSCi10090221
Bennett E amp Anway D W (2003) Statistical and Probabilistic Reasoning and Misconceptions among
Selected College Students McNair Scholars Journal Vol 4 httpwwwsocheclchjs
Cantoy O (2010) Mathematics teachersrsquo topic-specific pedagogical content knowledge in the context of
teaching a0 0 and a divide 0 Educational Sciences Theory and Practice 10 (2) 749-769
International Journal of Studies in Education and Science (IJSES)
137
Clements D H amp Battista M (1990) Constructivist Learning and Teaching The
Arithetic Teacher 38(1) ProQuest Central pg 34 DOI105951AT3810034
Creswell J W amp Creswell J D (2018) Research design Qualitative quantitative and
mixed methods approaches (5th
ed) Los Angeles SAGE Publications Inc
Courtney S A amp Caniglia J (2021) Comparing the mathematical practices pre-service teachers and
mathematics teacher educators identified as relevant to problems and tasks International Journal of
Research in Education and Science (IJRES) 7(3) 954-971 httpsdoiorg1046328ijres2335
Denton D W (2012) Enhancing instruction through constructivism cooperative learning and cloud
computing Tech Trends 56(4) 34-41
Gage J (2012) Towards a new Probability Curriculum for Secondary Schools Paper presented at 12th
International Congress on Mathematical Education 8 July-15 July COEX Seoul Korea Cambridge
Cambridge University Uk
Gurbuz R amp Birgin O (2011) The effect of computer-assisted teaching on remedying misconceptions The
case of the subject Probability Journal Homepage 58(2012) DOI 101016jcompedu201111005
Hirsh L amp ODonnell A M (2001) Representativeness in Statistical Reasoning Identifying and Assessing
Misconceptions Journal of Statistics Education 9(2) 96-105 DOI10108010691898200111910655
Johnson H D amp Dasgupta N (2005) Traditional versus Non-traditional Teaching during Perspectives of
Students in Introductory Statistics Classes Journal of Statistics Education 13(2)
httpsdoiorg10108010691898200511910558
Major T amp Mangope B (2012) The Constructivist Theory in Mathematics The case of Botswana Primary
Schools International Review of Social Sciencies and Humanities 3(2) 139-147
Jones G (2005) Reflections In GA Jones (Ed) Exploring probability in school chanlleges for teaching and
probability (367-372) New York Springer
Jun L (2000) Chinese Students Understanding of Probability Published doctoral dissertation Singapore
National Institute of Education Nanyang Technological University
Khazanov L amp Gourgey A (2009) Instructors Perspectives on Students Mistaken Beliefs about Probability
in an Elementary College Statistics Course In K Safford-Ramus (Ed) Proceedings of the Adults
Learning Mathematics a Resaerch Forum (ALM) 15th
Annual International Conference 249-264
Khazanov L amp Prado L (2010) Correcting Students Misconceptions about Probability in an Introductory
College Statistics Course Adults Learning Mathematics-An International Journal 5(1) 23-35
Kleickmann T Richter D Kunter M Elsner J Besser M Krauss S amp Baumert J (2013) Teachersrsquo
Content Knowledge and Pedagogical Content Knowledge The Role of Structural Differences in Teacher
Education Journal of Teacher Education 64(1) 90-106 DOI1011770022487112460398
Leedy P D and Ormrod J E (2020) Practical research Planning and design (12th Global Edition) Harlow
England Pearson
Lessani A Md Yunus AS amp Bakar KBA (2017) Comparison of new mathematics teaching methods with
teacher-centered approach International Journal of Social Sciences 3(2) 1285-1297
httpsdxdoiorg1020319pijss20173212851297
Lim C amp Hwa T (2007) Promoting Mathematical Thinking in the Malaysian Classroom Issues and
challenges httpswwwresearchgatenetpublication252353381
Hokor amp Sedofia
138
Lovett J N amp Lee H S (2017) New Standards Require Teaching More Statistics Are Preservice Secondary
Mathematics Ready Journal of Teachers Education 68(3) 299-311 DOI 1011770022487117697918
Major T amp Mangope B (2012) The Constructivist Theory in Mathematics The case of Botswana Primary
Schools International Review of Social Sciencies and Humanities 3(2) 139-147
National Council of Teachers of Mathematics (2003) Principles and Standards for School Mathematics and
their Implications for Professional Development Reston VA NCTM
Nguyen L (2015) Developing Conceptual Understanding and Probabilistic Thinking through Tree Diagrams
Published MPhil Dissertation Manitoba The Faculty of Graduate Studies of the University of
Manitoba
Prideaux J (2007) The learner-centered approach to Mathematics Teaching and the Active Learning
Strategies used to Enhance Students Understanding Mathematical and Computing Sciences Masters
Paper 29 Fisher Digital Publications httpfisherpubsjfcedumathcsetdmasters29
Roseth C J Garfield J B amp Ben-Zvi D (2008) Collaboration in Learning and Teaching Statistics Journal
of Statistics Education 16 (1) 1069-1898 httpsdoiorg10108010691898200811889557
Santagata R and Sandholtz J H (2019) Preservice teachersrsquo mathematics teaching competence Comparing
performance on two measures Journal of Teacher Education 70 (5) 472 ndash484
Schwerdt G amp Wuppermann A C (2011) Is traditional teaching really all that bad A within-student
between-subject approach Economics of Education Review 30(2) 365-379
Sharma S (2016) Probability from a socio-cultural perspective Statistics Education Research Journal 15(2)
126-144 httpiase-weborgPublicationsphpp=SERJ
Shay K (2008) Tracing middle school students understanding of probability a longitudinal study
Unpublished Doctoral Dissertation New Brunswick New Jersey Rutgers State University of New
Jersey
Shulman L S (1986) Those who understand Knowledge growth in teaching Educational Researcher 15(2)
4-14 doi 1031021001318X015002004
Thomas L (2020) An introduction to quasi-experimental designs
httpswwwscribbrcommethodologyquasi-experimental-design
Voskoglou M (2019) Comparing Teaching Methods of Mathematics at University Level Education Sciences
9(204) doi103390educsci9030204
Vygotsky L S (1978) Mind in society The development of higher psychological processes Cambridge MA
Harvard University Press
Weldeana H N amp Abraham S T (2014) The effect of an historical perspective on prospective teachersrsquo
beliefs in learning mathematics Journal of Mathematics Teacher Education 17 303-330
doi101007s10857-013-9266-z
Weltman D amp Whiteside M (2010) Comparing the Effectiveness of Traditional and active Learning Methods
in Business Statistics Convergence to the Mean 18(1)
httpsdoiorg10108010691898201011889480
White H amp Sabarwal S (2014) Quasi-experimental design and methods methological briefs impact
evaluations Florence UNICEF Office of research
International Journal of Studies in Education and Science (IJSES)
139
Author Information
Evans Kofi Hokor
httpsorcidorg0000-0002-8387-8294
St Teresarsquos College of Education Hohoe
Department of Mathematics and ICT
P O Box 129
Ghana
Contact e-mail evanskhokorgmailcom
John Sedofia
httpsorcidorg0000-0002-5409-516X
University of Ghana Legon
Department of Teacher Education
PO Box LG 1181
Ghana
Hokor amp Sedofia
140
Appendix A Pre-test Probabilistic Reasoning Assessment
This assessment is for research purpose to improve teaching and learning of probability
You are required to answer all questions honestly Do and leave all workings or rough work on the paper
Pre-test Probabilistic Reasoning Assessment Duration 1hr
Index numberhelliphelliphelliphelliphelliphelliphelliphelliphelliphelliphelliphelliphelliphelliphelliphelliphelliphellipLevelhelliphelliphelliphellipAgehelliphelliphellip
Read each statement carefully and circle the letter of the correct (best) option Provide appropriate response in
the space provided under some items as it apply
1 If you rolled an ordinary die and obtained 51246 which of these is most likely to occur on your next
roll
a 1
b 2
c 3
d 4
e 5
f 6
g The options a b c d e and f are all equally
2i A fair coin is tossed and it lands tail The coin is to be tossed a second time What is the probability that the
second toss will also be a tail
a 1
4
b 1
2
c 1
3
d Slightly less than 1
2
e Slightly more than 1
2
f 0
2ii Which of the following best describes the reason for the correct answer to the preceding question (2i)
a The second toss is less likely to be tail because the first toss was tail
b There are four possible outcomes when you toss a coin twice Getting two tails is only one of them
c The chance of getting heads or tails on any one toss is always 1
2
d There are three possible outcomes when you toss a coin twice Getting two tails is only one of the them
e No chance of being a tail in the second toss
3i A box contains 6 balls 2 are red 2 are black and 2 blue Three balls are picked at random one at a time
Each time a ball is picked the colour is recorded and the ball is put back in the box mixed thoroughly If the
first 2 balls are black what color is the third ball most likely to be
a Red
International Journal of Studies in Education and Science (IJSES)
141
b Black
c Blue
d Red and blue are equally likely than black
e Red black and blue are all equally likely
3ii Which of the following best describes the reason for the correct answer in the preceding question (3i)
a The third ball should not be black because too many black ones have already been picked
b The picks are independent so every color has an equally likely chance of being picked
c Black seems to be lucky
d This color is just as likely as any other color
4 A spinner with ten equally divided sectors in which four parts are white and the rests are red is about to
be spin which color is the spinner more likely to land
a White
b Red
c Both white and red are all equally
5 If you toss a fair coin and get heads two times in a row which of these is most likely on next toss
a Tail
b Head
c Both head and tail are all equally
6 A Gh 2 Gh 5 Ghcent10 Gh 20 Gh 50 and Gh 100 notes were put in a box and thoroughly mixed
What is the probability of picking Gh 50 note without looking
a 1
187
b 50
187
c 1
6
d 0
7 In a game you have been offered two options Which of the following give you higher chance of
winning GHcent200
a Tossing one die once and obtaining a 6
b Tossing two dice once and obtaining two 6rsquos
c The options a and b are all equally
8 A fair die is to be toss six times which of these is most likely to occur
a 251634
b 123456
c 666341
d 132244
e The options a b c and d are all equally likely
9 A fair coin is to be toss four times in a row which of these is least likely to occur
a THTH
b TTTH
c HHH
Hokor amp Sedofia
142
d The options a b and c are all equally likely
10 Two fair dice are to be tossed once Which of the following is more likely to occur
a Obtaining a sum of 11
b Obtaining a sum of 10
c A sum of 11 and a sum of 10 are all equally likely
10i Give reason for the correct answer in the preceding question (10)
helliphelliphelliphelliphelliphelliphelliphelliphelliphelliphelliphelliphelliphelliphelliphelliphelliphelliphelliphelliphelliphelliphelliphelliphelliphelliphelliphelliphelliphelliphelliphelliphelliphelliphelliphelliphelliphelliphelliphelliphelliphellip
helliphelliphelliphelliphelliphelliphelliphelliphelliphelliphelliphelliphelliphelliphelliphelliphelliphelliphelliphelliphelliphelliphelliphelliphelliphelliphelliphelliphelliphelliphelliphelliphelliphelliphelliphelliphelliphelliphelliphelliphelliphellip
helliphelliphelliphelliphelliphelliphelliphelliphelliphelliphelliphelliphelliphelliphelliphelliphelliphelliphelliphelliphelliphelliphelliphelliphelliphelliphelliphelliphelliphelliphelliphelliphelliphelliphelliphelliphelliphelliphelliphelliphelliphellip
helliphelliphelliphelliphelliphelliphelliphelliphelliphelliphelliphelliphelliphelliphelliphelliphelliphelliphelliphelliphelliphelliphelliphelliphelliphelliphelliphelliphelliphelliphelliphelliphelliphelliphelliphelliphelliphellip
11 In national lottery one has to choose five numbers from 1 to 90 inclusive You win when at least two of
your numbers are part of the numbers drawn on Saturday at random Eric has chosen 4 6 7 9 and 11
Alex has chosen 15 23 45 66 and 80 Daniel has chosen 71 77 78 83 and 85 Do Eric Alex and
Daniel have the same chance of winning or not and why
helliphelliphelliphelliphelliphelliphelliphelliphelliphelliphelliphelliphelliphelliphelliphelliphelliphelliphelliphelliphelliphelliphelliphelliphelliphelliphelliphelliphelliphelliphelliphelliphelliphelliphelliphelliphelliphelliphelliphelliphellip
helliphelliphelliphelliphelliphelliphelliphelliphelliphelliphelliphelliphelliphelliphelliphelliphelliphelliphelliphelliphelliphelliphelliphelliphelliphelliphelliphelliphelliphelliphelliphelliphelliphelliphelliphelliphelliphelliphelliphelliphellip
helliphelliphelliphelliphelliphelliphelliphelliphelliphelliphelliphelliphelliphelliphelliphelliphelliphelliphelliphelliphelliphelliphelliphelliphelliphelliphelliphelliphelliphelliphelliphelliphelliphelliphelliphelliphelliphelliphelliphelliphellip
helliphelliphelliphelliphelliphelliphelliphelliphelliphelliphelliphelliphelliphelliphelliphelliphelliphelliphelliphelliphelliphelliphelliphelliphelliphelliphelliphelliphelliphelliphelliphelliphelliphelliphelliphellip
12 A box contains 8 yellow balls and 4 green balls Two balls are chosen at random one after the other
without replacement determine the probability that the two balls are of different colours
helliphelliphelliphelliphelliphelliphelliphelliphelliphelliphelliphelliphelliphelliphelliphelliphelliphelliphelliphelliphelliphelliphelliphelliphelliphelliphelliphelliphelliphelliphelliphelliphelliphelliphelliphelliphelliphelliphelliphelliphellip
helliphelliphelliphelliphelliphelliphelliphelliphelliphelliphelliphelliphelliphelliphelliphelliphelliphelliphelliphelliphelliphelliphelliphelliphelliphelliphelliphelliphelliphelliphelliphelliphelliphelliphelliphelliphelliphelliphelliphelliphellip
helliphelliphelliphelliphelliphelliphelliphelliphelliphelliphelliphelliphelliphelliphelliphelliphelliphelliphelliphelliphelliphelliphelliphelliphelliphelliphelliphelliphelliphelliphelliphelliphelliphelliphelliphelliphelliphelliphelliphelliphellip
helliphelliphelliphelliphelliphelliphelliphelliphelliphelliphelliphelliphelliphelliphelliphelliphelliphelliphelliphelliphelliphelliphelliphelliphelliphelliphelliphelliphelliphelliphelliphelliphelliphelliphelliphelliphellip
International Journal of Studies in Education and Science (IJSES)
143
Appendix B Post-test Probabilistic Reasoning Assessment
This assessment is for research purpose to improve teaching and learning of probability
You are required to answer all questions honestly Do and leave all workings or rough work on the paper
Post-test Probabilistic Reasoning Assessment Duration One Hour
Index numberhelliphelliphelliphelliphelliphelliphelliphelliphelliphelliphelliphelliphelliphelliphellipClasshelliphelliphelliphellipAgehelliphelliphelliphellip
Read each statement carefully and circle the letter of the correct (best) option for each item as much as possible
and provide appropriate response in the space provided
1 Suppose a particular outcome from a random event has a probability of 04 Which of the following
statements represents correct interpretations of this probability
a The outcome will not happen
b The outcome will certainly happen about four times out of every 10 trials
c The outcome is expected to happen about four times out of every 10 trials
d The outcome could happen or it couldnrsquot of either result are the same
2 If you toss a fair coin and get heads 3 times in a row what is the chance of getting a head on the next toss
a 1
b Greater than 1
2
c 1
2
d Less than 1
2
e 0
3 A die is numbered 1 2 3 4 4 5 When the die is thrown once Which of these is most likely and why
a 1
b 2
c 3
d 4
e 5
f They are all equally likely
3i Give reason for your chosen answer in (3)
helliphelliphelliphelliphelliphelliphelliphelliphelliphelliphelliphelliphelliphelliphelliphelliphelliphelliphelliphelliphelliphelliphelliphelliphelliphelliphelliphelliphelliphelliphelliphelliphelliphelliphelliphelliphelliphelliphelliphelliphelliphelliphelliphelliphellip
helliphelliphelliphelliphelliphelliphelliphelliphelliphelliphelliphelliphelliphelliphelliphelliphelliphelliphelliphelliphelliphelliphelliphelliphelliphelliphelliphelliphelliphelliphelliphelliphelliphelliphelliphelliphelliphelliphelliphelliphelliphelliphelliphelliphellip
helliphelliphelliphelliphelliphelliphelliphelliphelliphelliphelliphelliphelliphelliphelliphelliphelliphelliphelliphelliphelliphelliphelliphelliphelliphelliphelliphelliphelliphelliphelliphelliphelliphelliphelliphelliphelliphelliphelliphelliphelliphelliphelliphelliphellip
helliphelliphelliphelliphelliphelliphelliphelliphelliphelliphelliphelliphelliphelliphelliphelliphelliphelliphelliphelliphelliphelliphelliphelliphelliphelliphelliphelliphelliphelliphelliphelliphelliphelliphelliphelliphelliphelliphellip
4 German MP tossed two dice once Which of these is mostly likely and why
a Obtaining a sum of 4
b Obtaining a sum of 7
c Obtaining a sum of 11
d All of them have equal chance of occurring that is a b c
Hokor amp Sedofia
144
4i Give reason for your chosen answer in (4)
helliphelliphelliphelliphelliphelliphelliphelliphelliphelliphelliphelliphelliphelliphelliphelliphelliphelliphelliphelliphelliphelliphelliphelliphelliphelliphelliphelliphelliphelliphelliphelliphelliphelliphelliphelliphelliphelliphelliphelliphelliphelliphelliphelliphellip
helliphelliphelliphelliphelliphelliphelliphelliphelliphelliphelliphelliphelliphelliphelliphelliphelliphelliphelliphelliphelliphelliphelliphelliphelliphelliphelliphelliphelliphelliphelliphelliphelliphelliphelliphelliphelliphelliphelliphelliphelliphelliphelliphelliphellip
helliphelliphelliphelliphelliphelliphelliphelliphelliphelliphelliphelliphelliphelliphelliphelliphelliphelliphelliphelliphelliphelliphelliphelliphelliphelliphelliphelliphelliphelliphelliphelliphelliphelliphelliphelliphelliphelliphelliphelliphelliphelliphelliphelliphellip
helliphelliphelliphelliphelliphelliphelliphelliphelliphelliphelliphelliphelliphelliphelliphelliphelliphelliphelliphelliphelliphelliphelliphelliphelliphelliphelliphelliphelliphelliphelliphelliphelliphelliphelliphelliphelliphelliphelliphelliphelliphelliphelliphelliphellip
helliphelliphelliphelliphelliphelliphelliphelliphelliphelliphelliphelliphelliphelliphelliphelliphelliphelliphelliphelliphelliphelliphelliphelliphelliphelliphelliphelliphellip
5i A fair coin is to be toss four times which of these is most likely to occur
a HTHT
b THTT
c TTTT
d HHTH
e The options a b c and d are all equally likely
5ii Give reason for your chosen answer in (5i)
helliphelliphelliphelliphelliphelliphelliphelliphelliphelliphelliphelliphelliphelliphelliphelliphelliphelliphelliphelliphelliphelliphelliphelliphelliphelliphelliphelliphelliphelliphelliphelliphelliphelliphelliphelliphelliphelliphelliphelliphelliphelliphelliphelliphellip
helliphelliphelliphelliphelliphelliphelliphelliphelliphelliphelliphelliphelliphelliphelliphelliphelliphelliphelliphelliphelliphelliphelliphelliphelliphelliphelliphelliphelliphelliphelliphelliphelliphelliphelliphelliphelliphelliphelliphelliphelliphelliphelliphelliphellip
helliphelliphelliphelliphelliphelliphelliphelliphelliphelliphelliphelliphelliphelliphelliphelliphelliphelliphelliphelliphelliphelliphelliphelliphelliphelliphelliphelliphelliphelliphelliphelliphelliphelliphelliphelliphelliphelliphelliphelliphelliphelliphelliphelliphellip
helliphelliphelliphelliphelliphelliphelliphelliphelliphelliphelliphelliphelliphelliphelliphelliphelliphelliphelliphelliphelliphelliphelliphelliphelliphelliphelliphelliphelliphelliphelliphelliphelliphelliphelliphelliphelliphelliphellip
6i A fair coin is to be toss four times which of these is least likely to occur
a HTHT
b THTT
c TTTT
d HHTH
e The options a b c and d are all equally likely
6ii Give reason for your chosen answer in (6i)
helliphelliphelliphelliphelliphelliphelliphelliphelliphelliphelliphelliphelliphelliphelliphelliphelliphelliphelliphelliphelliphelliphelliphelliphelliphelliphelliphelliphelliphelliphelliphelliphelliphelliphelliphelliphelliphelliphelliphelliphelliphelliphelliphelliphellip
helliphelliphelliphelliphelliphelliphelliphelliphelliphelliphelliphelliphelliphelliphelliphelliphelliphelliphelliphelliphelliphelliphelliphelliphelliphelliphelliphelliphelliphelliphelliphelliphelliphelliphelliphelliphelliphelliphelliphelliphelliphelliphelliphelliphellip
helliphelliphelliphelliphelliphelliphelliphelliphelliphelliphelliphelliphelliphelliphelliphelliphelliphelliphelliphelliphelliphelliphelliphelliphelliphelliphelliphelliphelliphelliphelliphelliphelliphelliphelliphelliphelliphelliphelliphelliphelliphelliphelliphelliphellip
helliphelliphelliphellip
7 A college has 300 level 200 students and 236 level 100 students in it Each studentrsquos name is written with
the level on a piece of paper and all the names are put into a box and mixed thoroughly A tutor picks one
name out of the box without looking Which level is the tutor more likely to pick from and why
helliphelliphelliphelliphelliphelliphelliphelliphelliphelliphelliphelliphelliphelliphelliphelliphelliphelliphelliphelliphelliphelliphelliphelliphelliphelliphelliphelliphelliphelliphelliphelliphelliphelliphelliphelliphelliphelliphelliphelliphelliphelliphelliphelliphellip
helliphelliphelliphelliphelliphelliphelliphelliphelliphelliphelliphelliphelliphelliphelliphelliphelliphelliphelliphelliphelliphelliphelliphelliphelliphelliphelliphelliphelliphelliphelliphelliphelliphelliphelliphelliphelliphelliphelliphelliphelliphelliphelliphelliphellip
helliphelliphelliphelliphelliphelliphelliphelliphelliphelliphelliphelliphelliphelliphelliphelliphelliphelliphelliphelliphelliphelliphelliphelliphelliphelliphelliphelliphelliphelliphelliphelliphelliphelliphelliphelliphelliphelliphelliphelliphelliphelliphelliphelliphellip
helliphelliphelliphelliphelliphelliphelliphelliphelliphelliphelliphelliphelliphelliphelliphelliphelliphelliphelliphelliphelliphelliphelliphelliphelliphelliphelliphelliphelliphelliphelliphelliphelliphelliphelliphelliphelliphelliphelliphellip
8 Suppose that you toss a coin three times and all eight outcomes are equally likely If it is known that the first
toss comes up heads what is the probability of an odd number of heads appearing
helliphelliphelliphelliphelliphelliphelliphelliphelliphelliphelliphelliphelliphelliphelliphelliphelliphelliphelliphelliphelliphelliphelliphelliphelliphelliphelliphelliphelliphelliphelliphelliphelliphelliphelliphelliphelliphelliphelliphelliphelliphelliphelliphelliphellip
helliphelliphelliphelliphelliphelliphelliphelliphelliphelliphelliphelliphelliphelliphelliphelliphelliphelliphelliphelliphelliphelliphelliphelliphelliphelliphelliphelliphelliphelliphelliphelliphelliphelliphelliphelliphelliphelliphelliphelliphelliphelliphelliphelliphellip
helliphelliphelliphelliphelliphelliphelliphelliphelliphelliphelliphelliphelliphelliphelliphelliphelliphelliphelliphelliphelliphelliphelliphelliphelliphelliphelliphelliphelliphelliphelliphelliphelliphelliphelliphelliphelliphelliphelliphelliphelliphelliphelliphelliphellip
International Journal of Studies in Education and Science (IJSES)
145
helliphelliphelliphelliphelliphelliphelliphelliphelliphelliphelliphelliphelliphelliphelliphelliphelliphelliphelliphelliphelliphelliphelliphelliphelliphelliphelliphelliphelliphelliphelliphelliphelliphelliphelliphelliphelliphelliphelliphelliphelliphelliphelliphelliphellip
helliphelliphelliphelliphelliphelliphelliphelliphelliphelliphelliphelliphelliphelliphelliphelliphelliphelliphelliphelliphelliphelliphelliphelliphelliphelliphelliphelliphelliphelliphelliphelliphelliphelliphelliphelliphelliphelliphelliphelliphelliphelliphelliphelliphellip
helliphelliphelliphelliphelliphelliphelliphelliphelliphelliphelliphelliphelliphelliphelliphelliphelliphelliphelliphellip
9 A card is selected at random from a pack of 52 cards Find the probability of selecting a card which is a red or
a queen
helliphelliphelliphelliphelliphelliphelliphelliphelliphelliphelliphelliphelliphelliphelliphelliphelliphelliphelliphelliphelliphelliphelliphelliphelliphelliphelliphelliphelliphelliphelliphelliphelliphelliphelliphelliphelliphelliphelliphelliphelliphelliphelliphelliphellip
helliphelliphelliphelliphelliphelliphelliphelliphelliphelliphelliphelliphelliphelliphelliphelliphelliphelliphelliphelliphelliphelliphelliphelliphelliphelliphelliphelliphelliphelliphelliphelliphelliphelliphelliphelliphelliphelliphelliphelliphelliphelliphelliphelliphellip
helliphelliphelliphelliphelliphelliphelliphelliphelliphelliphelliphelliphelliphelliphelliphelliphelliphelliphelliphelliphelliphelliphelliphelliphelliphelliphelliphelliphelliphelliphelliphelliphelliphelliphelliphelliphelliphelliphelliphelliphelliphelliphelliphelliphellip
helliphelliphelliphelliphelliphelliphelliphelliphelliphelliphelliphelliphelliphelliphelliphelliphelliphelliphelliphelliphelliphelliphelliphelliphelliphelliphelliphelliphelliphelliphelliphelliphelliphelliphelliphelliphelliphelliphelliphellip
10 A box contains 6 white balls and 4 green balls Two balls are chosen at random one after the other without
replacement determine the probability that the second ball is white
helliphelliphelliphelliphelliphelliphelliphelliphelliphelliphelliphelliphelliphelliphelliphelliphelliphelliphelliphelliphelliphelliphelliphelliphelliphelliphelliphelliphelliphelliphelliphelliphelliphelliphelliphelliphelliphelliphelliphelliphelliphelliphelliphelliphellip
helliphelliphelliphelliphelliphelliphelliphelliphelliphelliphelliphelliphelliphelliphelliphelliphelliphelliphelliphelliphelliphelliphelliphelliphelliphelliphelliphelliphelliphelliphelliphelliphelliphelliphelliphelliphelliphelliphelliphelliphelliphelliphelliphelliphellip
helliphelliphelliphelliphelliphelliphelliphelliphelliphelliphelliphelliphelliphelliphelliphelliphelliphelliphelliphelliphelliphelliphelliphelliphelliphelliphelliphelliphelliphelliphelliphelliphelliphelliphelliphelliphelliphelliphelliphelliphelliphelliphelliphelliphellip
helliphelliphelliphelliphelliphelliphelliphelliphelliphelliphelliphelliphelliphelliphelliphelliphelliphelliphelliphelliphelliphelliphelliphelliphelliphelliphelliphelliphelliphelliphelliphelliphelliphelliphelliphelliphelliphelliphelliphelliphelliphelliphellip

Hokor amp Sedofia
126
years were out for their teaching practice and the first year students had not taken the statistics and probability
course This institution was selected for one main reason they all studied Statistics and Probability and were
thus expected to teach it at the Junior High School level upon completion of their training
Sample and Sampling Procedure
Purposive sampling technique was used to select two intact classes out of six classes identified as Group A and
Group B respectively These groups are similar in terms of their performance in their second-year first-semester
mid-semester quiz scores in mathematics with mean scores of 139 and 137 respectively ldquoQuasi-experimental
designs identify a comparison group that is as similar as possible to the experimental group in terms of pre-
intervention characteristicsrdquo (White amp Sabarwal 2014 p 1) Also it helped to avoid selection bias which is a
concern in quasi-experimental studies
These two intact classes comprised 27 preservice teachers in Group B and 32 in Group A In purposive
sampling certain elements of the population are deliberately selected on the judgment of the researchers and
nothing is left to chance In this study respondents were chosen from a population of regular preservice teachers
who had studied probability previously and were taking statistics and probability as a course in a college of
education The reason for choosing both groups from the same population is that both Group A and Group B
used the same textbooks and course materials Also both groups were chosen from the same population to avoid
bias because all the colleges use different textbooks and the conditions under which students studied are
different from college to college
Achievement Tests (Pre-test and Post-Test)
The test items were administered in two phases in the classrooms These are pre-test and the post-test Items 2i
2ii 3i and 3ii of the pretest were adapted from (Anway amp Bennett 2004 Hirsh amp ODonnell 2001) Two
examiners of statistics and probability were consulted to ensure the questions are at the level of the participants
This is to ensure the validity of the test items The pre-test and the post-test were similar to measure whether
there is a change or not The items were developed to measure the probabilistic reasoning of preservice teachers
The items sought to ascertain preservice teachersrsquo ability in reasoning about uncertainties and the use of
probability daily
The achievement test assessed the following areas correctly applying probability in decision making
equiprobability bias correctly interpreting without replacement situations correctly listing the sample space and
determining the probability representativeness bias and interpreting probability statements correctly and
applying appropriate strategies There were 12 items for the pre-test and 10 items for the post-test We have
more items on the pre-test because the post-test was more open-ended than the pre-test Nevertheless the total
scores in each case was 20 Some of the test items consisted of two parts the principal question (multiple
choice) and a justification of the answer The pre-test and post-test can be seen in appendices A and B
respectively
International Journal of Studies in Education and Science (IJSES)
127
Evaluation of Materials by Experts
The researchers solicited two expertsrsquo views on the test items content coverage content relevance and course
materials It was the view of the experts that the test items of both the pre-test and the post-test were in line with
the mathematics syllabus of colleges of education in Ghana The activities designed for the Group A were also
assessed In the view of the experts the teaching activities had sufficient content coverage and would help pre-
service teachers develop better probabilistic reasoning They acknowledged the idea of having activities that
reflect real life situations to support pre-service teachers since they were aware students have difficulty with
probability related problems The experts further acknowledged that the objectives were measurable and
activities were practical to promote pre-service teachersrsquo involvement in the lessons They said the teaching and
learning materials reflected the learner-centered approach and were in line with the syllabus requirements for
Mathematics in colleges of education in Ghana They believed the activities would promote better probabilistic
reasoning since they reflected real life situations
Data Collection Procedure
Preservice teachers were informed one week ahead of the administration of the pre-test The format of the test
items and the purpose of the study were communicated to the respondents The tests were administered by the
researchers at an Examination Hall to ensure the respondents did independent work
Treatment
The learner-centered approach was applied to group A while the teacher-centered approach of instruction was
applied to group B In each approach the lessons were focused on addressing equiprobability bias
representativeness belief bias positive recency and negative recency effects since some studies suggest that
teaching approaches that target probabilistic misconceptions will help improve studentsrsquo performance
significantly (Khazanov amp Prado 2010 Shay 2008) The implementation of both teaching approaches were
done by the lead researcher
Group A The Learner-centered approach
The teaching and learning took place in traditional classroom settings generally consisting of activities
discussions and questions and answers concurrently once per week for two hours for a month In group A the
activities were designed focusing on probabilistic misconceptions using the learner-centered approach to
teaching to better their probabilistic reasoning Examples of the activities are given below
Card Game This game was played in groups Identical cards were numbered 3 3 4 4 5 5 5 6 6 7 8 and 9
and put in a container and thoroughly mixed Three students will reach in and without looking draw out a card
each at time If the three people pick different numbers then the group wins GH30000 else they lose Is the
chance of winning or losing the same and why The purpose of this activity is to enhance preservice teachersrsquo
Hokor amp Sedofia
128
decision-making ability by addressing equiprobability bias representativeness bias belief and positive and
negative recency effects The aim of predicting before picking was to keep students focused and to confront any
prior misconceptions The game was played 15 times If all the three members of the group pick different colors
then a point of one is recorded else zero After the activity a discussion was organized around their prediction
and the results to challenge their thinking
Pair Game In pairs preservice teachers were asked to toss a coin six times each recording the sequence of tails
and heads The purpose of this activity is to address representativeness bias Before the toss students were asked
to predict the number of tails and heads Their predictions were written in their notebook before the toss Most
preservice teachers predicted equal number of tails and heads Preservice teachers then compare their predicted
sequences to their results after the toss It was noted in many instances that those who predicted equal number of
tails and heads did not obtain results that were consistent with their prediction Discussions were organized
around their predicted sequences and the results obtained after the toss for better probabilistic reasoning
Coin Game Students perform this experiment ten times by tossing a number of fair coins once and record the
outcomes in each case In the first toss a coin was tossed once and the outcome recorded in the second toss
two coins were tossed once and outcomes recorded in third toss three coins were tossed once and outcomes
recorded and so on H stands for heads and T stands for tails The following are a sample of sequence of
outcomes by one student
1st toss H
2nd
toss HT
3rd
toss HTH
4th
toss HTTT
5th
toss THHTT
6th
toss HTHTTT
7th
toss TTHTHHT
8th
toss THTHTHHH
9th
toss HTTTHTHTT
10th
toss THTHTHTHTT
119873119906119898119887119890119903 119900119891 ℎ119890119886119889119904
119873119906119898119887119890119903 119900119891 119905119900119904119904119890119904=
1
1= 1
1
2= 05
2
3= 0667
1
4= 025
2
5= 04
2
6= 0333
3
7= 0429
5
8
= 0625 3
9= 0333
4
10= 04
The average of the probabilities of obtaining a head for each experiment is
=105066702504033304290625033304
10=
4937
10cong 05
International Journal of Studies in Education and Science (IJSES)
129
It must be noted that in experimental or frequentist probability we are concerned about conducting the
experiment many times and considering its approximation or convergence Students were led to conclude that in
general we can say when a fair coin is tossed the probability of getting a head at any time is 1
2 and vice versa
Group B The Teacher-centered approach
Group B was taught using the teacher-centered approach In this case the teacher rather than the learner was at
the center of the teaching and learning process The tutor presented the preservice teachers with facts or
procedures that had been established to solve problems Preservice teachers were given problems that require
the use of these facts or procedures to solve as either assignment exercise test or quiz It is believed that
preservice teachers learned more when they solved similar problems many times When examination questions
that demanded facts were set students could solve the problems without really understanding the concepts
Formulae were presented to students to learn to apply to similar problems Concepts were clearly explained
bearing in mind the probabilistic misconceptions Samples of lessons experienced by Group B are as follow
Lesson one Through questions and answers teacher revises preservice teachersrsquo previous knowledge on playing
of games and probabilistic situations Based on studentsrsquo responses the teacher introduces the lesson
Teacher explains to preservice teachers the concept of probability and three ways we can make probability
statements as classical frequentist and subjective Classical probability is the number of favorable outcomes (E)
divided by the total number of possible outcomes (S) It works on the assumptions that all outcomes are equally
likely Equally likely means that each outcome has the same probability of occurring
Mathematically P(E) =
Students were then led to solve problems using the formula
Experimental probability is a method of calculating probability where the probability is the ratio of the number
of the trials where the desired event occurs to the number of total trials Subjective probability is a statement that
an individual makes based on personal judgment to describe the likelihood of an event Or a personal belief
based on onersquos own experience or expertise The person making the statement should be an expert in the area or
someone who have a sound knowledge on the issue under consideration before it can be considered important
For the statement to be reliable it should be based on a sound premise(s) Nevertheless both experts and non-
experts make use of subjective probability daily For example I have a 90 chance of passing my statistics and
probability exam
Lesson two Teacher explains basic terms of probability such as sample space sample point an event equally
likely to preservice teachers Teacher guides preservice teachers through demonstration to solve probability
problems using classical definition of probability by listing the sample space and finding the probability of an
event Teacher leads preservice teachers to solve probability problems from frequency tables Similarly teacher
explains to preservice teachers independent and dependent events Teacher asks the preservice teachers to solve
problems on independent and dependent events
Hokor amp Sedofia
130
Data Analysis
The data collected were coded and edited before being transferred to computer for analysis using SPSS version
24 A Levenersquos test was used in the study to ensure that the assumptions between each group was not violated
Homogeneity of variances was considered to ensure that each grouprsquos pre-test scores were mostly equal Paired
samples T-test was used to compare two means within each group to determine whether or not the differences in
means were statistically significant Independent sample T-test was used to compare the probabilistic reasoning
mean scores in Group A and the Group B before the experiment at a time to determine whether the two groups
were at the same level or not The independent t-test was used because there were two different groups of
participants It works on the assumption that scores are unique because they come from different participants
Also the equality of variance for running ANCOVA at 5 significance level was checked using Levenersquos test
Table 2 Levenes Test of Equality of Variances
F df1 df2 Sig
1234 1 57 0456
The results from Table 2 indicate that the variances are roughly equal since the significance value of 0456 is
greater than the cut-off value of 005 Therefore we can conclude that homogeneity of variance assumption was
met (Field 2005) This allowed us to examine the relationship between the covariate (pre-test scores) and
dependent variable (post-test scores) Analysis of covariance (ANCOVA) was used to examine the effect of
learner-centered approach to teaching and teacher-centered approach on preservice teachersrsquo probabilistic
reasoning since different participants were in each group The ANCOVA is ideal in removing the bias of these
variables (Field 2005) In order to determine whether or not the occurrence of scores was not by chance a
partial eta squared was used to gauge the magnitude of the difference (effect size) between means of the scores
Pallant (2001) outlined the following criterion for interpreting partial eta squared values as 001 = small effect
006 = moderate effect and 014 = large effect
Results
Before introducing the learner-centered and teacher-centered approaches of teaching preservice teachersrsquo
probabilistic reasoning was compared to ascertain whether or not their results were similar in terms of the mean
scores The result is presented in Table 3
Table 3 Results of the Independent Samples t-test on the Pre-test of the Group B and Group A
Group N Mean Std Dev Mean Difference Df t-value p-value
Group B 27 585 1562 35 56 756 456
Group A 32 550 1967
The results in Table 3 indicate that there was no statistically significant difference between the probabilistic
reasoning mean scores of Group A = 550 = 1967 and Group B = 585 = 1562 in the
International Journal of Studies in Education and Science (IJSES)
131
pretest This is an indication that the two groups are similar and their performance could be compared after the
two teaching approaches
Comparison of Probabilistic Reasoning of the Preservice Teachers before and after Learner-centered
Approach in Group A
The results of analysis of the effect of the learner-centered approach on preservice teachersrsquo probabilistic
reasoning is presented in Table 4
Table 4 Pre-test and Post-test Scores for Group A
Minimum Maximum Mean Std Deviation
Pre-test 1 10 550 1967
Post-test 8 20 1572 3630
Table 4 reveals that in the post-test preservice teachersrsquo probabilistic reasoning mean scores increased from
550 to 1572 in the post-test in Group A
A paired sample t‐test was conducted to compare the post-test and pre-test scores for the preservice teachers
taught with the learner-centered approach to teaching (Group A) in order to determine if the mean difference in
scores was statistically significant This was done to evaluate the effect of the learner-centered approach on
preservice teachersrsquo probabilistic reasoning Table 5 presents the results
Table 5 Paired Sample t-test Results on the Post-test and Pre-test of Group A
Mean
Difference
Std
Deviation
Std Error
Mean
t Df Sig
Post-test ndash Pre-test 10219 2871 507 20137 31 000
The results from Table 5 shows a statistically significant difference in the preservice teachersrsquo probabilistic
reasoning from the pre-test (M = 550 SD = 1967) to the post-test (M = 1572 SD = 3630) with t (31) =
20137 p = 000 The result reveals that preservice teachersrsquo probabilistic reasoning has improved significantly
after the learner-centered approach was used since = 000 05 It can be inferred that the learner-centered
approach to teaching has a positive significant effect on preservice teachersrsquo probabilistic reasoning
Analysis of Probabilistic Reasoning of the Preservice Teachers before and after Teacher-centered
Approach to Teaching
The results of the analysis of the effect of the teacher-centered approach to teaching on preservice teachersrsquo
probabilistic reasoning is presented in Table 6
Hokor amp Sedofia
132
Table 6 Pre-test and Post-test Scores for the Group B
Minimum Maximum Mean Std Deviation
Pre-test 2 8 585 1562
Post-test 5 14 952 2208
The data on Table 6 show that the mean score of preservice teachers in the pre-test was 585 while that of the
post-test was 952 marks This indicates that in the post-test an average of each of the preservice teachersrsquo
probabilistic reasoning increased slightly in Group B To determine if the mean difference is statistically
significant a paired sample t‐test was conducted Table 7 presents the results
Table 7 Results of the Paired Samples t-test on the Post-test and Pre-test of the Group B
Mean
Difference
Std Deviation Std Error
Mean
t Df Sig
Post-test ndash Pre-test 3667 1441 0277 13220 26 000
The result presented on Table 7 shows that the mean score difference between the post-test and pre-test of
Group B was 3667 marks with a corresponding standard deviation of 1441 The paired sample t-test was
conducted to find out if the mean score difference (M = 3667 SD = 1441) was statistically significant This
was done to assess the effect of the teacher-centered approach targeted at addressing misconceptions on
preservice teachersrsquo probabilistic reasoning The results from Table 7 reveal that there was a statistically
significant difference in the preservice teachersrsquo probabilistic reasoning scores from the pre-test (M = 585 SD =
1562) to the post-test (M = 952 SD = 2208) with t (26) = 13220 p = 000 lt 05 This is an indication that the
teacher-centered approach to teaching probability targeted at addressing probabilistic misconceptions aids
students to improve upon their understanding and problem-solving abilities in probability
Next we compared the effectiveness of the learner-centered approach of teaching and the teacher-centered
approach of teaching in terms of probabilistic reasoning of preservice teachers and how they addressed
probabilistic misconceptions
Comparison of Effectiveness of Learner-centered Approach and Teacher-centered Approach in
Developing Probabilistic Reasoning
The preservice teachersrsquo scores on the pre-test of the achievement test were used as covariate in this analysis
The scores from the post-test were then compared using ANCOVA with = 05 to adjust for pre-test
differences that existed between Group A and Group B In the pre-test the mean scores of Group B and Group A
were 585 and 550 respectively ANCOVA was used to adjust the post-test scores statistically to compensate
for the 035 mean point difference between the two groups in the pre-test This adjustment led to a more
accurate post-test comparison Table 8 presents the results
International Journal of Studies in Education and Science (IJSES)
133
Table 8 Summary of ANCOVA of the Performance of Preservice Teachers taught with Learner-centered
Approach and Teacher-centered Approach (N = 59)
Source Sum of
Squares
Df
Mean
Square
F Sig Partial Eta
Squared
Corrected
Model
791144a 2 395562 72150 000 720
Intercept 205135 1 205135 37416 000 401
Pre-test 228184 1 228184 41620 000 426
Group 630253 1 630253 114955 000 672
Error 307026 56 5483
Total 10888000 59
Corrected Total 1098169 58
a R Squared = 720 (Adjusted R Squared = 710)
The data on Table 8 indicate that there is a statistically significant main effect on the preservice teachers who
were taught using the learner-centered approach to learn probability [F (1 56) = 114955 p = 000 lt 05]
Consequently the preservice teachers taught with the learner-centered approach performed better than their
counterparts who experienced the teacher-centered approach to learn probability The partial eta squared value
was found to be 0672 This value indicates a large effect size That is 672 of the variance in the dependent
variable (probabilistic reasoning achievement score) is expounded by the independent variable (teacher-centered
approach) This implies that the magnitude of the difference between the mean score of the preservice teachers
taught with the learner-centered approach and the teacher-centered approach is large With the high scores of
preservice teachers in the Group A it implies that the use of learner-centered approach in the teaching and
learning of probability improved the performance of the preservice teachers
The outcome of the study portrays that there was a statistically significant difference in the probabilistic
reasoning achievement mean scores of Group A than that of Group B [F (1 56) = 114955 p = 000 lt 05] This
finding implies that Group A performed better than Group B in the probabilistic reasoning achievement test
This is an indication that when the learner-centered approach to teaching probability is targeted at addressing
probabilistic misconceptions preservice teachers develop better probabilistic reasoning than teacher-centered
approach
Discussion
This study set out to compare the learner-centered and teacher-centered approaches of teaching in order to
determine the best way of developing preservice teachersrsquo probabilistic reasoning at the College of Education
Hokor amp Sedofia
134
level in Ghana The results as shown on Tables 3 4 5 6 7 and 8 indicate that the learner-centered approach to
teaching probability is more effective than the teacher-centered approach in motivating and inspiring preservice
teachers to learn and apply probability The learner-centered approach provides studentsrsquo opportunities to think
reason reflect and evaluate their ideals and that of colleagues
The findings of the present study are in tandem with several research findings Lessani Md Yunus and Bakar
(2017) investigated mathematics teaching approaches and their consequences on learnersrsquo ability to solve
challenging problems Their findings affirm the learner-centered approach to be more effective in studentsrsquo
creativity and innovation in solving real-life problems than the teacher-centered approach So training
programs for excellent teaching and learning should be flexible and innovative to allow preservice teachers to
explore gaps in learning and teaching (AIAhmad 2021) Similarly Prideaux (2007) found that students who
experienced the learner-centered approach of teaching performed significantly higher than those who were
taught without the learner-centered approach of teaching Roseth Garfield and Ben-Zvi (2008) also examined
the effect of the cooperative framework in classroom teaching and collaboration and found that student-
centered approaches to teaching help students to have better understanding of statistics than teacher-centered
instruction
Furthermore Gurbuz and Birgin (2011) studied the effect of computer-assisted teaching on addressing
probabilistic misconceptions of students The authors used pre-test to collect data on both the computer-assisted
and traditional groups before the experimental teachings After the intervention the post-test was administered
to ascertain the effect of computer-assisted teaching and teacher-centered approach on addressing studentsrsquo
probabilistic misconceptions Their study found computer-assisted teaching to have more significant effect on
studentsrsquo correct probabilistic reasoning than teacher-centered approach of teaching
As noted by Batanero and Diaz (2012) probability forms an integral part of the Mathematics curriculum in
many countries But the concept is one that some learners find difficult to understand partly due to the method
of teaching used by teachers This fact implies that teachers of mathematics should find more creative ways of
teaching the concept so as to make it easier for learners to understand and apply the concept As discovered in
this study the learner-centered approach is effective in developing probabilistic reasoning But the learner-
centered approach works best when certain conditions are present At the outset there is the need for relevant
teaching and learning materials Then teachers need to be trained and retrained in the use of the learner-centered
approach to teaching At the college of education level preservice teachers need to be taught using the learner-
centered approach not only to help them understand probability but also to help them use the learner-centered
approach in their own teaching
The activities used for Group A which is learner-centered approach group in the form of games promote
content knowledge and cognitive skills competencies such as collaboration and problem solving (Belova amp
Zowada 2020) The activities focus on promoting learning experiences rather than stressing on the
entertainment factor While some things students learn in school seem to them predetermined and bound by
laws in other branches of mathematics probability provides students with opportunity to learn that solutions to
International Journal of Studies in Education and Science (IJSES)
135
several problems depend on assumptions and have degrees of doubt So teaching methods that allow students to
predict and test their predictions should be encouraged for students to develop their intellectual repertoire The
processes used in reasoning about sample space will serve students well in life Several calls on the need to pay
attention to the study of probability show that teachers and mathematics teachers must provide their students
with appropriate teaching strategies to enhance their conceptual understanding In the preparation of preservice
teachers to become mathematically competent citizens teacher preparation programs such as teaching methods
must provide opportunities for preservice teachers to confront misconceptions and reason probabilistically
(Courtney amp Caniglia 2021)
The findings of the present study however run counter to those of Weltman and Whiteside (2010) They
conducted a study on the effectiveness of the traditional and active learning method in business statistics The
study found that active learning had not been effective for all category of students It is not precisely clear what
may have accounted for that result This is because active learning methods have generally been known to be
effective in promoting learning Further research is thus required in this regard
Conclusions
This study compared the effects of the learner-centered and teacher-centered approaches of teaching in
addressing probabilistic misconceptions by measuring preservice teachersrsquo probabilistic reasoning scores The
results show that the learner-centered approach aids preservice teachers to develop better probabilistic reasoning
than the teacher-centered approach to teaching Thus the study concludes that the learner-centered approach to
teaching is a solution to preservice teachersrsquo inability to answer questions on probability correctly Even though
each teaching approach targeted at addressing misconceptions was found to have significant effect on pre-
service teachersrsquo probabilistic reasoning the learner-centered approach was found to be more effective than the
teacher-centered approach in addressing misconceptions which limit studentsrsquo ability to solve probability
problems correctly
Implications and Recommendations
This study makes some key contributions to the teacher educationdevelopment literature in general and
particularly to the development of probabilistic reasoning of preservice teachers The study provides empirical
evidence that the learner-centered approach targeted at addressing probabilistic misconceptions is more effective
in developing probabilistic reasoning in preservice teachers What this means is that when teacher educators use
the learner-centered approach to teach the concept of probability and focus on addressing misconceptions
preservice teachers will develop better probabilistic reasoning This will in turn translate into preservice
teachers answering questions on probability correctly in their examinations and ultimately making them teach
the concept more effectively when they complete their training It is thus recommended that teachers should
consider employing the learner-centered approach in teaching the concept of probability
Hokor amp Sedofia
136
Limitations
As with every empirical study employing the quasi-experimental approach the current study has some
limitations which need to be acknowledged and used to guide users of the findings Firstly our sample was
drawn from a population of second year preservice teachers of a female only college of education in a peri-
urban area in Ghana Further experiments are therefore needed in other settings in order to see if the same or
similar results will occur Secondly owing to the narrow characteristics of the participants in the present study
the researchers cannot generalize the results to other individuals who do not have the same characteristics So
additional experiments with groups with different characteristics are necessary Lastly the experiments need to
be repeated at another time to determine if the results are the same (consistent) over time
Acknowledgements
We are grateful to the Principal and preservice teachers for granting access and participating in the study
respectively
References
AIAhmad H (2021) The role of educational communication in promoting student-centered learning style in
multicultural classrooms A reflective essay on learning and teaching in higher education International
Journal of Research in Education and Science (IJRES) 7(3) 838-851 httpsdoiorg1046328ijes2374
Aina J K Olanipekun S S amp Garuba I A (2015) Teachersrsquo effectiveness and its Influence on studentsrsquo
learning Advances in Social Sciences Research Journal 2(4) 88-95
Anway D W amp Bennett E (2004) Common Misconceptions in Probability among Students in an Elementary
Statistics class Unplished Senior Project The ARTIST Roundtable Conference on Assessment in
Statistics held at Lawrence University Supperior WI The University of Wisconsin-Superior
Bada S (2015) Constructivist Learning Theory A Paradigm for Teaching and Learning IOSR Journal of
Research and Method in Education (IOSR-JRME) 5(6) 66-70 httpsDOI1097907388-05616670
Baerveldt C (2013) Constructivism contested Implications of a genetic perspective in psychology Integrative
Psychological and Behavioral Science 47(1) 156-166
Batanero C (2013) Teaching and learning probability In S Lerman (Ed ) Encyclopedia of Mathematics
Education Heidelberg Springer
Batanero C and Diaz C (2012) Training school teachers to teach probability reflections and challenges
Chilean Journal of Statistics 3(1) 3-13
Belova N amp Zowada C (2020) Innovating Higher Education Via Game-Based Learning on Misconceptions
Education Sciences 10 221 doi103390educSCi10090221
Bennett E amp Anway D W (2003) Statistical and Probabilistic Reasoning and Misconceptions among
Selected College Students McNair Scholars Journal Vol 4 httpwwwsocheclchjs
Cantoy O (2010) Mathematics teachersrsquo topic-specific pedagogical content knowledge in the context of
teaching a0 0 and a divide 0 Educational Sciences Theory and Practice 10 (2) 749-769
International Journal of Studies in Education and Science (IJSES)
137
Clements D H amp Battista M (1990) Constructivist Learning and Teaching The
Arithetic Teacher 38(1) ProQuest Central pg 34 DOI105951AT3810034
Creswell J W amp Creswell J D (2018) Research design Qualitative quantitative and
mixed methods approaches (5th
ed) Los Angeles SAGE Publications Inc
Courtney S A amp Caniglia J (2021) Comparing the mathematical practices pre-service teachers and
mathematics teacher educators identified as relevant to problems and tasks International Journal of
Research in Education and Science (IJRES) 7(3) 954-971 httpsdoiorg1046328ijres2335
Denton D W (2012) Enhancing instruction through constructivism cooperative learning and cloud
computing Tech Trends 56(4) 34-41
Gage J (2012) Towards a new Probability Curriculum for Secondary Schools Paper presented at 12th
International Congress on Mathematical Education 8 July-15 July COEX Seoul Korea Cambridge
Cambridge University Uk
Gurbuz R amp Birgin O (2011) The effect of computer-assisted teaching on remedying misconceptions The
case of the subject Probability Journal Homepage 58(2012) DOI 101016jcompedu201111005
Hirsh L amp ODonnell A M (2001) Representativeness in Statistical Reasoning Identifying and Assessing
Misconceptions Journal of Statistics Education 9(2) 96-105 DOI10108010691898200111910655
Johnson H D amp Dasgupta N (2005) Traditional versus Non-traditional Teaching during Perspectives of
Students in Introductory Statistics Classes Journal of Statistics Education 13(2)
httpsdoiorg10108010691898200511910558
Major T amp Mangope B (2012) The Constructivist Theory in Mathematics The case of Botswana Primary
Schools International Review of Social Sciencies and Humanities 3(2) 139-147
Jones G (2005) Reflections In GA Jones (Ed) Exploring probability in school chanlleges for teaching and
probability (367-372) New York Springer
Jun L (2000) Chinese Students Understanding of Probability Published doctoral dissertation Singapore
National Institute of Education Nanyang Technological University
Khazanov L amp Gourgey A (2009) Instructors Perspectives on Students Mistaken Beliefs about Probability
in an Elementary College Statistics Course In K Safford-Ramus (Ed) Proceedings of the Adults
Learning Mathematics a Resaerch Forum (ALM) 15th
Annual International Conference 249-264
Khazanov L amp Prado L (2010) Correcting Students Misconceptions about Probability in an Introductory
College Statistics Course Adults Learning Mathematics-An International Journal 5(1) 23-35
Kleickmann T Richter D Kunter M Elsner J Besser M Krauss S amp Baumert J (2013) Teachersrsquo
Content Knowledge and Pedagogical Content Knowledge The Role of Structural Differences in Teacher
Education Journal of Teacher Education 64(1) 90-106 DOI1011770022487112460398
Leedy P D and Ormrod J E (2020) Practical research Planning and design (12th Global Edition) Harlow
England Pearson
Lessani A Md Yunus AS amp Bakar KBA (2017) Comparison of new mathematics teaching methods with
teacher-centered approach International Journal of Social Sciences 3(2) 1285-1297
httpsdxdoiorg1020319pijss20173212851297
Lim C amp Hwa T (2007) Promoting Mathematical Thinking in the Malaysian Classroom Issues and
challenges httpswwwresearchgatenetpublication252353381
Hokor amp Sedofia
138
Lovett J N amp Lee H S (2017) New Standards Require Teaching More Statistics Are Preservice Secondary
Mathematics Ready Journal of Teachers Education 68(3) 299-311 DOI 1011770022487117697918
Major T amp Mangope B (2012) The Constructivist Theory in Mathematics The case of Botswana Primary
Schools International Review of Social Sciencies and Humanities 3(2) 139-147
National Council of Teachers of Mathematics (2003) Principles and Standards for School Mathematics and
their Implications for Professional Development Reston VA NCTM
Nguyen L (2015) Developing Conceptual Understanding and Probabilistic Thinking through Tree Diagrams
Published MPhil Dissertation Manitoba The Faculty of Graduate Studies of the University of
Manitoba
Prideaux J (2007) The learner-centered approach to Mathematics Teaching and the Active Learning
Strategies used to Enhance Students Understanding Mathematical and Computing Sciences Masters
Paper 29 Fisher Digital Publications httpfisherpubsjfcedumathcsetdmasters29
Roseth C J Garfield J B amp Ben-Zvi D (2008) Collaboration in Learning and Teaching Statistics Journal
of Statistics Education 16 (1) 1069-1898 httpsdoiorg10108010691898200811889557
Santagata R and Sandholtz J H (2019) Preservice teachersrsquo mathematics teaching competence Comparing
performance on two measures Journal of Teacher Education 70 (5) 472 ndash484
Schwerdt G amp Wuppermann A C (2011) Is traditional teaching really all that bad A within-student
between-subject approach Economics of Education Review 30(2) 365-379
Sharma S (2016) Probability from a socio-cultural perspective Statistics Education Research Journal 15(2)
126-144 httpiase-weborgPublicationsphpp=SERJ
Shay K (2008) Tracing middle school students understanding of probability a longitudinal study
Unpublished Doctoral Dissertation New Brunswick New Jersey Rutgers State University of New
Jersey
Shulman L S (1986) Those who understand Knowledge growth in teaching Educational Researcher 15(2)
4-14 doi 1031021001318X015002004
Thomas L (2020) An introduction to quasi-experimental designs
httpswwwscribbrcommethodologyquasi-experimental-design
Voskoglou M (2019) Comparing Teaching Methods of Mathematics at University Level Education Sciences
9(204) doi103390educsci9030204
Vygotsky L S (1978) Mind in society The development of higher psychological processes Cambridge MA
Harvard University Press
Weldeana H N amp Abraham S T (2014) The effect of an historical perspective on prospective teachersrsquo
beliefs in learning mathematics Journal of Mathematics Teacher Education 17 303-330
doi101007s10857-013-9266-z
Weltman D amp Whiteside M (2010) Comparing the Effectiveness of Traditional and active Learning Methods
in Business Statistics Convergence to the Mean 18(1)
httpsdoiorg10108010691898201011889480
White H amp Sabarwal S (2014) Quasi-experimental design and methods methological briefs impact
evaluations Florence UNICEF Office of research
International Journal of Studies in Education and Science (IJSES)
139
Author Information
Evans Kofi Hokor
httpsorcidorg0000-0002-8387-8294
St Teresarsquos College of Education Hohoe
Department of Mathematics and ICT
P O Box 129
Ghana
Contact e-mail evanskhokorgmailcom
John Sedofia
httpsorcidorg0000-0002-5409-516X
University of Ghana Legon
Department of Teacher Education
PO Box LG 1181
Ghana
Hokor amp Sedofia
140
Appendix A Pre-test Probabilistic Reasoning Assessment
This assessment is for research purpose to improve teaching and learning of probability
You are required to answer all questions honestly Do and leave all workings or rough work on the paper
Pre-test Probabilistic Reasoning Assessment Duration 1hr
Index numberhelliphelliphelliphelliphelliphelliphelliphelliphelliphelliphelliphelliphelliphelliphelliphelliphelliphellipLevelhelliphelliphelliphellipAgehelliphelliphellip
Read each statement carefully and circle the letter of the correct (best) option Provide appropriate response in
the space provided under some items as it apply
1 If you rolled an ordinary die and obtained 51246 which of these is most likely to occur on your next
roll
a 1
b 2
c 3
d 4
e 5
f 6
g The options a b c d e and f are all equally
2i A fair coin is tossed and it lands tail The coin is to be tossed a second time What is the probability that the
second toss will also be a tail
a 1
4
b 1
2
c 1
3
d Slightly less than 1
2
e Slightly more than 1
2
f 0
2ii Which of the following best describes the reason for the correct answer to the preceding question (2i)
a The second toss is less likely to be tail because the first toss was tail
b There are four possible outcomes when you toss a coin twice Getting two tails is only one of them
c The chance of getting heads or tails on any one toss is always 1
2
d There are three possible outcomes when you toss a coin twice Getting two tails is only one of the them
e No chance of being a tail in the second toss
3i A box contains 6 balls 2 are red 2 are black and 2 blue Three balls are picked at random one at a time
Each time a ball is picked the colour is recorded and the ball is put back in the box mixed thoroughly If the
first 2 balls are black what color is the third ball most likely to be
a Red
International Journal of Studies in Education and Science (IJSES)
141
b Black
c Blue
d Red and blue are equally likely than black
e Red black and blue are all equally likely
3ii Which of the following best describes the reason for the correct answer in the preceding question (3i)
a The third ball should not be black because too many black ones have already been picked
b The picks are independent so every color has an equally likely chance of being picked
c Black seems to be lucky
d This color is just as likely as any other color
4 A spinner with ten equally divided sectors in which four parts are white and the rests are red is about to
be spin which color is the spinner more likely to land
a White
b Red
c Both white and red are all equally
5 If you toss a fair coin and get heads two times in a row which of these is most likely on next toss
a Tail
b Head
c Both head and tail are all equally
6 A Gh 2 Gh 5 Ghcent10 Gh 20 Gh 50 and Gh 100 notes were put in a box and thoroughly mixed
What is the probability of picking Gh 50 note without looking
a 1
187
b 50
187
c 1
6
d 0
7 In a game you have been offered two options Which of the following give you higher chance of
winning GHcent200
a Tossing one die once and obtaining a 6
b Tossing two dice once and obtaining two 6rsquos
c The options a and b are all equally
8 A fair die is to be toss six times which of these is most likely to occur
a 251634
b 123456
c 666341
d 132244
e The options a b c and d are all equally likely
9 A fair coin is to be toss four times in a row which of these is least likely to occur
a THTH
b TTTH
c HHH
Hokor amp Sedofia
142
d The options a b and c are all equally likely
10 Two fair dice are to be tossed once Which of the following is more likely to occur
a Obtaining a sum of 11
b Obtaining a sum of 10
c A sum of 11 and a sum of 10 are all equally likely
10i Give reason for the correct answer in the preceding question (10)
helliphelliphelliphelliphelliphelliphelliphelliphelliphelliphelliphelliphelliphelliphelliphelliphelliphelliphelliphelliphelliphelliphelliphelliphelliphelliphelliphelliphelliphelliphelliphelliphelliphelliphelliphelliphelliphelliphelliphelliphelliphellip
helliphelliphelliphelliphelliphelliphelliphelliphelliphelliphelliphelliphelliphelliphelliphelliphelliphelliphelliphelliphelliphelliphelliphelliphelliphelliphelliphelliphelliphelliphelliphelliphelliphelliphelliphelliphelliphelliphelliphelliphelliphellip
helliphelliphelliphelliphelliphelliphelliphelliphelliphelliphelliphelliphelliphelliphelliphelliphelliphelliphelliphelliphelliphelliphelliphelliphelliphelliphelliphelliphelliphelliphelliphelliphelliphelliphelliphelliphelliphelliphelliphelliphelliphellip
helliphelliphelliphelliphelliphelliphelliphelliphelliphelliphelliphelliphelliphelliphelliphelliphelliphelliphelliphelliphelliphelliphelliphelliphelliphelliphelliphelliphelliphelliphelliphelliphelliphelliphelliphelliphelliphellip
11 In national lottery one has to choose five numbers from 1 to 90 inclusive You win when at least two of
your numbers are part of the numbers drawn on Saturday at random Eric has chosen 4 6 7 9 and 11
Alex has chosen 15 23 45 66 and 80 Daniel has chosen 71 77 78 83 and 85 Do Eric Alex and
Daniel have the same chance of winning or not and why
helliphelliphelliphelliphelliphelliphelliphelliphelliphelliphelliphelliphelliphelliphelliphelliphelliphelliphelliphelliphelliphelliphelliphelliphelliphelliphelliphelliphelliphelliphelliphelliphelliphelliphelliphelliphelliphelliphelliphelliphellip
helliphelliphelliphelliphelliphelliphelliphelliphelliphelliphelliphelliphelliphelliphelliphelliphelliphelliphelliphelliphelliphelliphelliphelliphelliphelliphelliphelliphelliphelliphelliphelliphelliphelliphelliphelliphelliphelliphelliphelliphellip
helliphelliphelliphelliphelliphelliphelliphelliphelliphelliphelliphelliphelliphelliphelliphelliphelliphelliphelliphelliphelliphelliphelliphelliphelliphelliphelliphelliphelliphelliphelliphelliphelliphelliphelliphelliphelliphelliphelliphelliphellip
helliphelliphelliphelliphelliphelliphelliphelliphelliphelliphelliphelliphelliphelliphelliphelliphelliphelliphelliphelliphelliphelliphelliphelliphelliphelliphelliphelliphelliphelliphelliphelliphelliphelliphelliphellip
12 A box contains 8 yellow balls and 4 green balls Two balls are chosen at random one after the other
without replacement determine the probability that the two balls are of different colours
helliphelliphelliphelliphelliphelliphelliphelliphelliphelliphelliphelliphelliphelliphelliphelliphelliphelliphelliphelliphelliphelliphelliphelliphelliphelliphelliphelliphelliphelliphelliphelliphelliphelliphelliphelliphelliphelliphelliphelliphellip
helliphelliphelliphelliphelliphelliphelliphelliphelliphelliphelliphelliphelliphelliphelliphelliphelliphelliphelliphelliphelliphelliphelliphelliphelliphelliphelliphelliphelliphelliphelliphelliphelliphelliphelliphelliphelliphelliphelliphelliphellip
helliphelliphelliphelliphelliphelliphelliphelliphelliphelliphelliphelliphelliphelliphelliphelliphelliphelliphelliphelliphelliphelliphelliphelliphelliphelliphelliphelliphelliphelliphelliphelliphelliphelliphelliphelliphelliphelliphelliphelliphellip
helliphelliphelliphelliphelliphelliphelliphelliphelliphelliphelliphelliphelliphelliphelliphelliphelliphelliphelliphelliphelliphelliphelliphelliphelliphelliphelliphelliphelliphelliphelliphelliphelliphelliphelliphelliphellip
International Journal of Studies in Education and Science (IJSES)
143
Appendix B Post-test Probabilistic Reasoning Assessment
This assessment is for research purpose to improve teaching and learning of probability
You are required to answer all questions honestly Do and leave all workings or rough work on the paper
Post-test Probabilistic Reasoning Assessment Duration One Hour
Index numberhelliphelliphelliphelliphelliphelliphelliphelliphelliphelliphelliphelliphelliphelliphellipClasshelliphelliphelliphellipAgehelliphelliphelliphellip
Read each statement carefully and circle the letter of the correct (best) option for each item as much as possible
and provide appropriate response in the space provided
1 Suppose a particular outcome from a random event has a probability of 04 Which of the following
statements represents correct interpretations of this probability
a The outcome will not happen
b The outcome will certainly happen about four times out of every 10 trials
c The outcome is expected to happen about four times out of every 10 trials
d The outcome could happen or it couldnrsquot of either result are the same
2 If you toss a fair coin and get heads 3 times in a row what is the chance of getting a head on the next toss
a 1
b Greater than 1
2
c 1
2
d Less than 1
2
e 0
3 A die is numbered 1 2 3 4 4 5 When the die is thrown once Which of these is most likely and why
a 1
b 2
c 3
d 4
e 5
f They are all equally likely
3i Give reason for your chosen answer in (3)
helliphelliphelliphelliphelliphelliphelliphelliphelliphelliphelliphelliphelliphelliphelliphelliphelliphelliphelliphelliphelliphelliphelliphelliphelliphelliphelliphelliphelliphelliphelliphelliphelliphelliphelliphelliphelliphelliphelliphelliphelliphelliphelliphelliphellip
helliphelliphelliphelliphelliphelliphelliphelliphelliphelliphelliphelliphelliphelliphelliphelliphelliphelliphelliphelliphelliphelliphelliphelliphelliphelliphelliphelliphelliphelliphelliphelliphelliphelliphelliphelliphelliphelliphelliphelliphelliphelliphelliphelliphellip
helliphelliphelliphelliphelliphelliphelliphelliphelliphelliphelliphelliphelliphelliphelliphelliphelliphelliphelliphelliphelliphelliphelliphelliphelliphelliphelliphelliphelliphelliphelliphelliphelliphelliphelliphelliphelliphelliphelliphelliphelliphelliphelliphelliphellip
helliphelliphelliphelliphelliphelliphelliphelliphelliphelliphelliphelliphelliphelliphelliphelliphelliphelliphelliphelliphelliphelliphelliphelliphelliphelliphelliphelliphelliphelliphelliphelliphelliphelliphelliphelliphelliphelliphellip
4 German MP tossed two dice once Which of these is mostly likely and why
a Obtaining a sum of 4
b Obtaining a sum of 7
c Obtaining a sum of 11
d All of them have equal chance of occurring that is a b c
Hokor amp Sedofia
144
4i Give reason for your chosen answer in (4)
helliphelliphelliphelliphelliphelliphelliphelliphelliphelliphelliphelliphelliphelliphelliphelliphelliphelliphelliphelliphelliphelliphelliphelliphelliphelliphelliphelliphelliphelliphelliphelliphelliphelliphelliphelliphelliphelliphelliphelliphelliphelliphelliphelliphellip
helliphelliphelliphelliphelliphelliphelliphelliphelliphelliphelliphelliphelliphelliphelliphelliphelliphelliphelliphelliphelliphelliphelliphelliphelliphelliphelliphelliphelliphelliphelliphelliphelliphelliphelliphelliphelliphelliphelliphelliphelliphelliphelliphelliphellip
helliphelliphelliphelliphelliphelliphelliphelliphelliphelliphelliphelliphelliphelliphelliphelliphelliphelliphelliphelliphelliphelliphelliphelliphelliphelliphelliphelliphelliphelliphelliphelliphelliphelliphelliphelliphelliphelliphelliphelliphelliphelliphelliphelliphellip
helliphelliphelliphelliphelliphelliphelliphelliphelliphelliphelliphelliphelliphelliphelliphelliphelliphelliphelliphelliphelliphelliphelliphelliphelliphelliphelliphelliphelliphelliphelliphelliphelliphelliphelliphelliphelliphelliphelliphelliphelliphelliphelliphelliphellip
helliphelliphelliphelliphelliphelliphelliphelliphelliphelliphelliphelliphelliphelliphelliphelliphelliphelliphelliphelliphelliphelliphelliphelliphelliphelliphelliphelliphellip
5i A fair coin is to be toss four times which of these is most likely to occur
a HTHT
b THTT
c TTTT
d HHTH
e The options a b c and d are all equally likely
5ii Give reason for your chosen answer in (5i)
helliphelliphelliphelliphelliphelliphelliphelliphelliphelliphelliphelliphelliphelliphelliphelliphelliphelliphelliphelliphelliphelliphelliphelliphelliphelliphelliphelliphelliphelliphelliphelliphelliphelliphelliphelliphelliphelliphelliphelliphelliphelliphelliphelliphellip
helliphelliphelliphelliphelliphelliphelliphelliphelliphelliphelliphelliphelliphelliphelliphelliphelliphelliphelliphelliphelliphelliphelliphelliphelliphelliphelliphelliphelliphelliphelliphelliphelliphelliphelliphelliphelliphelliphelliphelliphelliphelliphelliphelliphellip
helliphelliphelliphelliphelliphelliphelliphelliphelliphelliphelliphelliphelliphelliphelliphelliphelliphelliphelliphelliphelliphelliphelliphelliphelliphelliphelliphelliphelliphelliphelliphelliphelliphelliphelliphelliphelliphelliphelliphelliphelliphelliphelliphelliphellip
helliphelliphelliphelliphelliphelliphelliphelliphelliphelliphelliphelliphelliphelliphelliphelliphelliphelliphelliphelliphelliphelliphelliphelliphelliphelliphelliphelliphelliphelliphelliphelliphelliphelliphelliphelliphelliphelliphellip
6i A fair coin is to be toss four times which of these is least likely to occur
a HTHT
b THTT
c TTTT
d HHTH
e The options a b c and d are all equally likely
6ii Give reason for your chosen answer in (6i)
helliphelliphelliphelliphelliphelliphelliphelliphelliphelliphelliphelliphelliphelliphelliphelliphelliphelliphelliphelliphelliphelliphelliphelliphelliphelliphelliphelliphelliphelliphelliphelliphelliphelliphelliphelliphelliphelliphelliphelliphelliphelliphelliphelliphellip
helliphelliphelliphelliphelliphelliphelliphelliphelliphelliphelliphelliphelliphelliphelliphelliphelliphelliphelliphelliphelliphelliphelliphelliphelliphelliphelliphelliphelliphelliphelliphelliphelliphelliphelliphelliphelliphelliphelliphelliphelliphelliphelliphelliphellip
helliphelliphelliphelliphelliphelliphelliphelliphelliphelliphelliphelliphelliphelliphelliphelliphelliphelliphelliphelliphelliphelliphelliphelliphelliphelliphelliphelliphelliphelliphelliphelliphelliphelliphelliphelliphelliphelliphelliphelliphelliphelliphelliphelliphellip
helliphelliphelliphellip
7 A college has 300 level 200 students and 236 level 100 students in it Each studentrsquos name is written with
the level on a piece of paper and all the names are put into a box and mixed thoroughly A tutor picks one
name out of the box without looking Which level is the tutor more likely to pick from and why
helliphelliphelliphelliphelliphelliphelliphelliphelliphelliphelliphelliphelliphelliphelliphelliphelliphelliphelliphelliphelliphelliphelliphelliphelliphelliphelliphelliphelliphelliphelliphelliphelliphelliphelliphelliphelliphelliphelliphelliphelliphelliphelliphelliphellip
helliphelliphelliphelliphelliphelliphelliphelliphelliphelliphelliphelliphelliphelliphelliphelliphelliphelliphelliphelliphelliphelliphelliphelliphelliphelliphelliphelliphelliphelliphelliphelliphelliphelliphelliphelliphelliphelliphelliphelliphelliphelliphelliphelliphellip
helliphelliphelliphelliphelliphelliphelliphelliphelliphelliphelliphelliphelliphelliphelliphelliphelliphelliphelliphelliphelliphelliphelliphelliphelliphelliphelliphelliphelliphelliphelliphelliphelliphelliphelliphelliphelliphelliphelliphelliphelliphelliphelliphelliphellip
helliphelliphelliphelliphelliphelliphelliphelliphelliphelliphelliphelliphelliphelliphelliphelliphelliphelliphelliphelliphelliphelliphelliphelliphelliphelliphelliphelliphelliphelliphelliphelliphelliphelliphelliphelliphelliphelliphelliphellip
8 Suppose that you toss a coin three times and all eight outcomes are equally likely If it is known that the first
toss comes up heads what is the probability of an odd number of heads appearing
helliphelliphelliphelliphelliphelliphelliphelliphelliphelliphelliphelliphelliphelliphelliphelliphelliphelliphelliphelliphelliphelliphelliphelliphelliphelliphelliphelliphelliphelliphelliphelliphelliphelliphelliphelliphelliphelliphelliphelliphelliphelliphelliphelliphellip
helliphelliphelliphelliphelliphelliphelliphelliphelliphelliphelliphelliphelliphelliphelliphelliphelliphelliphelliphelliphelliphelliphelliphelliphelliphelliphelliphelliphelliphelliphelliphelliphelliphelliphelliphelliphelliphelliphelliphelliphelliphelliphelliphelliphellip
helliphelliphelliphelliphelliphelliphelliphelliphelliphelliphelliphelliphelliphelliphelliphelliphelliphelliphelliphelliphelliphelliphelliphelliphelliphelliphelliphelliphelliphelliphelliphelliphelliphelliphelliphelliphelliphelliphelliphelliphelliphelliphelliphelliphellip
International Journal of Studies in Education and Science (IJSES)
145
helliphelliphelliphelliphelliphelliphelliphelliphelliphelliphelliphelliphelliphelliphelliphelliphelliphelliphelliphelliphelliphelliphelliphelliphelliphelliphelliphelliphelliphelliphelliphelliphelliphelliphelliphelliphelliphelliphelliphelliphelliphelliphelliphelliphellip
helliphelliphelliphelliphelliphelliphelliphelliphelliphelliphelliphelliphelliphelliphelliphelliphelliphelliphelliphelliphelliphelliphelliphelliphelliphelliphelliphelliphelliphelliphelliphelliphelliphelliphelliphelliphelliphelliphelliphelliphelliphelliphelliphelliphellip
helliphelliphelliphelliphelliphelliphelliphelliphelliphelliphelliphelliphelliphelliphelliphelliphelliphelliphelliphellip
9 A card is selected at random from a pack of 52 cards Find the probability of selecting a card which is a red or
a queen
helliphelliphelliphelliphelliphelliphelliphelliphelliphelliphelliphelliphelliphelliphelliphelliphelliphelliphelliphelliphelliphelliphelliphelliphelliphelliphelliphelliphelliphelliphelliphelliphelliphelliphelliphelliphelliphelliphelliphelliphelliphelliphelliphelliphellip
helliphelliphelliphelliphelliphelliphelliphelliphelliphelliphelliphelliphelliphelliphelliphelliphelliphelliphelliphelliphelliphelliphelliphelliphelliphelliphelliphelliphelliphelliphelliphelliphelliphelliphelliphelliphelliphelliphelliphelliphelliphelliphelliphelliphellip
helliphelliphelliphelliphelliphelliphelliphelliphelliphelliphelliphelliphelliphelliphelliphelliphelliphelliphelliphelliphelliphelliphelliphelliphelliphelliphelliphelliphelliphelliphelliphelliphelliphelliphelliphelliphelliphelliphelliphelliphelliphelliphelliphelliphellip
helliphelliphelliphelliphelliphelliphelliphelliphelliphelliphelliphelliphelliphelliphelliphelliphelliphelliphelliphelliphelliphelliphelliphelliphelliphelliphelliphelliphelliphelliphelliphelliphelliphelliphelliphelliphelliphelliphelliphellip
10 A box contains 6 white balls and 4 green balls Two balls are chosen at random one after the other without
replacement determine the probability that the second ball is white
helliphelliphelliphelliphelliphelliphelliphelliphelliphelliphelliphelliphelliphelliphelliphelliphelliphelliphelliphelliphelliphelliphelliphelliphelliphelliphelliphelliphelliphelliphelliphelliphelliphelliphelliphelliphelliphelliphelliphelliphelliphelliphelliphelliphellip
helliphelliphelliphelliphelliphelliphelliphelliphelliphelliphelliphelliphelliphelliphelliphelliphelliphelliphelliphelliphelliphelliphelliphelliphelliphelliphelliphelliphelliphelliphelliphelliphelliphelliphelliphelliphelliphelliphelliphelliphelliphelliphelliphelliphellip
helliphelliphelliphelliphelliphelliphelliphelliphelliphelliphelliphelliphelliphelliphelliphelliphelliphelliphelliphelliphelliphelliphelliphelliphelliphelliphelliphelliphelliphelliphelliphelliphelliphelliphelliphelliphelliphelliphelliphelliphelliphelliphelliphelliphellip
helliphelliphelliphelliphelliphelliphelliphelliphelliphelliphelliphelliphelliphelliphelliphelliphelliphelliphelliphelliphelliphelliphelliphelliphelliphelliphelliphelliphelliphelliphelliphelliphelliphelliphelliphelliphelliphelliphelliphelliphelliphelliphellip

International Journal of Studies in Education and Science (IJSES)
127
Evaluation of Materials by Experts
The researchers solicited two expertsrsquo views on the test items content coverage content relevance and course
materials It was the view of the experts that the test items of both the pre-test and the post-test were in line with
the mathematics syllabus of colleges of education in Ghana The activities designed for the Group A were also
assessed In the view of the experts the teaching activities had sufficient content coverage and would help pre-
service teachers develop better probabilistic reasoning They acknowledged the idea of having activities that
reflect real life situations to support pre-service teachers since they were aware students have difficulty with
probability related problems The experts further acknowledged that the objectives were measurable and
activities were practical to promote pre-service teachersrsquo involvement in the lessons They said the teaching and
learning materials reflected the learner-centered approach and were in line with the syllabus requirements for
Mathematics in colleges of education in Ghana They believed the activities would promote better probabilistic
reasoning since they reflected real life situations
Data Collection Procedure
Preservice teachers were informed one week ahead of the administration of the pre-test The format of the test
items and the purpose of the study were communicated to the respondents The tests were administered by the
researchers at an Examination Hall to ensure the respondents did independent work
Treatment
The learner-centered approach was applied to group A while the teacher-centered approach of instruction was
applied to group B In each approach the lessons were focused on addressing equiprobability bias
representativeness belief bias positive recency and negative recency effects since some studies suggest that
teaching approaches that target probabilistic misconceptions will help improve studentsrsquo performance
significantly (Khazanov amp Prado 2010 Shay 2008) The implementation of both teaching approaches were
done by the lead researcher
Group A The Learner-centered approach
The teaching and learning took place in traditional classroom settings generally consisting of activities
discussions and questions and answers concurrently once per week for two hours for a month In group A the
activities were designed focusing on probabilistic misconceptions using the learner-centered approach to
teaching to better their probabilistic reasoning Examples of the activities are given below
Card Game This game was played in groups Identical cards were numbered 3 3 4 4 5 5 5 6 6 7 8 and 9
and put in a container and thoroughly mixed Three students will reach in and without looking draw out a card
each at time If the three people pick different numbers then the group wins GH30000 else they lose Is the
chance of winning or losing the same and why The purpose of this activity is to enhance preservice teachersrsquo
Hokor amp Sedofia
128
decision-making ability by addressing equiprobability bias representativeness bias belief and positive and
negative recency effects The aim of predicting before picking was to keep students focused and to confront any
prior misconceptions The game was played 15 times If all the three members of the group pick different colors
then a point of one is recorded else zero After the activity a discussion was organized around their prediction
and the results to challenge their thinking
Pair Game In pairs preservice teachers were asked to toss a coin six times each recording the sequence of tails
and heads The purpose of this activity is to address representativeness bias Before the toss students were asked
to predict the number of tails and heads Their predictions were written in their notebook before the toss Most
preservice teachers predicted equal number of tails and heads Preservice teachers then compare their predicted
sequences to their results after the toss It was noted in many instances that those who predicted equal number of
tails and heads did not obtain results that were consistent with their prediction Discussions were organized
around their predicted sequences and the results obtained after the toss for better probabilistic reasoning
Coin Game Students perform this experiment ten times by tossing a number of fair coins once and record the
outcomes in each case In the first toss a coin was tossed once and the outcome recorded in the second toss
two coins were tossed once and outcomes recorded in third toss three coins were tossed once and outcomes
recorded and so on H stands for heads and T stands for tails The following are a sample of sequence of
outcomes by one student
1st toss H
2nd
toss HT
3rd
toss HTH
4th
toss HTTT
5th
toss THHTT
6th
toss HTHTTT
7th
toss TTHTHHT
8th
toss THTHTHHH
9th
toss HTTTHTHTT
10th
toss THTHTHTHTT
119873119906119898119887119890119903 119900119891 ℎ119890119886119889119904
119873119906119898119887119890119903 119900119891 119905119900119904119904119890119904=
1
1= 1
1
2= 05
2
3= 0667
1
4= 025
2
5= 04
2
6= 0333
3
7= 0429
5
8
= 0625 3
9= 0333
4
10= 04
The average of the probabilities of obtaining a head for each experiment is
=105066702504033304290625033304
10=
4937
10cong 05
International Journal of Studies in Education and Science (IJSES)
129
It must be noted that in experimental or frequentist probability we are concerned about conducting the
experiment many times and considering its approximation or convergence Students were led to conclude that in
general we can say when a fair coin is tossed the probability of getting a head at any time is 1
2 and vice versa
Group B The Teacher-centered approach
Group B was taught using the teacher-centered approach In this case the teacher rather than the learner was at
the center of the teaching and learning process The tutor presented the preservice teachers with facts or
procedures that had been established to solve problems Preservice teachers were given problems that require
the use of these facts or procedures to solve as either assignment exercise test or quiz It is believed that
preservice teachers learned more when they solved similar problems many times When examination questions
that demanded facts were set students could solve the problems without really understanding the concepts
Formulae were presented to students to learn to apply to similar problems Concepts were clearly explained
bearing in mind the probabilistic misconceptions Samples of lessons experienced by Group B are as follow
Lesson one Through questions and answers teacher revises preservice teachersrsquo previous knowledge on playing
of games and probabilistic situations Based on studentsrsquo responses the teacher introduces the lesson
Teacher explains to preservice teachers the concept of probability and three ways we can make probability
statements as classical frequentist and subjective Classical probability is the number of favorable outcomes (E)
divided by the total number of possible outcomes (S) It works on the assumptions that all outcomes are equally
likely Equally likely means that each outcome has the same probability of occurring
Mathematically P(E) =
Students were then led to solve problems using the formula
Experimental probability is a method of calculating probability where the probability is the ratio of the number
of the trials where the desired event occurs to the number of total trials Subjective probability is a statement that
an individual makes based on personal judgment to describe the likelihood of an event Or a personal belief
based on onersquos own experience or expertise The person making the statement should be an expert in the area or
someone who have a sound knowledge on the issue under consideration before it can be considered important
For the statement to be reliable it should be based on a sound premise(s) Nevertheless both experts and non-
experts make use of subjective probability daily For example I have a 90 chance of passing my statistics and
probability exam
Lesson two Teacher explains basic terms of probability such as sample space sample point an event equally
likely to preservice teachers Teacher guides preservice teachers through demonstration to solve probability
problems using classical definition of probability by listing the sample space and finding the probability of an
event Teacher leads preservice teachers to solve probability problems from frequency tables Similarly teacher
explains to preservice teachers independent and dependent events Teacher asks the preservice teachers to solve
problems on independent and dependent events
Hokor amp Sedofia
130
Data Analysis
The data collected were coded and edited before being transferred to computer for analysis using SPSS version
24 A Levenersquos test was used in the study to ensure that the assumptions between each group was not violated
Homogeneity of variances was considered to ensure that each grouprsquos pre-test scores were mostly equal Paired
samples T-test was used to compare two means within each group to determine whether or not the differences in
means were statistically significant Independent sample T-test was used to compare the probabilistic reasoning
mean scores in Group A and the Group B before the experiment at a time to determine whether the two groups
were at the same level or not The independent t-test was used because there were two different groups of
participants It works on the assumption that scores are unique because they come from different participants
Also the equality of variance for running ANCOVA at 5 significance level was checked using Levenersquos test
Table 2 Levenes Test of Equality of Variances
F df1 df2 Sig
1234 1 57 0456
The results from Table 2 indicate that the variances are roughly equal since the significance value of 0456 is
greater than the cut-off value of 005 Therefore we can conclude that homogeneity of variance assumption was
met (Field 2005) This allowed us to examine the relationship between the covariate (pre-test scores) and
dependent variable (post-test scores) Analysis of covariance (ANCOVA) was used to examine the effect of
learner-centered approach to teaching and teacher-centered approach on preservice teachersrsquo probabilistic
reasoning since different participants were in each group The ANCOVA is ideal in removing the bias of these
variables (Field 2005) In order to determine whether or not the occurrence of scores was not by chance a
partial eta squared was used to gauge the magnitude of the difference (effect size) between means of the scores
Pallant (2001) outlined the following criterion for interpreting partial eta squared values as 001 = small effect
006 = moderate effect and 014 = large effect
Results
Before introducing the learner-centered and teacher-centered approaches of teaching preservice teachersrsquo
probabilistic reasoning was compared to ascertain whether or not their results were similar in terms of the mean
scores The result is presented in Table 3
Table 3 Results of the Independent Samples t-test on the Pre-test of the Group B and Group A
Group N Mean Std Dev Mean Difference Df t-value p-value
Group B 27 585 1562 35 56 756 456
Group A 32 550 1967
The results in Table 3 indicate that there was no statistically significant difference between the probabilistic
reasoning mean scores of Group A = 550 = 1967 and Group B = 585 = 1562 in the
International Journal of Studies in Education and Science (IJSES)
131
pretest This is an indication that the two groups are similar and their performance could be compared after the
two teaching approaches
Comparison of Probabilistic Reasoning of the Preservice Teachers before and after Learner-centered
Approach in Group A
The results of analysis of the effect of the learner-centered approach on preservice teachersrsquo probabilistic
reasoning is presented in Table 4
Table 4 Pre-test and Post-test Scores for Group A
Minimum Maximum Mean Std Deviation
Pre-test 1 10 550 1967
Post-test 8 20 1572 3630
Table 4 reveals that in the post-test preservice teachersrsquo probabilistic reasoning mean scores increased from
550 to 1572 in the post-test in Group A
A paired sample t‐test was conducted to compare the post-test and pre-test scores for the preservice teachers
taught with the learner-centered approach to teaching (Group A) in order to determine if the mean difference in
scores was statistically significant This was done to evaluate the effect of the learner-centered approach on
preservice teachersrsquo probabilistic reasoning Table 5 presents the results
Table 5 Paired Sample t-test Results on the Post-test and Pre-test of Group A
Mean
Difference
Std
Deviation
Std Error
Mean
t Df Sig
Post-test ndash Pre-test 10219 2871 507 20137 31 000
The results from Table 5 shows a statistically significant difference in the preservice teachersrsquo probabilistic
reasoning from the pre-test (M = 550 SD = 1967) to the post-test (M = 1572 SD = 3630) with t (31) =
20137 p = 000 The result reveals that preservice teachersrsquo probabilistic reasoning has improved significantly
after the learner-centered approach was used since = 000 05 It can be inferred that the learner-centered
approach to teaching has a positive significant effect on preservice teachersrsquo probabilistic reasoning
Analysis of Probabilistic Reasoning of the Preservice Teachers before and after Teacher-centered
Approach to Teaching
The results of the analysis of the effect of the teacher-centered approach to teaching on preservice teachersrsquo
probabilistic reasoning is presented in Table 6
Hokor amp Sedofia
132
Table 6 Pre-test and Post-test Scores for the Group B
Minimum Maximum Mean Std Deviation
Pre-test 2 8 585 1562
Post-test 5 14 952 2208
The data on Table 6 show that the mean score of preservice teachers in the pre-test was 585 while that of the
post-test was 952 marks This indicates that in the post-test an average of each of the preservice teachersrsquo
probabilistic reasoning increased slightly in Group B To determine if the mean difference is statistically
significant a paired sample t‐test was conducted Table 7 presents the results
Table 7 Results of the Paired Samples t-test on the Post-test and Pre-test of the Group B
Mean
Difference
Std Deviation Std Error
Mean
t Df Sig
Post-test ndash Pre-test 3667 1441 0277 13220 26 000
The result presented on Table 7 shows that the mean score difference between the post-test and pre-test of
Group B was 3667 marks with a corresponding standard deviation of 1441 The paired sample t-test was
conducted to find out if the mean score difference (M = 3667 SD = 1441) was statistically significant This
was done to assess the effect of the teacher-centered approach targeted at addressing misconceptions on
preservice teachersrsquo probabilistic reasoning The results from Table 7 reveal that there was a statistically
significant difference in the preservice teachersrsquo probabilistic reasoning scores from the pre-test (M = 585 SD =
1562) to the post-test (M = 952 SD = 2208) with t (26) = 13220 p = 000 lt 05 This is an indication that the
teacher-centered approach to teaching probability targeted at addressing probabilistic misconceptions aids
students to improve upon their understanding and problem-solving abilities in probability
Next we compared the effectiveness of the learner-centered approach of teaching and the teacher-centered
approach of teaching in terms of probabilistic reasoning of preservice teachers and how they addressed
probabilistic misconceptions
Comparison of Effectiveness of Learner-centered Approach and Teacher-centered Approach in
Developing Probabilistic Reasoning
The preservice teachersrsquo scores on the pre-test of the achievement test were used as covariate in this analysis
The scores from the post-test were then compared using ANCOVA with = 05 to adjust for pre-test
differences that existed between Group A and Group B In the pre-test the mean scores of Group B and Group A
were 585 and 550 respectively ANCOVA was used to adjust the post-test scores statistically to compensate
for the 035 mean point difference between the two groups in the pre-test This adjustment led to a more
accurate post-test comparison Table 8 presents the results
International Journal of Studies in Education and Science (IJSES)
133
Table 8 Summary of ANCOVA of the Performance of Preservice Teachers taught with Learner-centered
Approach and Teacher-centered Approach (N = 59)
Source Sum of
Squares
Df
Mean
Square
F Sig Partial Eta
Squared
Corrected
Model
791144a 2 395562 72150 000 720
Intercept 205135 1 205135 37416 000 401
Pre-test 228184 1 228184 41620 000 426
Group 630253 1 630253 114955 000 672
Error 307026 56 5483
Total 10888000 59
Corrected Total 1098169 58
a R Squared = 720 (Adjusted R Squared = 710)
The data on Table 8 indicate that there is a statistically significant main effect on the preservice teachers who
were taught using the learner-centered approach to learn probability [F (1 56) = 114955 p = 000 lt 05]
Consequently the preservice teachers taught with the learner-centered approach performed better than their
counterparts who experienced the teacher-centered approach to learn probability The partial eta squared value
was found to be 0672 This value indicates a large effect size That is 672 of the variance in the dependent
variable (probabilistic reasoning achievement score) is expounded by the independent variable (teacher-centered
approach) This implies that the magnitude of the difference between the mean score of the preservice teachers
taught with the learner-centered approach and the teacher-centered approach is large With the high scores of
preservice teachers in the Group A it implies that the use of learner-centered approach in the teaching and
learning of probability improved the performance of the preservice teachers
The outcome of the study portrays that there was a statistically significant difference in the probabilistic
reasoning achievement mean scores of Group A than that of Group B [F (1 56) = 114955 p = 000 lt 05] This
finding implies that Group A performed better than Group B in the probabilistic reasoning achievement test
This is an indication that when the learner-centered approach to teaching probability is targeted at addressing
probabilistic misconceptions preservice teachers develop better probabilistic reasoning than teacher-centered
approach
Discussion
This study set out to compare the learner-centered and teacher-centered approaches of teaching in order to
determine the best way of developing preservice teachersrsquo probabilistic reasoning at the College of Education
Hokor amp Sedofia
134
level in Ghana The results as shown on Tables 3 4 5 6 7 and 8 indicate that the learner-centered approach to
teaching probability is more effective than the teacher-centered approach in motivating and inspiring preservice
teachers to learn and apply probability The learner-centered approach provides studentsrsquo opportunities to think
reason reflect and evaluate their ideals and that of colleagues
The findings of the present study are in tandem with several research findings Lessani Md Yunus and Bakar
(2017) investigated mathematics teaching approaches and their consequences on learnersrsquo ability to solve
challenging problems Their findings affirm the learner-centered approach to be more effective in studentsrsquo
creativity and innovation in solving real-life problems than the teacher-centered approach So training
programs for excellent teaching and learning should be flexible and innovative to allow preservice teachers to
explore gaps in learning and teaching (AIAhmad 2021) Similarly Prideaux (2007) found that students who
experienced the learner-centered approach of teaching performed significantly higher than those who were
taught without the learner-centered approach of teaching Roseth Garfield and Ben-Zvi (2008) also examined
the effect of the cooperative framework in classroom teaching and collaboration and found that student-
centered approaches to teaching help students to have better understanding of statistics than teacher-centered
instruction
Furthermore Gurbuz and Birgin (2011) studied the effect of computer-assisted teaching on addressing
probabilistic misconceptions of students The authors used pre-test to collect data on both the computer-assisted
and traditional groups before the experimental teachings After the intervention the post-test was administered
to ascertain the effect of computer-assisted teaching and teacher-centered approach on addressing studentsrsquo
probabilistic misconceptions Their study found computer-assisted teaching to have more significant effect on
studentsrsquo correct probabilistic reasoning than teacher-centered approach of teaching
As noted by Batanero and Diaz (2012) probability forms an integral part of the Mathematics curriculum in
many countries But the concept is one that some learners find difficult to understand partly due to the method
of teaching used by teachers This fact implies that teachers of mathematics should find more creative ways of
teaching the concept so as to make it easier for learners to understand and apply the concept As discovered in
this study the learner-centered approach is effective in developing probabilistic reasoning But the learner-
centered approach works best when certain conditions are present At the outset there is the need for relevant
teaching and learning materials Then teachers need to be trained and retrained in the use of the learner-centered
approach to teaching At the college of education level preservice teachers need to be taught using the learner-
centered approach not only to help them understand probability but also to help them use the learner-centered
approach in their own teaching
The activities used for Group A which is learner-centered approach group in the form of games promote
content knowledge and cognitive skills competencies such as collaboration and problem solving (Belova amp
Zowada 2020) The activities focus on promoting learning experiences rather than stressing on the
entertainment factor While some things students learn in school seem to them predetermined and bound by
laws in other branches of mathematics probability provides students with opportunity to learn that solutions to
International Journal of Studies in Education and Science (IJSES)
135
several problems depend on assumptions and have degrees of doubt So teaching methods that allow students to
predict and test their predictions should be encouraged for students to develop their intellectual repertoire The
processes used in reasoning about sample space will serve students well in life Several calls on the need to pay
attention to the study of probability show that teachers and mathematics teachers must provide their students
with appropriate teaching strategies to enhance their conceptual understanding In the preparation of preservice
teachers to become mathematically competent citizens teacher preparation programs such as teaching methods
must provide opportunities for preservice teachers to confront misconceptions and reason probabilistically
(Courtney amp Caniglia 2021)
The findings of the present study however run counter to those of Weltman and Whiteside (2010) They
conducted a study on the effectiveness of the traditional and active learning method in business statistics The
study found that active learning had not been effective for all category of students It is not precisely clear what
may have accounted for that result This is because active learning methods have generally been known to be
effective in promoting learning Further research is thus required in this regard
Conclusions
This study compared the effects of the learner-centered and teacher-centered approaches of teaching in
addressing probabilistic misconceptions by measuring preservice teachersrsquo probabilistic reasoning scores The
results show that the learner-centered approach aids preservice teachers to develop better probabilistic reasoning
than the teacher-centered approach to teaching Thus the study concludes that the learner-centered approach to
teaching is a solution to preservice teachersrsquo inability to answer questions on probability correctly Even though
each teaching approach targeted at addressing misconceptions was found to have significant effect on pre-
service teachersrsquo probabilistic reasoning the learner-centered approach was found to be more effective than the
teacher-centered approach in addressing misconceptions which limit studentsrsquo ability to solve probability
problems correctly
Implications and Recommendations
This study makes some key contributions to the teacher educationdevelopment literature in general and
particularly to the development of probabilistic reasoning of preservice teachers The study provides empirical
evidence that the learner-centered approach targeted at addressing probabilistic misconceptions is more effective
in developing probabilistic reasoning in preservice teachers What this means is that when teacher educators use
the learner-centered approach to teach the concept of probability and focus on addressing misconceptions
preservice teachers will develop better probabilistic reasoning This will in turn translate into preservice
teachers answering questions on probability correctly in their examinations and ultimately making them teach
the concept more effectively when they complete their training It is thus recommended that teachers should
consider employing the learner-centered approach in teaching the concept of probability
Hokor amp Sedofia
136
Limitations
As with every empirical study employing the quasi-experimental approach the current study has some
limitations which need to be acknowledged and used to guide users of the findings Firstly our sample was
drawn from a population of second year preservice teachers of a female only college of education in a peri-
urban area in Ghana Further experiments are therefore needed in other settings in order to see if the same or
similar results will occur Secondly owing to the narrow characteristics of the participants in the present study
the researchers cannot generalize the results to other individuals who do not have the same characteristics So
additional experiments with groups with different characteristics are necessary Lastly the experiments need to
be repeated at another time to determine if the results are the same (consistent) over time
Acknowledgements
We are grateful to the Principal and preservice teachers for granting access and participating in the study
respectively
References
AIAhmad H (2021) The role of educational communication in promoting student-centered learning style in
multicultural classrooms A reflective essay on learning and teaching in higher education International
Journal of Research in Education and Science (IJRES) 7(3) 838-851 httpsdoiorg1046328ijes2374
Aina J K Olanipekun S S amp Garuba I A (2015) Teachersrsquo effectiveness and its Influence on studentsrsquo
learning Advances in Social Sciences Research Journal 2(4) 88-95
Anway D W amp Bennett E (2004) Common Misconceptions in Probability among Students in an Elementary
Statistics class Unplished Senior Project The ARTIST Roundtable Conference on Assessment in
Statistics held at Lawrence University Supperior WI The University of Wisconsin-Superior
Bada S (2015) Constructivist Learning Theory A Paradigm for Teaching and Learning IOSR Journal of
Research and Method in Education (IOSR-JRME) 5(6) 66-70 httpsDOI1097907388-05616670
Baerveldt C (2013) Constructivism contested Implications of a genetic perspective in psychology Integrative
Psychological and Behavioral Science 47(1) 156-166
Batanero C (2013) Teaching and learning probability In S Lerman (Ed ) Encyclopedia of Mathematics
Education Heidelberg Springer
Batanero C and Diaz C (2012) Training school teachers to teach probability reflections and challenges
Chilean Journal of Statistics 3(1) 3-13
Belova N amp Zowada C (2020) Innovating Higher Education Via Game-Based Learning on Misconceptions
Education Sciences 10 221 doi103390educSCi10090221
Bennett E amp Anway D W (2003) Statistical and Probabilistic Reasoning and Misconceptions among
Selected College Students McNair Scholars Journal Vol 4 httpwwwsocheclchjs
Cantoy O (2010) Mathematics teachersrsquo topic-specific pedagogical content knowledge in the context of
teaching a0 0 and a divide 0 Educational Sciences Theory and Practice 10 (2) 749-769
International Journal of Studies in Education and Science (IJSES)
137
Clements D H amp Battista M (1990) Constructivist Learning and Teaching The
Arithetic Teacher 38(1) ProQuest Central pg 34 DOI105951AT3810034
Creswell J W amp Creswell J D (2018) Research design Qualitative quantitative and
mixed methods approaches (5th
ed) Los Angeles SAGE Publications Inc
Courtney S A amp Caniglia J (2021) Comparing the mathematical practices pre-service teachers and
mathematics teacher educators identified as relevant to problems and tasks International Journal of
Research in Education and Science (IJRES) 7(3) 954-971 httpsdoiorg1046328ijres2335
Denton D W (2012) Enhancing instruction through constructivism cooperative learning and cloud
computing Tech Trends 56(4) 34-41
Gage J (2012) Towards a new Probability Curriculum for Secondary Schools Paper presented at 12th
International Congress on Mathematical Education 8 July-15 July COEX Seoul Korea Cambridge
Cambridge University Uk
Gurbuz R amp Birgin O (2011) The effect of computer-assisted teaching on remedying misconceptions The
case of the subject Probability Journal Homepage 58(2012) DOI 101016jcompedu201111005
Hirsh L amp ODonnell A M (2001) Representativeness in Statistical Reasoning Identifying and Assessing
Misconceptions Journal of Statistics Education 9(2) 96-105 DOI10108010691898200111910655
Johnson H D amp Dasgupta N (2005) Traditional versus Non-traditional Teaching during Perspectives of
Students in Introductory Statistics Classes Journal of Statistics Education 13(2)
httpsdoiorg10108010691898200511910558
Major T amp Mangope B (2012) The Constructivist Theory in Mathematics The case of Botswana Primary
Schools International Review of Social Sciencies and Humanities 3(2) 139-147
Jones G (2005) Reflections In GA Jones (Ed) Exploring probability in school chanlleges for teaching and
probability (367-372) New York Springer
Jun L (2000) Chinese Students Understanding of Probability Published doctoral dissertation Singapore
National Institute of Education Nanyang Technological University
Khazanov L amp Gourgey A (2009) Instructors Perspectives on Students Mistaken Beliefs about Probability
in an Elementary College Statistics Course In K Safford-Ramus (Ed) Proceedings of the Adults
Learning Mathematics a Resaerch Forum (ALM) 15th
Annual International Conference 249-264
Khazanov L amp Prado L (2010) Correcting Students Misconceptions about Probability in an Introductory
College Statistics Course Adults Learning Mathematics-An International Journal 5(1) 23-35
Kleickmann T Richter D Kunter M Elsner J Besser M Krauss S amp Baumert J (2013) Teachersrsquo
Content Knowledge and Pedagogical Content Knowledge The Role of Structural Differences in Teacher
Education Journal of Teacher Education 64(1) 90-106 DOI1011770022487112460398
Leedy P D and Ormrod J E (2020) Practical research Planning and design (12th Global Edition) Harlow
England Pearson
Lessani A Md Yunus AS amp Bakar KBA (2017) Comparison of new mathematics teaching methods with
teacher-centered approach International Journal of Social Sciences 3(2) 1285-1297
httpsdxdoiorg1020319pijss20173212851297
Lim C amp Hwa T (2007) Promoting Mathematical Thinking in the Malaysian Classroom Issues and
challenges httpswwwresearchgatenetpublication252353381
Hokor amp Sedofia
138
Lovett J N amp Lee H S (2017) New Standards Require Teaching More Statistics Are Preservice Secondary
Mathematics Ready Journal of Teachers Education 68(3) 299-311 DOI 1011770022487117697918
Major T amp Mangope B (2012) The Constructivist Theory in Mathematics The case of Botswana Primary
Schools International Review of Social Sciencies and Humanities 3(2) 139-147
National Council of Teachers of Mathematics (2003) Principles and Standards for School Mathematics and
their Implications for Professional Development Reston VA NCTM
Nguyen L (2015) Developing Conceptual Understanding and Probabilistic Thinking through Tree Diagrams
Published MPhil Dissertation Manitoba The Faculty of Graduate Studies of the University of
Manitoba
Prideaux J (2007) The learner-centered approach to Mathematics Teaching and the Active Learning
Strategies used to Enhance Students Understanding Mathematical and Computing Sciences Masters
Paper 29 Fisher Digital Publications httpfisherpubsjfcedumathcsetdmasters29
Roseth C J Garfield J B amp Ben-Zvi D (2008) Collaboration in Learning and Teaching Statistics Journal
of Statistics Education 16 (1) 1069-1898 httpsdoiorg10108010691898200811889557
Santagata R and Sandholtz J H (2019) Preservice teachersrsquo mathematics teaching competence Comparing
performance on two measures Journal of Teacher Education 70 (5) 472 ndash484
Schwerdt G amp Wuppermann A C (2011) Is traditional teaching really all that bad A within-student
between-subject approach Economics of Education Review 30(2) 365-379
Sharma S (2016) Probability from a socio-cultural perspective Statistics Education Research Journal 15(2)
126-144 httpiase-weborgPublicationsphpp=SERJ
Shay K (2008) Tracing middle school students understanding of probability a longitudinal study
Unpublished Doctoral Dissertation New Brunswick New Jersey Rutgers State University of New
Jersey
Shulman L S (1986) Those who understand Knowledge growth in teaching Educational Researcher 15(2)
4-14 doi 1031021001318X015002004
Thomas L (2020) An introduction to quasi-experimental designs
httpswwwscribbrcommethodologyquasi-experimental-design
Voskoglou M (2019) Comparing Teaching Methods of Mathematics at University Level Education Sciences
9(204) doi103390educsci9030204
Vygotsky L S (1978) Mind in society The development of higher psychological processes Cambridge MA
Harvard University Press
Weldeana H N amp Abraham S T (2014) The effect of an historical perspective on prospective teachersrsquo
beliefs in learning mathematics Journal of Mathematics Teacher Education 17 303-330
doi101007s10857-013-9266-z
Weltman D amp Whiteside M (2010) Comparing the Effectiveness of Traditional and active Learning Methods
in Business Statistics Convergence to the Mean 18(1)
httpsdoiorg10108010691898201011889480
White H amp Sabarwal S (2014) Quasi-experimental design and methods methological briefs impact
evaluations Florence UNICEF Office of research
International Journal of Studies in Education and Science (IJSES)
139
Author Information
Evans Kofi Hokor
httpsorcidorg0000-0002-8387-8294
St Teresarsquos College of Education Hohoe
Department of Mathematics and ICT
P O Box 129
Ghana
Contact e-mail evanskhokorgmailcom
John Sedofia
httpsorcidorg0000-0002-5409-516X
University of Ghana Legon
Department of Teacher Education
PO Box LG 1181
Ghana
Hokor amp Sedofia
140
Appendix A Pre-test Probabilistic Reasoning Assessment
This assessment is for research purpose to improve teaching and learning of probability
You are required to answer all questions honestly Do and leave all workings or rough work on the paper
Pre-test Probabilistic Reasoning Assessment Duration 1hr
Index numberhelliphelliphelliphelliphelliphelliphelliphelliphelliphelliphelliphelliphelliphelliphelliphelliphelliphellipLevelhelliphelliphelliphellipAgehelliphelliphellip
Read each statement carefully and circle the letter of the correct (best) option Provide appropriate response in
the space provided under some items as it apply
1 If you rolled an ordinary die and obtained 51246 which of these is most likely to occur on your next
roll
a 1
b 2
c 3
d 4
e 5
f 6
g The options a b c d e and f are all equally
2i A fair coin is tossed and it lands tail The coin is to be tossed a second time What is the probability that the
second toss will also be a tail
a 1
4
b 1
2
c 1
3
d Slightly less than 1
2
e Slightly more than 1
2
f 0
2ii Which of the following best describes the reason for the correct answer to the preceding question (2i)
a The second toss is less likely to be tail because the first toss was tail
b There are four possible outcomes when you toss a coin twice Getting two tails is only one of them
c The chance of getting heads or tails on any one toss is always 1
2
d There are three possible outcomes when you toss a coin twice Getting two tails is only one of the them
e No chance of being a tail in the second toss
3i A box contains 6 balls 2 are red 2 are black and 2 blue Three balls are picked at random one at a time
Each time a ball is picked the colour is recorded and the ball is put back in the box mixed thoroughly If the
first 2 balls are black what color is the third ball most likely to be
a Red
International Journal of Studies in Education and Science (IJSES)
141
b Black
c Blue
d Red and blue are equally likely than black
e Red black and blue are all equally likely
3ii Which of the following best describes the reason for the correct answer in the preceding question (3i)
a The third ball should not be black because too many black ones have already been picked
b The picks are independent so every color has an equally likely chance of being picked
c Black seems to be lucky
d This color is just as likely as any other color
4 A spinner with ten equally divided sectors in which four parts are white and the rests are red is about to
be spin which color is the spinner more likely to land
a White
b Red
c Both white and red are all equally
5 If you toss a fair coin and get heads two times in a row which of these is most likely on next toss
a Tail
b Head
c Both head and tail are all equally
6 A Gh 2 Gh 5 Ghcent10 Gh 20 Gh 50 and Gh 100 notes were put in a box and thoroughly mixed
What is the probability of picking Gh 50 note without looking
a 1
187
b 50
187
c 1
6
d 0
7 In a game you have been offered two options Which of the following give you higher chance of
winning GHcent200
a Tossing one die once and obtaining a 6
b Tossing two dice once and obtaining two 6rsquos
c The options a and b are all equally
8 A fair die is to be toss six times which of these is most likely to occur
a 251634
b 123456
c 666341
d 132244
e The options a b c and d are all equally likely
9 A fair coin is to be toss four times in a row which of these is least likely to occur
a THTH
b TTTH
c HHH
Hokor amp Sedofia
142
d The options a b and c are all equally likely
10 Two fair dice are to be tossed once Which of the following is more likely to occur
a Obtaining a sum of 11
b Obtaining a sum of 10
c A sum of 11 and a sum of 10 are all equally likely
10i Give reason for the correct answer in the preceding question (10)
helliphelliphelliphelliphelliphelliphelliphelliphelliphelliphelliphelliphelliphelliphelliphelliphelliphelliphelliphelliphelliphelliphelliphelliphelliphelliphelliphelliphelliphelliphelliphelliphelliphelliphelliphelliphelliphelliphelliphelliphelliphellip
helliphelliphelliphelliphelliphelliphelliphelliphelliphelliphelliphelliphelliphelliphelliphelliphelliphelliphelliphelliphelliphelliphelliphelliphelliphelliphelliphelliphelliphelliphelliphelliphelliphelliphelliphelliphelliphelliphelliphelliphelliphellip
helliphelliphelliphelliphelliphelliphelliphelliphelliphelliphelliphelliphelliphelliphelliphelliphelliphelliphelliphelliphelliphelliphelliphelliphelliphelliphelliphelliphelliphelliphelliphelliphelliphelliphelliphelliphelliphelliphelliphelliphelliphellip
helliphelliphelliphelliphelliphelliphelliphelliphelliphelliphelliphelliphelliphelliphelliphelliphelliphelliphelliphelliphelliphelliphelliphelliphelliphelliphelliphelliphelliphelliphelliphelliphelliphelliphelliphelliphelliphellip
11 In national lottery one has to choose five numbers from 1 to 90 inclusive You win when at least two of
your numbers are part of the numbers drawn on Saturday at random Eric has chosen 4 6 7 9 and 11
Alex has chosen 15 23 45 66 and 80 Daniel has chosen 71 77 78 83 and 85 Do Eric Alex and
Daniel have the same chance of winning or not and why
helliphelliphelliphelliphelliphelliphelliphelliphelliphelliphelliphelliphelliphelliphelliphelliphelliphelliphelliphelliphelliphelliphelliphelliphelliphelliphelliphelliphelliphelliphelliphelliphelliphelliphelliphelliphelliphelliphelliphelliphellip
helliphelliphelliphelliphelliphelliphelliphelliphelliphelliphelliphelliphelliphelliphelliphelliphelliphelliphelliphelliphelliphelliphelliphelliphelliphelliphelliphelliphelliphelliphelliphelliphelliphelliphelliphelliphelliphelliphelliphelliphellip
helliphelliphelliphelliphelliphelliphelliphelliphelliphelliphelliphelliphelliphelliphelliphelliphelliphelliphelliphelliphelliphelliphelliphelliphelliphelliphelliphelliphelliphelliphelliphelliphelliphelliphelliphelliphelliphelliphelliphelliphellip
helliphelliphelliphelliphelliphelliphelliphelliphelliphelliphelliphelliphelliphelliphelliphelliphelliphelliphelliphelliphelliphelliphelliphelliphelliphelliphelliphelliphelliphelliphelliphelliphelliphelliphelliphellip
12 A box contains 8 yellow balls and 4 green balls Two balls are chosen at random one after the other
without replacement determine the probability that the two balls are of different colours
helliphelliphelliphelliphelliphelliphelliphelliphelliphelliphelliphelliphelliphelliphelliphelliphelliphelliphelliphelliphelliphelliphelliphelliphelliphelliphelliphelliphelliphelliphelliphelliphelliphelliphelliphelliphelliphelliphelliphelliphellip
helliphelliphelliphelliphelliphelliphelliphelliphelliphelliphelliphelliphelliphelliphelliphelliphelliphelliphelliphelliphelliphelliphelliphelliphelliphelliphelliphelliphelliphelliphelliphelliphelliphelliphelliphelliphelliphelliphelliphelliphellip
helliphelliphelliphelliphelliphelliphelliphelliphelliphelliphelliphelliphelliphelliphelliphelliphelliphelliphelliphelliphelliphelliphelliphelliphelliphelliphelliphelliphelliphelliphelliphelliphelliphelliphelliphelliphelliphelliphelliphelliphellip
helliphelliphelliphelliphelliphelliphelliphelliphelliphelliphelliphelliphelliphelliphelliphelliphelliphelliphelliphelliphelliphelliphelliphelliphelliphelliphelliphelliphelliphelliphelliphelliphelliphelliphelliphelliphellip
International Journal of Studies in Education and Science (IJSES)
143
Appendix B Post-test Probabilistic Reasoning Assessment
This assessment is for research purpose to improve teaching and learning of probability
You are required to answer all questions honestly Do and leave all workings or rough work on the paper
Post-test Probabilistic Reasoning Assessment Duration One Hour
Index numberhelliphelliphelliphelliphelliphelliphelliphelliphelliphelliphelliphelliphelliphelliphellipClasshelliphelliphelliphellipAgehelliphelliphelliphellip
Read each statement carefully and circle the letter of the correct (best) option for each item as much as possible
and provide appropriate response in the space provided
1 Suppose a particular outcome from a random event has a probability of 04 Which of the following
statements represents correct interpretations of this probability
a The outcome will not happen
b The outcome will certainly happen about four times out of every 10 trials
c The outcome is expected to happen about four times out of every 10 trials
d The outcome could happen or it couldnrsquot of either result are the same
2 If you toss a fair coin and get heads 3 times in a row what is the chance of getting a head on the next toss
a 1
b Greater than 1
2
c 1
2
d Less than 1
2
e 0
3 A die is numbered 1 2 3 4 4 5 When the die is thrown once Which of these is most likely and why
a 1
b 2
c 3
d 4
e 5
f They are all equally likely
3i Give reason for your chosen answer in (3)
helliphelliphelliphelliphelliphelliphelliphelliphelliphelliphelliphelliphelliphelliphelliphelliphelliphelliphelliphelliphelliphelliphelliphelliphelliphelliphelliphelliphelliphelliphelliphelliphelliphelliphelliphelliphelliphelliphelliphelliphelliphelliphelliphelliphellip
helliphelliphelliphelliphelliphelliphelliphelliphelliphelliphelliphelliphelliphelliphelliphelliphelliphelliphelliphelliphelliphelliphelliphelliphelliphelliphelliphelliphelliphelliphelliphelliphelliphelliphelliphelliphelliphelliphelliphelliphelliphelliphelliphelliphellip
helliphelliphelliphelliphelliphelliphelliphelliphelliphelliphelliphelliphelliphelliphelliphelliphelliphelliphelliphelliphelliphelliphelliphelliphelliphelliphelliphelliphelliphelliphelliphelliphelliphelliphelliphelliphelliphelliphelliphelliphelliphelliphelliphelliphellip
helliphelliphelliphelliphelliphelliphelliphelliphelliphelliphelliphelliphelliphelliphelliphelliphelliphelliphelliphelliphelliphelliphelliphelliphelliphelliphelliphelliphelliphelliphelliphelliphelliphelliphelliphelliphelliphelliphellip
4 German MP tossed two dice once Which of these is mostly likely and why
a Obtaining a sum of 4
b Obtaining a sum of 7
c Obtaining a sum of 11
d All of them have equal chance of occurring that is a b c
Hokor amp Sedofia
144
4i Give reason for your chosen answer in (4)
helliphelliphelliphelliphelliphelliphelliphelliphelliphelliphelliphelliphelliphelliphelliphelliphelliphelliphelliphelliphelliphelliphelliphelliphelliphelliphelliphelliphelliphelliphelliphelliphelliphelliphelliphelliphelliphelliphelliphelliphelliphelliphelliphelliphellip
helliphelliphelliphelliphelliphelliphelliphelliphelliphelliphelliphelliphelliphelliphelliphelliphelliphelliphelliphelliphelliphelliphelliphelliphelliphelliphelliphelliphelliphelliphelliphelliphelliphelliphelliphelliphelliphelliphelliphelliphelliphelliphelliphelliphellip
helliphelliphelliphelliphelliphelliphelliphelliphelliphelliphelliphelliphelliphelliphelliphelliphelliphelliphelliphelliphelliphelliphelliphelliphelliphelliphelliphelliphelliphelliphelliphelliphelliphelliphelliphelliphelliphelliphelliphelliphelliphelliphelliphelliphellip
helliphelliphelliphelliphelliphelliphelliphelliphelliphelliphelliphelliphelliphelliphelliphelliphelliphelliphelliphelliphelliphelliphelliphelliphelliphelliphelliphelliphelliphelliphelliphelliphelliphelliphelliphelliphelliphelliphelliphelliphelliphelliphelliphelliphellip
helliphelliphelliphelliphelliphelliphelliphelliphelliphelliphelliphelliphelliphelliphelliphelliphelliphelliphelliphelliphelliphelliphelliphelliphelliphelliphelliphelliphellip
5i A fair coin is to be toss four times which of these is most likely to occur
a HTHT
b THTT
c TTTT
d HHTH
e The options a b c and d are all equally likely
5ii Give reason for your chosen answer in (5i)
helliphelliphelliphelliphelliphelliphelliphelliphelliphelliphelliphelliphelliphelliphelliphelliphelliphelliphelliphelliphelliphelliphelliphelliphelliphelliphelliphelliphelliphelliphelliphelliphelliphelliphelliphelliphelliphelliphelliphelliphelliphelliphelliphelliphellip
helliphelliphelliphelliphelliphelliphelliphelliphelliphelliphelliphelliphelliphelliphelliphelliphelliphelliphelliphelliphelliphelliphelliphelliphelliphelliphelliphelliphelliphelliphelliphelliphelliphelliphelliphelliphelliphelliphelliphelliphelliphelliphelliphelliphellip
helliphelliphelliphelliphelliphelliphelliphelliphelliphelliphelliphelliphelliphelliphelliphelliphelliphelliphelliphelliphelliphelliphelliphelliphelliphelliphelliphelliphelliphelliphelliphelliphelliphelliphelliphelliphelliphelliphelliphelliphelliphelliphelliphelliphellip
helliphelliphelliphelliphelliphelliphelliphelliphelliphelliphelliphelliphelliphelliphelliphelliphelliphelliphelliphelliphelliphelliphelliphelliphelliphelliphelliphelliphelliphelliphelliphelliphelliphelliphelliphelliphelliphelliphellip
6i A fair coin is to be toss four times which of these is least likely to occur
a HTHT
b THTT
c TTTT
d HHTH
e The options a b c and d are all equally likely
6ii Give reason for your chosen answer in (6i)
helliphelliphelliphelliphelliphelliphelliphelliphelliphelliphelliphelliphelliphelliphelliphelliphelliphelliphelliphelliphelliphelliphelliphelliphelliphelliphelliphelliphelliphelliphelliphelliphelliphelliphelliphelliphelliphelliphelliphelliphelliphelliphelliphelliphellip
helliphelliphelliphelliphelliphelliphelliphelliphelliphelliphelliphelliphelliphelliphelliphelliphelliphelliphelliphelliphelliphelliphelliphelliphelliphelliphelliphelliphelliphelliphelliphelliphelliphelliphelliphelliphelliphelliphelliphelliphelliphelliphelliphelliphellip
helliphelliphelliphelliphelliphelliphelliphelliphelliphelliphelliphelliphelliphelliphelliphelliphelliphelliphelliphelliphelliphelliphelliphelliphelliphelliphelliphelliphelliphelliphelliphelliphelliphelliphelliphelliphelliphelliphelliphelliphelliphelliphelliphelliphellip
helliphelliphelliphellip
7 A college has 300 level 200 students and 236 level 100 students in it Each studentrsquos name is written with
the level on a piece of paper and all the names are put into a box and mixed thoroughly A tutor picks one
name out of the box without looking Which level is the tutor more likely to pick from and why
helliphelliphelliphelliphelliphelliphelliphelliphelliphelliphelliphelliphelliphelliphelliphelliphelliphelliphelliphelliphelliphelliphelliphelliphelliphelliphelliphelliphelliphelliphelliphelliphelliphelliphelliphelliphelliphelliphelliphelliphelliphelliphelliphelliphellip
helliphelliphelliphelliphelliphelliphelliphelliphelliphelliphelliphelliphelliphelliphelliphelliphelliphelliphelliphelliphelliphelliphelliphelliphelliphelliphelliphelliphelliphelliphelliphelliphelliphelliphelliphelliphelliphelliphelliphelliphelliphelliphelliphelliphellip
helliphelliphelliphelliphelliphelliphelliphelliphelliphelliphelliphelliphelliphelliphelliphelliphelliphelliphelliphelliphelliphelliphelliphelliphelliphelliphelliphelliphelliphelliphelliphelliphelliphelliphelliphelliphelliphelliphelliphelliphelliphelliphelliphelliphellip
helliphelliphelliphelliphelliphelliphelliphelliphelliphelliphelliphelliphelliphelliphelliphelliphelliphelliphelliphelliphelliphelliphelliphelliphelliphelliphelliphelliphelliphelliphelliphelliphelliphelliphelliphelliphelliphelliphelliphellip
8 Suppose that you toss a coin three times and all eight outcomes are equally likely If it is known that the first
toss comes up heads what is the probability of an odd number of heads appearing
helliphelliphelliphelliphelliphelliphelliphelliphelliphelliphelliphelliphelliphelliphelliphelliphelliphelliphelliphelliphelliphelliphelliphelliphelliphelliphelliphelliphelliphelliphelliphelliphelliphelliphelliphelliphelliphelliphelliphelliphelliphelliphelliphelliphellip
helliphelliphelliphelliphelliphelliphelliphelliphelliphelliphelliphelliphelliphelliphelliphelliphelliphelliphelliphelliphelliphelliphelliphelliphelliphelliphelliphelliphelliphelliphelliphelliphelliphelliphelliphelliphelliphelliphelliphelliphelliphelliphelliphelliphellip
helliphelliphelliphelliphelliphelliphelliphelliphelliphelliphelliphelliphelliphelliphelliphelliphelliphelliphelliphelliphelliphelliphelliphelliphelliphelliphelliphelliphelliphelliphelliphelliphelliphelliphelliphelliphelliphelliphelliphelliphelliphelliphelliphelliphellip
International Journal of Studies in Education and Science (IJSES)
145
helliphelliphelliphelliphelliphelliphelliphelliphelliphelliphelliphelliphelliphelliphelliphelliphelliphelliphelliphelliphelliphelliphelliphelliphelliphelliphelliphelliphelliphelliphelliphelliphelliphelliphelliphelliphelliphelliphelliphelliphelliphelliphelliphelliphellip
helliphelliphelliphelliphelliphelliphelliphelliphelliphelliphelliphelliphelliphelliphelliphelliphelliphelliphelliphelliphelliphelliphelliphelliphelliphelliphelliphelliphelliphelliphelliphelliphelliphelliphelliphelliphelliphelliphelliphelliphelliphelliphelliphelliphellip
helliphelliphelliphelliphelliphelliphelliphelliphelliphelliphelliphelliphelliphelliphelliphelliphelliphelliphelliphellip
9 A card is selected at random from a pack of 52 cards Find the probability of selecting a card which is a red or
a queen
helliphelliphelliphelliphelliphelliphelliphelliphelliphelliphelliphelliphelliphelliphelliphelliphelliphelliphelliphelliphelliphelliphelliphelliphelliphelliphelliphelliphelliphelliphelliphelliphelliphelliphelliphelliphelliphelliphelliphelliphelliphelliphelliphelliphellip
helliphelliphelliphelliphelliphelliphelliphelliphelliphelliphelliphelliphelliphelliphelliphelliphelliphelliphelliphelliphelliphelliphelliphelliphelliphelliphelliphelliphelliphelliphelliphelliphelliphelliphelliphelliphelliphelliphelliphelliphelliphelliphelliphelliphellip
helliphelliphelliphelliphelliphelliphelliphelliphelliphelliphelliphelliphelliphelliphelliphelliphelliphelliphelliphelliphelliphelliphelliphelliphelliphelliphelliphelliphelliphelliphelliphelliphelliphelliphelliphelliphelliphelliphelliphelliphelliphelliphelliphelliphellip
helliphelliphelliphelliphelliphelliphelliphelliphelliphelliphelliphelliphelliphelliphelliphelliphelliphelliphelliphelliphelliphelliphelliphelliphelliphelliphelliphelliphelliphelliphelliphelliphelliphelliphelliphelliphelliphelliphelliphellip
10 A box contains 6 white balls and 4 green balls Two balls are chosen at random one after the other without
replacement determine the probability that the second ball is white
helliphelliphelliphelliphelliphelliphelliphelliphelliphelliphelliphelliphelliphelliphelliphelliphelliphelliphelliphelliphelliphelliphelliphelliphelliphelliphelliphelliphelliphelliphelliphelliphelliphelliphelliphelliphelliphelliphelliphelliphelliphelliphelliphelliphellip
helliphelliphelliphelliphelliphelliphelliphelliphelliphelliphelliphelliphelliphelliphelliphelliphelliphelliphelliphelliphelliphelliphelliphelliphelliphelliphelliphelliphelliphelliphelliphelliphelliphelliphelliphelliphelliphelliphelliphelliphelliphelliphelliphelliphellip
helliphelliphelliphelliphelliphelliphelliphelliphelliphelliphelliphelliphelliphelliphelliphelliphelliphelliphelliphelliphelliphelliphelliphelliphelliphelliphelliphelliphelliphelliphelliphelliphelliphelliphelliphelliphelliphelliphelliphelliphelliphelliphelliphelliphellip
helliphelliphelliphelliphelliphelliphelliphelliphelliphelliphelliphelliphelliphelliphelliphelliphelliphelliphelliphelliphelliphelliphelliphelliphelliphelliphelliphelliphelliphelliphelliphelliphelliphelliphelliphelliphelliphelliphelliphelliphelliphelliphellip

Hokor amp Sedofia
128
decision-making ability by addressing equiprobability bias representativeness bias belief and positive and
negative recency effects The aim of predicting before picking was to keep students focused and to confront any
prior misconceptions The game was played 15 times If all the three members of the group pick different colors
then a point of one is recorded else zero After the activity a discussion was organized around their prediction
and the results to challenge their thinking
Pair Game In pairs preservice teachers were asked to toss a coin six times each recording the sequence of tails
and heads The purpose of this activity is to address representativeness bias Before the toss students were asked
to predict the number of tails and heads Their predictions were written in their notebook before the toss Most
preservice teachers predicted equal number of tails and heads Preservice teachers then compare their predicted
sequences to their results after the toss It was noted in many instances that those who predicted equal number of
tails and heads did not obtain results that were consistent with their prediction Discussions were organized
around their predicted sequences and the results obtained after the toss for better probabilistic reasoning
Coin Game Students perform this experiment ten times by tossing a number of fair coins once and record the
outcomes in each case In the first toss a coin was tossed once and the outcome recorded in the second toss
two coins were tossed once and outcomes recorded in third toss three coins were tossed once and outcomes
recorded and so on H stands for heads and T stands for tails The following are a sample of sequence of
outcomes by one student
1st toss H
2nd
toss HT
3rd
toss HTH
4th
toss HTTT
5th
toss THHTT
6th
toss HTHTTT
7th
toss TTHTHHT
8th
toss THTHTHHH
9th
toss HTTTHTHTT
10th
toss THTHTHTHTT
119873119906119898119887119890119903 119900119891 ℎ119890119886119889119904
119873119906119898119887119890119903 119900119891 119905119900119904119904119890119904=
1
1= 1
1
2= 05
2
3= 0667
1
4= 025
2
5= 04
2
6= 0333
3
7= 0429
5
8
= 0625 3
9= 0333
4
10= 04
The average of the probabilities of obtaining a head for each experiment is
=105066702504033304290625033304
10=
4937
10cong 05
International Journal of Studies in Education and Science (IJSES)
129
It must be noted that in experimental or frequentist probability we are concerned about conducting the
experiment many times and considering its approximation or convergence Students were led to conclude that in
general we can say when a fair coin is tossed the probability of getting a head at any time is 1
2 and vice versa
Group B The Teacher-centered approach
Group B was taught using the teacher-centered approach In this case the teacher rather than the learner was at
the center of the teaching and learning process The tutor presented the preservice teachers with facts or
procedures that had been established to solve problems Preservice teachers were given problems that require
the use of these facts or procedures to solve as either assignment exercise test or quiz It is believed that
preservice teachers learned more when they solved similar problems many times When examination questions
that demanded facts were set students could solve the problems without really understanding the concepts
Formulae were presented to students to learn to apply to similar problems Concepts were clearly explained
bearing in mind the probabilistic misconceptions Samples of lessons experienced by Group B are as follow
Lesson one Through questions and answers teacher revises preservice teachersrsquo previous knowledge on playing
of games and probabilistic situations Based on studentsrsquo responses the teacher introduces the lesson
Teacher explains to preservice teachers the concept of probability and three ways we can make probability
statements as classical frequentist and subjective Classical probability is the number of favorable outcomes (E)
divided by the total number of possible outcomes (S) It works on the assumptions that all outcomes are equally
likely Equally likely means that each outcome has the same probability of occurring
Mathematically P(E) =
Students were then led to solve problems using the formula
Experimental probability is a method of calculating probability where the probability is the ratio of the number
of the trials where the desired event occurs to the number of total trials Subjective probability is a statement that
an individual makes based on personal judgment to describe the likelihood of an event Or a personal belief
based on onersquos own experience or expertise The person making the statement should be an expert in the area or
someone who have a sound knowledge on the issue under consideration before it can be considered important
For the statement to be reliable it should be based on a sound premise(s) Nevertheless both experts and non-
experts make use of subjective probability daily For example I have a 90 chance of passing my statistics and
probability exam
Lesson two Teacher explains basic terms of probability such as sample space sample point an event equally
likely to preservice teachers Teacher guides preservice teachers through demonstration to solve probability
problems using classical definition of probability by listing the sample space and finding the probability of an
event Teacher leads preservice teachers to solve probability problems from frequency tables Similarly teacher
explains to preservice teachers independent and dependent events Teacher asks the preservice teachers to solve
problems on independent and dependent events
Hokor amp Sedofia
130
Data Analysis
The data collected were coded and edited before being transferred to computer for analysis using SPSS version
24 A Levenersquos test was used in the study to ensure that the assumptions between each group was not violated
Homogeneity of variances was considered to ensure that each grouprsquos pre-test scores were mostly equal Paired
samples T-test was used to compare two means within each group to determine whether or not the differences in
means were statistically significant Independent sample T-test was used to compare the probabilistic reasoning
mean scores in Group A and the Group B before the experiment at a time to determine whether the two groups
were at the same level or not The independent t-test was used because there were two different groups of
participants It works on the assumption that scores are unique because they come from different participants
Also the equality of variance for running ANCOVA at 5 significance level was checked using Levenersquos test
Table 2 Levenes Test of Equality of Variances
F df1 df2 Sig
1234 1 57 0456
The results from Table 2 indicate that the variances are roughly equal since the significance value of 0456 is
greater than the cut-off value of 005 Therefore we can conclude that homogeneity of variance assumption was
met (Field 2005) This allowed us to examine the relationship between the covariate (pre-test scores) and
dependent variable (post-test scores) Analysis of covariance (ANCOVA) was used to examine the effect of
learner-centered approach to teaching and teacher-centered approach on preservice teachersrsquo probabilistic
reasoning since different participants were in each group The ANCOVA is ideal in removing the bias of these
variables (Field 2005) In order to determine whether or not the occurrence of scores was not by chance a
partial eta squared was used to gauge the magnitude of the difference (effect size) between means of the scores
Pallant (2001) outlined the following criterion for interpreting partial eta squared values as 001 = small effect
006 = moderate effect and 014 = large effect
Results
Before introducing the learner-centered and teacher-centered approaches of teaching preservice teachersrsquo
probabilistic reasoning was compared to ascertain whether or not their results were similar in terms of the mean
scores The result is presented in Table 3
Table 3 Results of the Independent Samples t-test on the Pre-test of the Group B and Group A
Group N Mean Std Dev Mean Difference Df t-value p-value
Group B 27 585 1562 35 56 756 456
Group A 32 550 1967
The results in Table 3 indicate that there was no statistically significant difference between the probabilistic
reasoning mean scores of Group A = 550 = 1967 and Group B = 585 = 1562 in the
International Journal of Studies in Education and Science (IJSES)
131
pretest This is an indication that the two groups are similar and their performance could be compared after the
two teaching approaches
Comparison of Probabilistic Reasoning of the Preservice Teachers before and after Learner-centered
Approach in Group A
The results of analysis of the effect of the learner-centered approach on preservice teachersrsquo probabilistic
reasoning is presented in Table 4
Table 4 Pre-test and Post-test Scores for Group A
Minimum Maximum Mean Std Deviation
Pre-test 1 10 550 1967
Post-test 8 20 1572 3630
Table 4 reveals that in the post-test preservice teachersrsquo probabilistic reasoning mean scores increased from
550 to 1572 in the post-test in Group A
A paired sample t‐test was conducted to compare the post-test and pre-test scores for the preservice teachers
taught with the learner-centered approach to teaching (Group A) in order to determine if the mean difference in
scores was statistically significant This was done to evaluate the effect of the learner-centered approach on
preservice teachersrsquo probabilistic reasoning Table 5 presents the results
Table 5 Paired Sample t-test Results on the Post-test and Pre-test of Group A
Mean
Difference
Std
Deviation
Std Error
Mean
t Df Sig
Post-test ndash Pre-test 10219 2871 507 20137 31 000
The results from Table 5 shows a statistically significant difference in the preservice teachersrsquo probabilistic
reasoning from the pre-test (M = 550 SD = 1967) to the post-test (M = 1572 SD = 3630) with t (31) =
20137 p = 000 The result reveals that preservice teachersrsquo probabilistic reasoning has improved significantly
after the learner-centered approach was used since = 000 05 It can be inferred that the learner-centered
approach to teaching has a positive significant effect on preservice teachersrsquo probabilistic reasoning
Analysis of Probabilistic Reasoning of the Preservice Teachers before and after Teacher-centered
Approach to Teaching
The results of the analysis of the effect of the teacher-centered approach to teaching on preservice teachersrsquo
probabilistic reasoning is presented in Table 6
Hokor amp Sedofia
132
Table 6 Pre-test and Post-test Scores for the Group B
Minimum Maximum Mean Std Deviation
Pre-test 2 8 585 1562
Post-test 5 14 952 2208
The data on Table 6 show that the mean score of preservice teachers in the pre-test was 585 while that of the
post-test was 952 marks This indicates that in the post-test an average of each of the preservice teachersrsquo
probabilistic reasoning increased slightly in Group B To determine if the mean difference is statistically
significant a paired sample t‐test was conducted Table 7 presents the results
Table 7 Results of the Paired Samples t-test on the Post-test and Pre-test of the Group B
Mean
Difference
Std Deviation Std Error
Mean
t Df Sig
Post-test ndash Pre-test 3667 1441 0277 13220 26 000
The result presented on Table 7 shows that the mean score difference between the post-test and pre-test of
Group B was 3667 marks with a corresponding standard deviation of 1441 The paired sample t-test was
conducted to find out if the mean score difference (M = 3667 SD = 1441) was statistically significant This
was done to assess the effect of the teacher-centered approach targeted at addressing misconceptions on
preservice teachersrsquo probabilistic reasoning The results from Table 7 reveal that there was a statistically
significant difference in the preservice teachersrsquo probabilistic reasoning scores from the pre-test (M = 585 SD =
1562) to the post-test (M = 952 SD = 2208) with t (26) = 13220 p = 000 lt 05 This is an indication that the
teacher-centered approach to teaching probability targeted at addressing probabilistic misconceptions aids
students to improve upon their understanding and problem-solving abilities in probability
Next we compared the effectiveness of the learner-centered approach of teaching and the teacher-centered
approach of teaching in terms of probabilistic reasoning of preservice teachers and how they addressed
probabilistic misconceptions
Comparison of Effectiveness of Learner-centered Approach and Teacher-centered Approach in
Developing Probabilistic Reasoning
The preservice teachersrsquo scores on the pre-test of the achievement test were used as covariate in this analysis
The scores from the post-test were then compared using ANCOVA with = 05 to adjust for pre-test
differences that existed between Group A and Group B In the pre-test the mean scores of Group B and Group A
were 585 and 550 respectively ANCOVA was used to adjust the post-test scores statistically to compensate
for the 035 mean point difference between the two groups in the pre-test This adjustment led to a more
accurate post-test comparison Table 8 presents the results
International Journal of Studies in Education and Science (IJSES)
133
Table 8 Summary of ANCOVA of the Performance of Preservice Teachers taught with Learner-centered
Approach and Teacher-centered Approach (N = 59)
Source Sum of
Squares
Df
Mean
Square
F Sig Partial Eta
Squared
Corrected
Model
791144a 2 395562 72150 000 720
Intercept 205135 1 205135 37416 000 401
Pre-test 228184 1 228184 41620 000 426
Group 630253 1 630253 114955 000 672
Error 307026 56 5483
Total 10888000 59
Corrected Total 1098169 58
a R Squared = 720 (Adjusted R Squared = 710)
The data on Table 8 indicate that there is a statistically significant main effect on the preservice teachers who
were taught using the learner-centered approach to learn probability [F (1 56) = 114955 p = 000 lt 05]
Consequently the preservice teachers taught with the learner-centered approach performed better than their
counterparts who experienced the teacher-centered approach to learn probability The partial eta squared value
was found to be 0672 This value indicates a large effect size That is 672 of the variance in the dependent
variable (probabilistic reasoning achievement score) is expounded by the independent variable (teacher-centered
approach) This implies that the magnitude of the difference between the mean score of the preservice teachers
taught with the learner-centered approach and the teacher-centered approach is large With the high scores of
preservice teachers in the Group A it implies that the use of learner-centered approach in the teaching and
learning of probability improved the performance of the preservice teachers
The outcome of the study portrays that there was a statistically significant difference in the probabilistic
reasoning achievement mean scores of Group A than that of Group B [F (1 56) = 114955 p = 000 lt 05] This
finding implies that Group A performed better than Group B in the probabilistic reasoning achievement test
This is an indication that when the learner-centered approach to teaching probability is targeted at addressing
probabilistic misconceptions preservice teachers develop better probabilistic reasoning than teacher-centered
approach
Discussion
This study set out to compare the learner-centered and teacher-centered approaches of teaching in order to
determine the best way of developing preservice teachersrsquo probabilistic reasoning at the College of Education
Hokor amp Sedofia
134
level in Ghana The results as shown on Tables 3 4 5 6 7 and 8 indicate that the learner-centered approach to
teaching probability is more effective than the teacher-centered approach in motivating and inspiring preservice
teachers to learn and apply probability The learner-centered approach provides studentsrsquo opportunities to think
reason reflect and evaluate their ideals and that of colleagues
The findings of the present study are in tandem with several research findings Lessani Md Yunus and Bakar
(2017) investigated mathematics teaching approaches and their consequences on learnersrsquo ability to solve
challenging problems Their findings affirm the learner-centered approach to be more effective in studentsrsquo
creativity and innovation in solving real-life problems than the teacher-centered approach So training
programs for excellent teaching and learning should be flexible and innovative to allow preservice teachers to
explore gaps in learning and teaching (AIAhmad 2021) Similarly Prideaux (2007) found that students who
experienced the learner-centered approach of teaching performed significantly higher than those who were
taught without the learner-centered approach of teaching Roseth Garfield and Ben-Zvi (2008) also examined
the effect of the cooperative framework in classroom teaching and collaboration and found that student-
centered approaches to teaching help students to have better understanding of statistics than teacher-centered
instruction
Furthermore Gurbuz and Birgin (2011) studied the effect of computer-assisted teaching on addressing
probabilistic misconceptions of students The authors used pre-test to collect data on both the computer-assisted
and traditional groups before the experimental teachings After the intervention the post-test was administered
to ascertain the effect of computer-assisted teaching and teacher-centered approach on addressing studentsrsquo
probabilistic misconceptions Their study found computer-assisted teaching to have more significant effect on
studentsrsquo correct probabilistic reasoning than teacher-centered approach of teaching
As noted by Batanero and Diaz (2012) probability forms an integral part of the Mathematics curriculum in
many countries But the concept is one that some learners find difficult to understand partly due to the method
of teaching used by teachers This fact implies that teachers of mathematics should find more creative ways of
teaching the concept so as to make it easier for learners to understand and apply the concept As discovered in
this study the learner-centered approach is effective in developing probabilistic reasoning But the learner-
centered approach works best when certain conditions are present At the outset there is the need for relevant
teaching and learning materials Then teachers need to be trained and retrained in the use of the learner-centered
approach to teaching At the college of education level preservice teachers need to be taught using the learner-
centered approach not only to help them understand probability but also to help them use the learner-centered
approach in their own teaching
The activities used for Group A which is learner-centered approach group in the form of games promote
content knowledge and cognitive skills competencies such as collaboration and problem solving (Belova amp
Zowada 2020) The activities focus on promoting learning experiences rather than stressing on the
entertainment factor While some things students learn in school seem to them predetermined and bound by
laws in other branches of mathematics probability provides students with opportunity to learn that solutions to
International Journal of Studies in Education and Science (IJSES)
135
several problems depend on assumptions and have degrees of doubt So teaching methods that allow students to
predict and test their predictions should be encouraged for students to develop their intellectual repertoire The
processes used in reasoning about sample space will serve students well in life Several calls on the need to pay
attention to the study of probability show that teachers and mathematics teachers must provide their students
with appropriate teaching strategies to enhance their conceptual understanding In the preparation of preservice
teachers to become mathematically competent citizens teacher preparation programs such as teaching methods
must provide opportunities for preservice teachers to confront misconceptions and reason probabilistically
(Courtney amp Caniglia 2021)
The findings of the present study however run counter to those of Weltman and Whiteside (2010) They
conducted a study on the effectiveness of the traditional and active learning method in business statistics The
study found that active learning had not been effective for all category of students It is not precisely clear what
may have accounted for that result This is because active learning methods have generally been known to be
effective in promoting learning Further research is thus required in this regard
Conclusions
This study compared the effects of the learner-centered and teacher-centered approaches of teaching in
addressing probabilistic misconceptions by measuring preservice teachersrsquo probabilistic reasoning scores The
results show that the learner-centered approach aids preservice teachers to develop better probabilistic reasoning
than the teacher-centered approach to teaching Thus the study concludes that the learner-centered approach to
teaching is a solution to preservice teachersrsquo inability to answer questions on probability correctly Even though
each teaching approach targeted at addressing misconceptions was found to have significant effect on pre-
service teachersrsquo probabilistic reasoning the learner-centered approach was found to be more effective than the
teacher-centered approach in addressing misconceptions which limit studentsrsquo ability to solve probability
problems correctly
Implications and Recommendations
This study makes some key contributions to the teacher educationdevelopment literature in general and
particularly to the development of probabilistic reasoning of preservice teachers The study provides empirical
evidence that the learner-centered approach targeted at addressing probabilistic misconceptions is more effective
in developing probabilistic reasoning in preservice teachers What this means is that when teacher educators use
the learner-centered approach to teach the concept of probability and focus on addressing misconceptions
preservice teachers will develop better probabilistic reasoning This will in turn translate into preservice
teachers answering questions on probability correctly in their examinations and ultimately making them teach
the concept more effectively when they complete their training It is thus recommended that teachers should
consider employing the learner-centered approach in teaching the concept of probability
Hokor amp Sedofia
136
Limitations
As with every empirical study employing the quasi-experimental approach the current study has some
limitations which need to be acknowledged and used to guide users of the findings Firstly our sample was
drawn from a population of second year preservice teachers of a female only college of education in a peri-
urban area in Ghana Further experiments are therefore needed in other settings in order to see if the same or
similar results will occur Secondly owing to the narrow characteristics of the participants in the present study
the researchers cannot generalize the results to other individuals who do not have the same characteristics So
additional experiments with groups with different characteristics are necessary Lastly the experiments need to
be repeated at another time to determine if the results are the same (consistent) over time
Acknowledgements
We are grateful to the Principal and preservice teachers for granting access and participating in the study
respectively
References
AIAhmad H (2021) The role of educational communication in promoting student-centered learning style in
multicultural classrooms A reflective essay on learning and teaching in higher education International
Journal of Research in Education and Science (IJRES) 7(3) 838-851 httpsdoiorg1046328ijes2374
Aina J K Olanipekun S S amp Garuba I A (2015) Teachersrsquo effectiveness and its Influence on studentsrsquo
learning Advances in Social Sciences Research Journal 2(4) 88-95
Anway D W amp Bennett E (2004) Common Misconceptions in Probability among Students in an Elementary
Statistics class Unplished Senior Project The ARTIST Roundtable Conference on Assessment in
Statistics held at Lawrence University Supperior WI The University of Wisconsin-Superior
Bada S (2015) Constructivist Learning Theory A Paradigm for Teaching and Learning IOSR Journal of
Research and Method in Education (IOSR-JRME) 5(6) 66-70 httpsDOI1097907388-05616670
Baerveldt C (2013) Constructivism contested Implications of a genetic perspective in psychology Integrative
Psychological and Behavioral Science 47(1) 156-166
Batanero C (2013) Teaching and learning probability In S Lerman (Ed ) Encyclopedia of Mathematics
Education Heidelberg Springer
Batanero C and Diaz C (2012) Training school teachers to teach probability reflections and challenges
Chilean Journal of Statistics 3(1) 3-13
Belova N amp Zowada C (2020) Innovating Higher Education Via Game-Based Learning on Misconceptions
Education Sciences 10 221 doi103390educSCi10090221
Bennett E amp Anway D W (2003) Statistical and Probabilistic Reasoning and Misconceptions among
Selected College Students McNair Scholars Journal Vol 4 httpwwwsocheclchjs
Cantoy O (2010) Mathematics teachersrsquo topic-specific pedagogical content knowledge in the context of
teaching a0 0 and a divide 0 Educational Sciences Theory and Practice 10 (2) 749-769
International Journal of Studies in Education and Science (IJSES)
137
Clements D H amp Battista M (1990) Constructivist Learning and Teaching The
Arithetic Teacher 38(1) ProQuest Central pg 34 DOI105951AT3810034
Creswell J W amp Creswell J D (2018) Research design Qualitative quantitative and
mixed methods approaches (5th
ed) Los Angeles SAGE Publications Inc
Courtney S A amp Caniglia J (2021) Comparing the mathematical practices pre-service teachers and
mathematics teacher educators identified as relevant to problems and tasks International Journal of
Research in Education and Science (IJRES) 7(3) 954-971 httpsdoiorg1046328ijres2335
Denton D W (2012) Enhancing instruction through constructivism cooperative learning and cloud
computing Tech Trends 56(4) 34-41
Gage J (2012) Towards a new Probability Curriculum for Secondary Schools Paper presented at 12th
International Congress on Mathematical Education 8 July-15 July COEX Seoul Korea Cambridge
Cambridge University Uk
Gurbuz R amp Birgin O (2011) The effect of computer-assisted teaching on remedying misconceptions The
case of the subject Probability Journal Homepage 58(2012) DOI 101016jcompedu201111005
Hirsh L amp ODonnell A M (2001) Representativeness in Statistical Reasoning Identifying and Assessing
Misconceptions Journal of Statistics Education 9(2) 96-105 DOI10108010691898200111910655
Johnson H D amp Dasgupta N (2005) Traditional versus Non-traditional Teaching during Perspectives of
Students in Introductory Statistics Classes Journal of Statistics Education 13(2)
httpsdoiorg10108010691898200511910558
Major T amp Mangope B (2012) The Constructivist Theory in Mathematics The case of Botswana Primary
Schools International Review of Social Sciencies and Humanities 3(2) 139-147
Jones G (2005) Reflections In GA Jones (Ed) Exploring probability in school chanlleges for teaching and
probability (367-372) New York Springer
Jun L (2000) Chinese Students Understanding of Probability Published doctoral dissertation Singapore
National Institute of Education Nanyang Technological University
Khazanov L amp Gourgey A (2009) Instructors Perspectives on Students Mistaken Beliefs about Probability
in an Elementary College Statistics Course In K Safford-Ramus (Ed) Proceedings of the Adults
Learning Mathematics a Resaerch Forum (ALM) 15th
Annual International Conference 249-264
Khazanov L amp Prado L (2010) Correcting Students Misconceptions about Probability in an Introductory
College Statistics Course Adults Learning Mathematics-An International Journal 5(1) 23-35
Kleickmann T Richter D Kunter M Elsner J Besser M Krauss S amp Baumert J (2013) Teachersrsquo
Content Knowledge and Pedagogical Content Knowledge The Role of Structural Differences in Teacher
Education Journal of Teacher Education 64(1) 90-106 DOI1011770022487112460398
Leedy P D and Ormrod J E (2020) Practical research Planning and design (12th Global Edition) Harlow
England Pearson
Lessani A Md Yunus AS amp Bakar KBA (2017) Comparison of new mathematics teaching methods with
teacher-centered approach International Journal of Social Sciences 3(2) 1285-1297
httpsdxdoiorg1020319pijss20173212851297
Lim C amp Hwa T (2007) Promoting Mathematical Thinking in the Malaysian Classroom Issues and
challenges httpswwwresearchgatenetpublication252353381
Hokor amp Sedofia
138
Lovett J N amp Lee H S (2017) New Standards Require Teaching More Statistics Are Preservice Secondary
Mathematics Ready Journal of Teachers Education 68(3) 299-311 DOI 1011770022487117697918
Major T amp Mangope B (2012) The Constructivist Theory in Mathematics The case of Botswana Primary
Schools International Review of Social Sciencies and Humanities 3(2) 139-147
National Council of Teachers of Mathematics (2003) Principles and Standards for School Mathematics and
their Implications for Professional Development Reston VA NCTM
Nguyen L (2015) Developing Conceptual Understanding and Probabilistic Thinking through Tree Diagrams
Published MPhil Dissertation Manitoba The Faculty of Graduate Studies of the University of
Manitoba
Prideaux J (2007) The learner-centered approach to Mathematics Teaching and the Active Learning
Strategies used to Enhance Students Understanding Mathematical and Computing Sciences Masters
Paper 29 Fisher Digital Publications httpfisherpubsjfcedumathcsetdmasters29
Roseth C J Garfield J B amp Ben-Zvi D (2008) Collaboration in Learning and Teaching Statistics Journal
of Statistics Education 16 (1) 1069-1898 httpsdoiorg10108010691898200811889557
Santagata R and Sandholtz J H (2019) Preservice teachersrsquo mathematics teaching competence Comparing
performance on two measures Journal of Teacher Education 70 (5) 472 ndash484
Schwerdt G amp Wuppermann A C (2011) Is traditional teaching really all that bad A within-student
between-subject approach Economics of Education Review 30(2) 365-379
Sharma S (2016) Probability from a socio-cultural perspective Statistics Education Research Journal 15(2)
126-144 httpiase-weborgPublicationsphpp=SERJ
Shay K (2008) Tracing middle school students understanding of probability a longitudinal study
Unpublished Doctoral Dissertation New Brunswick New Jersey Rutgers State University of New
Jersey
Shulman L S (1986) Those who understand Knowledge growth in teaching Educational Researcher 15(2)
4-14 doi 1031021001318X015002004
Thomas L (2020) An introduction to quasi-experimental designs
httpswwwscribbrcommethodologyquasi-experimental-design
Voskoglou M (2019) Comparing Teaching Methods of Mathematics at University Level Education Sciences
9(204) doi103390educsci9030204
Vygotsky L S (1978) Mind in society The development of higher psychological processes Cambridge MA
Harvard University Press
Weldeana H N amp Abraham S T (2014) The effect of an historical perspective on prospective teachersrsquo
beliefs in learning mathematics Journal of Mathematics Teacher Education 17 303-330
doi101007s10857-013-9266-z
Weltman D amp Whiteside M (2010) Comparing the Effectiveness of Traditional and active Learning Methods
in Business Statistics Convergence to the Mean 18(1)
httpsdoiorg10108010691898201011889480
White H amp Sabarwal S (2014) Quasi-experimental design and methods methological briefs impact
evaluations Florence UNICEF Office of research
International Journal of Studies in Education and Science (IJSES)
139
Author Information
Evans Kofi Hokor
httpsorcidorg0000-0002-8387-8294
St Teresarsquos College of Education Hohoe
Department of Mathematics and ICT
P O Box 129
Ghana
Contact e-mail evanskhokorgmailcom
John Sedofia
httpsorcidorg0000-0002-5409-516X
University of Ghana Legon
Department of Teacher Education
PO Box LG 1181
Ghana
Hokor amp Sedofia
140
Appendix A Pre-test Probabilistic Reasoning Assessment
This assessment is for research purpose to improve teaching and learning of probability
You are required to answer all questions honestly Do and leave all workings or rough work on the paper
Pre-test Probabilistic Reasoning Assessment Duration 1hr
Index numberhelliphelliphelliphelliphelliphelliphelliphelliphelliphelliphelliphelliphelliphelliphelliphelliphelliphellipLevelhelliphelliphelliphellipAgehelliphelliphellip
Read each statement carefully and circle the letter of the correct (best) option Provide appropriate response in
the space provided under some items as it apply
1 If you rolled an ordinary die and obtained 51246 which of these is most likely to occur on your next
roll
a 1
b 2
c 3
d 4
e 5
f 6
g The options a b c d e and f are all equally
2i A fair coin is tossed and it lands tail The coin is to be tossed a second time What is the probability that the
second toss will also be a tail
a 1
4
b 1
2
c 1
3
d Slightly less than 1
2
e Slightly more than 1
2
f 0
2ii Which of the following best describes the reason for the correct answer to the preceding question (2i)
a The second toss is less likely to be tail because the first toss was tail
b There are four possible outcomes when you toss a coin twice Getting two tails is only one of them
c The chance of getting heads or tails on any one toss is always 1
2
d There are three possible outcomes when you toss a coin twice Getting two tails is only one of the them
e No chance of being a tail in the second toss
3i A box contains 6 balls 2 are red 2 are black and 2 blue Three balls are picked at random one at a time
Each time a ball is picked the colour is recorded and the ball is put back in the box mixed thoroughly If the
first 2 balls are black what color is the third ball most likely to be
a Red
International Journal of Studies in Education and Science (IJSES)
141
b Black
c Blue
d Red and blue are equally likely than black
e Red black and blue are all equally likely
3ii Which of the following best describes the reason for the correct answer in the preceding question (3i)
a The third ball should not be black because too many black ones have already been picked
b The picks are independent so every color has an equally likely chance of being picked
c Black seems to be lucky
d This color is just as likely as any other color
4 A spinner with ten equally divided sectors in which four parts are white and the rests are red is about to
be spin which color is the spinner more likely to land
a White
b Red
c Both white and red are all equally
5 If you toss a fair coin and get heads two times in a row which of these is most likely on next toss
a Tail
b Head
c Both head and tail are all equally
6 A Gh 2 Gh 5 Ghcent10 Gh 20 Gh 50 and Gh 100 notes were put in a box and thoroughly mixed
What is the probability of picking Gh 50 note without looking
a 1
187
b 50
187
c 1
6
d 0
7 In a game you have been offered two options Which of the following give you higher chance of
winning GHcent200
a Tossing one die once and obtaining a 6
b Tossing two dice once and obtaining two 6rsquos
c The options a and b are all equally
8 A fair die is to be toss six times which of these is most likely to occur
a 251634
b 123456
c 666341
d 132244
e The options a b c and d are all equally likely
9 A fair coin is to be toss four times in a row which of these is least likely to occur
a THTH
b TTTH
c HHH
Hokor amp Sedofia
142
d The options a b and c are all equally likely
10 Two fair dice are to be tossed once Which of the following is more likely to occur
a Obtaining a sum of 11
b Obtaining a sum of 10
c A sum of 11 and a sum of 10 are all equally likely
10i Give reason for the correct answer in the preceding question (10)
helliphelliphelliphelliphelliphelliphelliphelliphelliphelliphelliphelliphelliphelliphelliphelliphelliphelliphelliphelliphelliphelliphelliphelliphelliphelliphelliphelliphelliphelliphelliphelliphelliphelliphelliphelliphelliphelliphelliphelliphelliphellip
helliphelliphelliphelliphelliphelliphelliphelliphelliphelliphelliphelliphelliphelliphelliphelliphelliphelliphelliphelliphelliphelliphelliphelliphelliphelliphelliphelliphelliphelliphelliphelliphelliphelliphelliphelliphelliphelliphelliphelliphelliphellip
helliphelliphelliphelliphelliphelliphelliphelliphelliphelliphelliphelliphelliphelliphelliphelliphelliphelliphelliphelliphelliphelliphelliphelliphelliphelliphelliphelliphelliphelliphelliphelliphelliphelliphelliphelliphelliphelliphelliphelliphelliphellip
helliphelliphelliphelliphelliphelliphelliphelliphelliphelliphelliphelliphelliphelliphelliphelliphelliphelliphelliphelliphelliphelliphelliphelliphelliphelliphelliphelliphelliphelliphelliphelliphelliphelliphelliphelliphelliphellip
11 In national lottery one has to choose five numbers from 1 to 90 inclusive You win when at least two of
your numbers are part of the numbers drawn on Saturday at random Eric has chosen 4 6 7 9 and 11
Alex has chosen 15 23 45 66 and 80 Daniel has chosen 71 77 78 83 and 85 Do Eric Alex and
Daniel have the same chance of winning or not and why
helliphelliphelliphelliphelliphelliphelliphelliphelliphelliphelliphelliphelliphelliphelliphelliphelliphelliphelliphelliphelliphelliphelliphelliphelliphelliphelliphelliphelliphelliphelliphelliphelliphelliphelliphelliphelliphelliphelliphelliphellip
helliphelliphelliphelliphelliphelliphelliphelliphelliphelliphelliphelliphelliphelliphelliphelliphelliphelliphelliphelliphelliphelliphelliphelliphelliphelliphelliphelliphelliphelliphelliphelliphelliphelliphelliphelliphelliphelliphelliphelliphellip
helliphelliphelliphelliphelliphelliphelliphelliphelliphelliphelliphelliphelliphelliphelliphelliphelliphelliphelliphelliphelliphelliphelliphelliphelliphelliphelliphelliphelliphelliphelliphelliphelliphelliphelliphelliphelliphelliphelliphelliphellip
helliphelliphelliphelliphelliphelliphelliphelliphelliphelliphelliphelliphelliphelliphelliphelliphelliphelliphelliphelliphelliphelliphelliphelliphelliphelliphelliphelliphelliphelliphelliphelliphelliphelliphelliphellip
12 A box contains 8 yellow balls and 4 green balls Two balls are chosen at random one after the other
without replacement determine the probability that the two balls are of different colours
helliphelliphelliphelliphelliphelliphelliphelliphelliphelliphelliphelliphelliphelliphelliphelliphelliphelliphelliphelliphelliphelliphelliphelliphelliphelliphelliphelliphelliphelliphelliphelliphelliphelliphelliphelliphelliphelliphelliphelliphellip
helliphelliphelliphelliphelliphelliphelliphelliphelliphelliphelliphelliphelliphelliphelliphelliphelliphelliphelliphelliphelliphelliphelliphelliphelliphelliphelliphelliphelliphelliphelliphelliphelliphelliphelliphelliphelliphelliphelliphelliphellip
helliphelliphelliphelliphelliphelliphelliphelliphelliphelliphelliphelliphelliphelliphelliphelliphelliphelliphelliphelliphelliphelliphelliphelliphelliphelliphelliphelliphelliphelliphelliphelliphelliphelliphelliphelliphelliphelliphelliphelliphellip
helliphelliphelliphelliphelliphelliphelliphelliphelliphelliphelliphelliphelliphelliphelliphelliphelliphelliphelliphelliphelliphelliphelliphelliphelliphelliphelliphelliphelliphelliphelliphelliphelliphelliphelliphelliphellip
International Journal of Studies in Education and Science (IJSES)
143
Appendix B Post-test Probabilistic Reasoning Assessment
This assessment is for research purpose to improve teaching and learning of probability
You are required to answer all questions honestly Do and leave all workings or rough work on the paper
Post-test Probabilistic Reasoning Assessment Duration One Hour
Index numberhelliphelliphelliphelliphelliphelliphelliphelliphelliphelliphelliphelliphelliphelliphellipClasshelliphelliphelliphellipAgehelliphelliphelliphellip
Read each statement carefully and circle the letter of the correct (best) option for each item as much as possible
and provide appropriate response in the space provided
1 Suppose a particular outcome from a random event has a probability of 04 Which of the following
statements represents correct interpretations of this probability
a The outcome will not happen
b The outcome will certainly happen about four times out of every 10 trials
c The outcome is expected to happen about four times out of every 10 trials
d The outcome could happen or it couldnrsquot of either result are the same
2 If you toss a fair coin and get heads 3 times in a row what is the chance of getting a head on the next toss
a 1
b Greater than 1
2
c 1
2
d Less than 1
2
e 0
3 A die is numbered 1 2 3 4 4 5 When the die is thrown once Which of these is most likely and why
a 1
b 2
c 3
d 4
e 5
f They are all equally likely
3i Give reason for your chosen answer in (3)
helliphelliphelliphelliphelliphelliphelliphelliphelliphelliphelliphelliphelliphelliphelliphelliphelliphelliphelliphelliphelliphelliphelliphelliphelliphelliphelliphelliphelliphelliphelliphelliphelliphelliphelliphelliphelliphelliphelliphelliphelliphelliphelliphelliphellip
helliphelliphelliphelliphelliphelliphelliphelliphelliphelliphelliphelliphelliphelliphelliphelliphelliphelliphelliphelliphelliphelliphelliphelliphelliphelliphelliphelliphelliphelliphelliphelliphelliphelliphelliphelliphelliphelliphelliphelliphelliphelliphelliphelliphellip
helliphelliphelliphelliphelliphelliphelliphelliphelliphelliphelliphelliphelliphelliphelliphelliphelliphelliphelliphelliphelliphelliphelliphelliphelliphelliphelliphelliphelliphelliphelliphelliphelliphelliphelliphelliphelliphelliphelliphelliphelliphelliphelliphelliphellip
helliphelliphelliphelliphelliphelliphelliphelliphelliphelliphelliphelliphelliphelliphelliphelliphelliphelliphelliphelliphelliphelliphelliphelliphelliphelliphelliphelliphelliphelliphelliphelliphelliphelliphelliphelliphelliphelliphellip
4 German MP tossed two dice once Which of these is mostly likely and why
a Obtaining a sum of 4
b Obtaining a sum of 7
c Obtaining a sum of 11
d All of them have equal chance of occurring that is a b c
Hokor amp Sedofia
144
4i Give reason for your chosen answer in (4)
helliphelliphelliphelliphelliphelliphelliphelliphelliphelliphelliphelliphelliphelliphelliphelliphelliphelliphelliphelliphelliphelliphelliphelliphelliphelliphelliphelliphelliphelliphelliphelliphelliphelliphelliphelliphelliphelliphelliphelliphelliphelliphelliphelliphellip
helliphelliphelliphelliphelliphelliphelliphelliphelliphelliphelliphelliphelliphelliphelliphelliphelliphelliphelliphelliphelliphelliphelliphelliphelliphelliphelliphelliphelliphelliphelliphelliphelliphelliphelliphelliphelliphelliphelliphelliphelliphelliphelliphelliphellip
helliphelliphelliphelliphelliphelliphelliphelliphelliphelliphelliphelliphelliphelliphelliphelliphelliphelliphelliphelliphelliphelliphelliphelliphelliphelliphelliphelliphelliphelliphelliphelliphelliphelliphelliphelliphelliphelliphelliphelliphelliphelliphelliphelliphellip
helliphelliphelliphelliphelliphelliphelliphelliphelliphelliphelliphelliphelliphelliphelliphelliphelliphelliphelliphelliphelliphelliphelliphelliphelliphelliphelliphelliphelliphelliphelliphelliphelliphelliphelliphelliphelliphelliphelliphelliphelliphelliphelliphelliphellip
helliphelliphelliphelliphelliphelliphelliphelliphelliphelliphelliphelliphelliphelliphelliphelliphelliphelliphelliphelliphelliphelliphelliphelliphelliphelliphelliphelliphellip
5i A fair coin is to be toss four times which of these is most likely to occur
a HTHT
b THTT
c TTTT
d HHTH
e The options a b c and d are all equally likely
5ii Give reason for your chosen answer in (5i)
helliphelliphelliphelliphelliphelliphelliphelliphelliphelliphelliphelliphelliphelliphelliphelliphelliphelliphelliphelliphelliphelliphelliphelliphelliphelliphelliphelliphelliphelliphelliphelliphelliphelliphelliphelliphelliphelliphelliphelliphelliphelliphelliphelliphellip
helliphelliphelliphelliphelliphelliphelliphelliphelliphelliphelliphelliphelliphelliphelliphelliphelliphelliphelliphelliphelliphelliphelliphelliphelliphelliphelliphelliphelliphelliphelliphelliphelliphelliphelliphelliphelliphelliphelliphelliphelliphelliphelliphelliphellip
helliphelliphelliphelliphelliphelliphelliphelliphelliphelliphelliphelliphelliphelliphelliphelliphelliphelliphelliphelliphelliphelliphelliphelliphelliphelliphelliphelliphelliphelliphelliphelliphelliphelliphelliphelliphelliphelliphelliphelliphelliphelliphelliphelliphellip
helliphelliphelliphelliphelliphelliphelliphelliphelliphelliphelliphelliphelliphelliphelliphelliphelliphelliphelliphelliphelliphelliphelliphelliphelliphelliphelliphelliphelliphelliphelliphelliphelliphelliphelliphelliphelliphelliphellip
6i A fair coin is to be toss four times which of these is least likely to occur
a HTHT
b THTT
c TTTT
d HHTH
e The options a b c and d are all equally likely
6ii Give reason for your chosen answer in (6i)
helliphelliphelliphelliphelliphelliphelliphelliphelliphelliphelliphelliphelliphelliphelliphelliphelliphelliphelliphelliphelliphelliphelliphelliphelliphelliphelliphelliphelliphelliphelliphelliphelliphelliphelliphelliphelliphelliphelliphelliphelliphelliphelliphelliphellip
helliphelliphelliphelliphelliphelliphelliphelliphelliphelliphelliphelliphelliphelliphelliphelliphelliphelliphelliphelliphelliphelliphelliphelliphelliphelliphelliphelliphelliphelliphelliphelliphelliphelliphelliphelliphelliphelliphelliphelliphelliphelliphelliphelliphellip
helliphelliphelliphelliphelliphelliphelliphelliphelliphelliphelliphelliphelliphelliphelliphelliphelliphelliphelliphelliphelliphelliphelliphelliphelliphelliphelliphelliphelliphelliphelliphelliphelliphelliphelliphelliphelliphelliphelliphelliphelliphelliphelliphelliphellip
helliphelliphelliphellip
7 A college has 300 level 200 students and 236 level 100 students in it Each studentrsquos name is written with
the level on a piece of paper and all the names are put into a box and mixed thoroughly A tutor picks one
name out of the box without looking Which level is the tutor more likely to pick from and why
helliphelliphelliphelliphelliphelliphelliphelliphelliphelliphelliphelliphelliphelliphelliphelliphelliphelliphelliphelliphelliphelliphelliphelliphelliphelliphelliphelliphelliphelliphelliphelliphelliphelliphelliphelliphelliphelliphelliphelliphelliphelliphelliphelliphellip
helliphelliphelliphelliphelliphelliphelliphelliphelliphelliphelliphelliphelliphelliphelliphelliphelliphelliphelliphelliphelliphelliphelliphelliphelliphelliphelliphelliphelliphelliphelliphelliphelliphelliphelliphelliphelliphelliphelliphelliphelliphelliphelliphelliphellip
helliphelliphelliphelliphelliphelliphelliphelliphelliphelliphelliphelliphelliphelliphelliphelliphelliphelliphelliphelliphelliphelliphelliphelliphelliphelliphelliphelliphelliphelliphelliphelliphelliphelliphelliphelliphelliphelliphelliphelliphelliphelliphelliphelliphellip
helliphelliphelliphelliphelliphelliphelliphelliphelliphelliphelliphelliphelliphelliphelliphelliphelliphelliphelliphelliphelliphelliphelliphelliphelliphelliphelliphelliphelliphelliphelliphelliphelliphelliphelliphelliphelliphelliphelliphellip
8 Suppose that you toss a coin three times and all eight outcomes are equally likely If it is known that the first
toss comes up heads what is the probability of an odd number of heads appearing
helliphelliphelliphelliphelliphelliphelliphelliphelliphelliphelliphelliphelliphelliphelliphelliphelliphelliphelliphelliphelliphelliphelliphelliphelliphelliphelliphelliphelliphelliphelliphelliphelliphelliphelliphelliphelliphelliphelliphelliphelliphelliphelliphelliphellip
helliphelliphelliphelliphelliphelliphelliphelliphelliphelliphelliphelliphelliphelliphelliphelliphelliphelliphelliphelliphelliphelliphelliphelliphelliphelliphelliphelliphelliphelliphelliphelliphelliphelliphelliphelliphelliphelliphelliphelliphelliphelliphelliphelliphellip
helliphelliphelliphelliphelliphelliphelliphelliphelliphelliphelliphelliphelliphelliphelliphelliphelliphelliphelliphelliphelliphelliphelliphelliphelliphelliphelliphelliphelliphelliphelliphelliphelliphelliphelliphelliphelliphelliphelliphelliphelliphelliphelliphelliphellip
International Journal of Studies in Education and Science (IJSES)
145
helliphelliphelliphelliphelliphelliphelliphelliphelliphelliphelliphelliphelliphelliphelliphelliphelliphelliphelliphelliphelliphelliphelliphelliphelliphelliphelliphelliphelliphelliphelliphelliphelliphelliphelliphelliphelliphelliphelliphelliphelliphelliphelliphelliphellip
helliphelliphelliphelliphelliphelliphelliphelliphelliphelliphelliphelliphelliphelliphelliphelliphelliphelliphelliphelliphelliphelliphelliphelliphelliphelliphelliphelliphelliphelliphelliphelliphelliphelliphelliphelliphelliphelliphelliphelliphelliphelliphelliphelliphellip
helliphelliphelliphelliphelliphelliphelliphelliphelliphelliphelliphelliphelliphelliphelliphelliphelliphelliphelliphellip
9 A card is selected at random from a pack of 52 cards Find the probability of selecting a card which is a red or
a queen
helliphelliphelliphelliphelliphelliphelliphelliphelliphelliphelliphelliphelliphelliphelliphelliphelliphelliphelliphelliphelliphelliphelliphelliphelliphelliphelliphelliphelliphelliphelliphelliphelliphelliphelliphelliphelliphelliphelliphelliphelliphelliphelliphelliphellip
helliphelliphelliphelliphelliphelliphelliphelliphelliphelliphelliphelliphelliphelliphelliphelliphelliphelliphelliphelliphelliphelliphelliphelliphelliphelliphelliphelliphelliphelliphelliphelliphelliphelliphelliphelliphelliphelliphelliphelliphelliphelliphelliphelliphellip
helliphelliphelliphelliphelliphelliphelliphelliphelliphelliphelliphelliphelliphelliphelliphelliphelliphelliphelliphelliphelliphelliphelliphelliphelliphelliphelliphelliphelliphelliphelliphelliphelliphelliphelliphelliphelliphelliphelliphelliphelliphelliphelliphelliphellip
helliphelliphelliphelliphelliphelliphelliphelliphelliphelliphelliphelliphelliphelliphelliphelliphelliphelliphelliphelliphelliphelliphelliphelliphelliphelliphelliphelliphelliphelliphelliphelliphelliphelliphelliphelliphelliphelliphelliphellip
10 A box contains 6 white balls and 4 green balls Two balls are chosen at random one after the other without
replacement determine the probability that the second ball is white
helliphelliphelliphelliphelliphelliphelliphelliphelliphelliphelliphelliphelliphelliphelliphelliphelliphelliphelliphelliphelliphelliphelliphelliphelliphelliphelliphelliphelliphelliphelliphelliphelliphelliphelliphelliphelliphelliphelliphelliphelliphelliphelliphelliphellip
helliphelliphelliphelliphelliphelliphelliphelliphelliphelliphelliphelliphelliphelliphelliphelliphelliphelliphelliphelliphelliphelliphelliphelliphelliphelliphelliphelliphelliphelliphelliphelliphelliphelliphelliphelliphelliphelliphelliphelliphelliphelliphelliphelliphellip
helliphelliphelliphelliphelliphelliphelliphelliphelliphelliphelliphelliphelliphelliphelliphelliphelliphelliphelliphelliphelliphelliphelliphelliphelliphelliphelliphelliphelliphelliphelliphelliphelliphelliphelliphelliphelliphelliphelliphelliphelliphelliphelliphelliphellip
helliphelliphelliphelliphelliphelliphelliphelliphelliphelliphelliphelliphelliphelliphelliphelliphelliphelliphelliphelliphelliphelliphelliphelliphelliphelliphelliphelliphelliphelliphelliphelliphelliphelliphelliphelliphelliphelliphelliphelliphelliphelliphellip

International Journal of Studies in Education and Science (IJSES)
129
It must be noted that in experimental or frequentist probability we are concerned about conducting the
experiment many times and considering its approximation or convergence Students were led to conclude that in
general we can say when a fair coin is tossed the probability of getting a head at any time is 1
2 and vice versa
Group B The Teacher-centered approach
Group B was taught using the teacher-centered approach In this case the teacher rather than the learner was at
the center of the teaching and learning process The tutor presented the preservice teachers with facts or
procedures that had been established to solve problems Preservice teachers were given problems that require
the use of these facts or procedures to solve as either assignment exercise test or quiz It is believed that
preservice teachers learned more when they solved similar problems many times When examination questions
that demanded facts were set students could solve the problems without really understanding the concepts
Formulae were presented to students to learn to apply to similar problems Concepts were clearly explained
bearing in mind the probabilistic misconceptions Samples of lessons experienced by Group B are as follow
Lesson one Through questions and answers teacher revises preservice teachersrsquo previous knowledge on playing
of games and probabilistic situations Based on studentsrsquo responses the teacher introduces the lesson
Teacher explains to preservice teachers the concept of probability and three ways we can make probability
statements as classical frequentist and subjective Classical probability is the number of favorable outcomes (E)
divided by the total number of possible outcomes (S) It works on the assumptions that all outcomes are equally
likely Equally likely means that each outcome has the same probability of occurring
Mathematically P(E) =
Students were then led to solve problems using the formula
Experimental probability is a method of calculating probability where the probability is the ratio of the number
of the trials where the desired event occurs to the number of total trials Subjective probability is a statement that
an individual makes based on personal judgment to describe the likelihood of an event Or a personal belief
based on onersquos own experience or expertise The person making the statement should be an expert in the area or
someone who have a sound knowledge on the issue under consideration before it can be considered important
For the statement to be reliable it should be based on a sound premise(s) Nevertheless both experts and non-
experts make use of subjective probability daily For example I have a 90 chance of passing my statistics and
probability exam
Lesson two Teacher explains basic terms of probability such as sample space sample point an event equally
likely to preservice teachers Teacher guides preservice teachers through demonstration to solve probability
problems using classical definition of probability by listing the sample space and finding the probability of an
event Teacher leads preservice teachers to solve probability problems from frequency tables Similarly teacher
explains to preservice teachers independent and dependent events Teacher asks the preservice teachers to solve
problems on independent and dependent events
Hokor amp Sedofia
130
Data Analysis
The data collected were coded and edited before being transferred to computer for analysis using SPSS version
24 A Levenersquos test was used in the study to ensure that the assumptions between each group was not violated
Homogeneity of variances was considered to ensure that each grouprsquos pre-test scores were mostly equal Paired
samples T-test was used to compare two means within each group to determine whether or not the differences in
means were statistically significant Independent sample T-test was used to compare the probabilistic reasoning
mean scores in Group A and the Group B before the experiment at a time to determine whether the two groups
were at the same level or not The independent t-test was used because there were two different groups of
participants It works on the assumption that scores are unique because they come from different participants
Also the equality of variance for running ANCOVA at 5 significance level was checked using Levenersquos test
Table 2 Levenes Test of Equality of Variances
F df1 df2 Sig
1234 1 57 0456
The results from Table 2 indicate that the variances are roughly equal since the significance value of 0456 is
greater than the cut-off value of 005 Therefore we can conclude that homogeneity of variance assumption was
met (Field 2005) This allowed us to examine the relationship between the covariate (pre-test scores) and
dependent variable (post-test scores) Analysis of covariance (ANCOVA) was used to examine the effect of
learner-centered approach to teaching and teacher-centered approach on preservice teachersrsquo probabilistic
reasoning since different participants were in each group The ANCOVA is ideal in removing the bias of these
variables (Field 2005) In order to determine whether or not the occurrence of scores was not by chance a
partial eta squared was used to gauge the magnitude of the difference (effect size) between means of the scores
Pallant (2001) outlined the following criterion for interpreting partial eta squared values as 001 = small effect
006 = moderate effect and 014 = large effect
Results
Before introducing the learner-centered and teacher-centered approaches of teaching preservice teachersrsquo
probabilistic reasoning was compared to ascertain whether or not their results were similar in terms of the mean
scores The result is presented in Table 3
Table 3 Results of the Independent Samples t-test on the Pre-test of the Group B and Group A
Group N Mean Std Dev Mean Difference Df t-value p-value
Group B 27 585 1562 35 56 756 456
Group A 32 550 1967
The results in Table 3 indicate that there was no statistically significant difference between the probabilistic
reasoning mean scores of Group A = 550 = 1967 and Group B = 585 = 1562 in the
International Journal of Studies in Education and Science (IJSES)
131
pretest This is an indication that the two groups are similar and their performance could be compared after the
two teaching approaches
Comparison of Probabilistic Reasoning of the Preservice Teachers before and after Learner-centered
Approach in Group A
The results of analysis of the effect of the learner-centered approach on preservice teachersrsquo probabilistic
reasoning is presented in Table 4
Table 4 Pre-test and Post-test Scores for Group A
Minimum Maximum Mean Std Deviation
Pre-test 1 10 550 1967
Post-test 8 20 1572 3630
Table 4 reveals that in the post-test preservice teachersrsquo probabilistic reasoning mean scores increased from
550 to 1572 in the post-test in Group A
A paired sample t‐test was conducted to compare the post-test and pre-test scores for the preservice teachers
taught with the learner-centered approach to teaching (Group A) in order to determine if the mean difference in
scores was statistically significant This was done to evaluate the effect of the learner-centered approach on
preservice teachersrsquo probabilistic reasoning Table 5 presents the results
Table 5 Paired Sample t-test Results on the Post-test and Pre-test of Group A
Mean
Difference
Std
Deviation
Std Error
Mean
t Df Sig
Post-test ndash Pre-test 10219 2871 507 20137 31 000
The results from Table 5 shows a statistically significant difference in the preservice teachersrsquo probabilistic
reasoning from the pre-test (M = 550 SD = 1967) to the post-test (M = 1572 SD = 3630) with t (31) =
20137 p = 000 The result reveals that preservice teachersrsquo probabilistic reasoning has improved significantly
after the learner-centered approach was used since = 000 05 It can be inferred that the learner-centered
approach to teaching has a positive significant effect on preservice teachersrsquo probabilistic reasoning
Analysis of Probabilistic Reasoning of the Preservice Teachers before and after Teacher-centered
Approach to Teaching
The results of the analysis of the effect of the teacher-centered approach to teaching on preservice teachersrsquo
probabilistic reasoning is presented in Table 6
Hokor amp Sedofia
132
Table 6 Pre-test and Post-test Scores for the Group B
Minimum Maximum Mean Std Deviation
Pre-test 2 8 585 1562
Post-test 5 14 952 2208
The data on Table 6 show that the mean score of preservice teachers in the pre-test was 585 while that of the
post-test was 952 marks This indicates that in the post-test an average of each of the preservice teachersrsquo
probabilistic reasoning increased slightly in Group B To determine if the mean difference is statistically
significant a paired sample t‐test was conducted Table 7 presents the results
Table 7 Results of the Paired Samples t-test on the Post-test and Pre-test of the Group B
Mean
Difference
Std Deviation Std Error
Mean
t Df Sig
Post-test ndash Pre-test 3667 1441 0277 13220 26 000
The result presented on Table 7 shows that the mean score difference between the post-test and pre-test of
Group B was 3667 marks with a corresponding standard deviation of 1441 The paired sample t-test was
conducted to find out if the mean score difference (M = 3667 SD = 1441) was statistically significant This
was done to assess the effect of the teacher-centered approach targeted at addressing misconceptions on
preservice teachersrsquo probabilistic reasoning The results from Table 7 reveal that there was a statistically
significant difference in the preservice teachersrsquo probabilistic reasoning scores from the pre-test (M = 585 SD =
1562) to the post-test (M = 952 SD = 2208) with t (26) = 13220 p = 000 lt 05 This is an indication that the
teacher-centered approach to teaching probability targeted at addressing probabilistic misconceptions aids
students to improve upon their understanding and problem-solving abilities in probability
Next we compared the effectiveness of the learner-centered approach of teaching and the teacher-centered
approach of teaching in terms of probabilistic reasoning of preservice teachers and how they addressed
probabilistic misconceptions
Comparison of Effectiveness of Learner-centered Approach and Teacher-centered Approach in
Developing Probabilistic Reasoning
The preservice teachersrsquo scores on the pre-test of the achievement test were used as covariate in this analysis
The scores from the post-test were then compared using ANCOVA with = 05 to adjust for pre-test
differences that existed between Group A and Group B In the pre-test the mean scores of Group B and Group A
were 585 and 550 respectively ANCOVA was used to adjust the post-test scores statistically to compensate
for the 035 mean point difference between the two groups in the pre-test This adjustment led to a more
accurate post-test comparison Table 8 presents the results
International Journal of Studies in Education and Science (IJSES)
133
Table 8 Summary of ANCOVA of the Performance of Preservice Teachers taught with Learner-centered
Approach and Teacher-centered Approach (N = 59)
Source Sum of
Squares
Df
Mean
Square
F Sig Partial Eta
Squared
Corrected
Model
791144a 2 395562 72150 000 720
Intercept 205135 1 205135 37416 000 401
Pre-test 228184 1 228184 41620 000 426
Group 630253 1 630253 114955 000 672
Error 307026 56 5483
Total 10888000 59
Corrected Total 1098169 58
a R Squared = 720 (Adjusted R Squared = 710)
The data on Table 8 indicate that there is a statistically significant main effect on the preservice teachers who
were taught using the learner-centered approach to learn probability [F (1 56) = 114955 p = 000 lt 05]
Consequently the preservice teachers taught with the learner-centered approach performed better than their
counterparts who experienced the teacher-centered approach to learn probability The partial eta squared value
was found to be 0672 This value indicates a large effect size That is 672 of the variance in the dependent
variable (probabilistic reasoning achievement score) is expounded by the independent variable (teacher-centered
approach) This implies that the magnitude of the difference between the mean score of the preservice teachers
taught with the learner-centered approach and the teacher-centered approach is large With the high scores of
preservice teachers in the Group A it implies that the use of learner-centered approach in the teaching and
learning of probability improved the performance of the preservice teachers
The outcome of the study portrays that there was a statistically significant difference in the probabilistic
reasoning achievement mean scores of Group A than that of Group B [F (1 56) = 114955 p = 000 lt 05] This
finding implies that Group A performed better than Group B in the probabilistic reasoning achievement test
This is an indication that when the learner-centered approach to teaching probability is targeted at addressing
probabilistic misconceptions preservice teachers develop better probabilistic reasoning than teacher-centered
approach
Discussion
This study set out to compare the learner-centered and teacher-centered approaches of teaching in order to
determine the best way of developing preservice teachersrsquo probabilistic reasoning at the College of Education
Hokor amp Sedofia
134
level in Ghana The results as shown on Tables 3 4 5 6 7 and 8 indicate that the learner-centered approach to
teaching probability is more effective than the teacher-centered approach in motivating and inspiring preservice
teachers to learn and apply probability The learner-centered approach provides studentsrsquo opportunities to think
reason reflect and evaluate their ideals and that of colleagues
The findings of the present study are in tandem with several research findings Lessani Md Yunus and Bakar
(2017) investigated mathematics teaching approaches and their consequences on learnersrsquo ability to solve
challenging problems Their findings affirm the learner-centered approach to be more effective in studentsrsquo
creativity and innovation in solving real-life problems than the teacher-centered approach So training
programs for excellent teaching and learning should be flexible and innovative to allow preservice teachers to
explore gaps in learning and teaching (AIAhmad 2021) Similarly Prideaux (2007) found that students who
experienced the learner-centered approach of teaching performed significantly higher than those who were
taught without the learner-centered approach of teaching Roseth Garfield and Ben-Zvi (2008) also examined
the effect of the cooperative framework in classroom teaching and collaboration and found that student-
centered approaches to teaching help students to have better understanding of statistics than teacher-centered
instruction
Furthermore Gurbuz and Birgin (2011) studied the effect of computer-assisted teaching on addressing
probabilistic misconceptions of students The authors used pre-test to collect data on both the computer-assisted
and traditional groups before the experimental teachings After the intervention the post-test was administered
to ascertain the effect of computer-assisted teaching and teacher-centered approach on addressing studentsrsquo
probabilistic misconceptions Their study found computer-assisted teaching to have more significant effect on
studentsrsquo correct probabilistic reasoning than teacher-centered approach of teaching
As noted by Batanero and Diaz (2012) probability forms an integral part of the Mathematics curriculum in
many countries But the concept is one that some learners find difficult to understand partly due to the method
of teaching used by teachers This fact implies that teachers of mathematics should find more creative ways of
teaching the concept so as to make it easier for learners to understand and apply the concept As discovered in
this study the learner-centered approach is effective in developing probabilistic reasoning But the learner-
centered approach works best when certain conditions are present At the outset there is the need for relevant
teaching and learning materials Then teachers need to be trained and retrained in the use of the learner-centered
approach to teaching At the college of education level preservice teachers need to be taught using the learner-
centered approach not only to help them understand probability but also to help them use the learner-centered
approach in their own teaching
The activities used for Group A which is learner-centered approach group in the form of games promote
content knowledge and cognitive skills competencies such as collaboration and problem solving (Belova amp
Zowada 2020) The activities focus on promoting learning experiences rather than stressing on the
entertainment factor While some things students learn in school seem to them predetermined and bound by
laws in other branches of mathematics probability provides students with opportunity to learn that solutions to
International Journal of Studies in Education and Science (IJSES)
135
several problems depend on assumptions and have degrees of doubt So teaching methods that allow students to
predict and test their predictions should be encouraged for students to develop their intellectual repertoire The
processes used in reasoning about sample space will serve students well in life Several calls on the need to pay
attention to the study of probability show that teachers and mathematics teachers must provide their students
with appropriate teaching strategies to enhance their conceptual understanding In the preparation of preservice
teachers to become mathematically competent citizens teacher preparation programs such as teaching methods
must provide opportunities for preservice teachers to confront misconceptions and reason probabilistically
(Courtney amp Caniglia 2021)
The findings of the present study however run counter to those of Weltman and Whiteside (2010) They
conducted a study on the effectiveness of the traditional and active learning method in business statistics The
study found that active learning had not been effective for all category of students It is not precisely clear what
may have accounted for that result This is because active learning methods have generally been known to be
effective in promoting learning Further research is thus required in this regard
Conclusions
This study compared the effects of the learner-centered and teacher-centered approaches of teaching in
addressing probabilistic misconceptions by measuring preservice teachersrsquo probabilistic reasoning scores The
results show that the learner-centered approach aids preservice teachers to develop better probabilistic reasoning
than the teacher-centered approach to teaching Thus the study concludes that the learner-centered approach to
teaching is a solution to preservice teachersrsquo inability to answer questions on probability correctly Even though
each teaching approach targeted at addressing misconceptions was found to have significant effect on pre-
service teachersrsquo probabilistic reasoning the learner-centered approach was found to be more effective than the
teacher-centered approach in addressing misconceptions which limit studentsrsquo ability to solve probability
problems correctly
Implications and Recommendations
This study makes some key contributions to the teacher educationdevelopment literature in general and
particularly to the development of probabilistic reasoning of preservice teachers The study provides empirical
evidence that the learner-centered approach targeted at addressing probabilistic misconceptions is more effective
in developing probabilistic reasoning in preservice teachers What this means is that when teacher educators use
the learner-centered approach to teach the concept of probability and focus on addressing misconceptions
preservice teachers will develop better probabilistic reasoning This will in turn translate into preservice
teachers answering questions on probability correctly in their examinations and ultimately making them teach
the concept more effectively when they complete their training It is thus recommended that teachers should
consider employing the learner-centered approach in teaching the concept of probability
Hokor amp Sedofia
136
Limitations
As with every empirical study employing the quasi-experimental approach the current study has some
limitations which need to be acknowledged and used to guide users of the findings Firstly our sample was
drawn from a population of second year preservice teachers of a female only college of education in a peri-
urban area in Ghana Further experiments are therefore needed in other settings in order to see if the same or
similar results will occur Secondly owing to the narrow characteristics of the participants in the present study
the researchers cannot generalize the results to other individuals who do not have the same characteristics So
additional experiments with groups with different characteristics are necessary Lastly the experiments need to
be repeated at another time to determine if the results are the same (consistent) over time
Acknowledgements
We are grateful to the Principal and preservice teachers for granting access and participating in the study
respectively
References
AIAhmad H (2021) The role of educational communication in promoting student-centered learning style in
multicultural classrooms A reflective essay on learning and teaching in higher education International
Journal of Research in Education and Science (IJRES) 7(3) 838-851 httpsdoiorg1046328ijes2374
Aina J K Olanipekun S S amp Garuba I A (2015) Teachersrsquo effectiveness and its Influence on studentsrsquo
learning Advances in Social Sciences Research Journal 2(4) 88-95
Anway D W amp Bennett E (2004) Common Misconceptions in Probability among Students in an Elementary
Statistics class Unplished Senior Project The ARTIST Roundtable Conference on Assessment in
Statistics held at Lawrence University Supperior WI The University of Wisconsin-Superior
Bada S (2015) Constructivist Learning Theory A Paradigm for Teaching and Learning IOSR Journal of
Research and Method in Education (IOSR-JRME) 5(6) 66-70 httpsDOI1097907388-05616670
Baerveldt C (2013) Constructivism contested Implications of a genetic perspective in psychology Integrative
Psychological and Behavioral Science 47(1) 156-166
Batanero C (2013) Teaching and learning probability In S Lerman (Ed ) Encyclopedia of Mathematics
Education Heidelberg Springer
Batanero C and Diaz C (2012) Training school teachers to teach probability reflections and challenges
Chilean Journal of Statistics 3(1) 3-13
Belova N amp Zowada C (2020) Innovating Higher Education Via Game-Based Learning on Misconceptions
Education Sciences 10 221 doi103390educSCi10090221
Bennett E amp Anway D W (2003) Statistical and Probabilistic Reasoning and Misconceptions among
Selected College Students McNair Scholars Journal Vol 4 httpwwwsocheclchjs
Cantoy O (2010) Mathematics teachersrsquo topic-specific pedagogical content knowledge in the context of
teaching a0 0 and a divide 0 Educational Sciences Theory and Practice 10 (2) 749-769
International Journal of Studies in Education and Science (IJSES)
137
Clements D H amp Battista M (1990) Constructivist Learning and Teaching The
Arithetic Teacher 38(1) ProQuest Central pg 34 DOI105951AT3810034
Creswell J W amp Creswell J D (2018) Research design Qualitative quantitative and
mixed methods approaches (5th
ed) Los Angeles SAGE Publications Inc
Courtney S A amp Caniglia J (2021) Comparing the mathematical practices pre-service teachers and
mathematics teacher educators identified as relevant to problems and tasks International Journal of
Research in Education and Science (IJRES) 7(3) 954-971 httpsdoiorg1046328ijres2335
Denton D W (2012) Enhancing instruction through constructivism cooperative learning and cloud
computing Tech Trends 56(4) 34-41
Gage J (2012) Towards a new Probability Curriculum for Secondary Schools Paper presented at 12th
International Congress on Mathematical Education 8 July-15 July COEX Seoul Korea Cambridge
Cambridge University Uk
Gurbuz R amp Birgin O (2011) The effect of computer-assisted teaching on remedying misconceptions The
case of the subject Probability Journal Homepage 58(2012) DOI 101016jcompedu201111005
Hirsh L amp ODonnell A M (2001) Representativeness in Statistical Reasoning Identifying and Assessing
Misconceptions Journal of Statistics Education 9(2) 96-105 DOI10108010691898200111910655
Johnson H D amp Dasgupta N (2005) Traditional versus Non-traditional Teaching during Perspectives of
Students in Introductory Statistics Classes Journal of Statistics Education 13(2)
httpsdoiorg10108010691898200511910558
Major T amp Mangope B (2012) The Constructivist Theory in Mathematics The case of Botswana Primary
Schools International Review of Social Sciencies and Humanities 3(2) 139-147
Jones G (2005) Reflections In GA Jones (Ed) Exploring probability in school chanlleges for teaching and
probability (367-372) New York Springer
Jun L (2000) Chinese Students Understanding of Probability Published doctoral dissertation Singapore
National Institute of Education Nanyang Technological University
Khazanov L amp Gourgey A (2009) Instructors Perspectives on Students Mistaken Beliefs about Probability
in an Elementary College Statistics Course In K Safford-Ramus (Ed) Proceedings of the Adults
Learning Mathematics a Resaerch Forum (ALM) 15th
Annual International Conference 249-264
Khazanov L amp Prado L (2010) Correcting Students Misconceptions about Probability in an Introductory
College Statistics Course Adults Learning Mathematics-An International Journal 5(1) 23-35
Kleickmann T Richter D Kunter M Elsner J Besser M Krauss S amp Baumert J (2013) Teachersrsquo
Content Knowledge and Pedagogical Content Knowledge The Role of Structural Differences in Teacher
Education Journal of Teacher Education 64(1) 90-106 DOI1011770022487112460398
Leedy P D and Ormrod J E (2020) Practical research Planning and design (12th Global Edition) Harlow
England Pearson
Lessani A Md Yunus AS amp Bakar KBA (2017) Comparison of new mathematics teaching methods with
teacher-centered approach International Journal of Social Sciences 3(2) 1285-1297
httpsdxdoiorg1020319pijss20173212851297
Lim C amp Hwa T (2007) Promoting Mathematical Thinking in the Malaysian Classroom Issues and
challenges httpswwwresearchgatenetpublication252353381
Hokor amp Sedofia
138
Lovett J N amp Lee H S (2017) New Standards Require Teaching More Statistics Are Preservice Secondary
Mathematics Ready Journal of Teachers Education 68(3) 299-311 DOI 1011770022487117697918
Major T amp Mangope B (2012) The Constructivist Theory in Mathematics The case of Botswana Primary
Schools International Review of Social Sciencies and Humanities 3(2) 139-147
National Council of Teachers of Mathematics (2003) Principles and Standards for School Mathematics and
their Implications for Professional Development Reston VA NCTM
Nguyen L (2015) Developing Conceptual Understanding and Probabilistic Thinking through Tree Diagrams
Published MPhil Dissertation Manitoba The Faculty of Graduate Studies of the University of
Manitoba
Prideaux J (2007) The learner-centered approach to Mathematics Teaching and the Active Learning
Strategies used to Enhance Students Understanding Mathematical and Computing Sciences Masters
Paper 29 Fisher Digital Publications httpfisherpubsjfcedumathcsetdmasters29
Roseth C J Garfield J B amp Ben-Zvi D (2008) Collaboration in Learning and Teaching Statistics Journal
of Statistics Education 16 (1) 1069-1898 httpsdoiorg10108010691898200811889557
Santagata R and Sandholtz J H (2019) Preservice teachersrsquo mathematics teaching competence Comparing
performance on two measures Journal of Teacher Education 70 (5) 472 ndash484
Schwerdt G amp Wuppermann A C (2011) Is traditional teaching really all that bad A within-student
between-subject approach Economics of Education Review 30(2) 365-379
Sharma S (2016) Probability from a socio-cultural perspective Statistics Education Research Journal 15(2)
126-144 httpiase-weborgPublicationsphpp=SERJ
Shay K (2008) Tracing middle school students understanding of probability a longitudinal study
Unpublished Doctoral Dissertation New Brunswick New Jersey Rutgers State University of New
Jersey
Shulman L S (1986) Those who understand Knowledge growth in teaching Educational Researcher 15(2)
4-14 doi 1031021001318X015002004
Thomas L (2020) An introduction to quasi-experimental designs
httpswwwscribbrcommethodologyquasi-experimental-design
Voskoglou M (2019) Comparing Teaching Methods of Mathematics at University Level Education Sciences
9(204) doi103390educsci9030204
Vygotsky L S (1978) Mind in society The development of higher psychological processes Cambridge MA
Harvard University Press
Weldeana H N amp Abraham S T (2014) The effect of an historical perspective on prospective teachersrsquo
beliefs in learning mathematics Journal of Mathematics Teacher Education 17 303-330
doi101007s10857-013-9266-z
Weltman D amp Whiteside M (2010) Comparing the Effectiveness of Traditional and active Learning Methods
in Business Statistics Convergence to the Mean 18(1)
httpsdoiorg10108010691898201011889480
White H amp Sabarwal S (2014) Quasi-experimental design and methods methological briefs impact
evaluations Florence UNICEF Office of research
International Journal of Studies in Education and Science (IJSES)
139
Author Information
Evans Kofi Hokor
httpsorcidorg0000-0002-8387-8294
St Teresarsquos College of Education Hohoe
Department of Mathematics and ICT
P O Box 129
Ghana
Contact e-mail evanskhokorgmailcom
John Sedofia
httpsorcidorg0000-0002-5409-516X
University of Ghana Legon
Department of Teacher Education
PO Box LG 1181
Ghana
Hokor amp Sedofia
140
Appendix A Pre-test Probabilistic Reasoning Assessment
This assessment is for research purpose to improve teaching and learning of probability
You are required to answer all questions honestly Do and leave all workings or rough work on the paper
Pre-test Probabilistic Reasoning Assessment Duration 1hr
Index numberhelliphelliphelliphelliphelliphelliphelliphelliphelliphelliphelliphelliphelliphelliphelliphelliphelliphellipLevelhelliphelliphelliphellipAgehelliphelliphellip
Read each statement carefully and circle the letter of the correct (best) option Provide appropriate response in
the space provided under some items as it apply
1 If you rolled an ordinary die and obtained 51246 which of these is most likely to occur on your next
roll
a 1
b 2
c 3
d 4
e 5
f 6
g The options a b c d e and f are all equally
2i A fair coin is tossed and it lands tail The coin is to be tossed a second time What is the probability that the
second toss will also be a tail
a 1
4
b 1
2
c 1
3
d Slightly less than 1
2
e Slightly more than 1
2
f 0
2ii Which of the following best describes the reason for the correct answer to the preceding question (2i)
a The second toss is less likely to be tail because the first toss was tail
b There are four possible outcomes when you toss a coin twice Getting two tails is only one of them
c The chance of getting heads or tails on any one toss is always 1
2
d There are three possible outcomes when you toss a coin twice Getting two tails is only one of the them
e No chance of being a tail in the second toss
3i A box contains 6 balls 2 are red 2 are black and 2 blue Three balls are picked at random one at a time
Each time a ball is picked the colour is recorded and the ball is put back in the box mixed thoroughly If the
first 2 balls are black what color is the third ball most likely to be
a Red
International Journal of Studies in Education and Science (IJSES)
141
b Black
c Blue
d Red and blue are equally likely than black
e Red black and blue are all equally likely
3ii Which of the following best describes the reason for the correct answer in the preceding question (3i)
a The third ball should not be black because too many black ones have already been picked
b The picks are independent so every color has an equally likely chance of being picked
c Black seems to be lucky
d This color is just as likely as any other color
4 A spinner with ten equally divided sectors in which four parts are white and the rests are red is about to
be spin which color is the spinner more likely to land
a White
b Red
c Both white and red are all equally
5 If you toss a fair coin and get heads two times in a row which of these is most likely on next toss
a Tail
b Head
c Both head and tail are all equally
6 A Gh 2 Gh 5 Ghcent10 Gh 20 Gh 50 and Gh 100 notes were put in a box and thoroughly mixed
What is the probability of picking Gh 50 note without looking
a 1
187
b 50
187
c 1
6
d 0
7 In a game you have been offered two options Which of the following give you higher chance of
winning GHcent200
a Tossing one die once and obtaining a 6
b Tossing two dice once and obtaining two 6rsquos
c The options a and b are all equally
8 A fair die is to be toss six times which of these is most likely to occur
a 251634
b 123456
c 666341
d 132244
e The options a b c and d are all equally likely
9 A fair coin is to be toss four times in a row which of these is least likely to occur
a THTH
b TTTH
c HHH
Hokor amp Sedofia
142
d The options a b and c are all equally likely
10 Two fair dice are to be tossed once Which of the following is more likely to occur
a Obtaining a sum of 11
b Obtaining a sum of 10
c A sum of 11 and a sum of 10 are all equally likely
10i Give reason for the correct answer in the preceding question (10)
helliphelliphelliphelliphelliphelliphelliphelliphelliphelliphelliphelliphelliphelliphelliphelliphelliphelliphelliphelliphelliphelliphelliphelliphelliphelliphelliphelliphelliphelliphelliphelliphelliphelliphelliphelliphelliphelliphelliphelliphelliphellip
helliphelliphelliphelliphelliphelliphelliphelliphelliphelliphelliphelliphelliphelliphelliphelliphelliphelliphelliphelliphelliphelliphelliphelliphelliphelliphelliphelliphelliphelliphelliphelliphelliphelliphelliphelliphelliphelliphelliphelliphelliphellip
helliphelliphelliphelliphelliphelliphelliphelliphelliphelliphelliphelliphelliphelliphelliphelliphelliphelliphelliphelliphelliphelliphelliphelliphelliphelliphelliphelliphelliphelliphelliphelliphelliphelliphelliphelliphelliphelliphelliphelliphelliphellip
helliphelliphelliphelliphelliphelliphelliphelliphelliphelliphelliphelliphelliphelliphelliphelliphelliphelliphelliphelliphelliphelliphelliphelliphelliphelliphelliphelliphelliphelliphelliphelliphelliphelliphelliphelliphelliphellip
11 In national lottery one has to choose five numbers from 1 to 90 inclusive You win when at least two of
your numbers are part of the numbers drawn on Saturday at random Eric has chosen 4 6 7 9 and 11
Alex has chosen 15 23 45 66 and 80 Daniel has chosen 71 77 78 83 and 85 Do Eric Alex and
Daniel have the same chance of winning or not and why
helliphelliphelliphelliphelliphelliphelliphelliphelliphelliphelliphelliphelliphelliphelliphelliphelliphelliphelliphelliphelliphelliphelliphelliphelliphelliphelliphelliphelliphelliphelliphelliphelliphelliphelliphelliphelliphelliphelliphelliphellip
helliphelliphelliphelliphelliphelliphelliphelliphelliphelliphelliphelliphelliphelliphelliphelliphelliphelliphelliphelliphelliphelliphelliphelliphelliphelliphelliphelliphelliphelliphelliphelliphelliphelliphelliphelliphelliphelliphelliphelliphellip
helliphelliphelliphelliphelliphelliphelliphelliphelliphelliphelliphelliphelliphelliphelliphelliphelliphelliphelliphelliphelliphelliphelliphelliphelliphelliphelliphelliphelliphelliphelliphelliphelliphelliphelliphelliphelliphelliphelliphelliphellip
helliphelliphelliphelliphelliphelliphelliphelliphelliphelliphelliphelliphelliphelliphelliphelliphelliphelliphelliphelliphelliphelliphelliphelliphelliphelliphelliphelliphelliphelliphelliphelliphelliphelliphelliphellip
12 A box contains 8 yellow balls and 4 green balls Two balls are chosen at random one after the other
without replacement determine the probability that the two balls are of different colours
helliphelliphelliphelliphelliphelliphelliphelliphelliphelliphelliphelliphelliphelliphelliphelliphelliphelliphelliphelliphelliphelliphelliphelliphelliphelliphelliphelliphelliphelliphelliphelliphelliphelliphelliphelliphelliphelliphelliphelliphellip
helliphelliphelliphelliphelliphelliphelliphelliphelliphelliphelliphelliphelliphelliphelliphelliphelliphelliphelliphelliphelliphelliphelliphelliphelliphelliphelliphelliphelliphelliphelliphelliphelliphelliphelliphelliphelliphelliphelliphelliphellip
helliphelliphelliphelliphelliphelliphelliphelliphelliphelliphelliphelliphelliphelliphelliphelliphelliphelliphelliphelliphelliphelliphelliphelliphelliphelliphelliphelliphelliphelliphelliphelliphelliphelliphelliphelliphelliphelliphelliphelliphellip
helliphelliphelliphelliphelliphelliphelliphelliphelliphelliphelliphelliphelliphelliphelliphelliphelliphelliphelliphelliphelliphelliphelliphelliphelliphelliphelliphelliphelliphelliphelliphelliphelliphelliphelliphelliphellip
International Journal of Studies in Education and Science (IJSES)
143
Appendix B Post-test Probabilistic Reasoning Assessment
This assessment is for research purpose to improve teaching and learning of probability
You are required to answer all questions honestly Do and leave all workings or rough work on the paper
Post-test Probabilistic Reasoning Assessment Duration One Hour
Index numberhelliphelliphelliphelliphelliphelliphelliphelliphelliphelliphelliphelliphelliphelliphellipClasshelliphelliphelliphellipAgehelliphelliphelliphellip
Read each statement carefully and circle the letter of the correct (best) option for each item as much as possible
and provide appropriate response in the space provided
1 Suppose a particular outcome from a random event has a probability of 04 Which of the following
statements represents correct interpretations of this probability
a The outcome will not happen
b The outcome will certainly happen about four times out of every 10 trials
c The outcome is expected to happen about four times out of every 10 trials
d The outcome could happen or it couldnrsquot of either result are the same
2 If you toss a fair coin and get heads 3 times in a row what is the chance of getting a head on the next toss
a 1
b Greater than 1
2
c 1
2
d Less than 1
2
e 0
3 A die is numbered 1 2 3 4 4 5 When the die is thrown once Which of these is most likely and why
a 1
b 2
c 3
d 4
e 5
f They are all equally likely
3i Give reason for your chosen answer in (3)
helliphelliphelliphelliphelliphelliphelliphelliphelliphelliphelliphelliphelliphelliphelliphelliphelliphelliphelliphelliphelliphelliphelliphelliphelliphelliphelliphelliphelliphelliphelliphelliphelliphelliphelliphelliphelliphelliphelliphelliphelliphelliphelliphelliphellip
helliphelliphelliphelliphelliphelliphelliphelliphelliphelliphelliphelliphelliphelliphelliphelliphelliphelliphelliphelliphelliphelliphelliphelliphelliphelliphelliphelliphelliphelliphelliphelliphelliphelliphelliphelliphelliphelliphelliphelliphelliphelliphelliphelliphellip
helliphelliphelliphelliphelliphelliphelliphelliphelliphelliphelliphelliphelliphelliphelliphelliphelliphelliphelliphelliphelliphelliphelliphelliphelliphelliphelliphelliphelliphelliphelliphelliphelliphelliphelliphelliphelliphelliphelliphelliphelliphelliphelliphelliphellip
helliphelliphelliphelliphelliphelliphelliphelliphelliphelliphelliphelliphelliphelliphelliphelliphelliphelliphelliphelliphelliphelliphelliphelliphelliphelliphelliphelliphelliphelliphelliphelliphelliphelliphelliphelliphelliphelliphellip
4 German MP tossed two dice once Which of these is mostly likely and why
a Obtaining a sum of 4
b Obtaining a sum of 7
c Obtaining a sum of 11
d All of them have equal chance of occurring that is a b c
Hokor amp Sedofia
144
4i Give reason for your chosen answer in (4)
helliphelliphelliphelliphelliphelliphelliphelliphelliphelliphelliphelliphelliphelliphelliphelliphelliphelliphelliphelliphelliphelliphelliphelliphelliphelliphelliphelliphelliphelliphelliphelliphelliphelliphelliphelliphelliphelliphelliphelliphelliphelliphelliphelliphellip
helliphelliphelliphelliphelliphelliphelliphelliphelliphelliphelliphelliphelliphelliphelliphelliphelliphelliphelliphelliphelliphelliphelliphelliphelliphelliphelliphelliphelliphelliphelliphelliphelliphelliphelliphelliphelliphelliphelliphelliphelliphelliphelliphelliphellip
helliphelliphelliphelliphelliphelliphelliphelliphelliphelliphelliphelliphelliphelliphelliphelliphelliphelliphelliphelliphelliphelliphelliphelliphelliphelliphelliphelliphelliphelliphelliphelliphelliphelliphelliphelliphelliphelliphelliphelliphelliphelliphelliphelliphellip
helliphelliphelliphelliphelliphelliphelliphelliphelliphelliphelliphelliphelliphelliphelliphelliphelliphelliphelliphelliphelliphelliphelliphelliphelliphelliphelliphelliphelliphelliphelliphelliphelliphelliphelliphelliphelliphelliphelliphelliphelliphelliphelliphelliphellip
helliphelliphelliphelliphelliphelliphelliphelliphelliphelliphelliphelliphelliphelliphelliphelliphelliphelliphelliphelliphelliphelliphelliphelliphelliphelliphelliphelliphellip
5i A fair coin is to be toss four times which of these is most likely to occur
a HTHT
b THTT
c TTTT
d HHTH
e The options a b c and d are all equally likely
5ii Give reason for your chosen answer in (5i)
helliphelliphelliphelliphelliphelliphelliphelliphelliphelliphelliphelliphelliphelliphelliphelliphelliphelliphelliphelliphelliphelliphelliphelliphelliphelliphelliphelliphelliphelliphelliphelliphelliphelliphelliphelliphelliphelliphelliphelliphelliphelliphelliphelliphellip
helliphelliphelliphelliphelliphelliphelliphelliphelliphelliphelliphelliphelliphelliphelliphelliphelliphelliphelliphelliphelliphelliphelliphelliphelliphelliphelliphelliphelliphelliphelliphelliphelliphelliphelliphelliphelliphelliphelliphelliphelliphelliphelliphelliphellip
helliphelliphelliphelliphelliphelliphelliphelliphelliphelliphelliphelliphelliphelliphelliphelliphelliphelliphelliphelliphelliphelliphelliphelliphelliphelliphelliphelliphelliphelliphelliphelliphelliphelliphelliphelliphelliphelliphelliphelliphelliphelliphelliphelliphellip
helliphelliphelliphelliphelliphelliphelliphelliphelliphelliphelliphelliphelliphelliphelliphelliphelliphelliphelliphelliphelliphelliphelliphelliphelliphelliphelliphelliphelliphelliphelliphelliphelliphelliphelliphelliphelliphelliphellip
6i A fair coin is to be toss four times which of these is least likely to occur
a HTHT
b THTT
c TTTT
d HHTH
e The options a b c and d are all equally likely
6ii Give reason for your chosen answer in (6i)
helliphelliphelliphelliphelliphelliphelliphelliphelliphelliphelliphelliphelliphelliphelliphelliphelliphelliphelliphelliphelliphelliphelliphelliphelliphelliphelliphelliphelliphelliphelliphelliphelliphelliphelliphelliphelliphelliphelliphelliphelliphelliphelliphelliphellip
helliphelliphelliphelliphelliphelliphelliphelliphelliphelliphelliphelliphelliphelliphelliphelliphelliphelliphelliphelliphelliphelliphelliphelliphelliphelliphelliphelliphelliphelliphelliphelliphelliphelliphelliphelliphelliphelliphelliphelliphelliphelliphelliphelliphellip
helliphelliphelliphelliphelliphelliphelliphelliphelliphelliphelliphelliphelliphelliphelliphelliphelliphelliphelliphelliphelliphelliphelliphelliphelliphelliphelliphelliphelliphelliphelliphelliphelliphelliphelliphelliphelliphelliphelliphelliphelliphelliphelliphelliphellip
helliphelliphelliphellip
7 A college has 300 level 200 students and 236 level 100 students in it Each studentrsquos name is written with
the level on a piece of paper and all the names are put into a box and mixed thoroughly A tutor picks one
name out of the box without looking Which level is the tutor more likely to pick from and why
helliphelliphelliphelliphelliphelliphelliphelliphelliphelliphelliphelliphelliphelliphelliphelliphelliphelliphelliphelliphelliphelliphelliphelliphelliphelliphelliphelliphelliphelliphelliphelliphelliphelliphelliphelliphelliphelliphelliphelliphelliphelliphelliphelliphellip
helliphelliphelliphelliphelliphelliphelliphelliphelliphelliphelliphelliphelliphelliphelliphelliphelliphelliphelliphelliphelliphelliphelliphelliphelliphelliphelliphelliphelliphelliphelliphelliphelliphelliphelliphelliphelliphelliphelliphelliphelliphelliphelliphelliphellip
helliphelliphelliphelliphelliphelliphelliphelliphelliphelliphelliphelliphelliphelliphelliphelliphelliphelliphelliphelliphelliphelliphelliphelliphelliphelliphelliphelliphelliphelliphelliphelliphelliphelliphelliphelliphelliphelliphelliphelliphelliphelliphelliphelliphellip
helliphelliphelliphelliphelliphelliphelliphelliphelliphelliphelliphelliphelliphelliphelliphelliphelliphelliphelliphelliphelliphelliphelliphelliphelliphelliphelliphelliphelliphelliphelliphelliphelliphelliphelliphelliphelliphelliphelliphellip
8 Suppose that you toss a coin three times and all eight outcomes are equally likely If it is known that the first
toss comes up heads what is the probability of an odd number of heads appearing
helliphelliphelliphelliphelliphelliphelliphelliphelliphelliphelliphelliphelliphelliphelliphelliphelliphelliphelliphelliphelliphelliphelliphelliphelliphelliphelliphelliphelliphelliphelliphelliphelliphelliphelliphelliphelliphelliphelliphelliphelliphelliphelliphelliphellip
helliphelliphelliphelliphelliphelliphelliphelliphelliphelliphelliphelliphelliphelliphelliphelliphelliphelliphelliphelliphelliphelliphelliphelliphelliphelliphelliphelliphelliphelliphelliphelliphelliphelliphelliphelliphelliphelliphelliphelliphelliphelliphelliphelliphellip
helliphelliphelliphelliphelliphelliphelliphelliphelliphelliphelliphelliphelliphelliphelliphelliphelliphelliphelliphelliphelliphelliphelliphelliphelliphelliphelliphelliphelliphelliphelliphelliphelliphelliphelliphelliphelliphelliphelliphelliphelliphelliphelliphelliphellip
International Journal of Studies in Education and Science (IJSES)
145
helliphelliphelliphelliphelliphelliphelliphelliphelliphelliphelliphelliphelliphelliphelliphelliphelliphelliphelliphelliphelliphelliphelliphelliphelliphelliphelliphelliphelliphelliphelliphelliphelliphelliphelliphelliphelliphelliphelliphelliphelliphelliphelliphelliphellip
helliphelliphelliphelliphelliphelliphelliphelliphelliphelliphelliphelliphelliphelliphelliphelliphelliphelliphelliphelliphelliphelliphelliphelliphelliphelliphelliphelliphelliphelliphelliphelliphelliphelliphelliphelliphelliphelliphelliphelliphelliphelliphelliphelliphellip
helliphelliphelliphelliphelliphelliphelliphelliphelliphelliphelliphelliphelliphelliphelliphelliphelliphelliphelliphellip
9 A card is selected at random from a pack of 52 cards Find the probability of selecting a card which is a red or
a queen
helliphelliphelliphelliphelliphelliphelliphelliphelliphelliphelliphelliphelliphelliphelliphelliphelliphelliphelliphelliphelliphelliphelliphelliphelliphelliphelliphelliphelliphelliphelliphelliphelliphelliphelliphelliphelliphelliphelliphelliphelliphelliphelliphelliphellip
helliphelliphelliphelliphelliphelliphelliphelliphelliphelliphelliphelliphelliphelliphelliphelliphelliphelliphelliphelliphelliphelliphelliphelliphelliphelliphelliphelliphelliphelliphelliphelliphelliphelliphelliphelliphelliphelliphelliphelliphelliphelliphelliphelliphellip
helliphelliphelliphelliphelliphelliphelliphelliphelliphelliphelliphelliphelliphelliphelliphelliphelliphelliphelliphelliphelliphelliphelliphelliphelliphelliphelliphelliphelliphelliphelliphelliphelliphelliphelliphelliphelliphelliphelliphelliphelliphelliphelliphelliphellip
helliphelliphelliphelliphelliphelliphelliphelliphelliphelliphelliphelliphelliphelliphelliphelliphelliphelliphelliphelliphelliphelliphelliphelliphelliphelliphelliphelliphelliphelliphelliphelliphelliphelliphelliphelliphelliphelliphelliphellip
10 A box contains 6 white balls and 4 green balls Two balls are chosen at random one after the other without
replacement determine the probability that the second ball is white
helliphelliphelliphelliphelliphelliphelliphelliphelliphelliphelliphelliphelliphelliphelliphelliphelliphelliphelliphelliphelliphelliphelliphelliphelliphelliphelliphelliphelliphelliphelliphelliphelliphelliphelliphelliphelliphelliphelliphelliphelliphelliphelliphelliphellip
helliphelliphelliphelliphelliphelliphelliphelliphelliphelliphelliphelliphelliphelliphelliphelliphelliphelliphelliphelliphelliphelliphelliphelliphelliphelliphelliphelliphelliphelliphelliphelliphelliphelliphelliphelliphelliphelliphelliphelliphelliphelliphelliphelliphellip
helliphelliphelliphelliphelliphelliphelliphelliphelliphelliphelliphelliphelliphelliphelliphelliphelliphelliphelliphelliphelliphelliphelliphelliphelliphelliphelliphelliphelliphelliphelliphelliphelliphelliphelliphelliphelliphelliphelliphelliphelliphelliphelliphelliphellip
helliphelliphelliphelliphelliphelliphelliphelliphelliphelliphelliphelliphelliphelliphelliphelliphelliphelliphelliphelliphelliphelliphelliphelliphelliphelliphelliphelliphelliphelliphelliphelliphelliphelliphelliphelliphelliphelliphelliphelliphelliphelliphellip

Hokor amp Sedofia
130
Data Analysis
The data collected were coded and edited before being transferred to computer for analysis using SPSS version
24 A Levenersquos test was used in the study to ensure that the assumptions between each group was not violated
Homogeneity of variances was considered to ensure that each grouprsquos pre-test scores were mostly equal Paired
samples T-test was used to compare two means within each group to determine whether or not the differences in
means were statistically significant Independent sample T-test was used to compare the probabilistic reasoning
mean scores in Group A and the Group B before the experiment at a time to determine whether the two groups
were at the same level or not The independent t-test was used because there were two different groups of
participants It works on the assumption that scores are unique because they come from different participants
Also the equality of variance for running ANCOVA at 5 significance level was checked using Levenersquos test
Table 2 Levenes Test of Equality of Variances
F df1 df2 Sig
1234 1 57 0456
The results from Table 2 indicate that the variances are roughly equal since the significance value of 0456 is
greater than the cut-off value of 005 Therefore we can conclude that homogeneity of variance assumption was
met (Field 2005) This allowed us to examine the relationship between the covariate (pre-test scores) and
dependent variable (post-test scores) Analysis of covariance (ANCOVA) was used to examine the effect of
learner-centered approach to teaching and teacher-centered approach on preservice teachersrsquo probabilistic
reasoning since different participants were in each group The ANCOVA is ideal in removing the bias of these
variables (Field 2005) In order to determine whether or not the occurrence of scores was not by chance a
partial eta squared was used to gauge the magnitude of the difference (effect size) between means of the scores
Pallant (2001) outlined the following criterion for interpreting partial eta squared values as 001 = small effect
006 = moderate effect and 014 = large effect
Results
Before introducing the learner-centered and teacher-centered approaches of teaching preservice teachersrsquo
probabilistic reasoning was compared to ascertain whether or not their results were similar in terms of the mean
scores The result is presented in Table 3
Table 3 Results of the Independent Samples t-test on the Pre-test of the Group B and Group A
Group N Mean Std Dev Mean Difference Df t-value p-value
Group B 27 585 1562 35 56 756 456
Group A 32 550 1967
The results in Table 3 indicate that there was no statistically significant difference between the probabilistic
reasoning mean scores of Group A = 550 = 1967 and Group B = 585 = 1562 in the
International Journal of Studies in Education and Science (IJSES)
131
pretest This is an indication that the two groups are similar and their performance could be compared after the
two teaching approaches
Comparison of Probabilistic Reasoning of the Preservice Teachers before and after Learner-centered
Approach in Group A
The results of analysis of the effect of the learner-centered approach on preservice teachersrsquo probabilistic
reasoning is presented in Table 4
Table 4 Pre-test and Post-test Scores for Group A
Minimum Maximum Mean Std Deviation
Pre-test 1 10 550 1967
Post-test 8 20 1572 3630
Table 4 reveals that in the post-test preservice teachersrsquo probabilistic reasoning mean scores increased from
550 to 1572 in the post-test in Group A
A paired sample t‐test was conducted to compare the post-test and pre-test scores for the preservice teachers
taught with the learner-centered approach to teaching (Group A) in order to determine if the mean difference in
scores was statistically significant This was done to evaluate the effect of the learner-centered approach on
preservice teachersrsquo probabilistic reasoning Table 5 presents the results
Table 5 Paired Sample t-test Results on the Post-test and Pre-test of Group A
Mean
Difference
Std
Deviation
Std Error
Mean
t Df Sig
Post-test ndash Pre-test 10219 2871 507 20137 31 000
The results from Table 5 shows a statistically significant difference in the preservice teachersrsquo probabilistic
reasoning from the pre-test (M = 550 SD = 1967) to the post-test (M = 1572 SD = 3630) with t (31) =
20137 p = 000 The result reveals that preservice teachersrsquo probabilistic reasoning has improved significantly
after the learner-centered approach was used since = 000 05 It can be inferred that the learner-centered
approach to teaching has a positive significant effect on preservice teachersrsquo probabilistic reasoning
Analysis of Probabilistic Reasoning of the Preservice Teachers before and after Teacher-centered
Approach to Teaching
The results of the analysis of the effect of the teacher-centered approach to teaching on preservice teachersrsquo
probabilistic reasoning is presented in Table 6
Hokor amp Sedofia
132
Table 6 Pre-test and Post-test Scores for the Group B
Minimum Maximum Mean Std Deviation
Pre-test 2 8 585 1562
Post-test 5 14 952 2208
The data on Table 6 show that the mean score of preservice teachers in the pre-test was 585 while that of the
post-test was 952 marks This indicates that in the post-test an average of each of the preservice teachersrsquo
probabilistic reasoning increased slightly in Group B To determine if the mean difference is statistically
significant a paired sample t‐test was conducted Table 7 presents the results
Table 7 Results of the Paired Samples t-test on the Post-test and Pre-test of the Group B
Mean
Difference
Std Deviation Std Error
Mean
t Df Sig
Post-test ndash Pre-test 3667 1441 0277 13220 26 000
The result presented on Table 7 shows that the mean score difference between the post-test and pre-test of
Group B was 3667 marks with a corresponding standard deviation of 1441 The paired sample t-test was
conducted to find out if the mean score difference (M = 3667 SD = 1441) was statistically significant This
was done to assess the effect of the teacher-centered approach targeted at addressing misconceptions on
preservice teachersrsquo probabilistic reasoning The results from Table 7 reveal that there was a statistically
significant difference in the preservice teachersrsquo probabilistic reasoning scores from the pre-test (M = 585 SD =
1562) to the post-test (M = 952 SD = 2208) with t (26) = 13220 p = 000 lt 05 This is an indication that the
teacher-centered approach to teaching probability targeted at addressing probabilistic misconceptions aids
students to improve upon their understanding and problem-solving abilities in probability
Next we compared the effectiveness of the learner-centered approach of teaching and the teacher-centered
approach of teaching in terms of probabilistic reasoning of preservice teachers and how they addressed
probabilistic misconceptions
Comparison of Effectiveness of Learner-centered Approach and Teacher-centered Approach in
Developing Probabilistic Reasoning
The preservice teachersrsquo scores on the pre-test of the achievement test were used as covariate in this analysis
The scores from the post-test were then compared using ANCOVA with = 05 to adjust for pre-test
differences that existed between Group A and Group B In the pre-test the mean scores of Group B and Group A
were 585 and 550 respectively ANCOVA was used to adjust the post-test scores statistically to compensate
for the 035 mean point difference between the two groups in the pre-test This adjustment led to a more
accurate post-test comparison Table 8 presents the results
International Journal of Studies in Education and Science (IJSES)
133
Table 8 Summary of ANCOVA of the Performance of Preservice Teachers taught with Learner-centered
Approach and Teacher-centered Approach (N = 59)
Source Sum of
Squares
Df
Mean
Square
F Sig Partial Eta
Squared
Corrected
Model
791144a 2 395562 72150 000 720
Intercept 205135 1 205135 37416 000 401
Pre-test 228184 1 228184 41620 000 426
Group 630253 1 630253 114955 000 672
Error 307026 56 5483
Total 10888000 59
Corrected Total 1098169 58
a R Squared = 720 (Adjusted R Squared = 710)
The data on Table 8 indicate that there is a statistically significant main effect on the preservice teachers who
were taught using the learner-centered approach to learn probability [F (1 56) = 114955 p = 000 lt 05]
Consequently the preservice teachers taught with the learner-centered approach performed better than their
counterparts who experienced the teacher-centered approach to learn probability The partial eta squared value
was found to be 0672 This value indicates a large effect size That is 672 of the variance in the dependent
variable (probabilistic reasoning achievement score) is expounded by the independent variable (teacher-centered
approach) This implies that the magnitude of the difference between the mean score of the preservice teachers
taught with the learner-centered approach and the teacher-centered approach is large With the high scores of
preservice teachers in the Group A it implies that the use of learner-centered approach in the teaching and
learning of probability improved the performance of the preservice teachers
The outcome of the study portrays that there was a statistically significant difference in the probabilistic
reasoning achievement mean scores of Group A than that of Group B [F (1 56) = 114955 p = 000 lt 05] This
finding implies that Group A performed better than Group B in the probabilistic reasoning achievement test
This is an indication that when the learner-centered approach to teaching probability is targeted at addressing
probabilistic misconceptions preservice teachers develop better probabilistic reasoning than teacher-centered
approach
Discussion
This study set out to compare the learner-centered and teacher-centered approaches of teaching in order to
determine the best way of developing preservice teachersrsquo probabilistic reasoning at the College of Education
Hokor amp Sedofia
134
level in Ghana The results as shown on Tables 3 4 5 6 7 and 8 indicate that the learner-centered approach to
teaching probability is more effective than the teacher-centered approach in motivating and inspiring preservice
teachers to learn and apply probability The learner-centered approach provides studentsrsquo opportunities to think
reason reflect and evaluate their ideals and that of colleagues
The findings of the present study are in tandem with several research findings Lessani Md Yunus and Bakar
(2017) investigated mathematics teaching approaches and their consequences on learnersrsquo ability to solve
challenging problems Their findings affirm the learner-centered approach to be more effective in studentsrsquo
creativity and innovation in solving real-life problems than the teacher-centered approach So training
programs for excellent teaching and learning should be flexible and innovative to allow preservice teachers to
explore gaps in learning and teaching (AIAhmad 2021) Similarly Prideaux (2007) found that students who
experienced the learner-centered approach of teaching performed significantly higher than those who were
taught without the learner-centered approach of teaching Roseth Garfield and Ben-Zvi (2008) also examined
the effect of the cooperative framework in classroom teaching and collaboration and found that student-
centered approaches to teaching help students to have better understanding of statistics than teacher-centered
instruction
Furthermore Gurbuz and Birgin (2011) studied the effect of computer-assisted teaching on addressing
probabilistic misconceptions of students The authors used pre-test to collect data on both the computer-assisted
and traditional groups before the experimental teachings After the intervention the post-test was administered
to ascertain the effect of computer-assisted teaching and teacher-centered approach on addressing studentsrsquo
probabilistic misconceptions Their study found computer-assisted teaching to have more significant effect on
studentsrsquo correct probabilistic reasoning than teacher-centered approach of teaching
As noted by Batanero and Diaz (2012) probability forms an integral part of the Mathematics curriculum in
many countries But the concept is one that some learners find difficult to understand partly due to the method
of teaching used by teachers This fact implies that teachers of mathematics should find more creative ways of
teaching the concept so as to make it easier for learners to understand and apply the concept As discovered in
this study the learner-centered approach is effective in developing probabilistic reasoning But the learner-
centered approach works best when certain conditions are present At the outset there is the need for relevant
teaching and learning materials Then teachers need to be trained and retrained in the use of the learner-centered
approach to teaching At the college of education level preservice teachers need to be taught using the learner-
centered approach not only to help them understand probability but also to help them use the learner-centered
approach in their own teaching
The activities used for Group A which is learner-centered approach group in the form of games promote
content knowledge and cognitive skills competencies such as collaboration and problem solving (Belova amp
Zowada 2020) The activities focus on promoting learning experiences rather than stressing on the
entertainment factor While some things students learn in school seem to them predetermined and bound by
laws in other branches of mathematics probability provides students with opportunity to learn that solutions to
International Journal of Studies in Education and Science (IJSES)
135
several problems depend on assumptions and have degrees of doubt So teaching methods that allow students to
predict and test their predictions should be encouraged for students to develop their intellectual repertoire The
processes used in reasoning about sample space will serve students well in life Several calls on the need to pay
attention to the study of probability show that teachers and mathematics teachers must provide their students
with appropriate teaching strategies to enhance their conceptual understanding In the preparation of preservice
teachers to become mathematically competent citizens teacher preparation programs such as teaching methods
must provide opportunities for preservice teachers to confront misconceptions and reason probabilistically
(Courtney amp Caniglia 2021)
The findings of the present study however run counter to those of Weltman and Whiteside (2010) They
conducted a study on the effectiveness of the traditional and active learning method in business statistics The
study found that active learning had not been effective for all category of students It is not precisely clear what
may have accounted for that result This is because active learning methods have generally been known to be
effective in promoting learning Further research is thus required in this regard
Conclusions
This study compared the effects of the learner-centered and teacher-centered approaches of teaching in
addressing probabilistic misconceptions by measuring preservice teachersrsquo probabilistic reasoning scores The
results show that the learner-centered approach aids preservice teachers to develop better probabilistic reasoning
than the teacher-centered approach to teaching Thus the study concludes that the learner-centered approach to
teaching is a solution to preservice teachersrsquo inability to answer questions on probability correctly Even though
each teaching approach targeted at addressing misconceptions was found to have significant effect on pre-
service teachersrsquo probabilistic reasoning the learner-centered approach was found to be more effective than the
teacher-centered approach in addressing misconceptions which limit studentsrsquo ability to solve probability
problems correctly
Implications and Recommendations
This study makes some key contributions to the teacher educationdevelopment literature in general and
particularly to the development of probabilistic reasoning of preservice teachers The study provides empirical
evidence that the learner-centered approach targeted at addressing probabilistic misconceptions is more effective
in developing probabilistic reasoning in preservice teachers What this means is that when teacher educators use
the learner-centered approach to teach the concept of probability and focus on addressing misconceptions
preservice teachers will develop better probabilistic reasoning This will in turn translate into preservice
teachers answering questions on probability correctly in their examinations and ultimately making them teach
the concept more effectively when they complete their training It is thus recommended that teachers should
consider employing the learner-centered approach in teaching the concept of probability
Hokor amp Sedofia
136
Limitations
As with every empirical study employing the quasi-experimental approach the current study has some
limitations which need to be acknowledged and used to guide users of the findings Firstly our sample was
drawn from a population of second year preservice teachers of a female only college of education in a peri-
urban area in Ghana Further experiments are therefore needed in other settings in order to see if the same or
similar results will occur Secondly owing to the narrow characteristics of the participants in the present study
the researchers cannot generalize the results to other individuals who do not have the same characteristics So
additional experiments with groups with different characteristics are necessary Lastly the experiments need to
be repeated at another time to determine if the results are the same (consistent) over time
Acknowledgements
We are grateful to the Principal and preservice teachers for granting access and participating in the study
respectively
References
AIAhmad H (2021) The role of educational communication in promoting student-centered learning style in
multicultural classrooms A reflective essay on learning and teaching in higher education International
Journal of Research in Education and Science (IJRES) 7(3) 838-851 httpsdoiorg1046328ijes2374
Aina J K Olanipekun S S amp Garuba I A (2015) Teachersrsquo effectiveness and its Influence on studentsrsquo
learning Advances in Social Sciences Research Journal 2(4) 88-95
Anway D W amp Bennett E (2004) Common Misconceptions in Probability among Students in an Elementary
Statistics class Unplished Senior Project The ARTIST Roundtable Conference on Assessment in
Statistics held at Lawrence University Supperior WI The University of Wisconsin-Superior
Bada S (2015) Constructivist Learning Theory A Paradigm for Teaching and Learning IOSR Journal of
Research and Method in Education (IOSR-JRME) 5(6) 66-70 httpsDOI1097907388-05616670
Baerveldt C (2013) Constructivism contested Implications of a genetic perspective in psychology Integrative
Psychological and Behavioral Science 47(1) 156-166
Batanero C (2013) Teaching and learning probability In S Lerman (Ed ) Encyclopedia of Mathematics
Education Heidelberg Springer
Batanero C and Diaz C (2012) Training school teachers to teach probability reflections and challenges
Chilean Journal of Statistics 3(1) 3-13
Belova N amp Zowada C (2020) Innovating Higher Education Via Game-Based Learning on Misconceptions
Education Sciences 10 221 doi103390educSCi10090221
Bennett E amp Anway D W (2003) Statistical and Probabilistic Reasoning and Misconceptions among
Selected College Students McNair Scholars Journal Vol 4 httpwwwsocheclchjs
Cantoy O (2010) Mathematics teachersrsquo topic-specific pedagogical content knowledge in the context of
teaching a0 0 and a divide 0 Educational Sciences Theory and Practice 10 (2) 749-769
International Journal of Studies in Education and Science (IJSES)
137
Clements D H amp Battista M (1990) Constructivist Learning and Teaching The
Arithetic Teacher 38(1) ProQuest Central pg 34 DOI105951AT3810034
Creswell J W amp Creswell J D (2018) Research design Qualitative quantitative and
mixed methods approaches (5th
ed) Los Angeles SAGE Publications Inc
Courtney S A amp Caniglia J (2021) Comparing the mathematical practices pre-service teachers and
mathematics teacher educators identified as relevant to problems and tasks International Journal of
Research in Education and Science (IJRES) 7(3) 954-971 httpsdoiorg1046328ijres2335
Denton D W (2012) Enhancing instruction through constructivism cooperative learning and cloud
computing Tech Trends 56(4) 34-41
Gage J (2012) Towards a new Probability Curriculum for Secondary Schools Paper presented at 12th
International Congress on Mathematical Education 8 July-15 July COEX Seoul Korea Cambridge
Cambridge University Uk
Gurbuz R amp Birgin O (2011) The effect of computer-assisted teaching on remedying misconceptions The
case of the subject Probability Journal Homepage 58(2012) DOI 101016jcompedu201111005
Hirsh L amp ODonnell A M (2001) Representativeness in Statistical Reasoning Identifying and Assessing
Misconceptions Journal of Statistics Education 9(2) 96-105 DOI10108010691898200111910655
Johnson H D amp Dasgupta N (2005) Traditional versus Non-traditional Teaching during Perspectives of
Students in Introductory Statistics Classes Journal of Statistics Education 13(2)
httpsdoiorg10108010691898200511910558
Major T amp Mangope B (2012) The Constructivist Theory in Mathematics The case of Botswana Primary
Schools International Review of Social Sciencies and Humanities 3(2) 139-147
Jones G (2005) Reflections In GA Jones (Ed) Exploring probability in school chanlleges for teaching and
probability (367-372) New York Springer
Jun L (2000) Chinese Students Understanding of Probability Published doctoral dissertation Singapore
National Institute of Education Nanyang Technological University
Khazanov L amp Gourgey A (2009) Instructors Perspectives on Students Mistaken Beliefs about Probability
in an Elementary College Statistics Course In K Safford-Ramus (Ed) Proceedings of the Adults
Learning Mathematics a Resaerch Forum (ALM) 15th
Annual International Conference 249-264
Khazanov L amp Prado L (2010) Correcting Students Misconceptions about Probability in an Introductory
College Statistics Course Adults Learning Mathematics-An International Journal 5(1) 23-35
Kleickmann T Richter D Kunter M Elsner J Besser M Krauss S amp Baumert J (2013) Teachersrsquo
Content Knowledge and Pedagogical Content Knowledge The Role of Structural Differences in Teacher
Education Journal of Teacher Education 64(1) 90-106 DOI1011770022487112460398
Leedy P D and Ormrod J E (2020) Practical research Planning and design (12th Global Edition) Harlow
England Pearson
Lessani A Md Yunus AS amp Bakar KBA (2017) Comparison of new mathematics teaching methods with
teacher-centered approach International Journal of Social Sciences 3(2) 1285-1297
httpsdxdoiorg1020319pijss20173212851297
Lim C amp Hwa T (2007) Promoting Mathematical Thinking in the Malaysian Classroom Issues and
challenges httpswwwresearchgatenetpublication252353381
Hokor amp Sedofia
138
Lovett J N amp Lee H S (2017) New Standards Require Teaching More Statistics Are Preservice Secondary
Mathematics Ready Journal of Teachers Education 68(3) 299-311 DOI 1011770022487117697918
Major T amp Mangope B (2012) The Constructivist Theory in Mathematics The case of Botswana Primary
Schools International Review of Social Sciencies and Humanities 3(2) 139-147
National Council of Teachers of Mathematics (2003) Principles and Standards for School Mathematics and
their Implications for Professional Development Reston VA NCTM
Nguyen L (2015) Developing Conceptual Understanding and Probabilistic Thinking through Tree Diagrams
Published MPhil Dissertation Manitoba The Faculty of Graduate Studies of the University of
Manitoba
Prideaux J (2007) The learner-centered approach to Mathematics Teaching and the Active Learning
Strategies used to Enhance Students Understanding Mathematical and Computing Sciences Masters
Paper 29 Fisher Digital Publications httpfisherpubsjfcedumathcsetdmasters29
Roseth C J Garfield J B amp Ben-Zvi D (2008) Collaboration in Learning and Teaching Statistics Journal
of Statistics Education 16 (1) 1069-1898 httpsdoiorg10108010691898200811889557
Santagata R and Sandholtz J H (2019) Preservice teachersrsquo mathematics teaching competence Comparing
performance on two measures Journal of Teacher Education 70 (5) 472 ndash484
Schwerdt G amp Wuppermann A C (2011) Is traditional teaching really all that bad A within-student
between-subject approach Economics of Education Review 30(2) 365-379
Sharma S (2016) Probability from a socio-cultural perspective Statistics Education Research Journal 15(2)
126-144 httpiase-weborgPublicationsphpp=SERJ
Shay K (2008) Tracing middle school students understanding of probability a longitudinal study
Unpublished Doctoral Dissertation New Brunswick New Jersey Rutgers State University of New
Jersey
Shulman L S (1986) Those who understand Knowledge growth in teaching Educational Researcher 15(2)
4-14 doi 1031021001318X015002004
Thomas L (2020) An introduction to quasi-experimental designs
httpswwwscribbrcommethodologyquasi-experimental-design
Voskoglou M (2019) Comparing Teaching Methods of Mathematics at University Level Education Sciences
9(204) doi103390educsci9030204
Vygotsky L S (1978) Mind in society The development of higher psychological processes Cambridge MA
Harvard University Press
Weldeana H N amp Abraham S T (2014) The effect of an historical perspective on prospective teachersrsquo
beliefs in learning mathematics Journal of Mathematics Teacher Education 17 303-330
doi101007s10857-013-9266-z
Weltman D amp Whiteside M (2010) Comparing the Effectiveness of Traditional and active Learning Methods
in Business Statistics Convergence to the Mean 18(1)
httpsdoiorg10108010691898201011889480
White H amp Sabarwal S (2014) Quasi-experimental design and methods methological briefs impact
evaluations Florence UNICEF Office of research
International Journal of Studies in Education and Science (IJSES)
139
Author Information
Evans Kofi Hokor
httpsorcidorg0000-0002-8387-8294
St Teresarsquos College of Education Hohoe
Department of Mathematics and ICT
P O Box 129
Ghana
Contact e-mail evanskhokorgmailcom
John Sedofia
httpsorcidorg0000-0002-5409-516X
University of Ghana Legon
Department of Teacher Education
PO Box LG 1181
Ghana
Hokor amp Sedofia
140
Appendix A Pre-test Probabilistic Reasoning Assessment
This assessment is for research purpose to improve teaching and learning of probability
You are required to answer all questions honestly Do and leave all workings or rough work on the paper
Pre-test Probabilistic Reasoning Assessment Duration 1hr
Index numberhelliphelliphelliphelliphelliphelliphelliphelliphelliphelliphelliphelliphelliphelliphelliphelliphelliphellipLevelhelliphelliphelliphellipAgehelliphelliphellip
Read each statement carefully and circle the letter of the correct (best) option Provide appropriate response in
the space provided under some items as it apply
1 If you rolled an ordinary die and obtained 51246 which of these is most likely to occur on your next
roll
a 1
b 2
c 3
d 4
e 5
f 6
g The options a b c d e and f are all equally
2i A fair coin is tossed and it lands tail The coin is to be tossed a second time What is the probability that the
second toss will also be a tail
a 1
4
b 1
2
c 1
3
d Slightly less than 1
2
e Slightly more than 1
2
f 0
2ii Which of the following best describes the reason for the correct answer to the preceding question (2i)
a The second toss is less likely to be tail because the first toss was tail
b There are four possible outcomes when you toss a coin twice Getting two tails is only one of them
c The chance of getting heads or tails on any one toss is always 1
2
d There are three possible outcomes when you toss a coin twice Getting two tails is only one of the them
e No chance of being a tail in the second toss
3i A box contains 6 balls 2 are red 2 are black and 2 blue Three balls are picked at random one at a time
Each time a ball is picked the colour is recorded and the ball is put back in the box mixed thoroughly If the
first 2 balls are black what color is the third ball most likely to be
a Red
International Journal of Studies in Education and Science (IJSES)
141
b Black
c Blue
d Red and blue are equally likely than black
e Red black and blue are all equally likely
3ii Which of the following best describes the reason for the correct answer in the preceding question (3i)
a The third ball should not be black because too many black ones have already been picked
b The picks are independent so every color has an equally likely chance of being picked
c Black seems to be lucky
d This color is just as likely as any other color
4 A spinner with ten equally divided sectors in which four parts are white and the rests are red is about to
be spin which color is the spinner more likely to land
a White
b Red
c Both white and red are all equally
5 If you toss a fair coin and get heads two times in a row which of these is most likely on next toss
a Tail
b Head
c Both head and tail are all equally
6 A Gh 2 Gh 5 Ghcent10 Gh 20 Gh 50 and Gh 100 notes were put in a box and thoroughly mixed
What is the probability of picking Gh 50 note without looking
a 1
187
b 50
187
c 1
6
d 0
7 In a game you have been offered two options Which of the following give you higher chance of
winning GHcent200
a Tossing one die once and obtaining a 6
b Tossing two dice once and obtaining two 6rsquos
c The options a and b are all equally
8 A fair die is to be toss six times which of these is most likely to occur
a 251634
b 123456
c 666341
d 132244
e The options a b c and d are all equally likely
9 A fair coin is to be toss four times in a row which of these is least likely to occur
a THTH
b TTTH
c HHH
Hokor amp Sedofia
142
d The options a b and c are all equally likely
10 Two fair dice are to be tossed once Which of the following is more likely to occur
a Obtaining a sum of 11
b Obtaining a sum of 10
c A sum of 11 and a sum of 10 are all equally likely
10i Give reason for the correct answer in the preceding question (10)
helliphelliphelliphelliphelliphelliphelliphelliphelliphelliphelliphelliphelliphelliphelliphelliphelliphelliphelliphelliphelliphelliphelliphelliphelliphelliphelliphelliphelliphelliphelliphelliphelliphelliphelliphelliphelliphelliphelliphelliphelliphellip
helliphelliphelliphelliphelliphelliphelliphelliphelliphelliphelliphelliphelliphelliphelliphelliphelliphelliphelliphelliphelliphelliphelliphelliphelliphelliphelliphelliphelliphelliphelliphelliphelliphelliphelliphelliphelliphelliphelliphelliphelliphellip
helliphelliphelliphelliphelliphelliphelliphelliphelliphelliphelliphelliphelliphelliphelliphelliphelliphelliphelliphelliphelliphelliphelliphelliphelliphelliphelliphelliphelliphelliphelliphelliphelliphelliphelliphelliphelliphelliphelliphelliphelliphellip
helliphelliphelliphelliphelliphelliphelliphelliphelliphelliphelliphelliphelliphelliphelliphelliphelliphelliphelliphelliphelliphelliphelliphelliphelliphelliphelliphelliphelliphelliphelliphelliphelliphelliphelliphelliphelliphellip
11 In national lottery one has to choose five numbers from 1 to 90 inclusive You win when at least two of
your numbers are part of the numbers drawn on Saturday at random Eric has chosen 4 6 7 9 and 11
Alex has chosen 15 23 45 66 and 80 Daniel has chosen 71 77 78 83 and 85 Do Eric Alex and
Daniel have the same chance of winning or not and why
helliphelliphelliphelliphelliphelliphelliphelliphelliphelliphelliphelliphelliphelliphelliphelliphelliphelliphelliphelliphelliphelliphelliphelliphelliphelliphelliphelliphelliphelliphelliphelliphelliphelliphelliphelliphelliphelliphelliphelliphellip
helliphelliphelliphelliphelliphelliphelliphelliphelliphelliphelliphelliphelliphelliphelliphelliphelliphelliphelliphelliphelliphelliphelliphelliphelliphelliphelliphelliphelliphelliphelliphelliphelliphelliphelliphelliphelliphelliphelliphelliphellip
helliphelliphelliphelliphelliphelliphelliphelliphelliphelliphelliphelliphelliphelliphelliphelliphelliphelliphelliphelliphelliphelliphelliphelliphelliphelliphelliphelliphelliphelliphelliphelliphelliphelliphelliphelliphelliphelliphelliphelliphellip
helliphelliphelliphelliphelliphelliphelliphelliphelliphelliphelliphelliphelliphelliphelliphelliphelliphelliphelliphelliphelliphelliphelliphelliphelliphelliphelliphelliphelliphelliphelliphelliphelliphelliphelliphellip
12 A box contains 8 yellow balls and 4 green balls Two balls are chosen at random one after the other
without replacement determine the probability that the two balls are of different colours
helliphelliphelliphelliphelliphelliphelliphelliphelliphelliphelliphelliphelliphelliphelliphelliphelliphelliphelliphelliphelliphelliphelliphelliphelliphelliphelliphelliphelliphelliphelliphelliphelliphelliphelliphelliphelliphelliphelliphelliphellip
helliphelliphelliphelliphelliphelliphelliphelliphelliphelliphelliphelliphelliphelliphelliphelliphelliphelliphelliphelliphelliphelliphelliphelliphelliphelliphelliphelliphelliphelliphelliphelliphelliphelliphelliphelliphelliphelliphelliphelliphellip
helliphelliphelliphelliphelliphelliphelliphelliphelliphelliphelliphelliphelliphelliphelliphelliphelliphelliphelliphelliphelliphelliphelliphelliphelliphelliphelliphelliphelliphelliphelliphelliphelliphelliphelliphelliphelliphelliphelliphelliphellip
helliphelliphelliphelliphelliphelliphelliphelliphelliphelliphelliphelliphelliphelliphelliphelliphelliphelliphelliphelliphelliphelliphelliphelliphelliphelliphelliphelliphelliphelliphelliphelliphelliphelliphelliphelliphellip
International Journal of Studies in Education and Science (IJSES)
143
Appendix B Post-test Probabilistic Reasoning Assessment
This assessment is for research purpose to improve teaching and learning of probability
You are required to answer all questions honestly Do and leave all workings or rough work on the paper
Post-test Probabilistic Reasoning Assessment Duration One Hour
Index numberhelliphelliphelliphelliphelliphelliphelliphelliphelliphelliphelliphelliphelliphelliphellipClasshelliphelliphelliphellipAgehelliphelliphelliphellip
Read each statement carefully and circle the letter of the correct (best) option for each item as much as possible
and provide appropriate response in the space provided
1 Suppose a particular outcome from a random event has a probability of 04 Which of the following
statements represents correct interpretations of this probability
a The outcome will not happen
b The outcome will certainly happen about four times out of every 10 trials
c The outcome is expected to happen about four times out of every 10 trials
d The outcome could happen or it couldnrsquot of either result are the same
2 If you toss a fair coin and get heads 3 times in a row what is the chance of getting a head on the next toss
a 1
b Greater than 1
2
c 1
2
d Less than 1
2
e 0
3 A die is numbered 1 2 3 4 4 5 When the die is thrown once Which of these is most likely and why
a 1
b 2
c 3
d 4
e 5
f They are all equally likely
3i Give reason for your chosen answer in (3)
helliphelliphelliphelliphelliphelliphelliphelliphelliphelliphelliphelliphelliphelliphelliphelliphelliphelliphelliphelliphelliphelliphelliphelliphelliphelliphelliphelliphelliphelliphelliphelliphelliphelliphelliphelliphelliphelliphelliphelliphelliphelliphelliphelliphellip
helliphelliphelliphelliphelliphelliphelliphelliphelliphelliphelliphelliphelliphelliphelliphelliphelliphelliphelliphelliphelliphelliphelliphelliphelliphelliphelliphelliphelliphelliphelliphelliphelliphelliphelliphelliphelliphelliphelliphelliphelliphelliphelliphelliphellip
helliphelliphelliphelliphelliphelliphelliphelliphelliphelliphelliphelliphelliphelliphelliphelliphelliphelliphelliphelliphelliphelliphelliphelliphelliphelliphelliphelliphelliphelliphelliphelliphelliphelliphelliphelliphelliphelliphelliphelliphelliphelliphelliphelliphellip
helliphelliphelliphelliphelliphelliphelliphelliphelliphelliphelliphelliphelliphelliphelliphelliphelliphelliphelliphelliphelliphelliphelliphelliphelliphelliphelliphelliphelliphelliphelliphelliphelliphelliphelliphelliphelliphelliphellip
4 German MP tossed two dice once Which of these is mostly likely and why
a Obtaining a sum of 4
b Obtaining a sum of 7
c Obtaining a sum of 11
d All of them have equal chance of occurring that is a b c
Hokor amp Sedofia
144
4i Give reason for your chosen answer in (4)
helliphelliphelliphelliphelliphelliphelliphelliphelliphelliphelliphelliphelliphelliphelliphelliphelliphelliphelliphelliphelliphelliphelliphelliphelliphelliphelliphelliphelliphelliphelliphelliphelliphelliphelliphelliphelliphelliphelliphelliphelliphelliphelliphelliphellip
helliphelliphelliphelliphelliphelliphelliphelliphelliphelliphelliphelliphelliphelliphelliphelliphelliphelliphelliphelliphelliphelliphelliphelliphelliphelliphelliphelliphelliphelliphelliphelliphelliphelliphelliphelliphelliphelliphelliphelliphelliphelliphelliphelliphellip
helliphelliphelliphelliphelliphelliphelliphelliphelliphelliphelliphelliphelliphelliphelliphelliphelliphelliphelliphelliphelliphelliphelliphelliphelliphelliphelliphelliphelliphelliphelliphelliphelliphelliphelliphelliphelliphelliphelliphelliphelliphelliphelliphelliphellip
helliphelliphelliphelliphelliphelliphelliphelliphelliphelliphelliphelliphelliphelliphelliphelliphelliphelliphelliphelliphelliphelliphelliphelliphelliphelliphelliphelliphelliphelliphelliphelliphelliphelliphelliphelliphelliphelliphelliphelliphelliphelliphelliphelliphellip
helliphelliphelliphelliphelliphelliphelliphelliphelliphelliphelliphelliphelliphelliphelliphelliphelliphelliphelliphelliphelliphelliphelliphelliphelliphelliphelliphelliphellip
5i A fair coin is to be toss four times which of these is most likely to occur
a HTHT
b THTT
c TTTT
d HHTH
e The options a b c and d are all equally likely
5ii Give reason for your chosen answer in (5i)
helliphelliphelliphelliphelliphelliphelliphelliphelliphelliphelliphelliphelliphelliphelliphelliphelliphelliphelliphelliphelliphelliphelliphelliphelliphelliphelliphelliphelliphelliphelliphelliphelliphelliphelliphelliphelliphelliphelliphelliphelliphelliphelliphelliphellip
helliphelliphelliphelliphelliphelliphelliphelliphelliphelliphelliphelliphelliphelliphelliphelliphelliphelliphelliphelliphelliphelliphelliphelliphelliphelliphelliphelliphelliphelliphelliphelliphelliphelliphelliphelliphelliphelliphelliphelliphelliphelliphelliphelliphellip
helliphelliphelliphelliphelliphelliphelliphelliphelliphelliphelliphelliphelliphelliphelliphelliphelliphelliphelliphelliphelliphelliphelliphelliphelliphelliphelliphelliphelliphelliphelliphelliphelliphelliphelliphelliphelliphelliphelliphelliphelliphelliphelliphelliphellip
helliphelliphelliphelliphelliphelliphelliphelliphelliphelliphelliphelliphelliphelliphelliphelliphelliphelliphelliphelliphelliphelliphelliphelliphelliphelliphelliphelliphelliphelliphelliphelliphelliphelliphelliphelliphelliphelliphellip
6i A fair coin is to be toss four times which of these is least likely to occur
a HTHT
b THTT
c TTTT
d HHTH
e The options a b c and d are all equally likely
6ii Give reason for your chosen answer in (6i)
helliphelliphelliphelliphelliphelliphelliphelliphelliphelliphelliphelliphelliphelliphelliphelliphelliphelliphelliphelliphelliphelliphelliphelliphelliphelliphelliphelliphelliphelliphelliphelliphelliphelliphelliphelliphelliphelliphelliphelliphelliphelliphelliphelliphellip
helliphelliphelliphelliphelliphelliphelliphelliphelliphelliphelliphelliphelliphelliphelliphelliphelliphelliphelliphelliphelliphelliphelliphelliphelliphelliphelliphelliphelliphelliphelliphelliphelliphelliphelliphelliphelliphelliphelliphelliphelliphelliphelliphelliphellip
helliphelliphelliphelliphelliphelliphelliphelliphelliphelliphelliphelliphelliphelliphelliphelliphelliphelliphelliphelliphelliphelliphelliphelliphelliphelliphelliphelliphelliphelliphelliphelliphelliphelliphelliphelliphelliphelliphelliphelliphelliphelliphelliphelliphellip
helliphelliphelliphellip
7 A college has 300 level 200 students and 236 level 100 students in it Each studentrsquos name is written with
the level on a piece of paper and all the names are put into a box and mixed thoroughly A tutor picks one
name out of the box without looking Which level is the tutor more likely to pick from and why
helliphelliphelliphelliphelliphelliphelliphelliphelliphelliphelliphelliphelliphelliphelliphelliphelliphelliphelliphelliphelliphelliphelliphelliphelliphelliphelliphelliphelliphelliphelliphelliphelliphelliphelliphelliphelliphelliphelliphelliphelliphelliphelliphelliphellip
helliphelliphelliphelliphelliphelliphelliphelliphelliphelliphelliphelliphelliphelliphelliphelliphelliphelliphelliphelliphelliphelliphelliphelliphelliphelliphelliphelliphelliphelliphelliphelliphelliphelliphelliphelliphelliphelliphelliphelliphelliphelliphelliphelliphellip
helliphelliphelliphelliphelliphelliphelliphelliphelliphelliphelliphelliphelliphelliphelliphelliphelliphelliphelliphelliphelliphelliphelliphelliphelliphelliphelliphelliphelliphelliphelliphelliphelliphelliphelliphelliphelliphelliphelliphelliphelliphelliphelliphelliphellip
helliphelliphelliphelliphelliphelliphelliphelliphelliphelliphelliphelliphelliphelliphelliphelliphelliphelliphelliphelliphelliphelliphelliphelliphelliphelliphelliphelliphelliphelliphelliphelliphelliphelliphelliphelliphelliphelliphelliphellip
8 Suppose that you toss a coin three times and all eight outcomes are equally likely If it is known that the first
toss comes up heads what is the probability of an odd number of heads appearing
helliphelliphelliphelliphelliphelliphelliphelliphelliphelliphelliphelliphelliphelliphelliphelliphelliphelliphelliphelliphelliphelliphelliphelliphelliphelliphelliphelliphelliphelliphelliphelliphelliphelliphelliphelliphelliphelliphelliphelliphelliphelliphelliphelliphellip
helliphelliphelliphelliphelliphelliphelliphelliphelliphelliphelliphelliphelliphelliphelliphelliphelliphelliphelliphelliphelliphelliphelliphelliphelliphelliphelliphelliphelliphelliphelliphelliphelliphelliphelliphelliphelliphelliphelliphelliphelliphelliphelliphelliphellip
helliphelliphelliphelliphelliphelliphelliphelliphelliphelliphelliphelliphelliphelliphelliphelliphelliphelliphelliphelliphelliphelliphelliphelliphelliphelliphelliphelliphelliphelliphelliphelliphelliphelliphelliphelliphelliphelliphelliphelliphelliphelliphelliphelliphellip
International Journal of Studies in Education and Science (IJSES)
145
helliphelliphelliphelliphelliphelliphelliphelliphelliphelliphelliphelliphelliphelliphelliphelliphelliphelliphelliphelliphelliphelliphelliphelliphelliphelliphelliphelliphelliphelliphelliphelliphelliphelliphelliphelliphelliphelliphelliphelliphelliphelliphelliphelliphellip
helliphelliphelliphelliphelliphelliphelliphelliphelliphelliphelliphelliphelliphelliphelliphelliphelliphelliphelliphelliphelliphelliphelliphelliphelliphelliphelliphelliphelliphelliphelliphelliphelliphelliphelliphelliphelliphelliphelliphelliphelliphelliphelliphelliphellip
helliphelliphelliphelliphelliphelliphelliphelliphelliphelliphelliphelliphelliphelliphelliphelliphelliphelliphelliphellip
9 A card is selected at random from a pack of 52 cards Find the probability of selecting a card which is a red or
a queen
helliphelliphelliphelliphelliphelliphelliphelliphelliphelliphelliphelliphelliphelliphelliphelliphelliphelliphelliphelliphelliphelliphelliphelliphelliphelliphelliphelliphelliphelliphelliphelliphelliphelliphelliphelliphelliphelliphelliphelliphelliphelliphelliphelliphellip
helliphelliphelliphelliphelliphelliphelliphelliphelliphelliphelliphelliphelliphelliphelliphelliphelliphelliphelliphelliphelliphelliphelliphelliphelliphelliphelliphelliphelliphelliphelliphelliphelliphelliphelliphelliphelliphelliphelliphelliphelliphelliphelliphelliphellip
helliphelliphelliphelliphelliphelliphelliphelliphelliphelliphelliphelliphelliphelliphelliphelliphelliphelliphelliphelliphelliphelliphelliphelliphelliphelliphelliphelliphelliphelliphelliphelliphelliphelliphelliphelliphelliphelliphelliphelliphelliphelliphelliphelliphellip
helliphelliphelliphelliphelliphelliphelliphelliphelliphelliphelliphelliphelliphelliphelliphelliphelliphelliphelliphelliphelliphelliphelliphelliphelliphelliphelliphelliphelliphelliphelliphelliphelliphelliphelliphelliphelliphelliphelliphellip
10 A box contains 6 white balls and 4 green balls Two balls are chosen at random one after the other without
replacement determine the probability that the second ball is white
helliphelliphelliphelliphelliphelliphelliphelliphelliphelliphelliphelliphelliphelliphelliphelliphelliphelliphelliphelliphelliphelliphelliphelliphelliphelliphelliphelliphelliphelliphelliphelliphelliphelliphelliphelliphelliphelliphelliphelliphelliphelliphelliphelliphellip
helliphelliphelliphelliphelliphelliphelliphelliphelliphelliphelliphelliphelliphelliphelliphelliphelliphelliphelliphelliphelliphelliphelliphelliphelliphelliphelliphelliphelliphelliphelliphelliphelliphelliphelliphelliphelliphelliphelliphelliphelliphelliphelliphelliphellip
helliphelliphelliphelliphelliphelliphelliphelliphelliphelliphelliphelliphelliphelliphelliphelliphelliphelliphelliphelliphelliphelliphelliphelliphelliphelliphelliphelliphelliphelliphelliphelliphelliphelliphelliphelliphelliphelliphelliphelliphelliphelliphelliphelliphellip
helliphelliphelliphelliphelliphelliphelliphelliphelliphelliphelliphelliphelliphelliphelliphelliphelliphelliphelliphelliphelliphelliphelliphelliphelliphelliphelliphelliphelliphelliphelliphelliphelliphelliphelliphelliphelliphelliphelliphelliphelliphelliphellip

International Journal of Studies in Education and Science (IJSES)
131
pretest This is an indication that the two groups are similar and their performance could be compared after the
two teaching approaches
Comparison of Probabilistic Reasoning of the Preservice Teachers before and after Learner-centered
Approach in Group A
The results of analysis of the effect of the learner-centered approach on preservice teachersrsquo probabilistic
reasoning is presented in Table 4
Table 4 Pre-test and Post-test Scores for Group A
Minimum Maximum Mean Std Deviation
Pre-test 1 10 550 1967
Post-test 8 20 1572 3630
Table 4 reveals that in the post-test preservice teachersrsquo probabilistic reasoning mean scores increased from
550 to 1572 in the post-test in Group A
A paired sample t‐test was conducted to compare the post-test and pre-test scores for the preservice teachers
taught with the learner-centered approach to teaching (Group A) in order to determine if the mean difference in
scores was statistically significant This was done to evaluate the effect of the learner-centered approach on
preservice teachersrsquo probabilistic reasoning Table 5 presents the results
Table 5 Paired Sample t-test Results on the Post-test and Pre-test of Group A
Mean
Difference
Std
Deviation
Std Error
Mean
t Df Sig
Post-test ndash Pre-test 10219 2871 507 20137 31 000
The results from Table 5 shows a statistically significant difference in the preservice teachersrsquo probabilistic
reasoning from the pre-test (M = 550 SD = 1967) to the post-test (M = 1572 SD = 3630) with t (31) =
20137 p = 000 The result reveals that preservice teachersrsquo probabilistic reasoning has improved significantly
after the learner-centered approach was used since = 000 05 It can be inferred that the learner-centered
approach to teaching has a positive significant effect on preservice teachersrsquo probabilistic reasoning
Analysis of Probabilistic Reasoning of the Preservice Teachers before and after Teacher-centered
Approach to Teaching
The results of the analysis of the effect of the teacher-centered approach to teaching on preservice teachersrsquo
probabilistic reasoning is presented in Table 6
Hokor amp Sedofia
132
Table 6 Pre-test and Post-test Scores for the Group B
Minimum Maximum Mean Std Deviation
Pre-test 2 8 585 1562
Post-test 5 14 952 2208
The data on Table 6 show that the mean score of preservice teachers in the pre-test was 585 while that of the
post-test was 952 marks This indicates that in the post-test an average of each of the preservice teachersrsquo
probabilistic reasoning increased slightly in Group B To determine if the mean difference is statistically
significant a paired sample t‐test was conducted Table 7 presents the results
Table 7 Results of the Paired Samples t-test on the Post-test and Pre-test of the Group B
Mean
Difference
Std Deviation Std Error
Mean
t Df Sig
Post-test ndash Pre-test 3667 1441 0277 13220 26 000
The result presented on Table 7 shows that the mean score difference between the post-test and pre-test of
Group B was 3667 marks with a corresponding standard deviation of 1441 The paired sample t-test was
conducted to find out if the mean score difference (M = 3667 SD = 1441) was statistically significant This
was done to assess the effect of the teacher-centered approach targeted at addressing misconceptions on
preservice teachersrsquo probabilistic reasoning The results from Table 7 reveal that there was a statistically
significant difference in the preservice teachersrsquo probabilistic reasoning scores from the pre-test (M = 585 SD =
1562) to the post-test (M = 952 SD = 2208) with t (26) = 13220 p = 000 lt 05 This is an indication that the
teacher-centered approach to teaching probability targeted at addressing probabilistic misconceptions aids
students to improve upon their understanding and problem-solving abilities in probability
Next we compared the effectiveness of the learner-centered approach of teaching and the teacher-centered
approach of teaching in terms of probabilistic reasoning of preservice teachers and how they addressed
probabilistic misconceptions
Comparison of Effectiveness of Learner-centered Approach and Teacher-centered Approach in
Developing Probabilistic Reasoning
The preservice teachersrsquo scores on the pre-test of the achievement test were used as covariate in this analysis
The scores from the post-test were then compared using ANCOVA with = 05 to adjust for pre-test
differences that existed between Group A and Group B In the pre-test the mean scores of Group B and Group A
were 585 and 550 respectively ANCOVA was used to adjust the post-test scores statistically to compensate
for the 035 mean point difference between the two groups in the pre-test This adjustment led to a more
accurate post-test comparison Table 8 presents the results
International Journal of Studies in Education and Science (IJSES)
133
Table 8 Summary of ANCOVA of the Performance of Preservice Teachers taught with Learner-centered
Approach and Teacher-centered Approach (N = 59)
Source Sum of
Squares
Df
Mean
Square
F Sig Partial Eta
Squared
Corrected
Model
791144a 2 395562 72150 000 720
Intercept 205135 1 205135 37416 000 401
Pre-test 228184 1 228184 41620 000 426
Group 630253 1 630253 114955 000 672
Error 307026 56 5483
Total 10888000 59
Corrected Total 1098169 58
a R Squared = 720 (Adjusted R Squared = 710)
The data on Table 8 indicate that there is a statistically significant main effect on the preservice teachers who
were taught using the learner-centered approach to learn probability [F (1 56) = 114955 p = 000 lt 05]
Consequently the preservice teachers taught with the learner-centered approach performed better than their
counterparts who experienced the teacher-centered approach to learn probability The partial eta squared value
was found to be 0672 This value indicates a large effect size That is 672 of the variance in the dependent
variable (probabilistic reasoning achievement score) is expounded by the independent variable (teacher-centered
approach) This implies that the magnitude of the difference between the mean score of the preservice teachers
taught with the learner-centered approach and the teacher-centered approach is large With the high scores of
preservice teachers in the Group A it implies that the use of learner-centered approach in the teaching and
learning of probability improved the performance of the preservice teachers
The outcome of the study portrays that there was a statistically significant difference in the probabilistic
reasoning achievement mean scores of Group A than that of Group B [F (1 56) = 114955 p = 000 lt 05] This
finding implies that Group A performed better than Group B in the probabilistic reasoning achievement test
This is an indication that when the learner-centered approach to teaching probability is targeted at addressing
probabilistic misconceptions preservice teachers develop better probabilistic reasoning than teacher-centered
approach
Discussion
This study set out to compare the learner-centered and teacher-centered approaches of teaching in order to
determine the best way of developing preservice teachersrsquo probabilistic reasoning at the College of Education
Hokor amp Sedofia
134
level in Ghana The results as shown on Tables 3 4 5 6 7 and 8 indicate that the learner-centered approach to
teaching probability is more effective than the teacher-centered approach in motivating and inspiring preservice
teachers to learn and apply probability The learner-centered approach provides studentsrsquo opportunities to think
reason reflect and evaluate their ideals and that of colleagues
The findings of the present study are in tandem with several research findings Lessani Md Yunus and Bakar
(2017) investigated mathematics teaching approaches and their consequences on learnersrsquo ability to solve
challenging problems Their findings affirm the learner-centered approach to be more effective in studentsrsquo
creativity and innovation in solving real-life problems than the teacher-centered approach So training
programs for excellent teaching and learning should be flexible and innovative to allow preservice teachers to
explore gaps in learning and teaching (AIAhmad 2021) Similarly Prideaux (2007) found that students who
experienced the learner-centered approach of teaching performed significantly higher than those who were
taught without the learner-centered approach of teaching Roseth Garfield and Ben-Zvi (2008) also examined
the effect of the cooperative framework in classroom teaching and collaboration and found that student-
centered approaches to teaching help students to have better understanding of statistics than teacher-centered
instruction
Furthermore Gurbuz and Birgin (2011) studied the effect of computer-assisted teaching on addressing
probabilistic misconceptions of students The authors used pre-test to collect data on both the computer-assisted
and traditional groups before the experimental teachings After the intervention the post-test was administered
to ascertain the effect of computer-assisted teaching and teacher-centered approach on addressing studentsrsquo
probabilistic misconceptions Their study found computer-assisted teaching to have more significant effect on
studentsrsquo correct probabilistic reasoning than teacher-centered approach of teaching
As noted by Batanero and Diaz (2012) probability forms an integral part of the Mathematics curriculum in
many countries But the concept is one that some learners find difficult to understand partly due to the method
of teaching used by teachers This fact implies that teachers of mathematics should find more creative ways of
teaching the concept so as to make it easier for learners to understand and apply the concept As discovered in
this study the learner-centered approach is effective in developing probabilistic reasoning But the learner-
centered approach works best when certain conditions are present At the outset there is the need for relevant
teaching and learning materials Then teachers need to be trained and retrained in the use of the learner-centered
approach to teaching At the college of education level preservice teachers need to be taught using the learner-
centered approach not only to help them understand probability but also to help them use the learner-centered
approach in their own teaching
The activities used for Group A which is learner-centered approach group in the form of games promote
content knowledge and cognitive skills competencies such as collaboration and problem solving (Belova amp
Zowada 2020) The activities focus on promoting learning experiences rather than stressing on the
entertainment factor While some things students learn in school seem to them predetermined and bound by
laws in other branches of mathematics probability provides students with opportunity to learn that solutions to
International Journal of Studies in Education and Science (IJSES)
135
several problems depend on assumptions and have degrees of doubt So teaching methods that allow students to
predict and test their predictions should be encouraged for students to develop their intellectual repertoire The
processes used in reasoning about sample space will serve students well in life Several calls on the need to pay
attention to the study of probability show that teachers and mathematics teachers must provide their students
with appropriate teaching strategies to enhance their conceptual understanding In the preparation of preservice
teachers to become mathematically competent citizens teacher preparation programs such as teaching methods
must provide opportunities for preservice teachers to confront misconceptions and reason probabilistically
(Courtney amp Caniglia 2021)
The findings of the present study however run counter to those of Weltman and Whiteside (2010) They
conducted a study on the effectiveness of the traditional and active learning method in business statistics The
study found that active learning had not been effective for all category of students It is not precisely clear what
may have accounted for that result This is because active learning methods have generally been known to be
effective in promoting learning Further research is thus required in this regard
Conclusions
This study compared the effects of the learner-centered and teacher-centered approaches of teaching in
addressing probabilistic misconceptions by measuring preservice teachersrsquo probabilistic reasoning scores The
results show that the learner-centered approach aids preservice teachers to develop better probabilistic reasoning
than the teacher-centered approach to teaching Thus the study concludes that the learner-centered approach to
teaching is a solution to preservice teachersrsquo inability to answer questions on probability correctly Even though
each teaching approach targeted at addressing misconceptions was found to have significant effect on pre-
service teachersrsquo probabilistic reasoning the learner-centered approach was found to be more effective than the
teacher-centered approach in addressing misconceptions which limit studentsrsquo ability to solve probability
problems correctly
Implications and Recommendations
This study makes some key contributions to the teacher educationdevelopment literature in general and
particularly to the development of probabilistic reasoning of preservice teachers The study provides empirical
evidence that the learner-centered approach targeted at addressing probabilistic misconceptions is more effective
in developing probabilistic reasoning in preservice teachers What this means is that when teacher educators use
the learner-centered approach to teach the concept of probability and focus on addressing misconceptions
preservice teachers will develop better probabilistic reasoning This will in turn translate into preservice
teachers answering questions on probability correctly in their examinations and ultimately making them teach
the concept more effectively when they complete their training It is thus recommended that teachers should
consider employing the learner-centered approach in teaching the concept of probability
Hokor amp Sedofia
136
Limitations
As with every empirical study employing the quasi-experimental approach the current study has some
limitations which need to be acknowledged and used to guide users of the findings Firstly our sample was
drawn from a population of second year preservice teachers of a female only college of education in a peri-
urban area in Ghana Further experiments are therefore needed in other settings in order to see if the same or
similar results will occur Secondly owing to the narrow characteristics of the participants in the present study
the researchers cannot generalize the results to other individuals who do not have the same characteristics So
additional experiments with groups with different characteristics are necessary Lastly the experiments need to
be repeated at another time to determine if the results are the same (consistent) over time
Acknowledgements
We are grateful to the Principal and preservice teachers for granting access and participating in the study
respectively
References
AIAhmad H (2021) The role of educational communication in promoting student-centered learning style in
multicultural classrooms A reflective essay on learning and teaching in higher education International
Journal of Research in Education and Science (IJRES) 7(3) 838-851 httpsdoiorg1046328ijes2374
Aina J K Olanipekun S S amp Garuba I A (2015) Teachersrsquo effectiveness and its Influence on studentsrsquo
learning Advances in Social Sciences Research Journal 2(4) 88-95
Anway D W amp Bennett E (2004) Common Misconceptions in Probability among Students in an Elementary
Statistics class Unplished Senior Project The ARTIST Roundtable Conference on Assessment in
Statistics held at Lawrence University Supperior WI The University of Wisconsin-Superior
Bada S (2015) Constructivist Learning Theory A Paradigm for Teaching and Learning IOSR Journal of
Research and Method in Education (IOSR-JRME) 5(6) 66-70 httpsDOI1097907388-05616670
Baerveldt C (2013) Constructivism contested Implications of a genetic perspective in psychology Integrative
Psychological and Behavioral Science 47(1) 156-166
Batanero C (2013) Teaching and learning probability In S Lerman (Ed ) Encyclopedia of Mathematics
Education Heidelberg Springer
Batanero C and Diaz C (2012) Training school teachers to teach probability reflections and challenges
Chilean Journal of Statistics 3(1) 3-13
Belova N amp Zowada C (2020) Innovating Higher Education Via Game-Based Learning on Misconceptions
Education Sciences 10 221 doi103390educSCi10090221
Bennett E amp Anway D W (2003) Statistical and Probabilistic Reasoning and Misconceptions among
Selected College Students McNair Scholars Journal Vol 4 httpwwwsocheclchjs
Cantoy O (2010) Mathematics teachersrsquo topic-specific pedagogical content knowledge in the context of
teaching a0 0 and a divide 0 Educational Sciences Theory and Practice 10 (2) 749-769
International Journal of Studies in Education and Science (IJSES)
137
Clements D H amp Battista M (1990) Constructivist Learning and Teaching The
Arithetic Teacher 38(1) ProQuest Central pg 34 DOI105951AT3810034
Creswell J W amp Creswell J D (2018) Research design Qualitative quantitative and
mixed methods approaches (5th
ed) Los Angeles SAGE Publications Inc
Courtney S A amp Caniglia J (2021) Comparing the mathematical practices pre-service teachers and
mathematics teacher educators identified as relevant to problems and tasks International Journal of
Research in Education and Science (IJRES) 7(3) 954-971 httpsdoiorg1046328ijres2335
Denton D W (2012) Enhancing instruction through constructivism cooperative learning and cloud
computing Tech Trends 56(4) 34-41
Gage J (2012) Towards a new Probability Curriculum for Secondary Schools Paper presented at 12th
International Congress on Mathematical Education 8 July-15 July COEX Seoul Korea Cambridge
Cambridge University Uk
Gurbuz R amp Birgin O (2011) The effect of computer-assisted teaching on remedying misconceptions The
case of the subject Probability Journal Homepage 58(2012) DOI 101016jcompedu201111005
Hirsh L amp ODonnell A M (2001) Representativeness in Statistical Reasoning Identifying and Assessing
Misconceptions Journal of Statistics Education 9(2) 96-105 DOI10108010691898200111910655
Johnson H D amp Dasgupta N (2005) Traditional versus Non-traditional Teaching during Perspectives of
Students in Introductory Statistics Classes Journal of Statistics Education 13(2)
httpsdoiorg10108010691898200511910558
Major T amp Mangope B (2012) The Constructivist Theory in Mathematics The case of Botswana Primary
Schools International Review of Social Sciencies and Humanities 3(2) 139-147
Jones G (2005) Reflections In GA Jones (Ed) Exploring probability in school chanlleges for teaching and
probability (367-372) New York Springer
Jun L (2000) Chinese Students Understanding of Probability Published doctoral dissertation Singapore
National Institute of Education Nanyang Technological University
Khazanov L amp Gourgey A (2009) Instructors Perspectives on Students Mistaken Beliefs about Probability
in an Elementary College Statistics Course In K Safford-Ramus (Ed) Proceedings of the Adults
Learning Mathematics a Resaerch Forum (ALM) 15th
Annual International Conference 249-264
Khazanov L amp Prado L (2010) Correcting Students Misconceptions about Probability in an Introductory
College Statistics Course Adults Learning Mathematics-An International Journal 5(1) 23-35
Kleickmann T Richter D Kunter M Elsner J Besser M Krauss S amp Baumert J (2013) Teachersrsquo
Content Knowledge and Pedagogical Content Knowledge The Role of Structural Differences in Teacher
Education Journal of Teacher Education 64(1) 90-106 DOI1011770022487112460398
Leedy P D and Ormrod J E (2020) Practical research Planning and design (12th Global Edition) Harlow
England Pearson
Lessani A Md Yunus AS amp Bakar KBA (2017) Comparison of new mathematics teaching methods with
teacher-centered approach International Journal of Social Sciences 3(2) 1285-1297
httpsdxdoiorg1020319pijss20173212851297
Lim C amp Hwa T (2007) Promoting Mathematical Thinking in the Malaysian Classroom Issues and
challenges httpswwwresearchgatenetpublication252353381
Hokor amp Sedofia
138
Lovett J N amp Lee H S (2017) New Standards Require Teaching More Statistics Are Preservice Secondary
Mathematics Ready Journal of Teachers Education 68(3) 299-311 DOI 1011770022487117697918
Major T amp Mangope B (2012) The Constructivist Theory in Mathematics The case of Botswana Primary
Schools International Review of Social Sciencies and Humanities 3(2) 139-147
National Council of Teachers of Mathematics (2003) Principles and Standards for School Mathematics and
their Implications for Professional Development Reston VA NCTM
Nguyen L (2015) Developing Conceptual Understanding and Probabilistic Thinking through Tree Diagrams
Published MPhil Dissertation Manitoba The Faculty of Graduate Studies of the University of
Manitoba
Prideaux J (2007) The learner-centered approach to Mathematics Teaching and the Active Learning
Strategies used to Enhance Students Understanding Mathematical and Computing Sciences Masters
Paper 29 Fisher Digital Publications httpfisherpubsjfcedumathcsetdmasters29
Roseth C J Garfield J B amp Ben-Zvi D (2008) Collaboration in Learning and Teaching Statistics Journal
of Statistics Education 16 (1) 1069-1898 httpsdoiorg10108010691898200811889557
Santagata R and Sandholtz J H (2019) Preservice teachersrsquo mathematics teaching competence Comparing
performance on two measures Journal of Teacher Education 70 (5) 472 ndash484
Schwerdt G amp Wuppermann A C (2011) Is traditional teaching really all that bad A within-student
between-subject approach Economics of Education Review 30(2) 365-379
Sharma S (2016) Probability from a socio-cultural perspective Statistics Education Research Journal 15(2)
126-144 httpiase-weborgPublicationsphpp=SERJ
Shay K (2008) Tracing middle school students understanding of probability a longitudinal study
Unpublished Doctoral Dissertation New Brunswick New Jersey Rutgers State University of New
Jersey
Shulman L S (1986) Those who understand Knowledge growth in teaching Educational Researcher 15(2)
4-14 doi 1031021001318X015002004
Thomas L (2020) An introduction to quasi-experimental designs
httpswwwscribbrcommethodologyquasi-experimental-design
Voskoglou M (2019) Comparing Teaching Methods of Mathematics at University Level Education Sciences
9(204) doi103390educsci9030204
Vygotsky L S (1978) Mind in society The development of higher psychological processes Cambridge MA
Harvard University Press
Weldeana H N amp Abraham S T (2014) The effect of an historical perspective on prospective teachersrsquo
beliefs in learning mathematics Journal of Mathematics Teacher Education 17 303-330
doi101007s10857-013-9266-z
Weltman D amp Whiteside M (2010) Comparing the Effectiveness of Traditional and active Learning Methods
in Business Statistics Convergence to the Mean 18(1)
httpsdoiorg10108010691898201011889480
White H amp Sabarwal S (2014) Quasi-experimental design and methods methological briefs impact
evaluations Florence UNICEF Office of research
International Journal of Studies in Education and Science (IJSES)
139
Author Information
Evans Kofi Hokor
httpsorcidorg0000-0002-8387-8294
St Teresarsquos College of Education Hohoe
Department of Mathematics and ICT
P O Box 129
Ghana
Contact e-mail evanskhokorgmailcom
John Sedofia
httpsorcidorg0000-0002-5409-516X
University of Ghana Legon
Department of Teacher Education
PO Box LG 1181
Ghana
Hokor amp Sedofia
140
Appendix A Pre-test Probabilistic Reasoning Assessment
This assessment is for research purpose to improve teaching and learning of probability
You are required to answer all questions honestly Do and leave all workings or rough work on the paper
Pre-test Probabilistic Reasoning Assessment Duration 1hr
Index numberhelliphelliphelliphelliphelliphelliphelliphelliphelliphelliphelliphelliphelliphelliphelliphelliphelliphellipLevelhelliphelliphelliphellipAgehelliphelliphellip
Read each statement carefully and circle the letter of the correct (best) option Provide appropriate response in
the space provided under some items as it apply
1 If you rolled an ordinary die and obtained 51246 which of these is most likely to occur on your next
roll
a 1
b 2
c 3
d 4
e 5
f 6
g The options a b c d e and f are all equally
2i A fair coin is tossed and it lands tail The coin is to be tossed a second time What is the probability that the
second toss will also be a tail
a 1
4
b 1
2
c 1
3
d Slightly less than 1
2
e Slightly more than 1
2
f 0
2ii Which of the following best describes the reason for the correct answer to the preceding question (2i)
a The second toss is less likely to be tail because the first toss was tail
b There are four possible outcomes when you toss a coin twice Getting two tails is only one of them
c The chance of getting heads or tails on any one toss is always 1
2
d There are three possible outcomes when you toss a coin twice Getting two tails is only one of the them
e No chance of being a tail in the second toss
3i A box contains 6 balls 2 are red 2 are black and 2 blue Three balls are picked at random one at a time
Each time a ball is picked the colour is recorded and the ball is put back in the box mixed thoroughly If the
first 2 balls are black what color is the third ball most likely to be
a Red
International Journal of Studies in Education and Science (IJSES)
141
b Black
c Blue
d Red and blue are equally likely than black
e Red black and blue are all equally likely
3ii Which of the following best describes the reason for the correct answer in the preceding question (3i)
a The third ball should not be black because too many black ones have already been picked
b The picks are independent so every color has an equally likely chance of being picked
c Black seems to be lucky
d This color is just as likely as any other color
4 A spinner with ten equally divided sectors in which four parts are white and the rests are red is about to
be spin which color is the spinner more likely to land
a White
b Red
c Both white and red are all equally
5 If you toss a fair coin and get heads two times in a row which of these is most likely on next toss
a Tail
b Head
c Both head and tail are all equally
6 A Gh 2 Gh 5 Ghcent10 Gh 20 Gh 50 and Gh 100 notes were put in a box and thoroughly mixed
What is the probability of picking Gh 50 note without looking
a 1
187
b 50
187
c 1
6
d 0
7 In a game you have been offered two options Which of the following give you higher chance of
winning GHcent200
a Tossing one die once and obtaining a 6
b Tossing two dice once and obtaining two 6rsquos
c The options a and b are all equally
8 A fair die is to be toss six times which of these is most likely to occur
a 251634
b 123456
c 666341
d 132244
e The options a b c and d are all equally likely
9 A fair coin is to be toss four times in a row which of these is least likely to occur
a THTH
b TTTH
c HHH
Hokor amp Sedofia
142
d The options a b and c are all equally likely
10 Two fair dice are to be tossed once Which of the following is more likely to occur
a Obtaining a sum of 11
b Obtaining a sum of 10
c A sum of 11 and a sum of 10 are all equally likely
10i Give reason for the correct answer in the preceding question (10)
helliphelliphelliphelliphelliphelliphelliphelliphelliphelliphelliphelliphelliphelliphelliphelliphelliphelliphelliphelliphelliphelliphelliphelliphelliphelliphelliphelliphelliphelliphelliphelliphelliphelliphelliphelliphelliphelliphelliphelliphelliphellip
helliphelliphelliphelliphelliphelliphelliphelliphelliphelliphelliphelliphelliphelliphelliphelliphelliphelliphelliphelliphelliphelliphelliphelliphelliphelliphelliphelliphelliphelliphelliphelliphelliphelliphelliphelliphelliphelliphelliphelliphelliphellip
helliphelliphelliphelliphelliphelliphelliphelliphelliphelliphelliphelliphelliphelliphelliphelliphelliphelliphelliphelliphelliphelliphelliphelliphelliphelliphelliphelliphelliphelliphelliphelliphelliphelliphelliphelliphelliphelliphelliphelliphelliphellip
helliphelliphelliphelliphelliphelliphelliphelliphelliphelliphelliphelliphelliphelliphelliphelliphelliphelliphelliphelliphelliphelliphelliphelliphelliphelliphelliphelliphelliphelliphelliphelliphelliphelliphelliphelliphelliphellip
11 In national lottery one has to choose five numbers from 1 to 90 inclusive You win when at least two of
your numbers are part of the numbers drawn on Saturday at random Eric has chosen 4 6 7 9 and 11
Alex has chosen 15 23 45 66 and 80 Daniel has chosen 71 77 78 83 and 85 Do Eric Alex and
Daniel have the same chance of winning or not and why
helliphelliphelliphelliphelliphelliphelliphelliphelliphelliphelliphelliphelliphelliphelliphelliphelliphelliphelliphelliphelliphelliphelliphelliphelliphelliphelliphelliphelliphelliphelliphelliphelliphelliphelliphelliphelliphelliphelliphelliphellip
helliphelliphelliphelliphelliphelliphelliphelliphelliphelliphelliphelliphelliphelliphelliphelliphelliphelliphelliphelliphelliphelliphelliphelliphelliphelliphelliphelliphelliphelliphelliphelliphelliphelliphelliphelliphelliphelliphelliphelliphellip
helliphelliphelliphelliphelliphelliphelliphelliphelliphelliphelliphelliphelliphelliphelliphelliphelliphelliphelliphelliphelliphelliphelliphelliphelliphelliphelliphelliphelliphelliphelliphelliphelliphelliphelliphelliphelliphelliphelliphelliphellip
helliphelliphelliphelliphelliphelliphelliphelliphelliphelliphelliphelliphelliphelliphelliphelliphelliphelliphelliphelliphelliphelliphelliphelliphelliphelliphelliphelliphelliphelliphelliphelliphelliphelliphelliphellip
12 A box contains 8 yellow balls and 4 green balls Two balls are chosen at random one after the other
without replacement determine the probability that the two balls are of different colours
helliphelliphelliphelliphelliphelliphelliphelliphelliphelliphelliphelliphelliphelliphelliphelliphelliphelliphelliphelliphelliphelliphelliphelliphelliphelliphelliphelliphelliphelliphelliphelliphelliphelliphelliphelliphelliphelliphelliphelliphellip
helliphelliphelliphelliphelliphelliphelliphelliphelliphelliphelliphelliphelliphelliphelliphelliphelliphelliphelliphelliphelliphelliphelliphelliphelliphelliphelliphelliphelliphelliphelliphelliphelliphelliphelliphelliphelliphelliphelliphelliphellip
helliphelliphelliphelliphelliphelliphelliphelliphelliphelliphelliphelliphelliphelliphelliphelliphelliphelliphelliphelliphelliphelliphelliphelliphelliphelliphelliphelliphelliphelliphelliphelliphelliphelliphelliphelliphelliphelliphelliphelliphellip
helliphelliphelliphelliphelliphelliphelliphelliphelliphelliphelliphelliphelliphelliphelliphelliphelliphelliphelliphelliphelliphelliphelliphelliphelliphelliphelliphelliphelliphelliphelliphelliphelliphelliphelliphelliphellip
International Journal of Studies in Education and Science (IJSES)
143
Appendix B Post-test Probabilistic Reasoning Assessment
This assessment is for research purpose to improve teaching and learning of probability
You are required to answer all questions honestly Do and leave all workings or rough work on the paper
Post-test Probabilistic Reasoning Assessment Duration One Hour
Index numberhelliphelliphelliphelliphelliphelliphelliphelliphelliphelliphelliphelliphelliphelliphellipClasshelliphelliphelliphellipAgehelliphelliphelliphellip
Read each statement carefully and circle the letter of the correct (best) option for each item as much as possible
and provide appropriate response in the space provided
1 Suppose a particular outcome from a random event has a probability of 04 Which of the following
statements represents correct interpretations of this probability
a The outcome will not happen
b The outcome will certainly happen about four times out of every 10 trials
c The outcome is expected to happen about four times out of every 10 trials
d The outcome could happen or it couldnrsquot of either result are the same
2 If you toss a fair coin and get heads 3 times in a row what is the chance of getting a head on the next toss
a 1
b Greater than 1
2
c 1
2
d Less than 1
2
e 0
3 A die is numbered 1 2 3 4 4 5 When the die is thrown once Which of these is most likely and why
a 1
b 2
c 3
d 4
e 5
f They are all equally likely
3i Give reason for your chosen answer in (3)
helliphelliphelliphelliphelliphelliphelliphelliphelliphelliphelliphelliphelliphelliphelliphelliphelliphelliphelliphelliphelliphelliphelliphelliphelliphelliphelliphelliphelliphelliphelliphelliphelliphelliphelliphelliphelliphelliphelliphelliphelliphelliphelliphelliphellip
helliphelliphelliphelliphelliphelliphelliphelliphelliphelliphelliphelliphelliphelliphelliphelliphelliphelliphelliphelliphelliphelliphelliphelliphelliphelliphelliphelliphelliphelliphelliphelliphelliphelliphelliphelliphelliphelliphelliphelliphelliphelliphelliphelliphellip
helliphelliphelliphelliphelliphelliphelliphelliphelliphelliphelliphelliphelliphelliphelliphelliphelliphelliphelliphelliphelliphelliphelliphelliphelliphelliphelliphelliphelliphelliphelliphelliphelliphelliphelliphelliphelliphelliphelliphelliphelliphelliphelliphelliphellip
helliphelliphelliphelliphelliphelliphelliphelliphelliphelliphelliphelliphelliphelliphelliphelliphelliphelliphelliphelliphelliphelliphelliphelliphelliphelliphelliphelliphelliphelliphelliphelliphelliphelliphelliphelliphelliphelliphellip
4 German MP tossed two dice once Which of these is mostly likely and why
a Obtaining a sum of 4
b Obtaining a sum of 7
c Obtaining a sum of 11
d All of them have equal chance of occurring that is a b c
Hokor amp Sedofia
144
4i Give reason for your chosen answer in (4)
helliphelliphelliphelliphelliphelliphelliphelliphelliphelliphelliphelliphelliphelliphelliphelliphelliphelliphelliphelliphelliphelliphelliphelliphelliphelliphelliphelliphelliphelliphelliphelliphelliphelliphelliphelliphelliphelliphelliphelliphelliphelliphelliphelliphellip
helliphelliphelliphelliphelliphelliphelliphelliphelliphelliphelliphelliphelliphelliphelliphelliphelliphelliphelliphelliphelliphelliphelliphelliphelliphelliphelliphelliphelliphelliphelliphelliphelliphelliphelliphelliphelliphelliphelliphelliphelliphelliphelliphelliphellip
helliphelliphelliphelliphelliphelliphelliphelliphelliphelliphelliphelliphelliphelliphelliphelliphelliphelliphelliphelliphelliphelliphelliphelliphelliphelliphelliphelliphelliphelliphelliphelliphelliphelliphelliphelliphelliphelliphelliphelliphelliphelliphelliphelliphellip
helliphelliphelliphelliphelliphelliphelliphelliphelliphelliphelliphelliphelliphelliphelliphelliphelliphelliphelliphelliphelliphelliphelliphelliphelliphelliphelliphelliphelliphelliphelliphelliphelliphelliphelliphelliphelliphelliphelliphelliphelliphelliphelliphelliphellip
helliphelliphelliphelliphelliphelliphelliphelliphelliphelliphelliphelliphelliphelliphelliphelliphelliphelliphelliphelliphelliphelliphelliphelliphelliphelliphelliphelliphellip
5i A fair coin is to be toss four times which of these is most likely to occur
a HTHT
b THTT
c TTTT
d HHTH
e The options a b c and d are all equally likely
5ii Give reason for your chosen answer in (5i)
helliphelliphelliphelliphelliphelliphelliphelliphelliphelliphelliphelliphelliphelliphelliphelliphelliphelliphelliphelliphelliphelliphelliphelliphelliphelliphelliphelliphelliphelliphelliphelliphelliphelliphelliphelliphelliphelliphelliphelliphelliphelliphelliphelliphellip
helliphelliphelliphelliphelliphelliphelliphelliphelliphelliphelliphelliphelliphelliphelliphelliphelliphelliphelliphelliphelliphelliphelliphelliphelliphelliphelliphelliphelliphelliphelliphelliphelliphelliphelliphelliphelliphelliphelliphelliphelliphelliphelliphelliphellip
helliphelliphelliphelliphelliphelliphelliphelliphelliphelliphelliphelliphelliphelliphelliphelliphelliphelliphelliphelliphelliphelliphelliphelliphelliphelliphelliphelliphelliphelliphelliphelliphelliphelliphelliphelliphelliphelliphelliphelliphelliphelliphelliphelliphellip
helliphelliphelliphelliphelliphelliphelliphelliphelliphelliphelliphelliphelliphelliphelliphelliphelliphelliphelliphelliphelliphelliphelliphelliphelliphelliphelliphelliphelliphelliphelliphelliphelliphelliphelliphelliphelliphelliphellip
6i A fair coin is to be toss four times which of these is least likely to occur
a HTHT
b THTT
c TTTT
d HHTH
e The options a b c and d are all equally likely
6ii Give reason for your chosen answer in (6i)
helliphelliphelliphelliphelliphelliphelliphelliphelliphelliphelliphelliphelliphelliphelliphelliphelliphelliphelliphelliphelliphelliphelliphelliphelliphelliphelliphelliphelliphelliphelliphelliphelliphelliphelliphelliphelliphelliphelliphelliphelliphelliphelliphelliphellip
helliphelliphelliphelliphelliphelliphelliphelliphelliphelliphelliphelliphelliphelliphelliphelliphelliphelliphelliphelliphelliphelliphelliphelliphelliphelliphelliphelliphelliphelliphelliphelliphelliphelliphelliphelliphelliphelliphelliphelliphelliphelliphelliphelliphellip
helliphelliphelliphelliphelliphelliphelliphelliphelliphelliphelliphelliphelliphelliphelliphelliphelliphelliphelliphelliphelliphelliphelliphelliphelliphelliphelliphelliphelliphelliphelliphelliphelliphelliphelliphelliphelliphelliphelliphelliphelliphelliphelliphelliphellip
helliphelliphelliphellip
7 A college has 300 level 200 students and 236 level 100 students in it Each studentrsquos name is written with
the level on a piece of paper and all the names are put into a box and mixed thoroughly A tutor picks one
name out of the box without looking Which level is the tutor more likely to pick from and why
helliphelliphelliphelliphelliphelliphelliphelliphelliphelliphelliphelliphelliphelliphelliphelliphelliphelliphelliphelliphelliphelliphelliphelliphelliphelliphelliphelliphelliphelliphelliphelliphelliphelliphelliphelliphelliphelliphelliphelliphelliphelliphelliphelliphellip
helliphelliphelliphelliphelliphelliphelliphelliphelliphelliphelliphelliphelliphelliphelliphelliphelliphelliphelliphelliphelliphelliphelliphelliphelliphelliphelliphelliphelliphelliphelliphelliphelliphelliphelliphelliphelliphelliphelliphelliphelliphelliphelliphelliphellip
helliphelliphelliphelliphelliphelliphelliphelliphelliphelliphelliphelliphelliphelliphelliphelliphelliphelliphelliphelliphelliphelliphelliphelliphelliphelliphelliphelliphelliphelliphelliphelliphelliphelliphelliphelliphelliphelliphelliphelliphelliphelliphelliphelliphellip
helliphelliphelliphelliphelliphelliphelliphelliphelliphelliphelliphelliphelliphelliphelliphelliphelliphelliphelliphelliphelliphelliphelliphelliphelliphelliphelliphelliphelliphelliphelliphelliphelliphelliphelliphelliphelliphelliphelliphellip
8 Suppose that you toss a coin three times and all eight outcomes are equally likely If it is known that the first
toss comes up heads what is the probability of an odd number of heads appearing
helliphelliphelliphelliphelliphelliphelliphelliphelliphelliphelliphelliphelliphelliphelliphelliphelliphelliphelliphelliphelliphelliphelliphelliphelliphelliphelliphelliphelliphelliphelliphelliphelliphelliphelliphelliphelliphelliphelliphelliphelliphelliphelliphelliphellip
helliphelliphelliphelliphelliphelliphelliphelliphelliphelliphelliphelliphelliphelliphelliphelliphelliphelliphelliphelliphelliphelliphelliphelliphelliphelliphelliphelliphelliphelliphelliphelliphelliphelliphelliphelliphelliphelliphelliphelliphelliphelliphelliphelliphellip
helliphelliphelliphelliphelliphelliphelliphelliphelliphelliphelliphelliphelliphelliphelliphelliphelliphelliphelliphelliphelliphelliphelliphelliphelliphelliphelliphelliphelliphelliphelliphelliphelliphelliphelliphelliphelliphelliphelliphelliphelliphelliphelliphelliphellip
International Journal of Studies in Education and Science (IJSES)
145
helliphelliphelliphelliphelliphelliphelliphelliphelliphelliphelliphelliphelliphelliphelliphelliphelliphelliphelliphelliphelliphelliphelliphelliphelliphelliphelliphelliphelliphelliphelliphelliphelliphelliphelliphelliphelliphelliphelliphelliphelliphelliphelliphelliphellip
helliphelliphelliphelliphelliphelliphelliphelliphelliphelliphelliphelliphelliphelliphelliphelliphelliphelliphelliphelliphelliphelliphelliphelliphelliphelliphelliphelliphelliphelliphelliphelliphelliphelliphelliphelliphelliphelliphelliphelliphelliphelliphelliphelliphellip
helliphelliphelliphelliphelliphelliphelliphelliphelliphelliphelliphelliphelliphelliphelliphelliphelliphelliphelliphellip
9 A card is selected at random from a pack of 52 cards Find the probability of selecting a card which is a red or
a queen
helliphelliphelliphelliphelliphelliphelliphelliphelliphelliphelliphelliphelliphelliphelliphelliphelliphelliphelliphelliphelliphelliphelliphelliphelliphelliphelliphelliphelliphelliphelliphelliphelliphelliphelliphelliphelliphelliphelliphelliphelliphelliphelliphelliphellip
helliphelliphelliphelliphelliphelliphelliphelliphelliphelliphelliphelliphelliphelliphelliphelliphelliphelliphelliphelliphelliphelliphelliphelliphelliphelliphelliphelliphelliphelliphelliphelliphelliphelliphelliphelliphelliphelliphelliphelliphelliphelliphelliphelliphellip
helliphelliphelliphelliphelliphelliphelliphelliphelliphelliphelliphelliphelliphelliphelliphelliphelliphelliphelliphelliphelliphelliphelliphelliphelliphelliphelliphelliphelliphelliphelliphelliphelliphelliphelliphelliphelliphelliphelliphelliphelliphelliphelliphelliphellip
helliphelliphelliphelliphelliphelliphelliphelliphelliphelliphelliphelliphelliphelliphelliphelliphelliphelliphelliphelliphelliphelliphelliphelliphelliphelliphelliphelliphelliphelliphelliphelliphelliphelliphelliphelliphelliphelliphelliphellip
10 A box contains 6 white balls and 4 green balls Two balls are chosen at random one after the other without
replacement determine the probability that the second ball is white
helliphelliphelliphelliphelliphelliphelliphelliphelliphelliphelliphelliphelliphelliphelliphelliphelliphelliphelliphelliphelliphelliphelliphelliphelliphelliphelliphelliphelliphelliphelliphelliphelliphelliphelliphelliphelliphelliphelliphelliphelliphelliphelliphelliphellip
helliphelliphelliphelliphelliphelliphelliphelliphelliphelliphelliphelliphelliphelliphelliphelliphelliphelliphelliphelliphelliphelliphelliphelliphelliphelliphelliphelliphelliphelliphelliphelliphelliphelliphelliphelliphelliphelliphelliphelliphelliphelliphelliphelliphellip
helliphelliphelliphelliphelliphelliphelliphelliphelliphelliphelliphelliphelliphelliphelliphelliphelliphelliphelliphelliphelliphelliphelliphelliphelliphelliphelliphelliphelliphelliphelliphelliphelliphelliphelliphelliphelliphelliphelliphelliphelliphelliphelliphelliphellip
helliphelliphelliphelliphelliphelliphelliphelliphelliphelliphelliphelliphelliphelliphelliphelliphelliphelliphelliphelliphelliphelliphelliphelliphelliphelliphelliphelliphelliphelliphelliphelliphelliphelliphelliphelliphelliphelliphelliphelliphelliphelliphellip

Hokor amp Sedofia
132
Table 6 Pre-test and Post-test Scores for the Group B
Minimum Maximum Mean Std Deviation
Pre-test 2 8 585 1562
Post-test 5 14 952 2208
The data on Table 6 show that the mean score of preservice teachers in the pre-test was 585 while that of the
post-test was 952 marks This indicates that in the post-test an average of each of the preservice teachersrsquo
probabilistic reasoning increased slightly in Group B To determine if the mean difference is statistically
significant a paired sample t‐test was conducted Table 7 presents the results
Table 7 Results of the Paired Samples t-test on the Post-test and Pre-test of the Group B
Mean
Difference
Std Deviation Std Error
Mean
t Df Sig
Post-test ndash Pre-test 3667 1441 0277 13220 26 000
The result presented on Table 7 shows that the mean score difference between the post-test and pre-test of
Group B was 3667 marks with a corresponding standard deviation of 1441 The paired sample t-test was
conducted to find out if the mean score difference (M = 3667 SD = 1441) was statistically significant This
was done to assess the effect of the teacher-centered approach targeted at addressing misconceptions on
preservice teachersrsquo probabilistic reasoning The results from Table 7 reveal that there was a statistically
significant difference in the preservice teachersrsquo probabilistic reasoning scores from the pre-test (M = 585 SD =
1562) to the post-test (M = 952 SD = 2208) with t (26) = 13220 p = 000 lt 05 This is an indication that the
teacher-centered approach to teaching probability targeted at addressing probabilistic misconceptions aids
students to improve upon their understanding and problem-solving abilities in probability
Next we compared the effectiveness of the learner-centered approach of teaching and the teacher-centered
approach of teaching in terms of probabilistic reasoning of preservice teachers and how they addressed
probabilistic misconceptions
Comparison of Effectiveness of Learner-centered Approach and Teacher-centered Approach in
Developing Probabilistic Reasoning
The preservice teachersrsquo scores on the pre-test of the achievement test were used as covariate in this analysis
The scores from the post-test were then compared using ANCOVA with = 05 to adjust for pre-test
differences that existed between Group A and Group B In the pre-test the mean scores of Group B and Group A
were 585 and 550 respectively ANCOVA was used to adjust the post-test scores statistically to compensate
for the 035 mean point difference between the two groups in the pre-test This adjustment led to a more
accurate post-test comparison Table 8 presents the results
International Journal of Studies in Education and Science (IJSES)
133
Table 8 Summary of ANCOVA of the Performance of Preservice Teachers taught with Learner-centered
Approach and Teacher-centered Approach (N = 59)
Source Sum of
Squares
Df
Mean
Square
F Sig Partial Eta
Squared
Corrected
Model
791144a 2 395562 72150 000 720
Intercept 205135 1 205135 37416 000 401
Pre-test 228184 1 228184 41620 000 426
Group 630253 1 630253 114955 000 672
Error 307026 56 5483
Total 10888000 59
Corrected Total 1098169 58
a R Squared = 720 (Adjusted R Squared = 710)
The data on Table 8 indicate that there is a statistically significant main effect on the preservice teachers who
were taught using the learner-centered approach to learn probability [F (1 56) = 114955 p = 000 lt 05]
Consequently the preservice teachers taught with the learner-centered approach performed better than their
counterparts who experienced the teacher-centered approach to learn probability The partial eta squared value
was found to be 0672 This value indicates a large effect size That is 672 of the variance in the dependent
variable (probabilistic reasoning achievement score) is expounded by the independent variable (teacher-centered
approach) This implies that the magnitude of the difference between the mean score of the preservice teachers
taught with the learner-centered approach and the teacher-centered approach is large With the high scores of
preservice teachers in the Group A it implies that the use of learner-centered approach in the teaching and
learning of probability improved the performance of the preservice teachers
The outcome of the study portrays that there was a statistically significant difference in the probabilistic
reasoning achievement mean scores of Group A than that of Group B [F (1 56) = 114955 p = 000 lt 05] This
finding implies that Group A performed better than Group B in the probabilistic reasoning achievement test
This is an indication that when the learner-centered approach to teaching probability is targeted at addressing
probabilistic misconceptions preservice teachers develop better probabilistic reasoning than teacher-centered
approach
Discussion
This study set out to compare the learner-centered and teacher-centered approaches of teaching in order to
determine the best way of developing preservice teachersrsquo probabilistic reasoning at the College of Education
Hokor amp Sedofia
134
level in Ghana The results as shown on Tables 3 4 5 6 7 and 8 indicate that the learner-centered approach to
teaching probability is more effective than the teacher-centered approach in motivating and inspiring preservice
teachers to learn and apply probability The learner-centered approach provides studentsrsquo opportunities to think
reason reflect and evaluate their ideals and that of colleagues
The findings of the present study are in tandem with several research findings Lessani Md Yunus and Bakar
(2017) investigated mathematics teaching approaches and their consequences on learnersrsquo ability to solve
challenging problems Their findings affirm the learner-centered approach to be more effective in studentsrsquo
creativity and innovation in solving real-life problems than the teacher-centered approach So training
programs for excellent teaching and learning should be flexible and innovative to allow preservice teachers to
explore gaps in learning and teaching (AIAhmad 2021) Similarly Prideaux (2007) found that students who
experienced the learner-centered approach of teaching performed significantly higher than those who were
taught without the learner-centered approach of teaching Roseth Garfield and Ben-Zvi (2008) also examined
the effect of the cooperative framework in classroom teaching and collaboration and found that student-
centered approaches to teaching help students to have better understanding of statistics than teacher-centered
instruction
Furthermore Gurbuz and Birgin (2011) studied the effect of computer-assisted teaching on addressing
probabilistic misconceptions of students The authors used pre-test to collect data on both the computer-assisted
and traditional groups before the experimental teachings After the intervention the post-test was administered
to ascertain the effect of computer-assisted teaching and teacher-centered approach on addressing studentsrsquo
probabilistic misconceptions Their study found computer-assisted teaching to have more significant effect on
studentsrsquo correct probabilistic reasoning than teacher-centered approach of teaching
As noted by Batanero and Diaz (2012) probability forms an integral part of the Mathematics curriculum in
many countries But the concept is one that some learners find difficult to understand partly due to the method
of teaching used by teachers This fact implies that teachers of mathematics should find more creative ways of
teaching the concept so as to make it easier for learners to understand and apply the concept As discovered in
this study the learner-centered approach is effective in developing probabilistic reasoning But the learner-
centered approach works best when certain conditions are present At the outset there is the need for relevant
teaching and learning materials Then teachers need to be trained and retrained in the use of the learner-centered
approach to teaching At the college of education level preservice teachers need to be taught using the learner-
centered approach not only to help them understand probability but also to help them use the learner-centered
approach in their own teaching
The activities used for Group A which is learner-centered approach group in the form of games promote
content knowledge and cognitive skills competencies such as collaboration and problem solving (Belova amp
Zowada 2020) The activities focus on promoting learning experiences rather than stressing on the
entertainment factor While some things students learn in school seem to them predetermined and bound by
laws in other branches of mathematics probability provides students with opportunity to learn that solutions to
International Journal of Studies in Education and Science (IJSES)
135
several problems depend on assumptions and have degrees of doubt So teaching methods that allow students to
predict and test their predictions should be encouraged for students to develop their intellectual repertoire The
processes used in reasoning about sample space will serve students well in life Several calls on the need to pay
attention to the study of probability show that teachers and mathematics teachers must provide their students
with appropriate teaching strategies to enhance their conceptual understanding In the preparation of preservice
teachers to become mathematically competent citizens teacher preparation programs such as teaching methods
must provide opportunities for preservice teachers to confront misconceptions and reason probabilistically
(Courtney amp Caniglia 2021)
The findings of the present study however run counter to those of Weltman and Whiteside (2010) They
conducted a study on the effectiveness of the traditional and active learning method in business statistics The
study found that active learning had not been effective for all category of students It is not precisely clear what
may have accounted for that result This is because active learning methods have generally been known to be
effective in promoting learning Further research is thus required in this regard
Conclusions
This study compared the effects of the learner-centered and teacher-centered approaches of teaching in
addressing probabilistic misconceptions by measuring preservice teachersrsquo probabilistic reasoning scores The
results show that the learner-centered approach aids preservice teachers to develop better probabilistic reasoning
than the teacher-centered approach to teaching Thus the study concludes that the learner-centered approach to
teaching is a solution to preservice teachersrsquo inability to answer questions on probability correctly Even though
each teaching approach targeted at addressing misconceptions was found to have significant effect on pre-
service teachersrsquo probabilistic reasoning the learner-centered approach was found to be more effective than the
teacher-centered approach in addressing misconceptions which limit studentsrsquo ability to solve probability
problems correctly
Implications and Recommendations
This study makes some key contributions to the teacher educationdevelopment literature in general and
particularly to the development of probabilistic reasoning of preservice teachers The study provides empirical
evidence that the learner-centered approach targeted at addressing probabilistic misconceptions is more effective
in developing probabilistic reasoning in preservice teachers What this means is that when teacher educators use
the learner-centered approach to teach the concept of probability and focus on addressing misconceptions
preservice teachers will develop better probabilistic reasoning This will in turn translate into preservice
teachers answering questions on probability correctly in their examinations and ultimately making them teach
the concept more effectively when they complete their training It is thus recommended that teachers should
consider employing the learner-centered approach in teaching the concept of probability
Hokor amp Sedofia
136
Limitations
As with every empirical study employing the quasi-experimental approach the current study has some
limitations which need to be acknowledged and used to guide users of the findings Firstly our sample was
drawn from a population of second year preservice teachers of a female only college of education in a peri-
urban area in Ghana Further experiments are therefore needed in other settings in order to see if the same or
similar results will occur Secondly owing to the narrow characteristics of the participants in the present study
the researchers cannot generalize the results to other individuals who do not have the same characteristics So
additional experiments with groups with different characteristics are necessary Lastly the experiments need to
be repeated at another time to determine if the results are the same (consistent) over time
Acknowledgements
We are grateful to the Principal and preservice teachers for granting access and participating in the study
respectively
References
AIAhmad H (2021) The role of educational communication in promoting student-centered learning style in
multicultural classrooms A reflective essay on learning and teaching in higher education International
Journal of Research in Education and Science (IJRES) 7(3) 838-851 httpsdoiorg1046328ijes2374
Aina J K Olanipekun S S amp Garuba I A (2015) Teachersrsquo effectiveness and its Influence on studentsrsquo
learning Advances in Social Sciences Research Journal 2(4) 88-95
Anway D W amp Bennett E (2004) Common Misconceptions in Probability among Students in an Elementary
Statistics class Unplished Senior Project The ARTIST Roundtable Conference on Assessment in
Statistics held at Lawrence University Supperior WI The University of Wisconsin-Superior
Bada S (2015) Constructivist Learning Theory A Paradigm for Teaching and Learning IOSR Journal of
Research and Method in Education (IOSR-JRME) 5(6) 66-70 httpsDOI1097907388-05616670
Baerveldt C (2013) Constructivism contested Implications of a genetic perspective in psychology Integrative
Psychological and Behavioral Science 47(1) 156-166
Batanero C (2013) Teaching and learning probability In S Lerman (Ed ) Encyclopedia of Mathematics
Education Heidelberg Springer
Batanero C and Diaz C (2012) Training school teachers to teach probability reflections and challenges
Chilean Journal of Statistics 3(1) 3-13
Belova N amp Zowada C (2020) Innovating Higher Education Via Game-Based Learning on Misconceptions
Education Sciences 10 221 doi103390educSCi10090221
Bennett E amp Anway D W (2003) Statistical and Probabilistic Reasoning and Misconceptions among
Selected College Students McNair Scholars Journal Vol 4 httpwwwsocheclchjs
Cantoy O (2010) Mathematics teachersrsquo topic-specific pedagogical content knowledge in the context of
teaching a0 0 and a divide 0 Educational Sciences Theory and Practice 10 (2) 749-769
International Journal of Studies in Education and Science (IJSES)
137
Clements D H amp Battista M (1990) Constructivist Learning and Teaching The
Arithetic Teacher 38(1) ProQuest Central pg 34 DOI105951AT3810034
Creswell J W amp Creswell J D (2018) Research design Qualitative quantitative and
mixed methods approaches (5th
ed) Los Angeles SAGE Publications Inc
Courtney S A amp Caniglia J (2021) Comparing the mathematical practices pre-service teachers and
mathematics teacher educators identified as relevant to problems and tasks International Journal of
Research in Education and Science (IJRES) 7(3) 954-971 httpsdoiorg1046328ijres2335
Denton D W (2012) Enhancing instruction through constructivism cooperative learning and cloud
computing Tech Trends 56(4) 34-41
Gage J (2012) Towards a new Probability Curriculum for Secondary Schools Paper presented at 12th
International Congress on Mathematical Education 8 July-15 July COEX Seoul Korea Cambridge
Cambridge University Uk
Gurbuz R amp Birgin O (2011) The effect of computer-assisted teaching on remedying misconceptions The
case of the subject Probability Journal Homepage 58(2012) DOI 101016jcompedu201111005
Hirsh L amp ODonnell A M (2001) Representativeness in Statistical Reasoning Identifying and Assessing
Misconceptions Journal of Statistics Education 9(2) 96-105 DOI10108010691898200111910655
Johnson H D amp Dasgupta N (2005) Traditional versus Non-traditional Teaching during Perspectives of
Students in Introductory Statistics Classes Journal of Statistics Education 13(2)
httpsdoiorg10108010691898200511910558
Major T amp Mangope B (2012) The Constructivist Theory in Mathematics The case of Botswana Primary
Schools International Review of Social Sciencies and Humanities 3(2) 139-147
Jones G (2005) Reflections In GA Jones (Ed) Exploring probability in school chanlleges for teaching and
probability (367-372) New York Springer
Jun L (2000) Chinese Students Understanding of Probability Published doctoral dissertation Singapore
National Institute of Education Nanyang Technological University
Khazanov L amp Gourgey A (2009) Instructors Perspectives on Students Mistaken Beliefs about Probability
in an Elementary College Statistics Course In K Safford-Ramus (Ed) Proceedings of the Adults
Learning Mathematics a Resaerch Forum (ALM) 15th
Annual International Conference 249-264
Khazanov L amp Prado L (2010) Correcting Students Misconceptions about Probability in an Introductory
College Statistics Course Adults Learning Mathematics-An International Journal 5(1) 23-35
Kleickmann T Richter D Kunter M Elsner J Besser M Krauss S amp Baumert J (2013) Teachersrsquo
Content Knowledge and Pedagogical Content Knowledge The Role of Structural Differences in Teacher
Education Journal of Teacher Education 64(1) 90-106 DOI1011770022487112460398
Leedy P D and Ormrod J E (2020) Practical research Planning and design (12th Global Edition) Harlow
England Pearson
Lessani A Md Yunus AS amp Bakar KBA (2017) Comparison of new mathematics teaching methods with
teacher-centered approach International Journal of Social Sciences 3(2) 1285-1297
httpsdxdoiorg1020319pijss20173212851297
Lim C amp Hwa T (2007) Promoting Mathematical Thinking in the Malaysian Classroom Issues and
challenges httpswwwresearchgatenetpublication252353381
Hokor amp Sedofia
138
Lovett J N amp Lee H S (2017) New Standards Require Teaching More Statistics Are Preservice Secondary
Mathematics Ready Journal of Teachers Education 68(3) 299-311 DOI 1011770022487117697918
Major T amp Mangope B (2012) The Constructivist Theory in Mathematics The case of Botswana Primary
Schools International Review of Social Sciencies and Humanities 3(2) 139-147
National Council of Teachers of Mathematics (2003) Principles and Standards for School Mathematics and
their Implications for Professional Development Reston VA NCTM
Nguyen L (2015) Developing Conceptual Understanding and Probabilistic Thinking through Tree Diagrams
Published MPhil Dissertation Manitoba The Faculty of Graduate Studies of the University of
Manitoba
Prideaux J (2007) The learner-centered approach to Mathematics Teaching and the Active Learning
Strategies used to Enhance Students Understanding Mathematical and Computing Sciences Masters
Paper 29 Fisher Digital Publications httpfisherpubsjfcedumathcsetdmasters29
Roseth C J Garfield J B amp Ben-Zvi D (2008) Collaboration in Learning and Teaching Statistics Journal
of Statistics Education 16 (1) 1069-1898 httpsdoiorg10108010691898200811889557
Santagata R and Sandholtz J H (2019) Preservice teachersrsquo mathematics teaching competence Comparing
performance on two measures Journal of Teacher Education 70 (5) 472 ndash484
Schwerdt G amp Wuppermann A C (2011) Is traditional teaching really all that bad A within-student
between-subject approach Economics of Education Review 30(2) 365-379
Sharma S (2016) Probability from a socio-cultural perspective Statistics Education Research Journal 15(2)
126-144 httpiase-weborgPublicationsphpp=SERJ
Shay K (2008) Tracing middle school students understanding of probability a longitudinal study
Unpublished Doctoral Dissertation New Brunswick New Jersey Rutgers State University of New
Jersey
Shulman L S (1986) Those who understand Knowledge growth in teaching Educational Researcher 15(2)
4-14 doi 1031021001318X015002004
Thomas L (2020) An introduction to quasi-experimental designs
httpswwwscribbrcommethodologyquasi-experimental-design
Voskoglou M (2019) Comparing Teaching Methods of Mathematics at University Level Education Sciences
9(204) doi103390educsci9030204
Vygotsky L S (1978) Mind in society The development of higher psychological processes Cambridge MA
Harvard University Press
Weldeana H N amp Abraham S T (2014) The effect of an historical perspective on prospective teachersrsquo
beliefs in learning mathematics Journal of Mathematics Teacher Education 17 303-330
doi101007s10857-013-9266-z
Weltman D amp Whiteside M (2010) Comparing the Effectiveness of Traditional and active Learning Methods
in Business Statistics Convergence to the Mean 18(1)
httpsdoiorg10108010691898201011889480
White H amp Sabarwal S (2014) Quasi-experimental design and methods methological briefs impact
evaluations Florence UNICEF Office of research
International Journal of Studies in Education and Science (IJSES)
139
Author Information
Evans Kofi Hokor
httpsorcidorg0000-0002-8387-8294
St Teresarsquos College of Education Hohoe
Department of Mathematics and ICT
P O Box 129
Ghana
Contact e-mail evanskhokorgmailcom
John Sedofia
httpsorcidorg0000-0002-5409-516X
University of Ghana Legon
Department of Teacher Education
PO Box LG 1181
Ghana
Hokor amp Sedofia
140
Appendix A Pre-test Probabilistic Reasoning Assessment
This assessment is for research purpose to improve teaching and learning of probability
You are required to answer all questions honestly Do and leave all workings or rough work on the paper
Pre-test Probabilistic Reasoning Assessment Duration 1hr
Index numberhelliphelliphelliphelliphelliphelliphelliphelliphelliphelliphelliphelliphelliphelliphelliphelliphelliphellipLevelhelliphelliphelliphellipAgehelliphelliphellip
Read each statement carefully and circle the letter of the correct (best) option Provide appropriate response in
the space provided under some items as it apply
1 If you rolled an ordinary die and obtained 51246 which of these is most likely to occur on your next
roll
a 1
b 2
c 3
d 4
e 5
f 6
g The options a b c d e and f are all equally
2i A fair coin is tossed and it lands tail The coin is to be tossed a second time What is the probability that the
second toss will also be a tail
a 1
4
b 1
2
c 1
3
d Slightly less than 1
2
e Slightly more than 1
2
f 0
2ii Which of the following best describes the reason for the correct answer to the preceding question (2i)
a The second toss is less likely to be tail because the first toss was tail
b There are four possible outcomes when you toss a coin twice Getting two tails is only one of them
c The chance of getting heads or tails on any one toss is always 1
2
d There are three possible outcomes when you toss a coin twice Getting two tails is only one of the them
e No chance of being a tail in the second toss
3i A box contains 6 balls 2 are red 2 are black and 2 blue Three balls are picked at random one at a time
Each time a ball is picked the colour is recorded and the ball is put back in the box mixed thoroughly If the
first 2 balls are black what color is the third ball most likely to be
a Red
International Journal of Studies in Education and Science (IJSES)
141
b Black
c Blue
d Red and blue are equally likely than black
e Red black and blue are all equally likely
3ii Which of the following best describes the reason for the correct answer in the preceding question (3i)
a The third ball should not be black because too many black ones have already been picked
b The picks are independent so every color has an equally likely chance of being picked
c Black seems to be lucky
d This color is just as likely as any other color
4 A spinner with ten equally divided sectors in which four parts are white and the rests are red is about to
be spin which color is the spinner more likely to land
a White
b Red
c Both white and red are all equally
5 If you toss a fair coin and get heads two times in a row which of these is most likely on next toss
a Tail
b Head
c Both head and tail are all equally
6 A Gh 2 Gh 5 Ghcent10 Gh 20 Gh 50 and Gh 100 notes were put in a box and thoroughly mixed
What is the probability of picking Gh 50 note without looking
a 1
187
b 50
187
c 1
6
d 0
7 In a game you have been offered two options Which of the following give you higher chance of
winning GHcent200
a Tossing one die once and obtaining a 6
b Tossing two dice once and obtaining two 6rsquos
c The options a and b are all equally
8 A fair die is to be toss six times which of these is most likely to occur
a 251634
b 123456
c 666341
d 132244
e The options a b c and d are all equally likely
9 A fair coin is to be toss four times in a row which of these is least likely to occur
a THTH
b TTTH
c HHH
Hokor amp Sedofia
142
d The options a b and c are all equally likely
10 Two fair dice are to be tossed once Which of the following is more likely to occur
a Obtaining a sum of 11
b Obtaining a sum of 10
c A sum of 11 and a sum of 10 are all equally likely
10i Give reason for the correct answer in the preceding question (10)
helliphelliphelliphelliphelliphelliphelliphelliphelliphelliphelliphelliphelliphelliphelliphelliphelliphelliphelliphelliphelliphelliphelliphelliphelliphelliphelliphelliphelliphelliphelliphelliphelliphelliphelliphelliphelliphelliphelliphelliphelliphellip
helliphelliphelliphelliphelliphelliphelliphelliphelliphelliphelliphelliphelliphelliphelliphelliphelliphelliphelliphelliphelliphelliphelliphelliphelliphelliphelliphelliphelliphelliphelliphelliphelliphelliphelliphelliphelliphelliphelliphelliphelliphellip
helliphelliphelliphelliphelliphelliphelliphelliphelliphelliphelliphelliphelliphelliphelliphelliphelliphelliphelliphelliphelliphelliphelliphelliphelliphelliphelliphelliphelliphelliphelliphelliphelliphelliphelliphelliphelliphelliphelliphelliphelliphellip
helliphelliphelliphelliphelliphelliphelliphelliphelliphelliphelliphelliphelliphelliphelliphelliphelliphelliphelliphelliphelliphelliphelliphelliphelliphelliphelliphelliphelliphelliphelliphelliphelliphelliphelliphelliphelliphellip
11 In national lottery one has to choose five numbers from 1 to 90 inclusive You win when at least two of
your numbers are part of the numbers drawn on Saturday at random Eric has chosen 4 6 7 9 and 11
Alex has chosen 15 23 45 66 and 80 Daniel has chosen 71 77 78 83 and 85 Do Eric Alex and
Daniel have the same chance of winning or not and why
helliphelliphelliphelliphelliphelliphelliphelliphelliphelliphelliphelliphelliphelliphelliphelliphelliphelliphelliphelliphelliphelliphelliphelliphelliphelliphelliphelliphelliphelliphelliphelliphelliphelliphelliphelliphelliphelliphelliphelliphellip
helliphelliphelliphelliphelliphelliphelliphelliphelliphelliphelliphelliphelliphelliphelliphelliphelliphelliphelliphelliphelliphelliphelliphelliphelliphelliphelliphelliphelliphelliphelliphelliphelliphelliphelliphelliphelliphelliphelliphelliphellip
helliphelliphelliphelliphelliphelliphelliphelliphelliphelliphelliphelliphelliphelliphelliphelliphelliphelliphelliphelliphelliphelliphelliphelliphelliphelliphelliphelliphelliphelliphelliphelliphelliphelliphelliphelliphelliphelliphelliphelliphellip
helliphelliphelliphelliphelliphelliphelliphelliphelliphelliphelliphelliphelliphelliphelliphelliphelliphelliphelliphelliphelliphelliphelliphelliphelliphelliphelliphelliphelliphelliphelliphelliphelliphelliphelliphellip
12 A box contains 8 yellow balls and 4 green balls Two balls are chosen at random one after the other
without replacement determine the probability that the two balls are of different colours
helliphelliphelliphelliphelliphelliphelliphelliphelliphelliphelliphelliphelliphelliphelliphelliphelliphelliphelliphelliphelliphelliphelliphelliphelliphelliphelliphelliphelliphelliphelliphelliphelliphelliphelliphelliphelliphelliphelliphelliphellip
helliphelliphelliphelliphelliphelliphelliphelliphelliphelliphelliphelliphelliphelliphelliphelliphelliphelliphelliphelliphelliphelliphelliphelliphelliphelliphelliphelliphelliphelliphelliphelliphelliphelliphelliphelliphelliphelliphelliphelliphellip
helliphelliphelliphelliphelliphelliphelliphelliphelliphelliphelliphelliphelliphelliphelliphelliphelliphelliphelliphelliphelliphelliphelliphelliphelliphelliphelliphelliphelliphelliphelliphelliphelliphelliphelliphelliphelliphelliphelliphelliphellip
helliphelliphelliphelliphelliphelliphelliphelliphelliphelliphelliphelliphelliphelliphelliphelliphelliphelliphelliphelliphelliphelliphelliphelliphelliphelliphelliphelliphelliphelliphelliphelliphelliphelliphelliphelliphellip
International Journal of Studies in Education and Science (IJSES)
143
Appendix B Post-test Probabilistic Reasoning Assessment
This assessment is for research purpose to improve teaching and learning of probability
You are required to answer all questions honestly Do and leave all workings or rough work on the paper
Post-test Probabilistic Reasoning Assessment Duration One Hour
Index numberhelliphelliphelliphelliphelliphelliphelliphelliphelliphelliphelliphelliphelliphelliphellipClasshelliphelliphelliphellipAgehelliphelliphelliphellip
Read each statement carefully and circle the letter of the correct (best) option for each item as much as possible
and provide appropriate response in the space provided
1 Suppose a particular outcome from a random event has a probability of 04 Which of the following
statements represents correct interpretations of this probability
a The outcome will not happen
b The outcome will certainly happen about four times out of every 10 trials
c The outcome is expected to happen about four times out of every 10 trials
d The outcome could happen or it couldnrsquot of either result are the same
2 If you toss a fair coin and get heads 3 times in a row what is the chance of getting a head on the next toss
a 1
b Greater than 1
2
c 1
2
d Less than 1
2
e 0
3 A die is numbered 1 2 3 4 4 5 When the die is thrown once Which of these is most likely and why
a 1
b 2
c 3
d 4
e 5
f They are all equally likely
3i Give reason for your chosen answer in (3)
helliphelliphelliphelliphelliphelliphelliphelliphelliphelliphelliphelliphelliphelliphelliphelliphelliphelliphelliphelliphelliphelliphelliphelliphelliphelliphelliphelliphelliphelliphelliphelliphelliphelliphelliphelliphelliphelliphelliphelliphelliphelliphelliphelliphellip
helliphelliphelliphelliphelliphelliphelliphelliphelliphelliphelliphelliphelliphelliphelliphelliphelliphelliphelliphelliphelliphelliphelliphelliphelliphelliphelliphelliphelliphelliphelliphelliphelliphelliphelliphelliphelliphelliphelliphelliphelliphelliphelliphelliphellip
helliphelliphelliphelliphelliphelliphelliphelliphelliphelliphelliphelliphelliphelliphelliphelliphelliphelliphelliphelliphelliphelliphelliphelliphelliphelliphelliphelliphelliphelliphelliphelliphelliphelliphelliphelliphelliphelliphelliphelliphelliphelliphelliphelliphellip
helliphelliphelliphelliphelliphelliphelliphelliphelliphelliphelliphelliphelliphelliphelliphelliphelliphelliphelliphelliphelliphelliphelliphelliphelliphelliphelliphelliphelliphelliphelliphelliphelliphelliphelliphelliphelliphelliphellip
4 German MP tossed two dice once Which of these is mostly likely and why
a Obtaining a sum of 4
b Obtaining a sum of 7
c Obtaining a sum of 11
d All of them have equal chance of occurring that is a b c
Hokor amp Sedofia
144
4i Give reason for your chosen answer in (4)
helliphelliphelliphelliphelliphelliphelliphelliphelliphelliphelliphelliphelliphelliphelliphelliphelliphelliphelliphelliphelliphelliphelliphelliphelliphelliphelliphelliphelliphelliphelliphelliphelliphelliphelliphelliphelliphelliphelliphelliphelliphelliphelliphelliphellip
helliphelliphelliphelliphelliphelliphelliphelliphelliphelliphelliphelliphelliphelliphelliphelliphelliphelliphelliphelliphelliphelliphelliphelliphelliphelliphelliphelliphelliphelliphelliphelliphelliphelliphelliphelliphelliphelliphelliphelliphelliphelliphelliphelliphellip
helliphelliphelliphelliphelliphelliphelliphelliphelliphelliphelliphelliphelliphelliphelliphelliphelliphelliphelliphelliphelliphelliphelliphelliphelliphelliphelliphelliphelliphelliphelliphelliphelliphelliphelliphelliphelliphelliphelliphelliphelliphelliphelliphelliphellip
helliphelliphelliphelliphelliphelliphelliphelliphelliphelliphelliphelliphelliphelliphelliphelliphelliphelliphelliphelliphelliphelliphelliphelliphelliphelliphelliphelliphelliphelliphelliphelliphelliphelliphelliphelliphelliphelliphelliphelliphelliphelliphelliphelliphellip
helliphelliphelliphelliphelliphelliphelliphelliphelliphelliphelliphelliphelliphelliphelliphelliphelliphelliphelliphelliphelliphelliphelliphelliphelliphelliphelliphelliphellip
5i A fair coin is to be toss four times which of these is most likely to occur
a HTHT
b THTT
c TTTT
d HHTH
e The options a b c and d are all equally likely
5ii Give reason for your chosen answer in (5i)
helliphelliphelliphelliphelliphelliphelliphelliphelliphelliphelliphelliphelliphelliphelliphelliphelliphelliphelliphelliphelliphelliphelliphelliphelliphelliphelliphelliphelliphelliphelliphelliphelliphelliphelliphelliphelliphelliphelliphelliphelliphelliphelliphelliphellip
helliphelliphelliphelliphelliphelliphelliphelliphelliphelliphelliphelliphelliphelliphelliphelliphelliphelliphelliphelliphelliphelliphelliphelliphelliphelliphelliphelliphelliphelliphelliphelliphelliphelliphelliphelliphelliphelliphelliphelliphelliphelliphelliphelliphellip
helliphelliphelliphelliphelliphelliphelliphelliphelliphelliphelliphelliphelliphelliphelliphelliphelliphelliphelliphelliphelliphelliphelliphelliphelliphelliphelliphelliphelliphelliphelliphelliphelliphelliphelliphelliphelliphelliphelliphelliphelliphelliphelliphelliphellip
helliphelliphelliphelliphelliphelliphelliphelliphelliphelliphelliphelliphelliphelliphelliphelliphelliphelliphelliphelliphelliphelliphelliphelliphelliphelliphelliphelliphelliphelliphelliphelliphelliphelliphelliphelliphelliphelliphellip
6i A fair coin is to be toss four times which of these is least likely to occur
a HTHT
b THTT
c TTTT
d HHTH
e The options a b c and d are all equally likely
6ii Give reason for your chosen answer in (6i)
helliphelliphelliphelliphelliphelliphelliphelliphelliphelliphelliphelliphelliphelliphelliphelliphelliphelliphelliphelliphelliphelliphelliphelliphelliphelliphelliphelliphelliphelliphelliphelliphelliphelliphelliphelliphelliphelliphelliphelliphelliphelliphelliphelliphellip
helliphelliphelliphelliphelliphelliphelliphelliphelliphelliphelliphelliphelliphelliphelliphelliphelliphelliphelliphelliphelliphelliphelliphelliphelliphelliphelliphelliphelliphelliphelliphelliphelliphelliphelliphelliphelliphelliphelliphelliphelliphelliphelliphelliphellip
helliphelliphelliphelliphelliphelliphelliphelliphelliphelliphelliphelliphelliphelliphelliphelliphelliphelliphelliphelliphelliphelliphelliphelliphelliphelliphelliphelliphelliphelliphelliphelliphelliphelliphelliphelliphelliphelliphelliphelliphelliphelliphelliphelliphellip
helliphelliphelliphellip
7 A college has 300 level 200 students and 236 level 100 students in it Each studentrsquos name is written with
the level on a piece of paper and all the names are put into a box and mixed thoroughly A tutor picks one
name out of the box without looking Which level is the tutor more likely to pick from and why
helliphelliphelliphelliphelliphelliphelliphelliphelliphelliphelliphelliphelliphelliphelliphelliphelliphelliphelliphelliphelliphelliphelliphelliphelliphelliphelliphelliphelliphelliphelliphelliphelliphelliphelliphelliphelliphelliphelliphelliphelliphelliphelliphelliphellip
helliphelliphelliphelliphelliphelliphelliphelliphelliphelliphelliphelliphelliphelliphelliphelliphelliphelliphelliphelliphelliphelliphelliphelliphelliphelliphelliphelliphelliphelliphelliphelliphelliphelliphelliphelliphelliphelliphelliphelliphelliphelliphelliphelliphellip
helliphelliphelliphelliphelliphelliphelliphelliphelliphelliphelliphelliphelliphelliphelliphelliphelliphelliphelliphelliphelliphelliphelliphelliphelliphelliphelliphelliphelliphelliphelliphelliphelliphelliphelliphelliphelliphelliphelliphelliphelliphelliphelliphelliphellip
helliphelliphelliphelliphelliphelliphelliphelliphelliphelliphelliphelliphelliphelliphelliphelliphelliphelliphelliphelliphelliphelliphelliphelliphelliphelliphelliphelliphelliphelliphelliphelliphelliphelliphelliphelliphelliphelliphelliphellip
8 Suppose that you toss a coin three times and all eight outcomes are equally likely If it is known that the first
toss comes up heads what is the probability of an odd number of heads appearing
helliphelliphelliphelliphelliphelliphelliphelliphelliphelliphelliphelliphelliphelliphelliphelliphelliphelliphelliphelliphelliphelliphelliphelliphelliphelliphelliphelliphelliphelliphelliphelliphelliphelliphelliphelliphelliphelliphelliphelliphelliphelliphelliphelliphellip
helliphelliphelliphelliphelliphelliphelliphelliphelliphelliphelliphelliphelliphelliphelliphelliphelliphelliphelliphelliphelliphelliphelliphelliphelliphelliphelliphelliphelliphelliphelliphelliphelliphelliphelliphelliphelliphelliphelliphelliphelliphelliphelliphelliphellip
helliphelliphelliphelliphelliphelliphelliphelliphelliphelliphelliphelliphelliphelliphelliphelliphelliphelliphelliphelliphelliphelliphelliphelliphelliphelliphelliphelliphelliphelliphelliphelliphelliphelliphelliphelliphelliphelliphelliphelliphelliphelliphelliphelliphellip
International Journal of Studies in Education and Science (IJSES)
145
helliphelliphelliphelliphelliphelliphelliphelliphelliphelliphelliphelliphelliphelliphelliphelliphelliphelliphelliphelliphelliphelliphelliphelliphelliphelliphelliphelliphelliphelliphelliphelliphelliphelliphelliphelliphelliphelliphelliphelliphelliphelliphelliphelliphellip
helliphelliphelliphelliphelliphelliphelliphelliphelliphelliphelliphelliphelliphelliphelliphelliphelliphelliphelliphelliphelliphelliphelliphelliphelliphelliphelliphelliphelliphelliphelliphelliphelliphelliphelliphelliphelliphelliphelliphelliphelliphelliphelliphelliphellip
helliphelliphelliphelliphelliphelliphelliphelliphelliphelliphelliphelliphelliphelliphelliphelliphelliphelliphelliphellip
9 A card is selected at random from a pack of 52 cards Find the probability of selecting a card which is a red or
a queen
helliphelliphelliphelliphelliphelliphelliphelliphelliphelliphelliphelliphelliphelliphelliphelliphelliphelliphelliphelliphelliphelliphelliphelliphelliphelliphelliphelliphelliphelliphelliphelliphelliphelliphelliphelliphelliphelliphelliphelliphelliphelliphelliphelliphellip
helliphelliphelliphelliphelliphelliphelliphelliphelliphelliphelliphelliphelliphelliphelliphelliphelliphelliphelliphelliphelliphelliphelliphelliphelliphelliphelliphelliphelliphelliphelliphelliphelliphelliphelliphelliphelliphelliphelliphelliphelliphelliphelliphelliphellip
helliphelliphelliphelliphelliphelliphelliphelliphelliphelliphelliphelliphelliphelliphelliphelliphelliphelliphelliphelliphelliphelliphelliphelliphelliphelliphelliphelliphelliphelliphelliphelliphelliphelliphelliphelliphelliphelliphelliphelliphelliphelliphelliphelliphellip
helliphelliphelliphelliphelliphelliphelliphelliphelliphelliphelliphelliphelliphelliphelliphelliphelliphelliphelliphelliphelliphelliphelliphelliphelliphelliphelliphelliphelliphelliphelliphelliphelliphelliphelliphelliphelliphelliphelliphellip
10 A box contains 6 white balls and 4 green balls Two balls are chosen at random one after the other without
replacement determine the probability that the second ball is white
helliphelliphelliphelliphelliphelliphelliphelliphelliphelliphelliphelliphelliphelliphelliphelliphelliphelliphelliphelliphelliphelliphelliphelliphelliphelliphelliphelliphelliphelliphelliphelliphelliphelliphelliphelliphelliphelliphelliphelliphelliphelliphelliphelliphellip
helliphelliphelliphelliphelliphelliphelliphelliphelliphelliphelliphelliphelliphelliphelliphelliphelliphelliphelliphelliphelliphelliphelliphelliphelliphelliphelliphelliphelliphelliphelliphelliphelliphelliphelliphelliphelliphelliphelliphelliphelliphelliphelliphelliphellip
helliphelliphelliphelliphelliphelliphelliphelliphelliphelliphelliphelliphelliphelliphelliphelliphelliphelliphelliphelliphelliphelliphelliphelliphelliphelliphelliphelliphelliphelliphelliphelliphelliphelliphelliphelliphelliphelliphelliphelliphelliphelliphelliphelliphellip
helliphelliphelliphelliphelliphelliphelliphelliphelliphelliphelliphelliphelliphelliphelliphelliphelliphelliphelliphelliphelliphelliphelliphelliphelliphelliphelliphelliphelliphelliphelliphelliphelliphelliphelliphelliphelliphelliphelliphelliphelliphelliphellip

International Journal of Studies in Education and Science (IJSES)
133
Table 8 Summary of ANCOVA of the Performance of Preservice Teachers taught with Learner-centered
Approach and Teacher-centered Approach (N = 59)
Source Sum of
Squares
Df
Mean
Square
F Sig Partial Eta
Squared
Corrected
Model
791144a 2 395562 72150 000 720
Intercept 205135 1 205135 37416 000 401
Pre-test 228184 1 228184 41620 000 426
Group 630253 1 630253 114955 000 672
Error 307026 56 5483
Total 10888000 59
Corrected Total 1098169 58
a R Squared = 720 (Adjusted R Squared = 710)
The data on Table 8 indicate that there is a statistically significant main effect on the preservice teachers who
were taught using the learner-centered approach to learn probability [F (1 56) = 114955 p = 000 lt 05]
Consequently the preservice teachers taught with the learner-centered approach performed better than their
counterparts who experienced the teacher-centered approach to learn probability The partial eta squared value
was found to be 0672 This value indicates a large effect size That is 672 of the variance in the dependent
variable (probabilistic reasoning achievement score) is expounded by the independent variable (teacher-centered
approach) This implies that the magnitude of the difference between the mean score of the preservice teachers
taught with the learner-centered approach and the teacher-centered approach is large With the high scores of
preservice teachers in the Group A it implies that the use of learner-centered approach in the teaching and
learning of probability improved the performance of the preservice teachers
The outcome of the study portrays that there was a statistically significant difference in the probabilistic
reasoning achievement mean scores of Group A than that of Group B [F (1 56) = 114955 p = 000 lt 05] This
finding implies that Group A performed better than Group B in the probabilistic reasoning achievement test
This is an indication that when the learner-centered approach to teaching probability is targeted at addressing
probabilistic misconceptions preservice teachers develop better probabilistic reasoning than teacher-centered
approach
Discussion
This study set out to compare the learner-centered and teacher-centered approaches of teaching in order to
determine the best way of developing preservice teachersrsquo probabilistic reasoning at the College of Education
Hokor amp Sedofia
134
level in Ghana The results as shown on Tables 3 4 5 6 7 and 8 indicate that the learner-centered approach to
teaching probability is more effective than the teacher-centered approach in motivating and inspiring preservice
teachers to learn and apply probability The learner-centered approach provides studentsrsquo opportunities to think
reason reflect and evaluate their ideals and that of colleagues
The findings of the present study are in tandem with several research findings Lessani Md Yunus and Bakar
(2017) investigated mathematics teaching approaches and their consequences on learnersrsquo ability to solve
challenging problems Their findings affirm the learner-centered approach to be more effective in studentsrsquo
creativity and innovation in solving real-life problems than the teacher-centered approach So training
programs for excellent teaching and learning should be flexible and innovative to allow preservice teachers to
explore gaps in learning and teaching (AIAhmad 2021) Similarly Prideaux (2007) found that students who
experienced the learner-centered approach of teaching performed significantly higher than those who were
taught without the learner-centered approach of teaching Roseth Garfield and Ben-Zvi (2008) also examined
the effect of the cooperative framework in classroom teaching and collaboration and found that student-
centered approaches to teaching help students to have better understanding of statistics than teacher-centered
instruction
Furthermore Gurbuz and Birgin (2011) studied the effect of computer-assisted teaching on addressing
probabilistic misconceptions of students The authors used pre-test to collect data on both the computer-assisted
and traditional groups before the experimental teachings After the intervention the post-test was administered
to ascertain the effect of computer-assisted teaching and teacher-centered approach on addressing studentsrsquo
probabilistic misconceptions Their study found computer-assisted teaching to have more significant effect on
studentsrsquo correct probabilistic reasoning than teacher-centered approach of teaching
As noted by Batanero and Diaz (2012) probability forms an integral part of the Mathematics curriculum in
many countries But the concept is one that some learners find difficult to understand partly due to the method
of teaching used by teachers This fact implies that teachers of mathematics should find more creative ways of
teaching the concept so as to make it easier for learners to understand and apply the concept As discovered in
this study the learner-centered approach is effective in developing probabilistic reasoning But the learner-
centered approach works best when certain conditions are present At the outset there is the need for relevant
teaching and learning materials Then teachers need to be trained and retrained in the use of the learner-centered
approach to teaching At the college of education level preservice teachers need to be taught using the learner-
centered approach not only to help them understand probability but also to help them use the learner-centered
approach in their own teaching
The activities used for Group A which is learner-centered approach group in the form of games promote
content knowledge and cognitive skills competencies such as collaboration and problem solving (Belova amp
Zowada 2020) The activities focus on promoting learning experiences rather than stressing on the
entertainment factor While some things students learn in school seem to them predetermined and bound by
laws in other branches of mathematics probability provides students with opportunity to learn that solutions to
International Journal of Studies in Education and Science (IJSES)
135
several problems depend on assumptions and have degrees of doubt So teaching methods that allow students to
predict and test their predictions should be encouraged for students to develop their intellectual repertoire The
processes used in reasoning about sample space will serve students well in life Several calls on the need to pay
attention to the study of probability show that teachers and mathematics teachers must provide their students
with appropriate teaching strategies to enhance their conceptual understanding In the preparation of preservice
teachers to become mathematically competent citizens teacher preparation programs such as teaching methods
must provide opportunities for preservice teachers to confront misconceptions and reason probabilistically
(Courtney amp Caniglia 2021)
The findings of the present study however run counter to those of Weltman and Whiteside (2010) They
conducted a study on the effectiveness of the traditional and active learning method in business statistics The
study found that active learning had not been effective for all category of students It is not precisely clear what
may have accounted for that result This is because active learning methods have generally been known to be
effective in promoting learning Further research is thus required in this regard
Conclusions
This study compared the effects of the learner-centered and teacher-centered approaches of teaching in
addressing probabilistic misconceptions by measuring preservice teachersrsquo probabilistic reasoning scores The
results show that the learner-centered approach aids preservice teachers to develop better probabilistic reasoning
than the teacher-centered approach to teaching Thus the study concludes that the learner-centered approach to
teaching is a solution to preservice teachersrsquo inability to answer questions on probability correctly Even though
each teaching approach targeted at addressing misconceptions was found to have significant effect on pre-
service teachersrsquo probabilistic reasoning the learner-centered approach was found to be more effective than the
teacher-centered approach in addressing misconceptions which limit studentsrsquo ability to solve probability
problems correctly
Implications and Recommendations
This study makes some key contributions to the teacher educationdevelopment literature in general and
particularly to the development of probabilistic reasoning of preservice teachers The study provides empirical
evidence that the learner-centered approach targeted at addressing probabilistic misconceptions is more effective
in developing probabilistic reasoning in preservice teachers What this means is that when teacher educators use
the learner-centered approach to teach the concept of probability and focus on addressing misconceptions
preservice teachers will develop better probabilistic reasoning This will in turn translate into preservice
teachers answering questions on probability correctly in their examinations and ultimately making them teach
the concept more effectively when they complete their training It is thus recommended that teachers should
consider employing the learner-centered approach in teaching the concept of probability
Hokor amp Sedofia
136
Limitations
As with every empirical study employing the quasi-experimental approach the current study has some
limitations which need to be acknowledged and used to guide users of the findings Firstly our sample was
drawn from a population of second year preservice teachers of a female only college of education in a peri-
urban area in Ghana Further experiments are therefore needed in other settings in order to see if the same or
similar results will occur Secondly owing to the narrow characteristics of the participants in the present study
the researchers cannot generalize the results to other individuals who do not have the same characteristics So
additional experiments with groups with different characteristics are necessary Lastly the experiments need to
be repeated at another time to determine if the results are the same (consistent) over time
Acknowledgements
We are grateful to the Principal and preservice teachers for granting access and participating in the study
respectively
References
AIAhmad H (2021) The role of educational communication in promoting student-centered learning style in
multicultural classrooms A reflective essay on learning and teaching in higher education International
Journal of Research in Education and Science (IJRES) 7(3) 838-851 httpsdoiorg1046328ijes2374
Aina J K Olanipekun S S amp Garuba I A (2015) Teachersrsquo effectiveness and its Influence on studentsrsquo
learning Advances in Social Sciences Research Journal 2(4) 88-95
Anway D W amp Bennett E (2004) Common Misconceptions in Probability among Students in an Elementary
Statistics class Unplished Senior Project The ARTIST Roundtable Conference on Assessment in
Statistics held at Lawrence University Supperior WI The University of Wisconsin-Superior
Bada S (2015) Constructivist Learning Theory A Paradigm for Teaching and Learning IOSR Journal of
Research and Method in Education (IOSR-JRME) 5(6) 66-70 httpsDOI1097907388-05616670
Baerveldt C (2013) Constructivism contested Implications of a genetic perspective in psychology Integrative
Psychological and Behavioral Science 47(1) 156-166
Batanero C (2013) Teaching and learning probability In S Lerman (Ed ) Encyclopedia of Mathematics
Education Heidelberg Springer
Batanero C and Diaz C (2012) Training school teachers to teach probability reflections and challenges
Chilean Journal of Statistics 3(1) 3-13
Belova N amp Zowada C (2020) Innovating Higher Education Via Game-Based Learning on Misconceptions
Education Sciences 10 221 doi103390educSCi10090221
Bennett E amp Anway D W (2003) Statistical and Probabilistic Reasoning and Misconceptions among
Selected College Students McNair Scholars Journal Vol 4 httpwwwsocheclchjs
Cantoy O (2010) Mathematics teachersrsquo topic-specific pedagogical content knowledge in the context of
teaching a0 0 and a divide 0 Educational Sciences Theory and Practice 10 (2) 749-769
International Journal of Studies in Education and Science (IJSES)
137
Clements D H amp Battista M (1990) Constructivist Learning and Teaching The
Arithetic Teacher 38(1) ProQuest Central pg 34 DOI105951AT3810034
Creswell J W amp Creswell J D (2018) Research design Qualitative quantitative and
mixed methods approaches (5th
ed) Los Angeles SAGE Publications Inc
Courtney S A amp Caniglia J (2021) Comparing the mathematical practices pre-service teachers and
mathematics teacher educators identified as relevant to problems and tasks International Journal of
Research in Education and Science (IJRES) 7(3) 954-971 httpsdoiorg1046328ijres2335
Denton D W (2012) Enhancing instruction through constructivism cooperative learning and cloud
computing Tech Trends 56(4) 34-41
Gage J (2012) Towards a new Probability Curriculum for Secondary Schools Paper presented at 12th
International Congress on Mathematical Education 8 July-15 July COEX Seoul Korea Cambridge
Cambridge University Uk
Gurbuz R amp Birgin O (2011) The effect of computer-assisted teaching on remedying misconceptions The
case of the subject Probability Journal Homepage 58(2012) DOI 101016jcompedu201111005
Hirsh L amp ODonnell A M (2001) Representativeness in Statistical Reasoning Identifying and Assessing
Misconceptions Journal of Statistics Education 9(2) 96-105 DOI10108010691898200111910655
Johnson H D amp Dasgupta N (2005) Traditional versus Non-traditional Teaching during Perspectives of
Students in Introductory Statistics Classes Journal of Statistics Education 13(2)
httpsdoiorg10108010691898200511910558
Major T amp Mangope B (2012) The Constructivist Theory in Mathematics The case of Botswana Primary
Schools International Review of Social Sciencies and Humanities 3(2) 139-147
Jones G (2005) Reflections In GA Jones (Ed) Exploring probability in school chanlleges for teaching and
probability (367-372) New York Springer
Jun L (2000) Chinese Students Understanding of Probability Published doctoral dissertation Singapore
National Institute of Education Nanyang Technological University
Khazanov L amp Gourgey A (2009) Instructors Perspectives on Students Mistaken Beliefs about Probability
in an Elementary College Statistics Course In K Safford-Ramus (Ed) Proceedings of the Adults
Learning Mathematics a Resaerch Forum (ALM) 15th
Annual International Conference 249-264
Khazanov L amp Prado L (2010) Correcting Students Misconceptions about Probability in an Introductory
College Statistics Course Adults Learning Mathematics-An International Journal 5(1) 23-35
Kleickmann T Richter D Kunter M Elsner J Besser M Krauss S amp Baumert J (2013) Teachersrsquo
Content Knowledge and Pedagogical Content Knowledge The Role of Structural Differences in Teacher
Education Journal of Teacher Education 64(1) 90-106 DOI1011770022487112460398
Leedy P D and Ormrod J E (2020) Practical research Planning and design (12th Global Edition) Harlow
England Pearson
Lessani A Md Yunus AS amp Bakar KBA (2017) Comparison of new mathematics teaching methods with
teacher-centered approach International Journal of Social Sciences 3(2) 1285-1297
httpsdxdoiorg1020319pijss20173212851297
Lim C amp Hwa T (2007) Promoting Mathematical Thinking in the Malaysian Classroom Issues and
challenges httpswwwresearchgatenetpublication252353381
Hokor amp Sedofia
138
Lovett J N amp Lee H S (2017) New Standards Require Teaching More Statistics Are Preservice Secondary
Mathematics Ready Journal of Teachers Education 68(3) 299-311 DOI 1011770022487117697918
Major T amp Mangope B (2012) The Constructivist Theory in Mathematics The case of Botswana Primary
Schools International Review of Social Sciencies and Humanities 3(2) 139-147
National Council of Teachers of Mathematics (2003) Principles and Standards for School Mathematics and
their Implications for Professional Development Reston VA NCTM
Nguyen L (2015) Developing Conceptual Understanding and Probabilistic Thinking through Tree Diagrams
Published MPhil Dissertation Manitoba The Faculty of Graduate Studies of the University of
Manitoba
Prideaux J (2007) The learner-centered approach to Mathematics Teaching and the Active Learning
Strategies used to Enhance Students Understanding Mathematical and Computing Sciences Masters
Paper 29 Fisher Digital Publications httpfisherpubsjfcedumathcsetdmasters29
Roseth C J Garfield J B amp Ben-Zvi D (2008) Collaboration in Learning and Teaching Statistics Journal
of Statistics Education 16 (1) 1069-1898 httpsdoiorg10108010691898200811889557
Santagata R and Sandholtz J H (2019) Preservice teachersrsquo mathematics teaching competence Comparing
performance on two measures Journal of Teacher Education 70 (5) 472 ndash484
Schwerdt G amp Wuppermann A C (2011) Is traditional teaching really all that bad A within-student
between-subject approach Economics of Education Review 30(2) 365-379
Sharma S (2016) Probability from a socio-cultural perspective Statistics Education Research Journal 15(2)
126-144 httpiase-weborgPublicationsphpp=SERJ
Shay K (2008) Tracing middle school students understanding of probability a longitudinal study
Unpublished Doctoral Dissertation New Brunswick New Jersey Rutgers State University of New
Jersey
Shulman L S (1986) Those who understand Knowledge growth in teaching Educational Researcher 15(2)
4-14 doi 1031021001318X015002004
Thomas L (2020) An introduction to quasi-experimental designs
httpswwwscribbrcommethodologyquasi-experimental-design
Voskoglou M (2019) Comparing Teaching Methods of Mathematics at University Level Education Sciences
9(204) doi103390educsci9030204
Vygotsky L S (1978) Mind in society The development of higher psychological processes Cambridge MA
Harvard University Press
Weldeana H N amp Abraham S T (2014) The effect of an historical perspective on prospective teachersrsquo
beliefs in learning mathematics Journal of Mathematics Teacher Education 17 303-330
doi101007s10857-013-9266-z
Weltman D amp Whiteside M (2010) Comparing the Effectiveness of Traditional and active Learning Methods
in Business Statistics Convergence to the Mean 18(1)
httpsdoiorg10108010691898201011889480
White H amp Sabarwal S (2014) Quasi-experimental design and methods methological briefs impact
evaluations Florence UNICEF Office of research
International Journal of Studies in Education and Science (IJSES)
139
Author Information
Evans Kofi Hokor
httpsorcidorg0000-0002-8387-8294
St Teresarsquos College of Education Hohoe
Department of Mathematics and ICT
P O Box 129
Ghana
Contact e-mail evanskhokorgmailcom
John Sedofia
httpsorcidorg0000-0002-5409-516X
University of Ghana Legon
Department of Teacher Education
PO Box LG 1181
Ghana
Hokor amp Sedofia
140
Appendix A Pre-test Probabilistic Reasoning Assessment
This assessment is for research purpose to improve teaching and learning of probability
You are required to answer all questions honestly Do and leave all workings or rough work on the paper
Pre-test Probabilistic Reasoning Assessment Duration 1hr
Index numberhelliphelliphelliphelliphelliphelliphelliphelliphelliphelliphelliphelliphelliphelliphelliphelliphelliphellipLevelhelliphelliphelliphellipAgehelliphelliphellip
Read each statement carefully and circle the letter of the correct (best) option Provide appropriate response in
the space provided under some items as it apply
1 If you rolled an ordinary die and obtained 51246 which of these is most likely to occur on your next
roll
a 1
b 2
c 3
d 4
e 5
f 6
g The options a b c d e and f are all equally
2i A fair coin is tossed and it lands tail The coin is to be tossed a second time What is the probability that the
second toss will also be a tail
a 1
4
b 1
2
c 1
3
d Slightly less than 1
2
e Slightly more than 1
2
f 0
2ii Which of the following best describes the reason for the correct answer to the preceding question (2i)
a The second toss is less likely to be tail because the first toss was tail
b There are four possible outcomes when you toss a coin twice Getting two tails is only one of them
c The chance of getting heads or tails on any one toss is always 1
2
d There are three possible outcomes when you toss a coin twice Getting two tails is only one of the them
e No chance of being a tail in the second toss
3i A box contains 6 balls 2 are red 2 are black and 2 blue Three balls are picked at random one at a time
Each time a ball is picked the colour is recorded and the ball is put back in the box mixed thoroughly If the
first 2 balls are black what color is the third ball most likely to be
a Red
International Journal of Studies in Education and Science (IJSES)
141
b Black
c Blue
d Red and blue are equally likely than black
e Red black and blue are all equally likely
3ii Which of the following best describes the reason for the correct answer in the preceding question (3i)
a The third ball should not be black because too many black ones have already been picked
b The picks are independent so every color has an equally likely chance of being picked
c Black seems to be lucky
d This color is just as likely as any other color
4 A spinner with ten equally divided sectors in which four parts are white and the rests are red is about to
be spin which color is the spinner more likely to land
a White
b Red
c Both white and red are all equally
5 If you toss a fair coin and get heads two times in a row which of these is most likely on next toss
a Tail
b Head
c Both head and tail are all equally
6 A Gh 2 Gh 5 Ghcent10 Gh 20 Gh 50 and Gh 100 notes were put in a box and thoroughly mixed
What is the probability of picking Gh 50 note without looking
a 1
187
b 50
187
c 1
6
d 0
7 In a game you have been offered two options Which of the following give you higher chance of
winning GHcent200
a Tossing one die once and obtaining a 6
b Tossing two dice once and obtaining two 6rsquos
c The options a and b are all equally
8 A fair die is to be toss six times which of these is most likely to occur
a 251634
b 123456
c 666341
d 132244
e The options a b c and d are all equally likely
9 A fair coin is to be toss four times in a row which of these is least likely to occur
a THTH
b TTTH
c HHH
Hokor amp Sedofia
142
d The options a b and c are all equally likely
10 Two fair dice are to be tossed once Which of the following is more likely to occur
a Obtaining a sum of 11
b Obtaining a sum of 10
c A sum of 11 and a sum of 10 are all equally likely
10i Give reason for the correct answer in the preceding question (10)
helliphelliphelliphelliphelliphelliphelliphelliphelliphelliphelliphelliphelliphelliphelliphelliphelliphelliphelliphelliphelliphelliphelliphelliphelliphelliphelliphelliphelliphelliphelliphelliphelliphelliphelliphelliphelliphelliphelliphelliphelliphellip
helliphelliphelliphelliphelliphelliphelliphelliphelliphelliphelliphelliphelliphelliphelliphelliphelliphelliphelliphelliphelliphelliphelliphelliphelliphelliphelliphelliphelliphelliphelliphelliphelliphelliphelliphelliphelliphelliphelliphelliphelliphellip
helliphelliphelliphelliphelliphelliphelliphelliphelliphelliphelliphelliphelliphelliphelliphelliphelliphelliphelliphelliphelliphelliphelliphelliphelliphelliphelliphelliphelliphelliphelliphelliphelliphelliphelliphelliphelliphelliphelliphelliphelliphellip
helliphelliphelliphelliphelliphelliphelliphelliphelliphelliphelliphelliphelliphelliphelliphelliphelliphelliphelliphelliphelliphelliphelliphelliphelliphelliphelliphelliphelliphelliphelliphelliphelliphelliphelliphelliphelliphellip
11 In national lottery one has to choose five numbers from 1 to 90 inclusive You win when at least two of
your numbers are part of the numbers drawn on Saturday at random Eric has chosen 4 6 7 9 and 11
Alex has chosen 15 23 45 66 and 80 Daniel has chosen 71 77 78 83 and 85 Do Eric Alex and
Daniel have the same chance of winning or not and why
helliphelliphelliphelliphelliphelliphelliphelliphelliphelliphelliphelliphelliphelliphelliphelliphelliphelliphelliphelliphelliphelliphelliphelliphelliphelliphelliphelliphelliphelliphelliphelliphelliphelliphelliphelliphelliphelliphelliphelliphellip
helliphelliphelliphelliphelliphelliphelliphelliphelliphelliphelliphelliphelliphelliphelliphelliphelliphelliphelliphelliphelliphelliphelliphelliphelliphelliphelliphelliphelliphelliphelliphelliphelliphelliphelliphelliphelliphelliphelliphelliphellip
helliphelliphelliphelliphelliphelliphelliphelliphelliphelliphelliphelliphelliphelliphelliphelliphelliphelliphelliphelliphelliphelliphelliphelliphelliphelliphelliphelliphelliphelliphelliphelliphelliphelliphelliphelliphelliphelliphelliphelliphellip
helliphelliphelliphelliphelliphelliphelliphelliphelliphelliphelliphelliphelliphelliphelliphelliphelliphelliphelliphelliphelliphelliphelliphelliphelliphelliphelliphelliphelliphelliphelliphelliphelliphelliphelliphellip
12 A box contains 8 yellow balls and 4 green balls Two balls are chosen at random one after the other
without replacement determine the probability that the two balls are of different colours
helliphelliphelliphelliphelliphelliphelliphelliphelliphelliphelliphelliphelliphelliphelliphelliphelliphelliphelliphelliphelliphelliphelliphelliphelliphelliphelliphelliphelliphelliphelliphelliphelliphelliphelliphelliphelliphelliphelliphelliphellip
helliphelliphelliphelliphelliphelliphelliphelliphelliphelliphelliphelliphelliphelliphelliphelliphelliphelliphelliphelliphelliphelliphelliphelliphelliphelliphelliphelliphelliphelliphelliphelliphelliphelliphelliphelliphelliphelliphelliphelliphellip
helliphelliphelliphelliphelliphelliphelliphelliphelliphelliphelliphelliphelliphelliphelliphelliphelliphelliphelliphelliphelliphelliphelliphelliphelliphelliphelliphelliphelliphelliphelliphelliphelliphelliphelliphelliphelliphelliphelliphelliphellip
helliphelliphelliphelliphelliphelliphelliphelliphelliphelliphelliphelliphelliphelliphelliphelliphelliphelliphelliphelliphelliphelliphelliphelliphelliphelliphelliphelliphelliphelliphelliphelliphelliphelliphelliphelliphellip
International Journal of Studies in Education and Science (IJSES)
143
Appendix B Post-test Probabilistic Reasoning Assessment
This assessment is for research purpose to improve teaching and learning of probability
You are required to answer all questions honestly Do and leave all workings or rough work on the paper
Post-test Probabilistic Reasoning Assessment Duration One Hour
Index numberhelliphelliphelliphelliphelliphelliphelliphelliphelliphelliphelliphelliphelliphelliphellipClasshelliphelliphelliphellipAgehelliphelliphelliphellip
Read each statement carefully and circle the letter of the correct (best) option for each item as much as possible
and provide appropriate response in the space provided
1 Suppose a particular outcome from a random event has a probability of 04 Which of the following
statements represents correct interpretations of this probability
a The outcome will not happen
b The outcome will certainly happen about four times out of every 10 trials
c The outcome is expected to happen about four times out of every 10 trials
d The outcome could happen or it couldnrsquot of either result are the same
2 If you toss a fair coin and get heads 3 times in a row what is the chance of getting a head on the next toss
a 1
b Greater than 1
2
c 1
2
d Less than 1
2
e 0
3 A die is numbered 1 2 3 4 4 5 When the die is thrown once Which of these is most likely and why
a 1
b 2
c 3
d 4
e 5
f They are all equally likely
3i Give reason for your chosen answer in (3)
helliphelliphelliphelliphelliphelliphelliphelliphelliphelliphelliphelliphelliphelliphelliphelliphelliphelliphelliphelliphelliphelliphelliphelliphelliphelliphelliphelliphelliphelliphelliphelliphelliphelliphelliphelliphelliphelliphelliphelliphelliphelliphelliphelliphellip
helliphelliphelliphelliphelliphelliphelliphelliphelliphelliphelliphelliphelliphelliphelliphelliphelliphelliphelliphelliphelliphelliphelliphelliphelliphelliphelliphelliphelliphelliphelliphelliphelliphelliphelliphelliphelliphelliphelliphelliphelliphelliphelliphelliphellip
helliphelliphelliphelliphelliphelliphelliphelliphelliphelliphelliphelliphelliphelliphelliphelliphelliphelliphelliphelliphelliphelliphelliphelliphelliphelliphelliphelliphelliphelliphelliphelliphelliphelliphelliphelliphelliphelliphelliphelliphelliphelliphelliphelliphellip
helliphelliphelliphelliphelliphelliphelliphelliphelliphelliphelliphelliphelliphelliphelliphelliphelliphelliphelliphelliphelliphelliphelliphelliphelliphelliphelliphelliphelliphelliphelliphelliphelliphelliphelliphelliphelliphelliphellip
4 German MP tossed two dice once Which of these is mostly likely and why
a Obtaining a sum of 4
b Obtaining a sum of 7
c Obtaining a sum of 11
d All of them have equal chance of occurring that is a b c
Hokor amp Sedofia
144
4i Give reason for your chosen answer in (4)
helliphelliphelliphelliphelliphelliphelliphelliphelliphelliphelliphelliphelliphelliphelliphelliphelliphelliphelliphelliphelliphelliphelliphelliphelliphelliphelliphelliphelliphelliphelliphelliphelliphelliphelliphelliphelliphelliphelliphelliphelliphelliphelliphelliphellip
helliphelliphelliphelliphelliphelliphelliphelliphelliphelliphelliphelliphelliphelliphelliphelliphelliphelliphelliphelliphelliphelliphelliphelliphelliphelliphelliphelliphelliphelliphelliphelliphelliphelliphelliphelliphelliphelliphelliphelliphelliphelliphelliphelliphellip
helliphelliphelliphelliphelliphelliphelliphelliphelliphelliphelliphelliphelliphelliphelliphelliphelliphelliphelliphelliphelliphelliphelliphelliphelliphelliphelliphelliphelliphelliphelliphelliphelliphelliphelliphelliphelliphelliphelliphelliphelliphelliphelliphelliphellip
helliphelliphelliphelliphelliphelliphelliphelliphelliphelliphelliphelliphelliphelliphelliphelliphelliphelliphelliphelliphelliphelliphelliphelliphelliphelliphelliphelliphelliphelliphelliphelliphelliphelliphelliphelliphelliphelliphelliphelliphelliphelliphelliphelliphellip
helliphelliphelliphelliphelliphelliphelliphelliphelliphelliphelliphelliphelliphelliphelliphelliphelliphelliphelliphelliphelliphelliphelliphelliphelliphelliphelliphelliphellip
5i A fair coin is to be toss four times which of these is most likely to occur
a HTHT
b THTT
c TTTT
d HHTH
e The options a b c and d are all equally likely
5ii Give reason for your chosen answer in (5i)
helliphelliphelliphelliphelliphelliphelliphelliphelliphelliphelliphelliphelliphelliphelliphelliphelliphelliphelliphelliphelliphelliphelliphelliphelliphelliphelliphelliphelliphelliphelliphelliphelliphelliphelliphelliphelliphelliphelliphelliphelliphelliphelliphelliphellip
helliphelliphelliphelliphelliphelliphelliphelliphelliphelliphelliphelliphelliphelliphelliphelliphelliphelliphelliphelliphelliphelliphelliphelliphelliphelliphelliphelliphelliphelliphelliphelliphelliphelliphelliphelliphelliphelliphelliphelliphelliphelliphelliphelliphellip
helliphelliphelliphelliphelliphelliphelliphelliphelliphelliphelliphelliphelliphelliphelliphelliphelliphelliphelliphelliphelliphelliphelliphelliphelliphelliphelliphelliphelliphelliphelliphelliphelliphelliphelliphelliphelliphelliphelliphelliphelliphelliphelliphelliphellip
helliphelliphelliphelliphelliphelliphelliphelliphelliphelliphelliphelliphelliphelliphelliphelliphelliphelliphelliphelliphelliphelliphelliphelliphelliphelliphelliphelliphelliphelliphelliphelliphelliphelliphelliphelliphelliphelliphellip
6i A fair coin is to be toss four times which of these is least likely to occur
a HTHT
b THTT
c TTTT
d HHTH
e The options a b c and d are all equally likely
6ii Give reason for your chosen answer in (6i)
helliphelliphelliphelliphelliphelliphelliphelliphelliphelliphelliphelliphelliphelliphelliphelliphelliphelliphelliphelliphelliphelliphelliphelliphelliphelliphelliphelliphelliphelliphelliphelliphelliphelliphelliphelliphelliphelliphelliphelliphelliphelliphelliphelliphellip
helliphelliphelliphelliphelliphelliphelliphelliphelliphelliphelliphelliphelliphelliphelliphelliphelliphelliphelliphelliphelliphelliphelliphelliphelliphelliphelliphelliphelliphelliphelliphelliphelliphelliphelliphelliphelliphelliphelliphelliphelliphelliphelliphelliphellip
helliphelliphelliphelliphelliphelliphelliphelliphelliphelliphelliphelliphelliphelliphelliphelliphelliphelliphelliphelliphelliphelliphelliphelliphelliphelliphelliphelliphelliphelliphelliphelliphelliphelliphelliphelliphelliphelliphelliphelliphelliphelliphelliphelliphellip
helliphelliphelliphellip
7 A college has 300 level 200 students and 236 level 100 students in it Each studentrsquos name is written with
the level on a piece of paper and all the names are put into a box and mixed thoroughly A tutor picks one
name out of the box without looking Which level is the tutor more likely to pick from and why
helliphelliphelliphelliphelliphelliphelliphelliphelliphelliphelliphelliphelliphelliphelliphelliphelliphelliphelliphelliphelliphelliphelliphelliphelliphelliphelliphelliphelliphelliphelliphelliphelliphelliphelliphelliphelliphelliphelliphelliphelliphelliphelliphelliphellip
helliphelliphelliphelliphelliphelliphelliphelliphelliphelliphelliphelliphelliphelliphelliphelliphelliphelliphelliphelliphelliphelliphelliphelliphelliphelliphelliphelliphelliphelliphelliphelliphelliphelliphelliphelliphelliphelliphelliphelliphelliphelliphelliphelliphellip
helliphelliphelliphelliphelliphelliphelliphelliphelliphelliphelliphelliphelliphelliphelliphelliphelliphelliphelliphelliphelliphelliphelliphelliphelliphelliphelliphelliphelliphelliphelliphelliphelliphelliphelliphelliphelliphelliphelliphelliphelliphelliphelliphelliphellip
helliphelliphelliphelliphelliphelliphelliphelliphelliphelliphelliphelliphelliphelliphelliphelliphelliphelliphelliphelliphelliphelliphelliphelliphelliphelliphelliphelliphelliphelliphelliphelliphelliphelliphelliphelliphelliphelliphelliphellip
8 Suppose that you toss a coin three times and all eight outcomes are equally likely If it is known that the first
toss comes up heads what is the probability of an odd number of heads appearing
helliphelliphelliphelliphelliphelliphelliphelliphelliphelliphelliphelliphelliphelliphelliphelliphelliphelliphelliphelliphelliphelliphelliphelliphelliphelliphelliphelliphelliphelliphelliphelliphelliphelliphelliphelliphelliphelliphelliphelliphelliphelliphelliphelliphellip
helliphelliphelliphelliphelliphelliphelliphelliphelliphelliphelliphelliphelliphelliphelliphelliphelliphelliphelliphelliphelliphelliphelliphelliphelliphelliphelliphelliphelliphelliphelliphelliphelliphelliphelliphelliphelliphelliphelliphelliphelliphelliphelliphelliphellip
helliphelliphelliphelliphelliphelliphelliphelliphelliphelliphelliphelliphelliphelliphelliphelliphelliphelliphelliphelliphelliphelliphelliphelliphelliphelliphelliphelliphelliphelliphelliphelliphelliphelliphelliphelliphelliphelliphelliphelliphelliphelliphelliphelliphellip
International Journal of Studies in Education and Science (IJSES)
145
helliphelliphelliphelliphelliphelliphelliphelliphelliphelliphelliphelliphelliphelliphelliphelliphelliphelliphelliphelliphelliphelliphelliphelliphelliphelliphelliphelliphelliphelliphelliphelliphelliphelliphelliphelliphelliphelliphelliphelliphelliphelliphelliphelliphellip
helliphelliphelliphelliphelliphelliphelliphelliphelliphelliphelliphelliphelliphelliphelliphelliphelliphelliphelliphelliphelliphelliphelliphelliphelliphelliphelliphelliphelliphelliphelliphelliphelliphelliphelliphelliphelliphelliphelliphelliphelliphelliphelliphelliphellip
helliphelliphelliphelliphelliphelliphelliphelliphelliphelliphelliphelliphelliphelliphelliphelliphelliphelliphelliphellip
9 A card is selected at random from a pack of 52 cards Find the probability of selecting a card which is a red or
a queen
helliphelliphelliphelliphelliphelliphelliphelliphelliphelliphelliphelliphelliphelliphelliphelliphelliphelliphelliphelliphelliphelliphelliphelliphelliphelliphelliphelliphelliphelliphelliphelliphelliphelliphelliphelliphelliphelliphelliphelliphelliphelliphelliphelliphellip
helliphelliphelliphelliphelliphelliphelliphelliphelliphelliphelliphelliphelliphelliphelliphelliphelliphelliphelliphelliphelliphelliphelliphelliphelliphelliphelliphelliphelliphelliphelliphelliphelliphelliphelliphelliphelliphelliphelliphelliphelliphelliphelliphelliphellip
helliphelliphelliphelliphelliphelliphelliphelliphelliphelliphelliphelliphelliphelliphelliphelliphelliphelliphelliphelliphelliphelliphelliphelliphelliphelliphelliphelliphelliphelliphelliphelliphelliphelliphelliphelliphelliphelliphelliphelliphelliphelliphelliphelliphellip
helliphelliphelliphelliphelliphelliphelliphelliphelliphelliphelliphelliphelliphelliphelliphelliphelliphelliphelliphelliphelliphelliphelliphelliphelliphelliphelliphelliphelliphelliphelliphelliphelliphelliphelliphelliphelliphelliphelliphellip
10 A box contains 6 white balls and 4 green balls Two balls are chosen at random one after the other without
replacement determine the probability that the second ball is white
helliphelliphelliphelliphelliphelliphelliphelliphelliphelliphelliphelliphelliphelliphelliphelliphelliphelliphelliphelliphelliphelliphelliphelliphelliphelliphelliphelliphelliphelliphelliphelliphelliphelliphelliphelliphelliphelliphelliphelliphelliphelliphelliphelliphellip
helliphelliphelliphelliphelliphelliphelliphelliphelliphelliphelliphelliphelliphelliphelliphelliphelliphelliphelliphelliphelliphelliphelliphelliphelliphelliphelliphelliphelliphelliphelliphelliphelliphelliphelliphelliphelliphelliphelliphelliphelliphelliphelliphelliphellip
helliphelliphelliphelliphelliphelliphelliphelliphelliphelliphelliphelliphelliphelliphelliphelliphelliphelliphelliphelliphelliphelliphelliphelliphelliphelliphelliphelliphelliphelliphelliphelliphelliphelliphelliphelliphelliphelliphelliphelliphelliphelliphelliphelliphellip
helliphelliphelliphelliphelliphelliphelliphelliphelliphelliphelliphelliphelliphelliphelliphelliphelliphelliphelliphelliphelliphelliphelliphelliphelliphelliphelliphelliphelliphelliphelliphelliphelliphelliphelliphelliphelliphelliphelliphelliphelliphelliphellip

Hokor amp Sedofia
134
level in Ghana The results as shown on Tables 3 4 5 6 7 and 8 indicate that the learner-centered approach to
teaching probability is more effective than the teacher-centered approach in motivating and inspiring preservice
teachers to learn and apply probability The learner-centered approach provides studentsrsquo opportunities to think
reason reflect and evaluate their ideals and that of colleagues
The findings of the present study are in tandem with several research findings Lessani Md Yunus and Bakar
(2017) investigated mathematics teaching approaches and their consequences on learnersrsquo ability to solve
challenging problems Their findings affirm the learner-centered approach to be more effective in studentsrsquo
creativity and innovation in solving real-life problems than the teacher-centered approach So training
programs for excellent teaching and learning should be flexible and innovative to allow preservice teachers to
explore gaps in learning and teaching (AIAhmad 2021) Similarly Prideaux (2007) found that students who
experienced the learner-centered approach of teaching performed significantly higher than those who were
taught without the learner-centered approach of teaching Roseth Garfield and Ben-Zvi (2008) also examined
the effect of the cooperative framework in classroom teaching and collaboration and found that student-
centered approaches to teaching help students to have better understanding of statistics than teacher-centered
instruction
Furthermore Gurbuz and Birgin (2011) studied the effect of computer-assisted teaching on addressing
probabilistic misconceptions of students The authors used pre-test to collect data on both the computer-assisted
and traditional groups before the experimental teachings After the intervention the post-test was administered
to ascertain the effect of computer-assisted teaching and teacher-centered approach on addressing studentsrsquo
probabilistic misconceptions Their study found computer-assisted teaching to have more significant effect on
studentsrsquo correct probabilistic reasoning than teacher-centered approach of teaching
As noted by Batanero and Diaz (2012) probability forms an integral part of the Mathematics curriculum in
many countries But the concept is one that some learners find difficult to understand partly due to the method
of teaching used by teachers This fact implies that teachers of mathematics should find more creative ways of
teaching the concept so as to make it easier for learners to understand and apply the concept As discovered in
this study the learner-centered approach is effective in developing probabilistic reasoning But the learner-
centered approach works best when certain conditions are present At the outset there is the need for relevant
teaching and learning materials Then teachers need to be trained and retrained in the use of the learner-centered
approach to teaching At the college of education level preservice teachers need to be taught using the learner-
centered approach not only to help them understand probability but also to help them use the learner-centered
approach in their own teaching
The activities used for Group A which is learner-centered approach group in the form of games promote
content knowledge and cognitive skills competencies such as collaboration and problem solving (Belova amp
Zowada 2020) The activities focus on promoting learning experiences rather than stressing on the
entertainment factor While some things students learn in school seem to them predetermined and bound by
laws in other branches of mathematics probability provides students with opportunity to learn that solutions to
International Journal of Studies in Education and Science (IJSES)
135
several problems depend on assumptions and have degrees of doubt So teaching methods that allow students to
predict and test their predictions should be encouraged for students to develop their intellectual repertoire The
processes used in reasoning about sample space will serve students well in life Several calls on the need to pay
attention to the study of probability show that teachers and mathematics teachers must provide their students
with appropriate teaching strategies to enhance their conceptual understanding In the preparation of preservice
teachers to become mathematically competent citizens teacher preparation programs such as teaching methods
must provide opportunities for preservice teachers to confront misconceptions and reason probabilistically
(Courtney amp Caniglia 2021)
The findings of the present study however run counter to those of Weltman and Whiteside (2010) They
conducted a study on the effectiveness of the traditional and active learning method in business statistics The
study found that active learning had not been effective for all category of students It is not precisely clear what
may have accounted for that result This is because active learning methods have generally been known to be
effective in promoting learning Further research is thus required in this regard
Conclusions
This study compared the effects of the learner-centered and teacher-centered approaches of teaching in
addressing probabilistic misconceptions by measuring preservice teachersrsquo probabilistic reasoning scores The
results show that the learner-centered approach aids preservice teachers to develop better probabilistic reasoning
than the teacher-centered approach to teaching Thus the study concludes that the learner-centered approach to
teaching is a solution to preservice teachersrsquo inability to answer questions on probability correctly Even though
each teaching approach targeted at addressing misconceptions was found to have significant effect on pre-
service teachersrsquo probabilistic reasoning the learner-centered approach was found to be more effective than the
teacher-centered approach in addressing misconceptions which limit studentsrsquo ability to solve probability
problems correctly
Implications and Recommendations
This study makes some key contributions to the teacher educationdevelopment literature in general and
particularly to the development of probabilistic reasoning of preservice teachers The study provides empirical
evidence that the learner-centered approach targeted at addressing probabilistic misconceptions is more effective
in developing probabilistic reasoning in preservice teachers What this means is that when teacher educators use
the learner-centered approach to teach the concept of probability and focus on addressing misconceptions
preservice teachers will develop better probabilistic reasoning This will in turn translate into preservice
teachers answering questions on probability correctly in their examinations and ultimately making them teach
the concept more effectively when they complete their training It is thus recommended that teachers should
consider employing the learner-centered approach in teaching the concept of probability
Hokor amp Sedofia
136
Limitations
As with every empirical study employing the quasi-experimental approach the current study has some
limitations which need to be acknowledged and used to guide users of the findings Firstly our sample was
drawn from a population of second year preservice teachers of a female only college of education in a peri-
urban area in Ghana Further experiments are therefore needed in other settings in order to see if the same or
similar results will occur Secondly owing to the narrow characteristics of the participants in the present study
the researchers cannot generalize the results to other individuals who do not have the same characteristics So
additional experiments with groups with different characteristics are necessary Lastly the experiments need to
be repeated at another time to determine if the results are the same (consistent) over time
Acknowledgements
We are grateful to the Principal and preservice teachers for granting access and participating in the study
respectively
References
AIAhmad H (2021) The role of educational communication in promoting student-centered learning style in
multicultural classrooms A reflective essay on learning and teaching in higher education International
Journal of Research in Education and Science (IJRES) 7(3) 838-851 httpsdoiorg1046328ijes2374
Aina J K Olanipekun S S amp Garuba I A (2015) Teachersrsquo effectiveness and its Influence on studentsrsquo
learning Advances in Social Sciences Research Journal 2(4) 88-95
Anway D W amp Bennett E (2004) Common Misconceptions in Probability among Students in an Elementary
Statistics class Unplished Senior Project The ARTIST Roundtable Conference on Assessment in
Statistics held at Lawrence University Supperior WI The University of Wisconsin-Superior
Bada S (2015) Constructivist Learning Theory A Paradigm for Teaching and Learning IOSR Journal of
Research and Method in Education (IOSR-JRME) 5(6) 66-70 httpsDOI1097907388-05616670
Baerveldt C (2013) Constructivism contested Implications of a genetic perspective in psychology Integrative
Psychological and Behavioral Science 47(1) 156-166
Batanero C (2013) Teaching and learning probability In S Lerman (Ed ) Encyclopedia of Mathematics
Education Heidelberg Springer
Batanero C and Diaz C (2012) Training school teachers to teach probability reflections and challenges
Chilean Journal of Statistics 3(1) 3-13
Belova N amp Zowada C (2020) Innovating Higher Education Via Game-Based Learning on Misconceptions
Education Sciences 10 221 doi103390educSCi10090221
Bennett E amp Anway D W (2003) Statistical and Probabilistic Reasoning and Misconceptions among
Selected College Students McNair Scholars Journal Vol 4 httpwwwsocheclchjs
Cantoy O (2010) Mathematics teachersrsquo topic-specific pedagogical content knowledge in the context of
teaching a0 0 and a divide 0 Educational Sciences Theory and Practice 10 (2) 749-769
International Journal of Studies in Education and Science (IJSES)
137
Clements D H amp Battista M (1990) Constructivist Learning and Teaching The
Arithetic Teacher 38(1) ProQuest Central pg 34 DOI105951AT3810034
Creswell J W amp Creswell J D (2018) Research design Qualitative quantitative and
mixed methods approaches (5th
ed) Los Angeles SAGE Publications Inc
Courtney S A amp Caniglia J (2021) Comparing the mathematical practices pre-service teachers and
mathematics teacher educators identified as relevant to problems and tasks International Journal of
Research in Education and Science (IJRES) 7(3) 954-971 httpsdoiorg1046328ijres2335
Denton D W (2012) Enhancing instruction through constructivism cooperative learning and cloud
computing Tech Trends 56(4) 34-41
Gage J (2012) Towards a new Probability Curriculum for Secondary Schools Paper presented at 12th
International Congress on Mathematical Education 8 July-15 July COEX Seoul Korea Cambridge
Cambridge University Uk
Gurbuz R amp Birgin O (2011) The effect of computer-assisted teaching on remedying misconceptions The
case of the subject Probability Journal Homepage 58(2012) DOI 101016jcompedu201111005
Hirsh L amp ODonnell A M (2001) Representativeness in Statistical Reasoning Identifying and Assessing
Misconceptions Journal of Statistics Education 9(2) 96-105 DOI10108010691898200111910655
Johnson H D amp Dasgupta N (2005) Traditional versus Non-traditional Teaching during Perspectives of
Students in Introductory Statistics Classes Journal of Statistics Education 13(2)
httpsdoiorg10108010691898200511910558
Major T amp Mangope B (2012) The Constructivist Theory in Mathematics The case of Botswana Primary
Schools International Review of Social Sciencies and Humanities 3(2) 139-147
Jones G (2005) Reflections In GA Jones (Ed) Exploring probability in school chanlleges for teaching and
probability (367-372) New York Springer
Jun L (2000) Chinese Students Understanding of Probability Published doctoral dissertation Singapore
National Institute of Education Nanyang Technological University
Khazanov L amp Gourgey A (2009) Instructors Perspectives on Students Mistaken Beliefs about Probability
in an Elementary College Statistics Course In K Safford-Ramus (Ed) Proceedings of the Adults
Learning Mathematics a Resaerch Forum (ALM) 15th
Annual International Conference 249-264
Khazanov L amp Prado L (2010) Correcting Students Misconceptions about Probability in an Introductory
College Statistics Course Adults Learning Mathematics-An International Journal 5(1) 23-35
Kleickmann T Richter D Kunter M Elsner J Besser M Krauss S amp Baumert J (2013) Teachersrsquo
Content Knowledge and Pedagogical Content Knowledge The Role of Structural Differences in Teacher
Education Journal of Teacher Education 64(1) 90-106 DOI1011770022487112460398
Leedy P D and Ormrod J E (2020) Practical research Planning and design (12th Global Edition) Harlow
England Pearson
Lessani A Md Yunus AS amp Bakar KBA (2017) Comparison of new mathematics teaching methods with
teacher-centered approach International Journal of Social Sciences 3(2) 1285-1297
httpsdxdoiorg1020319pijss20173212851297
Lim C amp Hwa T (2007) Promoting Mathematical Thinking in the Malaysian Classroom Issues and
challenges httpswwwresearchgatenetpublication252353381
Hokor amp Sedofia
138
Lovett J N amp Lee H S (2017) New Standards Require Teaching More Statistics Are Preservice Secondary
Mathematics Ready Journal of Teachers Education 68(3) 299-311 DOI 1011770022487117697918
Major T amp Mangope B (2012) The Constructivist Theory in Mathematics The case of Botswana Primary
Schools International Review of Social Sciencies and Humanities 3(2) 139-147
National Council of Teachers of Mathematics (2003) Principles and Standards for School Mathematics and
their Implications for Professional Development Reston VA NCTM
Nguyen L (2015) Developing Conceptual Understanding and Probabilistic Thinking through Tree Diagrams
Published MPhil Dissertation Manitoba The Faculty of Graduate Studies of the University of
Manitoba
Prideaux J (2007) The learner-centered approach to Mathematics Teaching and the Active Learning
Strategies used to Enhance Students Understanding Mathematical and Computing Sciences Masters
Paper 29 Fisher Digital Publications httpfisherpubsjfcedumathcsetdmasters29
Roseth C J Garfield J B amp Ben-Zvi D (2008) Collaboration in Learning and Teaching Statistics Journal
of Statistics Education 16 (1) 1069-1898 httpsdoiorg10108010691898200811889557
Santagata R and Sandholtz J H (2019) Preservice teachersrsquo mathematics teaching competence Comparing
performance on two measures Journal of Teacher Education 70 (5) 472 ndash484
Schwerdt G amp Wuppermann A C (2011) Is traditional teaching really all that bad A within-student
between-subject approach Economics of Education Review 30(2) 365-379
Sharma S (2016) Probability from a socio-cultural perspective Statistics Education Research Journal 15(2)
126-144 httpiase-weborgPublicationsphpp=SERJ
Shay K (2008) Tracing middle school students understanding of probability a longitudinal study
Unpublished Doctoral Dissertation New Brunswick New Jersey Rutgers State University of New
Jersey
Shulman L S (1986) Those who understand Knowledge growth in teaching Educational Researcher 15(2)
4-14 doi 1031021001318X015002004
Thomas L (2020) An introduction to quasi-experimental designs
httpswwwscribbrcommethodologyquasi-experimental-design
Voskoglou M (2019) Comparing Teaching Methods of Mathematics at University Level Education Sciences
9(204) doi103390educsci9030204
Vygotsky L S (1978) Mind in society The development of higher psychological processes Cambridge MA
Harvard University Press
Weldeana H N amp Abraham S T (2014) The effect of an historical perspective on prospective teachersrsquo
beliefs in learning mathematics Journal of Mathematics Teacher Education 17 303-330
doi101007s10857-013-9266-z
Weltman D amp Whiteside M (2010) Comparing the Effectiveness of Traditional and active Learning Methods
in Business Statistics Convergence to the Mean 18(1)
httpsdoiorg10108010691898201011889480
White H amp Sabarwal S (2014) Quasi-experimental design and methods methological briefs impact
evaluations Florence UNICEF Office of research
International Journal of Studies in Education and Science (IJSES)
139
Author Information
Evans Kofi Hokor
httpsorcidorg0000-0002-8387-8294
St Teresarsquos College of Education Hohoe
Department of Mathematics and ICT
P O Box 129
Ghana
Contact e-mail evanskhokorgmailcom
John Sedofia
httpsorcidorg0000-0002-5409-516X
University of Ghana Legon
Department of Teacher Education
PO Box LG 1181
Ghana
Hokor amp Sedofia
140
Appendix A Pre-test Probabilistic Reasoning Assessment
This assessment is for research purpose to improve teaching and learning of probability
You are required to answer all questions honestly Do and leave all workings or rough work on the paper
Pre-test Probabilistic Reasoning Assessment Duration 1hr
Index numberhelliphelliphelliphelliphelliphelliphelliphelliphelliphelliphelliphelliphelliphelliphelliphelliphelliphellipLevelhelliphelliphelliphellipAgehelliphelliphellip
Read each statement carefully and circle the letter of the correct (best) option Provide appropriate response in
the space provided under some items as it apply
1 If you rolled an ordinary die and obtained 51246 which of these is most likely to occur on your next
roll
a 1
b 2
c 3
d 4
e 5
f 6
g The options a b c d e and f are all equally
2i A fair coin is tossed and it lands tail The coin is to be tossed a second time What is the probability that the
second toss will also be a tail
a 1
4
b 1
2
c 1
3
d Slightly less than 1
2
e Slightly more than 1
2
f 0
2ii Which of the following best describes the reason for the correct answer to the preceding question (2i)
a The second toss is less likely to be tail because the first toss was tail
b There are four possible outcomes when you toss a coin twice Getting two tails is only one of them
c The chance of getting heads or tails on any one toss is always 1
2
d There are three possible outcomes when you toss a coin twice Getting two tails is only one of the them
e No chance of being a tail in the second toss
3i A box contains 6 balls 2 are red 2 are black and 2 blue Three balls are picked at random one at a time
Each time a ball is picked the colour is recorded and the ball is put back in the box mixed thoroughly If the
first 2 balls are black what color is the third ball most likely to be
a Red
International Journal of Studies in Education and Science (IJSES)
141
b Black
c Blue
d Red and blue are equally likely than black
e Red black and blue are all equally likely
3ii Which of the following best describes the reason for the correct answer in the preceding question (3i)
a The third ball should not be black because too many black ones have already been picked
b The picks are independent so every color has an equally likely chance of being picked
c Black seems to be lucky
d This color is just as likely as any other color
4 A spinner with ten equally divided sectors in which four parts are white and the rests are red is about to
be spin which color is the spinner more likely to land
a White
b Red
c Both white and red are all equally
5 If you toss a fair coin and get heads two times in a row which of these is most likely on next toss
a Tail
b Head
c Both head and tail are all equally
6 A Gh 2 Gh 5 Ghcent10 Gh 20 Gh 50 and Gh 100 notes were put in a box and thoroughly mixed
What is the probability of picking Gh 50 note without looking
a 1
187
b 50
187
c 1
6
d 0
7 In a game you have been offered two options Which of the following give you higher chance of
winning GHcent200
a Tossing one die once and obtaining a 6
b Tossing two dice once and obtaining two 6rsquos
c The options a and b are all equally
8 A fair die is to be toss six times which of these is most likely to occur
a 251634
b 123456
c 666341
d 132244
e The options a b c and d are all equally likely
9 A fair coin is to be toss four times in a row which of these is least likely to occur
a THTH
b TTTH
c HHH
Hokor amp Sedofia
142
d The options a b and c are all equally likely
10 Two fair dice are to be tossed once Which of the following is more likely to occur
a Obtaining a sum of 11
b Obtaining a sum of 10
c A sum of 11 and a sum of 10 are all equally likely
10i Give reason for the correct answer in the preceding question (10)
helliphelliphelliphelliphelliphelliphelliphelliphelliphelliphelliphelliphelliphelliphelliphelliphelliphelliphelliphelliphelliphelliphelliphelliphelliphelliphelliphelliphelliphelliphelliphelliphelliphelliphelliphelliphelliphelliphelliphelliphelliphellip
helliphelliphelliphelliphelliphelliphelliphelliphelliphelliphelliphelliphelliphelliphelliphelliphelliphelliphelliphelliphelliphelliphelliphelliphelliphelliphelliphelliphelliphelliphelliphelliphelliphelliphelliphelliphelliphelliphelliphelliphelliphellip
helliphelliphelliphelliphelliphelliphelliphelliphelliphelliphelliphelliphelliphelliphelliphelliphelliphelliphelliphelliphelliphelliphelliphelliphelliphelliphelliphelliphelliphelliphelliphelliphelliphelliphelliphelliphelliphelliphelliphelliphelliphellip
helliphelliphelliphelliphelliphelliphelliphelliphelliphelliphelliphelliphelliphelliphelliphelliphelliphelliphelliphelliphelliphelliphelliphelliphelliphelliphelliphelliphelliphelliphelliphelliphelliphelliphelliphelliphelliphellip
11 In national lottery one has to choose five numbers from 1 to 90 inclusive You win when at least two of
your numbers are part of the numbers drawn on Saturday at random Eric has chosen 4 6 7 9 and 11
Alex has chosen 15 23 45 66 and 80 Daniel has chosen 71 77 78 83 and 85 Do Eric Alex and
Daniel have the same chance of winning or not and why
helliphelliphelliphelliphelliphelliphelliphelliphelliphelliphelliphelliphelliphelliphelliphelliphelliphelliphelliphelliphelliphelliphelliphelliphelliphelliphelliphelliphelliphelliphelliphelliphelliphelliphelliphelliphelliphelliphelliphelliphellip
helliphelliphelliphelliphelliphelliphelliphelliphelliphelliphelliphelliphelliphelliphelliphelliphelliphelliphelliphelliphelliphelliphelliphelliphelliphelliphelliphelliphelliphelliphelliphelliphelliphelliphelliphelliphelliphelliphelliphelliphellip
helliphelliphelliphelliphelliphelliphelliphelliphelliphelliphelliphelliphelliphelliphelliphelliphelliphelliphelliphelliphelliphelliphelliphelliphelliphelliphelliphelliphelliphelliphelliphelliphelliphelliphelliphelliphelliphelliphelliphelliphellip
helliphelliphelliphelliphelliphelliphelliphelliphelliphelliphelliphelliphelliphelliphelliphelliphelliphelliphelliphelliphelliphelliphelliphelliphelliphelliphelliphelliphelliphelliphelliphelliphelliphelliphelliphellip
12 A box contains 8 yellow balls and 4 green balls Two balls are chosen at random one after the other
without replacement determine the probability that the two balls are of different colours
helliphelliphelliphelliphelliphelliphelliphelliphelliphelliphelliphelliphelliphelliphelliphelliphelliphelliphelliphelliphelliphelliphelliphelliphelliphelliphelliphelliphelliphelliphelliphelliphelliphelliphelliphelliphelliphelliphelliphelliphellip
helliphelliphelliphelliphelliphelliphelliphelliphelliphelliphelliphelliphelliphelliphelliphelliphelliphelliphelliphelliphelliphelliphelliphelliphelliphelliphelliphelliphelliphelliphelliphelliphelliphelliphelliphelliphelliphelliphelliphelliphellip
helliphelliphelliphelliphelliphelliphelliphelliphelliphelliphelliphelliphelliphelliphelliphelliphelliphelliphelliphelliphelliphelliphelliphelliphelliphelliphelliphelliphelliphelliphelliphelliphelliphelliphelliphelliphelliphelliphelliphelliphellip
helliphelliphelliphelliphelliphelliphelliphelliphelliphelliphelliphelliphelliphelliphelliphelliphelliphelliphelliphelliphelliphelliphelliphelliphelliphelliphelliphelliphelliphelliphelliphelliphelliphelliphelliphelliphellip
International Journal of Studies in Education and Science (IJSES)
143
Appendix B Post-test Probabilistic Reasoning Assessment
This assessment is for research purpose to improve teaching and learning of probability
You are required to answer all questions honestly Do and leave all workings or rough work on the paper
Post-test Probabilistic Reasoning Assessment Duration One Hour
Index numberhelliphelliphelliphelliphelliphelliphelliphelliphelliphelliphelliphelliphelliphelliphellipClasshelliphelliphelliphellipAgehelliphelliphelliphellip
Read each statement carefully and circle the letter of the correct (best) option for each item as much as possible
and provide appropriate response in the space provided
1 Suppose a particular outcome from a random event has a probability of 04 Which of the following
statements represents correct interpretations of this probability
a The outcome will not happen
b The outcome will certainly happen about four times out of every 10 trials
c The outcome is expected to happen about four times out of every 10 trials
d The outcome could happen or it couldnrsquot of either result are the same
2 If you toss a fair coin and get heads 3 times in a row what is the chance of getting a head on the next toss
a 1
b Greater than 1
2
c 1
2
d Less than 1
2
e 0
3 A die is numbered 1 2 3 4 4 5 When the die is thrown once Which of these is most likely and why
a 1
b 2
c 3
d 4
e 5
f They are all equally likely
3i Give reason for your chosen answer in (3)
helliphelliphelliphelliphelliphelliphelliphelliphelliphelliphelliphelliphelliphelliphelliphelliphelliphelliphelliphelliphelliphelliphelliphelliphelliphelliphelliphelliphelliphelliphelliphelliphelliphelliphelliphelliphelliphelliphelliphelliphelliphelliphelliphelliphellip
helliphelliphelliphelliphelliphelliphelliphelliphelliphelliphelliphelliphelliphelliphelliphelliphelliphelliphelliphelliphelliphelliphelliphelliphelliphelliphelliphelliphelliphelliphelliphelliphelliphelliphelliphelliphelliphelliphelliphelliphelliphelliphelliphelliphellip
helliphelliphelliphelliphelliphelliphelliphelliphelliphelliphelliphelliphelliphelliphelliphelliphelliphelliphelliphelliphelliphelliphelliphelliphelliphelliphelliphelliphelliphelliphelliphelliphelliphelliphelliphelliphelliphelliphelliphelliphelliphelliphelliphelliphellip
helliphelliphelliphelliphelliphelliphelliphelliphelliphelliphelliphelliphelliphelliphelliphelliphelliphelliphelliphelliphelliphelliphelliphelliphelliphelliphelliphelliphelliphelliphelliphelliphelliphelliphelliphelliphelliphelliphellip
4 German MP tossed two dice once Which of these is mostly likely and why
a Obtaining a sum of 4
b Obtaining a sum of 7
c Obtaining a sum of 11
d All of them have equal chance of occurring that is a b c
Hokor amp Sedofia
144
4i Give reason for your chosen answer in (4)
helliphelliphelliphelliphelliphelliphelliphelliphelliphelliphelliphelliphelliphelliphelliphelliphelliphelliphelliphelliphelliphelliphelliphelliphelliphelliphelliphelliphelliphelliphelliphelliphelliphelliphelliphelliphelliphelliphelliphelliphelliphelliphelliphelliphellip
helliphelliphelliphelliphelliphelliphelliphelliphelliphelliphelliphelliphelliphelliphelliphelliphelliphelliphelliphelliphelliphelliphelliphelliphelliphelliphelliphelliphelliphelliphelliphelliphelliphelliphelliphelliphelliphelliphelliphelliphelliphelliphelliphelliphellip
helliphelliphelliphelliphelliphelliphelliphelliphelliphelliphelliphelliphelliphelliphelliphelliphelliphelliphelliphelliphelliphelliphelliphelliphelliphelliphelliphelliphelliphelliphelliphelliphelliphelliphelliphelliphelliphelliphelliphelliphelliphelliphelliphelliphellip
helliphelliphelliphelliphelliphelliphelliphelliphelliphelliphelliphelliphelliphelliphelliphelliphelliphelliphelliphelliphelliphelliphelliphelliphelliphelliphelliphelliphelliphelliphelliphelliphelliphelliphelliphelliphelliphelliphelliphelliphelliphelliphelliphelliphellip
helliphelliphelliphelliphelliphelliphelliphelliphelliphelliphelliphelliphelliphelliphelliphelliphelliphelliphelliphelliphelliphelliphelliphelliphelliphelliphelliphelliphellip
5i A fair coin is to be toss four times which of these is most likely to occur
a HTHT
b THTT
c TTTT
d HHTH
e The options a b c and d are all equally likely
5ii Give reason for your chosen answer in (5i)
helliphelliphelliphelliphelliphelliphelliphelliphelliphelliphelliphelliphelliphelliphelliphelliphelliphelliphelliphelliphelliphelliphelliphelliphelliphelliphelliphelliphelliphelliphelliphelliphelliphelliphelliphelliphelliphelliphelliphelliphelliphelliphelliphelliphellip
helliphelliphelliphelliphelliphelliphelliphelliphelliphelliphelliphelliphelliphelliphelliphelliphelliphelliphelliphelliphelliphelliphelliphelliphelliphelliphelliphelliphelliphelliphelliphelliphelliphelliphelliphelliphelliphelliphelliphelliphelliphelliphelliphelliphellip
helliphelliphelliphelliphelliphelliphelliphelliphelliphelliphelliphelliphelliphelliphelliphelliphelliphelliphelliphelliphelliphelliphelliphelliphelliphelliphelliphelliphelliphelliphelliphelliphelliphelliphelliphelliphelliphelliphelliphelliphelliphelliphelliphelliphellip
helliphelliphelliphelliphelliphelliphelliphelliphelliphelliphelliphelliphelliphelliphelliphelliphelliphelliphelliphelliphelliphelliphelliphelliphelliphelliphelliphelliphelliphelliphelliphelliphelliphelliphelliphelliphelliphelliphellip
6i A fair coin is to be toss four times which of these is least likely to occur
a HTHT
b THTT
c TTTT
d HHTH
e The options a b c and d are all equally likely
6ii Give reason for your chosen answer in (6i)
helliphelliphelliphelliphelliphelliphelliphelliphelliphelliphelliphelliphelliphelliphelliphelliphelliphelliphelliphelliphelliphelliphelliphelliphelliphelliphelliphelliphelliphelliphelliphelliphelliphelliphelliphelliphelliphelliphelliphelliphelliphelliphelliphelliphellip
helliphelliphelliphelliphelliphelliphelliphelliphelliphelliphelliphelliphelliphelliphelliphelliphelliphelliphelliphelliphelliphelliphelliphelliphelliphelliphelliphelliphelliphelliphelliphelliphelliphelliphelliphelliphelliphelliphelliphelliphelliphelliphelliphelliphellip
helliphelliphelliphelliphelliphelliphelliphelliphelliphelliphelliphelliphelliphelliphelliphelliphelliphelliphelliphelliphelliphelliphelliphelliphelliphelliphelliphelliphelliphelliphelliphelliphelliphelliphelliphelliphelliphelliphelliphelliphelliphelliphelliphelliphellip
helliphelliphelliphellip
7 A college has 300 level 200 students and 236 level 100 students in it Each studentrsquos name is written with
the level on a piece of paper and all the names are put into a box and mixed thoroughly A tutor picks one
name out of the box without looking Which level is the tutor more likely to pick from and why
helliphelliphelliphelliphelliphelliphelliphelliphelliphelliphelliphelliphelliphelliphelliphelliphelliphelliphelliphelliphelliphelliphelliphelliphelliphelliphelliphelliphelliphelliphelliphelliphelliphelliphelliphelliphelliphelliphelliphelliphelliphelliphelliphelliphellip
helliphelliphelliphelliphelliphelliphelliphelliphelliphelliphelliphelliphelliphelliphelliphelliphelliphelliphelliphelliphelliphelliphelliphelliphelliphelliphelliphelliphelliphelliphelliphelliphelliphelliphelliphelliphelliphelliphelliphelliphelliphelliphelliphelliphellip
helliphelliphelliphelliphelliphelliphelliphelliphelliphelliphelliphelliphelliphelliphelliphelliphelliphelliphelliphelliphelliphelliphelliphelliphelliphelliphelliphelliphelliphelliphelliphelliphelliphelliphelliphelliphelliphelliphelliphelliphelliphelliphelliphelliphellip
helliphelliphelliphelliphelliphelliphelliphelliphelliphelliphelliphelliphelliphelliphelliphelliphelliphelliphelliphelliphelliphelliphelliphelliphelliphelliphelliphelliphelliphelliphelliphelliphelliphelliphelliphelliphelliphelliphelliphellip
8 Suppose that you toss a coin three times and all eight outcomes are equally likely If it is known that the first
toss comes up heads what is the probability of an odd number of heads appearing
helliphelliphelliphelliphelliphelliphelliphelliphelliphelliphelliphelliphelliphelliphelliphelliphelliphelliphelliphelliphelliphelliphelliphelliphelliphelliphelliphelliphelliphelliphelliphelliphelliphelliphelliphelliphelliphelliphelliphelliphelliphelliphelliphelliphellip
helliphelliphelliphelliphelliphelliphelliphelliphelliphelliphelliphelliphelliphelliphelliphelliphelliphelliphelliphelliphelliphelliphelliphelliphelliphelliphelliphelliphelliphelliphelliphelliphelliphelliphelliphelliphelliphelliphelliphelliphelliphelliphelliphelliphellip
helliphelliphelliphelliphelliphelliphelliphelliphelliphelliphelliphelliphelliphelliphelliphelliphelliphelliphelliphelliphelliphelliphelliphelliphelliphelliphelliphelliphelliphelliphelliphelliphelliphelliphelliphelliphelliphelliphelliphelliphelliphelliphelliphelliphellip
International Journal of Studies in Education and Science (IJSES)
145
helliphelliphelliphelliphelliphelliphelliphelliphelliphelliphelliphelliphelliphelliphelliphelliphelliphelliphelliphelliphelliphelliphelliphelliphelliphelliphelliphelliphelliphelliphelliphelliphelliphelliphelliphelliphelliphelliphelliphelliphelliphelliphelliphelliphellip
helliphelliphelliphelliphelliphelliphelliphelliphelliphelliphelliphelliphelliphelliphelliphelliphelliphelliphelliphelliphelliphelliphelliphelliphelliphelliphelliphelliphelliphelliphelliphelliphelliphelliphelliphelliphelliphelliphelliphelliphelliphelliphelliphelliphellip
helliphelliphelliphelliphelliphelliphelliphelliphelliphelliphelliphelliphelliphelliphelliphelliphelliphelliphelliphellip
9 A card is selected at random from a pack of 52 cards Find the probability of selecting a card which is a red or
a queen
helliphelliphelliphelliphelliphelliphelliphelliphelliphelliphelliphelliphelliphelliphelliphelliphelliphelliphelliphelliphelliphelliphelliphelliphelliphelliphelliphelliphelliphelliphelliphelliphelliphelliphelliphelliphelliphelliphelliphelliphelliphelliphelliphelliphellip
helliphelliphelliphelliphelliphelliphelliphelliphelliphelliphelliphelliphelliphelliphelliphelliphelliphelliphelliphelliphelliphelliphelliphelliphelliphelliphelliphelliphelliphelliphelliphelliphelliphelliphelliphelliphelliphelliphelliphelliphelliphelliphelliphelliphellip
helliphelliphelliphelliphelliphelliphelliphelliphelliphelliphelliphelliphelliphelliphelliphelliphelliphelliphelliphelliphelliphelliphelliphelliphelliphelliphelliphelliphelliphelliphelliphelliphelliphelliphelliphelliphelliphelliphelliphelliphelliphelliphelliphelliphellip
helliphelliphelliphelliphelliphelliphelliphelliphelliphelliphelliphelliphelliphelliphelliphelliphelliphelliphelliphelliphelliphelliphelliphelliphelliphelliphelliphelliphelliphelliphelliphelliphelliphelliphelliphelliphelliphelliphelliphellip
10 A box contains 6 white balls and 4 green balls Two balls are chosen at random one after the other without
replacement determine the probability that the second ball is white
helliphelliphelliphelliphelliphelliphelliphelliphelliphelliphelliphelliphelliphelliphelliphelliphelliphelliphelliphelliphelliphelliphelliphelliphelliphelliphelliphelliphelliphelliphelliphelliphelliphelliphelliphelliphelliphelliphelliphelliphelliphelliphelliphelliphellip
helliphelliphelliphelliphelliphelliphelliphelliphelliphelliphelliphelliphelliphelliphelliphelliphelliphelliphelliphelliphelliphelliphelliphelliphelliphelliphelliphelliphelliphelliphelliphelliphelliphelliphelliphelliphelliphelliphelliphelliphelliphelliphelliphelliphellip
helliphelliphelliphelliphelliphelliphelliphelliphelliphelliphelliphelliphelliphelliphelliphelliphelliphelliphelliphelliphelliphelliphelliphelliphelliphelliphelliphelliphelliphelliphelliphelliphelliphelliphelliphelliphelliphelliphelliphelliphelliphelliphelliphelliphellip
helliphelliphelliphelliphelliphelliphelliphelliphelliphelliphelliphelliphelliphelliphelliphelliphelliphelliphelliphelliphelliphelliphelliphelliphelliphelliphelliphelliphelliphelliphelliphelliphelliphelliphelliphelliphelliphelliphelliphelliphelliphelliphellip

International Journal of Studies in Education and Science (IJSES)
135
several problems depend on assumptions and have degrees of doubt So teaching methods that allow students to
predict and test their predictions should be encouraged for students to develop their intellectual repertoire The
processes used in reasoning about sample space will serve students well in life Several calls on the need to pay
attention to the study of probability show that teachers and mathematics teachers must provide their students
with appropriate teaching strategies to enhance their conceptual understanding In the preparation of preservice
teachers to become mathematically competent citizens teacher preparation programs such as teaching methods
must provide opportunities for preservice teachers to confront misconceptions and reason probabilistically
(Courtney amp Caniglia 2021)
The findings of the present study however run counter to those of Weltman and Whiteside (2010) They
conducted a study on the effectiveness of the traditional and active learning method in business statistics The
study found that active learning had not been effective for all category of students It is not precisely clear what
may have accounted for that result This is because active learning methods have generally been known to be
effective in promoting learning Further research is thus required in this regard
Conclusions
This study compared the effects of the learner-centered and teacher-centered approaches of teaching in
addressing probabilistic misconceptions by measuring preservice teachersrsquo probabilistic reasoning scores The
results show that the learner-centered approach aids preservice teachers to develop better probabilistic reasoning
than the teacher-centered approach to teaching Thus the study concludes that the learner-centered approach to
teaching is a solution to preservice teachersrsquo inability to answer questions on probability correctly Even though
each teaching approach targeted at addressing misconceptions was found to have significant effect on pre-
service teachersrsquo probabilistic reasoning the learner-centered approach was found to be more effective than the
teacher-centered approach in addressing misconceptions which limit studentsrsquo ability to solve probability
problems correctly
Implications and Recommendations
This study makes some key contributions to the teacher educationdevelopment literature in general and
particularly to the development of probabilistic reasoning of preservice teachers The study provides empirical
evidence that the learner-centered approach targeted at addressing probabilistic misconceptions is more effective
in developing probabilistic reasoning in preservice teachers What this means is that when teacher educators use
the learner-centered approach to teach the concept of probability and focus on addressing misconceptions
preservice teachers will develop better probabilistic reasoning This will in turn translate into preservice
teachers answering questions on probability correctly in their examinations and ultimately making them teach
the concept more effectively when they complete their training It is thus recommended that teachers should
consider employing the learner-centered approach in teaching the concept of probability
Hokor amp Sedofia
136
Limitations
As with every empirical study employing the quasi-experimental approach the current study has some
limitations which need to be acknowledged and used to guide users of the findings Firstly our sample was
drawn from a population of second year preservice teachers of a female only college of education in a peri-
urban area in Ghana Further experiments are therefore needed in other settings in order to see if the same or
similar results will occur Secondly owing to the narrow characteristics of the participants in the present study
the researchers cannot generalize the results to other individuals who do not have the same characteristics So
additional experiments with groups with different characteristics are necessary Lastly the experiments need to
be repeated at another time to determine if the results are the same (consistent) over time
Acknowledgements
We are grateful to the Principal and preservice teachers for granting access and participating in the study
respectively
References
AIAhmad H (2021) The role of educational communication in promoting student-centered learning style in
multicultural classrooms A reflective essay on learning and teaching in higher education International
Journal of Research in Education and Science (IJRES) 7(3) 838-851 httpsdoiorg1046328ijes2374
Aina J K Olanipekun S S amp Garuba I A (2015) Teachersrsquo effectiveness and its Influence on studentsrsquo
learning Advances in Social Sciences Research Journal 2(4) 88-95
Anway D W amp Bennett E (2004) Common Misconceptions in Probability among Students in an Elementary
Statistics class Unplished Senior Project The ARTIST Roundtable Conference on Assessment in
Statistics held at Lawrence University Supperior WI The University of Wisconsin-Superior
Bada S (2015) Constructivist Learning Theory A Paradigm for Teaching and Learning IOSR Journal of
Research and Method in Education (IOSR-JRME) 5(6) 66-70 httpsDOI1097907388-05616670
Baerveldt C (2013) Constructivism contested Implications of a genetic perspective in psychology Integrative
Psychological and Behavioral Science 47(1) 156-166
Batanero C (2013) Teaching and learning probability In S Lerman (Ed ) Encyclopedia of Mathematics
Education Heidelberg Springer
Batanero C and Diaz C (2012) Training school teachers to teach probability reflections and challenges
Chilean Journal of Statistics 3(1) 3-13
Belova N amp Zowada C (2020) Innovating Higher Education Via Game-Based Learning on Misconceptions
Education Sciences 10 221 doi103390educSCi10090221
Bennett E amp Anway D W (2003) Statistical and Probabilistic Reasoning and Misconceptions among
Selected College Students McNair Scholars Journal Vol 4 httpwwwsocheclchjs
Cantoy O (2010) Mathematics teachersrsquo topic-specific pedagogical content knowledge in the context of
teaching a0 0 and a divide 0 Educational Sciences Theory and Practice 10 (2) 749-769
International Journal of Studies in Education and Science (IJSES)
137
Clements D H amp Battista M (1990) Constructivist Learning and Teaching The
Arithetic Teacher 38(1) ProQuest Central pg 34 DOI105951AT3810034
Creswell J W amp Creswell J D (2018) Research design Qualitative quantitative and
mixed methods approaches (5th
ed) Los Angeles SAGE Publications Inc
Courtney S A amp Caniglia J (2021) Comparing the mathematical practices pre-service teachers and
mathematics teacher educators identified as relevant to problems and tasks International Journal of
Research in Education and Science (IJRES) 7(3) 954-971 httpsdoiorg1046328ijres2335
Denton D W (2012) Enhancing instruction through constructivism cooperative learning and cloud
computing Tech Trends 56(4) 34-41
Gage J (2012) Towards a new Probability Curriculum for Secondary Schools Paper presented at 12th
International Congress on Mathematical Education 8 July-15 July COEX Seoul Korea Cambridge
Cambridge University Uk
Gurbuz R amp Birgin O (2011) The effect of computer-assisted teaching on remedying misconceptions The
case of the subject Probability Journal Homepage 58(2012) DOI 101016jcompedu201111005
Hirsh L amp ODonnell A M (2001) Representativeness in Statistical Reasoning Identifying and Assessing
Misconceptions Journal of Statistics Education 9(2) 96-105 DOI10108010691898200111910655
Johnson H D amp Dasgupta N (2005) Traditional versus Non-traditional Teaching during Perspectives of
Students in Introductory Statistics Classes Journal of Statistics Education 13(2)
httpsdoiorg10108010691898200511910558
Major T amp Mangope B (2012) The Constructivist Theory in Mathematics The case of Botswana Primary
Schools International Review of Social Sciencies and Humanities 3(2) 139-147
Jones G (2005) Reflections In GA Jones (Ed) Exploring probability in school chanlleges for teaching and
probability (367-372) New York Springer
Jun L (2000) Chinese Students Understanding of Probability Published doctoral dissertation Singapore
National Institute of Education Nanyang Technological University
Khazanov L amp Gourgey A (2009) Instructors Perspectives on Students Mistaken Beliefs about Probability
in an Elementary College Statistics Course In K Safford-Ramus (Ed) Proceedings of the Adults
Learning Mathematics a Resaerch Forum (ALM) 15th
Annual International Conference 249-264
Khazanov L amp Prado L (2010) Correcting Students Misconceptions about Probability in an Introductory
College Statistics Course Adults Learning Mathematics-An International Journal 5(1) 23-35
Kleickmann T Richter D Kunter M Elsner J Besser M Krauss S amp Baumert J (2013) Teachersrsquo
Content Knowledge and Pedagogical Content Knowledge The Role of Structural Differences in Teacher
Education Journal of Teacher Education 64(1) 90-106 DOI1011770022487112460398
Leedy P D and Ormrod J E (2020) Practical research Planning and design (12th Global Edition) Harlow
England Pearson
Lessani A Md Yunus AS amp Bakar KBA (2017) Comparison of new mathematics teaching methods with
teacher-centered approach International Journal of Social Sciences 3(2) 1285-1297
httpsdxdoiorg1020319pijss20173212851297
Lim C amp Hwa T (2007) Promoting Mathematical Thinking in the Malaysian Classroom Issues and
challenges httpswwwresearchgatenetpublication252353381
Hokor amp Sedofia
138
Lovett J N amp Lee H S (2017) New Standards Require Teaching More Statistics Are Preservice Secondary
Mathematics Ready Journal of Teachers Education 68(3) 299-311 DOI 1011770022487117697918
Major T amp Mangope B (2012) The Constructivist Theory in Mathematics The case of Botswana Primary
Schools International Review of Social Sciencies and Humanities 3(2) 139-147
National Council of Teachers of Mathematics (2003) Principles and Standards for School Mathematics and
their Implications for Professional Development Reston VA NCTM
Nguyen L (2015) Developing Conceptual Understanding and Probabilistic Thinking through Tree Diagrams
Published MPhil Dissertation Manitoba The Faculty of Graduate Studies of the University of
Manitoba
Prideaux J (2007) The learner-centered approach to Mathematics Teaching and the Active Learning
Strategies used to Enhance Students Understanding Mathematical and Computing Sciences Masters
Paper 29 Fisher Digital Publications httpfisherpubsjfcedumathcsetdmasters29
Roseth C J Garfield J B amp Ben-Zvi D (2008) Collaboration in Learning and Teaching Statistics Journal
of Statistics Education 16 (1) 1069-1898 httpsdoiorg10108010691898200811889557
Santagata R and Sandholtz J H (2019) Preservice teachersrsquo mathematics teaching competence Comparing
performance on two measures Journal of Teacher Education 70 (5) 472 ndash484
Schwerdt G amp Wuppermann A C (2011) Is traditional teaching really all that bad A within-student
between-subject approach Economics of Education Review 30(2) 365-379
Sharma S (2016) Probability from a socio-cultural perspective Statistics Education Research Journal 15(2)
126-144 httpiase-weborgPublicationsphpp=SERJ
Shay K (2008) Tracing middle school students understanding of probability a longitudinal study
Unpublished Doctoral Dissertation New Brunswick New Jersey Rutgers State University of New
Jersey
Shulman L S (1986) Those who understand Knowledge growth in teaching Educational Researcher 15(2)
4-14 doi 1031021001318X015002004
Thomas L (2020) An introduction to quasi-experimental designs
httpswwwscribbrcommethodologyquasi-experimental-design
Voskoglou M (2019) Comparing Teaching Methods of Mathematics at University Level Education Sciences
9(204) doi103390educsci9030204
Vygotsky L S (1978) Mind in society The development of higher psychological processes Cambridge MA
Harvard University Press
Weldeana H N amp Abraham S T (2014) The effect of an historical perspective on prospective teachersrsquo
beliefs in learning mathematics Journal of Mathematics Teacher Education 17 303-330
doi101007s10857-013-9266-z
Weltman D amp Whiteside M (2010) Comparing the Effectiveness of Traditional and active Learning Methods
in Business Statistics Convergence to the Mean 18(1)
httpsdoiorg10108010691898201011889480
White H amp Sabarwal S (2014) Quasi-experimental design and methods methological briefs impact
evaluations Florence UNICEF Office of research
International Journal of Studies in Education and Science (IJSES)
139
Author Information
Evans Kofi Hokor
httpsorcidorg0000-0002-8387-8294
St Teresarsquos College of Education Hohoe
Department of Mathematics and ICT
P O Box 129
Ghana
Contact e-mail evanskhokorgmailcom
John Sedofia
httpsorcidorg0000-0002-5409-516X
University of Ghana Legon
Department of Teacher Education
PO Box LG 1181
Ghana
Hokor amp Sedofia
140
Appendix A Pre-test Probabilistic Reasoning Assessment
This assessment is for research purpose to improve teaching and learning of probability
You are required to answer all questions honestly Do and leave all workings or rough work on the paper
Pre-test Probabilistic Reasoning Assessment Duration 1hr
Index numberhelliphelliphelliphelliphelliphelliphelliphelliphelliphelliphelliphelliphelliphelliphelliphelliphelliphellipLevelhelliphelliphelliphellipAgehelliphelliphellip
Read each statement carefully and circle the letter of the correct (best) option Provide appropriate response in
the space provided under some items as it apply
1 If you rolled an ordinary die and obtained 51246 which of these is most likely to occur on your next
roll
a 1
b 2
c 3
d 4
e 5
f 6
g The options a b c d e and f are all equally
2i A fair coin is tossed and it lands tail The coin is to be tossed a second time What is the probability that the
second toss will also be a tail
a 1
4
b 1
2
c 1
3
d Slightly less than 1
2
e Slightly more than 1
2
f 0
2ii Which of the following best describes the reason for the correct answer to the preceding question (2i)
a The second toss is less likely to be tail because the first toss was tail
b There are four possible outcomes when you toss a coin twice Getting two tails is only one of them
c The chance of getting heads or tails on any one toss is always 1
2
d There are three possible outcomes when you toss a coin twice Getting two tails is only one of the them
e No chance of being a tail in the second toss
3i A box contains 6 balls 2 are red 2 are black and 2 blue Three balls are picked at random one at a time
Each time a ball is picked the colour is recorded and the ball is put back in the box mixed thoroughly If the
first 2 balls are black what color is the third ball most likely to be
a Red
International Journal of Studies in Education and Science (IJSES)
141
b Black
c Blue
d Red and blue are equally likely than black
e Red black and blue are all equally likely
3ii Which of the following best describes the reason for the correct answer in the preceding question (3i)
a The third ball should not be black because too many black ones have already been picked
b The picks are independent so every color has an equally likely chance of being picked
c Black seems to be lucky
d This color is just as likely as any other color
4 A spinner with ten equally divided sectors in which four parts are white and the rests are red is about to
be spin which color is the spinner more likely to land
a White
b Red
c Both white and red are all equally
5 If you toss a fair coin and get heads two times in a row which of these is most likely on next toss
a Tail
b Head
c Both head and tail are all equally
6 A Gh 2 Gh 5 Ghcent10 Gh 20 Gh 50 and Gh 100 notes were put in a box and thoroughly mixed
What is the probability of picking Gh 50 note without looking
a 1
187
b 50
187
c 1
6
d 0
7 In a game you have been offered two options Which of the following give you higher chance of
winning GHcent200
a Tossing one die once and obtaining a 6
b Tossing two dice once and obtaining two 6rsquos
c The options a and b are all equally
8 A fair die is to be toss six times which of these is most likely to occur
a 251634
b 123456
c 666341
d 132244
e The options a b c and d are all equally likely
9 A fair coin is to be toss four times in a row which of these is least likely to occur
a THTH
b TTTH
c HHH
Hokor amp Sedofia
142
d The options a b and c are all equally likely
10 Two fair dice are to be tossed once Which of the following is more likely to occur
a Obtaining a sum of 11
b Obtaining a sum of 10
c A sum of 11 and a sum of 10 are all equally likely
10i Give reason for the correct answer in the preceding question (10)
helliphelliphelliphelliphelliphelliphelliphelliphelliphelliphelliphelliphelliphelliphelliphelliphelliphelliphelliphelliphelliphelliphelliphelliphelliphelliphelliphelliphelliphelliphelliphelliphelliphelliphelliphelliphelliphelliphelliphelliphelliphellip
helliphelliphelliphelliphelliphelliphelliphelliphelliphelliphelliphelliphelliphelliphelliphelliphelliphelliphelliphelliphelliphelliphelliphelliphelliphelliphelliphelliphelliphelliphelliphelliphelliphelliphelliphelliphelliphelliphelliphelliphelliphellip
helliphelliphelliphelliphelliphelliphelliphelliphelliphelliphelliphelliphelliphelliphelliphelliphelliphelliphelliphelliphelliphelliphelliphelliphelliphelliphelliphelliphelliphelliphelliphelliphelliphelliphelliphelliphelliphelliphelliphelliphelliphellip
helliphelliphelliphelliphelliphelliphelliphelliphelliphelliphelliphelliphelliphelliphelliphelliphelliphelliphelliphelliphelliphelliphelliphelliphelliphelliphelliphelliphelliphelliphelliphelliphelliphelliphelliphelliphelliphellip
11 In national lottery one has to choose five numbers from 1 to 90 inclusive You win when at least two of
your numbers are part of the numbers drawn on Saturday at random Eric has chosen 4 6 7 9 and 11
Alex has chosen 15 23 45 66 and 80 Daniel has chosen 71 77 78 83 and 85 Do Eric Alex and
Daniel have the same chance of winning or not and why
helliphelliphelliphelliphelliphelliphelliphelliphelliphelliphelliphelliphelliphelliphelliphelliphelliphelliphelliphelliphelliphelliphelliphelliphelliphelliphelliphelliphelliphelliphelliphelliphelliphelliphelliphelliphelliphelliphelliphelliphellip
helliphelliphelliphelliphelliphelliphelliphelliphelliphelliphelliphelliphelliphelliphelliphelliphelliphelliphelliphelliphelliphelliphelliphelliphelliphelliphelliphelliphelliphelliphelliphelliphelliphelliphelliphelliphelliphelliphelliphelliphellip
helliphelliphelliphelliphelliphelliphelliphelliphelliphelliphelliphelliphelliphelliphelliphelliphelliphelliphelliphelliphelliphelliphelliphelliphelliphelliphelliphelliphelliphelliphelliphelliphelliphelliphelliphelliphelliphelliphelliphelliphellip
helliphelliphelliphelliphelliphelliphelliphelliphelliphelliphelliphelliphelliphelliphelliphelliphelliphelliphelliphelliphelliphelliphelliphelliphelliphelliphelliphelliphelliphelliphelliphelliphelliphelliphelliphellip
12 A box contains 8 yellow balls and 4 green balls Two balls are chosen at random one after the other
without replacement determine the probability that the two balls are of different colours
helliphelliphelliphelliphelliphelliphelliphelliphelliphelliphelliphelliphelliphelliphelliphelliphelliphelliphelliphelliphelliphelliphelliphelliphelliphelliphelliphelliphelliphelliphelliphelliphelliphelliphelliphelliphelliphelliphelliphelliphellip
helliphelliphelliphelliphelliphelliphelliphelliphelliphelliphelliphelliphelliphelliphelliphelliphelliphelliphelliphelliphelliphelliphelliphelliphelliphelliphelliphelliphelliphelliphelliphelliphelliphelliphelliphelliphelliphelliphelliphelliphellip
helliphelliphelliphelliphelliphelliphelliphelliphelliphelliphelliphelliphelliphelliphelliphelliphelliphelliphelliphelliphelliphelliphelliphelliphelliphelliphelliphelliphelliphelliphelliphelliphelliphelliphelliphelliphelliphelliphelliphelliphellip
helliphelliphelliphelliphelliphelliphelliphelliphelliphelliphelliphelliphelliphelliphelliphelliphelliphelliphelliphelliphelliphelliphelliphelliphelliphelliphelliphelliphelliphelliphelliphelliphelliphelliphelliphelliphellip
International Journal of Studies in Education and Science (IJSES)
143
Appendix B Post-test Probabilistic Reasoning Assessment
This assessment is for research purpose to improve teaching and learning of probability
You are required to answer all questions honestly Do and leave all workings or rough work on the paper
Post-test Probabilistic Reasoning Assessment Duration One Hour
Index numberhelliphelliphelliphelliphelliphelliphelliphelliphelliphelliphelliphelliphelliphelliphellipClasshelliphelliphelliphellipAgehelliphelliphelliphellip
Read each statement carefully and circle the letter of the correct (best) option for each item as much as possible
and provide appropriate response in the space provided
1 Suppose a particular outcome from a random event has a probability of 04 Which of the following
statements represents correct interpretations of this probability
a The outcome will not happen
b The outcome will certainly happen about four times out of every 10 trials
c The outcome is expected to happen about four times out of every 10 trials
d The outcome could happen or it couldnrsquot of either result are the same
2 If you toss a fair coin and get heads 3 times in a row what is the chance of getting a head on the next toss
a 1
b Greater than 1
2
c 1
2
d Less than 1
2
e 0
3 A die is numbered 1 2 3 4 4 5 When the die is thrown once Which of these is most likely and why
a 1
b 2
c 3
d 4
e 5
f They are all equally likely
3i Give reason for your chosen answer in (3)
helliphelliphelliphelliphelliphelliphelliphelliphelliphelliphelliphelliphelliphelliphelliphelliphelliphelliphelliphelliphelliphelliphelliphelliphelliphelliphelliphelliphelliphelliphelliphelliphelliphelliphelliphelliphelliphelliphelliphelliphelliphelliphelliphelliphellip
helliphelliphelliphelliphelliphelliphelliphelliphelliphelliphelliphelliphelliphelliphelliphelliphelliphelliphelliphelliphelliphelliphelliphelliphelliphelliphelliphelliphelliphelliphelliphelliphelliphelliphelliphelliphelliphelliphelliphelliphelliphelliphelliphelliphellip
helliphelliphelliphelliphelliphelliphelliphelliphelliphelliphelliphelliphelliphelliphelliphelliphelliphelliphelliphelliphelliphelliphelliphelliphelliphelliphelliphelliphelliphelliphelliphelliphelliphelliphelliphelliphelliphelliphelliphelliphelliphelliphelliphelliphellip
helliphelliphelliphelliphelliphelliphelliphelliphelliphelliphelliphelliphelliphelliphelliphelliphelliphelliphelliphelliphelliphelliphelliphelliphelliphelliphelliphelliphelliphelliphelliphelliphelliphelliphelliphelliphelliphelliphellip
4 German MP tossed two dice once Which of these is mostly likely and why
a Obtaining a sum of 4
b Obtaining a sum of 7
c Obtaining a sum of 11
d All of them have equal chance of occurring that is a b c
Hokor amp Sedofia
144
4i Give reason for your chosen answer in (4)
helliphelliphelliphelliphelliphelliphelliphelliphelliphelliphelliphelliphelliphelliphelliphelliphelliphelliphelliphelliphelliphelliphelliphelliphelliphelliphelliphelliphelliphelliphelliphelliphelliphelliphelliphelliphelliphelliphelliphelliphelliphelliphelliphelliphellip
helliphelliphelliphelliphelliphelliphelliphelliphelliphelliphelliphelliphelliphelliphelliphelliphelliphelliphelliphelliphelliphelliphelliphelliphelliphelliphelliphelliphelliphelliphelliphelliphelliphelliphelliphelliphelliphelliphelliphelliphelliphelliphelliphelliphellip
helliphelliphelliphelliphelliphelliphelliphelliphelliphelliphelliphelliphelliphelliphelliphelliphelliphelliphelliphelliphelliphelliphelliphelliphelliphelliphelliphelliphelliphelliphelliphelliphelliphelliphelliphelliphelliphelliphelliphelliphelliphelliphelliphelliphellip
helliphelliphelliphelliphelliphelliphelliphelliphelliphelliphelliphelliphelliphelliphelliphelliphelliphelliphelliphelliphelliphelliphelliphelliphelliphelliphelliphelliphelliphelliphelliphelliphelliphelliphelliphelliphelliphelliphelliphelliphelliphelliphelliphelliphellip
helliphelliphelliphelliphelliphelliphelliphelliphelliphelliphelliphelliphelliphelliphelliphelliphelliphelliphelliphelliphelliphelliphelliphelliphelliphelliphelliphelliphellip
5i A fair coin is to be toss four times which of these is most likely to occur
a HTHT
b THTT
c TTTT
d HHTH
e The options a b c and d are all equally likely
5ii Give reason for your chosen answer in (5i)
helliphelliphelliphelliphelliphelliphelliphelliphelliphelliphelliphelliphelliphelliphelliphelliphelliphelliphelliphelliphelliphelliphelliphelliphelliphelliphelliphelliphelliphelliphelliphelliphelliphelliphelliphelliphelliphelliphelliphelliphelliphelliphelliphelliphellip
helliphelliphelliphelliphelliphelliphelliphelliphelliphelliphelliphelliphelliphelliphelliphelliphelliphelliphelliphelliphelliphelliphelliphelliphelliphelliphelliphelliphelliphelliphelliphelliphelliphelliphelliphelliphelliphelliphelliphelliphelliphelliphelliphelliphellip
helliphelliphelliphelliphelliphelliphelliphelliphelliphelliphelliphelliphelliphelliphelliphelliphelliphelliphelliphelliphelliphelliphelliphelliphelliphelliphelliphelliphelliphelliphelliphelliphelliphelliphelliphelliphelliphelliphelliphelliphelliphelliphelliphelliphellip
helliphelliphelliphelliphelliphelliphelliphelliphelliphelliphelliphelliphelliphelliphelliphelliphelliphelliphelliphelliphelliphelliphelliphelliphelliphelliphelliphelliphelliphelliphelliphelliphelliphelliphelliphelliphelliphelliphellip
6i A fair coin is to be toss four times which of these is least likely to occur
a HTHT
b THTT
c TTTT
d HHTH
e The options a b c and d are all equally likely
6ii Give reason for your chosen answer in (6i)
helliphelliphelliphelliphelliphelliphelliphelliphelliphelliphelliphelliphelliphelliphelliphelliphelliphelliphelliphelliphelliphelliphelliphelliphelliphelliphelliphelliphelliphelliphelliphelliphelliphelliphelliphelliphelliphelliphelliphelliphelliphelliphelliphelliphellip
helliphelliphelliphelliphelliphelliphelliphelliphelliphelliphelliphelliphelliphelliphelliphelliphelliphelliphelliphelliphelliphelliphelliphelliphelliphelliphelliphelliphelliphelliphelliphelliphelliphelliphelliphelliphelliphelliphelliphelliphelliphelliphelliphelliphellip
helliphelliphelliphelliphelliphelliphelliphelliphelliphelliphelliphelliphelliphelliphelliphelliphelliphelliphelliphelliphelliphelliphelliphelliphelliphelliphelliphelliphelliphelliphelliphelliphelliphelliphelliphelliphelliphelliphelliphelliphelliphelliphelliphelliphellip
helliphelliphelliphellip
7 A college has 300 level 200 students and 236 level 100 students in it Each studentrsquos name is written with
the level on a piece of paper and all the names are put into a box and mixed thoroughly A tutor picks one
name out of the box without looking Which level is the tutor more likely to pick from and why
helliphelliphelliphelliphelliphelliphelliphelliphelliphelliphelliphelliphelliphelliphelliphelliphelliphelliphelliphelliphelliphelliphelliphelliphelliphelliphelliphelliphelliphelliphelliphelliphelliphelliphelliphelliphelliphelliphelliphelliphelliphelliphelliphelliphellip
helliphelliphelliphelliphelliphelliphelliphelliphelliphelliphelliphelliphelliphelliphelliphelliphelliphelliphelliphelliphelliphelliphelliphelliphelliphelliphelliphelliphelliphelliphelliphelliphelliphelliphelliphelliphelliphelliphelliphelliphelliphelliphelliphelliphellip
helliphelliphelliphelliphelliphelliphelliphelliphelliphelliphelliphelliphelliphelliphelliphelliphelliphelliphelliphelliphelliphelliphelliphelliphelliphelliphelliphelliphelliphelliphelliphelliphelliphelliphelliphelliphelliphelliphelliphelliphelliphelliphelliphelliphellip
helliphelliphelliphelliphelliphelliphelliphelliphelliphelliphelliphelliphelliphelliphelliphelliphelliphelliphelliphelliphelliphelliphelliphelliphelliphelliphelliphelliphelliphelliphelliphelliphelliphelliphelliphelliphelliphelliphelliphellip
8 Suppose that you toss a coin three times and all eight outcomes are equally likely If it is known that the first
toss comes up heads what is the probability of an odd number of heads appearing
helliphelliphelliphelliphelliphelliphelliphelliphelliphelliphelliphelliphelliphelliphelliphelliphelliphelliphelliphelliphelliphelliphelliphelliphelliphelliphelliphelliphelliphelliphelliphelliphelliphelliphelliphelliphelliphelliphelliphelliphelliphelliphelliphelliphellip
helliphelliphelliphelliphelliphelliphelliphelliphelliphelliphelliphelliphelliphelliphelliphelliphelliphelliphelliphelliphelliphelliphelliphelliphelliphelliphelliphelliphelliphelliphelliphelliphelliphelliphelliphelliphelliphelliphelliphelliphelliphelliphelliphelliphellip
helliphelliphelliphelliphelliphelliphelliphelliphelliphelliphelliphelliphelliphelliphelliphelliphelliphelliphelliphelliphelliphelliphelliphelliphelliphelliphelliphelliphelliphelliphelliphelliphelliphelliphelliphelliphelliphelliphelliphelliphelliphelliphelliphelliphellip
International Journal of Studies in Education and Science (IJSES)
145
helliphelliphelliphelliphelliphelliphelliphelliphelliphelliphelliphelliphelliphelliphelliphelliphelliphelliphelliphelliphelliphelliphelliphelliphelliphelliphelliphelliphelliphelliphelliphelliphelliphelliphelliphelliphelliphelliphelliphelliphelliphelliphelliphelliphellip
helliphelliphelliphelliphelliphelliphelliphelliphelliphelliphelliphelliphelliphelliphelliphelliphelliphelliphelliphelliphelliphelliphelliphelliphelliphelliphelliphelliphelliphelliphelliphelliphelliphelliphelliphelliphelliphelliphelliphelliphelliphelliphelliphelliphellip
helliphelliphelliphelliphelliphelliphelliphelliphelliphelliphelliphelliphelliphelliphelliphelliphelliphelliphelliphellip
9 A card is selected at random from a pack of 52 cards Find the probability of selecting a card which is a red or
a queen
helliphelliphelliphelliphelliphelliphelliphelliphelliphelliphelliphelliphelliphelliphelliphelliphelliphelliphelliphelliphelliphelliphelliphelliphelliphelliphelliphelliphelliphelliphelliphelliphelliphelliphelliphelliphelliphelliphelliphelliphelliphelliphelliphelliphellip
helliphelliphelliphelliphelliphelliphelliphelliphelliphelliphelliphelliphelliphelliphelliphelliphelliphelliphelliphelliphelliphelliphelliphelliphelliphelliphelliphelliphelliphelliphelliphelliphelliphelliphelliphelliphelliphelliphelliphelliphelliphelliphelliphelliphellip
helliphelliphelliphelliphelliphelliphelliphelliphelliphelliphelliphelliphelliphelliphelliphelliphelliphelliphelliphelliphelliphelliphelliphelliphelliphelliphelliphelliphelliphelliphelliphelliphelliphelliphelliphelliphelliphelliphelliphelliphelliphelliphelliphelliphellip
helliphelliphelliphelliphelliphelliphelliphelliphelliphelliphelliphelliphelliphelliphelliphelliphelliphelliphelliphelliphelliphelliphelliphelliphelliphelliphelliphelliphelliphelliphelliphelliphelliphelliphelliphelliphelliphelliphelliphellip
10 A box contains 6 white balls and 4 green balls Two balls are chosen at random one after the other without
replacement determine the probability that the second ball is white
helliphelliphelliphelliphelliphelliphelliphelliphelliphelliphelliphelliphelliphelliphelliphelliphelliphelliphelliphelliphelliphelliphelliphelliphelliphelliphelliphelliphelliphelliphelliphelliphelliphelliphelliphelliphelliphelliphelliphelliphelliphelliphelliphelliphellip
helliphelliphelliphelliphelliphelliphelliphelliphelliphelliphelliphelliphelliphelliphelliphelliphelliphelliphelliphelliphelliphelliphelliphelliphelliphelliphelliphelliphelliphelliphelliphelliphelliphelliphelliphelliphelliphelliphelliphelliphelliphelliphelliphelliphellip
helliphelliphelliphelliphelliphelliphelliphelliphelliphelliphelliphelliphelliphelliphelliphelliphelliphelliphelliphelliphelliphelliphelliphelliphelliphelliphelliphelliphelliphelliphelliphelliphelliphelliphelliphelliphelliphelliphelliphelliphelliphelliphelliphelliphellip
helliphelliphelliphelliphelliphelliphelliphelliphelliphelliphelliphelliphelliphelliphelliphelliphelliphelliphelliphelliphelliphelliphelliphelliphelliphelliphelliphelliphelliphelliphelliphelliphelliphelliphelliphelliphelliphelliphelliphelliphelliphelliphellip

Hokor amp Sedofia
136
Limitations
As with every empirical study employing the quasi-experimental approach the current study has some
limitations which need to be acknowledged and used to guide users of the findings Firstly our sample was
drawn from a population of second year preservice teachers of a female only college of education in a peri-
urban area in Ghana Further experiments are therefore needed in other settings in order to see if the same or
similar results will occur Secondly owing to the narrow characteristics of the participants in the present study
the researchers cannot generalize the results to other individuals who do not have the same characteristics So
additional experiments with groups with different characteristics are necessary Lastly the experiments need to
be repeated at another time to determine if the results are the same (consistent) over time
Acknowledgements
We are grateful to the Principal and preservice teachers for granting access and participating in the study
respectively
References
AIAhmad H (2021) The role of educational communication in promoting student-centered learning style in
multicultural classrooms A reflective essay on learning and teaching in higher education International
Journal of Research in Education and Science (IJRES) 7(3) 838-851 httpsdoiorg1046328ijes2374
Aina J K Olanipekun S S amp Garuba I A (2015) Teachersrsquo effectiveness and its Influence on studentsrsquo
learning Advances in Social Sciences Research Journal 2(4) 88-95
Anway D W amp Bennett E (2004) Common Misconceptions in Probability among Students in an Elementary
Statistics class Unplished Senior Project The ARTIST Roundtable Conference on Assessment in
Statistics held at Lawrence University Supperior WI The University of Wisconsin-Superior
Bada S (2015) Constructivist Learning Theory A Paradigm for Teaching and Learning IOSR Journal of
Research and Method in Education (IOSR-JRME) 5(6) 66-70 httpsDOI1097907388-05616670
Baerveldt C (2013) Constructivism contested Implications of a genetic perspective in psychology Integrative
Psychological and Behavioral Science 47(1) 156-166
Batanero C (2013) Teaching and learning probability In S Lerman (Ed ) Encyclopedia of Mathematics
Education Heidelberg Springer
Batanero C and Diaz C (2012) Training school teachers to teach probability reflections and challenges
Chilean Journal of Statistics 3(1) 3-13
Belova N amp Zowada C (2020) Innovating Higher Education Via Game-Based Learning on Misconceptions
Education Sciences 10 221 doi103390educSCi10090221
Bennett E amp Anway D W (2003) Statistical and Probabilistic Reasoning and Misconceptions among
Selected College Students McNair Scholars Journal Vol 4 httpwwwsocheclchjs
Cantoy O (2010) Mathematics teachersrsquo topic-specific pedagogical content knowledge in the context of
teaching a0 0 and a divide 0 Educational Sciences Theory and Practice 10 (2) 749-769
International Journal of Studies in Education and Science (IJSES)
137
Clements D H amp Battista M (1990) Constructivist Learning and Teaching The
Arithetic Teacher 38(1) ProQuest Central pg 34 DOI105951AT3810034
Creswell J W amp Creswell J D (2018) Research design Qualitative quantitative and
mixed methods approaches (5th
ed) Los Angeles SAGE Publications Inc
Courtney S A amp Caniglia J (2021) Comparing the mathematical practices pre-service teachers and
mathematics teacher educators identified as relevant to problems and tasks International Journal of
Research in Education and Science (IJRES) 7(3) 954-971 httpsdoiorg1046328ijres2335
Denton D W (2012) Enhancing instruction through constructivism cooperative learning and cloud
computing Tech Trends 56(4) 34-41
Gage J (2012) Towards a new Probability Curriculum for Secondary Schools Paper presented at 12th
International Congress on Mathematical Education 8 July-15 July COEX Seoul Korea Cambridge
Cambridge University Uk
Gurbuz R amp Birgin O (2011) The effect of computer-assisted teaching on remedying misconceptions The
case of the subject Probability Journal Homepage 58(2012) DOI 101016jcompedu201111005
Hirsh L amp ODonnell A M (2001) Representativeness in Statistical Reasoning Identifying and Assessing
Misconceptions Journal of Statistics Education 9(2) 96-105 DOI10108010691898200111910655
Johnson H D amp Dasgupta N (2005) Traditional versus Non-traditional Teaching during Perspectives of
Students in Introductory Statistics Classes Journal of Statistics Education 13(2)
httpsdoiorg10108010691898200511910558
Major T amp Mangope B (2012) The Constructivist Theory in Mathematics The case of Botswana Primary
Schools International Review of Social Sciencies and Humanities 3(2) 139-147
Jones G (2005) Reflections In GA Jones (Ed) Exploring probability in school chanlleges for teaching and
probability (367-372) New York Springer
Jun L (2000) Chinese Students Understanding of Probability Published doctoral dissertation Singapore
National Institute of Education Nanyang Technological University
Khazanov L amp Gourgey A (2009) Instructors Perspectives on Students Mistaken Beliefs about Probability
in an Elementary College Statistics Course In K Safford-Ramus (Ed) Proceedings of the Adults
Learning Mathematics a Resaerch Forum (ALM) 15th
Annual International Conference 249-264
Khazanov L amp Prado L (2010) Correcting Students Misconceptions about Probability in an Introductory
College Statistics Course Adults Learning Mathematics-An International Journal 5(1) 23-35
Kleickmann T Richter D Kunter M Elsner J Besser M Krauss S amp Baumert J (2013) Teachersrsquo
Content Knowledge and Pedagogical Content Knowledge The Role of Structural Differences in Teacher
Education Journal of Teacher Education 64(1) 90-106 DOI1011770022487112460398
Leedy P D and Ormrod J E (2020) Practical research Planning and design (12th Global Edition) Harlow
England Pearson
Lessani A Md Yunus AS amp Bakar KBA (2017) Comparison of new mathematics teaching methods with
teacher-centered approach International Journal of Social Sciences 3(2) 1285-1297
httpsdxdoiorg1020319pijss20173212851297
Lim C amp Hwa T (2007) Promoting Mathematical Thinking in the Malaysian Classroom Issues and
challenges httpswwwresearchgatenetpublication252353381
Hokor amp Sedofia
138
Lovett J N amp Lee H S (2017) New Standards Require Teaching More Statistics Are Preservice Secondary
Mathematics Ready Journal of Teachers Education 68(3) 299-311 DOI 1011770022487117697918
Major T amp Mangope B (2012) The Constructivist Theory in Mathematics The case of Botswana Primary
Schools International Review of Social Sciencies and Humanities 3(2) 139-147
National Council of Teachers of Mathematics (2003) Principles and Standards for School Mathematics and
their Implications for Professional Development Reston VA NCTM
Nguyen L (2015) Developing Conceptual Understanding and Probabilistic Thinking through Tree Diagrams
Published MPhil Dissertation Manitoba The Faculty of Graduate Studies of the University of
Manitoba
Prideaux J (2007) The learner-centered approach to Mathematics Teaching and the Active Learning
Strategies used to Enhance Students Understanding Mathematical and Computing Sciences Masters
Paper 29 Fisher Digital Publications httpfisherpubsjfcedumathcsetdmasters29
Roseth C J Garfield J B amp Ben-Zvi D (2008) Collaboration in Learning and Teaching Statistics Journal
of Statistics Education 16 (1) 1069-1898 httpsdoiorg10108010691898200811889557
Santagata R and Sandholtz J H (2019) Preservice teachersrsquo mathematics teaching competence Comparing
performance on two measures Journal of Teacher Education 70 (5) 472 ndash484
Schwerdt G amp Wuppermann A C (2011) Is traditional teaching really all that bad A within-student
between-subject approach Economics of Education Review 30(2) 365-379
Sharma S (2016) Probability from a socio-cultural perspective Statistics Education Research Journal 15(2)
126-144 httpiase-weborgPublicationsphpp=SERJ
Shay K (2008) Tracing middle school students understanding of probability a longitudinal study
Unpublished Doctoral Dissertation New Brunswick New Jersey Rutgers State University of New
Jersey
Shulman L S (1986) Those who understand Knowledge growth in teaching Educational Researcher 15(2)
4-14 doi 1031021001318X015002004
Thomas L (2020) An introduction to quasi-experimental designs
httpswwwscribbrcommethodologyquasi-experimental-design
Voskoglou M (2019) Comparing Teaching Methods of Mathematics at University Level Education Sciences
9(204) doi103390educsci9030204
Vygotsky L S (1978) Mind in society The development of higher psychological processes Cambridge MA
Harvard University Press
Weldeana H N amp Abraham S T (2014) The effect of an historical perspective on prospective teachersrsquo
beliefs in learning mathematics Journal of Mathematics Teacher Education 17 303-330
doi101007s10857-013-9266-z
Weltman D amp Whiteside M (2010) Comparing the Effectiveness of Traditional and active Learning Methods
in Business Statistics Convergence to the Mean 18(1)
httpsdoiorg10108010691898201011889480
White H amp Sabarwal S (2014) Quasi-experimental design and methods methological briefs impact
evaluations Florence UNICEF Office of research
International Journal of Studies in Education and Science (IJSES)
139
Author Information
Evans Kofi Hokor
httpsorcidorg0000-0002-8387-8294
St Teresarsquos College of Education Hohoe
Department of Mathematics and ICT
P O Box 129
Ghana
Contact e-mail evanskhokorgmailcom
John Sedofia
httpsorcidorg0000-0002-5409-516X
University of Ghana Legon
Department of Teacher Education
PO Box LG 1181
Ghana
Hokor amp Sedofia
140
Appendix A Pre-test Probabilistic Reasoning Assessment
This assessment is for research purpose to improve teaching and learning of probability
You are required to answer all questions honestly Do and leave all workings or rough work on the paper
Pre-test Probabilistic Reasoning Assessment Duration 1hr
Index numberhelliphelliphelliphelliphelliphelliphelliphelliphelliphelliphelliphelliphelliphelliphelliphelliphelliphellipLevelhelliphelliphelliphellipAgehelliphelliphellip
Read each statement carefully and circle the letter of the correct (best) option Provide appropriate response in
the space provided under some items as it apply
1 If you rolled an ordinary die and obtained 51246 which of these is most likely to occur on your next
roll
a 1
b 2
c 3
d 4
e 5
f 6
g The options a b c d e and f are all equally
2i A fair coin is tossed and it lands tail The coin is to be tossed a second time What is the probability that the
second toss will also be a tail
a 1
4
b 1
2
c 1
3
d Slightly less than 1
2
e Slightly more than 1
2
f 0
2ii Which of the following best describes the reason for the correct answer to the preceding question (2i)
a The second toss is less likely to be tail because the first toss was tail
b There are four possible outcomes when you toss a coin twice Getting two tails is only one of them
c The chance of getting heads or tails on any one toss is always 1
2
d There are three possible outcomes when you toss a coin twice Getting two tails is only one of the them
e No chance of being a tail in the second toss
3i A box contains 6 balls 2 are red 2 are black and 2 blue Three balls are picked at random one at a time
Each time a ball is picked the colour is recorded and the ball is put back in the box mixed thoroughly If the
first 2 balls are black what color is the third ball most likely to be
a Red
International Journal of Studies in Education and Science (IJSES)
141
b Black
c Blue
d Red and blue are equally likely than black
e Red black and blue are all equally likely
3ii Which of the following best describes the reason for the correct answer in the preceding question (3i)
a The third ball should not be black because too many black ones have already been picked
b The picks are independent so every color has an equally likely chance of being picked
c Black seems to be lucky
d This color is just as likely as any other color
4 A spinner with ten equally divided sectors in which four parts are white and the rests are red is about to
be spin which color is the spinner more likely to land
a White
b Red
c Both white and red are all equally
5 If you toss a fair coin and get heads two times in a row which of these is most likely on next toss
a Tail
b Head
c Both head and tail are all equally
6 A Gh 2 Gh 5 Ghcent10 Gh 20 Gh 50 and Gh 100 notes were put in a box and thoroughly mixed
What is the probability of picking Gh 50 note without looking
a 1
187
b 50
187
c 1
6
d 0
7 In a game you have been offered two options Which of the following give you higher chance of
winning GHcent200
a Tossing one die once and obtaining a 6
b Tossing two dice once and obtaining two 6rsquos
c The options a and b are all equally
8 A fair die is to be toss six times which of these is most likely to occur
a 251634
b 123456
c 666341
d 132244
e The options a b c and d are all equally likely
9 A fair coin is to be toss four times in a row which of these is least likely to occur
a THTH
b TTTH
c HHH
Hokor amp Sedofia
142
d The options a b and c are all equally likely
10 Two fair dice are to be tossed once Which of the following is more likely to occur
a Obtaining a sum of 11
b Obtaining a sum of 10
c A sum of 11 and a sum of 10 are all equally likely
10i Give reason for the correct answer in the preceding question (10)
helliphelliphelliphelliphelliphelliphelliphelliphelliphelliphelliphelliphelliphelliphelliphelliphelliphelliphelliphelliphelliphelliphelliphelliphelliphelliphelliphelliphelliphelliphelliphelliphelliphelliphelliphelliphelliphelliphelliphelliphelliphellip
helliphelliphelliphelliphelliphelliphelliphelliphelliphelliphelliphelliphelliphelliphelliphelliphelliphelliphelliphelliphelliphelliphelliphelliphelliphelliphelliphelliphelliphelliphelliphelliphelliphelliphelliphelliphelliphelliphelliphelliphelliphellip
helliphelliphelliphelliphelliphelliphelliphelliphelliphelliphelliphelliphelliphelliphelliphelliphelliphelliphelliphelliphelliphelliphelliphelliphelliphelliphelliphelliphelliphelliphelliphelliphelliphelliphelliphelliphelliphelliphelliphelliphelliphellip
helliphelliphelliphelliphelliphelliphelliphelliphelliphelliphelliphelliphelliphelliphelliphelliphelliphelliphelliphelliphelliphelliphelliphelliphelliphelliphelliphelliphelliphelliphelliphelliphelliphelliphelliphelliphelliphellip
11 In national lottery one has to choose five numbers from 1 to 90 inclusive You win when at least two of
your numbers are part of the numbers drawn on Saturday at random Eric has chosen 4 6 7 9 and 11
Alex has chosen 15 23 45 66 and 80 Daniel has chosen 71 77 78 83 and 85 Do Eric Alex and
Daniel have the same chance of winning or not and why
helliphelliphelliphelliphelliphelliphelliphelliphelliphelliphelliphelliphelliphelliphelliphelliphelliphelliphelliphelliphelliphelliphelliphelliphelliphelliphelliphelliphelliphelliphelliphelliphelliphelliphelliphelliphelliphelliphelliphelliphellip
helliphelliphelliphelliphelliphelliphelliphelliphelliphelliphelliphelliphelliphelliphelliphelliphelliphelliphelliphelliphelliphelliphelliphelliphelliphelliphelliphelliphelliphelliphelliphelliphelliphelliphelliphelliphelliphelliphelliphelliphellip
helliphelliphelliphelliphelliphelliphelliphelliphelliphelliphelliphelliphelliphelliphelliphelliphelliphelliphelliphelliphelliphelliphelliphelliphelliphelliphelliphelliphelliphelliphelliphelliphelliphelliphelliphelliphelliphelliphelliphelliphellip
helliphelliphelliphelliphelliphelliphelliphelliphelliphelliphelliphelliphelliphelliphelliphelliphelliphelliphelliphelliphelliphelliphelliphelliphelliphelliphelliphelliphelliphelliphelliphelliphelliphelliphelliphellip
12 A box contains 8 yellow balls and 4 green balls Two balls are chosen at random one after the other
without replacement determine the probability that the two balls are of different colours
helliphelliphelliphelliphelliphelliphelliphelliphelliphelliphelliphelliphelliphelliphelliphelliphelliphelliphelliphelliphelliphelliphelliphelliphelliphelliphelliphelliphelliphelliphelliphelliphelliphelliphelliphelliphelliphelliphelliphelliphellip
helliphelliphelliphelliphelliphelliphelliphelliphelliphelliphelliphelliphelliphelliphelliphelliphelliphelliphelliphelliphelliphelliphelliphelliphelliphelliphelliphelliphelliphelliphelliphelliphelliphelliphelliphelliphelliphelliphelliphelliphellip
helliphelliphelliphelliphelliphelliphelliphelliphelliphelliphelliphelliphelliphelliphelliphelliphelliphelliphelliphelliphelliphelliphelliphelliphelliphelliphelliphelliphelliphelliphelliphelliphelliphelliphelliphelliphelliphelliphelliphelliphellip
helliphelliphelliphelliphelliphelliphelliphelliphelliphelliphelliphelliphelliphelliphelliphelliphelliphelliphelliphelliphelliphelliphelliphelliphelliphelliphelliphelliphelliphelliphelliphelliphelliphelliphelliphelliphellip
International Journal of Studies in Education and Science (IJSES)
143
Appendix B Post-test Probabilistic Reasoning Assessment
This assessment is for research purpose to improve teaching and learning of probability
You are required to answer all questions honestly Do and leave all workings or rough work on the paper
Post-test Probabilistic Reasoning Assessment Duration One Hour
Index numberhelliphelliphelliphelliphelliphelliphelliphelliphelliphelliphelliphelliphelliphelliphellipClasshelliphelliphelliphellipAgehelliphelliphelliphellip
Read each statement carefully and circle the letter of the correct (best) option for each item as much as possible
and provide appropriate response in the space provided
1 Suppose a particular outcome from a random event has a probability of 04 Which of the following
statements represents correct interpretations of this probability
a The outcome will not happen
b The outcome will certainly happen about four times out of every 10 trials
c The outcome is expected to happen about four times out of every 10 trials
d The outcome could happen or it couldnrsquot of either result are the same
2 If you toss a fair coin and get heads 3 times in a row what is the chance of getting a head on the next toss
a 1
b Greater than 1
2
c 1
2
d Less than 1
2
e 0
3 A die is numbered 1 2 3 4 4 5 When the die is thrown once Which of these is most likely and why
a 1
b 2
c 3
d 4
e 5
f They are all equally likely
3i Give reason for your chosen answer in (3)
helliphelliphelliphelliphelliphelliphelliphelliphelliphelliphelliphelliphelliphelliphelliphelliphelliphelliphelliphelliphelliphelliphelliphelliphelliphelliphelliphelliphelliphelliphelliphelliphelliphelliphelliphelliphelliphelliphelliphelliphelliphelliphelliphelliphellip
helliphelliphelliphelliphelliphelliphelliphelliphelliphelliphelliphelliphelliphelliphelliphelliphelliphelliphelliphelliphelliphelliphelliphelliphelliphelliphelliphelliphelliphelliphelliphelliphelliphelliphelliphelliphelliphelliphelliphelliphelliphelliphelliphelliphellip
helliphelliphelliphelliphelliphelliphelliphelliphelliphelliphelliphelliphelliphelliphelliphelliphelliphelliphelliphelliphelliphelliphelliphelliphelliphelliphelliphelliphelliphelliphelliphelliphelliphelliphelliphelliphelliphelliphelliphelliphelliphelliphelliphelliphellip
helliphelliphelliphelliphelliphelliphelliphelliphelliphelliphelliphelliphelliphelliphelliphelliphelliphelliphelliphelliphelliphelliphelliphelliphelliphelliphelliphelliphelliphelliphelliphelliphelliphelliphelliphelliphelliphelliphellip
4 German MP tossed two dice once Which of these is mostly likely and why
a Obtaining a sum of 4
b Obtaining a sum of 7
c Obtaining a sum of 11
d All of them have equal chance of occurring that is a b c
Hokor amp Sedofia
144
4i Give reason for your chosen answer in (4)
helliphelliphelliphelliphelliphelliphelliphelliphelliphelliphelliphelliphelliphelliphelliphelliphelliphelliphelliphelliphelliphelliphelliphelliphelliphelliphelliphelliphelliphelliphelliphelliphelliphelliphelliphelliphelliphelliphelliphelliphelliphelliphelliphelliphellip
helliphelliphelliphelliphelliphelliphelliphelliphelliphelliphelliphelliphelliphelliphelliphelliphelliphelliphelliphelliphelliphelliphelliphelliphelliphelliphelliphelliphelliphelliphelliphelliphelliphelliphelliphelliphelliphelliphelliphelliphelliphelliphelliphelliphellip
helliphelliphelliphelliphelliphelliphelliphelliphelliphelliphelliphelliphelliphelliphelliphelliphelliphelliphelliphelliphelliphelliphelliphelliphelliphelliphelliphelliphelliphelliphelliphelliphelliphelliphelliphelliphelliphelliphelliphelliphelliphelliphelliphelliphellip
helliphelliphelliphelliphelliphelliphelliphelliphelliphelliphelliphelliphelliphelliphelliphelliphelliphelliphelliphelliphelliphelliphelliphelliphelliphelliphelliphelliphelliphelliphelliphelliphelliphelliphelliphelliphelliphelliphelliphelliphelliphelliphelliphelliphellip
helliphelliphelliphelliphelliphelliphelliphelliphelliphelliphelliphelliphelliphelliphelliphelliphelliphelliphelliphelliphelliphelliphelliphelliphelliphelliphelliphelliphellip
5i A fair coin is to be toss four times which of these is most likely to occur
a HTHT
b THTT
c TTTT
d HHTH
e The options a b c and d are all equally likely
5ii Give reason for your chosen answer in (5i)
helliphelliphelliphelliphelliphelliphelliphelliphelliphelliphelliphelliphelliphelliphelliphelliphelliphelliphelliphelliphelliphelliphelliphelliphelliphelliphelliphelliphelliphelliphelliphelliphelliphelliphelliphelliphelliphelliphelliphelliphelliphelliphelliphelliphellip
helliphelliphelliphelliphelliphelliphelliphelliphelliphelliphelliphelliphelliphelliphelliphelliphelliphelliphelliphelliphelliphelliphelliphelliphelliphelliphelliphelliphelliphelliphelliphelliphelliphelliphelliphelliphelliphelliphelliphelliphelliphelliphelliphelliphellip
helliphelliphelliphelliphelliphelliphelliphelliphelliphelliphelliphelliphelliphelliphelliphelliphelliphelliphelliphelliphelliphelliphelliphelliphelliphelliphelliphelliphelliphelliphelliphelliphelliphelliphelliphelliphelliphelliphelliphelliphelliphelliphelliphelliphellip
helliphelliphelliphelliphelliphelliphelliphelliphelliphelliphelliphelliphelliphelliphelliphelliphelliphelliphelliphelliphelliphelliphelliphelliphelliphelliphelliphelliphelliphelliphelliphelliphelliphelliphelliphelliphelliphelliphellip
6i A fair coin is to be toss four times which of these is least likely to occur
a HTHT
b THTT
c TTTT
d HHTH
e The options a b c and d are all equally likely
6ii Give reason for your chosen answer in (6i)
helliphelliphelliphelliphelliphelliphelliphelliphelliphelliphelliphelliphelliphelliphelliphelliphelliphelliphelliphelliphelliphelliphelliphelliphelliphelliphelliphelliphelliphelliphelliphelliphelliphelliphelliphelliphelliphelliphelliphelliphelliphelliphelliphelliphellip
helliphelliphelliphelliphelliphelliphelliphelliphelliphelliphelliphelliphelliphelliphelliphelliphelliphelliphelliphelliphelliphelliphelliphelliphelliphelliphelliphelliphelliphelliphelliphelliphelliphelliphelliphelliphelliphelliphelliphelliphelliphelliphelliphelliphellip
helliphelliphelliphelliphelliphelliphelliphelliphelliphelliphelliphelliphelliphelliphelliphelliphelliphelliphelliphelliphelliphelliphelliphelliphelliphelliphelliphelliphelliphelliphelliphelliphelliphelliphelliphelliphelliphelliphelliphelliphelliphelliphelliphelliphellip
helliphelliphelliphellip
7 A college has 300 level 200 students and 236 level 100 students in it Each studentrsquos name is written with
the level on a piece of paper and all the names are put into a box and mixed thoroughly A tutor picks one
name out of the box without looking Which level is the tutor more likely to pick from and why
helliphelliphelliphelliphelliphelliphelliphelliphelliphelliphelliphelliphelliphelliphelliphelliphelliphelliphelliphelliphelliphelliphelliphelliphelliphelliphelliphelliphelliphelliphelliphelliphelliphelliphelliphelliphelliphelliphelliphelliphelliphelliphelliphelliphellip
helliphelliphelliphelliphelliphelliphelliphelliphelliphelliphelliphelliphelliphelliphelliphelliphelliphelliphelliphelliphelliphelliphelliphelliphelliphelliphelliphelliphelliphelliphelliphelliphelliphelliphelliphelliphelliphelliphelliphelliphelliphelliphelliphelliphellip
helliphelliphelliphelliphelliphelliphelliphelliphelliphelliphelliphelliphelliphelliphelliphelliphelliphelliphelliphelliphelliphelliphelliphelliphelliphelliphelliphelliphelliphelliphelliphelliphelliphelliphelliphelliphelliphelliphelliphelliphelliphelliphelliphelliphellip
helliphelliphelliphelliphelliphelliphelliphelliphelliphelliphelliphelliphelliphelliphelliphelliphelliphelliphelliphelliphelliphelliphelliphelliphelliphelliphelliphelliphelliphelliphelliphelliphelliphelliphelliphelliphelliphelliphelliphellip
8 Suppose that you toss a coin three times and all eight outcomes are equally likely If it is known that the first
toss comes up heads what is the probability of an odd number of heads appearing
helliphelliphelliphelliphelliphelliphelliphelliphelliphelliphelliphelliphelliphelliphelliphelliphelliphelliphelliphelliphelliphelliphelliphelliphelliphelliphelliphelliphelliphelliphelliphelliphelliphelliphelliphelliphelliphelliphelliphelliphelliphelliphelliphelliphellip
helliphelliphelliphelliphelliphelliphelliphelliphelliphelliphelliphelliphelliphelliphelliphelliphelliphelliphelliphelliphelliphelliphelliphelliphelliphelliphelliphelliphelliphelliphelliphelliphelliphelliphelliphelliphelliphelliphelliphelliphelliphelliphelliphelliphellip
helliphelliphelliphelliphelliphelliphelliphelliphelliphelliphelliphelliphelliphelliphelliphelliphelliphelliphelliphelliphelliphelliphelliphelliphelliphelliphelliphelliphelliphelliphelliphelliphelliphelliphelliphelliphelliphelliphelliphelliphelliphelliphelliphelliphellip
International Journal of Studies in Education and Science (IJSES)
145
helliphelliphelliphelliphelliphelliphelliphelliphelliphelliphelliphelliphelliphelliphelliphelliphelliphelliphelliphelliphelliphelliphelliphelliphelliphelliphelliphelliphelliphelliphelliphelliphelliphelliphelliphelliphelliphelliphelliphelliphelliphelliphelliphelliphellip
helliphelliphelliphelliphelliphelliphelliphelliphelliphelliphelliphelliphelliphelliphelliphelliphelliphelliphelliphelliphelliphelliphelliphelliphelliphelliphelliphelliphelliphelliphelliphelliphelliphelliphelliphelliphelliphelliphelliphelliphelliphelliphelliphelliphellip
helliphelliphelliphelliphelliphelliphelliphelliphelliphelliphelliphelliphelliphelliphelliphelliphelliphelliphelliphellip
9 A card is selected at random from a pack of 52 cards Find the probability of selecting a card which is a red or
a queen
helliphelliphelliphelliphelliphelliphelliphelliphelliphelliphelliphelliphelliphelliphelliphelliphelliphelliphelliphelliphelliphelliphelliphelliphelliphelliphelliphelliphelliphelliphelliphelliphelliphelliphelliphelliphelliphelliphelliphelliphelliphelliphelliphelliphellip
helliphelliphelliphelliphelliphelliphelliphelliphelliphelliphelliphelliphelliphelliphelliphelliphelliphelliphelliphelliphelliphelliphelliphelliphelliphelliphelliphelliphelliphelliphelliphelliphelliphelliphelliphelliphelliphelliphelliphelliphelliphelliphelliphelliphellip
helliphelliphelliphelliphelliphelliphelliphelliphelliphelliphelliphelliphelliphelliphelliphelliphelliphelliphelliphelliphelliphelliphelliphelliphelliphelliphelliphelliphelliphelliphelliphelliphelliphelliphelliphelliphelliphelliphelliphelliphelliphelliphelliphelliphellip
helliphelliphelliphelliphelliphelliphelliphelliphelliphelliphelliphelliphelliphelliphelliphelliphelliphelliphelliphelliphelliphelliphelliphelliphelliphelliphelliphelliphelliphelliphelliphelliphelliphelliphelliphelliphelliphelliphelliphellip
10 A box contains 6 white balls and 4 green balls Two balls are chosen at random one after the other without
replacement determine the probability that the second ball is white
helliphelliphelliphelliphelliphelliphelliphelliphelliphelliphelliphelliphelliphelliphelliphelliphelliphelliphelliphelliphelliphelliphelliphelliphelliphelliphelliphelliphelliphelliphelliphelliphelliphelliphelliphelliphelliphelliphelliphelliphelliphelliphelliphelliphellip
helliphelliphelliphelliphelliphelliphelliphelliphelliphelliphelliphelliphelliphelliphelliphelliphelliphelliphelliphelliphelliphelliphelliphelliphelliphelliphelliphelliphelliphelliphelliphelliphelliphelliphelliphelliphelliphelliphelliphelliphelliphelliphelliphelliphellip
helliphelliphelliphelliphelliphelliphelliphelliphelliphelliphelliphelliphelliphelliphelliphelliphelliphelliphelliphelliphelliphelliphelliphelliphelliphelliphelliphelliphelliphelliphelliphelliphelliphelliphelliphelliphelliphelliphelliphelliphelliphelliphelliphelliphellip
helliphelliphelliphelliphelliphelliphelliphelliphelliphelliphelliphelliphelliphelliphelliphelliphelliphelliphelliphelliphelliphelliphelliphelliphelliphelliphelliphelliphelliphelliphelliphelliphelliphelliphelliphelliphelliphelliphelliphelliphelliphelliphellip

International Journal of Studies in Education and Science (IJSES)
137
Clements D H amp Battista M (1990) Constructivist Learning and Teaching The
Arithetic Teacher 38(1) ProQuest Central pg 34 DOI105951AT3810034
Creswell J W amp Creswell J D (2018) Research design Qualitative quantitative and
mixed methods approaches (5th
ed) Los Angeles SAGE Publications Inc
Courtney S A amp Caniglia J (2021) Comparing the mathematical practices pre-service teachers and
mathematics teacher educators identified as relevant to problems and tasks International Journal of
Research in Education and Science (IJRES) 7(3) 954-971 httpsdoiorg1046328ijres2335
Denton D W (2012) Enhancing instruction through constructivism cooperative learning and cloud
computing Tech Trends 56(4) 34-41
Gage J (2012) Towards a new Probability Curriculum for Secondary Schools Paper presented at 12th
International Congress on Mathematical Education 8 July-15 July COEX Seoul Korea Cambridge
Cambridge University Uk
Gurbuz R amp Birgin O (2011) The effect of computer-assisted teaching on remedying misconceptions The
case of the subject Probability Journal Homepage 58(2012) DOI 101016jcompedu201111005
Hirsh L amp ODonnell A M (2001) Representativeness in Statistical Reasoning Identifying and Assessing
Misconceptions Journal of Statistics Education 9(2) 96-105 DOI10108010691898200111910655
Johnson H D amp Dasgupta N (2005) Traditional versus Non-traditional Teaching during Perspectives of
Students in Introductory Statistics Classes Journal of Statistics Education 13(2)
httpsdoiorg10108010691898200511910558
Major T amp Mangope B (2012) The Constructivist Theory in Mathematics The case of Botswana Primary
Schools International Review of Social Sciencies and Humanities 3(2) 139-147
Jones G (2005) Reflections In GA Jones (Ed) Exploring probability in school chanlleges for teaching and
probability (367-372) New York Springer
Jun L (2000) Chinese Students Understanding of Probability Published doctoral dissertation Singapore
National Institute of Education Nanyang Technological University
Khazanov L amp Gourgey A (2009) Instructors Perspectives on Students Mistaken Beliefs about Probability
in an Elementary College Statistics Course In K Safford-Ramus (Ed) Proceedings of the Adults
Learning Mathematics a Resaerch Forum (ALM) 15th
Annual International Conference 249-264
Khazanov L amp Prado L (2010) Correcting Students Misconceptions about Probability in an Introductory
College Statistics Course Adults Learning Mathematics-An International Journal 5(1) 23-35
Kleickmann T Richter D Kunter M Elsner J Besser M Krauss S amp Baumert J (2013) Teachersrsquo
Content Knowledge and Pedagogical Content Knowledge The Role of Structural Differences in Teacher
Education Journal of Teacher Education 64(1) 90-106 DOI1011770022487112460398
Leedy P D and Ormrod J E (2020) Practical research Planning and design (12th Global Edition) Harlow
England Pearson
Lessani A Md Yunus AS amp Bakar KBA (2017) Comparison of new mathematics teaching methods with
teacher-centered approach International Journal of Social Sciences 3(2) 1285-1297
httpsdxdoiorg1020319pijss20173212851297
Lim C amp Hwa T (2007) Promoting Mathematical Thinking in the Malaysian Classroom Issues and
challenges httpswwwresearchgatenetpublication252353381
Hokor amp Sedofia
138
Lovett J N amp Lee H S (2017) New Standards Require Teaching More Statistics Are Preservice Secondary
Mathematics Ready Journal of Teachers Education 68(3) 299-311 DOI 1011770022487117697918
Major T amp Mangope B (2012) The Constructivist Theory in Mathematics The case of Botswana Primary
Schools International Review of Social Sciencies and Humanities 3(2) 139-147
National Council of Teachers of Mathematics (2003) Principles and Standards for School Mathematics and
their Implications for Professional Development Reston VA NCTM
Nguyen L (2015) Developing Conceptual Understanding and Probabilistic Thinking through Tree Diagrams
Published MPhil Dissertation Manitoba The Faculty of Graduate Studies of the University of
Manitoba
Prideaux J (2007) The learner-centered approach to Mathematics Teaching and the Active Learning
Strategies used to Enhance Students Understanding Mathematical and Computing Sciences Masters
Paper 29 Fisher Digital Publications httpfisherpubsjfcedumathcsetdmasters29
Roseth C J Garfield J B amp Ben-Zvi D (2008) Collaboration in Learning and Teaching Statistics Journal
of Statistics Education 16 (1) 1069-1898 httpsdoiorg10108010691898200811889557
Santagata R and Sandholtz J H (2019) Preservice teachersrsquo mathematics teaching competence Comparing
performance on two measures Journal of Teacher Education 70 (5) 472 ndash484
Schwerdt G amp Wuppermann A C (2011) Is traditional teaching really all that bad A within-student
between-subject approach Economics of Education Review 30(2) 365-379
Sharma S (2016) Probability from a socio-cultural perspective Statistics Education Research Journal 15(2)
126-144 httpiase-weborgPublicationsphpp=SERJ
Shay K (2008) Tracing middle school students understanding of probability a longitudinal study
Unpublished Doctoral Dissertation New Brunswick New Jersey Rutgers State University of New
Jersey
Shulman L S (1986) Those who understand Knowledge growth in teaching Educational Researcher 15(2)
4-14 doi 1031021001318X015002004
Thomas L (2020) An introduction to quasi-experimental designs
httpswwwscribbrcommethodologyquasi-experimental-design
Voskoglou M (2019) Comparing Teaching Methods of Mathematics at University Level Education Sciences
9(204) doi103390educsci9030204
Vygotsky L S (1978) Mind in society The development of higher psychological processes Cambridge MA
Harvard University Press
Weldeana H N amp Abraham S T (2014) The effect of an historical perspective on prospective teachersrsquo
beliefs in learning mathematics Journal of Mathematics Teacher Education 17 303-330
doi101007s10857-013-9266-z
Weltman D amp Whiteside M (2010) Comparing the Effectiveness of Traditional and active Learning Methods
in Business Statistics Convergence to the Mean 18(1)
httpsdoiorg10108010691898201011889480
White H amp Sabarwal S (2014) Quasi-experimental design and methods methological briefs impact
evaluations Florence UNICEF Office of research
International Journal of Studies in Education and Science (IJSES)
139
Author Information
Evans Kofi Hokor
httpsorcidorg0000-0002-8387-8294
St Teresarsquos College of Education Hohoe
Department of Mathematics and ICT
P O Box 129
Ghana
Contact e-mail evanskhokorgmailcom
John Sedofia
httpsorcidorg0000-0002-5409-516X
University of Ghana Legon
Department of Teacher Education
PO Box LG 1181
Ghana
Hokor amp Sedofia
140
Appendix A Pre-test Probabilistic Reasoning Assessment
This assessment is for research purpose to improve teaching and learning of probability
You are required to answer all questions honestly Do and leave all workings or rough work on the paper
Pre-test Probabilistic Reasoning Assessment Duration 1hr
Index numberhelliphelliphelliphelliphelliphelliphelliphelliphelliphelliphelliphelliphelliphelliphelliphelliphelliphellipLevelhelliphelliphelliphellipAgehelliphelliphellip
Read each statement carefully and circle the letter of the correct (best) option Provide appropriate response in
the space provided under some items as it apply
1 If you rolled an ordinary die and obtained 51246 which of these is most likely to occur on your next
roll
a 1
b 2
c 3
d 4
e 5
f 6
g The options a b c d e and f are all equally
2i A fair coin is tossed and it lands tail The coin is to be tossed a second time What is the probability that the
second toss will also be a tail
a 1
4
b 1
2
c 1
3
d Slightly less than 1
2
e Slightly more than 1
2
f 0
2ii Which of the following best describes the reason for the correct answer to the preceding question (2i)
a The second toss is less likely to be tail because the first toss was tail
b There are four possible outcomes when you toss a coin twice Getting two tails is only one of them
c The chance of getting heads or tails on any one toss is always 1
2
d There are three possible outcomes when you toss a coin twice Getting two tails is only one of the them
e No chance of being a tail in the second toss
3i A box contains 6 balls 2 are red 2 are black and 2 blue Three balls are picked at random one at a time
Each time a ball is picked the colour is recorded and the ball is put back in the box mixed thoroughly If the
first 2 balls are black what color is the third ball most likely to be
a Red
International Journal of Studies in Education and Science (IJSES)
141
b Black
c Blue
d Red and blue are equally likely than black
e Red black and blue are all equally likely
3ii Which of the following best describes the reason for the correct answer in the preceding question (3i)
a The third ball should not be black because too many black ones have already been picked
b The picks are independent so every color has an equally likely chance of being picked
c Black seems to be lucky
d This color is just as likely as any other color
4 A spinner with ten equally divided sectors in which four parts are white and the rests are red is about to
be spin which color is the spinner more likely to land
a White
b Red
c Both white and red are all equally
5 If you toss a fair coin and get heads two times in a row which of these is most likely on next toss
a Tail
b Head
c Both head and tail are all equally
6 A Gh 2 Gh 5 Ghcent10 Gh 20 Gh 50 and Gh 100 notes were put in a box and thoroughly mixed
What is the probability of picking Gh 50 note without looking
a 1
187
b 50
187
c 1
6
d 0
7 In a game you have been offered two options Which of the following give you higher chance of
winning GHcent200
a Tossing one die once and obtaining a 6
b Tossing two dice once and obtaining two 6rsquos
c The options a and b are all equally
8 A fair die is to be toss six times which of these is most likely to occur
a 251634
b 123456
c 666341
d 132244
e The options a b c and d are all equally likely
9 A fair coin is to be toss four times in a row which of these is least likely to occur
a THTH
b TTTH
c HHH
Hokor amp Sedofia
142
d The options a b and c are all equally likely
10 Two fair dice are to be tossed once Which of the following is more likely to occur
a Obtaining a sum of 11
b Obtaining a sum of 10
c A sum of 11 and a sum of 10 are all equally likely
10i Give reason for the correct answer in the preceding question (10)
helliphelliphelliphelliphelliphelliphelliphelliphelliphelliphelliphelliphelliphelliphelliphelliphelliphelliphelliphelliphelliphelliphelliphelliphelliphelliphelliphelliphelliphelliphelliphelliphelliphelliphelliphelliphelliphelliphelliphelliphelliphellip
helliphelliphelliphelliphelliphelliphelliphelliphelliphelliphelliphelliphelliphelliphelliphelliphelliphelliphelliphelliphelliphelliphelliphelliphelliphelliphelliphelliphelliphelliphelliphelliphelliphelliphelliphelliphelliphelliphelliphelliphelliphellip
helliphelliphelliphelliphelliphelliphelliphelliphelliphelliphelliphelliphelliphelliphelliphelliphelliphelliphelliphelliphelliphelliphelliphelliphelliphelliphelliphelliphelliphelliphelliphelliphelliphelliphelliphelliphelliphelliphelliphelliphelliphellip
helliphelliphelliphelliphelliphelliphelliphelliphelliphelliphelliphelliphelliphelliphelliphelliphelliphelliphelliphelliphelliphelliphelliphelliphelliphelliphelliphelliphelliphelliphelliphelliphelliphelliphelliphelliphelliphellip
11 In national lottery one has to choose five numbers from 1 to 90 inclusive You win when at least two of
your numbers are part of the numbers drawn on Saturday at random Eric has chosen 4 6 7 9 and 11
Alex has chosen 15 23 45 66 and 80 Daniel has chosen 71 77 78 83 and 85 Do Eric Alex and
Daniel have the same chance of winning or not and why
helliphelliphelliphelliphelliphelliphelliphelliphelliphelliphelliphelliphelliphelliphelliphelliphelliphelliphelliphelliphelliphelliphelliphelliphelliphelliphelliphelliphelliphelliphelliphelliphelliphelliphelliphelliphelliphelliphelliphelliphellip
helliphelliphelliphelliphelliphelliphelliphelliphelliphelliphelliphelliphelliphelliphelliphelliphelliphelliphelliphelliphelliphelliphelliphelliphelliphelliphelliphelliphelliphelliphelliphelliphelliphelliphelliphelliphelliphelliphelliphelliphellip
helliphelliphelliphelliphelliphelliphelliphelliphelliphelliphelliphelliphelliphelliphelliphelliphelliphelliphelliphelliphelliphelliphelliphelliphelliphelliphelliphelliphelliphelliphelliphelliphelliphelliphelliphelliphelliphelliphelliphelliphellip
helliphelliphelliphelliphelliphelliphelliphelliphelliphelliphelliphelliphelliphelliphelliphelliphelliphelliphelliphelliphelliphelliphelliphelliphelliphelliphelliphelliphelliphelliphelliphelliphelliphelliphelliphellip
12 A box contains 8 yellow balls and 4 green balls Two balls are chosen at random one after the other
without replacement determine the probability that the two balls are of different colours
helliphelliphelliphelliphelliphelliphelliphelliphelliphelliphelliphelliphelliphelliphelliphelliphelliphelliphelliphelliphelliphelliphelliphelliphelliphelliphelliphelliphelliphelliphelliphelliphelliphelliphelliphelliphelliphelliphelliphelliphellip
helliphelliphelliphelliphelliphelliphelliphelliphelliphelliphelliphelliphelliphelliphelliphelliphelliphelliphelliphelliphelliphelliphelliphelliphelliphelliphelliphelliphelliphelliphelliphelliphelliphelliphelliphelliphelliphelliphelliphelliphellip
helliphelliphelliphelliphelliphelliphelliphelliphelliphelliphelliphelliphelliphelliphelliphelliphelliphelliphelliphelliphelliphelliphelliphelliphelliphelliphelliphelliphelliphelliphelliphelliphelliphelliphelliphelliphelliphelliphelliphelliphellip
helliphelliphelliphelliphelliphelliphelliphelliphelliphelliphelliphelliphelliphelliphelliphelliphelliphelliphelliphelliphelliphelliphelliphelliphelliphelliphelliphelliphelliphelliphelliphelliphelliphelliphelliphelliphellip
International Journal of Studies in Education and Science (IJSES)
143
Appendix B Post-test Probabilistic Reasoning Assessment
This assessment is for research purpose to improve teaching and learning of probability
You are required to answer all questions honestly Do and leave all workings or rough work on the paper
Post-test Probabilistic Reasoning Assessment Duration One Hour
Index numberhelliphelliphelliphelliphelliphelliphelliphelliphelliphelliphelliphelliphelliphelliphellipClasshelliphelliphelliphellipAgehelliphelliphelliphellip
Read each statement carefully and circle the letter of the correct (best) option for each item as much as possible
and provide appropriate response in the space provided
1 Suppose a particular outcome from a random event has a probability of 04 Which of the following
statements represents correct interpretations of this probability
a The outcome will not happen
b The outcome will certainly happen about four times out of every 10 trials
c The outcome is expected to happen about four times out of every 10 trials
d The outcome could happen or it couldnrsquot of either result are the same
2 If you toss a fair coin and get heads 3 times in a row what is the chance of getting a head on the next toss
a 1
b Greater than 1
2
c 1
2
d Less than 1
2
e 0
3 A die is numbered 1 2 3 4 4 5 When the die is thrown once Which of these is most likely and why
a 1
b 2
c 3
d 4
e 5
f They are all equally likely
3i Give reason for your chosen answer in (3)
helliphelliphelliphelliphelliphelliphelliphelliphelliphelliphelliphelliphelliphelliphelliphelliphelliphelliphelliphelliphelliphelliphelliphelliphelliphelliphelliphelliphelliphelliphelliphelliphelliphelliphelliphelliphelliphelliphelliphelliphelliphelliphelliphelliphellip
helliphelliphelliphelliphelliphelliphelliphelliphelliphelliphelliphelliphelliphelliphelliphelliphelliphelliphelliphelliphelliphelliphelliphelliphelliphelliphelliphelliphelliphelliphelliphelliphelliphelliphelliphelliphelliphelliphelliphelliphelliphelliphelliphelliphellip
helliphelliphelliphelliphelliphelliphelliphelliphelliphelliphelliphelliphelliphelliphelliphelliphelliphelliphelliphelliphelliphelliphelliphelliphelliphelliphelliphelliphelliphelliphelliphelliphelliphelliphelliphelliphelliphelliphelliphelliphelliphelliphelliphelliphellip
helliphelliphelliphelliphelliphelliphelliphelliphelliphelliphelliphelliphelliphelliphelliphelliphelliphelliphelliphelliphelliphelliphelliphelliphelliphelliphelliphelliphelliphelliphelliphelliphelliphelliphelliphelliphelliphelliphellip
4 German MP tossed two dice once Which of these is mostly likely and why
a Obtaining a sum of 4
b Obtaining a sum of 7
c Obtaining a sum of 11
d All of them have equal chance of occurring that is a b c
Hokor amp Sedofia
144
4i Give reason for your chosen answer in (4)
helliphelliphelliphelliphelliphelliphelliphelliphelliphelliphelliphelliphelliphelliphelliphelliphelliphelliphelliphelliphelliphelliphelliphelliphelliphelliphelliphelliphelliphelliphelliphelliphelliphelliphelliphelliphelliphelliphelliphelliphelliphelliphelliphelliphellip
helliphelliphelliphelliphelliphelliphelliphelliphelliphelliphelliphelliphelliphelliphelliphelliphelliphelliphelliphelliphelliphelliphelliphelliphelliphelliphelliphelliphelliphelliphelliphelliphelliphelliphelliphelliphelliphelliphelliphelliphelliphelliphelliphelliphellip
helliphelliphelliphelliphelliphelliphelliphelliphelliphelliphelliphelliphelliphelliphelliphelliphelliphelliphelliphelliphelliphelliphelliphelliphelliphelliphelliphelliphelliphelliphelliphelliphelliphelliphelliphelliphelliphelliphelliphelliphelliphelliphelliphelliphellip
helliphelliphelliphelliphelliphelliphelliphelliphelliphelliphelliphelliphelliphelliphelliphelliphelliphelliphelliphelliphelliphelliphelliphelliphelliphelliphelliphelliphelliphelliphelliphelliphelliphelliphelliphelliphelliphelliphelliphelliphelliphelliphelliphelliphellip
helliphelliphelliphelliphelliphelliphelliphelliphelliphelliphelliphelliphelliphelliphelliphelliphelliphelliphelliphelliphelliphelliphelliphelliphelliphelliphelliphelliphellip
5i A fair coin is to be toss four times which of these is most likely to occur
a HTHT
b THTT
c TTTT
d HHTH
e The options a b c and d are all equally likely
5ii Give reason for your chosen answer in (5i)
helliphelliphelliphelliphelliphelliphelliphelliphelliphelliphelliphelliphelliphelliphelliphelliphelliphelliphelliphelliphelliphelliphelliphelliphelliphelliphelliphelliphelliphelliphelliphelliphelliphelliphelliphelliphelliphelliphelliphelliphelliphelliphelliphelliphellip
helliphelliphelliphelliphelliphelliphelliphelliphelliphelliphelliphelliphelliphelliphelliphelliphelliphelliphelliphelliphelliphelliphelliphelliphelliphelliphelliphelliphelliphelliphelliphelliphelliphelliphelliphelliphelliphelliphelliphelliphelliphelliphelliphelliphellip
helliphelliphelliphelliphelliphelliphelliphelliphelliphelliphelliphelliphelliphelliphelliphelliphelliphelliphelliphelliphelliphelliphelliphelliphelliphelliphelliphelliphelliphelliphelliphelliphelliphelliphelliphelliphelliphelliphelliphelliphelliphelliphelliphelliphellip
helliphelliphelliphelliphelliphelliphelliphelliphelliphelliphelliphelliphelliphelliphelliphelliphelliphelliphelliphelliphelliphelliphelliphelliphelliphelliphelliphelliphelliphelliphelliphelliphelliphelliphelliphelliphelliphelliphellip
6i A fair coin is to be toss four times which of these is least likely to occur
a HTHT
b THTT
c TTTT
d HHTH
e The options a b c and d are all equally likely
6ii Give reason for your chosen answer in (6i)
helliphelliphelliphelliphelliphelliphelliphelliphelliphelliphelliphelliphelliphelliphelliphelliphelliphelliphelliphelliphelliphelliphelliphelliphelliphelliphelliphelliphelliphelliphelliphelliphelliphelliphelliphelliphelliphelliphelliphelliphelliphelliphelliphelliphellip
helliphelliphelliphelliphelliphelliphelliphelliphelliphelliphelliphelliphelliphelliphelliphelliphelliphelliphelliphelliphelliphelliphelliphelliphelliphelliphelliphelliphelliphelliphelliphelliphelliphelliphelliphelliphelliphelliphelliphelliphelliphelliphelliphelliphellip
helliphelliphelliphelliphelliphelliphelliphelliphelliphelliphelliphelliphelliphelliphelliphelliphelliphelliphelliphelliphelliphelliphelliphelliphelliphelliphelliphelliphelliphelliphelliphelliphelliphelliphelliphelliphelliphelliphelliphelliphelliphelliphelliphelliphellip
helliphelliphelliphellip
7 A college has 300 level 200 students and 236 level 100 students in it Each studentrsquos name is written with
the level on a piece of paper and all the names are put into a box and mixed thoroughly A tutor picks one
name out of the box without looking Which level is the tutor more likely to pick from and why
helliphelliphelliphelliphelliphelliphelliphelliphelliphelliphelliphelliphelliphelliphelliphelliphelliphelliphelliphelliphelliphelliphelliphelliphelliphelliphelliphelliphelliphelliphelliphelliphelliphelliphelliphelliphelliphelliphelliphelliphelliphelliphelliphelliphellip
helliphelliphelliphelliphelliphelliphelliphelliphelliphelliphelliphelliphelliphelliphelliphelliphelliphelliphelliphelliphelliphelliphelliphelliphelliphelliphelliphelliphelliphelliphelliphelliphelliphelliphelliphelliphelliphelliphelliphelliphelliphelliphelliphelliphellip
helliphelliphelliphelliphelliphelliphelliphelliphelliphelliphelliphelliphelliphelliphelliphelliphelliphelliphelliphelliphelliphelliphelliphelliphelliphelliphelliphelliphelliphelliphelliphelliphelliphelliphelliphelliphelliphelliphelliphelliphelliphelliphelliphelliphellip
helliphelliphelliphelliphelliphelliphelliphelliphelliphelliphelliphelliphelliphelliphelliphelliphelliphelliphelliphelliphelliphelliphelliphelliphelliphelliphelliphelliphelliphelliphelliphelliphelliphelliphelliphelliphelliphelliphelliphellip
8 Suppose that you toss a coin three times and all eight outcomes are equally likely If it is known that the first
toss comes up heads what is the probability of an odd number of heads appearing
helliphelliphelliphelliphelliphelliphelliphelliphelliphelliphelliphelliphelliphelliphelliphelliphelliphelliphelliphelliphelliphelliphelliphelliphelliphelliphelliphelliphelliphelliphelliphelliphelliphelliphelliphelliphelliphelliphelliphelliphelliphelliphelliphelliphellip
helliphelliphelliphelliphelliphelliphelliphelliphelliphelliphelliphelliphelliphelliphelliphelliphelliphelliphelliphelliphelliphelliphelliphelliphelliphelliphelliphelliphelliphelliphelliphelliphelliphelliphelliphelliphelliphelliphelliphelliphelliphelliphelliphelliphellip
helliphelliphelliphelliphelliphelliphelliphelliphelliphelliphelliphelliphelliphelliphelliphelliphelliphelliphelliphelliphelliphelliphelliphelliphelliphelliphelliphelliphelliphelliphelliphelliphelliphelliphelliphelliphelliphelliphelliphelliphelliphelliphelliphelliphellip
International Journal of Studies in Education and Science (IJSES)
145
helliphelliphelliphelliphelliphelliphelliphelliphelliphelliphelliphelliphelliphelliphelliphelliphelliphelliphelliphelliphelliphelliphelliphelliphelliphelliphelliphelliphelliphelliphelliphelliphelliphelliphelliphelliphelliphelliphelliphelliphelliphelliphelliphelliphellip
helliphelliphelliphelliphelliphelliphelliphelliphelliphelliphelliphelliphelliphelliphelliphelliphelliphelliphelliphelliphelliphelliphelliphelliphelliphelliphelliphelliphelliphelliphelliphelliphelliphelliphelliphelliphelliphelliphelliphelliphelliphelliphelliphelliphellip
helliphelliphelliphelliphelliphelliphelliphelliphelliphelliphelliphelliphelliphelliphelliphelliphelliphelliphelliphellip
9 A card is selected at random from a pack of 52 cards Find the probability of selecting a card which is a red or
a queen
helliphelliphelliphelliphelliphelliphelliphelliphelliphelliphelliphelliphelliphelliphelliphelliphelliphelliphelliphelliphelliphelliphelliphelliphelliphelliphelliphelliphelliphelliphelliphelliphelliphelliphelliphelliphelliphelliphelliphelliphelliphelliphelliphelliphellip
helliphelliphelliphelliphelliphelliphelliphelliphelliphelliphelliphelliphelliphelliphelliphelliphelliphelliphelliphelliphelliphelliphelliphelliphelliphelliphelliphelliphelliphelliphelliphelliphelliphelliphelliphelliphelliphelliphelliphelliphelliphelliphelliphelliphellip
helliphelliphelliphelliphelliphelliphelliphelliphelliphelliphelliphelliphelliphelliphelliphelliphelliphelliphelliphelliphelliphelliphelliphelliphelliphelliphelliphelliphelliphelliphelliphelliphelliphelliphelliphelliphelliphelliphelliphelliphelliphelliphelliphelliphellip
helliphelliphelliphelliphelliphelliphelliphelliphelliphelliphelliphelliphelliphelliphelliphelliphelliphelliphelliphelliphelliphelliphelliphelliphelliphelliphelliphelliphelliphelliphelliphelliphelliphelliphelliphelliphelliphelliphelliphellip
10 A box contains 6 white balls and 4 green balls Two balls are chosen at random one after the other without
replacement determine the probability that the second ball is white
helliphelliphelliphelliphelliphelliphelliphelliphelliphelliphelliphelliphelliphelliphelliphelliphelliphelliphelliphelliphelliphelliphelliphelliphelliphelliphelliphelliphelliphelliphelliphelliphelliphelliphelliphelliphelliphelliphelliphelliphelliphelliphelliphelliphellip
helliphelliphelliphelliphelliphelliphelliphelliphelliphelliphelliphelliphelliphelliphelliphelliphelliphelliphelliphelliphelliphelliphelliphelliphelliphelliphelliphelliphelliphelliphelliphelliphelliphelliphelliphelliphelliphelliphelliphelliphelliphelliphelliphelliphellip
helliphelliphelliphelliphelliphelliphelliphelliphelliphelliphelliphelliphelliphelliphelliphelliphelliphelliphelliphelliphelliphelliphelliphelliphelliphelliphelliphelliphelliphelliphelliphelliphelliphelliphelliphelliphelliphelliphelliphelliphelliphelliphelliphelliphellip
helliphelliphelliphelliphelliphelliphelliphelliphelliphelliphelliphelliphelliphelliphelliphelliphelliphelliphelliphelliphelliphelliphelliphelliphelliphelliphelliphelliphelliphelliphelliphelliphelliphelliphelliphelliphelliphelliphelliphelliphelliphelliphellip

Hokor amp Sedofia
138
Lovett J N amp Lee H S (2017) New Standards Require Teaching More Statistics Are Preservice Secondary
Mathematics Ready Journal of Teachers Education 68(3) 299-311 DOI 1011770022487117697918
Major T amp Mangope B (2012) The Constructivist Theory in Mathematics The case of Botswana Primary
Schools International Review of Social Sciencies and Humanities 3(2) 139-147
National Council of Teachers of Mathematics (2003) Principles and Standards for School Mathematics and
their Implications for Professional Development Reston VA NCTM
Nguyen L (2015) Developing Conceptual Understanding and Probabilistic Thinking through Tree Diagrams
Published MPhil Dissertation Manitoba The Faculty of Graduate Studies of the University of
Manitoba
Prideaux J (2007) The learner-centered approach to Mathematics Teaching and the Active Learning
Strategies used to Enhance Students Understanding Mathematical and Computing Sciences Masters
Paper 29 Fisher Digital Publications httpfisherpubsjfcedumathcsetdmasters29
Roseth C J Garfield J B amp Ben-Zvi D (2008) Collaboration in Learning and Teaching Statistics Journal
of Statistics Education 16 (1) 1069-1898 httpsdoiorg10108010691898200811889557
Santagata R and Sandholtz J H (2019) Preservice teachersrsquo mathematics teaching competence Comparing
performance on two measures Journal of Teacher Education 70 (5) 472 ndash484
Schwerdt G amp Wuppermann A C (2011) Is traditional teaching really all that bad A within-student
between-subject approach Economics of Education Review 30(2) 365-379
Sharma S (2016) Probability from a socio-cultural perspective Statistics Education Research Journal 15(2)
126-144 httpiase-weborgPublicationsphpp=SERJ
Shay K (2008) Tracing middle school students understanding of probability a longitudinal study
Unpublished Doctoral Dissertation New Brunswick New Jersey Rutgers State University of New
Jersey
Shulman L S (1986) Those who understand Knowledge growth in teaching Educational Researcher 15(2)
4-14 doi 1031021001318X015002004
Thomas L (2020) An introduction to quasi-experimental designs
httpswwwscribbrcommethodologyquasi-experimental-design
Voskoglou M (2019) Comparing Teaching Methods of Mathematics at University Level Education Sciences
9(204) doi103390educsci9030204
Vygotsky L S (1978) Mind in society The development of higher psychological processes Cambridge MA
Harvard University Press
Weldeana H N amp Abraham S T (2014) The effect of an historical perspective on prospective teachersrsquo
beliefs in learning mathematics Journal of Mathematics Teacher Education 17 303-330
doi101007s10857-013-9266-z
Weltman D amp Whiteside M (2010) Comparing the Effectiveness of Traditional and active Learning Methods
in Business Statistics Convergence to the Mean 18(1)
httpsdoiorg10108010691898201011889480
White H amp Sabarwal S (2014) Quasi-experimental design and methods methological briefs impact
evaluations Florence UNICEF Office of research
International Journal of Studies in Education and Science (IJSES)
139
Author Information
Evans Kofi Hokor
httpsorcidorg0000-0002-8387-8294
St Teresarsquos College of Education Hohoe
Department of Mathematics and ICT
P O Box 129
Ghana
Contact e-mail evanskhokorgmailcom
John Sedofia
httpsorcidorg0000-0002-5409-516X
University of Ghana Legon
Department of Teacher Education
PO Box LG 1181
Ghana
Hokor amp Sedofia
140
Appendix A Pre-test Probabilistic Reasoning Assessment
This assessment is for research purpose to improve teaching and learning of probability
You are required to answer all questions honestly Do and leave all workings or rough work on the paper
Pre-test Probabilistic Reasoning Assessment Duration 1hr
Index numberhelliphelliphelliphelliphelliphelliphelliphelliphelliphelliphelliphelliphelliphelliphelliphelliphelliphellipLevelhelliphelliphelliphellipAgehelliphelliphellip
Read each statement carefully and circle the letter of the correct (best) option Provide appropriate response in
the space provided under some items as it apply
1 If you rolled an ordinary die and obtained 51246 which of these is most likely to occur on your next
roll
a 1
b 2
c 3
d 4
e 5
f 6
g The options a b c d e and f are all equally
2i A fair coin is tossed and it lands tail The coin is to be tossed a second time What is the probability that the
second toss will also be a tail
a 1
4
b 1
2
c 1
3
d Slightly less than 1
2
e Slightly more than 1
2
f 0
2ii Which of the following best describes the reason for the correct answer to the preceding question (2i)
a The second toss is less likely to be tail because the first toss was tail
b There are four possible outcomes when you toss a coin twice Getting two tails is only one of them
c The chance of getting heads or tails on any one toss is always 1
2
d There are three possible outcomes when you toss a coin twice Getting two tails is only one of the them
e No chance of being a tail in the second toss
3i A box contains 6 balls 2 are red 2 are black and 2 blue Three balls are picked at random one at a time
Each time a ball is picked the colour is recorded and the ball is put back in the box mixed thoroughly If the
first 2 balls are black what color is the third ball most likely to be
a Red
International Journal of Studies in Education and Science (IJSES)
141
b Black
c Blue
d Red and blue are equally likely than black
e Red black and blue are all equally likely
3ii Which of the following best describes the reason for the correct answer in the preceding question (3i)
a The third ball should not be black because too many black ones have already been picked
b The picks are independent so every color has an equally likely chance of being picked
c Black seems to be lucky
d This color is just as likely as any other color
4 A spinner with ten equally divided sectors in which four parts are white and the rests are red is about to
be spin which color is the spinner more likely to land
a White
b Red
c Both white and red are all equally
5 If you toss a fair coin and get heads two times in a row which of these is most likely on next toss
a Tail
b Head
c Both head and tail are all equally
6 A Gh 2 Gh 5 Ghcent10 Gh 20 Gh 50 and Gh 100 notes were put in a box and thoroughly mixed
What is the probability of picking Gh 50 note without looking
a 1
187
b 50
187
c 1
6
d 0
7 In a game you have been offered two options Which of the following give you higher chance of
winning GHcent200
a Tossing one die once and obtaining a 6
b Tossing two dice once and obtaining two 6rsquos
c The options a and b are all equally
8 A fair die is to be toss six times which of these is most likely to occur
a 251634
b 123456
c 666341
d 132244
e The options a b c and d are all equally likely
9 A fair coin is to be toss four times in a row which of these is least likely to occur
a THTH
b TTTH
c HHH
Hokor amp Sedofia
142
d The options a b and c are all equally likely
10 Two fair dice are to be tossed once Which of the following is more likely to occur
a Obtaining a sum of 11
b Obtaining a sum of 10
c A sum of 11 and a sum of 10 are all equally likely
10i Give reason for the correct answer in the preceding question (10)
helliphelliphelliphelliphelliphelliphelliphelliphelliphelliphelliphelliphelliphelliphelliphelliphelliphelliphelliphelliphelliphelliphelliphelliphelliphelliphelliphelliphelliphelliphelliphelliphelliphelliphelliphelliphelliphelliphelliphelliphelliphellip
helliphelliphelliphelliphelliphelliphelliphelliphelliphelliphelliphelliphelliphelliphelliphelliphelliphelliphelliphelliphelliphelliphelliphelliphelliphelliphelliphelliphelliphelliphelliphelliphelliphelliphelliphelliphelliphelliphelliphelliphelliphellip
helliphelliphelliphelliphelliphelliphelliphelliphelliphelliphelliphelliphelliphelliphelliphelliphelliphelliphelliphelliphelliphelliphelliphelliphelliphelliphelliphelliphelliphelliphelliphelliphelliphelliphelliphelliphelliphelliphelliphelliphelliphellip
helliphelliphelliphelliphelliphelliphelliphelliphelliphelliphelliphelliphelliphelliphelliphelliphelliphelliphelliphelliphelliphelliphelliphelliphelliphelliphelliphelliphelliphelliphelliphelliphelliphelliphelliphelliphelliphellip
11 In national lottery one has to choose five numbers from 1 to 90 inclusive You win when at least two of
your numbers are part of the numbers drawn on Saturday at random Eric has chosen 4 6 7 9 and 11
Alex has chosen 15 23 45 66 and 80 Daniel has chosen 71 77 78 83 and 85 Do Eric Alex and
Daniel have the same chance of winning or not and why
helliphelliphelliphelliphelliphelliphelliphelliphelliphelliphelliphelliphelliphelliphelliphelliphelliphelliphelliphelliphelliphelliphelliphelliphelliphelliphelliphelliphelliphelliphelliphelliphelliphelliphelliphelliphelliphelliphelliphelliphellip
helliphelliphelliphelliphelliphelliphelliphelliphelliphelliphelliphelliphelliphelliphelliphelliphelliphelliphelliphelliphelliphelliphelliphelliphelliphelliphelliphelliphelliphelliphelliphelliphelliphelliphelliphelliphelliphelliphelliphelliphellip
helliphelliphelliphelliphelliphelliphelliphelliphelliphelliphelliphelliphelliphelliphelliphelliphelliphelliphelliphelliphelliphelliphelliphelliphelliphelliphelliphelliphelliphelliphelliphelliphelliphelliphelliphelliphelliphelliphelliphelliphellip
helliphelliphelliphelliphelliphelliphelliphelliphelliphelliphelliphelliphelliphelliphelliphelliphelliphelliphelliphelliphelliphelliphelliphelliphelliphelliphelliphelliphelliphelliphelliphelliphelliphelliphelliphellip
12 A box contains 8 yellow balls and 4 green balls Two balls are chosen at random one after the other
without replacement determine the probability that the two balls are of different colours
helliphelliphelliphelliphelliphelliphelliphelliphelliphelliphelliphelliphelliphelliphelliphelliphelliphelliphelliphelliphelliphelliphelliphelliphelliphelliphelliphelliphelliphelliphelliphelliphelliphelliphelliphelliphelliphelliphelliphelliphellip
helliphelliphelliphelliphelliphelliphelliphelliphelliphelliphelliphelliphelliphelliphelliphelliphelliphelliphelliphelliphelliphelliphelliphelliphelliphelliphelliphelliphelliphelliphelliphelliphelliphelliphelliphelliphelliphelliphelliphelliphellip
helliphelliphelliphelliphelliphelliphelliphelliphelliphelliphelliphelliphelliphelliphelliphelliphelliphelliphelliphelliphelliphelliphelliphelliphelliphelliphelliphelliphelliphelliphelliphelliphelliphelliphelliphelliphelliphelliphelliphelliphellip
helliphelliphelliphelliphelliphelliphelliphelliphelliphelliphelliphelliphelliphelliphelliphelliphelliphelliphelliphelliphelliphelliphelliphelliphelliphelliphelliphelliphelliphelliphelliphelliphelliphelliphelliphelliphellip
International Journal of Studies in Education and Science (IJSES)
143
Appendix B Post-test Probabilistic Reasoning Assessment
This assessment is for research purpose to improve teaching and learning of probability
You are required to answer all questions honestly Do and leave all workings or rough work on the paper
Post-test Probabilistic Reasoning Assessment Duration One Hour
Index numberhelliphelliphelliphelliphelliphelliphelliphelliphelliphelliphelliphelliphelliphelliphellipClasshelliphelliphelliphellipAgehelliphelliphelliphellip
Read each statement carefully and circle the letter of the correct (best) option for each item as much as possible
and provide appropriate response in the space provided
1 Suppose a particular outcome from a random event has a probability of 04 Which of the following
statements represents correct interpretations of this probability
a The outcome will not happen
b The outcome will certainly happen about four times out of every 10 trials
c The outcome is expected to happen about four times out of every 10 trials
d The outcome could happen or it couldnrsquot of either result are the same
2 If you toss a fair coin and get heads 3 times in a row what is the chance of getting a head on the next toss
a 1
b Greater than 1
2
c 1
2
d Less than 1
2
e 0
3 A die is numbered 1 2 3 4 4 5 When the die is thrown once Which of these is most likely and why
a 1
b 2
c 3
d 4
e 5
f They are all equally likely
3i Give reason for your chosen answer in (3)
helliphelliphelliphelliphelliphelliphelliphelliphelliphelliphelliphelliphelliphelliphelliphelliphelliphelliphelliphelliphelliphelliphelliphelliphelliphelliphelliphelliphelliphelliphelliphelliphelliphelliphelliphelliphelliphelliphelliphelliphelliphelliphelliphelliphellip
helliphelliphelliphelliphelliphelliphelliphelliphelliphelliphelliphelliphelliphelliphelliphelliphelliphelliphelliphelliphelliphelliphelliphelliphelliphelliphelliphelliphelliphelliphelliphelliphelliphelliphelliphelliphelliphelliphelliphelliphelliphelliphelliphelliphellip
helliphelliphelliphelliphelliphelliphelliphelliphelliphelliphelliphelliphelliphelliphelliphelliphelliphelliphelliphelliphelliphelliphelliphelliphelliphelliphelliphelliphelliphelliphelliphelliphelliphelliphelliphelliphelliphelliphelliphelliphelliphelliphelliphelliphellip
helliphelliphelliphelliphelliphelliphelliphelliphelliphelliphelliphelliphelliphelliphelliphelliphelliphelliphelliphelliphelliphelliphelliphelliphelliphelliphelliphelliphelliphelliphelliphelliphelliphelliphelliphelliphelliphelliphellip
4 German MP tossed two dice once Which of these is mostly likely and why
a Obtaining a sum of 4
b Obtaining a sum of 7
c Obtaining a sum of 11
d All of them have equal chance of occurring that is a b c
Hokor amp Sedofia
144
4i Give reason for your chosen answer in (4)
helliphelliphelliphelliphelliphelliphelliphelliphelliphelliphelliphelliphelliphelliphelliphelliphelliphelliphelliphelliphelliphelliphelliphelliphelliphelliphelliphelliphelliphelliphelliphelliphelliphelliphelliphelliphelliphelliphelliphelliphelliphelliphelliphelliphellip
helliphelliphelliphelliphelliphelliphelliphelliphelliphelliphelliphelliphelliphelliphelliphelliphelliphelliphelliphelliphelliphelliphelliphelliphelliphelliphelliphelliphelliphelliphelliphelliphelliphelliphelliphelliphelliphelliphelliphelliphelliphelliphelliphelliphellip
helliphelliphelliphelliphelliphelliphelliphelliphelliphelliphelliphelliphelliphelliphelliphelliphelliphelliphelliphelliphelliphelliphelliphelliphelliphelliphelliphelliphelliphelliphelliphelliphelliphelliphelliphelliphelliphelliphelliphelliphelliphelliphelliphelliphellip
helliphelliphelliphelliphelliphelliphelliphelliphelliphelliphelliphelliphelliphelliphelliphelliphelliphelliphelliphelliphelliphelliphelliphelliphelliphelliphelliphelliphelliphelliphelliphelliphelliphelliphelliphelliphelliphelliphelliphelliphelliphelliphelliphelliphellip
helliphelliphelliphelliphelliphelliphelliphelliphelliphelliphelliphelliphelliphelliphelliphelliphelliphelliphelliphelliphelliphelliphelliphelliphelliphelliphelliphelliphellip
5i A fair coin is to be toss four times which of these is most likely to occur
a HTHT
b THTT
c TTTT
d HHTH
e The options a b c and d are all equally likely
5ii Give reason for your chosen answer in (5i)
helliphelliphelliphelliphelliphelliphelliphelliphelliphelliphelliphelliphelliphelliphelliphelliphelliphelliphelliphelliphelliphelliphelliphelliphelliphelliphelliphelliphelliphelliphelliphelliphelliphelliphelliphelliphelliphelliphelliphelliphelliphelliphelliphelliphellip
helliphelliphelliphelliphelliphelliphelliphelliphelliphelliphelliphelliphelliphelliphelliphelliphelliphelliphelliphelliphelliphelliphelliphelliphelliphelliphelliphelliphelliphelliphelliphelliphelliphelliphelliphelliphelliphelliphelliphelliphelliphelliphelliphelliphellip
helliphelliphelliphelliphelliphelliphelliphelliphelliphelliphelliphelliphelliphelliphelliphelliphelliphelliphelliphelliphelliphelliphelliphelliphelliphelliphelliphelliphelliphelliphelliphelliphelliphelliphelliphelliphelliphelliphelliphelliphelliphelliphelliphelliphellip
helliphelliphelliphelliphelliphelliphelliphelliphelliphelliphelliphelliphelliphelliphelliphelliphelliphelliphelliphelliphelliphelliphelliphelliphelliphelliphelliphelliphelliphelliphelliphelliphelliphelliphelliphelliphelliphelliphellip
6i A fair coin is to be toss four times which of these is least likely to occur
a HTHT
b THTT
c TTTT
d HHTH
e The options a b c and d are all equally likely
6ii Give reason for your chosen answer in (6i)
helliphelliphelliphelliphelliphelliphelliphelliphelliphelliphelliphelliphelliphelliphelliphelliphelliphelliphelliphelliphelliphelliphelliphelliphelliphelliphelliphelliphelliphelliphelliphelliphelliphelliphelliphelliphelliphelliphelliphelliphelliphelliphelliphelliphellip
helliphelliphelliphelliphelliphelliphelliphelliphelliphelliphelliphelliphelliphelliphelliphelliphelliphelliphelliphelliphelliphelliphelliphelliphelliphelliphelliphelliphelliphelliphelliphelliphelliphelliphelliphelliphelliphelliphelliphelliphelliphelliphelliphelliphellip
helliphelliphelliphelliphelliphelliphelliphelliphelliphelliphelliphelliphelliphelliphelliphelliphelliphelliphelliphelliphelliphelliphelliphelliphelliphelliphelliphelliphelliphelliphelliphelliphelliphelliphelliphelliphelliphelliphelliphelliphelliphelliphelliphelliphellip
helliphelliphelliphellip
7 A college has 300 level 200 students and 236 level 100 students in it Each studentrsquos name is written with
the level on a piece of paper and all the names are put into a box and mixed thoroughly A tutor picks one
name out of the box without looking Which level is the tutor more likely to pick from and why
helliphelliphelliphelliphelliphelliphelliphelliphelliphelliphelliphelliphelliphelliphelliphelliphelliphelliphelliphelliphelliphelliphelliphelliphelliphelliphelliphelliphelliphelliphelliphelliphelliphelliphelliphelliphelliphelliphelliphelliphelliphelliphelliphelliphellip
helliphelliphelliphelliphelliphelliphelliphelliphelliphelliphelliphelliphelliphelliphelliphelliphelliphelliphelliphelliphelliphelliphelliphelliphelliphelliphelliphelliphelliphelliphelliphelliphelliphelliphelliphelliphelliphelliphelliphelliphelliphelliphelliphelliphellip
helliphelliphelliphelliphelliphelliphelliphelliphelliphelliphelliphelliphelliphelliphelliphelliphelliphelliphelliphelliphelliphelliphelliphelliphelliphelliphelliphelliphelliphelliphelliphelliphelliphelliphelliphelliphelliphelliphelliphelliphelliphelliphelliphelliphellip
helliphelliphelliphelliphelliphelliphelliphelliphelliphelliphelliphelliphelliphelliphelliphelliphelliphelliphelliphelliphelliphelliphelliphelliphelliphelliphelliphelliphelliphelliphelliphelliphelliphelliphelliphelliphelliphelliphelliphellip
8 Suppose that you toss a coin three times and all eight outcomes are equally likely If it is known that the first
toss comes up heads what is the probability of an odd number of heads appearing
helliphelliphelliphelliphelliphelliphelliphelliphelliphelliphelliphelliphelliphelliphelliphelliphelliphelliphelliphelliphelliphelliphelliphelliphelliphelliphelliphelliphelliphelliphelliphelliphelliphelliphelliphelliphelliphelliphelliphelliphelliphelliphelliphelliphellip
helliphelliphelliphelliphelliphelliphelliphelliphelliphelliphelliphelliphelliphelliphelliphelliphelliphelliphelliphelliphelliphelliphelliphelliphelliphelliphelliphelliphelliphelliphelliphelliphelliphelliphelliphelliphelliphelliphelliphelliphelliphelliphelliphelliphellip
helliphelliphelliphelliphelliphelliphelliphelliphelliphelliphelliphelliphelliphelliphelliphelliphelliphelliphelliphelliphelliphelliphelliphelliphelliphelliphelliphelliphelliphelliphelliphelliphelliphelliphelliphelliphelliphelliphelliphelliphelliphelliphelliphelliphellip
International Journal of Studies in Education and Science (IJSES)
145
helliphelliphelliphelliphelliphelliphelliphelliphelliphelliphelliphelliphelliphelliphelliphelliphelliphelliphelliphelliphelliphelliphelliphelliphelliphelliphelliphelliphelliphelliphelliphelliphelliphelliphelliphelliphelliphelliphelliphelliphelliphelliphelliphelliphellip
helliphelliphelliphelliphelliphelliphelliphelliphelliphelliphelliphelliphelliphelliphelliphelliphelliphelliphelliphelliphelliphelliphelliphelliphelliphelliphelliphelliphelliphelliphelliphelliphelliphelliphelliphelliphelliphelliphelliphelliphelliphelliphelliphelliphellip
helliphelliphelliphelliphelliphelliphelliphelliphelliphelliphelliphelliphelliphelliphelliphelliphelliphelliphelliphellip
9 A card is selected at random from a pack of 52 cards Find the probability of selecting a card which is a red or
a queen
helliphelliphelliphelliphelliphelliphelliphelliphelliphelliphelliphelliphelliphelliphelliphelliphelliphelliphelliphelliphelliphelliphelliphelliphelliphelliphelliphelliphelliphelliphelliphelliphelliphelliphelliphelliphelliphelliphelliphelliphelliphelliphelliphelliphellip
helliphelliphelliphelliphelliphelliphelliphelliphelliphelliphelliphelliphelliphelliphelliphelliphelliphelliphelliphelliphelliphelliphelliphelliphelliphelliphelliphelliphelliphelliphelliphelliphelliphelliphelliphelliphelliphelliphelliphelliphelliphelliphelliphelliphellip
helliphelliphelliphelliphelliphelliphelliphelliphelliphelliphelliphelliphelliphelliphelliphelliphelliphelliphelliphelliphelliphelliphelliphelliphelliphelliphelliphelliphelliphelliphelliphelliphelliphelliphelliphelliphelliphelliphelliphelliphelliphelliphelliphelliphellip
helliphelliphelliphelliphelliphelliphelliphelliphelliphelliphelliphelliphelliphelliphelliphelliphelliphelliphelliphelliphelliphelliphelliphelliphelliphelliphelliphelliphelliphelliphelliphelliphelliphelliphelliphelliphelliphelliphelliphellip
10 A box contains 6 white balls and 4 green balls Two balls are chosen at random one after the other without
replacement determine the probability that the second ball is white
helliphelliphelliphelliphelliphelliphelliphelliphelliphelliphelliphelliphelliphelliphelliphelliphelliphelliphelliphelliphelliphelliphelliphelliphelliphelliphelliphelliphelliphelliphelliphelliphelliphelliphelliphelliphelliphelliphelliphelliphelliphelliphelliphelliphellip
helliphelliphelliphelliphelliphelliphelliphelliphelliphelliphelliphelliphelliphelliphelliphelliphelliphelliphelliphelliphelliphelliphelliphelliphelliphelliphelliphelliphelliphelliphelliphelliphelliphelliphelliphelliphelliphelliphelliphelliphelliphelliphelliphelliphellip
helliphelliphelliphelliphelliphelliphelliphelliphelliphelliphelliphelliphelliphelliphelliphelliphelliphelliphelliphelliphelliphelliphelliphelliphelliphelliphelliphelliphelliphelliphelliphelliphelliphelliphelliphelliphelliphelliphelliphelliphelliphelliphelliphelliphellip
helliphelliphelliphelliphelliphelliphelliphelliphelliphelliphelliphelliphelliphelliphelliphelliphelliphelliphelliphelliphelliphelliphelliphelliphelliphelliphelliphelliphelliphelliphelliphelliphelliphelliphelliphelliphelliphelliphelliphelliphelliphelliphellip

International Journal of Studies in Education and Science (IJSES)
139
Author Information
Evans Kofi Hokor
httpsorcidorg0000-0002-8387-8294
St Teresarsquos College of Education Hohoe
Department of Mathematics and ICT
P O Box 129
Ghana
Contact e-mail evanskhokorgmailcom
John Sedofia
httpsorcidorg0000-0002-5409-516X
University of Ghana Legon
Department of Teacher Education
PO Box LG 1181
Ghana
Hokor amp Sedofia
140
Appendix A Pre-test Probabilistic Reasoning Assessment
This assessment is for research purpose to improve teaching and learning of probability
You are required to answer all questions honestly Do and leave all workings or rough work on the paper
Pre-test Probabilistic Reasoning Assessment Duration 1hr
Index numberhelliphelliphelliphelliphelliphelliphelliphelliphelliphelliphelliphelliphelliphelliphelliphelliphelliphellipLevelhelliphelliphelliphellipAgehelliphelliphellip
Read each statement carefully and circle the letter of the correct (best) option Provide appropriate response in
the space provided under some items as it apply
1 If you rolled an ordinary die and obtained 51246 which of these is most likely to occur on your next
roll
a 1
b 2
c 3
d 4
e 5
f 6
g The options a b c d e and f are all equally
2i A fair coin is tossed and it lands tail The coin is to be tossed a second time What is the probability that the
second toss will also be a tail
a 1
4
b 1
2
c 1
3
d Slightly less than 1
2
e Slightly more than 1
2
f 0
2ii Which of the following best describes the reason for the correct answer to the preceding question (2i)
a The second toss is less likely to be tail because the first toss was tail
b There are four possible outcomes when you toss a coin twice Getting two tails is only one of them
c The chance of getting heads or tails on any one toss is always 1
2
d There are three possible outcomes when you toss a coin twice Getting two tails is only one of the them
e No chance of being a tail in the second toss
3i A box contains 6 balls 2 are red 2 are black and 2 blue Three balls are picked at random one at a time
Each time a ball is picked the colour is recorded and the ball is put back in the box mixed thoroughly If the
first 2 balls are black what color is the third ball most likely to be
a Red
International Journal of Studies in Education and Science (IJSES)
141
b Black
c Blue
d Red and blue are equally likely than black
e Red black and blue are all equally likely
3ii Which of the following best describes the reason for the correct answer in the preceding question (3i)
a The third ball should not be black because too many black ones have already been picked
b The picks are independent so every color has an equally likely chance of being picked
c Black seems to be lucky
d This color is just as likely as any other color
4 A spinner with ten equally divided sectors in which four parts are white and the rests are red is about to
be spin which color is the spinner more likely to land
a White
b Red
c Both white and red are all equally
5 If you toss a fair coin and get heads two times in a row which of these is most likely on next toss
a Tail
b Head
c Both head and tail are all equally
6 A Gh 2 Gh 5 Ghcent10 Gh 20 Gh 50 and Gh 100 notes were put in a box and thoroughly mixed
What is the probability of picking Gh 50 note without looking
a 1
187
b 50
187
c 1
6
d 0
7 In a game you have been offered two options Which of the following give you higher chance of
winning GHcent200
a Tossing one die once and obtaining a 6
b Tossing two dice once and obtaining two 6rsquos
c The options a and b are all equally
8 A fair die is to be toss six times which of these is most likely to occur
a 251634
b 123456
c 666341
d 132244
e The options a b c and d are all equally likely
9 A fair coin is to be toss four times in a row which of these is least likely to occur
a THTH
b TTTH
c HHH
Hokor amp Sedofia
142
d The options a b and c are all equally likely
10 Two fair dice are to be tossed once Which of the following is more likely to occur
a Obtaining a sum of 11
b Obtaining a sum of 10
c A sum of 11 and a sum of 10 are all equally likely
10i Give reason for the correct answer in the preceding question (10)
helliphelliphelliphelliphelliphelliphelliphelliphelliphelliphelliphelliphelliphelliphelliphelliphelliphelliphelliphelliphelliphelliphelliphelliphelliphelliphelliphelliphelliphelliphelliphelliphelliphelliphelliphelliphelliphelliphelliphelliphelliphellip
helliphelliphelliphelliphelliphelliphelliphelliphelliphelliphelliphelliphelliphelliphelliphelliphelliphelliphelliphelliphelliphelliphelliphelliphelliphelliphelliphelliphelliphelliphelliphelliphelliphelliphelliphelliphelliphelliphelliphelliphelliphellip
helliphelliphelliphelliphelliphelliphelliphelliphelliphelliphelliphelliphelliphelliphelliphelliphelliphelliphelliphelliphelliphelliphelliphelliphelliphelliphelliphelliphelliphelliphelliphelliphelliphelliphelliphelliphelliphelliphelliphelliphelliphellip
helliphelliphelliphelliphelliphelliphelliphelliphelliphelliphelliphelliphelliphelliphelliphelliphelliphelliphelliphelliphelliphelliphelliphelliphelliphelliphelliphelliphelliphelliphelliphelliphelliphelliphelliphelliphelliphellip
11 In national lottery one has to choose five numbers from 1 to 90 inclusive You win when at least two of
your numbers are part of the numbers drawn on Saturday at random Eric has chosen 4 6 7 9 and 11
Alex has chosen 15 23 45 66 and 80 Daniel has chosen 71 77 78 83 and 85 Do Eric Alex and
Daniel have the same chance of winning or not and why
helliphelliphelliphelliphelliphelliphelliphelliphelliphelliphelliphelliphelliphelliphelliphelliphelliphelliphelliphelliphelliphelliphelliphelliphelliphelliphelliphelliphelliphelliphelliphelliphelliphelliphelliphelliphelliphelliphelliphelliphellip
helliphelliphelliphelliphelliphelliphelliphelliphelliphelliphelliphelliphelliphelliphelliphelliphelliphelliphelliphelliphelliphelliphelliphelliphelliphelliphelliphelliphelliphelliphelliphelliphelliphelliphelliphelliphelliphelliphelliphelliphellip
helliphelliphelliphelliphelliphelliphelliphelliphelliphelliphelliphelliphelliphelliphelliphelliphelliphelliphelliphelliphelliphelliphelliphelliphelliphelliphelliphelliphelliphelliphelliphelliphelliphelliphelliphelliphelliphelliphelliphelliphellip
helliphelliphelliphelliphelliphelliphelliphelliphelliphelliphelliphelliphelliphelliphelliphelliphelliphelliphelliphelliphelliphelliphelliphelliphelliphelliphelliphelliphelliphelliphelliphelliphelliphelliphelliphellip
12 A box contains 8 yellow balls and 4 green balls Two balls are chosen at random one after the other
without replacement determine the probability that the two balls are of different colours
helliphelliphelliphelliphelliphelliphelliphelliphelliphelliphelliphelliphelliphelliphelliphelliphelliphelliphelliphelliphelliphelliphelliphelliphelliphelliphelliphelliphelliphelliphelliphelliphelliphelliphelliphelliphelliphelliphelliphelliphellip
helliphelliphelliphelliphelliphelliphelliphelliphelliphelliphelliphelliphelliphelliphelliphelliphelliphelliphelliphelliphelliphelliphelliphelliphelliphelliphelliphelliphelliphelliphelliphelliphelliphelliphelliphelliphelliphelliphelliphelliphellip
helliphelliphelliphelliphelliphelliphelliphelliphelliphelliphelliphelliphelliphelliphelliphelliphelliphelliphelliphelliphelliphelliphelliphelliphelliphelliphelliphelliphelliphelliphelliphelliphelliphelliphelliphelliphelliphelliphelliphelliphellip
helliphelliphelliphelliphelliphelliphelliphelliphelliphelliphelliphelliphelliphelliphelliphelliphelliphelliphelliphelliphelliphelliphelliphelliphelliphelliphelliphelliphelliphelliphelliphelliphelliphelliphelliphelliphellip
International Journal of Studies in Education and Science (IJSES)
143
Appendix B Post-test Probabilistic Reasoning Assessment
This assessment is for research purpose to improve teaching and learning of probability
You are required to answer all questions honestly Do and leave all workings or rough work on the paper
Post-test Probabilistic Reasoning Assessment Duration One Hour
Index numberhelliphelliphelliphelliphelliphelliphelliphelliphelliphelliphelliphelliphelliphelliphellipClasshelliphelliphelliphellipAgehelliphelliphelliphellip
Read each statement carefully and circle the letter of the correct (best) option for each item as much as possible
and provide appropriate response in the space provided
1 Suppose a particular outcome from a random event has a probability of 04 Which of the following
statements represents correct interpretations of this probability
a The outcome will not happen
b The outcome will certainly happen about four times out of every 10 trials
c The outcome is expected to happen about four times out of every 10 trials
d The outcome could happen or it couldnrsquot of either result are the same
2 If you toss a fair coin and get heads 3 times in a row what is the chance of getting a head on the next toss
a 1
b Greater than 1
2
c 1
2
d Less than 1
2
e 0
3 A die is numbered 1 2 3 4 4 5 When the die is thrown once Which of these is most likely and why
a 1
b 2
c 3
d 4
e 5
f They are all equally likely
3i Give reason for your chosen answer in (3)
helliphelliphelliphelliphelliphelliphelliphelliphelliphelliphelliphelliphelliphelliphelliphelliphelliphelliphelliphelliphelliphelliphelliphelliphelliphelliphelliphelliphelliphelliphelliphelliphelliphelliphelliphelliphelliphelliphelliphelliphelliphelliphelliphelliphellip
helliphelliphelliphelliphelliphelliphelliphelliphelliphelliphelliphelliphelliphelliphelliphelliphelliphelliphelliphelliphelliphelliphelliphelliphelliphelliphelliphelliphelliphelliphelliphelliphelliphelliphelliphelliphelliphelliphelliphelliphelliphelliphelliphelliphellip
helliphelliphelliphelliphelliphelliphelliphelliphelliphelliphelliphelliphelliphelliphelliphelliphelliphelliphelliphelliphelliphelliphelliphelliphelliphelliphelliphelliphelliphelliphelliphelliphelliphelliphelliphelliphelliphelliphelliphelliphelliphelliphelliphelliphellip
helliphelliphelliphelliphelliphelliphelliphelliphelliphelliphelliphelliphelliphelliphelliphelliphelliphelliphelliphelliphelliphelliphelliphelliphelliphelliphelliphelliphelliphelliphelliphelliphelliphelliphelliphelliphelliphelliphellip
4 German MP tossed two dice once Which of these is mostly likely and why
a Obtaining a sum of 4
b Obtaining a sum of 7
c Obtaining a sum of 11
d All of them have equal chance of occurring that is a b c
Hokor amp Sedofia
144
4i Give reason for your chosen answer in (4)
helliphelliphelliphelliphelliphelliphelliphelliphelliphelliphelliphelliphelliphelliphelliphelliphelliphelliphelliphelliphelliphelliphelliphelliphelliphelliphelliphelliphelliphelliphelliphelliphelliphelliphelliphelliphelliphelliphelliphelliphelliphelliphelliphelliphellip
helliphelliphelliphelliphelliphelliphelliphelliphelliphelliphelliphelliphelliphelliphelliphelliphelliphelliphelliphelliphelliphelliphelliphelliphelliphelliphelliphelliphelliphelliphelliphelliphelliphelliphelliphelliphelliphelliphelliphelliphelliphelliphelliphelliphellip
helliphelliphelliphelliphelliphelliphelliphelliphelliphelliphelliphelliphelliphelliphelliphelliphelliphelliphelliphelliphelliphelliphelliphelliphelliphelliphelliphelliphelliphelliphelliphelliphelliphelliphelliphelliphelliphelliphelliphelliphelliphelliphelliphelliphellip
helliphelliphelliphelliphelliphelliphelliphelliphelliphelliphelliphelliphelliphelliphelliphelliphelliphelliphelliphelliphelliphelliphelliphelliphelliphelliphelliphelliphelliphelliphelliphelliphelliphelliphelliphelliphelliphelliphelliphelliphelliphelliphelliphelliphellip
helliphelliphelliphelliphelliphelliphelliphelliphelliphelliphelliphelliphelliphelliphelliphelliphelliphelliphelliphelliphelliphelliphelliphelliphelliphelliphelliphelliphellip
5i A fair coin is to be toss four times which of these is most likely to occur
a HTHT
b THTT
c TTTT
d HHTH
e The options a b c and d are all equally likely
5ii Give reason for your chosen answer in (5i)
helliphelliphelliphelliphelliphelliphelliphelliphelliphelliphelliphelliphelliphelliphelliphelliphelliphelliphelliphelliphelliphelliphelliphelliphelliphelliphelliphelliphelliphelliphelliphelliphelliphelliphelliphelliphelliphelliphelliphelliphelliphelliphelliphelliphellip
helliphelliphelliphelliphelliphelliphelliphelliphelliphelliphelliphelliphelliphelliphelliphelliphelliphelliphelliphelliphelliphelliphelliphelliphelliphelliphelliphelliphelliphelliphelliphelliphelliphelliphelliphelliphelliphelliphelliphelliphelliphelliphelliphelliphellip
helliphelliphelliphelliphelliphelliphelliphelliphelliphelliphelliphelliphelliphelliphelliphelliphelliphelliphelliphelliphelliphelliphelliphelliphelliphelliphelliphelliphelliphelliphelliphelliphelliphelliphelliphelliphelliphelliphelliphelliphelliphelliphelliphelliphellip
helliphelliphelliphelliphelliphelliphelliphelliphelliphelliphelliphelliphelliphelliphelliphelliphelliphelliphelliphelliphelliphelliphelliphelliphelliphelliphelliphelliphelliphelliphelliphelliphelliphelliphelliphelliphelliphelliphellip
6i A fair coin is to be toss four times which of these is least likely to occur
a HTHT
b THTT
c TTTT
d HHTH
e The options a b c and d are all equally likely
6ii Give reason for your chosen answer in (6i)
helliphelliphelliphelliphelliphelliphelliphelliphelliphelliphelliphelliphelliphelliphelliphelliphelliphelliphelliphelliphelliphelliphelliphelliphelliphelliphelliphelliphelliphelliphelliphelliphelliphelliphelliphelliphelliphelliphelliphelliphelliphelliphelliphelliphellip
helliphelliphelliphelliphelliphelliphelliphelliphelliphelliphelliphelliphelliphelliphelliphelliphelliphelliphelliphelliphelliphelliphelliphelliphelliphelliphelliphelliphelliphelliphelliphelliphelliphelliphelliphelliphelliphelliphelliphelliphelliphelliphelliphelliphellip
helliphelliphelliphelliphelliphelliphelliphelliphelliphelliphelliphelliphelliphelliphelliphelliphelliphelliphelliphelliphelliphelliphelliphelliphelliphelliphelliphelliphelliphelliphelliphelliphelliphelliphelliphelliphelliphelliphelliphelliphelliphelliphelliphelliphellip
helliphelliphelliphellip
7 A college has 300 level 200 students and 236 level 100 students in it Each studentrsquos name is written with
the level on a piece of paper and all the names are put into a box and mixed thoroughly A tutor picks one
name out of the box without looking Which level is the tutor more likely to pick from and why
helliphelliphelliphelliphelliphelliphelliphelliphelliphelliphelliphelliphelliphelliphelliphelliphelliphelliphelliphelliphelliphelliphelliphelliphelliphelliphelliphelliphelliphelliphelliphelliphelliphelliphelliphelliphelliphelliphelliphelliphelliphelliphelliphelliphellip
helliphelliphelliphelliphelliphelliphelliphelliphelliphelliphelliphelliphelliphelliphelliphelliphelliphelliphelliphelliphelliphelliphelliphelliphelliphelliphelliphelliphelliphelliphelliphelliphelliphelliphelliphelliphelliphelliphelliphelliphelliphelliphelliphelliphellip
helliphelliphelliphelliphelliphelliphelliphelliphelliphelliphelliphelliphelliphelliphelliphelliphelliphelliphelliphelliphelliphelliphelliphelliphelliphelliphelliphelliphelliphelliphelliphelliphelliphelliphelliphelliphelliphelliphelliphelliphelliphelliphelliphelliphellip
helliphelliphelliphelliphelliphelliphelliphelliphelliphelliphelliphelliphelliphelliphelliphelliphelliphelliphelliphelliphelliphelliphelliphelliphelliphelliphelliphelliphelliphelliphelliphelliphelliphelliphelliphelliphelliphelliphelliphellip
8 Suppose that you toss a coin three times and all eight outcomes are equally likely If it is known that the first
toss comes up heads what is the probability of an odd number of heads appearing
helliphelliphelliphelliphelliphelliphelliphelliphelliphelliphelliphelliphelliphelliphelliphelliphelliphelliphelliphelliphelliphelliphelliphelliphelliphelliphelliphelliphelliphelliphelliphelliphelliphelliphelliphelliphelliphelliphelliphelliphelliphelliphelliphelliphellip
helliphelliphelliphelliphelliphelliphelliphelliphelliphelliphelliphelliphelliphelliphelliphelliphelliphelliphelliphelliphelliphelliphelliphelliphelliphelliphelliphelliphelliphelliphelliphelliphelliphelliphelliphelliphelliphelliphelliphelliphelliphelliphelliphelliphellip
helliphelliphelliphelliphelliphelliphelliphelliphelliphelliphelliphelliphelliphelliphelliphelliphelliphelliphelliphelliphelliphelliphelliphelliphelliphelliphelliphelliphelliphelliphelliphelliphelliphelliphelliphelliphelliphelliphelliphelliphelliphelliphelliphelliphellip
International Journal of Studies in Education and Science (IJSES)
145
helliphelliphelliphelliphelliphelliphelliphelliphelliphelliphelliphelliphelliphelliphelliphelliphelliphelliphelliphelliphelliphelliphelliphelliphelliphelliphelliphelliphelliphelliphelliphelliphelliphelliphelliphelliphelliphelliphelliphelliphelliphelliphelliphelliphellip
helliphelliphelliphelliphelliphelliphelliphelliphelliphelliphelliphelliphelliphelliphelliphelliphelliphelliphelliphelliphelliphelliphelliphelliphelliphelliphelliphelliphelliphelliphelliphelliphelliphelliphelliphelliphelliphelliphelliphelliphelliphelliphelliphelliphellip
helliphelliphelliphelliphelliphelliphelliphelliphelliphelliphelliphelliphelliphelliphelliphelliphelliphelliphelliphellip
9 A card is selected at random from a pack of 52 cards Find the probability of selecting a card which is a red or
a queen
helliphelliphelliphelliphelliphelliphelliphelliphelliphelliphelliphelliphelliphelliphelliphelliphelliphelliphelliphelliphelliphelliphelliphelliphelliphelliphelliphelliphelliphelliphelliphelliphelliphelliphelliphelliphelliphelliphelliphelliphelliphelliphelliphelliphellip
helliphelliphelliphelliphelliphelliphelliphelliphelliphelliphelliphelliphelliphelliphelliphelliphelliphelliphelliphelliphelliphelliphelliphelliphelliphelliphelliphelliphelliphelliphelliphelliphelliphelliphelliphelliphelliphelliphelliphelliphelliphelliphelliphelliphellip
helliphelliphelliphelliphelliphelliphelliphelliphelliphelliphelliphelliphelliphelliphelliphelliphelliphelliphelliphelliphelliphelliphelliphelliphelliphelliphelliphelliphelliphelliphelliphelliphelliphelliphelliphelliphelliphelliphelliphelliphelliphelliphelliphelliphellip
helliphelliphelliphelliphelliphelliphelliphelliphelliphelliphelliphelliphelliphelliphelliphelliphelliphelliphelliphelliphelliphelliphelliphelliphelliphelliphelliphelliphelliphelliphelliphelliphelliphelliphelliphelliphelliphelliphelliphellip
10 A box contains 6 white balls and 4 green balls Two balls are chosen at random one after the other without
replacement determine the probability that the second ball is white
helliphelliphelliphelliphelliphelliphelliphelliphelliphelliphelliphelliphelliphelliphelliphelliphelliphelliphelliphelliphelliphelliphelliphelliphelliphelliphelliphelliphelliphelliphelliphelliphelliphelliphelliphelliphelliphelliphelliphelliphelliphelliphelliphelliphellip
helliphelliphelliphelliphelliphelliphelliphelliphelliphelliphelliphelliphelliphelliphelliphelliphelliphelliphelliphelliphelliphelliphelliphelliphelliphelliphelliphelliphelliphelliphelliphelliphelliphelliphelliphelliphelliphelliphelliphelliphelliphelliphelliphelliphellip
helliphelliphelliphelliphelliphelliphelliphelliphelliphelliphelliphelliphelliphelliphelliphelliphelliphelliphelliphelliphelliphelliphelliphelliphelliphelliphelliphelliphelliphelliphelliphelliphelliphelliphelliphelliphelliphelliphelliphelliphelliphelliphelliphelliphellip
helliphelliphelliphelliphelliphelliphelliphelliphelliphelliphelliphelliphelliphelliphelliphelliphelliphelliphelliphelliphelliphelliphelliphelliphelliphelliphelliphelliphelliphelliphelliphelliphelliphelliphelliphelliphelliphelliphelliphelliphelliphelliphellip

Hokor amp Sedofia
140
Appendix A Pre-test Probabilistic Reasoning Assessment
This assessment is for research purpose to improve teaching and learning of probability
You are required to answer all questions honestly Do and leave all workings or rough work on the paper
Pre-test Probabilistic Reasoning Assessment Duration 1hr
Index numberhelliphelliphelliphelliphelliphelliphelliphelliphelliphelliphelliphelliphelliphelliphelliphelliphelliphellipLevelhelliphelliphelliphellipAgehelliphelliphellip
Read each statement carefully and circle the letter of the correct (best) option Provide appropriate response in
the space provided under some items as it apply
1 If you rolled an ordinary die and obtained 51246 which of these is most likely to occur on your next
roll
a 1
b 2
c 3
d 4
e 5
f 6
g The options a b c d e and f are all equally
2i A fair coin is tossed and it lands tail The coin is to be tossed a second time What is the probability that the
second toss will also be a tail
a 1
4
b 1
2
c 1
3
d Slightly less than 1
2
e Slightly more than 1
2
f 0
2ii Which of the following best describes the reason for the correct answer to the preceding question (2i)
a The second toss is less likely to be tail because the first toss was tail
b There are four possible outcomes when you toss a coin twice Getting two tails is only one of them
c The chance of getting heads or tails on any one toss is always 1
2
d There are three possible outcomes when you toss a coin twice Getting two tails is only one of the them
e No chance of being a tail in the second toss
3i A box contains 6 balls 2 are red 2 are black and 2 blue Three balls are picked at random one at a time
Each time a ball is picked the colour is recorded and the ball is put back in the box mixed thoroughly If the
first 2 balls are black what color is the third ball most likely to be
a Red
International Journal of Studies in Education and Science (IJSES)
141
b Black
c Blue
d Red and blue are equally likely than black
e Red black and blue are all equally likely
3ii Which of the following best describes the reason for the correct answer in the preceding question (3i)
a The third ball should not be black because too many black ones have already been picked
b The picks are independent so every color has an equally likely chance of being picked
c Black seems to be lucky
d This color is just as likely as any other color
4 A spinner with ten equally divided sectors in which four parts are white and the rests are red is about to
be spin which color is the spinner more likely to land
a White
b Red
c Both white and red are all equally
5 If you toss a fair coin and get heads two times in a row which of these is most likely on next toss
a Tail
b Head
c Both head and tail are all equally
6 A Gh 2 Gh 5 Ghcent10 Gh 20 Gh 50 and Gh 100 notes were put in a box and thoroughly mixed
What is the probability of picking Gh 50 note without looking
a 1
187
b 50
187
c 1
6
d 0
7 In a game you have been offered two options Which of the following give you higher chance of
winning GHcent200
a Tossing one die once and obtaining a 6
b Tossing two dice once and obtaining two 6rsquos
c The options a and b are all equally
8 A fair die is to be toss six times which of these is most likely to occur
a 251634
b 123456
c 666341
d 132244
e The options a b c and d are all equally likely
9 A fair coin is to be toss four times in a row which of these is least likely to occur
a THTH
b TTTH
c HHH
Hokor amp Sedofia
142
d The options a b and c are all equally likely
10 Two fair dice are to be tossed once Which of the following is more likely to occur
a Obtaining a sum of 11
b Obtaining a sum of 10
c A sum of 11 and a sum of 10 are all equally likely
10i Give reason for the correct answer in the preceding question (10)
helliphelliphelliphelliphelliphelliphelliphelliphelliphelliphelliphelliphelliphelliphelliphelliphelliphelliphelliphelliphelliphelliphelliphelliphelliphelliphelliphelliphelliphelliphelliphelliphelliphelliphelliphelliphelliphelliphelliphelliphelliphellip
helliphelliphelliphelliphelliphelliphelliphelliphelliphelliphelliphelliphelliphelliphelliphelliphelliphelliphelliphelliphelliphelliphelliphelliphelliphelliphelliphelliphelliphelliphelliphelliphelliphelliphelliphelliphelliphelliphelliphelliphelliphellip
helliphelliphelliphelliphelliphelliphelliphelliphelliphelliphelliphelliphelliphelliphelliphelliphelliphelliphelliphelliphelliphelliphelliphelliphelliphelliphelliphelliphelliphelliphelliphelliphelliphelliphelliphelliphelliphelliphelliphelliphelliphellip
helliphelliphelliphelliphelliphelliphelliphelliphelliphelliphelliphelliphelliphelliphelliphelliphelliphelliphelliphelliphelliphelliphelliphelliphelliphelliphelliphelliphelliphelliphelliphelliphelliphelliphelliphelliphelliphellip
11 In national lottery one has to choose five numbers from 1 to 90 inclusive You win when at least two of
your numbers are part of the numbers drawn on Saturday at random Eric has chosen 4 6 7 9 and 11
Alex has chosen 15 23 45 66 and 80 Daniel has chosen 71 77 78 83 and 85 Do Eric Alex and
Daniel have the same chance of winning or not and why
helliphelliphelliphelliphelliphelliphelliphelliphelliphelliphelliphelliphelliphelliphelliphelliphelliphelliphelliphelliphelliphelliphelliphelliphelliphelliphelliphelliphelliphelliphelliphelliphelliphelliphelliphelliphelliphelliphelliphelliphellip
helliphelliphelliphelliphelliphelliphelliphelliphelliphelliphelliphelliphelliphelliphelliphelliphelliphelliphelliphelliphelliphelliphelliphelliphelliphelliphelliphelliphelliphelliphelliphelliphelliphelliphelliphelliphelliphelliphelliphelliphellip
helliphelliphelliphelliphelliphelliphelliphelliphelliphelliphelliphelliphelliphelliphelliphelliphelliphelliphelliphelliphelliphelliphelliphelliphelliphelliphelliphelliphelliphelliphelliphelliphelliphelliphelliphelliphelliphelliphelliphelliphellip
helliphelliphelliphelliphelliphelliphelliphelliphelliphelliphelliphelliphelliphelliphelliphelliphelliphelliphelliphelliphelliphelliphelliphelliphelliphelliphelliphelliphelliphelliphelliphelliphelliphelliphelliphellip
12 A box contains 8 yellow balls and 4 green balls Two balls are chosen at random one after the other
without replacement determine the probability that the two balls are of different colours
helliphelliphelliphelliphelliphelliphelliphelliphelliphelliphelliphelliphelliphelliphelliphelliphelliphelliphelliphelliphelliphelliphelliphelliphelliphelliphelliphelliphelliphelliphelliphelliphelliphelliphelliphelliphelliphelliphelliphelliphellip
helliphelliphelliphelliphelliphelliphelliphelliphelliphelliphelliphelliphelliphelliphelliphelliphelliphelliphelliphelliphelliphelliphelliphelliphelliphelliphelliphelliphelliphelliphelliphelliphelliphelliphelliphelliphelliphelliphelliphelliphellip
helliphelliphelliphelliphelliphelliphelliphelliphelliphelliphelliphelliphelliphelliphelliphelliphelliphelliphelliphelliphelliphelliphelliphelliphelliphelliphelliphelliphelliphelliphelliphelliphelliphelliphelliphelliphelliphelliphelliphelliphellip
helliphelliphelliphelliphelliphelliphelliphelliphelliphelliphelliphelliphelliphelliphelliphelliphelliphelliphelliphelliphelliphelliphelliphelliphelliphelliphelliphelliphelliphelliphelliphelliphelliphelliphelliphelliphellip
International Journal of Studies in Education and Science (IJSES)
143
Appendix B Post-test Probabilistic Reasoning Assessment
This assessment is for research purpose to improve teaching and learning of probability
You are required to answer all questions honestly Do and leave all workings or rough work on the paper
Post-test Probabilistic Reasoning Assessment Duration One Hour
Index numberhelliphelliphelliphelliphelliphelliphelliphelliphelliphelliphelliphelliphelliphelliphellipClasshelliphelliphelliphellipAgehelliphelliphelliphellip
Read each statement carefully and circle the letter of the correct (best) option for each item as much as possible
and provide appropriate response in the space provided
1 Suppose a particular outcome from a random event has a probability of 04 Which of the following
statements represents correct interpretations of this probability
a The outcome will not happen
b The outcome will certainly happen about four times out of every 10 trials
c The outcome is expected to happen about four times out of every 10 trials
d The outcome could happen or it couldnrsquot of either result are the same
2 If you toss a fair coin and get heads 3 times in a row what is the chance of getting a head on the next toss
a 1
b Greater than 1
2
c 1
2
d Less than 1
2
e 0
3 A die is numbered 1 2 3 4 4 5 When the die is thrown once Which of these is most likely and why
a 1
b 2
c 3
d 4
e 5
f They are all equally likely
3i Give reason for your chosen answer in (3)
helliphelliphelliphelliphelliphelliphelliphelliphelliphelliphelliphelliphelliphelliphelliphelliphelliphelliphelliphelliphelliphelliphelliphelliphelliphelliphelliphelliphelliphelliphelliphelliphelliphelliphelliphelliphelliphelliphelliphelliphelliphelliphelliphelliphellip
helliphelliphelliphelliphelliphelliphelliphelliphelliphelliphelliphelliphelliphelliphelliphelliphelliphelliphelliphelliphelliphelliphelliphelliphelliphelliphelliphelliphelliphelliphelliphelliphelliphelliphelliphelliphelliphelliphelliphelliphelliphelliphelliphelliphellip
helliphelliphelliphelliphelliphelliphelliphelliphelliphelliphelliphelliphelliphelliphelliphelliphelliphelliphelliphelliphelliphelliphelliphelliphelliphelliphelliphelliphelliphelliphelliphelliphelliphelliphelliphelliphelliphelliphelliphelliphelliphelliphelliphelliphellip
helliphelliphelliphelliphelliphelliphelliphelliphelliphelliphelliphelliphelliphelliphelliphelliphelliphelliphelliphelliphelliphelliphelliphelliphelliphelliphelliphelliphelliphelliphelliphelliphelliphelliphelliphelliphelliphelliphellip
4 German MP tossed two dice once Which of these is mostly likely and why
a Obtaining a sum of 4
b Obtaining a sum of 7
c Obtaining a sum of 11
d All of them have equal chance of occurring that is a b c
Hokor amp Sedofia
144
4i Give reason for your chosen answer in (4)
helliphelliphelliphelliphelliphelliphelliphelliphelliphelliphelliphelliphelliphelliphelliphelliphelliphelliphelliphelliphelliphelliphelliphelliphelliphelliphelliphelliphelliphelliphelliphelliphelliphelliphelliphelliphelliphelliphelliphelliphelliphelliphelliphelliphellip
helliphelliphelliphelliphelliphelliphelliphelliphelliphelliphelliphelliphelliphelliphelliphelliphelliphelliphelliphelliphelliphelliphelliphelliphelliphelliphelliphelliphelliphelliphelliphelliphelliphelliphelliphelliphelliphelliphelliphelliphelliphelliphelliphelliphellip
helliphelliphelliphelliphelliphelliphelliphelliphelliphelliphelliphelliphelliphelliphelliphelliphelliphelliphelliphelliphelliphelliphelliphelliphelliphelliphelliphelliphelliphelliphelliphelliphelliphelliphelliphelliphelliphelliphelliphelliphelliphelliphelliphelliphellip
helliphelliphelliphelliphelliphelliphelliphelliphelliphelliphelliphelliphelliphelliphelliphelliphelliphelliphelliphelliphelliphelliphelliphelliphelliphelliphelliphelliphelliphelliphelliphelliphelliphelliphelliphelliphelliphelliphelliphelliphelliphelliphelliphelliphellip
helliphelliphelliphelliphelliphelliphelliphelliphelliphelliphelliphelliphelliphelliphelliphelliphelliphelliphelliphelliphelliphelliphelliphelliphelliphelliphelliphelliphellip
5i A fair coin is to be toss four times which of these is most likely to occur
a HTHT
b THTT
c TTTT
d HHTH
e The options a b c and d are all equally likely
5ii Give reason for your chosen answer in (5i)
helliphelliphelliphelliphelliphelliphelliphelliphelliphelliphelliphelliphelliphelliphelliphelliphelliphelliphelliphelliphelliphelliphelliphelliphelliphelliphelliphelliphelliphelliphelliphelliphelliphelliphelliphelliphelliphelliphelliphelliphelliphelliphelliphelliphellip
helliphelliphelliphelliphelliphelliphelliphelliphelliphelliphelliphelliphelliphelliphelliphelliphelliphelliphelliphelliphelliphelliphelliphelliphelliphelliphelliphelliphelliphelliphelliphelliphelliphelliphelliphelliphelliphelliphelliphelliphelliphelliphelliphelliphellip
helliphelliphelliphelliphelliphelliphelliphelliphelliphelliphelliphelliphelliphelliphelliphelliphelliphelliphelliphelliphelliphelliphelliphelliphelliphelliphelliphelliphelliphelliphelliphelliphelliphelliphelliphelliphelliphelliphelliphelliphelliphelliphelliphelliphellip
helliphelliphelliphelliphelliphelliphelliphelliphelliphelliphelliphelliphelliphelliphelliphelliphelliphelliphelliphelliphelliphelliphelliphelliphelliphelliphelliphelliphelliphelliphelliphelliphelliphelliphelliphelliphelliphelliphellip
6i A fair coin is to be toss four times which of these is least likely to occur
a HTHT
b THTT
c TTTT
d HHTH
e The options a b c and d are all equally likely
6ii Give reason for your chosen answer in (6i)
helliphelliphelliphelliphelliphelliphelliphelliphelliphelliphelliphelliphelliphelliphelliphelliphelliphelliphelliphelliphelliphelliphelliphelliphelliphelliphelliphelliphelliphelliphelliphelliphelliphelliphelliphelliphelliphelliphelliphelliphelliphelliphelliphelliphellip
helliphelliphelliphelliphelliphelliphelliphelliphelliphelliphelliphelliphelliphelliphelliphelliphelliphelliphelliphelliphelliphelliphelliphelliphelliphelliphelliphelliphelliphelliphelliphelliphelliphelliphelliphelliphelliphelliphelliphelliphelliphelliphelliphelliphellip
helliphelliphelliphelliphelliphelliphelliphelliphelliphelliphelliphelliphelliphelliphelliphelliphelliphelliphelliphelliphelliphelliphelliphelliphelliphelliphelliphelliphelliphelliphelliphelliphelliphelliphelliphelliphelliphelliphelliphelliphelliphelliphelliphelliphellip
helliphelliphelliphellip
7 A college has 300 level 200 students and 236 level 100 students in it Each studentrsquos name is written with
the level on a piece of paper and all the names are put into a box and mixed thoroughly A tutor picks one
name out of the box without looking Which level is the tutor more likely to pick from and why
helliphelliphelliphelliphelliphelliphelliphelliphelliphelliphelliphelliphelliphelliphelliphelliphelliphelliphelliphelliphelliphelliphelliphelliphelliphelliphelliphelliphelliphelliphelliphelliphelliphelliphelliphelliphelliphelliphelliphelliphelliphelliphelliphelliphellip
helliphelliphelliphelliphelliphelliphelliphelliphelliphelliphelliphelliphelliphelliphelliphelliphelliphelliphelliphelliphelliphelliphelliphelliphelliphelliphelliphelliphelliphelliphelliphelliphelliphelliphelliphelliphelliphelliphelliphelliphelliphelliphelliphelliphellip
helliphelliphelliphelliphelliphelliphelliphelliphelliphelliphelliphelliphelliphelliphelliphelliphelliphelliphelliphelliphelliphelliphelliphelliphelliphelliphelliphelliphelliphelliphelliphelliphelliphelliphelliphelliphelliphelliphelliphelliphelliphelliphelliphelliphellip
helliphelliphelliphelliphelliphelliphelliphelliphelliphelliphelliphelliphelliphelliphelliphelliphelliphelliphelliphelliphelliphelliphelliphelliphelliphelliphelliphelliphelliphelliphelliphelliphelliphelliphelliphelliphelliphelliphelliphellip
8 Suppose that you toss a coin three times and all eight outcomes are equally likely If it is known that the first
toss comes up heads what is the probability of an odd number of heads appearing
helliphelliphelliphelliphelliphelliphelliphelliphelliphelliphelliphelliphelliphelliphelliphelliphelliphelliphelliphelliphelliphelliphelliphelliphelliphelliphelliphelliphelliphelliphelliphelliphelliphelliphelliphelliphelliphelliphelliphelliphelliphelliphelliphelliphellip
helliphelliphelliphelliphelliphelliphelliphelliphelliphelliphelliphelliphelliphelliphelliphelliphelliphelliphelliphelliphelliphelliphelliphelliphelliphelliphelliphelliphelliphelliphelliphelliphelliphelliphelliphelliphelliphelliphelliphelliphelliphelliphelliphelliphellip
helliphelliphelliphelliphelliphelliphelliphelliphelliphelliphelliphelliphelliphelliphelliphelliphelliphelliphelliphelliphelliphelliphelliphelliphelliphelliphelliphelliphelliphelliphelliphelliphelliphelliphelliphelliphelliphelliphelliphelliphelliphelliphelliphelliphellip
International Journal of Studies in Education and Science (IJSES)
145
helliphelliphelliphelliphelliphelliphelliphelliphelliphelliphelliphelliphelliphelliphelliphelliphelliphelliphelliphelliphelliphelliphelliphelliphelliphelliphelliphelliphelliphelliphelliphelliphelliphelliphelliphelliphelliphelliphelliphelliphelliphelliphelliphelliphellip
helliphelliphelliphelliphelliphelliphelliphelliphelliphelliphelliphelliphelliphelliphelliphelliphelliphelliphelliphelliphelliphelliphelliphelliphelliphelliphelliphelliphelliphelliphelliphelliphelliphelliphelliphelliphelliphelliphelliphelliphelliphelliphelliphelliphellip
helliphelliphelliphelliphelliphelliphelliphelliphelliphelliphelliphelliphelliphelliphelliphelliphelliphelliphelliphellip
9 A card is selected at random from a pack of 52 cards Find the probability of selecting a card which is a red or
a queen
helliphelliphelliphelliphelliphelliphelliphelliphelliphelliphelliphelliphelliphelliphelliphelliphelliphelliphelliphelliphelliphelliphelliphelliphelliphelliphelliphelliphelliphelliphelliphelliphelliphelliphelliphelliphelliphelliphelliphelliphelliphelliphelliphelliphellip
helliphelliphelliphelliphelliphelliphelliphelliphelliphelliphelliphelliphelliphelliphelliphelliphelliphelliphelliphelliphelliphelliphelliphelliphelliphelliphelliphelliphelliphelliphelliphelliphelliphelliphelliphelliphelliphelliphelliphelliphelliphelliphelliphelliphellip
helliphelliphelliphelliphelliphelliphelliphelliphelliphelliphelliphelliphelliphelliphelliphelliphelliphelliphelliphelliphelliphelliphelliphelliphelliphelliphelliphelliphelliphelliphelliphelliphelliphelliphelliphelliphelliphelliphelliphelliphelliphelliphelliphelliphellip
helliphelliphelliphelliphelliphelliphelliphelliphelliphelliphelliphelliphelliphelliphelliphelliphelliphelliphelliphelliphelliphelliphelliphelliphelliphelliphelliphelliphelliphelliphelliphelliphelliphelliphelliphelliphelliphelliphelliphellip
10 A box contains 6 white balls and 4 green balls Two balls are chosen at random one after the other without
replacement determine the probability that the second ball is white
helliphelliphelliphelliphelliphelliphelliphelliphelliphelliphelliphelliphelliphelliphelliphelliphelliphelliphelliphelliphelliphelliphelliphelliphelliphelliphelliphelliphelliphelliphelliphelliphelliphelliphelliphelliphelliphelliphelliphelliphelliphelliphelliphelliphellip
helliphelliphelliphelliphelliphelliphelliphelliphelliphelliphelliphelliphelliphelliphelliphelliphelliphelliphelliphelliphelliphelliphelliphelliphelliphelliphelliphelliphelliphelliphelliphelliphelliphelliphelliphelliphelliphelliphelliphelliphelliphelliphelliphelliphellip
helliphelliphelliphelliphelliphelliphelliphelliphelliphelliphelliphelliphelliphelliphelliphelliphelliphelliphelliphelliphelliphelliphelliphelliphelliphelliphelliphelliphelliphelliphelliphelliphelliphelliphelliphelliphelliphelliphelliphelliphelliphelliphelliphelliphellip
helliphelliphelliphelliphelliphelliphelliphelliphelliphelliphelliphelliphelliphelliphelliphelliphelliphelliphelliphelliphelliphelliphelliphelliphelliphelliphelliphelliphelliphelliphelliphelliphelliphelliphelliphelliphelliphelliphelliphelliphelliphelliphellip

International Journal of Studies in Education and Science (IJSES)
141
b Black
c Blue
d Red and blue are equally likely than black
e Red black and blue are all equally likely
3ii Which of the following best describes the reason for the correct answer in the preceding question (3i)
a The third ball should not be black because too many black ones have already been picked
b The picks are independent so every color has an equally likely chance of being picked
c Black seems to be lucky
d This color is just as likely as any other color
4 A spinner with ten equally divided sectors in which four parts are white and the rests are red is about to
be spin which color is the spinner more likely to land
a White
b Red
c Both white and red are all equally
5 If you toss a fair coin and get heads two times in a row which of these is most likely on next toss
a Tail
b Head
c Both head and tail are all equally
6 A Gh 2 Gh 5 Ghcent10 Gh 20 Gh 50 and Gh 100 notes were put in a box and thoroughly mixed
What is the probability of picking Gh 50 note without looking
a 1
187
b 50
187
c 1
6
d 0
7 In a game you have been offered two options Which of the following give you higher chance of
winning GHcent200
a Tossing one die once and obtaining a 6
b Tossing two dice once and obtaining two 6rsquos
c The options a and b are all equally
8 A fair die is to be toss six times which of these is most likely to occur
a 251634
b 123456
c 666341
d 132244
e The options a b c and d are all equally likely
9 A fair coin is to be toss four times in a row which of these is least likely to occur
a THTH
b TTTH
c HHH
Hokor amp Sedofia
142
d The options a b and c are all equally likely
10 Two fair dice are to be tossed once Which of the following is more likely to occur
a Obtaining a sum of 11
b Obtaining a sum of 10
c A sum of 11 and a sum of 10 are all equally likely
10i Give reason for the correct answer in the preceding question (10)
helliphelliphelliphelliphelliphelliphelliphelliphelliphelliphelliphelliphelliphelliphelliphelliphelliphelliphelliphelliphelliphelliphelliphelliphelliphelliphelliphelliphelliphelliphelliphelliphelliphelliphelliphelliphelliphelliphelliphelliphelliphellip
helliphelliphelliphelliphelliphelliphelliphelliphelliphelliphelliphelliphelliphelliphelliphelliphelliphelliphelliphelliphelliphelliphelliphelliphelliphelliphelliphelliphelliphelliphelliphelliphelliphelliphelliphelliphelliphelliphelliphelliphelliphellip
helliphelliphelliphelliphelliphelliphelliphelliphelliphelliphelliphelliphelliphelliphelliphelliphelliphelliphelliphelliphelliphelliphelliphelliphelliphelliphelliphelliphelliphelliphelliphelliphelliphelliphelliphelliphelliphelliphelliphelliphelliphellip
helliphelliphelliphelliphelliphelliphelliphelliphelliphelliphelliphelliphelliphelliphelliphelliphelliphelliphelliphelliphelliphelliphelliphelliphelliphelliphelliphelliphelliphelliphelliphelliphelliphelliphelliphelliphelliphellip
11 In national lottery one has to choose five numbers from 1 to 90 inclusive You win when at least two of
your numbers are part of the numbers drawn on Saturday at random Eric has chosen 4 6 7 9 and 11
Alex has chosen 15 23 45 66 and 80 Daniel has chosen 71 77 78 83 and 85 Do Eric Alex and
Daniel have the same chance of winning or not and why
helliphelliphelliphelliphelliphelliphelliphelliphelliphelliphelliphelliphelliphelliphelliphelliphelliphelliphelliphelliphelliphelliphelliphelliphelliphelliphelliphelliphelliphelliphelliphelliphelliphelliphelliphelliphelliphelliphelliphelliphellip
helliphelliphelliphelliphelliphelliphelliphelliphelliphelliphelliphelliphelliphelliphelliphelliphelliphelliphelliphelliphelliphelliphelliphelliphelliphelliphelliphelliphelliphelliphelliphelliphelliphelliphelliphelliphelliphelliphelliphelliphellip
helliphelliphelliphelliphelliphelliphelliphelliphelliphelliphelliphelliphelliphelliphelliphelliphelliphelliphelliphelliphelliphelliphelliphelliphelliphelliphelliphelliphelliphelliphelliphelliphelliphelliphelliphelliphelliphelliphelliphelliphellip
helliphelliphelliphelliphelliphelliphelliphelliphelliphelliphelliphelliphelliphelliphelliphelliphelliphelliphelliphelliphelliphelliphelliphelliphelliphelliphelliphelliphelliphelliphelliphelliphelliphelliphelliphellip
12 A box contains 8 yellow balls and 4 green balls Two balls are chosen at random one after the other
without replacement determine the probability that the two balls are of different colours
helliphelliphelliphelliphelliphelliphelliphelliphelliphelliphelliphelliphelliphelliphelliphelliphelliphelliphelliphelliphelliphelliphelliphelliphelliphelliphelliphelliphelliphelliphelliphelliphelliphelliphelliphelliphelliphelliphelliphelliphellip
helliphelliphelliphelliphelliphelliphelliphelliphelliphelliphelliphelliphelliphelliphelliphelliphelliphelliphelliphelliphelliphelliphelliphelliphelliphelliphelliphelliphelliphelliphelliphelliphelliphelliphelliphelliphelliphelliphelliphelliphellip
helliphelliphelliphelliphelliphelliphelliphelliphelliphelliphelliphelliphelliphelliphelliphelliphelliphelliphelliphelliphelliphelliphelliphelliphelliphelliphelliphelliphelliphelliphelliphelliphelliphelliphelliphelliphelliphelliphelliphelliphellip
helliphelliphelliphelliphelliphelliphelliphelliphelliphelliphelliphelliphelliphelliphelliphelliphelliphelliphelliphelliphelliphelliphelliphelliphelliphelliphelliphelliphelliphelliphelliphelliphelliphelliphelliphelliphellip
International Journal of Studies in Education and Science (IJSES)
143
Appendix B Post-test Probabilistic Reasoning Assessment
This assessment is for research purpose to improve teaching and learning of probability
You are required to answer all questions honestly Do and leave all workings or rough work on the paper
Post-test Probabilistic Reasoning Assessment Duration One Hour
Index numberhelliphelliphelliphelliphelliphelliphelliphelliphelliphelliphelliphelliphelliphelliphellipClasshelliphelliphelliphellipAgehelliphelliphelliphellip
Read each statement carefully and circle the letter of the correct (best) option for each item as much as possible
and provide appropriate response in the space provided
1 Suppose a particular outcome from a random event has a probability of 04 Which of the following
statements represents correct interpretations of this probability
a The outcome will not happen
b The outcome will certainly happen about four times out of every 10 trials
c The outcome is expected to happen about four times out of every 10 trials
d The outcome could happen or it couldnrsquot of either result are the same
2 If you toss a fair coin and get heads 3 times in a row what is the chance of getting a head on the next toss
a 1
b Greater than 1
2
c 1
2
d Less than 1
2
e 0
3 A die is numbered 1 2 3 4 4 5 When the die is thrown once Which of these is most likely and why
a 1
b 2
c 3
d 4
e 5
f They are all equally likely
3i Give reason for your chosen answer in (3)
helliphelliphelliphelliphelliphelliphelliphelliphelliphelliphelliphelliphelliphelliphelliphelliphelliphelliphelliphelliphelliphelliphelliphelliphelliphelliphelliphelliphelliphelliphelliphelliphelliphelliphelliphelliphelliphelliphelliphelliphelliphelliphelliphelliphellip
helliphelliphelliphelliphelliphelliphelliphelliphelliphelliphelliphelliphelliphelliphelliphelliphelliphelliphelliphelliphelliphelliphelliphelliphelliphelliphelliphelliphelliphelliphelliphelliphelliphelliphelliphelliphelliphelliphelliphelliphelliphelliphelliphelliphellip
helliphelliphelliphelliphelliphelliphelliphelliphelliphelliphelliphelliphelliphelliphelliphelliphelliphelliphelliphelliphelliphelliphelliphelliphelliphelliphelliphelliphelliphelliphelliphelliphelliphelliphelliphelliphelliphelliphelliphelliphelliphelliphelliphelliphellip
helliphelliphelliphelliphelliphelliphelliphelliphelliphelliphelliphelliphelliphelliphelliphelliphelliphelliphelliphelliphelliphelliphelliphelliphelliphelliphelliphelliphelliphelliphelliphelliphelliphelliphelliphelliphelliphelliphellip
4 German MP tossed two dice once Which of these is mostly likely and why
a Obtaining a sum of 4
b Obtaining a sum of 7
c Obtaining a sum of 11
d All of them have equal chance of occurring that is a b c
Hokor amp Sedofia
144
4i Give reason for your chosen answer in (4)
helliphelliphelliphelliphelliphelliphelliphelliphelliphelliphelliphelliphelliphelliphelliphelliphelliphelliphelliphelliphelliphelliphelliphelliphelliphelliphelliphelliphelliphelliphelliphelliphelliphelliphelliphelliphelliphelliphelliphelliphelliphelliphelliphelliphellip
helliphelliphelliphelliphelliphelliphelliphelliphelliphelliphelliphelliphelliphelliphelliphelliphelliphelliphelliphelliphelliphelliphelliphelliphelliphelliphelliphelliphelliphelliphelliphelliphelliphelliphelliphelliphelliphelliphelliphelliphelliphelliphelliphelliphellip
helliphelliphelliphelliphelliphelliphelliphelliphelliphelliphelliphelliphelliphelliphelliphelliphelliphelliphelliphelliphelliphelliphelliphelliphelliphelliphelliphelliphelliphelliphelliphelliphelliphelliphelliphelliphelliphelliphelliphelliphelliphelliphelliphelliphellip
helliphelliphelliphelliphelliphelliphelliphelliphelliphelliphelliphelliphelliphelliphelliphelliphelliphelliphelliphelliphelliphelliphelliphelliphelliphelliphelliphelliphelliphelliphelliphelliphelliphelliphelliphelliphelliphelliphelliphelliphelliphelliphelliphelliphellip
helliphelliphelliphelliphelliphelliphelliphelliphelliphelliphelliphelliphelliphelliphelliphelliphelliphelliphelliphelliphelliphelliphelliphelliphelliphelliphelliphelliphellip
5i A fair coin is to be toss four times which of these is most likely to occur
a HTHT
b THTT
c TTTT
d HHTH
e The options a b c and d are all equally likely
5ii Give reason for your chosen answer in (5i)
helliphelliphelliphelliphelliphelliphelliphelliphelliphelliphelliphelliphelliphelliphelliphelliphelliphelliphelliphelliphelliphelliphelliphelliphelliphelliphelliphelliphelliphelliphelliphelliphelliphelliphelliphelliphelliphelliphelliphelliphelliphelliphelliphelliphellip
helliphelliphelliphelliphelliphelliphelliphelliphelliphelliphelliphelliphelliphelliphelliphelliphelliphelliphelliphelliphelliphelliphelliphelliphelliphelliphelliphelliphelliphelliphelliphelliphelliphelliphelliphelliphelliphelliphelliphelliphelliphelliphelliphelliphellip
helliphelliphelliphelliphelliphelliphelliphelliphelliphelliphelliphelliphelliphelliphelliphelliphelliphelliphelliphelliphelliphelliphelliphelliphelliphelliphelliphelliphelliphelliphelliphelliphelliphelliphelliphelliphelliphelliphelliphelliphelliphelliphelliphelliphellip
helliphelliphelliphelliphelliphelliphelliphelliphelliphelliphelliphelliphelliphelliphelliphelliphelliphelliphelliphelliphelliphelliphelliphelliphelliphelliphelliphelliphelliphelliphelliphelliphelliphelliphelliphelliphelliphelliphellip
6i A fair coin is to be toss four times which of these is least likely to occur
a HTHT
b THTT
c TTTT
d HHTH
e The options a b c and d are all equally likely
6ii Give reason for your chosen answer in (6i)
helliphelliphelliphelliphelliphelliphelliphelliphelliphelliphelliphelliphelliphelliphelliphelliphelliphelliphelliphelliphelliphelliphelliphelliphelliphelliphelliphelliphelliphelliphelliphelliphelliphelliphelliphelliphelliphelliphelliphelliphelliphelliphelliphelliphellip
helliphelliphelliphelliphelliphelliphelliphelliphelliphelliphelliphelliphelliphelliphelliphelliphelliphelliphelliphelliphelliphelliphelliphelliphelliphelliphelliphelliphelliphelliphelliphelliphelliphelliphelliphelliphelliphelliphelliphelliphelliphelliphelliphelliphellip
helliphelliphelliphelliphelliphelliphelliphelliphelliphelliphelliphelliphelliphelliphelliphelliphelliphelliphelliphelliphelliphelliphelliphelliphelliphelliphelliphelliphelliphelliphelliphelliphelliphelliphelliphelliphelliphelliphelliphelliphelliphelliphelliphelliphellip
helliphelliphelliphellip
7 A college has 300 level 200 students and 236 level 100 students in it Each studentrsquos name is written with
the level on a piece of paper and all the names are put into a box and mixed thoroughly A tutor picks one
name out of the box without looking Which level is the tutor more likely to pick from and why
helliphelliphelliphelliphelliphelliphelliphelliphelliphelliphelliphelliphelliphelliphelliphelliphelliphelliphelliphelliphelliphelliphelliphelliphelliphelliphelliphelliphelliphelliphelliphelliphelliphelliphelliphelliphelliphelliphelliphelliphelliphelliphelliphelliphellip
helliphelliphelliphelliphelliphelliphelliphelliphelliphelliphelliphelliphelliphelliphelliphelliphelliphelliphelliphelliphelliphelliphelliphelliphelliphelliphelliphelliphelliphelliphelliphelliphelliphelliphelliphelliphelliphelliphelliphelliphelliphelliphelliphelliphellip
helliphelliphelliphelliphelliphelliphelliphelliphelliphelliphelliphelliphelliphelliphelliphelliphelliphelliphelliphelliphelliphelliphelliphelliphelliphelliphelliphelliphelliphelliphelliphelliphelliphelliphelliphelliphelliphelliphelliphelliphelliphelliphelliphelliphellip
helliphelliphelliphelliphelliphelliphelliphelliphelliphelliphelliphelliphelliphelliphelliphelliphelliphelliphelliphelliphelliphelliphelliphelliphelliphelliphelliphelliphelliphelliphelliphelliphelliphelliphelliphelliphelliphelliphelliphellip
8 Suppose that you toss a coin three times and all eight outcomes are equally likely If it is known that the first
toss comes up heads what is the probability of an odd number of heads appearing
helliphelliphelliphelliphelliphelliphelliphelliphelliphelliphelliphelliphelliphelliphelliphelliphelliphelliphelliphelliphelliphelliphelliphelliphelliphelliphelliphelliphelliphelliphelliphelliphelliphelliphelliphelliphelliphelliphelliphelliphelliphelliphelliphelliphellip
helliphelliphelliphelliphelliphelliphelliphelliphelliphelliphelliphelliphelliphelliphelliphelliphelliphelliphelliphelliphelliphelliphelliphelliphelliphelliphelliphelliphelliphelliphelliphelliphelliphelliphelliphelliphelliphelliphelliphelliphelliphelliphelliphelliphellip
helliphelliphelliphelliphelliphelliphelliphelliphelliphelliphelliphelliphelliphelliphelliphelliphelliphelliphelliphelliphelliphelliphelliphelliphelliphelliphelliphelliphelliphelliphelliphelliphelliphelliphelliphelliphelliphelliphelliphelliphelliphelliphelliphelliphellip
International Journal of Studies in Education and Science (IJSES)
145
helliphelliphelliphelliphelliphelliphelliphelliphelliphelliphelliphelliphelliphelliphelliphelliphelliphelliphelliphelliphelliphelliphelliphelliphelliphelliphelliphelliphelliphelliphelliphelliphelliphelliphelliphelliphelliphelliphelliphelliphelliphelliphelliphelliphellip
helliphelliphelliphelliphelliphelliphelliphelliphelliphelliphelliphelliphelliphelliphelliphelliphelliphelliphelliphelliphelliphelliphelliphelliphelliphelliphelliphelliphelliphelliphelliphelliphelliphelliphelliphelliphelliphelliphelliphelliphelliphelliphelliphelliphellip
helliphelliphelliphelliphelliphelliphelliphelliphelliphelliphelliphelliphelliphelliphelliphelliphelliphelliphelliphellip
9 A card is selected at random from a pack of 52 cards Find the probability of selecting a card which is a red or
a queen
helliphelliphelliphelliphelliphelliphelliphelliphelliphelliphelliphelliphelliphelliphelliphelliphelliphelliphelliphelliphelliphelliphelliphelliphelliphelliphelliphelliphelliphelliphelliphelliphelliphelliphelliphelliphelliphelliphelliphelliphelliphelliphelliphelliphellip
helliphelliphelliphelliphelliphelliphelliphelliphelliphelliphelliphelliphelliphelliphelliphelliphelliphelliphelliphelliphelliphelliphelliphelliphelliphelliphelliphelliphelliphelliphelliphelliphelliphelliphelliphelliphelliphelliphelliphelliphelliphelliphelliphelliphellip
helliphelliphelliphelliphelliphelliphelliphelliphelliphelliphelliphelliphelliphelliphelliphelliphelliphelliphelliphelliphelliphelliphelliphelliphelliphelliphelliphelliphelliphelliphelliphelliphelliphelliphelliphelliphelliphelliphelliphelliphelliphelliphelliphelliphellip
helliphelliphelliphelliphelliphelliphelliphelliphelliphelliphelliphelliphelliphelliphelliphelliphelliphelliphelliphelliphelliphelliphelliphelliphelliphelliphelliphelliphelliphelliphelliphelliphelliphelliphelliphelliphelliphelliphelliphellip
10 A box contains 6 white balls and 4 green balls Two balls are chosen at random one after the other without
replacement determine the probability that the second ball is white
helliphelliphelliphelliphelliphelliphelliphelliphelliphelliphelliphelliphelliphelliphelliphelliphelliphelliphelliphelliphelliphelliphelliphelliphelliphelliphelliphelliphelliphelliphelliphelliphelliphelliphelliphelliphelliphelliphelliphelliphelliphelliphelliphelliphellip
helliphelliphelliphelliphelliphelliphelliphelliphelliphelliphelliphelliphelliphelliphelliphelliphelliphelliphelliphelliphelliphelliphelliphelliphelliphelliphelliphelliphelliphelliphelliphelliphelliphelliphelliphelliphelliphelliphelliphelliphelliphelliphelliphelliphellip
helliphelliphelliphelliphelliphelliphelliphelliphelliphelliphelliphelliphelliphelliphelliphelliphelliphelliphelliphelliphelliphelliphelliphelliphelliphelliphelliphelliphelliphelliphelliphelliphelliphelliphelliphelliphelliphelliphelliphelliphelliphelliphelliphelliphellip
helliphelliphelliphelliphelliphelliphelliphelliphelliphelliphelliphelliphelliphelliphelliphelliphelliphelliphelliphelliphelliphelliphelliphelliphelliphelliphelliphelliphelliphelliphelliphelliphelliphelliphelliphelliphelliphelliphelliphelliphelliphelliphellip

Hokor amp Sedofia
142
d The options a b and c are all equally likely
10 Two fair dice are to be tossed once Which of the following is more likely to occur
a Obtaining a sum of 11
b Obtaining a sum of 10
c A sum of 11 and a sum of 10 are all equally likely
10i Give reason for the correct answer in the preceding question (10)
helliphelliphelliphelliphelliphelliphelliphelliphelliphelliphelliphelliphelliphelliphelliphelliphelliphelliphelliphelliphelliphelliphelliphelliphelliphelliphelliphelliphelliphelliphelliphelliphelliphelliphelliphelliphelliphelliphelliphelliphelliphellip
helliphelliphelliphelliphelliphelliphelliphelliphelliphelliphelliphelliphelliphelliphelliphelliphelliphelliphelliphelliphelliphelliphelliphelliphelliphelliphelliphelliphelliphelliphelliphelliphelliphelliphelliphelliphelliphelliphelliphelliphelliphellip
helliphelliphelliphelliphelliphelliphelliphelliphelliphelliphelliphelliphelliphelliphelliphelliphelliphelliphelliphelliphelliphelliphelliphelliphelliphelliphelliphelliphelliphelliphelliphelliphelliphelliphelliphelliphelliphelliphelliphelliphelliphellip
helliphelliphelliphelliphelliphelliphelliphelliphelliphelliphelliphelliphelliphelliphelliphelliphelliphelliphelliphelliphelliphelliphelliphelliphelliphelliphelliphelliphelliphelliphelliphelliphelliphelliphelliphelliphelliphellip
11 In national lottery one has to choose five numbers from 1 to 90 inclusive You win when at least two of
your numbers are part of the numbers drawn on Saturday at random Eric has chosen 4 6 7 9 and 11
Alex has chosen 15 23 45 66 and 80 Daniel has chosen 71 77 78 83 and 85 Do Eric Alex and
Daniel have the same chance of winning or not and why
helliphelliphelliphelliphelliphelliphelliphelliphelliphelliphelliphelliphelliphelliphelliphelliphelliphelliphelliphelliphelliphelliphelliphelliphelliphelliphelliphelliphelliphelliphelliphelliphelliphelliphelliphelliphelliphelliphelliphelliphellip
helliphelliphelliphelliphelliphelliphelliphelliphelliphelliphelliphelliphelliphelliphelliphelliphelliphelliphelliphelliphelliphelliphelliphelliphelliphelliphelliphelliphelliphelliphelliphelliphelliphelliphelliphelliphelliphelliphelliphelliphellip
helliphelliphelliphelliphelliphelliphelliphelliphelliphelliphelliphelliphelliphelliphelliphelliphelliphelliphelliphelliphelliphelliphelliphelliphelliphelliphelliphelliphelliphelliphelliphelliphelliphelliphelliphelliphelliphelliphelliphelliphellip
helliphelliphelliphelliphelliphelliphelliphelliphelliphelliphelliphelliphelliphelliphelliphelliphelliphelliphelliphelliphelliphelliphelliphelliphelliphelliphelliphelliphelliphelliphelliphelliphelliphelliphelliphellip
12 A box contains 8 yellow balls and 4 green balls Two balls are chosen at random one after the other
without replacement determine the probability that the two balls are of different colours
helliphelliphelliphelliphelliphelliphelliphelliphelliphelliphelliphelliphelliphelliphelliphelliphelliphelliphelliphelliphelliphelliphelliphelliphelliphelliphelliphelliphelliphelliphelliphelliphelliphelliphelliphelliphelliphelliphelliphelliphellip
helliphelliphelliphelliphelliphelliphelliphelliphelliphelliphelliphelliphelliphelliphelliphelliphelliphelliphelliphelliphelliphelliphelliphelliphelliphelliphelliphelliphelliphelliphelliphelliphelliphelliphelliphelliphelliphelliphelliphelliphellip
helliphelliphelliphelliphelliphelliphelliphelliphelliphelliphelliphelliphelliphelliphelliphelliphelliphelliphelliphelliphelliphelliphelliphelliphelliphelliphelliphelliphelliphelliphelliphelliphelliphelliphelliphelliphelliphelliphelliphelliphellip
helliphelliphelliphelliphelliphelliphelliphelliphelliphelliphelliphelliphelliphelliphelliphelliphelliphelliphelliphelliphelliphelliphelliphelliphelliphelliphelliphelliphelliphelliphelliphelliphelliphelliphelliphelliphellip
International Journal of Studies in Education and Science (IJSES)
143
Appendix B Post-test Probabilistic Reasoning Assessment
This assessment is for research purpose to improve teaching and learning of probability
You are required to answer all questions honestly Do and leave all workings or rough work on the paper
Post-test Probabilistic Reasoning Assessment Duration One Hour
Index numberhelliphelliphelliphelliphelliphelliphelliphelliphelliphelliphelliphelliphelliphelliphellipClasshelliphelliphelliphellipAgehelliphelliphelliphellip
Read each statement carefully and circle the letter of the correct (best) option for each item as much as possible
and provide appropriate response in the space provided
1 Suppose a particular outcome from a random event has a probability of 04 Which of the following
statements represents correct interpretations of this probability
a The outcome will not happen
b The outcome will certainly happen about four times out of every 10 trials
c The outcome is expected to happen about four times out of every 10 trials
d The outcome could happen or it couldnrsquot of either result are the same
2 If you toss a fair coin and get heads 3 times in a row what is the chance of getting a head on the next toss
a 1
b Greater than 1
2
c 1
2
d Less than 1
2
e 0
3 A die is numbered 1 2 3 4 4 5 When the die is thrown once Which of these is most likely and why
a 1
b 2
c 3
d 4
e 5
f They are all equally likely
3i Give reason for your chosen answer in (3)
helliphelliphelliphelliphelliphelliphelliphelliphelliphelliphelliphelliphelliphelliphelliphelliphelliphelliphelliphelliphelliphelliphelliphelliphelliphelliphelliphelliphelliphelliphelliphelliphelliphelliphelliphelliphelliphelliphelliphelliphelliphelliphelliphelliphellip
helliphelliphelliphelliphelliphelliphelliphelliphelliphelliphelliphelliphelliphelliphelliphelliphelliphelliphelliphelliphelliphelliphelliphelliphelliphelliphelliphelliphelliphelliphelliphelliphelliphelliphelliphelliphelliphelliphelliphelliphelliphelliphelliphelliphellip
helliphelliphelliphelliphelliphelliphelliphelliphelliphelliphelliphelliphelliphelliphelliphelliphelliphelliphelliphelliphelliphelliphelliphelliphelliphelliphelliphelliphelliphelliphelliphelliphelliphelliphelliphelliphelliphelliphelliphelliphelliphelliphelliphelliphellip
helliphelliphelliphelliphelliphelliphelliphelliphelliphelliphelliphelliphelliphelliphelliphelliphelliphelliphelliphelliphelliphelliphelliphelliphelliphelliphelliphelliphelliphelliphelliphelliphelliphelliphelliphelliphelliphelliphellip
4 German MP tossed two dice once Which of these is mostly likely and why
a Obtaining a sum of 4
b Obtaining a sum of 7
c Obtaining a sum of 11
d All of them have equal chance of occurring that is a b c
Hokor amp Sedofia
144
4i Give reason for your chosen answer in (4)
helliphelliphelliphelliphelliphelliphelliphelliphelliphelliphelliphelliphelliphelliphelliphelliphelliphelliphelliphelliphelliphelliphelliphelliphelliphelliphelliphelliphelliphelliphelliphelliphelliphelliphelliphelliphelliphelliphelliphelliphelliphelliphelliphelliphellip
helliphelliphelliphelliphelliphelliphelliphelliphelliphelliphelliphelliphelliphelliphelliphelliphelliphelliphelliphelliphelliphelliphelliphelliphelliphelliphelliphelliphelliphelliphelliphelliphelliphelliphelliphelliphelliphelliphelliphelliphelliphelliphelliphelliphellip
helliphelliphelliphelliphelliphelliphelliphelliphelliphelliphelliphelliphelliphelliphelliphelliphelliphelliphelliphelliphelliphelliphelliphelliphelliphelliphelliphelliphelliphelliphelliphelliphelliphelliphelliphelliphelliphelliphelliphelliphelliphelliphelliphelliphellip
helliphelliphelliphelliphelliphelliphelliphelliphelliphelliphelliphelliphelliphelliphelliphelliphelliphelliphelliphelliphelliphelliphelliphelliphelliphelliphelliphelliphelliphelliphelliphelliphelliphelliphelliphelliphelliphelliphelliphelliphelliphelliphelliphelliphellip
helliphelliphelliphelliphelliphelliphelliphelliphelliphelliphelliphelliphelliphelliphelliphelliphelliphelliphelliphelliphelliphelliphelliphelliphelliphelliphelliphelliphellip
5i A fair coin is to be toss four times which of these is most likely to occur
a HTHT
b THTT
c TTTT
d HHTH
e The options a b c and d are all equally likely
5ii Give reason for your chosen answer in (5i)
helliphelliphelliphelliphelliphelliphelliphelliphelliphelliphelliphelliphelliphelliphelliphelliphelliphelliphelliphelliphelliphelliphelliphelliphelliphelliphelliphelliphelliphelliphelliphelliphelliphelliphelliphelliphelliphelliphelliphelliphelliphelliphelliphelliphellip
helliphelliphelliphelliphelliphelliphelliphelliphelliphelliphelliphelliphelliphelliphelliphelliphelliphelliphelliphelliphelliphelliphelliphelliphelliphelliphelliphelliphelliphelliphelliphelliphelliphelliphelliphelliphelliphelliphelliphelliphelliphelliphelliphelliphellip
helliphelliphelliphelliphelliphelliphelliphelliphelliphelliphelliphelliphelliphelliphelliphelliphelliphelliphelliphelliphelliphelliphelliphelliphelliphelliphelliphelliphelliphelliphelliphelliphelliphelliphelliphelliphelliphelliphelliphelliphelliphelliphelliphelliphellip
helliphelliphelliphelliphelliphelliphelliphelliphelliphelliphelliphelliphelliphelliphelliphelliphelliphelliphelliphelliphelliphelliphelliphelliphelliphelliphelliphelliphelliphelliphelliphelliphelliphelliphelliphelliphelliphelliphellip
6i A fair coin is to be toss four times which of these is least likely to occur
a HTHT
b THTT
c TTTT
d HHTH
e The options a b c and d are all equally likely
6ii Give reason for your chosen answer in (6i)
helliphelliphelliphelliphelliphelliphelliphelliphelliphelliphelliphelliphelliphelliphelliphelliphelliphelliphelliphelliphelliphelliphelliphelliphelliphelliphelliphelliphelliphelliphelliphelliphelliphelliphelliphelliphelliphelliphelliphelliphelliphelliphelliphelliphellip
helliphelliphelliphelliphelliphelliphelliphelliphelliphelliphelliphelliphelliphelliphelliphelliphelliphelliphelliphelliphelliphelliphelliphelliphelliphelliphelliphelliphelliphelliphelliphelliphelliphelliphelliphelliphelliphelliphelliphelliphelliphelliphelliphelliphellip
helliphelliphelliphelliphelliphelliphelliphelliphelliphelliphelliphelliphelliphelliphelliphelliphelliphelliphelliphelliphelliphelliphelliphelliphelliphelliphelliphelliphelliphelliphelliphelliphelliphelliphelliphelliphelliphelliphelliphelliphelliphelliphelliphelliphellip
helliphelliphelliphellip
7 A college has 300 level 200 students and 236 level 100 students in it Each studentrsquos name is written with
the level on a piece of paper and all the names are put into a box and mixed thoroughly A tutor picks one
name out of the box without looking Which level is the tutor more likely to pick from and why
helliphelliphelliphelliphelliphelliphelliphelliphelliphelliphelliphelliphelliphelliphelliphelliphelliphelliphelliphelliphelliphelliphelliphelliphelliphelliphelliphelliphelliphelliphelliphelliphelliphelliphelliphelliphelliphelliphelliphelliphelliphelliphelliphelliphellip
helliphelliphelliphelliphelliphelliphelliphelliphelliphelliphelliphelliphelliphelliphelliphelliphelliphelliphelliphelliphelliphelliphelliphelliphelliphelliphelliphelliphelliphelliphelliphelliphelliphelliphelliphelliphelliphelliphelliphelliphelliphelliphelliphelliphellip
helliphelliphelliphelliphelliphelliphelliphelliphelliphelliphelliphelliphelliphelliphelliphelliphelliphelliphelliphelliphelliphelliphelliphelliphelliphelliphelliphelliphelliphelliphelliphelliphelliphelliphelliphelliphelliphelliphelliphelliphelliphelliphelliphelliphellip
helliphelliphelliphelliphelliphelliphelliphelliphelliphelliphelliphelliphelliphelliphelliphelliphelliphelliphelliphelliphelliphelliphelliphelliphelliphelliphelliphelliphelliphelliphelliphelliphelliphelliphelliphelliphelliphelliphelliphellip
8 Suppose that you toss a coin three times and all eight outcomes are equally likely If it is known that the first
toss comes up heads what is the probability of an odd number of heads appearing
helliphelliphelliphelliphelliphelliphelliphelliphelliphelliphelliphelliphelliphelliphelliphelliphelliphelliphelliphelliphelliphelliphelliphelliphelliphelliphelliphelliphelliphelliphelliphelliphelliphelliphelliphelliphelliphelliphelliphelliphelliphelliphelliphelliphellip
helliphelliphelliphelliphelliphelliphelliphelliphelliphelliphelliphelliphelliphelliphelliphelliphelliphelliphelliphelliphelliphelliphelliphelliphelliphelliphelliphelliphelliphelliphelliphelliphelliphelliphelliphelliphelliphelliphelliphelliphelliphelliphelliphelliphellip
helliphelliphelliphelliphelliphelliphelliphelliphelliphelliphelliphelliphelliphelliphelliphelliphelliphelliphelliphelliphelliphelliphelliphelliphelliphelliphelliphelliphelliphelliphelliphelliphelliphelliphelliphelliphelliphelliphelliphelliphelliphelliphelliphelliphellip
International Journal of Studies in Education and Science (IJSES)
145
helliphelliphelliphelliphelliphelliphelliphelliphelliphelliphelliphelliphelliphelliphelliphelliphelliphelliphelliphelliphelliphelliphelliphelliphelliphelliphelliphelliphelliphelliphelliphelliphelliphelliphelliphelliphelliphelliphelliphelliphelliphelliphelliphelliphellip
helliphelliphelliphelliphelliphelliphelliphelliphelliphelliphelliphelliphelliphelliphelliphelliphelliphelliphelliphelliphelliphelliphelliphelliphelliphelliphelliphelliphelliphelliphelliphelliphelliphelliphelliphelliphelliphelliphelliphelliphelliphelliphelliphelliphellip
helliphelliphelliphelliphelliphelliphelliphelliphelliphelliphelliphelliphelliphelliphelliphelliphelliphelliphelliphellip
9 A card is selected at random from a pack of 52 cards Find the probability of selecting a card which is a red or
a queen
helliphelliphelliphelliphelliphelliphelliphelliphelliphelliphelliphelliphelliphelliphelliphelliphelliphelliphelliphelliphelliphelliphelliphelliphelliphelliphelliphelliphelliphelliphelliphelliphelliphelliphelliphelliphelliphelliphelliphelliphelliphelliphelliphelliphellip
helliphelliphelliphelliphelliphelliphelliphelliphelliphelliphelliphelliphelliphelliphelliphelliphelliphelliphelliphelliphelliphelliphelliphelliphelliphelliphelliphelliphelliphelliphelliphelliphelliphelliphelliphelliphelliphelliphelliphelliphelliphelliphelliphelliphellip
helliphelliphelliphelliphelliphelliphelliphelliphelliphelliphelliphelliphelliphelliphelliphelliphelliphelliphelliphelliphelliphelliphelliphelliphelliphelliphelliphelliphelliphelliphelliphelliphelliphelliphelliphelliphelliphelliphelliphelliphelliphelliphelliphelliphellip
helliphelliphelliphelliphelliphelliphelliphelliphelliphelliphelliphelliphelliphelliphelliphelliphelliphelliphelliphelliphelliphelliphelliphelliphelliphelliphelliphelliphelliphelliphelliphelliphelliphelliphelliphelliphelliphelliphelliphellip
10 A box contains 6 white balls and 4 green balls Two balls are chosen at random one after the other without
replacement determine the probability that the second ball is white
helliphelliphelliphelliphelliphelliphelliphelliphelliphelliphelliphelliphelliphelliphelliphelliphelliphelliphelliphelliphelliphelliphelliphelliphelliphelliphelliphelliphelliphelliphelliphelliphelliphelliphelliphelliphelliphelliphelliphelliphelliphelliphelliphelliphellip
helliphelliphelliphelliphelliphelliphelliphelliphelliphelliphelliphelliphelliphelliphelliphelliphelliphelliphelliphelliphelliphelliphelliphelliphelliphelliphelliphelliphelliphelliphelliphelliphelliphelliphelliphelliphelliphelliphelliphelliphelliphelliphelliphelliphellip
helliphelliphelliphelliphelliphelliphelliphelliphelliphelliphelliphelliphelliphelliphelliphelliphelliphelliphelliphelliphelliphelliphelliphelliphelliphelliphelliphelliphelliphelliphelliphelliphelliphelliphelliphelliphelliphelliphelliphelliphelliphelliphelliphelliphellip
helliphelliphelliphelliphelliphelliphelliphelliphelliphelliphelliphelliphelliphelliphelliphelliphelliphelliphelliphelliphelliphelliphelliphelliphelliphelliphelliphelliphelliphelliphelliphelliphelliphelliphelliphelliphelliphelliphelliphelliphelliphelliphellip

International Journal of Studies in Education and Science (IJSES)
143
Appendix B Post-test Probabilistic Reasoning Assessment
This assessment is for research purpose to improve teaching and learning of probability
You are required to answer all questions honestly Do and leave all workings or rough work on the paper
Post-test Probabilistic Reasoning Assessment Duration One Hour
Index numberhelliphelliphelliphelliphelliphelliphelliphelliphelliphelliphelliphelliphelliphelliphellipClasshelliphelliphelliphellipAgehelliphelliphelliphellip
Read each statement carefully and circle the letter of the correct (best) option for each item as much as possible
and provide appropriate response in the space provided
1 Suppose a particular outcome from a random event has a probability of 04 Which of the following
statements represents correct interpretations of this probability
a The outcome will not happen
b The outcome will certainly happen about four times out of every 10 trials
c The outcome is expected to happen about four times out of every 10 trials
d The outcome could happen or it couldnrsquot of either result are the same
2 If you toss a fair coin and get heads 3 times in a row what is the chance of getting a head on the next toss
a 1
b Greater than 1
2
c 1
2
d Less than 1
2
e 0
3 A die is numbered 1 2 3 4 4 5 When the die is thrown once Which of these is most likely and why
a 1
b 2
c 3
d 4
e 5
f They are all equally likely
3i Give reason for your chosen answer in (3)
helliphelliphelliphelliphelliphelliphelliphelliphelliphelliphelliphelliphelliphelliphelliphelliphelliphelliphelliphelliphelliphelliphelliphelliphelliphelliphelliphelliphelliphelliphelliphelliphelliphelliphelliphelliphelliphelliphelliphelliphelliphelliphelliphelliphellip
helliphelliphelliphelliphelliphelliphelliphelliphelliphelliphelliphelliphelliphelliphelliphelliphelliphelliphelliphelliphelliphelliphelliphelliphelliphelliphelliphelliphelliphelliphelliphelliphelliphelliphelliphelliphelliphelliphelliphelliphelliphelliphelliphelliphellip
helliphelliphelliphelliphelliphelliphelliphelliphelliphelliphelliphelliphelliphelliphelliphelliphelliphelliphelliphelliphelliphelliphelliphelliphelliphelliphelliphelliphelliphelliphelliphelliphelliphelliphelliphelliphelliphelliphelliphelliphelliphelliphelliphelliphellip
helliphelliphelliphelliphelliphelliphelliphelliphelliphelliphelliphelliphelliphelliphelliphelliphelliphelliphelliphelliphelliphelliphelliphelliphelliphelliphelliphelliphelliphelliphelliphelliphelliphelliphelliphelliphelliphelliphellip
4 German MP tossed two dice once Which of these is mostly likely and why
a Obtaining a sum of 4
b Obtaining a sum of 7
c Obtaining a sum of 11
d All of them have equal chance of occurring that is a b c
Hokor amp Sedofia
144
4i Give reason for your chosen answer in (4)
helliphelliphelliphelliphelliphelliphelliphelliphelliphelliphelliphelliphelliphelliphelliphelliphelliphelliphelliphelliphelliphelliphelliphelliphelliphelliphelliphelliphelliphelliphelliphelliphelliphelliphelliphelliphelliphelliphelliphelliphelliphelliphelliphelliphellip
helliphelliphelliphelliphelliphelliphelliphelliphelliphelliphelliphelliphelliphelliphelliphelliphelliphelliphelliphelliphelliphelliphelliphelliphelliphelliphelliphelliphelliphelliphelliphelliphelliphelliphelliphelliphelliphelliphelliphelliphelliphelliphelliphelliphellip
helliphelliphelliphelliphelliphelliphelliphelliphelliphelliphelliphelliphelliphelliphelliphelliphelliphelliphelliphelliphelliphelliphelliphelliphelliphelliphelliphelliphelliphelliphelliphelliphelliphelliphelliphelliphelliphelliphelliphelliphelliphelliphelliphelliphellip
helliphelliphelliphelliphelliphelliphelliphelliphelliphelliphelliphelliphelliphelliphelliphelliphelliphelliphelliphelliphelliphelliphelliphelliphelliphelliphelliphelliphelliphelliphelliphelliphelliphelliphelliphelliphelliphelliphelliphelliphelliphelliphelliphelliphellip
helliphelliphelliphelliphelliphelliphelliphelliphelliphelliphelliphelliphelliphelliphelliphelliphelliphelliphelliphelliphelliphelliphelliphelliphelliphelliphelliphelliphellip
5i A fair coin is to be toss four times which of these is most likely to occur
a HTHT
b THTT
c TTTT
d HHTH
e The options a b c and d are all equally likely
5ii Give reason for your chosen answer in (5i)
helliphelliphelliphelliphelliphelliphelliphelliphelliphelliphelliphelliphelliphelliphelliphelliphelliphelliphelliphelliphelliphelliphelliphelliphelliphelliphelliphelliphelliphelliphelliphelliphelliphelliphelliphelliphelliphelliphelliphelliphelliphelliphelliphelliphellip
helliphelliphelliphelliphelliphelliphelliphelliphelliphelliphelliphelliphelliphelliphelliphelliphelliphelliphelliphelliphelliphelliphelliphelliphelliphelliphelliphelliphelliphelliphelliphelliphelliphelliphelliphelliphelliphelliphelliphelliphelliphelliphelliphelliphellip
helliphelliphelliphelliphelliphelliphelliphelliphelliphelliphelliphelliphelliphelliphelliphelliphelliphelliphelliphelliphelliphelliphelliphelliphelliphelliphelliphelliphelliphelliphelliphelliphelliphelliphelliphelliphelliphelliphelliphelliphelliphelliphelliphelliphellip
helliphelliphelliphelliphelliphelliphelliphelliphelliphelliphelliphelliphelliphelliphelliphelliphelliphelliphelliphelliphelliphelliphelliphelliphelliphelliphelliphelliphelliphelliphelliphelliphelliphelliphelliphelliphelliphelliphellip
6i A fair coin is to be toss four times which of these is least likely to occur
a HTHT
b THTT
c TTTT
d HHTH
e The options a b c and d are all equally likely
6ii Give reason for your chosen answer in (6i)
helliphelliphelliphelliphelliphelliphelliphelliphelliphelliphelliphelliphelliphelliphelliphelliphelliphelliphelliphelliphelliphelliphelliphelliphelliphelliphelliphelliphelliphelliphelliphelliphelliphelliphelliphelliphelliphelliphelliphelliphelliphelliphelliphelliphellip
helliphelliphelliphelliphelliphelliphelliphelliphelliphelliphelliphelliphelliphelliphelliphelliphelliphelliphelliphelliphelliphelliphelliphelliphelliphelliphelliphelliphelliphelliphelliphelliphelliphelliphelliphelliphelliphelliphelliphelliphelliphelliphelliphelliphellip
helliphelliphelliphelliphelliphelliphelliphelliphelliphelliphelliphelliphelliphelliphelliphelliphelliphelliphelliphelliphelliphelliphelliphelliphelliphelliphelliphelliphelliphelliphelliphelliphelliphelliphelliphelliphelliphelliphelliphelliphelliphelliphelliphelliphellip
helliphelliphelliphellip
7 A college has 300 level 200 students and 236 level 100 students in it Each studentrsquos name is written with
the level on a piece of paper and all the names are put into a box and mixed thoroughly A tutor picks one
name out of the box without looking Which level is the tutor more likely to pick from and why
helliphelliphelliphelliphelliphelliphelliphelliphelliphelliphelliphelliphelliphelliphelliphelliphelliphelliphelliphelliphelliphelliphelliphelliphelliphelliphelliphelliphelliphelliphelliphelliphelliphelliphelliphelliphelliphelliphelliphelliphelliphelliphelliphelliphellip
helliphelliphelliphelliphelliphelliphelliphelliphelliphelliphelliphelliphelliphelliphelliphelliphelliphelliphelliphelliphelliphelliphelliphelliphelliphelliphelliphelliphelliphelliphelliphelliphelliphelliphelliphelliphelliphelliphelliphelliphelliphelliphelliphelliphellip
helliphelliphelliphelliphelliphelliphelliphelliphelliphelliphelliphelliphelliphelliphelliphelliphelliphelliphelliphelliphelliphelliphelliphelliphelliphelliphelliphelliphelliphelliphelliphelliphelliphelliphelliphelliphelliphelliphelliphelliphelliphelliphelliphelliphellip
helliphelliphelliphelliphelliphelliphelliphelliphelliphelliphelliphelliphelliphelliphelliphelliphelliphelliphelliphelliphelliphelliphelliphelliphelliphelliphelliphelliphelliphelliphelliphelliphelliphelliphelliphelliphelliphelliphelliphellip
8 Suppose that you toss a coin three times and all eight outcomes are equally likely If it is known that the first
toss comes up heads what is the probability of an odd number of heads appearing
helliphelliphelliphelliphelliphelliphelliphelliphelliphelliphelliphelliphelliphelliphelliphelliphelliphelliphelliphelliphelliphelliphelliphelliphelliphelliphelliphelliphelliphelliphelliphelliphelliphelliphelliphelliphelliphelliphelliphelliphelliphelliphelliphelliphellip
helliphelliphelliphelliphelliphelliphelliphelliphelliphelliphelliphelliphelliphelliphelliphelliphelliphelliphelliphelliphelliphelliphelliphelliphelliphelliphelliphelliphelliphelliphelliphelliphelliphelliphelliphelliphelliphelliphelliphelliphelliphelliphelliphelliphellip
helliphelliphelliphelliphelliphelliphelliphelliphelliphelliphelliphelliphelliphelliphelliphelliphelliphelliphelliphelliphelliphelliphelliphelliphelliphelliphelliphelliphelliphelliphelliphelliphelliphelliphelliphelliphelliphelliphelliphelliphelliphelliphelliphelliphellip
International Journal of Studies in Education and Science (IJSES)
145
helliphelliphelliphelliphelliphelliphelliphelliphelliphelliphelliphelliphelliphelliphelliphelliphelliphelliphelliphelliphelliphelliphelliphelliphelliphelliphelliphelliphelliphelliphelliphelliphelliphelliphelliphelliphelliphelliphelliphelliphelliphelliphelliphelliphellip
helliphelliphelliphelliphelliphelliphelliphelliphelliphelliphelliphelliphelliphelliphelliphelliphelliphelliphelliphelliphelliphelliphelliphelliphelliphelliphelliphelliphelliphelliphelliphelliphelliphelliphelliphelliphelliphelliphelliphelliphelliphelliphelliphelliphellip
helliphelliphelliphelliphelliphelliphelliphelliphelliphelliphelliphelliphelliphelliphelliphelliphelliphelliphelliphellip
9 A card is selected at random from a pack of 52 cards Find the probability of selecting a card which is a red or
a queen
helliphelliphelliphelliphelliphelliphelliphelliphelliphelliphelliphelliphelliphelliphelliphelliphelliphelliphelliphelliphelliphelliphelliphelliphelliphelliphelliphelliphelliphelliphelliphelliphelliphelliphelliphelliphelliphelliphelliphelliphelliphelliphelliphelliphellip
helliphelliphelliphelliphelliphelliphelliphelliphelliphelliphelliphelliphelliphelliphelliphelliphelliphelliphelliphelliphelliphelliphelliphelliphelliphelliphelliphelliphelliphelliphelliphelliphelliphelliphelliphelliphelliphelliphelliphelliphelliphelliphelliphelliphellip
helliphelliphelliphelliphelliphelliphelliphelliphelliphelliphelliphelliphelliphelliphelliphelliphelliphelliphelliphelliphelliphelliphelliphelliphelliphelliphelliphelliphelliphelliphelliphelliphelliphelliphelliphelliphelliphelliphelliphelliphelliphelliphelliphelliphellip
helliphelliphelliphelliphelliphelliphelliphelliphelliphelliphelliphelliphelliphelliphelliphelliphelliphelliphelliphelliphelliphelliphelliphelliphelliphelliphelliphelliphelliphelliphelliphelliphelliphelliphelliphelliphelliphelliphelliphellip
10 A box contains 6 white balls and 4 green balls Two balls are chosen at random one after the other without
replacement determine the probability that the second ball is white
helliphelliphelliphelliphelliphelliphelliphelliphelliphelliphelliphelliphelliphelliphelliphelliphelliphelliphelliphelliphelliphelliphelliphelliphelliphelliphelliphelliphelliphelliphelliphelliphelliphelliphelliphelliphelliphelliphelliphelliphelliphelliphelliphelliphellip
helliphelliphelliphelliphelliphelliphelliphelliphelliphelliphelliphelliphelliphelliphelliphelliphelliphelliphelliphelliphelliphelliphelliphelliphelliphelliphelliphelliphelliphelliphelliphelliphelliphelliphelliphelliphelliphelliphelliphelliphelliphelliphelliphelliphellip
helliphelliphelliphelliphelliphelliphelliphelliphelliphelliphelliphelliphelliphelliphelliphelliphelliphelliphelliphelliphelliphelliphelliphelliphelliphelliphelliphelliphelliphelliphelliphelliphelliphelliphelliphelliphelliphelliphelliphelliphelliphelliphelliphelliphellip
helliphelliphelliphelliphelliphelliphelliphelliphelliphelliphelliphelliphelliphelliphelliphelliphelliphelliphelliphelliphelliphelliphelliphelliphelliphelliphelliphelliphelliphelliphelliphelliphelliphelliphelliphelliphelliphelliphelliphelliphelliphelliphellip