Developing new guidelines for riverfront development ... - CORE
269
Lincoln University Digital Thesis Copyright Statement The digital copy of this thesis is protected by the Copyright Act 1994 (New Zealand). This thesis may be consulted by you, provided you comply with the provisions of the Act and the following conditions of use: you will use the copy only for the purposes of research or private study you will recognise the author's right to be identified as the author of the thesis and due acknowledgement will be made to the author where appropriate you will obtain the author's permission before publishing any material from the thesis.
-
Upload
khangminh22 -
Category
Documents
-
view
0 -
download
0
Transcript of Developing new guidelines for riverfront development ... - CORE

Lincoln University Digital Thesis
Copyright Statement
The digital copy of this thesis is protected by the Copyright Act 1994 (New Zealand).
This thesis may be consulted by you, provided you comply with the provisions of the Act and the following conditions of use:
you will use the copy only for the purposes of research or private study you will recognise the author's right to be identified as the author of the thesis and
due acknowledgement will be made to the author where appropriate you will obtain the author's permission before publishing any material from the
thesis.

Developing New Guidelines
for Riverfront Development
in Malaysia
A thesis
submitted in partial fulfilment
of the requirements for the Degree of
Doctoral of Philosophy
at
Lincoln University
by
Azlina Binti Md. Yassin
Lincoln University
2011

ii
Abstract of a thesis submitted in partial fulfilment of the
requirements for the Degree of Doctoral of Philosophy.
Abstract
Developing New Guidelines
for Riverfront Development
in Malaysia
by
Azlina Binti Md. Yassin
Rivers and water are valuable natural resources for human life, for the environment and for
national development. A riverfront development is already a well-established phenomenon
internationally. In Malaysia, as the economy began to develop in the 1980s, so did the use of
land along many of the riverfronts. The pressure of new technology coupled with urban
population growth and urbanisation began to force a transition from water dependent
industries to a variety of non-water dependent urban developments. Residential riverfront
development has taken advantage of the land made available by changed land use and has
incorporated the water amenities as a feature or “selling point” of the development. The
development of riverfront land has occurred with limited federal, state, or municipal planning
guidance and in some cases has added a cost in terms of flooding and pollution. Although
some riverfront development projects continue to remain profitable and also maintain a
successful public access component, many have not.
The aim of the current study is to identify the current practices of riverfront development in
Malaysia and to evaluate the strengths and weaknesses of the regulations associated with
riverfront development in Malaysia, and any subsequent barriers to development. This will
allow guideline recommendations to be formulated to help ensure more sustainable
development in crucial riverfront locations throughout Malaysia in the future. Data and
information to undertake this research was obtained from in-depth interviews with
government officers, property developers and the waterfront community (qualitative phase),

iii
followed by a survey of property development companies through postal and email
questionnaires (quantitative phase).
The results show that the most of the interviewees and the property development companies
are familiar with waterfront development even though not directly involved in these projects.
Only limited numbers of them are familiar with guidelines for riverfront development, while
the rest have inadequate information about them. The majority of the interviewees and the
property development companies do not support the riverfront development guidelines for
many reasons such as weakness in policy administration and external interference. The
findings also identified eighteens attributed to be used in assisting developers when
undertaking riverfront development project in the future. This information will be used to
develop recommended guidelines for best practice riverfront development in Malaysia.
Keywords: Guidelines for riverfront development, Riverfront, Riverfront development,
Riverfront property.

iv
Acknowledgements
In the name of Allah, Most Gracious, Most Merciful.
Alhamdulillah, with His Blessings I have successfully completed this thesis.
Completion of this thesis would not have been possible without the help of my supervisors,
family and friends.
First of all, I would like to express my immense gratitude to my supervisor, Professor Sandy
Bond, for her willingness to take up the role as my supervisor, for her tireless reviewing and
commenting on the thesis, which resulted in many valuable comments and for her enduring
support.
A special note of heartfelt thanks goes to my associate supervisor, Associate Professor John
McDonagh, for his willingness to share knowledge and his assistance in helping me to
complete the thesis.
I sincerely thank Professor Chris Eves, previously my supervisor and a professor at Lincoln
University, who is now Professor of Property Economics at Queensland University of
Technology, Brisbane, for his guidance in setting the direction of the study and constructive
comments on early drafts.
I would also like to thank members of the Commerce Division, who have been instrumental in
providing a pleasant, warm and stimulating environment. In particular, I wish to thank Ms.
Annette Brixton, Personal Assistance to the Dean, for her continuing assistance at many
stages of this study, and to Dr. David Cohen, convenor of the Postgraduate Committee, for his
continuing support.
The financial support received from the Malaysian Ministry of Higher Education, the
University Tun Hussein Onn Malaysia and Lincoln University is gratefully acknowledged.
A big thanks must also be extended to all parties who participated in this research, for their
generous help in providing valuable information.
I would also like to extend my heartfelt thanks to all my colleagues and the Canterbury
Lincoln University Malaysian Post Graduate Society (CLUMPS) for their valuable advice,
assistance and friendship.

v
Most of all, I would like to thank my husband, Mahfouz Mohd Dom, for his enduring
encouragement and support. A big hug must go to my daughter Betty and to my son Adam,
and Adha who was born during the course of this study, for their understanding and patience.
Last but not least, a big thanks to my family for their never-ending support and
encouragement.
The faith, love and support I have received from my supervisors, family and friends have
given me the ongoing courage and motivation needed to complete this thesis. Without the
impetus from all of you, it would not have been possible to complete it. Thanks to you all.
vi
Table of Contents
Abstract.............. ....................................................................................................................... ii
Acknowledgements .................................................................................................................. iv
Table of Contents ..................................................................................................................... vi
Glossary of Terms .................................................................................................................... xi
List of Tables....... .................................................................................................................... xii
List of Figures..... ................................................................................................................... xiv
Chapter 1 Thesis Introduction ................................................................................................ 1
1.1 Introduction ....................................................................................................................... 1
1.2 Motivation for Conducting the Research .......................................................................... 3
1.3 Research Questions ........................................................................................................... 4
1.4 Objectives of the Research ................................................................................................ 5
1.5 Significance and Contribution of the Research ................................................................. 5
1.6 Scope of the Research ....................................................................................................... 6
1.7 Organisation of the Thesis ................................................................................................ 6
1.8 Operational Framework .................................................................................................... 7
1.8.1 Research Activities ................................................................................................ 8
Chapter 2 Waterfront Redevelopment: Issues, Trends and Principles ............................. 11
2.1 Introduction ..................................................................................................................... 11
2.2 Waterfront and Waterfront Development ....................................................................... 12
2.2.1 Why the Waterfront? ........................................................................................... 14
2.2.2 Waterfront: From Vibrant to Vacant ................................................................... 16
2.2.3 Waterfront Redevelopment: Moving Waterfronts from Vacant to Vibrant ........ 16
2.2.4 The Term “Waterfront” and “Waterfront Development” in this Research ......... 18
2.3 An Evolution of Waterfront Development ...................................................................... 19
2.4 Actors in the Waterfront Development Process .............................................................. 19
2.5 Successful Waterfront Development Projects ................................................................. 23
2.5.1 Principles for Successful Waterfront Development ............................................ 25
2.5.2 Principles for Sustainable Waterfront Development ........................................... 27
2.5.3 Sustainable Governance of Waterfront Development ......................................... 28
2.6 Chapter Summary ............................................................................................................ 31
Chapter 3 The Emergence of Waterfront Development in Malaysia ................................ 32
3.1 Introduction ..................................................................................................................... 32
3.2 The River and Its Economic Importance ........................................................................ 33
3.3 Urbanisation in Malaysia ................................................................................................ 34
3.3.1 Emerging Urbanisation of Malaysia .................................................................... 35
3.3.2 Urbanisation and Demographic Changes in Malaysia ........................................ 37
3.3.3 Urbanisation and the Economy of Malaysia ....................................................... 38
3.3.4 Urbanisation and Social Considerations in Malaysia .......................................... 40

vii
3.3.5 Urbanisation and the Environment in Malaysia .................................................. 40
3.4 Land Development Process in Malaysia ......................................................................... 44
3.4.1 Land Development Stages and Main Actors ....................................................... 45
3.5 An Evolution of Waterfront Development in Malaysia .................................................. 48
3.6 Governance for Waterfront Development in Malaysia ................................................... 51
3.6.1 Regulations Related to Waterfront Development in Malaysia ............................ 53
3.6.2 Guidelines for Development Related to Rivers and River Reserves ................... 57
Chapter 4 Methodology and Use of the Mixed Methods Research Strategy .................... 61
4.1 Introduction ..................................................................................................................... 61
4.2 Research Objectives ........................................................................................................ 61
4.3 Research Design .............................................................................................................. 61
4.4 Motivation for Using the Mixed Methods Research Strategy ........................................ 62
4.5 The Sequential Exploratory Mixed Methods Design ...................................................... 64
4.5.1 The Qualitative Phase: A Case Study Approach ................................................. 68
4.5.1.1 Motivation for Using the Case Study Approach ................................... 68
4.5.1.2 Case Study Design ................................................................................ 70
4.5.1.3 Case Study Area .................................................................................... 72
4.5.1.4 Description of Case Study Areas .......................................................... 74
4.5.1.5 Preparation and Collection of Data ....................................................... 84
4.5.1.6 Data Analysis ........................................................................................ 86
4.5.2 The Quantitative Phase: A Survey Approach ...................................................... 88
4.5.2.1 Sampling Method .................................................................................. 88
4.5.2.2 The Questionnaire Design: A Self-administered Questionnaire ........... 90
4.5.2.2.1 The Questionnaire Structure: Closed-ended Questions ... 91
4.5.2.3 The Pilot Study ...................................................................................... 93
4.5.2.4 The Questionnaire Distribution Process................................................ 94
4.5.2.5 Data Analysis Techniques ..................................................................... 96
4.5.2.5.1 Descriptive Statistics ........................................................ 96
4.5.2.5.2 Exploratory Factor Analysis (EFA) ................................. 96
Tests for Determining the Appropriateness of Factor
Analysis ........................................................................... 97
Factor Extraction .............................................................. 98
4.5.2.5.3 T-test Analysis ................................................................. 99
4.5.2.5.4 Correlation ....................................................................... 99
4.6 Some Considerations before Beginning the Analysis of the Data .................................. 99
4.6.1 Internal Reliability of the Data ............................................................................ 99
4.6.2 Normality of the Distribution in the Data.......................................................... 100
4.6.3 Missing Values and Outliers ............................................................................. 102
viii
Chapter 5 Qualitative Results – Survey Interviews .......................................................... 103
5.1 Introduction ................................................................................................................... 103
5.2 Response Rate ............................................................................................................... 103
5.3 Waterfront Development in Malaysia ........................................................................... 105
5.3.1 Waterfront Development in Malaysia – the Past ............................................... 105
5.3.2 Waterfront Development in Malaysia – the Present.......................................... 107
5.3.2.1 Waterfront Development – Demand and Supply ................................ 110
5.3.2.2 Successful Waterfront Development and Obstacles to Achieving this112
5.3.2.3 Waterfront Development – in the Future ............................................ 113
5.3.2.4 The Waterfront Development Process in Malaysia ............................ 113
5.3.2.5 Parties Involved in Waterfront Development in Malaysia .................. 114
5.3.2.6 Governance in Waterfront Development in Malaysia ........................ 115
5.3.3 Waterfront Development Effects in Malaysia ................................................... 117
5.3.4 Regulations Associated with Waterfront Development in Malaysia ................ 119
5.3.5 Recommendations for Best Practice for Waterfront Development in Malaysia 123
Chapter 6 Quantitative Method – Questionnaire Results ................................................ 126
6.1 Sample and Response Rates .......................................................................................... 126
6.2 Profile of Property Development Companies ............................................................... 127
6.3 Descriptive Statistics ..................................................................................................... 128
6.3.1 Waterfront Development Projects ..................................................................... 128
6.3.2 Waterfront Development: Reasons for Applying for Waterfront Development130
6.3.3 Successful Waterfront Development ................................................................. 131
6.3.4 Regulations and Guidelines Related to Waterfront Development .................... 133
6.3.4.1 Effectiveness of Guidelines for Riverfront Development ................... 136
6.3.5 Recommendations on the Statements for Waterfront Development Guidelines137
6.4 Cross Tabulation Analysis ............................................................................................ 139
6.4.1 Years of Operation and whether the Company Undertakes Waterfront
Development or not ........................................................................................... 139
6.4.2 Number of Employees and whether the Company Undertakes Waterfront
Development or not ........................................................................................... 140
6.4.3 Years of Operation and Percentage of Waterfront Development Projects ........ 140
6.4.4 Number of Employees and the Percentage of Waterfront Development
Projects .............................................................................................................. 141
6.5 T-Test Analysis ............................................................................................................. 142
6.5.1 T-test on the Statements for Waterfront Development Guidelines between
Two Groups of Respondents ............................................................................. 142
6.6 Exploratory Factor Analysis ......................................................................................... 143
6.6.1 Tests for Determining the Appropriateness of Exploratory Factor Analysis .... 144
6.6.1.1 Examination of the Correlation Matrix ............................................... 144

ix
6.6.1.2 Bartlett‟s Test of Sphericity ................................................................ 144
6.6.1.3 Kaiser-Meyer-Olkin Measure of Sampling Adequacy ....................... 144
6.6.2 Results of Exploratory Factor Analysis ............................................................. 144
6.6.2.1 Latent Root Criterion .......................................................................... 145
6.6.2.2 Percentage of Variance Criterion ........................................................ 145
6.6.2.3 Scree Test Criterion............................................................................. 146
6.6.2.4 Factor Rotation .................................................................................... 146
6.6.2.5 Interpretation of the Exploratory Factor Analysis .............................. 146
6.6.2.6 Reliability ............................................................................................ 150
6.7 T-test Analysis on Six Factor for Waterfront Development Guidelines between Two
Groups of Respondents ................................................................................................. 151
6.8 Correlation ..................................................................................................................... 152
6.9 Discussion ..................................................................................................................... 153
6.9.1 Research Objective One: Current Practices for Waterfront Development in
Malaysia. ........................................................................................................... 153
6.9.2 Research Objective Two: An Overseas Approach to Waterfront Development
with Emphasis on Guidelines Available. .......................................................... 157
6.9.2.1 Wellington‟s Waterfront, New Zealand .............................................. 157
6.9.2.1.1 Governance of Wellington‟s Waterfront ....................... 158
6.9.2.1.2 Objectives and Principles of Wellington‟s Waterfront .. 160
6.9.2.2 Singapore‟s Riverfront, Singapore ...................................................... 163
6.9.2.2.1 Singapore‟s Riverfront, Singapore ................................ 163
6.9.2.2.2 Characteristics of Singapore‟s Riverfront ...................... 164
6.9.2.2.3 Key Strategies for Redevelopment of Singapore‟s
Riverfront ....................................................................... 166
6.9.3 Research Objective Three: Evaluation of Current Regulations and Guidelines
Related to Waterfront Development in Malaysia. ............................................. 167
6.9.4 Research Objective Four: Recommendations for New Guidelines towards
More Sustainable Development of Waterfronts in Malaysia. ........................... 169
6.10 Summary ....................................................................................................................... 174
Chapter 7 Summary and Recommendations ..................................................................... 176
7.1 Summary ....................................................................................................................... 176
7.2 Research Limitations ..................................................................................................... 181
7.3 Conclusion and Recommendations ............................................................................... 182
7.3.1 Recommendations for Best Practice for Waterfront Development in Malaysia 182
7.3.2 Recommendations for Future Research ............................................................ 183
References.............................................................................................................................. 185
Appendix A – Objectives and Function of the Institutions Involved in Waterfront
Development in Malaysia ........................................................................ 203
Appendix B – Interview Questions ................................................................................. 207

x
Appendix C – Approval Letter and Research Pass ....................................................... 210
Appendix D – Invitation Letter for Conducting Interviews ......................................... 212
Appendix E – List of Property Development Companies ............................................. 213
Appendix F – Survey Questionnaire ............................................................................... 221
Appendix G – Invitation Letter for Conducting Survey Questionnaire ...................... 229
Appendix H – Normality of the Distribution in the Data .............................................. 230
Appendix I – List of Property Development Companies Who Participated in the
Survey ........................................................................................................ 233
Appendix J – Correlation Matrix and Anti-image Matrices Table ............................ 239

xi
Glossary of Terms
To clarify terms used in this thesis a list of definitions of selected terms is provided below.
“Bursa Malaysia” is an exchange holding company approved under Section 15 of the Capital
Markets and Services Act 2007. Bursa Malaysia operates a fully-integrated exchange, offering
the complete range of exchange-related services including trading, clearing, settlement and
depository services (Bursa Malaysia, 2009).
“Sustainable development” is defined as “development that meets the needs of the present
without compromising the ability of future generations to meet their own needs.” (Brundtland
Commission, 1987).
“The waterfront” refers to land fronting on to water (Dong, 2004). Different words were used
to replace the term waterfront: city port, harbour front, riverside, river edge, water edge and
riverfront (Hoyle, 2002; Hussein, 2006; Mann, 1973; Tunbridge & Ashworth, 1992; Watson,
1986). The water itself is any type of water body such as a lake, the ocean, a river or a stream
of all sizes (Breen & Rigby, 1994, p. 10). The waterfront zone is an area endowed with
special characteristics and includes ecological, economic and social characteristics (Costanza,
1999).
“Waterfront development” usually refers to land reclaimed from water in order to create an
extension of existing city centres (Butuner, 2006). Breen and Rigby (1994, 1996) considered
that waterfront development may not necessarily need to directly front water, but may need
only to look as if it is attached to the water. Waterfront development in this research refers
particularly to any development in front of river areas.
“Waterfront governance” refers to the management system that consists of the legal and
institutional frameworks necessary to maximise the benefits provided by the water zone and
to minimise the conflicts and negative effects of activities (Post & Lundin, 1996). Every stage
of the waterfront development process (setting objectives, planning and implementation) will
involve as wide a spectrum of interest groups as possible to balance the diverse uses of the
waterfront.

xii
List of Tables
Table 2.1 : Special characteristics of a waterfront zone...................................................... 13
Table 2.2 : Actors involved in the land development process ............................................ 20
Table 2.3 : Stakeholders in the waterfront development process........................................ 21
Table 2.4 : Examples of successful waterfront development projects ................................ 23
Table 2.5 : Elements for successful waterfront development ............................................. 26
Table 2.6 : Principles for sustainable waterfront development ........................................... 28
Table 2.7 : Principles for the sustainable governance of natural and social resources ....... 29
Table 2.8 : Principles for the sustainable governance of the waterfront ............................. 30
Table 3.1 : Economic value of rivers in Malaysia .............................................................. 34
Table 3.2 : Urban and rural population in Malaysia (1950-2030) ...................................... 35
Table 3.3 : Land use effects ................................................................................................ 41
Table 3.4 : The development stages and associated actors ................................................. 46
Table 3.5 : Examples of riverfront development projects in Malaysia ............................... 50
Table 3.6 : Related law, policies and guidelines related to waterfront development in
Malaysia .................................................................................................. 56
Table 3.7 : Criteria for guidelines for riverfront development ............................................ 58
Table 4.1 : Characteristics of case studies areas ................................................................. 73
Table 4.2 : Details of Kuching Riverfront development project ......................................... 77
Table 4.3 : Description of the Malacca Waterfront development project ........................... 81
Table 4.4 : Internal reliability of areas in the questionnaire using interval scales ............ 100
Table 4.5 : Test of normality – Skewness and Kurtosis .................................................... 101
Table 5.1 : Composition of the interviews ........................................................................ 104
Table 5.2 : Significance of rivers ...................................................................................... 105
Table 5.3 : Transformation factors for waterfront areas ................................................... 108
Table 5.4 : Success factors for international waterfront projects ...................................... 109
Table 5.5 : Reasons for having Waterfront development ................................................. 111
Table 5.6 : Level of successful waterfront development and obstacles ............................ 113
Table 5.7 : Reasons for ineffective governance for waterfront development ................... 117
Table 5.8 : Waterfront development – positive and negative effects ................................ 118
Table 5.9 : Regulations associated with waterfront development in Malaysia ................. 120
Table 5.10 : Guidelines for riverfront development – effectiveness levels ........................ 122
Table 5.11 : Guidelines for riverfront development – factors for ineffective guidelines ... 123
Table 5.12 : Statements for waterfront development guidelines......................................... 125
Table 6.1 : Profile of property development companies ................................................... 127
Table 6.2 : Waterfront development in Malaysia .............................................................. 129

xiii
Table 6.3 : Reasons for applying for waterfront development by property development
companies .............................................................................................. 130
Table 6.4 : Successful implementation of waterfront development .................................. 132
Table 6.5 : Factors for unsuccessful implementation of waterfront development ............ 133
Table 6.6 : Regulations and guidelines for waterfront development – respondents‟
levels of awareness ................................................................................ 134
Table 6.7 : Sufficient regulations and guidelines for waterfront development ................. 135
Table 6.8 : Enforcement of regulations for waterfront development ................................ 136
Table 6.9 : Effectiveness of guidelines for riverfront development.................................. 137
Table 6.10 : Statements about waterfront development guidelines .................................... 138
Table 6.11 : Cross tabulation between years of operation and whether the company
undertakes waterfront development ...................................................... 140
Table 6.12 : Cross tabulation between number of employees and whether the company
undertakes waterfront development ...................................................... 140
Table 6.13 : Cross tabulation between the years of operation and the percentage of
waterfront development projects ........................................................... 141
Table 6.14 : Cross tabulation between the number of employees and the percentage of
waterfront development projects ........................................................... 141
Table 6.15 : T-test on the statements for waterfront development guidelines between two
groups of respondents ............................................................................ 142
Table 6.16 : Bartlett's test of Sphericity .............................................................................. 144
Table 6.17 : Eigenvalues and the explained percentage of variance................................... 145
Table 6.18 : Factor analysis results: Principal Component extraction ................................ 149
Table 6.19 : Reliability test – Cronbanch‟s Alpha Coefficient ........................................... 150
Table 6.20 : T-test on six factors for waterfront development guidelines between two
groups of respondents ............................................................................ 152
Table 6.21 : Correlation matrix table .................................................................................. 153
Table 6.22 : Key principles for Wellington‟s Waterfront ................................................... 160
Table 6.23 : Characteristics of Singapore‟s Riverfront ....................................................... 165
Table 6.24 : Key strategies for development of Singapore‟s Riverfront ............................ 166
Table 6.25 : Guidelines for riverfront development for Malaysia ...................................... 171
Table 7.1 : Objectives and function of the institutions involved in waterfront
development in Malaysia ....................................................................... 203
Table 7.2 : List of property development companies ........................................................ 213
Table 7.3 : List of property development companies who participated in the survey ...... 233
Table 7.4 : Correlation matrix .......................................................................................... 239
Table 7.5 : Anti-image matrices ........................................................................................ 247

xiv
List of Figures
Figure 1.1 : Research strategy .............................................................................................. 10
Figure 2.1 : Pattern of waterfront development .................................................................... 19
Figure 2.2 : Participants in waterfront development – Triangular direction ........................ 22
Figure 2.3 : Participants in the waterfront development – Quadripartite direction .............. 22
Figure 3.1 : Distribution of population by stratum in Malaysia, 1970 and 2000 ................. 36
Figure 3.2 : Population growth in Malaysia between 1950 and 2010 .................................. 37
Figure 3.3 : Diversification of Malaysian exports ................................................................ 39
Figure 3.4 : Malaysian economy .......................................................................................... 39
Figure 3.5 : River basins water quality index, Malaysia (1998-2005) ................................. 42
Figure 3.6 : Land development process in Malaysia ............................................................ 47
Figure 3.7 : Institutional frameworks for land and water resource development in
Malaysia .................................................................................................. 53
Figure 4.1 : Mixed methods procedure – data collection and analysis ................................ 67
Figure 4.2 : Stages involved in conducting case studies ...................................................... 71
Figure 4.3 : Location map of the case study areas ............................................................... 72
Figure 4.4 : Location map of Sarawak Riverfront, Malaysia ............................................... 74
Figure 4.5 : Layout for the Kuching Waterfront development ............................................. 76
Figure 4.6 : Location map of State of Malacca, Malaysia. ................................................... 78
Figure 4.7 : Layout for Malacca Waterfront development ................................................... 80
Figure 4.8 : Location map of Selangor, Malaysia ................................................................ 82
Figure 4.9 : Map of Glenmarie Cove, Selangor ................................................................... 83
Figure 4.10 : Summary of data analysis ................................................................................. 87
Figure 4.11 : Sampling procedure used in this research ......................................................... 89
Figure 6.1 : Scree test criterion........................................................................................... 146
Figure 6.2 : Governance structure for Wellington‟s Waterfront ........................................ 159

1
Chapter 1
Thesis Introduction
This chapter provides the background for this study. It begins with a brief introduction to the
riverfront development phenomenon in Malaysia. Research goals and objectives are defined
and general research questions addressed. At the end of this chapter, the overall thesis
framework is presented.
1.1 Introduction
Rivers and water are valuable natural resources for human life, the environment and national
development. Hussein (2006) defined a river as “a copious stream of water flowing in a
channel to the sea, a lake or another river”. Mann (1973), however, sees a river as the “last
open valley of the urban terrain, the last remaining path where man may re-establish his rights
of access and enjoyment.”
Almost 71% of the earth‟s surface is covered by water (Lalli & Parsons, 1993). Water plays
an essential role in people‟s lives and has long been recognised as one of humanity‟s most
important natural resources. In addition, as one of nature's most essential resources, water is
widely used by people for settlement, public spaces and for recreation (Zhang, 2002). Despite
the importance of rivers for settlement and public space, their biodiversity and traditional
importance as sources of primary and secondary production, the contribution of rivers to
energy cycles is now becoming better appreciated (Costanza, et al., 1999; Lalli & Parsons,
1993; Zhang, 2002). Indeed, the allure of water is powerful and universal.
The unique location of rivers at the interface between water and the land initiated the
evolution of human society along the riverfront (Dong, 2004). History shows that many early
human settlements owe their origin and prosperity to water and waterfronts, and including
riverfronts, generally represent the focal point of settlements as a whole (Hoyle & Pinder,
1992). For example, in the history of human civilisation, Uruk, Eridu and Ur (to name a few)
emerged as early settlements about 6000 years ago in Mesopotamia. Moreover, Babylon also
developed and grew along the Tigris and Euphrates Rivers, recognised as very fertile valleys
(Macionis & Parrillo, 2001).
Waterfronts are also important for transport and trade. Konvitz (1978) indicates that from pre-
civilisation times to the present era of modernisation, water has served as transport modes for

2
facilitating economic growth at different rates. Therefore, the strong relationship between the
waterfront and human society was established very early, and has been discussed extensively
in the literature (see for example: Herzog, Herbert, Kaplan, & Crooks, 2000; Hoyle & Pinder,
1992; Wrenn, 1983).
The close association between cities and water has been known since the beginning of
civilisation as most major cities are located on or near, a water body of some type. For
example, the Yellow River, the Indus, the Euphrates and the Nile are the earliest main cities
developed along rivers. The trend continues with many modern major cities developing along
waterways such as Paris, London, New York and Tokyo (Dong, 2004). Moreover, for
example in the United States, only six out of the 75 largest cities are not located on a
significant body of water (Breen & Rigby, 1994). It can be seen from these examples that
both water and the cities they serve constitute a fundamental element in the spatial
organisation of economies and societies (Hoyle & Pinder, 1992).
Historically, the emergence of waterfront development in many countries was significantly
associated with the maritime industry (Hoyle, 2001). Port cities have been characterised by
innovation, enterprise and economic development. The establishment of port cities brought
increased prosperity to the urban waterfront communities worldwide.
After waterfronts had been abandoned for a long time for different reasons, the waterfront
redevelopment phenomenon began in the early 1960s. Even though waterfront cities are
synonymous with port cities, Hoyle (2001) explains that the emergence of waterfront
redevelopment is mainly but not exclusively associated with maritime activity. The
phenomenon grew in the 1970s, accelerated in the 1980s (Breen & Rigby, 1994) and
continues to the present day. So, viewed historically, urban waterfront development has
undergone cycles of change over the years and the latest pattern is the conversion of major
areas of industrial, shipping and transportation to more public endeavours such as residential
and recreational.
Over the decades, many cities have successfully made this transition and the waterfront
redevelopment phenomenon is popular throughout the world. Although the scale and type of
redevelopment of waterfronts varies from city to city due to the patterns of original
development, the basic physical configuration and urban form of each waterfront city should
continue to respond to new and changing demands, while attempting to maintain its heritage
and preserve its natural features.

3
1.2 Motivation for Conducting the Research
Urban waterfront development is already a well-established phenomenon internationally. Due
to the decline of harbour sites and waterfront industrial areas in the second half of the 20th
century, urban waterfront redevelopment started in North America, most notably, with
Baltimore‟s Inner Harbour in the 1970s and has gradually spread to Europe and elsewhere
since the 1980s (Gospodini, 2001). Many waterfronts have been transformed from working
industrial ports into commercial, recreational and tourist areas. In addition, private developers
began making profits by exploiting the waterfront‟s ambience in the marketing of their
projects. As a result of both private initiative and public involvement, cities have gained
valuable benefits from the redevelopment projects such as new parks, walkways and other
recreational facilities (Craig-Smith & Fagence, 1995) . They provide a unique opportunity to
reconnect what is special and remarkable about the river and to achieve a more sustainable
and enjoyable quality of life.
After gaining independence in 1957, Malaysia struggled to achieve urbanisation and focused
more on infrastructure developments (Menon, 2009). Similarly as with many other countries,
the increase in population size in urban areas was faster than in rural areas. In fact, urban
population growth in urban areas during the third period of urbanisation (1970 to 2000),
especially after restructuring the boundaries of urban areas, increased rapidly, from 26.8% to
61.8% (Jaafar, 2004). The extended growth of urban areas is also a sign of the healthy
Malaysian economy.
The rapid development and urbanisation over decades caused the Malaysian government to
start including many waterfront areas in future development with the focus on more
recreational use, while private property developers concentrated more on mixed-use
development. The Kuching Riverfront, the Malacca Waterfront, the Glenmarie Cove
Riverfront and the Kingfisher Cove Riverfront (to name a few) are examples of development
projects that apply waterfront redevelopment phenomena in Malaysia. To date, interest in
waterfront property is booming even when offered at high prices, as people want to live close
to the water for recreation and aesthetic reasons.
However, in some cases, the implementation of these waterfront projects is driven more by
investment needs rather than by community and environmental needs, with developers neither
taking part in nor contributing to the government goals of sustainable water use. In addition,
inadequate regulations and guidelines relating to waterfront development at every level of

4
government, is having a negative impact environmentally and socially such as water pollution
and crime (Ali & Nawawi, 2009; Latip, Heath, Shamsuddin, Liew, & Vallyutham, 2010).
The intensification of waterfront development in other countries, has led to increasing
academic interest, reflected in a series of international conferences and major publications
focusing on different aspects of the phenomenon (See for example Acosta, 1990; Breen &
Rigby, 1994; Gaffen, 2004; Goodwin, 1999; Gospodini, 2001; Hoyle & Pinder, 1992; Hoyle,
Pinder, & Husain, 1988; Latip, et al., 2010; Tsukio, 1984; Wrenn, 1983).
However, in Malaysia, waterfront development and associated environmental and social
issues have not gained the same level of attention. According to Ali and Nawawi (2009),
studies of urban waterfront development cases in Malaysia only emerged in the 1990s, and
then they only assessed the social impact on waterfront environments. Therefore, this research
aims to bring a new vision to waterfront development by incorporating economic
development goals with community goals and the government‟s desire to achieve successful
development practices. Incorporating the environmental, economic and social aspects with
adaptable related regulations for waterfront development is the way to develop successful
waterfront development practices that will benefit the population and subsequently, enhance
the economic success of waterfront locations.
1.3 Research Questions
Understanding the waterfront development processes, recognising the players involved and
identifying the critical factors affecting them will lead to practical models of waterfront
development guidelines, with an emphasis on environmental, economic and social aspects. In
order to accomplish those objectives, the following questions need to be answered:
(1) What are the past and current situations and the extent of waterfront development
practice in Malaysia?
(2) How is waterfront development being adopted by other countries, especially developed
countries?
(3) What variables determine “successful” waterfront development overseas and are these
relevant and able to be applied in Malaysia?
(4) What are the barriers that constrain waterfront development in Malaysia?

5
(5) What are the mechanisms for the implementation of waterfront development at the level
of the developer and the policy maker in Malaysia?
1.4 Objectives of the Research
The main reason for conducting this study is to improve the information about waterfront
development in Malaysia, with an emphasis on the associated guidelines. This information
will then be used to recommend new waterfront development guidelines to achieve more
successful outcomes. The research objectives of this study are to:
(1) Identify current practices of waterfront development in Malaysia.
(2) Examine the approach taken overseas to waterfront development with an emphasis on
available guidelines (for example, the Wellington Waterfront, New Zealand and the
Singapore‟s Riverfront, Singapore).
(3) Evaluate the current regulations and guidelines related to waterfront development in
Malaysia.
(4) Develop and recommend new guidelines towards more sustainable development of the
waterfront in Malaysia.
1.5 Significance and Contribution of the Research
The first contribution of this study is to the body of knowledge about how to achieve best
practice waterfront development specifically in the Malaysian context. With this attention on
best practice, neighbourhoods can be reconnected to the water and to each other, the water
quality can be improved and biodiversity can be rehabilitated. Waterfronts are valuable
economic resources that should be conserved and managed appropriately.
The second contribution is to inform and educate Malaysian policy makers responsible for the
control, development and administration of waterfront developments. These policy makers
need to understand the importance of best practice waterfront development and how the
critical aspects of waterfront development can be adopted and addressed through policy
intervention. By explicitly considering the interactions and mechanics of waterfront
development from an organisational, developmental and local context point of view, policy
makers at the national and local levels can develop guidelines and policies to ensure that

6
future waterfront development maximises the social, cultural, environmental and economic
aspects of the community.
The aim of the study is to provide guidelines for waterfront development. This study is also
important for property developers as they can play a significant part in the quest for
environmentally and ecologically successful waterfront development.
1.6 Scope of the Research
Waterfront development in this research refers specifically to the development of the
riverfront. This study focuses on any riverfront development use such as residential, mixed-
use development or recreational.
The exclusion of the waterfront development types, for example coastal development, is
because in Malaysia, the coastal areas are generally managed in a sectoral in nature (Hussein,
2008; Mokhtar & Aziz, 2003). The executive and legislative functions relating to coastal zone
management has determined by Federal Constitution 1957, either been delegated to Federal
and State government or remained partly shared by both, with local authorities sometimes
acting as a channel for the Federal and State government. This management approach is based
on a tiered structure between the Federal and State Governments and the Local Authorities. At
each level of government there are staffs responsible for playing the management roles of
planning and coordination, implementation and enforcement, and developmental roles, within
their jurisdictions.
This research aims to develop and recommend guidelines to be applied to riverfront
development with consideration being given to environmental, economic, social and
community impacts. In order to achieve this aim, the research will focus on guidelines and
any strategies that may lower the barriers for implementing and encouraging best practice for
waterfront development in Malaysia.
1.7 Organisation of the Thesis
This thesis will be organised into seven chapters. First, the current chapter introduces the
topic and outlines, in very broad terms, the objectives and contribution the research makes.
Following this chapter, the next two chapters focus on the literature review which comprises
two main areas: the general practice of waterfront development (Chapter Two) and the
Malaysian approach to waterfront development (Chapter Three). Both chapters provide an

7
overview of contemporary perspectives and issues as well as guidelines about successful
waterfront development.
Chapter Four discusses the methods to be employed and the reasons for adopting more than
one method as part of the research strategy. General background information and the context
of the selected case studies, data collection procedures and data analysis are provided in this
chapter. The chapter will also address reliability and validity issues related to data, as well as
the sampling and design. From this, a working model is established to provide a basic
framework for the research.
The following two chapters cover the analysis of the data which integrates and synthesises the
data from a variety of sources as presented in the previous chapter (Chapter Four). Initially,
the analysis will be divided into two chapters and will be conducted sequentially; the case
study analysis – interviews and document reviews (Chapter Five) followed by the survey
questionnaire analysis (Chapter Six). The interview data will be analysed using EXCEL and is
followed by a questionnaire, the developments of which was based on the qualitative findings.
The survey questionnaire data will then be analysed using the Statistical Package for Social
Science (SPSS) software. Descriptive statistics, T-test analysis, Exploratory Factor Analysis
(EFA) and Correlation techniques are used. These findings will provide the basis for
developing the waterfront development guidelines for Malaysia. Finally, using the research
objectives as set out in Chapter One, the data will be discussed and interpreted in detail in the
last section of Chapter Six.
This research then concludes with a discussion of the research limitations, the implications
and with recommendations for future research (in Chapter Seven).
1.8 Operational Framework
A three-stage research strategy is adopted in this study. This research starts by identifying the
research problems, posing the research questions and setting the research objectives. This is
followed by a review of the literature related to waterfront development, in order to develop
the key issues. Conference papers, proceedings and theses, either in journals or from the
internet, will be reviewed. The literature review will also include studies about successful
implementation of waterfront development internationally. Based on the information
generated from the literature review, the research questions and objectives of the study will be
refined.

8
The second stage of the research is the data gathering stage. The first part of the second stage
focuses on qualitative data collection. This involves a case study approach, selecting
waterfront development projects implemented in Malaysia. Semi-structured interviews and
document reviews are employed in this phase of the research with an emphasis on historical,
current and future practices of waterfront development in Malaysia. Special attention is given
to the guidelines associated with waterfront development as well as impacts resulting from the
development. Respondents are selected from government officers at each level of government
who are involved in selected waterfront projects, as well as property developers and
waterfront communities. The final part of the interviews asks for recommendations from the
respondents about guidelines for best practices for waterfront development in Malaysia.
The second part of the second stage involves quantitative data gathering. This includes the use
of questionnaires that are based on the qualitative findings generated in the first part. The
focus of the survey is to confirm the findings revealed from the first part of the data
collection. Stratified sampling techniques are used to identify respondents for the survey
questionnaire. Finally, 91 property development companies listed under Bursa Malaysia are
selected for participation in this survey.
The final stage (third stage) of the research involves developing the guidelines for waterfront
development in Malaysia. These guidelines are developed based on the findings revealed in
the second stage (from both the interviews and the questionnaires).
A schematic illustration of the details of the research strategy planned for and implemented in
the study is presented in Figure 1.1.
1.8.1 Research Activities
The overall activities involved in this research are as follows:-
(1) Identification of the research problem.
(2) Literature review – collecting relevant literature published locally and internationally.
(3) Refining the research questions – based on information generated from the literature
review.
(4) Preparation and design of the semi-structured interview questions to explore the
research topic – the qualitative approach.
9
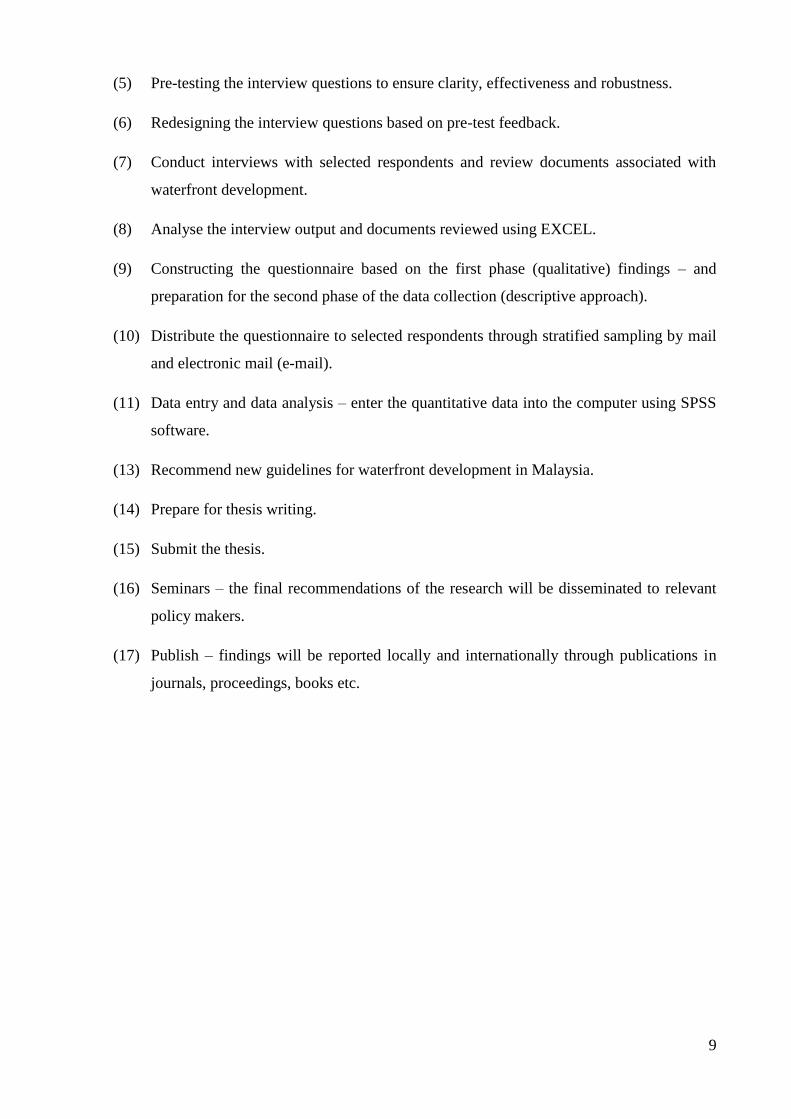
(5) Pre-testing the interview questions to ensure clarity, effectiveness and robustness.
(6) Redesigning the interview questions based on pre-test feedback.
(7) Conduct interviews with selected respondents and review documents associated with
waterfront development.
(8) Analyse the interview output and documents reviewed using EXCEL.
(9) Constructing the questionnaire based on the first phase (qualitative) findings – and
preparation for the second phase of the data collection (descriptive approach).
(10) Distribute the questionnaire to selected respondents through stratified sampling by mail
and electronic mail (e-mail).
(11) Data entry and data analysis – enter the quantitative data into the computer using SPSS
software.
(13) Recommend new guidelines for waterfront development in Malaysia.
(14) Prepare for thesis writing.
(15) Submit the thesis.
(16) Seminars – the final recommendations of the research will be disseminated to relevant
policy makers.
(17) Publish – findings will be reported locally and internationally through publications in
journals, proceedings, books etc.

10
Figure 1.1: Research strategy
START
Background of the research.
Identify research problems.
Pose research questions.
Set research objectives.
Literature Review:
Conduct literature search and
theoretical perspective.
Critically review relevant
literature.
1st Stage
● Refine research questions
and objectives in the light
of new insights from the
literature.
Design semi-
structured interview
questions.
● Pre-test interview
questions for clarity,
effectiveness &
robustness.
Redesign interview
questions based on the
pre-test results.
Finalise interview
questions.
● Conduct interviews with
representative respondents.
● Document review.
Data analysis:
Analyse data
using Ms. EXCEL.
Construct a
questionnaire:
Using output
from qualitative
approach.
Distribute a
questionnaire
to each
respondent.
2nd
Stage
1st Phase: Exploratory
2nd
Phase: Descriptive
Data analysis:
Analyse data
using SPSS –
Descriptive
statistics, Factor
analysis and
Correlation.
Developing guidelines:
Using results from Qualitative
and Quantitative research.
Recommend new guidelines.
3rd
Stage
END
Thesis Writing:
Prepare final report – Conclusions,
Discussion and Recommendations for
future research.
Pilot study:
Instrument
analysis.
Refine
questionnaires.

11
Chapter 2
Waterfront Redevelopment: Issues, Trends and Principles
“Wherever in the world, as an incident of the highway and wharves along
its riverbanks, a city has provided opportunity for the people to walk and sit
under pleasant conditions where they can watch the water and the life upon
it, where they can enjoy the breadth of outlook and the sight of the open sky
and the opposite bank and the reflections in the stream, the result has added
to the comeliness of the city itself, the health and happiness of the people
and their loyalty and local pride.”
(Torre, 1989)
The aim of this literature review is to become familiar with some theoretical perspectives on
waterfront development. The chapter begins with an introduction to the importance of the
waterfront and then outlines the definitions of waterfront and waterfront development. Next,
information on the evolution of waterfront development, the waterfront development process
and the principles behind successful waterfront developments practices is covered. The
implications and effects of the transition of waterfront areas from ports and shipping industry
domination to multidimensional uses such as recreational, mix-use and housing, is discussed.
The last section summarises the chapter.
2.1 Introduction
Water has been a valuable natural resource from the time of the growth of early settlements
up until the present day. When considering its various functions, for example for
transportation and trading, for agricultural production and as natural defence, water has long
been recognised as a most important natural resource for human life, for the environment and
for national development. Therefore, in many countries around the world, the water edge
areas developed earlier than other areas and became a favourable location for the development
of cities (Wrenn, 1983).
At the end of the 19th
century waterfront areas were places where settlements originated and
were dominated by industrial activities. According to Craig-Smith & Fagence (1995), for the
last 200 years waterfronts were mostly used for manufacturing, for water supplies, for
drainage, for sewage treatment plants and for electricity generation. However, due to several
factors such as rapid industrialisation, improved shipping technologies and changes in society
with the need for increased recreational activities, new port zones have been required to cater
for this scale of industrial activity. Therefore, in the mid 20th
century, new port zones were

12
developed and port facilities in the centres of cities began to move to outer city zones and
consequently, large amounts of unused property along the waterfronts were left (Breen &
Rigby, 1994; Butuner, 2006; Peter, 1993).
In the second half of the 20th
century, particularly in the 1970s, waterfront redevelopment
emerged, with numerous waterfront areas undergoing a transition from abandoned spaces to
commercial, residential and recreational areas (Bruttomesso, 1993; Butuner, 2006; Sairinen &
Kumpulainen, 2006). For example, Maryland began its famous redevelopment project
converting old and underused waterfront properties into economically viable space. Inspired
by this successful story of a waterfront redevelopment initiative, many other small and large
scale developments followed; for example, in Sydney, Australia, London (UK) and in
Portland, Grand Haven and Michigan (USA) (Breen & Rigby, 1994). Bear in mind that most
of the waterfront redevelopment throughout the world shares some common goals such as
redefining the waterfront‟s position in the urban context, remaking the urban image,
regeneration of the economy and improving social patterns (Butuner, 2006; Sairinen &
Kumpulainen, 2006).
Clearly, waterfront redevelopment over the decades has changed waterfronts in terms of
layout, function, uses and social patterns. Increasing demand for recreational activities
became a determinant in the development of waterfronts, and waterfronts were mostly
designed as new public open spaces of cities that were totally different from their former
structures.
In the next section, the definition and early history of the waterfront is discussed, followed by
a look at the future of waterfront development as well as a brief discussion about the
principles behind successful waterfront development practices internationally.
2.2 Waterfront and Waterfront Development
The waterfront is a zone of interaction between urban development and the water and a
waterfront area is considered to be a unique and irreplaceable resource where it interfaces
between land, water, air, sun and productive plants (Wrenn, 1983). Moreover, Zhang (2002)
characterised waterfronts as a place integrating land with water and having a natural attraction
to people. In fact, water edges are most attractive water features for human settlement and in
most countries the land in front of water developed earlier than the inland areas.

13
A more detailed definition by Guo (1998, as cited in Dong, 2004, p. 7) describes a waterfront
as the point of interface where land and water meet, within 200 to 300 metres from the water
line and 1-2 kilometres of the land site and within 20 minutes walking distance. By being an
interface between land and water, the waterfront zone is an area endowed with special
characteristics. The special features and functions of waterfront areas are described in Table
2.1 below.
Table 2.1: Special characteristics of a waterfront zone
Characteristic Description
Ecological The waterfront zone is a dynamic area with frequently changing
biological, chemical and geological attributes.
The waterfront zone includes highly productive and biologically
diverse ecosystems that offer crucial nursery habitats for many marine
species.
Economic The waterfront contributes significantly to human welfare, both
directly and indirectly and, therefore represents a significant portion
of the total economic value of the planet.
Social The waterfront zone is socially important for global transportation,
open access and common property and is a unifying element in the
cultures of each country.
(Source: Costanza, 1999)
In the development context, waterfront development have various interpretations depending
on the characteristics of the sites and the cities (Dong, 2004). Butuner (2006) sees waterfronts
as land to be reclaimed from water in order to create an extension of existing city centres.
Breen and Rigby (1994, 1996) considered that waterfront development may not necessarily
need to directly front water but may need only to look as if it is attached to the water. They
believed that a property with a commanding view of water, can be considered as a waterfront
property. Similarly, Ryckbost (2005) sees waterfronts as any property that has a strong visual
or physical connection to water with the water itself being any type of water body such as a
lake, the ocean, a river or a stream of all sizes (Breen & Rigby, 1994, p. 10).
For example, in China, developers classified two types of waterfront development. The first is
called a “borrowed” water view which integrates buildings into an existing water system and,
the second is called a “created” water view which includes man-made lakes and any other

14
water body (Murray, 2003). In this context, by being an interface between land and water, a
waterfront is considered an important resource that offers great opportunities to a city.
Therefore, waterfront development is best represented as a development directly fronting
water for any purpose and the water components can include river deltas, coastal plains,
wetlands, beach and dunes, lagoons and other water features.
The following sections will discuss the changing structure of waterfront characteristics and
their integration with city development.
2.2.1 Why the Waterfront?
Over recent decades, waterfront development and redevelopment have evolved with a focus
on historic preservation and recreation. During this time government and private sectors have
begun to incorporate waterfront planning and design into their development projects. In
particular, the patterns of development are changing by connecting land, water and air and
landscape aesthetics to land development planning. According to Gaffen (2004), the growing
focus on redeveloping urban waterfronts can be attributed to several factors, that include:
(1) Awareness of the natural environment and smart growth
Increased awareness of the natural environment along the water areas and preservation of
waterfront resources gave a new direction to new aspects of waterfront redevelopment. The
increased awareness of the natural environment has significantly helped to improve the
quality of the natural environment as well as improve water quality and subsequently,
encouraged many uses at waterfronts such as recreational activities and water based
entertainment.
In addition, local governments are starting to re-examine the importance of smart growth,
particularly the minimisation of urban sprawl, a proven culprit in many pollution problems. In
order to achieve the objectives of smart growth, developers are required to follow approaches
that include the provision of mixed land uses, taking advantage of compact building design,
developing a range of housing opportunities and choices, fashioning walk-able
neighbourhoods, preserving open spaces, strengthening and directing development towards
existing communities, making development decisions that are predictable, fair and cost-
effective and encouraging community and stakeholder collaborations in development
decisions.

15
(2) Preservation and adaptive reuse
Many cities throughout the world have been developed at the waterfront. With the
preservation and adaptive reuse (regeneration) of abandoned historic buildings, vacant
waterfronts space and adjacent areas along the waterfront has been an increase a property
values and an improvement in the waterfront environment and neighbourhoods. Also, the
preservation and regeneration of abandoned buildings and vacant waterfront spaces has
enhanced the waterfront community identity and encouraged community pride.
(3) Federal assistance
The redevelopment of waterfronts requires large amounts of funds. The development also
requires a major change in the pattern of use and the image of the waterfront. A stronger focus
by government institutions on urban renewal has made possible much waterfront development
and redevelopment. Federal governments can assist waterfront development and
redevelopment through the management and provision of sufficient funds. For example,
according to Wrenn (1983), federal government can encourage waterfront development
through taxation policies such as tax incentives, special tax districts, tax abatements and tax
increment financing.
(4) Tourism industry
Waterfront areas have special features that are able to attract local residents and also tourists
around the world. The growing popularity of waterfronts contributed income to the local
government. Increased numbers of visitors and increased demand on the facilities and
accommodation is a main contributor to waterfront development and redevelopment.
Therefore, maintaining the number of visitors and the beauty of waterfront environments is
important for enhancing the tourist industry.
(5) Recreation activities
One of the special characteristics of waterfront areas is that they offer opportunities for
outdoor recreation. The growing popularity of water based entertainment and increased
demand for recreation areas from the public has triggered governments to develop and
redevelop waterfront areas for public use.

16
2.2.2 Waterfront: From Vibrant to Vacant
Historically, a location close to a water area was an important factor in the decision to locate a
settlement. There were several advantages of the water location such as for fulfilling basic
human needs of transport and for drinking water and for trade development. In many
riverfront cities, the water was used mainly for the transportation of goods and so the
waterfront became focal points for related activities such as trade, industry, drainage, sewage
treatment and recreation, as well as for human settlement.
The improvement in shipping technology, the changes in society, the expansion of city sizes,
and the industrial revolution (from the 18th
to the 20th
centuries) resulted in a decline in the
value of waterfronts (Butuner, 2006; Tsukio, 1984). In the mid 20th
century, all industrial
activities and port facilities were moved to the outer zones of cities and the waterfront was no
longer economically or environmentally attractive, except for shipping, storage and heavy
manufacturing (Butuner, 2006; Craig-Smith & Fagence, 1995). Less dependence on the
waterfront industries reinforced the decline of waterfronts, from a position as the economic
heart of the city to becoming eyesores and subsequently, to the disappearance of the
integrated port-city model of the 19th
century (Craig-Smith & Fagence, 1995; Dong, 2004).
These areas were abandoned for many years until local governments began to recognise
waterfronts as areas with potential for development. Increasing demand for recreational
activities, coupled with this development potential became determinants in the redevelopment
process. The next section discusses how the redevelopment took place in many abandoned
waterfront areas.
2.2.3 Waterfront Redevelopment: Moving Waterfronts from Vacant to Vibrant
“With renewed interest in revitalizing their waterfronts, many cities are
turning their attention to parks and green spaces as critical elements to
success.”
(Greco, 2008)
After decades of remaining abandoned, governments decided to initiate a massive
redevelopment of waterfront properties (Ryckbost, 2005) and consequently, initiated the
world-wide era of waterfront revitalisation. The urban waterfront redevelopment phenomenon
of our time began in the 1960‟s, bloomed in the 1970s, accelerated in the 1980s (Breen &
Rigby, 1994) and continues to the present day. Most of the waterfront redevelopment has
occurred in the larger context of urban renewal (Gospodini, 2001).

17
The first attempt at a waterfront revitalisation process emerged in the 1960s in Baltimore and
was followed by Boston and San Francisco (USA), and from the 1970s to 1980s, waterfront
development was specifically focused on North America and Europe. Experience from these
successful examples contributed to a rapid spread of interest in this development concept, to
cities in Australasia and Japan (Breen & Rigby, 1994; Hoyle, 2001). Moreover, some Newly
Industrialising Countries (NICs), Islamic Cities and Less Economically Developed Countries
(LDCs) commenced looking at potential waterfront development in the 1990s (Hoyle, 2002).
Waterfront areas have undergone a large transition (See Breen & Rigby, 1994; Hudson,
1996), with the current waterfront redevelopment trend attributable to a number of factors,
namely: (1) Technological changes post World War II, which led to the abandonment of
thousands of hectares of land along waterfront areas, (2) The historic preservation movement,
(3) Heightened environmental awareness and water clean- up, (4) Consistent pressure to
redevelop central city areas, and (5) Public (state, federal, and municipal) urban renewal and
related assistance (Craig-Smith & Fagence, 1995; Hoyle & Pinder, 1992; Sairinen &
Kumpulainen, 2006). These factors have combined and brought about dramatic changes to
abandoned waterfronts (or their earliest uses for shipping, storage and ship building) to
contemporary waterfronts for present and future generations (Butuner, 2006; Sairinen &
Kumpulainen, 2006).
The scale and purpose of waterfront redevelopment are different in each city due to the
original pattern of the cities and their development. Basically, most waterfront revitalisation
throughout the world have similar aims namely, redefinition of the waterfront in the urban
context, the re-imaging of the urban city and the regeneration of the economy (Butuner,
2006).
As a result of the shift to post-industrial economies and after governments removed the
negative effects of abandoned waterfronts such as pollution, waterfronts became suitable land
to build on for recreation and leisure, with tourism becoming the most popular concept for
contemporary waterfront. The benefits of this transition included the generation of income
from the private development and growing the tourism industry with the flow on to the
community through a stronger economy and access to the new amenities such as recreational
facilities (Acosta, 1990; Butuner, 2006; Craig-Smith & Fagence, 1995; Krausse, 1995;
Tunbridge & Ashworth, 1992; Zhang, 2002).

18
The prominent achievement of waterfront revitalisation has led to an increase in the interest of
academics and professionals in waterfront revitalisation topics. The studies have focused on
the process of waterfront revitalisation and identifying the successful principles behind those
achievements (see Acosta, 1990; Breen & Rigby, 1994; Butuner, 2006; Fitzgerald, 1986;
Goldrick & Merrens, 1990; Goodwin, 1999; Gospodini, 2001; Hoyle, 2000, 2002; Hoyle &
Pinder, 1981, 1992; Hoyle, et al., 1988; Tsukio, 1984; Wrenn, 1983). However, few
waterfront studies have focused on policy issues, in general.
In the Malaysian context, most studies have focused on waterfronts in terms of coastal zone
development, rather than other water bodies such as rivers and lakes (see Mokhtar, Ajlouni, &
Elfithrie, 2008; Mokhtar & Elfithri, 2005; Muhamad, Toriman, Aiyub, & Jaafar, 2005; Noh,
2005 for examples). Previous studies have emphasised the effects of the redevelopment
process on the environmental, social and economic issues, rather than investigating the
development processes and the regulations and guidelines behind the development (for
example see Ali & Nawawi, 2009; Shaziman, Usman, & Tahir, 2010). Therefore, this
research is necessary to investigate specific principles and/or guidelines in order to maintain
and enhance waterfronts in Malaysia.
2.2.4 The Term “Waterfront” and “Waterfront Development” in this Research
In this research, waterfront development is used to represent such terms as waterfront
revitalisation and waterfront rehabilitation. The word (re) development is only used when it is
necessary to differentiate between the redevelopment of a previously built-up area and a new
development on a new site.
Waterfront development in this research refers to any development in front of rivers. The
exclusion of other waterfront development types, for example coastal development, is because
in Malaysia, the coastal areas are generally managed in a sectoral in nature (Hussein, 2008;
Mokhtar & Aziz, 2003). The executive and legislative functions relating to coastal zone
management has determined by Federal Constitution 1957, either been delegated to Federal
and State government or remained partly shared by both, with local authorities sometimes
acting as a channel for the Federal and State government. This management approach is based
on a tiered structure between the Federal and State governments and the Local authorities.
Each level of government is responsible for the planning and coordination, implementation
and enforcement, and development within their jurisdictions.

19
2.3 An Evolution of Waterfront Development
Waterfronts are widely regarded as a frontier for contemporary urban development, attracting
investment and publicity (Malone, 1996). Sydney, London, Amsterdam, Hong Kong, Tokyo,
Toronto, Osaka, Kobe and Dublin are examples of cities that have gone through the
waterfront development process. Therefore, understanding the historical context of waterfront
development is important because the historical context is a stimulant to modern
development. The pattern of waterfront development is summarised in Figure 2.1 below.
It is apparent that each city has a different waterfront character, scale and pace due to
variations in the typical waterfront evolution pattern. One factor is common though, urban
waterfronts changed dramatically due to social and technological factors.
(Source: Wrenn, 1983)
Figure 2.1: Pattern of waterfront development
2.4 Actors in the Waterfront Development Process
The development process has been divided into stages and every stage involves several actors
who play important roles in contributing to a successful development. According to
Wilkinson & Reed (2008) there are eight actors involved in a land development process.
Table 2.2 summarises the actors involved in the land development process and the roles
played by them in the process.
Phase 1: Settlement Phase 2: City detaches
Phase 3: Decline Phase 4: Rediscovery
A settlement was closely tied to the water‟s edge.
Inhabitants had direct contact with the natural waterfront.
A settlement becomes a city. As commerce and shipping
expand and industrialise in nature, the distance between
the waterfront and the city centre increases significantly.
As shipping decreased or larger facilities were
developed elsewhere to accommodate large modern
ships, the original waterfront was abandoned.
Redevelopment spearheaded by the city‟s
redevelopment agency brings about an environmental
clean-up and reconnects the city to its waterfront.

20
Table 2.2: Actors involved in the land development process
Actor Role
Land Owners
Involved directly or indirectly in the land development process.
Land owners may be individuals, corporations, public authorities or charities.
In some cases, landowners are the developers for the entire project or some part of it.
Developers
Government and private companies or a combination of them.
Invest money and make a direct profit from the development process.
In some cases, the developer also plays the contractor‟s role and has the additional
risks associated with the development process.
Public sector &
Government agencies
Involved directly in the developments process as decision makers and policy
providers.
In many developments, they act as the financier, developer and investor.
Building Contractors Employed by the developer to construct the development with a direct financial profit
objective.
Carry out specialist activities within the development process, commencing at a time
of maximum commitment and risk.
Planners Divided into two broad categories; political and professional.
Mainly to encourage development and prevent undesirable development.
Financial Institutions Financial institutions act as the financial provider if the entire development does not
use the developer‟s own capital.
Can be; a pension fund, an insurance company, a bank or other financial intermediary.
Two main types; short term (covers the cost during the development process) and
long term (covers the cost of holding the completed development as an investment.
Agents
Intermediary parties who bring together some of the main actors in the process of
selling/leasing the completed development.
Widely employed by developers to link the area between the developer and the
occupier/purchaser.
Involved in the development process and obtain direct profit through fees charged for
professional services.
Professional teams
Developers employ several professionals to advise them at every stage of the
development process.
This team may include; planning consultants, valuers and surveyors, architects,
project managers, engineers, solicitors, accountants, objectors and occupiers.
(Source: Wilkinson & Reed, 2008)
A waterfront development project usually becomes a large scale development known as a
mega project, that requires following several different regulations (Goodwin, 1999; Wrenn,
1983). Similar to other developments, waterfront development requires the involvement of
many parties that include the government, developers, private investors, community groups,
tourists and recreationalists (Goodwin, 1999; Hoyle, 2000; Wrenn, 1983; Yarnell, 1999).
Each of them has a varying influence in the development project. The variety of stakeholders
involved in the waterfront development process is summarised in Table 2.3 below.
In most cases, the government is responsible for initiating and facilitating the waterfront
development process and that requires government involvement at every level; federal, state

21
and the local authority. For example, the government is responsible for providing a proposal
that includes an establishment concept or theme, and a setting of the scale and sequence for
the project. Additionally, proper planning and good documentation is important for raising
investors‟ confidence to invest in the waterfront project (Yarnell, 1999).
Table 2.3: Stakeholders in the waterfront development process
Stakeholder Role
Governments, institutions
and agencies
Higher level government may be involved to play important leadership, policy-
setting and regulatory roles.
The role of government is critical during the planning and design process.
The government‟s role includes; to establish a development theme for the
waterfront, set the scale, quality, and sequence of projects, and to ensure that a
long-range perspective remains over the development decisions.
Private investors
Private investors include private sector and non-governmental organisations.
Public-private partnerships and private-non-governmental organisation
partnerships are important for initiating waterfront development and for moving
along the development process.
The private sector is important for stimulating property development and
investment. The more extensive the scale of the development, the greater the
dependence on private investment.
Communities,1 tourists and
recreationalists
Communities, tourists and recreationalists are users of waterfront development.
Communities have multi-directional relationships with governments and in
some cases are involved in decision making processes.
Relationships can be top-down or bottom-up approaches. Inclusions of these
groups into government agendas are important in achieving the fundamental
objective of the waterfront development – to enhance the quality of life.
(Source: Craig-Smith & Fagence, 1995; Dong, 2004)
In addition, Hoyle (2000) identifies the relationship of the three actors involved in the
waterfront development process, and the relationship is called the “Triangular relationship”.
Figure 2.2 illustrates the actors involved in the waterfront development process and the
relationship between them.
Relationships and collaboration between parties is important to achieve successful waterfront
development as well as to maximise economic benefits and to maintain public access, water
and views and to preserve the health of the natural environment (Goodwin, 1999; Hoyle,
2000; Yarnell, 1999). Even though not every actor is involved in each stage of the
development process and while some are only involved in a part of an area or indirectly
involved, a contribution from them however is important to the success of the development
process.
1 A “community group” refers to an unofficial association established by a number of people (normally many)
which has opinions that are not necessarily similar to those of the government (Hoyle, 2000).

22
(Source: Hoyle, 2000)
Figure 2.2: Participants in waterfront development – Triangular direction
In addition to the “Triangular relationship”, Hoyle (2000) designed another model, the so
called “Quadripartite relationship”. This model includes the involvement of trade unions in
supporting community groups. Figure 2.3 presents the “Quadripartite relationship”.
(Source: Hoyle, 2000)
Figure 2.3: Participants in the waterfront development – Quadripartite direction
Quadripartite
Relationship
Communities
Trade Unions
Urban Authorities Developers
Triangular
relationship
Community groups
Urban authorities Property developers

23
Even though the involvement of actors varies throughout the development stages, the
relationships between them are important for successful waterfront development. Clearly, all
parties need to agree or reach a consensus before a development can commence and proceed.
2.5 Successful Waterfront Development Projects
Waterfront development history shows that major waterfront development occurred primarily
in the 1970s (Butuner, 2006; Torre, 1989). Presently, there are thousands of successful
waterfront developments around the world, with most of them sharing the same principles and
functions. Table 2.4 provides a few examples of successful waterfront projects.
Table 2.4: Examples of successful waterfront development projects
Project’s name Description
Baltimore
The earliest example of urban renewal waterfront in America.
Baltimore was an example of using public investment to assist a private one.
The development process can be divided into three stages; Charles centre,
Inner Harbour and Market centre.
Baltimore‟s success was attributed to the following aspects; networking
between public authorities and private organisations and the innovation of a
quasi-public agency.
Three methods of design control were adopted; establishing an Architectural
Review Board, holding design competitions and private developers required to
meet design parameters set by public authority.
Boston
Boston‟s waterfront development consisted of four projects; Charlestown
Navy Yard, Harbour Point, Rowe‟s Wharf and South Seaport District.
Project aimed to integrate city fabric with waterfront while maximising public
benefit.
Three public authorities were established; Massport, Boston Redevelopment
Agency (BRA) and Commonwealth of Massachusetts.
Boston‟s success was attributed to the following aspects; strong public
leadership and partnership and amendment of Chapter 91 – which standardised
both procedures and independence among the three public authorities.
London
The London Docklands was developed in 1981 in one of the world‟s largest
urban regeneration projects.
The London Docklands Development Corporation (LDDC) was established as
the regeneration agency for the Docklands urban development area and
worked to secure the regeneration of the London Docklands.
LDDC managed a massive development program. A huge area of the
Docklands was converted into a mixture of residential, commercial and light
industrial space – the Canary Wharf project (Britain‟s tallest building and the
establishment of a second major financial centre in London) was the clearest
symbol of the success of the London waterfront development.

24
Project’s name Description
Amsterdam
Discussion on waterfront redevelopment in Amsterdam (involving the Eastern
Docklands and the rest of the southern IJ-Waterfront) began in the early
1980s, and was followed by the formal planning process for the IJ-Waterfront
in 1984.
The redevelopment of the Eastern Dockland has received international
recognition – attributed to its creative master plans.
The redevelopment was divided into five stages.
he redevelopments was a series of high-density, moderate-rise communities on
the water, thus remaking an historic and cultural bond with the water.
The project received a subsidy from the central government.
A real public-private partnership developed and was implemented by the
independent public authority – Project Management Bureau.
A variety of public authorities and private organisations were involved in the
development process.
New Zealand
Interest in the transformation of Wellington‟s Waterfront grew in the 1970s
and 1980s.
The joint-venture agreement to develop the waterfront was signed in 1986 by
the Harbour Board and the city Council.
Wellington‟s Waterfront was owned by the Harbour Board and the city
Council but the redevelopment were run as a wholly-owned separate company.
The development of public space on the waterfront was estimated to have cost
nearly NZD 40 million dollars.
Wellington‟s Waterfront encouraged public involvement through the
development process.
The Wellington Waterfront vision – “Wellington‟s Waterfront is a special
place that welcomes all people to live, work and play in the beautiful and
inspiring spaces and architecture that connect our city to the sea and protect
our heritage for future generations.”
There are five themes to Wellington‟s Waterfront; historical and contemporary
culture, city to water connections, promenade, open space and diversity.
Wellington‟s Waterfront consists of five individual areas and they are North
Queens Wharf, Queens Wharf, Frank Kitts Park, Taranaki Street
Wharf/Lagoon and Chaffers.
Over the past two decades, Wellington‟s Waterfront has become a world class
waterfront after a series of developments and redevelopments have taken
place.
(Source: Malone, 1996; Torre, 1989; Wang, 2003; Wellington City Council, 2001)
Experience from several case studies from the United Kingdom, the United States of America
and other European countries, shows that in any strategy and design for waterfront
development, there are three key elements for success that should be taken into account.
These are: (i) the development framework – master planning and implementation, (ii) the
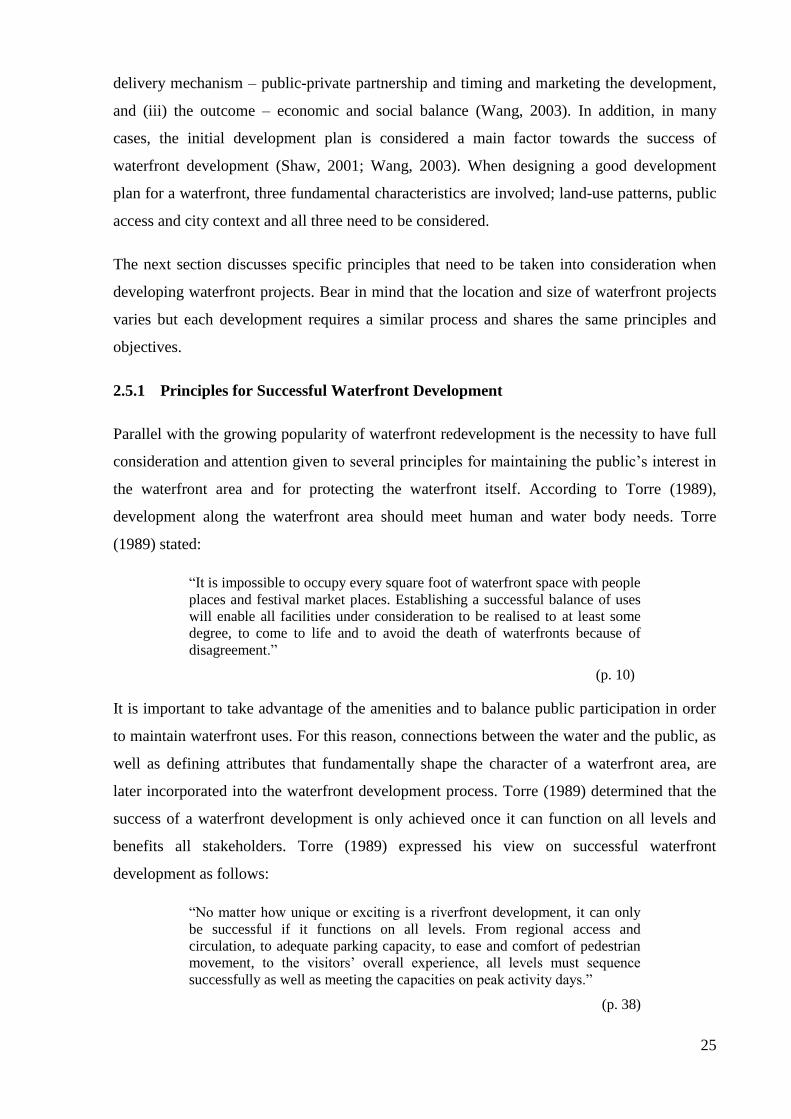
25
delivery mechanism – public-private partnership and timing and marketing the development,
and (iii) the outcome – economic and social balance (Wang, 2003). In addition, in many
cases, the initial development plan is considered a main factor towards the success of
waterfront development (Shaw, 2001; Wang, 2003). When designing a good development
plan for a waterfront, three fundamental characteristics are involved; land-use patterns, public
access and city context and all three need to be considered.
The next section discusses specific principles that need to be taken into consideration when
developing waterfront projects. Bear in mind that the location and size of waterfront projects
varies but each development requires a similar process and shares the same principles and
objectives.
2.5.1 Principles for Successful Waterfront Development
Parallel with the growing popularity of waterfront redevelopment is the necessity to have full
consideration and attention given to several principles for maintaining the public‟s interest in
the waterfront area and for protecting the waterfront itself. According to Torre (1989),
development along the waterfront area should meet human and water body needs. Torre
(1989) stated:
“It is impossible to occupy every square foot of waterfront space with people
places and festival market places. Establishing a successful balance of uses
will enable all facilities under consideration to be realised to at least some
degree, to come to life and to avoid the death of waterfronts because of
disagreement.”
(p. 10)
It is important to take advantage of the amenities and to balance public participation in order
to maintain waterfront uses. For this reason, connections between the water and the public, as
well as defining attributes that fundamentally shape the character of a waterfront area, are
later incorporated into the waterfront development process. Torre (1989) determined that the
success of a waterfront development is only achieved once it can function on all levels and
benefits all stakeholders. Torre (1989) expressed his view on successful waterfront
development as follows:
“No matter how unique or exciting is a riverfront development, it can only
be successful if it functions on all levels. From regional access and
circulation, to adequate parking capacity, to ease and comfort of pedestrian
movement, to the visitors‟ overall experience, all levels must sequence
successfully as well as meeting the capacities on peak activity days.”
(p. 38)

26
Therefore, in order to achieve the specific aims of a successful waterfront development, Torre
(1989) identified 10 elements recommended to be taken into consideration while planning a
waterfront development, as presented in Table 2.5 below.
Table 2.5: Elements for successful waterfront development
Elements Description
Theme “Theme” means a unifying idea, image or motif developed throughout a work
(Concise Oxford English Dictionary, 2009) Significantly important to maintaining
people‟s loyalty to a waterfront area.
Theme is designed in the initial stages and mainly to control future spatial analysis,
land use materials, scale and meaning. Determined with several considerations;
climate, layout, design, land use of development and project‟s culture and history.
Image “Image” means a representation of an object (Concise Oxford English Dictionary,
2009). The implementation of the theme creates the image.
Image could give a perception of the future waterfront project, and good images have
become benchmarks for other projects.
Authenticity “Authenticity” from the word authentic means undisputed origin or genuine (Concise
Oxford English Dictionary, 2009).
Maintaining authentic values in the waterfront area and areas surrounding them is
important for a successful waterfront project.
Function Pedestrian access to lively outdoor eating areas and entertainment centres gives
visitors the chance to enjoy the water environment, along with convenient services
for residential and working districts.
Public perception of
need
The combination of theme, image, authenticity, environmental and financial should
include public consideration to avoid environmental problems.
Financial feasibility A waterfront is considered feasible once it is packaged, designed, promoted, managed
and operated effectively.
The key fundamental is a waterfront concept that leads the financial assessment, not
the reverse.
Environmental
approvals
Inter-agency meetings are required sequentially to determine the environmental
impact of the waterfront development. Approval from various agencies is required.
As a rule of thumb; for every acre of impact, two acres of mitigation must be
provided.
Construction
technology
Use cost-effective and environmentally friendly materials for construction; pressure
treated wood is recommended.
Effective
management
Proper management must include a number of different sources of expertise, and
coordination between them is very important – no matter whether for public or
private waterfront development.
Beginning the project Combining all the elements listed above will result in a comprehensive, balanced and
self contained waterfront project.
Updated current information on waterfront areas is needed.
Participation from all responsible groups including the public is important at every
stage of development.
Organisational management; establish a waterfront committee and include

27
Elements Description
representatives from the government authority to make the process effective.
Maintain momentum; create anticipation and marketing and then maintaining
momentum until project completion is important.
Plan an opening celebration; celebration illustrates a commitment to the
development.
(Source: Torre, 1989)
In addition, Bertsch (2008) determined that for any use of a waterfront area, a water plan
should be developed before the land plan, to maintain an economically viable waterfront.
Therefore, he recommended several principles that must be included while developing plans
for waterfront areas, as follows:
(1) Accessibility – the waterfront should not be isolated or separated from the development,
so that the public can access the waterfront easily (convenient means for visitors to
access the waterfront area).
(2) Integrated – integration of the history, culture and existing architecture are
recommended for new waterfront development.
(3) Sharing benefits – a balance between public benefit and developer profitability must be
found. A public-private partnership is essential for realising the inspiration of the
design.
(4) Stakeholder participation – the involvement of multitudes of interested parties is
compulsory: government agencies, developers, community organisations,
environmental groups and the public all have a stake in the developments of a
waterfront property and all must be involved in the process.
(5) Construction phase – breaking down a huge project into several phases and allowing all
stakeholders and the general public to see this provides a vision for the future.
Thus, apparently, the harmonies of waterfront development could be achieved through
combinations of people, nature and technology (Mann, 1973).
2.5.2 Principles for Sustainable Waterfront Development
Waterfronts are one of the most valuable resources for the country – being limited, precious
and non-renewable assets. To secure long-term growth of the resource, it is important for
waterfront areas to be used strategically to maintain their economic value and enhance their

28
specific features or image (Bruttomesso, 2006). For this reason, Bruttomesso (2006)
recommended 10 principles for securing excellence in waterfront redevelopment projects. The
sustainable2 principles are presented in Table 2.6 below.
Table 2.6: Principles for sustainable waterfront development
Ten principles for a
sustainable waterfront
development
Secure the quality of water and the environment.
Waterfronts are part of the existing urban fabric.
The historic identity gives character.
Mixed-use is a priority.
Public access is a prerequisite.
Planning in public-private partnerships speeds the process.
Public participation is an element of sustainability.
Waterfronts are long term projects.
Revitalisation is an ongoing process.
Waterfronts profit from international networking.
(Source: Bruttomesso, 2006)
2.5.3 Sustainable Governance of Waterfront Development
Duxbury and Dickinson (2007) observed that between the years 1990 and 2000, the number
of people moving to the water‟s edge increased from 2.0 billion to 2.3 billion and this number
is forecast to increase to about 34% by the year 2025. The increasing population growth at the
waterfront has also increased the demand for supplies of clean water, as well as for tourism,
recreation and infrastructure development. Thus, this continued strain on the waterfront
requires a set of principles for governance that will ensure its future is sustainable. These
principles are required to mitigate both adverse impacts on the environment from human
activities as well as the adverse impact of environmental changes on human populations.
Achieving an integrated waterfront management system involves a process of governance that
consists of the legal and institutional framework necessary to maximise the benefits provided
by the water zone, and to minimise the conflicts and negative effects of activities (Post &
Lundin, 1996). This is seen as a comprehensive approach which, when considering all the
sectoral activities that affect waterfront resources, does not exclude dealing with the
2 The widely accepted definition of sustainability is that proffered in the Brundtland Report which states;
“Sustainable development is development that meets the needs of the present without compromising the ability
of future generations to meet their own needs.” (Brundtland Commission, 1987)
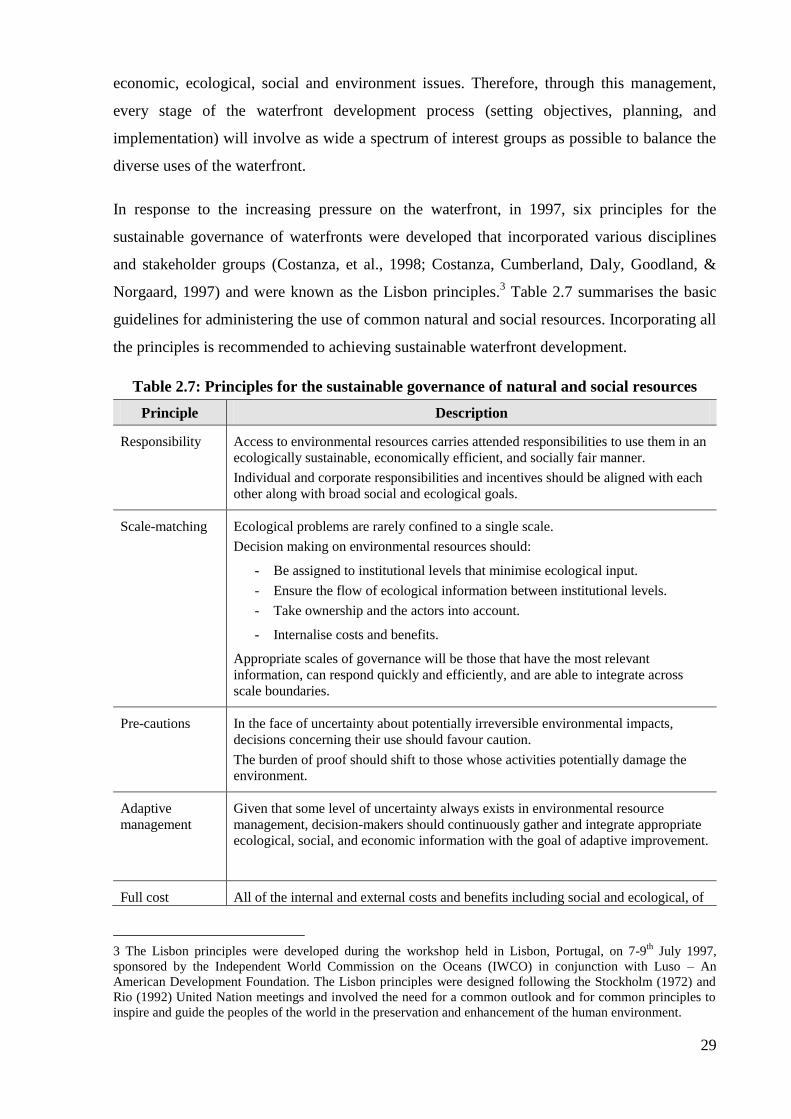
29
economic, ecological, social and environment issues. Therefore, through this management,
every stage of the waterfront development process (setting objectives, planning, and
implementation) will involve as wide a spectrum of interest groups as possible to balance the
diverse uses of the waterfront.
In response to the increasing pressure on the waterfront, in 1997, six principles for the
sustainable governance of waterfronts were developed that incorporated various disciplines
and stakeholder groups (Costanza, et al., 1998; Costanza, Cumberland, Daly, Goodland, &
Norgaard, 1997) and were known as the Lisbon principles.3 Table 2.7 summarises the basic
guidelines for administering the use of common natural and social resources. Incorporating all
the principles is recommended to achieving sustainable waterfront development.
Table 2.7: Principles for the sustainable governance of natural and social resources
Principle Description
Responsibility Access to environmental resources carries attended responsibilities to use them in an
ecologically sustainable, economically efficient, and socially fair manner.
Individual and corporate responsibilities and incentives should be aligned with each
other along with broad social and ecological goals.
Scale-matching Ecological problems are rarely confined to a single scale.
Decision making on environmental resources should:
- Be assigned to institutional levels that minimise ecological input.
- Ensure the flow of ecological information between institutional levels.
- Take ownership and the actors into account.
- Internalise costs and benefits.
Appropriate scales of governance will be those that have the most relevant
information, can respond quickly and efficiently, and are able to integrate across
scale boundaries.
Pre-cautions In the face of uncertainty about potentially irreversible environmental impacts,
decisions concerning their use should favour caution.
The burden of proof should shift to those whose activities potentially damage the
environment.
Adaptive
management
Given that some level of uncertainty always exists in environmental resource
management, decision-makers should continuously gather and integrate appropriate
ecological, social, and economic information with the goal of adaptive improvement.
Full cost All of the internal and external costs and benefits including social and ecological, of
3 The Lisbon principles were developed during the workshop held in Lisbon, Portugal, on 7-9
th July 1997,
sponsored by the Independent World Commission on the Oceans (IWCO) in conjunction with Luso – An
American Development Foundation. The Lisbon principles were designed following the Stockholm (1972) and
Rio (1992) United Nation meetings and involved the need for a common outlook and for common principles to
inspire and guide the peoples of the world in the preservation and enhancement of the human environment.

30
Principle Description
allocation the alternative decisions concerning the use of environmental resources, should be
identified and allocated.
Participation All stakeholders should be participated in the formulation and implementation of
decisions concerning environmental resources.
Full stakeholder awareness and participation contributes to credible, accepted rules
that identify and assign the corresponding responsibilities appropriately.
(Adopted from: Costanza, et al., 1997)
However, these core six principles are not limited to waterfront resources (including all
environmental resources). Therefore, taking the Lisbon principles as a guide, Duxbury and
Dickinson (2007) recommended principles for the sustainable governance of the waterfront.
In particular, these principles highlighted the waterfront issues, such as coastal disasters.
Table 2.8 presents these particular principles.
Table 2.8: Principles for the sustainable governance of the waterfront
Principle Description
Sustainability The use of natural capital within the water boundary should be sustainable
and achieved in an efficient and socially equitable manner.
Adaptive Management Decision makers should have the ability to integrate ecological, social and
economic information and to have the flexibility to cope with changes in
the environment.
Participation Stakeholder participation is vital in the decision making process regarding
environmental resources.
Integration Decision making should integrate policy, with input from the scientific
community.
(Source: Duxbury and Dickson, 2007)
Clear and coherent principles and/or policy are the main challenges for the development of
cities in order to be sustainable. The implementation of and the aims of the interventions
should not be contradictory (Yossi & Sajor, 2006). However, this would require more effort
particularly relating to the management of budgets and the working time of government
officers. Therefore, in making more integrative approaches, participation by relevant
stakeholders such as external experts, non-governmental organisations and community based
organisations is encouraged and this helps to address the constraints of government
institutions.
In addition, Yossi and Sajor (2006) agreed that good collaboration and coordination between
different government authorities and external stakeholders (as mentioned above) is important
31
for waterfront development projects. Also required is the willingness of cross boundary
government authorities to make a commitment to work together in the planning and
development process. Moreover, the willingness of governments to include public
participation (i.e. riverfront communities) in the development process would maximise the
waterfront developments benefits.
2.6 Chapter Summary
This chapter served as a review of waterfront development and provided the theoretical basis
for the research problem. The definition of a waterfront was explained. The emergence of
waterfront development and redevelopment were disussed, as well as the interrelated factors
in the transition of waterfronts from industrial areas to unused spaces.
Waterfront revitalisation was then explained and several attributes of the transformation were
discovered. Significant achievements from the international perspective were also included as
examples. Then, the actors participating in the waterfront development process were
discussed.
The literature dealing with the principles for successful waterfront development practice was
also explained. Considering multiple principles relating to successful waterfront development
practice is important and possibly could facilitate better decision-making towards developing
guidelines for best practice in waterfront development, specifically for Malaysia.

32
Chapter 3
The Emergence of Waterfront Development in Malaysia
This chapter provides the context for understanding waterfront development in Malaysia. It
also presents the background of waterfront development in Malaysia to provide the reader an
overview of the complex nature of waterfront development in Malaysia. Information about the
evolution of waterfront development in Malaysia is included, followed by the processes and
actors involved at each stage of development. Waterfront governance and regulations
associated with waterfront development are then discussed.
3.1 Introduction
Rivers make a huge contribution of social importance, to global transportation, as an element
in cultures and traditions, as a resource for primary and secondary production and for
biodiversity; while the contribution of the river to energy cycles is now beginning to be better
appreciated (Costanza, 1999; Weng, 2005).
In Malaysia, from earliest times, civilisations have been established along the banks of rivers.
Rivers hold prominent places in human society. In fact, in Malaysia, settlements have
historically developed along river banks, hence many urban cities in Malaysia such as Kuala
Lumpur, Terengganu, Malacca, Kuantan, Kota Bharu and Kuching were established after the
waterfront settlements had developed (developed on river edges or river valleys) (Andaya &
Andaya, 2001; Weng, 2005). As a consequence, some of the villages are named after the
rivers that run through them, namely “Sungai Rengit, Sungai Mati and Sungai Kapal in Johor
(Yassin, Eves, & McDonagh, 2010).
After the waterfront areas were abandoned for many years, Malaysia has begun to redevelop
these areas (along the riverbanks) and Kuching city in Sarawak has been selected to initiate
this project. The Kuching Riverfront was proposed in 1989 by the Chief Minister of Sarawak,
mainly for recreational purposes, and permission for the development to proceed was granted
in September 1993. The project was fully funded by the State Government of Sarawak and
managed by the Sarawak Economic Developments Corporation (SEDC) (Sarawak Economic
Development Corporation, 1990). After completion in 2003, the Kuching Riverfront became a
benchmark for waterfront development projects in Malaysia. To date, more than fifty

33
waterfront development projects have been developed in Malaysia, such as the Malacca
Waterfront, the Kuantan Waterfront and Kota Kinabalu Waterfront.
The next section discusses how river functions shaped Malaysian life, the emergence of
waterfront development and the evolution of waterfront development in Malaysia.
3.2 The River and Its Economic Importance
In Malaysia, rivers have been used for multiple purposes such as, for food, as a defensive
barrier and for human settlement (Malaysian Department of Irrigation and Drainage, 2009c)
History shows that many towns and cities in Malaysia were established near water areas
including ex-mining areas. For example, the city of Kuala Lumpur which is located at the
confluence of the Sungai Gombak and the Sungai Klang, was developed from the village of a
tin ore mine (Shaziman, et al., 2010).
Malaysia has 189 river basins of approximately 57,300 kilometres in length. Of those, 89 are
located in Peninsular Malaysia, 22 in Sabah and 78 in Sarawak (Keong, 2006). Most function
as river basins and 30 function as reservoirs that supply the 28 million people living in
Malaysia with clean water (Malaysian Department of Irrigation and Drainage, 2009b). Water
resources are used in various ways by societies throughout the world. For example in
Malaysia, water resources are used as the water supply for the Malaysian population, as
irrigation for agriculture, as a source of food, as a natural habitat for flora and fauna and to
support biodiversity (Keong, 2006; Weng, 2009). Table 3.1 below summarises the economic
importance of rivers to Malaysia.
According to Keong (2006), demand for domestic water in Malaysia will increase in the
future alongside increases in the population and national development growth. For example,
according to Malaysian Department of Irrigation and Drainage (2009a), water demand is
predicted to almost double from 2010 to 2050 (16,176 million litres per day in 2050 compared
to 8,814 million per day in 2010). Thus, rivers are living entities that play a huge role in
people‟s lives, in the environment and in natural developments and their functions will remain
unchanged in the future (Malaysian Department of Irrigation and Drainage, 2009b).

34
Table 3.1: Economic value of rivers in Malaysia
Economic Value Description
Source of drinking
water
In Malaysia, rivers provide 97% of the water supply. Among the 189 river
basins, 30 function as reservoirs supplying the 28 million people in
Malaysia with clean water.
Agricultural Rivers are used to irrigate crops and plantations.
Industry Industries need water to manufacture products.
Livelihood Many local communities depend on the resources provided by the river for
food (fish) and income.
Transportation Rivers were the main form of transportation before other forms of
transportation were invented.
Biodiversity Rivers are home to a wide range of plants and animals that live both in
and around the river. Forty percent of all fish species are freshwater
varieties.
Domestic use Without rivers, the only other source of freshwater is rainwater.
Recreational Rivers are widely used for recreational purposes. Left in their natural state,
rivers and surrounding forest areas are ideal for picnics, camping and
canoeing.
Religion Rivers are used in numerous religious ceremonies and festivals because
water is considered the purest resource on earth.
Human settlement Malaysia‟s rivers shape the life of the communities along their banks.
Many towns and cities in Malaysia are located close to rivers.
Renewable energy In recent years, rivers have become increasingly important for
hydroelectric power and for industry.
(Source: Abdullah & Mahmood, 1999; Keong, 2006; Malaysian Department of Irrigation and
Drainage, 2009c; Yassin, Eves, & McDonagh, 2009)
3.3 Urbanisation in Malaysia
This section discusses the social and spatial growth and changes in Malaysia since colonial
times.
Malaysia, formerly known as the Federation of Malays (in Malay, the word, “Persekutuan
Tanah Melayu”, means literally the Federation of Malaya) is a country located in Southeast
Asia and consists of thirteen states and three land mass components; the Peninsular Malaysia
and Sabah and Sarawak in Borneo. The Federation of Malays became independent on the 31st
August 1957 and Malaysia was formed in 1963, after the British colonies of Singapore and
the East Malaysian states of Sabah and Sarawak joined the Federation (Lepoer, 1989).
Malaysia has a total land size of 329,847 square kilometres; the land comprising 328,657

35
square kilometres and the water 1,190 square kilometres (Central Intelligence Agency, 2010;
Malaysia Constitutions, 2006).
3.3.1 Emerging Urbanisation of Malaysia
Over the past decades, both the scale and pattern of urban growth in Malaysia has increased
continuously. As well as the positive growth of the Malaysian economy and its rapid
development, the gradual increase in rural to urban migration was the main factor for
urbanisation in Malaysia. According to Jali, Stillwell, & Rees (2006), the migration patterns
in Malaysia can be divided into two stages; between 1986 and 1991, and between 1995 and
2000. Migration levels dropped during the second period possibly because of economic
decline and the currency crisis. Table 3.2 presents the urban and rural population in Malaysia
between 1950 and 2030 (forecasted).
Table 3.2: Urban and rural population in Malaysia (1950-2030)
Year Total
population
(,000)
Urban
population
(,000)
% Urban Rural population
(,000)
% Rural
1950
1955
1960
1965
1970
1975
1980
1985
1990
1995
2000
2003
2005
2010
2015
2020
2025
2030
6 110
7 000
8 140
9 502
10 853
12 258
13 763
15 677
17 845
20 363
23 001
24 425
25 325
27 513
29 563
31 580
33 479
35 191
1 244
1 639
2 165
2 842
3 631
4 615
5 787
7 197
8 891
11 326
14 212
15 617
16 479
18 768
20 998
23 218
25 351
27 324
20.4
23.4
26.6
29.9
33.5
37.7
42.0
45.9
49.8
55.6
61.8
63.9
65.1
68.2
71.0
73.5
75.7
77.6
4 866
5 361
5 975
6 660
7 222
7 642
7 977
8 480
8 955
9 038
8 790
8 808
8 846
8 745
8 565
8 362
8 128
7 867
79.6
76.6
73.4
70.1
66.5
62.3
58.0
54.1
50.2
44.4
38.2
36.1
34.9
31.8
29.0
26.5
24.3
22.4
(Source: Jali, et al., 2006)

36
In addition, Jaafar (2004) indicated that redefining and extending the boundaries of urban
areas4
also changed urbanisation levels dramatically. For example, the restructuring of urban
boundaries, which includes built-up areas with urban characteristics, has resulted in large
increases in the levels of urbanisation, accounting for 61.8% in 2000. Figure 3.1 illustrates the
level of urbanisation before and after the redefinition and reconstruction of urban boundaries
in Malaysia.
(Adopted from: Jaafar, 2004)
Figure 3.1: Distribution of population by stratum in Malaysia, 1970 and 2000
With rapid urbanisation, much land in urban areas that was originally designated for
agricultural use was converted into housing, townships and industrial parks (Weng, 2005). As
a result, some settlements already developed in the inner city gradually became under-utilised
and some were abandoned. This was common in the waterfront areas, as well as settlements
developed along the river edges.
The next section covers a number of effects derived from urbanisation and land use changes
in Malaysia.
4 The introduction of the Local Government Act, 1976 (Act 171) in the Peninsular Malaysia, the Local
Government Ordinance, 1961 for Sabah and the Local Authority Ordinance, 1977 for Sarawak, have resulted in
redefining and extending the boundaries of urban areas in order to reflect the more realistic urbanisation in
Malaysia (Jaafar, 2004).

37
3.3.2 Urbanisation and Demographic Changes in Malaysia
The population of Malaysia stands at over 27 million (estimated 2009), which makes it the
43rd
most populated country in the world. The Malaysian population has grown steadily since
1950 and is estimated to have increased by more than two percent per annum, adding over one
million people every five years (Hasan & Kasim, 2007; Jali, et al., 2006). The population is
forecasted to increase steadily in the future.
(Source: Jali, et al., 2006; Malaysian Department of Statistics, 2010)
Figure 3.2: Population growth in Malaysia between 1950 and 2010
The demographics of the Malaysian population are represented by five ethnic groups; Malay,
Chinese, Indian, indigenous and others. Among the Malaysian population, Malays and
indigenous groups make up 65.1% of the population, while Chinese (26%), Indian (7.7%) and
Others (1.2%) (Malaysian Department of Statistics, 2009). However, the population
distribution is uneven between the Peninsular Malaysia, Sabah and Sarawak, with almost 20
million residents concentrated in the Peninsular Malaysia. Figure 3.2 shows the demographic
trends in Malaysia between 1950 and 2030 (forecasted).

38
3.3.3 Urbanisation and the Economy of Malaysia
Malaysia is a relatively open state oriented market economy.5 After gaining independence in
1957, the Malaysian economy grew rapidly. Malaysia was known for its natural resources
such as forestry, agriculture and minerals,6 and presently Malaysia is dominated by exports of
natural resources such as rubber and petroleum (Husin, 2006).
Nevertheless, rapid industrial growth in the 1980s resulted in decreases in plantation and
petroleum exports for the country, amounting to a 30% decrease in plantations and a 20%
decrease in mining activities. Malaysian economic growth has slowed, especially after the
effects of the global economic crisis in 1980-1982, which was worse in the middle of the
1980s (oil palm and oil prices decreased by almost half). The Malaysian economy began to
recover in late 1986 and grew steadily until 1990 with an average annual growth rate of about
8% to 9% (Omar, 2002).
In response to the need for a massive economic recovery programme,7 the government
launched a privatisation programme in 1990. However, many privatised companies failed in
the Asian financial crisis of 1997-1998. Several recovery programmes undertaken since have
witnessed increased Malaysian economic growth at 6.3% in 1999 and 7.9% in 2000.
Unfortunately, the percentage subsequently reduced due to the global economic crisis and the
11th
September 2001 incident. In 2002, the Malaysian economy continued to recover and the
manufacturing sector became dominant for Malaysia, with electronic goods accounting for
two-thirds of total exports. However, Malaysia continues to be a producer and exporter of
other commodities such as palm oil, rubber, cocoa and petroleum. Figure 3.3 presents the
diversification of Malaysian exports.
5 The government provides the broad thrust and sets the direction for the whole economy, and ensures the
achievements of socio-economic goals, and the private sector is free to operate and is given appropriate policy,
institutional and infrastructural support (Husin, 2006).
6 Tin and petroleum are two main mineral resources, and are of major significance in the Malaysian economy.
Malaysia was the largest tin producer in the world and tin was Malaysia‟s largest export until petroleum took
over in 1972. Also, Malaysia is one of the top oil palm exporters, and oil palm is a major economic generator for
Malaysia.
7 Recovery programs had several objectives: (1) stabilizing the currency, (2) restoring market confidence, (3)
maintaining market stability, (4) strengthening economic fundamentals, (5) furthering socio-economic goals, and
(6) reviving badly affected sectors (Sarji, 1995).

39
(Source: Husin, 2006)
Figure 3.3: Diversification of Malaysian exports
Until 2010, the economy of Malaysia grew steadily and is expected to increase further due to
improvements in the labour market, rising disposable incomes and improved consumer
confidence (Husin, 2006; Malaysian Department of Statistics, 2010). Figure 3.4 presents the
economy of Malaysia for the past forty years (1970-2010) based on GDP growth.
(Source: Husin, 2006; Malaysian Economic Planning Unit, 2010; Nilai Harta Consultation
Research, 2010)
Figure 3.4: Malaysian economy
% GDP
Growth
Diversification of Exports (% to total exports)
2005
RM 533,790 million
(US$ 141,588 million)
1970
RM 5,163 million
(US$ 2,065 million)

40
3.3.4 Urbanisation and Social Considerations in Malaysia
The rate of economic growth in Malaysia increased significantly during the urbanisation
periods. In contrast, poverty8
remained one of the major social problems among Malaysians,
especially in the rural sector. According to Siwar (1996), poverty is a universal problem but it
has become a predominantly rural phenomenon due to its high rate of incidence in rural areas.
In addition, Aziz (1964) determined that the poverty problem was attributed to multi-
dimensional factors in nature ranging from social to economic factors.
In the 1970s, almost half of the Malaysian population lived in poverty and most of them in
rural areas (Arshad & Shamsudin, 1997). The Malay group (about 57% of the Malaysian
population) was the predominant problem and caused an economic imbalance between the
ethnic groups in Malaysia. However, over this period poverty incidents in urban areas were
also considered high, contributing 7.1% of the poverty rate.
In 2009, the Malaysian poverty rate declined to 3.8%, after the government took measures to
combat poverty (Malaysian Economic Planning Unit, 2010). In respect to urban and rural
areas, the poverty rate declined to 1.7% (urban areas) and 8.4% (rural areas) in 2009
(Malaysian Economic Planning Unit, 2010).
3.3.5 Urbanisation and the Environment in Malaysia
With respect to environmental considerations, one of the impacts of urbanisation is the
deterioration of the natural environment. Dramatic land use changes had contributed to rapid
land degradation and this problem was compounded by development in unsuitable and
environmentally sensitive areas – not only development along the water edges. For example,
urbanisation has exerted considerable pressure on water resources. Table 3.3 describes the
four major environmental problems directly related to urbanisation as well as waterfront
development in Malaysia. These problems disturb economic growth and the activities of life
and can result in the loss of property and lives (Abidin, 2004; Malaysian Department of
Environment, 2007).
8 According to Aziz (1964), “Poverty is a vicious cycle of low productivity, malnutrition, lack of infrastructure,
low incomes and unemployment, embedded in structural defects, reinforced by imperfect competition and the
relative neglect of the rural economy.”

41
Table 3.3: Land use effects
Water related
problem
Factors of pollution Effect
Water shortage
Increased population.
Expansion of urbanisation.
Industrialisation.
Irrigation for agriculture
Pressure on water resources.
Rising water pollution.
Water pollution Industrial effluent.
Farming community (animal waste and
irrigation systems).
Sediment from land clearance.
Solid waste.
Disruption of water supply.
Poor human health.
Aquatic life and habitat
destroyed.
Flooding Disposal of solid waste.
Sediment from land clearance.
Runoff from developed areas.
Decreased capacity of
waterways and frequent floods
of larger magnitude occur.
Landslides and
mud slides
Prolonged periods of high intensity rainfall.
Development on hill slide/hill tops/road
cuttings.
Threats to lives.
(Source: Abidin, 2004)
According to the Malaysian Department of Irrigation and Drainage (2007), despite providing
sufficient water resources, Malaysia still faces water related problems due to not managing
water effectively. For example, the increasing population and the per capita availability of
water for a better quality of life, has resulted in a decrease in the water available for industrial
and agricultural use (Abidin, 2004; Malaysian Department of Irrigation and Drainage, 2007;
Mokhtar, et al., 2008). Furthermore, Malaysia currently suffers from water stress and
droughts. In fact, the water demand has exceeded the available capacity of the river basins
(Malaysian Department of Irrigation and Drainage, 2007), meaning that the amount of water
available to sustain life is limited. Unfortunately, the physical scarcity of water is not the key
issue in most parts of Malaysia; rather economic issues seem to dominate. At present, there is
enough water to meet society‟s needs but there are few incentives for the wise and
conservative use of the resource.
Moreover, according to the Malaysian Department of Irrigation and Drainage (2009c), rivers
have been polluted for the last 20 years due to a number of human activities that directly
degrade the quality of the river water – for example, agricultural, industrial, commercial and
transportation wastes (Weng, 2005). In urban areas, land use change was identified as a major
contributor to issues of water pollution and Weng (1999) and Abdullah (2002) determined

42
that more that 90% of sediment loaded in the rivers was derived from land cleared for
construction.
As illustrated in Figure 3.5 below, between 1998 and 2005, the river basin water quality index
in Malaysia increased; however, the number of polluted rivers remained constant (Daud,
2009).
The main sources of river water pollution in Malaysia are from four main sectors; population
sewage, manufacturing industries, farms and agro-based industries (Malaysian Department of
Environment, 2004). As a convenient means of disposal, rivers were used for the discharge of
many contaminants and this decreased the quality of the water (Abdullah, 2002).
Another major environmental issue that needs to be addressed is flooding. Floods are normal
parts of the ecological process and are initially caused by heavy rainfall. However, given the
strategic geographical locations of rivers, flooding is considered the most significant natural
disaster in Malaysia. Recent rapid development within water areas including river catchments
has resulted in higher runoffs and increased flood frequencies. Malaysia has experienced
major floods in 1920, then in 1926 and 1963, 1965, 1967, 1969, 1971, 1973, 1979, 1983,
1988, 2005 and, most recently, in December 2006 and January 2007 (Malaysian Department
of Irrigation and Drainage, 2007).
(Adopted from: Daud, 2009)
Figure 3.5: River basins water quality index, Malaysia (1998-2005)
As a consequence, heavy floods may kill hundreds of people and destroy assets including
property, crops and infrastructure (Ninno, Dorosh, Smith, & Roy, 2001). For example, the

43
flash floods in 1971 resulted in the loss of more than 200 million Malaysian Ringgits (about
NZ$ 86.9 million) and the deaths of 61 persons. In addition, the recent massive floods that
occurred between December 2006 and January 2007 were considered to be the most costly
flood events in Malaysian history, with an estimated loss of about 149 million Malaysian
Ringgits (about NZ$ 65.2 million) (Malaysian Department of Irrigation and Drainage, 2007).
Experience with flood events has led the government to endeavour to practice sustainable
flood management. Sustainable flood management aims to reduce the adverse impact of
floods through the wide circulation of flood information to stakeholders. As recommended by
the Malaysian Drainage and Irrigation Department, the most effective flood mitigation
programmes should include the following strategies: (1) Prevention, (2) Protection, (3)
Preparedness, (4) Emergency response, and (5) Recovery and lessons learned (Malaysian
Department of Irrigation and Drainage, 2008).
Besides the environmental issues addressed above, landslides and mud slides are another
effect of urbanisation and land use changes. A landslide is a geological phenomenon which
includes a wide range of ground movements such as rock falls, shallow debris flows and the
deep failure of slopes that happens in offshore, coastal and onshore environments. It is
considered a significant hazard in mountainous areas (Fuhrmann, Konrad, & Band, 2008).
Usually, landslides are caused by a number of factors incorporating pore water pressure, the
loss of soil structure, volcanic eruptions, and erosion due to human causes such as
construction, agricultural and forestry activities (Kuriakose, Jetten, Westen, Sankar, & Beek,
2008).
In Malaysia, landslides that occurred were usually caused by rapid development on hill
slopes, construction of highways in hilly terrain, deforestation and poor maintenance of
drainage systems (Abidin, 2004; Malaysian Department of Public Works, 2007). The recent
massive landslide event that occurred on December 2008 was near to the site of another
landslide that occurred in 1993 (a 12 story condominium block collapsed) that killed at least
four people and left 15 others injured (The Associated Press, 2008). In fact, some major
landslide incidents have happened in residential areas, resulting in the loss of life and
economic hardship to the public. Although many strategies have been undertaken by the
government such as introducing the Developments Guidelines for Highlands and the
Guidelines on Slope Maintenance in Malaysia (CERUN 1), landslides still occur in Malaysia.

44
3.4 Land Development Process in Malaysia
Land has varied definitions and interpretations. In general, land may refer to the solid part of
the earth‟s surface that is not covered by water. More than that, from economic and legal
perspectives, land also includes minerals, soil fertility and the resources of the sea; it is
determined as the “free gifts of nature”. A more specific definition by the Town and Country
Planning Act, 1976 (Act 172) states that land includes (a) the surface and all substances
forming the surface of the earth, (b) all substances below the surface of the earth, (c) all
vegetation and other natural products, whether or not requiring periodical application of
labour to their production, and whether on or below the surface of the earth, (d) all things,
whether on or below the surface of the earth that are attached to the earth or permanently
fastened to anything attached to the earth, and (e) land covered by water, and (f) any estate or
interest in, or right over land.
In terms of land development in Malaysia, the process refers to the changing of the original
uses of the land for the purposes of residential, commercial, industrial or other activities.
From the perspective of land administration, land development is best defined “as any change
in the original alienated land, contrary to what was already approved by the State Authority
upon alienation” (Jaafar, 2009). More specifically, the Town and Country Planning Act, 1976
(Act 172) looked at developments itself, “as the carrying out of any building, engineering,
mining, industrial or other similar operation in, on, over, or under land, or making of any
material change in the use of any building or other land, or the subdivision or amalgamation
of lands”.
The National Land Code (NLC) 1965,9 is the governing code for land administration in
Malaysia. The NLC has rules and restrictions which control and/or guide land development in
the country. With reference to the planning requirements for development, the National Land
Code provides guidelines on the procedures for planning applications as follows:
(a) Variation of conditions, restrictions and categories (Section 124);
(b) Sub-division (Sections 135 – 139);
(c) Partition (Sections 140 – 145);
9 The National Land Code (1965) was made effective on 1st January 1966 as the main canon of land law to
administer land in Peninsular Malaysia. The main function of the National Land Code (1965) is to provide a
practical way of land administration in the country.

45
(d) Amalgamation (Sections 146 – 150);
(e) Simultaneous applications for sub-division and variation of conditions, restrictions and
categories (Section 124 A); and
(f) Surrender and re-alienation – special provisions (Sections 204A-204 H)
A land development is a unique activity in terms of its physical characteristics and locations.
Thus, any land chosen or required for the purpose of development remains under its
agricultural status until approval is gained for the conversion, sub division or partition of land
from responsible institutions or agencies, and actual developments can take place later.
In addition, in many cases in Malaysia, the private sector is the driver of growth, while the
public sector facilitates the development and ensures the desired objectives are achieved
(Husin, 2006). Practically, with any type of land, the decision for land development is made
by the government, and all land development must fit with national zoning and planning
regulations and also must fulfil the requirements of the urban planning policies of the
government (Jaafar, 2009; Omar, 2002) including national and sub-regional levels. The
implementation of the actual development is usually offered to private developers.
The next section discusses the development stages and the actors involved in the process.
3.4.1 Land Development Stages and Main Actors
Development in Malaysia has several stages and requires the participation of many actors.
The process is not necessarily followed in sequence, in some cases it could overlap or be
repeated. Table 3.4 below presents the relevant stages of the process and the corresponding
actors. The general procedures in the land development process in Malaysia are illustrated in
Figure 3.6 below.
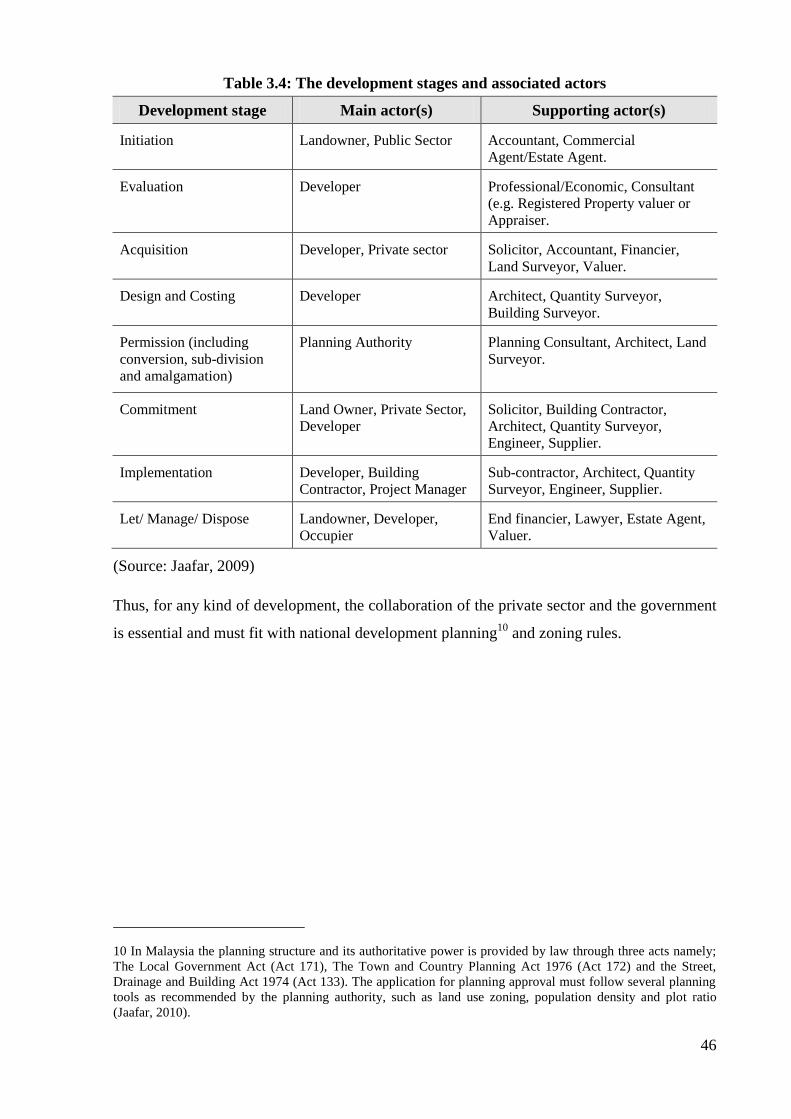
46
Table 3.4: The development stages and associated actors
Development stage Main actor(s) Supporting actor(s)
Initiation Landowner, Public Sector Accountant, Commercial
Agent/Estate Agent.
Evaluation Developer Professional/Economic, Consultant
(e.g. Registered Property valuer or
Appraiser.
Acquisition Developer, Private sector Solicitor, Accountant, Financier,
Land Surveyor, Valuer.
Design and Costing Developer Architect, Quantity Surveyor,
Building Surveyor.
Permission (including
conversion, sub-division
and amalgamation)
Planning Authority Planning Consultant, Architect, Land
Surveyor.
Commitment Land Owner, Private Sector,
Developer
Solicitor, Building Contractor,
Architect, Quantity Surveyor,
Engineer, Supplier.
Implementation Developer, Building
Contractor, Project Manager
Sub-contractor, Architect, Quantity
Surveyor, Engineer, Supplier.
Let/ Manage/ Dispose Landowner, Developer,
Occupier
End financier, Lawyer, Estate Agent,
Valuer.
(Source: Jaafar, 2009)
Thus, for any kind of development, the collaboration of the private sector and the government
is essential and must fit with national development planning10
and zoning rules.
10 In Malaysia the planning structure and its authoritative power is provided by law through three acts namely;
The Local Government Act (Act 171), The Town and Country Planning Act 1976 (Act 172) and the Street,
Drainage and Building Act 1974 (Act 133). The application for planning approval must follow several planning
tools as recommended by the planning authority, such as land use zoning, population density and plot ratio
(Jaafar, 2010).

47
(Adopted from: Real Estate and Housing Developers' Association Malaysia, 2010)
Figure 3.6: Land development process in Malaysia
Land purchase
Appointment of liaison with Consultants.
Either individually or concurrently application for proposal development via One-stop-centre (6 months).
Land Office LA Planning
Department
LA Building
Department LA Engineering
Department
Technical
Department
One-stop-centre Secretariat (Compilation/coordinating recommendation paper).
One-stop-centre Committee meeting.
LA prepares recommendation
papers to the Land and Mines
Director – 10 days.
One-stop-centre prepares
approval document of
planning permission – 7 days.
Local Authority full council
meeting (acknowledgement
– 1 day.
State EXCO meeting
(decision) – 1 day.
One-stop-centre prepares
decision paper – 3 days.
Applicant Land Office – 7 days.
Approval obtained (including low-cost requirement).
Application for developer‟s licence.
Application for sale and advertisement permit.
Construction stage (24 or 36 months).
Application for Bumiputera quota release.
Issuance of Certificate of Completion and Compliance.
Construction Sale
Strata title application (for subdivided building).
Delivery of vacant possession – defects of liability period for 24 months.
Execution of Memorandum of Transfer (MOT).
Closing/withdraw of surplus of housing development.

48
3.5 An Evolution of Waterfront Development in Malaysia
Rivers were homes to vital communities and initiated the emergence of cities around them.
Malaysia is fortunate to be able to call itself a water rich nation and possesses a number of
rivers with great potential for recreation. The importance of rivers as the physical centre of the
city and the site of trading from very early times remains in the history of all Malaysians
(Hussein, 2006).
Population growth, economic growth, urbanisation and increased technology have
transformed many Malaysian river systems from water industries into non-water industries.
This transformation symbolises the independent city states‟ efforts to remake themselves for
the 21st century. At the same time, due to these changes, the function of the waterfront areas
has also changed and the current pattern of waterfront development in Malaysia now focuses
more on mixed-use development and recreation, while incorporating Malaysian cultural and
historical values. So, it is important to understand the story behind urban waterfronts over the
last two centuries. The historic milestones of waterfront development in Malaysia can be
divided into four (4) periods which are in parallel with the urbanisation periods (Arshad &
Shamsudin, 1997; Rahman, 2001; Yassin et al., 2010) and are as follows:
(1) First phase: During colonial rule (1887-1956)
During this period, the river was the most important means of domestic and trade
transportation. The growth of societies along the river edges initiated the emergence of port
towns and several other urban forms. Business related to river activities expanded and the
river was transformed into a focal point. Later in this period, the relocation of people,
especially Chinese, occurred into “new villages” during the Malayan Emergency Period (1948
to 1960).11
(2) Second phase: After independence and early urbanisation (1957-1969)
During this period, development continued along the river edges and the establishment of the
perception of rivers as public open space corridors occurred. However, the government started
to separate Malaysians into different groups (Malays in rural areas, Chinese in urban areas
11 The Malayan Emergency was a conflict between communist guerrillas and British Commonwealth forces.
The guerrillas (most of them were Malayan Chinese), were seeking to overthrow the British colonial
administration in Malaya. The Malayan Emergency was declared on 18th
June 1948 after three European
plantation managers were murdered in the northern state of Perak, Malaya (Ghows, 2006).
49
and Indians in estate areas). Land settlement was one of the major approaches in agricultural
and socioeconomic development (Manshard & Morgan, 1988).
Another strategy to support rural sector transformation in Malaysia was “Agrarian reform”
(Arshad & Shamsudin, 1997). The strategy of agrarian reform affected a wider range of inputs
and institutions and was aimed at the transformation of rural life and activities in all their
economic, social, cultural, institutional, environmental and human aspects (Food and
Agricultural Organization, 1978). The major agrarian reforms implemented in Malaysia were
land development and settlement and in situ development.
For example, Malaysia‟s second Prime Minister, the late Tun Razak raised the idea of
developing the Federal Land Development Authority (FELDA) to reallocate land to rural
communities. FELDA was formed on 1st July 1956, after enforcement of the Land
Development Ordinance 1956, which was designed to mainly support poor and landless
communities, especially Malays (Federal Land Development Authority (FELDA), 2009).
FELDA focused mainly on the Peninsular Malaysia and to date, has developed approximately
317 new areas with 853,313 hectares becoming plantation and settlement areas, and
benefiting more than 530,000 settlers. After 50 years of development, the FELDA scheme
was the most successful scheme and became the world leader in the palm oil industry, and the
settlers became part of the middle income group by 2010. During this time the Malaysian
population began to adapt to urbanisation and started to migrate to urban areas.
(3) Third phase: Urban explosion during the industrialisation period (1970-1997)
City reshaping and rural reconstruction, urbanisation and the upgrading of transportation
systems to cater for trading and travellers, resulted in the decline of riverfronts. The
introduction of the New Economic Policy (NEP)12
of Malaysia in the 1970s, had a positive
effect in improving the Malaysian economy, as well as industrial production and the property
sector (Malaysian Economic Planning Unit, 2004). The positive effect of NEP continued
steadily until the early 1990s and in the early 1980s it achieved a high point (economic
12 The launching of the New Economic Policy (NEP) in 1971 was the most significant policy change in the
Malaysian history (Malaysian Economic Planning Unit, 2004). The NEP emphasised the importance of
achieving socio-economic goals alongside pursuing economic growth objectives. This policy seemed necessary
to provide increased economic opportunities for the poor and other disadvantaged groups to enable them to move
out of poverty. Two strategies were adopted: (1) to reduce absolute poverty for all Malaysians, and (2) to
restructure society to correct economic imbalances. NEP successfully drove the Malaysian economy until the
early 1990s, where a slight decline in the middle 1990s due to the Asian financial and economic crisis occurred
(Malaysian Economic Planning Unit, 2004).

50
growth more than 8% per annum). This positive effect for the Malaysian economy however,
resulted in the decline of river functions and caused buildings and traditional settlements
remaining along the riverfronts to be left to cope with the polluted water.
(4) Forth phase: Technology, modernisation and vision 2020 (2000 to present)
In this period, Malaysia continued to embrace technology and the expansion of manufacturing
and industry in urban areas. Increasing job opportunities and facilities provided by urban
areas caused increasing population in urban areas of up to 62% (Jaafar, 2004). Urban sprawl
and city reshaping caused the government to initiate urban waterfront development and urban
riverfront development for two main reasons; redevelopment and revitalisation (Sarawak
Economic Development Corporation, 2009). After several years waterfront areas became
popular as recreational centres. However, congestion in urban areas caused urban people to
start moving to suburban areas (urban boundaries) including river areas, for privacy. This
initiated a new pattern of waterfront development in Malaysia. Now, waterfront development
has become a new trend for development all over the country and is popular among
developers, placing an emphasis on housing and mixed-use development projects.
Waterfront development in Malaysia is forecast to expand in the future. Some projects will
proceed to the next phase, some projects will upgrade existing development (redeveloping)
while others are new projects. Also, private developers are taking opportunities to transform
water into gold by initiating housing waterfront development projects. Housing development
will continue to be one of the major new uses representing the most fundamental shift from all
previous uses. Examples of the major waterfront development projects in Malaysia are
presented in Table 3.5 below. Along with the incorporation of different aspects, the aim is still
to enhance waterfront development and to maintain the natural resources.
Table 3.5: Examples of riverfront development projects in Malaysia
No. Name of
project
Location Type of
project
Projetc’s
Developer
Name of
water
body
Status
1. Kuching
Riverfront
Kuching,
Sarawak
Recreational State of Sarawak Sarawak
River
Completed
2. Malacca
Waterfront
State of
Malacca
Recreational State of Malacca Malacca
River
Completed
3. Glennmarie
Riverfront Cove
Klang,
Selangor
Residential Glenmarie Cove
Development
Sdn Bhd.
Langat
River
Completed
4. Kingfisher
Cove,
Riverfront
Kota
Kinabalu,
State of Sabah
Residential Sabah Urban
Development
Corporation
South
China Sea
Completed

51
No. Name of
project
Location Type of
project
Projetc’s
Developer
Name of
water
body
Status
5. Kuantan
Waterfront
Pahang, State
of Pahang
Commercial
and
Recreation
Pahang State
Development
Corporation
(PASDEC)
Holdings Berhad
Kuantan
River
Completed
6. Mines Resort
City
Sri
Kembangan,
State of
Selangor
Mix-use
development
Country Heights
Holding Berhad
Lake –
Former
Hong Fatt
Mine
Completed
7. Kinta riverfront Ipoh, State of
Perak
Mix-use
development
Morubina Sdn
Bhd
Kinta River Completed
8. Jesselton
Waterfront
Kota
Kinabalu,
State of Sabah
Commercial
and Marinas
Suria Bumiria
Sdn Bhd
Former
Kota
Kinabal
Port
Expected
complete
on 2016
9. Kota Kinabalu
Waterfront
Kota
Kinabalu,
State of Sabah
Recreation Golden Fame
Property Sdn
Bhd
South
China Sea
Completed
10. River View
Kemensah
Melawati,
Kuala Lmpur
Residential Loh & Loh
Development
Sdn Bhd
- Completed
11. Sibu Riviera
City
Sibu, State of
Sarawak
Mix-use
development
Sara-Timur Sdn
Bhd
Pulau Kerto
and South
Bank
NA
12. Bayu Puteri
Marina
Johor Bahru,
State of Johor
Mix-use
development
Paradise Realty
Sdn Bhd
Tebrau
River Basin
Completed
13. Taman Tasik
Prima
Puchong,
Kala Lumpr
Residential Bolton Berhad Puchong's
premier
lakefront
Completed
14. Tamansari
Riverside
Garden City
Titiwangsa,
Kuala
Lumpur
Mix-use
development
Asie Sdn Bhd Gombak
River
NA
15. Kota Bharu
Waterfront
Kota Bharu,
State of
Kelantan
Residential Liziz Standaco
Sdn Bhd
Kelantan
River
NA
16. Putrajaya
Waterfront
Putrajaya Mix-use
development
Putrajaya
Corporation
Putrajaya
Lake
NA
17. Bandar Botanic Klang, State
of Selangor
Mix-use
development
Gamuda Land Central
Lake
NA
(Source: Ministry of Housing and Local Government, 2011)
3.6 Governance for Waterfront Development in Malaysia
Governance is about local change and reform and solving certain issues. According to Elfithri,
Mokhtar, Shah, & Idrus (2008), effective governance requires changing and reforming some
laws and regulations in order to solve certain issues. Due to different political, social,
economic and administrative systems that are in place to develop and manage natural
resources such as land resources, the balance of power and administration in a country are

52
important. In practice, the governance and administration of natural resources in Malaysia
involves several department and agencies that operate dependently or independently of one
another, according to the specific responsibilities assigned to them. Thus, this requires
participation and involvement from stakeholders within a larger context of shared
understanding, resulting in effective governance (Mokhtar & Elfithri, 2005). In addition,
Elfithri et al. (2008) noted that successful governance could be achieved by considering
moving decision making power, resources and capacity to lower levels of management.
Water and land are the two main resources directly associated with waterfront development.
In Malaysia, natural resources – land, water, rivers and forest – are under the jurisdiction of
the State government (Federal Constitution, 2006). In addition, the State government also has
full responsibility for water management including gazetting and preserving water
catchments, development along the river corridors, urban development and logging for forest
timber. In turn, those natural resources provide revenue to the State government through their
uses – timber logging, industry, township development and water supply (Abidin, 2004).
Nevertheless, with regard to natural resource development matters, both governments (federal
and state) are involved. In fact in Malaysia, involvement from both parties is required in the
management and administration activities, where each of them have their own specific tasks
in planning, land-use control and management (Welch & Keat, 1987). The specific tasks
assigned to them concern a wide range of aspects including political, social, economic and
administrative systems. Figure 3.7 shows the administration and government institutions‟
involvement in water and land matters in Malaysia, and Appendix A summarises the
objectives and functions of each institution.

53
(Source: Malaysian Department of Irrigation and Drainage, 2009c)
Figure 3.7: Institutional frameworks for land and water resource development in
Malaysia
3.6.1 Regulations Related to Waterfront Development in Malaysia
In most countries, various forms of regulations are implemented to correct physical,
economic, social and spatial imbalances (Singh, 1994). The importance of law, policies and
guidelines towards waterfronts has been recognised in Malaysia as it has been in many
CABINET
Ministry of Housing
& Local Government
Prime Minister
Department Ministry of Natural
Resources and
Environment
Ministry of
Agriculture
Town and country
planning
department
Department of Local
Government
Economic
Planning Unit Department of
mineral and geo
-science
Department of Irrigation and
Drainage
Department of Biodiversity
and forestry
Department of
Wildlife Department of
Environment
Department of
land and
mines
Irrigation
division
FEDERAL LEVEL
COMMITTEE
Town and
country planning
department
Local
authority
State economic
planning unit
Land
Administrator Department of
environment
Department of irrigation and
drainage
STATE LEVEL
LOCAL AUTHORITY LEVEL
National landscape
department
54
countries (Riley & Shurmer-Smith, 1988). For example, in the United States in the 1970s and
1980s, environmental regulations and policy formulation for the regeneration of waterfronts
were increased, and subsequently had significant impact upon waterfronts (West, 1989). In
fact, the establishment of the Clean Water Act (see US Public Law (92-500), 1972) and the
National Environmental Policy Act (see Public Law (91-190), 1970) have led to water quality
improvement and the reclamation of brown field sites, and have resulted in increased
investment in waterfront areas by developers and users alike as well as visually enhancing
waterfront areas (Breen & Rigby, 1996).
In Malaysia, legislative systems were implemented within a broader framework and
supervised by the federal government. Laws also were used as a form of management in
response to environmental problems in Malaysia (Daud, 2009). According to Latip et al.
(2010), the earliest law in Malaysia which included the urban river aspect was introduced in
1907 and was known as the Sanitary Board Enactment. The Sanitary Board Enactment was
focused on health and sanitation including drainage13
as part of the law. This enactment was
later reviewed and renamed as the Municipal Ordinance Cap 133/1913, and the Town
Improvement Enactment 1917, and focused more on health and the habitation of houses (the
setting of back lanes and open spaces for sanitary conveniences) (Norris, 1980). However,
these new regulations did not specifically discuss rivers or the importance of them.
The specific law in relation to rivers was established in the 1920s and was known as the
Water Act 1920. The Water Act 1920 provided a detailed definition of rivers, the responsible
authority for the rivers and the riverbanks, and those involved in the appeal board (Water Act,
1920). This law remains current and is used by the Department of Drainage and Irrigation of
Malaysia (Malaysian Department of Irrigation and Drainage, 2009b).
The first policy that stated the importance of waterfronts for public use was established in
1984 and was known as the Kuala Lumpur Structure Plan 198414
(Dewan Bandaraya Kuala
Lumpur, 1984). The Kuala Lumpur Structure Plan provided specific concerns on
13 The river is part of the drainage system (Norris, 1980).
14 The Kuala Lumpur Structure Plan 1984 was the master plan and was in the form of a written statement
covering the overall development of the Federal Territory of Kuala Lumpur. First published in 1984 and revised
in 1994, the Plan contained the broad goals and objectives, policies and proposals concerning development, land
use, the improvement of the social, economic and physical environment, and traffic management within the
Federal Territory of Kuala Lumpur. The Plan had a perspective period of 20 years, up to the year 2000, and was
reviewed periodically (Dewan Bandaraya Kuala Lumpur, 1984).

55
developments around the natural features and including rivers.15
After that, several other
initiatives directly and/or indirectly in relation to rivers and waterfronts were announced
including the Malaysia Plan16
and the amendment of the Town and Country Planning Act
1976 in 1994. Despite the laws, various guidelines in relation to waterfronts were drafted by
several department including guidelines for development related to rivers and river reserves
by the Malaysian Department of Irrigation and Drainage (2006), and waterfronts as
recreational areas by the National Landscape Department (2005).
Up to the present, many laws, policies and guidelines that directly and/or indirectly related to
waterfronts were put in place. However, most of the laws established concentrated on
penalties for the pollution of rivers rather than specifically mentioning the importance of
waterfronts including the Fishery Act (Act 317) (1985), the Environmental Quality Act (Act
127) (1974) and the Local Government Act (Act 171) (1976). The policies and guidelines
introduced were very general and mostly done based on zoning rather than specific plots, for
example the National Urbanisation Policy by the Town and Country Planning Department
and, this resulted in difficulty monitoring and controlling development (Latip, et al., 2010).
Moreover, some of the guidelines were not gazetted and were only used in isolation within the
department which produced them, such as the waterfront as recreational area by the National
Landscape Department, the planning guidelines for river reserves as public open space by the
Town and Country Planning Department and facing the river concept guidelines by the
15 The Environmental Improvement Policies in the Kuala Lumpur Structure Plan 1984 (under sub-section LC7)
specifically highlighted and acknowledged the waterfronts as potential public spaces.
16 The 5th
Malaysia Plan (1986-1990) stated the importance of preserving the environment and environmental
planning, and the importance of balancing the development of socioeconomic and environmental needs (Fifth
Malaysia Plan, 1986).
In the 6th
Malaysia Plan (1991-1995), Malaysia launched several initiatives to improve the waterfront and
rivers including the ten year Rehabilitation Programme and “Love Our River” campaign (Sixth Malaysia Plan,
1991). Unfortunately, ten years later, in 2005, the campaign was announced a failure by the Ministry of the
Environment due to concentrating more on riverbank beautification rather than river cleaning (The star online,
2007).
The 7th
Malaysia Plan (1996-2000) was a continuation of the 6th
Malaysia Plan. The plan focused on
sustainable development and the integration of environmental considerations with economic and social
development processes (Seventh Malaysia Plan, 1996).
The 8th
Malaysia Plan (2001-2005) continued the theme of sustainable development (Eight Malaysia Plan,
2001).
The 9th
Malaysia Plan (2006-2010) highlighted five main thrusts. One of them indirectly mentioned was
about planning to improve the integration between waterfronts and urban rivers (Ninth Malaysia Plan, 2006).
The 10th
Malaysia Plan (2011-2015) highlighted several key points as follows; charting development for a
high income nation, 6% growth target, increased Malaysian per capita income by 2015, creating private sector-
led economy, supporting innovation-led growth, full employment and restructuring of subsidies (Tenth Malaysia
Plan, 2010).

56
Drainage and Irrigation Department. This made difficulties for implementing the guidelines
and discouraged achieving more sustainable waterfront development (Latip, et al., 2010).
Table 3.6 summaries related laws, policies and guidelines to waterfront development in
Malaysia, according to the year it was introduced.
Table 3.6: Related law, policies and guidelines related to waterfront development in
Malaysia
Year Law Policy/Guideline
1907
1913
1920
1923
1927
1930
1953
1955
1960
1964
1965
1974
1974
1974
1976
1970
1976
1982
1984
1985
1985
1986-1990
1991-1995
1996-2000
1996-2000
2001-2005
2005
2005
2005
2005
2006
2006-2010
Sanitary Boards Enactment.
Municipal Ordinance Cap 133/1913
Water Act 1920 (Act 418).
Town Planning and Developments Bill, 1923.
Town Planning and Developments Bill, 1927.
Sanitary Boards Enactment Cap 137, 1930.
Irrigation Areas Act 1953 (Act 386).
Town Boards Enactment of the Federated Malay States
(Cap 137) amended in 21st April 1955.
Akta Ibu Kota Persekutuan 1960 (Act 190).
Land Conservation Act
National Land Code 1965 (Act 65).
Environmental Quality Act 1974.
Street and Drainage Act 1974.
Federal Constitution.
Local Government Act 1976.
City of Kuala Lumpur (Planning) Act 1973 (Act 107).
Town and Country Planning Act 1976.
Federal Territory (Planning) Act 1982 (Act 267).
Fisheries Act 1985 (Act 317).
Undang-undang kecil Bangunan (Wilayah Persekutuan
Kuala Lumpur) 1958.
National Heritage Act 2005 (Act 645).
Kuala Lumpur Structure Plan
1984.
5th
Malaysia Plan.
6th
Malaysia Plan.
Kuala Lumpur Structure Plan
2020.
7th
Malaysia Plan.
8th
Malaysia Plan.
National Physical Plan.
River Reserves (JPBD).
Guidelines for riverfront
developments concept.
Waterfront as Recreational
Area.
National Urbanisation Policy.
9th
Malaysia Plan.

57
Year Law Policy/Guideline
2008
2010
Draft Local Plan 2020.
10th Malaysia Plan.
(Source: Latip, et al., 2010)
3.6.2 Guidelines for Development Related to Rivers and River Reserves
The guidelines for development related to rivers and river reserves were designed by the
Department of Irrigation and Drainage, Malaysia (2006). Guidelines for development related
to rivers and river reserves were developed specifically for Local Authorities,17
to provide
guidance and to facilitate decision-making for land development planning approval, for rivers
and river reserves including riverfront development. These guidelines also include the
requirement for all information, the scope of impact assessment that is required for any
development that involve river reserves and the river itself, as well as a flow chart of the
development approval process.
The guidelines for riverfront development were designed and proposed concurrently with the
guidelines for development related to rivers and river reserves (Malaysian Department of
Irrigation and Drainage 2006). The guidelines for riverfront development were developed for
Local Authorities to use as a reference for the planning of development close to river areas. In
addition, these guidelines are also necessary as references for developers and consultants to
use who directly and/or indirectly involved in development close to river areas.
Specifically, the guidelines for riverfront development concept have four objectives as
follows:
(a) To explain and encourage the implementation of guidelines in the development
planning of riverfront areas.
(b) To be a reference and a guideline for any development near to river areas.
(c) To provide uniform guidelines for all parties involved in the riverfront development
process.
(d) To control all types of riverfront development.
17 The Land administrator and Local Authorities are responsible parties involved in land development planning
approval including development planning for rivers and river reserves.

58
According to the guidelines for riverfront development, planning for riverfront development
is required to include neighbourhood areas within 50 metres of a river reserve and the river
body itself. This is not considering the land status and/or land type of the development areas.
The guidelines proposed several criteria that guide and should be taken into consideration
while planning for development in front of river areas. Table 3.7 summarises and presents the
criteria proposed for guidelines for riverfront development.
Table 3.7: Criteria for guidelines for riverfront development
No. Criteria Description
1. River as a main
attraction of
developments
According to the guidelines, the river‟s role is to remain as a main
attraction for the development.
The river plan must be developed earlier than any other development
plan.
Removal of or changing the river line or bed are not permitted.
2. Beautification of
river reserves
According to the guidelines, developers are required to provide
recreation and beautification plans for river reserves to be approved by
the Department of Drainage and Irrigation, Malaysia.
Maintain river reserves as buffer zones to control environmental
problems such as soil erosion.
Utilising river reserves for green areas and for recreational use are
allowed to developers.
3. Level of river flow According to the guidelines, development close to river areas must not
increase the level of river flow. Development of more than 10
hectares, are required to build retention ponds with maximum area of
approximately between 3-5% of total development area.
4. Developments of
permanent
infrastructure
According to the guidelines, the development of permanent buildings
and infrastructure are not allowed within rivers and river reserves
unless they are facilities for recreational purposes such as a play
ground.
River beautification work that could increase a river‟s water flow must
obtain approval from the Department of Drainage and Irrigation.
5. Platform level of
building
According to the guidelines, the maximum platform level for buildings
is required to reduce any damage from flooding.
6. Riverfront
developments
concept
According to the guidelines, planning for the development close to
river areas must include the riverfront development concept. The main
access to the building must face the river.
Property developers are required to undertake beautification work for
the development close to the river area, and contribute a portion of the
maintenance costs for river reserve and beautification works to the
Local Authority.
7. River view According to the guidelines, the development planning of riverfront
areas should include the river view.

59
No. Criteria Description
The arrangement of the building and type and size is required in the
proposed development plan.
8. Open space According to the guidelines, any planning for infrastructure
development is highly required to maintain and conserve open spaces
along the river.
9. Public access According to the guidelines, gated communities and any activities
which will not allow public access to the river and river reserves are
prohibited.
10. Conservation of flora
and fauna
According to the guidelines, development close to river areas are
required to maintain the green zone along the river reserves as habitat
for flora and fauna.
Construction of concrete structures along river banks is limited and
forest trees with high commercial value are not allowed to be
harvested and cut.
11. Recreation activities According to the guidelines, recreational activities that involve rivers
such as fishing and kayaking are highly encouraged.
12. Preservation of
historic value of river
According to the guidelines, maintaining and preserving the historic
value of rivers including historical buildings along the river is
required.
13. Water restoration According to the guidelines, a centralise sewage system for
development along river areas is required.
Water treatment is needed before discharged to rivers to avoid water
pollution.
This requirement is compulsory for development projects of more
than10 hectares.
14. Bridge A bridge facility with good design and a high standard of quality is
required to facilitate people access to this area.
The width of the bridge is 4.5 metres and using the elevated bridge or
arch bridge type.
(Source: Malaysian Department of Irrigation and Drainage 2006)
In order to maintain the success of riverfront development, the guidelines for riverfront
development is recommended to be applied in conjunction with other regulations as follows:
1. Water Act 1920 (Amendment 1989);
2. Local Government Act 1976 (Act 171);
3. Environment Quality Act 1974 (Act 127);
4. Mining Enactment 1962 (F.M.S. Cap. 147);

60
5. Drainage Works Act 1954 (Act 354) (Amendment 1989);
6. Irrigation Areas Act 1953 (Act 386) (Amendment 1989);
7. Road, Drainage and Building Act 1974 (Act 133);
8. National Land Code 1965 (Act 56); and
9. Other regulations enforced from time to time.
The application of the guidelines for riverfront development would help all parties that are
directly and/or indirectly involved in riverfront development, and would encourage riverfront
development for future development in Malaysia.
This chapter served as a review of waterfront development in Malaysia context. The
emergence of waterfront development and redevelopment was discussed as well as the
interrelated factors in the transition of waterfronts from industrial areas to unused spaces.
This chapter has also reviewed the literature dealing with the governance as well as
regulations associated with waterfront development in Malaysia. Moreover, related guidelines
designed for development close to river areas, which were known as guidelines for the
development related to rivers and river reserves, and guidelines for riverfront development,
were also explained.

61
Chapter 4
Methodology and Use of the Mixed Methods Research Strategy
4.1 Introduction
This chapter discusses the rationalisation for the mixed methods research strategy adopted to
achieve the objectives of the research. It starts with a discussion of the research objectives,
followed by the research design, data collection, data preparation and analysis, and concludes
with a chapter summary.
4.2 Research Objectives
The specific objectives of this study are to:
(1) Identify current practices of waterfront development in Malaysia.
(2) Examine the approach taken overseas to waterfront development with an emphasis on
available guidelines (for example, the Wellington Waterfront, New Zealand and the
Singapore‟s Riverfront, Singapore).
(3) Evaluate the current regulations and guidelines related to waterfront development in
Malaysia.
(4) Develop and recommend new guidelines towards more sustainable development of the
waterfront in Malaysia.
Once the purpose of the study was identified and examined, the next step was to formulate a
strategy to achieve the research objectives. This is presented in the following section; research
design.
4.3 Research Design
The steps adopted in this research are as follows:
(1) Define the research problem.
(2) Determine the methods needed.
(3) Design the research strategy.

62
(4) Construct the interview questions and design the questionnaire.
(5) Specify the sampling process and the statistically robust sample size.
(6) Pre-testing of the questionnaire, revising it and preparing for the data collection.
(7) Data analysis and evaluation.
(8) Overall evaluation of the completed research study.
Specifically, in this research a mixed methods strategy was employed as the research process.
In particular, the exploratory design,18
also known as the sequential exploratory mixed
methods design, was chosen for this study. The rationale for using a mixed methods research
strategy with a sequential exploratory design is provided in the next section. This is followed
by an explanation of the case study approach in the qualitative stage, and also a description of
the way in which its findings are used to develop a questionnaire for the quantitative stage. A
questionnaire is used for a survey of property developers in Malaysia and serves to support
the findings of the qualitative stage. A detailed explanation about data analysis techniques
involved in the various research steps follows, and concludes with a summary of the chapter.
4.4 Motivation for Using the Mixed Methods Research Strategy
Social research is conducted to understand complex human behaviour and experiences
through qualitative or quantitative methods, or a combination of these (Morse, 2003, p. 189).
Both qualitative and quantitative methods have different strengths and weaknesses and are
used to answer different questions; however, they complement each other (Neuman, 2006, p.
151). Therefore, due to different emphases and limitations of the qualitative and quantitative
methods, the mixed methods approach was introduced as a third methodological paradigm in
social science research (Creswell, Clark, Gutmann, & Hanson, 2003; Johnson &
Onwuegbuzie, 2004; Morse, 2003; Tashakkori & Teddlie, 2003).
Mixed methods research is defined as research where both qualitative and quantitative data
are collected and analysed within a single study. Mixed methods requires data to be collected
concurrently, or sequentially (one after another) in one or more stages of the study (Creswell,
et al., 2003, p. 212). The combination of qualitative and quantitative methods in one study
could neutralise the biases inherent in any single method and provide an in-depth
18 Creswell and Clark (2007) introduced four major types of mixed method designs; the Triangulation Design,
the Embedded Design, the Explanatory Design and the Exploratory Design.

63
understanding of a phenomenon from a range of perspectives, different levels and groups of
respondents (Creswell, et al., 2003, p. 211; Morse, 2003, p. 205; Tashakkori & Teddlie, 1998,
pp. 93-94, 672). Furthermore, mixed methods has the ability to answer all research questions
(Creswell & Clark, 2007).
In this study, both qualitative and quantitative questions have been proposed. In order to
achieve the research objectives, the mixed methods strategy consisting of both approaches,
was applied. The qualitative phase in this study was a case study, which was followed by a
survey questionnaire in the second phase.
The significance of qualitative research in general, is to explore new phenomena and to
understand complexities that focus on the provision of in-depth information. The emphasis of
the case study approach in particular, in relation to this research, was to identify the attributes
associated with best practice for waterfront development from waterfront development
stakeholders in Malaysia. In order to obtain wider information of successful waterfront
development projects from other developed countries (i.e. the Wellington‟s Waterfront, New
Zealand and the Singapore‟s Riverfront, Singapore), documents relating to waterfront
development (i.e. guidelines and principles) were reviewed. This was to explore how and why
they have been successful. In addition, recommendations for best practice in waterfront
development were identified during the first phase of the research strategy.
Information gathered and the attributes identified from the first phase were then included in a
questionnaire (survey). The purpose of the quantitative phase (questionnaire survey) in this
research strategy was to confirm statistically the identified attributes associated with best
practice for waterfront development, and then to develop new guidelines for best practice for
waterfront development in Malaysia.
The semi-structured nature of qualitative research provided an opportunity to identify
unanticipated attributes associated with waterfront development in Malaysia, which could
then be used for developing the questionnaire. A semi-structured interview is flexible; while
the interviewer generally has guidelines to explore, new questions can be brought up during
the interview as a result of what the interviewee says.
The information associated with topics asked during the interview can then be included in
constructing the questionnaire before testing it quantitatively through statistical analysis
(second phase). For this reason the strengths of both qualitative (identification of new
considerations) and quantitative methods (confirmation of the statistical significance of newly

64
identified considerations) were combined in order to provide more robust and comprehensive
results.
The use of mixed methods facilitates the between method triangulation,19
whereby the use of
both methods leads to different assumptions and confirmations. The use of multiple methods
within a single study offers wide perspectives and more extensive results through the
combination of a variety of data sources (Creswell, et al., 2003, p. 211; Morse, 2003, p. 195;
Tashakkori & Teddlie, 2003, p. 16).
Although mixed methods research remains controversial in social science (Tashakkori &
Teddlie, 2003, p. 379), concentrating on the strengths of each method within the mixed
methods strategy may improve the quality of inferences20
and support more in-depth
understanding. Further, the mixed methods strategy is more difficult to complete, more time
consuming and costly and importantly, both methods (qualitative and quantitative method)
could be exposed to the same errors and biases. In this research, the use of a second method
for supplementary purposes helped provide more in-depth understanding about waterfront
development in Malaysia.
4.5 The Sequential Exploratory Mixed Methods Design
Over the years, a classification of mixed methods and multi-method designs has emerged
from the literature (see Creswell, et al., 2003, pp. 214, 216-217, for more detail). As
mentioned earlier, the sequential exploratory mixed methods strategy was carried out in this
research where, a qualitative research investigation followed by a quantitative research was
combined in a single mixed methods strategy. In short, this involved the integration of the two
types of data at various stages along the research process; data collection, data analysis and
interpretation (Creswell, 2003, pp. 212-215) and priority was generally given to the first phase
(Tashakkori & Teddlie, 2003, p. 227). Priority was given to the first phase because it formed
the basis for the research and provided the necessary information to be used as input for the
19 Triangulation is a terminology widely used within case study research. The term is originally borrowed from
the land surveying discipline mainly to determine a yet unknown position (C) through the combination of two
known points (A and B) by using trigonometric laws. In the social science discipline, triangulation is used for
two reasons; to describe research strategies that use different approaches to answer certain research questions,
or/and to improve the validity of results by collecting and analysing data from different sources and strategies
within a single study (Tashakkori & Teddlie, 2003, pp. 459-460).
20 Inference is defined as “a conclusion reached” (Angeles, 1981). The term can be used by QUALs and
QUANs alike because it refers to the inductively or deductively derived conclusions from a study (Tashakkori &
Teddlie, 2003, p. 35).
65
quantitative phase which, was carried out in response to the findings derived from the
qualitative phase. The findings from these two phases were then integrated during the
interpretation phase (Creswell, et al., 2003, p. 227). The decision to employ two phases of
data collection sequentially in a single research project was to ensure the research could
generate strong and comprehensive outcomes.
Although the methods followed in each phase are discussed in detail in the following section,
it is important to explain how these methods are used together. As depicted in Figure 4.1
below, a case study approach was used in the qualitative phase to provide in-depth
information and attributes, which contributed to the establishment of waterfront development
in Malaysia. The qualitative data was collected from multiple sources including personal
interviews and document reviews. This information was then transformed into text and
analysed with the help of Microsoft Excel software in order to identify current practices in
waterfront development in Malaysia, to evaluate the governance and regulations that control
them and to identify the important principles guiding waterfront development in Malaysia.
Bear in mind that Microsoft Excel was used as a data organiser rather than for solving the
research problem. The decision was made based on researcher judgment and supported by
information gathered.
Data consolidation occurred when these attributes (variables) were integrated into a
questionnaire which was then used in the survey questionnaire (Descriptive approach). The
data consolidation stage is appropriate if the purpose of the mixed methods strategy is the
development of subsequent steps in the research process21
(Greene, et al., 1989). After the
survey instrument was developed, the study moved into its second stage; the quantitative
phase (as indicated in the last three boxes in Figure 4.1 below).
The survey instrument used in this study was mainly to validate whether the perceptions of
waterfront development practices in Malaysia were different between waterfront development
stakeholders; and also, to assist in the determination of the attributes and relationships
between them in order to develop future waterfront development guidelines for Malaysia
through statistical analyses, such as descriptive statistics, exploratory factor analysis and
correlation. The survey questionnaire was then distributed to the respondents who were
property development companies listed under Bursa Malaysia. The returned survey was then
21 Greene et al. (1989) determine five major purposes for mixed method evaluation design: Triangulation,
Complementarities, Development, Initiation and Expansion.

66
analysed using the Statistical Package for Social Science (SPSS). The quantitative phase
supported the qualitative phase as stronger conclusions could be drawn (Onwuegbuzie &
Teddlie, 2003). The findings were integrated within the data collection and analysis phase and
conclusions were based on both methods (Creswell, et al., 2003, p. 218; Tashakkori &
Teddlie, 2003, p. 687).
In short, the purpose of the mixed methods analysis in this study can be summarised as
follows:
(1) The selected methods of inquiry were used to view waterfront development in Malaysia
from different angles, and the results from the qualitative phase were confirmed in the
quantitative phase.
(2) The case study results were used to develop a questionnaire.
(3) A description of the data collection procedures followed in the qualitative phase and the
quantitative phase improved the validity of the results.

67
(Adapted from: Creswell, 2003, p. 235)
Figure 4.1: Mixed methods procedure – data collection and analysis
Qual
data collection
Qual
data analysis
Qual
findings
Quan
data collection
Quan
data analysis
Overall results
&
interpretation
Phase 1: QUALITATIVE RESEARCH (Qual) Phase 2: QUANTITATIVE RESEARCH (Quan)
● Procedure:
i. Case study: 3 cases
selected within
Malaysia.
ii. Approach: Semi-
structured personal
interviews with all
parties involved in
waterfront
development projects
(government officers,
property developers,
waterfront
communities) and
documents review.
iii. 25 participants.
● Product:
i. Recorder, Field
notes, Transcripts.
● Procedure:
i. Text analysis
of interviews and
documents using
Microsoft Excel.
● Product:
i. Develop
codes, themes
and variables.
● Procedure:
i. Describe
identified
themes and
identify
attributes
recommended
for waterfront
development
guidelines.
● Product:
i. Description of
themes.
● Procedure:
i. Create a
questionnaire.
ii. Administer to 91
developers within
Malaysia.
● Product:
i. Questionnaire
● Procedure:
i. Validate and
confirm the
attributes through
descriptive
statistics,
exploratory
factor analysis,
and correlation.
● Product: i. Percentage,
Factor loadings
and Correlation.
● Procedure:
i. Integrate and
summarise the
results from both
methods in order
to answer
research
objectives.
● Product:
i. Summarise
research findings.
ii. Recommend a
new guideline for
waterfront
development in
Malaysia.
Note: There are three levels introduced in the procedure. First, the research is organised into two sequential phases; the qualitative phase is followed by quantitative phase.
Second, the more general procedures of data collection and analysis are presented in the top boxes and, finally the more specific procedures are explained in the boxes below.
The arrows indicate how the two phases are integrated sequentially along the study.

68
4.5.1 The Qualitative Phase: A Case Study Approach
A qualitative approach was adopted for the first phase in this research because waterfront
development in Malaysia is a relatively new research topic, thus, an exploratory approach
was used to understand its relevance from the stakeholders‟ perspective (Hair, Babin, Money,
& Samouel, 2003). Also, a qualitative study was the most effective approach to gain an
understanding of the perceptions of interviewees.
A case study approach has been used widely in various research areas (Yin, 2003) including
property studies (see Bond, 2010; Bond & Cook, 2004; Guilding & Whiteoak, 2008; Hong,
Ismail, & Yin, 2008; Kupke & Pearce, 2000; McDonagh, 2010; Omar, Yusof, & Samad,
2001, for examples of the case study approach). The case study is considered an empirical
inquiry that investigates a contemporary phenomenon within its real-life context when the
lines between phenomenon and context are not clear (Yin, 1984, p. 23). Therefore, choosing
the exploratory case study approach was well suited for this research (for the first phase)
when very little information was known about the situation and little information was
available on similar issues in the past. The case study was done through the collection of
several sources of evidence such as interviews, documents and physical artefacts (Eisenhardt,
1989, p. 534; Yin, 1984, p. 23).
The next section explains the motivation for choosing the case study approach for this
particular research, followed by an explanation of operational procedures applied along the
process.
4.5.1.1 Motivation for Using the Case Study Approach
Case studies are often viewed as useful tools for the exploratory stage of research – as a basis
for the development of the „more structured‟ tools that are necessary in surveys and
experiments. Eisenhardt (1989) said that case studies were:
“Particularly well suited to new research areas or research areas for which
existing theory seems inadequate. This type of work is highly
complementary to incremental theory building from normal science
research. The former is useful in early stages of research on a topic or when
a fresh perspective is needed, whilst the latter is useful later.”
(Eisenhardt, 1989)

69
In addition, the case study approach was the best way to investigate new themes where new
perspectives were needed (Eisenhardt, 1989, p. 543). In this research, information about the
emergence and establishment of waterfront development in Malaysia was required during the
exploration from the stakeholders involved in waterfront development projects. The
information needed included the history of the establishment of waterfront development in
Malaysia, the development process which included guidelines to control waterfront
development, the level of success, and other information about waterfront developments
projects. The closeness of the case study to real-life situations was important for the
developments of a nuanced view of reality (Flyvbjerg, 2006). In addition, the researcher also
required new perspectives or recommendations in order to provide a clear picture of how best
practice in waterfront developments, should be implemented in Malaysia in the future.
Furthermore, a case study approach was particularly useful in generating valuable
information about complex issues through the application of multiple sources of evidence, as
compared to being limited to one specific data source (May, 2001, p. 173; Yin, 1984, p. 90).
The in-depth focus of case studies often results in the creation of more valuable information
and sufficient understanding compared to a focus on a single data source and single method
(Eisenhardt, 1989; Yin, 2003). Therefore, the selection of three case studies in this research
was considered more compelling and more robust (Yin, 1994, 2003). Moreover, case studies
could yield more data points from different points of view – government officers, property
developers and waterfront communities; so the case study approach was the most suitable
method to manage and handle this situation.
Despite the many advantages offered, the case study approach has been accused of being less
rigorous because of the tendency for biases, which result from subjective sampling and
reliance on the researcher‟s interpretations. However, biases in verification do not just apply
to the case study approach but, to all methods (Flyvbjerg, 2006). Hence, by employing many
sources of evidence that converge in this research, it was possible to reduce bias and enhance
the appropriateness of the qualitative case method. At the same time, multiple sources of
evidence were used for data triangulation, which refers to the gathering of data through
different sources (personal interviews and document reviews) in order to strengthen the
validity and increase confidence in the interpretation of the data collected.

70
4.5.1.2 Case Study Design
This research developed guidelines for the best practice for waterfront development in
Malaysia by considering recommendations from the various parties involved in the
waterfront development projects identified. This research adopted a case study method in the
first phase (the whole study uses a mixed methods strategy) aimed at an in-depth
understanding for developing the guidelines. It is expected that these findings will help
improve government guidelines on waterfront development and in addition, add to
sustainable development in Malaysia.
Yin (2003, p. 13) emphasised the importance of case studies by stating that “case studies
investigate real-life events in their natural setting”. A natural setting offers researchers a
unique opportunity to observe people in settings where they choose to come and engage in
activities. Patton (1987) further explained that going into the field meant having direct and
personal contact with people in the programme in their own environment. More than that, by
employing the case study research design in particular, allowed a focus on specific cases.
In designing a case study approach, determining the unit of analysis as the first step is
especially important. In this research, the case study was exploratory and the unit of
analysis22
was various waterfront developments – to investigate the thoughts of the various
stakeholders participating in waterfront development projects. Specifically, each case
consisted of a semi-structured personal interview with the parties involved and a review of
the project proposals.
A multiple case study approach was employed in the research. As determined by Yin (1993),
multiple case studies should follow a replication, not a sampling logic. This meant that two or
more cases should be included within the same study precisely to predict that the similar
results (replication) will be found. Using multiple-case studies in this research provided more
confidence in the overall results. Consistent findings developed over the investigation of
more than one case study were considered to give more robust findings (Yin, 1993, 1994).
Additionally, investigating a number of waterfront development projects enhanced the
accuracy, validity and reliability of the results by capturing the holistic essence of the subject
studied (see Figure 4.2 for the case study design).
22 Unit of analysis is the actual source of information, such as individual, organisational document or artefact.
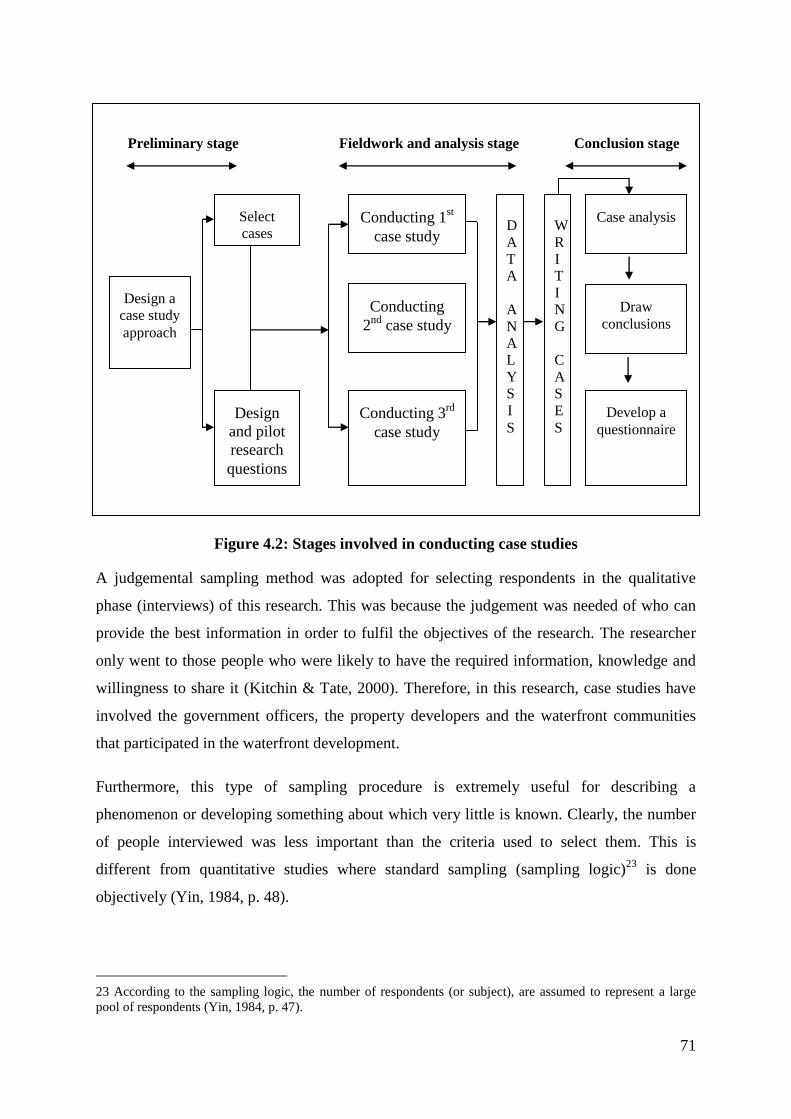
71
Figure 4.2: Stages involved in conducting case studies
A judgemental sampling method was adopted for selecting respondents in the qualitative
phase (interviews) of this research. This was because the judgement was needed of who can
provide the best information in order to fulfil the objectives of the research. The researcher
only went to those people who were likely to have the required information, knowledge and
willingness to share it (Kitchin & Tate, 2000). Therefore, in this research, case studies have
involved the government officers, the property developers and the waterfront communities
that participated in the waterfront development.
Furthermore, this type of sampling procedure is extremely useful for describing a
phenomenon or developing something about which very little is known. Clearly, the number
of people interviewed was less important than the criteria used to select them. This is
different from quantitative studies where standard sampling (sampling logic)23
is done
objectively (Yin, 1984, p. 48).
23 According to the sampling logic, the number of respondents (or subject), are assumed to represent a large
pool of respondents (Yin, 1984, p. 47).
Fieldwork and analysis stage Conclusion stage
Select
cases Conducting 1
st
case study
Conducting
2nd
case study
Design
and pilot
research
questions
D
A
T
A
A
N
A
L
Y
S
I
S Conducting 3
rd
case study
Preliminary stage
Design a
case study
approach
W
R
I
T
I
N
G
C
A
S
E
S
Case analysis
Draw
conclusions
Develop a
questionnaire
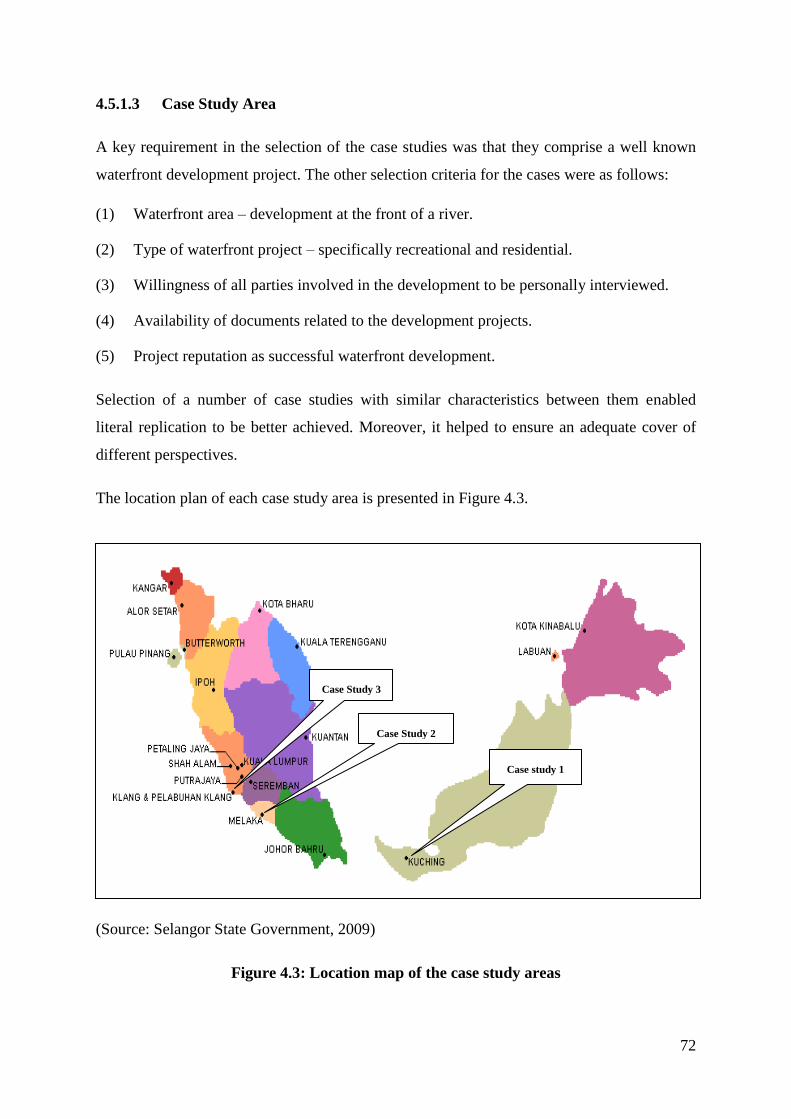
72
4.5.1.3 Case Study Area
A key requirement in the selection of the case studies was that they comprise a well known
waterfront development project. The other selection criteria for the cases were as follows:
(1) Waterfront area – development at the front of a river.
(2) Type of waterfront project – specifically recreational and residential.
(3) Willingness of all parties involved in the development to be personally interviewed.
(4) Availability of documents related to the development projects.
(5) Project reputation as successful waterfront development.
Selection of a number of case studies with similar characteristics between them enabled
literal replication to be better achieved. Moreover, it helped to ensure an adequate cover of
different perspectives.
The location plan of each case study area is presented in Figure 4.3.
(Source: Selangor State Government, 2009)
Figure 4.3: Location map of the case study areas
Case study 1
Case Study 2
Case Study 3

73
A brief description of each case study area is presented in Table 4.1, and details of the
projects are explained in the next section (Section 4.5.1.4).
The case study cannot be used to make generalisations from the sample to a population as is
done in statistical methods, because sampling is done purposefully and is not random (Yin,
1993, p. 91). Case studies, however, allow generalisations to be made that can lead to some
form of replication (Yin, 1993). For example, generalisations on particular issues in
waterfront development can be drawn from similar thoughts identified from different sources
within the multiple cases studied.
It must be stressed that the aim of the qualitative phase in this study was exploratory. As
such, the small sample size was not the issue that it would have been in quantitative research
because it enables generalisations to be made about the underlying population (Onwuegbuzie
& Leech, 2005). In fact, a feature of qualitative sampling is that the number of cases is often
small because qualitative investigation aims at depth as well as breadth which would make
analysis of large numbers of in-depth interviews unmanageable (Ritchie & Lewis, 2003).
Table 4.1: Characteristics of case studies areas
Case study area
Feature
Kuching Riverfront Malacca Waterfront Glenmarie
Riverfront Cove
Name of water body Sarawak River Malacca River Langat River
Type of project Recreational Recreational Residential
Project‟s Owner State of Sarawak State of Malacca DRB-HICOM
Amenities Restaurants, river
access, Shops,
waterfront settlement
River access, shops,
waterfront settlement.
Restaurants, housing,
river access.
Views River views and city River views and city Limited river views
Proximity to river 50 m 50 m 100 m
Proximity to CBD 1 km 1 km 35 km

74
4.5.1.4 Description of Case Study Areas
Details of the projects are explained as follows;
CASE STUDY 1: Kuching Riverfront, Kuching City, Sarawak, Malaysia.
The first case study was conducted in the state of Sarawak in the project area known as
Kuching riverfront.
Sarawak is separated from Peninsular Malaysia by about 600 kilometres by the South China
Sea. Located on the western island of Borneo with a land area of approximately 124,459
kilometres square, Sarawak is largest state of Malaysia. Sarawak is also known as “the land
of many rivers”. As home to the 590 kilometres long Batang Rajang River, the country‟s
longest river provides a natural means of transportation and communication and Sarawak is
blessed with much biodiversity (Sarawak Government Official Portal, 2009). The location
map of Sarawak Riverfront is shown in Figure 4.4 below.
(Source: Sarawak Economic Development Corporation, 2009)
Figure 4.4: Location map of Sarawak Riverfront, Malaysia
Kuching, the capital of the state of Sarawak is the largest city in Sarawak and is the fourth
largest city in Malaysia after Kuala Lumpur – Klang Valley, Penang and Johor (Butler, 2009;
Sarawak Government Official Portal, 2009). The population in Kuching is about 623,660
people and Chinese make up almost 40% of this population (Malaysian Department of
Kuching
Riverfront

75
Statistics (Sarawak Branch), 2009). Kuching is a river city, which is situated on the banks of
the Sarawak River on the North-Western part of the island of Borneo. In days gone by the
river was the city's main highway. The river still retains its importance and enchanting natural
beauty. Present day life is still concentrated on the riverfront.
Kuching Riverfront is an approximately 1.0 kilometre long riverside esplanade from the
heartland of the city to downtown Kuching. The Kuching Riverfront was developed as part of
the revitalisation of the river frontage to the city of Kuching. It was the brainchild of the
Chief Minister of Sarawak as a tribute to the people of the state. The layout for Kuching
Riverfront is shown in Figure 7.2 below.
The riverfront marketplace of Kuching had lost its traditional significance as a regional
distribution, trading and retailing centre for Kuching and its hinterlands. Instead it became
dirty and dilapidated and a focal point for unhealthy activities. In returning the forgotten
riverfront to the people, the Kuching Riverfront development seeks to draw them once again
to its banks and renew the vibrant relationship they once shared. It is also aimed at improving
the quality of life of the local residents. The river park is thus known as “The People‟s
Place”.
The development of the project was fully funded by the State Government. Construction
began in the year 1991 and was completed in August 1993. The Kuching Riverfront was
officially launched by the Chief Minister on 3rd
September 1993. The developments aimed to
create a new image for the city of Kuching as well as to provide benefits to other parties;
local residents, the government and tourists. Summaries of the Kuching Riverfront
developments project are presented in Table 4.5 below.
The Kuching Riverfront development was inspired by the Sydney Waterfront, Sydney,
Australia, one of the most established waterfront development projects in the world.
However, the development‟s concept blends the historical and cultural setting with the
provision of facilities and activities for tourists and the community, and particularly families.

76
(Source: Sarawak Economic Development Corporation, 2009)
Figure 4.5: Layout for the Kuching Waterfront development

77
Table 4.2: Details of Kuching Riverfront development project
Item Details
Developer : Sarawak Economic Development Corporation (SEDC).
Consultants : Conybeare Morrison & Partners (Australia).
United Consultants (Sarawak, Malaysia).
Contractors : PPES Bena Sdn Bhd.
Utraco (M) Sdn Bhd.
Project cost : Malaysian Ringgits 89.90 million.
Area of Developments : The south bank of the Sarawak River from the Holiday Inn to the
Vegetable Market – approximately 1.0 kilometre.
Features : (1) Fountains – musical; conventional fountain with sculpture
“birds in flight”.
(2) Audio visual centre on the history and tourist attractions of
Sarawak at the Square Tower – 22 metres high for viewing the
Astana and the Serpentine River.
(3) Godown Amphitheatre – 150 numbers of seats with open
concept amphitheatre.
(4) Tables and stools clustered together under umbrellas/shades for
eating, relaxing and other purposes.
(5) Childrens playground with the theme “from the mountains to
the sea”.
(6) Rotunda – shelter with decorative motif on the floor.
(7) A historical structure - Chinese pagoda.
(8) Eating area and eating outlet.
(9) Handicraft stalls.
(10) Floating pontoons – for berthing of leisure boats, recreational
fishing etc.
(11) Chinese museum.
(12) Tambang jetty – traditional river ferry.
(13) Promenade with ethnic motif.
(14) History walk – plaques on the history of Sarawak laid along
the promenade.
(15) Waterfront square – a venue for civic and cultural events,
recreational activities, and platform for viewing riverside
events.
(Source: Sarawak Economic Development Corporation, 2009)
CASE STUDY 2: Malacca Waterfront, Malacca City, Malacca, Malaysia
The second case study was conducted in the state of Malacca, Malaysia and the development
project is known as the Malacca Waterfront. Malacca is located on the West Coast of the
Peninsular Malaysia, about 147 kilometres from Kuala Lumpur. The state of Malacca covers
an area of 1,65024 square kilometres and is divided into three regions namely; Central
Malacca, Jasin, and Alor Gajah (State Government of Malacca, 2010). Strategically situated
24 Malacca is the third smallest state in Malaysia after Perlis and Penang, with a total population of about
738,8000 peoples (estimated 2007) (State Government of Malacca, 2010).

78
facing the Straits of Malacca in the west and faces the South China Sea in the east, Malacca
state is considered as a seaside city. The location of the Malacca Waterfront is presented in
Figure 4.6 below.
(Source: State Government of Malacca, 2009)
Figure 4.6: Location map of State of Malacca, Malaysia.
Historically, Malacca was a major maritime trading centre25 to all over the world and had a lot
of conquerors in past centuries; Chinese, Portuguese and Dutch. Malacca is a wonderful
repository for its cultural heritage, and in 1989, Malacca was declared as Malaysia's historic
city and has been listed as a UNESCO World Heritage Site26 since 7th
July 2008. Presently,
Malacca is well known as a tourism centre for Malaysia.
The Malacca River is the main waterway in the state of Malacca which flows through the
middle of the town, and was once an important trade route in past centuries (Malacca
Sultanate). Therefore, the 3.8 kilometres long Malacca River flows calmly and provides
limitless functions (such as transportation, a source of food, settlement, and a source of
drinking water) to waterfront communities.27
25 Malacca was a major port along the spice route, and its harbour bristled with the sails and masts of Chinese
junks and spice loaded vessels.
26 A World Heritage site is a place such as a forest, lake, desert, monument, building, complex or city that is
listed by UNESCO as having special cultural or physical significance.
27 Waterfront settlements emerged and established along both sides of the Malacca Riverbanks during Dutch
rule.
Malacca
Waterfront
MALACCA

79
Through hundreds of years, the Malacca River has changed its role from a busy major port
along the spice route to a tourist attraction. Since 2002, the state of Malacca has been
proactive in developing the abandoned riverbanks, and the City Local Authority was
mandated to initiate the development project, well known as the Malacca Waterfront
development project. The proposed project covered from Watergate (Straits of Malacca) and
adjacent areas to the areas of Portuguese and Dutch origins.
The project aimed to create a new image for the Malacca River and regain its historical status.
With the development aim of “beautification and rehabilitation”, the Malacca Waterfront
development project expected to have pollution free water, beautiful gardens along the
riverbanks and pedestrian walkways. Specifically, the project had the following objectives:
(i) To ensure that the riverfront retains its strong links with the city‟s heritage;
(ii) Creating opportunities to initiate lively riverside activities along the river for
commercial and tourism purposes;
(iii) To enhance and reinforce the riverfront character and be an integral part of living in the
city of Malacca;
(iv) To introduce pockets of gardens and spaces, proper and wide pavement esplanade
walkways complemented by landscape design;
(v) Introduce an interceptor sewer to channel all raw sewage, rubbish and debris away from
the river;
(vi) Introduce new vehicular and pedestrian bridges, jetties and waterfront activities to
rejuvenate the maritime history of the city;
(vii) Possible introduction of a barrage system to control the water levels in the river from
tidal changes.
The Malacca Waterfront development project is modelled after the San Antonio Riverfront, in
the United States. Fully government funded the project was divided into four phases focusing
on construction of the wave breaker, a promenade, a sewage system, landscaping, boat
mooring facilities and the installation of lighting. Figure 4.7 presents the layout of the
Malacca Waterfront development project.

80
(Source: State Government of Malacca, 2009)
Figure 4.7: Layout for Malacca Waterfront development
The first phase of the Malacca Waterfront project was started on 1st July 2002 and was
successfully completed in the middle 2005. The 2nd
phase commenced on November 2005
and continued on from the first phase activities. The 3rd
and 4th
phases focused on cleaning up
the water and controlling water levels for boating and cruising activities and commenced in
the year 2006. The total cost of the project in Malaysian Ringgits is 320 million (NZ$ 139
million). The project was completed in 2010. Table 4.3 summaries the Malacca Waterfront
development project.
An extensive waterfront redevelopment project has successfully transformed the Malacca
River from a once dirty muddy river way to a colourful waterway. City residents and tourists
can now enjoy a continuous riverfront walk from Hang Jebat Bridge upriver, all the way to
the tourist areas of the old port near the Syed Abdul Aziz Bridge. In recent years, the Malacca
Waterfront has become one of the most prominent places for tourists visiting Malacca and
Malaysia.

81
Table 4.3: Description of the Malacca Waterfront development project
Phase of development Descriptions
Phase 1
Cost Malaysian Ringgits 91,200,000 (NZ$ 39,600,000)
Budget Malaysian Ministry of Tourism.
Duration 31 months (01st July 2002 – 31
st January 2005).
Scope of Work Soil investigation, Develop a retaining wall, Soft and hard landscape,
Develop a pavement, Upgrading sewerage system – pipe laying,
Develop sewer treatment plant.
Contractor Pembinaan Kaleigh Sdn Bhd – Pesona Metro Sdn. Bhd. (Joint-
venture).
Status Completed.
Phase 2
Cost Malaysian Ringgits 49,950,000 (NZ$ 21,717,000).
Budget Ministry of Natural Resources and Environment.
Duration 20 months (01st November 2005 – 30
th Jun 2007).
Scope of Work Develop a pavement (Continue from 1st phase), Develop boat stop
(river taxi and tour boats), Soft and hard landscape, Upgrading
sewerage system – develop interceptor sewerage, Develop retaining
wall, Electricity works, Develop drainage outfall and Gross Pollutant
Traps (GPT).
Contractor Pembinaan Kaleigh Sdn Bhd – Pesona Metro Sdn. Bhd. (Joint-
venture).
Status Completed
Phase 3
Cost Malaysian Ringgits 93,000,000 (NZ$ 40,430,000).
Budget Ministry of Natural Resources and Environment.
Duration 23 months (01st August 2006 – 31
st July 2008).
Scope of Work Develop a tidal barrier, Develop a pavement, Develop causeway,
Electricity works, Soft and hard landscape.
Contractor Pembinaan Kaleigh Sdn Bhd – Pesona Metro Sdn. Bhd. (Joint-
venture).
Status Completed.
Phase 4
Cost Malaysian Ringgits 90,398,000 (NZ$ 39,300,000).
Budget Ministry of Natural Resources and Environment.
Duration 24 months (31st January 2008 – 30
th January 2010).
Scope of Work Upgrading a pavement bridge for Kg. Morten bridge, Cathay bridge,
Pasar bridge, Kg. Jawa bridge.
Upgrading bridge for vehicles for Hg. Jebat bridge, Hg. Tuah bridge,
Chan Koon Cheng bridge, Tan Kim Seng bridge.
Develop retaining wall.
Develop a pavement for Kg. Morten.
Develop a pavement from causeway to Syed Abdul Aziz bridge.
Contractor Kejuruteraan Asas Jaya Sdn Bhd.
Status Completed.
(Source: State Government of Malacca, 2009)

82
CASE STUDY3: Glenmarie Cove Riverfront Development, Selangor, Malaysia
Located on the West Coast of Peninsular Malaysia, at the northern outlet of the Straits of
Malacca, Selangor is known as the heartland of the nation. Selangor‟s land area is
approximately 8,000 square kilometres and was Malaysia‟s most populous state, with about
5.2 million (estimated 2009) inhabitants. As well as an aadvantageous geographic position,
Selangor is blessed with rich natural resources; natural forests, waterfalls, hills, and lakes to
complement its many man-made attractions. Today, Selangor is the industrial hub of
Malaysia28, and is the most prosperous and developed state in Malaysia. Figure 4.8 shows the
location map of the state of Selangor, Malaysia.
(Source: Glenmarie Cove Development Sdn. Bhd., 2009)
Figure 4.8: Location map of Selangor, Malaysia
Historically, Selangor was a tin mining area and had the busiest port (port Klang) to cater to
the tin mining trade. Surrounded by the river both to the north and south, Selangor is
dominated by fishing villages on the coast and villages inland. Langat River in Selangor29 is
120 kilometres long and flows from the main range (Gunung Niang), up to the Straits of
Malacca.
28 The country‟s largest industrial site is located in Shah Alam, Selangor.
29 As well as the Langat River are Klang River, Penchala River, Gombak River, Ampang River, Damansara
River, Bernam River, and Kemensah River.
Glenmarie Cove
Riverfront

83
Historically, the Langat River was the main source of communications and transportation
between the waterfront community30 and foreign traders during the early days. In recent years,
due to developments and modernisation, the Langat River became polluted (Malaysian
Department of Environment, 2006), and this also affected other rivers that flow from the
Langat River, such as the Sungai Balak, the Sungai Batang Benar, and the Sungai Pajam.
Glenmarie Cove is situated between the established townships of Subang Jaya and Klang
Town Centre. A gated and guarded residential scheme, Glenmarie Cove covers an area of
80.94 hectares along the banks of the Langat River. The low density development offers a life
style with the vibrancy of a riverfront along with a range of homes designed to complement
the green surroundings and shimmering waters. Glenmarie Cove is the model of Malaysia‟s
riverfront living. The riverfront concept is a unique factor that enhances the value of the
Glenmarie Cove. The layout of the Glenmarie Cove Riverfront development is presented in
Figure 4.9 below.
(Source: Glenmarie Cove Development Sdn. Bhd., 2009)
Figure 4.9: Map of Glenmarie Cove, Selangor
30 Tin Mining traders settled along the river in Selangor, and early human settlement and towns were developed,
such as Dusun Tua, Cheras, Kajang City, Dengkil, etc.

84
4.5.1.5 Preparation and Collection of Data
A purposive sampling procedure was used in this research. A representative from each case
study area was contacted by telephone and the purpose of the research was briefly explained
to them as well as the list of information needed that was required to be surveyed. In short, the
names of respondents were initially determined by the management of each organisation
through company records based on their job responsibilities, position and involvement in the
subject being studied. However, respondents were also selected on the basis of the
researcher‟s individual knowledge that they could provide the necessary information needed
in this research.
As the interview31 was the primary data gathering instrument in the qualitative phase, a semi-
structured personal interview with the named respondents suggested by the company
representatives was chosen. The objective of a semi-structured approach was to understand
the respondent‟s point of view rather than make generalisations. This would provide sufficient
flexibility and the best information about the subject under discussion based on their
respective interpretations. The interview questions were carefully designed to assist in
conducting the interviews and to provide adequate coverage for the purpose of the research.
Major questions were developed in the form of a general statement which was then followed
by a sequence of sub-questions that probed further. The questions were then piloted with four
identified stakeholders – a property developer, two government officers and one academic in
property studies in Malaysia. They were selected based on their willingness to share the
information needed. The pilot was aimed at identifying ambiguities, helping to clarify the
wording of questions and permit the early detection of any necessary additions or omissions.
The interview questions were then adjusted after the pilot case. See Appendix B for the
interview questions used in semi-structured interviews.
The waterfront development study in this research required data collection from within
Malaysia. As determined by the government of Malaysia, all researchers32
are required to
obtain approval from the Economic Planning Unit for any research that requires data from
31 The interview is a form of gathering of information through direct communication between two or more
individuals, while the face-to-face interview refers to a conversation between two individual (interviewer and
interviewee) as a platform for gathering information (Zikmund, 2003).
32 According to the Economic Planning Unit (1999), for the purpose of this regulation, the term “Researcher”
refers to foreign nationals or Malaysians from foreign institutions and/or organisations who scientifically and
objectively research a particular area or problem.

85
Malaysia (Economic Planning Unit, 1999). The General Circular No. 3 Year 199933
contained
the regulations pertaining to conducting research in Malaysia. The approval process took
about two months and the research pass was collected by the researcher before commencing
the research. See Appendix C for the research pass and approval letter from the respective
organisations.
All parties involved in waterfront development projects (as recommended by appointed
representatives) were contacted by telephone and electronic mail to inform them about the
research and to determine a date for the personal interview. This was followed up with a
formal letter containing the purpose of the research and other details, as discussed on the
telephone. See Appendix D for an example of the letter sent to all interviewees. Next, in order
to confirm acceptance a letter confirming the date for the interview and, a follow up call was
also made.
The interviews were recorded with a digital recorder to ensure an accurate account of the
conversations and to avoid losing data, since not everything can be written down during an
interview. Every record was labelled with the name of the interviewee in order to organise the
information. Then, the information was transcribed into Microsoft Word documents before
analysis.
Besides the in-depth interviewing, the data collection included analysis of documentary
sources related to each waterfront development project. Documents were collected from the
respondents‟ offices that were made available for the purpose of the research. This was
important to supplement and compensate for the limitations of the other methods. The
documentary evidence acted as a method to cross-validate information gathered from
interviews, which was sometimes different (what people say was sometimes different from
what people do). Moreover, the documents provided guidelines to assist the researcher with
inquiries during the interview. In order to achieve the research objectives, official and
unofficial documents and records relating to the project‟s development process were reviewed
and analysed. Thus, the integration of multiple qualitative techniques from the case studies
research, enhanced the validity and reliability of the findings from this research.
33 The objectives of the General Circular No. 3 Year 1999 are; (1) to ensure all research conducted is registered
with a central registry, (2) to ensure that the results of the research are beneficial to the country, (3) to ensure that
no specimens are taken out of the country without the approval of the department concerned, and (4) to monitor
that which is sensitive in nature in order to protect the nation‟s image and safeguard the national interest.
86
A data base was created to store all data collected and procedures followed, in the case study.
Data was either stored electronically or in hard copy (transcription of interviews, proposal of
the developments projects), while procedures followed were documented (e.g. time, place and
order in which interviews were undertaken). Instead of assisting in increasing the reliability of
the research by providing a chain of evidence (Yin, 1984, p. 96), the case study data base was
a formal procedure for organising all the evidence. The main objective was to arrange,
categorise and document the data collected to assist the management of the cases and to make
the primary evidence generated in the study available to other researchers (Yin, 1984, pp. 92-
93).
4.5.1.6 Data Analysis
The recorded interviews with the respondents were transcribed along with the data collection
procedures. Interviews with the respondents in the case studies were sometimes conducted in
English, as this is Malaysia‟s second language after Bahasa Malaysia which is the official
language of Malaysia. However, most respondents preferred to have the conversation in
Bahasa Malaysia. These English interviews were directly transcribed and then referred to as
„original transcription‟.
The conversations in Bahasa Malaysia were translated and then referred to as „translated
transcription‟ in the data interpretation, presented in Chapter five and onwards. All
respondents were given pseudonyms to ensure they remained anonymous in the reporting of
the research findings. For example „G‟ prefixed the government officer, and „P‟ referred to
private and waterfront community.
The next analytical process involved a coding process to identify key themes and patterns in
the research. The bulk of the data was organised in categories such as - river‟s significance
and transformation factors for waterfront, and effectiveness of waterfront regulations (to name
two categories created in this research). The coding process helped to create patterns and links
between categories, supporting further analytical thinking towards establishing the conceptual
themes of the research. Six themes were identified namely: (i) waterfront development in
Malaysia – in the past, (ii) waterfront development in Malaysia – present, (iii) the waterfront
development process, (iv) waterfront development effects, (v) regulations for waterfront
development, and (vi) recommended guidelines for best practice for waterfront development
in Malaysia. These themes were interrelated and presented in Chapter five – Qualitative
results. A summary of the data analysis process is presented in Figure 4.10.

87
The analysis in this research was exploratory in the sense that attributes associated with
waterfront development were identified but, only tested later during the quantitative phase.
The results of the case study are discussed in Chapter five – Qualitative results. The case
study results were used in the development of the questionnaire. The questionnaire was sent
to an expert panel consisting of ten persons in order to increase the reliability and to construct
validity through investigator triangulation. Their suggestions were included in the survey
questionnaire – with amendments.
Figure 4.10: Summary of data analysis
ANALYSIS OF DATA
WATERFRONT DEVELOPMENT IN
MALAYSIA – Kuching Riverfront,
Malacca Waterfront, Glenmarie Cove
Riverfront, Malaysia.
DATA PRESENTATION
Organising data in tables (Using EXCEL)
IDENTIFYING CATEGORIES
AND
CODING OF DATA
ESTABLISHING
THEMES
WATERFRONT
DEVELOPMENT IN
MALAYSIA – THE PRESENT
WATERFRONT
DEVELOPMENT PROCESS
WATERFRONT
DEVELOPMENT EFFECTS
REGULATIONS TO
CONTROL WATERFRONT
DEVELOPMENT IN
MALAYSIA
WATERFRONT
DEVELOPMENT IN
MALAYSIA – THE PAST
RECOMMENDED
GUIDELINES FOR BEST
PRACTICE FOR
WATERFRONT
DEVELOPMENT IN
MALAYSIA

88
4.5.2 The Quantitative Phase: A Survey Approach
A survey is a research technique for gathering information from a representative sample of
individuals through communication either verbally or written (Fink & Kosecoff, 2005;
Zikmund, 2003). In this research, a quantitative survey method was adopted as a strategy for
the second phase of the data collection. In the quantitative phase, the questionnaire developed
in the qualitative phase was used in a survey of property developers in Malaysia. The purpose
of the quantitative phase was to confirm the findings reached in the qualitative phase and
provide more support for these findings. Moreover, once information and attributes related to
waterfront developments in Malaysia, such as recommendations for best practice for
waterfront guidelines for future waterfront development projects were known, (during the
qualitative phase), they were subjected to quantitative testing for confirmation.
The survey was carried out within Malaysia and the respondents were property developers
listed under Bursa Malaysia. The following section discusses the sampling method employed
in this research and is followed by the instrument design and distribution and finally, the
analysis procedures.
4.5.2.1 Sampling Method
Generally, a sample is a finite part of a statistic, to gain information about the whole property
under study. In particular, sampling is defined as the act, process or technique of selecting a
suitable sample or a representative part of a population, for the purpose of determining
parameters or characteristics of the whole population (Cooper & Schindler, 2006). As well as
saving time and effort, sampling was also important for gathering consistent, accurate and
unbiased estimates of the population‟s status in terms of whatever was being researched
(Sapsford & Jupp, 2006).
In this research, a stratified sampling procedure was used as part of probabilistic sampling
(Sapsford & Jupp, 2006; Sekaran, 2003). This sampling procedure is considered to be the
most popular procedure in survey research, allowing the researcher to group the sample based
on specific variables such as financial status and company profile. The percentage of each
subgroup in the entire population is maintained in the sample. Furthermore, a stratified
sampling technique is more representative and time saving and is an economic means to
obtain a sample from the population (Newman & McNeil, 1998).

89
The sample data comprised firms listed under the property counter that traded at Bursa
Malaysia during 2009. Considering that a waterfront development project requires strong
financial records and sufficient and efficient management teams as well as excellent
experience in the past, the selection of property development companies who were listed in
Bursa Malaysia was therefore appropriate. As stated by Bursa Malaysia, only 91 property
development companies were listed in 2009 (Bursa Malaysia, 2009). See Figure 4.11 for the
stratified sampling procedure employed in this research and Appendix E for the list of
property development companies listed at Bursa Malaysia in 2009.
Figure 4.11: Sampling procedure used in this research
The sample size can be interpreted as covering two groups namely, unlisted companies with
N=1205 and, listed companies N=91. A sufficient sample size34 was important to maintain the
accuracy of the research (Kumar, 2005; Zikmund, 2003). Hair et al. (1998) noted that a
minimum sample size required for statistical analysis (e.g. factor analysis) is 100 while some
researchers used sample sizes from 250 to 500 respondents (Schumacker & Lomax, 1996).
Even though the acceptable numbers for a sample size varies between many researchers,
typically, a larger sample size leads to increased precision in the estimates of various
34 Sample size is defined as the actual number of subjects chosen as a sample to represent the population, and
further that it could be determined by estimating the variance of the population, the magnitude of acceptable
error, and the confidence level (Sekaran, 2003; Zikmund, 2003).
PROPERTY
DEVELOPERS
IN MALAYSIA
N=1296
Unlisted
companies
N=1205
Listed
companies
N=91
N= 91
POPULATION SAMPLE SIZE
90
properties of the population (Newman & McNeil, 1998, p. 49). However, larger samples can
be unsuitable because of their increased cost (Ruane, 2005). Hence, the exact figure is not
significant as long as the information obtained is from a representative sample although a
smaller sampling ratio is needed to maintain accuracy (Ruane, 2005).
4.5.2.2 The Questionnaire Design: A Self-administered Questionnaire
A questionnaire is a written instrument used to obtain information from a study‟s subject.
According to Zikmund (2003), a well-designed and administered questionnaire could
facilitate the researcher to address the research objectives. Zikmund (2003) stated that as a
“rule of thumb” in designing a questionnaire, it should be as simple as possible, collect only
the needed information and be valid. In short, the questionnaire design must be able to be
generalised and have a degree of freedom for respondents when answering questions.
In this research, self-administered questionnaires35 and the accompanying covering letter were
mailed to the respondents who completed them individually. The aim was to motivate the
respondents to answer the attached questions and then achieve as high a respondent rate as
possible (Bourque & Fielder, 1995, p. 126). Despite several advantages (i.e. inexpensive,
convenient for time and flexible), a self-administered questionnaire presents a challenge to the
researcher because the researcher relies on the clarity of the written questions rather than on
her/his skills (Bourque & Fielder, 1995; Zikmund, 2003). Also, the response rate tends to be
much lower with mailed questionnaires as compared to other modes (Singleton & Straits,
2010). Moreover, it also introduces a non-response bias as any doubts respondents might have
cannot be clarified. Nevertheless, the selection of experienced respondents regarding
waterfront development would increase the response rate and several follow-ups should yield
the most reliable information, especially when closed-ended questions are used and the
questionnaire is well structured (Singleton & Straits, 2010). This will result in the researcher
achieving the research objectives.
This specific questionnaire survey among selected property developers was designed to
examine several attributes of waterfront development in Malaysia as well as to determine the
characteristics for best practice for waterfront development guidelines in Malaysia. It sought
35 A self-administered questionnaire is defined as “a questionnaire that is filled in by the respondent rather than
by an interviewer” (Zikmund, 2003, p. 212) and mailing the survey is the technique to administer the
questionnaire to the respondents.

91
to identify the important characteristics that would make a significant contribution towards
developing guidelines for future waterfront development in this country. The questionnaire
structure, the pre-testing procedures, the questionnaire distribution process and finally, the
data analysis are discussed in the following sections.
4.5.2.2.1 The Questionnaire Structure: Closed-ended Questions
As explained in an earlier chapter, the quantitative phase (the questionnaire survey) in this
research was conducted mainly to statistically test the information gathered during the
qualitative phase (the interview approach). The questions in this questionnaire were
developed using attributes or information gathered in the first phase of data collection (where
the face-to-face interview approach was used).
In this research, closed-ended responses were employed in designing the questionnaire
questions. Once the exploratory stage is completed, questionnaires may use predominantly
closed-ended questions, which are sometimes called the fixed-alternative questions, to focus
on the issues identified as relevant to the investigation (Singleton & Straits, 2010). This
common structure was necessary to gather a sufficiently large body of comparable data across
different respondents in order to made statistical inferences.
Furthermore, several categories of closed-ended questions36 were used in designing the
questions, as recommended by Zikmund (2003, p. 333). The choice of closed-ended responses
will expose the research to a limited number of answers – requiring only recognition and a
choice from among answer options. However, the inclusion of „other – please specify‟
categories in the questionnaire will not confine the respondents to within the answers
suggested. Moreover, the “other” option could give useful non-specified answers. Therefore,
36 Zikmund (2003) suggests five categories of closed-ended questions, as follows:
(i) Simple-dichotomy questions - refers to a fixed alternative question that requires the respondent to
choose one of two alternatives.
(ii) Determinant-choice questions - refers to a type of fixed alternative question that requires a respondent
to choose one (and only one) response from among several possible alternatives.
(iii) Frequency-determination questions - refers to a type of fixed alternative question that asks for an
answer about general frequency of occurrence.
(iv) Attitude rating scale - refers to measures used to rate attitudes such as the Likert scale and the semantic
differential.
(v) Checklist questions - refers to a type of fixed alternative question that allows the respondent to provide
multiple answers to a single question.

92
employing the closed-ended questions approach for structuring the questionnaire in this
research was necessary as it offered greater precision and uniformity, as well as easier recall
for the respondents and easier coding and analysis for the researcher (Singleton & Straits,
2010, p. 314; Zikmund, 2003, p. 333).
The questionnaire was divided into three sections. The three sections were structured to
include questions from the six themes developed in the qualitative phase, as illustrated in
Figure 4.10. Section A sought information about the companies‟ profiles, which included the
property services offered by companies, the operating location, the number of years
operational and the number of staff. Section B, mainly focused on waterfront development
practices in Malaysia. This section was designed to obtain information about current
waterfront development in Malaysia including the percentage of projects undertaken, the
reasons to initiate waterfront development as well as identifying the sustainability and
constraint factors for achieving sustainable waterfront development. Finally, section C was
designed to examine regulations for controlling waterfront development including the
respondents‟ awareness of regulations imposed directly or indirectly on waterfront
development, an evaluation of the effectiveness of the regulations and finally, the
respondents‟ opinions on several statements of recommendations for future waterfront
development guidelines. Additionally, in order to offer more opportunity to the respondents to
draw out comments and suggestions, one open-ended question was provided in the last part of
the section C. New recommendations from respondents would provide support towards
developing the guidelines for best practice for waterfront development in this country. Space
at the end of the questionnaire also invited respondents to make additional comments.
Despite using closed-ended questions, a number of decisions were made during the process of
designing the questionnaire. One of these was to include a limited number of agree-disagree
statements while using the Likert scale,37 as some researchers have indicated that these have a
tendency to be prone to bias and the effects from the wording of the questions. The
questionnaire was designed to use a combination of 4-point and 5-point Likert scales. To
assess the respondents‟ attitudes such as their level of awareness on waterfront regulation‟s
terms, a 4-point Likert scale was used; ranging from 1= never heard of it, 2= have heard of it,
3= somewhat familiar, and 4= very familiar. A 4-point Likert scale forced respondents to
indicate their agreement which demanded much more from the respondents (no middle
37 The Likert scale is a common approach used to measure the strength or intensity of the respondents‟ feelings
toward an attitudinal object (Sekaran, 2003; Zikmund, 2003).

93
choice). Moreover, Garland (1991) indicated that a scale without a mid-point would be more
suitable as long as either the reliability or the validity of responses was not affected. In
contrast, the exclusion of a mid-point can lead respondents towards the positive end of the
scale (Worcester and Burns (1975, in Dawes, 2001)).
Additionally, to assess respondent agreement for questions such as the effectiveness of
guidelines for riverfront developments concept, a 5-point Likert scale was used. A 5-point
Likert scale gave respondents neutral ground to answer neither positively nor negatively. This
5-point Likert scale was commonly used in property studies (Alias & Daud, 2006; Newell,
2003; Wong, 2004 - to name a few examples). The 5-point Likert scale used in the
questionnaire ranged from 1= strongly disagree, 2= disagree, 3= neither agree nor disagree,
4= agree and 5= strongly agree.
While each alternative presented advantages and disadvantages, adoption of the 4-point rating
scale and the 5-point rating scale was appropriate for this research. Some researchers have
preferred to use seven categories or more as they offer more freedom for answering
(Singleton & Straits, 2010, p. 322), but limiting it to a few categories such as the 4-point
scale and the 5-point scale were also useful for obtaining precise information, as it allowed
respondents to be firm in their decisions. In fact, Likert (1932) in his original paper did not
consider the number of choices to be an important issue and in practice, the researcher often
decides on the number of choices they like (Munshi, 1990).
Another decision made was to include both numerical and adjectival labelling for each
response category. The researcher decided to use both numerical information in determining
an appropriate answer and adjectival labelling of each response category, as it conveyed less
ambiguity to the respondent (Fowler & Cosenza, 2008; Singleton & Straits, 2010; Zikmund,
2003). A combination of both numerical and adjectival labelling would also facilitate the
respondents‟ ability to understand the alternatives given, as well as helping them to make the
right decisions. See Appendix F for an example of the questionnaire used in this research.
4.5.2.3 The Pilot Study
Prior to the pilot study, pre-testing of the questionnaire contents with peers was conducted
both in New Zealand and in Malaysia. Since the research would be conducted within
Malaysia, the involvement of Malaysian points of view was important and necessary.
Therefore, three experts from New Zealand and four experts from Malaysia were selected to
review the questionnaire design. There were lecturers in property studies, property

94
developers, and government officers, and they were selected based on their expertise in this
research area and also on their willingness to review the questionnaire. A questionnaire was
handed to each of the reviewers in New Zealand and was mailed and e-mailed to the
reviewers in Malaysia. They were asked to comment on any words, sentences, terminology or
scales they found difficult to understand or were confusing, or were inappropriate to ask or
uncomfortable to answer. In addition to being a starting point for the subsequent stages, this
stage allowed for the refinement of the survey questionnaire and for improving its content. At
the end, the comments were analysed and the design of the questionnaire was revised greatly.
Prior to distributing the questionnaire, a pilot study was conducted in Malaysia. Ten property
development companies who were listed under Bursa Malaysia were asked to complete the
questionnaire. The respondents for the pre-tests were drawn from the same population of the
actual survey in terms of background, familiarity with the content, and attitudes and
behaviours, as suggested by Malhotra (2002). A reviewed questionnaire was then distributed
to these respondents to pilot test. The purpose of pilot testing a survey is to increase the
reliability, validity and usability of the survey (Newman & McNeil, 1998, p. 42). Instead of
just mailing it to the respondents, the questionnaire was also e-mailed to them concurrently, in
order to obtain a 100% response rate.
Moreover, the pilot study also offered several other advantages. Firstly, the pilot study could
examine the effectiveness of the mail survey strategy adopted for this research by identifying
the number of questionnaires returned. Secondly, the pilot study allowed for a tentative
securing of future participation in the actual data collection. Thirdly, the pilot study allowed
for refinements in the original survey questionnaire which then proceeded to the actual
survey. Finally, after three weeks and two reminders that were sent to the respondents, a total
of ten questionnaires were returned, so a 100% response rate was achieved for the pilot test.
4.5.2.4 The Questionnaire Distribution Process
A self-administered questionnaire was used in this research and a mail survey was the
technique used to administer the questionnaires. Respondents in this research were property
development companies listed under Bursa Malaysia. Ninety-one questionnaires were mailed
to the identified respondents‟ addresses in April 2010 and were also mailed electronically (e-
mail) concurrently. Newman and McNeil (1998, p. 25) determined that a mail survey was
considered one of the most frequently and widely used survey procedures in social sciences
research, while e-mail was a relatively new mechanism of distribution of a questionnaire.

95
Incorporation of the e-mail technique allows for speed of distribution, a fast turnover time,
low processing costs and more flexibility (Zikmund, 2003).
Once a personal letter address was identified, respondents were contacted by sending them an
invitation letter38 to participate in this research. The invitation letter was typed on the Lincoln
University letterhead and explained the purpose of the research, as well as inviting them to
participate by filling in the attached questionnaire. See Appendix G for the invitation letter to
participate in the survey). A personalised letter addressed to a specific respondent showed
how important they were to this research. Moreover, the invitation letter printed on the
Lincoln University letterhead also indicated importance and therefore encouragement to the
respondents to complete and return the questionnaire (Zikmund, 2003).
Approximately two weeks after mailing the questionnaire, the respondents were contacted to
enquire whether they had received the questionnaire and whether they had completed and
returned it. It was found that some respondents had returned it and most had received but not
yet completed it. Several reasons that hindered them from completing it earlier were identified
as: (i) work commitments, (ii) outstation visits and (iii) time consuming. After two weeks,
about 11 out of 91 questionnaires had been returned and amounted to a 12% response rate.
This response rate was relatively low even though stamped return envelopes were enclosed
together with the questionnaire.
The low response rate for the first two weeks required a follow-up reminder letter to be sent
through e-mail. The reminder letter clearly restated the purpose of the survey and requested
that the questionnaires be returned before the deadline. Interestingly, this follow-up email
resulted in about a 39% response rate (35 out of 91 questionnaires were returned).
In light of the low response rate, the respondents were then contacted by phone to ask their
willingness to fill in the questionnaire. An unanswered call, a busy signal and the non-
availability of the respondent each required a call back later. Concurrently, a second reminder
letter and questionnaire were emailed to the respondents who had not yet returned the
questionnaire. After three months and sequential follow-ups through e-mail and telephone, it
resulted in a total of 61 participating companies. Therefore, the total number of usable
responses was 61, representing an overall response rate of 67%.
38 The invitation letter that accompanied the questionnaire, consisted of the purpose of the research, the
approximate time to complete the questionnaire, assurance about the confidentiality of respondents, and
alternatives to contacting the researcher or other research teams (Zikmund, 2003).

96
Even though response rates from mailed questionnaires are typically low, achieving a high
response rate is important to maintaining the accuracy of the data (Sekaran, 2003, p. 237;
Zikmund, 2003, p. 217). As suggested by Sekaran (2003), a 30% response rate is acceptable
for a mailed questionnaire, thus, the 67% response rate obtained was sufficient for the
analytical purposes of the research.
4.5.2.5 Data Analysis Techniques
The data collected from the survey was analysed using Statistical Package for Social Science
(SPSS). Four techniques were used in this part of the data analysis process: Descriptive
statistics, T-test analysis, Exploratory factor analysis (EFA) and Correlation.
The first stage involved descriptive statistics on the data set in the form of frequency,
percentage, mean scores and crosstabs, to examine waterfront developments in Malaysia,
which in turn satisfied research objectives one and three. The second stage of data analysis
was performing T-test analysis, to test significant difference on waterfront development
practices in Malaysia between the two groups of respondents; the respondents undertaking
waterfront development projects and the respondents did not undertaking waterfront
development projects in Malaysia. The next stage of data analysis was performing exploratory
factor analysis (EFA) on the data set to identify underlying factors that made up the sub
dimensions, and subsequently the correlation technique was conducted to examine the
relationship between the factors (stage three), which in turn, satisfied research objective four.
4.5.2.5.1 Descriptive Statistics
In this research, descriptive statistics were used for screening of the data set prior to doing
factor analysis and correlation, and to address research objective one and three (Pallant,
2007). Descriptive statistics in this research included frequency and percentage for categorical
variables and mean scores for continuous variables.
4.5.2.5.2 Exploratory Factor Analysis (EFA)
Exploratory Factory Analysis (EFA) was used to explore the number of factors available, to
examine the correlation of each factor, and to observe whether variables appear to best
measure each factor (Schumacker & Lomax, 2004). EFA is often used in the early stages of
the research to gather information or to explore the interrelationships among a set of variables
(Pallant, 2007).

97
Factor Analysis (FA) and Principal Component Analysis (PCA) are two basic modes of EFA
used in order to obtain factor solutions (Pallant, 2007). The objective of FA is to explain the
interrelationships among the original variables. On the other hand, the objective of PCA is to
select the components which explain as much of the variance in a sample as possible
(Hutcheson & Sofroniou, 1999). Clearly, both approaches (FA and PCA) usually generate
similar results, however, PCA is preferable (Pallant, 2007), and has been extensively used by
many researchers because PCA is identified as being less problematic and complicated than
applying FA (Jackson & Velicer, 1990).
Moreover, the VARIMAX factor rotation39 method was used in the computation for EFA. The
objective of the factor rotation was to make the factor structure more interpretable when the
dimensions were rotated. Therefore, specifically PCA and the VARIMAX rotation were used
in this study to extract the factors for all 18 items submitted for factor analysis technique. The
VARIMAX factor rotation was used because this rotation focused on simplifying the columns
in a factor matrix (Hair, Black, Babin, Anderson, & Tatham, 2006). The following sections
discuss the test for determining the appropriateness of factor analysis and factor extraction.
Tests for Determining the Appropriateness of Factor Analysis
Factor loadings were used as the criterion for item reduction in the EFA performed for this
study. Hair et al. (2006) suggested that factor loadings in the range 0.30 to 0.40 met the
minimal level for interpretation of structure; factor loadings of 0.50 or greater are considered
practically significant and factor loadings exceeding 0.70 are considered indicative of a well-
defined structure. Therefore, factor loading values of 0.50 and greater were used in this study
as suggested by Hair et al. (2006).
Next, in order to determine whether the correlations in the data matrix were sufficient for
factor analysis, several approaches needed to be conducted (Hair, et al., 2006). The
approaches included: (1) examining of the correlation matrix, (2) assessing the Kaiser-Meyer-
Olkin (KMO) measure of sampling adequacy, and (3) conducting Barlett‟s Test of Sphericity.
The following is a discussion of each of the three approaches:
(1) Examination of the correlation matrix is a simple method to determine the
appropriateness of factor analysis (Hair, et al., 2006). Hair et al. (2006) also suggested
39 Two factor rotation methods commonly used in the computation for EFA are Oblique and Orthogonal
rotations. VARIMAX, QUARTIMAX, and EQUIMAX are the three major orthogonal rotations; however,
VARIMAX is the most popular factor rotation method.

98
that factor analysis is appropriate if visual inspection reveals that substantial numbers of
correlations are greater than 0.30. This indicates that the items share common factors
and are therefore, suitable for factor analysis.
(2) KMO provided a measure to determine whether the variables belong together. KMO
interpretations are that, less than 0.50 is unacceptable; ±0.50 is considered miserable;
±0.60 is considered mediocre; ±0.70 is considered middling; and ±0.80 is considered
meritorious (Hair, et al., 2006). By convention, to indicate appropriateness, KMO
values should be above 0.50 for either the entire matrix or for an individual variable.
(3) Barlett‟s Test of Sphericity is a statistical test for the presence of correlations among
variables and therefore, provides the statistical significance that the correlation matrix
has significant correlations among at least some of the variables (Hair, et al., 2006).
Factor Extraction
Three commonly used criteria for determining the number of factors and the criteria for
ceasing extraction are: (1) Eigenvalues or latent root criterion, (2) Percentage of variance
criterion, and (3) Scree test criterion (Pallant, 2007). Eigenvalues are the most commonly
used technique for selecting the number of factors (Hair, et al., 2006). Pallant (2007)
suggested that any factors with Eigenvalues greater than 1.0 should be considered significant.
Otherwise, the factors should be ignored.
Moreover, the percentage of variance criterion was also checked. The purpose of percentage
of variance criterion is to ensure practical significance for the derived factors, by ensuring that
they explain at least a specified amount of total variance (Hair, et al., 2006). Hair et al. (2006)
suggest that in the social sciences, it is common to consider that a solution that accounts for
60% of the total variance is satisfactory.
Furthermore, the Scree test criterion was also checked. According to Hair et al. (2006), “the
Scree test criterion is derived by plotting the latent roots against the number of factors in their
order of extraction, and the shape of the resulting curve was used to assess the cut-off point”.
The procedure was explained by Stewart (1981, p. 58) as follows: “A straight edge is laid
across the bottom portion of the roots to see where they form an approximate straight line.
The point where the factors curve above the straight line gives the number of factors, the last
factor being the one whose eigenvalues immediately precedes the straight line.”

99
Once the final factors were established, the Cronbach‟s alphas were conducted for the
remaining items to be examined. The purpose of conducting the Cronbach‟s alphas is to
ensure the scale reliability. Finally, the last step was to label or name the final factor (Hair, et
al., 2006). Hair et al. (2006, p. 149) recommend that “variables with higher loadings are
considered more important and have greater influence on the name or label selected to
represent a factor‟s conceptual meaning”.
4.5.2.5.3 T-test Analysis
An independent t-test analysis was carried in this research to study significant differences in
waterfront development practices with respect to group of respondents; the respondents
undertaking waterfront development projects and the respondents did not undertaking
waterfront development projects in Malaysia. The t-test analysis was conducted mainly to test
for a statistically significant difference between two independent sample means in this
research (Allen & Bennett, 2010).
4.5.2.5.4 Correlation
A correlation was carried out for the six factors extracted by factor analysis. The correlation
was conducted mainly to examine the correlation between factors and to examine the
relationships among the variables, extracted in each factor (Pallant, 2007).
4.6 Some Considerations before Beginning the Analysis of the Data
The next section discusses three critical aspects that need to be taken into consideration before
analysing the data. The first relates to the level of reliability of the data, the second is the
normality of the distribution of the data and the final aspect considers the missing values and
outliers in the data set.
4.6.1 Internal Reliability of the Data
Reliability is concerned with the ability of a measure to generate consistent results. Zikmund
(2003, p. 300) defines reliability as “a degree to which measures are free from error and
therefore yield consistent results”. Cronbach‟s coefficient alpha is the most commonly used
measure for examining the scale reliability (Pallant, 2007). A reliability test was conducted
for this study. Cronbach‟s Alpha Coefficient was run to test the internal consistency in areas
of the questionnaire using interval scales including the Likert scale. Specifically, it was used
to measure how well a set of items (or variables) hung together as a set (Pallant, 2007;
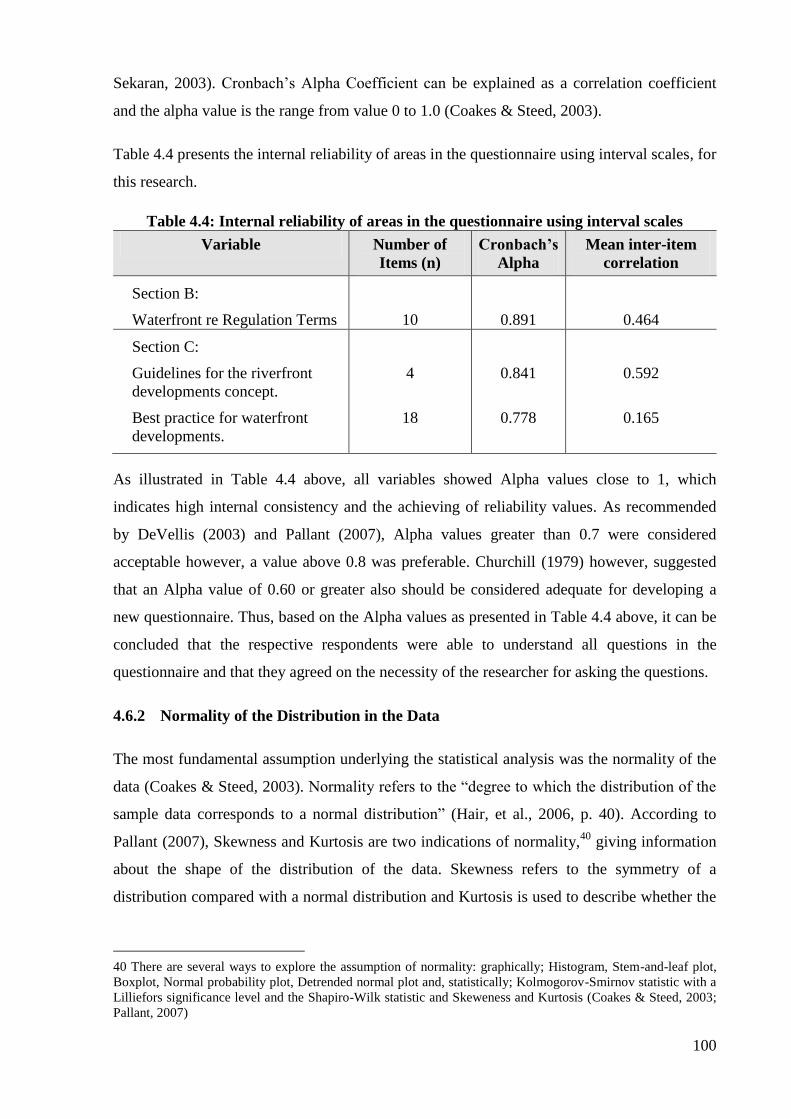
100
Sekaran, 2003). Cronbach‟s Alpha Coefficient can be explained as a correlation coefficient
and the alpha value is the range from value 0 to 1.0 (Coakes & Steed, 2003).
Table 4.4 presents the internal reliability of areas in the questionnaire using interval scales, for
this research.
Table 4.4: Internal reliability of areas in the questionnaire using interval scales
Variable Number of
Items (n)
Cronbach’s
Alpha
Mean inter-item
correlation
Section B:
Waterfront re Regulation Terms
10
0.891
0.464
Section C:
Guidelines for the riverfront
developments concept.
Best practice for waterfront
developments.
4
18
0.841
0.778
0.592
0.165
As illustrated in Table 4.4 above, all variables showed Alpha values close to 1, which
indicates high internal consistency and the achieving of reliability values. As recommended
by DeVellis (2003) and Pallant (2007), Alpha values greater than 0.7 were considered
acceptable however, a value above 0.8 was preferable. Churchill (1979) however, suggested
that an Alpha value of 0.60 or greater also should be considered adequate for developing a
new questionnaire. Thus, based on the Alpha values as presented in Table 4.4 above, it can be
concluded that the respective respondents were able to understand all questions in the
questionnaire and that they agreed on the necessity of the researcher for asking the questions.
4.6.2 Normality of the Distribution in the Data
The most fundamental assumption underlying the statistical analysis was the normality of the
data (Coakes & Steed, 2003). Normality refers to the “degree to which the distribution of the
sample data corresponds to a normal distribution” (Hair, et al., 2006, p. 40). According to
Pallant (2007), Skewness and Kurtosis are two indications of normality,40
giving information
about the shape of the distribution of the data. Skewness refers to the symmetry of a
distribution compared with a normal distribution and Kurtosis is used to describe whether the
40 There are several ways to explore the assumption of normality: graphically; Histogram, Stem-and-leaf plot,
Boxplot, Normal probability plot, Detrended normal plot and, statistically; Kolmogorov-Smirnov statistic with a
Lilliefors significance level and the Shapiro-Wilk statistic and Skeweness and Kurtosis (Coakes & Steed, 2003;
Pallant, 2007)
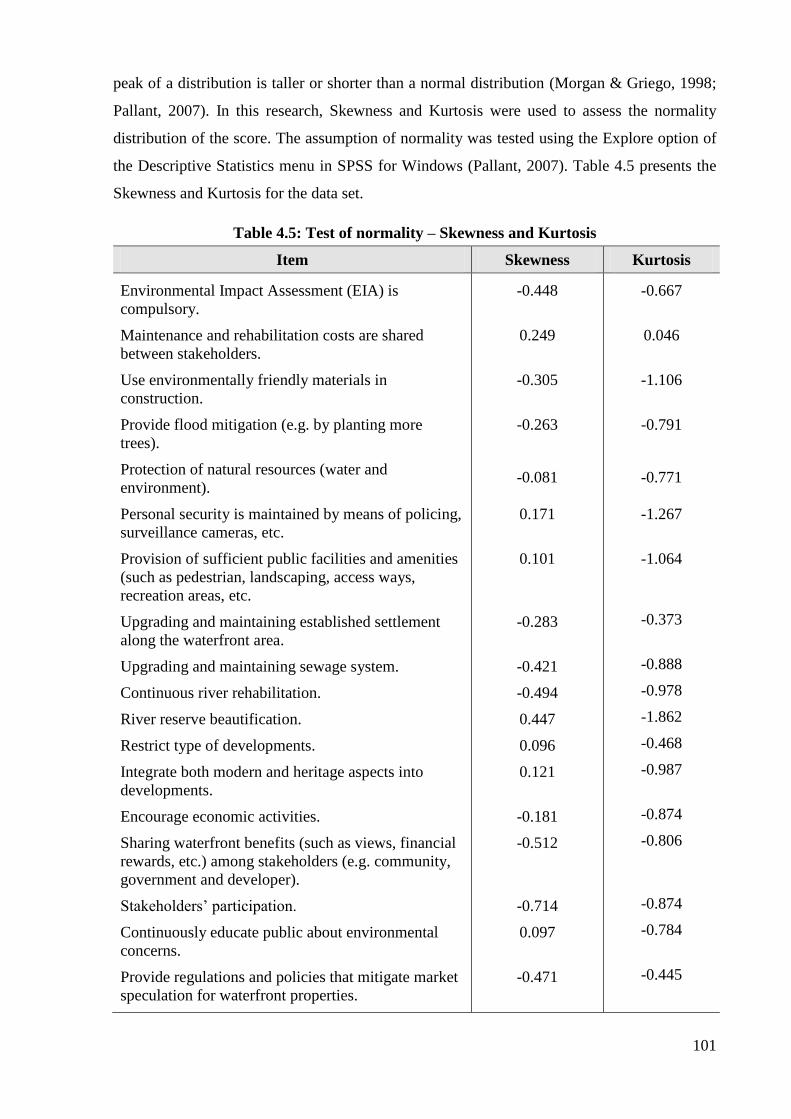
101
peak of a distribution is taller or shorter than a normal distribution (Morgan & Griego, 1998;
Pallant, 2007). In this research, Skewness and Kurtosis were used to assess the normality
distribution of the score. The assumption of normality was tested using the Explore option of
the Descriptive Statistics menu in SPSS for Windows (Pallant, 2007). Table 4.5 presents the
Skewness and Kurtosis for the data set.
Table 4.5: Test of normality – Skewness and Kurtosis
Item Skewness Kurtosis
Environmental Impact Assessment (EIA) is
compulsory.
Maintenance and rehabilitation costs are shared
between stakeholders.
Use environmentally friendly materials in
construction.
Provide flood mitigation (e.g. by planting more
trees).
Protection of natural resources (water and
environment).
Personal security is maintained by means of policing,
surveillance cameras, etc.
Provision of sufficient public facilities and amenities
(such as pedestrian, landscaping, access ways,
recreation areas, etc.
Upgrading and maintaining established settlement
along the waterfront area.
Upgrading and maintaining sewage system.
Continuous river rehabilitation.
River reserve beautification.
Restrict type of developments.
Integrate both modern and heritage aspects into
developments.
Encourage economic activities.
Sharing waterfront benefits (such as views, financial
rewards, etc.) among stakeholders (e.g. community,
government and developer).
Stakeholders‟ participation.
Continuously educate public about environmental
concerns.
Provide regulations and policies that mitigate market
speculation for waterfront properties.
-0.448
0.249
-0.305
-0.263
-0.081
0.171
0.101
-0.283
-0.421
-0.494
0.447
0.096
0.121
-0.181
-0.512
-0.714
0.097
-0.471
-0.667
0.046
-1.106
-0.791
-0.771
-1.267
-1.064
-0.373
-0.888
-0.978
-1.862
-0.468
-0.987
-0.874
-0.806
-0.874
-0.784
-0.445

102
As determined by many scholars, a distribution was perfectly normal if it had Skewness and
Kurtosis values of zero (0) (George & Mallery 2009, pp. 98-99; Morgan, Leech, Gloeckner, &
Barrett, 2007, p. 50; Pallant, 2007, p. 56). However, for the purposes of statistical analysis,
Skewness and kurtosis values of more than ±1.0 were excellent, and a value ± 2.0 in many
cases was also acceptable (George & Mallery 2009, pp. 98-99). Even though most of the
items indicated a negative kurtosis value, it did not seem to affect the results of most of the
statistical analyses. Therefore, based on the results (as presented in table 4.5), the data was
considered to be normally distributed and appropriate for statistical analysis. The actual shape
of the distribution for each item can be seen in the Histogram as presented in Appendix H.
4.6.3 Missing Values and Outliers
The non-response rate for the items in this research was zero, which meant that all the items
provided complete information in all cases. Moreover, the data set was also screened for
outliers. An outlier may have a disproportionate impact on the statistical analysis. Therefore,
it was necessary to identify data that may be unduly influential on the results of the analysis.
However, there were no outliers detected in the data set, meaning that all scores were within
the possible range for the items or there were no extreme points in the data set (Pallant, 2007,
p. 63). Thus, the data set in this research was satisfactory for statistical analysis.
Chapter four has presented the sequence of steps involved in the developments of the methods
used for this research; the design of the survey and questionnaire including its content, as well
as the process of conducting interviews and distributing the questionnaires were outlined. A
number of issues regarding the limited number of responses obtained in the initial phase of
the data collection, as well as the representativeness of the sample were discussed. Finally, the
data set was screened for the appropriateness of the analytical procedures.
103
Chapter 5
Qualitative Results – Survey Interviews
5.1 Introduction
This section presents the interview results. Talking to interviewees face-to-face enabled
“deep” and “rich” data to be obtained about the emergence of waterfront developments in
Malaysia until the present day. The analysis in this section was exploratory in the sense that
information associated with waterfront development was identified, but only tested later
during the quantitative phase. Six themes developed from the interviews and inspired the
development of the questionnaire.
5.2 Response Rate
A total of 25 face-to-face interviews were conducted within the three months from May to
July 2009. The interviewees were selected from the case study areas namely: Kuching
Riverfront in Sarawak, Malacca Waterfront in Malacca and Glenmarie Cove Riverfront in
Selangor.41 Input was obtained from three different sources: (i) Federal, State and Local
Government; (ii) Private sectors; and (iii) Waterfront community. All interviewees
represented in the sample are parties that have been actively involved in property
development projects and, directly involved in the waterfront development projects in the
selected case study areas. Moreover, case study areas in this research have involved
waterfront development projects proposed by the State of government, therefore, a minimum
number of private sector (28%) involved in this research is considerable. Table 5.1
summarises the information from the interviewees who participated in the interviews.
Interviews were sufficiently well answered to allow a response rate of 100% to be obtained.
The one-to-one in-depth interviews were mainly to gather a clear view about waterfront
development history in Malaysia and about the selected areas. The objective for the
interviewees‟ feedback was two-pronged. Firstly, to obtain reactions from the respondents
about waterfront development in Malaysia including their experience and their thoughts on
future implementations of waterfront development, and guidelines related to waterfront
development as well as any obstacles along the development process. Secondly, it provided a
41 Interviewees were parties directly and/or indirectly involved in the selected case study areas – refer Section
4.5.1.2 for details of sampling procedures used for survey interviews.

104
platform for interviewees to offer insights and alternative perspectives or views on how they
visualised future waterfront development in Malaysia especially in relation to guidelines and
practices.
Table 5.1: Composition of the interviews
Organisation Institution Number of
Interviewees
n (%)
Working
Experience
Federal
Government
Department of Irrigation and Drainage
(Headquarters).
Department of Water, Ministry of
Natural Resources and Environment.
Department of Environment, Ministry
of Natural Resources and Environment.
3 (12)
10-28 years
State
Government
Department of Drainage and Irrigation.
Property management - state.
Economic Planning Unit (State).
Department of Planning.
River Board, Sarawak.
5 (20)
10-15 years
Local Authority Local Authority for each case study
area.
10 (40) 7-20 years
Private Sector Property Developer.
Mechanical Engineer.
2 (8) 5-10 years
Waterfront
community
Individual. 5 (20) Not related
TOTAL = 25 (100)
Interviewees were contacted in advance by telephone before an appointment letter was sent by
mail and electronically. For the most part, in the beginning the majority of officers refused to
be interviewed citing reasons such as lack of time and resources. However, all agreed to
cooperate after they received an appointment letter. The longest interview lasted one and a
half hours while most took between 45 minutes to one hour. All interviewees agreed for the
conversation to be recorded and later transcribed for analysis. Although the officers were
interviewed, project reports were also used as the source of evidence for this study. In cases
where the interpretation of officers, as stated in the interviews, differed from the project
reports, the reports were given more weight because these were official documents.
The interviewees‟ points of view discussed here were not intended to be exhaustive and
representative of all stakeholders. The intention was to present divergent viewpoints within

105
the context of responsible parties, to frame regulations, guidelines and strategies for
waterfront development in Malaysia.
5.3 Waterfront Development in Malaysia
This section presents six themes generated from the exploratory analysis in this study
(qualitative phase). The results generated from the cases were beneficial for the next phase of
data collection.
5.3.1 Waterfront Development in Malaysia – the Past
All 25 respondents were asked their opinions on the importance of rivers and riverfront areas
for Malaysia and the country as well. They were asked an interview question as follows:
Q: What do you think of the importance of the boundary between the river and the country?
From interviews, it appears that rivers significantly impact the lives of people, for
communication, trade, sources of food and agriculture. History shows that many towns and
cities in Malaysia were established near water areas (such as Kuala Lumpur, Malacca and
Perak). Table 5.2 summarises the interviewees‟ views on the significance of rivers for the
Malaysian environment and the country.
Table 5.2: Significance of rivers
River’s significance
Respondent
(n = 25)
Ranking
G1
n=25(%)
G1
n=18(%)
G3
n=7(%)
G1 G2 G3
Drainage and Irrigation for farming
and agriculture.
Water sources for household
consumption.
Transportation and communication.
Source of food and protein.
Recreational / Fishing / water sport.
Habitat for water species.
Human settlement along the river edge.
Trading activities / Port activities.
Tourism business.
Hydroelectric.
Country‟s defense.
Religious events.
13 (52)
12 (48)
11 (44)
11 (44)
9 (36)
6 (24)
5 (20)
4 (16)
4 (16)
3 (12)
3 (12)
2 (8)
10 (55.5)
10 (55.5)
9 (50)
8 (44.4)
5 (27.8)
5 (27.8)
4 (22.2)
3 (16.7)
2 (11.1)
2 (11.1)
2 (11.1)
1 (5.5)
3 (42.8)
2 (28.6)
2 (28.6)
3 (42.8)
4 (57.1)
1 (14.3)
1 (14.3)
1 (14.3)
2 (28.6)
1 (14.3)
1 (14.3)
1 (14.3)
1
2
3
4
5
6
7
8
9
10
11
12
1
2
3
4
5
6
7
8
9
10
11
12
1
4
5
3
2
7
8
9
6
10
11
12
* Note: G1 = All interviewees; G2= Government officers; G3 = Non-government officers

106
As presented in Table 5.2 above, overall, more than half (52%) of interviewees from
Government and Non-government officers agreed that river is significantly important for
drainage and irrigation for farming and agriculture. This is followed by using water sources
for household consumption which accounting for 48%, transportation and communication
(44%), and source of food and protein (44%). The least number of interviewees agreed that
river is significantly functioning for religious events, accounted for 8%.
On the other hand, when considering the respondent groups separately, responses varied
slightly but were very similar in their ranking. For example, about 55.5% of the government
officers and 42.8% of non-government officers agreed that the river is most important for
drainage and irrigation for farming and agriculture. The least significant factor for both
groups was for religious events with (5.5% of government officers and 14.3% of non-
government officers).
Respondents were then asked how rivers would function in the future. All of the respondents
thought that rivers provide many functions for the Malaysian people that will remain, but that
the significance of rivers has changed over time for many reasons, such as taking
transportation away from rivers to the land. One of the respondents stated his thoughts as
follows:
I believe the river is important for the country. It serves many uses,
water resource, food, transportation, country defence and settlement.
Today, the important function has changed, and I am sure it remains
important. River still serves as the medium of communication for the
residents on left and right riverbanks. (Original transcription)
(Interviewee G4)
Respondents were then asked their opinions about how waterfront settlements developed
along the water edges.
Q: Early human settlement and cities in Malaysia developed along the river area. Could
you please comment about this history?
As discussed above, rivers provided multiple functions for Malaysia. Although important for
catering for trade, transportation and irrigation, waterfront areas were also important for
human settlement. From interviews it appears that early human settlements in Malaysia were
developed for traders and local people42 and subsequently, enlarged to become trading
42 In colonial times, Malaysia catered for trade with Gujerat, Arabia, China and Europe.
107
settlements along the water edges. All 25 interviewees agreed that strong relationships
between water and people meant that waterfront settlements were established in early times.
Moreover, in order to identify what the waterfront settlements looked like in the past,
interviewees were asked their opinions on that particular matter.
Q: What did the areas looks like in the past time, specifically the developments you are
associated with?
From interviews, about 32% of respondents thought that the waterfront settlements were
developed near to agricultural land, and then the land utilised for farming to support their life.
In terms of planning development, one of the respondents said:
In this state, “kampong”43
was established along the river banks (both sides).
They relied on rivers for food. Regarding on planning, maybe houses were
developed without permission and guidelines. (Translated transcription)
(Interviewee G6)
Therefore, from interviews, information about how waterfront developments took place in
Malaysia in the past was obtained. Subsequently, the next discussion will focus on why some
waterfront areas remained and why some of them were destroyed.
5.3.2 Waterfront Development in Malaysia – the Present
Q: Waterfront development in Malaysia has changed over the decades and the current
pattern of development is more focussed on public uses (recreational) and mix use
development. Are you aware of this transformation?
After waterfront areas lay abandoned for many years, the government has started to set aside
large waterfront areas for future development. Extensive work on waterfront areas and river
beautification has shown the government‟s efforts towards maintaining waterfront areas as a
valuable asset for the country is effective.
From the interviews it appears that all 25 interviewees were aware of the transformation of
waterfront areas – from the abandoned spaces to developed areas and public uses.
Observation of the case study areas show that waterfront functions had changed to recreation
and mixed-use development.
43 According to Maliki (2008), Kampong is a Malay word meaning Village.

108
They were then asked about factors that led to the transformation of waterfront areas in
Malaysia. From interviews, several factors were identified, as presented in table 5.3.
Table 5.3: Transformation factors for waterfront areas
Factor
Respondent
(n = 25)
Respondent
(n = 25)
G1
n=25(%)
G2
n=18(%)
G3
n=7(%)
G1 G2 G3
Development and redevelopment.
Urbanisation.
Improved quality of life.
Industrialisation.
Increase in population.
Increased environmental concerns.
Tourism activities.
Upgrading transportation system.
Resettlement programmes.
16 (64)
11 (44)
7 (28)
6 (24)
6 (24)
5 (20)
5 (20)
5 (20)
4 (16)
13 (72.2)
9 (50)
4 (22.2)
4 (22.2)
4 (22.2)
2 (11.1)
3 (16.7)
4 (22.2)
4 (22.2)
3 (42.8)
2 (28.6)
3 (42.8)
2 (28.6)
2 (28.6)
3 (42.8)
2 (28.6)
1 (14.3)
0 (0)
1
2
3
4
5
6
7
8
9
1
2
3
4
5
9
8
6
7
1
4
2
5
6
3
7
8
9
* Note: G1 = All interviewees; G2= Government officers; G3 = Non-government officers
Table 5.3 presents the responses from interviewees on influential factors in the transformation
of waterfronts in Malaysia. Overall, all 25 interviewees from both government and non-
government officer groups agreed that development and redevelopment was the main
contributor to the decline and transformation of waterfronts in Malaysia, accounting for 64%.
Moreover, urbanisation also showed as a trigger for the decline of waterfront areas accounting
for 44% in total. It was followed by other factors, such as improved quality of life,
industrialisation, environmental awareness, tourism and upgrading the transportation system.
A few (16%) interviewees indicated that resettlement programmes was also a cause of the
transformation of waterfront areas in Malaysia.
On the other hand, when considering respondent groups separately, 72.2% of Government
officers considered that development and redevelopment as a trigger for the decline of
waterfront areas, accounted for 72.2%. This is followed by urbanisation (50%), improved
quality of life (22.2%), and industrialisation (22.2%). A mere 11.1% of government officers
indicated that increased environmental concerns among Malaysian was the reason for the
decline of waterfront areas in Malaysia.
In contrast to these results, the majority of non-government officers indicated that
transformation of waterfront areas in Malaysia was attributed to three main factors:
development and redevelopment, improved quality of life and increased environmental
concerns, accounting for 42.8% each respectively. None of the non-government officers
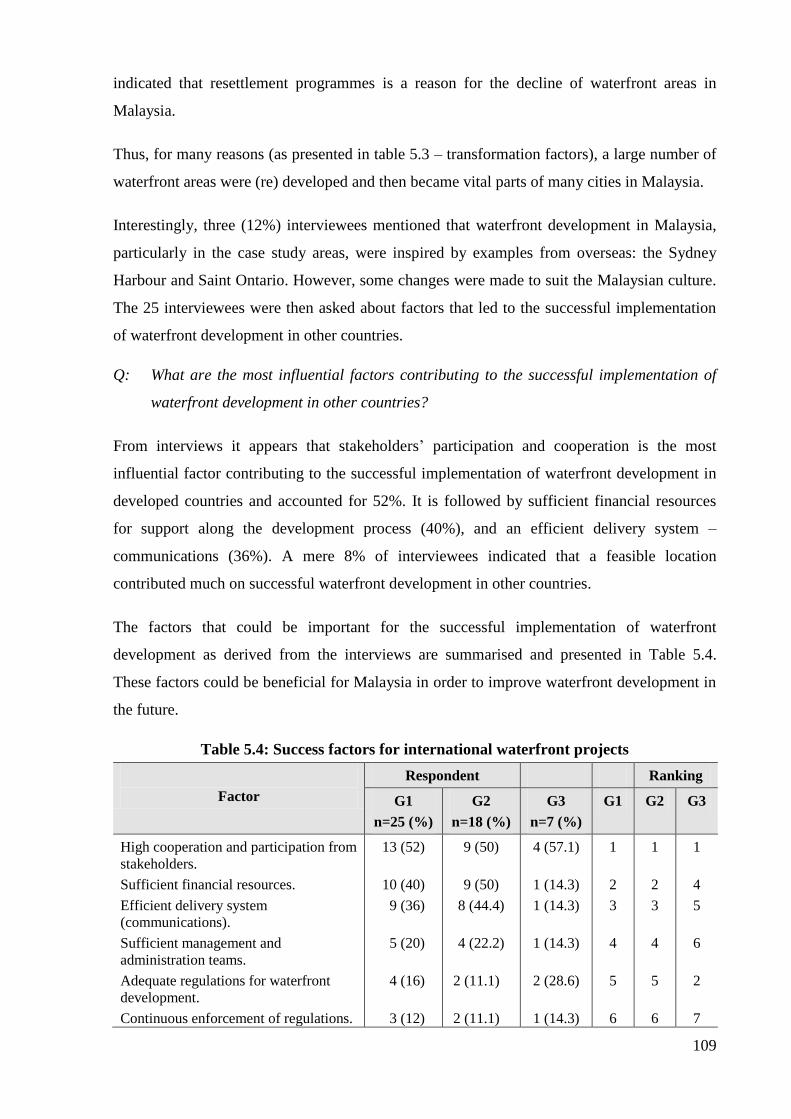
109
indicated that resettlement programmes is a reason for the decline of waterfront areas in
Malaysia.
Thus, for many reasons (as presented in table 5.3 – transformation factors), a large number of
waterfront areas were (re) developed and then became vital parts of many cities in Malaysia.
Interestingly, three (12%) interviewees mentioned that waterfront development in Malaysia,
particularly in the case study areas, were inspired by examples from overseas: the Sydney
Harbour and Saint Ontario. However, some changes were made to suit the Malaysian culture.
The 25 interviewees were then asked about factors that led to the successful implementation
of waterfront development in other countries.
Q: What are the most influential factors contributing to the successful implementation of
waterfront development in other countries?
From interviews it appears that stakeholders‟ participation and cooperation is the most
influential factor contributing to the successful implementation of waterfront development in
developed countries and accounted for 52%. It is followed by sufficient financial resources
for support along the development process (40%), and an efficient delivery system –
communications (36%). A mere 8% of interviewees indicated that a feasible location
contributed much on successful waterfront development in other countries.
The factors that could be important for the successful implementation of waterfront
development as derived from the interviews are summarised and presented in Table 5.4.
These factors could be beneficial for Malaysia in order to improve waterfront development in
the future.
Table 5.4: Success factors for international waterfront projects
Factor
Respondent Ranking
G1
n=25 (%)
G2
n=18 (%)
G3
n=7 (%)
G1 G2 G3
High cooperation and participation from
stakeholders.
Sufficient financial resources.
Efficient delivery system
(communications).
Sufficient management and
administration teams.
Adequate regulations for waterfront
development.
Continuous enforcement of regulations.
13 (52)
10 (40)
9 (36)
5 (20)
4 (16)
3 (12)
9 (50)
9 (50)
8 (44.4)
4 (22.2)
2 (11.1)
2 (11.1)
4 (57.1)
1 (14.3)
1 (14.3)
1 (14.3)
2 (28.6)
1 (14.3)
1
2
3
4
5
6
1
2
3
4
5
6
1
4
5
6
2
7

110
Feasible location – must be at the right
place.
2 (8) 0 (0) 2 (28.6) 7 7 3
* Note: G1 = All interviewees; G2= Government officers; G3 = Non-government officers
When considering the respondent groups separately, government officers agreed that high
cooperation and participation from stakeholders involved in waterfront development projects,
and sufficient financial resources are the most influential factor contributing to the successful
implementation of waterfront development in developed countries, accounting for 50% each
respectively
Similar to the government officer groups, non-government officers also indicated that the
main successful factor for implementation of waterfront development projects in developed
countries was high cooperation and participation from stakeholders involved in waterfront
development projects, accounting for 57.1% of respondents. This is followed by adequate
regulations for controlling waterfront development (28.6%), and feasible location (28.6%).
From the results, the Non-government officers indicated that continuous enforcement of
regulations for waterfront development was the least factor contributed for successful
waterfront development in developed countries.
5.3.2.1 Waterfront Development – Demand and Supply
In general, increased awareness about preserving and conserving natural resources was
determined as the main reason for the government initiating waterfront redevelopment
projects in Malaysia. In order to have an idea about waterfront development in the future, the
demand and supply factors for waterfront development were identified in this study. Nine of
the 25 respondents (about 36%) who are property developers and government officers
(Federal and State Government) were asked their opinions on the supply side of waterfront
development in Malaysia as follows:
Q: What are important reasons in a decision to initiate a waterfront development project?
From the interviews it appears that maintaining heritage and cultural values along the
waterfront areas is a main reason in the decision to undertake waterfront development projects
in Malaysia (about 44%). The second most important reason is to provide tourist attractions,
the third to protect natural resources and the forth to provide amenities or facilities for the
public. These three share the same percentage at about 33% each. A few respondents
indicated that catering for demand from buyers (11%) and making higher profits (11%) were
reasons for undertaking waterfront development projects in Malaysia.

111
On the other hand, the rest (16 out of 25 respondents) were asked their opinions on the
demand side of waterfront developments in Malaysia.
Q: What reasons most influence people interested in waterfront property?
All 16 respondents answered the question sufficiently. From the interviews, about 56.3% of
the respondents thought that they were interested in waterfront properties mostly to have a
more private environment for their residential area. The second most influential factor for
people to have waterfront property is for investment and/or wealth creation purposes and this
accounted for 43.8%. Only 12.5% of respondents chose waterfront property for health and
psychological benefit, reasons. Table 5.5 summarises the factors identified from the
interviews from both sections.
Table 5.5: Reasons for having Waterfront development
Factors of demand Frequency
n=16 (%)
Ranking
More private environment.
As an investment/wealth creation.
To obtain a scenic view.
A better lifestyle.
More convenient living environment.
The availability of leisure and recreational activities.
To create a business activity.
Health and psychological benefits.
9 (56.3)
7 (43.8)
6 (37.5)
5 (31.3)
5 (31.3)
4 (25)
3 (18.8)
2 (12.5)
1
2
3
4
5
6
7
8
Table 5.5: Reasons for having Waterfront development (cont.)
Factors of supply Frequency
n=9 (%)
Ranking
To maintain heritage and cultural values.
To provide a tourist attraction.
To protect natural resources.
To provide community amenities.
To introduce a new concept of development.
To create an investment for investors.
To reduce environmental damage.
To cater for demand from buyers.
To make higher profits.
4 (44.4)
3 (33.3)
3 (33.3)
3 (33.3)
2 (22.2)
2 (22.2)
2 (22.2)
1 (11.1)
1 (11.1)
1
2
3
4
5
6
7
8
9

112
5.3.2.2 Successful Waterfront Development and Obstacles to Achieving this
From the interviews, all 25 interviewees were asked their opinions on waterfront development
in Malaysia, in terms of the level of success and the obstacles behind the lack of success. All
of them were asked the question as follows:
Q: Do you think waterfront development in Malaysia have reaped the similar achievement
like in other countries? Please comment with reasons.
As presented in Table 5.6, from the interviews, only 28% of interviewees thought that
Malaysia has successfully implemented waterfront development projects while the rest were
unsure and not successful as compared to other countries and accounted for 40% and 32%
each. For the interviewees who responded “not successful”, they provided two obstacles for
not achieving success: (i) insufficient financial resources (62.5%) and (ii) lack of human and
technology expertise (50%).
Of the 18 Government officers who answered the interviews, only 16.7% indicated that
Malaysia has successfully implemented waterfront development projects, 38.9% indicated
that is was not successful and 44.4% were. In terms of reasons for unsuccessful
implementation of waterfront development, from the seven interviewees who indicated that
the implementation of waterfront development projects was not successful, 57.7% of them
thought that it was due to insufficient financial resources and lack of human and technology
expertise (57.7%).
In contrast, of the seven Non-government officers to respond to the interviews, 57.1% agreed
that Malaysia has successfully implemented waterfront development projects. Only one
(14.3%) indicated that it was not successful while another 28.6% were unsure. The
interviewee who indicated unsuccessful implementation of waterfront development projects
gave the reason of insufficient financial resources. Table 5.6 summarises the results.

113
Table 5.6: Level of successful waterfront development and obstacles
Level of successful of waterfront development
Respondent
G1
n=25 (%)
G2
n=18 (%)
G3
n=7 (%)
Yes – successful implemented waterfront
development.
No – not successful implemented waterfront
development.
Unsure.
7 (28)
8 (32)
10 (40)
3 (16.7)
7 (38.9)
8 (44.4)
4 (57.1)
1 (14.3)
2 (28.6)
Reasons for unsuccessful implementation of waterfront development
Reasons for lack of success
Respondent
G1
n=8 (%)
G2
n=7 (%)
G3
n=1(%)
Insufficient financial resources.
Lack of human and technology expertise.
5 (62.5)
4 (50)
4 (57.1)
4 (57.1)
1 (100)
0 (0)
* Note: G1 = All interviewees; G2= Government officers; G3 = Non-government officers
5.3.2.3 Waterfront Development – in the Future
During the interview sessions, all 25 interviewees were asked about waterfront development
in the future, in terms of numbers and the purpose of development. They were asked for their
opinions on the particular matter as follows:
Q: What is your expectation about the future of waterfront development in Malaysia?
From the interviews, it appears that the majority of interviewees (84%) agreed that waterfront
development in Malaysia will be increased in terms of numbers. On the other hand, about
16% were not sure whether the number of waterfront development projects will be increased
in the future. From the 84% of interviewees who agreed that waterfront development will be
increased in Malaysia, 76.2% were government officers while, the rest (23.8%) were non-
government officers. The interviewees who indicated not sure responses thought that
waterfront development require more resources (human and capital) and that they also have
the potential for costs to outweigh benefits.
5.3.2.4 The Waterfront Development Process in Malaysia
In order to understand how waterfront development has taken place in Malaysia, an
understanding of the first phase of the development process is necessary. During the
interviews, 20 respondents who are government officers (Federal, State and Local

114
Government) and property developers were asked several interview questions related to the
waterfront development process in Malaysia.
Q: Does the waterfront development process differ from the general development process?
From the interviews, it appears that the majority of interviewees (85%) thought that
waterfront development in Malaysia requires a similar process as other forms of development
and that the government has full responsibility for development, starting from planning
approval right up to completion. About 15% of respondents thought that in some cases
approval from other departments such as the Museum Corporation or the Department of Wild
Life was required; for example, if the development included preservation areas.
Practically, the One-stop-centre (OSC) is responsible for facilitating and standardising the
land development process in Peninsular Malaysia. Land development in the state of Sarawak
is controlled by the State Planning Authority (SPA),44 and the Local Authority (the Council of
the City of Kuching South and Kuching North City Hall) which does not get involved directly
with the development process unless the development is proposed by them and uses their
allocation budgets.
Therefore, land development in Malaysia including waterfront projects, is required to follow
similar processes imposed at each stage of development. Importantly, development must meet
the Planning Guidelines and Standard as designed by the Department of Town and Country
Planning (Peninsular Malaysia) (2011) and, also takes into consideration the land use
planning guidelines.45 Refer Figure 3.6 on page 47 for the land development process in
Malaysia.
5.3.2.5 Parties Involved in Waterfront Development in Malaysia
As described in the previous section, the development process for waterfronts in Malaysia has
similar processes imposed on it as other forms of development. This section discusses the
stakeholders involved in the development process. In order to have an idea about parties
44 Under the Land Code (Amendment) Ordinance 1997, the committee consists of the Chief Minister, The State
Planning Authority with the Minister as Chairman, the Permanent Secretary to the Ministry of Planning
Management as the Secretary of the State Planning Authority, the Director of Lands and Survey Department, and
three (3) ministers from different ministries.
45 The land use planning guidelines are the systematic assessment of the land and water potential, the
alternatives for land use, and the economic and social conditions, in order to select and adopt the best land use
options. Its purpose is to select and put into practice those land uses that will best meet the needs of the people
while safeguarding resources for the future (Soil Resources Management and Conservation Service, 1993).

115
involved in the waterfront development process, the following interview question was asked
to the 20 respondents who are government officers (Federal, State and Local Government)
and who are from the private sector.
Q: Any developments usually involve many parties which integrated into the development
process. How about waterfront development in Malaysia?
From the interviews, all respondents (100%) thought that waterfront development followed
the same processes, involved the same officers and sometimes shared the same problems as
other types of development. Moreover, one of the interviewees thought that for development
projects which were proposed by the federal government, the state and local governments
acted as the implementing agencies for the proposed project. He shares his opinion as follows:
A government body has been involved for private and government projects
from the beginning stage to the planning approval, no matter whether the
project is funded by government and/or private sector. The contractor who is
normally a private contractor is appointed in the implementation stage and
local people do not participate. (Original transcription)
(Interviewee G7)
In addition, from the interviews, it appears that in most cases, no involvement from public
parties and the public is required if the proposed development involves public land
acquisition. Refer to Section 4.5.1.4 – Description of case study areas for parties involved in
the selected case study areas.
5.3.2.6 Governance in Waterfront Development in Malaysia
In Malaysia, the management and administration of natural resources involves several
departments and agencies that operate dependently or independently of one another according
to the specific responsibilities assigned to them (Rogers & Hall, 2003).
From the interviews, all 25 respondents were asked their opinions about the management and
administration of waterfront resources in Malaysia. The interview question about the
governance of waterfront development in Malaysia was as follows:
Q: How does Malaysia practice governance for waterfront project? Please comment.
From the interviews, it appears that more than half (60%) of the respondents answered the
question, while the rest (about 40%) gave no response. From the 60% of respondents who
answered the interview question, a majority (93%) thought that the management and
administration of waterfront resources was not effective, even though Malaysia has a well

116
structured system for the management and administration of natural resources including
waterfront resources. Only one respondent answered positively, as follows:
I am satisfied with the management and administration system for natural
resources, land, forest, and river. For example, our department has sufficient
numbers of staff, and each of them understands their jobs or task. We have a
mission and vision and clear management and work flow charts. (Original
transcription)
(Interviewee G11)
The 14 respondents, who answered that there is ineffective governance for waterfront
development in Malaysia, were further asked for reasons that constrain the delivery of
effective governance in managing waterfront resources and waterfront development in
Malaysia.
Q: In your opinion, what are the reasons that constrain for effective administration and
management for waterfront resources and waterfront development in Malaysia?
All the 14 respondents (100%) answered the question and most of them thought that low
levels of cooperation between stakeholders was the main reason for the ineffective
governance for waterfront development in Malaysia, accounting for 42.9% of responses. This
was followed by an inefficient communication system (35.7%) and low enforcement of
regulations for controlling waterfront development (28.6%). The least important reason for
ineffective governance for waterfront development given by 7.1% of interviewees was
conflicts of interest.
From the 42.9% interviewees that indicated that low level of cooperation between
stakeholders was the main reason for ineffective governance for waterfront development,
35.7% responses were from Government officers while 7.1% were from Non-government
officers. Moreover, only 14.3% and 7.1% of Government officers indicated that external party
interference and conflicts of interest contributed to the ineffective governance. By
comparison, none of the Non-government officers indicated that external party interference
and conflicts of interest are reasons for ineffective governance. Table 5.7 presents several
reasons identified for the ineffective governance for waterfront development in Malaysia.

117
Table 5.7: Reasons for ineffective governance for waterfront development
Factor
Respondent Ranking
G1
n=14 (%)
G2
n=14 (%)
G3
n=14 (%)
G1 G2 G3
Low levels of cooperation between
stakeholders.
Inefficient communication system.
Low enforcement on regulations.
Inadequate policies/guidelines.
Lack of expertise.
External party interference.
Conflicts of interest.
6 (42.9)
5 (35.7)
4 (28.6)
3 (21.4)
3 (21.4)
2 (14.3)
1 (7.1)
5 (35.7)
4 (28.6)
3 (21.4)
1 (7.1)
1 (7.1)
2 (14.3)
1 (7.1)
1(7.1)
1 (7.1)
1 (7.1)
2 (14.3)
2 (14.3)
0 (0)
0 (0)
1
2
3
4
5
6
7
1
2
3
5
6
4
7
3
4
5
1
2
6
7
* Note: G1 = All interviewees; G2= Government officers; G3 = Non-government officers
Indeed, less participation and low collaboration levels amongst parties involved in the
waterfront development was identified as a main cause for the ineffective managing of
waterfront development in Malaysia. Therefore, in order to achieve sustainable waterfront
development, support and responsibility from appropriate parties such as from the property
developers and from the public is required, and efficient delivery systems with regularly
updated information is needed from each responsible agency.
5.3.3 Waterfront Development Effects in Malaysia
Waterfront redevelopment in Malaysia has taken place over the last twenty years. Many
issues abounded when a city decided to transform its vacant or underused waterfront areas.
Some waterfront development projects have successfully included waterfront attraction
projects, but many others have not succeeded. From the interviews, all 25 respondents gave
their responses to the question asked for them on waterfront development effects.
Q: Based on your observation and knowledge, what are the effects might be derived from
waterfront development projects?
From the interviews, all 25 respondents thought that waterfront development in Malaysia
have produced an effect socially, economically and environmentally. Table 5.8 below
summarises interviewees‟ responses on the effects of waterfront development in Malaysia
from both the positive and negative sides.

118
Table 5.8: Waterfront development – positive and negative effects
Positive Effects Respondent Ranking
G1
n= 25 (%)
G2
n= 18 (%)
G3
n= 7 (%)
G1 G1 G2
Improving riverbank beautification and
landscape.
Generated income for the state and
country.
Increased property markets.
Increased property prices.
Business activity.
Job availability for residents.
Upgrading waterfront settlement.
Accessibility.
11 (44)
9 (36)
7 (28)
6 (24)
5 (20)
4 (16)
4 (16)
3 (12)
10 (55.5)
8 (44.4)
5 (27.8)
3 (16.7)
3 (16.7)
3 (16.7)
4 (22.2)
2 (11.1)
1 (14.3)
1 (14.3)
2 (28.6)
3 (42.8)
2 (28.6)
1 (14.3)
0 (0)
1 (14.3)
1
2
3
4
5
6
7
8
1
2
3
5
6
7
4
8
4
5
2
1
3
6
8
7
Negative Effects Respondent Ranking
G1
n= 25 (%)
G2
n= 18 (%)
G3
n= 7 (%)
G1 G2 G3
Environmental problem water pollution
and flooding.
Social impact – vandalism.
Increased cost for maintenance and
river cleaning.
Lost cultural values.
Property market speculation.
15 (60)
8 (32)
7 (28)
5 (20)
2 (8)
13 (72.2)
7 (38.9)
6 (33.3)
5 (27.8)
1 (5.5)
2 (28.6)
1 (14.3)
1 (14.3)
0 (0)
1 (14.3)
1
2
3
4
5
1
2
3
4
5
1
2
3
5
4
* Note: G1 = All interviewees; G2= Government officers; G3 = Non-government officers
According to Table 5.8 above, on the positive side, from the interviews it appears that nearly
half of the respondents (44%) agreed that waterfront development could improve riverbank
beautification and the landscape. Moreover, an overall 36% of respondents thought that
waterfront development has the potential to generate income for the state and for Malaysia
through the tourism industry. For example, a waterfront development especially for
recreational purposes is identified as attractions for tourists and/or visitors. The interviews
also identified that waterfront development have good effects on waterfront property in terms
of demand and property prices as well as property at surrounding waterfront areas, and these
two accounted for 28% and 24% respectively. Only a few (12%) respondents thought that
waterfront development could improve accessibility between water areas and the city.
Considering respondent group results separately, of the 18 Government officers who
responded, 55.5% agreed that waterfront development could improve riverbank beautification
and the landscape, and also has the potential to generate income for the state and country,
accounting for 44.4% of respondents. Moreover, from the interviews, it appears that
119
waterfront development could also encourage business activity at surrounding waterfront
areas (16.7%), and have the potential to increase property prices (16.7%) and property
markets (16.7%). Only 11.1% of interviewees agreed that waterfront development could
improve accessibility between water areas and the city.
In contrast, 42.8% of Non-government officers agreed that waterfront development has the
potential to increase property markets and also increased property prices (28.6%). None of the
Non-government officers thought that waterfront development could upgrade waterfront
settlement.
Waterfront development also has negative effects. From the interviews, 44% of the
interviewees thought that waterfront development have major negative effects on the
environment such as flooding and water pollution. Furthermore, from the interviews, 32%
thought that the social effects for example vandalism, have contributed to the negative effects
derived from waterfront development in Malaysia for the case study areas. For example,
interviewees‟ stated that facilities provided for public use within the waterfront boundary
were damaged due to vandalism. More than that, in some cases, the facilities provided were
stolen. A few interviewees (8%) thought that waterfront developments could cause market
speculation.
From the results, of the 18 Government officers, 72.2% agreed that waterfront development
have major negative effects on the environment such as water pollution. Moreover, about
38.9% of Government officers thought that waterfront development also has negative effects
on social matters such as vandalism. A mere 5.5% of Government officers thought that
waterfront development cause loss of cultural values derived from the development.
On the other hand, about 28.6% of the Non-government officers agreed that waterfront
development have major effects on the environment. Moreover, they also agreed that
waterfront development have negative effects on social matters (14.3%), increased cost for
maintenance and river cleaning (14.3%) and could create property market speculation
(14.3%). None of the Non-government officers thought that waterfront development could
cause loss in cultural values.
5.3.4 Regulations Associated with Waterfront Development in Malaysia
Regarding the regulations associated with waterfront development in Malaysia, all 25
interviewees were asked for their opinions as follows:

120
Q: Based on your knowledge, what are the regulations associated with waterfront
development in Malaysia?
From the interviews, all the respondents (100%) thought that waterfront development is
required to follow similar regulations as enforced for any land development in Malaysia.
From the interviews, they were also suggesting several regulations that could be associated
with waterfront development in Malaysia as presented in Table 5.9 below.
Table 5.9: Regulations associated with waterfront development in Malaysia
Regulations Respondent Ranking
G1
n=25 (%)
G2
n=18 (%)
G3
n=7 (%)
G1 G2 G3
National Land Code, 1965.
Land Acquisition Act 1960.
Act 127 in Environmental Quality Act 1974.
Uniform Building by Laws 1984.
Act 172 in Town and Country Planning Act
1976.
Coastal Zone guidelines.
Act 171 in Local Government Act 1976.
Guidelines for riverfront development.
Act 133 in Street, Drainage & Building Act
1974.
National Landscape Guidelines.
10 (40)
8 (32)
8 (32)
7 (28)
6 (24)
6 (24)
4 (16)
4 (16)
4 (16)
4 (16)
9 (50)
5 (27.8)
6 (33.3)
4 (22.2)
5 (27.8)
4 (22.2)
3 (16.7)
3 (16.7)
2 (11.1)
3 (16.7)
1 (14.3)
3 (42.8)
2 (28.6)
3 (42.8)
1 (14.3)
2 (28.6)
1 (14.3)
1 (14.3)
2 (28.6)
1 (14.3)
1
2
3
4
5
6
7
8
9
10
1
3
2
5
4
6
7
8
10
9
6
1
3
2
7
4
8
9
5
10
* Note: G1 = All interviewees; G2= Government officers; G3 = Non-government officers
From the interviews, 10 regulations and guidelines were identified as associated with
waterfront development in Malaysia. From the results, 40% of the respondents thought that
the property development companies followed the National Land Code 1965 as guidance for
undertaking waterfront development in Malaysia. It was followed by the Land Acquisition
Act 1960 and the Environmental Quality Act 1974 which accounted for 32% each, of the
results. Table 5.9 above lists the regulations and guidelines associated with waterfront
development in Malaysia as suggested by interviewees.
By respondent group, of the 18 Government officers, 50% agreed that property development
companies followed the National Land Code 1965 as guidance for undertaking waterfront
development in Malaysia. It was followed by the Environmental Quality Act 1974 (33.3%),
the Land Acquisition Act (27.8%) and the Town and Country Planning Act 1976 (27.8%). A
mere 11.1% of the Government officers thought that property development companies

121
followed the Street, Drainage and Building Act 1974 as guidance for undertaking waterfront
development projects in Malaysia.
In contrast, from the seven of Non-government officers, 42.8% of them thought that property
development companies followed the Uniform Building by Laws 1984 and the Land
Acquisition Act 1960 as guidance for undertaking waterfront development in Malaysia. Few
of them thought that property development companies followed the Town and Country
Planning Act 1976, the Local Government Act 1976, the guidelines for riverfronts, and the
National Landscape Guidelines as guidance for implementing waterfront development
projects in Malaysia, accounting for 14.3% each (or one respondent for each guidance).
Next, all 25 respondents were asked about guidelines for riverfront development as follows:
Q: Guidelines for riverfront development is designed mainly to control development in
front of water areas, particularly close to river areas. Do you aware about this
guideline?
From the interviews it appears that the 21 of respondents are aware of the guidelines for
riverfront development while the rest (about 4 respondents) are not familiar with these. From
the 21 respondents that are aware of the guidelines for riverfront development, only 16
respondents were Government officers while another five respondents were Non-government
officers. Table 5.10 summaries the responses of the interviews.
The 21 respondents who are aware and familiar with the guidelines were further asked about
the sufficiency of the guidelines for controlling waterfront development in Malaysia.
Q: Is this guideline considered effective towards successful riverfront development?
From the interviews it appears that only three respondents thought that guidelines for
riverfront development were sufficient to control waterfront development in Malaysia and the
majority (about 18 respondents) thought that the guidelines were not sufficient to control
waterfront development. From the results, the respondents thought that Malaysia also has
inadequate regulations for waterfront development; in fact they claimed that there are no
specific regulations designed for controlling waterfront development. Furthermore, they also
mentioned that the guidelines designed for riverfront development by the Department of
Drainage and Irrigation Malaysia was apparently not enforced by the State Government and
the Local Authority.

122
On the other hand, from the interviews it appears that only one of Government officers
thought that guidelines for riverfront development were sufficient to control waterfront
development in Malaysia while the majority of them (15 respondents) thought that the
guidelines were not sufficient to control waterfront development. In contrast, about two of
Non-government officers thought that guidelines for riverfront development were sufficient to
control waterfront development in Malaysia while another three respondents thought
differently.
Moreover, both government and non-government officers thought that Malaysia also had
inadequate regulations for waterfront development; in fact they claimed that there are no
specific regulations designed for controlling waterfront development. Furthermore, they also
mentioned that the guidelines designed for riverfront development by the Department of
Drainage and Irrigation Malaysia, were apparently not enforced by the State Government and
the Local Authority. Table 5.10 summarises the responses of the interviewees.
Table 5.10: Guidelines for riverfront development – effectiveness levels
Respondent
Are you aware of the guidelines for riverfronts
development concept?
G1
n=25 (%)
G2
n=18 (%)
G3
n=7 (%)
Yes
Not familiar
21 (84)
4 (16)
16 (88.9)
2 (11.1)
5 (71.4)
2 (28.6)
Are these guidelines considered effective towards
successful riverfront development projects?
Respondent
G1
n=21 (%)
G2
n=16 (%)
G3
n=5 (%)
Sufficient
Not sufficient
3 ( 14.3)
18 (85.7)
1 (6.2)
15 (93.8)
2 (40)
3 (60)
* Note: G1 = All interviewees; G2= Government officers; G3 = Non-government officers
The 18 respondents who indicated that the guidelines for riverfront development are
insufficient for controlling waterfront development in Malaysia were then asked for the
reasons behind that view. Table 5.11 summarises the responses from these respondents.
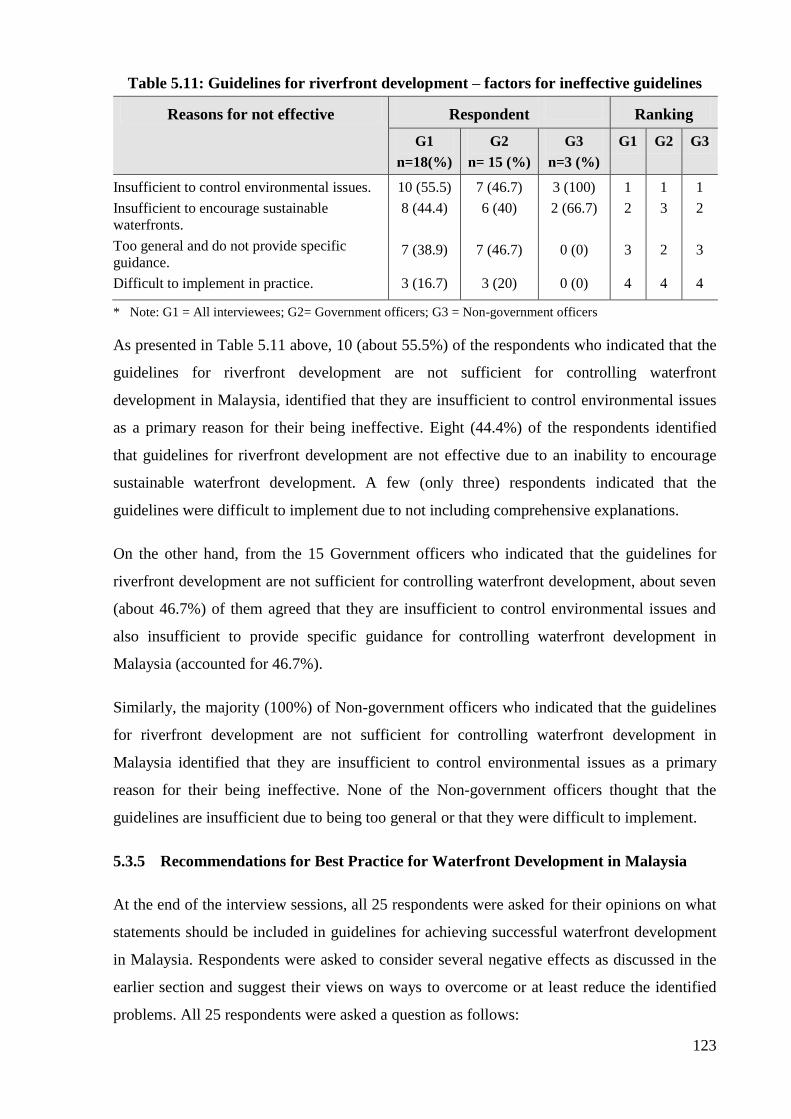
123
Table 5.11: Guidelines for riverfront development – factors for ineffective guidelines
Reasons for not effective Respondent Ranking
G1
n=18(%)
G2
n= 15 (%)
G3
n=3 (%)
G1 G2 G3
Insufficient to control environmental issues.
Insufficient to encourage sustainable
waterfronts.
Too general and do not provide specific
guidance.
Difficult to implement in practice.
10 (55.5)
8 (44.4)
7 (38.9)
3 (16.7)
7 (46.7)
6 (40)
7 (46.7)
3 (20)
3 (100)
2 (66.7)
0 (0)
0 (0)
1
2
3
4
1
3
2
4
1
2
3
4
* Note: G1 = All interviewees; G2= Government officers; G3 = Non-government officers
As presented in Table 5.11 above, 10 (about 55.5%) of the respondents who indicated that the
guidelines for riverfront development are not sufficient for controlling waterfront
development in Malaysia, identified that they are insufficient to control environmental issues
as a primary reason for their being ineffective. Eight (44.4%) of the respondents identified
that guidelines for riverfront development are not effective due to an inability to encourage
sustainable waterfront development. A few (only three) respondents indicated that the
guidelines were difficult to implement due to not including comprehensive explanations.
On the other hand, from the 15 Government officers who indicated that the guidelines for
riverfront development are not sufficient for controlling waterfront development, about seven
(about 46.7%) of them agreed that they are insufficient to control environmental issues and
also insufficient to provide specific guidance for controlling waterfront development in
Malaysia (accounted for 46.7%).
Similarly, the majority (100%) of Non-government officers who indicated that the guidelines
for riverfront development are not sufficient for controlling waterfront development in
Malaysia identified that they are insufficient to control environmental issues as a primary
reason for their being ineffective. None of the Non-government officers thought that the
guidelines are insufficient due to being too general or that they were difficult to implement.
5.3.5 Recommendations for Best Practice for Waterfront Development in Malaysia
At the end of the interview sessions, all 25 respondents were asked for their opinions on what
statements should be included in guidelines for achieving successful waterfront development
in Malaysia. Respondents were asked to consider several negative effects as discussed in the
earlier section and suggest their views on ways to overcome or at least reduce the identified
problems. All 25 respondents were asked a question as follows:

124
Q: Considering of all barriers and limitations, what is your recommendation relating to a
new guideline for waterfront development in Malaysia incorporating economical,
environmental and social factors?
All 25 respondents gave useful feedback that resulted in eighteen recommended statements.
From the eighteen recommendations, 40% of the government officers and 4% of non-
government officers thought that all waterfront development projects should require
compulsory approval for Environmental Impact Assessment (EIA). Moreover, 56% of the
government and non-government officers thought that new guidelines for waterfront
development in Malaysia should emphasise the river reserves beautification aspect
(accounting for 36%) and that the river be continuously rehabilitated (20%). Respondents also
thought that the guidelines for waterfront development should include provision for sufficient
public facilities and amenities such as pedestrian paths, toilets, landscaping and recreation
areas, which accounting for 52% in total. Respondents‟ suggestions about which statements
that should be included in new guidelines for waterfront development in Malaysia are
presented in Table 5.12 below.
The interviewees were then broken into two groups; the Government officers and the Non-
government officers to see if their responses differed. From the 18 Government officers,
55.5% thought that all waterfront development projects should require compulsory approval
for Environmental Impact Assessment (EIA). Respondents also agreed that the guidelines
should include provision for sufficient public facilities and amenities such as pedestrian paths,
toilets, landscaping and recreation areas (55.5%) and should emphasise the river reserves
beautification aspect (44.4%).
In contrast, from the seven Non-government officers that did not undertake waterfront
development, about 42.8% thought that the waterfront development guidelines for Malaysia
should emphasise environment protection and awareness and should include provision for
sufficient public facilities and amenities such as pedestrian paths, landscaping, access ways,
recreation areas, etc..

125
Table 5.12: Statements for waterfront development guidelines
No Statement Respondent No. Statement
Respondent
G1
n=25 (%)
G2
n=18 (%)
G3
n=7 (%)
G1
n=25 (%)
G2
n=18 (%)
G3
n=7 (%)
1. Environmental Impact Assessment (EIA)
is compulsory.
11 (44) 10 (55.5) 1 (14.3) 10. Continuous river rehabilitation. 5 (20) 4 (22.2) 1 (14.3)
2. Environment protection and awareness. 10 (20) 7 (38.9) 3 (42.8) 11. River reserve beautification. 9 (36) 8 (44.4) 1 (14.3)
3. Maintenance and rehabilitation costs are
shared between stakeholders.
8 (32) 4 (22.2) 4 (5.7) 12. Upgrading and maintaining sewage
systems.
3 (12) 3 (16.7) 0 (0)
4. Use environmentally friendly materials in
construction.
4 (16) 4 (22.2) 0 (0) 13. Restrict type of development. 7 (28) 6 (33.3) 1 (14.3)
5. Provide flood mitigation (e.g. by planting
more trees).
4 (16) 3 (16.7) 1 (14.3) 14. Integrate both modern and heritage aspects
into development.
6 (24) 6 (33.3) 0 (0)
6. Protection of natural resources (water and
environment).
6 (25) 4 (22.2) 2 (28.6) 15 Encourage economic activities. 2 (8) 2 (11.1) 0 (0)
7. Provision of sufficient public facilities
and amenities (such as pedestrian paths,
landscaping, access ways, recreation
areas, etc.).
13 (52) 10 (55.5) 3 (42.8) 16. Sharing waterfront benefits (such as view,
financial rewards, etc.) among stakeholders
(e.g. community, government, property
developer).
8 (32) 4 (22.2) 4 (57.1)
8. Personal security is maintained by means
of policing, surveillance cameras, etc.
5 (20) 5 (22.2) 0 (0) 17. Continuously educate public about
environmental concerns.
1 (4) 0 (0) 1 (14.3)
9. Upgrading and maintaining established
settlements along the waterfront areas.
1 (4) 1 (5.5) 0 (0) 18. Provide regulations and policies that
mitigate market speculation for waterfront
properties.
1 (4) 0 (0) 1 (14.3)
* Note: G1 = All interviewees; G2= Government officers; G3 = Non-government officers

126
Chapter 6
Quantitative Method – Questionnaire Results
The results from the interviews were then used in the questionnaire which was designed and
then distributed to property development companies in Malaysia. The analysis in this section
was confirmatory in the sense that information gathered during the first set of interviews was
also tested in this phase. The questionnaire responses were coded and entered into a
computerised database.46 The analysis of the questionnaire involved the calculations of means
and percentages by response category for all questions, to provide an overview of respondent
characteristics and response patterns. A comparative analysis by applying T-test was applied
to study significant differences in waterfront development practices with respect to
respondents‟ groups. The Exploratory Factor Analysis (EFA) and Correlation were also used
as part of the analysis involved in this section. The EFA and Correlation were tested mainly to
identify groups of a substantial number of variables and to determine the structure of the
relationships between variables included in the guidelines for waterfront development.
6.1 Sample and Response Rates
In the second phase of data collection in this research, the sample data comprises property
development companies listed under Bursa Malaysia during 2009. Respondents were selected
using a stratified sampling procedure as part of probabilistic sampling. As stated by Bursa
Malaysia, only 91 property development companies were listed in 2009 (Bursa Malaysia,
2009).
Of the 91 sets of questionnaires mailed and electronic-mailed (e-mailed) to respondents, 11
respondents returned the questionnaires within two weeks and 24 respondents sent them back
after a month. This response gave a 39% response rate one month after the questionnaires
were distributed. After a series of telephone follow-ups and e-mail reminders over three
months, a total of 61 questionnaires were returned giving a 67% response rate.
Only valid responses were reported in this research. The 67% response rate obtained was
considered a high response rate for this type of postal or e-mail survey given that a typical
response rate would be 30% (Sekaran, 2003, p. 251). Thus, the 67% response rate obtained
46 The computer programme SPSS was selected as the appropriate analytical tool for processing the data.
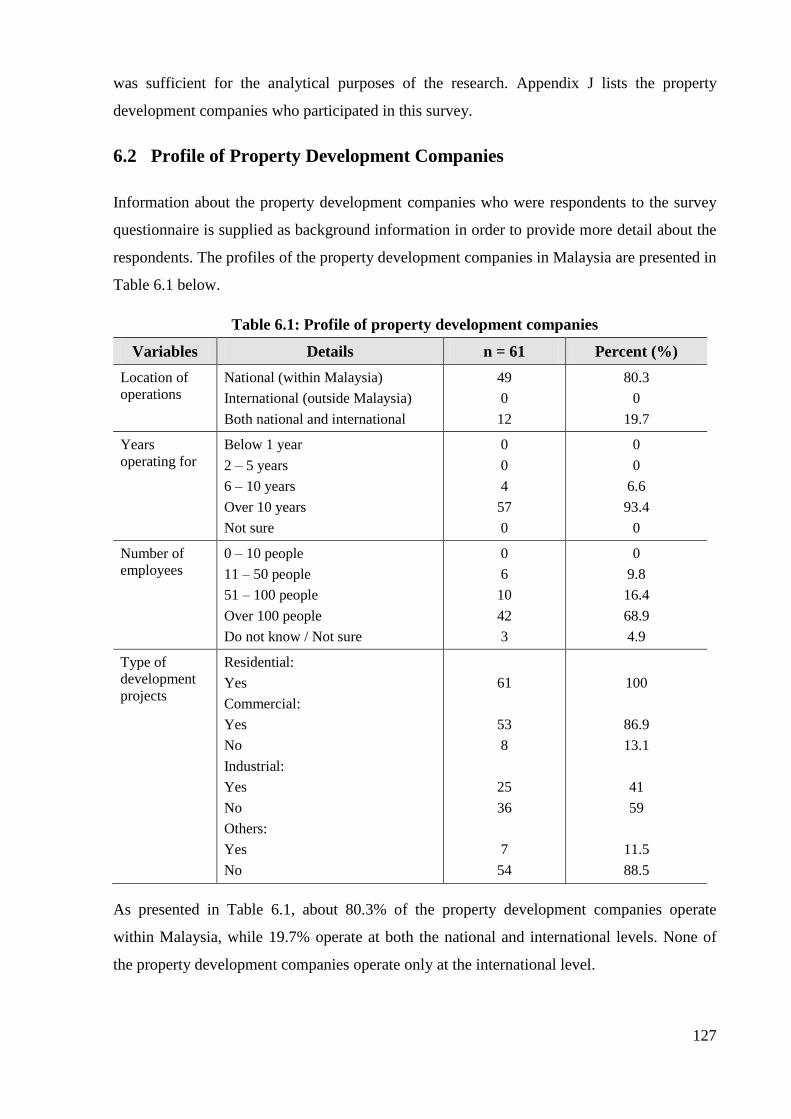
127
was sufficient for the analytical purposes of the research. Appendix J lists the property
development companies who participated in this survey.
6.2 Profile of Property Development Companies
Information about the property development companies who were respondents to the survey
questionnaire is supplied as background information in order to provide more detail about the
respondents. The profiles of the property development companies in Malaysia are presented in
Table 6.1 below.
Table 6.1: Profile of property development companies
Variables Details n = 61 Percent (%)
Location of
operations
National (within Malaysia)
International (outside Malaysia)
Both national and international
49
0
12
80.3
0
19.7
Years
operating for
Below 1 year
2 – 5 years
6 – 10 years
Over 10 years
Not sure
0
0
4
57
0
0
0
6.6
93.4
0
Number of
employees
0 – 10 people
11 – 50 people
51 – 100 people
Over 100 people
Do not know / Not sure
0
6
10
42
3
0
9.8
16.4
68.9
4.9
Type of
development
projects
Residential:
Yes
Commercial:
Yes
No
Industrial:
Yes
No
Others:
Yes
No
61
53
8
25
36
7
54
100
86.9
13.1
41
59
11.5
88.5
As presented in Table 6.1, about 80.3% of the property development companies operate
within Malaysia, while 19.7% operate at both the national and international levels. None of
the property development companies operate only at the international level.
128
The majority (93.4%) of the property development companies participating in this survey
have been operating their companies for over 10 years and only 6.6% have been operating
them for between six and nine years. None of the property development companies
participating in this research have been operating them for less than five years. Moreover,
more than half (68.9%) of all the property development companies participating in this
research employ over 100 workers. Around 16.4% employ between 51 and 100 workers,
while a further 9.8% employ between 11 and 50 workers. Not surprisingly, no companies
employ fewer than 10 workers.
Companies participating in this research are involved in several property development
activities such as residential, commercial, industrial and recreational. In particular, all (100%)
companies actively participate in residential development, followed by 86.9% who are active
in commercial development, while only 41% are active in industrial development. Only
11.5% are involved in „other‟ development activities such as recreation.
From the results, it appears that the range of the respondents represented in the sample are
similar; that is, they are property development companies that have been actively practising
property developments for many years and were listed in Bursa Malaysia in 2009.
6.3 Descriptive Statistics
6.3.1 Waterfront Development Projects
The overall finding in this study is that nearly a third (32.8%) of the property development
companies undertook waterfront development projects in Malaysia, while the rest (67.2%)
were not involved in waterfront development in Malaysia or internationally.
Of the 67.2% of respondents who did not undertake waterfront development projects, more
than half (58.6%) of the respondents are now motivated to undertake waterfront development
in the future, 14.6% have decided not to undertake waterfront development in the future and
26.8% are still not sure whether to undertake waterfront development or not, depending on the
financial support and demand for waterfront property at the time. Based on these responses it
appears that waterfront development in Malaysia may increase in the future.
Of the one third of respondents who undertake waterfront development, over half (60%) of
them only incorporate between 1-20% of waterfront development in their projects. Twenty-

129
five percent of respondents undertake waterfront development projects between 21-40% of
the time, while 15% of them incorporate 41-60% of waterfront development in their projects.
From the 32.8% of respondents who undertake waterfront development, 75% of them had
undertaken waterfront development for residential use, 70% were developed for mixed-use
and 25% were developed for recreational purposes. However, the results indicated that no
companies developed waterfront projects for industrial use, while only five percent developed
them for „other‟ uses.
The results indicated that “a profit/financial benefit” and “to diversify property type of
developments” considerations greatly influence the respondents‟ decisions as to whether to
undertake waterfront development in Malaysia, accounting for 35% for each response.
Twenty percent of the property development companies undertake waterfront development
for the conservation of natural resources, while 10% undertake waterfront projects for „other‟
reasons such as public benefit use such as to provide public amenities for locals and visitors.
Table 6.2 summarises results for waterfront development in Malaysia.
Table 6.2: Waterfront development in Malaysia
Variable n=61 Percent (%)
Undertake waterfront development projects:
Yes
No
20
41
32.8
67.2
Undertake waterfront development projects in future:
Yes
No
Not sure
24
6
11
58.6
14.6
26.8
Percentage of waterfront development projects:
1-20%
21-40%
41-60%
12
5
3
60
25
15
Type of waterfront development projects:
Residential
Commercial
Mixed-use
Industrial
Recreational
Other
15
8
14
0
5
1
75
40
70
0
25
5
Primary motive for undertaking waterfront development:
Profit/financial benefits
To diversify property type of development
Conservation of natural resources
Other
7
7
4
2
35
35
20
10

130
6.3.2 Waterfront Development: Reasons for Applying for Waterfront Development
A question was included to assess the respondents‟ reactions to various reasons for initiating
waterfront development in Malaysia in the future. By using a scale of “1”, most influential
factor to “9”, least influential factor, respondents were asked to rank their perception towards
reasons for beginning waterfront development projects in Malaysia.47 Table 6.3 presents the
reasons for undertaking waterfront development projects in Malaysia based on property
development companies‟ preferences.
Table 6.3: Reasons for applying for waterfront development by property development
companies
Reason Respondent
To introduce a new concept in development.
To provide community amenities.
To cater for demand from buyers.
To create investments for investors.
To make higher profits.
To reduce environmental damage.
As a tourist attraction.
To protect natural resources.
Maintain heritage and cultural values
Group 1
n = 61 (%) (*)
Group 2
n = 20 (%) (*)
Group 3
n = 41 (%) (*)
22 (36.1) (1)
11 (18) (2)
9 (14.8) (3)
8 (13.1) (4)
7 (11.5) (5)
5 (8.2) (6)
4 (6.5) (7)
2 (3.3) (8)
2 (3.3) (9)
6 (30) (1)
5 (25) (2)
3 (15) (3)
3 (15) (4)
3 (15) (5)
0 (0) (8)
0 (0) (9)
2 (10) (6)
2 (10) (7)
16 (39) (1)
6 (14.6) (2)
6 (14.6) (3)
5 (12.2) (4)
4 (9.7) (6)
5 (12.2) (5)
4 (9.7) (7)
0 (0) (8)
0 (0) (9)
* Ranking: From Most Influential = 1 to Least Influential = 9.
** Note: Group 1 = All respondents; Group 2 = Respondents who undertook waterfront development; Group 3
= Respondents who did not undertake waterfront development .
From the 61 questionnaires returned, over a third (36.1%) of property development companies
indicated that their main reason for undertaking waterfront development was to introduce a
new concept in development. The second most popular reason was to provide amenities to
communities, accounting for 18%, followed by a desire to cater for demand from buyers,
especially waterfront property buyers (14.8%). Moreover, respondents thought that supplying
waterfront properties for investment (13.1%) and making a profit (11.5%) were their reasons.
Interestingly, a mere 8.2% of respondents were motivated to supply waterfront properties for
environmental concerns such as to reduce environmental damage and protect natural
resources (3.3%).
47 Eight reasons for initiating waterfront development were revealed from the interviews in the first phase of
data collection.

131
Not surprisingly, results indicate that most of the respondents tended to be more profit driven
rather than motivated by environmental reasons when initiating waterfront development.
Again, responses were broken down to those that had undertaken waterfront development and
those that had not. In terms of property development companies undertaking waterfront
development projects in Malaysia, 30% of them indicated that to introduce a new concept in
development was their main reasons for undertaking waterfront development. This was
followed by providing community amenities, accounting for 25%, followed by catering for
demand from buyers, creating to investment for investors, and making higher profits,
accounting for 15% of respondents each respectively. Interestingly, none of the property
development companies undertaking waterfront development were motivated to supply
waterfront properties for environmental or tourist reasons. A mere 10% of respondents were
motivated to undertake waterfront development to protect the natural resources and maintain
heritage and cultural values.
On the other hand, of the 41 property development companies that did not undertake
waterfront development, 39% of them indicated that their main reason for undertaking
waterfront development was to introduce a new concept in development. About 14.6% of
them indicated that providing community amenities and catering for demand from buyers
were the reasons for undertaking waterfront development projects.
6.3.3 Successful Waterfront Development
Overall, from 61 returned questionnaires, 44.2% of the respondents were unsure as to whether
Malaysia had successful implementation of waterfront development or not. Forty-one percent
of respondents firmly stated that waterfront development undertaken in Malaysia were not
successful as compared to other developed countries. Only 14.8% indicated that Malaysia had
successfully implemented waterfront development.
On the other hand, of the 20 property development companies undertaking waterfront
development projects in Malaysia, nearly half (45%) of them thought that Malaysia did not
have successful implementation of waterfront development, while 35% were unsure whether
Malaysia had successful implementation or not. Surprisingly, 20% of them indicated that
Malaysia has successfully implemented waterfront development projects. Table 6.4 presents
the results of the successful implementation of waterfront development.

132
Table 6.4: Successful implementation of waterfront development
Yes
n (%)
No
n (%)
Unsure
n (%)
Total
n (%)
Within all development companies. 9 (14.8) 25 (41) 27 (44.2) 61 (100)
Within development companies undertaking
waterfront development projects.
4 (20) 9 (45) 7 (35) 20 (100)
Within development companies who did not
undertake waterfront development projects.
5 (12.2) 16 (39) 20 (48.8) 41 (100)
As shown in Table 6.5 below, factors that prevented the successful implementation of
waterfront development were then investigated. From the responses, 32.8% of respondents
thought that difficulty in balancing the social, economic and financial needs of the various
stakeholders involved in the waterfront development projects was the most influential factor
that prevented the successful implementation of waterfront development in Malaysia. That
there is no collaboration between stakeholders involved in waterfront development was
identified as a factor by 18% of the respondents. About 14.8% of respondents identified
insufficient financial support as a reason for unsuccessful waterfront development, while less
participation (domination by government and less involvement by non-government
organisations) was suggested as a reason by 14.8% of respondents. The least number (3.3%)
of respondents identified difficulty in obtaining planning permission for waterfront
development as a factor that prevented successful waterfront development in Malaysia.
On the other hand, from the 32.8% of respondents who undertake waterfront development,
nearly half (45%) of them thought that difficulty in balancing social, economic and financial
needs between various stakeholders was a main factor that contributed to the unsuccessful
implementation of waterfront development in Malaysia. Moreover, about 20% of respondents
identified insufficient financial support for the development as a reason for the unsuccessful
implementation of waterfront development projects, while 10% indicated that lack of
collaboration between stakeholders in waterfront development projects as a reason. None of
the respondents indicated the limited number of viable locations for waterfront development
as a main reason for the unsuccessful implementation of waterfront development in Malaysia.

133
Table 6.5: Factors for unsuccessful implementation of waterfront development
Factor
Group 1
n = 61 (%)
Group 2
n = 20 (%)
Group 3
n = 41 (%)
Difficulty in balancing the various social,
economic and financial needs of the various
stakeholders.
No collaboration between stakeholders.
Insufficient financial resources.
Less participation (domination by government
and less involvement by non-government
organisations).
Other - external interference and lack of human
expertise).
Limited number of viable locations
Difficulty in obtaining planning permission.
20 (32.8)
11 (18.0)
9 (14.8)
9 (14.8)
6 (9.8)
4 (6.6)
2 (3.3)
9 (45)
2 (10)
4 (20)
2 (10)
2 (10)
0 (0)
1 (5)
11 (26.8)
9 (21.9)
5 (12.2)
7 (17.1)
4 (9.8)
4 (9.8)
1 (2.4)
* Group 1 = All respondents; Group 2 = Respondents who undertook waterfront development; Group 3 =
Respondents who did not undertake waterfront development.
6.3.4 Regulations and Guidelines Related to Waterfront Development
A question was included to determine the respondents‟ levels of awareness of various
regulations that relate to waterfront development in Malaysia. Ten response options were
provided as outlined in Table 6.6 below.
Overall, the results indicate that the majority of the respondents were somewhat familiar with
the regulations and guidelines related to waterfront development in Malaysia (average mean
score=3.40). The mean scores for each regulation are presented in Table 6.6 below.
The results showed that respondents were most familiar with the National Land Code 1965
(mean score=3.59). The Town and Country Planning Act 1976, the Uniform Building By-
Law 1984, the Land Acquisition Act 1960 and the Local Government Act 1976 were more
familiar to respondents with mean scores greater than 3.50 and were more familiar than the
other regulations listed in Table 6.6. The results showed that the lowest mean score was
guidelines for riverfront development (mean=3.05). However, respondents were still familiar
with this guideline.
On the other hand, of the 20 respondents undertaking waterfront development projects, the
results showed that respondents were most familiar with the Uniform Building By-Law 1984
(mean score=3.85), and followed by the Town and Country Planning Act 1976 (mean

134
score=3.70). The results showed that the lowest mean score was guidelines for riverfront
development (mean score=3.45).
In contrast, of the 41 respondents did not undertaking waterfront development projects, most of them
were familiar with the National Land Code 1965 (mean score=3.56). This is followed by the Town
and Country Planning Act 1976 (mean score=3.51), and the Land Acquisition Act 1960 (mean
score=3.46). Interestingly, the results showed that the lowest mean score for regulations and
guidelines for waterfront development were National Landscape Guidelines and the Guidelines for
Riverfront Development Concept with mean score 2.98 and 2.85, indicating that the respondents have
heard about the guidelines but not familiar of it.
Table 6.6: Regulations and guidelines for waterfront development – respondents’ levels
of awareness
Regulation
Mean scores
Group 1
Mean score
Group 2
Mean score
Group 3
Mean score
National Land Code 1965.
Town and Country Planning Act 1976.
Uniform Building By-Law 1984.
Land Acquisition Act 1960.
Local Government Act 1976.
Environment Quality Act 1974.
Street, Drainage and Building Act 1974.
Coastal Zone Development Guidelines.
National Landscape Guidelines.
Guidelines for Riverfront Development
Concept
3.59
3.57
3.56
3.52
3.51
3.48
3.38
3.16
3.16
3.05
3.65
3.70
3.85
3.65
3.70
3.65
3.65
3.50
3.55
3.45
3.56
3.51
3.41
3.46
3.41
3.39
3.24
3.00
2.98
2.85
Average mean score = 3.40
* Scale: From Never heard of it = 1 to Very familiar = 4
** Group 1 = All respondents; Group 2 = Respondents who undertook waterfront development; Group 3 =
Respondents who did not undertake waterfront development
To determine the concern that respondents might have about sufficiency of those regulations
and guidelines (as listed in Table 6.6 above) to control waterfront development in Malaysia,
four options were provided as outlined in Table 6.7 below. Results show that nearly half
(44.3%) of the respondents determined that Malaysia did not have sufficient regulations to
control waterfront development. About 37.7% of the respondents agreed that the government
had provided regulations for waterfront development, but only to a moderate extent. On the
other hand, only 6.5% of respondents thought that Malaysia has many such regulations and
that these were sufficient for controlling waterfront development, while another 11.5% of the
respondents thought that Malaysia has sufficient regulations for waterfront development, and
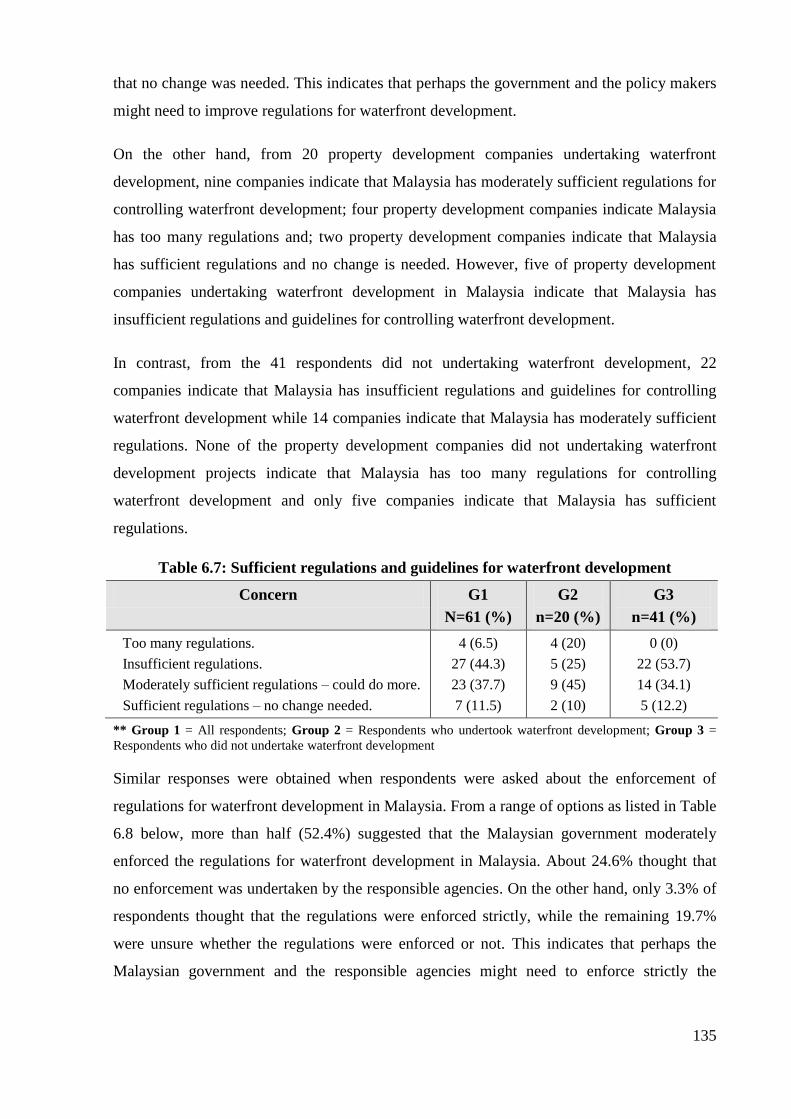
135
that no change was needed. This indicates that perhaps the government and the policy makers
might need to improve regulations for waterfront development.
On the other hand, from 20 property development companies undertaking waterfront
development, nine companies indicate that Malaysia has moderately sufficient regulations for
controlling waterfront development; four property development companies indicate Malaysia
has too many regulations and; two property development companies indicate that Malaysia
has sufficient regulations and no change is needed. However, five of property development
companies undertaking waterfront development in Malaysia indicate that Malaysia has
insufficient regulations and guidelines for controlling waterfront development.
In contrast, from the 41 respondents did not undertaking waterfront development, 22
companies indicate that Malaysia has insufficient regulations and guidelines for controlling
waterfront development while 14 companies indicate that Malaysia has moderately sufficient
regulations. None of the property development companies did not undertaking waterfront
development projects indicate that Malaysia has too many regulations for controlling
waterfront development and only five companies indicate that Malaysia has sufficient
regulations.
Table 6.7: Sufficient regulations and guidelines for waterfront development
Concern G1
N=61 (%)
G2
n=20 (%)
G3
n=41 (%)
Too many regulations.
Insufficient regulations.
Moderately sufficient regulations – could do more.
Sufficient regulations – no change needed.
4 (6.5)
27 (44.3)
23 (37.7)
7 (11.5)
4 (20)
5 (25)
9 (45)
2 (10)
0 (0)
22 (53.7)
14 (34.1)
5 (12.2)
** Group 1 = All respondents; Group 2 = Respondents who undertook waterfront development; Group 3 =
Respondents who did not undertake waterfront development
Similar responses were obtained when respondents were asked about the enforcement of
regulations for waterfront development in Malaysia. From a range of options as listed in Table
6.8 below, more than half (52.4%) suggested that the Malaysian government moderately
enforced the regulations for waterfront development in Malaysia. About 24.6% thought that
no enforcement was undertaken by the responsible agencies. On the other hand, only 3.3% of
respondents thought that the regulations were enforced strictly, while the remaining 19.7%
were unsure whether the regulations were enforced or not. This indicates that perhaps the
Malaysian government and the responsible agencies might need to enforce strictly the

136
regulations for waterfront development. Table 6.8 summarises the responses about the
enforcement of waterfront regulations in Malaysia.
Table 6.8: Enforcement of regulations for waterfront development
Concern G1
N=61 (%)
G2
n=20 (%)
G3
n=41 (%)
Strictly enforced.
Moderately enforced.
Not enforced.
Unsure.
2 (3.3)
32 (52.4)
15 (24.6)
12 (19.7)
2 (10)
13 (65)
5 (25)
0 (0)
0 (0)
19 (46.3)
10 (24.4)
12 (29.3)
** Group 1 = All respondents; Group 2 = Respondents who undertook waterfront development; Group 3 =
Respondents who did not undertake waterfront development
From the results, thirteen of the property development companies undertaking waterfront
development projects agree that Malaysia has moderately enforced regulations for waterfront
development. Moreover, five of the property development companies indicate that Malaysian
government has not enforced the regulations while, only two companies indicate that
Malaysia has strictly enforced.
In contrast, about nineteen of the property development companies did not undertaking
waterfront development indicate that Malaysia has moderately enforced regulations for
waterfront development. None of the property development companies indicate that Malaysia
has strictly enforced the regulations for controlling waterfront development.
6.3.4.1 Effectiveness of Guidelines for Riverfront Development
A question was included to assess the respondents‟ reactions to guidelines for riverfront
development in terms of the effectiveness of the guidelines as something solely designed for
controlling riverfront development in Malaysia. Four factors that were previously suggested
by the interviewees in the first phase of data collection were provided as outlined in Table 6.9
below.

137
Table 6.9: Effectiveness of guidelines for riverfront development
Factors Mean score
Group 1 Group 2 Group 3
Sufficient to control environment problems.
Provide specific guidance for riverfront development.
Easy to implement the guidelines in practice.
Encourage sustainable riverfront development.
2.25
2.43
2.43
2.57
2.45
2.25
2.30
2.55
2.15
2.51
2.49
2.59
Average mean score = 2.45
* Scale: from strongly disagree = 1 to strongly agree = 5
** Group 1 = All respondents; Group 2 = Respondents who undertook waterfront development; Group 3 =
Respondents who did not undertake waterfront development
Overall, the results indicate that the majority of the respondents disagreed about the
effectiveness of the guidelines for riverfront development with an average mean score of 2.45.
The mean values for each factor ranges between 2.25 and 2.57, indicating that the respondents
disagreed about the effectiveness of the guidelines for controlling waterfront development in
Malaysia. For example, the respondents disagreed that the guidelines were sufficient for
controlling environmental problems (mean score=2.25) that could develop from the
waterfront development areas. Guidelines for riverfront development were also identified as
not providing specific guidance (mean score=2.43) for waterfront development in Malaysia.
By respondent groups, in terms of respondents undertaking waterfront development projects
in Malaysia, the results show that the majority disagreed about the effectiveness of the
guidelines for riverfront development with a mean score for each factor ranging between 2.25
and 2.55.
Similar responses were obtained from respondents that do not undertake waterfront
development. The respondents disagreed that the guidelines were sufficient to control
environmental problems (mean score=2.15), and also identified that it is not easy to implement
the guidelines (mean score=2.49).
6.3.5 Recommendations on the Statements for Waterfront Development Guidelines
In the final part of the questionnaire form, a question was included to determine the
respondents‟ levels of agreement about various statements in future waterfront development
guidelines for Malaysia. Eighteen statements were provided as outlined in Table 6.10 below.
These statements were obtained from the interviews conducted in the first phase of data
collection to determine if there were statistically significant statements to be recommended

138
for future waterfront development guidelines for Malaysia, based on the mean scores. Table
6.10 below summarises the responses.
Table 6.10: Statements about waterfront development guidelines
Statements Mean score
G1 G2 G3
River reserve beautification.
Participation among stakeholders should be compulsory at every
stage of the development.
Environmental Impact Assessment (EIA) is compulsory.
Sharing waterfront benefits (such as view, financial rewards,
etc.) among stakeholders (e.g. community, government,
developer).
Continuous river rehabilitation.
Upgrading and maintaining sewage systems.
Maintenance & rehabilitation costs are shared between
stakeholders.
Provide flood mitigation (e.g. by planting more trees).
Should use environmentally friendly materials in construction.
Encourage economic activities.
Protection of natural resources (water and environment).
Provision of sufficient public facilities and amenities (such as
pedestrian, landscaping, access ways, recreation areas, etc.).
Integrate both modern and heritage aspects into development.
Personal security is maintained by means of policing,
surveillance cameras, etc.
Restrict type of development.
Continuously educate public about environmental concerns.
Upgrading and maintaining established settlements along the
waterfront areas.
Mitigate property speculation.
4.39
4.36
4.33
4.31
4.28
4.26
4.21
4.20
4.18
4.13
4.07
3.93
3.92
3.90
3.89
3.85
3.64
3.54
4.45
4.40
4.35
4.20
4.25
4.45
4.40
3.95
4.20
4.25
4.20
3.85
3.60
4.10
3.90
3.85
3.30
3.65
4.37
4.34
4.32
4.37
4.20
4.20
4.20
4.20
4.15
4.22
4.00
3.98
4.07
3.80
3.88
3.98
3.80
3.49
Average mean score = 4.08
* Scale: from strongly disagree = 1 to strongly agree = 5
** G1 = All respondents; G2 = Respondents who undertook waterfront development; G3 = Respondents who
did not undertake waterfront development
The majority of respondents agreed with all of the statements suggested for future waterfront
development guidelines in Malaysia, with an average mean score of 4.08. In particular, from
the results, the majority of the respondents indicated that beautification of the river reserve as
well as the river itself, was most likely to be included in the waterfront development
guidelines (mean score=4.39). It was followed by participation among stakeholders, being
compulsory at every stage of the development (mean score=4.36) and the Environmental
Impact Assessment (mean score=4.33) being compulsory in the waterfront development
guidelines as suggested by the respondents. Moreover, some respondents were unsure

139
whether statements such as the provision of sufficient public facilities and amenities (mean
score=3.93) and personal security maintained by means of policing and surveillance cameras
(mean score=3.90) should be included in the guidelines. However, results show that each
statement indicated mean scores close to 4.0 indicating that respondents agreed that the
statement should be included in the future waterfront development guidelines for Malaysia.
The results by respondent group show that the majority of the 20 property development
companies undertaking waterfront development indicate that beautification of the river
reserve and river itself, and upgrading and maintaining sewage system, were most likely to be
included in the waterfront development guidelines with a mean score 4.45 each respectively.
These was followed by participation among stakeholders being compulsory at every stage of
the development (mean score=4.40) and the compulsory sharing maintenance and
rehabilitation costs between stakeholders (mean score=4.40).
In contrast, the majority of the 41 respondents that did not undertaking waterfront
development projects agreed that beautification of the river and river reserve and sharing
waterfront benefits among stakeholders were mostly important to be included in the
guidelines for waterfront development with a mean score of 4.37 each respectively.
Moreover, the respondents also agreed that the participation among stakeholders being
compulsory at every stage of the development (mean score = 4.34) and the Environmental
Impact Assessment (EIA) (mean score = 4.32) should be included in the guidelines.
6.4 Cross Tabulation Analysis
6.4.1 Years of Operation and whether the Company Undertakes Waterfront
Development or not
Table 6.11 presents the cross tabulation analysis result between years of operations and
undertake whether the company undertakes waterfront development. From the results, 57
respondents operated over 10 years in the construction industry in Malaysia while only four
respondents operated less than 10 years. For respondents that did not undertake waterfront
development shows that 66.7% (38 respondents) have operated over 10 years while only 19
respondents (33.3%) undertake waterfront development operated over 10 years. Moreover,
only 1 respondent that undertakes waterfront development has been operating less than 10
years. Table 6.11 summarises these result.

140
Table 6.11: Cross tabulation between years of operation and whether the company
undertakes waterfront development
Undertakes waterfront development
Yes
n (%)
No
n (%)
Total
n (%)
Years of Operation
6-10 years 1 (25) 3 (75) 4 (100)
Over 10 years 19 (33.3) 38 (66.7) 57 (100)
Total n (%) 20 (32.8) 41 (67.2) 61 (100)
6.4.2 Number of Employees and whether the Company Undertakes Waterfront
Development or not
Table 6.12 presents the cross tabulation analysis result between number of employees and
whether the company undertakes waterfront development. From the results, 42 respondents
employed over 100 people in their companies while 16 respondents employed less than 100
people. From the 41 respondents that did not undertake waterfront development, 27
respondents employed over 100 peoples, while 7 respondents employed less than 100 and
three respondents were unsure about the number of employees in their company. About 15
respondents that undertake waterfront development employed between 11 and 100 people.
Table 6.12: Cross tabulation between number of employees and whether the company
undertakes waterfront development
Undertake waterfront development
Yes
n (%)
No
n (%)
Total
n (%)
Number of employees
11-50 people 2 (33.3) 4 (66.7) 6 (100)
51-100 people 3 (30) 7 (70) 10 (100)
Over 100 people 15 (35.7) 27 (64.3) 42 (100)
Do not know / not sure 0 (0) 3 (100) 3 (100)
Total n (%) 20 (32.8) 41 (67.2) 61 (100)
6.4.3 Years of Operation and Percentage of Waterfront Development Projects
Table 6.13 presents the cross tabulation analysis between the years of operation and the
percentage of waterfront development projects undertaken by property development
companies. From the 20 property development companies undertaking waterfront
development, 19 of them have been operating more than 10 years, and only one company
operated less than 10 years. Moreover, about 11 property development companies have been
operating over 10 years in the construction industry have undertaken 1-20% of their

141
development projects as waterfront development, while only five companies have undertaken
21-40% of waterfront development projects and three companies have developed 41-60%
waterfront development projects. In contrast, none of the property development companies
that operated less than 10 years have undertaken more than 20% of waterfront development
projects as a share of their development projects.
Table 6.13: Cross tabulation between the years of operation and the percentage of
waterfront development projects
Waterfront development percentage
1-20%
n (%)
21-40%
n (%)
41-60%
n (%)
Not applicable*
n (%)
Total
n (%)
Years of
operation
6-10 years 1 (25) 0 (0) 0 (0) 3 (75) 4 (100)
More than 10 years 11 (19.3) 5 (8.8) 3 (5.2) 38 (66.7) 57 (100)
Total n (%) 12 (19.7) 5 (8.2) 3 (4.9) 41 (67.2) 61 (100)
* Note: Not applicable refers to respondents that did not undertake waterfront development.
6.4.4 Number of Employees and the Percentage of Waterfront Development Projects
Table 6.14 shows the cross tabulation analysis between the number of employees and the
percentage of waterfront development projects undertaken by property development
companies. From the results, ten property development companies have that employed over
100 people have undertaken1-20% of waterfront development projects as a share of their total
developments, while only five companies have undertaken between 20-60% of their
development projects.
Table 6.14: Cross tabulation between the number of employees and the percentage of
waterfront development projects
Waterfront development percentage
1-20%
n (%)
21-40%
n (%)
41-60%
n (%)
Not applicable
n (%)
Total
n (%)
Number of
employees
11-50 people 0 2 (33.3) 0 4 (66.7) 6 (100)
51-100 people 2 (20) 1 (10) 0 (0) 7 (70) 10 (100)
Over 100 people 10 (23.8) 2 (4.8) 3 (7.1) 27 (64.3) 42 (100)
Do not know /
not sure
0 (0) 0 (0) 0 (0) 3 (100) 3 (100)
Total n (%) 12 (19.7) 5 (8.2) 3 (4.9) 41 (67.2) 61 (100)
* Note: Not applicable refers to respondents that did not undertake waterfront development.

142
6.5 T-Test Analysis
6.5.1 T-test on the Statements for Waterfront Development Guidelines between Two
Groups of Respondents
An independent sample t-test was carried out on eighteen statements recommended for
waterfront development guidelines for Malaysia, to determine if there was statistical evidence
of difference between how the two respondent groups replied; those that had undertaken
development and those that hadn‟t. Table 6.15shows the mean, standard deviation, t-values
and p-vales of the factors for each group.
Table 6.15: T-test on the statements for waterfront development guidelines between two
groups of respondents
Statements Undertake
waterfront
development projects
Mean
score
SD t-values p-values
River reserve beautification.
Yes
No
4.45
4.37
0.510
0.488
0.623 0.536
Participation among
stakeholders should be
compulsory at every stage of
the development.
Yes
No
4.40
4.34
0.598
0.825
0.315 0.754
Environmental Impact
Assessment (EIA) is
compulsory.
Yes
No
4.35
4.32
0.745
0.610
0.184 0.855
Sharing waterfront benefits
(such as view, financial
rewards, etc.) among
stakeholders (e.g. community,
government, developer).
Yes
No
4.20
4.37
0.616
0.733
-0.872 0.387
Continuous river
rehabilitation.
Yes
No
4.45
4.20
0.605
0.782
1.281 0.205
Upgrading and maintaining
sewage systems.
Yes
No
4.40
4.20
0.681
0.715
1.067 0.290
Maintenance & rehabilitation
costs are shared between
stakeholders.
Yes
No
4.25
4.20
0.550
0.511
0.384 0.702
Provide flood mitigation (e.g.
by planting more trees).
Yes
No
4.20
4.20
0.523
0.749
0.029 0.977
Should use environmentally
friendly materials in
construction.
Yes
No
4.25
4.15
0.851
0.691
0.509 0.613
Encourage economic
activities.
Yes
No
3.95
4.22
0.759
0.652
-1.435 0.157

143
Statements Undertake
waterfront
development projects
Mean
score
SD t-values p-values
Protection of natural
resources (water and
environment).
Yes
No
4.20
4.00
0.696
0.671
1.080 0.285
Provision of sufficient public
facilities and amenities (such
as pedestrian, landscaping,
access ways, recreation areas,
etc.).
Yes
No
3.85
3.98
0.745
0.724
-0.630 0.531
Integrate both modern and
heritage aspects into
development.
Yes
No
3.60
4.07
0.598
0.721
-2.537 0.014
Personal security is
maintained by means of
policing, surveillance
cameras, etc.
Yes
No
4.10
3.80
0.788
0.749
1.420 0.161
Restrict type of development. Yes
No
3.90
3.88
0.718
0.600
0.126 0.900
Continuously educate public
about environmental
concerns.
Yes
No
3.85
3.85
0.745
0.654
-0.020 0.984
Upgrading and maintaining
established settlements along
the waterfront areas.
Yes
No
3.30
3.80
0.865
0.782
-2.287 0.026
Mitigate property speculation. Yes
No
3.65
3.49
0.813
0.870
0.698 0.488
* Significant at 5 percent confident level
From the results, there is no significant difference in the responses to the statements
recommended for waterfront development for Malaysia between the two groups, the
respondents undertaking waterfront development and those that did not undertake waterfront
development. However, there is a significant difference on two statements recommended for
waterfront development guidelines namely upgrading and maintaining established settlements along
the waterfront areas (p<0.022) and integrate both modern and heritage aspects into development (p<
0.014) between the two groups, the respondents undertake waterfront development and the
respondents do not undertake waterfront development.
6.6 Exploratory Factor Analysis
The following sections provide the results of the Exploratory Factor Analysis.
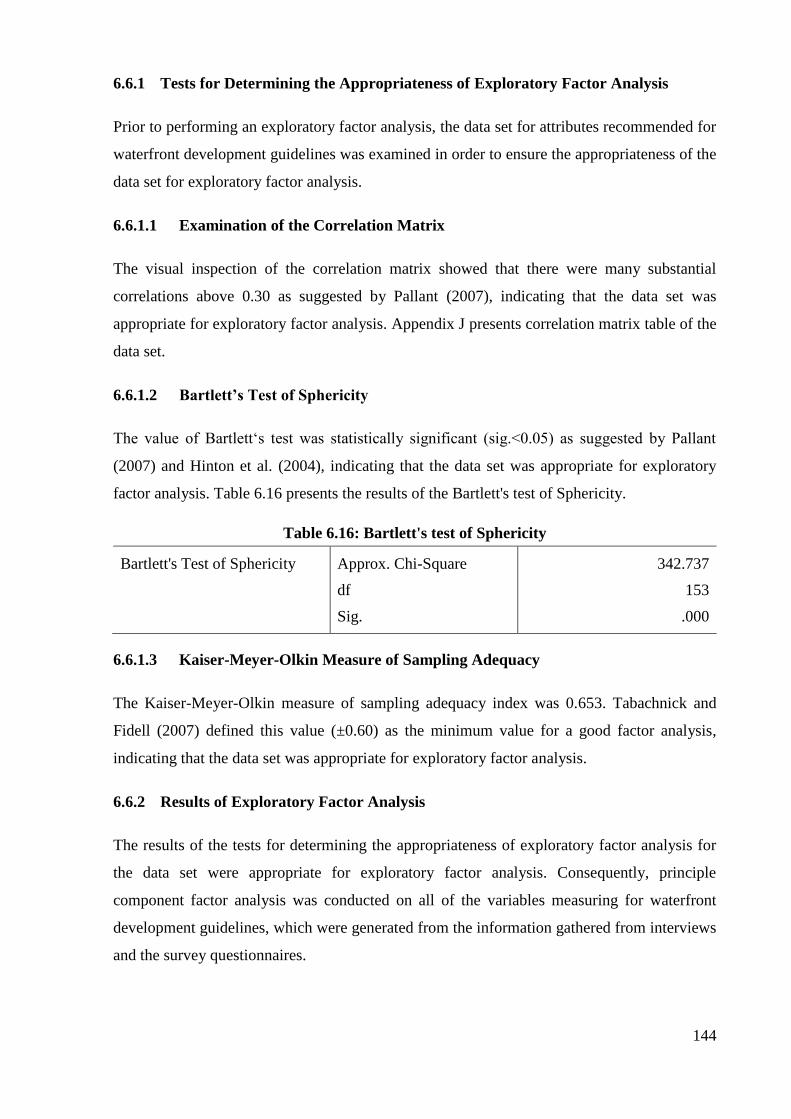
144
6.6.1 Tests for Determining the Appropriateness of Exploratory Factor Analysis
Prior to performing an exploratory factor analysis, the data set for attributes recommended for
waterfront development guidelines was examined in order to ensure the appropriateness of the
data set for exploratory factor analysis.
6.6.1.1 Examination of the Correlation Matrix
The visual inspection of the correlation matrix showed that there were many substantial
correlations above 0.30 as suggested by Pallant (2007), indicating that the data set was
appropriate for exploratory factor analysis. Appendix J presents correlation matrix table of the
data set.
6.6.1.2 Bartlett’s Test of Sphericity
The value of Bartlett„s test was statistically significant (sig.<0.05) as suggested by Pallant
(2007) and Hinton et al. (2004), indicating that the data set was appropriate for exploratory
factor analysis. Table 6.16 presents the results of the Bartlett's test of Sphericity.
Table 6.16: Bartlett's test of Sphericity
Bartlett's Test of Sphericity
Approx. Chi-Square
df
Sig.
342.737
153
.000
6.6.1.3 Kaiser-Meyer-Olkin Measure of Sampling Adequacy
The Kaiser-Meyer-Olkin measure of sampling adequacy index was 0.653. Tabachnick and
Fidell (2007) defined this value (±0.60) as the minimum value for a good factor analysis,
indicating that the data set was appropriate for exploratory factor analysis.
6.6.2 Results of Exploratory Factor Analysis
The results of the tests for determining the appropriateness of exploratory factor analysis for
the data set were appropriate for exploratory factor analysis. Consequently, principle
component factor analysis was conducted on all of the variables measuring for waterfront
development guidelines, which were generated from the information gathered from interviews
and the survey questionnaires.

145
6.6.2.1 Latent Root Criterion
Latent root criterion considers all factors that have eigenvalues greater than 1.0 as significant
(Stewart, 1981). Results of the latent root criterion (see Table 6.23) indicated that the 18
variables submitted for factor analysis should be extracted to form six factors. See Table 6.23
below for eigenvalues and the explained percentage of variance of the data set.
6.6.2.2 Percentage of Variance Criterion
The six factors for waterfront development guidelines extracted, explained approximately
66.26% of the variation in the data set and was above 60% as suggested by Hair et al. (2006).
See Table 6.17.
Table 6.17: Eigenvalues and the explained percentage of variance
Component
Initial Eigenvalues Extraction Sums of Squared Loadings
Total
% of
Variance
Cumulative
% Total
% of
Variance
Cumulative
%
1
2
3
4
5
6
7
8
9
10
11
12
13
14
15
16
17
18
4.536
1.778
1.619
1.539
1.241
1.214
0.983
0.890
0.717
0.674
0.622
0.467
0.394
0.358
0.319
0.268
0.221
0.160
25.201
9.875
8.993
8.552
6.897
6.742
5.463
4.945
3.983
3.742
3.457
2.593
2.187
1.990
1.774
1.490
1.228
0.889
25.201
35.076
44.069
52.620
59.518
66.259
71.723
76.668
80.651
84.393
87.850
90.442
92.630
94.620
96.394
97.884
99.111
100.000
4.536
1.778
1.619
1.539
1.241
1.214
25.201
9.875
8.993
8.552
6.897
6.742
25.201
35.076
44.069
52.620
59.518
66.259

146
6.6.2.3 Scree Test Criterion
According to Hair, Black, Babin, & Anderson (2009), the scree test criterion is used “to
identify the optimum number of factors that can be extracted before the amount of unique
variance begins to dominate the common variance structure.” As depicted in Figure 6.1, there
were six factors extracted before the curve became approximately a horizontal line. The plot
slopes steeply downward at the beginning before slowly became approximately a straight line,
indicating that the extraction of six factors is qualified for this analysis.
Figure 6.1: Scree test criterion
6.6.2.4 Factor Rotation
The VARIMAX normalised rotation displayed all eighteen variables for waterfront
developments guidelines loading in the six factors as presented in Table 6.24 below.
6.6.2.5 Interpretation of the Exploratory Factor Analysis
A principal component factor analysis specifying six factors that included all variables for
waterfront development guidelines was attempted with a VARIMAX normalised rotation, to
highlight a simple structure amongst the six factors identified.48 Table 6.18 below summarises
48 In this research, an orthogonal rotation (VARIMAX) was conducted. The latent root criterion and the scree
test criterion, which state that only factors with Eigenvalues greater than one should be used, was also considered
in the choice of the number of factors to include (Hair, et al., 2006).
Factor Number
Scree Plot

147
the results of the exploratory factor analysis. The six factors extracted by factor analysis
explained 66.26% of the variation in the data.
All factor loadings ranged from 0.548 to 0.821. Each factor was named according to the
salient themes among the items (Hair, et al., 2006). The final factors were identified as
Environment (Factor 1), Waterfront benefits (Factor 2), Mitigation (Factor 3), Beautification
(Factor 4), Security (Factor 5), and Type of developments (Factor 6). Hair et al. (2006)
determined that items with higher loadings had a greater influence on the name selected to
represent a factor and the name assigned to the factor should accurately reflect the items
loaded on that factor.
Factor 1 was named „Environment‟ and was strongly correlated with variables associated with
environmental matters. The variables included in Factor 1 are listed in Table 6.24 below such
as „Environment Impact Assessment (EIA) is compulsory‟, „maintenance and rehabilitation
costs are shared between stakeholders‟ and „upgrading and maintaining established
settlements along the waterfront areas‟.
The second factor was named „Waterfront benefits‟. This Factor included several variables
such as „sharing waterfront benefits such as views, financial rewards, etc. among stakeholders
(e.g. community, government officers and developers)‟ and „encourage economic activity‟.
Factor 3 was named „Mitigation‟ and correlated highly with variables associated with public
and developer awareness on waterfront developments. Two variables were loaded in Factor 3
namely, „mitigate property speculation‟ and „continuously educate the public about
environmental concerns‟.
Factor 4 was named „Beautification‟ which was related to protecting natural resources close to
waterfront developments areas. This Factor included two variables namely, „river reserve
beautification‟ and „protecting of natural resources e.g. water and environment‟.
The collective name for the correlated variables loaded in Factor 5 was „Security‟ and relates
to both waterfront users (community) and developers. Two variables loaded within this factor
were „personal security is maintained by means of policing, surveillance cameras, etc.‟ and
„should use environmentally friendly materials in construction‟.

148
Factor 6 posed a challenge as most variables with high loadings were categorised with other
factors. In the end, this Factor was called „Type of development‟ as this was the only variable
that remained.
Lastly, the variables loaded in each factor were subjected to a reliability test using Cronbach‟s
Alpha. The next section explains the results for the reliability test conducted for each factor.

149
Table 6.18: Factor analysis results: Principal Component extraction
* Factor loadings in the range of ± .30 to ± .40 are considered to meet the minimal level for interpretation of structure. Loadings ± .50 or greater are considered practically significant,
and loadings exceeding ± .70 are indicative of well defined structures (Hair, et al., 2006).
Factor number
Factor name
Factor variables
Factor
Factor 1
Environment
Factor 2
Waterfront
benefits
Factor 3
Mitigation
Factor 4
Beautification
Factor 5
Security
Factor 6
Type of
developments
(1) Environment Impact Assessment (EIA) is compulsory.
(2) Maintenance & rehabilitation costs are shared between stakeholders.
(3) Upgrading and maintaining established settlements along the waterfront areas.
(4) Provision of sufficient public facilities and amenities (such as pedestrian paths,
landscaping, access ways, recreation areas, etc.).
(5) Provide flood mitigation (e.g. by planting more trees).
(6) Continuous river rehabilitation.
(7) Integrate both modern and heritage aspects into development.
.703
.697
.674
.670
.636
.586
.574
.827
.691
.656
.551
.799
.718
.745
.600
.737
.548
.821
(1) Sharing waterfront benefits (such as views, financial rewards, etc.) among
stakeholders (e.g. community, government, developers).
(2) Encourage economic activity.
(3) Upgrading and maintaining sewage systems.
(4) Participation among stakeholders should be compulsory at every stage of the
development.
(1) Mitigate property speculation.
(2) Continuously educate public about environmental concerns.
(1) River reserve beautification.
(2) Protection of natural resources (water and environment).
(1) Personal security is maintained by means of policing, surveillance cameras, etc.
(2) Should use environmentally friendly materials in construction.
(1) Restrict type of development.
Percentage Variation Explained 25.201% 9.875% 8.993% 8.552% 6.897% 6.742%
Cumulative Percentage Variation Explained 25.201% 35.076% 44.069% 52.620% 59.518% 66.259%

150
6.6.2.6 Reliability
The eighteen variables were subjected to the reliability test, except for the variable loading in
Factor 6 – Type of development because it had a loading of only a single variable. Reliability
referred to the degree to which the items combined together and Cronbanch‟s Alpha
Coefficient is the most widely used measure for reliability (Hair, et al., 2006). Table 6.19
below summaries the Alpha values for each factor.
Table 6.19: Reliability test – Cronbanch’s Alpha Coefficient
Factor Principles Cronbanch’s
Alpha
Coefficient
Mean
inter-item
correlation
Environment
Environment Impact Assessment (EIA) is
compulsory.
Maintenance & rehabilitation costs are shared
between stakeholders.
Upgrading and maintaining established settlements
along the waterfront areas.
Provision of sufficient public facilities and amenities
(such as pedestrian paths, landscaping, access ways,
recreation areas, etc.).
Provide flood mitigation (e.g. by planting more
trees).
Continuous river rehabilitation.
Integrate both modern and heritage aspects into
development.
0.778
–
Waterfront
benefits
Sharing waterfront benefits (such as views,
financial rewards, etc.) among stakeholders (e.g.
community, government, developers).
Encourage economic activity.
Upgrading and maintaining sewage systems.
Participation among stakeholders should be
compulsory at every stage of the development.
0.717
–
Mitigation Mitigate property speculation.
Continuously educate public about environmental
concerns.
0.502
0.343
Beautification River reserve beautification.
Protection of natural resources (water and
environment).
0.346
0.220
Security
Personal security is maintained by means of
policing, surveillance cameras, etc.
Should use environmentally friendly materials in
construction.
0.259
0.149
Type of
developments
Restrict type of development. – –

151
As depicted in Table 6.19, only two factors (Environment and Waterfront benefits) had Alpha
values greater than 0.60 as suggested by Churchill (1979), DeVellis (2003) and Pallant (2007)
for exploratory research, while the rest did not. However, it is common to find quite low
Alpha values because Cronbach‟s Alpha Coefficient is sensitive to the number of items in the
scale (e.g. scales with fewer than ten items). In the case of low Alpha values, Pallant (2007)
recommended it may be appropriate to report the mean inter-item correlation for the items. In
this case, the mean inter-item correlation for Factors 3,4 and 5 (Mitigation, Beautification, and
Security) were reported as part of the reliability test – as presented in table 6.25 above.
Factors 3 and Factor 4 (Mitigation and Beautification) had a strong relationship among the
variables with mean inter-item correlation values greater than 0.20 but not for Factor 5 –
Security. Although the variables with low mean inter-item correlation (determined as not
reliable to group together) were recommended to be removed from the analysis (Pallant, 2007,
p. 98), it was decided to allow this factor to remain because the factor analysis and the
descriptive statistics results (mean scores) determined that this factor was statistically
significant. Further, it was considered that this factor was important to include in the
waterfront development guidelines.
6.7 T-test Analysis on Six Factor for Waterfront Development Guidelines
between Two Groups of Respondents
An independent sample t-test was carried out on the six factors extracted by exploratory factor
analysis. The t-test analysis was conducted to test for a statistically significant difference in
response on six factors extracted for waterfront development guidelines between the two
groups, the respondents undertaking waterfront development and those that did not undertake
waterfront development. Table 6.20 shows the mean, standard deviation, t-values and p-vales
of the factors for each group.
As presented in Table 6.20, the results show that there is no significant difference in any
factors on waterfront development guidelines for Malaysia between the two groups of
respondents as determined by Pallant (2007) at 0.05 significant levels.

152
Table 6.20: T-test on six factors for waterfront development guidelines between two
groups of respondents
Factor Undertake waterfront
development projects
Mean
score
SD t-value p-value
Environment
Yes
No
4.00
4.10
0.47
0.47
-0.834 0.408
Waterfront benefits Yes
No
4.23
4.28
0.50
0.53
-0.298 0.766
Mitigation Yes
No
3.75
3.67
0.71
0.58
0.460 0.647
Beautification
Yes
No
4.32
4.18
0.51
0.42
1.131 0.263
Security
Yes
No
4.17
3.97
0.61
0.54
1.284 0.204
Type of development Yes
No
3.90
3.87
0.71
0.59
0.126 0.900
6.8 Correlation
A correlation was carried out for the six factors extracted by factor analysis. A correlation
matrix was conducted to identify associations between the factors extracted for waterfront
development guidelines. Information about the correlations explained the extent to which the
variables were related to each other (Wagner, 2010, p. 75). The results presented in Table
6.27 explain that each factor was positively correlated with small correlations as suggested by
Cohen (1988), except for Factor 1 – Environment, which indicated a strong correlation with
Factor 2 – Waterfront benefits at the 1.0 percent level (Sweet & Grace-Martin, 2008). Factor
6 – Type of development, indicates a very poor relationship with each factor and has a
negative direction in Factors 3, 4 and 5 (Mitigation, Beautification, and Security).49
The
negative sign indicates a non-linear relationship among them (Sweet & Grace-Martin, 2008).
See Table 6.21 for correlation results.
49 Cohen (1988) suggests the following guidelines for interpreting the correlation; Small (r=0.10 to 0.29);
Medium (r=0.30 to 0.49); and Large (r=0.50 to 1.0). On the other hand, Sweet & Grace-Martin (2008)
determined in the social sciences, that a correlation of 0.30 is considered a “Good” correlation; a correlation
above 0.40 is considered “Strong”.

153
Table 6.21: Correlation matrix table
Factor Environment Waterfront
benefits
Mitigation Beautification Security Type of
development
Environment
Waterfront
benefits
Mitigation
Beautification
Security
Type of
development
1
0.458**
0.000
0.232
0.000
0.249
0.053
0.099
0.449
0.012
0.925
1
0.199
0.124
0.234
0.070
0.116
0.374
0.043
0.740
1
0.144
0.270
0.116
0.372
-0.089
0.496
1
0.200
0.122
-0.051
0.697
1
-0.079
0.547
1
** Correlation is significant at the p < 0.01 level (2-tailed).
6.9 Discussion
This section discusses the information related to waterfront development in Malaysia. This
discussion considers information that was gained from the interviews and statistical analysis
that pertains to the research objectives as stated in Chapter 1 – Introduction.
6.9.1 Research Objective One: Current Practices for Waterfront Development in
Malaysia.
The results show that only a small number of property development companies had
undertaken waterfront development projects in Malaysia. Only a third (32.8%) of the
respondents had undertaken waterfront development projects, while the rest had not, even
though they had more than 10 years experience in property developments and employed
sufficient numbers of staff.
Although the results showed that only a small number of property development companies
have undertaken waterfront development projects the number of waterfront development
projects in Malaysia is forecasted to increase in the future. From the results, 84% of the
interviewees agreed that waterfront development projects in Malaysia will be increased in
terms of numbers and more than half (58.5%) of property development companies statistically
indicated their interest in waterfront development. This finding was consistent with previous
studies that found that waterfronts are a magnet for human populations throughout the world,

154
for many reasons such as recreation, tourism and leisure (Martinez, et al., 2007; Tumbde,
2005). It was determined that waterfronts are one of the most potentially developed areas in a
city. In fact, the world‟s waterfront population was recorded at 1.2 billion in 1990 (Small &
Nicholls, 2003) and this percentage rose to 41% (2.5 billion) in 2002 (United Nations, 2005).
Until year 2011, there was no figure recorded that indicated waterfront populations for
Malaysia, but findings from this study forecast that waterfront development projects will
increase in the future. Therefore, the researcher would recommend identifying waterfront
populations in Malaysia in future research.
Over the last 10 years, Malaysia has begun waterfront redevelopment projects and has
focused on recreational, residential and mixed-use development rather than regenerating
waterfront businesses (shipping and transportation). The findings of this study indicate that
waterfront development undertaken in Malaysia have been mainly for residential (75%),
mixed-use (70%) and commercial (40%) purposes. This finding was supported by the
literature that indicated that in the past, many waterfront redevelopment areas underwent a
transition from abandoned spaces to commercial, residential and recreational areas
(Bruttomesso, 1993; Butuner, 2006; Sairinen & Kumpulainen, 2006). Moreover, research
conducted by Tumbde (2005) also found that the riverfront redevelopment with emphasis on
mixed-use developments helps enhance the economic feasibility of the redevelopment
projects. In short, waterfront redevelopment projects can be economically viable with
implementation of mixed land use development during the redevelopment processes
(Bruttomesso, 2006; Torre, 1989; Tumbde, 2005).
The findings from the interviews indicate that waterfront redevelopment undertaken by the
Malaysian government were mainly for public use and environmental improvement such as to
provide tourist attractions (33%), to protect natural resources (33%) and to provide
community amenities (33%). These findings were supported by other research that indicates
that waterfront development by the government were concentrated on environmental
improvements and sightseeing rather than economic development, for example in China
(Yingxia & Xiaofeng, 2006). Moreover, according to Gaffen (2004), growing numbers of
waterfront development were attributed to reasons such as environmental awareness and
providing public spaces (recreational).
On the other hand, findings from the research indicate that decisions made by the property
development companies undertaking waterfront development projects were greatly influenced

155
by wanting a profit/financial benefit (35%) and by wanting to diversify their type of property
developments (35%). Despite the concentration on environmental concerns, many of the
waterfront redevelopment around the world have shared some common goals such as
redefining the waterfront‟s position in the urban context, remaking the urban image, the
regeneration of the economy and improving social patterns (Butuner, 2006; Sairinen &
Kumpulainen, 2006).
Reasons provided for wanting to undertake waterfront development in the future by the
government and property development companies include: to diversify the government‟s and
companies‟ businesses; to introduce new concepts in development; provide community
amenities; cater for demand from buyers; makes profits; reduce environmental damage; offer
tourist attractions; protect natural resources and help maintain heritage and cultural values.
These reasons are supported by the literature that indicate that the growing number of
waterfront development and redevelopment projects throughout the world are attributed to
several factors such as environmental awareness and smart growth, preservation and adaptive
reuse, recreation, increased tourism and enhanced federal assistance (Gaffen, 2004; Tumbde,
2005). An increasing demand for recreational activities and a number of other factors have
become determinants in the redevelopment process and waterfronts have been mostly
designed as new public open spaces of cities that are totally different from their former
structures (Butuner, 2006; Tsukio, 1984). Moreover, research conducted by Oliva (2006)
showed that waterfront development has a positive impact on housing prices (1996-2003) and
established a positive relationship between waterfront development and house prices although
the impact varied with distance from the water body.
In terms of the governance of waterfront development in Malaysia, the results of this research
indicate that the majority (93%) of respondents thought that the management and
administration of waterfront resources was not effective. From the results, ineffective
governance for waterfront development in Malaysia was attributed to several factors such as
low levels of cooperation between stakeholders, inefficient communication systems, low
enforcement of regulations, inadequate policies/guidelines, the lack of expertise, external
party interference and conflicts of interest. These factors are supported by the literature that
show that sustainable governance is required in order to achieve sustainable waterfront
development, and sustainable governance can be achieved through the combination of several
principles: sustainability, adaptive management, participation and integration (Duxbury &
Dickinson, 2007).

156
The research conducted by Latip et al. (2010) found that the absence of policies and
regulations to control waterfront development in Malaysia was identified as a reason for the
loss of integration between cities and water bodies. Moreover, inadequate assessment and
mitigation of the river environment had deteriorated the quality and quantity of rivers, as well
as caused the uncontrolled growth of settlements along the river areas (Yossi & Sajor, 2006).
In addition, the failure of city planners responsible for creating properly managed land such as
along riversides, had also contributed to environmental problems (Baiquni, 2004).
Therefore in order to maximise the benefits provided by the waterfront and to minimise the
conflict and negative effects of waterfront activities, an integrated waterfront management
system that consists of legal and institutional frameworks are necessary (Post & Lundin,
1996). In addition, good collaboration and coordination between different government
authorities and external stakeholders is highly required and the implementation of and the
aims of the interventions should not be contradictory (Yossi & Sajor, 2006).
The results indicate that a third (32%) of interviewees and 41% of the questionnaires returned
indicate that Malaysia currently does not successfully implement waterfront development
projects. In addition, at least 45% of property development companies which are currently
undertaking waterfront development also thought that Malaysia currently did not successfully
implement waterfront development projects. Most respondents thought that there are several
reasons that prevent the successful implementation of waterfront development in Malaysia
such as the following: insufficient financial support, lack of human expertise and technology,
difficulty in balancing social, economic and financial issues, the lack of collaboration between
stakeholders involved in waterfront development, lower levels of participation (domination by
government and less involvement by non-government organisations) and difficulty obtaining
planning permission for waterfront development (3.3%). These results are supported by the
literature that determined that successful waterfront development could be achieved through a
combination of several factors such as financial feasibility, environmental approval, effective
management, construction technology, stakeholders participation and sharing benefits etc.
(Bertsch, 2008; Bruttomesso, 2006; Mann, 1973; Torre, 1989; Tumbde, 2005). Moreover, a
lack of manpower and technical expertise, development approaches that prioritise economic
and engineering feasibility and a low priority in the allocation of funds for landscaping and
beautification works were identified as reasons the government failed to improve the
environmental quality in Malaysia (Dewan Bandaraya Kuala Lumpur, 1984)

157
Previous research focusing on the social impact of waterfront development indicated that
successful waterfront development was significant in increasing household income, job
opportunities, regional business sales and tourism (Krausse, 1995; Parsons & Wu, 1991;
Rexhausen & Vredeveld, 2003). In addition, waterfront redevelopment provided better safety
and access to downtown areas and also created new economic activities (Small & Arnott,
1994). Thus, apparently, in order to achieve and maintain economically viable waterfront
development, a combination of several factors that could result in successful waterfront
development is recommended, for the practice of waterfront development in Malaysia.
6.9.2 Research Objective Two: An Overseas Approach to Waterfront Development
with Emphasis on Guidelines Available.
This section discusses how waterfront development is being implemented in another country.
In particular, Wellington‟s Waterfront in New Zealand and Singapore‟s Riverfront in
Singapore were adopted as an example of a successful waterfront development project from
overseas. Due to it functioning successfully as a public space and recreation centre,
Wellington‟s Waterfront has evolved into a world-class waterfront over the past 15 years
(Grondelle & Price, 2005) and therefore inclusion of Wellington‟s Waterfront and
Singapore‟s Riverfront (as an example of an overseas approach) in this research is relevant.
The discussion emphasises the governance, the guidelines and the strategies behind the
success of Wellington‟s Waterfront development and Singapore‟s Riverfront development.
6.9.2.1 Wellington’s Waterfront, New Zealand
“In reality, waterfront is our city‟s heart and soul – it‟s our promenade, our
playground and a treasured place that all of us who live here care about
deeply. Increasingly, we are not just admiring it, but using the water for
sailing, swimming, rowing and skiing.”
(Grondelle & Price, 2005, p. 5)
Waterfront development has been established in New Zealand for a long time and specifically
in Wellington, since the first land reclamations occurred in 1852 followed again in 1975 and
continued until the present (Grondelle & Price, 2005; Wellington City Council, 2010). Over
the past 15 years, the waterfront has turned into a world-class waterfront and presently is seen
as a vital element in Wellington‟s future prosperity.50
The transition of Wellington‟s
50 Known as “Te Whanganui a Tara – the great harbour of Tara”, Wellington harbour was the centre of activity
in pre-European times. Until the 20th century, Wellington was established as New Zealand‟s premier port and
was handling half of the trade.

158
Waterfront from a working port to a vibrant part of the city for recreational uses and public
life grew in the 1970s and 1980s after the port administrator decided to redevelop the
abandoned waterfront areas.51
A joint-venture agreement to develop the area was signed by
the Harbour Board and the City Council in 1986. The agreement established a special
development zone, a concept plan and the formation of two companies to provide the
management and administration for the Wellington Waterfront project: Lambton Harbour
Overview Limited and Lambton Harbour Management Limited (LHML), a Local Authority
Trading Enterprise (LATE). This meant that it was owned by the Harbour Board and the
Council but run as a separate company. Since then, Wellington‟s Waterfront has grown and
also has set aside much land for public space. In fact, according to the Wellington City
Council (2001), almost 80% of the waterfront area will be kept as open space and all the land
along the waterfront area will be publicly accessible.
It is important to note that the concept plan in Wellington‟s Waterfront framework52
was
developed after several public consultations and a lot of controversy. The involvement of the
public in the decision making process for Wellington‟s Waterfront is important for the
successful future direction of the waterfront development (Wellington City Council, 2001).
6.9.2.1.1 Governance of Wellington’s Waterfront
“Wellington‟s Waterfront is a special place that welcomes all people to live,
work and play in the beautiful and inspiring spaces and architecture that
connect our city to the sea and protect our heritage for future generations.”
(Wellington City Council, 2001, p. 11)
According to the Wellington City Council (2001), there are two entities53
responsible for
management and administration of Wellington‟s Waterfront namely: the Waterfront
Development Group and the Waterfront Implementation Agency. The structure of
management and administration for Wellington‟s Waterfront and the roles of each entity are
summarised in Figure 6.2 below.
51 In the 1960s, Wellington‟s port declined due to several reasons such as the beginning of air travel, the
upgrading of port facilities (containerisation) and the decline of the shipping industry.
52 Wellington‟s Waterfront framework is a platform for the development of the waterfront. The Wellington
waterfront framework was carried out by the Waterfront Leadership Group (appointed by the Wellington City
Council) in September 2000 to recommend a vision for the waterfront and the principles and values and urban
design for the waterfront for the future.
53 The Waterfront Development Group consists of professional and community representatives, while the
Waterfront Implementation Agency includes a Local Authority Trading Enterprise (LATE).

159
(Adopted from: Wellington City Council, 2001)
Figure 6.2: Governance structure for Wellington’s Waterfront
As well as the well structured governance for Wellington‟s Waterfront, the Waterfront
Leadership Group also outlined six principles as a guide for the management and
administration process for Wellington‟s Waterfront (Wellington City Council, 2001). The
principles are used to guide management and administration for Wellington‟s Waterfront and
includes: (i) Transparency, (ii) Public engagement, (iii) Momentum, (iv) Separation of
planning and implementation, (v) Arm‟s length governance, and (vi) Final accountability with
the council. The Wellington City Council (2001) identified that public engagement and
transparency were important principles in driving the management and administration for
Wellington‟s Waterfront. The Waterfront Leadership Group believed that disclosing all
information about the waterfront development to the public (Wellingtonians) as an “owner” of
the waterfront and include input from them in the decision making processes of waterfront
development was and is important so as to have confident in the decisions being made. This is
also supported by the literature that highlights participation, adaptive management, full cost
allocation and integration etc. as essential principles in administering natural resources and
the waterfront resources, and maintaining the economic value of the waterfront area
(Costanza, et al., 1997; Duxbury & Dickinson, 2007).
Waterfront Development Group
(Membership includes professional and
community representatives).
● Prepares development plan.
● Runs public engagement process.
● Prepares performance briefs for design
work.
● Monitors delivery of plans to brief
(including sign-off of design plans).
● Monitors implementation of plans.
Waterfront Implementation Agency
(A Local Authority Trading Enterprise –
LATE).
● Performance briefs, including
engaging designers to do detailed
plans based on performance briefs.
● Day-to- day operational management
of the waterfront.
● Point of contact for potential
developers.
Wellington City Council
Approves waterfront policy.
Approves work plan and budget.
Monitors both entities.

160
Therefore, incorporating all the principles driving the management and administration for
Wellington‟s Waterfront into the governance structure for waterfront development in
Malaysia would promote effective management of the waterfront resources and is
recommended for the future.
6.9.2.1.2 Objectives and Principles of Wellington’s Waterfront
According to the Wellington City Council (2001), the development of Wellington‟s
Waterfront aimed to achieve seven objectives as follows:
(i) That the waterfront is locally and internationally recognised for its design.
(ii) That the waterfront is readily accessible to all people.
(iii) That the waterfront is and is perceived to be safe at all times.
(iv) That the waterfront is seen as an attractive place that draws Wellingtonians and visitors
alike.
(v) That the waterfront successfully caters for a wide range of events and activities.
(vi) That significant heritage buildings are protected on the waterfront.
(vii) That activities on the waterfront are integrated with those on the harbour.
In order to achieve these objectives, the development of Wellington‟s Waterfront has
followed several key principles as a fundamental element of the development. These
principles were set out by the Waterfront Leadership Group and take into consideration all
issues related to waterfront development. Table 6.22 lists key principles for Wellington‟s
Waterfront.
Table 6.22: Key principles for Wellington’s Waterfront
Principle Description
Principle 1:
Expression of
heritage and
history
Heritage and the history of the waterfront are important parts of the identity of the
waterfront. There is a range of aspects to the pre- and post-colonial history of the
waterfront, including maritime, social and economic aspects, and all these stories
need to be told.
Heritage buildings are an important aspect of the history of the waterfront and
should be restored and reused.
Principle 2:
Expression of
Maori cultural heritage will have a strong presence on the waterfront and play a
key role in identifying the waterfront.

161
Principle Description Maori heritage
and presence Maori cultural presence on the waterfront should be an active one – to show a
living culture – and will include a focus on Waka culture.
Maori history and heritage will be reinforced by a variety of methods.
Principle 3:
Sense of place
for
Wellingtonians
The waterfront as a whole is, and will remain, a unique asset to the city that is a
draw card in its own right.
Any development will be of a high quality.
Any new buildings will be complementary to, and in a scale appropriate to, the
existing buildings around them.
The identity developed for each area will be in character with the waterfront as a
whole.
The design and use of buildings should be orientated outwards to maximise the
unique value of the waterfront location.
The waterfront is part of Wellington and new work will complement the buildings
and public spaces in the adjacent city.
Principle 4:
Diversity of
experience
The waterfront is somewhere to live, work and play.
The waterfront will meet the needs of a diverse range of people.
Recreational, cultural and civic uses are particularly appropriate for the
waterfront, complementary to similar uses in other parts of the city.
There will be an allowance for some commercial development on the waterfront.
Public space development does not depend for funding on commercial
development.
New buildings can be considered for the waterfront.
Ecological values of the waterfront will be maintained – bearing in mind that this
is a highly modified environment.
The entire waterfront is predominantly for people, not motor vehicles. Pedestrian
and non-motorised transport will be able to use the waterfront safely. However,
service vehicle access needs to be provided for.
Principle 5:
Sense of
collective
ownership
The waterfront is predominantly a public area.
The public should be consulted – either through the stage two process or through a
statutory planning process – about any proposed new buildings and any significant
changes to existing buildings.
Ground floor of buildings will be predominantly accessible to the public.
Principle 6:
Experience of
space and
openness
The harbour is the primary open space on the waterfront.
There will be a network of paths throughout the area.
A series of different open spaces that cater for diverse uses and activities will
predominate.
In addition to Frank Kitts Park there will be a second large green open space at
Chaffers.
There will be a variety of open spaces – some green, some sheltered and some
paved.
Important views and vistas from the city to the sea will be protected and important

162
Principle Description new ones created.
Panoramic views from the water‟s edge, along with framed views of the
waterfront, are important.
Buildings will support the open spaces, both in their design and their associated
uses and activities.
Principle 7:
Ease of access
for all
There will be a public walkway/promenade along the length of the waterfront,
predominantly at the water‟s edge.
There will be better pedestrian access from the city to the waterfront. There will
be better access points for pedestrians. Improvements to pedestrian access points
will include the provision of shelter. The council encouraged implementing the
proposed upgrade of the quays and streets, including landscaping and improving
street crossings.
The waterfront needs to be linked to the rest of the city, in terms of both physical
access and visual links such as views and signage.
More private and public transport drop-off points are needed.
There should be opportunities for people to gain access to and from the water.
The waterfront should be accessible for people with special needs.
The waterfront will be designed with safety and security in mind.
Natural surveillance achieved through good design is preferred to electronic or
formal methods of surveillance.
Ideally, surface parking should be progressively removed as developments takes
place. The parking requirements of Te Papa, Circa, Chaffers Marina and other
waterfront venues need to be considered.
Parking provided on the waterfront will be primarily for waterfront users.
(Adopted from: Wellington City Council, 2001)
As presented in Table 6.28 above, all principles set up for the development of Wellington‟s
Waterfront area emphasised the integration between heritage and modern, conservation and
preservation, public participation, open spaces and public accessibility. For example,
Principle 1, Principle 2 and Principle 3 have clearly stated the importance of maintaining the
heritage and history of the waterfront area and maximising the unique value of the waterfront
area while developing the waterfront area. Principle 4, Principle 5, Principle 6 and Principle 7,
emphasised the importance of open spaces, public participation at every stage of the
development and public accessibility to waterfront areas. Apparently, all the principles that
were recommended for Wellington‟s Waterfront have provided full consideration and
attention to the public‟s interest in the waterfront area and provided protection for the
waterfront itself, and these principles were also determined as being essential for maintaining

163
the economically viability and success of the waterfront development (Bertsch, 2008;
Bruttomesso, 2006; Torre, 1989; Tumbde, 2005).
In relation to Malaysia, waterfront development is growing in popularity and is currently
focusing more on recreational and mixed-use development purposes. Inclusion of all the
principles recommended for Wellington‟s Waterfront, is necessary for developing any
waterfront areas in Malaysia particularly for recreational purposes. It is important for
Malaysia to consider all the principles for achieving successful waterfront development and
maintaining economically viable waterfront areas as achieved by other countries, and
Wellington‟s Waterfront specifically.
Therefore, in order to guarantee the economic viability and success of waterfront projects in
Malaysia in future as gained by Wellington‟s Waterfront for example, the government which
includes Federal, State and Local Governments is required to:
1. Review guidelines for developments close to water areas in Malaysia by adopting and
integrating the key principles set up for Wellington‟s Waterfront to give more economic
benefit to the country.
2. Consistently promote and integrate the application of the key principles of the
governance for Wellington‟s Waterfront into the governance of waterfront development
in Malaysia to more effectively and efficiently manage the waterfront resources.
3. Encourage agencies that are directly and indirectly related to waterfront development in
Malaysia to make provision, where appropriate, for the key principles of governance
and the key principles for development close to water areas, as recommended by
Wellington‟s Waterfront, to be consistent with the objectives of the development and
the regulations.
6.9.2.2 Singapore’s Riverfront, Singapore
This section discusses how waterfront development has been implemented in Singapore.
Singapore‟s Riverfront was adopted as an overseas example of a successful waterfront
development. The next section discusses the history and strategies behind the success of
Singapore‟s Riverfront development.
6.9.2.2.1 Singapore’s Riverfront, Singapore

164
Singapore an island city has been blessed with a long coastline and waterbodies right in the
heart of the city centre. The 3.0 kilometre long Singapore River and runs through the City
Centre and was an excellent place for trading and warehousing activities since Singapore‟s
colonial days. During that time, many office buildings and jetties were developed to facilitate
trading activities along the riverbank (Urban Redevelopment Authority, 2010).
By the 1860s, almost three quarters of all shipping business in Singapore was done along the
Singapore River. However, by the 1970s, both the river banks and water became polluted due
to increased numbers of business activities and squatters along the river, and consequently the
river became an open sewer (Chang & Huang, 2005).
Beginning in 1977, the task to clean up Singapore River began and involved many
government agencies. An enormous river clean up has transformed the river from open sewer
to green landscape (Dobbs, 2002).54
After ten years of clean up, the river was ready for a new lease of life. In year 1990s, the
waterfront was redeveloped under the Urban Redevelopment Authority‟s Development Guide
Plan (DGP)55
for the Singapore River (Urban Redevelopment Authority, 1994). The
redevelopment has changed from a “working river” to “heritage and entertainment site.
6.9.2.2.2 Characteristics of Singapore’s Riverfront
According to the Master Plan for Singapore‟s Riverfront (Urban Redevelopment Authority,
1994), the development of Singapore‟s Riverfront has several characteristics that were a
fundamental element of the development. These characteristics take into consideration all
issues related to waterfront development. The characteristics of Singapore‟s Riverfront are
presented in Table 6.23 below;
54
The task to clean up Singapore River was an enormous one, and involved many government agencies. To start
off, all boats were moved out to Pasir Panjang as container shipping had replaced this earlier mode of
transporting goods from the ships to the godowns, and also removal derelict warehouses. As a result, tonnes of
garbage were dredged from the river (Dobbs, 2002).
55 The Urban Redevelopment Authority is Singapore‟s national planning authority. Micro planning is
accomplished through 55 development guide plans (DGPs) which are detailed plans that lay down guidelines on
land zoning, density and height of developments for specific areas in Singapore.
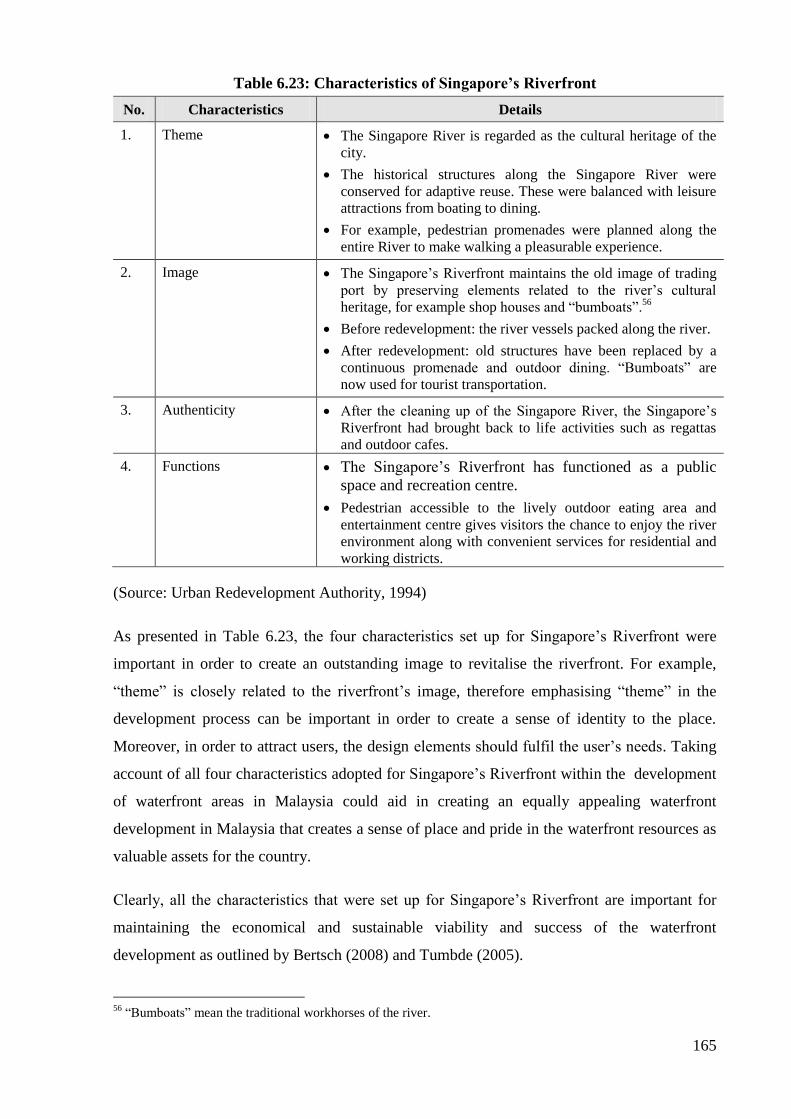
165
Table 6.23: Characteristics of Singapore’s Riverfront
No. Characteristics Details
1. Theme The Singapore River is regarded as the cultural heritage of the
city.
The historical structures along the Singapore River were
conserved for adaptive reuse. These were balanced with leisure
attractions from boating to dining.
For example, pedestrian promenades were planned along the
entire River to make walking a pleasurable experience.
2. Image The Singapore‟s Riverfront maintains the old image of trading
port by preserving elements related to the river‟s cultural
heritage, for example shop houses and “bumboats”.56
Before redevelopment: the river vessels packed along the river.
After redevelopment: old structures have been replaced by a
continuous promenade and outdoor dining. “Bumboats” are
now used for tourist transportation.
3. Authenticity After the cleaning up of the Singapore River, the Singapore‟s
Riverfront had brought back to life activities such as regattas
and outdoor cafes.
4. Functions The Singapore‟s Riverfront has functioned as a public
space and recreation centre.
Pedestrian accessible to the lively outdoor eating area and
entertainment centre gives visitors the chance to enjoy the river
environment along with convenient services for residential and
working districts.
(Source: Urban Redevelopment Authority, 1994)
As presented in Table 6.23, the four characteristics set up for Singapore‟s Riverfront were
important in order to create an outstanding image to revitalise the riverfront. For example,
“theme” is closely related to the riverfront‟s image, therefore emphasising “theme” in the
development process can be important in order to create a sense of identity to the place.
Moreover, in order to attract users, the design elements should fulfil the user‟s needs. Taking
account of all four characteristics adopted for Singapore‟s Riverfront within the development
of waterfront areas in Malaysia could aid in creating an equally appealing waterfront
development in Malaysia that creates a sense of place and pride in the waterfront resources as
valuable assets for the country.
Clearly, all the characteristics that were set up for Singapore‟s Riverfront are important for
maintaining the economical and sustainable viability and success of the waterfront
development as outlined by Bertsch (2008) and Tumbde (2005).
56
“Bumboats” mean the traditional workhorses of the river.

166
6.9.2.2.3 Key Strategies for Redevelopment of Singapore’s Riverfront
According to the Master Plan for the Singapore‟s Riverfront (Urban Redevelopment
Authority, 1994), the redevelopment of Singapore‟s Riverfront adopted three key strategies
as presented in Table 6.24 below;
Table 6.24: Key strategies for development of Singapore’s Riverfront
No. Strategy for
development
Details
1.
Creating an activity
corridor for recreation
and leisure through
mixed land-uses.
According to the Master Plan for the Singapore‟s Riverfront, the river
was zoned for a mixture of land uses that include commercial,
residential, hotel and institutional uses.
These mixed-use developments would attract people to the area.
The new developments are required to have activity generating uses on
the ground floor to ensure that the area is lively at the street level.
A guideline for the Kiosks and Outdoor Refreshment Areas was
released by Urban Redevelopment Authority (URA) mainly to
encourage more development to locate their commercial activities onto
the waterfront promenade areas.
2.
Mixing old and new
developments.
The identity and character for the Singapore River would be preserved
through selective conservation of architecturally significant buildings
and integrating them with new development.
The old buildings must be kept for the benefit of future generations.
The adjacent land can be used more intensively for commercial and
residential purposes.
The conserved buildings would be allowed to be adapted for new uses
to increase their viability.
3.
Forging a public /
private sector
partnership.
The government implemented the key infrastructure works to make the
area attractive for redevelopment.
Many parts of the river walls which had fallen into disrepair were
reconstructed and strengthened.
The bridges across Singapore River were upgraded.
Underpasses were constructed to provide continuous pedestrian access
along the river banks.
The government provided the planning framework and guidelines for
the private sector to carry out the redevelopment along the river using
private resources.
In order to encourage the private sector to participate in the
transformation of the Singapore River, State land and conserved
buildings were sold through the Government Land Sales Programme.
The urban design guidelines were designed by Urban Redevelopment
Authority, to guide developers to design their buildings at a compatible
scale with rivers cape, and design the riverfront promenade to
complement their development.
All the vision for Singapore‟s River Waterfront was thus realised
through a public / private partnership.
(Source: Urban Redevelopment Authority, 1994)

167
Incorporating the appropriate key strategies used for the redevelopment of Singapore‟s
Riverfront into the development of waterfront areas in Malaysia could improve the likelihood
of achieving sustainable waterfront development and could aid in creating outstanding
waterfront areas in Malaysia.
6.9.3 Research Objective Three: Evaluation of Current Regulations and Guidelines
Related to Waterfront Development in Malaysia.
This section evaluates current regulations and guidelines related to waterfront development in
Malaysia. Specifically, the effectiveness of the Guidelines for riverfront development is
examined because it was identified as the only guidelines designed for riverfront development
in Malaysia. Even though the Malaysian government also developed Coastal Zone
Guidelines, it is beyond the scope of this research and not relevant to the riverfronts.
The findings from the results indicate that overall, property development companies are
somewhat familiar with regulations and guidelines related to waterfront development in
Malaysia such as the National Land Code 1965 (mean score=3.59), the Town and Country
Planning Act 1976 (mean score=3.57), the Building By-Law 1984 (mean score=3.56), the
Land Acquisition 1960 (mean score=3.52) and guidelines for riverfront development (mean
score=3.05) (just to name a few of the regulations and guidelines). The findings from the
interviews show that 84% of interviewees were aware of the guidelines for riverfront
development designed by the Department of Drainage and Irrigation Malaysia.
The findings from the results also indicate that almost half (44.3%) of the property
development companies disagreed that Malaysia had sufficient regulations for waterfront
development. Also, only a quarter (24.6%) of property development companies agreed that
Malaysia has enforced the regulations and guidelines developed for waterfront development,
sufficiently. These findings, are consistent with previous studies conducted by Latip et al.
(2010) that showed that several reasons contributed to the loss of integration between cities
and their water bodies in Malaysia such as an absence of policies and guidelines for
waterfront development, the lack of policies and guidelines suitable for waterfront
development, policies and guidelines developed and implemented in isolation by different
government agencies, and some guidelines that are not gazetted. Subsequently, insufficient
regulations and guidelines to control waterfront development in Malaysia and poor
enforcement by the policy makers, has possibly caused unsustainable waterfront development
in Malaysia. These findings are supported by the literature that indicate that various forms of

168
regulations are important for successful waterfront development (Riley & Shurmer-Smith,
1988). In addition, adequate regulations and guidelines formulated for waterfront regeneration
could have a significant impact upon waterfronts and subsequently considerably enhance
waterfront areas (Breen & Rigby, 1996; West, 1989).
In terms of the guidelines for riverfront development, about 85.7% of interviewees disagreed
that these guidelines are sufficient to control waterfront development in Malaysia. The
questionnaires returned also indicate that a majority of property development companies
disagreed about the effectiveness of the guidelines for riverfront development, to control
waterfront development in Malaysia (average mean score=2.45). Using the benchmark of 3.0
or higher to indicate acceptability of the characteristics used to evaluate the guidelines, the
average mean score for all the characteristics were below the mid-point of the satisfaction
scale (mean scores range from between 2.25 and 2.57).
The research findings indicate four issues that contributed to ineffective guidelines for
riverfront development for controlling waterfront development: (i) they are not sufficient to
control environmental problems, (ii) they do not provide specific guidance for riverfront
development in Malaysia, (iii) they are difficult to implement in practice and (iv) they do not
encourage sustainable riverfront development. Moreover, the guidelines are neither law nor
gazetted and this causes difficulty with implements.
The lack of ability to control environmental problems has had a negative impact on the
environment with problems such as flooding and pollution. Previous research conducted
indicates that the growth of waterfront development has also caused the environmental impact
to worsen, especially in regard to flooding and pollution (for example see: Bialaszewski &
Newsome, 1990; Eves, 1999, 2001, 2002, 2004; Fibbens, 1992; Guttery, Poe, & Sirmans,
1998; Guttery, Poe, & Sirmans, 2004). Subsequently, extreme negative effects from flooding
and drought can alter property values (Kauko, 2002; Kauko, Hooimeijer, & Hakfoort, 2002;
Mooney & Eisgruber, 2001). Therefore, to avoid the negative impact on property values,
flooding needs to be avoided and therefore highlighted as an important factor for control in
the guidelines for riverfront development. In addition, clear and coherent principles and/or
policy are important in order to maximise the positive effects of waterfront development
(Riley & Shurmer-Smith, 1988; Yossi & Sajor, 2006) and subsequently are highly required in
order to control waterfront development in Malaysia.

169
6.9.4 Research Objective Four: Recommendations for New Guidelines towards More
Sustainable Development of Waterfronts in Malaysia.
This section discusses the results used for achieving research objective four in this research.
As stated in Chapter one – Introduction, research objective four is to recommend guidelines
for more sustainable waterfront development in Malaysia and to examine the relationships
between them. These results were derived from the interviews and the results were confirmed
by statistical analysis.
“The construction sector is not only to deliver buildings and infrastructures,
but to look beyond on opportunities that can reduce the usage of resources
and energy, minimise pollution and waste, and enhance economic efficiency
and social objectives. It is time for industry players to think in different
dimensions, rather than just on construction costs and immediate profits.”
(Hussein, 2010)
The construction industry is an important element of the Malaysian economy.57
According to
Hussein (2010), the construction sector is determined to be an enabler of economic growth in
Malaysia as well as helping in stimulating domestic demand, in the creation of wealth and in
improving the quality of life for Malaysians. Even when the whole global economy was
reeling from the economic crisis in 2009, in Malaysia the affect was tolerable and cushioned
by government aid. The increasing number of development projects is a good indication that
the Malaysian economy is relatively healthy at present.
Even though the output from construction is worthwhile, the increasing environmental
problems in Malaysia such as water pollution and flooding and the consequential impact on
socio-economic activities has resulted in an increased awareness in Malaysia about the
development sector and the need for it to act more sustainably. In short, rapid changes in land
use in many developing countries, including Malaysia has been blamed for environmental
degradation (Saiful Arif & Nakagoshi, 2006). For example, the continuous and rapid changes
in land use has been recognised as bringing severe environmental degradation to natural
ecosystems such as forest ecosystems (Endress & Chinea, 2001), wetland ecosystems (Zarin,
et al., 2001), riverside ecosystems (Yunus, Nakagoshi, & Ibrahim, 2003) and coastal
ecosystems (Nazery, 2009).
57 The output of the construction industry in Malaysia is in Malaysian Ringgits about 50 billion a year (NZ$
21.7 billion). It accounts for 3-5% of Gross Domestic Product (GDP) and provides employment for around
800,000 workers (Construction Industry Development Board Malaysia, 2009).

170
In practice, the trend in managing the impact from development, as well as those derived from
waterfront development, is by reducing the risk associated with each development through
improving the management strategies and programmes including revising some development
guidelines. Thus, for example, the government through The Construction Industry Master
Plan (CIMP),58
has expressed the government‟s commitment to preserving the environment
through Strategic Thrust no. 3, which is to strive for the highest standard of quality,
occupational safety and health, and environmental practices (Hussein, 2008). Moreover, the
2011 budget speech presented on 15th
October 2010 by the Malaysian Prime Minister stated
that the government had introduced the Government Transformation Programme (GTP). The
Government Transformation Programme (GTP) aims to position Malaysia as a developed and
high-income economy with inclusive and sustainable development (Malaysian Department of
the Prime Minister, 2010).
Therefore, in this research, a set of recommendations which outline several priorities for the
waterfront development guidelines, and the desire to achieve sustainable development in the
undertaking of waterfront development in Malaysia is presented. The recommendations take
into consideration suggestions and opinions from stakeholders involved in waterfront
development, as well as property development companies in Malaysia. The recommended
guidelines are presented in Table 6.25 below. The six factors drawn in this research will
complement the existing waterfront development guidelines – called guidelines for riverfront
development concept.
The findings indicate that the „Environment‟ is the most important factor to include in future
riverfront development guidelines for Malaysia. Maintaining the green corridor along the
water body will provide an important amenity for residents and visitors. Conserving the
waterfront and waterfront environment will also preserve it for future generations. According
to Bertsch (2008), several principles such as integration of the history, the culture and existing
58 The Construction Industry Master Plan (CIMP) launched by Prime Minister, Dato‟ Sri Najib Tun Razak in
December 2007, aims mainly to achieve four objectives as follows:
i. To develop a global reputation for Malaysia as a country that promotes sustainability in construction and
that has the resources, expertise and technology to deliver efficient services.
ii. To monitor and ensure the sustainability of domestic and imported supplies of construction materials.
iii. To promote and monitor certification ISO 14000 (Environment management system or EMS) within the
construction industry.
iv. Strive for the incorporation of best environmental practices at sites, into the Uniform Building By-Laws
and construction procurement processes (Hussein, 2008).

171
architecture and the involvement of multitudes of interested parties, should be compulsorily
taken into consideration while developing waterfront development so that an economically
viable waterfront is maintained. Moreover, environmental approval from various agencies
should be required and considered a rule of thumb for successful waterfront development
(Torre, 1989). Sustainable waterfront development would then be achievable (Bruttomesso,
2006).
Table 6.25: Guidelines for riverfront development for Malaysia
Environment
Statements:
(1) Environmental Impact Assessment (EIA) is compulsory.
(2) Maintenance & rehabilitation costs are shared between stakeholders.
(3) Upgrading and maintaining established settlements along waterfront
areas.
(4) Provision of sufficient public facilities and amenities (such as
pedestrian, landscaping, access ways, recreation areas, etc.).
(5) Provide flood mitigation (e.g. by planting more trees).
(6) Continuous river rehabilitation.
(7) Integrate both modern and heritage aspects into development.
* Note: All the statements loaded in the „Environment‟ is range between 0.574 and
0.703 which are indicated practically significant as determined by Hair et al.
(2006). The “Environment” had alpha values greater than 0.6 which is high
reliability as suggested by Pallant (2007), and also has strong correlation as
determined by Sweet & Grace-Martin (2008). Therefore “Environment” is
considered high priority to be included in future guidelines for riverfront
development.
Waterfront benefits
Statements:
(1) Sharing waterfront benefits (such as view, financial rewards, etc.)
among stakeholders (e.g. waterfront community, government,
developers).
(2) Encourage economic activity.
(3) Upgrading and maintaining sewage systems.
(4) Participation among stakeholders should be compulsory at every
stage of the development.
* Note: All the statements loaded in the „Waterfront benefits‟ is range
between 0.551 and 0.827 which are considered well defined structures as
determined by Hair et al. (2006). The “Waterfront benefits” had alpha values
greater than 0.6 which is high reliability as suggested by Pallant (2007), and
also has strong correlation as determined by Sweet & Grace-Martin (2008).
Therefore “Waterfront benefits” is considered high priority to be included in
future guidelines for riverfront development.

172
Table 6.25: Guidelines for riverfront development for Malaysia
Mitigation
Statements:
(1) Mitigate property speculation.
(2) Continuously educate public about environmental concerns.
* Note: All the statements loaded in the „Mitigation” is range between 0.718 and
0.799 which are considered practically significant as determined by Hair et al.
(2006). The “Mitigation” had alpha values 0.5 which is acceptable reliability as
suggested by Pallant (2007), and also has low correlation as determined by Sweet
& Grace-Martin (2008). Therefore “Waterfront benefits” is considered medium
priority to be included in future guidelines for riverfront development.
Beautification
Statements:
(1) River reserve beautification.
(2) Protection of natural resources (water and environment).
* Note: All the statements loaded in the “Beautification” is range between
0.60 and 0.745 which are considered practically significant as determined by
Hair et al. (2006). The “Beautification” had alpha values less than 0.5 which
are considered low reliability as suggested by Pallant (2007), and also has low
correlation as determined by Sweet & Grace-Martin (2008). Therefore
“Beautification” is considered important to be included in the future
guidelines for riverfront development with medium priority.
Security
Statements:
(1) Personal security is maintained by means of policing, surveillance
cameras, etc.
(2) Should use environmentally friendly materials in construction.
* Note: All the statements loaded in the “Security” is range between 0.348 and
0.737 which are considered practically significant as determined by Hair et al.
(2006). The “Beautification” had alpha values less than 0.5 which are considered
low reliability as suggested by Pallant (2007), and also has low correlation as
determined by Sweet & Grace-Martin (2008). Therefore “Beautification” is
considered important to be included in the future guidelines for riverfront
development with medium priority.
Type of
development
Statement:
(1) Restrict type of development.
* Note: Only one statement loaded in the “Type of development” with factor
loading 0.821 which is considered well defined structures as determined by Hair et
al. (2006). The “Type of development” has low correlation as determined by
Sweet & Grace-Martin (2008). Therefore “Beautification” is considered important
to be included in the future guidelines for riverfront development with a medium
priority.
The „Waterfront benefit‟ is the second most important factor identified to include in the
riverfront development guidelines. Ensuring that waterfront benefits such as waterfront views
are shared amongst the waterfront development stakeholders such as government, waterfront
community and developers are important aspects to achieve. As determined by Bertsch
(2008), the success of a waterfront development could only be achieved by balancing public
benefit and developer profitability.

173
As well as sharing waterfront benefits among waterfront development stakeholders, the
participation of all stakeholders should be compulsory at each stage of the waterfront
development. The emerging role of the government in development projects (acting as a
facilitator and/or a provider) is common and the involvement of the public in the planning and
implementation of local initiatives is required. Choguill (1996) suggests that local
participation is important particularly to solve local problems including resource management
and development. Thus, the use of locally generated solutions, the active involvement of
residents in their own affairs and a facilitating government, would be expected to be a sound
basis for the success of waterfront development in Malaysia. Bruttomesso (2006) believed
that public participation is an essential element to securing the long-term successful use of
resources as well as the long-term success of the waterfront areas.
The third factor recommended to include in the riverfront development guidelines is
„Mitigation‟. “Mitigation” emphasises the desirability for public awareness towards
environmental concerns. According to Tong & Chen (2002), one of the greatest causes of
poor water quality problems is the consequence of built up urban land use areas and the
increasing intensity of human activities. In addition, land use and land cover changes can play
a pivotal role in environmental changes and contribute to global change (Meyer & Turner,
1994). Therefore, continuously educating people about environmental concerns by providing
them with updated information about waterfront development projects is important in helping
to maintain the quality of the environment. In addition, including public consideration at
every stage of the waterfront development process helps to increase public awareness and
responsibility towards the waterfront environment (self-belonging to the waterfront project)
(Torre, 1989).
The forth factor that it is recommended to include in riverfront development guidelines for
Malaysia is „Beautification‟. Preserving the natural resources, for example the water resource,
helps to maintain the economic value of the river and helps to provide a pleasant environment
for water sports and picnic activities. According to Torre (1989), maintaining original values
in the waterfront and areas surrounding the waterfront is important for a successful waterfront
development. Moreover, Bruttomesso (2006) determined that the continuous beautification
work of waterfront areas, protecting the river resources and securing the quality of the water
and the environment, are important elements for sustainable waterfront development.
Therefore, including the „Beautification‟ factor in the guidelines for riverfront development in
Malaysia is important for maintaining the economic value of waterfront areas.

174
The fifth factor to include in the guidelines for riverfront development is „Security‟. As well
as recreation space and the availability of goods and services, security was also identified as
an important factor that aids good development. Security can include serviced security and the
full fencing of the property (Logan, 2001). Although historical records show that there are
very few vehicle accidents involving open waterways, there is a perception that unfenced
bodies of water may pose a safety threat to children. Thus, a combination of security factors is
appropriate for new guidelines.
The last factor to be included in the riverfront development guidelines is the type of
development. According to Yunus et al. (2003), the types of development (land-uses) are
significantly correlated to water quality. For example, built up areas along the Penang river
indicate a strong negative relationship with water quality (r=-0.911 in 2000), as compared to
forested areas (r=0.861 in 2000). These findings confirm that one of the greatest causes of
water quality problems is derived from the land-use type and is the result of the increasing
intensity of human activity. Tong & Chen (2002) also identified that runoff from different
types of land use may be polluted with different kinds of contaminants. Moreover,
Bruttomesso (2006) and Tumbde (2005) determined that prioritising mixed-use development
types is necessary for achieving sustainable waterfront development. Thus, land use type is an
important consideration for planners and decision makers in designing the plans for water
quality matters and for the developer in developing a waterfront project.
To secure the long-term growth of the waterfront resource, it is important for waterfront areas
to be used strategically to maintain the economic value and enhance the specific features or
image. Therefore, inclusion of all the factors (as presented in Table 6.25) in the proposed
guidelines for riverfront development for Malaysia is appropriate and highly recommended.
6.10 Summary
The outcomes of the qualitative and quantitative methods were discussed in this chapter. The
purpose for using the qualitative method was to determine attributes for waterfront
development from the waterfront development stakeholders. It was also to identify several
statements that could be important for waterfront development guidelines in Malaysia. The
qualitative analyses were undertaken within three case study areas: Kuching Waterfront,
Malacca Waterfront and Glenmarie Cove Riverfront. From the interviews, several reasons
that motivated the waterfront stakeholders to initiate waterfront development and invest in
waterfront properties were identified. The qualitative results also revealed that the majority of

175
stakeholders participating in waterfront development projects confirmed that Malaysia did not
have specific regulations to control waterfront development. The specific guidelines designed
for the control of development near to river areas, were identified as being too general and not
sufficient to achieve successful waterfront development. At the end, interviewees were asked
what they think should be recommended in the guidelines for waterfront development, to
achieve the best practices for waterfront development in Malaysia in the future.
The quantitative analyses were undertaken with property development companies listed under
Bursa Malaysia. The objective of the quantitative analyses was to determine whether the
identified attributes for waterfront development in Part one of this research (qualitative
approach) were statistically different from one another. The involvement in this research of
waterfront stakeholders in the qualitative study was considered important to providing good
information about waterfront development, while the inclusion of property development
companies registered under Bursa Malaysia was considered necessary as the financial and
skill-based capabilities of their companies are required in order to undertake waterfront
development.
Factor analysis was carried out in order to group the statements recommended for waterfront
development guidelines and this led to the classification of six main factors, namely:
Environment, Waterfront benefits, Mitigation, Beautification, Security and Type of
development. The T-test results indicate that there is no significant difference on six factors
extracted for waterfront development guidelines between two groups of respondents; the
respondents undertaking waterfront development projects and the respondents did not
undertaking waterfront development projects in Malaysia. The correlation results indicate that
overall, each factor was correlated with some positive relationships as well as some negative
relationships. Only Environment and Waterfront benefits indicated a strong relationship
between factors, while the rest indicated that they related to each other, but it was not a strong
relationship. Therefore, based on the qualitative and quantitative results (mean scores, factor
analysis and correlation), all the factors were shown to be significant and thus were included
in recommendations for waterfront development guidelines in Malaysia.

176
Chapter 7
Summary and Recommendations
This chapter provides a brief summary of the research, its conclusions and some
recommendations. The final section outlines the limitations of the research and proposes
potential areas for future research.
7.1 Summary
While many waterfront development projects are being carried out around Malaysia, these
kinds of development remain an issue for Malaysia, as detrimental effects outweigh beneficial
effects, and some projects have been abandoned altogether. Although the Malaysian
government has pursued many regulations and guidelines to tackle these issues, such as the
Environmental Quality Act 1974, the Environment Impact Assessment, and the guidelines for
riverfront development, it seems that they are not sufficient to achieve the stated objectives or
are not successful in resolving the issues. For example, there was a significant reduction in
the number of clean river basins in 2008 as compared with 2007; there were 53% (76 out of
146) clean river basins in 2008, compared with 62% (91 out of 146) in 2007 (Malaysian
Department of Environment, 2010).
The introduction to and motivation for this research as well as the research questions
proposed were discussed in Chapter 1. The purpose of the research is to offer guidelines and
recommendations for more successful waterfront development in Malaysia. The main
objective was therefore, to examine waterfront development in Malaysia, identifying the main
constraints currently existing and to identify significant attributes for successful waterfront
development.
Chapter 2 presented an overview of waterfront development theory and provided the
theoretical basis for the research problem. This theoretical context included a definition of
waterfronts and waterfront development, successful experiences from other developed
countries and guidelines and principles for successful waterfront development. Views on the
principles for sustainable governance for waterfront development as well as the attributes
involved in sustainable waterfront development also aided the evolvement of suggestions in
the development of guidelines for waterfront development in Malaysia.

177
The next chapter reviewed the background of waterfront development in Malaysia. In this
research, the term waterfront development is limited to any development in front of river
areas. Coastal zone development in Malaysia for example, are separately dealt with compared
to riverfront development and are subject to different managerial, administrative and market
challenges. The chapter started by identifying the importance of water resources. The next
section discussed the emergence of waterfront development in Malaysia including several
factors associated with the transformation of waterfront from trading settlements to recreation
and urban centres. This chapter also provided some theoretical context for the development
process and the governance and regulations associated with waterfront resources. The limited
sources of literature in regard to the Malaysian context were a challenge to the researcher.
To accomplish the research‟s objectives, a mixed method research strategy comprising a
qualitative phase followed by a quantitative phase was pursued as described in Chapter 4. The
exploratory nature of the research made it well suited to a mixed method design where the
open-ended nature of qualitative research provided an opportunity for the identification of
new and unanticipated ideas to be considered, which would be confirmed quantitatively
through statistical analysis. For this reason the strengths of both qualitative (identification)
and quantitative (confirmation) methods were combined to provide solid and comprehensive
results. At the same time, the use of the mixed method strategy decreased uncertainties in
interpretation and led to multiple inferences that validated and strengthened each other. The
driver for the research was predominantly inductive with the qualitative phase forming the
basis of the mixed method approach.
The qualitative phase took the form of multiple case studies to provide in-depth information
that contributed to the establishment of waterfront development in Malaysia, as well as to
determine the attributes to be considered when developing guidelines for waterfront
development. These attributes were then used in the development of a questionnaire to be sent
to property development companies during the quantitative phase. Three case study areas
were selected: Kuching Riverfront, Malacca Waterfront and Glenmarie Cove Riverfront. The
selection of a number of case study areas with similar characteristics, which were project
developed in front of river areas, enabled adequate information to be better achieved.
A judgemental sampling method was adopted as a sampling procedure for selecting
respondents in the qualitative phase (interviews) in this research. In total, 25 respondents were
interviewed, which included these parties involved in the development of Kuching Riverfront,
Malacca Waterfront and Glenmarie Cove Riverfront. Semi-structured personal interviews

178
were conducted with all parties involved in waterfront projects. This was also complemented
by document reviews for the waterfront development projects. The gathering of data from a
variety of sources assisted with data triangulation.
Recorded interviews and document reviews were transcribed and analysed with assistance
from Microsoft EXCEL. This software assisted with the organisation of the qualitative data.
The attributes identified that were associated with waterfront development were used in
developing a questionnaire that was then mailed and e-mailed to the property development
companies in Malaysia. The purpose of the survey questionnaire was to confirm the findings
reached in the qualitative phase and provide more support for these findings. The respondents
were identified from property development companies listed under Bursa Malaysia in 2009.
After experiencing numerous problems in contacting the respondents, for example, some were
in official outstations, in total about 25 face-to-face interviews were conducted within three
months from May to July 2009. The interviews were sufficiently well answered to allow a
response rate of 100% to be obtained.
Qualitative analysis showed that respondents believed that rivers have significantly affected
Malaysian life in the past and would do so in the future, for example for water resources,
transportation and sources of food. However, it was noted that the importance of rivers is
changing due to urbanisation and the improvement of land transportation. Respondents were
also aware about the historical emergence of waterfront development in Malaysia.
The interviews also revealed that waterfront development in Malaysia has followed a similar
development process as other types of development and that they also include the
participation of similar stakeholders in the land development processes. The majority of
respondents agreed that Malaysia does not have effective governance for managing waterfront
resources which leads on to the increasing negative effects from development, such as
environmental and social problems. From interviews, two very important reasons for
ineffective governance of waterfront resources in Malaysia were identified: (i) low levels of
cooperation between stakeholders and (ii) inefficient communication systems between
relevant agencies.
Furthermore, from the interviews, 84 percent of respondents indicated that they are familiar
with guidelines for riverfront development but they disagreed that these guidelines are
effective for controlling development close to river areas in Malaysia. From the interviews,
four reasons were identified for ineffective guidelines for riverfront development: (i) were not

179
sufficient to control environmental issues, (ii) did not encourage sustainable waterfronts, (iii)
were too general and did not provide specific guidance and (iv) were difficult to implement in
practice.
Finally, the interviews revealed 18 statements for the best practice for waterfront development
as suggested by the respondents. These suggestions could be used for developing guidelines
for waterfront development in Malaysia.
Next, of the 91 sets of questionnaires that were sent to property development companies in
Malaysia, a total of 61 questionnaires were returned, resulting in a 67% useable response rate.
The 67% response rate was obtained within three months of data collection (from April to
July 2009) and after the respondents were personally informed about the survey and various
follow-ups were made to encourage the completion of the questionnaire.
The survey results indicated that some 32.8% of property development companies undertook
waterfront development projects while most (67.2%) were not involved in waterfront projects
either in Malaysia or outside the country. More than half (58.6%) of the property development
companies are motivated to undertake waterfront development in the future, while some
14.6% had decided not to undertake waterfront development in the future, and another 26.8%
were not sure. These figures reveal statistically that waterfront development in Malaysia is
forecast to increase in the future. As expected, the property development companies had
undertaken waterfront development projects for profit and financial benefit reasons (35%)
and/or to diversify the type of property development undertaken by their companies (35%).
In terms of the successful implementation of waterfront development in Malaysia, almost half
(45%) of the property development companies who were currently undertaking waterfront
projects, stated that Malaysia did not have successful waterfront development for several
reasons such as the difficulty in balancing the social, economic and environmental goals
between stakeholders, and that there is no collaboration between the stakeholders involved in
the development processes. A few of the companies indicated that Malaysia does have
successful implementation of waterfront development, while some respondents were unsure
about that.
Moreover, the results showed that introducing a new concept for development, as the main
reason, explained why property development companies were undertaking a waterfront
development project. The results also revealed statistically, that protection of natural
resources and maintaining heritage and cultural values are the least important reasons for

180
developers to initiate waterfront development in Malaysia in the future.
The statistical results also showed the mean scores for all statements suggested for guidelines
for waterfront development, and subsequently, the statements were ranked according to the
mean scores. Based on the results, all 18 statements suggested for the guidelines for
waterfront development showed a mean score range between 3.54 and 4.39, indicating that
respondents agreed that all the statements should be included for guidelines for waterfront
development for Malaysia. In particular, river reserve beautification had the highest mean
score (mean score=4.39) indicating that the majority of respondents were agreed that river
reserve beautification is the most important statement to be included in the guidelines.
Although mitigating property speculation was identified as the least important statement
(lowest mean score=3.54) the respondents never-the-less agreed that it should be included in
the guidelines for waterfront development for Malaysia in the future.
Factor analysis was carried out to identify and order the statements suggested for guidelines
for waterfront development. A Principal Component Analysis (PCA) specified six factors that
included all 18 statements with Eigenvalues exceeding 1.0, and explained 66.26% of the
variation in the data. Each factor was then allocated a name: (i) Environment, (ii) Waterfront
benefits, (iii) Mitigation, (iv) Beautification, (v) Security, and (vi) Type of developments.
The factor analysis results were then subjected to a reliability test except for the statement
loading on „Type of development‟, as this factor has only a single statement. Reliability tests
indicated that only „Environment‟ and „Waterfront benefits‟ had Alpha values greater than 0.6
as recommended by Churchill (1979)59 indicating the internal consistency of the variables in
the exploratory study. The reported mean inter-item correlations were appropriate for the
remaining factors. The „Security‟ factor reported weak mean inter-item correlations and
indicated not to be reliable to group together and could have been removed from the analysis
(Pallant, 2007), nevertheless, „Security‟ was allowed to remain because factor analysis and the
mean scores determined that the „Security‟ factor was statistically significant. Moreover,
„Security‟ was determined as important to be included in the waterfront development
guidelines as explained in the previous research (see Logan, 2001).
The focus of this research was to develop guidelines for best practice for waterfront
development in Malaysia. The qualitative and quantitative investigations were therefore used
59 Cronbach‟s alpha greater than 0.60 is adequate for a newly developed questionnaire for the scale to express
reliability (Churchill, 1979).
181
together to support and confirm the findings which ensured that the study benefitted from the
synergy of the mixed methods approach. When considering the results from interviews and
questionnaires as discussed in an earlier thesis chapter, this study confirmed that 18
statements loaded in six factors are important for taking into consideration when planning a
waterfront development project. Instead of guideline recommendations, enforcement of the
guidelines by the responsible institutions was considered by respondents to be highly
desirable in order to achieve successful waterfront development in Malaysia as is evidenced in
other countries.
The main contributions of this research are summarised, as follows:
1. The research confirmed that the level of awareness of regulations and guidelines
relating to waterfront development among the respondents is high. However, the
effectiveness of these regulations for control and achieving successful waterfront
development is relatively low. For example, most of the respondents agreed that
Malaysia did not implement successful waterfront development and also agreed that
Malaysia did not have sufficient regulations and guidelines for waterfront development.
2. The government has undertaken waterfront development projects for re-imaging cities
and/or redeveloping waterfront areas for recreational use as public space. However,
private developers think differently about waterfront development and are motivated
predominantly by financial gain.
3. A review of related documents from another country (in this research, Wellington‟s
waterfront, New Zealand and Singapore‟s Riverfront were selected) showed that an
emphasis was placed on waterfront governance and key successful factors that enabled
the achievement of successful waterfront development. This provides a best practice
example on how to achieve successful and sustainable waterfront development.
4. Value attributes associated with best practice in waterfront development were identified
for the purpose of being used as guidelines by developers when they undertake
waterfront development.
7.2 Research Limitations
This study was subject to a number of limitations relating to the research method, the scope of
the research and the conduct of it.
182
The findings of this research were drawn from interviews (Government officers, Property
developers and the Waterfront community) and from a survey of property development
companies listed under Bursa Malaysia. The limited number of cases in this research may
confine the results to the data collected. Therefore, generalising the results to other officers
and property development companies should be done with caution.
A further limitation of this research is related to its scope of study. It dealt with development
in front of rivers. This was a problem when introducing the research topic to the respondents
being interviewed because some of them thought that waterfront development referred to
coastal development, but it did not. Waterfront development was commonly associated with
coastal areas but for the purposes of this study, this was excluded.
The final limitation related to the translation of the interview data. The interviews were
conducted in Malay and English, so it was time consuming to translate the Malay words into
English. The most difficult part was the translation of technical terminology into another
language without losing its true meaning. This was a very challenging task.
7.3 Conclusion and Recommendations
The focus of this study was to examine waterfront development in Malaysia as well as to
identify the attributes of waterfront development, in order to develop guidelines for waterfront
development. The findings of this research were based on interviews conducted with
Government officers, Property developers, and the Waterfront community from three case
study areas (qualitative phase), and from questionnaires mailed and e-mailed to property
development companies listed under Bursa Malaysia (quantitative phase). The attributes
identified were then recommended to be used as guidelines to assist developers when
undertaking waterfront projects in the future.
7.3.1 Recommendations for Best Practice for Waterfront Development in Malaysia
In this section, a set of recommendations is provided to improve practices in waterfront
development. These recommendations emerge from the conclusions drawn from this research
and are aimed at enhancing waterfront development in Malaysia. The following
recommendations are presented in five categories:

183
1. There is a need to strengthen the governance in the waterfront development process, to
alleviate problems and/or issues arising from waterfront development. Therefore, the
Malaysian government needs to restructure management and administration specifically
for managing waterfront resources.
2. If the government decides to reconstruct waterfront governance, it should place an
emphasis on participation and collaboration among the stakeholders that has proved
successful in other waterfront development. Establishment of an administration system
for the entire development process would also help encourage more successful
waterfront projects.
3. Upgrade the quality of information provided by the agencies and departments
responsible for waterfront development. In the short term, the existing officers could be
re-trained and provided with performance based incentives. In the long term, the
government needs to appoint more skilled technical officers in relation with water
resource management.
4. The government needs to revise the existing regulations for controlling waterfront
development in Malaysia, by adopting the recommended guidelines for waterfront
development as presented in Table 6.25 – Guidelines for riverfront development for
Malaysia. In this regard, they should recognise the importance of environmental
concerns and sharing costs and benefits among the stakeholders involved during the
waterfront development process. This would help the government facilitate and control
waterfront development in Malaysia.
5. The government and specifically the policy makers should strictly enforce the
guidelines recommended for best practice for waterfront development in Malaysia in
order to achieve successful waterfront outcomes similar to other countries.
7.3.2 Recommendations for Future Research
This study concludes with some suggestions for future research. These largely relate to the
limitations discussed above.
A limited number of cases were identified in this research. Future research that would
advance the knowledge would consider all waterfront development projects throughout
Malaysia and also include listed and unlisted property development companies, in order to

184
draw more generally applicable conclusions and recommendations. Further research to assess
each of these groups (Government officers, Property developers, Waterfront community), for
example to determine what encourages them to be involved in waterfront development and
what strategies they use to develop successful waterfront development, may be required in
order to evaluate the ability to generalise the findings.
This research dealt with developments in front of rivers and with projects developed for
recreational and mixed-use purposes. Further research could be carried out at different water
bodies such as lakesides and also the crucial coastal development areas.
The interviews were conducted in the Malay and English languages and required time
consuming translation prior to analysis. Further research could be fully conducted in the
English language. To avoid the time consuming translation process further, it would help to
provide an outline of the research and the information needed prior to the interviews, so that
they could be better prepared to answer the questions.
This study identified a set of recommendations to use as guidelines for achieving successful
waterfront outcomes in Malaysia that would avoid the problems that arose under the previous
guidelines. These recommendations relate to property development companies, policy makers
and the community who are involved in waterfront development. Further research could be
undertaken to examine if the recommendations have been adopted and how successful they
have been to waterfront development projects and how the parties involved have been
influenced in or affected by them.

185
References
Abdullah, K. (2002). Integtrated river basin management. In C. N. Weng (Ed.),
Rivers:Towards sustainable development (pp. 3-14). Penang, Malaysia: Universiti
Sains Malaysia Press.
Abdullah, K., & Mahmood, M. F. (1999). River management – The way forward. Paper
presented at the Workshop on River Management (30th
-31st March 1999), Kuala
Selangor, Malaysia, retrieved 16th
July, 2008, from www.water.gov.my.
Abidin, R. Z. R. Z. (2004). Water resources management in Malaysia: The way forward.
Paper presented at the Asia Water 2004 (30th
March-02rd
April 2004), retrieved 24th
July, 2008, from
http://www.epu.gov.my/html/themes/epu/images/common/pdf/.../txtspeech.pdf.
Acosta, M. (1990). Reclaiming the waterfront through urban design guidelines: Case study of
the Chicago River urban design guidelines. Paper presented at the 7th
International
Conference on Making Cities Livable (1st
March 1990), Carmel, California, retrieved
2nd
November, 2008, from www.livablecities.org/conferences/7th.conferences.carmel.
Ali, S. M., & Nawawi, A. H. (2009). The social impact of urban waterfront landscapes:
Malaysian perspectives. Paper presented at the 14th
International Conference on Urban
Planning, Regional Development and Information Society (22nd
-25th
April 2009),
Centre de Disseny de Sitges Catalonia/Spain, retrieved 12th
December, 2008, from
http://programm.corp.at/cdrom2009/papers2009/CORP2009_15.pdf.
Alias, A., & Daud, M. N. (2006). Payment of compensation for land acquisition in Malaysia.
Pacific Rim Property Research Journal, 12(3).
Allen, P., & Bennett, K. (2010). PASW statistics by SPSS - A practical guide version 18.0 (1st
ed.). Australia: Cengage Learning.
Andaya, B. W., & Andaya, L. Y. (2001). A history of Malaysia (2nd ed.). Hampshire, Britain:
Palsgrave
Angeles, P. A. (1981). Dictionary of Philosophy. New York: Barnes & Noble.
Arshad, F. M., & Shamsudin, M. N. (1997). Rural development model in Malaysia. Paper
presented to the Hon. President of Peru (13th
October, 1997), Lima, PERU, retrieved
3rd
October, 2008, from www.econ.upm.edu.my/~fatimah/rural.pdf.
Aziz, U. A. (1964). Poverty and rural development in Malaysia. Malaysian Economy Study, 1,
70-105.
Baiquni, M. (2004). Urbanisation and urban settlement dualism: A case study and research
agenda of Yogjakarta, Indonesia. Paper presented at the International Workshop on
Asian Approach Toward Sustainable Urban Regeneration, University of Tokyo, Japan,
retrieved 5th
February, 2009, from www.forum-urban-
futures.net/files/5Urbanisation%20Baiquni.pdf.
Bertsch, H. (2008). The key elements to successful waterfront design. Real Estate Weekly,
54.39.

186
Bialaszewski, D., & Newsome, B. A. (1990). Adjusting comparable sales for floodplain
location: The case of homewood, Alabama. The Appraisal Journal, 58(1), 114.
Bond, S. (2010). Community perceptions of wind farm development and the property value
impacts of siting decisions. Pacific Rim Property Research Journal, 16(1), 52-69.
Bond, S., & Cook, D. (2004). Residents perceptions towards asbestos contamination of land
and its impact on residential property values. Pacific Rim Property Research Journal,
10(3).
Bourque, L. B., & Fielder, E. P. (1995). How to conduct self-administered and mail surveys.
London: SAGE Publications.
Breen, A., & Rigby, D. (1994). Waterfronts: Cities reclaim their edge. United State:
McGraw-Hill.
Breen, A., & Rigby, D. (1996). The new waterfront: A worldwide urban success story. New
York: McGraw-Hill.
Brundtland Commission. (1987). Report of the World Commission on Environment and
Development: Our common future: UN General Assembly, retrieved 16th
April, 2010,
from www.un-documents.net/wced-ocf.htm.
Bruttomesso, R. (1993). Working on the water's edge. In R. Bruttomesso (Ed.), Waterfronts –
A new frontier for cities on water (pp. 10-11). Venice: International Center Cities on
Water.
Bruttomesso, R. (2006). Waterfront development: A strategic choice for cities on water. Paper
presented at the Waterfront Development Forum: China Maritime (02nd
March 2006),
Hong Kong, retrieved 24th
January, 2009, from
www.harbourbusinessforum.com/download/060303_transcript.pdf.
Bursa Malaysia. (2009). Products and services. Retrieved 20th
January, 2009, from
http://www.bursamalaysia.com/website/bm/
Butler, R. (2009). Largest cities in Malaysia. Retrieved 18th
August, 2009, from
http://www.mongabay.com/igapo/Malaysia.htm
Butuner, B. (2006). Waterfront revitalisation as a challenging urban issue in Istanbul. Paper
presented at the 42nd
ISoCaRP Congress: Waterfront Revitalisation as a Challenging
Urban Issue, retrieved 17th
May, 2010, from
www.isocarp.net/Data/case_studies/792.pdf.
Central Intelligence Agency. (2010). The World Fact Book. Retrieved 26th
January, 2010,
from https://www.cia.gov/library/publications/the-world-factbook/
Chang, T. C., & Huang, S. (2005). Recreating place, replacing memory: Creative destruction
at the Singapore River. Asia Pacific Viewpoint, 46(3), 267-280.
Choguill, C. L. (1996). Towards sustainability of Human Settlements. Habitat International,
20(3), v-viii.

187
Churchill, G. A. (1979). A Paradigm for Developing Better Measures of Marketing
Constructs. Journal of Marketing Research, 16, 64 - 73.
Coakes, S. J., & Steed, L. G. (2003). SPSS: Analysis without anguish (11th ed.). Australia:
John Wiley & Son.
Cohen, J. W. (1988). Statistical power analysis for the behavioral sciences (2nd ed.). New
Jersey: Lawrence Erlbaum Associates.
Concise Oxford English Dictionary. (2009). Concise Oxford English Dictionary (11th ed.).
Oxford: Oxford University Press.
Construction Industry Development Board Malaysia. (2009). Facing the current economic
crisis: Managing risk and opportunity. CIDB News.
Cooper, D. R., & Schindler, P. S. (2006). Business research methods (9th ed.). New York:
McGraw-Hill/Irwin.
Costanza, R. (1999). The ecological, economic, and social importance of the oceans.
Ecological Economics 31, 199-213.
Costanza, R., Andrade, F., Antunes, P., Belt, M. V. D., Boersma, D., Boesch, D. F., et al.
(1998). Principles for sustainable governance of the oceans. Science, 281(198-199).
Costanza, R., Andrade, F., Antunes, P., Belt, M. v. d., Boesch, D., Boersma, D., et al. (1999).
Ecological economics and sustainable governance of the oceans. Ecological
Economics, 31, 171-187.
Costanza, R., Cumberland, J. H., Daly, H., Goodland, R., & Norgaard, R. B. (1997). An
introduction to ecological economics. In R. Costanza (Ed.), Lisbon principles of
sustainable governance. Florida: St. Lucie Press.
Craig-Smith, S. J., & Fagence, M. (1995). Recreation and tourism as a catalyst for urban
waterfront redevelopment : An international survey. Westport: Praeger Publisher.
Creswell, J. W. (2003). Research design: Quantitative, qualitative, and mixed methods
approaches (2nd ed.). Thousand Oaks, London: SAGE Publications, Inc.
Creswell, J. W., & Clark, V. L. P. (2007). Designing and conducting mixed methods research.
Thousand Oaks, California: SAGE Publications, Inc.
Creswell, J. W., Clark, V. L. P., Gutmann, M. L., & Hanson, W. E. (2003). Advanced mixed-
methods research designs. In A. Tashakorri & C. Teddlie (Eds.), Mixed methods in
social & behavioral research (pp. 209-240). Thousand Oaks, California: SAGE
Publications, Inc.
Daud, H. (2009). Legislative approach to water quality management in Malaysia: success
and challanges. Kuala Lumpur, Malaysia: Department of Environment, Ministry of
Natural Resources and Environment, retrieved 16th
November, 2010, from
www.doe.gov.my.
Dawes, J. (2001). The impact of mentioning a scale mid-point in administering a customer
satisfaction questionnaire via telephone. Australasian Journal of Market Research, 9.

188
Department of Town and Country Planning (Peninsular Malaysia). (2011). Planning
Guidelines and Standard. Kuala Lumpur, Malaysia: Department of Town and Country
Planning, Peninsular Malaysia, retrieved 26th
January, 2011, from
www.townplan.gov.my.
DeVellis, R. F. (2003). Scale development: Theory and applications (2nd ed.). Thousand
Oaks: SAGE Publications.
Dewan Bandaraya Kuala Lumpur. (1984). Kuala Lumpur Structure Plan. Kuala Lumpur:
Kuala Lumpur City Hall.
Dobbs, S. (2002). Urban redevelopment and forced eviction of lighters from the Singapore
River. Singapore Journal of Tropical Geography, 23(3), 288-230.
Dong, L. (2004). Waterfront development : A case study of Dalian, China. Unpublished
master thesis, University of Waterloo, Canada, retrieved 2nd
June, 2008, from
uwspace.uwaterloo.ca/bitstream/10012/988/1/I2dong2004.pdf.
Duxbury, J., & Dickinson, S. (2007). Principles for sustainable governance of the coastal
zone: In the contex of coastal disasters. Ecological Economics, 63, 319-330.
Economic Planning Unit. (1999). General circular no. 3: Regulation for the conduct research
in Malaysia. Retrieved 17th
Disember, 2008, from www.epu.jpm.my
Eight Malaysia Plan. (2001). Eight Malaysia Plan (2001-2005). Kuala Lumpur, Malaysia:
Economic Plannig Unit, Prime Minister Department, retrieved 21st April, 2009, from
www.epu.gov.my.
Eisenhardt, K. M. (1989). Building theories from case study research. Academy of
Management, 14(4), 532.
Elfithri, R., Mokhtar, M., Shah, A. H. H., & Idrus, S. (2008). Collaborative decision making
within the context of integrated water resources management in Langat River Basin,
Malaysia. Paper presented at the 7th
World Wide Workshop for Young Environmental
Scientist 2008 (13th
-16th
May 2008), Créteil – France, retrieved 8th
October, 2008,
from www.inweb.gr/twm4/abs/ELFITHRI%20Rahmad.pdf.
Endress, B. A., & Chinea, J. D. (2001). Landscape patterns of tropical forest recovery in the
republic of Palau. BIOTROPICA, 33(4), 555-565.
Environmental Quality Act (Act 127). (1974). Kuala Lumpur, Malaysia: Percetakan National
Malaysia Berhad.
Eves, C. (1999). Long term impact of flood affection on residential property prices. Paper
presented at the Pacific Rim Real Estate Society Conference, Kuala Lumpur,
Malaysia, retrieved 19th
September, 2008, from www.prres.net/.
Eves, C. (2001). The long-term impact of flooding on residential property values. Paper
presented at the 8th
European Real Estate Society Conference (26th
-29th
June 2001),
Alicante, Spain, retrieved 4th
November, 2008, from eres.scix.net/cgi-
bin/works/Show?eres2001_154.

189
Eves, C. (2002). The long term impact of flooding on residential property values. Property
Management, 20(4), 214-227.
Eves, C. (2004). The impact of flooding on residential property buyer behaviour : An England
and Australian comparison on flood affected property. Structural Survey, 22(2), 84-94.
Federal Constitution. (2006). Laws of Malaysia. Kuala Lumpur, Malaysia: Percetakan
Nasional Berhad.
Federal Land Development Authority (FELDA). (2009). FELDA establishment and goals.
Kuala Lumpur, Malaysia: Federal Land Development Authority, retrieved 1st October,
2009, from www.felda.net.my.
Fibbens, M. (1992). Effect of flooding on residential property values. Australia: Property
Research Centre.
Fifth Malaysia Plan. (1986). Fifth Malaysia Plan (1986-1990). Kuala Lumpur, Malaysia:
Economic Planning Unit, Prime Minister Department, retrieved 3rd
March, 2010, from
www.epu.gov.my.
Fink, A., & Kosecoff, J. (2005). How to conduct surveys: A step-by-step guide (3rd ed.).
Beverly Hills, CA: SAGE Publications.
Fishery Act (Act 317). (1985). Petaling Jaya, Selangor: International Law Book Services.
Fitzgerald, A. R. (1986). Waterfront planning and development. Paper presented at the
Waterfront Planning and Development Symposium (28th
-30th
October 1986), Boston,
Massachusetts, retrieved 25th
July, 2008, from
cedb.asce.org/cgi/wwwdisplaybn.cgi?08726257.
Flyvbjerg, B. (2006). Five misunderstandings about case-study research. Qualitative Inquiry,
12(2), 219-245.
Food and Agricultural Organization. (1978). Integrated rural development: Core element of
the rural system. Rome.
Fowler, F. J., & Cosenza, C. (2008). Writing effective questions. In E. D. d. Leeuw, J. Hox &
D. Dillman (Eds.), International handbook of survey methodology (pp. 136-160). New
York: Lawrence Erlbaum Associates.
Fuhrmann, C. M., Konrad, C. E., & Band, L. E. (2008). Climatological perspectives on the
rainfall characteristics associated with landslides in Western North Carolina Physical
Geography, 29(4), 289-305.
Gaffen, Y. G. (2004). Cities riding waves of success with well-planned waterfront restoration.
Public Management, 86(10).
Garland, R. (1991). The mid-point on a rating scale: Is it desirable? Marketing Bulletin, 2, 66-
70.
George, D., & Mallery, P. (2009). SPSS for windows – step by step: A simple guide and
reference 16.0 update (9th ed.). United States of America: Pearson Higher Education.

190
Ghows, M. A. M. H. (2006). The Malayan Emergency revisited 1948-1960 – A pictorial
history. Kuala Lumpur, Malaysia: AMR Holdings Sdn. Bhd.
Glenmarie Cove Development Sdn. Bhd. (2009). Proposal of development – Report.
Glenmarie Cove Development Sdn. Bhd.
Goldrick, M., & Merrens, H. R. (1990). Waterfront changes and institutional: The role of the
Toronto Harbour Commission, 1911-1989. In B. Hoyle (Ed.), Port cities in context:
The impact of waterfront regeneration (pp. 95-117). London: Transport Geography
Study Group, Institute of British Geographers.
Goodwin, R. F. (1999). Redeveloping deteriorated urban waterfronts:The effectiveness of
U.S. coastal management programs. Coastal Management, 27, 239-269.
Gospodini, A. (2001). Urban waterfront redevelopment in Greek cities: A framework for
redesigning space. Cities, 18(5), 285-295.
Greco, J. (2008). Waterfront and center. Parks & Recreation, 43(6), 34-39.
Greene, J. C., Caracelli, V. J., & Graham, W. F. (1989). Toward a conceptual framework for
mixed method evaluation designs. Educational Evaluation and Policy Analysis, 11(3),
255-274.
Grondelle, C. V., & Price, N. (2005). Touch the water. Wellington: Wellington City Council.
Guilding, C., & Whiteoak, J. (2008). An Examination of Management and Governance Issues
Arising in Residential Golf Complexs. Pacific Rim Property Research Journal, 14(1),
44-65.
Guttery, R. S., Poe, S., & Sirmans, C. F. (1998). The impact of compliance with federal
wetlands regulation on housing prices Paper presented at the 14th
American Real
Estate Conference, Monterey, CA, retrieved 7th
February, 2009, from
http://www.aresnet.org/Meetings/1998.htm.
Guttery, R. S., Poe, S., & Sirmans, C. F. (2004). An empirical investigation of federal
wetlands regulation and flood delineation: Implications for residential property owners
Journal of Real Estate Research, 26(3).
Hair, J. F., Anderson, R. E., Tatham, R. L., & Black, W. C. (1998). Multivariate data analysis
(5th ed.). New Jersey: Prentice-Hall.
Hair, J. F., Babin, B., Money, A. H., & Samouel, P. (2003). Essentials of business research
methods New Jersey: John Wiley & Sons Inc.
Hair, J. F., Black, B., Babin, B., Anderson, R. E., & Tatham, R. L. (2006). Multivariate data
analysis (6th ed.). New Jersey: Pearson Prentice Hall.
Hair, J. F., Black, W. C., Babin, B. J., & Anderson, R. E. (2009). Multivariate data analysis
(7th ed.). Upper Saddle River, New Jersey: Prentice Hall.
Hasan, A. R., & Kasim, N. H. (2007). Malaysia population census: review of enumeration
strategies and topics. Journal of the Department of Statistics Malaysia, Volume 1, 51-
60.

191
Herzog, T. R., Herbert, E. J., Kaplan, R., & Crooks, C. L. (2000). Cultural and developmental
comparisons of landscape perceptions and preferences. Environment and Behavior,
32( 3), 323-346.
Hinton, P., Brownlow, C., McMurray, I., & Cozens, B. (2004). SPSS explained (2nd ed.). East
Sussex: Routledge.
Hong, S. Y. L., Ismail, M., & Yin, T. S. (2008). Corporate social responsibility in Malaysia
housing development – The developer's perspective. Pacific Rim Property Research
Journal, 14(2), 177-198.
Hoyle, B. (2000). Confrontation, consultation, cooperation? Community groups and urban
change in Canadian port-city waterfronts. The Canadian Geographer, 44(3), 228-243.
Hoyle, B. (2001). Lamu: Waterfront revitalisation in an East African port-city. Cities, 18(5),
297-313.
Hoyle, B. (2002). Urban waterfront revitalisation in developing countries: The example of
Zanzibar's Stone town. The Geographical Journal, 168(2), 141-162.
Hoyle, B., & Pinder, D. (1981). Cityport industrialisation and regional development. Oxford:
Pergamon Press.
Hoyle, B., & Pinder, D. (Eds.). (1992). European port cities in transition (1st ed.). London:
Belhaven Press
Hoyle, B., Pinder, D., & Husain, M. S. (1988). Revitalising the waterfront: International
dimensions of redevelopment. London: Architectural Press Belhaven.
Hudson, B. J. (1996). Cities on the shore: The urban littoral frontier. New York: Pinter.
Husin, A. R. (2006). Malaysia‟s economic development with emphasis on public-private
collaboration. Paper presented at the World Bank PSD Conference (May 2006),
retrieved 18th
September, 2010, from www.epu.gov.my.
Hussein, H. (2006). Urban recreational riverfronts: Successful revitalisation elements. Journal
of Design and the Built Environment, 2 (1).
Hussein, J. (2008). Opportunities and challenges in sustainable construction. Paper presented
at the International Conference and Expo on Environment Management and
Technologies (ICEEMAT 2008) on (10th
-12th
December 2008), PWTC, Kuala
Lumpur, retrieved 16th
May, 2009, from www.puncakniaga.com.my.
Hussein, J. (2010). The construction sector takes the lead – The Malaysian perspectives.
Paper presented at the The MEF-MUNICH Spring Dialogue: The global green
agenda: "Securing a sustainable future", retrieved 19th
November, 2010, from
www.malaysia-europeforum.com/download/munichprogramme.pdf.
Hutcheson, G. D., & Sofroniou, N. (1999). The multivariate social scientist: Introductory
statistics using generalized linear models. London: SAGE Publications Ltd.
Jaafar, J. (2004). Emerging trends of urbanisation in Malaysia. Journal of The Department of
Statistics, Volume 1, 43-60.

192
Jaafar, N. N. N. (2009). Land development process in Malaysia. Kuala Lumpur, Malaysia:
Nilai Harta Consultant Sdn. Bhd, retrieved 1st July, 2010, from
www.nilaiharta.com.my/.../land-development-process-and-property.
Jaafar, N. N. N. (2010). Brief scenario on planning structure in Malaysia. Kuala Lumpur,
Malaysia: Nilai Harta Consultant Sdn. Bhd, retrieved 12th
July, 2010, from
www.nilaiharta.com.my/.../brief-scenario-on-planning-structure-in-malaysia.
Jackson, D., & Velicer, W. (1990). Component analysis versus common factor analysis: Some
issues in selecting an appropriate procedure. Multivariate Behavioural Research, 25,
1.
Jali, R., Stillwell, J., & Rees, P. (2006). The changing pattern of rural and urban migration in
Malaysia. Paper presented at the 3rd
International Population Geographies Conference
(19th
-21st June 2006), University of Liverpool, retrieved 17
th September, 2008, from
www.geog.leeds.ac.uk/groups/pgrg/docs/conf2006/TIPG.../Jali.ppt.
Johnson, R. B., & Onwuegbuzie, A. J. (2004). Mixed methods research: A research paradigm
whose time has come. Educational Researcher, 33(14).
Kauko, T. (2002). Spatial housing market structure of urban areas: Comparison between
evidence from Helsinki and Amsterdam. Paper presented at the ENHR Workshop,
retrieved 28th
July, 2010, from housing.epfl.ch/ENHR2002.
Kauko, T., Hooimeijer, P., & Hakfoort, J. (2002). Capturing housing market segmentation:
Analternative approach based on neural network modelling. Housing Studies, 17(6),
875-894.
Keong, C. W. (2006). River restoration in Malaysia. Kuala Lumpur, Malaysia: Department of
Irrigation and Drainage, Ministry of Natural Resources and Environment Malaysia,
retrieved 15th
March, 2009, from www.water.gov.my.
Kitchin, R., & Tate, N. J. (2000). Conducting research in human geography: Theory,
methodology and practice. Harlow: Prentice Hall.
Konvitz, J. W. (1978). Cities and the sea: Port city planning in early modern Europe.
Baltimore and London: The Johns Hopkins University Press.
Krausse, G. H. (1995). Tourism and waterfront renewal: Assessing residential perception in
Newport, Rhode Island, USA. Ocean and Coastal Management, 26(3), 179-203.
Kumar, R. (2005). Research methodology: A step by step guide for beginners (2nd ed.).
N.S.W: Pearson Education Australia.
Kupke, V., & Pearce, J. (2000). Identifying industrial location and sites preferences for small
business: A South Australian case study. Pacific Rim Property Research Journal,
6(12-24).
Kuriakose, S. L., Jetten, V. G., Westen, J. v., Sankar, G., & Beek, L. P. H. v. (2008). Pore
water pressure as a trigger of shallow landslides in the western ghats of Kerala, India:
Some preliminary observations from an experimental catchment. Physical Geography,
29(4), 374-386.

193
Lalli, C. M., & Parsons, T. R. (1993). Biological oceanography: An introduction (1st ed.).
Oxford: Elsevier Buttorworth – Heinemann.
Latip, N. S. A., Heath, T., Shamsuddin, S., Liew, M. S., & Vallyutham, K. (2010). The
contextual integration and sustainable development of Kuala Lumpur's city centre
waterfront: An evaluation of the policies, law and guidelines. Paper presented at the
The World, Engineering, Science and Technology Congress (ESTCON 2010) (15th
-
17th
June 2010), Kuala Lumpur Convention Centre, Malaysia, retrieved 29th
January,
2011, from eprints.utp.edu.my/2811/1/SBI-06-CI-07.pdf.
Lepoer, B. L. (1989). Road to independence Singapore: A country study Washington: Federal
Research Division, Library of Congress.
Likert, R. (1932). A Technique for the Measurement of Attitudes. Archives of Psychology,
140.
Local Government Act. (1976). Kuala Lumpur, Malaysia: Percetakan Nasional Malaysia
Berhad.
Logan, J. R. (2001). The New Ethnic Enclaves in America's Suburbs. Albany, New York:
Lewis Mumford Center.
Macionis, J. J., & Parrillo, V. N. (2001). Cities and urban life (2nd ed.). Upper Saddle River,
New Jersey: Prentice Hall.
Malaysia Constitutions. (2006). Article 21 (15th ed.). Kuala Lumpur, Malaysia: Percetakan
Nasional Berhad.
Malaysian Department of Irrigation and Drainage. (2008). Flood mitigation Kuala Lumpur,
Malaysia: Department of Irrigation and Drainage, Ministry of Natural Resources and
Environment Malaysia, retrieved 10th
December, 2008, from www.doe.gov.my.
Malaysian Department of Drainage and Irrigation. (2009). River management activities. Kuala
Lumpur, Malaysia: Department of Drainage and Irrigation, Ministry of Natural
Resources and Environment.
Malaysian Department of Environment. (2004). Environmental quality report. Kuala Lumpur,
Malaysia: Department of Environment, Ministry of Natural Resources and
Environment Malaysia, retrieved 9th
December, 2008, from www.doe.gov.my.
Malaysian Department of Environment. (2006). Malaysia environmental quality report 2006.
Kuala Lumpur, Malaysia: Department of Environment, Ministry of Natural Resaorces
and Environment Malaysia, retrieved 10th
December, 2008, from www.doe.gov.my.
Malaysian Department of Environment. (2007). Environmental quality report. Kuala Lumpur,
Malaysia: Department of Environment, Ministry of Natural Resources and
Environment Malaysia, retrieved 10th
December, 2008, from www.doe.gov.my.
Malaysian Department of Environment. (2010). River water pollution sources. Kuala
Lumpur, Malaysia: Department of Environment, Ministry of Natural Resources and
Environment Malaysia, retrieved 11st
December, 2008, from www.doe.gov.my.

194
Malaysian Department of Irrigation and Drainage (2006). Guidelines for riverfront
development concept. Kuala Lumpur, Malaysia: Department of Irrigation and
Drainage, Ministry of Natural Resources and Environment Malaysia, retrieved 29th
November, 2008, from www.water.gov.my.
Malaysian Department of Irrigation and Drainage. (2006). Guidelines for the development
related to river and river reserves. Kuala Lumpur, Malaysia: Department of Irrigation
and Drainage Malaysia, retrieved 30th
July, 2008, from www.water.gov.my.
Malaysian Department of Irrigation and Drainage. (2007). Flood and drought management in
Malaysia. Kuala Lumpur, Malaysia: Department of Irrigation and Drainage, Ministry
of Natural Resources and Environment Malaysia, retrieved 22nd
February, 2009, from
www.water.gov.my.
Malaysian Department of Irrigation and Drainage. (2009a). Five years development report.
Kuala Lumpur, Malaysia: Department of Irrigation and Drainage Malaysia, retrieved
3rd
December, 2009, from www.water.gov.my.
Malaysian Department of Irrigation and Drainage. (2009b). Manual and guidelines for water
management. Kuala Lumpur, Malaysia: Department of Irrigation and Drainage,
Ministry of Natural Resource and Environment Malaysia, retrieved 11st November,
2009, from www.water.gov.my.
Malaysian Department of Irrigation and Drainage. (2009c). River management activities.
Kuala Lumpur, Malaysia: Department of Irrigation and Drainage, Ministry of Natural
Resources and Environment Malaysia, retrieved 4th
November, 2009, from
www.water.gov.my.
Malaysian Department of Public Works. (2007). National slope master plan study. Kuala
Lumpur, Malaysia: Department of Public Works Malaysia, retrieved 4th
October,
2008, from www.jkr.gov.my.
Malaysian Department of Statistics. (2009). Census of population and housing malaysia.
Kuala Lumpur, Malaysia: Department of Statistics Malaysia, retrieved 24th
June, 2009,
from www.statistics.gov.my.
Malaysian Department of Statistics. (2010). Key Statistics. Kuala Lumpur, Malaysia:
Department of Statistics Malaysia, retrieved 23rd
June, 2010, from
www.statistics.gov.my.
Malaysian Department of Statistics (Sarawak Branch). (2009). Sarawak population and vital
statistics. Kuching, Sarawak: Department of Statistics (Sarawak Branch), retrieved
27th
July, 2009, from www.statistics.gov.my/portal/index.
Malaysian Department of the Prime Minister. (2010). The 2011 budget speech. Kuala
Lumpur, Malaysia: Prime' Minister Department malaysia, retrieved 22nd
February,
2011, from www.pmo.gov.my.
Malaysian Economic Planning Unit. (2004). Development planning in Malaysia. Kuala
Lumpur, Malaysia: Economic Planning Unit, Prime Minister's Department, retrieved
15th
October, 2008, from www.epu.gov.my.

195
Malaysian Economic Planning Unit. (2010). The Malaysian economy in figure. Kuala
Lumpur, Malaysia: Economic Planning Unit, Prime Minister's Department, retrieved
9th
June, 2008, from www.epu.gov.my.
Malhotra, N. K. (2002). Marketing Research: An applied orientation (2nd ed.). Frenchs
Forest, N.S.W: Prentice Hall.
Maliki, N. Z. (2008). Kampung / landscape: Rural-urban migrants‟ interpretations of their
home landscape – The case of Alor Star and Kuala Lumpur Unpublished doctoral
thesis, Lincoln University, New Zealand.
Malone, P. (1996). City, capital, and water. New York: Routledge.
Mann, R. (Ed.). (1973). Rivers in the city. Newton Abbot: David & Charles.
Manshard, W., & Morgan, W. B. (1988). Agricultural expansion and pioneer settlements in
the humid tropics. Tokyo, Japan: United Nations University Press.
Martinez, M. L., Intralawan, A., Vazquez, G., Perez-Maqueoa, O., Sutton, P., & Landgrave,
R. (2007). The coasts of our world: Ecological, economic and social importance.
Ecological Economics of Coastal Disaster – Coastal Disasters Special Edition, 63(2-
3), 254-272.
May, T. (2001). Social research: Issues, methods and process (3rd ed.). Buckingham,
England: Open University Press.
McDonagh, J. (2010). Land development in New Zealand – Case studies on the importance of
site selection, due diligence, finance and the regulatory environment. Pacific Rim
Property Research Journal, 16(1), 70-96.
Menon, J. (2009). Macroeconomic management amid ethnic diversity: Fifty years of
Malaysian experience. Journal of Asian Economics, 20, 25-33.
Meyer, W. B., & Turner, B. L. (1994). Changes in land use and land cover: A global
perspective. Cambridge: Cambridge University Press.
Ministry of Housing and Local Government. (2011). Malaysia waterfront. Malaysia: Ministry
of Housing and Local Government, Malaysia, from http://www.mhlg.gov.my.
Mokhtar, M., Ajlouni, M. F. A., & Elfithrie, R. (2008). Integrated water resources
management improving Langat basin ecosystem health. American Journal of
Environmental Sciences, 4(4), 380-382.
Mokhtar, M., & Aziz, S. A. A. G. (2003). Integrated coastal zone management using the
ecosystems approach, some perspectives in Malaysia. Ocean & Coastal Management,
46, 407-419.
Mokhtar, M., & Elfithri, R. (2005). Participatory management for integrated water resources
management through collaborative decision making. Paper presented at the IWRM
consultation for senior executive in the public sector, retrieved 22nd
May, 2009, from
www.inweb.gr/twm4/abs/ELFITHRI%20Rahmad.pdf.

196
Mooney, S., & Eisgruber, L. M. (2001). The infuence of riparian protection measures on
residential property values: The case of the Oregon plan for salmon and watersheds.
Journal of Real Estate Finance and Economics, 22(2/3), 273-286.
Morgan, G. A., & Griego, O. V. (1998). Easy use and interpretation of SPSS for Windows:
Answering research questions with statistics. New Jersey: Lawrence Erlbaum
Associates Inc.
Morgan, G. A., Leech, N. L., Gloeckner, G. W., & Barrett, K. C. (2007). SPSS for
introductory statistics: Use and interpretation (3rd ed.). United State of America:
Lawrence Erlbaum Association, Inc.
Morse, J. M. (2003). Principles of mixed-method and multi-method research design. In A.
Tashakorri & C. Teddlie (Eds.), Handbook of mixed method in social and behavioral
research (pp. 189-208). Thousand Oaks, California: SAGE Publication, Inc.
Muhamad, S., Toriman, M. E., Aiyub, K., & Jaafar, M. (2005). River and the development:
Malaysian urban river reserve. Bangi, Malaysia: UKM Publisher.
Munshi, J. ( 1990). A Method For Constructing Likert Scales. Sonoma State Univesity.
Murray, G. (2003). A Room with a Water View. Beijing Review, 46(19), 26.
National Land Code. (1965). Kuala Lumpur: Malaysian Government Press.
National Landscape Department. (2005). Waterfront as recreational area. Kuala Lumpur,
Malaysia: National Landscape Department, Ministry of Housing and Local
Government Malaysia, retrieved 24th
September, 2009, from www.mhlg.gov.my.
Nazery, K. (2009). Maritime economic activities in Malaysia: Planning towards sustainable
development. Maritime Institute of Malaysia.
Neuman, W. L. (2006). Social research methods: Qualitative and quantitative approaches
(6th ed.). United States of America: Pearson.
Newell, G. (2003). The quality of property education in australia. Pacific Rim Property
Research Journal, 9(4).
Newman, I., & Benz, C. R. (1998). Qualitative – Quantitative research methodology:
Exploring the interactive continuum USA: Southern Illinois University.
Newman, I., & McNeil, K. (1998). Conducting survey research in the social sciences.
Lanham, Maryland: University Press of America.
Nilai Harta Consultation Research. (2010). Property market outlook, 2010. Malaysia: Nilai
Harta Consultation Research, retrieved 25th
January, 2010, from
www.nilaiharta.com.my/page/90/property-market-outlook-2010.
Ninno, B. C. D., Dorosh, P. A., Smith, L. C., & Roy, D. K. (2001). The 1998 floods in
Bangladesh: Disaster impacts, household coping strategies and response.
Washington: International Food Policy Research Institute.
197
Ninth Malaysia Plan. (2006). Ninth Malaysia Plan (2006-2010). Kuala Lumpur, Malaysia:
Economic Planning Unit, Prime Minister Department, retrieved 19th
August, 2010,
from www.parlimen.gov.my/news/eng-ucapan_rnk9.pdf.
Noh, M. N. M. (2005). Strategic planning and management of water resources in Malaysia:
Langat river basin case study. Malaysia: Department of Irrigation and Drainage,
Malaysia, retrieved 12nd
March, 2009, from www.water.gov.my.
Norris, M. (1980). Local government in Peninsular Malaysia. England: Gower Pub Co.
Oliva, S. (2006). The effects of waterfront development on housing prices: the case of Eastern
Baltimore. University of Maryland, United State.
Omar, I. (2002). Rules affecting the land development process in Malaysia – A review on
regulation of Environmental Impact Assessment (EIA). Paper presented at the 8th
Pacific Rim Real Estate Society Conference, Lincoln University, New Zealand,
retrieved 3rd
February, 2009, from www.prres.net.
Omar, I., Yusof, A. M., & Samad, A. R. (2001). The economic recession and trends in hotel
rental in Malaysia – An institutional perspective. Paper presented at the 7th
Pacific
Rim Real Estate Society Conference (21st-24
th January 2001), University of South
Australia, Adelaide, retrieved 22nd
April, 2010, from www.prres.net.
Onwuegbuzie, A. J., & Leech, N. L. (2005). the role of sampling in qualitative research.
Academic Exchange Quarterly, Fall 2005.
Onwuegbuzie, A. J., & Teddlie, C. (2003). A framework for analyzing data in mixed methods
research. In A. Tashakkori & C. Teddlie (Eds.), Mixed methods in social & behavioral
research. Thousands Oaks, California: SAGE Publications Inc.
Pallant, J. (2007). SPSS Survival Manual: A step-by-step guide to dataanalysis using SPSS for
windows (version 15) (3rd ed.). Australia: Allen & Unwin.
Parsons, G. R., & Wu, Y. (1991). The opportunity cost of coastal land-use controls an
empirical analysis Land Economics, 67(3), 308-316.
Patton, M. Q. (1987). How to use qualitative methods in evaluation. Newbury Park,
California: SAGE Publications.
Peter, H. (1993). Waterfronts: A new urban frontier. In R. Bruttomesso (Ed.), Waterfronts – A
new frontier for cities on water (pp. 12-20). Venice: International Center Cities on
Water.
Post, J. C., & Lundin, C. G. (1996). Guidelines for integrated coastal zone management.
Washington D.C.: The International.
Public Law (91-190). (1970). National Environmental Policy Act of 1969. United States:
United States Statutes at Large.
Public Law (92-500). (1972). Federal Water Pollution Control Act. United States: United
States Statutes at Large.

198
Rahman, S. A. (2001). Preliminary count report for urban and rural areas. Kuala Lumpur,
Malaysia: Department of Statistics Malaysia, retrieved 29th
October, 2008, from
www.statistics.gov.my.
Real Estate and Housing Developers' Association Malaysia. (2010). Land development
process in Malaysia Kuala Lumpur, Malaysia: Real Estate and Housing Developers'
Association Malaysia, retrieved 14th
July, 2009, from
www.rehda.com/industry/bumiputra-housing/index.html.
Rexhausen, J., & Vredeveld, G. (2003). Riverfront investment: Economic impact on the
Cincinnati Metropolitan Area. Economic Development Journal, Spring 2003, 8.
Riley, R., & Shurmer-Smith, L. (1988). Global imperatives, local forces and waterfront
redevelopment. In B. Hoyle, D. Pinder & M. S. Husain (Eds.), Revitalising the
waterfront: International dimensions of dockland redevelopment. London:
Architectural Press Belhaven.
Ritchie, J., & Lewis, J. (2003). Qualitative research practice: A guide for social science
students and researchers. London: Sage Publication Ltd.
Rogers, P., & Hall, A. W. (2003). Effective water governance. Sweden: Global Water
Partnership.
Ruane, J. M. (2005). Essentials of research method: A guide to social science research.
Malden, MA: Blackwell Publishing.
Ryckbost, P. (2005). Redeveloping urban waterfront property, retrieved 19th
June, 2008, from
www.umich.edu/~econdev/waterfronts/.
Saiful Arif, A., & Nakagoshi, N. (2006). Changes in landscape spatial pattern in the highly
developing state of Selangor, Peninsular Malaysia. Landscape and Urban Planning,
77, 263-275.
Sairinen, R., & Kumpulainen, S. (2006). Assessing social impacts in urban waterfront
regeneration. Environmental Impact Assessment Review, 26(1), 120-135.
Sapsford, R., & Jupp, V. (2006). Data collection and analysis (2nd ed.). London: SAGE
Publications.
Sarawak Economic Development Corporation. (1990). Kuching Riverfront Master Plan.
Sarawak, Malaysia: Sarawak Economic Development Corporation.
Sarawak Economic Development Corporation. (2009). Urban design of Kuching Waterfront.
Unpublished Report. Sarawak Economic Development Corporation.
Sarawak Government Official Portal. (2009). History of Sarawak. Retrieved 3rd
January,
2009, from http://www.sarawak.gov.my
Sarji, A. H. A. (1995). Vision 2020. Selangor Darul Ehsan, Malaysia: Pelanduk Publications.
Schumacker, R. E., & Lomax, R. G. (1996). A beginner‟s guide to structural equation
modelling. Mahwah, New Jersey Lawrence Erlbaum Associates.

199
Schumacker, R. E., & Lomax, R. G. (2004). A beginner's guide to structural equation
modeling (2nd ed.). New Jersey: LEA.
Sekaran, U. (2003). Research methods for business: A skill building approach (4th ed.). New
York: John Wiley & Sons.
Selangor State Government. (2009). History: Location map of Selangor. Retrieved 10th
August, 2009, from www.selangor.gov.my
Seventh Malaysia Plan. (1996). Seventh Malaysia Plan (1996-2000). Kuala Lumpur,
Malaysia: Economic Planning Unit, Prime Minister Department, retrieved 5th
May,
2009, from www.epu.gov.my.
Shaw, B. (2001). History at the water‟s edge. In R. Marshall (Ed.), Waterfronts in post-
industrial cities (1st ed., pp. 160-172). New York: Spon Press.
Shaziman, S., Usman, I. M. S., & Tahir, M. (2010). Waterfront as public space: Case study
Klang River between Masjid Jamek and Central Market, Kuala Lumpur. Paper
presented at the 6th
WSEAS International Conference on Energy, Environment,
Ecosystems and Sustainable Development (EEESD' 2010) and 3rd
WSEAS
International Conference on Landscape Architecture (LA' 2010), 21st-23
rd October,
Politehnica University of Timisoara, Romania, retrieved 6th
January, 2011, from
www.wseas.us/e-library/conferences/2010/TimisoaraP/...EELA-56.pdf.
Singh, G. (1994). UMP – Asia occasional paper: Lands laws, land policies and planning in
Malaysia: Urban Management Programme Regional Office for Asia – Pacific (UMP-
Asia), retrieved 20th
December, 2008, from www.kptg.gov.my.
Singleton, R. A., & Straits, B. C. (2010). Approaches to social research (5th ed.). New York:
Oxford University Press.
Siwar, C. (1996). Rural development. In K. S. Jomo & N. S. Kiat (Eds.), Malaysia's economic
development experience. Malaysia: Pelanduk Publications.
Sixth Malaysia Plan. (1991). Sixth Malaysia Plan (1991-1995). Kuala Lumpur, Malaysia:
Economic Planning Unit, Prime Minister Department, retrieved 29th
November, 2010,
from www.epu.gov.my.
Small, C., & Nicholls, R. J. (2003). A Global Analysis of Human Settlement in Coastal
Zones. Journal of Coastal Research, 19(3 (summer 2003)), 584-599.
Small, K. A., & Arnott, R. J. (1994). The economics of traffic congestion. American Scientist,
82(446-455).
Soil Resources Management and Conservation Service. (1993). Guidelines for land use-
planning. Rome, Italy: Food and Agriculture Organization of the United Nation.
State Government of Malacca. (2009). Fact sheet – Malacca Waterfront. State Government of
Malacca, retrieved 10th
April, 2010 from http://www.melaka.gov.my.
State Government of Malacca. (2010). History of Malacca: Fact and number. Retrieved 10th
April 2010, from http://www.melaka.gov.my

200
Stewart, D. W. (1981). The application and misapplication of factor analysis in marketing
research. Journal of Marketing Research, 18, 51.
Sweet, S. A., & Grace-Martin, K. (2008). Data analysis with SPSS: A first course in applied
statistics (3rd ed.). USA: Pearson Education, Inc.
Tabachnick, B. G., & Fidell, L. S. (2007). Using multivariate statistics (5th ed.). Boston:
Allyn and Bacon.
Tashakkori, A., & Teddlie, C. (1998). Mixed Methodology: Combining qualitative and
quantitative approaches (applied social research methods). Thousand Oaks,
California: SAGE Publications.
Tashakkori, A., & Teddlie, C. (2003). Mixed methods in social and behavioral research.
California: SAGE Publications Inc.
Tenth Malaysia Plan. (2010). Tenth Malaysia Plan (2011-2015). Kuala Lumpur, Malaysia:
Economic Planning Unit, Prime Minister Department, retrieved 25th
September, 2010,
from www.epu.gov.my.
The Associated Press. (2008). Landslide kills four Malaysia ban hillside projects.
International Herald Tribune, retrieved 6th
July, 2008, from
www.topix.com/forum/business/TR7C588VV4RORAJBG.
The star online. (2007, April 25). New love-our river campaign. The star online. Retrieved
from http://thestar.com.my/news/story.asp?file=/2007/4/25/nation
Tong, S. T. Y., & Chen, W. (2002). Modeling the relationship between land use and surface
water quality. Journal of Environmental Management, 66, 377-393.
Torre, L. A. (1989). Waterfront development. New York: Van Nostrand Reinhold.
Town and Country Planning Act. (1976). Act 172. Malaysia: The Commissioner of Law
Revision & Percetakan Nasional Malaysia Berhad.
Tsukio, Y. (1984). Waterfront. Tokyo: Process Architecture Publishing Company.
Tumbde, D. (2005). Conceptual model for economically viable urban riverfront revitalization
in United States. Unpublished master thesis, University of Cincinnati, retrieved 18th
August, 2010, from rave.ohiolink.edu/etdc/view?acc_num=ucin1123542011.
Tunbridge, J., & Ashworth, G. (1992). Leisure resource development in cityport
revitalisation: The tourist-historic dimension. In B. Hoyle & D. Pinder (Eds.),
European port cities in transition (1st ed., pp. 177-199). London: Belhaven Press.
United Nations. (2005). Human development report – International cooperation at a
crossroads: Aid, trade and security in an unequal world.
Urban Redevelopment Authority. (1994). Master Plan for Singapore's Riverfront. Singapore:
Urban Redevelopment Authority.
Urban Redevelopment Authority. (2010). Singapore River. Singapore: Urban Redevelopment
Authority.
201
Wagner, W. E. (2010). Using SPSS for social statistics and research methods (2nd ed.). Los
Angeles: Pine Forge Press.
Wang, C. (2003). Watefront Regeneration – Lessons of European waterfront practices. Paper
presented at the Planning Summer School (September, 2003), Bangor, retrieved 4th
July, 2009, from www.scribd.com/mobile/documents/7222338/.
Water Act. (1920). Waters Act 1920 (Act 418). Malaysia: The Commissioner of Law Revision
& Percetakan Nasional Malaysia Berhad.
Watson, J. S. (1986). Ross's landing: A river edge park opportunity. Paper presented at the
2nd
International Conference on Making Cities Liable, retrieved 10th
June, 2008, from
www.livablecities.org/documentationsets/15-waterfront-design.
Welch, D. N., & Keat, L. T. (1987). Water Resources Development and Management in
Malaysia Water Resources Policy for Asia. Rotterdam, Netherlands: A. A. Balkema.
Wellington City Council. (2001). The Wellington waterfront framework. Wellington, New
Zealand.
Wellington City Council. (2010). Kilbirnie town centre – Draft revitalisation plan
Wellington, New Zealand: Wellington City Council.
Weng, C. N. (1999). Water conservation, reuse and reduction of water use. Paper presented at
the Sustainable Management of Water Resource in Malaysia (20th
July 1999), Kuala
Lumpur, Malaysia, retrieved 16th
May, 2009, from www.waterwatcherpenang.com.
Weng, C. N. (2005). Sustainable management of rivers in Malaysia – Involving all
stakeholders. International Journal River Basin Management, 3(3), 147-162.
Weng, C. N. (2009). Issue and challenges in water governance in Malaysia. Environmental
Health Science Engineering, 6(3), 143-152.
West, N. (1989). Urban-waterfront developments: a geographic problem in search of a model
Geoforum, 20(4), 459-468.
Wilkinson, S., & Reed, R. (2008). Property development (5th ed.). New York: Routledge.
Wong, G. (2004). Quality of life of the elderly in Singapore‟s multi-racial society. Paper
presented at the Pacific Rim Real Estate Society Conference (25th
-28th
January 2004),
Bangkok, Thailand, retrieved 27th
September, 2009, from www.prres.net.
Worcester, R. M., & Burns, T. R. (1975). A statistical examination of the relative precision
ofverbal scales. Journal of the Market Research Society, 17(3), 181-197.
Wrenn, D. M. (1983). Urban waterfront development. Washington, D.C.: The Urban Land
Institute.
Yarnell, P. (1999). Port administration and integrated coastal management under the Canada
Marine Act in Vancouver, British Columbia, Canada Coastal Management 27(4), 12.
Yassin, A. M., Eves, C., & McDonagh, J. (2009). Waterfront development for residential in
Malaysia. Paper presented at the 15th
Pacific Rim Real Estate Society Conference
(24th
-27th
January 2009), University Technology of Sydney, Sydney, Australia.

202
Yassin, A. M., Eves, C., & McDonagh, J. (2010). An evolution of waterfront development in
Malaysia. Paper presented at the 16th
Pacific Rim Real Estate Society Conference
(24th
-27th
January 2010), Intercontinental Hotel, Wellington, New Zealand.
Yin, R. K. (1984). Case study research: Design and methods. Beverly Hills, California:
SAGE Publications.
Yin, R. K. (1993). Application of case study research (applied social research methods) (Vol.
34). Newbury Park, California: SAGE Publications.
Yin, R. K. (1994). Case study research: Design and methods (applied social research
methods) (2nd ed. Vol. 5). Thousand Oaks, California: SAGE Publications.
Yin, R. K. (2003). Case study research: Design and methods (3rd ed.). Thousand Oaks,
California: SAGE Publications.
Yingxia, Y., & Xiaofeng, L. (2006). Research of the development functional demand of
waterfront in cities. Urban Studies, 13(6), 113-118.
Yossi, B., & Sajor, E. E. (2006). Development of riverside kampung and management of
rivers in Yogjakarta Indonesia: Issue of policy coherence and relevance of socio
economic characteristics of river bank communities Paper presented at the Regional
Conference on Urban Water and Sanitation in Southest Asean Cities, Vientiane, Lao
PDR, retrieved 5th
Jun, 2008, from
uemlaopdr.wordpress.com/publicaions/conference_uws_laos_06/.
Yunus, A. J. M., Nakagoshi, N., & Ibrahim, A. L. (2003). Application of GIS and remote
sensing for measuring and evaluating land use change and its impact on water quality
in the Pinang River watershed. Ecology and Civil Engineering, 6(1), 97-110.
Zarin, D. J., Pereira, V. F. G., Raffles, H., Rabelo, F. G., Pinedo-Vasquez, M., & Congalton,
R. G. (2001). Landscape change in tidal floodplains near the mouth of the Amazon
River. Forest Ecology and Management, 154(3), 383-393.
Zhang, L. (2002). An evaluation an urban riverfront park, Riverfront Park, Spokane,
Washington – Experience and lessons for designer. Unpublished master thesis,
Washington State University, United States.
Zikmund, W. G. (2003). Business research methods (7th ed.). United States of America:
Thompson Learning.
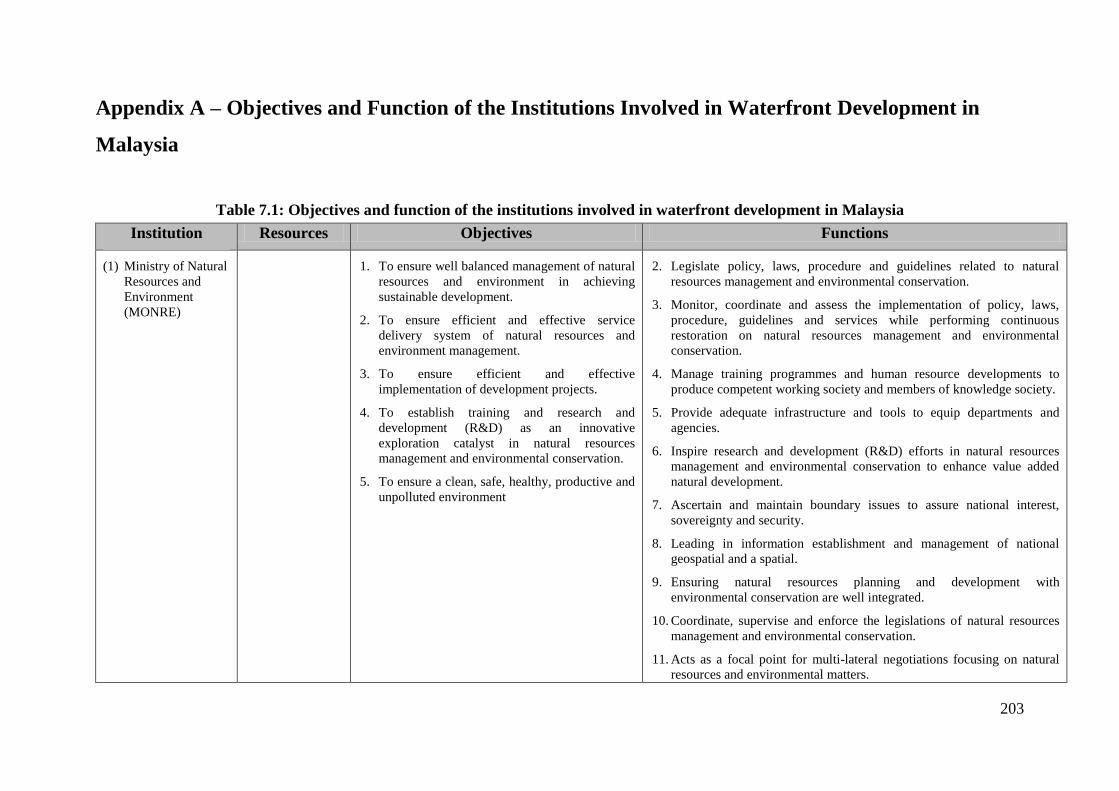
203
Appendix A – Objectives and Function of the Institutions Involved in Waterfront Development in
Malaysia
Table 7.1: Objectives and function of the institutions involved in waterfront development in Malaysia
Institution Resources Objectives Functions
(1) Ministry of Natural
Resources and
Environment
(MONRE)
1. To ensure well balanced management of natural
resources and environment in achieving
sustainable development.
2. To ensure efficient and effective service
delivery system of natural resources and
environment management.
3. To ensure efficient and effective
implementation of development projects.
4. To establish training and research and
development (R&D) as an innovative
exploration catalyst in natural resources
management and environmental conservation.
5. To ensure a clean, safe, healthy, productive and
unpolluted environment
2. Legislate policy, laws, procedure and guidelines related to natural
resources management and environmental conservation.
3. Monitor, coordinate and assess the implementation of policy, laws,
procedure, guidelines and services while performing continuous
restoration on natural resources management and environmental
conservation.
4. Manage training programmes and human resource developments to
produce competent working society and members of knowledge society.
5. Provide adequate infrastructure and tools to equip departments and
agencies.
6. Inspire research and development (R&D) efforts in natural resources
management and environmental conservation to enhance value added
natural development.
7. Ascertain and maintain boundary issues to assure national interest,
sovereignty and security.
8. Leading in information establishment and management of national
geospatial and a spatial.
9. Ensuring natural resources planning and development with
environmental conservation are well integrated.
10. Coordinate, supervise and enforce the legislations of natural resources
management and environmental conservation.
11. Acts as a focal point for multi-lateral negotiations focusing on natural
resources and environmental matters.

204
Institution Resources Objectives Functions
12. Safeguarding national interest in regional and international negotiations
in terms of natural resources and environment.
13. Enhancing public awareness and public support in identifying the
importance of well balanced utilization of natural resources and
conservation of the environment.
14. Establish smart partnership among various authorities in managing
natural resources and environment.
15. Ensure continuous improvement of the service delivery system in
managing natural resources and environment.
(2) Department of
Irrigation and
Drainage, MONRE
Water resources,
drainage and
hydrology
1. To ensure that formulation of policies,
strategies and programs are based on the
Cabinet and NRE‟s top managements decisions
while implement action base on current needs.
2. To ensure that implementation of policies,
strategies and programs are monitored
efficiently and effectively.
3. To ensure that all matters related to Cabinet
Papers, Concept Papers, Reports and relevant
documents are properly prepared and updated.
4. To ensure that Parliament matters are managed
according to the standard procedures.
5. To ensure that planned project development
will have positive impact on the nation‟s
developments; and
6. To ensure that monitoring of project
development being done consistently.
1. To formulate policies/ guide lines/ rules and regulation for water
resources management.
2. To formulate strategies for the implementation of National Water
Resources Management and Seashore Management.
3. To monitor issues related to development allocation of DID and
NAHRIM.
4. To manage and coordinate NRE functions that is related to Water
Resources.
5. To identify and evaluate the implementation of DID‟s and NAHRIM‟s
Policies and Strategies; and.
6. To manage matters related to Cabinet Paper and Parliament on Water
Resources issues.
(3) Department of
Mineral and Geo-
sciences, MONRE
Minerals 1. To plan and set policies and directions for the
development and enhancement of the mineral
and geo-science sector.
1. To formulate and legislates policy, laws, regulations and development
programmes of minerals and geosciences sector.

205
Institution Resources Objectives Functions
2. To ensure that policies and legislations related
to the development of minerals and geo-science
is constantly relevant and contributes to the
development of the industry and economy
progress and is implemented in an
environmentally friendly manner.
2. To plan, determine way forward and prepare short and long terms
strategic plan for minerals and geosciences sector.
3. To collect and promote data and information for planning and
developing minerals and geosciences sector.
4. To monitor, coordinate and evaluate execution of policy, programme,
laws, regulations and service and doing value adding continuously for
minerals and geosciences sector.
5. To process the application and produce export permit for minerals and
ores of all kinds.
6. To establish multilateral/bilateral relationship and safe guard the nations
interest at international level for minerals and geosciences sector.
7. To operate management and financial activities to support Division‟s
functions.
(4) Department of
Forestry of
Peninsular
Malaysia;
Department of
Wild life and
National Park,
Peninsular
Malaysia
Biodiversity and
Forestry
Management
1. To ensure the advancement in forestry sector by
conservation and development of forest area to
achieve sustainable forest management
objective for the conservation of
environmentally stability.
2. Protection, management and preservation of
biodiversity for the production of optimum
benefits.
3. Protection and development of protected areas
for the purpose of research, education,
economic, aesthetic, recreation and ecological
purposes.
4. Enhancement of knowledge, awareness and
public support on the importance of biodiversity
conservation.
1. Implementation of sustainable forest management in ensuring sufficient
timber resources and conservation of environmental stability.
2. Research and development in forestry sectors and forest produce in
effort of optimizing and varied the resources use.
3. To upgrade the forest management based on the Malaysian Criteria and
Indicator or MC&I according to national policy and strategy.
4. To ensure and upgrade the role of the sector according to national and
international forestry and environmental objective as agreed in
international forums.

206
Institution Resources Objectives Functions
(5) Department of
Environment,
MONRE
Environmental
management and
climate change
1. To establish a holistic policy framework to
ensure a healthy, clean, safe and productive
environment so as to achieve sustainable
development. This division also responsible to
ensure that the country's interest in global and
regional environmental issues is protected.
1. Plan, formulate and coordinate the implementation of policy, strategy
and environment program.
2. Coordinate the implementation of Multilateral of Environmental
Agreements, MEAS.
3. Monitor the environmental programs and activities.
4. Enhance and promote the environmental knowledge and encourage
public to actively participate in the environmental culture.
(6) Department of
Director General of
lands and Mines;
Department of
Survey and
Mapping, Malaysia
Land, survey, and
mapping
1. To ensure that the implementation of land
administration in the country and the provision
of survey and mapping services are in line with
current government‟s policy.
2. To enable the National Land Council to
function as an effective forum in ensuring the
uniformity and consistency of land
administration in the country.
1. To draft/coordinate the drafting of legislations / regulations / policies on
land matters, survey and mapping.
2. Monitor and consolidate the implementation of
policies/legislation/regulations and Ministry's decisions that are related
with the land, survey and mapping.
3. To assist the Minister in the implementation of his powers and functions
under the various legislations/regulations related to land matters, survey
and mapping.
4. To coordinate follow-up actions on the incoming issues or instructions
from the cabinet with the various departments/agencies within the
Ministry on land matters, survey and mapping.
5. To act as the secretariat and coordinate Malaysian international border
meetings and inter-state border meetings.
6. Consolidate and manage the National Land Council meetings.
(Source: Malaysian Department of Drainage and Irrigation, 2009)

207
Appendix B – Interview Questions
DEVELOPING GUIDELINES FOR RIVERFRONT DEVELOPMENT
IN MALAYSIA
INTERVIEW QUESTIONS
Dear Sir / Madam
Thank you for taking time to do this interview with me. My name is Azlina Binti Md. Yassin. I am
a post graduate student from Lincoln University, Canterbury, New Zealand. I am currently doing
research on waterfront development in Malaysia. Waterfront in this research refers to any
development areas in front of river such as Kuching riverfront and Malacca waterfront. The
purpose of this study is to look at waterfront development practice in Malaysia with emphasis on
guidelines related to the development process.
The information gathered from this interview will comprise the main evidence for the study and be
used for the thesis write up and subsequent journal publications. Individual responding to the
survey will not be personally identified in the results.
Therefore, I would appreciate if you would contribute to this research. It will take approximately
one hour to complete the interview sessions. Your valuable participation will be deeply
appreciated.
Thank you for assisting in my research
Azlina Binti Md. Yassin
PhD Student,
Priperty studies, Commerce Division,
Lincoln University, Canterbury,
New Zealand.

208
Part 1: Source of Information
The purpose of this opening section is to provide some background details of your company.
Name of Organisation : ____________________________________________
Name of Department : ____________________________________________
Address of Organisation : ____________________________________________
____________________________________________
Telephone : ____________________________________________
Fax Number : ____________________________________________
Website / E-mail : ____________________________________________
Name of Respondents : ____________________________________________
Your Position : ____________________________________________
E-Mail : ____________________________________________
Part 2: Waterfront development in Malaysia
(1) What do you think the importance of the boundary between the river and the country?
(2) Early human settlement and cities in Malaysia developed along the river area. Could you
please comment about this history?
(3) What did the areas looks like at that time specifically the development you are associated
with?
(4) Waterfront development in Malaysia has changed over the decades and the current pattern of
development is more focussed on public uses (recreational) and mix use development. Are
you aware of this transformation?
(5) What are the most influential factors contribute to the successful implementation of
waterfront development in other countries?
(6) What are important reasons in a decision to initiate a waterfront development project?
(7) What reasons most influence people interested in waterfront property?
(8) Do you think waterfront development in Malaysia has reaped the similar achievement like in
other countries? Please comment with reasons.
(9) What is your expectation about the future of waterfront development in Malaysia?
(10) Does the waterfront development process differ from the general development process?
(11) Any development usually involves many parties which integrated into the development
process. How about waterfront development in Malaysia?

209
(12) How does Malaysia practice governance for waterfront project? Please comment.
(13) In your opinion, what are the reasons that constrain for effective administration and
management for waterfront resources and waterfront development in Malaysia?
(14) Based on your observation and knowledge, what are the effects might be derived from
waterfront development projects?
(15) Based on your knowledge, what are the regulations associated with waterfront development
in Malaysia?
(16) The guideline for riverfront development concept is designed mainly to control development
in front of water areas, particularly close to river areas. Do you aware about this guideline?
(17) Is this guideline considered effective towards successful riverfront development?
(18) Considering of all barriers and limitations, what is your recommendation relating to a new
guideline for waterfront development in Malaysia incorporating economical, environmental
and social factors?

210
Appendix C – Approval Letter and Research Pass
DEVELOPING GUIDELINES FOR WATERFRONT
DEVELOPMENT IN MALAYSIA
211
RESEARCH PASS

212
Appendix D – Invitation Letter for Conducting Interviews

213
Appendix E – List of Property Development Companies
Table 7.2: List of property development companies
No. Name of company Address No. Name of company Address No. Name of company Address
1. S P SETIA BERHAD
Setia Corporate Tower,
5A, Jalan Setia
Nusantara U13/17,
Seksyen U13, Setia
Alam, 40170 Shah
Alam, Selangor Darul
Ehsan, MALAYSIA.
2. SUNWAY CITY
BERHAD
The Property Gallery,
Lobby Level, Menara
Sunway, Jln Lagoon
Timur, Bandar
Sunway, 46150
Petaling Jaya,
selangor Darul
Ehsan, MALAYSIA.
3. UEM LAND
HOLDINGS BERHAD
Nusajaya Centre, 8 Ledang
Heights, Nusajaya, 81560,
Johor, MALAYSIA.
4. KLCC PROPERTY
HOLDINGS
BERHAD
Level 4&5, City Point,
Kompleks Dayabumi,
Jalan Sultan
Hishamuddin,
P.O. Box 13214,
50050 Kuala Lumpur,
MALAYSIA.
5. MAH SING GROUP
BERHAD
Wisma Mah Sing,
Penthouse Suite 1,
No. 163 Jalan Sungai
Besi, 57100 Kuala
Lumpur,
MALAYSIA.
6. SELANGOR
PROPERTIES
BERHAD
Level 2, Block D,
Kompleks Pejabat
Damansara,
Jalan Dungun, Damansara
Heights, 50490 Kuala
Lumpur, MALAYSIA.
7. KRISASSETS
HOLDINGS
Level 32, The Gardens
South Tower, Mid
Valley City, Lingkaran
Syed Putra, 59200
Kuala Lumpur,
MALAYSIA.
8. PRIME GROUP
Suite 27-01, 27th
Floor, Menara MSC
cyberport, 5, Jalan
Bukit Meldrum,
80300 Johor Bahru,
Johor Darul Takzim,
MALAYSIA.
9. IJM LAND BERHAD Ground Floor, Wisma IJM,
Jalan Yong Shook Lin,
46050 Petaling Jaya,
Selangor, MALAYSIA.

214
No. Name of company Address No. Name of company Address No. Name of company Address
10. E & O PROPERTY
DEVELOPMENTS
BHD
Level 3A (Annexe),
Menara Milenium, No.
8, Jln Damanlela,
Damansara Heights,
50490 Kuala Lumpur,
MALAYSIA.
11. SUNRISE BERHAD,
Penthouse, Wisma
Sunrise, Plaza
Mont'Kiara,
No.2, Jalan Kiara,
Mont'Kiara,
50480 Kuala
Lumpur,
MALAYSIA.
12. GUOCOLAND
(Malaysia) BERHAD,
Level 8, Wisma Hong
Leong,18 Jalan Perak,
50450 Kuala Lumpur,
MALAYSIA
13. YNH PROPERTY
BHD & KAR SIN
BHD
2272, Jln Dato Yu Neh
Huat, Taman
Samudera, 32040 Sri
Manjung, Perak,
MALAYSIA.
14. YTL CORPORATION
BERHAD,
11th
Floor, Yeoh
Tiong Lay Plaza, 55,
Jln B. Bintang,
55100 Kuala
Lumpur,
MALAYSIA.
15. PLENITUDE
BERHAD,
No.213, Jalan Perdana,
3/1, Bandar Perdana,
08000 Sungai Petani,
Kedah Darul Aman,
MALAYSIA.
16. MK LAND
HOLDINGS
BERHAD
No.19, Jalan PJU 8/5H,
Perdana Business
Centre, Bandar
Damansara Perdana,
47820 Petaling Jaya,
Selangor Darul Ehsan,
MALAYSIA.
17.
JOHOR LAND
BERHAD.
Kompleks Mutiara
Johor Land
Jalan Bukit Mutiara,
Bandar Dato' Onn,
81100 Johor Bahru,
Johor, MALAYSIA.
18. DAIMAN
DEVELOPMENTS
BERHAD
Room 501. 5th
Floor,
Wisma Daiman, No. 64,
Jalan Sulam, Taman
Sentosa, 80150 Johor
Bahru, Johor Darul
Takzim, MALAYSIA.
19. UNITED
MALAYAN LAND
BHD,
Suite 1.1, 1st Floor,
Kompleks
Antarabangsa,
Jalan Sultan Ismail,
50250 Kuala Lumpur,
MALAYSIA.
20. KUMPULAN
HARTANAH
SELANGOR BERHAD
Lot 1A, Level 1A,
Plaza Perangsang,
Persiaran
perbandaran, 40000
Shah Alam, Selangor
Darul Ehsan,
MALAYSIA.
21. METRO KAJANG
HOLDINGS BERHAD
Ground Floor, Wisma
Metro Kajang,
Jalan Semenyih, 43000
Kajang, Selangor Darul
Ehsan, MALAYSIA.

215
No. Name of company Address No. Name of company Address No. Name of company Address
22. DIJAYA
CORPORATION
BERHAD
Lot 301, 3rd
Floor,
Wisma Dijaya, 1A
Jalan SS 20/1,
Damansara Utama,
47400 Petaling Jaya,
Selangor Darul Ehsan,
MALAYSIA.
23. GLOMAC BERHAD
12th
Floor, Wisma
Glomac 3, Kompleks
Kelana Centre Point,
Jalan SS7/19, Kelana
Jaya, 47301 Petaling
Jaya, Selangor Darul
Ehsan, MALAYSIA.
24. LBS BINA GROUP
BERHAD
Plaza Seri Setia, Level 1-4
No. 1, Jalan SS9/2 Seri
Setia, 47300 Petaling Jaya,
Selangor Darul Ehsan,
MALAYSIA.
25. GOLDEN PLUS
HOLDINGS
BERHAD
Suite 6-7 & 6-8,
Wisma UOA,
Damansara II, No. 6,
Jalan Changkat
Semantan, Damansara
Heights, 50490 Kuala
Lumpur, MALAYSIA.
26.
A & M REALTY
BERHAD
10th
Floor, Menara
A&M, Garden
Business Center, No.
3, Jalan Istana, 41000
Klang,Selangor Darul
Ehsan, MALAYSIA.
27. CRESCENDO CORP.
BHD.
Lot 18.02, 18th
Floor,
Public Bank Tower,
19, Jalan Wong Ah Fook,
80000 Johor Bahru,
MALAYSIA.
28. TAHPS GROUP
BERHAD,
5th
Floor, Bangunan
Yee Seng, No. 15,
Jalan Raja chulan,
50200 Kuala Lumpur,
MALAYSIA.
29. AP LAND BERHAD 468-16, 3rd
Mile,
Jalan Ipoh, 51200
Kuala Lumpur,
MALAYSIA.
30. MUTIARA
GOODYEAR
DEVELOPMENTS
BERHAD
P.S. No.46, Tingkat 11,
Menara Tun Razak,
Jalan Raja Laut, 50350
Kuala Lumpur,
MALAYSIA.
31. BOLTON BERHAD
6th
Floor Campbell
Complex, 98 Jalan
Dang Wangi,
50100 Kuala Lumpur,
MALAYSIA.
32. KELADI MAJU
BERHAD
Wisma Keladi, 11-A,
Level 7, Jalan Bank,
08000 Sungai Petani,
Kedah Darul Aman,
MALAYSIA.
33. TALAM
CORPORATION,
Level 1, Menara
Maxisegar,
Jalan Pandan Indah 4/2,
Pandan Indah, 55100
Kuala Lumpur,
MALAYSIA.

216
No. Name of company Address No. Name of company Address No. Name of company Address
34. MAHAJAYA
PROPERTY
DIVISIONS
No. 1-1-1, Wisma
Mahajaya,
Block A, Megan Salak
Park, Jalan 2/125E,
Taman Desa Petaling,
57100 Kuala Lumpur,
MALAYSIA.
35. MUI PROPERTIES
BERHAD (MPB),
5th
Floor, Menara
PMI, No. 2, Jalan
Changkat Ceylon,
50200 Kuala
Lumpur,
MALAYSIA.
36. MAGNA PRIMA
BERHAD
Lot No. C-G11 & C-G12,
Block C, Jalan Persiaran
Surian, 47810 Kota
Damansara, Petaling Jaya,
Selangor Darul Ehsan,
MALAYSIA.
37. ORIENTAL
INTEREST BHD
Room 102 1st Floor,
Wisma Penang Garden
42, Jalan Sultan
Ahmad Shah, 10500
Pulau Pinang,
MALAYSIA.
38. ASIAN PAC
HOLDING
12th
Floor, Menara
SMI, No.6 Lorong P.
Ramlee, 50250 Kuala
Lumpur,
MALAYSIA.
39. BCB BERHAD
7th
floor, Plaza BCB (Hotel
Tower Block), No. 20, Jln
Bakawali, 86000 Kluang,
Johor Darul Takzim,
MALAYSIA.
40. OSK PROPERTY
HOLDINGS
BERHAD
16th
Floor, Plaza OSK,
Jalan Ampang, 50450
Kuala Lumpur,
MALAYSIA.
41. MERGE HOUSING
BERHAD
Suite 13A-2, Menara
Uni.Asia, 1008, Jalan
Sultan Ismail, 50250
Kuala Lumpar,
MALAYSIA.
42. TRIplc BERHAD
No. 6 & 8, Jalan Apollo
CH U5/CH, Bandar
Pinggiran Subang,
Seksyen U5, 40150 Shah
Alam, Selangor Darul
Ehsan, MALAYSIA.
43. GROMUTUAL
BERHAD
Suite 15.3A, Level 15,
Menara Pelangi, No.2,
Jln Kuning, Tmn
Pelangi, 80400, Johor
Bahru, Johor Darul
Takzim, MALAYSIA.
44. HUA YANG BERHAD C-21, Jalan Medan
Selayang 1, Medan
Selayang, 68100 Batu
Caves, Selangor
Darul Ehsan,
MALAYSIA.
45. PETALING TIN
BERHAD
1st Floor, No.118 Jalan
Semangat, 46300 Petaling
Jaya, Selangor Darul
Ehsan, MALAYSIA.

217
No. Name of company Address No. Name of company Address No. Name of company Address
46. NILAI RESOURCES
GROUP BERHAD
11/F Wisma Tractors,
7 Jalan SS16/1, 47500
Petaling Jaya, Selangor
Darul Ehsan,
MALAYSIA.
47. MEDA
INCORPORATION
BHD
No. 11, USJ Sentral,
Jalan USJ Sentral 3,
Persiaran Subang,
47600 UEP Subang
Jaya, Selangor Darul
Ehsan, MALAYSIA.
48. PERDUREN (M)
BERHAD
38-3-1, Jalan 4/91,
Taman Shamelin Perkasa,
56100 Cheras, Kuala
Lumpur, MALAYSIA.
49. GAMUDA LAND No 56, Jln SS22/25
Damansara Jaya, 47400
Petaling Jaya,
Selangor,
MALAYSIA.
50. FOCAL AIMS
HOLDINGS BHD
Suite 338, 3rd
Floor,
Johor Tower, Jalan
Gereja, 80100 Johor
Bahru, Johor Darul
Takzim,
MALAYSIA.
51. MENANG
CORPORATION (M)
BERHAD
8th
Storey South Block
Wisma Selangor Dredging,
142-A Jalan Ampang,
50450 Kuala Lumpur,
MALAYSIA.
52. MULPHA LAND
BERHAD
Bangunan Mulpha,
17 Jalan Semangat,
46100 Petaling Jaya,
Selangor Darul Ehsan,
MALAYSIA.
53. FARLIM GROUP (M)
1 Lintang Angsana ,
Bandar Baru Ayer
Itam, 11500 Penang,
MALAYSIA.
54. SOUTH MALAYSIA
INDUSTRIES BHD
Suite 1301, 13th
Floor, City
Plaza, Jalan Tebrau,
80300 Johor Bahru,
Johor Darul Takzim,
MALAYSIA.
55. Y&G
CORPORATION
BHD
No. 14, Jalan Tengku
Ampuan Zabedah 9/A,
Seksyen 9, 40000 Shah
Alam, Selangor Darul
Ehsan, MALAYSIA.
56. LBI CAPITAL
BERHAD
Lot 1282, Jalan Bukit
Kemuning, Seksyen
32 Shah Alam, 40460
Selangor,
MALAYSIA.
57. MAJUPERAK
HOLDINGS BERHAD
(MHB)
6th
Floor, Wisma Wan
Mohamed, Jln Panglima
Bukit Gantang Wahab,
30000 Perak Darul
Ridzuan, MALAYSIA.
58. TANCO HOLDINGS
BERHAD
No, 1, Persiaran
Ledang, Off Jalan
Duta, 50480 Kuala
Lumpur, MALAYSIA.
59. NAIM INDAH
CORPORATION
BERHAD
Suite 12A, 03 - 05,
Level 12A Plaza,
Permata Jln Kampar,
Off Tun Razak,
50400 Kuala Lumpur
MALAYSIA.
60. SBC CORPORATION
BERHAD
Wisma Siah Brothers,
74, Jalan Pahang,
53000 Kuala Lumpur,
MALAYSIA.
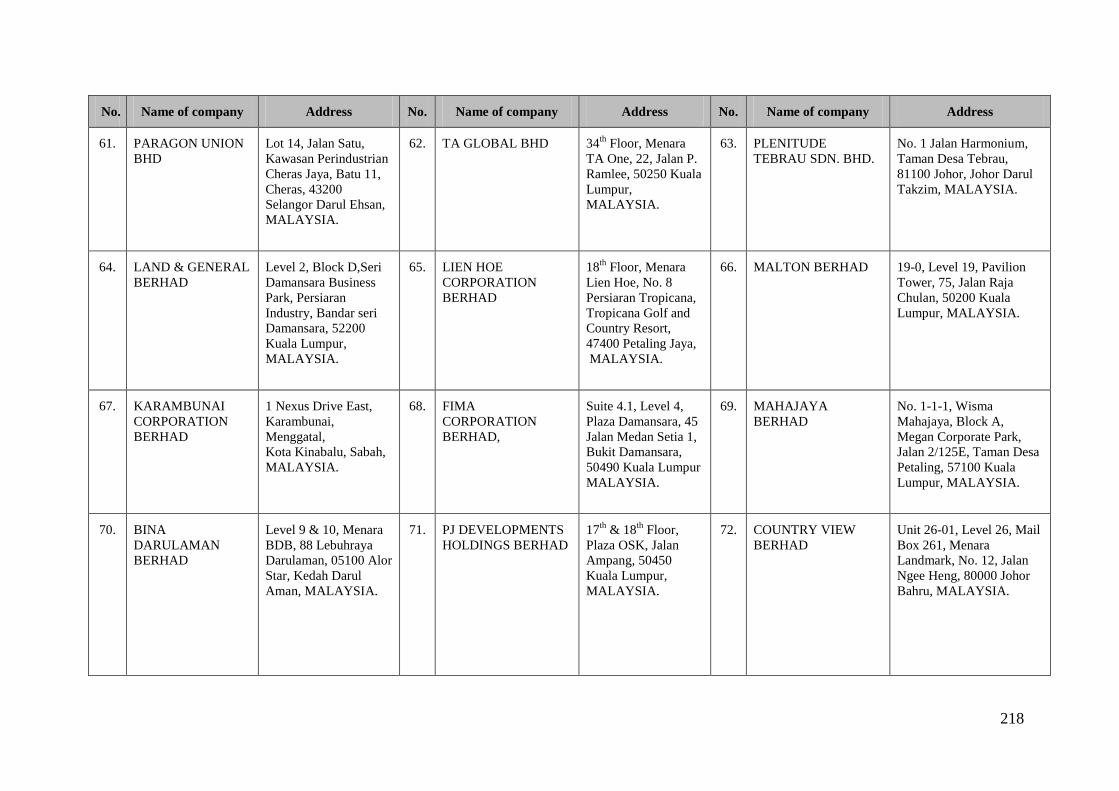
218
No. Name of company Address No. Name of company Address No. Name of company Address
61. PARAGON UNION
BHD
Lot 14, Jalan Satu,
Kawasan Perindustrian
Cheras Jaya, Batu 11,
Cheras, 43200
Selangor Darul Ehsan,
MALAYSIA.
62. TA GLOBAL BHD 34th
Floor, Menara
TA One, 22, Jalan P.
Ramlee, 50250 Kuala
Lumpur,
MALAYSIA.
63. PLENITUDE
TEBRAU SDN. BHD.
No. 1 Jalan Harmonium,
Taman Desa Tebrau,
81100 Johor, Johor Darul
Takzim, MALAYSIA.
64. LAND & GENERAL
BERHAD
Level 2, Block D,Seri
Damansara Business
Park, Persiaran
Industry, Bandar seri
Damansara, 52200
Kuala Lumpur,
MALAYSIA.
65.
LIEN HOE
CORPORATION
BERHAD
18th
Floor, Menara
Lien Hoe, No. 8
Persiaran Tropicana,
Tropicana Golf and
Country Resort,
47400 Petaling Jaya,
MALAYSIA.
66. MALTON BERHAD
19-0, Level 19, Pavilion
Tower, 75, Jalan Raja
Chulan, 50200 Kuala
Lumpur, MALAYSIA.
67. KARAMBUNAI
CORPORATION
BERHAD
1 Nexus Drive East,
Karambunai,
Menggatal,
Kota Kinabalu, Sabah,
MALAYSIA.
68. FIMA
CORPORATION
BERHAD,
Suite 4.1, Level 4,
Plaza Damansara, 45
Jalan Medan Setia 1,
Bukit Damansara,
50490 Kuala Lumpur
MALAYSIA.
69. MAHAJAYA
BERHAD
No. 1-1-1, Wisma
Mahajaya, Block A,
Megan Corporate Park,
Jalan 2/125E, Taman Desa
Petaling, 57100 Kuala
Lumpur, MALAYSIA.
70. BINA
DARULAMAN
BERHAD
Level 9 & 10, Menara
BDB, 88 Lebuhraya
Darulaman, 05100 Alor
Star, Kedah Darul
Aman, MALAYSIA.
71. PJ DEVELOPMENTS
HOLDINGS BERHAD
17th
& 18th
Floor,
Plaza OSK, Jalan
Ampang, 50450
Kuala Lumpur,
MALAYSIA.
72. COUNTRY VIEW
BERHAD
Unit 26-01, Level 26, Mail
Box 261, Menara
Landmark, No. 12, Jalan
Ngee Heng, 80000 Johor
Bahru, MALAYSIA.

219
No. Name of company Address No. Name of company Address No. Name of company Address
73. DAMANSARA
REALTY BERHAD
Level 2, Persada Johor
International
Convention Centre,
Jalan Abdullah
Ibrahim, 80000 Johor
Bahru, Johor Darul
Takzim, MALAYSIA.
74. DNP HOLDINGS
BERHAD
5 Jalan SS23/11,
Taman SEA, Petaling
Jaya, 4700 Selangor,
Selangor Darul
Ehsan, MALAYSIA.
75. SAPURA
RESOURCES
BERHAD
1st floor, Sapura @ Mines,
No.7, Jalan Tasik, The
Mines Resort City, 43300
Seri Kembangan,
MALAYSIA.
76. BERJAYA
CORPORATION
BERHAD
Level 12 (East Wing),
Berjaya Times Square,
No. 1, Jalan Imbi,
55100 Kuala Lumpur,
MALAYSIA.
77. ENCORP BERHAD. Level 18, Wisma
Sunway Mas, No. 1,
Jalan Tengku
Ampuan Zabedah
C9/C, Section 9,
40100 Shah Alam,
Selangor Darul
Ehsan, MALAYSIA.
78. EKRAN BERHAD
Lot 5428-5429, Block 16,
KCLD, Lorong Lapangan
Terbang Baru 1, 93350
Kuching, Sarawak,
MALAYSIA.
79. IGB
CORPORATION
BERHAD
Level 32, The Gardens
South Tower, Mid
Valley City, Lingkaran
Syed Putra, 59200
Kuala Lumpur,
MALAYSIA.
80. ASAS DUNIA
BERHAD
Wisma Asas, No.
228-B, Lebuh Chulia,
10200 Penang,
MALAYSIA.
81. EQUINE CAPITAL
BERHAD
Equine Capital Berhad
No 1, Jalan Putra Permai
1A, Taman Equine,
43300 Seri Kembangan
Selangor Darul Ehsan,
MALAYSIA.
82. PARAMOUNT
BERHAD
Level 8, Uptown 1,
Jalan SS21/58,
Damansara Uptown,
47400 Petaling Jaya,
Selangor Darul Ehsan,
MALAYSIA.
83. HUNZA PROPERTIES
BERHAD
5-4-8/11, Hunza
Complex, Jalan
Gangsa, Island Park,
11600 Penang,
MALAYSIA.
84. SHL
CONSOLIDATED
BERHAD
16th
Floor, Wisma Sin
Heap Lee, 346 Jalan Tun
Razak, 50400 Kuala
Lumpur, MALAYSIA.
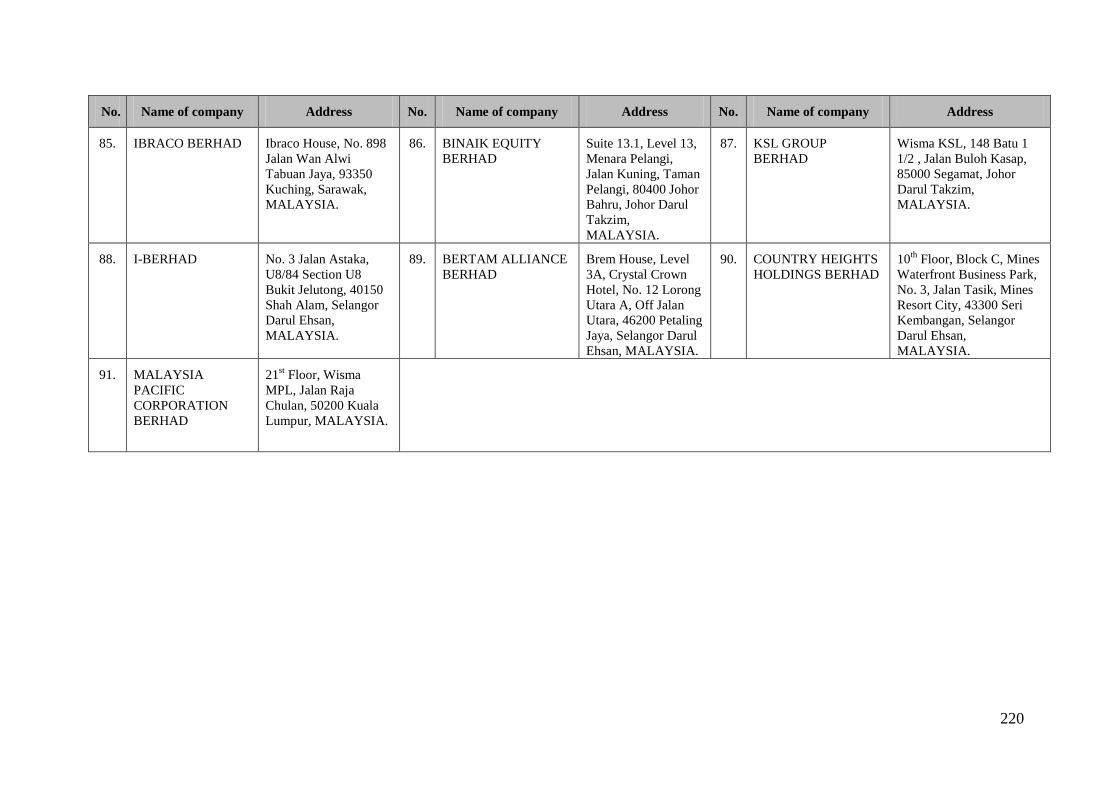
220
No. Name of company Address No. Name of company Address No. Name of company Address
85. IBRACO BERHAD Ibraco House, No. 898
Jalan Wan Alwi
Tabuan Jaya, 93350
Kuching, Sarawak,
MALAYSIA.
86. BINAIK EQUITY
BERHAD
Suite 13.1, Level 13,
Menara Pelangi,
Jalan Kuning, Taman
Pelangi, 80400 Johor
Bahru, Johor Darul
Takzim,
MALAYSIA.
87. KSL GROUP
BERHAD
Wisma KSL, 148 Batu 1
1/2 , Jalan Buloh Kasap,
85000 Segamat, Johor
Darul Takzim,
MALAYSIA.
88. I-BERHAD No. 3 Jalan Astaka,
U8/84 Section U8
Bukit Jelutong, 40150
Shah Alam, Selangor
Darul Ehsan,
MALAYSIA.
89. BERTAM ALLIANCE
BERHAD
Brem House, Level
3A, Crystal Crown
Hotel, No. 12 Lorong
Utara A, Off Jalan
Utara, 46200 Petaling
Jaya, Selangor Darul
Ehsan, MALAYSIA.
90. COUNTRY HEIGHTS
HOLDINGS BERHAD
10th
Floor, Block C, Mines
Waterfront Business Park,
No. 3, Jalan Tasik, Mines
Resort City, 43300 Seri
Kembangan, Selangor
Darul Ehsan,
MALAYSIA.
91. MALAYSIA
PACIFIC
CORPORATION
BERHAD
21st Floor, Wisma
MPL, Jalan Raja
Chulan, 50200 Kuala
Lumpur, MALAYSIA.

221
Appendix F – Survey Questionnaire
Questionnaire No.:______________
Dear Sir / Madam
My name is Azlina Binti Md. Yassin. I am a post graduate student from Lincoln University,
Canterbury, New Zealand. I am currently doing research on waterfront development in Malaysia.
Waterfront in this research refers to any development areas in front of river. The purpose of this
study is to look at waterfront development practice in Malaysia with an emphasis on guidelines
related to the development process.
The information gathered from this questionnaire will comprise the main evidence for the research
and be used for the thesis write up and subsequent journal publications. Individuals responding to
the survey will not be personally identified in the results.
I would be most appreciative if you would contribute to this research. It will take approximately
15 minutes to complete the questionnaire. Your valuable participation will make the research
more meaningful.
Thank you for assisting in my research
Azlina Binti Md. Yassin
PhD Student,
Commerce Division, Lincoln University,
Canterbury, New Zealand.

222
SECTION A: COMPANY PROFILE
Please tick which is appropriate:
A1) Property services offered
1. Residential
2. Commercial (Office and Retail)
3. Industrial
4. Others (please specify)
__________________
__________________
__________________
A2) In which location does your company operate in?
1. Nationally (within Malaysia)
2. Internationally (outside Malaysia)
3. Both nationally and internationally
A3) Years Operational
1. Less than 1 year
2. 1-5 years
3. 6-10 years
4. Over 10 years
5. Not sure
A4) How many people are employed at your organisation?
1. Less than 10 people
2. 10 – 50 people
3. 51 – 100 people
4. Over 100 people
5. Do not know / Not sure
√
INSTRUCTIONS
For each question, please tick the box alongside your answer(s); otherwise follow the
instructions given to answer the questions.

223
SECTION B: WATERFRONT DEVELOPMENT IN MALAYSIA
Using the 1 – 4 scale below, Please tick which is appropriate:
B1) Does your company currently undertake waterfront development?
1. Yes Go to Question B3 onwards 2. No Go to Question B2
B2) If your company is not already involved in waterfront development, are you
considering undertaking any in the future?
1. Yes Go to Question B6 onwards 2. No Go to Question B6
onwards
3. Unsure Go to Question B6 onwards
B3) What percentage of your development projects involve development of the
waterfront?
1. 1 – 20% 2. 21% – 40%
3. 41% – 60% 4. 61% – 80%
5. 81% - 100%
B4) What type of waterfront development is your company involved in? (You can tick
more than one).
1. Residential scheme 2. Industrial
3. Mixed use scheme 4. Commercial (Office / Retail)
5. Recreational 6. Others (please specify)
_________________
_________________
_________________
B5) What are your primary motives for undertaking a waterfront development
project? (Please tick one option only).
1. Environmental improvement. 2. Profit / financial benefits.
3. To diversify the property type 4. Conservation of natural
developed. resources.
5. Others (please specify)
_________________
√
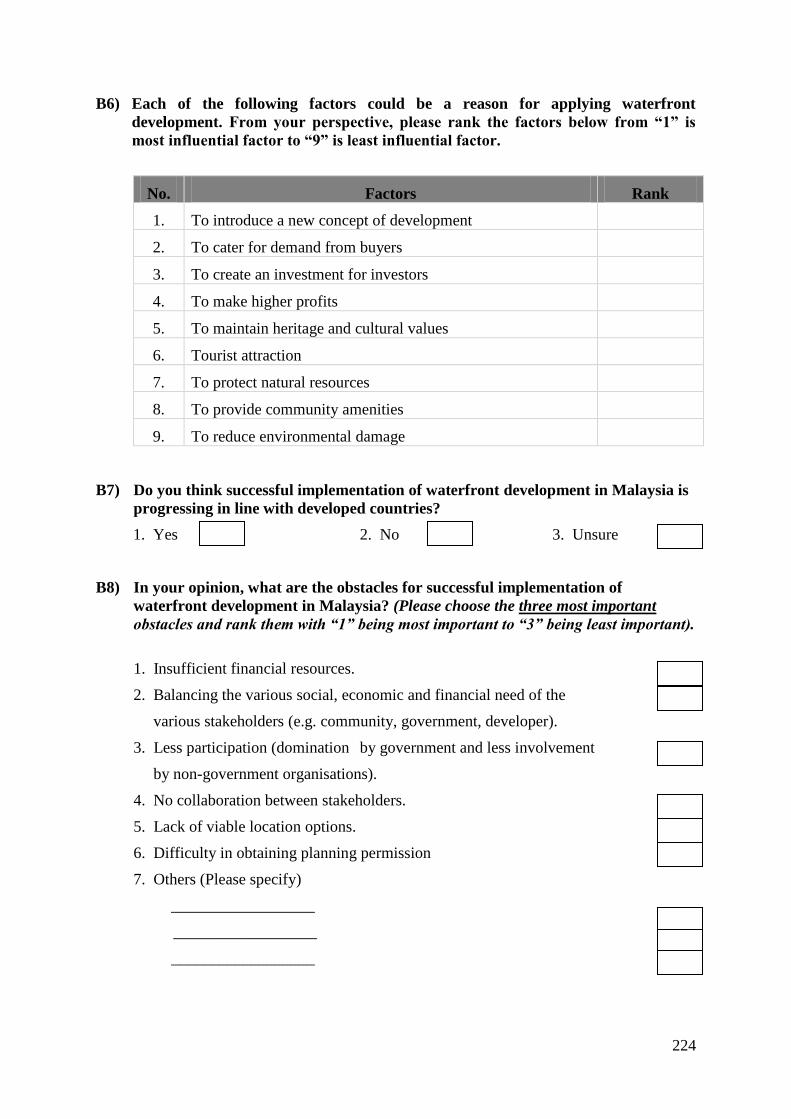
224
B6) Each of the following factors could be a reason for applying waterfront
development. From your perspective, please rank the factors below from “1” is
most influential factor to “9” is least influential factor.
No. Factors Rank
1. To introduce a new concept of development
2. To cater for demand from buyers
3. To create an investment for investors
4. To make higher profits
5. To maintain heritage and cultural values
6. Tourist attraction
7. To protect natural resources
8. To provide community amenities
9. To reduce environmental damage
B7) Do you think successful implementation of waterfront development in Malaysia is
progressing in line with developed countries?
1. Yes 2. No 3. Unsure
B8) In your opinion, what are the obstacles for successful implementation of
waterfront development in Malaysia? (Please choose the three most important
obstacles and rank them with “1” being most important to “3” being least important).
1. Insufficient financial resources.
2. Balancing the various social, economic and financial need of the
various stakeholders (e.g. community, government, developer).
3. Less participation (domination by government and less involvement
by non-government organisations).
4. No collaboration between stakeholders.
5. Lack of viable location options.
6. Difficulty in obtaining planning permission
7. Others (Please specify)
__________________
__________________
__________________

225
SECTION C: REGULATIONS RELATED TO WATERFRONT DEVELOPMENT IN
MALAYSIA
Please tick where appropriate:
C1) How familiar are you with the following guidelines and legislation:
1 = Never heard of it
2 = Have heard of it
3 = Somewhat familiar
4 = Very familiar
Guidelines and Regulation 1 2 3 4
1. National Land Code 1965.
2. Uniform Building By Laws 1984.
3. Land Acquisition Act 1960.
4. Act 172 in Town and Country
Planning Act 1976
5. Act 171 in Local Government Act
1976.
6. Act 127 in Environmental Quality Act 1974.
7. Act 133 in Street, Drainage & Building Act 1974.
8. Guidelines for riverfront development
concept.
9. Coastal Zone guidelines.
10. National Landscape Guidelines.
For Question C2, Please use the scale below.
1 2 3 4 5
Strongly Disagree Neither agree Agree Strongly
Disagree nor Disagree Agree
C2) The Department of Drainage and Irrigation, Malaysia has designed the guidelines
for riverfront development. Using the scale above, please tick which box best
represents your answer about the effectiveness of these guidelines from the list of
statements below.
No. Statement Scale
They: 1 2 3 4 5
1. Provide specific guidance
2. Are easy to implement
3. Are sufficient to control environmental problems
√
√

226
4. Encourage sustainable waterfront development
C3) Do you think there are sufficient regulations to control waterfront development in
Malaysia? (Please tick one option only).
1. Too many 2. Sufficient - No change
3. Moderate - Could do more needed
4. Insufficient 5. Others (please specify) __________________
__________________
__________________
C4) How well are the government regulations relating to waterfront development in
Malaysia being enforced? (Please tick one option only).
1. Strictly enforced 2. Moderately enforced
3. Not enforced 4. Unsure

227
For question C5, please use the scale given below.
1 2 3 4 5
Strongly Disagree Neither agree Agree Strongly
Disagree nor Disagree Agree
C5. Below are the statements about “best practice” towards sustainable waterfront
development in Malaysia. Please provide your level of agreement on these.
No Statements Scale
1 2 3 4 5
1. Environmental Impact Assessment (EIA) is compulsory.
2. Maintenance & rehabilitation costs are shared between
stakeholders.
3. Should use environmentally friendly materials in
construction.
4. Provides flood mitigation (e.g. by planting more trees).
5. Protection of natural resources (water and environment).
6. Personal security is maintained by means of policing;
surveillance cameras; etc.
7. Provision of sufficient public facilities and amenities (such as
pedestrian, landscaping; access ways; recreation areas; etc.)
8. Upgrading and maintaining established settlement along the
waterfront area.
9. Upgrading and maintaining sewage system.
10. Continuous river rehabilitation.
11. River reserve beautification.
12. Restrict type of development.
13. Integrate both modern and heritage aspects into development.
14. Encourage economic activities.
15. Sharing waterfront benefits (such as view; financial rewards;
etc.) among stakeholders (e.g. community; government;
developer).
16. Participation among stakeholders should be compulsory at
every stage of the development.
17. Continuously educate public about environmental concerns.
18. Provide regulation and policies that mitigate market
speculation for waterfront properties.

228
C6) Please provide your comments and suggestions towards “best practice” of
waterfront development application in Malaysia.
______________________________________________________________________
______________________________________________________________________
______________________________________________________________________
______________________________________________________________________
______________________________________________________________________
______________________________________________________________________
______________________________________________________________________
______________________________________________________________________
______________________________________________________________________
______________________________________________________________________
______________________________________________________________________
______________________________________________________________________
____________________________________________________________
-Thank you for completing this questionnaire-
Your participation in this survey is greatly appreciated. Thank you for your time and if you
have further comments about this questionnaire, please feel free to comment in the space
provided below. Once again, we assure you that your identity will remain STRICTLY
CONFIDENTIAL.
Please return your completed survey in the envelope provided.
Comments:
___________________________________________________________________________
___________________________________________________________________________
___________________________________________________________________________
___________________________________________________________________________
___________________________________________________________________________
___________________________________________________________________________
___________________________________________________________________________
___________________________________________________________________________
___________________________________________________________________________
___________________________________________________________________________
___________________________________________________________________________
___________________________________________________________________________
__________________________________________________

229
Appendix G – Invitation Letter for Conducting Survey
Questionnaire

230
Appendix H – Normality of the Distribution in the Data

231

232

233
Appendix I – List of Property Development Companies Who Participated in the Survey
Table 7.3: List of property development companies who participated in the survey
No. Company’s Name Commencement
Year
Address No. Company’s Name Commencement
Year
Address
1. UEM LAND HOLDINGS 17-Nov-08 Nusajaya Centre, 8 Ledang
Heights, Nusajaya, 81560,
JOHOR, MALAYSIA.
6. GAMUDA LAND 1995 No 56, Jln SS22/25 Damansara
Jaya, 47400 Petaling Jaya,
Selangor, MALAYSIA.
2. AP LAND BERHAD 1961 468-16, 3rd
Mile, Jalan Ipoh,
51200 Kuala Lumpur,
MALAYSIA.
7. GOLDEN PLUS
HOLDINGS
16 Jan 1984 Suite 6-7 & 6-8, Wisma UOA
Damansara II, No. 6, Jalan
Changkat Semantan, Damansara
Heights, 50490 Kuala Lumpur,
MALAYSIA.
3. A & M REALTY 20-Jan-95 10th
Floor, Menara A&M,
Garden Business Center, No.
3, Jalan Istana, 41000 Klang,
Selangor Darul Ehsan,
MALAYSIA.
8. KLCC PROPERTY
HOLDINGS
17-Aug-04 Level 4&5, City Point,
Kompleks Dayabumi,
Jalan Sultan Hishamuddin,P.O.
Box 13214, 50050 Kuala
Lumpur, MALAYSIA.
4. BOLTON BERHAD 15 July 1964 6th
Floor Campbell Complex,
98 Jalan Dang Wangi,
50100 Kuala Lumpur,
MALAYSIA.
9. KARAMBUNAI
CORPORATION
BERHAD
1 Nexus Drive East,
Karambunai, Menggatal, Kota
Kinabalu, Sabah, MALAYSIA.
5. FIMA CORPORATION
BERHAD
1960 Ste. 4.1, Level 4, Block C, Plz
Damansara 45, Jln Medan
Setia 1, Bukit Damansara,
Kuala Lumpur, 50490,
MALAYSIA.
10. MAGNA PRIMA
BERHAD
16 Jan 1997 Lot No. C-G11&12, Block C,
Jln Persiaran Surian, Palm
Spring, 47810 Kota Damansara,
Petaling Jaya, Selangor,
MALAYSIA.

234
No. Company’s Name Commencement
Year
Address No. Company’s Name Commencement
Year
Address
11. BCB BERHAD 3 Dec 1996 7th
floor, Plaza BCB (Hotel
Tower Block), No. 20, Jln
Bakawali, 86000 Kluang,
Johor Darul Takzim,
MALAYSIA.
17. IBRACO
BERHAD
15 Jun 2004 Ibraco House, No.898 Jalan
Wan Alwi Tabuan Jaya, 93350
Kuching, Sarawak,
MALAYSIA.
12. PERDUREN (M)
BERHAD
28 Dec 1992 38-3-1, Jln 4/91, Tmn
Shamelin Perkasa, 56100
Cheras, Kuala Lumpur,
MALAYSIA.
18. IGB
CORPORATION
BERHAD
2 Jan 1986 Level 32, The Gardens South
Tower, Mid Valley City,
Lingkaran Syed Putra,
59200 Kuala Lumpur,
MALAYSIA.
13. OSK PROPERTY
HOLDINGS
28 Jan 1997 16th
floor, Plaza OSK, Jln
Ampang, 50450 Kuala
Lumpur, MALAYSIA.
19. MALTON
BERHAD
1980 19-0, Level 19, Pavilion Tower,
75, Jalan Raja Chulan, 50200
Kuala Lumpur, MALAYSIA.
14. MALAYSIA PACIFIC
CORPORATION
BERHAD (MPCB)
23 May 1972 21st Floor, Wisma MPL, Jalan
Raja Chulan, 50200 Kuala
Lumpur, MALAYSIA.
20. MENANG
CORPORATION
(M) BERHAD
2 Jan 1986 8th
Storey South Block Wisma
Selangor dredging, 142-A Jln
Ampang, 50450 Kuala Lumpur,
MALAYSIA.
15. HUA YANG BERHAD 28 Nov 2002 C-21, Jln Medan Selayang 1,
Medan Selayang, 68100 Batu
Caves, Selangor Darul Ehsan,
MALAYSIA.
21. SP SETIA
BERHAD
12 April 1993 Setia Corporate Tower, 5A,
Jalan Setia Nusantara U13/17,
Seksyen U13, Setia Alam,
40170 Shah Alam, Selangor,
MALAYSIA.
16. PETALING TIN
BERHAD
14 Feb 1986 1st Floor, No.118 Jalan
Semangat, 46300 Petaling
Jaya, Selangor Darul Ehsan,
MALAYSIA.
22. SELANGOR
PROPERTIES
BERHAD
12 Oct 1963 Level 2, Block D, Kompleks
Pejabat Damansara, Jalan
Dungun, Damansara Heights,
50490 Kuala Lumpur,
MALAYSIA.
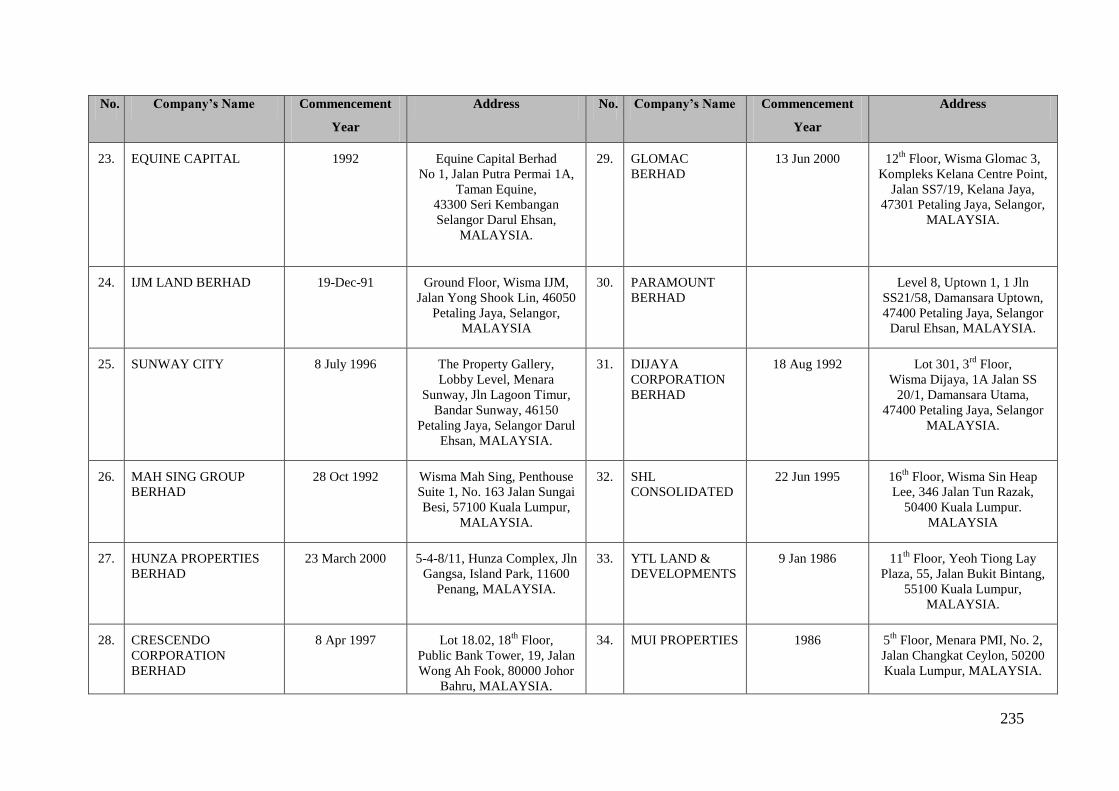
235
No. Company’s Name Commencement
Year
Address No. Company’s Name Commencement
Year
Address
23. EQUINE CAPITAL 1992 Equine Capital Berhad
No 1, Jalan Putra Permai 1A,
Taman Equine,
43300 Seri Kembangan
Selangor Darul Ehsan,
MALAYSIA.
29. GLOMAC
BERHAD
13 Jun 2000 12th
Floor, Wisma Glomac 3,
Kompleks Kelana Centre Point,
Jalan SS7/19, Kelana Jaya,
47301 Petaling Jaya, Selangor,
MALAYSIA.
24. IJM LAND BERHAD 19-Dec-91 Ground Floor, Wisma IJM,
Jalan Yong Shook Lin, 46050
Petaling Jaya, Selangor,
MALAYSIA
30. PARAMOUNT
BERHAD
Level 8, Uptown 1, 1 Jln
SS21/58, Damansara Uptown,
47400 Petaling Jaya, Selangor
Darul Ehsan, MALAYSIA.
25. SUNWAY CITY 8 July 1996 The Property Gallery,
Lobby Level, Menara
Sunway, Jln Lagoon Timur,
Bandar Sunway, 46150
Petaling Jaya, Selangor Darul
Ehsan, MALAYSIA.
31. DIJAYA
CORPORATION
BERHAD
18 Aug 1992 Lot 301, 3rd
Floor,
Wisma Dijaya, 1A Jalan SS
20/1, Damansara Utama,
47400 Petaling Jaya, Selangor
MALAYSIA.
26. MAH SING GROUP
BERHAD
28 Oct 1992 Wisma Mah Sing, Penthouse
Suite 1, No. 163 Jalan Sungai
Besi, 57100 Kuala Lumpur,
MALAYSIA.
32. SHL
CONSOLIDATED
22 Jun 1995 16th
Floor, Wisma Sin Heap
Lee, 346 Jalan Tun Razak,
50400 Kuala Lumpur.
MALAYSIA
27. HUNZA PROPERTIES
BERHAD
23 March 2000 5-4-8/11, Hunza Complex, Jln
Gangsa, Island Park, 11600
Penang, MALAYSIA.
33. YTL LAND &
DEVELOPMENTS
9 Jan 1986 11th
Floor, Yeoh Tiong Lay
Plaza, 55, Jalan Bukit Bintang,
55100 Kuala Lumpur,
MALAYSIA.
28. CRESCENDO
CORPORATION
BERHAD
8 Apr 1997 Lot 18.02, 18th
Floor,
Public Bank Tower, 19, Jalan
Wong Ah Fook, 80000 Johor
Bahru, MALAYSIA.
34. MUI PROPERTIES 1986 5th
Floor, Menara PMI, No. 2,
Jalan Changkat Ceylon, 50200
Kuala Lumpur, MALAYSIA.

236
No. Company’s Name Commencement
Year
Address No. Company’s Name Commencement
Year
Address
35. PLENITUDE BERHAD 17 Nov 2003 No.213, Jalan Perdana,
3/1, Bandar Perdana, 08000
Sungai Petani, Kedah Darul
Aman, MALAYSIA.
40. GROMUTUAL
BERHAD
3 Nov 1995 Suite 15.3A, Level 15, Menara
Pelangi, No.2, Jln Kuning, Tmn
Pelangi, 80400, Johor Bahru,
Johor Darul Takzim,
MALAYSIA.
36. EASTERN & ORIENTAL
PROPERTY
DEVELOPMENTS BHD.
7 Jan 1986 Level 3A (Annexe), Menara
Milenium, No. 8, Jalan
Damanlela, Damansara
Heights, 50490 Kuala
Lumpur, MALAYSIA.
41. FARLIM GROUP
(M) BERHAD
26 July 1995 1 Lintang Angsana, Bandar
Baru Ayer Itam, 11500 Penang,
MALAYSIA.
37. ASAS DUNIA BERHAD 25 Jan 1995 Wisma Asas, No. 228-B,
Lebuh Chulia, 10200 Penang,
MALAYSIA.
42. LAND &
GENERAL
BERHAD
21 May 1964 Block D, Sri Damansara
Business Park, Persiaran
industry, Bandar Sri Damansara,
52200 Kuala Lumpur,
MALAYSIA.
38. LBS BINA GROUP
BERHAD
10 Oct 1994 Plaza Seri Setia, Level 1-4 No.
1, Jalan SS9/2 Seri Setia,
47300 Petaling Jaya, Selangor
Darul Ehsan, MALAYSIA.
43. BINA DARUL
AMAN
Aras 9, Menara Bina Darulaman
Berhad, Lebuhraya Darulaman,
Alor Star, 05100, MALAYSIA
39. ENCORP BERHAD 2 March 2000 Level 18, Wisma Sunway
Mas, No. 1, Jln Tengku
Ampuan Zabedah C9/C,
Section 9, 40100 Shah Alam,
Selangor, M‟SIA.
44. JOHOR LAND
BERHAD
31 Dec 1996 Kompleks Mutiara Johor Land
Jalan Bukit Mutiara,
Bandar Dato' Onn, 81100
Johor Bahru, Johor,
MALAYSIA.

237
No. Company’s Name Commencement
Year
Address No. Company’s Name Commencement
Year
Address
45. MK LAND HOLDINGS
BERHAD
15 Sept 1993 No.19, Jalan PJU 8/5H,
Perdana Business Centre,
Bandar Damansara Perdana,
47820 Petaling Jaya, Selangor
Darul Ehsan, MALAYSIA.
51. TAHPS GROUP 2 Aug 1988 5th
Floor, Bangunan Yee Seng,
No. 15, Jalan Raja Chulan,
50200 Kuala Lumpur,
MALAYSIA.
46. KRISASSETS
HOLDINGS BERHAD
19 Feb 1997 Level 32, The Gardens South
Tower, Mid Valley City,
Lingkaran Syed Putra, 59200
Kuala Lumpur, MALAYSIA.
52. UNITED
MALAYAN
LAND BERHAD
1986 Suite 1.1, 1st Floor, Kompleks
Antarabangsa, Jalan Sultan
Ismail, 50250 Kuala Lumpur,
MALAYSIA.
47. MAHAJAYA BERHAD 28 March 1995 No. 1-1-1, Wisma Mahajaya,
Block A, Megan Corporate
Park, Jalan 2/125E, Taman
Desa Petaling, 57100 Kuala
Lumpur, MALAYSIA.
53. MULPHA LAND
BERHAD
9 Jun 1997 Bangunan Mulpha, 17 Jalan
Semangat, 46100 Petaling Jaya,
Selangor Darul Ehsan,
MALAYSIA.
48. MAJUPERAK
HOLDINGS BERHAD
20 Dec 1990 6th Floor, Wisma Wan
Mohamed, Jln Panglima Bukit
Gantang Wahab, 30000 Perak
Darul Ridzuan, MALAYSIA.
54. DAIMAN
DEVELOPMENTS
29 Jun 1992 Room 501. 5th Floor, Wisma
Daiman, No. 64, Jalan Sulam,
Taman Sentosa, 80150 Johor
Bahru, Johor Darul Takzim,
MALAYSIA.
49. NAIM INDAH
CORPORATION
BERHAD
1986 Suite 12A, 03 - 05, Level 12A
Plaza, Permata Jln Kampar,
Off Tun Razak, 50400 Kuala
Lumpur, MALAYSIA.
55. KUMPULAN
HARTANAH
SELANGOR
BERHAD
1 Jul 1996 Lot 1A, Level 1A, Plaza
Perangsang, Persiaran
Perbandaran, 40000 Shah Alam,
Selangor Darul Ehsan,
MALAYSIA.
50. GUOCOLAND
(MALAYSIA) BERHAD
1986 Level 8, Wisma Hong Leong,
18 Jalan Perak, 50450 Kuala
Lumpur, MALAYSIA
56. BINAIK EQUITY 14 Aug 2002 Suite 13.1, Level 13, Menara
Pelangi, Jalan Kuning, Taman
Pelangi, 80400 Johor Bahru,
MALAYSIA.

238
No. Company’s Name Commencement
Year
Address No. Company’s Name Commencement
Year
Address
57. COUNTRY VIEW
BERHAD
29 May 2002 Unit 26-01, Level 26, Mail
Box 261, Menara Landmark,
No. 12, Jalan Ngee Heng,
80000 Johor Bahru,
MALAYSIA.
60. LIEN HOE
CORPORATION
BERHAD
July 1970 18th
Floor, Menara Lien Hoe,
No. 8 Persiaran Tropicana,
Tropicana Golf and Country
Resort, 47400 Petaling Jaya,
Selangor Darul Ehsan,
MALAYSIA.
58. SOUTH MALAYSIA
INDUSTRIES BHD
27 March 1969 Suite 1301, 13th
Floor, City
Plaza, Jalan Tebrau, 80300
Johor Bahru, Johor Darul
Takzim, MALAYSIA.
61. MUTIARA
GOODYEAR
DEVELOPMENTS
BERHAD
1990 P.S. No.46, Tingkat 11,
Menara Tun Razak,
Jalan Raja Laut, 50350 Kuala
Lumpur, MALAYSIA.
59. DAMANSARA REALTY
BERHAD
1955 Level 2, Persada Johor,
International Convention
Centre, Jln Abdullah Ibrahim,
80000 Johor Bahru, Johor
Darul Takzim, MALAYSIA.

239
Appendix J – Correlation Matrix and Anti-image Matrices Table
Table 7.4: Correlation matrix
EIA
Sharing
maintenance
and
rehabilitation
cost
Using
Environment
friendly
material in
construction
Flood
mitigation
Protect natural
resources Security
Public
facilities
Maintaining
waterfront
settlement
Sewage
system
Correlation EIA 1.000 .528 .083 .342 .365 .066 .363 .373 .209
Sharing
maintenance
and
rehabilitation
cost
.528 1.000 .158 .399 .243 .095 .346 .294 .300
Using friendly
material in
construction
.083 .158 1.000 .061 .141 .149 -.070 -.055 .259
Flood
mitigation
.342 .399 .061 1.000 .333 .166 .567 .274 .378
Protect natural
resources
.365 .243 .141 .333 1.000 .172 .278 .247 .346
Security .066 .095 .149 .166 .172 1.000 .137 .073 .233
Public
facilities
.363 .346 -.070 .567 .278 .137 1.000 .426 .262
Maintaining
waterfront
settlement
.373 .294 -.055 .274 .247 .073 .426 1.000 .276
Sewage
system
.209 .300 .259 .378 .346 .233 .262 .276 1.000

240
Table 7.4: Correlation Matrix (Cont.)
River
rehabilitation
River reserve
beautification
Type of
developments
Integrate
modern and
heritage in
developments
Economy
Activity
Sharing
waterfront
benefits
Stakeholders
participation
Educate
public
Mitigate
property
speculation
Correlation EIA .294 .059 -.069 .310 .198 .175 .163 .224 .187
Sharing
maintenance
and
rehabilitation
cost
.453 .123 .025 .272 .244 .182 .056 .043 -.039
Using friendly
material in
construction
.029 .122 -.168 -.066 .115 .180 -.029 .318 .054
Flood
mitigation
.558 -.036 -.063 .309 .263 .115 .217 .317 .160
Protect natural
resources
.297 .220 .056 -.057 .087 .062 .278 .166 .284
Security .109 .016 .045 -.015 .025 -.035 -.197 .004 -.045
Public
facilities
.379 -.066 .056 .407 .281 .206 .226 .385 .167
Maintaining
waterfront
settlement
.221 -.135 .140 .396 .169 .139 -.055 -.066 -.049
Sewage
system
.501 .082 .106 .242 .507 .442 .290 .187 .010

241
Table 7.4: Correlation Matrix (Cont.)
EIA
Sharing
maintenance
and
rehabilitation
cost
Using
Environment
friendly
material in
construction
Flood
mitigation
Protect
natural
resources Security
Public
facilities
Maintaining
waterfront
settlement
Sewage
system
Correlation River
rehabilitation
.294 .453 .029 .558 .297 .109 .379 .221 .501
River reserve
beautification
.059 .123 .122 -.036 .220 .016 -.066 -.135 .082
Type of
developments
-.069 .025 -.168 -.063 .056 .045 .056 .140 .106
Integrate
modern and
heritage in
developments
.310 .272 -.066 .309 -.057 -.015 .407 .396 .242
Economy
activity
.198 .244 .115 .263 .087 .025 .281 .169 .507
Sharing
waterfront
benefits
.175 .182 .180 .115 .062 -.035 .206 .139 .442
Stakeholders
participation
.163 .056 -.029 .217 .278 -.197 .226 -.055 .290
Educate public .224 .043 .318 .317 .166 .004 .385 -.066 .187
Mitigate
property
speculation
.187 -.039 .054 .160 .284 -.045 .167 -.049 .010

242
Table 7.4: Correlation Matrix (Cont.)
River
rehabilitation
River reserve
beautification
Type of
developments
Integrate
modern and
heritage in
developments
Economy
Activity
Sharing
waterfront
benefits
Stakeholders
participation
Educate
public
Mitigate
property
speculation
Correlation River
rehabilitation
1.000 .061 -.038 .395 .581 .186 .147 .184 .048
River reserve
beautification
.061 1.000 -.173 -.049 -.105 .074 .150 -.023 -.159
Type of
developments
-.038 -.173 1.000 -.021 -.003 .007 .018 -.156 -.007
Integrate
modern and
heritage in
developments
.395 -.049 -.021 1.000 .358 .387 .087 .284 .074
Economy
activity
.581 -.105 -.003 .358 1.000 .431 .195 .254 .047
Sharing
waterfront
benefits
.186 .074 .007 .387 .431 1.000 .481 .205 -.205
Stakeholders
participation
.147 .150 .018 .087 .195 .481 1.000 .431 .133
Educate public .184 -.023 -.156 .284 .254 .205 .431 1.000 .343
Mitigate
property
speculation
.048 -.159 -.007 .074 .047 -.205 .133 .343 1.000

243
Table 7.4: Correlation Matrix (Cont.)
EIA
Sharing
maintenance
and
rehabilitation
cost
Using
Environment
friendly
material in
construction
Flood
mitigation
Protect natural
resources Security
Public
facilities
Maintaining
waterfront
settlement
Sewage
system
Sig.
(1-tailed)
EIA .000 .263 .004 .002 .308 .002 .002 .053
Sharing
maintenance
and
rehabilitation
cost
.000
.112 .001 .030 .233 .003 .011 .009
Using friendly
material in
construction
.263 .112
.321 .139 .126 .295 .338 .022
Flood
mitigation .004 .001 .321 .004 .101 .000 .016 .001
Protect natural
resources .002 .030 .139 .004 .092 .015 .027 .003
Security .308 .233 .126 .101 .092 .145 .287 .035
Public
facilities .002 .003 .295 .000 .015 .145 .000 .021
Maintaining
waterfront
settlement
.002 .011 .338 .016 .027 .287 .000
.016
Sewage
system .053 .009 .022 .001 .003 .035 .021 .016

244
Table 7.4: Correlation Matrix (Cont.)
River
rehabilitation
River reserve
beautification
Type of
developments
Integrate
modern and
heritage in
developments
Economy
Activity
Sharing
waterfront
benefits
Stakeholders
participation
Educate
public
Mitigate
property
speculation
Sig.
(1-tailed)
EIA .011 .326 .299 .008 .063 .088 .105 .041 .075
Sharing
maintenance
and
rehabilitation
cost
.000 .173 .425 .017 .029 .080 .335 .370 .383
Using friendly
material in
construction
.413 .175 .098 .307 .189 .083 .413 .006 .339
Flood
mitigation .000 .392 .315 .008 .020 .189 .046 .006 .110
Protect natural
resources .010 .044 .333 .330 .252 .318 .015 .101 .013
Security .202 .452 .366 .454 .425 .394 .064 .489 .366
Public
facilities .001 .306 .335 .001 .014 .056 .040 .001 .100
Maintaining
waterfront
settlement
.044 .150 .140 .001 .097 .143 .338 .307 .353
Sewage
system .000 .265 .209 .030 .000 .000 .012 .075 .471
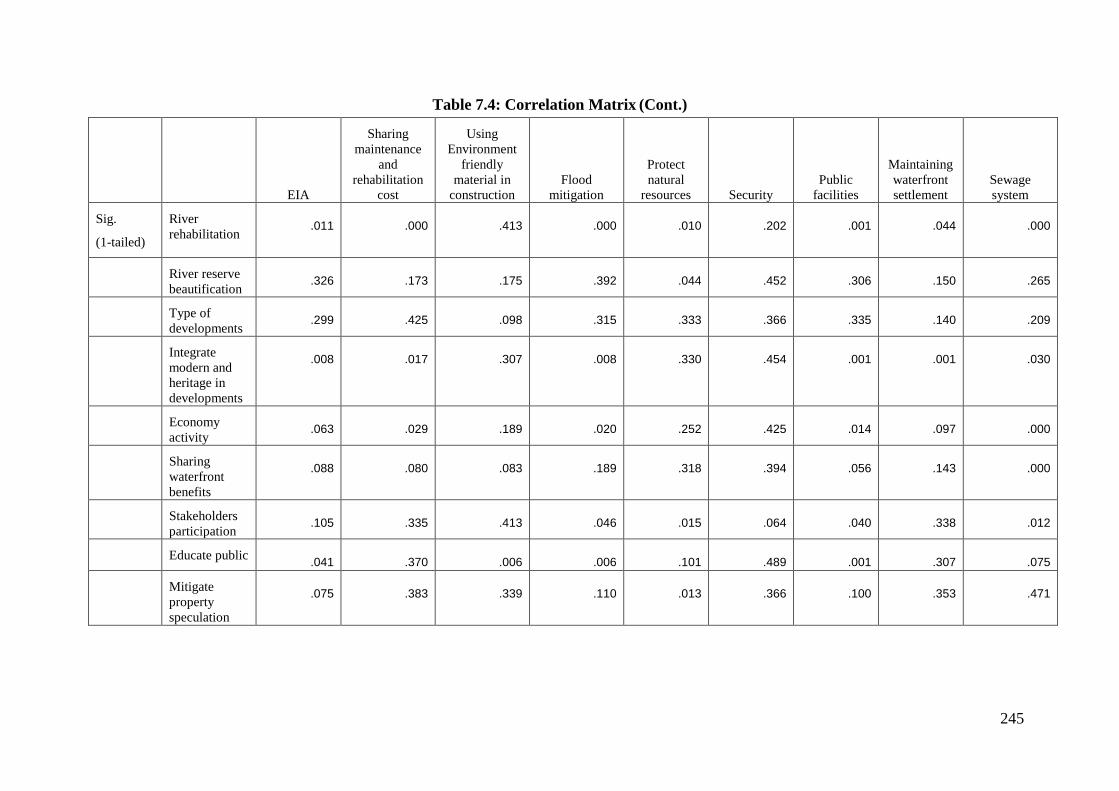
245
Table 7.4: Correlation Matrix (Cont.)
EIA
Sharing
maintenance
and
rehabilitation
cost
Using
Environment
friendly
material in
construction
Flood
mitigation
Protect
natural
resources Security
Public
facilities
Maintaining
waterfront
settlement
Sewage
system
Sig.
(1-tailed)
River
rehabilitation .011 .000 .413 .000 .010 .202 .001 .044 .000
River reserve
beautification .326 .173 .175 .392 .044 .452 .306 .150 .265
Type of
developments .299 .425 .098 .315 .333 .366 .335 .140 .209
Integrate
modern and
heritage in
developments
.008 .017 .307 .008 .330 .454 .001 .001 .030
Economy
activity .063 .029 .189 .020 .252 .425 .014 .097 .000
Sharing
waterfront
benefits
.088 .080 .083 .189 .318 .394 .056 .143 .000
Stakeholders
participation .105 .335 .413 .046 .015 .064 .040 .338 .012
Educate public .041 .370 .006 .006 .101 .489 .001 .307 .075
Mitigate
property
speculation
.075 .383 .339 .110 .013 .366 .100 .353 .471

246
Table 7.4: Correlation Matrix (Cont.)
River
rehabilitation
River reserve
beautification
Type of
developments
Integrate
modern and
heritage in
developments
Economy
Activity
Sharing
waterfront
benefits
Stakeholders
participation
Educate
public
Mitigate
property
speculation
Sig.
(1-tailed)
River
rehabilitation .322 .387 .001 .000 .075 .129 .077 .356
River reserve
beautification .322 .091 .354 .211 .285 .124 .431 .111
Type of
developments .387 .091 .436 .491 .479 .444 .115 .480
Integrate
modern and
heritage in
developments
.001 .354 .436
.002 .001 .253 .013 .284
Economy
activity .000 .211 .491 .002 .000 .066 .024 .359
Sharing
waterfront
benefits
.075 .285 .479 .001 .000
.000 .057 .056
Stakeholders
participation .129 .124 .444 .253 .066 .000 .000 .153
Educate public .077 .431 .115 .013 .024 .057 .000 .003
Mitigate
property
speculation
.356 .111 .480 .284 .359 .056 .153 .003

247
Table 7.5: Anti-image matrices
EIA
Sharing
maintenance
and
rehabilitation
cost
Using friendly
material in
construction
Flood
mitigation
Protect natural
resources Security
Public
facilities
Maintaining
waterfront
settlement Sewage system
Anti-image
Covariance
EIA
.552
-.235
.036
-.008
-.101
-.025
.016
-.118
.046
Sharing
maintenance
and
rehabilitation
cost
-.235 .532 -.126 -.055 .021 .028 -.075 .019 -.002
Using friendly
material in
construction
.036 -.126 .584 -.019 -.031 -.030 .130 -.036 -.101
Flood
mitigation
-.008 -.055 -.019 .471 -.028 -.042 -.155 .002 -.061
Protect natural
resources
-.101 .021 -.031 -.028 .517 -.084 -.022 -.137 -.051
Security -.025 .028 -.030 -.042 -.084 .794 -.076 .070 -.140
Public
facilities
.016 -.075 .130 -.155 -.022 -.076 .458 -.152 .046
Maintaining
waterfront
settlement
-.118 .019 -.036 .002 -.137 .070 -.152 .517 -.093
Sewage
system
.046 -.002 -.101 -.061 -.051 -.140 .046 -.093 .457

248
Table 7.5: Anti-image matrices (Cont.)
River
rehabilitation
River reserve
beautification
Type of
developments
Integrate
modern and
heritage in
developments
Economy
activity
Sharing
waterfront
benefits
Stakeholders
participation
Educate
public
Mitigate
property
speculation
Anti-image
Covariance
EIA
.023
-.012
.083
-.034
-.016
-.028
-.009
-.056
-.083
Sharing
maintenance
and
rehabilitation
cost
-.097 -.052 -.072 -.021 .015 .002 .003 .093 .060
Using friendly
material in
construction
.043 -.070 .085 .128 .008 -.131 .181 -.235 -.049
Flood
mitigation
-.137 .087 .081 -.017 .078 .043 -.049 -.023 .000
Protect natural
resources
-.090 -.165 -.054 .161 .062 -.018 -.069 .002 -.182
Security .017 .010 -.033 .016 .040 .003 .158 -.017 .072
Public
facilities
.005 -.017 -.046 -.007 -.027 -.046 .013 -.147 -.034
Maintaining
waterfront
settlement
.061 .135 -.035 -.173 -.003 .052 .034 .123 .123
Sewage
system
-.082 -.042 -.094 .016 -.108 -.088 -.062 .020 -.021

249
Table 7.5: Anti-image matrices (Cont.)
EIA
Sharing
maintenance
and
rehabilitation
cost
Using friendly
material in
construction
Flood
mitigation
Protect natural
resources Security
Public
facilities
Maintaining
waterfront
settlement Sewage system
Anti-image
Covariance
River
rehabilitation
.023 -.097 .043 -.137 -.090 .017 .005 .061 -.082
River reserve
beautification
-.012 -.052 -.070 .087 -.165 .010 -.017 .135 -.042
Type of
developments
.083 -.072 .085 .081 -.054 -.033 -.046 -.035 -.094
Integrate
modern and
heritage in
developments
-.034 -.021 .128 -.017 .161 .016 -.007 -.173 .016
Economy
activity
-.016 .015 .008 .078 .062 .040 -.027 -.003 -.108
Sharing
waterfront
benefits
-.028 .002 -.131 .043 -.018 .003 -.046 .052 -.088
Stakeholders
participation
-.009 .003 .181 -.049 -.069 .158 .013 .034 -.062
Educate
public
-.056 .093 -.235 -.023 .002 -.017 -.147 .123 .020
Mitigate
property
speculation
-.083 .060 -.049 .000 -.182 .072 -.034 .123 -.021

250
Table 7.5: Anti-image matrices (Cont.)
River
rehabilitation
River reserve
beautification
Type of
developments
Integrate
modern and
heritage in
developments
Economy
activity
Sharing
waterfront
benefits
Stakeholders
participation
Educate
public
Mitigate
property
speculation
Anti-image
Covariance
River
rehabilitation
.370 -.029 .037 -.106 -.198 .087 .000 .023 .059
River reserve
beautification
-.029 .741 .150 -.082 .093 .039 -.085 .057 .161
Type of
developments
.037 .150 .845 -.004 .014 .017 -.041 .058 -.011
Integrate
modern and
heritage in
developments
-.106 -.082 -.004 .450 .024 -.179 .112 -.135 -.123
Economy
activity
-.198 .093 .014 .024 .466 -.123 .042 -.051 -.051
Sharing
waterfront
benefits
.087 .039 .017 -.179 -.123 .396 -.207 .079 .179
Stakeholders
participation
.000 -.085 -.041 .112 .042 -.207 .430 -.179 -.055
Educate
public
.023 .057 .058 -.135 -.051 .079 -.179 .426 -.057
Mitigate
property
speculation
.059 .161 -.011 -.123 -.051 .179 -.055 -.057 .626
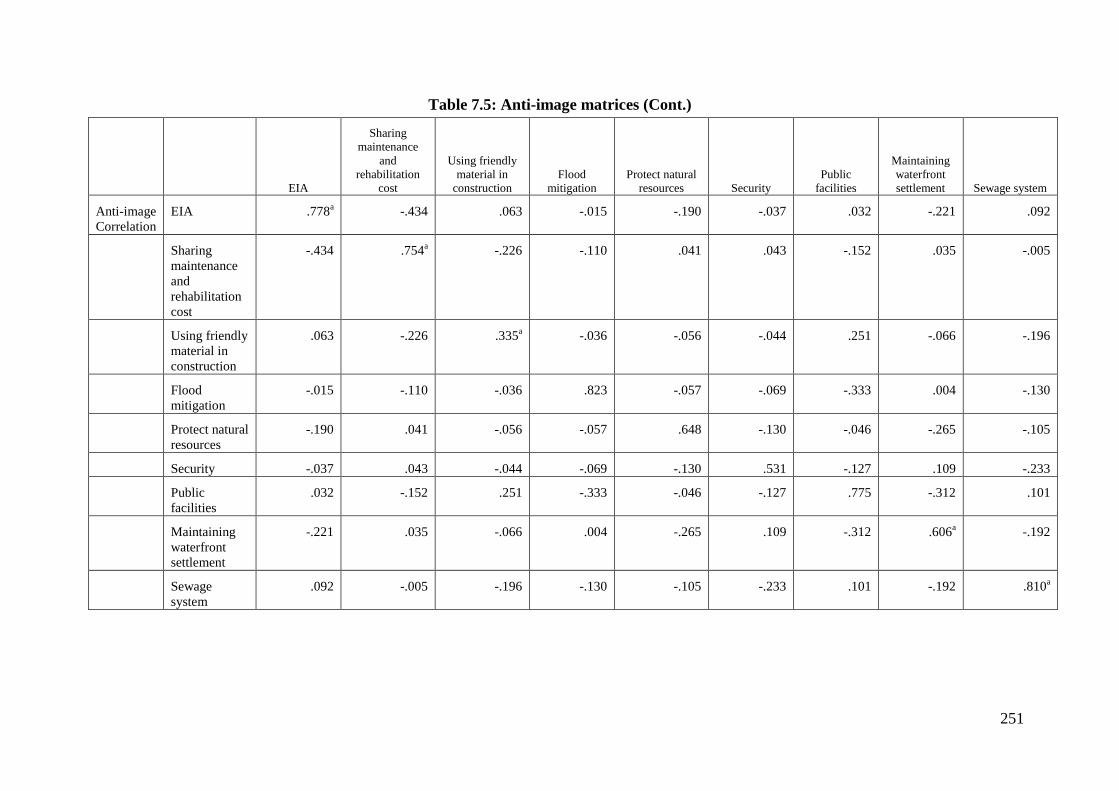
251
Table 7.5: Anti-image matrices (Cont.)
EIA
Sharing
maintenance
and
rehabilitation
cost
Using friendly
material in
construction
Flood
mitigation
Protect natural
resources Security
Public
facilities
Maintaining
waterfront
settlement Sewage system
Anti-image
Correlation
EIA .778a -.434 .063 -.015 -.190 -.037 .032 -.221 .092
Sharing
maintenance
and
rehabilitation
cost
-.434 .754a -.226 -.110 .041 .043 -.152 .035 -.005
Using friendly
material in
construction
.063 -.226 .335a -.036 -.056 -.044 .251 -.066 -.196
Flood
mitigation
-.015 -.110 -.036 .823 -.057 -.069 -.333 .004 -.130
Protect natural
resources
-.190 .041 -.056 -.057 .648 -.130 -.046 -.265 -.105
Security -.037 .043 -.044 -.069 -.130 .531 -.127 .109 -.233
Public
facilities
.032 -.152 .251 -.333 -.046 -.127 .775 -.312 .101
Maintaining
waterfront
settlement
-.221 .035 -.066 .004 -.265 .109 -.312 .606a -.192
Sewage
system
.092 -.005 -.196 -.130 -.105 -.233 .101 -.192 .810a

252
Table 7.5: Anti-image matrices (Cont.)
River
rehabilitation
River reserve
beautification
Type of
developments
Integrate
modern and
heritage in
developments
Economy
activity
Sharing
waterfront
benefits
Stakeholders
participation
Educate
public
Mitigate
property
speculation
Anti-image
Correlation
EIA .052 -.018 .122 -.068 -.032 -.060 -.018 -.116 -.141
Sharing
maintenance
and
rehabilitation
cost
-.219 -.083 -.107 -.043 .030 .004 .007 .196 .104
Using friendly
material in
construction
.092 -.107 .120 .250 .015 -.272 .361 -.472 -.081
Flood
mitigation
-.328 .147 .128 -.037 .166 .100 -.109 -.051 .000
Protect natural
resources
-.206 -.266 -.082 .333 .125 -.040 -.145 .005 -.321
Security .032 .013 -.040 .028 .065 .006 .271 -.030 .102
Public
facilities
.013 -.030 -.074 -.016 -.059 -.108 .029 -.333 -.064
Maintaining
waterfront
settlement
.141 .219 -.053 -.358 -.005 .115 .072 .263 .216
Sewage
system
-.200 -.073 -.151 .036 -.233 -.206 -.140 .045 -.040

253
Table 7.5: Anti-image matrices (Cont.)
EIA
Sharing
maintenance
and
rehabilitation
cost
Using friendly
material in
construction
Flood
mitigation
Protect natural
resources Security
Public
facilities
Maintaining
waterfront
settlement Sewage system
Anti-image
Correlation
River
rehabilitation
.052 -.219 .092 -.328 -.206 .032 .013 .141 -.200
River reserve
beautification
-.018 -.083 -.107 .147 -.266 .013 -.030 .219 -.073
Type of
developments
.122 -.107 .120 .128 -.082 -.040 -.074 -.053 -.151
Integrate
modern and
heritage in
developments
-.068 -.043 .250 -.037 .333 .028 -.016 -.358 .036
Economy
activity
-.032 .030 .015 .166 .125 .065 -.059 -.005 -.233
Sharing
waterfront
benefits
-.060 .004 -.272 .100 -.040 .006 -.108 .115 -.206
Stakeholders
participation
-.018 .007 .361 -.109 -.145 .271 .029 .072 -.140
Educate
public
-.116 .196 -.472 -.051 .005 -.030 -.333 .263 .045
Mitigate
property
speculation
-.141 .104 -.081 .000 -.321 .102 -.064 .216 -.040

254
Table 7.5: Anti-image matrices (Cont.)
River
rehabilitation
River reserve
beautification
Type of
developments
Integrate
modern and
heritage in
developments
Economy
activity
Sharing
waterfront
benefits
Stakeholders
participation
Educate
public
Mitigate
property
speculation
Anti-image
Correlation
River
rehabilitation
.730 -.055 .067 -.261 -.478 .227 -.002 .058 .122
River reserve
beautification
-.055 .383 .189 -.142 .158 .073 -.151 .101 .237
Type of
developments
.067 .189 .466 -.006 .022 .029 -.069 .097 -.016
Integrate
modern and
heritage in
developments
-.261 -.142 -.006 .598 .053 -.424 .255 -.309 -.232
Economy
activity
-.478 .158 .022 .053 .735 -.287 .094 -.115 -.094
Sharing
waterfront
benefits
.227 .073 .029 -.424 -.287 .544 -.500 .192 .359
Stakeholders
participation
-.002 -.151 -.069 .255 .094 -.500 .517 -.418 -.105
Educate
public
.058 .101 .097 -.309 -.115 .192 -.418 .555 -.111
Mitigate
property
speculation
.122 .237 -.016 -.232 -.094 .359 -.105 -.111 .444