DEVELOPING AN INSTRUMENT FOR MEASURING TEACHERS’ MATHEMATICS CONTENT KNOWLEDGE ON RATIO AND...
24
ROOSELYNA EKAWATI, FOU-LAI LIN and KAI-LIN YANG DEVELOPING AN INSTRUMENT FOR MEASURING TEACHERS’ MATHEMATICS CONTENT KNOWLEDGE ON RATIO AND PROPORTION: A CASE OF INDONESIAN PRIMARY TEACHERS Received: 9 September 2013; Accepted: 9 March 2014 ABSTRACT. In this study, we developed an instrument for assessing teachers’ mathematics content knowledge (MCK) on ratio and proportion and examined the profile of Indonesian primary teacher’s MCK on this topic. The MCK items were administered to 271 Indonesian in-service primary teachers with a variety of educational backgrounds and teaching experiences. Teachers’ responses were analyzed by factor analysis and cluster analysis. The MCK instrument was found to have good acceptability in the reliability analysis with 3 factor components—meaning of proportional and non-proportional situations, number structures in situation, and figural representation—which was the main result of the study. With respect to the 3 factors, the teachers in the 3 assigned categories (“Good,”“Middle,” or “Low”) showed consistent performance on the items of the 3 factors. In particular, our results indicated that Indonesian in-service primary teachers had difficulty with the factor on figural representation, but they performed best on number structures in situation representing products of proportional reasoning. KEY WORDS: Indonesia, mathematics content knowledge, proportional reasoning, ratio and proportion INTRODUCTION In the last two decades, there has been increased attention to teachers’ knowledge of mathematics. On the essentials of mathematics content knowledge, Ball, Hill & Bass (2005) asserted: “How well teachers know mathematics is central to their capacity to use instructional materials wisely, to assess students’ progress, and to make sound judgments about presentation, emphasis, and sequencing” (p. 14). More specific attention was paid to the conceptual understanding of mathematics as Fennema & Franke (1992) found its positive relation with classroom instruction. Another important finding was the strong connection between the knowledge of potential future teachers and students’ achievement in the Teacher Education and Development Study in Mathematics (TEDS-M) Electronic supplementary material The online version of this article (doi:10.1007/s10763-014- 9532-2) contains supplementary material, which is available to authorized users. International Journal of Science and Mathematics Education 2014 # National Science Council, Taiwan 2014
Transcript of DEVELOPING AN INSTRUMENT FOR MEASURING TEACHERS’ MATHEMATICS CONTENT KNOWLEDGE ON RATIO AND...

ROOSELYNA EKAWATI, FOU-LAI LIN and KAI-LIN YANG
DEVELOPING AN INSTRUMENT FOR MEASURINGTEACHERS’ MATHEMATICS CONTENT KNOWLEDGE
ON RATIO AND PROPORTION: A CASE OF INDONESIANPRIMARY TEACHERS
Received: 9 September 2013; Accepted: 9 March 2014
ABSTRACT. In this study, we developed an instrument for assessing teachers’ mathematicscontent knowledge (MCK) on ratio and proportion and examined the profile of Indonesianprimary teacher’s MCK on this topic. The MCK items were administered to 271 Indonesianin-service primary teachers with a variety of educational backgrounds and teachingexperiences. Teachers’ responses were analyzed by factor analysis and cluster analysis. TheMCK instrument was found to have good acceptability in the reliability analysis with 3 factorcomponents—meaning of proportional and non-proportional situations, number structuresin situation, and figural representation—which was the main result of the study. With respectto the 3 factors, the teachers in the 3 assigned categories (“Good,” “Middle,” or “Low”)showed consistent performance on the items of the 3 factors. In particular, our results indicatedthat Indonesian in-service primary teachers had difficulty with the factor on figuralrepresentation, but they performed best on number structures in situation representingproducts of proportional reasoning.
KEY WORDS: Indonesia, mathematics content knowledge, proportional reasoning, ratioand proportion
INTRODUCTION
In the last two decades, there has been increased attention to teachers’knowledge of mathematics. On the essentials of mathematics contentknowledge, Ball, Hill & Bass (2005) asserted: “How well teachers knowmathematics is central to their capacity to use instructional materialswisely, to assess students’ progress, and to make sound judgments aboutpresentation, emphasis, and sequencing” (p. 14). More specific attentionwas paid to the conceptual understanding of mathematics as Fennema &Franke (1992) found its positive relation with classroom instruction.Another important finding was the strong connection between theknowledge of potential future teachers and students’ achievement in theTeacher Education and Development Study in Mathematics (TEDS-M)
Electronic supplementary material The online version of this article (doi:10.1007/s10763-014-9532-2) contains supplementary material, which is available to authorized users.
International Journal of Science and Mathematics Education 2014# National Science Council, Taiwan 2014

and the Trends in International Mathematics and Science Study (TIMSS)(Schmidt, Houang & Cogan, 2011). TEDS-M provided data on theknowledge that future primary and lower secondary teachers need toacquire in their mathematics teacher education, whereas TIMMS isabout the international assessment on mathematics and scienceknowledge on students in fourth and eighth grades.
Numerous studies have researched the assessment of the domain ofmathematics content knowledge (MCK), for example, some researchgroups have productively assessed teachers’ knowledge in projectssuch as TEDS-M (Blömeke et al. as cited in Blömeke & Delaney,2012), Mathematics Teaching in the 21st Century (MT21) (Schmidtet al., 2011), and Professional Competence of Teachers, CognitivelyActivating Instruction, and the Development of Students’ Mathemat-ical Literacy (COACTIV) (Krauss, Baumert & Blum, 2008). Inves-tigation of different knowledge facets for teaching and teachers’mathematics content knowledge is the most recent approach in thestudies such as the Programme of International Student Assessment(PISA) and TEDS-M. Most instruments used for measuring teachers’content knowledge in previous studies did not specifically relate tothe knowledge on ratio and proportion even though these conceptsare fundamental to mathematics and important in many other fields ofknowledge (Chaim, Keret & Ilany, 2012). Moreover, past literaturesaddressed that ratio and proportion are too complex and identifiedthat the topics are difficult for teachers to teach and for students tolearn (Behr, Harel, Post & Lesh, 1992; Lamon, 2007). Students’ poorunderstanding and misconceptions in solving problems on ratio andproportion have been found in many studies, and these phenomenamight be related to teachers’ MCK on this content.
Understanding ratio and proportion implies possessing intuitivefoundation of the proportional scheme. Moreover, proportionalreasoning plays an important role and has some practical functions.Research has also shown that during mathematics teaching, teachersconsulted a textbook when planning and implementing their teaching(Thomson & Fleming, 2004). The quality of tasks in textbooks in thecase of proportional reasoning was analyzed by Bayazit (2013) whopointed out that textbooks could give insight into the mathematicsteachers’ teaching with these tasks. Therefore, developing a qualifiedinstrument for measuring teachers’ mathematics content knowledge(MCK) on ratio and proportion would also be helpful to reflect onthe quality of textbooks in addition to evaluating teachers’ MCK.Regarding the content of ratio and proportion, reasoning ability was
ROOSELYNA EKAWATI ET AL.

never the main concern in Indonesian elementary mathematicscurriculum which was more about computational skills in problemsolving. In this study, we aimed at comprehensively and empiricallydeveloping a measuring instrument for assessing Indonesian in-serviceprimary teachers’ MCK on the domain of ratio and proportion. Weintended to explore the constructive elements for measuring teachers’MCK on ratio and proportion. Moreover, we would also investigatethe profile of Indonesian primary teachers’ MCK on ratio andproportion. Recent studies all over the world have shown that thereis a gap in the content knowledge of pre-service and in-serviceteachers on mathematics topics taught in elementary and middleschools, including the topics of ratio and proportion (Ilany, Keret &Chaim, 2004). In order to put forward the operationally reliablemeasure, we started with reviewing the literature on MCK, develop-ing initial instrumental framework and items, as well as pretestingand undertaking detailed item analysis.
Mathematics Content Knowledge
In the field of education, the notion of content knowledge had been well-researched by Shulman (1986) who described the fundamental idea ofcontent knowledge as follows:
To think properly about content knowledge requires going beyond knowledge of the facts orconcepts of a domain. It requires understanding the structures of the subject matter […].Content knowledge refers to the amount and organization of knowledge per se in the mind ofteacher. This involves the understanding beyond the structure of the subject matter (p. 9).
Furthermore, Shulman also stated that those teachers needed toknow and understand not only what something is so but also why itis so. Specifically, in the field of mathematics education, Ma (1999)defined content knowledge as a thorough understanding of thebreadth and depth of the relevant topics in mathematics, includingawareness of their interconnections. It was clear that teachers’knowledge of content should be much deeper than that of theirstudents. In this study, we focused on the aspects of MCK which wasspecifically applied to the topic of ratio and proportion. We selectedas our methods of measurement three of the four levels of MCKdescribed by Krauss, Blum, Brunner, Neubrand, Baumert, Kunter,Elsner et al. (2013): (1) everyday mathematics knowledge required bythe average adult, (2) a reasonable command of school-levelmathematical knowledge, and (3) a profound understanding of the
DEVELOPING AN INSTRUMENT FOR MEASURING TEACHERS’ MCK

content of the secondary school mathematics curriculum. The fourthlevel about university-level knowledge of mathematics was notincluded as it is beyond the scope of this study.
Mathematical Perspective of Ratio and Proportion
Of all topics in the school curriculum, fractions, ratios and proportions arguably hold thedistinction of being the most protracted in terms of development, the most difficult toteach, the most mathematically complex, the most cognitively challenging, the mostessential to success in higher mathematics and science, and the most compelling researchsites (Lamon, 2007, p. 629).
The concept of ratio can be inferred as a multiplicative relationshipbetween two values. A ratio is a comparison between two quantities (Livy& Vale, 2011). Children usually learn the ratio concept before they attendthe primary level—for example, as described by Brink & Streefland(1979)—that “(b)y means of perspective and reality-turn the childrengrasp the non-variance of the internal ratio” (p. 418) but they have notbeen introduced yet to the term “ratio.”
The other related concept to ratio is proportion. Mathematically,proportion is a statement of equality of two ratios, that is, a/b=c/d(Tourniaire & Pulos, 1985). Both teachers and students need to have theability of proportional reasoning which was described by Dole (2008) asthe understanding of multiplicative relationship between variables inproportional situations and to use this knowledge to solve problems. Thisability has a central role to play in the development of mathematical thinking and is frequentlydescribed as a concept that, on the one hand, is a cornerstone of highermathematics, and, on the other hand, is the core of the basic tenets ofmathematics. Some tasks developed to investigate proportionalunderstanding—in which the most frequently used tasks are wordproblems—are given without illustration and presented either in writtenor oral form (Tourniaire & Pulos, 1985). Regarding MCK in proportionalunderstanding, Fischbein (1994) described component knowledge as (1)formal knowledge such as definition, rules, and properties of proportion;(2) algorithmic knowledge about problem-solving strategies; and (3)intuitive knowledge (the ability to recognize proportional relationship,i.e., in the form of graphs). To be more specific, Chaim et al. (2012)stated the importance of the MCK obtained from ratio and proportionwhich should be connected to educational judgment in the proportional
ROOSELYNA EKAWATI ET AL.
scheme that was crucial to the development of proportional reasoning.Proportional reasoning is a psychological construct, not a mathematical one,and its characteristic is that it focuses on describing, predicting, or evaluatingthe relationship between two relationships (i.e. a second-order relationship)rather than simply a relationship between two concrete objects (or twodirectly perceivable quantities) (Piaget & Inhelder as cited in Lesh, Post &Behr, 1988). Some proportional reasoning tasks require quantitativeargumentations and also in the form of a qualitative scheme which is relatedto intuitive understanding of the ordinal or interval quantities of a situation,for example, cold, warm, or hot (Ahl, Moore & Dixon, 1992).
METHODOLOGY
Sample
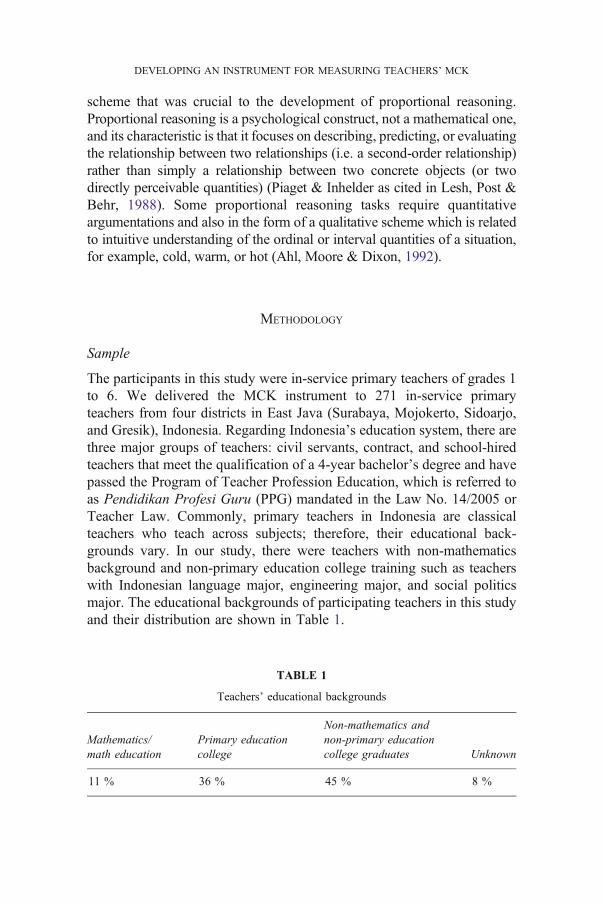
The participants in this study were in-service primary teachers of grades 1to 6. We delivered the MCK instrument to 271 in-service primaryteachers from four districts in East Java (Surabaya, Mojokerto, Sidoarjo,and Gresik), Indonesia. Regarding Indonesia’s education system, there arethree major groups of teachers: civil servants, contract, and school-hiredteachers that meet the qualification of a 4-year bachelor’s degree and havepassed the Program of Teacher Profession Education, which is referred toas Pendidikan Profesi Guru (PPG) mandated in the Law No. 14/2005 orTeacher Law. Commonly, primary teachers in Indonesia are classicalteachers who teach across subjects; therefore, their educational back-grounds vary. In our study, there were teachers with non-mathematicsbackground and non-primary education college training such as teacherswith Indonesian language major, engineering major, and social politicsmajor. The educational backgrounds of participating teachers in this studyand their distribution are shown in Table 1.
TABLE 1
Teachers’ educational backgrounds
Mathematics/math education
Primary educationcollege
Non-mathematics andnon-primary educationcollege graduates Unknown
11 % 36 % 45 % 8 %
DEVELOPING AN INSTRUMENT FOR MEASURING TEACHERS’ MCK

Some participants were novice teachers (11.8 %), that is, those withone with less than 3 years of teaching experience (Huberman as cited inBarrett, Jones, Mooney, Thornton, Cady & Guinee et al., 2002), andothers were expert teachers (88.2 %) who already had teaching experienceof more than 3 years at primary level. They were invited to take the MCKtest on a voluntary basis and were given a small present as appreciationfor their participation. The test was held before the start of the secondsemester of an academic year and before the topics ratio and proportionwere taught.
Test Items Development and Validation
This study aimed at developing comprehensive test measures andconceptualizing Indonesian in-service primary teachers’ mathematicscontent knowledge (MCK) on ratio and proportion. We first developeda framework for assessing teachers’ knowledge on teaching ratio andproportion. Our chosen items were called investigative items because theproblems posed were routine and non-routine ones with consistency withschool and non-school mathematics that asked teachers to investigate anduse their knowledge to solve the problems. The item design involved twophases: (1) defining conceptions of item components and (2) developingand validating the test instrument.
Phase 1: Defining Conceptions of Item Components. The initialframework for MCK items was influenced by some existing theoriesrelated to ratio and proportion as the content and also elaborated usingprevious frameworks for assessing MCK, specifically on the topic such asthe “knowing, applying and reasoning” developed by TEDS-M. Theunderlying elements of 12 initial MCK items on ratio and proportion inthis study were about proportional reasoning. The correspondingproblems of these items consisted of three important variables: contextsituations, task type, and number structures which were also regarded inAlatorre & Figueras (2005).
Regarding the variable context situation, Lamon (1993) have distin-guished four types—(a) well-chunked measures, (b) part-part-wholeproblems, (c) associated sets, and (d) stretchers and shrinkers—whichanother two authors, Tourniaire & Pulos (1985), set differently asphysical, rate, mixture, and probability problems. In this study, we dealtwith different context situations for MCK such as stretchers and shrinkers(i.e. enlargement figures) and well-chunked measure problems (i.e. fuelused liter/hour). Different context situations in proportional probleminfluence different students’ reasoning strategies such as the recipe
ROOSELYNA EKAWATI ET AL.

context in which students could use a unitary method and another contextsuch as geometrical enlargement that requires them to use a multiplemethod (i.e. doubling and halving). Stretcher and shrinkers contextsituations were considered mostly in our MCK instrument since thesesituations were not available in primary textbooks and were notexperienced in teaching practice in Indonesia compared to well-chunkedmeasures. Furthermore, in order to have a clear picture of teachers’ abilityin distinguishing proportional and non-proportional problems in differentsituations, we provided six different situations to be matched with theircorresponding types. An investigation of proportional and non-propor-tional situations was also conducted in the study of Masters (2012) suchas identifying proportional versus non-proportional situations, forexample, “A video store charges $25 per month for unlimited rentals.Sally rented five videos last month. This month she rented six videos,How much did it cost her to rent each video? Choices a.) Proportionalsituation. b.) Non-Proportional situation.”
In terms of task type, there was a classification of tasks by Tourniaire& Pulos (1985) such as missing-value problems and ratio-comparisonproblems. In solving the missing-value problems, students might use areasoning strategy with respect to the result, and an alternative reasoningapproach (make comparisons) could be used in solving ratio-comparisonproblems.
The third variable that we considered was number structures whichconsist of integer multiple and non-integer multiple number structures. Asto context situation, number structures in proportional problems influ-enced the reasoning strategies and the performance in solving theproblems. Hart (1981) described the hierarchical levels of difficulty onratio and proportion problems regarding the number structures, such asmultiplication by 2, 3, or taking half were considered as easy problems.On the other hand, fraction operation was regarded as complex numberstructure. We considered both easy number structures (i.e. doublingenlargement line) and complex number structures with complex contextsituation (i.e. Mr. Short and Mr. Tall problem with fraction operationsthat use different unit measurements) in the MCK instrument.
Phase 2: Developing and Validating the Test Instrument. The taskswent through multiple stages of revision before being applied to a largernumber of participants. Discussion with mathematics education expertsand a pilot test among 20 pre-service/in-service teachers were executed.Twelve MCK items were developed, and the reliability result orCronbach’s alpha of the piloted MCK items on ratio and proportion was
DEVELOPING AN INSTRUMENT FOR MEASURING TEACHERS’ MCK

0.719 which is considered as acceptably consistent within the survey items.The instruments were initially developed in English, and valid translationwas required to make sure that the questionnaire would properly measure theMCK on ratio and proportion for Indonesian teachers. This study took intoconsideration the stages of the guideline for translating questionnairesdescribed by Beaton, Bombardier & Ferraz (2000). The first stage was calledadaptation in which the terms of the instrument were forwarded to twoIndonesians with different educational backgrounds (a mathematics educatorand an engineer) to be independently translated from English to BahasaIndonesia. Afterwards, the second stage was about synthesizing the twotranslations into one common translation. Beaton et al. (2000) suggestedback translation of the common synthesized translation. This process was tocheck the validity and consistency of the same items in the translated version;it should be done by a person who considers English as a source language.The resulted English translation was reviewed by one of the authors as aninstrumental developer. It was found in the back translation to English thatthe translator used some synonymous terms without changing the meaningof the different terms in the original instrument. Finally, the BahasaIndonesia items with slight revision were used. The MCK items werecreated in three different forms: multiple choice (MC) items in whichaccording to Schmelzing, Driel, Juttner, Brandenbusch, Sandmann &Neuhaus (2013) raise problem with correct answer and distracters, complexmultiple choice (CMC) items—which were designed to test in-serviceteachers to enact and distinguish whether situation problems are proportionalor non-proportional—and open problem (OP) items. Table 2 presents theoverview of MCK items instrument.
Coding Scheme
The comprehensive coding scheme for all MCK items mentioned abovewas developed and discussed with expert mathematics educators andsome pre-service teachers. Furthermore, MCK items with one solutionwere coded as “correct=score 1” and “incorrect=score 0.” Another itemwith its form of scoring level rubric is shown in Fig. 1 and Table 3 below.
The responses were coded more than once to make sure theconsistency in the codings. If we found some answers which made thecoders doubtful, we discussed with the coders and consulted the experts.
Factor Analysis and Cluster Analysis
In this study, factor analysis and cluster analysis were applied to the datamainly concerning the teachers’ responses to the items. Item analysis
ROOSELYNA EKAWATI ET AL.

TABLE 2
Overview of 12 MCK items
Code Overview Problem Task typeItemformat
MCK1 Rate missing-valueproblems aboutthe use of fuelwith non-integernumber structure
Fuel used (liter/hour)for the same ratemachine operation
Missingvalue
MC
MCK2 Innate ratio in thecongruency of twogeometrical figures
Congruency of tworhombus
Ratiocomparison
MC
MCK3 Reasoning ofcongruencyof two geometricalfigures
Congruency oftwo rhombus
Ratiocomparison
OP
MCK4 Non-integer multiplenumber structure(“Mr. Short andMr. Tall” problem)
“Mr. Short and Mr.Tall” problem
Missingvalue
OP
MCK5 Proportional andnon-proportionalsituations
Differentiateproportional andnon-proportionalsituation problem
Missingvalue
CMC
MCK6 Ratio relation of twodifferent objects
Speed context Ratiocomparison
OP
MCK7 Meaning ofproportionalrelations in situation
The meaning ofequivalence signfor distance totime in statementp→ s1
t1 ¼ s2t2
� �
Ratiocomparison
OP
MCK8 Meaning ofequivalence signin proportionalrelations
The meaning ofequivalence signon statementq→s1
s2 ¼ t1t2
Ratiocomparison
OP
MCK9 The conditionalstatement of twoproportionalstatements withinspeed context
Reasoning in statement:If the statement pis correct, thenstatement q iscorrect
Ratiocomparison
OP
MC-K10
Drawing theenlargement figurewith integernumber structurescaling
Enlargement context Missingvalue
OP
Missing-value Enlargement context Missing OP
DEVELOPING AN INSTRUMENT FOR MEASURING TEACHERS’ MCK

which was conducted before the exploratory factor analysis aimed at“investigating the performance of items considered individually either inrelation to some external criterion or in relation to the remaining items onthe test” (Thompson & Levitov, 1985). There were three methods in theitem analysis:
1.a. Classify participants based on their total scores and pick up the topand bottom 27 % of participants. According to Wiersma & Jurs(1990), “27 % is used because it has shown that this value willmaximize differences in normal distributions while providing enoughcases for analysis” (p. 145).
1.b. Conduct an independent t test for each item in the two differentgroups above. It was used to compare the means from two samples.
2. Apply correlation analysis of each item to the total score and delete theitem if the item-total correlation is less than 0.30. In terms ofdiscrimination index, items with correlation above 0.40 are very gooditems, those items with correlation from 0.30 to 0.39 are reasonablygood but possibly subject to improvement, those items with correlationfrom 0.20 to 0.29 are marginal and needed some revision, and thoseitems with correlation below 0.19 are considered as poor and needmajor revision (Ebel & Frisbie, 1986).
MC-K11
problems withnon-integer scalefactor enlargement
value
MC-K12
Representationof ratio relations
Representationof ratio relationsin Cartesiancoordinates
Ratiocomparison
MC
Fig. 1. Item MCK 10
ROOSELYNA EKAWATI ET AL.

3. Execute factor analysis and determine the factor loadings for eachvariable. In order to understand the patterns in the data, each variablein a single factor loading should be high (90.30).
Each item should fulfill at least two out of three criteria for the above-mentioned item analysis. If not, it needed to be deleted for factor analysis.Afterwards, exploratory factor analysis was conducted to explore therelationships between variables which showed the broad overall patternclearly, but this could not identify different patterns of relationship whichmay exist in subgroups within a population (Entwistle, Tait & McCune,2000). Moreover, cluster analysis based on factor scores was conducted todraw attention to discrepant patterns of teachers’ responses, and it helps toclarify the structure of validity by indicating how much latent constructare measured within the test (Schmelzing et al., 2013).
RESULTS
Descriptive Statistics
The three methods in item analysis with the criteria explained aboveresulted from deleting one item (MCK2) because of its correlation to thetotal score and the factor loading value of this item was less than 0.30.Among the 271 samples, the Cronbach’s alpha of MCK was 0.65.According to Hair, Anderson, Tatham & Black (1998), the valuesbetween 0.60 and 0.70 were the lowest limit of acceptability for the
TABLE 3
Scoring rubric for item MCK10
Code Responses Score
70 Incorrect (the position of drawing vertical line is not the sameas figure A)
0
71 Incorrect (the drawing scale is not twice as the vertical line of A) 072 Incorrect. Missing (no drawing, only calculation is performed) 010 Partially correct (drawing the vertical line with correct enlargement
factor but not enlarge the gap)0.5
20 Correct (the drawing vertical line in B is twice as the vertical line A, andthe gap between the vertical and horizontal lines is also enlarged withappropriate enlargement factor
1
99 Blank 0
DEVELOPING AN INSTRUMENT FOR MEASURING TEACHERS’ MCK

internal consistent reliability coefficient based on the correlation betweenvariables. Thus, those two results indicated a reliable measure of thecategories of MCK items. The detailed means and standard deviations ofMCK items (after deleting MCK2) obtained from the factor analysisprocess are shown in Table 4.
As shown in Table 4, the maximum standard deviations of the MCKitems were around 0.4 which indicate that the dispersion of data pointtended to be close to the mean.
Exploratory Factors
In order to explore the dimensionality of the framework of MCK, theresponses to MCK items were submitted to the exploratory principalcomponent factor analysis with Oblimin with Kaiser Normalization rotationmethod. The communalities of items which showed variances with the factorwere from 0.329 to 0.612 which could be considered as high communality.The procedure identified three underlying factors in MCK items with theeigenvalue greater than 1 as shown in the scree plot and the rotated structurematrix (see Table 5). Furthermore, the value of Kaiser-Meyer-Olkin’smeasure of sampling adequacy (KMO) of MCK was 0.717 which could beinterpreted as an appropriate number as Coakes & Steed (1997) suggestedthat the KMO measure should exceed 0.6 so that factoring could be
TABLE 4
Descriptive statistics of MCK item scores
Number of samples Mean Std. deviation
MCK1 271 0.9373 0.24293MCK3 271 0.1107 0.31434MCK4 271 0.7712 0.42083MCK5 271 0.5762 0.24722MCK6 271 0.7159 0.45183MCK7 271 0.3542 0.47917MCK8 271 0.0959 0.29506MCK9 271 0.1162 0.22843MCK10 271 0.3192 0.30209MCK11 271 0.7565 0.43001MCK12 271 0.3819 0.31459Valid N (listwise) 271
ROOSELYNA EKAWATI ET AL.

processed. The Bartlett’s test of sphericity value for MCK items also showedits significance; therefore, the factor analysis was considered appropriate.
0.00
0.10
0.20
0.30
0.40
0.50
0.60
0.70
0.80
0.90
Mean F1 Mean F2 Mean F3
Mean of all data
Fig. 2. Mean score of items in each factor
TABLE 5
Rotated structure matrix of principal component factor analysis
Description
Factor
1 2 3
Proportional and non-proportional situations 0.551Ratio relation of two different objects (speed context) 0.586Meaning of proportional relation in situation 0.770Meaning of equivalent sign in proportional relations 0.649The conditional statement of two proportional statements 0.690Rate missing-value problem about the use of fuel withnon-integer number structure
0.759
Non-integer scaling and number structure (the problem ofMr. Short and Mr. Tall)
0.492
Missing-value problem with non-integer scale factorenlargement
0.749
Reasoning the congruency of two geometrical figures 0.570Drawing the enlarged figure with integer number structurescale
0.572
Ratio relation in Cartesian coordinate system 0.672
Only loadings greater than 0.3 were outputted
DEVELOPING AN INSTRUMENT FOR MEASURING TEACHERS’ MCK

As described in Table 5, the 11 MCK items were distributed overthree factors. MCK items 5, 6, 7, 8, and 9 that loaded highly on factor1 (F1) were interpreted as meaning of proportional and non-proportional situations. F1 pertained to understanding proportional/non-proportional situation problems and the meaning of ratio relationsin proportional patterns within situations. The knowledge used in F1items was considered as the incorporation of teachers’ proportionalreasoning ability. Lesh et al. (1988) considered this as a transforma-tional problem regarding an equivalence in the form A/B=C/D; then,one or two of the four values A, B, C, or D are increased or decreasedby a certain amount, and the goal is to judge which relation (=) is truefor the transformed values. From another perspective, Tourniaire &Pulos (1985) indicated this as a problem on logical proportionsregarding logical relationships between the four terms of proportions.This dimension is also recognizable as level 3 in adequate level ofteacher knowledge (Shulman, 1986) which requires deeper understand-ing of the ratio and proportion content.
The three items (MCK1, MCK4, and MCK11) that loaded on factor 2(F2) had common characteristics which were interpreted as numberstructures in situation. F2 pertained to the different numerical structureproblems within different situations. Teachers were asked to find onemissing value when given three values and non-integer number structurewithin different situations. These kinds of problems were posited in thehighest level of understanding in ratio and proportion/level 4 for studentsin the Concept of School Science and Mathematics (CSMS) researchproject (Hart, 1981).
Besides those two factors with variables concerning situations andnumber structures, factor 3 (F3) was likewise identified and interpreted asfigural representation. This factor pertained to ratio relations ingeometrical figures and in representations. One item was about thecongruency of two geometrical figure and reasoning ability in ratiorelation of teachers. This reasoning ability was also considered as onecognitive demand for assessing teachers’ mathematics content knowledgein TEDS-M (Senk, Peck, Bankov & Tatto, 2008). The other two itemswere about drawing enlargement figures and portrayed the relation ofratio in the graphical representation which Lesh et al. (1988) stated as“between-mode translation problems” which can be considered asportraying from one representative system to another with the samerelationship. Finally, the 11 MCK items on these three factors about ratioand proportion were applied in our study to explore the contentknowledge of Indonesian in-service primary teachers.
ROOSELYNA EKAWATI ET AL.

Indonesian Primary Teachers’ Performance
Besides the factor analysis, cluster analysis based on the factor score wasused as an analytical tool to group the teachers (N=271) who respondedto the items in similar ways so that the nature of the cluster could beobtained. The outcomes of cluster analysis by SPSS were three clustergroup classifications: group 1/G1 (n=72), group 2/G2 (n=162), andgroup 3/G3 (n=37). The overview of all Indonesian primary teachers’performances (mean score of items in each factor) are shown in Figs. 2and 3.
Based on the mean score in each group and trends shown in Fig. 3, thethree groups G1, G2, and G3 could be interpreted as teachers with“Good,” “Middle,” or “Low” performance, respectively. The mean scoreof all teacher participants was 0.47. Overall, Indonesian in-serviceprimary teachers performed the best and above the total mean in numberstructures in situation (F2) and performed worst in figural representation(F3). This phenomenon was consistent with the trends of teachers in eachof the three groups (G1, G2, and G3).
The teachers performed successfully with relatively high percentagesin F2 items which were about missing-value problems. To be morespecific, 94.0 % of the teachers were able to solve problems withsituations of the consumption of fuel at the same rate. Moreover, 77.5 and75.5 % of teachers were able to correctly answer “Mr. Tall and Mr. Short”problem and a problem on rectangle enlargement, respectively. On thecontrary, F3 (figural representation) became the most difficult factor for
0
0.2
0.4
0.6
0.8
1
1.2
F1 F2 F3
G1 (Good)
G2 (Middle)
G3 (Low)
Fig. 3. Mean score of items in the three factors by group
DEVELOPING AN INSTRUMENT FOR MEASURING TEACHERS’ MCK

all the primary teacher participants in each category. There were 11.1 %of teachers who were able to reason appropriately in solving the problemon the congruency of two rhombus figures (MCK 3) by comparing theratio of corresponding diagonal lines. For another F3 item which wasabout drawing enlargement horizontal line (MCK10), 6.6 % of teachersrealized the need of enlargement gap, whereas 50.6 % of teachers ignoredthe gap and only drew the enlarged vertical line with appropriate scale,and the rest of the teachers (42.8 %) could not draw an enlarged verticalline properly. These responses might be due to the fact that we did not putadditional information into the item about the gap; thus, most teachersignored it. For another F3 problem about the representation of ratiorelation in Cartesian coordinates, there were 10.7 % of teachers who wereable to identify that the line representation passes through the origin of aCartesian coordinate system. About one third of teachers considered thatthe graph sketch of a ratio relation does not pass through the origin.
For F1 items (meaning of proportional and non-proportional situa-tions), teachers’ performances were below the mean. Regarding theproblem of identifying the proportional or non-proportional situationproblems, 53.9 % of teachers were able to match at least four out of sixcontextual situations to their corresponding types. In identifying the ratiorelation of distance/time, 71.6 % of teachers were able to correctly answerthe items. The lower percentages of correct answers that appeared in theproblems of explaining the meaning of equivalence sign on proportionswith ratio relations s1
t2 ¼ s2t2 and s1
s2 ¼ t1t2 were 35.4 % and 9.59 %,
respectively. In addition, for the problem on conditional statements “if pthen q” within the speed situation, four teachers were able to answer theproblem properly with mathematical proofs, and 4.4 % of teachers
Fig. 4. An example of wrong use of additive strategy (with English translation)
ROOSELYNA EKAWATI ET AL.

explained their answers using their perception of the situation. Further-more, 16.6 % of teachers used cross-multiplication strategy to show theirunderstanding in “statement p will be the same as statement q.”
As regards the teachers’ educational backgrounds, teachers withmathematics/mathematics education backgrounds were distributed in the“Good” and “Middle” categories for 78.6 % and 21.4 %, respectively. Forteachers with primary education college major and non-mathematics andnon-primary education college training, most of them were in the“Middle” category. Furthermore, the trend of teachers’ distribution basedon teaching experience in the teachers’ group showed that most noviceand expert teachers were in the “Middle” category.
DISCUSSION
There was still a relatively little attention given to the underlyingconstructs for assessing primary teachers’ knowledge on ratio andproportion. In response to this, our study identified the factors in aframework for an assessment instrument by designing items to measureteachers’ mathematics content knowledge (MCK) on ratio and proportion.Regarding the variables in the framework for the MCK instrument such ascontext situation, teachers faced relative difficulties in stretcher andshrinkers situations compared to well-chunked problems. It is due to thisproblem that situations involving stretcher and shrinkers might be delayedin their teacher education until their multiplicative thinking frame is betterdeveloped. In the type of proportional problems, teachers performedbetter in missing-value problems compared to ratio-comparison prob-lems. Most teachers applied formal strategies with the proportionalformula and operated it with cross multiplication to solve missing-valueproblems. The more relative difficulties in solving ratio-comparisonproblems compared to missing-value problems was also observed in thestudy of Ben-Chaim, Fey, Fitzgerald, Benedett & Miller (1998). Ratio-comparison problem was more focused on conceptual understanding, asopposed to the understanding of cross-multiplication procedure. Further-more, for the number structures variable, some teachers applied theadditive strategy to solving the problems with complex number structure(ratio 5:12) in a stretcher and shrinker situation as shown in Fig. 4. Thisphenomenon reflects the level of problems on number structuresdescribed in CSMS research project’s (Hart, 1981) ratio test such as the
DEVELOPING AN INSTRUMENT FOR MEASURING TEACHERS’ MCK

integer multiple/easy number structure at levels 0 to 2 and non-integermultiple/complex number structure at levels 3 to 4.
Based on statistical analysis, the three essential factors to measureteachers’ MCK on ratio and proportion indicated proportional reasoningwithin different situations as the underlying elements. Proportionalreasoning is the main indicator of operational development during thestage of formal development (Chaim, Keret & Ilany, 2012). Teachers asfacilitators for students’ proportional reasoning must be good atproportional reasoning themselves. Therefore, proportional reasoningability is needed to be accomplished not only by students but also byteachers as facilitators. Factor 1 (F1) (meaning of proportional and non-proportional situations) items could be viewed as items for measuringunderstanding of the types of situations (proportional or non-proportional)and the relations of proportional patterns, whereas factor 2 (F2) (numberstructures in situation) items could be viewed as items for measuring theability to find quantitative mathematical solutions for proportionalproblems. Furthermore, factor 3 (F3) (figural representation) items couldbe viewed as items for measuring understanding of ratio relations infigures and formal representations. In addition, figural representation thatinvolves ratio in similarities was discussed in the study of Margarit &Figueras (2001). In this study, these three factors were included in theMCK instrument for exploring Indonesian primary teachers’ contentknowledge of ratio and proportion.
F2 appeared to be the easiest factor among all Indonesian primaryteachers in this study. Teachers were supposed to train students the skills,and they should be proficient in solving missing-value problems.Although most teachers were able to handle F2 questions, it was stillfound that a few teachers exhibited misunderstanding of these missing-value problems with contextual situations and applied the additivestrategy to solving the problems. This difficulty was also shown inprevious research studies of Tirosh & Graeber (1990) and Chaim, Keret,
Fig. 5. Age context problem
ROOSELYNA EKAWATI ET AL.

& Ilany (2007) showing that pre-service and mathematics teachers haddifficulty in solving a variety of verbal problems, including those on ratioand proportion. Moreover, Peled & Hershkovitz (2004) found that someteachers attended to irrelevant situational features of the problems andtherefore resulted in finding incorrect solutions.
Most teachers had difficulty in F3 problems. In the problem ofcongruency on two rhombus figures, teachers shared different miscon-ception strategies such as using their visual ability to recognize that thetwo rhombuses were similar, comparing the area of rhombuses and thegrid covered the rhombus figures. Furthermore, teachers ignored the gridsize that we purposely put in the problem (3 cm×2 cm) and assumed thegrid was a square. The misunderstanding presented by teachers might bebecause they did not recognize the need of implicit ratio in showingsimilarities figures that teachers commonly learned from their teachingpractice. Teaching about enlargement scale is not available in theIndonesian curriculum but in line with the finding on students’ strategiesfor recognizing similar figures in the CSMS research project (Hart, 1981),where the word “similar” had trivial meaning to teachers. Furthermore,another problem on figural representation of ratio relations required ageneral model (y=kx) that describes the relationship between any twovariables linearly related. Some of teachers performed their calculation inthe ratio table to find the number structure relations and referred to linearscaling (y=kx) in the answer sheet. About one third of teacher participantsconsidered that the line representing a ratio relation in the formalCartesian coordinate system did not pass through the origin.
As for F1 problems, there were still some teachers whomisunderstood the given situations in a problem on distinguishingproportional and non-proportional situations. Many strategiesexpressed in the answer sheets indicated that teachers translated allthe given situations into the form of an algebraic representation/proportional pattern and took it as a proportional situation. It couldbe interpreted that these teachers lacked proportional reasoning. Theunderlying reason might be in line with the findings of Lawton
Since with the same speed, if the distance is short, this implies a short travel time and if the distance is longer, the travel is also longer.
Fig. 6. An example of teachers’ answers
DEVELOPING AN INSTRUMENT FOR MEASURING TEACHERS’ MCK
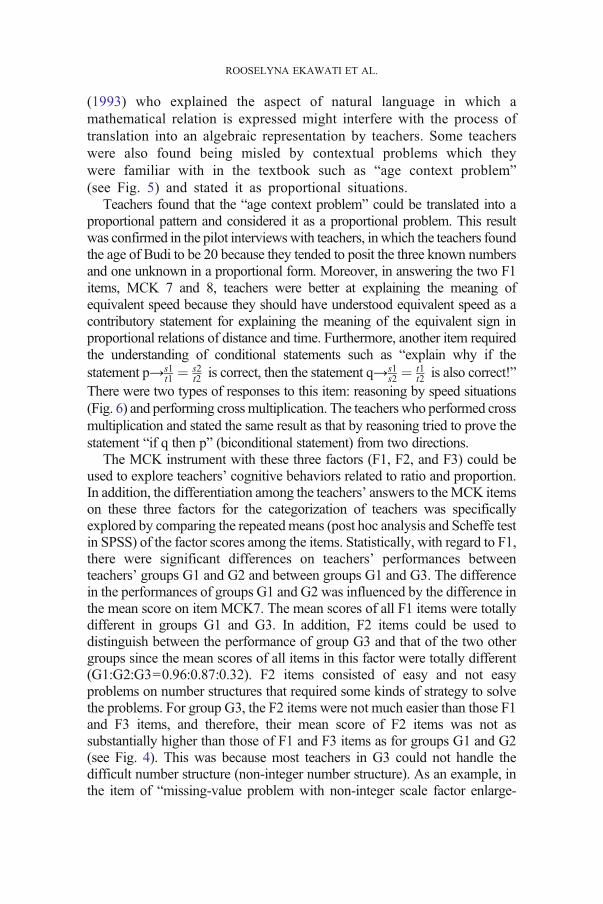
(1993) who explained the aspect of natural language in which amathematical relation is expressed might interfere with the process oftranslation into an algebraic representation by teachers. Some teacherswere also found being misled by contextual problems which theywere familiar with in the textbook such as “age context problem”(see Fig. 5) and stated it as proportional situations.
Teachers found that the “age context problem” could be translated into aproportional pattern and considered it as a proportional problem. This resultwas confirmed in the pilot interviewswith teachers, in which the teachers foundthe age of Budi to be 20 because they tended to posit the three known numbersand one unknown in a proportional form. Moreover, in answering the two F1items, MCK 7 and 8, teachers were better at explaining the meaning ofequivalent speed because they should have understood equivalent speed as acontributory statement for explaining the meaning of the equivalent sign inproportional relations of distance and time. Furthermore, another item requiredthe understanding of conditional statements such as “explain why if thestatement p→s1
t1 ¼ s2t2 is correct, then the statement q→s1
s2 ¼ t1t2 is also correct!”
There were two types of responses to this item: reasoning by speed situations(Fig. 6) and performing crossmultiplication. The teachers who performed crossmultiplication and stated the same result as that by reasoning tried to prove thestatement “if q then p” (biconditional statement) from two directions.
The MCK instrument with these three factors (F1, F2, and F3) could beused to explore teachers’ cognitive behaviors related to ratio and proportion.In addition, the differentiation among the teachers’ answers to theMCK itemson these three factors for the categorization of teachers was specificallyexplored by comparing the repeatedmeans (post hoc analysis and Scheffe testin SPSS) of the factor scores among the items. Statistically, with regard to F1,there were significant differences on teachers’ performances betweenteachers’ groups G1 and G2 and between groups G1 and G3. The differencein the performances of groups G1 and G2 was influenced by the difference inthe mean score on item MCK7. The mean scores of all F1 items were totallydifferent in groups G1 and G3. In addition, F2 items could be used todistinguish between the performance of group G3 and that of the two othergroups since the mean scores of all items in this factor were totally different(G1:G2:G3=0.96:0.87:0.32). F2 items consisted of easy and not easyproblems on number structures that required some kinds of strategy to solvethe problems. For group G3, the F2 items were not much easier than those F1and F3 items, and therefore, their mean score of F2 items was not assubstantially higher than those of F1 and F3 items as for groups G1 and G2(see Fig. 4). This was because most teachers in G3 could not handle thedifficult number structure (non-integer number structure). As an example, inthe item of “missing-value problem with non-integer scale factor enlarge-
ROOSELYNA EKAWATI ET AL.

ment,” only 10.8 % of low-performance teachers in G3 could correctlyanswer the problem.
Based on the results of Indonesian primary teachers’ responses to theMCK instrument on ratio and proportion in this study, there is a potentialimplication. There is a possibility that primary teachers’ knowledge onratio and proportion in other Asian countries, such as Thailand or thePhilippines, is similar to that of Indonesian teachers. Therefore, our MCKinstrument can be useful to these countries for measuring primaryteachers’ MCK. As described by Schmidt et al. (2011), there is a strongrelation between teachers’ knowledge and students’ achievement. In thisstudy, we found that many primary teachers did in fact lack a conceptualunderstanding of the mathematics they were teaching. Therefore, morepre-service programs, especially those for primary teachers, are neededfor developing their conceptual understanding of the intertwiningmathematics concepts.
CONCLUSION
There are three factors in the framework considered for developing ourinstrument to measure in-service primary teachers’ mathematics contentknowledge (MCK) on ratio and proportion. Most problems in thisinstrument focused on situations, number structures, and figural repre-sentation. With respect to those three factor components, Indonesianprimary teachers performed worse in figural representation. However,most teachers were able to apply their knowledge in number structures insituation that allowed them to perform better on computations. Specifi-cally, the results of the three assigned teachers’ performance categoriesor groups indicated consistent trends of the teachers’ overallperformance in terms of the significant roles played by the threefactors in content knowledge on ratio and proportion. In addition, acomprehensive overview of mathematics teachers’ knowledge, espe-cially on teaching ratio and proportion, is essentially needed in futurestudies to develop instruments for assessing mathematics pedagogicalcontent knowledge (MPCK).
REFERENCES
Ahl, V. A., Moore, C. F. & Dixon, J. A. (1992). Development of intuitive and numericalproportional reasoning. Cognitive Development, 7, 81–108.
DEVELOPING AN INSTRUMENT FOR MEASURING TEACHERS’ MCK

Alatorre, S., & Figueras, O. (2005). A developmental model for proportional reasoning inratio comparison tasks. In H. L. Chick, H. L. & J. L. Vincent, (Eds.), Proceeding of the29th conference of the International Group for the Psychology of MathematicsEducation, Vol. 2 (pp. 25–32). Melbourne: PME.
Ball, D. L., Hill, H. C., & Bass, H. (2005). Knowing mathematics for teaching: whoknows mathematics well enough to teach third grade, and how can we decide? The fall2005 issue of American Educator, the quarterly Journal of the American Federation ofTeachers, AFL-CIO.
Barret, J. (2002). Working with novice teachers: Challenges for professional developmentmathematics. Teacher Education and Development Journal, 4, 15–27.
Barrett, J., Jones, G., Mooney, E., Thornton, C., Cady, J. & Guinee, P., et al. (2002).Working with novice teachers: challenges for professional development. MathematicsTeacher Education and Development, 4, 15–27.
Bayazit, I. (2013). Quality of the tasks in the new Turkish elementary mathematicstextbooks: The case of proportional reasoning. International Journal of Science andMathematics Education, 11, 651–682.
Beaton, D., Bombardier, C. & Ferraz, M. (2000). Guidelines for the process of cross-cultural adaptation of self-report measures. Spine, 25(24), 3186–3191.
Behr, M., Harel, G., Post, T. & Lesh, R. (1992). Rational number, ratio and proportion. InD. Grouws (Ed.), Handbook of research on mathematics teaching and learning (pp.296–333). NY: Macmillan Publishing.
Ben-Chaim, D., Fey, J. T., Fitzgerald, W. M., Benedett, O. C. & Miller, J. (1998).Proportional reasoning among 7th grade students with different curricular experiences.Educational Studies in Mathematics, 36, 247–273.
Blömeke, S. & Delaney, S. (2012). Assessment of teacher knowledge across countries: Areview of the state of research. ZDM, 44(3), 223–247.
Brink, J. V. D. & Streefland, L. (1979). Young children (6–8)-ratio and proportion.Educational Studies in Mathematics, 10, 403–420.
Chaim, D. B., Keret, Y., & Ilany, B. (2007). Designing and implementing authenticinvestigative proportional reasoning tasks: the impact on pre-service mathematicsteachers’ content and pedagogical knowledge and attitudes. Journal of MathematicsTeacher Education, 10, 333–340
Chaim, D. B., Keret, Y. Z. & Ilany, B. S. (2012). Research and teaching in mathematicsteachers’ education: Pre- and in-service mathematics teachers of elementary andmiddle school classes. Rotterdam: Sense.
Coakes, S. J. & Steed, L. G. (1997). SPSS analysis without anguish. Brisbane: John Wileyand Sons.
Dole, S. (2008). Ratio tables to promote proportional reasoning in the primary classroom.Australian Primary Mathematics Classroom, 13(2), 19–22.
Ebel, R. L. & Frisbie, D. A. (1986). Essentials of educational measurement. EnglewoodCliffs: Prentice-Hall.
Entwistle, N., Tait, H., & McCune, V. (2000). Patterns of response to an approaches tostudying inventory across contrasting groups and contexts. European Journal ofPsychology of Education, 15(1), 33–48.
Fennema, E. & Franke, M. (1992). Teachers’ knowledge and its impact. In D. A. Grouws(Ed.), Handbook of research on mathematics teaching and learning. NY: Macmillan.
Fischbein, E. (1994). Tacit models. In D. Tirosh (Ed.), Implicit and explicit knowledge: Aneducational approach (pp. 96–110). Norwood: Ablex.
ROOSELYNA EKAWATI ET AL.
Hair, J. F., Jr., Anderson, R. E., Tatham, R. L. & Black, W. C. (1998). Multivariate dataanalysis (5th ed.). Upper Saddle River: Prentice-Hall.
Hart, K. M. (1981). Ratio and proportion. In K. M. Hart (Ed.), Children’s understandingof mathematics: 11–16. The CSMS Mathematics Team (pp. 88–101). London: John.
Ilany, B-S., Keret, Y., & Ben-Chaim, D. (2004). Implementation of a model usingauthentic investigative activities for teaching ratio & proportion in pre-service teachereducation. Proceedings of the 28th Conference of the International Group for thePsychology of Mathematics Education, 3, 81–88.
Krauss, S., Baumert, J., & Blum, W. (2008). Secondary mathematics teachers’
pedagogical content knowledge and content knowledge: validation of the COACTIVconstructs. ZDM Mathematics Education, 40, 873–892.
Krauss S., Blum, W., Brunner, M., Neubrand, M., Baumert, J., Kunter, M., …, Elsner. J.(2013). Mathematics teachers’ domain specific professional knowledge: Conceptuali-zation and test construction in COACTIV. In Kunter, M., Baumert, J., Blum, W.,Klusmann, U., Krauss, S., Neubrand, M. (Eds.) 2013, VI, 378 p 31. MathematicsTeacher Education 8. NY: Springer Science+Business Media.
Lamon, S. (1993). Ratio and proportion: Connecting content and children’s thinking.Journal for Research in Mathematics Education, 24(1), 41–61.
Lamon, S. J. (2007). Rational and proportional reasoning: Toward a theoretical frameworkfor research. In F. K. Lester (Ed.), Second handbook of research on mathematicsteaching and learning (Vol. 1, pp. 629–668). Charlottes: Information Age.
Lawton, C. (1993). Contextual factors affecting errors in proportional reasoning. Journalfor Research in Mathematics Education, 24(5), 460–466.
Lesh, R., Post, T. & Behr, M. (1988). Proportional reasoning. In J. Hiebert & M. Behr(Eds.), Number concepts and operations in the middle grades (pp. 93–118). Hillsdale:Lawrence Erlbaum Associates/National Council of Teachers of Mathematics.
Livy, S. & Vale, C. (2011). First year pre-service teachers’ mathematical contentknowledge: Methods of solution for a ratio question. Mathematics Teacher Educationand Development, 13(2), 22–43.
Ma, L. (1999). Knowing and teaching elementary mathematics: Teachers’ understandingof fundamental mathematics in China and the United States. NJ: Lawrence ErlbaumAssociates.
Margarit, J., & Figueras, O. (2001) Ratio comparison: Performance on ratio in similaritytasks. Utrecht Netherlands: PME Conference Proceeding paper.
Masters, J. (2012). Eight grade in-service teachers’ knowledge of proportional reasoningand functions: A secondary data analysis. International Journal for MathematicsTeaching & Learning [Published only in electronic form].February 3rd Issue. Retrievedfrom http://www.cimt.plymouth.ac.uk/journal/masters.pdf.
Peled, I. & Hershkovitz, S. (2004). Evolving research of mathematics teacher educators:The case of non-standard issues in solving standard problems. Journal of MathematicsTeacher Education, 7, 299–327.
Schmelzing, S., Driel, J. H. V., Juttner, M., Brandenbusch, S., Sandmann, A. & Neuhaus,B. J. (2013). Development, evaluation and validation of a paper-and-pencil test formeasuring two components of biology teachers’ pedagogical content knowledgeconcerning the “cardiovascular system”. International Journal of Science andMathematics Education, 11(6), 1369–1390.
Schmidt, S. H., Houang, R. & Cogan, L. S. (2011). Preparing future math teachers.Science, 332, 1266–1267.
DEVELOPING AN INSTRUMENT FOR MEASURING TEACHERS’ MCK

Senk, S. L., Peck, R., Bankov, K., & Tatto, M. T. (2008). Conceptualizing and measuringmathematical knowledge for teaching: Issues from TEDS-M, an IEA cross-nationalstudy. Mexico: 11th International Congress of Mathematics Education.
Shulman, L. (1986). Those who understand: Knowledge growth in teaching. EducationalResearcher, 15(2), 4–14.
Thompson, B. & Levitov, J. E. (1985). Using microcomputers to score and evaluate testitems. Collegiate Microcomputer, 3, 163–168.
Thomson, S. & Fleming, N. (2004). Summing it up: Mathematics achievement in Australianschools in TIMSS 2002. Melbourne: Australian Council for Educational Research.
Tirosh, D. & Graeber, A. O. (1990). Evoking cognitive conflict to explore pre-serviceteachers’ thinking about division. Journal for Research in Mathematics Education,21(2), 98–108.
Tourniaire, F. & Pulos, S. (1985). Proportional reasoning: A review of the literature.Educational Studies in Mathematics, 16(2), 181–204.
Wiersma, W. & Jurs, S. G. (1990). Educational measurement and testing (2nd ed.).Boston: Allyn and Bacon.
FOU-LAI LIN AND FOU-LAI LINRooselyna EkawatiKai-Lin Yang
National Taiwan Normal UniversityNo. 88, Section 4, Ting-jou Road, Taipei, 11677, Taiwan
Rooselyna Ekawati
The State University of SurabayaJln. Ketintang, Surabaya, IndonesiaE-mail: [email protected]
ROOSELYNA EKAWATI ET AL.