An experience in cooperative learning developing a real aerospacial project
Upload
khangminh22Category
view
1download
0
“Developing a Project Management Office model for Information Technology projects in the financial sector in
Singapore”
A thesis submitted in partial fulfilment of the requirements
for the degree of
PhD (Built Environment)
Tan, Lee Kiat
Master of Computing, National University of Singapore
Bachelor of Computing, National University of Singapore
School of Property, Construction & Project Management
RMIT University
2017

i
Declaration
I declare that, except where due acknowledgement has been made to the work of others; the work contained in this thesis is that of the author alone. The work has not been submitted previously, either in whole or in part, to qualify for any other academic award. The content of this thesis is the result of work, which has been carried out since the official commencement date of the approved research program. Any editorial work, paid or unpaid, carried out by a third party is acknowledged.
Signed:
___________________
Tan, Lee Kiat
10 May 2017

ii
Acknowledgements
“The act of reflection leads to action because it gives you space to think and plan
interventions. The outcomes will be new knowledge, for you and your organisation,
documented papers for your DPM studies and potential innovation that may be realised in
your organisation through your interventions”
Professor Derek H.T. Walker, Doctor of Project Management (DPM) Program Coordinator.
As a practising project manager, I had a simple career objective: to become better in what I was doing. The above citation summarises the motivation for me to take on this lengthy and fulfilling nine-year journey of investigation.
I would like to express my sincere thanks to my senior supervisor, Dr Eric Too and co-supervisors Emeritus Professor Derek Walker and Adjunct Professor Peter Edwards, for their time, energy and patience in reviewing drafts, and providing me with feedback and guidance to enable me to complete this dissertation.
On a more personal note, I feel very fortunate to have known these “Jedi Masters of Project Management” as they provided the inspiration and encouragement throughout the entire journey. I have enjoyed the face-to-face discussions on my dissertation during Peter’s visits to Singapore, where he enlightened me with a different definition of “retirement”. Having done both my Bachelor and Master degrees in Singapore, the 1-week workshop with Derek in Melbourne 2008 was for me a great experience, and at the same time a minor “culture shock” due to differences in learning pedagogy. Dr Eric Too made special arrangements to spend time with me when he was in Singapore.
The path to complete this dissertation was pursued during the prime of my adult life that comprises several life-defining moments: memorable trips, getting married, our first house, the passing of a great man (my Father), leaving the financial industry for an academic role, the passing of another great man (Mr Lee Kuan Yew).
Last but not least, I would like to thank my wife, Jacqueline who supported me and gave me the courage to overcome all odds.
iii
Abstract
Projects are unique endeavours that, in different ways, have to be managed from their inception to their completion. Contemporary project management embraces several approaches to this task. One such approach involves the establishment of a Project Management Office (PMO) within a host organisation. Establishing a PMO requires careful consideration and, while customisation of a PMO is inevitable, there exists a need for a model or template framework to guide this process.
This research develops a conceptual PMO model to guide organisations in building a PMO for Information Technology (IT) projects in Singapore’s financial industry. Effective PMOs in this sector should improve the chances of achieving project success through establishing and pursuing the significant relationships between critical characteristics of the PMO itself, the host organisation, the project managers, and the organisation’s project management maturity. Important considerations include the structure of a PMO and the roles it undertakes or is expected to undertake. Furthermore, with the introduction of Generation Y into the workforce, PMOs will need to take into consideration the unique perspective and values of this new cohort in the inter-generational aspects of the PMO in order to be relevant.
The research is to some extent theory building, since the untested final proposition is that, with an optimised form of structure and role definitions, PMOs can be better placed to improve the success rate of IT projects in the Singapore financial sector.
The outcome of this research is a theoretically based and practically relevant model that has been refined and validated. The research findings should advance project management knowledge and practice by providing guidance to organisations that plan to form a new PMO or restructure an existing functional unit. The opportunities for further related research could include applying the model to different types of projects, in different industries and in different countries.

iv
Table of Contents Declaration .. . . . . . . . . . . . . . . . . . . . . . . . . . . . . . . . . . . . . . . . . . . . . . . . . . . . . . . . . . . . . . . . . . . . . . . . . . . . . . . . . . . . . . . . . . . . . . . . . . . . . . . . . . . . . . . . . . . . . . . i
Acknowledgements .. . . . . . . . . . . . . . . . . . . . . . . . . . . . . . . . . . . . . . . . . . . . . . . . . . . . . . . . . . . . . . . . . . . . . . . . . . . . . . . . . . . . . . . . . . . . . . . . . . . . . . . . . . . i i
Abstract . . . . . . . . . . . . . . . . . . . . . . . . . . . . . . . . . . . . . . . . . . . . . . . . . . . . . . . . . . . . . . . . . . . . . . . . . . . . . . . . . . . . . . . . . . . . . . . . . . . . . . . . . . . . . . . . . . . . . . . . . . . i i i
Table of Contents .. . . . . . . . . . . . . . . . . . . . . . . . . . . . . . . . . . . . . . . . . . . . . . . . . . . . . . . . . . . . . . . . . . . . . . . . . . . . . . . . . . . . . . . . . . . . . . . . . . . . . . . . . . . . iv
List of Tables .. . . . . . . . . . . . . . . . . . . . . . . . . . . . . . . . . . . . . . . . . . . . . . . . . . . . . . . . . . . . . . . . . . . . . . . . . . . . . . . . . . . . . . . . . . . . . . . . . . . . . . . . . . . . . . . . . vi i i
List of Figures .. . . . . . . . . . . . . . . . . . . . . . . . . . . . . . . . . . . . . . . . . . . . . . . . . . . . . . . . . . . . . . . . . . . . . . . . . . . . . . . . . . . . . . . . . . . . . . . . . . . . . . . . . . . . . . . . . . x
Glossary of Terms ... . . . . . . . . . . . . . . . . . . . . . . . . . . . . . . . . . . . . . . . . . . . . . . . . . . . . . . . . . . . . . . . . . . . . . . . . . . . . . . . . . . . . . . . . . . . . . . . . . . . . . . . . . xi
Chapter 1 Introduction .. . . . . . . . . . . . . . . . . . . . . . . . . . . . . . . . . . . . . . . . . . . . . . . . . . . . . . . . . . . . . . . . . . . . . . . . . . . . . . . . . . . . . . . . . . . . . . . . . 1 1.1 Introduction .. . . . . . . . . . . . . . . . . . . . . . . . . . . . . . . . . . . . . . . . . . . . . . . . . . . . . . . . . . . . . . . . . . . . . . . . . . . . . . . . . . . . . . . . . . . . . . . . . . . . . . . . . . 1 1.2 Research Study Background ... . . . . . . . . . . . . . . . . . . . . . . . . . . . . . . . . . . . . . . . . . . . . . . . . . . . . . . . . . . . . . . . . . . . . . . . . . . . . . . . . 1 1.3 Background of the Research .. . . . . . . . . . . . . . . . . . . . . . . . . . . . . . . . . . . . . . . . . . . . . . . . . . . . . . . . . . . . . . . . . . . . . . . . . . . . . . . . . . 2 1.4 The research context . . . . . . . . . . . . . . . . . . . . . . . . . . . . . . . . . . . . . . . . . . . . . . . . . . . . . . . . . . . . . . . . . . . . . . . . . . . . . . . . . . . . . . . . . . . . . 3
1.4.1 The Financial Industry in Singapore .................................................................................................. 3 1.4.2 Financial IT Projects .......................................................................................................................... 3 1.4.3 IT Project Management ..................................................................................................................... 4 1.4.4 The Project Management Office ....................................................................................................... 4
1.5 The research problem ... . . . . . . . . . . . . . . . . . . . . . . . . . . . . . . . . . . . . . . . . . . . . . . . . . . . . . . . . . . . . . . . . . . . . . . . . . . . . . . . . . . . . . . . . . 5 1.6 Research objective .. . . . . . . . . . . . . . . . . . . . . . . . . . . . . . . . . . . . . . . . . . . . . . . . . . . . . . . . . . . . . . . . . . . . . . . . . . . . . . . . . . . . . . . . . . . . . . . 5 1.7 Research Proposit ions .. . . . . . . . . . . . . . . . . . . . . . . . . . . . . . . . . . . . . . . . . . . . . . . . . . . . . . . . . . . . . . . . . . . . . . . . . . . . . . . . . . . . . . . . . . 5 1.8 Research Questions .. . . . . . . . . . . . . . . . . . . . . . . . . . . . . . . . . . . . . . . . . . . . . . . . . . . . . . . . . . . . . . . . . . . . . . . . . . . . . . . . . . . . . . . . . . . . . . 6 1.9 Research Scope ... . . . . . . . . . . . . . . . . . . . . . . . . . . . . . . . . . . . . . . . . . . . . . . . . . . . . . . . . . . . . . . . . . . . . . . . . . . . . . . . . . . . . . . . . . . . . . . . . . 6 1.10 Research Methodology and Methods .. . . . . . . . . . . . . . . . . . . . . . . . . . . . . . . . . . . . . . . . . . . . . . . . . . . . . . . . . . . . . . . . . . . . 7 1.11 The Expected Contribution of the Research Study .. . . . . . . . . . . . . . . . . . . . . . . . . . . . . . . . . . . . . . . . . . . . . . . . . 7 1.12 Limitat ions of the Research .. . . . . . . . . . . . . . . . . . . . . . . . . . . . . . . . . . . . . . . . . . . . . . . . . . . . . . . . . . . . . . . . . . . . . . . . . . . . . . . . . 7 1.13 Structure of Thesis .. . . . . . . . . . . . . . . . . . . . . . . . . . . . . . . . . . . . . . . . . . . . . . . . . . . . . . . . . . . . . . . . . . . . . . . . . . . . . . . . . . . . . . . . . . . . . 8
Chapter 2 Literature Review ... . . . . . . . . . . . . . . . . . . . . . . . . . . . . . . . . . . . . . . . . . . . . . . . . . . . . . . . . . . . . . . . . . . . . . . . . . . . . . . . . . . . . . 10 2.1 Introduction .. . . . . . . . . . . . . . . . . . . . . . . . . . . . . . . . . . . . . . . . . . . . . . . . . . . . . . . . . . . . . . . . . . . . . . . . . . . . . . . . . . . . . . . . . . . . . . . . . . . . . . . . 10 2.2 Definit ions .. . . . . . . . . . . . . . . . . . . . . . . . . . . . . . . . . . . . . . . . . . . . . . . . . . . . . . . . . . . . . . . . . . . . . . . . . . . . . . . . . . . . . . . . . . . . . . . . . . . . . . . . . . 10
2.2.1 Project ............................................................................................................................................. 10 2.2.2 Project Management ....................................................................................................................... 11 2.2.3 Project Success .............................................................................................................................. 12 2.2.4 Critical Success Factors (CSF) ....................................................................................................... 16
2.3 Strategic Project Management .. . . . . . . . . . . . . . . . . . . . . . . . . . . . . . . . . . . . . . . . . . . . . . . . . . . . . . . . . . . . . . . . . . . . . . . . . . . . . 22 2.4 Project Management Practice in Singapore .. . . . . . . . . . . . . . . . . . . . . . . . . . . . . . . . . . . . . . . . . . . . . . . . . . . . . . . . . . . 23
2.4.1 About Singapore ............................................................................................................................. 24 2.4.2 Singapore Finance Industry ............................................................................................................ 24 2.4.3 Singapore IT Industry ...................................................................................................................... 27 2.4.4 Singapore Culture ........................................................................................................................... 27 2.4.5 Generation Y in Singapore .............................................................................................................. 30
2.5 Project Management Off ices (PMOs) .. . . . . . . . . . . . . . . . . . . . . . . . . . . . . . . . . . . . . . . . . . . . . . . . . . . . . . . . . . . . . . . . . . . . 30 2.5.1 Benefits of PMO .............................................................................................................................. 31 2.5.2 PMO Structure ................................................................................................................................ 32 2.5.3 Impact of Organisation Maturity on PMO ........................................................................................ 35 2.5.4 PMO Roles and Functions .............................................................................................................. 39 2.5.5 PMO Typology ................................................................................................................................ 41
2.6 Project Manager Competencies .. . . . . . . . . . . . . . . . . . . . . . . . . . . . . . . . . . . . . . . . . . . . . . . . . . . . . . . . . . . . . . . . . . . . . . . . . . . . 43 2.6.1 Relationship management .............................................................................................................. 46 2.6.2 Technical skills ................................................................................................................................ 46

v
2.7 Effect of generational change in project teams ... . . . . . . . . . . . . . . . . . . . . . . . . . . . . . . . . . . . . . . . . . . . . . . . . . . . . 47 2.7.1 Incorporation of Generation Y into the PMO structure .................................................................... 49
2.8 Contingency Theory .. . . . . . . . . . . . . . . . . . . . . . . . . . . . . . . . . . . . . . . . . . . . . . . . . . . . . . . . . . . . . . . . . . . . . . . . . . . . . . . . . . . . . . . . . . . . 51 2.9 Chapter Summary .. . . . . . . . . . . . . . . . . . . . . . . . . . . . . . . . . . . . . . . . . . . . . . . . . . . . . . . . . . . . . . . . . . . . . . . . . . . . . . . . . . . . . . . . . . . . . . . 51
Chapter 3 Research Approach ... . . . . . . . . . . . . . . . . . . . . . . . . . . . . . . . . . . . . . . . . . . . . . . . . . . . . . . . . . . . . . . . . . . . . . . . . . . . . . . . . . . 53 3.1 Introduction .. . . . . . . . . . . . . . . . . . . . . . . . . . . . . . . . . . . . . . . . . . . . . . . . . . . . . . . . . . . . . . . . . . . . . . . . . . . . . . . . . . . . . . . . . . . . . . . . . . . . . . . . 53 3.2 Research Questions .. . . . . . . . . . . . . . . . . . . . . . . . . . . . . . . . . . . . . . . . . . . . . . . . . . . . . . . . . . . . . . . . . . . . . . . . . . . . . . . . . . . . . . . . . . . . 53 3.3 Research Approach ... . . . . . . . . . . . . . . . . . . . . . . . . . . . . . . . . . . . . . . . . . . . . . . . . . . . . . . . . . . . . . . . . . . . . . . . . . . . . . . . . . . . . . . . . . . . 55
3.3.1 Epistemology ................................................................................................................................... 56 3.3.2 Theoretical Perspective ................................................................................................................... 58 3.3.3 Methodology .................................................................................................................................... 60 3.3.4 Methods .......................................................................................................................................... 64
3.4 Data Analysis .. . . . . . . . . . . . . . . . . . . . . . . . . . . . . . . . . . . . . . . . . . . . . . . . . . . . . . . . . . . . . . . . . . . . . . . . . . . . . . . . . . . . . . . . . . . . . . . . . . . . . 67 3.5 Research Design and Methods .. . . . . . . . . . . . . . . . . . . . . . . . . . . . . . . . . . . . . . . . . . . . . . . . . . . . . . . . . . . . . . . . . . . . . . . . . . . . . 68
3.5.1 Phase 1 ........................................................................................................................................... 68 3.5.2 Phase 2 ........................................................................................................................................... 69
3.6 Research Validity and Reliabi l i ty . . . . . . . . . . . . . . . . . . . . . . . . . . . . . . . . . . . . . . . . . . . . . . . . . . . . . . . . . . . . . . . . . . . . . . . . . . . 69 3.7 Focus groups .. . . . . . . . . . . . . . . . . . . . . . . . . . . . . . . . . . . . . . . . . . . . . . . . . . . . . . . . . . . . . . . . . . . . . . . . . . . . . . . . . . . . . . . . . . . . . . . . . . . . . 70
3.7.1 Role of researcher ........................................................................................................................... 70 3.8 Online Focus Groups (OFGs) .. . . . . . . . . . . . . . . . . . . . . . . . . . . . . . . . . . . . . . . . . . . . . . . . . . . . . . . . . . . . . . . . . . . . . . . . . . . . . . . 71
3.8.1 Advantages of OFGs ....................................................................................................................... 71 3.9 Disadvantages of OFGs ... . . . . . . . . . . . . . . . . . . . . . . . . . . . . . . . . . . . . . . . . . . . . . . . . . . . . . . . . . . . . . . . . . . . . . . . . . . . . . . . . . . . . . 73 3.10 Ethics .. . . . . . . . . . . . . . . . . . . . . . . . . . . . . . . . . . . . . . . . . . . . . . . . . . . . . . . . . . . . . . . . . . . . . . . . . . . . . . . . . . . . . . . . . . . . . . . . . . . . . . . . . . . . . . 73 3.11 Chapter Summary .. . . . . . . . . . . . . . . . . . . . . . . . . . . . . . . . . . . . . . . . . . . . . . . . . . . . . . . . . . . . . . . . . . . . . . . . . . . . . . . . . . . . . . . . . . . . . 74
Chapter 4 Primary Data Collection Design .. . . . . . . . . . . . . . . . . . . . . . . . . . . . . . . . . . . . . . . . . . . . . . . . . . . . . . . . . . . . . . . . . . . 75 4.1 Introduction .. . . . . . . . . . . . . . . . . . . . . . . . . . . . . . . . . . . . . . . . . . . . . . . . . . . . . . . . . . . . . . . . . . . . . . . . . . . . . . . . . . . . . . . . . . . . . . . . . . . . . . . . 75 4.2 Summary re-statement of research questions and issues .. . . . . . . . . . . . . . . . . . . . . . . . . . . . . . . . . . . . . . . 75 4.3 The Relevant Issues .. . . . . . . . . . . . . . . . . . . . . . . . . . . . . . . . . . . . . . . . . . . . . . . . . . . . . . . . . . . . . . . . . . . . . . . . . . . . . . . . . . . . . . . . . . . 76 4.4 Administrat ion .. . . . . . . . . . . . . . . . . . . . . . . . . . . . . . . . . . . . . . . . . . . . . . . . . . . . . . . . . . . . . . . . . . . . . . . . . . . . . . . . . . . . . . . . . . . . . . . . . . . . 77 4.5 Pilot Testing .. . . . . . . . . . . . . . . . . . . . . . . . . . . . . . . . . . . . . . . . . . . . . . . . . . . . . . . . . . . . . . . . . . . . . . . . . . . . . . . . . . . . . . . . . . . . . . . . . . . . . . . 79 4.6 Sample Frame ... . . . . . . . . . . . . . . . . . . . . . . . . . . . . . . . . . . . . . . . . . . . . . . . . . . . . . . . . . . . . . . . . . . . . . . . . . . . . . . . . . . . . . . . . . . . . . . . . . . 80 4.7 Semi-Structured Interview Format .. . . . . . . . . . . . . . . . . . . . . . . . . . . . . . . . . . . . . . . . . . . . . . . . . . . . . . . . . . . . . . . . . . . . . . . . 80
4.7.1 Data analysis Method ...................................................................................................................... 83 4.8 Online Survey .. . . . . . . . . . . . . . . . . . . . . . . . . . . . . . . . . . . . . . . . . . . . . . . . . . . . . . . . . . . . . . . . . . . . . . . . . . . . . . . . . . . . . . . . . . . . . . . . . . . . . 84 4.9 Chapter Summary .. . . . . . . . . . . . . . . . . . . . . . . . . . . . . . . . . . . . . . . . . . . . . . . . . . . . . . . . . . . . . . . . . . . . . . . . . . . . . . . . . . . . . . . . . . . . . . . 84
Chapter 5 Survey data analysis .. . . . . . . . . . . . . . . . . . . . . . . . . . . . . . . . . . . . . . . . . . . . . . . . . . . . . . . . . . . . . . . . . . . . . . . . . . . . . . . . . . . 85 5.1 Introduction .. . . . . . . . . . . . . . . . . . . . . . . . . . . . . . . . . . . . . . . . . . . . . . . . . . . . . . . . . . . . . . . . . . . . . . . . . . . . . . . . . . . . . . . . . . . . . . . . . . . . . . . . 85 5.2 Data Collection .. . . . . . . . . . . . . . . . . . . . . . . . . . . . . . . . . . . . . . . . . . . . . . . . . . . . . . . . . . . . . . . . . . . . . . . . . . . . . . . . . . . . . . . . . . . . . . . . . . . 85
5.2.1 Interview and survey demographics ................................................................................................ 85 5.3 Data Analysis .. . . . . . . . . . . . . . . . . . . . . . . . . . . . . . . . . . . . . . . . . . . . . . . . . . . . . . . . . . . . . . . . . . . . . . . . . . . . . . . . . . . . . . . . . . . . . . . . . . . . . 86
5.3.1 Analysis ........................................................................................................................................... 86 5.3.2 PMO label and reporting hierarchy ................................................................................................. 87 5.3.3 Reason the PMO was established .................................................................................................. 88 5.3.4 PMO staffing ................................................................................................................................... 89 5.3.5 PMO functions ................................................................................................................................. 90 5.3.6 Important factors in shaping the PMO structure .............................................................................. 96 5.3.7 PMO decision-making authority ...................................................................................................... 99 5.3.8 Type of projects delivered by the PMOs ....................................................................................... 102 5.3.9 Number of projects delivered by PMOs in a year .......................................................................... 103 5.3.10 Structuring of functions and role adoptions for PMOs ................................................................ 104 5.3.11 Usefulness of a PMO model ....................................................................................................... 106 5.3.12 Critical success factors for projects ............................................................................................ 107 5.3.13 PM competencies for achieving project success ........................................................................ 109 5.3.14 PMO contribution to project performance ................................................................................... 115

vi
5.3.15 PMO project management maturity ............................................................................................ 116 5.3.16 Inter-generational aspects of PMO staffing ................................................................................ 118 5.3.17 Adoption of a PMO model for managing financial IT projects in Singapore ............................... 120
5.4 Discussion of Results .. . . . . . . . . . . . . . . . . . . . . . . . . . . . . . . . . . . . . . . . . . . . . . . . . . . . . . . . . . . . . . . . . . . . . . . . . . . . . . . . . . . . . . . . 120 5.4.1 Conflicting Priorities of PMO ......................................................................................................... 121 5.4.2 Proportion of projects within PMO mandate .................................................................................. 123 5.4.3 Project Management Maturity ....................................................................................................... 123 5.4.4 PMO Organisational Learning ....................................................................................................... 124 5.4.5 Identifying the most suitable project managers ............................................................................. 125 5.4.6 PMO management support and decision-making authority .......................................................... 126 5.4.7 Flexibility and Time to Market ....................................................................................................... 127 5.4.8 PMO model essential features ...................................................................................................... 129
5.5 Chapter Summary .. . . . . . . . . . . . . . . . . . . . . . . . . . . . . . . . . . . . . . . . . . . . . . . . . . . . . . . . . . . . . . . . . . . . . . . . . . . . . . . . . . . . . . . . . . . . . 130
Chapter 6 The PMO Model development .. . . . . . . . . . . . . . . . . . . . . . . . . . . . . . . . . . . . . . . . . . . . . . . . . . . . . . . . . . . . . . . . . . . . 131 6.1 Introduction .. . . . . . . . . . . . . . . . . . . . . . . . . . . . . . . . . . . . . . . . . . . . . . . . . . . . . . . . . . . . . . . . . . . . . . . . . . . . . . . . . . . . . . . . . . . . . . . . . . . . . . 131 6.2 Definit ion of Model . . . . . . . . . . . . . . . . . . . . . . . . . . . . . . . . . . . . . . . . . . . . . . . . . . . . . . . . . . . . . . . . . . . . . . . . . . . . . . . . . . . . . . . . . . . . . 131 6.3 Development of a PMO model . . . . . . . . . . . . . . . . . . . . . . . . . . . . . . . . . . . . . . . . . . . . . . . . . . . . . . . . . . . . . . . . . . . . . . . . . . . . . 133 6.4 CYNEFIN framework .. . . . . . . . . . . . . . . . . . . . . . . . . . . . . . . . . . . . . . . . . . . . . . . . . . . . . . . . . . . . . . . . . . . . . . . . . . . . . . . . . . . . . . . . . 135
6.4.1 Known (Simple) domain ................................................................................................................ 136 6.4.2 Knowable (Complicated) domain .................................................................................................. 136 6.4.3 Complex domain ........................................................................................................................... 137 6.4.4 Chaos domain ............................................................................................................................... 137 6.4.5 Disorder domain ............................................................................................................................ 137 6.4.6 Domain boundaries ....................................................................................................................... 138 6.4.7 Cynefin Framework and the PMO model ...................................................................................... 138
6.5 Model Variables and Parameters .. . . . . . . . . . . . . . . . . . . . . . . . . . . . . . . . . . . . . . . . . . . . . . . . . . . . . . . . . . . . . . . . . . . . . . . . 139 6.5.1 PMO functions ............................................................................................................................... 140 6.5.2 PMO structuring and adoption of roles .......................................................................................... 141 6.5.3 PMO decision-making authority .................................................................................................... 141 6.5.4 Critical success factors ................................................................................................................. 142 6.5.5 Project manager competencies ..................................................................................................... 143 6.5.6 Project management maturity ....................................................................................................... 143 6.5.7 PMO inter-generational integration ............................................................................................... 144
6.6 Proposed PMO Model . . . . . . . . . . . . . . . . . . . . . . . . . . . . . . . . . . . . . . . . . . . . . . . . . . . . . . . . . . . . . . . . . . . . . . . . . . . . . . . . . . . . . . . . . 144 6.6.1 Variables in Simple Domain .......................................................................................................... 145 6.6.2 Variables in Complicated Domain ................................................................................................. 145 6.6.3 Variables in Complex Domain ....................................................................................................... 145 6.6.4 Variables in Chaos Domain ........................................................................................................... 148 6.6.5 Variables in Disorder Domain ....................................................................................................... 148 6.6.6 Crossing Boundaries ..................................................................................................................... 149
6.7 Potential value of the Model . . . . . . . . . . . . . . . . . . . . . . . . . . . . . . . . . . . . . . . . . . . . . . . . . . . . . . . . . . . . . . . . . . . . . . . . . . . . . . . 152 6.7.1 Model Attributes Unique to financial IT projects ............................................................................ 152
6.8 Testing the Model . . . . . . . . . . . . . . . . . . . . . . . . . . . . . . . . . . . . . . . . . . . . . . . . . . . . . . . . . . . . . . . . . . . . . . . . . . . . . . . . . . . . . . . . . . . . . . 153 6.9 Chapter Summary .. . . . . . . . . . . . . . . . . . . . . . . . . . . . . . . . . . . . . . . . . . . . . . . . . . . . . . . . . . . . . . . . . . . . . . . . . . . . . . . . . . . . . . . . . . . . . 153
Chapter 7 Model Validation .. . . . . . . . . . . . . . . . . . . . . . . . . . . . . . . . . . . . . . . . . . . . . . . . . . . . . . . . . . . . . . . . . . . . . . . . . . . . . . . . . . . . . . . 155 7.1 Introduction .. . . . . . . . . . . . . . . . . . . . . . . . . . . . . . . . . . . . . . . . . . . . . . . . . . . . . . . . . . . . . . . . . . . . . . . . . . . . . . . . . . . . . . . . . . . . . . . . . . . . . . 155 7.2 OFG Design .. . . . . . . . . . . . . . . . . . . . . . . . . . . . . . . . . . . . . . . . . . . . . . . . . . . . . . . . . . . . . . . . . . . . . . . . . . . . . . . . . . . . . . . . . . . . . . . . . . . . . 155
7.2.1 Processes ..................................................................................................................................... 155 7.2.2 Number of participants .................................................................................................................. 156 7.2.3 Questions and time length ............................................................................................................ 157 7.2.4 Technical Tool: Edmodo ............................................................................................................... 158
7.3 OFG Results .. . . . . . . . . . . . . . . . . . . . . . . . . . . . . . . . . . . . . . . . . . . . . . . . . . . . . . . . . . . . . . . . . . . . . . . . . . . . . . . . . . . . . . . . . . . . . . . . . . . . 159 7.3.1 Participants Response .................................................................................................................. 159 7.3.2 Findings ......................................................................................................................................... 159
vii
7.3.3 Relevance and Completeness of Variables .................................................................................. 159 7.3.4 Solutions and Approaches for identified Variables ........................................................................ 160 7.3.5 Generation Y Variable ................................................................................................................... 160 7.3.6 Conceptual PMO model ................................................................................................................ 161 7.3.7 Reflections on the OFG ................................................................................................................. 162
7.4 Final revision to PMO model . . . . . . . . . . . . . . . . . . . . . . . . . . . . . . . . . . . . . . . . . . . . . . . . . . . . . . . . . . . . . . . . . . . . . . . . . . . . . . . 166 7.5 Chapter summary .. . . . . . . . . . . . . . . . . . . . . . . . . . . . . . . . . . . . . . . . . . . . . . . . . . . . . . . . . . . . . . . . . . . . . . . . . . . . . . . . . . . . . . . . . . . . . . 168
Chapter 8 Conclusions and Recommendations .. . . . . . . . . . . . . . . . . . . . . . . . . . . . . . . . . . . . . . . . . . . . . . . . . . . . . . . . . . . 169 8.1 Introduction .. . . . . . . . . . . . . . . . . . . . . . . . . . . . . . . . . . . . . . . . . . . . . . . . . . . . . . . . . . . . . . . . . . . . . . . . . . . . . . . . . . . . . . . . . . . . . . . . . . . . . . 169 8.2 Contribution of this Research .. . . . . . . . . . . . . . . . . . . . . . . . . . . . . . . . . . . . . . . . . . . . . . . . . . . . . . . . . . . . . . . . . . . . . . . . . . . . . 170
8.2.1 Insights from the literature review ................................................................................................. 170 8.2.2 Findings from Primary data Analysis ............................................................................................. 171 8.2.3 Value to PM Practice delivered by the PMO Model ...................................................................... 174
8.3 Limitat ions .. . . . . . . . . . . . . . . . . . . . . . . . . . . . . . . . . . . . . . . . . . . . . . . . . . . . . . . . . . . . . . . . . . . . . . . . . . . . . . . . . . . . . . . . . . . . . . . . . . . . . . . 175 8.4 Recommendations for Practice .. . . . . . . . . . . . . . . . . . . . . . . . . . . . . . . . . . . . . . . . . . . . . . . . . . . . . . . . . . . . . . . . . . . . . . . . . . . 176 8.5 Recommendations for Future Research .. . . . . . . . . . . . . . . . . . . . . . . . . . . . . . . . . . . . . . . . . . . . . . . . . . . . . . . . . . . . . . 177 8.6 Achievement of research objectives .. . . . . . . . . . . . . . . . . . . . . . . . . . . . . . . . . . . . . . . . . . . . . . . . . . . . . . . . . . . . . . . . . . . 177 8.7 Reflections on the research journey .. . . . . . . . . . . . . . . . . . . . . . . . . . . . . . . . . . . . . . . . . . . . . . . . . . . . . . . . . . . . . . . . . . . 178
8.7.1 Reflections as a practitioner .......................................................................................................... 178 8.7.2 Reflections working with Generation Y ......................................................................................... 179
References .. . . . . . . . . . . . . . . . . . . . . . . . . . . . . . . . . . . . . . . . . . . . . . . . . . . . . . . . . . . . . . . . . . . . . . . . . . . . . . . . . . . . . . . . . . . . . . . . . . . . . . . . . . . . . . . . . . 181
Appendix A .. . . . . . . . . . . . . . . . . . . . . . . . . . . . . . . . . . . . . . . . . . . . . . . . . . . . . . . . . . . . . . . . . . . . . . . . . . . . . . . . . . . . . . . . . . . . . . . . . . . . . . . . . . . . . . . . . . 216 Ethics Clearance .. . . . . . . . . . . . . . . . . . . . . . . . . . . . . . . . . . . . . . . . . . . . . . . . . . . . . . . . . . . . . . . . . . . . . . . . . . . . . . . . . . . . . . . . . . . . . . . . . . . . . . . 216
Appendix B .. . . . . . . . . . . . . . . . . . . . . . . . . . . . . . . . . . . . . . . . . . . . . . . . . . . . . . . . . . . . . . . . . . . . . . . . . . . . . . . . . . . . . . . . . . . . . . . . . . . . . . . . . . . . . . . . . . 217 Appendix B-1 (Pilot Interview Questions) .. . . . . . . . . . . . . . . . . . . . . . . . . . . . . . . . . . . . . . . . . . . . . . . . . . . . . . . . . . . . . . . . . . . . . 217 Appendix B-2 (Revised Interview Questions) .. . . . . . . . . . . . . . . . . . . . . . . . . . . . . . . . . . . . . . . . . . . . . . . . . . . . . . . . . . . . . . . . 220 Appendix B-3 (Part icipant Request Letter) . . . . . . . . . . . . . . . . . . . . . . . . . . . . . . . . . . . . . . . . . . . . . . . . . . . . . . . . . . . . . . . . . . . . 223 Appendix B-4 (Part icipant Consent Form) .. . . . . . . . . . . . . . . . . . . . . . . . . . . . . . . . . . . . . . . . . . . . . . . . . . . . . . . . . . . . . . . . . . . . 226 Appendix B-5 (Part icipant Request for Online Focus Group) .. . . . . . . . . . . . . . . . . . . . . . . . . . . . . . . . . . . . . . . . . 227 Appendix B-6 (Information on the PMO model variables) . . . . . . . . . . . . . . . . . . . . . . . . . . . . . . . . . . . . . . . . . . . . . . . . 228 Appendix B-7 (Proposed PMO model) . . . . . . . . . . . . . . . . . . . . . . . . . . . . . . . . . . . . . . . . . . . . . . . . . . . . . . . . . . . . . . . . . . . . . . . . . . 231
Appendix C (Correspondences with SPMI) .. . . . . . . . . . . . . . . . . . . . . . . . . . . . . . . . . . . . . . . . . . . . . . . . . . . . . . . . . . . . . . . . . . . . . . 232
Appendix D (Sample Transcript ions) .. . . . . . . . . . . . . . . . . . . . . . . . . . . . . . . . . . . . . . . . . . . . . . . . . . . . . . . . . . . . . . . . . . . . . . . . . . . . . . . 233
viii
L ist of Tables Table 1.1: Project resolution results from chaos research from years 2004 to 2012 (Adapted from Standish Group
International 2013) .......................................................................................................................................... 2 Table 2.1: The Square Route to understanding success criteria (Source: Atkinson 1999) ................................... 14 Table 2.2: Mapping intangible outcomes and benefits to tangible project and operational outputs in project
management: a conceptual template (Source: Nogeste & Walker 2005) ..................................................... 15 Table 2.3: Sixteen planning processes grouped by knowledge areas (Adapted from Zwikael & Globerson 2006)17 Table 2.4: Outline of the Singapore Critical Project Characteristics ...................................................................... 19 Table 2.5: Matching CSFs with Critical Project Characteristics ............................................................................. 20 Table 2.6: Organisational Structures (Source: PMI 2013, p. 28) ........................................................................... 32 Table 2.7: Key PMO characteristics impacting PMO performance (Adapted from Hobbs & Aubry 2007, p. 68) .. 34 Table 2.8: Eight groups of PMO key functions (ranked by decreasing level of perceived importance by survey
respondents for Groups 1 -5) (Adapted from Hobbs & Aubry 2007) and key roles (Adapted from Carrillo et
al. 2010) ........................................................................................................................................................ 40 Table 2.9: Four types of PMO based on the percentage of project managers and the percentage of projects
within the PMO’s mandate (Adapted from Hobbs & Aubry 2010, p. 87) ....................................................... 43 Table 2.10: Top four project success factors in 1994 and 2000 (Standish Group International 2001) compared
with Critical Success Factors (CSF) from Kerzner (1987) ............................................................................ 44 Table 2.11: Definitions of Generations .................................................................................................................. 47 Table 3.1: Subsidiary Research Questions ........................................................................................................... 54 Table 3.2: Social Research Design Framework (Adapted from Crotty 1998, p. 13) .............................................. 56 Table 3.3: Explanations of Positivism, Interpretivism and Epistemology (Adapted from Carson et al. 2001, p. 6) 59 Table 3.4: Comparisons of Mixed Methods research approaches (Adapted from Creswell 2003, p. 15) .............. 63 Table 4.1: Identified issues for each research question ........................................................................................ 76 Table 4.2: Aligning Research Questions and identified issues with Proposed Interview Questions ..................... 81 Table 4.3: Number of Questions for each Interview Topic ..................................................................................... 83 Table 5.1: Reporting structure of the PMOs in the survey ..................................................................................... 87 Table 5.2: Types of staff employed in the surveyed PMOs ................................................................................... 91 Table 5.3: Functions incorporated in surveyed PMOs ........................................................................................... 92 Table 5.4: Grouping of surveyed PMOs by size .................................................................................................... 93 Table 5.5: Functions incorporated in Small PMOs ................................................................................................ 94 Table 5.6: Functions incorporated in Medium PMOs ............................................................................................. 94 Table 5.7: Functions incorporated in Large PMOs ................................................................................................ 95 Table 5.8: Mean rating scores for factors shaping the PMO structure .................................................................. 97 Table 5.9: Mean rating scores for factors shaping the PMO structure for different sized PMOs ........................... 97 Table 5.10: Kruskal-Wallis H test results for testing the comparative importance between PMO sizes for factors
shaping the PMO structure ........................................................................................................................... 98 Table 5.11: Mean rating scores for PMO Authority for different sized PMOs ...................................................... 100 Table 5.12: Kruskal-Wallis H test results for testing PMO Authority .................................................................... 100 Table 5.13: Mann-Whitney U test results for Small and Medium PMOs .............................................................. 101 Table 5.14: Mann-Whitney U test results for Medium and Large PMOs ............................................................. 101 Table 5.15: Mann-Whitney U test results for Small and Large PMOs ................................................................. 102 Table 5.16: No of projects delivered by PMOs in a year ..................................................................................... 103 Table 5.17: Kruskal-Wallis H test results for usefulness of a PMO model ........................................................... 106 Table 5.18: Mean rating scores for respondents’ CSF importance ratings .......................................................... 108 Table 5.19: Friedman test results for CSF importance ratings ............................................................................ 108 Table 5.20: Mean rating scores for CSF importance ratings for different sized PMOs ........................................ 108 Table 5.21: Kruskal-Wallis H test results for CSF importance ratings ................................................................. 109 Table 5.22: Mean rating scores for importance of PM competencies .................................................................. 110 Table 5.23: Friedman test results for PM competencies rating ........................................................................... 111 Table 5.24: Mean importance-rating values for PM competencies among PMO size categories ....................... 111 Table 5.25: Most Important PM competencies identified by surveyed PMOs ..................................................... 112 Table 5.26: Kruskal-Wallis H test results for PM competencies ratings .............................................................. 113 Table 5.27: Mann-Whitney U test results for Small and Medium PMOs .............................................................. 113

ix
Table 5.28: Mann-Whitney U test results for Medium and Large PMOs ............................................................. 114 Table 5.29: Mann-Whitney U test results for Small and Large PMOs ................................................................. 114 Table 5.30: Five levels of project management maturity (Adapted from Mullaly 2006) ....................................... 116 Table 5.31: Levels of project management maturity reported by PMO respondents ........................................... 117 Table 5.32: Mean rating scores for levels of project management maturity for different PMO size categories ... 117 Table 5.33: Kruskal-Wallis H test results for project management maturity ratings ............................................ 117 Table 5.34: Inter-generational PMO staffing reported by respondents ................................................................ 118 Table 5.35: Percentage of Generation Y staff for each PMO size category ........................................................ 119 Table 5.36 Comparison of priorities from business units and IT division ............................................................. 122 Table 6.1 Key functions and key PMO function groups ....................................................................................... 140 Table 6.2 Mapping of identified drivers to variables ............................................................................................ 145 Table 6.3 PMO model variables within the Cynefin Framework .......................................................................... 146 Table 6.4 PMO model variables categoried into Structural Characteristics and Organisational Context ............ 151 Table 7.1: Posted Questions in OFG ................................................................................................................... 157 Table 7.2: Comment and Proposed Action based on OFG Responses .............................................................. 162 Table 7.3 Mapping of suggested factors to variables .......................................................................................... 165
x
List of Figures Figure 2.1: The Triple Constraints for Project Success ......................................................................................... 13 Figure 2.2: The Square Route (Source: Atkinson 1999, p. 341) ............................................................................ 14 Figure 2.3: The organisational strategic management context for project success (Adapted from Cooke-Davies,
Terence J. 2002, p. 188) ............................................................................................................................... 22 Figure 2.4: Real monthly household income per household member (Source: Ministry of Finance, p. 8) ............ 26 Figure 2.5: Singapore Gini coefficient 2009-2013 based on household income (Source: Ministry of Finance, p. 11)
...................................................................................................................................................................... 26 Figure 2.6: Singapore unemployment rate (Source: Ministry of Finance, p. 5) ..................................................... 28 Figure 2.7: Singapore’s Scores for The Hofstede Centre 6-D Model .................................................................... 29 Figure 2.8: The Five Levels of Process Maturity (Adapted from Paulk et al. 1993, p. 8) ....................................... 36 Figure 2.9: The Portfolio, Program and Project Management Maturity Model (P3M3) .......................................... 36 Figure 2.10: The Processes of PRINCE2 (Adapted from http://www.prince2.com/prince2-processes) ................ 37 Figure 3.1: Structure of the Research .................................................................................................................... 64 Figure 3.2: Data Analysis in Qualitative Research (Adapted from Creswell 2003, p. 185) .................................... 67 Figure 5.1: Response sample demographics for interviews/online survey ............................................................ 86 Figure 5.2: Important factors in shaping the PMO structure .................................................................................. 97 Figure 5.3: Level of decision-making authority for PMOs .................................................................................... 100 Figure 5.4: Type of projects delivered the PMOs ................................................................................................ 103 Figure 5.5: Changing role of a PMO (Adapted from Hill 2004, p. 46) .................................................................. 123 Figure 6.1 Models and realities (Source: Raftery 1998, p. 297) .......................................................................... 131 Figure 6.2 Model building procedure (Source: Raftery 1998, p. 299) .................................................................. 134 Figure 6.3 Cynefin domains (Source: Kurtz & Snowden 2003, p. 468) ............................................................... 136 Figure 6.4 Proposed PMO Model of 2 stages (initial and definite) ...................................................................... 147 Figure 6.5 Cynefin Dynamics (Adapted from Kurtz & Snowden 2003, p. 476) .................................................... 149 Figure 7.1: Final PMO Model of 2 stages (initial and definite) ............................................................................. 167
xi
Glossary of Terms APM Agile Project Management BSC Balanced Scorecard BAU Business As Usual CMM Capability Maturity Model CEO Chief Executive Officer CSF Critical Success Factors CSP Critical Success Processes DPM Doctor of Project Management D-SIBs Domestic Systemically Important Banks ERM Electronic Records Management EI Emotional Intelligence EPM Enterprise Project Management GDP Gross Domestic Product HR Human Resources IDV Individualism versus Collectivism ICT Information and Communication Technologies IS Information Science IT Information Technology LTO Long-Term Orientation MAS Monetary Authority of Singapore OFG Online Focus Group OECD Organisation for Economic Cooperation and Development OCBC Overseas Chinese Banking Corporation PDI Power Distance Index PERT Program Evaluation and Review Techniques PIP Project Implementation Profile PMBOK Project Management Body of Knowledge PMI Project Management Institution PMO Project Management Office PSO Project Support Office QA Quality Assurance ROI Return On Investment RMIT Royal Melbourne Institute of Technology University SPO Strategic Project Office SEM Structural Equation Modeling UAI Uncertainty Avoidance UOB United Overseas Bank
1
Chapter 1 Introduction 1.1 Introduction
In today's business world, keeping up with competitors is no longer sufficient for competitive advantage; instead, companies must rethink themselves as being creators of new sources of knowledge and value that can deliver breakthrough products and services to their customers almost immediately (Lei et al. 1999). Teece (2007, 2014) argues that ‘best practice’ is not enough and that firms should develop their own signature dynamic capabilities to offer unique value to clients and customers in a world of rapid change and turbulence.
As financial institutions in Singapore continue to transform their strategies and organisational designs to become more agile and responsive to their environments, sources of competitive advantage often lead to the building of new strategies and organisational structures based on creating and cultivating new sources of knowledge and ideas to develop better projects, products and services more quickly and more effectively. Project management offices (PMOs) are often created as part of these new strategies and organisational designs. This growing popularity of the PMO is a relatively recent phenomenon that represents a “significant step in the evolution of (financial) IT project management” (Aubry et al. 2007, 2008; Hobbs et al. 2008; Letavec 2006; Rad & Raghavan 2000). However, given the scarcity of guidance for implementing a PMO, the full potential of the PMO may remain unfulfilled.
1.2 Research Study Background
The research was undertaken through the academic environment of the PhD degree program in the School of Property, Construction and Project Management at RMIT University. Before the commencement of the PhD research study, and through initial enrolment into the Doctor of Project Management (DPM) coursework program (now discontinued), the researcher had completed a series of research preparation courses based on three core areas. These core areas included Knowledge Management, Project Management Leadership, Procurement and Ethics, and each area was accompanied by a reflective learning course.
During the process of fulfilling those coursework requirements and writing reflective learning papers, the researcher, in his professional project management work saw the rising trend of financial organisations forming PMOs associated with much difficulty and confusion, due to the lack of industry-relevant guidelines and standards. The concept of Project Management Offices (PMO) in the financial Information Technology (IT) industry in Singapore was relatively new and there were few available industry-relevant guidelines, and a scarcity of standards or examples of best practices where organisations could draw insights on how the PMO should be organised with a view to improving the rate of success for IT projects.
The study of Project Management Offices (PMO) thus began to interest the researcher, leading to questions such as: What is the purpose of PMO? Should the success of a project
be dependent on the heroics of the project manager? How can PMO duplicate such
successes? These questions arose in the context of the researcher’s employment situation at that time with a Singapore bank. The bank had set up its PMO in 2007, with responsibility

2
for increasing the rate of project success in its technology project environment. The researcher, who was then working as a Project Manager, got involved in the initial brainstorming workshops that were tasked to establish the structure and roles to be played by the new PMO.
Through this involvement the researcher realised the need for a PMO model to guide organisations on the creation and structuring of PMOs, and sought to pursue investigation of this topic as part of his doctoral study. However, with the discontinuation of the DPM coursework program, a transfer was made to the RMIT University PhD program. This has provided the opportunity for the researcher to extend his professional project management expertise and achieve a more complete understanding of emerging PMO issues through research that hopefully will be relevant to the financial industry and worthwhile to project management professional practice.
1.3 Background of the Research
Based on project data accumulated over 50,000 information technology (IT) projects, the Standish Group International (2004) investigated the overall outcome of these projects. Less than 30% were delivered on time, within budget, with required features and functions effectively delivered; 53% were challenged (late, over budget and/or achieved less than required features and functions); while 18% failed (cancelled prior to completion or delivered and never used). In a more recent chaos report from the year 2013, the project success rate indicates that 39% of projects were delivered successfully, 18% completely failed and 43% were challenged as shown in Table 1.1 (Standish Group International 2013). The project success rate was slightly improved compared to year 2004 but the percentage of failed projects still remains about the same. It was noted that an estimate of 60% of the projects were challenged or failed through years 2004 to 2012 and this was considered as high percentage of failure.
Table 1.1: Project resolut ion results from chaos research from years 2004 to 2012 (Adapted from Standish Group International 2013)
2004 2006 2008 2010 2012 Successful 29% 35% 32% 37% 39% Failed 18% 19% 24% 21% 18% Challenged 53% 46% 44% 42% 43%
These findings pose a challenge for PMOs dealing with financial IT projects, particularly where operational requirements place a high premium on financial security and customer confidentiality.
The aim of this research study is to develop a theoretically based and practically relevant model of the Project Management Office (PMO) based on critical characteristics of the PMO, the organisational context and the organisation’s project maturity. The implementation of an effective PMO model should guide organisational thinking about PMO development.
This chapter establishes the context and rationale for the research; formulates the research problem; states the research objective and briefly describes the methodology chosen to

3
address it. The chapter concludes with expected contributions of the research, its limitations, and a summary chapter outline of the dissertation.
1.4 The research context
1.4.1 The Financial Industry in Singapore
The success of Singapore as a regional and international financial centre is the outward indicator of a financial industry sector that has, over the years, been consistently reinforced by high standards of financial regulation and strict supervision. The Monetary Authority of Singapore (MAS), the country’s central bank and financial regulator conducts regular assessments of risks and vulnerabilities arising from developments in Singapore and the global economy, and assesses their implications for the Singapore’s financial system (Monetary Authority of Singapore 2012b), thus allowing the Singapore government to manipulate economic and financial policy levers for the overall benefit of the nation.
The banking sector in Singapore has a three-tier structure, which comprises full-service banks, wholesale banks and offshore banks (Tan 2005). A good indication of where the financial and banking industry stands in its developments is observed by the number of top financial institutions or banks located in the country (Low 2000). Three Singapore banks were featured in the Top 1000 World Banks 2015. The leading banks from Singapore, with their position in the 2015 rankings are as follows: DBS Bank (58th), Overseas Chinese Banking Corporation (OCBC) (71st) and United Overseas Bank (74th) (Palma 2015).
Despite challenging market conditions experienced in 2011, Singapore’s financial services sector registered a 9.1% growth (Monetary Authority of Singapore 2012a). Even when the Singapore economy experienced a downshift in growth in 2014 largely due to a moderation in the external-oriented services sectors, the financial services sector continued to outperform the rest of the economy (Monetary Authority of Singapore 2015a).
1.4.2 Financial IT Projects
According to Tan (2012), in order to stay competitive Singapore needs to boost its productivity, enhance its innovative capability and strengthen its research and development capacity. The Singapore Government aims to achieve this by investing in Information Technology (IT) to enhance operational efficiency and productivity within the public sector and improve service delivery to businesses and citizens. Vu (2013) reported that the contributions of Information and Communication Technology (ICT) to Singapore’s growth are solid in ICT use, ICT investment, and ICT production. In 2011, Singapore awarded 638 IT contracts with a combined value of more than S$1.12 billion and expects to procure S$1.2 billion (US$932 million) worth of information and communications (infocomm) projects in 2012 (Info-communications Development Authority of Singapore 2012b). The enterprise spending on IT products and services in Singapore has increased to US$19.1 billion in 2015, reported in a press release by Gartner. Communications, media and services, banking and securities, government and manufacturing are the dominant sectors in Singapore (Gartner 2015).
Projects, though non-routine, transitory and insular by nature, have become the principal method for effecting change in large organisations (Pellegrinelli & Garagna 2009). According to an IDC Financial Insights Asia Pacific 2010 report, Singapore banks are investing in
4
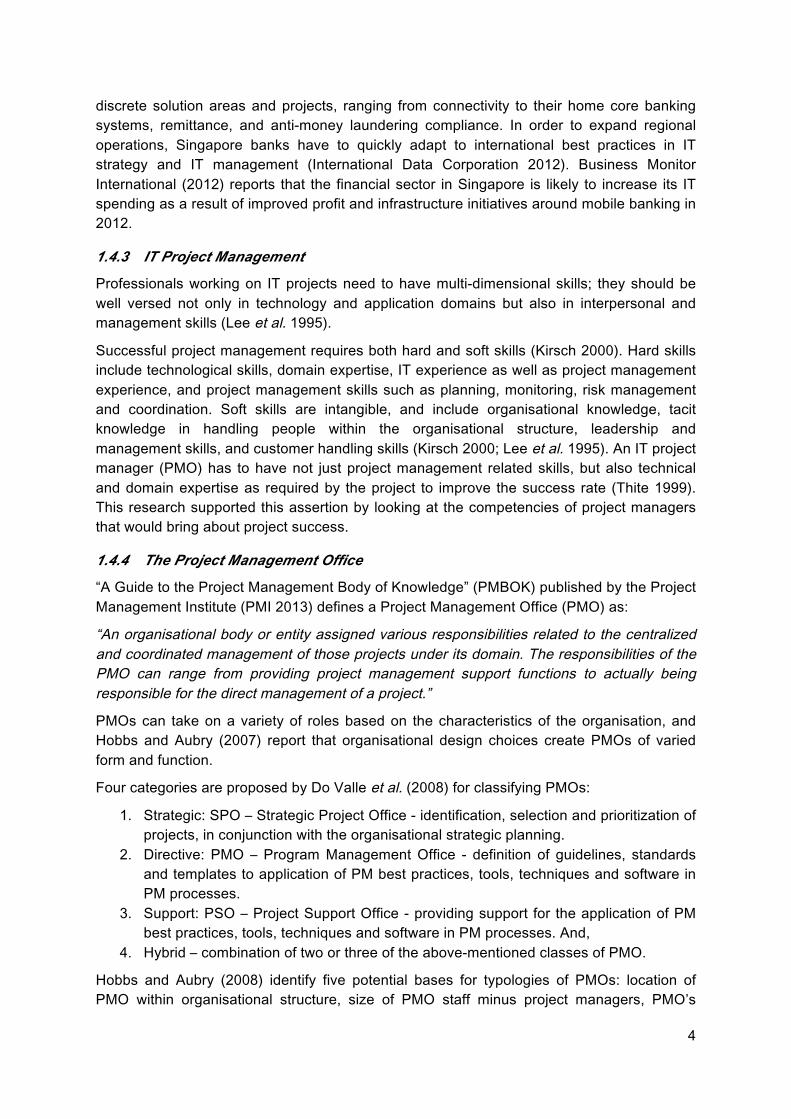
discrete solution areas and projects, ranging from connectivity to their home core banking systems, remittance, and anti-money laundering compliance. In order to expand regional operations, Singapore banks have to quickly adapt to international best practices in IT strategy and IT management (International Data Corporation 2012). Business Monitor International (2012) reports that the financial sector in Singapore is likely to increase its IT spending as a result of improved profit and infrastructure initiatives around mobile banking in 2012.
1.4.3 IT Project Management
Professionals working on IT projects need to have multi-dimensional skills; they should be well versed not only in technology and application domains but also in interpersonal and management skills (Lee et al. 1995).
Successful project management requires both hard and soft skills (Kirsch 2000). Hard skills include technological skills, domain expertise, IT experience as well as project management experience, and project management skills such as planning, monitoring, risk management and coordination. Soft skills are intangible, and include organisational knowledge, tacit knowledge in handling people within the organisational structure, leadership and management skills, and customer handling skills (Kirsch 2000; Lee et al. 1995). An IT project manager (PMO) has to have not just project management related skills, but also technical and domain expertise as required by the project to improve the success rate (Thite 1999). This research supported this assertion by looking at the competencies of project managers that would bring about project success.
1.4.4 The Project Management Office
“A Guide to the Project Management Body of Knowledge” (PMBOK) published by the Project Management Institute (PMI 2013) defines a Project Management Office (PMO) as:
“An organisational body or entity assigned various responsibilities related to the centralized
and coordinated management of those projects under its domain. The responsibilities of the
PMO can range from providing project management support functions to actually being
responsible for the direct management of a project.”
PMOs can take on a variety of roles based on the characteristics of the organisation, and Hobbs and Aubry (2007) report that organisational design choices create PMOs of varied form and function.
Four categories are proposed by Do Valle et al. (2008) for classifying PMOs:
1. Strategic: SPO – Strategic Project Office - identification, selection and prioritization of projects, in conjunction with the organisational strategic planning.
2. Directive: PMO – Program Management Office - definition of guidelines, standards and templates to application of PM best practices, tools, techniques and software in PM processes.
3. Support: PSO – Project Support Office - providing support for the application of PM best practices, tools, techniques and software in PM processes. And,
4. Hybrid – combination of two or three of the above-mentioned classes of PMO.
Hobbs and Aubry (2008) identify five potential bases for typologies of PMOs: location of PMO within organisational structure, size of PMO staff minus project managers, PMO’s

5
decision-making authority, proportion of projects within PMO’s mandate, and proportion of project managers within the PMO. They argue that the formalisation of PMO standards is deterred by the lack of consensus on the structure and roles PMO performs and a typology of PMOs will make the “great variability” easier to understand and manage. This research adopted the categories by Do Valle et al. (2008) and Hobbs and Aubry (2010), and the value of having PMOs typologies.
Over the last decade, the project management office (PMO) has become a prominent feature in many organisations, but no consensus exists as to the way PMOs are, or should be, structured nor as to the functions they fill (Hobbs & Aubry 2007). Literature review in Chapter 2 shows that PMOs are often characterised in terms of their structure, the roles they play and their perceived value to the organisation. Ideally, however, while the PMO should be structured to suit the host organisation within which it operates, the adoption of a generic structure allows its effectiveness to be more easily assessed.
1.5 The research problem
There is a rising trend for financial organisations in Singapore to form PMOs in order to improve project performance, but little is known about the effectiveness of PMOs in Singapore and elsewhere, other than more general suggestions made by Hobbs and Aubry (2010). The PMO concept is relatively new and there are few available models or guidelines where Singaporean organisations can seek direction or insights, apart from the best practice standards suggested in the “Capability Maturity Model Integration®” model (discussed in Chapter 2) developed by the Software Engineering Institute (2006). There is little literature written specifically for the Singapore project environment to ascertain if the PMO practice in Singapore is any different to the research work already done in the sector in Canada and USA by Hobbs and Aubry and in Europe by Müller, and others such as Klakegg (Hobbs & Aubry 2010; Müller et al. 2013; Shiferaw & Klakegg 2013). There are theory gaps in understanding the impact upon the PMO structure with the introduction of Generation Y into the workforce, and the using of the Cynefin Framework as a means to study the impact of complexity.
The research problem is thus framed as: “How can a PMO model be developed for IT projects for the financial industry in Singapore?”
1.6 Research objective
The objective of this research study is to develop a theoretically based and practically relevant and applicable model of PMOs, based on critical characteristics of the PMO, the organisational context and the organisation’s project and PMO maturity, for IT projects in the financial sector of Singapore. It aims to fill the theory and practice gaps identified in section 1.5.
1.7 Research Proposit ions
The research focuses on the development of a model to guide organisations in forming and structuring a PMO that, if implemented effectively, should improve the chances of success for IT projects in the financial industry in Singapore. The objective is to develop a theory based model that can be applied in practice, such that the theoretical objectives are

6
explicated in both the model and the “theory of practice” for its application. The proposition is that the model will be able to improve the effectiveness of the PMO in the host organisation and thereby increase its value and relevance. Organisations could also use the model as a benchmarking tool to compare the role of the PMO and its success rate with other organisations of similar in size and structure within the financial industry.
The research will establish the significance of, and relationships between, critical characteristics of the PMO, the organisation, project managers, and an organisation’s project maturity, through the structure and roles of a PMO. With the imminent introduction of Generation Y workers into the financial industry workforce, PMOs may also need to consider the implications of inter-generational change through the unique perspective and values of this generation, in order to be relevant to its needs and expectations.
1.8 Research Questions
The main research question to be addressed in this dissertation is:
What structure and roles should PMOs adopt, based on critical characteristics of PMO, organisational context and an organisation’s project maturity, that could improve the likelihood of achieving success for financial Information Technology (IT) projects in Singapore?
In addressing the main research question, the following subsidiary questions will have to be addressed:
• What are PMOs? • What is their purpose in influencing IT projects? • How are they typically established? • What factors shape their structure and operational methods? • How effective are they? • How do they mature? • What are the competencies of project managers that are best suited to a PMO
structure? • How should the relevance of PMO to Generation Y be ensured?
Various methods of data collection are required to answer these questions. These methods will be discussed in Chapter 3. The research questions have defined what the research is about, and may be further refined and developed after literature review so as to embrace more specific issue identification derived from the review.
1.9 Research Scope
The PMO model development will comprise a framework that guides the implementation of a PMO in terms of structure, functions and roles.
The scope of this research thus includes:
• Developing a theoretically based organisational structure model for IT PMOs within a Singapore financial industry context.
• Identifying critical characteristics of organisational and cultural context that influence the structure and roles of the organisation PMO.
7
• Exploring the relative influence and relationships between the organisation’s project maturity and the structure and roles of the PMO.
• Analysing the different competencies of project managers and assessing their effect on the project dynamics as part of the PMO structure.
• Analysing the impact upon the PMO structure with the introduction of Generation Y into the workforce.
• Refining the PMO model through validating by focus group to ensure its practical relevance.
The scope of the research will be addressed through an appropriate methodology and methods.
1.10 Research Methodology and Methods
Research designs are the plans and procedures for research that span the decisions from broad assumptions to detailed methods of data collections and analysis. Creswell suggests that research design involves the intersection of philosophy, strategies of inquiry, and specfic methods (Creswell 2003).
The research identifies that the opportunity exists, in the rising trends of financial organisations in Singapore, for forming PMOs. Investigating this requires research to gather information, analyse the data, and determine the factors or critical characteristics that are associated with solving the research questions. These are then integrated into a model, or framework, to guide PMO formulation and implementation.
A phenomenological perspective was adopted as the research paradigm and a qualitative approach was used for the research methodology. The research was conducted in two phases whereby, in the first phase, literature review was used to gather secondary data that then informed the design and administration of a primary data collection instrument and administration process whereby facilitated interviews and online surveys were conducted. The findings were then used in the development of a theoretically based model for PMO application to financial IT projects in Singapore. The second phase used a focus group method of model validation and refinement.
A fuller explanation and justification for the research methodology and methods are provided in Chapter 3.
1.11 The Expected Contribution of the Research Study
The research is expected to contribute to the body of project management knowledge through a theoretically based and practically relevant model of PMO, designed to guide organisations in forming a PMO that should help to improve the likelihood of achieving success for IT projects in the financial sector in Singapore.
1.12 Limitations of the Research
There are two limitations to this search: sample size for primary data collection, and contextual appropriateness.
8
No published research has yet been carried out on PMOs in the Singapore context (and particularly with respect to PMOs for IT projects in finance industry organisations). The willingness, of professionals engaged in this industry to participate in such research was not known, but reluctance could be anticipated on grounds such as time commitment and confidentiality of information in an industry that is highly competitive. This would be likely to affect response rates in primary data collection processes. This limitation is discussed more fully in the appropriate sections dealing with data collection and analysis. The literature reviews are based on extant research into organisations that may differ culturally, socially and politically from those in Singapore. While care is taken to distinguish such differences, residual influences may remain that cannot be identified or explained.
1.13 Structure of Thesis
This thesis comprises eight chapters followed by a bibliography and appendixes.
Chapter 1 provides an introduction by describing the research context; the research problem, objectives, propositions, questions and scope; the research methodology, research design and methods; the expected contribution of the research; and the limitations.
Chapter 2 comprises a Literature Review. This is substantially the first phase of the research, and reviews available literature on the subject of project management offices (PMO). It begins by introducing the Singapore context and reviews the related literature on project management practices. The aim of this chapter is to identify different design and management characteristics among PMOs, and the significance of each organisational context. It includes a study of the different competencies and generations of project managers and their suitability based on the project dynamics as part of the PMO structure.
Chapter 3 describes the research approach and methodology, where the research questions are considered in greater detail. The chapter also provides justification for the selected research approach and data collection techniques, and discusses issues relating to data validity and reliability.
Chapter 4 introduces the research design for the primary data collection and the administrative process for the conduct of facilitated interviews and online surveys. It describes the criteria for and selection of participants, format and design for the primary data collection instrument and pilot testing.
Chapter 5 explores the relevance of existing design and management characteristics for PMOs, and the relevance and importance of the organisational context, through the views and activities of people in practice. The combined results of the interviews and online survey responses are presented and analysed in this chapter.
Chapter 6 develops and presents a conceptual model of PMO, based upon the findings from the data analysis in chapter 5. The chapter explains the use of the Cynefin Framework to map the PMO design considerations and composite variables as part of its design framework. The model offers suggestions about suitable PMO structures, the PMO functions to be filled and appropriate selection of approaches to establish and maintain a PMO.
Chapter 7 validates the proposed PMO model using an online focus group. This chapter first describes the benefits of using online focus group, and presents the validation design, the processes used and questions asked. The aim is to gauge the model’s effectiveness and

9
facilitate its refinement though the use of online discussions. The results of the online focus group responses are presented, analysed and used to revise the PMO model.
Chapter 8 concludes the dissertation with a summary of the researching findings relating to the research questions. It assesses the contribution of the research to the profession of project management, reviews its limitations and makes recommendations for further research and practice.
10
Chapter 2 Literature Review 2.1 Introduction
The purpose of this chapter is to review the literature on the subject of PMOs, identify the different forms, functions and categories of the PMO, consider their contribution to project and organisational performance, and identify pertinent issues. The review addresses the structure and roles PMOs should adopt based on critical characteristics of PMO, organisational context and an organisation’s project maturity. The review of contemporary thinking on this topic will inform the development of a PMO framework for Financial Information Technology (IT) projects in Singapore.
The chapter begins by defining project, project management and project success. Following this, the Critical Success Factors (CSF) for achieving project success are discussed, and an argument is presented that a PMO could adopt guidelines that address the issues identified by these CSFs to improve the project success rate. Success is considered from multiple perspectives of project success (implementation), project success (performance), project management success, PMO success, and successful project managers, and is discussed in sections 2.2.3, 2.2.4, 2.3, 2.5.1, 2.5.3 and 2.6.
The chapter then continues to review the achievable benefits to justify the creation of a PMO and the functions it should play. A typology of PMOs is presented with the six interrelated variables proposed by Hobbs and Aubry (2010) to make the variability of PMOs more manageable: maturity in project management, supportiveness of organisational culture, decision-making authority of the PMO, percentage of projects within the mandate of the PMO, percentage of project managers within the PMO and total number of important functions. The chapter also highlights the importance of competent project managers in achieving project success and how a PMO should consider different project managers competence profiles for different project types.
Finally, the impacts of the perceived influences of inter-generational change are discussed. With more Generation Y people entering the workforce, there is an increasing need to capitalise on the strengths and minimise the impact of the weaknesses of Generation Y in order to integrate them effectively into project teams. Suggestions are made for accomplishing this.
The chapter concludes with a summary and re-statement of the issues identified for further investigation.
2.2 Definit ions
2.2.1 Project
A project is “a temporary endeavour undertaken to create a unique product, service, or
result”. The “temporary” term implies that every project has a defined beginning and a recognisable end (PMI 2013). To relate this to the financial industry, providing a new product or service for Internet banking would be considered a project; while ensuring the continuing availability of the product or service becomes an operational consideration. However,
11
establishing the operational environment (eg planning, testing, and commissioning or rolling-out) is an essential element of the project. So also is setting the criteria to measure project success.
Projects serve the “needs of stakeholders by ensuring that their expectations and needs are
realised” (Walker et al. 2008). Organisations and businesses, of all sizes across all industries, increasingly find themselves confronted with the need to implement projects essential to company growth. The need may be reactive, arising from competitive and operational necessity; or it may be proactive, using forward vision to obtain a competitive advantage.
It is the management of engineering projects at the end of the 1950s that lead to standardised tools, practices and roles, and the emergence of management models (Garel 2013). Frameworks or models for classification of projects have been developed to ensure more effective management of projects (Dvir et al. 2003).
Turner and Cochrane (1993) judge projects against two parameters: how well defined are the goals, and how well defined are the methods of achieving them. Their proposed goals-and-methods matrix results in four types of project:
• Type-1 projects: for which the goals and methods of achieving the project are well defined,
• Type-2 projects: for which the goals are well defined but the methods are not, • Type-3 projects: for which the goals are not well defined but the methods are, • Type-4 projects: for which neither the goals nor the methods are well defined.
Project Typology Continuum is another such typology which categorises project type by studying how well they are defined, the tangibility of the project outcomes, and the formality of its structure, administration and control mechanisms; and classifies these into Concrete, Occasional, and Open projects (Briner et al. 1996).
Shenhar and Dvir (2004) also propose four dimensions from which projects can be distinguished. Their NCTP framework, representing Novelty, Complexity, Technology and Pace, was developed to guide project management style. One of the features that they identify is how pace, as part of pace, complexity and uncertainty intervenes between the project product, task and environment and appropriate project management style. They developed an Uncertainty, Complexity, Pace (UCP) Model where the Uncertainty dimension can be seen as a combination of novelty and technology.
Having a typology model of PMOs would make the variability of PMOs more manageable and in this case the PMO model more practical.
2.2.2 Project Management
Project management is the application of knowledge, skills, tools and techniques to project activities in order to meet project requirements (PMI 2013). Knowledge and skills include those that are generic (such as management), and those that are specialised, such as industry- or profession-specific capabilities. Tools and techniques (whether generic or specialized) include the methodologies, processes, information systems and templates needed to achieve the project requirements. Deriving from the methodologies and frameworks of organisations, project management is about the management of resources and processes to achieve the desired project outcomes and goals.
12
Project management is seen by many to provide a bridge between strategy and operations and to convert visions into actions. It is a strategic management function responsible for coordinating, prioritising, planning, overseeing, and monitoring an organisation’s projects to achieve business strategy and benefits (KPMG 2003).
Project management is not purely science, but also an art that involves selecting an appropriate management style, assessing the nature of the project-external environment including available resources and stakeholder expectations, and deciding upon the nature and characteristics of the end-product (deliverable) and the details of the task to be accomplished (Walker & Rowlinson 2008b).
The project management definition adopted by this research requires the application of “hard” techniques and art of “soft” skills to achieve project success, and the PMO model proposed in this thesis incorporates these “hard” and “soft” variables.
2.2.3 Project Success
There is no universal agreed notion of what constitutes project success in the field of project management (Pinto & Slevin 1988). The Sydney Opera House was seen by most, from a project delivery point of view, as a stupendous failure: the outcome a music hall with poor performance acoustics for grand opera (due to late design changes to satisfy other needs), stunningly over cost and far behind schedule. Design rarely preceded construction; technical problems required innovative risky solutions; massive political interference occurred; funding was always at risk; the original architect was dismissed and replaced by a reluctant public sector architect forced by the client to take over the work, who never received sufficient credit and who subsequently sank into alcoholism and committed suicide. Even the need for, and intended purpose of such an elite cultural venue, was continually and aggressively debated in public media along with frequent escalation of estimates of the costs required to complete it. Design changes were made, to increase the seating capacity and improve the financial viability of the project, but these compromised its musical and theatrical performance capabilities. Decades later, however the same building has become a unique national treasure, its massive cost and schedule over-runs long forgotten. In place of these signals of project failure, is a world-renowned icon and marvel of modern architecture. The Sydney Opera House is an example where customers (theatregoers) and users (performers) perceived the project as successful and those directly involved in its implementation perceived it as failure. Latterly, a decision has been made to revert to the original architect’s acoustic plan for the interior, to address the imperfections of the scheme that was substituted for reasons of cost.
On the other hand, it is also possible for projects to be perceived as successful by those involved in their implementation, and yet which are poorly received by customers. Some low-cost housing schemes in South Africa may be examples of this; where housing has been built to budget and delivered on time, but occupants’ expectations have not been satisfied in terms of style, finish, amenities and location.
A project is usually considered successful when the project objectives are delivered within the traditional constraints of the project - project scope, time and cost. This is known as the “triple constraint” or the “iron triangle”. Project quality is affected by balancing these three factors (PMI 2013). Figure 2.1 portrays the typical view; that a successful project is one which has been accomplished within time, within budget at the desired performance or

13
quality level and achieving the desired scope (Jiang et al. 2002; Kerzner 1987; Kerzner 1989; Nicholas 1989).
Figure 2.1: The Triple Constraints for Project Success
Although displayed as an apparently fixed relationship in the diagram, it is easy to conceive how changes occurring in any one or more of the constituent elements will distort the equanimity of the triangle. In reality however, there are several limitations to this definition of project success. A project that “does not meet the expectations of influential stakeholders is
not likely to be regarded as successful, even if it remains within the original time, budget and
scope” (Walker et al. 2008). Project success can be defined and determined differently by project stakeholders. It is possible for a project to be perceived as a success by a project manager and at the same time perceived as a failure by the project users; or vice versa. The examples referred to above confirm this. The success of a project and the performance of its project management are not necessarily directly or fully correlated, where the one can be deemed successful with the other a failure. The inadequacies of a simple tri-partite model suggest that project success is a more complex and nuanced concept.
The definition of project success can also be drawn from the project implementation process as distinct from the delivered project itself. The key elements that need to be considered when defining project success are those dealing with the project itself (schedule, cost and scope/ performance), and those dealing with the client (user satisfaction and effectiveness). As measures of project and implementation success complement each other, the integration of both elements has the potential to present more accurate, holistic, comprehensive and useful frameworks of project success (Pinto & Slevin 1988). One observation is that project success is concerned with achievable long-term benefits, whereas project management
success is limited to the context of short-term (implementation) life of the project development and delivery (Shenhar et al. 2001). The success of project and project management are thus not necessarily directly related, where one can be successful with the other failure (Munns & Bjeirmi 1996). Thus the traditional measurement of project success based on the triple parameters was later expanded to include a fourth dimension, client satisfaction, which equates to keeping the customers and stakeholders happy (Globerson & Zwikael 2002; Pinto & Kharbanda 1995).
Atkinson (1999) suggests merging project and project management success by adopting yet more new categories to the triple constraint or iron triangle. He proposes a new framework ‘Square Route’ to consider success criteria as presented in Figure 2.2. The “iron triangle” of cost, time and quality is viewed as a necessary criterion to measure project management process and at the same time the measurement of the success of the project implementation
Time
Cost Scope
Qual ity
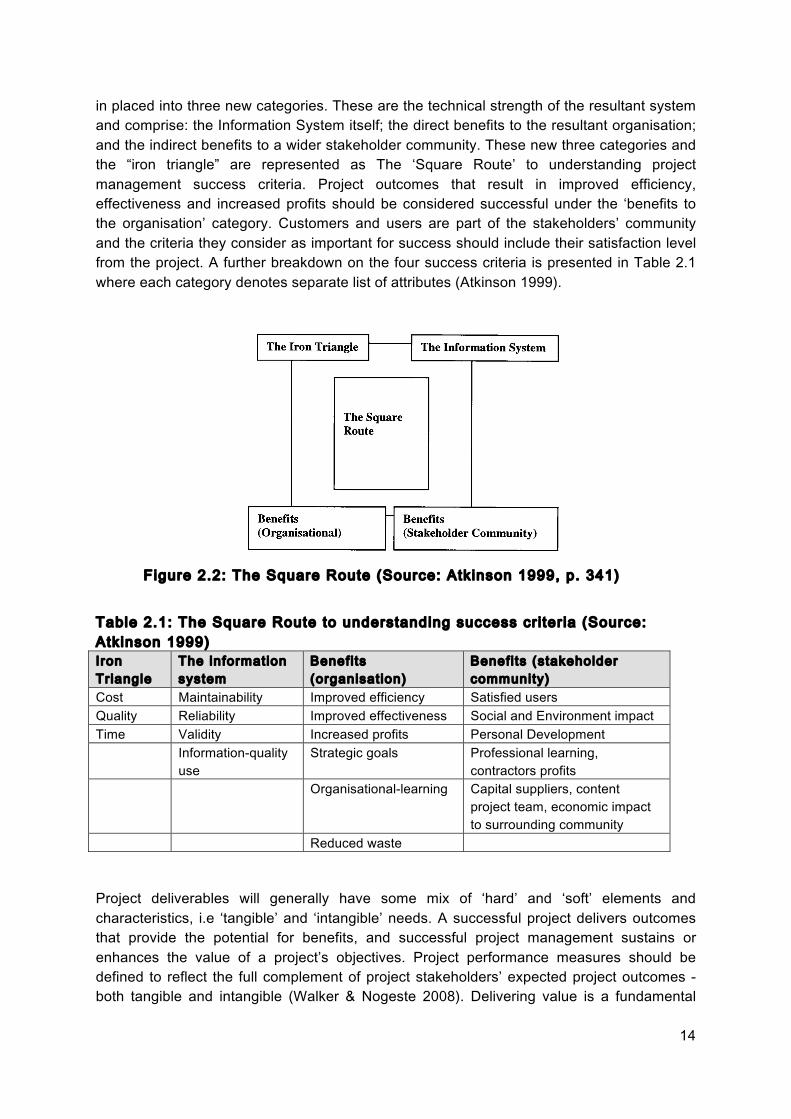
14
in placed into three new categories. These are the technical strength of the resultant system and comprise: the Information System itself; the direct benefits to the resultant organisation; and the indirect benefits to a wider stakeholder community. These new three categories and the “iron triangle” are represented as The ‘Square Route’ to understanding project management success criteria. Project outcomes that result in improved efficiency, effectiveness and increased profits should be considered successful under the ‘benefits to the organisation’ category. Customers and users are part of the stakeholders’ community and the criteria they consider as important for success should include their satisfaction level from the project. A further breakdown on the four success criteria is presented in Table 2.1 where each category denotes separate list of attributes (Atkinson 1999).
Figure 2.2: The Square Route (Source: Atkinson 1999, p. 341)
Table 2.1: The Square Route to understanding success cri ter ia (Source: Atkinson 1999) Iron Triangle
The information system
Benefits (organisation)
Benefits (stakeholder community)
Cost Maintainability Improved efficiency Satisfied users Quality Reliability Improved effectiveness Social and Environment impact Time Validity Increased profits Personal Development Information-quality
use Strategic goals Professional learning,
contractors profits Organisational-learning Capital suppliers, content
project team, economic impact to surrounding community
Reduced waste
Project deliverables will generally have some mix of ‘hard’ and ‘soft’ elements and characteristics, i.e ‘tangible’ and ‘intangible’ needs. A successful project delivers outcomes that provide the potential for benefits, and successful project management sustains or enhances the value of a project’s objectives. Project performance measures should be defined to reflect the full complement of project stakeholders’ expected project outcomes - both tangible and intangible (Walker & Nogeste 2008). Delivering value is a fundamental
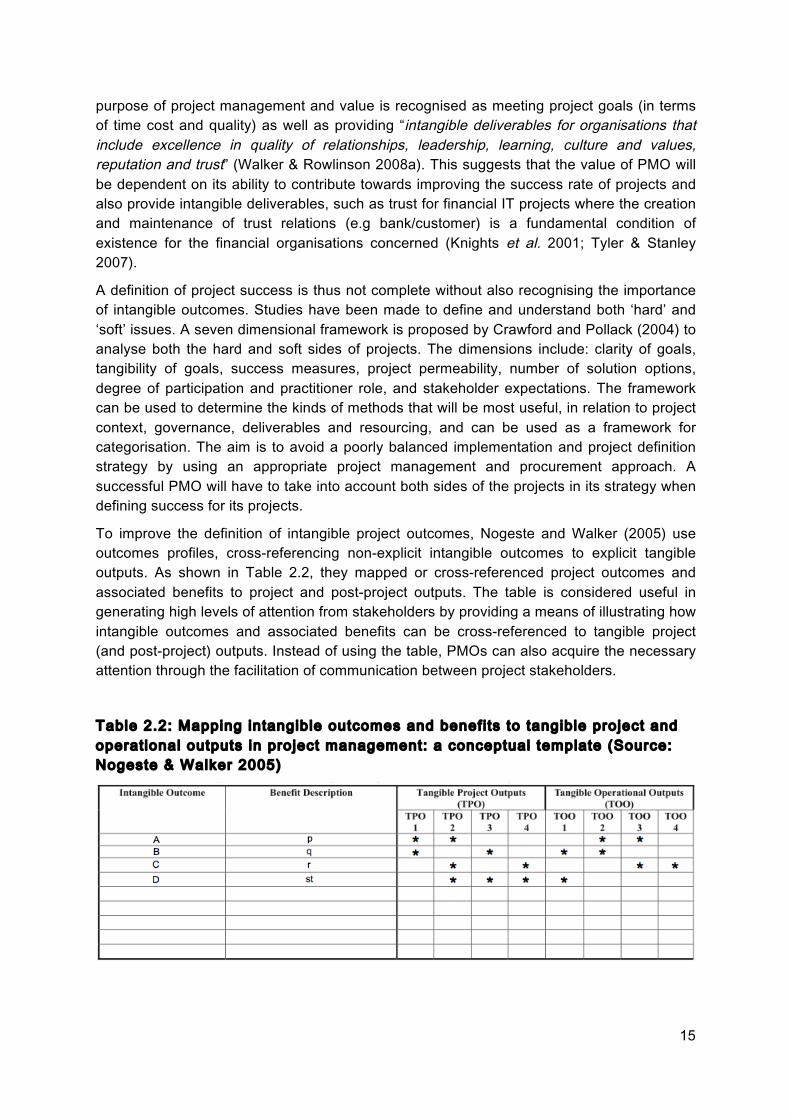
15
purpose of project management and value is recognised as meeting project goals (in terms of time cost and quality) as well as providing “intangible deliverables for organisations that
include excellence in quality of relationships, leadership, learning, culture and values,
reputation and trust” (Walker & Rowlinson 2008a). This suggests that the value of PMO will be dependent on its ability to contribute towards improving the success rate of projects and also provide intangible deliverables, such as trust for financial IT projects where the creation and maintenance of trust relations (e.g bank/customer) is a fundamental condition of existence for the financial organisations concerned (Knights et al. 2001; Tyler & Stanley 2007).
A definition of project success is thus not complete without also recognising the importance of intangible outcomes. Studies have been made to define and understand both ‘hard’ and ‘soft’ issues. A seven dimensional framework is proposed by Crawford and Pollack (2004) to analyse both the hard and soft sides of projects. The dimensions include: clarity of goals, tangibility of goals, success measures, project permeability, number of solution options, degree of participation and practitioner role, and stakeholder expectations. The framework can be used to determine the kinds of methods that will be most useful, in relation to project context, governance, deliverables and resourcing, and can be used as a framework for categorisation. The aim is to avoid a poorly balanced implementation and project definition strategy by using an appropriate project management and procurement approach. A successful PMO will have to take into account both sides of the projects in its strategy when defining success for its projects.
To improve the definition of intangible project outcomes, Nogeste and Walker (2005) use outcomes profiles, cross-referencing non-explicit intangible outcomes to explicit tangible outputs. As shown in Table 2.2, they mapped or cross-referenced project outcomes and associated benefits to project and post-project outputs. The table is considered useful in generating high levels of attention from stakeholders by providing a means of illustrating how intangible outcomes and associated benefits can be cross-referenced to tangible project (and post-project) outputs. Instead of using the table, PMOs can also acquire the necessary attention through the facilitation of communication between project stakeholders.
Table 2.2: Mapping intangible outcomes and benefi ts to tangible project and operational outputs in project management: a conceptual template (Source: Nogeste & Walker 2005)
16
It is important for PMOs to justify their existence by ensuring stakeholder buy-in, which is demonstrated in surveys as an important contributing factor to success of the PMO (Bourne 2006; Sexton & KPMG 2007). In other words, while project success is vital for PMOs, championing their use and recognition of their achievements is also important. Failure to obtain and maintain stakeholder buy-in will inevitably lead to PMO decay and hence impact project success.
2.2.4 Critical Success Factors (CSF)
Critical Success Factors (CSF) are those characteristics, conditions, or variables that when properly sustained, maintained, or managed can have a significant impact on the success of a firm competing in a particular industry (Leidecker & Bruno 1984). Being aware of CSF is of great importance; focusing on the most relevant factors will ensure the organisation’s successful project competitive performance. The literature has provided in-depth studies of project success and identified an extensive list of CSF. The wrong choice of a project manager, unplanned project termination and non-supportive top management were found to be the main reasons for project failure (Avots 1969). The list of CSFs for project management excellence includes: good organisational understanding of the role and importance of project management, executive commitment to project management, organisational adaptability, project manager selection criteria, project manager’s leadership style and commitment to planning and control (Kerzner 1987). Another research study on CSFs (Pinto & Slevin 1987) suggests a ten-factor process known as the Project Implementation Profile (PIP). PIP identifies and measures ten critical success factors (CSFs) that have a relationship between the factors to determine the success of a project. The PIP allows organisations to make an assessment of the status of the ten critical factors: project mission; top management support; project schedule/plan; client consultation; personnel issues (including recruitment, selection, and training); adequate technology to support the project; client acceptance; monitoring and feedback; adequate channels of communication; and adequate trouble-shooting expertise (Pinto & Slevin 1987). In the previous section, project vision was identified as a key component for project success. In another study, a survey was conducted asking respondents to indicate the most critical factors for a successful project in order to review the characteristics of the critical success/failure factors based on different organisational conditions. The survey results indicate that communication is a more significant factor in bigger organisation and adequacy of resources is more critical for smaller organisation (Hyväri 2006).
Researchers have also developed schemes to classify the critical factors that affect projects. CSFs can be classified as strategic or tactical, where the two groups affect project performance at different phases of implementation. The strategic group includes factors such as “project mission”, “top management support” and “project scheduling” whereas the tactical group consists of factors such as “client consultation”, “personnel selection and training” (Schultz et al. 1987). Another study identifies the groups to which the critical factors belong, to be sufficient for evaluation of projects. It emphasises the grouping of success factors and explaining the interactions between them, rather than the identification of individual factors. The classifications are project, project manager, team members, organisation and the external environment (Belassi & Tukel 1996).
Other researchers have tried to specify specific planning processes that exert the most influence on project success. The project management processes of developing a work

17
breakdown structure, program evaluation and review techniques (PERT), a project plan, a quality plan and a risk plan have been identified as processes that significantly impact on project success and cost overrun at the end of the project (Raz et al. 2002; Shenhar et al. 2002).
Critical Success Processes (CSP) was proposed by Zwikael and Globerson as a more applicable and detailed list of CSFs that have the greatest influence on the success of projects, based on the specific sixteen CSP shown in Table 2.3 required for the planning phase of the project, out of the twenty-one planning processes identified in the Project Management Body of Knowledge (PMBOK) (PMI 2013). The value of CSP is that project managers can focus their effort on the most critical planning process success factors to improve the likelihood of project success. The six project planning process factors analysed in the study that yielded the highest impact include: ‘‘definition of activities to be performed in the project’’, ‘‘schedule development’’, ‘‘organisational planning’’, ‘‘staff acquisition’’, ‘‘communications planning’’ and ‘‘developing a project plan’’. This study identified project activities executed via a Work Breakdown Structure (WBS) as the most critical planning process. It also suggested that project managers tend to focus little effort and time on human resources and communications planning processes, both of which are critical to project success, and do not divide their time effectively among the different processes based on their relative importance (Zwikael & Globerson 2006).
Table 2.3: Sixteen planning processes grouped by knowledge areas (Adapted from Zwikael & Globerson 2006)
While the literature is prolific on the subject of ‘project management’ and its ‘success factors’, little has been written specifically for the Singapore project environment. This section
Planning process Knowledge area 1. Project Plan Development Integration 2. Scope planning
Scope 3. Scope definition 4. Activity definition
Time 5. Activity sequencing 6. Activity duration estimating 7. Schedule development 8. Resource planning
Cost 9. Cost estimating 10. Cost budgeting 11. Quality planning Quality 12. Organisational planning
Human resources 13. Staff acquisition 14. Communications planning Communications 15. Risk management planning Risk 16. Procurement planning Procurement

18
reviews the available literature that has an impact on the project and organisation performance within the Singapore context.
Yap Chee, Foo Say et al. (1998) studied the impact of organisational characteristics on the outcome of new product development projects in Singapore-based firms and found that the encouragement of adequate participation by project members and the provision of an organic setting within the project organisation facilitate project success. The level of participation in decision-making is reported to be higher in successful projects than in unsuccessful projects. Their analysis also identifies the essential skill base of the project manager, namely: technical, marketing and management skills, and ability to motivate the team members, to be critical for project success. Even though the project manager in Singapore is usually selected based on hierarchical rank, the technical and managerial competence of the project manager has a significant bearing on project outcome. Their study supported the benefits of having a PMO to provide the organic setting, and the importance of decision-making authority and project managers’ competencies for project success.
Through a survey, it was revealed that the coordination of designers and contractors and technical and innovation-oriented factors are the most critical success factors in managing Green Mark certified building projects in Singapore (Tan & Chong 2003). There is also a rising need to view strategic stakeholder management as an important competitive imperative of e-government. Nevertheless, while it is important to involve stakeholders in the development multi-agency projects, project leaders should not completely give in to the stakeholders’ demands (Tan et al. 2005).
The linkage between organisational structure and cross-cultural management against the background of the Credit Suisse Project Copernicus was studied in Singapore. Here it was suggested that the type of structure adopted affects the extent to which cross-cultural management is facilitated (Jacob 2007).
Leidecker and Bruno (1984) define Critical Success Factors (CSFs) as “those characteristics, conditions, or variables that when properly sustained, maintained, or managed can have a significant impact on the success of a firm competing in a particular industry”. In a Singapore study, Ng (2008) examined the prediction of project success in the Singaporean context. He argues that project management is one of the key competencies of organisations and seeks to discover and identify the CSFs in the Singaporean project environment. Five independent variables in his study were found to be significant in predicting project success: ‘Project Mission’, ‘Project Schedule/Plan’, ‘Technical Tasks’, ‘Client Acceptance’ and ‘Project Leader’.
In the implementation of the Online Business Licensing Service (OBLS) system by the Singapore government, project leadership and getting buy-in were found to be critical to project success in a multi-agency information management project (Teo & Koh 2010). Table 2.4 summarises the project characteristics critical in the context of Singapore. These characteristics clearly play an important role in the successful implementation of the Project Management Office for IT projects in the banking industry of Singapore.
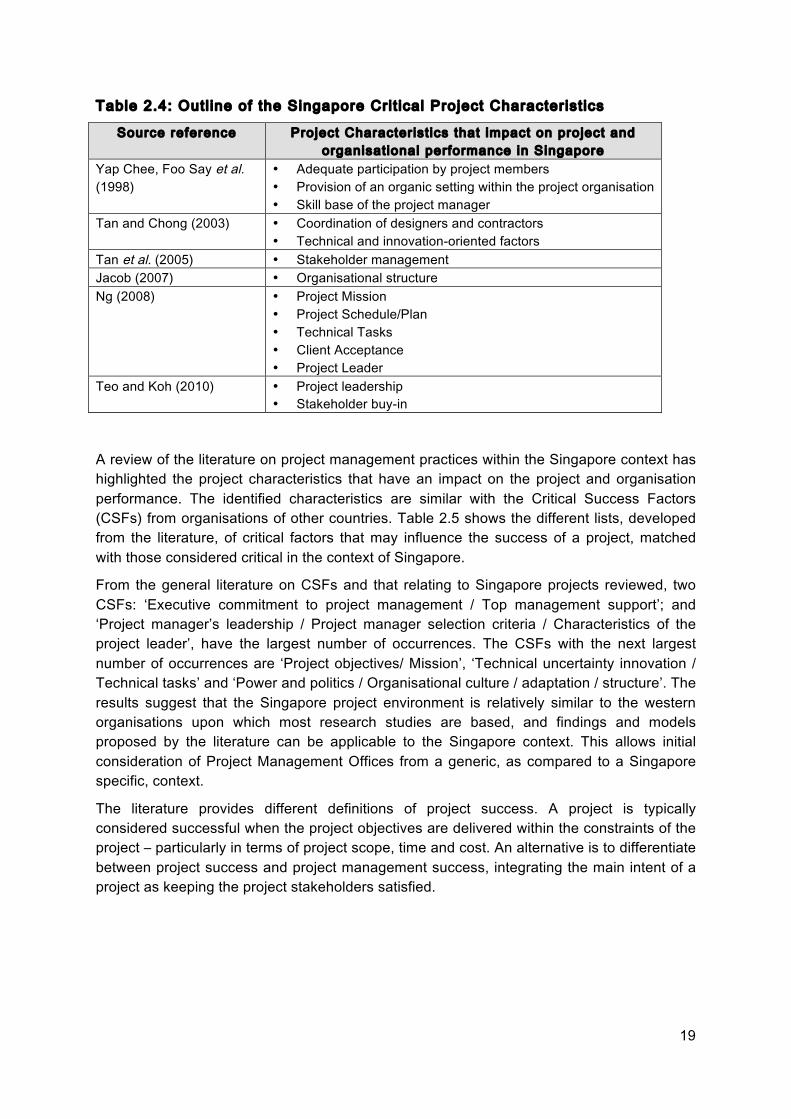
19
Table 2.4: Outl ine of the Singapore Crit ical Project Characterist ics
Source reference Project Characterist ics that impact on project and organisational performance in Singapore
Yap Chee, Foo Say et al.
(1998) • Adequate participation by project members • Provision of an organic setting within the project organisation • Skill base of the project manager
Tan and Chong (2003) • Coordination of designers and contractors • Technical and innovation-oriented factors
Tan et al. (2005) • Stakeholder management Jacob (2007) • Organisational structure Ng (2008) • Project Mission
• Project Schedule/Plan • Technical Tasks • Client Acceptance • Project Leader
Teo and Koh (2010) • Project leadership • Stakeholder buy-in
A review of the literature on project management practices within the Singapore context has highlighted the project characteristics that have an impact on the project and organisation performance. The identified characteristics are similar with the Critical Success Factors (CSFs) from organisations of other countries. Table 2.5 shows the different lists, developed from the literature, of critical factors that may influence the success of a project, matched with those considered critical in the context of Singapore.
From the general literature on CSFs and that relating to Singapore projects reviewed, two CSFs: ‘Executive commitment to project management / Top management support’; and ‘Project manager’s leadership / Project manager selection criteria / Characteristics of the project leader’, have the largest number of occurrences. The CSFs with the next largest number of occurrences are ‘Project objectives/ Mission’, ‘Technical uncertainty innovation / Technical tasks’ and ‘Power and politics / Organisational culture / adaptation / structure’. The results suggest that the Singapore project environment is relatively similar to the western organisations upon which most research studies are based, and findings and models proposed by the literature can be applicable to the Singapore context. This allows initial consideration of Project Management Offices from a generic, as compared to a Singapore specific, context.
The literature provides different definitions of project success. A project is typically considered successful when the project objectives are delivered within the constraints of the project – particularly in terms of project scope, time and cost. An alternative is to differentiate between project success and project management success, integrating the main intent of a project as keeping the project stakeholders satisfied.
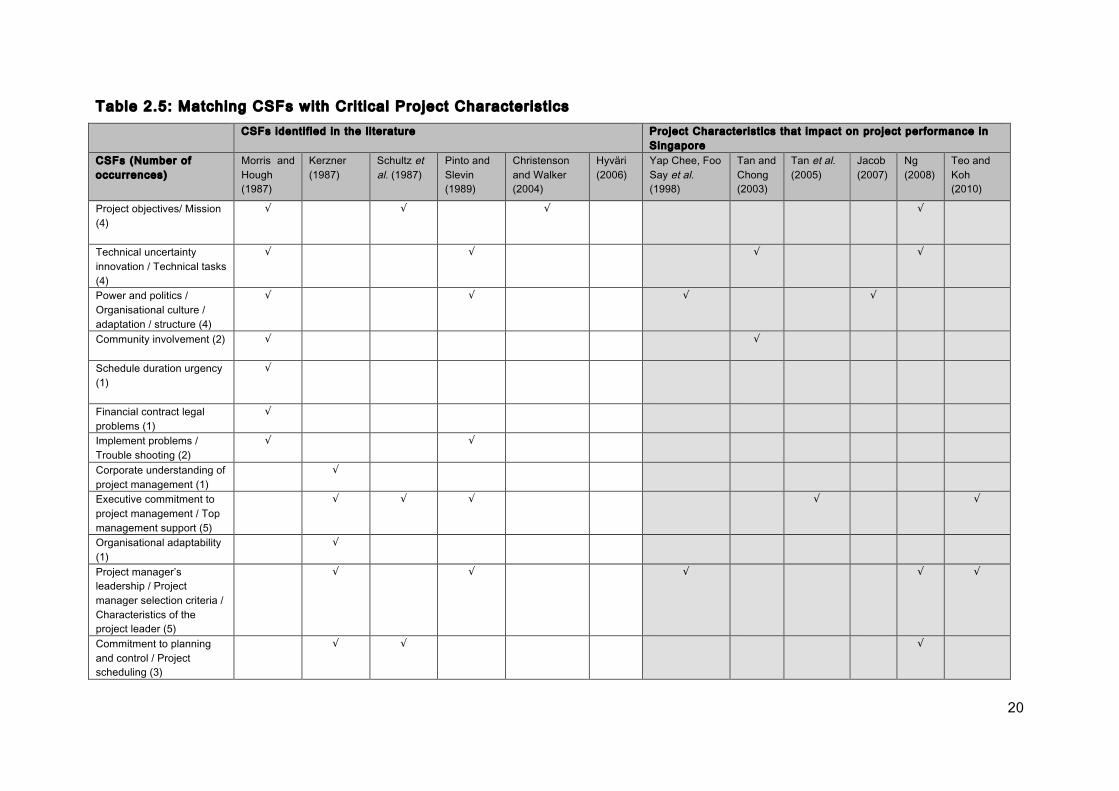
20
Table 2.5: Matching CSFs with Crit ical Project Characterist ics CSFs identif ied in the l i terature Project Characterist ics that impact on project performance in
Singapore CSFs (Number of occurrences)
Morris and Hough (1987)
Kerzner (1987)
Schultz et al. (1987)
Pinto and Slevin (1989)
Christenson and Walker (2004)
Hyväri (2006)
Yap Chee, Foo Say et al. (1998)
Tan and Chong (2003)
Tan et al. (2005)
Jacob (2007)
Ng (2008)
Teo and Koh (2010)
Project objectives/ Mission (4)
√ √ √ √
Technical uncertainty innovation / Technical tasks (4)
√ √ √ √
Power and politics / Organisational culture / adaptation / structure (4)
√ √ √ √
Community involvement (2)
√ √
Schedule duration urgency (1)
√
Financial contract legal problems (1)
√
Implement problems / Trouble shooting (2)
√ √
Corporate understanding of project management (1)
√
Executive commitment to project management / Top management support (5)
√ √ √ √ √
Organisational adaptability (1)
√
Project manager’s leadership / Project manager selection criteria / Characteristics of the project leader (5)
√ √ √ √ √
Commitment to planning and control / Project scheduling (3)
√ √ √
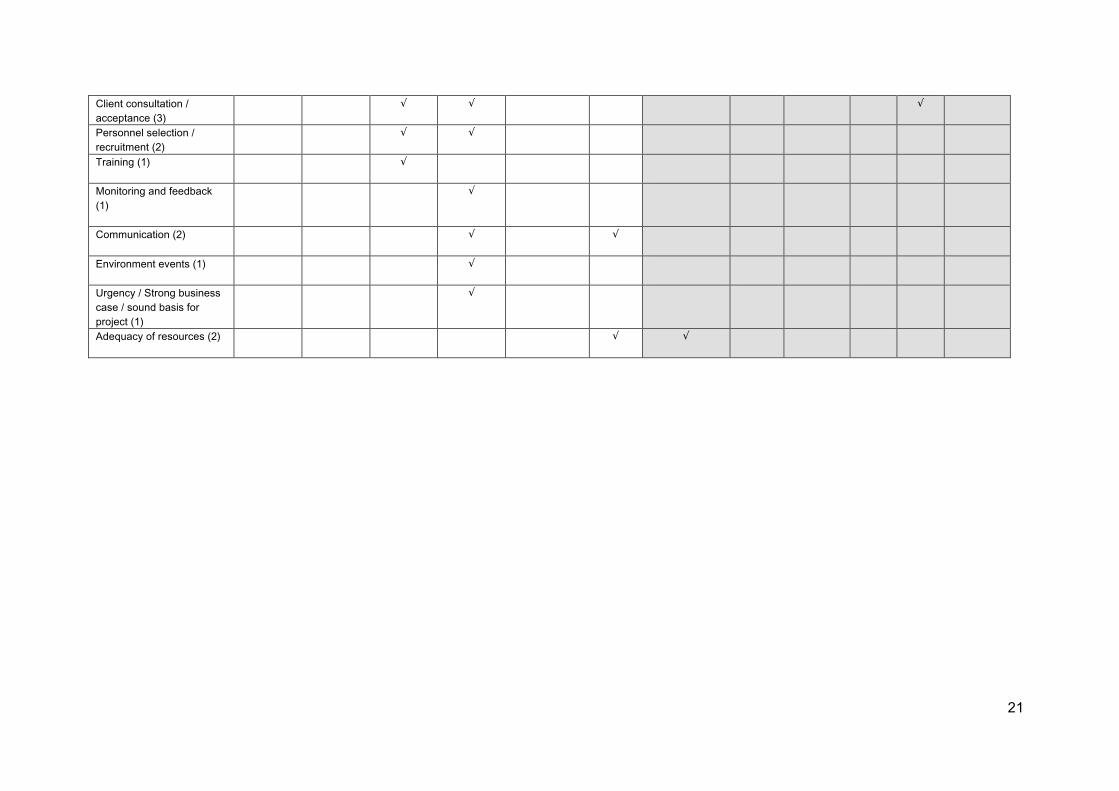
21
Client consultation / acceptance (3)
√ √ √
Personnel selection / recruitment (2)
√ √
Training (1)
√
Monitoring and feedback (1)
√
Communication (2)
√ √
Environment events (1)
√
Urgency / Strong business case / sound basis for project (1)
√
Adequacy of resources (2)
√ √
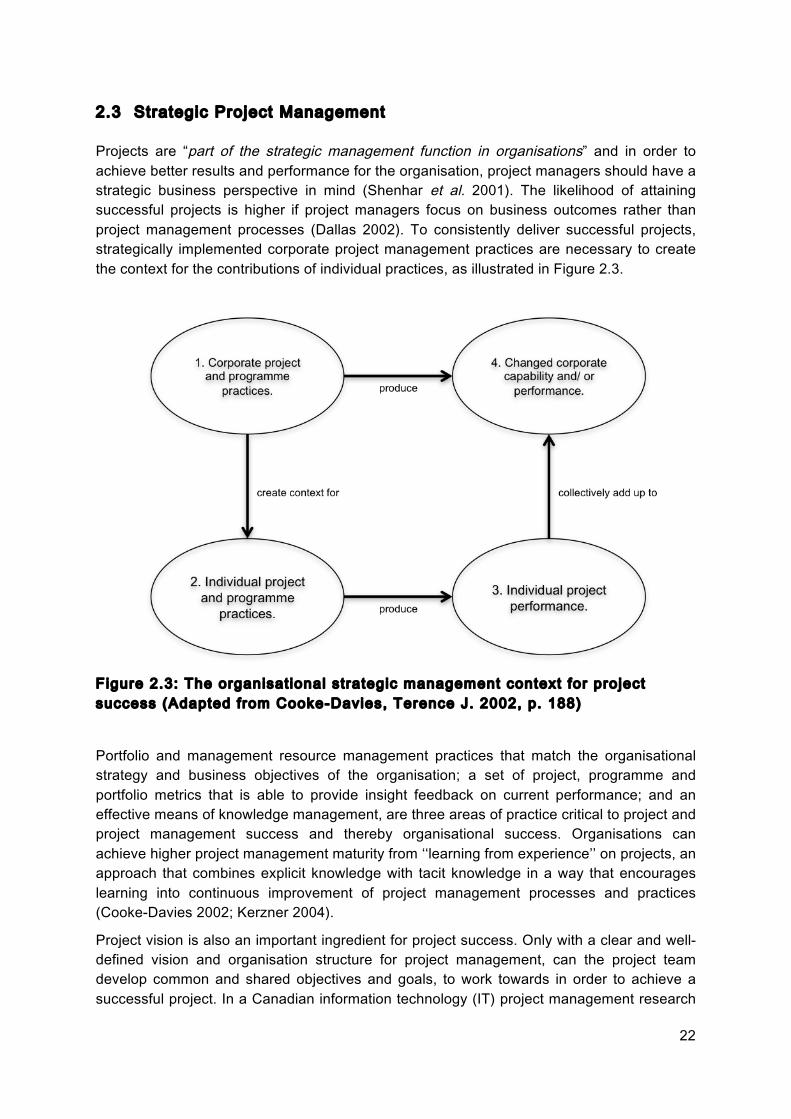
22
2.3 Strategic Project Management
Projects are “part of the strategic management function in organisations” and in order to achieve better results and performance for the organisation, project managers should have a strategic business perspective in mind (Shenhar et al. 2001). The likelihood of attaining successful projects is higher if project managers focus on business outcomes rather than project management processes (Dallas 2002). To consistently deliver successful projects, strategically implemented corporate project management practices are necessary to create the context for the contributions of individual practices, as illustrated in Figure 2.3.
Figure 2.3: The organisational strategic management context for project success (Adapted from Cooke-Davies, Terence J. 2002, p. 188)
Portfolio and management resource management practices that match the organisational strategy and business objectives of the organisation; a set of project, programme and portfolio metrics that is able to provide insight feedback on current performance; and an effective means of knowledge management, are three areas of practice critical to project and project management success and thereby organisational success. Organisations can achieve higher project management maturity from ‘‘learning from experience’’ on projects, an approach that combines explicit knowledge with tacit knowledge in a way that encourages learning into continuous improvement of project management processes and practices (Cooke-Davies 2002; Kerzner 2004).
Project vision is also an important ingredient for project success. Only with a clear and well-defined vision and organisation structure for project management, can the project team develop common and shared objectives and goals, to work towards in order to achieve a successful project. In a Canadian information technology (IT) project management research

23
case study, Christenson and Walker (2004) argued that a shared project vision contributed to the studied project successfully delivering its intended goal despite poor project management practices. Thus “project success” can be used to describe both project and organisational performance. For a project to achieve on-time delivery, within-budget expenditures and appropriate performance standards is alone not enough to constitute success, an established success definition is also important.
2.4 Project Management Practice in Singapore
Developed countries including the United States, the United Kingdom and Japan are still recovering from the damage caused by the 2008 global financial crisis, resulting in shrinking economies, high unemployment and stalled projects.
Hunsberger (2011) argued that this has created opportunities for fast-growing economies like Singapore to rise above the fray and become global players. Singapore has yet to prove itself to be as financially stalwart as its more developed counterparts. A key to continuing growth and staying power in all these countries may depend on how their organisations can improve their project management practices.
The purpose of this section is to provide a more comprehensive context for the research, in terms of the island nation of Singapore, its finance industry, IT industry, culture and project management capability. Though much research on project management tends to focus upon westernised countries (Europe, USA), results from the studies are found to be applicable in Singapore – a major player in the economy of the Asian and South East Asian region. For example, evidence is found in the research by Pheng and Leong (2001) that shows the managerial aspects of a typical family-based building firm in Singapore are not much different from practices explained by contemporary management theories from the Western world. In an earlier Singapore study on productivity improvement approaches, Check-Teck (1992) found little difference between domestic-owned and Western-owned companies and correlation results suggesting cultural influence on organising. It is possible for organisations to follow their western headquarters to structure the project office.
Some cultural differences were identified in a virtual project involving teams from United Kingdom (UK) and Singapore, which included difference in work ethics where the “West” team worked very hard while the “East” team worked longer and at more socially unacceptable hours, and the non-confrontation culture of the East. The authors suggested different management and relational strategies to resolve the cultural issues, like effective project communications and management of requirements which are essentially good Western project management practices (Lee-Kelley & Sankey 2008). Other evidence is the recognition of Project Management Professional (PMP)® certification in Singapore. This certification requires the understanding of western project management methodologies and is a basic entry requirement for many Project Manger positions in Singapore. The PMI Singapore Chapter (SPMI), a chapter in the PMI Network, is the second largest in Asia with more than 1800 active members and its mission is to promote project management principles within the community, business and practitioners (SPMI). It is thus fair to say that, for the most part, research and practice emanating from a Western project management culture should be relevant for Singapore.

24
2.4.1 About Singapore
Singapore is a small island nation of 712.4 km2 located in the heart of South East Asia, between Malaysia and Indonesia. It is home to 5.3 million people and consists of one large and 62 small islands. Its core industries lie in electronics, chemicals, financial services, oil drilling equipment, petroleum refining, rubber processing and products, processed food and beverages, ship repair, offshore platform construction, life sciences, and entrepôt trade (Ministry of Information 2012; Singapore Department of Statistics 2012).
Singapore has a free market economy, with a low inflation rate, stable prices, and a high per capita Gross Domestic Product (GDP) supported by its highly developed infrastructure, transparent legal system and educated workforce (Bergh 2009; Singapore Media Fusion 2011). GDP is the monetary, market value of all final goods and services produced in a country over a period of a year. The GDP per capita (corrected for inflation) is generally used as the core indicator in judging the position of the economy of a country over time or relative to that of other countries. The Singapore economy is expected to remain on a stable growth path in 2012-16, and GDP growth is expected to average 5% annually in the next five years (Economist Intelligence Unit 2011).
According to The Global Competitiveness Report 2011-2012, Singapore was rated the second-most competitive economy in the world, after Switzerland, and maintaining the lead among Asian economies. The country’s institutions continue to be assessed as the best in the world, ranked 1st for both their lack�of corruption and government efficiency. Singapore was ranked favourably in the Global Competitiveness Index due to its relative freedom from corruption, high government efficiency and its efficient goods, labour and financial markets (Schwab & Sala-i-Martin 2011).
The Hong Kong-based Political & Economic Risk Consultancy (PERC), in its 2012 survey report on Corruption in Asia, ranked Singapore as the least corrupt country in Asia and favourably in overall country risk. The survey revealed that the Singapore government has strong anti-corruption programs and the population has a low tolerance for graft (PERC 2012).
Singapore has advantages in its location, connectivity, reputation, infrastructure and efficiency to enhance its competitiveness. In order to stay competitive, Tan (2012) suggests that Singapore will need to boost its productivity, enhance its innovative capability and strengthen its research and development capacity.
2.4.2 Singapore Finance Industry
The importance of financial centres in the Asia-Pacific region is likely to continue, especially with the rehabilitation and growth of several Asian economies, such as Australia, Hong Kong, Japan and Singapore. The financial centre that emerges in a leading position will depend not only on the static comparative advantage of the different cities, but also on the dynamic competitive advantages created by their policies and strategies (Lee 2001).
Singapore’s ability to change its policies based on market conditions further strengthens its competitive advantages and its position as an open economy. During the global financial crisis of 2008-2009, Singapore responded by changing its policy from a recessionary scenario requiring loose monetary and fiscal policy during the crisis, to a scenario in which
25
large capital inflows, booming property markets and inflationary pressures became the challenges (Caplen 2011).
The Monetary Authority of Singapore (MAS), the country’s financial regulator, reinforced high standards of financial regulation and strict supervision on local banks, and manipulated economic and financial policy levers to ensure the success of Singapore as a regional and international financial (Monetary Authority of Singapore 2012b). One of Singapore’s key strategies as a finance centre is good regulation; Singapore’s banks were protected from the ill effects of the crisis by enforcing high capital ratios. MAS requires domestic systemically important banks (D-SIBs) in Singapore to meet higher capital requirements – a minimum Common Equity Tier 1 (CET1) capital adequacy ratio (CAR) of 6.5%, Tier 1 CAR of 8% and Total CAR of 10%, compared with the Basel III minimum requirements of 4.5%, 6% and 8% respectively (Monetary Authority of Singapore 2015b). The three Locally-incorporated D-SIBs (DBS, UOB and OCBC) have implemented Tier 1 ratios in the 13% to 15.5% range – more than twice the required minimum. However, high capital ratios have a negative impact on the banks’ profitability, Singapore banks faced challenges in competing successfully internationally and at the same time achieving a good return on equity (ROE) given their unusually strong capital base. Despite the disadvantage, in the Top 1000 World Banks 2015 rankings the three banks achieved good standings with: DBS Bank (58th), Overseas Chinese Banking Corporation (OCBC) (71st) and United Overseas Bank (74th) (Palma 2015). In order to further strengthen resilience, in 2015 MAS published a framework for identifying and supervising domestic systemically important banks (Monetary Authority of Singapore 2015a).
In 2011, Singapore had banking assets equivalent to 242% of gross domestic product (GDP) and gross external debt of 203% of GDP, although overall the country is a net external creditor for both the public and private sectors, including banks and non-banks, of 153% of GDP. According to a report from The Banker, Singapore is the second top destination for foreign investment in the Asian financial services sector after Shanghai, attracting $1.33 billion of foreign direct investment (FDI) into its financial services sector in the 12 months to the end of January 2015 (Pavoni 2015). In March 2015, Qatar Financial Centre (QFC) Authority ranks New York, London, Hong Kong, and Singapore as the four leading global financial centres (Yeandle et al. 2015).
Many of the government’s policies that have enabled or contributed to the remarkable increase in Singapore’s per capita national income over the last forty years have also led to the gradual emergence of some serious economic challenges, which includes the widening of income inequality (Verweij & Pelizzo 2009). The Asian Development Bank blames the widening of income gap in Singapore and many other Asia countries partly to globalization, which favours the well-educated, and recommends policies to create more equal opportunities and wealth (ABD 2007). Singapore's government has made the reduction of the income gap a priority, but argues welfare should not be a crutch, and rules out unemployment benefits or a minimum wage (Lee 2007). The apparent success of the government’s policies to fix the widening of income issue was shown in a report released by the Singapore Public Sector Outcomes Review in 2012, which suggests that overall income is growing and social security is strengthening (Heng 2012).
The Singapore Government’s efforts in economic restructuring and lifelong learning have contributed to income growth for lower- and middle-income Singaporeans since 2009 as shown in Figure 2.4 and through upgrade initiatives cope with rising costs of living. The rise

26
was attributed to the increase in individual wages and more working people per household (Ministry of Finance 2014).
Figure 2.4: Real monthly household income per household member (Source: Ministry of Finance, p. 8)
In 2007, Singapore had an income inequality profile similar to those of third-world countries. Singapore's Gini coefficient, a measure of income inequality, has worsened from 0.425 in 1998 to 0.472 in 2006, and was in league with the Philippines (0.461) and Guatemala (0.483), and worse than China (0.447) (Lee 2007). The Gini coefficient (also known as the Gini index) measures the inequality among values of a frequency distribution (for example levels of income) (Gini 1912). Figure 2.5 shows that the Gini coefficient had dropped to 0.463 in 2013, from 0.478 in 2012. The Singapore Government’s inclusive approach and progressive fiscal system had lowered income inequality and provided further support for those at the lower end of the income ladder through government transfers (Ministry of Finance 2014).
Figure 2.5: Singapore Gini coeff ic ient 2009-2013 based on household income (Source: Ministry of Finance, p. 11)
27
Singapore’s advantage is derived from government support and solid economic fundamentals. While Singapore is regarded by rating agencies as the most vulnerable to external economic shocks due to the openness of its economy and its small size relative to other countries, the Republic is one of the keenest competitors to be the leading financial centre of the future (Caplen 2011; Sagaram & Wickramanayake 2012). A major player in the economy of Singapore is its Information Technology (IT) industry, which offers opportunities for more projects and PMOs to gain value by improving project success rate.
2.4.3 Singapore IT Industry
Singapore has managed to harness the on going technological revolution to accelerate development and transform a whole economy. Information technology (IT) was identified early in the late 1970s as one key technology that would help improve Singapore’s economic performance by doing more with less - increasing labour productivity, making processes leaner and more efficient, and delivering better services to customers. Despite limited natural resources and unpromising initial economic conditions, Singapore has compressed its development journey and moved from a third world to a first world economy, and has positioned itself effectively for a global, knowledge-based, and innovation-driven economy (Hanna & Knight 2011).
According to Yunis et al. (2012), information and communication technologies (ICT) play an important role in driving a country’s global competitiveness forward, with a stronger relationship existing in high readiness countries than in low readiness countries. Singapore has a country level strategic intent to deploy ICT to achieve economic growth, where the government is keen to enhance ICT capabilities all over the nation, improve PC and internet access, increase high-speed broadband connectivity, and thereby transform businesses and economic models to make better use of ICT (Yunis et al. 2012).
Singapore has achieved a world-class excellence manifested in e-government and e-education, with a 4th place in the global information technology (GIT) index score in 2008-2009, and high global competitiveness with a 5th place in the global competitiveness index (GCI) in 2008-2009 and a 3rd place in 2009-2010. It is one of the several countries (including Korea and Finland) that succeeded in improving their global competitiveness by placing ICT at the core of their national strategies for innovation and development (Dutta 2009; Porter & Schwab 2009; Schwab 2009).
IT spending in Singapore is expected to reach US$6.4 billion in 2012, where Government IT spending has become a major market driver, which continued with implementation of the e-Government plan. Singapore's ambitions to emerge as a regional cloud-computing hub will fuel vendor investment in service capabilities (Business Monitor International 2012). IT is thus of strategic importance to Singapore, its economy, and its role in the world, which means more IT project implementations.
2.4.4 Singapore Culture
The Singapore Government, whilst having a tight grip on Singaporean politics, is also blessed with a civil bureaucracy that is "efficient" as well as having "considerable clout" (Gale 1999). Singapore has often been labelled as a “Nanny State” with the Government perceived as looming too large in too many sectors, and initiating, leading and growing businesses through Government-linked companies (GLCs). However it is claimed that it is
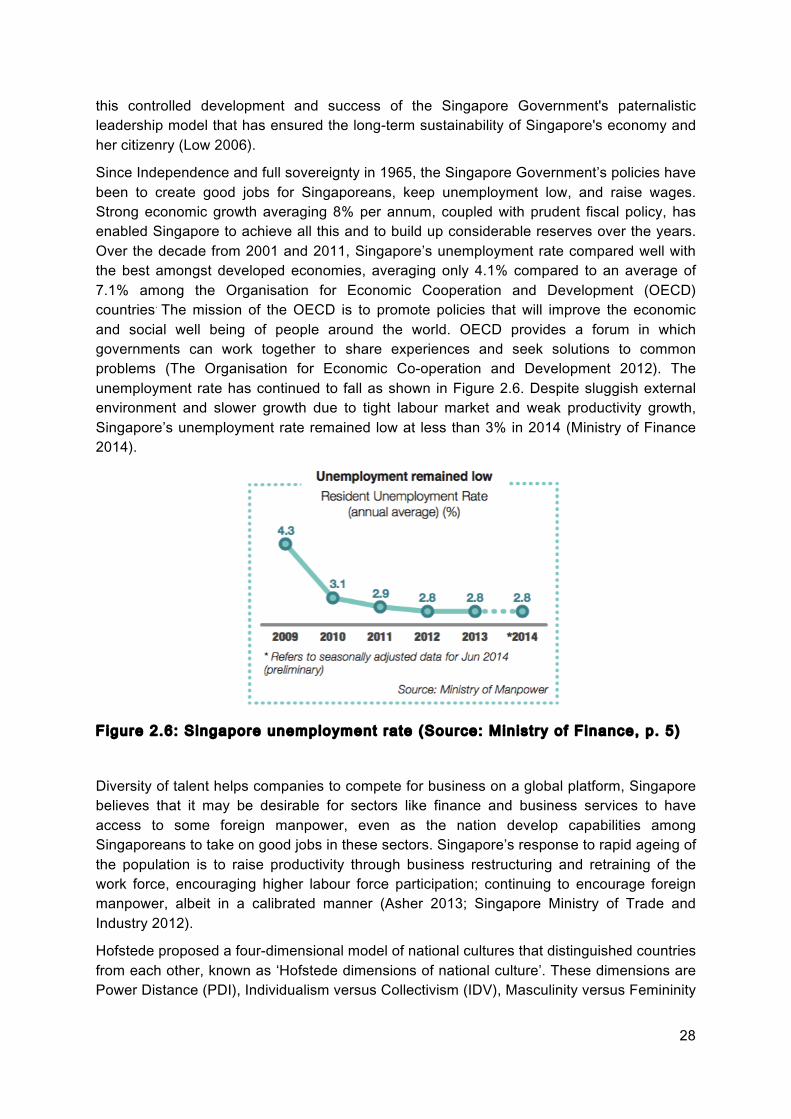
28
this controlled development and success of the Singapore Government's paternalistic
leadership model that has ensured the long-term sustainability of Singapore's economy and
her citizenry (Low 2006).
Since Independence and full sovereignty in 1965, the Singapore Government’s policies have
been to create good jobs for Singaporeans, keep unemployment low, and raise wages.
Strong economic growth averaging 8% per annum, coupled with prudent fiscal policy, has
enabled Singapore to achieve all this and to build up considerable reserves over the years.
Over the decade from 2001 and 2011, Singapore’s unemployment rate compared well with
the best amongst developed economies, averaging only 4.1% compared to an average of
7.1% among the Organisation for Economic Cooperation and Development (OECD)
countries. The mission of the OECD is to promote policies that will improve the economic
and social well being of people around the world. OECD provides a forum in which
governments can work together to share experiences and seek solutions to common
problems (The Organisation for Economic Co-operation and Development 2012). The
unemployment rate has continued to fall as shown in Figure 2.6. Despite sluggish external
environment and slower growth due to tight labour market and weak productivity growth,
Singapore’s unemployment rate remained low at less than 3% in 2014 (Ministry of Finance
2014).
Figure 2.6: Singapore unemployment rate (Source: Ministry of Finance, p. 5)
Diversity of talent helps companies to compete for business on a global platform, Singapore
believes that it may be desirable for sectors like finance and business services to have
access to some foreign manpower, even as the nation develop capabilities among
Singaporeans to take on good jobs in these sectors. Singapore’s response to rapid ageing of
the population is to raise productivity through business restructuring and retraining of the
work force, encouraging higher labour force participation; continuing to encourage foreign
manpower, albeit in a calibrated manner (Asher 2013; Singapore Ministry of Trade and
Industry 2012).
Hofstede proposed a four-dimensional model of national cultures that distinguished countries
from each other, known as ‘Hofstede dimensions of national culture’. These dimensions are
Power Distance (PDI), Individualism versus Collectivism (IDV), Masculinity versus Femininity
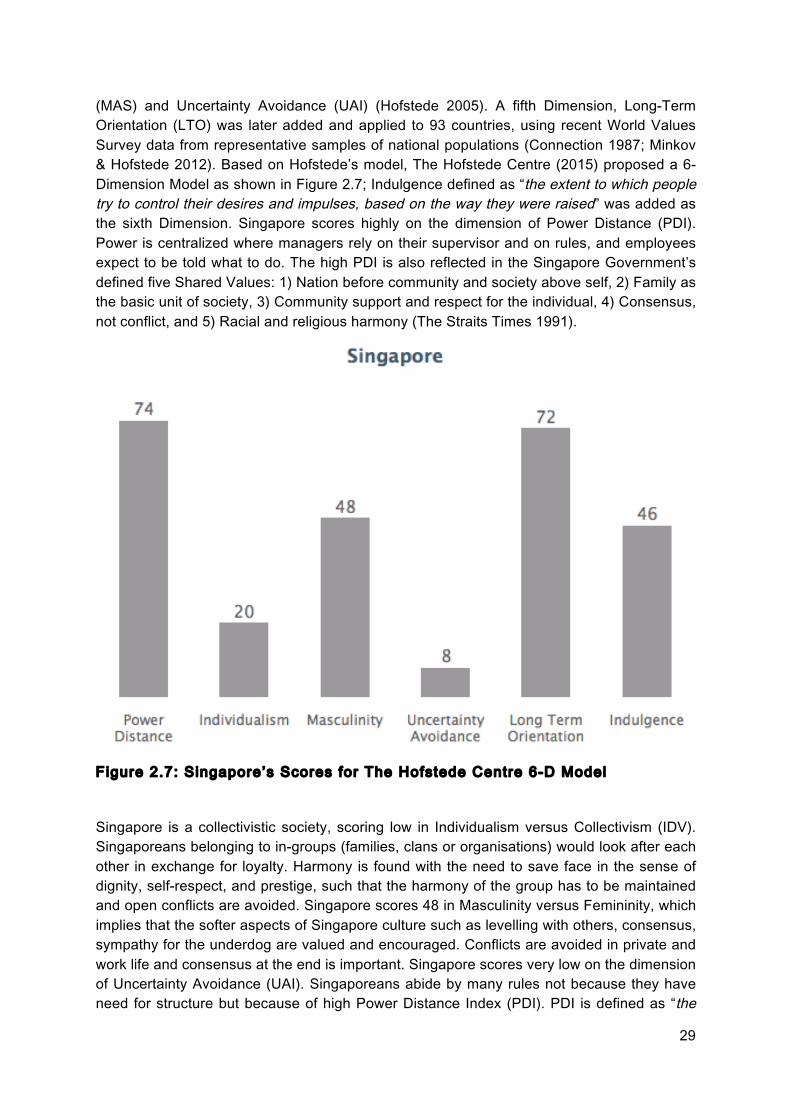
29
(MAS) and Uncertainty Avoidance (UAI) (Hofstede 2005). A fifth Dimension, Long-Term Orientation (LTO) was later added and applied to 93 countries, using recent World Values Survey data from representative samples of national populations (Connection 1987; Minkov & Hofstede 2012). Based on Hofstede’s model, The Hofstede Centre (2015) proposed a 6-Dimension Model as shown in Figure 2.7; Indulgence defined as “the extent to which people try to control their desires and impulses, based on the way they were raised” was added as the sixth Dimension. Singapore scores highly on the dimension of Power Distance (PDI). Power is centralized where managers rely on their supervisor and on rules, and employees expect to be told what to do. The high PDI is also reflected in the Singapore Government’s defined five Shared Values: 1) Nation before community and society above self, 2) Family as the basic unit of society, 3) Community support and respect for the individual, 4) Consensus, not conflict, and 5) Racial and religious harmony (The Straits Times 1991).
Figure 2.7: Singapore’s Scores for The Hofstede Centre 6-D Model
Singapore is a collectivistic society, scoring low in Individualism versus Collectivism (IDV). Singaporeans belonging to in-groups (families, clans or organisations) would look after each other in exchange for loyalty. Harmony is found with the need to save face in the sense of dignity, self-respect, and prestige, such that the harmony of the group has to be maintained and open conflicts are avoided. Singapore scores 48 in Masculinity versus Femininity, which implies that the softer aspects of Singapore culture such as levelling with others, consensus, sympathy for the underdog are valued and encouraged. Conflicts are avoided in private and work life and consensus at the end is important. Singapore scores very low on the dimension of Uncertainty Avoidance (UAI). Singaporeans abide by many rules not because they have need for structure but because of high Power Distance Index (PDI). PDI is defined as “the
30
extent to which the less powerful members of institutions and organisations within a country expect and accept that power is distributed unequally”. On Long-Term Orientation (LTO),
Singapore has a high score of 72. LTO describes “how every society has to maintain some links with its own past while dealing with the challenges of the present and future”.
Singaporeans emphasize virtue and the way things are done. The mind-set of keeping
options open allows for a more pragmatic approach to business. Singapore's intermediate
score of 46 for Indulgence shows that Singaporeans are neither overly indulgent or
restrained (The Hofstede Centre 2015).
Singapore has been working hard to establish itself as South East Asia's technology hub, by
implementing several competition policies to promote economy growth, including The
National Infocomm Competency Framework (NICF). NICF is a framework that articulates
competencies and skills required for different infocomm occupations, and lists relevant
training programmes available to build these skills (Info-communications Development
Authority of Singapore 2012a). This drive for improvement has led many organisations in
Singapore to more fully embrace project management techniques (Hunsberger 2011).
2.4.5 Generation Y in Singapore
The Singapore Human Resources Institute (2008) defined the Generation Y to be ranged
from the age of 14 to 30 years old, and reported that the Generation Y nurtured under a
different education system is “confident, restless, tech-savvy and prefer an unconventional approach”. The Generation Y is mostly intrinsically motivated, and “losing their family”, not
job is their biggest fear – a misconception by their seniors.
The Generation Y is an important pool of talent in Singapore’s tight labour market as
Generation X and Y now make up 60% of the Singapore workforce (Tripartite Alliance for
Fair Employment Practices 2010). According to Singapore Deputy Prime Minister Thurman
Shanmugaratnam, the Generation Y “does not stay long on the job, and are impatient to move on ” if their expectations on pay rise and promotion are not meet. Nearly four in ten of
the Generation Y says they will look for a new job when refused a pay rise. This could have
resulted in the tightening of the labour market, although Singapore’s unemployment rate at
2015 is 1.9 per cent, a rate considered low by other countries in Asia and in the West (Lim
2016).
2.5 Project Management Offices (PMOs)
Andersen et al. (2006) define the project management office (PMO) as “A systematic coordination and unified handling of key project-related tasks, as an enterprise-wide responsibility”. The authors suggest that the success of the PMO is related to ensuring the
necessary authority of the PMO exists, real organisational authority as well as academic and
social credibility, top management support and that the PMO covers true needs in the
organisation. According to the Project Management Body of Knowledge (PMBOK), the
project management office (PMO) is an organisational unit to centralise and coordinate the
management of projects under its domain (PMI 2013). It is also referred to as a “program
management office,” “project office,” or “program office.” The PMO focuses on the
coordinated planning, prioritization and execution of projects and subprojects that are tied to
the parent organisation’s or client’s overall business objectives. Projects are frequently
31
divided into more manageable components or subprojects, which are often contracted to an external enterprise or to another functional unit in the performing organisation.
A typical PMO’s function in an organisation may range from an advisory influence, limited to the recommendation of specific policies and procedures on individual projects, to a formal grant of authority from executive management (PMI 2013) to execute the project. The definition by Andersen et al. (2006) is accepted whereby the PMO is “A systematic coordination and unified handling of key project-related tasks, as an enterprise-wide responsibility”. The PMO brings with it the concept of enterprise project management (EPM). EPM in a large organisation facilitates organisational change in which specific projects and programmes of projects provide precious opportunities to reassess the enterprise's operational scope and efficiently accomplish more in less time (Szymczak & Walker 2003). The PMO’s precise roles and scope reflects the organisation’s unique needs and priorities, they are organisations’ responses in the form of unique structural arrangements designed to fulfil a specific purpose. PMOs are the “fulcrum between forces for centralisation - the tendency for decision to reside in a dedicated corporate function and decentralisation - the tendency for decision to be devolved throughout the organisation” (Pellegrinelli & Garagna 2009).
2.5.1 Benefits of PMO
Based on a survey of 750 companies, Stanleigh (2006) asserts that “over 75% of organisations that set up a PMO shut it down within three years because it didn’t demonstrate any added value”. Hobbs and Aubry (2007) argue that “the issues of value for money and the contribution or lack of contribution to project and program performance are key to the perceived performance and ultimately to the legitimacy of the PMO”. On the other hand, several benefits are proposed to justify the creation of a PMO and the functions it should play. Do Valle et al. (2008) suggest that the most important PMO benefit is the link between corporate governance (global strategy and goals) and project management (individual project success and results) through an effective portfolio management.
A project manager who focuses purely upon cost control is regarded as lacking an ability to also focus on strategic business development issues. The formation of a PMO can fill this void and ensure that both commercial and strategic project success become major organisational drivers. Another purpose for having a PMO is to make existing PM skill sets available across the organisation and to grow project management maturity (Cartwright & Walker 2008). A mature PMO can play the role of an information (and experience) repository (a knowledge bank), and be a coach or manager to trainee project managers (Light & Berg 2000). The success of the PMO is also related to ensuring the necessary authority of the PMO exists: real organisational authority as well as academic and social credibility, and top management support, as well as ensuring that the PMO covers true needs in the organisation (Andersen, Bjørn et al. 2006).
One of the PMO success factors in the “LEGO” toy manufacturing organisation is that the PMO is seen as a “unit representing the project managers toward the rest of the organisation, as opposed to being a tool to teach the project managers how to behave, as is the case in many other organisations” (Andersen, Bjørn et al. 2006). A research report by the PMI on the results of the Fortune 500 Project Management Benchmarking Forum (Toney & Powers 1997) identifies three key elements in delivering project objectives and goals. These are
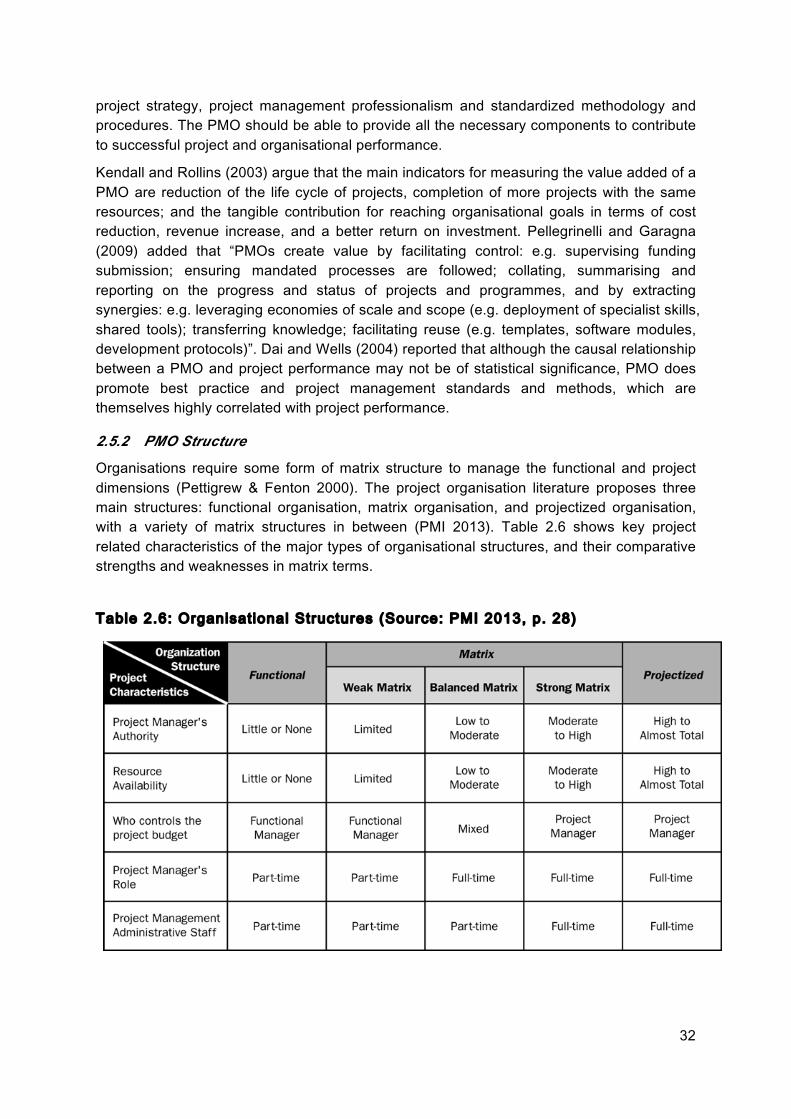
32
project strategy, project management professionalism and standardized methodology and procedures. The PMO should be able to provide all the necessary components to contribute to successful project and organisational performance.
Kendall and Rollins (2003) argue that the main indicators for measuring the value added of a PMO are reduction of the life cycle of projects, completion of more projects with the same resources; and the tangible contribution for reaching organisational goals in terms of cost reduction, revenue increase, and a better return on investment. Pellegrinelli and Garagna (2009) added that “PMOs create value by facilitating control: e.g. supervising funding submission; ensuring mandated processes are followed; collating, summarising and reporting on the progress and status of projects and programmes, and by extracting synergies: e.g. leveraging economies of scale and scope (e.g. deployment of specialist skills, shared tools); transferring knowledge; facilitating reuse (e.g. templates, software modules, development protocols)”. Dai and Wells (2004) reported that although the causal relationship between a PMO and project performance may not be of statistical significance, PMO does promote best practice and project management standards and methods, which are themselves highly correlated with project performance.
2.5.2 PMO Structure
Organisations require some form of matrix structure to manage the functional and project dimensions (Pettigrew & Fenton 2000). The project organisation literature proposes three main structures: functional organisation, matrix organisation, and projectized organisation, with a variety of matrix structures in between (PMI 2013). Table 2.6 shows key project related characteristics of the major types of organisational structures, and their comparative strengths and weaknesses in matrix terms.
Table 2.6: Organisational Structures (Source: PMI 2013, p. 28)
Chapter 2 � Project Life Cycle and Organization
Organizational cultures often have a direct influence on the project. For example: x� A team proposing an unusual or high-risk approach is more likely to secure
approval in an aggressive or entrepreneurial organization x� A project manager with a highly participative style is apt to encounter
problems in a rigidly hierarchical organization, while a project manager with an authoritarian style will be equally challenged in a participative organization.
2.3.3 Organizational Structure The structure of the performing organization often constrains the availability of resources in a spectrum from functional to projectized, with a variety of matrix structures in between. Figure 2-6 shows key project-related characteristics of the major types of organizational structures.
Figure 2-6. Organizational Structure Influences on Projects
The classic functional organization, shown in Figure 2-7, is a hierarchy where each employee has one clear superior. Staff members are grouped by specialty, such as production, marketing, engineering, and accounting at the top level. Engineering may be further subdivided into functional organizations that support the business of the larger organization, such as mechanical and electrical. Functional organizations still have projects, but the scope of the project is usually limited to the boundaries of the function. The engineering department in a functional organization will do its project work independent of the manufacturing or marketing departments. When new product development is undertaken in a purely functional organization, the design phase, often called a design project, includes only engineering department staff. Then, when questions about manufacturing arise, they are passed up the organizational hierarchy to the department head, who consults with the head of the manufacturing department. The engineering department head then passes the answer back down the hierarchy to the engineering functional manager.
A Guide to the Project Management Body of Knowledge (PMBOK® Guide) Third Edition
28 �2004 Project Management Institute, Four Campus Boulevard, Newtown Square, PA 19073-3299 USA
33
In a functional organisation, each employee has one clear superior and is often grouped (into a ‘team’) by specialty, such as production, marketing, engineering, and accounting. The functional organisation’s scope of project is usually limited to the boundaries of the function. Conversely, team members within a project-based organisation are often co-located. Most of the projectised organisation’s resources are involved in project work, and project managers have a great deal of independence and authority.
The PMO is a centre of intelligence (in the sense of news, information) and coordination, which allows a link between the strategic business objectives and the related practical results through organisational portfolio, program and project management (Kendall & Rollins 2003). However the lack of consensus on desirable PMO structure and the roles organisations undertake may prevent the establishment of formal standards for PMOs. Instead, flexible guidelines (associated with a model) may be more useful.
The Gartner Group (Light & Berg 2000) proposed three roles for the maturing PMO: PMO as a repository, where the custodians of the project methodology are not directly involved in the decision-making process; PMO as a coach which provides guidance on projects, may support project planning, monitors and reports on projects but does not order corrective action; and PMO as a manager which operates as an agent of senior management, manages the project portfolio and master resource plan, reviews project proposals and is accountable for the portfolio.
Kendall and Rollins (2003) present four categories of PMOs: strategic (SPO – Strategic Project Office) for the identification, selection and prioritization of projects, in conjunction with the organisational strategic planning; directive (PMO – Program Management Office) for the definition of guidelines, standards and templates to the application of PM best practices, tools, techniques and software in PM processes; support (PSO – Project Support Office) to provide support for the application of PM best practices, tools, techniques and software in PM processes; and hybrid, which is the combination of two or three of the above-mentioned classes of PMO. Archibald (2003) classified organisations into two types: organisations that offer a service of project management for external clients (type I) and organisations where project management is not their core business and where projects are a means for other business objectives (type II). Effective PMO models would need to consider and adopt the proposed PMO roles and categories.
The implementation of a PMO often has an impact on the internal system of power within an organisation (Crawford & Cabanis-Brewin 2010). This is more prevalent in organisations having internal clients, as the PMO and business units clash in struggles for control over projects. The image of a PMO with internal customers is likely to be “one of a less powerful PMO working in a culture that is not particularly supportive of project management but that provides policies and methods that are followed on projects” (Hobbs & Aubry 2008). PMOs with external project customers hold more decision-making authority than those with internal project customers (Aubry, Hobbs et al. 2011). Top management support and project leadership were noted to be two of the project key CSFs and characteristics that impact project performance in Singapore. This seems to suggest that the PMO in Singapore is more suited for the role of manager with substantive authority deriving from stakeholders’ buy-in. PMO for Financial IT projects in Singapore can fall either into the category of strategic or directive depending on the organisation’s executive commitment to project management.

34
Hobbs and Aubry (2007) conducted descriptive surveys of 502 PMOs aimed at identifying characteristics that are associated with high and low performing PMOs. They investigated the relationships between the descriptive characteristics of PMOs and PMO performance. The performance of PMOs was measured by analysing the survey responses on the PMO’s legitimacy and impact on the performance of projects and programs within the organisation. The researchers identified six interrelated variables as shown in Table 2.7; four describing structural characteristics of PMOs: decision-making authority of the PMO, percentage of projects within the mandate of the PMO, percentage of project managers within the PMO and total number of important functions; and two describing the organisational context: maturity in project management and supportiveness of organisational culture. Given the relevance of the surveys, all six variables were considered as possible attributes of the PMO model.
Table 2.7: Key PMO characterist ics impacting PMO performance (Adapted from Hobbs & Aubry 2007, p. 68)
Structural Characterist ics Organisational Context
1. Decision-making authority of the PMO
2. Percentage of projects within the
mandate of the PMO
3. Percentage of project managers within
the PMO
4. Total number of important functions.
1. Maturity in project management
2. Supportiveness of organisational culture
According to Hobbs and Aubry, PMOs with more decision-making authority and more projects and project managers tend to be found more in organisations that are mature in project management and have a supportive organisational culture. PMOs with these characteristics and in these organisational contexts tend to perform better than other PMOs. The position of staff within the structure of the PMO defines the level of accountability for project results. Organisations can choose to place all, some, or none of their project managers within the PMO. An example of PMO without project managers can be a project support office consisting of only project clerks providing administrative support. Organisations can determine the projects to include in the PMO’s mandate by categorizing projects for different purposes. The question as to what projects and project managers to put in a PMO is an important organisational design issue likely to have important consequences for the PMO and the organisation. These two structural characteristics of the PMO, together with the level of decision-making authority are often more amenable as compared to the organisational context variables as they are more amenable to managerial control. Organisational context variables can only be changed very slowly, with significant effort and resources (Hobbs & Aubry 2007). This means that it is easier for the organisation to change the projects, project managers and project managers’ authority by modifying the PMO’s structure than raising the level of its project management maturity or support within the organisation.
PMOs can change their structure frequently and it is highly plausible that it is the internal dynamics of the organisation that are driving the implementations and frequent

35
reconfigurations of PMOs (Hobbs & Aubry 2010). For example, the Australian and New Zealand division of the international Ericsson Company first established its PMO based on the Project Support Office structure. The activities that the PMO was responsible for included: owning and institutionalising the use of the project management process, setting standards, benchmarking the level of competence and process maturity in project management, centralising and developing project managers, owning the project management profession, the certification of project managers, and alignment of the PMO with business goals. The PMO was initially perceived as a threat by company managers and had to continuously justify its position within the organisation. This was overcome by clear, consistent communication of its role to the rest of the organisation. The PMO later moved towards the Program Management Office structure by taking on the function of portfolio management with a set of Balanced Scorecard (BSC) measures linked directly to the main company’s BSC. It took on responsibility for more activities including: ensuring project managers’ adherence to process through reviews and facilitation, reporting of projects to management and managing forecast loads. The PMO was slowly exerting more influence upon the organisation to push further into project performance and impinge upon organisational competence. On the wave of an organisation restructuring and a better-looking BSC, the PMO took on services that tended towards that of a Strategic Project Office. It became accountable to support sales team and estimates, delivering agreed margin and benefits, and providing business support.
Cartwright and Walker (2008) reported that top management support was found to be critical to the success to the Australian and New Zealand Ericsson company (ANZA) PMO and so was the decision to centralise the project managers with users paying for the service of a project manager only if he or she was employed on a project
This reaffirms that PMOs change their structure based on the organisation’s needs where each structure brings about its own issues, and communication of its role and stakeholders’ buy-in is critical.
2.5.3 Impact of Organisation Maturity on PMO
The maturity of the organisation with respect to its project management system, culture, style, organisational structure and PMO structure can influence the delivery of the project (PMI 2013). Project maturity is an indication of the organisation’s ability to implement and use projects for different purposes, which develops through a maturity ladder where the ladder steps are proposed to be increasing capability in project management, program management, and portfolio management. Maturity can measured along three dimensions, which are knowledge (capability to carry out different tasks), attitudes (willingness to carry them out), and actions (actually doing them) (Andersen & Jessen 2003).
Several models are used to determine the maturity levels of organisations. The maturity models are useful because they enable the PMO to evolve towards more efficient models with high levels of standardisation and continual improvement (Carrillo et al. 2010). A widely accepted way to measure the level of project management maturity is to use the Capability Maturity Model (CMM) developed by the Software Engineering Institute of Carnegie Mellon University between 1986 and 1993 (Cooke-Davies & Arzymanow 2003). CMM proposes five levels as shown in Figure 2.8 through which an organisation is expected to progress: initial level, repeatable level, defined level, managed level, and optimized level. It is a process
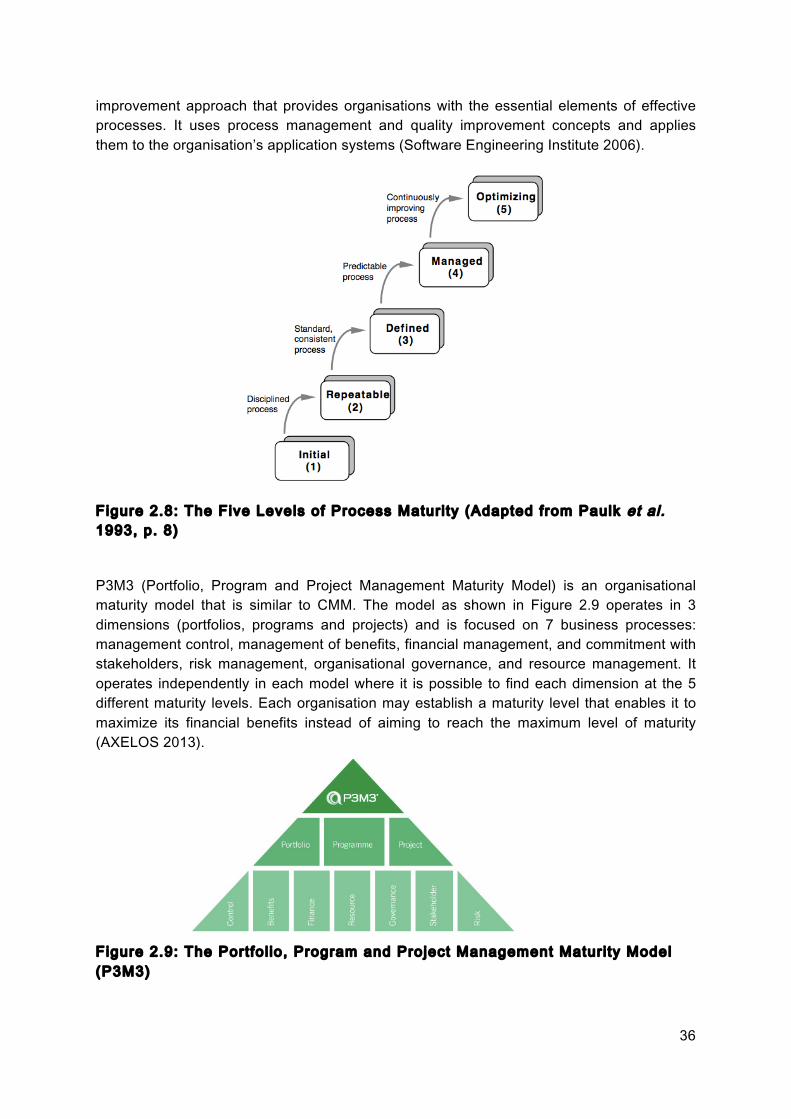
36
improvement approach that provides organisations with the essential elements of effective processes. It uses process management and quality improvement concepts and applies them to the organisation’s application systems (Software Engineering Institute 2006).
Figure 2.8: The Five Levels of Process Maturity (Adapted from Paulk et al. 1993, p. 8)
P3M3 (Portfolio, Program and Project Management Maturity Model) is an organisational maturity model that is similar to CMM. The model as shown in Figure 2.9 operates in 3 dimensions (portfolios, programs and projects) and is focused on 7 business processes: management control, management of benefits, financial management, and commitment with stakeholders, risk management, organisational governance, and resource management. It operates independently in each model where it is possible to find each dimension at the 5 different maturity levels. Each organisation may establish a maturity level that enables it to maximize its financial benefits instead of aiming to reach the maximum level of maturity (AXELOS 2013).
Figure 2.9: The Portfol io, Program and Project Management Maturity Model (P3M3)
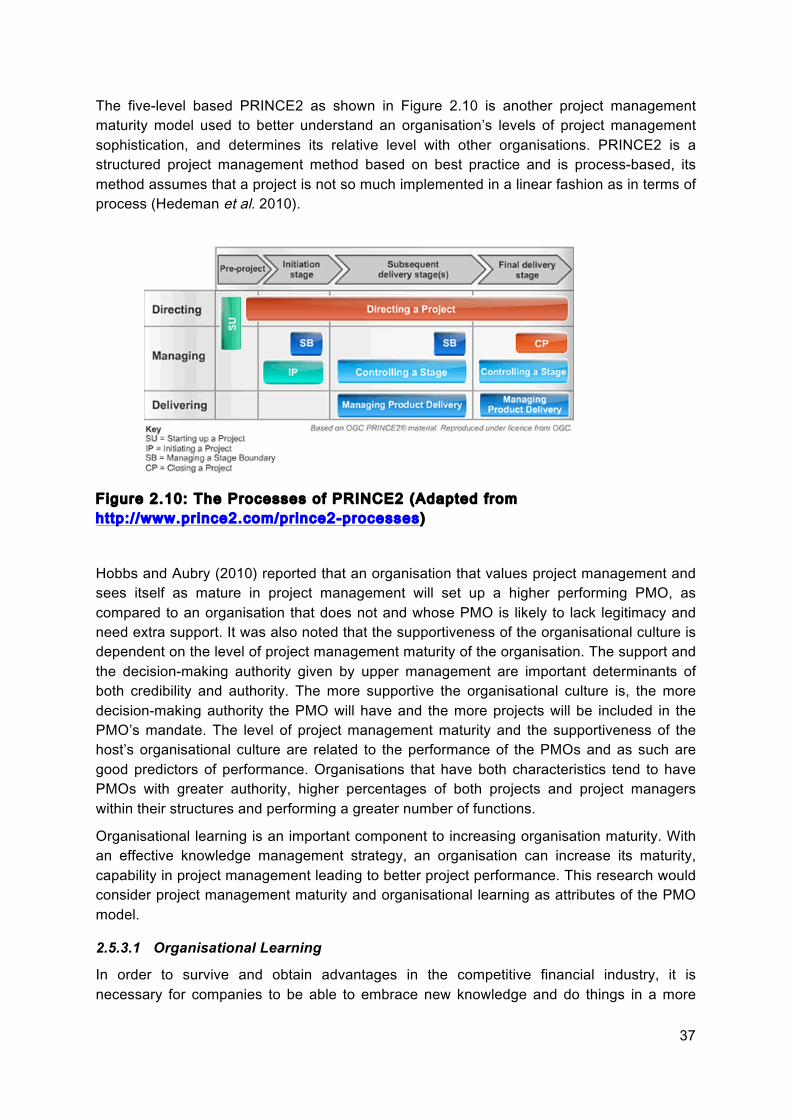
37
The five-level based PRINCE2 as shown in Figure 2.10 is another project management
maturity model used to better understand an organisation’s levels of project management
sophistication, and determines its relative level with other organisations. PRINCE2 is a
structured project management method based on best practice and is process-based, its
method assumes that a project is not so much implemented in a linear fashion as in terms of
process (Hedeman et al. 2010).
Figure 2.10: The Processes of PRINCE2 (Adapted from
http://www.prince2.com/prince2-processes)
Hobbs and Aubry (2010) reported that an organisation that values project management and
sees itself as mature in project management will set up a higher performing PMO, as
compared to an organisation that does not and whose PMO is likely to lack legitimacy and
need extra support. It was also noted that the supportiveness of the organisational culture is
dependent on the level of project management maturity of the organisation. The support and
the decision-making authority given by upper management are important determinants of
both credibility and authority. The more supportive the organisational culture is, the more
decision-making authority the PMO will have and the more projects will be included in the
PMO’s mandate. The level of project management maturity and the supportiveness of the
host’s organisational culture are related to the performance of the PMOs and as such are
good predictors of performance. Organisations that have both characteristics tend to have
PMOs with greater authority, higher percentages of both projects and project managers
within their structures and performing a greater number of functions.
Organisational learning is an important component to increasing organisation maturity. With
an effective knowledge management strategy, an organisation can increase its maturity,
capability in project management leading to better project performance. This research would
consider project management maturity and organisational learning as attributes of the PMO
model.
2.5.3.1 Organisational Learning
In order to survive and obtain advantages in the competitive financial industry, it is
necessary for companies to be able to embrace new knowledge and do things in a more
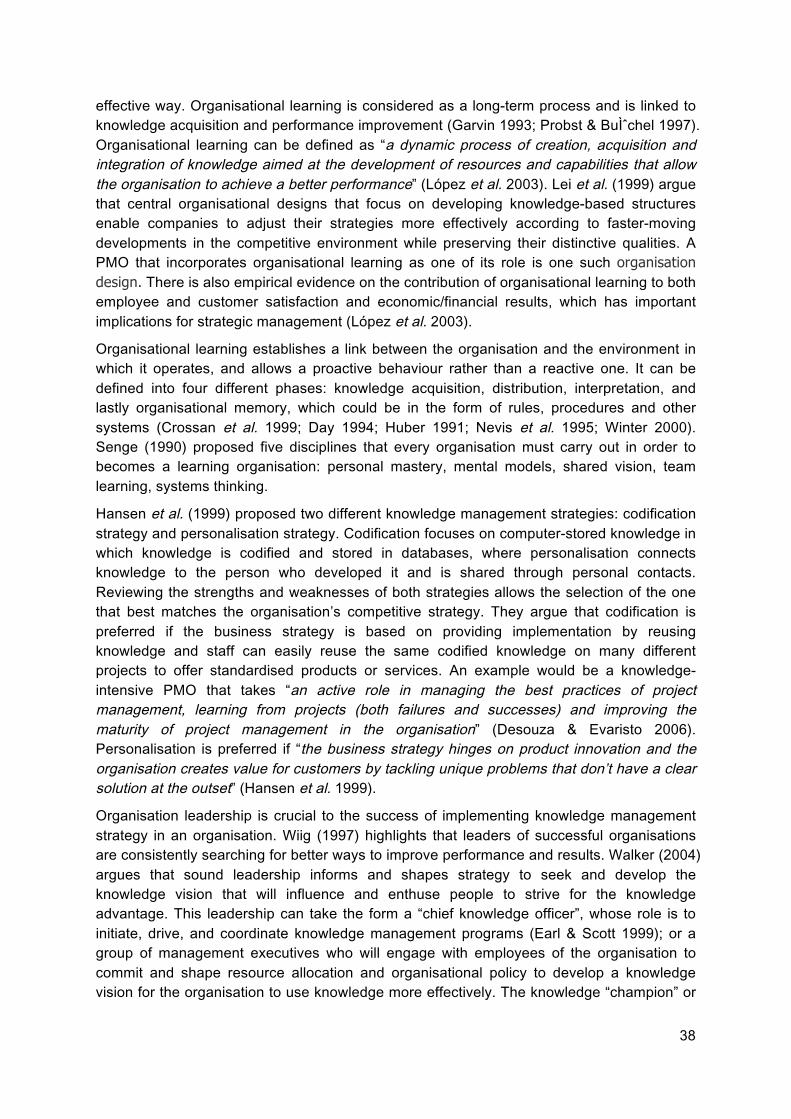
38
effective way. Organisational learning is considered as a long-term process and is linked to knowledge acquisition and performance improvement (Garvin 1993; Probst & Büchel 1997). Organisational learning can be defined as “a dynamic process of creation, acquisition and integration of knowledge aimed at the development of resources and capabilities that allow the organisation to achieve a better performance” (López et al. 2003). Lei et al. (1999) argue that central organisational designs that focus on developing knowledge-based structures enable companies to adjust their strategies more effectively according to faster-moving developments in the competitive environment while preserving their distinctive qualities. A PMO that incorporates organisational learning as one of its role is one such organisation design. There is also empirical evidence on the contribution of organisational learning to both employee and customer satisfaction and economic/financial results, which has important implications for strategic management (López et al. 2003).
Organisational learning establishes a link between the organisation and the environment in which it operates, and allows a proactive behaviour rather than a reactive one. It can be defined into four different phases: knowledge acquisition, distribution, interpretation, and lastly organisational memory, which could be in the form of rules, procedures and other systems (Crossan et al. 1999; Day 1994; Huber 1991; Nevis et al. 1995; Winter 2000). Senge (1990) proposed five disciplines that every organisation must carry out in order to becomes a learning organisation: personal mastery, mental models, shared vision, team learning, systems thinking.
Hansen et al. (1999) proposed two different knowledge management strategies: codification strategy and personalisation strategy. Codification focuses on computer-stored knowledge in which knowledge is codified and stored in databases, where personalisation connects knowledge to the person who developed it and is shared through personal contacts. Reviewing the strengths and weaknesses of both strategies allows the selection of the one that best matches the organisation’s competitive strategy. They argue that codification is preferred if the business strategy is based on providing implementation by reusing knowledge and staff can easily reuse the same codified knowledge on many different projects to offer standardised products or services. An example would be a knowledge-intensive PMO that takes “an active role in managing the best practices of project management, learning from projects (both failures and successes) and improving the maturity of project management in the organisation” (Desouza & Evaristo 2006). Personalisation is preferred if “the business strategy hinges on product innovation and the organisation creates value for customers by tackling unique problems that don’t have a clear solution at the outset” (Hansen et al. 1999).
Organisation leadership is crucial to the success of implementing knowledge management strategy in an organisation. Wiig (1997) highlights that leaders of successful organisations are consistently searching for better ways to improve performance and results. Walker (2004) argues that sound leadership informs and shapes strategy to seek and develop the knowledge vision that will influence and enthuse people to strive for the knowledge advantage. This leadership can take the form a “chief knowledge officer”, whose role is to initiate, drive, and coordinate knowledge management programs (Earl & Scott 1999); or a group of management executives who will engage with employees of the organisation to commit and shape resource allocation and organisational policy to develop a knowledge vision for the organisation to use knowledge more effectively. The knowledge “champion” or

39
activist approach has been defined as “a manager with broad social and intellectual vision as well as experience in the nitty-gritty business operations, someone who connects external and internal knowledge initiatives and mobilizes workers throughout the Organisation” (von Krough et al. 2000).
Another major factor that influences the creation of knowledge is how people are engaged and enabled; people need incentives to participate in knowledge sharing (Hansen et al. 1999; Stewart 2000). Karlsen and Gottschalk (2004) presented empirical research studying factors affecting knowledge transfer in information technology (IT) projects. Their research results show that total project success relates to the extent of a facilitating culture for effective knowledge transfer. In Singapore, it is a challenge to influence project managers’ behavior to knowledge creation, sharing and use, where culture and top management support are critical. However, from personal experience in managing IT projects, the relationship between project success and effective knowledge transfer has not been observed. Nor is the relationship apparent in the CSFs identified in the literature relating to Singapore projects. This could be due to the research context of Dai and Wells (2004) since their study was conducted in Norway, or perhaps to the low survey response rate of 6.5% which resulted in unclear conclusions.
2.5.4 PMO Roles and Functions
PMOs can take on a variety of roles based on the context of the organisation, and organisational design choices create PMOs of varied form and function. The roles of the PMO should be established based on the characteristics of the organisation and that which is expected from human resources.
Hobbs and Aubry (2007) identified 27 key functions that form the mandates of PMOs and measured their perceived importance for project success. According to the authors, the three functions rated by PMOs to be most important are: reporting projects status to upper management, developing and implementing a standard methodology, and monitoring and controlling project performance. Table 2.8 shows some of their research findings, with eight groups of functions presented in decreasing order of perceived importance for the first five groups.

40
Table 2.8: Eight groups of PMO key functions (ranked by decreasing level of perceived importance by survey respondents for Groups 1 -5) (Adapted from Hobbs & Aubry 2007) and key roles (Adapted from Carri l lo et al. 2010)
Group Name Key Functions proposed by Hobbs and Aubry
Key Roles proposed by Carri l lo et al.
1 Monitoring and controlling project performance
• Report project status to upper management
• Monitor and control project performance • Implement and operate a project
information system • Develop and maintain a project
performance scoreboard
• Control of scope • Follow-up of: chronogram,
costs, risks, quality
2 Development of project management competencies and methodologies
• Develop and implement standard methodologies
• Promote project management within the organisation
• Develop competency of personnel, including training
• Provide mentoring for project managers • Provide a set of tools without an effort to
standardize
• Provide processes, templates and tools
3 Multi-project management
• Coordinate between projects • Identify, select, and prioritize new
projects • Manage one or more portfolios • Manage one or more programs • Allocate resources between projects
• Support project managers • Manage resources and
guarantee the equal provision of agreements with the organisational priorities
4 Strategic management
• Provide advice to upper management • Participate in strategic planning • Manage benefits • Networking and environmental scanning
• Validate the aligning of the projects with the business strategy
• Provide status indicators and use of resources
5 Organisational learning
• Monitor and control the performance of the PMO
• Manage archives of project documentation
• Conduct post-project reviews • Conduct project audits • Implement and manage a database of
lessons learned • Implement and manage a risk database
• Train the project managers in project management practices
• Provide training in project management and methodology
6 Execute specialized tasks for PMs
• Preparation of schedules • Contract management • Risk management
• Generate indicators geared toward results obtained- based on business value
• Ensure that the project results are meaningful and in accordance with the established scope
7 Manage customer interfaces
• Manage outsourcing contracts • Multiple Level Communications Centre
8 Manage PM HR related matters
• Recruit, select, evaluate and determine salaries for project managers
41
Each group is independent from the other such that an organisation designing a PMO has eight groups to choose from, and the choice of one group does not constrain the choice of other groups. Carrillo et al. also described some roles that the PMO may undertake based on requirements which are embedded in Table 2.8 (Carrillo et al. 2010). It is noted that organisational and strategic context have to be considered when deciding which functions to include within the mandate of a particular PMO. PMOs that fill multiple functions that are in line with management’s vision are more likely to be better perceived (Hobbs & Aubry 2007). For a PMO to remain feasible, it is important that it is always aligned with the objectives and organisational strategy (Carrillo et al. 2010).
2.5.5 PMO Typology
Typologies for PMOs are proposed by different authors in the literature to characterise the different properties of PMOs (Crawford & Cabanis-Brewin 2011; Dinsmore 1999; Englund et al. 2003; Hobbs & Aubry 2007; Kendall & Rollins 2003; Light & Berg 2000). The most common types of PMOs described in the literature proposed three or four models (Aubry, Müller et al. 2010).
Rad and Levin (2002) introduce the project-focused tasks for a PMO, which involve consultation, mentorship, and augmentation, and the enterprise-oriented tasks, which include promotion, archiving, practice, and training. Santosus (2003) suggest two basic configurations of a PMO: one that acts in a consulting capacity, providing project managers with training, guidance, and best practices; and a centralised version, with project staff outsourced to business units to execute various IT projects. Another model implements PMOs based on three distinct levels of the parent organisations: the project control office, which is designed for a single strategic initiative or program; the business unit PMO, which is designed for a business or functional unit; and the Strategic/Enterprise PMO, which is designed to be implemented across an organisation's entire enterprise (PM Solutions 2004). Letavec (2006) differentiates PMO as a consulting organisation, a knowledge organisation, and a standards organisation. Artto et al. (2011) categorise the tasks of a PMO into: managing practices, providing administrative support, monitoring and controlling projects, training and consulting, and evaluating, analysing and choosing projects. Müller et al. (2013) propose a three-dimensional role space with super-ordinate, subordinate, and co-equal identified as roles in a framework of servicing, controlling, and partnering in organisation. The framework enables the locating of complex relational profiles that PMOs take on with respect to their stakeholders in practice. Hill (2014) presents five distinctive PMO tasks: practice management, infrastructure management, resource integration, technical support, business alignment.
Each of the typologies basically comprises a model of a PMO that attempts to simplify and reduce the complexities of organisational reality. This simplification often results in a spectrum where at one end the PMO will have ‘minimal staff and no direct control over the management of individual projects’ and at the other end, the PMO will have a ‘large complement of full time project managers and direct control over individual projects’ (Singh et al. 2009). The PMO-light model Singh and Keil et al. proposed plays a passive, supporting role, creating standards for project implementation and acting as a project information repository. This can transit along the spectrum to a PMO-heavy model playing a more proactive role and which is fully responsible for the outcome of projects.
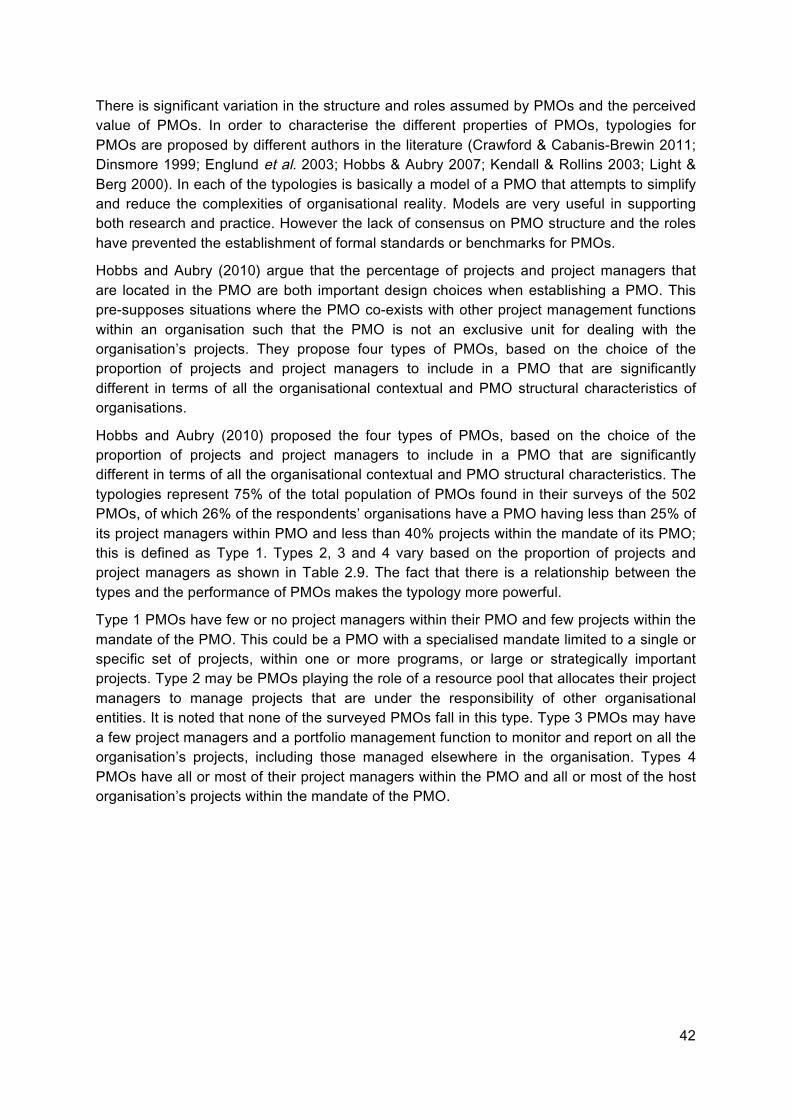
42
There is significant variation in the structure and roles assumed by PMOs and the perceived value of PMOs. In order to characterise the different properties of PMOs, typologies for PMOs are proposed by different authors in the literature (Crawford & Cabanis-Brewin 2011; Dinsmore 1999; Englund et al. 2003; Hobbs & Aubry 2007; Kendall & Rollins 2003; Light & Berg 2000). In each of the typologies is basically a model of a PMO that attempts to simplify and reduce the complexities of organisational reality. Models are very useful in supporting both research and practice. However the lack of consensus on PMO structure and the roles have prevented the establishment of formal standards or benchmarks for PMOs.
Hobbs and Aubry (2010) argue that the percentage of projects and project managers that are located in the PMO are both important design choices when establishing a PMO. This pre-supposes situations where the PMO co-exists with other project management functions within an organisation such that the PMO is not an exclusive unit for dealing with the organisation’s projects. They propose four types of PMOs, based on the choice of the proportion of projects and project managers to include in a PMO that are significantly different in terms of all the organisational contextual and PMO structural characteristics of organisations.
Hobbs and Aubry (2010) proposed the four types of PMOs, based on the choice of the proportion of projects and project managers to include in a PMO that are significantly different in terms of all the organisational contextual and PMO structural characteristics. The typologies represent 75% of the total population of PMOs found in their surveys of the 502 PMOs, of which 26% of the respondents’ organisations have a PMO having less than 25% of its project managers within PMO and less than 40% projects within the mandate of its PMO; this is defined as Type 1. Types 2, 3 and 4 vary based on the proportion of projects and project managers as shown in Table 2.9. The fact that there is a relationship between the types and the performance of PMOs makes the typology more powerful.
Type 1 PMOs have few or no project managers within their PMO and few projects within the mandate of the PMO. This could be a PMO with a specialised mandate limited to a single or specific set of projects, within one or more programs, or large or strategically important projects. Type 2 may be PMOs playing the role of a resource pool that allocates their project managers to manage projects that are under the responsibility of other organisational entities. It is noted that none of the surveyed PMOs fall in this type. Type 3 PMOs may have a few project managers and a portfolio management function to monitor and report on all the organisation’s projects, including those managed elsewhere in the organisation. Types 4 PMOs have all or most of their project managers within the PMO and all or most of the host organisation’s projects within the mandate of the PMO.
43
Table 2.9: Four types of PMO based on the percentage of project managers and the percentage of projects within the PMO’s mandate (Adapted from Hobbs & Aubry 2010, p. 87)
Type (Survey Frequency
Percentage)
Percent of project managers within PMO
Percent of projects within mandate
1 (26%) Less than 25% Less than 40%
2 (5%) More than 75% Less than 40%
3 (14%) Less than 25% More than 60%
4 (30%) More than 75% More than 60%
Müller et al. (2013) suggested multiple PMOs within an organisation and developed a relational typology of PMOs based on their roles with stakeholders. The researchers identified super-ordinate, subordinate, and co-equal as roles in a framework of servicing, controlling, and partnering in organisations. While servicing (subordinate role profile) and controlling (super-ordinate role profile) support organisational effectiveness and exploitation of knowledge, partnering (co-equal role profile) creates the slack necessary for potential exploration of new knowledge.
The literature shows that there is significant variation in the structure, roles and functions assumed by PMOs. A host organisation should consider structural variables when designing and establishing a PMO, and organisational variables are related to the performance of the PMO and thereby act as predictors. With the complicated and complex contexts of the PMOs, this thesis takes a Cynefin Framework perspective (later explicated in section 6.4) to increase the theoretical understanding of the impact of the complicated and complex contexts that may be emerging in Singapore.
2.6 Project Manager Competencies
Project management is defined as the application of knowledge, skills, tools and techniques to project activities to meet project requirements (PMI 2013). Deriving from methodologies and frameworks of organisations, project management is about the management of resources and processes to achieve the desired project outcomes and goals. A project team usually does not comprise of just a single person, but rather a number of project participants who perform the work required for the successful completion of a project. Project management is perhaps more about managing project participants, than managing projects. This can be very challenging since each project participant is a unique individual with different competencies and proprieties.
Kotter (2009) argues that “managers promote stability while leaders press for change, and only organisations that embrace both sides of that contradiction can thrive in turbulent times”. Managers and leaders are two very different types of people. Managers' goals arise out of necessities rather than desires; they excel at diffusing conflicts between individuals or

44
departments, placating all sides while ensuring that an organisation's day to day business
gets done. Leaders, on the other hand, adopt personal, active attitudes towards goals. They
look for the potential opportunities and rewards that lie around the corner, inspiring
subordinates and firing up the creative process with their own energy. Businesses must find
ways to train good managers and develop leaders at the same time to survive and succeed.
Without a solid organisational framework, leaders with the most brilliant of ideas may
accomplishing little; but without the entrepreneurial culture that develops when a leader is at
the helm of an organisation, a business will stagnate, and rapidly lose competitive power
(Zaleznik 1992).
The managerial challenge is to “improve the process of knowledge acquisition, integration and utilization, but any improvement must stem from an understanding of the ways in which knowledge is currently acquired and harnessed within the organisation” (Jordan & Jones
1997).
Project management involves the management of resources, especially human resources, to
achieve the desired project outcomes and goals. Human resources rarely comprise of just a
single person, but rather a number of project participants who work as a team to perform the
work required for the successful completion of a project. Project management is thus as
much about managing project participants and teams, as managing projects. This can be
challenging since each project participant is a unique individual with different competencies,
behaviours, traits and attitudes. The inter-relationships between team members are also
variable.
This significance is also apparent in surveys attempting to measure project management
success. Kerzner (1987) identified six Critical Success Factors (CSF) for project
management excellence. These include: corporate understanding of project management,
executive commitment to project management, organisational adaptability, project manager
selection criteria, project manager’s leadership style and commitment to planning and control.
In Table 2.10, these factors are compared with the findings of two surveys (1994 and 2000)
of IT executive managers on the factors that are critical to their project success, conducted
by the Standish Group International, based on its extensive database of information systems
(IS) projects (Standish Group International 2001).
Table 2.10: Top four project success factors in 1994 and 2000 (Standish
Group International 2001) compared with Crit ical Success Factors (CSF) from
Kerzner (1987)
Top Four
Success
Factors
Year 1994 Year 2000 Crit ical Success Factors (CSF)
(Kerzner 1987)
1 User Involvement Executive Support Corporate understanding of project
management, executive commitment to
project management, organisational
adaptability, project manager selection
criteria, project manager’s leadership style
and commitment to planning and control.
2 Executive Support User Involvement
3 Clear Business
Objectives
Experienced
Project Manager
4 Experienced
Project Manager
Clear Business
Objectives
45
The compiled list shows that the competence and experience of the project manager are common project success factors evident in academic surveys. Turner and Müller (2005) concluded that the project manager’s leadership style influences project success and different leadership styles are appropriate for different types of project. The research findings emphasize the importance of good leadership in achieving project success. A project manager needs to be competent in managing both the behavioral (in the sense of stakeholder behaviours) and technical aspects of the project (Kezsbom 1988; Loo 2003; Posner 1987; Smith 1999; Thamhain 2004). These researchers all find that management skills are more significant in ensuring the success of a project, compared to purely technical skills, as project managers are usually required to manage team members across a matrix structure. The design of a PMO should thus consider how different competence profiles are appropriate for different project types, and how these might relate to desired leadership and stakeholder management styles, in order to assign project managers more effectively.
In managing the behavioral aspect of the project participants, project leadership is found to be the only significant predictor of both team and project performance (Ammeter & Dukerich 2002; Bubshait & Farooq 1999). To effectively pursue the complex, multidisciplinary efforts that characterise much of the project work, the necessary qualities of leadership, managerial competency, analytical competency, integrative competency, collaborative competency and organisational know-how are involved (Donnelly & Kezsbom 1994).
Besides the competence and experience of the project manager, Thal and Bedingfield (2010) argued that some aspects of personality do indeed seem to predict project management success. The emotional intelligence (EI) of the project manager as the leader of the project team has a big impact on the success of a leader and the performance of the team (Goleman et al. 2002). EI was initially defined as a sub-set of social intelligence and was described as the ability to reason about a particular type of information as follows: “The ability to perceive accurately, appraise, and express emotion; the ability to access and/or generate feelings when they facilitate thought; the ability to understand emotion and emotional knowledge; and the ability to regulate emotions to promote emotional and intellectual growth” (Mayer & Salovey 1997). It was later suggested to be particularly important in projects due to its nature and their importance to successful project outcomes (Clarke 2010).
Studies of IT projects have consistently shown that interpersonal conflicts between users and IT programmers can ultimately lead to project failure despite the existence of a high level of financial and management support (Sanford & Bhattacherjee 2007). In a post-mortem examination of failed IT projects, Kappelman et al. revealed that interpersonal conflicts and uncertain requirements are two significant symptoms (Kappelman et al. 2006). Requirements uncertainty is a process-related symptom that is often caused by communication breakdowns or a lack of process controls. Avoiding interpersonal conflicts can either strengthen or undermine the commitment of users to project success (Liu et al. 2011; Pan et al. 2006) This suggests that managing the conflict between users and the IS team is imperative to the success of an IT project where conflict management is usually performed by the project manager (PMI 2013). Emotional intelligence is one of the key strengths in helping project managers to successfully manage conflict, especially where there is scope for misunderstanding and miscommunication arising from cross-cultural projects (Druskat & Druskat 2012).
46
2.6.1 Relationship management
Project stakeholders are individuals and organisations that are actively involved in the project, or whose interests may be affected as a result of project execution or project completion. They may also exert influence over the project’s objectives and outcomes. A key stakeholder is the project sponsor, defined as the individual or group within or external to the performing organisation that provides the financial resources, in cash or in kind, for the project. The project sponsor is the primary risk taker for the project (PMI 2013).
Stakeholder theory proposes that the successful completion of project deliverables is critically dependent upon relationship management skills, amongst these the need to achieve project objectives that fully address stakeholder expectations throughout the project life cycle (Cleland 1999). This relationship management skill includes the ability to understand the often hidden power and influence of various stakeholders. This ability is considered a critical skill for successful project managers. Stakeholders play an important role in the success of a project. Project managers are unlikely to deliver project success without paying attention to the expectations and needs of people or entities who are key influence drivers and the diverse range of project stakeholders that may cumulatively exert a significant impact on the perception of project success. Identification of stakeholders and mapping of their power and influence is a key risk-management issue for project managers. Effective project managers require keen analytical and intuitive skills to identify high-impact and cumulative-impact stakeholders, and to work with them to understand their expectations to influence project success (Walker et al. 2008).
In an investigation of five project case studies involving IT implementations, senior management support is identified as the only clear factor influencing project success (Young 2005). To successfully deliver projects, therefore, requires effective management of relationships among these stakeholders to elicit their contributions and cooperation, while, at the same time, maintaining progress toward the project’s goal (Beath & Orlikowski 1994; Walz et al. 1993). Good stakeholder management can improve the chances of project success by de-scoping performance objectives to a more achievable level, negotiating less stringent deadlines, and obtaining additional resources for undertaking the project. Such project management activities, typically requires stakeholder consensuses, buffer the project from risk drivers and ensure that they are not significant to begin with (Kirsch 1997).
2.6.2 Technical skills
IT projects can broadly include software development, system integration, IT software and hardware procurement, maintenance, infrastructure, network, and IT security systems. In a project that contains an IT deliverable, the technical skills and knowledge of technology of the assigned IT project managers are critical to the project success (Wateridge 1997). Technical skill implies an understanding of, and proficiency in, a specific kind of activity, particularly one that involves methods, processes, procedures or techniques (El-Sabaa 2001).
An IT project manager must be both a technologist and a project manager, with an understanding of a variety of technologies, and be capable of integrating several technologies when managing an application development. The knowledge of technology must be sufficient to help him or her to more quickly determine effective application designs, and be confident in planning a project (Godsave 1989). Successful project managers should

47
have relevant experience or knowledge of the technology required by the project they manage (El-Sabaa 2001). This understanding of technology is a necessary condition for project success where the level of sophistication is an important part of its authority (Daojin 2010).
The importance of technical skills and knowledge is supported by research in the area of information systems. A lack of required knowledge/skills was ranked as one of the top five risks that can affect the success of an IT project (Schmidt et al. 2001). Meredith and Mantel (2002) categorise the skills needed for a project manager into six skill areas: communication, organisational, team building, leadership, coping, and technological skills. Hartman and Ashrafi (2002) identify a list of 10 factors for Information Systems projects, which included appropriate technology and expertise as one of the factors.
Technology will change, but analytical, communication, and project management skills will remain essential (Koval 2011). What do change with time are the work ethics, values and perceptions of people from different generations. The effect of this generational change in project teams is discussed further in the following section.
In the literature, two critical success factors for PMOs are executive commitment to project management, and the project manager’s leadership (associated with project manager selection criteria and the characteristics of the project leader). The PMO should adopt guidelines that assign project managers to projects based on suitable competence profiles and which address the issues identified by the CSFs. This section identifies the need for competencies in handling highly complicated and complex contexts and that the use of the Cynefin Framework (later explicated in section 6.4) will be a new way to investigate the competencies of PMO staff.
2.7 Effect of generational change in project teams
Different studies have identified different time periods and different characteristics associated with human generations. There is no common definition of generations among studies in terms of the precise years of birth, but it is generally agreed that, in the current millennium there are four living generations, ranging from oldest to youngest: Veterans, Baby Boomers, Generation X, and Generations Y and Z (Anantatmula & Shrivastav 2012).
This dissertation uses the following time periods (based upon year of birth) shown in Table 2.11 for each generation in the 20th century and progressing into the 21st (Zemke et al. 2000).
Table 2.11: Definitions of Generations
Generation Years of birth Veterans 1922-1945 Baby Boomers 1946-1964 Generation X 1965-1979 Generation Y 1980-2000 Generation Z 2001- Present Day
48
Most Veterans and many Baby Boomers have reached the age of retirement; while the relatively smaller population of Generation X (compared to the post-Second World War Baby Boomers) reflects the personal wealth focus in its formative years that has led to smaller families and slower rates of family formation. Although work values do change as the individuals mature, these generational experiences tend to influence work values more than age or maturation (Smola & Sutton 2002). This was already apparent when Generation X started entering the workforce, resulting in a strong antagonism between the generations in the workplace. Generation X was pigeonholed as lazy, cynical and all-but-illiterate whiners but they, on the other hand, perceived the preceding generation as smug workaholics who play corporate politics and who are out of touch with current economic realities (Filipczak 1994). Obviously, a qualitative difference with respect to work exists between the two generations. Sirias et al. suggested that Generation X is more individualistic and independent as compared to Baby Boomers (Sirias et al. 2007).
Understanding and respecting each generation’s different work styles and challenges are critical in retaining an engaged, successful workforce (Macon & Artley 2009; Simons 2009). More Generation Y members are currently in or entering the workforce as the generations comprising of Veterans (born between 1922 and 1945) and Baby Boomers (born between 1946 and 1964) retire and Generation X (born between 1965 and 1979) becomes older (Levack 2007). Generation Y is thought to bring to the workforce a different attitude in terms of work ethics, values, perceptions, and skill sets. Project managers will be tasked to address this generational diversity when building a cohesive project team as projects are managed using teams in a work environment that is complex with each project being unique, and team dynamics and organisational structures that are different (Smith 2001).
Generation Y participation in project teams presents a number of challenges and there is a need to understand the perceived characteristics of this generation; “capitalise on the strengths and minimise the impact of weaknesses of Generation Y in order to integrate its members into project teams effectively” (Anantatmula & Shrivastav 2012). The explanations offered that affect behaviours, communication approaches, and viewpoints between preceding generations and Generation Y are claimed to be life experiences and social trends. Generation Y has grown up with the Internet and is exposed to a vast array of media and educational opportunities in an increasingly globally connected world (Hammett 2007; O'Bannon 2001; Timmermann 2007). Compared to other generations, Generation Y has characteristics of being ethnically diverse (within an increasing number of countries), globally aware, independent, confident, technically adept, adaptable, innovative, efficient, resilient, tolerant, learner-centered and multitasking. However, at the same time this generation is thought to lack loyalty towards its employers; and to be impatient, de-sensitized, disengaged, skeptical, disrespectful, and bluntly expressive. They communicate mostly via social networking websites and text messaging (with little regard to potentially adverse consequences), expecting instant feedback and acknowledgement, and are sometimes thought to have a short attention span and poor communication and problem-solving skills (Crumpacker & Crumpacker 2007; Dahlroth 2008; Gursoy et al. 2008; Macon & Artley 2009; Spiro 2006). Some have a strong financial safety net, in the form of parental support and are considered more likely than previous generations to take risks, particularly in being willing to change jobs more frequently, and to challenge the status quo or voice concerns and opinions if they are uncomfortable with a decision. They do not blindly conform to

49
organisational standards (Chester 2002; Deal 2007; Dobbs et al. 2007; Gale 2007; Lyon et al. 2005).
Such behaviour can be attributed to this generation having grown up by being encouraged to question their parents and their teachers, and this “asking of tough questions of their employers is a natural extension of the way they have been raised” (Shaw & Fairhurst 2008). Generation Y is also found to demonstrate higher self-esteem, personal admiration, anxiety, depression, with lower need for social approval (except among its peers), and more external locus of control, compared to its predecessors (Twenge & Campbell 2008). While these are generalised traits, and not every individual will portray them, the characteristics claimed for Generation Y should not be ignored in the PMO context. At this time, however, the general traits of Generation Z have yet to emerge.
2.7.1 Incorporation of Generation Y into the PMO structure
One of the inter-generational findings is that Generation Y does not see a difference between work and life, and hence is more willing to work at anytime and in any place; they values flexibility and work-life integration (Stevenson 2008). This would make its members suitable for international projects that require support across different time zones. Generation Y are competitive in the workplace, enjoy challenges, and desire growth and recognition (Pooley 2005). Generation Y have met the basic needs in Maslow’s hierarchy of needs and are hence looking for self-actualization by choosing employers based on their ability to provide this need (Solnet & Hood 2008). Maslow's hierarchy of needs is a theory in psychology based on a classification of basic needs into five categories: physiological, safety and security, belongingness, esteem, and self-actualization (Maslow 1943). Generation Y put great importance in having meaning in their work and seek to make an important impact immediately on projects they are involved with (and upon society and the environment generally), while looking for immediate gratification and an opportunity to excel. The generations before Generation Y exhibit more patience in terms of similar needs to gratify and excel (Hurst & Good 2009; Spiro 2006).
As such, the role and responsibilities Generation Y staff are assigned in the PMO should be carefully defined and recognised. Ideally they should be given opportunities to quickly learn different segments of the organisation to see “the big picture” thereby making them valuable in the organisation. With each generation reporting themselves as less optimistic than the previous generation, Generation Y can be a group of increasingly negative and possibly cynical employees that require constant challenges in the workplace (Wong et al. 2008). Generation Y displays more issues working with Baby Boomers, as compared to working with Generation X, specifically in industries such as financial services, marketing, real estate, and the technology and utility sectors. This suggests that they may be age-intolerant to some extent. They try to minimise their struggles by demonstrating adaptability, team-orientation, technical skills, respect for diversity and multi-tasking (Anantatmula & Shrivastav 2012).
The value society places on ‘hard work’ shows a clear pattern of decline with younger generations, whereby the most important work value for Generation Y has been perceived as ‘leisure’. Generation Y value their non-work time, and while they want to enjoy work, they do not want it to dominate their lives; rather they want it to fund their lifestyle (Barron et al. 2007). As such, accommodation for Generation Y might need to include variable work

50
schedules and extended leave for study or travel, and even some choice regarding their
work situation (Cogin 2012).
Generation Y want frequent contact with their managers, although this can be via email or
text messaging (Herbison & Boseman 2009) rather than face-to-face. They also prefer
managers who know the tricks and the shortcuts, who can warn them of pitfalls, and help
them solve problems. They want managers to support them through bad days and counsel
them through difficult judgment calls (Tulgan 2011). They are different from Generation X
staff who prefer their managers to give them the responsibility and autonomy to determine
how to perform a job. Generation X are more natural innovators, they want to solve problems
independently in their own way (Dunn-Cane et al. 1999).
When designing a PMO, it is therefore imperative to consider the Generation Y factor such
that it would be able to engage people from different generations productively to complete
projects on time, within budget, and as per requirements. Wagner suggested that managers
should provide opportunities for the strengths of each generation to flourish, even to the
extent of deliberately creating mixed generational teams to bring different and varied skills to
the table (Wagner 2007). In order to consider the Generation Y factor, PMOs need to review
the differences among the various generations in the workforce within the context of project
management as projects are essentially managed using teams consisting of diverse groups
of people from different generations. The knowledge will also help organisational leaders in
making important decisions about human resource policies and practices (Sullivan et al. 2009). The behaviour diversity also presents an opportunity as customers also come in
different generational categories, the need for the teams to work together in a
multigenerational work environment will provide better customer service and satisfaction
(White 2006).
Suggestions for the PMO to effectively manage these differences offered by past research
studies include altering communications and management practices and providing a variety
of incentives choices, training, and mentoring programs (Deal 2007; O'Bannon 2001).
Assigning a mentor to assist the Generation Y in bridging the knowledge gap is important in
developing and managing project teams (McDonald 2006). Simons (2009) suggests
establishing reward structures that build management skills and harness the unique talents
of the different generations. Generation Y’s preference for gratification of immediate needs
suggests that its members may respond more positively to receiving more regular feedback
and recognition. Generation Y values inclusion and recognition, and thus it is desirable to
incorporate their participation, inclusion and recognition throughout the project management
lifecycle and more specifically in the project closeout phase where lessons learned are
captured and achievements of the project are recognised with reasonable, progressive
rewards built in (Cogin 2012; Pooley 2005). When Generation Y takes up a leadership role, it
will be worthwhile to formally “announce the new leadership to the project team and articulate the nature of this person’s new authority” regardless of how small the project or
how short the duration of the leadership role (Tulgan 2011).
The Tripartite Alliance for Fair Employment Practices (2010) reported that as Singaporeans
live and work longer, the age diversity of Singapore’s workforce will increase. Generation X
and Y now make up 60% of the Singapore workforce. Generation Y in Singapore is fast
moving and demands immediate results. With the average anticipated length of staff tenure
between two and four years, the PMO needs to manage the Generation Y effectively to
51
retain them. In order to achieve superior performance, a successfully managed PMO need to know how to deal with such diversity and exploit a wider pool of talent, which can contribute better results.
The design of the PMO should take into account the effect of introducing Generation Y into project teams, by validating the design input parameters in the Singapore context.
2.8 Contingency Theory
In a 2012 paper, Hanisch and Wald (2012) reported that the study of context factors in project management research is relatively new, even though organisation theory had been influenced by contingency theory and the notion of organisational fit since the 1950s. Donaldson (2001) argued that the value of the contingency theory paradigm was in the organisational effectiveness that resulted from fitting characteristics of the organisation, such as its structure, environment, organizational size and organizational strategy (Burns & Stalker 1961; Chandler 1962; Child 1975; Lawrence & Lorsch 1967; Woodward 1980). The contingency theory postulated that there is “one best way” to organise such that maximum organisational performance can come from the maximum level of a structural variable. The maximum performance is based on adopting the appropriate level and not maximum of the structural variable that fits the contingency (Taylor 1947). Donaldson (2001) defined a contingency is any variable that “moderates the effect of an organizational characteristic on organizational performance”.
The application of the contingency theory in project management research was discussed in section 2.2.4 where project context, and project success and failure were identified as critical success factors. The subsequent sections extended the contingency theory by including PMO structure, PMO roles and functions, project manager competencies and effect of generational change (environment). Hanisch and Wald (2012) noted that the most active contingency theory authors are from North American and European and there is value to apply the contingency theory to projects in Africa and Asia. The authors also suggested studying the contingency factors of other industries other than the popular, dominant construction industry. The proposition of this research follows the contingency theory that the fit of organisational characteristics in an optimised form of structure and role definitions for PMOs leads to high performance in IT project delivery within the financial industry.
2.9 Chapter Summary
Given the extensive research studies undertaken on the topic, it is clear that the professional-practitioner project management community is seeking best practice guidelines, and standards for PMOs. The intention of this dissertation is to develop a suitable model for PMOs for IT projects in Singapore financial industry.
The best way to set up a PMO is context-specific. This chapter has reviewed available literature to identify different design and management characteristics for PMOs, and the significance of each organisational context. The chapter began by defining project success. Traditionally, a project is considered successful when the project objectives are delivered within the constraints of the project - project scope, time and cost. However, more recent studies have proposed a more holistic appreciation of project success, differentiating
52
between project success and project management success, and integrating the main intent of a project as keeping the project stakeholders satisfied.
There is significant variation in the structure, roles and functions assumed by PMOs. For structural variables such as the decision-making authority of the PMO, the portion of projects within its mandate, and the total number of important functions related to the performance of PMOs, it would make sense for parent organisations to consider these when designing and establishing a PMO. Three important structural variables arise when designing a PMO: the percentage of project managers placed within a PMO, the percentage of the parent organisation’s projects included in its mandate, and the decision-making authority that is given to the PMO. Two organisational variables arise when designing a PMO: the level of project management maturity, and the supportiveness of the organisational culture are also both related to the performance of the PMO and thereby act as predictors. After considering the structural and organisational context for the PMO, it is then necessary to decide which functions to include within its mandate. Such functions may include: monitoring and controlling project performance, and development of project management competencies and methodologies.
The two critical success factors are identified from literature for PMOs: executive commitment to project management (associated with senior management support; and the project manager’s leadership (associated with project manager selection criteria and the characteristics of the project leader. A project manager needs to be competent in managing both the behavioural (organisational) and technical aspects of the project. The PMO should adopt guidelines that assign project managers to projects based on suitable competence profiles and which address the issues identified by the CSFs. The design of the PMO will increasingly need to take into account the effect of introducing Generation Y into project teams (and eventually Generation Z too). While many of the design input parameters for a PMO model have been found in the literature, these need to be validated through research in the Singapore context. The means of doing this are described in the following chapter.
53
Chapter 3 Research Approach
3.1 Introduction
Chapter 1 introduced the research problem, framed the proposed solution, and formulated the research questions. Chapter 2 established geographical and business contexts against which the research problem could be set in pertinent management theory frameworks.
This chapter describes and amplifies the research approach, methodology and methods that were broadly outlined in Chapter 1. The research approach is viewed from both epistemological and theoretical perspectives. The research questions are first considered in greater detail, in order to establish the nature of the primary data required to address them. Justification for the selected research approach is provided and appropriate techniques are considered for collecting and dealing with primary data. Issues relating to data validity and reliability, the use of focus groups for the validation of the PMO model and the ethics of conducting the research, are considered.
3.2 Research Questions
The research objective, established in Chapter 1, is to develop a theoretically based and practically relevant and applicable model of a Project Management Office (PMO) for financial IT projects in Singapore, and based on critical characteristics of the PMO, the organisational context and the host organisation’s project and PMO maturity.
The main research question addressed in this dissertation is:
“What structure and roles should Project Management Offices (PMO) adopt, based on critical characteristics of PMO, organisational context and an organisation’s project maturity for Financial Information Technology (IT) projects in Singapore?”
The main question may be disaggregated into basic introductory questions, process subsidiary questions, and a synthesising question. These are shown in Table 3.1. The nature of each question will determine the type of information needed to address it, and the type of information required then determines how the data should be collected and analysed.
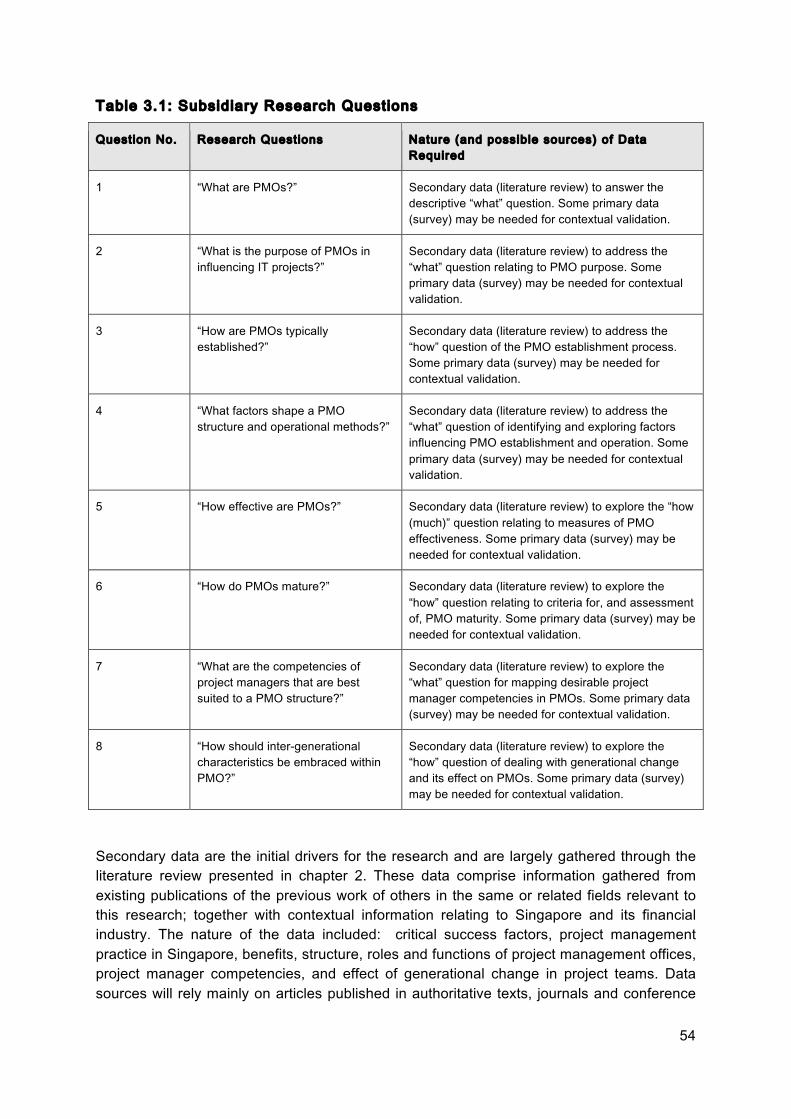
54
Table 3.1: Subsidiary Research Questions
Question No. Research Questions Nature (and possible sources) of Data
Required
1 “What are PMOs?” Secondary data (literature review) to answer the
descriptive “what” question. Some primary data
(survey) may be needed for contextual validation.
2 “What is the purpose of PMOs in
influencing IT projects?”
Secondary data (literature review) to address the
“what” question relating to PMO purpose. Some
primary data (survey) may be needed for contextual
validation.
3 “How are PMOs typically
established?”
Secondary data (literature review) to address the
“how” question of the PMO establishment process.
Some primary data (survey) may be needed for
contextual validation.
4 “What factors shape a PMO
structure and operational methods?”
Secondary data (literature review) to address the
“what” question of identifying and exploring factors
influencing PMO establishment and operation. Some
primary data (survey) may be needed for contextual
validation.
5 “How effective are PMOs?” Secondary data (literature review) to explore the “how
(much)” question relating to measures of PMO
effectiveness. Some primary data (survey) may be
needed for contextual validation.
6 “How do PMOs mature?” Secondary data (literature review) to explore the
“how” question relating to criteria for, and assessment
of, PMO maturity. Some primary data (survey) may be
needed for contextual validation.
7 “What are the competencies of
project managers that are best
suited to a PMO structure?”
Secondary data (literature review) to explore the
“what” question for mapping desirable project
manager competencies in PMOs. Some primary data
(survey) may be needed for contextual validation.
8 “How should inter-generational
characteristics be embraced within
PMO?”
Secondary data (literature review) to explore the
“how” question of dealing with generational change
and its effect on PMOs. Some primary data (survey)
may be needed for contextual validation.
Secondary data are the initial drivers for the research and are largely gathered through the
literature review presented in chapter 2. These data comprise information gathered from
existing publications of the previous work of others in the same or related fields relevant to
this research; together with contextual information relating to Singapore and its financial
industry. The nature of the data included: critical success factors, project management
practice in Singapore, benefits, structure, roles and functions of project management offices,
project manager competencies, and effect of generational change in project teams. Data
sources will rely mainly on articles published in authoritative texts, journals and conference

55
proceedings, and may include appropriate web-based material. In this instance, secondary data provide an essential foundation upon which new PMO knowledge can be constructed. They establish topic contexts and boundaries, existing theoretical frameworks, the current ‘state of the art’ for the field, the nature and effectiveness of techniques used in previous research; and serve to facilitate the identification of gaps in existing knowledge. Secondary data also provide a ‘platform’, against which the meaning and validity of primary data can be compared and assessed.
Primary data for this research comprise raw information collected at first hand through methods such as facilitated interview surveys or online surveys with PMO stakeholders from organisations with different characteristics of PMO, and through focus groups and/or case studies. Primary data collected in this way include quantitative and qualitative data and may require processing, transformation, analysis and interpretation. While primary data for research may also embrace existing published information (such as government statistics), which is then transformed and interpreted to create new knowledge, it is not anticipated that this will form a major part of this research.
Given the above context, the research approach is first considered from epistemological and methodological perspectives.
3.3 Research Approach
Approaches to research inform an overall research design that becomes progressively more detailed as the inquiry proceeds.
Research designs are plans and the procedures for research that influence the decisions from broad assumptions to detailed methods of data collections and analysis. Research design involves the intersection of philosophy, strategies of inquiry, and specfic methods (Creswell 2003). Myers (1997) argue that the nature of a research problem should “drive the methodology adopted to address it” and it is necessary to recognize the underlying assumptions behind “valid research” so as to “justify the methodologies and methods to be employed in the research design”. The justification of the methodological choice should also take into consideration “what constitutes human knowledge, what kind of knowledge will be attained from the research and what characteristics this knowledge will have” (Levy 2006).
Since the research focuses upon the management of projects, and in particular financial IT projects, it is essentially sociological in nature as, although the projects may be technical in nature, people are engaged in the management tasks. Crotty (1998) proposes four elements that a social research design must address: methods, methodology, theoretical perspective or philosophical stance, and epistemology. He defines the elements as:
• Methods: the techniques or procedures used to gather and analyse data related to
some research question or hypothesis.
• Methodology: the strategy, plan of action, process or design lying behind the choice
and use of particular methods and linking the choice and use of methods to the
desired outcomes.
• Theoretical perspective: the philosophical stance informing the methodology and
thus providing a context for the process and grounding its logic and criteria.
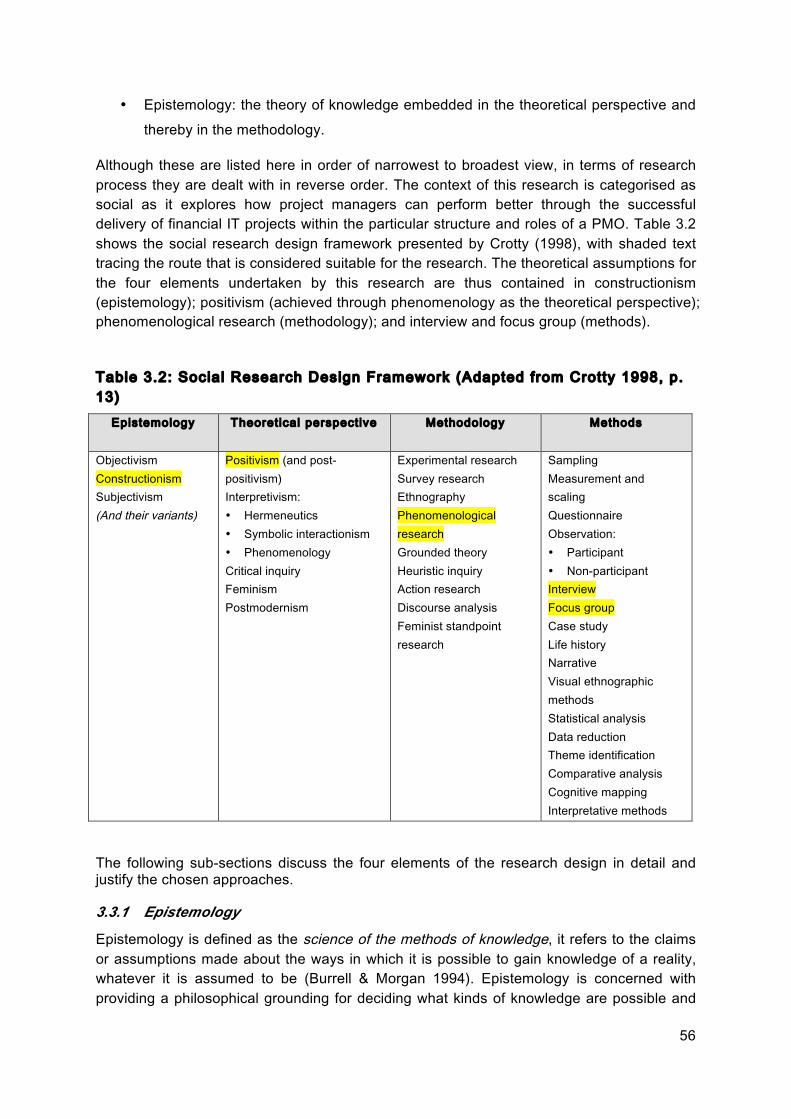
56
• Epistemology: the theory of knowledge embedded in the theoretical perspective and
thereby in the methodology.
Although these are listed here in order of narrowest to broadest view, in terms of research process they are dealt with in reverse order. The context of this research is categorised as social as it explores how project managers can perform better through the successful delivery of financial IT projects within the particular structure and roles of a PMO. Table 3.2 shows the social research design framework presented by Crotty (1998), with shaded text tracing the route that is considered suitable for the research. The theoretical assumptions for the four elements undertaken by this research are thus contained in constructionism (epistemology); positivism (achieved through phenomenology as the theoretical perspective); phenomenological research (methodology); and interview and focus group (methods).
Table 3.2: Social Research Design Framework (Adapted from Crotty 1998, p. 13)
Epistemology
Theoretical perspective Methodology Methods
Objectivism Constructionism Subjectivism (And their variants)
Positivism (and post- positivism) Interpretivism: • Hermeneutics • Symbolic interactionism • Phenomenology Critical inquiry Feminism Postmodernism
Experimental research Survey research Ethnography Phenomenological research Grounded theory Heuristic inquiry Action research Discourse analysis Feminist standpoint research
Sampling Measurement and scaling Questionnaire Observation: • Participant • Non-participant Interview Focus group Case study Life history Narrative Visual ethnographic methods Statistical analysis Data reduction Theme identification Comparative analysis Cognitive mapping Interpretative methods
The following sub-sections discuss the four elements of the research design in detail and justify the chosen approaches.
3.3.1 Epistemology
Epistemology is defined as the science of the methods of knowledge, it refers to the claims or assumptions made about the ways in which it is possible to gain knowledge of a reality, whatever it is assumed to be (Burrell & Morgan 1994). Epistemology is concerned with providing a philosophical grounding for deciding what kinds of knowledge are possible and
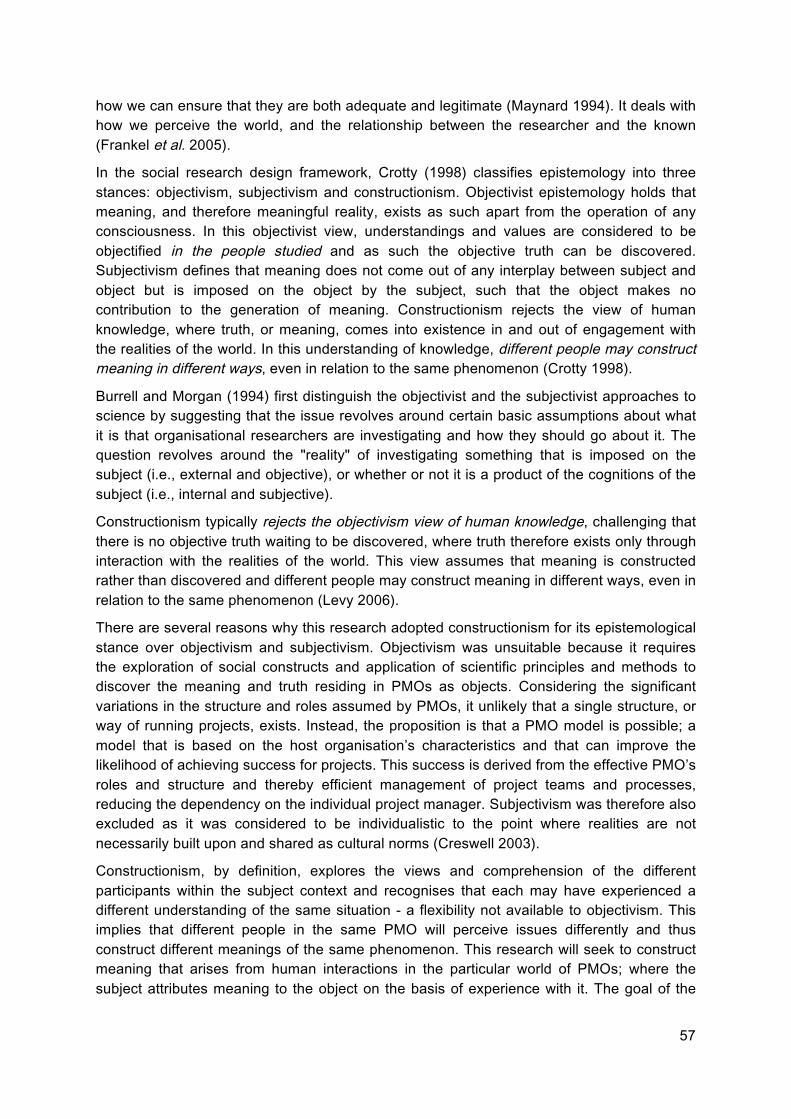
57
how we can ensure that they are both adequate and legitimate (Maynard 1994). It deals with how we perceive the world, and the relationship between the researcher and the known (Frankel et al. 2005).
In the social research design framework, Crotty (1998) classifies epistemology into three stances: objectivism, subjectivism and constructionism. Objectivist epistemology holds that meaning, and therefore meaningful reality, exists as such apart from the operation of any consciousness. In this objectivist view, understandings and values are considered to be objectified in the people studied and as such the objective truth can be discovered. Subjectivism defines that meaning does not come out of any interplay between subject and object but is imposed on the object by the subject, such that the object makes no contribution to the generation of meaning. Constructionism rejects the view of human knowledge, where truth, or meaning, comes into existence in and out of engagement with the realities of the world. In this understanding of knowledge, different people may construct meaning in different ways, even in relation to the same phenomenon (Crotty 1998).
Burrell and Morgan (1994) first distinguish the objectivist and the subjectivist approaches to science by suggesting that the issue revolves around certain basic assumptions about what it is that organisational researchers are investigating and how they should go about it. The question revolves around the "reality" of investigating something that is imposed on the subject (i.e., external and objective), or whether or not it is a product of the cognitions of the subject (i.e., internal and subjective).
Constructionism typically rejects the objectivism view of human knowledge, challenging that there is no objective truth waiting to be discovered, where truth therefore exists only through interaction with the realities of the world. This view assumes that meaning is constructed rather than discovered and different people may construct meaning in different ways, even in relation to the same phenomenon (Levy 2006).
There are several reasons why this research adopted constructionism for its epistemological stance over objectivism and subjectivism. Objectivism was unsuitable because it requires the exploration of social constructs and application of scientific principles and methods to discover the meaning and truth residing in PMOs as objects. Considering the significant variations in the structure and roles assumed by PMOs, it unlikely that a single structure, or way of running projects, exists. Instead, the proposition is that a PMO model is possible; a model that is based on the host organisation’s characteristics and that can improve the likelihood of achieving success for projects. This success is derived from the effective PMO’s roles and structure and thereby efficient management of project teams and processes, reducing the dependency on the individual project manager. Subjectivism was therefore also excluded as it was considered to be individualistic to the point where realities are not necessarily built upon and shared as cultural norms (Creswell 2003).
Constructionism, by definition, explores the views and comprehension of the different participants within the subject context and recognises that each may have experienced a different understanding of the same situation - a flexibility not available to objectivism. This implies that different people in the same PMO will perceive issues differently and thus construct different meanings of the same phenomenon. This research will seek to construct meaning that arises from human interactions in the particular world of PMOs; where the subject attributes meaning to the object on the basis of experience with it. The goal of the

58
search is to gather and rely on the research participants’ views of the PMO situation being studied, in order to propose a model for more effective delivery of financial IT projects through PMOs. The questions asked would be broad and general so the participants construct the meaning of a situation, which usually involves discussions or interactions with other persons. More open-ended questioning is preferred as the researcher listens carefully to what the participants do in their life settings. The intent is to interpret the meanings others have about the world (Creswell 2003). Therefore, the epistemological position for this research is constructivism.
Ontology is the study of being, of the ‘what is’, with the nature of existence, with the structure of reality as such. Crotty (1998) suggests that realism in ontology and constructionism in epistemology can be quite compatible and that the world only becomes a world of meaning when meaning-making human beings begins to make sense of it. The existence of a world without a mind is conceivable, but meaning without a mind is not. Realism is an ontological notion asserting that realities exist outside the mind. As such, this research adopted realism as its ontology because it shares the principle that the world and things in it exist independently of our consciousness of them, and at the same time the realism ontology will be compatible with the constructionism epistemology.
3.3.2 Theoretical Perspective
The theoretical perspective is the philosophical stance that lies behind the chosen methodology providing a context for the process as well as grounding its logic and criteria. It states the assumptions brought to the research task and embedded in the methodology. It is an approach to understand and explain the human world and social life within that world, wherein the assumptions are grounded (Crotty 1998).
Positivism, relates directly to the epistemology of objectivism, and is based on the belief that observers are independent and that science is value-free. Positivism subscribes to the theory that it is possible to use a set of specific formalised techniques to discover and measure independent facts about a single reality, which is assumed to exist, driven by natural laws and mechanisms (Carson et al. 2001). Positivist studies tend to test theory in order to increase the predictive understanding of certain phenomena (Hirschheim 1985; Myers 1997).
Interpretivism arose in contradistinction to positivism in attempts to understand and explain human and social reality. Interpretivism entails an ontology in which social reality is regarded as the product of processes by which social actors together negotiate the meanings for actions and situations (Blaikie 1993; Crotty 1998). Positivists assume that it is possible to obtain hard, secure and objective knowledge by focusing on generalisation and abstraction to a wider context, whereas interpretivists believe that an understanding of the world can only be achieved through knowledge as perceived by individuals (Levy 2006). Interpretivism avoids the rigidities of positivism in relation to certain types of problems in the social field. Instead of trying to explain causal relationships by means of objective ‘facts’ and statistical analysis, interpretivism uses a more personal process in order to understand reality. Interpretivism allows the focus of research to be an understanding of what is happening in a given context and includes consideration of multiple realities, and different participants’ perspectives, taking account of the contexts under study (Carson et al. 2001). Table 3.3 summaries the main characteristics and fundamental differences between positivism and
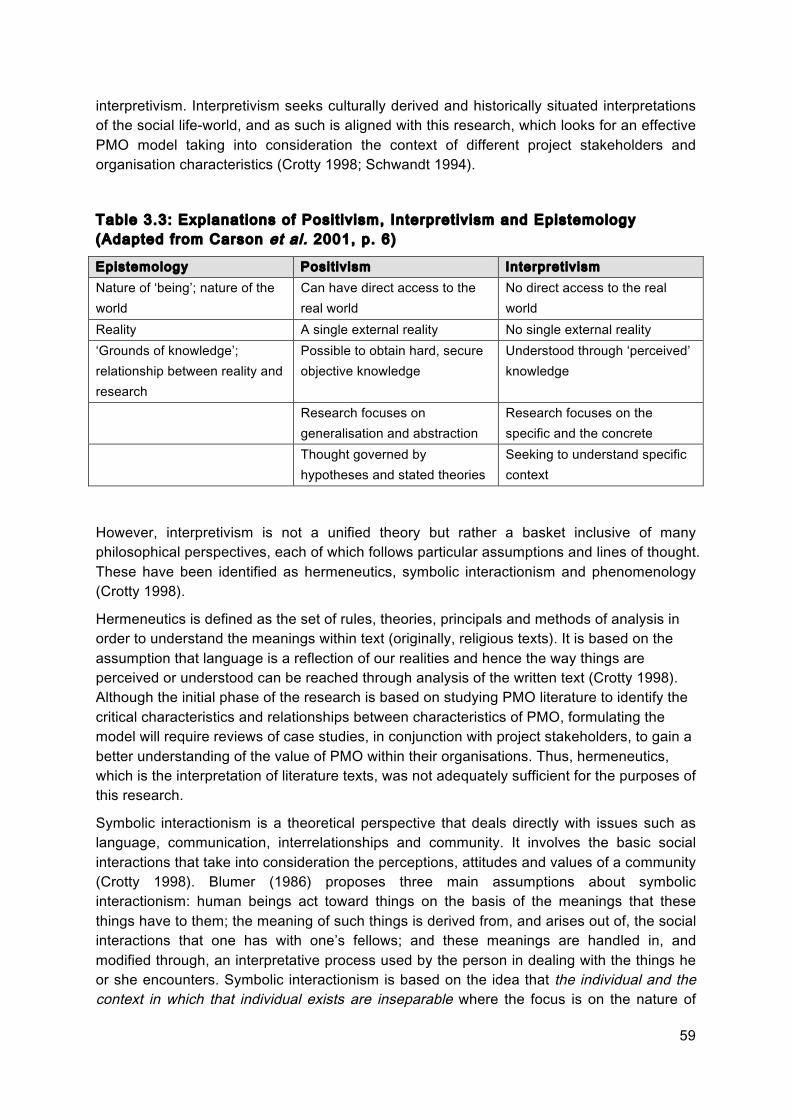
59
interpretivism. Interpretivism seeks culturally derived and historically situated interpretations of the social life-world, and as such is aligned with this research, which looks for an effective PMO model taking into consideration the context of different project stakeholders and organisation characteristics (Crotty 1998; Schwandt 1994).
Table 3.3: Explanations of Posit iv ism, Interpretiv ism and Epistemology (Adapted from Carson et al. 2001, p. 6)
Epistemology Posit iv ism Interpretivism Nature of ‘being’; nature of the world
Can have direct access to the real world
No direct access to the real world
Reality A single external reality No single external reality ‘Grounds of knowledge’; relationship between reality and research
Possible to obtain hard, secure objective knowledge
Understood through ‘perceived’ knowledge
Research focuses on generalisation and abstraction
Research focuses on the specific and the concrete
Thought governed by hypotheses and stated theories
Seeking to understand specific context
However, interpretivism is not a unified theory but rather a basket inclusive of many philosophical perspectives, each of which follows particular assumptions and lines of thought. These have been identified as hermeneutics, symbolic interactionism and phenomenology (Crotty 1998).
Hermeneutics is defined as the set of rules, theories, principals and methods of analysis in order to understand the meanings within text (originally, religious texts). It is based on the assumption that language is a reflection of our realities and hence the way things are perceived or understood can be reached through analysis of the written text (Crotty 1998). Although the initial phase of the research is based on studying PMO literature to identify the critical characteristics and relationships between characteristics of PMO, formulating the model will require reviews of case studies, in conjunction with project stakeholders, to gain a better understanding of the value of PMO within their organisations. Thus, hermeneutics, which is the interpretation of literature texts, was not adequately sufficient for the purposes of this research.
Symbolic interactionism is a theoretical perspective that deals directly with issues such as language, communication, interrelationships and community. It involves the basic social interactions that take into consideration the perceptions, attitudes and values of a community (Crotty 1998). Blumer (1986) proposes three main assumptions about symbolic interactionism: human beings act toward things on the basis of the meanings that these things have to them; the meaning of such things is derived from, and arises out of, the social interactions that one has with one’s fellows; and these meanings are handled in, and modified through, an interpretative process used by the person in dealing with the things he or she encounters. Symbolic interactionism is based on the idea that the individual and the context in which that individual exists are inseparable where the focus is on the nature of
60
individual and collective social interaction (Benzies & Allen 2001). Since the objective of this research is not to study how individuals interpret objects, symbolic interactionism was not selected as the theoretical perspective.
Phenomenology is defined as the science of the subjective where is assumes that even though there is no certainty about the independent existence of objects in the external world, there is certainty about how it appears in consciousness (Brown 1995; Husserl & Cairns 1960). A phenomenologist is committed to understanding social phenomena from a participant’s own perspective (Taylor & Bogdan 1998). Phenomenology can applied as a methodology for investigating and understanding the lived and experienced perspectives of others. Comparing phenomenology with hermeneutics, phenomenology is primarily oriented toward the immediate phenomena of human experience, such as thinking and feeling, where hermeneutics is more context directed. In interpreting human traces, hermeneutics often tries to go beyond the observable in order to ‘read between the lines’ (Odman 1985). Phenomenology is concerned with the constitution of the stream of consciousness while symbolic interactionism does not focus on this consciousness, but the contexts within a given situation (Gallant & Kleinman 1983).
Goldkuhl (2012) states that in interpretivism the aim of understanding the subjective meanings of persons in studied domains is important, and the concept of interpretivism is thereby to “work with these subjective meanings, to understand them, and to use them as building-blocks in theorizing”. Braa and Vidgen (1999) argue that positivism is about reducing the area of study in order to be able to “make reliable predictions and explanations”, while interpretivism is about reading a situation in order to gain understanding. Comparing the two approaches, the interpretivist approach considers the methods of natural science to be inappropriate, as different people would interpret a situation differently; while positivism assumes that phenomena can be observed objectively where a good research is backed by references to the virtues of “repeatability, reductionism, and refutability” (Braa & Vidgen 1999; Checkland 1999).
For this research, positivism was chosen as the theoretical perspective. This research study assumes that there is an “ideal” configuration of a PMO, which will fit a specific context, and will attempt to develop a model that could contribute towards improving the success rate of IT projects in the financial sector of Singapore. The research epistemological orientation aims for “explanation and modeling for improvement” and is thus best located within positivism. Based on positivism, the PMO model reduces the complexities of organisational reality, and proposes how a PMO can be effectively structured to achieve good project performance. The survey will be conducted directly within a positivism perspective and uses a mixed methodology: combining qualitative and quantitative approaches to better interpret the data. According to Braa and Vidgen (1999), surveys are designed to have some level of statistical generalisability and the understanding and interpretation of the research area can be gained through analysis of the collected data (Braa & Vidgen 1999).
3.3.3 Methodology
Methodology is the strategy, plan of action, process or design underlying the choice of particular methods. The methodology inherits all the assumptions established in the epistemology, ontology and theoretical perspective as previously discussed (Crotty 1998).

61
Dowling (2007) describes the key epistemological strategy of phenomenology as the
“concept of phenomenological reduction”. Henriques (2014) argues that the
phenomenological approach enables the understanding of “subjective experience of social contexts”, and suggests the use of characterisation of these contexts through ideal type
construction for organisational research methodologies. A phenomenological research
methodology was therefore a more appropriate approach to answer the research question of
this study, as it is effective for understanding subjective experience and gaining insights into
people's motivations and actions. This research adopted the suggestion of characterising
PMO’s structure and roles for the development of an ideal PMO configuration.
It is worthwhile here to first note the distinction between qualitative and quantitative research.
Often the two approaches are set against each other as polar opposites. However, Newman
and Benz (1998) suggest that qualitative and quantitative approaches should not be viewed
as rigid, distinct categories, polar opposites, or dichotomies; instead, they represent different
ends on a continuum. Crotty (1998) argues that the distinction between qualitative and
quantitative research occurs at the level of methods, not at the level of epistemology or
theoretical perspective. Crotty’s model challenges views that objectivist research must use
quantitative methods whilst subjectivist research must be limited to qualitative methods.
Quantification is by no means ruled out within non-positivist research.
Quantitative research is defined as a means for testing objective theories by examining the relationship among variables. These variables are measured, so that numbered (and
preferably continuous) data can be analysed using statistical procedures (Creswell 2003).
Hobbs and Aubry (2007, 2008) used a web-based questionnaire to collect quantitative data
to investigate the dynamics through which PMOs contribute to organisational performance.
In this quantitative approach, the researchers test a theory by specifying narrow hypotheses
and the collection of data to support or refute them. Surveys and experiments are two types
of quantitative methodologies. Survey research provides a quantitative or numeric
description of trends, attitudes, or opinions of a population by studying a sample of that
population, using questionnaires or structured interviews for data collection. It has the intent
of generalising from a sample to a population (Fowler 2002) or of identifying and assessing
the strength of issues for further investigation. Experimental research seeks to determine if a
specific treatment influences an outcome, by applying a specific treatment to one group and
withholding it from another (the control group), and then determining how both groups
scored on an outcome (Keppel 1991).
Qualitative research is defined as a means for exploring and understanding the meaning that
individuals or groups ascribe to a social or human problem. The processing of qualitative
research involves emerging questions and procedures; collecting data in the participants’
settings; analysing the data inductively, building from particular to more general themes; and
making interpretations regarding the meaning of the data (Creswell 2003). Miles and
Huberman (1994) define qualitative research by focusing on data in the form of words, such
as observations, interviews or documents. They propose that data collection activities are
carried out in close proximity to a local setting for a continued period of time and that the
data are not usually accessible for immediate analysis, but require some processing
(transformation).
Qualitative research produces findings that are not normally arrived at by means of statistical
procedures or other means of quantification, yet the label ‘qualitative methods’ has no
62
precise meaning in any of the social sciences. It is an umbrella term covering an array of interpretive techniques which seek to describe, decode, translate and otherwise come to terms with the meaning, rather than the frequency, of certain more or less naturally occurring phenomena in the social world (Cassell & Symon 1994; Strauss & Corbin 1998). Qualitative research allows researchers to get at the inner experiences of participants, to determine how meanings are formed through and in culture, and to make discoveries that will contribute to the development of empirical knowledge (Strauss & Corbin 1998). Using phenomenology when the focus of a study is on understanding and interpretation, the researcher is also encouraged to apply personal experience and prior knowledge rather than just being a detached observer. The framework accepts influences from both science and personal experience (Carson et al. 2001).
Different types of qualitative methodologies include: ethnography, narrative research, grounded theory, case studies and phenomenological research. Ethnography is defined as a form of research in which the social settings to be studied aim to ‘get inside’ the way each group of people sees the world (Hammersley 1985). The researcher studies the shared patterns of behaviours, language, and actions of an intact cultural group in a natural setting over a prolonged period of time. Narrative research is a design of inquiry from the humanities, in which the researcher studies the lives of individuals and asks one or more individuals to provide stories about their lives (Riessman 2008). Clandinin and Connelly (2000) state that the narrative often combines views from the participant’s life with those of the researcher’s life in a collaborative narrative. Grounded theory is a design of inquiry from sociology in which the researcher derives a general, abstract theory of a process, action, or interaction grounded in the views of participants. This process involves using multiple stages of data collection and the refinement and interrelationship of categories of information (Charmaz 2014; Strauss & Corbin 1998). A researcher using case studies develops an in-depth analysis of a case, often a program, event, activity, process, of one or more individuals and collects detailed information using a variety of data collection procedures over a sustained period of time (Stake 1995; Yin 2014). Phenomenological research is designed to illuminate the specific, to identify phenomena through how they are perceived by the actors (participants) in a situation. The efforts usually involve the collection of these external world phenomena, perceptions that are otherwise “unobservable” and develop as much information as possible about the subject of the research to describe a totality of the situation. The key contention for phenomenologists is that, since the world in which management science is socially constructed and therefore subjectively viewed, it is not possible for the researcher to remain completely objective (and impartial) during the study (Easterby-Smith et al. 1991; Giorgi 2009; Leplin 1984; Marshall & Rossman 1995; Moustakas 1994). Inevitably, one or more aspects of the research study will resonate with the researchers more (or less) than others. Careful research design can minimise researcher bias to a great extent, but never completely.
A third method combines qualitative and quantitative research and data in a research study. This is known as ‘mixed methods’. Jick (1979) proposed triangulating data sources as a means for seeking convergence across qualitative and quantitative methods. The triangulating researcher searches for a logical pattern in mixed method results through the role of builder and creator, piecing together many pieces of a complex puzzle into a coherent whole. The identified four benefits of triangulation are increased confidence in research data, innovative ways of looking at a phenomenon, unique findings and a clearer understanding of

63
the problem (Thurmond 2001). By the early 1990s, mixed methods turned toward the systematic convergence of quantitative and qualitative databases, and the idea of integration in different types of research designs emerged. The three primary mixed methods research models found in the social sciences are convergent parallel, explanatory sequential and exploratory sequential mixed methods (Creswell 2003). Table 3.4 summaries the definitions and differences of the methods.
Table 3.4: Comparisons of Mixed Methods research approaches (Adapted from Creswell 2003, p. 15)
Convergent Paral lel Mixed Methods
Explanatory Sequential Mixed Methods
Exploratory Sequential Mixed Methods
Definition and Differences
The quantitative and qualitative data are merged in order to provide a comprehensive analysis of the research problem. Both forms of data are collected at roughly the same time and the information is integrated in the interpretation of the overall results, where contradictions or incongruent findings are further probed.
The quantitative research is first conducted and the results analysed. It is then uses qualitative research to explain in more detail.
This is the reverse sequence from the explanatory sequential design. The qualitative research phase first explores the views of participants. The data are then analysed to build into a second, quantitative phase.
The intended outcome of this research is the development of a PMO model based upon a positivist, phenomenology framework. It is based upon some quantitative and some qualitative analysis and interpretation of collected primary data. The decision to include a qualitative approach is supported by Collins and Hussey (2014) who argue that qualitative research in the business environment provides a strong basis for analysis and interpretation because it is grounded in the natural environment of the phenomenon. Levy (2006) also suggests that, when the goal of research is to develop a conceptual model for the purpose of building or exploring theory around a particular phenomenon or process, an interpretive approach utilising a qualitative methodology may be more appropriate.
The research sought to establish the significance of structure and roles of the PMO and is thereby concerned with the study of experience from the perspective of the project stakeholders, their assumptions and usual ways of perceiving the value and performance of a PMO. The qualitative approach allowed the researcher to work closely with participants within an organisation and collect information pertaining to their personal thoughts and experiences (Bonoma 1985; Yin 2014). A phenomenological research methodology was considered an appropriate approach to answer the research question of this study, as it is effective for understanding subjective experience and gaining insights into people's motivations and actions. This study tried to establish why, and due to which characteristics,

64
PMOs are more successful and therefore develop concepts about the PMO’s structure and roles derived inductively from the data. Given that there is likely to be variation in the structure and roles assumed by PMOs, the emphasis of the research effort is therefore to gather appropriate qualitative information, within a phenomenological paradigm, concerning the human and socio-technical factors behind the implementation of PMO in the Singapore financial sector. At the same time, some quantitative data is sought; for example the counts or frequency estimates canvassed as specific information.
This research is conducted in two phases to address the research questions and the research themes. A theoretically based model of PMO is developed as the fulcrum or hinge between the phases. In the first phase, model conception is informed by secondary data gathered through literature review, and by primary data obtained from interviews with appropriate PMO stakeholders. The collected data are analysed to inform the subsequent development of a conceptual model of PMO that is both practical and relevant. In the second phase, a focus group is conducted to validate the PMO model. The research methods underpinning the two phases are now considered. The structure of the research design is illustrated in Figure 3.1. The choice of sample size for the interviews is 25. The focus group is discussed in more detail in section 3.7 and the administrative process for the interviews is discussed in section 4.4.
Figure 3.1: Structure of the Research
3.3.4 Methods
Crotty (1998) defines methods as the techniques or procedures used to gather and analyse data related to some research question or hypothesis. Methods may involve the forms of data collection, analysis, and interpretation that researchers propose for their studies. Levy (2006) argues that the research philosophy and methodology usually guide the choice of the most appropriate data collection methods and help to highlight the appropriateness of using
65
different methods in order to develop a model of the phenomenon of interest. Qualitative data collected by the researcher may derive from in-depth descriptions of circumstances, people, interactions, observed behaviours, events, attitudes, thoughts and beliefs and direct quotes from people who have experienced or are experiencing the phenomenon (Patton 2002). This research adopts a phenomenological approach as the research paradigm and qualitative data to drive the research approach.
Observation is based on watching what people do, looking at their behavioural patterns and actions and at objects, occurrences, events and interactions. It can be divided into non-participant, where it involves collecting data without communicating with people, and participant observation that allows more interaction and communication with people in a research setting (Gill & Johnson 1991). Creswell (2003) defines participant observation as a process of data collection where the researcher observes participants or is a participant in the phenomenon being studied. The advantages proposed by Creswell include the researcher having first-hand experience with the participant and the ability to record information as it occurs. It is useful in exploring topics that the participant may be uncomfortable to discuss. Observation studies need the particular phenomenon of interest to occur frequently and repetitively in order to allow time for patterns and habits to be observed (MacDaniel & Gates 1991). This is impractical for this study, as it would require the researcher to follow projects from commencement to completion, which could sometimes take years. Observations are also inappropriate for the assessment of people's “internal” values as they primarily record observable behaviour and not intention, which does not meet the research objectives (Carson et al. 2001).
Interviews are typically a face-to-face conversation between the participant and the researcher (Gubrium & Holstein 2002). Other forms of interviews proposed by Creswell (2003) include the researcher interviewing by telephone, focus group(s) where the researcher interviews participants in a group setting, and e-mail or internet-based interviews. Contemporary communication technologies allow all these interview forms to be conducted with individual participants or in groups, to suit particular purposes or overcome logistical constraints. Interviews can also be categorised into three different types: structured, unstructured and semi-structured. Structured interviews are based on a set of pre-designed questions that are asked of each and every participant, with no variation in the questions between participants. Unstructured interviews have no predetermined set of questions (Miller & Crabtree 1999; Patton 2002), but rely on a relevant ‘topic’ of conversation to generate meaningful contributions from the interviewee, with the interviewer delving deeper into the emerging issues in an ad hoc fashion. Semi-structured interviews lie somewhere between structured interviews and unstructured interviews. Questions are mainly open-ended, and structured questions may contain open-ended options, thus not limiting the participant’s choice of answers (Gubrium & Holstein 2002; McCracken 1988). Semi-structured interviews thus follow a pre-determined path, but also allow the participants to provide interpretations and information about factors often not anticipated or expected by the investigator (Rogelberg 2002). While the interviewer may have a pre-determined list of topics to cover, this acts more as an aide memoire for the interviewer and is not intended to limit the interviewee. The purpose of this type of interview is to provide a setting where the interviewer can make use of cues and prompts to help and direct the participant into the research topic area, thus eventually being able to gather a more in-depth or detailed data set. Interviews are also useful when the participants can provide historical information that
66
cannot be directly observed. They allow the interviewer to have reasonable control over the
line of questioning (Creswell 2003).
However, it is essential to phenomenological data analysis that the interviews be recorded
and that the recordings be transcribed to maintain accuracy. The transcribed narratives
provide the raw data to be analysed. They can also be returned (usually in an edited format
to remove unwanted verbatim distractions) to the interviewees for validation and
confirmation. The recording of the interviews allows the interviewer to probe systematically
and in-depth without the distraction of note taking (Sanders 1982), although the prudent
interviewer will also make hand-written notes. Modern digitally-based audio and visual
recording technologies have simplified and given added reliability to this form of data
collection; and have enhanced data-archiving capabilities.
An interview protocol is a form used in qualitative research for recording and writing down
information obtained during an interview (Creswell 2003). The protocol may include the
following components: heading (date, place, interviewer, interviewee), questions, probes,
adequate space between questions to record responses and a final thank-you statement to
acknowledge the time the interviewee has spent during the interview. The most important
part of an interview protocol is the set of substantive questions reflecting the actual inquiry,
as the majority of the required data will be collected through semi-structured face-to-face
interviews with the key project stakeholders. Sanders (1982) suggest that it is better to ask fewer questions and to probe participants intensively than it is to ask many questions assuming that more questions will yield more data; the rule of quality triumphs over quantity,
since the ‘richness’ of the data is important. The PMO research uses the protocol as a guide
as to the nature of the material to be discussed, and interviews are then conducted with a
structured but flexible question framework to gather information. The design can thus
legitimately be described as a semi-structured interview technique. The interview questions
for this research are defined in Chapter 4. Their purpose is to elicit data that can be used to
inform the propositions for a PMO model.
‘Focus group’ is defined as a method whereby a number of respondents in the research
process are brought together to discuss a given phenomenon, in which they have shared or
individual experiences, to generate the primary data (Creswell 2003; Silverman 2010). The
key feature of focus groups is the explicit use and exploitation of the group interaction to
produce data and insights that might be less accessible without the interaction found in a
group (Morgan 1997). However, modern communication technology now allows the
dynamics of group interactions to occur electronically rather than just in the physical
proximity of the participants. The process of focus group enquiry usually incorporates the
active role of the researcher as a moderator/facilitator in addressing the research problem. In
the context of the PMO research, the focus group method is used to consider and validate
PMO model propositions.
Exploratory research attempts to clarify and explore an idea, or poorly understood
phenomenon, to develop propositions for further enquiry. It is focused on “what” questions,
using observations, open-ended questions in interviews, or focus groups (Sekaran & Bougie
2010). Formulating a theoretical PMO model is exploratory in nature, and in order to explain
the relationship between host organisation’s characteristics and IT project success, the “how”
questions are also essential. Considering the exploratory nature of this research, the
interview survey and focus group methods are selected.
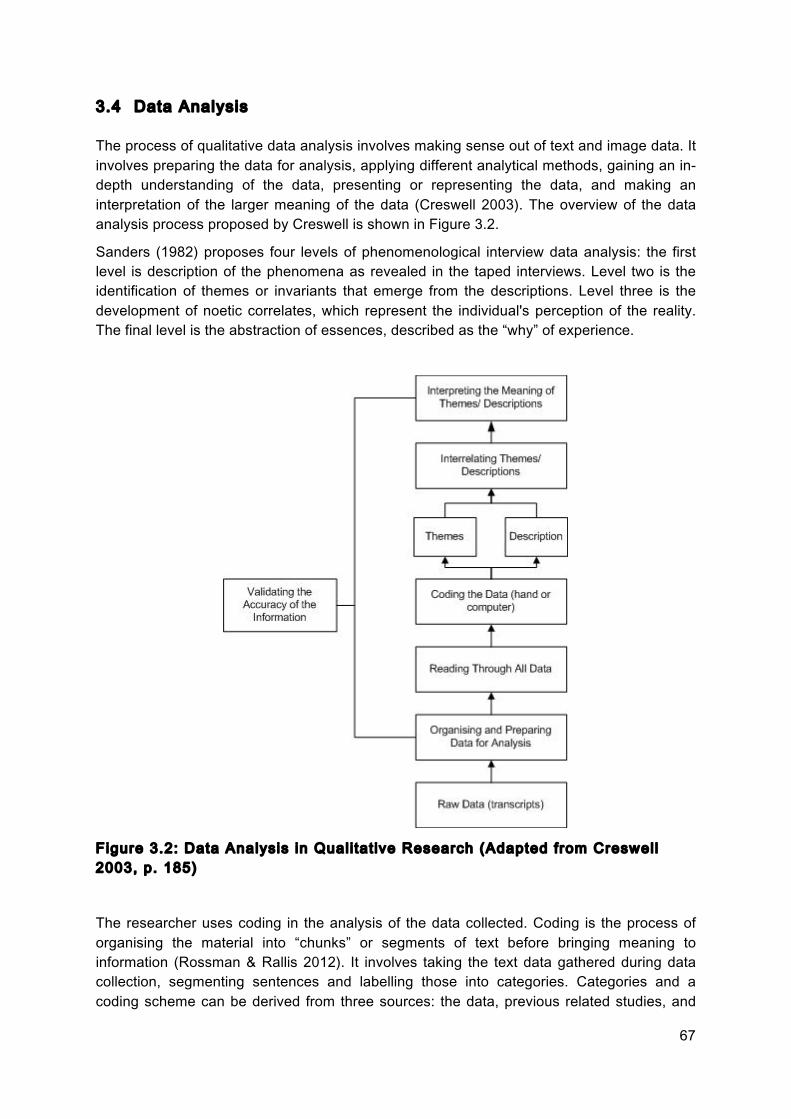
67
3.4 Data Analysis
The process of qualitative data analysis involves making sense out of text and image data. It involves preparing the data for analysis, applying different analytical methods, gaining an in-depth understanding of the data, presenting or representing the data, and making an interpretation of the larger meaning of the data (Creswell 2003). The overview of the data analysis process proposed by Creswell is shown in Figure 3.2.
Sanders (1982) proposes four levels of phenomenological interview data analysis: the first level is description of the phenomena as revealed in the taped interviews. Level two is the identification of themes or invariants that emerge from the descriptions. Level three is the development of noetic correlates, which represent the individual's perception of the reality. The final level is the abstraction of essences, described as the “why” of experience.
Figure 3.2: Data Analysis in Quali tat ive Research (Adapted from Creswell 2003, p. 185)
The researcher uses coding in the analysis of the data collected. Coding is the process of organising the material into “chunks” or segments of text before bringing meaning to information (Rossman & Rallis 2012). It involves taking the text data gathered during data collection, segmenting sentences and labelling those into categories. Categories and a coding scheme can be derived from three sources: the data, previous related studies, and
68
theories (Zhang & Wildemuth 2009). Miles and Huberman (1994) suggest generating an initial list of coding categories and then modifying the list within the course of the analysis as new categories emerge inductively. Creswell (2003) also suggests developing a qualitative code book which is a table that contains a list of predetermined codes that researchers can use for coding the data. While this process of analysis is essential where the magnitude of the data-set precludes a less formal approach, for small samples the researcher can engage with the data in a simpler manner.
3.5 Research Design and Methods
This research is conducted in two phases. A theoretically based model of PMO is developed as the fulcrum or hinge between the phases. In the first phase, model conception is informed by secondary data gathered through literature review, and by primary data obtained from facilitated interviews held with PMO stakeholders and online surveys. In the second phase, an online focus group is conducted to validate the proposed PMO model.
3.5.1 Phase 1
Phase 1 involves review of available academic and practitioner literature on the subject of project management offices (PMOs) to identify the different design and management approaches prevalent among PMOs generally. The review comprises a literature search to understand the different forms, functions and categories of PMO, and their contribution to project and organisational performance.
Hobbs and Aubry (2007, 2008) conducted a three-year research program to investigate PMOs and the dynamics through which they contribute to organisational performance. The research program, undertaken at the University of Quebec in Montreal, was supported by the Project Management Institute Research Department, and titled “Modelling Organisational Project Management and PMO Performance.”
Although the project environment where that research program survey was conducted may not differ much from Singapore, only 14% of their respondents came from the IT industry. The first phase of the current research uses the analysis of descriptive survey data on 500 PMOs collected by Hobbs and Aubry (2007) and review of the extant literature to inform and formulate a proposed theoretically based model of PMO structure and roles based on critical characteristics of PMO, organisational context and the organisation’s project maturity. The aim was to differentiate the identified characteristics into good or poor candidates for forming an optimal PMO.
The different competencies of project managers and their suitability for this PhD research are also studied in Phase 1 as part of the PMO model development. This review and data collection also embraces inter-generational considerations in optimising resources from Generation Y in the structuring of PMOs.
Do Valle et al. (2008) suggest that the most important PMO benefit is the link between corporate governance (global strategy and goals) and the project management (individual project success and results) through an effective portfolio management. Phase 1 of this research defined the links between critical characteristics of PMO, organisational context and the organisation’s project maturity, and PMO structure and roles.
The literature topic areas and theoretical frameworks that this thesis covered includes:
69
• Project management office (PMO) • Typology of PMOs • Organisational context • PMO characteristics • Project success • Critical Success Factors (CSFs) • Project manager competencies • Introduction of Generation Y into the workforce
Facilitated interviews and online surveys of PMO stakeholders with different characteristics of PMO within appropriate organisations in Singapore are conducted, and the collected data analysed to inform the subsequent development of a model of PMO that is both practical and relevant.
3.5.2 Phase 2
The aim of phase 2 is to gauge the model’s effectiveness and refine it though a validation process using online focus group discussions. The selected participants in the focus group should hold senior positions within their respective PMOs and have had experience with PMO implementation. The intent is to gather insights that might be otherwise be less accessible without the interactivity found in a group (Morgan 1997). This allows the theoretically based model proposed in Phase 1 to undergo a validation process with respect to practical relevance.
3.6 Research Validity and Reliabil i ty
In qualitative research, validity means that the researcher checks for the accuracy of the findings by employing certain procedures, while reliability indicates that the researcher’s approach is consistent both within the research and externally across different researchers and different projects (Gibbs 2008).
Yin (2014) suggests documenting the procedure of case studies with as many of the steps as possible, and setting up a detailed case study protocol and database to increase reliability. Other suggestions include checking of interview/direct observation transcripts, definitions of analytical extraction codes and improving communication in a team research environment by regular documented meetings and by sharing analyses (Gibbs 2008).
To improve research validity, Creswell (2003) recommends incorporating validity strategies that enhance the researcher’s ability to assess the accuracy of the findings.
This PMO research incorporates two validity strategies. Firstly the interview participants are purposively selected. Instead of statistically random sampling, interviewees were deliberately chosen based on their relevance to, and understanding of, the research problem and questions. The researcher’s background industry experience permitted this strategy. Validity and reliability were reinforced by asking interviewees to confirm the accuracy and completeness of the interview transcripts. The use of focus groups for the Phase 2 research completes the validation process.
70
3.7 Focus groups
The term ‘focus group’ was first coined by Merton and Kendall (1946) who established
procedures for focus group interviews. Krueger and Casey (2009) define focus group as “an exploratory group discussion to obtain perceptions on specific topics in a defined environment”.
The key feature of using focus group for research is the opportunity this presents for the
“simultaneous involvement of a number of respondents in the research process to generate the data” (Carson et al. 2001). This enables the explicit use of the group interaction to
produce data and insights that might be less accessible without the interactions found in
such a group (Morgan 1997).
Du Bois (1979) argues that a focus group encourages participants to collectively develop
ideas and explore specific issues based on their actual experiences related to controlled
topics. The aim is to share and stimulate individual participant's perceptions, feelings, and
experiences, so as to widen the range of opinions on specific topics and avoid the
drawbacks of individual bias (Fisher 2011; Krueger et al. 1998). It incorporates the active
role of the researcher as a catalyst or moderator in addressing the discussion topic.
Parasuraman et al. (1985) used the insights obtained from focus groups to form the basis of
a model and proposed a conceptual service quality framework. In the testing phase of
generic model development, De Bruin et al. (2005) argued that a model “must be tested for relevance and rigor”, and suggested using focus groups and interviews to assess the face
validity of the model and to determine if good translations of the constructs have been
attained.
In summary, a focus group represents a research technique in which selected participants
are encouraged to interact and data is collected through group interaction on a topic.
3.7.1 Role of researcher
Focus groups are conducted by a moderator who works with a small group of participants in
an unstructured and natural manner. The moderator’s main purpose is to gain insights by
listening to (and recording in an appropriate manner) the interactions in a group of people
from an carefully chosen target group as it discusses issues of interest to the researcher
(Malhotra 2010). In this study, the role of the researcher as a moderator is also to minimise
any moderator bias or over-dominant voices by encouraging participants to share opinions
and to facilitate the discussion in a non-directive manner (Krueger & Casey 2009; Myers
1998; Smithson 2000). The researcher, who in this study is familiar with the discussion
topics, is able to set the style and tone of the focus group, to indicate the scope and topics of
the discussion and to ensure that the important issues are addressed; these are considered
important tasks of a moderator (Kidd & Parshall 2000; Sim 1998).
While the focus group technique has traditionally been based upon the physical assembly of
members in a carefully arranged environment, the logistics of achieving this, particularly if
needed over a comparatively long period, have lead to the adoption of electronic
communication using Internet facilities.
71
3.8 Online Focus Groups (OFGs)
The use of online format for focus group is not novel or uncommon. Murray (1997) first
proposed the concept of a ‘virtual focus group’, but his application was limited to private e-
mail discussions with little consideration to group participation, group dynamics and
interactions. He was constrained by the existing technology, given that techniques using
multi-threaded discussions had not yet emerged.
Kenny (2005) suggests that with new technologies, “there is the opportunity to use a computer program that facilitates online engagement and interaction to bring together a group of people to explore issues, attitudes and perceptions”. He reported a positive
experience of conducting an online focus group with 38 Australian nurses (Kenny 2005).
Swedish researchers used an online focus group for their qualitative study with childhood
cancer survivors in Sweden. The online focus group discussions were performed on a “chat”
platform in real time (Nilsson et al. 2014).
The active engagement and group interaction required in a focus group can thus be
captured in an online environment. This has motivated the researcher to use an OFG to
collect qualitative data for the validation of the PMO model, subject to achieving the benefits
and minimizing any disadvantages of this approach.
3.8.1 Advantages of OFGs
The advantages of choosing to use OFG for this research are justified in terms of cost,
timing and location; anonymity and confidentiality; and transcription.
3.8.1.1 Cost, Timing and Location
Focus group meetings can be divided into four phases: planning, conducting, analysing, and
reporting (Morgan 1997). Reiskin argues that “budget and time constraints are important considerations in planning” and highlights the cost of conducting focus groups. A budget for
traditional focus groups must usually include the cost of a focus group site, audiotape or
videotape production and transcription of recorded data. There is also the moderator's time
required to recruit participants, to set up the necessary facilities, and to have the material
transcribed and analysed (Reiskin 1992). Location is an important consideration; a
comfortable environment for the focus group that is accessible to participants can maximize
the quality of the data collected (Asbury 1995). Given that the participants in this study may
be from different organisation and separated by distance, it may be challenging to organize a
location that is acceptable to all (Krueger & Casey 2009). Travel, accommodation and
subsistence costs may also be incurred for the group. On top of that there is also the
difficulties in recruiting participants due to the required time commitments for the focus group
meetings (Grbich 1998). In practice, a traditional physically co-located focus group may only
be able to meet for half a day or less because of these restrictions.
Conducting the focus group using the online format enables the participants to participate in
the discussion at any time and from any location. Internet-assisted methods described in the
literature for hosting OFGs can be asynchronous (predominantly), where the discussions do
not occur in real time and synchronous, though the use of real-time chat room environments
(Tuttas 2015). The preferred approach for this study is the asynchronous mode such that
participants do not all have to login and participate at the same time. This is critical to this

72
study, as the participants are busy senior PMO professionals from different organisations
within the Singapore financial IT industry, and to arrange a common available time could be
almost impossible. The asynchronous mode is also considered more suitable as immediacy
of response is not required; participants could benefit from time to reflect and ponder over
other participants’ inputs and review their responses before posting them. It is conceded that
this would forfeit the potential to capture spontaneity, but the ‘richness’ of the response data
is likely to be improved by such opportunities for member reflection. Asynchronous also
means that group members are less exposed to skill-related limitations such as typing
speeds and the need to “think, type, which is to look at the screen, read the text and maintain a logical thread of answering” (O'Connor & Madge 2003). Oringderff (2008) argue
that the use an OFG in asynchronous environments “can produce in-depth, rich responses”.
3.8.1.2 Anonymity and confidentiality
It is claimed that an online format of focus group gives participants the opportunity to be
anonymous towards other participants and furthermore, attendance is facilitated as anyone
with a computer with internet access can participate (Meier et al. 2006). Traditional focus
groups have the challenge of ensuring (approximately) equal participation by each member,
whereas OFGs have the advantage of providing the opportunity for quieter members to
deliver their considered responses (Robinson 1999). OFG’s also eliminate the ‘synergistic
bandwagon effect’ (Carey 1995) as an outcome of ‘group rethink’ where group members are
over-influenced by other stronger opinions within the group that can be aggressively
delivered and may be tantamount to bullying; and ‘social posturing’ where participants may
be forced to be compliant with group opinion because to do otherwise might cause them to
feel socially compromised or ostracized (Nyamathi & Shuler 1990). In the event if either
scenario still occurs, the researcher playing the role of a moderator will have to step in to
minimise the over-dominant voices.
Confidentiality has been highlighted as a major limitation of traditional focus groups, with
participants fearing the reporting of their information back to their own organisation or
authority (Kitzinger 1995; Parsons & Greenwood 2000). The participants selected for this
OFG comes from different organisations and thus there is a possibility that their contributions
may contain or reveal confidential information about their own organisations. Participants will
only articulate strong views and opinions when they feel assured of the anonymity and
confidentiality of the online environment. In this study, participants are assigned pseudonym
IDs in order to maintain anonymity.
The online environment should provide a comfortable, non-threatening medium that
encourages richly detailed responses. In one OFG, “there was considerable diversity in the responses posted and participants generally expressed their views in a great deal of detail” (Kenny 2005).
3.8.1.3 Transcription
Having a faithful, complete account of what was said and discussed in a focus group
enables a more complete audit trail that contributes to the overall credibility of the study.
However, the task of transcription has been considered arduous and costly for qualitative
researchers, and particularly difficult, tedious and time-consuming when conducted for
traditional focus groups (Krueger 1995; Sandelowski 1994).
73
There is no need to transcribe any data in an OFG, as they can be automatically stored in the OFG technology tool. Given that the complete transcript can be made available at all times, participants could have “the opportunity to reflect on what they had written and could post additional information or clarify points that they had made” (Kenny 2005). He also argues that, for a researcher, major advantages of an OFG emerge during the analysis process. Besides the advantage of not having to undertake transcription, the multi-threaded OFG tool also makes interaction sequencing easily identified and maintained throughout the analysis process (Kenny 2005).
3.9 Disadvantages of OFGs
One of the disadvantages of OFG is that eligible participants may be precluded from participating due to lack of access to required technology or proficiency to navigate the technology. Kenny (2005) argues that “computer access by participants may be a limiting factor with OFG”. However, with Internet access becoming more available, the problem is reducing. Lack of access or IT proficiency should not be a problem in this research.
Another potential disadvantage is the high no-show rate among participants agreeing but failing to take part in the OFGs. Weissman (1998) reports the no-show rate for online focus groups to be twice the rate of face-to-face focus groups and suggests the recruitment of double the number of potential participants for a synchronous OFG environment. Even for an asynchronous online focus group, participants often choose not to participate in the discussion, even after agreeing to be a part of the OFG. Sending follow-up e-mails to participants who are not entering the discussion is a one way of eliciting their participation (Burton & Goldsmith 2002). This disadvantage together with issues of coordination conflicts and last-minute attrition makes achieving the necessary attendance in an OFG a challenge. Even though the format of OFG enables participants to participate in the discussion at any time and from any location, “the virtual methodology might have distanced them from a compelling sense of commitment” to contribute to the discussions (Tuttas 2015). Besides this potential participant no-show issue, other disadvantages reported by Burton and Bruening (2003) include the lack of face-to-face contact and the difficulty of securing data on the Internet. None of these disadvantages were considered to apply to the OFG used for this research.
3.10 Ethics
Ethical issues are present in any kind of research (Orb et al. 2001). Researchers have an ethical responsibility to protect their research participants, promote the integrity of the research and guard against misconduct and impropriety (Israel & Hay 2006). An interview is usually equated with confidentiality, informed consent, and privacy. The interview participants were informed of the aim, purpose and intent of the interview and all applicable documentation relating to this complied with the RMIT University ethics approval process. The relevant ethics approval documentation is attached as Appendix A.

74
3.11 Chapter Summary
This chapter has discussed the methodological approach to the PMO research problem. It explored and explained the justification for selecting a phenomenological perspective as the research paradigm and a qualitative approach for the research methodology.
The research is conducted in two phases whereby in the first phase literature review is used to gather secondary data that then informs the design and administration of a primary data collection instrument and process whereby facilitated interviews are conducted. The findings are then used in the development of a theoretically based model for PMO application to financial IT projects in Singapore. The second phase uses a focus group method of model validation and refinement. The interview and focus group processes uses structured but flexible question frameworks to gather information. Research primary data validity and reliability processes have also been addressed in this chapter. The justification for and benefits of using online focus group (OFG) are presented. Ethical issues associated with the research were discussed and compliance with university research ethics approval requirements was noted and documented.
The following chapter engages with the extant literature to inform the subsequent design of the primary interview data collection instrument and the preliminary formulation of the theoretically based PMO model.
75
Chapter 4 Primary Data Collection Design
4.1 Introduction
An introduction to the research and the formulation of the research questions was provided
in Chapter 1. The literature review in Chapter 2, concerning principles, procedures and
issues relating to PMOs for financial IT projects, particularly in a Singapore context, informed
the choice of subject matter for the interviews. Chapter 3 presented the justification of the
research approach and the rationale for the chosen research methods, arguing that semi-
structured interviews would be the best method for collecting primary data.
This chapter describes the research design for the primary data collection in greater detail.
First the research questions, and the relevant issues that relate to them, are summarized
and re-stated. The administrative process for the interviews is discussed followed by the
criteria for and selection of participants. The format and design for the primary data
collection instrument is discussed. Pilot testing for the instrument is described, and an
amended design presented. Lastly the chapter rationalises the use of parallel online surveys
to supplement the primary data collection.
4.2 Summary re-statement of research questions and issues
The main research question in this dissertation was presented in Chapter 3 section 3.2:
“What structure and roles should Project Management Offices (PMO) adopt, based on critical characteristics of PMO, organisational context and an organisation’s project maturity for Financial Information Technology (IT) projects in Singapore?”
Table 3.1 in Chapter 3 outlined the subsidiary and synthesizing questions associated with
the main question. Using the reflective outcomes of the literature review and contextualizing
features of Chapter 2, Table 4.1 now maps the research questions more directly with the
identified issues.
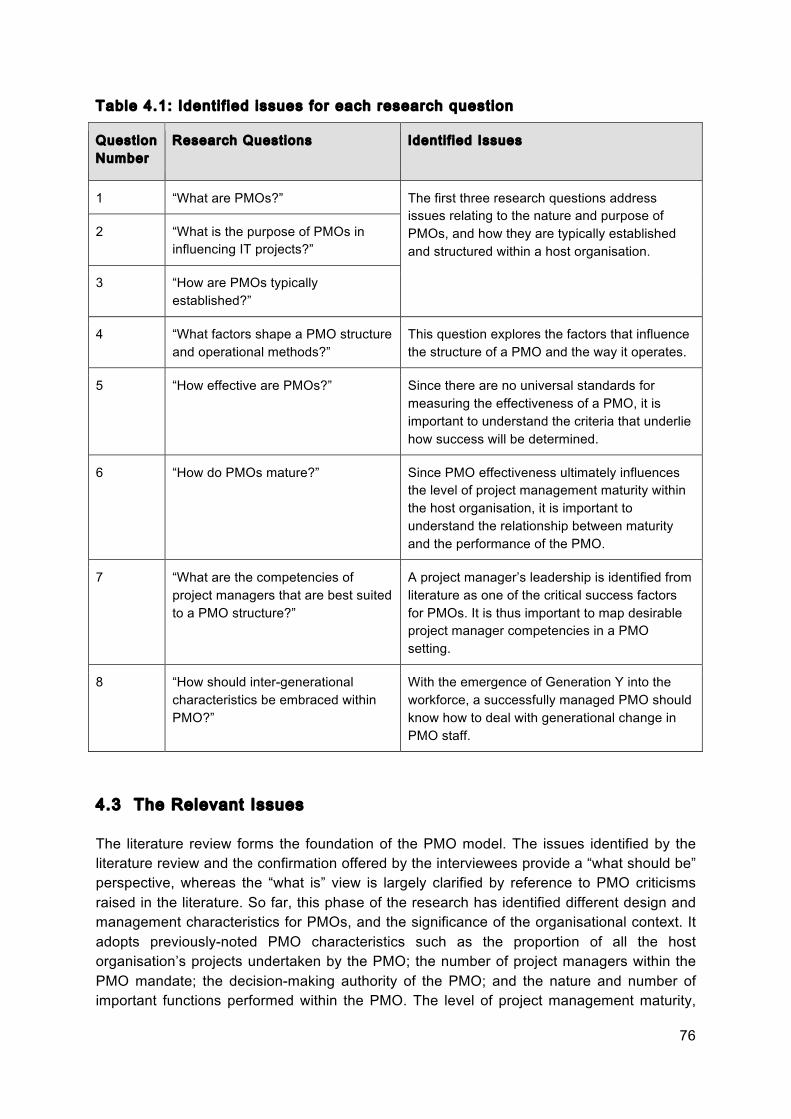
76
Table 4.1: Identi f ied issues for each research question
Question Number
Research Questions Identif ied Issues
1 “What are PMOs?” The first three research questions address issues relating to the nature and purpose of PMOs, and how they are typically established and structured within a host organisation.
2 “What is the purpose of PMOs in influencing IT projects?”
3 “How are PMOs typically established?”
4 “What factors shape a PMO structure and operational methods?”
This question explores the factors that influence the structure of a PMO and the way it operates.
5 “How effective are PMOs?” Since there are no universal standards for measuring the effectiveness of a PMO, it is important to understand the criteria that underlie how success will be determined.
6 “How do PMOs mature?” Since PMO effectiveness ultimately influences the level of project management maturity within the host organisation, it is important to understand the relationship between maturity and the performance of the PMO.
7 “What are the competencies of project managers that are best suited to a PMO structure?”
A project manager’s leadership is identified from literature as one of the critical success factors for PMOs. It is thus important to map desirable project manager competencies in a PMO setting.
8 “How should inter-generational characteristics be embraced within PMO?”
With the emergence of Generation Y into the workforce, a successfully managed PMO should know how to deal with generational change in PMO staff.
4.3 The Relevant Issues
The literature review forms the foundation of the PMO model. The issues identified by the literature review and the confirmation offered by the interviewees provide a “what should be” perspective, whereas the “what is” view is largely clarified by reference to PMO criticisms raised in the literature. So far, this phase of the research has identified different design and management characteristics for PMOs, and the significance of the organisational context. It adopts previously-noted PMO characteristics such as the proportion of all the host organisation’s projects undertaken by the PMO; the number of project managers within the PMO mandate; the decision-making authority of the PMO; and the nature and number of important functions performed within the PMO. The level of project management maturity,
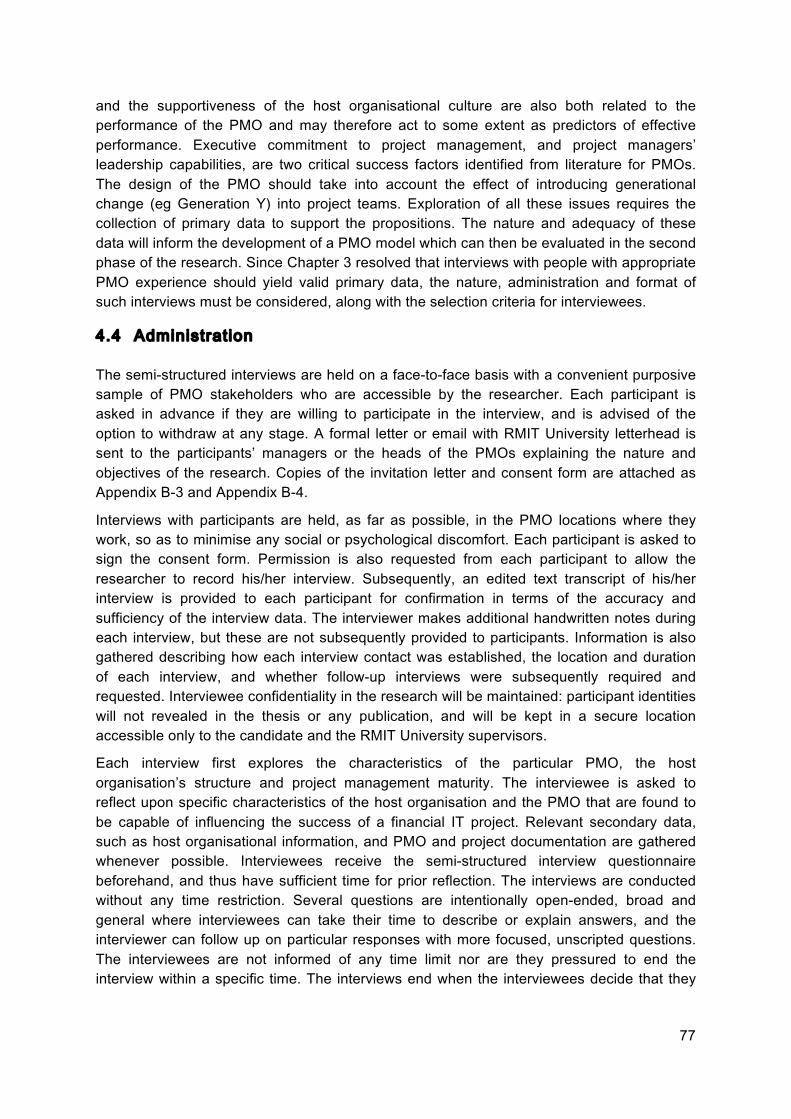
77
and the supportiveness of the host organisational culture are also both related to the performance of the PMO and may therefore act to some extent as predictors of effective performance. Executive commitment to project management, and project managers’ leadership capabilities, are two critical success factors identified from literature for PMOs. The design of the PMO should take into account the effect of introducing generational change (eg Generation Y) into project teams. Exploration of all these issues requires the collection of primary data to support the propositions. The nature and adequacy of these data will inform the development of a PMO model which can then be evaluated in the second phase of the research. Since Chapter 3 resolved that interviews with people with appropriate PMO experience should yield valid primary data, the nature, administration and format of such interviews must be considered, along with the selection criteria for interviewees.
4.4 Administration
The semi-structured interviews are held on a face-to-face basis with a convenient purposive sample of PMO stakeholders who are accessible by the researcher. Each participant is asked in advance if they are willing to participate in the interview, and is advised of the option to withdraw at any stage. A formal letter or email with RMIT University letterhead is sent to the participants’ managers or the heads of the PMOs explaining the nature and objectives of the research. Copies of the invitation letter and consent form are attached as Appendix B-3 and Appendix B-4.
Interviews with participants are held, as far as possible, in the PMO locations where they work, so as to minimise any social or psychological discomfort. Each participant is asked to sign the consent form. Permission is also requested from each participant to allow the researcher to record his/her interview. Subsequently, an edited text transcript of his/her interview is provided to each participant for confirmation in terms of the accuracy and sufficiency of the interview data. The interviewer makes additional handwritten notes during each interview, but these are not subsequently provided to participants. Information is also gathered describing how each interview contact was established, the location and duration of each interview, and whether follow-up interviews were subsequently required and requested. Interviewee confidentiality in the research will be maintained: participant identities will not revealed in the thesis or any publication, and will be kept in a secure location accessible only to the candidate and the RMIT University supervisors.
Each interview first explores the characteristics of the particular PMO, the host organisation’s structure and project management maturity. The interviewee is asked to reflect upon specific characteristics of the host organisation and the PMO that are found to be capable of influencing the success of a financial IT project. Relevant secondary data, such as host organisational information, and PMO and project documentation are gathered whenever possible. Interviewees receive the semi-structured interview questionnaire beforehand, and thus have sufficient time for prior reflection. The interviews are conducted without any time restriction. Several questions are intentionally open-ended, broad and general where interviewees can take their time to describe or explain answers, and the interviewer can follow up on particular responses with more focused, unscripted questions. The interviewees are not informed of any time limit nor are they pressured to end the interview within a specific time. The interviews end when the interviewees decide that they

78
have nothing more to add or contribute to the study. The later on-line respondents are
presented with the same questions and have as much time as they need.
The profile criteria for potential interviewees comprise: experience with PMO implementation,
and have worked in or with a PMO as an employee or as a consultant. Interviewees should
also be working in, or have worked in, a financial-related organisation in Singapore. Since
the population of suitable interviewees in Singapore is not known, the question of how many
interviews are needed, to ensure that sufficient and relevant financial IT PMO practices
within Singapore are captured by the outcomes of the research, is similar to the issue of
achieving ‘saturation’. Galvin (2015) defined achieving saturation as “conducting new interviews until the researcher is confident that no new data relevant to the research question is emerging or would emerge if more interviews were conducted” and suggested
three main ways: “wisdom of the elders”, “quasi-empirical foundation” and “experience of the
researcher”. Relying on the “wisdom of the elders”, which is to look for past similar research
and follow the precedents set by others, is not feasible since there is no comparable
published research. The “quasi-empirical foundation” method is not suitable for small
samples. The “experience of the researcher” suggests that the researcher should weigh up
all the issues involved in her or his intended project, and settle on a number of interviews in
that light (Galvin 2015). Finlay (2011) argued that, for a phenomenological, qualitative
research, “more is not necessarily better when it comes to sample size” as the aim is to
obtain a “strategic” or an “illustrative” sample that can offer data relevant to the research
question. Participants in a strategic sample can provide a broad picture of the researched
phenomenon, and in an illustrative sample can focus on individual experience with little
attempt to generalize beyond, in this case the Singapore financial industry.
For this research, the small strategic sample can be justified based on the researcher’s prior
knowledge of the subject and the possible characteristics and contribution of each of the
chosen interviewees, professional work experience within the industry in context and study
of available PMO literature. The interviewees were purposefully chosen based on their
experience on PMO implementation, instead of statistically random sampling (which would
have required a known population). This is to reinforce the validity and reliability of the
research. It is also likely that the total number of suitable interviewees in Singapore is quite
small (i.e. less than 50), but accessing them all would be difficult since there is no entry point
existing other than the PMI Singapore Chapter (SPMI) (which in itself will not guarantee
suitable financial IT project managers as interviewees) or a professional networking platform
such as “Linked In”. SPMI is the second largest in Asia with more than 1800 active members
and its mission is to promote project management principles within the community, business
and practitioners (SPMI). Support has been sought from SPMI for volunteers to take part in
the research, but there was no response from the 1800 member project professionals in
Singapore. Personal correspondence between 24/11/2016 and 27/3/2017 details the attempt
to recruit more interviewees and also reveals that SPMI does not have enough demographic
information in their database to determine how many members fulfil the profile criteria and
are thus eligible to take part in the research study (correspondence with SPMI attached as
Appendix C).
Administration of the semi-structured interviews is conducted in compliance with the
requirements of the RMIT University Research Ethics Policy (approval attached as Appendix
A).

79
4.5 Pilot Testing
A pilot study was conducted to test the data collection instrument. The four participants (P1,
P2, P3 and P4) who took part in the pilot testing are currently lecturers in a tertiary institution
in Singapore. Previously they had been project managers working with or in PMOs
implementing IT projects in Singapore. Two had worked in a Singapore bank managing
financial IT projects.
Although the participants are academics now, their industry experiences in IT and managing
projects, averaging more than 10 years each, are valuable in informing their insights into
PMO. All interviews were held in the tertiary institution, and the durations ranged from 23 to
29 minutes. All participants signed the consent form and had no issue with audio recording.
The interview responses were subsequently summarised into transcripts and verified via
email by the participants.
Following the interviewee’s comments, amendments to the ordering and phrasing of the
questions were made to improve the flow of questioning, as shown in Appendix B-2. An
interesting response from the pilot interviews concerns the name used to identify the PMO.
Two of the participants’ organisations (P1 and P2) describe a PMO as a temporary team
assembled to implement a “special” project. This description would better fit the definition of
a project than a PMO. The revised instrument now includes questions that attempt to
capture the degree of permanence of the PMO. It was also found that the PMO role was
sometimes played by a Group Quality Department. The name and location of the PMO are
therefore included as questions in the revised instrument (Appendix B-2 Q1.1, Appendix B-2
Q1.2).
Even though the questions were communicated to with the participants before the interview,
some participants were not able to describe or explain some of their answers in detail. This
could be due to the novelty of PMOs in the financial IT industry in Singapore, or perhaps to
unwillingness on the part of working professionals to engage in such academic analysis. The
participants found it particularly challenging to elaborate on “What is the current structure
and size of the PMO? What are their job scopes?” (Appendix B-1 Q1.6), “Please describe
how the structuring of functions and adopting of roles for your PMO has improved the rate of
project success in your organisation.” (Appendix B-1 Q1.10), and “Do you see any areas of
improvement derived from the projects based on the current functions and roles?” (Appendix
B-1 Q1.12). A more complete list of 15 PMO functions adapted from Hobbs and Aubry (2007)
was included in the revised instrument to enable the data capture of a more complete PMO
structure. The 15 functions are selected based on the researcher’s experience working in
financial PMOs and the revised questions now include “other” options to capture additional
items (Appendix B-2 Q1.5).
Another issue discovered during the interview is the practicality for participants to rate the
importance of the factors (Appendix B-1 Q1.11) in 5 intervals ranging from “totally
unimportant” to “critically important”. It confuses the participants and is of little quantitative
value since each participant has his own internal scale. Given that it is not essential for the
model to compare and establish the degrees of importance of each factor, the question has
been revised to ascertain if the factor is important or unimportant as shown in (Appendix B-2
Q1.7).
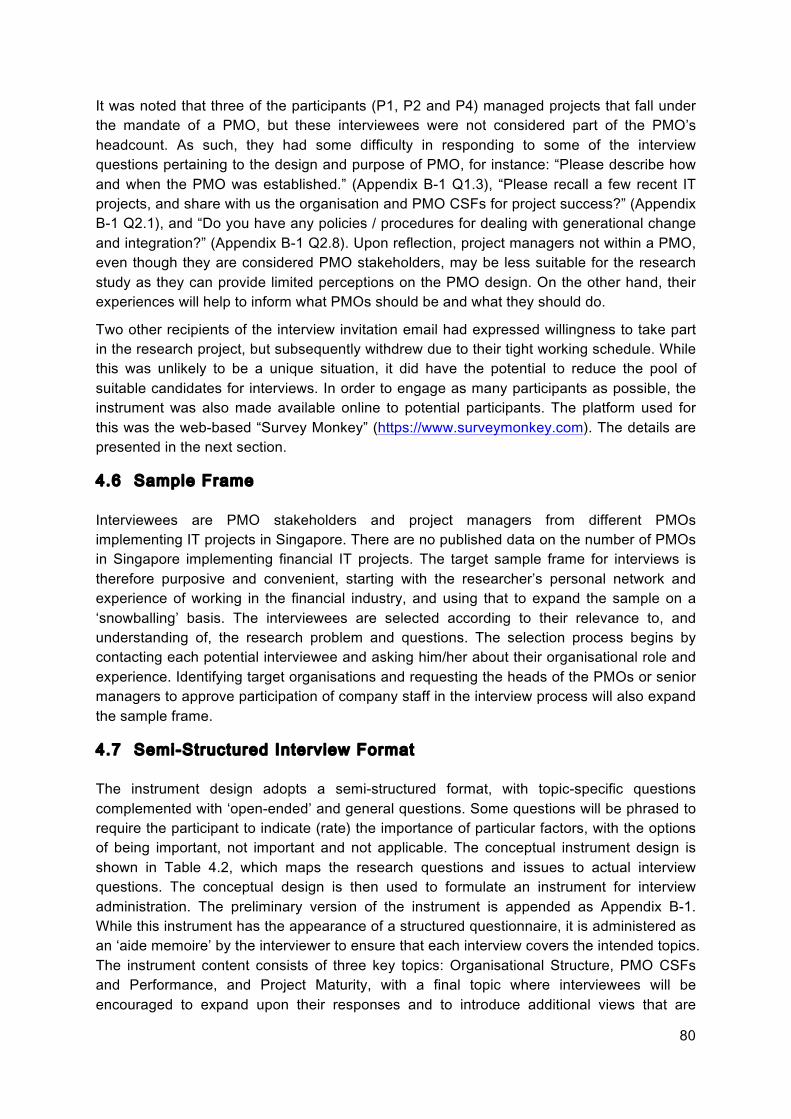
80
It was noted that three of the participants (P1, P2 and P4) managed projects that fall under the mandate of a PMO, but these interviewees were not considered part of the PMO’s headcount. As such, they had some difficulty in responding to some of the interview questions pertaining to the design and purpose of PMO, for instance: “Please describe how and when the PMO was established.” (Appendix B-1 Q1.3), “Please recall a few recent IT projects, and share with us the organisation and PMO CSFs for project success?” (Appendix B-1 Q2.1), and “Do you have any policies / procedures for dealing with generational change and integration?” (Appendix B-1 Q2.8). Upon reflection, project managers not within a PMO, even though they are considered PMO stakeholders, may be less suitable for the research study as they can provide limited perceptions on the PMO design. On the other hand, their experiences will help to inform what PMOs should be and what they should do.
Two other recipients of the interview invitation email had expressed willingness to take part in the research project, but subsequently withdrew due to their tight working schedule. While this was unlikely to be a unique situation, it did have the potential to reduce the pool of suitable candidates for interviews. In order to engage as many participants as possible, the instrument was also made available online to potential participants. The platform used for this was the web-based “Survey Monkey” (https://www.surveymonkey.com). The details are presented in the next section.
4.6 Sample Frame
Interviewees are PMO stakeholders and project managers from different PMOs implementing IT projects in Singapore. There are no published data on the number of PMOs in Singapore implementing financial IT projects. The target sample frame for interviews is therefore purposive and convenient, starting with the researcher’s personal network and experience of working in the financial industry, and using that to expand the sample on a ‘snowballing’ basis. The interviewees are selected according to their relevance to, and understanding of, the research problem and questions. The selection process begins by contacting each potential interviewee and asking him/her about their organisational role and experience. Identifying target organisations and requesting the heads of the PMOs or senior managers to approve participation of company staff in the interview process will also expand the sample frame.
4.7 Semi-Structured Interview Format
The instrument design adopts a semi-structured format, with topic-specific questions complemented with ‘open-ended’ and general questions. Some questions will be phrased to require the participant to indicate (rate) the importance of particular factors, with the options of being important, not important and not applicable. The conceptual instrument design is shown in Table 4.2, which maps the research questions and issues to actual interview questions. The conceptual design is then used to formulate an instrument for interview administration. The preliminary version of the instrument is appended as Appendix B-1. While this instrument has the appearance of a structured questionnaire, it is administered as an ‘aide memoire’ by the interviewer to ensure that each interview covers the intended topics. The instrument content consists of three key topics: Organisational Structure, PMO CSFs and Performance, and Project Maturity, with a final topic where interviewees will be encouraged to expand upon their responses and to introduce additional views that are
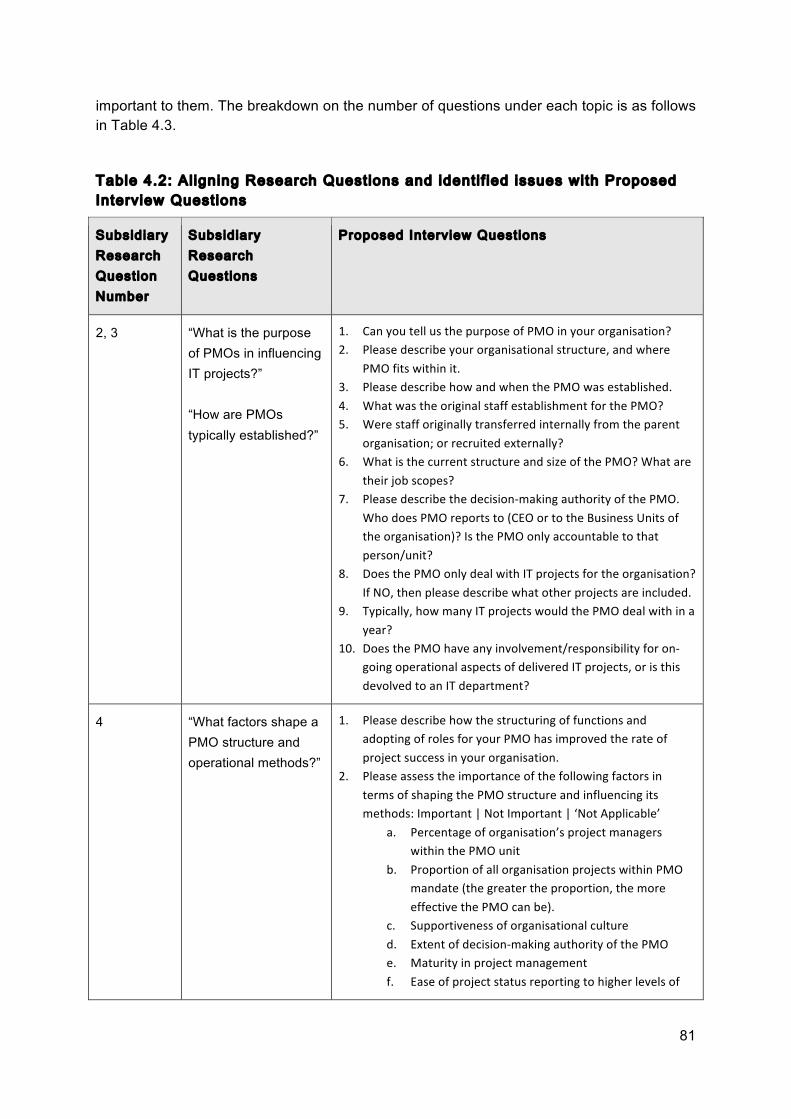
81
important to them. The breakdown on the number of questions under each topic is as follows
in Table 4.3.
Table 4.2: Al igning Research Questions and identi f ied issues with Proposed
Interview Questions
Subsidiary
Research
Question
Number
Subsidiary
Research
Questions
Proposed Interview Questions
2, 3 “What is the purpose
of PMOs in influencing
IT projects?”
“How are PMOs
typically established?”
1. CanyoutellusthepurposeofPMOinyourorganisation?2. Pleasedescribeyourorganisationalstructure,andwhere
PMOfitswithinit.3. PleasedescribehowandwhenthePMOwasestablished.4. WhatwastheoriginalstaffestablishmentforthePMO?5. Werestafforiginallytransferredinternallyfromtheparent
organisation;orrecruitedexternally?6. WhatisthecurrentstructureandsizeofthePMO?Whatare
theirjobscopes?7. Pleasedescribethedecision-makingauthorityofthePMO.
WhodoesPMOreportsto(CEOortotheBusinessUnitsoftheorganisation)?IsthePMOonlyaccountabletothatperson/unit?
8. DoesthePMOonlydealwithITprojectsfortheorganisation?IfNO,thenpleasedescribewhatotherprojectsareincluded.
9. Typically,howmanyITprojectswouldthePMOdealwithinayear?
10. DoesthePMOhaveanyinvolvement/responsibilityforon-goingoperationalaspectsofdeliveredITprojects,oristhisdevolvedtoanITdepartment?
4 “What factors shape a
PMO structure and
operational methods?”
1. PleasedescribehowthestructuringoffunctionsandadoptingofrolesforyourPMOhasimprovedtherateofprojectsuccessinyourorganisation.
2. PleaseassesstheimportanceofthefollowingfactorsintermsofshapingthePMOstructureandinfluencingitsmethods:Important|NotImportant|‘NotApplicable’
a. Percentageoforganisation’sprojectmanagerswithinthePMOunit
b. ProportionofallorganisationprojectswithinPMOmandate(thegreatertheproportion,themoreeffectivethePMOcanbe).
c. Supportivenessoforganisationalcultured. Extentofdecision-makingauthorityofthePMOe. Maturityinprojectmanagementf. Easeofprojectstatusreportingtohigherlevelsof
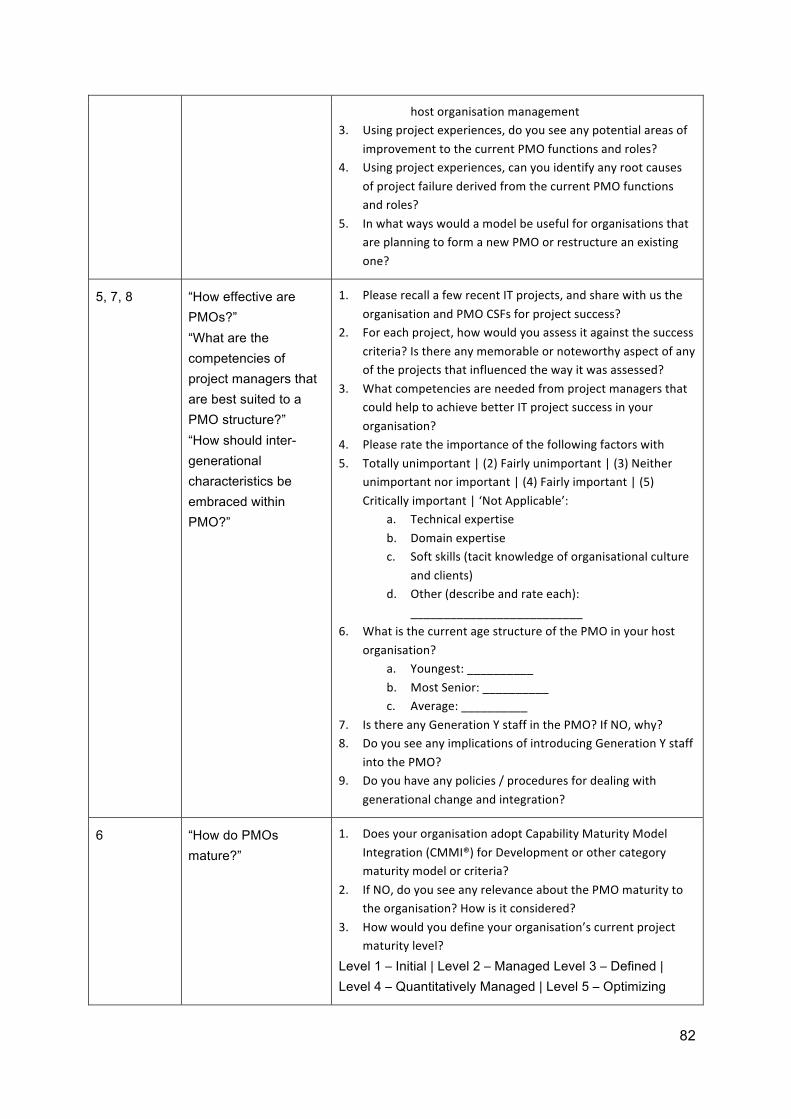
82
hostorganisationmanagement
3. Usingprojectexperiences,doyouseeanypotentialareasof
improvementtothecurrentPMOfunctionsandroles?
4. Usingprojectexperiences,canyouidentifyanyrootcauses
ofprojectfailurederivedfromthecurrentPMOfunctions
androles?
5. Inwhatwayswouldamodelbeusefulfororganisationsthat
areplanningtoformanewPMOorrestructureanexisting
one?
5, 7, 8 “How effective are
PMOs?”
“What are the
competencies of
project managers that
are best suited to a
PMO structure?”
“How should inter-
generational
characteristics be
embraced within
PMO?”
1. PleaserecallafewrecentITprojects,andsharewithusthe
organisationandPMOCSFsforprojectsuccess?
2. Foreachproject,howwouldyouassessitagainstthesuccess
criteria?Isthereanymemorableornoteworthyaspectofany
oftheprojectsthatinfluencedthewayitwasassessed?
3. Whatcompetenciesareneededfromprojectmanagersthat
couldhelptoachievebetterITprojectsuccessinyour
organisation?
4. Pleaseratetheimportanceofthefollowingfactorswith
5. Totallyunimportant|(2)Fairlyunimportant|(3)Neither
unimportantnorimportant|(4)Fairlyimportant|(5)
Criticallyimportant|‘NotApplicable’:
a. Technicalexpertise
b. Domainexpertise
c. Softskills(tacitknowledgeoforganisationalculture
andclients)
d. Other(describeandrateeach):
__________________________
6. WhatisthecurrentagestructureofthePMOinyourhost
organisation?
a. Youngest:__________
b. MostSenior:__________
c. Average:__________
7. IsthereanyGenerationYstaffinthePMO?IfNO,why?
8. DoyouseeanyimplicationsofintroducingGenerationYstaff
intothePMO?
9. Doyouhaveanypolicies/proceduresfordealingwith
generationalchangeandintegration?
6 “How do PMOs
mature?”
1. DoesyourorganisationadoptCapabilityMaturityModel
Integration(CMMI®)forDevelopmentorothercategory
maturitymodelorcriteria?
2. IfNO,doyouseeanyrelevanceaboutthePMOmaturityto
theorganisation?Howisitconsidered?
3. Howwouldyoudefineyourorganisation’scurrentproject
maturitylevel?
Level 1 – Initial | Level 2 – Managed Level 3 – Defined |
Level 4 – Quantitatively Managed | Level 5 – Optimizing

83
9 “How can a PMO
model be developed
that will improve the
success rate of IT
projects for the
financial industry?”
1. WhatfeatureswouldyouexpecttofindinaPMOmodelformanagingfinancialITprojectsinSingapore?
2. WhatfeatureswouldbeexclusivetoSingapore?3. Howwouldyouexpectahostorganisationto
support/encouragetheadoptionofaPMOmodel?4. Othercomments/views?
Table 4.3: Number of Questions for each Interview Topic
Interview Topics Number Of Questions
Organisational Structure 14
PMO CSFs and Performance 6
Project Maturity 3
Additional Points 3
4.7.1 Data analysis Method
After each interview, the audio files and summarised transcript for the interview were
emailed to the participant for verification. The open coding technique (Strauss & Corbin 1998)
was used to explore conceptual ideas and meanings contained within the transcribed text of
interviews. The open coding technique is a process of discovering the properties and dimensions of the concepts contained in each of the interviews, and is effective in theory
building as it allows the researcher to identify concepts. The collected data was broken down
into discrete parts, closely examined and compared for similarities and differences. The
responses to the interview questions were classified according to the organisation’s
characteristics and the number of times the organisation’s characteristics were mentioned in
defining the PMO success during the interview. The words and contents of the descriptions
of each characteristic and its relation to PMO success were later analysed by carefully
reviewing the audio files and written notes. The method used could be described as intuitive
but informed by the nature of the topic and the issues identified in the literature.
For the analysis of quantitative data, some responses are scored with a weight of 1 =
“Important”, -1 = “Not Important” and 0 = “Not Applicable” to compute mean rating scores.
This method is used instead of the more popular 5-point Likert frequency scales, as the
intent is not to establish (possibly meaningless) finer degrees of importance or comparison
of factors, but rather to simply establish if the factor is important or unimportant in the opinion
of practitioners. The Kruskal-Wallis H test was used to determine if there was a significant
difference in importance between the factors for each PMO size. This test is a non-
parametric statistical procedure for comparing more than two samples that are independent,
or not related (Corder & Foreman 2011). Since the data belong to a semi-ordinal measure
and the sample sizes are small, non-parametric statistics are the best way to analyse the
data and test hypotheses.
84
4.8 Online Survey
Sue et al. (2007) define a survey as “a system for collecting information”. With the development of the Internet, the online version may be added to the traditional methods of administering surveys, which included telephone interviewing, self-administered mail questionnaires, and face-to-face interviewing. The online survey has the advantage of having the data collected from the respondents stored in online database, which greatly reduces time, costs, and errors arising from the transcription of interview records.
Biemer and Lyberg (2003) argue that “an optimal data collection method is defined as the best method, given the research question and given certain restrictions”. The basic research question defined the population under study - busy financial IT executives and the type of questions that should be asked - which may be deemed confidential. In the course of administrating the interviews, the need for a more flexible format surfaced, which resulted in moving interviews to online surveys. The participants expressed concerns about the about the time commitment required for the interviews and revealing confidential information about their organisations. With the participants directed to a web site to complete the questionnaire, anonymity was preserved and because there is no interviewer present in person thus, “respondents tend to feel safer providing honest answers in an online environment” (Sue et al. 2007). Vasja and Katja (2008) argue that in a online survey respondents can “complete a questionnaire at the time, place, and pace of their own preference and with an increased sense of privacy”, and this increased the “sense of privacy and absence of interviewer-related biases can importantly contribute to higher data quality”.
The invited participants were offered the online survey mode if they were unable to participate in the face-to-face interview. Leeuw (2005) describes this approach as a concurrent multi-mode system, which is “one sample, one time period, one questionnaire” - one mode of data collection is used for some respondents of a sample and another mode for others in the same sample in order to collect the same data. This implementation of multiple modes (mixed modes) offers opportunities for compensating the weaknesses of individual modes, in this case, increasing response rates. The administration of the online survey is similar to the interview and the online instrument with most parts similar to the interview version. The online survey uses the web-based “Survey Monkey”, which is an Internet programme that enables a researcher to develop a survey for use over the Internet (Waclawski 2012). The administration of the online survey is similar to the interview approach and, since the online instrument is very similar to the interview version, additional pilot testing is not required.
4.9 Chapter Summary
This chapter describes the design and administration processes for the primary data collection instrument for the research whereby semi-structured interviews are conducted with staff from PMOs within appropriate organisations in Singapore. Pilot testing of the instrument with four interviewees has led to amendments and additions to the final version, and the development of an online survey instrument as a means of increasing responses. The following chapter presents the analysis and interpretation of the interview data gathered via the two instrument methods, and shows how it informs the PMO model design.
85
Chapter 5 Survey data analysis
5.1 Introduction
The purpose of this chapter is to present survey results and to therefore explore the
relevance of existing design and management characteristics for PMOs, and the relevance
and importance of the organisational context, through the views and activities of people in
practice in Singapore.
First, the combined data from the interview survey responses and the online survey
responses are presented together as the two data collection instruments are almost identical.
Then the findings from the primary data analysis are aligned to existing PMO design and
management principles and processes in order to inform the subsequent development of a
model of PMO that is both practical and relevant.
5.2 Data Collection
5.2.1 Interview and survey demographics
Semi-structured interviews and online surveys were undertaken between Nov 2014 and April
2015. Since the aim of the research is to understand the prevalence and relevance of PMO
design variables within existing organisational contexts and to elicit opinions about PMO
performance determinants, interview and survey participants should have experience with
PMO implementation, and have worked in or with a PMO as an employee or as a consultant,
as a prerequisite for selection. Project managers with experience of managing PMO
implementation are difficult to find, and not every financial-related organisation in Singapore
has an identifiable PMO. The initial sample set of IT project managers, with Singapore PMO
experience, was recruited through the researcher’s personal contacts. Additional participants
who met the criteria were recruited by using the snowball sampling technique for making
“contacts from contacts” and also searched via the “LinkedIn” online professional network.
Recruiting participants through LinkedIn proved to be particularly useful, as suitable PMO
professionals with relevant work experience in Singapore, who might otherwise be
unreachable, were found and invited.
The total number of participants is 22; comprising 6 interviewees and 16 online survey
respondents. In general, the participants are considered experienced and senior in the IT
industry with all having more than 10 years of working experience, with a range of 10 to 30
years and a mean of 17 years. Participants’ work titles indicate a status range from “project
manager” to “senior vice president” (in the bank); two participants are the Heads of their
respective PMOs. Since this research specifically targets the Singapore financial industry, all
respondents come from financial-related organisations, and include all three Singapore
banks, five foreign banks operating in Singapore, a global asset management company, two
telecommunication companies, a payment processing company and a financial solutions
vendor. The average duration of each interview was 34 minutes and the average time spent
on the online survey declared by the participants is 33 minutes.
There are two main reasons for the small response sample. The first relates to the novelty of
the research topic; to date no published research has been carried out on PMOs in the
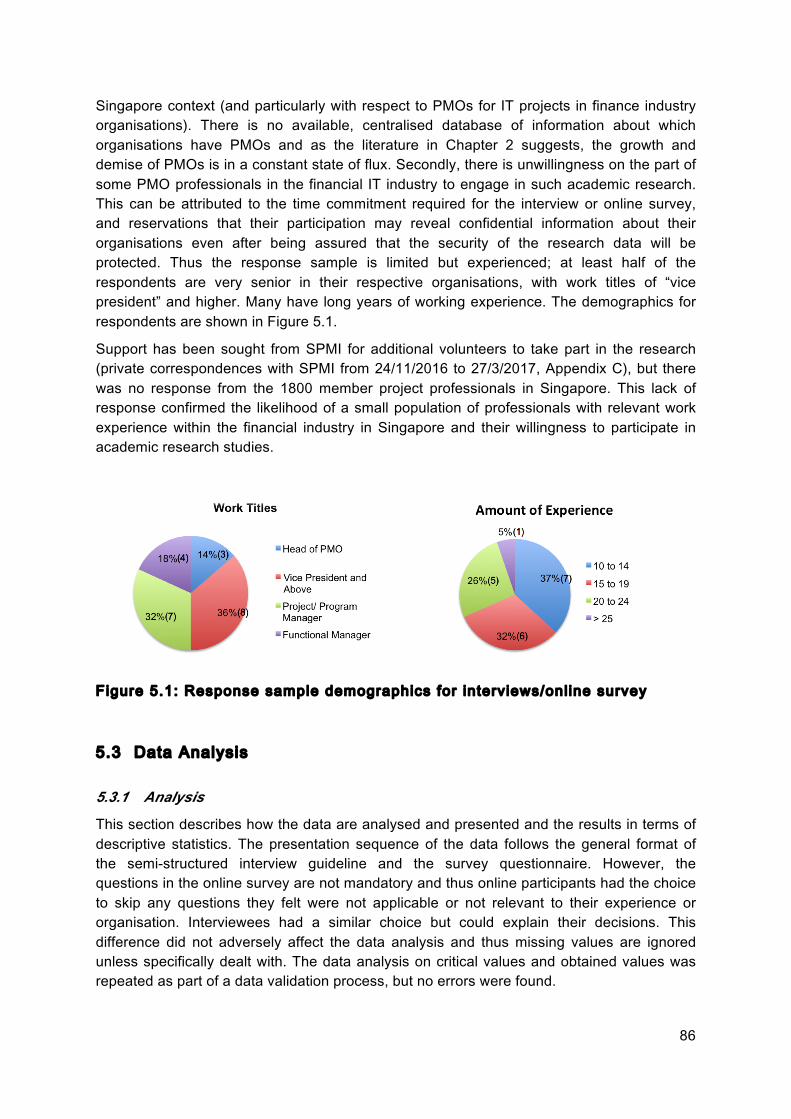
86
Singapore context (and particularly with respect to PMOs for IT projects in finance industry organisations). There is no available, centralised database of information about which organisations have PMOs and as the literature in Chapter 2 suggests, the growth and demise of PMOs is in a constant state of flux. Secondly, there is unwillingness on the part of some PMO professionals in the financial IT industry to engage in such academic research. This can be attributed to the time commitment required for the interview or online survey, and reservations that their participation may reveal confidential information about their organisations even after being assured that the security of the research data will be protected. Thus the response sample is limited but experienced; at least half of the respondents are very senior in their respective organisations, with work titles of “vice president” and higher. Many have long years of working experience. The demographics for respondents are shown in Figure 5.1.
Support has been sought from SPMI for additional volunteers to take part in the research (private correspondences with SPMI from 24/11/2016 to 27/3/2017, Appendix C), but there was no response from the 1800 member project professionals in Singapore. This lack of response confirmed the likelihood of a small population of professionals with relevant work experience within the financial industry in Singapore and their willingness to participate in academic research studies.
Figure 5.1: Response sample demographics for interviews/onl ine survey
5.3 Data Analysis
5.3.1 Analysis
This section describes how the data are analysed and presented and the results in terms of descriptive statistics. The presentation sequence of the data follows the general format of the semi-structured interview guideline and the survey questionnaire. However, the questions in the online survey are not mandatory and thus online participants had the choice to skip any questions they felt were not applicable or not relevant to their experience or organisation. Interviewees had a similar choice but could explain their decisions. This difference did not adversely affect the data analysis and thus missing values are ignored unless specifically dealt with. The data analysis on critical values and obtained values was repeated as part of a data validation process, but no errors were found.
87
The Kruskal-Wallis H test was used to determine if there was a significant difference in importance between the factors for each of the PMO sizes. This test is a non-parametric statistical procedure for comparing more than two samples that are independent, or not related. Since the data belong to an ordinal scale and the sample sizes are small, non-parametric statistics are the best way to analyse the data and test (Corder & Foreman 2011). Kruskal and Wallis (1952) introduced the Kruskal-Wallis H test with exact probability tables for samples with five or fewer in each of three groups, and tables were limited to N ≤ 15, where N is the total sample size. Large rather than small sample size is an issue for the Kruskal-Wallis test, as most applications use a large-sample approximation instead of exact distribution. Statistical packages such as SPSS and R can use exact distribution for very small sample sizes (Meyer & Seaman 2013).
5.3.2 PMO label and reporting hierarchy
Question: Does your organisation have a Project Management Office (PMO)? What is it called?
Most respondents (17) use the term “Project Management Office” (PMO) in their organisation, except for a financial solutions provider [P2] where the respondent refers to it as the “Group Quality Department”, and two participants [P6 and P14] who each identified their units as just “Project Office”. One participant [P23] identified having a global project office known as “Programme Office” and a regional PMO.
Although all the banks in this survey used the PMO name, the names do not clearly differentiate the roles of PMOs. For the purposes of this research, PMOs are regarded as typically permanent structures within the host organisation.
Question: Which part of the host organisation does the PMO report to?
Table 5.1 shows the reporting structure of the PMOs represented by the respondents. Logically, since the focus is upon IT projects for financial institutions in Singapore, many respondents (11) indicated that their PMOs report to the IT Heads of their host organisations. The financial solutions provider’s Group Quality Department [P2] and the PMO of the asset management company [P21] are the only instances where the PMOs report directly to the CEO of the host organisation. The other PMOs report to the head of operations or business. Only 5 respondents [P3, P5, P10, P20 and P23] reported having business units as part of their PMO. One participant [P22] explained that the reporting structure depends on the project, which suggests that the PMO in that case could be a temporary structure implemented to fulfil the immediate needs of the project.
Table 5.1: Report ing structure of the PMOs in the survey
Report ing Structure Interview/ Survey Part ic ipant No. Frequency CEO P2 1 CEO, Operations Head P21 1 IT Head P6, P7, P9, P12, P14, P15, P16, P17,
P18 9
IT Head, Business Head, Operations Head P3, P5 2 Business Head P10, P20 2 Business Head, Operations Head P23 1
88
Operations Head P11, P13 2 Change Delivery Head P19 1 Depends on project P22 1
5.3.3 Reason the PMO was established
Question: Please describe why the PMO was established.
The two most frequent reasons offered to explain the formation and establishment of PMOs, are; (a) to establish the project management governance for the host organisation in terms of processes and best practices [P15] and pool together the PM resources to effectively manage and support projects [P16]; and (b) to prepare, maintain and deliver management reports relating to programs and projects [P21]. In two cases [P3 and P5], the original establishment of a new PMO was driven by a major project or initiative, and a distinct PMO was deemed necessary to better manage it.
The interview and survey questions did not ask when the PMO was formed, as organisations frequently reconfigure their PMOs (Aubry, Hobbs et al. 2011; Aubry, Müller et al. 2010; Pellegrinelli & Garagna 2009). Indeed, some interviewees had no knowledge in this regard. Thus the age of the PMO could not be explored in relation to any other issues.
Spelta and Albertin (2012) report that one of the most common goals of the creation of an IT PMO is to “reduce the number of problem projects through the adoption of project management methodologies”. Unger et al. (2012) identify and characterise three distinct roles of PMOs that have a positive direct effect on the success of project portfolios: coordinating, controlling and supporting. The coordinating role involves allocating limited resources across projects, facilitating cooperation and improving collaboration between stakeholders. The controlling role deals with information management to deliver inputs in decision-making and information sharing. Finally the supporting role develops appropriate project management standards and promotes organisational learning. The coordinating and controlling roles help to confirm that the appropriate projects are selected and prioritised, and the supporting role helps to ensure that projects are managed appropriately.
The reasons to establish a PMO in Singapore, provided by the interview and survey participants, are categorised into these roles. The results are as follows:
• Nearly half of the PMOs surveyed were established largely for the purpose of establishing and standardising the project management practices and providing governance to projects. This is understandable as Dai and Wells (2004) report strong evidence that the implementation of project management standards and methods are most highly correlated with project performance, and as such should take priority over other PMO functions.
• A third of the PMOs surveyed were established to play the coordinating role. • One fifth indicated priority for the controlling role.
Most of the larger PMOs, typically with more than 30 employees were established to play supporting role [P6, P7, P10, P14 and P15] or the coordinating role [P16 and P22]. The controlling role is only performed by smaller PMOs with 11 employees or less [P9, P11, P19 and P21]. This makes sense, as the PMO does not require a big team to establish the information base for decision-making or milestone controlling.
89
5.3.4 PMO staffing
Question: Were staff originally transferred internally from the parent organisation; or recruited externally?
Answers to this question reveal if the organisations already had the necessary expertise or experienced project managers when the PMOs were established, or if staff were recruited from other organisations.
More than half of the respondents reported their PMOs as having staff who transferred internally from the parent organisation and then subsequently recruited externally (indicated by 11 respondents). Four respondents reported their PMOs as only transferring staff internally from the parent organisation, while three indicated their PMOs recruiting wholly externally. Three participants did not answer, presumably on the basis of not knowing this information; while one respondent [P20] is not sure about his organisation’s PMO staffing origin. It is noted that the three PMOs that recruited their staff externally are not situated within financial institutions with headquarters based in Singapore, but in the Singapore regional offices of international organisations.
With 14 out of the 19 responses indicating the need to recruit externally, the results suggest most organisations required at least some external expertise when setting up a PMO. On the other hand, where the host organisation is “native” to Singapore, its preference for local expertise might make it more inclined to establish its PMO with staff already employed in the organisation.
Question: What is the number of staff in the PMO?
Table 5.2 shows the staff statistics for the surveyed PMOs. The results show that 14 of 18 respondents have at least one IT Senior Management person in the PMO. Four respondents reported having Business Management staff in their PMOs.
Participant P16 reported a PMO that employs more than 100 people; it is the only PMO having Operational staff (i.e. staff employed on the operational activities of the host organisation) within the unit and 80 functional managers. Functional managers typically have the responsibility to “provide sufficient and qualified resources to perform project activities and accomplish the objectives within the project’s constraints”. It is not uncommon for project managers to have no direct control over project resources and they must then depend on the functional managers (e.g. division heads) for resource-related issues (Kerzner & Saladis 2009). Respondents P20 and P23 did not indicate PMO staff details, and are excluded from the table.
The size of PMOs may be related to the number and types of projects undertaken, and the extent to which decision-makers other than project managers are included in the PMO. Several inferences can be drawn from Table 5.2:
1. Besides P2, P5 and P16, Project Managers form the largest group within the PMOs. This is also reflected when the staff statistics for the surveyed PMOs are consolidated in the last row of Table 5.2. Smaller PMOs like P1, P3, and P19 have Project Managers as more than half the staff would focus mainly on project management.
2. Besides P19, Senior Business and Business Managers are only included in bigger PMOs like P5, P10, P14, P16 and P22.
90
Bigger PMOs like P5, P14, P16 and P22 have IT Functional Managers, Project Finance Managers and Operation Managers within their PMOs, suggestive of the wider scope of functions of big PMOs. Having functional managers within the PMO ensures that higher priority projects are equipped with the necessary resources, and that resource conflicts are resolved at the PMO level. Project Finance Managers are often required to manage project finances across projects and provide a consolidated report to upper management. The PMO will be better able to handle operational issues after project delivery with the support of and inputs from Operation Managers during project implementation.
5.3.5 PMO functions
Question: Select all the functions that are applicable to the PMO in your organisation, and identify any additional ones [table of functions given].
Given that the surveyed organisations have different contextual and structural dimensions, it was expected that their PMOs would differ in terms of structural and functional characteristics.
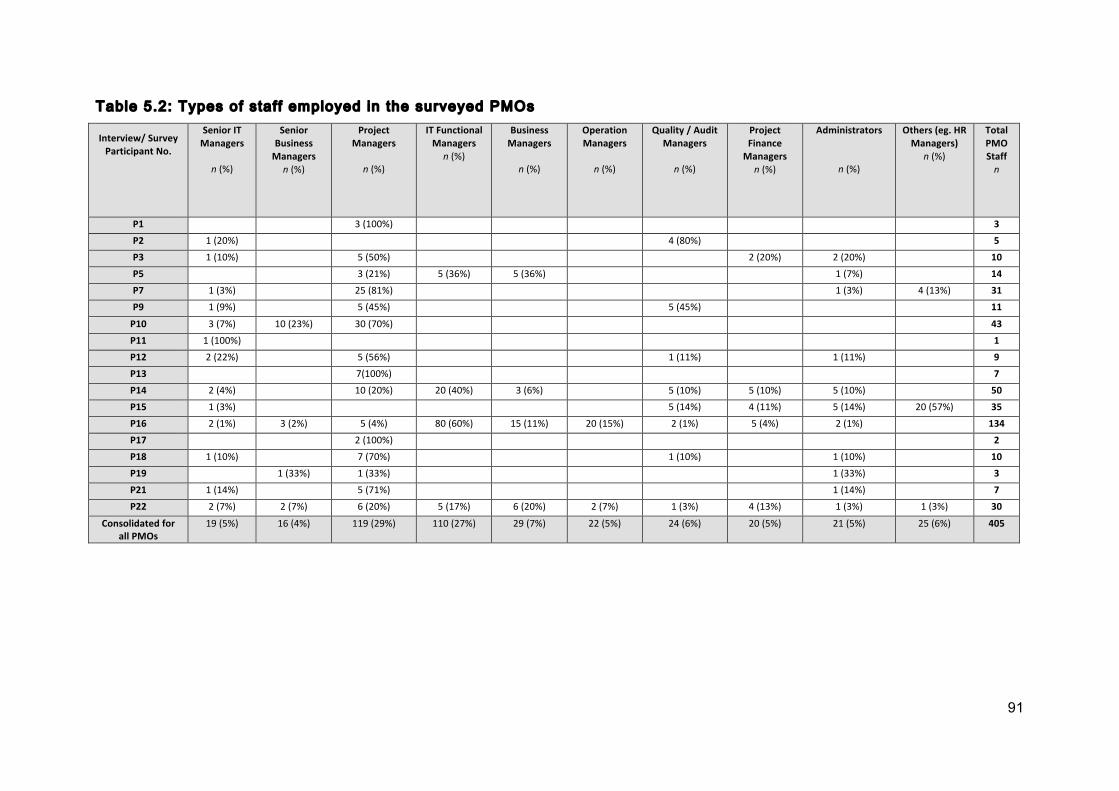
91
Table 5.2: Types of staff employed in the surveyed PMOs
Interview/SurveyParticipantNo.
SeniorITManagers
n(%)
SeniorBusinessManagers
n(%)
ProjectManagers
n(%)
ITFunctionalManagers
n(%)
BusinessManagers
n(%)
OperationManagers
n(%)
Quality/AuditManagers
n(%)
ProjectFinanceManagers
n(%)
Administrators
n(%)
Others(eg.HRManagers)
n(%)
TotalPMOStaffn
P1 3(100%) 3P2 1(20%) 4(80%) 5P3 1(10%) 5(50%) 2(20%) 2(20%) 10P5 3(21%) 5(36%) 5(36%) 1(7%) 14P7 1(3%) 25(81%) 1(3%) 4(13%) 31P9 1(9%) 5(45%) 5(45%) 11
P10 3(7%) 10(23%) 30(70%) 43P11 1(100%) 1P12 2(22%) 5(56%) 1(11%) 1(11%) 9P13 7(100%) 7P14 2(4%) 10(20%) 20(40%) 3(6%) 5(10%) 5(10%) 5(10%) 50P15 1(3%) 5(14%) 4(11%) 5(14%) 20(57%) 35P16 2(1%) 3(2%) 5(4%) 80(60%) 15(11%) 20(15%) 2(1%) 5(4%) 2(1%) 134P17 2(100%) 2P18 1(10%) 7(70%) 1(10%) 1(10%) 10P19 1(33%) 1(33%) 1(33%) 3P21 1(14%) 5(71%) 1(14%) 7P22 2(7%) 2(7%) 6(20%) 5(17%) 6(20%) 2(7%) 1(3%) 4(13%) 1(3%) 1(3%) 30
ConsolidatedforallPMOs
19(5%) 16(4%) 119(29%) 110(27%) 29(7%) 22(5%) 24(6%) 20(5%) 21(5%) 25(6%) 405

92
To enable the data capture of the functions of a PMO, a catalogue of 14 PMO functions (as
described in Appendix B-2 Q1.5) was offered to interview and survey participants, with an
option to add others. It is assumed that, if the project managers are situated within the PMO,
then the direct management activities for the projects themselves will be part of the PMO’s
mandate and thereby not constitute a separate identifiable function in the catalogue. Table
5.3 shows the frequency of responses from the surveyed PMOs performing the suggested
14 functions.
Referring to Table 5.3, the top two functions performed by the PMOs are “Report project
status to upper management”, followed by “Develop and implement standard methodologies”.
PMOs can provide specialised services to project managers; common examples may
include preparation of schedules (indicated by 10 respondents) and contract management
(indicated by 7 respondents). This can help to offload some administrative work.
Archibald (2003) classifies organisations into two types: organisations that offer a service of
project management for external clients and organisations where project management is not
their core business and where projects are a means for other business objectives. PMOs in
the former organisation type may have the responsibility for managing external customer
interfaces (subcontractor), which would require managing outsourcing contracts with these
customers (indicated by 7 respondents). Organisations that offer a service of project
management for external clients would have responsibilities for the activity: manage
outsourcing contracts. Project management competencies are a primary concern in IT
outsourcing or Information Systems Outsourcing (ISO). Feeny et al. (2006) observe that
competent project managers influence ISO project outcomes and determine the status of
client-vendor relationships. The results from ISO risk studies attribute lack of expertise and
experience in managerial activities as a factor in project failures (Aubert et al. 2005; Currie
2003; Earl 1996; Schmidt et al. 2001; Taylor 2007). Banks are examples of the latter
organisation type where the PMOs perform contract management for contract staff within the
PMO, such as software and hardware systems leasing.
As PMOs become more involved with issues of strategic alignment, functions related to
strategic management may also be performed by PMOs. Managing project benefits
(indicated by 6 respondents), which is associated with program management, is one such
function that stretches project management towards the product life cycle (Jugdev & Moller
2006; PMI 2013). Examples of “Other” functions offered by respondents (not shown in Table
5.3) include “project costing management and evaluations” [P5], “project defect management” [P18] and “handling of logistic and admin matters, like scheduling of meetings, writing of minutes, and booking of seats and tables for outsourced resources” [P3].
Table 5.3: Functions incorporated in surveyed PMOs
Function Response % (n)
(a) Report project status to higher management 85.7% (18)
(b) Develop and implement standard methodologies 76.2% (16)
(c) Manage archives of project documentation 66.7% (14)
(d) Implement and operate a project information system 61.9% (13)
(e) Coordinate between projects 61.9% (13)
(f) Conduct project audits 57.1% (12)
(g) Develop competency of personnel, including training 52.4% (11)
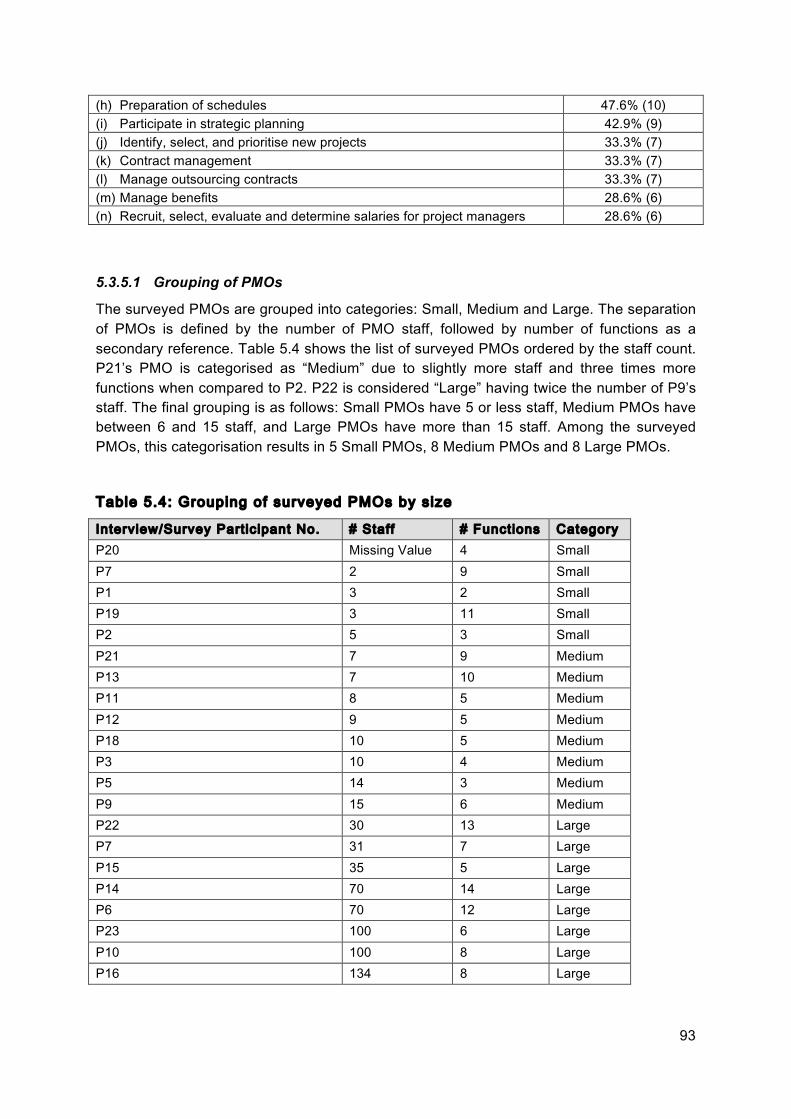
93
(h) Preparation of schedules 47.6% (10) (i) Participate in strategic planning 42.9% (9) (j) Identify, select, and prioritise new projects 33.3% (7) (k) Contract management 33.3% (7) (l) Manage outsourcing contracts 33.3% (7) (m) Manage benefits 28.6% (6) (n) Recruit, select, evaluate and determine salaries for project managers 28.6% (6)
5.3.5.1 Grouping of PMOs
The surveyed PMOs are grouped into categories: Small, Medium and Large. The separation of PMOs is defined by the number of PMO staff, followed by number of functions as a secondary reference. Table 5.4 shows the list of surveyed PMOs ordered by the staff count. P21’s PMO is categorised as “Medium” due to slightly more staff and three times more functions when compared to P2. P22 is considered “Large” having twice the number of P9’s staff. The final grouping is as follows: Small PMOs have 5 or less staff, Medium PMOs have between 6 and 15 staff, and Large PMOs have more than 15 staff. Among the surveyed PMOs, this categorisation results in 5 Small PMOs, 8 Medium PMOs and 8 Large PMOs.
Table 5.4: Grouping of surveyed PMOs by size
Interview/Survey Part ic ipant No. # Staff # Functions Category P20 Missing Value 4 Small P7 2 9 Small P1 3 2 Small P19 3 11 Small P2 5 3 Small P21 7 9 Medium P13 7 10 Medium P11 8 5 Medium P12 9 5 Medium P18 10 5 Medium P3 10 4 Medium P5 14 3 Medium P9 15 6 Medium P22 30 13 Large P7 31 7 Large P15 35 5 Large P14 70 14 Large P6 70 12 Large P23 100 6 Large P10 100 8 Large P16 134 8 Large
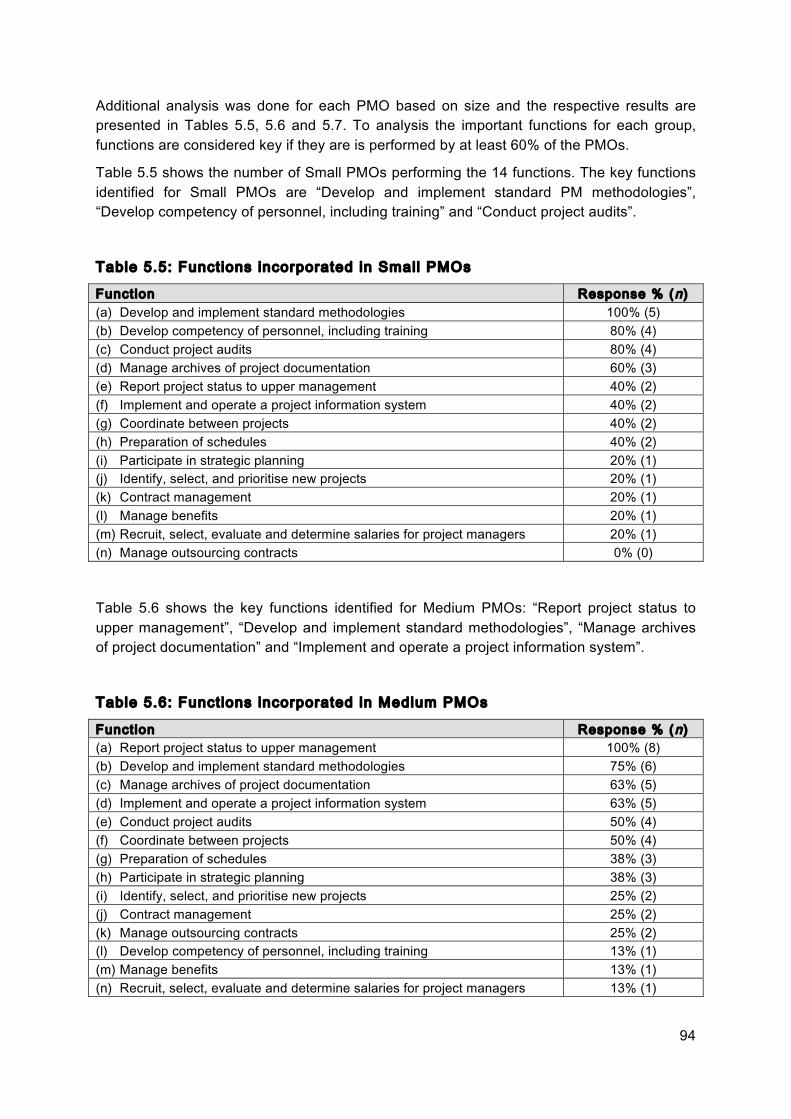
94
Additional analysis was done for each PMO based on size and the respective results are presented in Tables 5.5, 5.6 and 5.7. To analysis the important functions for each group, functions are considered key if they are is performed by at least 60% of the PMOs.
Table 5.5 shows the number of Small PMOs performing the 14 functions. The key functions identified for Small PMOs are “Develop and implement standard PM methodologies”, “Develop competency of personnel, including training” and “Conduct project audits”.
Table 5.5: Functions incorporated in Small PMOs
Function Response % (n) (a) Develop and implement standard methodologies 100% (5) (b) Develop competency of personnel, including training 80% (4) (c) Conduct project audits 80% (4) (d) Manage archives of project documentation 60% (3) (e) Report project status to upper management 40% (2) (f) Implement and operate a project information system 40% (2) (g) Coordinate between projects 40% (2) (h) Preparation of schedules 40% (2) (i) Participate in strategic planning 20% (1) (j) Identify, select, and prioritise new projects 20% (1) (k) Contract management 20% (1) (l) Manage benefits 20% (1) (m) Recruit, select, evaluate and determine salaries for project managers 20% (1) (n) Manage outsourcing contracts 0% (0)
Table 5.6 shows the key functions identified for Medium PMOs: “Report project status to upper management”, “Develop and implement standard methodologies”, “Manage archives of project documentation” and “Implement and operate a project information system”.
Table 5.6: Functions incorporated in Medium PMOs
Function Response % (n) (a) Report project status to upper management 100% (8) (b) Develop and implement standard methodologies 75% (6) (c) Manage archives of project documentation 63% (5) (d) Implement and operate a project information system 63% (5) (e) Conduct project audits 50% (4) (f) Coordinate between projects 50% (4) (g) Preparation of schedules 38% (3) (h) Participate in strategic planning 38% (3) (i) Identify, select, and prioritise new projects 25% (2) (j) Contract management 25% (2) (k) Manage outsourcing contracts 25% (2) (l) Develop competency of personnel, including training 13% (1) (m) Manage benefits 13% (1) (n) Recruit, select, evaluate and determine salaries for project managers 13% (1)
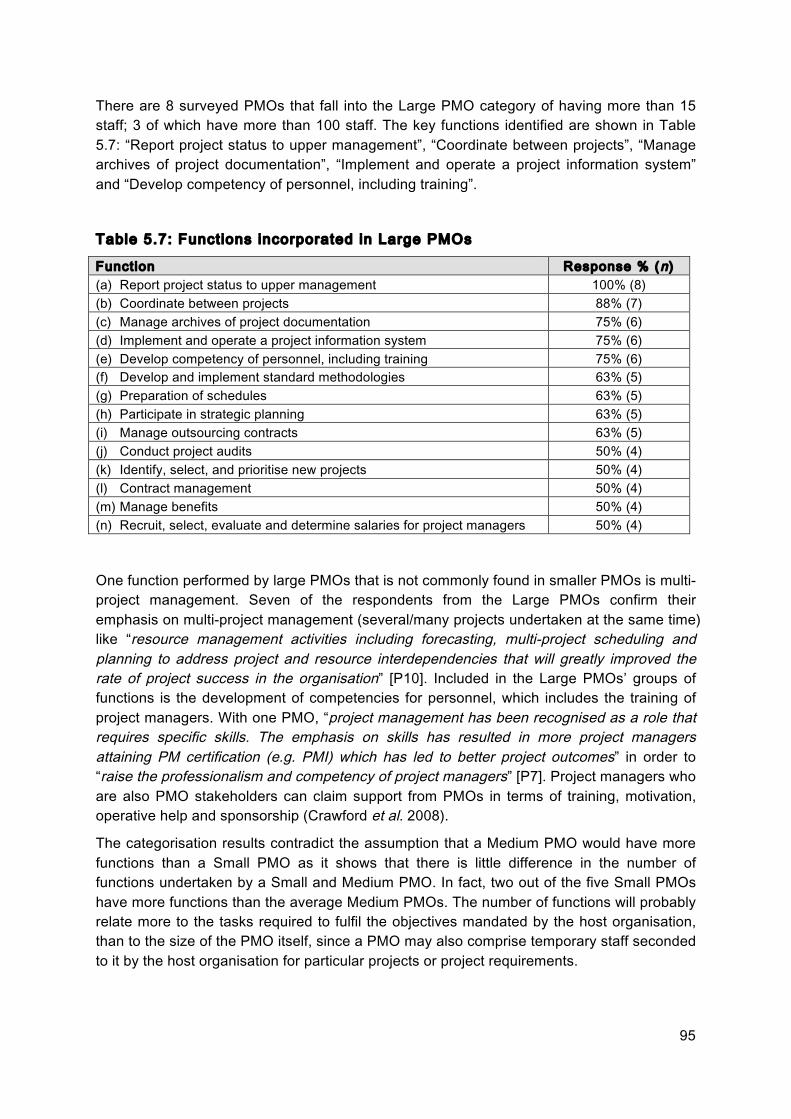
95
There are 8 surveyed PMOs that fall into the Large PMO category of having more than 15 staff; 3 of which have more than 100 staff. The key functions identified are shown in Table 5.7: “Report project status to upper management”, “Coordinate between projects”, “Manage archives of project documentation”, “Implement and operate a project information system” and “Develop competency of personnel, including training”.
Table 5.7: Functions incorporated in Large PMOs
Function Response % (n) (a) Report project status to upper management 100% (8) (b) Coordinate between projects 88% (7) (c) Manage archives of project documentation 75% (6) (d) Implement and operate a project information system 75% (6) (e) Develop competency of personnel, including training 75% (6) (f) Develop and implement standard methodologies 63% (5) (g) Preparation of schedules 63% (5) (h) Participate in strategic planning 63% (5) (i) Manage outsourcing contracts 63% (5) (j) Conduct project audits 50% (4) (k) Identify, select, and prioritise new projects 50% (4) (l) Contract management 50% (4) (m) Manage benefits 50% (4) (n) Recruit, select, evaluate and determine salaries for project managers 50% (4)
One function performed by large PMOs that is not commonly found in smaller PMOs is multi-project management. Seven of the respondents from the Large PMOs confirm their emphasis on multi-project management (several/many projects undertaken at the same time) like “resource management activities including forecasting, multi-project scheduling and planning to address project and resource interdependencies that will greatly improved the rate of project success in the organisation” [P10]. Included in the Large PMOs’ groups of functions is the development of competencies for personnel, which includes the training of project managers. With one PMO, “project management has been recognised as a role that requires specific skills. The emphasis on skills has resulted in more project managers attaining PM certification (e.g. PMI) which has led to better project outcomes” in order to “raise the professionalism and competency of project managers” [P7]. Project managers who are also PMO stakeholders can claim support from PMOs in terms of training, motivation, operative help and sponsorship (Crawford et al. 2008).
The categorisation results contradict the assumption that a Medium PMO would have more functions than a Small PMO as it shows that there is little difference in the number of functions undertaken by a Small and Medium PMO. In fact, two out of the five Small PMOs have more functions than the average Medium PMOs. The number of functions will probably relate more to the tasks required to fulfil the objectives mandated by the host organisation, than to the size of the PMO itself, since a PMO may also comprise temporary staff seconded to it by the host organisation for particular projects or project requirements.
96
The implications of the data highlight the different sets of key functions identified for Small, Medium and Large PMOs that will be incorporated in the proposed PMO model.
5.3.6 Important factors in shaping the PMO structure
Question: Please assess the importance of the following factors in terms of shaping the PMO structure and influencing its methods [table of factors given].
In the questionnaire, participants were asked to assess the relative importance of catalogued factors in shaping the PMO structure and influencing its methods. The catalogue of factors (drawn from the literature) includes: percentage of the organisation’s project managers within the PMO unit; proportion of all organisation projects within the PMO mandate; supportiveness of host organisational culture; extent of decision-making authority of the PMO; maturity in project management; and ease of project status reporting to higher levels of host organisational management, with an option to indicate other factors.
The results are shown in Figure 5.2. For the analysis, responses are scored with a weight of 1 to “Important”, -1 to “Not Important” and 0 to “Not Applicable” to compute mean rating scores in Table 5.8. This method is used instead of the 5-point Likert scales, as the intent is not to establish degrees of importance or comparing of factors, but rather to simply establish if the factor is important or unimportant. The statistics in Table 5.8 show the response count and the mean rating score for each factor. The analysis shows that the top three factors regarded by respondents as important are: “maturity in project management”, “percentage of PMs within the PMO” and “supportiveness of organisational culture”. Fifteen respondents thought that the “extent of decision-making authority of the PMO” was important. Other factors provided by respondents include “having project managers well versed in business domain and operational processes” [P14] and “standardisation of processes” [P19]. A PMO model can use the importance measures as an indication of what to focus on when establishing a new PMO. Using the PMOs sizing categories defined in 5.3.5.1, a comparative analysis is done to compare the importance of factors for different sized PMOs as shown in Table 5.9.

97
Figure 5.2: Important factors in shaping the PMO structure
The overall mean rating score values are shown in Table 5.8, and the mean values for each PMO size category in Table 5.9.
Table 5.8: Mean rat ing scores for factors shaping the PMO structure
PMO Shaping Factor Important Not Important Not Applicable Mean Score Maturity in project management
20 1 0 0.90
Support iveness of organisational culture
19
1 1 0.86
Percentage of PMs within PMO
19 2 0 0.81
Ease of project status report ing
18 3 0 0.71
Proport ion of projects within PMO
16 4 1 0.57
Extent of decision-making authority
15 5 1 0.48
Table 5.9: Mean rat ing scores for factors shaping the PMO structure for dif ferent sized PMOs
PMO Shaping Factor Small PMOs Medium PMOs Large PMOs Maturity in project management
1 1 0.75
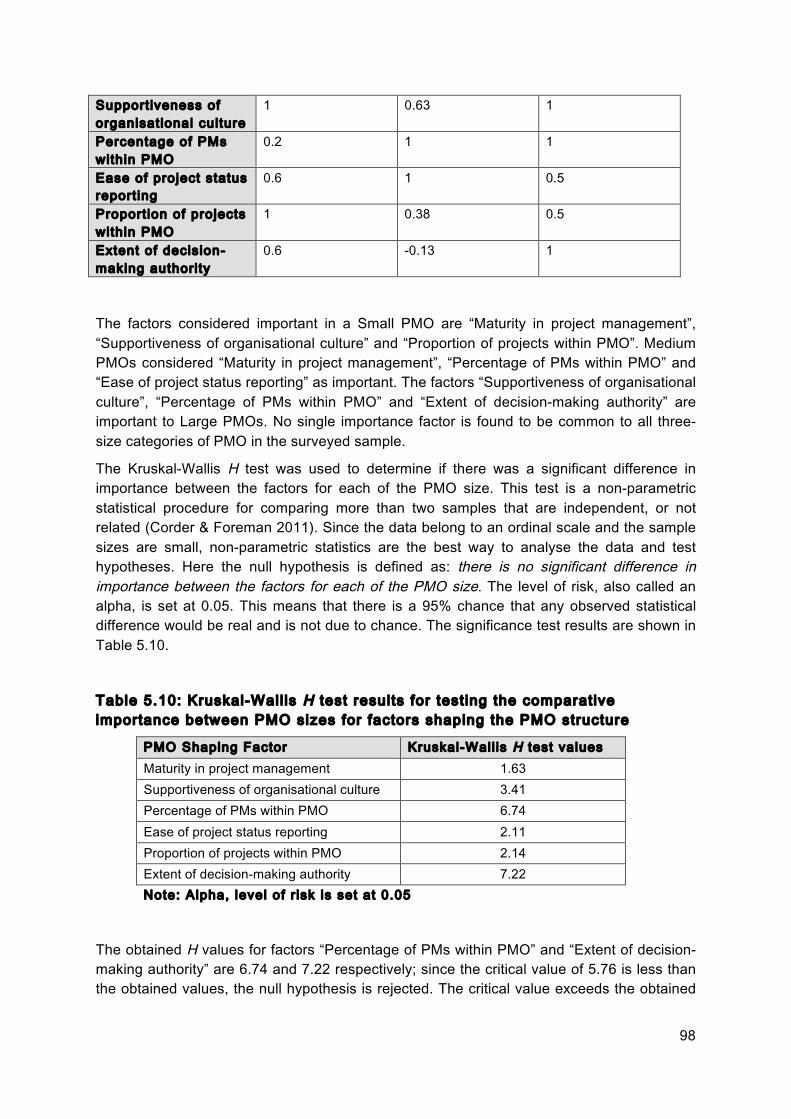
98
Support iveness of organisational culture
1
0.63 1
Percentage of PMs within PMO
0.2 1 1
Ease of project status report ing
0.6 1 0.5
Proport ion of projects within PMO
1 0.38 0.5
Extent of decision-making authority
0.6 -0.13 1
The factors considered important in a Small PMO are “Maturity in project management”, “Supportiveness of organisational culture” and “Proportion of projects within PMO”. Medium PMOs considered “Maturity in project management”, “Percentage of PMs within PMO” and “Ease of project status reporting” as important. The factors “Supportiveness of organisational culture”, “Percentage of PMs within PMO” and “Extent of decision-making authority” are important to Large PMOs. No single importance factor is found to be common to all three-size categories of PMO in the surveyed sample.
The Kruskal-Wallis H test was used to determine if there was a significant difference in importance between the factors for each of the PMO size. This test is a non-parametric statistical procedure for comparing more than two samples that are independent, or not related (Corder & Foreman 2011). Since the data belong to an ordinal scale and the sample sizes are small, non-parametric statistics are the best way to analyse the data and test hypotheses. Here the null hypothesis is defined as: there is no significant difference in importance between the factors for each of the PMO size. The level of risk, also called an alpha, is set at 0.05. This means that there is a 95% chance that any observed statistical difference would be real and is not due to chance. The significance test results are shown in Table 5.10.
Table 5.10: Kruskal-Wall is H test results for test ing the comparative importance between PMO sizes for factors shaping the PMO structure
PMO Shaping Factor Kruskal-Wall is H test values
Maturity in project management 1.63
Supportiveness of organisational culture 3.41
Percentage of PMs within PMO 6.74
Ease of project status reporting 2.11
Proportion of projects within PMO 2.14
Extent of decision-making authority 7.22
Note: Alpha, level of r isk is set at 0.05
The obtained H values for factors “Percentage of PMs within PMO” and “Extent of decision-making authority” are 6.74 and 7.22 respectively; since the critical value of 5.76 is less than the obtained values, the null hypothesis is rejected. The critical value exceeds the obtained
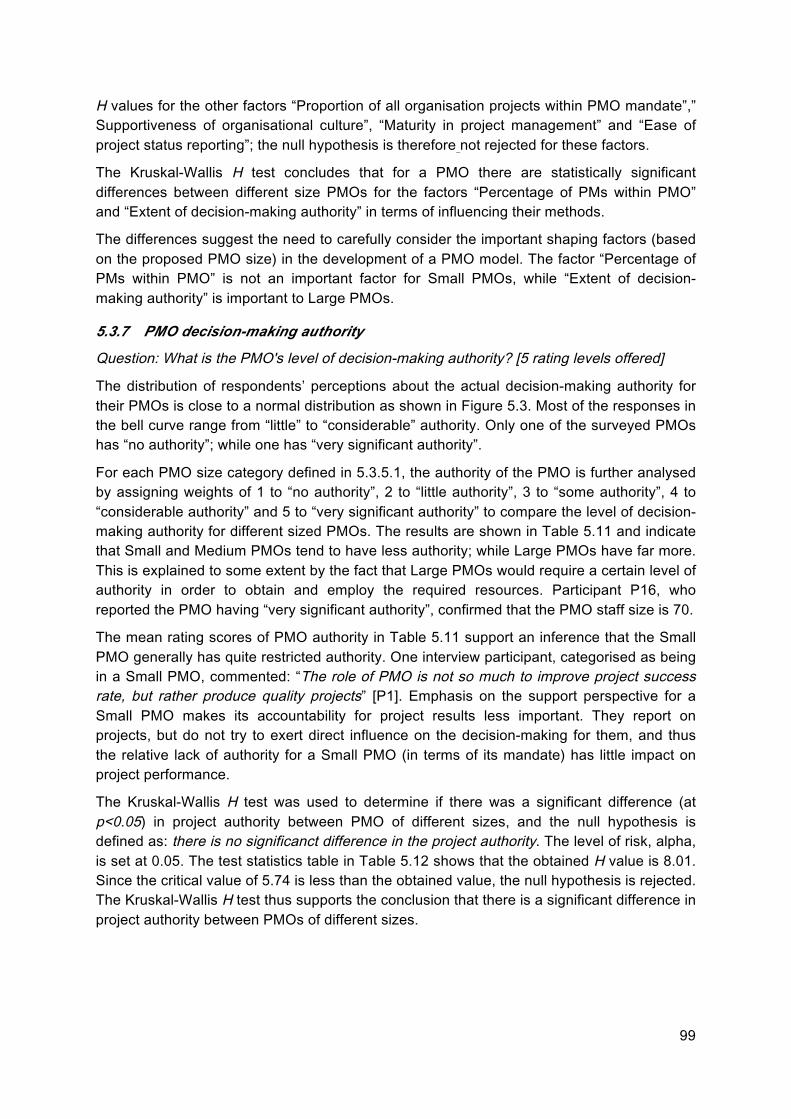
99
H values for the other factors “Proportion of all organisation projects within PMO mandate”,” Supportiveness of organisational culture”, “Maturity in project management” and “Ease of project status reporting”; the null hypothesis is therefore not rejected for these factors.
The Kruskal-Wallis H test concludes that for a PMO there are statistically significant differences between different size PMOs for the factors “Percentage of PMs within PMO” and “Extent of decision-making authority” in terms of influencing their methods.
The differences suggest the need to carefully consider the important shaping factors (based on the proposed PMO size) in the development of a PMO model. The factor “Percentage of PMs within PMO” is not an important factor for Small PMOs, while “Extent of decision-making authority” is important to Large PMOs.
5.3.7 PMO decision-making authority
Question: What is the PMO's level of decision-making authority? [5 rating levels offered]
The distribution of respondents’ perceptions about the actual decision-making authority for their PMOs is close to a normal distribution as shown in Figure 5.3. Most of the responses in the bell curve range from “little” to “considerable” authority. Only one of the surveyed PMOs has “no authority”; while one has “very significant authority”.
For each PMO size category defined in 5.3.5.1, the authority of the PMO is further analysed by assigning weights of 1 to “no authority”, 2 to “little authority”, 3 to “some authority”, 4 to “considerable authority” and 5 to “very significant authority” to compare the level of decision-making authority for different sized PMOs. The results are shown in Table 5.11 and indicate that Small and Medium PMOs tend to have less authority; while Large PMOs have far more. This is explained to some extent by the fact that Large PMOs would require a certain level of authority in order to obtain and employ the required resources. Participant P16, who reported the PMO having “very significant authority”, confirmed that the PMO staff size is 70.
The mean rating scores of PMO authority in Table 5.11 support an inference that the Small PMO generally has quite restricted authority. One interview participant, categorised as being in a Small PMO, commented: “The role of PMO is not so much to improve project success rate, but rather produce quality projects” [P1]. Emphasis on the support perspective for a Small PMO makes its accountability for project results less important. They report on projects, but do not try to exert direct influence on the decision-making for them, and thus the relative lack of authority for a Small PMO (in terms of its mandate) has little impact on project performance.
The Kruskal-Wallis H test was used to determine if there was a significant difference (at p<0.05) in project authority between PMO of different sizes, and the null hypothesis is defined as: there is no significanct difference in the project authority. The level of risk, alpha, is set at 0.05. The test statistics table in Table 5.12 shows that the obtained H value is 8.01. Since the critical value of 5.74 is less than the obtained value, the null hypothesis is rejected. The Kruskal-Wallis H test thus supports the conclusion that there is a significant difference in project authority between PMOs of different sizes.

100
Figure 5.3: Level of decision-making authority for PMOs
Table 5.11: Mean rat ing scores for PMO Authority for dif ferent sized PMOs
PMO Size Mean Scores of PMO Authority Small 2.3 Medium 2.5 Large 3.8
Table 5.12: Kruskal-Wall is H test results for test ing PMO Authority
The Kruskal-Wallis H test identifies if a statistically significant difference exists, but not how many differences exist and which samples are different (Corder & Foreman 2011). The Mann-Whitney U test is used to compare the paired samples from Small and Medium PMOs, Medium and Large PMOs, and Small and Large PMOs. The null hypothesises defined are: there is no significant difference between Small and Medium PMOs, Medium and Large PMOs, and Small and Large PMOs respectively for the project authority. The critical values for each pair that is based on the sample sizes are as follows: 2 for Small and Medium PMOs, 8 for Medium and Large PMOs, and 4 for Small and Large PMOs. The test statistics tables in Table 5.13, 5.14 and 5.15 show the Mann-Whitney U test results for the 3 pairs of samples.
AuthorityChi-squaredfAsymp. Sig. .018
28.012
Test Statisticsa ,b
a. Kruskal Wallis Testb. Grouping Variable: PMO Size
Median Test
LargeMediumSmallPMO Size
> Median<= Median
Authority354510
Frequencies
AuthorityNMedianChi-squaredfAsymp. Sig. .055
25.813a
3.0018
Test Statisticsb
a. 5 cells (83.3%) have expected frequencies less than 5. The minimum expected cell frequency is 1.3.b. Grouping Variable: PMO Size
Page 4
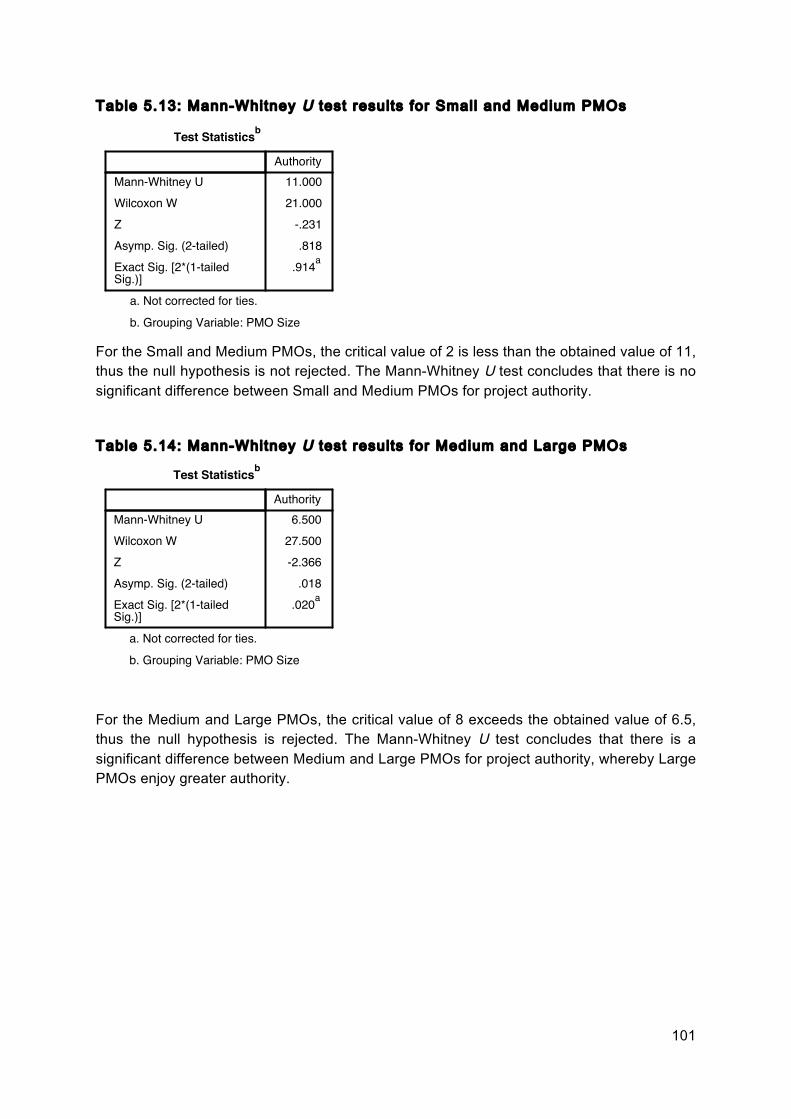
101
Table 5.13: Mann-Whitney U test results for Small and Medium PMOs
For the Small and Medium PMOs, the critical value of 2 is less than the obtained value of 11, thus the null hypothesis is not rejected. The Mann-Whitney U test concludes that there is no significant difference between Small and Medium PMOs for project authority.
Table 5.14: Mann-Whitney U test results for Medium and Large PMOs
For the Medium and Large PMOs, the critical value of 8 exceeds the obtained value of 6.5, thus the null hypothesis is rejected. The Mann-Whitney U test concludes that there is a significant difference between Medium and Large PMOs for project authority, whereby Large PMOs enjoy greater authority.
AuthorityMann-Whitney UWilcoxon WZAsymp. Sig. (2-tailed)Exact Sig. [2*(1-tailed Sig.)]
.914a.818
-.23121.00011.000
Test Statisticsb
a. Not corrected for ties.b. Grouping Variable: PMO Size
NPAR TESTS /M-W= Authority BY PMOSize(2 3) /STATISTICS=DESCRIPTIVES /MISSING ANALYSIS.
NPar Tests
Output CreatedComments
DataActive DatasetFilterWeightSplit FileN of Rows in Working Data FileDefinition of Missing
Cases Used
Syntax
Processor TimeElapsed TimeNumber of Cases Alloweda
Input
Missing Value Handling
Resources
11234700:00:00.00000:00:00.000
NPAR TESTS /M-W= Authority BY PMOSize(2 3) /STATISTICS=DESCRIPTIVES /MISSING ANALYSIS.
Statistics for each test are based on all cases with valid data for the variable(s) used in that test.
User-defined missing values are treated as missing.
21<none><none><none>DataSet2D:\DPM\Authority.sav
10-Jul-2015 00:16:18
Notes
a. Based on availability of workspace memory.
[DataSet2] D:\DPM\Authority.sav
Page 4
MaximumMinimumStd. DeviationMeanNAuthorityPMO Size 31.7932.1421
511.0293.0018
Descriptive Statistics
Mann-Whitney Test
Sum of RanksMean RankNMediumLargeTotal
Authority
1477.509.69827.504.586
PMO SizePMO Size
Ranks
AuthorityMann-Whitney UWilcoxon WZAsymp. Sig. (2-tailed)Exact Sig. [2*(1-tailed Sig.)]
.020a.018
-2.36627.5006.500
Test Statisticsb
a. Not corrected for ties.b. Grouping Variable: PMO Size
NPAR TESTS /M-W= Authority BY PMOSize(1 3) /STATISTICS=DESCRIPTIVES /MISSING ANALYSIS.
NPar Tests
Page 5
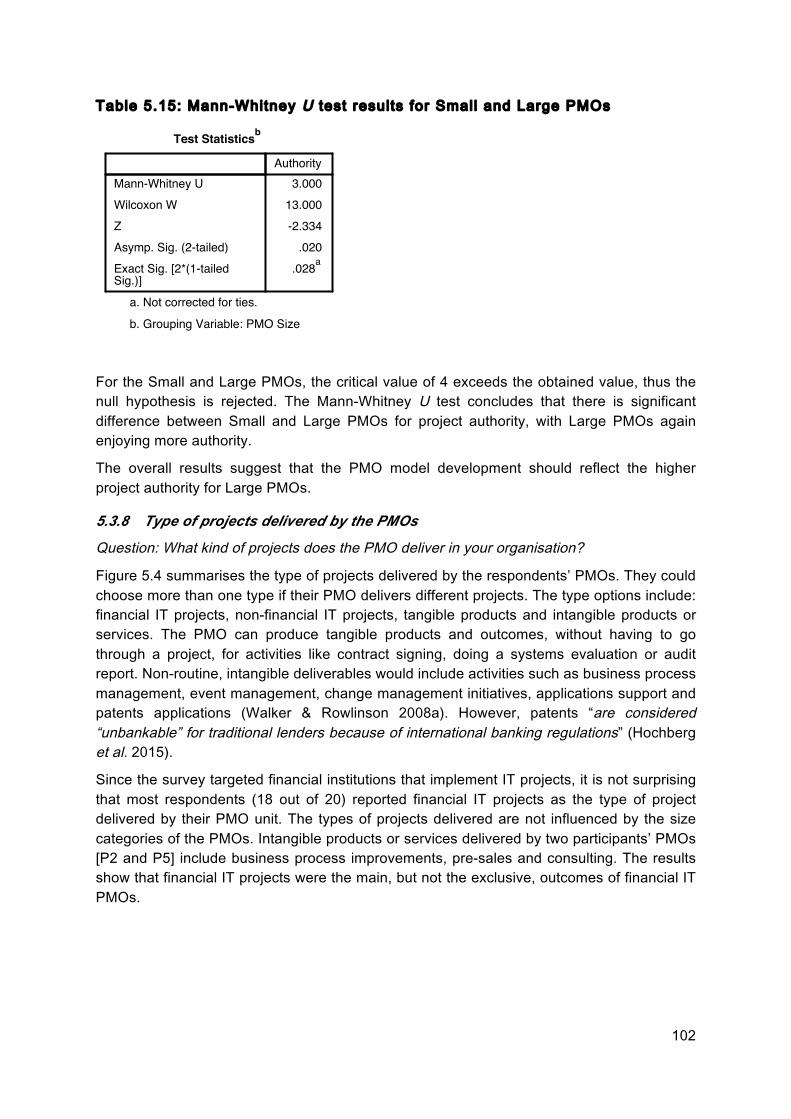
102
Table 5.15: Mann-Whitney U test results for Small and Large PMOs
For the Small and Large PMOs, the critical value of 4 exceeds the obtained value, thus the null hypothesis is rejected. The Mann-Whitney U test concludes that there is significant difference between Small and Large PMOs for project authority, with Large PMOs again enjoying more authority.
The overall results suggest that the PMO model development should reflect the higher project authority for Large PMOs.
5.3.8 Type of projects delivered by the PMOs
Question: What kind of projects does the PMO deliver in your organisation?
Figure 5.4 summarises the type of projects delivered by the respondents’ PMOs. They could choose more than one type if their PMO delivers different projects. The type options include: financial IT projects, non-financial IT projects, tangible products and intangible products or services. The PMO can produce tangible products and outcomes, without having to go through a project, for activities like contract signing, doing a systems evaluation or audit report. Non-routine, intangible deliverables would include activities such as business process management, event management, change management initiatives, applications support and patents applications (Walker & Rowlinson 2008a). However, patents “are considered “unbankable” for traditional lenders because of international banking regulations” (Hochberg et al. 2015).
Since the survey targeted financial institutions that implement IT projects, it is not surprising that most respondents (18 out of 20) reported financial IT projects as the type of project delivered by their PMO unit. The types of projects delivered are not influenced by the size categories of the PMOs. Intangible products or services delivered by two participants’ PMOs [P2 and P5] include business process improvements, pre-sales and consulting. The results show that financial IT projects were the main, but not the exclusive, outcomes of financial IT PMOs.
AuthorityMann-Whitney UWilcoxon WZAsymp. Sig. (2-tailed)Exact Sig. [2*(1-tailed Sig.)]
.028a.020
-2.33413.0003.000
Test Statisticsb
a. Not corrected for ties.b. Grouping Variable: PMO Size
Page 7
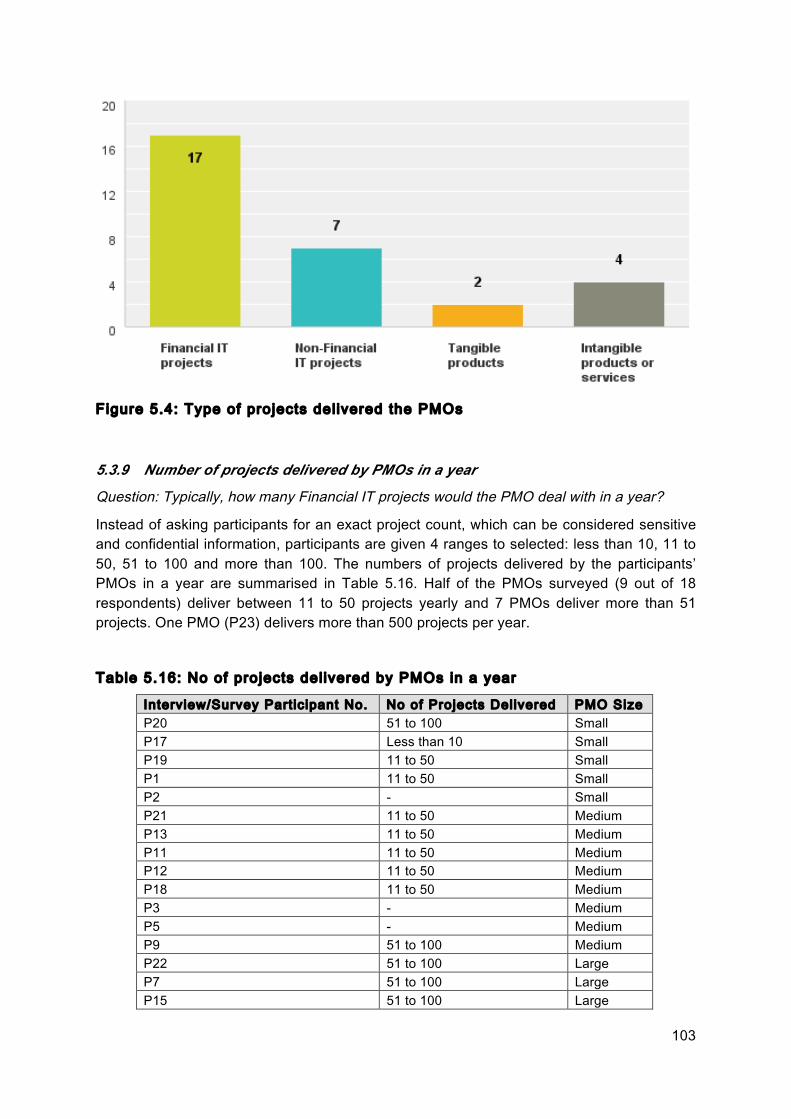
103
Figure 5.4: Type of projects del ivered the PMOs
5.3.9 Number of projects delivered by PMOs in a year
Question: Typically, how many Financial IT projects would the PMO deal with in a year?
Instead of asking participants for an exact project count, which can be considered sensitive
and confidential information, participants are given 4 ranges to selected: less than 10, 11 to
50, 51 to 100 and more than 100. The numbers of projects delivered by the participants’
PMOs in a year are summarised in Table 5.16. Half of the PMOs surveyed (9 out of 18
respondents) deliver between 11 to 50 projects yearly and 7 PMOs deliver more than 51
projects. One PMO (P23) delivers more than 500 projects per year.
Table 5.16: No of projects del ivered by PMOs in a year
Interview/Survey Part ic ipant No. No of Projects Delivered PMO Size
P20 51 to 100 Small
P17 Less than 10 Small
P19 11 to 50 Small
P1 11 to 50 Small
P2 - Small
P21 11 to 50 Medium
P13 11 to 50 Medium
P11 11 to 50 Medium
P12 11 to 50 Medium
P18 11 to 50 Medium
P3 - Medium
P5 - Medium
P9 51 to 100 Medium
P22 51 to 100 Large
P7 51 to 100 Large
P15 51 to 100 Large
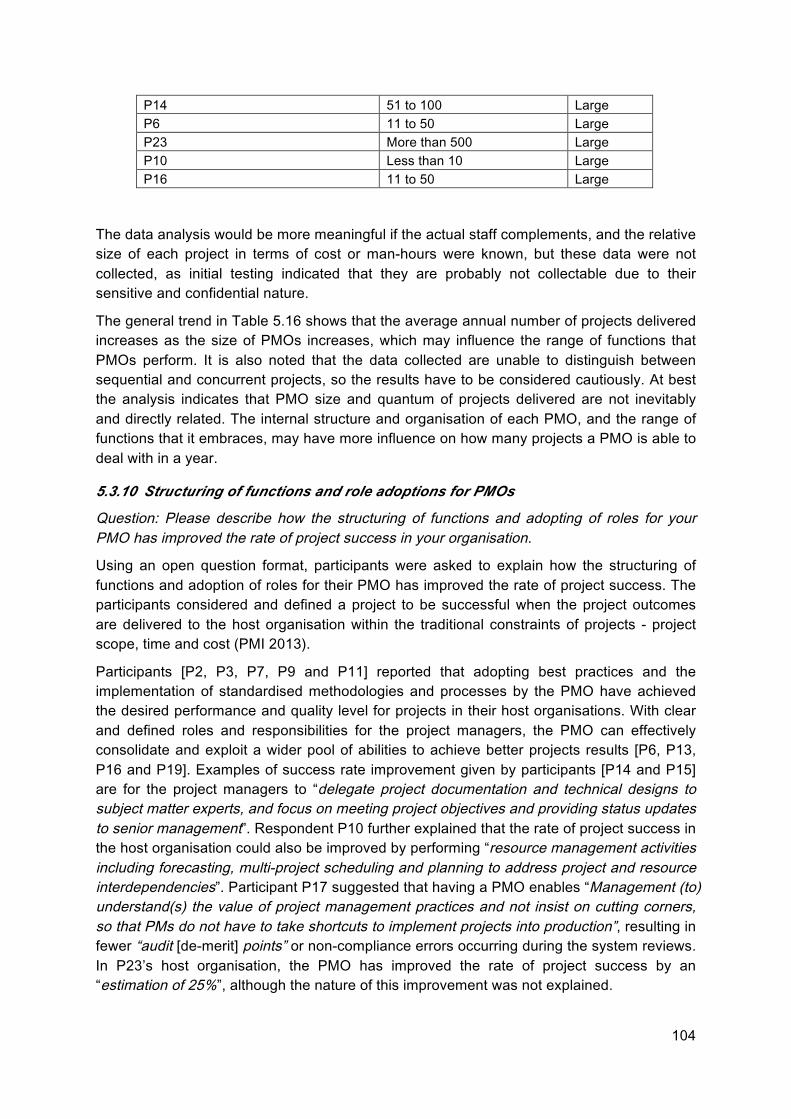
104
P14 51 to 100 Large P6 11 to 50 Large P23 More than 500 Large P10 Less than 10 Large P16 11 to 50 Large
The data analysis would be more meaningful if the actual staff complements, and the relative size of each project in terms of cost or man-hours were known, but these data were not collected, as initial testing indicated that they are probably not collectable due to their sensitive and confidential nature.
The general trend in Table 5.16 shows that the average annual number of projects delivered increases as the size of PMOs increases, which may influence the range of functions that PMOs perform. It is also noted that the data collected are unable to distinguish between sequential and concurrent projects, so the results have to be considered cautiously. At best the analysis indicates that PMO size and quantum of projects delivered are not inevitably and directly related. The internal structure and organisation of each PMO, and the range of functions that it embraces, may have more influence on how many projects a PMO is able to deal with in a year.
5.3.10 Structuring of functions and role adoptions for PMOs
Question: Please describe how the structuring of functions and adopting of roles for your PMO has improved the rate of project success in your organisation.
Using an open question format, participants were asked to explain how the structuring of functions and adoption of roles for their PMO has improved the rate of project success. The participants considered and defined a project to be successful when the project outcomes are delivered to the host organisation within the traditional constraints of projects - project scope, time and cost (PMI 2013).
Participants [P2, P3, P7, P9 and P11] reported that adopting best practices and the implementation of standardised methodologies and processes by the PMO have achieved the desired performance and quality level for projects in their host organisations. With clear and defined roles and responsibilities for the project managers, the PMO can effectively consolidate and exploit a wider pool of abilities to achieve better projects results [P6, P13, P16 and P19]. Examples of success rate improvement given by participants [P14 and P15] are for the project managers to “delegate project documentation and technical designs to subject matter experts, and focus on meeting project objectives and providing status updates to senior management”. Respondent P10 further explained that the rate of project success in the host organisation could also be improved by performing “resource management activities including forecasting, multi-project scheduling and planning to address project and resource interdependencies”. Participant P17 suggested that having a PMO enables “Management (to) understand(s) the value of project management practices and not insist on cutting corners, so that PMs do not have to take shortcuts to implement projects into production”, resulting in fewer “audit [de-merit] points” or non-compliance errors occurring during the system reviews. In P23’s host organisation, the PMO has improved the rate of project success by an “estimation of 25%”, although the nature of this improvement was not explained.
105
Two common explanations offered for the ability to improve project performance are: the establishment of standardised project management methodologies; and more effective resource management at the host organisation level. These explanations are not linked to specific PMO sizes. Having a PMO forces senior management in the host organisation to acknowledge the value of project management and at the same time be willing to assign sufficient resources to meet the goal of improving the rate of project success. This could be a challenge as the literature has shown that the value of project management is not generally recognised, particularly at senior levels within organisations (Thomas et al. 2002). Lack of project management skills was ranked among the top-five risks by a panel of experts in a study of information system (IS) project risks (Schmidt et al. 2001).
Question: Please describe how you would improve the structuring of functions and adopting of roles for your PMO?
Using an open question format, participants were also invited to suggest improvements in the structuring of functions and adoption of roles for their PMOs. Suggestions offered include:
• Extending the functions of the PMO by “prioritising new projects and involving project managers in the architectural design of the system solution” [P7]; and
• “A stronger focus on knowledge sharing within the PMO to ensure the PMO capability improves with every project and not just specifically individual learning” [P11].
• Participant P12 suggested that the PMO “take a more advisory role and provide guidance to IT PM”.
• Two respondents proposed more authority for the PMO so as to have oversight over all projects, budgets and project resources within the host organisation [P19, P20].
• Participant P20 commented “it is also easier for PMs as an escalation point, where issues can be reported and quickly dealt with by the PMO, which has high level of authority. Otherwise each project will run within the confines of the project team and be subject to the team’s own problem solving capability and often facing internal political issues”.
Interview participants [P1, P3 and P5] blamed red tape (excessively-bureaucratic administration requirements) and over-detailed project documentation (ie, more than simply performance-based) as possible contributory causes of project failure. The implicit suggestion here is that addressing these barriers would bring about improvement.
In other words, when a PMO is in place, the powers, influence and flexibility available to project managers remaining in the host organisation will likely be reduced. A repeated theme surfacing in the responses was the authority level exercised by the PMO. One group of the respondents wanted the PMO to have more authority, in order to have better control over the usage of projects resources, while another group saw comparative lack of authority as a form of restriction and red tape. This suggest that a PMO with authority can be seen as removing substantial degrees of autonomy, creativity and ownership away from external project managers, who may resist the imposed authority unless the value of the more authoritative PMO is clear (Unger et al. 2012). This negative view is more likely to arise if PMs have previously enjoyed a more autonomous role and have then been faced with the imposition of a quite structured PMO. PMOs will need to establish and maintain a balance between control and flexibility so that each project staff member can “participate in the line of
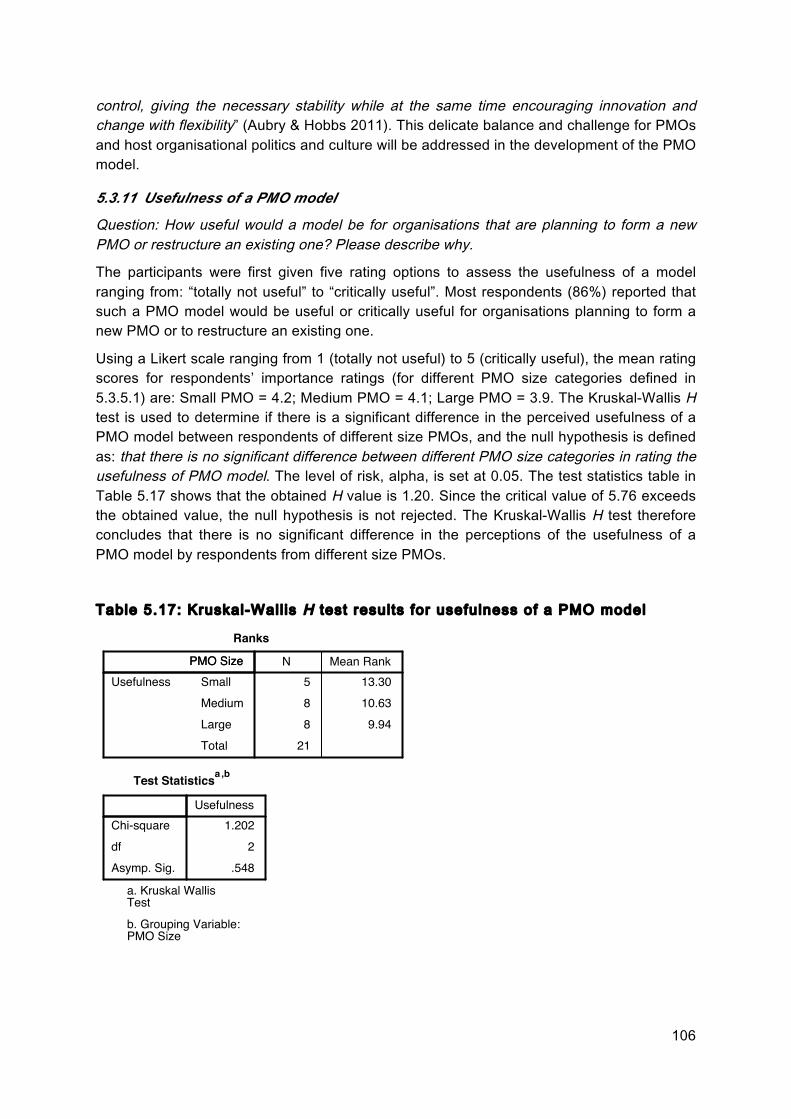
106
control, giving the necessary stability while at the same time encouraging innovation and change with flexibility” (Aubry & Hobbs 2011). This delicate balance and challenge for PMOs
and host organisational politics and culture will be addressed in the development of the PMO
model.
5.3.11 Usefulness of a PMO model
Question: How useful would a model be for organisations that are planning to form a new PMO or restructure an existing one? Please describe why.
The participants were first given five rating options to assess the usefulness of a model
ranging from: “totally not useful” to “critically useful”. Most respondents (86%) reported that
such a PMO model would be useful or critically useful for organisations planning to form a
new PMO or to restructure an existing one.
Using a Likert scale ranging from 1 (totally not useful) to 5 (critically useful), the mean rating
scores for respondents’ importance ratings (for different PMO size categories defined in
5.3.5.1) are: Small PMO = 4.2; Medium PMO = 4.1; Large PMO = 3.9. The Kruskal-Wallis H
test is used to determine if there is a significant difference in the perceived usefulness of a
PMO model between respondents of different size PMOs, and the null hypothesis is defined
as: that there is no significant difference between different PMO size categories in rating the usefulness of PMO model. The level of risk, alpha, is set at 0.05. The test statistics table in
Table 5.17 shows that the obtained H value is 1.20. Since the critical value of 5.76 exceeds
the obtained value, the null hypothesis is not rejected. The Kruskal-Wallis H test therefore
concludes that there is no significant difference in the perceptions of the usefulness of a
PMO model by respondents from different size PMOs.
Table 5.17: Kruskal-Wall is H test results for usefulness of a PMO model
Mean RankNSmallMediumLargeTotal
Usefulness
219.948
10.63813.305
PMO SizePMO Size
Ranks
UsefulnessChi-squaredfAsymp. Sig. .548
21.202
Test Statisticsa ,b
a. Kruskal Wallis Testb. Grouping Variable: PMO Size
Page 2
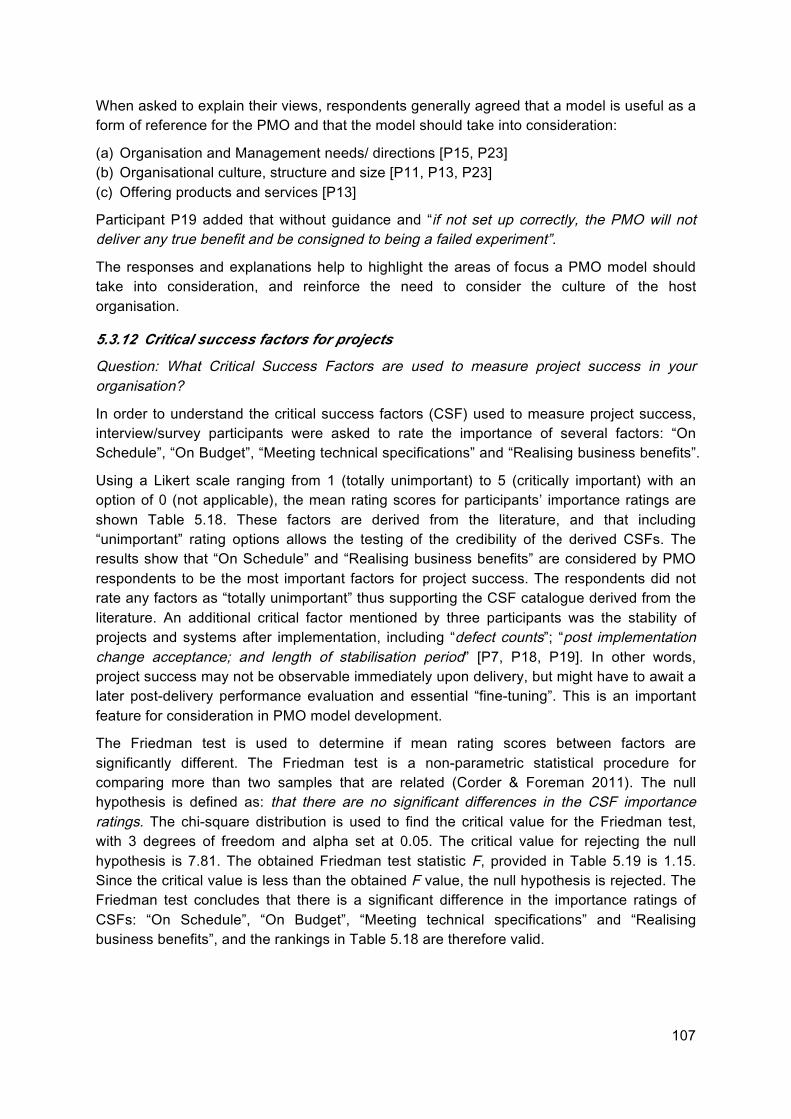
107
When asked to explain their views, respondents generally agreed that a model is useful as a form of reference for the PMO and that the model should take into consideration:
(a) Organisation and Management needs/ directions [P15, P23] (b) Organisational culture, structure and size [P11, P13, P23] (c) Offering products and services [P13]
Participant P19 added that without guidance and “if not set up correctly, the PMO will not deliver any true benefit and be consigned to being a failed experiment”.
The responses and explanations help to highlight the areas of focus a PMO model should take into consideration, and reinforce the need to consider the culture of the host organisation.
5.3.12 Critical success factors for projects
Question: What Critical Success Factors are used to measure project success in your organisation?
In order to understand the critical success factors (CSF) used to measure project success, interview/survey participants were asked to rate the importance of several factors: “On Schedule”, “On Budget”, “Meeting technical specifications” and “Realising business benefits”.
Using a Likert scale ranging from 1 (totally unimportant) to 5 (critically important) with an option of 0 (not applicable), the mean rating scores for participants’ importance ratings are shown Table 5.18. These factors are derived from the literature, and that including “unimportant” rating options allows the testing of the credibility of the derived CSFs. The results show that “On Schedule” and “Realising business benefits” are considered by PMO respondents to be the most important factors for project success. The respondents did not rate any factors as “totally unimportant” thus supporting the CSF catalogue derived from the literature. An additional critical factor mentioned by three participants was the stability of projects and systems after implementation, including “defect counts”; “post implementation change acceptance; and length of stabilisation period” [P7, P18, P19]. In other words, project success may not be observable immediately upon delivery, but might have to await a later post-delivery performance evaluation and essential “fine-tuning”. This is an important feature for consideration in PMO model development.
The Friedman test is used to determine if mean rating scores between factors are significantly different. The Friedman test is a non-parametric statistical procedure for comparing more than two samples that are related (Corder & Foreman 2011). The null hypothesis is defined as: that there are no significant differences in the CSF importance ratings. The chi-square distribution is used to find the critical value for the Friedman test, with 3 degrees of freedom and alpha set at 0.05. The critical value for rejecting the null hypothesis is 7.81. The obtained Friedman test statistic F, provided in Table 5.19 is 1.15. Since the critical value is less than the obtained F value, the null hypothesis is rejected. The Friedman test concludes that there is a significant difference in the importance ratings of CSFs: “On Schedule”, “On Budget”, “Meeting technical specifications” and “Realising business benefits”, and the rankings in Table 5.18 are therefore valid.
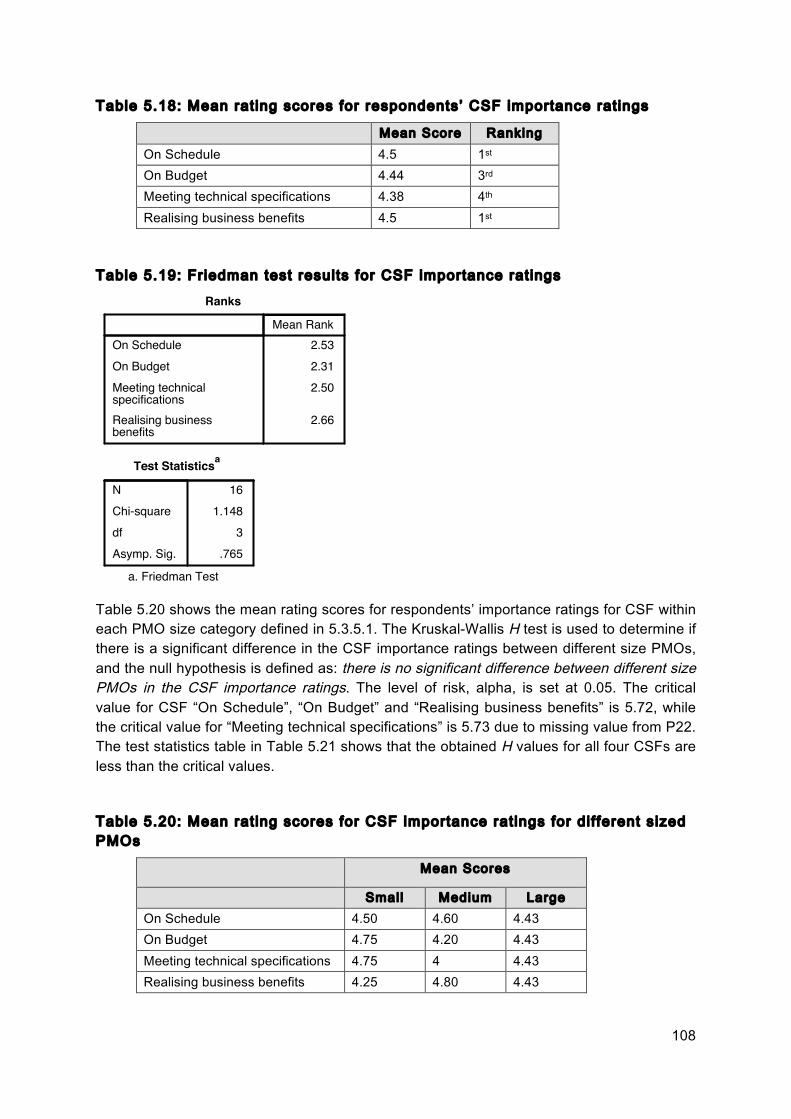
108
Table 5.18: Mean rat ing scores for respondents’ CSF importance rat ings
Mean Score Ranking
On Schedule 4.5 1st
On Budget 4.44 3rd
Meeting technical specifications 4.38 4th
Realising business benefits 4.5 1st
Table 5.19: Friedman test results for CSF importance rat ings
Table 5.20 shows the mean rating scores for respondents’ importance ratings for CSF within
each PMO size category defined in 5.3.5.1. The Kruskal-Wallis H test is used to determine if
there is a significant difference in the CSF importance ratings between different size PMOs,
and the null hypothesis is defined as: there is no significant difference between different size PMOs in the CSF importance ratings. The level of risk, alpha, is set at 0.05. The critical
value for CSF “On Schedule”, “On Budget” and “Realising business benefits” is 5.72, while
the critical value for “Meeting technical specifications” is 5.73 due to missing value from P22.
The test statistics table in Table 5.21 shows that the obtained H values for all four CSFs are
less than the critical values.
Table 5.20: Mean rat ing scores for CSF importance rat ings for dif ferent sized
PMOs
Mean Scores
Small Medium Large
On Schedule 4.50 4.60 4.43
On Budget 4.75 4.20 4.43
Meeting technical specifications 4.75 4 4.43
Realising business benefits 4.25 4.80 4.43
MaximumMinimumStd. DeviationMeanNOn ScheduleOn BudgetMeeting technical specificationsRealising business benefits
53.7304.5016
52.8854.381653.6294.441653.6324.5016
Descriptive Statistics
75th50th (Median)25thPercentiles
On ScheduleOn BudgetMeeting technical specificationsRealising business benefits
5.005.004.00
5.005.004.005.004.504.005.005.004.00
Descriptive Statistics
Friedman Test
Mean RankOn ScheduleOn BudgetMeeting technical specificationsRealising business benefits
2.66
2.502.312.53
Ranks
NChi-squaredfAsymp. Sig. .765
31.148
16
Test Statisticsa
a. Friedman Test
Page 2
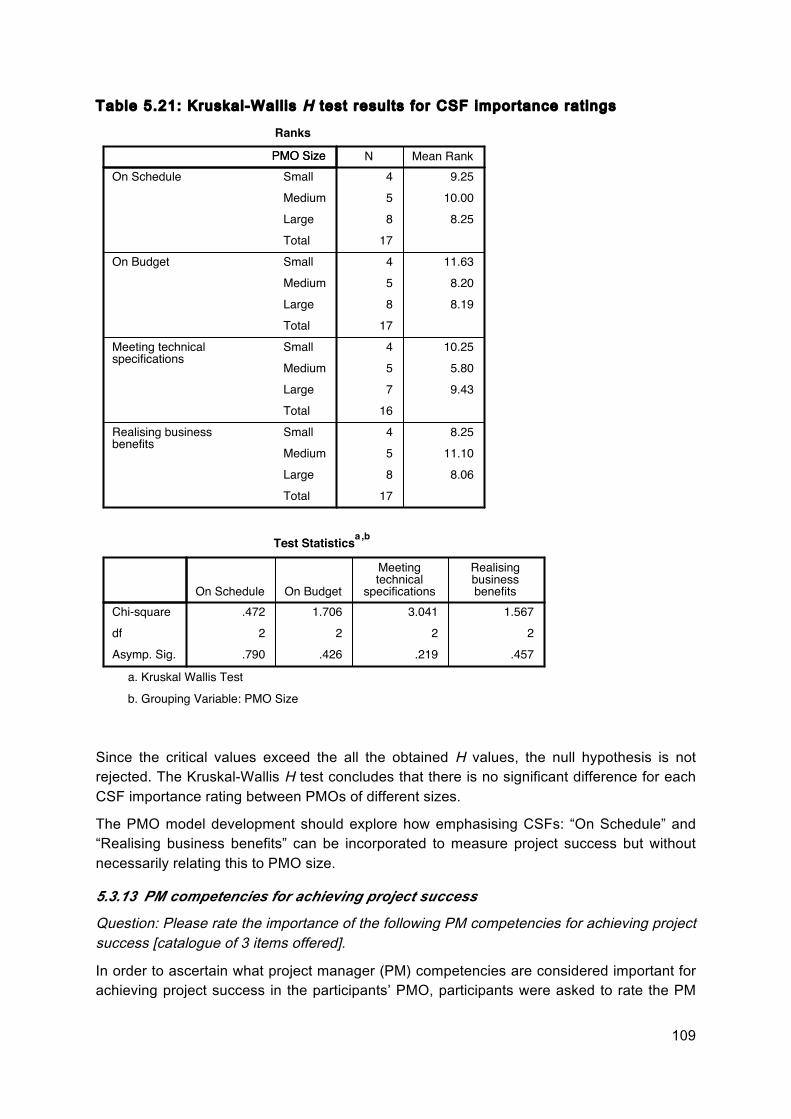
109
Table 5.21: Kruskal-Wall is H test results for CSF importance rat ings
Since the critical values exceed the all the obtained H values, the null hypothesis is not rejected. The Kruskal-Wallis H test concludes that there is no significant difference for each CSF importance rating between PMOs of different sizes.
The PMO model development should explore how emphasising CSFs: “On Schedule” and “Realising business benefits” can be incorporated to measure project success but without necessarily relating this to PMO size.
5.3.13 PM competencies for achieving project success
Question: Please rate the importance of the following PM competencies for achieving project success [catalogue of 3 items offered].
In order to ascertain what project manager (PM) competencies are considered important for achieving project success in the participants’ PMO, participants were asked to rate the PM
Mean RankNSmallMediumLargeTotalSmallMediumLargeTotalSmallMediumLargeTotalSmallMediumLargeTotal
On Schedule
On Budget
Meeting technical specifications
Realising business benefits
178.068
11.1058.254
169.4375.805
10.25417
8.1988.205
11.63417
8.25810.005
9.254PMO SizePMO Size
Ranks
Realising business benefits
Meeting technical
specificationsOn BudgetOn ScheduleChi-squaredfAsymp. Sig. .457.219.426.790
22221.5673.0411.706.472
Test Statisticsa ,b
a. Kruskal Wallis Testb. Grouping Variable: PMO Size
Median Test
LargeMediumSmallPMO Size
> Median<= Median> Median<= Median> Median<= Median> Median<= Median
On Schedule
On Budget
Meeting technical specifications
Realising business benefits
854000754000531323854000
Frequencies
Page 3
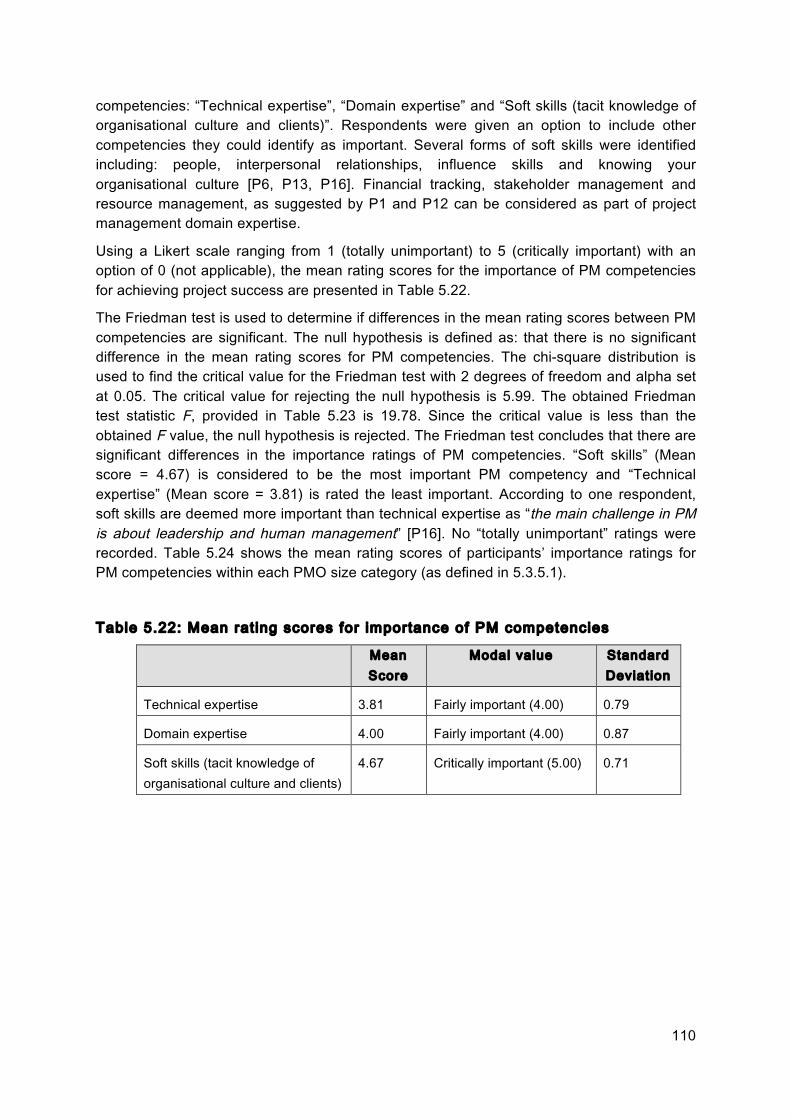
110
competencies: “Technical expertise”, “Domain expertise” and “Soft skills (tacit knowledge of organisational culture and clients)”. Respondents were given an option to include other competencies they could identify as important. Several forms of soft skills were identified including: people, interpersonal relationships, influence skills and knowing your organisational culture [P6, P13, P16]. Financial tracking, stakeholder management and resource management, as suggested by P1 and P12 can be considered as part of project management domain expertise.
Using a Likert scale ranging from 1 (totally unimportant) to 5 (critically important) with an option of 0 (not applicable), the mean rating scores for the importance of PM competencies for achieving project success are presented in Table 5.22.
The Friedman test is used to determine if differences in the mean rating scores between PM competencies are significant. The null hypothesis is defined as: that there is no significant difference in the mean rating scores for PM competencies. The chi-square distribution is used to find the critical value for the Friedman test with 2 degrees of freedom and alpha set at 0.05. The critical value for rejecting the null hypothesis is 5.99. The obtained Friedman test statistic F, provided in Table 5.23 is 19.78. Since the critical value is less than the obtained F value, the null hypothesis is rejected. The Friedman test concludes that there are significant differences in the importance ratings of PM competencies. “Soft skills” (Mean score = 4.67) is considered to be the most important PM competency and “Technical expertise” (Mean score = 3.81) is rated the least important. According to one respondent, soft skills are deemed more important than technical expertise as “the main challenge in PM is about leadership and human management” [P16]. No “totally unimportant” ratings were recorded. Table 5.24 shows the mean rating scores of participants’ importance ratings for PM competencies within each PMO size category (as defined in 5.3.5.1).
Table 5.22: Mean rat ing scores for importance of PM competencies
Mean Score
Modal value Standard Deviation
Technical expertise 3.81 Fairly important (4.00) 0.79
Domain expertise 4.00 Fairly important (4.00) 0.87
Soft skills (tacit knowledge of organisational culture and clients)
4.67 Critically important (5.00) 0.71

111
Table 5.23: Friedman test results for PM competencies rat ing
Table 5.24: Mean importance-rat ing values for PM competencies among PMO size categories
Weighted Average
Small Medium Large Technical expertise 3.2 4.25 3.75 Domain expertise 3.2 4.38 4.13 Soft skills (tacit knowledge of organisational culture and clients)
4.2 4.75 4.88
Crawford and Pollack (2004) presented a seven-dimensions framework for the analysis of the hard and soft dimensions of projects. The identified dimensions are (1) goal clarity, (2) goal tangibility, (3) success measures, (4) project permeability, (5) number of solution options, (6) degree of participation and practitioner role, and (7) stakeholder expectations. The goals and objectives of soft projects are typically not clearly defined at the beginning of a project and project managers will be more successful in such projects employing soft skills like negotiation, debate and accommodation. Respondents still considered “Soft skills” to be the most important PM competency regardless of the size of PMOs.
Table 5.25 displays the most important PM competencies perceived by respondents for achieving project success, and whether or not technical or domain expertise is considered as the most important. It shows that participants from Small PMOs (except participant P19) ranked soft skills higher than technical and domain expertise as an important PM competency for achieving project success. Participant P19 ranked all three competencies as “Fairly unimportant” and commented “A PM does not need to be an SME (Subject Matter Expert) as long as the core skills of resourcing and managing the right people to deliver the scope is there”. This compares with findings from Medium PMOs where the technical and domain expertise factors are deemed more important as PM competencies than soft skills. Technology project managers are responsible to “evaluate and control all technical aspects of the project and all project management activities”, including daily planning and supervising of project activities and resolving project problems (Jagadeesh 2009).
75th50th (Median)25thPercentiles
Technical expertiseDomain expertiseSoft skills 5.005.004.50
5.004.004.004.004.004.00
Descriptive Statistics
Friedman Test
Mean RankTechnical expertiseDomain expertiseSoft skills 2.67
1.791.55
Ranks
NChi-squaredfAsymp. Sig. .000
219.774
21
Test Statisticsa
a. Friedman Test
Page 2

112
Table 5.25: Most Important PM competencies identi f ied by surveyed PMOs
Interview/Survey Part ic ipant No.
Most Important PM competencies
Most Important PM competencies include Technical or Domain expert ise?
Small PMOs P20 Soft skills No P17 Soft skills No P19 - - P1 Soft skills No P2 Soft skills No Medium PMOs P21 Domain expertise and Soft skills Yes P13 Soft skills No P11 Technical expertise Yes P12 Soft skills No P18 Domain expertise and Soft skills Yes P3 Technical expertise and Soft skills Yes P5 Domain expertise and Soft skills Yes P9 Domain expertise Yes Large PMO P22 Soft skills No P7 Soft skills No 15 Technical expertise and Soft skills Yes 14 Soft skills No 6 Domain expertise and Soft skills Yes 23 Soft skills No 10 Domain expertise and Soft skills Yes 16 Soft skills No
The Kruskal-Wallis H test is used to determine if there is a significant difference between different size PMOs in having technical or domain expertise as the most important PM competencies, and the null hypothesis is defined as: that there is no significant difference between PMO sizes in having technical or domain expertise rated as the most important PM competency. The level of risk, alpha, is set at 0.05. The obtained H value is 6.05 as shown in Table 5.26. Since the critical value of 5.76 is lesser than the obtained H value, the null hypothesis is rejected. The Kruskal-Wallis H test concludes that there is a significant difference between PMOs of different sizes in having technical or domain expertise as the most important PM competency.

113
Table 5.26: Kruskal-Wall is H test results for PM competencies rat ings
The Mann-Whitney U test is used to compare the paired samples from Small and Medium PMOs, Medium and Large PMOs, and Small and Large PMOs. The null hypothesises defined are: there is no significant difference between Small and Medium PMOs, Medium and Large PMOs, and Small and Large PMOs respectively for whether or not technical or domain expertise is considered as the most important PM competency. The critical values for each pair that is based on the sample sizes are as follows: 4 for Small and Medium PMOs, 13 for Medium and Large PMOs, and 4 for Small and Large PMOs. The test statistics tables in Table 5.27, 5.28 and 5.29 show the Mann-Whitney U test results for the 3 pairs of samples.
Table 5.27: Mann-Whitney U test results for Small and Medium PMOs
Mean RankNSmallMediumLargeTotal
Most Important Includes Technical or Domain
209.758
13.5086.004
PMO SizePMO Size
Ranks
Most Important Includes
Technical or Domain
Chi-squaredfAsymp. Sig. .049
26.045
Test Statisticsa ,b
a. Kruskal Wallis Testb. Grouping Variable: PMO Size
Median Test
LargeMediumSmallPMO Size
> Median<= Median
Most Important Includes Technical or Domain
524360
Frequencies
Most Important Includes
Technical or Domain
NMedianChi-squaredfAsymp. Sig. .042
26.364a
.0020
Test Statisticsb
a. 6 cells (100.0%) have expected frequencies less than 5. The minimum expected cell frequency is 1.8.b. Grouping Variable: PMO Size
NPAR TESTS /M-W= TechnicalorDomainExpertise BY PMOSize(1 2) /STATISTICS=DESCRIPTIVES QUARTILES
Page 2
Sum of RanksMean RankNSmallMediumTotal
Most Important Includes Technical or Domain
1264.008.00814.003.504
PMO SizePMO Size
Ranks
Most Important Includes
Technical or Domain
Mann-Whitney UWilcoxon WZAsymp. Sig. (2-tailed)Exact Sig. [2*(1-tailed Sig.)]
.048a.019
-2.34514.000
4.000
Test Statisticsb
a. Not corrected for ties.b. Grouping Variable: PMO Size
NPAR TESTS /M-W= TechnicalorDomainExpertise BY PMOSize(2 3) /STATISTICS=DESCRIPTIVES QUARTILES /MISSING ANALYSIS.
NPar Tests
Page 4

114
For the Small and Medium PMOs, the critical value of 4 equals the obtained value, thus the null hypothesis is rejected. The Mann-Whitney U test concludes that there is significant difference between Small and Medium PMOs in having technical or domain expertise as the most important PM competency.
Table 5.28: Mann-Whitney U test results for Medium and Large PMOs
For the Medium and Large PMOs, the critical value of 13 is less than the obtained value of 20, thus the null hypothesis is not rejected. The Mann-Whitney U test concludes that there is no significant difference between Medium and Large PMOs in having technical or domain expertise as the most important PM competency.
Table 5.29: Mann-Whitney U test results for Small and Large PMOs
For the Small and Large PMOs, the critical value of 4 is less than the obtained value of 10, thus the null hypothesis is not rejected. The Mann-Whitney U test concludes that there is no significant difference between Small and Large PMOs in having technical or domain expertise as the most important PM competency.
Most Important Includes
Technical or Domain
Mann-Whitney UWilcoxon WZAsymp. Sig. (2-tailed)Exact Sig. [2*(1-tailed Sig.)]
.234a.143
-1.46456.00020.000
Test Statisticsb
a. Not corrected for ties.b. Grouping Variable: PMO Size
NPAR TESTS /M-W= TechnicalorDomainExpertise BY PMOSize(1 3) /STATISTICS=DESCRIPTIVES QUARTILES /MISSING ANALYSIS.
NPar Tests
Output CreatedComments
DataActive DatasetFilterWeightSplit FileN of Rows in Working Data FileDefinition of Missing
Cases Used
Syntax
Processor TimeElapsed TimeNumber of Cases Alloweda
Input
Missing Value Handling
Resources
11234700:00:00.00000:00:00.000
NPAR TESTS /M-W= TechnicalorDomainExpertise BY PMOSize(1 3) /STATISTICS=DESCRIPTIVES QUARTILES /MISSING ANALYSIS.
Statistics for each test are based on all cases with valid data for the variable(s) used in that test.
User-defined missing values are treated as missing.
21<none><none><none>DataSet1D:\DPM\Competencies.sav
07-Aug-2015 01:52:14
Notes
a. Based on availability of workspace memory.
[DataSet1] D:\DPM\Competencies.sav
Page 6
MaximumMinimumStd. DeviationMeanNMost Important Includes Technical or DomainPMO Size 31.7932.1421
10.510.4520
Descriptive Statistics
75th50th (Median)25thPercentiles
Most Important Includes Technical or DomainPMO Size 3.002.001.50
1.00.00.00
Descriptive Statistics
Mann-Whitney Test
Sum of RanksMean RankNSmallLargeTotal
Most Important Includes Technical or Domain
1258.007.25820.005.004
PMO SizePMO Size
Ranks
Most Important Includes
Technical or Domain
Mann-Whitney UWilcoxon WZAsymp. Sig. (2-tailed)Exact Sig. [2*(1-tailed Sig.)]
.368a.176
-1.35420.00010.000
Test Statisticsb
a. Not corrected for ties.b. Grouping Variable: PMO Size
Page 7
115
The overall finding suggests that the PMO model should reflect the key competencies for project managers in relation to the size of the PMO, where Medium and Large PMOs are more likely to have technical or domain expertise as the most important PM competency.
5.3.14 PMO contribution to project performance
Question: How did the PMO contribute to project performance?
In response to the question on how PMO contributed to project performance, respondents’ perceptions of the contribution are summarised as follows:
1. PMO’s Best Practice Participant P2 commented that, because of the PMO’s commitment to best practice, “projects could reuse materials, processes and templates that have been proved successful on similar projects” and thereby achieve better project performance. This reuse of knowledge, however, “can be said to be ‘sticky’, difficult to transfer” (Szulanski 1996). Szulanski described four factors that affect knowledge transfer fluidity: the characteristics of the knowledge transferred; the source of knowledge; the recipient(s) of knowledge; and context. A PMO, as the knowledge hub of project management practices in a host organisation, will be able to improve knowledge transfer fluidity by removing ambiguity about whether a practice works, motivating knowledge sharing and sharing success, and inciting a fertile context of communication. Szulanski and Jensen (2004) suggest the use of a template to replicate knowledge assets or best practices effectively and overcome the challenges of knowledge stickiness.
2. Project Control A PMO is also able to contribute to project performance by identifying and managing risks, issues and important stakeholders, all of which may arise upfront on a project where the raised awareness allows remedial action to be taken sooner. Project control also includes the tracking of changes, schedules and financial spending [P3, P7, P11, P18 and P22]. The PMO can “perform quality checks on the deliverables and provide advice to IT PM to rectify the gaps identified” [P12] and it “facilitates communication, prioritisation of projects, ownership, and accountability (first point of contact)” [P13]. It is noted that these responses come from participants in Medium and Large PMOs, which infers that the relevance of project control is important to bigger PMOs.
3. Project Status Update The PMO is able to “collate project status and statistics into a single dashboard for senior management to better manage risks and able to make split second decisions to on going projects if there are changes to the industry” [P14]. With the PMO providing the update, standard project status metrics can be established and at the same time offloading some administration work from the project manager. Note how this response reflects the rapid dynamics associated with IT projects compared, perhaps, to the longevity of other types of projects.
4. Organisational Training Participant P17 noticed a considerable performance difference between projects executed by a PMO using formally trained project managers and one using untrained project managers (i.e. where staff develop skills through experiential trial and error
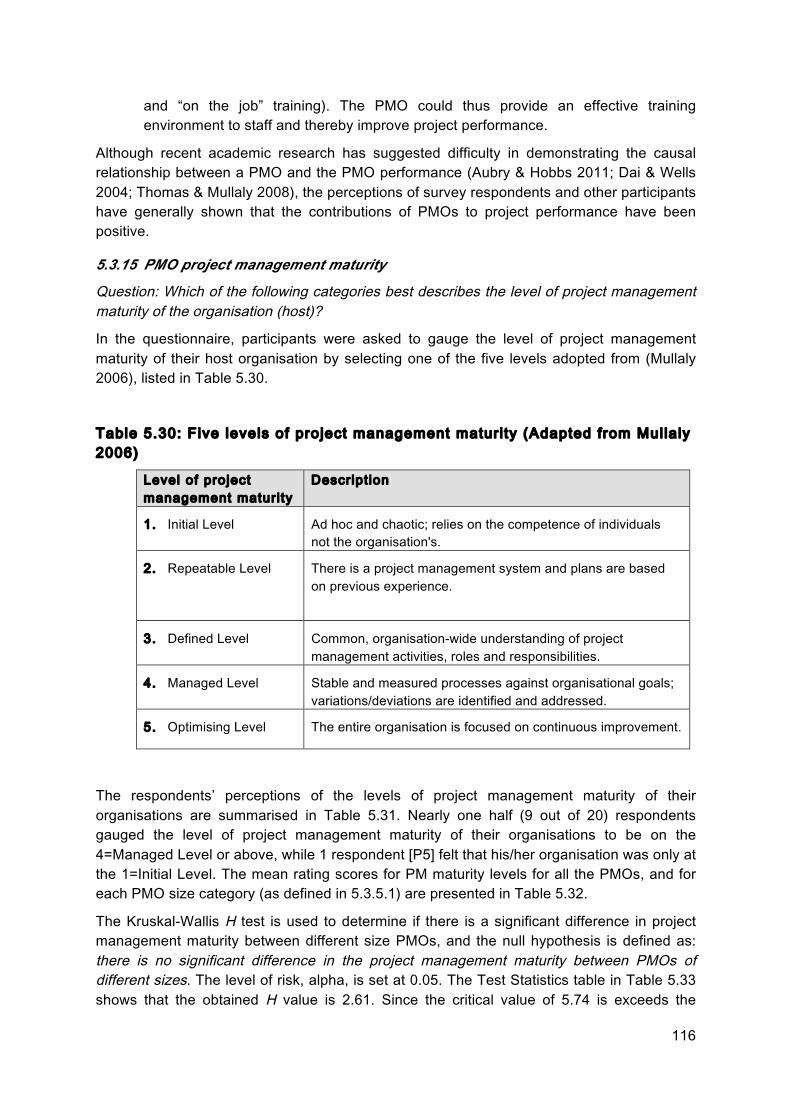
116
and “on the job” training). The PMO could thus provide an effective training environment to staff and thereby improve project performance.
Although recent academic research has suggested difficulty in demonstrating the causal relationship between a PMO and the PMO performance (Aubry & Hobbs 2011; Dai & Wells 2004; Thomas & Mullaly 2008), the perceptions of survey respondents and other participants have generally shown that the contributions of PMOs to project performance have been positive.
5.3.15 PMO project management maturity
Question: Which of the following categories best describes the level of project management maturity of the organisation (host)?
In the questionnaire, participants were asked to gauge the level of project management maturity of their host organisation by selecting one of the five levels adopted from (Mullaly 2006), listed in Table 5.30.
Table 5.30: Five levels of project management maturity (Adapted from Mullaly 2006)
Level of project management maturity
Descript ion
1. Initial Level Ad hoc and chaotic; relies on the competence of individuals not the organisation's.
2. Repeatable Level There is a project management system and plans are based on previous experience.
3. Defined Level Common, organisation-wide understanding of project management activities, roles and responsibilities.
4. Managed Level Stable and measured processes against organisational goals; variations/deviations are identified and addressed.
5. Optimising Level The entire organisation is focused on continuous improvement.
The respondents’ perceptions of the levels of project management maturity of their organisations are summarised in Table 5.31. Nearly one half (9 out of 20) respondents gauged the level of project management maturity of their organisations to be on the 4=Managed Level or above, while 1 respondent [P5] felt that his/her organisation was only at the 1=Initial Level. The mean rating scores for PM maturity levels for all the PMOs, and for each PMO size category (as defined in 5.3.5.1) are presented in Table 5.32.
The Kruskal-Wallis H test is used to determine if there is a significant difference in project management maturity between different size PMOs, and the null hypothesis is defined as: there is no significant difference in the project management maturity between PMOs of different sizes. The level of risk, alpha, is set at 0.05. The Test Statistics table in Table 5.33 shows that the obtained H value is 2.61. Since the critical value of 5.74 is exceeds the
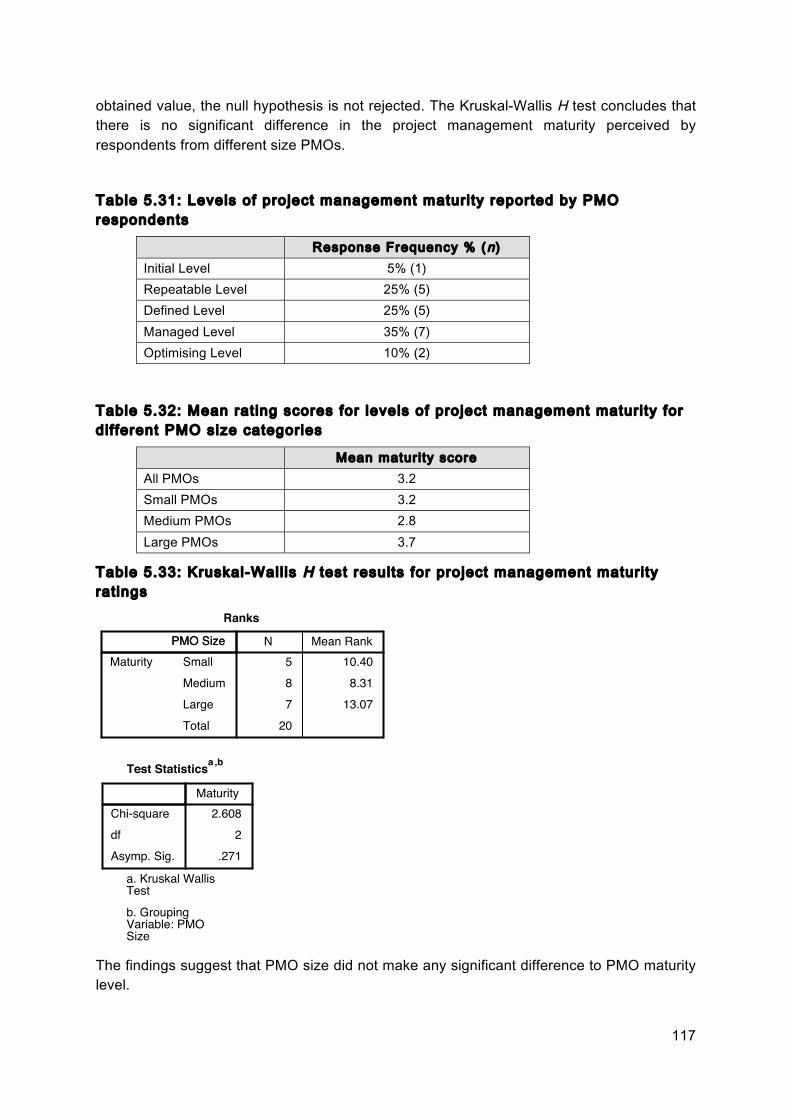
117
obtained value, the null hypothesis is not rejected. The Kruskal-Wallis H test concludes that there is no significant difference in the project management maturity perceived by respondents from different size PMOs.
Table 5.31: Levels of project management maturi ty reported by PMO respondents
Response Frequency % (n) Initial Level 5% (1) Repeatable Level 25% (5) Defined Level 25% (5) Managed Level 35% (7) Optimising Level 10% (2)
Table 5.32: Mean rat ing scores for levels of project management maturity for dif ferent PMO size categories
Mean maturity score All PMOs 3.2 Small PMOs 3.2 Medium PMOs 2.8 Large PMOs 3.7
Table 5.33: Kruskal-Wall is H test results for project management maturity rat ings
The findings suggest that PMO size did not make any significant difference to PMO maturity level.
NPAR TESTS /K-W=Maturity BY PMOSize(1 3) /MEDIAN=Maturity BY PMOSize(1 3) /STATISTICS DESCRIPTIVES /MISSING ANALYSIS.
NPar Tests
Output CreatedComments
DataActive DatasetFilterWeightSplit FileN of Rows in Working Data FileDefinition of Missing
Cases Used
Syntax
Processor TimeElapsed TimeNumber of Cases Alloweda
Input
Missing Value Handling
Resources
11234700:00:00.00000:00:00.000
NPAR TESTS /K-W=Maturity BY PMOSize(1 3) /MEDIAN=Maturity BY PMOSize(1 3) /STATISTICS DESCRIPTIVES /MISSING ANALYSIS.
Statistics for each test are based on all cases with valid data for the variable(s) used in that test.
User-defined missing values are treated as missing.
21<none><none><none>DataSet1D:\DPM\Maturity.sav
10-Jul-2015 00:12:37
Notes
a. Based on availability of workspace memory.[DataSet1] D:\DPM\Maturity.sav
MaximumMinimumStd. DeviationMeanNMaturityPMO Size 31.7932.1421
511.1053.2020
Descriptive Statistics
Kruskal-Wallis Test
Mean RankNSmallMediumLargeTotal
Maturity
2013.077
8.31810.405
PMO SizePMO Size
Ranks
Page 1
MaturityChi-squaredfAsymp. Sig. .271
22.608
Test Statisticsa ,b
a. Kruskal Wallis Testb. Grouping Variable: PMO Size
Median Test
LargeMediumSmallPMO Size
> Median<= Median
Maturity353432
Frequencies
MaturityNMedianChi-squaredfAsymp. Sig. .723
2.649a
3.0020
Test Statisticsb
a. 6 cells (100.0%) have expected frequencies less than 5. The minimum expected cell frequency is 2.3.b. Grouping Variable: PMO Size
NPAR TESTS /M-W= Maturity BY PMOSize(1 2) /STATISTICS=DESCRIPTIVES /MISSING ANALYSIS.
NPar Tests
Page 2
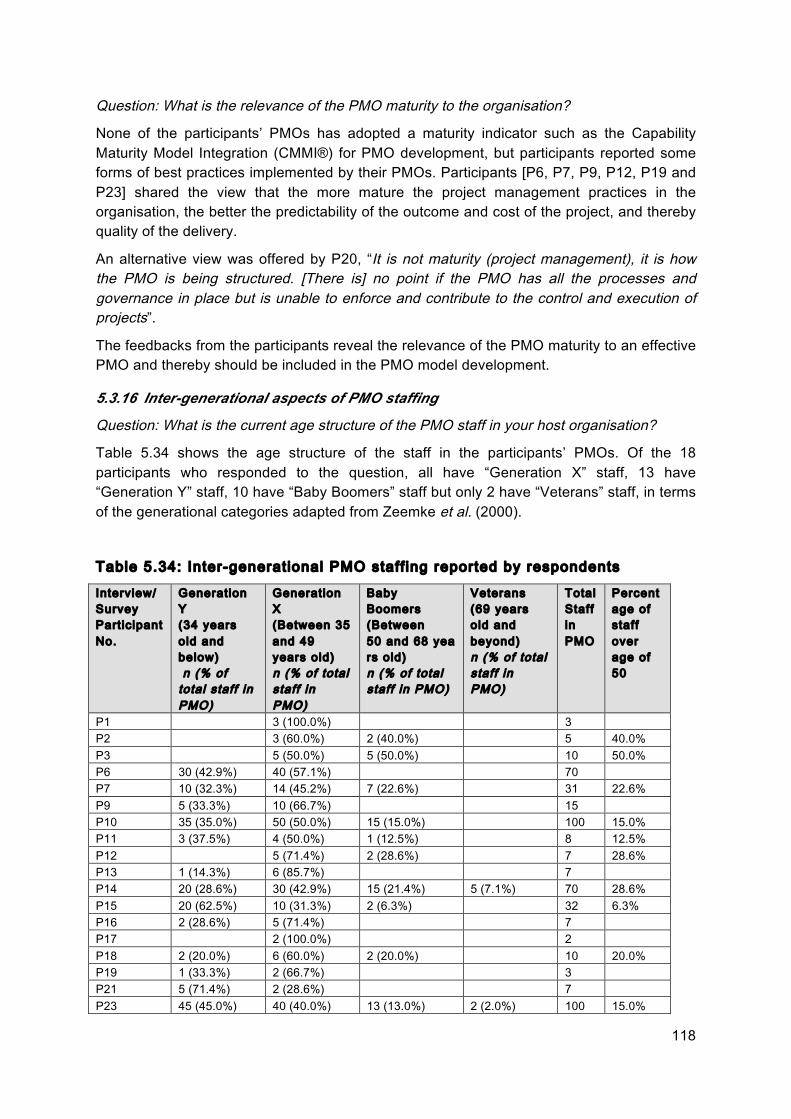
118
Question: What is the relevance of the PMO maturity to the organisation?
None of the participants’ PMOs has adopted a maturity indicator such as the Capability Maturity Model Integration (CMMI®) for PMO development, but participants reported some forms of best practices implemented by their PMOs. Participants [P6, P7, P9, P12, P19 and P23] shared the view that the more mature the project management practices in the organisation, the better the predictability of the outcome and cost of the project, and thereby quality of the delivery.
An alternative view was offered by P20, “It is not maturity (project management), it is how the PMO is being structured. [There is] no point if the PMO has all the processes and governance in place but is unable to enforce and contribute to the control and execution of projects”.
The feedbacks from the participants reveal the relevance of the PMO maturity to an effective PMO and thereby should be included in the PMO model development.
5.3.16 Inter-generational aspects of PMO staffing
Question: What is the current age structure of the PMO staff in your host organisation?
Table 5.34 shows the age structure of the staff in the participants’ PMOs. Of the 18 participants who responded to the question, all have “Generation X” staff, 13 have “Generation Y” staff, 10 have “Baby Boomers” staff but only 2 have “Veterans” staff, in terms of the generational categories adapted from Zeemke et al. (2000).
Table 5.34: Inter-generational PMO staff ing reported by respondents
Interview/ Survey Part icipant No.
Generation Y (34 years old and below) n (% of total staff in PMO)
Generation X (Between 35 and 49 years old) n (% of total staff in PMO)
Baby Boomers (Between 50 and 68 years old) n (% of total staff in PMO)
Veterans (69 years old and beyond) n (% of total staff in PMO)
Total Staff in PMO
Percentage of staff over age of 50
P1 3 (100.0%) 3 P2 3 (60.0%) 2 (40.0%) 5 40.0% P3 5 (50.0%) 5 (50.0%) 10 50.0% P6 30 (42.9%) 40 (57.1%) 70 P7 10 (32.3%) 14 (45.2%) 7 (22.6%) 31 22.6% P9 5 (33.3%) 10 (66.7%) 15 P10 35 (35.0%) 50 (50.0%) 15 (15.0%) 100 15.0% P11 3 (37.5%) 4 (50.0%) 1 (12.5%) 8 12.5% P12 5 (71.4%) 2 (28.6%) 7 28.6% P13 1 (14.3%) 6 (85.7%) 7 P14 20 (28.6%) 30 (42.9%) 15 (21.4%) 5 (7.1%) 70 28.6% P15 20 (62.5%) 10 (31.3%) 2 (6.3%) 32 6.3% P16 2 (28.6%) 5 (71.4%) 7 P17 2 (100.0%) 2 P18 2 (20.0%) 6 (60.0%) 2 (20.0%) 10 20.0% P19 1 (33.3%) 2 (66.7%) 3 P21 5 (71.4%) 2 (28.6%) 7 P23 45 (45.0%) 40 (40.0%) 13 (13.0%) 2 (2.0%) 100 15.0%
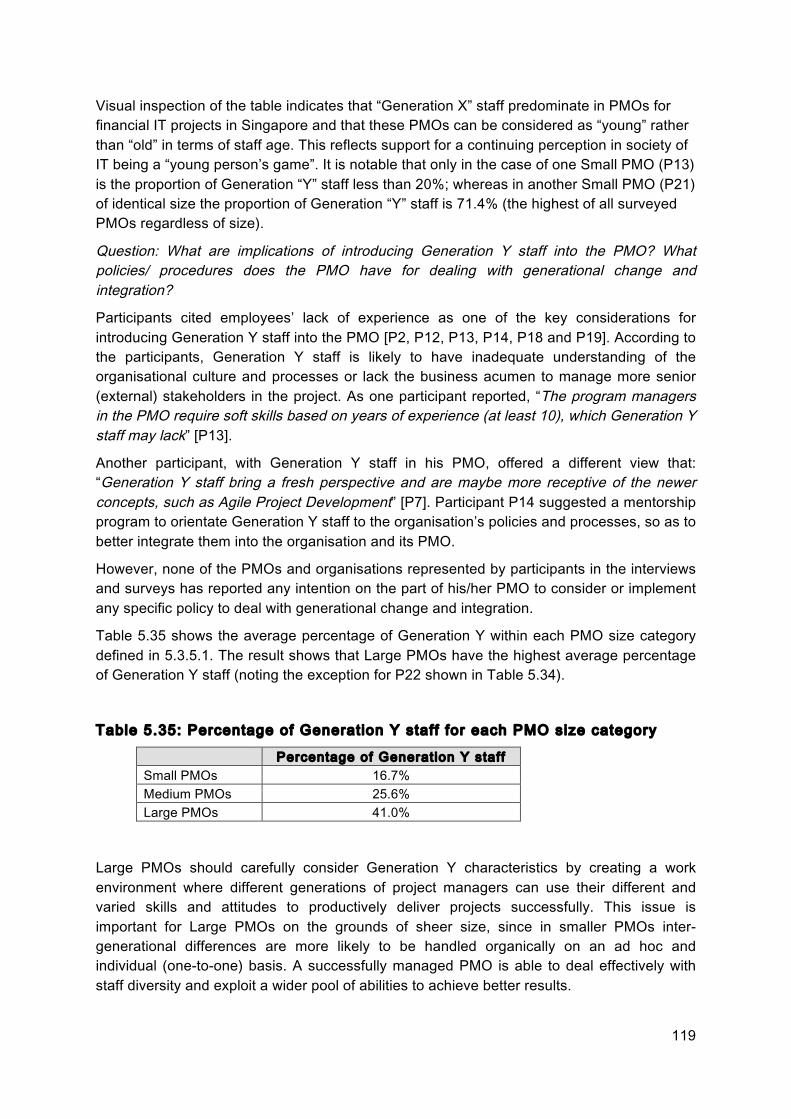
119
Visual inspection of the table indicates that “Generation X” staff predominate in PMOs for financial IT projects in Singapore and that these PMOs can be considered as “young” rather than “old” in terms of staff age. This reflects support for a continuing perception in society of IT being a “young person’s game”. It is notable that only in the case of one Small PMO (P13) is the proportion of Generation “Y” staff less than 20%; whereas in another Small PMO (P21) of identical size the proportion of Generation “Y” staff is 71.4% (the highest of all surveyed PMOs regardless of size).
Question: What are implications of introducing Generation Y staff into the PMO? What policies/ procedures does the PMO have for dealing with generational change and integration?
Participants cited employees’ lack of experience as one of the key considerations for introducing Generation Y staff into the PMO [P2, P12, P13, P14, P18 and P19]. According to the participants, Generation Y staff is likely to have inadequate understanding of the organisational culture and processes or lack the business acumen to manage more senior (external) stakeholders in the project. As one participant reported, “The program managers in the PMO require soft skills based on years of experience (at least 10), which Generation Y staff may lack” [P13].
Another participant, with Generation Y staff in his PMO, offered a different view that: “Generation Y staff bring a fresh perspective and are maybe more receptive of the newer concepts, such as Agile Project Development” [P7]. Participant P14 suggested a mentorship program to orientate Generation Y staff to the organisation’s policies and processes, so as to better integrate them into the organisation and its PMO.
However, none of the PMOs and organisations represented by participants in the interviews and surveys has reported any intention on the part of his/her PMO to consider or implement any specific policy to deal with generational change and integration.
Table 5.35 shows the average percentage of Generation Y within each PMO size category defined in 5.3.5.1. The result shows that Large PMOs have the highest average percentage of Generation Y staff (noting the exception for P22 shown in Table 5.34).
Table 5.35: Percentage of Generation Y staff for each PMO size category
Percentage of Generation Y staff Small PMOs 16.7% Medium PMOs 25.6% Large PMOs 41.0%
Large PMOs should carefully consider Generation Y characteristics by creating a work environment where different generations of project managers can use their different and varied skills and attitudes to productively deliver projects successfully. This issue is important for Large PMOs on the grounds of sheer size, since in smaller PMOs inter-generational differences are more likely to be handled organically on an ad hoc and individual (one-to-one) basis. A successfully managed PMO is able to deal effectively with staff diversity and exploit a wider pool of abilities to achieve better results.
120
5.3.17 Adoption of a PMO model for managing financial IT projects in Singapore
Question: What features would you expect to find in a PMO model for managing financial IT projects in Singapore? What features would be exclusive to Singapore?
Asked about the PMO model features, participant P3 suggested the PMO model should take into consideration the “different human resources involved in the projects, which can be: internal, external, outsourced or contracted”.
The Monetary Authority of Singapore (MAS), the country’s financial regulator, has reinforced high standards of financial regulation and strict supervision of banks operating in Singapore (Monetary Authority of Singapore 2012b). Two banking participants [P14 and P19] suggested incorporating a compliance component in the managing of risks and outsourcing projects within the PMO. Nevertheless, particularity to Singapore is not clear in this response, as both of their organisations are multinational companies.
Factors suggested by participants for a host organisation to support the adoption of a PMO model (the PMO performance determinants) include:
• Ease of project status reporting, • Top management and • Organisational support, and • Decision-making authority of the PMO with clear roles and responsibilities defined
[P5, P9, P7 and P12].
Participant P4 commented “the challenge of setting up a PMO is the buy-in from the functional groups, which is also the biggest culture impediment”.
Hobbs and Aubry (2010) report that there is limited current knowledge about PMOs and how they contribute to value creation, and the practitioner community is looking for standards and guidelines to help them and their executives to be more successful in establishing and managing PMOs. Implementing a PMO or reconfiguring an existing PMO is an important organisational change (Hobbs et al. 2008). It is noted that Hobbs and Aubry (2007) have shown that PMOs' organisational characteristics and mandates vary significantly and highlight the existence of a wide and diverse range of PMOs. The implicit underlying assumptions in this study are that there can be a limited number of variations of PMOs, and it possible to reduce the complexities and varieties surrounding PMOs into relatively stable structural entities using an optimised PMO model for an industry like finance in Singapore as the challenges, services and products are common, and the industry is closely regulated by Monetary Authority of Singapore (MAS). There is little variation in terms of forms and structures of these financial organisations. The model will provide guidance to project management practitioners and senior management in the implementation and remodelling of PMOs.
5.4 Discussion of Results
This section will discuss the findings of the data analysis and interpretation, with particular focus on qualitative data and comparisons to the literature. Incorporation of the findings and their implications for the PMO model development will be considered.

121
5.4.1 Conflicting Priorities of PMO
PMOs are organisational “responses to needs with the consequence of making unique structural arrangements designed to fulfil a specific purpose” (Pellegrinelli & Garagna 2009). Participants [P3 and P5] shared the experience of witnessing the establishment of a new PMO that was driven by a major project. For both respondents, the main functions of the early PMO were project status reporting and development of a standard methodology. The number of project managers in each of the two PMOs was between 10 and 20, most of whom came from the IT, Operations and Business sections of the host organisation. However, both these PMOs were considered unsuccessful and were dissolved within a year of their establishment. A business is defined as a fully functional unit with its own product and service lines that include multiple business units (Galbraith 2014). In financial banks, a business unit is a profit center that focuses on product offering and market segment; examples of business units are (credit) cards, wealth management, loans and (access) channels (ATMs and Internet Banking). Participants P3 and P5 attributed the root causes of failure of their PMOs to excessive red tape, over-detailed user and design documentation, and ‘politics’ between the IT and Business units within the PMO. In the course of standardising processes and templates, several new project documents were defined and more details were needed for existing documents. Seeking approval for issues required more time as the IT and Business units adopted different priorities. This is consistent with P13’s remarks that “In banking, the back office often delivers Financial IT projects; PMO would require the authority to control. There are often clashes between business (front office) and IT (back office)”. P5’s PMO had engaged expertise from an international consulting firm to assist in the formation of the original PMO. The consulting firm’s inexperience, lack of familiarity with the structure of the parent organisation and culture, and the PMO’s inability to select the right consultant were offered as additional reasons for failure. Thus it is critically important to pre-assess consultants’ skills and experience before appointing them. This also reaffirms the usefulness of a PMO model that takes into consideration the structure of the organisation, and that support for the PMO is crucial.
PMOs are part of a “political system that plays an important role in organisations” (Magenau & Pinto 2004). In finance, a co-equal PMO where ideally the business and IT components of a organisation do not assert priority over each other promotes partnership and dialogue on different projects perspectives (Müller et al. 2013). However as Pellegrinelli and Garagna (2009) report, the PMO often becomes the “battleground between empowerments and control, between people and processes, and between political factions”. Opposition can also emerge between business and IT PMO components in decision-making where business managers demand flexibility to meet business needs while IT project managers require stability in project requirements (Hobbs et al. 2008). Managing this kind of conflict between business units and the IT component throughout an IT project to avoid requirements instability is imperative to its success (Liu et al. 2011). Internal politics and power systems may result in dissatisfaction with the performance of a PMO, resulting in pressure for it to be disbanded (Aubry, Müller et al. 2010). This is again echoed in a case study of a financial services organisation with two interrelated PMOs: a central one and one in a business unit. The two PMOs had conflicting priorities with the business unit regarding PMO values, product quality and business results; while the central PMO valued process maturity and project performance in terms of cost, schedule, and the project requirements (Aubry & Hobbs 2011). The business unit may ultimately view the PMO as “an extra layer of
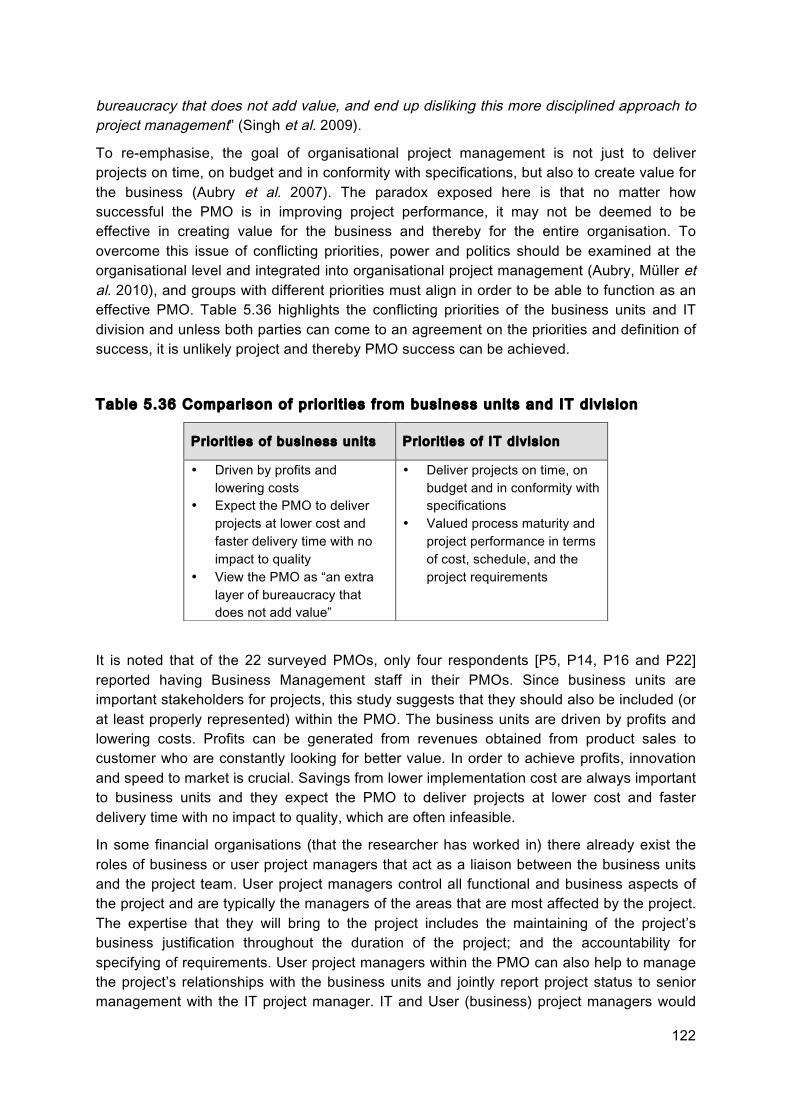
122
bureaucracy that does not add value, and end up disliking this more disciplined approach to project management” (Singh et al. 2009).
To re-emphasise, the goal of organisational project management is not just to deliver projects on time, on budget and in conformity with specifications, but also to create value for the business (Aubry et al. 2007). The paradox exposed here is that no matter how successful the PMO is in improving project performance, it may not be deemed to be effective in creating value for the business and thereby for the entire organisation. To overcome this issue of conflicting priorities, power and politics should be examined at the organisational level and integrated into organisational project management (Aubry, Müller et al. 2010), and groups with different priorities must align in order to be able to function as an effective PMO. Table 5.36 highlights the conflicting priorities of the business units and IT division and unless both parties can come to an agreement on the priorities and definition of success, it is unlikely project and thereby PMO success can be achieved.
Table 5.36 Comparison of pr ior i t ies from business units and IT division
It is noted that of the 22 surveyed PMOs, only four respondents [P5, P14, P16 and P22] reported having Business Management staff in their PMOs. Since business units are important stakeholders for projects, this study suggests that they should also be included (or at least properly represented) within the PMO. The business units are driven by profits and lowering costs. Profits can be generated from revenues obtained from product sales to customer who are constantly looking for better value. In order to achieve profits, innovation and speed to market is crucial. Savings from lower implementation cost are always important to business units and they expect the PMO to deliver projects at lower cost and faster delivery time with no impact to quality, which are often infeasible.
In some financial organisations (that the researcher has worked in) there already exist the roles of business or user project managers that act as a liaison between the business units and the project team. User project managers control all functional and business aspects of the project and are typically the managers of the areas that are most affected by the project. The expertise that they will bring to the project includes the maintaining of the project’s business justification throughout the duration of the project; and the accountability for specifying of requirements. User project managers within the PMO can also help to manage the project’s relationships with the business units and jointly report project status to senior management with the IT project manager. IT and User (business) project managers would
Priori t ies of business units Priori t ies of IT division
• Driven by profits and lowering costs
• Expect the PMO to deliver projects at lower cost and faster delivery time with no impact to quality
• View the PMO as “an extra layer of bureaucracy that does not add value”
• Deliver projects on time, on budget and in conformity with specifications
• Valued process maturity and project performance in terms of cost, schedule, and the project requirements
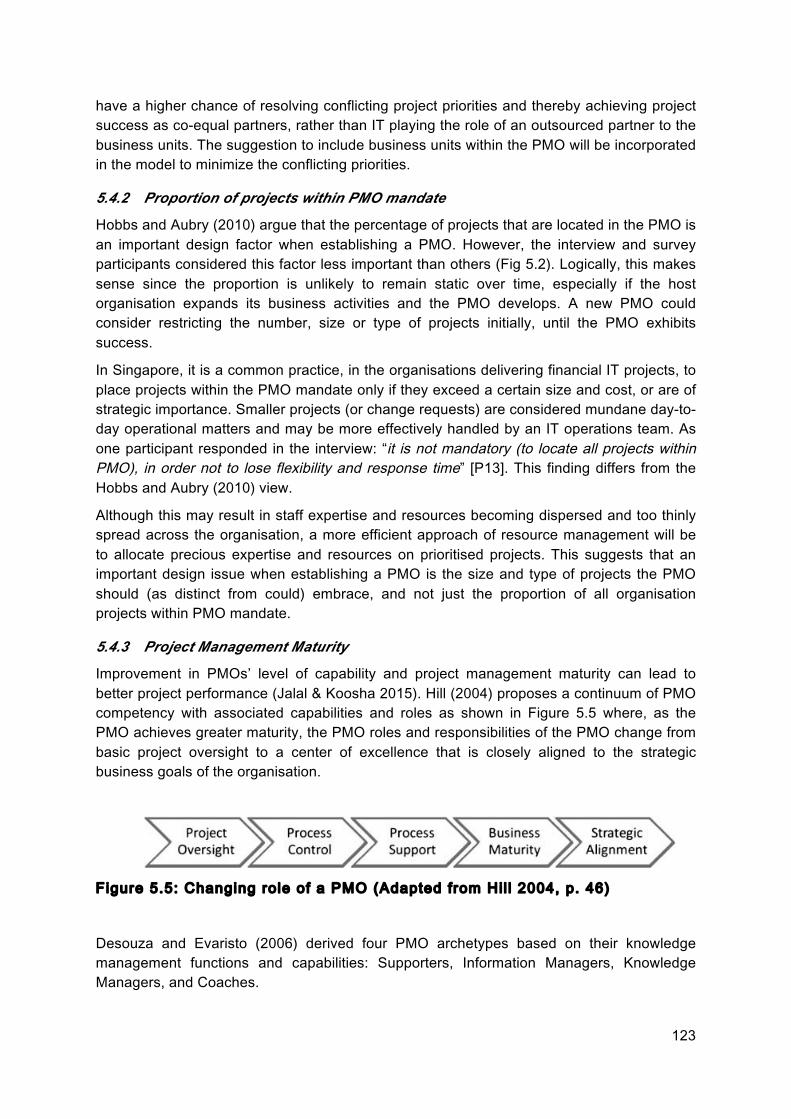
123
have a higher chance of resolving conflicting project priorities and thereby achieving project success as co-equal partners, rather than IT playing the role of an outsourced partner to the business units. The suggestion to include business units within the PMO will be incorporated in the model to minimize the conflicting priorities.
5.4.2 Proportion of projects within PMO mandate
Hobbs and Aubry (2010) argue that the percentage of projects that are located in the PMO is an important design factor when establishing a PMO. However, the interview and survey participants considered this factor less important than others (Fig 5.2). Logically, this makes sense since the proportion is unlikely to remain static over time, especially if the host organisation expands its business activities and the PMO develops. A new PMO could consider restricting the number, size or type of projects initially, until the PMO exhibits success.
In Singapore, it is a common practice, in the organisations delivering financial IT projects, to place projects within the PMO mandate only if they exceed a certain size and cost, or are of strategic importance. Smaller projects (or change requests) are considered mundane day-to-day operational matters and may be more effectively handled by an IT operations team. As one participant responded in the interview: “it is not mandatory (to locate all projects within PMO), in order not to lose flexibility and response time” [P13]. This finding differs from the Hobbs and Aubry (2010) view.
Although this may result in staff expertise and resources becoming dispersed and too thinly spread across the organisation, a more efficient approach of resource management will be to allocate precious expertise and resources on prioritised projects. This suggests that an important design issue when establishing a PMO is the size and type of projects the PMO should (as distinct from could) embrace, and not just the proportion of all organisation projects within PMO mandate.
5.4.3 Project Management Maturity
Improvement in PMOs’ level of capability and project management maturity can lead to better project performance (Jalal & Koosha 2015). Hill (2004) proposes a continuum of PMO competency with associated capabilities and roles as shown in Figure 5.5 where, as the PMO achieves greater maturity, the PMO roles and responsibilities of the PMO change from basic project oversight to a center of excellence that is closely aligned to the strategic business goals of the organisation.
Figure 5.5: Changing role of a PMO (Adapted from Hil l 2004, p. 46)
Desouza and Evaristo (2006) derived four PMO archetypes based on their knowledge management functions and capabilities: Supporters, Information Managers, Knowledge Managers, and Coaches.
124
• A Supporter is an administrative PMO that provides project status, identifies risks and potential issues, and maintains project archives.
• Information Managers track and report the progress of projects and serves as a source of information about projects and consolidated status updates. This is a knowledge-intensive PMO with a partial administrative function and no enforcement authority.
• A Knowledge Manager provides project expertise, mentoring and training. • A Coach is an enforcer of best practices and knowledge on project management.
Coaches focus on strategic and corporate activities to coordinate and improve project management within the organisation.
Desouza and Evaristo argue that knowledge management is one of the primary functions of the PMO and that the four archetypes usually map to the maturity level of project management in an organisation. This means that the knowledge-intensity increases as a PMO transits from a Supporter to Coach role.
Among the interview and survey participants, several Small PMOs were identified as being in the Supporter archetypes and Medium PMOs as Information Manager archetypes. It is noted that the participants assessed the level of project management maturity of Small PMOs to be either “defined” or “managed” which is considered quite mature. It is intuitive to assume that a Medium PMO having more functions than a Small PMO is more knowledge-intensive and thereby would assume a higher level of project management maturity. Contrary to Hill’s (2004) model, however, a PMO does not always achieve greater maturity when the roles and responsibilities of the PMO increase.
There can be several reasons for this situation:
• Newly established PMOs tend to incorporate the Medium PMO role [P3 and P5]. • A Medium PMO is implemented to fulfil the immediate needs of a PMO project and
“as that need is progressively addressed, the relevance and value of the PMO decreases” (Pellegrinelli & Garagna 2009). The lack of a strong management strategy that looks beyond project fulfilment may reflect low project management maturity.
• Current PMO initiatives do not have experienced project managers that understand the challenges of a larger PMO implementation (Singh et al. 2009).
It is possible for a Small PMO to have a high level of project management maturity, and have no aspiration to increase its size and functions. A Medium PMO, on the other hand would require some support in terms of standards and guidelines for it to become more mature and relevant. This is where a PMO model would be valuable.
5.4.4 PMO Organisational Learning
PMOs are part of a general trend towards the increased importance of organisational learning in the knowledge economy (Hobbs & Aubry 2010). By studying the functions list in Table 5.3, manage archives of project documentation (66.7%) is one of the key functions that is performed by the surveyed PMOs, behind that of report project status to upper management (85.7%) and develop and implement standard methodologies (76.2%). It is noted that these findings are in line with the results of Hobbs and Aubry (2007), in which a
125
list of 27 tasks of general PMOs was reduced to five general function groups of PMOs and the importance of function groups are ranked as follows:
1. Monitoring and controlling project performance 2. Development of project management competencies and methodologies 3. Multi-project management 4. Strategic management 5. Organisational learning
“Manage archives of project documentation” belongs to the organisational learning group. The establishment of a PMO is a strategy for “preventing project failures caused by poor management of project management knowledge“ (Desouza & Evaristo 2006).
Participant P2 suggested “projects could reuse materials, processes and templates that have been proved successful by similar projects” which is an example of good knowledge management. Project teams are more efficient when using a repeatable and predictable approach and thus are more competent in a centralised PMO due to the availability of repeatable and standard processes (Curlee 2008; Toney 2002). A PMO can develop and maintain a set of standards and best practices by providing centralised archives/databases of systematically collected project knowledge in a form of lessons learned and project templates (Dai & Wells 2004). Reliable information can be developed into PMO policies and procedural guides. P11 described “a stronger focus on the knowledge sharing within the PMO to ensure the PMO capability improves with every project” as a way of improving the PMO. Due to the one-time and unique nature of many finance IT projects, an organisation may derive little benefit from previous successes and failures unless knowledge acquisition and transfer is effective (Jessen 1992). A successful PMO will have to fill the gap and be capable of managing retrospective learning, which refers to generating knowledge from past projects, as well as prospective learning that refers to transferring knowledge from past experience to future projects (Pemsel & Wiewiora 2013).
Organisational learning is thus a vital component of an effective PMO and should be embraced within a PMO model.
5.4.5 Identifying the most suitable project managers
The skills of IT project managers are critical to the success of IT projects (Wateridge 1997). In a qualitative study, O’Leary and Williams (2008) found that the introduction of standard project methodologies in the organisation is not “as effective as having highly skilled, experienced project managers to intervene directly as required in problematic projects”. This reaffirms the importance of having the “right” project managers in the PMO. PMO policies and procedural guides can only go so far.
PMOs typically segment project managers based on their knowledge, aptitude, and orientation, and “segmenting project managers by their orientation allows the PMO to ensure that the best talent is harnessed in terms of the best fit for project requirements“ (Desouza & Evaristo 2006).
Smith (2014) argues that there is no perfect project manager who will have all the soft skills, technical, and domain expertise, and who can play the full range of roles and archetypes: analyst in the project team, enforcer to financial backers, expert to critics, impresario to customers, master of ceremonies to the wider public, and a reshaper to allies. He further
126
reasons that there is “no multiplicity of situation types that demands a similar multiplicity in the archetypes” and playing another archetype introduces an additional burden on project managers.
Revisiting the subsidiary research question, which asks what are the competencies of project managers that best suited to a PMO structure, it is noted that the relative importance of “Technical expertise” and “Domain expertise” for project managers differs between the three defined PMO size categories in the surveys. Table 5.25 reveals that 75% of the participants from Medium PMOs ranked technical or domain expertise as the most important PM competency. The obvious conclusion is that Medium sized PMOs require project managers with relevant experience and knowledge of the domain required by the projects they manage. The project manager must have the technical ability and domain knowledge in order to perform the required activities to ensure project success, and thereby the success of the PMO itself. The consequence to this is that other sized PMOs may have to (or prefer to) outsource technical domain knowledge, which may render the PMO less effective by complicating their external communication requirements.
Singh, Keil et al. (2009) argue that understanding the corporate culture and power relationships within the organisation can be very useful. In Large PMOs, PM competencies are no longer limited to technical and domain expertise and “interpersonal, influence skills and knowing your organisational culture (‘politics’)” are considered more valuable [P13]. This is reaffirmed in a Delphi study on the most critical skills for managing IT projects, where the top five IT project management skills identified were: leadership, verbal communication skills, scope management, listening skills, and project planning; and these are not all technical in nature (Keil et al. 2013). Given the size and availability of technical resources in Large PMOs, it is possible for the project manager to utilise appropriate technically skilled staff to undertake different roles within the project team. In other words, in Large PMOs there should be (by design) a greater range of skills resources available.
All the participants from Large PMOs considered soft skills as an important PM competency for achieving project success as shown in Table 5.25. Soft skills, such as interrelationship management, are particularly important when projects are done in an international context (Aubry, Müller et al. 2010). Project managers from Large PMOs would require “support related to leadership and soft skill development, primarily with respect to the maintenance of positive relationships with customers and other stakeholders” (Pemsel & Wiewiora 2013).
The right mix of resource skills is thus an important consideration for a PMO model.
5.4.6 PMO management support and decision-making authority
Hobbs and Aubry (2010) report that the level of project management maturity and the supportiveness and culture of the host organisation are related to the performance of a PMO, and can act as good predictors of performance. The more supportive the organisational culture is, the more decision-making authority the PMO will enjoy; the more projects will be included within its mandate; and the more likely that the majority of projects will be successful.
An organisation that has assigned the required resources to set up a Large PMO is likely to place a high value on project management, and may actually see itself as mature in project management simply in terms of the large resource commitment. The support of senior

127
management, identified in the literature review as a CSF that impacts project performance in Singapore, which drives the supportiveness of organisational culture is defined by willingness to provide sufficient resources, as well as delegation of authority (Pinto & Slevin 1987).
One of the factors that may lead to the failure of a PMO is the lack of “buy-in” (supportive commitment) from senior functional managers (Kendall & Rollins 2003). Singh and Keil et al. (2009) have identified that one of the challenges of implementing a PMO for managing IT projects is the organisational culture and its resistance to change (or conversely its willingness to embrace change). Having a strong PMO “champion” and obtaining support from other leaders in the host organisation are two strategies to deal with the challenge. These leaders can help to promote the need for, and implementation of, the PMO.
PMOs may have the responsibility for standardising methodologies, but whether these standards are followed or not is closely related to issues of power and control (Hobbs et al. 2008). They usually take a controlling role and are responsible for the enforcement of project management standards, control of compliance with set standards and evaluation of project performance (Müller et al. 2013). It thus requires a certain level of authority to control managerial action and impose sanctions against malpractice when necessary and at the same time exert a role of relative dominance over project managers.
The PMOs that are placed internally within IT departments often showed less decision-making authority and a culture not particularly supportive of project management but merely providing policies and methods that are followed on projects (Hobbs & Aubry 2010). For a Large PMO to be successful, the support and the decision-making authority given by senior management in the parent organisation are considered more important performance determinants than in the case of a Small or Medium PMO. This is reflected in Table 5.11.
5.4.7 Flexibility and Time to Market
In order for PMOs to be more successful in delivering projects, the consistent theme across PMOs is to “enable a systematic coordination and unified handling of key project-related tasks” (Andersen, Bjørn et al. 2007). However, not all respondents agreed that the systematic, unified approach (using a PMO) could inevitably lead to better project performance. Participant P4, a Country Manager for an international telecommunications organisation, believes that a PMO is not suitable for his organisation. According to him, the expertise to run the PMO effectively transcends across the organisation, and the downside of a centralised PMO is that the people running the PMO may not know, fully and intimately, the whole host organisation and its intricacies. In the telecommunications industry where business is rapid and dynamic, a strictly hierarchical PMO (which could actually increase delay in the products’ ‘time to market’ requirements) will not succeed. In his organisation, the success of projects depends very strongly on the efforts of individuals, where there is a need for trust, freedom to do what is required, and empowerment; thus reverting to the autonomy/authority issue. This perceived pessimism by P4 may be a response to global market competition, by which the PMO failed to address two specific features of project management: the flexibility of project management processes and methodology, and the ‘time to market’ constraints.
One of the participants interviewed [P13] works in a PMO of a payment processor organisation that practices “Agile Software Development”. Agile software development, as
128
defined by Cockburn and Williams (2003) is an empirical or nonlinear process where short feedback-loops are necessary to achieve a desirable, predictable outcome. It aims to “strip away as much of the heaviness, commonly associated with the traditional software development methodologies, as possible to promote quick response to changing environments, changes in user requirements, accelerated project deadlines and the like” (Erickson et al. 2005). “Agile” may be seen as a synonym for both “quickly responsive” and “flexible”. It has become an umbrella term for a number of changes in how software developers plan and coordinate their work, how they communicate with customers and external stakeholders (Dingsøyr et al. 2010). This type of software development falls under Agile Project Management (APM), which is defined as an approach based on “a set of values, principles, and practices that assist project teams in coming to grips with this challenging environment”. The values address both the need to build agile and adaptable products and the need to create agile and adaptable development teams, where the principles are developed by iterations and add value to customers by means of short-time deliverables (Highsmith 2009). The goal of APM is to “render the process of project management simpler, more flexible and iterative in order to achieve better performance (cost, time and quality), with less management effort and higher levels of innovation and added value for the customer” (Amaral et al. 2011; Conforto & Amaral 2010).
Participant P13 described how his PMO had recently decided to employ APM. Unlike more typical PMOs in banks, that have authority to control standards and processes, P13’s PMO has greater support and flexibility because there is a product manager that represents customers who can translate demand to structure requirements. With the product manager in control of requirements, it enables APM to focus on core problems and challenges in projects, and helps to identify which key aspects are valued most by customers, not “how” to develop the project (Conforto et al. 2014). This differs from the plan-based practice of defining the product and project scope or traditional development methods, mainly with the focus adapting to change and delivering products of high quality through simple work processes (PMI 2013). P13 shared that his/her PMO facilitates communication, prioritisation of projects, ownership, and promotes accountability as the first point of contact. APM has enables the organisation to reach a bigger scale with minimum effort.
The argument for developing a PMO model is, that without clarity on how to implement a PMO successfully, many PMO initiatives will fail to produce the improvements that were originally hoped for (Kendall & Rollins 2003). Stanleigh (2006) reports that “over 75% of organisations that set up a PMO shut it down within three years because it didn’t demonstrate any added value”. This has resulted in organisations reconfiguring their PMOs every few years (Hobbs et al. 2008). A valid PMO model should help to avoid or at least minimise such situations. One possible approach to improve the flexibility of project management processes and methodology, and time to market, is for the PMO to consider APM.
There are also other suggestions from the literature to convince senior management to overcome the problems of PMO implementation. In order for PMOs to be viable, they have to continuously demonstrate that they are making a substantial contribution to organisational performance at a reasonable cost (Pellegrinelli & Garagna 2009); i.e. the benefit/cost ratio must be positive. To do this sort of benchmarking requires a baseline to be established. Ward and Daniel (2013) propose collecting baseline data to compare the status of projects

129
before the existence of the PMO with the performance data on all projects carried out after the PMO is implemented. The justification of a PMO can then be based on the hard data on cost, schedule, functionality (in terms of meeting customer requirements), and quality of project deliverables. A major difficulty here is ensuring that such baseline data is available and retrievable. They also suggest PMO involvement in identifying and quantifying benefits earlier in the project to improve project success and management satisfaction, but again such quantification is likely to require comparisons with historic performance. If baseline benchmarking is not established at the time of PMO implementation, then it needs to be done as soon as possible afterwards, with suitable resourcing for the benchmarking task and a senior management commitment to a cycle of continuous improvement. The benchmarking objective should therefore come within the compass of a PMO model.
5.4.8 PMO model essential features
This section summarises all the arguments for, and the essential features of, a PMO model.
This study aims to develop a PMO model that empirically derives from and characterises three distinct typologies of PMOs. By studying the relevance of existing design and management characteristics of PMOs in practice, the functions and roles performed by PMOs have been clarified and, where possible, validated through direct investigation.
The results of the interviews and online surveys have provided evidence and arguments to derive the essential features of a PMO model that would bring about a positive direct impact on project performance. These features include:
• Proportion of all the organisation’s projects within the PMOs mandate The size and type of projects the PMO should (as distinct from could) embrace is an important design issue when establishing a PMO.
• PMO functions The implications of the data suggest different sets of key functions identified for different sized PMOs.
• PMO shaping factors The PMO model to emphasise relevant important shaping factors based on the PMO size. The factor “Percentage of PMs within PMO” is not important to Small PMOs, while “Extent of decision-making authority” is critical to Large PMOs.
• PMO decision-making authority The PMO model to reflect the higher project authority found in Large PMOs, while there is less and limited difference between Small and Medium PMOs in terms of project authority.
• Structuring of functions and adopting of roles The delicate balance and challenge of PMO and organisation politics, culture to be addressed in the PMO model. One suggestion is to include business units within the PMO to minimize conflicting priorities. Another role that will be embraced within a PMO model is organisational learning, which is a vital component of an effective PMO.
• Critical success factors The PMO model to suggest more emphasis on CSFs: “On Schedule” and “Realising business benefits” to measure project success.
• PM competencies
130
The PMO model is to reflect the key competencies for project managers in relation to the size of the PMO.
• Usefulness of a PMO model The areas of focus for a PMO model to take into consideration include: organisation and management needs/ directions, organisational culture, structure and size, and offering products and services.
• Project management maturity The findings suggest that PMO size did not make any significant difference to PMO maturity level, but benchmarking should play a role in maturity assessment.
These features are fundamentally important structural and organisational factors that form the constituents of effective PMOs. Feedback collected from respondents and literature studies on the topic are analysed to derive the PMO performance determinants.
5.5 Chapter Summary
Interview and survey data, from participants active in PMOs dealing with financial IT projects in Singapore, have been analysed, using descriptive and inferential statistics. The results have been interpreted and discussed, particularly with reference to the literature and their relevance for the development of a PMO model. The essential features of such a model have been identified.
A PMO model should be useful as a form of reference for the host organisation and the PMO proponents and staff. It should take into consideration organisational and management needs, organisational culture, PMO structure and size and the offered products and services. The next chapter will develop and present the conceptual PMO model.

131
Chapter 6 The PMO Model development 6.1 Introduction
The purpose of this chapter is to develop a PMO model, based upon the findings from the data analysis in chapter 5, that is both practical and relevant in practice. First, the nature of models is discussed. Then the specific PMO model is developed with its design framework and composite variables.
6.2 Definit ion of Model
Tate and Jones (1975) define a model as “a representation of reality made sufficiently explicit for one to be able to examine the assumptions embodied within it, to manipulate it and experiment with it, and, most important of all, to draw inferences from it which can be applied to reality”. Models enable us to “solve specific problems and learn more about the world around us” by providing an idealized representation of that which is being studied (Raftery 1998). The concept is illustrated in Figure 6.1.
Figure 6.1 Models and real i t ies (Source: Raftery 1998, p. 297)
The figure deliberately depicts the model as a regular almost uniform representation attempting to replicate two quite “messy” perspectives of reality; a real world perspective and a perspective based upon our assumptions about that world. The inference here is that such models are framed by perceptions that are sometimes quite subjective – however hard we try to be objective – and that there will inevitably shortcomings and discrepancies in the model. Such models can only gain robustness through refinement.
Churchman, Ackoff et al. (1957) and Raftery (1998) propose four types of models: iconic, analogue, symbolic and the conceptual model.
Iconic models are scale transformations of the real world system that come with some loss of detail and dimensions. An architectural model that represents a scaled down version of a building with identical shape, color and layout is an example of an iconic model. While it may
1. Iconic models are essentially scale transforma-tions of the real world system which they repre-sent. For example, an architectural modelrepresents a scaled down version of the buildingwith, for all intents and purposes, identicalshape, colour and lay-out. As with all models,certain details are absent from the model. Forexample, cooling, heating and electrical instal-lations. Sometimes also, there may be a loss ofdimension. For example, a photograph is a two-dimensional representation of a three-dimen-sional subject.
2. Analogue models are at a higher level of abstrac-tion than iconic models. In the former, the properties of the real world system underconsideration are transformed. For example, thedistance between contour lines on a map repre-sents the gradient. A common example inbuilding economics is the cash ¯ow curve wherethe property, the elapsed time in the project isrepresented by distance along a horizontal line.Similarly, the property cumulative expenditureon the project so far is represented by distancealong a vertical line.
3. Symbolic models are the most abstract form ofmodel. Symbolic models are mathematicalrepresentations of the phenomenon underscrutiny. A classic example is Boyle’s law ofgases which describes the relationship betweenthe temperature, volume and pressure of a gas.Boyle’s law is expressed as follows:
P ~ t/v
where p, v and t are the pressure, volume andtemperature of the gas.
4. Conceptual models represent our conception ofwhich variables are relevant and how they arerelated. They often take the form of ¯ow charts,or what are sometimes referred to unkindly asswirling arrowgrams.
There is usually a level of detail (in modelling, called`decomposition’ or `disaggregation’) which is more
appropriate than others for a given problem. Forexample, consider the problem of producing a map forthe rapid transit or underground rail system of anymajor city. The ®rst requirement for the traveller is torecognize which stations are on which lines, and theirrelative positions for the purposes of deciding whereto change lines. Minutiae of distance between stationsare not important due to the high speed of the trains.Therefore, it is inappropriate for the map to be as anormal ordnance survey map. This would supply toomuch information, it would be dif®cult to use for quickdecisions and, most importantly, it would not beapparent from the map which stations are on whichlines. Hence, it is no coincidence that metro maps formajor cities tend to be schematic, texture or colourcoded, with information on relative positions, but notabsolute distance between points. Indeed, many peopleare familiar with the experience of discovering, on a®rst visit to a city, that the topography, above ground,is quite different from that which might have beenexpected by extrapolation from the metro map.
Let us turn now to the uses of models. Using asystems approach, Tate and Jones (1975) of the OpenUniversity suggested: 1, to communicate facts aboutthe system; 2, to communicate ideas about the system;3, to generate new ideas for designing or operating thesystem; 4, to predict how the system will behave indifferent circumstances; and 5, to provide insights intowhy the system behaves as it does. However, in thereal world, the distinctions are rarely so well de®ned,and models often are used for combinations of theabove purposes. Our metro map, for example, wouldbe primarily used by passengers for purposes 1 and 3.Our model of K values and air-conditioning designwould be used primarily for purposes 1, 3 and 4.
A note on causality
Many models will predict behaviour without offeringmuch, or any, insight into cause and effect. In macroeconomics, for example, there is a relationship betweenmoney supply and in¯ation. The monetarists of thelate 1970s and early 1980s assumed that the causalityran from money supply to in¯ation. In other words,given a reduction in the rate of increase in moneysupply they thought it possible to forecast a same direc-tion adjustment in in¯ation. The governments of boththe UK and the USA experimented with this modelin the early 1980s. It was, of course, entirely inaccu-rate, and it seems likely that the causality runs preciselycounter to that which was assumed originally (Keegan,1991). It is less than ideal to forecast the future behav-iour of some variable or other without attempting togain some understanding of causality. Models whichlack some approximation to causality will fail if thereare changes in the underlying conditions.
Models and reality 297
Figure 1 Model and reality (after Taha, 1971)
Dow
nloa
ded
by [R
MIT
Uni
vers
ity] a
t 18:
03 0
2 Ju
ne 2
015
132
be to scaled dimensions, and communicates a realistic representation of the appearance, form and proportions of the proposed building, it cannot be used to examine every minute detail of a real-life building. A dolls’ house is an often cruder version of a similar iconic model, but constructed for a different purpose.
Traditionally, architectural iconic models were static, physical representations of buildings in miniature. Now such models can be created as virtual realities through computer simulation and used for 3-D modelling effects of form, appearance, solar shading, wind effects, sightings and overshadowing, and construction assembly processes including site access, crane location and materials handling of placing. However, they suffer some of the same limitations of the earlier physical and drawn two-dimensional models. The proposed PMO model is not intended for visualisation purposes and is thus not iconic.
Analogue models transform properties of the real world system under consideration at a higher level of abstraction than iconic models. For example, the distance between contour lines on a map represents the topographical gradients of the land. The PMO model is also not an analogue form since it is not intended to represent any continuous measurement data.
Symbolic models are often the most abstract form of model, and can be in the form of mathematical representations of the phenomenon under consideration. An example is the Boyle’s law of gases, which is a mathematical representation of the relationship between the temperature, volume and pressure of a gas. The PMO model does not represent exclusive mathematical relationships (despite attempting variations in emphasis) and is thus not symbolic.
Conceptual models are conceptions of relevant variables and how they are related. A flow chart is an example of a conceptual model. A mind-map is another.
The various uses of models facilitate the communication of facts and ideas about the target system and may generate new ideas, predict how the system will behave in different circumstances, and offer insights into why the system behaves as it does (Tate & Jones 1975). A hybrid model may be found in a combination of symbolic and conceptual representations. The combination generally comprises the conceptual identification of dependent and independent variables, and testing the relationships between them through predictive mathematical modelling applications such as Structural Equation Modeling (SEM), whereby single item measures are grouped as category variables and assigned scale measures are derived from data collected through surveys or observations. SEM uses hypothesised path models to “depict relationships among observed variables, with the same basic goal of providing a quantitative test of a theoretical model hypothesized by the researcher” (Schumacker & Lomax 2012). It provides a flexible way of assessing the quality of measurement and at the same time examining causal relationships among variables (Wang & Wang 2012). The hybrid approach is attractive for a PMO model, which seeks ways of improving financial IT project success rates in Singapore, to serve a quasi-predictive purpose. The approach would produce a hybrid model that is based on historical experience of the research participants and research studies, and can be used to make meaningful predictions on project performance. However, the PMO model is not intended to be deterministically predictive and final, as it employs no discrete measures, but should be seen more as a preliminary ‘starting point’ to guide organisational decision-making about the structure and purpose of PMOs, and the evaluation of their performance. As will be seen
133
later, the independent variables of the PMO model are not susceptible to the reliable and accurate measurement needed for acceptability in terms of the predictive capacity of dependent variables. The proposed PMO model is thereby essentially conceptual and intended to guide organisational thinking about PMO development.
Evidence-based practices (EBP) can be defined as “the integration of best research evidence with clinical expertise and patient values to facilitate clinical decision making” (Sackett et al. 2000). Rycroft-Malone and Bucknall (2011) argued that the use of best evidence to solve patient health problems could oversimplify the complexity of clinical judgment and fail to acknowledge the contextual influences. In a Canadian healthcare case study, the introduction of a PMO was able to facilitate the successful implementation of evidence-based practices in care delivery. The PMO improved practices by changing them, based on the evidence and acquired knowledge of change management, and the patients were able to receive better quality care (Lavoie-Tremblay et al. 2012). Van Beurden et al. (2011) argued that within health promotion, “Cynefin” together with Complex Adaptive Systems (CAS) theory is useful for understanding ordered and linear approaches of ‘evidence-based practice’ and hierarchical management structures, but detrimental when addressing complex multi-dimensional issues.
The use of the Cynefin Framework (later explicated in section 6.4) enables the presentation of the best practices based on evidence with the contextual influences in a model. Rogers (1995) argued that one of the attributes of evidence for sustained adoption is to integrate the evidence into differing contexts by reinventing, refining, or adapting the evidence to suit the organisational needs, which is what the PMO model adopters are expected to do during implementation.
6.3 Development of a PMO model
PMOs are part of the responses of host organisations to their needs and environments, with precise roles and emphases that reflect the organisations’ unique priorities (Pellegrinelli & Garagna 2009). A PMO helps both the project manager and the organisation to “understand and apply professional practices of project management, as well as to adapt and integrate business interests into the project management efforts” (Hill 2004). The PMO is part of a “network of complex relations that links strategy, projects and structures” (Aubry et al. 2007). The governance of projects and project management coexists within the corporate governance framework, as it comprises the value system, responsibilities, processes and policies that enable projects to achieve organisational objectives (Müller et al. 2013).
Ideally, a ‘PMO model’ will reflect all these features by showing how they, along with other requirements, fit into a structure with identifiable and purpose-driven functions and roles. PMO authors such as Hobbs and Aubry (2011) and Müller et al. (2013) have proposed typologies of PMOs. In general, however, the understanding of PMO roles and the impact of these roles on value contribution and creation remain unclear (Unger et al. 2012), particularly in the context of the Singapore financial industry. In today’s business context, the need to apply project management knowledge to optimise use of resource and increase productivity is critical (Jalal & Koosha 2015). A well-defined, effective PMO is an important step to greater success for organisations (Desouza & Evaristo 2006).The intention of this research is to create value for project management and PMOs in organisational contexts in terms of IT projects for financial institutions in Singapore.
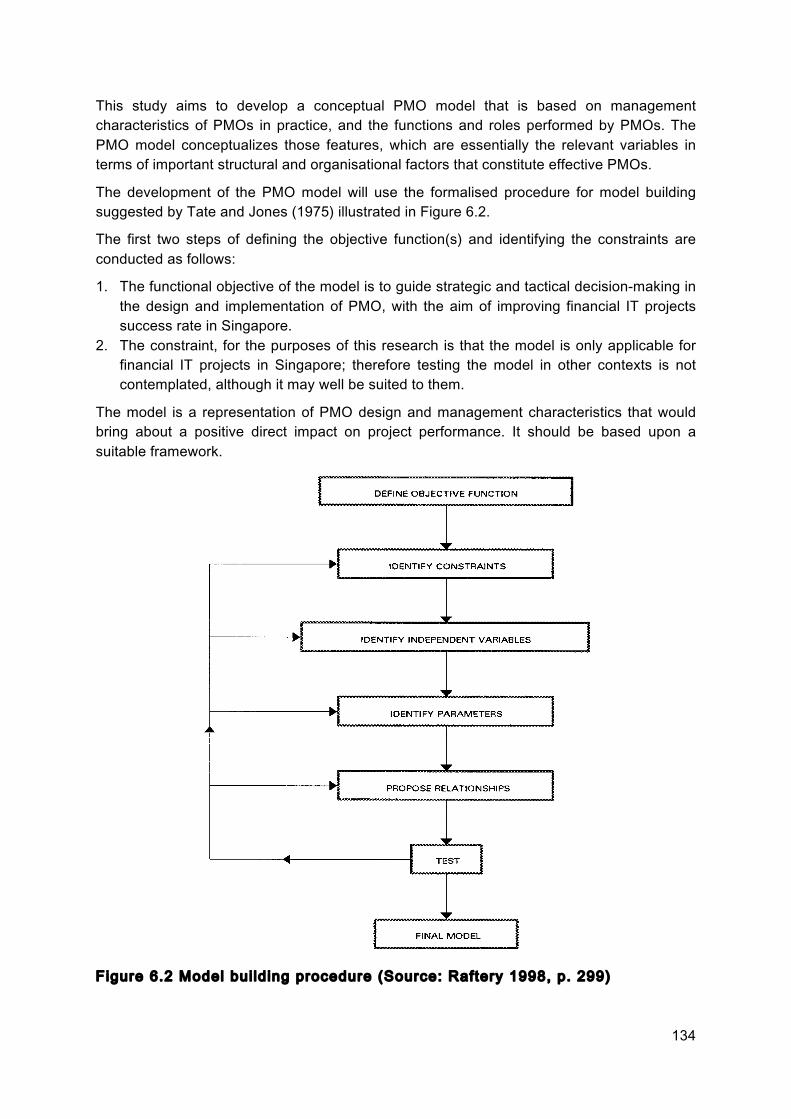
134
This study aims to develop a conceptual PMO model that is based on management characteristics of PMOs in practice, and the functions and roles performed by PMOs. The PMO model conceptualizes those features, which are essentially the relevant variables in terms of important structural and organisational factors that constitute effective PMOs.
The development of the PMO model will use the formalised procedure for model building suggested by Tate and Jones (1975) illustrated in Figure 6.2.
The first two steps of defining the objective function(s) and identifying the constraints are conducted as follows:
1. The functional objective of the model is to guide strategic and tactical decision-making in the design and implementation of PMO, with the aim of improving financial IT projects success rate in Singapore.
2. The constraint, for the purposes of this research is that the model is only applicable for financial IT projects in Singapore; therefore testing the model in other contexts is not contemplated, although it may well be suited to them.
The model is a representation of PMO design and management characteristics that would bring about a positive direct impact on project performance. It should be based upon a suitable framework.
Figure 6.2 Model bui lding procedure (Source: Raftery 1998, p. 299)
a variable but remains constant in a particular case.Independent variables are variables which have amaterial effect on the thing being studied, the depen-dent variable ± usually cost. For the purposes of costmodelling, a clear distinction must be made betweendiscrete variables (boiler size, duct size) and continu-ous variables (insulation and slab thickness).
In order to identify the relationships among vari-ables, the constraints on the design solution must beexposed formally. It is unsafe to assume that all rela-tionships are linear. The set of relationships in a costmodel will usually consist of both linear and nonlinearfunctions, the latter being common among discretevariables.
Symbolic models will often take the general form:
optimize xo = f(x1, x2, . . . ,xn)
subject to separately de®ned constraints. The objec-tive function f determines the value of the variables xj, j = 1 . . . n. The variables xj, often will be derivedvariables which themselves have been calculated fromexpressions further up the modelling hierarchy. Hence,the objective function f will normally be a function ofother functions further up in a hierarchy.
Complex mathematical models are sometimessimpli®ed by (i) converting discrete variables intocontinuous ones, (ii) translating nonlinear functionsinto linear form, and (iii) eliminating some constraints(Tate and Jones, 1975). The most powerful computa-tional techniques that exist are for linear functionsdealing with continuous variables. Clearly, such simpli-®cations may lead to problems by increasing the levelof abstraction of the model from the real world. If usedthey should be made explicit.
Testing of models and the scienti®c method
Rigorous testing of the model is a vital part of themodel building process. Twentieth century thought onthis subject takes the general perspective that testingas such is possible only in the negative sense. That is,while it is never really possible to prove the truth, ora model or theory, it is possible to falsify or disproveit. In other words, to show that the theory or modelis inadequate in some way. Models and theories standas useful only as long as they appear to ®t their situ-
Models and reality 299
Table 1 A formalized procedure for building symbolicmodelsa
A Decide on the measures of effectivenessB List the alternative policies/designsC Identify the main components of the measures of
effectivenessD List and name the main identi®able and measurable
variables which affect these components. These are:(a) controllable variables(b) uncontrollable variables
There are also:(c) constants
E List the main constraints applying to these variablesF Hypothesize relationships between the measures of
effectiveness and these variables, constants and constraints
G Test these hypotheses. Strictly, this involves:(a) devising criteria for acceptability(b) collecting test data(c) applying the test(d) accepting or modifying the hypotheses as
necessaryH Reformulate the problem clearly in mathematical
terms on the basis of the previous stepsI Test the model as a whole (similar content to step G)J Calculate the values of the measures of effectiveness
for alternative policies/designsK Select the best policy/designL Test the policy/design selectedM Monitor the adopted policy
aFrom Tate and Jones (1975).
Figure 2 Simpli®ed model building procedure
Down
loade
d by [
RMIT
Univ
ersity
] at 1
8:03 0
2 Jun
e 201
5
135
The research was conducted in two phases whereby, in the first phase, exploratory research in the form of literature review and interviews were conducted, followed by conceptualisation where the findings are then used to formulate the PMO model. The second phase is the validation of the model through the focus group method. The conceptual PMO model design is based on analysing the collected data, and the author’s experience working in, and study of, the Singapore banking environment. These two approaches enabled the research to be kept close to reality and relevant, given that project management research is very practice-oriented (Blomquist et al. 2006, pp. 540-549); whilst at the same time confirming or extending theory. The model variables are the realities discovered through literature review and confirmed through primary interview data analysis. The model building process itself is an abstraction from the reality in that it is representational. The arrangement of variables/ factors in the model is determined by the Cynefin Framework used (Section 6.4) and the outcome validated by the focus group evaluation in Chapter 7. The focus group validation outcomes will support the practicality of the model if no major barriers to model implementation are identified. The focus group participants will be able to compare the structure of their PMOs with the design of the model proposition and provide valuable inputs about its practicality.
6.4 CYNEFIN framework
Kurtz and Snowden (2003) propose the “Cynefin” framework as a “means of distinguishing between formal and informal communities, and as a means of talking about the interaction of both with structured processes and uncertain conditions”.
The conceptual underpinning of the framework has its roots in knowledge management (Nonaka & Takeuchi 1995; Senge 2006) and complexity science (Burnes 2005; Stacey 2011). The Cynefin Framework can be used to inform practice by helping practitioners choose the most appropriate approach, dependent on the level of complexity, to make sense of the issues and potential solutions (Childs & McLeod 2013; Snowden 2010). It is applicable for different organisational contexts to support decision-making and strategy development in dynamic and challenging situations (Kurtz & Snowden 2003). The Cynefin Framework has been applied to knowledge and strategy management, research, policy making and leadership training (Mark & Snowden 2006; Snowden & Boone 2007).
As shown in Figure 6.3, the Cynefin Framework has five domains: (1) Known (Simple), in which the relationship between cause and effect is perceivable, (2) Knowable (Complicated), in which the relationship between cause and effect requires greater analysis, (3) Complex, in which the relationship between cause and effect can only be perceived in retrospect, (4) Chaotic, in which there is no detectable relationship between cause and effect at a systems level, and a fifth central area (shown in grey shading in Fig. 6.3), which is the domain of (5) Disorder, where the lack of any explicable cause/effect relationships at any level is also resistant to any attempt hypothesise them. While complex and chaotic contexts are considered unordered, the nature of this fifth context makes it particularly difficult to recognize when one is in it (Snowden & Boone 2007).
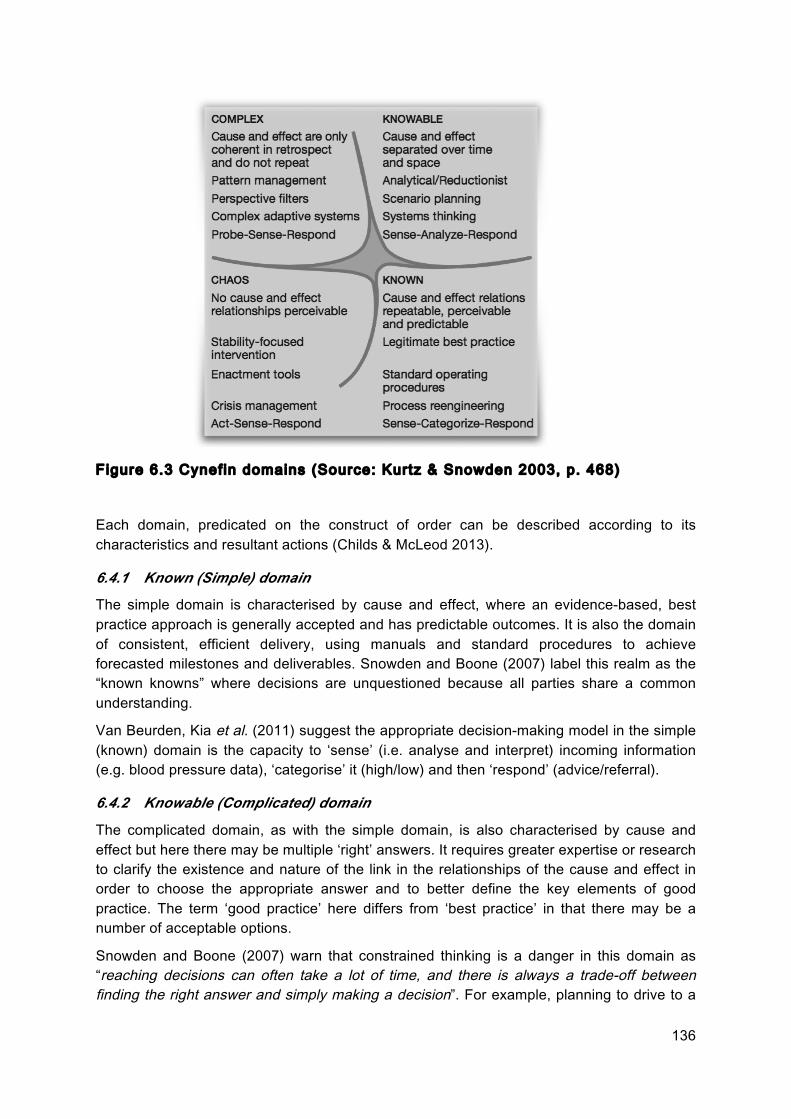
136
Figure 6.3 Cynefin domains (Source: Kurtz & Snowden 2003, p. 468)
Each domain, predicated on the construct of order can be described according to its characteristics and resultant actions (Childs & McLeod 2013).
6.4.1 Known (Simple) domain
The simple domain is characterised by cause and effect, where an evidence-based, best practice approach is generally accepted and has predictable outcomes. It is also the domain of consistent, efficient delivery, using manuals and standard procedures to achieve forecasted milestones and deliverables. Snowden and Boone (2007) label this realm as the “known knowns” where decisions are unquestioned because all parties share a common understanding.
Van Beurden, Kia et al. (2011) suggest the appropriate decision-making model in the simple (known) domain is the capacity to ‘sense’ (i.e. analyse and interpret) incoming information (e.g. blood pressure data), ‘categorise’ it (high/low) and then ‘respond’ (advice/referral).
6.4.2 Knowable (Complicated) domain
The complicated domain, as with the simple domain, is also characterised by cause and effect but here there may be multiple ‘right’ answers. It requires greater expertise or research to clarify the existence and nature of the link in the relationships of the cause and effect in order to choose the appropriate answer and to better define the key elements of good practice. The term ‘good practice’ here differs from ‘best practice’ in that there may be a number of acceptable options.
Snowden and Boone (2007) warn that constrained thinking is a danger in this domain as “reaching decisions can often take a lot of time, and there is always a trade-off between finding the right answer and simply making a decision”. For example, planning to drive to a
137
destination, which does not have a ‘best route’ often requires consideration of trade-offs between distance, duration, traffic and weather conditions before reaching a decision.
6.4.3 Complex domain
When the ‘right’ answer is elusive, and the decision is based on incomplete data, the situation is probably complex rather than complicated (Snowden & Boone 2007). While there are multiple ‘right’ answers for complicated domain, the complex domain requires emergent order and practice that is often unique. The domain is characterised by unpredictability and fluidity such that the unpredictable patterns that emerge from the cause and effect can only be understood in retrospect. There is no certainty that apparent repeating patterns will continue, without understanding the underlying causes. Examples of complex situations and decisions in organisations include: a bad quarterly performance that is not readily explained, a shift in management staff, practice or culture, and a merger or acquisition requiring integration into a different organisation. Experimentation may be required to find answers before improved practice emerges.
Leaders in a complex context would thereby require a more experimental, instead of traditional command-and-control, management style in order to allow informative patterns to emerge and create discernment opportunities for innovation, creativity, and new business models (Snowden & Boone 2007).
6.4.4 Chaos domain
The domain of chaos is characterised by turbulence and lack of any discernible link between cause and effect. This is often apparent in situations where there is an absence of any right answers.
In this domain, best practice protocols are of limited use as unprecedented circumstances call for novel responses. There are often “no data to analyse, and no time to wait for emerging patterns” (Van Beurden et al. 2011). French (2013) suggests that in the complex and chaotic spaces, effective decision support often needs to focus on facilitating collaboration. A medical emergency situation, perhaps involving multiple accident trauma, is a good example of a chaos situation, where there is a need to stabilise the patient or situation very quickly, largely in order to gain time for more detailed investigation and treatment decisions.
6.4.5 Disorder domain
Lastly, the domain of disorder is where people are unable to decide which of the other domains represents their situation, or are not conscious of suitable alternatives. The relationships between cause and effect are considered impossible to determine as they shift constantly and no manageable patterns exist or cannot be detected (Snowden & Boone 2007).
When it is not clear which of the four domains is dominant, people generally resort to decision-making techniques that are known and comfortable. This is why in this situation, a personalised or default approach to management that reflects the comfort zone rather than any rational choice is usually employed (Van Beurden et al. 2011). McLeod and Childs (2013) argue that this domain can be reduced through discussion to reach consensus about the nature of the situation and what may be the most appropriate type of response.

138
6.4.6 Domain boundaries
The boundaries between domains are also important elements of the Cynefin Framework; they are derived in the process of using the framework in a given context, and dynamics which are related to movements across boundaries. The notion of boundaries is “not to restrict issues and solutions to one domain but to demonstrate that an organisation exists within many domains, and needs to flexibly adopt the approaches applicable to the different domains” (Childs & McLeod 2013). Domain boundaries should therefore be regarded as porous rather than impermeable.
Figure 6.3 illustrates that the simple domain lies adjacent to the chaotic domain. Snowden and Boone (2007) argue that the “most frequent collapses into chaos (from simple domain) occur because success has bred complacency”. Van Beurden et al. (2011) support this view adding that the transition from simple to chaos domain “requires special mention as it can happen rapidly, with dramatic consequences”.
As emergent practice becomes good practice this example would move to complicated and, ultimately, simple domains (McLeod & Childs 2013). The examination of transitions at boundaries between the domains is the key to understanding changes such that an issue can easily shift across a boundary as a project progresses, or context changes.
6.4.7 Cynefin Framework and the PMO model
Leaders who understand that the world is often irrational and unpredictable will find the Cynefin Framework particularly useful (Snowden & Boone 2007). To address complex issues, there is a need for a conceptual framework, like Cynefin that helps choose and organize action that is appropriate to context (Van Beurden et al. 2011).
This is not the first time Cynefin is used in the information science (IS) discipline, McLeod and Childs (2013) used the Cynefin Framework to interpret empirical qualitative data collected from a research project on electronic records management (ERM). Other published uses of Cynefin in IS research have been related to information systems design and information architecture (Burford 2011; Lambe 2014; Snowden 2007). However, its use here is the first for financial sector IT project management through PMOs.
The most basic application of the Cynefin Framework is as a tool for categorising issues and strategies; this makes it suitable as a PMO model that helps PMO stakeholders to make decisions on the most appropriate organisational structures for effective team governance and conditions for emergent innovation (Van Beurden et al. 2011). Using Cynefin to recognise in which domain the various PMOs management characteristics are situated enables the appropriate combination of solutions or approaches to be used. Geraldi (2008) proposed a model to reconcile order and chaos in multi-project companies using flexibility in organisational structure. The aim is to analysis organisational structures to avoid “chaotification”. Geraldi (2008) defined order as “efficiency, control and clarity“ and chaos as “creativity, trust and uncertainty, ambiguity” and the author’s approach of finding balance between order and chaos is different from the Cynefin Framework, where each domain, predicated on the construct of order can be described according to its characteristics and resultant actions (Childs and McLeod, 2013).
Snowden (2010) proposed a range of techniques that “allow the boundaries in the Cynefin Framework to emerge from the data”. One of such techniques used for deploying the
139
Cynefin Framework is the “four points” method, which is used extensively in strategy and conflict resolution work. McLeod and Childs (2013) summarise the social construction approach to comprise a pre-process in which items are collected about the topic of interest, a representative group of people places the items in the Cynefin Framework and both the definitions of the domains and the boundaries between them emerge from the data; and a post-process in which the resultant contextualised Cynefin Framework of the issue of interest is used
A variant of this approach is used for this research using the findings from the Chapter 5 data analysis. The researcher will be the sole participant to define the domains and the boundaries. The post-formulation process will comprise the presentation of the PMO model to a focus group for validation and subsequent amendment.
6.5 Model Variables and Parameters
This section identifies the parameters and variables for the PMO model. Raftery (1998) provides the definitions of parameters and variables:
A parameter is “a variable but remains constant in a particular case”.
Independent variables are “variables which have a material effect on the thing being studied, the dependent variable”. In this case the dependent variable is the likelihood of improving project performance.
The parameters identified for the model are the Cynefin domains into which the variables can be categorised. The objective for having Cynefin domains as parameters is to gain new or additional views and insights by studying how the variables can be further exploited because of their presentation in the domains of the Cynefin Framework. For instance, if there is a solution for a variable that is generally accepted as a best practice approach with predictable outcomes, then it can fall under the “Simple” domain. However, if there are multiple possible ‘right’ approaches or solutions, then the Cynefin domain parameter for this variable will be “Complicated”. The grouping of PMOs based on sizes: Small, Medium and Large (defined in chapter 5.3.5) is considered a useful attribute of the model, rather than a constraint.
Kurtz and Snowden (2003) argue that no domain is more desirable than another; they just describe the situation facing the organisation. However, the adoption of Cynefin as a PMO model framework would debate this claim. An organisation would find it easier to design and implement a PMO if all the variables were located within the “Simple”, or at least in the “Complicated”, domain.
The validated list of essential features of a PMO that have a positive direct impact on project performance, and are thus variables since they may change over time or circumstances, is summarised in 5.4.8 and re-stated here for convenience:
• PMO functions • PMO structuring and adoption of roles • PMO decision-making authority • Project Critical Success Factors (CSFs) • Project managers competencies • Project management maturity
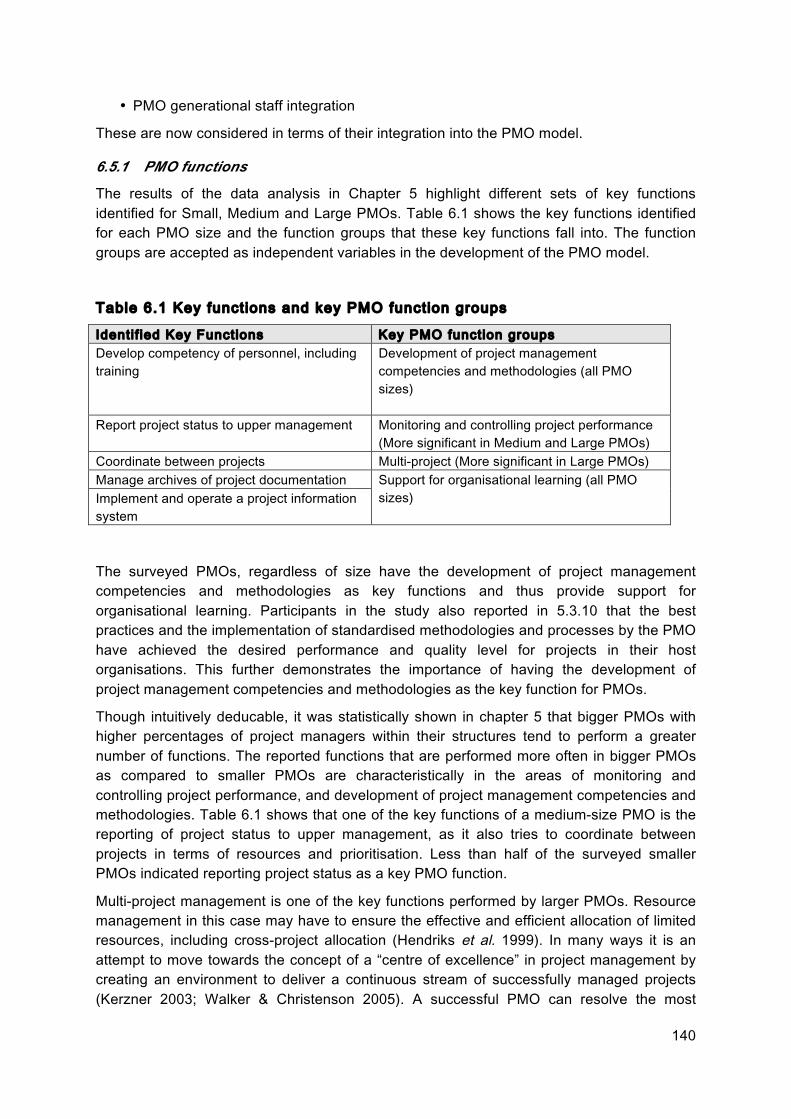
140
• PMO generational staff integration
These are now considered in terms of their integration into the PMO model.
6.5.1 PMO functions
The results of the data analysis in Chapter 5 highlight different sets of key functions
identified for Small, Medium and Large PMOs. Table 6.1 shows the key functions identified
for each PMO size and the function groups that these key functions fall into. The function
groups are accepted as independent variables in the development of the PMO model.
Table 6.1 Key functions and key PMO function groups
Identif ied Key Functions Key PMO function groups
Develop competency of personnel, including
training
Development of project management
competencies and methodologies (all PMO
sizes)
Report project status to upper management Monitoring and controlling project performance
(More significant in Medium and Large PMOs)
Coordinate between projects Multi-project (More significant in Large PMOs)
Manage archives of project documentation Support for organisational learning (all PMO
sizes)
Implement and operate a project information
system
The surveyed PMOs, regardless of size have the development of project management
competencies and methodologies as key functions and thus provide support for
organisational learning. Participants in the study also reported in 5.3.10 that the best
practices and the implementation of standardised methodologies and processes by the PMO
have achieved the desired performance and quality level for projects in their host
organisations. This further demonstrates the importance of having the development of
project management competencies and methodologies as the key function for PMOs.
Though intuitively deducable, it was statistically shown in chapter 5 that bigger PMOs with
higher percentages of project managers within their structures tend to perform a greater
number of functions. The reported functions that are performed more often in bigger PMOs
as compared to smaller PMOs are characteristically in the areas of monitoring and
controlling project performance, and development of project management competencies and
methodologies. Table 6.1 shows that one of the key functions of a medium-size PMO is the
reporting of project status to upper management, as it also tries to coordinate between
projects in terms of resources and prioritisation. Less than half of the surveyed smaller
PMOs indicated reporting project status as a key PMO function.
Multi-project management is one of the key functions performed by larger PMOs. Resource
management in this case may have to ensure the effective and efficient allocation of limited
resources, including cross-project allocation (Hendriks et al. 1999). In many ways it is an
attempt to move towards the concept of a “centre of excellence” in project management by
creating an environment to deliver a continuous stream of successfully managed projects
(Kerzner 2003; Walker & Christenson 2005). A successful PMO can resolve the most
141
challenging project management issues by “capturing and transferring knowledge, maximising the power of cross-functional teams, regulating the demand of integrated technologies, and providing ownership and accountability for key efforts” (Desouza & Evaristo 2006).
The respondent demographics and organisational contexts for the large sample - 502 responses used by Hobbs and Aubry (2010) included 11% categorised as “Others geographical” (outside Canada, United States and Europe, which may not include Singapore) and 13% under “Financial Services” organisations. The context of this study and its survey is targeting: a) financial IT PMOs and b) those in Singapore. The findings from that “larger” sample may still not adequately and accurately reflect local PMO structures and practices; whilst the size of the “small sample” used here does not preclude it from yielding valuable knowledge for PMOs generally. Nevertheless, no attempt has been made to go beyond the capacity of the small sample data in its analysis and interpretation.
6.5.2 PMO structuring and adoption of roles
Chapter 5.4.2 argues that the size and type of projects the PMO should and could embrace, and not the proportion of all organisation projects within PMO mandate, is an important design and structuring consideration when establishing a PMO. Such a PMO structure reflects a more efficient approach to resource management as precious expertise and resources are allocated on prioritised projects.
Another structuring consideration is the project methodology that is adopted by the PMO. Most of the studied PMOs have authority to control standards and processes and have adopted the plan-based practice of defining the product and project scope. If flexibility and time to market are the main goals of the organisation, then a PMO can consider Agile Project Management (APM), as discussed in section 5.4.7. Project management processes and methodology thus become another variable for the PMO model.
The analysis in Chapter 5 also reflected the increased importance of organisational learning in the PMOs studied, indicating that the PMO manages archives of project documentation. This study thus argues that organisational learning is a vital component of an effective PMO and should be included as a variable within the PMO model.
6.5.3 PMO decision-making authority
The Chapter 5 findings relating to PMO shaping factors show that the “percentage of project managers within the PMOs mandate” is important to Medium and Large PMOs and “extent of decision-making authority” is more important to Large PMOs. The analysis on the level of decision-making authority for PMOs also reiterates that the PMO model development should reflect the higher project authority for Large PMOs. Both factors are considered as independent variables for the PMO model.
The characteristics of Small PMOs are: few functions with some authority and soft skills as the most important PM competencies, while Medium PMOs have more functions, but have little authority and domain and technical expertise are important PM competencies. A Small PMO is a good example of being part of an organisation for which projects are peripheral to its core business such that its PMO does not take on roles beyond the development of systematic project management using processes, methodologies, and tools; and the professionalisation of project management, which can include the creation of competence

142
frameworks for appraising project managers, knowledge sharing and creating communities of practice (Pellegrinelli & Garagna 2009). The Small PMO plays the role of a repository support unit where the custodians of the project methodology provide support for the application of PM best practices, tools, techniques and software in PM processes executed by others and are not directly involved in the decision-making processes for particular projects (Kendall & Rollins 2003; Light & Berg 2000). The project managers or administrators serve a primarily administrative function by providing project status, identifying risks and potential issues, and maintaining project archives (Desouza & Evaristo 2006). A Small PMO can also extend the existing administrative capacity of a project and “provides for operational support in projects through training, consulting, and specialised task execution” (Müller et al. 2013). For a Small PMO to be practical, it has to execute its key functions well: development of project management competencies and methodologies and support by making it easier for other project managers to carry out their functions. Only with ‘buy-in’ from these extrinsic project managers will the PMO will be deemed successful.
When deciding on the decision-making authority for PMOs, there is a need to create and maintain a balance between control and flexibility. The decision of how much control will be dependent on the nature of projects and deliverables of the PMO. Chapter 5.3.8 shows that the types of projects delivered by the PMOs are not influenced by the size categories and that financial IT projects are the main, but not the exclusive, outcomes of financial IT PMOs. The PMO model should allow the PMO designer to decide if project resource management, or project innovation and flexibility is more important to the PMO and the host organisation on the whole. If the former is deemed more important, stronger control over the usage of project resources is expected. In the case that innovation and flexibility are preferred, higher degrees of autonomy, creativity and ownership can be assigned to project managers.
6.5.4 Critical success factors
From the study of critical success factors (CSF) in chapter 5.3.12, “On Schedule” and “Realising business benefits” are considered critical in measuring project success regardless of PMO size. The general literature on CSFs and that relating to Singapore projects reviewed in chapter 2.6 also revealed the importance of “Top management support” and “Project manager’s leadership”.
The relationship between “Top management support” and “Realising business benefits” has been discussed in detail in chapter 5.4.1 (Conflicting Priorities of PMO). This study argues that top management support is essential to resolve and avoid any conflicting priorities between business units and a PMO. For the organisation as a whole, the purpose of undertaking projects is to create value for the business. This realization of business benefits requires support from the most senior management and, through power and politics at the organisational level, gains the necessary ‘buy-in’ from business units. One recommendation identified in this study is to include business units (or at least representation from them) within the PMO structure in order to minimize any conflicting priorities.
For projects to be delivered on schedule, senior management support will place a high value on project management and the PMO, and drives the supportiveness of the organisational culture to provide sufficient resources, as well as authority to decide on matters such as the delivery schedule for projects. ‘Speed to market’ is very often crucial to business units in the financial IT sector, which are inevitably driven by external competition, profits and strategies
143
for lowering cost. PMOs must have (and retain) the mandate to decide on project schedules
amidst the pressures from business units. Once the project schedule is agreed, the project
manager would then have a key (and accountable) role to play to ensure the project team is
able to meet the timeline.
The PMO model emphasises the two CSFs with their corresponding objectives as variables
in the PMO model.
6.5.5 Project manager competencies
Chapter 5.4.5 reaffirms the importance of having the “right” project managers in the PMO
and concluded that the right mix of resource skills is an important consideration for a PMO
model. The findings from the analysis on the project managers’ competencies are:
• “Technical expertise” and “Domain expertise” are (more) important to Medium PMOs.
The relative importance of “Technical expertise” and “Domain expertise” for project
managers differs between the three defined PMO size categories in the surveys. It
was revealed that 75% of the participants from Medium PMOs ranked technical or
domain expertise as the most important PM competency.
• “Soft expertise” is (more) important to Small and Large PMOs. All the participants
from Small and Large PMOs considered soft skills as an important PM competency
for achieving project success as shown in Table 5.25.
The reason that the project managers’ competencies are related to the PMO size distinction
is the different key roles and scope of work performed by the project managers. Project
managers in Medium PMOs need to focus more on technical aspect of the IT deliverables
and as such “Technical expertise” and “Domain expertise” are an important factor to achieve
project success.
The key focus of project managers in Small and Large PMOs is not technical in nature; the
project managers typically have to manage the relationships among project stakeholders
effectively to improve the chances of project success. These project stakeholders include
different project teams, business units and organisation upper management. “Soft expertise”
is required for project management activities like engaging programmers to work overtime,
negotiating with business units to de-scope performance objectives to a more achievable
level or for less stringent deadlines, and obtaining support from upper management to obtain
additional resources for undertaking the project.
Technical expertise is likely to abound in Large PMOs; while in Small PMOs it may either be
found in the parent organisation, or is bought-in from external sources for specific project
requirements.
6.5.6 Project management maturity
The more mature the project management practices in the organisation, the better the
predictability of the outcome and cost of the project, and thereby quality of the delivery.
There is, however, no rigid relationship between PMO size and PMO maturity level.
Given the established importance of project management maturity, it is accommodated in
the PMO model.
144
6.5.7 PMO inter-generational integration
Their almost certain lack of working experience is one the key considerations when introducing Generation Y staff into the PMO. This translates into their inadequate understanding of the organisational culture and processes or lack of the business acumen needed to manage more senior (external) stakeholders in the project. There is also no reported intention (among the surveyed PMOs) to consider or implement any specific policy to deal with inter-generational change and integration. Studies have shown the value of creating a work environment where different generations of project managers can use their different and varied skills and attitudes to productively deliver projects successfully.
Large PMOs should focus more on this issue as it may have a greater impact on the grounds of sheer size and number of younger employees joining the PMO. At the same time, bigger PMOs are more likely than smaller units to have the resource capacity to focus upon inter-generational integration as one aspect of succession planning. Medium PMOs on the other hand, prefer “Technical expertise” and “Domain expertise” that they believe can be provided by younger newly trained project managers, whereas the Large PMOs prefer and require the “Soft expertise”, based upon years of experience, which younger project managers may lack.
Based on the above arguments, PMO inter-generational integration is thereby a variable for Large PMOs (parameter) in the PMO model.
6.6 Proposed PMO Model
The Cynefin Framework is a conceptual and strategic mapping of issues and a clearer, more coherent approach to identifying the appropriate solutions/options/approaches for practitioners to use (McLeod & Childs 2013).
This section presents the PMO model using the Cynefin Framework by first mapping the variables identified in 6.4 and 6.5 into the Cynefin Framework with the Cynefin domains as parameters. Table 6.2 summaries the results of mapping and the Proposed PMO Model is illustrated in Figure 6.4.
The PMO Model uses two instances of Cynefin Frameworks encapsulated in circles indicating two progressive stages of PMO. The full circle denotes the initial stage of a PMO that evolves into a more definite stage within the doted line circle as the organisation and PMO changes to improve project performance, resulting in variables crossing boundaries.
Aubry, Hobbs et al. (2011) reported that organisations frequently reconfigure their PMOs and PMOs are unlikely to achieve the desired outcomes by changing characteristics or functions to a “correct ” configuration. The researchers argued that organisations should not focus on the “right or wrong” PMO characteristics and functions, but on issues driving the changes and outcomes from the changes. A PMO transformation is “undertaken as a business response to solve existing issues and that outcomes are expected from this transformation”. The use of Cynefin Framework in the PMO model provides greater scope to explain shortcomings in assuming that projects that the PMO addresses are all best addressed in a typical PMO regardless of configuration. The list of variables in the proposed PMO model (Table 6.2) supported this finding with “PMO functions” as only one of the 11 variables, and
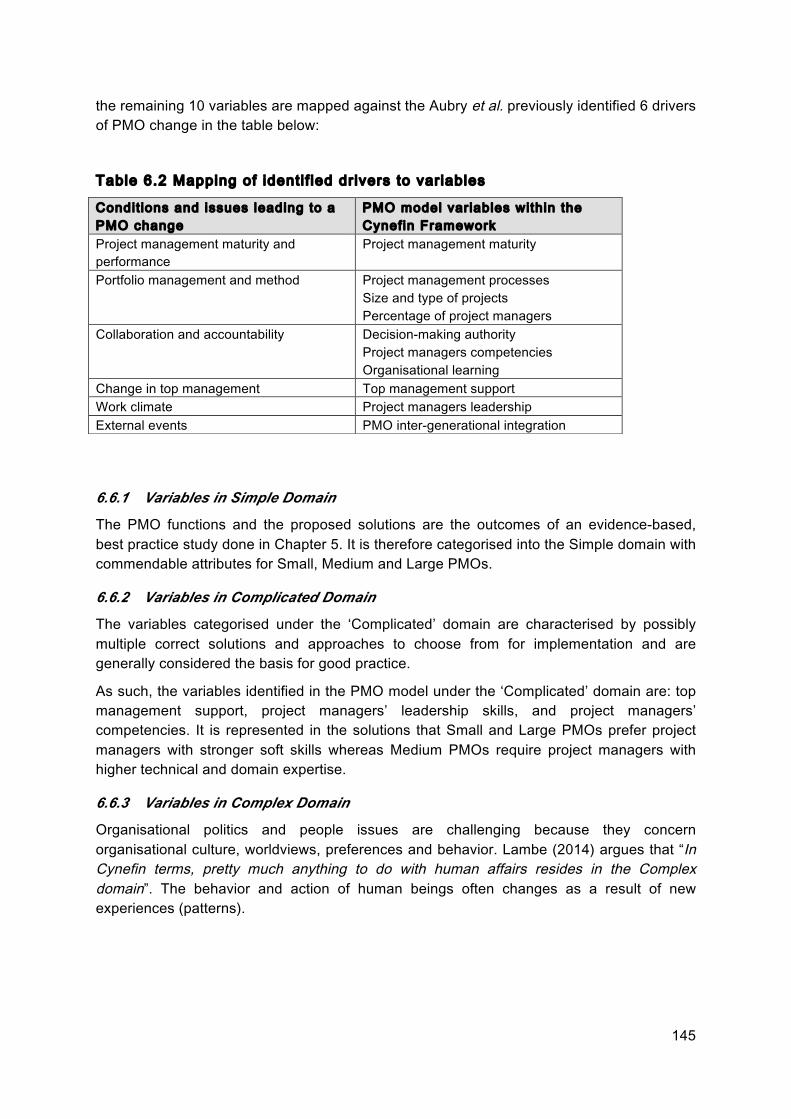
145
the remaining 10 variables are mapped against the Aubry et al. previously identified 6 drivers of PMO change in the table below:
Table 6.2 Mapping of identi f ied drivers to variables
6.6.1 Variables in Simple Domain
The PMO functions and the proposed solutions are the outcomes of an evidence-based, best practice study done in Chapter 5. It is therefore categorised into the Simple domain with commendable attributes for Small, Medium and Large PMOs.
6.6.2 Variables in Complicated Domain
The variables categorised under the ‘Complicated’ domain are characterised by possibly multiple correct solutions and approaches to choose from for implementation and are generally considered the basis for good practice.
As such, the variables identified in the PMO model under the ‘Complicated’ domain are: top management support, project managers’ leadership skills, and project managers’ competencies. It is represented in the solutions that Small and Large PMOs prefer project managers with stronger soft skills whereas Medium PMOs require project managers with higher technical and domain expertise.
6.6.3 Variables in Complex Domain
Organisational politics and people issues are challenging because they concern organisational culture, worldviews, preferences and behavior. Lambe (2014) argues that “In Cynefin terms, pretty much anything to do with human affairs resides in the Complex domain”. The behavior and action of human beings often changes as a result of new experiences (patterns).
Condit ions and issues leading to a PMO change
PMO model variables within the Cynefin Framework
Project management maturity and performance
Project management maturity
Portfolio management and method Project management processes Size and type of projects Percentage of project managers
Collaboration and accountability Decision-making authority Project managers competencies Organisational learning
Change in top management Top management support Work climate Project managers leadership External events PMO inter-generational integration

146
Table 6.3 PMO model variables within the Cynefin Framework Variable Simple Complicated Complex Chaos Disorder Proposed Solutions/ Approaches PMO functions √ • Development of project management competencies and methodologies
• Support for organisational learning • Monitoring and controlling project performance, which includes the
reporting of project status (More significant in Medium and Large PMOs) • Multi-project (More significant in to Large PMOs)
Size and type of projects
√ Review the size and type of projects before incorporating into PMO mandate.
Project management processes
√ Agile Project Management (APM) as alternative approach.
Organisational learning
√ Adopt the role of organisational learning within the PMO.
Percentage of project managers
√ Important shaping factor for PMO. (More significant to Medium and Large PMOs)
Decision-making authority
√ Important shaping factor for PMO based on control vs. flexibility (More significant to Large PMOs)
Top management support
√ This is a critical success factor (CSF) for realising business benefits and delivering project on schedule. Proposed the inclusion of business units within the PMO structure to minimize conflicting priorities.
Project managers leadership
√ This is a critical success factor (CSF) for delivering project on schedule.
Project managers competencies
√ • Technical and domain expertise are more important (More significant to Medium PMOs)
• Soft skills are more important (More significant to Small and Large PMOs) Project management maturity
√ Important shaping factor for PMO.
PMO inter-generational integration
√ Plan to deal with generational change and integration (More significant to Large PMOs)
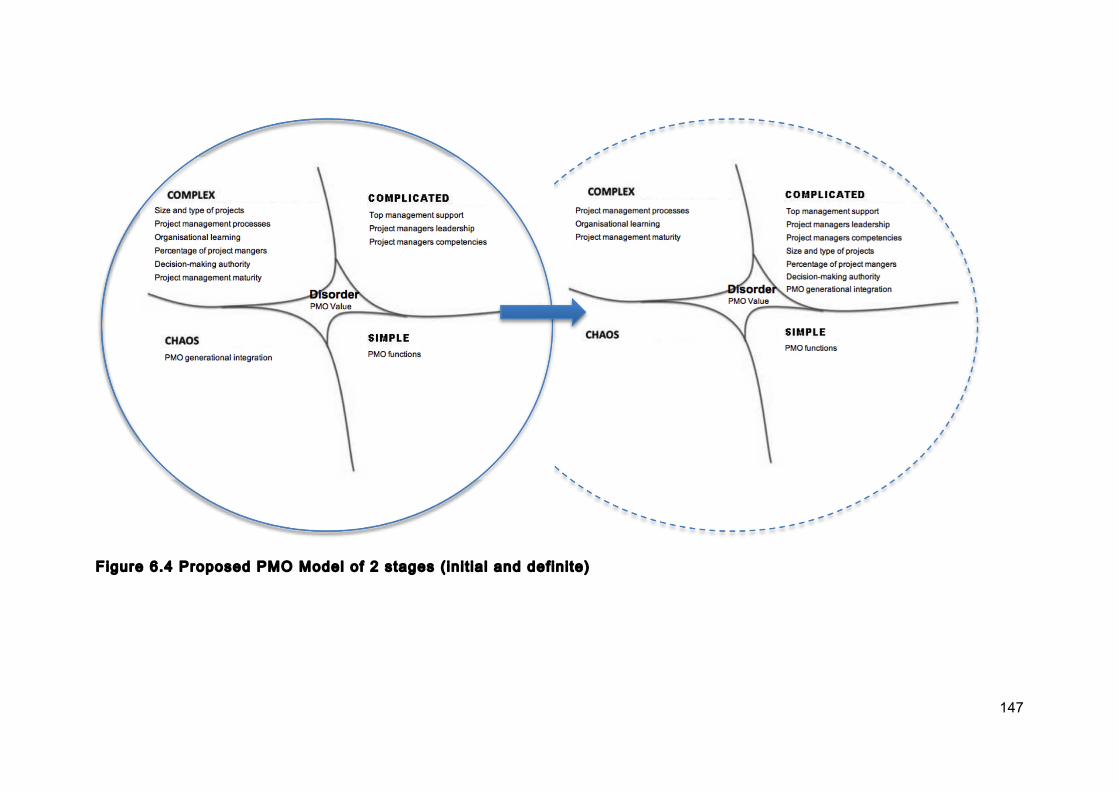
147
Figure 6.4 Proposed PMO Model of 2 stages ( init ia l and definite)
148
In this case, the identified variables may entail solutions that require some forms of
experimentation before good practice emerges. There is no certainty that apparently
repeating patterns will continue or be similar for all PMOs implementing the proposed
solutions. For example, the size and type of projects to be included in the PMO mandate is
an important structuring factor when designing a PMO. However, the actual dimensions of
size and type will vary for each PMO and its host organisation and the impact of the
implemented project inclusive criteria may only be understandable in retrospect. This aligns
with Childs and McLeod (2013) comments that “in the complex domain the success of a solution is not guaranteed. It is a matter of trying a solution, seeing if it works, and if not trying another one”. Brown and Eisenhardt (1998) describe an approach to strategy
development for organisations facing rapid and unpredictable change. This involves
“competing on the edge”, and that in turn may involve working in the complex domain. This
is similar to the variable “Project management processes” that stipulated implementation of
Agile Project Management (APM) as a solution, and which is also placed within the complex
domain.
The variables identified in the PMO model under the ‘Complex’ domain are: size and type of
projects, project management processes, organisational learning, percentage of project
managers within the PMO, and decision-making authority. These variables are applicable to
all sizes of PMOs, although the percentage of project managers is significantly more
important to Medium and Large PMOs, and decision-making authority is significantly more
important to Large PMOs.
6.6.4 Variables in Chaos Domain
This issue of generational change and integration is placed in the domain of ‘Chaos’ as there
is currently a lack of any evidence to show any apparent link between cause and effect, that
is whether the introduction of Generation Y staff has any real impact on the success of the
PMO. The literature review in chapter 2 has highlighted the importance and value of
considering the Generation Y factor when designing a PMO. However in practice, there is no
reported evidence of any initiative from the studied PMOs to manage generational change
and integration. The gap between academic literature and practice is an example of
unprecedented circumstances that categorised the variable “PMO generational integration”
to the ‘Chaos’ domain.
6.6.5 Variables in Disorder Domain
Based on a survey of 750 companies, Stanleigh (2006) found that 75 per cent of PMOs in
the IS domain were shut down within three years of formation because they failed to
demonstrate their value. Several indicators for measuring the value added by a PMO were
suggested by Kendall and Rollins (2003) including: the reduction of the life cycle of projects;
completion of more projects during the fiscal year with the same resources; and tangible
contribution for reaching organisational goals in terms of cost reduction, revenue increase,
and a better return on investment (ROI). Attempts to demonstrate the direct influence of
PMO and thereby project management on return on investment were often unsuccessful as
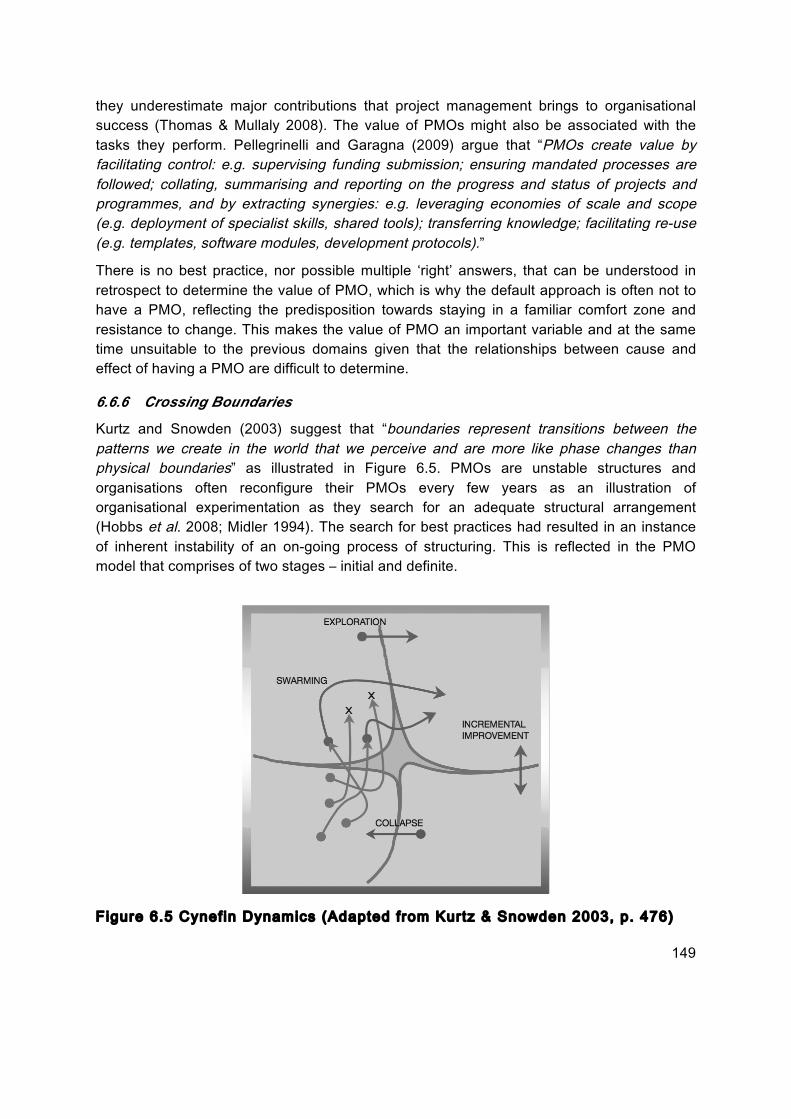
149
they underestimate major contributions that project management brings to organisational
success (Thomas & Mullaly 2008). The value of PMOs might also be associated with the
tasks they perform. Pellegrinelli and Garagna (2009) argue that “PMOs create value by facilitating control: e.g. supervising funding submission; ensuring mandated processes are followed; collating, summarising and reporting on the progress and status of projects and programmes, and by extracting synergies: e.g. leveraging economies of scale and scope (e.g. deployment of specialist skills, shared tools); transferring knowledge; facilitating re-use (e.g. templates, software modules, development protocols).”
There is no best practice, nor possible multiple ‘right’ answers, that can be understood in
retrospect to determine the value of PMO, which is why the default approach is often not to
have a PMO, reflecting the predisposition towards staying in a familiar comfort zone and
resistance to change. This makes the value of PMO an important variable and at the same
time unsuitable to the previous domains given that the relationships between cause and
effect of having a PMO are difficult to determine.
6.6.6 Crossing Boundaries
Kurtz and Snowden (2003) suggest that “boundaries represent transitions between the patterns we create in the world that we perceive and are more like phase changes than physical boundaries” as illustrated in Figure 6.5. PMOs are unstable structures and
organisations often reconfigure their PMOs every few years as an illustration of
organisational experimentation as they search for an adequate structural arrangement
(Hobbs et al. 2008; Midler 1994). The search for best practices had resulted in an instance
of inherent instability of an on-going process of structuring. This is reflected in the PMO
model that comprises of two stages – initial and definite.
F igure 6.5 Cynefin Dynamics (Adapted from Kurtz & Snowden 2003, p. 476)
150
6.6.6.1 Movement at the known-knowable boundary
Kurtz and Snowden (2003) defined the incremental improvement shown in Figure 6.5 as the
“movement from the knowable to the known and back, repeatedly” (2003). In the proposed
PMO model, the variable PMO Functions is placed initially at the known (simple) domain as
shown in Figure 6.4.
The PMO functions variable is identified as best practice in the model. Best practice is
always a problem for research essentially based upon “theory of practice” in applied
disciplines. Theories of practice can be abstract and inadequately relate to the social
processes involved in the reproduction of practices (Warde 2005). Best practices are often
defined in the literature as optimal ways of “performing work processes to achieve high performance” (Bogan & English 1994; Loo 2002; Zairi 1998). There can be an instance when
the practice is no longer “best” or relevant and feasible, good solutions surface. In this
scenario the variable crosses the boundary into the knowable (complicated) domain.
Similarly if a best practice emerges from PMO restructuring, the variable would have return
back to the simple domain. The model implicitly implies that there is an optimal set of PMO
functions that may be likely to contribute to achieving higher project success rates based on
the characteristics of the PMO.
6.6.6.2 Movement at the known-chaos boundary
It is also possible for the PMO Functions variable in the simple domain to cross the known-
chaos boundary disastrously as an asymmetric collapse. Kurtz and Snowden reported “a tendency for organisations to oscillate between the domains of the known and the chaotic, avoiding the upper domains”. This is often the result of organisations failing to recognize that
the dynamics of the environment have changed until it is too late. PMO decision makers
should be conscious about “things that fall outside the pattern of their expectation” and take
necessary remedial actions to prevent the system from breaking and ending up in chaos
(Kurtz & Snowden 2003).
Even though the proposed PMO functions are best practice, based upon the findings from
the data analysis in chapter 5, the model suggests periodical review of the PMO functions,
with the observed reality for their relevance and with consideration of good alternatives,
when required. This would mean moving the variable to the complicated domain as
discussed in 6.6.6.1. PMO decision makers should avoid trying to force-fit reality into the
proposed PMO model when it is not longer valid.
6.6.6.3 Movement at the knowable-complex boundary
The identified variables are categorised into variables describing the structural
characteristics of PMOs and the organisational context as shown in Table 6.4.
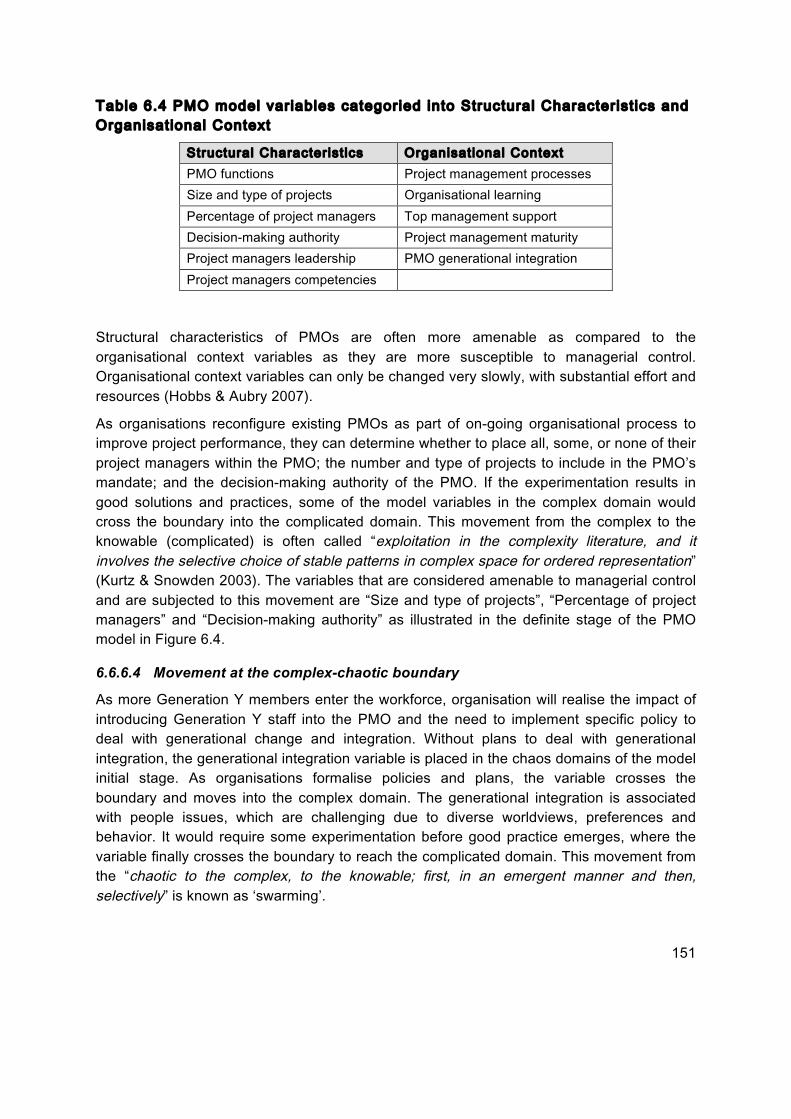
151
Table 6.4 PMO model variables categoried into Structural Characterist ics and
Organisational Context
Structural Characterist ics Organisational Context
PMO functions Project management processes
Size and type of projects Organisational learning
Percentage of project managers Top management support
Decision-making authority Project management maturity
Project managers leadership PMO generational integration
Project managers competencies
Structural characteristics of PMOs are often more amenable as compared to the
organisational context variables as they are more susceptible to managerial control.
Organisational context variables can only be changed very slowly, with substantial effort and
resources (Hobbs & Aubry 2007).
As organisations reconfigure existing PMOs as part of on-going organisational process to
improve project performance, they can determine whether to place all, some, or none of their
project managers within the PMO; the number and type of projects to include in the PMO’s
mandate; and the decision-making authority of the PMO. If the experimentation results in
good solutions and practices, some of the model variables in the complex domain would
cross the boundary into the complicated domain. This movement from the complex to the
knowable (complicated) is often called “exploitation in the complexity literature, and it involves the selective choice of stable patterns in complex space for ordered representation”
(Kurtz & Snowden 2003). The variables that are considered amenable to managerial control
and are subjected to this movement are “Size and type of projects”, “Percentage of project
managers” and “Decision-making authority” as illustrated in the definite stage of the PMO
model in Figure 6.4.
6.6.6.4 Movement at the complex-chaotic boundary
As more Generation Y members enter the workforce, organisation will realise the impact of
introducing Generation Y staff into the PMO and the need to implement specific policy to
deal with generational change and integration. Without plans to deal with generational
integration, the generational integration variable is placed in the chaos domains of the model
initial stage. As organisations formalise policies and plans, the variable crosses the
boundary and moves into the complex domain. The generational integration is associated
with people issues, which are challenging due to diverse worldviews, preferences and
behavior. It would require some experimentation before good practice emerges, where the
variable finally crosses the boundary to reach the complicated domain. This movement from
the “chaotic to the complex, to the knowable; first, in an emergent manner and then, selectively” is known as ‘swarming’.
152
Kurtz and Snowden argued that the “boundary between chaos and order (complex) is a chasm difficult to cross”, where in this case organisations surveyed in the study have yet to see the need and urgency to review its current policy to cater for Generation Y. These organisations will probably take action only after strong antagonism starts to appear between the generations in the workplace due to different generational characteristics. The vertical transition into the complicated domain from complex is considered more manageable where “the possibilities of many patterns formed are reviewed and desirable patterns are stabilised through a transfer to the exploitable (complicated) domain of the knowable; those that are undesirable are destroyed” as shown in Figure 6.5 (Kurtz & Snowden 2003). This implies that organisations will be exploring different generational integration policies, and aspects of the policies that worked (desirable) would become good practice as illustrated in the definite stage of the PMO model in Figure 6.4.
6.7 Potential value of the Model
The decision to establish a PMO forces senior management (in a parent organisation) to exercise considerable judgment when it is designed and planned; with the array of important functions to be performed carefully considered to fit the specific context, culture and business objectives of the host organisation. Having a typology model of PMOs as a basis for establishment can ‘make the great variability much more manageable’ (Hobbs & Aubry 2008). The model developed in this study is specifically aimed at financial IT projects in Singapore where the organisational contextual variables and the PMO characteristics identified from the literature review and case studies are all related to the performance of the PMOs.
The identification of characteristics of the model is useful for studying and designing PMOs and the model thereby creates value for project management and PMOs in organisational contexts by proposing PMO characteristics to incorporate suitable functions to be filled and the determinants for performance. The suggested list of functions can provide guidance to the development and implantation of a PMO on what are the suitable roles and functions to incorporate in the PMO. The PMO performance determinants establish the basis and requirements for measuring, monitoring and improving performance.
The potential value of the model lies in its ability to guide strategic and tactical decision-making pertaining to PMOs; their design and implementation; and their performance.
6.7.1 Model Attributes Unique to financial IT projects
In a success case study of a financial institution implementing an IT project to support the back-office processes of an Enterprise resource planning (ERP) system, two of the identified critical factors are “top management support” and “experienced IT project manager”. The project manager for the project was familiar with all major business issues within the organisation and was supported and advised by a steering committee during all of the crucial moments of the project (Lech 2013). This case echoed the insights gained from reviewing the Critical Success Factors in the literature where the two most critical for PMOs are “top
153
management support” and “project leadership”. To deliver successful financial IT projects,
the initial stage of the PMO model advises the assessment of the project type by looking at
the deliverables and assigning a project manager based on competencies: whether soft
skills or the knowledge of technology is a more important ingredient for project success.
These three attributes in the model: “top management support”; “project managers
competencies”; and “size and type of projects” are thereby considered important for financial
IT projects, although not necessarily to any significantly greater degree than for other types
of projects. In other words, the relative importance of these factors is likely to be similar for
all projects.
6.8 Testing the Model
Raftery (1998) argues that a “comprehensive way of testing models is to use a series of tests encompassing rational, empirical and predictive approaches”. This suggests that the
testing of the PMO model would include:
1. Testing the a priori basis of the model, by searching for missing or redundant variables.
2. Testing the logic of the functional relationships, by studying the connectivity between the
components of the model.
3. Testing the predictive results.
Given that the intent of this research study does not include building a quantitatively
predictive model, the testing of predictive results is not required.
Raftery (1998) warns that “even if the results and the relationships among the variables have been tested there will remain many subjective judgments locked up within a model” and
subjectivity is never completely absent from a model. For the model to be effective and to be
implemented in practice, Brandon and Newton (1986) suggest to allow human judgment to
be exercised over the processes. This means that the decision maker for the PMO should be
aware of the model as an abstraction and be able to make different judgment decisions.
These limitations, together with the validating of the PMO model will be described in the next
chapter (Chapter 7).
6.9 Chapter Summary
This chapter has described how a PMO model has been designed and developed, and the
variables to be included in the model. The proposed PMO model uses the Cynefin
Framework to map the PMO design considerations into the five contexts defined by the
nature of the relationships between cause and effect. The outcome is a model that reflects
the two progressive stages of PMO and offers suggestions about suitable PMO structures,
the PMO functions to be filled and appropriate selection of approaches to establish and
maintain a PMO. The model assumes that a PMO is “progressing” from an initial purely
conceptual stage to a “more definite stage”, given that progress and change are part and

154
parcel of contemporary organisations but both are unlikely to be regressive by retreating to initial uncertainty.
In the following chapter, the process of validating the PMO model will be presented.
155
Chapter 7 Model Validation 7.1 Introduction
This chapter describes the validation of the proposed PMO model (Chapter 6) using an online focus group (OFG). The motivation for adopting the technical tool (Edmodo) in OFG and its online administration are considered. The research design is presented for administering to the focus group, and the group participants’ responses are presented and analysed. The findings are then used to revise the PMO model.
In this context, validation of the model is defined as confirming that relevant experts understand and recognize the realities that the model describes.
7.2 OFG Design
This section describes how the OFG was designed and used to collect qualitative data for the validation of the PMO model proposed in Chapter 6.
7.2.1 Processes
Up to five respondents who took part in the interviews and survey described in chapter 5 were targeted to participate in the OFG. They did not receive a formal invitation, since this had been done for the earlier interviews and survey. Potential OFG participants were simply contacted informally and invited to participate. One participant was nominated by his Head of PMO to take part in the OFG, even though he was not involved in the earlier part of the research.
Each accepting participant received login details for the OFG Internet site by telephone or email prior to the discussion period. The login details included a pseudonym ID and a generic password, which the participant was encouraged to change and personalise.
A three-stage process was used in the OFG. In Stage 1, the list of variables in the PMO model as described in Appendix B-6 was shown to the participants. Participants could consider each variable as a constituent of effective PMOs and reflect and provide feedback on its relevance (individually within the PMO model and in conjunction with other variables). Stage 2 introduced the Cynefin Framework to the participants. This is the first time the participants could see the Cynefin Framework and how it might be used to make sense of the variables and potential solutions. They would require some time to understand the framework. The PMO model in Appendix B-7 (with some explanations) was presented to the participants in Stage 3, where the variables from Stage 1 were integrated into the PMO model. Participants were invited to give 'open' answers about the design of the conceptual PMO model.
The OFG Internet site material included:
156
• Discussion guide • Information on the PMO model variables (Appendix B-6) • Information on the Cynefin Framework • Link to Dave Snowden’s YouTube video titled “The Cynefin Framework” at
https://www.youtube.com/watch?v=N7oz366X0-8 • Proposed PMO Model (Appendix B-7) • Five open-ended questions as shown in Table 7.1, each posted in a separate discussion
track.
Access to the OFG site was possible from any computer with Internet access and a private e-mail facility enabled the participants to ask the researcher any questions about the study. The text postings from the OFG discussions were used for data analysis.
7.2.2 Number of participants
In the literature, there is no consensus among academics on the ideal size for a focus group (Morgan 1997; Stewart et al. 2007). Krueger and Casey (2009) argue that six is an effective size for complex topics, although some focus groups may be smaller and still be successful including two (dyad), three (triad), four to six (mini-group). Beyond that, seven to ten (small), or eleven-twenty (super-group) participants can also be effective (Cooper & Schindler 2014).
Tuttas (2015) argues that a larger number of participants for focus groups is not necessarily better and there are trade offs. While larger groups are harder to audiotape and transcribe, small groups may result in selective group formation (Krueger & Casey 2009; Reiskin 1992). OFG does not have such issues with transcription as these are done by the participants on the research site. All the participants in this study have a professional IT background. Finch and Lewis (2014) argue that such participants tend to contribute more freely in a focus group, in which case a smaller group might be preferable to accommodate this feedback. Murray (1997) argues that in an OFG, the number of participants does not necessarily determine the level of participation.
In this study, a focus group consisting of 3-5 expert participants was selected. The participants were selected based on their expertise, experience and relatively homogeneous backgrounds; as with similar perceptions and experiences relating to PMO the issue of dominant voices is prevented or minimized (Sim 1998). Low (2002) argues that the use of experts in the focus groups helps, as they are able to provide more accurate evidence, very much the same as courts of law inviting the testimony of expert witnesses.
The key determinant of focus group size should really be saturation of the issues; ensuring that a sufficient range and depth of views about the PMO model and its variables are canvassed. If the saturation is considered insufficient, it should still be possible to recruit additional participants, subject to the constraints of time. The selected participants of the OFG were either the heads of their respective PMOs or at least held a senior position in their organisations, and had appropriate experience with PMO implementation. The selected participants are experts and decision makers of their organisation’s PMO, and given that they were involved in the prior interviews or surveys, they reflected and provided inputs for
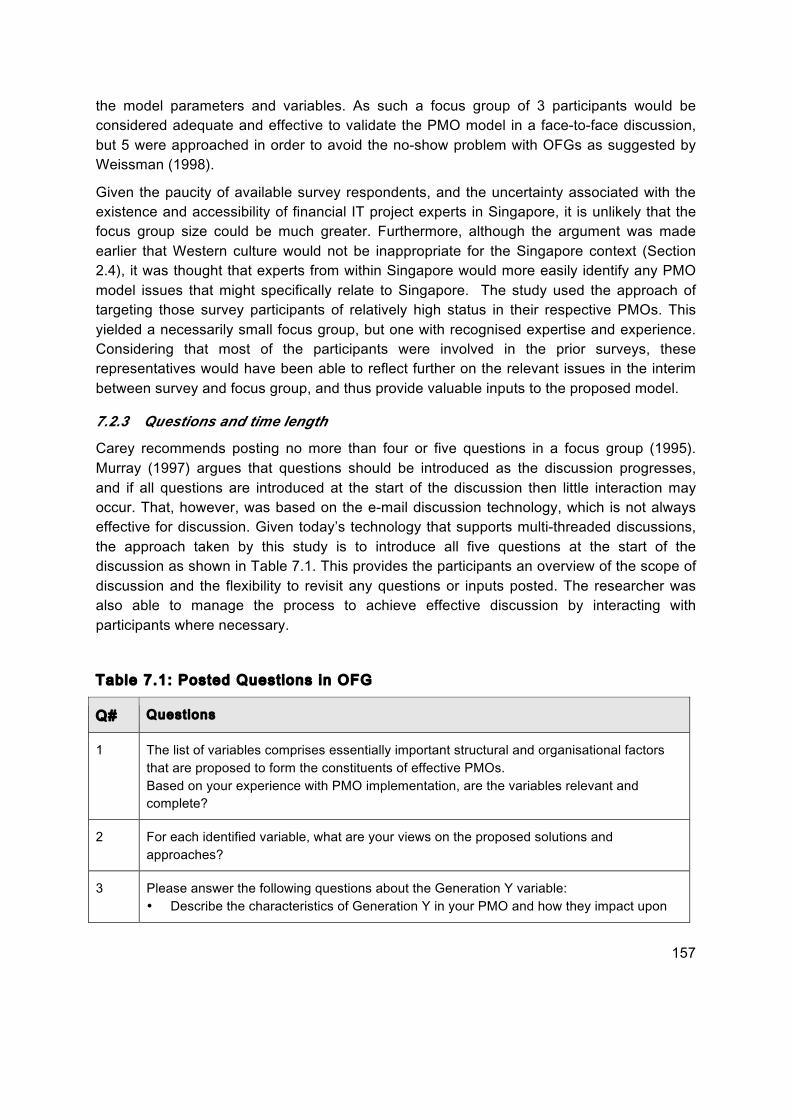
157
the model parameters and variables. As such a focus group of 3 participants would be considered adequate and effective to validate the PMO model in a face-to-face discussion, but 5 were approached in order to avoid the no-show problem with OFGs as suggested by Weissman (1998).
Given the paucity of available survey respondents, and the uncertainty associated with the existence and accessibility of financial IT project experts in Singapore, it is unlikely that the focus group size could be much greater. Furthermore, although the argument was made earlier that Western culture would not be inappropriate for the Singapore context (Section 2.4), it was thought that experts from within Singapore would more easily identify any PMO model issues that might specifically relate to Singapore. The study used the approach of targeting those survey participants of relatively high status in their respective PMOs. This yielded a necessarily small focus group, but one with recognised expertise and experience. Considering that most of the participants were involved in the prior surveys, these representatives would have been able to reflect further on the relevant issues in the interim between survey and focus group, and thus provide valuable inputs to the proposed model.
7.2.3 Questions and time length
Carey recommends posting no more than four or five questions in a focus group (1995). Murray (1997) argues that questions should be introduced as the discussion progresses, and if all questions are introduced at the start of the discussion then little interaction may occur. That, however, was based on the e-mail discussion technology, which is not always effective for discussion. Given today’s technology that supports multi-threaded discussions, the approach taken by this study is to introduce all five questions at the start of the discussion as shown in Table 7.1. This provides the participants an overview of the scope of discussion and the flexibility to revisit any questions or inputs posted. The researcher was also able to manage the process to achieve effective discussion by interacting with participants where necessary.
Table 7.1: Posted Questions in OFG
Q# Questions
1 The list of variables comprises essentially important structural and organisational factors that are proposed to form the constituents of effective PMOs. Based on your experience with PMO implementation, are the variables relevant and complete?
2 For each identified variable, what are your views on the proposed solutions and approaches?
3 Please answer the following questions about the Generation Y variable: • Describe the characteristics of Generation Y in your PMO and how they impact upon
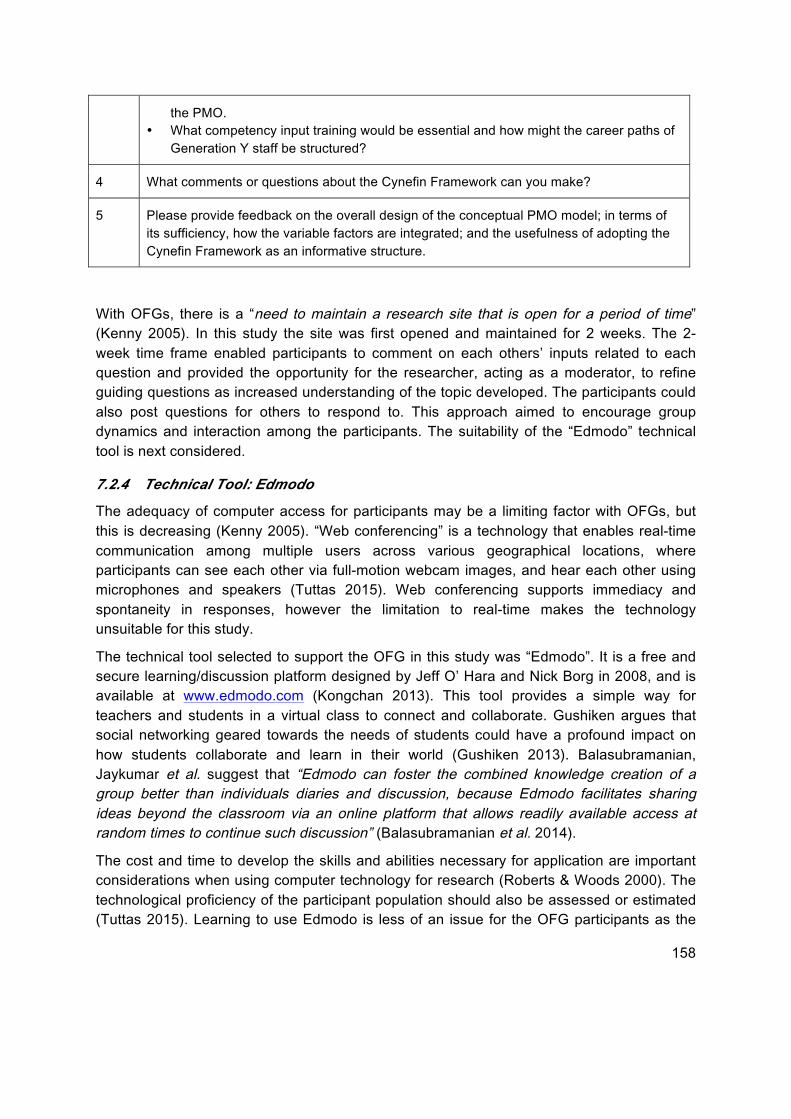
158
the PMO. • What competency input training would be essential and how might the career paths of
Generation Y staff be structured?
4 What comments or questions about the Cynefin Framework can you make?
5 Please provide feedback on the overall design of the conceptual PMO model; in terms of its sufficiency, how the variable factors are integrated; and the usefulness of adopting the Cynefin Framework as an informative structure.
With OFGs, there is a “need to maintain a research site that is open for a period of time” (Kenny 2005). In this study the site was first opened and maintained for 2 weeks. The 2-week time frame enabled participants to comment on each others’ inputs related to each question and provided the opportunity for the researcher, acting as a moderator, to refine guiding questions as increased understanding of the topic developed. The participants could also post questions for others to respond to. This approach aimed to encourage group dynamics and interaction among the participants. The suitability of the “Edmodo” technical tool is next considered.
7.2.4 Technical Tool: Edmodo
The adequacy of computer access for participants may be a limiting factor with OFGs, but this is decreasing (Kenny 2005). “Web conferencing” is a technology that enables real-time communication among multiple users across various geographical locations, where participants can see each other via full-motion webcam images, and hear each other using microphones and speakers (Tuttas 2015). Web conferencing supports immediacy and spontaneity in responses, however the limitation to real-time makes the technology unsuitable for this study.
The technical tool selected to support the OFG in this study was “Edmodo”. It is a free and secure learning/discussion platform designed by Jeff O’ Hara and Nick Borg in 2008, and is available at www.edmodo.com (Kongchan 2013). This tool provides a simple way for teachers and students in a virtual class to connect and collaborate. Gushiken argues that social networking geared towards the needs of students could have a profound impact on how students collaborate and learn in their world (Gushiken 2013). Balasubramanian, Jaykumar et al. suggest that “Edmodo can foster the combined knowledge creation of a group better than individuals diaries and discussion, because Edmodo facilitates sharing ideas beyond the classroom via an online platform that allows readily available access at random times to continue such discussion” (Balasubramanian et al. 2014).
The cost and time to develop the skills and abilities necessary for application are important considerations when using computer technology for research (Roberts & Woods 2000). The technological proficiency of the participant population should also be assessed or estimated (Tuttas 2015). Learning to use Edmodo is less of an issue for the OFG participants as the
159
website resembles the “Facebook” page which they are familiar with, and all participants have an IT background. Participants did not require extensive skills or knowledge of Hyper Text Markup Language (HTML) to use Edmodo which is also more private and safe than other platforms because it allows the creation of accounts accessible only by participants, who receive a group code and then register in the OFG, and subsequently access it for focus group activity; no one else can view the group discussions (Jarc 2010).
7.3 OFG Results
7.3.1 Participants Response
Invitations to selected participants to take part in the OFG were sent in the first week of October 2015 and the OFG discussion in Edmodo was opened for six weeks. Although 5 respondents agreed to take part in the OFG, only 4 respondents replied to the discussion topics. This reinforced the issue of no-show in OFGs. Follow-up and reminder emails were sent to the participants in an effort to elicit their participation and stimulate discussion. The researcher also encountered difficulties in generating discussion among the OFG participants, who just responded in detail to discussion topics. Despite facilitation efforts from the researcher, OFG participants showed some reluctance to engage in more extensive discussion about the model and its practicality. This was not a cultural issue, but rather due to perceived limitations on the time they could spare, and their existing perceptions of the relevance, adequacy and sufficiency of the parameters shown in the PMO model and its fitness for purpose.
7.3.2 Findings
This section presents and describes the data posted by the OFG participants in Edmodo. The presentation sequence of the data follows the general format of the discussion topics in Table 7.1. The discussion topics set up in Edmodo are not mandatory and thus the participants had the choice to skip any questions they felt were not applicable to their experience or organisation, or were unfamiliar with.
7.3.3 Relevance and Completeness of Variables
The list of variables comprises essentially important structural and organisational factors that are proposed to form the constituents of effective PMOs. Participants were asked to comment on the list.
Participant OFGP2 commented that the list is comprehensive, with the inclusion of the organisational project maturity variable. OFGP2 argued: “this is an important factor that influences the other variables in your list. In an organisation that is less mature, the PMO may set an objective to advance the maturity level”.
In the same discussion thread, participant OFGP4 suggested additional critical success factors for an effective PMO:
1. Organisation Alignment to Enterprise IT Strategy (Project Prioritisation & Selection),
160
2. Sponsorship (Leadership & Commitment), 3. Capability Development – up-skilling of resources (Coaching, Mentoring, Knowledge
Management), 4. Stakeholder Management (Communication & Integration Horizontally & Vertically across
clusters), 5. Project Management (Schedule, Budget, Quality, Risk), 6. Project Management Standards (Processes, Tools, Guidelines, Checklist), 7. Measurement (Defects, Risks, QA, ROI-Business Value), and 8. Benefit Assurance (Post Implementation Review with Lessons learned).
Participant OFGP1 suggested adding the “appraisal and recognition structure” variable, and explained: “if a PM is being recognised for a typical behaviour and his appraisal system
affirms it, then he will be try to do more of the same. However that goes as a counter
strategy that if a good behaviour is not being appreciated or rewarded, then there will be lot
of demotivation set in the organisation. The senior management reward and recognition
behaviour also determines if you have a motivated workforce”. OFGP1 also proposed the segregation of project managers and support staff into 2 different organisation entities, each with a different set of functions and responsibilities. OFGP1 concluded that an “Advanced
PMO would work toward improving the skills / up skilling of the staff and putting up a highly
motivated task force. The more we are independently judged by data, objectively and
transparent, the more there is motivation to improve”.
7.3.4 Solutions and Approaches for identified Variables
Participants were asked for their views on the proposed solutions and approaches.
On “Organisational Learning”, OFGP2 recommended “the conduct of a post-implementation
review of the project on what went well and not so well. The learning should be incorporated
into future projects”. Participant OFGP4 adapted the PMO definitions from Hill (2014) and added that, in the area of PMO functions, “organisation should thrive to drive towards Basic,
Standard or Advanced PMO according to their drivers, vision, mission, and strategy &
sponsorship, size”.
The general consensus from OFGP1, OFGP2 and OFGP3 is that the “percentage of project managers” should not be a critical factor as “it is driven by the demand of projects and
number of resources trying to deliver it”. OFGP1 also opined that the size and type of projects to be incorporated into the PMO is a business mandate from the host organisation and not determined by PMO’s.
7.3.5 Generation Y Variable
Participant OFGP2 characterised Generation Y as “more impatient to move ahead, less
interested in doing the same nature of work for a long time; desire a high profile role; not too
worried about job security; may not believe in importance of "face time"; accept new
approaches to doing things; sometimes may not have the patience or discipline required in
projects”. Participant OFGP4 on the other hand, identified some positive characteristics of
161
Generation Y. OFGP4 described Generation Y as “confident and ambitious. They are not just doers but also not afraid to question authority status quo as are constantly seeking out new challenges and want meaningful work with improvements. They want to be part of the team and same time desire to contribute to bank with Value adds. They do seek feedback and attention but are overall committed and want to be involved and engaged enthusiastic lot.”
OFGP2 suggested that the style of training delivery more than the content should match the
characteristics of Generation Y; “Gen Y learn in different ways - more interactive, bite-sized, etc. - and the training should be structured appropriately for that style”. OFGP4 added to this
by suggesting training for Generation Y to be “interactive and structured appropriately with live samples”. Participant OFGP1 proposed that their training should also be “more unstructured, unhindered and not follow the norm”. OFGP1 explained that Generation Y
does not have the background and the depth (in knowledge), and often does not see issues
from an end-to-end point of view. According to OFGP1, Generation Y “need to be taught the discipline (and patient), while not stopping their creativity. Instead of calling standard names, they can be called fancy names, Allow them the use of latest technology”.
7.3.6 Conceptual PMO model
Participants were asked to provide feedback on the overall design of the model, including its
sufficiency, how the variable factors are integrated; and the usefulness of adopting the
Cynefin Framework as an informative structure.
Participant OFGP2 commented that fitting the PMO model into the Cynefin Framework
provides an understanding on how to move the PMO along the maturity curve. OFGP2
argued that in the more definitive stage of the PMO model, the “project management
processes” variable is more appropriate in the complicated rather than complex space.
OFGP2 believes that “there is a definite relationship between any project management process and the outcome of the project, although it is not an obvious relationship”.
Participant OFGP4 discussed some objectives for the PMO transformation from an initial to
a definite stage, which includes PMO as an enabler for strategy formulation and
implementation, and to incorporate both IT and non-IT resources in the PMO for better
management of projects. Participant OFGP1 suggested that each organisation needs to
evolve its own PMO model, and attempts to categorise projects into different Cynefin
Framework domains. Participant OFGP3 highlighted that his organisation has a Project
Management Office (PMO) and Project Office (PO), which deviates from the PMO model.
The latter two comments are not regarded as criticisms of the Cynefin model, but as an
acceptance that it provides a useful starting point which can be customised to each
organisations project requirements and culture.
For OFGP3’s organisation, all project managers are under the PO which has its respective
heads under different functional domains, and the main functions of PMO are to: “support projects and SDLC processes, conduct governance and compliance checks, provide MIS reporting, do some level of financial analytics and project data analysis for management”.
162
OFGP3 added that project supporting functions and portfolio management are important functions of PMO, and having good tools and a good level of automation are very important success factors for PMOs.
7.3.7 Reflections on the OFG
The OFG participants in general found the list of important PMO structural and organisational factors relevant and comprehensive. The highlighted PMO functions to be included in the PMO are the appraisal and recognition structure, and the conduct of post-implementation reviews. The Generation Y behaviours and traits identified by the participants were similar to those discussed in the Literature Review in Chapter 2. A PMO should also match the style of training to the characteristics of Generation Y. Suggested changes to the PMO model which include the removal of “percentage of project managers” as a variable, and placement of “project management processes” in the complex domain (for PMO in definite stage) were taken into consideration.
The analysis of the qualitative focus group responses was undertaken on a simple content analysis basis, without need to attempt higher level coding since the guideline questions were specific to the proposed PMO model.
The comments and proposed actions based on OFG responses are presented in Table 7.2 below.
Table 7.2: Comment and Proposed Action based on OFG Responses
Q# Question Comment and Proposed Action
1 Based on your experience with PMO implementation, are the variables relevant and complete?
Three additional variables suggested by the OFG participants are the organisational project maturity [OFGP2], a rewards structure [OFGP1] and skills training [OFGP1]. The project maturity issue has already been recognised as an important shaping factor for PMO and an important variable of the model. The PMO designer upon considering the structural and organisational context for the PMO can choose to decide which functions to include within its mandate. The functions and model solutions stipulated for the PMO functions variable included: “manage benefits” and “develop competency of personnel, including training”. Managing project benefits, as indicated by the surveyed PMOs (Chapter 5) is one function that is performed by the PMO. One of the findings from this study is the lack of intention in Singapore financial PMOs to
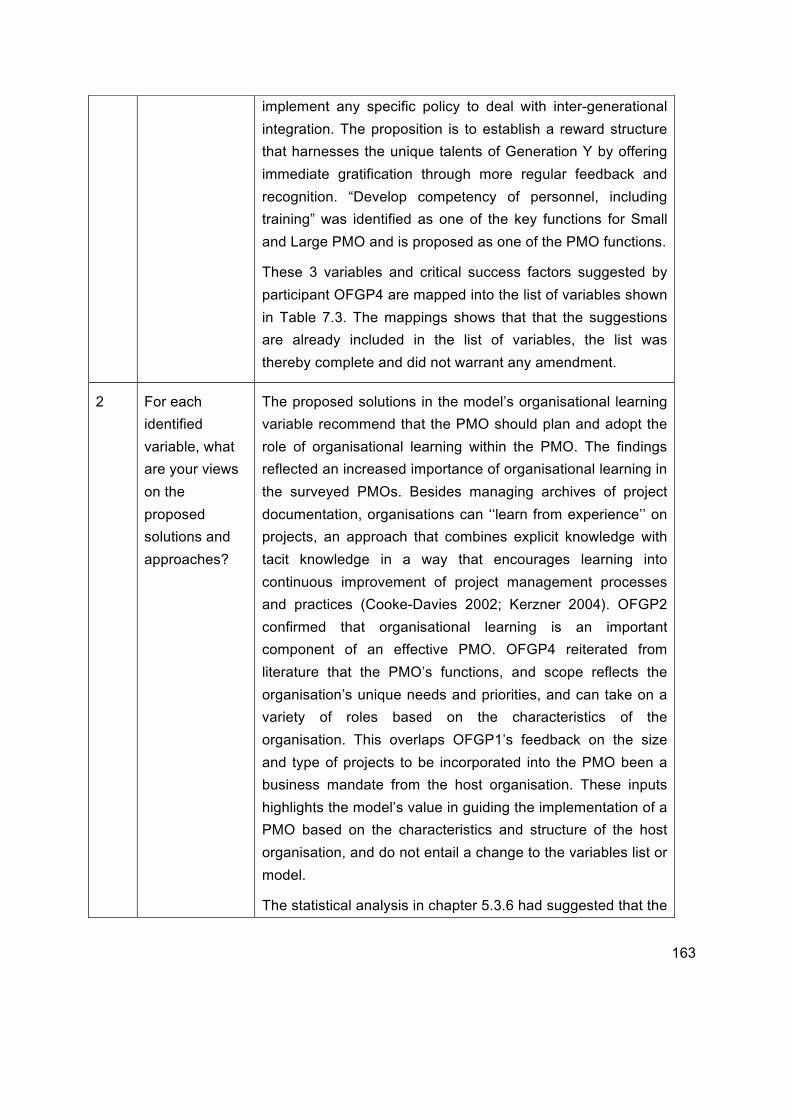
163
implement any specific policy to deal with inter-generational
integration. The proposition is to establish a reward structure
that harnesses the unique talents of Generation Y by offering
immediate gratification through more regular feedback and
recognition. “Develop competency of personnel, including
training” was identified as one of the key functions for Small
and Large PMO and is proposed as one of the PMO functions.
These 3 variables and critical success factors suggested by
participant OFGP4 are mapped into the list of variables shown
in Table 7.3. The mappings shows that that the suggestions
are already included in the list of variables, the list was
thereby complete and did not warrant any amendment.
2 For each
identified
variable, what
are your views
on the
proposed
solutions and
approaches?
The proposed solutions in the model’s organisational learning
variable recommend that the PMO should plan and adopt the
role of organisational learning within the PMO. The findings
reflected an increased importance of organisational learning in
the surveyed PMOs. Besides managing archives of project
documentation, organisations can ‘‘learn from experience’’ on
projects, an approach that combines explicit knowledge with
tacit knowledge in a way that encourages learning into
continuous improvement of project management processes
and practices (Cooke-Davies 2002; Kerzner 2004). OFGP2
confirmed that organisational learning is an important
component of an effective PMO. OFGP4 reiterated from
literature that the PMO’s functions, and scope reflects the
organisation’s unique needs and priorities, and can take on a
variety of roles based on the characteristics of the
organisation. This overlaps OFGP1’s feedback on the size
and type of projects to be incorporated into the PMO been a
business mandate from the host organisation. These inputs
highlights the model’s value in guiding the implementation of a
PMO based on the characteristics and structure of the host
organisation, and do not entail a change to the variables list or
model.
The statistical analysis in chapter 5.3.6 had suggested that the

164
“percentage of project managers within PMO” was not an important factor for Small PMOs. With the general consensus from OFGP1, OFGP2 and OFGP3 contending that the “percentage of project managers” should not be a critical factor, the variable was removed from the model.
3 Describe the characteristics of Generation Y in your PMO and how they impact upon the PMO.
What competency input training would be essential and how might the career paths of Generation Y staff be structured?
The Generation Y factor is the only variable that starts off from the chaos domain in the initial stage of the model. The lack of specific policy to deal with generational change, good practice, and the diverse worldviews, preferences and behavior has made it challenging to manage and reach a practical solution to address the issue. OFGP2 and OFGP4 described contrasting generalised traits and behaviours attributable to Generation Y, confirming its diverse characteristics. Some of the suggested solutions are in the form of Generation Y-adapted rewards structure or training programmes. The PMO model postulates that as good (or better) practice emerges, the variable can move to the complicated domain.
However before the emergence of good practices, the acknowledgment of the integration issue and experimentation of solutions are necessary. Only upon reaching such a stage, would the model then be required to change and place the generation Y variable in the same category of project management maturity and organisational learning, within the complex domain during initial stage.
5 Please provide feedback on the overall design of the conceptual PMO model; in terms of its sufficiency, how the variable factors are integrated; and
OFG participants attempted to compare the structure of their PMOs with the design of the model. Participant OFGP3 highlighted how the PMO functions and roles are divided into two project units with different responsibilities. While the PMO model does not dictate that all the variable factors and functions are to be performed by a single body, it does not explicitly deal with this possibility. Additional research work is required to study the impact, if any of incorporating such a feature in the model, and can be considered for future research studies.
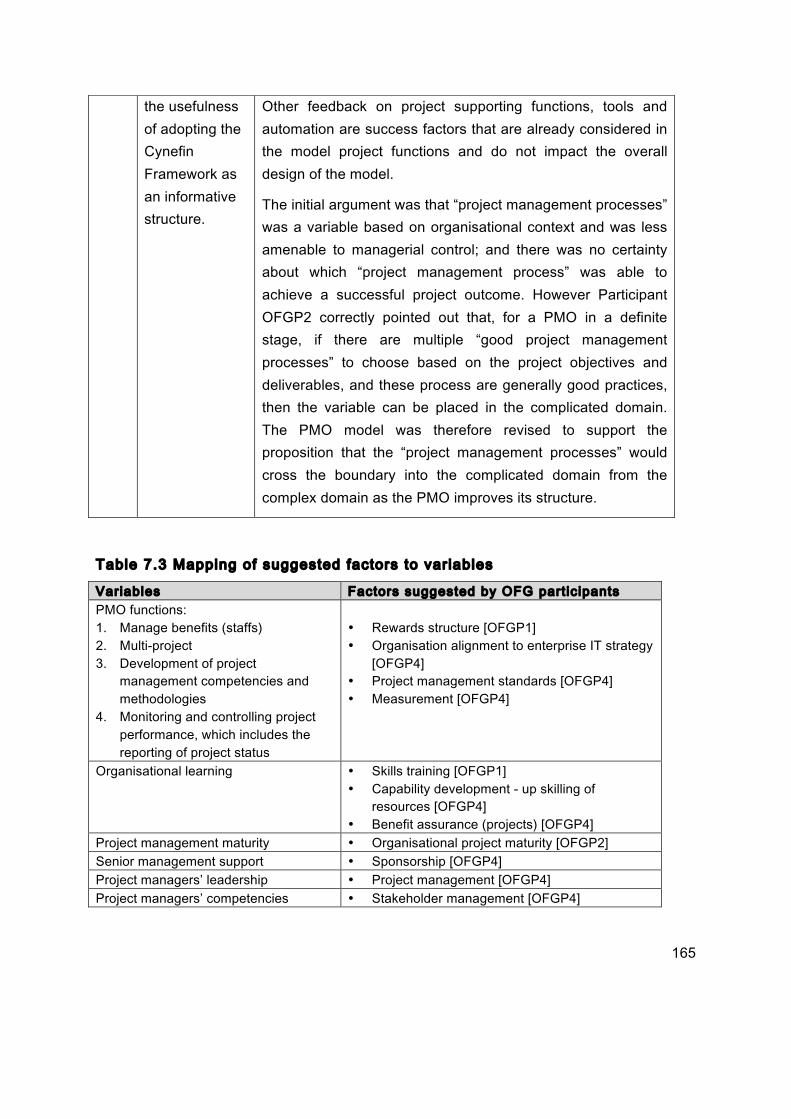
165
Table 7.3 Mapping of suggested factors to variables
Variables Factors suggested by OFG part ic ipants PMO functions: 1. Manage benefits (staffs) 2. Multi-project 3. Development of project
management competencies and methodologies
4. Monitoring and controlling project performance, which includes the reporting of project status
• Rewards structure [OFGP1] • Organisation alignment to enterprise IT strategy
[OFGP4] • Project management standards [OFGP4] • Measurement [OFGP4]
Organisational learning • Skills training [OFGP1] • Capability development - up skilling of
resources [OFGP4] • Benefit assurance (projects) [OFGP4]
Project management maturity • Organisational project maturity [OFGP2] Senior management support • Sponsorship [OFGP4] Project managers’ leadership • Project management [OFGP4] Project managers’ competencies • Stakeholder management [OFGP4]
the usefulness of adopting the Cynefin Framework as an informative structure.
Other feedback on project supporting functions, tools and automation are success factors that are already considered in the model project functions and do not impact the overall design of the model.
The initial argument was that “project management processes” was a variable based on organisational context and was less amenable to managerial control; and there was no certainty about which “project management process” was able to achieve a successful project outcome. However Participant OFGP2 correctly pointed out that, for a PMO in a definite stage, if there are multiple “good project management processes” to choose based on the project objectives and deliverables, and these process are generally good practices, then the variable can be placed in the complicated domain. The PMO model was therefore revised to support the proposition that the “project management processes” would cross the boundary into the complicated domain from the complex domain as the PMO improves its structure.

166
Changes to the proposed PMO model arising from the OFG process are summarised in the next section.
7.4 Final revision to PMO model
In line with the findings from the focus group analysis, and after careful consideration of the literature and previous findings the final version of the PMO model is presented in Figure 7.1, with the removal of the “percentage of project managers” variable from the model and the change in the placement of the “project management processes” variable in the complicated domain for the definite stage PMO.
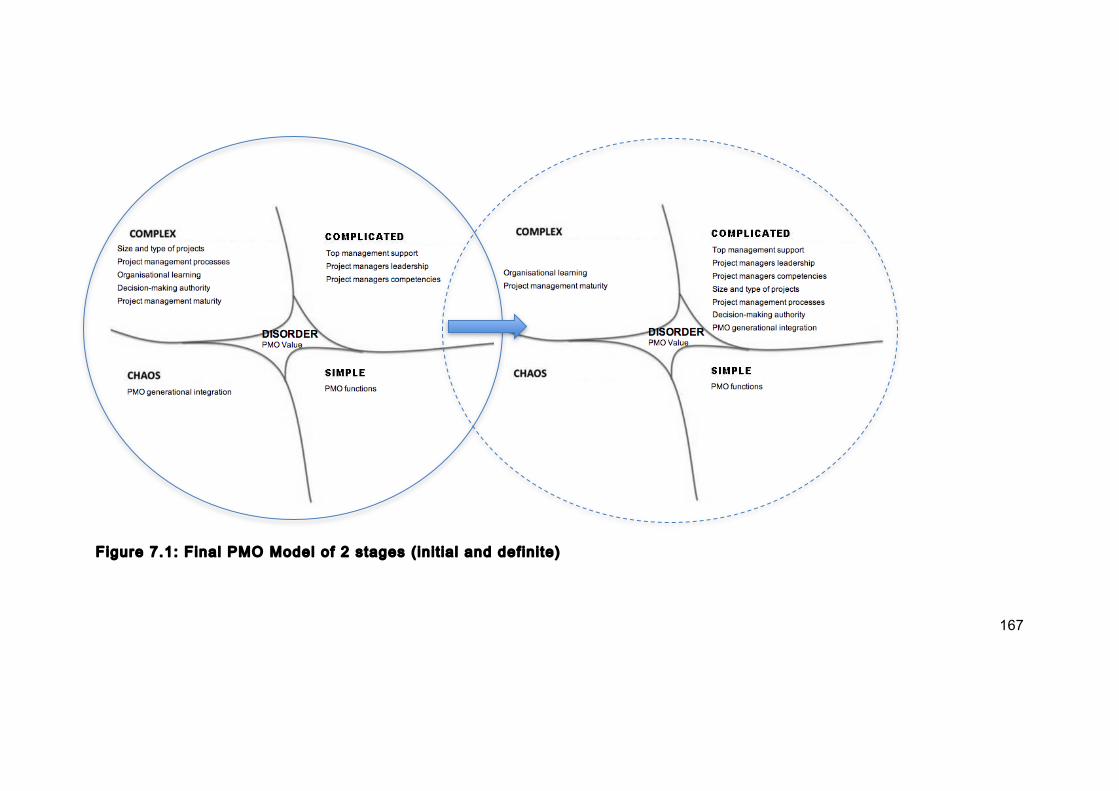
167
Figure 7.1: Final PMO Model of 2 stages ( init ia l and definite)
168
7.5 Chapter summary
This chapter has described the use of online focus group (OFG) to validate the proposed PMO model. The research design for administering the OFG was developed with design considerations about the process, number of participants, the discussion topics and duration of the OFG, and the motivation for adopting the technical tool (Edmodo). The responses to the discussion topics in Edmodo have been presented and analysed. The proposed list of variables and PMO model were reviewed and validated by the OFG participants. A final version of the PMO model has been created and, in the following chapter, conclusions are drawn and recommendations made for practice and for future research.
169
Chapter 8 Conclusions and Recommendations 8.1 Introduction
This chapter concludes the dissertation with a summary of the researching findings relating to the research questions. It assesses the contribution of the research to the profession of project management, reviews its limitations and makes recommendations for practice and further research.
As discussed in Chapter 1, the research objective was to develop a model, based upon sound theoretical considerations, designed to guide strategic and tactical decision-making in the design and implementation of a Project Management Office, so as to improve the likelihood of achieving success for financial IT projects in Singapore. An introduction to the research and the formulation of the research questions was also provided in the chapter.
The literature review in Chapter 2 explicated the relevant theoretical frameworks and identified different design and management characteristics among PMOs, and the significance of each organisational context for financial IT projects, particularly in a Singapore context. The chapter also included a study of the different competencies and inter-generational aspects of project managers and their suitability based on the project dynamics as part of the PMO structure.
Chapter 3 presented the justification of the research approach and the rationale for the chosen research methods, arguing that semi-structured interviews and online surveys would be the best method for collecting primary data. This would be informed by an extensive prior literature review.
Chapter 4 described the research design for the primary data collection and the administrative process for the conduct of facilitated interviews and online surveys. Based on the views and activities of people in practice, the combined results of the interviews and online survey responses were presented and analysed in Chapter 5.
The conceptual model of PMO was developed in Chapter 6; using the Cynefin Framework to map the PMO design considerations and composite variables. Chapter 7 then validated the proposed PMO model using an online focus group. Based upon this process, a final version of the PMO model was proposed.
Now conclusions are drawn by assessing the contribution of the research and summarising the main findings. Recommendations are made for practice and for further research. The achievement of the research objectives is considered; and personal reflections on the research journey are offered.
170
8.2 Contribution of this Research
The contribution of the research to the profession of project management is considered by first summarising the insights attained from literature reviews on the subject of PMO, and then listing the analytical findings from the views and activities of financial IT professionals practicing project management within a PMO. The value delivered by the PMO Model is discussed. Its main theoretical contribution relates to providing much needed research from a different cultural and geographical perspective as that from previous studies. While Singapore is a developed and prosperous country it is situated, physically and culturally, quite apart from Europe and North America where much of the PMO theory has been developed. It therefore adds to this body of knowledge. The inclusion of considering Generation Y and Generation X perspectives also represents a new line of inquiry into how PMOs may function.
In the re-thinking project management study (Winter et al. 2006) five research directions were identified. They argued that “there needs to be a much greater focus in future research on concepts and theories closely resonating with these realities, to provide practitioners with practical concepts and approaches more in alignment with contemporary thinking”. This thesis contributes to the research direction of “theory for practice”, which is a reference to concepts and approaches that have practical application. The PMO model is developed through the study of PMOs and project management processes as pre-existing, which also takes practice as emerging within the Singapore financial IT industry, on the basis of experienced PMO practitioners. The direction of this study is concerned with the actual process of conceptualising PMOs from different perspectives, such that the structuring of an effective PMO is ”multidisciplinary, with multiple purposes that are permeable, contestable and open to renegotiation throughout”.
Another key contribution is the novel employment of the Cynefin Framework as part of a PMO model, which maps the PMO design considerations into contexts, defined by the nature of the relationship between cause and effect. The framework is very effective in highlighting the complexity and gaps between theory and practice in issues like PMO generational integration and project management processes. However, the level of effectiveness depends upon how much the practitioners appreciate the Cynefin Framework power and influence in thinking about PM complexity issues.
8.2.1 Insights from the literature review
The literature review informs the foundation for the PMO model. The insights gained from studying the present state of knowledge in PMO are as follows:
1. The review identified different design and management characteristics for PMOs, and the significance of the organisational context. It supported the proposition that PMO characteristics such as the proportion of all the organisation’s projects undertaken by the PMO; the number of project managers in the PMO mandate; the decision-making
171
authority of the PMO; and the nature and number of important functions performed within the PMO, are each important considerations for an effective PMO.
2. Two Critical Success Factors emerge as important for PMOs: “top management support” and “project leadership”. This suggests that the PMO in Singapore is more suited for the role of manager with substantive authority deriving from stakeholders’ buy-in. PMOs for Financial IT projects in Singapore can fall either into the category of strategic or directive depending on the organisation’s executive commitment to project management.
3. The design of the PMO should take into account the effect of dealing with or introducing generational change (eg Generation Y) in project teams. Generation Y (as a group) now expects and seeks to pursue a lifestyle that is more balanced, in terms of work and personal lives, than in past generations (Smola & Sutton 2002). An effective PMO should carefully consider Generation Y characteristics by creating a work environment where different generations of project managers can use their different and varied skills and attitudes to co-operatively deliver projects successfully. For Generation Z and beyond, different generational factors may be pertinent.
There is a paucity of academic literature relating to PMOs and their development in Singapore. In private correspondence, SPMI has confirmed that they do not hold any information or statistics on the topic of PMO (SPMI) (Appendix C).
8.2.2 Findings from Primary data Analysis
The analysis of primary data, gathered from interviews and online survey responses, revealed the following findings:
1. The main reasons to establish a PMO for financial IT projects in Singapore are as follows: • For the purposes of establishing and standardising the project management practices. • For providing governance to projects. • To play the coordinating role. • To play a controlling role.
2. The analysis also suggests that the size of PMOs may be related to the number and types of projects undertaken, and the extent to which decision-makers other than project managers are included in the PMO. When establishing a PMO, the size and type of projects the PMO should embrace is an important design issue. To place all organisation projects within the PMO mandate may result in staff expertise and resources becoming dispersed and too thinly spread across the organisation, a more efficient approach of resource management would be to allocate expertise and resources on prioritised projects.
3. The top two functions performed by the PMOs are “Report project status to upper management”, and “Develop and implement standard methodologies”. When the surveyed PMOs are grouped into small, medium and large size categories:
172
• The key functions identified for Small PMOs are “Develop and implement standard PM methodologies”, “Develop competency of personnel, including training” and “Conduct project audits”.
• The key functions identified for Medium PMOs are “Report project status to upper management”, “Develop and implement standard methodologies”, “Manage archives of project documentation” and “Implement and operate a project information system”.
• The key functions identified for Large PMOs are “Report project status to upper management”, “Coordinate between projects”, “Manage archives of project documentation”, “Implement and operate a project information system” and “Develop competency of personnel, including training”.
PMOs also have the function of “managing archives of project documentation”. This suggests that organisational learning is a vital component of an effective PMO.
4. In terms of the relative importance of factors in shaping the PMO structure and influencing its methods, the top three factors were “maturity in project management”, “percentage of PMs within the PMO” and “supportiveness of organisational culture”. The analysis further revealed that “Percentage of PMs within PMO” is not important for Small PMOs, while “Extent of decision-making authority” is important to Large PMOs.
5. Most PMOs have authority to control standards and processes and adopt the plan-based practice of defining the product and project scope. If flexibility and time to market are the main goals of the organisation, then a PMO can consider Agile Project Management (APM).
6. Small and Medium PMOs tend to have less decision-making authority; while Large PMOs have more. This is explained to some extent by the fact that Large PMOs would require a certain level of authority in order to obtain and employ the required resources. For a Large PMO to be successful, the support and the decision-making authority given by senior management in the parent organisation are considered more important performance determinants than in the case of a Small or Medium PMO. A Small PMO might have a high level of project management maturity, and yet have no aspirations to increase in size and functions. A Medium PMO, on the other hand, would require some support in terms of standards and guidelines for it to become more mature and relevant.
7. Suggestions for improving project performance are: the establishment of standardised project management methodologies; and more effective resource management at the host organisation level. These were not linked to specific PMO sizes. Achievement of “best practice”, and the implementation of standardised methodologies and processes by the PMO, should help to achieve the performance and quality levels for projects sought by host organisations.
173
8. Red tape and over-detailed project documentation are contributory causes of project failure (or failure to achieve complete success). The PMO should have sufficient authority, in order to have better control over the usage of projects resources. There is a challenge in managing the delicate balance between PMOs and host organisational politics.
9. Few PMOs include Business Management staff. Including business units within the PMO may help to minimize conflicting priorities between business activities and project activities.
10. “Being On Schedule” and “Realising business benefits” are considered by PMO respondents to be the most important factors for project success. However, project success may not be observable immediately upon delivery if essential post-delivery performance evaluation is delayed. The “stability of projects and systems after implementation” emerges as an additional factor for success, which may be measured by “defect counts”; “post implementation change acceptance”; and “length of stabilisation period”.
11. Contributions to project performance may be categorized into areas such as: “PMO’s Best Practice”, “Project Control”, “Project Status Update” and “Organisational Training”.
12. “Soft skills” are considered to be the most important PM competency regardless of the size of PMOs. Medium sized PMOs require project managers with relevant experience and knowledge of the domain required by the projects they manage. The project manager must have the technical ability and domain knowledge in order to perform the required activities to ensure project success, and thereby the success of the PMO itself. In Large PMOs there would be a greater range of skills resources available so that the project manager can utilise appropriate technically skilled staff to undertake different roles within the project team. The right mix of resource skills is thus an important consideration for an effective PMO.
13. No evidence was found for the use of a maturity indicator such as the Capability Maturity Model Integration (CMMI®) for PMO development, but achievement of best practice may be regarded as a surrogate measure. The more mature the project management practices in the organisation, the better the predictability of the outcome and cost of the project, and thereby quality of the delivery.
14. “Generation X” staff predominates in PMOs for financial IT projects in Singapore. “Lack of experience” is one of the key considerations against introducing Generation Y staff into the PMO but since generational change is inevitable organisations need to develop specific policies to deal with it.
174
15. Finally, in terms of considering the Cynefin Framework in context with the role and functions of PMOs, it is important for PMO designers to consider the domain that PMO design variables may fall into. Some design variables are relatively simple and standard, others may be complicated but many appear to be complex and the findings from this thesis suggest the search for best practices had resulted in an instance of inherent instability of an on-going process of structuring as elaborated upon in section 8.2.3.1 below.
8.2.3 Value to PM Practice delivered by the PMO Model
In Singapore, there is a rising trend for financial organisations to form PMOs in order to improve project performance, but the concept of PMO is relatively new and there are few available models or guidelines where organisations can seek direction or insights. To date no published research has been carried out on PMOs in the Singapore context (and particularly with respect to PMOs for IT projects in finance industry organisations). The proposed PMO model is thereby novel and practically relevant to provide value and contribute to the body of project management knowledge.
The argument for developing a PMO model is, that without clarity on how to implement a PMO successfully, many PMO initiatives will fail to produce the improvements that were originally hoped for (Kendall & Rollins 2003). This research has found that a PMO model would be useful or critically useful for organisations planning to form a new PMO or to restructure an existing one. The model is useful as a form of reference for the PMO and should take into consideration:
• Organisation and Management needs/ directions • Organisational culture, structure and size • Offering products and services
The other factors suggested to support the adoption of a PMO model for managing financial IT projects in Singapore are “ease of project status reporting", “top management and organisational support,” and “decision-making authority of the PMO with clear roles and responsibilities”.
The research has highlighted the importance of considering inter-generational differences when designing and implementing a PMO. Important initiatives might include providing attractive incentives and reward structures, recognition throughout the project management lifecycle and using mentoring programs.
The proposition is that organisations using the PMO model to initiate or re-structure their PMOs are likely to improve the chances of achieving success for their projects. While testing this outcome lies beyond the scope of this research, it is possible for such improvement to be argued here. Besides the success factors and inter-generational differences, the parts of the model that are most effective are listed in section 8.2.2. The power of the model lays in its applicability, where PMO designers can determine what are the ideal functions and roles to incorporate, level of decision-making authority and important PM competency based on
175
their PMO size and organisational context. The list of PMO design variables and suggested solutions is the end result of studying the academic literature and effective PMOs in Singapore major finance industry organisations. This would definitely achieve a higher success rate as compared to the alternative of structuring a PMO as a form of organisational experimentation.
8.2.3.1 Using the Cynefin Framework
The Cynefin Framework is intended to be a sense-making framework, and not to simply categorize. It describes the domains and considers no particular virtue in attempting to migrate a system from one domain to another - “it is what it is” (Dettmer 2011).
The proposed PMO model innovatively uses the Cynefin Framework to map the PMO design considerations and composite variables as part of its design framework. In analysing the relevance of existing design and management characteristics for PMOs, the model provides some value judgment about in which domain each variable is better placed. This has resulted in a model with two instances of Cynefin Frameworks indicating two progressive stages of PMO and at the same time describes the crossing of boundaries by variables as the PMO changes to improve project performance. This allows model users to gain new views and insights by studying how the variables can be further exploited because of their presentation in the domains of the Cynefin Framework. This new approach of proposing an ideal state within the Cynefin Framework is likely to become more common as the popularity of Cynefin increases.
8.3 Limitations
There are three limitations of this study. The first relates to sample size and coverage of the research for both the interviews and focus groups. This is due to the low number of organisations and people in Singapore familiar with, and experienced in, PMOs and their operation for financial IT projects. There was also some unwillingness on the part of potential respondents to participate in the research study, due to the time commitment required for the research activities, and reservations that their participation, despite assurances to the contrary, might somehow reveal confidential information about their organisations. To overcome the size limitation, this research study made use of technology in the form of “LinkedIn” contacts, online surveys and online focus group to increase the research sample representativeness and improve the capacity to validate the data. While it is conceded that that sample size remains small, it is considered sufficient to serve the conceptual nature of the PMO model and its development through “saturation” of the pertinent issues.
Secondly the PMO model is based on the Cynefin Framework. This implies that, before the practitioners can apply the model, they have to have a basic understanding of the Cynefin Framework. This may limit the “marketability” of the model to PMO professionals.
176
This limitation is not thought to have impaired or compromised the quality of this study. The Cyneifn Framework actually adds a dynamic aspect, which has lead to the development of the PMO model that is practical and relevant to industry.
The final limitation is the lack of testing the model as part of the research. Financial organisations in Singapore may form PMOs with the goal of improving the rate of delivering successful projects. Establishing a PMO has been regarded as an effective approach of achieving the goal, with the PMO focusing on the coordinated planning, prioritization and execution of projects that are tied to the organisation’s overall business objectives. Even with the lack of industry-relevant guidelines and standards, a PMO is still expected to provide project strategy, project management professionalism and standardized methodology and procedures - the key components to contribute to successful project and organisational performance. In order to test the model, an organisation would have to endorse and employ the model in the structuring of its PMO. The organisation will then collect baseline data to compare the performance of projects carried out before and after the PMO is implemented using the proposed model. Resources have to be set aside for the benchmarking task. The effectiveness of the model can then be evaluated based on the hard data on cost, schedule, functionality (in terms of meeting customer requirements), and quality of project deliverables. However, the time required for ensuring the necessary commitments from organisations, and collecting and analysing pre and post-model application data on a sufficient number of financial IT projects in Singapore, is beyond the academically constrained temporal scope of this research. Testing the PMO model in practice must therefore await future research.
8.4 Recommendations for Practice
The recommendations here relate specifically to the Singapore financial industry. Financial organisations tend to measure the value and success of their investments by return on investment (ROI). To do so for the establishment of a PMO would be unproductive as attempts to demonstrate the direct influence of PMO often underestimate major contributions that project management brings to organisational success.
The organisation must allow some time for the PMO to show its results, which often come in the form of reduction of the life cycle of projects; projects that are better conceived and executed; completion of more projects during the fiscal year with the same resources; and tangible contributions for reaching organisational goals in terms of cost reduction and revenue increase. The PMO is fundamentally a cost centre, which does not itself generate revenue for the organisation. Before a PMO can bear fruit, it must be protected and shielded from criticisms and unjustified pressures to demonstrate its value. Such protection can only come from top management support, which is also often described in the literature as one of the critical success factors for a successful PMO. With a PMO, inevitably there will be changes on how projects are managed and implemented, and new project management methodology and procedures implemented. Management support is again critical to empower the relevant Project Managers with the decision-making authority to drive the changes and produce results.
177
Besides project schedule, cost and performance, the success of PMO within Singapore financial organisations with internal clients often hinges on the client’s or in most organisations the business units’ satisfaction and buy-in. The implementation of a PMO often has an impact on the internal system of power deployment within an organisation, as the PMO and business units clash in struggles for control over projects. One recommendation is to include business units within the PMO to help minimize conflicting priorities between business activities and project activities.
8.5 Recommendations for Future Research
The organisations participating in the research are Singapore-based, but several of the findings suggest that a wider target frame could be attempted. Further research, including participants from different organisations in other countries may be useful to further examine the relationships between characteristics of PMO, organisation, project managers, organisational project maturity and the roles of PMO.
The application of the PMO model in practice should be investigated, and here too opportunities for further related research could include applying and testing the model on different projects, for other industries and in other countries.
Two new concepts were introduced through this research and explored, the issues relating to Generation X, Y etc. and the consideration of complexity and the Cynefin Framework’s role in better understanding and responding to complexity and turbulence. Both these could be greatly expanded upon by additional research. The PMBOK (PMI 2013) has tended to focus on more simple and perhaps less complicated projects, yet throughout this research, practitioners and the literature have stressed the impact of complexity on managing projects. The Cynefin Framework perspective may be highly valuable as a sense-making tool to study other PMO contexts in future.
8.6 Achievement of research objectives
The objective of this research study was to develop a model to guide strategic and tactical decision-making in the design and implementation of PMO, with the aim of improving the likelihood of achieving better success rates for financial IT projects in Singapore. The research objective was achieved by conducting the research in two connected phases. In the first phase, the PMO model concept was informed by secondary data gathered through literature review, and by primary data obtained from facilitated interviews and online surveys with PMO stakeholders. This information facilitated the development of a PMO, using Cynefin as an integrating framework. In the second phase, an online focus group was used to validate the PMO model, and refine it.
The research objective is thus considered to have been fulfilled.

178
8.7 Reflections on the research journey
Pursuing a PhD degree has been a personal challenge for continuous improvement as a project management practitioner. RMIT University has provided me an opportunity to increase my expertise in the field by reflecting on industry practices and studying related literature. My prior degrees have been in the field of computing and I am fundamentally an IT project manager. The most difficult learning of this research has been how to present the research and write about it in an academic manner that is logically coherent. The collection and analysis of primary data was a satisfying process. Having completed this research, I have gained a greater appreciation for the value of academic study and the important role of the academic supervisor in postgraduate research.
In the course of doing the research on PMO, I have come to know many project managers and professionals with PMO implementation experience. I discovered that there is a lack of understanding among professionals on the value of an effectively structured PMO and the benefits it can bring. They see the design of a PMO as no more than the balance of centralization vs. decentralisation of control. Supporters of PMOs tend to focus on the implementation of “improved” standardised project management methodologies and processes as a form of best practice based on their past successes in other organisations (which may be structurally different from their current organisation), or books and professional standards like PMBOK (PMI 2013). There is limited scope to improve the PMO beyond these processes. PMO “haters” will equate PMO to more red tape and unnecessary project documentation. This group of professionals sees little value in PMO, centralised planning and prioritization. The challenge is to get their buy-in by providing positive management support for the projects and at the same time making their role as project managers easier. Looking at ways of achieving that has been an interesting and rewarding experience.
Academic studies on PMO typologies and models in the literature have a more holistic view on the topic. There are many organisations that structure their PMOs based upon trial and error, but subsequently resulting in the undesirable outcome of frustrating project managers and clients. There is potential and value for academics and professionals together to bridge the gap between theory and practice, and the proposed model in this dissertation is one step towards realizing that goal.
8.7.1 Reflections as a practitioner
As a practitioner with experience in managing IT projects in banks, I was able to identify, comprehend the issues faced by PMO senior executives and stakeholders. When the bank I was employed by wanted to set up its PMO, the senior executives could find limited guidance from academic literature or professional surveys based on the local context and decided to conduct brainstorming workshops to establish the structure and roles to be played by the new PMO. The key motivations for the bank to implement a PMO were to
179
harness the capacity to duplicate project successes, regardless of who the project manager is and at the same time improve the project time, cost and quality performance.
There are costs involved in setting up a PMO as a new organisational structure and PMO stakeholders would want to implement the right configuration in the initial set-up. Aubry, Hobbs et al. (2011) found that organisations frequently reconfigure their PMOs: that organisations should not focus on the “right or wrong” PMO characteristics and functions, organisations; that they are unlikely to reconfigure often due to the restructuring work and costs involved, and that senior management in the host organisation would not be supportive if the PMO continues to be unable to improve project performance and prove its value. Based on my own experience and interviews with the other practitioners, the deciding critical success factor for a PMO is almost always top management support. This shows that there is an opportunity to help practitioners structure an effective PMO that should attract such support. Interview and survey respondents have generally agreed that a model is useful as a form of reference for the PMO.
This research study has proposed a PMO model based on the Cynefin Framework that can help PMO stakeholders to simply “see a pattern” to make sense of the issues (in the list of variables) and choose the most appropriate approach (proposed solutions). As stated in the limitations, PMO practitioners using this approach would need to have a basic understanding of the Cynefin Framework. In a follow-up interview, participant P2 commented that “it takes time to understand the framework & analyse how / why to classify the variables into the contexts of the framework” (Appendix D). I believe that once the practitioners make the effort to appreciate the Cynefin Framework, they would benefit from its implementation.
8.7.2 Reflections working with Generation Y
I recently joined a local Polytechnic as an academic lecturer involved in teaching students who are predominantly Generation Y and Z. One of the findings from this study is the lack of intention in PMOs to implement any specific policy to deal with inter-generational integration. In a 2013 study, the job turnover rate in Singapore was estimated to be 16%, and expected to climb (Low 2013). The financial IT industry is thus likely feel the impact of rising hiring costs and talent gaps over the short to medium term future, with more Generation Y taking up leadership roles in managing projects. As an educator, it is easy to understand why there is a perceived disconnect between what the industry expects in terms of quality of work ethics and the behavior of Generation Y. I noted the common Generation Y traits in my students as identified by Neubronner (2016), who did a recent research study on the Generation Y in Singapore: the need for immediate gratification, poor attention to details, self-centeredness, lack of a sense of urgency and responsibility to see tasks through, and most of all the need to be motivated to work. Generation Y are generally not staying in an organisations for longer than two years, and those who do are not fitting in the organisations well, making knowledge transfer difficult (Neubronner 2016). As a matter of urgency, organisations must realise the importance of considering these inter-generational differences

180
when designing and implementing a PMO so as to exploit a wider pool of talent and achieve better employee performance.

181
References ABD 2007, Rich Growing Richer Faster Than Poor in Developing Asia - ADB Study, Asian Development Bank, <http://www.adb.org/news/rich-growing-richer-faster-poor-developing-asia-adb-study>. Amaral, DC, Conforto, EC, Benassi, JLG & Araujo, Cd 2011, Gerenciamento ágil de projetos: aplicação em produtos inovadores, São Paulo: Saraiva. Ammeter, AP & Dukerich, JM 2002, 'Leadership, Team Building, and Team Member Characteristics in High Performance Project Teams', Engineering Management Journal, vol. 14, no. 4, pp. 3-10. Anantatmula, VS & Shrivastav, B 2012, 'Evolution of project teams for Generation Y workforce', International Journal of Managing Projects in Business, vol. 5, no. 1, pp. 9-26. Andersen, B, Hendriksen, B & Wenche, A 2006, 'Project Management Office Establishment Best Practices', Project perspectives - Annual Publication of International Project Management Association, vol. XXVIII, no. 1, pp. 30-35. Andersen, B, Henriksen, B & Aarseth, W 2007, 'Benchmarking of project management office establishment: Extracting best practices', Journal of Management in Engineering, vol. 23, no. 2, pp. 97-104. Andersen, ES & Jessen, SA 2003, 'Project maturity in organisations', International Journal of Project Management, vol. 21, no. 6, pp. 457-461. Archibald, RD 2003, Managing high-technology programs and projects, John Wiley & Sons. Artto, K, Kulvik, I, Poskela, J & Turkulainen, V 2011, 'The integrative role of the project management office in the front end of innovation', International Journal of Project Management, vol. 29, no. 4, pp. 408-421. Asbury, J-E 1995, 'Overview of focus group research', Qualitative Health Research, vol. 5, no. 4, pp. 414-420. Asher, MG 2013, 'Singapore’s CPF: A Sustainable and Fair Solution to the Country’s Pension Challenge?', vol., pp. 10-34.
182
Atkinson, R 1999, 'Project management: cost, time and quality, two best guesses and a phenomenon, its time to accept other success criteria', International Journal of Project Management, vol. 17, no. 6, pp. 337-342. Aubert, BA, Patry, M & Rivard, S 2005, 'A Framework for Information Technology Outsourcing Risk Management', The DATA BASE for Advances in Information Systems, vol. 36, no. 4, pp. 9-28. Aubry, M, Hobbs, B, Müller, R & Blomquist, T 2010, 'Identifying forces driving PMO changes', Project Management Journal, vol. 41, no. 4, pp. 30-45. Aubry, M, Hobbs, B & Thuillier, D 2007, 'A new framework for understanding organisational project management through the PMO', International Journal of Project Management, vol. 25, no. 4, pp. 328-336. Aubry, M, Hobbs, B & Thuillier, D 2008, 'Organisational project management: An historical approach to the study of PMOs', International Journal of Project Management, vol. 26, no. 1, pp. 38-43. Aubry, M & Hobbs, JB 2011, 'A fresh look at the contribution of project management to organizational performance', Project Management Journal, vol. 42, no. 1, pp. 3-16. Aubry, M, Müller, R, Hobbs, B & Blomquist, T 2010, 'Project management offices in transition', International Journal of Project Management, vol. 28, no. 8, pp. 766-778. Avots, I 1969, 'Why does project management fail?', California Management Review, Berkeley: Fall 1969., vol. 12, no. 000001, p. 6. AXELOS 2013, Portfolio, Programme and Project Management (P3M3). Introduction and Guide to P3M3., <https://www.axelos.com/p3m3-maturity-model.aspx>. Balasubramanian, K, Jaykumar, V & Fukey, LN 2014, 'A Study on “Student Preference towards the Use of Edmodo as a Learning Platform to Create Responsible Learning Environment”', Procedia - Social and Behavioral Sciences, vol. 144, pp. 416-422. Barron, P, Maxwell, G, Broadbridge, A & Ogden, S 2007, 'Careers in hospitality management: Generation Y's experiences and perceptions', Journal of Hospitality and Tourism Management, vol. 14, no. 2, pp. 119-128. Beath, CM & Orlikowski, WJ 1994, 'The Contradictory Structure of Systems Development Methodologies: Deconstructing the IS-User Relationship Information Engineering', Information System Research, vol. 5, no. 4, pp. 350-377.
183
Belassi, W & Tukel, OI 1996, 'A New Framework for Determining Critical Success/Failure Factors in Projects', International Journal of Project Management, vol. 14, no. 3, pp. 141-151. Benzies, KM & Allen, MN 2001, 'Symbolic interactionism as a theoretical perspective for multiple method research', Journal of Advanced Nursing, vol. 33, no. 4, pp. 541-547. Bergh, JCJMV 2009, 'The GDP paradox', Journal of Economic Psychology, vol. 30, no. 2, pp. 117-135. Biemer, PP & Lyberg, LE 2003, 'Data Collection Modes and Associated Errors', in, John Wiley & Sons, Inc., pp. 188-214, <http://dx.doi.org/10.1002/0471458740.ch6>. Blaikie, NWH 1993, Approaches to social enquiry, Polity Press in association with Blackwell, Cambridge [England]. Blumer, H 1986, Symbolic interactionism: Perspective and method, Univ of California Press. Bogan, CE & English, MJ 1994, 'Benchmarking for best practices: winning through innovative adaptation', vol. Bonoma, TV 1985, 'Case research in marketing: opportunities, problems, and a process', Journal of marketing research, vol., pp. 199-208. Bourne, L 'Supersizing PMO Performance', Bangkok, Thailand, 27 February - 1 March 2006, pp. 1-12. Braa, K & Vidgen, R 1999, 'Interpretation, intervention, and reduction in the organizational laboratory: a framework for in-context information system research', Accounting, Management and Information Technologies, vol. 9, no. 1, pp. 25-47. Brandon, P & Newton, S 1986, 'Improving the forecast', Chartered quantity surveyor, vol. no. May, pp. 24-27. Briner, W, Hastings, C & Geddes, M 1996, Project Leadership, 2nd edn, Gower, Aldershot, UK. Brown, S 1995, Postmodern marketing, Routledge London. Brown, SL & Eisenhardt, KM 1998, Competing on the edge: Strategy as structured chaos, Harvard Business School Press, Boston, Mass.

184
Bubshait, A & Farooq, G 1999, 'Team building and project success', Cost engineering, vol. 41, no. 7, pp. 34-38. Burford, S 2011, 'Complexity and the practice of web information architecture', Journal of the
American Society for Information Science and Technology, vol. 62, no. 10, pp. 2024-2037. Burnes, B 2005, 'Complexity theories and organizational change', International Journal of
Management Reviews, vol. 7, no. 2, pp. 73-90. Burns, T & Stalker, GM 1961, The management of innovation, Tavistock Publications, London. Burrell, G & Morgan, G 1994, Sociological paradigms and organisational analysis : elements
of the sociology of corporate life, Arena, Aldershot, Hants. Burton, L & Bruening, J 2003, 'Technology and Method Intersect in the Online Focus Group', Quest, vol. 55, no. 4, pp. 315-327. Burton, L & Goldsmith, D 2002, 'The Medium Is the Message: Using Online Focus Groups To Study Online Learning', New Britain: Connecticut Distance Learning Consortium, vol., pp. 6-13. Business Monitor International 2012, Singapore Information Technology Report Q2 2012, London, viewed December 18th 2013, ProQuest Central; ProQuest SciTech Collection database. Caplen, B 2011, Singapore’s challenge as a financial centre, The Banker, December 18th 2013, <http://www.thebanker.com/Banker-Data/International-Financial-Centres/Singapore-s-challenge-as-a-financial-centre>. Carey, MA 1995, 'Comment: concerns in the analysis of focus group data', Qualitative Health
Research, vol. 5, no. 4, pp. 487-495. Carrillo, JV, Abad, ME, Cabrera, AS & Jaramillo, DH 'Success factors for creating a PMO aligned with the objectives and organizational strategy', 15-17 Sept. 2010, pp. 1-6. Carson, D, Gilmore, A, Perry, C & Gronhaug, K 2001, Qualitative Marketing Research.
Qualitative Marketing Research. SAGE Publications, Ltd, Sage Publications, London, England, SAGE Research Methods database, <http://dx.doi.org/10.4135/9781849209625 http://srmo.sagepub.com.ezproxy.lib.rmit.edu.au/view/qualitative-marketing-research-carson/SAGE.xml>.
185
Cartwright, C & Walker, DHT 2008, 'Case Study - Developing a Centre of Excellence (CoE)', in DHT Walker & S Rowlinson (eds), Procurement Systems - A Cross Industry Project Management Perspective, Taylor & Francis, Abingdon, Oxon, pp. 358-377. Cassell, C & Symon, G 1994, Qualitative methods in organizational research : a practical guide, Sage Publications, London, Thousand Oaks, Calif. Chandler, AD 1962, Strategy and structure: chapters in the history of the industrial enterprise, M.I.T. Press, Cambridge. Charmaz, Ka 2014, Constructing grounded theory, 2nd Edition. edn, Sage Publications. Check-Teck, F 1992, 'Culture, Productivity and Structure: A Singapore Study', Organization Studies, vol. 13, no. 4, pp. 589-609. Checkland, P 1999, Systems Thinking, Systems Practice, John Wiley & Sons Ltd, Chichester, UK. Chester, E 2002, Employing Generation Why?, Chess Press, Vacaville, CA. Child, J 1975, 'Managerial and organizational factors associated with company performance. Part 2: A contingency analysis.', Journal of Management Studies, vol. 12, no. 1, pp. 12-27. Childs, S & McLeod, J 2013, 'Tackling the wicked problem of ERM: using the Cynefin framework as a lens', Records Management Journal, vol. 23, no. 3, pp. 191-227. Christenson, D & Walker, DHT 2004, 'Understanding the Role of "Vision" in Project Success', Project Management Journal, vol. 35, no. 3, pp. 39-52. Churchman, CW, Ackoff, RL & Arnoff, EL 1957, Introduction to Operations Research, John Wiley & Sons, New York, NY. Clandinin, DJ & Connelly, FM 2000, Narrative inquiry: Experience and story in qualitative research, 1st ed. edn, Jossey-Bass Publishers, San Francisco. Clarke, N 2010, 'Emotional intelligence and its relationship to transformational leadership and key project manager competences', Project Management Journal, vol. 41, no. 2, pp. 5-20. Cleland, DI 1999, Project Management Strategic Design and Implementation, 3rd edn, McGraw-Hill, Singapore, Singapore.
186
Cockburn, A & Williams, L 2003, 'Agile software development: it's about feedback and change', Computer, vol. 36, no. 6, pp. 39-43. Cogin, J 2012, 'Are generational differences in work values fact or fiction? Multi-country evidence and implications', International Journal of Human Resource Management, vol. 23, no. 11, pp. 2268-2294. Collis, Ja & Hussey, R 2014, Business research : a practical guide for undergraduate and postgraduate students, Fourth edition. edn, Palgrave Macmillan. Conforto, EC & Amaral, DC 2010, 'Evaluating an agile method for planning and controlling innovative projects', Project Management Journal, vol. 41, no. 2, pp. 73-80. Conforto, EC, Salum, F, Amaral, DC, Da Silva, SL & De Almeida, LFM 2014, 'Can Agile Project Management Be Adopted by Industries Other than Software Development?', Project Management Journal, vol. 45, no. 3, pp. 21-34. Connection, CC 1987, 'Chinese values and the search for culture-free dimensions of culture', Journal of Cross-Cultural Psychology, vol. 18, no. 2, pp. 143-164. Cooke-Davies, TJ 2002, 'The "Real" Success Factors on Projects', International Journal of Project Management, vol. 20, no. 3, pp. 185-190. Cooke-Davies, TJ & Arzymanow, A 2003, 'The maturity of project management in different industries: An investigation into variations between project management models', International Journal of Project Management, vol. 21, no. 6, pp. 471-478. Cooper, DRa & Schindler, PS 2014, Business research methods, Twelfth edition. edn, McGraw-Hill/Irwin. Corder, GW & Foreman, DI 2011, Comparing More than Two Unrelated Samples: The Kruskal–Wallis H‐Test, Hoboken, NJ, USA: John Wiley & Sons, Inc., Hoboken, NJ, USA. Crawford, JK & Cabanis-Brewin, J 2010, Optimizing human capital with a strategic project office: select, train, measure, and reward people for organization success, CRC Press. Crawford, JK & Cabanis-Brewin, J 2011, The Strategic Project Office, PM Solutions Research, CRC Press, Boca Raton, FL, nlebk database, <http://search.ebscohost.com/login.aspx?direct=true&db=nlebk&AN=345401&site=ehost-live&scope=site>.
187
Crawford, L, Cooke‐Davies, T, Hobbs, B, Labuschagne, L, Remington, K & Chen, P 2008, 'Governance and support in the sponsoring of projects and programs', Project Management Journal, vol. 39, no. S1, pp. S43-S55. Crawford, L & Pollack, J 2004, 'Hard and soft projects: a framework for analysis', International Journal of Project Management, vol. 22, no. 8, pp. 645-653. Creswell, JW 2003, Research Design: Qualitative, Quantitative, and Mixed Method Approaches, Sage Publications, <http://books.google.com.sg/books?id=nSVxmN2KWeYC>. Crossan, MM, Lane, HW & White, RE 1999, 'An Organizational Learning Framework: From Intuition to Institution', Academy of Management Review, vol. 24, no. 3, pp. 522-537. Crotty, M 1998, The foundations of social research: Meaning and perspective in the research process, Sage Publications. Crumpacker, M & Crumpacker, JM 2007, 'Succession planning and generational stereotypes: should HR consider age-based values and attitudes a relevant factor or a passing fad?', Public Personnel Management, vol. 36, no. 4, pp. 349-369. Curlee, W 2008, 'Modern virtual project management: The effects of a centralized and decentralized project management office', Project Management Journal, vol. 39, no. S1, pp. S83-S96. Currie, WL 2003, 'A knowledge-based risk assessment framework for evaluating web-enabled application outsourcing projects', International Journal of Project Management, vol. 21, no. 3, p. 207. Dahlroth, J 'The generations factor', p. 32. Dai, CX & Wells, WG 2004, 'An exploration of project management office features and their relationship to project performance', International Journal of Project Management, vol. 22, no. 7, pp. 523-532. Dallas, M 'Measuring Success', Cannes, France, Daojin, F 'Analysis of critical success factors in IT project management', 10-11 July 2010, pp. 487-490. Day, G 1994, 'Continuous learning about markets', California Management Review, vol. 36, no. summer, pp. 9-31.
188
De Bruin, T, Freeze, R, Kaulkarni, U & Rosemann, M 2005, 'Understanding the Main Phases of Developing a Maturity Assessment Model', paper presented to Australasian Conference on Information Systems (ACIS), Australia, New South Wales, Sydney, <http://eprints.qut.edu.au/25152/>. Deal, JJ 2007, Retiring the generation gap : How employees young and old can find
common ground, Wiley. com. Desouza, KC & Evaristo, JR 2006, 'Project management offices: A case of knowledge-based archetypes', International Journal of Information Management, vol. 26, no. 5, pp. 414-423. Dettmer, H 2011, 'Systems Thinking and the Cynefin Framework-A Strategic Approach to Managing Complex Systems', Port Angeles, WA: Goal Systems International, vol., pp. 10-28. Dingsøyr, T, Dybå, T & Moe, NB 2010, 'Agile software development: an introduction and overview', in Agile Software Development, Springer, pp. 1-13. Dinsmore, PC 1999, Winning in business with enterprise project management, AMACOM Div American Mgmt Assn. do Valle, JAS, da Silviera e Silvia, W & Soares, CAP 2008, 'Project Management Office (PMO) - Principles in Practice', AACE International Transactions, vol., pp. PM71-PM79. Dobbs, J, Healey, P, Kane, K, Mak, D & McNamara, T 2007, 'Age bias and employment discrimination (Fact Sheet 2007)', Chestnut Hill, MA: Boston College, Center on Aging and
Work/Workplace Flexibility, vol. Donaldson, L 2001, The Contingency Theory of Organizations, The contingency theory of organizations, United States, California, Thousand Oaks: SAGE Publications, Inc., Thousand Oaks. Donnelly, RG & Kezsbom, DS 1994, 'Overcoming the responsibility-authority gap: An investigation of effective project team leadership for a new decade', Cost Engineering-
Morgantown, vol. 36, no. 5, pp. 33-40. Dowling, M 2007, 'From Husserl to van Manen. A review of different phenomenological approaches', International Journal of Nursing Studies, vol. 44, no. 1, pp. 131-142. Druskat, V & Druskat, P 2012, Applying emotional intelligence in project working, The management of complex projects: A relationship approach, Wiley, Hoboken.
189
Du Bois, B 1979, 'Passionate scholarship: Notes on values, knowing and method in feminist social science', in Theories of Women's Studies, Gloria Bowles, Renate Duelli Klein edn, Routledge and Kegan Paul, London. Dunn-Cane, K, Gonzalez, J & Stewart, H 1999, 'Managing the New Generation', Association
of Operating Room Nurses. AORN Journal, vol. 69, no. 5, pp. 930-936, 939-940. Dutta, S 2009, Global Information Technology Report 2008-2009, Geneva, <http://www.weforum.org/reports>. Dvir, D, Shenhar, AJ & Alkaher, S 2003, 'From a single discipline product to a multidisciplinary system: Adapting the right style to the right project', Systems Engineering, vol. 6, no. 3, pp. 123-134. Earl, MJ 1996, 'The Risk of Outsourcing IT', Sloan Management Review, vol. 37, no. 3, pp. 26 – 32. Earl, MJ & Scott, IA 1999, 'What is a Chief Knowledge Officer?', Sloan Management Review, vol. 40, no. 2, pp. 29-38. Easterby-Smith, M, Thorpe, R & Lowe, A 1991, Management research : an introduction, Sage Publications, London. Economist Intelligence Unit 2011, 'Economic forecast', Country Report. Singapore, vol. no. 11, pp. 7-10. El-Sabaa, S 2001, 'The skills and career path of an effective project manager', International
Journal of Project Management, vol. 19, no. 1, pp. 1-7. Englund, RL, Graham, RJ & Dinsmore, PC 2003, Creating the Project Office : A Manager's
Guide to Leading Organizational Change, The Jossey-Bass Business & Management Series, Jossey-Bass, San Francisco, Calif, nlebk database, <http://search.ebscohost.com/login.aspx?direct=true&db=nlebk&AN=82067&site=ehost-live&scope=site>. Erickson, J, Lyytinen, K & Siau, K 2005, 'Agile modeling, agile software development, and extreme programming: the state of research', Journal of database Management, vol. 16, no. 4, p. 88. Feeny, D, Lacity, M & Willcocks, L 2006, 'Assessing 12 Supplier Capabilities', In Global
Sourcing of Business & IT Services, Palgrave Macmillan UK, vol., pp. 97-113.
190
Filipczak, B 1994, 'It's just a job: Generation X at work', Training, vol. 31, no. 4, p. 21. Finch, H & Lewis, J 2014, Focus groups, Second edition. edn, Qualitative research practice: A guide for social science students and researchers, Sage Publications, Los Angeles. Finlay, L 2011, 'Interpretative Phenomenological Analysis', in Phenomenology for Therapists, John Wiley & Sons, Ltd, pp. 139-147, <http://dx.doi.org/10.1002/9781119975144.ch9>. Fisher, E 2011, 'What practitioners consider to be the skills and behaviours of an effective people project manager', International Journal of Project Management, vol. 29, no. 8, pp. 994-1002. Fowler, FJ 2002, Survey research methods, 3rd ed. edn, Sage Publications, Thousand Oaks, Calif. Frankel, R, Naslund, D & Bolumole, Y 2005, 'THE "WHITE SPACE" OF LOGISTICS RESEARCH: A LOOK AT THE ROLE OF METHODS USAGE.', Journal of Business
Logistics, vol. 26, no. 2, pp. 185-208. French, S 2013, 'Cynefin, statistics and decision analysis', The Journal of the Operational
Research Society, vol. 64, no. 4, pp. 547-561. Galbraith, JR 2014, Designing Organizations Strategy, Structure, and Process at the
Business Unit and Enterprise Levels, 3rd ed. edn, Designing Organizations : Strategy, Structure, and Process at the Business Unit and Enterprise Levels (3rd Edition), Wiley, Hoboken. Gale, B 1999, 'Evaluating Singapore's national institutions', Political and Economic Risk
Consultancy Ltd - Library, 28 July, PERC, vol. Gale, SF 2007, 'Bridging the Gap-The latest generation of project managers seems overly self-confident in their own tech-filled world. But they possess skills that, if fostered, can help the team', PM Network, vol. 21, no. 3, p. 26. Gallant, MJ & Kleinman, S 1983, 'Symbolic Interactionism vs. Ethnomethodology', Symbolic
Interaction, vol. 6, no. 1, pp. 1-18. Galvin, R 2015, 'How many interviews are enough? Do qualitative interviews in building energy consumption research produce reliable knowledge?', Journal of Building Engineering, vol. 1, pp. 2-12.
191
Garel, G 2013, 'A history of project management models: From pre-models to the standard models', International Journal of Project Management, vol. 31, no. 5, pp. 663-669. Gartner 2015, 'Gartner Says Enterprise IT Spending in Southeast Asia Will Reach $62 Billion by 2018', Targeted News Service, March 23, 2015, ProQuest Central database. Garvin, DA 1993, 'Building a Learning Organisation', Harvard Business Review on Knowledge Management, vol. 71, no. 4, pp. 47-80. Geraldi, JG 2008, 'The balance between order and chaos in multi-project firms: A conceptual model', International Journal of Project Management, vol. 26, no. 4, pp. 348-356. Gibbs, GR 2008, Analysing qualitative data, Sage Publications. Gill, J & Johnson, P 1991, Research methods for managers, Paul Chapman, London. Gini, C 1912, 'Italian: Variabilità e mutabilità (Variability and Mutability)', Contributo allo Studio delle Distribuzioni e delle Relazioni Statistiche. C. Cuppini, Bologna, vol. Giorgi, A 2009, The descriptive phenomenological method in psychology: A modified Husserlian approach, Duquesne University Press. Globerson, S & Zwikael, O 2002, 'The impact of the project manager on project management planning processes', Project Management Journal, vol. Sylva: Sep 2002. Vol. 33, no. 3, p. 7. Godsave, S 1989, 'Tomorrow's IT project manager: Winner of the Deloitte award for IT project management 1988‚Äîover 30 category', International Journal of Project Management, vol. 7, no. 1, pp. 5-7. Goldkuhl, G 2012, 'Pragmatism vs interpretivism in qualitative information systems research', European Journal of Information Systems, vol. 21, no. 2, pp. 135-146. Goleman, D, Boyatzis, RE, McKee, A & Buntine, A 2002, The leadership repertoire; emotional intelligence: leadership competencies, Little Brown, London, <http://digital.lib.rmit.edu.au/ereserve/notes06/busm1530/31259007734358.pdf >. Grbich, C 1998, Qualitative research in health: an introduction, Sage Publications. Gubrium, JF & Holstein, JA 2002, From the individual interview to the interview society, In J. F. Gubrium & J. A. Holstein edn, Handbook of interview research, Sage Publications, London.
192
Gursoy, D, Maier, TA & Chi, CG 2008, 'Generational differences: An examination of work values and generational gaps in the hospitality workforce', International Journal of Hospitality Management, vol. 27, no. 3, pp. 448-458. Gushiken, B 'Integrating Edmodo into a High school service club: To promote Interactive online communication', Hawai, USA, TCC Worldwide Online Conference, Hammersley, M 1985, Ethnography: What it is and what it does, In S. Hagerty & P. Evans edn, Research and Evaluation Methods in Special Education, Nefar-Nelson, Philadelphia, PA. Hammett, P 2007, Unbalanced influence: recognizing and resolving the impact of myth and paradox in executive performance, Davies-Black Publishing. Hanisch, B & Wald, A 2012, 'A Bibliometric View on the Use of Contingency Theory in Project Management Research', Project Management Journal, vol. 43, no. 3, pp. 4-23. Hanna, NK & Knight, PT 2011, National Strategies to Harness Information Technology, National strategies to harness information technology: seeking transformation in Singapore, Finland, the Philippines, and South Africa, Springer, Dordrecht. Hansen, MT, Nohria, N & Tierney, T 1999, 'What's Your Strategy for Managing Knowledge?', Harvard Business Review, vol. 77, no. 2, pp. 106-116. Hartman, F & Ashrafi, RA 2002, 'Project Management in the Information Systems and Information Technologies Industries', Project Management Institute, vol. 33, no. 3, pp. 5-15. Hedeman, B, Heemst, GVv & Fredriksz, H 2010, Project Management Based on PRINCE2® 2009 edition, 1 edn, Van Haren Publishing, Zaltbommel, 9789087535834, <http://RMIT.eblib.com.au/patron/FullRecord.aspx?p=592808>. Hendriks, M, Voeten, B & Kroep, L 1999, 'Human resource allocation in a multi-project R&D environment: resource capacity allocation and project portfolio planning in practice', International Journal of Project Management, vol. 17, no. 3, pp. 181-188. Heng, J 2012, 'Families better off despite rise in prices, says report', The Straits Times, Dec 27, 2012, <http://www.straitstimes.com/st/print/704426>. Henriques, G 2014, 'In Search of Collective Experience and Meaning: A Transcendental Phenomenological Methodology for Organizational Research', Human Studies, vol. 37, no. 4, pp. 451-468.
193
Herbison, G & Boseman, G 2009, 'Here they come-Generation Y. Are you ready', Journal of Financial Service Professionals, vol. 63, no. 3, pp. 33-34. Highsmith, J 2009, Agile project management: creating innovative products, Pearson Education. Hill, GM 2004, 'Evolving the Project Management Office: A Competency Continuum', Information Systems Management, vol. 21, no. 4, pp. 45-51. Hill, GM 2014, The Complete Project Management Office Handbook, ESI International Project Management Series, CRC Press, Boca Raton, Fla, nlebk database, <http://search.ebscohost.com/login.aspx?direct=true&db=nlebk&AN=631618&site=ehost-live>. Hirschheim, R 1985, 'Information systems epistemology: An historical perspective', Research methods in information systems, vol., pp. 13-35. Hobbs, JB & Aubry, M 2007, 'A Multi-Phase Research Program Investigating Project Management Offices (PMOs): The Results of Phase 1', Project Management Journal, vol. 38, no. 1, pp. 74-86. Hobbs, JB & Aubry, M 2008, 'An empirically grounded search for a typology of project management offices', Project Management Journal, vol. 39, pp. S69-S82. Hobbs, JB & Aubry, M 2010, The Project Management Office (PMO): A Quest for Understanding: Final Research Report, Project Management Institute, Newtown Square, Pa. Hobbs, JB & Aubry, M 2011, A typology of PMOs derived using cluster analysis and the relationship with performance, IRNOP X, Montreal, Canada. Hobbs, JB, Aubry, M & Thuillier, D 2008, 'The project management office as an organisational innovation', International Journal of Project Management, vol. 26, no. 5, pp. 547-555. Hochberg, YV, Serrano, C & Ziedonis, R 2015, 'Intangible but bankable', Science, vol. 348, no. 6240, pp. 1202-1202. Hofstede, G 2005, Cultures and Organizations. Software of the Mind., McGrawHill, New York.
194
Huber, GP 1991, 'Organizational Learning: The Contributing Processes and the Literatures', Organization Science: A Journal of the Institute of Management Sciences, vol. 2, no. 1, p. 88. Hunsberger, K 2011, 'THE SECRET OF THEIR SUCCESS', PM Network, vol. 25, no. 10, pp. 68-72. Hurst, JL & Good, LK 2009, 'Generation Y and career choice: the impact of retail career perceptions, expectations and entitlement perceptions', Career Development International, vol. 14, no. 6, pp. 570-593. Husserl, E & Cairns, D 1960, Cartesian meditations, M. Nijhoff The Hague, Netherlands. Hyväri, I 2006, 'Success of projects in different organizational conditions', Project
Management Journal, vol. 37, no. 4, pp. 31-41. Info-communications Development Authority of Singapore 2012a, The National Infocomm
Competency Framework (NICF), Info-communications Development Authority of Singapore, December 18th 2013, <http://www.ida.gov.sg>. Info-communications Development Authority of Singapore 2012b, Public sector to invest
S$1.2b in infocomm, iN.SG, December 18th 2013, <https://www.ida.gov.sg/blog/insg/egov-sectors/govt-to-sustain-1-2b-in-it-spending/>. International Data Corporation 2012, Market Analysis: Signals of Recovery in Singapore
Banks' IT Investments, International Data Corporation, October 23rd 2012, <http://www.idc.com/>. Israel, M & Hay, I 2006, Research ethics for social scientists, Sage Publications, London, England, SAGE Research Methods database, <http://dx.doi.org/10.4135/9781849209779>. Jacob, N 2007, 'Organizational Structure and Crosscultural Management: The Case of Credit Suisse's Project Copernicus in Singapore', Vikalpa: The Journal for Decision Makers, vol. 32, no. 4, pp. 63-73. Jagadeesh, B 2009, OCBC SDLC Roles and Responsibilities, OCBC Bank, Singapore. Jalal, MP & Koosha, SM 2015, 'Identifying organizational variables affecting project management office characteristics and analyzing their correlations in the Iranian project-oriented organizations of the construction industry', International Journal of Project
Management, vol. 33, no. 2, pp. 458-466.
195
Jarc, J 2010, Edmodo-a free, web2. 0 classroom management tool, August 24th, 2010, <http://trendingeducation.com/?p=190>. Jessen, SA 1992, The nature of project leadership, A Scandinavian University Press Publication. Jiang, JJ, Klein, G & Ellis, TS 2002, 'A measure of software development risk', Project Management Journal, vol. 33, no. 3, pp. 30-41. Jick, TD 1979, 'Mixing Qualitative and Quantitative Methods: Triangulation in Action', Administrative Science Quarterly, vol. 24, no. 4, pp. 602-611. Jordan, J & Jones, P 1997, 'Assessing Your company's Knowledge Management Style', Long Range Planning, Elsevier Science Limited, vol. 30, no. 3, pp. 392-398. Jugdev, K & Moller, R 2006, 'A retrospective look at our evolving understanding of project success', Engineering Management Review, IEEE, vol. 34, no. 3, pp. 110-110. Kappelman, LA, McKeeman, R & Zhang, L 2006, 'Early warning signs of IT project failure: The dominant dozen', Information Systems Management, vol. 23, no. 4, pp. 31-36. Karlsen, JT & Gottschalk, P 2004, 'Factors Affecting Knowledge Transfer in IT Projects.', Engineering Management Journal, vol. 16, no. 1, pp. 3-10. Keil, M, Lee, HK & Deng, T 2013, 'Understanding the most critical skills for managing IT projects: A Delphi study of IT project managers', Information & Management, vol. 50, no. 7, pp. 398-414. Kendall, GI & Rollins, SC 2003, Advanced Project Portfolio Management and the PMO - Multiplying ROI at Warp Speed, J Ross Publishing, Boca Raton, Fl. Kenny, AJ 2005, 'Interaction in cyberspace: an online focus group', Journal of Advanced Nursing, vol. 49, no. 4, pp. 414-422. Keppel, G 1991, Design and analysis : a researcher's handbook, 3rd ed. edn, Prentice Hall, Englewood Cliffs, N.J. Kerzner, H 1987, 'In Search of Excellence in Project Management', Journal of Systems Management, vol. 38, no. 2, pp. 30-39. Kerzner, H 1989, 'Systems project management: A case study at the IRS', Journal of Systems Management, vol. 40, no. 1, pp. 7-9.
196
Kerzner, H 2003, 'Strategic Planning for a Project Office', Project Management Journal, vol. 34, no. 2, pp. 13-25. Kerzner, H 2004, Advanced project management: Best practices on implementation, John Wiley & Sons. Kerzner, H & Saladis, FP 2009, What Functional Managers Need to Know About Project Management, Wiley International Institute for Learning, Hoboken, N.J. : New York. Kezsbom, DS 1988, 'Leadership and Influence: The Challenge of Project Management', American Association of Cost Engineers-Transactions of the American Association of Cost Engineers, vol., pp. 1.2.1-1.2.4. Kidd, PS & Parshall, MB 2000, 'Getting the focus and the group: enhancing analytical rigor in focus group research', Qualitative Health Research, vol. 10, no. 3, pp. 293-308. Kirsch, LJ 1997, 'Portfolios of Control Modes and IS Project Management', Information Systems Research, vol. 8, no. 3, p. 215. Kirsch, LJ 2000, 'Software Project Management: An Integrated Perspective for an Emerging Paradigm', Framing the Domains of IT Management: Projecting the Future... Through the Past, vol., pp. 285-304. Kitzinger, J 1995, 'Introducing focus groups', British Medical Journal, vol. 311, no. 7000, p. 299. Knights, D, Noble, F, Vurdubakis, T & Willmott, H 2001, 'Chasing Shadows: Control, Virtuality and the Production of Trust', Organization Studies (Walter de Gruyter GmbH & Co. KG.), vol. 22, no. 2, p. 311. Kongchan, C 2013, 'How Edmodo and Google Docs can change traditional classrooms', paper presented to The European Conference on Language Learning 2013, Brighton, UK, viewed September 16th 2015, <http://iafor.org/>. Kotter, JP 2009, 'What Leaders Really Do', IEEE Engineering Management Review, vol. 37, no. 3, pp. 18-28. Koval, M 2011, 'The Technologist's Tool Set: A CIO's Perspective', IT Professional Magazine, vol. 13, no. 6, pp. 34-39.
197
KPMG 2003, Programme Management Survey - Why Keep Punishing Your Bottom Line?,
Singapore, <
http://search.atomz.com/search/?sp-q=Programme+Management+Survey&sp-a=000433c3-
sp00000000&x=12&y=13>.
Krueger, RA 1995, 'The future of focus groups', Qualitative Health Research, vol. 5, no. 4, pp.
524-530.
Krueger, RA & Casey, MA 2009, Focus groups : a practical guide for applied research, 4th
edn, Sage Publications, Los Angeles.
Krueger, RA, King, JA & Morgan, DL 1998, Focus group kit, Sage Publications, Thousand
Oaks, Calif.
Kruskal, WH 1952, 'A Nonparametric test for the Several Sample Problem', The Annals of Mathematical Statistics, vol. 23, no. 4, pp. 525-540.
Kurtz, CF & Snowden, DJ 2003, 'The new dynamics of strategy: Sense-making in a complex
and complicated world', IBM Systems Journal, vol. 42, no. 3, p. 462.
Lambe, P 2014, Organising knowledge: taxonomies, knowledge and organisational effectiveness, Elsevier.
Lavoie-Tremblay, M, Richer, M-C, Marchionni, C, Cyr, G, Biron, AD, Aubry, M, Bonneville-
Roussy, A & Vézina, M 2012, 'Implementation of Evidence-Based Practices in the Context of
a Redevelopment Project in a Canadian Healthcare Organization', Journal of Nursing Scholarship, vol. 44, no. 4, pp. 418-427.
Lawrence, PR & Lorsch, JW 1967, Organization and environment : managing differentiation and integration, Division of Research, Graduate School of Business Administration, Harvard
University, Boston.
Lech, P 2013, 'Time, Budget, And Functionality?—IT Project Success Criteria Revised',
Information Systems Management, vol. 30, no. 3, pp. 263-275.
Lee, DMS, Trauth, EM & Farwell, D 1995, 'Critical skills and knowledge requirements of IS
professionals: A joint academic/industry investigation', MIS Quarterly, vol. 19, no. 3, pp. 323-
334.
Lee, HL 'Financial Centers today and tomorrow: A Singapore perspective', Singapore, June
4th 2001,

198
Lee, M 2007, Singapore's economic boom widens income gap, Reuters, Singapore, December 18th 2013, <http://www.reuters.com/article/2007/11/09/us-singapore-economy-inequality-idUSSIN20069020071109>. Lee-Kelley, L & Sankey, T 2008, 'Global virtual teams for value creation and project success: A case study', International Journal of Project Management, vol. 26, no. 1, pp. 51-62. Leeuw, Dd 2005, 'To Mix or Not to Mix Data Collection Modes in Surveys', Journal of Official Statistics, vol. 21, no. 2, p. 233. Lei, D, Slocum, JW & Pitts, RA 1999, 'Designing Organizations for Competitive Advantage: The Power of Unlearning and Learning', Organizational Dynamics, vol. 27, no. 3, p. 24. Leidecker, JK & Bruno, AV 1984, 'Identifying and Using Critical Success Factors', Long Range Planning, London, vol. 17, no. 1, pp. 23-32. Leplin, J 1984, Scientific realism, Univ of California Press. Letavec, CJ 2006, The program management office: establishing, managing and growing the value of a PMO, J. Ross Publishing. Levack, K 2007, 'Generation Whisperer', Successful Meetings, vol. 56, no. 13, p. 21. Levy, D 2006, 'Qualitative methodology and grounded theory in property research', Pacific Rim Property Research Journal, vol. 12, no. 4, pp. 369-388. Light, M & Berg, T 2000, The Project Office: Teams, Processes and Tools, viewed October 6th 2013, <http://www.inforede.net/Technical/Business/IT/PM Project Office.pdf>. Lim, L 2016, Millennials in the workforce: How to deal, Channel NewsAsia, Singapore. Liu, JY-C, Chen, H-G, Chen, CC & Sheu, TS 2011, 'Relationships among interpersonal conflict, requirements uncertainty, and software project performance', International Journal of Project Management, vol. 29, no. 5, pp. 547-556. Loo, R 2002, 'Working towards best practices in project management: a Canadian study', International Journal of Project Management, vol. 20, no. 2, pp. 93-98. Loo, R 2003, 'A Multi-level Causal Model for Best Practices in Project Management', Benchmarking, vol. 10, no. 1, pp. 29-36.
199
López, SP, Peón, JMM & Ordás, CJV 2003, 'Organizational learning as a determining factor in business performance', The Learning Organization, vol. 12, no. 3, pp. 227-245. Low, A 2013, Worker Turnover Rate Rising, Says Hay Study, The Business Times, <http://www.stjobs.sg/career-resources/hr-updates/worker-turnover-rate-rising-says-hay-study/a/132560>. Low, L 2000, 'Singapore’s Competitiveness in Financial Services', Research Paper Series, NUS Business School, National University of Singapore, vol. Low, PKC 2002, Corporate culture and values : perceptions of corporate leaders of co-operatives in Singapore, PhD in Business and Management thesis, The University of South Australia, Adelaide, Australia, viewed September 13th 2015. Low, PKC 2006, 'Father leadership: the Singapore case study', Management Decision, vol. 44, no. 1, pp. 89-104. Lyon, K, Legg, S & Toulson, P 2005, 'Generational Cohorts: What are They and What are the Implications for Management?', International Journal of Diversity in Organizations, Communities and Nations, vol. 5, no. 1, pp. 89-98. MacDaniel, C & Gates, R 1991, Contemporary marketing research, West Publishing, Cincinnati, OH. Macon, M & Artley, JB 2009, 'Can't We All Just Get Along? A Review Of The Challenges And Opportunities In A Multigenerational Workforce', International Journal of Business Research, vol. 9, no. 6, pp. 90-94. Magenau, JM & Pinto, JK 2004, Power, Influence and Negotiation in Project Management, The Wiley guide to managing projects, Wiley, Hoboken, New Jersey. Malhotra, NK 2010, Marketing research : an applied orientation, 6th ed. edn, Prentice Hall, Upper Saddle River, N.J. Mark, A & Snowden, DJ 2006, 'Researching practice or practicing research: innovating methods in healthcare–the contribution of Cynefin', Innovations in Health Care: A Reality Check. Basingstoke: Palgrave McMillan, vol. Marshall, C & Rossman, GB 1995, Designing qualitative research, Sage Publications, London. Maslow, AH 1943, 'A Theory of Human Motivation', Psychology Review, vol. 50, pp. 370-396.

200
Mayer, JD & Salovey, P 1997, What is emotional intelligence?, Emotional Development and Emotional Intelligence: Educational Implications, New York: Basic Books. Maynard, M 1994, 'Methods, practice and epistemology: The debate about feminism and research', Researching women‚Äôs lives from a feminist perspective, vol. 10, p. 26. McCracken, G 1988, The long interview, Sage Publications, Newbury Park, Calif. McDonald, P 2006, 'THE QUEST FOR TALENT: Audit departments must adjust their recruiting and retention strategies to compete for the best people in a changing workforce', Internal Auditor, vol. 63, no. 3, p. 72. McLeod, J & Childs, S 2013, 'The Cynefin framework: A tool for analyzing qualitative data in information science?', Library & Information Science Research, vol. 35, no. 4, pp. 299-309. Meier, A, Campbell, MK, Carr, C, Enga, Z, James, A, Reedy, J & Zheng, B 2006, 'Using the Internet to Gather Evidence in Formative Intervention Research: A Feasibility Study of Internet “Chat” Focus Groups in a Study of Lifestyle Changes in Colon Cancer Survivors', Journal of Evidence-Based Social Work, vol. 3, no. 3-4, pp. 183-200. Meredith, JR & Mantel, SJ 2002, Project management : a managerial approach, 5th ed. edn, J. Wiley, Hoboken, NJ. Merton, RK & Kendall, PL 1946, 'The Focused Interview', American journal of Sociology, vol. 51, no. 6, pp. 541-557. Meyer, JP & Seaman, MA 2013, 'A Comparison of the Exact Kruskal-Wallis Distribution to Asymptotic Approximations for All Sample Sizes up to 105', The Journal of Experimental Education, vol. 81, no. 2, pp. 139-156. Midler, C 1994, L’auto qui n’existait pas, InterE ́ ditions, Paris. Miles, MB & Huberman, AM 1994, Qualitative data analysis : an expanded sourcebook, 2nd ed. edn, Sage Publications, Thousand Oaks. Miller, WL & Crabtree, BF 1999, Doing Qualitative Research, Sage Publications, Thousand Oaks, Calif, nlebk database, <http://search.ebscohost.com/login.aspx?direct=true&db=nlebk&AN=63285&site=ehost-live&scope=site>.
201
Ministry of Finance 2014, Singapore Public Sector Outcomes Review (SPOR), viewed
December 16th 2015.
Ministry of Information, Communications and the Arts (MICA), 2012, Who we are: Economy & Trade, December 18th 2013, <http://app.www.sg/who/20/Economy-and-Trade.aspx>.
Minkov, M & Hofstede, G 2012, 'Hofstede’s Fifth Dimension: New Evidence From the World
Values Survey', Journal of Cross-Cultural Psychology, vol. 43, no. 1, pp. 3-14.
Monetary Authority of Singapore 2012a, Annual Report 2011/2012, viewed December 18th
2013, <http://www.mas.gov.sg/annual_reports/annual20112012/index.html>.
Monetary Authority of Singapore 2012b, Monetary Authority of Singapore (MAS), December
18th 2013, <http://www.mas.gov.sg>.
Monetary Authority of Singapore 2015a, Annual Report 2014/2015, viewed December 13th
2015, <http://www.mas.gov.sg/annual_reports/annual20142015/index.html>.
Monetary Authority of Singapore 2015b, MAS Publishes Framework for Domestic Systemically Important Banks in Singapore, 30 April 2015.
Morgan, DL 1997, Focus Groups as Qualitative Research, Second Edition edn, Sage
Publications.
Moustakas, C 1994, Phenomenological research methods, Sage Publications.
Mullaly, M 2006, 'LONGITUDINAL ANALYSIS OF PROJECT MANAGEMENT MATURITY',
Project Management Journal, vol. 37, no. 3, pp. 62-73.
Müller, R, Glückler, J & Aubry, M 2013, 'A Relational Typology of Project Management
Offices', vol. 44, pp. 59-76.
Munns, AK & Bjeirmi, BF 1996, 'The Role of Project Management in Achieving Project
Success', International Journal of Project Management, vol. 14, no. 2, pp. 81-87.
Murray, PJ 1997, 'Using virtual focus groups in qualitative research', Qualitative Health Research, vol. 7, no. 4, pp. 542-549.
Myers, G 1998, 'Displaying opinions: Topics and disagreement in focus groups', Language in Society, vol. 27, no. 01, pp. 85-111.
202
Myers, M 1997, 'Interpretive research in information systems', Information systems: An emerging discipline, vol., pp. 239-266. Neubronner, M 2016, Turning Gen Y On: What Every Leader Needs to Know about Recruiting and Retaining the Millennials, Candid Creation Publishing, <https://books.google.com.sg/books?id=NqgIDAAAQBAJ>. Nevis, C, DiBella, AJ & Gould, JM 1995, 'Understanding Organizations as Learning Systems', Sloan Management Review, vol. 36, no. 2, pp. 73-85. Newman, I & Benz, CR 1998, Qualitative-quantitative research methodology: Exploring the interactive continuum, Southern Illinois University Press, Carbondale, Illinois. Ng, CCJ 2008, Predictors of Project Success: A Singapore Study, Doctor of Business Administration thesis, University of Western Australia, Australia, viewed April 23rd 2015. Nicholas, JM 1989, 'Successful project management: a force-field analysis', Journal of Systems Management, vol. 40, no. 1, pp. 24-30. Nilsson, J, Jervaeus, A, Lampic, C, Eriksson, LE, Widmark, C, Armuand, GM, Malmros, J, Marshall Heyman, M & Wettergren, L 2014, '‘Will I be able to have a baby?’ Results from online focus group discussions with childhood cancer survivors in Sweden', Human Reproduction, vol. 29, no. 12, pp. 2704-2711. Nogeste, K & Walker, DHT 2005, 'Project Outcomes and Outputs—Making the Intangible Tangible', Measuring Business Excellence, vol. 9, no. 4, pp. 55-68. Nonaka, I & Takeuchi, H 1995, The Knowledge-Creating Company, Oxford University Press, Oxford. Nyamathi, A & Shuler, P 1990, 'Focus group interview: a research technique for informed nursing practice', Journal of Advanced Nursing, vol. 15, no. 11, pp. 1281-1288. O'Bannon, G 2001, 'Managing Our Future: The Generation X Factor', Public Personnel Management, vol. 30, no. 1, pp. 95-109. O'Connor, H & Madge, C 2003, '“Focus groups in cyberspace”: using the Internet for qualitative research', Qualitative Market Research: An International Journal, vol. 6, no. 2, pp. 133-143.
203
O’Leary, T & Williams, T 2008, 'Making a difference? Evaluating an innovative approach to the project management Centre of Excellence in a UK government department', International
Journal of Project Management, vol. 26, no. 5, pp. 556-565. Odman, P-J 1985, Hermeneutics, Huse ́n, T. and Postlethwaite, N.T. edn, The International Encyclopaedia of Education, Pergamon, Oxford. Orb, A, Eisenhauer, L & Wynaden, D 2001, 'Ethics in Qualitative Research', Journal of
Nursing Scholarship, vol. 33, no. 1, pp. 93-96. Oringderff, J 2008, '“My way”: Piloting an online focus group', International Journal of
Qualitative Methods, vol. 3, no. 3, pp. 69-75. Palma, S 2015, Top 1000 World Banks – Intra-Asian economic ties spur diverse bank growth, 29 June 2015 edn, The Banker, December 10th 2015, <http://www.thebanker.com>. Pan, SL, Pan, GS, Newman, M & Flynn, D 2006, 'Escalation and de-escalation of commitment to information systems projects: Insights from a project evaluation model', European Journal of Operational Research, vol. 173, no. 3, pp. 1139-1160. Parasuraman, A, Zeithaml, VA & Berry, LL 1985, 'A Conceptual Model of Service Quality and Its Implications for Future Research', Journal of Marketing, vol. 49, no. 4, pp. 41-50. Parsons, M & Greenwood, J 2000, 'A guide to the use of focus groups in health care research: Part 1', Contemporary Nurse, vol. 9, no. 2, pp. 169-180. Patton, MQ 2002, Qualitative research and evaluation methods, 3rd ed. edn, Sage Publications, Thousand Oaks, Calif. Paulk, MC, Curtis, B, Chrissis, MB & Weber, CV 1993, Capability Maturity Model for
Software, Version 1.1 (CMU/SEI-93-TR-24, ADA 263 403). Pittsburgh, Pa.: Software
Engineering Institute, Carnegie Mellon University. Pavoni, S 2015, Shanghai leads Asian FDI ranking, The Banker, December 16th 2015, <http://www.thebanker.com>. Pellegrinelli, S & Garagna, L 2009, 'Towards a conceptualisation of PMOs as agents and subjects of change and renewal', International Journal of Project Management, vol. 27, no. 7, pp. 649-656. Pemsel, S & Wiewiora, A 2013, 'Project management office a knowledge broker in project-based organisations', International Journal of Project Management, vol. 31, no. 1, pp. 31-42.
204
PERC 2012, PERC’s 2012 Report on Corruption in Asia, PER Consultancy, Hong Kong, viewed Decemebr 18th 2013, <http://www.asiarisk.com/subscribe/dataindx.html>. Pettigrew, AM & Fenton, EM 2000, The innovating organization, Sage Publications, Thousand Oaks, CA. Pheng, LS & Leong, CHY 2001, 'Asian management style versus Western management theories - A Singapore case study in construction project management', Journal of Managerial Psychology, vol. 16, no. 2, pp. 127-141. Pinto, JK & Kharbanda, OP 1995, 'Lessons for an accidental profession', Business Horizons, vol. 38, no. 2, pp. 41-50. Pinto, JK & Slevin, D 1987, 'Critical Factors in Successful Project Implementation', IEEE Transactions on Engineering Management, vol. EM-34, no. 1, pp. 22-27. Pinto, JK & Slevin, DP 1988, 'Project Success: Definitions and Measurement Techniques', Project Management Journal, vol. 19, no. 1, pp. 67-72. PM Solutions 2004, 'PM Solutions Introduces PMO in a Box; First-of-Its-Kind Offering Helps Companies Quickly Establish and Maintain Effective PMOs without Straining Internal Resources', Business Wire, 2004 Mar 24, viewed December 28th 2014, ProQuest Central database. PMI 2013, A Guide to the Project Management Body of Knowledge, 5th ed. edn, Project management body of knowledge, Project Management Institute, Newtown Square, Pa. Pooley, E 2005, 'GENERATION Y-Kids these days Twentysomethings are changing the workplace. And they're coming to a corner office near you', Canadian Business, vol. 78, no. 12, pp. 67-70. Porter, ME & Schwab, K 2009, The Global Competitiveness Report 2008-2009, Geneva, <http://www.weforum.org/reports>. Posner, BZ 1987, 'What it Takes to be a Good Project Manager', Project Management Journal, vol. 18, no. 1, pp. 51-54. Probst, G & Büchel, BST 1997, Organizational learning: The competitive advantage of the future, Prentice Hall, London, New York, N.Y.

205
Rad, PF & Levin, G 2002, The Advanced Project Management Office: A Comprehensive Look at Function and Implementation, Taylor and Francis, Hoboken. Rad, PF & Raghavan, A 2000, 'Establishing an organizational project office', AACE International Transactions, vol., p. P13A. Raftery, J 1998, 'From Ptolemy to Heisenberg: quantitative models and reality', Construction Management and Economics, vol. 16, no. 3, pp. 295-302. Raz, T, Shenhar, AJ & Dvir, D 2002, 'Risk management, project success, and technological uncertainty', R&D Management, vol. 32, no. 2, p. 101. Reiskin, H 1992, 'Focus groups: A useful technique for research and practice in nursing', Applied Nursing Research, vol. 5, no. 4, pp. 197-201. Riessman, CK 2008, Narrative methods for the human sciences, Sage Publications, Thousand Oaks. Roberts, P & Woods, L 2000, 'Alternative methods of gathering and handling data: Maximising the use of modern technology', Nurse Researcher, vol. 8, no. 2, p. 84. Robinson, N 1999, 'The use of focus group methodology — with selected examples from sexual health research', Journal of Advanced Nursing, vol. 29, no. 4, pp. 905-913. Rogelberg, SG 2002, Handbook of research methods in industrial and organizational psychology, Blackwell Publishers, Malden, MA. Rogers Everett, M 1995, 'Diffusion of innovations', New York, vol. 12. Rossman, GB & Rallis, SF 2012, Learning in the field : an introduction to qualitative research, 3rd ed. edn, Sage Publications, Thousand Oaks, Calif. Rycroft-Malone, J & Bucknall, T 2011, Models and frameworks for implementing evidence-based practice: linking evidence to action, John Wiley & Sons. Sackett, DL, Straus, SE, Richardson, WS, Rosenberg, W & Haynes, RB 2000, 'How to practice and teach EBM', Edinburgh: Churchill Livingstone, vol. Sagaram, J & Wickramanayake, J 2012, 'Financial centers in the Asia-Pacific region: an empirical study on Australia, Hong Kong, Japan and Singapore', PSL Quarterly Review, vol. 58, no. 232, pp. 1-7.
206
Sandelowski, M 1994, 'Focus on qualitative methods. Notes on transcription', Research in Nursing & Health, vol. 17, no. 4, pp. 311-314. Sanders, P 1982, 'Phenomenology: A New Way of Viewing Organizational Research', The Academy of Management Review, vol. 7, no. 3, pp. 353-360. Sanford, C & Bhattacherjee, A 2007, 'IT implementation in a developing country municipality: a sociocognitive analysis', Journal of Global Information Management (JGIM), vol. 15, no. 3, pp. 20-42. Santosus, M 2003, 'Office Discipline: Why You Need a Project Management Office', CIO, vol. 16, no. 18, pp. 1-88. Schmidt, R, Lyytinen, K, Keil, M & Cule, P 2001, 'Identifying Software Project Risks: An International Delphi Study', Journal of Management Information Systems, vol. 17, no. 4, pp. 5-36. Schultz, RL, Slevin, DP & Pinto, JK 1987, 'Strategy and tactics in process model of project implementation', Interfaces, vol. 17, no. 3, pp. 34-46. Schumacker, RE & Lomax, RG 2012, A Beginner's Guide to Structural Equation Modeling : Third Edition, 3 edn, Taylor and Francis, Hoboken, 9780203851319, <http://RMIT.eblib.com.au/patron/FullRecord.aspx?p=668347>. Schwab, K 2009, The Global Competitiveness Report 2009-2010, Geneva, <http://www.weforum.org/reports>. Schwab, K & Sala-i-Martin, X 2011, The Global Competitiveness Report 2011-2012, Citeseer. Schwandt, TA 1994, 'Constructivist, interpretivist approaches to human inquiry', in Handbook of qualitative research, Norman K. Denzin and Yvonna S. Lincoln edn, Sage Publications, London, pp. 118 - 137. Sekaran, U & Bougie, R 2010, Research methods for business: A skill building approach, 5th edn, Wiley, Chichester. Senge, PM 1990, The Fifth Discipline - The Art & Practice of the Learning Organization, Random House, Sydney, Australia. Senge, PM 2006, The fifth discipline : the art and practice of the learning organization, Rev. ed. edn, Currency Doubleday, New York, N.Y., London.
207
Sexton, PA & KPMG, M 2007, Why PMOs don't work - learning from practical experiences in non-performing Program Management Offices, KPMG, Melbourne, VIC, Australia. Shaw, S & Fairhurst, D 2008, 'Engaging a new generation of graduates', Education+ Training, vol. 50, no. 5, pp. 366-378. Shenhar, AJ & Dvir, D 2004, 'How Projects Differ, and What to Do About It', in PWG Morris & JK Pinto (eds), The Wiley guide to managing projects, Wiley, New York, pp. 1265-1286. Shenhar, AJ, Dvir, D, Levy, O & Maltz, AC 2001, 'Project Success: A Multidimensional Strategic Concept', Long Range Planning, vol. 34, no. 6, pp. 699-725. Shenhar, AJ, Tishler, A, Dvir, D, Lipovetsky, S & Lechler, T 2002, 'Refining the search for project success factors: a multivariate, typological approach', R&D Management, vol. 32, no. 2, pp. 111-126. Shiferaw, AT & Klakegg, OJ 2013, 'Project Evaluation: Accomplishments, Shortfalls, and Lessons Learned in Housing Development Projects in Ethiopia', Journal of Management in Engineering, vol. 29, no. 3, pp. 289-301. Silverman, D 2010, Doing qualitative research : a practical handbook, 3rd ed. edn, Sage Publications, London, Thousand Oaks, Calif. Sim, J 1998, 'Collecting and analysing qualitative data: issues raised by the focus group', Journal of Advanced Nursing, vol. 28, no. 2, pp. 345-352. Simons, A 2009, 'Changing workplace demographics: T + B + Y + X = opportunity', CPA Practice Management Forum, vol. 5, no. 5, pp. 15-23, viewed April 18th 2014, Academic OneFile database, <http://go.galegroup.com.ezproxy.lib.rmit.edu.au/ps/i.do?id=GALE%7CA204419463&v=2.1&u=rmit&it=r&p=AONE&sw=w&asid=dafed5f0dc8c8778bdce6b474ea66876>. Singapore Department of Statistics 2012, 'Singapore in Figures 2012', viewed December 18th 2013, <http://www.singstat.gov.sg/statistics>. Singapore Human Resources Institute 2008, Harnessing the Potential of Gen-Y Workforce in Singapore, <http://shri.org.sg/recent-works/harnessing-the-potential-of-gen-y-workforce-in-singapore/>. Singapore Media Fusion 2011, 'About Singapore', viewed December 18th 2013, <http://www.smf.sg/SingaporeMediaCity/Pages/AboutSingapore.aspx>.
208
Singapore Ministry of Trade and Industry 2012, MTI Occasional Paper on Population and Economy, MTI: Singapore, Singapore, September 25, 2012, <http://www.mti.gov.sg/MTIInsights/Pages/MTI-Occasional-Paper-on-Population-and-Economy.aspx>. Singh, R, Keil, M & Kasi, V 2009, 'Identifying and overcoming the challenges of implementing a project management office', European Journal of Information Systems, vol. 18, no. 5, pp. 409-427. Sirias, D, Karp, H & Brotherton, T 2007, 'Comparing the levels of individualism/collectivism between baby boomers and generation X: Implications for teamwork', Management Research News, vol. 30, no. 10, pp. 749-761. Smith, C 2014, Playing the project manager, CreateSpace Independent Publishing Platform, Manchester. Smith, G 2001, 'Making the team [project team building and leadership]', IEE Review, vol. 47, no. 5, pp. 33-36. Smith, GR 1999, 'Project Leadership: Why Project Management Alone Doesn't Work'', Hospital Materiel Management Quarterly, vol. 21, no. 1, pp. 88-92. Smithson, J 2000, 'Using and analysing focus groups: limitations and possibilities', International Journal of Social Research Methodology, vol. 3, no. 2, pp. 103-119. Smola, KW & Sutton, CD 2002, 'Generational Differences: Revisiting Generational Work Values for the New Millennium', Journal of Organizational Behavior, vol. 23, no. 4, pp. 363-382. Snowden, DJ 2007, 'The intranet as a complex ecology', Content Management Review, vol. no. 1, pp. 17–20. Snowden, DJ 2010, 'The origins of Cynefin', vol. 2011, viewed July 23rd 2015, <http://cognitive-edge.com/blog/part-one-origins-of-cynefin/>. Snowden, DJ & Boone, ME 2007, 'A Leader's Framework for Decision Making. (cover story)', Harvard Business Review, vol. 85, no. 11, pp. 68-76. Software Engineering Institute, C-MU 2006, Capability Maturity Model Integration (CMMI®) for Development, 1.2, Carnegie Mellon University, viewed August 22nd 2010, <http://www.sei.cmu.edu/cmmi>.

209
Solnet, D & Hood, A 2008, 'Generation Y as hospitality employees: framing a research agenda', Journal of Hospitality and Tourism Management, vol. 15, no. 1, pp. 59-68. Spelta, AG & Albertin, AL 2012, 'Project Management Offices in the IT Area: A Context–Discriminant Model for their Establishment', Information Systems Management, vol. 29, no. 1, pp. 40-54. Spiro, C 2006, 'Generation Y in the Workplace', Defense AT&l, vol. 35, no. 6, p. 4. SPMI 'PMI Singapore Chapter', viewed <http://www.pmi.org.sg>. Stacey, RD 2011, Strategic management and organisational dynamics : the challenge of
complexity to ways of thinking about organisations, 6th ed. edn, Strategic management and organizational dynamics, Financial Times Prentice Hall, Harlow, England, New York. Stake, RE 1995, The art of case study research, Sage Publications, Thousand Oaks. Standish Group International 2001, Extreme Chaos, Boston, MA. Standish Group International 2004, 2004 Third Quarter Research Report, Boston, MA, <http://www.infoq.com/articles/Interview-Johnson-Standish-CHAOS>. Standish Group International 2013, Chaos Manifesto 2013, Boston, MA. Stanleigh, M 2006, 'From crisis to control: New standards for project management', Ivey
Business Journal. Ontario, Canada, vol., pp. 1-4. Stevenson, J 2008, 'Managing the ‘millennials’', Business West, vol. 24, no. 21, pp. 42-46. Stewart, DW, Shamdasani, PN & Rook, DW 2007, Focus groups : theory and practice, 2nd ed. edn, Sage Publications, Thousand Oaks. Stewart, TA 2000, Intellectual Capital - The New Wealth of Organizations, Nicholas Brealey Publishing, London. Strauss, AL & Corbin, JM 1998, Basics of qualitative research : techniques and procedures
for developing grounded theory, 2nd ed. edn, Sage Publications, Thousand Oaks, <http://srmo.sagepub.com.ezproxy.lib.rmit.edu.au/view/basics-of-qualitative-research/SAGE.xml>.
210
Sue, VM, Ritter, LA & Sue, VMA 2007, Conducting online surveys, Sage Publications, Los
Angeles, CA, USA.
Sullivan, SE, Forret, ML, Carraher, SM & Mainiero, LA 2009, 'Using the kaleidoscope career
model to examine generational differences in work attitudes', Career Development International, vol. 14, no. 3, pp. 284-302.
Szulanski, G 1996, 'Exploring internal stickiness: Impediments to the transfer of best practice
within the firm', Strategic Management Journal, vol. 17, no. Winter special Issue, pp. 27-43.
Szulanski, G & Jensen, RJ 2004, 'Overcoming Stickiness: An Empirical Investigation of the
Role of the Template in the Replication of Organizational Routines', Managerial and Decision Economics, vol. 25, no. 6-7, pp. 347-363.
Szymczak, CC & Walker, DHT 2003, 'Boeing-A Case Study Example of Enterprise Project
Management from a Learning Organisation Perspective', The Learning Organization, vol. 10,
no. 3, pp. 125-139.
Tan, CH 2005, Financial Markets and Institutions in Singapore, 11th ed. edn, Financial
markets & institutions in Singapore, Singapore University Press, Singapore, viewed
December 18th 2013.
Tan, CW, Pan, SL & Lim, ETK 2005, 'Managing stakeholder interests in e- government
implementation: Lessons learned from a Singapore e-government project.', Journal Of Global Information Management, vol. 13, no. 1, pp. 31–35.
Tan, KB 2012, 'Do those rankings matter?', Today, 06 June 2012,
<http://www.channelnewsasia.com/stories/singaporelocalnews/view/1205837/1/.html>.
Tan, W & Chong, E 2003, 'Power distance in Singapore construction organizations:
implications for project managers', International Journal of Project Management, vol. 21, no.
7, pp. 529-536.
Tate, E & Jones, L 1975, 'Systems, Models and Decisions, units 1/2 from the Third Level
Course on Systems Modelling', The Open University Press, Milton Keynes, vol.
Taylor, FW 1947, Principles of Scientific Management, Harper, New York.
Taylor, H 2007, 'Outsourced IT Projects from the Vendor Perspective: Different Goals,
Different Risks', Journal Of Global Information Management, vol. 15, no. 2, pp. 1-27.
211
Taylor, SJ & Bogdan, R 1998, Introduction to qualitative research methods: The search for meaning, 3rd ed. edn, Wiley, New York. Teece, DJ 2007, 'Explicating dynamic capabilities: the nature and microfoundations of (sustainable) enterprise performance', Strategic Management Journal, vol. 28, no. 13, pp. 1319-1350. Teece, DJ 2014, 'A dynamic capabilities-based entrepreneurial theory of the multinational enterprise', Journal of International Business Studies, vol. 45, no. 1, pp. 8-37. Teo, TSH & Koh, TK 2010, 'Lessons from multi-agency information management projects: Case of the Online Business Licensing Service (OBLS) Project, Singapore', International Journal of Information Management, vol. 30, no. 1, pp. 85-93. Thal, AE & Bedingfield, JD 2010, 'Successful project managers: an exploratory study into the impact of personality', Technology Analysis & Strategic Management, vol. 22, no. 2, pp. 243-259. Thamhain, HJ 2004, 'Leading Technology-Based Project Teams', Engineering Management Journal, vol. 16, no. 2, pp. 35-42. The Hofstede Centre 2015, 'Dimensions of National Culture - Singapore', vol., viewed December 19th 2013, database. The Organisation for Economic Co-operation and Development 2012, OECD, viewed <http://www.oecd.org/about/>. The Straits Times 1991, 'Shared values should help us develop a Singaporean identity', The Straits Times, 16th January 1991, viewed December 16th 2015. Thite, M 1999, 'Identifying key characteristics of technical project leadership', Leadership & Organization Development Journal, vol. 20, no. 5, pp. 253-261. Thomas, J, Delisle, CL & Jugdev, K 2002, Selling Project Management to Senior Executives: framing the moves that matter, Project Management Journal, Project Management Institute, Newtown Square, PA. Thomas, J & Mullaly, ME 2008, Researching the value of project management, Project Management Institute, Newtown Square, PA. Thurmond, VA 2001, 'The point of triangulation', Journal of Nursing Scholarship, vol. 33, no. 3, pp. 253-258.
212
Timmermann, S 2007, 'What a difference a generation makes: How our life experiences shape our viewpoints and behaviors', Journal of Financial Service Professionals, vol. 61, no. 3, p. 25. Toney, F 2002, The superior project organization: Global competency standards and best practices, Marcel Dekker, New York. Toney, F & Powers, R 1997, Best Practices of Project Management Groups in Large Functional Organizations, Project Management Institute, Upper Darby, Pa., USA. Tripartite Alliance for Fair Employment Practices 2010, 'Harnessing the potential of Singapore’s multi-generational workforce', Singapore: TAFEP, vol., pp. 3-11. Tulgan, B 2011, 'Generation Y', Journal of Leadership Studies, vol. 5, no. 3, pp. 77-81. Turner, JR & Cochrane, RA 1993, 'Goals-and-methods matrix: coping with projects with ill defined goals and/or methods of achieving them', International Journal of Project Management, vol. 11, no. 2, pp. 93-102. Turner, JR & Müller, R 2005, 'The Project Manager's Leadership Style as a Success Factor on Projects: A Literature Review.', Project Management Journal, vol. 36, no. 2, pp. 49-61. Tuttas, CA 2015, 'Lessons Learned Using Web Conference Technology for Online Focus Group Interviews', Qualitative Health Research, vol. 25, no. 1, pp. 122-133. Twenge, JM & Campbell, SM 2008, 'Generational differences in psychological traits and their impact on the workplace', Journal of Managerial Psychology, vol. 23, no. 8, pp. 862-877. Tyler, K & Stanley, E 2007, 'The role of trust in financial services business relationships', The Journal of Services Marketing, vol. 21, no. 5, pp. 334-344. Unger, BN, Gemünden, HG & Aubry, M 2012, 'The three roles of a project portfolio management office: Their impact on portfolio management execution and success', International Journal of Project Management, vol. 30, no. 5, pp. 608-620. Van Beurden, EK, Kia, AM, Zask, A, Dietrich, U & Rose, L 2011, 'Making sense in a complex landscape: how the Cynefin Framework from Complex Adaptive Systems Theory can inform health promotion practice', Health Promotion International, vol. 28, no. 1, pp. 73-83.
213
Vasja, V & Katja, LM 2008, Overview: Online Surveys. The SAGE Handbook of Online Research Methods. SAGE Publications, Ltd, Sage Publications, London, England, SAGE
Research Methods database, <http://dx.doi.org/10.4135/9780857020055>.
Verweij, M & Pelizzo, R 2009, 'SINGAPORE: DOES AUTHORITARIANISM PAY?', Journal of Democracy, vol. 20, no. 2, pp. 18-32.
von Krough, G, Ichijo, K & Takeuchi, H 2000, Enabling Knowledge Creation, Oxford
University Press, Oxford.
Vu, KM 2013, 'Information and Communication Technology (ICT) and Singapore’s economic
growth', Information Economics and Policy, vol. 25, no. 4, pp. 284-300.
Waclawski, E 2012, 'How I Use It: Survey Monkey', Occupational Medicine, vol. 62, no. 6, pp.
477-477.
Wagner, KL 2007, 'Filling the Gap: The generation gap in the workplace creates challenges
for managers wanting to build a team', Journal of Property Management, vol. 72, no. 5, p. 29.
Walker, DHT 2004, The Knowledge Advantage (K-Adv) Unleashing Creativity and Innovation,
Final Report for CRC in Construction Innovation Project 2001-004 (2B) "Delievering
Improved Knowledge Management and Innovation Diffusion in the Construction Industry",
Melbourne, <C:\04-DPM\Busm2077-Bm601\04-K-Adv-final.pdf>.
Walker, DHT, Bourne, L & Rowlinson, S 2008, 'Stakeholders and the Supply Chain', in DHT
Walker & S Rowlinson (eds), Procurement Systems - A Cross Industry Project Management Perspective, Taylor & Francis, Abingdon, Oxon, pp. 70-100.
Walker, DHT & Christenson, D 2005, 'Knowledge Wisdom and Networks: A Project
Management Centre of Excellence Example', The Learning Organization, vol. 12, no. 3, pp.
275-291.
Walker, DHT & Nogeste, K 2008, 'Performance Measures and Project Procurement', in DHT
Walker & S Rowlinson (eds), Procurement Systems - A Cross Industry Project Management Perspective, Taylor & Francis, Abingdon, Oxon, pp. 177-210.
Walker, DHT & Rowlinson, S (eds) 2008a, Procurement Systems - A Cross Industry Project Management Perspective, Taylor & Francis, Abingdon, Oxon.
Walker, DHT & Rowlinson, S 2008b, 'Project Types and their Procurement Needs', in DHT
Walker & S Rowlinson (eds), Procurement Systems - A Cross Industry Project Management Perspective, Taylor & Francis, Abingdon, Oxon, pp. 32-69.

214
Walz, DB, Elam, JJ & Curtis, B 1993, 'Inside a Software Design Team: Knowledge Acquisition, Sharing, and Integration', Commun. ACM, vol. 36, no. 10, pp. 63-77. Wang, J & Wang, X 2012, Structural Equation Modeling Applications Using Mplus, Structural Equation Modeling -Applications Using Mplus, Wiley, Hoboken, Chichester, West Sussex. Ward, J & Daniel, EM 2013, 'The role of project management offices (PMOs) in IS project success and management satisfaction', Journal of Enterprise Information Management, vol. 26, no. 3, pp. 316-336. Warde, A 2005, 'Consumption and theories of practice', Journal of consumer culture, vol. 5, no. 2, pp. 131-153. Wateridge, J 1997, 'Training for IS/IT project managers: a way forward', International Journal of Project Management, vol. 15, no. 5, pp. 283-288. Weissman, RX 1998, 'Online or off target?', American Demographics, vol. 20, no. 11, pp. 20-21. White, R 2006, 'Four generations learning to work better together', Public Management, vol. 88, p. 35. Wiig, KM 1997, 'Knowledge Management: An Introduction and Perspective', Journal of Knowledge Management, vol. 1, no. 1, pp. 6-14. Winter, M, Smith, C, Morris, P & Cicmil, S 2006, 'Directions for future research in project management: The main findings of a UK government-funded research network', International Journal of Project Management, vol. 24, no. 8, pp. 638-649. Winter, S 2000, 'The satisficing principle in capability learning', Strategic Management Journal, vol. 21, pp. 981-996. Wong, M, Gardiner, E, Lang, W & Coulon, L 2008, 'Generational differences in personality and motivation: do they exist and what are the implications for the workplace?', Journal of Managerial Psychology, vol. 23, no. 8, pp. 878-890. Woodward, J 1980, Industrial organization : theory and practice, 2nd ed. edn, Oxford University Press, Oxford, New York.
215
Yap Chee, M, Foo Say, W, Wong Pob, K & Singh, M 1998, 'The Impact of Organisational Characteristics on the Outcome of New Product Development Projects In Singapore-based Firms', Singapore Management Review, vol. 20, no. 1, p. 25. Yeandle, M, Jiang, X & Mainelli, M 2015, The Global Financial Centres Index 17, London, <http://www.finance-montreal.com/sites/default/files/publications/gfci17_23march2015.pdf>. Yin, RK 2014, Case study research : design and methods, Fifth edition. edn, Sage Publications, Thousand Oaks, Calif. Young, RC 2005, Explaining senior management support through IT project governance, thesis, Macquarie University, Sydney, MGSM. Yunis, MM, Koong, KS, Liu, LC, Kwan, R & Tsang, P 2012, 'ICT maturity as a driver to global competitiveness: a national level analysis', International Journal of Accounting and
Information Management, vol. 20, no. 3, pp. 255-281. Zairi, M 1998, Benchmarking for best practice : continuous learning through sustainable
innovation, Paperback ed. edn, Butterworth Heinemann, Oxford, Boston. Zaleznik, A 1992, 'Managers and leaders: Are they different?', Harvard Business Review, vol. 70, no. 2, pp. 126-136. Zemke, R, Raines, C & Filipczak, B 2000, Generations at work : managing the clash of
veterans, boomers, xers, and nexters in your workplace, AMACOM, New York. Zhang, Y & Wildemuth, BM 2009, Qualitative analysis of content, Wildemuth, Barbara M edn, August 31st 2014, <https://www.ischool.utexas.edu/~yanz/Content_analysis.pdf>. Zwikael, O & Globerson, S 2006, 'From Critical Success Factors to Critical Success Processes', International Journal of Production Research, vol. 44, no. 17, pp. 3433-3449.
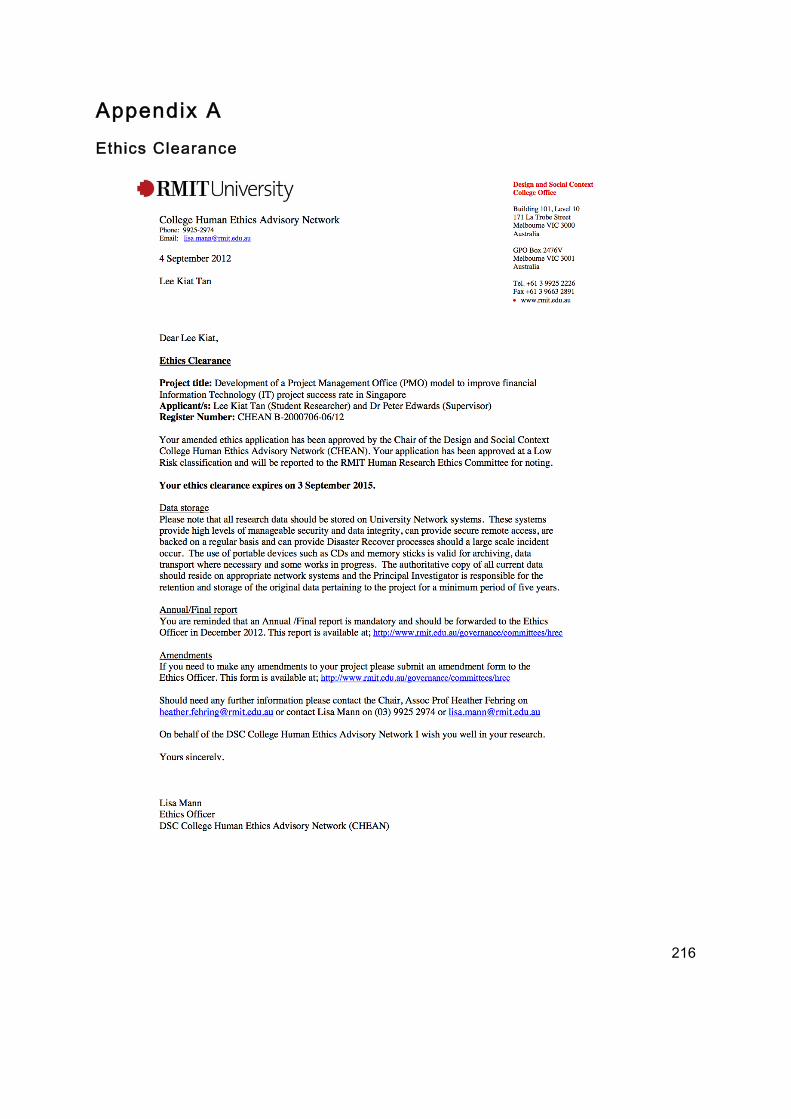
216
Appendix A Ethics Clearance
217
Appendix B Appendix B-1 (Pilot Interview Questions)
Demographics
Demographics: participant’s experience, organisation’s business model, position, role in PMO, types of projects.
Documentation: PMO project documentation and processes, mission and policy documents and organograms for the parent organisation.
Interview start and end date and time.
Organisational Structure
I would like to understand better on the organisation’s structure and what roles does your PMO play within the company.
1. Can you tell us the purpose of PMO in your organisation?
2. Please describe your organisational structure, and where PMO fits within it.
3. Please describe how and when the PMO was established.
4. What was the original staff establishment for the PMO?
5. Were staff originally transferred internally from the parent organisation; or recruited externally?
6. What is the current structure and size of the PMO? What are their job scopes?
7. Please describe the decision-making authority of the PMO. Who does PMO reports to (CEOor to the Business Units of the organisation)?
8. Does the PMO only deal with IT projects for the organisation? If NO, then please describewhat other projects are included.
9. Typically, how many IT project would the PMO deal with in a year?
10. Please describe how the structuring of functions and adopting of roles for your PMO hasimproved the rate of project success in your organisation.
11. Please rate the importance of the following factors that shape your PMO structure andoperational methods:
a. Percentage of organisation’s project managers within the PMO unit(1) Totally unimportant | (2) Fairly unimportant | (3) Neither unimportant nor important | (4)Fairly important | (5) Critically important | ‘Not Applicable’

218
b. Proportion of all organisation projects within PMO mandate (the greater the proportion, the more effective the PMO can be).
(1) Totally unimportant | (2) Fairly unimportant | (3) Neither unimportant nor important | (4) Fairly important | (5) Critically important | ‘Not Applicable’
c. Supportiveness of organisational culture (1) Totally unimportant | (2) Fairly unimportant | (3) Neither unimportant nor important | (4) Fairly important | (5) Critically important | ‘Not Applicable’
d. Extent of decision-making authority of the PMO (1) Totally unimportant | (2) Fairly unimportant | (3) Neither unimportant nor important | (4) Fairly important | (5) Critically important | ‘Not Applicable’
e. Maturity in project management (1) Totally unimportant | (2) Fairly unimportant | (3) Neither unimportant nor important | (4) Fairly important | (5) Critically important | ‘Not Applicable’
f. Ease of project status reporting to higher levels of host organisation management (1) Totally unimportant | (2) Fairly unimportant | (3) Neither unimportant nor important | (4) Fairly important | (5) Critically important | ‘Not Applicable’
12. Do you see any areas of improvement derived from the projects based on the current functions and roles?
13. How about any root causes of failure derived from the projects based on the current functions and roles?
14. How useful would a model be for organisations that are planning to form a new PMO or restructure an existing one?
PMO CSFs and Performance
There is not universal standard of measuring the effectiveness of a PMO. I would like to understand better the PMO CSFs for project success and how PMO can contribute to project performance.
1. Please recall a few recent IT projects, and share with us the organisation and PMO CSFs for project success?
2. For each project, how would you assess it against the success criteria? Is there any memorable or noteworthy aspect of any of the projects that influenced the way it was assessed?
3. What competencies are needed from project managers that could help to achieve better IT project success within the PMO?

219
4. Please rate the importance of the following project manager competencies in your organisation:
a. Technical expertise (1) Totally unimportant | (2) Fairly unimportant | (3) Neither unimportant nor important | (4) Fairly important | (5) Critically important | ‘Not Applicable’
b. Domain expertise
(1) Totally unimportant | (2) Fairly unimportant | (3) Neither unimportant nor important | (4) Fairly important | (5) Critically important | ‘Not Applicable’
c. Soft skills (tacit knowledge of organisational culture and clients) (1) Totally unimportant | (2) Fairly unimportant | (3) Neither unimportant nor important | (4) Fairly important | (5) Critically important | ‘Not Applicable’
5. What is the current age structure of the PMO in your host organisation?
6. Is there any Generation Y staff in the PMO? If NO, why?
7. Do you see any implications of introducing Generation Y staff into the PMO?
8. Do you have any policies / procedures for dealing with generational change and integration?
Project Maturity
Organisations have different metrics for project management maturity. The PMO maturity ultimately influences the level of project management maturity within the organisation, which is related to the performance of the PMO and thereby act as predictor.
1. Does your organisation adopt Capability Maturity Model Integration (CMMI®) for Development or other category maturity model or criteria?
2. If NO, do you see any relevance about the PMO maturity to the organisation? How is it considered?
3. How would you define your organisation’s current project maturity level? Level 1 – Initial | Level 2 – Managed Level 3 – Defined | Level 4 – Quantitatively Managed | Level 5 – Optimizing
Additional Points
1. What features would you expect to find in a PMO model for managing financial IT projects in Singapore?
2. What features would be exclusive to Singapore?
3. How would you expect a host organisation to support/encourage the adoption of a PMO model?
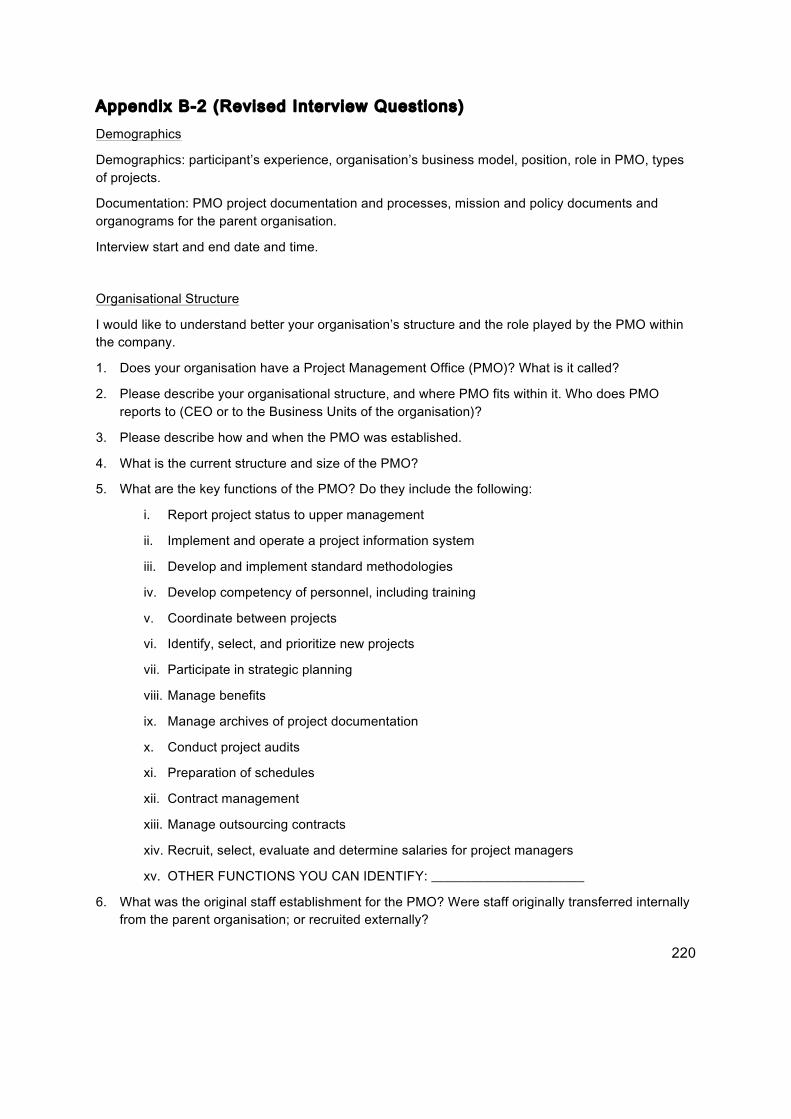
220
Appendix B-2 (Revised Interview Questions) Demographics
Demographics: participant’s experience, organisation’s business model, position, role in PMO, types of projects.
Documentation: PMO project documentation and processes, mission and policy documents and organograms for the parent organisation.
Interview start and end date and time.
Organisational Structure
I would like to understand better your organisation’s structure and the role played by the PMO within the company.
1. Does your organisation have a Project Management Office (PMO)? What is it called?
2. Please describe your organisational structure, and where PMO fits within it. Who does PMO reports to (CEO or to the Business Units of the organisation)?
3. Please describe how and when the PMO was established.
4. What is the current structure and size of the PMO?
5. What are the key functions of the PMO? Do they include the following:
i. Report project status to upper management
ii. Implement and operate a project information system
iii. Develop and implement standard methodologies
iv. Develop competency of personnel, including training
v. Coordinate between projects
vi. Identify, select, and prioritize new projects
vii. Participate in strategic planning
viii. Manage benefits
ix. Manage archives of project documentation
x. Conduct project audits
xi. Preparation of schedules
xii. Contract management
xiii. Manage outsourcing contracts
xiv. Recruit, select, evaluate and determine salaries for project managers
xv. OTHER FUNCTIONS YOU CAN IDENTIFY: _______________________
6. What was the original staff establishment for the PMO? Were staff originally transferred internally from the parent organisation; or recruited externally?
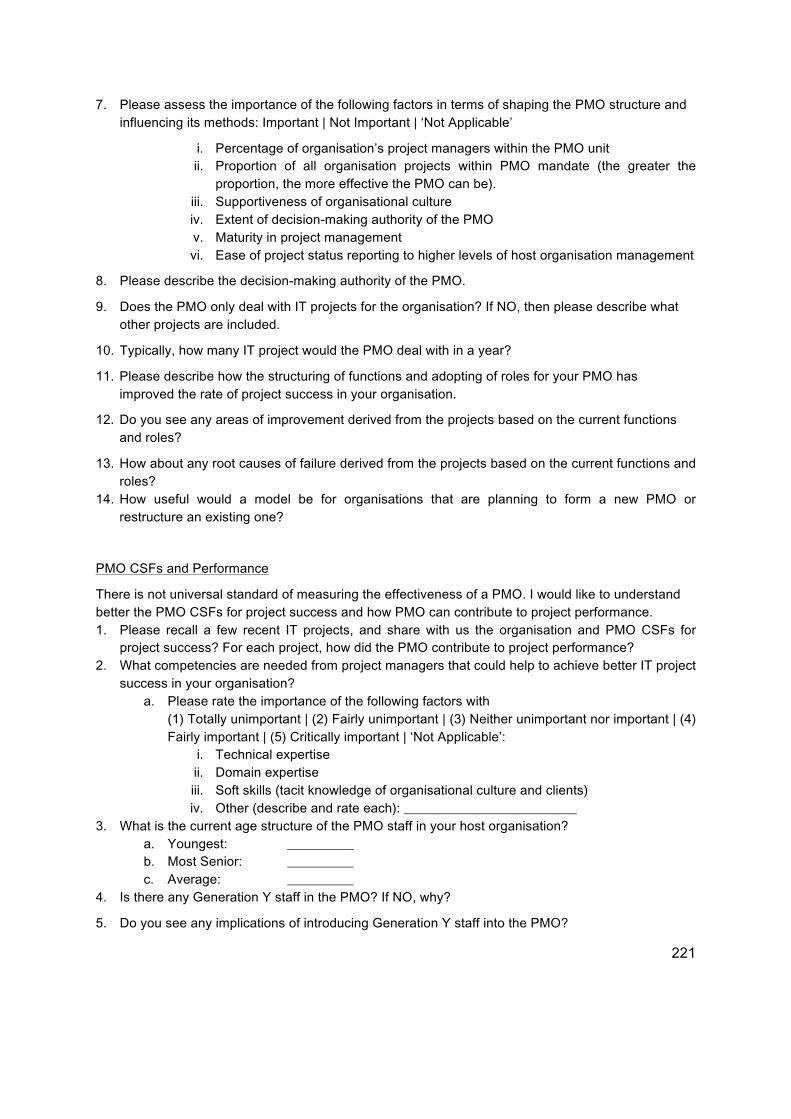
221
7. Please assess the importance of the following factors in terms of shaping the PMO structure and influencing its methods: Important | Not Important | ‘Not Applicable’
i. Percentage of organisation’s project managers within the PMO unit ii. Proportion of all organisation projects within PMO mandate (the greater the
proportion, the more effective the PMO can be). iii. Supportiveness of organisational culture iv. Extent of decision-making authority of the PMO v. Maturity in project management vi. Ease of project status reporting to higher levels of host organisation management
8. Please describe the decision-making authority of the PMO.
9. Does the PMO only deal with IT projects for the organisation? If NO, then please describe what other projects are included.
10. Typically, how many IT project would the PMO deal with in a year?
11. Please describe how the structuring of functions and adopting of roles for your PMO has improved the rate of project success in your organisation.
12. Do you see any areas of improvement derived from the projects based on the current functions and roles?
13. How about any root causes of failure derived from the projects based on the current functions and roles?
14. How useful would a model be for organisations that are planning to form a new PMO or restructure an existing one?
PMO CSFs and Performance
There is not universal standard of measuring the effectiveness of a PMO. I would like to understand better the PMO CSFs for project success and how PMO can contribute to project performance. 1. Please recall a few recent IT projects, and share with us the organisation and PMO CSFs for
project success? For each project, how did the PMO contribute to project performance? 2. What competencies are needed from project managers that could help to achieve better IT project
success in your organisation? a. Please rate the importance of the following factors with
(1) Totally unimportant | (2) Fairly unimportant | (3) Neither unimportant nor important | (4) Fairly important | (5) Critically important | ‘Not Applicable’:
i. Technical expertise ii. Domain expertise iii. Soft skills (tacit knowledge of organisational culture and clients) iv. Other (describe and rate each): __________________________
3. What is the current age structure of the PMO staff in your host organisation? a. Youngest: __________ b. Most Senior: __________ c. Average: __________
4. Is there any Generation Y staff in the PMO? If NO, why?
5. Do you see any implications of introducing Generation Y staff into the PMO?

222
6. Does the PMO have any policies / procedures for dealing with generational change and integration?
Project Maturity
Organisations have different metrics for project management maturity. The PMO maturity ultimately influences the level of project management maturity within the organisation, which is related to the performance of the PMO and thereby acts as performance predictor.
1. Does your organisation adopt Capability Maturity Model Integration (CMMI®) for Development or other category maturity model or criteria?
2. If NO, do you see any relevance about the PMO maturity to the organisation? How is it considered?
3. How would you define your organisation’s current project maturity level (according to CMMI)? Level 1 – Initial | Level 2 – Managed Level 3 – Defined | Level 4 – Quantitatively Managed | Level 5 – Optimizing
Additional Points
1. What features would you expect to find in a PMO model for managing financial IT projects in Singapore? What features would be exclusive to Singapore?
2. How would you expect a host organisation to support/encourage the adoption of a PMO model?
3. Other comments/views?

223
RMIT University
Building 8, Level 8
360 Swanston Street
Melbourne VIC 3001
Australia
GPO Box 2476V
Melbourne VIC 3001
Australia
Appendix B-3 (Participant Request Letter)
Design and Social Context Portfolio
School of Property Construction and Project Management.
INVITATION TO PARTICIPATE IN A RESEARCH PROJECT
PARTICIPANT INFORMATION
Project Tit le: Development of a Project Management Office (PMO) model to improve financial Information Technology (IT) projects success rate in Singapore
Investigators:
• Tan Lee Kiat, MComp, BComp, Email: • Professor Derek Walker, PhD, MSc, MAE, GradDip Mngt Sys, DipBld, Email:
[email protected] (Senior Supervisor) • Dr Peter Edwards, PhD, MSc, ADip Arts, SQE QS, Email: [email protected]
Dear XXXXX,
You are invited to participate in a research project being conducted by RMIT University. Please read this sheet carefully and be confident that you understand its contents before deciding whether to participate. If you have any questions about the project, please ask one of the investigators.
Who is involved in this research project? Why is i t being conducted?
My name is Tan Lee Kiat and I am conducting this research as part of the Doctor of Philosophy program at RMIT University. The title of my research is “Development of a Project Management Office (PMO) model to improve financial Information Technology (IT) projects success rate in Singapore”. Dr Peter Edwards from RMIT is supervising the thesis.
The aim of this research study is to develop a theoretically based and practically relevant model of PMO that will improve the success rate of projects based on critical characteristics of the PMO, organisational context and the organisation’s project maturity. The outcome of this research is a
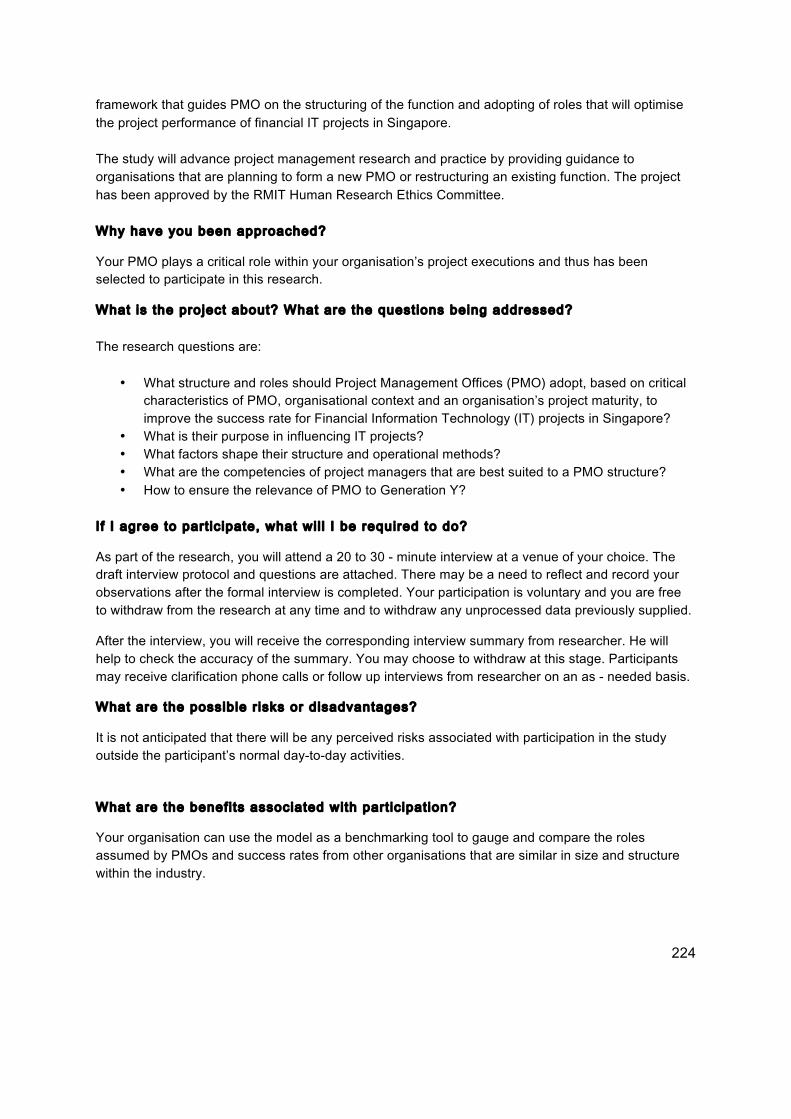
224
framework that guides PMO on the structuring of the function and adopting of roles that will optimise
the project performance of financial IT projects in Singapore.
The study will advance project management research and practice by providing guidance to
organisations that are planning to form a new PMO or restructuring an existing function. The project
has been approved by the RMIT Human Research Ethics Committee.
Why have you been approached?
Your PMO plays a critical role within your organisation’s project executions and thus has been
selected to participate in this research.
What is the project about? What are the questions being addressed?
The research questions are:
• What structure and roles should Project Management Offices (PMO) adopt, based on critical
characteristics of PMO, organisational context and an organisation’s project maturity, to
improve the success rate for Financial Information Technology (IT) projects in Singapore?
• What is their purpose in influencing IT projects?
• What factors shape their structure and operational methods?
• What are the competencies of project managers that are best suited to a PMO structure?
• How to ensure the relevance of PMO to Generation Y?
If I agree to part ic ipate, what wil l I be required to do?
As part of the research, you will attend a 20 to 30 - minute interview at a venue of your choice. The
draft interview protocol and questions are attached. There may be a need to reflect and record your
observations after the formal interview is completed. Your participation is voluntary and you are free
to withdraw from the research at any time and to withdraw any unprocessed data previously supplied.
After the interview, you will receive the corresponding interview summary from researcher. He will
help to check the accuracy of the summary. You may choose to withdraw at this stage. Participants
may receive clarification phone calls or follow up interviews from researcher on an as - needed basis.
What are the possible r isks or disadvantages?
It is not anticipated that there will be any perceived risks associated with participation in the study
outside the participant’s normal day-to-day activities.
What are the benefits associated with part ic ipation?
Your organisation can use the model as a benchmarking tool to gauge and compare the roles
assumed by PMOs and success rates from other organisations that are similar in size and structure
within the industry.
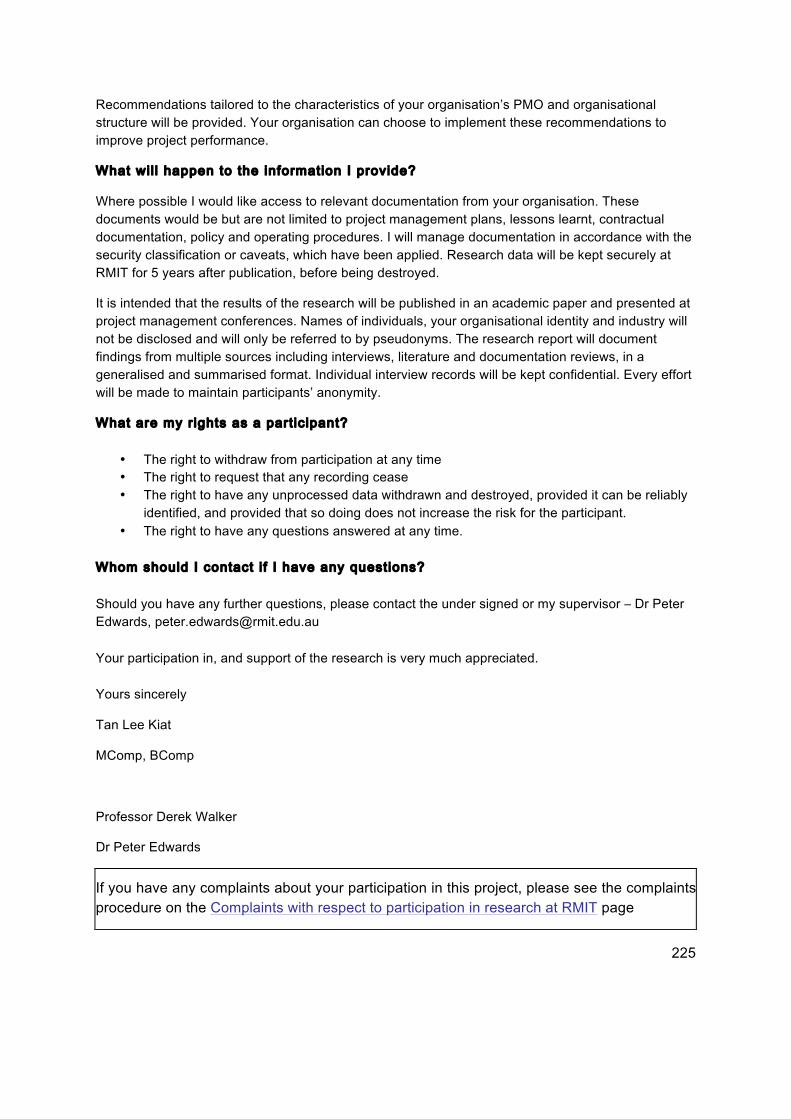
225
Recommendations tailored to the characteristics of your organisation’s PMO and organisational structure will be provided. Your organisation can choose to implement these recommendations to improve project performance.
What wil l happen to the information I provide?
Where possible I would like access to relevant documentation from your organisation. These documents would be but are not limited to project management plans, lessons learnt, contractual documentation, policy and operating procedures. I will manage documentation in accordance with the security classification or caveats, which have been applied. Research data will be kept securely at RMIT for 5 years after publication, before being destroyed.
It is intended that the results of the research will be published in an academic paper and presented at project management conferences. Names of individuals, your organisational identity and industry will not be disclosed and will only be referred to by pseudonyms. The research report will document findings from multiple sources including interviews, literature and documentation reviews, in a generalised and summarised format. Individual interview records will be kept confidential. Every effort will be made to maintain participants’ anonymity.
What are my r ights as a part ic ipant?
• The right to withdraw from participation at any time • The right to request that any recording cease • The right to have any unprocessed data withdrawn and destroyed, provided it can be reliably
identified, and provided that so doing does not increase the risk for the participant. • The right to have any questions answered at any time.
Whom should I contact i f I have any questions?
Should you have any further questions, please contact the under signed or my supervisor – Dr Peter Edwards, [email protected]
Your participation in, and support of the research is very much appreciated.
Yours sincerely
Tan Lee Kiat
MComp, BComp
Professor Derek Walker
Dr Peter Edwards
If you have any complaints about your participation in this project, please see the complaints procedure on the Complaints with respect to participation in research at RMIT page

226
Appendix B-4 (Participant Consent Form)
1. I have had the project explained to me, and I have read the information sheet
2. I agree to participate in the research project as described
3. I agree:
• to be interviewed • that my voice will be audio recorded
4. I acknowledge that:
(a) I understand that my participation is voluntary and that I am free to withdraw from the
project at any time and to withdraw any unprocessed data previously supplied (unless follow-up is needed for safety).
(b) The project is for the purpose of research. It may not be of direct benefit to me.
(c) The privacy of the personal information I provide will be safeguarded and only disclosed where I have consented to the disclosure or as required by law.
(d) The security of the research data will be protected during and after completion of the study. The data collected during the study may be published, and a report of the project outcomes will be provided to XXX. Any information that will identify me will not be used.
Participant’s Consent
Participant: Date:
(Signature)

227
Appendix B-5 (Participant Request for Online Focus Group)
Invitat ion to part ic ipate in an Online Focus Group
Hi xxx,
Thanks again for providing your inputs in the online survey.
The title of my research is “Development of a Project Management Office (PMO) model to improve
financial Information Technology (IT) projects success rate in Singapore”. The combined results of the
interviews and online survey responses have been analysed and I have formulated a list of variables,
which are essentially important structural and organisational factors that form the constituents of
effective PMOs. A conceptual model of PMO, based upon the variables and findings from the data
analysis has been developed.
Can I once again invite you to participate in an online focus group? The objective is to seek your
expert opinions on the PMO model, which is designed to guide strategic and tactical decision-making
in the design and implementation of PMO, with the aim of improving financial IT projects success rate
in Singapore.
The technical tool selected to support the online focus group is Edmodo. If you are agreeable, I will
send you the login details.
Regards,
Tan Lee Kiat
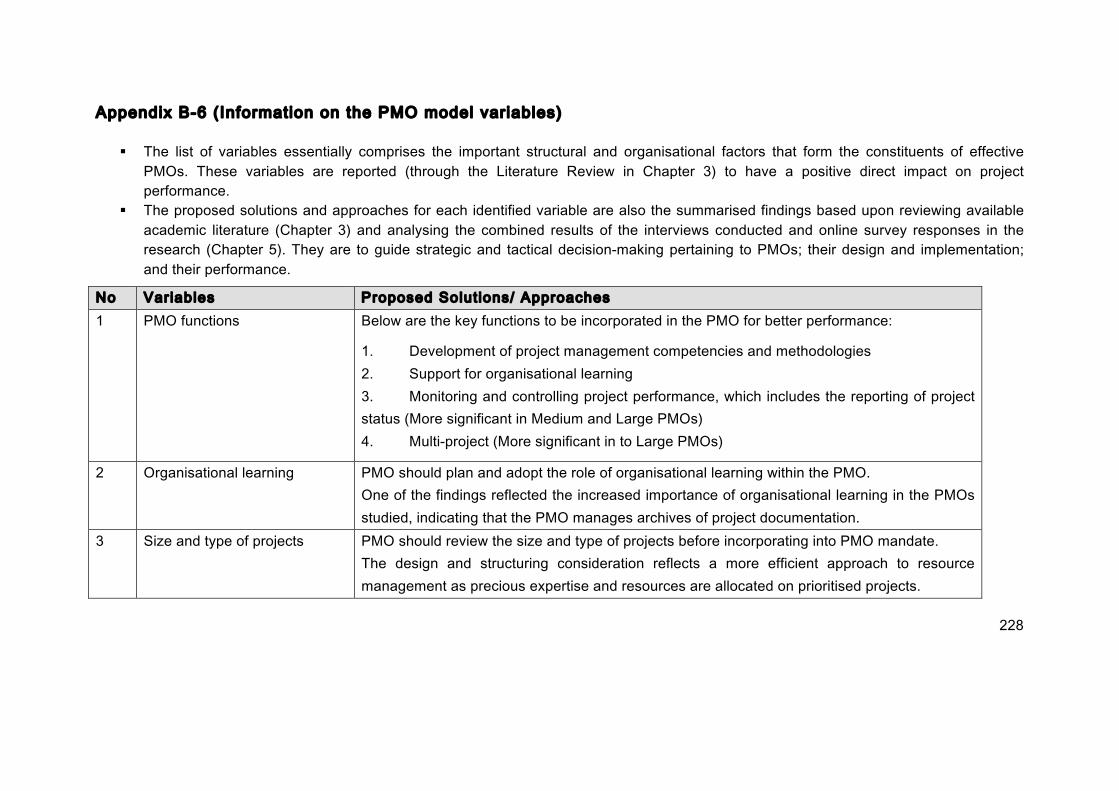
228
Appendix B-6 (Information on the PMO model variables)
§ The list of variables essentially comprises the important structural and organisational factors that form the constituents of effective PMOs. These variables are reported (through the Literature Review in Chapter 3) to have a positive direct impact on project performance.
§ The proposed solutions and approaches for each identified variable are also the summarised findings based upon reviewing available academic literature (Chapter 3) and analysing the combined results of the interviews conducted and online survey responses in the research (Chapter 5). They are to guide strategic and tactical decision-making pertaining to PMOs; their design and implementation; and their performance.
No Variables Proposed Solut ions/ Approaches 1 PMO functions Below are the key functions to be incorporated in the PMO for better performance:
1. Development of project management competencies and methodologies 2. Support for organisational learning 3. Monitoring and controlling project performance, which includes the reporting of project status (More significant in Medium and Large PMOs) 4. Multi-project (More significant in to Large PMOs)
2 Organisational learning PMO should plan and adopt the role of organisational learning within the PMO. One of the findings reflected the increased importance of organisational learning in the PMOs studied, indicating that the PMO manages archives of project documentation.
3 Size and type of projects PMO should review the size and type of projects before incorporating into PMO mandate. The design and structuring consideration reflects a more efficient approach to resource management as precious expertise and resources are allocated on prioritised projects.
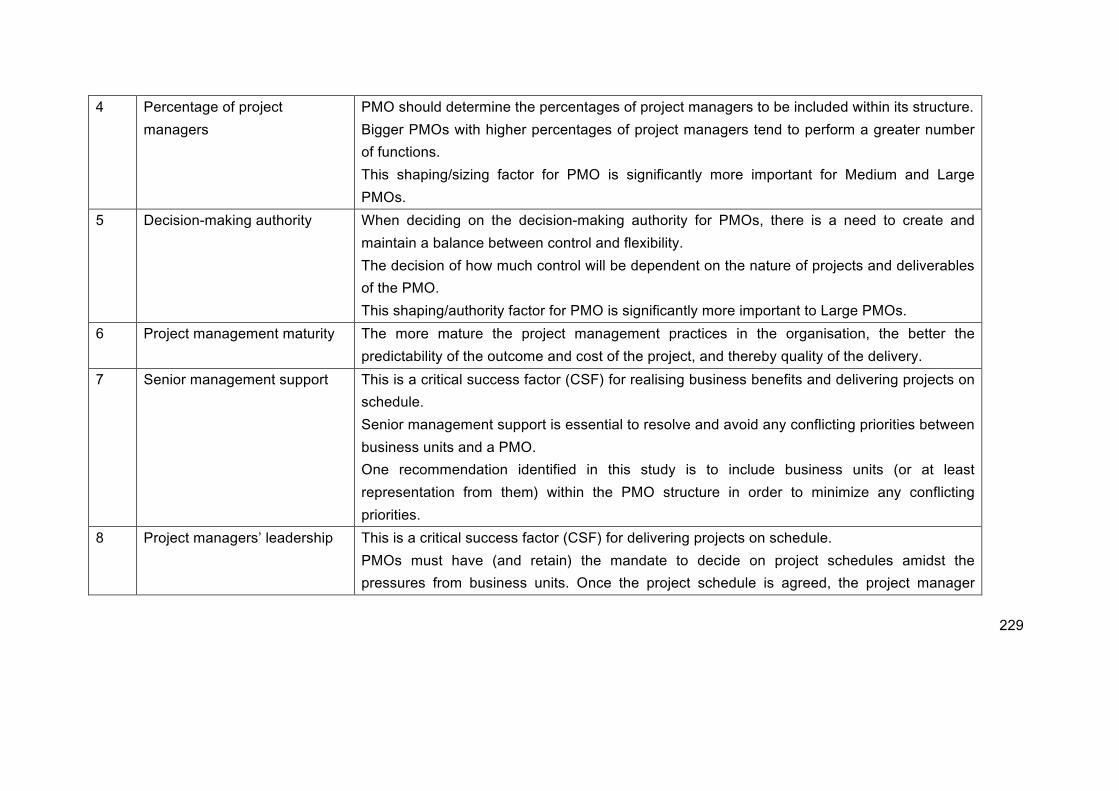
229
4 Percentage of project
managers
PMO should determine the percentages of project managers to be included within its structure.
Bigger PMOs with higher percentages of project managers tend to perform a greater number
of functions.
This shaping/sizing factor for PMO is significantly more important for Medium and Large
PMOs.
5 Decision-making authority When deciding on the decision-making authority for PMOs, there is a need to create and
maintain a balance between control and flexibility.
The decision of how much control will be dependent on the nature of projects and deliverables
of the PMO.
This shaping/authority factor for PMO is significantly more important to Large PMOs.
6 Project management maturity The more mature the project management practices in the organisation, the better the
predictability of the outcome and cost of the project, and thereby quality of the delivery.
7 Senior management support This is a critical success factor (CSF) for realising business benefits and delivering projects on
schedule.
Senior management support is essential to resolve and avoid any conflicting priorities between
business units and a PMO.
One recommendation identified in this study is to include business units (or at least
representation from them) within the PMO structure in order to minimize any conflicting
priorities.
8 Project managers’ leadership This is a critical success factor (CSF) for delivering projects on schedule.
PMOs must have (and retain) the mandate to decide on project schedules amidst the
pressures from business units. Once the project schedule is agreed, the project manager
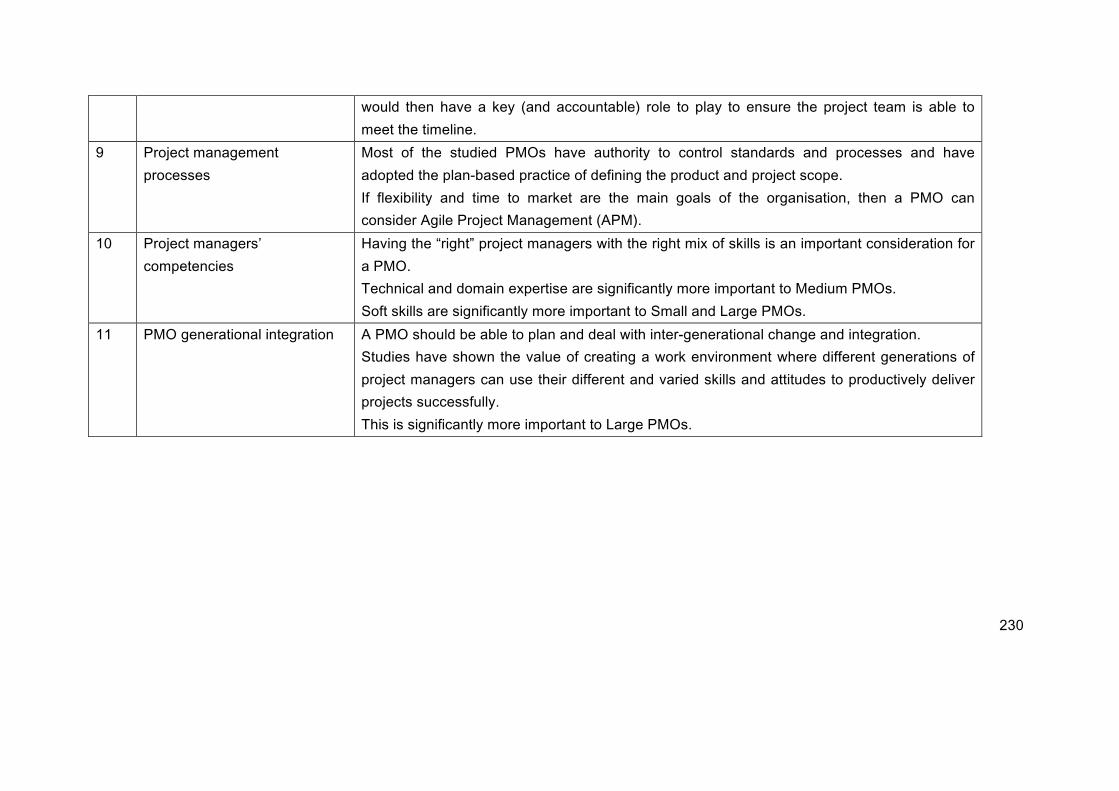
230
would then have a key (and accountable) role to play to ensure the project team is able to meet the timeline.
9 Project management processes
Most of the studied PMOs have authority to control standards and processes and have adopted the plan-based practice of defining the product and project scope. If flexibility and time to market are the main goals of the organisation, then a PMO can consider Agile Project Management (APM).
10 Project managers’ competencies
Having the “right” project managers with the right mix of skills is an important consideration for a PMO. Technical and domain expertise are significantly more important to Medium PMOs. Soft skills are significantly more important to Small and Large PMOs.
11 PMO generational integration A PMO should be able to plan and deal with inter-generational change and integration. Studies have shown the value of creating a work environment where different generations of project managers can use their different and varied skills and attitudes to productively deliver projects successfully. This is significantly more important to Large PMOs.
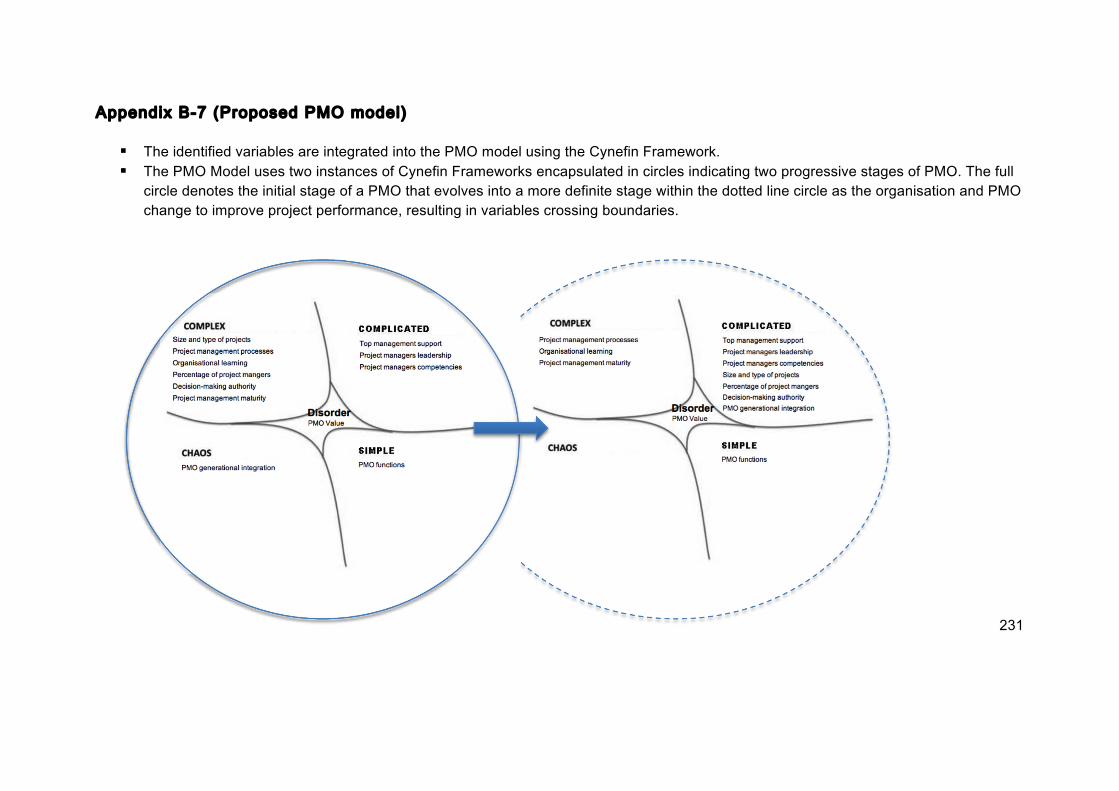
231
Appendix B-7 (Proposed PMO model)
§ The identified variables are integrated into the PMO model using the Cynefin Framework. § The PMO Model uses two instances of Cynefin Frameworks encapsulated in circles indicating two progressive stages of PMO. The full
circle denotes the initial stage of a PMO that evolves into a more definite stage within the dotted line circle as the organisation and PMO change to improve project performance, resulting in variables crossing boundaries.
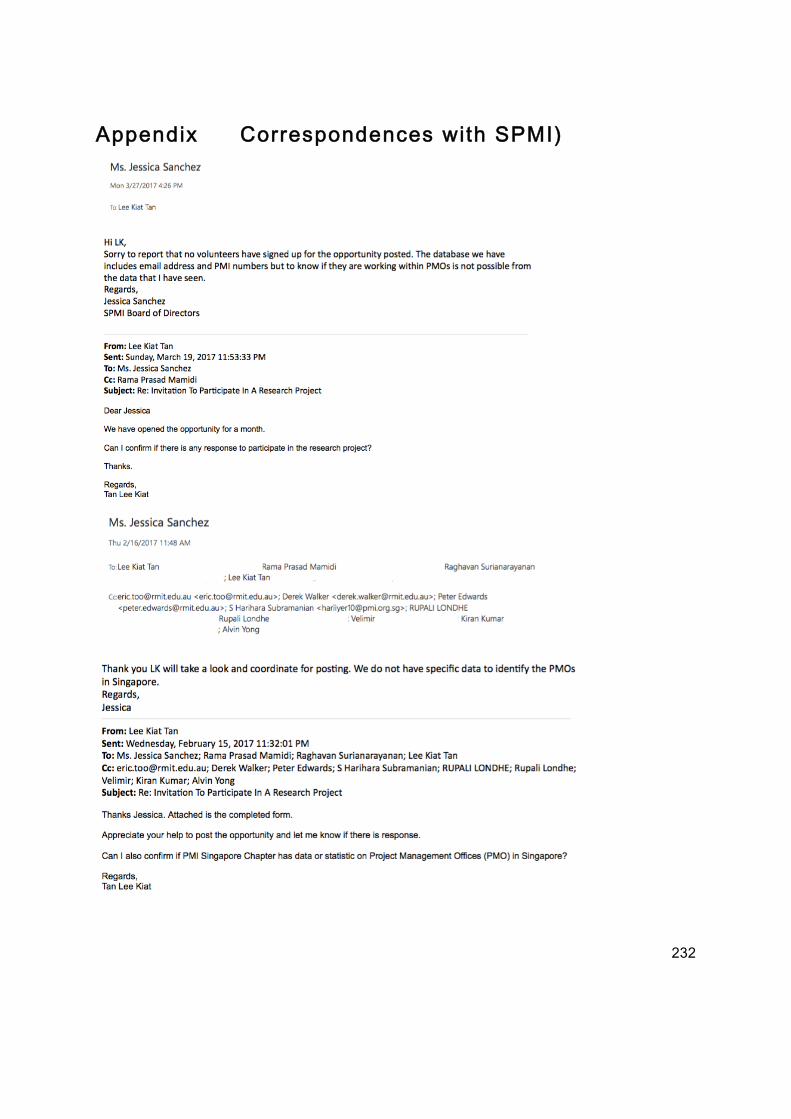
232
Appendix Correspondences with SPMI)
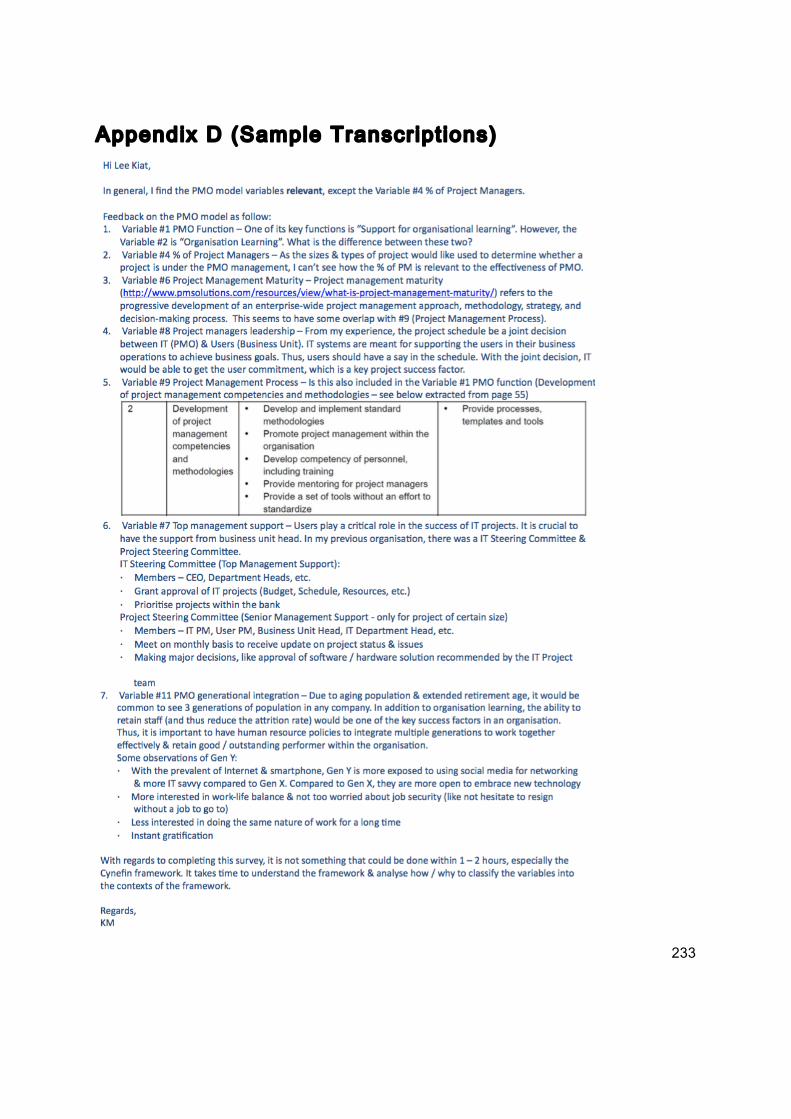
233
Appendix D (Sample Transcript ions)
Copyright © 2022 FDOKUMEN