Determinants of Tourism Product Development in Southeast ...
21
sustainability Article Determinants of Tourism Product Development in Southeast Ethiopia: Marketing Perspectives Kassegn Berhanu Melese 1, * and Temesgen Heiyo Belda 2 Citation: Melese, K.B.; Belda, T.H. Determinants of Tourism Product Development in Southeast Ethiopia: Marketing Perspectives. Sustainability 2021, 13, 13263. https://doi.org/ 10.3390/su132313263 Academic Editors: Dimitrios Aidonis, Naoum Tsolakis and Charisios Achillas Received: 10 October 2021 Accepted: 9 November 2021 Published: 30 November 2021 Publisher’s Note: MDPI stays neutral with regard to jurisdictional claims in published maps and institutional affil- iations. Copyright: © 2021 by the authors. Licensee MDPI, Basel, Switzerland. This article is an open access article distributed under the terms and conditions of the Creative Commons Attribution (CC BY) license (https:// creativecommons.org/licenses/by/ 4.0/). 1 Department of Tourism Management, Debre Berhan University, Debre Berhan P.O. Box 445, Ethiopia 2 Department of Tourism Management, Assosa University, Assosa P.O. Box 18, Ethiopia; [email protected] * Correspondence: [email protected] Abstract: Tourism has been given much attention in developing countries like Ethiopia. In this regard, tourism product development played a great role in achieving sustainable developmental goals. The study aims to examine the determinants of tourism product development in southeast Ethiopia. The research employed a mixed research approach, and descriptive and explanatory research design was used. Both secondary and primary data sources were in place to obtain the relevant data. A total of 398 samples were employed to collect the data. A convenience sampling technique was employed to select domestic tourists and walk-in guests and purposive sampling was applied to select marketing managers of hotels, lodges, boat associations, park administration, resorts, restaurants, nightclubs, and guest houses. The qualitative data was analyzed through thematic analysis and the quantitative data was analyzed using descriptive and inferential statistics by computing SPSS. The study revealed that tourism product development is affected by marketing mixes of which promotion was the major factor of tourism product development and price was the only tool inversely related to tourism product development. The brand image also positively determined tourism product development. The results showed that the exercise of tourism product development strategies among tourism businesses was low. The main implication drawn from the study is that the tourism businesses have to develop new customer profiles or segmenting in customers in their specified characteristics like gender, level of income, and age. Furthermore, the need to invest in research and development of the current market to develop new tourism products is of great importance. Keywords: tourism; Ethiopia; product development; marketing mixes; brand image; determinants; sustainability 1. Introduction Tourism activity is a combination of the use of tourism products like transportation, accommodation, infrastructure, attractions, and support services. These products highly influence the demand for tourism at the destinations [1]. According to Khan, Hassan, Fahad, and Naushad [2] economic development and tourism development have a direct relationship. In this regard, tourism product availability, product quality, and product management played a great role in developing the tourism industry [3]. Tourism product development, in tourist receiving destinations, highly influences the development of the tourism industry [4]. In this article the authors discussed that the destination may be rich in tourism resources but the growth of travel and tourism would depend on tourism product development. Tourism product development is determined by marketing, political, environmental, technological, social, and economic factors [5]. According to Camilleri [6], the function of tourism is serving tourism products for travelers from their homes to their destinations. Tourism product can be defined as the con- jugation of visible and invisible components, i.e., cultural, human-made attractions, service and facilities which create travelers’ experience and motivation to potential customers and Sustainability 2021, 13, 13263. https://doi.org/10.3390/su132313263 https://www.mdpi.com/journal/sustainability
-
Upload
khangminh22 -
Category
Documents
-
view
1 -
download
0
Transcript of Determinants of Tourism Product Development in Southeast ...

sustainability
Article
Determinants of Tourism Product Development in SoutheastEthiopia: Marketing Perspectives
Kassegn Berhanu Melese 1,* and Temesgen Heiyo Belda 2
�����������������
Citation: Melese, K.B.; Belda, T.H.
Determinants of Tourism Product
Development in Southeast Ethiopia:
Marketing Perspectives. Sustainability
2021, 13, 13263. https://doi.org/
10.3390/su132313263
Academic Editors: Dimitrios Aidonis,
Naoum Tsolakis and
Charisios Achillas
Received: 10 October 2021
Accepted: 9 November 2021
Published: 30 November 2021
Publisher’s Note: MDPI stays neutral
with regard to jurisdictional claims in
published maps and institutional affil-
iations.
Copyright: © 2021 by the authors.
Licensee MDPI, Basel, Switzerland.
This article is an open access article
distributed under the terms and
conditions of the Creative Commons
Attribution (CC BY) license (https://
creativecommons.org/licenses/by/
4.0/).
1 Department of Tourism Management, Debre Berhan University, Debre Berhan P.O. Box 445, Ethiopia2 Department of Tourism Management, Assosa University, Assosa P.O. Box 18, Ethiopia;
[email protected]* Correspondence: [email protected]
Abstract: Tourism has been given much attention in developing countries like Ethiopia. In this regard,tourism product development played a great role in achieving sustainable developmental goals. Thestudy aims to examine the determinants of tourism product development in southeast Ethiopia. Theresearch employed a mixed research approach, and descriptive and explanatory research design wasused. Both secondary and primary data sources were in place to obtain the relevant data. A total of398 samples were employed to collect the data. A convenience sampling technique was employed toselect domestic tourists and walk-in guests and purposive sampling was applied to select marketingmanagers of hotels, lodges, boat associations, park administration, resorts, restaurants, nightclubs,and guest houses. The qualitative data was analyzed through thematic analysis and the quantitativedata was analyzed using descriptive and inferential statistics by computing SPSS. The study revealedthat tourism product development is affected by marketing mixes of which promotion was the majorfactor of tourism product development and price was the only tool inversely related to tourismproduct development. The brand image also positively determined tourism product development.The results showed that the exercise of tourism product development strategies among tourismbusinesses was low. The main implication drawn from the study is that the tourism businesses haveto develop new customer profiles or segmenting in customers in their specified characteristics likegender, level of income, and age. Furthermore, the need to invest in research and development of thecurrent market to develop new tourism products is of great importance.
Keywords: tourism; Ethiopia; product development; marketing mixes; brand image; determinants;sustainability
1. Introduction
Tourism activity is a combination of the use of tourism products like transportation,accommodation, infrastructure, attractions, and support services. These products highlyinfluence the demand for tourism at the destinations [1]. According to Khan, Hassan,Fahad, and Naushad [2] economic development and tourism development have a directrelationship. In this regard, tourism product availability, product quality, and productmanagement played a great role in developing the tourism industry [3].
Tourism product development, in tourist receiving destinations, highly influencesthe development of the tourism industry [4]. In this article the authors discussed that thedestination may be rich in tourism resources but the growth of travel and tourism woulddepend on tourism product development. Tourism product development is determined bymarketing, political, environmental, technological, social, and economic factors [5].
According to Camilleri [6], the function of tourism is serving tourism products fortravelers from their homes to their destinations. Tourism product can be defined as the con-jugation of visible and invisible components, i.e., cultural, human-made attractions, serviceand facilities which create travelers’ experience and motivation to potential customers and
Sustainability 2021, 13, 13263. https://doi.org/10.3390/su132313263 https://www.mdpi.com/journal/sustainability
Sustainability 2021, 13, 13263 2 of 21
it is valued at price and ready to sell for actual travelers and prospects [7]. According to the2016 report of Central Board of Secondary Education cited in [8], Western nations such asFrance and Switzerland have accumulated the highest share of economic and social welfarefrom the tourism industry. As stated by Worku and Tessema [9], tourism in developingcountries including Sub-Saharan countries has shown fast growth. As per the report ofWorld Travel and Tourism Council [10], the Ethiopian tourism sector has registered thegreatest rate in the world, which is 48.6%.
Moreover, the country is rich in cultural heritages which show the past and the currentgeneration’s manifestation and identity [11]. However, tourism product development islimited to some areas even within the same region due to natural and historical endow-ments of potential tourism product distribution, hence resulting in unbalanced growth.
The tourism development potential in Ethiopia is still hindered by many factors [12].The authors found that lack of skilled human power, lack of tourist information centers,less marketing and promotional activities, inadequate infrastructure, lack of tourism or-ganizations travel agents, tour guides, and tour operators are the major challenges fortourism development in the country. In 2017, the number of foreign tourists who visitedEthiopia was about 871,000 [10].
Strong control and effective management of the main tourism products like attractions(natural, historical, cultural, paleontological, and archaeological), accessibilities, ameni-ties, and ancillaries leads to tourism product development and lack of coordinating thesetourism product components leads to failing in tourism development [13]. The growthof per capita income and the exchange rate have a direct relationship with tourist sup-plies [14]. However, the studies focused on tourism development and tourism productdevelopment and therefore showed a gap in investigating the determinants of tourismproduct development from a marketing perspective at the site level. Further, many of thestudies were conducted in developed nations’ contexts making the generalizability of thefindings difficult for developing countries like Ethiopia. Akama and Kieti [15] discussedhow tourism product development affects tourist attitude and buying behavior. However,the study did not address the determinants of tourism product development. Moreover,Fiseha, [13] has found that tourism product development is assured when all tourismresources are developed together but his study failed to identify factors that affect tourismproduct development. Furthermore, Chiriko [16] found that cultural tourism productmarketability in Sidama Region, Ethiopia is under low marketable value and is highlydependent on the typology of tourist arrival.
Therefore, little is known about the determinants of tourism product development indeveloping countries like Ethiopia at the destination level. All the above-related studiestried to emphasize tourism products from different dimensions but none of them studiedmarketing determination of tourism product development in the studied geographical area.Factors that determine tourism product development in Southeast Ethiopia remain oneof the overlooked research areas; hence, this study aims to fill the gap through examiningthe determinants of tourism product development in Ethiopia, taking Batu town and itsvicinities as a study context. To this end, the study will address the following objectives:
1. Explaining tourism product development strategies used among tourism businesses.2. Examining the effect of marketing mix elements on tourism product development.3. Investigating the effect of the brand image of tourism service providers on tourism
product development.
2. Literature Review Graduate2.1. The Concept of Tourism
There is no universally accepted definition for tourism. Theobald [17] defined tourismas a “tour” which is derived from the Latin word “tornare”. In the Greek language, “tornos”means circle rotating from the central point. Nowadays, the meaning is “once turn” and thesuffix tourism (ism) stands for action for travel or the process needed to travel. Therefore,

Sustainability 2021, 13, 13263 3 of 21
when the words “tour” and “ism” are combined, it will give the meaning of action to travelaround, over the world or circle.
The word tourism is an activity of traveling to somewhere and staying more than anight away from one’s resident place (home), not for more than a year for different purposes(business, education, leisure, etc.), and not participating in remunerative activities withinthe visited place.
These days, tourism is experienced by many people around the world. Especially thelast two decades were a crucial time for the development of the tourism sector because oftechnological changes and globalization effect. Tourism is a unique common denominatorthat combines different industries and service providers like parks, restaurants, the aviationsector, transportation, accommodations, and museums.
2.2. Tourism Product Development
Product development starts from idea generation, business analysis, testing the market,and commercializing. Therefore, tourism product development is the completion of allthe life cycle of the product to meet the customers’ needs: the standard they need toobtain and the entire journey of the product itself considered and expressed as tourismproduct development.
As narrated by Alemshet [1], tourism product is the aggregate of perception andpresentation of attraction and transportation facilities accompanied by standard services.Hence, the indicators of tourism product development include attractions (i.e., natural,cultural, and archeological) and transportation services which are suitable for the attractionsites with acceptable and suitable accommodation services, accurate and timely informa-tion, and desirable food and beverage products. Therefore, the author added that tourismproduct development attracts and increases the flow of tourists to the area and highlyraises the revenue of tourism service providers and the diversification of tourism product.
Tourism product development is defined as either creating new products injected intothe market or innovating and rejuvenating the existing products, experiences, and servicesas per the tourists’ needs and wants [18]. It is argued that either creating or improving theproduct may attract different types of visitors and the situation upgrade sales of tourismproducts, strengthen the market positioning, or expand new market opportunities.
2.3. Marketing in Tourism and Tourism Marketing Mixes
The main aim of tourism marketing is the production and placement of products to thetargeted customers [19]. According to the authors, tourism marketing helps to gather andanalyze information about the actual and future offer of goods and services to the targetedusers. After developing tourism products, the next issue is marketing and promotionalactivities which lead the customers to purchase the product [1].
Marketing mixes are variables that are controlled by the firm or organization to satisfythe targeted customers [20]. The authors narrated that marketing mix was explainedin 1960 by Borden and Culibon cited in [20], and it has 4Ps: price, place, promotion,and products. These help in the production and creation of a transaction to deliver andsatisfy the target customers [21]. Kotler and Armstrong [22] defined marketing mixes ascontrollable variables that have the power to change the buying attitude of the customers.In this respect, the oldest 4Ps of marketing are questioned as they missed some points. Asa result, it has been extended into 7Ps by including physical evidence, people, and process.These 3Ps are used further in the case of service provider organizations and industry.Therefore, since tourism is more of a service-oriented and independent service industry,the researchers use the 7Ps of the marketing mix to examine the determinants of tourismproduct development in the study area.
2.3.1. Product in Tourism
A product is anything offered to the market that may directly or indirectly be used orconsumed for the satisfaction of the users [23]. The product can be expressed in terms of per-

Sustainability 2021, 13, 13263 4 of 21
sons, places, goods, services, ideas, and organizations. Panizzon, Vidor, and Camargo [24]coined that a product is complex and might be a visible or invisible attribute, includingpackaging, color, price, prestige, and services that create the experience by satisfying cus-tomers’ needs. Therefore, from the above illustrations, product is a collection of physicaland psychological elements that are needed by the market and to fill the expectation of thecustomer. Moreover, the product is considered as the basic and the first component of themarketing mix. Developing the existing product is considered as the destabilization of themarket and the new product development is considered as the chaos of the market [25].Mason and Staude [25] concluded that developing products is a fundamental and tacticalstrategy for competitors from the market.
World Tourism Organization [26] argued that the demand point of view (visitors’perspective) is the perception of customers for their expenditure which includes packagetours, food and beverage, accommodation services, transportation, recreational activity,and shopping. The supply point of view is the analysis of the production process bysuppliers and it includes consuming and non-consuming products.
Madafuri [27] contemplated that three elements make tourism a product: attractionand its environment, facilities, and accessibility.
Tourism product is a process that used the destination resources to meet the needsand wants of both domestic and international tourists [28]. This study clearly shows thatdeveloped countries consider tourism as a major sector always characterized by diversifiedtourism products and well-developed tourism products and developing countries are verycommitted to developing the tourism product. However, under-developed countries haveto focus on limited or small-scale development. Based on the above empirical reviews, thefollowing hypothesis is proposed.
Hypothesis (H1): There is a statistically significant and positive relationship between the avail-ability of tourism products and tourism product development.
2.3.2. Price in Tourism
Price is the total payment of the product consumed or purchased by the customer [22].Pricing is also one of the marketing mix strategies which have the power of stabilizing ordestabilizing the market. Eavani and Nazari [29] argued that price is the determinant ofthe level of satisfaction and the amount of currency that the product would be offered.
Cirikovic [19] underlined that high quality of tourism product needs high cost andthe perception of customers for high pricing product is high quality. Therefore, pricingtechniques and pricing management play a great role in winning the competition. Theabove literature leads to the development of the following hypothesis.
Hypothesis (H2): There is a statistically significant and positive relationship between tourismprice and tourism product development.
2.3.3. Place in Tourism
Distribution and accessibility of products (goods and services) are considered as thebasic stabilizing mechanisms of the marketing mix [25]. Managing the supply chain fromsupplier to producers and from producer to customers can create a successful distributionchannel (place). According to Eavani and Nazari [29], distribution is the system of how tocontact and deliver to the target customers by analyzing and solving issues like channelsto distribution, target market area coverage, inventories, and means of transportation.
A tourism distribution system is a way of making tourism products (goods/services)available and accessible for the targeted travelers [19]. Place in tourism is about theprovision of different tourist spots, information centers for different travelers, selectingtourism attractions and destinations [22]. Hence, the following hypothesis is established.
Hypothesis (H3): There is a statistically significant and positive relationship between place(distribution) and tourism product development.

Sustainability 2021, 13, 13263 5 of 21
2.3.4. Promotion in Tourism
According to Mason and Staude [25], promotion is mostly stabilizing and slightlydestabilizing the market. Communication between producers and customers is veryessential [30]. Effective communications about product design, price, structures, andfeatures should have been well addressed to the customers via different promotional mixeslike sales promotion, personal selling, advertising, public relation, and direct marketingtools [22,29].
Tourism product promotion is creating awareness and image for positioning in themarket to attract potential tourists to the destination [19]. Based on the existing scholars’work, an assumption is proposed.
Hypothesis (H4): There is a statistically significant and positive relationship between promotionand tourism product development.
2.3.5. People in the Tourism
In the hospitality sector, the quality of people (behavior, quality control, personnelselling) is needed [22]. People create soul in the tourism industry and key stakeholderssuch as employees in the industry serve tourism product [31]. People who are engaged intourism sectors should have a good attitude, educational background, skill performance,grooming, or the total appearance to create satisfaction and memorable tourist experience.People in the hospitality and tourism industry are mandatory because the service industryis intangible and may be expressed and available for customers via the presentation of theemployee. Having analyzed the central values of people in the tourism and hospitalityindustry, the following hypothesis is developed.
Hypothesis (H5): There is a statistically significant and positive relationship between people andtourism product development.
2.3.6. Physical Evidence in Tourism
The physical evidence includes physically touched facilities like buildings, decors,gardens, parking lots, lighting systems, and colors, surrounding environments and ev-erything which could be visible and attractive based on some standards during the useof tourism products by the tourists [32]. In their work, they elaborate that the physicalevidence makes the intangible characteristics of services tangible and supports the tourismproduct development). Then the researchers develop a research hypothesis.
Hypothesis (H6): There is a statistically significant and positive relationship between physicalevidence and tourism product development.
2.3.7. Process in Tourism
The process is a way of serving customers and relies on planning, anticipating, con-sumption and recollection, standard product delivery, time, and money [33]. The authorsadd that the standard service delivery period plays its role in tourism product development.As a result, researchers propose a research hypothesis as follows.
Hypothesis (H7): There is a statistically significant and positive relationship between process andtourism product development.
2.4. Tourism Product Providers Brand IMAGE
According to Sonnleitner [34], image is a very important aspect compared with othercompetitors’ resources to attract potential customers. Further, he defines tourism destina-tion reputation as the total reaction of the organization to the needs and expectations ofindividuals. Having reviewed scholarly works, the researchers established the followingresearch hypothesis.

Sustainability 2021, 13, 13263 6 of 21
Hypothesis (H8): There is a statistically significant and positive relationship between tourismproduct providers’ brand image and tourism product development.
2.5. Tourism Product Development Strategies
Tourism marketing strategy includes mechanisms and activities that are prepared bydestination management and concerned bodies for utilization and maximizing marketingvalues of products [22]. They include that tourism marketing strategies encompass marketpenetration strategy, new tourism product development strategy, market developmentstrategy, and product diversification.
3. Methods and Materials3.1. Description of the Study Area
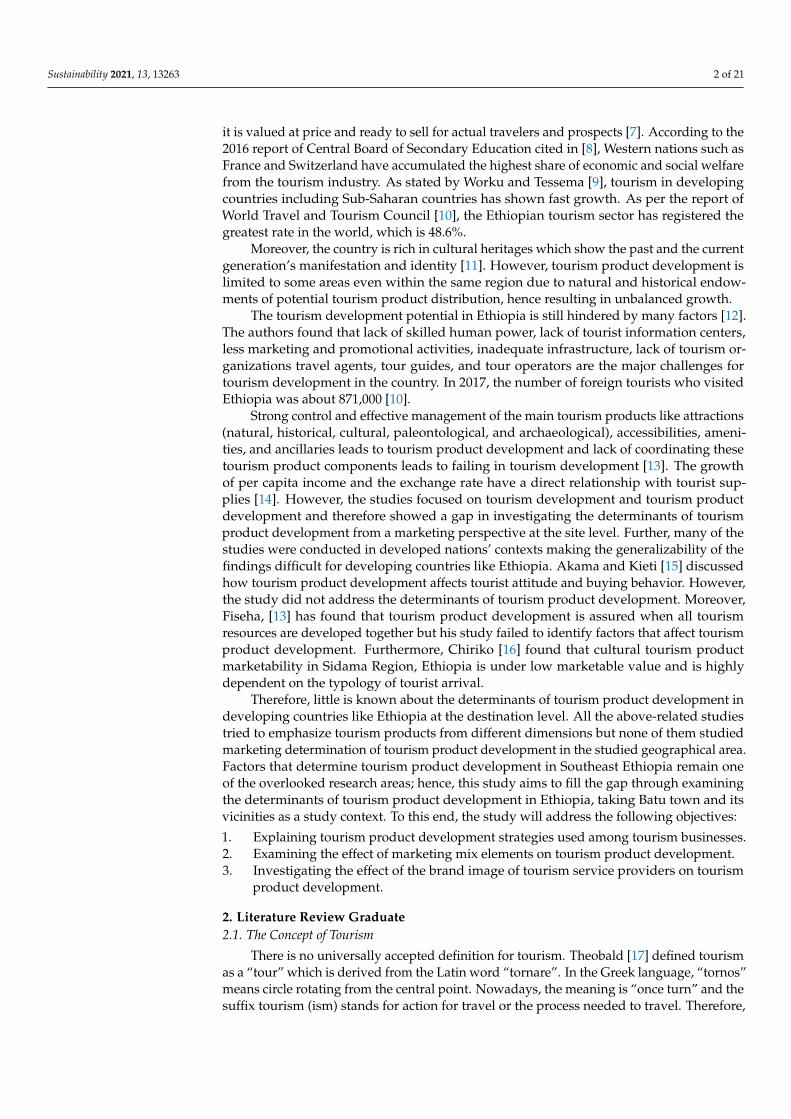
Batu, a town laying on the shore of Lake Ziway Ethiopia, is located 162 km south ofAddis Ababa on the road connecting Addis Ababa to Hawassa in the East Shewa Zone ofthe Oromia Region of Ethiopia. Batu has a latitude and longitude of 7◦56′ N 38◦43′ E withan elevation of 1643 m above sea level [35] (see Figure 1: Map of the study area).
Figure 1. Map of the study area. Source: developed by authors, 2021.
Bird watching, horse riding, religious sites, geological sites (Lake), trips to AbijattaShalla National Park, wildlife watching, and boat trips on the lake to visit the islandmonasteries where the Ark of the Covenant was residing for 800 years, parchments ofhistorical bibles, and other national heritages are the main tourism products and activitiespracticed in the area [36].
The town and the surroundings are rich with tourism potential resources like at-tractions including Abidjata & Shalla Lakes and the Park is rich in flora and fauna, likebirds (455 specious) grant gazelle, greater kudu, and black-backed jackals, Ziway lake,Langano lake, beaches, cultural resources like monasteries Tullu Guddo or Debre Tsion,and Galilla, Debre Sina, Funduro, and Tsedecha are the volcanic islands located in Ziway
Sustainability 2021, 13, 13263 7 of 21
lake [37]. However, the potential of tourism resources and products in the area are notwell developed because of many factors including marketing of those products. There isa lot of biodiversity (flora and fauna) in Batu and its surroundings. The acacia trees aredensely grown in the Batu vicinities which help for research and study of plants and attractscientists and tourists to the area [4].
3.2. Research Design
In this study, descriptive and explanatory research designs were employed. Thedescriptive research design was used for describing the existing situation or phenomenonof the study in detail [38]. Therefore, it was employed to examine the strategies used bytourism businesses in the study area to develop tourism products.
The explanatory research method is applied to examine the cause-and-effect relation-ship between variables [39]. Therefore, the current study also employed an explanatoryresearch design to explain the effect of marketing mixes on tourism products developmentas well as how the brand image of tourism business organizations influences tourismproduct development.
A qualitative approach was used to narrate and interpret qualitative responses frominterviews respondents. A quantitative approach was in place to generalize the findingsresulting from descriptive and inferential statistics. The data was collected in Batu townand surrounding tourism product providers. Primary data and secondary data werecollected from September 2020 to July 2021 through a questionnaire survey and interview.The questions or units of measurement (items) were prepared according to the modelspecification (see the questionnaire in Appendix A).
3.3. Target Population
The providers of tourism products and domestic tourists (customers) were the sub-ject of this study. Tourism product providers (hotels, restaurants, souvenir shops, boatassociations, parks, lodges, night clubs, and tourism offices) were targeted. The exclusivecriterion for international tourists was considered as it was difficult to find internationaltourists during data collection because of travel restrictions and challenges caused by theCOVID-19 pandemic. Hence, the study targeted domestic tourists and walk-in guests toobtain the relevant data.
3.4. Sampling Techniques and Sample Size Determination
The researchers used non-probability sampling techniques. Convenience samplingwas employed to select domestic tourists and walk-in guests and purposive samplingwas also appropriate for the selection head of marketing or general managers of tourismproduct suppliers.
Cochran [40] created the formula that is used for a large and unknown populationin order to take appropriate sample sizes. The formula considers 95% level of confidenceand 5% or 0.05 level of estimated precision. The sample size is determined using the
following formulae. n =p(1−p)z2
E2 , where n = is the sample size; Z2 = 1.96 is the desiredconfidence level for 95%; p = 0.5 is the estimated proportion of an attribute that is presentin the population; E = 0.05 is the desired level of precision, 5%. Hence, n = (1.96)2(0.5)(0.5)/(0.05)2 = 384 sample would be employed to collect data from domestic tourists andwalk-in guests via questionnaire using convenience/accidental selection technique. Forqualitative data gathering, the study followed the concept of data saturation point. Datasaturation point is when the researchers get similar answers from the interviewee; thenthe data is saturated and the researcher should stop collecting further interview data fromrespondents [41]. Accordingly, in this study, the interview data was saturated at the pointof the 10th interviewee. Therefore, the researchers select mostly available tourism businessorganizations for the interview (marketing manager, general manager, coordinators, etc.)of resort hotels, national parks, business associations, cultural restaurants, beach andlodge, souvenir shop, guest house, tourist hotel, and night clubs. Generally, the study

Sustainability 2021, 13, 13263 8 of 21
involves 10 interviewees and 384 participants for the questionnaire survey making a totalof 394 respondents for both questionnaires and interviews.
3.5. Variables and Model Specification
Qualitative data was narrated through content and thematic analysis whereas quantita-tive data was interpreted by using descriptive and inferential statistics (multiple regressionand correlation analysis). Multiple regression model analysis is used for quantitative dataanalysis and helps to predict the quantitative dependent variable [41].
Y = β0 + β1X1 + β2X2 + . . .βkXk + ε
Y = β0 + β1X1 + β2X2 + β3X3 + β4X4 + β5X5 + βx6β6 + β7X7 + β8X8+ε . . . model specification
Y = dependent variable, X1, X2, X3 = independent variables, β0 = Y-intercept (constantterm), β1, β2, β3, . . . = Slop coefficient for each independent variables, ε = the model error.
In this study “Y” is the dependent variable which is the tourism product developmentand X1 = product, X2 = price, X3 = distribution channel, X4 = promotion,X5 = people/employee, X6 = process, and X7 = physical evidence. (See the marketingmix model in Table 1)
Mason and Staude [25] suggested a marketing mix model focused on marketing strat-egy for the complex and turbulent environment by using marketing mixes in South Africa.The current study adopts this marketing mix model because of the complex nature of thetourism industry. Since the tourism industry is broad in concept and interrelated with manyindustries, the tourism product development would be determined by many dimensionsand the researchers look at those determinants from a marketing perspective only.
Table 1. Marketing mix model.
Tourism product
New tourism product development planning New tourism product development involves customers in the process
Product innovation Modifying the existing tourism product
Product customization Local tourism product development for the local users and customizationof the products for all users too
Product design/flexibility Updated and latest design use
Price of tourism product
Credit terms Postpaid service for customers
Price leadership Price setter of the tourism product because of dominancy in the market
Value for money Customers get equivalent value from the product at a given price
Discount Selling of product with a minimum price to attract and retain customers
Distribution of tourism product
Changes in the channel If needed substitute the current channels by other best alternatives
Intermediaries Reduce No. of intermediaries’ chain system or contact users directly
Reduce perishability Selling to the maximum effort of tourism perishable
Promotion of tourism product
Media Changing the mind of customers or changing perceptions of thedestination by using appropriate media advertisement.
Personal selling Selling or booking tourism products face-to-face is especially helpful forawareness of new tourism products
Public relations Public relations increase trust in the tourism product in the destination

Sustainability 2021, 13, 13263 9 of 21
Table 1. Cont.
Sales promotions Appreciation purchase of the tourism product by giving some unusualadvantages to the consumer
Word of mouth Customers’ recommendation to influence their friends and relatives byinternet and orally
People in tourism and hospitality
Training Periodical training for updating employees with current job policies
Certified Graduated with the right certification for the right position
Satisfied Create a comfortable working environment and payment
Process in tourism and hospitality products
Standard products Produce the same products all the time
Timing Deliver the requested product within standard time specification
Money savor Saves customers unnecessary payment
Physical evidence in tourism and hospitalityservices and products
Surrounding environment The surrounding environment should be attractive
Design Building and working area designated according to needed standard
Décor Offices, working environments, lobbies depict decor well
Source: adapted from [25].
3.6. Validity and Reliability
According to Kothari [38], validity is the items or constructs in the questionnaires thatcan measure the issues or contents of the study appropriately, which is about using a truemeasurement of the study findings. In this regard, the research design, the questionnaire,and interview questions and all the contents included in the research were developed fromrelated scholars’ work and adopted model specifications then evaluated by tourism experts.
Reliability is one of the crucial concepts which refer to how the results are real whenthe variables are measured at a different time with similar instruments and conditions [42].Therefore, the questionnaire reliability was calculated statistically by Cronbach’s alpha.Cronbach’s alpha reliability coefficient normally ranges between 0 and 1. The closerCronbach’s alpha coefficient is to 1.0, the greater the internal consistency of the items in thescale. The size of alpha is determined by both the number of items in the scale and the meaninter-item correlations. The reliability test showed that all the variables had a Cronbach’svalue of greater than 0.93 (rule of thumb) in this research, which is commendable anddeemed to be excellent (see the reliability tests or results of variables in Table 2).
3.7. Ethical Consideration
The researchers believe they have chosen the right participants for this study. Con-sequently, diverse ethical issues were taken into consideration during this research, fromthe administration of the research instrument with respondents to the acknowledgmentof all the primary and secondary sources being used. Before collecting the data question-naire and interview questions, the checklists were tested by experts and academicianswho have knowledge in the area and later the questions were corrected based on theinputs received from the professionals. Moreover, the researchers highly care about theprivacy of respondents and selected organizations for data surveys as promised duringdata collection.

Sustainability 2021, 13, 13263 10 of 21
Table 2. Cranach’s Alpha Test.
Items Cranach’s Alpha Number of Items
Product 0.955 4Process 0.964 3
Brand image 0.928 3People 0.958 5Price 0.955 4
Physical evidence 0.939 3Place 0.936 5
Promotion 0.971 5Product development 0.950 5
Source: Authors survey, 2021.
4. Results and Discussions4.1. Characteristics of Respondents
The total questionnaires that have been distributed were 384 of which 372 (96.8%response rate) were valid for analysis. A detailed characteristic of respondents is illustratedas follows.
From Table 3, a total of 274 (73.7%) were male and 98 (26.3) were female. A de-tailed general profile of participants is illustrated below in the Table 3. Demographiccharacteristics of interviewees are presented in Table 4.
Table 3. Demographic characteristics of respondents.
Category Frequency Percentage (%)
SexMale 274 73.7
Female 98 26.3
Age
18–29 256 68.830–45 114 30.646–60 2 0.5Total 372 100
Marital status
Unmarried 219 58.9Married 143 38.4Divorced 5 1.3Widowed 5 1.3
Level Education
TVET certificate 91 24.5Diploma 124 33.3Degree 128 34.4
Master’s degree 16 4.3Other 13
Years of loyalty
5–1 298 80.110–6 66 17.715–11 5 1.316–20 1 0.3
<1 year 2 0.5Total 372 100
Sustainability 2021, 13, 13263 11 of 21
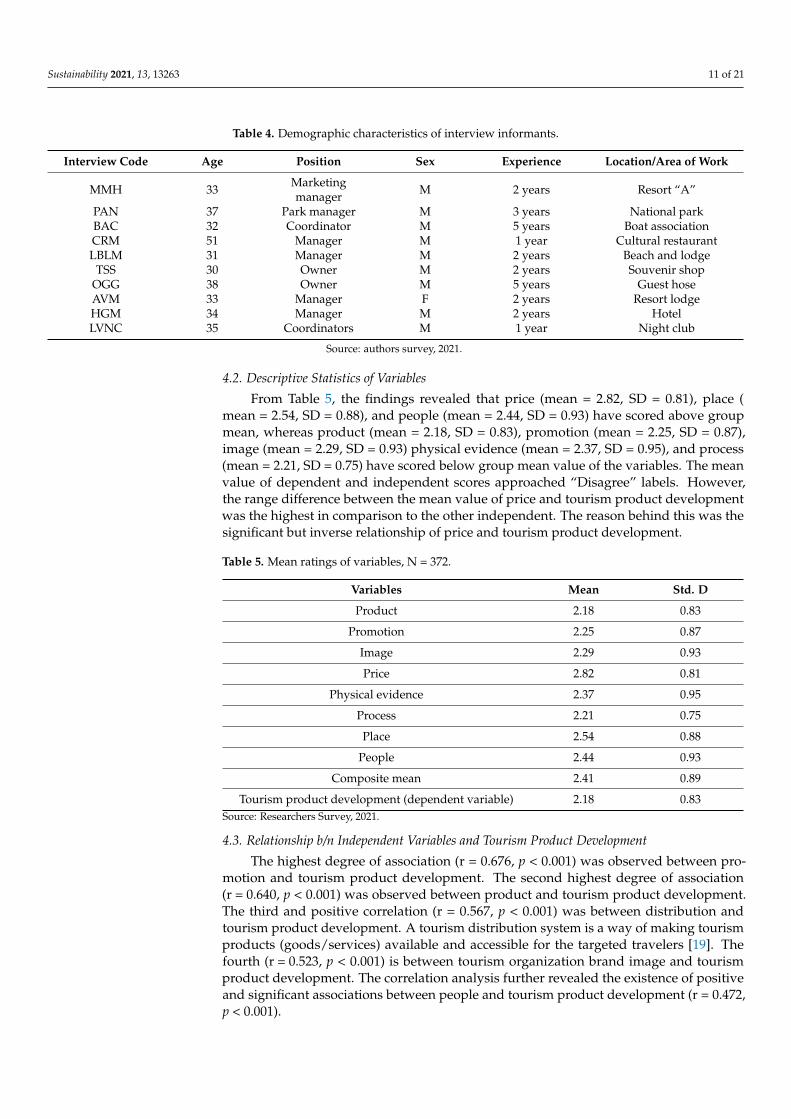
Table 4. Demographic characteristics of interview informants.
Interview Code Age Position Sex Experience Location/Area of Work
MMH 33 Marketingmanager M 2 years Resort “A”
PAN 37 Park manager M 3 years National parkBAC 32 Coordinator M 5 years Boat associationCRM 51 Manager M 1 year Cultural restaurantLBLM 31 Manager M 2 years Beach and lodge
TSS 30 Owner M 2 years Souvenir shopOGG 38 Owner M 5 years Guest hoseAVM 33 Manager F 2 years Resort lodgeHGM 34 Manager M 2 years HotelLVNC 35 Coordinators M 1 year Night club
Source: authors survey, 2021.
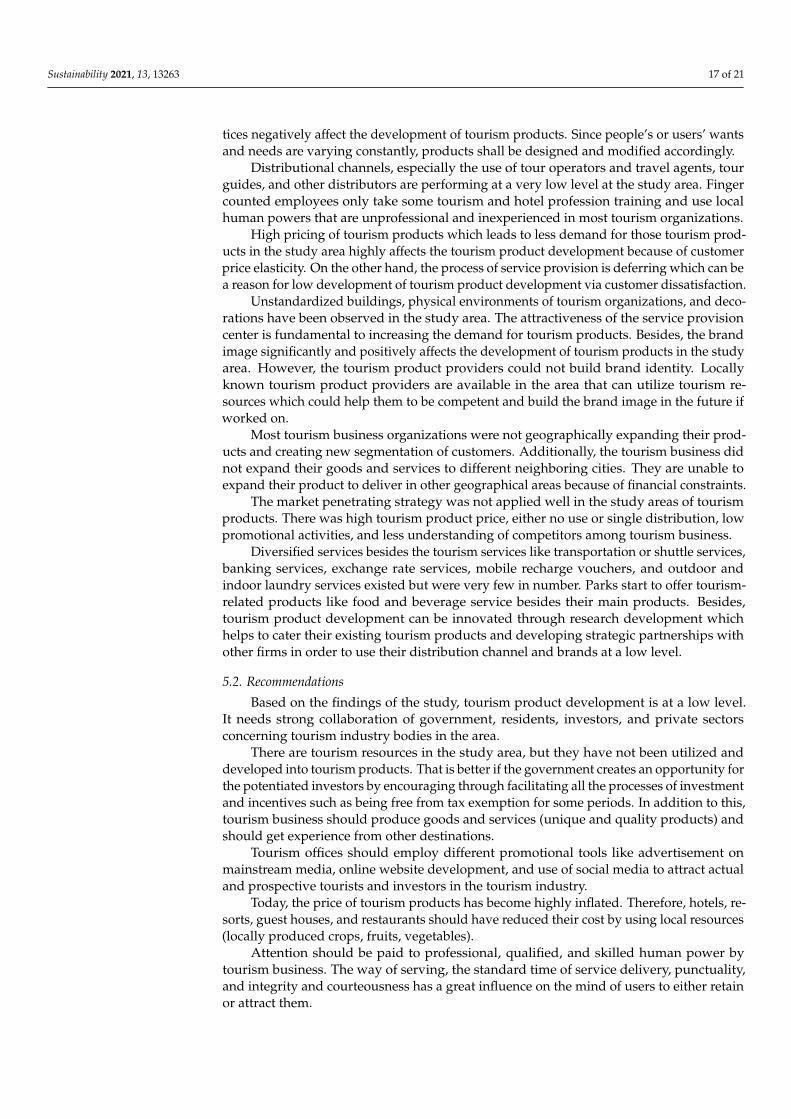
4.2. Descriptive Statistics of Variables
From Table 5, the findings revealed that price (mean = 2.82, SD = 0.81), place (mean = 2.54, SD = 0.88), and people (mean = 2.44, SD = 0.93) have scored above groupmean, whereas product (mean = 2.18, SD = 0.83), promotion (mean = 2.25, SD = 0.87),image (mean = 2.29, SD = 0.93) physical evidence (mean = 2.37, SD = 0.95), and process(mean = 2.21, SD = 0.75) have scored below group mean value of the variables. The meanvalue of dependent and independent scores approached “Disagree” labels. However,the range difference between the mean value of price and tourism product developmentwas the highest in comparison to the other independent. The reason behind this was thesignificant but inverse relationship of price and tourism product development.
Table 5. Mean ratings of variables, N = 372.
Variables Mean Std. D
Product 2.18 0.83
Promotion 2.25 0.87
Image 2.29 0.93
Price 2.82 0.81
Physical evidence 2.37 0.95
Process 2.21 0.75
Place 2.54 0.88
People 2.44 0.93
Composite mean 2.41 0.89
Tourism product development (dependent variable) 2.18 0.83Source: Researchers Survey, 2021.
4.3. Relationship b/n Independent Variables and Tourism Product Development
The highest degree of association (r = 0.676, p < 0.001) was observed between pro-motion and tourism product development. The second highest degree of association(r = 0.640, p < 0.001) was observed between product and tourism product development.The third and positive correlation (r = 0.567, p < 0.001) was between distribution andtourism product development. A tourism distribution system is a way of making tourismproducts (goods/services) available and accessible for the targeted travelers [19]. Thefourth (r = 0.523, p < 0.001) is between tourism organization brand image and tourismproduct development. The correlation analysis further revealed the existence of positiveand significant associations between people and tourism product development (r = 0.472,p < 0.001).

Sustainability 2021, 13, 13263 12 of 21
Price was the only independent variable that was inversely related to tourism productdevelopment but significantly (r = −0.341, p < 0.001). As the price of tourism productincreases the level of tourism product development decreases reversely. There were pos-itive and less significant associations between physical evidence and tourism productdevelopment (r = 0.389, p < 0.001). Process positively and less significantly associated withtourism product development (r = 0.242, p < 0.001).
In general, the researchers concluded that all the independent variables positively(except price) and significantly correlated (p < 0.001) with tourism product development.
4.4. Regression Assumptions
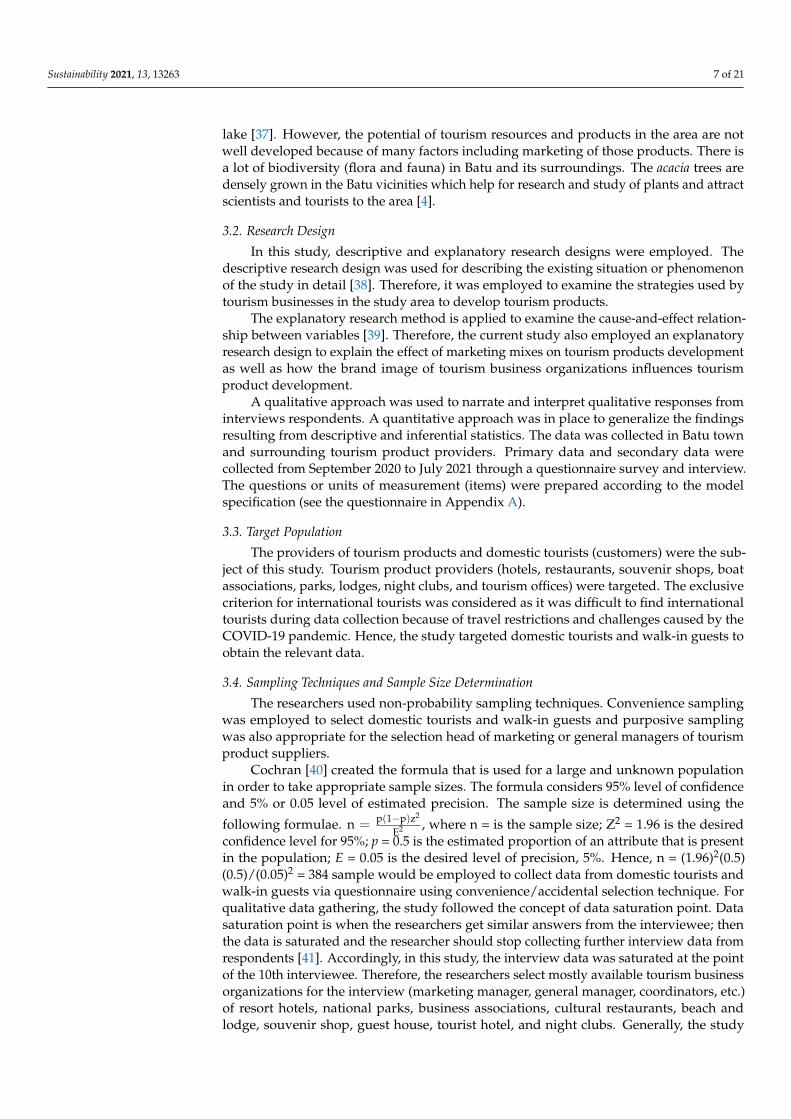
The authors checked that histogram, Kurtosis, and skewness were procedures ofnormality expression.
The histogram graph (see Figure 2) indicates normality if it is bell-shaped from theorigin [43].
Figure 2. Histogram.
Multi-collinearity test happened when there is a high correlation between variables [44].When there is high multi-collinearity among independent variables then the regressioncoefficient lacks uniqueness, tolerance, and variance inflation factor (VIF). If the value ofVIF is less than 10 and the tolerance value is greater than 0.1, it indicates freedom from themulti-collinearity problem [43]. (See multi-collinearity diagonistics in Table 6)
Table 6. Multi-collinearity tests.
Model Tolerance VIF
1 Product 0.677 1.478Promotion 0.729 1.372
Price 0.881 1.136Image 0.804 1.244People 0.846 1.181Place 0.745 1.343
Process 0.947 1.056Physical evidence 0.891 1.122
Dependent Variable: tourism product development. Source: Researcher Survey, 2021.
4.4.1. Regression Output and Interpretation
The multiple regression model examines the relationship of an independent variableover dependent variables [45]. In Steven’s work, the regression coefficient of predictorsshows the degree of their effect on the dependent variable and the total effect of allindependent variables measured as a whole in (R2) to the dependent variable.

Sustainability 2021, 13, 13263 13 of 21
4.4.2. Model Summary
Table 7 shows that promotion, product, image, price, place, people, physical evidence,and process had R (0.912), which indicates that they have a strong effect on the depen-dent variable (tourism product development). The (R2) is 0.832, which is very high andinterpreted as 83.2% of the variance in the dependent variable being explained by theindependent variables (marketing mixes and image).
Table 7. Model summary.
Model R R Square Adjusted RSquare
Std. Error ofthe Estimate
Durbin-Watson
1 0.912 a 0.832 0.829 1.56136 1.841a: Dependent Variable: tourism product development. Source: Researchers’ Survey, 2021.
4.4.3. ANOVA Test
From Table 8, of analysis of (ANOVA), F statistics shows how the fitness of the modelis significant (p = 0.000).
Table 8. ANOVA test.
Model Sum of Squares df Mean Square F Sig.
1Regression 4393.136 8 549.142 225.257 0.000Residual 884.937 363 2.438
Total 5278.073 371Source: Researcher Survey, 2021.
Table 9 shows the influence of the predictors’ variables on the dependent variables.Depending on unstandardized beta coefficient analysis, the independent variables havea strong contribution to the existence of the dependent variable. This beta coefficientindicates that the average amount of change in the dependent variable is caused by a unitchange in the independent variable. Therefore, the researcher used the following statedmodel to show that the predictors level of the determinant as follows:
Y = β0 + β1X1 + β2X2 + β3X3 + β3X4 + β3X5 + e
where: Y is tourism product development, β0 = the constant (coefficient of intercept),β1 = regression coefficient of promotion, β2 = regression coefficient of product β3 = regres-sion coefficient of image β4 = regression coefficient of place, β5 = regression coefficient ofphysical evidence, β6 = regression coefficient process, β7 = regression coefficient of people,β8 = regression coefficient of price.
Table 9. Summarized beta coefficients of the regression model.
ModelUnstandardized Coefficients Standardized
Coefficients t Sig.B Std. Error Beta
(Constant) −1.133 0.472 −2.403 0.017Product 0.273 0.030 0.241 9.209 0.000
Promotion 0.316 0.022 0.365 14.488 0.000Price −0.117 0.018 −0.151 −6.611 0.000
Image 0.221 0.032 0.163 6.816 0.000People 0.140 0.018 0.187 7.989 0.000Place 0.176 0.020 0.218 8.769 0.000
Process 0.143 0.026 0.123 5.582 0.000Physicalevidence 0.165 0.030 0.125 5.510 0.000
Source: Researchers’ Survey, 2021.

Sustainability 2021, 13, 13263 14 of 21
Then, the above equation can be expressed in terms of b-values as follows:
Tourism product development = −1.133 + 0.316 promotion + 0.273 product + 0.221 image + 0.176 place +0.165 physical evidence + 0.143 process + 0.140 people − 0.117 price.
The above equation can be interpreted asPromotion: a one-unit coefficient increase in the promotion will increase tourism
product development by 0.316 units. Promotion is encouraging the users for havingproducts [25].
Product: a one-unit increase in the product will increase tourism product developmentby 0.273 units. Updated product design and development help for the development oftourism products [25].
Image: a one-unit coefficient increase in the image will increase tourism productdevelopment by 0.221 units. Brand image supports the maximum sales of products [25].
Distribution/place: a one-unit coefficient increase in distribution or place will increasetourism product development by0.143 units. Good relationships between providers andusers decrease the extra costs [25].
Physical evidence: a one-unit increase in one unit in physical evidence will increasetourism product development by 0.143 coefficient units. Attractive and good physicalevidence guaranteed the loyalty of customers at the organization [32].
Process: a one-unit increase in the process will increase tourism product developmentby 0.143 units. The process is the way of delivering the products to the customers [33].
People: a one-unit increase in people will increase tourism product development by0.140 units.
Price: a one-unit increase in price will decrease tourism product development by−0.117 units. Acceptable pricing reduces the competition and increases the marketshare [25].
To recap, from these regression results of the seven marketing mixes, promotion wasthe first variable that determined tourism product development followed by product, place,physical evidence, process, people, and price respectively affecting positively (except price)tourism product development. (See Table 10 regarding the hypothesis testing results andthe effect of independent variables on the outcome variable)
Table 10. Summary of hypothesis testing.
Hypothesis Results Conclusion/Decision
Hypothesis (H1): There is a significant relationship betweenproduct and tourism product development. β = 0.273; p = 0.000; Positive, significant H1: supported
Hypothesis (H2): There is a significant relationship betweenprice and tourism product development.
β = −0.117; p = 0.000Negative, significant H2: not supported
Hypothesis (H3): There is a significant relationship betweenplace (distribution) and tourism product development. B = 0.176; p = 0.000 Positive, significant H3: supported
Hypothesis (H4): There is a significant relationship betweenpromotion and tourism product development. B = 0.316; p = 0.000 Positive, significant H4: supported
Hypothesis (H5): There is a significant relationship betweenpeople and tourism product development. B = 0.140; p = 0.000 positive, significant H5: supported
Hypothesis (H6): There is a significant relationship betweenprocess and tourism product development. β= 0.143; p = 0.000; positive, significant H6: supported
Hypothesis (H7): There is a significant relationship betweenphysical evidence and tourism product development. β= 0.165; p = 0.000 positive, significant H7: supported
Hypothesis (H8): There is a significant relationship betweentourism product brand image and tourism product development. B = 0.221; p = 0.000 positive, significant H8: supported

Sustainability 2021, 13, 13263 15 of 21
4.5. Tourism Product Strategies4.5.1. Market Penetration Strategy
This strategy mainly focused on existing tourism products that help the destinationsto get a higher share of the market. There are some techniques used for the effectiveness ofthese strategies. Reducing the price of tourism products to attract new customers, increas-ing the distribution channels and promotional activities, and understanding competitors’power are basic techniques that are used in the success of the strategy. Batu and surround-ing tourism business interviewees responded as follows. Regarding price reduction, theinterviewee (MMH) replied that their hotel offers price discounts during low seasons toattract tourists and to reduce the perishability of the hotel’s products. The hotel sellsits products at the breakeven point during the low season. Contractual agreement priceoffers and package sales are some of the techniques they used. The resident customerswere price-sensitive and tourists largely paid without price complaint. Other interviewees(PAN, BAC, CRM, LBLM, TSS, OGG, AVM, HGM, and LVNC) answered that they needto reduce the price of the goods but the cost of a resource or raw material from supplierschallenges them to reduce the price. Therefore, there was a big challenge to reduce theprice of a tourism product among the providers. This situation implied that there was nopricing strategy effectively in the study area. The researchers compared this interview withcollected and analyzed questionnaire data and concluded price had inversely related withproduct development too.
Most interviewees responded that they would not use effective distribution channels.(PAN, BAC, CRM, LBLM, OGG, AVM, HGM, and LVNC) use online distribution channelslike TripAdvisor and interviewee but interview code MMH said that:
“We have a head office in Addis Ababa which helps to facilitate and reducetravel barriers for their international tourist and facilitate domestic tourists andcorporate agreed companies with our hotel. In addition to this, we have otherhotels in a different part of the country which helps as a distribution channel byrecommending travelers to our hotel when they arrived at Batu/Ziway”
Therefore, the researchers understood that there were not enough distribution chan-nels used by most of the tourism businesses in the study area.
Regarding promotional activities, they were very low according to the intervieweeresponse (MMH, PAN, BAC, CRM, LBLM, OGG, AVM, HGM, LVNC) and they did notuse promotional tools. Their best promotional activity is customers’ recommendation andwalk-in guests is their common type of customers. Therefore, the researcher concludedthat the promotional activity is very low.
In the study area, there were competitors who participated in similar tourism businesses.The interviewee (MMH) responded that
“We know our competitors well and they were finger counted even in numbersbut we are the winners and for the time being we don’t worry about competitorsrival but we expect the competition will be increased. Therefore, we carefullyfollow up with future potential competitors”
Interviewees (MMH, PAN, BAC, CRM, LBLM, OGG, AVM, HGM, LVNC) think theyhad competitors and they understood who their competitors were. However, they did notcare about their competitors because they had the same ability to compute and they wereunder similar computational advantage.
4.5.2. New Tourism Products Development Strategy
This strategy is used when the organization or the destination strongly understandsthat the currently existing market needs some modifications or else the current marketwould be at risk. These strategies use different techniques which support the effectivenessof strategies. It includes merging resources which are used for developing their newtourism products to cater to their existing tourism products and developing a strategicpartnership with other firms to use their distribution channel and brand names for the

Sustainability 2021, 13, 13263 16 of 21
new tourism product development strategy. Then the interviewer asked the intervieweeswhether they employed new tourism product development strategies.
Interviewee TSS responded as
“We don’t conduct formal research to gather the needs of customers, but weinformally know what our customers need, as you know that our products arehighly fashionable and somehow luxury the customer’s order show as to howthe needs of customers shifted and demanded some sorts of products, then westart to produce to the trend of the demand shift”
However, the interviewee (MMH) reflected that:
“We want to add and consider what our customers need. For that reason, wealways find out a new product, by the way, this new product is not producedfor the needs and satisfaction of our customers only but they help us in order todiversify new business stream and revenue increment”
Most of the interviewees (PAN, BAC, CRM, LBLM, OGG, AVM, HGM, LVNC) didnot invest in finding new needs and research. Therefore, it can be concluded that therewas very little searching of new needs of customers. If the customers cannot be offered theneeds they want in the market, the concerned business could fail in the market [19].
4.5.3. Market Development Strategy
This strategy focused on the expansion of new markets within the existed tourismproducts. That means without creating or innovating the current tourism products, it isjust expanding the market into new profiles of customers like expanding to new tourismgeographic areas, customer segments, etc. These strategies encouraged addressing allthe potential customers and ensuring the efficient utilization of existing tourism products’development. Market development strategy uses different techniques for its success. Usingtheir own proprietary technology helps with the entry of new market, considering theacceptability of the tourism products’ development by the consumer in the new market.The interviewees responded that they did not expand their market when this interviewwas held. They were not geographically expanding their products and creating newsegmentation of customers; however, interviewee code MMH commented:
“We geographically segmented to different Ethiopian parts. Adama, AddisAbaba, Arbaminch, Hawassa were some of our destiny where our product wasavailable and some of the rest of towns were our potential for future expansions”
In addition to code (MMH), code (TSS) also segmented their product to the profilecharacteristics of their customers (segmentation by age, sex, culture). Moreover, those codes(MMH) and (TSS) expand their new market based on customers’ needs. According to theinterview with the interviewee (TSS), they expand their market based on the characteristicsof customers.
“Gender and age are the main segmentation of our product. Moreover, femalecustomers were frequent buyers and highly fashionable in comparison of malesand babies are also the main customers of our products”
5. Conclusions and Recommendations5.1. Conclusions
Marketing mixes which are promotion, product, place, physical evidence, people, andprocess have significantly and positively affected the development of tourism products inthe study area. However, the price was negatively and significantly determining tourismproduct development. The findings revealed that low promotional habits in the tourismproduct provision organizations lead to low development of tourism product development.Most tourism product providers are not using promotional tools effectively and customerword of mouth is the main promotional tool. Poor product design and less innovative prac-
Sustainability 2021, 13, 13263 17 of 21
tices negatively affect the development of tourism products. Since people’s or users’ wantsand needs are varying constantly, products shall be designed and modified accordingly.
Distributional channels, especially the use of tour operators and travel agents, tourguides, and other distributors are performing at a very low level at the study area. Fingercounted employees only take some tourism and hotel profession training and use localhuman powers that are unprofessional and inexperienced in most tourism organizations.
High pricing of tourism products which leads to less demand for those tourism prod-ucts in the study area highly affects the tourism product development because of customerprice elasticity. On the other hand, the process of service provision is deferring which can bea reason for low development of tourism product development via customer dissatisfaction.
Unstandardized buildings, physical environments of tourism organizations, and deco-rations have been observed in the study area. The attractiveness of the service provisioncenter is fundamental to increasing the demand for tourism products. Besides, the brandimage significantly and positively affects the development of tourism products in the studyarea. However, the tourism product providers could not build brand identity. Locallyknown tourism product providers are available in the area that can utilize tourism re-sources which could help them to be competent and build the brand image in the future ifworked on.
Most tourism business organizations were not geographically expanding their prod-ucts and creating new segmentation of customers. Additionally, the tourism business didnot expand their goods and services to different neighboring cities. They are unable toexpand their product to deliver in other geographical areas because of financial constraints.
The market penetrating strategy was not applied well in the study areas of tourismproducts. There was high tourism product price, either no use or single distribution, lowpromotional activities, and less understanding of competitors among tourism business.
Diversified services besides the tourism services like transportation or shuttle services,banking services, exchange rate services, mobile recharge vouchers, and outdoor andindoor laundry services existed but were very few in number. Parks start to offer tourism-related products like food and beverage service besides their main products. Besides,tourism product development can be innovated through research development whichhelps to cater their existing tourism products and developing strategic partnerships withother firms in order to use their distribution channel and brands at a low level.
5.2. Recommendations
Based on the findings of the study, tourism product development is at a low level.It needs strong collaboration of government, residents, investors, and private sectorsconcerning tourism industry bodies in the area.
There are tourism resources in the study area, but they have not been utilized anddeveloped into tourism products. That is better if the government creates an opportunity forthe potentiated investors by encouraging through facilitating all the processes of investmentand incentives such as being free from tax exemption for some periods. In addition to this,tourism business should produce goods and services (unique and quality products) andshould get experience from other destinations.
Tourism offices should employ different promotional tools like advertisement onmainstream media, online website development, and use of social media to attract actualand prospective tourists and investors in the tourism industry.
Today, the price of tourism products has become highly inflated. Therefore, hotels, re-sorts, guest houses, and restaurants should have reduced their cost by using local resources(locally produced crops, fruits, vegetables).
Attention should be paid to professional, qualified, and skilled human power bytourism business. The way of serving, the standard time of service delivery, punctuality,and integrity and courteousness has a great influence on the mind of users to either retainor attract them.

Sustainability 2021, 13, 13263 18 of 21
Being innovative or creating newly adopted tourism products and diversifying prod-ucts is advisable to hotels and lodges particularly focusing on local (cultural) products,which could bring high competitive advantage even over nearby destinations.
Author Contributions: Conceptualization, T.H.B.; Writing—review & editing, K.B.M. All authorshave read and agreed to the published version of the manuscript.
Funding: This research received no external funding.
Institutional Review Board Statement: The study was conducted according to the research guide-lines of Hawassa University, Ethiopia, and approved by the research committee on 2 August 2021.
Informed Consent Statement: Informed consent was obtained from all subjects involved in the study.
Data Availability Statement: Not Applicable.
Acknowledgments: First and foremost, we thank almighty God for giving us the courage andstrength to complete this study. Secondly, this work was not the result of an independent effort. Itwas accomplished with the assistance of many people to whom the authors are very indebted. Ourheartfelt gratefulness goes to participants of the study for their willingness, enthusiasm, thoughts,and for providing essential information pertaining to the issue under investigation. We also wouldlike to express our genuine thanks to Hawassa University Tourism Management department staff,anonymous reviewers of the manuscript and managing editors of Sustainability (the assistant editorof the journal: Bianca Bode, and the academic editors: Dimitrios Aidonis, Naoum Tsolakis andCharisios Achillas) for their constructive comments.
Conflicts of Interest: The authors declare no conflict of interest.
Appendix A. Questionnaire
Part 1: Indicators of tourism product developmentDear respondents, please rate the existing tourism product in Batu and its vicinity.1 = Strongly disagree; 2 = Disagree; 3 = Neutral; 4 = Agree; 5 = strongly agree
No. Tourism Product 1 2 3 4 5
1Batu city and its surroundings have well conserved and protectednatural tourism resources (forests, parks, birds, water bodies,animals, and plants)
2There are well visited and managed cultural or human-madetourism resources (buildings, obelisks, museums, palaces, arts)
3Batu and surroundings are suitable for hosting event tourism(sports, conferences, meetings, exhibitions, etc.)
4There are modern accommodations (hotels, pensions, guesthouses, lodges, etc.) in the city and its surroundings
5There are qualified food and beverage service providers(restaurants, lounges, hotels, cultural food houses, bars)
Part 2. Marketing mix determinants of tourism product developmentDear respondent, please rate the determinants of tourism product development1 = Strongly disagree; 2 = Disagree; 3 = Neutral; 4 = Agree; 5 = strongly agree
No. New Tourism Product Development 1 2 3 4 5
1 The organization develops new products for the market
2 The organization improves its product
3 The organization provides locally used products
4 The organization uses the latest design for its product
Price

Sustainability 2021, 13, 13263 19 of 21
1 The organization offers discounts to its customers
2 Customers are happy with the price charged
3 The organization gives credit service for customers
4 The organization has the power of changing prices in the market
Place
1 The organization uses intermediaries
2 The organization uses its best alternative channel
3 The organization reduces the perishability of products
4 The organization is easily accessible for customers
5 The organization is at a convenient place to get other services
People
1 The organization gives training for its employees periodically
2 The organization recruits the right employees for the position
3 The organization’s employees are certified
4 The working environment of the organization is safe
5 The organization’s employees are happy with their salary
Promotion
1 The organization advertises its product by using media
2 The organization sells products to customers face to face
3 The organization’s product is publicized
4 The organization gives additional free services to the customers
5The organization’s customers have positive feedback for theservice they receive
Physical evidence
1 The organization’s surrounding environment is attractive
2 The design of the organization’s building is new and attractive
3 The organization’s product delivery area is well decorated
Process
1 The organization delivers the same standard products all the time
2 The organization delivers its product within a short period
3The organization saves customers unnecessary payments incurredin the process of receiving the product
Part 3. Branding image determination on tourism product development
Brand Image
1 The organization has better experience in the industry
2 The organization’s product is well known by its customers
3 The organization is the customers’ first choice

Sustainability 2021, 13, 13263 20 of 21
References1. Alemshet, D. Assessing Tourism Product Development. The Case of Mekelle City, Tigray Region, Ethiopia; Addis Ababa University:
Addis Ababa, Ethiopia, 2013.2. Khan, N.; Hassan, A.U.; Fahad, S.; Naushad, M. Factors Affecting Tourism Industry and Its Impacts on Global Economy of the
World. 2020. Available online: https://papers.ssrn.com/sol3/Papers.cfm?abstract (accessed on 10 June 2021).3. Bramwell, B. User satisfaction and product development in urban tourism. Tour. Manag. 1998, 19, 35–47. [CrossRef]4. Desta, H.; Lemma, B.; Albert, G.; Stellmacher, T. Degradation of Lake Ziway, Ethiopia: A study of the environmental perceptions
of school students. Lakes Reserv. Res. Manag. 2015, 20, 243–255. [CrossRef]5. Schmitz, S.; Lekane Tsobgou, D. Developing tourism products and new partnerships through participatory action research in
rural Cameroon. Geogr. Res. 2016, 54, 143–152. [CrossRef]6. Camilleri, M.A. Travel marketing, tourism economics and the airline product. In An Introduction to Theory and Practice; Tourism,
Hospitality & Event Management, Springer: Cham, Switzerland, 2018; pp. 69–83.7. UNWTO. United Nations World Tourism Organizations Tourism Highlights 2016 edition: UNWTO Annual Report. Madrid,
Spain, 2016. Available online: http://www.unwto.org (accessed on 12 March 2021).8. United Nations World Tourism Organization. European Union Tourism Trends; UNWTO: Madrid, Spain, 2018.9. Worku, Y.G.; Tessema, G.A. Public-private collaboration in the tourism industry in Northwestern Ethiopia. Afr. J. Hosp. Tour. Leis.
2018, 7, 1–12.10. WTTC. World Travel and Tourism Council Annual Report; WTTC: Madrid, Spain, 2019. Available online: www.wttc.org (accessed on
7 March 2021).11. Chiu, H.Y.; Chan, C.S.; Marafa, L.M. Local perception and preferences in nature tourism in Hong Kong. Tour. Manag. Perspect.
2016, 20, 87–97. [CrossRef]12. Fakana, S.T.; Mengist, A.B. Factors Hindering Tourism Industry Development: Gambella People’s National Regional State, South
West Ethiopia. Glob. J. Manag. Bus. Res. 2019, 9, 1–9.13. Fiseha, M. The Fundamental of Community Based Ecotourism Development in Ethiopia; Addis Ababa University Press: Addis Ababa,
Ethiopia, 2012.14. Adebisi, S.O.; Akinruwa, T.E. Effectiveness of product packaging on customer patronage of Bournvita in Ekiti State. Br. J. Mark.
Stud. 2019, 7, 1–14.15. Akama, J.S.; Kieti, D. Tourism and socio-economic development in developing countries: A case study of Mombasa Resort in
Kenya. J. Sustain. Tour. 2007, 15, 735–748. [CrossRef]16. Chiriko, A.Y. Assessing the marketability of cultural resources as a tourism product. Afr. J. Hosp. Tour. Leis. 2020, 9, 1–6.17. Theobald, W.F. Global Tourism: The Next Decade, Illustrated, Ed.; University of Michigan: Ann Arbor, MI, USA; Butterworth-
Heinemann: Oxford, UK, 1994.18. Hamley, W. Tourism in the Northwest Territories. Geogr. Rev. 1991, 81, 389–399. [CrossRef]19. Cirikovic, E. Marketing mix in tourism. Acad. J. Interdiscip. Stud. 2014, 3, 111–121. [CrossRef]20. Farzanegan, M.R.; Gholipour, H.F.; Feizi, M.; Nunkoo, R.; Andargoli, A.E. International tourism and outbreak of coronavirus
(COVID-19): A cross-country analysis. J. Travel Res. 2021, 60, 687–692. [CrossRef]21. Išoraite, M. Marketing mix theoretical aspects. Int. J. Res. Granthaalayah 2016, 4, 25–37. [CrossRef]22. Kotler, P.; Armstrong, G. Principles of Marketing; Pearson Education: London, UK, 2010.23. Kotler, P.; Armstrong, G.; da Silva, G. Marketing: An Introduction: An Asian Perspective; Pearson/Prentice Hall: New York, NY,
USA, 2006.24. Panizzon, M.; Vidor, G.; Camargo, M.E. Cross-Cutting Best Practices for New Product Development (NPD) in Turbulent
Environments: The Effects of Integration and Co-Creation. Innov. Manag. Rev. 2021. Available online: https://www.emerald.com/insight/content/doi/10.1108/INMR-04-2020-0053/full/html (accessed on 19 February 2021).
25. Mason, R.B.; Staude, G. A marketing mix model for a complex and turbulent environment. Acta Commer. 2007, 7, 236–254.[CrossRef]
26. World Tourism Organization. WNTWO Annual Report; World Tourism Organization: Madrid, Spain, 2017. Available online:www.unwto.org (accessed on 23 April 2021).
27. Madafuri, B. The implication of characteristics of tourism products towards marketing strategy. Int. J. Sci. Technol. Res. 2018,7, 233–235.
28. Nulty, P.M.; Rural tourism in Europe: Experiences, Development and Perspectives. 2002. Available online: cabdirect.org (accessedon 17 May 2021).
29. Eavani, F.; Nazari, K. Marketing mix: A critical review of the concept. Elixer Int. J. 2012, 5, 9914–9920.30. Nuseir, T.M.; Madanat, H. 4Ps: A strategy to secure customers’ loyalty via customer satisfaction. Int. J. Mark. Stud. 2015, 7, 78–87.
[CrossRef]31. Amofah, O.; Gyamfi, I.; Tutu, C.O. The influence of service marketing mix on customer choice of repeat purchase of restaurant in
Kumasi, Ghana. Eur. J. Bus. Manag. 2016, 8, 102–112.32. Park, J.; Musa, G.; Moghavvemi, S.; Thirumoorthi, T.; Taha, A.Z.; Mohtar, M.; Sarker, M.M. Travel motivation among cross-border
tourists: A case study of Langkawi. Tour. Manag. Perspect. 2019, 31, 63–71. [CrossRef]

Sustainability 2021, 13, 13263 21 of 21
33. Kannan, S. Tourism Marketing: A Service Marketing Perspective. 2009. Available online: https://mpra.ub.uni-muenchen.de(accessed on 21 March 2021).
34. Sonnleitner, K. Destination Image and Its Effects on Marketing and Branding a Tourist Destination: A Case Study about theAustrian National Tourist Office-with a Focus on the Market Sweden. 2011. Available online: https://www.diva-portal.org/smash/record (accessed on 15 May 2021).
35. Haile, A.K.; Seid, E. The psycho-social context of Lake Ziway/Dembel: Oromia Regional State, Ethiopia. Int. J. Sociol. Anthropol.2020, 12, 18–28.
36. Zegeye, H.; Teketay, D.; Kelbessa, E. Diversity, regeneration status and socio-economic importance of the vegetation in the islandsof Lake Ziway, south-central Ethiopia. Flora-Morphol. Distrib. Funct. Ecol. Plants 2006, 201, 483–498. [CrossRef]
37. Datiko, D.; Bekele, A. Population and feeding ecology of the Marabou stork (Leptoptilos crumeniferus) around Lake Ziway,Ethiopia. Ethiop. J. Biol. Sci. 2012, 11, 181–191.
38. Kothari, C. Research Methodology: Methods and Techniques. New Age International: New Delhi, India, 2004.39. Bhattacherje, A. Social Science Research: Principle Methods and Practices, 2nd ed; CreateSpace Independent Publishing Platform:
Scotts Valley, CA, USA, 2012. Available online: https://digitalcommons.usf.edu/cgi/viewcontent.cgi?article (accessed on 10April 2021).
40. Cochran, W. Sampling Technique, 2nd ed.; John Wiley and Sons: New York, NY, USA, 1963.41. Saunders, B.; Sim, J.; Kingston, T.; Baker, S.; Waterfield, J. Saturation in qualitative research. Exploring its conceptualization and
operationalization. Qual. Quant. 2017, 52, 1893–1907. [CrossRef] [PubMed]42. Andargie, G.; Berhane, Y.; Worku, A.; Kebede, Y. Predictors of perinatal mortality in rural population of Northwest Ethiopia: A
prospective longitudinal study. BMC Public Health 2013, 13, 1–7. [CrossRef] [PubMed]43. Field, A. Discovering Statistics Using SPSS, 3rd ed.; Sage publication Ltd.: London, UK, 2009; Available online: http://sutlib2.sut.
ac.th/sut_contents/H124897.pdf (accessed on 6 May 2021).44. Gujarati, D.N.; Porter, D.C.; Gunasekar, S. Basic Econometrics; Tata McGraw-Hill Education: New York, NY, USA, 2012.45. Steven, J.P. Applied Multivariate Statistics for Social Science; Routledge: London, UK, 2002.