determinants of operational sustainability of micro - CiteSeerX
76
DETERMINANTS OF OPERATIONAL SUSTAINABILITY OF MICRO FINANCE INSTITUTIONS IN KENYA BY GIBSON, ALBERT BERNARD A RESEARCH PROJECT SUBMITTED IN PARTIAL FULFILLMENT OF THE REQUIREMENTS FOR THE AWARD OF MASTER OF BUSINESS ADMINISTRATION (MBA) DEGREE, SCHOOL OF BUSINESS, UNIVERSITY OF NAIROBI NOVEMBER, 2012
-
Upload
khangminh22 -
Category
Documents
-
view
0 -
download
0
Transcript of determinants of operational sustainability of micro - CiteSeerX
DETERMINANTS OF OPERATIONAL SUSTAINABILITY OF MICRO
FINANCE INSTITUTIONS IN KENYA
BY
GIBSON, ALBERT BERNARD
A RESEARCH PROJECT SUBMITTED IN PARTIAL FULFILLMENT OF THE
REQUIREMENTS FOR THE AWARD OF MASTER OF BUSINESS
ADMINISTRATION (MBA) DEGREE,
SCHOOL OF BUSINESS, UNIVERSITY OF NAIROBI
NOVEMBER, 2012
ii
DECLARATION
Student’s Declaration
I declare that this project is my original work and has not been submitted for an award of
a degree in any other University.
Signature: __________________________ Date …..…………………….
GIBSON, ALBERT BERNARD
D61 / 60905 / 2011
This research project report has been submitted for examination with my approval as the
University Supervisor.
Signature:………………………… Date:………………………….
MR.HERICK ONDIGO
LECTURER
DEPARTMENT OF FINANCE AND ACCOUNTING
SCHOOL OF BUSINESS
UNIVERSITY OF NAIROBI

iii
DEDICATION
I dedicate this study to my lovely wife, Agnes Sherman Gibson (cka Honey) and to my
children; Ebenezer, Zelyn, Comfort, Naomi, Joshua and Victoria Happy Gibson and to
my dear family members, my mom Larwuo Mama Gibson for all their endless support
they gave me as I prepared and worked on this project.
iv
ACKNOWLEDGEMENT
It has been an exciting and instructive study period in the University of Nairobi and I feel
privileged to have had the opportunity to carry out this study as a demonstration of
knowledge gained during the period studying for my master’s degree. With these
acknowledgments, it would be impossible not to remember those who in one way or
another, directly or indirectly, have played a role in the realization of this research
project. Let me, therefore, thank them all equally.
First, I am indebted to the all-powerful GOD for all the blessings he showered on me and
for being with me throughout the study. I am deeply obliged to my supervisor Mr. Herick
Ondigo for his exemplary guidance and support without whose help; this project would
not have been a success. I take this opportunity to express my deepest gratitude to my
loving family for their never ending support, understanding and encouragement you
accorded me while studying for the MBA programme.
Finally, my special thanks go to my former boss, Mr. John S. Morlu, II (the former
Auditor General of the Republic of Liberia) who through his selfless effort awarded me
this scholarship by and through the Government of the Republic of Liberia. He is my
constant source of motivation.
v
ABSTRACT
Many people in developing countries have been given access to formal financial services
through microfinance programs. Nevertheless, millions of potential clients still remain
un-served and the demand for financial services far exceeds the currently available
supply. Given significant capital constraints, expansion of microfinance programs
remains a formidable challenge facing the microfinance industry. Moreover, it is
observed that microfinance organizations have had various degrees of sustainability. One
such sustainability is the financial sustainability. Financial sustainability has been defined
by various researchers differently. As such there is no clear cut definition of the word
financial sustainability. Therefore this paper attempts to find out the factors which affect
the operations self- sufficiency and financial sustainability and thereafter propose a more
comprehensive and representative model for financial sustainability and create an index
to observe the financial performance of microfinance sector. The financial data of
microfinance institutions from Kenya suggests that the capital / asset ratio, operating
expenses / loan portfolio and portfolio at risk > 30 days are the main factors which affect
the sustainability of microfinance institutions.
The study was guided by the main objective which was to establish the factors that
determines the operational sustainability of micro finance institutions in Kenya. The
study utilized a descriptive research design and it targeted 30 microfinance institutions
(MFIs) listed from the Association of Microfinance Institutions (AMFI) in Kenya, which
provided financial services to low income people in Kenya. The data for the study was
drawn from a database of audited financial statements of MFIs in Kenya. The data
collected from the financial statements included capital structure variables which include
debt, equity, total assets, etc. A multiple regression model was used to analyze data
collected.
It can be observed that the factors that affect the operations and financial sustainability
are Capital/ asset ratio and Operating expenses/Loan Portfolio. Therefore these indictors
have been included along with Operational Self Sufficiency to create Sustainability
index.
vi
This model of operational self-sufficiency and financial sustainability Index for
microfinance institutions is more comprehensive. With the help of this model, the MFIs
in Kenya can quantify the level of operations and financial sustainability. This model can
also be used to create a sustainability index for various countries and help the regulator
identifying the strong and weak areas of the sector. In addition, the existence of new
model is also expected to facilitate MFIs to access to capital markets. Having access to
sustainability information may reduce some of the transaction uncertainty. This model
may be considered as one more step in the process of the emergence of the microfinance
standards.

vii
TABLE OF CONTENTS
DECLARATION............................................................................................................... ii
DEDICATION.................................................................................................................. iii
ACKNOWLEDGEMENT ............................................................................................... iv
ABSTRACT ....................................................................................................................... v
LIST OF TABLES ............................................................................................................ x
LIST OF FIGURES ......................................................................................................... xi
ABBREVIATIONS ......................................................................................................... xii
CHAPTER ONE: INTRODUCTION ............................................................................. 1
1.1 Background of the study ........................................................................................... 1
1.1.1 Operational Sustainability of MFI in Kenya ...................................................... 3
1.1.2 The Profile of MFIs in Kenya ............................................................................ 4
1.2 Problem Statement .................................................................................................... 6
1.3 Research Objective ................................................................................................... 7
1.4 Significance of the Study .......................................................................................... 7
CHAPTER TWO: LITERATURE REVIEW ................................................................ 9
2.1 Introduction ............................................................................................................... 9
2.2 Theoretical Orientation ............................................................................................. 9
2.2.1 Theory of Creative Destruction ............................................................................. 9
2.2.2 Modern Economics Theory.............................................................................. 10
2.2.3 Institutional Theory .......................................................................................... 10
2.2.4 Evolutionary Theory ........................................................................................ 10
2.3 Dimensions of Operational Sustainability of MFIs ................................................ 11
2.3.1 Institutional Sustainability ............................................................................... 11
viii
2.3.2 Mission Sustainability ...................................................................................... 11
2.3.3 Programme Sustainability ........................................................................... 11
2.3.4 Human Resource Sustainability .................................................................. 11
2.3.5 Financial Sustainability ............................................................................... 12
2.3.6 Market Sustainability ....................................................................................... 12
2.3.7 Legal and Policy Environment Sustainability.................................................. 13
2.3.8 Impact Sustainability .................................................................................. 13
2.4 Empirical Review.................................................................................................... 13
2.4.1 Factors that Influencing Operational Sustainability of MFIs; An Empirical
Review ...................................................................................................................... 13
2.4.2 Form of Incorporation ...................................................................................... 13
2.4.3 Level of Support/ Subsidies ............................................................................. 14
2.4.4 Flexibility of Repayment Schedule .................................................................. 14
2.4.5 Donor Involvement .......................................................................................... 15
2.4.6 Group Lending ................................................................................................. 17
2.4.7 Savings Mobilized ........................................................................................... 18
2.4.8 Loans Disbursed............................................................................................... 19
2.4.9 Per Capital Income ........................................................................................... 19
2.5 Summary ............................................................................................................. 25
CHAPTER THREE: RESEARCH METHODOLOGY ............................................. 26
3.1 Introduction ............................................................................................................. 26
3.2 Research Design...................................................................................................... 26
3.3 Target Population .................................................................................................... 26
3.4 Data Collection ....................................................................................................... 26
ix
3.5 Data Analysis and Presentation .............................................................................. 27
CHAPTER FOUR: DATA ANALYSIS, FINDINGS AND DISCUSSION ............... 29
4.1 Introduction ............................................................................................................. 29
4.2 Scales of Financial Indicators ................................................................................. 29
4.3 Summary of Linear Regression for Sustainability of Kenya MFIs ........................ 30
4.4 Coefficients of Financial Factors affecting Sustainability of Kenya MFIs ............ 31
4.5 Weight for the Indicators ........................................................................................ 32
4.6 Range of Indicators and the Score of Standards for MFIs ...................................... 33
4.7 Financial Sustainability Index for Kenya Microfinance Institutions ...................... 35
4.8 Methodology to Develop the Operations and Financial Sustainability Index: ....... 36
4.9 Descriptive Statistics ............................................................................................... 38
4.10 Correlation Analysis ............................................................................................. 41
4.11 Regression Analyses ............................................................................................. 43
4.11.1 Regression Model for 2011 .......................................................................... 46
4.11.2 Interpretation of the Findings......................................................................... 49
CHAPTER FIVE : SUMMARY, CONCLUSION AND RECOMMENDATIONS . 52
5.1 Introduction ............................................................................................................. 52
5.2 Summary ................................................................................................................. 52
5.3 Conclusion .............................................................................................................. 54
5.4 Recommendations for Policy .................................................................................. 55
5.5 Limitations of the Study.......................................................................................... 57
5.6 Suggestions for Further Studies .............................................................................. 57
REFERENCES ................................................................................................................ 58
APPENDICES ................................................................................................................. 62
x
LIST OF TABLES
Table 4.1: Scales of Financial Indicators..………………………………………………29
Table 4.2: Model Summary of Linear Regression for Sustainability of Kenya MFIs ...... 30
Table 4.3: ANOVA (b) ..................................................................................................... 30
Table 4.4: Coefficients (a) of Financial Factors affecting Sustainability of Kenya MFIs 31
Table 4.5: Weight for the Indicators ................................................................................. 33
Table 4.6: Indicators Range and standard ......................................................................... 34
Table 4.7: Financial Sustainability Index for Kenya Microfinance Institutions ............... 35
Table4.8: Annual Averages of Key MFIs Statistics ………………………………………38
Table 4.9: Descriptive statistics of key variables for the entire sector ............................. 39
Table 4.10: Descriptive statistics of key variables for the top-tier MFIs .......................... 40
Table 4.11: Descriptive statistics of key variables for the bottom-tier MFIs ................... 41
Table 4.12: Pearson Correlation Matrix ............................................................................ 42
Table 4.13: Pearson Correlation Matrix ............................................................................ 43
Table 4.14: Goodness of Fit Statistics .............................................................................. 43
Table 4.15: Analysis of Variance (ANOVA) ................................................................... 44
Table 4.16: Regression Coefficients ................................................................................. 44
Table 4.17: Goodness of fit statistics ................................................................................ 46
Table 4.18: Analysis of Variance (ANOVA) ................................................................... 47
Table 4.19: Regression Model Coefficient ....................................................................... 47
xi
LIST OF FIGURES
Figure 4.1: Profitability/Standardized Coefficients .......................................................... 45
Figure 4.2: Profitability/Standardized Residuals .............................................................. 46
Figure 4.3 :Profitability/Standardized Coefficients .......................................................... 48
Figure 4.4: Profitability/Standardized Residuals .............................................................. 48
xii
ABBREVIATIONS
AMFI Association of Microfinance institutions
BBK Barclays Bank of Kenya
BIMAS Business Initiative and Management Assistance Services
CBK Co-operative Bank of Kenya
CGAPA Consultative Group to Assist the poor
CIC Co-operative Insurance Company
CRCL Canyon Rural Credit Limited
ECLF Ecumenical Church Loan Fund of Kenya
FSAs Financial Services Associations
FSS Financial Self Sufficiency
KADET Kenya Agency for the Development of Enterprise and Technology
KCB Kenya Commercial Bank
KDA K-rep Development Agency
KPOSB Kenya Post Office Saving Bank
K-REPB Kenya Rural Enterprise Programme Bank
KWFT Kenya Women Finance Trust
MAL Micro Africa Limited
ME Microcredit Enterprises
MFIs Microfinance Institutions
MSE’s Micro and Small Enterprises
NGOs Non-Governmental Organizations
xiii
OSS Operational Self Sufficiency
PAWDEP Pamoja Women Development Programme
ROSCAs Rotating Savings and Credit Associations
SACCOs Savings and Credit Co-operative Societies
SISDO Small holder Irrigation Scheme Development Organization
SMEA Stromme Microfinance East Africa Limited
SMEP Small Micro Enterprise Program
USAID United States Agency for international Development
1
CHAPTER ONE
INTRODUCTION
1.1 Background of the study
Sustainability refers to the long- term continuation of the Microfinance programme after the
project activities have been discontinued (Ahlin and Lin, 2006). It entails that appropriate
systems and processes have been put in place that will enable the Microfinance services to be
available on a continuous basis and the clients continue to benefit from these services in a
routine manner. This also would mean that the programme would meet the needs of the
members through resources raised on their own strength, either from among themselves or
from external sources. Though sustainability does get understood immediately in the financial
terms or the resource terms, it actually has broader dimensions, of which financial
sustainability is only one major dimension (Ahlin and Lin, 2006). The different dimensions of
operational sustainability are: institutional sustainability (mission sustainability, programme
sustainability, human resource sustainability, financial sustainability, and market
sustainability), legal policy environment sustainability, and impact sustainability.
The factors that generally influence sustainability of microfinance institutions include the
capital/ asset ratio, operating expenses/loan portfolio and portfolio at risk > 30 days (repayment schedule), others are loans disbursed, donor involvement, the lending model,
savings mobilized, per capita income, level of support as well as form of incorporation,.
Given that there has been a growth in the MFI industry in Kenya, it is also important to
establish what factors have influenced the sustainability of such institutions. This is the gap
that the present study seeks to bridge. The present study differs from the previous ones since it
is based on the Kenyan context.
Millions of people in developing countries have been given access to formal financial services
through microfinance programs. Nevertheless, millions of potential clients still remain un-
served and the demand for financial services far exceeds the currently available supply. Given
significant capital constraints, expansion of microfinance programs remains a formidable
2
challenge facing the microfinance industry. Moreover, it is observed that microfinance
organizations have had various degrees of sustainability. One such sustainability is the
financial sustainability. Financial sustainability has been defined by various researchers
differently. As such there is no clear cut definition of the word financial sustainability. The
Financial Self Sufficiency is an approximate indicator of the impact of subsidies on an
organization’s sustainability. In an environment where grants represent less than 1% of the
sources of funds of MFIs (Microfinance Institutions) the FSS calculation is no longer relevant.
Since profit rates are also running at quite high levels and very few MFIs are now making
losses, the Operational Self Sufficiency too is not a very interesting indicator. Therefore this
paper attempts to propose a more comprehensive and representative model for financial
sustainability and create an index to observe the financial performance of microfinance sector
in Kenya.
In a stable political environment and enabling macro economy, evidence arising over several
decades has supported the view that the provision of microfinance is an important component
of any effort to improve the livelihoods of the poor in any society. In recent years in Kenya,
there has been renewed interest in microfinance by both policymakers and practitioners. This
interest is based on its valued contribution to efforts aimed at improving the livelihoods of the
rural population in Kenya through policies and programs geared towards addressing
inequalities arising from the country’s socio-political history.
The lack of oversight, however, has enabled them to innovate and develop different
techniques of providing microfinance services. Therefore to stimulate development of the
sector, appropriate laws, regulations and supervision framework need to be in place. Omino
(2005), noted that regulation and supervision will lead to quality growth, broaden the funding
base for MFIs eligible to mobilize and administer deposits and initiate the process of
integrating these institutions into the formal financial system. The regulation of the sector will
enable authorities to define procedures for their operations, entrance, and exit and ultimately
create an environment for fair competition and efficiency in the sector (Omino 2005).
3
Microfinance institution has come to refer to a wide range of organizations dedicated to
providing these services: NGOs, credit unions, cooperatives, private commercial banks and
non-bank financial institutions (some that have transformed from NGOs into regulated
institutions) and parts of state-owned banks. Microfinance refers to all types of financial
intermediation services; savings, credit funds transfer, insurance, pension remittances,
provided to low-income households and enterprises in both urban and rural areas, including
employees in the public and private sectors and the self-employed (Robinson, 2003).
1.1.1 Operational Sustainability of MFI in Kenya
A microfinance institution is said to have reached sustainability when the operating income
from the loan is sufficient to cover all the operating costs (Sharma and Nepal, 1997). This
definition adopts the bankers’ perspective and sticks to ‘accounting approach’ of
sustainability. Shah (1999) adopts for an ‘integrated approach’ in defining the term
sustainability as the ‘accounting approach’ to sustainability that takes into account the
financial aspect of the institution is too narrow for him.
A growing number of writers over the last quarter of a century have recognized that the
activities of an organization impact upon the external environment and have suggested that
such an organization should therefore be accountable to a wider audience than simply its
shareholders. This concern was stated by Ackerman (1975) who argued that big business was
recognizing the need to adapt to a new social climate of community accountability, but that
the orientation of business to financial results was inhibiting social responsiveness. McDonald
and Puxty (1979). This influence is so significant that it can be argued that the power and
influence of these stakeholders is such that it amounts to quasi-ownership of the organization.
Indeed Gray et al. (1987) challenge the traditional role of accounting in reporting results and
consider that, rather than an ownership approach to accountability, a stakeholder approach,
recognizing the wide stakeholder community, is needed. Moreover Rubenstein (1992) goes
further and argues that there is a need for a new social contract between a business and its
stakeholders.
For Shah, the concept of sustainability includes, amongst other criteria, - obtaining funds at
market rate and mobilization of local resources. Therefore, his performance assessment
4
criteria for the financial viability of any microfinance related financial institution are:
repayment rate, operating cost ratio, market interest rates, portfolio quality, and ‘demand
driven’ rural credit system in which farmers themselves demand the loans for their proposal.
Various researchers have argued that in democratic societies, small scale entrepreneurs have a
right to a participatory role and full ownership of microfinance organizations including
planning, management, and decision-making (Weitz,1982; Wehnert and Shakya, 2003).The
basis of the argument is that the entrepreneurs have access to local knowledge, which is
unknown to official experts. The supporters of this school of thought have argued that
microfinance institutions should not be run by public sector organizations; it should rather be
handed over to small farmers in order to generate a sense of ownership among small farmers
(Sharma and Nepal, 1997) and to attain institutional sustainability of microfinance institutions
(MFIs). According to microfinance gateway (2007) microfinance means providing very poor
families with very small loans (micro credit) to help them engage in productive activities or
grow their tiny businesses. Over time, microfinance has come to include a broader range of
services (credit, savings, insurance, etc.) as we have come to realize that the poor and the very
poor that lack access to traditional formal financial institutions require a variety of financial
products.
1.1.2 The Profile of MFIs in Kenya
Micro finance organizations came to prominence in Kenya in the 1980s, although early
experiments date back 30 years in Bangladesh, Brazil and a few other countries. The
important difference of micro finance was that it avoided the pitfalls of an earlier generation
of targeted development lending, by insisting on repayment, by charging interest rates that
could cover the costs of credit delivery, and by focusing on client groups whose alternative
source of credit was the informal sector. Emphasis shifted from rapid disbursement of
subsidized loans to prop up targeted sectors towards the building up of local, sustainable
institutions to serve the poor.
Micro finance has largely been a private (non-profit) sector initiative that avoided becoming
overtly political, and as a consequence, has outperformed virtually all other forms of
development lending. Kenya’s Micro finance industry focuses on delivering financial services
5
to low-income individuals and Micro and Small Enterprises (MSE’s) engaged in non-farm
productive activities. Over time MFIs have introduced significant innovations in products and
services, which are patronized by MSE’s. The following key service providers characterize
the industry: -
The Kenya Microfinance sector consists of a large number of competing institutions which
vary in formality, commercial orientation, professionalism, visibility, size and geographical
coverage. These institutions range from informal organizations e.g. rotating savings and credit
associations (ROSCAs), financial services associations (FSAs). Savings and credit co-
operative societies (SACCOs), NGOs, to commercial banks that are down scaling (Dondo
2003)
The goal of MFI organizations in Kenya is to raise the levels of income and welfare of people.
They support the poor and unemployed by giving them loans often without collateral to
establish small businesses. Kenyans today are faced by increased poverty, unemployment and
insecurity of the AIDS pandemic, scarcity of food and rural urban migration among others.
MFIs address the above problems by accessing small loans at affordable repayment rates, and
other financial services for Micro and Small Enterprises (MSE). These take the form of self-
help proposals and individual enterprises. Most MFIs lend up to a maximum of Shs. 500,000
and a minimum of Shs. 5,000 per applicant.
The 1999 MSE base line survey found that micro-financing, a core source of funding for
micro and small enterprises contributes about 18% of the country's GDP and employs 2.3
million people (The Financial Standard, March 19, 2002).
Most MFIs started as NGOs whose funding is from foreign donors and agencies. Wainana
(2002), NGO’s in Kenya have been accused of misappropriation of donor funds and questions
have been raised as to whether the funds they receive are used for the designated purposes.
The issue of ownership of NGOs has raised fundamental concerns for their governance. For
instance, if there are no owners or shareholders, then who hold and exercises the supreme
authority of the institution to appoint Directors or change the composition of the Board,
appoint auditors and satisfy themselves that an appropriate governance structure is in place?
(Mwaura, and Gatamah 2000). Secondly if the Board and Management are part owners of the
6
institution, and have to balance the interests of all stakeholders including their own, what
would prevent them from maximizing their “joint” interests through empire building, perks,
and special benefits at the expense of other stakeholders – given that they are responsible for
determining and implementing organization purpose and implied accountable to themselves?
(Mwaura, and Gatamah 2000).
The growth of Kenya’s MFI industry has witnessed at least 100 non-governmental
organizations (NGOs) offering services to clients. However, only 15 organizations can be
classified as significant players. It has however been recognized widely in Kenya that
promotion of the micro and small enterprise sector is a viable and dynamic strategy for
achieving national goals, including employment creation, poverty alleviation and balanced
development between sectors and sub sectors. All these together are essential for the
achievement of the government vision of industrialization by the year 2020 (Mullei and
Bokea, 1999).
There has been no specific legislation to govern the MFIs in Kenya until Parliament passed
MFI Bill 2006. The MFI Bill 2006 seeks to regulate all deposit taking organizations. In order
to promote investor confidence and to assist companies meet stakeholders expectations MFI
Bill 2006 has developed a set of guidelines and principles of corporate governance as key to
maintaining the trust of the investors (Central bank newsletter 2006).
1.2 Research Problem
The growth of MFIs can be attributed to factors such as changes in social welfare policies and
a focus on economic development and job creation at the macro level. Focus inducing
employment, including self-employment, as a strategy for improving the lives of the poor
(Servon 1999; Gonzalez-Vega 1998).
These factors have created particular incentives and generated public and private subsidies for
micro lending activity in the developing countries where most MFIs are structured as non-
profit organizations (Servon 1997). However, despite the interest in the sector and the
subsidies that have flowed into mission-oriented MFIs, it appears challenging to make an MFI
viable over the long term. One survey found that 30 percent of domestic microfinance
7
programs operating in 1996 were either no longer in operation or were no longer lending
capital two years later (Bhatt, Painter, and Tang 2002). Furthermore most microfinance
programs report difficulty in covering expenses without continued reliance on grants, external
fundraising, or other subsidies.
Despite the many determinants of operational sustainability of micro finance institutions in
Kenya, there is limited research in the area. Given the inability of most Microfinance
institutions in Kenya to rise up to the sustainable levels, this research seeks to investigate and
provide an answer to what are the determinants of operational and financial sustainability of
micro finance institutions in Kenya?
1.3 Objective
To establish the factors that determines the operational sustainability of micro finance
institutions in Kenya.
1.4 Value of the Study
First, by focusing on achieving institutional, financial sustainability; regulators and
practitioners of microfinance in Kenya, the study will contribute towards domestic institution
building for financial capacity widening and deepening in locally constituted organizations
and funds.
Secondly, the owners of the enterprises will be able to know their contribution towards the
success and sustainability of the microfinance institutions, which are important to their
operations. Eventually, they will take up their ultimate role in supporting the performance of
the institutions. This study would help micro financial organization to focus their attention on
development of risk management tools that will enhance setting up of new offices in rural
areas where financial services demand is high and un met. Hence benefit of profit and high
income as a result of Lower management borrowing credit facilities.
Thirdly the study will provide a source of reference for future studies on microfinance
institutions. It will also act as a source of literature for academics in the field of
entrepreneurship.
8
Lastly, the investors would also benefits from the study by accessing how improved risk
management will assist in the distribution system of the microfinance organizations .They
come to contrary do business and would like to know which MFIs is available in particular
area in the business environment such research would enable the investor to determine the
MFIs products and services available for their use e.g. credit facilities when transacting
business within and outside the country.
9
CHAPTER TWO
LITERATURE REVIEW
2.1 Introduction
This chapter presents review of literature on various factors that influence the sustainability of
microfinance institutions. The literature explored discusses various factors that can influence
the sustainability of these institutions. This was done with a view of collecting views,
prospective and opinions and understanding the factors affecting distribution systems of MFIs
in Kenya. The review depends on theoretical literature that include; books, research papers,
magazines and information from the internet.
2.2 Theoretical Review 2.2.1 Theory of Creative Destruction
Schumpeter's theory of creative destruction posits that in a capitalist economy, the collapse
and renewal of firms and industries is necessary to sustain the vitality of the larger economic
system (Schumpeter, 1961). However, if the capitalist economic system relies on endless
growth, then sustaining it for too long will inevitably borrow from the sustainability of the
global ecosystem. In economic analysis, inter-temporal discount rates essentially tell us how
long we should care about sustaining any given system. Economists distinguish between
discount rates for individuals based on personal time preference; lower discount rates for
firms based on the opportunity cost of capital, and even lower discount rates for society. For
issues affecting even higher-level systems, such as global climate change, many economists
question the suitability of discounting future values at all (Richard Timberlake, 2005).
This is a theory of “how” one thinks an initiative can be sustained, diversified, changed, or
modified from not only its current origin but where it is needs to be currently positioned (John
Bellamy Foster, 2008). The theory helps to strengthen the ability to make choices or
redirection efforts with other groups, organizations, or partners based upon growth and
evolution of the initiative.
10
2.2.2 Modern Economics Theory
Modern economics has gone far in discovering the various pathways through which millions
of expectations of, and decisions by, individuals can give rise to emergent features of
communities and societies (e.g., rate of inflation, productivity gains, level of national income,
prices, stocks of various types of capital, cultural values, and social norms). Two factors make
economic theory particularly difficult (Hannagan Tim, 1998). First, individual decisions at
any moment are themselves influenced by these emergent features, by past decisions (e.g.,
learning, practice, and habit), and by future expectations. Second, the emergent features that
can be well handled by existing economic theory and policy concern only fast-moving
variables. The more slowly emergent properties that affect attitudes, culture, and institutional
arrangements are recognized, but are poorly incorporated.
2.2.3 Institutional Theory
Institutional theory and analysis does consider such features, but in a largely static sense.
Hence, it also stops just short of the confluence point among the three fields that could
provide the integration needed. Institutional theory currently provides an understanding of the
variety of arrangements and rules that have evolved in different societies to harmonize the
relationship between people and nature. Social scientists have gone far in describing the way
people store, maintain, and use knowledge in stable circumstances. But an integrative
approach requires attention to the very same dynamic dimensions that economics and ecology,
each in their own way, have developed. Scott, W. R. (2004).
2.2.4 Evolutionary Theory
The emergence of novelty that creates unpredictable opportunity is at the heart of
development. It is biological evolutionary theory, expanded to include cultural evolution that
does deal with just those issues. The recent invention of complex systems studies explicitly
sees ecological, economic, and social systems each as specialized representations of a
complex adaptive system. There have been wonderful advances achieved by borrowing those
mechanisms that generate variability from known biological processes and exposing the
emergent patterns that result. But, as for each of the other fields, the representations are
11
partial. They are detached from efforts to represent the necessary and just sufficient
complexity in natural and human processes, and to test the adequacy and credibility of the
results. Darwin, C. (1859).
2.3 Dimensions of Operational Sustainability of MFIs
2.3.1 Institutional Sustainability
Institutional sustainability looks at those dimensions of the organization, which deals with the
internal organizational environment (Ruben and Schers, 2007). These are the dimensions that
make the organization a wholesome, vibrant and a going concern.
2.3.2 Mission Sustainability
Sustainability of its mission is what will keep the organization in its chosen path in the long
term. Activities that the organization is engaged in have to be constantly evaluated for its
compatibility with the defined mission of the organization. If changes are brought about in the
mission, it would be through a well articulated and participatory process in the organization
(Ruben and Schers, 2007).
2.3.3 Programme Sustainability
Programme Sustainability occurs when stakeholders ( clients) perceive that the services that
they are receiving are of sufficient importance and value and are willing to assume
responsibility and ownership for them. When this occurs the MFI can develop a phasing out
strategy because the programme remains client supported and no external subsidized support
is sought (Bret, 2006).
2.3.4 Human Resource Sustainability
It means that the MFI is able to recruit, train maintain well qualified staff that are capable of
delivering services as required. Also the staffs are able to monitor and maintain the
organization on the right track, keeping in minds all other parameters of sustainability (Ruben
and Schers, 2007).
12
2.3.5 Financial Sustainability
Financial sustainability means that the MFI is able to cover all its present costs and incurred in
the growth, if its expands operations (Johnson et al, 2006). It would mean that the MFI is able
to meet its operations costs, its financial costs adjusted for inflation and costs incurred in
growth. Financial sustainability is a tangible parameter and can be measured and monitored
continually through a set of indicators.
Otero and Rhyne classified financial sustainability into four levels, starting from the stage
when the MFI is totally dependent on subsidies and grants for running its operations to the
final stage when the programme is fully financed from resources mobilized from the clients
and on funds raised from financial institutions on commercial rates of interest.
To summarize, the financial sustainability is to charge an interest rate that is high enough to
cover operating costs, loan losses and interest and adjustment expenses. However, MFIs must
operate efficiently enough that reasonable, affordable and competitive interest rates can be
charged to cover these costs. Therefore, long term sustainability requires MFIs to manage
delinquency, keep their cost of capital low (by mobilizing savings), rotate their portfolio
efficiently, keep operating costs to the minimum and most importantly, set interest rates to
cover all these costs (Rutherford, 2000).
2.3.6 Market Sustainability
This deals with the whole gamut of issues that deal with demand and supply of microfinance.
It deals with issues relating to the different types of the clientele, their differing types of
needs, and designing products that suit the needs of this clientele. Servicing these needs in the
most client friendly manner will lead to the sustainability of the demand. A sustainable supply
of resources will need that the MFI is financially self sufficient and meets all its costs from
operations and has access to resources raised from the clients and from external sources at
commercially viable rates of interest (Johnson et al, 2006).
13
Market sustainability is also about availability of a large number of choices to the clientele.
The MFIs sustain purely on the effectiveness and efficiency of its services and not due to
artificially created imperfections (Rosenberg, 2003).
2.3.7 Legal and Policy Environment Sustainability
Market sustainability as described above assumes the existence of a stable and friendly legal
and policy environment that will enable the proliferation of a large number of organizations
involved in the delivery of microfinance services (Onyuma and Shem, 2005). It would deal
with issues relating to legal forms of organization, interest rates, savings mobilization, and
resource mobilization from capital markets, from overseas commercial sources, etc.
2.3.8 Impact Sustainability
Microfinance has emerged as an effective methodology for alleviating poverty among the
disadvantage sectors. Thus it is necessary that services delivered by the different organizations
have a positive impact on poverty. The positive changes that occur in the life of the poor
family have to be sustained over the long term for the family to gradually emerge out of the
state of poverty (Onyuma and Shem, 2005).
2.4 Empirical Review
2.4.1 Factors that Influencing Operational Sustainability of MFIs; An Empirical Review
2.4.2 Form of Incorporation
In financial literature, the principal- agent theory argues that the form of institutional
incorporation should have an effect on the behavior of its managers and how they are
influenced by external stakeholders (Myers & Majluf, 1984). The study by Adongo and Stork
(2005) showed that the forms of incorporation common to micro lenders i.e. closed
corporations, trusts and proprietary limited, are negatively (positively) related to financial un-
sustainability (sustainability).
14
2.4.3 Level of Support/ Subsidies
It is theoretically expected that microfinance institutions that are supported by other bodies
will have a positive relationship to financial sustainability due to closer support they receive.
Subsidies are common in microfinance, especially in the form of soft loans. In a study by
Balkenhol (2007), all 45 MFIs reviewed in the survey were being subsidized in one way or the
other, of which 34 were convinced that without subsidies, they would not be able to move up-
scale by improving the use of human and financial resources. These results have implications
for public policy, and especially subsidies. Subsidies should enhance and stimulate efficiency,
rather than obliging an MFI to choose between its social objectives and financial performance.
2.4.4 Flexibility of Repayment Schedule
The flexibility of the repayment schedule is theatrically expected to influence financial
sustainability to the extent that it affects the effective rate of interest, which in turn has an
effect on the break-even interest rate. To the extent that a more frequent repayment schedule
generates a higher effective interest rate, a weekly payment schedule should be negatively
(positively) associate with financial un-sustainability (sustainability) (Adongo and Stork,
2005).
This theoretical expectation highlights the trade –off between aiming to provide more flexible
microfinance credit products for customers’ satisfaction while reducing cost of frequent
collection and reducing risk when designing microfinance products from an institutional
perspective. It is argued that in the pursuit of lower cost for microfinance through less
frequent collection schedules and higher levels of customer satisfaction through more flexible
repayment terms, microfinance institutions should not lose sight of the need for stronger loan
delinquency control systems to prevent moral hazard from creeping in that may lead to the
collapse of the microfinance institution.
In stork contracts to bank debt contracts, most microfinance contracts require that repayments
start immediately after loan disbursement and occur weekly thereafter. Even though economic
theory suggests that more flexible repayment schedules would benefits clients and potentially
improve their repayment capability, microfinance practitioners argue that the fiscal discipline
15
imposed by frequent repayment is critical to preventing loan default. In a study by Field and
Pande (2008) data from a field experiment which randomized client assignment to a weekly or
monthly repayment schedule was used. The study found no significant effect of type of
repayment schedule on client delinquency or default. The findings suggest that, among
microfinance clients who are willing to borrow at either weekly or monthly repayment
schedules, a more flexible schedule can significantly lower transaction costs without
increasing client default.
Adongo and Stork (2005) in their study found that the coefficient of the variable capturing the
weekly repayment schedule has a negative sign, while that of the monthly and term repayment
schedules have positive sign.
2.4.5 Donor Involvement
Underlying the role of outside assistance in the success of MFIs, theory would suggest that, to
a certain extent, some form of outside assistance, most often in form of financial aids, would
be necessary in the early stages of MFI creation. Without help from donors and other outside
aid organizations, it would be difficult for MFIs to build up a financial base from which to
provide loans and other services to borrowers. However, noting that successful MFIs are
defined in part by their ability to, eventually, provide sustainable financial services to the
poor, their reliance upon donor organizations should be limited to the beginning stages of
development. At some point, it can be assumed that successful MFIs develop sufficient profits
from interest gained on loans, allowing them to provide loans and other services from such
profits rather than relying upon donors for such funding. Successful MFIs must strike a
balance between realizing the need for outside assistance in initial capacity building and
overusing aid, in turn becoming reliant upon the help of outside donors.
Nearly all successful MFIs have benefited from some forms of outside funding or assistance
during the course of their existence. The extent to which MFIs are reliant upon this outside
assistance, however, varies greatly. According to Christen (2004) in his analysis of the role
that the World Bank played in the success of the Credit Amigo program, “multilateral donors
can play catalytic role in microfinance development” if they 1) adopt policies individualized
for the needs of specific countries rather than creating a universal model, 2) encourage MFIs
16
to develop management capacity for growth before funding expansion, 3) encourage MFIs to
take advantage of up to date technological advancements, and 4) ensure that workers on both
the donating side and the receiving side are grounded in the basic elements of sustainable
microfinance.” This framework for relationships between donors and MFIs is relatively
constant across institutions and countries. Most importantly, the hope is that in receiving
foreign aids MFIs will not suffer from mission drift, and will thus be able to use the donated
funding top support the original mission of sustainable financial services for the poor.
Van de Ruit (2001), reports that donors were integral to the establishment of the micro-
finance sector in South Africa and Mozambique. Donor such as DFID, USAID, FES were
instrumental in promoting the practice of microfinance and supporting the policy
environment. Overall, donors have had a limited influence on the development of SME
policies but have had a direct role in the implementation of sector support strategies. At times
however, donor policies and approaches have been contradictory.
The model implemented in the report by Adongo and Stork (2005) provided evidence that
donor involvement in providing start- up funds for the loan portfolio is positively associated
with financial sustainability. However, this report strongly qualifies this statement by
reiterating that the definition of financial sustainability is the ability cover costs independent
of external subsidies from donors or government. The formula promoted to calculate financial
sustainability in this report does not focus on the sources of funds used to cover costs and does
not differentiate between donor and government funds or self- generated funds.
The study by Chua (1998) reveals that donor support plays a critical role in contributing to the
two NGOs’ outreach and movement towards sustainability. A review of AusAID’s
involvement in microcredit in the Philippines highlighted the important contribution of
various AusAID microcredit support projects to Philippine microcredit NGOs particular, and
to the development of the Philippines microfinance sector in general. AusAID support was
instrumental in the development and adaptation of models in start- up program and in the
growth and expansion of tested models (Chua, 1998)
The key contributing factor was AusAID’s continuing support to selected NGOs for over a
decade which no doubt help moved those NGOs from start- up to stabilization, and to
17
expansion. This support has also facilitated the NGOs’ progress towards increased self
sustainability. The level of AusAID funding was significant in comparison to the NGOs’ scale
of operations (Chua, 1998).
2.4.6 Group Lending
The model of lending employed by MFIs has proven to be a very important determinant of
success and sustainability over time. Most importantly, the lending model established tends to
have a large effect on loan repayment rates. MFI lending can be broken down into three
common models: The village Banking Model, the solidarity Group Model, and the Individual
Model. Under the framework of the Village Banking Model, loans are made to entire villages
for projects such as community gardens and water systems. Villages as whole are then
expected to repay the loan over time, from community funds rather than the pockets of
individuals.
The Solidarity Group Model is similar to the Village Banking Model in the cooperative sense,
yet on a smaller scale. Under the Solidarity Group Model loans are given to groups of five or
six community members, chosen on the basis of societal reputation, and often composed only
of women. In this scenario each member backs the loans of the other members of the group,
thus if one member of the group fails to repay their portion of the loan the remaining members
are held responsible. While solidarity groups most often do not all use the funding for a
common project, but rather individual business endeavors, they meet as a whole to provide
support and guidance for one another. Finally, under the Individual Model, as the name
implies, loans are given to individuals for personal business endeavors. The individual alone
is held responsible for repayment of the loan: however they do still maintain some level of
group support in the form of business development classes and guidance provided by lending
institutions (Armendariz and Murdoch, 2004).
The Solidarity Group Model is the most common framework for lending, attributed to its
ability to reduce a number of the information asymmetries that are present in other models.
Group members are chosen and approved by their peers, thus people would likely to default
on loans are less likely to be involved in the system. The K- rep program in Nairobi is based
in a group lending model that has evolved over time to fit the specific needs of the local
18
clientele. The Juhudi program, which operates under the umbrella of the K-rep program, is
modeled after a similar group-based system employed by the Grameen Bank. Groups made of
five to seven members, receive two months of training on group dynamics and the importance
of savings and are then issued loans.
Group is expected to positively influence financial sustainability fro microfinance institutions
because the peer pressure that group members exert on each other should lead to lower default
rates on the number of loans disbursed (Adongo and Stork, 2005). The study revealed that
group lending positively (negatively) influences the financial un-sustainability (sustainability)
of microfinance institutions. In addition, there is evidence that this relationship is robust
because the coefficient of the variable that captures group lending is significant at the 10%
level.
2.4.7 Savings Mobilized
While currently MFIs tend to focus outreach efforts on providing credit services to the poor,
the hope is that eventually efforts will enable borrowers to start saving. It is thought that
achieving long- term financial sustainability in developing areas is not only dependent upon
access to capital, but also the ability to save a portion of funds generated through the use of
given capital. Solimano et al (1994) ensuring an adequate savings level is crucial for
development in its ability to finance capital accumulation over time. A consultative Group to
Assist the poor (CGAP) study, aimed at developing deposit services for the poor, found that
access to such services allowed the poor to better manage emergencies, smooth consumption,
meet demands for larger amounts of cash, such as school fees, and take advantage of future
investment opportunities.
In providing savings services to the poor MFIs are not only increasing the welfare of those
serve but also reducing the risk of involuntary default on the parts of borrowers. In making
borrowers better prepared to deal with adverse shocks, such as sickness or drought, such
shocks are less likely to make an individual unable to repay existing loans. If faced with
severe drought, farmers who have been given access to, and taken advantage of, savings
institutions will still have the funds to repay at least a portion of loans, as compare to a farmer
with no savings who would be forced to default. Once MFIs have successfully developed the
19
institutional capacity to become independent of donor and government subsidies, savings
generation theory would suggest that adding savings institutions to the already existing MFI
framework will benefit both lenders and borrowers, leaving both parties better off than in the
absence of these institutions.
2.4.8 Loans Disbursed
The amount of loans disbursed is theoretically expected to be negatively (positively) related to
financial un-sustainability (sustainability) because it reduces per unit cost of the lending. The
findings of Adongo and Stark (2005) revealed that the coefficient of the variable that captures
the amount of loans disbursed confirmed the expected theoretical relationship. However,
based on the model adopted in this report there is no evidence to suggest that this relationship
is robust because this variable is not significant at the 5% or 10% level.
2.4.9 Per Capital Income
Per capital income of a location reflects the welfare and socio-economic profile of its
residents. The more income the microfinance clientele has, the higher the probability that the
microfinance institution serving this target group will be financially sustainable. According to
this theoretical perspective per capita income is expected to be negatively related to the
financial un-sustainability of microfinance institutions in Kenya.
Based on the model in the report by Adongo and Stork (2005) the coefficient of the variable
that captures the per capita income of the microfinance target group has the expected negative
sign. However, based on the model there is no evidence to suggest that this relationship is
robust because the per capita income variable is not significant at the 5% or 10% level. Thus
the model adopted in the report does not find evidence that a lower per capita income in the
microfinance target group will hinder financial sustainability of the selected microfinance
institutions in this report.
2.4.10 Other Empirical Studies
Matu (2008) in his research paper entitled “Attracting microfinance investment funds
promoting microfinance Growth through increased investments in Kenya” has studied
20
microfinance capital structure in order to find out best policy decisions to enhance efficiency
in MFI in Kenya. According to his study Kenya still faces major challenges with efficiently
and effectively delivering microfinance services in the country. He analyzed three policy
alternatives i.e. maintaining status quo, the government regulation of all MFIs and voluntarily
for closing the microfinance gap in the supply of microfinance services. All these three
alternatives were evaluated against the following criteria: efficiency, financial and political
feasibility, and accessibility to determine the best policy option.
His paper explored the feasibility of microfinance investment funds (MFI) as key drivers for
channeling alternative sources of funding to microfinance institutions (MFIs). The growing
competition to access funding sources had led to a financial gap in supplying microfinance
services, which is jeopardizing MFI sustainability in the country. In 2006, the microfinance
Act was passed to enhance the regulating and legal framework for microfinance and to
support the growth and development of microfinance in Kenya. This had greatly helped boost
the sector resulting in increase in microfinance loans volumes, especially the deposit-taking
MFIs such as Equity Bank, K-rep Bank and Jamii Bora. The ability of MFIS to collect
deposits has some advantages, especially as the pool for alternative funding shrinks. A vast
majority of MFIs in Kenya are informal and unregulated, which has limited their funding
sources further weakening their institutional capacity to supply microfinance services and
limits their ability to grow (Matu, 2008).
In 1999, the Association of Microfinance institutions (AMFI) was registered under the
societies Act as an umbrella organization to represent the microfinance institutions operating
in Kenya. The AMFI’s activities were initially funded through a 3 year grant from the United
States Agency for international Development (USAID) which aimed to support the growth
and development of MFIs, by promoting sustainable, efficient and effective delivery of
microfinance services. Further, AMFI aimed to organize a network of MFIs in the country
who were committed to developing and making available a wide array of microfinance
services to those who needed it, especially those whose needs were unmet by the formal
financial sector (Matu,2008).
21
His data for the study included MFIs in Kenya especially those affiliated to AMFI. They
included Jamii Bora, Equity Bank, Faulu Kenya, SISDO, Jitegemee Credit Scheme, Micro
Kenya Limited, Kenya Women Finance Trust Co-operative bank, CIC insurance, K-rep bank
Limited, Aga khan Foundation among others. While Kenya has 250 organizations that
practice some form of microfinance business, only 20 practice pure Microfinance, of which 4
are deposit taking and 16 are credit only. The remaining 230 MFIs in Kenya are classified into
three different tiers, with the first tier being deposit-taking institutions such as bank, the
second tier being credit only facilities and the third tier being informal organization
supervised by an external agency other than the government. These distinct classifications
have led to some of the MFIs specializing in certain niche markets, which have contributed to
their growth and sustainability in delivering microfinance. For example, the ability to collect
deposits has enabled Equity Bank to appeal to those excluded by the high costs of accessing
traditional banks, while Jamii Bora has identified itself as the financial provider to former
thieves and beggars (Matu, 2008).
Despite the enactment of the microfinance Act, AMFI still faces challenges in building the
capacity of the Microfinance sectors and reducing the inefficient delivery of microfinance
products and services. Furthermore the continued success and rapid growth of microfinance
has led to a financial gap in the funding needed to meet the growing demand. This could
serious impact the ability of Kenyans to access the financial resources needed to obtain basic
socio-economic benefits such as education, health care services, land ownership, income
generating activities and credit facilities. A study on the financial sector found that 35.2%
who are entirely excluded from accessing any financial services. This has greatly undermined
the overall wellbeing of the poor people by limiting their opportunities to improve their socio-
economic status (Matu, 2008).
There are a range of Microfinance investment fund (MIF) investors. According to
presentations at the 2004 Financial sector Development Symposium Berlin, the main types of
MFIs investors fall under four categories; private donors, development agencies , private
individuals and institutional investors. These investors use a variety of lending instruments
such as grants, subsidized loans, and loans at or close to market rates, equity participation,
22
guarantees, and technical assistance (TA) as a means of supporting the microfinance sector
(Matu,2008).
After conducting his study Matu (2008) analyzed his data. In 2007, there were more than 45
microfinance investment funds (MIFs) that either allocated their investments directly or
indirectly to MFIs in Africa. These MFIs ranged in their total assets where a majority (89.8%)
operated above the conventionally accepted sustainable size of having microfinance portfolio
of at least $ 20 Million. According to the Mix market, of the 45 MIFs that reported in
investing in Africa, only 38 MIFs reported their total asset and share of fund allocation. The
total assets of the 38 MIFs were approximately 1.7 Billion and they were invested in 150%
MFIs (Matu, 2008).
The major findings of the case analysis of MIFs investing in Africa found that; a country’s
risk rating, the corporate governance systems that protect investments the administrative and
economic environments that businesses operate under and the ease of accessing domestic
capital markets play an integral role in determining where investors choose to place their
investments. Found out that there is an inverse relationship between the government’s
involvement in the economy and levels of investment. The share of government activity in the
economy as a share of GDP may crow-out private investments activity. According to the
crowding out theory, government spending that competes with the private sector inherently
causes the cost of private investment to increase. As consequence, the policy implication for a
country trying to attract MIF investments is to ensure that they have a favorable business
environment, where the government does not crowd out investors and corporate governance
systems are in place to mitigate potential investments in the country (Matu, 2009).
After analyzing various policy alternatives to enhance efficiency, financial feasibility, political
feasibility and accessibility the best policy alternative was selected. The preferred policy
alternative should consist of rules and frame work for provision and delivery of microfinance
in Kenya and it should apply to all rules to guide MFIs operation, in addition to providing the
information, performance criteria and governance structure. Based on the evaluation criteria, a
combination of policy alternatives 2 and 3 (government regulations and self-regulation
23
policies) is the best policy option for closing the financial gap facing MFIs in the country and
for providing the greatest opportunity for the growth and development of microfinance in
Kenya (Matu,2008).
Mwangi and Brown (2005) on their study entitled “Overview of the outreach and financial
performance of MFIs in Africa”, MFIs still face many challenges. Operating and financial
expenses are very high, and on average, revenues remain lower than in other global.
Efficiency in terms of cost per borrower is lowest for African MFIs. The MFIs for the study
were grouped according to regions. Kenyan MFIs were categorized under East African which
among other countries included Ethiopia, Tanzania and Uganda. This formed 42% of the
MFIs for the study. The main questions were how performances of African MFIs sector
compare with global peers and how performance varies among African MFIs. The African
MFIs were examined through the lens of standard performance metrics over a series of
variables: outreach (breadth and depth), financial structure, financial performance, efficiency
and portfolio at risk.
Efforts to extend microfinance services to the people who are underserved by financial
institutions are classified as outreach. This can be measured in terms of breadth-number of
clients served and volume of services or depth-the socio-economic levels of clients that MFIs
serve. Outreach in East Africa varies by regions. East Africa region dominates outreach
results with 52% of all savers and 45% of all borrowers in Africa. This dominance is
explained by the presence of two large borrowing institutions in Kenya i.e. Postbank and
Amhara saving institution in Ethiopia. Kenya has 65% of borrowers. MFIs in Africa which
includes Kenya tend to report lower levels of profitability as measured by return of assets than
MFIs in other global regions. Among the African MFIs that provided information for the
study, 47% post positive unadjusted returns. Regulated MFIs report the highest return on
assets of all MFI types averaging around 2.6% as compared to unregulated MFIs. The
findings also show that African MFIs fund only 25% of assets with equity. MFIs finance their
activities with funds from various sources both debt and equity (Mwangi and Brown 2005).
24
George Omino (2005) on His study entitled “Regulation and supervision of MFIs in Kenya’’
MFIs have faced a number of constraints that need to be addressed to improve outreach and
sustainability. The major impediment to the development and performance is lack of specific
legislation and set of regulations to guide the operations of the microfinance sub sector. MFIs
have operated without an appropriate policy and legal framework. This has contributed to a
large extent to the poor performance and eventual demise of many MFIs. This has had a
bearing on a number of other constraints faced by the industry namely; diversity in
institutional form, inadequate governance and management capacity, limited outreach, limited
access to funds and lack of performance standards.
Yaron (1992), discussed that the two most important objectives for a rural financial
institutions to be successful are financial self-sustainability and more outreach to the target
rural population. Financial self-sustainability is said to be achieved when the return on equity,
net of any subsidy received, equals or exceeds the opportunity cost of funds.
Khandker et al. (1995), the concept of sustainability of microfinance can be divided into four
interrelated ideas; namely, financial viability, economic viability, institutional viability and
borrower viability.
Financial viability relates to the fact that a lending institution should at least equate the cost
per each unit of currency lent to the price it charges its borrowers (i.e. the interest rate).
Economic viability relates to meeting the economic cost of funds (opportunity cost) used for
credit and other operations with the income it generates from its lending activities. Regarding
indicator of financial sustainability, they pointed out that loan repayment (measured by default
rate) could be another indicator for financial sustainability of MFIs; because, low default rate
would help to realize future lending.
Meyer (2002) noted that the poor needed to have access to financial service on long-term
basis rather than just a onetime financial support. Short-term loan would worsen the welfare
of the poor (Navajas et al., 2000). He also stated that the financial un-sustainability in the MFI
arises due to low repayment rate or un-materialization of funds promised by donors or
25
governments. He further indicated, "Measuring financial sustainability requires that MFIs
maintain good financial accounts and follow recognized accounting practices that provide full
transparency for income, expenses, loan recovery, and potential losses."
2.5 Summary
The chapter has presented a review of literature regarding sustainability of microfinance
institutions. The empirical review has provided the factors that generally influence
sustainability of microfinance institutions. The main factors which affect the sustainability of
microfinance institutions are capital/ asset ratio, operating expenses/loan portfolio and
portfolio at risk> 30 days. The review also shows mixed results on the determinants of
operations and financial sustainability of microfinance institutions. Such include the form of
incorporation, level of support, repayment schedule, donor involvement, the lending model,
savings mobilized, per capita income as well as the amount of loans disbursed. Given that
there has been a growth in the MFI industry in Kenya, it is also important to establish what
factors have influenced the sustainability of such institutions. This is the gap that the present
study seeks to bridge. The present study differs from the previous ones since it is based on the
Kenyan context.
The lack of oversight, however, has enabled them to innovate and develop different
techniques of providing microfinance services. Therefore to stimulate development of the
sector, appropriate laws, regulations and supervision framework need to be in place.
According to Him regulation and supervision will lead to quality growth, broaden the funding
base for MFIs eligible to mobilize and administer deposits and initiate the process of
integrating these institutions into the formal financial system. The regulation of the sector will
enable authorities to define procedures for their operations, entrance, and exit and ultimately
create an environment for fair competition and efficiency in the sector (Omino 2005).
26
CHAPTER THREE
RESEARCH METHODOLOGY
3.1 Introduction
This chapter is a blueprint of the methodology that was used by the researcher to find answers
to the research question. This chapter explains research design, target population, sampling
procedures, data collection instruments, data collection and analysis.
3.2 Research Design
Donald (2006) notes that a research design is the structure of the research; it is the ‘‘glue that
holds all the elements in a research together. Further, Orodho (2003) defines a research design
as the scheme, outline or plan that is used to generate answers to research problems. The type
of research design used was descriptive. This design describes the relationships that exist
between the independent and dependent variables, (Kothari, 2003).
3.3 Target Population The research population was 30 microfinance institutions (MFIs) listed from the Association
of Microfinance Institutions (AMFI) in Kenya, which provide financial services to low
income people in Kenya. The respondents were employees of various financial institutions
especially the finance managers and chief executive officers of the institutions concerned. The
study analyzes financial statements of these MFIs to find out the relationship between capital
structure variables and MFI performance variable which is Operational Self Sufficiency
(OSS).
3.4 Data Collection The data for the study was drawn from a database of audited financial statements of MFIs in
Kenya. The data collected from the financial statements include capital structure variables
which include debt, equity, total assets, etc. The data was captured by reviewing financial
statements of listed MFIs from the Central Bank of Kenya (CBK). The data covered the years
of 2007 to 2011.
27
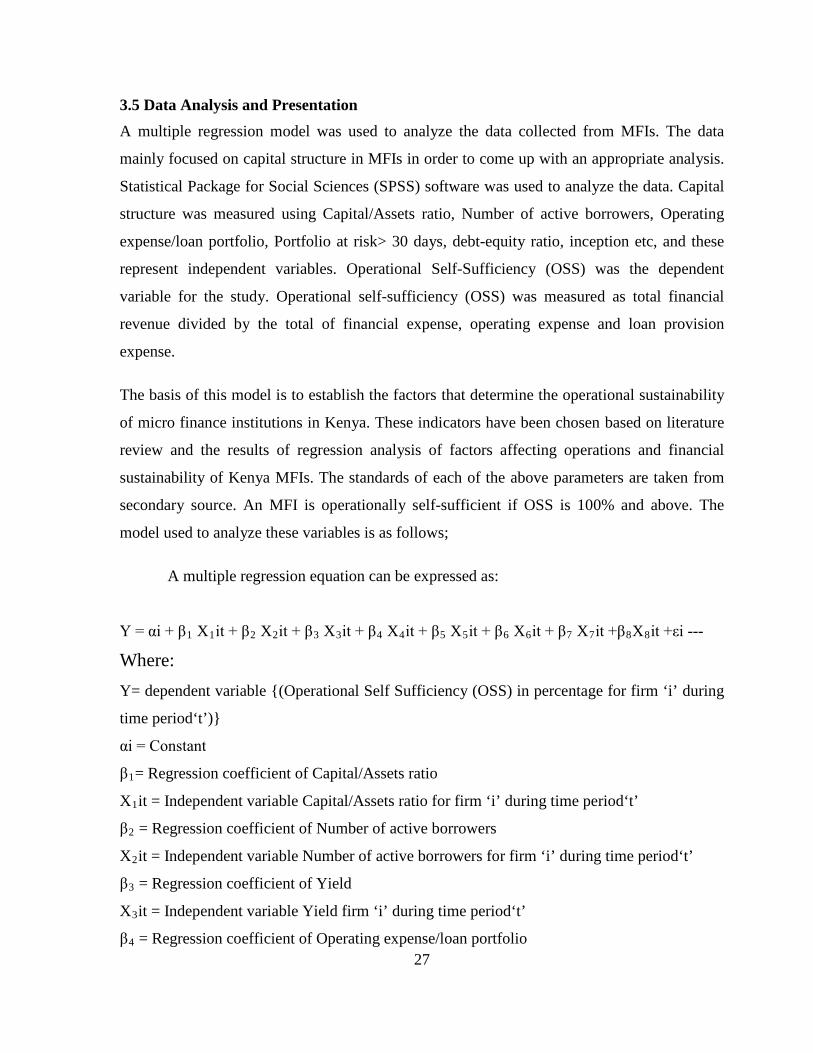
3.5 Data Analysis and Presentation A multiple regression model was used to analyze the data collected from MFIs. The data
mainly focused on capital structure in MFIs in order to come up with an appropriate analysis.
Statistical Package for Social Sciences (SPSS) software was used to analyze the data. Capital
structure was measured using Capital/Assets ratio, Number of active borrowers, Operating
expense/loan portfolio, Portfolio at risk> 30 days, debt-equity ratio, inception etc, and these
represent independent variables. Operational Self-Sufficiency (OSS) was the dependent
variable for the study. Operational self-sufficiency (OSS) was measured as total financial
revenue divided by the total of financial expense, operating expense and loan provision
expense.
The basis of this model is to establish the factors that determine the operational sustainability
of micro finance institutions in Kenya. These indicators have been chosen based on literature
review and the results of regression analysis of factors affecting operations and financial
sustainability of Kenya MFIs. The standards of each of the above parameters are taken from
secondary source. An MFI is operationally self-sufficient if OSS is 100% and above. The
model used to analyze these variables is as follows;
A multiple regression equation can be expressed as:
Y = αi + β1 X1it + β2 X2it + β3 X3it + β4 X4it + β5 X5it + β6 X6it + β7 X7it +β8X8it +εi ---
Where: Y= dependent variable {(Operational Self Sufficiency (OSS) in percentage for firm ‘i’ during
time period‘t’)}
αi = Constant
β1= Regression coefficient of Capital/Assets ratio
X1it = Independent variable Capital/Assets ratio for firm ‘i’ during time period‘t’
β2 = Regression coefficient of Number of active borrowers
X2it = Independent variable Number of active borrowers for firm ‘i’ during time period‘t’
β3 = Regression coefficient of Yield
X3it = Independent variable Yield firm ‘i’ during time period‘t’
β4 = Regression coefficient of Operating expense/loan portfolio
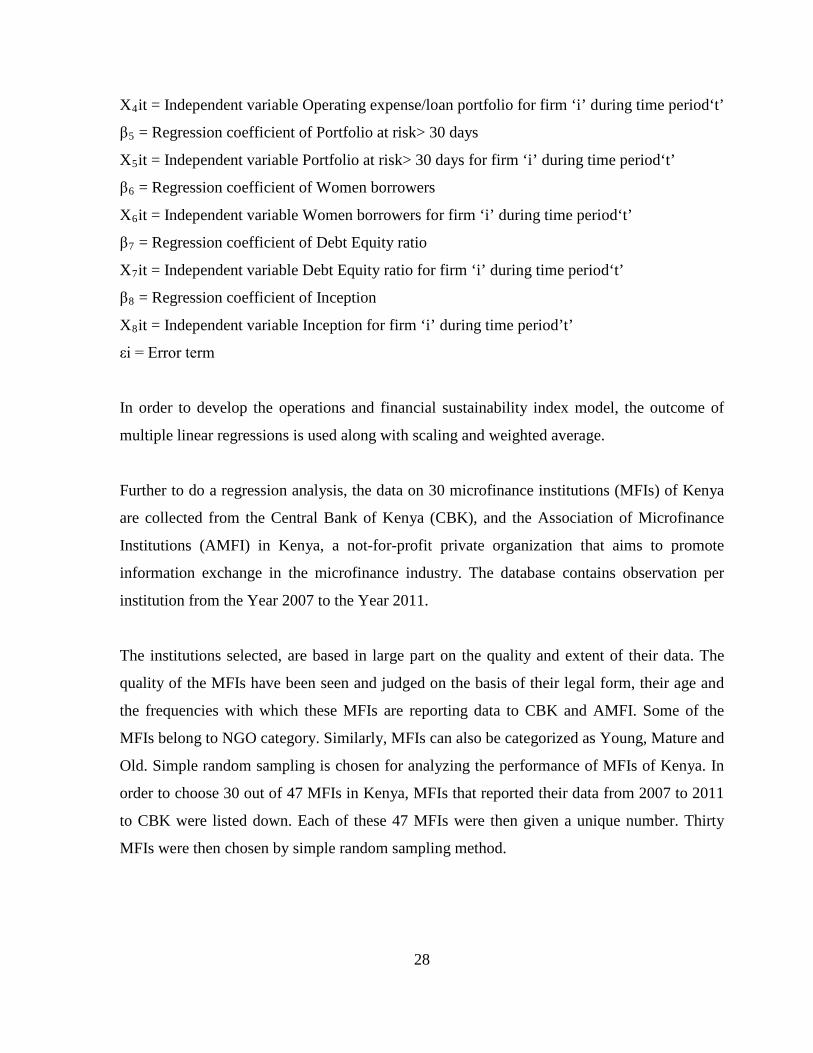
28
X4it = Independent variable Operating expense/loan portfolio for firm ‘i’ during time period‘t’
β5 = Regression coefficient of Portfolio at risk> 30 days
X5it = Independent variable Portfolio at risk> 30 days for firm ‘i’ during time period‘t’
β6 = Regression coefficient of Women borrowers
X6it = Independent variable Women borrowers for firm ‘i’ during time period‘t’
β7 = Regression coefficient of Debt Equity ratio
X7it = Independent variable Debt Equity ratio for firm ‘i’ during time period‘t’
β8 = Regression coefficient of Inception
X8it = Independent variable Inception for firm ‘i’ during time period’t’
εi = Error term
In order to develop the operations and financial sustainability index model, the outcome of
multiple linear regressions is used along with scaling and weighted average.
Further to do a regression analysis, the data on 30 microfinance institutions (MFIs) of Kenya
are collected from the Central Bank of Kenya (CBK), and the Association of Microfinance
Institutions (AMFI) in Kenya, a not-for-profit private organization that aims to promote
information exchange in the microfinance industry. The database contains observation per
institution from the Year 2007 to the Year 2011.
The institutions selected, are based in large part on the quality and extent of their data. The
quality of the MFIs have been seen and judged on the basis of their legal form, their age and
the frequencies with which these MFIs are reporting data to CBK and AMFI. Some of the
MFIs belong to NGO category. Similarly, MFIs can also be categorized as Young, Mature and
Old. Simple random sampling is chosen for analyzing the performance of MFIs of Kenya. In
order to choose 30 out of 47 MFIs in Kenya, MFIs that reported their data from 2007 to 2011
to CBK were listed down. Each of these 47 MFIs were then given a unique number. Thirty
MFIs were then chosen by simple random sampling method.
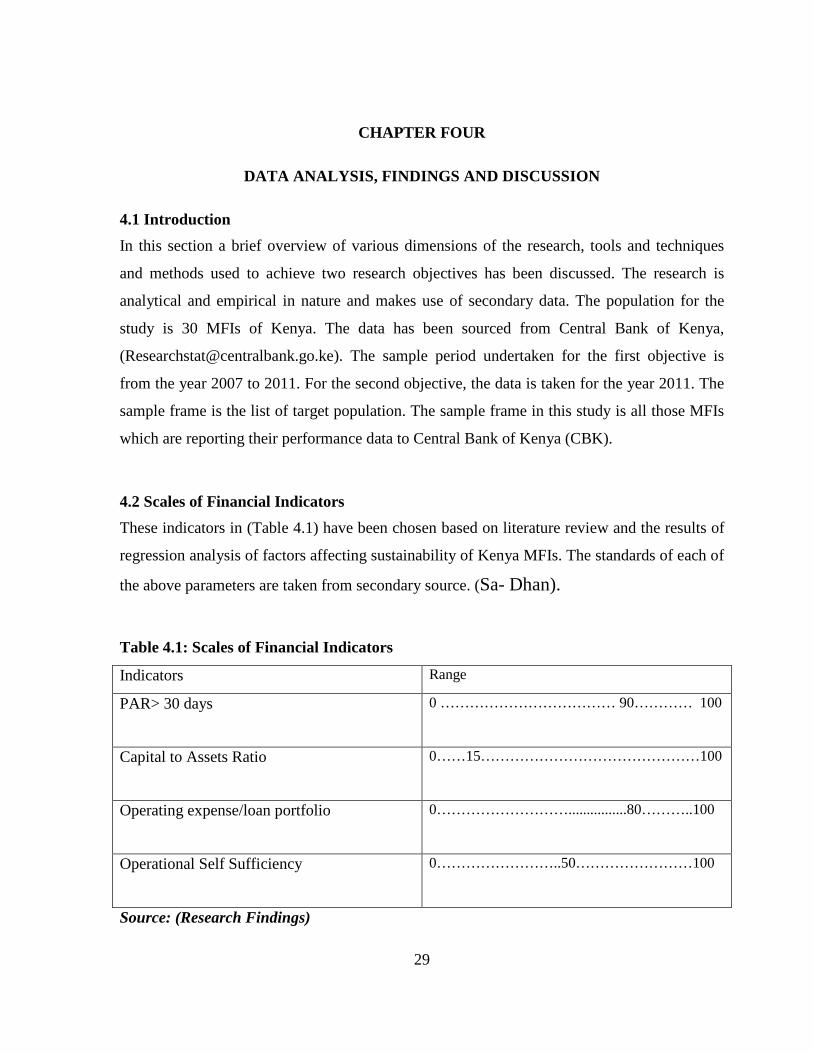
29
CHAPTER FOUR
DATA ANALYSIS, FINDINGS AND DISCUSSION
4.1 Introduction In this section a brief overview of various dimensions of the research, tools and techniques
and methods used to achieve two research objectives has been discussed. The research is
analytical and empirical in nature and makes use of secondary data. The population for the
study is 30 MFIs of Kenya. The data has been sourced from Central Bank of Kenya,
([email protected]). The sample period undertaken for the first objective is
from the year 2007 to 2011. For the second objective, the data is taken for the year 2011. The
sample frame is the list of target population. The sample frame in this study is all those MFIs
which are reporting their performance data to Central Bank of Kenya (CBK).
4.2 Scales of Financial Indicators These indicators in (Table 4.1) have been chosen based on literature review and the results of
regression analysis of factors affecting sustainability of Kenya MFIs. The standards of each of
the above parameters are taken from secondary source. (Sa- Dhan).
Table 4.1: Scales of Financial Indicators
Indicators Range
PAR> 30 days
0 ……………………………… 90………… 100
Capital to Assets Ratio
0……15………………………………………100
Operating expense/loan portfolio
0………………………................80………..100
Operational Self Sufficiency
0……………………..50……………………100
Source: (Research Findings)
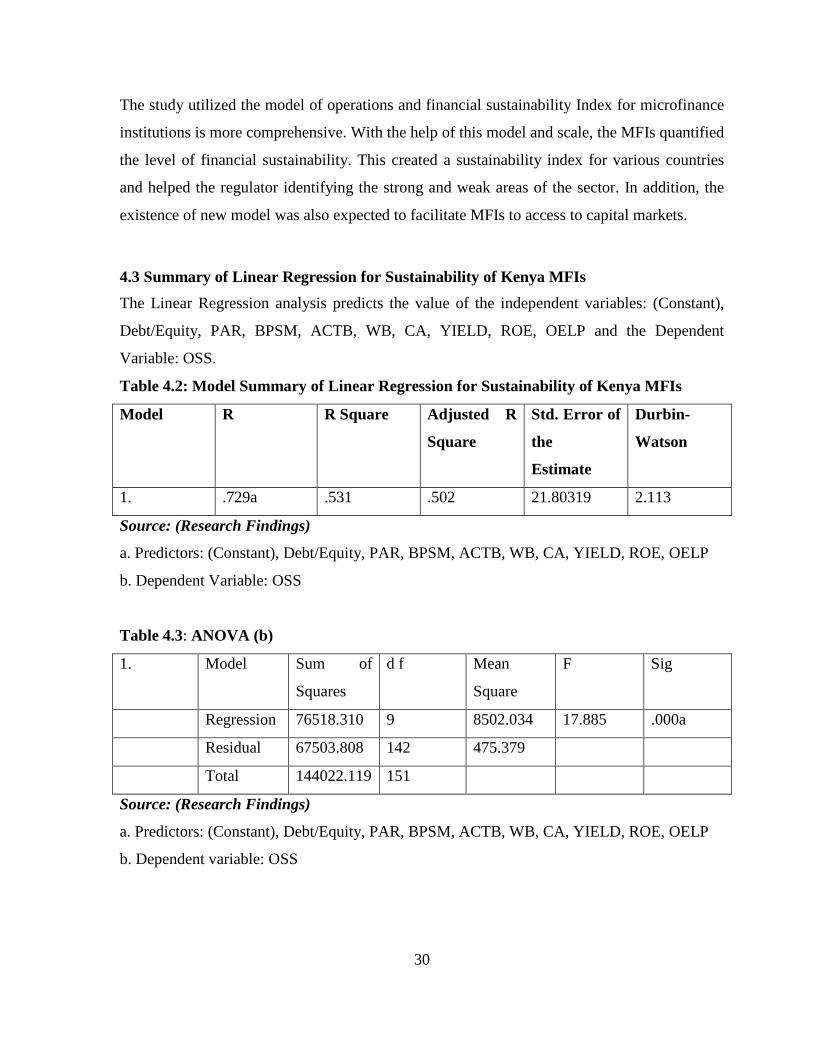
30
The study utilized the model of operations and financial sustainability Index for microfinance
institutions is more comprehensive. With the help of this model and scale, the MFIs quantified
the level of financial sustainability. This created a sustainability index for various countries
and helped the regulator identifying the strong and weak areas of the sector. In addition, the
existence of new model was also expected to facilitate MFIs to access to capital markets.
4.3 Summary of Linear Regression for Sustainability of Kenya MFIs The Linear Regression analysis predicts the value of the independent variables: (Constant),
Debt/Equity, PAR, BPSM, ACTB, WB, CA, YIELD, ROE, OELP and the Dependent
Variable: OSS.
Table 4.2: Model Summary of Linear Regression for Sustainability of Kenya MFIs
Model R R Square Adjusted R
Square
Std. Error of
the
Estimate
Durbin-
Watson
1. .729a .531 .502 21.80319 2.113
Source: (Research Findings)
a. Predictors: (Constant), Debt/Equity, PAR, BPSM, ACTB, WB, CA, YIELD, ROE, OELP
b. Dependent Variable: OSS
Table 4.3: ANOVA (b)
1. Model Sum of
Squares
d f Mean
Square
F Sig
Regression 76518.310 9 8502.034 17.885 .000a
Residual 67503.808 142 475.379
Total 144022.119 151
Source: (Research Findings)
a. Predictors: (Constant), Debt/Equity, PAR, BPSM, ACTB, WB, CA, YIELD, ROE, OELP
b. Dependent variable: OSS
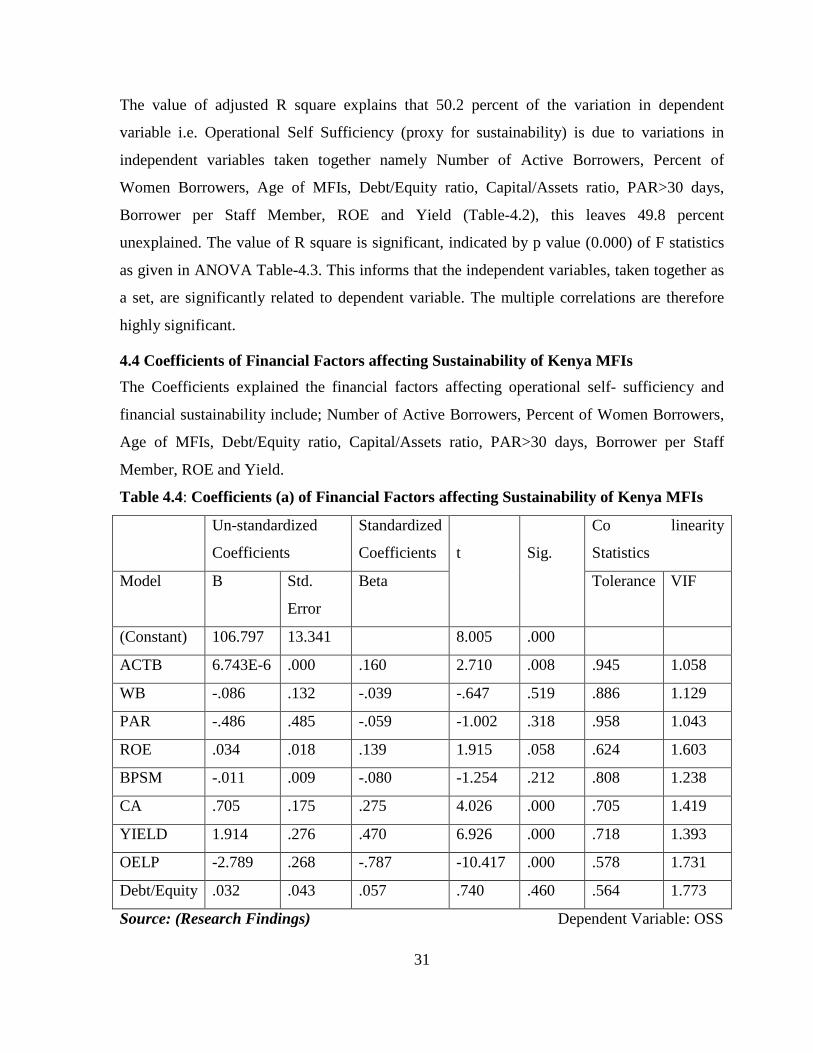
31
The value of adjusted R square explains that 50.2 percent of the variation in dependent
variable i.e. Operational Self Sufficiency (proxy for sustainability) is due to variations in
independent variables taken together namely Number of Active Borrowers, Percent of
Women Borrowers, Age of MFIs, Debt/Equity ratio, Capital/Assets ratio, PAR>30 days,
Borrower per Staff Member, ROE and Yield (Table-4.2), this leaves 49.8 percent
unexplained. The value of R square is significant, indicated by p value (0.000) of F statistics
as given in ANOVA Table-4.3. This informs that the independent variables, taken together as
a set, are significantly related to dependent variable. The multiple correlations are therefore
highly significant.
4.4 Coefficients of Financial Factors affecting Sustainability of Kenya MFIs The Coefficients explained the financial factors affecting operational self- sufficiency and
financial sustainability include; Number of Active Borrowers, Percent of Women Borrowers,
Age of MFIs, Debt/Equity ratio, Capital/Assets ratio, PAR>30 days, Borrower per Staff
Member, ROE and Yield.
Table 4.4: Coefficients (a) of Financial Factors affecting Sustainability of Kenya MFIs
Un-standardized
Coefficients
Standardized
Coefficients
t
Sig.
Co linearity
Statistics
Model B Std.
Error
Beta Tolerance VIF
(Constant) 106.797 13.341 8.005 .000
ACTB 6.743E-6 .000 .160 2.710 .008 .945 1.058
WB -.086 .132 -.039 -.647 .519 .886 1.129
PAR -.486 .485 -.059 -1.002 .318 .958 1.043
ROE .034 .018 .139 1.915 .058 .624 1.603
BPSM -.011 .009 -.080 -1.254 .212 .808 1.238
CA .705 .175 .275 4.026 .000 .705 1.419
YIELD 1.914 .276 .470 6.926 .000 .718 1.393
OELP -2.789 .268 -.787 -10.417 .000 .578 1.731
Debt/Equity .032 .043 .057 .740 .460 .564 1.773
Source: (Research Findings) Dependent Variable: OSS
32
The values of p are 0.008, 0.000, 0.000 and 0.000 for the indicators: Number of Active
Borrowers, Capital/Assets ratio, Yield and Operating Expense/Loan Portfolio respectively.
These values are less than the level of significance (0.05). Therefore, the null hypotheses are
rejected and, it can be concluded that these indicators influence the dependent variable OSS.
Other independent variables are not significant thereby not making a significant contribution
to the prediction.
The coefficient of Operating Expenses/Loan Portfolio is -2.78. The sign of the coefficient
explains that the Operating Expenses/Loan Portfolio is negatively correlated with
Sustainability (OSS). The magnitude explains that for one unit increase in the Operating
Expenses/Loan Portfolio, the OSS will decrease by 2.78 units. The coefficient of Yield is
1.91, which indicates that the Yield is positively correlated with Sustainability (OSS). The
magnitude explains that for one unit increase in the Yield, the OSS will increase by 1.91 units.
The coefficient of Capital/Asset ratio is 0.705, which indicates that the Capital/Asset ratio is
positively correlated with Sustainability (OSS). The magnitude explains that for one percent
increase in Capital/Asset ratio, the OSS will increase by 0.70 percent. The coefficient of
Number of Active borrowers (ACTB) is 0.00000674, which indicates that ACTB is positively
correlated with Sustainability (OSS). The magnitude explains that for one percent increase in
ACTB, the OSS will increase by 0.0000067 percent. The VIF data suggest that collinearity is
no problem as the figures are well below 10% for each indicator and the error term is also
normally distributed as shown in (Table 4.4) above.
4.5 Weight for the Indicators A weight is assigned to each of these financial indicators. The weight has been assigned
analyzing the importance of indicators used by different microfinance research agencies
worldwide.
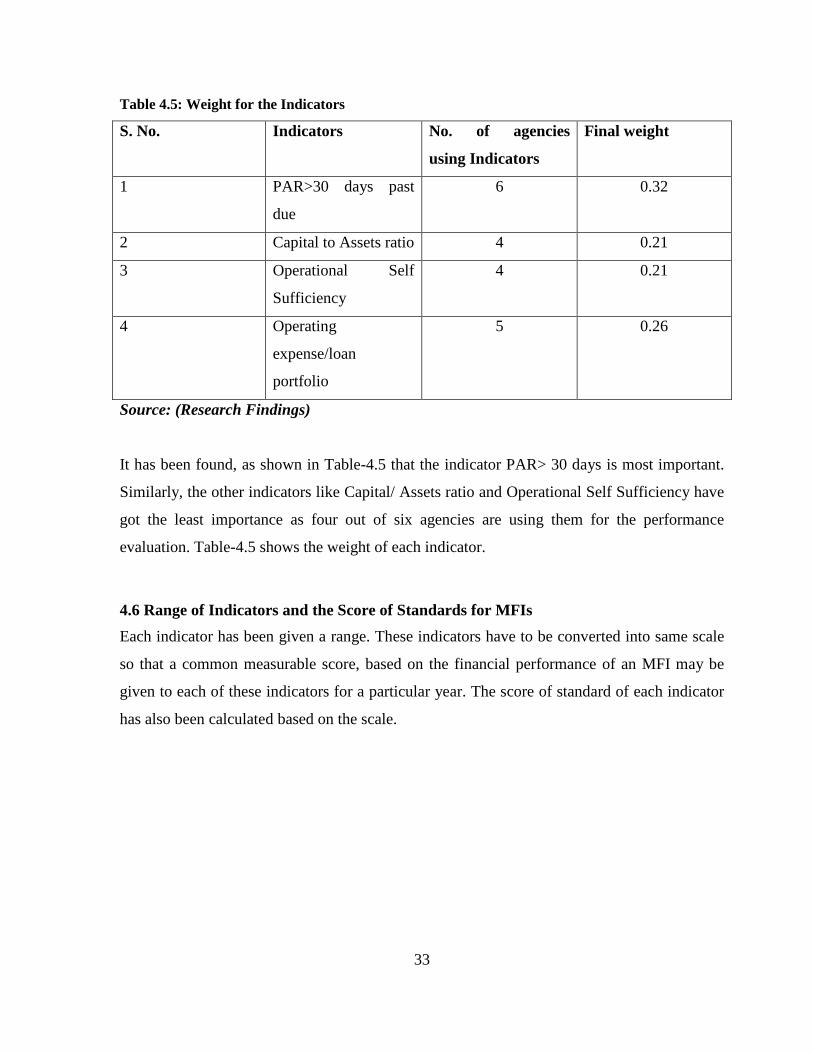
33
Table 4.5: Weight for the Indicators
S. No. Indicators No. of agencies
using Indicators
Final weight
1 PAR>30 days past
due
6 0.32
2 Capital to Assets ratio 4 0.21
3 Operational Self
Sufficiency
4 0.21
4 Operating
expense/loan
portfolio
5 0.26
Source: (Research Findings)
It has been found, as shown in Table-4.5 that the indicator PAR> 30 days is most important.
Similarly, the other indicators like Capital/ Assets ratio and Operational Self Sufficiency have
got the least importance as four out of six agencies are using them for the performance
evaluation. Table-4.5 shows the weight of each indicator.
4.6 Range of Indicators and the Score of Standards for MFIs Each indicator has been given a range. These indicators have to be converted into same scale
so that a common measurable score, based on the financial performance of an MFI may be
given to each of these indicators for a particular year. The score of standard of each indicator
has also been calculated based on the scale.
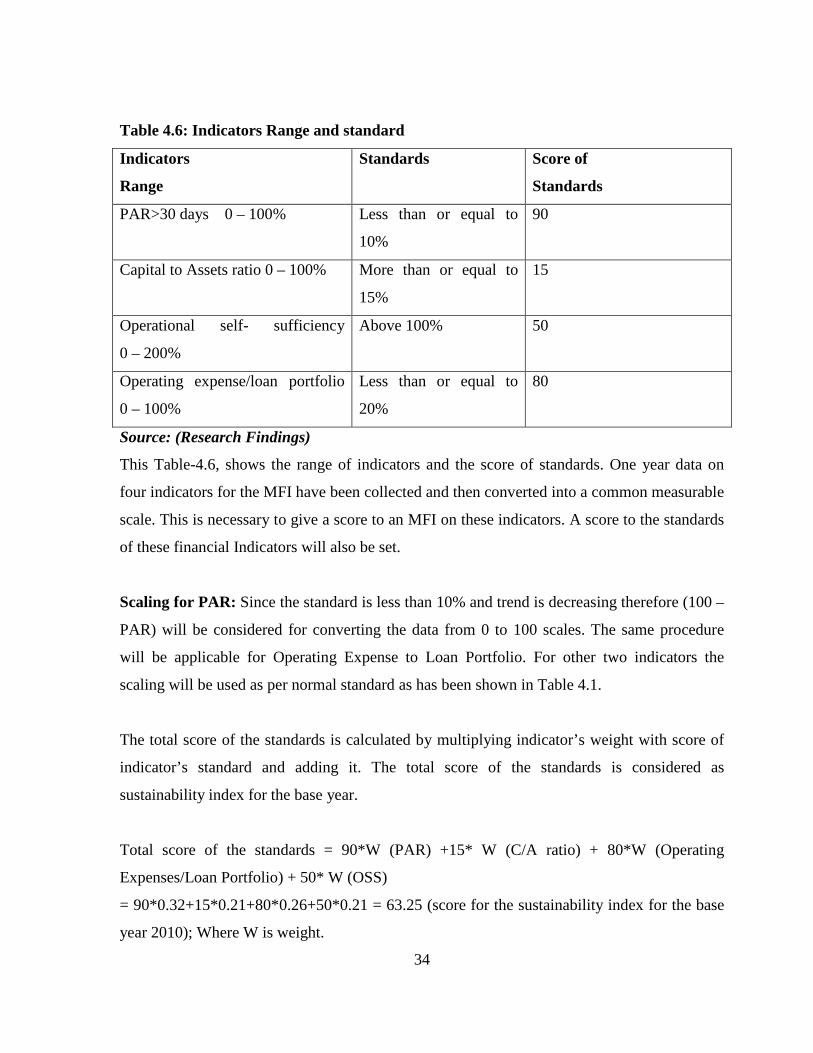
34
Table 4.6: Indicators Range and standard
Indicators
Range
Standards Score of
Standards
PAR>30 days 0 – 100% Less than or equal to
10%
90
Capital to Assets ratio 0 – 100% More than or equal to
15%
15
Operational self- sufficiency
0 – 200%
Above 100% 50
Operating expense/loan portfolio
0 – 100%
Less than or equal to
20%
80
Source: (Research Findings)
This Table-4.6, shows the range of indicators and the score of standards. One year data on
four indicators for the MFI have been collected and then converted into a common measurable
scale. This is necessary to give a score to an MFI on these indicators. A score to the standards
of these financial Indicators will also be set.
Scaling for PAR: Since the standard is less than 10% and trend is decreasing therefore (100 –
PAR) will be considered for converting the data from 0 to 100 scales. The same procedure
will be applicable for Operating Expense to Loan Portfolio. For other two indicators the
scaling will be used as per normal standard as has been shown in Table 4.1.
The total score of the standards is calculated by multiplying indicator’s weight with score of
indicator’s standard and adding it. The total score of the standards is considered as
sustainability index for the base year.
Total score of the standards = 90*W (PAR) +15* W (C/A ratio) + 80*W (Operating
Expenses/Loan Portfolio) + 50* W (OSS)
= 90*0.32+15*0.21+80*0.26+50*0.21 = 63.25 (score for the sustainability index for the base
year 2010); Where W is weight.
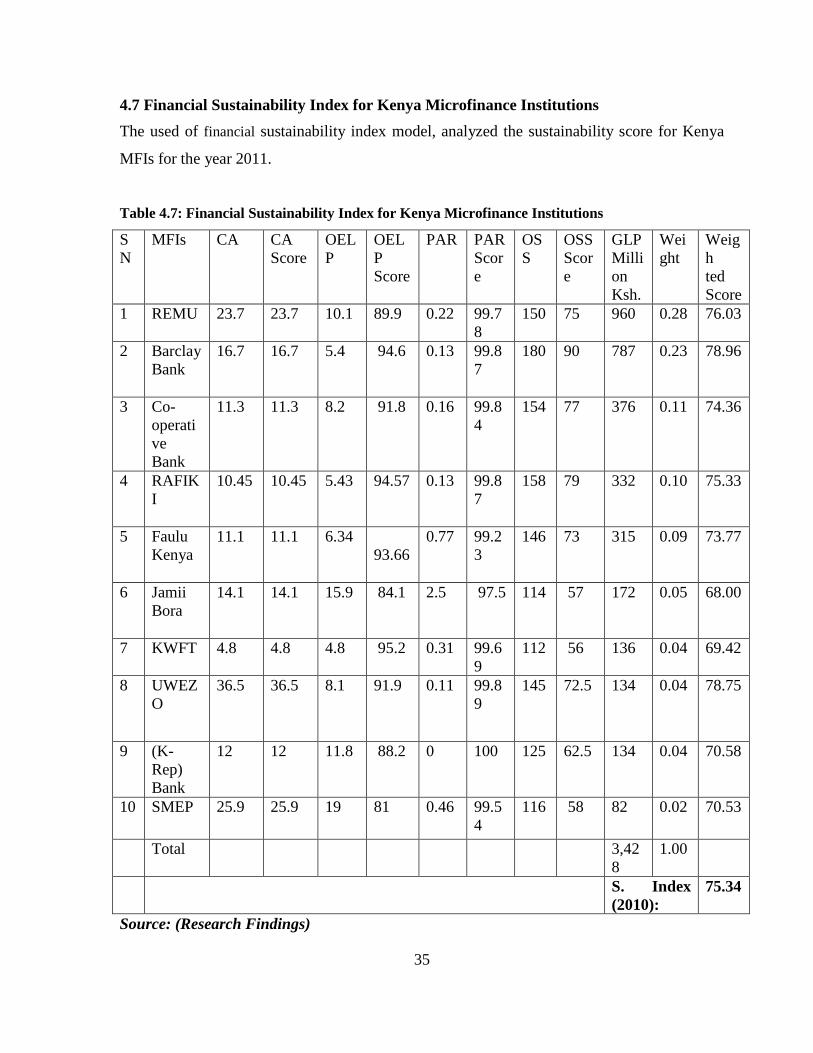
35
4.7 Financial Sustainability Index for Kenya Microfinance Institutions The used of financial sustainability index model, analyzed the sustainability score for Kenya
MFIs for the year 2011.
Table 4.7: Financial Sustainability Index for Kenya Microfinance Institutions
SN
MFIs CA CA Score
OELP
OELP Score
PAR PAR Score
OSS
OSS Score
GLP Million Ksh.
Weight
Weigh ted Score
1 REMU
23.7 23.7 10.1 89.9 0.22 99.78
150 75 960 0.28 76.03
2 Barclay Bank
16.7 16.7 5.4 94.6 0.13 99.87
180 90 787 0.23 78.96
3 Co-operative Bank
11.3 11.3 8.2 91.8 0.16 99.84
154 77 376 0.11 74.36
4 RAFIKI
10.45 10.45 5.43 94.57 0.13 99.87
158 79 332 0.10 75.33
5 Faulu Kenya
11.1 11.1 6.34 93.66
0.77 99.23
146 73 315 0.09 73.77
6 Jamii Bora
14.1 14.1 15.9 84.1 2.5 97.5 114 57 172 0.05 68.00
7 KWFT 4.8 4.8 4.8 95.2 0.31 99.69
112 56 136 0.04 69.42
8 UWEZO
36.5 36.5 8.1 91.9 0.11 99.89
145 72.5 134 0.04 78.75
9 (K-Rep) Bank
12 12 11.8 88.2 0 100 125 62.5 134 0.04 70.58
10 SMEP
25.9 25.9 19 81 0.46 99.54
116 58 82 0.02 70.53
Total 3,428
1.00
S. Index (2010):
75.34
Source: (Research Findings)
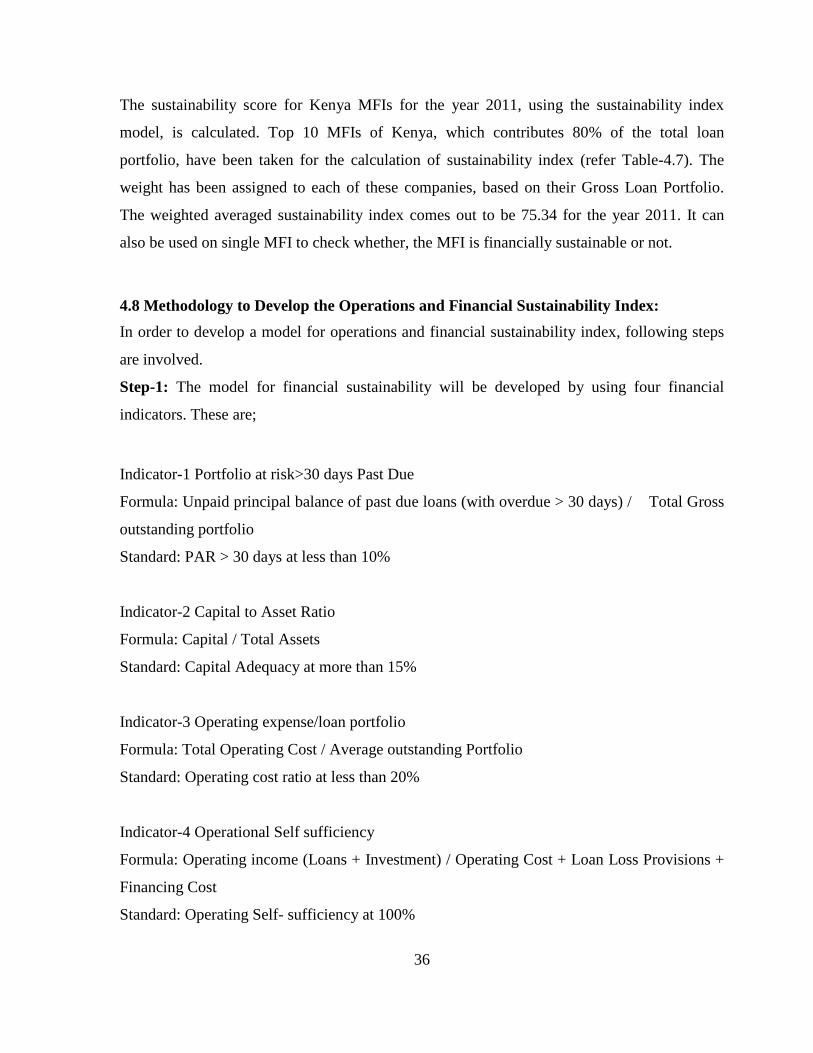
36
The sustainability score for Kenya MFIs for the year 2011, using the sustainability index
model, is calculated. Top 10 MFIs of Kenya, which contributes 80% of the total loan
portfolio, have been taken for the calculation of sustainability index (refer Table-4.7). The
weight has been assigned to each of these companies, based on their Gross Loan Portfolio.
The weighted averaged sustainability index comes out to be 75.34 for the year 2011. It can
also be used on single MFI to check whether, the MFI is financially sustainable or not.
4.8 Methodology to Develop the Operations and Financial Sustainability Index: In order to develop a model for operations and financial sustainability index, following steps
are involved.
Step-1: The model for financial sustainability will be developed by using four financial
indicators. These are;
Indicator-1 Portfolio at risk>30 days Past Due
Formula: Unpaid principal balance of past due loans (with overdue > 30 days) / Total Gross
outstanding portfolio
Standard: PAR > 30 days at less than 10%
Indicator-2 Capital to Asset Ratio
Formula: Capital / Total Assets
Standard: Capital Adequacy at more than 15%
Indicator-3 Operating expense/loan portfolio
Formula: Total Operating Cost / Average outstanding Portfolio
Standard: Operating cost ratio at less than 20%
Indicator-4 Operational Self sufficiency
Formula: Operating income (Loans + Investment) / Operating Cost + Loan Loss Provisions +
Financing Cost
Standard: Operating Self- sufficiency at 100%
37
These indicators have been chosen based on literature review and the results of regression
analysis of factors affecting sustainability of Kenya MFIs. The standards of each of the above
parameters are taken from secondary source.
Step-2: In the second step, a weight is assigned to each of these financial indicators. The
weight has been assigned analyzing the importance of indicators used by different
microfinance research agencies worldwide.
It has been found, as shown in Table-4.5 that the indicator PAR> 30 days is most important.
Similarly, the other indicators like Capital/ Assets ratio and Operational Self Sufficiency have
got the least importance as four out of six agencies are using them for the performance
evaluation. Table-4.5 shows the weight of each indicator.
Step-3: In the third step, each indicator has been given a range. These indicators have to be
converted into same scale so that a common measurable score, based on the financial
performance of an MFI may be given to each of these indicators for a particular year. The
score of standard of each indicator has also been calculated based on the scale.
Table-4.5 shows the range of indicators and the score of standards.
One year data on four indicators for the MFI have been collected and then converted into a
common measurable scale. This is necessary to give a score to an MFI on these indicators. A
score to the standards of these financial
Indicators will also be set.
Scaling for PAR: Since the standard is less than 10% and trend is decreasing therefore (100 –
PAR) will be considered for converting the data from 0 to 100 scales. The same procedure
will be applicable for Operating Expense to Loan Portfolio. For other two indicators the
scaling will be used as per normal standard as has been shown in Table 4.1.
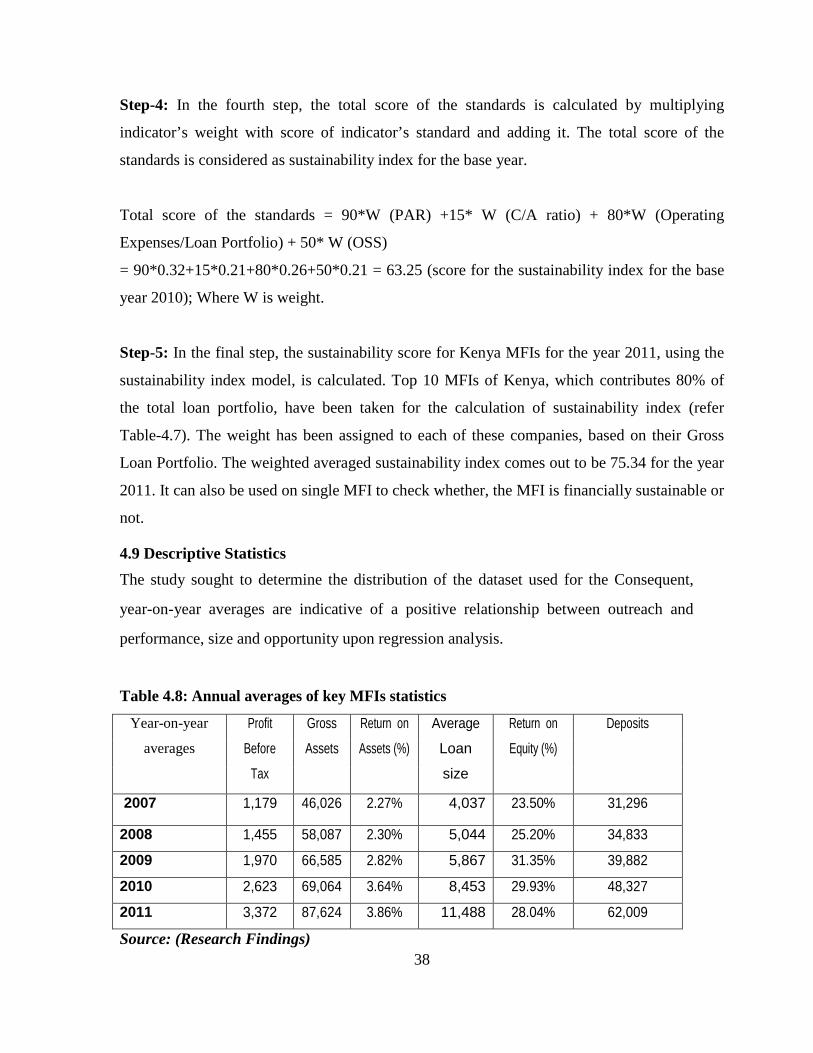
38
Step-4: In the fourth step, the total score of the standards is calculated by multiplying
indicator’s weight with score of indicator’s standard and adding it. The total score of the
standards is considered as sustainability index for the base year.
Total score of the standards = 90*W (PAR) +15* W (C/A ratio) + 80*W (Operating
Expenses/Loan Portfolio) + 50* W (OSS)
= 90*0.32+15*0.21+80*0.26+50*0.21 = 63.25 (score for the sustainability index for the base
year 2010); Where W is weight.
Step-5: In the final step, the sustainability score for Kenya MFIs for the year 2011, using the
sustainability index model, is calculated. Top 10 MFIs of Kenya, which contributes 80% of
the total loan portfolio, have been taken for the calculation of sustainability index (refer
Table-4.7). The weight has been assigned to each of these companies, based on their Gross
Loan Portfolio. The weighted averaged sustainability index comes out to be 75.34 for the year
2011. It can also be used on single MFI to check whether, the MFI is financially sustainable or
not.
4.9 Descriptive Statistics The study sought to determine the distribution of the dataset used for the Consequent,
year-on-year averages are indicative of a positive relationship between outreach and
performance, size and opportunity upon regression analysis.
Table 4.8: Annual averages of key MFIs statistics
Year-on-year
averages
Profit
Before
Tax
Gross
Assets
Return on
Assets (%)
Average
Loan
size
Return on
Equity (%)
Deposits
2007 1,179 46,026 2.27% 4,037 23.50% 31,296
2008 1,455 58,087 2.30% 5,044 25.20% 34,833
2009 1,970 66,585 2.82% 5,867 31.35% 39,882
2010 2,623 69,064 3.64% 8,453 29.93% 48,327
2011 3,372 87,624 3.86% 11,488 28.04% 62,009
Source: (Research Findings)
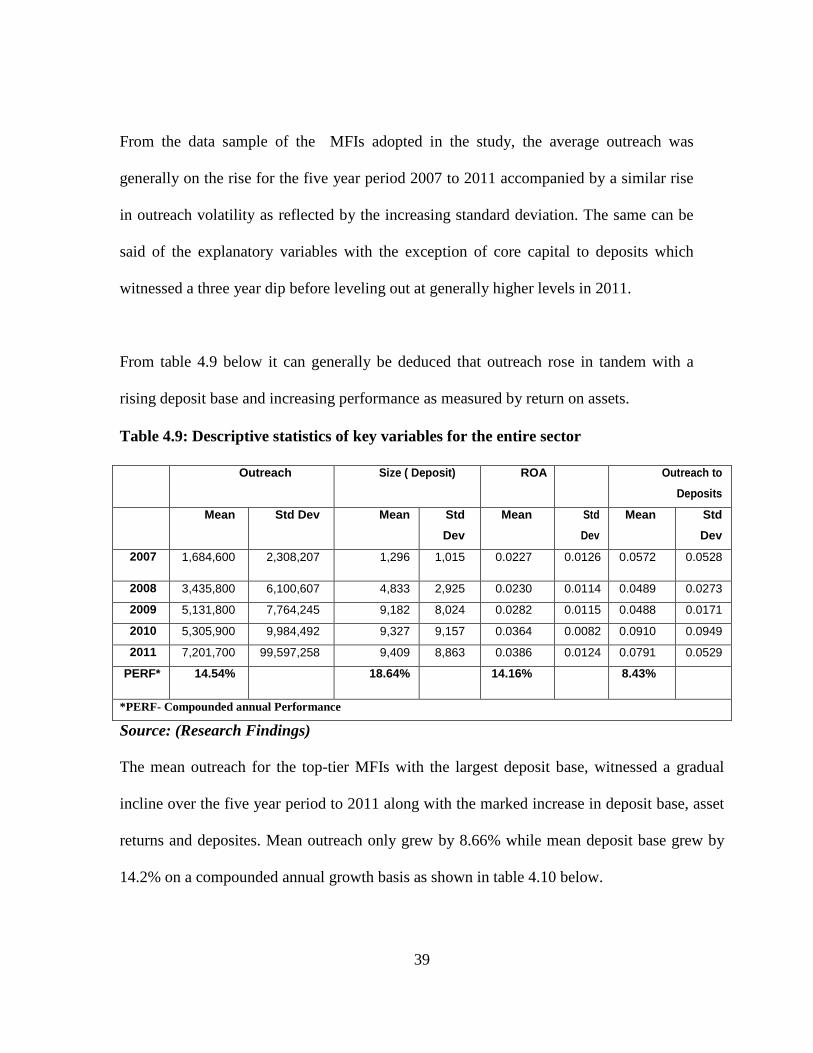
39
From the data sample of the MFIs adopted in the study, the average outreach was
generally on the rise for the five year period 2007 to 2011 accompanied by a similar rise
in outreach volatility as reflected by the increasing standard deviation. The same can be
said of the explanatory variables with the exception of core capital to deposits which
witnessed a three year dip before leveling out at generally higher levels in 2011.
From table 4.9 below it can generally be deduced that outreach rose in tandem with a
rising deposit base and increasing performance as measured by return on assets. Table 4.9: Descriptive statistics of key variables for the entire sector Outreach Size ( Deposit) ROA Outreach to
Deposits Mean Std Dev Mean Std
Dev Mean Std
Dev Mean Std
Dev 2007 1,684,600 2,308,207 1,296 1,015 0.0227 0.0126 0.0572 0.0528
2008 3,435,800 6,100,607 4,833 2,925 0.0230 0.0114 0.0489 0.0273 2009 5,131,800 7,764,245 9,182 8,024 0.0282 0.0115 0.0488 0.0171 2010 5,305,900 9,984,492 9,327 9,157 0.0364 0.0082 0.0910 0.0949 2011 7,201,700 99,597,258 9,409 8,863 0.0386 0.0124 0.0791 0.0529
PERF* 14.54% 18.64% 14.16% 8.43%
*PERF- Compounded annual Performance
Source: (Research Findings)
The mean outreach for the top-tier MFIs with the largest deposit base, witnessed a gradual
incline over the five year period to 2011 along with the marked increase in deposit base, asset
returns and deposites. Mean outreach only grew by 8.66% while mean deposit base grew by
14.2% on a compounded annual growth basis as shown in table 4.10 below.
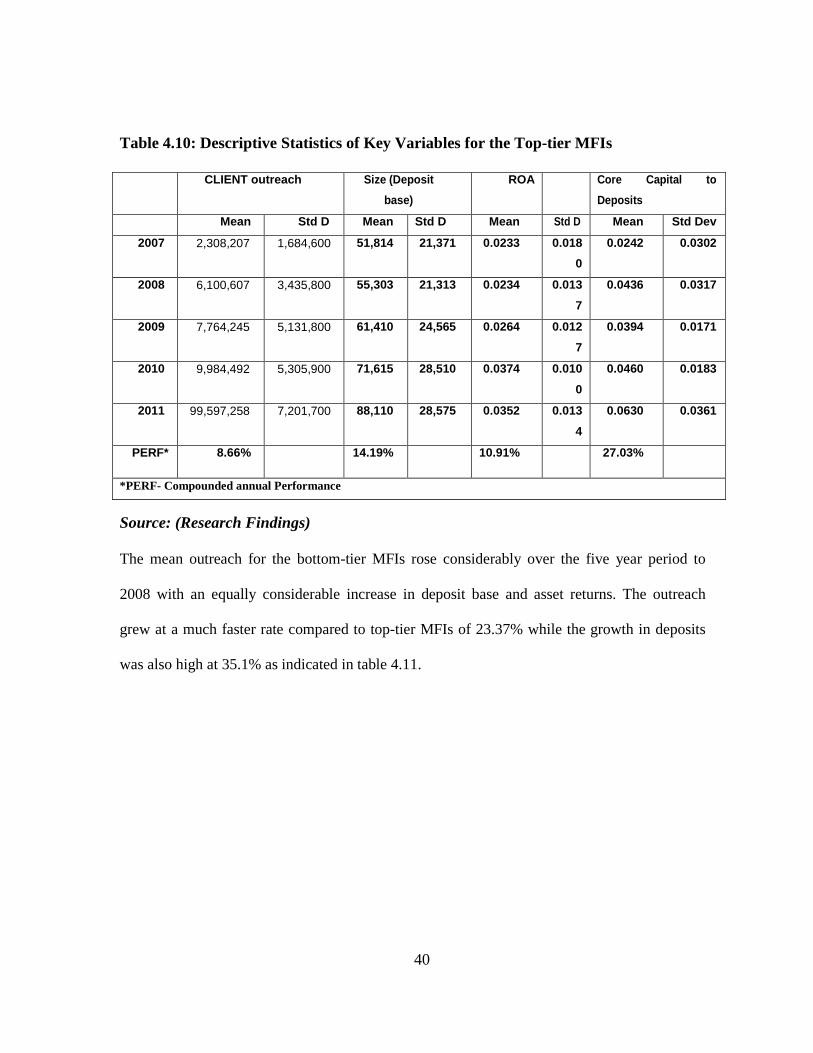
40
Table 4.10: Descriptive Statistics of Key Variables for the Top-tier MFIs CLIENT outreach Size (Deposit
base) ROA Core Capital to
Deposits Mean Std D Mean Std D Mean Std D Mean Std Dev
2007 2,308,207 1,684,600 51,814 21,371 0.0233 0.0180
0.0242 0.0302
2008 6,100,607 3,435,800 55,303 21,313 0.0234 0.0137
0.0436 0.0317
2009 7,764,245 5,131,800 61,410 24,565 0.0264 0.0127
0.0394 0.0171
2010 9,984,492 5,305,900 71,615 28,510 0.0374 0.0100
0.0460 0.0183
2011 99,597,258 7,201,700 88,110 28,575 0.0352 0.0134
0.0630 0.0361
PERF* 8.66% 14.19% 10.91% 27.03%
*PERF- Compounded annual Performance
Source: (Research Findings)
The mean outreach for the bottom-tier MFIs rose considerably over the five year period to
2008 with an equally considerable increase in deposit base and asset returns. The outreach
grew at a much faster rate compared to top-tier MFIs of 23.37% while the growth in deposits
was also high at 35.1% as indicated in table 4.11.
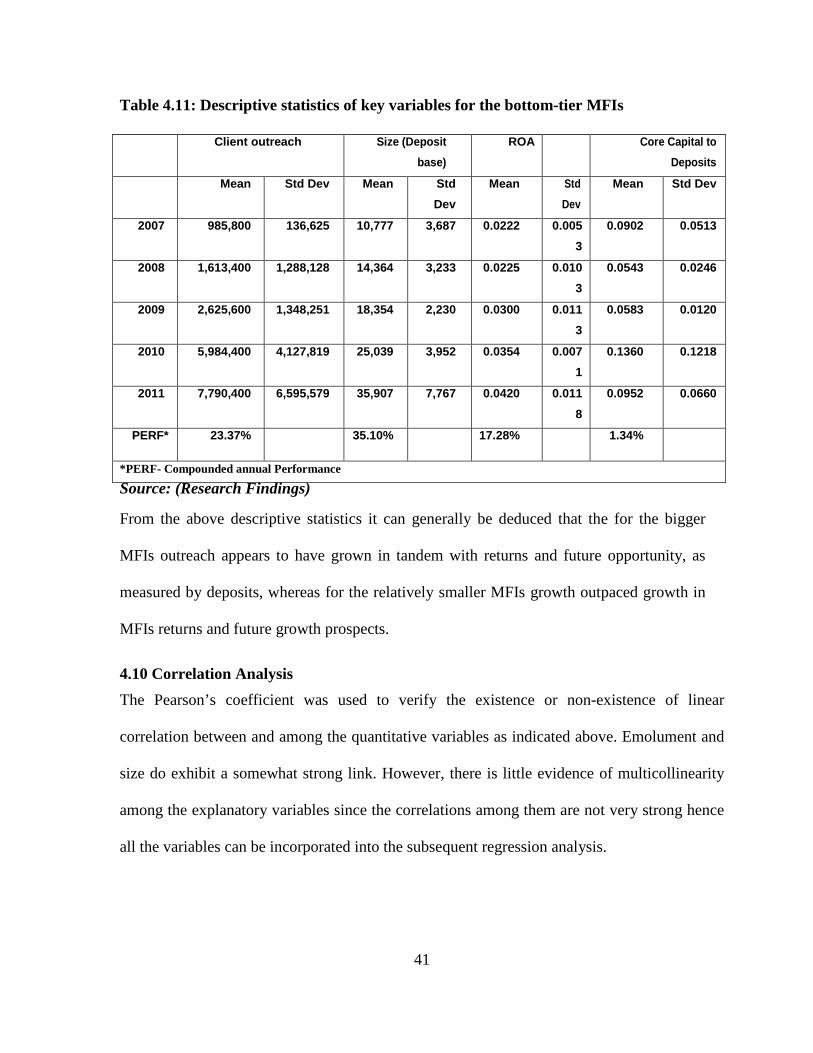
41
Table 4.11: Descriptive statistics of key variables for the bottom-tier MFIs Client outreach Size (Deposit
base) ROA Core Capital to
Deposits Mean Std Dev Mean Std
Dev Mean Std
Dev Mean Std Dev
2007 985,800 136,625 10,777 3,687 0.0222 0.0053
0.0902 0.0513
2008 1,613,400 1,288,128 14,364 3,233 0.0225 0.0103
0.0543 0.0246
2009 2,625,600 1,348,251 18,354 2,230 0.0300 0.0113
0.0583 0.0120
2010 5,984,400 4,127,819 25,039 3,952 0.0354 0.0071
0.1360 0.1218
2011 7,790,400 6,595,579 35,907 7,767 0.0420 0.0118
0.0952 0.0660
PERF* 23.37% 35.10% 17.28% 1.34%
*PERF- Compounded annual Performance
Source: (Research Findings) From the above descriptive statistics it can generally be deduced that the for the bigger
MFIs outreach appears to have grown in tandem with returns and future opportunity, as
measured by deposits, whereas for the relatively smaller MFIs growth outpaced growth in
MFIs returns and future growth prospects.
4.10 Correlation Analysis The Pearson’s coefficient was used to verify the existence or non-existence of linear
correlation between and among the quantitative variables as indicated above. Emolument and
size do exhibit a somewhat strong link. However, there is little evidence of multicollinearity
among the explanatory variables since the correlations among them are not very strong hence
all the variables can be incorporated into the subsequent regression analysis.
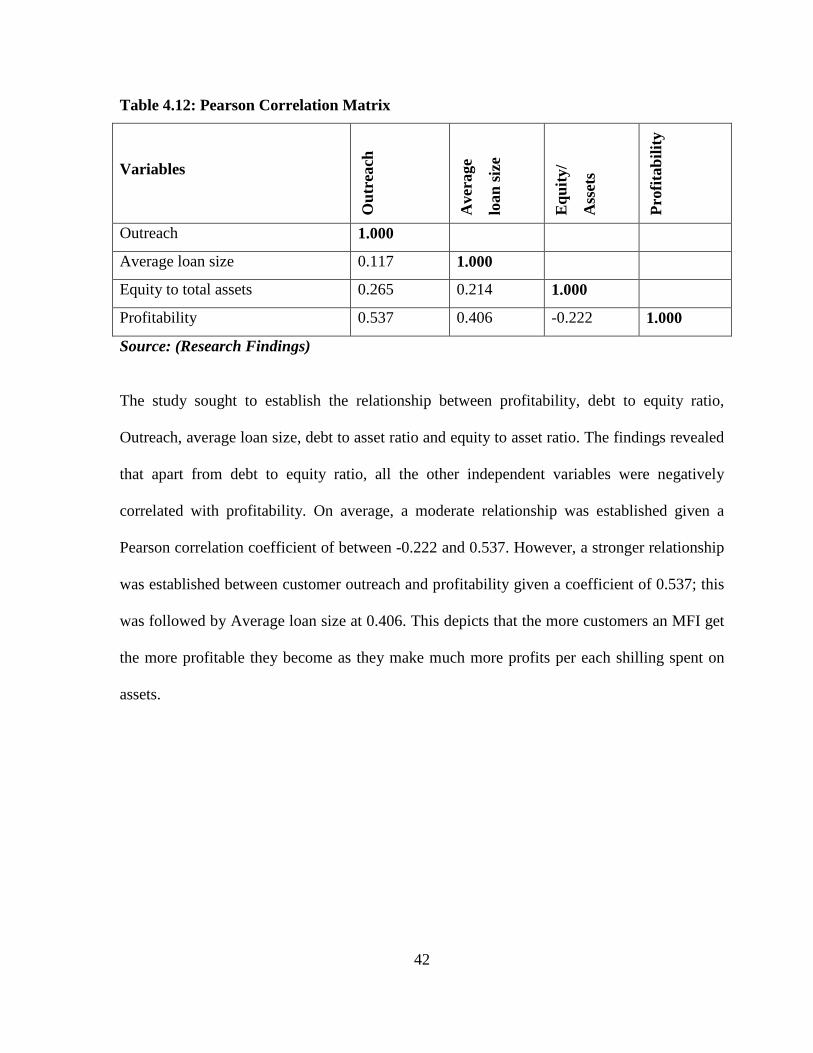
42
Table 4.12: Pearson Correlation Matrix
Variables
Out
reac
h
Ave
rage
loan
size
Equ
ity/
Ass
ets
Prof
itabi
lity
Outreach 1.000
Average loan size 0.117 1.000
Equity to total assets 0.265 0.214 1.000
Profitability 0.537 0.406 -0.222 1.000
Source: (Research Findings)
The study sought to establish the relationship between profitability, debt to equity ratio,
Outreach, average loan size, debt to asset ratio and equity to asset ratio. The findings revealed
that apart from debt to equity ratio, all the other independent variables were negatively
correlated with profitability. On average, a moderate relationship was established given a
Pearson correlation coefficient of between -0.222 and 0.537. However, a stronger relationship
was established between customer outreach and profitability given a coefficient of 0.537; this
was followed by Average loan size at 0.406. This depicts that the more customers an MFI get
the more profitable they become as they make much more profits per each shilling spent on
assets.
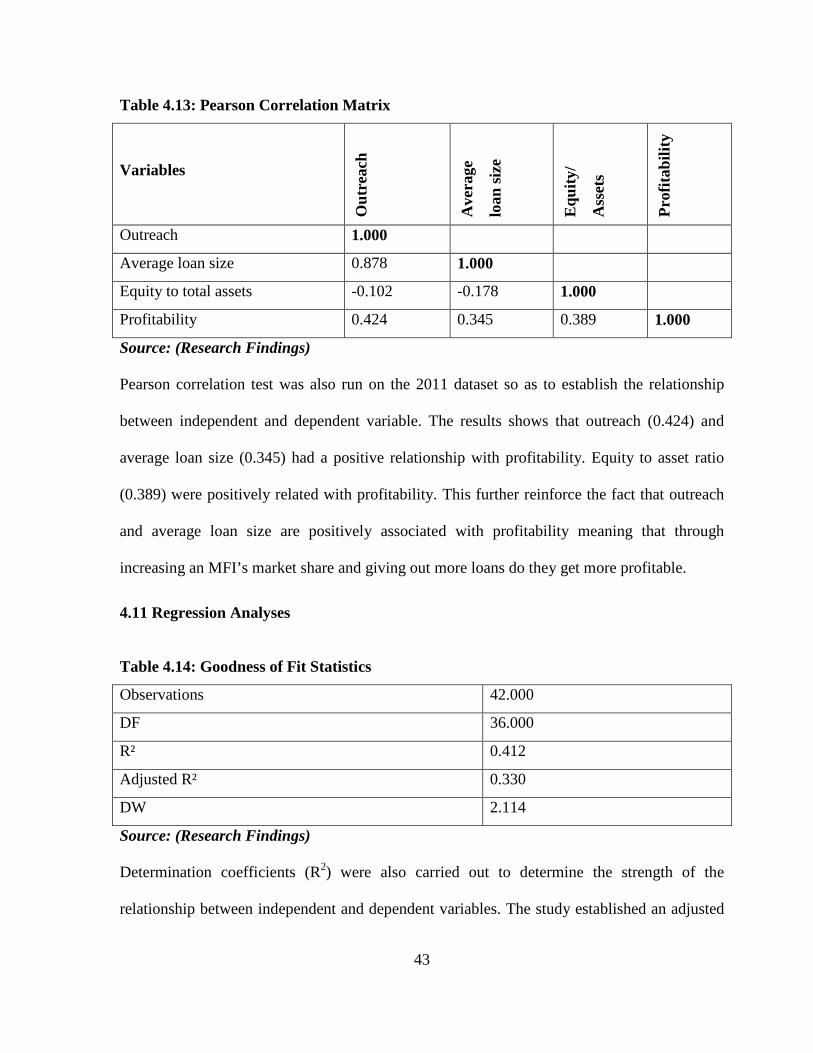
43
Table 4.13: Pearson Correlation Matrix
Variables
Out
reac
h
Ave
rage
loan
size
Equ
ity/
Ass
ets
Prof
itabi
lity
Outreach 1.000
Average loan size 0.878 1.000
Equity to total assets -0.102 -0.178 1.000
Profitability 0.424 0.345 0.389 1.000
Source: (Research Findings)
Pearson correlation test was also run on the 2011 dataset so as to establish the relationship
between independent and dependent variable. The results shows that outreach (0.424) and
average loan size (0.345) had a positive relationship with profitability. Equity to asset ratio
(0.389) were positively related with profitability. This further reinforce the fact that outreach
and average loan size are positively associated with profitability meaning that through
increasing an MFI’s market share and giving out more loans do they get more profitable.
4.11 Regression Analyses
Table 4.14: Goodness of Fit Statistics
Observations 42.000
DF 36.000
R² 0.412
Adjusted R² 0.330
DW 2.114
Source: (Research Findings)
Determination coefficients (R2) were also carried out to determine the strength of the
relationship between independent and dependent variables. The study established an adjusted
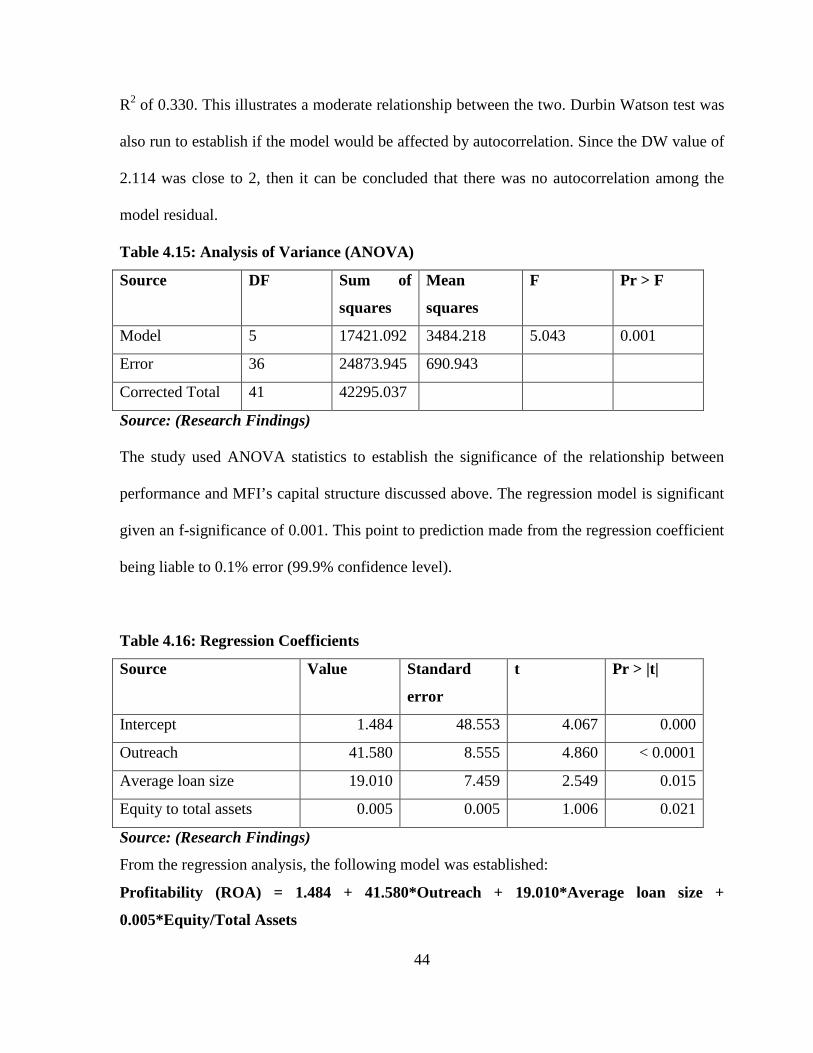
44
R2 of 0.330. This illustrates a moderate relationship between the two. Durbin Watson test was
also run to establish if the model would be affected by autocorrelation. Since the DW value of
2.114 was close to 2, then it can be concluded that there was no autocorrelation among the
model residual.
Table 4.15: Analysis of Variance (ANOVA)
Source DF Sum of
squares
Mean
squares
F Pr > F
Model 5 17421.092 3484.218 5.043 0.001
Error 36 24873.945 690.943
Corrected Total 41 42295.037
Source: (Research Findings)
The study used ANOVA statistics to establish the significance of the relationship between
performance and MFI’s capital structure discussed above. The regression model is significant
given an f-significance of 0.001. This point to prediction made from the regression coefficient
being liable to 0.1% error (99.9% confidence level).
Table 4.16: Regression Coefficients
Source Value Standard
error
t Pr > |t|
Intercept 1.484 48.553 4.067 0.000
Outreach 41.580 8.555 4.860 < 0.0001
Average loan size 19.010 7.459 2.549 0.015
Equity to total assets 0.005 0.005 1.006 0.021
Source: (Research Findings)
From the regression analysis, the following model was established:
Profitability (ROA) = 1.484 + 41.580*Outreach + 19.010*Average loan size +
0.005*Equity/Total Assets
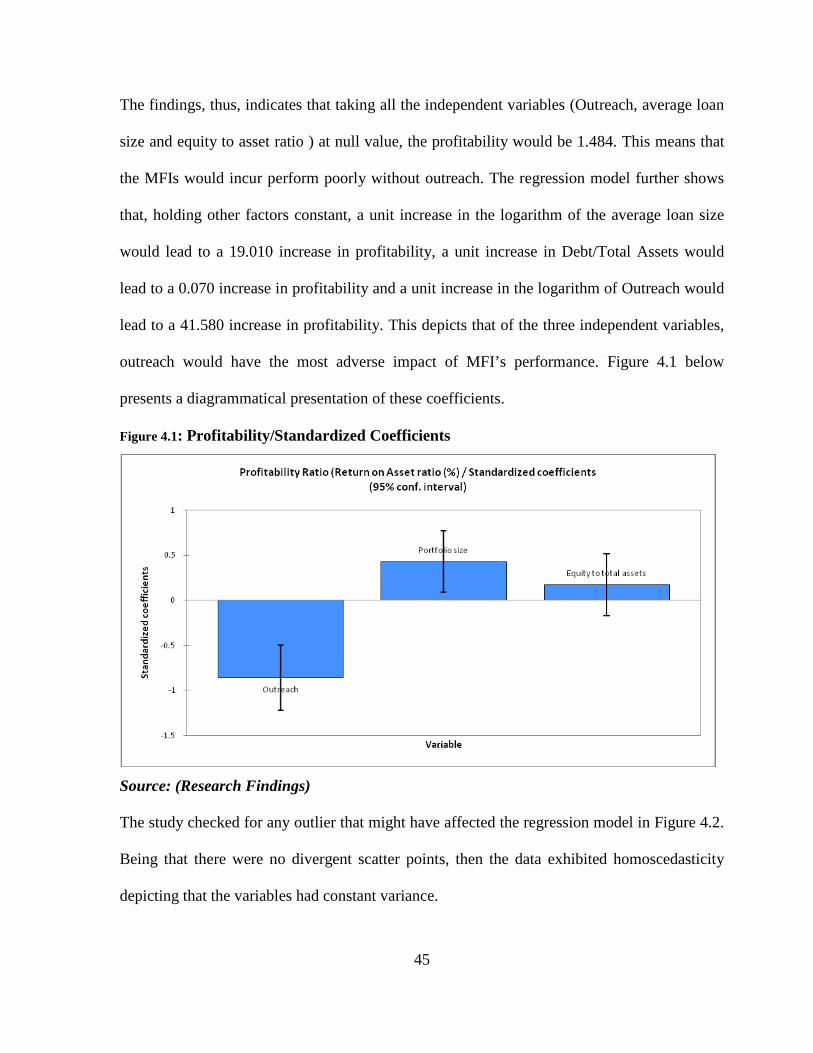
45
The findings, thus, indicates that taking all the independent variables (Outreach, average loan
size and equity to asset ratio ) at null value, the profitability would be 1.484. This means that
the MFIs would incur perform poorly without outreach. The regression model further shows
that, holding other factors constant, a unit increase in the logarithm of the average loan size
would lead to a 19.010 increase in profitability, a unit increase in Debt/Total Assets would
lead to a 0.070 increase in profitability and a unit increase in the logarithm of Outreach would
lead to a 41.580 increase in profitability. This depicts that of the three independent variables,
outreach would have the most adverse impact of MFI’s performance. Figure 4.1 below
presents a diagrammatical presentation of these coefficients.
Figure 4.1: Profitability/Standardized Coefficients
Source: (Research Findings)
The study checked for any outlier that might have affected the regression model in Figure 4.2.
Being that there were no divergent scatter points, then the data exhibited homoscedasticity
depicting that the variables had constant variance.
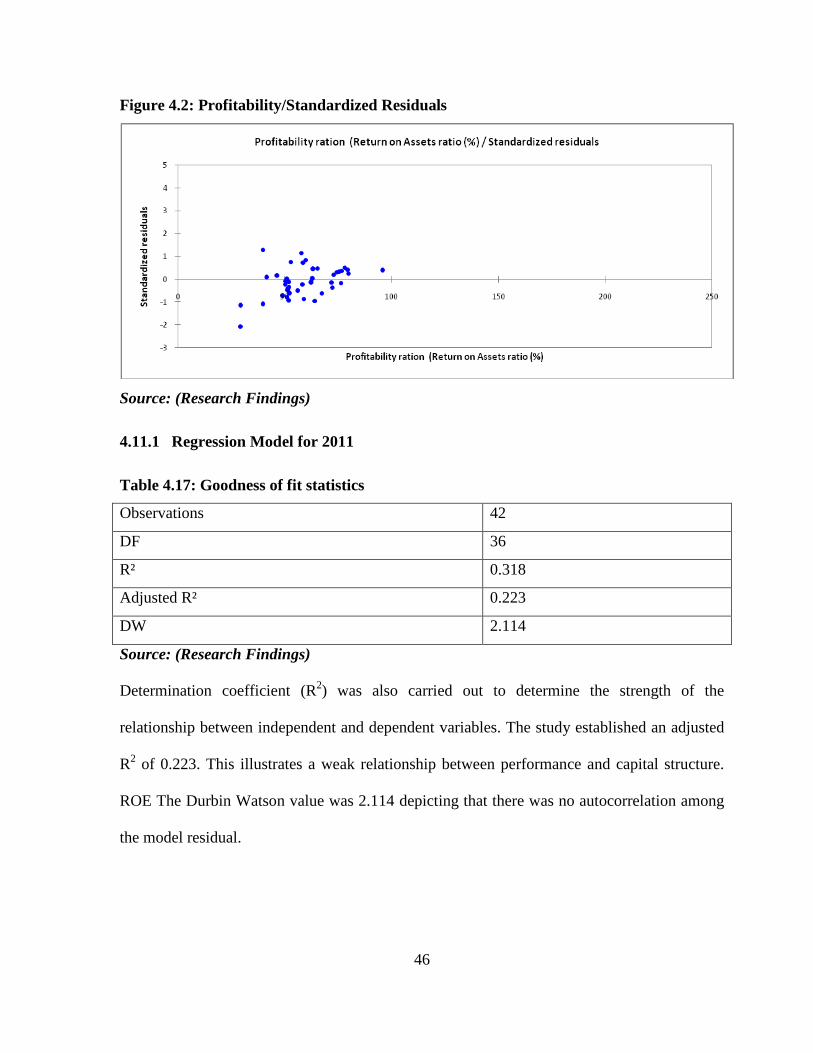
46
Figure 4.2: Profitability/Standardized Residuals
Source: (Research Findings)
4.11.1 Regression Model for 2011
Table 4.17: Goodness of fit statistics
Observations 42
DF 36
R² 0.318
Adjusted R² 0.223
DW 2.114
Source: (Research Findings)
Determination coefficient (R2) was also carried out to determine the strength of the
relationship between independent and dependent variables. The study established an adjusted
R2 of 0.223. This illustrates a weak relationship between performance and capital structure.
ROE The Durbin Watson value was 2.114 depicting that there was no autocorrelation among
the model residual.
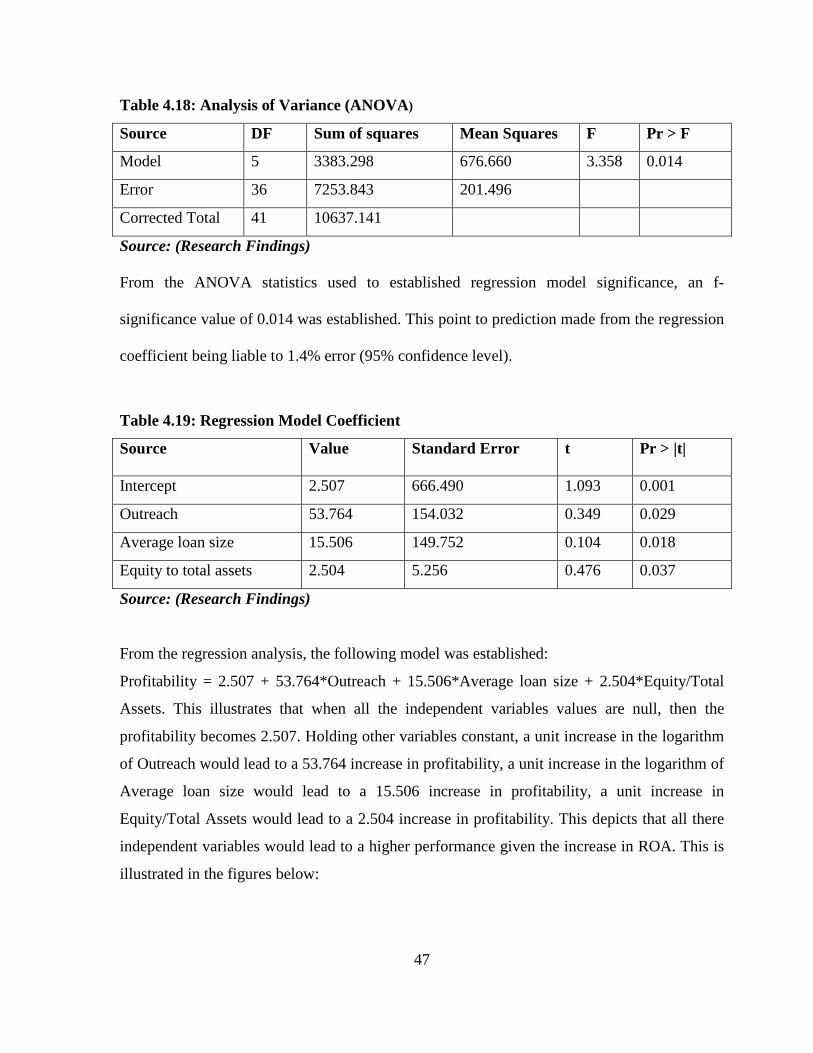
47
Table 4.18: Analysis of Variance (ANOVA)
Source DF Sum of squares Mean Squares F Pr > F
Model 5 3383.298 676.660 3.358 0.014
Error 36 7253.843 201.496
Corrected Total 41 10637.141
Source: (Research Findings)
From the ANOVA statistics used to established regression model significance, an f-
significance value of 0.014 was established. This point to prediction made from the regression
coefficient being liable to 1.4% error (95% confidence level).
Table 4.19: Regression Model Coefficient
Source Value Standard Error t Pr > |t|
Intercept 2.507 666.490 1.093 0.001
Outreach 53.764 154.032 0.349 0.029
Average loan size 15.506 149.752 0.104 0.018
Equity to total assets 2.504 5.256 0.476 0.037
Source: (Research Findings)
From the regression analysis, the following model was established:
Profitability = 2.507 + 53.764*Outreach + 15.506*Average loan size + 2.504*Equity/Total
Assets. This illustrates that when all the independent variables values are null, then the
profitability becomes 2.507. Holding other variables constant, a unit increase in the logarithm
of Outreach would lead to a 53.764 increase in profitability, a unit increase in the logarithm of
Average loan size would lead to a 15.506 increase in profitability, a unit increase in
Equity/Total Assets would lead to a 2.504 increase in profitability. This depicts that all there
independent variables would lead to a higher performance given the increase in ROA. This is
illustrated in the figures below:
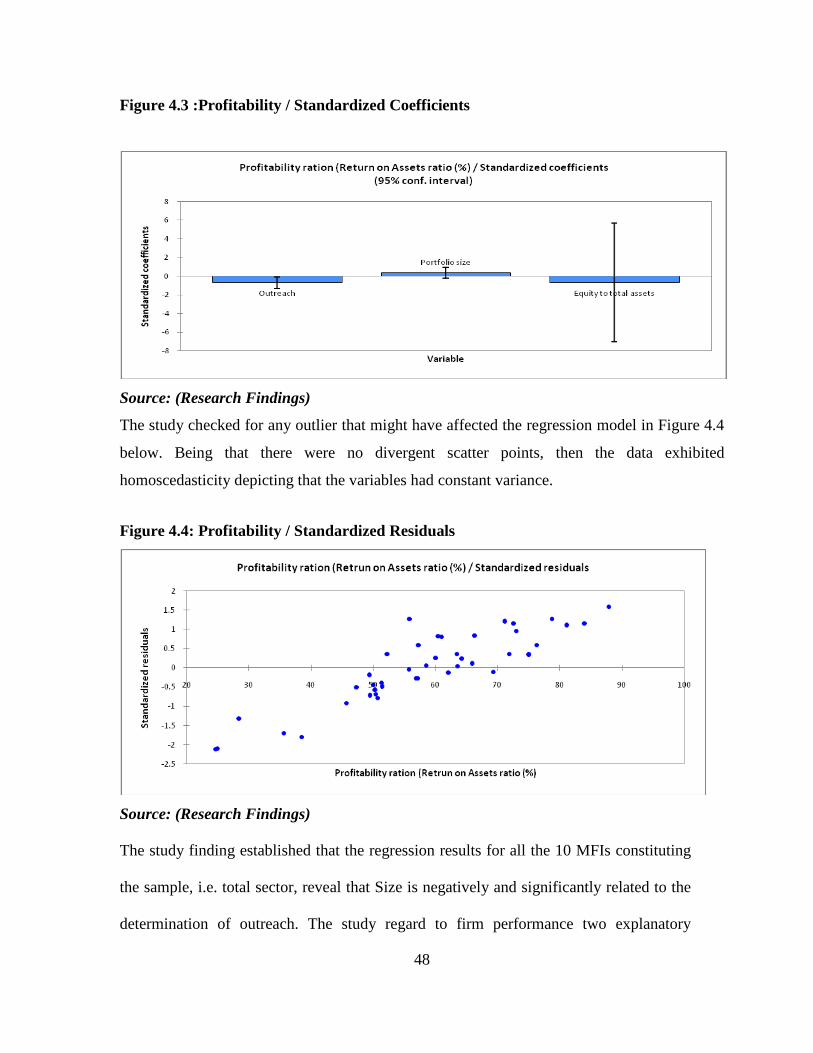
48
Figure 4.3 :Profitability / Standardized Coefficients
Source: (Research Findings)
The study checked for any outlier that might have affected the regression model in Figure 4.4
below. Being that there were no divergent scatter points, then the data exhibited
homoscedasticity depicting that the variables had constant variance.
Figure 4.4: Profitability / Standardized Residuals
Source: (Research Findings)
The study finding established that the regression results for all the 10 MFIs constituting
the sample, i.e. total sector, reveal that Size is negatively and significantly related to the
determination of outreach. The study regard to firm performance two explanatory
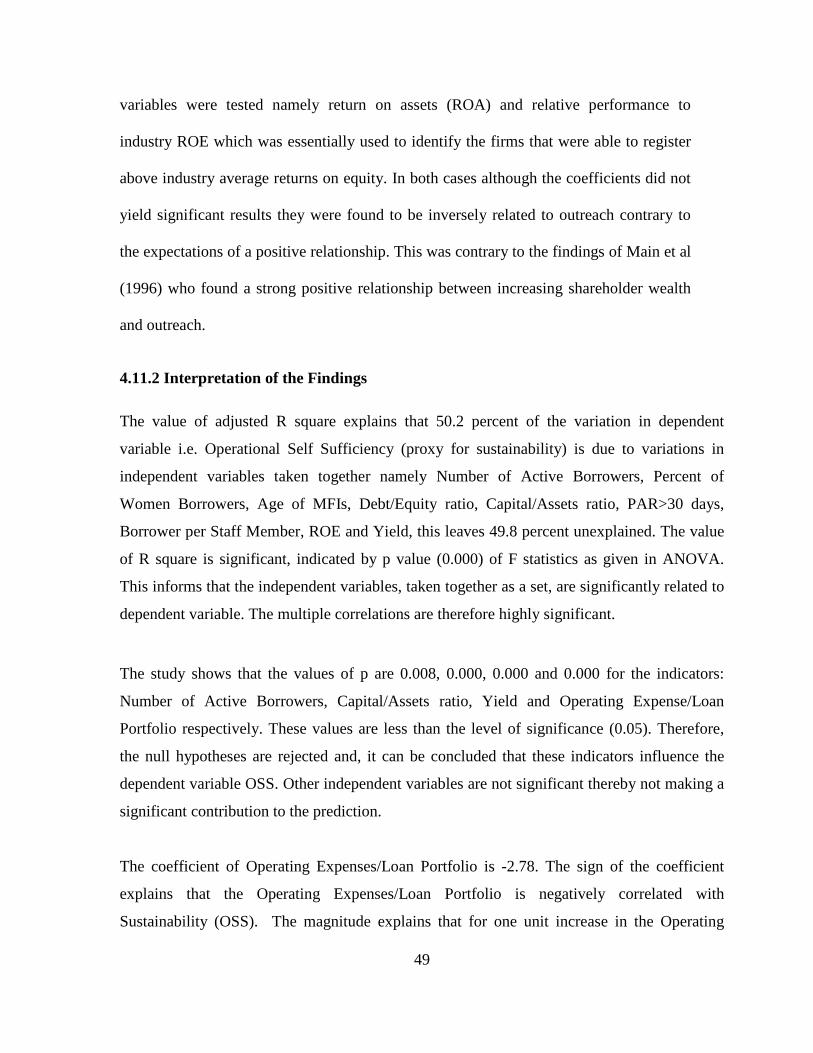
49
variables were tested namely return on assets (ROA) and relative performance to
industry ROE which was essentially used to identify the firms that were able to register
above industry average returns on equity. In both cases although the coefficients did not
yield significant results they were found to be inversely related to outreach contrary to
the expectations of a positive relationship. This was contrary to the findings of Main et al
(1996) who found a strong positive relationship between increasing shareholder wealth
and outreach.
4.11.2 Interpretation of the Findings
The value of adjusted R square explains that 50.2 percent of the variation in dependent
variable i.e. Operational Self Sufficiency (proxy for sustainability) is due to variations in
independent variables taken together namely Number of Active Borrowers, Percent of
Women Borrowers, Age of MFIs, Debt/Equity ratio, Capital/Assets ratio, PAR>30 days,
Borrower per Staff Member, ROE and Yield, this leaves 49.8 percent unexplained. The value
of R square is significant, indicated by p value (0.000) of F statistics as given in ANOVA.
This informs that the independent variables, taken together as a set, are significantly related to
dependent variable. The multiple correlations are therefore highly significant.
The study shows that the values of p are 0.008, 0.000, 0.000 and 0.000 for the indicators:
Number of Active Borrowers, Capital/Assets ratio, Yield and Operating Expense/Loan
Portfolio respectively. These values are less than the level of significance (0.05). Therefore,
the null hypotheses are rejected and, it can be concluded that these indicators influence the
dependent variable OSS. Other independent variables are not significant thereby not making a
significant contribution to the prediction.
The coefficient of Operating Expenses/Loan Portfolio is -2.78. The sign of the coefficient
explains that the Operating Expenses/Loan Portfolio is negatively correlated with
Sustainability (OSS). The magnitude explains that for one unit increase in the Operating
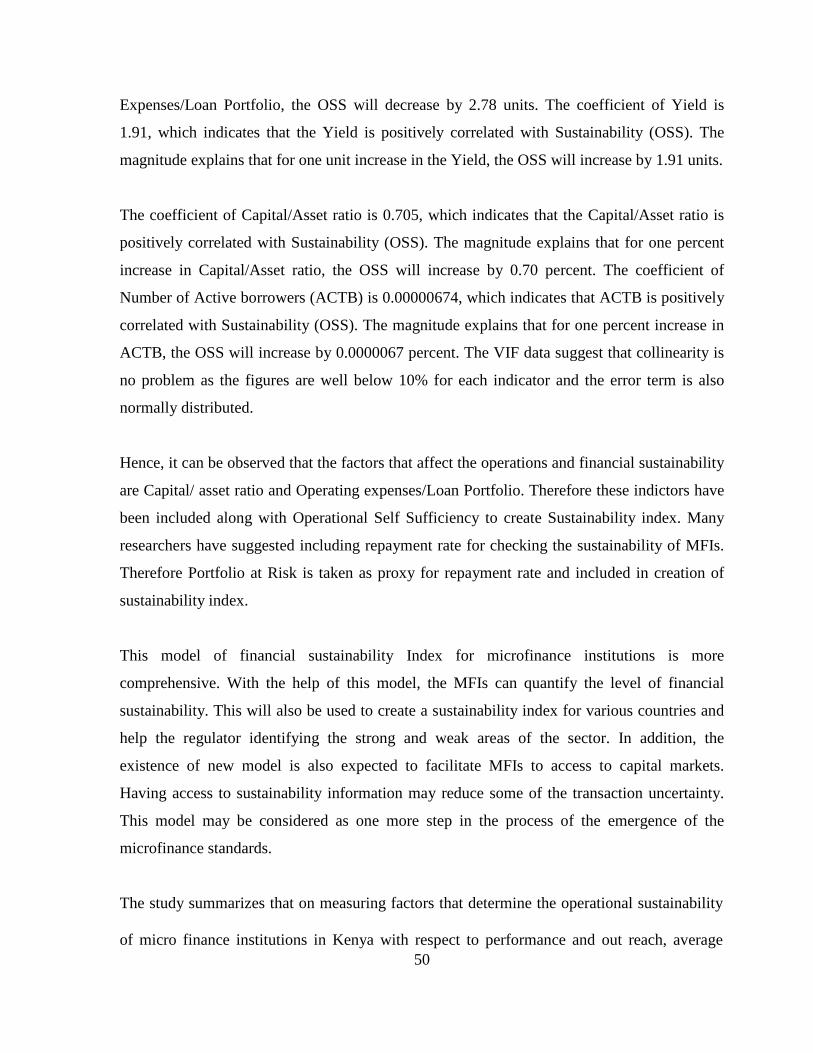
50
Expenses/Loan Portfolio, the OSS will decrease by 2.78 units. The coefficient of Yield is
1.91, which indicates that the Yield is positively correlated with Sustainability (OSS). The
magnitude explains that for one unit increase in the Yield, the OSS will increase by 1.91 units.
The coefficient of Capital/Asset ratio is 0.705, which indicates that the Capital/Asset ratio is
positively correlated with Sustainability (OSS). The magnitude explains that for one percent
increase in Capital/Asset ratio, the OSS will increase by 0.70 percent. The coefficient of
Number of Active borrowers (ACTB) is 0.00000674, which indicates that ACTB is positively
correlated with Sustainability (OSS). The magnitude explains that for one percent increase in
ACTB, the OSS will increase by 0.0000067 percent. The VIF data suggest that collinearity is
no problem as the figures are well below 10% for each indicator and the error term is also
normally distributed.
Hence, it can be observed that the factors that affect the operations and financial sustainability
are Capital/ asset ratio and Operating expenses/Loan Portfolio. Therefore these indictors have
been included along with Operational Self Sufficiency to create Sustainability index. Many
researchers have suggested including repayment rate for checking the sustainability of MFIs.
Therefore Portfolio at Risk is taken as proxy for repayment rate and included in creation of
sustainability index.
This model of financial sustainability Index for microfinance institutions is more
comprehensive. With the help of this model, the MFIs can quantify the level of financial
sustainability. This will also be used to create a sustainability index for various countries and
help the regulator identifying the strong and weak areas of the sector. In addition, the
existence of new model is also expected to facilitate MFIs to access to capital markets.
Having access to sustainability information may reduce some of the transaction uncertainty.
This model may be considered as one more step in the process of the emergence of the
microfinance standards.
The study summarizes that on measuring factors that determine the operational sustainability
of micro finance institutions in Kenya with respect to performance and out reach, average
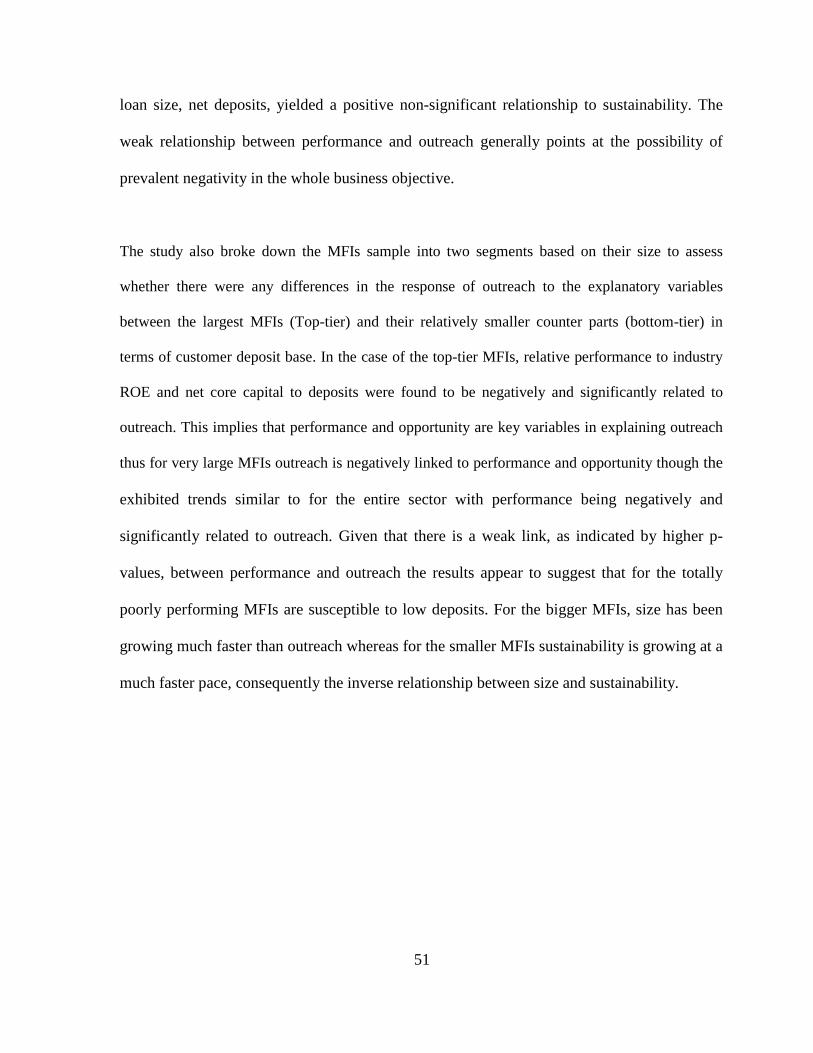
51
loan size, net deposits, yielded a positive non-significant relationship to sustainability. The
weak relationship between performance and outreach generally points at the possibility of
prevalent negativity in the whole business objective.
The study also broke down the MFIs sample into two segments based on their size to assess
whether there were any differences in the response of outreach to the explanatory variables
between the largest MFIs (Top-tier) and their relatively smaller counter parts (bottom-tier) in
terms of customer deposit base. In the case of the top-tier MFIs, relative performance to industry
ROE and net core capital to deposits were found to be negatively and significantly related to
outreach. This implies that performance and opportunity are key variables in explaining outreach
thus for very large MFIs outreach is negatively linked to performance and opportunity though the
exhibited trends similar to for the entire sector with performance being negatively and
significantly related to outreach. Given that there is a weak link, as indicated by higher p-
values, between performance and outreach the results appear to suggest that for the totally
poorly performing MFIs are susceptible to low deposits. For the bigger MFIs, size has been
growing much faster than outreach whereas for the smaller MFIs sustainability is growing at a
much faster pace, consequently the inverse relationship between size and sustainability.
52
CHAPTER FIVE
SUMMARY, CONCLUSION AND RECOMMENDATIONS
5.1 Introduction This chapter presents discussions of the key findings presented in chapter four, conclusions
drawn based on such findings and recommendations for policy and practice. This section also
presents the suggestions for further research.
5.2 Summary
The sustainability score for Kenya MFIs for the year 2011, using the sustainability index
model, is calculated. Top 10 MFIs of Kenya, which contributes 80% of the total loan
portfolio, have been taken for the calculation of sustainability index. The weight has been
assigned to each of these companies, based on their Gross Loan Portfolio. The weighted
averaged sustainability index comes out to be 75.34 for the year 2011. It can also be used on
single MFI to check whether, the MFI is financially sustainable or not.
The total score of the standards is calculated by multiplying indicator’s weight with score of
indicator’s standard and adding it. The total score of the standards is considered as
sustainability index for the base year.
The value of adjusted R square explains that 50.2 percent of the variation in dependent
variable i.e. Operational Self Sufficiency (proxy for sustainability) is due to variations in
independent variables taken together namely Number of Active Borrowers, Percent of
Women Borrowers, Age of MFIs, Debt/Equity ratio, Capital/Assets ratio, PAR>30 days,
Borrower per Staff Member, ROE and Yield, this leaves 49.8 percent unexplained. The value
of R square is significant, indicated by p value (0.000) of F statistics as given in ANOVA, this
informs that the independent variables, taken together as a set, are significantly related to
dependent variable. The multiple correlations are therefore highly significant.
53
The study shows that the values of p are 0.008, 0.000, 0.000 and 0.000 for the indicators:
Number of Active Borrowers, Capital/Assets ratio, Yield and Operating Expense/Loan
Portfolio respectively. These values are less than the level of significance (0.05). Therefore,
the null hypotheses are rejected and, it can be concluded that these indicators influence the
dependent variable OSS. Other independent variables are not significant thereby not making a
significant contribution to the prediction.
The coefficient of Operating Expenses/Loan Portfolio is -2.78. The sign of the coefficient
explains that the Operating Expenses/Loan Portfolio is negatively correlated with
Sustainability (OSS). The magnitude explains that for one unit increase in the Operating
Expenses/Loan Portfolio, the OSS will decrease by 2.78 units. The coefficient of Yield is
1.91, which indicates that the Yield is positively correlated with Sustainability (OSS). The
magnitude explains that for one unit increase in the Yield, the OSS will increase by 1.91 units.
The coefficient of Capital/Asset ratio is 0.705, which indicates that the Capital/Asset ratio is
positively correlated with Sustainability (OSS). The magnitude explains that for one percent
increase in Capital/Asset ratio, the OSS will increase by 0.70 percent. The coefficient of
Number of Active borrowers (ACTB) is 0.00000674, which indicates that ACTB is positively
correlated with Sustainability (OSS). The magnitude explains that for one percent increase in
ACTB, the OSS will increase by 0.0000067 percent. The VIF data suggest that collinearity is
no problem as the figures are well below 10% for each indicator and the error term is also
normally distributed.
Observing the mean rank from pair-wise comparison using Mann-Whitney U test, it can be
concluded that the Young MFIs are doing better as compared to the Mature and Old MFIs on
Number of Active Borrowers. In case of Yield on Gross Portfolio indicator, both Young and
Old MFIs are performing better than Mature MFIs but no difference found between Young
and Old MFIs. Similarly, in Operating Expense/Loan Portfolio indicator, both Mature and Old
MFIs are doing better as compared to than Young MFIs but no difference found between
Mature and Old MFIs. In case of Women Borrowers, both Old MFIs are performing better as
compared to Mature MFIs but no difference found between Old and Young MFIs.
54
The study also summarizes that on measuring factors that determine the operational
sustainability of micro finance institutions in Kenya with respect to performance and
profitability, average loan size, net deposits, yielded a positive non-significant relationship to
sustainability. The weak relationship between performance and outreach generally points at
the possibility of prevalent negativity in the whole business objective.
The study also broke down the MFIs sample into two segments based on their size to assess
whether there were any differences in the response of outreach to the explanatory variables
between the largest MFIs (Top-tier) and their relatively smaller counter parts (bottom-tier) in
terms of customer deposit base. In the case of the top-tier MFIs, relative performance to industry
ROE and net core capital to deposits were found to be negatively and significantly related to
outreach. This implies that performance and opportunity are key variables in explaining outreach
thus for very large MFIs outreach is negatively linked to performance and opportunity though the
exhibited trends similar to for the entire sector with performance being negatively and
significantly related to outreach. Given that there is a weak link, as indicated by higher p-
values, between performance and outreach the results appear to suggest that for the totally
poorly performing MFIs are susceptible to low deposits. For the bigger MFIs, size has been
growing much faster than outreach whereas for the smaller MFIs sustainability is growing at a
much faster pace, consequently the inverse relationship between size and sustainability.
5.3 Conclusion It can be observed that the factors that affect the operations and financial sustainability are
Capital/ asset ratio and Operating expenses/Loan Portfolio. Therefore these indictors have
been included along with Operational Self Sufficiency to create Sustainability index. Many
researchers have suggested including repayment rate for checking the sustainability of MFIs.
55
Therefore Portfolio at Risk is taken as proxy for repayment rate and included in creation of
sustainability index.
There are differences found between the performance and sustainability on other financial
indicators namely Return on Equity, Return on Assets, OSS, and PAR>30 days. The SPSS
output of One Way ANOVA shows that the Kruskal-Wallis statistics (chi square) is equal to
15.52 with significance equal to 0.000. Therefore, the null hypothesis, that there is no
significant difference in Number of Active Borrowers indicator among different age groups of
MFIs, is rejected.
Hence, it can be concluded that the difference in Number of Active Borrowers indicator could
be attributed to the age of the MFIs. Now, using Man-Whitney U test with pair-wise
comparison it can be concluded that the young MFIs are the best performer in the given
category. Similarly, it can be observed that the significance values of Percent of Women
Borrowers, PAR>30 days, Operating Expense/ Loan Portfolio, and Yield on Gross Portfolio
are less than 0.05, the assumed level of significance. Therefore, the null hypotheses are
rejected. Hence, it can be concluded that the difference in Percent of Women Borrowers,
PAR>30 days, Operating Expense/Loan Portfolio, and Yield on Gross Portfolio indicators
could be attributed to the age of the MFIs. No significant difference is found on other
indicators namely OSS, ROA and ROE, Borrower per Staff Member and Capital/Assets ratio.
5.4 Recommendations for Policy
This model of operational self-sufficiency and financial sustainability Index for microfinance
institutions is more comprehensive. With the help of this model, the MFIs in Kenya can
quantify the level of operations and financial sustainability. This model can also be used to
create a sustainability index for various countries and help the regulator identifying the strong
and weak areas of the sector. In addition, the existence of new model is also expected to
facilitate MFIs to access to capital markets. Having access to sustainability information may
56
reduce some of the transaction uncertainty. This model may be considered as one more step in
the process of the emergence of the microfinance standards.
Kenyan microfinance has shown resiliency despite local droughts and high inflation rates that
afflicted the nation in 2008 and 2009. With the Kenyan government and the Central Bank of
Kenya emphasizing financial access as a key to modernizing the economy, the sector has been
strengthened by progressive policies and innovative approaches to delivering financial
services. A large deposit base, along with the existence of well-developed MFIs, have allowed
financial and operational expenses to remain relatively low and have led to some of the
highest profitability measures in the SSA region. A detailed explanation of growth trends as
well as relevant policy measures taken by the government can be found throughout the Kenya
Country Briefing:
Innovative forms of microfinance and progressive government policies have helped to make
Kenya’s microfinance sector one of the most developed in Sub-Saharan Africa. Leading
contributors to this dynamic are (M-Pesa’s) success in mobile banking, the passing of the
Finance Act of 2010 allowing for agent banking, and the development of effective credit
bureaus throughout the country.
A strong culture of savings has meant that MFI outreach to depositors has far outweighed
outreach to borrowers, although overall loan portfolio and total deposits have both increased
steadily since 2008. High product-line diversification has allowed MFIs to evolve to meet
customer needs, although growth has primarily targeted an urban clientele.
Deposits account for nearly 70% of the funding base for the sector, with the savings of micro -
depositors contributing the majority of these funds. Kenyan microfinance also benefits from
the confidence of many international lenders, although the largest national source of
microfinance credit is Kenya itself.
The ability to maintain low financial and operational expense ratios has made Kenyan
microfinance fairly profitable with an ROA of over 5% in 2010. High PAR levels do however
57
raise concerns about the riskiness of the overall portfolio, and whether profitability can be
sustained over time.
5.5 Limitations of the Study The first limitation of the study was the fact that it was a sample study. Samples do not
completely represent the characteristics of the population.
Secondly, the secondary data of some of the MFIs was not available and this might have
reduced the accuracy of research findings.
Lastly, some respondents did not provide all the information thus depriving the study of some
required data.
5.6 Suggestions for Further Studies
There is need for further studies to carry out similar tests for a longer time period. A similar
study should also be carried out on MFIs with total income (interest and non-interest income)
as the proxy for size to try and assess whether the relationship between outreach and
performance is drastically altered by the change of variables. Given that a good chunk of the
studies touched on sustainability of MFIs in Kenya, there is need to ascertain the relationship
between the firm values of all firms in Kenya.
The study primarily utilized secondary data and to this extent, the study suggests that in future
studies dealing with the same, primary data should be utilized to enhance the quality and the
reliability of the findings. The same study should also be used in other MFIs which are
situated in the rural areas as this study concentrated within and around Nairobi.
58
REFERENCES
Abrams, Julie and Von Stauffenberg, Damian (2007), Role Reversal: Are Public
Development Institutions Crowding Out Private Investment in Microfinance?
http://www.microrate.com/pdf/rolereversal.pdf, Retrieved June 2012.
Adongo, J. and Stork C. (2005) Factors Influencing the Financial Sustainability of Selected
Microfinance Institutions in Namibia, The Namibian Economic Policy Research
Unit, available on www.nepru.org.na
Armandariz de Aghion, Beatrice and Jonathan Morduch (2005). The Economics of
Microfinance. Cambridge, MA: MIT Press.
Association Press. (2005). Macy’s to sell Rwandan baskets. AP Online.
Balkenhol, B. (2007) Microfinance and public policy: Outreach, performance and efficiency,
International labour Organization
Baumann, T. (2004). ‘Pro-poor Microcredit in South Africa: Cost Efficiency and Productivity
of South African Pro- poor Microfinance Institutions’, Development Southern
Africa, vol.21, no. 5, pp. 785-98.
Bhatt, Nitin, Gary Painter and Shui-Yan Tang (2002). “The Challenges of Outreach and
Sustainability,” in Replicating Microfinance in the United States. Carr. Eds. J. H.
Carr and Z. Y. Tong. Washington, DC: Woodrow Wilson Center Press, 191-221.
Brau, J. C. and Woller, G. M., 2004. ‘Microfinance: A Comprehensive Review of the Existing
Literature, Journal of Entrepreneurial Finance and Business Ventures, vol. 9, no.
1, pp.1-26.
59
Borg, W., & Gall, M. D. (1989). Educational research: An introduction. (5th ed.). New York: Longman.
Bryman, A and Bell, E (2003) Business Research Methods. Oxford University Press
CGAP. (2000a). Microfinance and risk management: A client perspective. Focus Note 17.
http://www.cgap.org/html/p_focus_notes17.html
Chua R.T. (1998) The performance and Sustainability of two Philipine Microfinance
Institutions, Commission by The Foundation for Development Coorperation,
available on
http://fdc.clients.ecbd.com/files/Microfinance/Performance%20and%20Sustainabi
lity%20of%20two%20Philipine%20MFIs.pdf
Darwin, C. (1859) “The Origin of Species”
Doering et al (2001), Concepts and practices, 2nd edition, Pitman Publishers, USA
Donald C. (2006) Synthesizing Research; A guide for Literature Reviews (3rd edn) Sage: Thousand Oaks
Directorate of Youth Development (2005). Commonwealth Youth Credit Initiative in Namibia
through the SCA model (pilot phase March 2005 – September 2006). Namibia:
Ministry of Youth, National Service, Sports and Culture in collaboration with the
Commonwealth Secretariat.
Field, E. and Pande, R. (2008) Repayment Frequency and Default in Microfinance: Evidence
from India, Havard Business Review
Fin Access (2007) ,Financial institution and banking survey, Financial Sector Deepening, Kenya
Frances Roland (1997,) Training Needs Analysis, 8th edition, Prentice Hall, London. George Omino (2005) study entitled “Regulation and supervision of MFIs in Kenya’’
60
Gregory H. S, (1988), Ten Keys to Dynamic Customer Relations, Horizon Publishers & Distributors Inc, USA.
Hannagan Tim, (1998),Management Concepts and Practices, 2nd edition,
Pitman Publishers, USA.
Honohan, P. (2004). Financial sector policy and the poor: Selected findings and issues. WP
43, Washington D.C.: The World Bank.
Johnson, S. & Malkanaki, S. & Wanjou, K. (2006). Tackling the frontiers of microfinance in
Kenya: the role for decentralized services, Small Enterprise Development, 17 (3):
41-53.
John Bellamy Foster (May 2008). "Sweezy in Perspective". Monthly Review. http://www.monthlyreview.org/080526foster.php.
Journal of Economics and Sustainable Development www.iiste.org
Kluwer et al,(2002), Knowledge Management – A Blueprint for Delivery, Elsevier Publishers,
Amazon. Kotler (1987), strategic Marketing for educational institutions,3rd edition ,prentice hall,
Englewood cliffs. Lauden et all (2003) Management pf productivity, 3rd edition, John wiley and sons, USA. Marguerite S Robinson (2001), The microfinance revolution: sustainable finance for the poor,
Irwin Mc Grawhill, Washington D.C Mugenda, O.M and Mugenda, A.G (2003) Research Methods, Quantitative & Qualitative
Approaches, Acts Press, Mugenda M. O. and Mugenda A. (1999), Research Methods: Qualitative and Quantitative
Approaches, African Centre for Technology Studies, , Kenya. Ngechu. M. (2004), Understanding the research process and methods. An introduction to
research methods. Acts Press. Onserio et al ( 2001) Quality Management ,2nd edition, Prenctice Hall, New Delhi ,India
61
Onyuma, S.O. & Shem, A. O. (2005) Myths of microfinance as a panacea for poverty
eradication and women empowerment, Savings and Development 29 (2): 199-
222.
Peter Drunker (1997) Human resource management, 6th edition, prentice hall publishers ,London.
Rosenberg, R. (2003) Core performance indicators for microfinance, CGAP, no. 9, July 2003.
Ruben, R. and Schers, S. (2007) Microfinance Portfolio Performance: An Explorative
Analysis of Determinants of Outreach, Sustainability and Risk, Centre for
International Development Issues Nijmegen.
Rutherford, S. (2000) Raising the curtain on the ‘microfinance services era’, Focusnote,
CGAP, Washington D.C., 15, May 2000.
Richard, B C, et al (2001), Operations Management for Competitive Advantage, McGraw-Hill Irwin, New York.
Schermerhorn, John R (1989), Management for Productivity, 3rd edition, , John Wiley and
Sons, USA. Schumpeter, J.A. (1961) The theory of economic development: an inquiry into profits, capital,
credit, interest, and the business cycle / translated from the German by Redvers Opie New York: OUP
Stoner A F, et al , (1995) Management, 6th edition, Prentice Hall. New Jersey. Stoner C. R et al (1998), Business an Integrated Framework, Irwin Mc Grawhill, New York. Scott, W. R. (2004). “Institutional Theory” P408 Encyclopedia of social Theory William B, (1991), Managing Quality Customer Service, Kogan Page Ltd, Great
Britain.
William, (1993) Quality Customer Service, 3rd edition, Crisp Publications, USA.
Yaron, (1992) The impact of Microfinance Institutions (MFIs) in the Development of
Small and Medium Enterprises.
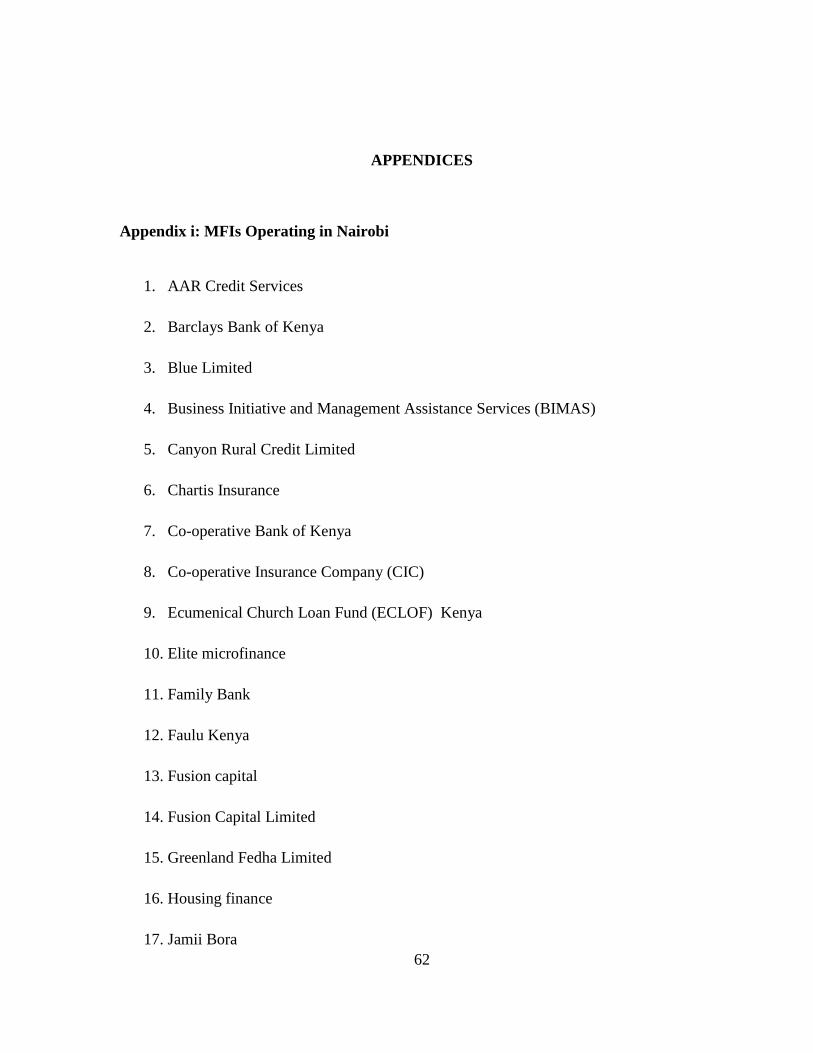
62
APPENDICES
Appendix i: MFIs Operating in Nairobi
1. AAR Credit Services
2. Barclays Bank of Kenya
3. Blue Limited
4. Business Initiative and Management Assistance Services (BIMAS)
5. Canyon Rural Credit Limited
6. Chartis Insurance
7. Co-operative Bank of Kenya
8. Co-operative Insurance Company (CIC)
9. Ecumenical Church Loan Fund (ECLOF) Kenya
10. Elite microfinance
11. Family Bank
12. Faulu Kenya
13. Fusion capital
14. Fusion Capital Limited
15. Greenland Fedha Limited
16. Housing finance
17. Jamii Bora
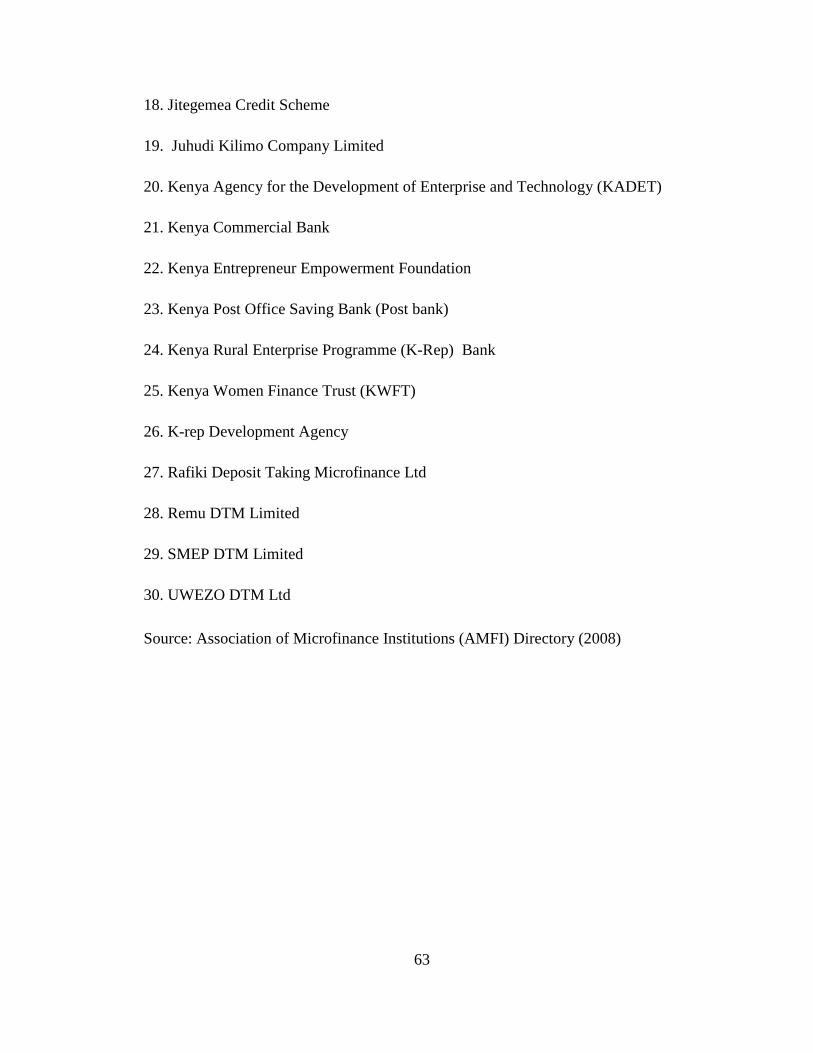
63
18. Jitegemea Credit Scheme
19. Juhudi Kilimo Company Limited
20. Kenya Agency for the Development of Enterprise and Technology (KADET)
21. Kenya Commercial Bank
22. Kenya Entrepreneur Empowerment Foundation
23. Kenya Post Office Saving Bank (Post bank)
24. Kenya Rural Enterprise Programme (K-Rep) Bank
25. Kenya Women Finance Trust (KWFT)
26. K-rep Development Agency
27. Rafiki Deposit Taking Microfinance Ltd
28. Remu DTM Limited
29. SMEP DTM Limited
30. UWEZO DTM Ltd
Source: Association of Microfinance Institutions (AMFI) Directory (2008)