Detecting upwelling along the central coast of California during an El Niño year using HF-radar
12
Pergamon ContinentalShelfResearch, Vol. 15, No. 7, pp. 803--814, 1995 Copyright © 1995 Elsevier Science Ltd Printed in Great Britain. All rights reserved 0278--4343/95$9.50+ 0.00 0278-4343(94)00042-5 Detecting upwelling along the central coast of California during an E! Nifio year using HF-radar YEHOSHUA SHKEDY,* DANIEL FERNANDEZ,iS CALVIN TEAGUE,t JOHN VESECKYt§ and JONATHAN ROUGHGARDEN*II (Received 23 November 1993; in revisedform 24 February 1994; accepted 18 March 1994) Abstract--Surface currents in the vicinity of Granite Canyon, California (36°25.9'N, 121°55.0'W), were measured hourly using HF-radar in 1990-1992. The 1990 data revealed the M2 and $2 semi-diurnal tidal constituents. These high frequency components were removed from 6-month records taken during part of the upwelling season of 1991 and 1992. Daily and weekly variations in current speed and direction were generally similar in 1991 and 1992 even though 1992 was an El Nifio year. Correlation analysis revealed that in both years daily and weekly variation in currents were mostly explained by corresponding changes in the alongshore component of the wind stress, indicating the effects of coastal upwelling. Variation in sea surface temperatures adjacent to the coast were correlated with the currents generated by coastal upwelling in 1991, but not in 1992. These observations are consistent with the hypothesis that during an El Nifio event the water is upwelled to the surface from above a depressed thermocline. In 1992, at Granite Canyon, normal coastal upwelling was superimposed upon the El Nifio event of that year. INTRODUCTION Using high frequency radarfor measuring surface current During the last decade, high frequency (HF) radar has been used to observe sea surface currents (Barrick et al., 1977; Sherman, 1986; Teague, 1986; Prandle and Matthews, 1990). Remote sensing techniques enable long-term current measurements from a relatively wide area, compared to existing techniques such as moored arrays and drifters. We used HF-radar to measure sea surface currents off the central California coast in 1990, 1991 and 1992. Because 1992 was an El Nifio year, we tested whether upwelling continues normally during an El Nifio. The principle of the radar is as follows: a pulse of a high-frequency radar wave is transmitted across the ocean surface. The pulse is reflected back towards the radar from ocean waves with half the wavelength of the radio signal (Bragg scattering). The Doppler *Department of Biological Sciences, Stanford University, Stanford, CA 94305, U.S.A. tDepartment of Electrical Engineering, Stanford University, Stanford, CA 94035, U.S.A. SPresent address: The Baskin Center for Computer Engineering and Computer and Information Sciences, University of California, Santa Cruz, CA 95064, U.S.A. §Space Physics Research Laboratory, University of Michigan, 2455 Hayward, Ann Arbor, M1 48109, U.S.A. tlDepartment of Geophysics, Stanford University, Stanford, CA 94035, U.S.A. 803
Transcript of Detecting upwelling along the central coast of California during an El Niño year using HF-radar

Pergamon Continental Shelf Research, Vol. 15, No. 7, pp. 803--814, 1995
Copyright © 1995 Elsevier Science Ltd Printed in Great Britain. All rights reserved
0278--4343/95 $9.50 + 0.00
0278-4343(94)00042-5
Detec t ing u p w e l l i n g a long the central coast o f Ca l i forn ia d u r i n g
an E! Nif io year us ing H F - r a d a r
YEHOSHUA SHKEDY,* DANIEL FERNANDEZ, iS CALVIN TEAGUE, t JOHN VESECKYt§ and
JONATHAN ROUGHGARDEN*II
(Received 23 November 1993; in revised form 24 February 1994; accepted 18 March 1994)
Abstract--Surface currents in the vicinity of Granite Canyon, California (36°25.9'N, 121°55.0'W), were measured hourly using HF-radar in 1990-1992. The 1990 data revealed the M2 and $2 semi-diurnal tidal constituents. These high frequency components were removed from 6-month records taken during part of the upwelling season of 1991 and 1992. Daily and weekly variations in current speed and direction were generally similar in 1991 and 1992 even though 1992 was an El Nifio year. Correlation analysis revealed that in both years daily and weekly variation in currents were mostly explained by corresponding changes in the alongshore component of the wind stress, indicating the effects of coastal upwelling. Variation in sea surface temperatures adjacent to the coast were correlated with the currents generated by coastal upwelling in 1991, but not in 1992. These observations are consistent with the hypothesis that during an El Nifio event the water is upwelled to the surface from above a depressed thermocline. In 1992, at Granite Canyon, normal coastal upwelling was superimposed upon the El Nifio event of that year.
INTRODUCTION
Using high frequency radar for measuring surface current
During the last decade, high frequency (HF) radar has been used to observe sea surface currents (Barrick et al., 1977; Sherman, 1986; Teague, 1986; Prandle and Matthews, 1990). Remote sensing techniques enable long-term current measurements from a relatively wide area, compared to existing techniques such as moored arrays and drifters. We used HF-radar to measure sea surface currents off the central California coast in 1990, 1991 and 1992. Because 1992 was an El Nifio year, we tested whether upwelling continues normally during an El Nifio.
The principle of the radar is as follows: a pulse of a high-frequency radar wave is transmitted across the ocean surface. The pulse is reflected back towards the radar from ocean waves with half the wavelength of the radio signal (Bragg scattering). The Doppler
*Department of Biological Sciences, Stanford University, Stanford, CA 94305, U.S.A. tDepartment of Electrical Engineering, Stanford University, Stanford, CA 94035, U.S.A. SPresent address: The Baskin Center for Computer Engineering and Computer and Information Sciences,
University of California, Santa Cruz, CA 95064, U.S.A. §Space Physics Research Laboratory, University of Michigan, 2455 Hayward, Ann Arbor, M1 48109, U.S.A. tlDepartment of Geophysics, Stanford University, Stanford, CA 94035, U.S.A.
803

804 Y. Shkedy et al.
~1~ 20 m ~ ~ ((( ~Transmi t
.......................... "~//""~--~ V V ~ S e a t t e r
// //
lm~,- 5km - ~ '
~1, ~ , ~ Offshore Advection
I <,,-Offshore ^dvection | ~ Slatla~an/Water Mass
Echo from o u t g o i n g ~ ' ", ~ ' ", Echo from incoming oceanwa~.,,, , ~ , / , , ," ~,ocean wave
'"., | Transmit f Frequency
Fig. 1. An illustration of the radar system and its principle of operation. The ground station is illustrated at the right-hand side of the figure, the water slab in the center, and the Doppler shift of
the received radio wave is at the bottom.
shift of the reflection includes two components: that due to the phase velocity of the ocean wave and that due to the surface currents. The phase velocity of the ocean gravity wave is subtracted, leaving an estimate of the surface currents (Fig. 1). For more information on this technique see Barrick et al. (1977); Sherman (1986); Teague (1986).
The performance of the system was explored during 1990 by detecting tidal constituents in the currents. Then, after removing the tidal constituents, variation in currents on the scale of a few days was detected--this scale relates primarily to upwelling events. We then tested whether changes in currents can be explained by changes in wind stress, and lastly, if changes in currents can explain changes in sea surface temperatures (SSTs) measured at Granite Canyon Marine Laboratory, where the radar was located.
Upwelling and El Niho
Upwelling is primarily a seasonal phenomenon and occurs along parts of the eastern Pacific coast during the northern hemisphere spring and summer. The upwelled water is normally drawn up to the surface from below the thermocline and is generally colder, more saline and richer in nutrients than the surface water it replaces (Barber and Smith, 1981). Along the western coast of North America upwelling occurs mostly between April and September (Barber and Smith, 1981; Norton et al., 1985).

Detecting upwelling using HF-radar 805
The most obvious effect of El Nifio is warming detected at the sea surface (Philander, 1990). Wyrtki (1975) found that the wind regime during the upwelling season along the Peruvian coast (a major upwelling region) is similar in both El Nifio and non-El Nifio years, and suggested that upwelling continues to occur during El Nifio events. He suggested that during El Nifio, warm water is pumped to the surface from above a deeper inshore thermocline, resulting in relatively high coastal water temperatures (see also Enfield, 1981, 1989). On the other hand, Huyer et al. (1987) found that during the 1982- 1983 El Nifio, upwelling favorable winds off Peru were not always well correlated with upwelling, and suggested that onshore geostrophic flow was balanced by wind driven offshore flow in the surface layer. Simpson (1984, 1992) offered data from the California coast that indicates a similar depression of the inshore thermocline during the 1982-1983 El Nifio event (see also Chelton and Davis 1982; McGowan, 1986). Contrary to the scenario suggested by Wyrtki (1975), Simpson suggested that upwelling did not occur during that E1 Nifio event due to anomalous atmospheric circulation that weakened the wind stress.
METHODS
Experimental set up, procedure and data analysis
The radar was located at Granite Canyon Marine Laboratory in Carmel, California (36°25.9'N, 121°55.0'W) about 15 km north of Point Sur, which is a strong upwelling center (Breaker and Mooers, 1986). The coastline orientation in the area of Granite Canyon is approximately north-northwest to south-southeast, thus the alongshore direc- tion was determined as 342.5 °. The receiving array was about 15 m above mean sea level. The eight receiving antenna loops were equi-spaced over a line 49 m long, parallel to the coast line, with the broadside facing west-southwest (257 ° ) (Fig. 1). The radar was operated for 8 min and 36 s each hour. Resolution consisted of eight partially overlapping bins each 7.5 km long. To illustrate the ability of the radar to detect tidal components we present data from the third range bin, centered at about 17 km from shore and pointed southwest (227 °) (data collected in 1990). For detecting upwelling currents (data collected in 1991 and 1992) we present data from the first bin, the bin extending from 3 km to 10.5 km from shore. In 1991 and 1992 measurements were taken from January to June only. The radar transmitted at two frequencies, 13.38 MHz and 21.77 MHz. For this study we examined only the 13.38 MHz signal because generally there was less interference at 13.38 MHz. At this frequency the radar measures currents within the uppermost meter. The accuracy of the velocity estimate was no less than _+4 cm s -1. By knowing the amplitude- phase relationship among the eight receiving antennas, the radar look direction can be steered a posteriori. The backscattered echoes were sampled at five angles, 0 °, _ 15 °, _+30 ° from the direction that the antenna faced.
Tidal constituents were detected in the raw observations using the fast-Fourier trans- formation in 1990. Tidal constituents were then filtered from the observed radial current vectors in 1991 and 1992 and the residual examined for consistency with coastal upwelling theory. A low-pass filter (PL-64, developed by L. Rosenfeld, cfBeardsley et al., 1985), a symmetric 129-point temporal, was applied to the time series of radial current measure- ments to generate a new time series with tidal influences removed. The filtering procedure was performed for each of the five observation angles independently. Missing data points
806 Y. Shkedy et al.
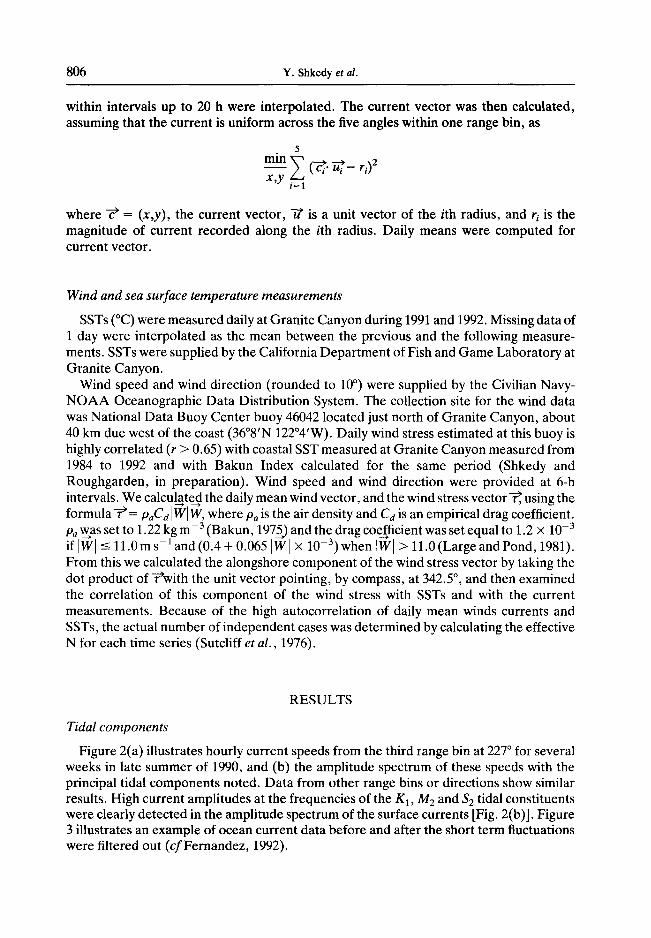
within intervals up to 20 h were interpolated. The current vector was then calculated, assuming that the current is uniform across the five angles within one range bin, as
5
min ~ (~i" ~ / - ri) 2
x , y i=1
where T ~ = (x,y), the current vector, -/~ is a unit vector of the ith radius, and ri is the magnitude of current recorded along the ith radius. Daily means were computed for current vector.
Wind and sea surface temperature measurements
SSTs (°C) were measured daily at Granite Canyon during 1991 and 1992. Missing data of 1 day were interpolated as the mean between the previous and the following measure- ments. SSTs were supplied by the California Department of Fish and Game Laboratory at Granite Canyon.
Wind speed and wind direction (rounded to 10 ° ) were supplied by the Civilian Navy- NOAA Oceanographic Data Distribution System. The collection site for the wind data was National Data Buoy Center buoy 46042 located just north of Granite Canyon, about 40 km due west of the coast (36°8'N 122°4'W). Daily wind stress estimated at this buoy is highly correlated (r > 0.65) with coastal SST measured at Granite Canyon measured from 1984 to 1992 and with Bakun Index calculated for the same period (Shkedy and Roughgarden, in preparation). Wind speed and wind direction were provided at 6-h intervals. We calculated the daily mean wind vector, and the wind stress vector ~ using the formula-~ = paCd[~'r[ ~r, where Pa is the air density and Cd is an empirical drag coefficient.
3 3 pa was set to 1.22 kg m- (Bakun, 1975) and the drag coefficient was set equal to 1.2 × 10- if Iwl 11.0 m s - and (0.4 + 0,065 Iwl × 10 -3) when Iwl > 11.0 (Large and Pond, 1981). From this we calculated the alongshore component of the wind stress vector by taking the dot product of-~with the unit vector pointing, by compass, at 342.5 °, and then examined the correlation of this component of the wind stress with SSTs and with the current measurements. Because of the high autocorrelation of daily mean winds currents and SSTs, the actual number of independent cases was determined by calculating the effective N for each time series (Sutcliff et al., 1976).
RESULTS
Tidal components
Figure 2(a) illustrates hourly current speeds from the third range bin at 227 ° for several weeks in late summer of 1990, and (b) the amplitude spectrum of these speeds with the principal tidal components noted. Data from other range bins or directions show similar results. High current amplitudes at the frequencies of the K1, M2 and Sz tidal constituents were clearly detected in the amplitude spectrum of the surface currents [Fig. 2(b)]. Figure 3 illustrates an example of ocean current data before and after the short term fluctuations were filtered out (cfFernandez, 1992).

(a) Hourly Radial Sudace Current Measurements 17 krn from shore, 227*
( ~ / s ~ ) _ 1:. 8101190 8131190 9/30/90
Date
Fig. 2.
Fig. 3.
(b) Amplitude Spectrum of Ocean Surface Currents from 8/01/90 - 9131190
8 - M~ t ida l
T" ./¢OmllltU~t Current 6. I Ks tidal S~ tidal
Amplitude s- I a~ntt.~t II / ¢o.~it,ut
0 , , , , 1 2 3 4
Frequency (cycles per day)
Hourly radial surface current measurements (a) and (b) the ampli tude spectrum of ocean surface currents from 8/01/90-9/31/90 at Granite Canyon.
Current (,~I~) -i0-
Filtered and Unfiltered Ocean Current Data from 17 kin, 227 °
1
i0
Filtered d~t8 U~ltemd cutout dat&
Detecting upwelling using HF-radar 807
- 6 O
8/01/90 8/31/90 913o19o
Date
Current speed before and after filtration, measured 17 km offshore, at 227 °, during 8/01/90-9/31/90 at Grani te Canyon.

808 Y. Shkedy et al.
Current Velocity (cm/sec) and Direction at Granite Canyon
(a)
Velocity
I 1991
J . . . . . i . . . . . i . . . . . i . . . . . i . . . . . J . . . . . i . . . .
0 30 60 90 120 150 180
J F M A M J J
Fig. 4.
(b)
Velocity
40 3o: 2o: io-
-10
-20
-30 - 4 0
1992
J F M A M J J Days since Ja.uuaxy 1st
(a) and (b) daily mean filtered current direction and velocity. Daily means were calculated from 24 daily measurements by the radar.
Currents
Daily mean current vectors for 1991 and 1992 are presented in Fig. 4. In both years, changes in current direction were more frequent during January-March than during April-June. During the later period, from the beginning of April (day of the year 95-100), currents flowing to the south and south-west, the expected upwelling current direction, dominated. We will later refer to the period, April-June, as the upwelling season. The sequences of days with currents moving to the south and southwest were interrupted every 10-20 days by a few days during which the currents were flowing to the opposite direction. This pattern is less evident during 1992, in part because gaps in the radar data occurred more often than in 1991. The radar also detected some very large current velocities during April 1992.
Sea surface temperatures
The daily mean sea surface temperature at Granite Canyon between 1971 and 1992 was 11.9°C + 0.05 (S.E.). During E1 Nifio events throughout that period SSTs were higher. Daily mean SSTs at Granite Canyon were 12.3°C + 0.06 in 1982, 13.5°C + 0.05 in 1983,

Detecting upwelling using HF-radar 809
Sea Surface Temperatures (C ° ) at Granite Canyon
(a)
Temperature
17
16
1 5
14
13.
12-
I I -
I 0 -
9-
S -
1991
. . . . . . 3'o . . . . . ~ . . . . . 9'o . . . . . 1~ . . . . . 1~o . . . . . 1~o . . . . J F M A M J J
Fig. 5.
(b) 1,- 16-
15 -
14 -
13 -
Temperature 12- 11 -
1 0 -
9 -
S o
1992
. . . . . 3'0 . . . . . ~ . . . . . 9'0 . . . . . 120 . . . . . 150 . . . . . 180 . . . .
J F M A M J J
Days since January 1st
(a) and (b) sea surface temperatures measured daily at Granite Canyon.
and 13.0°C + 0.08 in 1992. In 1991, which was a "normal" year, daily mean SSTs at Granite Canyon was 11.7°C + 0.07, significantly lower than that of 1992 (t = 12.6, d.f. = 82, P ~< 0.001) (Fig. 5).
Wind
The mean alongshore component of the wind stress (dynes cm -2 + S.E.) measured at buoy 46042 over the first 6 months of 1984-1992 was 0.573 _ 0.02. The mean alongshore component of the wind stress (dynes cm -2 + S.E.) in the first 6 months of 1991, 0.416 _ 0.04, was significantly stronger (t = 2.47, d.f. = 121, P = 0.014) than that of 1992 (0.246 _ 0.04). Figure 6 illustrates the wind direction and stress during the first 180 days of 1991 and 1992. The major difference between the years is during the second half of February, where in 1991 generally north winds were blowing, while in 1992 the winds blew from the opposite direction. Reversals in wind direction are common during the winter along the California coast, and the reversals in wind direction during February 1992 are within the between-year variation in the winds (Hickey, 1979). Also, reversals in wind direction during the upwelling season were more frequent in 1992 than in 1991 (13 days in 1992 vs 4 days in 1991). Regardless, Fig. 6 indicates a similar wind pattern in both years, i.e.

810 Y. Shkedy et al.
(a)
Stress
Wind Direction and Stress (dynes/cm ~) at Buoy 46042
2-
0.
-2-
I 1991
J F M A M J J
Fig. 6.
(b) 2-
1-
Stress 0;
-2
. . . . . ~ . . . . . ~ . . . . . 9'0 . . . . . I~o . . . . . x~o . . . . . i~o . . . . J F M A M J J
Days since January 1st
(a) and (b) mean daily wind direction and stress on N O A A buoy 46042. Values calculated from four measurements taken at 6 h intervals.
reversals in wind direction were more frequent in the first 90 days of the both years, and during the upwelling season relatively steady alongshore winds were blowing. The alongshore winds are the moving force of the upwelling process, and as was ment ioned above, the surface currents during the upwelling season in both years were oriented to the south-southwest.
Correlation between the wind, SSTs, and the currents
The current vector components in 10 ° increments was correlated with SSTs and the alongshore component of the wind stress. Components of the current vector (from 140 to 290 ° in 1991 and f rom 130 to 280 ° in 1992) were significantly correlated with the alongshore component of the wind stress [Fig. 7(a)]. Lagged by 1 day, SSTs were significantly correlated with components of the current vector from 150 to 300 ° in 1991, but in 1992 SSTs were not correlated with components of the current vector [Fig. 7(b)].
D I S C U S S I O N
The statistical relation between changes in SST, wind stress, and surface currents measured by H F radar at Grani te Canyon, California, was studied. The results are used to test the hypothesis that in 1992 upwelling was superimposed on the El Nifio, and we also compare our results to studies on other El Nifio event, that of 1982-1983. Repor ts on wind

Detecting upwelling using HF-radar 811
(a)
0 . 0 -
0 . 7 ~
Co.elation 0.5~
0 . 3 ~
0 . 1 ~
Significant Correlations Between Current Component at Granite Canyon and the Along-Shore Component
of Wind Stress Vector at Buoy 46042
, , , . F . i • , . , , , , i • i
130 150 170 1 9 0 210 230 250 270 290
-0.9.
-0.7-
Correlation -o.s-
-0.3-
- 0 . 1 -
(b) Significant Correlations Between Current Component and SST at Granite Canyon (SST Lagged by I Day)
1991
Direction (Degrees)
Fig. 7. Significant correlations between the current vector component and (a) the alongshore component of wind stress and the (b) SSTs. The current vector was calculated at I(F increments.
direction during the 1982-1983 El Nifio event are contradicting. Miller et al. (1985) reported that there were upwelling-favorable winds on the Oregon coast during 1982- 1983. On the other hand, others (Huyer and Smith, 1985; Norton et al., 1985; Simpson, 1992) reported that Bakun upwelling indices calculated for the California and Oregon coasts during 1982-1983 indicate downwelling favorable conditions. Regardless, in both locations (California and Oregon) upwelling was in fact absent during the 1982-1983 El Nirio event (Simpson, 1984). During the upwelling season of 1991 and 1992 the winds were mostly northerly to northwesterly (upwelling-favorable), similar to the mean of 122 years for the month of July (Nelson, 1977).
The correlations among the tidally filtered currents, wind stress and SSTs during the first 180 days of 1991 were generally high. Hence, during 1991 changes in advection can be explained largely by changes in wind stress, and changes in SSTs can be explained largely by changes in advection. In the E1 Nifio event of 1992 the correlation between the tidally filtered currents and wind stress was similar to that of 1991, but in 1992 SSTs were not correlated with the currents. Hence changes in SSTs were not well explained by changes in advection for the El Nifio year. Data from two moorings at the mouth of Monterey Bay indicates that the thermocline during 1992 was depressed (F. Chavez, personal communi- cation). This observation is consistent with the hypothesis that during E1 Nifio upwelled water is pumped up to the surface from above a depressed thermocline. It is also possible that the lack of correlation between the currents and temperature is due to the occurrence

812 Y. Shkedy et al.
of poleward propagating coastal trapped waves that are common during El Nifios (Hurlbert et a l . , 1976; Chelton and Davis, 1982; Enfield and Allen, 1980). Either way, the results indicate that at Granite Canyon upwelling evidently continued during the 1992 E1 Nifio event, with relatively warm water being upwelled to the surface.
The main difference between 1991 and 1992 was in SSTs. High SSTs like those observed in 1992, are the most conspicuous indicator of an E1 Nifio event (Fiedler, 1984; Philander, 1990). The SSTs at Granite Canyon dropped about 2°C during April in both years from about 12°C in 1991 and from about 13°C in 1992 (Fig. 5). During July 1991 and August 1992 SSTs increased back to the pre-April level or higher. During the upwelling season, when the wind relaxed and the SSTs increased, SSTs did not increase to the pre- or post- upwelling season levels. Thus, though changes in SSTs were coupled to changes in the wind stress, there is a clear seasonal pattern in SSTs that cannot be explained only by daily changes in the wind regime.
B i o l o g i c a l i m p l i c a t i o n
E1 Nifio is a devastating event for many marine and terrestrial ecosystems (Canby, 1984; Cane et a l . , 1986; Philander, 1990). The input of nutrients to surface water by coastal upwelling ceases during E1 Nifio events. The results of this study are consistent with the hypothesis that the reason for the low nutrient concentration in the 1992 El Nifio event (F. Chavez, personal communication) is that upwelled water is pumped to the surface from above the thermocline, where the water is relatively poor in nutrients.
El Nifio has other effects on the biological system besides causing a low nutrient supply. Roughgarden et al. (1991) suggested that pelagic larvae of coastal benthic organisms are carried offshore by upwelling-generated advection in central California. According to this hypothesis, the larvae recruit to the adult populations when the wind relaxes and the larvae are carried back onshore. If the E1 Nifio did not affect the advective aspect of the upwelling process during the 1992 event, recruitment to the intertidal community in 1992 should be similar to the average recruitment. Analysis of barnacle larvae recruitment to the intertidal zone in central California during 1992 suggests that indeed the recruitment was similar to that of 1989 and 1990, or even lower (Table 1). On the other hand, recruitment of
Table 1. Recruitment o f barnacles (S.E.) to the rocky intertidal zone during E1 Niho and non-El Nifzo years. Data for 1982-1985 gives recruitment to a site at Hopkins Marine Station on Monterey Bay in central California (Roughgarden et al., 1988). Data for 1989, 1990 (Miller, 1992) and 1992 gives recruitment to a site at Asilomar,
on the southern mouth o f Monterey Bay and at Granite Canyon
Barnacle recruitment Site Year El Nifio ( r e c r u i t s c m - 2 week -1)
Monterey 1982 no 1.1 (0.1) 1983 yes 3.7 (0.3) 1984 no 1.4 (0.1) 1985 no 0.05 (0.01)
Asilomar 1989 no 0.06 (0.02) 1990 no 0.47 (0.23) 1992 yes 0.19 (0.04)

Detecting upwelling using HF-radar 813
barnacle larvae to the intertidal zone during the 1982-1983 E1 Nifio event was much higher than normal (Table 1) (Roughgarden et al., 1988). Thus, biological data as well as physical data (Fiedler, 1984; Simpson, 1984, 1992) support the hypothesis that the 1982-1983 El Nifio event was a time of relatively weak upwelling along the California coast, whereas upwelling did continue during the 1992 El Nifio event along the central California coast, although only warm nutrient-poor water was upwelled.
Acknowledgements--We thank F. Chavez for supplying unpublished data on the depth of the thermocline and nutrient concentration during 1992, L. Rosenfeld for contributing the low pass filter, K. Miller for recruitment data, S. Alexander, B. Grantham, E. Bjorkstedt and two anonymous reviewers for valuable comments on the earlier draft of this paper, Granite Canyon Marine Laboratory staff for technical help at the field, and for supplying sea surface temperature data, and NOAA for supplying wind data. Support from the Biospherics (now Ocean Biogeochemistry) Program of NASA (grant NAGW-2159) to J. Roughgarden is gratefully acknowl- edged.
REFERENCES
Bakun A. (1975) Daily and weekly upwelling indices, west coast of North America, 1967-73. NOAA technical report, NMFS SSRF 693,114 pp.
Barber R. T. and R. L. Smith (1981) Coastal upwelling ecosystems. In: Analysis of marine ecosystems, A. R. Longhurst, editor, Academic Press, London, pp. 31-68.
Barrick D. E., M. W. Evans and B. L. Weber (1977) Ocean surface currents mapped by radar. Science, 198,138- 198.
Beardsley R. C., R. Limeburner and L. K. Rosenfeld (1985) Introduction to the CODE-2 moored array and large-scale data report. In: CODE-2: moored array and large-scale data report, CODE Technical Report No. 38, WHOI Technical Report 85-35, Woods Hole Oceanographic Institution, Woods Hole, MA, pp. 1- 36.
Breaker L. C. and C. N. K. Mooers (1986) Oceanic variability off the Central California Coast. Progress in Oceanography, 17, 61-135.
Canby T. Y. (1984) E1 Nifio ill wind. National Geographic, 165, 144-183. Cane M. A., S. E. Zebiak and S. C. Dolan (1986) Experimental forecast of El Nifio. Nature, 321,827~832. Chelton D. B. and R. E. Davis (1982) Monthly sea level variability along the west coast of North America.
Journal of Physical Oceanography, 12,757-784. Enfield D. B. (1981) E1 Nifio: Pacific eastern boundary response to interannual forcing. In: Resource
management and environmental uncertainty: lessons from coastal upwelling fisheries , M. H. Glantz and J. D. Thompson, editors, John Wiley, New York, pp. 213-254.
Enfield D. B. (1989) E1 Nifio, past and present. Review of Geophysics, 27,159-187. Enfield D. B. and J. S. Allen (1980) On the structure and dynamics of monthly mean sea level anomalies along
the Pacific coast of North America. Journal of Physical Oceanography, 10, 557-588. Fernandez D. M. (1992) High frequency radar measurements of coastal ocean surface currents. IEEE Oceanic
Engineering Society Newsletter. Fiedler P. C. (1984) Satellite observations of the 1982-1983 El Nifio along the U.S. Pacific coast. Science, 224,
1251-1254. Hickey B. M. (1979) The California current system--hypotheses and facts. Progress in Oceanography, 8, 191-
279. Hurlbert H. J., J. Kindle and J. J. O'Brien (1976) A numerical simulation of the onset of El Nifio. Journal of
Physical Oceanography, 6, 621-631. Huyer A. and R. L. Smith (1985) The signature of El Nifio off Oregon, 1982-1983. Journal of Geophysical
Research, 90, 7133-7142. Huyer A., R. L. Smith and T. Paluszkiewiez (1987) Coastal upwelling off Peru during normal and El Nifio times,
1981-1984. Journal of Geophysical Research, 92, 14,279-14,307. Large W. G. and S. Pond (1981) Open ocean momentum flux measurements in moderate to strong winds.
Journal of Physical Oceanography, 11,324-336. McGowan J. A. (1986) The California El Nifio, 1983. Oceanus, 27, 48-71.

814 Y. Shkedy et al.
Miller C. B., H. P. Brodeur and W. G. Pearcy (1985) Response of zooplankton and ichthyoplankton off Oregon to the El Nifio event of 1983. In: El N#io north : El Niho effects in the Eastern Subarctic Pacific Ocean, W. S. Wooster and D. L. Fluharty, editors, University of Washington, Seattle, pp. 185-187.
Miller K. M. (1992) The biology of barnacles. Doctoral Thesis, Stanford University. Nelson C. S. (1977) Wind stress and wind stress curl over the California current. NOAA technical report NMFS
SSRF-714, U.S. Department of Commerce, 89 pp. Norton J., D. McLain, R. Brainard and D. Husby (1985) The 1982-1983 El Nifio off Baja and Alta California and
its ocean climatic context. In: El Nitio north: El Nilio effects in the Eastern Subarctic Pacific Ocean, W. S. Wooster and D. L. Fluharty, editors, University of Washington, Seattle, pp. 44-72.
Philander S. G. (1990) El Nitio, La-Niha, and the Southern Oscillation, Academic Press, San Diego, 293 pp. Prandle D. and J. Matthews (1990) The dynamics of nearshore surface and horizontal density gradients.
Continental Shelf Research, 10, 665-681. Roughgarden J., S. Gaines and H. Possingham (1988) Recruitment dynamics in complex life cycles. Science, 241,
1460--1466. Roughgarden J., J. T. Pennington, D. Stoner, S. Alexander and K. Miller (1991) Collisions of upwelling fronts
with the intertidal zone: The cause of recruitment pulses in barnacle populations in central California. Acta Oecologica, 12, 35-51.
Sherman E. D. R. (1986) A review of methods of remote sensing of sea-surface conditions by HF-radar and design considerations for narrow-beam systems. IEEE Journal of Oceanic Engineering, OE-II, 150.
Simpson J. J. (1984) E1 Nifio induced onshore transport in the California current during 1982-1983. Geophysical Research Letters, 11,233-236.
Simpson J. J. (1992) Response of the southern California current system to the mid-latitude north Pacific coastal warming event of 1982-1983 and 1940-1941. Fisheries Oceanography, 1, 57-79.
Sutcliff W. H. Jr, R. H. Loucks and K. F. Drinkwater (1976) Coastal circulation and physical oceanography of the Scotian Shelf and the Gulf of Maine. Journal of the Fisheries Research Board of Canada, 33, 98--115.
Teague C. (1986) Multifrequency HF radar observations of currents and current shears. IEEE Journal of Oceanic Engineering, OE-I 1,258-269.
Wyrtki K. (1975) El Nifit>---the dynamic response of the equatorial Pacific ocean at atmospheric forcing. Journal of Physical Oceanography, 5,572-584.