Design problems are not of a kind: differences in the effectiveness of visual stimuli in design...
292
Visual and Spatial Reasoning in Design III
-
Upload
independent -
Category
Documents
-
view
0 -
download
0
Transcript of Design problems are not of a kind: differences in the effectiveness of visual stimuli in design...

Visual and Spatial Reasoning in Design III


Visual and Spatial Reasoning in Design III
Preprints of the 3rd International Conference on Visual and
Spatial Reasoning in Design Massachusetts Institute of Technology, Cambridge, USA
22-23 July 2004
edited by John S Gero
Barbara Tversky Terry Knight

3rd International Conference on Visual and Spatial Reasoning in Design Massachusetts Institute of Technology, Cambridge, USA 22-23 July 2004 ISBN 1 86487 132 6 2004 PUBLISHED BY Key Centre of Design Computing and Cognition University of Sydney NSW 2006 Australia Email: [email protected] INTERNATIONAL REVIEW COMMITTEE Uday Athavankar, Indian Institute of Technology, India B Chandrasekaran, Ohio State University, USA Nigel Cross, Open University, UK Randy Davis, Massachusetts Institute of Technology, USA Chris Earl, Open University, UK Christian Freksa, Hamburg University, Germany Merideth Gattis, University of Sheffield, UK John Gero, University of Sydney, Australia Gabi Goldschmidt, Technion University of Technology, Israel Ewa Grabska, Jagiellonian University, Poland Mark Gross, University of Washington, USA Leo Joskowicz, Hebrew University of Jerusalem, Israel Julie Jupp, University of Sydney, Australia Terry Knight, Massachusetts Institute of Technology, USA Hari Narayanan, Auburn University, USA Rivka Oxman, Technion Israel Institute of Technology, Israel Stephen Scrivener, Coventry University, UK Tim Smithers, Universidad de Navarra and CEIT, Spain George Stiny, Massachusetts Institute of Technology, USA Masaki Suwa, Chukyo University, Japan Barbara Tversky, Stanford University, USA
TABLE OF CONTENTS
Preface vii
SESSION ONE 1 Engineering design in a different way: A cognitive perspective on the contact & channel model approach Alber Albars, Manfred Ohmer and Claudia Eckert
3
Conceptual design from Geons – An interactive evolution approach Amitabha Mukerjee and Hemant Muley
23
Heuristic methods and hierarchical graph grammars in design Grazyna Slusarczyk
45
SESSION TWO 67 Sketches for and from collaboration Julie Heiser, Barbara Tversky and Mia Silverman
69
Sketching across design domains Claudia Eckert, Alan Blackwell, Mark Stacey and Chris Earl
79
SESSION THREE 103 Critiquing freehand sketching: A computational tool for design evaluation Yeonjoo Oh, Ellen Do and Mark Gross
105
Analysis of a blindfolded architect’s design session Zafer Bilda and John S Gero
121
SESSION FOUR 137 Qualitative representation and reasoning in design: A hierarchy of shape and spatial languages Julie Jupp and John S Gero
139
Developing an ontology of spatial relations Jane Brennan, Eric A Martin and Mihye Kim
163
Spatial motifs in design Janice Glasgow, Susan Epstein, Nathalie Meurice, Andy Becue and Daniel Vercauteren
183
SESSION FIVE 197 Design problems are not of a kind: Differences in the effectiveness of visual stimuli in design problem solving Gabriela Goldschmidt and Maria Smolkov
199
Cognitive analyses and creative operations Mine Ozkar
219
SESSION SIX 231 Visual analogy: Viewing retrieval and mapping as constraint satisfaction problems Patrick Yaner and Ashok Goel
233
Aspectualize and conquer in architectural design Sven Bertel, Christian Freska and Geroge Vrachliotis
255
CONTACT AUTHORS EMAIL ADDRESSES 281 AUTHOR INDEX 283
PREFACE
Design is for the creation of artifacts that exist in space and that serve human ends. Artifacts are tied at one end to appearance and at the other end to function or purpose. Forms that give no clues to expected behaviour or service and functions that cannot be readily inferred by users confuse and frustrate. Visuospatial reasoning joins form to function by creating objects that have parts and configurations linked to goals and organizations of goals. Easier said than done. Volumes have been written groaning at poor design, more than matched by the unpublished groans. Design entails the interaction of minds and artifacts. There are the representations in the mind and the mental manipulations on them. There is the artifact to be designed and the artifacts used to design it. There are the interfaces, the communicative links among representations in the mind and representations in the world. Facilitating good design depends on understanding all of these representations, manipulations, links. The breadth and diversity of the contributions here reflect the breadth and diversity of visuospatial reasoning. What is the nature of visuospatial mental representations? How do they come to be? What skills and talents are needed to arrange and rearrange them? How can those skills be taught? How are design ideas expressed, in words, in models, in gesture? How do the expression and the interaction with external representations affect the internal representations? How do minds link form and function? How does design relate to other varieties of visuospatial reasoning? How domain specific is reasoning about design? How can the domain of design ideas be characterized? This volume presents the proceedings of the Third International Conference on Visual and Spatial Reasoning in Design (VR04). They address these questions and more spanning disciplines and spanning the globe. They maintain a dialog begun at MIT in 2001 and continued at Bellagio in 2003, forming a community from minds trained differently. The papers were selected from a large number of submissions by the International Review Committee, listed on previous page. The Committee members span disciplines and they span the globe. Each paper was reviewed by at least three referees. The support of the Key Centre of Design Computing and Cognition of the University of Sydney and the MIT School of Architecture and Planning in organizing this conference is gratefully acknowledged. Lai Chui Looi and Julie Jupp worked hard to unify the multifarious interpretations of what were thought to be clear formatting instructions to produce a coherent volume.
John Gero, Barbara Tversky and Terry Knight Sydney, Stanford, and MIT
June 2004


SESSION 1
Engineering design in a different way: A cognitive perspective on the contact & channel modelapproach
Alber Albars, Manfred Ohmer and Claudia Eckert
Conceptual design from Geons – An interactive evolution approach Amitabha Mukerjee and Hemant Muley
Heuristic methods and hierarchical graph grammars in design
Grazyna Slusarczyk


JS Gero, B Tversky and T Knight (eds), Visual and Spatial Reasoning in Design III, 2004 Key Centre of Design Computing and Cognition, University of Sydney, pp 3-21
ENGINEERING DESIGN IN A DIFFERENT WAY: COGNITIVE PERSPECTIVE ON THE CONTACT & CHANNEL MODEL APPROACH
A New Approach for the Engineering Thinking Process
ALBERT ALBERS, MANFRED OHMER University of Karlsruhe, Germany
and
CLAUDIA ECKERT University of Cambridge, UK
Abstract. Engineering design often involves the integration of new design ideas into existing products, requiring designers to think simultaneously about abstract properties and functions as well as concrete solution constraints. Often designers struggle to reason with functional descriptions, while not fixating on existing solutions. This paper introduces the Contact & Channel Model (C&CM) approach, which combines abstract functional models of technical systems with the concrete geometric descriptions that many designers are familiar with. By locating functions at working surface pairs, they receive a concrete location in mental models. The C&CM approach can be applied to analyze existing product descriptions and synthesize creative new solutions for parts of the system or for entire new systems. At the moment the approach is being developed into an complete modeling and problem solving approach. C&CM has been used for several years in undergraduate engineering teaching at the University of Karlsruhe (TH) and is increasingly being introduced into industry by its use in research and development projects, by its students and its alumni.
1. Introduction
Engineering design deals with the eternal tension between keeping well working solutions and coming up with new ideas. The majority of engineering designs are modifications from existing solutions. This modification process can be very creative and involve the unexpected generation of novel ideas, for example when trying to contain change within
4 A ALBERS, M OHMER AND C ECKERT
one system. However, it can also be a very tedious series of well-understood steps. Designers often struggle between these two ways of working. How can they make themselves come up with new ideas when they have to, but also do routine tasks efficiently? The standard answer of engineering design research is to come up with focused methods for particular aspects of problem solving: methods for idea generation, such as TRIZ or brainstorming, methods for solution evaluation, such as FMEA, methods for planning processes, methods for selecting resources, etc… (see Ehrlenspiel 2003 and Pahl and Beitz 1995 for numerous examples). Some of these methods are step-by-step guides on how to carry out particular tasks, others such as DSM (see Browning 2002 for a review), provide both a tool kit and a method of visualizing design information. For example, a DSM is a matrix notation of the linkage between different components or different process steps, which can be reordered to find the best order to carry out and to define interfaces between components.
What many designers need is a way to think about the problem that they have in hand, which is congenial enough, that they learn it easily, like DSM, but that gives them new insights into their problem. When designers need to come up with new ideas, they can get fixated on existing ideas and find it difficult to think about the problem in new ways or to go back to basic principles in order to solve it. However, when they are required to solve standard problems, they don’t want to have to do something different to what has worked successfully for them in the past. Designers need to be able to use their strengths while overcoming their weakness. While it is very difficult to change the fundamental ways in which people think, it is possible to teach them compensation strategies for some of the weaknesses of their thinking process. Unless it is possible to obtain massive corporate buy-in, a new way of designing will only be taken up if it is intuitive and congenial for practicing designers as well as easy to teach to students. Additionally, it must also fit into the current working methods of organizations and individuals, because thinking needs to evolve rather then being forced to change radically.
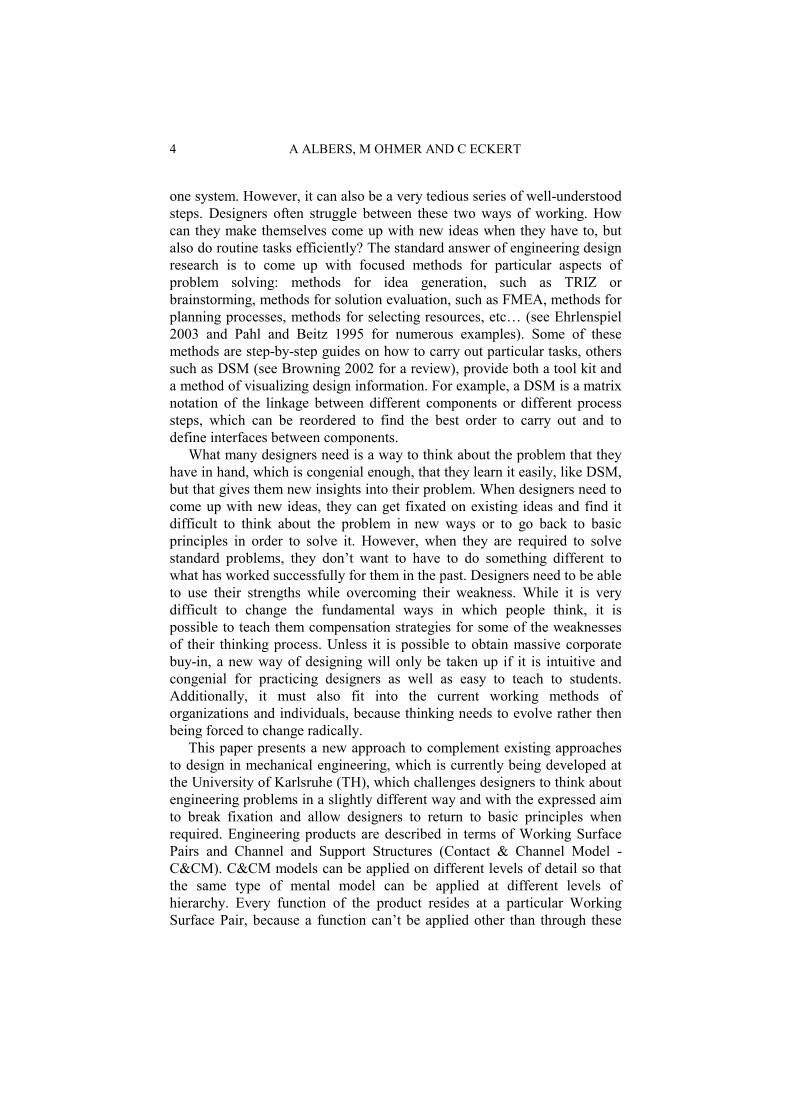
This paper presents a new approach to complement existing approaches to design in mechanical engineering, which is currently being developed at the University of Karlsruhe (TH), which challenges designers to think about engineering problems in a slightly different way and with the expressed aim to break fixation and allow designers to return to basic principles when required. Engineering products are described in terms of Working Surface Pairs and Channel and Support Structures (Contact & Channel Model - C&CM). C&CM models can be applied on different levels of detail so that the same type of mental model can be applied at different levels of hierarchy. Every function of the product resides at a particular Working Surface Pair, because a function can’t be applied other than through these
COGNITIVE PERSPECTIVE ON CONTACT & CHANNEL MODEL 5
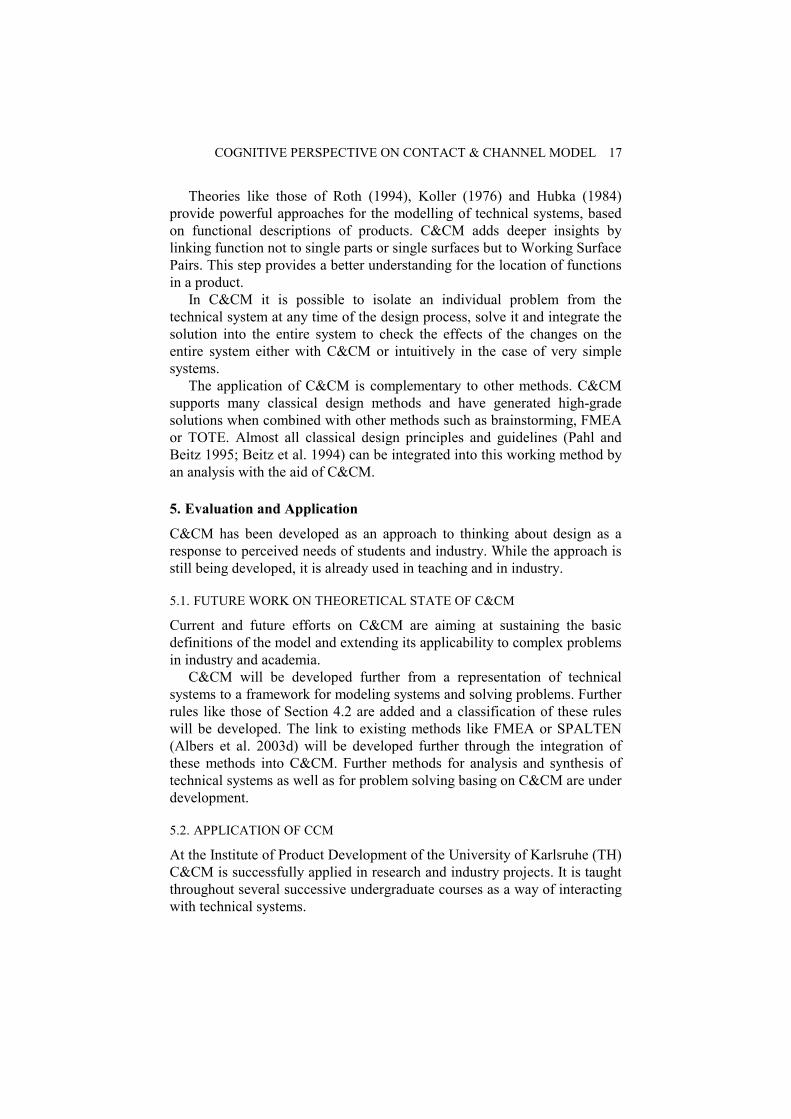
interfaces. This enables designers to think about abstract functions in a concrete way, because they can picture them at a working surface pair. Figure 1 shows a crane and its corresponding representation in C&CM with the abstraction to the basic elements “Working Surfaces (WS)”, “Working Surface Pairs” (WSP), “Limiting Structures” (LS) and “Channel and Support Structures” (CSS). These elements will be described in detail below.
abstraction
WSWSP
WS
WSWSP
WS
CSS
CSS
LS
CSS
Figure 1. A Crane abstracted to its Working Surface Pairs and Channel and Support Structures
This method has been developed over the last years motivated by the difficulties students and engineers have with analyzing a concrete product in abstract terms and linking abstract concepts, such as a functional model, to a part of the system. The way of thinking of successful engineers was observed over years of industrial practice and in many university projects. These engineers seem to be able to generate specific ad hoc descriptions of part of the problem on the right level of detail to reason about a specific problem highly effectively, because they know the aspects of design that are relevant to the given problem. It was abstracted and formalized in C&CM, which generates descriptions for problems as and when required, by assigning a working surface pair to a function at the appropriate level of detail. For example, in order to assess wind resistance the entire surface of the crane is one working surface interacting with the working surface of the wind in the function wind resistance. The description can be discarded as soon as the problem is solved, i.e. when the wind resistance has been
6 A ALBERS, M OHMER AND C ECKERT
calculated. However, the same surfaces of the crane can form part of a different working surface pair. For example the lateral surfaces of the pillars could form a Working Surface pair with another object in case of an accident or parts of the surface could form a Working Surface Pair with rain and corrosion.
As the method is developed and applied to problems of higher complexity, it is becoming increasingly evident that it is also possible to describe entire systems in a C&CM way. A C&CM description then comprises a model of the product on different levels of detail, its use and its interaction with other objects or the environment. C&CM is currently in the transition from an informal approach of designing, that is intuitively correct and practically successful, to a complete theory of technical systems with axioms, operators and rules. In the time honored German teaching tradition of Humboldt, new research developments are instantly incorporated into undergraduate teaching. This allows theoretical developments to be tested for their intuitiveness and utility. As engineers the developers of C&CM are fundamentally more interested in the quality of the solutions that are generated using C&CM and the endorsement it is receiving in industry rather then the theoretical soundness of the theory itself.
In this paper we argue, how this intuitive understanding of engineering thinking is supported by the literature on design cognition (section 2) and how the power of this approach comes from its ability to make engineers think about their problems in a slightly different way without alienating them. The basic elements of C&CM will be explained in section 3 and the operations that can be performed with them in section 4. Section 5 discusses the application of C&CM in teaching and industry. In the conclusions the effect of C&CM is reviewed and conclusions of its effect on human cognition are drawn.
2. Design Cognition
It is not surprising that designers struggle to innovate. In this section we will argue that way designers typically think and the experiences that they have made, biases them towards thinking along the line of existing solutions. Innovation is embedded in existing products and production methods with multiple constraints; with a complex product there is a great deal to remember. Designers typically either work on specific components or they carry out a certain function. For example in helicopter design a specialist team works on the undercarriage and that is all they concentrate on whilst dedicated people work on stress analysis and load calculations. These different specialists work in what Bucciarelli (1994) terms different object worlds. Each group has its own way of looking at design problems: shared background knowledge, concepts and terminology, problem solving

COGNITIVE PERSPECTIVE ON CONTACT & CHANNEL MODEL 7
procedures, and skills for creating and making sense of visual representations of various kinds of design information. However there are general mental processes, which are shared by designers regardless of their object world.
2.1. DESIGN COGNITION
Designers interpret visual and verbal information using the concepts comprising their object world to develop mental representations of design ideas. They may have multiple representations of the same design. Some of designers’ mental representations are mental models that they can use to envision how the artefact will behave (Johnson-Laird 1983). While some mental models are models of how thing works, others map inputs to external behaviour – a user’s-eye view. Designers with similar expertise will have very similar mental models, but it is easy for both designers themselves and outsiders to overestimate the similarity of their thinking. For instance we have met diesel engine designers with superficially similar backgrounds who employ radically different mental representations.
Many designers think visually and have very vivid mental imagery. Anecdotal evidence indicates that mechanical engineers are usually extremely visual and think about problems by mentally manipulating the geometry in their heads. Several mechanical engineers we have interviewed describe this as akin to a “CATIA system in their head”. More analytical engineers such as stress engineers often think in terms of the correlation of parameters required to achieve a target performance. Some of them have commented to us that while they can construct mental imagery at a push, they do not naturally think in images.
Designers’ mental representations of designs are limited: they may only include part of the design, and there is no guarantee that these are consistent or even coherent; people may only recognise the limitations of their mental representations when encounter questions they cannot answer. Research on mental imagery (Kosslyn 1980; 1994; Logie 1995) shows that people can have a subjective sense that their mental representations are more complete and detailed than they actually are, and that details are only filled in when people focus on parts of their mental images. This is partly because the capacity of working memory is limited; Miller (1956) famously assessed its capacity as seven plus or minus two chunks. The richness of mental representations depends on the complexity of the chunks. The reliability of memory recall depends largely on the richness of the relationships between the elements to be remembered; this is increased by creating mental images of to-be-remembered information. Chunk size has been found to influence the accuracy of memory recall of, for instance, electronic circuits (Egan and Schwartz 1979) and architectural drawings (Akin 1978).
8 A ALBERS, M OHMER AND C ECKERT
Many designers however think about new designs with reference to existing designs, using mental representations including physical embodiments as well as functions and performance factors (Schön 1988; Oxman 1990; Eckert and Stacey 2001, for discussions of the roles of types of design elements and individual examples in design thinking). This provides them with very large chunks and enables them to handle large and complex information, because details can be constructed from the reference point as the focus of attention moves to them.
However, this locks them into tacit assumptions about the structure of the new design that are very difficult to escape – a phenomenon known as fixation (see in the psychology of problem solving: people copy recently-encountered previous examples even when they are clearly inappropriate). For instance, one out of several studies on fixation in design (Purcell and Gero 1996; Jansson and Smith 1991) showed design students a mug with a mouthpiece and told them to create a non-spill mug without a mouthpiece: despite this instruction, the majority of designs incorporated a mouthpiece. In many fields, experts will possess memories of a greater stock of relevant designs and will be better able to find an appropriate model, but will find it harder to escape closer matches to the present situation and stronger situation-action associations. Thinking is channelled both by conscious awareness of situations and goals, and by associations in memory: what the psychologists call mental set. People with expert knowledge have both richer and stronger associations between elements of their factual knowledge, and more specialised mental procedures. Thus, they can focus recall from memory and mental actions more narrowly. This can be an advantage, but mental actions can embody tacit constraints inherited from previous similar problem situations that are no longer relevant, leading to incorrect or unsuccessful problem solving (Whiley 1998). It can lead designers to produce excessively conservative designs.
Breaking fixation requires developing mental representations of what the design should do that abstract away from physical embodiments. Getting designers to do this is a major purpose of many prescriptive design methods. Axiomatic design (Suh 1990) instructs engineering designers to begin with a functional breakdown and develop the concepts on a high level of abstraction, then break the function down further and then develop the form from it until the design is fully defined. Many engineers find abstract functional thinking very difficult; students who have learnt the axiomatic design method vary enormously in how easy they find it to use. One reason why thinking in terms of abstract functional relationships is difficult is because functional properties are associated in memory with physical embodiments, which are hard to consciously ignore, and because the relationships between the components of functionally-imagined systems are sparse and more-or-less arbitrary, so they do not serve as effective cues for
COGNITIVE PERSPECTIVE ON CONTACT & CHANNEL MODEL 9
remembering each other. By contrast, actual machines and descriptions of physical structure have rich, non-arbitrary, mutually reinforcing spatial relationships that are relatively easy to visualise and remember, and that are effective retrieval cues for spatial information in memory. Causal relationships such as noise transmission are not salient parts of primarily geometric representations.
How designers formulate their problems profoundly influences how and what they design (Glock 2003; Valkenburg 2000). The aspects of design problems that designers actively consider when they make major preliminary decisions and invent core ideas exert a powerful influence on the design, notably the characteristics of the site in architecture (Darke 1979). Research on designer behaviour in a variety of industries has found that expert designers put a lot of effort, typically more than novices, into elaborating their understanding of the problems they are trying to solve – the requirements and constraints the design should meet. Of course, problem formulations are not static; they evolve as designers reflect about their designing activities (Schön 1983; Glock 2003) and discuss them with others (Valkenburg 2000; Stumpf and McDonnell 2002). Problem framing is a skill that is developed with practice, but sometimes reframing the problem to see the design challenge differently is the key to success.
3. Describing a Product in the Contact & Channel Model
The Contact & Channel Model (C&CM) is a way of thinking about engineering products and well as a model of products. It has been developed to address some of the challenged in engineering thinking outlined above: • Facilitating the thinking process of successful engineers in a theoretical
model to support other designers; • Breaking fixation; • Thinking on different levels of abstraction; • Integrating functional thinking and visual thinking in concrete solutions. C&CM is intended to be used in two ways. One way is analyze and enhance an existing system, for example to develop a new transmission system for a car. In this case most of the elements are known and the starting point is given in an existing description, for example a bill of materials or a CAD model. C&CM then picks and groups elements of the existing description in a new way, exploring in the inherent ambiguity of how elements of a description are grouped (Stiny 2000). These C&CM descriptions are generated for specific purposes and are personal and fleeting. Therefore the coherence between different C&CM description is not an issue. C&CM is used as a way to generate new ideas, by enabling designers to reduce problems to basic principles and think about them in an abstract form that is
10 A ALBERS, M OHMER AND C ECKERT
well anchored in other representations without losing reference to the geometrical representation of the system. Analyzing an existing system in C&CM terms can draw designers’ attention to functions and their realisation, which is difficult to see in other models, that don’t combine functional and geometric descriptions.
The second way - currently under development – is C&CM as a complete modeling approach, which enables designer to describe the functionality and the geometry of the system in C&CM concepts and provides them with a set of methods, tools and techniques to developed new designs effectively and efficiently.
This section provides a very brief overview of the general approach, but excludes rules to handle special cases. For example an extension to the approach to model the interaction of a product with fields such as magnetic fields or gravity has been development, but will be excluded from this paper.
3.1. THE BASIC ELEMENTS
Conventionally engineering products are modeled by components with defined geometry, which are grouped into sub-system and systems (see Figure 2 on the left). C&CM takes a different cut on the geometry, by using working surface pairs, which carry out functions and channel and support structures that sit between the working surface pairs and link them. This idea was originally purposed by (Albers and Matthiesen 2002). With the following definitions any technical system undertaking any function can be described: Working Surface Pairs are all pair-wise interfaces between a component and its environment. This can be solid surfaces of bodies or boundaries with surfaces of liquids, gases or fields which are in permanent or occasional contact with the Working Surface. They take part in the exchange of energy, material and information within the technical system. Channel and Support Structures are physical components or volumes of liquids, gases or spaces containing fields, which connect only two Working Surface Pairs. Limiting Surfaces are surfaces that are not involved in fulfilling the regarded function of a system. But they are potential working surfaces. E.g. the side of the crane pillar in Figure 2 only needs to be regarded as a working surface, when wind is considered or when it fulfils any other function that the designer has to think about.

COGNITIVE PERSPECTIVE ON CONTACT & CHANNEL MODEL 11
3.2. DESCRIBING A PRODUCT IN C&CM: A SIMPLE EXAMPLE
WSWSP
WS
WSWSP
WS
CSS
CSS
LS
CSS
Beam
Pillar1
Pillar2
translation
Figure 2. Translation from a component representation to a C&CM approach
Figure 2 shows the Working Surface Pairs (WSP) and Channel and Support Structures (CSS) of the abstracted crane (see Figure 1), when it only has to carry its own weight. For example, the left pillar 1 has two WSP with its environment: At the top WSP, the weight force of the beam is transmitted into the pillar. At the lower WSP, this force is transmitted into the foundation. The CSS between these WSPs transmits this force from the upper WSP to the lower one and does not store it. This pillar is a minimal technical subsystem as it has the minimal number of WSPs and CSSs that is required to fulfil a technical function. This function can be described as “Define the distance between the cross beam and the foundation and transmit appearing forces”. Removing one of the both WSP or the CSS the pillar could not fulfil this function any more.
Regarding the cross beam in Figure 2 there are the Working Surface Pairs where the forces are transmitted into the pillars but there are no Working Surface Pairs where these forces are transmitted into the beam itself. As long as there is no Working Surface Pair where any forces are transmitted into the beam it will not fulfil any technical function. (There is a WSP between the field of gravity and the cross beam that induces a large amount of force into the beam. But carrying its own weight is not the main function of a crane so this is not shown in Figure 2).
Giving the crane a function means using an additional WSP at the hook of the crane where a force can be transmitted into the subsystem “beam with hook” and from there over the CSS of the beam into the WSPs that infaces with the pillars. If needed, the beam can be divided into further WSPs and
12 A ALBERS, M OHMER AND C ECKERT
CSSs e.g. those WSPs where the hook is linked with the rope, where the rope is connected with a barrel and so on. But if these details are not of interest for the moment they can be regarded as a black box with each a WSP at the interface to the neighbour-subsystems.
The lateral surfaces of the pillars do not fulfill a technical function. They do only limit the CSS of the pillar so they are regarded as “limiting surfaces” (LS) for the present case. But if the designer regards the same system from another perspective, the same surface of the pillar can also be a Working Surface. For example, if the crane is used outside, the designer will have to calculate the wind load for the crane. In this case the lateral surfaces of the crane will fulfill a harmful additional function “transmit the wind load into the pillar” so it is a Working Surface that generates a WSP with the Working Surface of the wind. An additional CSS will occur in the pillar that links the WSP “wind – pillar” with the WSP “pillar – foundation”. It is important to keep in mind that the original CSS that connects the WSPs “beam-pillar” with the WSP “pillar – foundation” still exists in this case. Both CSS share the same material (and both put load on it!).
For further functions such as corrosion or optical design more and more WSPs will be discovered. Every WSP will be linked with another WSP by a CSS, otherwise it could not fulfill its function.
3.3. THE THEORICAL GROUNDING OF C&CM
In mechanical engineering all psychical systems have to follow Newton’s third axiom: “action = reaction”. If the system boundary is sufficiently extended during the analysis of a technical system a feedback loop of interactions or “causes and effects“ will develop. A simple example is the analysis of power transmission in technical parts. In the case of stationary systems this loop is generally closed, in dynamic systems of power transmission the loop can be also closed very easily with through energy storage, although this might be delayed. The C&CM has three fundamental hypotheses about technical systems, which so far have not been falsified: 1. Non-Singularity of elements Every basic element of a technical system
fulfils its function by interacting with at least one further basic element. The actual function – and thus the desired effect – is only possible by the contact of one surface with another surface. In the example of the crane, this is reflected by the fact that the function "transmits force from the beam to the pillar” is only possible as both parts are permanently in contact.
2. Situatedness of function: Every function is exclusively determined by the properties and the interactions of the two Working Surface Pairs and one Channel and Support Structure connecting them, which can be
COGNITIVE PERSPECTIVE ON CONTACT & CHANNEL MODEL 13
treated as a black box, containing other working surface pairs and channel and support structures
3. Unlimited Model: Every system that fulfils functions contains of the basic elements Working Surface Pair and Channel and Support Structure, which can occur in any number, order and form.
3.4. C&CM DESCRIPTIONS AND NOTATION
C&CM allows modelling of both the component and the environment in the same way. So the parts of environment can be modelled as channel and support structures, which interact on one working surface, as illustrated in the example of wind resistance. If, within a technical part, neither energy, material nor information is conducted, a Channel and Support Structure does not exist. The Channel and Support Structure only occurs together with Working Surface Pairs.
This is not a unique description for each product, but depends on the purpose of the description. C&CM description takes a particular viewpoint on a product while excluding factors that are not of interest. This is a very rich description of a product that is generated to solve a particular problem that has been previously identified. Through the grouping and regrouping of elements into working surface pairs and Channel and Support Structures a focused description can be generated on different levels of hierarchy. As illustrated in the example of the crane, the entire surface of the crane is seen as one working surface as far as wind resistance is concerned, but broken down into more detail for other functions, such as carry load. As we will argue later, the description treats lower levels of hierarchies as “black boxes” that are subsumed in the higher level description.
C&CM is an approach to designing as well as a mind set for looking at design. To avoid restricting a designer’s individual way of thinking, it does not require a prescribed notation, but can be used in conjunction with other product notations. However, a set of verbal or visual annotations is under development (Albers et al. 2004) for recurring features of C&CM. This notation is based on graphic symbols defined in (DIN ISO 1101). This is an international industry standard for the entering of form and positional tolerances in technical drawings. Symbols for Working Surface Pairs and Channel and Support Structures as well as common properties such as the transmission of the system quantities, material, energy and information and some more detailed properties such as the positive or frictional force transmission are being developed. These notations make it easier to express properties of sketches and drawings, which enables designers to create properties that could not previously be expressed visible and therefore perceivable. A C&CM will support designers to express functions on sketches and drawing through the symbols of their associated working

14 A ALBERS, M OHMER AND C ECKERT
surface pairs. A simple example for such symbols in an abstracted sketch of a link between a shaft and its guide is shown in Figure 3.
Figure 3. Example for the notation of WFP-descriptions in
sketches
3.5. HIERARCHICAL DESCRIPTION OF SYSTEMS - FRACTAL STRUCTURE
Herb Simon point out in Sciences of the Artificial (Simon 1969) that a complex engineering system is an almost decomposable system, which can be thought of as hierarchical, while never quite neatly decomposing broken down into sub-systems. Complex systems form lattice structures rather than trees, i.e. lower level sub-systems need to belong to more than one higher level system. Engineers reason effortlessly on many different level of hierarchy from minute details of components to sub-systems overarching the entire design, however it can be very difficult to describe a system coherently on the same level of detail across the entire system.
The C&CM approach works on all levels of detail applying the same basic modeling elements. In the example of the crane, the function of “ load of the pillar” can be described as a two WSP and one CSS, but it comprises the beam itself, the hook, the rope, the barrel, and all elements of its drive and fastening. If required this “black box” can be looked at in more detail. The definition of the WSP and CSS is tailored exactly the function it carries out, so that for this purpose the details of the sub-system comprised in it can be ignored.

COGNITIVE PERSPECTIVE ON CONTACT & CHANNEL MODEL 15
4. Designing a Product in the Contact & Channel Model
The pervious section introduced the basic concepts of C&CM, while this section introduces some the basic operations and gives a flavor how more specific rules can be support a designer. At the end the relationship to other design methods is discussed.
4.1. BASIC OPERTIONS IN C&CM
To support designers using C&CM, some rules and heuristics have been generated, which give heuristics on different levels about how to solve technical problems.
To generate new ideas rather, for four operations can be defined, which underlie more specific rules: 1. Add Working Surface Pairs and Channel and Support Structures together 2. Remove Working Surface Pairs and Channel and Support Structures
together 3. Change the properties of Working Surface Pairs 4. Change the properties of Channel and Support Structures For example if the crane is used outdoors the function avoid corrosion can be added to the system. There are several possibilities for fulfilling this function with different basic operations: • An additional Working Surface Pair and Channel and Support Structure
can be added in form of paint. The paint will form one Working Surface Pair with the pillars and the beam and another Working Surface Pair with the atmosphere. These newly created Working Surface Pairs both have the property not to react with each other in a chemical way so the corrosion can be avoided.
• Another possibility is to change the property of the Working Surface Pair “crane-atmosphere” itself so that there will be no corrosion, e.g. stainless steel could be used.
There are many more possibilities to avoid corrosion. They all fit into the four basic operators. To make it easier for the designer, these possibilities have to be structured and the way they are applied must be described. A first step is to formulate concrete rules that help the designer to solve special problems. The abstraction in terms of C&CM helps designers to avoid fixation, because it forces them to think through the problem in a logical way. In the example, the designers would have to ask themselves: how could I add a WSP and CCS (e.g. by adding paint) or how could I change the property of the WSS (e.g. stainless steal). This forces them to step away from what they know about crane (they are not make of stainless steal), yet they can think in

16 A ALBERS, M OHMER AND C ECKERT
concrete term. Maybe in the particular application stainless steal is the only answer.
4.2. SPECIFIC RULES
In each design situation many operations like design principles (Pahl and Beitz 1995) could be applied. However, a number of solution heuristics can be applied for classes of problems. Figure 4 shows an example rule, where two fundamentally different solutions are given together with some examples of how this could be carried out. Problem Create a Detachable Connection Solutions Frictional Working Surface
Pair is to be added to the technical system
"elasticity“ of a Channel and Support Structure must be increased so that that form closure within the technical system can be deleted
Example clamping or screwed connections
snap-on caps are a good example
Figure 4. Example of a rule
The concrete rules are provided on several levels ensuring the availability of approaches for solving completely new problems as well as offering concrete solutions for problems, which have occurred before and could be solved successfully. The next step will be to classify and structure the rules and develop an easy notation.
These rules are akin to patterns, a term that refers to an abstractly-formulated solution to a recurring problem, together with a description of the type of problem it fits and the consequences of using it. The idea was introduced into architecture by Christopher Alexander (Alexander et al. 1977) and widely adopted in software engineering (notably, Gamma et al. 1995). This notion has long been implicit in much engineering practice.
4.3. USING C&CM IN CONJUNCTION WITH OTHER METHODS
C&CM is a way of thinking that helps the designer to deal with the analysis and the synthesis of technical systems both in one single tool. Most existing methods and representations of technical systems are only applicable to either the analysis or the synthesis process. However, since designing requires continuous switching between synthesis and analysis of the design, a single representation is very helpful.
COGNITIVE PERSPECTIVE ON CONTACT & CHANNEL MODEL 17
Theories like those of Roth (1994), Koller (1976) and Hubka (1984) provide powerful approaches for the modelling of technical systems, based on functional descriptions of products. C&CM adds deeper insights by linking function not to single parts or single surfaces but to Working Surface Pairs. This step provides a better understanding for the location of functions in a product.
In C&CM it is possible to isolate an individual problem from the technical system at any time of the design process, solve it and integrate the solution into the entire system to check the effects of the changes on the entire system either with C&CM or intuitively in the case of very simple systems.
The application of C&CM is complementary to other methods. C&CM supports many classical design methods and have generated high-grade solutions when combined with other methods such as brainstorming, FMEA or TOTE. Almost all classical design principles and guidelines (Pahl and Beitz 1995; Beitz et al. 1994) can be integrated into this working method by an analysis with the aid of C&CM.
5. Evaluation and Application
C&CM has been developed as an approach to thinking about design as a response to perceived needs of students and industry. While the approach is still being developed, it is already used in teaching and in industry.
5.1. FUTURE WORK ON THEORETICAL STATE OF C&CM
Current and future efforts on C&CM are aiming at sustaining the basic definitions of the model and extending its applicability to complex problems in industry and academia.
C&CM will be developed further from a representation of technical systems to a framework for modeling systems and solving problems. Further rules like those of Section 4.2 are added and a classification of these rules will be developed. The link to existing methods like FMEA or SPALTEN (Albers et al. 2003d) will be developed further through the integration of these methods into C&CM. Further methods for analysis and synthesis of technical systems as well as for problem solving basing on C&CM are under development.
5.2. APPLICATION OF CCM
At the Institute of Product Development of the University of Karlsruhe (TH) C&CM is successfully applied in research and industry projects. It is taught throughout several successive undergraduate courses as a way of interacting with technical systems.
18 A ALBERS, M OHMER AND C ECKERT
As other German universities, the Institute of Product Development carries out many projects with industry. In these projects the elementary model C&CM has enabled researchers to find high-quality solutions in a very simple way. One example is a successful solution for the improvement of the friction contact between the pin and the disc of a CVT transmission in a current Center of excellence in research (Albers et al. 2003a). The approach has lead to several actual and pending patents.
The C&CM model has been applied in lectures in the last 5 years through the entire curriculum of the Karlsruhe Education Model for Industrial Product Development, which applies new findings from research immediately in teaching (Albers et al. 2000). As early as in the basic lectures “Mechanical Design I-III“ – a compulsory course for every student in their first and second year- C&CM is presented as a fundamental approach to designing. The very first lectures of Mechanical Design explain C&CM as a basic way of regarding every technical system. Similarities and differences between systems and machine parts are explained using C&CM. In the following lectures of the main diploma “Methods of Product Development“ and “Integrated Product Development“ all technical problems are approached by means of this elementary model.
Karlsruhe students put design into practice as they were taught by C&CM. The first students who have been taught C&CM have now finished their studies and take this new way of thinking into industry. Industry has given very positive feedback. As the students are in positions to hire graduates, they often look for others with C&CM skills, giving the approach a strong foothold in companies. Students working on projects or diploma theses or graduates they employed in their companies have all made only positive impressions.
6. Conclusion
C&CM is not only a method to solve specific problems; it is also a way to consider technical systems and to reason with functional descriptions.
With a small number of simple concepts, all aspects of complex products can be described. C&CM is based on a simple hypothesis. Any design can be represented as Working Surface Pairs and Channel and Support Structures. Modifications can be made through basic operations and a set of rules for specific recurring patterns. Within the same theoretical concepts, it also offers abstract as well as very detailed instructions which support the designers in solving problems they are not able to solve intuitively or for which they cannot find the obvious solution.
C&CM is a flexible, helpful instrument for the analysis as well as for the synthesis of technical systems, which supports the designer’s natural mental process and provides assistance in any step, if required. Many examples of

COGNITIVE PERSPECTIVE ON CONTACT & CHANNEL MODEL 19
successful product development and problem solving processes with students in projects with industry confirm the strong utility of C&CM.
6.1. INDICATION FROM STUDENT PERFORMANCE
An examination of changes in students’ thinking with and without the application of C&CM in course projects shows that C&CM helps them to understand technical systems better and to carry cognition forward from a known system to a unknown. Since 1999 an annual model test is carried out on students’ ability to analyse. This test has demonstrated that this ability has considerably increased the more C&CM has been used in teaching. Unlike those who had been taught with the “classical“ machine parts method, twice as many of the students who had encountered the elementary model C&CM as the basis of a mental process were able to analyse the function of an unfamiliar machine system with the aid of an engineering drawing. The number of students who were able to find the most functional relevant parts of the unknown system has increased even more during the years (Albers et al 2003c).
6.2. MEETING DESIGNERS’ COGNITIVE NEEDS
As C&CM enables designers to use the same concepts to express designs on different levels of details, it enables them to maintain an overview of a product. The chunk sizes are variable and can be represented visually, so that designers can keep context in mind, when they are switching to abstract analyses of problems. Abstract functions are linked to specific locations in products, which have visual representations, designers can think visually about them. It enables them to switch quickly between abstraction and embodiment. The problem solving rules challenge designers to think through any given problem in a very systematic way. This enables them to break out of fixation by forcing them to abstract from the concrete problem in hand to the solution principle.
C&CM enables and also forces designers to switch frequently between abstraction and detail and between function and form. This is not supported by other methods to the same extent. The close link of form and function makes systems are transparent and allows designers to get closer to the real problems of engineering, which lie in the relationships between parts of a complex system.
References
Albers, A, Burkardt, N, Matthiesen, S and Schweinberger, D.: 2000, The “Karlsruhe model” - a successful approach to an academic education in industrial product development, Proceedings of Engineering & Product Design Education Conference 2000, University of Sussex, Brighton (UK).

20 A ALBERS, M OHMER AND C ECKERT
Albers, A and Matthiesen, S: 2002, Konstruktionsmethodisches grundmodell zum zusammenhang von gestalt und funktion technischer systeme - das elementmodell "wirkflächenpaare & leitstützstrukturen" zur analyse und synthese technischer systeme, Konstruktion, Zeitschrift für Produktentwicklung, Springer-VDI-Verlag, Düsseldorf, 54: 55-60.
Albers, A, Matthiesen, S and Ohmer, M: 2003a, An innovative new basic model in design methodology for analysis and synthesis of technical systems, in A Folkeson, K Gralén, M Novell and U Sellgreen (eds), Research for Practice - International Conference on Engineering Design, Stockholm, pp. 147-148.
Albers, A; Marz, J; Burkardt, N: 2003b, Design methodology in micro technology, in A Folkeson, K Gralén, M Novell and U Sellgreen (eds), Research for Practice - International Conference on Engineering Design, Stockholm, pp. 25-26.
Albers, A, Matthiesen, S and Ohmer, M: 2003c, Evaluation of the element model, working surface pairs & channel and support structures, Proceedings of International CIRP Design Seminar 2003, Methods and Tools for Co-operative and Integrated Design, Laboratoire 3S, Grenoble, France.
Albers, A, Saak, M and Burkardt, N: 2003d, Methodology in problem solving processes, Proceedings of 14th international DAAAM Symposium Intelligent Manufacturing and Automation: Focus on Reconstruction and Development, Sarajevo, Bosnia and Herzegowina, pp 005-006.
Alexander, C, Ishikawa, S, Silverstein, M, Jacobson, M, Fiksdahl-King, I and Angel, S: 1977, A Pattern Language, Oxford University Press, New York.
Akin, Ö: 1978, How do architects design?, in J-C Latombe (ed), Artificial Intelligence and Pattern Recognition in Computer-Aided Design, North-Holland, pp. 65-104.
Beitz, W.and Küttner, K-H (eds), 1994, DUBBEL – Handbook of Mechanical Engineering, Springer-Verlag, Berlin, Heidelberg, New York.
Bucciarelli, LL: 1994, Designing Engineers, MIT Press, Cambridge MA. Browning, TR: 2001, Applying the design structure matrix to system decomposition and
integration problems: A review and new directions, IEEE Transactions on Engineering Management 48(3): 292-306.
Darke, J: 1979, The Primary Generator and the Design Process, Design Studies 1:36-44. DIN ISO 1101, 1983, Technical Drawings; Geometrical Tolerancing; Tolerancing of Form,
Orientation, Location and Run-Out; Generalities, Definitions, Symbols, Indications on Drawings, Beuth-Verlag, Berlin, Wien, Zürich.
Eckert, CM and Stacey, MK: 2001, Designing in the context of fashion designing the fashion context, in P Lloyd and HHCM Christiaans (eds), Designing in Context: Proceedings of the 5th Design Thinking Research Symposium, pp. 113-129
Egan, DE, and Schwartz, BJ: 1979, Chunking in recall of symbolic drawings, Memory and Cognition 7: 149-158.
Ehrlenspiel, K, Integrierte Produktentwicklung, Carl Hanser Verlag, München, Wien. Gamma, E, Helm, R Johnson, R and Vlissides, J: 1995, Design Patterns, Reading, MA, Addison-Wesley. Glock, F: 2003, Design Tools and Framing Practices, Computer Supported Cooperative
Work. Hubka, V: 1984, Theorie Technischer Systeme, Springer-Verlag, Berlin. Jansson, DG and Smith, SM: 1991, Design fixation, Design Studies 12: 3-11. Johnson-Laird, PN: 1983, Mental Models, Harvard University Press, Cambridge, MA. Koller, R: 1976, Konstruktionsmethode für den Maschinen-, Geräte- und Apparatebau,
Springer-Verlag, Berlin, Heldelberg, New York. Kosslyn, S: 1980, Image and Mind, Harvard University Press, Cambridge, MA.

COGNITIVE PERSPECTIVE ON CONTACT & CHANNEL MODEL 21
Kosslyn, S: 1994, Image and Brain, MIT Press, Cambridge, MA. Lindemann, U and Pulm, U: 2001, Enhanched systematics for functional product structuring,
Proceeding of ICED ‘01, Design Research – Theories, Methodologies, and Product Modelling (1), Glasgow, pp. 477-484.
Logie, RH: 1995, Visuo-Spatial Working Memory, Psychology Press, Hove. Matthiesen, S: 2002, Ein Beitrag zur Basisdefinition des Elementmodells ‚Wirkflächenpaare
und Leitstützstrukturen’ zum Zusammenhang von Funktion und Gestalt technischer Systeme, A. Albers (ed), Forschungsberichte mkl, Vol 6, Karlsruhe.
Miller GA: 1956, The magical number seven, plus or minus two: Some limits on our capacity for processing information, The Psychological Review 63: 81-97.
Oxman, R: 1990, Prior knowledge in design: A dynamic knowledge-based model of design and creativity, Design Studies 11: 17-28.
Pahl, G and Beitz, W: 1995, Engineering Design, Springer-Verlag, Berlin. Purcell, AT.and Gero, JS: 1996, Design and other types of fixation, Design Studies 17:
363-383. Roth, K: 1994, Konstruieren mit Konstruktionskatalogen, Springer-Verlag, Berlin. Schön, DA : 1983, The Reflective Practitioner, Basic Books, New York, NY. Schön, DA: 1988, Designing: Rules, types and worlds, Design Studies 9: 181-190. Simon H: 1969, Sciences of the Artificial, MIT Press, Cambridge, MA. Stiny, G: 2000, How to calculate with shapes, in E Antonsson and J Cagan (eds), Formal
Engineering Design Synthesis, Cambridge University Press, Cambridge, UK. Stumpf. SC and McDonnell, JT: 2002, Talking about team framing: using argumentation to
analyse and support experiential learning in early design episodes, Design Studies 23: 5-23.
Suh, NP: 1990, The Principles of Design, Oxford University Press, New York. Terninko, J, Zusaman, A and Zlotin, B: 1998, Step-.by-step TRIZ – Creating Innovative
Solution Concepts, CRC Press LCC, Boca Raton. Tollenaere, M, Belloy, P and Tichkiewitch S: 1995, A part description Model for the
preliminary design, in Advanced CAD/CAM Systems – State-of-the-art and Future Trends in Feature Technology, Chapman & Hall, London.
Valkenburg, RC: 2000, The Reflective Practice in Product Design Teams, PhD Thesis, Department of Industrial Design Engineering, Technical University of Delft.
Wiley, J: 1998, Expertise as mental set: The effects of domain knowledge on creative problem solving, in Memory and Cognition 26: 716-730.

22

JS Gero, B Tversky and T Knight (eds), Visual and Spatial Reasoning in Design III, 2004 Key Centre of Design Computing and Cognition, University of Sydney, pp 23-43
CONCEPTUAL DESIGN FROM GEONS: AN INTERACTIVE EVOLUTION APPROACH
AMITABHA MUKERJEE AND HEMANT MULEY Indian Institute of Technology, Kanpu, India
Abstract. Evidence from the depictive processes of conceptual design (sketching, gestures, modeling) increasingly point to mental models with volumetric decompositions that reflect vague shapes with vague positional constraints. An important goal for computer aided conceptual design would be to enable designers to capture this vague stage of design specification, but models of such vague geometries (such as Biederman's influential Geon model), are difficult to integrate into the traditional computer aided design process, since the process of “concretizing” the design becomes difficult. We present an interactive optimization approach that resolves this problem. The designer: selects vague volumetric decompositions represented as variations on an extended set of parametric geons; specifies relative joins between geons as qualitative spatial constraints; interacts with various instances of the design, altering the design specification as appropriate; evaluates designs, which guides the search through the design space, and optionally defines some computable functional measure with which to guide the search. Other benefits of this approach are that since the initial design is imprecise, it actually encompasses a class of designs, and geon-based similarity measures can be used to query design databases. Also, visualizing the design instances exposes unexpected aspects of the design (what has been called visual emergence), leading to design space redefinition. The interactive design process also accounts for holistic factors such as aesthetic factors. A sample design process is demonstrated using an interactive 3D CACD system implemented on top of a commercial CAD engine that leads from conceptual stages to the end design.
1. Conceptualizing Shapes in Early Design
Observations of designers engaged in conceptualizing a design have focused on the visible artifacts of this process, such as sketching (Tang and Gero 2001; Goel 1999; Kavakli et al 1998; Suwa et al 1999), language (Goel and Perolli 1989), and gestures (Athavankar 1999), appears to point increasingly towards a volumetric decomposition. Quoting Kavakli (Kavakli et al 1998):
24 A MUKERJEE AND H MULEY
Theoretical insights deriving from research on both object recognition and imagery provide a solid basis for assuming that the part by part externalisation of objects may be a characteristic feature of sketching activity… …the basic structural parts of an object (as denoted by geon-like volumetric primitives)
Similar observations have also been noted by Lim and Duffy (2000), who use the term “hierarchical child-elements” to refer to the decomposition.
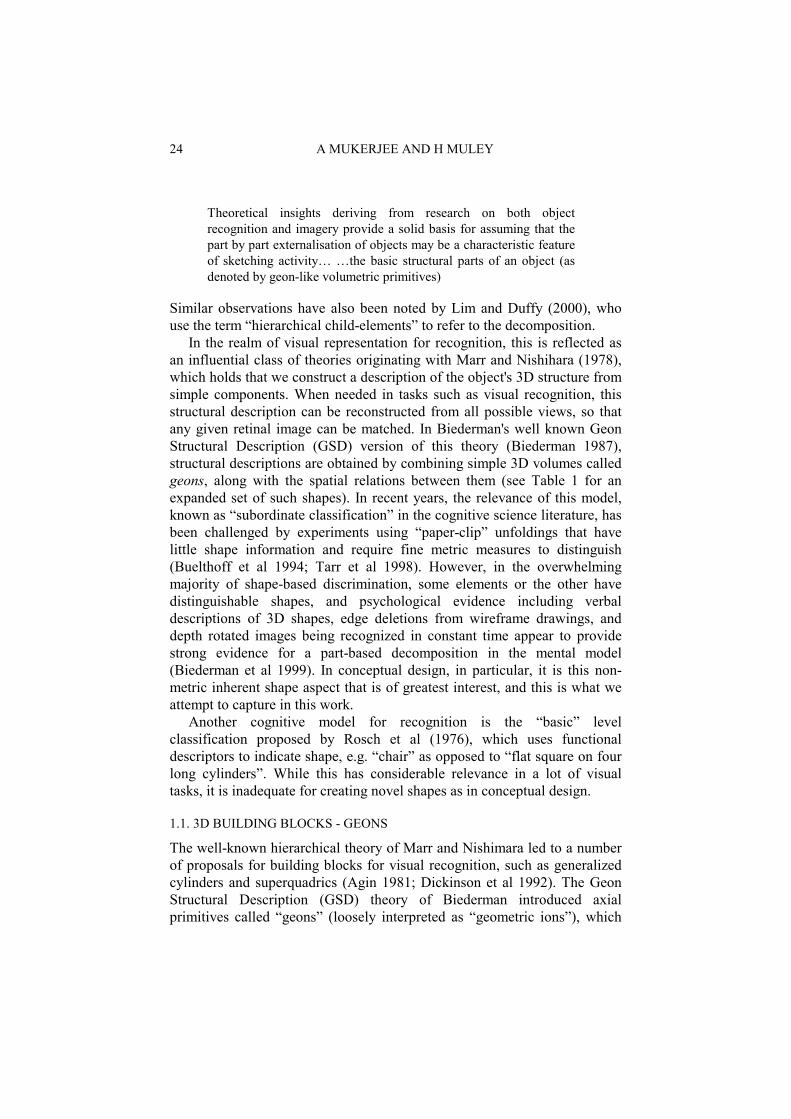
In the realm of visual representation for recognition, this is reflected as an influential class of theories originating with Marr and Nishihara (1978), which holds that we construct a description of the object's 3D structure from simple components. When needed in tasks such as visual recognition, this structural description can be reconstructed from all possible views, so that any given retinal image can be matched. In Biederman's well known Geon Structural Description (GSD) version of this theory (Biederman 1987), structural descriptions are obtained by combining simple 3D volumes called geons, along with the spatial relations between them (see Table 1 for an expanded set of such shapes). In recent years, the relevance of this model, known as “subordinate classification” in the cognitive science literature, has been challenged by experiments using “paper-clip” unfoldings that have little shape information and require fine metric measures to distinguish (Buelthoff et al 1994; Tarr et al 1998). However, in the overwhelming majority of shape-based discrimination, some elements or the other have distinguishable shapes, and psychological evidence including verbal descriptions of 3D shapes, edge deletions from wireframe drawings, and depth rotated images being recognized in constant time appear to provide strong evidence for a part-based decomposition in the mental model (Biederman et al 1999). In conceptual design, in particular, it is this non-metric inherent shape aspect that is of greatest interest, and this is what we attempt to capture in this work.
Another cognitive model for recognition is the “basic” level classification proposed by Rosch et al (1976), which uses functional descriptors to indicate shape, e.g. “chair” as opposed to “flat square on four long cylinders”. While this has considerable relevance in a lot of visual tasks, it is inadequate for creating novel shapes as in conceptual design.
1.1. 3D BUILDING BLOCKS - GEONS
The well-known hierarchical theory of Marr and Nishimara led to a number of proposals for building blocks for visual recognition, such as generalized cylinders and superquadrics (Agin 1981; Dickinson et al 1992). The Geon Structural Description (GSD) theory of Biederman introduced axial primitives called “geons” (loosely interpreted as “geometric ions”), which
CONCEPTUAL DESIGN FROM GEONS 25
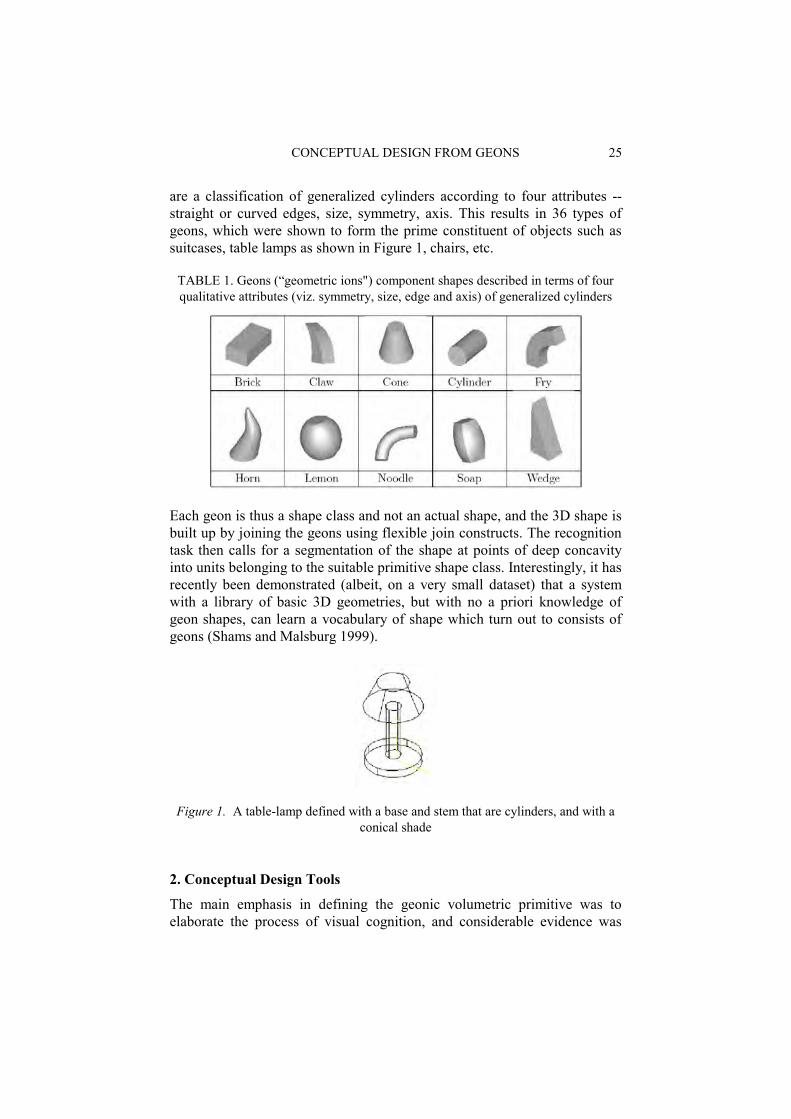
are a classification of generalized cylinders according to four attributes -- straight or curved edges, size, symmetry, axis. This results in 36 types of geons, which were shown to form the prime constituent of objects such as suitcases, table lamps as shown in Figure 1, chairs, etc.
TABLE 1. Geons (“geometric ions") component shapes described in terms of four qualitative attributes (viz. symmetry, size, edge and axis) of generalized cylinders
Each geon is thus a shape class and not an actual shape, and the 3D shape is built up by joining the geons using flexible join constructs. The recognition task then calls for a segmentation of the shape at points of deep concavity into units belonging to the suitable primitive shape class. Interestingly, it has recently been demonstrated (albeit, on a very small dataset) that a system with a library of basic 3D geometries, but with no a priori knowledge of geon shapes, can learn a vocabulary of shape which turn out to consists of geons (Shams and Malsburg 1999).
Figure 1. A table-lamp defined with a base and stem that are cylinders, and with a conical shade
2. Conceptual Design Tools
The main emphasis in defining the geonic volumetric primitive was to elaborate the process of visual cognition, and considerable evidence was

26 A MUKERJEE AND H MULEY
furnished that a mental model consisting of such volumetric decompositions can provide an efficient and cognitively plausible model for visual recognition from non-accidental views (Biederman 1995). In such situations, a number of “viewpoint-invariant-properties” such as straight and curvedness, parallelism, symmetry, colinearity, etc. are preserved in the image transformations, and these were the basis for choosing the qualitative aspects that are discriminated in the geons. A number of authors have extended this set with somewhat differing assumptions, and in this work, we have adopted the extension in (Tarr et al 1998), which proposes ten basic shapes with axial variations as shown in Table 1.
2.1. JOINS: RELATIVE POSES
The geonic construction proceeds by the “glueing” one geon onto another, to obtain a complete shape. The glue operation (Requicha 1980) is a union with no overlaps between the parts, though in practice a “small” degree of overlap (e.g. the top of the cone disappearing into a brick), is tolerated. The principal disadvantage of this approach as it applies to Geometric Design is that since there is no difference, intersection, or complement operator, it is impossible to “remove” material -- and thus holes, for example cannot be created. An easy way out to this would be to permit difference operations, so that a small cylindrical geon can be removed from a part to create a hole. Gregoire et al (1999) implement such a system by calling the holes “negative” geons. The cognitive ramifications of this are at this stage unclear, but it is our conjecture that this should be a plausible approach by which designers work, and may provide a lively line of cognitive exploration.
The other aspect of the joins are that just as the geons are imprecise in shape, their joins are imprecise in position. This permits the designer considerable flexibility, which is the primary hallmark of conceptual design, either because the designer prefers not to commit the design too much, or because even she is unclear about some aspect of the shape (Goel 1999; Lim and Duffy 2000). The ability to maintain the vagueness of an early concept until it is sufficiently developed is the holy grail of CACD (Computer Aided Conceptual Design) systems, and the geonic model fits in with this perfectly. For instance, in designing the faucet in Figure 2, the input relations of the constraints may be specified as a vector whose elements are not numbers but are expressed in (-, 0, +) as in Table 2.
2.2. CONCRETIZING THE CONCEPT
Algorithmically, the emphasis in the GSD theory in object recognition, and a number of authors have attempted to obtain a decomposition of a shape into geonic components which can be seen in work of Rom and Medioni

CONCEPTUAL DESIGN FROM GEONS 27
(1994), Wu and Levine (1997), Pentland (1986), and Dickinson et al (1992). In the CAD arena, a burning issue is that of managing CAD libraries so that similar shapes can be identified quickly. This is an area which relates to visual similarity and recognition, and Gregoire et al (1999) have built a system which recognizes the geons from a CAD model, with a view to identifying the right model for the part from a CAD database, which is presumably indexed in terms of the parts geons.
Figure 2. 2D sketch of a faucet showing the direction vectors of inlet, outlet and
knob respectively Zin = (+, 0, 0), Zout = (0, 0, -), and Zknob = (0, 0, +)
TABLE 2. The input, output and knob orientations of the Faucets A, B, and E as shown in Table 3
While precise-3D to imprecise-geons is a common purpose application in CAD, the opposite process, to go use the imprecision of the geons as design input, appears to be rather uncommon. This is because most CAD systems are ultimately charged with the task of producing exact engineering shape specifications, and thus the inchoate nature of geonic models become a challenge. An early attempt at using geonic primitives in building a conceptual design system can be found in Mukerjee (1991), which uses
28 A MUKERJEE AND H MULEY
generalized cylinders with medial-axis cross-sections as geons for for defining simple 3D assemblies.
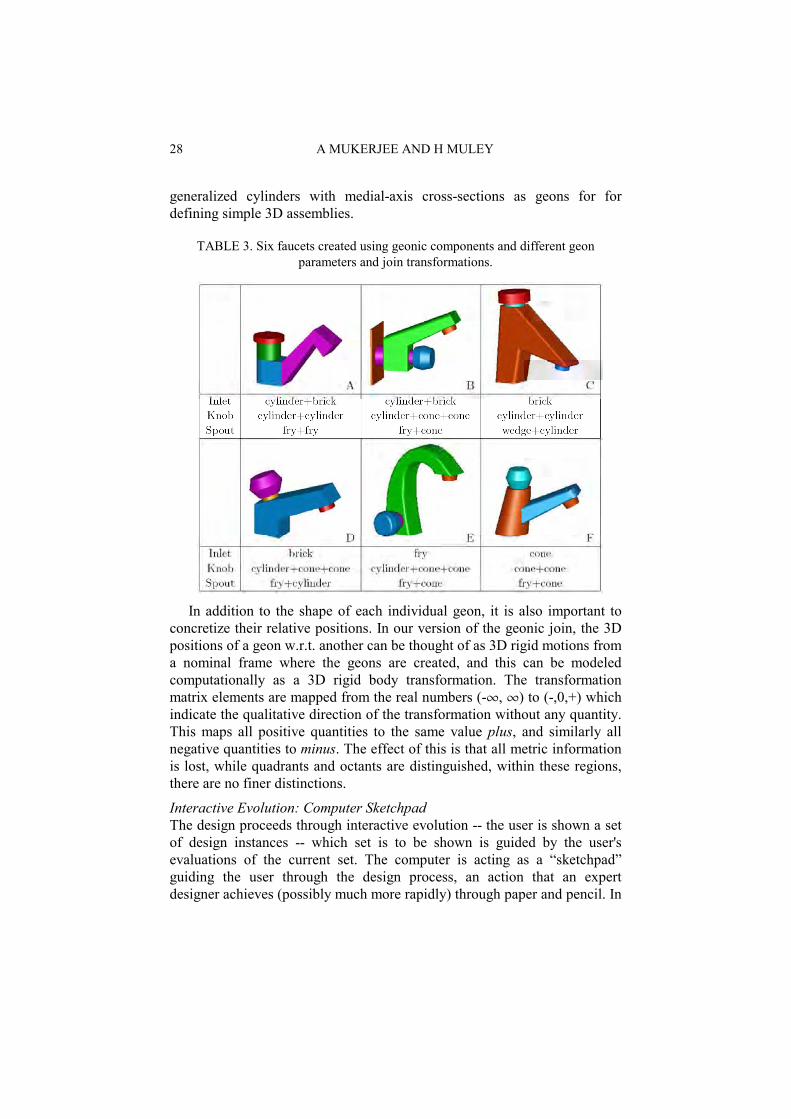
TABLE 3. Six faucets created using geonic components and different geon parameters and join transformations.
In addition to the shape of each individual geon, it is also important to concretize their relative positions. In our version of the geonic join, the 3D positions of a geon w.r.t. another can be thought of as 3D rigid motions from a nominal frame where the geons are created, and this can be modeled computationally as a 3D rigid body transformation. The transformation matrix elements are mapped from the real numbers (-, ) to (-,0,+) which indicate the qualitative direction of the transformation without any quantity. This maps all positive quantities to the same value plus, and similarly all negative quantities to minus. The effect of this is that all metric information is lost, while quadrants and octants are distinguished, within these regions, there are no finer distinctions.
Interactive Evolution: Computer Sketchpad The design proceeds through interactive evolution -- the user is shown a set of design instances -- which set is to be shown is guided by the user's evaluations of the current set. The computer is acting as a “sketchpad” guiding the user through the design process, an action that an expert designer achieves (possibly much more rapidly) through paper and pencil. In
CONCEPTUAL DESIGN FROM GEONS 29
addition to the parameters for the geonic primitives, the parameters of this transformation are also concretized during the interactive evolution.
2.3. MODELING VAGUENESS
Capturing the flexibility of conceptual design requires the ability to model vagueness, i.e. one needs to deal with whole classes of shape as opposed to the unambiguous models (Requicha 1980) of traditional Computer-Aided Design (CAD). Any move that can move CAD processes in this direction would reap benefits, for as pointed out in Will (1991), “85% of the cost component of a product is incurred directly due to decisions made before the product is released for manufacturing.”, and as much as 75% of the cost may be locked in beyond the detailed design stage. Indeed, this may be the prime reason for the tremendous success of parametric design system in the 80's.
The vagueness can be modeled in many ways, but computers are clearly not very easily adapted to this task. A review of some early attempts that minimize commitment in a parameterized behaviour space can be found in Yaacov et al (1993), who presents a co-variance based approach. Shape flexibility was severely restricted; indeed shape handling in CACD became possible only after the variational geometry models (Lin and Gossard 1981) were incorporated into the stream of parametric design; a review of CACD as applied to mechanical products can be found in Hsu and Woon (1998), but most of the models attempt only very limited shape parameterizations.
More recently, attempts have been made to directly use sketches by adopting line-interpretation algorithms that generate 3D geometries from 2D-views (Qin et al 2000). This is certainly an area worth exploring, for the expert designer can run through hundreds of ideas very rapidly in using paper and pencil (Tang and Gero 2001), and this speed is unlikely to be achieved in 3D CAD interfaces. However, the power of the geonic system is not so much for expert designers, who are often quite comfortable \em without CACD help, but for the novice designer, for whom an interactive walk can lead more quickly to surprises and discoveries that may have remained hidden until much later otherwise.
A large related body of research in a similar direction attempts to use the idea of design features as the basic shape primitive (Hoffmann and Arinyo 1998; Marcheix and Pierra 2002; Elinson et al 1997; Suh and Wozny 1997; Eisfeld and Scherer 2003). Here the design imprecision in the early stages of CAD is worked in by using constraints, which can be as loose as the user wants. At the same time, features have considerable importance in terms of being able to relate to part function and manufacturing process design, and a case can also be made that humans are cognitively aware of entities such as “slots” as rectangloid holes. The main advantage of the geon model, however, is that it provides the designer with a clear lexicon of primitive

30 A MUKERJEE AND H MULEY
shapes, as well as a well-defined constraint language for joins (qualitative sign algebra); in the end however, both systems are processing constraints. This can make quite a difference because the set of features can be very large and complex; in fact often two designers may never agree on a complete set. Also, feature interactions require lower-level volumetric definitions for these features themselves, and then we are back to square one - for an attempt to define the features themselves in terms of basic shape primitives, see (Bidarra et al 1998).
While features approximate the modeling volumes, not much work has looked at the flexibility in the joining process. Most CAD systems consider joining in terms of faces and datums, which are available only in nearly-finished designs. Thus even defining constraints become a problem in early design. An interesting attempt in this direction is to use half-planes, which provide for abstract of linguistic concepts such as “adjacent to” or “left of” in Damski and Gero (1998), but constructing volumetric primitives in the same manner restricts the user to large boolean formulae that can only define polyhedral structures.
2.4. SHAPE SIMILARITY AND MANAGING DESIGN LIBRARIES
An important benefit of using geons or other cognitively relevant volumetric models for the design is that the design history now contains these shapes, and can constitute a first model for design similarity, and for constructing design libraries. This has been a very complex problem in CAD, where in practice a designer always starts from some intuitive library of designs that she carries in her head; see Tang and Gero (2001) for some experimental examples. For computers to be able to display designs to the user, it must be possible to perform shape and function based queries. In recent years, attempts have been made to identify shape similarity in CAD using feature-graphs (Elinson et al 1997; McWherter et al 2001), convex decompositions (Mukai et al 2002), an interesting idea based on histograms of angles and distances between a number of random points on the boundary (a sort of stochastic 3D chain-code) (Ohbuchi et al 2003), and search engines have been built based on 3D shape similarity (Funkhouser et al 2003); see Cardone et al (2003) for a survey.
The advantage of geons over other models is that there is a long history of computer vision algorithms that have used geon-like components in identifying 3D shape similarity, and hence it is a natural approach. The second advantage when using geons as the building block is that one is not required to do the geonic decomposition, which often is a complex task, thus shape similarity is much easier to determine. In future, it is quite likely that imprecise volumetric decompositions may become the mainstream for managing digital design libraries.
CONCEPTUAL DESIGN FROM GEONS 31
2.5. ACADEMIC RESEARCH VS CLOSURE
Despite the flurry of interest in CACD, work remains largely confined to the laboratory; the blame for this can be assigned to three factors as in a recent survey of conceptual design (Horvath:2000):
the endeavor in academia to introduce abstract models, to develop highly specialized non-integral tools, and to give preference to automated, rather than highly interactive means.
In this work, in an attempt to avoid these three pitfalls, from the start our attempt has been to build a tool on top of an existing commercial CAD package. However, the tool needs to be interactive, which in our case is achieved by forking a parallel routine that computes the user responses, generates new design instances in the design space, and writes the solid models into a file which is read into the package using macros. Conceptually, the ideas of geonic primitives are very easy to grasp and there are no specialized mechanisms, and the process is clearly interactive. We have called our CACD system OASIS, and it works on top of the I-DEAS geometric modelling package. At another level however, it is not a full commercial implementation, and is limited in the range of geometries it can handle.
We construct computational models by mapping the notion of geons to simple 3D primitives, and constraining their relative join poses through a set of 3D motion parameters. The resulting model can then be placed in the canon of traditional CAD practice, thus enabling the designer to harness a powerful set of tools with which she can communicate and optimize her shape ideas. The method requires the user to define an early model of the overall shape, defined in terms of a few simple primitives, the shapes and relative poses of which are specified by a set of constraints defined on the independent geometric parameters (called driving parameters). Subsequently, the use of interactive evaluation for aesthetics permits optimization and visualization of a variety of shapes at an early stage of design. This permits a clearer perspective of the design space, with the possibility of its re-evaluation. By varying the geon types and the join geometries a wide variety of shapes can be obtained with a limited vocabulary of part geometries. Table 3 shows six different concepts for the design of a faucet that can be built up quickly using simple geonic components.
3. Geonic Modeling for Conceptual Design Input
Let us say that we are designing a water faucet, Figure 2. The input space is characterized by a surface on which the tap will be mounted (defined by an
32 A MUKERJEE AND H MULEY
Inlet frame, with the Zin axis, and a point at which the water will spout, defined by an Outlet Frame, (the Zout axis). An added consideration may be the direction in which the knob will turn - indicated by the Frame Knob, with its Zknob axis. There will be a geon fixed to the inlet, and one to the outlet. These may be connected by a number of geons for the tube and valve-body, and the knob may get attached to one of these or the input. The conceptual design can now proceed along these steps:
1. Choose and Refine geonic elements: Select vague volumetric decompositions represented as variations on an extended set of parametric geons,
2. Specify parameter and join constraints: Obtain the semi-qualitative transformations, fix the level of indeterminacy. Identify free variables (called the “driving parameters”).
3. Explore Design Space with Computer Sketchpad: The system displays diverse instances of the design, and the user may choose to alter the design space or the constraints.
4. Evaluate designs: This guides the search through the design space, and
5. Define Computable Performance metric: This will be combined with users subjective inputs to guide the search.
The first task of the designer is to identify the basic geonic elements that will be needed. She does not have to be precise; it can be a guess which will be refined later. Next the designer defines the interrelationships between the geon dimensions -- e.g. the radius at the base of the knob will be defined in relation to the valve diameter, which in turn will have a relation to the input pipe diameter. Thus the entire design can be related in terms of a few parameters called “driving parameters”. The remaining parameters are obtained in terms of these driving parameters using a set of constraints which are defined by the user and are used in generating the complete part geometry from a given set of parameter values.
In addition to these parameter values which specify the shape of the geons, a number of parameters relate to the relative pose of each geon. Where these can be fixed, they are known, but often they would be imprecise. Such imprecision in the relative poses are specified in terms of sign-algebra transformations - which merely indicate the relative quadrant within which any orientation is permissible. The transformations are modeled as 3 x 4 homogeneous coordinate transforms, with the bottom row being (0 0 0 1) as is the norm. For example in the faucet A in Table 3, the knob has the same z-axis as the inlet, but the inlet may have a different orientation for its x and y. Assuming the knob to be symmetric, this relation
CONCEPTUAL DESIGN FROM GEONS 33
can be captured by defining the Knob frame [K] in terms of the inlet frame [I], expressed as the homogeneous coordinate transformation T(K,I):
Note that the z-axis of the tranformation is (1, 0, 0)T and the fourth column (0, 0, +, 1)T is a shift along +Z. The first two columns define a possible rotation about z-axis. Altogether this matrix then represents the fact that the knob is on the same axis as the input and its frame is shifted a bit upwards and may be rotated about z-axis by an angle less than 90 degrees.
In general, it may not be possible to directly obtain such constraints -- e.g. if there is a valve geon between inlet and knob as in Figure 2, then the frame of the valve (V) with respect to the inlet (I) would be given by a semi-qualitative transformation T(V,I), and the the knob (K) w.r.t. the valve by T(K,V). Then the constraint on Zin and Zknob must be related only after composing the transformation T(K,I). In the Genetic Algorithm approach used here, such constraints are handled by severely penalizing design instances that violates it. A critical consideration at this stage is to minimize the total number of free parameters, which constitutes the design search space, so that the effects of their interactions can also be perceived. As the design progresses, these can in fact be altered. In almost all cases, the constraints undergo considerable revision after the first few visualization runs.
Figure 3 shows the geometric parameters of the geons involved in the Faucet A -- the geons are fry and cylinder unioned with brick. In this design, the variability of the geons are defined using a set of parameters. This involves ensuring the proper alignment of the geons while obtaining a meaningful object. Figure 4 shows the complete faucet.
Figure 3. A cylinder combined with brick and a fry as an inlet and outlet of a faucet
respectively with the driving parameters set as Wi, Hi and Wo, Ho, Lo, θ1, θ2 respectively. Combining these, we have the constraints Wi = Wo, Hi = Ho.
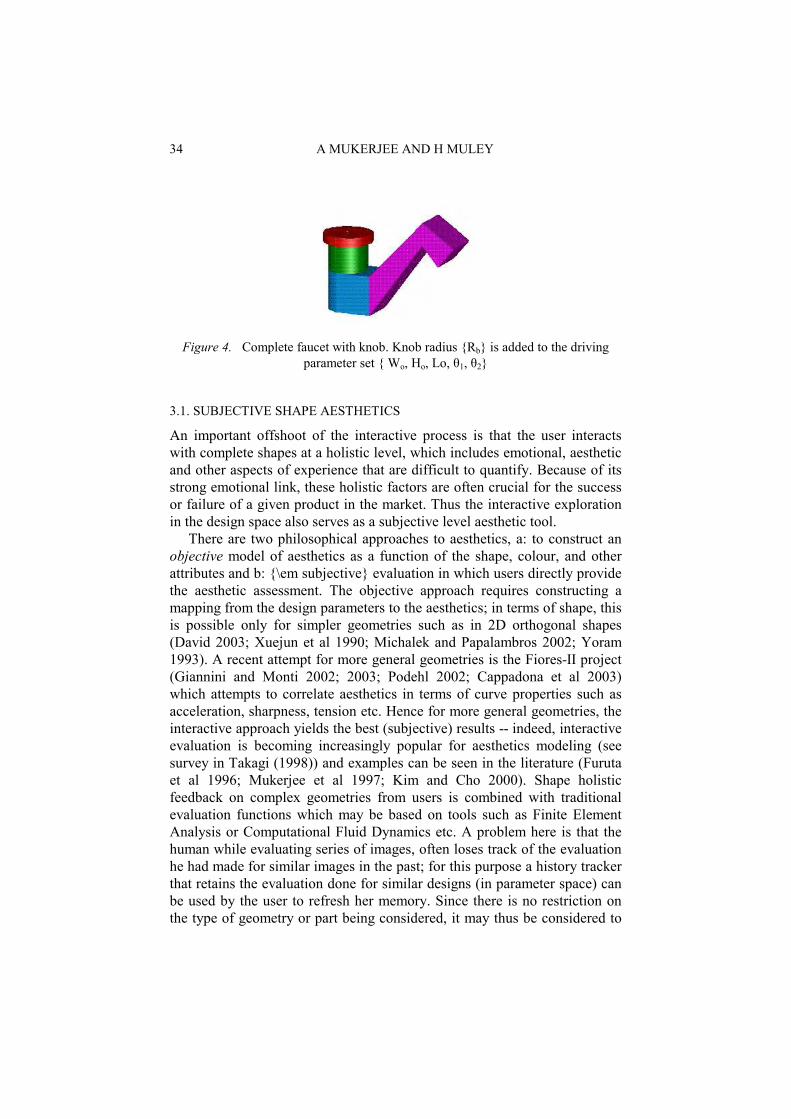
34 A MUKERJEE AND H MULEY
Figure 4. Complete faucet with knob. Knob radius Rb is added to the driving
parameter set Wo, Ho, Lo, θ1, θ2
3.1. SUBJECTIVE SHAPE AESTHETICS
An important offshoot of the interactive process is that the user interacts with complete shapes at a holistic level, which includes emotional, aesthetic and other aspects of experience that are difficult to quantify. Because of its strong emotional link, these holistic factors are often crucial for the success or failure of a given product in the market. Thus the interactive exploration in the design space also serves as a subjective level aesthetic tool.
There are two philosophical approaches to aesthetics, a: to construct an objective model of aesthetics as a function of the shape, colour, and other attributes and b: \em subjective evaluation in which users directly provide the aesthetic assessment. The objective approach requires constructing a mapping from the design parameters to the aesthetics; in terms of shape, this is possible only for simpler geometries such as in 2D orthogonal shapes (David 2003; Xuejun et al 1990; Michalek and Papalambros 2002; Yoram 1993). A recent attempt for more general geometries is the Fiores-II project (Giannini and Monti 2002; 2003; Podehl 2002; Cappadona et al 2003) which attempts to correlate aesthetics in terms of curve properties such as acceleration, sharpness, tension etc. Hence for more general geometries, the interactive approach yields the best (subjective) results -- indeed, interactive evaluation is becoming increasingly popular for aesthetics modeling (see survey in Takagi (1998)) and examples can be seen in the literature (Furuta et al 1996; Mukerjee et al 1997; Kim and Cho 2000). Shape holistic feedback on complex geometries from users is combined with traditional evaluation functions which may be based on tools such as Finite Element Analysis or Computational Fluid Dynamics etc. A problem here is that the human while evaluating series of images, often loses track of the evaluation he had made for similar images in the past; for this purpose a history tracker that retains the evaluation done for similar designs (in parameter space) can be used by the user to refresh her memory. Since there is no restriction on the type of geometry or part being considered, it may thus be considered to
CONCEPTUAL DESIGN FROM GEONS 35
be a general purpose aesthetics optimization tool. With this aesthetic function in mind, we have called our system Optimization of Aesthetic Shape via Interactive Search (OASIS); this is a tool that currently works in Linux in tandem with I-DEAS running in Windows-NT through a shared file system.
4. Interactive Evolutionary Optimization
Genetic Algorithms (GA) is an iterative multi-front optimization procedure, which has found wide applicability in design optimization, as can be seen in the overviews (Renner and Ekart 2003; Graham et al 2001). This work uses an interactive version of GA in order to obtain user inputs on the aesthetics of the part. Similar approaches have been used in fashion design (Kim and Cho 2000), music composition (Tokui and Iba 2001), dam design (Furuta et al 1996), and also in the field of architectural design as layout design (Michalek and Papalambros 2002). We incorporate a hybrid objective function including both the user choice as well as a computed measure of functional effectiveness. However, obtaining user choices for more complex geometries may require many visualizations, resulting in it may be necessary to reduce the number of items shown simultaneously. Unlike the Analytic Hierarchy approach in (Furuta et al 1996), which displays two choices at a time, we ask the user to evaluate six design choices which are shown simultaneously, thus speeding up the interactive design iterations.
4.1. DESIGN SPACE RE-DEFINITION
It is the experience of most designers that the Design Specification (DS) itself evolves as the designer explores further with the various attributes of the design. This is in fact, one of the main purposes of initial exploration in conceptual design. In our experience with OASIS, we commonly find the three following types of re-definition occurring during this early optimization interaction:
• Re-Defining the Design Specifications: Often the design space is determined by the range given to the various parameters. Here, occasionally the optimum will appear at an extremity of the design space, so that it becomes prudent to redefine the ranges of the parameters so as to expand it in this direction, and reduce some of the values that are far from this point so as to reduce the total search. A diagram showing this conceptual process is shown in Figure 5.
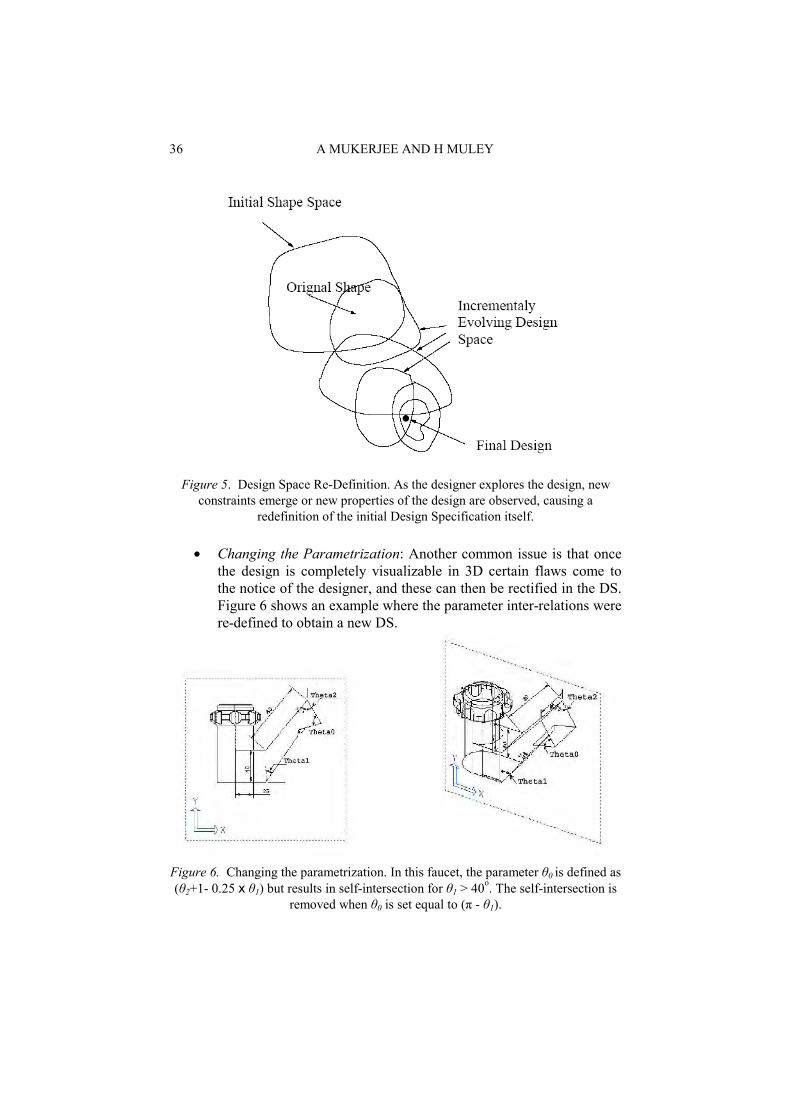
36 A MUKERJEE AND H MULEY
Figure 5. Design Space Re-Definition. As the designer explores the design, new
constraints emerge or new properties of the design are observed, causing a redefinition of the initial Design Specification itself.
• Changing the Parametrization: Another common issue is that once the design is completely visualizable in 3D certain flaws come to the notice of the designer, and these can then be rectified in the DS. Figure 6 shows an example where the parameter inter-relations were re-defined to obtain a new DS.
Figure 6. Changing the parametrization. In this faucet, the parameter θ0 is defined as (θ2+1- 0.25 x θ1) but results in self-intersection for θ1 > 40o. The self-intersection is
removed when θ0 is set equal to (π - θ1).
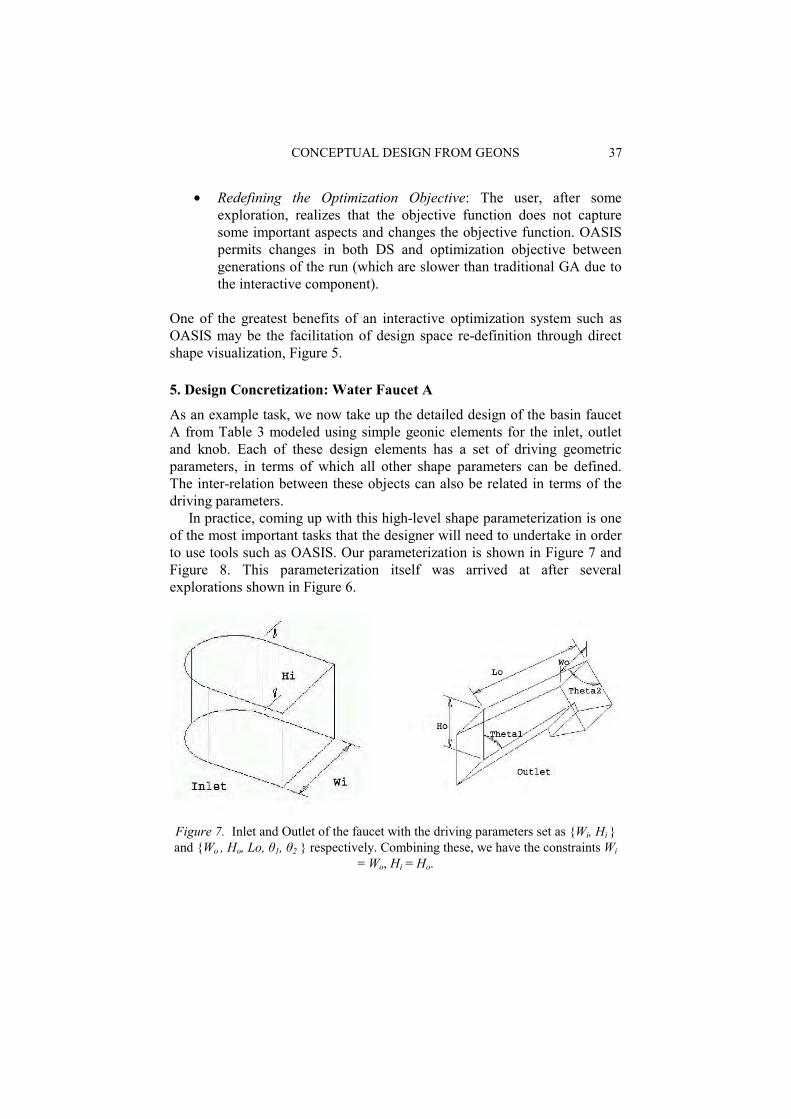
CONCEPTUAL DESIGN FROM GEONS 37
• Redefining the Optimization Objective: The user, after some exploration, realizes that the objective function does not capture some important aspects and changes the objective function. OASIS permits changes in both DS and optimization objective between generations of the run (which are slower than traditional GA due to the interactive component).
One of the greatest benefits of an interactive optimization system such as OASIS may be the facilitation of design space re-definition through direct shape visualization, Figure 5.
5. Design Concretization: Water Faucet A
As an example task, we now take up the detailed design of the basin faucet A from Table 3 modeled using simple geonic elements for the inlet, outlet and knob. Each of these design elements has a set of driving geometric parameters, in terms of which all other shape parameters can be defined. The inter-relation between these objects can also be related in terms of the driving parameters.
In practice, coming up with this high-level shape parameterization is one of the most important tasks that the designer will need to undertake in order to use tools such as OASIS. Our parameterization is shown in Figure 7 and Figure 8. This parameterization itself was arrived at after several explorations shown in Figure 6.
Figure 7. Inlet and Outlet of the faucet with the driving parameters set as Wi, Hi and Wo , Ho, Lo, θ1, θ2 respectively. Combining these, we have the constraints Wi
= Wo, Hi = Ho.
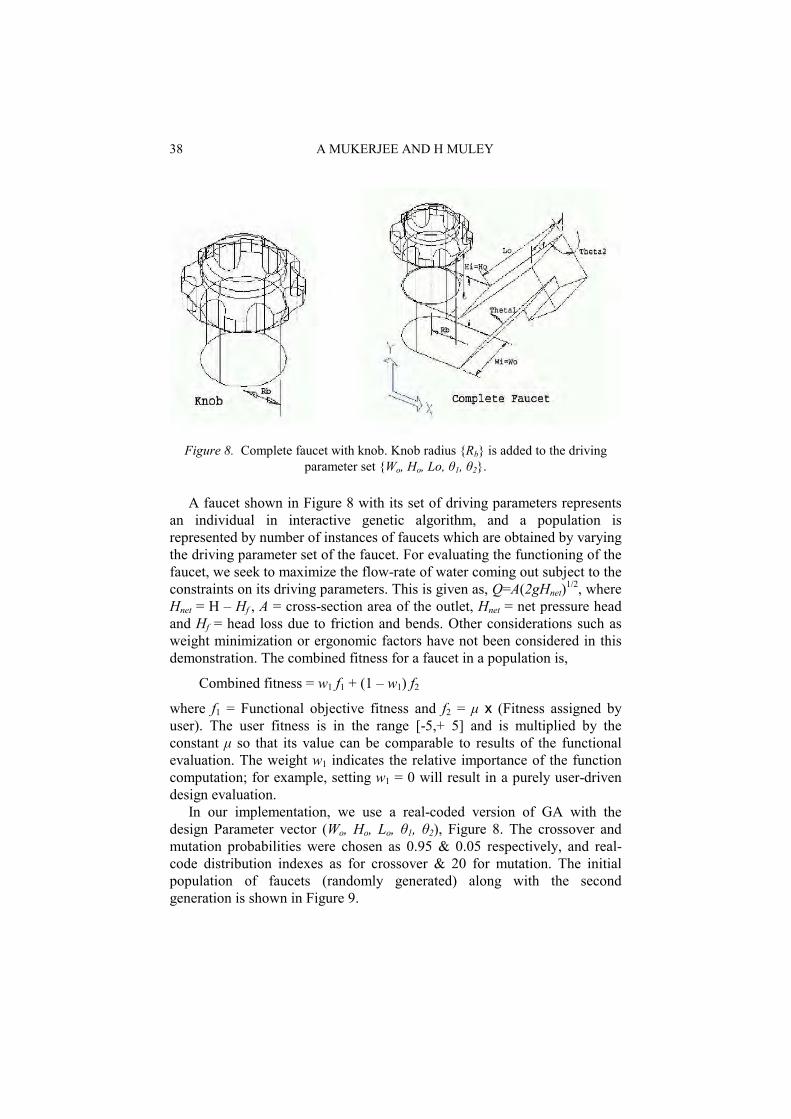
38 A MUKERJEE AND H MULEY
Figure 8. Complete faucet with knob. Knob radius Rb is added to the driving
parameter set Wo, Ho, Lo, θ1, θ2.
A faucet shown in Figure 8 with its set of driving parameters represents an individual in interactive genetic algorithm, and a population is represented by number of instances of faucets which are obtained by varying the driving parameter set of the faucet. For evaluating the functioning of the faucet, we seek to maximize the flow-rate of water coming out subject to the constraints on its driving parameters. This is given as, Q=A(2gHnet)1/2, where Hnet = H – Hf , A = cross-section area of the outlet, Hnet = net pressure head and Hf = head loss due to friction and bends. Other considerations such as weight minimization or ergonomic factors have not been considered in this demonstration. The combined fitness for a faucet in a population is,
Combined fitness = w1 f1 + (1 – w1) f2
where f1 = Functional objective fitness and f2 = µ x (Fitness assigned by user). The user fitness is in the range [-5,+ 5] and is multiplied by the constant µ so that its value can be comparable to results of the functional evaluation. The weight w1 indicates the relative importance of the function computation; for example, setting w1 = 0 will result in a purely user-driven design evaluation.
In our implementation, we use a real-coded version of GA with the design Parameter vector (Wo, Ho, Lo, θ1, θ2), Figure 8. The crossover and mutation probabilities were chosen as 0.95 & 0.05 respectively, and real-code distribution indexes as for crossover & 20 for mutation. The initial population of faucets (randomly generated) along with the second generation is shown in Figure 9.

CONCEPTUAL DESIGN FROM GEONS 39
Figure 9. First randomly initialized and second evolved population (after user's
feedback) of faucets
The fourth population of faucets as shown in Figure 10 still contains some faucets (e.g. (A) and (E)) which are assigned negative fitness by user. However, by generation ten, the faucets in the population are all very similar, converging nearly to the user’s perception of aesthetics.
Figure 10. Fourth and final (tenth) generations showing the evolved shapes of faucets based on user's feedback. While there are still some negatively assessed
shapes in the fourth population, by the tenth the shapes appear to have converged to what the user finds acceptable.

40 A MUKERJEE AND H MULEY
6. Conclusion
In this work, we have reported a 3D modeling system based on a cognitively plausible volumetric decomposition. By defining the geonic primitives as generalized cylinders in a CAD environment, we can handle a large conceptual diversity although much remains to be done to demonstrate this tool in fully general CAD settings.
The use of geonic elements, which are imprecise, at the input stage, provides a design trace through a number of design revisions and constraint redefinitions. These can eventually form an important reference for creating design libraries that can trace the similarity of different designs using the shape similarity (obtained from the geons) as well as its design histories which reflect functional needs that emerged as the design progressed.
In addition, the system also acts as a subjective system for Aesthetic Evaluation. In fact, in this role, it is possibly one of the first general purpose shape aesthetics optimization tools.
Overall, by permitting the user to interact directly at early phases of design, such approaches are likely to present significant lifetime cost savings. The chief benefit (even for experienced designers) in this approach is in its ability to pull up diverse design instances from throughout the design space, and merely by evaluating some designs as good and some as bad, the user is effectively constraining the search.
Among our objectives for the future are constructing logic-based codification of the constraints (these are now procedurally defined through an API). Also, we are interested in integrating differing objectives (aesthetics, functional and cost) in a multi-objective form, where the user is presented not with a single optimum but with a set of solutions where no solution is better than another for all the objectives (dominating). Such solutions lie on the non-dominated front, and visualizing this set of solutions can provide the user with an overview of a high-information content boundary in the parameter space. In future work, we hope to use multi-criteria evolutionary optimization method (Deb 2001).
A limitation is that interactive evaluation often limits the search owing to human fatigue. As mentioned earlier, humans tend to deviate from previous evaluation norms – and one solution to this problem may be to show single individuals representative of a shape class (Kim and Cho 2000), but this requires a shape similarity metric, which is not possible for arbitrary shapes. Our use of a history profile that the user can refer to makes this process somewhat easier for the user.
On the whole it is hoped that this type of a volumetric decomposition approach with a simple set of shapes and a set of constraints to define the design space will become an important and cost-saving tool for conceptual design.
CONCEPTUAL DESIGN FROM GEONS 41
References
Agin, GJ: 1981, Hierarchical representation of three-dimensional objects using verbal models, IEEE Trans. Pattern Analysis and Machine Intelligence 3(2): 197-204.
Athavankar, UA: 1999, Gestures, mental imagery and spatial reasoning, in JS Gero and B Tversky (eds), Visual and Spatial Reasoning in Design, Key Centre of Design Computing and Cognition, University of Sydney, pp. 103-128.
Bidarra, R, de Kraker, K and Bronsvoort, W: 1998, Representation and management of feature information in a cellular model, Computer-Aided Design 30(4): 301-313.
Biederman, I: 1987, Recognition by components: a theory of human image understanding. Psychological Review 94(2): 115-147.
Biederman, I: 1995, Visual object recognition, in SF Kosslyn, and DN Osherson (eds), An Invitation to Cognitive Science Volume 2, MIT Press, 2nd edition, pp. 121-165.
Biederman, I, Subramaniam, S, Bar, M, Kalocsai, P and Fiser, J: 1999, Subordinate-level object classification reexamined, Psychological Research 62: 131-153.
Buelthoff, HH, Edelman, SY and Tarr, MJ: 1995, How are three-dimensional objects represented in the brain? CogSci Memo No. 5, pp. 247-260.
Cao, X, He, Z, and Pan, Y: 1990, Automated design of house floor layout with distributed planning, Computer-Aided Design 22(4): 213-222.
Cappadona, F, Goussard, J, and Sutra, L: 2003, A qualitative approach of aesthetic notions, Collaborative Design – MICAD’03 Conference.
Cardone, A, Gupta, S, and Karnik, M: 2003, A survey of shape similarity assessment algorithms for product design and manufacturing applications, ASME Journal of Computing and Information Science in Engineering 3(2): 109-118.
Damski, J and Gero, J: 1998, Object representation and reasoning using halfplanes and logic, in J S Gero and F Sudweeks (eds), Artificial Intelligence in Design '98, pp. 107-126.
Deb, K: 2001, Multi-Objective Optimization using Evolutionary Algorithms, Chichester, John Wiley and Sons, Ltd., 1 edition.
Dickinson, SJ, Pentland, AP, and Rosenfeld, A: 1992, 3-D shape recovery using distributed aspect matching, IEEE Transactions on Pattern Analysis and Machine Intelligence 14(2): 174-198.
Eisfeld, M and Scherer, R: 2003, Assisting conceptual design of building structures by an interactive description logic based planner, Advances in Engineering Informatics 17(1): 41-57.
Elinson, A, Nau, DS, and Regli, WC: 1997, Feature-based similarity assessment of solid models, Symposium on Solid Modeling and Applications, pp. 297-310.
Funkhouser, T, Min, P, Kazhdan, M, Chen, J, Halderman, A, Dobkin, D, and Jacobs, D: 2003, A search engine for 3D models, ACM Transactions on Graphics 22(1): 83-105.
Furuta, H, Hase, H, Watanabe, E, Tonegawa, T, and Morimoto, H: 1996, Applications of genetic algorithm to aesthetic design of dam structures, Advances in Engineering Software 25(2-3): 185-195.
Giannini, F and Monti, M: 2002, CAD tools based on aesthetic properties, Primo Convergno Eurographics Italian Chapter, pp. 11-12.
Giannini, F and Monti, M: 2003, Design intent-oriented modelling tools for aesthetic design, Journal of WSGS 11(1).
Goel, V: 1999, Cognitive role of ill-structured representations in preliminary design, in JS Gero and B Tversky (eds) proceedings of the International Conference on Visual and Spatial Reasoning, page 283.
Goel, V and Pirolli, P: 1989, Motivating the notion of generic design within information-processing theory: The design problem space, AI Magazine 10(1): 19-36.
42 A MUKERJEE AND H MULEY
Graham, IJ, Case, K, and Wood, RL: 2001, Genetic algorithms in computer-aided design, Journal of Materials Processing Technology 117(1-2): 216-221.
Gregoire, N, Lepage, R, and Redarce, T: 1999, From CAD to geons: a simplified data representation for rapid indexing of large cad models database, Machine Vision Applications in Industrial Inspection VII 3652(27): 224-231.
Hel-Or, Y, Rappoport, A, and Werman, M: 1993, Relaxed parametric design with probabilistic constraints, Proceedings on the second ACM symposium on Solid modeling and applications, ACM Press, pp. 261-270.
Hoffmann, CM and Joan-Arinyo, R: 1998, On user-defined features, Computer-Aided Design 30: 321-332.
Horvath, I: 2000, Conceptual design: Inside outside, CADE publications. Hsu, W and Woon, IMY: 1998, Current research in the conceptual design of mechanical
products, Computer-Aided Design 30(5): 377- 389. Kim, H-S and Cho, S-B: 2000, Application of interactive genetic algorithm to fashion design,
Engineering Applications of Artificial Intelligence 13(6): 635-644. Lim, SW, Lee, BS, and Duffy, AHB: 2001, Incremental modelling of ambiguous geometric
ideas (i-magi): Representation and maintenance of vague geometry, Artificial Intelligence in Engineering 15(2): 93-108.
Lin, VC, Gossard, DC, and Light, RA: 1981, Variational geometry in computer aided design, Computer Graphics 15(3).
M Kavakli, SARS and Ball, LJ: 1998, Structure in idea sketching behaviour, Design Studies 19(4): 485-517.
Marcheix, D and Pierra, G: 2002, A survey of the persistent naming problem, Proceedings of the seventh ACM symposium on Solid modeling and applications, ACM Press, pp. 13-22.
Marr, D and Nishihara, H: 1978, Representation and recognition of the spatial organization of three-dimensional shapes, Proceedings Roy. Soc. B, Lond. B-200: 269-294.
McWherter, D, Peabody, M, Regli, WC, and Shok-oufandeh, A: 2001, Transformation invariant shape similarity comparison of solid models, ASME Design Engineering Technical Confs., 6th Design for Manufacturing Conf. (DETC 2001 and DFM-21191).
Michalek, JJ and Papalambros, PY: 2002, Interactive design optimization of architectural layouts, Engineering optimization 35(5): 485-501.
Mukai, S, Furukawa, S, and Kuroda, M: 2002, An algorithm for deciding similarities of 3-D objects, Proceedings of the seventh ACM symposium on Solid modeling and applications, ACM Press, pp. 367-375.
Mukerjee, A: 1991, Qualitative geometric design, Proceedings of the first ACM symposium on Solid modeling foundations and CAD and CAM applications, ACM Press, pp. 503-514.
Mukerjee, A, Agrawal, RB, Tiwari, N, and Hussain, N: 1997, Qualitative sketch optimization, Journal of Artificial Intelligence in Engineering Design, Analysis and Manufacturing (AI-EDAM) 11(4): 311-323.
Ngo, DCL, Teo, LS, and Byrne, JG: 2003, Modelling interface aesthetics, Information Sciences 152: 25-46.
Ohbuchi, R, Minamitani, T, and Takei, T: 2003, Shape- similarity search of 3d models by using enhanced shape functions, Proceedings of the Theory and Practice of Computer Graphics, IEEE Computer Society, page 97.
Pentland, AP: 1986, Perceptual organization and the representation of natural form, Artificial Intelligence 28: 293-331.
Podehl, G: 2002, Terms and measures for styling properties, Proceedings of 7th International Design Conference.

CONCEPTUAL DESIGN FROM GEONS 43
Qin, SF, Wright, DK, and Jordanov, IN: 2000, From on-line sketching to 2d and 3d geometry: A system based on fuzzy knowledge, Computer-Aided Design 32(14): 851-866.
Reich, Y: 1993, A model of aesthetic judgment in design, Artificial Intelligence in Engineering 8(2): 141-153.
Renner, G and Ekart, A: 2003, Genetic algorithms in computer aided design, Computer Aided Design 35: 709-726.
Requicha, AAG: 1980, Representations for rigid solids: Theory, methods, and systems, ACM Computing Surveys 12(4): 437-464.
Rom, H and Medioni, G: 1994, Part decomposition and description of 3d shapes, ARPA Image Understanding Workshop’94, volume II.
Rosch, E, Mervis, CB, Gray, WD, and Boyes-Braem, P: 1976, Basic objects in natural categories, Cognitive Psychology 8: 382-439.
Shams, L and von der Malsburg, C: 1999, Are object shape primitives learnable? NeuroComputing 26-27: 855-863.
Suh, YS and Wozny, MJ: 1997, Interactive feature extraction for a form feature conversion system, Proceedings of the fourth ACM symposium on Solid modeling and applications, ACM Press, pp. 111-122.
Suwa, M, Gero, J, and Purcell, T: 1999, Unexpected discoveries and s-inventions of design requirements: A key to creative designs, in JS Gero and ML Maher (eds), Computational Models of Creative Design IV, pp. 297-320.
Takagi, H: 1998, Interactive evolutionary computation: System optimization based on human subjective evaluation, IEEE Int'l Conf. on Intelligent Engineering Systems (INES'98), Vienna, Austria.
Tang, H-H and Gero, JS: 2001, Cognition-based CAAD, in B de Vries, J van Leeuwen and H Achten (eds), CAADFutures 2001, Kluwer, Dordrecht, pp. 523-531.
Tarr, MJ, Williams, P, Hayward, WG, and Gauthier, I: 1998, Three-dimensional object recognition is viewpoint dependent, Nature Neuroscience 1(4): 275-277.
Tokui, N and Iba, H: 2001, Music composition by means of interactive GA and GP, Proceedings IEEE Systems, Man and Cybernetics Conference.
Will, P: 1991, Simulation and modeling in early concept design: An industrial perspective, Research in Engineering Design 3(1): 1-14.
Wu, K and Levine, MD: 1997, 3-D shape approximation using parametric geons, Image and Vision Computing 15(2): 143-158.

44
JS Gero, B Tversky and T Knight (eds), Visual and Spatial Reasoning in Design III, 2004 Key Centre of Design Computing and Cognition, University of Sydney, pp 45-66
HEURISTIC METHODS AND HIERARCHICAL GRAPH GRAMMARS IN DESIGN
GRAŻYNA ŚLUSARCZYK Jagiellonian University, Poland
Abstract. A new approach to a design process, which uses heuristic methods combined with generating power of hierarchical graph grammars, is presented. Hierarchical graph representations of object structures are described. The representations are generated by hierarchical graph grammars, which include both generating and modifying rules. Creation of solutions is governed by design control diagrams. The proposed approach is illustrated on examples of laying out furniture and equipment in rooms.
1. Introduction A design process can be seen as search for potential solutions in a design space. In this paper a new method of automated synthesis of design solutions, which takes advantage of heuristic methods combined with generating power of hierarchical graph grammars, is proposed. It supports the designer as it offers the animated visualization of partial solutions at different stages of the design process and allows them to modify solutions being generated.
During a design process the designer performs different types of actions in order to change the external world (Suwa et al. 2000). Physical actions concern representing elements by drawing, coping, erasing and redrawing them. Perceptual actions refer to attending to features of depicted elements and spatial relations among them. Functional actions associate meaning, functions or abstract concepts to features. Conceptual actions allow the designer to evaluate the obtained solutions.
It should be stressed that at the outset of a design process not all design requirements are known. Some of them emerge when the process goes on. Inspecting partial solutions enables the designer to find important design issues and invent new requirements of a given problem, which are then carried through the entire process. Thus emergence of new conceptual design ideas is situated in the acts of representing and perceiving (Suwa et al. 2000).
46 G ŚLUSARCZYK
With each invented issue or requirement the design space expands. On the other hand, the invention of new requirements encourages modifications of solutions being generated and develops the space of solutions. Therefore, the design space and the solution space evolve together as new requirements and solutions emerge during a design process.
In this paper a new approach, which enables us to take into account the dynamic context of design, is proposed. It extends our previous studies on design where generative systems in the form of graph grammars have been used (Hliniak-Ślusarczyk 1999; Ślusarczyk 2003). We adopt here the design method, where syntactic and semantic aspects of the design process are separated (Grabska and Borkowski 1996). In this approach the object structure is described by means of a graph and then the possible ways of mapping the graph into graphical models are determined. Such a composite representation makes the designer think about objects at two levels: the higher level of structural properties and the lower level of primitives, transformations, topological relations and non-geometric attributes.
In this paper structures of modelled objects are represented by hierarchical composition graphs (Grabska et al. 2001; Grabska et al. 2003). Nodes of the graphs correspond to object components, whose subcomponents are represented by other hierarchical graphs nested in these nodes. Attributes assigned to the graph nodes provide semantic information about components. Graph edges represent relations among object components or subcomponents and can connect nodes of different levels of hierarchy and having different parent nodes.
When structures of design objects are represented by graphs, graph methods constitute effective tools for generating design tasks solutions. Therefore various kinds of graph grammars have been proposed for producing designs (Bunke 1983; Gottler 1983; Grabska 1993). In this paper hierarchical graph grammars equipped with design control diagrams, which control the search through the space of possible solutions of the design tasks, are used. In our previous approach (Hliniak-Ślusarczyk 1999; Ślusarczyk 2003) models corresponding to generated graph structures being elements of a graph language have been evaluated and then the graphs could have been modified using graph operations.
However, as it was mentioned above, some new design issues and requirements emerge during the design process and make the designer modify incomplete solutions or even change the direction of search. Therefore our previous approach as well as the well-known methods for solving design problems such as generate-and-test, PCM (i.e. propose, critique, modify) (Chandrasekaran 1990) or improvement procedures are not sufficient as they require the data structure to be fully specified before any evaluation of potential solutions takes place.
HIERARCHICAL GRAPH GRAMMARS IN DESIGN 47
Thus we propose to take advantage of the fact that representations of objects in the form of hierarchical graphs are generated in sequences of stages and to combine graph derivation methods with heuristic methods, where evaluation of partially-specified solutions is used to select appropriate sequences of grammar productions which should be applied in order to generate potential solutions. Derivation of hierarchical graphs is guided by a design control diagram which determines the possible order of applying grammar rules. Each hierarchical graph obtained during a derivation process represents a partial solution whose further development depends on a graph rule chosen by the designer to be applied in the next step. Our set of graph grammar productions contains three types of rules: generating rules, undo rules and modifying rules.
At each step of derivation a hierarchical graph can be mapped into a graphical model of the object using a realization scheme (Grabska et al. 2003; Hliniak-Ślusarczyk 1999). This scheme determines a correspondence between graph nodes and model primitives as well as specifies relations, which should take place between these primitives in order to obtain spatial arrangements consistent with the design criteria.
It should be noted that separating the process of generation object structures (using graph grammars) from defining their interpretations (using realization schemes) enables us to obtain many more possible solutions than when spatial (shape) grammars are used. As one composition graph specifies the general structural characteristics of the whole class of designed objects it can correspond to many graphical models obtained by applying different realization schemes which determine semantics of specific objects.
In this paper the graphical models obtained during derivation are animated in order to present the designer various possible arrangements of object components. While inspecting visualized partial solutions the designer is able to generate new concepts or take decisions about required modifications. Thus, at a given stage of derivation another step of graph generation using one of the generating productions (specified by the design control diagram) can be done, one of the modifying rules (admissible at this point) can be applied or the undo rule, which enables us to go back one step on the diagram path, can be performed.
Backtracking is characteristic of human problem solving processes and is used in heuristic search programs (Mitchell 1977), which are often applied to problems of floor plan layout and laying out furniture within spaces (Eastman 1971; 1973). A heuristic program DPS, which arranges furniture or equipment in a room in accordance with a constraint graph specifying spatial requirements, is described in (Pfefferkorn 1975). Backtracking enables the designer to restart the search for a solution along an alternative path. However, it partially destroys the structure which has
48 G ŚLUSARCZYK
been produced so far. The modifying rules which are added here to the common control diagram allow to make some local changes of the generated graph structure without destroying those parts which have been created later than the part being modified.
Computer aided generation of design object structures, where partial solutions can be mapped into animated graphical models, combined with easy methods of modifying these structures enables us to obtain many substantially different design solutions and supports creativity.
The paper is illustrated by examples of different layouts of furniture and kitchen equipment generated by the system FARR (Furniture ARRangement) (Stochel 2002). This program, written in Java, creates two-dimensional visualizations of layouts corresponding to hierarchical graphs generated at different stages of derivation and representing partially-specified solutions. Layouts are animated in order to present various possible arrangements specified by each generated graph structure. The analysis of the presented layouts stimulates the designer to introduce changes in order to create better solutions.
2. Hierarchical Composition Graphs
In this paper structures of layouts of kitchen furniture and equipment are represented by attributed and labelled graphs called hierarchical composition graphs (Grabska et al. 2001; Grabska et al. 2003). Hierarchical graphs enable to express relations between pieces of furniture placed in different parts of the kitchen by means of edges connecting nodes of different levels of hierarchy.
Each node of a hierarchical composition graph with nonempty contents will be called a hierarchical node. Hierarchical nodes represent places with different functions or some groups of furniture and are labelled by names corresponding these functions or groups. They contain nested composition graphs, which can also be hierarchical (i.e., some of its nodes can be hierarchical), representing furniture located in different parts of the kitchen. Graph nodes, which are not hierarchical, correspond to single pieces of furniture or equipment and are labelled by names of the corresponding elements. They are also equipped with attributes which provide semantic information by specifying characteristic features of these pieces.
Moreover, to each node a sequence of bonds, which express potential connections with other pieces, is assigned. Bonds of different nodes can be connected by edges, which represent relations among the pieces corresponding to the connected nodes. These relations are denoted by edge labels. Node bonds which are not connected by edges are called external. The number of external bonds determines the type of a hierarchical graph.
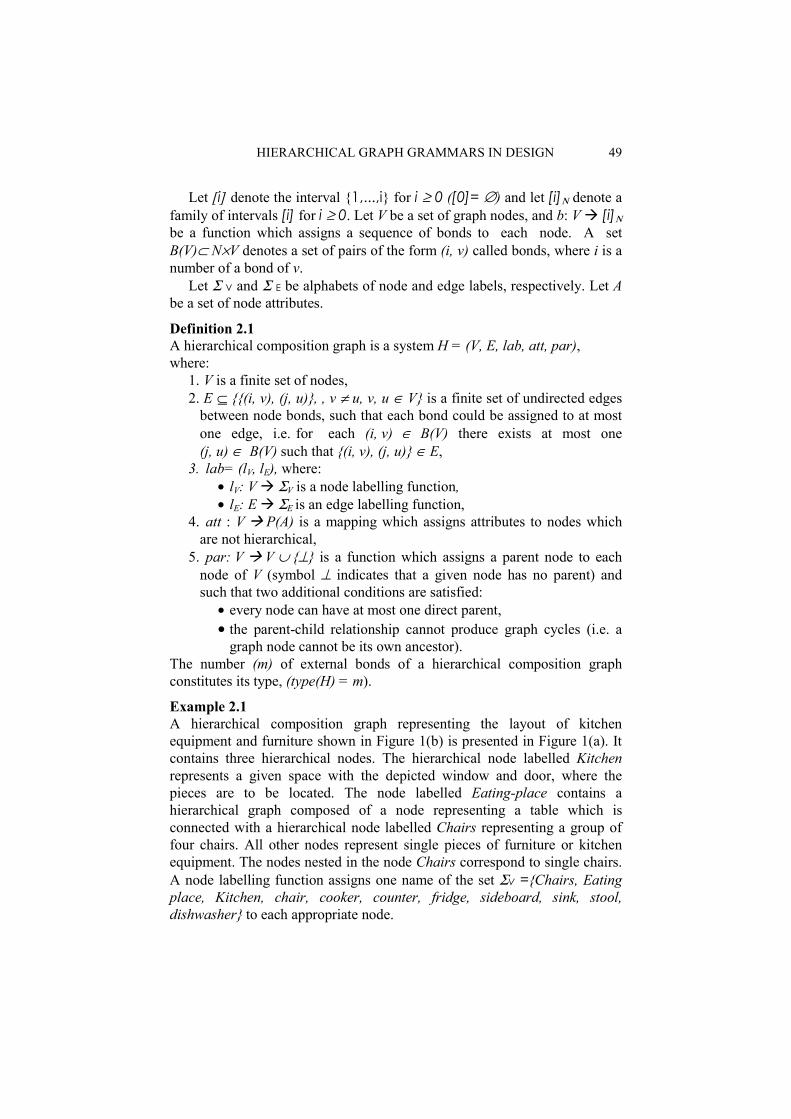
HIERARCHICAL GRAPH GRAMMARS IN DESIGN 49
Let [i] denote the interval 1,...,i for i ≥ 0 ([0]= ∅) and let [i]Ν denote a family of intervals [i] for i ≥ 0. Let V be a set of graph nodes, and b: V [i]Ν be a function which assigns a sequence of bonds to each node. A set B(V)⊂ N×V denotes a set of pairs of the form (i, v) called bonds, where i is a number of a bond of v.
Let Σ V and Σ E be alphabets of node and edge labels, respectively. Let A be a set of node attributes.
Definition 2.1 A hierarchical composition graph is a system H = (V, E, lab, att, par), where:
1. V is a finite set of nodes, 2. E ⊆ (i, v), (j, u), , v ≠ u, v, u ∈ V is a finite set of undirected edges
between node bonds, such that each bond could be assigned to at most one edge, i.e. for each (i, v) ∈ B(V) there exists at most one (j, u) ∈ B(V) such that (i, v), (j, u) ∈ E,
3. lab= (lV, lE), where: • lV: V ΣV is a node labelling function, • lE: E ΣE is an edge labelling function,
4. att : V P(A) is a mapping which assigns attributes to nodes which are not hierarchical,
5. par: V V ∪ ⊥ is a function which assigns a parent node to each node of V (symbol ⊥ indicates that a given node has no parent) and such that two additional conditions are satisfied:
• every node can have at most one direct parent, • the parent-child relationship cannot produce graph cycles (i.e. a
graph node cannot be its own ancestor). The number (m) of external bonds of a hierarchical composition graph constitutes its type, (type(H) = m). Example 2.1 A hierarchical composition graph representing the layout of kitchen equipment and furniture shown in Figure 1(b) is presented in Figure 1(a). It contains three hierarchical nodes. The hierarchical node labelled Kitchen represents a given space with the depicted window and door, where the pieces are to be located. The node labelled Eating-place contains a hierarchical graph composed of a node representing a table which is connected with a hierarchical node labelled Chairs representing a group of four chairs. All other nodes represent single pieces of furniture or kitchen equipment. The nodes nested in the node Chairs correspond to single chairs. A node labelling function assigns one name of the set ΣV =Chairs, Eating place, Kitchen, chair, cooker, counter, fridge, sideboard, sink, stool, dishwasher to each appropriate node.
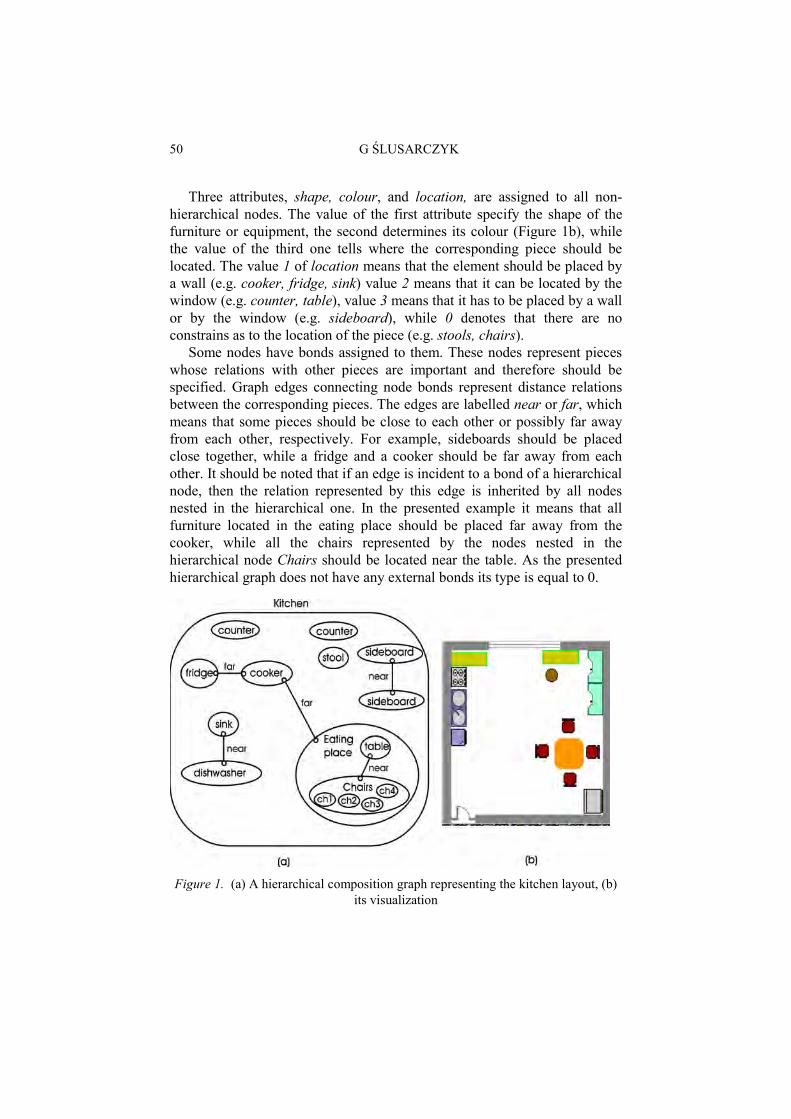
50 G ŚLUSARCZYK
Three attributes, shape, colour, and location, are assigned to all non-hierarchical nodes. The value of the first attribute specify the shape of the furniture or equipment, the second determines its colour (Figure 1b), while the value of the third one tells where the corresponding piece should be located. The value 1 of location means that the element should be placed by a wall (e.g. cooker, fridge, sink) value 2 means that it can be located by the window (e.g. counter, table), value 3 means that it has to be placed by a wall or by the window (e.g. sideboard), while 0 denotes that there are no constrains as to the location of the piece (e.g. stools, chairs).
Some nodes have bonds assigned to them. These nodes represent pieces whose relations with other pieces are important and therefore should be specified. Graph edges connecting node bonds represent distance relations between the corresponding pieces. The edges are labelled near or far, which means that some pieces should be close to each other or possibly far away from each other, respectively. For example, sideboards should be placed close together, while a fridge and a cooker should be far away from each other. It should be noted that if an edge is incident to a bond of a hierarchical node, then the relation represented by this edge is inherited by all nodes nested in the hierarchical one. In the presented example it means that all furniture located in the eating place should be placed far away from the cooker, while all the chairs represented by the nodes nested in the hierarchical node Chairs should be located near the table. As the presented hierarchical graph does not have any external bonds its type is equal to 0.
Figure 1. (a) A hierarchical composition graph representing the kitchen layout, (b) its visualization
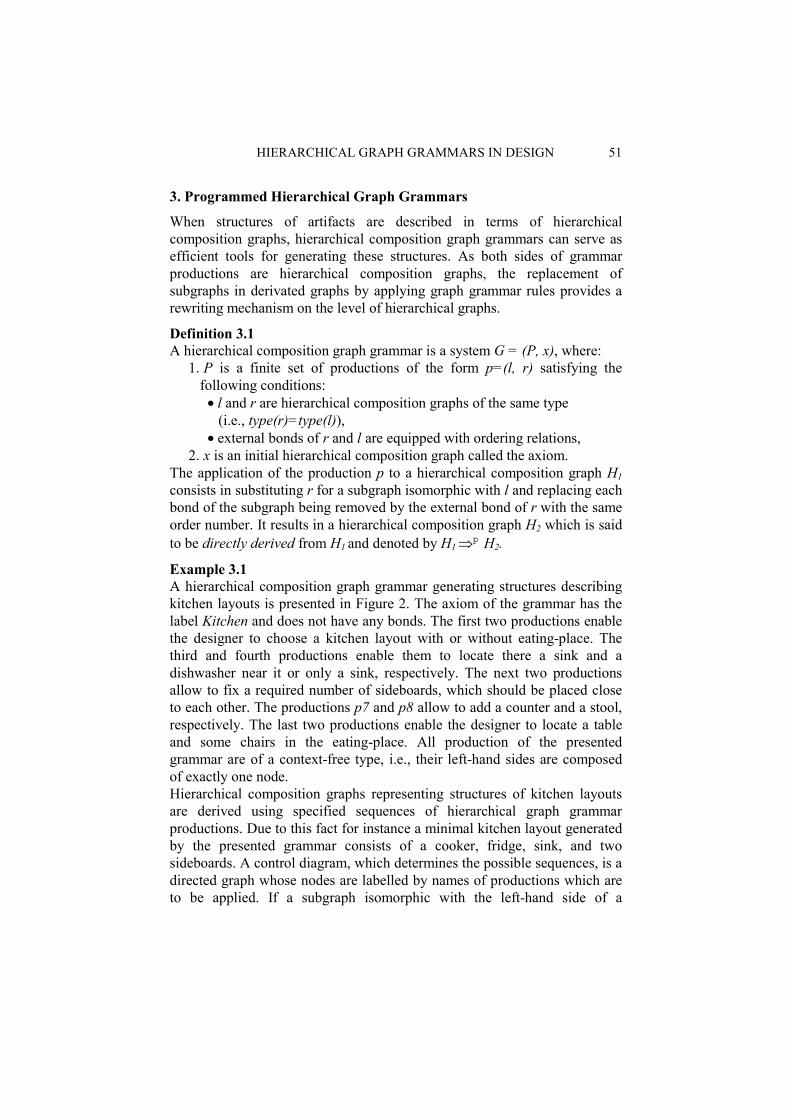
HIERARCHICAL GRAPH GRAMMARS IN DESIGN 51
3. Programmed Hierarchical Graph Grammars
When structures of artifacts are described in terms of hierarchical composition graphs, hierarchical composition graph grammars can serve as efficient tools for generating these structures. As both sides of grammar productions are hierarchical composition graphs, the replacement of subgraphs in derivated graphs by applying graph grammar rules provides a rewriting mechanism on the level of hierarchical graphs.
Definition 3.1 A hierarchical composition graph grammar is a system G = (P, x), where:
1. P is a finite set of productions of the form p=(l, r) satisfying the following conditions:
• l and r are hierarchical composition graphs of the same type (i.e., type(r)=type(l)), • external bonds of r and l are equipped with ordering relations,
2. x is an initial hierarchical composition graph called the axiom. The application of the production p to a hierarchical composition graph H1 consists in substituting r for a subgraph isomorphic with l and replacing each bond of the subgraph being removed by the external bond of r with the same order number. It results in a hierarchical composition graph H2 which is said to be directly derived from H1 and denoted by H1
p H2.
Example 3.1 A hierarchical composition graph grammar generating structures describing kitchen layouts is presented in Figure 2. The axiom of the grammar has the label Kitchen and does not have any bonds. The first two productions enable the designer to choose a kitchen layout with or without eating-place. The third and fourth productions enable them to locate there a sink and a dishwasher near it or only a sink, respectively. The next two productions allow to fix a required number of sideboards, which should be placed close to each other. The productions p7 and p8 allow to add a counter and a stool, respectively. The last two productions enable the designer to locate a table and some chairs in the eating-place. All production of the presented grammar are of a context-free type, i.e., their left-hand sides are composed of exactly one node. Hierarchical composition graphs representing structures of kitchen layouts are derived using specified sequences of hierarchical graph grammar productions. Due to this fact for instance a minimal kitchen layout generated by the presented grammar consists of a cooker, fridge, sink, and two sideboards. A control diagram, which determines the possible sequences, is a directed graph whose nodes are labelled by names of productions which are to be applied. If a subgraph isomorphic with the left-hand side of a
52 G ŚLUSARCZYK
production which should be used is not found in a generated composition graph, the production will not be applied.
Figure 2. A context-free hierarchical composition graph grammar generating structures representing kitchen layouts
Definition 3.2 Let G = (P, x) be a hierarchical composition graph grammar. Let Ω = I, F ∪ p1,...,pm, where m = #P, be a set of node labels. A control diagram for G is a directed node labelled graph CD = (V, E, l), where:
• V is a finite set of nodes, • E ⊆ V x V is a finite set of directed edges, • l : V Ω is a node labeling function, such that there exists exactly one
node labelled I and exactly one node labelled F, • there is no edge incoming to the node labelled I and no edge coming
out from the node labelled F.
Definition 3.3 A pair (G, CD), where G is a hierarchical composition graph grammar and CD is a control diagram defined for G, is called a programmed hierarchical composition graph grammar.

HIERARCHICAL GRAPH GRAMMARS IN DESIGN 53
It should be noted that although a control diagram for a graph grammar determines the order in which the productions should be applied, it still leaves the possibility of producing a variety of design alternatives as a great or even infinite number of paths leading to different solutions can be specified.
Definition 3.4 Let (G, CD) be a programmed hierarchical composition graph grammar. Let c1 and c2 be two hierarchical composition graphs and p =(l, r) be a production of G. Let v1 and v2 be two nodes of CD and p be the label of v2. The pair (c2, v2) is directly derived from the pair (c1, v1) ((c1, v1) (c2, v2)) iff:
• c1 p c2 and there exists an edge e=(v1, v2) ∈ E of CD, or
• x p c2, where x= c1 is an axiom of G, and there exists an edge e=(v1, v2) ∈ E of CD, where l(v1)=I, or • c1 = c2 and there exists an edge e=(v1, v2) ∈ E of CD, where l(v2)=F.
Definition 3.5 Let Gp = (G, CD) be a programmed hierarchical composition graph grammar and let vI and vF denote the initial and final nodes of the CD, respectively. A language generated by Gp is defined as L(Gp) = c| (x, vI) * (c, vF ). Example 3.2 A control diagram for a hierarchical composition graph grammar generating structures of kitchen layouts, shown in Figure 2, is presented in Figure 3. The number of generated nodes corresponding to furniture and equipment depends on the chosen path. Each path from the node labelled I to the node labelled F represents one possible way of obtaining a hierarchical graph representing a potential solution. Application of a production sequence p2, p3, p6, p7, p8, p9, 4 x p10, p7 results in the hierarchical graph shown in Figure 1a.
Figure 3. A control diagram for the hierarchical graph grammar from Figure 2
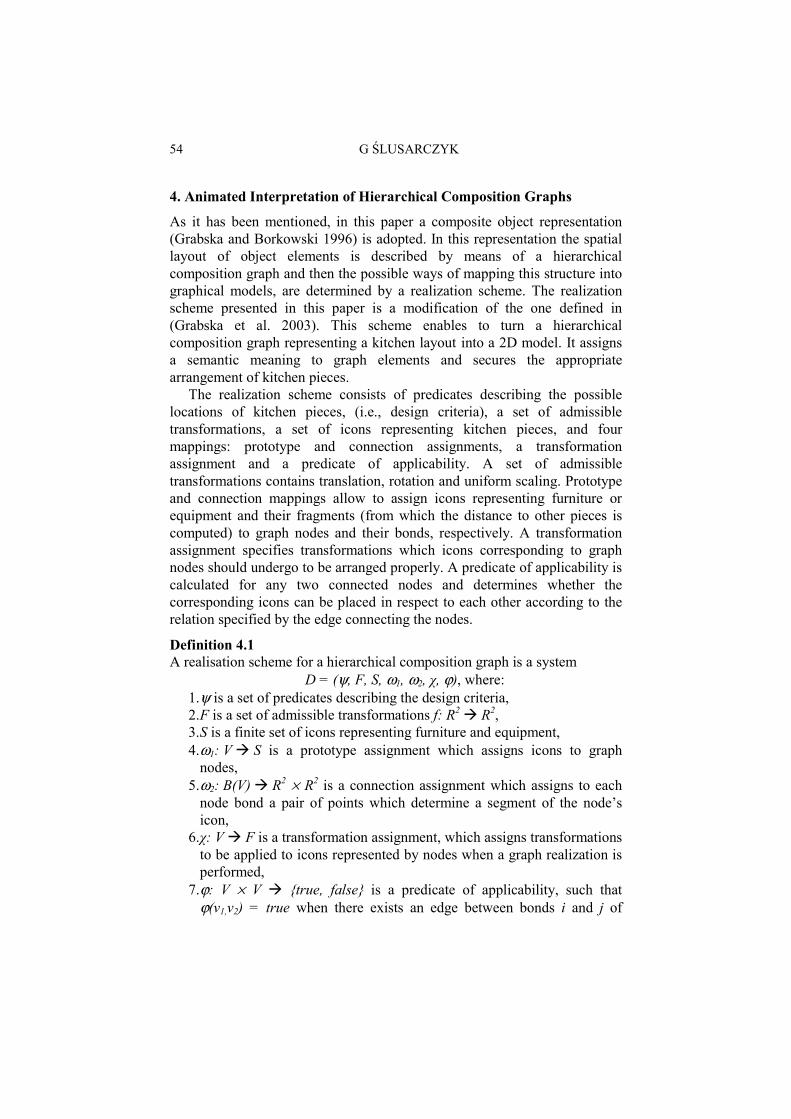
54 G ŚLUSARCZYK
4. Animated Interpretation of Hierarchical Composition Graphs
As it has been mentioned, in this paper a composite object representation (Grabska and Borkowski 1996) is adopted. In this representation the spatial layout of object elements is described by means of a hierarchical composition graph and then the possible ways of mapping this structure into graphical models, are determined by a realization scheme. The realization scheme presented in this paper is a modification of the one defined in (Grabska et al. 2003). This scheme enables to turn a hierarchical composition graph representing a kitchen layout into a 2D model. It assigns a semantic meaning to graph elements and secures the appropriate arrangement of kitchen pieces.
The realization scheme consists of predicates describing the possible locations of kitchen pieces, (i.e., design criteria), a set of admissible transformations, a set of icons representing kitchen pieces, and four mappings: prototype and connection assignments, a transformation assignment and a predicate of applicability. A set of admissible transformations contains translation, rotation and uniform scaling. Prototype and connection mappings allow to assign icons representing furniture or equipment and their fragments (from which the distance to other pieces is computed) to graph nodes and their bonds, respectively. A transformation assignment specifies transformations which icons corresponding to graph nodes should undergo to be arranged properly. A predicate of applicability is calculated for any two connected nodes and determines whether the corresponding icons can be placed in respect to each other according to the relation specified by the edge connecting the nodes.
Definition 4.1 A realisation scheme for a hierarchical composition graph is a system D = (ψ, F, S, ω1, ω2, χ, ϕ), where:
1. ψ is a set of predicates describing the design criteria, 2. F is a set of admissible transformations f: R2 R2, 3. S is a finite set of icons representing furniture and equipment, 4. ω1: V S is a prototype assignment which assigns icons to graph
nodes, 5. ω2: B(V) R2 × R2 is a connection assignment which assigns to each
node bond a pair of points which determine a segment of the node’s icon,
6. χ: V F is a transformation assignment, which assigns transformations to be applied to icons represented by nodes when a graph realization is performed,
7. ϕ: V × V true, false is a predicate of applicability, such that ϕ(v1,v2) = true when there exists an edge between bonds i and j of
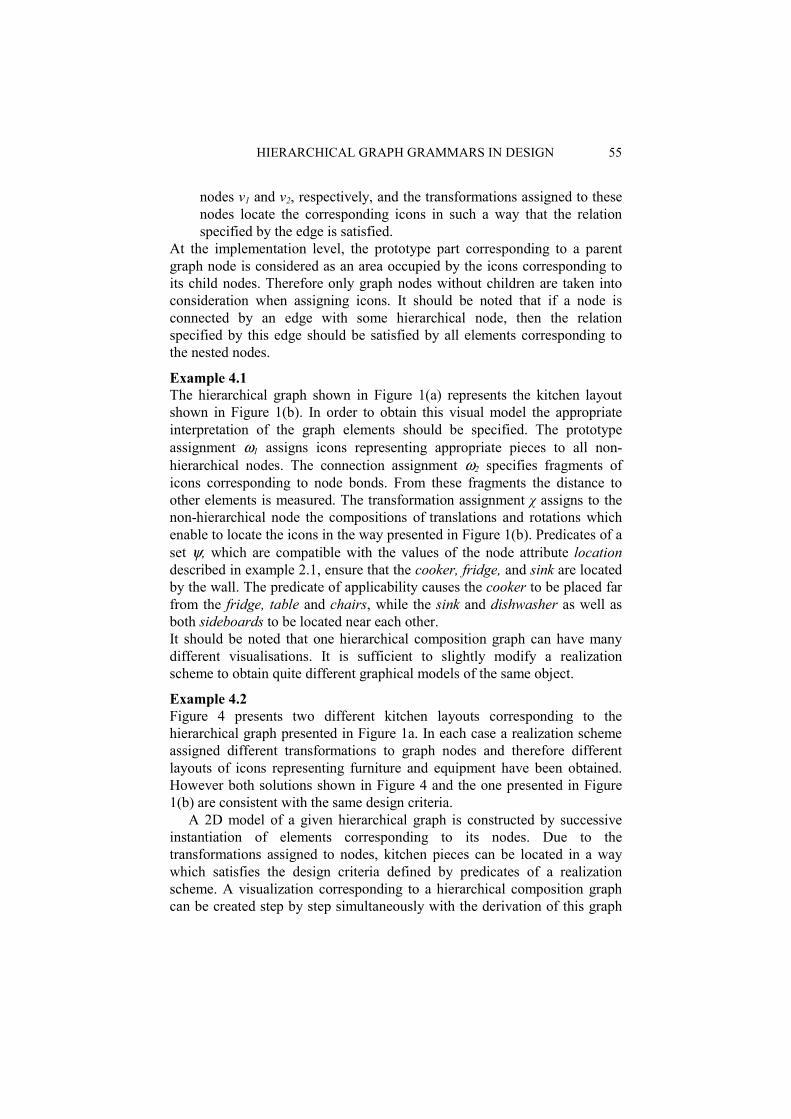
HIERARCHICAL GRAPH GRAMMARS IN DESIGN 55
nodes v1 and v2, respectively, and the transformations assigned to these nodes locate the corresponding icons in such a way that the relation specified by the edge is satisfied.
At the implementation level, the prototype part corresponding to a parent graph node is considered as an area occupied by the icons corresponding to its child nodes. Therefore only graph nodes without children are taken into consideration when assigning icons. It should be noted that if a node is connected by an edge with some hierarchical node, then the relation specified by this edge should be satisfied by all elements corresponding to the nested nodes.
Example 4.1 The hierarchical graph shown in Figure 1(a) represents the kitchen layout shown in Figure 1(b). In order to obtain this visual model the appropriate interpretation of the graph elements should be specified. The prototype assignment ω1 assigns icons representing appropriate pieces to all non-hierarchical nodes. The connection assignment ω2 specifies fragments of icons corresponding to node bonds. From these fragments the distance to other elements is measured. The transformation assignment χ assigns to the non-hierarchical node the compositions of translations and rotations which enable to locate the icons in the way presented in Figure 1(b). Predicates of a set ψ, which are compatible with the values of the node attribute location described in example 2.1, ensure that the cooker, fridge, and sink are located by the wall. The predicate of applicability causes the cooker to be placed far from the fridge, table and chairs, while the sink and dishwasher as well as both sideboards to be located near each other. It should be noted that one hierarchical composition graph can have many different visualisations. It is sufficient to slightly modify a realization scheme to obtain quite different graphical models of the same object.
Example 4.2 Figure 4 presents two different kitchen layouts corresponding to the hierarchical graph presented in Figure 1a. In each case a realization scheme assigned different transformations to graph nodes and therefore different layouts of icons representing furniture and equipment have been obtained. However both solutions shown in Figure 4 and the one presented in Figure 1(b) are consistent with the same design criteria.
A 2D model of a given hierarchical graph is constructed by successive instantiation of elements corresponding to its nodes. Due to the transformations assigned to nodes, kitchen pieces can be located in a way which satisfies the design criteria defined by predicates of a realization scheme. A visualization corresponding to a hierarchical composition graph can be created step by step simultaneously with the derivation of this graph
56 G ŚLUSARCZYK
(using productions of a given hierarchical graph grammar) by locating icons represented by non-hierarchical nodes created in the successive stages of the generation process.
Figure 4. Different results of applying slightly modified realization schemes to the
graph presented in Figure 1(a)
Example 4.3 The first two steps, which use productions p2 and p3, in a derivation of a composition graph presented in Figure 1a together with the corresponding visualizations (partial solutions), which are simultaneously generated, are shown in Figure 5. After applying the production p2, the fridge, cooker and one sideboard are located. After applying the third production next two elements, namely the sink and dishwasher, are added to the model. At each step of derivation the obtained hierarchical composition graph can be mapped into various graphical models representing different partial solutions by instantiating icons corresponding to non-hierarchical nodes that represent pieces of furniture or equipment. Therefore it seems to be useful to create one graphical model and then animate it by moving the icons in a way consistent with the defined designed criteria. Thus many various possible arrangements of furniture and equipment are presented to the designer at each stage of the design process. While inspecting visualized partial solutions the designer is able to find new elements and generate new concepts or take decisions about required modifications.
Example 4.4 Three different arrangements of kitchen pieces corresponding to the composition graph obtained after two steps of derivation are shown in Figure 6.
5. Heuristic Methods in Design
Some new requirements of a design task are invented only while partial solutions are inspected. The design issues and requirements, which emerge
HIERARCHICAL GRAPH GRAMMARS IN DESIGN 57
when the design process goes on, lead to modifications of solutions being generated. In order to enable the designer making modifications of partial solutions before final ones are obtained, undo and modifying rules are added to a hierarchical composition graph grammar. At each step of a graph derivation the designer can use an undo rule, which enables them to go back one step in generation, or one of the modifying rules admissible at that point.
Figure 5. Two steps of derivation and the corresponding visualizations
Figure 6. Three different visualisations being partial solutions of a design task
The undo rules allow to go back step by step along the chosen derivation path and restart the search for a solution along another path. We obtain undo rules by exchanging places of the right and left-hand sides of generating productions of a given hierarchical composition graph grammar. The
58 G ŚLUSARCZYK
application of each undo rule consists in substituting the right-hand side for a subgraph isomorphic with the left-hand side of the rule. It should be noted that if a generating production has on its right-hand side a hierarchical node with the same label as the node on its left-hand side (i.e., it nests some nodes in another node), then in the corresponding undo rule this node becomes a context and the undo rule removes all its child nodes. Therefore some undo rules are not context-free.
Example 5.1 The undo rules u5-u8 corresponding to the productions p5-p8 of the grammar presented in Figure 2 are shown in Figure 7. The rules u7 and u8 are context ones and enable us to remove a counter and a stool, respectively, from a kitchen layout.
Figure 7. Four undo rules corresponding to the productions p5-p8 of the grammar presented in Figure 2
Let us assume that after application of the production sequence p2, p3, p5 and p6 (according to the control diagram) the designer obtained a composition graph presented in Figure 8(a) and a visualization of the corresponding kitchen layout with three sideboards inside as shown in Figure 8(b). Then the designer notices that in such a configuration there would not be enough place for a table and chairs and decides to place there only two sideboards. He/she applies the undo rules u6 and u5 (and obtains as the result the last composition graph presented in Figure 5) and then applies again the generating production p6. However in the same case, if the designer wants to remove a dishwasher instead of one sideboard, before applying the proper undo rule u3 (corresponding to the production p3) they need to apply the undo rules u6 and u5 what destroys the previously fixed configuration of sideboards.
It should be stressed that undo rules are useful only when the last generated part of the structure is to be changed. In all other cases backtracking destroys these parts of the structure which have been produced later then the fragment that is to be modified. Therefore also modifying rules

HIERARCHICAL GRAPH GRAMMARS IN DESIGN 59
are added to a hierarchical composition graph grammar. Application of these rules causes local modifications of a graph structure without changing other parts.
Figure 8. A hierarchical composition graph and a corresponding visualisation
Modification rules which have on the left-hand sides hierarchical nodes are not context-free. Moreover, as productions of a hierarchical graph grammar must be constructed in such a way that a hierarchical node cannot be removed without its child nodes (Palacz 2004), all nested nodes of each hierarchical node should be specified on the left-hand side of a rule. However, a hierarchical node can have many various contents and for each one a different rule would be needed. On the other hand, the designer often wants to remove a hierarchical node whatever configuration of child nodes it contains. Thus rules with variables, where one variable can be nested in each hierarchical node of the production left-hand side, are used (Palacz 2003). When such a rule is matched against a graph being derived, all variables present on the left-hand side are instantiated. To each variable a set of all child nodes of the hierarchical node this variable is nested in is assigned.
This problem is not present in case of undo rules. As the rules of this type are always applied in the order reverse to the one in which generating rules have been used, all child node of a given hierarchical node are explicitly specified or removed before their parent node is erased.
Example 5.2 Ten modification rules which are useful for the problem of designing kitchen layouts are presented in Figure 9. The first rule (m1) enables the designer to remove all equipment and furniture of the generated layout which does not satisfy them and restart the design process from the beginning. The second and third rules are inverted to each other and enable us to add a dishwasher near a sink or remove it, respectively. In the analogous way, the fourth and
60 G ŚLUSARCZYK
fifth rules are also inverted to each other and allow to add one more sideboard or remove one, respectively. The sixth, seventh and eighth rules are the same as the undo rules u8, u7 shown in Figure 7 and the one which is inverted to the generating production p10, respectively. They enable us to remove stools, counters and chairs from the kitchen layouts. The modifying rule m9 enables the designer to resign of an eating-place whatever furniture has been placed there, while m10 rule allows to remove all chairs and to leave in an eating part of the kitchen only a table.
The rules m1, m9 and m10 contain variables nested in hierarchical nodes of their left-hand sides. While these productions are applied, all nodes nested in the nodes labelled Kitchen, Eating place and Chairs are assigned to the variables, respectively. By adding undo and modifying rules to a hierarchical composition graph grammar we obtain a heuristic version of this grammar.
Figure 9. Modifying rules for designing a kitchen layout
HIERARCHICAL GRAPH GRAMMARS IN DESIGN 61
Definition 5.1 A heuristic hierarchical composition graph grammar is a system
HG = (P’, x), where: 1. P’ = P ( U ( M is a finite set of productions of the form as in definition
3.1, where: • P is a finite set of generating rules, i.e., these rules are alone
sufficient to generate a set of admissible solutions, • U is a finite set of undo rules such that for each production of P there
exists exactly one corresponding undo rule, • M is a finite set of modifying rules which can contain variables
on the left-hand sides and enable the designer to make local modifications of graphs being derived using productions of P,
2. x is an initial hierarchical composition graph called the axiom of the grammar.
The application of each production of P’ of a heuristic grammar HG to a given hierarchical composition graph is done in the same way as it was described for productions of a hierarchical composition graph grammar.
Modifying rules are also added to a control diagram. In this way a design control diagram (DCD), which determines the possible sequences of generating and modifying rules, is obtained. The undo rules are not depicted in a DCD as it obvious that immediately after applying a generating production the corresponding undo rule can be used.
Definition 5.2 Let HG = (P ∪ U ∪ M, x) be a heuristic hierarchical composition graph grammar. Let Ω’ = I, F ∪ p1,...,pn ∪ m1,…,mk, where n = #P and k = #M, be a set of node labels. A design control diagram for HG is a node labelled graph DCD = (V’, E’, l’), where:
1. V’ = VP ∪ VM ∪ vI, vF is a finite set of nodes with the distinguished initial and final one,
2. l’: V’ P(Ω’) is a node labeling function, such that: • l’: VP p1,...,pn assigns to each node of VP a name of one
generating production of P, • l’: VMP(m1,…,mk) assigns to each node of VM a subset of names
of modifying rules of M, • l’(vI) = I and l’(vF) = F,
3. E’ = ED ∪ EN is a finite set of edges, where: • ED ⊆ VP ∪ vI × VP ∪ vF and for each e =(vi, vj) ∈ ED l’(vi), l’(vj)
∈ p1,...,pn, i.e., edges of ED are directed and connect nodes with labels of p1,...,pn, I, F,
62 G ŚLUSARCZYK
• EN contains edges of the form e = vi, vj, where vi ∈ VP, vj ∈ VM, or e = (vi, vj), where vi ∈ VP and vj ∈ VM, or vi ∈ VM and vj ∈ V’- VM, i.e., edges of EN are directed or undirected and connect nodes labelled by subsets of m1,…,mk with nodes of V’- VM .
Definition 5.3 A pair (HG, DCD), where HG is a heuristic hierarchical composition graph grammar and DCD is a control diagram defined for HG, is called a programmed heuristic hierarchical composition graph grammar.
It should be noted that in DCD nodes of VM are labelled by subsets of names corresponding to modifying rules. These nodes are connected by undirected or directed edges with other types of nodes. If a node vi labelled by a name of a generating production pi is connected by an undirected edge with a node vj of VM, it means that after application of the production pi to the graph being derivated any modifying rule listed in the label of the node vj can be applied assuming that its left-hand side can be matched against the source graph. Then the design control goes back to the node vi and the generation using productions whose names label target nodes of edges coming out of vi can be continued or another modifying rule named in the label of vj can be applied. In case of a directed edge connecting a node vi labelled by a name of a production pi with a node vj of VM, after application of a modifying rule named in the label of vj only one of the productions whose names label target nodes of edges coming out of vj can be applied. The generation process can be started from the beginning if the target node of an edge coming out of vj is labelled I. In contrast to the control diagram from definition 3.2 in a DCD there can be edges coming into the initial node as the designer sometimes wants to completely discard the solution generated so far and start the whole design process again.
Example 5.3 A design control diagram for a task of planning kitchen layouts is presented in Figure 10. There are five nodes labelled by subsets of ten possible modifying rules. It can be seen that after the number of sideboards is fixed using productions p5 and p6 the layout can be modified to contain or not a dishwasher by modifying rules m2 or m3, respectively. After applying productions p7, p8 and p10 various parts of layouts generated so far may be modified using rules m2-m10. The application of modifying rule m1 brings the designer to the starting point again.
For example, let us assume that the designer after applying the sequence p2, p3, p6, p7, p9, 3× p10 and 2× p8 of productions obtained a hierarchical composition graph and a corresponding visualization shown in Figures 11(a) and 11(b), respectively. Then he/she decides that this layout would not be comfortable as the furniture are too close to each other. So they resigns of

HIERARCHICAL GRAPH GRAMMARS IN DESIGN 63
the eating place at all by applying modifying rule m9 and instead adds two more sideboards by applying two times modifying rule m4. It should be noted that due to the possibility of applying modifying rules at different steps of graph derivation in order to change the number of sideboards there is no longer any need to backtrack the diagram to the node labelled p5. The obtained hierarchical composition graph and one of the corresponding visualizations are shown in Figures 12(a) and 12(b), respectively.
A language generated by a programmed heuristic hierarchical composition graph grammar contains many more admissible solutions than the language generated by grammar Gp without modifying rules.
Figure 10. A design control diagram for kitchen layout planning
Figure 11. A composition graph and a visualisation of a kitchen layout before
modifications

64 G ŚLUSARCZYK
Definition 5.4 Let (HG, DCD) be a programmed heuristic hierarchical composition graph grammar. Let c1 and c2 be two hierarchical composition graphs and p =(l, r) be a production of HG named p. Let v1 and v2 be two nodes of DCD. The pair (c2, v2) is directly derived from the pair (c1, v1) ((c1, v1) (c2, v2)) iff:
• c1 p c2 and there exists an edge e=(v1,v2)∈E’ of DCD and p ⊆ l’(v2), • c1 p c2, v1=v2 and there exists an edge e=v1, vj, vj ∈ VM, p ⊆ l’(vj) • c1 p c2, p ∈ U and there exists an edge e=(v2, v1) ∈ ED of DCD and
p’= l’(v1), where p is the undo rule inverse to p’ and (c1, v1) was directly derived from the pair (c2, v2) using p’,
• x p c2, where x= c1 is an axiom of HG, and there exists an edge e=(vI, v2) ∈ ED of DCD and p = l’(v2),
• c1 = c2 and there exists an edge e=(v1, vI) or e=(v1, vF) ∈ E’ of DCD.
Definition 5.5 Let HGp be a programmed heuristic hierarchical composition graph grammar. A language generated by HGp is defined as L(HGp) = c| (x, vI) * (c, vF ).
Figure 12. A composition graph and a visualisation of a kitchen layout after
modifications
6. Conclusions
The design process lies in the interaction of the constraints and the design context with the graph rewriting rules used to generate the object structure, as well as in the co-ordination of subsequent derivation steps managed through the design control diagram. The presented approach, which
HIERARCHICAL GRAPH GRAMMARS IN DESIGN 65
combines heuristic methods with generating power of hierarchical graph grammars, considerably expands the space of solutions. The animated visualization of partial solutions at successive stages of the design process allows to inspect many possible variants of component arrangements and supports the designer in choosing the proper direction of search. Adding modifying rules to a composition graph grammar and to a control diagram enables the designer to act accordingly to new ideas and requirements which emerge during the design process. The required local modifications can be done without changing or destroying the previously generated other substructures.
So far we have used the hierarchical graph grammars equipped with control diagrams in the domain of architecture to generate floor layouts (Borkowski et al. 1999) and in the domain of engineering to generate truss structures (Borkowski et al. 2003). However, this paper presents our first attempt to combine the previous approach with heuristic methods. The described system arranges equipment and furniture in different types of rooms (living room, bedroom, kitchen, bathroom).
In Grabska et al. (2003) the system, which implements realization schemes for hierarchical composition graphs and generates graphical models of designed objects in the form of VRML scenes, has been described. In future we would like to create a 3D scene corresponding to each 2D visualisation chosen from animated views of structures represented by hierarchical graphs obtained during the design process. Such a 3D scene could be navigated through and the relations among kitchen furniture and equipment could be checked precisely.
References Bunke, H: 1983, Graph grammars as a generative tool in mage understanding, LNCS 153: 8-
19. Borkowski, A, Grabska, E and Szuba, J: 1999, Visualisation of graphs in ArchiCAD, LNCS
1774: 241-246. Borkowski, A, Grabska, E, Nikodem, P and Strug, B: 2003, Searching for innovative
structural layouts by means of graph grammars and evolutionary optimization, System-based Vision for Strategic and Creative Design, Swets & Zeitlinger, Lisse, 599(1): 475-480.
Chandrasekaran, B: 1990, Design problem solving: A task analysis, AI Magazine, Winter 1990: 59-71.
Eastman, CM: 1971, Heuristic algorithms for automated space planning, Pittsburgh, Pennsylvania, Carnegie-Mellon University, Institute for Physical Planning, Report no.17.
Eastman, CM: 1973, Automated space planning, Artificial Intelligence 4: 41-64. Gottler, H: 1983, Attributed graph grammars for graphics, LNCS 153: 130-142. Grabska, E: 1993, Theoretical concepts of graphical modelling, Part two: CP-graph grammars
and languages, Machine GRAPHICS and VISION 2(2): 149-178.

66 G ŚLUSARCZYK
Grabska, E and Borkowski, A: 1996, Assisting creativity by composite representation, in JS Gero and F Sudweeks (eds), Artificial Intelligence in Design'96, Kluwer, Dordrecht, pp. 743-759.
Grabska, E, Ślusarczyk, G and Niewiadomska, A: 2001, Hierarchical graph grammars in graphic prints design and generation, Machine GRAPHICS and VISION 10: 519-536.
Grabska, E, Ślusarczyk, G and Papiernik, K: 2003, Interpretation of objects represented by hierarchical graphs, KOSYR 2003, Wrocław, pp. 287-293.
Hliniak-Ślusarczyk, G: 1999, Graph operations and graph rewriting in graphic design, PhD Thesis, PAS, Warszawa.
Mitchell, W: 1977, Computer-Aided Architectural Design, Charter Publishers, New York. Palacz, W: 2003, Designing with hierarchical hypergraphs and algebraic transformation rules
with variables, KOSYR 2003, Wrocław, pp. 301-306. Palacz, W: 2004, Algebraic hierarchical graph transformation, accepted for publication,
Journal of Computer and System Sciences 64 (3): 497-520. Pfefferkorn, CE: 1975, The design problem solver: A system for designing equipment or
furniture layouts, in CM Eastman (ed), Spatial Synthesis in Computer-Aided Building Design, New York, Wiley.
Stochel, T: 2002, Aranżacja wnętrz z użyciem javy, MSc Thesis, Jagiellonian University, Kraków.
Suwa, M, Gero, JS and Purcell, T: 2000, Unexpected discoveries and s-invention of design requirements: Important vehicles for a design process, Design Studies 21 (6): 539-567.
Ślusarczyk, G: 2003, Hierarchical hypergraph transformations in engineering design, Journal of Applied Computer Science 11 (2): 67-82.

SESSION 2
Sketches for and from collaboration Julie Heiser, Barbara Tversky and Mia Silverman
Sketching across design domains Claudia Eckert, Alan Blackwell, Mark Stacey and Chris Earl

JS Gero, B Tversky and T Knight (eds), Visual and Spatial Reasoning in Design III, 2004 Key Centre of Design Computing and Cognition, University of Sydney, pp 69-78
SKETCHES FOR AND FROM COLLABORATION
JULIE HEISER, BARBARA TVERSKY AND MIA SILVERMAN Stanford University, USA
Abstract. Pairs of collaborators worked side-by-side using a campus map to design and produce an optimal emergency rescue route. Co-present collaborators shared a map; remote partners were separated by a barrier and used separate maps. In the co-present condition, gestures on the maps, notably pointing and tracing, served to focus attention and to communicate solutions. A shared diagram increased the efficiency of the collaboration, the product of the collaboration, and the enjoyability of the collaboration.
1. Sketches Promote and Reflect Thought
Sketches, diagrams, graphics, visualizations, external representations--call them what you will—play numerous roles in thought and communication (e.g., Tversky 2001). They record information, to remind one’s self or to convey information and preserve it for others. They externalize internal thought, making it visible to self and others. They convert internal memory and mental manipulations to external memory and physical manipulations, relieving limited cognitive resources. They serve as a platform for inference, reasoning and insight. They capitalize on human spatial experience and reasoning facility by representing abstract concepts spatially. External representations can also serve to facilitate collaborations. This is the role we focus on here, though in facilitating collaboration, sketches can simultaneously facilitate memory, reasoning, and insight. Diagrams do multiple duties.
1.1. TASK: DESIGNING A RESCUE ROUTE COLLABORATIVELY
Before we illustrate many of the ways that external representations can facilitate collaborations, we describe the collaborative situation in which we have been studying. The task given to pairs of students was to find the most efficient route to rescue a certain number of injured people collected at centers on campus after an earthquake. Students were provided with a standard map of the Stanford campus annotated to show the roads blocked

70 J HEISER, B TVERSKY AND M SILVERMAN
off, the locations where injured are situated, and the number of injured at each location. The students’ task was to draw a route that would enable picking up 60 injured people in the shortest path. In the face-to-face condition, pairs shared a single campus map and produced a single sketch of the route they developed together. In the remote condition, pairs viewed separate but identical campus maps and sketched separate maps of the route they developed together. In the remote condition, the pairs sat next to each other, separated by a curtain, so that they could effortlessly hear each other. Thus, the major difference between the face-to-face and remote condition was whether participants viewed the external representations together or not. This difference had large effects on the nature and the outcome of the collaboration.
2. Process of Collaboration
2.1. SKETCHES CAPTURE JOINT ATTENTION
Despite conventions that speakers make eye contact with listeners in conversations, pairs in the face-to-face condition did not look at each other. The gaze of both participants was on the maps. What’s more, their conversation was directed at the maps, which served as a shared task focus. Pairs in the remote condition also looked at the maps, but they did not look together. In the face-to-face condition, pairs of participants were working in a coordinated fashion on the same subtask whereas in the remote condition, pairs of participants frequently split up the work and concentrated on separate subtasks, with coordination only at a relatively high level. Thus, pairs in the remote condition had separate task foci. Eye-gaze and task focus are evident in Figures 1 and 2 showing pairs of participants in the face-to-face and remote conditions respectively.
2.2. GESTURES ON SKETCHES
The sketch maps did not function alone. What was critical were the gestures participants made on the sketches. Gestures are an inevitable and natural element of speaking; blind children produce them even though they have never seen gestures (Iverson and Goldin-Meadow 1997). Because gestures, like diagrams, serve many roles, there have been a number of classifications for them (e.g., Goldin-Meadow 2003; McNeill 1992). All distinguish several higher order groups, among them, emblems like the OK sign or nodding “yes” or “no.” Emblems are lexicalized, that is, they serve much like spoken words. Another category of gesture is those that promote the discourse, gestures like beats, up and down hand movements timed with items on a list, or alternating hand movements corresponding to “on the one hand” and “on the other hand.” These serve to structure the discourse.
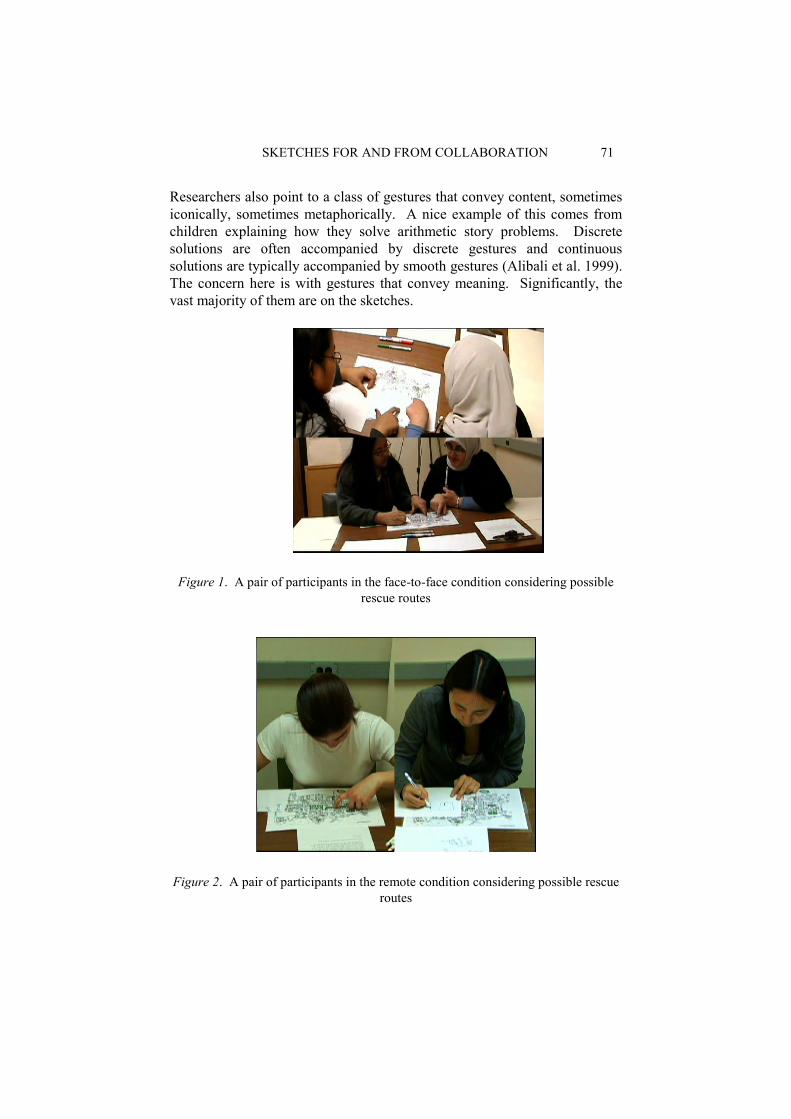
SKETCHES FOR AND FROM COLLABORATION 71
Researchers also point to a class of gestures that convey content, sometimes iconically, sometimes metaphorically. A nice example of this comes from children explaining how they solve arithmetic story problems. Discrete solutions are often accompanied by discrete gestures and continuous solutions are typically accompanied by smooth gestures (Alibali et al. 1999). The concern here is with gestures that convey meaning. Significantly, the vast majority of them are on the sketches.
Figure 1. A pair of participants in the face-to-face condition considering possible rescue routes
Figure 2. A pair of participants in the remote condition considering possible rescue routes

72 J HEISER, B TVERSKY AND M SILVERMAN
2.3. WHAT ARE GESTURES FOR?
This question arouses controversy (see Goldin-Meadow 2003 for a review of this and other topics). On one side are those who claim that gestures promote the gesturer’s cognition but are not communicative. They try to show that on the one hand, preventing speakers from gesturing interferes with their fluency and even with their cognitive agility (e.g., Krauss et al. 1991) and on the other hand, listeners learn nothing from the gestures that they did not learn from the words. On the other side are those who show that gestures can and do communicate (e.g., Goldin-Meadow 2003; Rogers 1978), conveying information that is available in the gestures but not in words. There is no reason that gestures, like spoken words and like diagrams, cannot do both; they can promote the thought of the gesturer and they can communicate to listeners. We find numerous examples of both in the collaborations we have studied, as well as other roles that gestures can serve, such as maintaining joint attention.
2.4. GESTURES ON SKETCHES FACILITATE COLLABORATION
2.4.1. Pointing Gestures on Sketches Establish Focus. The dominant gesture is pointing. A sketch is a large window, typically larger than the focus of attention, so a sketch is not sufficient to assure joint attention. To ensure joint focus, collaborators point to the relevant part of sketch, as is evident in the photographs above. Because focus is at a small portion of a larger sketch, it is harder to ensure joint attention in the remote condition than in the face-to-face condition. This may account in part for the interactive nature of face-to-face collaboration in contrast to the fractionated nature of remote collaboration. In face-to-face collaboration, both partners are working jointly on the same subtask most of the time whereas in remote collaboration, partners often work in parallel on different subtasks. Pointing does more than insure joint focus. Pointing also defines the suggested routes, along with a related gesture, tracing. More on this later.
2.4.2. Shared Sketches Promote Interactivity. The map, then, served as the focus of attention in both conditions, but in the face-to-face condition, in conjunction with gestures, maps served to insure a joint focus of attention. Pointing assured that face-to-face participants were looking at the same part of the map The remote collaborators could not do that; they had to establish joint reference on the map with circuitous language, not always worth the trouble. Having a shared diagram, hence a shared focus of attention, changed the nature of the collaboration: in the face-to-face condition, collaboration was a continuous, on-going process. In the remote condition, collaboration was disjointed and distributed. This was evidenced in the number of interchanges in the two conditions. There was
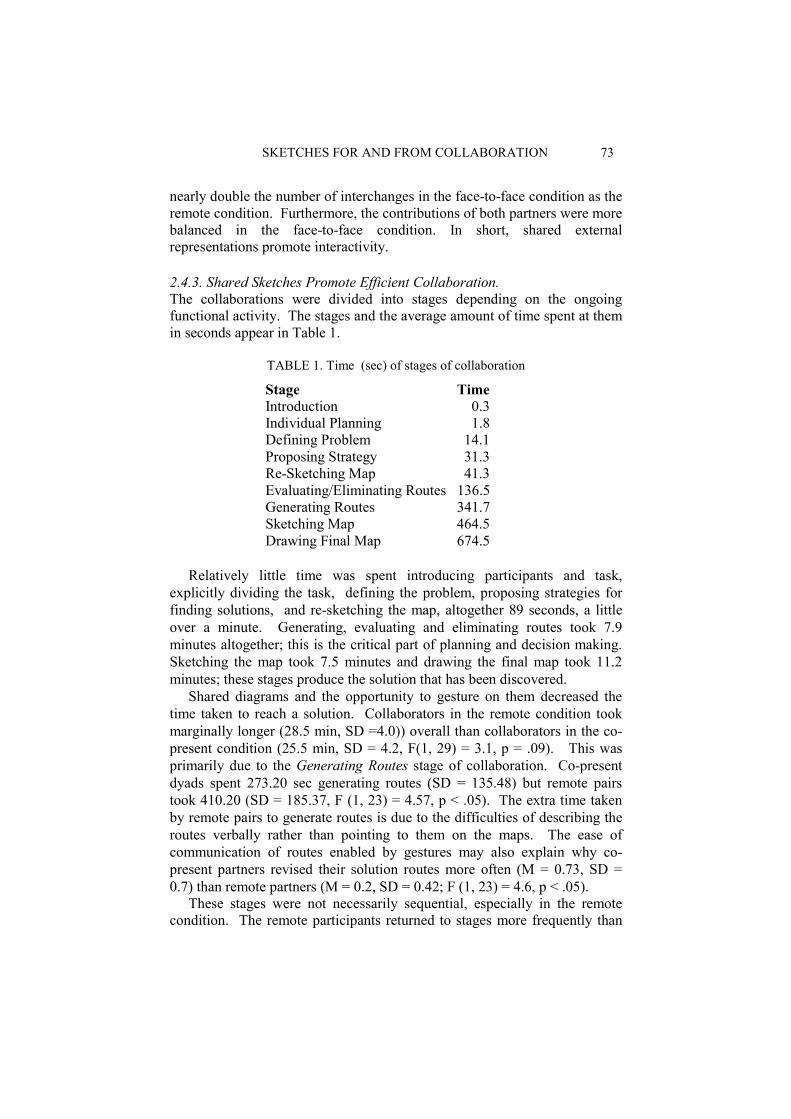
SKETCHES FOR AND FROM COLLABORATION 73
nearly double the number of interchanges in the face-to-face condition as the remote condition. Furthermore, the contributions of both partners were more balanced in the face-to-face condition. In short, shared external representations promote interactivity.
2.4.3. Shared Sketches Promote Efficient Collaboration. The collaborations were divided into stages depending on the ongoing functional activity. The stages and the average amount of time spent at them in seconds appear in Table 1.
TABLE 1. Time (sec) of stages of collaboration
Stage Time Introduction 0.3 Individual Planning 1.8 Defining Problem 14.1
Proposing Strategy 31.3 Re-Sketching Map 41.3 Evaluating/Eliminating Routes 136.5 Generating Routes 341.7
Sketching Map 464.5 Drawing Final Map 674.5
Relatively little time was spent introducing participants and task, explicitly dividing the task, defining the problem, proposing strategies for finding solutions, and re-sketching the map, altogether 89 seconds, a little over a minute. Generating, evaluating and eliminating routes took 7.9 minutes altogether; this is the critical part of planning and decision making. Sketching the map took 7.5 minutes and drawing the final map took 11.2 minutes; these stages produce the solution that has been discovered. Shared diagrams and the opportunity to gesture on them decreased the time taken to reach a solution. Collaborators in the remote condition took marginally longer (28.5 min, SD =4.0)) overall than collaborators in the co-present condition (25.5 min, SD = 4.2, F(1, 29) = 3.1, p = .09). This was primarily due to the Generating Routes stage of collaboration. Co-present dyads spent 273.20 sec generating routes (SD = 135.48) but remote pairs took 410.20 (SD = 185.37, F (1, 23) = 4.57, p < .05). The extra time taken by remote pairs to generate routes is due to the difficulties of describing the routes verbally rather than pointing to them on the maps. The ease of communication of routes enabled by gestures may also explain why co-present partners revised their solution routes more often (M = 0.73, SD = 0.7) than remote partners (M = 0.2, SD = 0.42; F (1, 23) = 4.6, p < .05).
These stages were not necessarily sequential, especially in the remote condition. The remote participants returned to stages more frequently than

74 J HEISER, B TVERSKY AND M SILVERMAN
the co-present participants in the Defining Problem stage (remote M = 1.4, SD = 0.84; co-present M = 0.73, SD = 0.59, F (1, 23) = 5.412, p < 0.03) and in the Proposing Strategy stage (remote M = 1.3, SD = 0.48, co-present M = 0.87, SD = 0.35, F (1, 23) = 6.76, p < 0.002).
The increase in overall time and the revisiting of previous stages are evidence that remote collaborations were less efficient than co-present. This conclusion is further supported by the relative frequencies of partners’ working on separate stages during the collaboration. This never happened in the co-present situation, but half the remote partners worked on different stages at some point during the problem-solving process.
2.4.4. Shared Sketches Promote Enjoyable Collaboration. The shared external representation also made the collaboration more enjoyable. Participants in the face-to-face condition enjoyed working on the task more than participants in the remote condition. Participants in the face-to-face condition gave significantly higher ratings to the statement “my partner and I worked well together” than pairs in the remote condition. In addition, participants in the face-to-face condition gave higher agreement to the statement “redrawing the map was important to solving the problem.”
2.4.5. Gesturing While Speaking: Construction of Joint Meaning. Language in the remote condition was complex and clumsy, requiring elaborate and often awkward spatial descriptions. What simplified the language for the face-to-face condition were gestures on the maps. Prominent among them were points and tracings. Locations could be established by pointing, typically along with a verbalized “here” or “there.” Proposing, altering, querying, and clarifying routes could be accomplished by tracing them on the map. Describing a location and especially a route literally required circumlocution in the remote conditions. Some of the major roles of the gestures on the map, then, were to propose or modify or clarify routes, allowing efficient establishment of joint understanding. The most common gestures on the sketches were forms of pointing and forms of tracing. Points were often used with deictic expressions, such as “here” and “there” as well as with referring nouns, such as names of buildings. Points in a single place were sometimes repeated for emphasis. When participants suggested routes, they did so by tracing the route on the map, stopping for each collection point. Subsequent offerings of the same or slightly revised route often indicated the route by a series of points on the collection areas rather than a continuous rendering of the route. Similarly, revisions were often suggested as a series of points rather than as a smooth tracing. On the whole, speakers took turns gesturing just as they took turns speaking. Quite often, though, a listener left a finger on the map as a placeholder. For example, there were several cases where a speaker did not

SKETCHES FOR AND FROM COLLABORATION 75
complete a route and the listener picked it up; in many of those cases, the original speaker left a finger pointing to the last location the speaker described. Gestures sometimes overlapped, for example, when one participant suggested an alteration of another’s route. Gesturing on the sketches, then, played a critical role in proposing, comprehending, and altering routes and thereby, in establishing the common ground necessary for effective decision making and planning.
2.4.6. Gestures While Listening: Comprehension and Memory. Gestures in the remote condition served entirely different functions. Instead of serving as communications to partners, gestures served as communications to self. Interestingly, they often accompanied listening rather than speaking, a phenomenon rarely if ever noted in the earlier literature. In face-to-face conversation, gestures are normally accompanied by speech, often tightly timed to speech (Clark 2004); listeners rarely gesture. The gestures listeners in the collaborative situation used seemed to function to understand a route proposed by a partner, and to rehearse it. Frequently, when a speaker in the remote condition proposed a route, a listener traced the route on the map with discrete pointing or continuous tracing, the pointing and tracing closely timed to the speaker’s speech. The pointing or tracing seemed to serve two functions: to comprehend the proposed route and to remember it. Whether such gestures actually function to improve comprehension and memory is a topic under current investigation.
3. Product of Collaboration
Better Maps in Less Time. All pairs in both conditions found efficient routes to rescue the injured. The face-to-face pairs and remote pairs were equally good in finding a route that rescued the most injured in the shortest time. However, the face-to-face group accomplished that in 25.5 minutes, compared to the remote groups’ average of 28.5 minutes. Importantly, the face-to-face groups also produced far superior maps. Producing a clear, complete, well-labeled map was part of the assignment. In a separate study, we had 16 new participants rate the effectiveness of each map produced in the collaboration experiment. They rated effectiveness on a 1-7 scale, 1 being poor and7 being excellent. Four of the five top-rated maps were produced by partners in the co-present condition. The top two campus maps, both by face-to-face collaborators, are depicted in Figure 3.
The ratings are supported by qualitative advantages to the maps produced by co-present collaborators. The maps produced by the face-to-face groups included more landmarks that indicated where turns should be taken, more landmarks on the paths to assure users that they are on the correct path, and
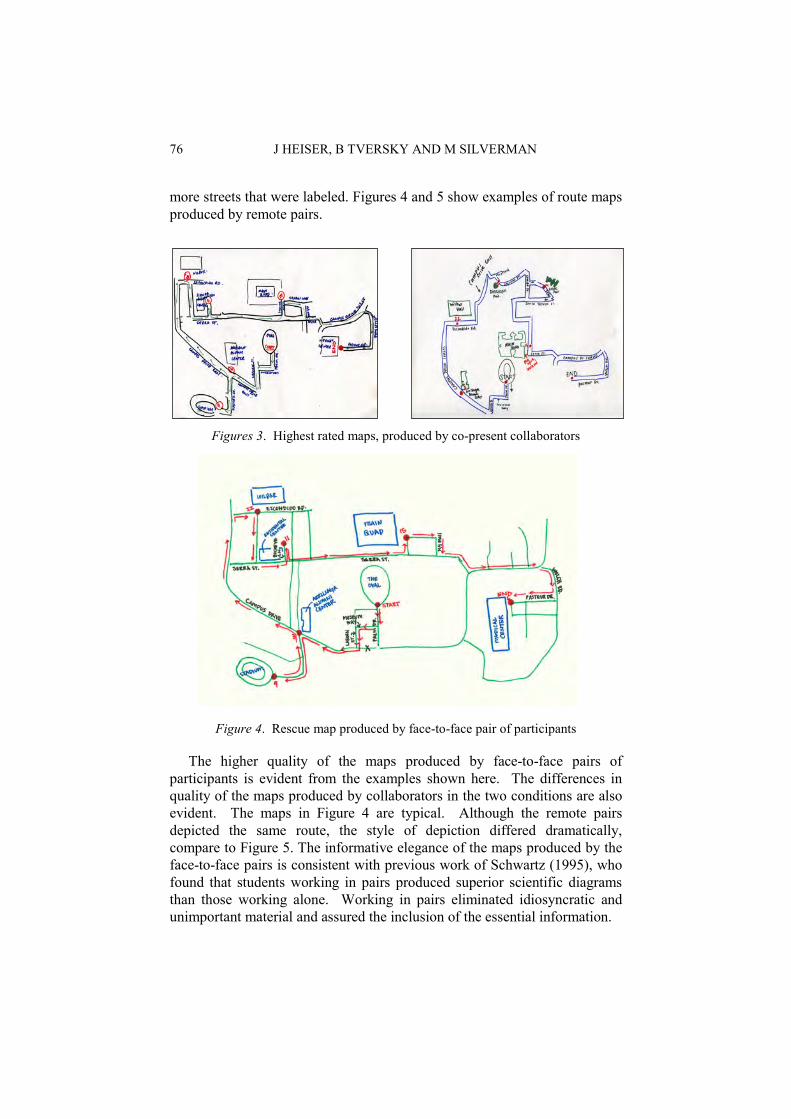
76 J HEISER, B TVERSKY AND M SILVERMAN
more streets that were labeled. Figures 4 and 5 show examples of route maps produced by remote pairs.
Figures 3. Highest rated maps, produced by co-present collaborators
Figure 4. Rescue map produced by face-to-face pair of participants
The higher quality of the maps produced by face-to-face pairs of participants is evident from the examples shown here. The differences in quality of the maps produced by collaborators in the two conditions are also evident. The maps in Figure 4 are typical. Although the remote pairs depicted the same route, the style of depiction differed dramatically, compare to Figure 5. The informative elegance of the maps produced by the face-to-face pairs is consistent with previous work of Schwartz (1995), who found that students working in pairs produced superior scientific diagrams than those working alone. Working in pairs eliminated idiosyncratic and unimportant material and assured the inclusion of the essential information.
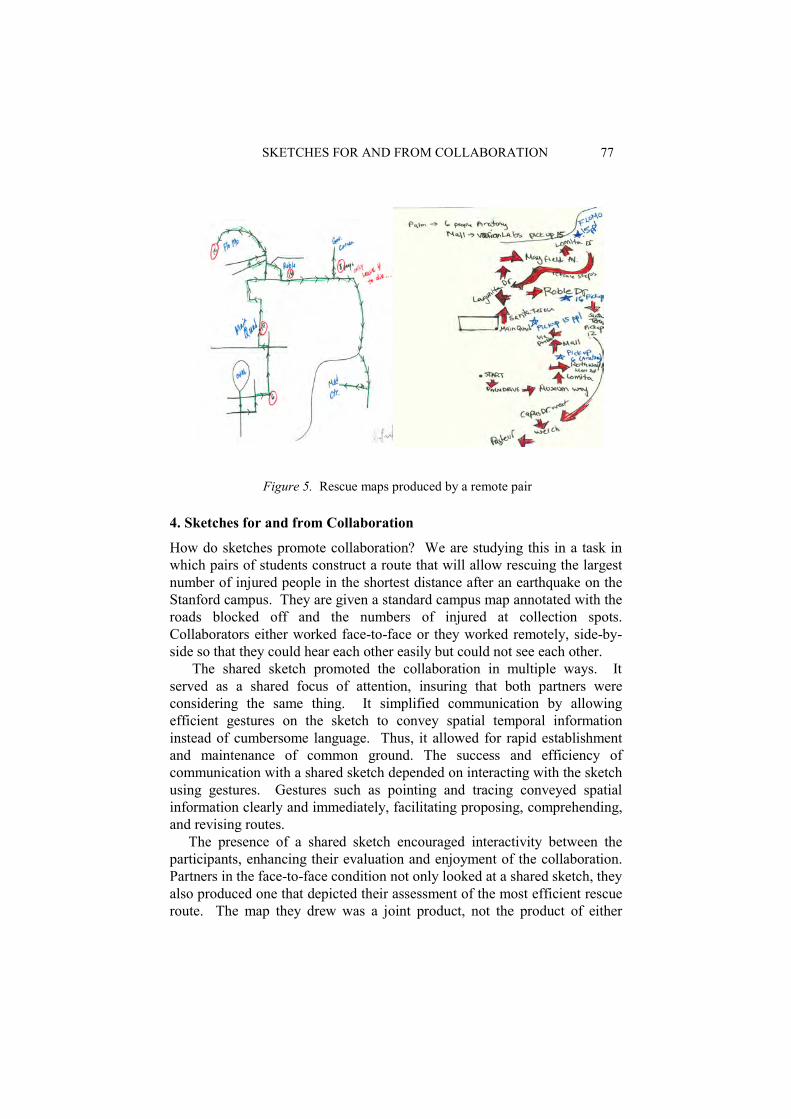
SKETCHES FOR AND FROM COLLABORATION 77
Figure 5. Rescue maps produced by a remote pair
4. Sketches for and from Collaboration
How do sketches promote collaboration? We are studying this in a task in which pairs of students construct a route that will allow rescuing the largest number of injured people in the shortest distance after an earthquake on the Stanford campus. They are given a standard campus map annotated with the roads blocked off and the numbers of injured at collection spots. Collaborators either worked face-to-face or they worked remotely, side-by-side so that they could hear each other easily but could not see each other. The shared sketch promoted the collaboration in multiple ways. It served as a shared focus of attention, insuring that both partners were considering the same thing. It simplified communication by allowing efficient gestures on the sketch to convey spatial temporal information instead of cumbersome language. Thus, it allowed for rapid establishment and maintenance of common ground. The success and efficiency of communication with a shared sketch depended on interacting with the sketch using gestures. Gestures such as pointing and tracing conveyed spatial information clearly and immediately, facilitating proposing, comprehending, and revising routes. The presence of a shared sketch encouraged interactivity between the participants, enhancing their evaluation and enjoyment of the collaboration. Partners in the face-to-face condition not only looked at a shared sketch, they also produced one that depicted their assessment of the most efficient rescue route. The map they drew was a joint product, not the product of either
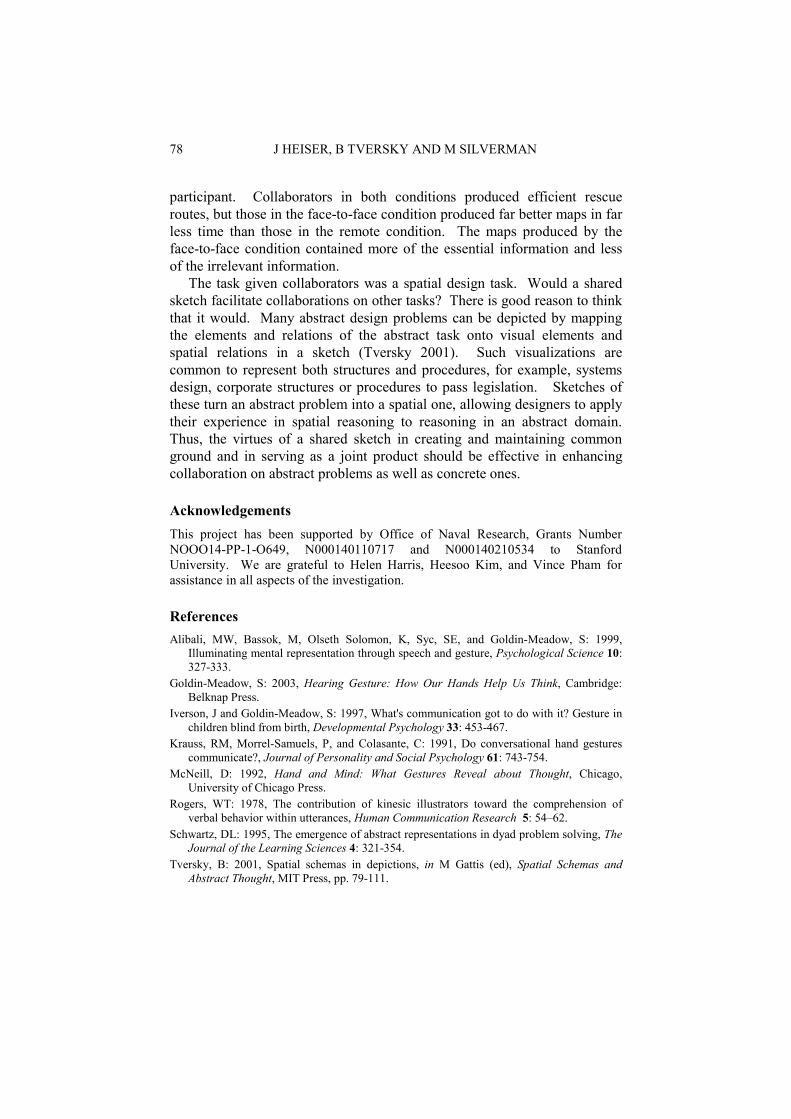
78 J HEISER, B TVERSKY AND M SILVERMAN
participant. Collaborators in both conditions produced efficient rescue routes, but those in the face-to-face condition produced far better maps in far less time than those in the remote condition. The maps produced by the face-to-face condition contained more of the essential information and less of the irrelevant information. The task given collaborators was a spatial design task. Would a shared sketch facilitate collaborations on other tasks? There is good reason to think that it would. Many abstract design problems can be depicted by mapping the elements and relations of the abstract task onto visual elements and spatial relations in a sketch (Tversky 2001). Such visualizations are common to represent both structures and procedures, for example, systems design, corporate structures or procedures to pass legislation. Sketches of these turn an abstract problem into a spatial one, allowing designers to apply their experience in spatial reasoning to reasoning in an abstract domain. Thus, the virtues of a shared sketch in creating and maintaining common ground and in serving as a joint product should be effective in enhancing collaboration on abstract problems as well as concrete ones.
Acknowledgements This project has been supported by Office of Naval Research, Grants Number NOOO14-PP-1-O649, N000140110717 and N000140210534 to Stanford University. We are grateful to Helen Harris, Heesoo Kim, and Vince Pham for assistance in all aspects of the investigation.
References Alibali, MW, Bassok, M, Olseth Solomon, K, Syc, SE, and Goldin-Meadow, S: 1999,
Illuminating mental representation through speech and gesture, Psychological Science 10: 327-333.
Goldin-Meadow, S: 2003, Hearing Gesture: How Our Hands Help Us Think, Cambridge: Belknap Press.
Iverson, J and Goldin-Meadow, S: 1997, What's communication got to do with it? Gesture in children blind from birth, Developmental Psychology 33: 453-467.
Krauss, RM, Morrel-Samuels, P, and Colasante, C: 1991, Do conversational hand gestures communicate?, Journal of Personality and Social Psychology 61: 743-754.
McNeill, D: 1992, Hand and Mind: What Gestures Reveal about Thought, Chicago, University of Chicago Press.
Rogers, WT: 1978, The contribution of kinesic illustrators toward the comprehension of verbal behavior within utterances, Human Communication Research 5: 54–62.
Schwartz, DL: 1995, The emergence of abstract representations in dyad problem solving, The Journal of the Learning Sciences 4: 321-354.
Tversky, B: 2001, Spatial schemas in depictions, in M Gattis (ed), Spatial Schemas and Abstract Thought, MIT Press, pp. 79-111.
JS Gero, B Tversky and T Knight (eds), Visual and Spatial Reasoning in Design III, 2004 Key Centre of Design Computing and Cognition, University of Sydney, pp 79-101
SKETCHING ACROSS DESIGN DOMAINS
CLAUDIA M ECKERT, ALAN F BLACKWELL University of Cambridge, UK
MARTIN K STACEY De Montfort University, UK
and
CHRISTOPHER F EARL Open University, UK
Abstract. Sketching research so far has focused on sketching in a particular phase in specific design domains. This paper draws on descriptions of design processes given by designers from a wide variety of domains, as part of a research project on comparisons across design domains. A comparison across design domains draws attention to the multiple roles and forms sketching can take in idea generation and communication. Sketches are used as depictions of potential objects in idea generation, but also as thinking aids for reasoning about abstract concepts. They are used in those domains, such as software design, where there is no pictorial description of the product, but also in more visual design domains such as engineering design, to sketch out abstract properties. Sketches are a vital means of communicating design ideas. This paper also looks at the way the functions of sketches are performed by other media in those domains that don’t produce visual products, as well as additional media in those that do.
1. Introduction
Sketching is a vital part of the public image of design. A designer sitting at a desk, fluidly drafting an impressionistic rendering of a new idea, is a popular picture of the designer at work. However while many designers do engage in this type of sketching activity, such sketches are only a small part of the entire design process. Other designers never sketch, either because they generate ideas in their heads or because they work in design domains too abstract for pictorial representation. However every designer needs a way to express imprecise and provisional information. This paper looks at
80 CM ECKERT, AF BLACKWELL, MK STACEY AND CF EARL
sketching in a range of different design domains and analyses the different roles a sketch can have, including ways in which the main functions of sketches may be carried out by other representations.
The word ‘sketch’ is used in two related senses. First: to create a drawing on paper that depicts something in an informal way, where decisions are to some extent provisional and details approximate. (Informality is relative: engineers reserve the word ‘drawing’ for precise formal depictions with exact measurements; anything less formal is a sketch, even precise-looking pictures that non-engineers would never call sketches.) Second, by metaphorical extension: to describe something in a quick informal imprecise way, in which details are inexact, provisional or missing. This paper focuses mostly on sketches as marks on paper, which might be called drawings by architects or thumbnails by graphic designers. But we are interested in how the functions of sketches are met in other ways. Occasionally people talk metaphorically about sketches when they mean vague verbal descriptions, but this meaning will be highlighted whenever it occurs.
Sketching research so far has primarily been conducted from the viewpoint of a particular domain, so that our understanding of sketching is influenced by the use of sketching in a particular domain at a particular time in the design process. For example, sketching has been intensively studied in early architectural design, where solitary designers begin to develop the conceptual design for a building by sketching out a floor plan or a view of the building. An extensive body of research on how architects and other designers use sketches, notably by Goldschmidt (1991; 1994; 1999) and Goel (1995), has focused on how designers reinterpret elements of their sketches (see Purcell and Gero 1998, for a review). Schön (1983) views this interaction with the sketches as a conversation: the designers see more in their sketches than they put in when they draw them, and these insights drive further designing; designers alternate between seeing as and seeing that (Schön and Wiggins 1992). Similarly Goldschmidt (1991) observed architects’ conceptual designing proceeding through an alternation between pictorial and non-pictorial reasoning.
In this paper, we offer some further evidence in support of this view of sketching (the section entitled “Imagery and Creative Discovery”), but we also consider many other ways in which sketches are employed in design processes, projects and organizations. These results are derived from a series of workshops and interviews with expert designers recruited from a wide range of disciplines within a large project called “Across Design”.
In the rest of this paper, we first describe the structure and methodology of the Across Design project, then present our findings grouped in areas of thematic interest with regard to the properties and function of sketches.
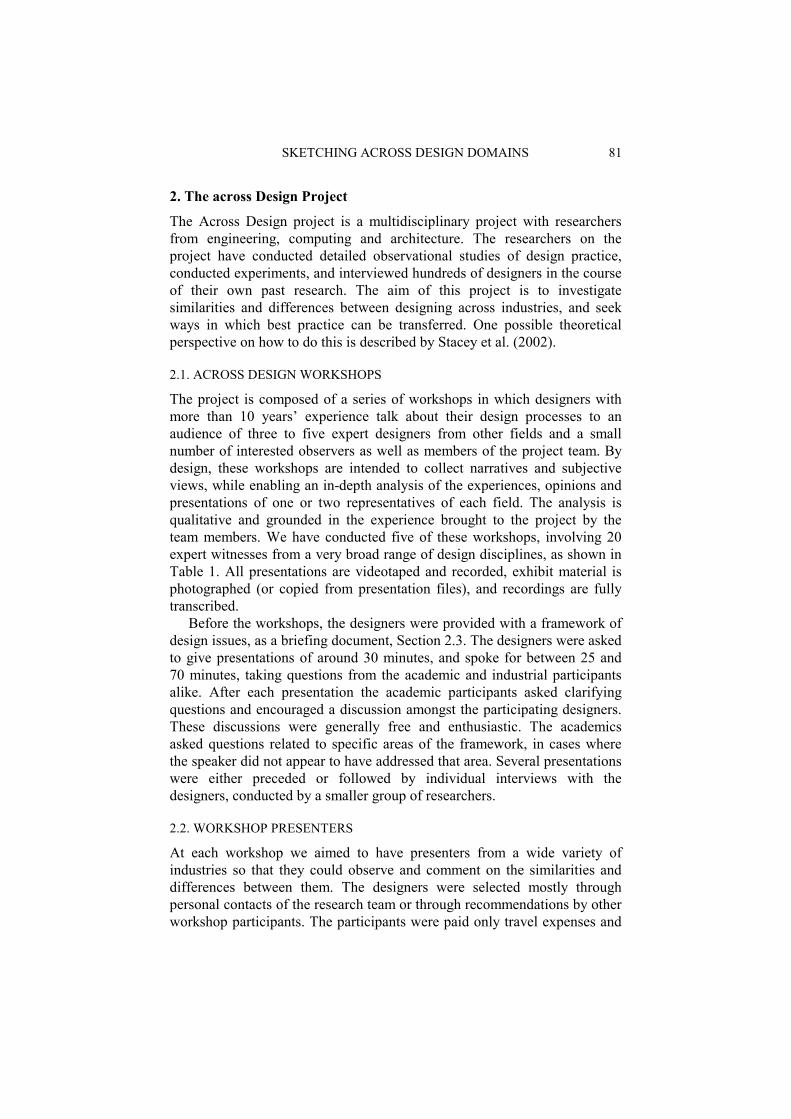
SKETCHING ACROSS DESIGN DOMAINS 81
2. The across Design Project
The Across Design project is a multidisciplinary project with researchers from engineering, computing and architecture. The researchers on the project have conducted detailed observational studies of design practice, conducted experiments, and interviewed hundreds of designers in the course of their own past research. The aim of this project is to investigate similarities and differences between designing across industries, and seek ways in which best practice can be transferred. One possible theoretical perspective on how to do this is described by Stacey et al. (2002).
2.1. ACROSS DESIGN WORKSHOPS
The project is composed of a series of workshops in which designers with more than 10 years’ experience talk about their design processes to an audience of three to five expert designers from other fields and a small number of interested observers as well as members of the project team. By design, these workshops are intended to collect narratives and subjective views, while enabling an in-depth analysis of the experiences, opinions and presentations of one or two representatives of each field. The analysis is qualitative and grounded in the experience brought to the project by the team members. We have conducted five of these workshops, involving 20 expert witnesses from a very broad range of design disciplines, as shown in Table 1. All presentations are videotaped and recorded, exhibit material is photographed (or copied from presentation files), and recordings are fully transcribed.
Before the workshops, the designers were provided with a framework of design issues, as a briefing document, Section 2.3. The designers were asked to give presentations of around 30 minutes, and spoke for between 25 and 70 minutes, taking questions from the academic and industrial participants alike. After each presentation the academic participants asked clarifying questions and encouraged a discussion amongst the participating designers. These discussions were generally free and enthusiastic. The academics asked questions related to specific areas of the framework, in cases where the speaker did not appear to have addressed that area. Several presentations were either preceded or followed by individual interviews with the designers, conducted by a smaller group of researchers.
2.2. WORKSHOP PRESENTERS
At each workshop we aimed to have presenters from a wide variety of industries so that they could observe and comment on the similarities and differences between them. The designers were selected mostly through personal contacts of the research team or through recommendations by other workshop participants. The participants were paid only travel expenses and
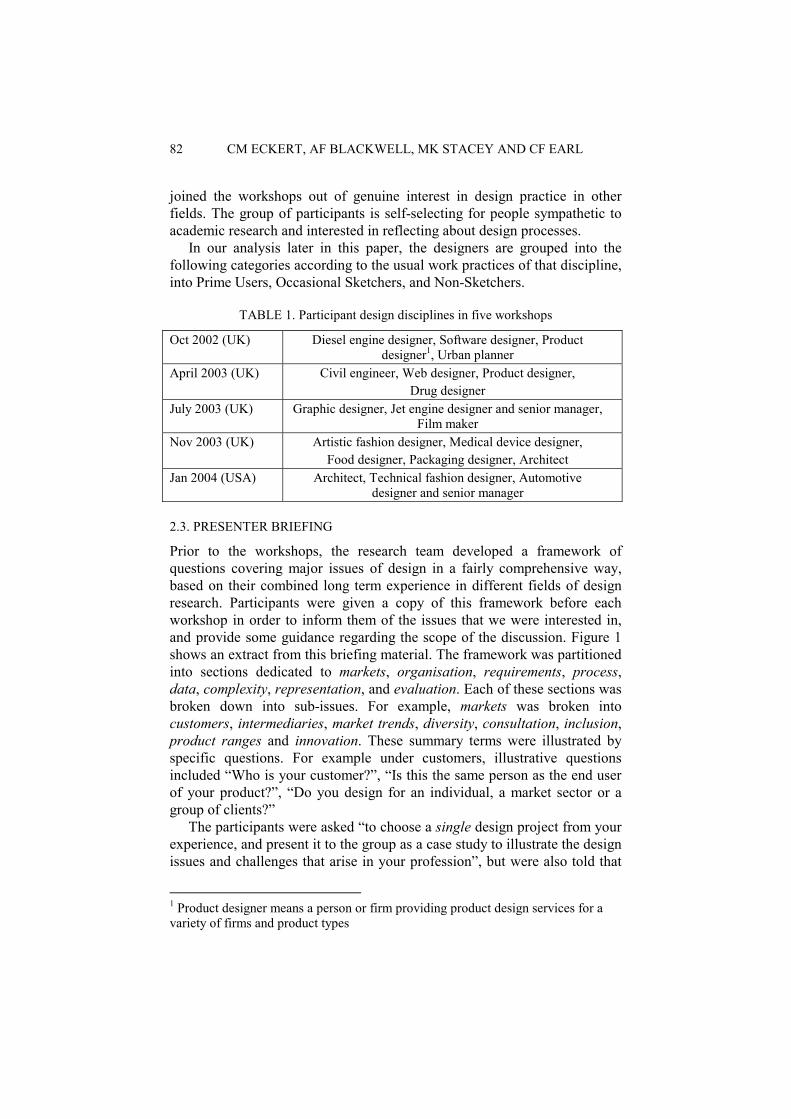
82 CM ECKERT, AF BLACKWELL, MK STACEY AND CF EARL
joined the workshops out of genuine interest in design practice in other fields. The group of participants is self-selecting for people sympathetic to academic research and interested in reflecting about design processes.
In our analysis later in this paper, the designers are grouped into the following categories according to the usual work practices of that discipline, into Prime Users, Occasional Sketchers, and Non-Sketchers.
TABLE 1. Participant design disciplines in five workshops
Oct 2002 (UK) Diesel engine designer, Software designer, Product designer1, Urban planner
April 2003 (UK) Civil engineer, Web designer, Product designer, Drug designer
July 2003 (UK) Graphic designer, Jet engine designer and senior manager, Film maker
Nov 2003 (UK) Artistic fashion designer, Medical device designer, Food designer, Packaging designer, Architect
Jan 2004 (USA) Architect, Technical fashion designer, Automotive designer and senior manager
2.3. PRESENTER BRIEFING
Prior to the workshops, the research team developed a framework of questions covering major issues of design in a fairly comprehensive way, based on their combined long term experience in different fields of design research. Participants were given a copy of this framework before each workshop in order to inform them of the issues that we were interested in, and provide some guidance regarding the scope of the discussion. Figure 1 shows an extract from this briefing material. The framework was partitioned into sections dedicated to markets, organisation, requirements, process, data, complexity, representation, and evaluation. Each of these sections was broken down into sub-issues. For example, markets was broken into customers, intermediaries, market trends, diversity, consultation, inclusion, product ranges and innovation. These summary terms were illustrated by specific questions. For example under customers, illustrative questions included “Who is your customer?”, “Is this the same person as the end user of your product?”, “Do you design for an individual, a market sector or a group of clients?”
The participants were asked “to choose a single design project from your experience, and present it to the group as a case study to illustrate the design issues and challenges that arise in your profession”, but were also told that
1 Product designer means a person or firm providing product design services for a variety of firms and product types
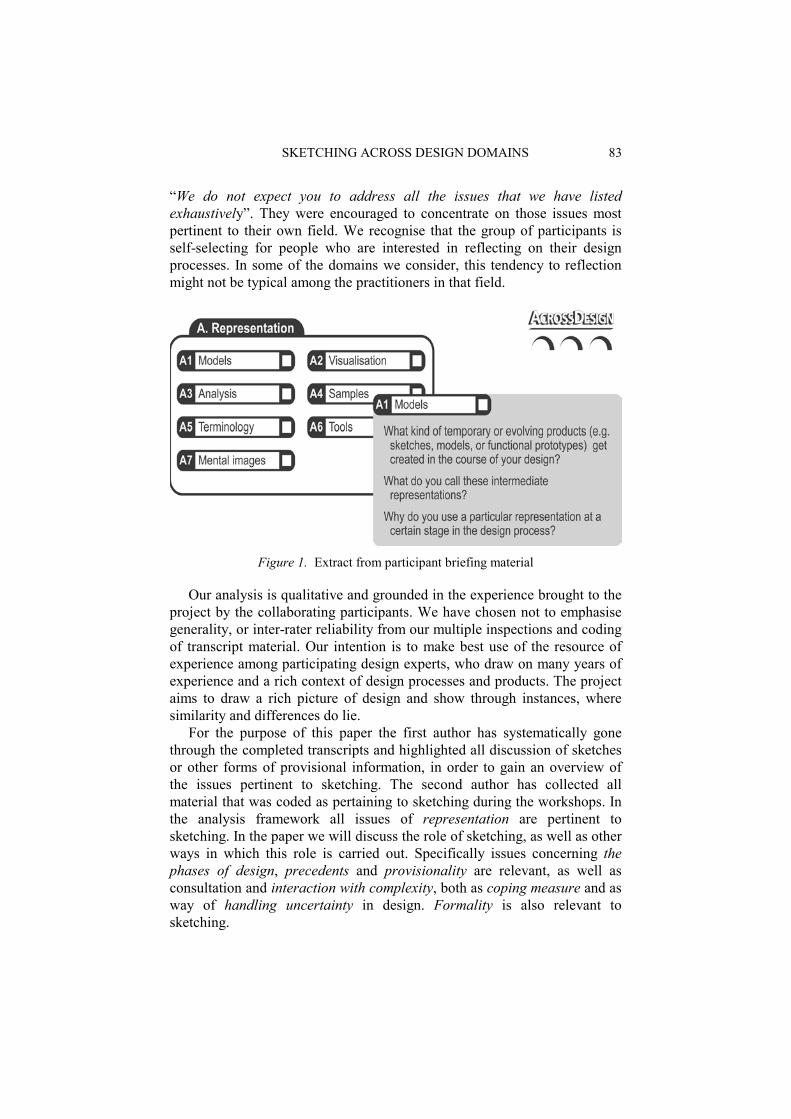
SKETCHING ACROSS DESIGN DOMAINS 83
“We do not expect you to address all the issues that we have listed exhaustively”. They were encouraged to concentrate on those issues most pertinent to their own field. We recognise that the group of participants is self-selecting for people who are interested in reflecting on their design processes. In some of the domains we consider, this tendency to reflection might not be typical among the practitioners in that field.
Figure 1. Extract from participant briefing material
Our analysis is qualitative and grounded in the experience brought to the project by the collaborating participants. We have chosen not to emphasise generality, or inter-rater reliability from our multiple inspections and coding of transcript material. Our intention is to make best use of the resource of experience among participating design experts, who draw on many years of experience and a rich context of design processes and products. The project aims to draw a rich picture of design and show through instances, where similarity and differences do lie.
For the purpose of this paper the first author has systematically gone through the completed transcripts and highlighted all discussion of sketches or other forms of provisional information, in order to gain an overview of the issues pertinent to sketching. The second author has collected all material that was coded as pertaining to sketching during the workshops. In the analysis framework all issues of representation are pertinent to sketching. In the paper we will discuss the role of sketching, as well as other ways in which this role is carried out. Specifically issues concerning the phases of design, precedents and provisionality are relevant, as well as consultation and interaction with complexity, both as coping measure and as way of handling uncertainty in design. Formality is also relevant to sketching.
84 CM ECKERT, AF BLACKWELL, MK STACEY AND CF EARL
3. The Roles of Sketches
Sketches, as marks on paper in various degrees of refinement, have multiple roles in the design processes. They are a means to generate or communicate ideas about the product, but also about the process itself. Some designers use sketches of design plans to do this, as illustrated by this web designer:
“So, these steps in our phases, they came about initially at the planning workshop, I have a piece of paper somewhere where I sketched them by hand.”
Here we will concentrate on sketches of products, where the same sketch can play multiple roles. In many design processes all these roles of sketches occur, although some are apparently missing in certain disciplines. In the following sections, we highlight several of these roles, summarizing previous research, followed by findings from our analysis of informants’ contributions in Across Design.
3.1. MENTAL IMAGERY AND CREATIVITY
The nature of mental imagery is not yet fully understood, and debate continues about whether imagery is essentially pictorial, and associated with symbolic information about the identities and properties of the objects imagined (Kosslyn 1994) or is essentially symbolic, comprising information about imagined objects (for instance Pylyshyn 2003). Several cognitive accounts of sketching have focused on the use of an external representation as a tool for discovery of new content in images (Chambers & Reisberg 1985; Finke and Slayton 1988; Finke et al. 1989; Finke 1996). According to these theories, mental images are relatively tightly bound to fixed semantic interpretations, whereas external percepts can trigger different interpretations. This means that people can facilitate the discovery of new information in a form imagined as a mental image by a process of externalizing that image (drawing a potentially ambiguous sketch of the imagined form), then inspecting the sketch to discover a creative new interpretation.
It seems that designers can readily find unintended configurations of sketch elements (Goldschmidt 1999), although this ordinarily requires active interest in new possibilities, usually triggered by dissatisfaction with the current design (McFadzean et al. 1999), or forgetting of context. As shown by Finke’s (1990) findings on how preinventive forms can facilitate creativity, using chance forms to meet design goals is often a fruitful idea generation strategy. For reinterpretation leading to creative insight, ambiguity is a benefit, regarded as important by both researchers and reflective practitioners.
SKETCHING ACROSS DESIGN DOMAINS 85
The cognitive science literature reports substantial controversy around these issues, with both sides of the debate supported by experimental evidence. It is therefore interesting to inspect the assertions of designers with regard to the relationship between sketches and mental images as a strategy for discovery or creativity. In the past we have found that even designers in detailed and technical disciplines (the software industry) report vivid mental imagery in experiential accounts of their own design process (Petre and Blackwell 1997). Our own informant from the software industry confirmed those findings in reporting his own introspective insight that “Designing software is a visual process”.
Several of our designers referred to mental images as somewhat ineffable sources of inspiration, for example a product designer saying that inspiration comes from “three gin and tonics and a hot bath”, but many were intrigued by the imagery inherent in their own processes, grappling with a representation that can’t quite be pinned down. Both fashion designers spoke of an almost mystical “feel” associated with the early creative stages incorporating impressions of force and movement.
3.2. THE PROCESS OF IDEA GENERATION AND RECORDING
This creative process can occur in a solitary situation. However joint sketching also plays a very important part in joint designing, where designers often draw on the same sheet of paper, and again benefit from reinterpreting ambiguous marks (Bly 1988).
Sketches also play an important role in visualizing and capturing ideas during early stages of the design process. These sketches are often done very rapidly and not worked out in detail, but enable designers to get a feeling for the design space and to compare and evaluate their own ideas, Figure 2. As one of our product designers put it: at the beginning of the design process:
”We really need to get familiar with the product and that’s done through those visits but also through understanding the products and brainstorms. And we will then start to initiate it here, the initial sketch freehand, and come up with quite a lot of ideas in three dimensions, drawings and sketches with a bit of colour on.”
Another of our informants put the emphasis on capturing design ideas as they are developed through sketching. A senior jet engine engineer commented:
“I am a great believer in sketching as well. I believe that sketching itself, not only is it able to capture the concepts, but it is also a way of being creative. Let your fingers do the thinking if you like. So I am a great believer – and I watch my guys when they are working, they do use sketching, and I am sure at the time they are being creative as well as recording.”

86 CM ECKERT, AF BLACKWELL, MK STACEY AND CF EARL
In many instances it is difficult to draw a line between sketching to generate ideas and sketching to communicate these ideas. This is illustrated by the sketches in Figure 2 as well as the quote above. Designers need to record their ideas in order to develop them.
Figure 2. Mood board for product design showing multiple sketches of the object and the sources of inspiration for it. While we don’t know for what role the rough
sketches have originally been drawn, they give a good impression of an idea generation sketch in product design.
It has been noted in the past that introspective reports of mental imagery or “visual thinking” are correlated with personal assessments of creativity (Katz 1983). It is not certain in which direction the causal relation lies for these reports. Several of our informants described their own sketches either as evidence for us of creative originality (in the case of fashion designers), as evidence for clients of the creative nature of the work (in the case of a product designer), or as a strategy for rejuvenating creative practice within a large corporation (in the cases of aerospace, automotive design, and packaging design). In these latter cases, the sketch is seen as a generator of creativity, or possibly an outcome of creativity, with the exact status uncertain. This is the same ambiguity with respect to causal relationships that has been found in reports of mental imagery.
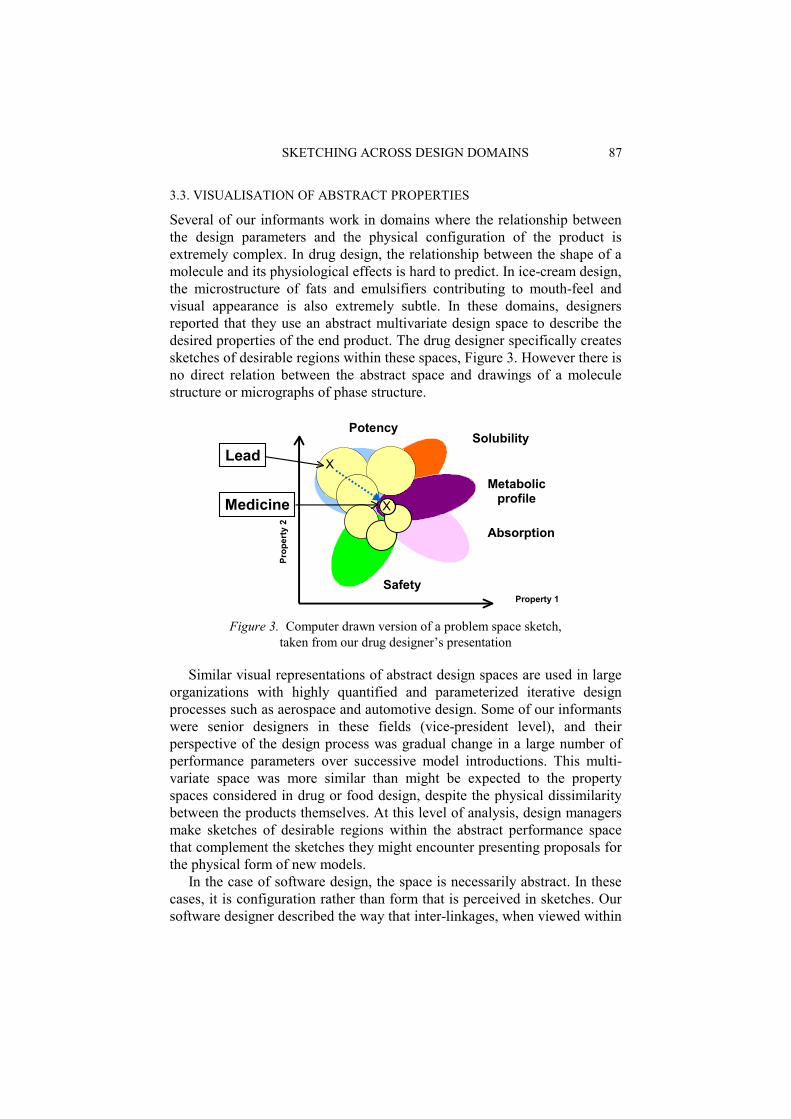
SKETCHING ACROSS DESIGN DOMAINS 87
3.3. VISUALISATION OF ABSTRACT PROPERTIES
Several of our informants work in domains where the relationship between the design parameters and the physical configuration of the product is extremely complex. In drug design, the relationship between the shape of a molecule and its physiological effects is hard to predict. In ice-cream design, the microstructure of fats and emulsifiers contributing to mouth-feel and visual appearance is also extremely subtle. In these domains, designers reported that they use an abstract multivariate design space to describe the desired properties of the end product. The drug designer specifically creates sketches of desirable regions within these spaces, Figure 3. However there is no direct relation between the abstract space and drawings of a molecule structure or micrographs of phase structure.
Absorption
Solubility
Metabolicprofile
Potency
SafetyProperty 1
Prop
erty
2
XLead
XMedicine
Figure 3. Computer drawn version of a problem space sketch,
taken from our drug designer’s presentation
Similar visual representations of abstract design spaces are used in large organizations with highly quantified and parameterized iterative design processes such as aerospace and automotive design. Some of our informants were senior designers in these fields (vice-president level), and their perspective of the design process was gradual change in a large number of performance parameters over successive model introductions. This multi-variate space was more similar than might be expected to the property spaces considered in drug or food design, despite the physical dissimilarity between the products themselves. At this level of analysis, design managers make sketches of desirable regions within the abstract performance space that complement the sketches they might encounter presenting proposals for the physical form of new models.
In the case of software design, the space is necessarily abstract. In these cases, it is configuration rather than form that is perceived in sketches. Our software designer described the way that inter-linkages, when viewed within
88 CM ECKERT, AF BLACKWELL, MK STACEY AND CF EARL
the Gestalt of an overall system design, can help the designer to re-conceptualise the structural core of the design. He was pleased with the fact that the standard sketch formalism in his discipline, the “universal bubble and stick diagram”, was in fact completely free of prior semantic associations.
“When I’m designing software, I like to draw sequence diagrams with pencil and paper …. I couldn’t find a piece of paper on my desk that didn’t have a diagram on it.”
Recording ideas plays just as important a role in abstract domains as it does in the more visual design domains.
3.4. COMMUNICATION TO OTHERS
Not all designers use sketches to generate ideas, but for many designers the most fundamental role of sketches is to communicate quickly with others, as expressed in this quote from an architect
“When you draw you’re trying to express something to somebody else. You’re trying to reach across to someone else and to show them something. That quality of reaching across means that you can work with people who don’t draw. I work with someone who draws really badly, awful. I’m embarrassed of his drawing, but he asks the right questions. He pushes the pen in a funny way and it’s so ugly to look at, but his ideas are fantastic. So it’s not about good sketching and bad sketching, it’s about the quality of the vision to communicate and that’s the crucial stage, of course you don’t let them draw the picture for the client because that puts them off, but they know to share, is that true? There are lots of interesting different qualities of sharing in design. Very, very important.”
Studies of sketching in engineering design, have mainly concentrated on using sketches to develop designs jointly in meetings. Tang (1989; 1991; Tang and Leifer 1988), Bly (1988), Minneman (1991) and Neilson and Lee (1994) have shown that designers use speech, sketches and gestures in combination, using each mode to explain and disambiguate the others. Studies of solitary engineering sketching (Pache 2001) have seen a wide variety of different sketching behavior and ability, with evidence for the reinterpretation of ambiguous notation in only a small number of cases. The key challenge for many mechanical engineers lies in expressing and visualizing movement of multiple parts through sketches.
An analysis of sketching behaviour in the knitwear industry (Eckert 2001; Stacey et al. 1999) looked at the use of sketching to express design ideas at a handover point between different stakeholders in the design process. In the knitwear industry sketches, measurements and verbal descriptions were used together to form inconsistent, incomplete and inaccurate specifications. These ambiguous specifications were interpreted
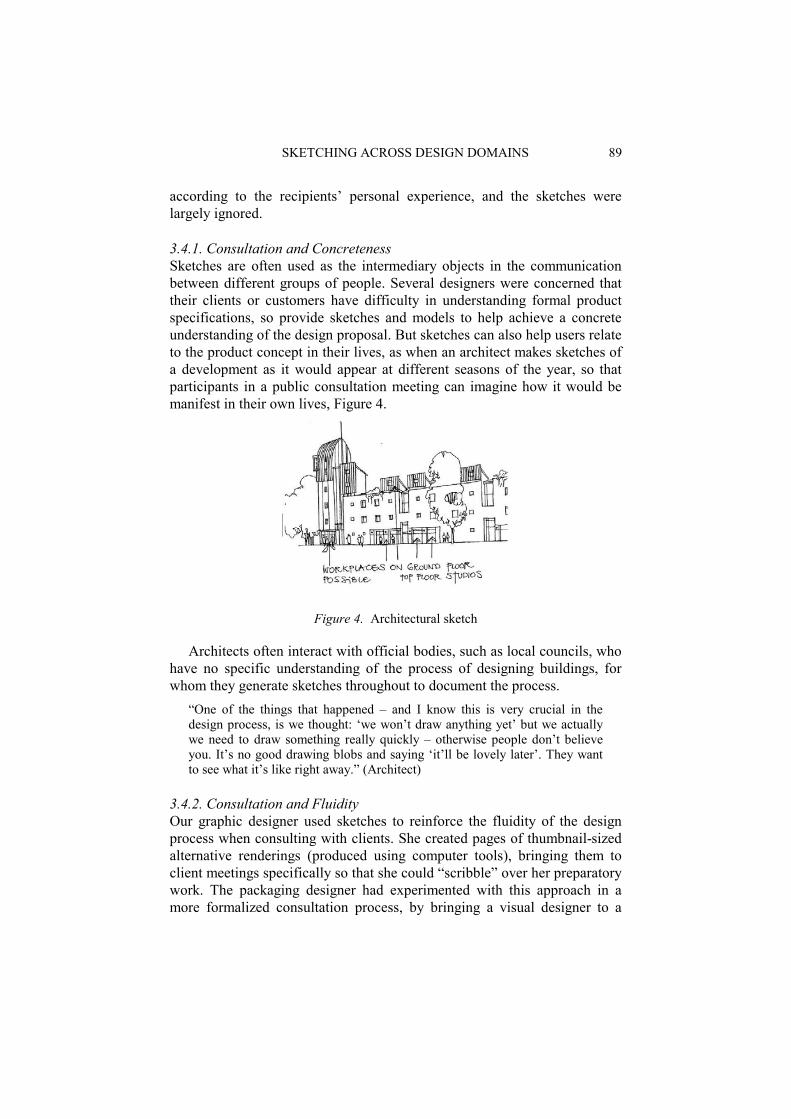
SKETCHING ACROSS DESIGN DOMAINS 89
according to the recipients’ personal experience, and the sketches were largely ignored.
3.4.1. Consultation and Concreteness Sketches are often used as the intermediary objects in the communication between different groups of people. Several designers were concerned that their clients or customers have difficulty in understanding formal product specifications, so provide sketches and models to help achieve a concrete understanding of the design proposal. But sketches can also help users relate to the product concept in their lives, as when an architect makes sketches of a development as it would appear at different seasons of the year, so that participants in a public consultation meeting can imagine how it would be manifest in their own lives, Figure 4.
Figure 4. Architectural sketch
Architects often interact with official bodies, such as local councils, who have no specific understanding of the process of designing buildings, for whom they generate sketches throughout to document the process.
“One of the things that happened – and I know this is very crucial in the design process, is we thought: ‘we won’t draw anything yet’ but we actually we need to draw something really quickly – otherwise people don’t believe you. It’s no good drawing blobs and saying ‘it’ll be lovely later’. They want to see what it’s like right away.” (Architect)
3.4.2. Consultation and Fluidity Our graphic designer used sketches to reinforce the fluidity of the design process when consulting with clients. She created pages of thumbnail-sized alternative renderings (produced using computer tools), bringing them to client meetings specifically so that she could “scribble” over her preparatory work. The packaging designer had experimented with this approach in a more formalized consultation process, by bringing a visual designer to a
90 CM ECKERT, AF BLACKWELL, MK STACEY AND CF EARL
market focus group, and having that design produce sketches “live” during the focus group meeting, so that participants directly appreciate the opportunity they have to modify the proposals being discussed.
3.4.3. Consultation and Selection Several informants described the way that sketches can be used to engage customers or clients with the design process. Sketches play an important part in the selection of design concepts, and designers preselect their sketches so as to guide their customers to the designs that they favour. Our car designer cynically described the practice of some offices as a “snow job” in which a wide range of design sketches are displayed on the studio wall to clients who might be sufficiently impressed by creative diversity (or simply distracted by the colours) that they relax creative control. One of the product designers guided the customers strongly through his selection of sketches:
“In our case, I tended to present maybe two or three designs, and I would normally know which one I wanted the client to buy and I had good reasons for wanting him to buy, and so I used that approach.”
While another product designers is less restrictive and shows his customers a wide range of sketches:
“We have hopefully created a vision for the product in terms of a lot of sketches. Clients choose one or two, which we then have to work on in more detail for them.”
Even where the client is open-minded, it is possible to get them more engaged in the process (according to an industrial product designer) through the use of freehand sketches that illustrate a creative product “vision”.
3.4.4. Joint Designing Designers routinely exchange sketches with their colleagues through the design process, as illustrated in this quote by a web designer:
“The left-hand side shows the faxed sketches he sent to me. Once I had chosen one, middle black circle shows the worked-out image, also faxed, and then the last images show the final graphics.”
In many case this is part of a dual negotiation processes: negotiation for understanding and negotiation for meaning. If designers do not understand the sketch, they then discuss this meaning using gestures and speech to disambiguate the sketch (Bly 1988; Tang 1991). In doing so ideas are often developed further and designers gain new insights in the problem. Another form of negotiation occurs when people have different viewpoints that need to be resolved by a common compromise solution. Problems arise when different parties don’t recognise that they have conflicting opinions, and
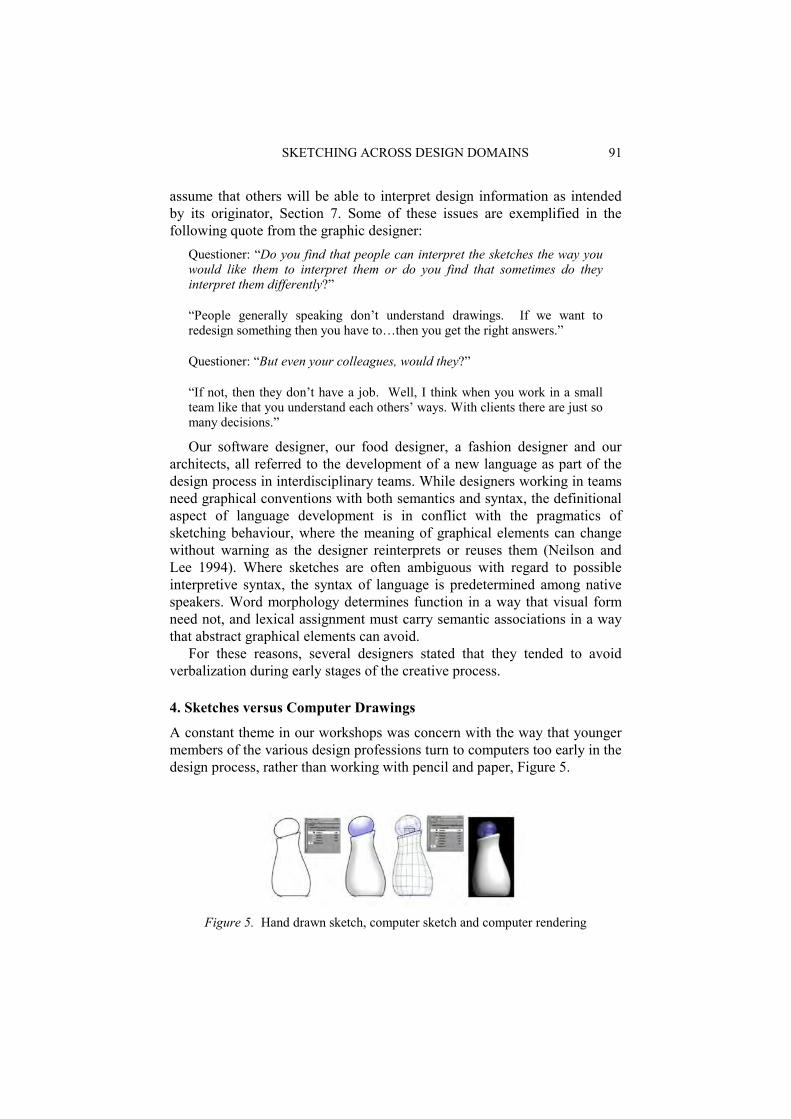
SKETCHING ACROSS DESIGN DOMAINS 91
assume that others will be able to interpret design information as intended by its originator, Section 7. Some of these issues are exemplified in the following quote from the graphic designer:
Questioner: “Do you find that people can interpret the sketches the way you would like them to interpret them or do you find that sometimes do they interpret them differently?”
“People generally speaking don’t understand drawings. If we want to redesign something then you have to…then you get the right answers.”
Questioner: “But even your colleagues, would they?”
“If not, then they don’t have a job. Well, I think when you work in a small team like that you understand each others’ ways. With clients there are just so many decisions.”
Our software designer, our food designer, a fashion designer and our architects, all referred to the development of a new language as part of the design process in interdisciplinary teams. While designers working in teams need graphical conventions with both semantics and syntax, the definitional aspect of language development is in conflict with the pragmatics of sketching behaviour, where the meaning of graphical elements can change without warning as the designer reinterprets or reuses them (Neilson and Lee 1994). Where sketches are often ambiguous with regard to possible interpretive syntax, the syntax of language is predetermined among native speakers. Word morphology determines function in a way that visual form need not, and lexical assignment must carry semantic associations in a way that abstract graphical elements can avoid.
For these reasons, several designers stated that they tended to avoid verbalization during early stages of the creative process.
4. Sketches versus Computer Drawings
A constant theme in our workshops was concern with the way that younger members of the various design professions turn to computers too early in the design process, rather than working with pencil and paper, Figure 5.
Figure 5. Hand drawn sketch, computer sketch and computer rendering
92 CM ECKERT, AF BLACKWELL, MK STACEY AND CF EARL
At first this might be seen as an appeal to craft traditions. However even design domains in which the computer itself is the traditional tool share this concern. Our software designer said that pencil and paper were essential to his work, and was also concerned that this might be a generational effect.
“Yes, very much a sketch. Obviously computers are very very important, but there’s nothing better than the right pen and the right pad. And they have to be that soft pencil and you sit there and you smoke and…Well, we all have different ways of doing it. And you sit there and suddenly, and so, the younger designers we use don’t do that, they use the computers and straight in 3-D. We all do it differently.” (Product Designer)
Hand sketches have qualities that computer sketches don’t have. They are easier to share and easier to grasp by others, as they are portable or not scalable.
“Sketching is crucial, and sometimes computer work is too private, because when you are sketching you become vulnerable. I’ve brought some sketches in case you don’t know what sketches look like. They are just terrible things.” (Architect)
A sketch does not have to be polished yet it can have detail where a computer model would not have it.
“And they are primitive but somehow there’s detail there. You can just see three people, nobody else can see that. It’s your own little reference.” (Product Designer)
In many cases, the computer was seen as a device that destroys uncertainty and provisionality. A sketch maintains its provisional quality where a computer model looks more final, therefore conveying that they design might be more finalized than it really it. To recapture this uncertainty and provisionality, our graphic designer said that it was necessary to create many small pencil sketches, rather than turning too early to the computer, which she believed militated against creative work from her own graphic design students. On the other hand, one of the engineers commented in a follow-up interview that he had banned sketches from customer communication to avoid ambiguity and the appearance of provisionality in design handover. He instructed his designers to draw rough CAD models and use elements of past designs as placeholders for components that have not yet been designed.
5. Sketches in other Media
In domains where designers don’t sketch on paper, the roles sketches fulfil need to be taken over by a different medium. Designers in many fields use other types of representations for thinking about and communicating skeletal, approximate and provisional ideas.

SKETCHING ACROSS DESIGN DOMAINS 93
5.1. VERBAL SKETCHES
This was most salient in the presentation by the film maker. He talked frequently about sketches, but his sketches were verbal, not pictorial. He expresses the basic idea for his film in words:
“One of the most important things to do when I reckoned I had the ideas and participants tied down was to write a 30-second version. Actually, no, it was about 15-second version of the programme that said: ‘This is what it does’. I haven’t got it, actually. I found a sort of copy but it was much later on and it’s far too detailed. The fact is you really do do a little sketch. If that little sketch doesn’t work, the programme isn’t going to work.”
The film maker makes documentaries. He depends on material that he can shoot on days he is on location. Because he can’t control his material as much as a studio-based film maker, he does not see the point of making detailed story boards, but instead he says:
“What you do is you write pseudo-scripts. So in a sense they are storyboards. You, to be plonking about it, you set up a table in two columns with sections so it’s controllable. And then you put in a thought, pictures, a thought, pictures. It’s not a storyboard. It’s a sketch. A storyboard is more detailed than that. You get to the storyboard point, actually I never get to the storyboard point.”
His verbal descriptions of the future film are at the same time plans for the recording he wants to make.
“Now, we had a whiteboard. We didn’t have any flow charts. All the whiteboard said was ‘Kosovo, week 23’. It was really as basic as that. It was us talking that established what was going to happen, the flow. The future.”
The non-sketchers amongst our informants were struggling with not being able to express and evaluate provisional information. The food designer conducted experiments. The project she described aimed to redevelop an artisanal ice cream on an industrial scale. The team went to the test kitchen and experimented with reconstructing the texture of the ice cream. Once they had succeeded in recreating the desired texture they analyzed their samples and transferred those to industrial processes. For drug designers it is important to evaluate the effect of their drug. They tried out many chemical combinations and applied standard evaluation strategies. The more promising ones were tested in standard batteries of in-vitro tests.
5.2. PHYSICAL MODELS
Several of our informants reported their collaborations with specialist designers whose “sketches” filled the function of design exploration, but were constructed in three dimensional or moving media. A traditional car body designer was reported as working directly in modeling clay, possibly
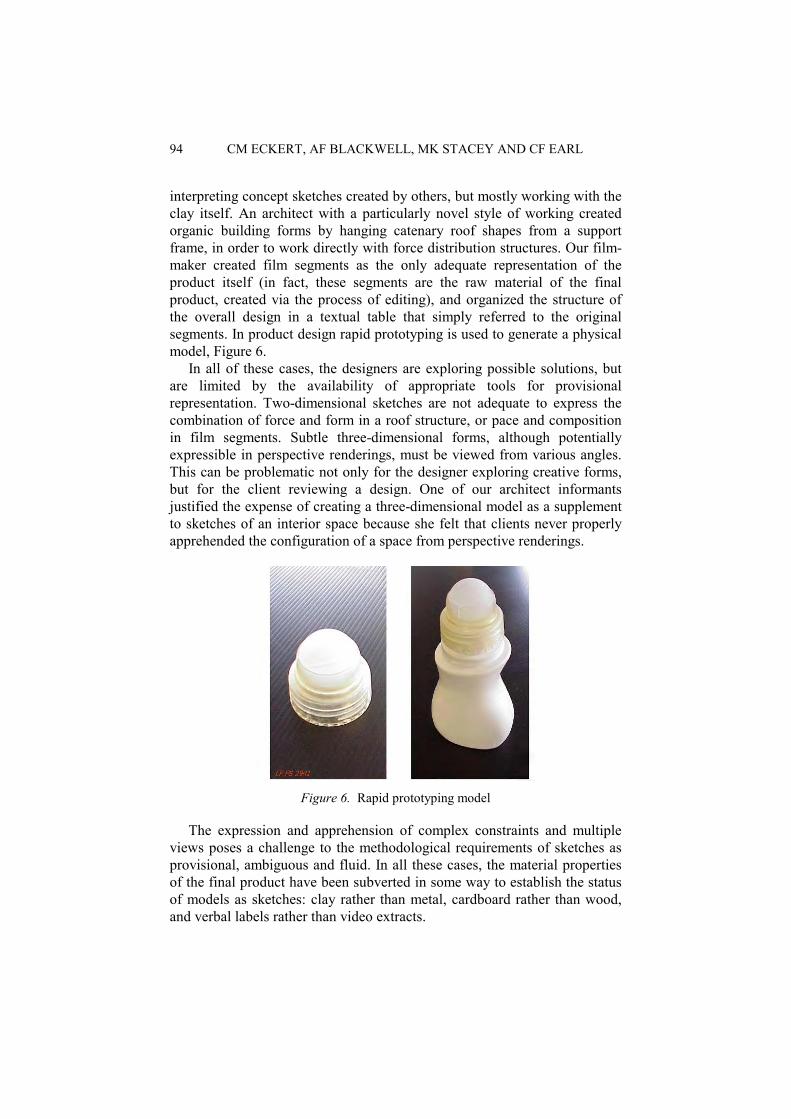
94 CM ECKERT, AF BLACKWELL, MK STACEY AND CF EARL
interpreting concept sketches created by others, but mostly working with the clay itself. An architect with a particularly novel style of working created organic building forms by hanging catenary roof shapes from a support frame, in order to work directly with force distribution structures. Our film-maker created film segments as the only adequate representation of the product itself (in fact, these segments are the raw material of the final product, created via the process of editing), and organized the structure of the overall design in a textual table that simply referred to the original segments. In product design rapid prototyping is used to generate a physical model, Figure 6.
In all of these cases, the designers are exploring possible solutions, but are limited by the availability of appropriate tools for provisional representation. Two-dimensional sketches are not adequate to express the combination of force and form in a roof structure, or pace and composition in film segments. Subtle three-dimensional forms, although potentially expressible in perspective renderings, must be viewed from various angles. This can be problematic not only for the designer exploring creative forms, but for the client reviewing a design. One of our architect informants justified the expense of creating a three-dimensional model as a supplement to sketches of an interior space because she felt that clients never properly apprehended the configuration of a space from perspective renderings.
Figure 6. Rapid prototyping model
The expression and apprehension of complex constraints and multiple views poses a challenge to the methodological requirements of sketches as provisional, ambiguous and fluid. In all these cases, the material properties of the final product have been subverted in some way to establish the status of models as sketches: clay rather than metal, cardboard rather than wood, and verbal labels rather than video extracts.
SKETCHING ACROSS DESIGN DOMAINS 95
5.3. MENTAL IMAGERY
Especially in those domains with extensive visual sketches, designers often also develop exceptional mental imagery. These designers can develop their ideas through visualisation and might only resort to sketches to communicate. For example the knitwear designers the first author has interviewed commented without exception that they can visualise garments, rotate them mentally and recolour them (Eckert and Stacey 2003). A senior knitwear designer once commented that the most important skill of a knitwear designer was to visualise garments. Often they refer to their memories of existing objects, instead of sketches, as reference points that they mentally modify. Objects are also used as reference points in communication. As Eckert and Stacey (2001) argue, this works highly efficiently in communication within peer groups that share the same reference objects, but it poses problems in communication with technicians and customers, who do not know those reference objects. However the technicians and customers would also need the context information derived from other objects to disambiguate sketches. Communication through objects is also frequent in engineering design, where it has great creative potential to enable the listeners to reframe their thoughts through new reference objects, while it poses problem in expressing exact specifications (Eckert et al. 2003). It has this double-edged potential because it enables the listener to pick up on different aspects of the design from those the speaker might have intended. While designing purely through mental imagery can be both quick and powerful, it has obvious limitations, such as the development process being unrecordable. Mental imagery is also limited by the amount of information people can keep in mind at any one time; Miller (1956) famously assessed the capacity of working memory as seven plus or minus two chunks. Even though expert designers can remember and manipulate large chunks, this is only a small fraction of the information required to create and describe a complex product (Egan and Schwartz 1979). Research on mental imagery (Kosslyn 1980; 1994; Logie 1995) shows that people can have a subjective sense that their mental representations are more complete and detailed than they really are, and that details are only filled in when people focus on parts of their mental images.
6. Sketching across Domains
Idea generation and communication are absolutely central to any design activity; and need to be supported by some form of representation. Visual two dimensional sketching takes carries out these function to a varying extent in most domains. However in other domains, roles that are carried out by paper sketches are taken over by verbal description or physical models.
96 CM ECKERT, AF BLACKWELL, MK STACEY AND CF EARL
6.1. CLASSIFICATION OF SKETCHING
For the purpose of using paper sketches the design domains studied in the across design project can be classified in the following way: • Prime users (product design, architecture, urban planning, fashion
design, graphic design). The design domains in which the visual appearance of the product is central are prime users of sketching. In these domains ideas are generated through sketching. They are usually presented through visual storyboards, which often include sketches. In this domain only very exceptional designers would not sketch.
• Occasional sketchers (engineers, software engineers, system engineers and web designers). In these domains there is great variation between individuals. For example engineers typically sketch during early conceptual design and to communicate to their colleagues solutions to problems that crop up during the design process. Many software designers or system engineers draw blob diagrams to indicate parts of a system when developing system architectures. Their sketches are typically abstract and non-pictorial
• Non-sketchers (drug design and food design). Non-sketchers can typically be found in the design domains that are non-pictorial and which have standard encoding conventions. Among our informants, the drug designers and the food designer did not sketch, but used standard chemical notations to express their ideas, and used computer tools to visualise the product ideas early. In both domains the design process was very lengthy, because to test the product a real prototype needed to be made.
7. Abstract Properties of Sketches
The literal meaning of the word sketch refers to marks on paper, quickly drawn in two dimensions. This section reviews some of the properties of sketches of visual sketches. These are exactly the properties of those representations that also function as sketches, as discussed in section 5.
7.1. SKETCHES AS DENSE SYMBOLS
Most fundamentally a sketch is a series of marks on paper. These marks form dense symbols, whose interpretation depends on both category information and exact spatial form (Goel 1995). Their meanings lie in the combination of symbolic and geometric mappings from the sketch elements to the referent objects the viewer interprets the sketch to depict.
Sketch elements have symbolic meanings, defined by notational conventions and mediated by the recognition of abstract category memberships, mapping categories of mark-combinations to categories of
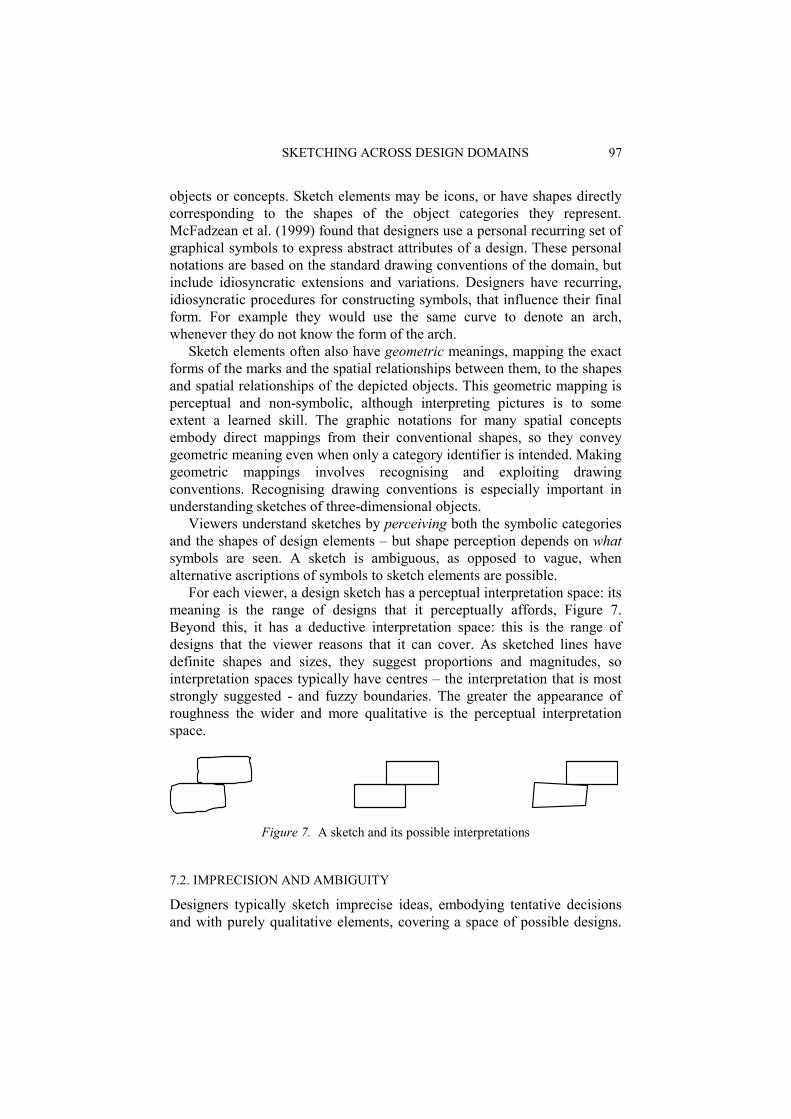
SKETCHING ACROSS DESIGN DOMAINS 97
objects or concepts. Sketch elements may be icons, or have shapes directly corresponding to the shapes of the object categories they represent. McFadzean et al. (1999) found that designers use a personal recurring set of graphical symbols to express abstract attributes of a design. These personal notations are based on the standard drawing conventions of the domain, but include idiosyncratic extensions and variations. Designers have recurring, idiosyncratic procedures for constructing symbols, that influence their final form. For example they would use the same curve to denote an arch, whenever they do not know the form of the arch.
Sketch elements often also have geometric meanings, mapping the exact forms of the marks and the spatial relationships between them, to the shapes and spatial relationships of the depicted objects. This geometric mapping is perceptual and non-symbolic, although interpreting pictures is to some extent a learned skill. The graphic notations for many spatial concepts embody direct mappings from their conventional shapes, so they convey geometric meaning even when only a category identifier is intended. Making geometric mappings involves recognising and exploiting drawing conventions. Recognising drawing conventions is especially important in understanding sketches of three-dimensional objects.
Viewers understand sketches by perceiving both the symbolic categories and the shapes of design elements – but shape perception depends on what symbols are seen. A sketch is ambiguous, as opposed to vague, when alternative ascriptions of symbols to sketch elements are possible.
For each viewer, a design sketch has a perceptual interpretation space: its meaning is the range of designs that it perceptually affords, Figure 7. Beyond this, it has a deductive interpretation space: this is the range of designs that the viewer reasons that it can cover. As sketched lines have definite shapes and sizes, they suggest proportions and magnitudes, so interpretation spaces typically have centres – the interpretation that is most strongly suggested - and fuzzy boundaries. The greater the appearance of roughness the wider and more qualitative is the perceptual interpretation space.
Figure 7. A sketch and its possible interpretations
7.2. IMPRECISION AND AMBIGUITY
Designers typically sketch imprecise ideas, embodying tentative decisions and with purely qualitative elements, covering a space of possible designs.

98 CM ECKERT, AF BLACKWELL, MK STACEY AND CF EARL
Such a design space is difficult to express in a pictorial form. Designers often draw a typical instance or a range of instances, which can either be typical of sub-categories, or mark the edges of the design space that they represent. This strategy for indicating spaces can be applied equally to rough sketches and precise representations. Figure 8 might represent the relative location of two houses. Any range between the two extremes would be acceptable, but typically only the middle instance would be sketched. As design sketches are necessarily imprecise, they introduce ambiguity and inaccuracy into the transmission of meaning. Designers draw their mental concepts with varying degrees of accuracy according to their own conventions, but the sketches are interpreted according to the viewer’s conventions as a different space of possible designs. Different people have different conceptions of central or typical category members; this is important when design element categories can vary over time, as in knitwear design.
Figure 8. Sketch and its intended scope of vagueness
A sketch may be ambiguous; that is, it affords alternative symbolic interpretations. This can happen when a sketch element can be interpreted as a roughly drawn instance of one symbol or a more precisely drawn instance of another (such as a flared sleeve); or is on a fuzzy boundary between two category symbols (for instance, a slightly flared sleeve); or when marks can be grouped into symbols in different ways; or when the sketch is self-contradictory (for instance, a sweater with two different sleeves); or when alternative notational conventions are in conflict (a common problem in interpreting sketches of three-dimensional objects). A sketch element can be quantitatively ambiguous when it is unclear whether it is purely a category symbol or has a meaningful shape, or how wide the range of its geometric meaning should be. The degree of apparent roughness is a powerful signal of how wide the interpretation space should be, but the recipients cannot easily distinguish between intentional roughness and poor drawing. Roughness biases interpretation (for better or worse) towards simple shapes.

SKETCHING ACROSS DESIGN DOMAINS 99
7.3. COMPARISON TO OTHER MEDIA
The imprecision and ambiguity of two-dimensional sketches are well recognized. While it is not clear what the scope of interpretation of a sketch is, nobody expects a sketch to be a precise medium or would use is as an exact specification. Other media lack this immediately visible sketchiness. While they might carry out the same role for the designers themselves, they might be received very differently by others. As our informants point out, a computer rendering or a model appear to be more defined, in the same way that a well laid out computer document looks more finished than handwritten notes. In the generation of other media, such are models, it is necessary to resolve some of the uncertainties that a sketch can carry, so that the balance between symbolic and depictive meaning is different. Often verbal references to other objects carry out the role of sketches. A sketch is always an abstraction of a potential object, where important characteristics are highlighted. In verbal references this abstraction is also implicit. This makes them inherently more imprecise and ambiguous than sketches, while this is less recognized.
8. Discussion and Future Research
The current state of research on sketching in design is patchy, with researchers concentrating on particular phases in particular domains. Through looking at sketching behavior across a number of domains this paper examines the multiple roles that sketching can carry out: • To generate and record ideas, • To represent abstract properties pictorially, • To communicate design ideas to others.
Our informants placed great emphasis on sketching as a means to communicate provisional design information both to customers and their peer groups. But these roles are not always carried out by sketches on paper. Some design domains use verbal descriptions. Existing objects can play a similar role to sketches, in that they support the generation of new ideas and serve as reference points in communication. Our analysis of sketching behaviour across design domains is only a small part of ongoing analysis of the similarities and differences between design domains.
Acknowledgements
The Across Design project would like to thank the Cambridge MIT Institute for funding this research project (nmzh/013). But most of all we would like to thank all the participants in our workshops for giving us their time with such productive enthusiasm.
100 CM ECKERT, AF BLACKWELL, MK STACEY AND CF EARL
References
Akin, Ö: 1978, How do architects design?, in J-C Latombe (ed), Artificial Intelligence and Pattern Recognition in Computer-Aided Design, North-Holland, pp. 65-104.
Bly, SA and Minneman, SL 1990: Commune: A shared drawing surface, Proceedings of the Office Information System Conference, Boston, MA, pp. 184 – 193.
Bly, SA 1988: A use of drawing surfaces in different collaborative settings, Proceedings of CSCW’88, ACM Press, pp. 250-256.
Bucciarelli, LL: 1994, Designing Engineers, MIT Press, Cambridge MA. Chambers, D and Reisberg, D: 1985, Can mental images be ambiguous? Journal of
Experimental Psychology: Human Perception and Performance 11(3): 317-328. Eckert, CM and Stacey, MK: 2000, Sources of inspiration: A language of design, Design
Studies 21 (5): 523-538. Eckert, CM: 2001, The communication bottleneck in knitwear design: Analysis and
computing solutions, Computer Supported Cooperative Work 10 (1): 29-74. Eckert, CM and Stacey, MK: 2001, Designing in the context of fashion designing the fashion
context, in P Lloyd and HHCM Christiaans (eds), Designing in Context: Proceedings of the 5th Design Thinking Research Symposium, pp. 113-129.
Eckert CM and Stacey MK: 2003, Sources of inspiration in industrial practice: The case of knitwear design, Journal of Design Research 15(4): 355-384.
Eckert, CM, Stacey MK and Earl CF: 2003, Ambiguity is a double-edged sword: Similarity references in communication, Proceedings of 14th International Conference on Engineering Design, Stockholm, Sweden.
Egan, DE and Schwartz, BJ: 1979, Chunking in recall of symbolic drawings, Memory and Cognition 7: 149-158.
Finke, RA: 1990, Creative Imagery: Discoveries and Inventions in Visualization, Hillsdale, NJ: Lawrence Erlbaum Associates.
Finke, RA: 1996, Imagery, creativity, and emergent structure, Consciousness and Cognition 5(3): 381-393.
Finke, RA and Slayton, K: 1988, Explorations of creative visual synthesis in mental imagery, Memory & Cognition 16(3): 252-257.
Finke, RA, Pinker, S and Farah, MJ: 1989, Reinterpreting visual patterns in mental imagery, Cognitive Science 13(1): 51-78.
Goel, V: 1995, Sketches of Thought, MIT Press, Cambridge MA. Goldschmidt, G: 1991, The dialectics of sketching, Creativity Research Journal 4: 123-143. Goldschmidt, G: 1994, On visual design thinking: The vis kids of architecture, Design Studies
15: 158-174. Goldschmidt, G: 1999, The backtalk of self-generated sketches, in JS Gero & B Tversky
(eds), Visual and Spatial Reasoning in Design, Key Centre of Design Computing and Cognition, University of Sydney, pp. 163-184.
Katz, AN: 1983, What does it mean to be a high imager?, in JC Yuille (ed.), Imagery, Memory and Cognition: Essays in Honor of Allan Paivio, Erlbaum, Hillsdale, NJ, pp. 39-63.
Kosslyn, S: 1980, Image and Mind, Harvard University Press, Cambridge, MA. Kosslyn, S: 1994, Image and Brain, MIT Press, Cambridge, MA. Logie, RH: 1995, Visuo-Spatial Working Memory, Psychology Press, Hove. Miller GA: 1956, The magical number seven, plus or minus two: Some limits on our capacity
for processing information, The Psychological Review 63: 81-97.

SKETCHING ACROSS DESIGN DOMAINS 101
Minneman SL: 1991, The Social Construction of a Technical Reality: Empirical Studies of Group Engineering Design Practice, PhD Thesis, Department of Mechanical Engineering, Stanford University, Stanford, CA.
Neilson, I and Lee J: 1994, Conversations with graphics: Implications for the design of natural language/graphics interfaces, International Journal of Human-Computer Studies 40: 509-541.
Oxman, R: 1990, Prior knowledge in design: A dynamic knowledge-based model of design and creativity, Design Studies 11: 17-28.
Pache, M, Roemer, A, Lindemann, U and Hacker, W: 2001, Re-interpretation of conceptual design sketches in mechanical engineering, Proceedings of DETC’01, Pittsburgh, Pennsylvania.
Petre, M and Blackwell, AF: 1997. A glimpse of expert programmer's mental imagery, in S Wiedenbeck and J Scholtz (eds), Proceedings of the 7th Workshop on Empirical Studies of Programmers, pp. 109-123.
Purcell, AT and Gero, JS: 1998, Drawings and the design process, Design Studies 19: 389-430.
Pylyshyn, ZW: 2003, Mental imagery: In search of a theory, Behavioural and Brain Sciences 25: 157-237.
Schön, DA: 1983, The Reflective Practitioner: How Professionals Think in Action, Basic Books, New York, NY.
Schön, DA: 1988, Designing: Rules, types and worlds, Design Studies 9: 181-190. Schön, DA and Wiggins, G: 1992, Kinds of seeing and their function in designing, Design
Studies 13:135-156. Stacey, MK, Eckert, CM, Earl, CF, Bucciarelli, LL and Clarkson, PJ: 2002, A comparative
programme for design research, Proceedings of the Design Research Society 2002 International Conference: Common Ground, Brunel University, Runnymede, London.
Stacey, MK, Eckert, C.M. and McFadzean, J: 1999, Sketch interpretation in design communication, Proceedings of the 12th International Conference on Engineering Design, Technical University of Munich, Munich, August 1999, volume 2, pp. 923-928.
Star, SL: 1989, The structure of ill-structured solutions: Heterogeneous problem-solving, boundary objects, and distributed artificial intelligence, in L Gasser and MN Huhns (eds), Distributed Artificial Intelligence 2, Morgan Kaufman.
Suh, NP: 1990, The Principles of Design, Oxford University Press, New York. Tang, JC: 1989, Listing, Drawing and Gesturing in Design: A Study of the Use of Shared
Workspaces by Design Teams, PhD Thesis, Department of Mechanical Engineering, Stanford University, Stanford, CA. Xerox Palo Alto Research Center report SSL-89-3.
Tang, JC: 1991, Findings from observational studies of collaborative work, International Journal of Man-Machine Studies 34: 143-160.
Tang, JC and Leifer L: 1988, A framework for understanding the workspace activity of design teams, Proceedings of CSCW’88, Portland, OR: ACM Press, pp 226-232.

102

SESSION 3
Critiquing freehand sketching: A computational tool for design evaluation Yeonjoo Oh, Ellen Do and Mark Gross
Analysis of a blindfolded architect’s design session
Zafer Bilda and John S Gero

JS Gero, B Tversky and T Knight (eds), Visual and Spatial Reasoning in Design III, 2004 Key Centre of Design Computing and Cognition, University of Sydney, pp 105-120
CRITIQUING FREEHAND SKETCHING
A Computational Tool for Design Evaluation
YEONJOO OH, MARK D GROSS AND ELLEN YI-LUEN DO University of Washington, USA
Abstract. In this paper we discuss how architects reason about spatial relations, functional concerns and 3D space with drawings. We present Design Evaluator, a freehand sketching environment that offers critiquing of circulation paths and arrangement of functions in a floor plan diagram. The critiques are presented in the forms of text, diagram annotation and 3D model.
1. Introduction
1.1. ROLE OF SKETCHING: REFLECTIONS AND RESTRUCTURING
Design researchers have identified the role of freehand design drawings (i.e. sketches and diagrams) as material that stimulates reflection in the early stages of design. Schön, for example, describes designing as ‘reflection-in-action’: designers go through the actions of generating a design solution, evaluating it, reflecting on, and changing it. He argues that drawing is essential as a tool in this reflecting process (Schön 1985). Designers use drawings to externalize design ideas and then, through examining and interacting with the drawings, develop their designs further. Designers must see the visual image on the drawing (Fish and Scrivener 1990; Goldschmidt 1991) to make a decision, to add a new design idea, or to modify the design (Laseau 1980). Schön argues that designers perform ‘seeing-moving-seeing cycles’ in designing. In this cycle, ‘seeing’ is the interpretation of a drawing that is composed of graphical symbols; it induces the designers to "have a conversation with themselves" about the design ideas that they have recorded in the drawing (Schön and Wiggins 1992). In ‘seeing’ their drawings, they might discover alternative interpretations from what they originally drew. Cognitive scientists describe this process as ‘restructuring’ and alternative interpretations as ‘emergence’ (Verstijinen et al. 2001). This feedback initiates an action, resulting in adding, moving, or removing
106 Y OH, MD GROSS AND EY-L DO
symbols in the drawing. Experiments show that people cannot remember all design information and reason about alternatives without using external representations (Tversky 1999). These representations (drawings) help people offload the burden of keeping all relevant information in short-term memory.
1.2. STUDIO CRITIQUES AND REASONING
Architecture has a unique and traditional education method, the design studio. Architectural educators give frequent critiques at the students’ desks, so-called ‘desk crits’. The examples of design review in Schon’s research show how these critiques can support reasoning, which points to the importance of the drawing in this reasoning (Schön 1985). In a discussion with the student, the reviewer sees and points out graphical elements, properties, and relationships in the students’ drawings. The reviewer applies different levels of knowledge to the student’s designing and can reframe the student’s problem depending on what he sees in the drawing. The student absorbs the reviewer’s critiques, transfers them into his understanding (Goldschmidt 2003) and restructures his knowledge. Critiques prompt the student to refocus or shift attention within the current design problem (Hayes-Roth and Hayes-Roth 1979). Critiques also help designers to understand and resolve conflicts among design intentions (Nakakoji and Sumner 1994). During a desk crit, they perform a continual evaluation as they experiment with design variations. They ‘move’ graphical elements in the drawing and reason about the design within their constraints. Therefore, critiques can help students reframe the design problem and offer reasons to guide further moves.
1.3. DESIGN EVALUATOR
Following these observations, we built the Design Evaluator, a design environment that offers critiquing annotations on drawings to facilitate design reflection. Design Evaluator encourages designers to think about alternative possibilities of design through critical feedback. This feedback can be the impetus to move spatial elements. The current Design Evaluator critiques architectural plans that specify configurations of spatial elements. In early design architects draw a bubble diagram and then manipulate shapes, functions and relationships of graphical elements to facilitate design development.
Design Evaluator offers critiques about functional issues and concerns about circulation path, and adjacency requirements; it also offers an interactive 3D visualization.
The rest of this paper is organized as follows. Section 2 describes related work in computer based sketching and critiquing. Section 3 is a scenario
CRITIQUING FREEHAND SKETCHING 107
that illustrates how architects reason with their drawings. Section 4 describes Design Evaluator and Section 5 concludes with a summary and discussion.
2. Related Work
We begin with two related premises. First, sketching is important in the creative design process. Second, a freehand drawing system therefore is an appropriate tool to access systems that support design reasoning.
Computationally enhanced design tools can offer support for reasoning. In order to build an environment supporting architectural design reasoning, we examined architectural concept sketches. They mainly employ three kinds of reasoning: spatial reasoning, functional reasoning and 3D visualization. Our Design Evaluator is therefore concerned with these three kinds of reasoning. We briefly review related work in these areas.
Sketching systems that support spatial reasoning have been developed for design. Electronic Cocktail Napkin (Gross 1996; Gross and Do 2000) recognizes and interprets users’ sketches to activate a simulation or image retrieval. For example, if the user draws a stack of boxes, the system might recognize the diagram as Frank Lloyd Wright's Guggenheim museum and retrieves a record from a collection of visual images.
The sKEA (Sketching Knowledge Entry Associate) system interprets sketches and the spatial relations in them to retrieve relevant information (Forbus and Usher 2002). For example in a sketch, sKEA can match a rounded body of a cat to the rounded human torso. This matching capability can suggest possible placement locations for the limbs of a cat.
Critiquing systems have also been built to support design. KID (Knowing-in-Design) (Nakakoji 1993) and CRACK (A Critiquing Approach to Cooperative Kitchen Design) (Fischer and Morch 1988) support kitchen floor plan design with critiquing messages about problematic aspects such as a poorly placed appliance or an incorrectly sized work triangle. The systems also offer successful kitchen layout examples for identified design tasks.
Several design systems provide critiques about functional behavior based on a design diagram. For example, Critter (Kelly 1984) is an early system for critiquing digital circuit designs. It provides critiques about behaviors such as unsatisfactory operating speed or power consumption. SketchIT (Stahovich 1996) is a system for conceptual design of mechanical devices such as hook and pushrod. SketchIT identifies the parts and simulates the system’s behavior to provide design feedback about function.
Several systems provide 3D visualization from 2D sketches. Teddy (Igarashi et al. 1999) enables a designer to quickly generate a three dimensional model from a sketch. Teddy generates three-dimensional
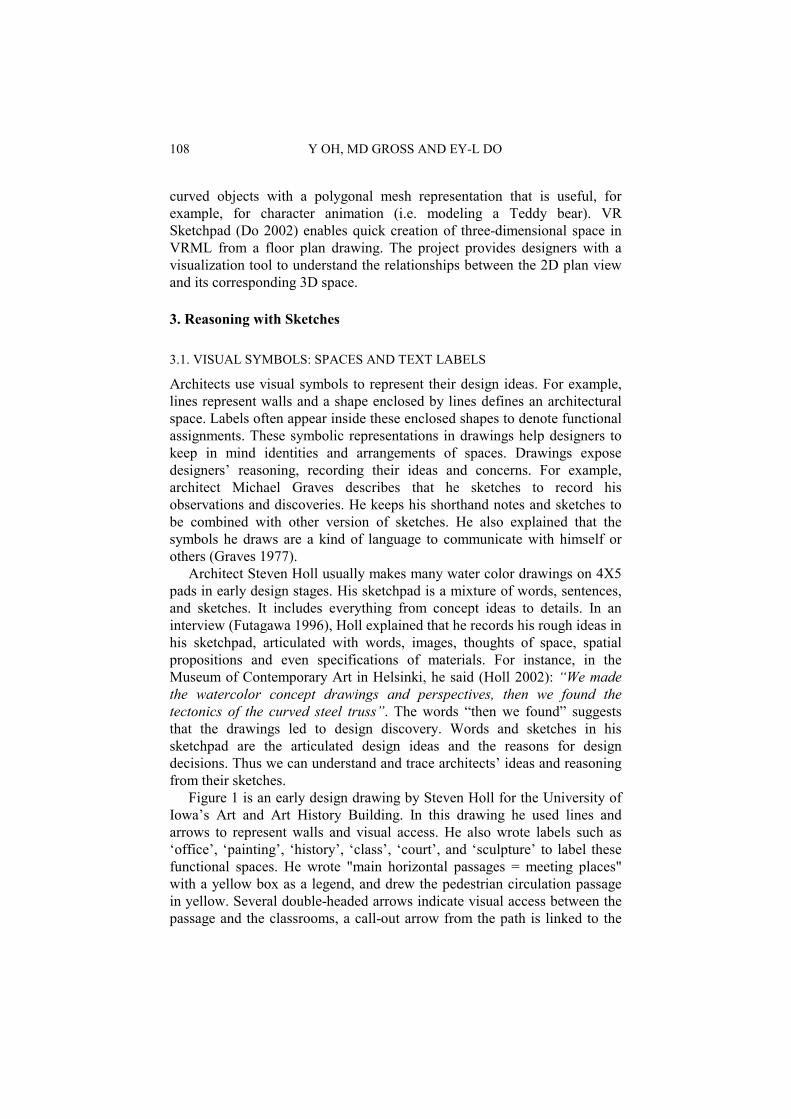
108 Y OH, MD GROSS AND EY-L DO
curved objects with a polygonal mesh representation that is useful, for example, for character animation (i.e. modeling a Teddy bear). VR Sketchpad (Do 2002) enables quick creation of three-dimensional space in VRML from a floor plan drawing. The project provides designers with a visualization tool to understand the relationships between the 2D plan view and its corresponding 3D space.
3. Reasoning with Sketches
3.1. VISUAL SYMBOLS: SPACES AND TEXT LABELS
Architects use visual symbols to represent their design ideas. For example, lines represent walls and a shape enclosed by lines defines an architectural space. Labels often appear inside these enclosed shapes to denote functional assignments. These symbolic representations in drawings help designers to keep in mind identities and arrangements of spaces. Drawings expose designers’ reasoning, recording their ideas and concerns. For example, architect Michael Graves describes that he sketches to record his observations and discoveries. He keeps his shorthand notes and sketches to be combined with other version of sketches. He also explained that the symbols he draws are a kind of language to communicate with himself or others (Graves 1977).
Architect Steven Holl usually makes many water color drawings on 4X5 pads in early design stages. His sketchpad is a mixture of words, sentences, and sketches. It includes everything from concept ideas to details. In an interview (Futagawa 1996), Holl explained that he records his rough ideas in his sketchpad, articulated with words, images, thoughts of space, spatial propositions and even specifications of materials. For instance, in the Museum of Contemporary Art in Helsinki, he said (Holl 2002): “We made the watercolor concept drawings and perspectives, then we found the tectonics of the curved steel truss”. The words “then we found” suggests that the drawings led to design discovery. Words and sketches in his sketchpad are the articulated design ideas and the reasons for design decisions. Thus we can understand and trace architects’ ideas and reasoning from their sketches.
Figure 1 is an early design drawing by Steven Holl for the University of Iowa’s Art and Art History Building. In this drawing he used lines and arrows to represent walls and visual access. He also wrote labels such as ‘office’, ‘painting’, ‘history’, ‘class’, ‘court’, and ‘sculpture’ to label these functional spaces. He wrote "main horizontal passages = meeting places" with a yellow box as a legend, and drew the pedestrian circulation passage in yellow. Several double-headed arrows indicate visual access between the passage and the classrooms, a call-out arrow from the path is linked to the
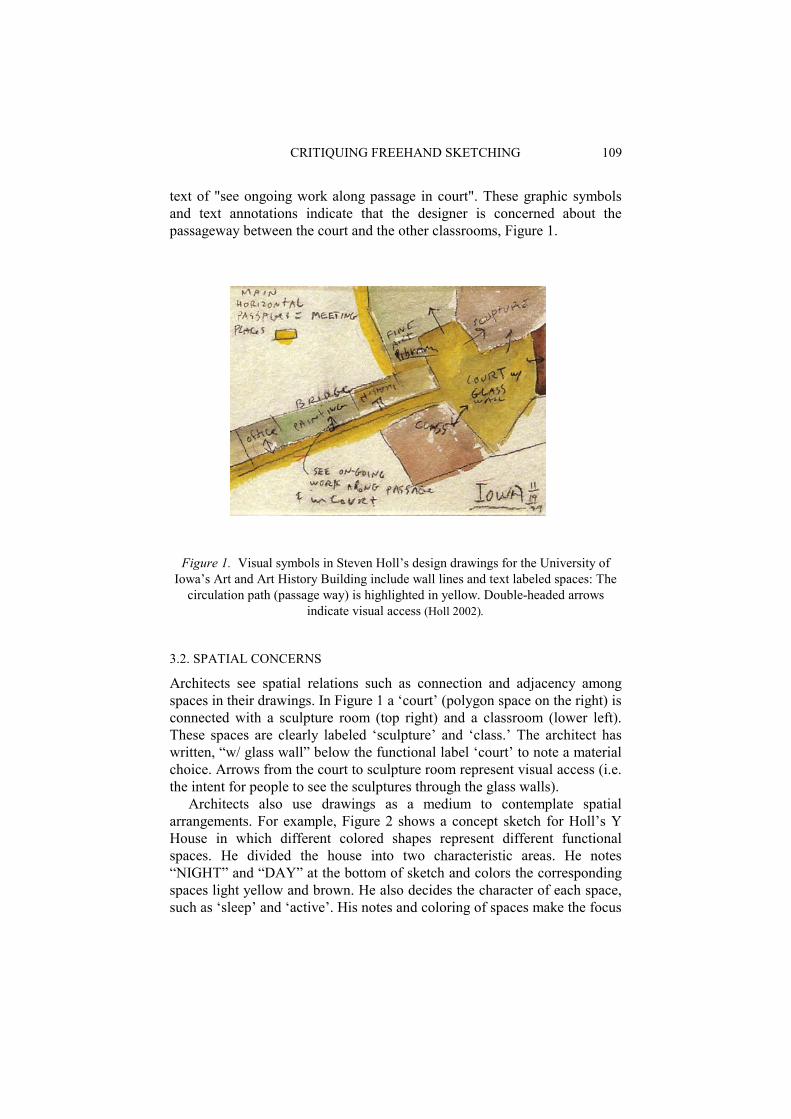
CRITIQUING FREEHAND SKETCHING 109
text of "see ongoing work along passage in court". These graphic symbols and text annotations indicate that the designer is concerned about the passageway between the court and the other classrooms, Figure 1.
Figure 1. Visual symbols in Steven Holl’s design drawings for the University of Iowa’s Art and Art History Building include wall lines and text labeled spaces: The
circulation path (passage way) is highlighted in yellow. Double-headed arrows indicate visual access (Holl 2002).
3.2. SPATIAL CONCERNS
Architects see spatial relations such as connection and adjacency among spaces in their drawings. In Figure 1 a ‘court’ (polygon space on the right) is connected with a sculpture room (top right) and a classroom (lower left). These spaces are clearly labeled ‘sculpture’ and ‘class.’ The architect has written, “w/ glass wall” below the functional label ‘court’ to note a material choice. Arrows from the court to sculpture room represent visual access (i.e. the intent for people to see the sculptures through the glass walls).
Architects also use drawings as a medium to contemplate spatial arrangements. For example, Figure 2 shows a concept sketch for Holl’s Y House in which different colored shapes represent different functional spaces. He divided the house into two characteristic areas. He notes “NIGHT” and “DAY” at the bottom of sketch and colors the corresponding spaces light yellow and brown. He also decides the character of each space, such as ‘sleep’ and ‘active’. His notes and coloring of spaces make the focus

110 Y OH, MD GROSS AND EY-L DO
and concerns more visible on the paper and perhaps helps him to keep the idea in mind or to communicate it to others.
Figure 2. Functional spaces are drawn in different colors in the concept sketch for
the Y House (Holl 2002)
3.3. FUNCTIONAL CONCERNS
We can identify architects’ concerns and decisions about functional arrangement of spaces and circulation from their design drawings. For example, in the plan for the Y house, Figure 3, Holl wrote ‘MBR’, ‘BR’, ‘DR/K’ and ‘LR’ as functional labels. The connecting linear shapes in yellow (center of the drawing) represent a continuous ramp. We can see that he drew a call-out line to label this a “Y” ramp. The rectangle next to the ramp represents a staircase. We suppose that this is a design for a two story house, judging from symbols (stair and ramp) and text (“upper level” and “below”).
In this drawing, the designer is concerned about the functional arrangements on the different floors. For example, at the top right, the architect wrote “BR below LR”, a shorthand for the placement of a bedroom below the living room. He places ‘BR’ in the ‘NIGHT’ area (lower level) and ‘LR’ in the ‘DAY’ area (upper level). Similar markings of ‘MBR (master bedroom)’ and ‘BR (bedroom)’ also appear on the lower part of the sketch. Adjacent to the rooms is an arrow with the text DR/K (dining room/kitchen). He places ‘MBR’ and ‘BR’ in the ‘NIGHT’ area and ‘DR/K’ in the ‘DAY’ area. Holl also circled his annotation of “2BR upper level” (lower left). This drawing shows that the designer was concerned about arrangements of functional spaces and spatial relationships such as horizontal or vertical adjacency between rooms.

CRITIQUING FREEHAND SKETCHING 111
Figure 3. Text labels in the concept sketch for Y House indicate concerns about
spatial arrangements of functional spaces (Holl 2002)
We can understand Holl’s sequential actions in terms of Shank and Abelson’s ‘scripts’. These interconnected activities of zoning and room placement are causally linked (Schank and Abelson 1977). Holl considers the previously decided characters of spaces in the room placements: for example, the living room, kitchen, and dinning room that have ‘active’ character are placed in the ‘DAY’ area while ‘BR’ and ‘MBR’ are placed in ‘NIGHT’ and ‘sleep' zone.
Architects also consider circulation paths. In Figure 4, Steven Holl wrote on his sketch page the concepts of ‘Freedom of Movement’ and ‘view to landscape & gardens.’ Reflecting this, the drawing has entangled curvy arrows between lines, which represent wall partitions. The curvy arrows represent the circulation paths.
Figure 4. Circulation path concerns represented as curvy arrows in Holl’s concept
sketch of the Nelson Atkin Museum of Art Expansion (4/9/99) (Holl 2002)

112 Y OH, MD GROSS AND EY-L DO
3.4. 3D VISUALIZATION
Architects use 3D perspective or isometric drawings during designing to reason about form and functional arrangements. Often these plan and 3D drawings appear on the same piece of tracing paper or on pages in the same sketchbook. Figure 5 shows a 3D drawing that appears directly below the plan drawings of the Y House on the same page. This figure shows that the designer was concerned about the look and feel of the 3D form when he represented his design ideas in 2D drawings.
Figure 5. Concept Sketch for Y House includes plan diagrams and perspective
views (Holl 2002)
Figure 6 shows a bird’s eye view (right). The relations of rooms are illustrated clearly in this drawing by extruding the wall lines from the plan diagram (left). The circulation path is also colored in yellow as in the plan diagrams, Figure 6 left, also Figure 1.
Figure 6. Concept Sketch for University of Iowa’s Art and Art History Building
(Holl 2002)
CRITIQUING FREEHAND SKETCHING 113
4. Computational Tool for Reasoning with Design Critiques
To support architects’ reasoning activities about spatial and functional relationships and 3D spaces in their design drawings, we built the Design Evaluator. The Design Evaluator supports designer’s reasoning process by providing critiques.
In architectural design, one of the most complicated tasks is hospital design. In this section we show Design Evaluator at work using examples from hospital design. The designer starts with diagrams of the large functional zones. A hospital typically has three zones: Clinical zone, Nursing zone, and Support zone. The architect first specifies and draws the extent of these zones, then plans and draws several rooms for specific functional activities such as ER (emergency room), ICU (intensive care unit), and the (patient) ward. The zone checker in Design Evaluator then verifies that the ER and ICU are in the clinical zone, and the ward is in the nursing zone.
Arranging the rooms, the architect is concerned with circulation path and functional issues. For example, ER and ICU should be adjacent; or a path must follow a specific sequence. To support this kind of reasoning, Design Evaluator provides a path checker to give design feedback.
The checkers also provide visual annotation (e.g., path from ICU to ER, and incorrect placement of rooms in a zone) and visualization to suggest design revisions. Like graphical maps, visual annotations deliver knowledge in a compact way and help designers generate new design ideas in problem-solving process (Tversky 2001).
4.1. KNOWLEDGE CAPTURE FROM FREEHAND DIAGRAMS
Design Evaluator is a computational sketching environment. The designer uses a stylus with a digitizing tablet to make freehand 'bubble' diagrams that represent spatial arrangements of rooms in a floor plan. Designers enter two types of data into their drawings: spatial diagrams and text labels. Spatial diagrams of drawn shapes are recognized as functional zones and rooms and their connections. Design Evaluator supports two kinds of bubbles: zone and room. The designer uses a type-in box to input a text label for each room.
The system also has two modes of display: sketch mode and rectified mode. The designer draws bubble diagrams to represent functional spaces such as entrance and triage, Figure 7 – left, and draws lines to connect bubbles to represent connections between functional spaces. The system can also display the space in a ‘rectified’ mode. In this mode, a freehand bubble will be converted to a rectangle shaped room and doorways are shown as open areas along the wall lines of the room, Figure 7 - right.
The Design Evaluator system captures information from the designer’s sketches. Recognized symbols (zones, rooms, and doors), text and spatial

114 Y OH, MD GROSS AND EY-L DO
relationships are compared with stored a-priori design knowledge to generate critiques. Design Evaluator recognizes the spatial relationships in the diagram and generates a network representation of all the rooms and doors. It also generates the set of all possible paths through the floor plan.
Figure 7. Sketched Diagrams: Design Evaluator provides two modes of drawing;
sketched and rectified diagrams. In sketch mode, lines represent doors and in rectified mode, doors are represented as white space.
These sketched symbols are connected with each other in the database. Each zone object stores the list of all rooms that are drawn in the zone. Likewise, each room object stores the object describing the zone it is in. In this way, the system represents zoning information from the diagram. Rooms and their connecting doors are represented in a similar fashion, Figure 8.
Figure 8. Relations of the Sketched Objects: Each zone has a list of its rooms and
each room has a list of its doors. Each door knows which rooms it connects.

CRITIQUING FREEHAND SKETCHING 115
4.2. CRITIQUING
Design Evaluator works with two kinds of information: captured information from the drawing and design criteria as built-in rules. Design Evaluator has two checkers: a Path Checker and a Zone Checker. The Path Checker operates with two kinds of rules: 1) path sequence rules, and 2) room adjacency rules. The Zone Checker currently only has one kind of rule dealing with room placements in appropriate zones.
The design criteria are categorized as Zone Rules and Path Rules. These rules are previously proposed by the designer to the Design Evaluator system for determining the proper placement of rooms and proper sequence of circulation for the rooms. (1) The Room Sequence Rule in the Path Checker takes the form of:
(<Requirement> <room1> <room2> [<room3>]) This expression indicates that path sequence should follow room1– room2 –room3. For example, the following expression represents a required circulation sequence in a hospital design:
(MUST-PASS-THROUGH ENTRANCE TRIAGE ER) The path from entrance to the ER must pass through the Triage area. This requirement ensures that once patients are received from the entrance, they should be directed to Triage for treatment decisions before being sent to the ER.
(2) The Adjacency Requirement in Path Checker takes the form of:
(<Requirement> <room1> <room2>) For example, the following expression represents a required adjacency of two rooms in a hospital design.
(SHOULD-BE-ADJACENT ER ICU) This requirement means Emergency Room and Intensive Care Unit should be adjacent. (3) The Room Placements in the Appropriate Zone Checker takes the form of:
(<Requirement> <Zone> (<Room> <Room> <Room> <Room> ……)) This expression indicates that all the Rooms should be in the given Zone. For example, the following expression represents a typical room placement requirement in hospital design: (MUST-BE-IN CLINICAL-ZONE (ER TRIAGE CLINIC-FOR-OUTPATIENT DAYWARD…)). Certain rooms used for direct patient care such as Emergency Room, Triage, and Clinic for Outpatient, and Dayward should be placed in the clinical zone.
Each rule is compared with the zone and room in the designer’s sketch,
and the paths that the system has derived. The checkers compare the spatial
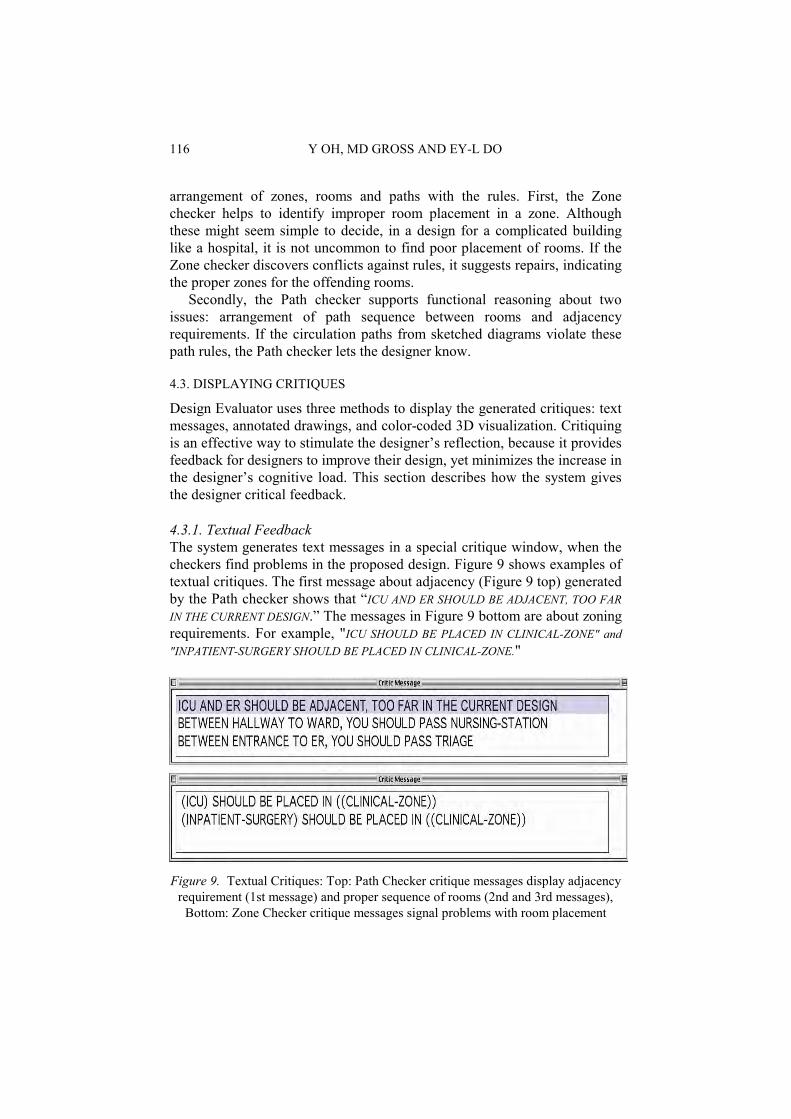
116 Y OH, MD GROSS AND EY-L DO
arrangement of zones, rooms and paths with the rules. First, the Zone checker helps to identify improper room placement in a zone. Although these might seem simple to decide, in a design for a complicated building like a hospital, it is not uncommon to find poor placement of rooms. If the Zone checker discovers conflicts against rules, it suggests repairs, indicating the proper zones for the offending rooms.
Secondly, the Path checker supports functional reasoning about two issues: arrangement of path sequence between rooms and adjacency requirements. If the circulation paths from sketched diagrams violate these path rules, the Path checker lets the designer know.
4.3. DISPLAYING CRITIQUES
Design Evaluator uses three methods to display the generated critiques: text messages, annotated drawings, and color-coded 3D visualization. Critiquing is an effective way to stimulate the designer’s reflection, because it provides feedback for designers to improve their design, yet minimizes the increase in the designer’s cognitive load. This section describes how the system gives the designer critical feedback.
4.3.1. Textual Feedback The system generates text messages in a special critique window, when the checkers find problems in the proposed design. Figure 9 shows examples of textual critiques. The first message about adjacency (Figure 9 top) generated by the Path checker shows that “ICU AND ER SHOULD BE ADJACENT, TOO FAR IN THE CURRENT DESIGN.” The messages in Figure 9 bottom are about zoning requirements. For example, "ICU SHOULD BE PLACED IN CLINICAL-ZONE" and "INPATIENT-SURGERY SHOULD BE PLACED IN CLINICAL-ZONE."
Figure 9. Textual Critiques: Top: Path Checker critique messages display adjacency requirement (1st message) and proper sequence of rooms (2nd and 3rd messages),
Bottom: Zone Checker critique messages signal problems with room placement
CRITIQUING FREEHAND SKETCHING 117
4.3.2 Visual Feedback Each generated textual critique message is connected with annotation symbols added to the design drawing. When a problem space is identified, the system will highlight that room boundary with thick wall lines.
Figure 10 shows that the ICU and Surgery are not placed in the proper zones. The Zone Checker shows the designer the wrongly placed rooms with highlighted thicker lines and also gives a text suggestion to move the rooms to the appropriate zone.
Textual and visual critiques are connected: if the user clicks on the second message in Figure 9, “BETWEEN HALLWAY TO WALL, YOU SHOULD PASS THROUGH NURSING-STATION,” the Path Checker shows the path from Ward to Hallway, Figure 11.
Figure 10. Annotated drawing of zone rules conflicts: This annotation draws
designer’s attention to the placements of ICU and inpatient-surgery
Figure 11. Path checker: Annotated drawing of conflicts against path rules
118 Y OH, MD GROSS AND EY-L DO
4.3.3. 3D Visualization for 2D floor plan The third method for displaying design critiques is a 3D visualization of
the space with VRML (Virtual Reality Modeling Language). Figure 12 shows the texture-mapped VRML model in the web browser, with path highlighting. Texture-mapped models give the designer a realistic simulation of the designed space. For example, in the model, the interior walls of the emergency room are painted with photographs of a real emergency room, to give the model a more convincing appearance. A 3D model enables the designers to easily visualize the spatial relations in 3D and be able to “walk” inside the simulated space to further evaluate the spatial quality of the design.
5. Discussion
In section 3 we saw how one architect, Steven Holl, recorded his concerns about spatial, functional relations and 3D visualizations in drawings. Holl uses visual symbols and shorthand notes for recording his design ideas and concerns. He reasons about the relations among neighboring rooms (Figure 1) as well as the whole arrangement with divided larger functional spaces (Figure 2 and 3). Figure 4 shows that he is concerned about functional relationship and circulation path. Using his drawing, he reasons about horizontal or vertical adjacency. For reasoning about the form and relationship of spaces, he used 3D perspective drawings as shown in Figures 5-6.
Figure 12. Texture-mapped VRML model: Each room label is appears in the middle
of room and path between ICU and ER is displayed
CRITIQUING FREEHAND SKETCHING 119
Architects reason when they are making design drawings. As discussed above, Holl drew graphical symbols to represent his design solutions. These symbols include lines and enclosures to represent functional spaces and text labeling for the rooms. Holl included semantic information such as notations of design rationale on drawings apparently to remind himself of that information or to communicate it to others.
We observed that architects reason about spatial relations, functional concerns and 3D space with their design drawings. We explored the potential of supporting these three categories of reasoning by implementing Design Evaluator, a sketch-based design critiquing system.
When sketched diagrams violate previously stated rules, Design Evaluator generates annotated critiques. Knowledge is represented in the system as predefined rules that concern spatial relation, functional concerns and 3D space. Design Evaluator provides designers with textual and visual design critiques. Through visual critiques, designers may recognize potential problems. The designer might then try to solve those problems by moving rooms based on the provided critiques. In other words, Design Evaluator reminds designers of missing design information visually as well as in other ways; these visual critiques might trigger new design alternatives. The critiquing helps the designer to reason with his drawings about any issues he might have overlooked.
Acknowledgement
A more complete description of the Design Evaluator project can be found in Yeonjoo Oh's master of science in design computing thesis at the University of Washington's department of architecture. We thank architect Steven Holl and publisher El Croquis for permission to reprint Holl's sketches. This research was supported in part by the National Science Foundation under Grant CCLI-0127579. The views and findings contained in this material are those of the authors and do not necessarily reflect the views of the National Science Foundation.
References
Do, EY-L: 2002, Drawing marks, acts and reacts: Toward a computational sketching for architectural design, AIEDAM 16: 149-171.
Fischer, G and Morch, A: 1988, A critiquing approach to cooperative kitchen design, Proceedings of the International Conference on Intelligent Tutoring Systems, Montreal, Canada, pp. 176-185.
Fish, JC and Scrivener, S: 1990, Amplifying the mind's eye: Sketching and visual cognition, Leonardo 23(1): 117-126.
Forbus, K and Usher, J: 2002, Sketching for knowledge capture: A progress report, International Conference on Intelligent User Interfaces, pp. 71-77.
Futagawa, Y: 1996, Steven Holl, A.D.A. Edita, Tokyo.
120 Y OH, MD GROSS AND EY-L DO
Goldschmidt, G: 1991, The dialectics of sketching, Creativity Research Journal 4(2): 123-143.
Goldschmidt, G: 2003, Expert knowledge or creative spark? Predicaments in design education, in N Cross and E Edmonds (eds), Expertise in Design, University of Technology Sydney, Sydney, pp 221-233.
Graves, M: 1977, The necessity for drawing: Tangible speculation, Architectural Design 6(77): 384-394.
Gross, MD: 1996, The electronic cocktail napkin - working with diagrams, Design Studies 17(1): 53-69.
Gross, MD and Do, EY-L: 2000, Drawing on the back of an envelope, in JA Jorge and E Glinert (eds), Computers and Graphics, Calligraphy Interface, Pergamon Press, New York, 24: 835-849.
Hayes-Roth, B and Hayes-Roth, F: 1979, A cognitive model of planning, Cognitive Science 3: 275-310.
Holl, S: 2002, Steven Holl - Thought, Matter and Experience, El Croquis, Spain. Igarashi, T, Matsuoka, S and Tanaka, H: 1999, Teddy: A sketching interface for 3D freeform
design, Proceedings of the SIGGRAPH 1999, pp. 409-416. Kelly, V: 1984, The critter system: Automated critiquing of digital circuit designs,
Proceedings of the 21st Design Automation Conference, pp. 419-425. Laseau, P: 1980, Graphic Thinking for Architects and Designers, Van Nostrand Reinhold,
New York. Nakakoji, K: 1993, Increasing Shared Understanding of a Design Task between Designers
and Design Environment: The Role of a Specification Component, PhD Dissertation, Computer Science, University of Colorado at Boulder.
Nakakoji, K and Sumner, T: 1994, Perspective-based critiquing: Helping designers cope with conflicts among design intentions, in JS Gero and F Sudweeks (eds), Artificial Intelligence in Design'94, Kluwer, pp. 449-466.
Schank, R and Abelson, R: 1977, Scripts, Plans, Goals and Understanding, Erlbaum, Hillsdale, NJ.
Schön, DA: 1985, The Design Studio, RIBA Publications, London. Schön, DA and Wiggins, G: 1992, Kinds of seeing and their functions in designing, Design
Studies 13(2): 135-156. Stahovich, TF: 1996, SketchIT: A Sketch Interpretation Tool for Conceptual Mechanical
Design, PhD, Artificial Intelligence Laboratory, Massachusetts Institute of Technology. Tversky, B: 1999, What does drawing reveal about thinking, in JS Gero and B Tversky (eds),
Visual and Spatial Reasoning in Design, Key Centre of Design Computing and Cognition, University of Sydney, pp. 93-101.
Tversky, B: 2001, Multiple mental space, in J Gero, B Tversky and T Purcell (eds), Visual and Spatial Reasoning in Design II, Key Centre of Design Computing and Cognition, University of Sydney, pp. 1-13.
Verstijinen, IM, Heylighen, A, Wagemans, J and Neuckmans, H: 2001, Sketching, analogies, and creativity on the shared research interests of psychologists and designers, in JS Gero, B Tversky and T Purcell (eds), Visual and Spatial Reasoning in Design II, Key Centre of Design Computing and Cognition, University of Sydney, pp. 299-310.
JS Gero, B Tversky and T Knight (eds), Visual and Spatial Reasoning in Design III, 2004 Key Centre of Design Computing and Cognition, University of Sydney, pp 121-136
ANALYSIS OF A BLINDFOLDED ARCHITECT’S DESIGN SESSION
ZAFER BILDA AND JOHN S GERO University of Sydney, Australia
Abstract: Architects deal with visual/spatial features and organization of larger scale real world elements than other domains. The use of mental imagery in the architectural design process is the key issue to transform and mimic the spatial aspects of the environment. Depending on the focus of the design process, the use of imagery could relate directly to visuo-spatial aspects, or could be about manipulating functions and concepts in an abstract manner since no externalization is involved. The research reported here concerns what types of design tasks are associated with spatial, visual and recall components in imagery. Using protocol analysis we analyzed the design session of an architect wearing a blindfold and concurrently verbalizing her design thoughts about a design brief. At the end of the session she quickly sketched the final design she held in her imagery on paper . This paper presents the analysis of the interactions between visuo-spatial, internal perceptual and recall actions. We found that the involvement level of percepts, recall and visuo-spatial actions differs through the episodes of the session possibly due to the different rates of visuo-spatial processing and due to the different nature of the design tasks at hand.
1. Related Work
Kosslyn (1980) defined mental imagery as “seeing in the absence of the appropriate sensory input”. Thus mental images are not directly observable; as such the functions and properties of mental imagery are always inferred. In the cognitive psychology literature most experiments focus on simple mental imagery tasks conducted over a short time span. The cognitive load and the complexity of the tasks were low including short term memory recalls and transforming a basic figure/image over a relatively short time.
In another stream of research, studies with the expert chess players identified a skilled imagery (Simon and Chase 1973; Saarilouma 1998, Ericsson and Kintsch 1995) which shows evidence of the use of imagery for longer periods and with higher cognitive loads. An expert chess player can
122 Z BILDA AND JS GERO
play more than 10 concurrent games while blindfolded (Saarilouma 1998). These studies showed that experts with skilled imagery performance can maintain and transform associative connections between the elements in their imagery effectively over an extended time period. Similar to expert chess players, expert architects were found to maintain, inspect and regenerate their internal representations over a relatively long blindfolded design session (Bilda and Purcell 2003). In this paper we analyze the think-aloud imagery activity session of one architect, where the design thinking session is divided into episodes, and each episode is analyzed within categories of internal perceptions, long-term memory recall and visuo-spatial actions.
Use of imagery could be critical in design, because imagery allows one to transform information and to mimic dynamic aspects of the environment (Kosslyn 1980). Considering that a designer needs to initiate some simulations, thoughts and transformations during designing, imagery could be an active design tool. Based on this view, one can ask if imagery alone can be a design tool? Athavankar (1997) conducted an experiment where the subject was required to design a product in his imagery (with an eye mask on), so that the subject had no access to sketching, and the visual feedback it provides. The study claimed that the subject was able to evolve the shape of the object, manipulate it, evaluate alternative modifications, and add details, and colour as well. Those actions could be interpreted as evidence for existence of a virtual model in designer’s imagery, which s/he can manipulate. The study concluded that the use of imagery in design, because of its depictive qualities, can potentially be a substitute for sketching.
Similar studies have been conducted at the University of Sydney where architects wear a blindfold and start to design in imagery. When the design is mentally finalized they externalize it with sketching. The architects think aloud while they design blindfolded, and the sessions are videotaped. The content analysis of the three architects’ protocols showed that common cognitive actions were used to produce an internal design representation (Bilda and Purcell 2003). These actions (mostly image operations) were observed to be dynamic and linked to each other over the timeline of the design process. This demonstrated that the architects were able to generate, regenerate, inspect, and transform the design images.
Other than empirical studies of imagery in design, research on sketching puts an emphasis on the use of imagery. Imagery is regarded as a source of candidate shapes, objects, or geometries for design (Goldschmidt 1991; 1995). Goldschmidt (1995) defines “interactive imagery” to occur when the designer retrieves images from memory, and externalizes them interactively by sketching. Kavakli, and Gero (2001a) interpreted sketching as a mental imagery process, in other words sketching as a cognitive activity with imagery abilities. Based on a previous study revealing differences between

ANALYSIS OF A BLINDFOLDED ARCHITECT’S DESIGN SESSION 123
novice and expert designers, they proposed that the differences can be explained with the rate of the use of imagery processing by designers. Imagery processing was defined in terms of Kosslyn’s (1980) five basic image operations. The study provides interpretations on the use of mental imagery within sketching activity. The nature of Kosslyn’s (1980) and his colleagues’ experiments are aimed at testing one image operation at a time, thus the imagery tasks were simple enough to observe the response times (scanning a previously shown map, rotate a figure, etc). Additionally the tasks require retrieval of an existing or previously shown image. However, use of imagery in design has different characteristics:
1. a new image is created which did not exist before, 2. the designing task requires constructing relatively complex associations, 3. the imagery representation changes dynamically over time. We presume that more than one image operation could occur at the same
time. For example image generation could be done in parallel with image inspection. An architect attends to visual and spatial features as well as spatial organization of elements over the period of a design session. This implies that a high rate of visuo-spatial processing must be involved. Recent revisions of visuo-spatial sketch-pad (of working memory) models propose that visual and spatial mechanisms could be separate (Cornoldi and Vecchi, 2003). It is possible that in imagery visual processing or spatial processing could be dominant for the specific tasks involved. Thus one question is whether the type of imagery processing changes due to the visual or spatial requirements of the task. Another question is whether spatial qualities in imagery correlate with image operations and if yes, which image operations frequently occur with spatial qualities/thinking.
In order to explore the above questions we examine the correlations of cognitive actions of an architect engaged in a design process using only her mental imagery. The data coding is based on a constrained protocol study of one architect, thus the results are not general, they could however be insightful for distinguishing between the visual and spatial natures of the tasks in imagery activity. We devised a coding scheme which specifies hypothetical cognitive mechanisms in the imagery activity. The next section describes the methodology and provides the definition of the codes of the imagery coding scheme.
2. Method
We adopted the strategy of having designers engage in the design process without being able to use sketching as part of that process. We used a similar approach to that taken by Athavankar (1997), where we had one architect engaged in the design process while wearing a blindfold and
124 Z BILDA AND JS GERO
thinking aloud. The protocol analysis technique was employed to investigate the architect’s cognitive actions.
The task for the architect was to design a house for a couple on a particular site. The architect is an expert, and has been practicing for more than 10 years. At the start of the session she was told that she was to engage in a design activity but that she would do it while wearing a blindfold. The aim was to produce an initial design for the house during a 45 minute design session and at the end of the session she was asked to represent the design by drawing it as rapidly as possible and without any changes being permitted. The design session was recorded using a digital video camera. The participant was given a written brief for the design project, asked to read through it and then asked to recite it without reference to the written document. This process was repeated until she could recite the brief without mistakes. The aim of this procedure was to ensure that she would have similar access to the brief as an architect who could consult the written brief during the design process. She was then shown a montage of photographs of the site and allowed to examine them and ask questions if necessary. The participant was also given training in the think aloud method. When this section of the experiment was completed she was asked to put on the blindfold and to start designing. Five minutes before the end of the session the participant was told that this was the amount of time remaining.
The audio files of the concurrent verbalizations were transcribed, and then segmented. The segments were time stamped, and coded with the imagery coding scheme. The protocol was coded twice by the same coder with a one month period between the two coding. Then the codes were arbitrated into a final coding.
The protocol was segmented using the same approach as for segmenting sketching protocols i.e. by inspecting designer’s intentions (Suwa and Tversky 1997; Suwa et al. 1998). However for the blindfolded designing case we needed to define how we specify the information shift when a description of an image is involved. The information shift becomes the architect’s attention shift to a different part, or the aspect of the image when an image is described in the protocol. The attention shift to a different part /aspect of the image was taken to be the start of a new segment.
2.1. IMAGERY CODING SCHEME
The coding scheme borrows action categories from the sketching studies of Suwa et al (1998). The five action categories include visuo-spatial actions, internal perceptions, functional actions, conceptual actions, and recall actions.

ANALYSIS OF A BLINDFOLDED ARCHITECT’S DESIGN SESSION 125
2.1.1. Visuo-Spatial (VS) Actions Visuo-spatial (VS) actions, Table 1, are based on Kosslyn’s (1980) image operations: image generation, image inspection, image scanning, and transformation. We extended the types of image generation and coded a spatial action that refers to the spatial component in mental imagery.
TABLE 1. VS actions
Vgen Design boundary generation (partial, or global) Vregen Regenerate a design image, or state of affairs (SoA) Vsce Static or dynamic 3D image generation Vsyn Synthesis of parts or boundaries Sgen Generate spatial experiences. Vscan Scanning a 2D image, or walk-thru in a 3D environment Vins Maintain the image in the previous segment, and inspect
Vtrans Relocate a part/boundary or perform a geometrical/3D operation on a design image
Boundary generation (Vgen) is coded when a designer describes a design boundary for the first time in the protocol eg. “the masonry wall runs along the southern side of the building” or locates a space component eg “kitchen is next to the entry”. Boundary generation is an action to develop a space layout which is presumed, here, to be two dimensional.
Scene generation (Vsce) refers to description of 3D physical world-like images. The designer could recall memories of the scenes or combine images from long-term memory to make up a new scene. Prior to previous analysis of three imagery protocols (Bilda and Purcell 2003) scene generation was observed to be utilized by the designers for different purposes:
• to attend to the possible use or mechanics of parts or objects (which usually appear as a dynamic scene generation),
• for assigning material, color or texture as well as evaluating some aesthetical preferences,
• to recall the past cases/experiences, • to view the surrounding of the imagined design entity (or in the
architectural context, to view the site and its environment globally), and • to refer to the spatial aspects, light, and orientation.
Image regeneration (Vregen) can be considered as a form of image generation since it refers to revisiting the previous design boundaries, scenes, or previous associations between design elements. Regeneration is an essential process in mental imagery because image maintenance time is very short.
126 Z BILDA AND JS GERO
The image also can be generated by synthesizing the partial images of boundary/part which has been previously described by Vgen. Use of synthesis is apparent in a strategy where the designer is imagining the sketch design part by part and then bringing the parts together to visualize a region or the global image at some stage. Synthesizing could be used optionally to generate the whole or several parts of the “working design image”.
Spatial qualities are assumed to be a part of the tacit knowledge (which is based on real world experiences) and assumed to be simulated by the participant in his/her mental imagery in a similar way to the experiences themselves. Description of spatial experiences (Sgen) could be the slope of the site, height of the other buildings, exposure of a building, experiences of over-looking, over-shadowing, the feeling of far/near distance or height, or sense of the orientation (to the North, West, South or East), etc. Use of hand gestures is also a clue to the participant’s spatial experience.
The generated (or regenerated) image should be maintained to be inspected (Vins). The maintenance time is hypothesized to be quite short, so inspection could be carried out in the next couple of segments following the image (re) generation segments.
The theoretical definition for scanning (Vscan) operation is that the attention window moves on the mental image. Scanning a 2D image can be described as sliding the focus of attention incrementally on a sketchpad i.e. when the designer creates the architectural spaces next to each other, one by one, moving along an axis. On the other hand scanning a 3D image is a walk through (or walk around) experience to describe or inspect perceptual features or 3D properties of the design. This type of scanning is very similar to the real world experience of the designer walking through in an architectural space.
Image transformation (Vtrans) occurs when designer re-positions a part/boundary, or performs geometrical/3D operation. Some phrases used are: wrap, peel off, bevel off, triangulate, and lift up. Re-positioning of the observer or rotation of the image plane (change of viewpoint, revolving the object/image) are also image transformations.
2.1.2. Internal Perceptual (IP) Actions We borrowed some of the perceptual actions from the sketching activity (Suwa et al. 1998) coding scheme. The selected codes, Table 2, are the ones found to be highly correlated with drawing actions during the sketching activity of experts (Kavakli and Gero 2001b).
2.1.3. Functional and Conceptual Actions The functional actions, Table 3, are coded based on the Suwa et al. (1998) definitions, the same with the sketch coding scheme. Conceptual actions, Table 3, are constituted of 4 types of goals (Kavakli and Gero 2001b).
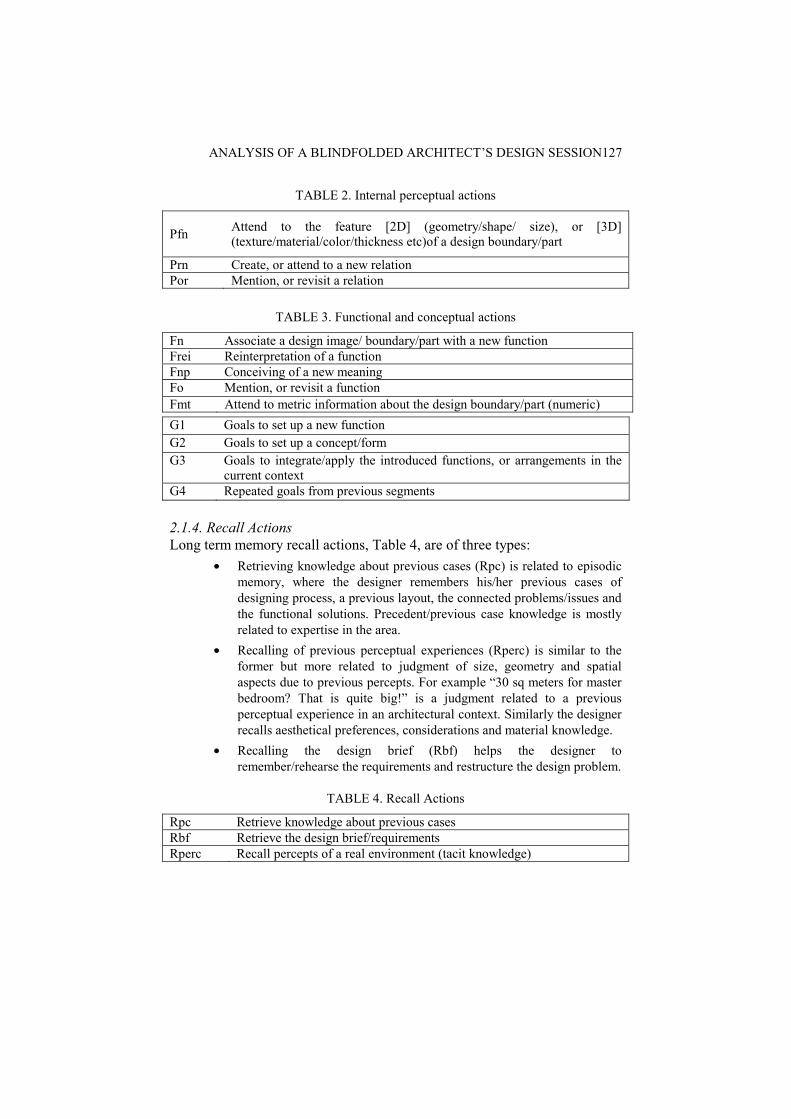
ANALYSIS OF A BLINDFOLDED ARCHITECT’S DESIGN SESSION 127
TABLE 2. Internal perceptual actions
Pfn Attend to the feature [2D] (geometry/shape/ size), or [3D] (texture/material/color/thickness etc)of a design boundary/part
Prn Create, or attend to a new relation Por Mention, or revisit a relation
TABLE 3. Functional and conceptual actions
Fn Associate a design image/ boundary/part with a new function Frei Reinterpretation of a function Fnp Conceiving of a new meaning Fo Mention, or revisit a function Fmt Attend to metric information about the design boundary/part (numeric)
2.1.4. Recall Actions Long term memory recall actions, Table 4, are of three types:
• Retrieving knowledge about previous cases (Rpc) is related to episodic memory, where the designer remembers his/her previous cases of designing process, a previous layout, the connected problems/issues and the functional solutions. Precedent/previous case knowledge is mostly related to expertise in the area.
• Recalling of previous perceptual experiences (Rperc) is similar to the former but more related to judgment of size, geometry and spatial aspects due to previous percepts. For example “30 sq meters for master bedroom? That is quite big!” is a judgment related to a previous perceptual experience in an architectural context. Similarly the designer recalls aesthetical preferences, considerations and material knowledge.
• Recalling the design brief (Rbf) helps the designer to remember/rehearse the requirements and restructure the design problem.
TABLE 4. Recall Actions
Rpc Retrieve knowledge about previous cases Rbf Retrieve the design brief/requirements Rperc Recall percepts of a real environment (tacit knowledge)
G1 Goals to set up a new function G2 Goals to set up a concept/form G3 Goals to integrate/apply the introduced functions, or arrangements in the
current context G4 Repeated goals from previous segments

128 Z BILDA AND JS GERO
3. Results
Coding consistency is measured by the percentage agreement between the first coding and the second coding, between first coding and the arbitrated coding and between second coding and arbitrated coding, Table 5.
TABLE 5. Coding consistency between different coding phases
Agreement Percentages Number of segments
Between 1st and 2nd coding
1st coding and arbitrated coding
2nd coding and arbitrated coding
169 76.65% 86.23% 91.62%
The architect’s protocol is parsed into 169 segments, and the average length of the segments is 15 seconds. 1244 actions exist in the imagery session and the average number of actions in one segment is 7.5 (with a standard deviation of 4).
3.1. ACTION CORRELATIONS OVER THE EPISODES
The imagery session is divided into episodes, ie smaller and more specific design sub-problems. Tracing the descriptions of the working design image from the verbal protocol we have identified the shifts to different parts of the design. Another way to determine the start and end of a episode is to see if image operations in consecutive segments are connected for a relatively longer periods of time. Then the designer is referring to one design image through that period which defines one episode. Table 6 shows the contents of the eight episodes located in this experiment.
TABLE 6. Episode contents
Episodes Content
E1 Analyze the site and the problem space (global and environmental issues)
E2 Structuring the first outline of the building E3 Working parts of the building/ main areas and orientations E4 Parts of the building: Dealing with two studios and observatory E5 Parts of the building: car-space and sculpture garden E6 Go over the brief, explore the dance studio as a space E7 Outline of the building, the roof structure E8 Material & color selections / aesthetics
In every episode correlations are produced between the actions in VS, IP
and Recall categories. Table 7 shows the selected actions in a descending
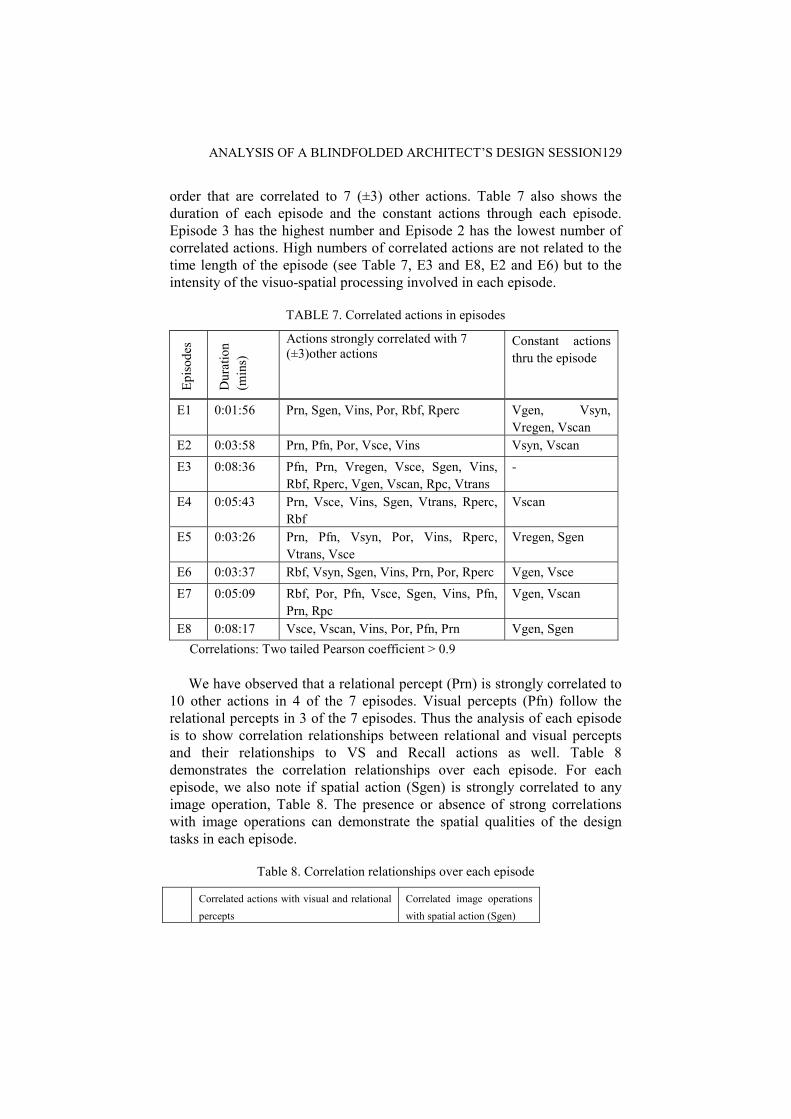
ANALYSIS OF A BLINDFOLDED ARCHITECT’S DESIGN SESSION 129
order that are correlated to 7 (±3) other actions. Table 7 also shows the duration of each episode and the constant actions through each episode. Episode 3 has the highest number and Episode 2 has the lowest number of correlated actions. High numbers of correlated actions are not related to the time length of the episode (see Table 7, E3 and E8, E2 and E6) but to the intensity of the visuo-spatial processing involved in each episode.
TABLE 7. Correlated actions in episodes
Epis
odes
Dur
atio
n (m
ins)
Actions strongly correlated with 7 (±3)other actions
Constant actions thru the episode
E1 0:01:56 Prn, Sgen, Vins, Por, Rbf, Rperc Vgen, Vsyn, Vregen, Vscan
E2 0:03:58 Prn, Pfn, Por, Vsce, Vins Vsyn, Vscan E3 0:08:36 Pfn, Prn, Vregen, Vsce, Sgen, Vins,
Rbf, Rperc, Vgen, Vscan, Rpc, Vtrans -
E4 0:05:43 Prn, Vsce, Vins, Sgen, Vtrans, Rperc, Rbf
Vscan
E5 0:03:26 Prn, Pfn, Vsyn, Por, Vins, Rperc, Vtrans, Vsce
Vregen, Sgen
E6 0:03:37 Rbf, Vsyn, Sgen, Vins, Prn, Por, Rperc Vgen, Vsce E7 0:05:09 Rbf, Por, Pfn, Vsce, Sgen, Vins, Pfn,
Prn, Rpc Vgen, Vscan
E8 0:08:17 Vsce, Vscan, Vins, Por, Pfn, Prn Vgen, Sgen Correlations: Two tailed Pearson coefficient > 0.9
We have observed that a relational percept (Prn) is strongly correlated to
10 other actions in 4 of the 7 episodes. Visual percepts (Pfn) follow the relational percepts in 3 of the 7 episodes. Thus the analysis of each episode is to show correlation relationships between relational and visual percepts and their relationships to VS and Recall actions as well. Table 8 demonstrates the correlation relationships over each episode. For each episode, we also note if spatial action (Sgen) is strongly correlated to any image operation, Table 8. The presence or absence of strong correlations with image operations can demonstrate the spatial qualities of the design tasks in each episode.
Table 8. Correlation relationships over each episode
Correlated actions with visual and relational percepts
Correlated image operations with spatial action (Sgen)
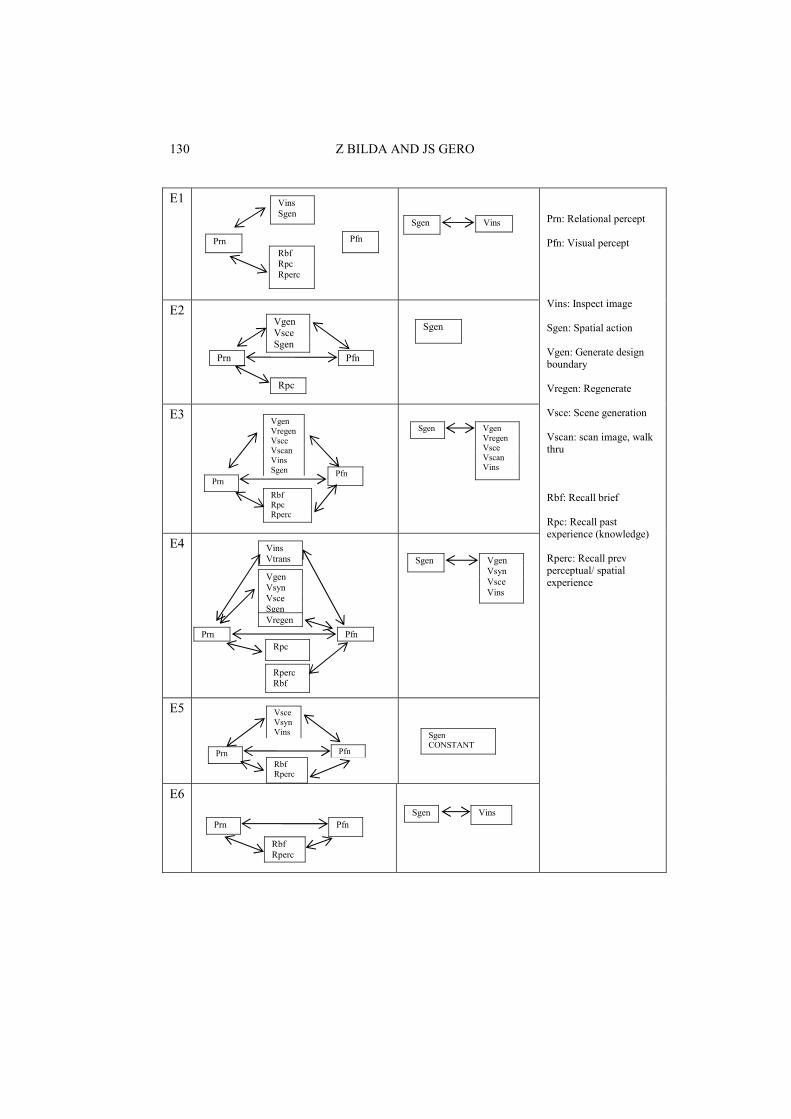
130 Z BILDA AND JS GERO
E1
E2
E3
E4
E5
E6
Prn: Relational percept Pfn: Visual percept Vins: Inspect image Sgen: Spatial action Vgen: Generate design boundary Vregen: Regenerate Vsce: Scene generation Vscan: scan image, walk thru Rbf: Recall brief Rpc: Recall past experience (knowledge) Rperc: Recall prev perceptual/ spatial experience
Vins Sgen
Pfn Rbf Rpc Rperc
Prn
Sgen Vins
Sgen Vgen Vsce Sgen
Pfn
Rpc
Prn
Sgen Vgen Vregen Vsce Vscan Vins
Vgen Vregen Vsce Vscan Vins Sgen Pfn
Rbf Rpc Rperc
Prn
Sgen Vgen Vsyn Vsce Vins
Vins Vtrans
Pfn Rpc
Prn Vregen
Vgen Vsyn Vsce Sgen
Rperc Rbf
Sgen CONSTANT
Vsce Vsyn Vins
Pfn Rbf Rperc
Prn
Sgen Vins Pfn
Rbf Rperc
Prn
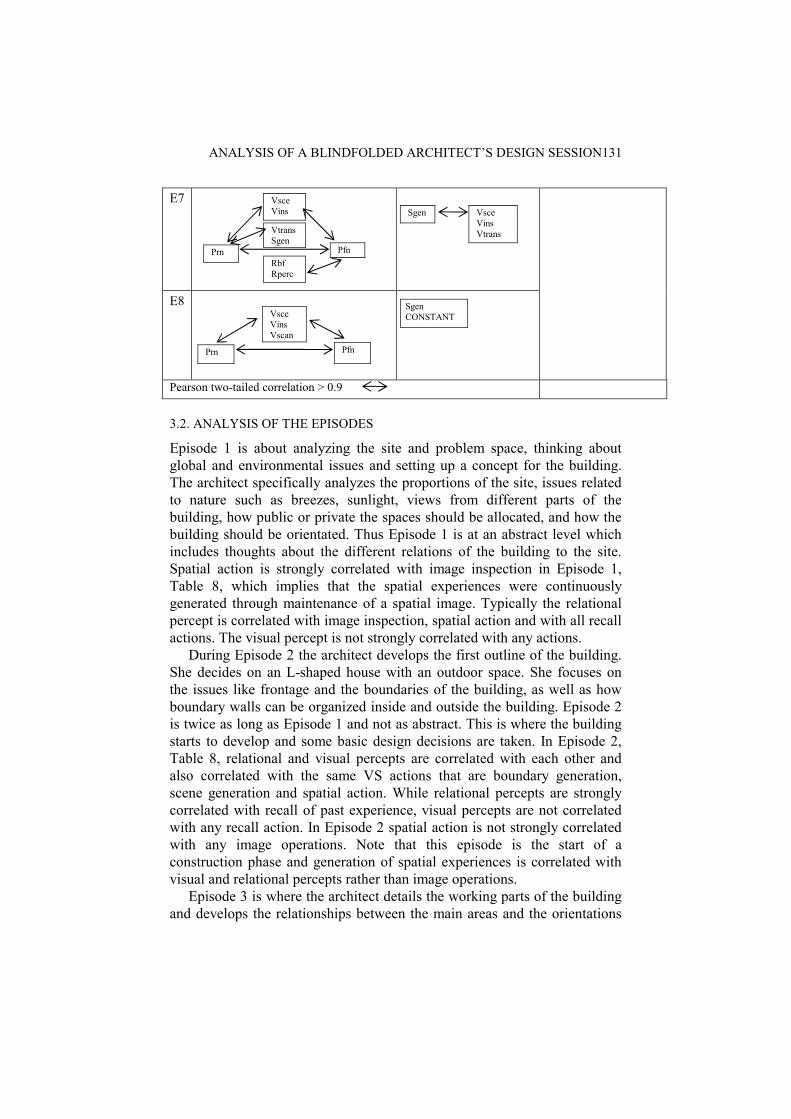
ANALYSIS OF A BLINDFOLDED ARCHITECT’S DESIGN SESSION 131
E7
E8
Pearson two-tailed correlation > 0.9
3.2. ANALYSIS OF THE EPISODES
Episode 1 is about analyzing the site and problem space, thinking about global and environmental issues and setting up a concept for the building. The architect specifically analyzes the proportions of the site, issues related to nature such as breezes, sunlight, views from different parts of the building, how public or private the spaces should be allocated, and how the building should be orientated. Thus Episode 1 is at an abstract level which includes thoughts about the different relations of the building to the site. Spatial action is strongly correlated with image inspection in Episode 1, Table 8, which implies that the spatial experiences were continuously generated through maintenance of a spatial image. Typically the relational percept is correlated with image inspection, spatial action and with all recall actions. The visual percept is not strongly correlated with any actions.
During Episode 2 the architect develops the first outline of the building. She decides on an L-shaped house with an outdoor space. She focuses on the issues like frontage and the boundaries of the building, as well as how boundary walls can be organized inside and outside the building. Episode 2 is twice as long as Episode 1 and not as abstract. This is where the building starts to develop and some basic design decisions are taken. In Episode 2, Table 8, relational and visual percepts are correlated with each other and also correlated with the same VS actions that are boundary generation, scene generation and spatial action. While relational percepts are strongly correlated with recall of past experience, visual percepts are not correlated with any recall action. In Episode 2 spatial action is not strongly correlated with any image operations. Note that this episode is the start of a construction phase and generation of spatial experiences is correlated with visual and relational percepts rather than image operations.
Episode 3 is where the architect details the working parts of the building and develops the relationships between the main areas and the orientations
Sgen Vsce Vins Vtrans
Vsce Vins
Pfn Rbf Rperc
Prn
Vtrans Sgen
Sgen CONSTANT Vsce
Vins Vscan
Pfn Prn
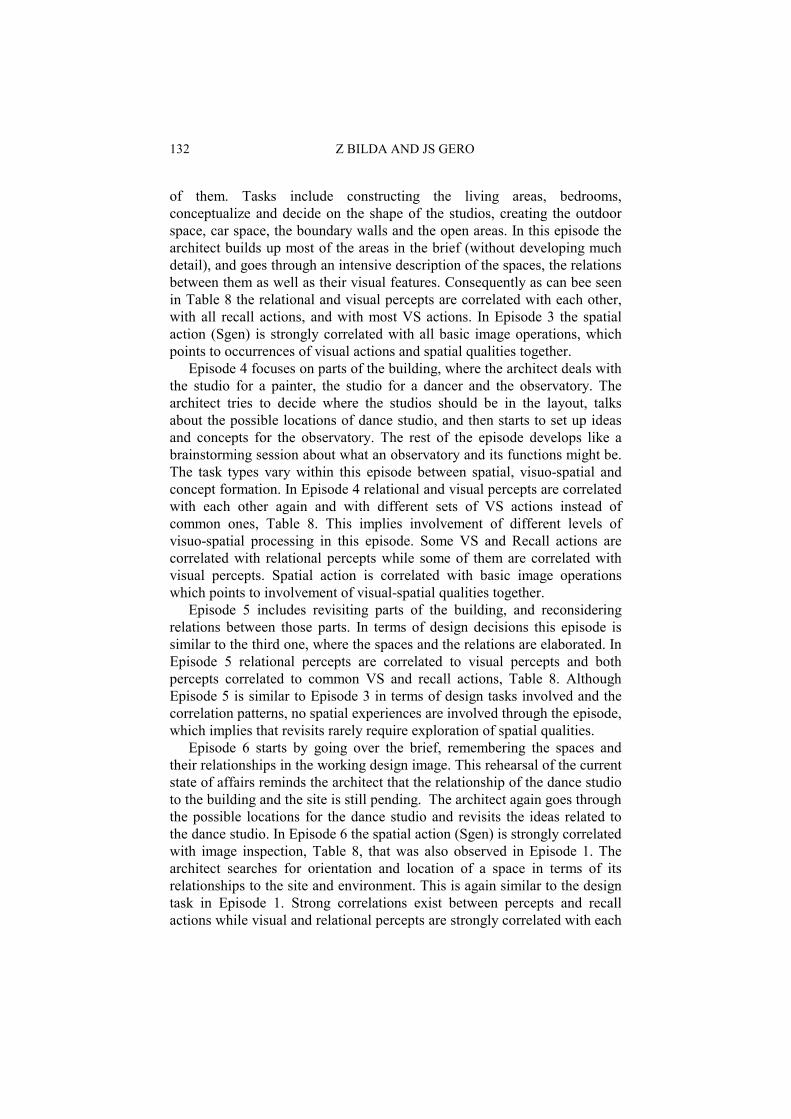
132 Z BILDA AND JS GERO
of them. Tasks include constructing the living areas, bedrooms, conceptualize and decide on the shape of the studios, creating the outdoor space, car space, the boundary walls and the open areas. In this episode the architect builds up most of the areas in the brief (without developing much detail), and goes through an intensive description of the spaces, the relations between them as well as their visual features. Consequently as can bee seen in Table 8 the relational and visual percepts are correlated with each other, with all recall actions, and with most VS actions. In Episode 3 the spatial action (Sgen) is strongly correlated with all basic image operations, which points to occurrences of visual actions and spatial qualities together.
Episode 4 focuses on parts of the building, where the architect deals with the studio for a painter, the studio for a dancer and the observatory. The architect tries to decide where the studios should be in the layout, talks about the possible locations of dance studio, and then starts to set up ideas and concepts for the observatory. The rest of the episode develops like a brainstorming session about what an observatory and its functions might be. The task types vary within this episode between spatial, visuo-spatial and concept formation. In Episode 4 relational and visual percepts are correlated with each other again and with different sets of VS actions instead of common ones, Table 8. This implies involvement of different levels of visuo-spatial processing in this episode. Some VS and Recall actions are correlated with relational percepts while some of them are correlated with visual percepts. Spatial action is correlated with basic image operations which points to involvement of visual-spatial qualities together.
Episode 5 includes revisiting parts of the building, and reconsidering relations between those parts. In terms of design decisions this episode is similar to the third one, where the spaces and the relations are elaborated. In Episode 5 relational percepts are correlated to visual percepts and both percepts correlated to common VS and recall actions, Table 8. Although Episode 5 is similar to Episode 3 in terms of design tasks involved and the correlation patterns, no spatial experiences are involved through the episode, which implies that revisits rarely require exploration of spatial qualities.
Episode 6 starts by going over the brief, remembering the spaces and their relationships in the working design image. This rehearsal of the current state of affairs reminds the architect that the relationship of the dance studio to the building and the site is still pending. The architect again goes through the possible locations for the dance studio and revisits the ideas related to the dance studio. In Episode 6 the spatial action (Sgen) is strongly correlated with image inspection, Table 8, that was also observed in Episode 1. The architect searches for orientation and location of a space in terms of its relationships to the site and environment. This is again similar to the design task in Episode 1. Strong correlations exist between percepts and recall actions while visual and relational percepts are strongly correlated with each
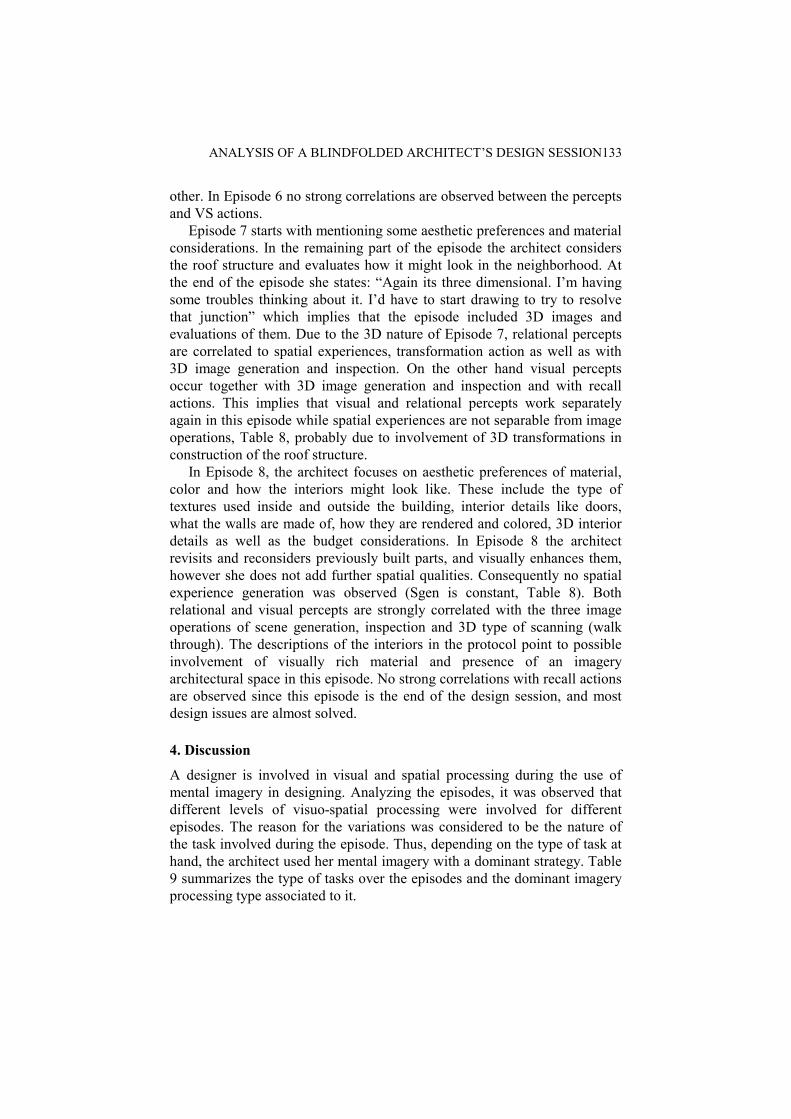
ANALYSIS OF A BLINDFOLDED ARCHITECT’S DESIGN SESSION 133
other. In Episode 6 no strong correlations are observed between the percepts and VS actions.
Episode 7 starts with mentioning some aesthetic preferences and material considerations. In the remaining part of the episode the architect considers the roof structure and evaluates how it might look in the neighborhood. At the end of the episode she states: “Again its three dimensional. I’m having some troubles thinking about it. I’d have to start drawing to try to resolve that junction” which implies that the episode included 3D images and evaluations of them. Due to the 3D nature of Episode 7, relational percepts are correlated to spatial experiences, transformation action as well as with 3D image generation and inspection. On the other hand visual percepts occur together with 3D image generation and inspection and with recall actions. This implies that visual and relational percepts work separately again in this episode while spatial experiences are not separable from image operations, Table 8, probably due to involvement of 3D transformations in construction of the roof structure.
In Episode 8, the architect focuses on aesthetic preferences of material, color and how the interiors might look like. These include the type of textures used inside and outside the building, interior details like doors, what the walls are made of, how they are rendered and colored, 3D interior details as well as the budget considerations. In Episode 8 the architect revisits and reconsiders previously built parts, and visually enhances them, however she does not add further spatial qualities. Consequently no spatial experience generation was observed (Sgen is constant, Table 8). Both relational and visual percepts are strongly correlated with the three image operations of scene generation, inspection and 3D type of scanning (walk through). The descriptions of the interiors in the protocol point to possible involvement of visually rich material and presence of an imagery architectural space in this episode. No strong correlations with recall actions are observed since this episode is the end of the design session, and most design issues are almost solved.
4. Discussion
A designer is involved in visual and spatial processing during the use of mental imagery in designing. Analyzing the episodes, it was observed that different levels of visuo-spatial processing were involved for different episodes. The reason for the variations was considered to be the nature of the task involved during the episode. Thus, depending on the type of task at hand, the architect used her mental imagery with a dominant strategy. Table 9 summarizes the type of tasks over the episodes and the dominant imagery processing type associated to it.

134 Z BILDA AND JS GERO
TABLE 9. Visual/spatial processing with task types
Task Type Dominant Strategy
E1 Explore state of affairs (SoA) in global terms Spatial processing E2 Thoughts about geometry/ layout Visual processing E3 Creating new parts or elaborating parts Visuo-spatial processing E4 Adding new parts or elaborating parts Visuo-spatial processing E5 Revisiting previous parts Visual processing E6 Explore and revisit state of affairs in local terms Spatial processing E7 Create new 3D structure Visuo-spatial processing E8 Material/ Color/ 3D looks Visual processing
The correlation relationships in Table 8 point out to the following:
The strong correlations of visual percepts with relational percepts frequently occur (in 7 of the 8 episodes - except Episode 1 where the global and environmental issues are explored) in imagery processing.
The strong correlations of visual and relational percepts with common VS actions are frequently observed (except Episodes 1 and 6 where dominant strategy is spatial processing). It is reasonable to think that visually richer internal representations are involved in those episodes (E2-5, E7-8).
Some types of imagery tasks can be done through the spatial components (such as spatial action, relational percepts, maintaining/ inspecting the current state of affairs), without intensive involvement of image operations (eg. in E1 and E6 where spatial processing is dominant).
In the first two episodes, where the architect is deciding on the building layout, only relational percepts are connected to recall actions, then in the following episodes, visual precepts are also connected to recall actions. This implies that the architect recalls the information about relations in the beginning of the design and then the recall of visual information follows. In the cognitive science literature, Kosslyn (1980) makes a distinction between a skeletal surface image representation, and a richer representation in which the skeletal image is mapped later with visual features from the deeper representations in long-term memory. Similarly designing with a higher number of correlated actions in one episode is related to the intensity of the visuo-spatial processing involved, not the duration of the episode. Imagery commences with an abstract representation having more spatial qualities, and then develops with added visual percepts into a quasi-pictorial representation.
We observed that spatial action is strongly correlated with more than two image operations in Episodes 3, 4 and 7; where there are new physical parts constructed or added to the design. Thus involvement of spatial experiences to image operations becomes intensive when spaces are developed, otherwise they can be constant where previously parts are revisited
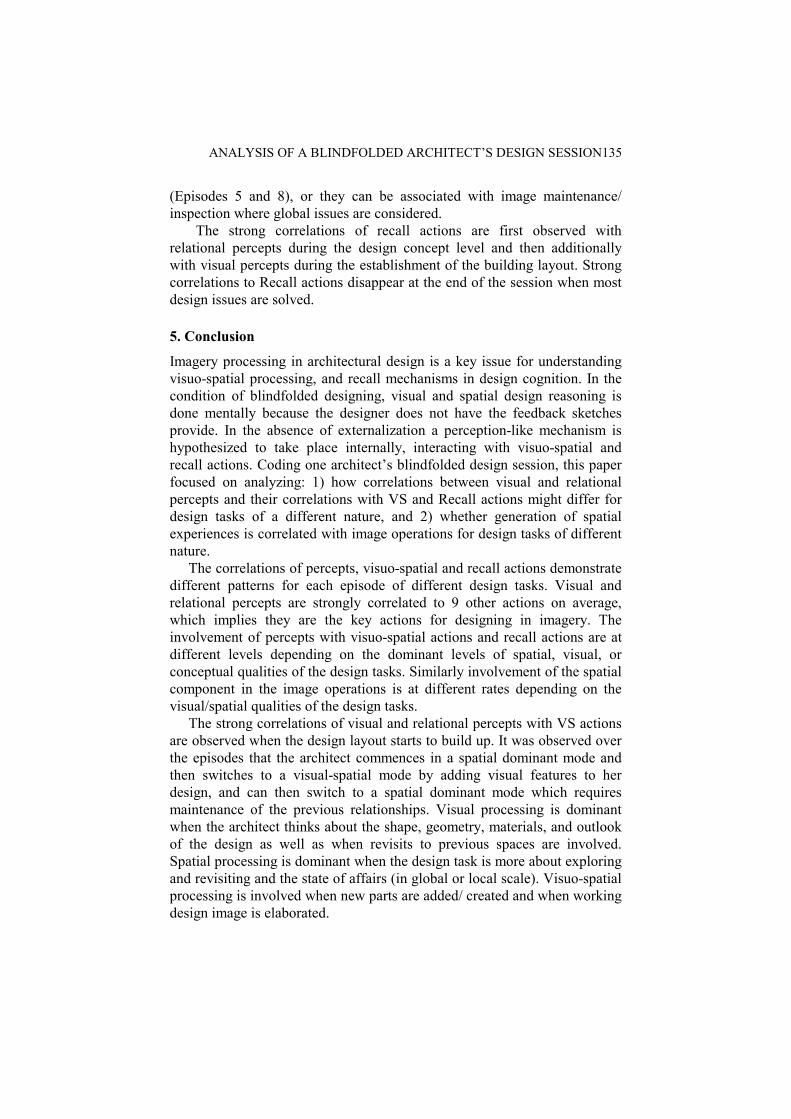
ANALYSIS OF A BLINDFOLDED ARCHITECT’S DESIGN SESSION 135
(Episodes 5 and 8), or they can be associated with image maintenance/ inspection where global issues are considered.
The strong correlations of recall actions are first observed with relational percepts during the design concept level and then additionally with visual percepts during the establishment of the building layout. Strong correlations to Recall actions disappear at the end of the session when most design issues are solved.
5. Conclusion
Imagery processing in architectural design is a key issue for understanding visuo-spatial processing, and recall mechanisms in design cognition. In the condition of blindfolded designing, visual and spatial design reasoning is done mentally because the designer does not have the feedback sketches provide. In the absence of externalization a perception-like mechanism is hypothesized to take place internally, interacting with visuo-spatial and recall actions. Coding one architect’s blindfolded design session, this paper focused on analyzing: 1) how correlations between visual and relational percepts and their correlations with VS and Recall actions might differ for design tasks of a different nature, and 2) whether generation of spatial experiences is correlated with image operations for design tasks of different nature.
The correlations of percepts, visuo-spatial and recall actions demonstrate different patterns for each episode of different design tasks. Visual and relational percepts are strongly correlated to 9 other actions on average, which implies they are the key actions for designing in imagery. The involvement of percepts with visuo-spatial actions and recall actions are at different levels depending on the dominant levels of spatial, visual, or conceptual qualities of the design tasks. Similarly involvement of the spatial component in the image operations is at different rates depending on the visual/spatial qualities of the design tasks.
The strong correlations of visual and relational percepts with VS actions are observed when the design layout starts to build up. It was observed over the episodes that the architect commences in a spatial dominant mode and then switches to a visual-spatial mode by adding visual features to her design, and can then switch to a spatial dominant mode which requires maintenance of the previous relationships. Visual processing is dominant when the architect thinks about the shape, geometry, materials, and outlook of the design as well as when revisits to previous spaces are involved. Spatial processing is dominant when the design task is more about exploring and revisiting and the state of affairs (in global or local scale). Visuo-spatial processing is involved when new parts are added/ created and when working design image is elaborated.
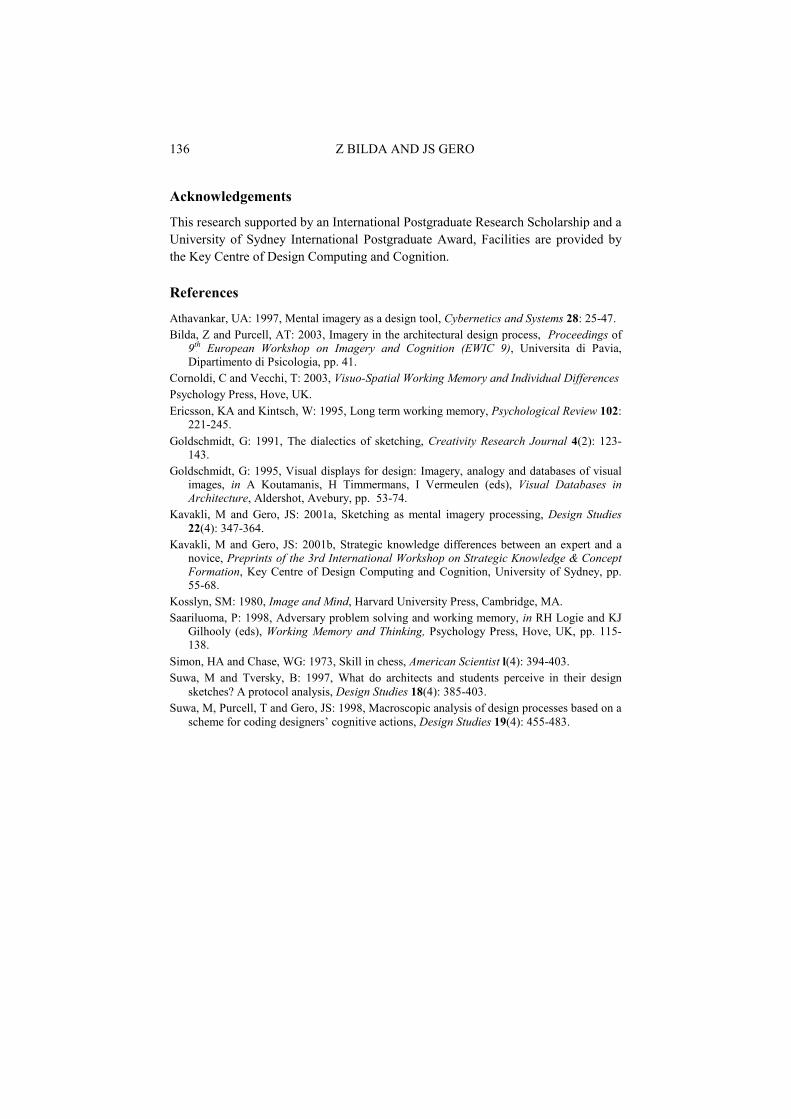
136 Z BILDA AND JS GERO
Acknowledgements
This research supported by an International Postgraduate Research Scholarship and a University of Sydney International Postgraduate Award, Facilities are provided by the Key Centre of Design Computing and Cognition.
References
Athavankar, UA: 1997, Mental imagery as a design tool, Cybernetics and Systems 28: 25-47. Bilda, Z and Purcell, AT: 2003, Imagery in the architectural design process, Proceedings of
9 PthP European Workshop on Imagery and Cognition (EWIC 9), Universita di Pavia, Dipartimento di Psicologia, pp. 41.
Cornoldi, C and Vecchi, T: 2003, Visuo-Spatial Working Memory and Individual Differences Psychology Press, Hove, UK. Ericsson, KA and Kintsch, W: 1995, Long term working memory, Psychological Review 102:
221-245. Goldschmidt, G: 1991, The dialectics of sketching, Creativity Research Journal 4(2): 123-
143. Goldschmidt, G: 1995, Visual displays for design: Imagery, analogy and databases of visual
images, in A Koutamanis, H Timmermans, I Vermeulen (eds), Visual Databases in Architecture, Aldershot, Avebury, pp. 53-74.
Kavakli, M and Gero, JS: 2001a, Sketching as mental imagery processing, Design Studies 22(4): 347-364.
Kavakli, M and Gero, JS: 2001b, Strategic knowledge differences between an expert and a novice, Preprints of the 3rd International Workshop on Strategic Knowledge & Concept Formation, Key Centre of Design Computing and Cognition, University of Sydney, pp. 55-68.
Kosslyn, SM: 1980, Image and Mind, Harvard University Press, Cambridge, MA. Saariluoma, P: 1998, Adversary problem solving and working memory, in RH Logie and KJ
Gilhooly (eds), Working Memory and Thinking, Psychology Press, Hove, UK, pp. 115-138.
Simon, HA and Chase, WG: 1973, Skill in chess, American Scientist l(4): 394-403. Suwa, M and Tversky, B: 1997, What do architects and students perceive in their design
sketches? A protocol analysis, Design Studies 18(4): 385-403. Suwa, M, Purcell, T and Gero, JS: 1998, Macroscopic analysis of design processes based on a
scheme for coding designers’ cognitive actions, Design Studies 19(4): 455-483.

SESSION 4
Qualitative representation and reasoning in design: A hierarchy of shape and spatial languages
Julie Jupp and John S Gero
Developing an ontology of spatial relations Jane Brennan, Eric A Martin and Mihye Kim
Spatial motifs in design
Janice Glasgow, Susan Epstein, Nathalie Meurice, Andy Becue and Daniel Vercauteren

JS Gero, B Tversky and T Knight (eds), Visual and Spatial Reasoning in Design III, 2004 Key Centre of Design Computing and Cognition, University of Sydney, pp 139-162
QUALITATIVE REPRESENTATION AND REASONING IN DESIGN: A HIERARCHY OF SHAPE AND SPATIAL LANGUAGES
JULIE R JUPP AND JOHN S GERO University of Sydney, Australia
Abstract. A novel approach to shape and spatial representation and reasoning is proposed in this paper. We develop (i) a schema for qualitatively encoding two-dimensional design diagrams; and (ii) methods of recognition and classification for design reasoning. The schema is founded on boundary- and graph-based landmarks and utilizes qualitative feature based (QFB) representation techniques. The encoder invokes a qualitative schema describing morphological, topological and mereological features. The generic encoding format deals with recognition of invariant patterns and QFB representation facilitates robust measures of similarity using clustering algorithms. The proposed encoder-analyser (E-A) is demonstrated in experimental results. The preliminary study compares and classifies a variety of building plans. This paper concludes by illustrating how the E-A can be used as a basis for design reasoning.
1. Introduction
In all visual design domains, designers are influenced by their understanding of the external visual world. During the design process designers often use diagrams to facilitate problem solving which involves reasoning with and without ideas concerned with shape and form. Visual and spatial reasoning are fundamental in the solution process since recognising and manipulating shape is essential to external representations of design ideas.
To facilitate reasoning and design analysis a need exists to construct a representation scheme that automates recognition for two-dimensional (2D) design diagrams. Many solutions to the problem of recognition in 2D images have been proposed using a variety of data structures. The choice of data structure and applications to represent 2D images is crucial to the type of analysis tasks required. Generally, approaches to representation can be divided into quantitative and qualitative methods. Representational specifications for 2D images can be further divided into: grammar-like and non-grammar-like formalisms. We focus on qualitative feature-based (QFB)
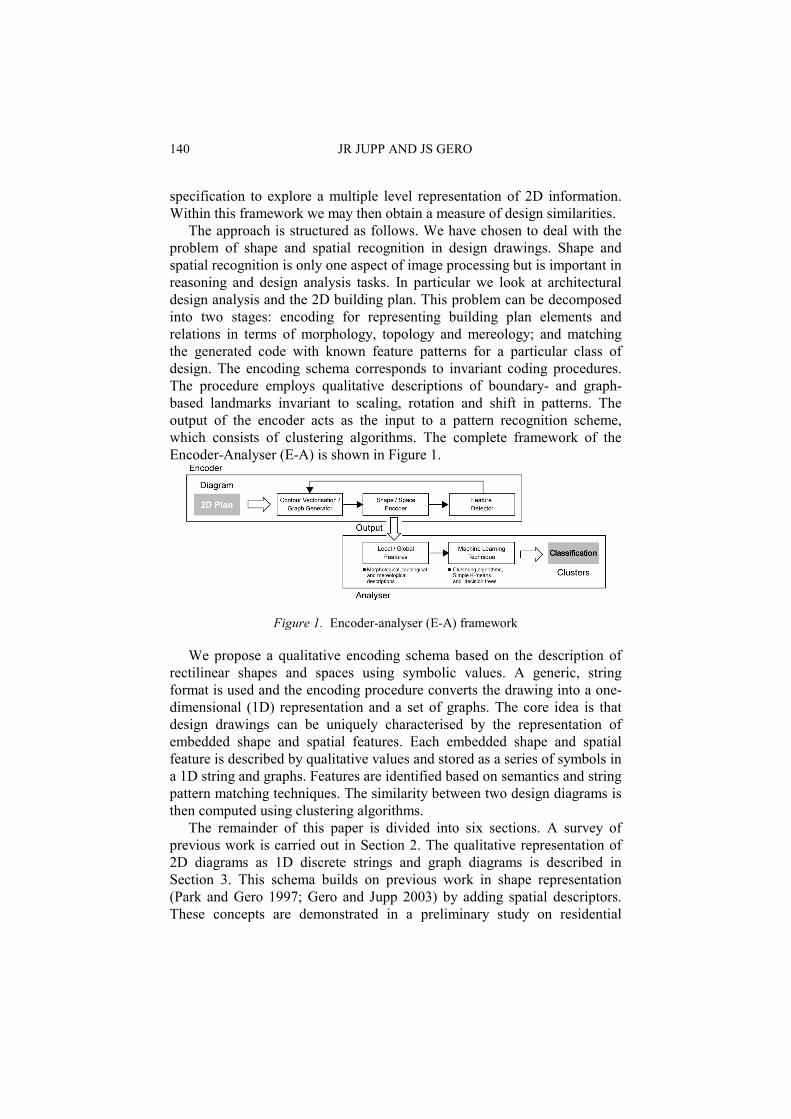
140 JR JUPP AND JS GERO
specification to explore a multiple level representation of 2D information. Within this framework we may then obtain a measure of design similarities.
The approach is structured as follows. We have chosen to deal with the problem of shape and spatial recognition in design drawings. Shape and spatial recognition is only one aspect of image processing but is important in reasoning and design analysis tasks. In particular we look at architectural design analysis and the 2D building plan. This problem can be decomposed into two stages: encoding for representing building plan elements and relations in terms of morphology, topology and mereology; and matching the generated code with known feature patterns for a particular class of design. The encoding schema corresponds to invariant coding procedures. The procedure employs qualitative descriptions of boundary- and graph-based landmarks invariant to scaling, rotation and shift in patterns. The output of the encoder acts as the input to a pattern recognition scheme, which consists of clustering algorithms. The complete framework of the Encoder-Analyser (E-A) is shown in Figure 1.
Figure 1. Encoder-analyser (E-A) framework
We propose a qualitative encoding schema based on the description of rectilinear shapes and spaces using symbolic values. A generic, string format is used and the encoding procedure converts the drawing into a one-dimensional (1D) representation and a set of graphs. The core idea is that design drawings can be uniquely characterised by the representation of embedded shape and spatial features. Each embedded shape and spatial feature is described by qualitative values and stored as a series of symbols in a 1D string and graphs. Features are identified based on semantics and string pattern matching techniques. The similarity between two design diagrams is then computed using clustering algorithms.
The remainder of this paper is divided into six sections. A survey of previous work is carried out in Section 2. The qualitative representation of 2D diagrams as 1D discrete strings and graph diagrams is described in Section 3. This schema builds on previous work in shape representation (Park and Gero 1997; Gero and Jupp 2003) by adding spatial descriptors. These concepts are demonstrated in a preliminary study on residential
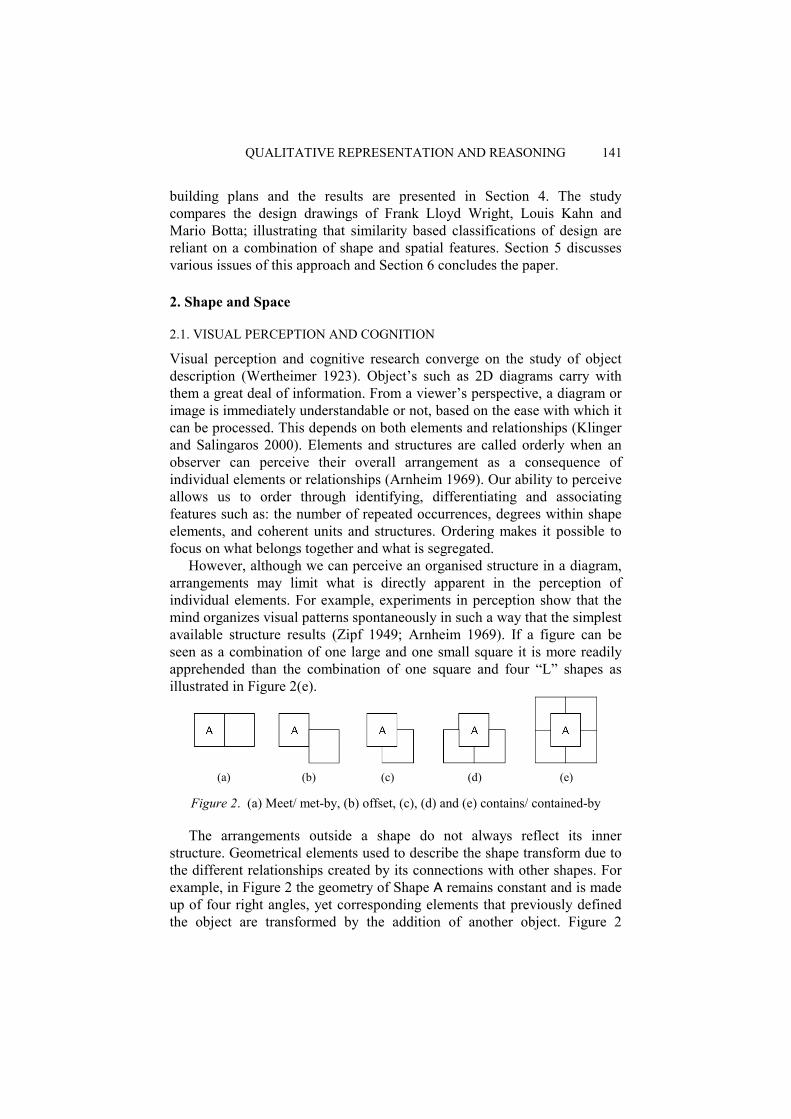
QUALITATIVE REPRESENTATION AND REASONING 141
building plans and the results are presented in Section 4. The study compares the design drawings of Frank Lloyd Wright, Louis Kahn and Mario Botta; illustrating that similarity based classifications of design are reliant on a combination of shape and spatial features. Section 5 discusses various issues of this approach and Section 6 concludes the paper.
2. Shape and Space
2.1. VISUAL PERCEPTION AND COGNITION
Visual perception and cognitive research converge on the study of object description (Wertheimer 1923). Object’s such as 2D diagrams carry with them a great deal of information. From a viewer’s perspective, a diagram or image is immediately understandable or not, based on the ease with which it can be processed. This depends on both elements and relationships (Klinger and Salingaros 2000). Elements and structures are called orderly when an observer can perceive their overall arrangement as a consequence of individual elements or relationships (Arnheim 1969). Our ability to perceive allows us to order through identifying, differentiating and associating features such as: the number of repeated occurrences, degrees within shape elements, and coherent units and structures. Ordering makes it possible to focus on what belongs together and what is segregated. However, although we can perceive an organised structure in a diagram, arrangements may limit what is directly apparent in the perception of individual elements. For example, experiments in perception show that the mind organizes visual patterns spontaneously in such a way that the simplest available structure results (Zipf 1949; Arnheim 1969). If a figure can be seen as a combination of one large and one small square it is more readily apprehended than the combination of one square and four “L” shapes as illustrated in Figure 2(e).
(a) (b) (c) (d) (e)
Figure 2. (a) Meet/ met-by, (b) offset, (c), (d) and (e) contains/ contained-by
The arrangements outside a shape do not always reflect its inner structure. Geometrical elements used to describe the shape transform due to the different relationships created by its connections with other shapes. For example, in Figure 2 the geometry of Shape A remains constant and is made up of four right angles, yet corresponding elements that previously defined the object are transformed by the addition of another object. Figure 2
142 JR JUPP AND JS GERO
illustrates some possible combinations for different types of connectivity for Shape A. Shape A maintains the same morphological description of four adjacent right-angles. However when shape A is combined with one, two, or more other shapes (in a finite number of ways) it produces: (a) a new description at its intersections and/or (b) additional intersections.
Thus, we assume that when perceiving a diagram, individuals perceive an interrelation between the whole and its parts, as well as a hierarchical scale of importance by which some elements or relations are more dominant than others. It is therefore, not adequate to represent shapes only in terms of its internal or isolated structures, they need to be represented in relation to the organisation which they are part of. The shape’s physicality may be explicit and yet misleading, because a description of it may not correspond to the arrangements embedded in its contours.
Thus, different levels of processing are required in the recognition of diagrams, creating the need to take sensory data as input and produce higher-level information. Marr’s (1982), computational theory of vision proposes that recognition and association are ultimately achieved using abstract features of relations that represent meaningful properties of the external world. Although Marr’s theory is based on computational geometry algorithms its approach is related to the problem we are addressing. Descriptions of 2D diagrams should therefore be constructed at a variety of levels, abstracting away from the original representation and characterising, rather than exactly replicating perceived shapes and spatial relations. This raises the question: how can we represent shape and space computationally so that the description contains the knowledge required to recognise higher-level information for design analysis and reasoning tasks? We investigate one approach based on qualitative representation and reasoning.
2.2. QUALITATIVE REPRESENTATION
There is a large body of literature on qualitative representation. Schemes are commonly described as being either region-based or boundary-based. Region-based schemes found descriptions on shape interior (Brady and Asada 1984; Randell 1992; Cohn 1995; 1997). In contrast, boundary-based schemes typically describe types of localised features round the bounding edge of a region (Leyton 1988; 2001; Cinque and Lombardi 1995). Schemas of the boundary-based approach use descriptors which are ultimately analysable in terms of qualitative variation.
In design reasoning, qualitative representations of shape and space have not been as extensively studied. Gero and Park (1997) developed a schema founded on Freeman’s chain coding scheme (1961) using landmark-based qualitative codes. Until recently, their approach was restricted to representing the outline or silhouette of shapes in isolation. A schema that
QUALITATIVE REPRESENTATION AND REASONING 143
extended landmark descriptions to include topological information about groups of shapes was developed by Gero and Jupp (2003). They proposed descriptions based on intersection-type applied to boundary landmarks. We extend this approach in a schema for shape and spatial representation that defines a hierarchy for a three-class qualitative language.
2.3. REASONING AND SIMILARITY-BASED ANALYSIS
Similarity is an important concept in design analysis and reasoning tasks. Once we are able to represent diagrams canonically, patterns and features identified can be compared to obtain a measure of their “likeness”. This can then be exploited for various tasks such as automated classification and information retrieval. The notion of “likeness” can be highly subjective, since it depends on the criteria chosen and therefore contextual knowledge is required.
Despite this requirement, there have been various solutions proposed for automated image processing and comparative analysis. Attneave (1966), in his theory on visual perception proposed that significant points (such as corners) contain the high information content necessary for successful shape recognition. Methods of polygon approximation (Pavlidis 1977) and formal grammars have also be used to define patterns, where parsing is used for matching. Similar approaches include feature extraction where recognition is achieved using either statistical pattern recognition (Gero and Kazakov 2001) or machine learning techniques (Colagrossi et al 2003). Colagrossi et al (2003) classify a sample of paintings by Mondrian by ascribing lines and areas a value called an order and use a neural network based classifier. Watanabe et al (1995) proposed a technique for recognition of table-form documents using graphs. A variety of form recognition studies base their systems on summarising line intersection information in a 1D string (Ting et al 1995; Lin et al 1996). The use of strings is based on structural and syntactic pattern recognition methods where a set of high level symbols is used to represent a pattern.
We investigate a similar approach in describing salient pictorial features as symbols and patterns of symbols. We implement clustering algorithms as the principal means for matching and computing a measure of similarity. The following section describes a computational means of representing shapes and spatial relations symbolically.
3. Qualitative Representation Schema
The description of shapes and space in any symbolic scheme may be treated as the problem of describing distinctive characteristics at the categorical level. Since shape and spatial characteristics can be treated as features, the representation of sketches and drawings involves recognizing, capturing and
144 JR JUPP AND JS GERO
representing these features qualitatively as discrete symbols. The aim of any QFB representation is to produce a canonical representation analogous to a natural language that captures information relating to the qualitative character of the diagram. The schema focuses on representing rectilinear shapes and their spatial relations. We establish shape and spatial features as classes derivable from the intersection of contours under the following conditions:
i) bounded rectilinear polyline shape – a shape composed of a set of only perpendicular straight lines where for any point on its contour there exists a circuit that starts from and ends at a vertex without covering any vertex more than once. Shapes are closed, without holes and oriented vertically and horizontally;
ii) shape aggregation – a shape that satisfies the conditions in (i) and exists as an aggregation of two or more other shapes.
The first principle of the approach is the encoding of vertices where qualitative changes occur. The system looks at vertices of shape contours and graph edges and captures distinctive physical characteristics. On each singular contour vertex or graph edge, a landmark value for a particular design quality (shape attribute or spatial relation) is abstracted into a single symbol.
We use standard first order logic and set membership notation with the following symbols: constants; connectives: ∧ (and), ∨ (or), ⇒ (if… then); quantifiers:, and sets: (is a subset of), (the intersection of). This specification method provides descriptions represented in terms of position, length, relation and area.
3.1. QFB SHAPE REPRESENTATION
We take the representation of shape contours and add intersection semantics to the vertices. Encoding follows where vertices are scanned and labelled in a counter-clockwise direction. As a result the symbol strings that represent the outlines of shapes are cyclic. The following three discrete stages describe the first class of qualitative representation in the schema hierarchy.
physicality symbol This specification method provides a description for shape attributes represented in terms of intersection type for contours: their relative position and length. Intersection attributes are encoded into qualitative value signs at the vertex as a landmark point. Landmarks are set when a new contour is compared to the previous contour. The schema can be defined by the following in relation to a 2D diagram:
Definition 1: Let be a vertex, where is the list of contours that intersect at
and the qualitative symbol value that describes its intersection type.

QUALITATIVE REPRESENTATION AND REASONING 145
A vertex must carry a minimum of two contours and includes both external (boundary) and internal contours.
= (1) Definition 2: (convex) Let L be the symbol value produced by two contours
intersecting at a vertex when viewed from (inside) the acute angle . ( +1)⇒ = L (2) Definition 3: (concave) Let be the symbol value produced by two contours
intersecting at a vertex when viewed from the complementary angle . comp ( +1)⇒ = (3)
As a consequence of the nature of the intersection types two shapes that look geometrically different may nonetheless have the same qualitative description. An example is shown in Figure 3, where a sample of geometrically different shapes are described by the sequence: L,L,L,L,L, , ,L (commencing at landmark L for all three shapes).
(a) (b) (c)
Figure 3. U-Shape examples L, L, L, L, L, , , L
Geometric differences are included by adding three auxiliary attributes for relative lengths of segments (Gero and Park 1997). Definitions 1 and 2 are annotated with a symbol value indicating relative length. The landmark provides a ratio to distinguish the relative difference under the labels of equal to, greater than or less than. These auxiliary codes describe lengths between the previous contour and the current contour. We define equal to: =; greater than: >; and less than: <; where is the qualitative symbol value L or . Thus in Figure 3, shape (a) is described by the sequence: L>,L=,L=,L<,L>, < , > ,L<; shape (b) is described by: L>,L=,L=,L<,L=, < , > ,L=; and (c) is described by: L>,L>,L<,L<,L>, < , > ,L<.
Where there is contact of more than two contours at a single vertex, the representation of shape attributes is transformed (Gero and Jupp 2003). Vertices of this type can be described by one of the following three qualitative symbol values describing intersection type. Definition 4: (straight + two right angles) Let T be the symbol value
produced by three contours intersecting at a vertex when viewed from (inside) either of the two acute angles .
, ( +1 +2)⇒ =T (4)

146 JR JUPP AND JS GERO
Definition 5: (complement of straight + two right angles) Let ⊥ be the symbol value produced by three contours intersecting at a vertex when viewed from the complementary of the two acute angles .
comp , ( +1 +2) ⇒ = ⊥ (5) Definition 6: (four right-angles and its own complement) Let + be the
symbol value produced by four contours intersecting at a vertex when viewed from the inside any of its acute angles .
, , , ( +1 +2 +3) ⇒ = + (6) A distinction is made between morphological descriptions (L, ,) and
topological descriptions (T, ⊥, and +) where the latter focuses on concepts of connectedness that emerge from descriptions of shape aggregation. Thus, a critical difference exists in the scanning and labelling of vertices for aggregated shapes. Isolated shapes (and embedded shapes) contain vertices with only two contours each (see examples in Figures 4 (a) and (b)), and therefore have one scanning direction. Aggregated shapes can contain vertices with three or four contours i.e. multi-region vertices, and therefore have more than one scanning direction, Figure 4.
(a) (b) (c) (d) (e) (f)
Figure 4. Scanning directions
Figure 4 illustrates vertices involved in one (a), two (b), (c) and (e), three (d), (e) and (f) or four (f) regions.
symbol regularity The physicality and connectivity of a shape is described as a sequence of symbols which is assumed to denote design characteristics of a building plan. Some of these characteristics are easy to identify from structural regularities in symbol strings, while others are more difficult because they appear in more complex patterns. Transformation from sequences of symbols (unstructured) to regularities (structured) brings interpretation possibilities.
Patterns that reflect basic repetitions and convexity are: indentation, protrusion, iteration, alternation and symmetry. Iteration refers to a repetition of patterns with no interval; alternation refers to a repetition of patterns with irregular intervals; and symmetry refers to a reflective

QUALITATIVE REPRESENTATION AND REASONING 147
arrangement of patterns (not necessarily expressed as visual symmetry). The five syntactic regularities and their definitions are listed below. Definition 7: (indentation) Let be the symbol for indentation where is an
integer:
= L ( ) L (7)
Definition 8: (protrusion) Let be the symbol for protrusion where is an integer:
= (L) (8)
Definition 9: (iteration) Let be the symbol for iteration where is an integer:
= (L) ∧ ( ) ∧ (T) ∧ (⊥) ∧ (+) (9)
Definition 10: (alteration) Let be the symbol for alternation where is an integer:
= (L) ∧∨ ( ) ∧∨ (T) ∧∨ (⊥) ∧∨ (+) (10)
Definition 11: (symmetry) Let be the symbol for symmetry where is an integer, is the class descriptor and comp is the complement of :
= () ∧ comp (11)
A pattern of symbol sequences can denote specific categories of shape classes that are well known or familiar in contour.
regularity feature Syntactic regularities identified from the symbol sequence become shape features. Discovering visual patterns plays an important role in organising and providing order and is known also as shape semantics. Shape features are recognised by matching symbols with an existing feature knowledge base. Since shape features are derived from basic neighbouring shape elements we describe them as local. The five syntactic regularities listed above define five atomic local shape features, i.e., indentation, protrusion, iteration, alternation and symmetry. Conceptual units are also defined for local shape features, which correspond to how they can be chunked. These units define four discrete levels (Gero and Park 1997). The terminology used for these conceptual units correspond to terms used in natural language. Conceptual units and their definitions are provided in Table 1.
Local shape features are used as the basis for reasoning about design diagrams. For example, it is possible to determine categorical information about shapes, since by identifying syntactic regularities patterns can be compared. In the following section we extend this schema to include spatial

148 JR JUPP AND JS GERO
relations by abstracting two additional levels of information. Each level is in keeping with the same three discrete stages presented in this section.
TABLE 1. Conceptual unit definitions (after Gero and Park 1997)
Unit Definition Word Sequence referring to a shape pattern with a particular design
meaning
Phrase Sequence in which one or more words show a distinctive pattern of structural arrangement
Sentence An aggregation of words and phrases so that it refers to a closed and complete shape contour
Paragraph A group of sentences where an aggregation of shapes are described without any spatial relationships
3.3. QFB SPATIAL REPRESENTATION
The formal treatment of visual languages is often based on graph representations. In the following we utilise graphs in order to represent spatial information. We maintain our analogy with language since by generalising descriptions of both adjacency and area in to a QFB language we are essentially moving from symbols related by one relationship (linear ordering given by sequencing) to multiple relationships which can be represented by graphs. Further, in assuming that diagrams can be represented by graphs, a spatial language is a set of such graphs abstracted from the original contour representation. The aim of constructing spatial descriptors as a second hierarchy of a qualitative codes is to produce spatial (global) features.
3.3.1. Graph diagrams designed for representing topology The QFB approach to spatial descriptors is based on graph diagrams derived from the original contour representation. Graphs abstracted from contours are able to represent spatial topologies, which denote adjacency (Mantyla 1988). Graphs, as duals of the spatial layout, are constructed by locating new vertices in the centres of all bounded rectilinear polyline shapes, as well as one other vertex within the external region or background of the diagram. Using this approach we examine two types of spatial relations. First, symbol values derived to represent properties of adjacency. Second, symbols are derived for area descriptions of regions. Figure 5 shows the original contours in (a) the location of vertices in (b) and graph diagram (c). We consider how to define syntax and semantics from these graphs. In particular we ignore all structural constraints and simply regard the QFB language as a set of graph diagrams. We utilise symbol values produced in the previous level as our principal building blocks. In keeping with the
QUALITATIVE REPRESENTATION AND REASONING 149
previous three discrete stages described in Section 3.1 we present the second level of representation in the same format.
physicality (dyad) symbol Let us define an abstract syntax for QFB spatial descriptions of graphs. (a) (b) (c)
Figure 5. (a) Shapes x, y and z, (b) location of vertices and edges, wv’, xv’, yv’, zv’; and (c) sequenced graph diagram
Definition 12: Let G be an undirected graph with vertices ′ located at centre of regions and where edges have a mapping defining for each edge the vertices it connects.
′ , ′ + 1 (12)
After a graph is constructed it must then be sequenced (Kaufmann 1984) and labelled. The term topology network is used to label such a labelled graph. We label each edge with a pair of symbols; derived from the values of the previous level (for intersection), i.e., L, , T, ⊥, +. Therefore, labels assigned to edges correspond to the labels of the two vertices belonging to a shape contour. Edge labels are defined by the following: Definition 13: Let be the set of dyad symbols for vertices
, + 1
( , , , , ) ∧∨ ( , , , , ) (13)
Edges can be labelled therefore with one of 15 dyad symbol values to produce an adjacency description. The 15 dyad symbols have auxiliary symbol values indicating the relative area of regions.
Definition 14: Let a regular polygon be a region and have an area that is represented at the vertex ′. The area of a regular polygon with n sides and side length s is given by:
n-gon = ¼ ns2 cot (π/n) (14)
A landmark is set to the numeric point of the magnitude of adjacent region areas providing a ratio to distinguish the relative area under the labels of equal to, greater than or less than, or infinite for all external vertices. We
150 JR JUPP AND JS GERO
define equal to: =; greater than: >; less than: <; and infinite: ; where is the qualitative dyad symbol value. If vertex ′ is external define = .
Continuing the example given in Figure 5 we illustrate these mappings in Figure 6. Figure 6(b) shows four vertices: w′, x′, y′, and z′, (w′, is an external vertex), eight edges and six new (abstract) regions.
(a) (b)
Figure 6. (a) Network: sequenced and labelled graph and (b) six new regions
In Figure 6 (a), edges are labelled according to the intersection type of the two vertices belonging to the contour it crosses (a dyad symbol) as well as the values describing the relative area of regions. Graph vertex labels are not required and thus abstract syntax is produced only for edges by the set and = ; < ; > ; . This specification method provides a description for spatial attributes in terms of adjacency and area descriptors. In order to analyse the topology network semantics are defined.
symbol regularity The representation of dyad symbols reveals distinctive topological characteristics that can be recognised from syntactic regularities. Some of these characteristics are easy to identify, while others are more difficult. Unlike the morphological characteristics, topological characteristics contain variations depending on the viewpoint (orientation) of T and/or ⊥ intersections. Depending ons their orientation, these dyad symbols can define two types of adjacency.
Topological features recognised in syntactic regularities of dyad symbols include: complete adjacency, partial adjacency and offset. Complete adjacency refers to a region having total adjacency along a boundary with another region; partial adjacency refers to a region having only incomplete adjacency along a boundary with another region; and offset refers to a region having adjacency shared along more than one boundary with another region. Definitions for adjacency regularities are provided:
Definition 15: is a set of the : ; ; ∧∨ ; ; ; where is a semantic symbol value denoting complete adjacency, and the set is labelled according to intersection type:
( ∧ ); ( ∧ )*; ( ∧ ); ( ∧ )*
; ( ∧ )*; ( ∧ ) (15)
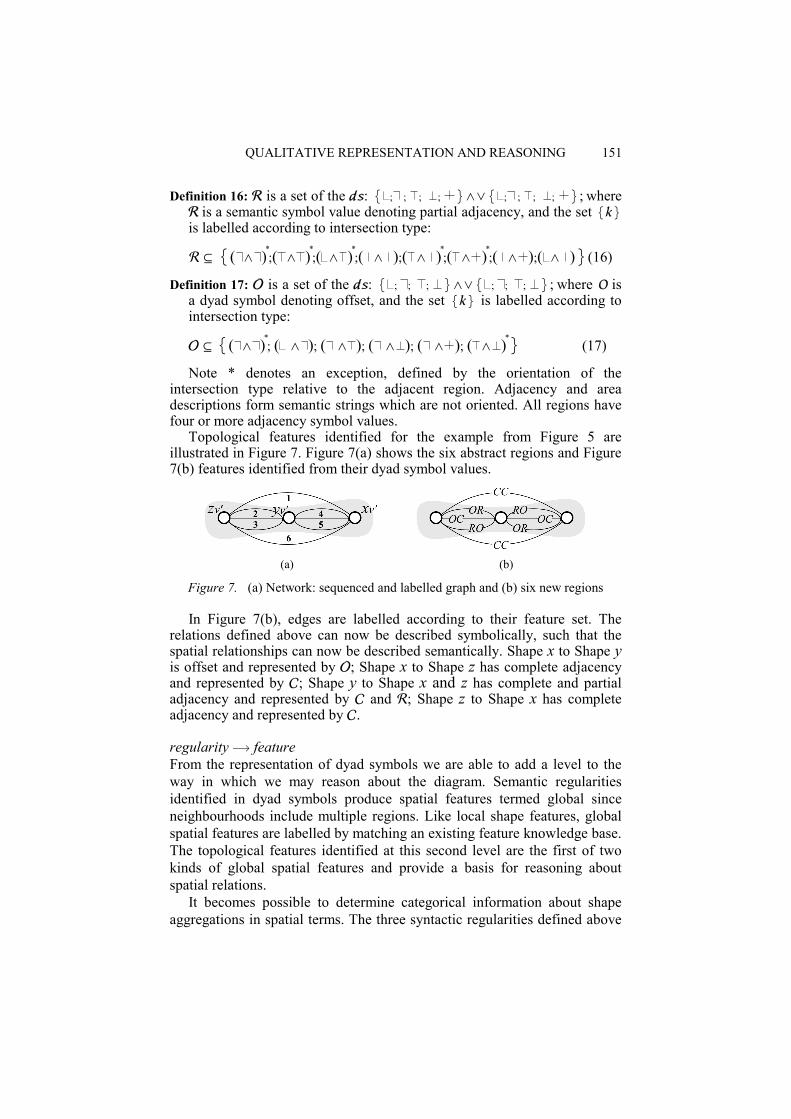
QUALITATIVE REPRESENTATION AND REASONING 151
Definition 16: is a set of the : ; ; ; ; ∧∨ ; ; ; ; ; where is a semantic symbol value denoting partial adjacency, and the set is labelled according to intersection type:
( ∧ )*;( ∧ )*
;( ∧ )*;( ∧ );( ∧ )*
;( ∧ )*;( ∧ );( ∧ )(16)
Definition 17: is a set of the : ; ; ; ∧∨ ; ; ; ; where O is a dyad symbol denoting offset, and the set is labelled according to intersection type:
( ∧ )*; ( ∧ ); ( ∧ ); ( ∧ ); ( ∧ ); ( ∧ )*
(17)
Note * denotes an exception, defined by the orientation of the intersection type relative to the adjacent region. Adjacency and area descriptions form semantic strings which are not oriented. All regions have four or more adjacency symbol values.
Topological features identified for the example from Figure 5 are illustrated in Figure 7. Figure 7(a) shows the six abstract regions and Figure 7(b) features identified from their dyad symbol values.
(a) (b)
Figure 7. (a) Network: sequenced and labelled graph and (b) six new regions
In Figure 7(b), edges are labelled according to their feature set. The relations defined above can now be described symbolically, such that the spatial relationships can now be described semantically. Shape x to Shape y is offset and represented by ; Shape x to Shape z has complete adjacency and represented by ; Shape y to Shape x and z has complete and partial adjacency and represented by and ; Shape z to Shape x has complete adjacency and represented by .
regularity feature From the representation of dyad symbols we are able to add a level to the way in which we may reason about the diagram. Semantic regularities identified in dyad symbols produce spatial features termed global since neighbourhoods include multiple regions. Like local shape features, global spatial features are labelled by matching an existing feature knowledge base. The topological features identified at this second level are the first of two kinds of global spatial features and provide a basis for reasoning about spatial relations. It becomes possible to determine categorical information about shape aggregations in spatial terms. The three syntactic regularities defined above
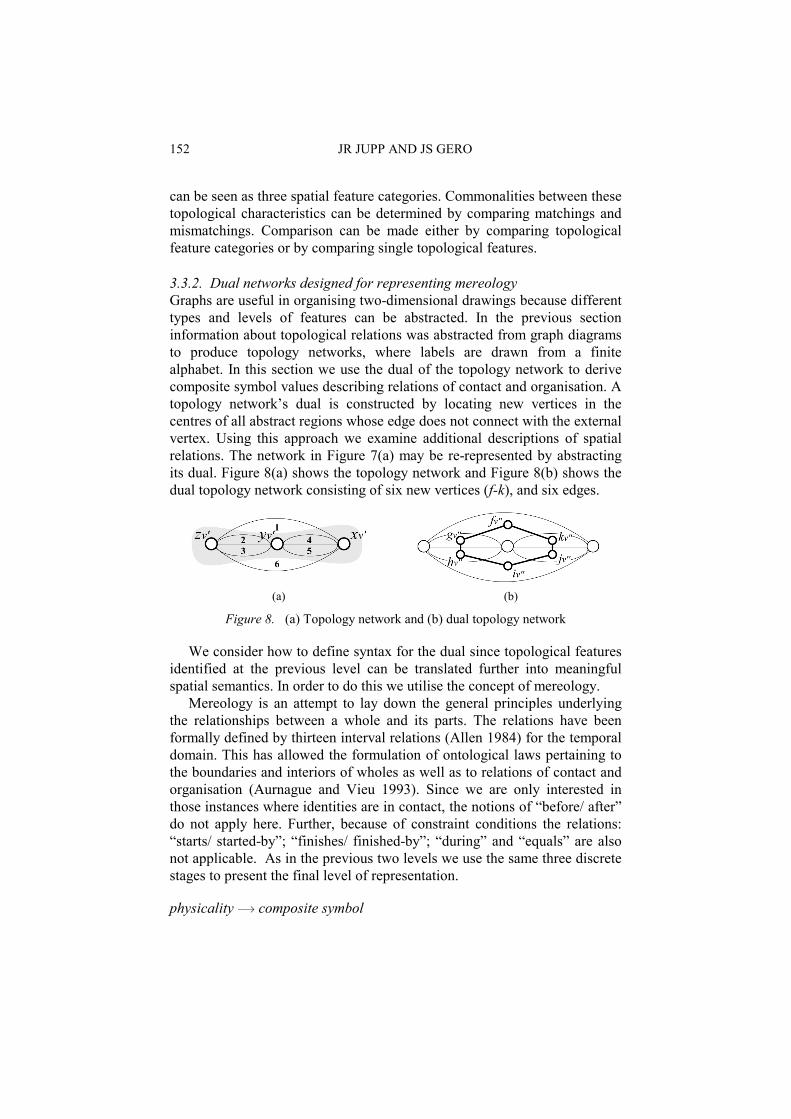
152 JR JUPP AND JS GERO
can be seen as three spatial feature categories. Commonalities between these topological characteristics can be determined by comparing matchings and mismatchings. Comparison can be made either by comparing topological feature categories or by comparing single topological features.
3.3.2. Dual networks designed for representing mereology Graphs are useful in organising two-dimensional drawings because different types and levels of features can be abstracted. In the previous section information about topological relations was abstracted from graph diagrams to produce topology networks, where labels are drawn from a finite alphabet. In this section we use the dual of the topology network to derive composite symbol values describing relations of contact and organisation. A topology network’s dual is constructed by locating new vertices in the centres of all abstract regions whose edge does not connect with the external vertex. Using this approach we examine additional descriptions of spatial relations. The network in Figure 7(a) may be re-represented by abstracting its dual. Figure 8(a) shows the topology network and Figure 8(b) shows the dual topology network consisting of six new vertices (f-k), and six edges.
(a) (b)
Figure 8. (a) Topology network and (b) dual topology network
We consider how to define syntax for the dual since topological features identified at the previous level can be translated further into meaningful spatial semantics. In order to do this we utilise the concept of mereology.
Mereology is an attempt to lay down the general principles underlying the relationships between a whole and its parts. The relations have been formally defined by thirteen interval relations (Allen 1984) for the temporal domain. This has allowed the formulation of ontological laws pertaining to the boundaries and interiors of wholes as well as to relations of contact and organisation (Aurnague and Vieu 1993). Since we are only interested in those instances where identities are in contact, the notions of “before/ after” do not apply here. Further, because of constraint conditions the relations: “starts/ started-by”; “finishes/ finished-by”; “during” and “equals” are also not applicable. As in the previous two levels we use the same three discrete stages to present the final level of representation.
physicality composite symbol
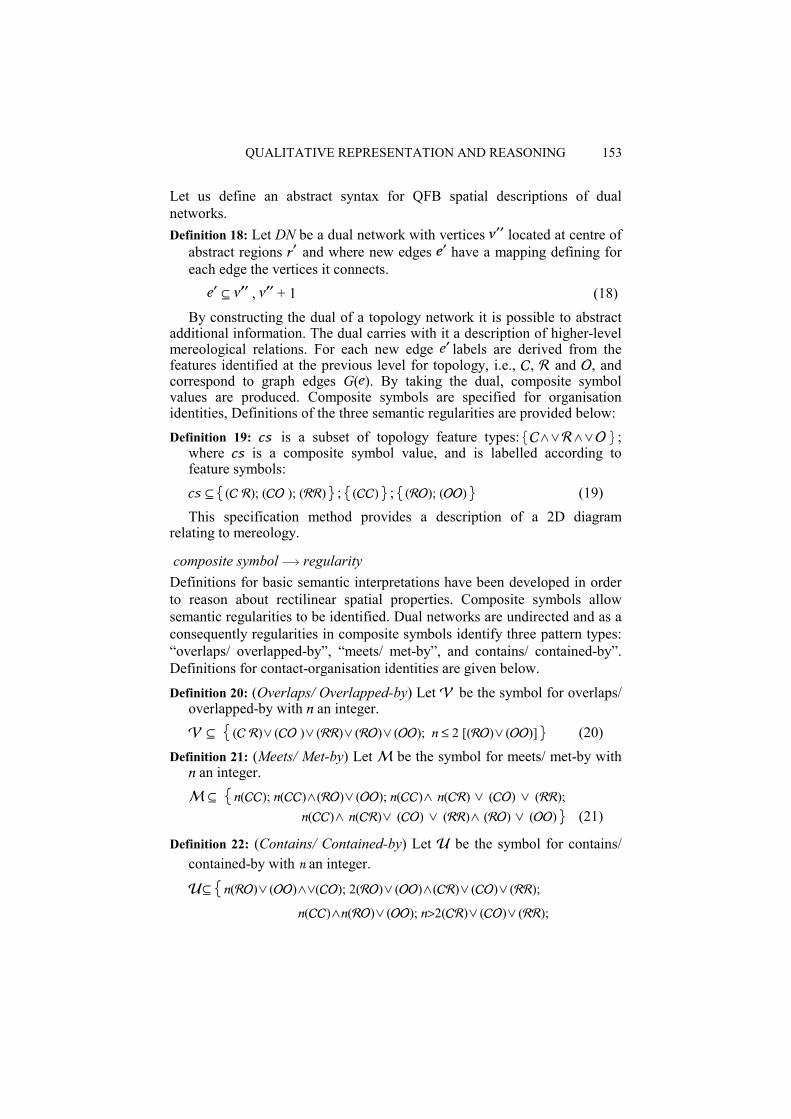
QUALITATIVE REPRESENTATION AND REASONING 153
Let us define an abstract syntax for QFB spatial descriptions of dual networks. Definition 18: Let DN be a dual network with vertices ′ ′ located at centre of
abstract regions ′ and where new edges ′ have a mapping defining for each edge the vertices it connects.
′ ′′ ′ , ′′ ′ + 1 (18) By constructing the dual of a topology network it is possible to abstract additional information. The dual carries with it a description of higher-level mereological relations. For each new edge ′ labels are derived from the features identified at the previous level for topology, i.e., , and , and correspond to graph edges G(). By taking the dual, composite symbol values are produced. Composite symbols are specified for organisation identities, Definitions of the three semantic regularities are provided below: Definition 19: is a subset of topology feature types: ∧∨∧∨;
where is a composite symbol value, and is labelled according to feature symbols:
( ); ( ); ();();(); () (19) This specification method provides a description of a 2D diagram relating to mereology.
composite symbol regularity Definitions for basic semantic interpretations have been developed in order to reason about rectilinear spatial properties. Composite symbols allow semantic regularities to be identified. Dual networks are undirected and as a consequently regularities in composite symbols identify three pattern types: “overlaps/ overlapped-by”, “meets/ met-by”, and contains/ contained-by”. Definitions for contact-organisation identities are given below.
Definition 20: (Overlaps/ Overlapped-by) Let be the symbol for overlaps/ overlapped-by with an integer.
( )∨( )∨()∨()∨(); ≤ 2 [()∨()] (20) Definition 21: (Meets/ Met-by) Let be the symbol for meets/ met-by with
an integer. (); ()∧()∨(); ()∧ () ∨ () ∨ (); ()∧ ()∨ () ∨ ()∧ () ∨ () (21)
Definition 22: (Contains/ Contained-by) Let be the symbol for contains/ contained-by with n an integer.
()∨()∧∨(); 2()∨()∧()∨()∨(); ()∧()∨(); >2()∨()∨();
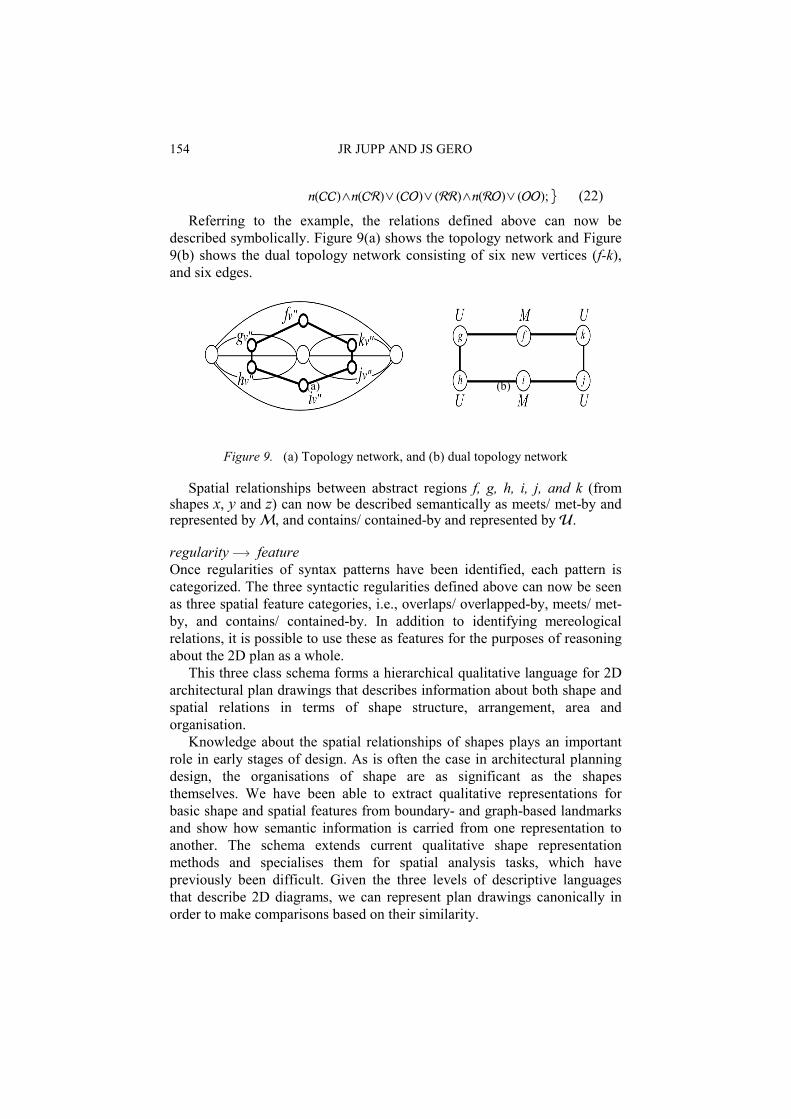
154 JR JUPP AND JS GERO
()∧()∨()∨()∧()∨(); (22)
Referring to the example, the relations defined above can now be described symbolically. Figure 9(a) shows the topology network and Figure 9(b) shows the dual topology network consisting of six new vertices (f-k), and six edges.
(a) (b)
Figure 9. (a) Topology network, and (b) dual topology network
Spatial relationships between abstract regions f, g, h, i, j, and k (from shapes x, y and z) can now be described semantically as meets/ met-by and represented by , and contains/ contained-by and represented by .
regularity feature Once regularities of syntax patterns have been identified, each pattern is categorized. The three syntactic regularities defined above can now be seen as three spatial feature categories, i.e., overlaps/ overlapped-by, meets/ met-by, and contains/ contained-by. In addition to identifying mereological relations, it is possible to use these as features for the purposes of reasoning about the 2D plan as a whole.
This three class schema forms a hierarchical qualitative language for 2D architectural plan drawings that describes information about both shape and spatial relations in terms of shape structure, arrangement, area and organisation.
Knowledge about the spatial relationships of shapes plays an important role in early stages of design. As is often the case in architectural planning design, the organisations of shape are as significant as the shapes themselves. We have been able to extract qualitative representations for basic shape and spatial features from boundary- and graph-based landmarks and show how semantic information is carried from one representation to another. The schema extends current qualitative shape representation methods and specialises them for spatial analysis tasks, which have previously been difficult. Given the three levels of descriptive languages that describe 2D diagrams, we can represent plan drawings canonically in order to make comparisons based on their similarity.
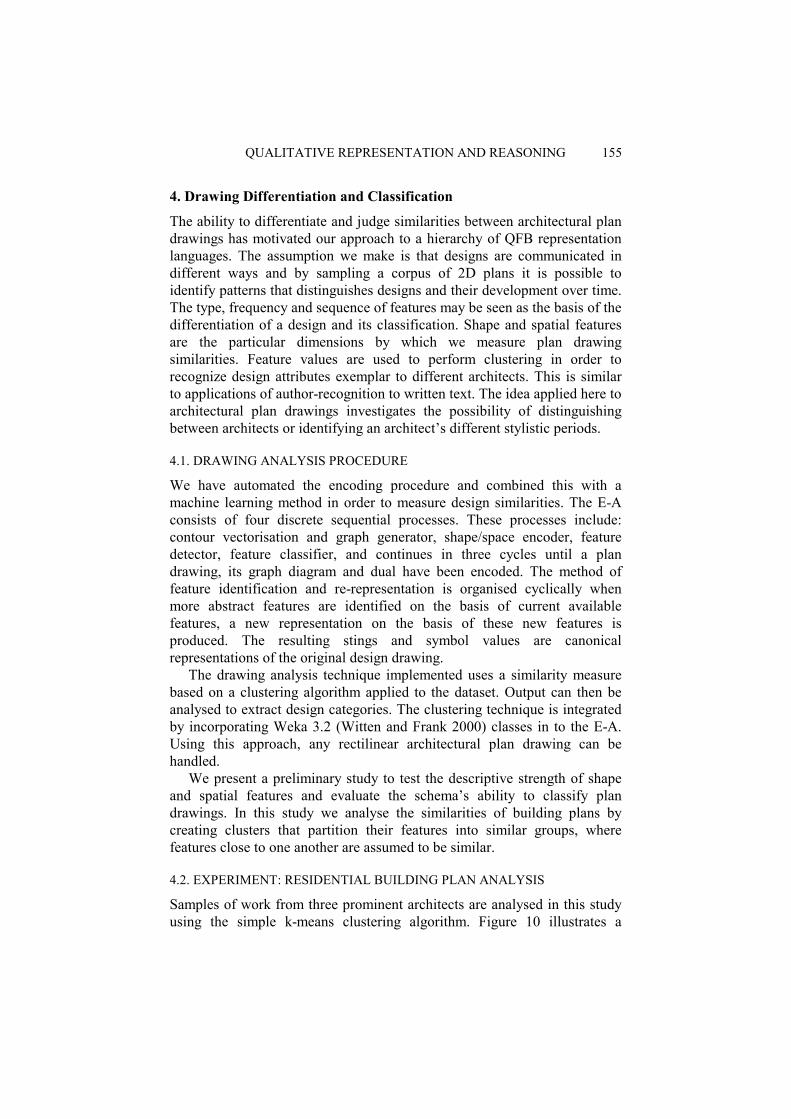
QUALITATIVE REPRESENTATION AND REASONING 155
4. Drawing Differentiation and Classification
The ability to differentiate and judge similarities between architectural plan drawings has motivated our approach to a hierarchy of QFB representation languages. The assumption we make is that designs are communicated in different ways and by sampling a corpus of 2D plans it is possible to identify patterns that distinguishes designs and their development over time. The type, frequency and sequence of features may be seen as the basis of the differentiation of a design and its classification. Shape and spatial features are the particular dimensions by which we measure plan drawing similarities. Feature values are used to perform clustering in order to recognize design attributes exemplar to different architects. This is similar to applications of author-recognition to written text. The idea applied here to architectural plan drawings investigates the possibility of distinguishing between architects or identifying an architect’s different stylistic periods.
4.1. DRAWING ANALYSIS PROCEDURE
We have automated the encoding procedure and combined this with a machine learning method in order to measure design similarities. The E-A consists of four discrete sequential processes. These processes include: contour vectorisation and graph generator, shape/space encoder, feature detector, feature classifier, and continues in three cycles until a plan drawing, its graph diagram and dual have been encoded. The method of feature identification and re-representation is organised cyclically when more abstract features are identified on the basis of current available features, a new representation on the basis of these new features is produced. The resulting stings and symbol values are canonical representations of the original design drawing.
The drawing analysis technique implemented uses a similarity measure based on a clustering algorithm applied to the dataset. Output can then be analysed to extract design categories. The clustering technique is integrated by incorporating Weka 3.2 (Witten and Frank 2000) classes in to the E-A. Using this approach, any rectilinear architectural plan drawing can be handled.
We present a preliminary study to test the descriptive strength of shape and spatial features and evaluate the schema’s ability to classify plan drawings. In this study we analyse the similarities of building plans by creating clusters that partition their features into similar groups, where features close to one another are assumed to be similar.
4.2. EXPERIMENT: RESIDENTIAL BUILDING PLAN ANALYSIS
Samples of work from three prominent architects are analysed in this study using the simple k-means clustering algorithm. Figure 10 illustrates a
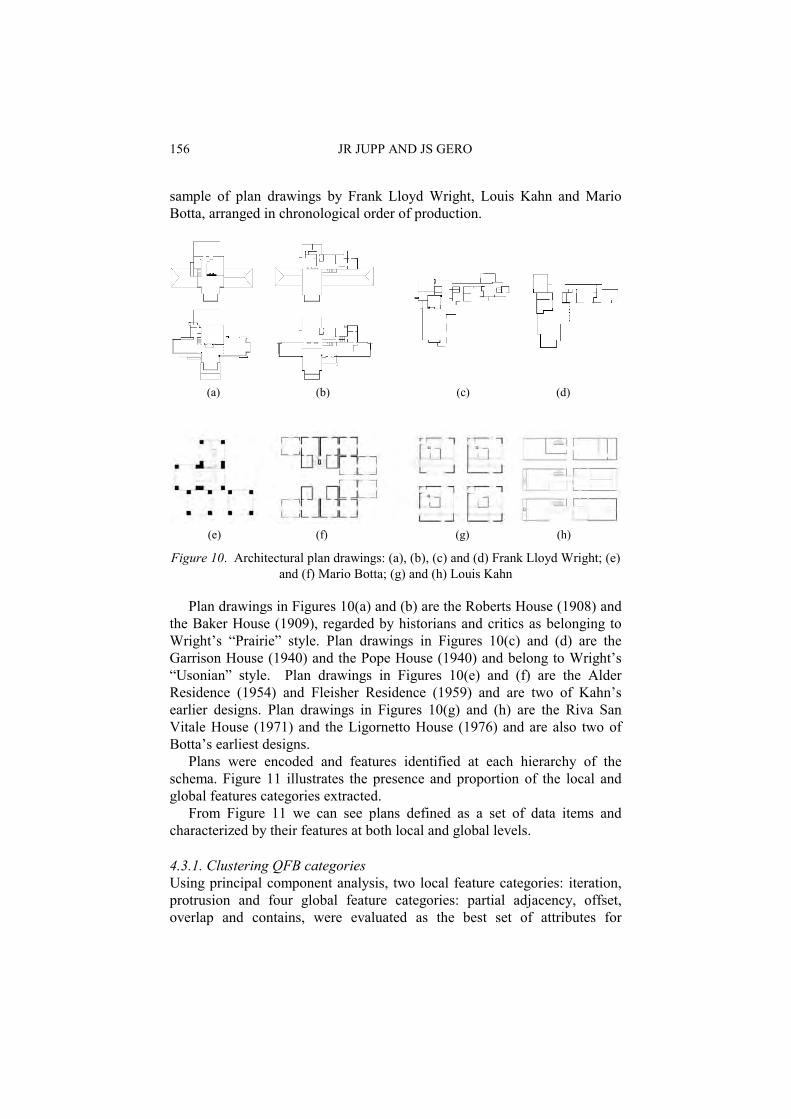
156 JR JUPP AND JS GERO
sample of plan drawings by Frank Lloyd Wright, Louis Kahn and Mario Botta, arranged in chronological order of production.
(a) (b) (c) (d)
(e) (f) (g) (h)
Figure 10. Architectural plan drawings: (a), (b), (c) and (d) Frank Lloyd Wright; (e) and (f) Mario Botta; (g) and (h) Louis Kahn
Plan drawings in Figures 10(a) and (b) are the Roberts House (1908) and the Baker House (1909), regarded by historians and critics as belonging to Wright’s “Prairie” style. Plan drawings in Figures 10(c) and (d) are the Garrison House (1940) and the Pope House (1940) and belong to Wright’s “Usonian” style. Plan drawings in Figures 10(e) and (f) are the Alder Residence (1954) and Fleisher Residence (1959) and are two of Kahn’s earlier designs. Plan drawings in Figures 10(g) and (h) are the Riva San Vitale House (1971) and the Ligornetto House (1976) and are also two of Botta’s earliest designs.
Plans were encoded and features identified at each hierarchy of the schema. Figure 11 illustrates the presence and proportion of the local and global features categories extracted.
From Figure 11 we can see plans defined as a set of data items and characterized by their features at both local and global levels.
4.3.1. Clustering QFB categories Using principal component analysis, two local feature categories: iteration, protrusion and four global feature categories: partial adjacency, offset, overlap and contains, were evaluated as the best set of attributes for
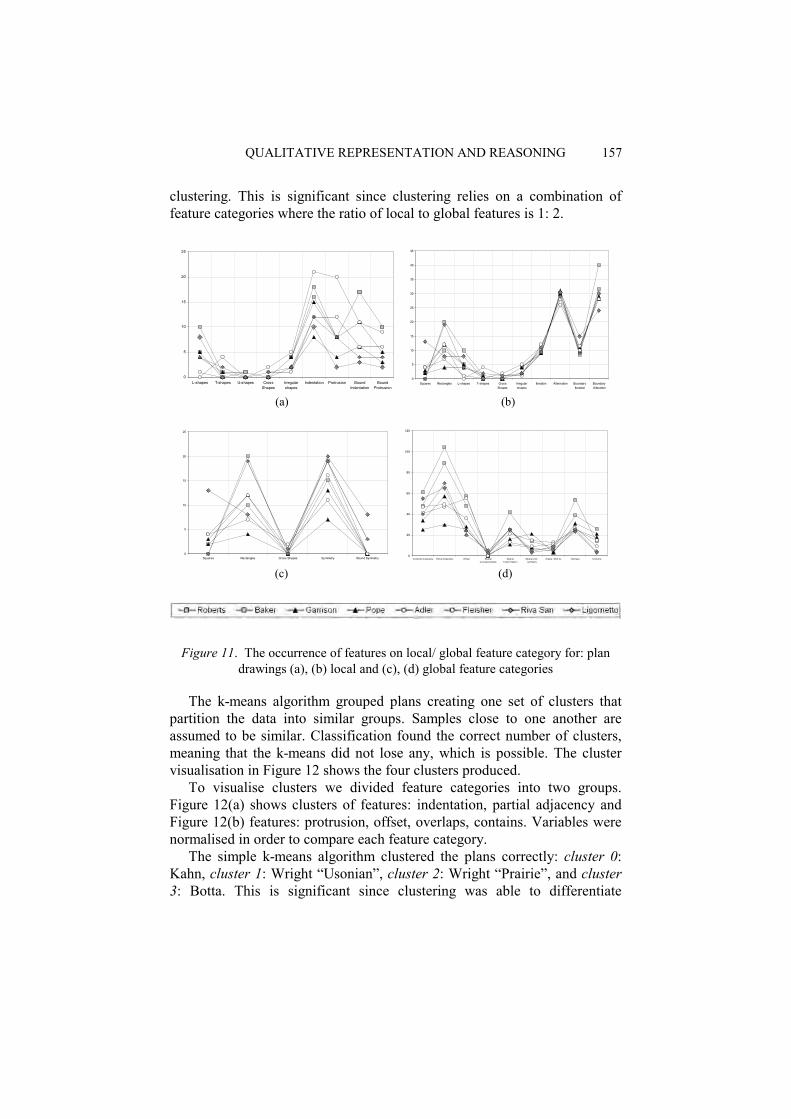
QUALITATIVE REPRESENTATION AND REASONING 157
clustering. This is significant since clustering relies on a combination of feature categories where the ratio of local to global features is 1: 2.
0
5
10
15
20
25
L-shapes T-shapes U-shapes CrossShapes
Irregularshapes
Indentation Protrusion BoundIndentation
BoundProtrusion
0
5
10
15
20
25
30
35
40
45
Squares Rectangles L-shapes T-shapes CrossShapes
Irregularshapes
Iteration Alternation BoundaryIteration
BoundaryAlteration
(a) (b)
0
5
10
15
20
25
Squares Rectangles Cross Shapes Symmetry Bound Symmetry 0
20
40
60
80
100
120
Complete Adjacency Partial Adjacency Of fset SpatialCorrespondence
Spat ialTranformation
Spatial Anti-symmetry
M eets / M et by Overlaps Contains (c) (d)
Figure 11. The occurrence of features on local/ global feature category for: plan drawings (a), (b) local and (c), (d) global feature categories
The k-means algorithm grouped plans creating one set of clusters that partition the data into similar groups. Samples close to one another are assumed to be similar. Classification found the correct number of clusters, meaning that the k-means did not lose any, which is possible. The cluster visualisation in Figure 12 shows the four clusters produced.
To visualise clusters we divided feature categories into two groups. Figure 12(a) shows clusters of features: indentation, partial adjacency and Figure 12(b) features: protrusion, offset, overlaps, contains. Variables were normalised in order to compare each feature category.
The simple k-means algorithm clustered the plans correctly: cluster 0: Kahn, cluster 1: Wright “Usonian”, cluster 2: Wright “Prairie”, and cluster 3: Botta. This is significant since clustering was able to differentiate

158 JR JUPP AND JS GERO
between all three architects as well as differentiating between two stylistic periods of a single architect, i.e., Wright’s Prairie and Usonian designs.
Further insights can be interpreted from the clustering. In Figure 11(a), at point A the k-means algorithm clusters 0 and 2 together by the smallest overall distance. Since the distance between clusters is an indication of their similarity we can infer that clusters 0 and 2 share more similarities. This could be interpreted that Kahn and Botta’s two samples of plan drawings share more commonalities with one another for occurrences of indentation, and partial adjacency. Other insights include similarities between both Kahn and Botta’s residential designs and Wright’s Prairies houses. The k-means algorithm identified greater similarity between Wright’s Prairie and Kahn and Botta’s residential designs than for Wright’s Usonian houses.
(a) (b)
Figure 12. Clustering Result for k-means: (a) indentation, partial adjacency, and (b) protrusion, offset, overlapped, contains
In addition, the distance from a feature to a cluster reflects its degree of membership. In Figure 11(a), at point B the k-means algorithm incorrectly clusters an attribute, a protrusion feature category, from cluster 2 with cluster 0. This indicates that Botta’s Ligornetto residence shares more protrusion similarities with Kahn’s Fleisher residence.
We can verify the visualisation representing the clustering results by comparing metrics against insights derived from the visualisation. From Table 2, features whose cluster is 0, 1 or 3 have degrees of membership that are on average very high with low standard deviations. These features belong very strongly to their cluster. The textual description of what differentiates clusters 0 and 2 illustrate that they are more similar.
Based on these metrics, simple k-means clustering effectively compares plan drawings for one or more features and analyses the extent of feature similarities as well as identifying what differentiates them. The results, although not for a large enough data set to analyse further statistically, are promising given the distinct partitioning within the results and the visual
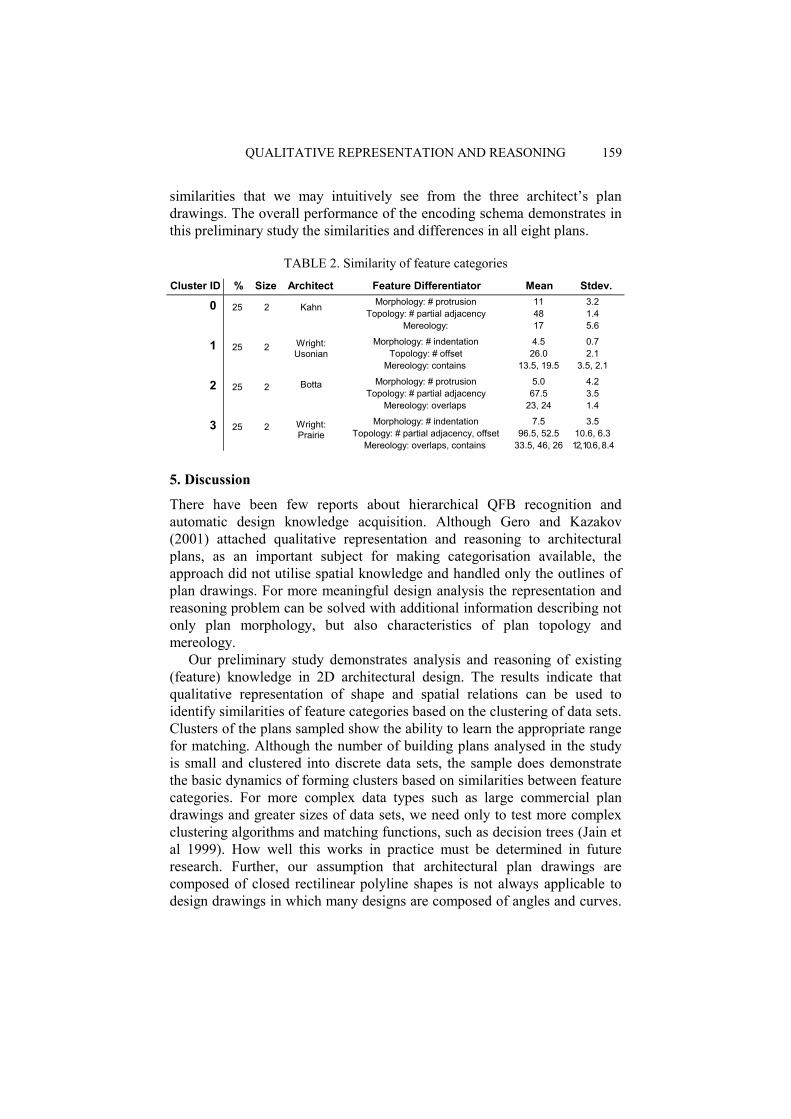
QUALITATIVE REPRESENTATION AND REASONING 159
similarities that we may intuitively see from the three architect’s plan drawings. The overall performance of the encoding schema demonstrates in this preliminary study the similarities and differences in all eight plans.
TABLE 2. Similarity of feature categories
Cluster ID % Size Architect Feature Differentiator Mean Stdev.
0 25 2 Kahn Morphology: # protrusion Topology: # partial adjacency
Mereology:
11 48 17
3.2 1.4 5.6
1 25 2 Wright: Usonian
Morphology: # indentation Topology: # offset
Mereology: contains
4.5 26.0
13.5, 19.5
0.7 2.1
3.5, 2.1
2 25 2 Botta Morphology: # protrusion Topology: # partial adjacency
Mereology: overlaps
5.0 67.5
23, 24
4.2 3.5 1.4
3 25 2 Wright: Prairie
Morphology: # indentation Topology: # partial adjacency, offset
Mereology: overlaps, contains
7.5 96.5, 52.5
33.5, 46, 26
3.5 10.6, 6.3 12, 10. 6 , 8 . 4
5. Discussion
There have been few reports about hierarchical QFB recognition and automatic design knowledge acquisition. Although Gero and Kazakov (2001) attached qualitative representation and reasoning to architectural plans, as an important subject for making categorisation available, the approach did not utilise spatial knowledge and handled only the outlines of plan drawings. For more meaningful design analysis the representation and reasoning problem can be solved with additional information describing not only plan morphology, but also characteristics of plan topology and mereology. Our preliminary study demonstrates analysis and reasoning of existing (feature) knowledge in 2D architectural design. The results indicate that qualitative representation of shape and spatial relations can be used to identify similarities of feature categories based on the clustering of data sets. Clusters of the plans sampled show the ability to learn the appropriate range for matching. Although the number of building plans analysed in the study is small and clustered into discrete data sets, the sample does demonstrate the basic dynamics of forming clusters based on similarities between feature categories. For more complex data types such as large commercial plan drawings and greater sizes of data sets, we need only to test more complex clustering algorithms and matching functions, such as decision trees (Jain et al 1999). How well this works in practice must be determined in future research. Further, our assumption that architectural plan drawings are composed of closed rectilinear polyline shapes is not always applicable to design drawings in which many designs are composed of angles and curves.
160 JR JUPP AND JS GERO
However it is possible to relax encoding constraints in order to handle non-rectilinear shapes and incorporate a wider range of designs. The E-A model presented here provides the basis for new kinds of design tools. The applications of our technique are wide ranging and include design diagram identification, indexing, retrieval, and robust description for 2D diagrams in computational design reasoning. Current CAD systems are unable to aid the designer in the perception of figures and gestalts and in the recognition and categorisation of shape and spatial characteristics. Categorisation of design features is important and influential during designing since it enables the designer to extend design knowledge by grouping or classifying according to some distinguishable properties. The approach presented in the E-A model can potentially assist designers in useful ways by “amplifying the mind’s eye” (Fish and Scrivener 1999). Automatic identification of visual similarities makes past designs relevant to present ones and consequently information about a design can be categorized and re-categorised. A fully automated approach to classification of a variety of shape and spatial features like that presented here is required if the advantages of computer-aided design and planning is to be exploited in support systems.
6. Conclusion
This paper addresses qualitative representation concepts for shape and spatial relations of rectilinear 2D diagrams. In particular, the paper proposes an E-A model for local and global feature categories to acquire morphological, topological and mereological knowledge. By constructing a hierarchy of qualitative languages for shape and space we have automated the recognition, capture and re-representation of 2D design features. Our model has demonstrated that similarity exists not only between shape features, but also between relationships of spatial features, providing an additional level of reasoning about architectural plans. Together, shape and spatial feature categories present a novel approach to reason about 2D design.
Acknowledgements This research is supported by an Australian Postgraduate Research Award. Computing support is provided by the Key Centre of Design Computing and Cognition.
References:
Allen, JF: 1984, Towards a general theory of action and time, Artificial Intelligence 23: 123-154.
QUALITATIVE REPRESENTATION AND REASONING 161
Arnheim, R: 1969, Art and Visual Perception, University of California Press, Berkeley and Los Angeles,
Aurnague, M and Vieu, L: 1993, A three-level approach to the semantics of space, in C Zelinsky-Wibbelt (ed), The Semantics of Prepositions. From Mental Processing to Natural Language Processing, Mouton/de Gruyter, Berlin, pp. 393-439.
Brady, M and Asada, H: 1984, Smoothed local symmetries and their implementation, International Journal of Robotics Research 3(3): 36-61.
Cinque, L and Lombardi, L: 1995, Shape description and recognition by a multi-resolution approach, Image and Vision Computing 13: 599-607.
Cohn, AG:1997, Qualitative spatial representation and reasoning techniques, in G Brewka, C Habel and B Nebel (eds), Proceedings of KI-97, LNAI, Springer-Verlag, 1303, pp. 1-30.
Cohn, AG: 1995, A hierarchical representation of qualitative shape based on connection and convexity, in AU Frank and W Kuhn (eds), Spatial Information Theory: A Theoretical Basis for GIS, Lecture Notes in Computer Science, Springer-Verlag, 988, pp. 311-326.
Colagrossi, A, Sciarrone, F and Seccaroni, C: 2003, A methodology for automating the classification of works of art using neural networks, Leonardo 36 (1): 69-69.
Fish, J and Scrivener, S: 1999, Amplifying the mind’s eye: Sketching and visual cognition, Leonardo 23(1): 117-126.
Freeman, H: 1961, On the encoding of arbitrary geometric configurations, IRE Trans. On Electronic Computers EC-10: 260-268.
Gero, JS and Jupp, J: 2003, Feature-based qualitative representations of plans, in A Choutgrajank, E Charoenslip, K Keatruangkamala and W Nakapan (eds), CAADRIA03, Rangsit University, Bangkok, pp. 117-128.
Gero, JS and Kazakov, V: 2001, Entropic similarity and complexity measures for architectural drawings, in JS Gero B Tversky and T Purcell (eds), Visual and Spatial Reasoning in Design II, Key Centre of Design Computing and Cognition, University of Sydney, Sydney, pp. 147-161.
Gero, JS and Park, S-H: 1997, Computable feature-based qualitative modelling of shape and space, in R Junge (ed), CAADFutures 1997, Kluwer, Dordrecht, pp. 821-830.
Jain, A, Murty, M, Flynn, P: 1999, Algorithms for clustering data: A review, ACM Computing Surveys 32(3): 264-322.
Kaufmann, A: 1967, Graphs, Dynamic Programming, and Finite Games, Academic Press, New York.
Klinger, A and Salingaros, NA: 2000, Complexity and visual images, Environment and Planning B: Planning and Design 27: 537-547.
Leyton, M: 1988, A process-grammar for shape, Artificial Intelligence 34: 213-247. Leyton, M: 2001, A Generative Theory of Shape, Lecture Notes in Computer Science,
Springer-Verlag Berlin Heidelberg New York. Lin, J-Y; Lee, C-W and Chen, Z: 1996, Identification of business forms using relationships
between adjacent frames, Machine Vision Applications 9(2): 56-64. Mantyla, M: 1988, An Introduction to Solid Modelling, Computer Science Press, Rockville. Marr, D: 1982, Vision: A Computational Investigation into the Human Representation and
Processing of Visual Information, WH Freeman, New York. Pavlidis, T: 1977, Structural Pattern Recognition, Springer-Verlag, Berlin. Randell, DA, Cui, Z and Cohn, AG: 1992, A spatial logic based on regions and connection,
Proc. 3rd Int. Conf. on Knowledge Representation and Reasoning, Cambridge MA, pp. 165-176.
Ting, A, Leung, M-K, Hui, S-C and Chan, K-Y: 1995 A syntactic business form classifier, Proceedings 3rd ICDAR, pp. 301-304.

162 JR JUPP AND JS GERO
Watanabe, T, Luo, Q and Sugie, N: 1995, Layout recognition of multi-kinds of table-form documents, IEEE Trans. Pattern Anal. Mach. Intell. 17(4): 432-445.
Wertheimer, M: 1923, Untersuchungen zur Lehre von der Gestalt, Psychologische Forschung 4: 301-350.
Witten, IH and Frank, E: 2000, Data Mining: Practical Machine Learning Tools with Java Implementations, Morgan Kaufmann, San Francisco.
Zipf, GK: 1949, Human Behavior and the Principle of Least Effort, Cambridge, Mass, Addison-Wesley.
JS Gero, B Tversky and T Knight (eds), Visual and Spatial Reasoning in Design III, 2004 Key Centre of Design Computing and Cognition, University of Sydney, pp 163-182
DEVELOPING AN ONTOLOGY OF SPATIAL RELATIONS
JANE BRENNAN University of Technology, Sydney, Australia
and
ERIC A MARTIN AND MIHYE KIM University of New South Wales, Australia
Abstract. We propose a spatial ontology that brings together three aspects of spatial knowledge, namely connectivity, proximity and orientation. These aspects are rich enough to represent knowledge about physical space and each of them can be described in terms of a fixed subsumption hierarchy. The three subsumption hierarchies can then be combined into a relation hierarchy; the way the former are combined into the latter depends on the application domain. For an illustration, we examine how spatial knowledge is represented in natural languages, with an analysis of spatial prepositions in English as a particular case. We obtain a relation hierarchy R from the subsumption hierarchies using Formal Concept Analysis. We argue that R is a suitable ontology for the representation of physical space, as other natural languages would also result in the same relation hierarchy R. It can also form part of computer-aided design systems to enable visual representations of verbal spatial descriptions, which might have been the result of discussion between designers.
1. Introduction
“Much of real world design takes place in domains with a spatial component” (Chandrasekaran 1999). Software tools that are to be developed to support the design process therefore need suitable representations of spatial knowledge. As Goel (1995) pointed out, sketches are a very important tool in the early stages of design, because they do not force designers to be committed to precise representations as, for example, CAD systems do. On the same account, qualitative representations are needed for spatial reasoning to support the early stages of the design process within a computing environment. This paper will examine spatial relations and show how generic qualitative representations can be derived.
164 J BRENNAN, E MARTN AND M KIM
Spatial relations can be subdivided into several classes and intensive research has been conducted to investigate their properties. Over the last few decades, three classes of spatial relations have emerged as natural candidates for representing spatial knowledge: connectivity, orientation and proximity. They have often been studied independently of each other. Only rarely have all three aspects been combined. An exception is the work of Kettani and Moulin (1999), who developed a spatial model to support navigation through natural language instruction. Their model is very specific and a more general model is still in need. In this paper, we propose an approach that combines connectivity, orientation and proximity together with their subsumption hierarchies. These hierarchies are discussed in more detail in Sections 2, 3 and 4. We show how Formal Concept Analysis (Wille 1982; Ganter and Wille 1999) can be used to define a relation hierarchy R representing an ontology for a particular domain, by locating each of the relevant aspects of spatial knowledge on some level of R. The Formal Concept Analysis (FCA) is conducted on examples from the spatial knowledge domain. For the sake of simplicity, we will be analysing a set of English prepositions that describe spatial relations. The resulting relation hierarchy could therefore also be referred to as a “Meta-Lingua,” since its definition is linguistically motivated.
However, as natural languages are often assumed to encode our internal representations of the real world, R offers a generic representation of spatial knowledge suitable for applications of different kinds. Note that this paper is not meant to answer the question whether universal concepts of the world actually exist in the reasoning agents' mind, but rather to explore the possibilities of a set of universal concepts to solve computational issues in spatial knowledge representation. The research reported here stemmed from the observation that distinct natural languages can embrace very different concepts to describe the same spatial situation. For example, when comparing the use of above and on in English with the use of prepositions in the Mexican language Mixtec, a completely different structure is revealed (Regier 1996) as shown in Figure 1. Work employing universal primitives to represent these spatial situations using conceptual graphs (Sowa 2000) was reported in Brennan (1999). Spatial relations themselves were stipulated, while objects were described as concepts in terms of their orienting axes in 3-D space. The notion of shape, a very important point in design, can also be added to the object concept as needed. This representation is too weak to describe some spatial situations and contexts. However, the weakness of this representation can be overcome by refining the stipulated spatial relations. The relation hierarchy R provides a valuable tool to create these refinements. We focus here on binary spatial relations, as these are the most common ones. We assume that spatial relations can be expressed in terms of the three
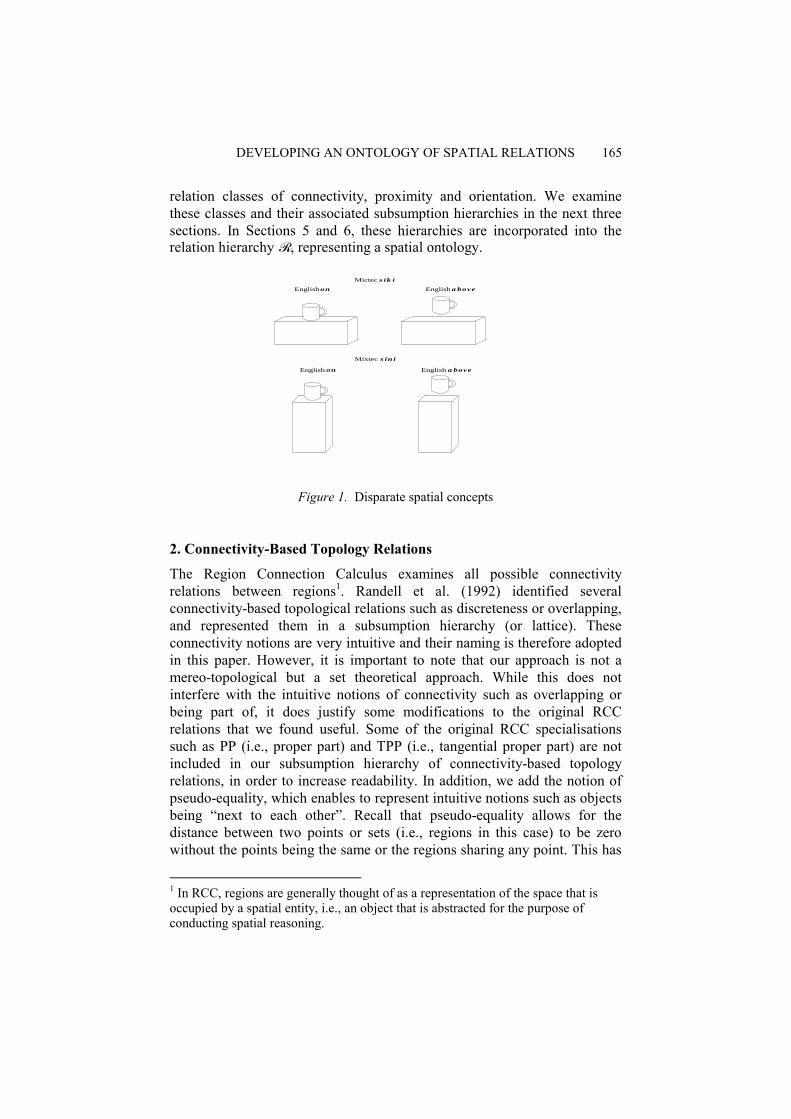
DEVELOPING AN ONTOLOGY OF SPATIAL RELATIONS 165
relation classes of connectivity, proximity and orientation. We examine these classes and their associated subsumption hierarchies in the next three sections. In Sections 5 and 6, these hierarchies are incorporated into the relation hierarchy R, representing a spatial ontology.
Figure 1. Disparate spatial concepts
2. Connectivity-Based Topology Relations
The Region Connection Calculus examines all possible connectivity relations between regions1. Randell et al. (1992) identified several connectivity-based topological relations such as discreteness or overlapping, and represented them in a subsumption hierarchy (or lattice). These connectivity notions are very intuitive and their naming is therefore adopted in this paper. However, it is important to note that our approach is not a mereo-topological but a set theoretical approach. While this does not interfere with the intuitive notions of connectivity such as overlapping or being part of, it does justify some modifications to the original RCC relations that we found useful. Some of the original RCC specialisations such as PP (i.e., proper part) and TPP (i.e., tangential proper part) are not included in our subsumption hierarchy of connectivity-based topology relations, in order to increase readability. In addition, we add the notion of pseudo-equality, which enables to represent intuitive notions such as objects being “next to each other”. Recall that pseudo-equality allows for the distance between two points or sets (i.e., regions in this case) to be zero without the points being the same or the regions sharing any point. This has
1 In RCC, regions are generally thought of as a representation of the space that is occupied by a spatial entity, i.e., an object that is abstracted for the purpose of conducting spatial reasoning.
Mictec siki
Englishon English above
Mixtec sini
English on English above
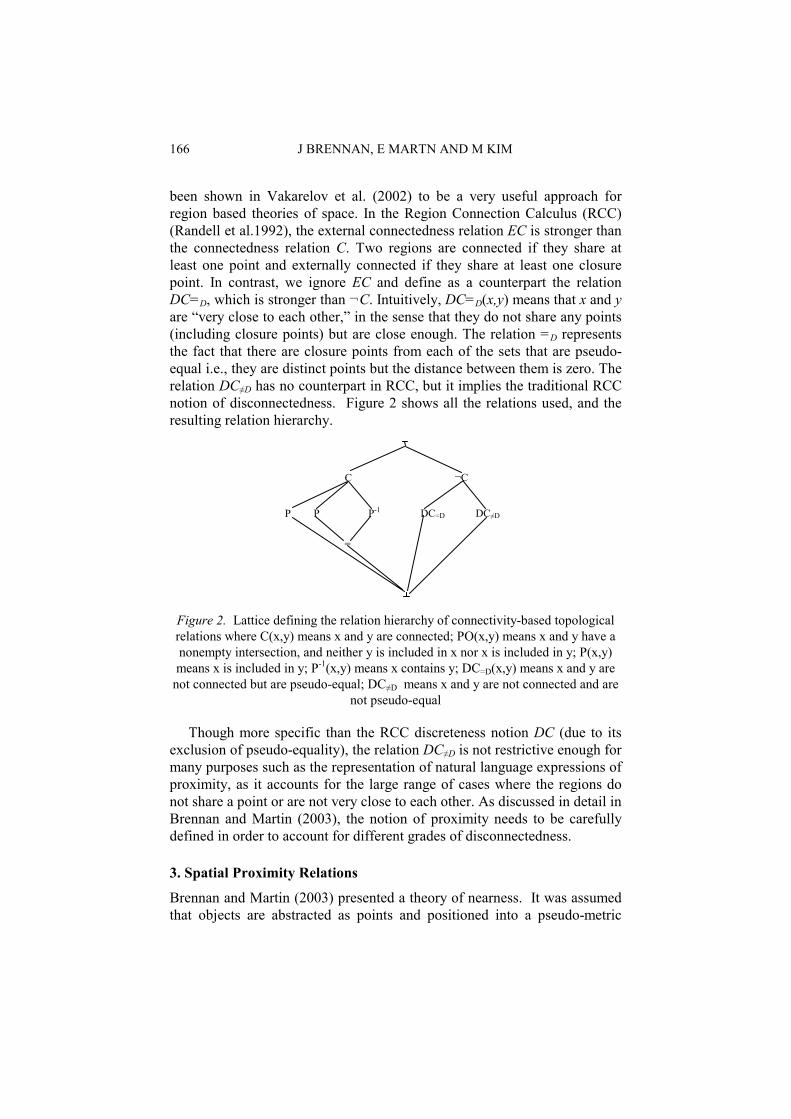
166 J BRENNAN, E MARTN AND M KIM
been shown in Vakarelov et al. (2002) to be a very useful approach for region based theories of space. In the Region Connection Calculus (RCC) (Randell et al.1992), the external connectedness relation EC is stronger than the connectedness relation C. Two regions are connected if they share at least one point and externally connected if they share at least one closure point. In contrast, we ignore EC and define as a counterpart the relation DC=D, which is stronger than ¬C. Intuitively, DC=D(x,y) means that x and y are “very close to each other,” in the sense that they do not share any points (including closure points) but are close enough. The relation =D represents the fact that there are closure points from each of the sets that are pseudo-equal i.e., they are distinct points but the distance between them is zero. The relation DC≠D has no counterpart in RCC, but it implies the traditional RCC notion of disconnectedness. Figure 2 shows all the relations used, and the resulting relation hierarchy.
Figure 2. Lattice defining the relation hierarchy of connectivity-based topological relations where C(x,y) means x and y are connected; PO(x,y) means x and y have a nonempty intersection, and neither y is included in x nor x is included in y; P(x,y) means x is included in y; P-1(x,y) means x contains y; DC=D(x,y) means x and y are
not connected but are pseudo-equal; DC≠D means x and y are not connected and are not pseudo-equal
Though more specific than the RCC discreteness notion DC (due to its exclusion of pseudo-equality), the relation DC≠D is not restrictive enough for many purposes such as the representation of natural language expressions of proximity, as it accounts for the large range of cases where the regions do not share a point or are not very close to each other. As discussed in detail in Brennan and Martin (2003), the notion of proximity needs to be carefully defined in order to account for different grades of disconnectedness.
3. Spatial Proximity Relations
Brennan and Martin (2003) presented a theory of nearness. It was assumed that objects are abstracted as points and positioned into a pseudo-metric
C ¬C
P P P-1 DC=D DC≠D
=
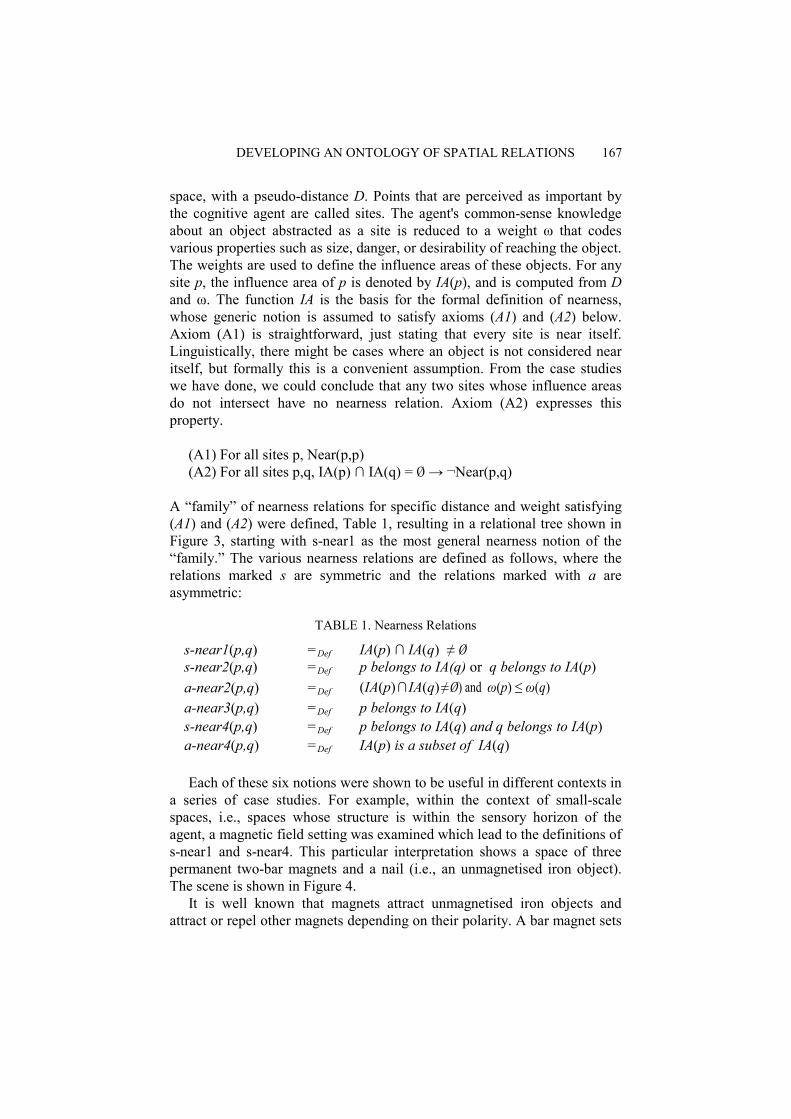
DEVELOPING AN ONTOLOGY OF SPATIAL RELATIONS 167
space, with a pseudo-distance D. Points that are perceived as important by the cognitive agent are called sites. The agent's common-sense knowledge about an object abstracted as a site is reduced to a weight ω that codes various properties such as size, danger, or desirability of reaching the object. The weights are used to define the influence areas of these objects. For any site p, the influence area of p is denoted by IA(p), and is computed from D and ω. The function IA is the basis for the formal definition of nearness, whose generic notion is assumed to satisfy axioms (A1) and (A2) below. Axiom (A1) is straightforward, just stating that every site is near itself. Linguistically, there might be cases where an object is not considered near itself, but formally this is a convenient assumption. From the case studies we have done, we could conclude that any two sites whose influence areas do not intersect have no nearness relation. Axiom (A2) expresses this property. (A1) For all sites p, Near(p,p) (A2) For all sites p,q, IA(p) ∩ IA(q) = Ø → ¬Near(p,q) A “family” of nearness relations for specific distance and weight satisfying (A1) and (A2) were defined, Table 1, resulting in a relational tree shown in Figure 3, starting with s-near1 as the most general nearness notion of the “family.” The various nearness relations are defined as follows, where the relations marked s are symmetric and the relations marked with a are asymmetric:
TABLE 1. Nearness Relations
s-near1(p,q) =Def IA(p) ∩ IA(q) ≠ Ø s-near2(p,q) =Def p belongs to IA(q) or q belongs to IA(p) a-near2(p,q) =Def (IA(p) ∩ IA(q) ≠ Ø) and ω(p) ≤ ω(q) a-near3(p,q) =Def p belongs to IA(q) s-near4(p,q) =Def p belongs to IA(q) and q belongs to IA(p) a-near4(p,q) =Def IA(p) is a subset of IA(q)
Each of these six notions were shown to be useful in different contexts in
a series of case studies. For example, within the context of small-scale spaces, i.e., spaces whose structure is within the sensory horizon of the agent, a magnetic field setting was examined which lead to the definitions of s-near1 and s-near4. This particular interpretation shows a space of three permanent two-bar magnets and a nail (i.e., an unmagnetised iron object). The scene is shown in Figure 4. It is well known that magnets attract unmagnetised iron objects and attract or repel other magnets depending on their polarity. A bar magnet sets

168 J BRENNAN, E MARTN AND M KIM
up a magnetic field in the space around it, and a second body responds to it (Sears et al. 2000). For example, if a nail happens to be within a magnetic field, it will be drawn towards the magnet. The second magnet does not have to be within the first magnet's field to either be drawn to or repelled from it, it is sufficient when the second magnet's field gets into contact with the first magnet's field.
s−near1
s−near2 a−near2
a−near3
s−near4 a−near4 Figure 3. A “Family” of nearness relations for specific (D,ω)
(a) Magnets and Nail (b) Abstracted Space
Figure 4. The influence of magnetic fields
In this interpretation, the term magnetic field describes the region within which the friction with the table top is not enough to stop an object (the magnets or the nail) from moving. This means that the influence areas depend on the frictional characteristics of the object being attracted or the frictional characteristics in addition to the magnetic properties of a magnet being attracted or repelled. In order to consider the spatial setting of the magnets, we assume that the observing agent is moving the magnets into the
N
N
S
S
N
S
Nail
M1
M3
M2

DEVELOPING AN ONTOLOGY OF SPATIAL RELATIONS 169
positions shown and then holding on to them. This allows their fields to intersect without them being physically moved at first encounter. The nail in the scene is not affected by any of the magnets. The nearness relations between these magnetic objects and even between unmagnetised iron objects and magnets are truly symmetric. This results in exactly one model of the scene, Table 2, where T stands for a True and F stands for a False nearness relation.
TABLE 2. Model of nearness in the scene in Figure 4
M1 M2 M3 Nail
M1 T T T F
M2 T T T F M3 T T T F
Nail F F F T
The model clearly satisfies axiom (A1) with every object being near
itself. Axiom (A2) is satisfied by the nail, whose influence area does not intersect with the influence area of any of the magnets, being not near any of the magnets. It can be observed that the magnets whose influence areas intersect are also near. The definition of s-near1 in Table 1 expresses this symmetric nearness notion. It is the most general nearness notion in our “family” of nearness relations for specific (D,ω). Its formulation was derived from the context of proximity spaces, in which two sets are near each other if they share at least one closure point. Adopting this to a universe containing distinctive points, i.e., sites and their associated areas of influence, nearness holds for two sites if their influence areas intersect.
This does not only make sense in the context of proximity spaces, but is also a reasonable approach for physical space. Worboys (2001) conducted studies in the domain of environmental spaces. His experimental results were analysed in the context of influence areas and used to validate the general nearness notion s-near1. It was found that s-near1 was satisfied in 99.56% of all empirical cases (230 out of 231 cases recorded by Worboys).
In addition to notion s-near1, it can also be noted that in the model shown in Table 2, two sites are always near whenever one of them belongs to the influence area of the other. For example, magnet M2 is in the influence area of magnet M1 and M1 in the influence of M2. The nearness notion s-near4 is a specialisation of s-near1 as defined in Table 1.
Asymmetric aspects of nearness arose from the examination of an environmental space setting, depicted in Figure 5(a). It is a small-scale space, because the scene can be observed from a single viewpoint by the

170 J BRENNAN, E MARTN AND M KIM
cognitive agent. Moreover, since it is also interpreted in a natural language, linguistic restrictions are imposed on its possible models.
(a) Environmental Small-Scale Space (b) Abstracted Space Figure 5. Environmental small-scale space example
The scene contains a bicycle next to a house which is in the vicinity of a church. A tree is shown in the distance. According to Talmy (1983), natural language expressions representing spatial relations are commonly asymmetric. Such an asymmetry can occur when the objects differ greatly in the value of some common property such as size. While a small object might be near a large object, the large object is usually not correctly described as being near the small object, in natural language terms. For the scene depicted, the bicycle is definitely near the house, but not the other way around as can be seen in all four models shown in Tables 3 and 4.
TABLE 3. Models 1 and 2 of nearness in the environmental small-scale space of Figure 5
Model 1
church house bicycle tree
church T T F F
house T T F F
Bicycle T T T F
Tree F F F T
Model 2
church house bicycle tree
church T F F F
house T T F F
bicycle T T T F
tree F F F T
TABLE 4. Models 3 and 4 of nearness in the environmental small-scale space of Figure 5
Model 3
church house bicycle tree
church T T F F
house T T F F
bicycle F T T F
Tree F F F T
Model 4
Church house bicycle tree
church T F F F
house T T F F
bicycle F T T F
tree F F F T
tree
bicycle house
church

DEVELOPING AN ONTOLOGY OF SPATIAL RELATIONS 171
The whole influence area of the bicycle is enclosed in the influence area of the house, but not conversely. This example and similar ones justify the introduction of the asymmetric nearness notion a-near4 defined in Table 1. The bicycle can also be considered near the church in certain contexts as shown in Models 1 and 2 in Table 3. For example, if the emphasis is on the bicycle being parked next to the house and near the church, and not, for example, near the station where it is usually parked. The bicycle is therefore considered to be near the church, while in this context, it would not be said that the church is near the bicycle. The asymmetric nearness notion a-near2 accounts for this kind of situations. The relationship between house and church is symmetric in some contexts, abstracted in Models 1 and 3, but asymmetric in other contexts, abstracted in Models 2 and 4 in Table 3 and 4 respectively.
In the FCA that will be performed in Section 5 on a set of spatial prepositions, proximity relations are only considered when regions are not connected. The reader should however keep in mind that proximity relations are also true when regions overlap. Although the original framework assumed a point-based universe for representing existing spatial entities, it is possible to adapt the theory to a region-based universe. The point-based universe is mainly chosen for simplicity and to derive more general properties of nearness thanks to a high level of abstraction. However, to investigate the properties of spatial knowledge, especially in the context of design, it is desirable to represent the original spatial entities as regions instead of points. These regions, as in RCC, represent the space that a physical object occupies. We assume that all the objects are two dimensional projections resulting in geometrical figures such as circle, triangles or rectangles. This is also important for consistency reasons, because proximity relations do provide a specification of the discrete relations discussed in Section 2, which assumed point-based regions.
In order to generalise the framework of Brennan and Martin (2003) to a region based approach, the notion of influence area needs to be redefined. We will adopt Kettani and Moulin’s (1999) approach to influence areas, which assumes projections of buildings onto a map image resulting in geometric figures. The influence area is then calculated from the outer boundary of these figures using simple Euclidian geometry. While for practical applications, this approach will most likely be directly adopted, for the purpose of abstraction, we will be defining the influence areas of regions by considering these geometric figures as sets of points and generating their influence areas from their closure points and the stipulated notion of weight.
Definition 1 (Influence Area of Regions) Let a region R be given. Let R’ be the closure of R, and let ω(R) be the weight of R. The influence area of R is defined as the union of sets of points P where for each closure point r in

172 J BRENNAN, E MARTN AND M KIM
R’ and each point p in P the distance between p and r is at most equal to ω(R).
Note that the influence area of a region R contains R’. The influence areas of regions can be used to determine the degree of nearness between regions in the same way as for points. This means that regions can only be considered near if their influence areas intersect. Nearness notions for regions are denoted by adding a superscript R to the original notion's name when referring to objects abstracted into regions instead of points, in accordance with the fact that the notions for regions generalise the notions for points. The relation hierarchy of nearness relations, previously defined for a point-based universe and adapted to a region-based universe, is shown in Figure 6.
Figure 6. Lattice defining the relation hierarchy of proximity relations where Near(x,y) means x is near y and s-near1R to a-near4R denote different nearness
notions between regions
4. Orientation Relations
Orientation or direction relations are also a very important aspect of spatial knowledge and can be used in conjunction with connectivity to describe the position of objects to each other in a qualitative way (Hernández 1994). Spatial descriptions of directions can be classified as either relative or absolute. The most studied relative reference system is no doubt the left-right system, but as we have previously seen, the Mexican language Mixtec does also use a relative reference system. However, the research in the field of spatial reasoning has mainly focused on the Cardinal direction system,
¬Near Near
s-near1R
s-near2R a-near2R
a-near3R
s-near4R a-near4R
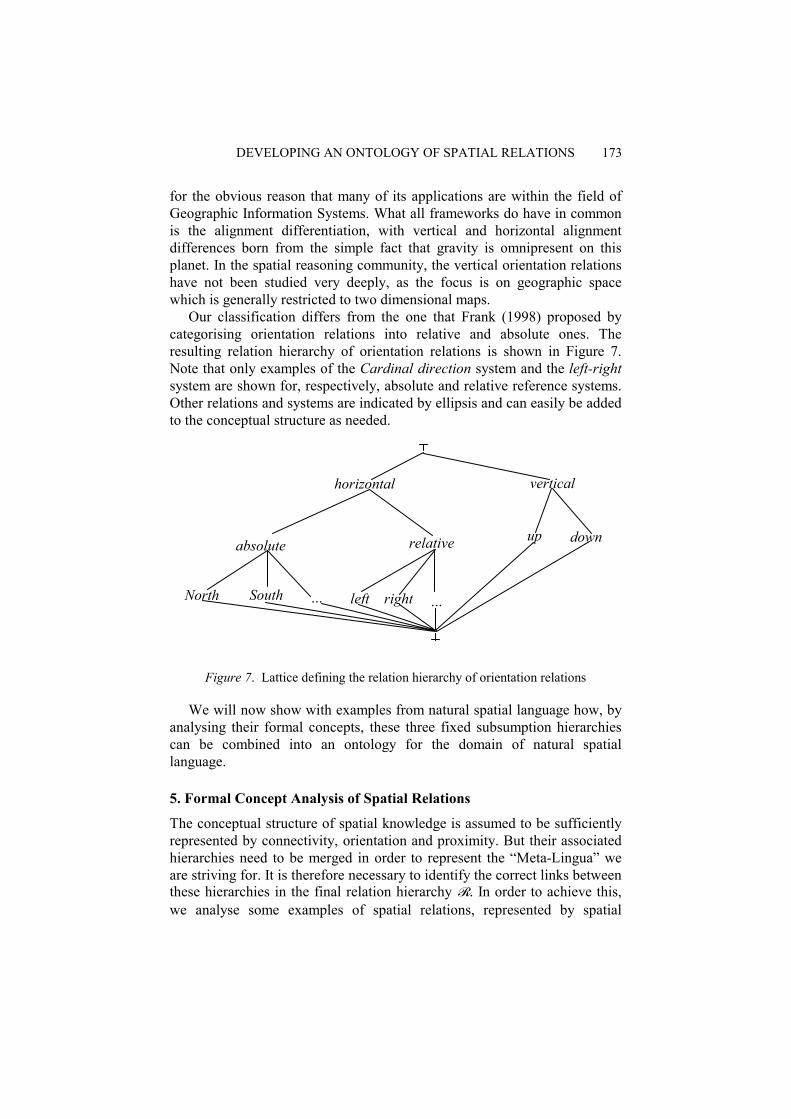
DEVELOPING AN ONTOLOGY OF SPATIAL RELATIONS 173
for the obvious reason that many of its applications are within the field of Geographic Information Systems. What all frameworks do have in common is the alignment differentiation, with vertical and horizontal alignment differences born from the simple fact that gravity is omnipresent on this planet. In the spatial reasoning community, the vertical orientation relations have not been studied very deeply, as the focus is on geographic space which is generally restricted to two dimensional maps.
Our classification differs from the one that Frank (1998) proposed by categorising orientation relations into relative and absolute ones. The resulting relation hierarchy of orientation relations is shown in Figure 7. Note that only examples of the Cardinal direction system and the left-right system are shown for, respectively, absolute and relative reference systems. Other relations and systems are indicated by ellipsis and can easily be added to the conceptual structure as needed.
Figure 7. Lattice defining the relation hierarchy of orientation relations
We will now show with examples from natural spatial language how, by analysing their formal concepts, these three fixed subsumption hierarchies can be combined into an ontology for the domain of natural spatial language.
5. Formal Concept Analysis of Spatial Relations
The conceptual structure of spatial knowledge is assumed to be sufficiently represented by connectivity, orientation and proximity. But their associated hierarchies need to be merged in order to represent the “Meta-Lingua” we are striving for. It is therefore necessary to identify the correct links between these hierarchies in the final relation hierarchy R. In order to achieve this, we analyse some examples of spatial relations, represented by spatial
absolute
horizontal
relative
vertical
up down
left right …North South …
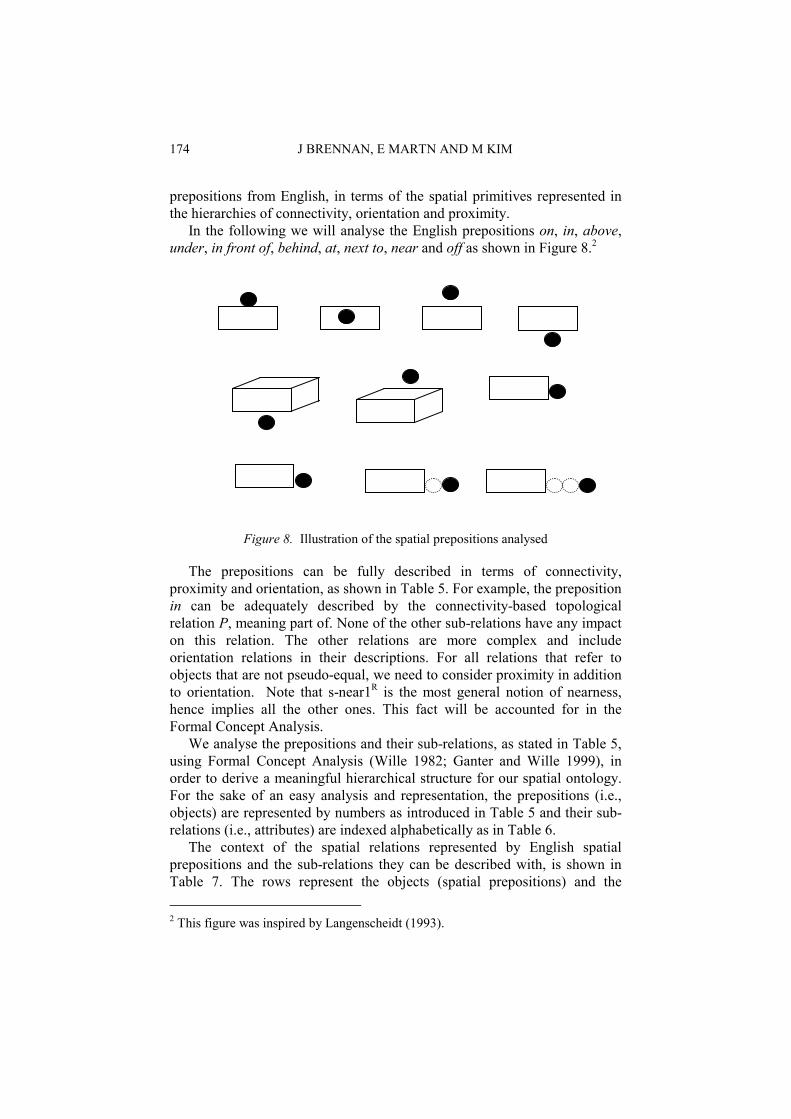
174 J BRENNAN, E MARTN AND M KIM
prepositions from English, in terms of the spatial primitives represented in the hierarchies of connectivity, orientation and proximity. In the following we will analyse the English prepositions on, in, above, under, in front of, behind, at, next to, near and off as shown in Figure 8.2
Figure 8. Illustration of the spatial prepositions analysed
The prepositions can be fully described in terms of connectivity, proximity and orientation, as shown in Table 5. For example, the preposition in can be adequately described by the connectivity-based topological relation P, meaning part of. None of the other sub-relations have any impact on this relation. The other relations are more complex and include orientation relations in their descriptions. For all relations that refer to objects that are not pseudo-equal, we need to consider proximity in addition to orientation. Note that s-near1R is the most general notion of nearness, hence implies all the other ones. This fact will be accounted for in the Formal Concept Analysis.
We analyse the prepositions and their sub-relations, as stated in Table 5, using Formal Concept Analysis (Wille 1982; Ganter and Wille 1999), in order to derive a meaningful hierarchical structure for our spatial ontology. For the sake of an easy analysis and representation, the prepositions (i.e., objects) are represented by numbers as introduced in Table 5 and their sub-relations (i.e., attributes) are indexed alphabetically as in Table 6.
The context of the spatial relations represented by English spatial prepositions and the sub-relations they can be described with, is shown in Table 7. The rows represent the objects (spatial prepositions) and the 2 This figure was inspired by Langenscheidt (1993).
DEVELOPING AN ONTOLOGY OF SPATIAL RELATIONS 175
columns represent the attributes (sub-relations with which the prepositions can be described). The symbol x signifies that the spatial prepositions in the corresponding row can be described (at least in part) with the sub-relation in the corresponding column.
TABLE 5. English prepositions described in terms of connectivity, proximity and orientation relations, i.e., objects
ID Preposition Connectivity Proximity Orientation 1 in P 2 on DC=D vertical, up 3 above DC≠D s-near1R vertical, up 4 under DC≠D s-near1R vertical, down 5 in front of DC≠D s-near1R horizontal, relative, front 6 behind DC≠D s-near1R horizontal, relative, back 7 at DC=D horizontal 8 next to DC≠D s-near4R horizontal 9 near DC≠D s-near1R horizontal
10 off DC≠D ¬Near horizontal
TABLE 6. Alphabetically indexed sub-relations, i.e. attributes
ID Relation ID Relation ID Relation ID Relation a P e up i front m a-near2R b DC=D f down j back n a-near3R c DC≠D g horizontal k s-near1R o s-near4R d vertical h relative l s-near2R p a-near4R q ¬Near
The context of the spatial relations represented by English spatial prepositions and the sub-relations they can be described with, is shown in Table 7. The rows represent the objects (spatial prepositions) and the columns represent the attributes (sub-relations with which the prepositions can be described). The symbol x signifies that the spatial prepositions in the corresponding row can be described (at least in part) with the sub-relation in the corresponding column.
Based on the formulae of Wille (1982), we determine all formal concepts of the context in Table 5. A formal concept is defined as a pair (X,Y) where X is the set of objects and Y is the set of attributes. The set X is called the extent and the set Y is called the intent of the concept (X,Y). Applying this to the context in Table 5, we can see that none of the attributes is applicable to all of the 10 objects as shown in the first line of Table 8. Object 1 is the extent of attribute a and the set of objects 2 and 7 is the extent of attribute b,
176 J BRENNAN, E MARTN AND M KIM
as shown in lines 2 and 3 of Table 8. In order to find all possible extents, intersections are formed from the sets already formulated. For instance, the intersection of the extents of a and b is empty, as can be seen on line 4 in Table 8. Objects 2, 3 and 4 form the extent of attribute d; the intersection of d's extent with the extents of attributes occurring above d in the table, results in extents 2 and 3,4 shown on lines 7 and 8, respectively. Extents are unique, therefore if an extent already exists it is not added a second time. For this reason, attributes l, m and n are not added to the extent formulation, because they have exactly the same extent as attribute k. Using the extents i.e., sets of objects, we can then formulate the intents i.e., sets of attributes, from our context, as shown in the third column of Table 8. Due to their repetition, the attributes k,l,m,n,p are abstracted to one attribute and are denoted by x in the Abstracted Intent column of Table 8.
TABLE 7. Context of spatial relations: spatial prepositions and their attributes
Attributes Objects
a b c d e f g h i j k l m n o p q
1 in x 2 on x x x 3 above x x x x x x x x x 4 under x x x x x x x x x 5 in front of x x x x x x x x x x 6 behind x x x x x x x x x x 7 at x x 8 next to x x x 9 near x x x x x x x x 10 off x x x
From Table 8, we can now draw a concept lattice of the context in
Table 7. This lattice is shown in Figure 9. For drawing the lattice, we use the abstracted intent. The structure of the concept lattice in Figure 9 outlines the possible arrangement of the sub-hierarchies, shown in Figures 2, 6 and 7, within the final relation hierarchy representing our ontology for concepts of physical space. We anticipate that this is possible, because the concept lattice of the FCA provides the implicit and explicit representations of the spatial data, to allow a meaningful and comprehensive interpretation of the information. Our main interest lies in the sub-relations, with which the spatial prepositions can be described, and not with the prepositions themselves. In order to analyse the hierarchical structure of the sub-relations, a lattice, displaying the sub-relations only, is generated as shown in Figure 10. Note

DEVELOPING AN ONTOLOGY OF SPATIAL RELATIONS 177
that more specialised levels in a lattice always inherit the sub-relations from more general levels. We have therefore only added the additional relations to each level or all relations for nodes that would otherwise have been empty, in order to make the lattice more readable.
TABLE 8. Formal concepts from the context in Table 7
Attribute Extent Intent Abstracted Intent
1,2,3,4,5,6,7,8,9,10 a 1 a a b 2,7 b b a,b,c,d,e,f,g,h,i,j,k,l,m,n,o,p,q c 3,4,5,6,8,9,10 c c d 2,3,4 d d 2 b,d,e b,d,e 3,4 c,d,k,l,m,n,o,p c,d,o,x e 2,3 d,e d,e 3 c,d,e,k,l,m,n,o,p c,d,e,o,x f 4 c,d,f,k,l,m,n,o,p c,d,f,o,x g 5,6,7,8,9,10 g g 7 b,g b,g 5,6,8,9,10 c,g c,g
h 5,6 c,g,h,k,l,m,n,o,p c,g,h,o,x i 5 c,g,h,i,k,l,m,n,o,p c,g,h,i,o,x j 6 c,g,h,j,k,l,m,n,o,p c,g,h,j,o,x k 3,4,5,6,9 c,k,l,m,n,o,p c,o,x 5,6,9 c,g,k,l,m,n,o,p c,g,o,x
o 3,4,5,6,8,9 c,o c,o 5,6,8,9 c,g,o c,g,o
q 10 c,g,q c,g,q
6. A Relation Hierarchy of Spatial Relations
As expected, the proximity relations are always a refinement3 of the topological relation DC≠D. The final relation type hierarchy of spatial relations therefore has the relation hierarchy of proximity relations from Figure 6 as a refinement of DC≠D. Orientation is a refinement of both connectivity and proximity. These relations between the subsumption hierarchies of connectivity, proximity and orientation are shown in 3 A relation R is a refinement of a relation S if R is a subset of S.

178 J BRENNAN, E MARTN AND M KIM
Figure 11. The resulting hierarchy is refined further by the relation hierarchy R.
T
T
(1,a) (2,7,b) (5,6,7,8,9,10,g) (3,4,5,6,8,9,10,c)
(5,6,8,9,10,c,g) (3,4,5,6,8,9,c,o)
(5,6,8,9,c,g,o)
(5,6,9,c,g,o,x)
(5,6,c,g,o,h,x)(7,b,g)
(5,c,g,o,h,i,x)(4,c,d,f,o,x)
(3,4,5,6,9,c,o,x)
(3,4,c,d,o,x)
(3,c,d,e,o,x)(7,b,g)(7,b,g)
(2,b,d,e)(10,c,g,q)
(2,3,4,d)
(2,3,d,e)
(6,c,g,o,h,j,x)
Figure 9. Concept lattice of the context in Table 7
DC =D
DC=D
T
T
horizontal
,horizontal=DDC
,horinzontalDC=D
s−near4
=DDC Pvertical
x
relative
back front
x
vertical
up
up
down
,vertical,up
s−near4 R
~Near
Figure 10. Sub-relation lattice where both occurrences of x stand for s-near1R, s-
near2R, a-near2R, a-near3R and a-near4R. More specialised levels in a lattice always inherit the sub-relations from more general levels. Therefore only the additional
relations are added to each level or all relations for nodes that would otherwise have been empty.
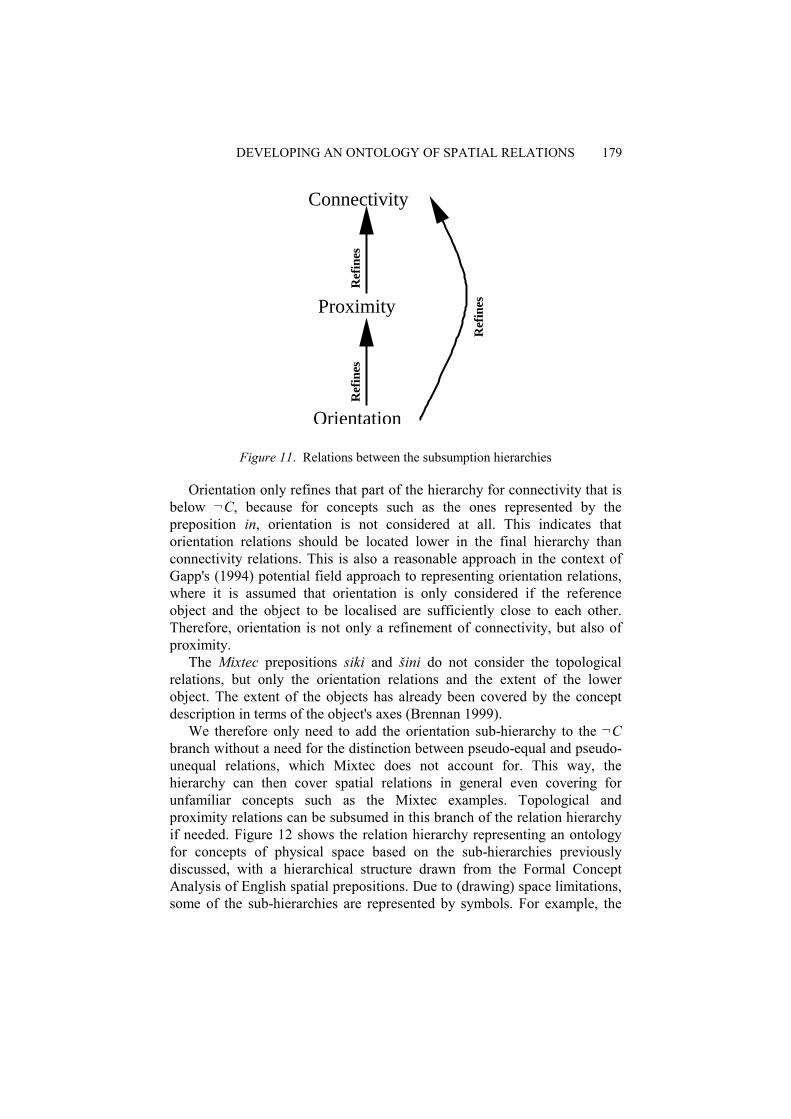
DEVELOPING AN ONTOLOGY OF SPATIAL RELATIONS 179
Proximity
Connectivity
Orientation
Ref
ines
Ref
ines
Ref
ines
Figure 11. Relations between the subsumption hierarchies
Orientation only refines that part of the hierarchy for connectivity that is below ¬C, because for concepts such as the ones represented by the preposition in, orientation is not considered at all. This indicates that orientation relations should be located lower in the final hierarchy than connectivity relations. This is also a reasonable approach in the context of Gapp's (1994) potential field approach to representing orientation relations, where it is assumed that orientation is only considered if the reference object and the object to be localised are sufficiently close to each other. Therefore, orientation is not only a refinement of connectivity, but also of proximity.
The Mixtec prepositions siki and šini do not consider the topological relations, but only the orientation relations and the extent of the lower object. The extent of the objects has already been covered by the concept description in terms of the object's axes (Brennan 1999).
We therefore only need to add the orientation sub-hierarchy to the ¬C branch without a need for the distinction between pseudo-equal and pseudo-unequal relations, which Mixtec does not account for. This way, the hierarchy can then cover spatial relations in general even covering for unfamiliar concepts such as the Mixtec examples. Topological and proximity relations can be subsumed in this branch of the relation hierarchy if needed. Figure 12 shows the relation hierarchy representing an ontology for concepts of physical space based on the sub-hierarchies previously discussed, with a hierarchical structure drawn from the Formal Concept Analysis of English spatial prepositions. Due to (drawing) space limitations, some of the sub-hierarchies are represented by symbols. For example, the
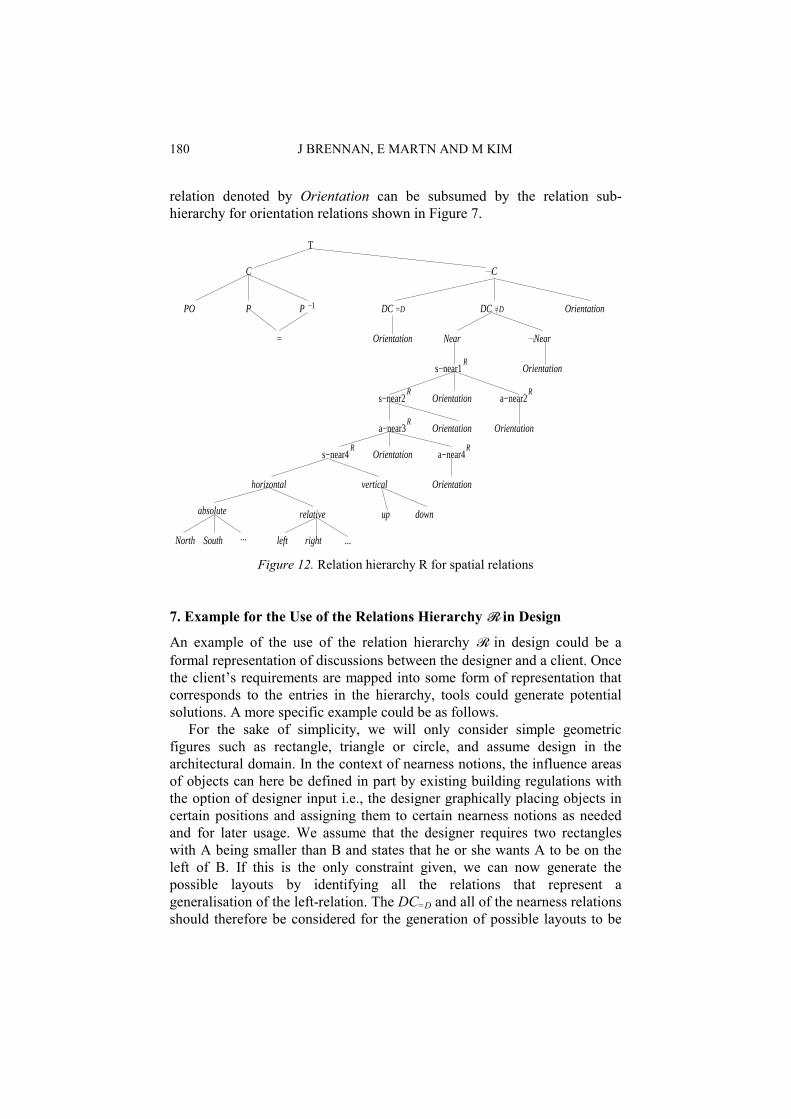
180 J BRENNAN, E MARTN AND M KIM
relation denoted by Orientation can be subsumed by the relation sub-hierarchy for orientation relations shown in Figure 7.
T
s−near2
s−near1
a−near2
a−near3
s−near4 a−near4
... ...
=
−1
horizontal
relative
left right
vertical
up down
Orientation
Orientation
Orientation Orientation
Orientation
Near Near
Orientation
C
DC =D DC
C
PO P P
Orientation
Orientation
North South
absolute
R
R
R
RR
R
=D
Figure 12. Relation hierarchy R for spatial relations
7. Example for the Use of the Relations Hierarchy R in Design
An example of the use of the relation hierarchy R in design could be a formal representation of discussions between the designer and a client. Once the client’s requirements are mapped into some form of representation that corresponds to the entries in the hierarchy, tools could generate potential solutions. A more specific example could be as follows.
For the sake of simplicity, we will only consider simple geometric figures such as rectangle, triangle or circle, and assume design in the architectural domain. In the context of nearness notions, the influence areas of objects can here be defined in part by existing building regulations with the option of designer input i.e., the designer graphically placing objects in certain positions and assigning them to certain nearness notions as needed and for later usage. We assume that the designer requires two rectangles with A being smaller than B and states that he or she wants A to be on the left of B. If this is the only constraint given, we can now generate the possible layouts by identifying all the relations that represent a generalisation of the left-relation. The DC=D and all of the nearness relations should therefore be considered for the generation of possible layouts to be
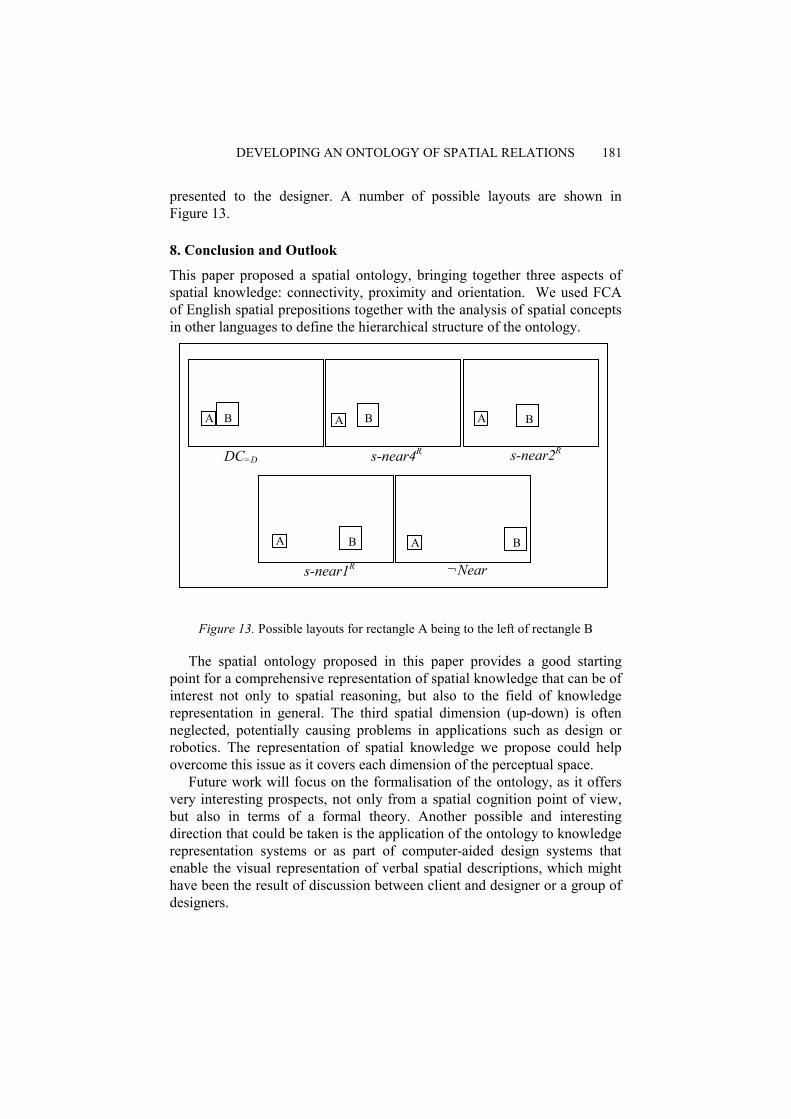
DEVELOPING AN ONTOLOGY OF SPATIAL RELATIONS 181
presented to the designer. A number of possible layouts are shown in Figure 13.
8. Conclusion and Outlook
This paper proposed a spatial ontology, bringing together three aspects of spatial knowledge: connectivity, proximity and orientation. We used FCA of English spatial prepositions together with the analysis of spatial concepts in other languages to define the hierarchical structure of the ontology.
Figure 13. Possible layouts for rectangle A being to the left of rectangle B
The spatial ontology proposed in this paper provides a good starting point for a comprehensive representation of spatial knowledge that can be of interest not only to spatial reasoning, but also to the field of knowledge representation in general. The third spatial dimension (up-down) is often neglected, potentially causing problems in applications such as design or robotics. The representation of spatial knowledge we propose could help overcome this issue as it covers each dimension of the perceptual space. Future work will focus on the formalisation of the ontology, as it offers very interesting prospects, not only from a spatial cognition point of view, but also in terms of a formal theory. Another possible and interesting direction that could be taken is the application of the ontology to knowledge representation systems or as part of computer-aided design systems that enable the visual representation of verbal spatial descriptions, which might have been the result of discussion between client and designer or a group of designers.
B A
A A
A A
B
B B
DC=D s-near4R s-near2R
s-near1R ¬Near
B

182 J BRENNAN, E MARTN AND M KIM
Acknowledgements We would like to thank the reviewers of the paper and members of the Creativity and Cognition Studios at the University of Technology, Sydney for their valuable comments.
References
Brennan, J: 1999, Spatial universals as the human spatial notion, in WM Tepfenhart, W Cyre (eds), Conceptual Structures: Standards and Practises, Lecture Notes in Artificial Intelligence, Springer-Verlag, Berlin, pp. 90-96.
Brennan, J and Martin, E: 2003, A theory of proximity relations, UNSW Technical Report - TR0322.
Chandrasekaran, B: 1999, Multimodal perceptual representations and design problem solving, invited paper, in JS Gero and B Tversky (eds), Visual and Spatial Reasoning in Design, Key Centre of Design Computing and Cognition, University of Sydney, pp. 3-14.
Frank, AU: 1998, Formal Models for Cognition - Taxonomy of Spatial Location Description and Frames of Reference, Lecture notes in computer science, 1404, Springer, Berlin.
Ganter, B and Wille, R: 1999, Formal Concept Analysis - Mathematical Foundations, Springer Verlag, Berlin.
Gapp, K-P: 1994, Basic meanings of spatial relations: Computation and evaluation in 3D space, National Conference on Artificial Intelligence, pp. 1393-1398.
Goel, V: 1995, Sketches of Thought, MIT Press, Cambridge, MA. Gärdenfors, P and Williams, M-A: 2001, Reasoning about categories in computational
spaces, Proceedings of the Seventeenth International Joint Conference on Artificial Intelligence, Morgan Kaufmann, pp. 385--392.
Hernández, D: 1994, Qualitative Representation of Spatial Knowledge, Number 804 in Lecture Notes in Artificial Intelligence, Springer-Verlag, Berlin, Heidelberg.
Langenscheidt-Redaktion (ed): 1993, Englische Präapositionen - Bedeutung und korrekter Gebrauch der englischen Verhältniswörter, Langenscheidt.
Nicoletti, MC and Brennan, J: 2002, Learning spatial relations using an inductive logic programming system, Computing and Informatics (formerly: Computers and Artificial Intelligence) 21(1):17-36.
Randell, DA, Cui, Z and Cohn, AG: 1992, A spatial logic based on regions and connection, Proc. 3rd Int. Conf. on Knowledge Representation and Reasoning, Morgan Kaufmann, San Mateo, pp. 165-176.
Regier, T: 1996, The Human Semantic Potential - Spatial Language and Constrained Connectionism, A Bradford Book, The MIT Press, Cambridge.
Sears, FW, Zemansky, MW, Young and Freedman: 2000, University Physics with Modern Physics, Addison-Wesley.
Sowa, JF: 2000, Knowledge Representation: Logical, Philosophical, and Computational Foundations, Brooks Cole.
Talmy, L: 1983, Spatial Orientation - Theory, Research, and Application, How language structures space, Plenum Press, New York and London.
Vakarelov, D, Dimov, G, Düntsch, I and Bennett, B.: 2002, A proximity approach to some region-based theories of space, Journal of Applied Non-Classical Logics, 12.
Wille, R: 1982, Restructuring lattice theory: An approach based on hierarchies of concepts, in I Rival (ed), Ordered Sets, Reidel, pp. 445-470.
Worboys, MF: 2001, Nearness relations in environmental space, International Journal of Geographical Information Science 15(7):633-651.
JS Gero, B Tversky and T Knight (eds), Visual and Spatial Reasoning in Design III, 2004 Key Centre of Design Computing and Cognition, University of Sydney, pp 183-196
SPATIAL MOTIFS IN DESIGN
JANICE GLASGOW Queen's University, Canada
SUSAN L EPSTEIN The City University of New York, USA
and
NATHALIE MEURICE, ANDY BECUE AND DANIEL P VERCAUTEREN Facultés Universitaires Notre-Dame de la Paix Namur, Belgium
Abstract. Spatial design problems are rarely solved solely from first principles. Rather, previous designs or portions of designs are reused for novel problems. An important attribute of any computational approach to spatial design reuse is the ability to represent, abstract, transform and combine spatial patterns or motifs. This paper considers the issues and some possible solutions for reasoning with motifs. It also demonstrates how motifs can be applied in two diverse problem domains: park design and drug design.
1. Introduction
Rarely to people begin from first principles when contemplating a new design problem. On every scale, from cities to molecules, we reuse designs. Spatial design reuse involves the ability to abstract, transform and reassemble spatial motifs to address the goals of a new problem. A spatial motif can be defined as an abstraction over a set of recurring patterns observed in a dataset; it captures essential features shared by similar or related objects. In many problem domains, including design, there exist special regularities that permit motif abstraction and reuse. Such regularities may also exist across domains. Consider the spiral motif, one that occurs often in nature in forms such as hurricanes, seashells and alpha helices, Figure 1(a). This motif has also be incorporated in architectural design, Figure 1(b).

184 J GLASGOW ET AL
Figure 1. Examples of the spiral motif occurring in: (a) nature, in the form of an
alpha helix in a protein structure, and in (b) architectural design, in the form of a six story spiral ramp in the Guggenheim museum
Issues that need to be considered when applying motifs in a computational approach to design include:
• How are designs and motifs represented and transformed;
• How can motifs be abstracted from existing designs; and
• How are motifs combined to solve new problems.
Figure 2(a) illustrates the notion of motif representation and abstraction for a musical passage. The motif is represented as a two-dimensional graph that captures the order, relative pitch and duration of the notes in each of the passages. It does not preserve the precise pitch, thus several different passages can be abstracted to the same motif. Once a motif is abstracted it can be transformed then re-specified. In Figure 2(b) we abstract a motif from an initial passage, transform this through an inversion operation applied to the graph then re-specify the motif as the new inverted passage.
In the remainder of the paper we explore in more detail the above issues involved in applying spatial motifs to design and some existing computational techniques that can be used to address them. We also demonstrate how using motifs can assist in two diverse problem domains: park design and drug design.
2. Motifs in Design
This section examines in more detail the issues of motif representation, abstraction and application to design problems. We do not attempt to propose universal solutions; rather, we present possible approaches for addressing the challenges of applying motifs in spatial design.
2.1. REPRESENTATION AND TRANSFORMATION OF SPATIAL MOTIFS
The first question that must be addressed when considering a representation for spatial motifs is: What spatial relations need to be preserved in the repre-
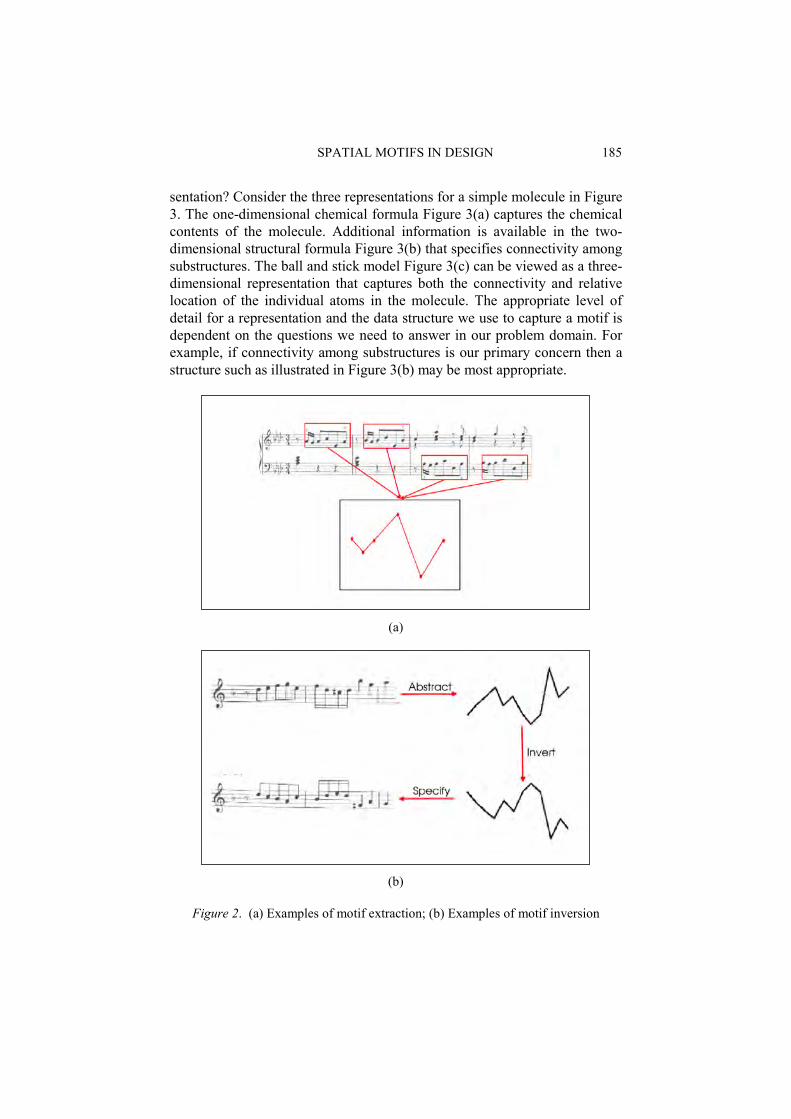
SPATIAL MOTIFS IN DESIGN 185
sentation? Consider the three representations for a simple molecule in Figure 3. The one-dimensional chemical formula Figure 3(a) captures the chemical contents of the molecule. Additional information is available in the two-dimensional structural formula Figure 3(b) that specifies connectivity among substructures. The ball and stick model Figure 3(c) can be viewed as a three-dimensional representation that captures both the connectivity and relative location of the individual atoms in the molecule. The appropriate level of detail for a representation and the data structure we use to capture a motif is dependent on the questions we need to answer in our problem domain. For example, if connectivity among substructures is our primary concern then a structure such as illustrated in Figure 3(b) may be most appropriate.
(a)
(b)
Figure 2. (a) Examples of motif extraction; (b) Examples of motif inversion

186 J GLASGOW ET AL
Figure 3. Alternative representations for a molecular structure
2.1. REPRESENTATION AND TRANSFORMATION OF SPATIAL MOTIFS
In terms of computation, it is not only important what features are to be extracted from the representation but also what transformations need to be applied in order to solve new design problems. Certainly a design and/or a motif can be captured and implemented in many forms: a logical description, a multidimensional graph, a symbolic array that preserves spatial locations, etc. However, it can be argued that a representation that explicitly preserves relevant spatial properties may be preferable in terms of criteria such as programming ease, efficiency and inferential adequacy (Glasgow 1993).
One approach to representing spatial objects and motifs that can be applied to design problems is computational imagery (Glasgow and Papadias 1992). This knowledge representation scheme, based on theories of mental imagery and model based reasoning, incorporates three representations: spatial, visual and descriptive, each appropriate for a different kind of processing. It also includes a set of primitive functions defined to generate, transform and inspect image representations. For example, we can apply computational imagery to the blocks world to represent designs and motifs as multidimensional arrays and use the primitive operations, such as “move object” to transform a scene, see Figure 4. Other image transformations include ones to resize parts of an image or motif, rotate a part and focus on details of a given part.
A representation may also be hierarchical in the sense that design may progress at different levels of complexity. As we will see in the park design application, initially we consider high level motifs (i.e., consisting of the main components of a park). Once the design is completed at this level, we then consider motifs for the lower level objects, such as play area, parking lot, etc. This is also true in the case of drug design where we consider representations of varying resolution and complexity. Abstracting and re-specifying objects in a design requires the representation of a conceptual

SPATIAL MOTIFS IN DESIGN 187
hierarchy for objects in the domain. Take the problem of interior design. Figure 5 illustrates a conceptual hierarchy for possible furniture, where the leaves of the tree correspond to real objects which can be generalized and re-specified during motif abstraction and specification.
Figure 4. Application of a ''move object c'' transformation represented using arrays
Figure 5. Conceptual hierarchy for objects in a design
188 J GLASGOW ET AL
2.2. MOTIF ABSTRACTION
Motifs may be designed by hand, based on expert knowledge. This is feasible when there are a limited number of previous, relevant designs to work from, as may be the case in a park design. In domains where motifs are extracted from a large experience base of designs, such as in drug design, automated knowledge discovery may be more appropriate. Knowledge discovery has been defined as “the nontrivial process of identifying valid, novel, potentially useful and ultimately understandable patterns in data” (Fayyad et al. 1996). Generally, the automated discovery process is interactive and iterative, and can be broken into several steps (Brachman and Anand 1996): understanding of domain; creating a large data set; data cleaning and preprocessing; finding useful features to represent the data; data mining representation to search for patterns of interest; and interpreting and consolidating discovered patterns.
Many approaches to knowledge discovery and data mining have been proposed in the literature. However, most of these systems rely on an object representation that is expressed as a list of attribute value pairs. Such a repre-sentation is not generally suitable for a spatial domain, where the most salient features of a design are the relationships among its parts. One method that has been developed for the discovery of spatial motifs is IMEM (Conklin et al. 1996). This conceptual clustering approach was specifically developed for the representation and classification of objects or scenes in terms of their parts and the relationships among these parts. These relationships may be topological (connectivity, proximity, nestedness) or spatial (direction, relative location, symmetry).
2.3. MOTIF COMPOSITION
Once motifs have been abstracted from previous designs, it is often necessary to reassemble them in novel configurations to address the goals of the new problem. One approach to this is by applying constraints that specify both preferred and prohibited configurations, as we will see in the park design domain. Heuristic search and/or constraint satisfaction techniques can be applied to find possible new designs. Once motifs have been configured then they can be specified to correspond to individual objects.
3. Applications
Following we present two applications, where motifs are used in the computational design of parks and of drugs. In both cases, previous designs are used to extract design patterns that can be reused in novel designs.

SPATIAL MOTIFS IN DESIGN 189
3.1. PARK DESIGN
The two-dimensional layout design for parks involves positioning a set of objects within a pre-specified outline (design frame) to meet a set of restrictions (criteria) (Epstein 1998; 2001). The purpose of a design frame is to anchor the design in a context. It distinguishes between the site, where the objects are to be placed, and the periphery, the site's border. A design frame includes relevant preexisting objects, such as utility connections, transportation access, and bodies of water.
An example of a design frame and a set of objects to be placed within it appears in Figure 6. The initial construction of a design frame may result from an abstraction over one or more previous designs. At the initial stage of design, the objects are abstract entities that are spatially configured to adhere to the given restrictions.
3.1.1. Representation There are two kinds of criteria in a two-dimensional layout design problem: constraints, which must be satisfied, and principles, which are not required but are important in some unspecified combination. In every design problem, there is a constraint that prohibits any two objects from overlapping (e.g., no bench in a road). Other constraints describe each object as a set of property values that vary in degree of specificity and flexibility. A tennis court, for example, should have fixed dimensions, while a picnic area could vary more. Additional constraints may state how an object relates to the design frame (e.g., within 30 feet of the western boundary) or to another object (e.g., the tennis courts should be far from the pond). Other constraints describe the nature of the design frame (e.g., soil quality, slope, drainage) which could prevent the location of particular objects (e.g., no uphill tennis, no grass on claylike soil). Principles, in contrast, are sensible or aesthetically desirable features (e.g., restrooms near the playground or a building with a good view of the pond, a picnic ground that is not too steep).
A solution to a two-dimensional layout design problem anchors all the objects and satisfies all the constraints. To anchor an object, one must assign it fixed dimensions, a shape, a location, and an orientation. This corresponds to our notion of specifying a motif. Typically there are many solutions to such a problem; it is the multiple, vague goal tests (as embodied in principles) that make such problems particularly difficult (Goel and Pirolli 1992). Although designers speak of solutions that are “better” or “worse”, design is a search for a high quality solution, not an optimal one (Goel and Pirolli 1992). The quality of a solution in two dimensional layout design is measured by how well a solution serves all the tasks' principles. Because design is so difficult, human designers are taught to work with varying levels of detail, beginning with functionally specific use areas. Individual objects
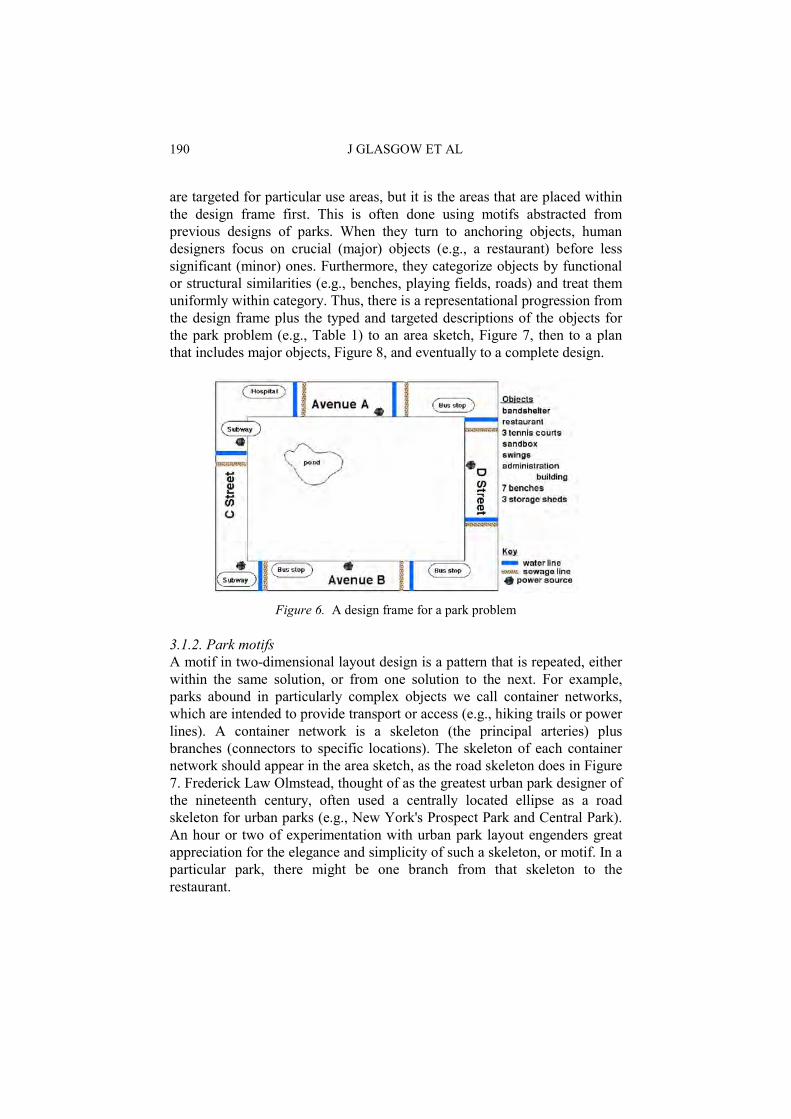
190 J GLASGOW ET AL
are targeted for particular use areas, but it is the areas that are placed within the design frame first. This is often done using motifs abstracted from previous designs of parks. When they turn to anchoring objects, human designers focus on crucial (major) objects (e.g., a restaurant) before less significant (minor) ones. Furthermore, they categorize objects by functional or structural similarities (e.g., benches, playing fields, roads) and treat them uniformly within category. Thus, there is a representational progression from the design frame plus the typed and targeted descriptions of the objects for the park problem (e.g., Table 1) to an area sketch, Figure 7, then to a plan that includes major objects, Figure 8, and eventually to a complete design.
Figure 6. A design frame for a park problem
3.1.2. Park motifs A motif in two-dimensional layout design is a pattern that is repeated, either within the same solution, or from one solution to the next. For example, parks abound in particularly complex objects we call container networks, which are intended to provide transport or access (e.g., hiking trails or power lines). A container network is a skeleton (the principal arteries) plus branches (connectors to specific locations). The skeleton of each container network should appear in the area sketch, as the road skeleton does in Figure 7. Frederick Law Olmstead, thought of as the greatest urban park designer of the nineteenth century, often used a centrally located ellipse as a road skeleton for urban parks (e.g., New York's Prospect Park and Central Park). An hour or two of experimentation with urban park layout engenders great appreciation for the elegance and simplicity of such a skeleton, or motif. In a particular park, there might be one branch from that skeleton to the restaurant.
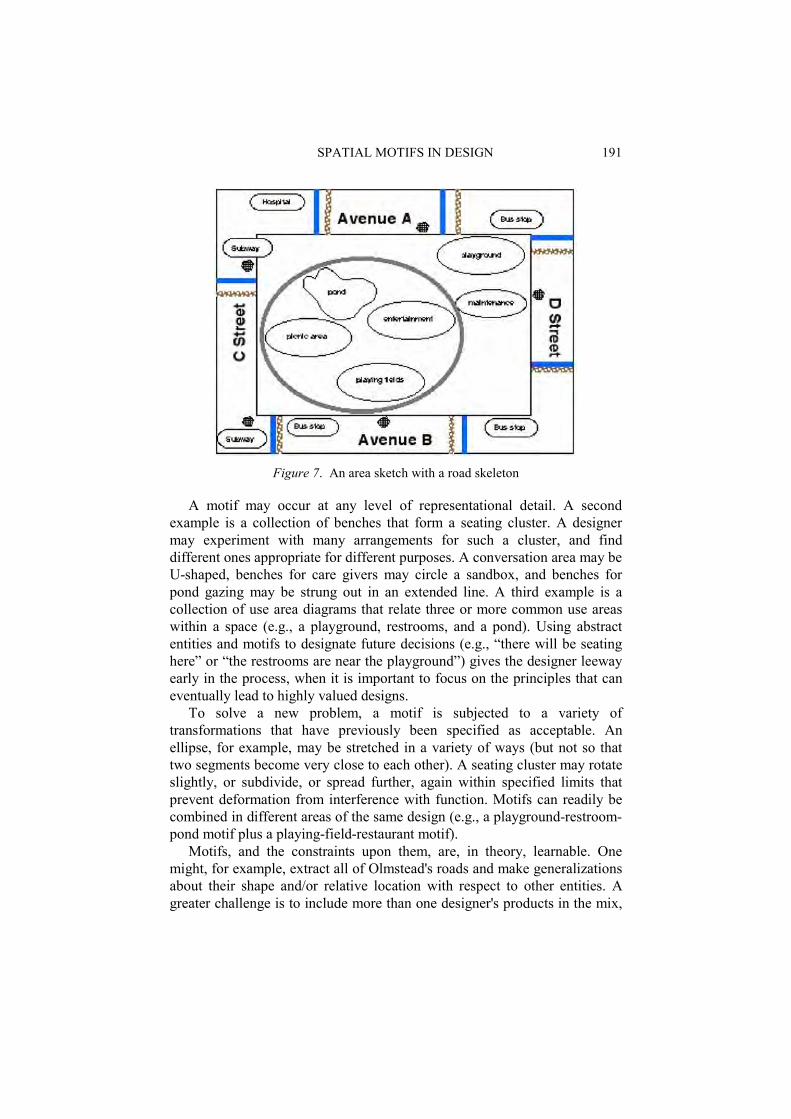
SPATIAL MOTIFS IN DESIGN 191
Figure 7. An area sketch with a road skeleton
A motif may occur at any level of representational detail. A second example is a collection of benches that form a seating cluster. A designer may experiment with many arrangements for such a cluster, and find different ones appropriate for different purposes. A conversation area may be U-shaped, benches for care givers may circle a sandbox, and benches for pond gazing may be strung out in an extended line. A third example is a collection of use area diagrams that relate three or more common use areas within a space (e.g., a playground, restrooms, and a pond). Using abstract entities and motifs to designate future decisions (e.g., “there will be seating here” or “the restrooms are near the playground”) gives the designer leeway early in the process, when it is important to focus on the principles that can eventually lead to highly valued designs.
To solve a new problem, a motif is subjected to a variety of transformations that have previously been specified as acceptable. An ellipse, for example, may be stretched in a variety of ways (but not so that two segments become very close to each other). A seating cluster may rotate slightly, or subdivide, or spread further, again within specified limits that prevent deformation from interference with function. Motifs can readily be combined in different areas of the same design (e.g., a playground-restroom-pond motif plus a playing-field-restaurant motif).
Motifs, and the constraints upon them, are, in theory, learnable. One might, for example, extract all of Olmstead's roads and make generalizations about their shape and/or relative location with respect to other entities. A greater challenge is to include more than one designer's products in the mix,
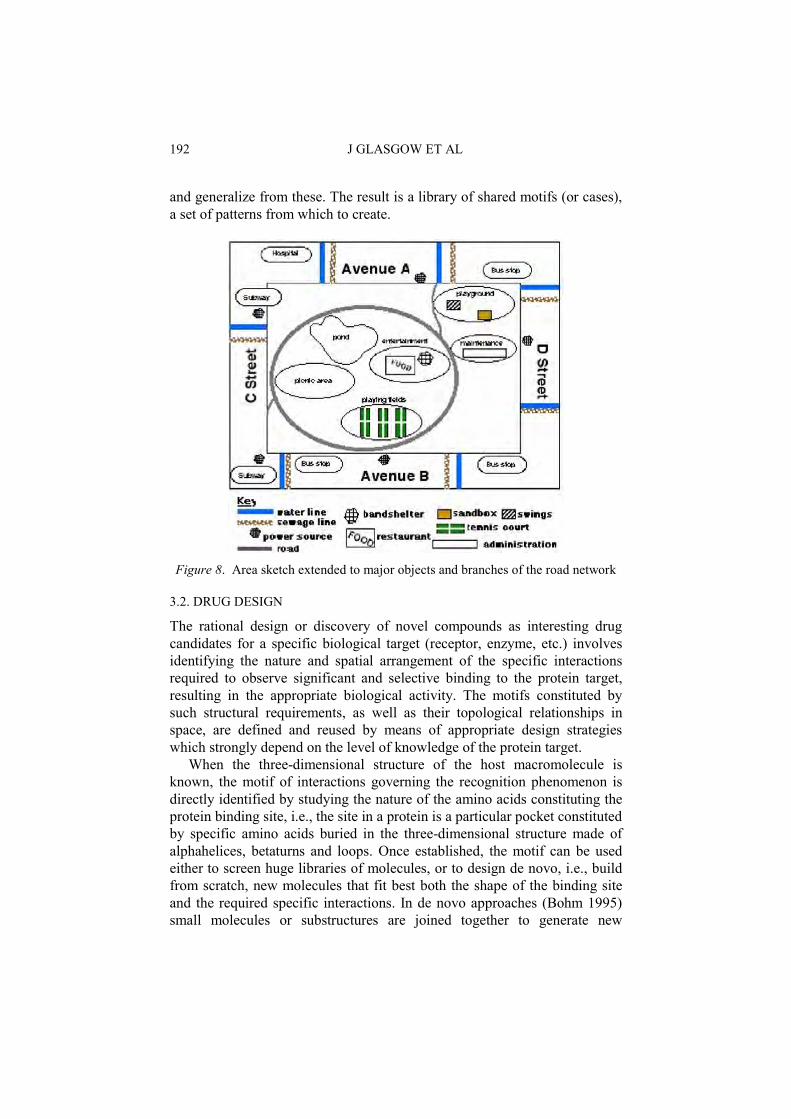
192 J GLASGOW ET AL
and generalize from these. The result is a library of shared motifs (or cases), a set of patterns from which to create.
Figure 8. Area sketch extended to major objects and branches of the road network
3.2. DRUG DESIGN
The rational design or discovery of novel compounds as interesting drug candidates for a specific biological target (receptor, enzyme, etc.) involves identifying the nature and spatial arrangement of the specific interactions required to observe significant and selective binding to the protein target, resulting in the appropriate biological activity. The motifs constituted by such structural requirements, as well as their topological relationships in space, are defined and reused by means of appropriate design strategies which strongly depend on the level of knowledge of the protein target.
When the three-dimensional structure of the host macromolecule is known, the motif of interactions governing the recognition phenomenon is directly identified by studying the nature of the amino acids constituting the protein binding site, i.e., the site in a protein is a particular pocket constituted by specific amino acids buried in the three-dimensional structure made of alphahelices, betaturns and loops. Once established, the motif can be used either to screen huge libraries of molecules, or to design de novo, i.e., build from scratch, new molecules that fit best both the shape of the binding site and the required specific interactions. In de novo approaches (Bohm 1995) small molecules or substructures are joined together to generate new
SPATIAL MOTIFS IN DESIGN 193
structures. There are two major strategies for fragment joining. First, several fragments are positioned in the binding site in such a way to fit the motif of required specific interactions, and then search for an existing molecule that connects the fragments into one molecule. Alternatively, you can start with a first element of the motif, Place a first fragment, and append additional ones in a step-by-step procedure. The second procedure tends to generate more flexible structures and allows the inclusion of chemical information such as synthetic feasibility.
In the difficult but common case where the three-dimensional structure of the protein is not available, as for trans-membrane receptors, the direct study of the binding sites is not possible, and as a consequence, the evaluation of molecular similarity among a selected set of molecules (also called ligands) binding to the same protein target remains essential (Kuntz 1992). Such comparative approaches usually lead to models called “pharmacophore models” obtained by the best superimposition of substructures of the molecules (Wermuth and Langer 1993). These models, grouping the structural (and electronic) elements required for binding, as well as their spatial topology, can further be used to search for new drug candidates through database screening. The variety of chemical or pharmacological families, the number of ligands to consider in such comparisons, their flexibility, as well as their structural diversity however present severe difficulties that turn the superimposition process into a real challenge.
On one hand, for efficiency most existing molecular alignment methods are often specifically designed for a given family of pharmacological molecules, and are therefore rarely readily adapted to another pharmacological problem. On the other hand, such an approach is classically based on both the use of the nature and coordinates of the atoms constituting the molecules, as well as on several three-dimensional physicochemical properties computed at an atomic level of resolution. The methods consequently fail to properly align compounds presenting similar binding abilities and pharmacological activities, but that are structurally significantly different, i.e., constituted of very different chemical substructures, also called functions.
3.2.1. Representation Approaches based on reduced representations describing the molecules at a chemical function resolution level (medium scale) rather than at an atomic resolution level (atomic scale), are particularly appropriate and powerful. They avoid the limitations described above and support the development of portable methods that can be applied to any set of biopharmacological molecules. More particularly, pharmacological ligands can be described by reduced representations based on the topological properties of their electron

194 J GLASGOW ET AL
density, which gives the most accurate information on the stereoelectronic properties of the molecules. For example, in Figure 9, the three-dimensional structure of a given molecule is represented by its electron density (envelopes in middle images) at atomic level (upper part) and medium level (lower part). At atomic scale, the electron density envelopes correspond exactly to the atom positions, at medium scale, the three-dimensional structure is transformed into a more fuzzy representation, which interestingly can be further transformed, by topological analysis to an even more reduced representations constituted by selected relevant points of the electron density, called critical points, which still contain all the important stereoelectronic characteristics. In the bottom right part of Figure 9, one sees that the three critical points at medium scale are sufficient to describe the functional groups of the molecules, e.g., the chlorine atom (bottom), the phenyl ring (middle) and the carboxylic acid moiety (top).
Figure 9. Views of the electron density (isosurfaces) and the corresponding reduced representations (spheres) of 4chlorophenylacetic acid at atomic and medium levels
of resolution
3.2.2. Molecular Motifs By assigning the critical points to the centre of the closest chemical function, any pharmacological molecule can thus be expressed in terms of a critical points pattern. Such critical points motifs can further be used either to design databases of descriptors directly correlated to the most common functions encountered in medicinal chemistry (Binamé et al. 2004), or to search for similarities among structurally dissimilar ligands. For example, Vercauteren and coworkers have shown that the critical points patterns describing molecules of interest may be superimposed (Meurice et al. 1998; Leherte et al. 2000; Meurice et al. 1994); the resulting critical points alignments directly point out the matching chemical functions and can be easily interpreted in terms of molecular overlays leading to pharmacophore models.
SPATIAL MOTIFS IN DESIGN 195
Another advantage of critical point motif representation is the considerable reduction of the amount of data to handle. This occurs without loss of significant information. For this reason, such patterns are also useful in molecular complementarity applications and in particular for describing complex macro molecular systems such as proteins and DNA strings. At medium scale, it has been shown that the substructures of the proteins, as the alphahelices represented in Figure 1(a), and the subparts of the DNA strings, as the sugars or base pairs, can be simplified to critical points motifs preserving the global three-dimensional topology as well as the stereoelectronic characteristics of the interacting partners (Becue et al. 2003). Such obtained motifs have been usefully implemented in an original docking tool to perform complementarity studies between two or three macromolecular systems (Becue et al. 2004). By designing such approaches, one will certainly help understanding how biomolecules, such as proteins and DNA strings, interact and recognize themselves, which is of major importance nowadays. In deed, DNA and proteins are more and more considered as potential targets in biotechnology for the development of new efficient therapeutic agents.
4. Discussion
It is apparent that there is value in the reuse of old designs when considering a novel spatial design problem. To get value out of these involves abstracting patterns or motifs from the previous designs, which can then be transformed and reapplied to address the constraints of a novel problem. We have discussed some of the approaches for the representation of spatial motifs and designs, along with computational techniques for abstracting, transforming, combining and specifying motifs. Two diverse applications were considered, drug design and park design, that benefit from the use of design motifs.
We can conclude that a motif is an experience rich, knowledge rich reusable design segment. Some representation of a motif within a design engenders to coherence and harmony; too much may make the design non-unique and/or boring. Expert human designers typically have a vocabulary of design motifs, ones that can be reused in multiple projects. Future work in the area involves the incorporation of such expert knowledge as well as the development of automated techniques for extracting useful design motifs.
Acknowledgements Funding for this research has been provided by the Natural Science and Engineering Research Council of Canada, the Institute for Robotics and Intelligent Systems (Canada), National Science Foundation (USA) IIS0328743, PSC CUNY, and the National Foundation for Scientific Research (Belgium).
196 J GLASGOW ET AL
References Becue, A, Meurice, N, Leherte, L, and Vercauteren, DP: 2003, Description of proteindna
complexes in terms of electron density topological features, Acta Crystallographica, D59: 2150-2162.
Becue, A, Meurice, N, Leherte, L, and Vercauteren, DP: 2004, Evaluation of the protein solvent accessible surface using reduced representations in terms of critical points of the electron density, Journal of Computational Chemistry, submitted.
Binam'e, J, Meurice, N, Leherte, L, and Vercauteren DP: 2004, Use of electron density critical points as chemical functionbased reduced representations of pharmacological ligands, Journal of Chemical Information and Computer Science, accepted.
Bohm, HJ: 1995, Site directed structure generation by fragment joining, Perspectives in Drug Discovery and Design 3: 21-33.
Brachman, RJ and Anand, T: 1996, The process of knowledge discovery in databases, in UM Fayyad, G Piatetsky Shapiro, P Smyth, and R Uthurusamy (eds), Advances in Knowledge Discovery and Data Mining, AAAI Press/The MIT Press, pp. 37-57.
Conklin, D, Fortier, S, Glasgow, JI, and Allen, FH: 1996, Conformational analysis from crystallographic data using conceptual clustering, Acta Crystallographica, B52: 535-549.
Epstein, SL: 1998, Toward design as collaboration, Proceeding of Fifteenth National Conference on Artificial Intelligence, AAAI Press.
Epstein, SL: 2001, Toward autonomous layout design an AI approach, in JS Gero, B Tversky and T Purcell, Visual and Spatial Reasoning in Design II, Key Centre of Design Computing and Cognition, Univeristy of Sydney, pp. 325-344.
Fayyad, UM, Piatetsky Shapiro, G and Smyth, P: 1996, From data mining to knowledge discovery: An overview, in UM Fayyad, G Piatetsky Shapiro, P Smyth, and R Uthurusamy (eds), Advances in Knowledge Discovery and Data Mining, AAAI Press/The MIT Press, pp. 1-34.
Glasgow, JI: 1993, The imagery debate revisited: A computational perspective, Computational Intelligence 9(4): 309-333.
Glasgow, JI and Papadias, D: 1992, Computational imagery, Cognitive Science 16(3):355-394.
Goel, V and Pirolli, P: 1992, The structure of design problem spaces, Cognitive Science 16: 395-429.
Kuntz, ID: 1992, Structure-based strategies for drug design and discovery, Science 257: 1078-1082.
Leherte, L, Meurice, N and Vercauteren, DP: 2000, Critical point representations of electron density maps for the comparison of benzodiazepine-type ligands, Journal of Chemical Information and Computer Science 40: 816-- 832.
Meurice, N, Leherte, L and Vercauteren, DP: 1998, Comparison of benzodiazepine-like compounds using topological analysis and genetic algorithms, SAR and QSAR in Environmental Research 8: 195--232.
Meurice, N, Rohrer, DC, Maggiora, GM and Vercauteren, DP: 1994, Molecular field and electron density-based comparative matching of benzodiazepine-like compounds, Journal of Computer Aided Molecular Design, submitted.
Wermuth CG and Langer T: 1993, Pharmacophore identification, in Escom Leiden (ed), 3D QSAR in Drug Design, pp. 117-136.

SESSION 5
Design problems are not of a kind: Differences in the effectiveness of visual stimuli in design problem solving
Gabriela Goldschmidt and Maria Smolkov
Cognitive analyses and creative operations Mine Ozkar


JS Gero, B Tversky and T Knight (eds), Visual and Spatial Reasoning in Design III, 2004 Key Centre of Design Computing and Cognition, University of Sydney, pp 199-218
DESIGN PROBLEMS ARE NOT OF A KIND: DIFFERENCES IN THE EFFECTIVENESS OF VISUAL STIMULI IN DESIGN PROBLEM SOLVING
GABRIELA GOLDSCHMIDT AND MARIA SMOLKOV Technion – Israel Institute of Technology, Israel
Abstract. Research in cognitive psychology and in design thinking has shown that inner representation is a powerful strategy that designers can use, and use, in solving design problems. Generating external representations by way of sketching is instrumental in problem-structuring and was found to be particularly momentous in creative performance. In this paper we look at the 'consumption' of external visual representations, thought of as stimuli, when those are present in the designer's work environment. The empirical study that was conducted revealed that the presence of visual stimuli of different kinds can effect performance, measured in terms of practicality and originality scores assigned to designs developed by subjects under different conditions. The effect of stimuli is contingent on the type of the design problem that is being solved.
1. Introduction
Designers in all disciplines live in a very visual world. They are sensitive to the appearance of artifacts and environments, as a matter of course. Needless to say, the visual qualities of their design products are, with practically no exception, of great importance to them (as well as to clients and users). Therefore, it is not surprising that visual information is also prominent in the design process. We often say that designers think visually, by which we mean that representations that serve designers to think with are not only verbal but also consist of shapes and forms. There is a debate concerning the mode of such representations: are inner representations, using imagery, the prime generator of visual thinking in designing, or are external representations, in the form of drawings of all sorts and other two and three-dimensional representations, indispensable to design thinking? Fish (2003) claimed that we were equipped with mental imagery to survive as hunters in prehistoric times, but evolution has not yet adapted this capacity to deal with complex inventive processes such as are required in designing. Therefore

200 G GOLDSCHMIDT AND M SMOLKOV
external representation is beneficial as a means of representational amplification. Most research pertaining to representational issues has not yet addressed typical complex design problems of the kind designers handle routinely. An exception is research into the activity of sketching in designing which continues to be the subject of detailed investigations, among others because of the importance of the understanding of the role of sketching in designing to the development of computational support tools for design (Akin and Moustapha 2004).
In this paper we focus on visual stimuli and the effect they have on design performance. Visual stimuli include displays in the designer's work environment and they may take various shapes, including the sketches produced by the designer him or herself. It is not the activity of sketching that we studyhere, though, but the presence of visuals to which the designer has easy access. Although we know that environmental factors have an impact on people in general (e.g., colors in the environment, such as the color of walls), we found it difficult to predict the impact that specific stimuli may have on design performance. Therefore we set out to conduct an experiment with the general hypotheses that visual stimuli do indeed have a bearing on designers' performance, and that this influence is dissimilar for different types of design problems. Following a brief survey of the literature we consider relevant, we describe the experiment, report its results, and discuss what we learned from it.
2. "Mental Synthesis" and Beyond
In the 1980s, Finke and his associates (Finke 1990) pioneered a research agenda whose subject matter came to be known as 'mental synthesis'. The purpose of these investigations was to establish how powerful mental imagery is in manipulating forms and acting on them. In a series of influential experiments, Finke showed his subjects a set of 15 labeled forms; half were geometric forms (e.g., sphere, cone) and the other half simple objects (e.g., hook, bracket). After the subject had memorized them, the forms were removed. The subject was then blindfolded and given the labels of three of the initial forms, randomly selected. He or she was asked to combine the three elements whose names were called out into a useful object that belongs to a given category (e.g., toy, household item). The time allotted was two minutes. After those two minutes, the subject was asked to name the object or objects (if there were more than one) into which he or she synthesized the three forms, and then draw it, or them, on paper. The great majority of subjects – all psychology students – were able to come up with at least one such synthesized object. The drawings were then scored by naïve judges for practicality and for originality; scores beyond a certain threshold were considered creative. The experiments were repeated several times with
DESIGN PROBLEM ARE NOT OF A KIND 201
slight variations and Finke concluded that imagery is a strong cognitive resource that people can use for inventive thinking. He called the creative objects that his subjects came up with "preinventions" (Finke 1990).
2.1. SKETCHING
Finke's experiments were repeated, with variations, by other researchers who were also interested in related topics that Finke had left out of his agenda. Anderson and Helstrup (1993), who like Finke used psychology students as subjects, designed an experiment in which a control group was not blindfolded but on the contrary, was allowed to use paper and pencil and sketch during the two minutes in which they were to synthesize useful objects. When comparing the creativity scores of the subjects, no significant differences were found between the blindfolded subjects and those who were allowed to sketch. Logie and his associates who conducted similar experiments came to similar conclusions, but qualified them to subjects with no prior sketching experience (Pearson et al. 1999). Verstijnen, who insisted that sketching must be of some benefit to those who practice it routinely, like designers, repeated the experiment. She used only geometric forms (and a smaller set of them) and in addition to having blindfolded subjects and open-eyed sketchers, she also had two categories of subjects by background: psychology students and industrial design students (with a minimum of two drawing courses). The difference between them was the amount of experience they had in employing sketching to solve problems: design students had such experience whereas psychology students did not. The findings showed clearly that at least for some classes of 'preinventions', sketching results in more creative solutions provided the subject is an experienced sketcher, in this case an advanced design student (Verstijnen et al. 1998).
Design researchers followed the 'mental synthesis' literature with great interest, but made the point that synthesizing three elements into a useful object in two minutes does not qualify as designing. Athavankar and his associates (Athavankar 1996; 2003) carried out several experiments in which designers and design students were asked to undertake design assignments while blindfolded, a typical design session lasting one to two hours. The subjects talked out loud during the process and drew the resultant designs at the end of the session. Athavankar concluded that complex designs can be generated using mental imagery as the only medium of visual representation. Kokotovich and Purcell (2000) went back to mental synthesis experiments, but used twoseparate sets of stimuli: two-dimensional shapes and three-dimensional forms1. Their subjects included graphic design and industrial design students, and law students as a control group. They were able to show that both designer groups performed better than the non-designers (law
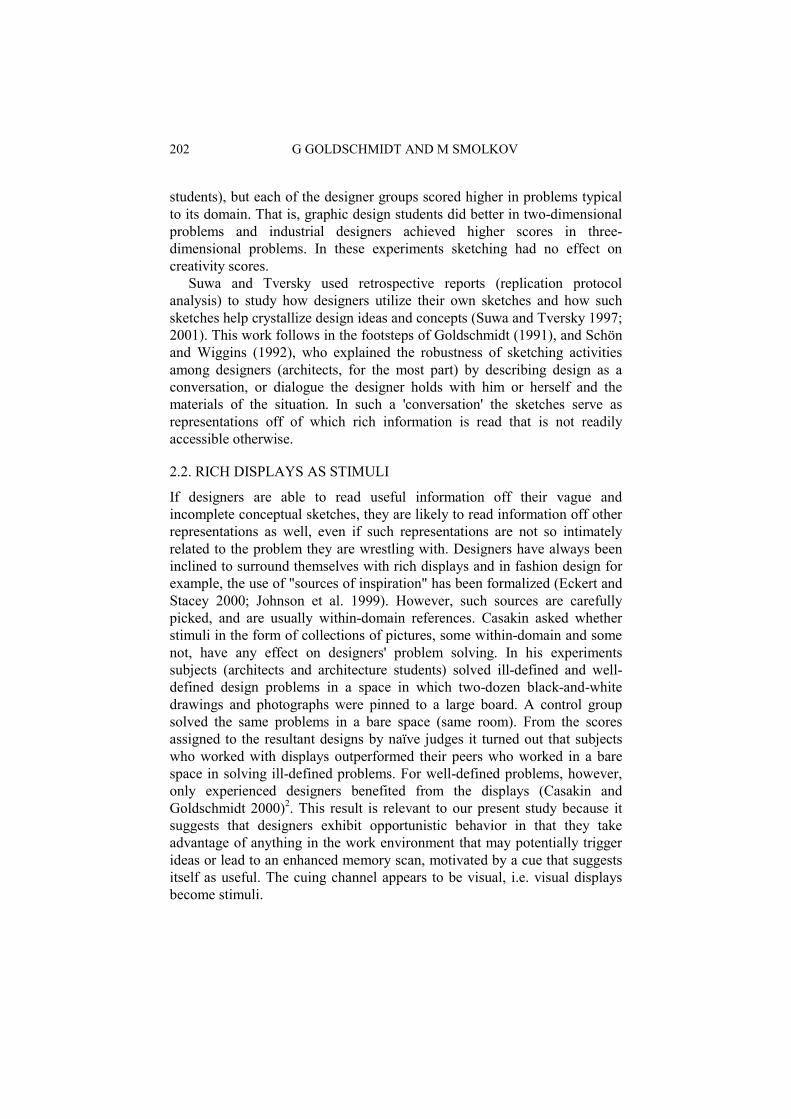
202 G GOLDSCHMIDT AND M SMOLKOV
students), but each of the designer groups scored higher in problems typical to its domain. That is, graphic design students did better in two-dimensional problems and industrial designers achieved higher scores in three-dimensional problems. In these experiments sketching had no effect on creativity scores.
Suwa and Tversky used retrospective reports (replication protocol analysis) to study how designers utilize their own sketches and how such sketches help crystallize design ideas and concepts (Suwa and Tversky 1997; 2001). This work follows in the footsteps of Goldschmidt (1991), and Schön and Wiggins (1992), who explained the robustness of sketching activities among designers (architects, for the most part) by describing design as a conversation, or dialogue the designer holds with him or herself and the materials of the situation. In such a 'conversation' the sketches serve as representations off of which rich information is read that is not readily accessible otherwise.
2.2. RICH DISPLAYS AS STIMULI
If designers are able to read useful information off their vague and incomplete conceptual sketches, they are likely to read information off other representations as well, even if such representations are not so intimately related to the problem they are wrestling with. Designers have always been inclined to surround themselves with rich displays and in fashion design for example, the use of "sources of inspiration" has been formalized (Eckert and Stacey 2000; Johnson et al. 1999). However, such sources are carefully picked, and are usually within-domain references. Casakin asked whether stimuli in the form of collections of pictures, some within-domain and some not, have any effect on designers' problem solving. In his experiments subjects (architects and architecture students) solved ill-defined and well-defined design problems in a space in which two-dozen black-and-white drawings and photographs were pinned to a large board. A control group solved the same problems in a bare space (same room). From the scores assigned to the resultant designs by naïve judges it turned out that subjects who worked with displays outperformed their peers who worked in a bare space in solving ill-defined problems. For well-defined problems, however, only experienced designers benefited from the displays (Casakin and Goldschmidt 2000)2. This result is relevant to our present study because it suggests that designers exhibit opportunistic behavior in that they take advantage of anything in the work environment that may potentially trigger ideas or lead to an enhanced memory scan, motivated by a cue that suggests itself as useful. The cuing channel appears to be visual, i.e. visual displays become stimuli.
DESIGN PROBLEM ARE NOT OF A KIND 203
To summarize, research suggests that: a) Designers, like others, can use mental imagery to manipulate shapes and forms and recombine them in meaningful and even creative ways – an activity that is most relevant to designing. b) Sketching is useful (i.e., leads to more creative results) to those who due to experience are proficient users of sketching in design problem-solving, in certain types of spatial manipulations of simple forms. It is postulated that the advantage results from self-generated sketches becoming displays that are particularly rich in useful cues. c) Domain specific design experience controls performance and qualifies the benefit from sketching in problem-solving. d) Visual displays in the work environment act as stimuli and possibly as prompts in design problem-solving.
We are now ready to ask the next question in this line of inquiry: are different kinds of visuals equally effective in enhancing designing in all problem types? We already have evidence that various types of spatial manipulations in mental synthesis are not equally supported by sketching (Verstijnen et al. 1998), and that prior sketching experience can be meaningful to certain types of spatial manipulation. When it comes to designing, do different problems require different types of cognitive resources and, therefore, is performance in terms of parameters of creativity affected by visual stimuli, and how?
3. Design Problems
If prior experience modulates the benefits a designer is able to draw from the use of sketching, and if visual displays improve design problem-solving for ill-defined, but not necessarily for well-defined problems, then we may conclude that many factors may have an impact on preferred cognitive strategies in designing. A factor that has hitherto not been investigated is the types of design problem that are being solved (beyond ill or well-defined) and the visual design support systems to which they may be responsive. In this paper we consider only the effect of visual displays on parameters of creativity of design solutions. No relevant literature on differences among design problems was found3, but based on our general conclusion above that many factors may have an impact on preferred cognitive strategies in designing, we hypothesized that design problems of different types show partiality towards different kinds of visual displays as support systems. However, we were not able to predict which displays would benefit the solving of what design problems. Therefore, our research question is: how do different kinds of visual displays effect the solving of dissimilar design problems? We set out to investigate the question empirically. Section 4 below describes the experiment that was carried out toward this end.
204 G GOLDSCHMIDT AND M SMOLKOV
4. The Experiment
At the outset, the question we posed was: "what is the role of sketching and visual displays in design problem solving?" An experiment was planned to answer this question, in which students of architecture and industrial design were asked to solve design problems (at a conceptual level) under different conditions. The variability in conditions included the use of sketching during the process versus the use of mental imagery alone, with a final descriptive sketch of the solution (similar to "mental synthesis" experiments), and work with or without visual displays of one of two types, as described below. In this paper we address the differences in the judged performance of subjects as a function of the design problem they solved, which emerged as one of the most interesting topics raised in this research project. The following is a report of the experimental setup.
4.1. SETTING
All of the experimental sessions were conducted in an enclosed, windowless area within a larger space. Subjects were tested individually by an experimenter who dispensed problems to the subjects and explained the procedure, but did not intervene in what the subjects did. Subjects were asked to talk out loud and sessions were videotaped with the camera pointed at the desk surface on which the subjects worked. Before the first experimental task was presented, a brief training problem was given, the purpose of which was to accustom subjects to talking out loud. Following each session a short debriefing interview was conducted, in which the subject was asked to articulate his or her difficulties, if any, during the session, feelings regarding the experiment, and a subjective view on the effect of having made sketches or being prevented from sketching. All graphic output by the subjects was collected and coded for subject identity and experimental condition.
4.2. TASKS
Each subject was asked to solve two design problems, at a fixed order. For each problem 20 minutes were allotted to the development of ideas, and 5 minutes were dedicated to the execution of the final version of the solution in the form of a sketch.
4.2.1. Task 1 In this task subjects were asked to design packaging for fancy chocolate candies, sold by the unit. The individual candy is round, two centimeters in diameter, and wrapped in foil. The packaging must accommodate any desired number of candies between three and 50. Some of the adjectives
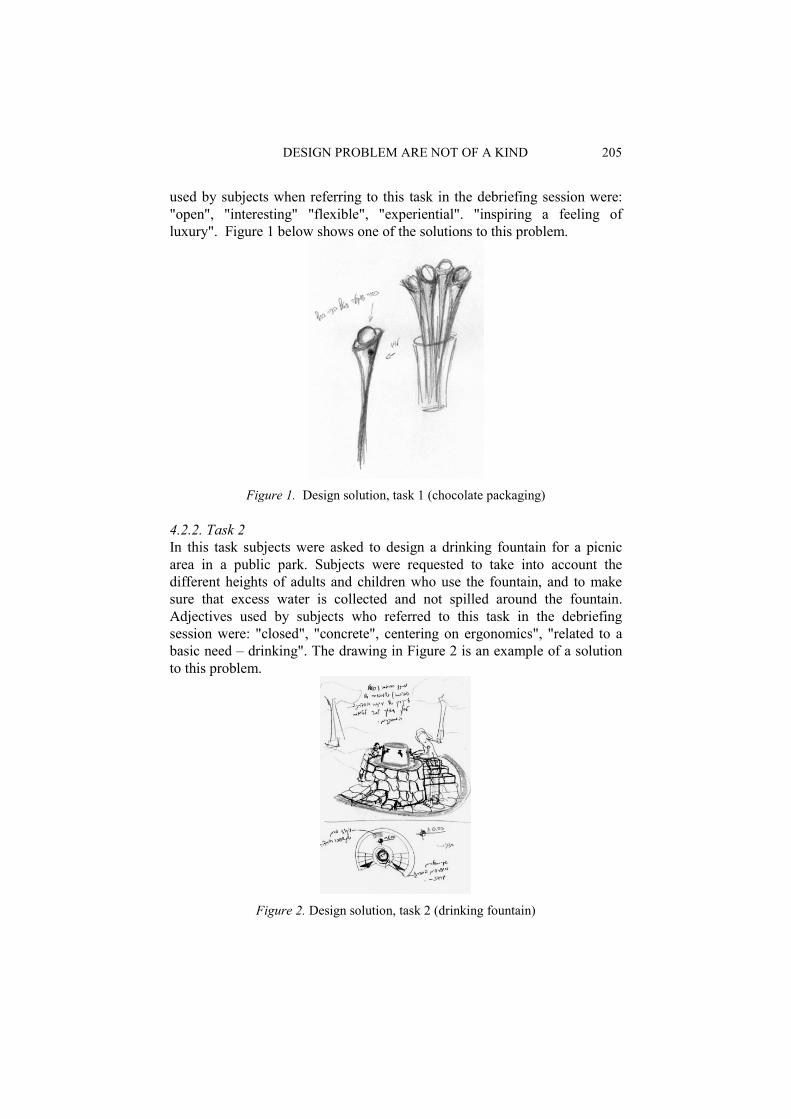
DESIGN PROBLEM ARE NOT OF A KIND 205
used by subjects when referring to this task in the debriefing session were: "open", "interesting" "flexible", "experiential". "inspiring a feeling of luxury". Figure 1 below shows one of the solutions to this problem.
Figure 1. Design solution, task 1 (chocolate packaging)
4.2.2. Task 2 In this task subjects were asked to design a drinking fountain for a picnic area in a public park. Subjects were requested to take into account the different heights of adults and children who use the fountain, and to make sure that excess water is collected and not spilled around the fountain. Adjectives used by subjects who referred to this task in the debriefing session were: "closed", "concrete", centering on ergonomics", "related to a basic need – drinking". The drawing in Figure 2 is an example of a solution to this problem.
Figure 2. Design solution, task 2 (drinking fountain)
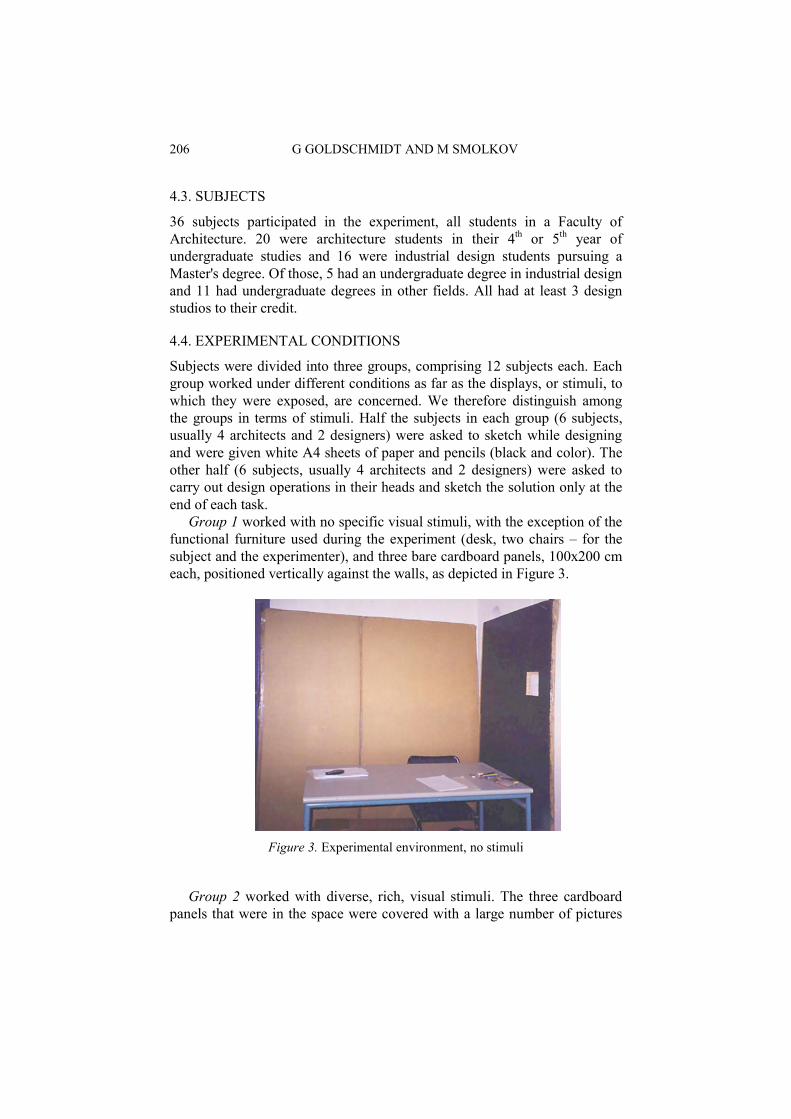
206 G GOLDSCHMIDT AND M SMOLKOV
4.3. SUBJECTS
36 subjects participated in the experiment, all students in a Faculty of Architecture. 20 were architecture students in their 4th or 5th year of undergraduate studies and 16 were industrial design students pursuing a Master's degree. Of those, 5 had an undergraduate degree in industrial design and 11 had undergraduate degrees in other fields. All had at least 3 design studios to their credit.
4.4. EXPERIMENTAL CONDITIONS
Subjects were divided into three groups, comprising 12 subjects each. Each group worked under different conditions as far as the displays, or stimuli, to which they were exposed, are concerned. We therefore distinguish among the groups in terms of stimuli. Half the subjects in each group (6 subjects, usually 4 architects and 2 designers) were asked to sketch while designing and were given white A4 sheets of paper and pencils (black and color). The other half (6 subjects, usually 4 architects and 2 designers) were asked to carry out design operations in their heads and sketch the solution only at the end of each task.
Group 1 worked with no specific visual stimuli, with the exception of the functional furniture used during the experiment (desk, two chairs – for the subject and the experimenter), and three bare cardboard panels, 100x200 cm each, positioned vertically against the walls, as depicted in Figure 3.
Figure 3. Experimental environment, no stimuli
Group 2 worked with diverse, rich, visual stimuli. The three cardboard
panels that were in the space were covered with a large number of pictures

DESIGN PROBLEM ARE NOT OF A KIND 207
and drawings of various kinds (color and black and white), drawn from a host of fields (e.g., product design, art, history, morphology, nature). In addition a variety of three dimensional objects were places on the desk and around it (e.g., architectural models, polyhedra, wooden blocks). Figure 4 shows this environment.
Figure 4. Experimental environment, diverse rich stimuli
Group 3 worked with a modest number of visual stimuli, in the form of photocopies of sketches pinned to the cardboard panels. The sketches in question were made by group 1 and group 2 subjects who had participated in the experiment earlier. Sketches were selected for display on the basis of their clarity and provided they were sufficiently abstract, i.e., they did not contain explicit solutions to the design problems. The sketches were enlarged (150%), to compensate for viewing distance. The number of sketches shown was approximately equal to the average number of sketches produced by subjects (8 sketches per subject). Each subject was shown a different set of sketches. The environment under this condition is shown in Figure 5.
4.5. JUDGES
All design solutions were evaluated by three judges who were blind to the research goals. The judges were graduate students in design or architecture towards the end of their studies towards a Masters degree, and who also had professional design experience.
4.6. SCORING
Each design solution was assessed for originality, practicality, and general quality. Scores were given on a scale of 1 to 5, where 1 is low and 5 is high.
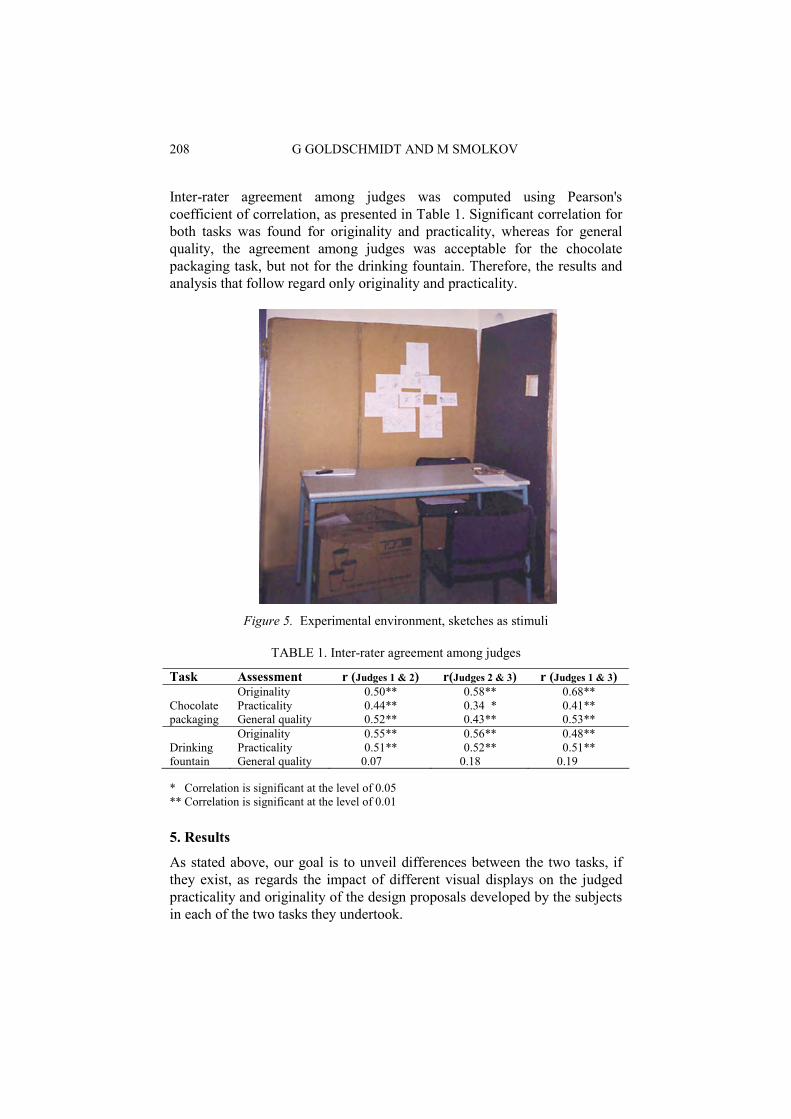
208 G GOLDSCHMIDT AND M SMOLKOV
Inter-rater agreement among judges was computed using Pearson's coefficient of correlation, as presented in Table 1. Significant correlation for both tasks was found for originality and practicality, whereas for general quality, the agreement among judges was acceptable for the chocolate packaging task, but not for the drinking fountain. Therefore, the results and analysis that follow regard only originality and practicality.
Figure 5. Experimental environment, sketches as stimuli
TABLE 1. Inter-rater agreement among judges
Task Assessment r (Judges 1 & 2) r(Judges 2 & 3) r (Judges 1 & 3) Originality 0.50** 0.58** 0.68** Chocolate Practicality 0.44** 0.34 * 0.41** packaging General quality 0.52** 0.43** 0.53** Originality 0.55** 0.56** 0.48** Drinking Practicality 0.51** 0.52** 0.51** fountain General quality 0.07 0.18 0.19 * Correlation is significant at the level of 0.05 ** Correlation is significant at the level of 0.01
5. Results
As stated above, our goal is to unveil differences between the two tasks, if they exist, as regards the impact of different visual displays on the judged practicality and originality of the design proposals developed by the subjects in each of the two tasks they undertook.

DESIGN PROBLEM ARE NOT OF A KIND 209
5.1. PRACTICALITY
Table 2 and Figure 6 show the mean practicality scores, based on the judges' ratings (on a scale of 1-5) of the final design proposals for the chocolate packaging and drinking fountain. The mean scores were computed for designs made with and without sketching during the design process. A t-test was performed to assess the differences between mean scores for each of the experimental conditions, at a significance level of 0.05.
TABLE 2. Mean practicality scores
Task Without stimuli Rich stimuli Sketches as stimuli Chocolate packaging
3.08 3.33 3.33
Drinking fountain
3.58 3.22 2.83
Mean Practicality Score
Figure 6. Practicality scores
An analysis of the results indicates the following: • When no visual stimuli were provided, a significant difference
between practicality scores for the two tasks was found (T(23)=2.11; p<0.05). In this environment subjects reached higher practicality scores for the drinking fountain than for chocolate packaging.
Without stimuli Rich stimuli Sketches as stimuli
Type of Stimuli
Drinking Fountain Chocolate Packaging
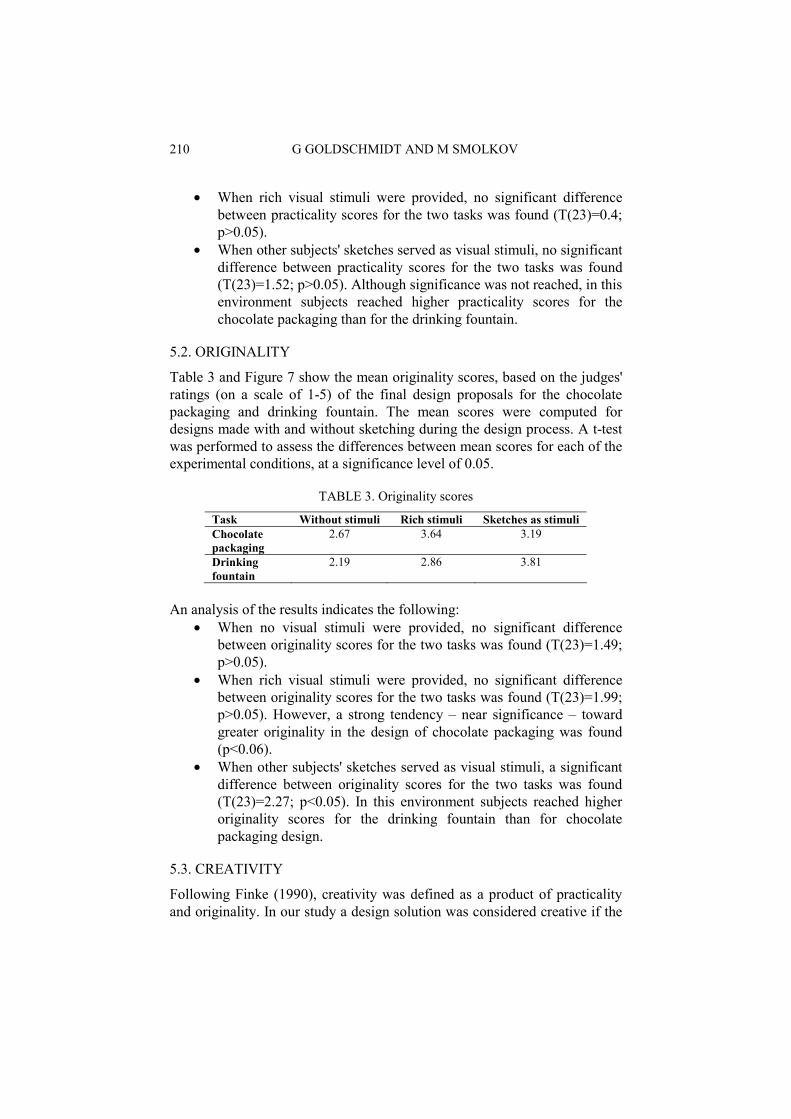
210 G GOLDSCHMIDT AND M SMOLKOV
• When rich visual stimuli were provided, no significant difference between practicality scores for the two tasks was found (T(23)=0.4; p>0.05).
• When other subjects' sketches served as visual stimuli, no significant difference between practicality scores for the two tasks was found (T(23)=1.52; p>0.05). Although significance was not reached, in this environment subjects reached higher practicality scores for the chocolate packaging than for the drinking fountain.
5.2. ORIGINALITY
Table 3 and Figure 7 show the mean originality scores, based on the judges' ratings (on a scale of 1-5) of the final design proposals for the chocolate packaging and drinking fountain. The mean scores were computed for designs made with and without sketching during the design process. A t-test was performed to assess the differences between mean scores for each of the experimental conditions, at a significance level of 0.05.
TABLE 3. Originality scores
Task Without stimuli Rich stimuli Sketches as stimuli Chocolate packaging
2.67 3.64 3.19
Drinking fountain
2.19 2.86 3.81
An analysis of the results indicates the following:
• When no visual stimuli were provided, no significant difference between originality scores for the two tasks was found (T(23)=1.49; p>0.05).
• When rich visual stimuli were provided, no significant difference between originality scores for the two tasks was found (T(23)=1.99; p>0.05). However, a strong tendency – near significance – toward greater originality in the design of chocolate packaging was found (p<0.06).
• When other subjects' sketches served as visual stimuli, a significant difference between originality scores for the two tasks was found (T(23)=2.27; p<0.05). In this environment subjects reached higher originality scores for the drinking fountain than for chocolate packaging design.
5.3. CREATIVITY
Following Finke (1990), creativity was defined as a product of practicality and originality. In our study a design solution was considered creative if the
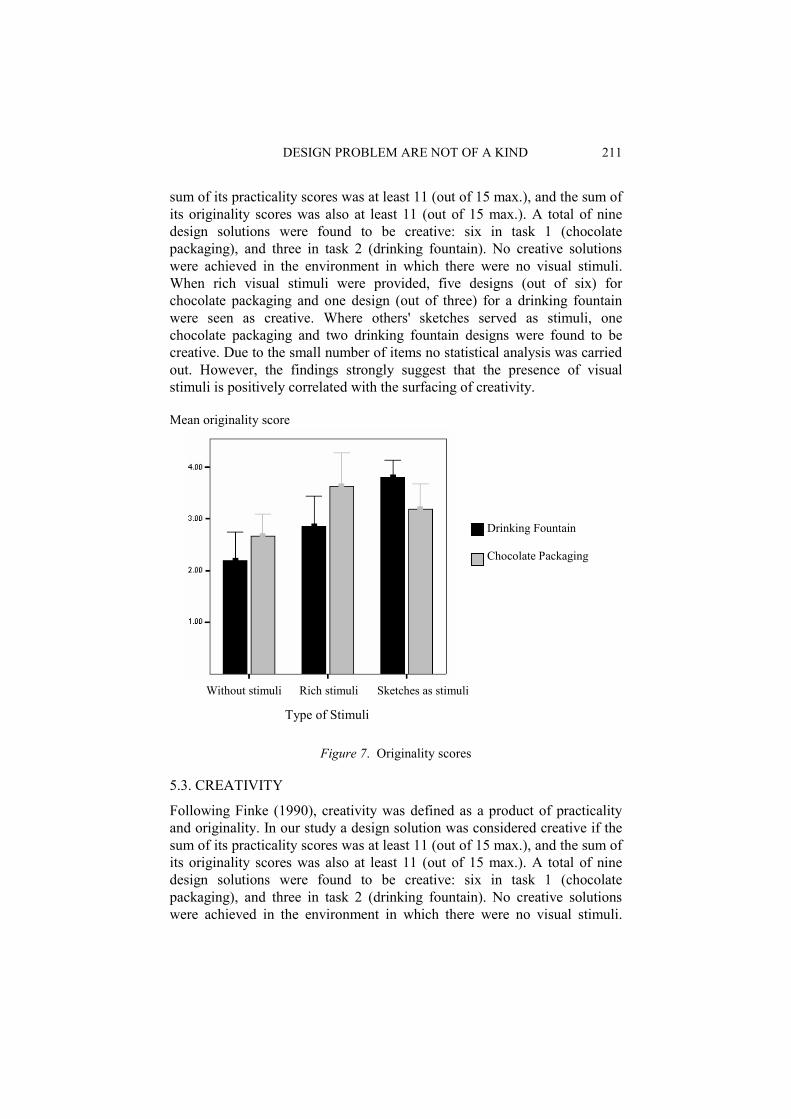
DESIGN PROBLEM ARE NOT OF A KIND 211
sum of its practicality scores was at least 11 (out of 15 max.), and the sum of its originality scores was also at least 11 (out of 15 max.). A total of nine design solutions were found to be creative: six in task 1 (chocolate packaging), and three in task 2 (drinking fountain). No creative solutions were achieved in the environment in which there were no visual stimuli. When rich visual stimuli were provided, five designs (out of six) for chocolate packaging and one design (out of three) for a drinking fountain were seen as creative. Where others' sketches served as stimuli, one chocolate packaging and two drinking fountain designs were found to be creative. Due to the small number of items no statistical analysis was carried out. However, the findings strongly suggest that the presence of visual stimuli is positively correlated with the surfacing of creativity. Mean originality score
Figure 7. Originality scores
5.3. CREATIVITY
Following Finke (1990), creativity was defined as a product of practicality and originality. In our study a design solution was considered creative if the sum of its practicality scores was at least 11 (out of 15 max.), and the sum of its originality scores was also at least 11 (out of 15 max.). A total of nine design solutions were found to be creative: six in task 1 (chocolate packaging), and three in task 2 (drinking fountain). No creative solutions were achieved in the environment in which there were no visual stimuli.
Without stimuli Rich stimuli Sketches as stimuli
Type of Stimuli
Drinking Fountain Chocolate Packaging
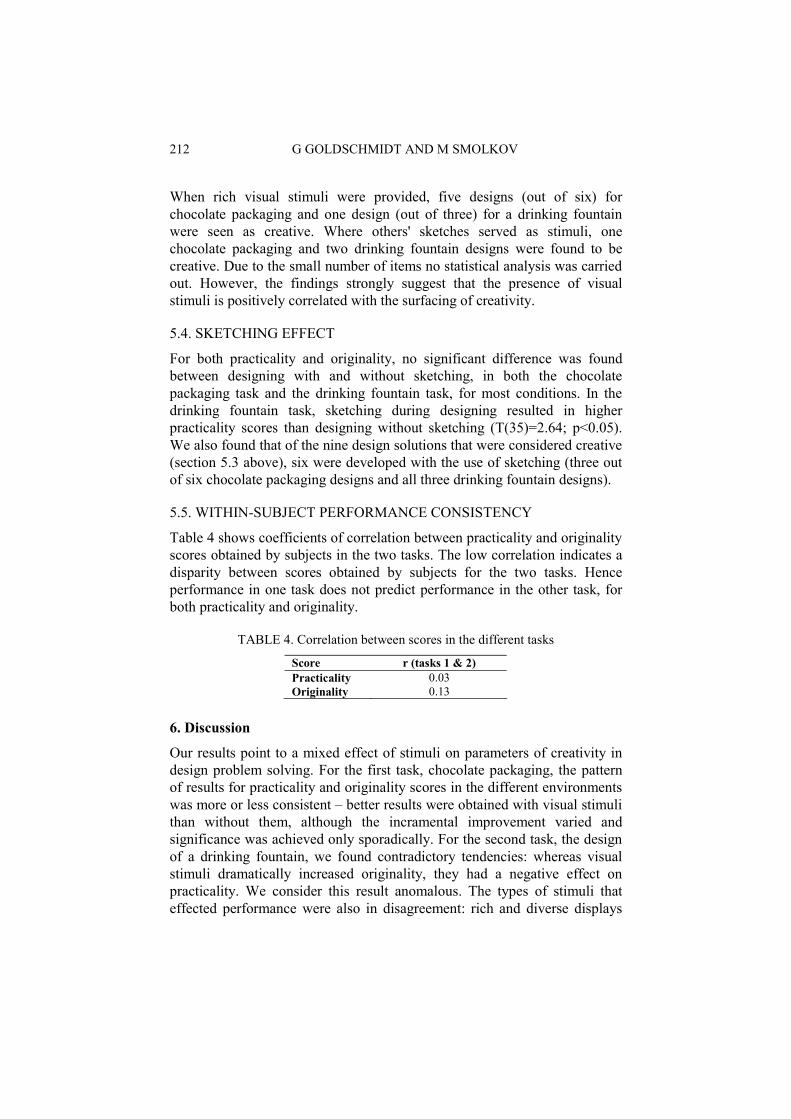
212 G GOLDSCHMIDT AND M SMOLKOV
When rich visual stimuli were provided, five designs (out of six) for chocolate packaging and one design (out of three) for a drinking fountain were seen as creative. Where others' sketches served as stimuli, one chocolate packaging and two drinking fountain designs were found to be creative. Due to the small number of items no statistical analysis was carried out. However, the findings strongly suggest that the presence of visual stimuli is positively correlated with the surfacing of creativity.
5.4. SKETCHING EFFECT
For both practicality and originality, no significant difference was found between designing with and without sketching, in both the chocolate packaging task and the drinking fountain task, for most conditions. In the drinking fountain task, sketching during designing resulted in higher practicality scores than designing without sketching (T(35)=2.64; p<0.05). We also found that of the nine design solutions that were considered creative (section 5.3 above), six were developed with the use of sketching (three out of six chocolate packaging designs and all three drinking fountain designs).
5.5. WITHIN-SUBJECT PERFORMANCE CONSISTENCY
Table 4 shows coefficients of correlation between practicality and originality scores obtained by subjects in the two tasks. The low correlation indicates a disparity between scores obtained by subjects for the two tasks. Hence performance in one task does not predict performance in the other task, for both practicality and originality.
TABLE 4. Correlation between scores in the different tasks
Score r (tasks 1 & 2) Practicality 0.03 Originality 0.13
6. Discussion
Our results point to a mixed effect of stimuli on parameters of creativity in design problem solving. For the first task, chocolate packaging, the pattern of results for practicality and originality scores in the different environments was more or less consistent – better results were obtained with visual stimuli than without them, although the incramental improvement varied and significance was achieved only sporadically. For the second task, the design of a drinking fountain, we found contradictory tendencies: whereas visual stimuli dramatically increased originality, they had a negative effect on practicality. We consider this result anomalous. The types of stimuli that effected performance were also in disagreement: rich and diverse displays

DESIGN PROBLEM ARE NOT OF A KIND 213
had different effects in the two tasks and for the two parameters of practicality and originality. Sketching, which produces "self-generated displays", had an effect only on practicality scores in one task, and no effect at all in the other task. In addition, and quite surprisingly, there was no correlation between subjects' performance in the two tasks. Several explanations of these results should be considered.
First, we must look at the differences between the two tasks. Both were 'sketch problems' (i.e. solutions are expected at a rough conceptual level only) and well suited to the subjects' level of knowledge and experience, and to the amount of time allotted to the exercises. However, the nature of the problems was different, and we can surmise the difference from the subjects' descriptions of one problem as being closed, concrete and emphasizing ergonomic considerations (drinking fountain), and the other as being open, flexible and experiential (chocolate packaging). The judges' assessment criteria also stressed different priorities. For the drinking fountain, in order of preference: convenience of use, compatibility with the natural environment, and ease of installation and maintenance. For the chocolate packaging: high aesthetic appeal, uniqueness, and ease with which candies can be drawn out of the packaging. The drinking fountain task can therefore be seen as mainly utilitarian, with its operational properties considered of the greatest importance. In contrast the chocolate packaging task is seen as aiming primarily at emotional satisfaction and pleasure through its appearance.
None of the displays, including subjects' sketches, contained any cues that could possibly assist in operational aspects of the drinking fountain, and therefore it is not surprising that displays provided little support in this case. Why did scores actually drop with displays? A possible explanation is that attention to the useless – as it turned out – displays, distracted subjects and subtracted from the attention they were able to dedicate to their problem-solving activity. It may also have been costly in terms of the time allocated to solve the problem, which was rather limited; scanning the displays limited it further. Operational considerations were of a much lower priority in the chocolate packaging task, and therefore the lack of cues in the displays was of no consequence. However, some of the images, in both types of displays, seemed to have suggested assembly principles that could be used, with or without transformation, in this task. For example, the flower-like candies placed in a vase as shown in Figure 1, could have been influenced by a picture of individual artificial flowers in a vase-like recepticle that was displayed when the subject in question was in session. Such a solution must have been seen as original to the judges, who were not exposed to the displays. Therefore, displays in this case were more useful, and diverse rich displays in particular, as they were more complete, coherent and well-
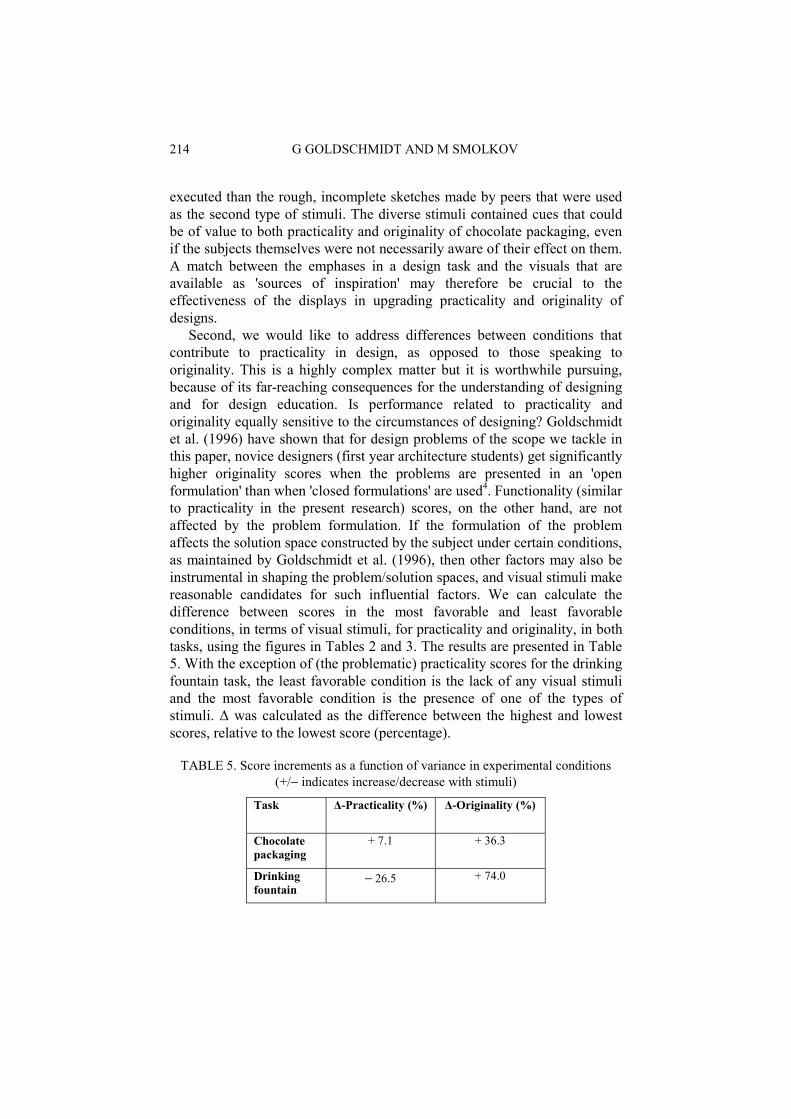
214 G GOLDSCHMIDT AND M SMOLKOV
executed than the rough, incomplete sketches made by peers that were used as the second type of stimuli. The diverse stimuli contained cues that could be of value to both practicality and originality of chocolate packaging, even if the subjects themselves were not necessarily aware of their effect on them. A match between the emphases in a design task and the visuals that are available as 'sources of inspiration' may therefore be crucial to the effectiveness of the displays in upgrading practicality and originality of designs.
Second, we would like to address differences between conditions that contribute to practicality in design, as opposed to those speaking to originality. This is a highly complex matter but it is worthwhile pursuing, because of its far-reaching consequences for the understanding of designing and for design education. Is performance related to practicality and originality equally sensitive to the circumstances of designing? Goldschmidt et al. (1996) have shown that for design problems of the scope we tackle in this paper, novice designers (first year architecture students) get significantly higher originality scores when the problems are presented in an 'open formulation' than when 'closed formulations' are used4. Functionality (similar to practicality in the present research) scores, on the other hand, are not affected by the problem formulation. If the formulation of the problem affects the solution space constructed by the subject under certain conditions, as maintained by Goldschmidt et al. (1996), then other factors may also be instrumental in shaping the problem/solution spaces, and visual stimuli make reasonable candidates for such influential factors. We can calculate the difference between scores in the most favorable and least favorable conditions, in terms of visual stimuli, for practicality and originality, in both tasks, using the figures in Tables 2 and 3. The results are presented in Table 5. With the exception of (the problematic) practicality scores for the drinking fountain task, the least favorable condition is the lack of any visual stimuli and the most favorable condition is the presence of one of the types of stimuli. ∆ was calculated as the difference between the highest and lowest scores, relative to the lowest score (percentage).
TABLE 5. Score increments as a function of variance in experimental conditions (+/− indicates increase/decrease with stimuli)
Task ∆-Practicality (%) ∆-Originality (%)
Chocolate packaging
+ 7.1 + 36.3
Drinking fountain
− 26.5 + 74.0
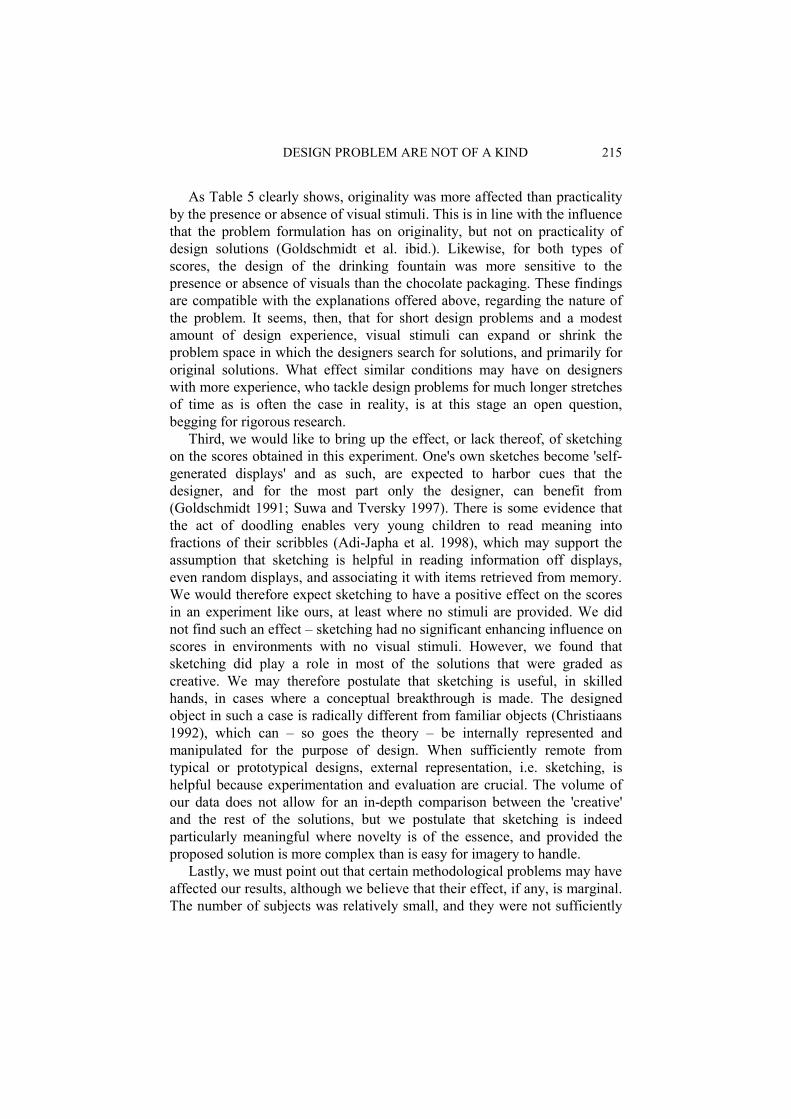
DESIGN PROBLEM ARE NOT OF A KIND 215
As Table 5 clearly shows, originality was more affected than practicality by the presence or absence of visual stimuli. This is in line with the influence that the problem formulation has on originality, but not on practicality of design solutions (Goldschmidt et al. ibid.). Likewise, for both types of scores, the design of the drinking fountain was more sensitive to the presence or absence of visuals than the chocolate packaging. These findings are compatible with the explanations offered above, regarding the nature of the problem. It seems, then, that for short design problems and a modest amount of design experience, visual stimuli can expand or shrink the problem space in which the designers search for solutions, and primarily for original solutions. What effect similar conditions may have on designers with more experience, who tackle design problems for much longer stretches of time as is often the case in reality, is at this stage an open question, begging for rigorous research.
Third, we would like to bring up the effect, or lack thereof, of sketching on the scores obtained in this experiment. One's own sketches become 'self-generated displays' and as such, are expected to harbor cues that the designer, and for the most part only the designer, can benefit from (Goldschmidt 1991; Suwa and Tversky 1997). There is some evidence that the act of doodling enables very young children to read meaning into fractions of their scribbles (Adi-Japha et al. 1998), which may support the assumption that sketching is helpful in reading information off displays, even random displays, and associating it with items retrieved from memory. We would therefore expect sketching to have a positive effect on the scores in an experiment like ours, at least where no stimuli are provided. We did not find such an effect – sketching had no significant enhancing influence on scores in environments with no visual stimuli. However, we found that sketching did play a role in most of the solutions that were graded as creative. We may therefore postulate that sketching is useful, in skilled hands, in cases where a conceptual breakthrough is made. The designed object in such a case is radically different from familiar objects (Christiaans 1992), which can – so goes the theory – be internally represented and manipulated for the purpose of design. When sufficiently remote from typical or prototypical designs, external representation, i.e. sketching, is helpful because experimentation and evaluation are crucial. The volume of our data does not allow for an in-depth comparison between the 'creative' and the rest of the solutions, but we postulate that sketching is indeed particularly meaningful where novelty is of the essence, and provided the proposed solution is more complex than is easy for imagery to handle.
Lastly, we must point out that certain methodological problems may have affected our results, although we believe that their effect, if any, is marginal. The number of subjects was relatively small, and they were not sufficiently
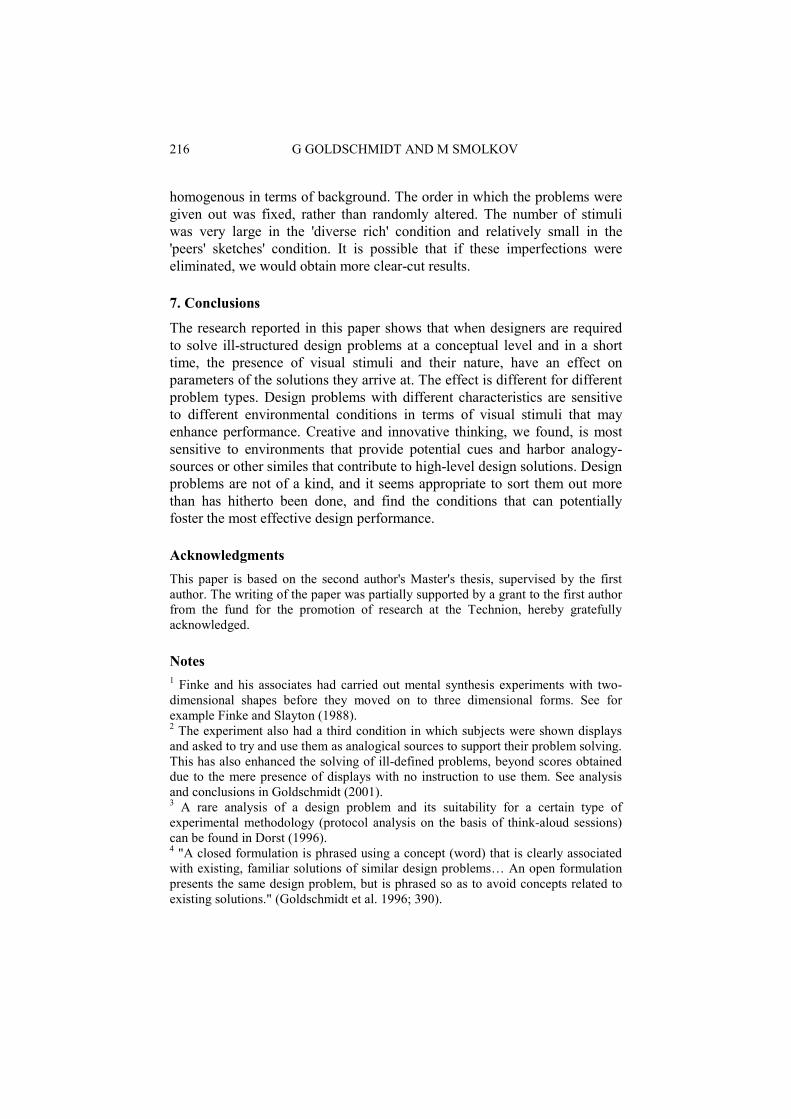
216 G GOLDSCHMIDT AND M SMOLKOV
homogenous in terms of background. The order in which the problems were given out was fixed, rather than randomly altered. The number of stimuli was very large in the 'diverse rich' condition and relatively small in the 'peers' sketches' condition. It is possible that if these imperfections were eliminated, we would obtain more clear-cut results.
7. Conclusions
The research reported in this paper shows that when designers are required to solve ill-structured design problems at a conceptual level and in a short time, the presence of visual stimuli and their nature, have an effect on parameters of the solutions they arrive at. The effect is different for different problem types. Design problems with different characteristics are sensitive to different environmental conditions in terms of visual stimuli that may enhance performance. Creative and innovative thinking, we found, is most sensitive to environments that provide potential cues and harbor analogy-sources or other similes that contribute to high-level design solutions. Design problems are not of a kind, and it seems appropriate to sort them out more than has hitherto been done, and find the conditions that can potentially foster the most effective design performance.
Acknowledgments This paper is based on the second author's Master's thesis, supervised by the first author. The writing of the paper was partially supported by a grant to the first author from the fund for the promotion of research at the Technion, hereby gratefully acknowledged.
Notes 1 Finke and his associates had carried out mental synthesis experiments with two-dimensional shapes before they moved on to three dimensional forms. See for example Finke and Slayton (1988). 2 The experiment also had a third condition in which subjects were shown displays and asked to try and use them as analogical sources to support their problem solving. This has also enhanced the solving of ill-defined problems, beyond scores obtained due to the mere presence of displays with no instruction to use them. See analysis and conclusions in Goldschmidt (2001). 3 A rare analysis of a design problem and its suitability for a certain type of experimental methodology (protocol analysis on the basis of think-aloud sessions) can be found in Dorst (1996). 4 "A closed formulation is phrased using a concept (word) that is clearly associated with existing, familiar solutions of similar design problems… An open formulation presents the same design problem, but is phrased so as to avoid concepts related to existing solutions." (Goldschmidt et al. 1996; 390).

DESIGN PROBLEM ARE NOT OF A KIND 217
References Adi-Japha, E, Levin, I and Solomon, S: 1998, Emergence of representation in drawing: The
relation between dynamic and referential aspects, Cognitive Development 13(1): 25-51. Akin, O, and Moustapha, H: 2004, Strategic use of representation in architectural massing,
Design Studies 25(1): 31-50. Anderson, RE and Helstrup, T: 1993, Multiple perspectives on discovery and creativity in
mind and on paper, in B Roskos-Ewoldsen, MJ Intons-Peterson and RE Anderson (eds), Imagery, Creativity and Discovery: A Cognitive Perspective, Elsevier Science, Amsterdam, pp. 223-253.
Athavankar, U: 1996, Mental imagery as a design tool, Cybernetics and Systems 28(1): 25-42. Athavankar, U and Mukherjee, A: 2003, Blindfolded classroom: Getting design students to
use mental imagery, in U Lindemann (ed), Human Behaviour in Design, Springer Verlag, Berlin, pp. 111-120.
Casakin, H and Goldschmidt, G: 2000, Reasoning by visual analogy in design problem-solving: The role of guidance, Journal of Planning and Design: Environment & Planning B 27: 105-119.
Christiaans, H: 1992, Creativity in Design: The Role of Domain Knowledge in Designing, Doctoral dissertation, Delft University of Technology, Delft.
Dorst, K: 1996, The design problem and its structure, in N Cross, H Christiaans and K Dorst (eds), Analysing Design Activity, Wiley, Chichester, pp. 17-34.
Eckert, C and Stacey, M: 2000, Sources of inspiration: A language of design, Design Studies 21(5): 523-538.
Finke, R: 1990, Creative Imagery: Discoveries and Inventions in Visualization, Erlbaum, Hillsdale, NJ.
Finke, R and Slayton, K: 1988, Explorations of creative visual synthesis in mental imagery, Memory & Cognition 16: 252-257.
Fish, J: 2003, Cognitive catalysis: Sketches for a time-lagged brain, in G Goldschmidt and WL Porter (eds), Design Representation, Springer Verlag, London, pp. 151-184.
Goldschmidt, G: 1991, The dialectics of sketching, Creativity Research Journal 4(2): 123-143.
Goldschmidt, G: 2001, Visual analogy - a strategy for design reasoning and learning, in C Eastman, W Newsletter, and M McCracken (eds), Design Knowing and Learning: Cognition in Design Education, Elsevier, New York, pp. 199-219.
Goldschmidt, G., Ben-Zeev, A. and Levi, S.: 1996, Design problem solving: The effect of problem formulation on the solution space, in Trappl, R. (ed), Cybernetics and Systems '96, University of Vienna,Vienna, pp. 388-393.
Johnson, J, Sharp, H and Petre, M: 1999, The use of sources of inspiration in early knitwear design: A computational model, in JS Gero and B Tversky (eds), Visual and Spatial Reasoning in Design, pp. 275-280.
Kokotovich, V and Purcell, T: 2000, Mental synthesis and creativity in design: An experimental examination, Design Studies 21(5): 473-499.
Pearson, DG, Logie, RH and Gilhooly, KJ: 1999, Verbal representation and spatial manipulation during mental synthesis, European Journal of Cognitive Psychology 11: 295-314.
Schön, DA and Wiggins, G: 1992, Kinds of seeing and their functions in designing, Design Studies 13(2): 135-156.
Suwa, M and Tversky, B: 1997, What do architects and students perceive in their design sketches? A protocol analysis, Design Studies 18(4): 385-403.

218 G GOLDSCHMIDT AND M SMOLKOV
Suwa, M and Tversky, B: 2001, Constructive perception in design, in JS Gero and ML Maher (eds), Computational and Cognitive Models of Creative Design V, Key Centre of Design Computing and Cognition, University of Sydney, Sydney, pp. 227-239.
Tversky, B, Suwa, M, Heiser, J, Agrawala, M, Lee, P, Stole, C, Hanrahan, P, Phan, D, Haymaker, J and Klinger, J: 2003, Contribution of cognitive studies to design, in U Lindemann, U (ed), Human Behaviour in Design, Springer Verlag, Berlin, pp. 79-86.
Verstijnen, IM, Hennessey, JM, Leeuwen, C, Hamel, R and Goldshmidt, G: 1998, Sketching and creative discovery, Design Studies 19(4): 519-546.

JS Gero, B Tversky and T Knight (eds), Visual and Spatial Reasoning in Design III, 2004 Key Centre of Design Computing and Cognition, University of Sydney, pp 219-229
COGNITIVE ANALYSES AND CREATIVE OPERATIONS
MINE OZKAR Massachusetts Institute of Technology, USA
Abstract. Embedding recognized parts in wholes plays an important role in generative shape computations. However, parts, and features in general, need not be predefined as they are subject to cognitive change within the dynamics of the context. This paper reflects on the dynamic aspect of visual cognition and reconsiders the cognitive model presented in object feature lattices from a creative point of view. An object feature lattice, moving from more general objects to more specified objects, categorically shows the convergence of predefined features in objects of the same kind. The features define constraining rules. For example, in a lattice where the top node is a quadrilateral, the bottom node is a square – an instance of the quadrilateral that is constrained with right angles as its feature. This study inverts the lattice and replaces its top with its end. Object features then function differently, and transformational rules are identified. Later, the lattice is abandoned completely in thinking about creative processes where both types of rules are worked jointly and indeterminately.
1. Object Feature Lattices
Cognitive structures play key roles in generative processes, and models of the first can be adapted to computationally represent aspects of the latter. Fundamental cognitive models (Feldman 1992; 1997; Richards et al. 1992) employ object feature lattices to illustrate that the mind associates partial perceptions to interpret images of objects. Object feature lattices build on predetermined key features shared by a familial set of objects. In the cognitive context, the lattices represent meaning-acquisition as a top down process where predefined object features hierarchically combine and subsequently converge to an ultimate object of recognition that comprises all the features. Figure 1 shows a simple lattice for cognitive analysis. It illustrates the genealogy of an object from the cognitive standpoint.
Starting at the top, each step downward adds a constraint to the shape. Here, the first set of constraints is right angles and equal sides. The

220 M OZKAR
constraints are identified as the key features of a square and the lattice hierarchically illustrates the process in which the square is recognized through a conglomeration of these features.
Figure 1. Simple lattice for cognitive analysis
This model feasibly establishes the fundamental relationships between similar objects in a given set and projects cognition through shared features. It does not, however, sufficiently inform us on cognition in creative acts where a shape might be perceived through unforeseen features. The lattice only assumes what the fundamental relationships and parts of the objects are based on shared biases. The cognitive model mentioned here is that the mind associates partial perceptions to interpret images of objects. The breaking of holistic perceptions is an appealing idea for design related research. Leyton (1992) has considered the object feature lattice in creative contexts and utilized it for inferring causal history from shapes in generative processes. Using Galois lattices, March (1996) has shown multiple structures for a line and pointed out that a line is more multifaceted than how it is perceived in a Boolean analysis. In both approaches, the object feature lattice is utilized to draw attention to temporal and flexible aspects of creative processes. The more conventional uses of object feature lattices in design research include generating design spaces in computer scientific approaches, and analyses of art work for psychological comprehension. (Santolini et al. 1994)
Nevertheless, creative processes often do not follow the top down approach presented in object feature lattices, as predefining a finite set of features contradicts the process. As discussed by March and Stiny (1985), social, physical and other types of constraints are relevant aspects of a design process, but are not simply determinants. Perception of constraints varies from context to context. Furthermore, creativity does not necessarily build on acquiring shared meaning. To the contrary, it thrives on variation. The discussion in this paper attempts to show that in design processes, constraints are understood differently than in the object feature lattice.
The object feature lattice poses some shortcomings for the designer. Primarily, difficulties start when more elaborate lattices and genealogies are
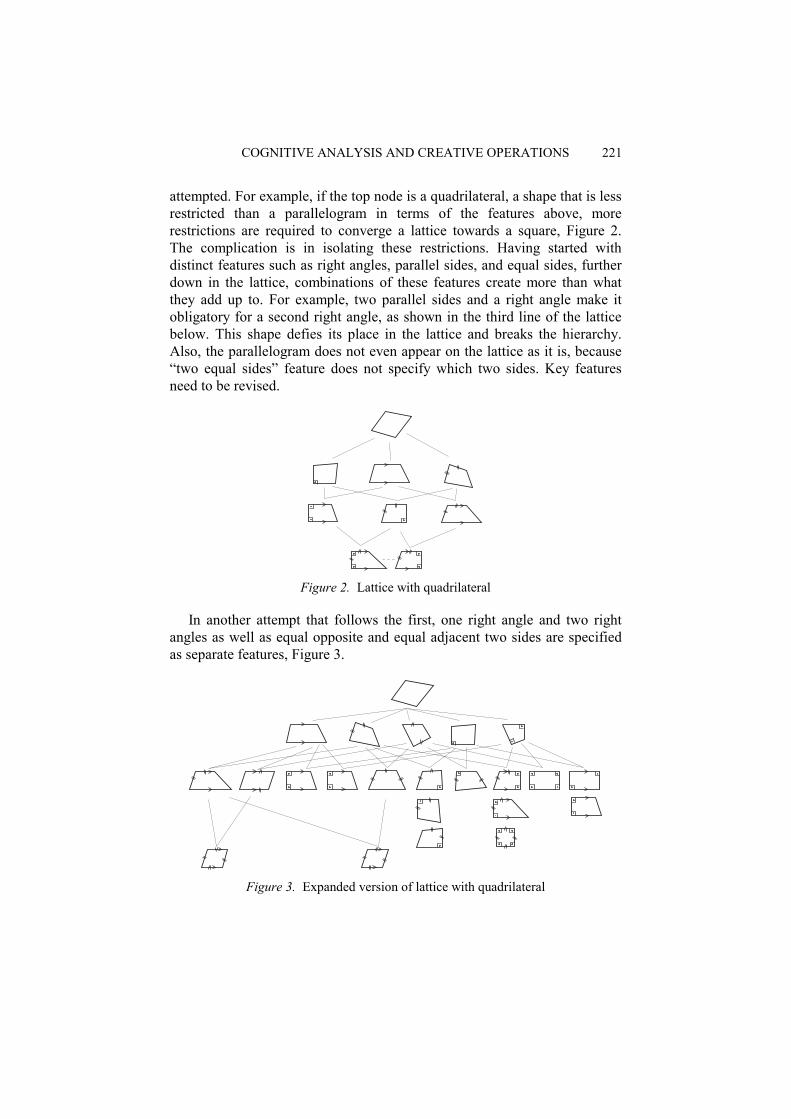
COGNITIVE ANALYSIS AND CREATIVE OPERATIONS 221
attempted. For example, if the top node is a quadrilateral, a shape that is less restricted than a parallelogram in terms of the features above, more restrictions are required to converge a lattice towards a square, Figure 2. The complication is in isolating these restrictions. Having started with distinct features such as right angles, parallel sides, and equal sides, further down in the lattice, combinations of these features create more than what they add up to. For example, two parallel sides and a right angle make it obligatory for a second right angle, as shown in the third line of the lattice below. This shape defies its place in the lattice and breaks the hierarchy. Also, the parallelogram does not even appear on the lattice as it is, because “two equal sides” feature does not specify which two sides. Key features need to be revised.
Figure 2. Lattice with quadrilateral
In another attempt that follows the first, one right angle and two right angles as well as equal opposite and equal adjacent two sides are specified as separate features, Figure 3.
Figure 3. Expanded version of lattice with quadrilateral
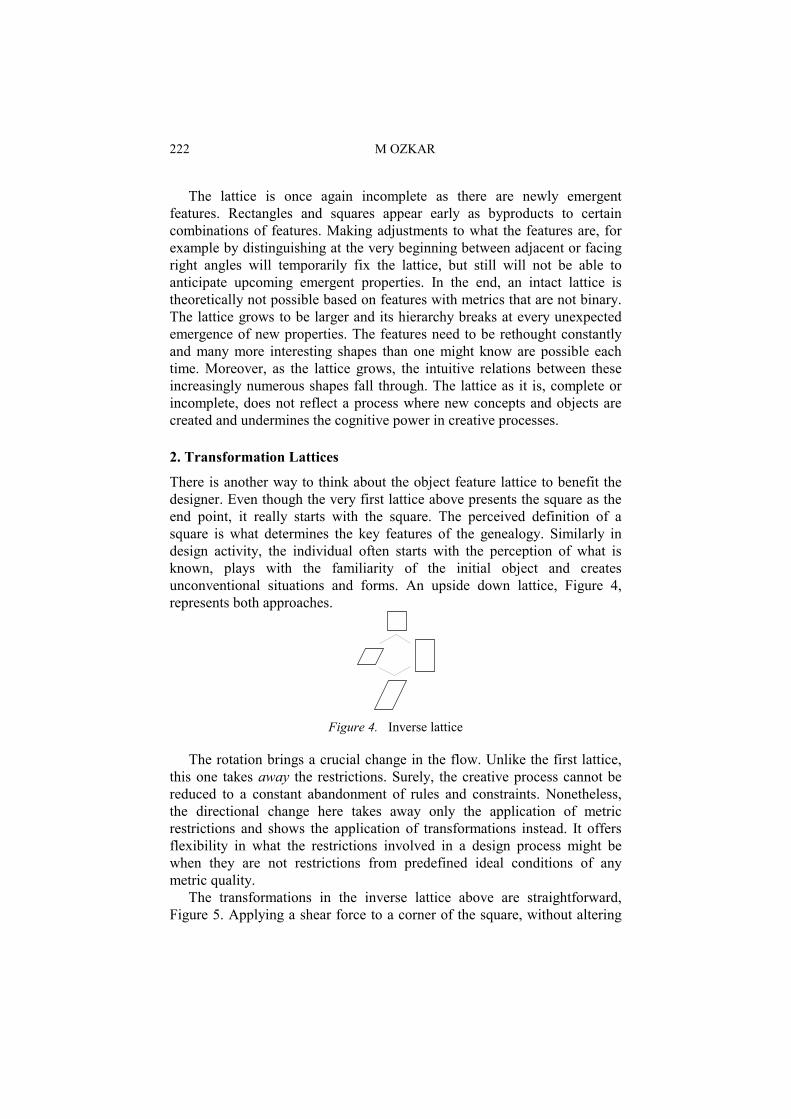
222 M OZKAR
The lattice is once again incomplete as there are newly emergent features. Rectangles and squares appear early as byproducts to certain combinations of features. Making adjustments to what the features are, for example by distinguishing at the very beginning between adjacent or facing right angles will temporarily fix the lattice, but still will not be able to anticipate upcoming emergent properties. In the end, an intact lattice is theoretically not possible based on features with metrics that are not binary. The lattice grows to be larger and its hierarchy breaks at every unexpected emergence of new properties. The features need to be rethought constantly and many more interesting shapes than one might know are possible each time. Moreover, as the lattice grows, the intuitive relations between these increasingly numerous shapes fall through. The lattice as it is, complete or incomplete, does not reflect a process where new concepts and objects are created and undermines the cognitive power in creative processes.
2. Transformation Lattices
There is another way to think about the object feature lattice to benefit the designer. Even though the very first lattice above presents the square as the end point, it really starts with the square. The perceived definition of a square is what determines the key features of the genealogy. Similarly in design activity, the individual often starts with the perception of what is known, plays with the familiarity of the initial object and creates unconventional situations and forms. An upside down lattice, Figure 4, represents both approaches.
Figure 4. Inverse lattice
The rotation brings a crucial change in the flow. Unlike the first lattice, this one takes away the restrictions. Surely, the creative process cannot be reduced to a constant abandonment of rules and constraints. Nonetheless, the directional change here takes away only the application of metric restrictions and shows the application of transformations instead. It offers flexibility in what the restrictions involved in a design process might be when they are not restrictions from predefined ideal conditions of any metric quality. The transformations in the inverse lattice above are straightforward, Figure 5. Applying a shear force to a corner of the square, without altering
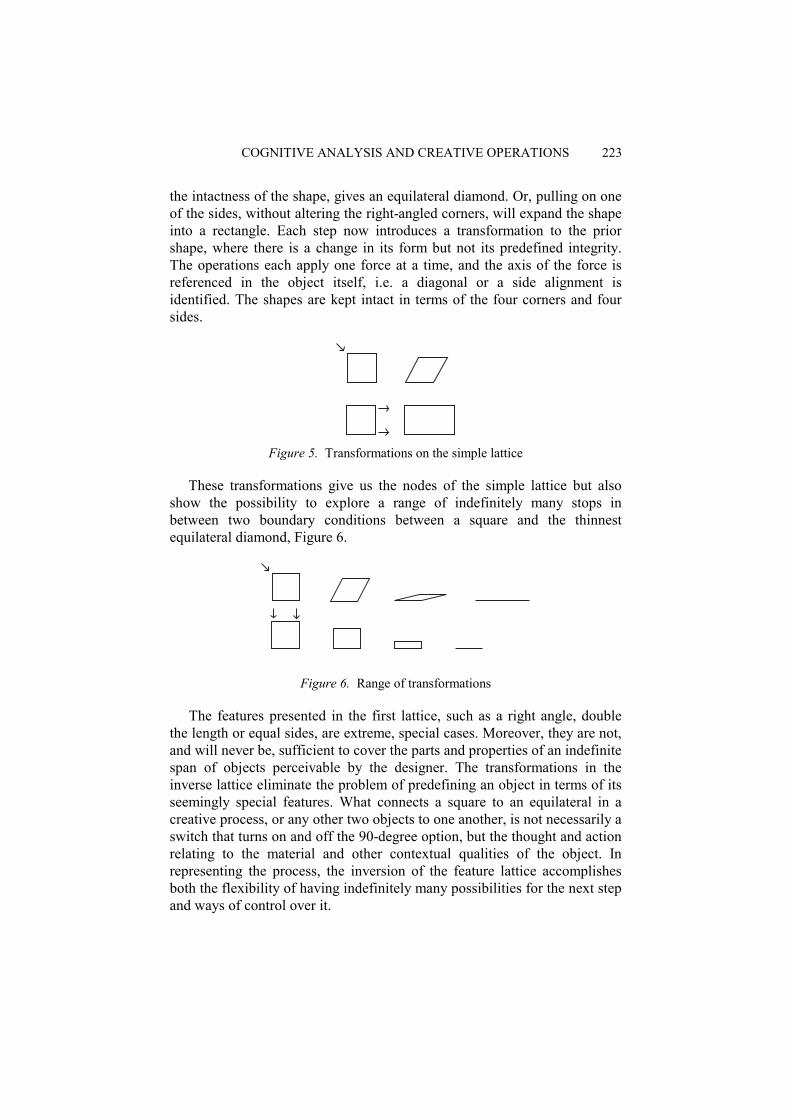
COGNITIVE ANALYSIS AND CREATIVE OPERATIONS 223
the intactness of the shape, gives an equilateral diamond. Or, pulling on one of the sides, without altering the right-angled corners, will expand the shape into a rectangle. Each step now introduces a transformation to the prior shape, where there is a change in its form but not its predefined integrity. The operations each apply one force at a time, and the axis of the force is referenced in the object itself, i.e. a diagonal or a side alignment is identified. The shapes are kept intact in terms of the four corners and four sides.
Figure 5. Transformations on the simple lattice
These transformations give us the nodes of the simple lattice but also show the possibility to explore a range of indefinitely many stops in between two boundary conditions between a square and the thinnest equilateral diamond, Figure 6.
Figure 6. Range of transformations
The features presented in the first lattice, such as a right angle, double the length or equal sides, are extreme, special cases. Moreover, they are not, and will never be, sufficient to cover the parts and properties of an indefinite span of objects perceivable by the designer. The transformations in the inverse lattice eliminate the problem of predefining an object in terms of its seemingly special features. What connects a square to an equilateral in a creative process, or any other two objects to one another, is not necessarily a switch that turns on and off the 90-degree option, but the thought and action relating to the material and other contextual qualities of the object. In representing the process, the inversion of the feature lattice accomplishes both the flexibility of having indefinitely many possibilities for the next step and ways of control over it.

224 M OZKAR
3. Constraints in Transformations
The ways of control over the next step in a process imply material and organizational constraints in the transformations. For example, when defining new transformations for the square to expand the lattice above with other quadrilaterals, keeping one adjacent side aligned while pulling a corner, and fixing one adjacent corner while rotating one side around it are such constraints, Figure 7.
Figure 7. Transformations for a square
These constraints are not metric. Distinct integral parts of the topology, namely lines and corners, are explicitly identified, and only one parameter is changed at a time, but there is no reference to any special feature that is not common in all of the objects. The transformational constraints are derived from the general material qualities of the objects and their structural integrity. There is a lower limiting condition that the transformation moves away from – that is the original object – and there is an upper limit where the next level of restriction is – that is the material intactness, environment, etc, Figure 8. The triangles, L, the chevron and the butterflies are not possible if there is an assumed material intactness of a closed wire, and if the transformations are specified on a two dimensional plane.
Figure 8. Transformation limits
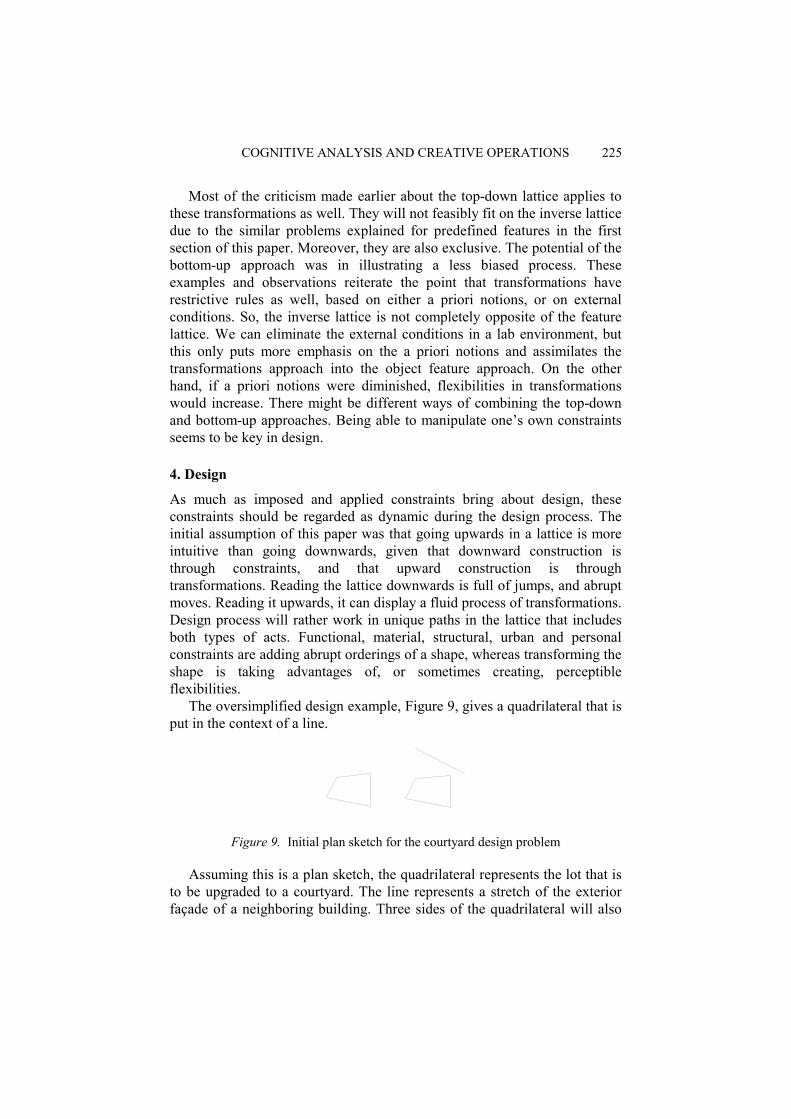
COGNITIVE ANALYSIS AND CREATIVE OPERATIONS 225
Most of the criticism made earlier about the top-down lattice applies to these transformations as well. They will not feasibly fit on the inverse lattice due to the similar problems explained for predefined features in the first section of this paper. Moreover, they are also exclusive. The potential of the bottom-up approach was in illustrating a less biased process. These examples and observations reiterate the point that transformations have restrictive rules as well, based on either a priori notions, or on external conditions. So, the inverse lattice is not completely opposite of the feature lattice. We can eliminate the external conditions in a lab environment, but this only puts more emphasis on the a priori notions and assimilates the transformations approach into the object feature approach. On the other hand, if a priori notions were diminished, flexibilities in transformations would increase. There might be different ways of combining the top-down and bottom-up approaches. Being able to manipulate one’s own constraints seems to be key in design.
4. Design
As much as imposed and applied constraints bring about design, these constraints should be regarded as dynamic during the design process. The initial assumption of this paper was that going upwards in a lattice is more intuitive than going downwards, given that downward construction is through constraints, and that upward construction is through transformations. Reading the lattice downwards is full of jumps, and abrupt moves. Reading it upwards, it can display a fluid process of transformations. Design process will rather work in unique paths in the lattice that includes both types of acts. Functional, material, structural, urban and personal constraints are adding abrupt orderings of a shape, whereas transforming the shape is taking advantages of, or sometimes creating, perceptible flexibilities.
The oversimplified design example, Figure 9, gives a quadrilateral that is put in the context of a line.
Figure 9. Initial plan sketch for the courtyard design problem
Assuming this is a plan sketch, the quadrilateral represents the lot that is to be upgraded to a courtyard. The line represents a stretch of the exterior façade of a neighboring building. Three sides of the quadrilateral will also
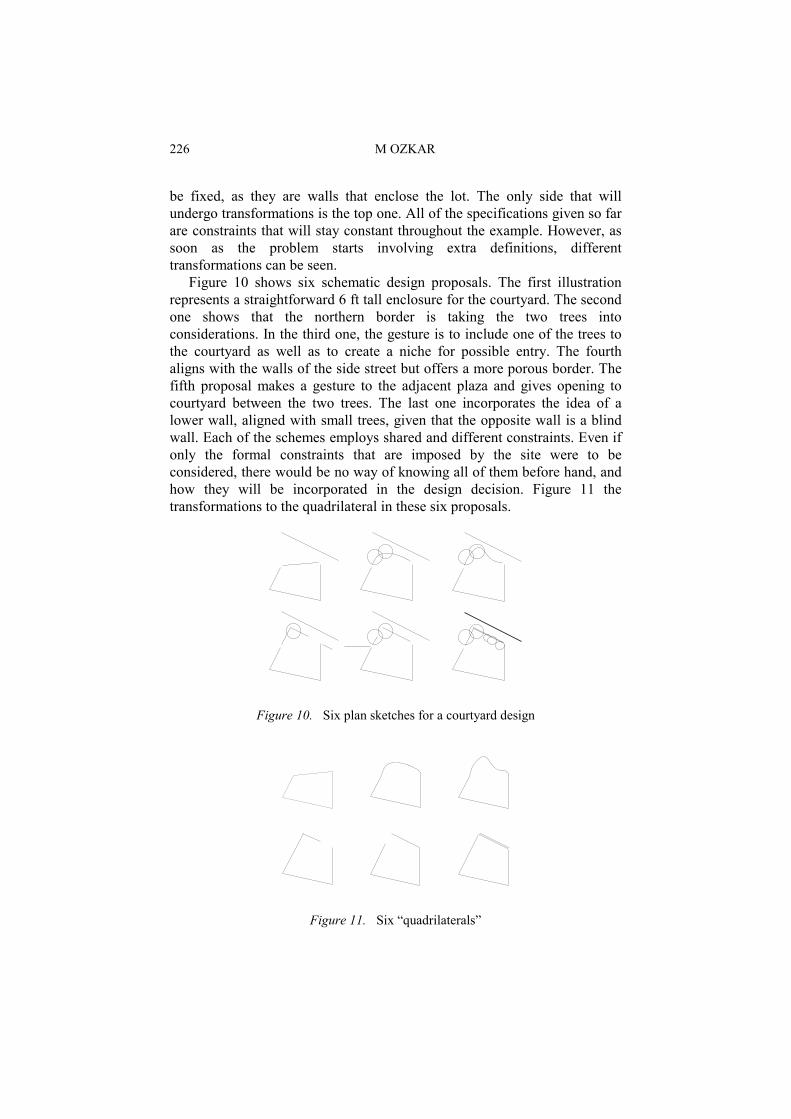
226 M OZKAR
be fixed, as they are walls that enclose the lot. The only side that will undergo transformations is the top one. All of the specifications given so far are constraints that will stay constant throughout the example. However, as soon as the problem starts involving extra definitions, different transformations can be seen.
Figure 10 shows six schematic design proposals. The first illustration represents a straightforward 6 ft tall enclosure for the courtyard. The second one shows that the northern border is taking the two trees into considerations. In the third one, the gesture is to include one of the trees to the courtyard as well as to create a niche for possible entry. The fourth aligns with the walls of the side street but offers a more porous border. The fifth proposal makes a gesture to the adjacent plaza and gives opening to courtyard between the two trees. The last one incorporates the idea of a lower wall, aligned with small trees, given that the opposite wall is a blind wall. Each of the schemes employs shared and different constraints. Even if only the formal constraints that are imposed by the site were to be considered, there would be no way of knowing all of them before hand, and how they will be incorporated in the design decision. Figure 11 the transformations to the quadrilateral in these six proposals.
Figure 10. Six plan sketches for a courtyard design
Figure 11. Six “quadrilaterals”
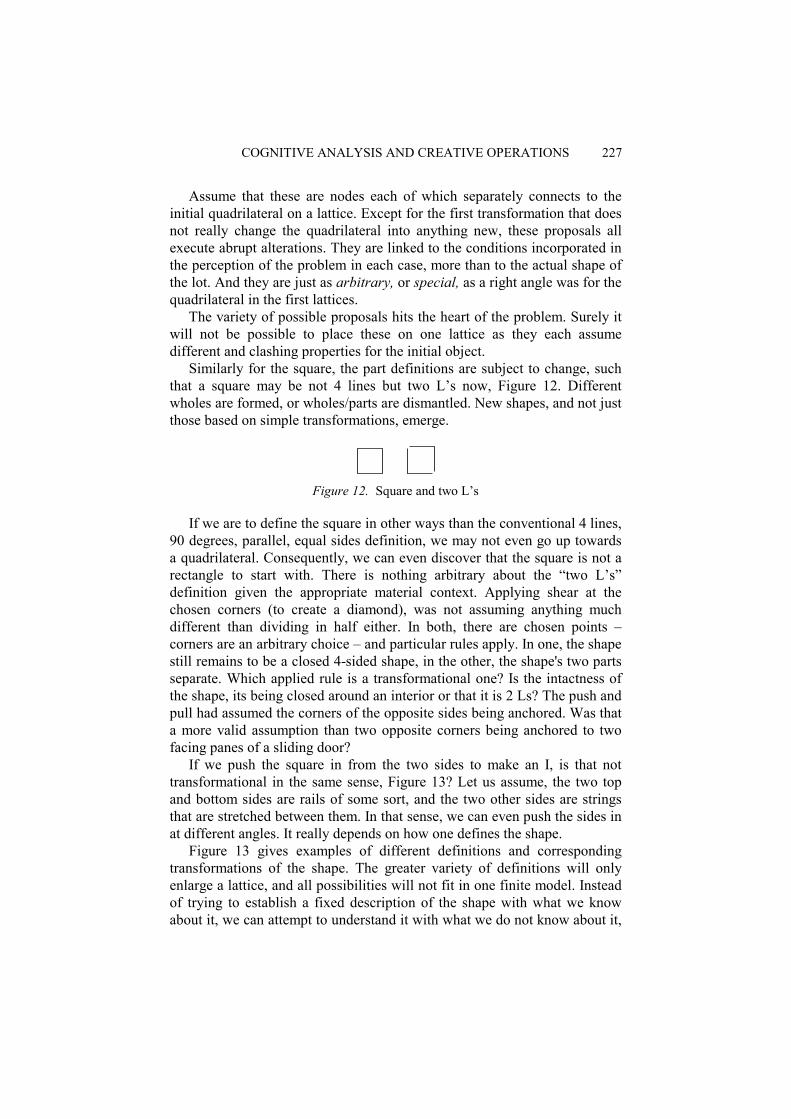
COGNITIVE ANALYSIS AND CREATIVE OPERATIONS 227
Assume that these are nodes each of which separately connects to the initial quadrilateral on a lattice. Except for the first transformation that does not really change the quadrilateral into anything new, these proposals all execute abrupt alterations. They are linked to the conditions incorporated in the perception of the problem in each case, more than to the actual shape of the lot. And they are just as arbitrary, or special, as a right angle was for the quadrilateral in the first lattices.
The variety of possible proposals hits the heart of the problem. Surely it will not be possible to place these on one lattice as they each assume different and clashing properties for the initial object.
Similarly for the square, the part definitions are subject to change, such that a square may be not 4 lines but two L’s now, Figure 12. Different wholes are formed, or wholes/parts are dismantled. New shapes, and not just those based on simple transformations, emerge.
Figure 12. Square and two L’s
If we are to define the square in other ways than the conventional 4 lines, 90 degrees, parallel, equal sides definition, we may not even go up towards a quadrilateral. Consequently, we can even discover that the square is not a rectangle to start with. There is nothing arbitrary about the “two L’s” definition given the appropriate material context. Applying shear at the chosen corners (to create a diamond), was not assuming anything much different than dividing in half either. In both, there are chosen points – corners are an arbitrary choice – and particular rules apply. In one, the shape still remains to be a closed 4-sided shape, in the other, the shape's two parts separate. Which applied rule is a transformational one? Is the intactness of the shape, its being closed around an interior or that it is 2 Ls? The push and pull had assumed the corners of the opposite sides being anchored. Was that a more valid assumption than two opposite corners being anchored to two facing panes of a sliding door?
If we push the square in from the two sides to make an I, is that not transformational in the same sense, Figure 13? Let us assume, the two top and bottom sides are rails of some sort, and the two other sides are strings that are stretched between them. In that sense, we can even push the sides in at different angles. It really depends on how one defines the shape.
Figure 13 gives examples of different definitions and corresponding transformations of the shape. The greater variety of definitions will only enlarge a lattice, and all possibilities will not fit in one finite model. Instead of trying to establish a fixed description of the shape with what we know about it, we can attempt to understand it with what we do not know about it,
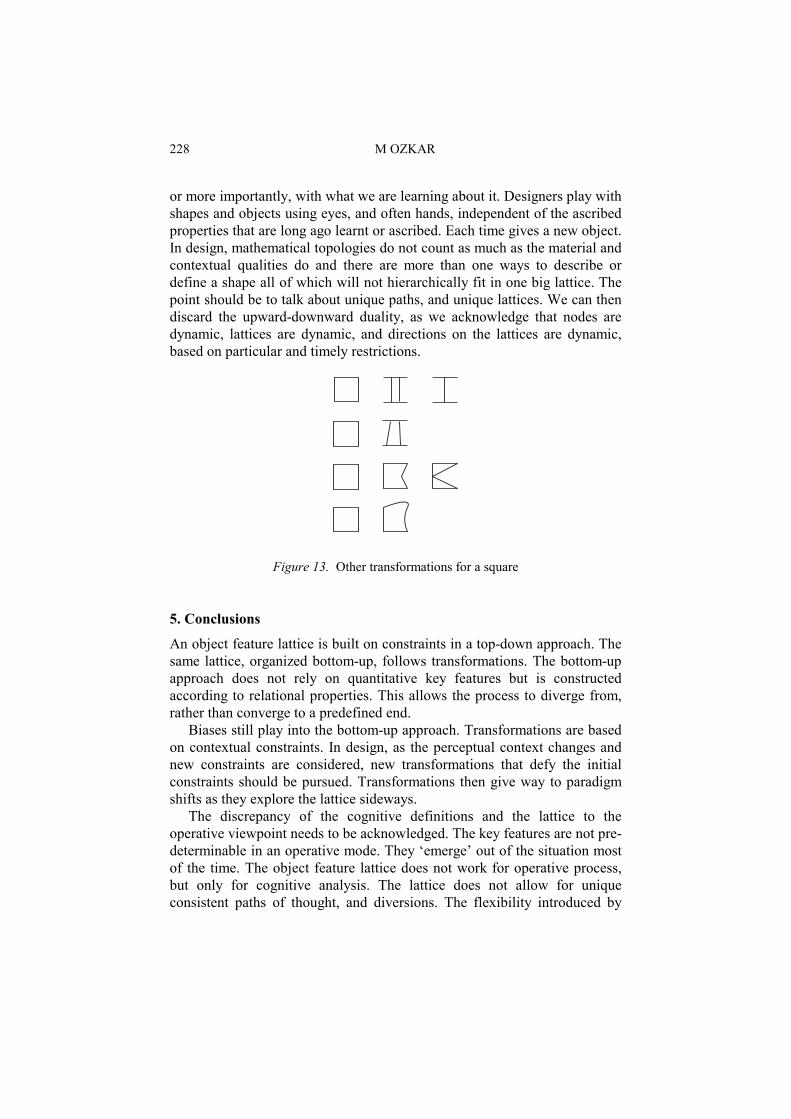
228 M OZKAR
or more importantly, with what we are learning about it. Designers play with shapes and objects using eyes, and often hands, independent of the ascribed properties that are long ago learnt or ascribed. Each time gives a new object. In design, mathematical topologies do not count as much as the material and contextual qualities do and there are more than one ways to describe or define a shape all of which will not hierarchically fit in one big lattice. The point should be to talk about unique paths, and unique lattices. We can then discard the upward-downward duality, as we acknowledge that nodes are dynamic, lattices are dynamic, and directions on the lattices are dynamic, based on particular and timely restrictions.
Figure 13. Other transformations for a square
5. Conclusions
An object feature lattice is built on constraints in a top-down approach. The same lattice, organized bottom-up, follows transformations. The bottom-up approach does not rely on quantitative key features but is constructed according to relational properties. This allows the process to diverge from, rather than converge to a predefined end. Biases still play into the bottom-up approach. Transformations are based on contextual constraints. In design, as the perceptual context changes and new constraints are considered, new transformations that defy the initial constraints should be pursued. Transformations then give way to paradigm shifts as they explore the lattice sideways. The discrepancy of the cognitive definitions and the lattice to the operative viewpoint needs to be acknowledged. The key features are not pre-determinable in an operative mode. They ‘emerge’ out of the situation most of the time. The object feature lattice does not work for operative process, but only for cognitive analysis. The lattice does not allow for unique consistent paths of thought, and diversions. The flexibility introduced by
COGNITIVE ANALYSIS AND CREATIVE OPERATIONS 229
transformations in the bottom-up approach however, needs to be expanded by allowing for the contextual changes every time.
The lattice works in all directions and with dynamic nodes. There are multiple paths that are each viable in different contexts. The designer follows a unique path that goes up, down and sideways in an inclusive lattice, which may not ever be conceived. The unique paths could instead be described using schemas that incorporate both the constraints and the transformations as proposed by Stiny (2004).
Acknowledgements I would like to thank Professor Whitman Richards for the essential discussions that brought about this work.
References
Feldman, J: 1992, Constructing perceptual categories, Proc Comp Vis and Pat Recog, Champaign, IL, June, pp. 244-250.
Feldman, J: 1997, The structure of perceptual categories, Journal of Mathematical Psychology, 41(2): 145-170.
Leyton, M: 1992, Symmetry, Causality, Mind, MIT Press, Cambridge, MA March, L: 1996, The smallest interesting world? Environment and Planning B: Planning and
Design 23(2): 133-142. March, L and Stiny, G: 1985, Spatial systems in architecture and design: Some history and
logic, Environment and Planning B: Planning and Design 12(1): 31-53. Richards, W, Feldman, J and Jepson, A: 1992, From features to perceptual categories, in D
Hogg & R Boyle (eds), British Machine Vision Conference, Springer-Verlag, Berlin, pp. 99-108.
Santolini, A, Danis, A, Tijus, C and Poitrenaud, S: 2002, Applying galois lattices to the interactions of the virgin and child in Bellini's paintings, Leonardo 35(4): 391-2.
Stiny, G: 2004, Shape, MIT Press, Cambridge, MA (forthcoming).

230

SESSION 6
Visual analogy: Viewing retrieval and mapping as constraint satisfaction problems Patrick Yaner and Ashok Goel
Aspectualize and conquer in architectural design
Sven Bertel, Christian Freska and Geroge Vrachliotis


JS Gero, B Tversky and T Knight (eds), Visual and Spatial Reasoning in Design III, 2004 Key Centre of Design Computing and Cognition, University of Sydney, pp 233-253
VISUAL ANALOGY: VIEWING RETRIEVAL AND MAPPING AS CONSTRAINT SATISFACTION PROBLEMS
PATRICK W YANER AND ASHOK K GOEL Georgia Institute of Technology, USA
Abstract. We examine the retrieval and mapping tasks of visual analogy as constraint satisfaction problems. We describe a constraint satisfaction method for the two tasks; the method organizes the source cases in a discrimination tree; uses heuristics to guide the search; performs backtracking, and searches all the source cases at once. We present an evaluation of this method for retrieval and mapping of diagrammatic cases containing 2D line drawings.
1. Introduction
Holyoak and Thagard (1989; Thagard et al. 1990) proposed that the retrieval and mapping tasks can be productively viewed as constraint satisfaction problems. Their proposal incorporated structural, semantic, and pragmatic constraints and used graph isomorphism as the primary similarity measure. Their mapping system, ACME, and the complementary retrieval system, ARCS, provided connectionist implementations of their proposal. In ACME, nodes are constructed for each map hypothesis (between a source element and a target element), with inhibitory and excitatory links between the nodes, and the network is run until it reaches quiescence. The work here builds on Holyoak and Thagard’s proposal but seeks a different solution to the retrieval and mapping tasks. While we also view the retrieval and mapping tasks as constraint satisfaction problems, our method for addressing the tasks, firstly, organizes the source cases in a discrimination tree, secondly, uses (general-purpose) heuristics to guide the search, thirdly, performs a backtracking search, and fourthly, searches all the source cases at once.
This work is concerned specifically with visual analogy. Although visual cases in general may contain knowledge of many kinds, such as photographs, drawings, diagrams, animations and videos, this work deals only with diagrammatic knowledge represented symbolically. Diagrams play an important role in complex problem solving, for example, in design.

234 PW YANER AND AK GOEL
Specifically, this work deals with diagrammatic knowledge of shapes, their sizes and locations, and the spatial relationships between the shapes.
In general, analogical reasoning spawns several tasks, as illustrated in Figure 1. The first part of this paper focuses on the retrieval and mapping tasks of visual analogy. The retrieval task assumes a computer-based library of 2D line drawings, takes as input a query (target) in the form of a drawing (and no other information), and gives as output the source drawing that is most similar to the target. The mapping task takes as input a target problem and a source case, and gives as output correspondences between the basic elements of the source case and the target problem. In a companion project, we have developed a technique for transfer of spatial knowledge, given a target problem and a source case, and given a mapping between the two (Davies and Goel 2001; 2003). We are presently integrating the computer programs into one.
focus of this section
Retrieval
focus of our system
Mapping StorageEvaluationAdaptation
Transfer and
Figure 1. The tasks of analogy. This paper focuses on the retrieval and mapping
tasks, with the first part of this paper focusing on retrieval.
The first part of this paper describes an architecture for retrieval of drawings, and then describes the representation of the drawings. Next, it describes the retrieval task as a constraint satisfaction problem, a method of constraint satisfaction with backtracking for addressing the task, and the organization of the computer-based library on which the external memory of drawings indexed by feature vectors (a feature extractor on which the method operates). Then, it presents experimental results on the performance of this method. The second part of the paper first describes how the CSP method used for the retrieval task can be extended to the mapping task. Finally, it compares our work with related research and ends with some conclusions.
2. Computational Architecture
Following earlier work on associative retrieval—e.g. MAC/FAC (Forbus, Gentner, and Law 1995)—our architecture supports a two-stage process for diagram retrieval: reminding (or initial recall), and selection. The architecture, illustrated in Figure 2, consists of (up to) six basic components: an initial stage generating feature vectors, a process that generates a

VISUAL ANALOGY 235
semantic network describing the contents (spatial structure in this case) of a drawing, a process that matches a target's description (semantic network) to source descriptions from memory, a working memory with potential sources to match with the target, and finally, an interface to the rest of the analogy system in which this retrieval would be taking place.
Feature Vector
Description
External Memory
Target
DescriptionMatcher
FeatureComparison
WorkingMemory
DescriptionGenerator
ResultsFeatureExtractor
Image
Figure 2. System architecture
The reminding task takes as input a target example and returns as output references to stored drawings whose feature vectors match that of the target. The stored drawings are indexed by feature vectors describing their spatial elements; the feature vector for the target is constructed dynamically. References to those drawings with sufficiently similar feature vectors (according to some appropriate criteria, as explained below) are brought into the working memory. In the selection stage, the semantic networks of the drawings in working memory are matched with that of the target example. Drawings whose descriptions match the target description sufficiently well are collected and returned. Semantic networks describing the spatial structure of the drawing are constructed for each source drawing when they are entered into library; the semantic network for the target is constructed dynamically.
While the reminding stage of the retrieval process uses a vector of features—i.e. a vector of attribute-value pairs—as a heuristic to gauge the potential of a source drawing matching the target drawing, the selection task uses the spatial structure of line drawings—i.e. the qualitative arrangement of the various shapes in them—to actually match the target to the source drawings.
There are, essentially, three representations in this system: the representation of the drawings themselves, the feature vectors, and the
236 PW YANER AND AK GOEL
network of spatial relations (called “description” in Figure 2). The representation of the drawings themselves is simply object-based: a list of each visual element, such as lines, triangles, etc., and their specific geometric properties (location, and so on). The feature vector is a multiset of the object and relation types contained in a semantic network. A multiset is a set that can contain more than one of each element (e.g. 2·A, 3·B, …). Given a semantic network describing a drawing, a feature vector in our system would look something like this: 3·rectangle, 2·circle, 3·leftOf, 1·contains, ….
A drawing is recalled if the multiset of shape and relation types contained in it is a superset of that of the target. The method scans all stored drawings, calculating whether or not the multiset of objects and relations in the target is a subset of the multiset of objects in each source drawing, and returning those for which this is the case. That is, if Q is the feature vector for the target, and S1, S2, … , Sk are the feature vectors of the drawings currently in memory, then the method returns those drawings for which Q ⊆ Si.
2.1. SEMANTIC NETWORKS
Figure 3 illustrates a simple 2D line drawing and its representation (in terms of spatial relations) in our system. The system at present recognizes four types of spatial elements: individual lines, triangles, rectangles, and ellipses (circles and squares are special cases of ellipses and rectangles, and are not treated as being of a separate type). Also, it presently recognizes five types of relations among the elements: “left-of”, “right-of”, “above”, “below”, and “contains”. The automatic generation of a semantic network for a target drawing works by taking the input drawing (in XFig format) and comparing every pair of shapes using the available predicates. If a particular predicate holds, a link is added between the associated nodes in the semantic network, with the appropriate label. As an example, the semantic network in Figure 3 would represent the drawing shown above it.
2.2. MEMORY ORGANIZATION
When a source drawing is added to memory, several things happen. First, its description is generated, the network of relations describing the spatial layout of the drawing, as well as its feature vector. Second, once this network is generated, each “term” in the network, by which we mean a link (relation) together with its incident nodes (elements), is added to a discrimination tree. This allows the selection method to match individual terms in the target with all terms of the same form that appear across all source drawings in memory, thus allowing all of the descriptions of all of the drawings to be searched at once.
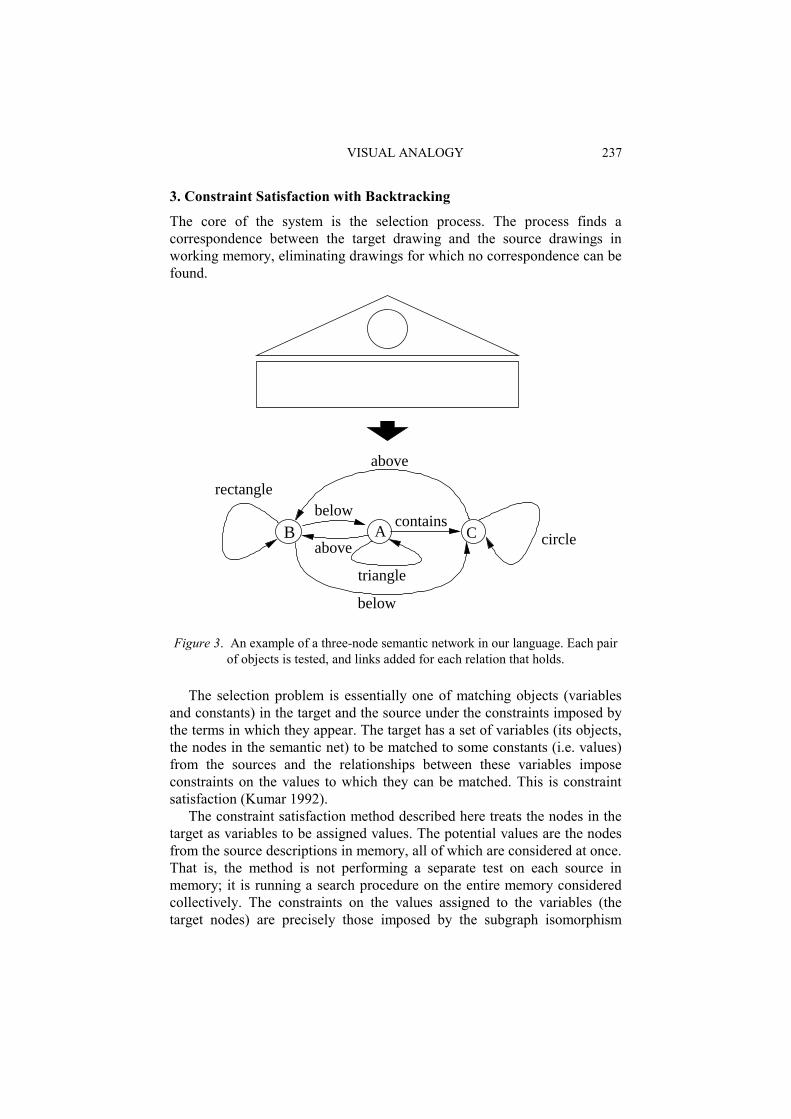
VISUAL ANALOGY 237
3. Constraint Satisfaction with Backtracking
The core of the system is the selection process. The process finds a correspondence between the target drawing and the source drawings in working memory, eliminating drawings for which no correspondence can be found.
below
above
containsbelow
above
triangle
rectangle
circleB CA
Figure 3. An example of a three-node semantic network in our language. Each pair of objects is tested, and links added for each relation that holds.
The selection problem is essentially one of matching objects (variables and constants) in the target and the source under the constraints imposed by the terms in which they appear. The target has a set of variables (its objects, the nodes in the semantic net) to be matched to some constants (i.e. values) from the sources and the relationships between these variables impose constraints on the values to which they can be matched. This is constraint satisfaction (Kumar 1992).
The constraint satisfaction method described here treats the nodes in the target as variables to be assigned values. The potential values are the nodes from the source descriptions in memory, all of which are considered at once. That is, the method is not performing a separate test on each source in memory; it is running a search procedure on the entire memory considered collectively. The constraints on the values assigned to the variables (the target nodes) are precisely those imposed by the subgraph isomorphism
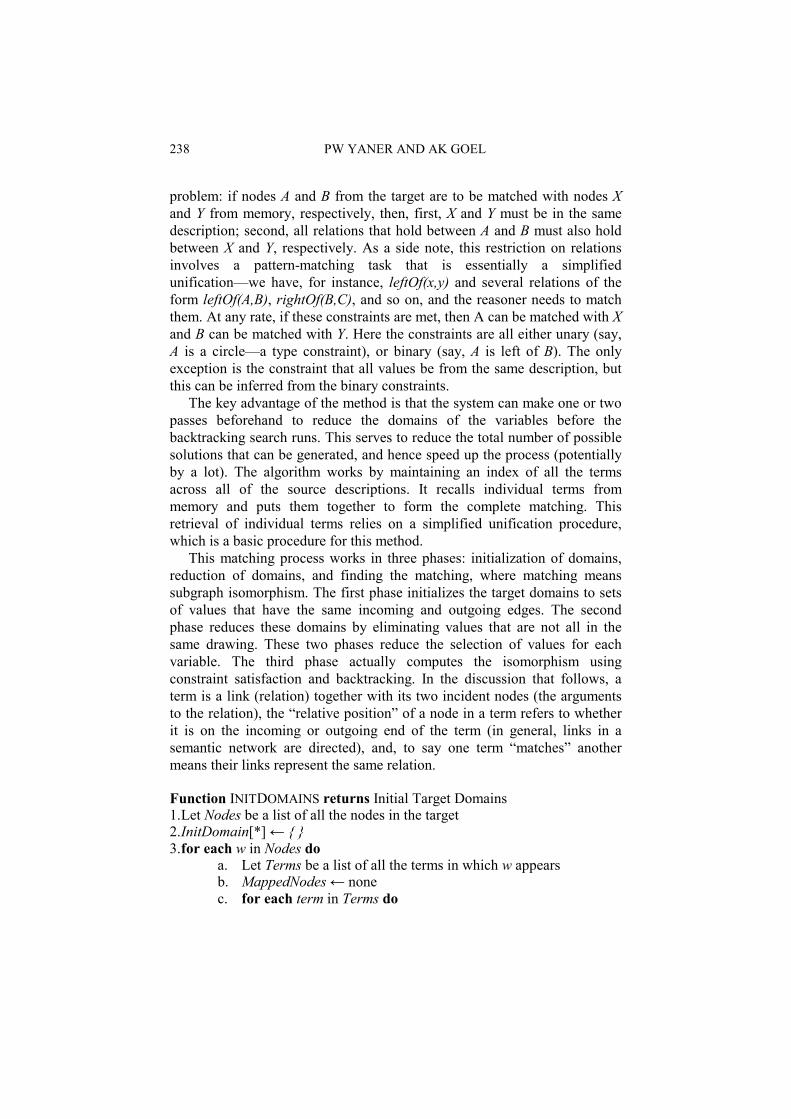
238 PW YANER AND AK GOEL
problem: if nodes A and B from the target are to be matched with nodes X and Y from memory, respectively, then, first, X and Y must be in the same description; second, all relations that hold between A and B must also hold between X and Y, respectively. As a side note, this restriction on relations involves a pattern-matching task that is essentially a simplified unification—we have, for instance, leftOf(x,y) and several relations of the form leftOf(A,B), rightOf(B,C), and so on, and the reasoner needs to match them. At any rate, if these constraints are met, then A can be matched with X and B can be matched with Y. Here the constraints are all either unary (say, A is a circle—a type constraint), or binary (say, A is left of B). The only exception is the constraint that all values be from the same description, but this can be inferred from the binary constraints.
The key advantage of the method is that the system can make one or two passes beforehand to reduce the domains of the variables before the backtracking search runs. This serves to reduce the total number of possible solutions that can be generated, and hence speed up the process (potentially by a lot). The algorithm works by maintaining an index of all the terms across all of the source descriptions. It recalls individual terms from memory and puts them together to form the complete matching. This retrieval of individual terms relies on a simplified unification procedure, which is a basic procedure for this method.
This matching process works in three phases: initialization of domains, reduction of domains, and finding the matching, where matching means subgraph isomorphism. The first phase initializes the target domains to sets of values that have the same incoming and outgoing edges. The second phase reduces these domains by eliminating values that are not all in the same drawing. These two phases reduce the selection of values for each variable. The third phase actually computes the isomorphism using constraint satisfaction and backtracking. In the discussion that follows, a term is a link (relation) together with its two incident nodes (the arguments to the relation), the “relative position” of a node in a term refers to whether it is on the incoming or outgoing end of the term (in general, links in a semantic network are directed), and, to say one term “matches” another means their links represent the same relation. Function INITDOMAINS returns Initial Target Domains 1. Let Nodes be a list of all the nodes in the target 2. InitDomain[*] ← 3. for each w in Nodes do
a. Let Terms be a list of all the terms in which w appears b. MappedNodes ← none c. for each term in Terms do
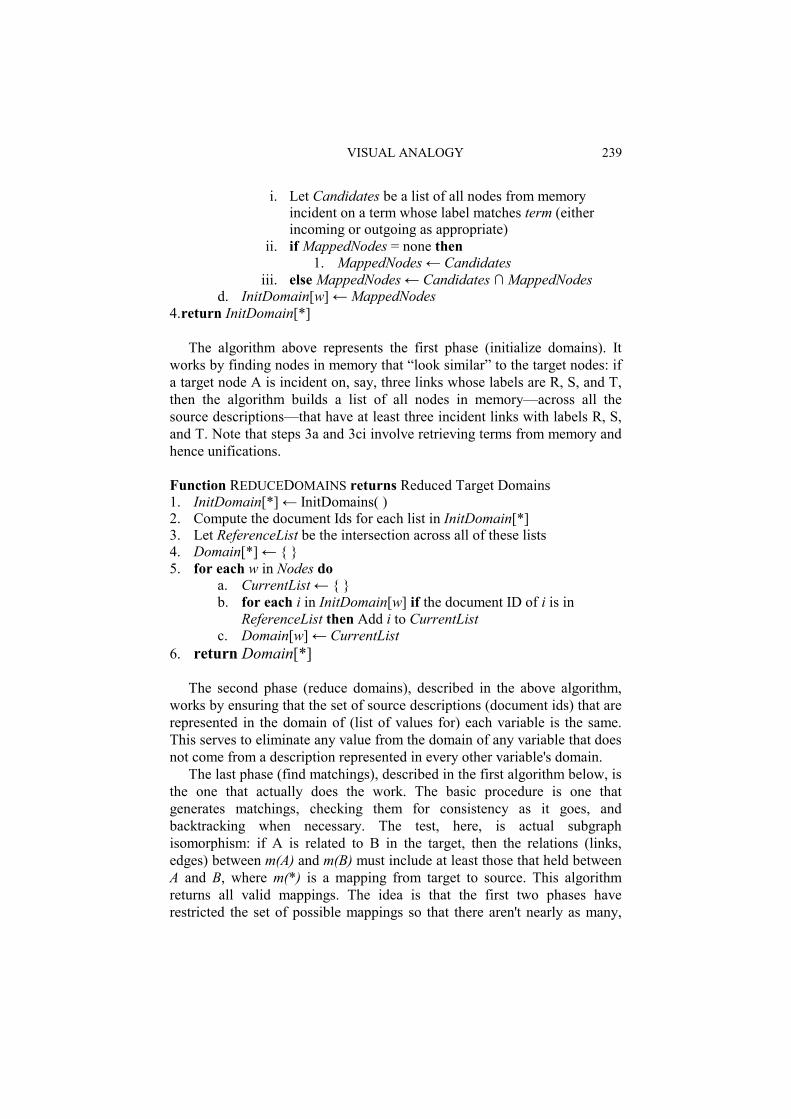
VISUAL ANALOGY 239
i. Let Candidates be a list of all nodes from memory incident on a term whose label matches term (either incoming or outgoing as appropriate)
ii. if MappedNodes = none then 1. MappedNodes ← Candidates
iii. else MappedNodes ← Candidates ∩ MappedNodes d. InitDomain[w] ← MappedNodes
4. return InitDomain[*]
The algorithm above represents the first phase (initialize domains). It works by finding nodes in memory that “look similar” to the target nodes: if a target node A is incident on, say, three links whose labels are R, S, and T, then the algorithm builds a list of all nodes in memory—across all the source descriptions—that have at least three incident links with labels R, S, and T. Note that steps 3a and 3ci involve retrieving terms from memory and hence unifications.
Function REDUCEDOMAINS returns Reduced Target Domains 1. InitDomain[*] ← InitDomains( ) 2. Compute the document Ids for each list in InitDomain[*] 3. Let ReferenceList be the intersection across all of these lists 4. Domain[*] ← 5. for each w in Nodes do
a. CurrentList ← b. for each i in InitDomain[w] if the document ID of i is in
ReferenceList then Add i to CurrentList c. Domain[w] ← CurrentList
6. return Domain[*]
The second phase (reduce domains), described in the above algorithm, works by ensuring that the set of source descriptions (document ids) that are represented in the domain of (list of values for) each variable is the same. This serves to eliminate any value from the domain of any variable that does not come from a description represented in every other variable's domain.
The last phase (find matchings), described in the first algorithm below, is the one that actually does the work. The basic procedure is one that generates matchings, checking them for consistency as it goes, and backtracking when necessary. The test, here, is actual subgraph isomorphism: if A is related to B in the target, then the relations (links, edges) between m(A) and m(B) must include at least those that held between A and B, where m(*) is a mapping from target to source. This algorithm returns all valid mappings. The idea is that the first two phases have restricted the set of possible mappings so that there aren't nearly as many,
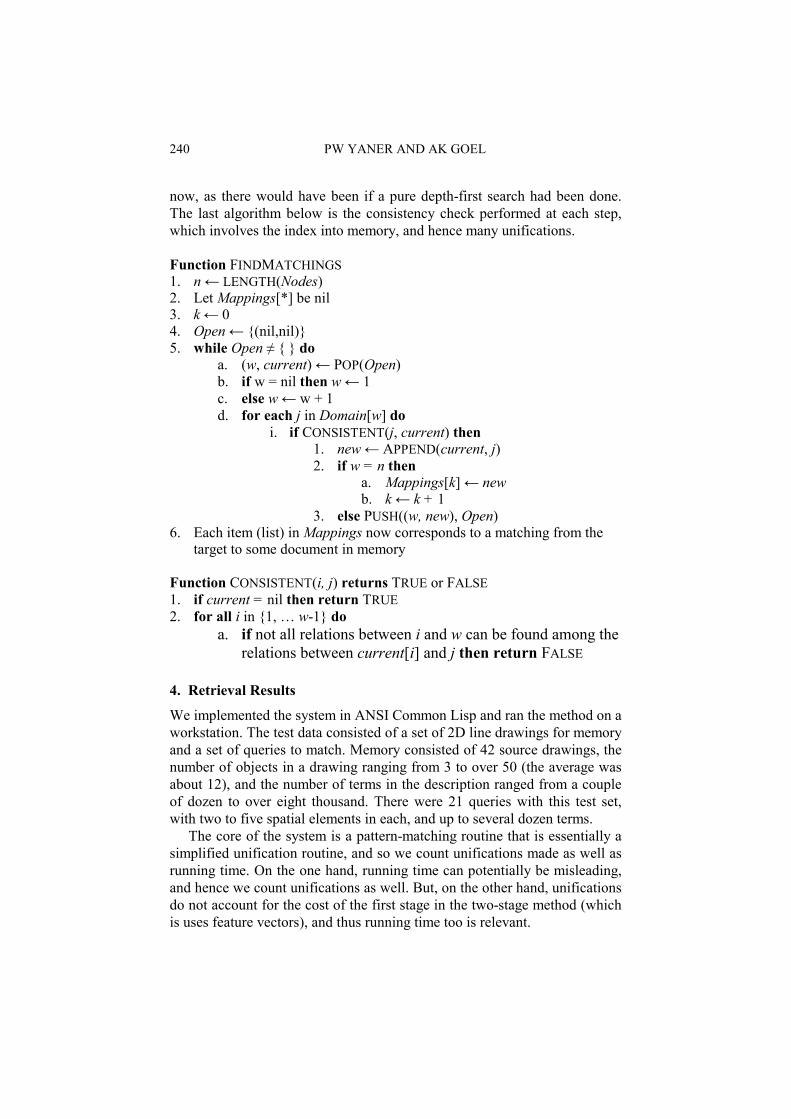
240 PW YANER AND AK GOEL
now, as there would have been if a pure depth-first search had been done. The last algorithm below is the consistency check performed at each step, which involves the index into memory, and hence many unifications. Function FINDMATCHINGS 1. n ← LENGTH(Nodes) 2. Let Mappings[*] be nil 3. k ← 0 4. Open ← (nil,nil) 5. while Open ≠ do
a. (w, current) ← POP(Open) b. if w = nil then w ← 1 c. else w ← w + 1 d. for each j in Domain[w] do
i. if CONSISTENT(j, current) then 1. new ← APPEND(current, j) 2. if w = n then
a. Mappings[k] ← new b. k ← k + 1
3. else PUSH((w, new), Open) 6. Each item (list) in Mappings now corresponds to a matching from the
target to some document in memory Function CONSISTENT(i, j) returns TRUE or FALSE 1. if current = nil then return TRUE 2. for all i in 1, … w-1 do
a. if not all relations between i and w can be found among the relations between current[i] and j then return FALSE
4. Retrieval Results
We implemented the system in ANSI Common Lisp and ran the method on a workstation. The test data consisted of a set of 2D line drawings for memory and a set of queries to match. Memory consisted of 42 source drawings, the number of objects in a drawing ranging from 3 to over 50 (the average was about 12), and the number of terms in the description ranged from a couple of dozen to over eight thousand. There were 21 queries with this test set, with two to five spatial elements in each, and up to several dozen terms.
The core of the system is a pattern-matching routine that is essentially a simplified unification routine, and so we count unifications made as well as running time. On the one hand, running time can potentially be misleading, and hence we count unifications as well. But, on the other hand, unifications do not account for the cost of the first stage in the two-stage method (which is uses feature vectors), and thus running time too is relevant.
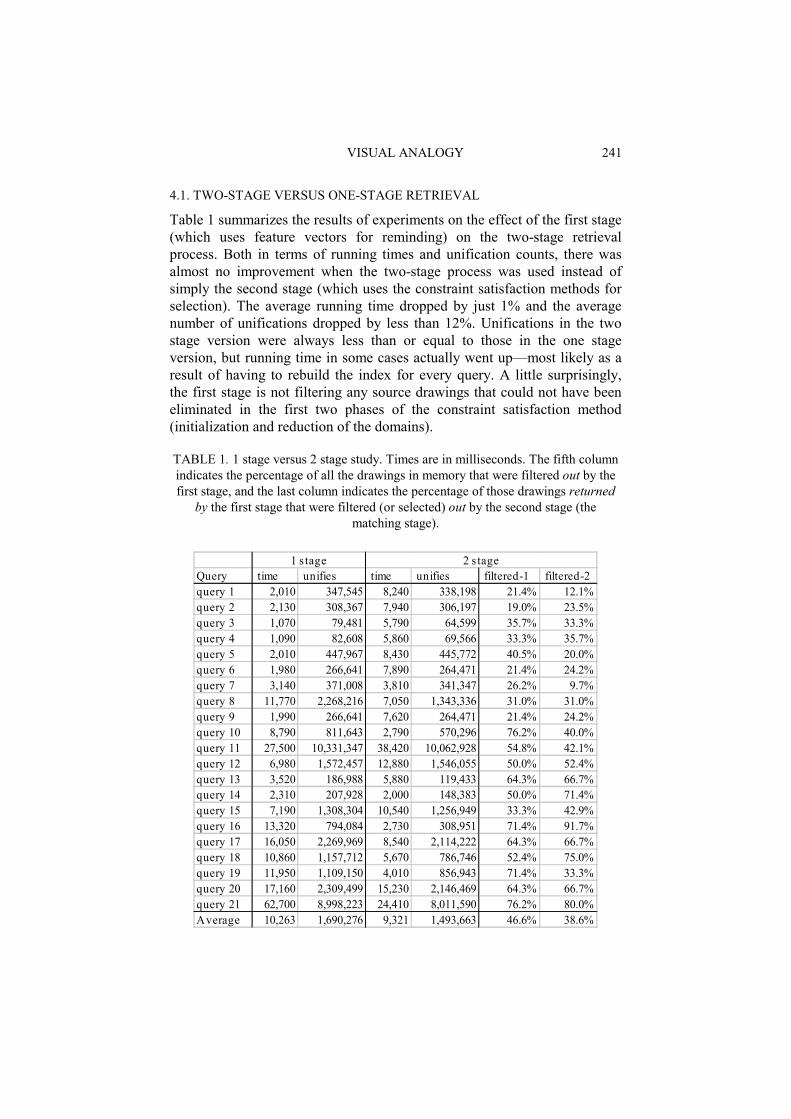
VISUAL ANALOGY 241
4.1. TWO-STAGE VERSUS ONE-STAGE RETRIEVAL
Table 1 summarizes the results of experiments on the effect of the first stage (which uses feature vectors for reminding) on the two-stage retrieval process. Both in terms of running times and unification counts, there was almost no improvement when the two-stage process was used instead of simply the second stage (which uses the constraint satisfaction methods for selection). The average running time dropped by just 1% and the average number of unifications dropped by less than 12%. Unifications in the two stage version were always less than or equal to those in the one stage version, but running time in some cases actually went up—most likely as a result of having to rebuild the index for every query. A little surprisingly, the first stage is not filtering any source drawings that could not have been eliminated in the first two phases of the constraint satisfaction method (initialization and reduction of the domains).
TABLE 1. 1 stage versus 2 stage study. Times are in milliseconds. The fifth column indicates the percentage of all the drawings in memory that were filtered out by the first stage, and the last column indicates the percentage of those drawings returned
by the first stage that were filtered (or selected) out by the second stage (the matching stage).
Query time unifies time unifies filtered-1 filtered-2query 1 2,010 347,545 8,240 338,198 21.4% 12.1%query 2 2,130 308,367 7,940 306,197 19.0% 23.5%query 3 1,070 79,481 5,790 64,599 35.7% 33.3%query 4 1,090 82,608 5,860 69,566 33.3% 35.7%query 5 2,010 447,967 8,430 445,772 40.5% 20.0%query 6 1,980 266,641 7,890 264,471 21.4% 24.2%query 7 3,140 371,008 3,810 341,347 26.2% 9.7%query 8 11,770 2,268,216 7,050 1,343,336 31.0% 31.0%query 9 1,990 266,641 7,620 264,471 21.4% 24.2%query 10 8,790 811,643 2,790 570,296 76.2% 40.0%query 11 27,500 10,331,347 38,420 10,062,928 54.8% 42.1%query 12 6,980 1,572,457 12,880 1,546,055 50.0% 52.4%query 13 3,520 186,988 5,880 119,433 64.3% 66.7%query 14 2,310 207,928 2,000 148,383 50.0% 71.4%query 15 7,190 1,308,304 10,540 1,256,949 33.3% 42.9%query 16 13,320 794,084 2,730 308,951 71.4% 91.7%query 17 16,050 2,269,969 8,540 2,114,222 64.3% 66.7%query 18 10,860 1,157,712 5,670 786,746 52.4% 75.0%query 19 11,950 1,109,150 4,010 856,943 71.4% 33.3%query 20 17,160 2,309,499 15,230 2,146,469 64.3% 66.7%query 21 62,700 8,998,223 24,410 8,011,590 76.2% 80.0%Average 10,263 1,690,276 9,321 1,493,663 46.6% 38.6%
1 s tage 2 s tage
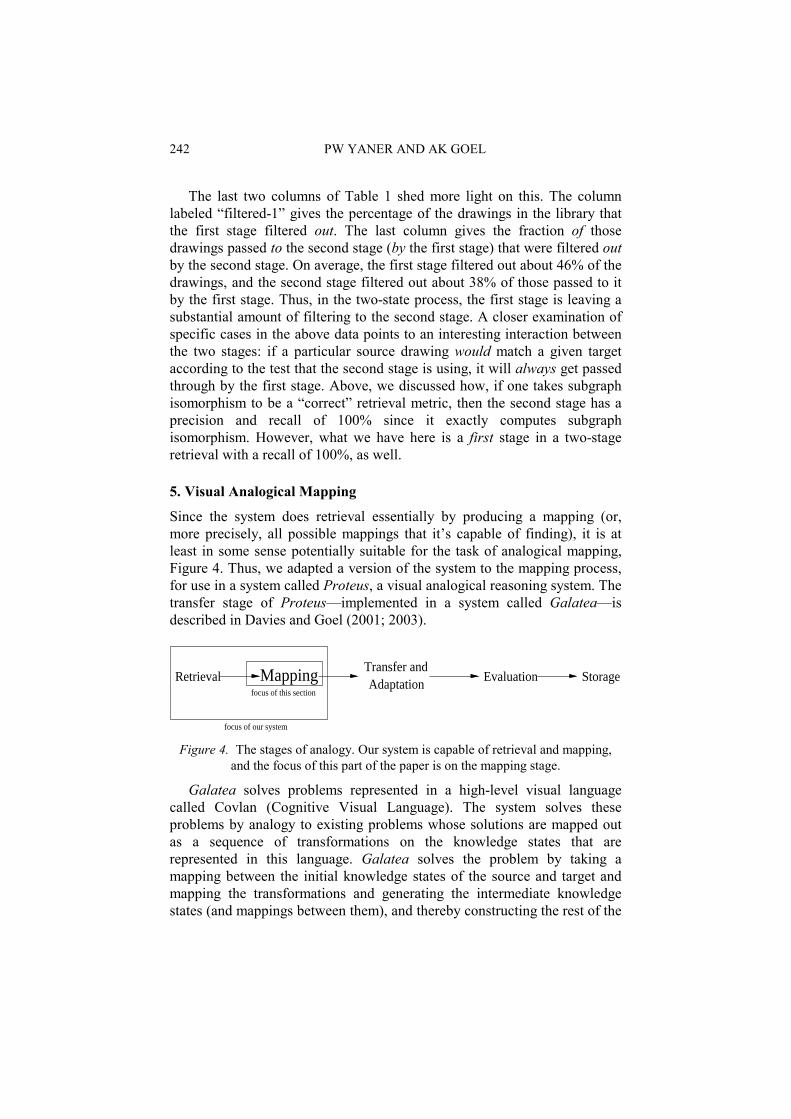
242 PW YANER AND AK GOEL
The last two columns of Table 1 shed more light on this. The column labeled “filtered-1” gives the percentage of the drawings in the library that the first stage filtered out. The last column gives the fraction of those drawings passed to the second stage (by the first stage) that were filtered out by the second stage. On average, the first stage filtered out about 46% of the drawings, and the second stage filtered out about 38% of those passed to it by the first stage. Thus, in the two-state process, the first stage is leaving a substantial amount of filtering to the second stage. A closer examination of specific cases in the above data points to an interesting interaction between the two stages: if a particular source drawing would match a given target according to the test that the second stage is using, it will always get passed through by the first stage. Above, we discussed how, if one takes subgraph isomorphism to be a “correct” retrieval metric, then the second stage has a precision and recall of 100% since it exactly computes subgraph isomorphism. However, what we have here is a first stage in a two-stage retrieval with a recall of 100%, as well.
5. Visual Analogical Mapping
Since the system does retrieval essentially by producing a mapping (or, more precisely, all possible mappings that it’s capable of finding), it is at least in some sense potentially suitable for the task of analogical mapping, Figure 4. Thus, we adapted a version of the system to the mapping process, for use in a system called Proteus, a visual analogical reasoning system. The transfer stage of Proteus—implemented in a system called Galatea—is described in Davies and Goel (2001; 2003).
focus of this section
focus of our system
Retrieval Mapping StorageEvaluationAdaptation
Transfer and
Figure 4. The stages of analogy. Our system is capable of retrieval and mapping,
and the focus of this part of the paper is on the mapping stage.
Galatea solves problems represented in a high-level visual language called Covlan (Cognitive Visual Language). The system solves these problems by analogy to existing problems whose solutions are mapped out as a sequence of transformations on the knowledge states that are represented in this language. Galatea solves the problem by taking a mapping between the initial knowledge states of the source and target and mapping the transformations and generating the intermediate knowledge states (and mappings between them), and thereby constructing the rest of the

VISUAL ANALOGY 243
transformations and knowledge states leading to the solution to the target problem, Figure 5. The mapping system, then, needs to connect the initial knowledge state of the source and the target drawing. Our only questions for this task, then, are: (1) what is that knowledge representation, and (2) what is the nature of the required mappings?
Output by reasoner
Source
Target
mapping
Source Simage 1
mapping
Source Simage 2 Source Simage n
Target Simage 1 Target Simage 2 Target Simage n
mapping
Figure 5. The grey box indicates the portion constructed by Galatea, things outside
are provided to it. The entire source analog, transformations and all, would come from memory, while our analogical mapping component would complete the analogy
between the initial knowledge states.
5.1. KNOWLEDGE REPRESENTATION
Covlan consists of knowledge states, primitive elements, primitive relations, primitive transformations, general visual concepts, and correspondence and transform representations. In Covlan, all knowledge is represented as propositions. In this paper we will only be concerned with the primitive elements and the primitive visual relations. The primitive elements are polygon, rectangle, triangle, ellipse, circle, arrow, line, point, curve, and text. There is also a set element type, with members that have in-set relations back to the set they are members of, though these do not correspond to visible entities—this is purely for grouping purposes. Each element is represented as a frame with attribute slots such as location, size, orientation, and thickness, but these attributes will not concern us, since mappings between attribute values are not part of the required mappings, and thus representing them in the semantic network is not necessary.
Primitive visual relations represented are touching, above-below, right-of-left-of, in-front-of-behind, and off-s-image. There are also two motion relations: translation and rotation. A typical knowledge state is represented with a node corresponding to that knowledge state (e.g. L14-simage1), and elements (which may be sets) are represented with contains-object relations from the knowledge state element to the visual elements themselves.

244 PW YANER AND AK GOEL
5.1.1. Examples We describe here some example problems originally designed for Galatea. The first example problem is a fairly simple one: dividing a pizza into some number of slices based on analogy to the problem of dividing up a cake into some number of pieces, Figure 6. In this case, there is a cake (or pizza), and a set of people in the initial problem state. Set members are not mapped, and the division is made in transformations in later problem states, so the only possible mappings are cake to pizza and set of people to set of people, or cake to set of people and set of people to pizza. The problem, as represented in Galatea, does not contain any visual relations between the set of people and the cake (or pizza), and thus there is nothing constraining the mapping to be the “correct” mapping. The latter mapping will probably lead to failure in the transfer stage, but both are returned by the system.
pizza s−image 1
cake s−image 2cake s−image 1
mappingmapping
pizza s−image 2
Output by the agentTARGET PROBLEM
SOURCE CASE
pizza set 4
cake set 3
n= size of set 1object: cake
n= size of set 2object: pizza
DECOMPOSE
DECOMPOSE
people set 2
people set 1
pizza
cake
Figure 6. The cake/pizza example, a simple analogy between the problem of
dividing a cake into n pieces and the problem of dividing a pizza into m pieces. The boxed-in portion indicates the output of Galatea.
A more interesting example is based on Gick and Holyoak’s fortress/tumor problem (1980), shown in Figure 7. In this problem, we have an army attacking a fortress over mined roads, and the general decides to split his army to avoid setting off the mines, and a target case in which there is a patient with a tumor and a doctor who wants to kill the tumor with radiation. The supposed analogy is to split the beam (somehow) to avoid killing the healthy tissue that is in the way. The visual representation of these problems has a fortress (and a tumor represented similarly) and four roads (sections of the body surrounding the tumor), and an army represented
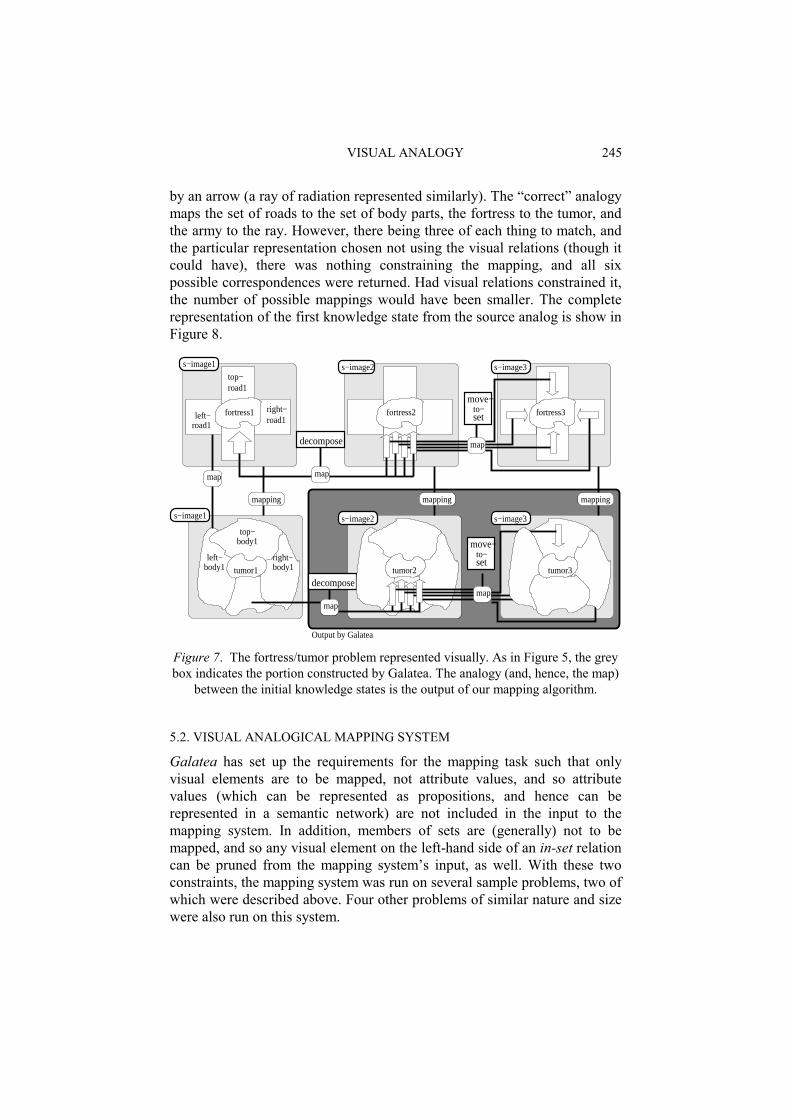
VISUAL ANALOGY 245
by an arrow (a ray of radiation represented similarly). The “correct” analogy maps the set of roads to the set of body parts, the fortress to the tumor, and the army to the ray. However, there being three of each thing to match, and the particular representation chosen not using the visual relations (though it could have), there was nothing constraining the mapping, and all six possible correspondences were returned. Had visual relations constrained it, the number of possible mappings would have been smaller. The complete representation of the first knowledge state from the source analog is show in Figure 8.
s−image1
s−image1
s−image3s−image2
s−image3s−image2
decompose
decompose
left−road1
road1top−
Output by Galatea
map
map
map
map
to−set
move−
mapping
to−
mapping
move−
setright−road1
map
mapping
body1
top−
tumor2 tumor3
right−body1
body1
tumor1
left−
fortress1 fortress3fortress2
Figure 7. The fortress/tumor problem represented visually. As in Figure 5, the grey box indicates the portion constructed by Galatea. The analogy (and, hence, the map)
between the initial knowledge states is the output of our mapping algorithm.
5.2. VISUAL ANALOGICAL MAPPING SYSTEM
Galatea has set up the requirements for the mapping task such that only visual elements are to be mapped, not attribute values, and so attribute values (which can be represented as propositions, and hence can be represented in a semantic network) are not included in the input to the mapping system. In addition, members of sets are (generally) not to be mapped, and so any visual element on the left-hand side of an in-set relation can be pruned from the mapping system’s input, as well. With these two constraints, the mapping system was run on several sample problems, two of which were described above. Four other problems of similar nature and size were also run on this system.

246 PW YANER AND AK GOEL
left−road−end−point
mine
soldier−path
road
left−road
right−road
top−road
left−mine
left−road−start−point
right−road−start−point
right−road−end−point
top−road−start−point
top−road−end−point
road−end−point
road−start−point
path
bottom
fortress s−image1
small
right−mine
top−mine
fortress
generic−visual−element
left
right
top
center
very−thick
looks−like
has−component
has−location
looks−like
has−size
has−location
has−location
has−thickness
has−location
contains−element
Figure 8. The representation of the first knowledge state of the source analog (the
fortress problem) from the fortress/tumor problem in Covlan. The complete problem representation is sketched in Figure 7.
The mapping algorithm works as follows: the outer procedure (generate mappings) first retrieves the named source and target representations from memory, then applies the above heuristics to it, and finally generates the mappings and returns them. The procedure follows: Function GENERATEMAPPINGS 1. source-rels ← first simage from source problem 3. target-rels ← target problem simage 4. s-rel-lables ← names of all relations represented in source-rels 5. t-rels ← remove from target-rels all relations that don’t match one in s-
rel-labels and all relations involving a literal (i.e. attribute-value pairs) 6. t-rel-labels ← names of all relations represented in t-rels 7. s-rels ← remove from source-rels all relations that don’t match one in t-
rel-labels and all relations involving a literal (i.e. attribute-value pairs) 8. s-nodes ← list of all nodes (elements) from s-rels 9. t-nodes ← list of all nodes (elements) from t-rels 10. domains ← GENERATEDOMAINS(s-nodes, length(t-nodes)) 11. r-domains ← GENERATEDOMAINS(t-nodes, length(s-nodes)) 12. f-mappings ← FINDPROJECTIONS(s-rels, t-nodes, t-rels, domains)
VISUAL ANALOGY 247
13. r-mappings ← FINDPROJECTIONS(t-rels, s-nodes, s-rels, r-domains) 14. r-mappings ← reverse each of the mappings returned in r-mappings so
that they map source onto target properly instead of target onto source
15. return f-mappings ∪ r-mappings
Since FINDPROJECTIONS computes subgraph isomorphism, as above, we run it both ways—attempting to map source onto target, and also attempting to map target onto source and reversing the returned mappings. Thus it is possible to find the target within the source or vice versa, finding the source within the target. The algorithm for FINDPROJECTIONS is identical with that of FINDMATCHINGS, above, where the second argument is Nodes, and the fourth is Domains, and the first and third are used in the consistency check to see if the relations match. The cake/pizza example described above, when run through this system, came up with two mappings: one that maps the cake to the pizza and the set of people to the set of people, and one that maps the cake to the set of people and the other set of people to the pizza:
CAKE maps-to PIZZA SET12 maps-to SET14 CAKE maps-to SET14 SET12 maps-to PIZZA SET12 is the set of people in first cake problem knowledge state, and
SET14 is the set of people in the first pizza problem knowledge state. Proteus, recall, does not map members of sets, and so the individual people are not mapped onto each other, only the sets. The first one, obviously, is the “correct” one, the one that would lead to a successful transfer and evaluation of the problem solution.
The fortress/tumor problem was slightly more interesting. The heuristics pruned out the set of roads and body parts, as well as the shapes and sizes and positions of all the elements, and so the only details left to influence the mappings were the fact that the elements were part of the problem. There were three elements, thus, remaining, for each one: FORTRESS and TUMOR, SOLDIER-PATH and RAY, and SET1 (the set of roads) and SET2 (the set of body parts surrounding the tumor), and six mappings produced:
FORTRESS maps-to TUMOR SOLDIER-PATH maps-to RAY SET1 maps-to SET2
248 PW YANER AND AK GOEL
FORTRESS maps-to TUMOR SOLDIER-PATH maps-to SET2 SET1 maps-to RAY FORTRESS maps-to RAY SOLDIER-PATH maps-to TUMOR SET1 maps-to SET2 FORTRESS maps-to RAY SOLDIER-PATH maps-to SET2 SET1 maps-to TUMOR FORTRESS maps-to SET2 SOLDIER-PATH maps-to TUMOR SET1 maps-to RAY FORTRESS maps-to SET2 SOLDIER-PATH maps-to RAY SET1 maps-to TUMOR Now, this really represents all correspondences between three things and
three things. The primary reason for this is that the representation chosen for this particular problem does not involve any reference-frame relations such as left-of or right-of. If it had, these relations would constrain the mappings.
As this illustrates, our system doesn’t exactly solve the mapping problem, as it returns all possible mappings. Even with the above structural gains to be gotten by altering the representation, it would still return all possible mappings—for instance, if there are four circles arranged in a square pattern, they would map to another set of four shapes in a square pattern in 24 ways in spite of structural constraints, and the mapping program would probably return all 24. In this case, pragmatic constraints might encourage (say) the most obvious and direct mapping (upper-left to upper-left, lower-right to lower-right and so on) and leave out the other more or less equivalent mappings.
6. Discussion
In the introduction, we mentioned Holyoak and Thagard’s ACME system (1989) and noted the similarities and differences between our work and theirs. ANALOGY (Evans 1968) was an even earlier AI program that performed the task of finding similarities and differences between visual cases. It performed simple geometric analogies of the kind that appear on
VISUAL ANALOGY 249
many intelligence tests. Let us suppose that each of A, B, C, D, E and F is an arrangement of simple geometric objects, e.g., a small triangle inside a large triangle, a small circle inside a larger circle, etc. Given an analogy A:B, and given C and multiple choices D, E and F, ANALOGY found which of D, E, and F had a relationship with C analogous to that between A and B. It represented the objects and the spatial relationships between them in the form of semantic networks, which enabled it to compare the spatial structure of the various arrangements. However, since ANALOGY performed an exhaustive and linear search of the mappings, its method cannot scale up to any realistic problem. While ANALOGY was an early program that matched symbolic descriptions of two drawings and found similarities and differences between the drawings, MAGI (Ferguson 2000) and JUXTA (Ferguson and Forbus 1998) are two recent systems that find mappings between symbolic representations of two drawings (or two portions of the same drawing). These systems use truth maintenance as the mechanism for keeping track of new constraints and retracting old conclusions, which is computationally inefficient. Our work offers a different symbolic approach to mapping visual cases, namely, constraint satisfaction with backtracking. Many case-based design systems, including our own earlier work on Archie (Pearce et al. 1992) and AskJef (Barber et al. 1992), contain multi-modal cases, i.e., cases that contain both visual (e.g., photographs, drawings, diagrams, animations and videos) and non-visual knowledge (e.g., goals, constraints, plans and lessons). Nevertheless, the multi-modal cases in these systems typically are indexed only by non-visual constructs such as goals and constraints. The target problem too typically is specified by its goal and constraints, and cases are retrieved based on a match between the goals and constraints with the source cases.
FABEL (Gebhardt et al. 1997) was an early project to explore the automated reuse of diagrammatic cases. In particular, TOPO (Börner et al. 1996), a subsystem of FABEL, used the maximum common subgraph (MCS) of the target drawing with the stored drawings for retrieve similar drawings. Although some work in case-based design, such as CADRE (Hua and Faltings, 1993) and CADSYN (Maher and Zhang 1993), has previously used constraint satisfaction methods, they have done so for the adaptation task (Sqalli et al. 1999).
An enormous amount of work has been previously done on such structural methods for matching, e.g., Forbus et al. (1995), Levinson and Ellis’ work (1992) on matching semantic networks based on subgraph isomorphism, and Petrakis et al.’s work (2002) on retrieval of medical images. Tombre (1996) provides a survey of such structural methods. In case-based reasoning, Perner (1995; 1999) and Grimnes (1996) have used similar methods for the task of image interpretation.
250 PW YANER AND AK GOEL
In computer vision, Grimson and Huttenlocher (1991) developed a similar method for object recognition. They begin with a model with a set of features, such as a set of potential edges in some arrangement, and sensor data with a set of sensor features (edges, vertices, etc.); a lot of sensor features might be noise. The task is to find a set of sensor features that comes from one (and the same) object. Their method matches model features to sensor features under some transformations within specific limit of tolerance. The model imposes constraints, for instance, by its arrangement of features. Although they do not describe it as constraint satisfaction, their method in fact is in assigning values to variables under unary and binary constraints imposed by the arrangement by using a backtracking depth-first search.
Constraint satisfaction methods have become common in AI: Kumar (1992) provides a survey; Prosser (1993) describes methods of constraint satisfaction with backtracking; and Bayardo and Schrag (1997) provide evidence of applicability of constraint satisfaction with backtracking for real-world intractable problems in planning and scheduling. Our method of constraint satisfaction with backtracking, with the case memory organized into discrimination trees, builds on the work of Ounis and Pasca (1998). They view the general problem of associative image retrieval as one of computing projections over conceptual graphs representing their content. Although they do not describe it as a constraint satisfaction method, their algorithm, in fact, is doing constraint satisfaction to compute the projection. However, their method is limited to constraint satisfaction with generate and test with no backtracking.
In the context of computer-aided design, Gross and Do (1995) describe a method for retrieving designs that contain a given design pattern in the domain of architectural design. Do and Gross' heuristic method is very simple: given two drawings, it compares the type and number of spatial elements and the spatial relations by counting. Their method is roughly equivalent to the first stage in the two-stage retrieval process.
In the context of geographical information systems, Egenhofer (1997) describes Spatial-Query-by-Sketch, a query drawing system that represents spatial relations between spatial regions (such as overlap or containment) as semantic networks. Although his work focuses on query formation and does not address retrieval per se, many practical geographical systems are based on either his scheme or the RCC8 scheme (Randell et al. 1992).
Associative image retrieval recently has received enormous attention in the literature on information retrieval and knowledge management. Extensive surveys (e.g. Gupta and Jain 1997; Rui et al. 1999; Santini and Jain 1999; Veltkamp and Tanase 2000) indicate much work on associative image retrieval has focused on the use of numerical and statistical techniques for extracting and comparing low-level features such as color,
VISUAL ANALOGY 251
texture, shape and spatial locations from bitmapped encodings of complex images. Various approaches involve the making of histograms of different kinds (such as simple color histograms) representing a distribution that somehow characterizes the image in various ways (such as the distribution of colors in the image over some color space like RGB). Similarity then can be computed simply by comparing the histograms.
7. Conclusions
This paper presented a method of constraint satisfaction for the retrieval and mapping tasks of visual analogy. The method organizes the source cases in a discrimination tree; uses heuristics to guide the search; performs backtracking, and searches all the source cases at once.
The experimental results for retrieval and mapping of diagrammatic cases containing 2D line drawings described lead us to make three preliminary conclusions. First, our laboratory-scale experiments, with drawings containing only up to fifty spatial elements and their representations containing only up to eight thousand terms, indicate that the method of constraint satisfaction is fast and appears quite promising for use in practice. On the one hand, we fully expect that the complexity of the task will significantly worsen for larger drawings and larger libraries of drawings, but, on the other, we also expect that it should be possible to develop significantly faster methods for the task. For example, we expect that use of spatial aggregations and abstractions to organize the representation of the spatial structure of a drawing in the form of a linked hierarchy of semantic networks would partition the search space performance especially for large, complex drawings. In addition, more sophisticated constraint satisfaction techniques such as forward checking and intelligent variable ordering, to name just a couple of common ones, can be brought to bear on the problem as well, taking advantage of structure in the knowledge representation and the search space.
Second, in a two-stage retrieval process, the first stage of initial recall, using feature vectors of spatial elements and relations, surprisingly provides little efficiency benefit to the second stage of selection using semantic networks of spatial elements and relations as the knowledge representation and subgraph isomorphism as similarity measure. Our experiments show that when the method of constraint satisfaction is used for the second stage, at least for retrieval of 2D line drawings, two-stage retrieval offered little improvement in performance over the one stage version consisting only of the selection task. Again, it is possible that the first stage in two-stage retrieval does improve efficiency for larger drawings and larger libraries of drawings.
252 PW YANER AND AK GOEL
Finally, although the method of constraint satisfaction not only retrieves relevant drawings but also generates mappings between a source drawing and the target problem, it does not of and by itself rank the different mappings. This means that additional metrics need to be invented to rank the mappings for use by the transfer task of analogy.
Acknowledgements This work has benefited from many discussions with Jim Davies, who is the primary architect of the Galatea system. Our description of Galatea has been taken from Davies and Goel (2003).
References Barber, J, Jacobson, M, Penberthy, L, Simpson, R, Bhatta, S, Goel, A, Pearce, M, Shankar, M
and Stroulia, E: 1992, Integrating artificial intelligence and multimedia technologies for interface design advising, NCR Journal of Research and Development 6(1):75-85.
Bayardo, RJ, Jr. and Schrag, R: 1997, Using CSP look-back techniques to solve real-world SAT instances, Proc. AAAI-97, AAAI Press, pp. 203-208.
Börner, K, Eberhard, P, Tammer, E-C, and Coulon, C-H: 1996, Structural similarity and adaptation, in I Smith and B Faltings (eds), Advances in Cased-Based Reasoning: Proc. 3rd European Workshop on Cased-Based Reasoning, vol. 1168 of Lecture Notes in Artificial Intelligence, Springer-Verlag, pp. 58-75.
Davies, J and Goel, AK: 2003, Visual case-based reasoning II: Transfer and adaptation, Proc. IICAI-03.
Davies, J and Goel, AK: 2001, Visual analogy in problem solving, Proc. IJCAI-01, Morgan Kaufmann, pp 377-382.
Egenhofer, MJ: 1997, Query processing in spatial-query-by-sketch, Journal of Visual Languages and Computing 8(4):403-424.
Evans, TG: 1968, A heuristic program to solve geometric analogy problems, in M Minsky (ed), Semantic Information Processing, MIT Press, Cambridge, MA.
Ferguson, RW: 2000, Modeling orientation effects in symmetry detection: The role of visual structure, in LR Gleitman and AK Josh (eds), Proc. 22nd Conf. of the Cognitive Science Society, Lawrence Erlbaum Associates.
Ferguson, RW and Forbus, KD: 1998, Telling juxtapositions: Using repretition and alignable difference in diagram understanding, in K Holyoak, D Gentner, and B Kokinov (eds), Advances in Analogy Research, New Bulgarian University, Sofia, Bulgaria, pp. 109-117.
Forbus, KD, Gentner, D, and Law, K: (1995). MAC/FAC: A model of similarity-based retrieval, Cognitive Science 19(2): 141-205.
Gebhardt, F, Voß, A, Gräther, W, and Schmidt-Belz B: 1997, Reasoning with Complex Cases, vol. 393 of Kluwer Series in Engineering and Computer Science, Kluwer Academic Publishers.
Gick, ML and Holyoak, KJ: 1980, Analogical problem solving, Cognitive Psychology 12: 306-355.
Grimnes, M: 1996, A two-layer case-based reasoning architecture for medical image understanding, in I Smith and B Faltings (eds), Advances in Case-Based Reasoning, 3rd European Workshop, EWCBR-96, vol. 1168 of Lecture Notes in Artificial Intelligence, Springer-Verlag, pp. 164-178.
Grimson, WEL and Huttenlocher, DP: 1991, On the verification of hypothesized matches in model-based recognition, IEEE Transactions on Pattern Analysis and Machine Intelligence 13(12): 1201-1213.
VISUAL ANALOGY 253
Gross, MD and Do, EY-L: 1995, Diagram query and image retrieval in design, Proc. 2nd International Conference on Image Processing, IEEE Computer Society Press.
Gupta, A and Jain, R: 1997, Visual information retrieval, Communications of the ACM, 40(5): 69-79.
Holyoak, KJ and Thagard, P: 1989, Analogical mapping by constraint satisfaction, Cognitive Science 13(3): 295-355.
Hua, K, Smith, I, and Faltings, B: 1993, Exploring case-based building design—CADRE, Artificial Intelligence for Engineering Design, Analysis and Manufacturing (AI EDAM), 7(2):135-144.
Kumar, V: 1992, Algorithms for constraint satisfaction problems: A survey, AI Magazine, 13(1): 32-44.
Levinson, R and Ellis, G: 1992, Multi-level hierarchical retrieval, Knowledge-Based Systems, 5(3): 233-244.
Maher, ML and Zhang, DM: 1993, CADSYN: A case-based design process model, Artificial Intelligence for Engineering Design, Analysis and Manufacturing (AI EDAM) 7(2): 135- 144.
Ounis, I and Paşca, M: 1998, RELIEF: Combining expressiveness and rapidity into a single system, Proc. 21st Annual ACM SIGIR Conference, ACM Press, pp. 266-274.
Pearce, M, Goel, AK, Kolodner, JL, Zimring, C, Sentosa, L, and Billington, R: 1992, Case-based design support: A case study in architectural design, IEEE Expert: Intelligent Systems & Their Applications 7(5): 14-20.
Perner, P; 1995, Case-based reasoning for image interpretation, in V Hlavac and R Sara (eds), Computer Analysis of Images and Patterns, 6th International Conf., CAIP ’95, vol. 970 of Lecture Notes in Computer Science, Springer-Verlag, pp. 532-537.
Perner, P: 1999, An architecture for a CBR image segmentation system, in K-D Althoff, R Bergmann, and LK Branting (eds), Case-Based Reasoning Research and Development, 3rd International Conf on Case-Based Reasoning, ICCBR-99, vol. 1650 of Lecture Notes in Artificial Intelligence, Springer-Verlag, pp. 525-534.
Prosser, P: 1993, Hybrid algorithms for the constraint satisfaction problem, Computational Intelligence 9(3): 268-299.
Randell, DA, Cui, Z and Cohn, AG: 1992, A spatial logic based on regions and connections, Proc. 3rd International Conf. On Knowledge Representation and Reasoning, Morgan Kaufmann Publishers, pp. 165-176.
Reisbeck, CK and Schank, RC: 1989, Inside Case-Based Reasoning, Lawrence Erlbaum Associates, Hillsdale, NJ.
Rui, Y, Huang, TS and Chang, S-F: 1999, Image retrieval: Current techniques, promising directions, and open issues, Journal of Visual Communications and Image Representation 10(4): 39-62.
Santini, S and Jain, R: 1999, Similarity measures, IEEE Transactions on Pattern Analysis and Machine Intelligence 21(9): 871-883.
Sqalli, MH, Purvis, L and Freuder, EC: 1999, Survey of applications integrating constraint satisfaction and case-based reasoning, in C Layfield, B Smith, and A Wren (eds), Proc. PACLP 99.
Thagard, P, Holyoak, KJ, Nelson, G, and Gochfeld, D: 1990, Analog retrieval by constraint satisfaction, Artificial Intelligence 46: 259-310.
Tombre, K: 1996, Structural and semantic methods in line drawing analysis: To which extent do they work? in P Perner, PS-P Wang, and A Rosenfeld (eds), Advances in Structural and Syntactical Pattern Recognition, 6th International Workshop, SSPR ’96, vol. 1121 of Lecture Notes in Computer Science, Springer-Verlag, pp. 310-321.
Veltkamp, RC and Tanase, M: 2000, Content-based image retrieval systems: A survey, Technical Report UU-CS-2000-34, Institute of Information and Computing Sciences, Utrecht University.

254
JS Gero, B Tversky and T Knight (eds), Visual and Spatial Reasoning in Design III, 2004 Key Centre of Design Computing and Cognition, University of Sydney, pp 255-279
ASPECTUALIZE AND CONQUER IN ARCHITECTURAL DESIGN
SVEN BERTEL, CHRISTIAN FREKSA Universität Bremen, Germany
and
GEORG VRACHLIOTIS Swiss Federal Institute of Technology, Switzerland
Abstract. This paper describes architectural design processes from a cognitive science/artificial intelligence perspective. It characterizes the design task in terms of classical AI problem solving attributes. As architectural design specifications leave many relevant dimensions unspecified, it is a fascinating question how these dimensions are fixed during the design process. We identify general strategies to cope with the complex space of spatial design by considering cognitive approaches to understanding and problem solving. The AI “divide and conquer” problem solving strategy is adapted to the common design strategy of reducing problem complexity by focusing on different aspects of the design problem at a time. Examples from design principles in architecture are presented.
1. The Designer’s Dilemma
The domain of creative design in general and the domain of architectural spatial design in particular pose special challenges for the modeling of the processes involved. We will briefly outline some of the characteristics of the problem space that architects are confronted with. We will use concepts and terminology from computer science/artificial intelligence to describe the architectural domain. In the article, we analyze the design problem from a knowledge representation and reasoning point of view. For this purpose, various abstract spaces are introduced to characterize the design task and the design process. In this framework, cognitive principles are considered and applied to principles from architectural design.

256 S BERTEL, C FREKSA AND G VRACHLIOTIS
1.1. DESIGN IS FOR HUMAN USE AND FOR PLEASURE
Architectural design has two objectives which do not always harmonize well: a functional objective (the product of the design must permit specific or unspecific applications) and an aesthetic objective (the product of the design should fulfill unspecific or specific extra-practical goals). In this article, we focus on the design of functional spaces, although the principles we discuss seem not to be limited to spatial design.
There are lots of variables designers can ‘play around’ with: they include spatial dimensions like lengths, widths, or heights; shapes, materials, colors, to name but a few. Abstractly speaking, we can view design as consisting of a large feature space spun up by such variables; each point in this feature space in turn may expand to a large feature space by its own as a decision for a given feature value opens up yet more dimensions to be decided upon. Theoretically, there is no limit to the degree of nesting of those feature spaces; the nesting corresponds to a hierarchical decomposition of features into sub-features. In practice, there will be a limit when designers resort to the use of pre-designed components (rather than designing all the details of their components from scratch).
1.2. DESIGN ACTS IN HIGH-DIMENSIONAL DECISION SPACES
While the feature spaces just described correspond to the composition of physical entities from components, we also can consider the structure of decisions to be taken in the design process as abstract spaces. The corresponding decision space consists of all decisions that could be taken during the design (including those decisions that do not need to be taken because preceding decisions eliminated certain options that might exist when previously different decisions had been taken). This decision space is a high-dimensional space when we attribute separate dimensions to separate types of decisions that we could choose to take at any stage in the design process.
1.3. DYNAMICS OF FILTERED DECISION SPACE
The decision space can be conceptualized as a structure built upon the states of the problem space. Depending on the actual problem and the methods employed to traverse the problem space, the decision space can be as simple as a sequence or a tree; however, generally, it is a directed graph, in which the nodes correspond to individual problem states and the directed edges to transitions between states. Edges in the graph are directed as not all transitions are reversible, and where they are a transition and its reverse still differ conceptually and should, thus, be denoted separately.
It is one of the key properties of designing that not all states of the problem space are considered during a design process; the same holds for
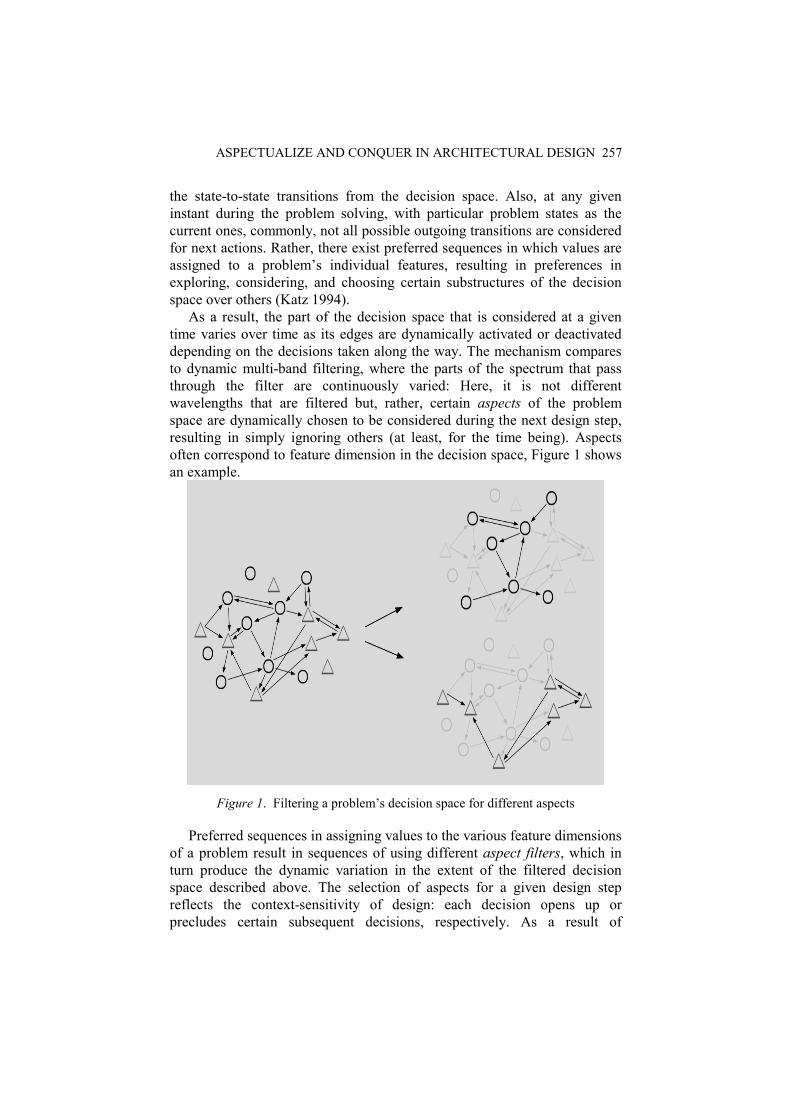
ASPECTUALIZE AND CONQUER IN ARCHITECTURAL DESIGN 257
the state-to-state transitions from the decision space. Also, at any given instant during the problem solving, with particular problem states as the current ones, commonly, not all possible outgoing transitions are considered for next actions. Rather, there exist preferred sequences in which values are assigned to a problem’s individual features, resulting in preferences in exploring, considering, and choosing certain substructures of the decision space over others (Katz 1994).
As a result, the part of the decision space that is considered at a given time varies over time as its edges are dynamically activated or deactivated depending on the decisions taken along the way. The mechanism compares to dynamic multi-band filtering, where the parts of the spectrum that pass through the filter are continuously varied: Here, it is not different wavelengths that are filtered but, rather, certain aspects of the problem space are dynamically chosen to be considered during the next design step, resulting in simply ignoring others (at least, for the time being). Aspects often correspond to feature dimension in the decision space, Figure 1 shows an example.
Figure 1. Filtering a problem’s decision space for different aspects
Preferred sequences in assigning values to the various feature dimensions of a problem result in sequences of using different aspect filters, which in turn produce the dynamic variation in the extent of the filtered decision space described above. The selection of aspects for a given design step reflects the context-sensitivity of design: each decision opens up or precludes certain subsequent decisions, respectively. As a result of
258 S BERTEL, C FREKSA AND G VRACHLIOTIS
considering only a subset of all aspects for a certain design decision, the decisions are often not irrevocable; rather, they may serve as tentative assumptions to set the stage for further considerations, and they may be revised later. The underlying feature dependencies make design a complex decision process. We will investigate some of the characteristics of the selection and decision processes in more detail later on, with a particular focus on information processing and complexity issues. The role of aspects in design problem solving will be a recurrent theme throughout the remainder of this paper; in particular, it will be the topic of Section 4.
1.4. DESIGN TASKS ARE UNDER-CONSTRAINED
Design tasks do not have just a single solution which needs to be determined; a potentially large variety of alternative solutions may fulfill the requirements of the design specification. In terms of the feature space, this means that many nodes in the decision graph may correspond to solutions of the design task. Furthermore, there may be several or many different routes in the design decision graph that lead to a given solution, as certain decisions can be sequenced in a variety of ways.
1.5. DESIGN TASKS ARE OVER-CONSTRAINED
To make things worse: many design tasks do not seem to have any solution at all. The requirements may be formulated in such a way that they correspond to unachievable ideal values such that trade-offs must be accepted to enable a solution. This creates new difficulties as trade-offs require the comparison of incommensurable feature dimensions.
1.6. HARD AND SOFT PARAMETERS
Fortunately, the world is not black and white. In our conception of the world, properties are not either true or false, feature values are not all or none, and even feature dimensions may be applicable to a higher or lesser degree. ‘Soft’ transitions in our perceptions of the structures and properties of the world help tremendously in modifying and trading-off design decisions. In fact, taking design decisions may turn into establishing tendencies and specifying trade-offs between incommensurable feature dimensions, rather than choosing between discrete alternatives, in certain situations.
1.7. INTERDEPENDENT AND INDEPENDENT PARAMETERS
Certain pairs of design decisions depend strongly on one another, while other decision pairs can be taken rather independently; most pairs, however,
ASPECTUALIZE AND CONQUER IN ARCHITECTURAL DESIGN 259
are somewhere in between: there exists an (inter-) dependency between decisions, but it is possible to abstract from it, for example, during the earlier phases of the design process, as the dependency may not have global consequences for the design decision process. In a later refinement phase, these more local interdependencies then may be considered.
One of the issues we will address in this paper is how the consideration of only a selected part of the design decision graph serves to reduce of the number of interdependencies considered, thus making the process as a whole more tractable.
1.8. DESIGN INVOLVES EXISTING AND NEW SOLUTIONS
One of the most efficient ways to reducing cognitive complexity of a design process lies in modifying existing solutions rather than starting from scratch. Such an approach strongly corresponds to how most designers seem to think about their objects of design: they have in mind a complete solution (which might not be specified in detail) rather than a collection of details which is configured into a complete design.
1.9. DILEMMAS AND PARADOXES
The list of properties that characterize design problems could be continued further. However, for the purposes of the present analysis we will restrict ourselves to what has been discussed so far. From a modeler’s perspective the least that can be said is that design activities hold intriguing challenges and nightmares at the same time: First, a description of design goals can be rather complex in terms of the number of both the features and their properties involved. Conversely, a prescription of adequate operators is as complex. Second, design processes operate in high-dimensional, filtered decision spaces that reconfigure dynamically. Past stages of the current or other design processes can again become important later on which further adds to the complexity. Third, the requirements that determine decision and solution spaces are regularly too few or too many.
Design problems are difficult to model and even more difficult to prescribe. Seen as searching for states in problem spaces, design problem solving becomes prototypically ill-defined as neither start states, goals states, nor transitions can usually be fully specified in advance (Simon 1973). Yet, houses, airplanes, tools, etc. exist, they get designed and constructed by humans, and, in most cases, they fulfill their functions as planned, i.e. we live, work, or fly in them, or use them otherwise.
It is, thus, reasonable to assume that human problem solving in design is different from the search-through-problem-space paradigm of Human Problem Solving (Newell and Simon 1972). Many authors before have pointed towards this issue (Goel 1995). As we are interested in the cognitive
260 S BERTEL, C FREKSA AND G VRACHLIOTIS
mechanisms of descriptive and prescriptive levels of modeling, we will continue the present analysis and examine the cognitive efforts involved in solving design problems.
2. Cognitive Effort in Architectural Design
Looking at description and modeling needs is only one way to reach an understanding of design problem solving. This section presents a selection of cognitive faculties involved in designing, and of cognitive efforts associated with design tasks.
2.1. VISUAL PERCEPTION STRUCTURES MENTAL REPRESENTATIONS
Vision seems to be the most important of the human senses for understanding the environment, in particular, in terms of the feature dimensions exploited in parallel. The graduated organization of information processing in the human visual system has great impact on the organization of visual percepts, and this organization influences the segmentation of the environment into objects, classes, and categories (Rosch 1975). Gestalt effects (Wertheimer 1912) provide good evidence of such organization. Perceptual processes mediate external organizational properties to mental representations and create analogical relationships (i.e. in the sense of Sloman 1975) between mental conception and manipulation, and objects and processes in the world.
2.2. VISUAL EXTERNALIZATION IN ARCHITECTURAL DESIGN
Architectural practice makes extensive use of all kinds of representation formats (diagrams, sketches, drawings, layouts) on various kinds of graphical media (regular paper, plan size paper, Post-Its, CAD models, physical models, VR models, etc.). Many of the representations are apprehended visually and spatially, and the importance of computational offloading of content and processes from the mental to the external world has been frequently stressed (Wilson 2002). Graphical representations are used also in the communication between designers (Healey et al. 2002). In this case, stable semantic interpretations of graphical symbols can lead to a reduction of cognitive load (Giordano 2002). Furthermore, a special relationship between the designer and her sketches seems to get established, such that they enter into a private dialogue in which mental constructions are externalized, visually analyzed, internalized, mentally processed, externalized again, and so on (Goldschmidt 1991; 1995). Generally, the basics of this relationship is attributed to a close coupling between visual mental imagery and visual perceptive systems (Finke 1990; Kosslyn 2003).

ASPECTUALIZE AND CONQUER IN ARCHITECTURAL DESIGN 261
2.3. MENTAL CONSTRUCTIONS
Problem solving in the architectural domain requires the integration of various kinds of information with various demands. Mental models (Johnson-Laird 1983) are dynamically assembled working memory constructions; they serve integrative purposes in that they are instantiations in which some of the information and demands are coherently arranged. Mental model based problem solving is specific, and instead of the systematic construction of all possible models the construction of some is preferred over that of others (Knauff et al. 1995). Mental images are special kinds of mental models in which some of the content is in visuo-analogical formats.
2.4. IMAGERY AND SKETCHING
In the dialectics between the designer and her sketches (Goldschmidt 1991) the constant re-representation of contents together with effects of graphical constraints can be seen as a driving force in imagery-based graphical reasoning (Scaife and Rogers 1996), as structural variants favor different mechanisms of inference and lead to the introduction of new operators and operands. In design processes, the iteration between mental and external representation of content can indeed lead to detailed design (Purcell and Gero 1998). Mental imagery models based on processes such as image generation, inspection, and transformation have further been suggested to explain behavioral differences in sketching between expert and novice designers (Kavakli and Gero 2001).
2.5. IMAGERY AND CREATIVITY
Mental imagery processes seem to play an important role for creative discovery in design (Roskos-Ewoldson et al. 1993; Kosslyn 1999), especially through their link to external pictorial representations. Manipulations to representational content differ in the mental and external realm in the ease with which they may be exerted. With respect to physical and mental synthesis tasks many similarities have been found (Finke et al. 1992; Anderson and Helstrup 1993) while structural manipulations seem to require external representations, e.g. a sketch (Verstijnen et al. 1998), in particular, when they entail the semantic reinterpretation of object parts.
2.6. CREATIVE ACTS IN DESIGN
The designer’s creative thought is often related to her inspiration, inventiveness and ingenuity. However, there exist many facets in design (and in architectural design, in particular) where creative acts seem less of an art, and more of a craft, i.e. a craft that can be taught and learned. In

262 S BERTEL, C FREKSA AND G VRACHLIOTIS
some of the current endeavors to create meta-theories for architectural design (Friedman 2003), the fundaments are laid for a transition “from the notion of Christopher Alexander’s (Alexander 1964) of a partially unself-conscious design to self-conscious and explicit design processes” (Eastman 1999). There seem to be design activities where the “creative leap” can indeed be related to necessary and sufficient conditions that must hold for creative acts to occur (Arkin 1998). Finally, there is good reason to believe that such activities can be adequately conceptualized in terms of mental model construction, inspection, and manipulation. The postulation of moves and arguments in design (Goldschmidt 1991) rests on similar theoretical grounds.
2.7. USE OF EXISTING SOLUTIONS IN DESIGN
It has already been stated that design practice significantly relies on modifying existing designs rather than constructing entirely new ones. Existing solutions play a two-fold role in design: (1) they provide context that helps identify decision criteria and (2) they provide analogies that may be exploited for the design (i.e. in that concepts, partial solutions, or methods are mapped from an existing design to the current problem). The mapping between base and target of the analogy is influenced by the differences in decision criteria between both problems, and, often, it is partial in that only certain aspects of the problems are considered. With respect to mental and external representations, many descriptions exist that point to the fundamental role of analogical mental reasoning (i.e. exploiting structural or visual properties; Goldschmidt 1994).
2.8. RE-REPRESENTATIONAL SYSTEMS
We have seen that specific properties of organization in mental and external representations seem to be important for solving design tasks, This is in particular true where differences in organizational schemes lead to re-representations of knowledge and entail new (structural) insights into the nature of a task as well as of its potential solutions. The duality of specific mental models and specific external representations (e.g. in the coupling of visual mental imagery and visual perception) thus creates a powerful system that sits at the core of cognitive faculties engaged in design tasks.
3. Techniques, Representations and Models
So far, we have seen characteristics of architectural design problems as well as of human cognitive systems that contribute to solving the problems. The following section presents a third part of the analysis: A range of examples will be given of methods and techniques that are characteristic of
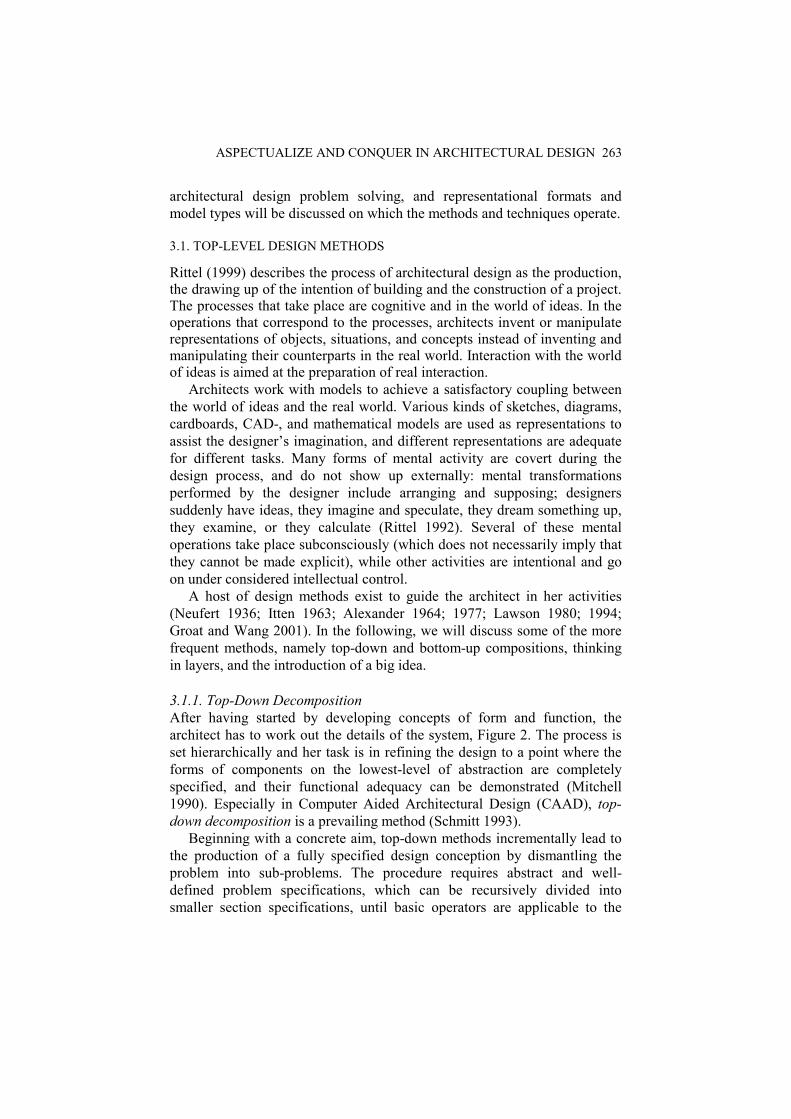
ASPECTUALIZE AND CONQUER IN ARCHITECTURAL DESIGN 263
architectural design problem solving, and representational formats and model types will be discussed on which the methods and techniques operate.
3.1. TOP-LEVEL DESIGN METHODS
Rittel (1999) describes the process of architectural design as the production, the drawing up of the intention of building and the construction of a project. The processes that take place are cognitive and in the world of ideas. In the operations that correspond to the processes, architects invent or manipulate representations of objects, situations, and concepts instead of inventing and manipulating their counterparts in the real world. Interaction with the world of ideas is aimed at the preparation of real interaction.
Architects work with models to achieve a satisfactory coupling between the world of ideas and the real world. Various kinds of sketches, diagrams, cardboards, CAD-, and mathematical models are used as representations to assist the designer’s imagination, and different representations are adequate for different tasks. Many forms of mental activity are covert during the design process, and do not show up externally: mental transformations performed by the designer include arranging and supposing; designers suddenly have ideas, they imagine and speculate, they dream something up, they examine, or they calculate (Rittel 1992). Several of these mental operations take place subconsciously (which does not necessarily imply that they cannot be made explicit), while other activities are intentional and go on under considered intellectual control.
A host of design methods exist to guide the architect in her activities (Neufert 1936; Itten 1963; Alexander 1964; 1977; Lawson 1980; 1994; Groat and Wang 2001). In the following, we will discuss some of the more frequent methods, namely top-down and bottom-up compositions, thinking in layers, and the introduction of a big idea.
3.1.1. Top-Down Decomposition After having started by developing concepts of form and function, the architect has to work out the details of the system, Figure 2. The process is set hierarchically and her task is in refining the design to a point where the forms of components on the lowest-level of abstraction are completely specified, and their functional adequacy can be demonstrated (Mitchell 1990). Especially in Computer Aided Architectural Design (CAAD), top-down decomposition is a prevailing method (Schmitt 1993).
Beginning with a concrete aim, top-down methods incrementally lead to the production of a fully specified design conception by dismantling the problem into sub-problems. The procedure requires abstract and well-defined problem specifications, which can be recursively divided into smaller section specifications, until basic operators are applicable to the
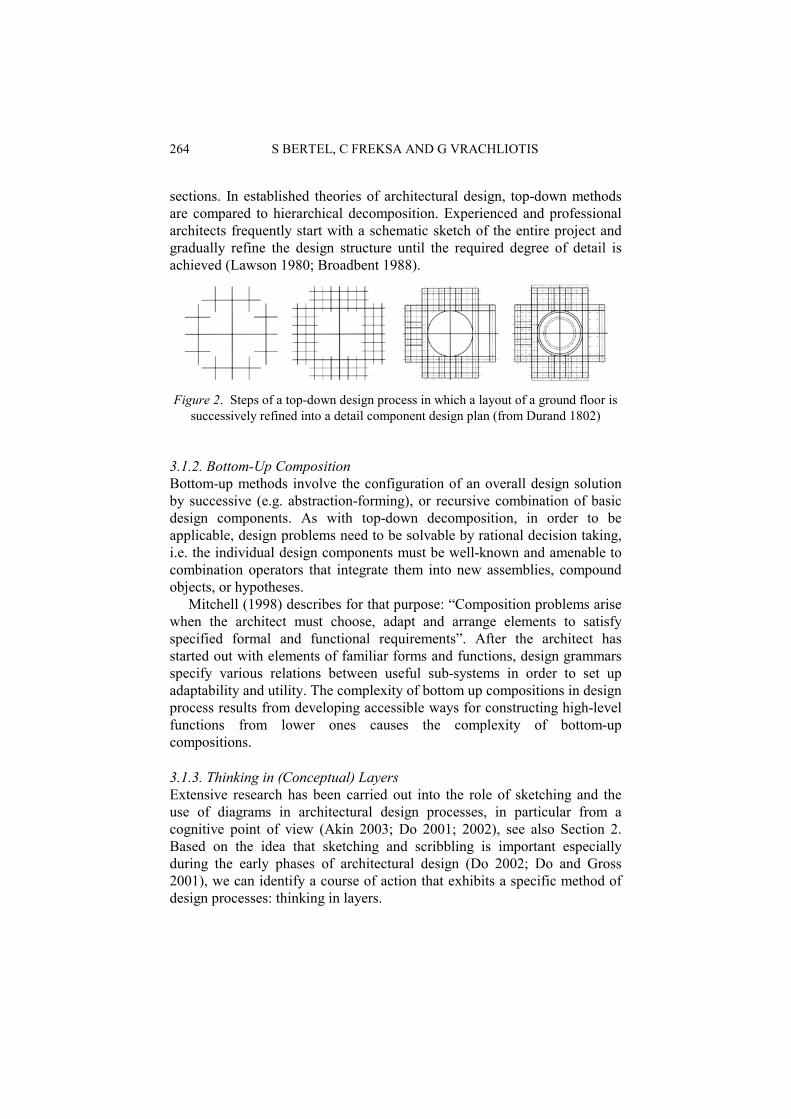
264 S BERTEL, C FREKSA AND G VRACHLIOTIS
sections. In established theories of architectural design, top-down methods are compared to hierarchical decomposition. Experienced and professional architects frequently start with a schematic sketch of the entire project and gradually refine the design structure until the required degree of detail is achieved (Lawson 1980; Broadbent 1988).
Figure 2. Steps of a top-down design process in which a layout of a ground floor is
successively refined into a detail component design plan (from Durand 1802)
3.1.2. Bottom-Up Composition Bottom-up methods involve the configuration of an overall design solution by successive (e.g. abstraction-forming), or recursive combination of basic design components. As with top-down decomposition, in order to be applicable, design problems need to be solvable by rational decision taking, i.e. the individual design components must be well-known and amenable to combination operators that integrate them into new assemblies, compound objects, or hypotheses.
Mitchell (1998) describes for that purpose: “Composition problems arise when the architect must choose, adapt and arrange elements to satisfy specified formal and functional requirements”. After the architect has started out with elements of familiar forms and functions, design grammars specify various relations between useful sub-systems in order to set up adaptability and utility. The complexity of bottom up compositions in design process results from developing accessible ways for constructing high-level functions from lower ones causes the complexity of bottom-up compositions.
3.1.3. Thinking in (Conceptual) Layers Extensive research has been carried out into the role of sketching and the use of diagrams in architectural design processes, in particular from a cognitive point of view (Akin 2003; Do 2001; 2002), see also Section 2. Based on the idea that sketching and scribbling is important especially during the early phases of architectural design (Do 2002; Do and Gross 2001), we can identify a course of action that exhibits a specific method of design processes: thinking in layers.
ASPECTUALIZE AND CONQUER IN ARCHITECTURAL DESIGN 265
Architects are trained to draw and to use diagrams to communicate their thoughts and to describe ideas and suggestions. Characteristic of a designer’s sketching actions is “redrawing” (Do 2003) in which the designer repeatedly outlines a particular area of a drawing, e.g. as to define the final shapes of a building, compare Figure 3. The combination of redrawing techniques with tracing paper as a medium serves as a complex and efficient design method to the experienced architect.
Figure 3. Gradual refinement of ideas in sketches shows thinking in layers
3.1.4. The Big Idea Architectural design from an artistic and more imaginative point of view claims that structural design is the product of intuitive inspiration and creation. The design of Le Corbusier´s chapel Notre Dame du Haut (1950-65) for examples, was inspired by a crap shell that he found somewhere on a beach of Long Island. Years later, when making the first drawings of the roof shape, the crab shell was lying next to his sketchbook and, thus, was used with respect to function and form. The introduction of a “big idea” into a design process can lend further structure to it, for instance, by implicitly or explicitly introducing structural analogies to problems, solutions, and methods in other domains. In addition, big ideas often promote more artistic aspects of architectural design.
3.2. REPRESENTING DOMAINS
Finding appropriate descriptions for architectural design processes that adequately capture the ill-defined interconnections between the different sub-processes remains one of the main challenges of architectural design research. At every time in the history of architecture, the paradoxical process existed of moving back and forth among the rational and the non-rational, the objective and the subjective, and the individual and the universal. However, we know that most features in architectural design thinking range in continua between those two-paired extremes, (Bamford 2002). Akin (2001) describes buildings as a complex system whose intention is to bring the user in line with a number of dimensions: functional, psychological, cognitive, ergonomic, climatic, economical, etc.
3.2.1. Volumetric Design Architects often resort to using basic three-dimensional volumes. Le Corbusier, for example, suggested this method in a well-known sketch (Le

266 S BERTEL, C FREKSA AND G VRACHLIOTIS
Corbusier 1923) in which he introduced a vocabulary of fundamental architectural elements and illustrated how these might be assembled into more complex compositions. The architectural composition of volumetric basic shapes remains popular in architectural design education, because the underlying theory is easily understood, the conceptual and graphic manipulations of the shapes follow simple rules, while the resulting drawings are nevertheless representative of various relevant design aspects. Particularly with regard to the discussion of cognitive effort in Section 2, it seems plausible to assume that basic volumetric shapes are more accessible to mental imagery faculties than more complex 3D-shapes.
Each architect knows how to operate cubes, prisms, spheres, cones and combinations thereof. However, volumes can be seen as solid elements of construction or as bounded voids. Mitchell (1996) explains that especially in CAD-based design a building appears in two complementary ways: as composition of voids or as composition of solids.
3.2.2. Case-Based Reasoning For most cases, architectural design involves a blending of existing and new solutions. CAD-based systems usually include a knowledge base of classified past or otherwise accessible designs. A case-based reasoning system can assist the development of a design solution by looking up similar cases, adapt them to the current problem, and provide the architect with background knowledge. Characteristic aspects of the case-based system are the database of cases, methods for matching cases, and methods for adapting them to current requirements (Schmitt 1993), Casually, the most comprehensive case base is the real, built environment that we experience daily; it is a collective starting point for all new designs in architecture.
3.2.3. Symmetrical Means in Architecture Throughout the history of architectural design, there exists a clear tendency to use symmetry for aesthetical expression. Pythagorean architectural theory, for example, transformed buildings into mathematical models that illustrate and demonstrate the idea of a universal order. Le Corbusier described the cognitive need of order and arrangement for keeping thoughts together (Giedeon 1949). Creativity, thus, is a process of structuring. Ideas of symmetry and the claim of pure architecture can be traced back to Aristotle’s idea of nature: that is, recognizing the nature of something means in particular to emphasize a difference (species est genus et differentia).
3.3. REPRESENTING RELEVANT PROCESSES
While considering the design of a garden greenhouse, Lawson (1980) describes a number of design features whose values are subject to variation
ASPECTUALIZE AND CONQUER IN ARCHITECTURAL DESIGN 267
by the architect. For example, he could choose from a number of different materials for the frame, such as wood, steel, aluminum, orplastic. “In fact there are many more design variables including the glazing material, method of ventilation and type of door. What the architect has to do is to select the combination of all these features, which will give the most satisfactory performance”. Thus, the focus is on selecting features, as well as their values.
3.3.1. Working with Prototypes In architectural design, prototypes are conceptual patterns that represent generalized design knowledge. They are structured hierarchically, from the most general patterns to the most specific ones (Schmitt 1993). Three classes of design operations with prototypes have been proposed: the refinement of prototypes, their adjustment, and the development of new prototypes. The classes are suggested to correspond to applications in routine, innovative, and creative design (Gero 1990). The use of design prototypes in architecture can lead to extensive investigations into design parts, as the designer has the possibility to develop various levels of details.
3.4. PRIORITIZING CONSTRAINTS
Constraints in design largely result from required or desired relationships between two or more elements (Lawson 1980). We can distinguish internal and external constraints: internal constraints can be easily changed by the architect, their values can be varied by common design methods. External constraints, on the other hand, cannot be changed without problems (or cannot be changed at all); they are commonly outside the problem’s subspace on which design methods have an effect. A building site’s direction relation to the sun is a good example of an external relation. Despite being widely inaccessible, external constraints are often extremely important for the design as a whole, as they set the frame of possible action, and provide seeds for introducing structure.
If we reconsider the greenhouse example for a moment, we see that there exist too many features to be possibly considered all. The challenge lies in selecting the features that are considered (i.e. the aspects) and to choose an order of their respective considerations. There is good empirical indication that experienced architects and novices behaviorally differ in how they prioritize a collection of constraints. There exist differences in the order in which features are considered (Katz 1994). Along this line, Carrara, Kalay and Novembri (1994) recommend that “a prioritization of goals, reflecting a descending order of preferences, may be imposed by the designer or by the client. It will indicate which combination of performances the designer should attempt to accomplish first. Prioritization of preferences […] has a

268 S BERTEL, C FREKSA AND G VRACHLIOTIS
very profound effect on the direction of the design process and on its results. This is due to the fact that design is inherently a linear process, where the decisions leading to the specification of a design solution are made in sequence and are linked to each other.”
3.5. CONTROLLING THE SIZE OF THE PROBLEM SPACE
We use abstraction to describe and manipulate reality. In the case of architectural design, reality means an existing building or a plan. Naturally, each attempt to representation is already an abstraction, such that the only veridical representation of a real object is the object itself (Akin 1986). In architectural design, abstraction is employed to control, to design, or to generate new facts. What abstraction means can vary between abstraction levels, or from situation to situation, and single modes of abstraction do not seem sufficient for architectural design (Schmitt 1996). The number of different abstractions considered for a design is usually depends on the methods that are applied to structure the design process.
The number of alternatives that are considered on the same level of abstraction may further depend more on aspects of solution quality or personal style, rather than on the general design method. Near-optimal approaches to finding appropriate levels of abstraction have been proposed for conceptual design; they involve alternating phases of a divergent and convergent problem space (Liu 2003).
3.6. SCHEMATIZING REPRESENTATIONS AND PROCESSES
An essential and important quality of architectural design processes is the use of diagrammatic representations, particularly in the early phases (e.g. for functional reasoning, formal arrangements, analogy transfer, structure mapping, and knowledge acquisition; Do 2002). In general, architectural diagrams represent and symbolize not only physical entities, but also forces and flows, i.e. forces of sun or wind and flows of people passing by, as well as materials (Do and Gross 2001). It appears that the use of varying degrees of schematization helps to distinguish different aspects in architectural diagrams, as well as different qualities of the architectural design process. Schematizations enable the designer to focus on specific aspects of a design problem, and to explore her design from various viewpoints.
3.7. EXAMPLE TO THE METHODS – A DISCUSSION OF LE CORBUSIER´S VILLA SAVOYE
In the last few subsections we analyzed significant top-level methods of architectural design processes individually. This subsection sees a reprise of those methods as they are exemplarily discussed in relation to Le Corbusier´s Villa Savoye, Figure 4.
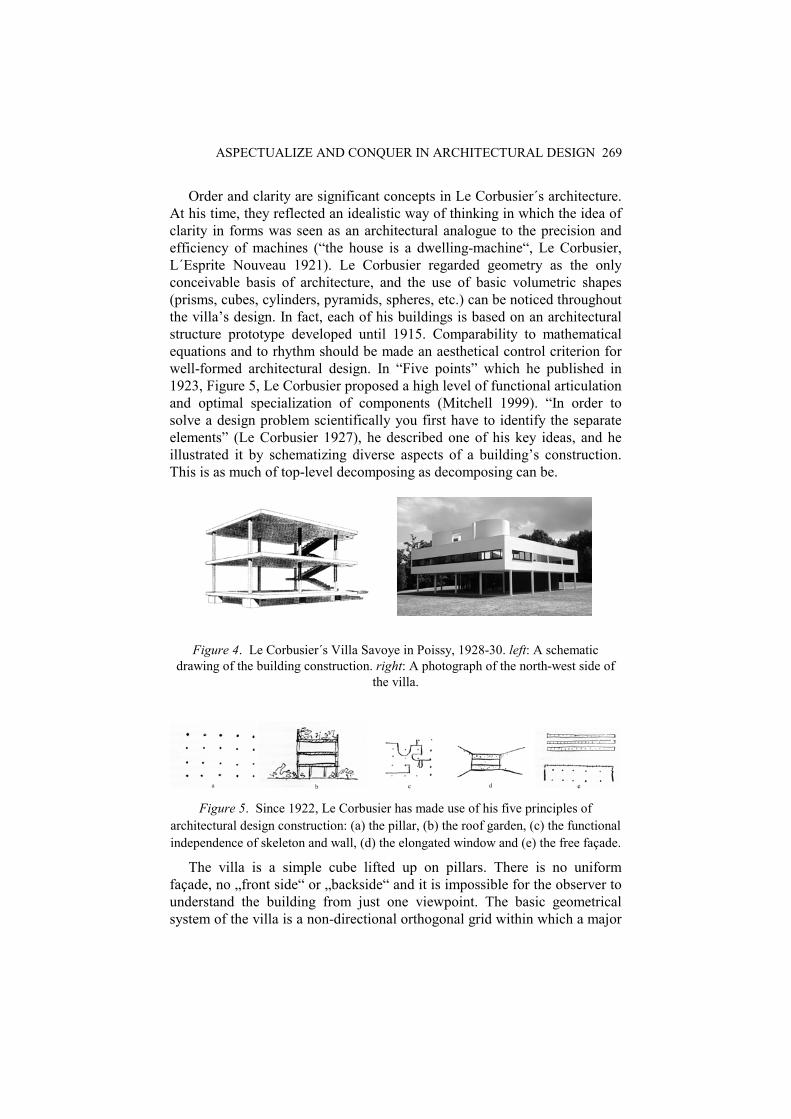
ASPECTUALIZE AND CONQUER IN ARCHITECTURAL DESIGN 269
Order and clarity are significant concepts in Le Corbusier´s architecture. At his time, they reflected an idealistic way of thinking in which the idea of clarity in forms was seen as an architectural analogue to the precision and efficiency of machines (“the house is a dwelling-machine“, Le Corbusier, L´Esprite Nouveau 1921). Le Corbusier regarded geometry as the only conceivable basis of architecture, and the use of basic volumetric shapes (prisms, cubes, cylinders, pyramids, spheres, etc.) can be noticed throughout the villa’s design. In fact, each of his buildings is based on an architectural structure prototype developed until 1915. Comparability to mathematical equations and to rhythm should be made an aesthetical control criterion for well-formed architectural design. In “Five points” which he published in 1923, Figure 5, Le Corbusier proposed a high level of functional articulation and optimal specialization of components (Mitchell 1999). “In order to solve a design problem scientifically you first have to identify the separate elements” (Le Corbusier 1927), he described one of his key ideas, and he illustrated it by schematizing diverse aspects of a building’s construction. This is as much of top-level decomposing as decomposing can be.
Figure 4. Le Corbusier´s Villa Savoye in Poissy, 1928-30. left: A schematic drawing of the building construction. right: A photograph of the north-west side of
the villa.
Figure 5. Since 1922, Le Corbusier has made use of his five principles of
architectural design construction: (a) the pillar, (b) the roof garden, (c) the functional independence of skeleton and wall, (d) the elongated window and (e) the free façade.
The villa is a simple cube lifted up on pillars. There is no uniform façade, no „front side“ or „backside“ and it is impossible for the observer to understand the building from just one viewpoint. The basic geometrical system of the villa is a non-directional orthogonal grid within which a major
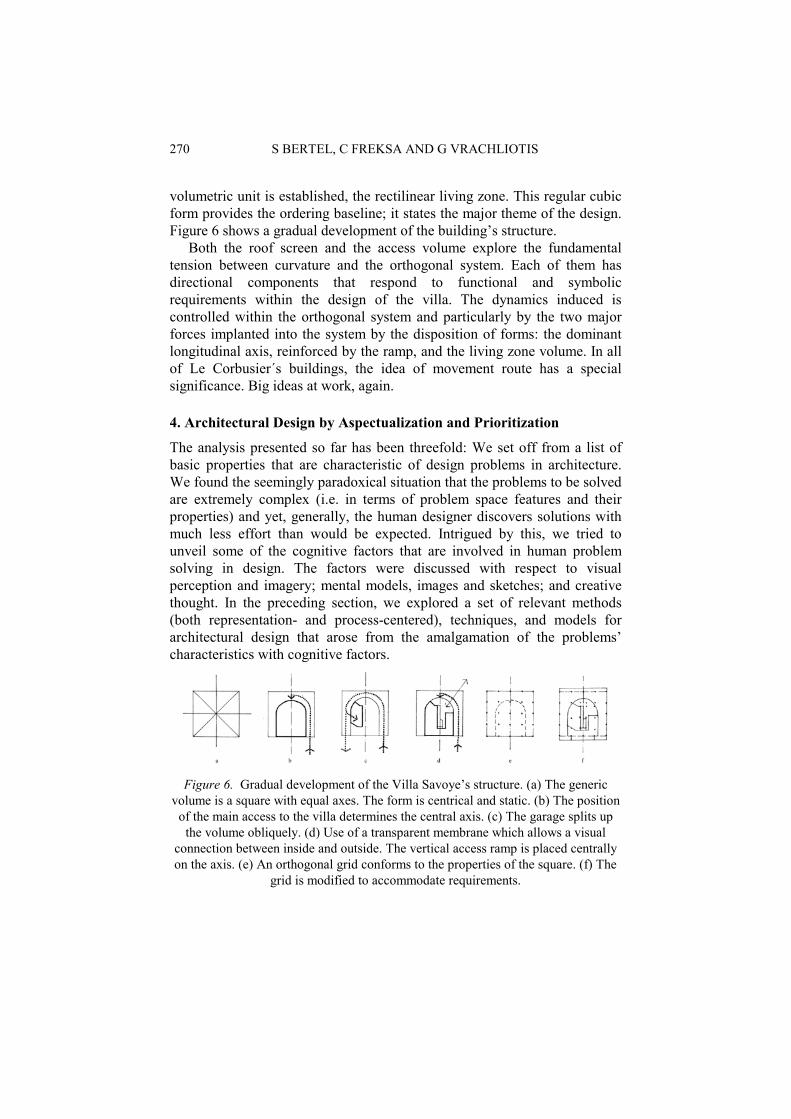
270 S BERTEL, C FREKSA AND G VRACHLIOTIS
volumetric unit is established, the rectilinear living zone. This regular cubic form provides the ordering baseline; it states the major theme of the design. Figure 6 shows a gradual development of the building’s structure.
Both the roof screen and the access volume explore the fundamental tension between curvature and the orthogonal system. Each of them has directional components that respond to functional and symbolic requirements within the design of the villa. The dynamics induced is controlled within the orthogonal system and particularly by the two major forces implanted into the system by the disposition of forms: the dominant longitudinal axis, reinforced by the ramp, and the living zone volume. In all of Le Corbusier´s buildings, the idea of movement route has a special significance. Big ideas at work, again.
4. Architectural Design by Aspectualization and Prioritization
The analysis presented so far has been threefold: We set off from a list of basic properties that are characteristic of design problems in architecture. We found the seemingly paradoxical situation that the problems to be solved are extremely complex (i.e. in terms of problem space features and their properties) and yet, generally, the human designer discovers solutions with much less effort than would be expected. Intrigued by this, we tried to unveil some of the cognitive factors that are involved in human problem solving in design. The factors were discussed with respect to visual perception and imagery; mental models, images and sketches; and creative thought. In the preceding section, we explored a set of relevant methods (both representation- and process-centered), techniques, and models for architectural design that arose from the amalgamation of the problems’ characteristics with cognitive factors.
Figure 6. Gradual development of the Villa Savoye’s structure. (a) The generic
volume is a square with equal axes. The form is centrical and static. (b) The position of the main access to the villa determines the central axis. (c) The garage splits up
the volume obliquely. (d) Use of a transparent membrane which allows a visual connection between inside and outside. The vertical access ramp is placed centrally on the axis. (e) An orthogonal grid conforms to the properties of the square. (f) The
grid is modified to accommodate requirements.
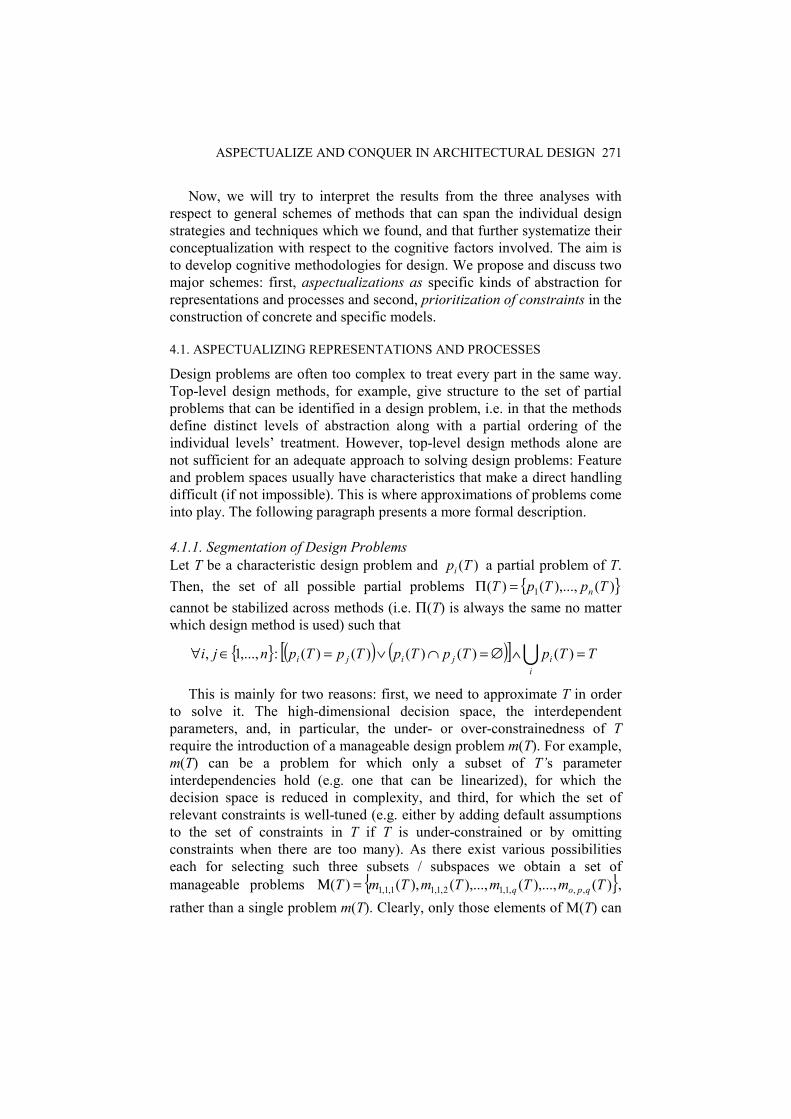
ASPECTUALIZE AND CONQUER IN ARCHITECTURAL DESIGN 271
Now, we will try to interpret the results from the three analyses with respect to general schemes of methods that can span the individual design strategies and techniques which we found, and that further systematize their conceptualization with respect to the cognitive factors involved. The aim is to develop cognitive methodologies for design. We propose and discuss two major schemes: first, aspectualizations as specific kinds of abstraction for representations and processes and second, prioritization of constraints in the construction of concrete and specific models.
4.1. ASPECTUALIZING REPRESENTATIONS AND PROCESSES
Design problems are often too complex to treat every part in the same way. Top-level design methods, for example, give structure to the set of partial problems that can be identified in a design problem, i.e. in that the methods define distinct levels of abstraction along with a partial ordering of the individual levels’ treatment. However, top-level design methods alone are not sufficient for an adequate approach to solving design problems: Feature and problem spaces usually have characteristics that make a direct handling difficult (if not impossible). This is where approximations of problems come into play. The following paragraph presents a more formal description.
4.1.1. Segmentation of Design Problems Let T be a characteristic design problem and )(Tpi a partial problem of T. Then, the set of all possible partial problems )(),...,()( 1 TpTpT n=Π cannot be stabilized across methods (i.e. Π(T) is always the same no matter which design method is used) such that
( ) ( )[ ] i
ijiji TTpTpTpTpTpnji =∧∅=∩∨=∈∀ )()()()()(:,...,1,
This is mainly for two reasons: first, we need to approximate T in order to solve it. The high-dimensional decision space, the interdependent parameters, and, in particular, the under- or over-constrainedness of T require the introduction of a manageable design problem m(T). For example, m(T) can be a problem for which only a subset of T’s parameter interdependencies hold (e.g. one that can be linearized), for which the decision space is reduced in complexity, and third, for which the set of relevant constraints is well-tuned (e.g. either by adding default assumptions to the set of constraints in T if T is under-constrained or by omitting constraints when there are too many). As there exist various possibilities each for selecting such three subsets / subspaces we obtain a set of manageable problems )(),...,(),...,(),()( ,,,1,12,1,11,1,1 TmTmTmTmT qpoq=Μ , rather than a single problem m(T). Clearly, only those elements of M(T) can
272 S BERTEL, C FREKSA AND G VRACHLIOTIS
be considered for suitable approximation of T whose solutions are judged acceptable to be taken for the expected solutions of T. As a result, for two suitable problems )(,, Tm cba and )(,, Tm fed from M(T) an overlap of their respective subsets / subspaces is likely, as is an overlap of partial problems. Second, the filtered decision space of T can be expected to vary during the design process. As a result, even if we could find a Π(T) for which equation above holds at a certain time t, variations that occur until t+1 may easily introduce partial problems that overlap with those that already are in Π(T).
4.1.2. Getting Better Hold of Feature and Problem Spaces It follows from these deliberations that chances are that the human designer does not solve design problem T in a traditional divide and conquer fashion, i.e. T is split into disjoint partial problems which are solved independently of each other, and their solutions are reassembled afterwards to form a solution for T itself, Figure 7. If we further recall the discussion in Section 2 on the role of mental models in design problem solving, along with mental models being concrete rather than abstract mental constructions, it seems likely that the systematic generation of alternatives to (partial) solutions is no characterizing trait in human design problem solving. Rather, it may be the use of features, and of specific feature values.
The feature space is not searched completely. Instead, there exist preferences for the order in which features are considered and in how the selection of the features is accomplished. Figure 3 in Section 3 illustrates a conceptualization in design in terms of layers and the selection of certain features across layers for an intermediate result. Obvious candidates for feature selection methods are design methods on top-levels (e.g. the big idea that structures the design process) or methods and techniques on lower levels of abstraction (such as the use of volumetric primitives for depictions in some design stages which in turn entails detailed prescriptions of which features are to be included). No less important but perhaps less obvious in its influence on feature selection are the designer’s personal cognitive preferences (i.e. in mental model construction, cf. Subsection 2.3).
4.1.3. Aspects of Representations and Processes Preferences in feature selection do not just concern features individually but sets of features that typically occur in combination. Figure 6 provides examples of drawings in which different features are combined, respectively, for purposes of demonstration and exploration. Each of the drawings is schematic in that not all information that could be displayed is displayed and they bring into focus certain aspects of the design problem. We have already briefly discussed such roles of aspects in Section 1. More systematically and from a representational point of view, we need to
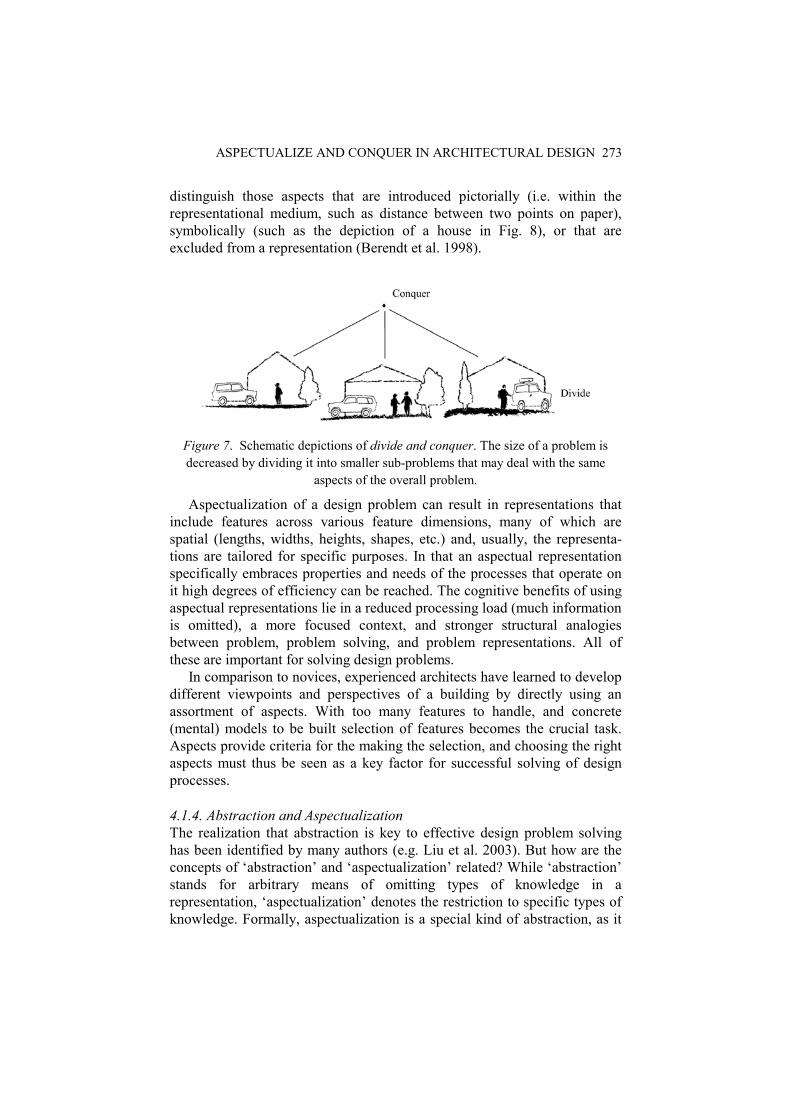
ASPECTUALIZE AND CONQUER IN ARCHITECTURAL DESIGN 273
distinguish those aspects that are introduced pictorially (i.e. within the representational medium, such as distance between two points on paper), symbolically (such as the depiction of a house in Fig. 8), or that are excluded from a representation (Berendt et al. 1998).
Figure 7. Schematic depictions of divide and conquer. The size of a problem is decreased by dividing it into smaller sub-problems that may deal with the same
aspects of the overall problem.
Aspectualization of a design problem can result in representations that include features across various feature dimensions, many of which are spatial (lengths, widths, heights, shapes, etc.) and, usually, the representa-tions are tailored for specific purposes. In that an aspectual representation specifically embraces properties and needs of the processes that operate on it high degrees of efficiency can be reached. The cognitive benefits of using aspectual representations lie in a reduced processing load (much information is omitted), a more focused context, and stronger structural analogies between problem, problem solving, and problem representations. All of these are important for solving design problems.
In comparison to novices, experienced architects have learned to develop different viewpoints and perspectives of a building by directly using an assortment of aspects. With too many features to handle, and concrete (mental) models to be built selection of features becomes the crucial task. Aspects provide criteria for the making the selection, and choosing the right aspects must thus be seen as a key factor for successful solving of design processes.
4.1.4. Abstraction and Aspectualization The realization that abstraction is key to effective design problem solving has been identified by many authors (e.g. Liu et al. 2003). But how are the concepts of ‘abstraction’ and ‘aspectualization’ related? While ‘abstraction’ stands for arbitrary means of omitting types of knowledge in a representation, ‘aspectualization’ denotes the restriction to specific types of knowledge. Formally, aspectualization is a special kind of abstraction, as it
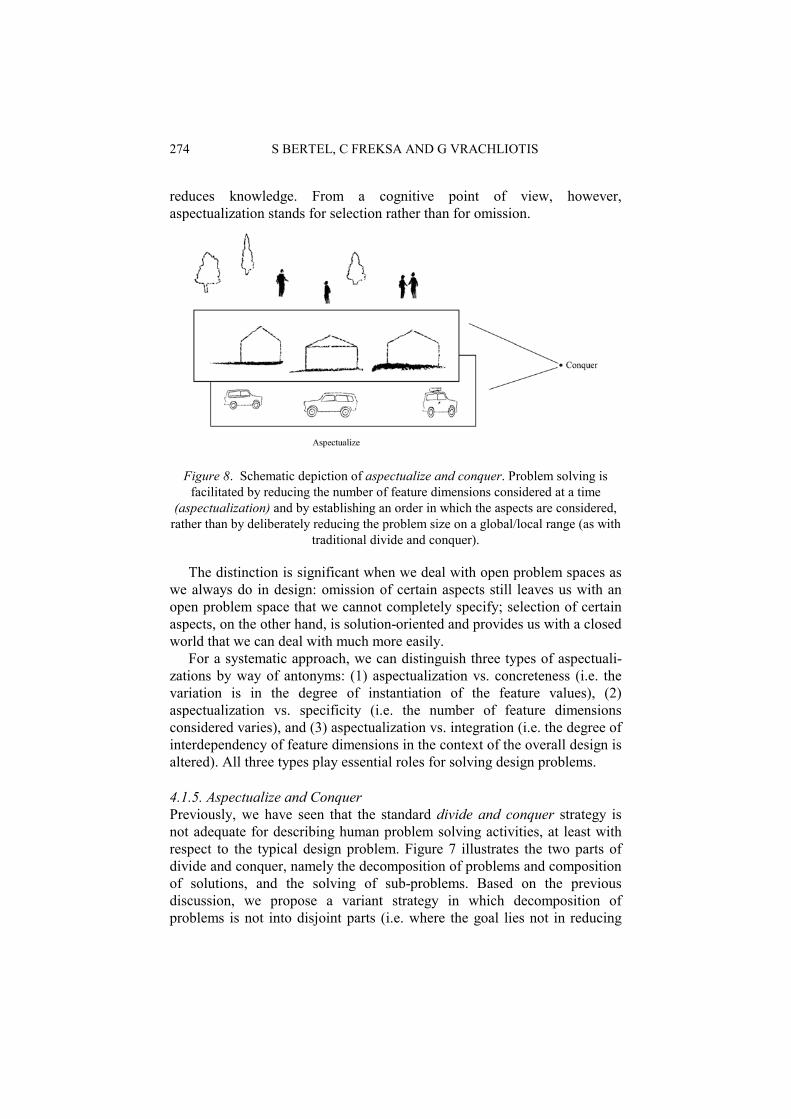
274 S BERTEL, C FREKSA AND G VRACHLIOTIS
reduces knowledge. From a cognitive point of view, however, aspectualization stands for selection rather than for omission.
Figure 8. Schematic depiction of aspectualize and conquer. Problem solving is
facilitated by reducing the number of feature dimensions considered at a time (aspectualization) and by establishing an order in which the aspects are considered,
rather than by deliberately reducing the problem size on a global/local range (as with traditional divide and conquer).
The distinction is significant when we deal with open problem spaces as we always do in design: omission of certain aspects still leaves us with an open problem space that we cannot completely specify; selection of certain aspects, on the other hand, is solution-oriented and provides us with a closed world that we can deal with much more easily.
For a systematic approach, we can distinguish three types of aspectuali-zations by way of antonyms: (1) aspectualization vs. concreteness (i.e. the variation is in the degree of instantiation of the feature values), (2) aspectualization vs. specificity (i.e. the number of feature dimensions considered varies), and (3) aspectualization vs. integration (i.e. the degree of interdependency of feature dimensions in the context of the overall design is altered). All three types play essential roles for solving design problems.
4.1.5. Aspectualize and Conquer Previously, we have seen that the standard divide and conquer strategy is not adequate for describing human problem solving activities, at least with respect to the typical design problem. Figure 7 illustrates the two parts of divide and conquer, namely the decomposition of problems and composition of solutions, and the solving of sub-problems. Based on the previous discussion, we propose a variant strategy in which decomposition of problems is not into disjoint parts (i.e. where the goal lies not in reducing
ASPECTUALIZE AND CONQUER IN ARCHITECTURAL DESIGN 275
the problem size on a global/local range), but that instead is based on the notion of a problem’s aspects. Different aspects of the problem are brought to attention at different times during the problem solving. The goal is to reduce the problem in terms of the number of aspects that are considered at a given time; reductions that may occur on the global/local range are incidental. In imitation of the divide and conquer strategy, we call this approach aspectualize and conquer. Figure 8 provides an illustration.
As with divide and conquer, the strategy as such does not provide a solution to a specific problem. Rather, it offers a framework to accommodate different classes of processes, such as those that aspectualize a problem, that provide solutions with respect to selected aspects, and those that based on a partial ordering of aspectualizations serve to integrate the partial solutions with one another. According to the aspects chosen, the partial problems are explored with the aim of further concretizing or specifying constraints of the problem. Decisions as to when and how exploration results are to be integrated are subject to various factors.
4.1.6. Aspectualize and Conquer in Architectural Design A universal method for conquering architectural design problems does not exist. Rather, design practice requires the combination of a host of different methods, techniques, and representational formats. Problem segmentation into non-overlapping parts is not an option for typical design problems. Instead of taking this property as a weak spot (i.e. in comparison to computational properties of well-defined problems) and trying to work around and hide it, aspectualize and conquer can serve as a framework to turn the diverse complexity of design problems into an opportunity: We see that humans are able to find solutions to design problems and that working with concrete mental and external models that aspectualizing problems is important to their success. The considerations presented here further support this on a theoretical note.
We argue that setting the focus on design problems as being ill-defined actually results in too much effort being devoted to the marginal parts of them that happen to be well-defined or to special kinds of problems that are not typical of the problem class. Instead, conceptualizations of problem structure should capture the existing properties adequately and without valuation. Aspectualize and conquer provides such a framework.
4.2. PRIORITIZING CONSTRAINTS
We have already argued that selecting is key for solving problems which have too many variables (= features) to handle. Since design processes have inherently linear components, in particular when there is only one designer at work, the selected features need be partially sequentialized in that the

276 S BERTEL, C FREKSA AND G VRACHLIOTIS
designer handles them one by one. In a way, we can look at the selection process as one that by selecting leads to the production of a sequential structure.
If we turn our turn our attention to the selection of features, the sequentialization turns into a prioritization process. As model construction for design problems involves aspectualization, and as aspectualization involves selection of features, it is also evident that prioritizing constraints is another facet of aspectualization. In short, prioritization provides the temporal ordering to aspectualization.
Where many roads can be taken, the expert is revealed by her method of finding out which road to take. Likely, where many features can be selected, the design expert has many methods at her disposal (either explicit or implicit ones) that govern the selection. The top-level design methods that were discussed in Section 3 fulfill exactly such purposes. More specifically, empirical studies have revealed behavioral differences in constraint prioritization between experienced and novice architects (Katz 1994). Besides external influence of methods, preferences in mental model construction are likely to contribute to these findings.
5. Conclusion
Our investigation of architectural design processes started with three analyses, namely (1) into properties that we find with architectural design problems; (2) into the cognitive factors that are involved when architects are at designing; and (3) into methods and techniques that architects have developed to structure and facilitate their work. We then proposed two related general strategies to address the properties shown by design problems and to span the cognitive factors and established methods. These strategies are, aspectualize and conquer and prioritization of constraints. Aspectualize and conquer is a variant of the well-known divide and conquer strategy in artificial intelligence that we propose for open world problems like design. Prioritization of constraints is a result of (mental) model construction and responds to the need for linearization of design decisions.
One of the challenges of analyzing the design process is that there is no well-defined problem space and although most approaches acknowledge this fact, many are still guided by the hope to someday find well-defined work-arounds. A second challenge is that whatever the architect knows about her design will be part of its solution (Rittel 1990). In conclusion, Rittel recommends that design sciences should concentrate on three prime issues: the development of theories of the designer to know more about the thinking during the design process, the development of empirical methodologies to research the interaction between plans in relation to aims. And, finally, the search for useful methods to develop new tools, which can support and
ASPECTUALIZE AND CONQUER IN ARCHITECTURAL DESIGN 277
assist architects during their work. In that respect, aspects and priorities are just small building blocks for the construction of theories and methodologies. It is, however, important to keep in mind that many relations exist between fields across disciplines whose exploitations can be more than worthwhile for design research.
Acknowledgements We thank Birger Gigla for providing information on architectural design theory. Also, our thanks go to Kai-Florian Richter and to two anonymous reviewers for their helpful comments on earlier versions of this paper. We gratefully acknowledge financial support through the Transregional Collaborative Research Center Spatial Cognition: Reasoning, Action, Interaction supported by the Deutsche Forschungs-gemeinschaft (DFG) and through the International Spatial Cognition Quality Network supported by the German Academic Exchange Service.
References
Alexander, C: 1964, Notes on the Synthesis of Form, Harvard University Press, Cambridge, MA.
Alexander, C, Ishikawa, S and Silverstein, M: 1977, A Pattern Language – Towns, Buildings, Construction, Oxford University Press, New York.
Anderson, RE and Helstrup, T: 1993, Visual discovery in the mind and on paper, Memory and Cognition 21(3): 283–293.
Akin, O: 1998, Cognition based computational design, Proceeding of the 30th Anniversary Celebration Meeting of the Key Centre for Design Computing, University of Sydney, Australia.
Akin, Ö: 1986, Psychology of Architectural Design, Pion Limited, London. Bamfort, G: 2002, From analysis/synthesis to conjecture/analysis: A review of Karl Popper’s
influence on design methodology in architecture, Design Studies 23: 245–261. Berendt, B, Barkowsky, B, Freksa, C, & Kelter, S: 1998, Spatial representation with aspect
maps, in C Freksa, C Habel and KF Wender (eds), Spatial Cognition I - An Interdisciplinary Approach to Representing and Processing Spatial Knowledge, Springer-Verlag, Berlin, pp. 313–336.
Carrara, G, Yehunda, EK, and Novembri, G: 1994, Knowledge-based computational support for Architectural design, Automation in Construction 3: 157-175.
Do, EY and Gross, MD: 2001, Thinking with diagrams in architectural design, Artificial Intelligence Review 15: 135-149.
Do, EY: 2002, Drawing marks, acts, and reacts: Toward a computational sketching interface for architectural design, Artificial Intelligence for Engineering Design, Analysis and Manufacturing 16: 149–171.
Durand, JNL : 1802, Précis des leçons d'architecture, Paris. Eastman, CM: 1999, Representation of design processes, invited keynote address, Conference
on Design Thinking, MIT, Cambridge, MA. Finke, RA: 1990, Creative Imagery: Discoveries and Inventions in Visualization, Erlbaum,
Hillsdale, NJ. Finke, RA, Ward, TB and Smith, SM (eds): 1992, Creative Cognition, Theory, Research and
Applications, MIT Press, Cambridge, MA.
278 S BERTEL, C FREKSA AND G VRACHLIOTIS
Fonatti, F: 1982, Elementare Gestaltungsprinzipien in der Architektur, Edition Tusch Buch- und Kunstverlag, Wien.
Friedman, K: 2003, Theory construction in design research: criteria: approaches and methods, Design Studies 24: 507–522.
Gerkan, M von: 1982, Die Verantwortung des Architekten: Bedingungen für die gebaute Umwelt, Deutsche Verlags-Anstalt, Stuttgart.
Giedeon, S: 1949, Space, Time and Architecture, the Harvard University Press, Cambridge. Giordano, D: 2002, Evolution of interactive graphical representations into a design language:
a distributed cognition account, International Journal of Human-Computer Studies 57: 317–345.
Goel, V: 1995, Sketches of Thought, MIT Press, Cambridge, MA. Goldschmidt, G: 1991, The dialectics of sketching, Design Studies 4: 123–143. Goldschmidt, G: 1994, Visual analogy in design, in R Trappl (ed), Cybernetics and Systems
’94, Vol. 1, World Scientific, NJ, pp. 507–514. Goldschmidt, G: 1995, The designer as a team of one, Design Studies 16: 189–209. Groat, L and Wang, D: 2002, Architectural Research Methods, John Wiley & Sons, New
York. Healey, PGT, Swoboda, N, Umata, I and Katagiri, Y: 2002, Graphical representation in
graphical dialogue, International Journal of Human-Computer Studies 57: 375–395. Itten, J: 1963, Gestaltungs- und Formenlehre, Otto Maier Verlag, Ravensburg. Johnson-Laird, PN: 1983, Mental Models, Harvard University Press, Cambridge, MA. Jormakka, K: 2003, Geschichte der Architekturtheorie, Edetion Selene, Wien. Kavakli, M and Gero, JS: 2001, Sketching as mental imagery processing, Design Studies 22:
347–364. Katz, I: 1994, Coping with the complexity of design: Avoiding conflicts and prioritizing
constraints, Proceedings of the Sixteenth Annual Meeting of the Cognitive Science Society, Erlbaum, Hillsdale, NJ, pp. 485–489.
Knauff, M, Rauh, R and Schlieder, C: 1995, Preferred mental models in qualitative spatial reasoning: A cognitive assessment of Allen's calculus, Proceedings of the Seventeenth Annual Conference of the Cognitive Science Society, Erlbaum, Hillsdale, NJ, pp. 200–205.
Kosslyn, SM: 1999, Visual mental images as re-presentations of the world: A cognitive neuroscience approach, in JS Gero and B Tversky (eds), Visual and Spatial Reasoning in Design, Key Centre of Design Computing and Cognition, University of Sydney, Australia, pp. 83-92.
Kosslyn, SM and Thompson, WL: 2003, When is early visual cortex activated during visual mental imagery?, Psychological Bulletin 129(5): 723–746.
Lawson, B: 1980, How Designers Think –The Design Process Demystified, Architectural Press Ltd., London.
Lawson, B: 1994, Design in Mind, Architectural Press Ltd, London. Le Corbusier, 1923, Vers une architecture, Verlag Crès et Cie, Paris. Le Corbusier: 1946, Towards a New Architecture, Trans. Frederick Etchells., The
Architectural Press, London. Le Corbusier: 1965, Texte und Zeichnungen zu Ronchamp, Oeuvres de Notre-Dame du Haut,
Ronchamp. Liu, Y-C, Bligh, T and Chakrabarti, A: 2003, Towards an ‘ideal’ approach for concept
generation, Design Studies 24: 341–355. Minai, AT: 1989, Design as Aesthetic Communication - Structuring Random-Order;
Deconstruction of Formal Rationality, Peter Lang Publishing, New York.

ASPECTUALIZE AND CONQUER IN ARCHITECTURAL DESIGN 279
Mitchell, WJ: 1990, The Logic of Architecture, MIT Press, Cambridge, MA. Neufert, E: 1936, Bau- Entwurfslehre, Bauwelt-Verlag, Berlin. Newell, A and Simon, HA: 1972, Human Problem Solving, Prentice-Hall, Englewood Cliffs,
NJ. Purcell, AT and Gero, JS: 1998, Drawings and the design process, Design Studies 19: 389–
430. Rosch, E: 1975, Cognitive representations of semantic categories, Journal of Experimental
Psychology: General 104: 192–223. Roskos-Ewoldson, B, Intons-Peterson, MJ and Anderson, RE (eds): 1993, Imagery, Creative
and Discovery: A Cognitive Approach, Elsevier, Amsterdam. Scaife, M and Rogers, Y: 1996, External cognition: How do graphical representations work?,
International Journal of Human-Computer Studies 45: 185–213. Schlieder, C and Hagen, C: 2000, Interactive layout generation with a diagrammatic
constraint language, in C Freksa, C Habel and K Wender (eds), Spatial Cognition II: Integrating Abstract Theories, Empirical Studies, Formal Methods, and Practical Applications, Springer-Verlag, Berlin, pp. 198–211.
Simon, HA: 1973, The structure of ill-structured problems, Artificial Intelligence 4: 181–201. Sloman, A: 1975, Afterthoughts on analogical representations, Proc. Theoretical Issues in
Natural Language Processing, pp. 164–168. Tang, HH and Gero, JS: 2001, Roles of knowledge while designing and their implications for
CAAD, in JS Gero, S Chase, and M Rosenman (eds), CAADRIA 2001, Key Centre of Design Computing and Cognition, University of Sydney, Australia, pp. 81–89.
Tarassow, L: 1999, Symmetrie – Strukturprinzipien in Natur und Technik, Spektrum Akademischer Verlag, Heidelberg.
Verstijnen, IM, van Leeuwen, C, Goldschmidt, G, Hamel, R, Hennessey, JM: 1998, Creative discovery in imagery and perception: Combining is relatively easy, restructuring takes a sketch, Acta Psychologica 99: 177–200.
Wertheimer, M: 1912, Experimentelle Studien über das Sehen von Bewegung, Zeitschrift für Psychologie 61: 161–265.
Wilson, M: 2002, Six views of embodied cognition, Psychonomic Bulletin and Review 9: 625–636.

280
281
CONTACT AUTHORS’ EMAIL ADDRESSES Bertel, S [email protected] Bilda, Z [email protected] Brennan, J [email protected] Eckert, C [email protected] Glasgow, J [email protected] Goldschmidt, G [email protected] Heiser, J [email protected] Jupp, J [email protected] Mukerjee, A [email protected] Oh, Y [email protected] Ohmer, M [email protected] Ozkar, M [email protected] Slusarczyk, G [email protected] Yaner, P [email protected]

282

283
AUTHOR INDEX Albars, A 3 Becue, A 183 Bertel, S 255 Bilda, Z 121 Blackwell, A 79 Brennan, J 163 Do, E 105 Earl, C 79 Eckert, C 3, 79 Epstein, S 183 Freska, C 255 Gero, JS 121, 139 Goel, A 233 Glasgow, J 183 Goldschmidt, G 199 Gross, M 105 Heiser, J 69
Jupp, J 139 Kim, M 163 Martin, EA 163 Meurice, N 183 Mukerjee, A 23 Muley, H 23 Oh, Y 105 Ohmer, M 3 Ozkar, M 219 Silverman, M 69 Slusarczyk, G 45 Smolkov, M 199 Stacey, M 79 Tversky, B 69 Vercauteren, D 183 Vrachlioti, G 255 Yaner, P 233