design of five story building
110
Reinforced Concrete Design Project Five Story Office Building Andrew Bartolini | December 7, 2012 Designer 1 | Partner: Shannon Warchol CE 40270: Reinforced Concrete Design
Transcript of design of five story building

Reinforced Concrete Design Project Five Story Office Building
Andrew Bartolini | December 7, 2012 Designer 1 | Partner: Shannon Warchol CE 40270: Reinforced Concrete Design

Bartolini | 2
Table of Contents Abstract ...............................................................................................................................3 Introduction ..........................................................................................................................4 Design ..................................................................................................................................5 i. Slab Thickness ............................................................................................................6 ii. Loads ..........................................................................................................................6 iii. Estimation of Column Sizes .....................................................................................6 iv. Slab Design ..............................................................................................................7 v. T-beam Design for Flexure ......................................................................................10 vi. T-beam Design for Shear ........................................................................................14 viii. Crack Control .......................................................................................................16 ix. T-beam deflection control .......................................................................................17 x. Column Design ........................................................................................................18 Summary and Conclusion .................................................................................................21 Recommendations ..............................................................................................................22 Appendix A: Design Figures ..................................................................................................24 B: Load Estimate Calculations ...............................................................................39 C: Slab Design Calculations ..................................................................................40 D: T-Beam Flexure Calculations ...........................................................................42 E: T-Beam Shear Calculations ...............................................................................48 F: Crack Control Calculations ...............................................................................54 G: Deflection Calculations .....................................................................................56 H: Column Design Calculations ............................................................................68

Bartolini | 3
Abstract
This report outlines the structural design of a five-story reinforced concrete office building
following ACI 318-11. The framing arrangement and column locations of the building were
provided based on architectural and structural requirements. The structure system of the office
building is a reinforced concrete frame with a one-way slab and beam floor system. This report
covers the design process in the following order: the calculation of the expected loads on the
structure, the design of the slab depth, the estimation of the column sizes, the design of the slab
reinforcement, the design of the T-beam reinforcement for both flexural and shear, the
calculation to check crack control, the calculation to check T-beam deflections and finally the
design of the column reinforcement. Additionally, figures displaying the placement of the steel
rebar in the structure are contained in the report.
The details of the design can be found within the report. The basic design of the office building
includes seven (7) inch slabs throughout, fifteen (15) inch by fifteen (15) inch square columns
and T-beam depths of eighteen (18) inches for the exterior column spans and twenty (20) inches
for the interior column spans. Due to deflection control issues that arose in this preliminary
design, some of the interior beam lines have to be re-designed in further iterations of this design.
The maximum depth of the interior T-beams would be twenty-two (22 inches). The
reinforcement is varied throughout the project depending on necessary loads and ACI 318-11.
The slab reinforcement spacing would also have to be edited in future designs because it did not
comply with ACI 318 crack control limits. All beams were designed to be under-reinforced
beams in order to provide extensive warning before failure (should it ever occur) and all beams
were design for shear in order to avoid a sudden and catastrophic failure. Finally, the column
reinforcement was designed under two different loading conditions, the first of which maximized
both the axial and moment in the column and the second which maximized the moment but
minimized the axial loads for a maximum eccentricity.
Three recommendations that I would make if I were re-designing this structure from the
beginning would be to use deeper T-beams initially so the building would not fail the deflection
limits, use #3 bars for the slab reinforcement while limiting the spacing to twelve (12) inches and
use smaller columns dimensions. I would still use at least two T-beam depths, however, as the

Bartolini | 4
exterior beam lines can be eighteen (18) inches deep while some interior beam lines may need to
be twenty-two (22) inches deep.
Introduction
The framing plan of the five-story reinforced concrete building was provided and can be seen in
Figure 1. As shown in the framing plan, the building is six bays by three bays. The outer bays
along the six-bay side are 14 feet center-to-center while the inner bays along the six-bay side are
16 feet center-to-center. The outer bays along the three-bay side are 25 feet center-to-center
while the inner bay along the three-bay side is 30 feet center-to-center. The framing plan also
denotes one-way slabs with T-beams that run along the six-bay columns.
Figure 1: Plan View of Five-Story Building
The first story height of the building is 16 feet while all the other story heights are 12 feet. An
elevation view of the office building can be found in Figure 2.

Bartolini | 5
Figure 2: Elevation View
This report will explain the preliminary design process for this five-story reinforced concrete
office building according to ACI 318-11. It should be noted that this design is preliminary and
would undergo a number of iterations. First the slab thickness was found followed by the
calculation of loads on the structure. Next an estimation of the column sizes was calculated.
The slab reinforcement was then designed followed by the flexure and shear reinforcement of the
T-beams. Subsequently the design was checked for crack control and deflection control.
Finally, the column reinforcement was designed. This report will detail both the technical
design procedure as well as a discussion into the reasons for each type of reinforcement and each
step in the design process and why certain decisions were made in the design process. Finally, at
the end of this report, there are recommendations on how to adapt the design when future
iterations of this design are carried out or if someone was to start the design over from scratch.
Design
The design of the five-story reinforced concrete structure entailed a number of steps and
calculations. Each section listed below describes one step in the process of the design. Attached
to the end of this report are sample hand calculations for each step in the design process.

Bartolini | 6
Slab Thickness
The slab thickness was determined to be seven (7) inches by using Table 9.5(a) in ACI 318. The
exterior spans required seven-inch slab thickness, which was slightly larger than the slab
thickness requirement for the interior spans. For ease of construction and economical purposes,
a slab thickness of seven inches was used throughout the entire building.
Loads
The loads were calculated using ASCE 7 and the load combinations in Table 1.2 of ACI 318.
For the floors, the dead loads included the load from the mechanical equipment and the ceiling
(15 psf) and the load from the slab (87.5 psf). The live load for the floors was 50 psf while the
partition loading (which was also considered a live load) was 20 psf. The dead loads for the roof
included the load from the mechanical equipment and the ceiling (15 psf), the load from the
roofing material (7 psf) and load from the slab (87.5 psf). The live load for the roof was
comprised of the snow load only (30 psf). The load for the slabs was calculated by multiplying
the slab thickness by the unit weight of concrete (150 psf).
The load combination from Table 1.2 of ACI 318 consisted of a load factor of 1.2 for the dead
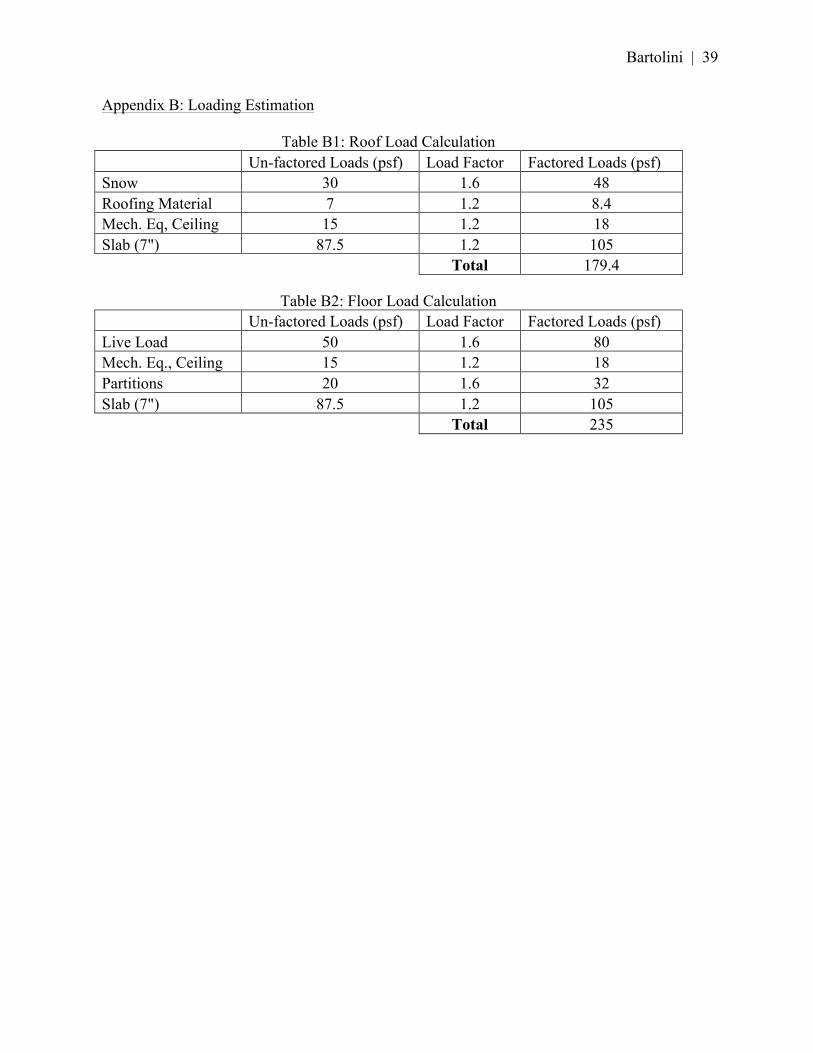
loads and 1.6 for the live loads. Using this load combination, the roof load was found to be
179.4 psf and the floor load was found to be 235 psf.
Table 1 and 2 in the Appendix B contain the breakdown of the load design along with the final
loading values for both the roof and the floor.
Estimation of the Column Size
The first step in the process of determining the column size was the calculation of the tributary
area of the most heavily loaded column, which in this building plan was a column in the interior
section of the building, (i.e. C3), which resulted in a tributary area of 440 ft2.

Bartolini | 7
The loading of the roof and four floors was multiplied by this tributary area to determine the
factored load experience by the ground story column. The area of the concrete needed to support
the calculated force was then calculated, taking into account both the strength of the concrete and
the steel. Appropriate overall strength reduction factors were included to not only provide a
further factor of safety but also account for eccentric loading of the column. It was also assumed
that 2% of the area of the column was steel. Using this assumption, the overall area of the
column was 209 in2.
Using a square cross-section, the column width and depth were chosen to be fifteen (15) inches.
It should be noted that this calculation was for preliminary design only and would be checked
later in the design process.
Slab Design
The slabs were primarily designed with reinforcing steel parallel to the numerical grid lines.
This is because the floor system is a one-way slab, which means that bending will occur between
the two supporting beams in a parabolic shape, with the largest moments being at the top of the
slab near the supports and at the bottom of the slabs at the mid-spans. Steel was also provided in
the transverse direction to provide resistance to the temperature and shrinkage cracks in the
tension regions.
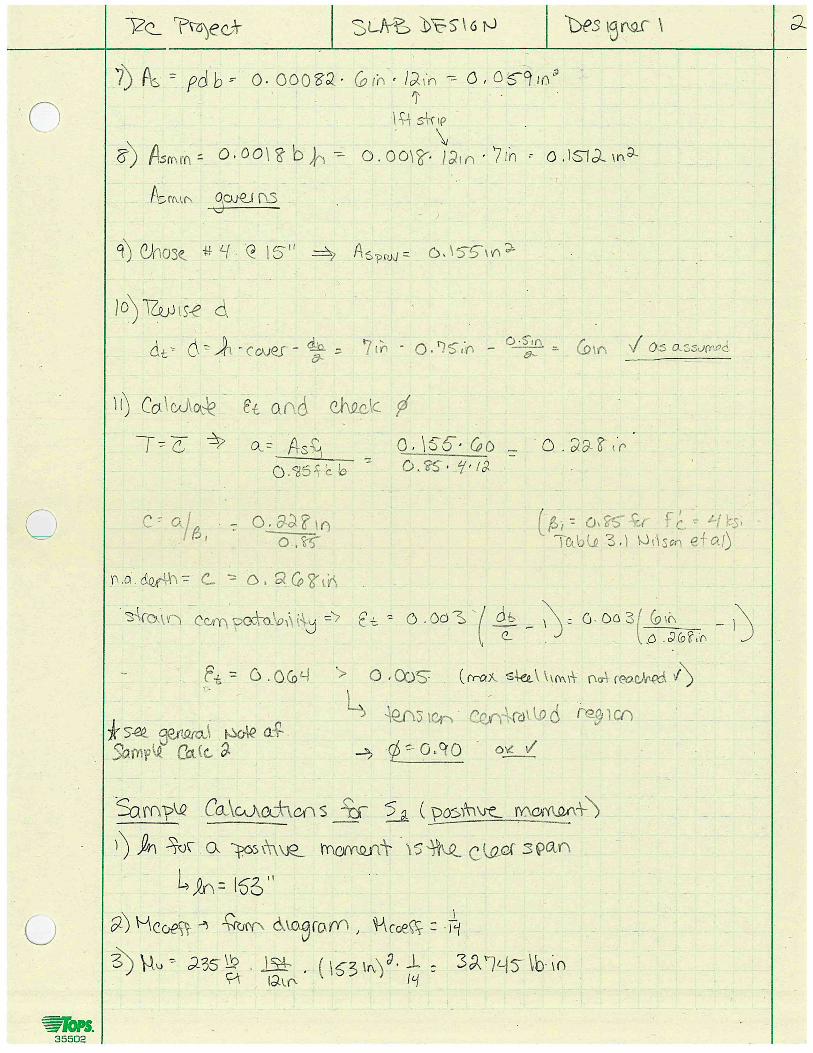
The first step in the slab design was to find the effective span length. For negative moments, the
effective span length is taken as the average of the two adjacent clear spans while for positive
moments the effective span length is the given slab’s clear span. Next, the ACI moment
coefficients were found for a spandrel slab with two or more spans. The spandrel slab was used
because the majority of the slab acts as a spandrel (i.e. the slab was just supported by beams).
Since the portion of the slab that was supported just by the beams is so much greater than the
portion of the slab that is supported by the columns, the spandrel condition was used for the
moment coefficient. Following ACI 318, the moments were found for the various critical cross
sections along the slab.

Bartolini | 8
Using the moments at the critical sections, the steel required was tabulated along with the
minimum steel requirement according to ACI 318. The larger quantity of steel governed and a
steel size and spacing combination was chosen. The extreme tension fiber depth was checked to
verify that it remain nearly the same as was assumed earlier in the procedure. The strain in the
extreme tension fiber was also checked for each critical section of the slab to verify that the
strain was above 0.005 in order to verify a previous assumption that the strength reduction factor
(ϕ) was 0.90.
Two additional ACI 318 requirements were then checked. The first was that the maximum steel
spacing could not exceed eighteen (18) inches or three (3) times the slab thickness (which is
twenty-one (21) inches). Additionally, a practical limit of the spacing being greater than one and
a half (1.5) times the slab thickness (which is ten and a half (10.5) inches) was checked.
Next, the design of the transverse steel reinforcing was completed. In the transverse direction of
the main longitudinal steel, there is a minimum amount of steel required (which is the same as
the minimum reinforcing that was referred to in the above calculations). This amount of steel
was calculated and a combination of size and spacing of bars was chosen. The maximum
spacing of eighteen (18) inches or five (5) times the slab thickness (which is thirty-five (35)
inches) was checked along with the same practical limit that was used above.
The roof slab design consisted of #4 bars at 15” spacing in both the longitudinal and transverse
(for temperature and shrinkage cracks) directions. The floor slab design consisted of #4 bars at
13” to 15” spacing for the longitudinal direction and #4 bars at 15” spacing in the transverse
direction (for temperature and shrinkage cracks).
Finally, following Figure 5.20(a) from Nilson et al, the simplified standard cut off points for the
slab reinforcement were calculated.
Sample design drawings of the floor slabs are shown in Figures 3-5. The full set of design
drawings are shown in Figures A1-A6 in the Appendix.

Bartolini | 9
Figure 3: Floor Slab Design
Figure 4: Plan of Floor Slab Design (Top Steel)

Bartolini | 10
Figure 5: Plan of Floor Slab Design (Bottom and Temperature/Shrinkage Steel)
The full, tabulated calculations for the floor slab can be found in Appendix C.
T-beam Design for Flexure
The T-beams were then designed for the flexural forces they would experience. This design
comprised of the determination and selection of the adequate amount of steel necessary in each
of the critical T-beam sections. The steel reinforcement is necessary in the portions of the T-
beam that are in tension because steel is strong in tension while concrete is very weak and brittle
in tension. However, the T-beam sections cannot have too much steel or they become over-
reinforced and the failure mode of an over-reinforcement beam is very sudden. The T-beam
should be under-reinforced so there is warning before a failure would occur (under a loading
condition that was not designed for).
Bartolini | 11
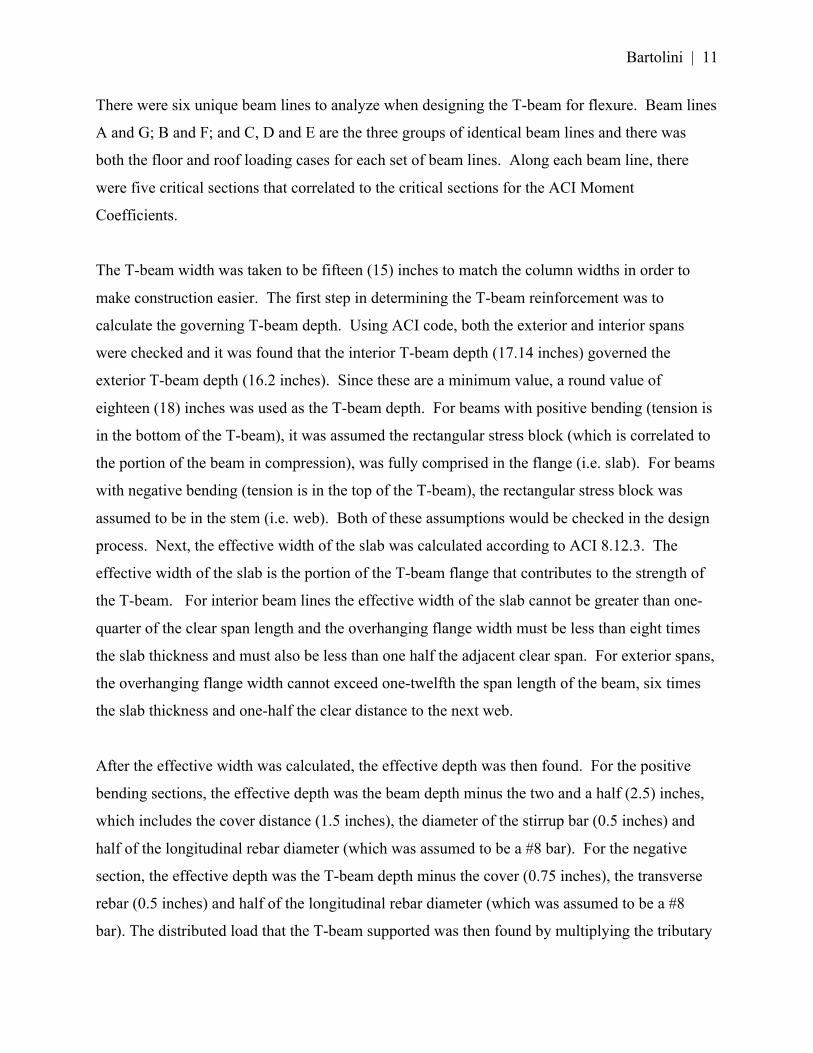
There were six unique beam lines to analyze when designing the T-beam for flexure. Beam lines
A and G; B and F; and C, D and E are the three groups of identical beam lines and there was
both the floor and roof loading cases for each set of beam lines. Along each beam line, there
were five critical sections that correlated to the critical sections for the ACI Moment
Coefficients.
The T-beam width was taken to be fifteen (15) inches to match the column widths in order to
make construction easier. The first step in determining the T-beam reinforcement was to
calculate the governing T-beam depth. Using ACI code, both the exterior and interior spans
were checked and it was found that the interior T-beam depth (17.14 inches) governed the
exterior T-beam depth (16.2 inches). Since these are a minimum value, a round value of
eighteen (18) inches was used as the T-beam depth. For beams with positive bending (tension is
in the bottom of the T-beam), it was assumed the rectangular stress block (which is correlated to
the portion of the beam in compression), was fully comprised in the flange (i.e. slab). For beams
with negative bending (tension is in the top of the T-beam), the rectangular stress block was
assumed to be in the stem (i.e. web). Both of these assumptions would be checked in the design
process. Next, the effective width of the slab was calculated according to ACI 8.12.3. The
effective width of the slab is the portion of the T-beam flange that contributes to the strength of
the T-beam. For interior beam lines the effective width of the slab cannot be greater than one-
quarter of the clear span length and the overhanging flange width must be less than eight times
the slab thickness and must also be less than one half the adjacent clear span. For exterior spans,
the overhanging flange width cannot exceed one-twelfth the span length of the beam, six times
the slab thickness and one-half the clear distance to the next web.
After the effective width was calculated, the effective depth was then found. For the positive
bending sections, the effective depth was the beam depth minus the two and a half (2.5) inches,
which includes the cover distance (1.5 inches), the diameter of the stirrup bar (0.5 inches) and
half of the longitudinal rebar diameter (which was assumed to be a #8 bar). For the negative
section, the effective depth was the T-beam depth minus the cover (0.75 inches), the transverse
rebar (0.5 inches) and half of the longitudinal rebar diameter (which was assumed to be a #8
bar). The distributed load that the T-beam supported was then found by multiplying the tributary

Bartolini | 12
area of the T-beam (half the center-to-center span to each side of the T-beam) by either the floor
or roof load. This value was added to the self-weight of the beam stem for the total line load.
Then using the corresponding ACI moment coefficients, the moment for each section was found.
Using the moment for the section along with the effective depth of the section, the width of the
T-beam and an assumed reduction factor (ϕ) of 0.90, the area of steel required in each section
was found and a combination of bar sizes was selected. The effective depth was then check
again using the same methodology (but using the actual value of half the diameter of the
longitudinal steel) to make sure it was approximately the value that was assumed. The extreme
tension strain and the reduction factor (ϕ) were then verified to be the same as the values that
were assumed. The clear distance spacing of the bars was also checked using ACI 318. Finally,
the minimum and maximum steel requirements were verified according to ACI 10.3.5 and 10.5.1
and the design strength of the T-beam was checked.
For beam lines C, D and E, the extreme tension stress and ϕ factor were not verified as they were
assumed and the beams were not in compliance with the code. Therefore, for these beam lines
the beam depth was increased to twenty (20) inches and the process was repeated. This beam
depth resulted in a design that complied with the code.
The reinforcement details (elevation and cross-sections) for floor beam lines A and G can be
seen in Figure 6. The elevation and cross-section reinforcement details for all the unique beam
lines can be found in Figures A7 to A12 in the Appendix. The T-beam flexural reinforcement
calculations can be found in Appendix D. It should be noted that only one steel reinforcement
design was used between S3 and S4. The section that requires the larger amount of steel will
control the steel region at the first interior support.

Bartolini | 13
Figure 6: Floor T-Beam Reinforcing Elevation and Sections for Beam Lines A and G

Bartolini | 14
T-beam Design for Shear
Next in the design process was the determination of the shear reinforcement. Without shear
reinforcement the beam would have a catastrophic failure due to shear-web and flexure-shear
cracks. These cracks would form due to the shear forces in the beam and cause equivalent
tension stresses that would cause failure in the beam since concrete is very weak in tension. This
failure would be sudden and extremely dangerous and must be designed against. Additionally,
this is incredibly important because this failure occurs substantially before the flexural strength
of the beam is reached. Therefore stirrups at a determined spacing are used to provide a source
of tensile strength against these shear forces (and equivalent tensile stresses).
As was the case with the T-beam flexural design, there are six unique beam lines that must be
designed for shear. Additionally, like the T-beam flexural design, beam lines A and G; B and F;
and C, D and E compose three groups of identical beam lines and then there are the two loading
conditions for each group (i.e. the floor and the roof loads).
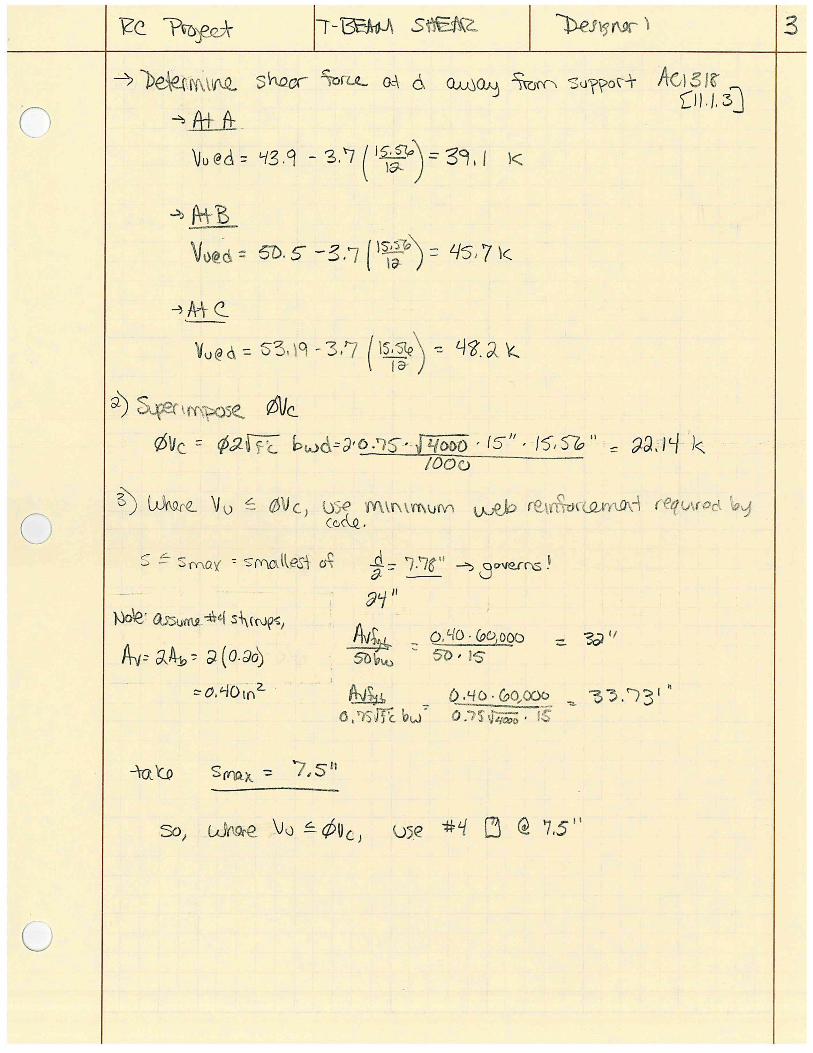
The shear forces at the critical locations were determined using the shear coefficients from ACI
318 with the same line load that was used in the flexural design (i.e. the tributary area of the T-
beam multiplied by the area load combined with the T-beam stem self-weight). The effective
depth was also calculated using the most conservative value from the positive moment sections
in the flexural design. The shear diagram was then constructed by applying the shear coefficients
from ACI 318. The shear at the columns was truncated at a distance d away from the support (so
there is a constant shear away from the supports to a distance d away from the support at which
the shear will connect back to the original shear diagram).
The strength of the concrete in shear was then calculated with a factor of safety. The portions of
the beam where the reduced strength of the concrete itself was greater than the factored shear
force on the beam are required to have the minimum web reinforcement. A #4 stirrup was used
and the required maximum spacing was determined to be seven and a half (7.5) inches. For the
portion of the shear diagram that had a shear force above the concrete shear strength, the
minimum spacing for strength purposes were tabulated. In all the sections, this value was above
the maximum spacing limits that were the same as above (for the region where the reduced

Bartolini | 15
concrete shear strength was greater than the factored shear force). An additional check was
conducted to make sure that the maximum spacing limits could be used according to ACI code.
After conducting all of these checks, it was determined that #4 stirrups could be used at seven
and a half (7.5) inches for all T-beams in the entire structure. Next, the starting locations were
determined with a goal of having them roughly half of the spacing away from the supports. It
was actually determined that the stirrups could start exactly one half of the spacing away from
the supports, which is three and three-quarter (3.75) inches. Figure 7 shows the shear
reinforcement.
Figure 7: Shear Reinforcement
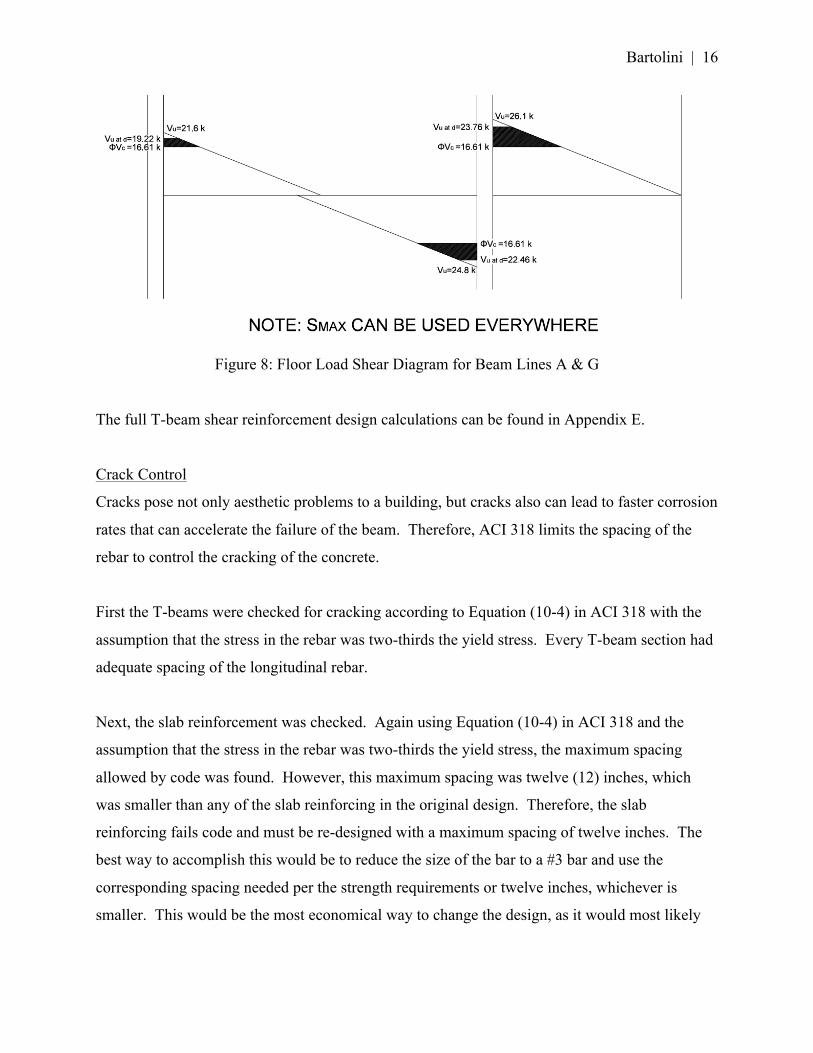
Figures 8 shows a sample factored shear diagram for the floor load for beam lines A and G. It
should be noted that the smax value of seven and a half (7.5) inches can be used everywhere. For
the full set of shear diagrams, see Figures A13 to A18 in the Appendix.
Bartolini | 16
Figure 8: Floor Load Shear Diagram for Beam Lines A & G
The full T-beam shear reinforcement design calculations can be found in Appendix E.
Crack Control
Cracks pose not only aesthetic problems to a building, but cracks also can lead to faster corrosion
rates that can accelerate the failure of the beam. Therefore, ACI 318 limits the spacing of the
rebar to control the cracking of the concrete.
First the T-beams were checked for cracking according to Equation (10-4) in ACI 318 with the
assumption that the stress in the rebar was two-thirds the yield stress. Every T-beam section had
adequate spacing of the longitudinal rebar.
Next, the slab reinforcement was checked. Again using Equation (10-4) in ACI 318 and the
assumption that the stress in the rebar was two-thirds the yield stress, the maximum spacing
allowed by code was found. However, this maximum spacing was twelve (12) inches, which
was smaller than any of the slab reinforcing in the original design. Therefore, the slab
reinforcing fails code and must be re-designed with a maximum spacing of twelve inches. The
best way to accomplish this would be to reduce the size of the bar to a #3 bar and use the
corresponding spacing needed per the strength requirements or twelve inches, whichever is
smaller. This would be the most economical way to change the design, as it would most likely

Bartolini | 17
not rely on an ACI minimum anymore. When a design relies on an ACI minimum it is typically
not the most efficient design.
The full crack control calculations can be found in Appendix F.
T-beam Deflection Control
Deflections must be controlled in any structure in order to make the building feels safe and is
serviceable. Additionally, deflections must be controlled so that the non-structural components
of the building do not fail.
For the T-beam deflection control analysis, the un-factored loads were used in the calculation,
but were found exactly the same way as they were in the flexural design of the T-beams.
Additionally, each span was checked for deflection. Therefore, there were twelve (12) spans that
had to be checked, as there were the exterior and interior spans under roof and floor loading for
three distinct beam lines.
The first step in the deflection calculation was to find the effective moment of inertia of the T-
beam cross-section assuming the full load was applied to the building early on in the
construction process (this is in order to be conservative). This effective moment of inertia is the
moment of inertia for the beam based on the amount of cracking in the beam (it is always
somewhere in-between the moment of inertia of a fully cracked beam and a completely un-
cracked beam). First the gross moment of inertia was found for the T-beam cross-sections
(disregarding the fact that there was steel in the T-beam, which is allowed by code and is
conservative). Then each critical point on each span (i.e. the negative bending moments near the
columns and the positive bending moment at the mid-span) was checked to see if the section was
cracked. If the section was cracked (which was the case for the majority of the sections), the
cracked moment of inertia for the beam was calculated. Next the effective moment of inertia for
each of the critical sections was found according to ACI 318 using the weighted average method
for each span (i.e. the mid-span effective moment of inertia was multiplied by one half and each
of the support effective moment of inertias was multiplied by one quarter). Using the deflection
equation for a continuous span, the deflection under the total load was found.
Bartolini | 18
It was assumed that the beam carried a partition that was sensitive to deflections and therefore
according to ACI 318, the beam deflection after the partition is installed cannot be greater than
the span length divided by 480. The assumed loading history used was that the partitions were
installed after the shoring from the dead load of the structure was removed and the immediate
deflection due to the dead load was experienced. Therefore, the deflection experienced by the
partitions would be the long-term dead load deflection; the immediate live load deflection for
both the short-term portion of the live load (50 psf) and the sustained portion of the live load,
which was the partition’s weight (20 psf); and the long-term deflection from the partitions.
Assuming that after the full initial deflection occurred, that the stress-strain plot was linear and
passed through the origin, the above deflections were calculated using ACI 318. All the T-
beams passed except the interior spans under floor loads for beam column lines B, C, D, E and F.
These cross-sections would need to be redesigned with a larger T-beam web depth or maybe
additional steel. However, if additional steel was added, the design must be re-checked to make
sure the extreme tension fiber stress is below the limits set by ACI 318. The full set of deflection
calculations can be found in Appendix G.
Column Design
The last part of the design that was completed was the determination of the reinforcement for the
columns. The columns are the most critical part of the building because the failure of a column,
especially a column lower in the building, could have devastating ramifications. The failure of a
column could result in the failure of a large portion, or all, of the building. Columns are deemed
more important in the design of building than the design of the beams or the floor systems
because if a beam or floor collapses, the damage may be contained to a much smaller area than if
a column fails. This is called the “strong column, weak beam” design theory.
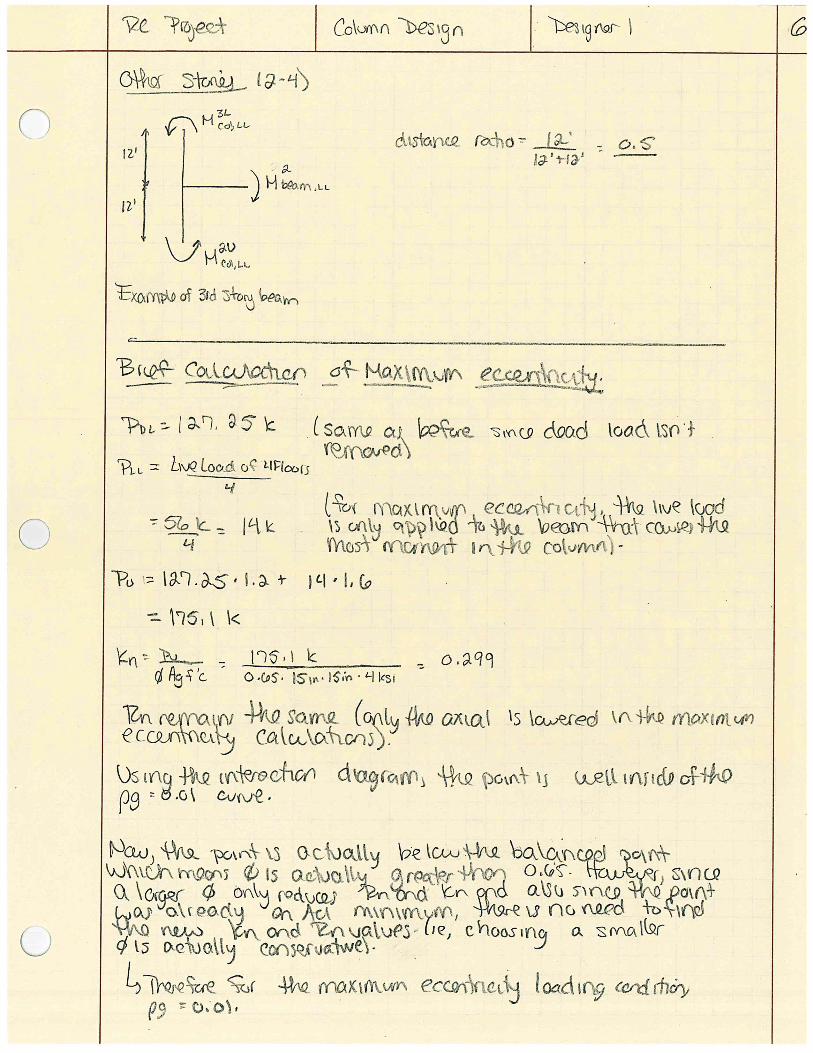
First the maximum axial and moment loads that each column could experience were found.
These loads were divided into the dead loads (i.e. mechanical equipment, roofing material, slab
self-weight, column self-weight, T-beam self-weight) and the live loads (i.e. the partitions,
general live load, and snow). The top and bottom of each column were analyzed by looking at
two different loading conditions. Both conditions include the entire dead load of the structure.
However, the loading conditions vary based on which bays the live load is applied. For both

Bartolini | 19
scenarios the simplest loading scenario that causes the maximum bending is assumed to be the
starting point (this is typically achieved by applying the live load on the bay that frames into the
section of the column being analyzed that causes that largest moment). In the first loading
scenario, the live load is then applied to the other bays of the structure as long as the moment in
the column being analyzed is not affected. In the second loading scenario, only the initial live
load to cause the maximum moment is applied (i.e. no additional bays are loaded from the first
step). In this way, the column is designed for both axial loading and eccentric loading.
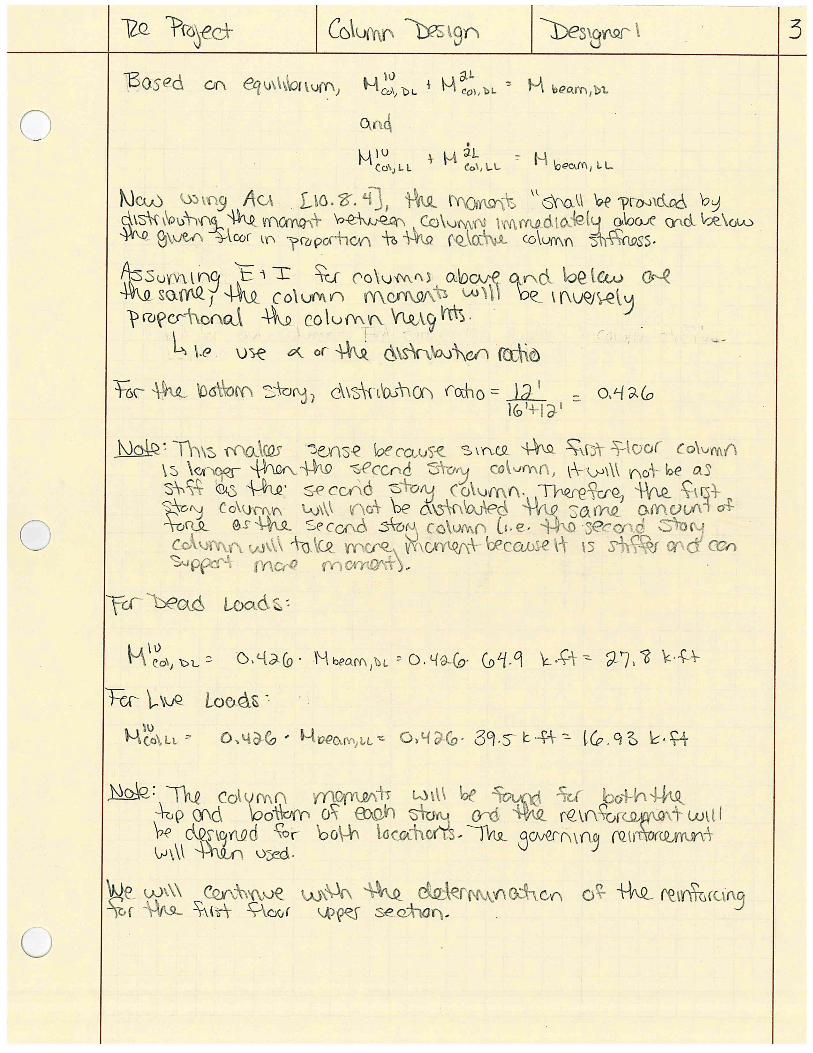
Using these loading scenarios, the moment was calculated in the beams and using structural
analysis the distribution of the moment in the beam to the moments in the column was computed.
Then using this moment in the column along with the axial load in the column, the reinforcement
was found using Graph A.5 and Graph A.6 in Nilson et al for both loading cases at the top and
bottom of each column. Next, the governing steel requirement was found for a given column
(i.e. the largest steel requirement from the top and bottom of each column when considering both
loading conditions). After the longitudinal steel was chosen, the ties were chosen in accordance
to ACI 318. Since #4 bars were used as the stirrups in the T-beams, #4 ties were also chosen so
that there was consistency in the materials on the jobsite and no confusion would be made
between the bars. Using the constraints that the spacing could not be more than sixteen times the
diameter of the longitudinal steel, forty-eight times the diameter of the ties and the least
dimension of the compression member, the tie spacing was determined for every floor of every
column line as well. The longitudinal reinforcement along with the tie spacing for each story of
every column in the building is present in Tables 1 and 2. The exterior column notation refers to
columns on grid lines 1 and 4 while the interior column notation refers to columns on grid lines 2
and 3.

Bartolini | 20
Table 1: Column Longitudinal Reinforcement
Story Column Lines A and G Column Lines B and F Column Lines C, D and E
Exterior Interior Exterior Interior Exterior Interior
1 4 #7 4 #7 4 #7 4 #9 4 #7 4 #11
2 4 #7 4 #7 4 #7 4 #9 4 #7 4 #11
3 4 #7 4 #7 4 #7 4 #7 4 #7 4 #7
4 4 #7 4 #7 4 #7 4 #7 4 #7 4 #7
5 4 #7 4 #7 4 #11 4 #7 4 #11 4 #7
Table 2: Column Tie Spacing
Story Column Lines A and G Column Lines B and F Column Lines C, D and E
Exterior Interior Exterior Interior Exterior Interior
1 #4 @ 14” #4 @ 14” #4 @ 14” #4 @ 15” #4 @ 14” #4 @ 15”
2 #4 @ 14” #4 @ 14” #4 @ 14” #4 @ 15” #4 @ 14” #4 @ 15”
3 #4 @ 14” #4 @ 14” #4 @ 14” #4 @ 14” #4 @ 14” #4 @ 14”
4 #4 @ 14” #4 @ 14” #4 @ 14” #4 @ 14” #4 @ 14” #4 @ 14”
5 #4 @ 14” #4 @ 14” #4 @ 15” #4 @ 14” #4 @ 15” #4 @ 14”
A number of the column longitudinal reinforcement was based on the ACI minimum of 1% steel
in the column. This indicates an efficient design. Ideally the percentage of steel in the column
should be closer to 4%. Therefore, in future iterations of this design, a smaller columns size
should be used.
The pattern in the column reinforcement is that on the exterior of the building, the roof
experiences considerable bending and therefore more steel is needed in these regions.
Additionally, the interior middle column lines of the structure also need additional reinforcement
at the lower stories due to the large axial loads that the columns are subjected to.
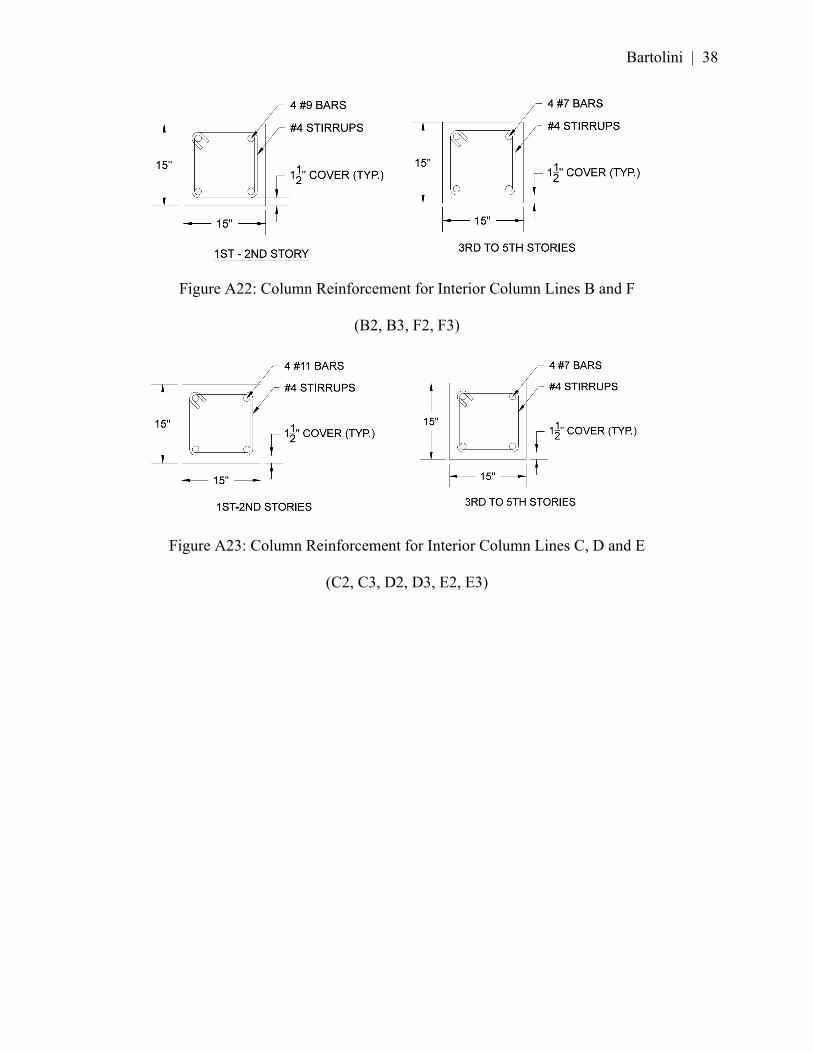
Figure 9 shows the column cross-sections for column lines B2, B3, F2 and F3.

Bartolini | 21
Figure 9: Column Reinforcement for Interior Column Lines B and F
(B2, B3, F2, F3)
The cross-sections showing the reinforcement for all the column lines can be found in Appendix
A (FigureA19 to Figure A23).
The tabulated data for the design of the columns can be found in Appendix H. In these
tabulations, any column reinforcement that is denoted with an asterisk means that for this value,
a higher value of the reduction factor (ϕ) was used to keep the necessary steel reinforcement to a
minimum. This higher value was checked for each section in which it was used and all
calculations comply with ACI 318.
Summary and Conclusions
Using ACI 318, a preliminary design of a five-story office reinforced concrete office building
was completed. Overall, the structure is a very efficient building with only a couple of edits
needed in future iterations of the design. It was determined that the design did not fully comply
with ACI 318 code, but that these flaws would be revised in future edits to the overall design.
The loads for the structure were determined from ASCE 7 with the load combinations from ACI
318. The columns were determined to be fifteen (15) inches by fifteen (15) inches with a slab
thickness of seven (7) inches and T-beam depths that varied from eighteen (18) inches to twenty
(20) inches in the first design. These T-beam depths would be increased for selected beam lines
up to twenty-two (22) inches for deflection control reasons. The chosen T-beam flexural
reinforcement was verified through crack control checks and strength checks, as was the T-beam
shear reinforcement. However, the slab reinforcement did not comply the ACI 318 crack control
standards. Therefore, the size and spacing of the slab reinforcing would have to be edited in the

Bartolini | 22
next design check to make sure the spacing was no more than twelve (12) inches. Finally, the
reinforcement in the columns varied throughout the structure with the maximum reinforcement
in the top of the exterior column lines (due to high bending) and at the bottom of the interior
columns lines (due to large axial loads). The ties for the columns were also designed according
to ACI 318. Because the minimum steel reinforcement according to ACI 318 was used for the
columns, these columns should be made smaller in future iterations of the design so the structure
can be more efficient.
The next step in this design project would be to complete a number of iterations on the design
until it compiles with ACI 318.
Recommendations
This design is only a preliminary design for this reinforced concrete building and several further
revisions are still needed for this design to be complete. In future revisions to this building, there
are a handful of recommendations that I would make.
The first is to reduce the slab reinforcement to #3 bars, which would mean a closer spacing. This
would be the most economic solution to the problem with the spacing of the slab reinforcement
that arose when checking the crack control. Whenever a design is forced to use a minimum
value in the code, which was the case in the slab spacing, that design is typically not as
economical as it could be. In this case, simply reducing the spacing while still using #4 bars
would not be economical. Using a #3 bar at a smaller spacing would result in a more efficient
design, as less material would be used.
Additionally, I would increase the depth of the T-beams under floor loading on beam lines B and
F to twenty (20) inches and then I would increase the depth of the T-beams under floor loading
on beam lines C, D and E to twenty-one (21) or twenty (22) inches. These changes would result
in all the T-beams being in compliance with ACI 318 deflection limits.
Finally, since the column reinforcement was commonly governed by the ACI minimum, in
future iterations I would decrease the column sizes so that the columns would be more efficient

Bartolini | 23
and have closer to 4% steel instead of the minimum 1% steel. As stated above, whenever the
design is limited by the ACI minimum, it means there is a more efficient way to the design the
structure. In this case it would be smaller column sizes and more column steel reinforcement.

Bartolini | 24
Appendix A: Design Figures
Figure A1: Floor Slab Design
Figure A2: Plan of Floor Slab Design (Top Steel)

Bartolini | 25
Figure A3: Plan of Floor Slab Design (Bottom and Temperature/Shrinkage Steel)

Bartolini | 26
Figure A4: Roof Slab Design
Figure A5: Plan of Roof Slab Design (Top Steel)

Bartolini | 27
Figure A6: Plan of Roof Slab Design (Bottom and Temperature/Shrinkage Steel)
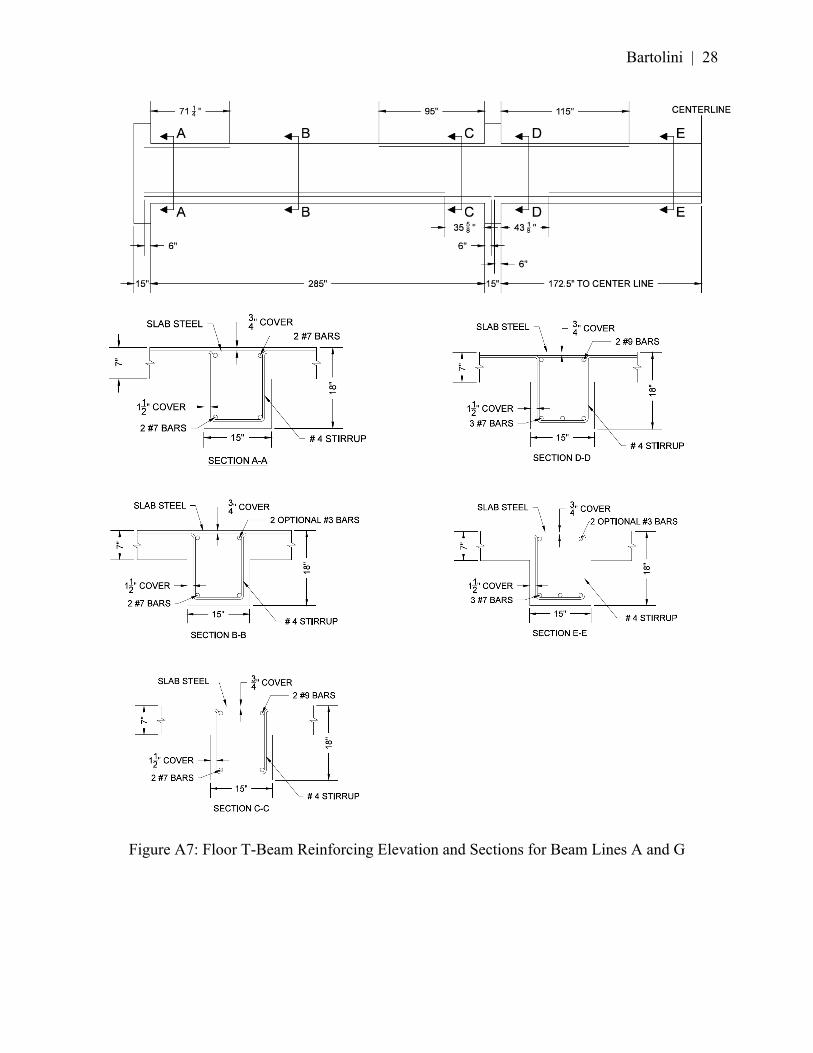
Bartolini | 28
Figure A7: Floor T-Beam Reinforcing Elevation and Sections for Beam Lines A and G
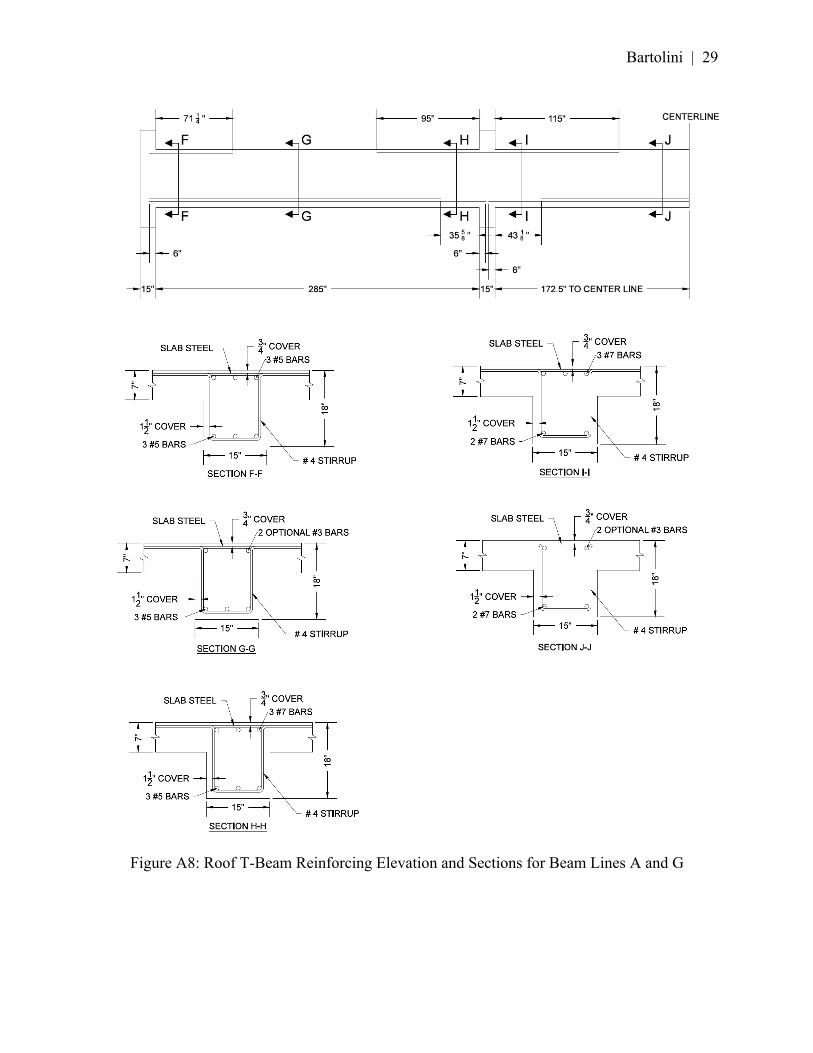
Bartolini | 29
Figure A8: Roof T-Beam Reinforcing Elevation and Sections for Beam Lines A and G

Bartolini | 30
Figure A9: Floor T-Beam Reinforcing Elevation and Sections for Beam Lines B and F

Bartolini | 31
Figure A10: Roof T-Beam Reinforcing Elevation and Sections for Beam Lines B and F

Bartolini | 32
Figure A11: Floor T-Beam Reinforcing Elevation and Sections for Beam Lines C, D and E

Bartolini | 33
Figure A12: Roof T-Beam Reinforcing Elevation and Sections for Beam Lines C, D and E

Bartolini | 34
Figure A13: Floor Load Shear Diagram for Beam Lines A & G
Figure A14: Roof Load Shear Diagram for Columns A & G

Bartolini | 35
Figure A15: Floor Load Shear Diagram for Columns B & F
Figure A16: Roof Load Shear Diagram for Columns B & F

Bartolini | 36
Figure A17: Floor Load Shear Diagram for Columns C, D & E
Figure A18: Roof Load Shear Diagram for Columns C, D & E

Bartolini | 37
Figure A19: Column Reinforcement For Column Lines A and G
(A1, A2, A3, A4, G1, G2, G3, G4)
Figure A20: Column Reinforcement for Exterior Column Lines B and F
(B1, B4, F1, F4)
Figure A21: Column Reinforcement for Exterior Column Lines C, D and E
(C1, C4, D1, D4, E1, E4)
Bartolini | 38
Figure A22: Column Reinforcement for Interior Column Lines B and F
(B2, B3, F2, F3)
Figure A23: Column Reinforcement for Interior Column Lines C, D and E
(C2, C3, D2, D3, E2, E3)
Bartolini | 39
Appendix B: Loading Estimation
Table B1: Roof Load Calculation Un-factored Loads (psf) Load Factor Factored Loads (psf) Snow 30 1.6 48 Roofing Material 7 1.2 8.4 Mech. Eq, Ceiling 15 1.2 18 Slab (7") 87.5 1.2 105
Total 179.4
Table B2: Floor Load Calculation Un-factored Loads (psf) Load Factor Factored Loads (psf) Live Load 50 1.6 80 Mech. Eq., Ceiling 15 1.2 18 Partitions 20 1.6 32 Slab (7") 87.5 1.2 105
Total 235

Bartolini | 40
Appendix C: Slab Design Calculations
Table C1: Slab Design - Floor
Givens
Quadratic Equation Solver wu (lb/ft) 235
a 529200
b 12
b -60000 d 6
φ 0.9 β 0.85
S1 S2 S3 S4 S5 S6 ln (in) 153.00 153.00 165.00 165.00 177.00 177.00 Mcoeff 0.04 0.07 0.10 0.09 0.06 0.09
Mu (lb-in) 19101 32745 53316 48469 38345 55775 R (psi) 49.13 84.22 137.13 124.66 98.62 143.45 ρ 0.00082 0.00142 0.00233 0.00212 0.00167 0.00244
Asreqd (in2) 0.059 0.102 0.168 0.152 0.120 0.176
Asmin (in2) 0.1512 0.1512 0.1512 0.1512 0.1512 0.1512
Asgoverning (in2) 0.151 0.151 0.168 0.152 0.151 0.176 Bar Size and Spacing #4 @ 15" #4 @ 15" #4 @ 14" #4 @ 15" #4 @ 15" #4 @ 13"
Asprovided (in2) 0.155 0.155 0.17 0.155 0.155 0.18 CHECKS
d OK OK OK OK OK OK a 0.228 0.228 0.250 0.228 0.228 0.265 c 0.268 0.268 0.294 0.268 0.268 0.311 εt 0.0641 0.0641 0.0582 0.0641 0.0641 0.0548
Max Steel ok if εt > 0.004 OK OK OK OK OK OK φ = 0.90 if εt > 0.005 OK OK OK OK OK OK
Max Spacing (1) 21 21 21 21 21 21 Max Spacing (2) 18 18 18 18 18 18
Spacing < Max Spacing OK OK OK OK OK OK Minimum Spacing 10.5 10.5 10.5 10.5 10.5 10.5
Spacing > Min Spacing OK OK OK OK OK OK Temperature/Shrinkage Steel
Asmin (in2) 0.1512 0.1512 0.1512 0.1512 0.1512 0.1512 Bar Size and Spacing #4 @ 15" #4 @ 15" #4 @ 15" #4 @ 15" #4 @ 15" #4 @ 15"
Asprovided (in2) 0.155 0.155 0.155 0.155 0.155 0.155 Max Spacing (1) 35 35 35 35 35 35 Max Spacing (2) 18 18 18 18 18 18
Spacing < Max Spacing OK OK OK OK OK OK

Bartolini | 41
Table C2: Slab Design - Roof
Givens
Quadratic Equation Solver wu (lb/ft) 179.4
a 529200
b 12
b -60000 d 6
φ 0.9 β 0.85
S1 S2 S3 S4 S5 S6 ln (in) 153.00 153.00 165.00 165.00 177.00 177.00 Mcoeff 0.04 0.07 0.10 0.09 0.06 0.09
Mu (lb-in) 14582 24997 40701 37001 29273 42579 R (psi) 37.50 64.29 104.68 95.17 75.29 109.51 ρ 0.00063 0.00108 0.00177 0.00161 0.00127 0.00186
Asreqd (in2) 0.045 0.078 0.128 0.116 0.091 0.134
Asmin (in2) 0.1512 0.1512 0.1512 0.1512 0.1512 0.1512
Asgoverning (in2) 0.151 0.151 0.151 0.151 0.151 0.151 Bar Size and Spacing #4 @ 15" #4 @ 15" #4 @ 15" #4 @ 15" #4 @ 15" #4 @ 15"
Asprovided (in2) 0.155 0.155 0.155 0.155 0.155 0.155 CHECKS
d OK OK OK OK OK OK a 0.228 0.228 0.228 0.228 0.228 0.228 c 0.268 0.268 0.268 0.268 0.268 0.268 εt 0.0641 0.0641 0.0641 0.0641 0.0641 0.0641
Max Steel ok if εt > 0.004 OK OK OK OK OK OK φ = 0.90 if εt > 0.005 OK OK OK OK OK OK
Max Spacing (1) 21 21 21 21 21 21 Max Spacing (2) 18 18 18 18 18 18
Spacing < Max Spacing OK OK OK OK OK OK Minimum Spacing 10.5 10.5 10.5 10.5 10.5 10.5
Spacing > Min Spacing OK OK OK OK OK OK Temperature/Shrinkage Steel
Asmin (in2) 0.1512 0.1512 0.1512 0.1512 0.1512 0.1512 Bar Size and Spacing #4 @ 15" #4 @ 15" #4 @ 15" #4 @ 15" #4 @ 15" #4 @ 15"
Asprovided (in2) 0.155 0.155 0.155 0.155 0.155 0.155 Max Spacing (1) 35 35 35 35 35 35 Max Spacing (2) 18 18 18 18 18 18
Spacing < Max Spacing OK OK OK OK OK OK

Bartolini | 42
Appendix D: T-Beam Flexure Design Calculations
Table D1: T-Beam Flexure Design – Floor Load – Col. A/G
Givens
Quadratic Equation Solver W (lb/ft2) 235
a 529200
wu (lb/ft) 0.15
b -60000 b 15
h 18 d (positive bending) 15.5 d (negative bending) 16 φ 0.9 β 0.85
S1 S2 S3 S4 S5 ln (in) 285.00 285.00 315.00 315.00 345.00
Clear Span Length (in) 285.00 285.00 285.00 345.00 345.00 bf (in) - span length 38.75 38.75 38.75 43.75 43.75
bf (in) - slab thickness 57.00 57.00 57.00 57.00 57.00 bf (in) - adjacent span 91.50 91.50 91.50 91.50 91.50
bf (in) - governing 38.00 38.00 38.00 43.00 43.00 Mcoeff 0.06 0.07 0.10 0.09 0.06
Mu (k-in) 769 878 1502 1366 1126 R (psi) 222.40 106.91 434.70 395.18 121.14 ρ 0.00384 0.00181 0.00778 0.00702 0.00206
Asreqd (in2) 0.921 1.067 1.867 1.685 1.371 Bar Size and Spacing 2 #7 2 #7 2 #9 2 #9 3 #7
Asprovided (in2) 1.2 1.2 2 2 1.8 CHECKS
Spacing - 9.25 - - 4.1875 d 16.3125 15.5625 16.1875 16.1875 15.5625 a 1.412 0.557 2.353 2.353 0.739 c 1.661 0.656 2.768 2.768 0.869 εt 0.0265 0.0682 0.0145 0.0145 0.0507
Max Steel ok if εt > 0.004 OK OK OK OK OK φ = 0.90 if εt > 0.005 OK OK OK OK OK Minimum Steel (1) 0.76 0.74 0.76 0.76 0.74 Minimum Steel (2) 0.80 0.78 0.80 0.80 0.78
Governing Minimum Steel 0.80 0.78 0.80 0.80 0.78 Steel > Minimum Steel OK OK OK OK OK
φMn 991.06 986.34 1600.94 1600.94 1470.70 φMn > Mu OK OK OK OK OK

Bartolini | 43
Table D2: T-Beam Flexure Design – Roof Load – Col. A/G
Givens
Quadratic Equation Solver W (lb/ft2) 179.4
a 529200
wu (lb/ft) 0.12
b -60000 b 15
h 18 d (positive bending) 15.5 d (negative bending) 16 φ 0.9 β 0.85
S1 S2 S3 S4 S5 ln (in) 285.00 285.00 315.00 315.00 345.00
Clear Span Length (in) 285.00 285.00 285.00 345.00 345.00 bf (in) - span length 38.75 38.75 38.75 43.75 43.75
bf (in) - slab thickness 57.00 57.00 57.00 57.00 57.00 bf (in) - adjacent span 91.50 91.50 91.50 91.50 91.50
bf (in) - governing 38.00 38.00 38.00 43.00 43.00 Mcoeff 0.06 0.07 0.10 0.09 0.06
Mu (k-in) 604 690 1181 1073 885 R (psi) 174.76 84.01 341.58 310.53 95.19 ρ 0.00299 0.00142 0.00601 0.00544 0.00161
Asreqd (in2) 0.718 0.835 1.443 1.305 1.073 Bar Size and Spacing 3 #5 3 #5 3 #7 3 #7 2 #7
Asprovided (in2) 0.93 0.93 1.8 1.8 1.2 CHECKS
Spacing - 4.5625 - - 9.25 d 16.4375 15.6875 16.3125 16.3125 15.5625 a 1.094 0.432 2.118 2.118 0.492 c 1.287 0.508 2.491 2.491 0.579 εt 0.0353 0.0896 0.0166 0.0166 0.0776
Max Steel ok if εt > 0.004 OK OK OK OK OK φ = 0.90 if εt > 0.005 OK OK OK OK OK Minimum Steel (1) 0.76 0.74 0.76 0.76 0.74 Minimum Steel (2) 0.80 0.78 0.80 0.80 0.78
Governing Minimum Steel 0.80 0.78 0.80 0.80 0.78 Steel > Minimum Steel OK OK OK OK OK
φMn 776.05 767.57 1452.28 1452.28 988.44 φMn > Mu OK OK OK OK OK
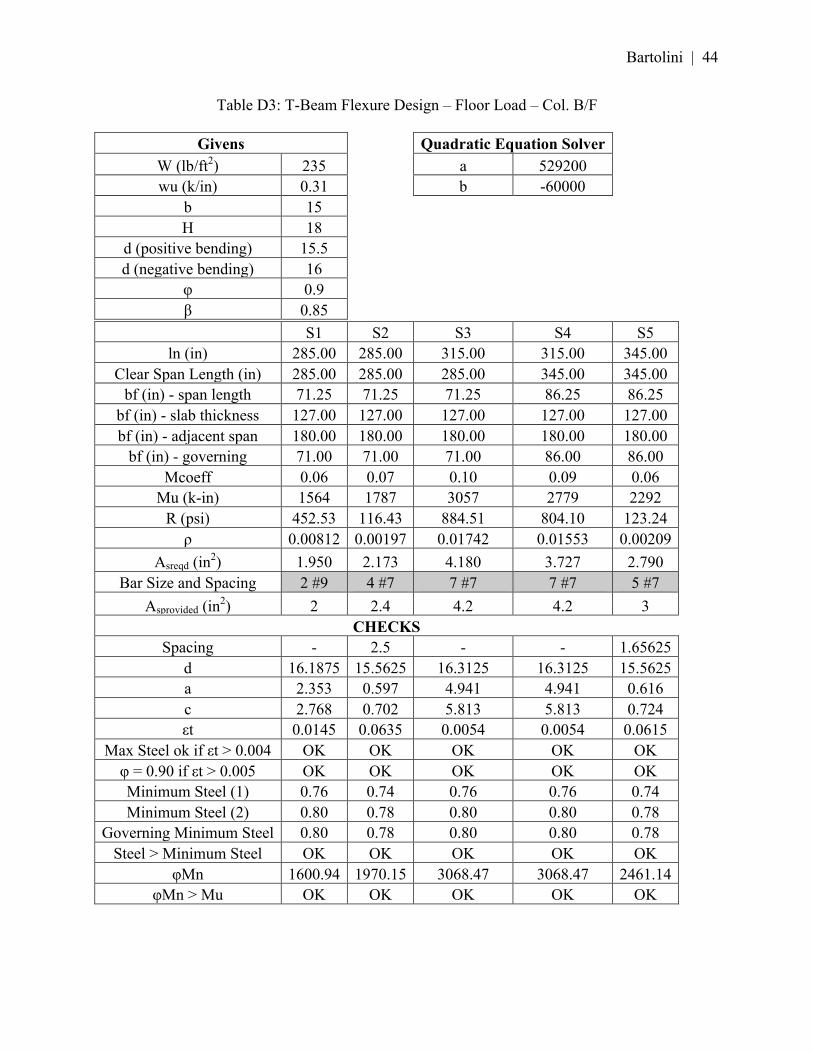
Bartolini | 44
Table D3: T-Beam Flexure Design – Floor Load – Col. B/F
Givens
Quadratic Equation Solver W (lb/ft2) 235
a 529200
wu (k/in) 0.31
b -60000 b 15
H 18 d (positive bending) 15.5 d (negative bending) 16 φ 0.9 β 0.85
S1 S2 S3 S4 S5 ln (in) 285.00 285.00 315.00 315.00 345.00
Clear Span Length (in) 285.00 285.00 285.00 345.00 345.00 bf (in) - span length 71.25 71.25 71.25 86.25 86.25
bf (in) - slab thickness 127.00 127.00 127.00 127.00 127.00 bf (in) - adjacent span 180.00 180.00 180.00 180.00 180.00
bf (in) - governing 71.00 71.00 71.00 86.00 86.00 Mcoeff 0.06 0.07 0.10 0.09 0.06
Mu (k-in) 1564 1787 3057 2779 2292 R (psi) 452.53 116.43 884.51 804.10 123.24 ρ 0.00812 0.00197 0.01742 0.01553 0.00209
Asreqd (in2) 1.950 2.173 4.180 3.727 2.790 Bar Size and Spacing 2 #9 4 #7 7 #7 7 #7 5 #7
Asprovided (in2) 2 2.4 4.2 4.2 3 CHECKS
Spacing - 2.5 - - 1.65625 d 16.1875 15.5625 16.3125 16.3125 15.5625 a 2.353 0.597 4.941 4.941 0.616 c 2.768 0.702 5.813 5.813 0.724 εt 0.0145 0.0635 0.0054 0.0054 0.0615
Max Steel ok if εt > 0.004 OK OK OK OK OK φ = 0.90 if εt > 0.005 OK OK OK OK OK Minimum Steel (1) 0.76 0.74 0.76 0.76 0.74 Minimum Steel (2) 0.80 0.78 0.80 0.80 0.78
Governing Minimum Steel 0.80 0.78 0.80 0.80 0.78 Steel > Minimum Steel OK OK OK OK OK
φMn 1600.94 1970.15 3068.47 3068.47 2461.14 φMn > Mu OK OK OK OK OK

Bartolini | 45
Table D4: T-Beam Flexure Design – Roof Load – Col. B/F
Givens
Quadratic Equation Solver W (lb/ft2) 179.4
a 529200
wu (lb/ft) 0.24
b -60000 b 15
h 18 d (positive bending) 15.5 d (negative bending) 16 φ 0.9 β 0.85
S1 S2 S3 S4 S5 ln (in) 285.00 285.00 315.00 315.00 345.00
Clear Span Length (in) 285.00 285.00 285.00 345.00 345.00 bf (in) - span length 71.25 71.25 71.25 86.25 86.25
bf (in) - slab thickness 127.00 127.00 127.00 127.00 127.00 bf (in) - adjacent span 180.00 180.00 180.00 180.00 180.00
bf (in) - governing 71.00 71.00 71.00 86.00 86.00 Mcoeff 0.06 0.07 0.10 0.09 0.06
Mu (k-in) 1211 1384 2367 2152 1775 R (psi) 350.44 90.16 684.97 622.70 95.44 ρ 0.00618 0.00152 0.01288 0.01156 0.00161
Asreqd (in2) 1.483 1.676 3.091 2.773 2.151 Bar Size and Spacing 5 # 5 3 #7 6 # 7 6 #7 4 #7
Asprovided (in2) 1.55 1.8 3.6 3.6 2.4 CHECKS
Spacing - 4.1875 - - 2.5 d 16.4375 15.5625 16.3125 16.3125 15.5625 a 1.824 0.447 4.235 4.235 0.492 c 2.145 0.526 4.983 4.983 0.579 εt 0.0200 0.0857 0.0068 0.0068 0.0776
Max Steel ok if εt > 0.004 OK OK OK OK OK φ = 0.90 if εt > 0.005 OK OK OK OK OK Minimum Steel (1) 0.76 0.74 0.76 0.76 0.74 Minimum Steel (2) 0.80 0.78 0.80 0.80 0.78
Governing Minimum Steel 0.80 0.78 0.80 0.80 0.78 Steel > Minimum Steel OK OK OK OK OK
φMn 1262.89 1484.86 2698.73 2698.73 1976.89 φMn > Mu OK OK OK OK OK

Bartolini | 46
Table D5: T-Beam Flexure Design – Floor Load – Col. C/D/E
Givens
Quadratic Equation Solver W (lb/ft2) 235
a 529200
wu (lb/ft) 0.3303
b -60000 b 15
H 20 d (positive bending) 17.5 d (negative bending) 18 φ 0.9 β 0.85
S1 S2 S3 S4 S5 ln (in) 285.00 285.00 315.00 315.00 345.00
Clear Span Length (in) 285.00 285.00 285.00 345.00 345.00 bf (in) - span length 71.25 71.25 71.25 86.25 86.25
bf (in) - slab thickness 127.00 127.00 127.00 127.00 127.00 bf (in) - adjacent span 192.00 192.00 192.00 192.00 192.00
bf (in) - governing 71.00 71.00 71.00 86.00 86.00 Mcoeff 0.06 0.07 0.10 0.09 0.06
Mu (k-in) 1677 1916 3277 2979 2457 R (psi) 383.31 97.91 749.20 681.09 103.65 ρ 0.00680 0.00166 0.01429 0.01280 0.00175
Asreqd (in2) 1.835 2.058 3.857 3.455 2.641 Bar Size and Spacing 2 #9 4 #7 4 #9 4 #9 5 #7
Asprovided (in2) 2 2.4 4 4 3 CHECKS
Spacing - 2.5 - - 1.65625 d 18.1875 17.5625 18.1875 18.1875 17.5625 a 2.353 0.597 4.706 4.706 0.616 c 2.768 0.702 5.536 5.536 0.724 εt 0.0167 0.0721 0.0069 0.0069 0.0697
Max Steel ok if εt > 0.004 OK OK OK OK OK φ = 0.90 if εt > 0.005 OK OK OK OK OK Minimum Steel (1) 0.85 0.83 0.85 0.85 0.83 Minimum Steel (2) 0.90 0.88 0.90 0.90 0.88
Governing Minimum Steel 0.90 0.88 0.90 0.90 0.88 Steel > Minimum Steel OK OK OK OK OK
φMn 1816.94 2229.35 3379.76 3271.76 2461.14 φMn > Mu OK OK OK OK OK

Bartolini | 47
Table D6: T-Beam Flexure Design – Roof Load – Col. C/D/E
Givens
Quadratic Equation Solver W (lb/ft2) 179.4
a 529200
wu (lb/ft) 0.26
b -60000 b 15
h 20 d (positive bending) 17.5 d (negative bending) 18 φ 0.9 β 0.85
S1 S2 S3 S4 S5 ln (in) 285.00 285.00 315.00 315.00 345.00
Clear Span Length (in) 285.00 285.00 285.00 345.00 345.00 bf (in) - span length 71.25 71.25 71.25 86.25 86.25
bf (in) - slab thickness 127.00 127.00 127.00 127.00 127.00 bf (in) - adjacent span 192.00 192.00 192.00 192.00 192.00
bf (in) - governing 71.00 71.00 71.00 86.00 86.00 Mcoeff 0.06 0.07 0.10 0.09 0.06
Mu (k-in) 1300 1486 2541 2310 1905 R (psi) 297.27 75.93 581.03 528.21 80.38 ρ 0.00519 0.00128 0.01069 0.00962 0.00136
Asreqd (in2) 1.402 1.590 2.887 2.597 2.041 Bar Size and Spacing 3 #7 3 #7 3 #9 3 #9 4 #7
Asprovided (in2) 1.8 1.8 3 3 2.4 CHECKS
Spacing - 4.1875 - - 2.5 d 18.3125 17.5625 18.1875 18.1875 17.5625 a 2.118 0.447 3.529 3.529 0.492 c 2.491 0.526 4.152 4.152 0.579 εt 0.0191 0.0971 0.0101 0.0101 0.0879
Max Steel ok if εt > 0.004 OK OK OK OK OK φ = 0.90 if εt > 0.005 OK OK OK OK OK Minimum Steel (1) 0.85 0.83 0.85 0.85 0.83 Minimum Steel (2) 0.90 0.88 0.90 0.90 0.88
Governing Minimum Steel 0.90 0.88 0.90 0.90 0.88 Steel > Minimum Steel OK OK OK OK OK
φMn 1646.68 1679.26 2630.12 2630.12 2236.09 φMn > Mu OK OK OK OK OK

Bartolini | 48
Appendix E: T-Beam Shear Design Calculations
Table E1: T-Beam Shear Design – Floor Load – Col. A/G
Givens W (lb/ft2) 235 wu (k/in) 0.15 b 15 h 18 d (positive bending) 15.5625 φ 0.75 Av 0.4 (#4 stirrups)
A B C ln (in) 285.00 285.00 345.00
Cv 1.00 1.15 1.00 Vu 21.58 24.81 26.12
Vu at d 19.22 22.46 23.76 φVc 16.61 16.61 16.61
smax (1) 7.78 7.78 7.78 smax (2) 24.00 24.00 24.00 smax (3) 32 32 32 smax (4) 34 34 34 smax 7.5 7.5 7.5 φVs 2.610 5.846 7.152
4φ*sqrt(f'c)*bwd 44.29165148 44.29165148 44.29165148 8φ*sqrt(f'c)*bwd 88.58330296 88.58330296 88.58330296
φVs < 4φ*sqrt(f'c)*bwd OK OK OK φVs < 8φ*sqrt(f'c)*bwd OK OK OK
smin 107.34 47.92 39.17 smax<smin OK OK OK
Practical Limit (s>4") OK OK OK SPACING
Exterior - Interior # of spacing 38.00 - 46.00 # of stirrups 38 - 46
# of spacing (actual) 37 - 45 distance away from support 3.75 - 3.75

Bartolini | 49
Table E2: T-Beam Shear Design – Roof Load – Col. A/G
Givens W (lb/ft2) 179.4 wu (lb/ft) 0.12 b 15 h 18 d (postive bending) 15.5625 φ 0.75 Av 0.4 (#4 stirrups)
A B C ln (in) 285.00 285.00 345.00
Cv 1.00 1.15 1.00 Vu 16.95 19.50 20.52
Vu at d 15.10 17.65 18.67 φVc 16.61 16.61 16.61
smax (1) 7.78 7.78 7.78 smax (2) 24.00 24.00 24.00 smax (3) 32 32 32 smax (4) 34 34 34 smax 7.5 7.5 7.5 φVs -1.507 1.036 2.062
4φ*sqrt(f'c)*bwd 44.29165148 44.29165148 44.29165148 8φ*sqrt(f'c)*bwd 88.58330296 88.58330296 88.58330296
φVs < 4φ*sqrt(f'c)*bwd OK OK OK φVs < 8φ*sqrt(f'c)*bwd OK OK OK
smin -185.85 270.44 135.85 smax<smin -- OK OK
Practical Limit (s>4") OK OK OK SPACING
Exterior - Interior # of spacing 38.00 - 46.00 # of stirrups 38 - 46
# of spacing (actual) 37 - 45 distance away from support 3.75 - 3.75

Bartolini | 50
Table E3: T-Beam Shear Design – Floor Load – Col. B/F
Givens W (lb/ft2) 235 wu (k/in) 0.31 b 15 h 18 d (postive bending) 15.5625 φ 0.75 Av 0.4 (#4 stirrups)
A B C ln (in) 285.00 285.00 345.00
Cv 1.00 1.15 1.00 Vu 43.90 50.49 53.14
Vu at d 39.11 45.69 48.35 φVc 16.61 16.61 16.61
smax (1) 7.78 7.78 7.78 smax (2) 24.00 24.00 24.00 smax (3) 32 32 32 smax (4) 34 34 34 smax 7.5 7.5 7.5 φVs 22.497 29.082 31.739
4φ*sqrt(f'c)*bwd 44.29165148 44.29165148 44.29165148 8φ*sqrt(f'c)*bwd 88.58330296 88.58330296 88.58330296
φVs < 4φ*sqrt(f'c)*bwd OK OK OK φVs < 8φ*sqrt(f'c)*bwd OK OK OK
smin 12.45 9.63 8.83 smax<smin OK OK OK
Practical Limit (s>4") OK OK OK SPACING
Exterior - Interior # of spacing 38.00 - 46.00 # of stirrups 38 - 46
# of spacing (actual) 37 - 45 distance away from support 3.75 - 3.75

Bartolini | 51
Table E4: T-Beam Shear Design – Roof Load – Col. B/F
Givens W (lb/ft2) 179.4 wu (lb/ft) 0.24 b 15 h 18 d (postive bending) 15.5625 φ 0.75 Av 0.4 (#4 stirrups)
A B C ln (in) 285.00 285.00 345.00
Cv 1.00 1.15 1.00 Vu 34.00 39.10 41.15
Vu at d 30.28 35.38 37.44 φVc 16.61 16.61 16.61
smax (1) 7.78 7.78 7.78 smax (2) 24.00 24.00 24.00 smax (3) 32 32 32 smax (4) 34 34 34 smax 7.5 7.5 7.5 φVs 13.674 18.774 20.832
4φ*sqrt(f'c)*bwd 44.29165148 44.29165148 44.29165148 8φ*sqrt(f'c)*bwd 88.58330296 88.58330296 88.58330296
φVs < 4φ*sqrt(f'c)*bwd OK OK OK φVs < 8φ*sqrt(f'c)*bwd OK OK OK
smin 20.49 14.92 13.45 smax<smin OK OK OK
Practical Limit (s>4") OK OK OK SPACING
Exterior - Interior # of spacing 38.00 - 46.00 # of stirrups 38 - 46
# of spacing (actual) 37 - 45 distance away from support 3.75 - 3.75

Bartolini | 52
Table E5: T-Beam Shear Design – Floor Load – Col. C/D/E
Givens W (lb/ft2) 235 wu (lb/ft) 0.3303 b 15 h 20 d (postive bending) 15.5625 φ 0.75 Av 0.4 (#4 stirrups)
A B C ln (in) 285.00 285.00 345.00
Cv 1.00 1.15 1.00 Vu 47.06 54.12 56.97
Vu at d 41.92 48.98 51.83 φVc 16.61 16.61 16.61
smax (1) 7.78 7.78 7.78 smax (2) 24.00 24.00 24.00 smax (3) 32 32 32 smax (4) 34 34 34 smax 7.5 7.5 7.5 φVs 25.313 32.372 35.221
4φ*sqrt(f'c)*bwd 44.29165148 44.29165148 44.29165148 8φ*sqrt(f'c)*bwd 88.58330296 88.58330296 88.58330296
φVs < 4φ*sqrt(f'c)*bwd OK OK OK φVs < 8φ*sqrt(f'c)*bwd OK OK OK
smin 11.07 8.65 7.95 smax<smin OK OK OK
Practical Limit (s>4") OK OK OK SPACING
Exterior - Interior # of spacing 38.00 - 46.00 # of stirrups 38 - 46
# of spacing (actual) 37 - 45 distance away from support 3.75 - 3.75

Bartolini | 53
Table E6: T-Beam Shear Design – Roof Load – Col. C/D/E
Givens W (lb/ft2) 179.4 wu (lb/ft) 0.26 b 15 h 20 d (postive bending) 15.5625 φ 0.75 Av 0.4 (#4 stirrups)
A B C ln (in) 285.00 285.00 345.00
Cv 1.00 1.15 1.00 Vu 36.50 41.97 44.18
Vu at d 32.51 37.99 40.20 φVc 16.61 16.61 16.61
smax (1) 7.78 7.78 7.78 smax (2) 24.00 24.00 24.00 smax (3) 32 32 32 smax (4) 34 34 34 smax 7.5 7.5 7.5 φVs 15.903 21.377 23.587
4φ*sqrt(f'c)*bwd 44.29165148 44.29165148 44.29165148 8φ*sqrt(f'c)*bwd 88.58330296 88.58330296 88.58330296
φVs < 4φ*sqrt(f'c)*bwd OK OK OK φVs < 8φ*sqrt(f'c)*bwd OK OK OK
smin 17.61 13.10 11.88 smax<smin OK OK OK
Practical Limit (s>4") OK OK OK SPACING
Exterior - Interior # of spacing 38.00 - 46.00 # of stirrups 38 - 46
# of spacing (actual) 37 - 45 distance away from support 3.75 - 3.75

Bartolini | 54
Appendix F: Crack Control
Table F1: Crack Control – Floor Load – Col.
A/G
Givens fy (psi) 60000 fs (psi) 40000 Cover (in) 1.5 Stirrup Diameter (in) 0.5 Width 15
S2 S5 Steel Provided 2 # 7 3 # 7
smax 10 10 smax limit 12 12
smax governing 10 10 s 9.80 4.90
Is s<smax Yes Yes
Table F2: Crack Control – Roof Load – Col.
A/G
Givens fy (psi) 60000 fs (psi) 40000 Cover (in) 1.5 Stirrup Diameter (in) 0.5 Width 15
S2 S5 Steel Provided 3 # 5 2 # 7
smax 10 10 smax limit 12 12
smax governing 10 10 s 5.19 9.80
Is s<smax Yes Yes
Table F3: Crack Control – Floor Load – Col.
B/F
Givens fy (psi) 60000 fs (psi) 40000 Cover (in) 1.5 Stirrup Diameter (in) 0.5 Width 15
S2 S5 Steel Provided 4 # 7 5 # 7
smax 10 10 smax limit 12 12
smax governing 10 10 s 3.27 2.45
Is s<smax Yes Yes
Table F4: Crack Control – Roof Load – Col.
B/F
Givens fy (psi) 60000 fs (psi) 40000 Cover (in) 1.5 Stirrup Diameter (in) 0.5 Width 15
S2 S5 Steel Provided 3 # 7 4 # 7
smax 10 10 smax limit 12 12
smax governing 10 10 s 4.90 3.27
Is s<smax Yes Yes

Bartolini | 55
Table F5: Crack Control – Floor Load – Col.
C/D/E
Givens fy (psi) 60000 fs (psi) 40000 Cover (in) 1.5 Stirrup Diameter (in) 0.5 Width 15
S2 S5 Steel Provided 4 # 7 5 # 7
smax 10 10 smax limit 12 12
smax governing 10 10 s 3.27 2.45
Is s<smax Yes Yes
Table F6: Crack Control – Roof Load – Col.
C/D/E
Givens fy (psi) 60000 fs (psi) 40000 Cover (in) 1.5 Stirrup Diameter (in) 0.5 Width 15
S2 S5 Steel Provided 3 # 7 4 # 7
smax 10 10 smax limit 12 12
smax governing 10 10 s 4.90 3.27
Is s<smax Yes Yes

Bartolini | 56
Appendix G: Deflection Calculations
Table G1: Deflection– Floor Load – Col. A/G
Interior Exterior
Loads Dead Load - Mech (psf) 15 15 Dead Load - Slab (psf) 87.5 87.5
Tributary Length 7 7 Width (in) 15 15
T-Beam Depth (in) 18 18 Slab Depth (in) 7 7
γconcrete (pcf) 150 150 Beam Stem Weight (lb/ft) 171.88 171.88
Total Dead Load (k/ft) 0.89 0.89 Live Load (psf) 50 50
Partition Load (psf) 20 20 Total Live Load (k/ft) 0.49 0.49
Total Load (k/ft) 1.38 1.38
Ig for Uncracked Setion
beff (in) 43 38
yt (in) 6.69 6.95
yb (in) 11.31 11.05
Ig (in4) 11526 10998.4 Check if Negative Section #1 is Cracked
fr (psi) 474.34 474.34
Mcr- (k-ft) 68.134 62.595
Center-to-Center Span (ft) 30 30 Adjacent C-to-C Span (ft) 25 25
Clear Span (ft) 28.75 28.75 Adjacent Clear Span (ft) 23.75 23.75
ln (ft) 26.25 26.25
Ma- 86.41 95.048
Cracked? Yes Yes
Check if Negative Section #2 is Cracked
fr (psi) n/a 474.34
Mcr- (k-ft) n/a 62.595
Center-to-Center Span (ft) n/a 25 Adjacent C-to-C Span (ft) n/a n/a
Clear Span (ft) n/a 23.75 Adjacent Clear Span (ft) n/a n/a
ln (ft) n/a 23.75
Ma- n/a 48.628
Cracked? n/a No, Use Ig Check if Positive Section is Cracked
fr (psi) 474.34 474.34
Mcr+
(k-ft) 40.27 39.328 Center-to-Center Span (ft) 30 25
Clear Span (ft) 28.75 23.75
ln (ft) 28.75 23.75
Ma+ 71.23 55.58
Cracked? Yes Yes
Calculate Negative Ict #1 n 8.04 8.04
Steel 2 # 9 2 # 9
As (in2) 1.99 1.99
nAs (in2) 15.99 15.99 d (in) 16 16
Finding kd- A 7.5 7.5 B 15.99 15.99 C -255.9 -255.9
kd- (in) 4.87 4.87 Is kd In Web? Yes Yes
Ict- #2 2558.62 2558.62

Bartolini | 57
Calculate Negative Ict #2 n n/a n/a
Steel n/a n/a
As (in2) n/a n/a
nAs (in2) n/a n/a d (in) n/a n/a
Finding kd- A n/a n/a B n/a n/a C n/a n/a
kd- (in) n/a n/a Is kd In Web? n/a n/a
Ict- #1 n/a n/a
Calculate Positive Ict n 8.04 8.04
Steel 3 # 7 2 # 7
As (in2) 1.80 1.20
nAs (in2) 14.51 9.67 d (in) 15.5 15.5
Finding kd+ A 21.5 19 B 14.51 9.67 C -224.93 -149.95
kd+ 2.91 2.57 Is kd In Slab? Yes Yes
Ict+ 2653.43 1832.44
Calculating Ie
Ie- (#1) 6954.90 4969.18
Less Than Ig? Yes Yes
Ie- (#2) n/a 10998.39
Less Than Ig? n/a n/a
Ie+ 4254.71 5080.54
Less Than Ig? Yes Yes
Average Ie 5604.81 6532.16 Deflection
Δ 0.397 0.178 Deflections Affecting Partitions
Δi,0.70l 0.0989 0.0442
Δi,0.30l 0.0424 0.0189
λ∞ 2 2
Δl,0.30l 0.0847 0.0379
λ3m 1 1
Δl,d 0.2563 0.1146
Δtotal 0.4821 0.21554
Δall 0.75 0.625 Passed? Yes Yes

Bartolini | 58
Table G2: Deflection – Roof Load – Col. A/G
Interior Exterior
Loads Dead Load - Mech (psf) 22 22 Dead Load - Slab (psf) 87.5 87.5
Tributary Length 7 7 Width (in) 15 15
T-Beam Depth (in) 18 18 Slab Depth (in) 7 7
γconcrete (pcf) 150 150 Beam Stem Weight (lb/ft) 171.88 171.88
Total Dead Load (k/ft) 0.94 0.94 Live Load (psf) 30 30
Partition Load (psf) 0 0 Total Live Load (k/ft) 0.21 0.21
Total Load (k/ft) 1.15 1.15
Ig for Uncracked Section
beff (in) 43 38
yt (in) 6.69 6.95
yb (in) 11.31 11.05
Ig (in4) 11525.6 10998.4 Check if Negative Section #1 is Cracked
fr (psi) 474.34 474.34
Mcr- (k-ft) 68.134 62.595
Center-to-Center Span (ft) 30 30 Adjacent C-to-C Span (ft) 25 25
Clear Span (ft) 28.75 28.75 Adjacent Clear Span (ft) 23.75 23.75
ln (ft) 26.25 26.25
Ma- 71.937 79.1302
Cracked? Yes Yes
Check if Negative Section #2 is Cracked
fr (psi) n/a 474.34
Mcr- (k-ft) n/a 62.595
Center-to-Center Span (ft) n/a 25 Adjacent C-to-C Span (ft) n/a n/a
Clear Span (ft) n/a 23.75 Adjacent Clear Span (ft) n/a n/a
ln (ft) n/a 23.75
Ma- n/a 40.485
Cracked? n/a No, Use Ig
Check if Positive Section is Cracked
fr (psi) 474.34 474.34
Mcr+
(k-ft) 40.270 39.3277 Center-to-Center Span
(ft) 30 25 Clear Span (ft) 28.75 23.75
ln (ft) 28.75 23.75
Ma+ 59.325 46.268
Cracked? Yes Yes
Calculate Negative Ict #1 n 8.04 8.04
Steel 3 # 7 3 # 7
As (in2) 1.80 1.80
nAs (in2) 14.51 14.51 d (in) 16 16
Finding kd- A 7.5 7.5 B 14.51 14.51 C -232.19 -232.19
kd- (in) 4.68 4.68 Is kd In Web? Yes Yes
Ict- #2 2372.09 2372.09

Bartolini | 59
Calculate Negative Ict #2 n n/a n/a
Steel n/a n/a
As (in2) n/a n/a
nAs (in2) n/a n/a d (in) n/a n/a
Finding kd- A n/a n/a B n/a n/a C n/a n/a
kd- (in) n/a n/a Is kd In Web? n/a n/a
Ict- #1 n/a n/a
Calculate Positive Ict n 8.04 8.04
Steel 2 # 7 3 # 5
As (in2) 1.20 0.92
nAs (in2) 9.67 7.40 d (in) 15.5 15.5
Finding kd+ A 21.5 19 B 9.67 7.40 C -149.95 -114.76
kd+ 2.43 2.27
Is kd In Slab? Yes Yes
Ict+ 1858.31 1444.10
Calculating Ie
Ie- (#1) 10149.29 6641.90
Less Than Ig? Yes Yes
Ie- (#2) n/a 10998.39
Less Than Ig? n/a n/a
Ie+ 4882.00 7311.51
Less Than Ig? Yes Yes
Average Ie 7515.65 8065.82 Deflection
Δ 0.247 0.120 Deflections Affecting Partitions
Δi,l 0.045125
9 0.021905
9
- - -
λ∞ 2 2
- - -
λ3m 1 1
Δl,d 0.2016 0.09789
Δtotal 0.2468 0.11979
Δall 0.75 0.625 Passed? Yes Yes

Bartolini | 60
Table G3: Deflection – Floor Load – Col. B/F
Interior Exterior
Loads Dead Load - Mech (psf) 15 15 Dead Load - Slab (psf) 87.5 87.5
Tributary Length 15 15 Width (in) 15 15
T-Beam Depth (in) 18 18 Slab Depth (in) 7 7
γconcrete (pcf) 150 150 Beam Stem Weight (lb/ft) 171.88 171.88
Total Dead Load (k/ft) 1.71 1.71 Live Load (psf) 50 50
Partition Load (psf) 20 20 Total Live Load (k/ft) 1.05 1.05
Total Load (k/ft) 2.76 2.76
Ig for Uncracked Section
beff (in) 86 71
yt (in) 5.44 5.74
yb (in) 12.56 12.26
Ig (in4) 14611.8 13727.0 Check if Negative Section #1 is Cracked
fr (psi) 474.34 474.34
Mcr- (k-ft) 106.249 94.478
Center-to-Center Span (ft) 30 30
Adjacent C-to-C Span (ft) 25 25 Clear Span (ft) 28.75 28.75
Adjacent Clear Span (ft) 23.75 23.75
ln (ft) 26.25 26.25
Ma- 172.85 190.14
Cracked? Yes Yes
Check if Negative Section #2 is Cracked
fr (psi) n/a 474.34
Mcr- (k-ft) n/a 94.478
Center-to-Center Span (ft) n/a 25
Adjacent C-to-C Span (ft) n/a n/a Clear Span (ft) n/a 23.75
Adjacent Clear Span (ft) n/a n/a
ln (ft) n/a 23.75
Ma- n/a 97.279
Cracked? n/a Yes Check if Positive Section is Cracked
fr (psi) 474.34 474.34
Mcr+
(k-ft) 45.9716 44.270 Center-to-Center Span
(ft) 30 25 Clear Span (ft) 28.75 23.75
ln (ft) 28.75 23.75
Ma+ 142.55 111.18
Cracked? Yes Yes
Calculate Negative Ict #1 n 8.04 8.04
Steel 7 # 7 7 # 7
As (in2) 4.21 4.21
nAs (in2) 33.86 33.86 d (in) 16 16
Finding kd- A 7.5 7.5 B 33.86 33.86 C -541.77 -541.77
kd- (in) 6.54 6.54 Is kd In Web? Yes Yes
Ict- #2 4428.89 4428.89

Bartolini | 61
Calculate Negative Ict #2 n n/a 8.04
Steel n/a 2 # 9
As (in2) n/a 1.99
nAs (in2) n/a 15.99 d (in) n/a 16
Finding kd- A n/a 6.12840 B n/a 15.99 C n/a -255.88
kd- (in) n/a 5.29 Is kd In Web? n/a Yes
Ict- #1 n/a 2439.23
Calculate Positive Ict n 8.04 8.04
Steel 5 # 7 4 # 7
As (in2) 3.01 2.41
nAs (in2) 24.19 19.35 d (in) 15.5 15.5
Finding kd+ A 43 35.5 B 24.19 19.35 C -374.89 -299.91
kd+ 2.68 2.65
Is kd In Slab? Yes Yes
Ict+ 4526.87 3635.39
Calculating Ie
Ie- (#1) 6793.80 5569.62
Less Than Ig? Yes Yes
Ie- (#2) n/a 12780
Less Than Ig? n/a Yes
Ie+ 4865.12 4272.56
Less Than Ig? Yes Yes
Average Ie 5829.46 6723.67 Deflection
Δ 0.764 0.345 Deflections Affecting Partitions
Δi,0.70l 0.203625
2 0.091975
4
Δi,0.30l 0.0873 0.0394
λ∞ 2 2
Δl,0.30l 0.1745 0.0788
λ3m 1 1
Δl,d 0.4736 0.2139
Δtotal 0.9390 0.4241
Δall 0.75 0.625 Passed? No Yes

Bartolini | 62
Table G4: Deflection – Roof Load – Col. B/F
Interior Exterior
Loads Dead Load - Mech (psf) 22 22 Dead Load - Slab (psf) 87.5 87.5
Tributary Length 15 15 Width (in) 15 15
T-Beam Depth (in) 18 18 Slab Depth (in) 7 7
γconcrete (pcf) 150 150 Beam Stem Weight (lb/ft) 171.88 171.88
Total Dead Load (k/ft) 1.81 1.81 Live Load (psf) 30 30
Partition Load (psf) 0 0 Total Live Load (k/ft) 0.45 0.45
Total Load (k/ft) 2.26 2.26
Ig for Uncracked Setion
beff (in) 86 71
yt (in) 5.44 5.74
yb (in) 12.56 12.26
Ig (in4) 14611.8 13727.0 Check if Negative Section #1 is Cracked
fr (psi) 474.34 474.34
Mcr- (k-ft) 106.249 94.478
Center-to-Center Span (ft) 30 30 Adjacent C-to-C Span (ft) 25 25
Clear Span (ft) 28.75 28.75 Adjacent Clear Span (ft) 23.75 23.75
ln (ft) 26.25 26.25
Ma- 141.845 156.03
Cracked? Yes Yes
Check if Negative Section #2 is Cracked
fr (psi) n/a 474.342
Mcr- (k-ft) n/a 94.478
Center-to-Center Span (ft) n/a 25 Adjacent C-to-C Span (ft) n/a n/a
Clear Span (ft) n/a 23.75 Adjacent Clear Span (ft) n/a n/a
ln (ft) n/a 23.75
Ma- n/a 79.828
Cracked? n/a No, Use
Ig Check if Positive Section is Cracked
fr (psi) 474.34 474.34
Mcr+
(k-ft) 45.9716 44.270 Center-to-Center Span
(ft) 30 25 Clear Span (ft) 28.75 23.75
ln (ft) 28.75 23.75
Ma+ 116.98 91.232
Cracked? Yes Yes
Calculate Negative Ict #1 n 8.04 8.04
Steel 7 # 7 7 # 7
As (in2) 4.21 4.21
nAs (in2) 33.86 33.86 d (in) 16 16
Finding kd- A 7.5 7.5 B 33.86 33.86 C -541.77 -541.77
kd- (in) 6.54 6.54 Is kd In Web? Yes Yes
Ict- #2 4428.89 4428.89

Bartolini | 63
Calculate Negative Ict #2 n n/a 8.04
Steel n/a 2 # 9
As (in2) n/a 1.99
nAs (in2) n/a 15.99 d (in) n/a 16
Finding kd- A n/a 6.128 B n/a 15.99 C n/a -255.88
kd- (in) n/a 5.29 Is kd In Web? n/a Yes
Ict- #1 n/a 2439.23
Calculate Positive Ict n 8.04 8.04
Steel 5 # 7 4 # 7
As (in2) 3.01 2.41
nAs (in2) 24.19 19.35 d (in) 15.5 15.5
Finding kd+ A 43 35.5 B 24.19 19.35 C -374.89 -299.91
kd+ 2.68 2.65
Is kd In Slab? Yes Yes
Ict+ 4526.87 3635.39
Calculating Ie
Ie- (#1) 8708.48 6493.17
Less Than Ig? Yes Yes
Ie- (#2) n/a 21151.97
Less Than Ig? n/a No
Ie+ 5138.98 4788.43
Less Than Ig? Yes Yes
Average Ie 6923.73 9305.50 Deflection
Δ 0.528 0.205 Deflections Affecting Partitions
Δi,l 0.104965
1 0.0406877
- - -
λ∞ 2 2
- - -
λ3m 1 1
Δl,d 0.423 0.1641
Δtotal 0.528 0.205
Δall 0.75 0.625 Passed? Yes Yes

Bartolini | 64
Table G5: Deflection – Floor Load – Col. C/D/E
Interior Exterior
Loads Dead Load - Mech (psf) 15 15 Dead Load - Slab (psf) 87.5 87.5
Tributary Length 16 16 Width (in) 15 15
T-Beam Depth (in) 20 20 Slab Depth (in) 7 7
γconcrete (pcf) 150 150 Beam Stem Weight (lb/ft) 203.13 203.13
Total Dead Load (k/ft) 1.84 1.84 Live Load (psf) 50 50
Partition Load (psf) 20 20 Total Live Load (k/ft) 1.12 1.12
Total Load (k/ft) 2.96 2.96
Ig for Uncracked Section
beff (in) 86 71
yt (in) 5.95 6.32
yb (in) 14.05 13.68
Ig (in4) 19933.4 18780.7 Check if Negative Section #1 is Cracked
fr (psi) 474.34 474.34
Mcr- (k-ft) 132.50 117.50
Center-to-Center Span (ft) 30 30 Adjacent C-to-C Span (ft) 25 25
Clear Span (ft) 28.75 28.75 Adjacent Clear Span (ft) 23.75 23.75
ln (ft) 26.25 26.25
Ma- 185.62 204.18
Cracked? Yes Yes
Check if Negative Section #2 is Cracked
fr (psi) n/a 474.34
Mcr- (k-ft) n/a 117.51
Center-to-Center Span (ft) n/a 25 Adjacent C-to-C Span (ft) n/a n/a
Clear Span (ft) n/a 23.75 Adjacent Clear Span (ft) n/a n/a
ln (ft) n/a 23.75
Ma- n/a 104.46
Cracked? n/a No, Use Ig Check if Positive Section is Cracked
fr (psi) 474.34 474.34
Mcr+
(k-ft) 56.07 54.259 Center-to-Center Span (ft) 30 25
Clear Span (ft) 28.75 23.75
ln (ft) 28.75 23.75
Ma+ 153.0755 119.38484
Cracked? Yes Yes
Calculate Negative Ict #1 n 8.04 8.04
Steel 4 # 9 4 # 9
As (in2) 3.98 3.98
nAs (in2) 31.99 31.99 d (in) 16 16
Finding kd- A 7.5 7.5 B 31.99 31.99 C -511.76 -511.76
kd- (in) 6.40 6.40 Is kd In Web? Yes Yes
Ict- #2 4258.47 4258.47

Bartolini | 65
Calculate Negative Ict #2 n n/a n/a
Steel n/a n/a
As (in2) n/a n/a
nAs (in2) n/a n/a d (in) n/a n/a
Finding kd- A n/a n/a B n/a n/a C n/a n/a
kd- (in) n/a n/a Is kd In Web? n/a n/a
Ict- #1 n/a n/a
Calculate Positive Ict n 8.04 8.04
Steel 5 # 7 4 # 7
As (in2) 3.01 2.41
nAs (in2) 24.19 19.35 d (in) 15.5 15.5
Finding kd+ A 43 35.5 B 24.19 19.35 C -374.89 -299.91
kd+ 2.68 2.65
Is kd In Slab? Yes Yes
Ict+ 4526.87 3635.39
Calculating Ie
Ie- (#1) 9960.24 7026.39
Less Than Ig? Yes Yes
Ie- (#2) n/a 18780.72
Less Than Ig? n/a n/a
Ie+ 5283.92 5057.20
Less Than Ig? Yes Yes
Average Ie 7622.08 8980.38 Deflection
Δ 0.628 0.278 Deflections Affecting Partitions
Δi,0.70l 0.166 0.0735
Δi,0.30l 0.071 0.03148
λ∞ 2 2
Δl,0.30l 0.1424 0.0630
λ3m 1 1
Δl,d 0.391 0.173
Δtotal 0.7702 0.341
Δall 0.75 0.625 Passed? No Yes

Bartolini | 66
Table G6: Deflection – Roof Load – Col. C/D/E
Interior Exterior
Loads Dead Load - Mech (psf) 22 22 Dead Load - Slab (psf) 87.5 87.5
Tributary Length 16 16 Width (in) 15 15
T-Beam Depth (in) 20 20 Slab Depth (in) 7 7
γconcrete (pcf) 150 150 Beam Stem Weight (lb/ft) 203.13 203.13
Total Dead Load (k/ft) 1.96 1.96 Live Load (psf) 30 30
Partition Load (psf) 20 20 Total Live Load (k/ft) 0.8 0.8
Total Load (k/ft) 2.76 2.76
Ig for Uncracked Section
beff (in) 86 71
yt (in) 5.95 6.32
yb (in) 14.05 13.68
Ig (in4) 19933.4 18780.7 Check if Negative Section #1 is Cracked
fr (psi) 474.3 474.3
Mcr- (k-ft) 132.5004 117.50282
Center-to-Center Span (ft) 30 30
Adjacent C-to-C Span (ft) 25 25
Clear Span (ft) 28.75 28.75 Adjacent Clear Span (ft) 23.75 23.75
ln (ft) 26.25 26.25
Ma- 172.6 189.8
Cracked? Yes Yes
Check if Negative Section #2 is Cracked
fr (psi) n/a 474.3
Mcr- (k-ft) n/a 117.5
Center-to-Center Span (ft) n/a 25
Adjacent C-to-C Span (ft) n/a n/a
Clear Span (ft) n/a 23.75 Adjacent Clear Span (ft) n/a n/a
ln (ft) n/a 23.75
Ma- n/a 97.13
Cracked? n/a No, Use
Ig Check if Positive Section is Cracked
fr (psi) 474.3 474.3
Mcr+
(k-ft) 56.067 54.26 Center-to-Center Span
(ft) 30 25 Clear Span (ft) 28.75 23.75
ln (ft) 28.75 23.75
Ma+ 142.3 111.0
Cracked? Yes Yes
Calculate Negative Ict #1 n 8.04 8.04
Steel 4 # 9 4 # 9
As (in2) 3.98 3.98
nAs (in2) 31.99 31.99 d (in) 16 16
Finding kd- A 7.5 7.5 B 31.99 31.99 C -511.76 -511.76
kd- (in) 6.40 6.40 Is kd In Web? Yes Yes
Ict- #2 4258.47 4258.47

Bartolini | 67
Calculate Negative Ict #2 n n/a n/a
Steel n/a n/a
As (in2) n/a n/a
nAs (in2) n/a n/a d (in) n/a n/a
Finding kd- A n/a n/a B n/a n/a C n/a n/a
kd- (in) n/a n/a Is kd In Web? n/a n/a
Ict- #1 n/a n/a
Calculate Positive Ict n 8.04 8.04
Steel 5 # 7 4 # 7
As (in2) 3.01 2.41
nAs (in2) 24.19 19.35 d (in) 15.5 15.5
Finding kd+ A 43 35.5 B 24.19 19.35 C -374.89 -299.91
kd+ 2.68 2.65
Is kd In Slab? Yes Yes
Ict+ 4526.87 3635.39
Calculating Ie
Ie- (#1) 11351.56 7701.80
Less Than Ig? Yes Yes
Ie- (#2) n/a 18780.72
Less Than Ig? n/a n/a
Ie+ 5468.65 5404.14
Less Than Ig? Yes Yes
Average Ie 8410.11 9322.70 Deflection
Δ 0.529 0.249 Deflections Affecting Partitions
Δi,l 0.153624
7 0.0722003
- - -
λ∞ 2 2
- - -
λ3m 1 1
Δl,d 0.375 0.176
Δtotal 0.529 0.2487
Δall 0.75 0.625 Passed? Yes Yes

Bartolini | 68
Appendix H: Column Design Calculations
Table H1: Column Reinforcement | Maximum Axial | Exterior Column Lines A and G
1L 1U 2L 2U 3L 3U 4L 4U 5L 5U Unfactored Loads
Beam Moment (DL) (k-ft) 31.4 31.4 31.4 31.4 31.4 31.4 31.4 31.4 31.4 33.1
Beam Moment (LL) (k-ft) 17.3 17.3 17.3 17.3 17.3 17.3 17.3 17.3 17.3 7.4
Distance Ratio 0.213 0.426 0.574 0.5 0.5 0.5 0.5 0.5 0.5 1 Column Moment
(DL) (k-ft) 6.68 13.36 18.00 15.68 15.68 15.68 15.68 15.68 15.68 33.08
Column Moment (LL) (k-ft) 3.68 7.36 9.92 8.64 8.64 8.64 8.64 8.64 8.64 7.40
Axial Force (DL) (k) 70.22 66.48 55.56 52.75 41.82 39.01 28.09 25.27 14.35 11.54
Axial Force (LL) (k) 27.13 27.13 21.00 21.00 14.88 14.88 8.75 8.75 2.63 2.63
Factored Loads
Mu (k-ft) 13.9 27.8 37.5 32.6 32.6 32.6 32.6 32.6 32.6 51.5
Pu (k) 127.7 123.2 100.3 96.9 74.0 70.6 47.7 44.3 21.4 18.0
Kn 0.218 0.211 0.171 0.166 0.126 0.121 0.082 0.076 0.037 0.022
Rn 0.02 0.04 0.05 0.04 0.04 0.04 0.04 0.04 0.04 0.05
pg 0.01 0.01 0.01 0.01 0.01 0.01 0.01 0.01 0.01 0.010
Ast (in2) 2.25 2.25 2.25 2.25 2.25 2.25 2.25 2.25 2.25 2.25
Steel Provided 4 #7 4 #7 4 #7 4 #7 4 #7 4 #7 4 #7 4 #7 4 #7 4 #7* Tie Spacing
smax (1) (in) 14 14 14 14 14 14 14 14 14 14
smax (2) (in) 24 24 24 24 24 24 24 24 24 24
smax (3) (in) 15 15 15 15 15 15 15 15 15 15
smax (governing) 14 14 14 14 14 14 14 14 14 14
Ties Provided #4 @ 14"
#4 @ 14"
#4 @ 14"
#4 @ 14"
#4 @ 14"
#4 @ 14"
#4 @ 14"
#4 @ 14"
#4 @ 14"
#4 @ 14"

Bartolini | 69
Table H2: Column Reinforcement | Minimum Axial | Exterior Column Lines A and G
1L 1U 2L 2U 3L 3U 4L 4U 5L 5U Unfactored Loads
Beam Moment (DL) (k-ft) 31.4 31.4 31.4 31.4 31.4 31.4 31.4 31.4 31.4 33.1
Beam Moment (LL) (k-ft) 17.3 17.3 17.3 17.3 17.3 17.3 17.3 17.3 17.3 7.4
Distance Ratio 0.213 0.426 0.574 0.5 0.5 0.5 0.5 0.5 0.5 1 Column Moment
(DL) (k-ft) 6.68 13.36 18.00 15.68 15.68 15.68 15.68 15.68 15.68 33.08
Column Moment (LL) (k-ft) 3.68 7.36 9.92 8.64 8.64 8.64 8.64 8.64 8.64 7.40
Axial Force (DL) (k) 70.22 66.48 55.56 52.75 41.82 39.01 28.09 25.27 14.35 11.54
Axial Force (LL) (k) 6.13 6.13 6.13 6.13 6.13 6.13 6.13 6.13 2.63 2.63
Factored Loads
Mu (k-ft) 13.9 27.8 37.5 32.6 32.6 32.6 32.6 32.6 32.6 51.5
Pu (k) 94.1 89.6 76.5 73.1 60.0 56.6 43.5 40.1 21.4 18.0
Kn 0.161 0.153 0.131 0.125 0.103 0.097 0.074 0.069 0.037 0.022
Rn 0.02 0.04 0.05 0.04 0.04 0.04 0.04 0.04 0.04 0.05
pg 0.01 0.01 0.01 0.01 0.01 0.01 0.01 0.01 0.01 0.010
Ast (in2) 2.25 2.25 2.25 2.25 2.25 2.25 2.25 2.25 2.25 2.25
Steel Provided 4 #7 4 #7 4 #7 4 #7 4 #7 4 #7 4 #7 4 #7 4 #7 4 #7* Tie Spacing
smax (1) (in) 14 14 14 14 14 14 14 14 14 14
smax (2) (in) 24 24 24 24 24 24 24 24 24 24
smax (3) (in) 15 15 15 15 15 15 15 15 15 15
smax (governing) 14 14 14 14 14 14 14 14 14 14
Ties Provided #4 @ 14"
#4 @ 14"
#4 @ 14"
#4 @ 14"
#4 @ 14"
#4 @ 14"
#4 @ 14"
#4 @ 14"
#4 @ 14"
#4 @ 14"

Bartolini | 70
Table H3: Column Reinforcement | Maximum Axial | Exterior Column Lines B and F
1L 1U 2L 2U 3L 3U 4L 4U 5L 5U Unfactored Loads
Beam Moment (DL) (k-ft) 61.4 61.4 61.4 61.4 61.4 61.4 61.4 61.4 61.4 65.1
Beam Moment (LL) (k-ft) 37.0 37.0 37.0 37.0 37.0 37.0 37.0 37.0 37.0 15.9
Distance Ratio 0.213 0.426 0.574 0.5 0.5 0.5 0.5 0.5 0.5 1 Column Moment
(DL) (k-ft) 13.07 26.14 35.22 30.68 30.68 30.68 30.68 30.68 30.68 65.07
Column Moment (LL) (k-ft) 7.88 15.77 21.25 18.51 18.51 18.51 18.51 18.51 18.51 15.86
Axial Force (DL) (k) 123.95 120.21 98.68 95.87 74.34 71.53 50.00 47.18 25.65 22.84
Axial Force (LL) (k) 58.13 58.13 45.00 45.00 31.88 31.88 18.75 18.75 5.63 5.63
Factored Loads
Mu (k-ft) 28.3 56.6 76.3 66.4 66.4 66.4 66.4 66.4 66.4 103.5
Pu (k) 241.7 237.3 190.4 187.0 140.2 136.8 90.0 86.6 39.8 36.4
Kn 0.413 0.406 0.325 0.320 0.240 0.234 0.154 0.148 0.068 0.062
Rn 0.04 0.08 0.10 0.09 0.09 0.09 0.09 0.09 0.09 0.14
pg 0.01 0.01 0.01 0.01 0.01 0.01 0.01 0.01 0.0100 0.0250
Ast (in2) 2.25 2.25 2.25 2.25 2.25 2.25 2.25 2.25 2.25 5.625
Steel Provided 4 #7 4 #7 4 #7 4 #7 4 #7 4 #7 4 #7 4 #7 4 #7 4 #11 Tie Spacing
smax (1) (in) 14 14 14 14 14 14 14 14 18.048 22.4
smax (2) (in) 24 24 24 24 24 24 24 24 24 24
smax (3) (in) 15 15 15 15 15 15 15 15 15 15
smax (govering) 14 14 14 14 14 14 14 14 15 15
Ties Provided #4 @ 14"
#4 @ 14"
#4 @ 14"
#4 @ 14"
#4 @ 14"
#4 @ 14"
#4 @ 14"
#4 @ 14"
#4 @ 14"
#4 @ 15"
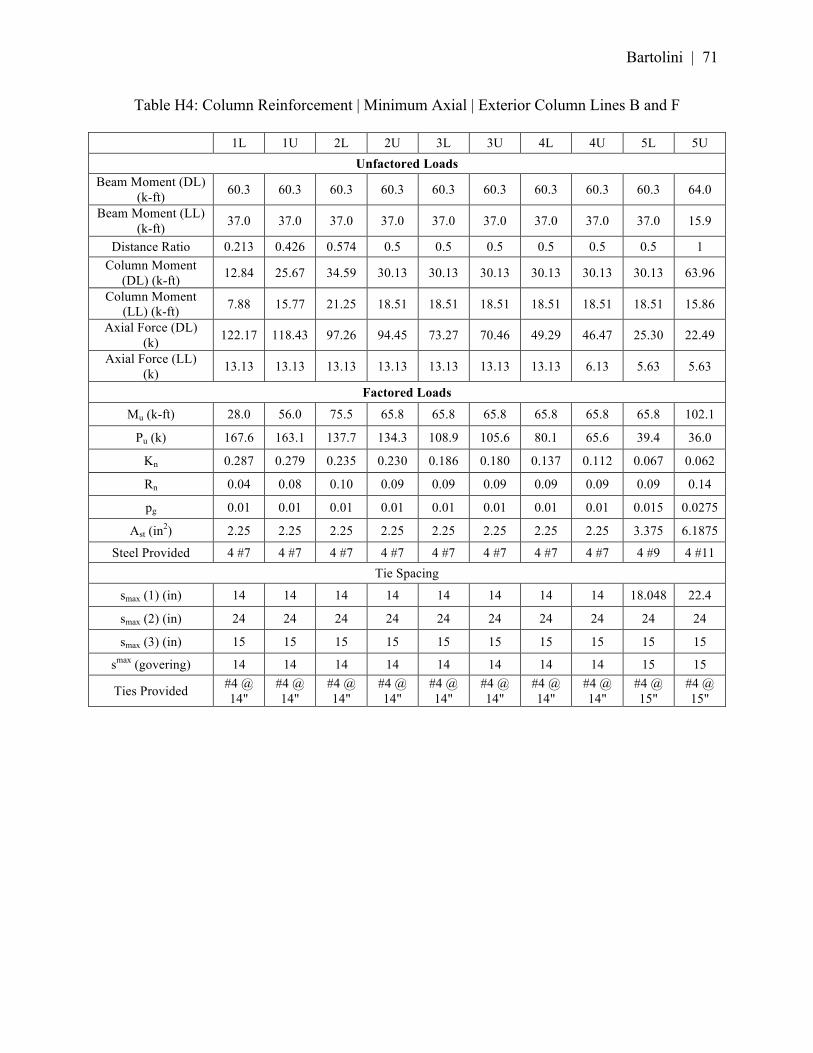
Bartolini | 71
Table H4: Column Reinforcement | Minimum Axial | Exterior Column Lines B and F
1L 1U 2L 2U 3L 3U 4L 4U 5L 5U Unfactored Loads
Beam Moment (DL) (k-ft) 60.3 60.3 60.3 60.3 60.3 60.3 60.3 60.3 60.3 64.0
Beam Moment (LL) (k-ft) 37.0 37.0 37.0 37.0 37.0 37.0 37.0 37.0 37.0 15.9
Distance Ratio 0.213 0.426 0.574 0.5 0.5 0.5 0.5 0.5 0.5 1 Column Moment
(DL) (k-ft) 12.84 25.67 34.59 30.13 30.13 30.13 30.13 30.13 30.13 63.96
Column Moment (LL) (k-ft) 7.88 15.77 21.25 18.51 18.51 18.51 18.51 18.51 18.51 15.86
Axial Force (DL) (k) 122.17 118.43 97.26 94.45 73.27 70.46 49.29 46.47 25.30 22.49
Axial Force (LL) (k) 13.13 13.13 13.13 13.13 13.13 13.13 13.13 6.13 5.63 5.63
Factored Loads
Mu (k-ft) 28.0 56.0 75.5 65.8 65.8 65.8 65.8 65.8 65.8 102.1
Pu (k) 167.6 163.1 137.7 134.3 108.9 105.6 80.1 65.6 39.4 36.0
Kn 0.287 0.279 0.235 0.230 0.186 0.180 0.137 0.112 0.067 0.062
Rn 0.04 0.08 0.10 0.09 0.09 0.09 0.09 0.09 0.09 0.14
pg 0.01 0.01 0.01 0.01 0.01 0.01 0.01 0.01 0.015 0.0275
Ast (in2) 2.25 2.25 2.25 2.25 2.25 2.25 2.25 2.25 3.375 6.1875
Steel Provided 4 #7 4 #7 4 #7 4 #7 4 #7 4 #7 4 #7 4 #7 4 #9 4 #11 Tie Spacing
smax (1) (in) 14 14 14 14 14 14 14 14 18.048 22.4
smax (2) (in) 24 24 24 24 24 24 24 24 24 24
smax (3) (in) 15 15 15 15 15 15 15 15 15 15
smax (govering) 14 14 14 14 14 14 14 14 15 15
Ties Provided #4 @ 14"
#4 @ 14"
#4 @ 14"
#4 @ 14"
#4 @ 14"
#4 @ 14"
#4 @ 14"
#4 @ 14"
#4 @ 15"
#4 @ 15"

Bartolini | 72
Table H5: Column Reinforcement | Maximum Axial | Exterior Column Lines C, D and E
1L 1U 2L 2U 3L 3U 4L 4U 5L 5U Unfactored Loads
Beam Moment (DL) (k-ft) 65.0 65.0 65.0 65.0 65.0 65.0 65.0 65.0 65.0 68.9
Beam Moment (LL) (k-ft) 39.5 39.5 39.5 39.5 39.5 39.5 39.5 39.5 39.5 16.9
Distance Ratio 0.213 0.426 0.574 0.5 0.5 0.5 0.5 0.5 0.5 1 Column Moment
(DL) (k-ft) 13.84 27.68 37.30 32.49 32.49 32.49 32.49 32.49 32.49 68.93
Column Moment (LL) (k-ft) 8.41 16.82 22.66 19.74 19.74 19.74 19.74 19.74 19.74 16.92
Axial Force (DL) (k) 130.44 126.70 103.89 101.08 78.27 75.46 52.65 49.83 27.02 24.21
Axial Force (LL) (k) 62.00 62.00 48.00 48.00 34.00 34.00 20.00 20.00 6.00 6.00
Factored Loads
Mu (k-ft) 30.1 60.1 81.0 70.6 70.6 70.6 70.6 70.6 70.6 109.8
Pu (k) 255.7 251.2 201.5 198.1 148.3 144.9 95.2 91.8 42.0 38.7
Kn 0.437 0.429 0.344 0.339 0.254 0.248 0.163 0.157 0.072 0.048
Rn 0.04 0.08 0.11 0.10 0.10 0.10 0.10 0.10 0.10 0.11
pg 0.01 0.01 0.01 0.01 0.01 0.01 0.01 0.01 0.0175 0.0250
Ast (in2) 2.25 2.25 2.25 2.25 2.25 2.25 2.25 2.25 3.9375 5.625
Steel Provided 4 #7 4 #7 4 #7 4 #7 4 #7 4 #7 4 #7 4#7 4 #9 4 #11* Tie Spacing
smax (1) (in) 14 14 14 14 14 14 14 14 18.048 22.4
smax (2) (in) 24 24 24 24 24 24 24 24 24 24
smax (3) (in) 15 15 15 15 15 15 15 15 15 15
smax (governing) 14 14 14 14 14 14 14 14 15 15
Ties Provided #4 @ 14"
#4 @ 14"
#4 @ 14"
#4 @ 14"
#4 @ 14"
#4 @ 14"
#4 @ 14"
#4 @ 14"
#4 @ 15"
#4 @ 15"

Bartolini | 73
Table H6: Column Reinforcement | Minimum Axial | Exterior Column Lines C, D and E
1L 1U 2L 2U 3L 3U 4L 4U 5L 5U Unfactored Loads
Beam Moment (DL) (k-ft) 65.0 65.0 65.0 65.0 65.0 65.0 65.0 65.0 65.0 68.9
Beam Moment (LL) (k-ft) 39.5 39.5 39.5 39.5 39.5 39.5 39.5 39.5 39.5 16.9
Distance Ratio 0.213 0.426 0.574 0.5 0.5 0.5 0.5 0.5 0.5 1 Column Moment
(DL) (k-ft) 13.84 27.68 37.30 32.49 32.49 32.49 32.49 32.49 32.49 68.93
Column Moment (LL) (k-ft) 8.41 16.82 22.66 19.74 19.74 19.74 19.74 19.74 19.74 16.92
Axial Force (DL) (k) 130.44 126.70 103.89 101.08 78.27 75.46 52.65 49.83 27.02 24.21
Axial Force (LL) (k) 14.00 14.00 14.00 14.00 14.00 14.00 14.00 6.13 6.00 6.00
Factored Loads
Mu (k-ft) 30.1 60.1 81.0 70.6 70.6 70.6 70.6 70.6 70.6 109.8
Pu (k) 178.9 174.4 147.1 143.7 116.3 112.9 85.6 69.6 42.0 38.7
Kn 0.306 0.298 0.251 0.246 0.199 0.193 0.146 0.086 0.052 0.048
Rn 0.04 0.08 0.11 0.10 0.10 0.10 0.10 0.07 0.07 0.11
pg 0.01 0.01 0.01 0.01 0.01 0.01 0.01 0.01 0.0175 0.025
Ast (in2) 2.25 2.25 2.25 2.25 2.25 2.25 2.25 2.25 3.9375 5.625
Steel Provided 4 #7 4 #7 4 #7 4 #7 4 #7 4 #7 4 #7 4 #7* 4 #9* 4 #11* Tie Spacing
smax (1) (in) 14 14 14 14 14 14 14 14 18.048 22.4
smax (2) (in) 24 24 24 24 24 24 24 24 24 24
smax (3) (in) 15 15 15 15 15 15 15 15 15 15
smax (governing) 14 14 14 14 14 14 14 14 15 15
Ties Provided #4 @ 14"
#4 @ 14"
#4 @ 14"
#4 @ 14"
#4 @ 14"
#4 @ 14"
#4 @ 14"
#4 @ 14"
#4 @ 15"
#4 @ 15"
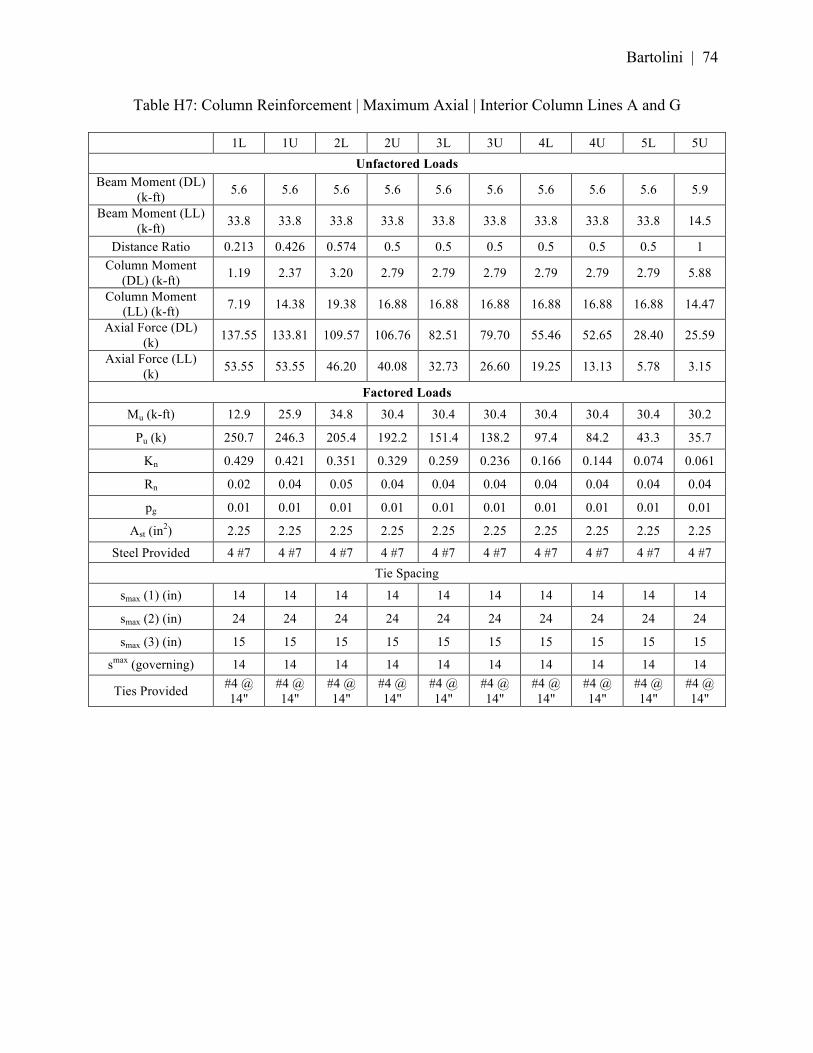
Bartolini | 74
Table H7: Column Reinforcement | Maximum Axial | Interior Column Lines A and G
1L 1U 2L 2U 3L 3U 4L 4U 5L 5U Unfactored Loads
Beam Moment (DL) (k-ft) 5.6 5.6 5.6 5.6 5.6 5.6 5.6 5.6 5.6 5.9
Beam Moment (LL) (k-ft) 33.8 33.8 33.8 33.8 33.8 33.8 33.8 33.8 33.8 14.5
Distance Ratio 0.213 0.426 0.574 0.5 0.5 0.5 0.5 0.5 0.5 1 Column Moment
(DL) (k-ft) 1.19 2.37 3.20 2.79 2.79 2.79 2.79 2.79 2.79 5.88
Column Moment (LL) (k-ft) 7.19 14.38 19.38 16.88 16.88 16.88 16.88 16.88 16.88 14.47
Axial Force (DL) (k) 137.55 133.81 109.57 106.76 82.51 79.70 55.46 52.65 28.40 25.59
Axial Force (LL) (k) 53.55 53.55 46.20 40.08 32.73 26.60 19.25 13.13 5.78 3.15
Factored Loads
Mu (k-ft) 12.9 25.9 34.8 30.4 30.4 30.4 30.4 30.4 30.4 30.2
Pu (k) 250.7 246.3 205.4 192.2 151.4 138.2 97.4 84.2 43.3 35.7
Kn 0.429 0.421 0.351 0.329 0.259 0.236 0.166 0.144 0.074 0.061
Rn 0.02 0.04 0.05 0.04 0.04 0.04 0.04 0.04 0.04 0.04
pg 0.01 0.01 0.01 0.01 0.01 0.01 0.01 0.01 0.01 0.01
Ast (in2) 2.25 2.25 2.25 2.25 2.25 2.25 2.25 2.25 2.25 2.25
Steel Provided 4 #7 4 #7 4 #7 4 #7 4 #7 4 #7 4 #7 4 #7 4 #7 4 #7 Tie Spacing
smax (1) (in) 14 14 14 14 14 14 14 14 14 14
smax (2) (in) 24 24 24 24 24 24 24 24 24 24
smax (3) (in) 15 15 15 15 15 15 15 15 15 15
smax (governing) 14 14 14 14 14 14 14 14 14 14
Ties Provided #4 @ 14"
#4 @ 14"
#4 @ 14"
#4 @ 14"
#4 @ 14"
#4 @ 14"
#4 @ 14"
#4 @ 14"
#4 @ 14"
#4 @ 14"

Bartolini | 75
Table H8: Column Reinforcement | Minimum Axial | Interior Column Lines A and G
1L 1U 2L 2U 3L 3U 4L 4U 5L 5U Unfactored Loads
Beam Moment (DL) (k-ft) 5.6 5.6 5.6 5.6 5.6 5.6 5.6 5.6 5.6 5.9
Beam Moment (LL) (k-ft) 33.8 33.8 33.8 33.8 33.8 33.8 33.8 33.8 33.8 14.5
Distance Ratio 0.213 0.426 0.574 0.5 0.5 0.5 0.5 0.5 0.5 1 Column Moment
(DL) (k-ft) 1.19 2.37 3.20 2.79 2.79 2.79 2.79 2.79 2.79 5.88
Column Moment (LL) (k-ft) 7.19 14.38 19.38 16.88 16.88 16.88 16.88 16.88 16.88 14.47
Axial Force (DL) (k) 137.55 133.81 109.57 106.76 82.51 79.70 55.46 52.65 28.40 25.59
Axial Force (LL) (k) 13.13 13.13 13.13 13.13 13.13 13.13 13.13 13.13 5.78 3.15
Factored Loads
Mu (k-ft) 12.9 25.9 34.8 30.4 30.4 30.4 30.4 30.4 30.4 30.2
Pu (k) 186.1 181.6 152.5 149.1 120.0 116.6 87.6 84.2 43.3 35.7
Kn 0.318 0.310 0.261 0.255 0.205 0.199 0.150 0.144 0.074 0.061
Rn 0.02 0.04 0.05 0.04 0.04 0.04 0.04 0.04 0.04 0.04
pg 0.01 0.01 0.01 0.01 0.01 0.01 0.01 0.01 0.01 0.01
Ast (in2) 2.25 2.25 2.25 2.25 2.25 2.25 2.25 2.25 2.25 2.25
Steel Provided 4 #7 4 #7 4 #7 4 #7 4 #7 4 #7 4 #7 4 #7 4 #7 4 #7 Tie Spacing
smax (1) (in) 14 14 14 14 14 14 14 14 14 14
smax (2) (in) 24 24 24 24 24 24 24 24 24 24
smax (3) (in) 15 15 15 15 15 15 15 15 15 15
smax (governing) 14 14 14 14 14 14 14 14 14 14
Ties Provided #4 @ 14"
#4 @ 14"
#4 @ 14"
#4 @ 14"
#4 @ 14"
#4 @ 14"
#4 @ 14"
#4 @ 14"
#4 @ 14"
#4 @ 14"

Bartolini | 76
Table H9: Column Reinforcement | Maximum Axial | Interior Column Lines B and F
1L 1U 2L 2U 3L 3U 4L 4U 5L 5U Unfactored Loads
Beam Moment (DL) (k-ft) 16.7 16.7 16.7 16.7 16.7 16.7 16.7 16.7 16.7 17.6
Beam Moment (LL) (k-ft) 72.4 72.4 72.4 72.4 72.4 72.4 72.4 72.4 72.4 31.0
Distance Ratio 0.213 0.426 0.574 0.5 0.5 0.5 0.5 0.5 0.5 1 Column Moment
(DL) (k-ft) 3.56 7.11 9.59 8.35 8.35 8.35 8.35 8.35 8.35 17.60
Column Moment (LL) (k-ft) 15.41 30.82 41.53 36.18 36.18 36.18 36.18 36.18 36.18 31.01
Axial Force (DL) (k) 251.84 248.10 201.31 198.50 151.70 148.89 102.10 99.29 52.49 49.68
Axial Force (LL) (k) 114.75 114.75 99.00 85.88 70.13 57.00 41.25 28.13 12.38 6.75
Factored Loads
Mu (k-ft) 28.9 57.9 78.0 67.9 67.9 67.9 67.9 67.9 67.9 70.7
Pu (k) 485.8 481.3 400.0 375.6 294.2 269.9 188.5 164.1 82.8 70.4
Kn 0.830 0.823 0.684 0.642 0.503 0.461 0.322 0.281 0.142 0.087
Rn 0.04 0.02 0.11 0.09 0.09 0.09 0.09 0.09 0.09 0.07
pg 0.02 0.02 0.015 0.010 0.01 0.01 0.01 0.01 0.01 0.01
Ast (in2) 3.375 4.5 3.375 2.25 2.25 2.25 2.25 2.25 2.25 2.25
Steel Provided 4 #9 4 #9 4 # 9 4 #7 4 #7 4 #7 4 #7 4 #7 4 #7 4 #7* Tie Spacing
smax (1) (in) 18.048 18.048 14 14 14 14 14 14 14 14
smax (2) (in) 24 24 24 24 24 24 24 24 24 24
smax (3) (in) 15 15 15 15 15 15 15 15 15 15
smax (govering) 15 15 14 14 14 14 14 14 14 14
Ties Provided #4 @ 15"
#4 @ 15"
#4 @ 15"
#4 @ 14"
#4 @ 14"
#4 @ 14"
#4 @ 14"
#4 @ 14"
#4 @ 14"
#4 @ 14"

Bartolini | 77
Table H10: Column Reinforcement | Minimum Axial | Interior Column Lines B and F
1L 1U 2L 2U 3L 3U 4L 4U 5L 5U Unfactored Loads
Beam Moment (DL) (k-ft) 16.7 16.7 16.7 16.7 16.7 16.7 16.7 16.7 16.7 17.6
Beam Moment (LL) (k-ft) 72.4 72.4 72.4 72.4 72.4 72.4 72.4 72.4 72.4 31.0
Distance Ratio 0.213 0.426 0.574 0.5 0.5 0.5 0.5 0.5 0.5 1 Column Moment
(DL) (k-ft) 3.56 7.11 9.59 8.35 8.35 8.35 8.35 8.35 8.35 17.60
Column Moment (LL) (k-ft) 15.41 30.82 41.53 36.18 36.18 36.18 36.18 36.18 36.18 31.01
Axial Force (DL) (k) 251.84 248.10 201.31 198.50 151.70 148.89 102.10 99.29 52.49 49.68
Axial Force (LL) (k) 28.13 28.13 28.13 28.13 28.13 28.13 28.13 28.13 12.38 6.75
Factored Loads
Mu (k-ft) 28.9 57.9 78.0 67.9 67.9 67.9 67.9 67.9 67.9 70.7
Pu (k) 347.2 342.7 286.6 283.2 227.0 223.7 167.5 164.1 82.8 70.4
Kn 0.594 0.586 0.490 0.484 0.388 0.382 0.286 0.281 0.142 0.087
Rn 0.04 0.08 0.11 0.09 0.09 0.09 0.09 0.09 0.09 0.07
pg 0.01 0.01 0.01 0.01 0.01 0.01 0.01 0.01 0.01 0.01
Ast (in2) 2.25 2.25 2.25 2.25 2.25 2.25 2.25 2.25 2.25 2.25
Steel Provided 4 #7 4 #7 4 #7 4 #7 4 #7 4 #7 4 #7 4 #7 4 #7 4 #7* Tie Spacing
smax (1) (in) 14 14 14 14 14 14 14 14 14 14
smax (2) (in) 24 24 24 24 24 24 24 24 24 24
smax (3) (in) 15 15 15 15 15 15 15 15 15 15
smax (govering) 14 14 14 14 14 14 14 14 14 14
Ties Provided #4 @ 14"
#4 @ 14"
#4 @ 14"
#4 @ 14"
#4 @ 14"
#4 @ 14"
#4 @ 14"
#4 @ 14"
#4 @ 14"
#4 @ 14"

Bartolini | 78
Table H11: Column Reinforcement | Maximum Axial | Interior Column Lines C, D and E
1L 1U 2L 2U 3L 3U 4L 4U 5L 5U Unfactored Loads
Beam Moment (DL) (k-ft) 10.9 10.9 10.9 10.9 10.9 10.9 10.9 10.9 10.9 11.6
Beam Moment (LL) (k-ft) 72.4 72.4 72.4 72.4 72.4 72.4 72.4 72.4 72.4 31.0
Distance Ratio 0.213 0.426 0.574 0.5 0.5 0.5 0.5 0.5 0.5 1 Column Moment
(DL) (k-ft) 2.32 4.64 6.26 5.45 5.45 5.45 5.45 5.45 5.45 11.56
Column Moment (LL) (k-ft) 15.41 30.82 41.53 36.18 36.18 36.18 36.18 36.18 36.18 31.01
Axial Force (DL) (k) 270.23 266.49 216.06 213.25 162.81 160.00 109.57 106.76 56.32 53.51
Axial Force (LL) (k) 122.40 122.40 105.60 91.60 74.80 60.80 44.00 30.00 13.20 7.20
Factored Loads
Mu (k-ft) 27.4 54.9 74.0 64.4 64.4 64.4 64.4 64.4 64.4 63.5
Pu (k) 520.1 515.6 428.2 402.5 315.1 289.3 201.9 176.1 88.7 75.7
Kn 0.889 0.881 0.732 0.688 0.539 0.494 0.345 0.301 0.152 0.093
Rn 0.04 0.08 0.10 0.09 0.09 0.09 0.09 0.09 0.09 0.06
pg 0.02 0.02 0.02 0.015 0.01 0.01 0.01 0.01 0.010 0.01
Ast (in2) 4.5 4.5 4.5 3.375 2.25 2.25 2.25 2.25 2.25 2.25
Steel Provided 4 #11 4 #11 4 #11 4 #11 4 #7 4 #7 4 #7 4 #7 4 #7 4 #7* Tie Spacing
smax (1) (in) 22.4 22.4 18.048 18.048 14 14 14 14 14 14
smax (2) (in) 24 24 24 24 24 24 24 24 24 24
smax (3) (in) 15 15 15 15 15 15 15 15 15 15
smax (governing) 15 15 15 15 14 14 14 14 14 14
Ties Provided #4 @ 15"
#4 @ 15"
#4 @ 15"
#4 @ 15"
#4 @ 14"
#4 @ 14"
#4 @ 14"
#4 @ 14"
#4 @ 14"
#4 @ 14"

Bartolini | 79
Table H12: Column Reinforcement | Minimum Axial | Interior Column Lines C, D and E
1L 1U 2L 2U 3L 3U 4L 4U 5L 5U Unfactored Loads
Beam Moment (DL) (k-ft) 10.9 10.9 10.9 10.9 10.9 10.9 10.9 10.9 10.9 11.6
Beam Moment (LL) (k-ft) 72.4 72.4 72.4 72.4 72.4 72.4 72.4 72.4 72.4 31.0
Distance Ratio 0.213 0.426 0.574 0.5 0.5 0.5 0.5 0.5 0.5 1 Column Moment
(DL) (k-ft) 2.32 4.64 6.26 5.45 5.45 5.45 5.45 5.45 5.45 11.56
Column Moment (LL) (k-ft) 15.41 30.82 41.53 36.18 36.18 36.18 36.18 36.18 36.18 31.01
Axial Force (DL) (k) 270.23 266.49 216.06 213.25 162.81 160.00 109.57 106.76 56.32 53.51
Axial Force (LL) (k) 30.00 30.00 30.00 30.00 30.00 30.00 30.00 30.00 13.20 7.20
Factored Loads Mu (k-ft) 27.4 54.9 74.0 64.4 64.4 64.4 64.4 64.4 64.4 63.5
Pu (k) 372.3 367.8 307.3 303.9 243.4 240.0 179.5 176.1 88.7 75.7
Kn 0.636 0.629 0.525 0.519 0.416 0.410 0.307 0.301 0.152 0.093
Rn 0.04 0.08 0.10 0.09 0.09 0.09 0.09 0.09 0.09 0.06
pg 0.01 0.01 0.01 0.01 0.01 0.01 0.01 0.01 0.01 0.010
Ast (in2) 2.25 2.25 2.25 2.25 2.25 2.25 2.25 2.25 2.25 2.25 Steel Provided 4 #7 4 #7 4 #7 4 #7 4 #7 4 #7 4 #7 4 #7 4 #7 4 #7
Tie Spacing smax (1) (in) 14 14 14 14 14 14 14 14 14 14
smax (2) (in) 24 24 24 24 24 24 24 24 24 24
smax (3) (in) 15 15 15 15 15 15 15 15 15 15
smax (governing) 14 14 14 14 14 14 14 14 14 14
Ties Provided #4 @ 14"
#4 @ 14"
#4 @ 14"
#4 @ 14"
#4 @ 14"
#4 @ 14"
#4 @ 14"
#4 @ 14"
#4 @ 14"
#4 @ 14"