Design and Optimization of Process in Spinning Mill to ...
6
International Journal of Recent Technology and Engineering (IJRTE) ISSN: 2277-3878, Volume-8 Issue-5, January 2020 1845 Published By: Blue Eyes Intelligence Engineering & Sciences Publication Retrieval Number: E5016018520 /2020©BEIESP DOI:10.35940/ijrte.E5016.018520 Design and Optimization of Process in Spinning Mill to Improve Quality and Productivity of Yarn Arif Kadir Mansuri, Sunil K. Somani Abstract— Food, shelter and clothing are very basic needs of human beings. Cloths are used by the human beings to protect themselves from light, wind and rain and other environmental factors. Cloths are manufactured from the cotton. In spinning mill industry raw cotton is processed to produce yarn. At present condition quality and productivity of yarn is very important factor and lot of mills failing to achieve the quality as per standards due to this the spinning mills are in financial crisis. In India many spinning mills have stopped their production. So it has direct impact on economical condition of farmers, mill workers and the people who are connected directly or indirectly to spinning mill industry. As it’s affecting the life of many people it is very important to do research work in this field but still now this topic is not touched by researchers in large context. This is the reason why this research work initiated. Various continuous improvements processes are used in industries. Instead of applying single method at one time if we use two methods in integrated approach which compliments each other that will give benefits of both methods in single attempt. To achieve the fine quality of yarn the continuous improvement processes can be used like Six Sigma and Theory of Constraints. If we combine six sigma and theory of constraints and apply over a system as an integrated method that would give us benefits of both methodologies in single attempt with saving of time, money and man power and in results we can achieve fine quality of yarn with increased plant productivity and efficiency which will leads to profitability of mill. In this research by applying the integrated model bottleneck processes were found out and optimum solution is provided by doing improvements in processes. The process capability analysis was done before and after improvements done so we can measure the performance of system. Yarn properties such as unevenness, imperfection index, count variation, hairiness, strength, short fiber content are considered as parameters to measure effectiveness of system. In current system before improvements done there was lot of variation in values of this parameters and by reducing this variations integrated approach leads towards the profitability of spinning mill. Keywords— Spinning mill, Yarn, Quality, Six Sigma, Theory of Constraints, and Integrated Approach. I. INTRODUCTION Now days every manufacturing industry uses the continuous improvement methods and management techniques like Six Sigma, Kaizen, 5S, Just in Time, Theory of constraints(TOC), Total Quality Control etc. to enhance the performance. To implement any of method industry spends its valuable time, money and efforts. If we integrate the two methodologies then in single attempt we can have benefits of two methods resulting in saving of time, money and efforts which required for implementation of method. Revised Manuscript Received on January 15, 2020 Arif Kadir Mansuri, Department of Mechanical Engineering, Sandip University Nashik, India [email protected] Dr. Sunil K. Somani, Vice Chancellor Department of Mechanical Engineering Medi-Caps University, M.P., India [email protected] This research integrates the two different methodologies Six Sigma and Theory of Constraints. This integrated approach applied in the spinning mill and final target was to improve the quality and productivity of final product. This integrated approach applied to spinning mill “Priyadarshini Sahakari Soot Girani Limited” situated in Shirpur town of Dhule district of Maharashtra state, India. In this spinning mill the bottleneck processes were found out and by use of integrated approach of six sigma and Theory of Constraints solutions are provided which leads to the improvement in quality and productivity of yarn. Six Sigma is a technique for process improvement introduced by Bill Smith while working at Motorola in 1980 further Jack Welch used it to his business strategy at General Electric in 1995[1]. A six sigma is process in which 99.99966% of all opportunities are expected to be free from defects. DMAIC is a basic tool of Six Sigma methodology. The DMAIC methodology has five phases as follows; 1. Define: Identify customer needs and critical to quality issue and select system, 2. Measure: Data collection and measure the performance of the selected process, 3. Analyze: Identify and determine defects and variation in process, 4. Improve: Identify causes and solution to remove them for process improvement, 5. Control: Maintain and sustain the improvement done using above phases [2]. The concept of theory of constraints (TOC) was invented by Dr. E. M. Goldratt in 1984 in his book ‘The Goal, he states that every system has at least one weakest link. This weakest link decreases the productivity, quality and efficiency of the system so it’s very important to identify that weakest link and eliminate it completely [3].TOC consists of five-step methodology. The 5 steps are given as, 1.Identify the constraint, 2.Exploit the constraint, 3.Subordinate the constraint, 4.Elevate the systems constraint, 5.If a constraint is broken then Repeat the cycle. Yarn properties such as unevenness, imperfection index, count variation, hairiness, strength, short fiber content are considered as parameters to measure effectiveness of system. Yarn evenness is the variation in linear density of yarn it can be defined as mass variation per unit length.Yarn unevenness(U%) is the variation in fineness of yarn per unit length. The inperfection in the yarn can be defined as the total number of thin places (-50%), thick places (+50%) and neps (+200%) present per kilo meter of yarn. Thin places, thick places and neps are the imperfection in the yarn they detoriates the quality of yarn so the values of imperfections should be as minimum as possible. Yarn hairiness can be defined as the quantity of freely moving fiber ends and loops of fiber projecting from yarn. The hairiness (H) means the total length of protruding fibers divided by the length of the sensor of 1 cm. The hairiness is parameter without a unit. SH is standard deviation of hairiness. Short fibers are the fibers less than 12.7 mm in length. Percentage of short fiber content denoted as sfc %.
-
Upload
khangminh22 -
Category
Documents
-
view
1 -
download
0
Transcript of Design and Optimization of Process in Spinning Mill to ...

International Journal of Recent Technology and Engineering (IJRTE) ISSN: 2277-3878, Volume-8 Issue-5, January 2020
1845
Published By: Blue Eyes Intelligence Engineering & Sciences Publication
Retrieval Number: E5016018520 /2020©BEIESP DOI:10.35940/ijrte.E5016.018520
Design and Optimization of Process in Spinning Mill to Improve Quality and Productivity of Yarn
Arif Kadir Mansuri, Sunil K. Somani
Abstract— Food, shelter and clothing are very basic needs of human beings. Cloths are used by the human beings to protect themselves from light, wind and rain and other environmental factors. Cloths are manufactured from the cotton. In spinning mill industry raw cotton is processed to produce yarn. At present condition quality and productivity of yarn is very important factor and lot of mills failing to achieve the quality as per standards due to this the spinning mills are in financial crisis. In India many spinning mills have stopped their production. So it has direct impact on economical condition of farmers, mill workers and the people who are connected directly or indirectly to spinning mill industry. As it’s affecting the life of many people it is very important to do research work in this field but still now this topic is not touched by researchers in large context. This is the reason why this research work initiated. Various continuous improvements processes are used in industries. Instead of applying single method at one time if we use two methods in integrated approach which compliments each other that will give benefits of both methods in single attempt. To achieve the fine quality of yarn the continuous improvement processes can be used like Six Sigma and Theory of Constraints. If we combine six sigma and theory of constraints and apply over a system as an integrated method that would give us benefits of both methodologies in single attempt with saving of time, money and man power and in results we can achieve fine quality of yarn with increased plant productivity and efficiency which will leads to profitability of mill. In this research by applying the integrated model bottleneck processes were found out and optimum solution is provided by doing improvements in processes. The process capability analysis was done before and after improvements done so we can measure the performance of system. Yarn properties such as unevenness, imperfection index, count variation, hairiness, strength, short fiber content are considered as parameters to measure effectiveness of system. In current system before improvements done there was lot of variation in values of this parameters and by reducing this variations integrated approach leads towards the profitability of spinning mill.
Keywords— Spinning mill, Yarn, Quality, Six Sigma, Theory
of Constraints, and Integrated Approach.
I. INTRODUCTION
Now days every manufacturing industry uses the continuous improvement methods and management techniques like Six Sigma, Kaizen, 5S, Just in Time, Theory of constraints(TOC), Total Quality Control etc. to enhance the performance. To implement any of method industry spends its valuable time, money and efforts. If we integrate the two methodologies then in single attempt we can have benefits of two methods resulting in saving of time, money and efforts which required for implementation of method.
Revised Manuscript Received on January 15, 2020 Arif Kadir Mansuri, Department of Mechanical Engineering, Sandip
University Nashik, India [email protected] Dr. Sunil K. Somani, Vice Chancellor Department of Mechanical
Engineering Medi-Caps University, M.P., India [email protected]
This research integrates the two different methodologies Six Sigma and Theory of Constraints. This integrated approach applied in the spinning mill and final target was to improve the quality and productivity of final product. This integrated approach applied to spinning mill “Priyadarshini Sahakari Soot Girani Limited” situated in Shirpur town of Dhule district of Maharashtra state, India. In this spinning mill the bottleneck processes were found out and by use of integrated approach of six sigma and Theory of Constraints solutions are provided which leads to the improvement in quality and productivity of yarn.
Six Sigma is a technique for process improvement introduced by Bill Smith while working at Motorola in 1980 further Jack Welch used it to his business strategy at General Electric in 1995[1]. A six sigma is process in which 99.99966% of all opportunities are expected to be free from defects. DMAIC is a basic tool of Six Sigma methodology. The DMAIC methodology has five phases as follows; 1. Define: Identify customer needs and critical to quality issue and select system, 2. Measure: Data collection and measure the performance of the selected process, 3. Analyze: Identify and determine defects and variation in process, 4. Improve: Identify causes and solution to remove them for process improvement, 5. Control: Maintain and sustain the improvement done using above phases [2].
The concept of theory of constraints (TOC) was invented by Dr. E. M. Goldratt in 1984 in his book ‘The Goal, he states that every system has at least one weakest link. This weakest link decreases the productivity, quality and efficiency of the system so it’s very important to identify that weakest link and eliminate it completely [3].TOC consists of five-step methodology. The 5 steps are given as, 1.Identify the constraint, 2.Exploit the constraint, 3.Subordinate the constraint, 4.Elevate the systems constraint, 5.If a constraint is broken then Repeat the cycle.
Yarn properties such as unevenness, imperfection index, count variation, hairiness, strength, short fiber content are considered as parameters to measure effectiveness of system. Yarn evenness is the variation in linear density of yarn it can be defined as mass variation per unit length.Yarn unevenness(U%) is the variation in fineness of yarn per unit length. The inperfection in the yarn can be defined as the total number of thin places (-50%), thick places (+50%) and neps (+200%) present per kilo meter of yarn. Thin places, thick places and neps are the imperfection in the yarn they detoriates the quality of yarn so the values of imperfections should be as minimum as possible. Yarn hairiness can be defined as the quantity of freely moving fiber ends and loops of fiber projecting from yarn. The hairiness (H) means the total length of protruding fibers divided by the length of the sensor of 1 cm. The hairiness is parameter without a unit. SH is standard deviation of hairiness. Short fibers are the fibers less than 12.7 mm in length. Percentage of short fiber content denoted as sfc %.

Design and Optimization of Process in Spinning Mill to Improve Quality and Productivity of Yarn
1846
Published By: Blue Eyes Intelligence Engineering & Sciences Publication
Retrieval Number: E5016018520 /2020©BEIESP DOI:10.35940/ijrte.E5016.018520
II. IMPLEMENTATION OF INTEGRATED
APPROACH
The parameters which influences the quality of yarn are yarn evenness, short fiber content, imperfection index, hairiness, thick places, thin places, strength, elongation, nep percentage etc. The quality of yarn is totally depends upon this parameters [4, 5, 6]. The survey was done in mill to find out bottlenecks in yarn manufacturing process. Due to these bottlenecks the quality of yarn was deteriorating and also productivity was low. So target was to remove bottlenecks and to achieve fine quality, higher productivity. Three bottle neck processes were found out in carding section, in comber section and in ring frame. After studying and research done on this processes the integrated approach were implemented through which some changes were suggested in system.
Figure1. Integrated approach for combining Six Sigma
and TOC For combing Six Sigma and Theory of Constraints integrated approach is given in figure 1. Different phases of Six Sigma and TOC are combined to form the integrated approach. The purpose of step 1of this integrated approach is to identify constraints presented in current system which acts as obstacle to achieve improvements and customer needs. Specific process is selected for the improvement from the system. Step 2 includes the measurement of performance and identification of root cause due to which performance of process reducing. In step 3 to remove the root cause by using manufacturing, engineering and statistical tools of Six Sigma and necessary improvements are done. In step 4 ensure that improvements done are supported by rest of system. Company employees are trained to monitor the system to sustain improvement. Step 5 includes continuously monitoring of system to find new constraints and then improve them [7, 8].
A.
2.1Phase I - Identification the constraints and determine process to be improved
Every system has at least one constraint or weak link which affects the performance of system. Identification of the constraints or weak links which reducing the quality and productivity of yarn was done. Due to these constraints the mill was suffering from problem of low profitability. According to TOC concept for improvement processes were chosen in which by making local improvements leads to the global benefits. After studying the processes thoroughly in spinning mill we identified the two constraints, first was “variation in quality parameters of yarn” such as count, evenness, thick places, thin places, nep percentage, hairiness and second was “waste”. These two things were identified
as the constraints or weak links and target was to eliminate them. The three sections which having bottleneck operations were selected for process improvement are mentioned-1. Carding section: In carding section there was scope to improve the quality of product by reducing the variation in quality parameters of yarn. By applying some local improvements in process the whole carding process can be improved.2. Comber section: While studying comber section it was found that wastage of material is the constraint to the system. Waste percent can be optimized by controlling removal of short fibers.3. Ring frame: This is most important section of spinning process. In this section sliver roving is get converted into yarn. This is very important process which affects quality of yarn. The improvements were found out and implemented in this section for better results.
These three sections were chosen as target for improvement. The up gradation of current system was not feasible from economic point of view. So according to TOC concept it was decided to exploit the current technology to elevate the constraint by replacing the small parts which available in spinning mill only to avoid new investments. Following figure 2 shows the process flow chart of spinning mill industry. From figure we can understand how the row cotton gets converted into yarn with given different processes.
Figure 2. Process flow chart
2.2Phase II - Current Performance Measurement and Identification of Root Cause
This phase includes the measurement of current performance level of the system. This phase also includes identification of root cause which responsible for low quality and productivity of system. Current system performance can be calculated through process capability analysis. Process capability analysis is based on counting the number of defects produced by the system. The terms used in performance measurement.
Defect (D) - It is failure of system results in dissatisfaction of customer. It is the failure in process according to given specifications. If performance value of any unit is varying out of the standard range then it called as defective unit.

International Journal of Recent Technology and Engineering (IJRTE) ISSN: 2277-3878, Volume-8 Issue-5, January 2020
1847
Published By: Blue Eyes Intelligence Engineering & Sciences Publication
Retrieval Number: E5016018520 /2020©BEIESP DOI:10.35940/ijrte.E5016.018520
Unit (U) - Number of samples that inspected or tested. Opportunity (O) – chances to commit errors it is the
maximum numbers of defects possible in one unit. Defects per unit (DPU) = D/U Defects per unit opportunities = DPU/O = D/ (U x O) (DPO) Defects per million opportunities = DPO x 106 Yield
(DPMO) = (1-DPU) x 100 % [9]. Unevenness, imperfection index, count variation,
hairiness, strength, short fiber content are the parameters which considered as critical to quality.
Table 1. Sigma level calculation before improvement
As given in table 1 sampling is done for 72 hours (three days or 9 shifts), every day 100 units were tested. Sigma level was calculated to measure the performance of system before improve phase. The average sigma level was 3.78 and average yield percentage was 93.55 as shown in table.
In carding section carding machine used to open the fiber flocks to individual level, remove neps, clean impurities, eliminate short fibers, alignment of fiber i.e. parallelization and equalization is done and at last sliver formation is done. In carding machine stationary flats are used to open the fiber bundles. Stationary flats are of rectangular shape and have wire point structure. Flats available with different wire point densities. Wire point density is measured in points per square inch (PPSI). In current system flats with high number PPSI were used due to this yarn unevenness, imperfection index and hairiness was increasing.
Comber machine is used to remove short fibers so quality of product is maintained. These short fibers called as comber noil. If comber noil percentage is high then wastage of material increased and if it is to low then amount of short fiber increased and quality decreased. So there should be optimum value of comber noil percentage which giving high quality with lowest possible waste. But in current system comber noil percentage was not optimized leading to the waste of material and due to this productivity was lowered.
In ring frame section roving is converted into yarn by using the drafting system. This drafting system contains several components such as pressure arm, top and bottom rollers, cots, aprons etc. In current system breakage rate of yarn was high resulting in low quality and productivity and this was due to high imperfection index of yarn. One of reason of high imperfection index was high shoe hardness of rubber cot. It also influences the hairiness and evenness of yarn.
2.3Phase III - Improvement in process by exploiting the constraints
As explained earlier there was three sections of spinning mill where was the scope for improvement. In this phase the improvements are done. After the improvements done
samples were collected and send to the quality control lab for quality testing. Quality control lab has testing instruments for quality check of different parameters of yarn samples. The samples before and after improvements were tested using the instrument USTER TESTER 5 – S800 (UT-5) for unevenness of mass, imperfection index, Coefficient of variation of the yarn mass, and yarn hairiness.
2.3.1Improvement in carding section:
Carding is the most vital process in yarn manufacturing industry. In this process flocks of cotton fibers are opened to individual level, neps are removed, impurities are cleaned, short fibers are eliminated, alignment of fiber i.e. parallelization and equalization is done and at last sliver formation is done. The importance of carding process can be understood by proverbs which are very popular in spinning mill industries are “Carding is the heart of spinning process” and “Well carded is half spun”. Depending on quality of carding of the fiber the mill can produce a homogeneous, regular, resistant and clean yarn. Process of carding directly affects the quality of sliver and yarn characteristics [10]. Very high production rate of carding machine can affect the quality. The production rate of Rieter C 60 card machine is up to 220 kg of card sliver per hour.
The cylinder and flats combined forms the main carding zone in carding machine. The main functions of flats are opening of tufts or flocks into individual fibers, elimination impurities of various kinds, elimination of short fibers, elimination of nep and dust removal. The stationary flats are placed at two positions in carding machine above licker in and above doffer. The flats above licker in are called as SFL (stationary flats above licker in). Flats above doffer are called as SFD (stationary flats above doffer). The use of stationary flats is necessary in carding machines. The stationary flats at the licker-in side of the card are used to opening and cleaning the fibers. Flats reduce the workload of the cylinder and revolving tops and improve the quality of carded sliver [11]. The wire points density play important roll to ensure quality of yarn. It was found that current system using the stationary flats of licker in side with higher point density so it was making adverse effect on quality of yarn. So for improvement the stationary flats with high point density were replaced with flats which having low point density. Output of each condition is tested in quality department and comparative analysis was done. In current system SFL with PPSI 90,240,240,320,320,320,240,420,420 were used, consider this as condition 1. For improvement in system SFL replaced with PPSI 90, 90,140,140,140,240,240,320,320 consider this as condition 2. Flat with 90 PPSI means flat having wire point density of 90 PPSI (Points Per Square Inch).
Table 2. PPSI on SFL for condition 1 and 2
PPSI on SFL (Stationary Flat Licker in Side)
Condition 1 90,240,240,320,320,320,240,420,420
Condition 2 90, 90,140,140,140,240,240,320,320
The samples from above two conditions were taken and after testing comparative analysis done. Following graph with table shows the test results of condition 1 (before
Design and Optimization of Process in Spinning Mill to Improve Quality and Productivity of Yarn
1848
Published By: Blue Eyes Intelligence Engineering & Sciences Publication
Retrieval Number: E5016018520 /2020©BEIESP DOI:10.35940/ijrte.E5016.018520
improvement) and condition 2 (after improvement).
Condition 1
Condition 2
U% 13.36 12.86
Thin -50%/km 28.5 19.5
Thick +50%/km 41 36.5
Neps +200%/km 77.4 55.8
Total IPI 146.9 111.8
H 6.45 6.06
020406080
100120140160
Yarn
pro
pert
ise
Figure 3. Effect on yarn parameters when PPSI changed in SFL
As shown in above figure 3 which includes graph and table shows the effect on yarn parameters when we reduce the PPSI on SFL. It was observed that as the PPSI on SFL decreases the yarn unevenness (U%), total imperfection index (addition of thin -50%/km, thick +50%/km and neps +200%/km) and hairiness (H) are also decreases which results in higher quality of yarn. Also increases the productivity of mill.
2.3.2 Improvement in Comber machine:
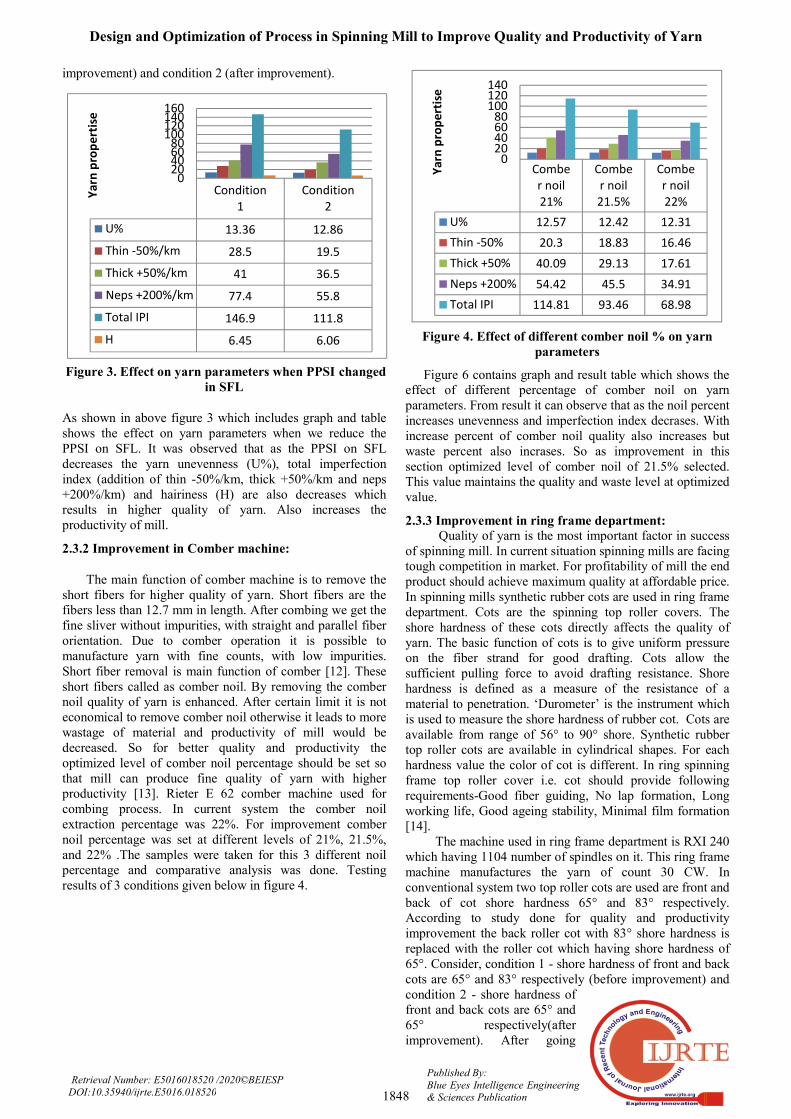
The main function of comber machine is to remove the short fibers for higher quality of yarn. Short fibers are the fibers less than 12.7 mm in length. After combing we get the fine sliver without impurities, with straight and parallel fiber orientation. Due to comber operation it is possible to manufacture yarn with fine counts, with low impurities. Short fiber removal is main function of comber [12]. These short fibers called as comber noil. By removing the comber noil quality of yarn is enhanced. After certain limit it is not economical to remove comber noil otherwise it leads to more wastage of material and productivity of mill would be decreased. So for better quality and productivity the optimized level of comber noil percentage should be set so that mill can produce fine quality of yarn with higher productivity [13]. Rieter E 62 comber machine used for combing process. In current system the comber noil extraction percentage was 22%. For improvement comber noil percentage was set at different levels of 21%, 21.5%, and 22% .The samples were taken for this 3 different noil percentage and comparative analysis was done. Testing results of 3 conditions given below in figure 4.
Comber noil 21%
Comber noil 21.5%
Comber noil 22%
U% 12.57 12.42 12.31
Thin -50% 20.3 18.83 16.46
Thick +50% 40.09 29.13 17.61
Neps +200% 54.42 45.5 34.91
Total IPI 114.81 93.46 68.98
020406080
100120140
Yarn
pro
pert
ise
Figure 4. Effect of different comber noil % on yarn
parameters
Figure 6 contains graph and result table which shows the effect of different percentage of comber noil on yarn parameters. From result it can observe that as the noil percent increases unevenness and imperfection index decrases. With increase percent of comber noil quality also increases but waste percent also incrases. So as improvement in this section optimized level of comber noil of 21.5% selected. This value maintains the quality and waste level at optimized value.
2.3.3 Improvement in ring frame department: Quality of yarn is the most important factor in success
of spinning mill. In current situation spinning mills are facing tough competition in market. For profitability of mill the end product should achieve maximum quality at affordable price. In spinning mills synthetic rubber cots are used in ring frame department. Cots are the spinning top roller covers. The shore hardness of these cots directly affects the quality of yarn. The basic function of cots is to give uniform pressure on the fiber strand for good drafting. Cots allow the sufficient pulling force to avoid drafting resistance. Shore hardness is defined as a measure of the resistance of a material to penetration. ‘Durometer’ is the instrument which is used to measure the shore hardness of rubber cot. Cots are available from range of 56° to 90° shore. Synthetic rubber top roller cots are available in cylindrical shapes. For each hardness value the color of cot is different. In ring spinning frame top roller cover i.e. cot should provide following requirements-Good fiber guiding, No lap formation, Long working life, Good ageing stability, Minimal film formation [14].
The machine used in ring frame department is RXI 240 which having 1104 number of spindles on it. This ring frame machine manufactures the yarn of count 30 CW. In conventional system two top roller cots are used are front and back of cot shore hardness 65° and 83° respectively. According to study done for quality and productivity improvement the back roller cot with 83° shore hardness is replaced with the roller cot which having shore hardness of 65°. Consider, condition 1 - shore hardness of front and back cots are 65° and 83° respectively (before improvement) and condition 2 - shore hardness of front and back cots are 65° and 65° respectively(after improvement). After going

International Journal of Recent Technology and Engineering (IJRTE) ISSN: 2277-3878, Volume-8 Issue-5, January 2020
1849
Published By: Blue Eyes Intelligence Engineering & Sciences Publication
Retrieval Number: E5016018520 /2020©BEIESP DOI:10.35940/ijrte.E5016.018520
through various tests the comparative analysis was done. Figure 5 contains the graph and table of test results
shows the effect on yarn parameters when cot shore hardness is decreased. As figure 9 indicates when the shoe hardness of cot is decreased the yarn unevenness (U %), count variation (CVm %), total imperfection index (IPI), hairiness (H) and standard deviation of hairiness (SH) also decreases. It results in greater yarn quality and productivity. This happens due to use of soft cot. With low cot shore hardness the area of contact between cot and steel bottom roller increases. When higher will the contact area nit gives higher mass uniformity of yarn and unevenness in yarn decreases. The length of area of contact between rubber cot and steel bottom roller is inversely proportional to the shore hardness value of rubber cot.
Figure 5. Effect on yarn parameters when cot shore hardness is decreased.
2.4 Measurement of sigma level after improvements done
After improvement done in 3 sections again six sigma levels were calculated as given in following table.
Table 3. Sigma level calculation after improvement
As shown in table 3 sampling process was done for 72 hours (3 days or 9 shifts) after improvements done and by using the process capability analysis sigma level was calculated.
2.5 Phase IV - Subordinate the system to sustain the improvement.
After the improvements done to the existing system it is time to support the changes done to the system. In this phase it is very important to monitor the process and to confirm that the improvements are sustained. The industry can leads towards the profitability only if the improvements done are maintained. In this case in spinning mill operators, quality
persons and technicians were trained to monitor the improved process for its sustainability. In this work by using the integrated approach the process capability of spinning mill industry is improved by raising the sigma level from 3.78 to 4.03. The yield percentage increased from 93.55percent to 96.71 percent after improvement. 2.6 Phase V - Elevate the constraints
After the improvements done and sustain up to IV phase, in V phase the industry should be in search of new constraints and also monitor the process any they should find the appropriate solution to new constraints so quality and productivity will be maintained. When the integrated approach is applied over the spinning mill, the two techniques six sigma and theory of constraints were complimenting each other.
III. RESULT AND DISCUSSION
As shown in table 3 sampling process was done for 3 days after improvements done and calculated the sigma level. The average sigma level was 4.03 and average yield percentage was 96.71 after the improvements. In figure 6 and 7comparison between sigma level before and after improvements and comparison between yield percentage level before and after improvements was done.
Figure 6. Sigma level comparison
Figure 7. Yield level comparison

Design and Optimization of Process in Spinning Mill to Improve Quality and Productivity of Yarn
1850
Published By: Blue Eyes Intelligence Engineering & Sciences Publication
Retrieval Number: E5016018520 /2020©BEIESP DOI:10.35940/ijrte.E5016.018520
In carding section when we reduced the wire point density we can observe that there is decrease in unevenness, total imperfection levels and hairiness of yarn, so as this parameters reduced quality of yarn raises and productivity also enhanced.
In comber section results were taken for 3different comber noil percentages and optimized level of 21.5% selected for improvement, so it effects on waste generated by comber i.e. waste is reduced by 0.5%.
In ring frame section top front rubber cot with hardness 65° and top back rubber cot with hardness 83° were used. In this experimental work the front back roller cot which having high shore hardness is replaced with the cot with low hardness of 65°. When the shoe hardness decreased the parameters unevenness, count variation, total imperfection levels, hairiness also reduced. Also when cot with high hardness used it has lower abrasion resistance results in wear and tear of surface which shortens the durability of cot. When we use hard cot it has long life than soft cot but badly affects the quality and productivity of yarn.
IV. CONCLUSION
In this work by applying the integrated approach of Six Sigma and TOC the sigma level of spinning mill industry was raised from 3.788 to 4.03. Due to this, variations of parameters which are critical to quality is reduced so results in the production of cotton yarn with fine quality which can be acceptable all over world. After improvements done it was seen yield percentage of spinning mill raised from 93.55 % to 96.71 %.
In this integrated approach management aspects of TOC and engineering aspects of Six Sigma are used. TOC concept identifies the weakest link in system and eliminated the weak link to achieve global benefits while Six sigma identifies the customer needs, measure performances by its engineering and statistical tools during the integrated approach.
It can be concluded that the integrated model will be always beneficial than the use of single or individual method. In any industry to use any of the continuous improvement method will requires a lot of efforts, money and man power to achieve the target. So if we use the integrated model it will definitely give the better results with maximum output at minimum investment. We can get the primary effect level from one methodology, and secondary and tertiary effect level from other methodology. So the newly integrated methodology can be results into serious advantages. Theory of constraints helps to eliminating out the limiting factor which is obstacle in the growth and profitability of system while Six Sigma concentrates on customer needs, performance measures and statistical tools which results in increased efficiency and profitability of system. This approach can be applied to other process industries also.
In the spinning mill industry this integrated approach can effectively used which can be results in higher yarn productivity, higher quality with saving of money, time and man power. This will also optimize the whole process and will leads towards the profitability of mill.
REFERENCES
1. Bisgaard S and Freiesleben J, ‘Six Sigma and the bottom line’, Quality progress, Journal of High Energy Physics 2004, Vol. 37, No. 9. pp 57-62.
2. Ali Erdogan and Hacer Canatan, “Literature Search Consisting of the Areas of Six Sigma’s Usage”, Procedia - Social and Behavioral Sciences 195, 2015, pp 695 – 704.
3. Cox, Jeff; Goldratt, Eliyahu M., The goal: a process of ongoing improvement. [Croton-on-Hudson, New York]: North River Press 1986, ISBN 0-88427-061-0.
4. H. Taher, A. Bechir, B. Mohamed and S. Faouzi, Influence of Spinning Parameters and Recovered Fibers from Cotton Waste on the Uniformity and Hairiness of Rotor Spun Yarn, Journal of Engineered Fibers and Fabrics 2009, Volume 4, Issue 3, pp 36-44.
5. T. Jackowski, B. Chylewska and D. Cyniak, Influence of the Spinning Process Parameters on Strength Characteristics of Cotton Yarns, Technical University of £ódŸ,ul. eromskiego 2002, 90-543 £ódŸ, Poland, pp 27-31.
6. P. Balasubramanian, Production of international quality of yarn, International Journal of Fiber and Textile Research 1992, Vol. 17,pp 267-270.
7. Ike Ehie and Chwen Sheu, “Integrating Six Sigma and Theory of Constraints for Continuous Improvement: A Case Study”, Journal of Manufacturing Technology Management 2005, Vol. 16, Issue 5, pp 542-553.
8. Arif K. Mansuri, “A Review on Management Tools and an Integrated Approach for Process Improvement”, International Journal of Engineering Technology and Management 2015, Volume 2, Issue 6, pp 32-41.
9. Breyfogle, F.W., Implementing Six Sigma: Smarter Solutions using Statistical Methods, John Wiley & Sons, 605 Third Ave 1999,ISBN 0-471--29659-7.c
10. C. Patil, R. Parsi, and R. Mehta, Impact of Latest Card on Yarn Quality, International Journal on Textile Engineering and Processes (2016), ISSN 2395-3578 Vol. 2, Issue 4, pp 24-30.
11. Bhushan Patil, R.D.Parsi, M. Kakde and S. Jadhav, To reduce card waste by SFD inactive and its impact on yarn quality, International Journal on Textile Engineering and Processes (2016), ISSN 2395-3578, Vol. 2, Issue 1, pp 64-67.
12. M. Messiry, N. Hosny and G. Esmat, Optimization of the combing noil percentage for quality single and ply compact spun yarn, Alexandria Engineering Journal 52 (2013),pp 307-311.
13. D. Thibodeaux, H. Senter, J. Knowlton, D. McAlister, and X. Cui, The Impact of Short Fiber Content on the Quality of Cotton Ring Spun Yarn, The Journal of Cotton Science 12 (2008), pp 368-377.
14. A. Akbar, M. Zeshan, M. Neaz, Y. Cai, and L. Lin, Effect of Ring Machine Front Roller Rubber Cot Hardness on Properties of Coarser Yarn, The International Conference on Composite Material, Polymer Science and Engineering (2017), Vol. 130, Issue MATEC Web Conf., pp 1-5.